UNITED STATES
SECURITIES AND EXCHANGE COMMISSION
FORM N-CSR
CERTIFIED SHAREHOLDER REPORT OF REGISTERED MANAGEMENT INVESTMENT COMPANIES
Investment Company Act file number811-01829
Columbia Acorn Trust
(Exact name of registrant as specified in charter)
71 S Wacker Dr.
Suite 2500
Chicago, IL 60606, USA
(Address of principal executive offices) (Zip code)
Ryan C. Larrenaga
c/o Columbia Management
Investment Advisers, LLC
290 Congress Street
Boston, Massachusetts 02210
Daniel J. Beckman
c/o Columbia Management Investment Advisers, LLC
290 Congress Street
Boston, Massachusetts 02210
Mary C. Moynihan
Perkins Coie LLP
700 13th Street, NW
Suite 800
Washington, DC 20005
(Name and address of agent for service)
Registrant's telephone number, including area code: (312) 634-9200
Date of fiscal year end: December 31
Date of reporting period: December 31, 2021
Form N-CSR is to be used by management investment companies to file reports with the Commission not later than 10 days after the transmission to stockholders of any report that is required to be transmitted to stockholders under Rule 30e-1 under the Investment Company Act of 1940 (17 CFR 270.30e-1). The Commission may use the information provided on Form N-CSR in its regulatory, disclosure review, inspection, and policymaking roles.
A registrant is required to disclose the information specified by Form N-CSR, and the Commission will make this information public. A registrant is not required to respond to the collection of information contained in Form N-CSR unless the Form displays a currently valid Office of Management and Budget ("OMB") control number. Please direct comments concerning the accuracy of the information collection burden estimate and any suggestions for reducing the burden to Secretary, Securities and Exchange Commission, 100 F Street, NE, Washington, DC 20549. The OMB has reviewed this collection of information under the clearance requirements of 44 U.S.C. § 3507.
Item 1. Reports to Stockholders.

Annual Report
December 31, 2021
Columbia
Acorn® Fund
Columbia
Acorn International®
Columbia
Acorn USA®
Columbia
Acorn International SelectSM
Columbia
Thermostat FundSM
Columbia
Acorn European FundSM
Not Federally Insured • No Financial Institution Guarantee • May Lose Value
| 3 |
| 5 |
| 7 |
| 9 |
| 11 |
| 13 |
| 15 |
| 17 |
| 19 |
| 21 |
| 23 |
| 25 |
| 27 |
| 30 |
| 53 |
| 57 |
| 59 |
| 66 |
| 90 |
| 112 |
| 113 |
| 114 |
| 117 |
| 122 |
Columbia Acorn Family of Funds | Annual Report 2021
Fund at a glance
Columbia Acorn® Fund
Investment objective
Columbia Acorn® Fund (the Fund) seeks long-term capital appreciation.
Portfolio management
Daniel Cole, CFA
Co-Portfolio Manager since April 2021
Service with Fund since 2021
Erika K. Maschmeyer, CFA
Co-Portfolio Manager since 2019
Service with Fund since 2016
John L. Emerson, CFA
Co-Portfolio Manager since April 2021
Service with Fund since 2003
Morningstar style boxTM
The Morningstar Style Box is based on a fund’s portfolio holdings. For equity funds, the vertical axis shows the market capitalization of the stocks owned, and the horizontal axis shows investment style (value, blend, or growth). Information shown is based on the most recent data provided by Morningstar.
© 2022 Morningstar, Inc. All rights reserved. The Morningstar information contained herein: (1) is proprietary to Morningstar and/or its content providers; (2) may not be copied or distributed; and (3) is not warranted to be accurate, complete or timely. Neither Morningstar nor its content providers are responsible for any damages or losses arising from any use of this information.
| Average annual total returns (%) (for the period ended December 31, 2021) |
| | | Inception | 1 Year | 5 Years | 10 Years | Life of Fund |
| Class A | Excluding sales charges | 10/16/00 | 8.79 | 16.00 | 13.35 | 13.97 |
| | Including sales charges | | 2.57 | 14.64 | 12.68 | 13.84 |
| Advisor Class | 11/08/12 | 9.03 | 16.27 | 13.61 | 14.32 |
| Class C | Excluding sales charges | 10/16/00 | 7.95 | 15.11 | 12.51 | 13.11 |
| | Including sales charges | | 7.10 | 15.11 | 12.51 | 13.11 |
| Institutional Class | 06/10/70 | 8.99 | 16.26 | 13.64 | 14.33 |
| Institutional 2 Class | 11/08/12 | 9.09 | 16.30 | 13.67 | 14.34 |
| Institutional 3 Class | 11/08/12 | 9.16 | 16.37 | 13.73 | 14.35 |
| Russell 2500 Growth Index | | 5.04 | 17.65 | 15.75 | - |
Performance numbers reflect all Fund expenses. Returns for Class A shares are shown with and without the maximum initial sales charge of 5.75%. Returns for Class C shares are shown with and without the maximum contingent deferred sales charge of 1.00% for the first year after purchase. The Fund’s other share classes are not subject to sales charges, but may be subject to other fees and expenses, and have limited eligibility. Please see the Fund’s prospectus for details. Performance for different share classes will vary based on differences in sales charges and certain fees and expenses associated with each share class.
As stated in the May 1, 2021 prospectus, as supplemented, the Fund’s annual operating expense ratio is 0.86% for Institutional Class shares and 1.11% for Class A shares.
All results shown assume reinvestment of distributions during the period. Returns do not reflect the deduction of taxes that a shareholder may pay on Fund distributions or on the redemption of Fund shares. Performance results reflect the effect of fee waivers or reimbursements of Fund expenses by the investment manager and/or its affiliates. Absent these fee waivers and/or expense reimbursement arrangements, performance results may have been lower.
The performance information shown represents past performance and is not a guarantee of future results. The investment return and principal value of your investment will fluctuate so that shares, when redeemed, may be worth more or less than their original cost. Current performance may be lower or higher than the performance data shown. You may obtain performance information current to the most recent month-end by contacting your financial intermediary, visiting columbiathreadneedleus.com/investor/ or calling 800.922.6769.
The returns shown for periods prior to the share class inception date (including returns for the Life of the Fund, if shown, which are since Fund inception) include the returns of the Fund’s oldest share class. These returns are adjusted to reflect any higher class-related operating expenses of the newer share classes, as applicable. Please visit columbiathreadneedleus.com/investor/investment-products/mutual-funds/appended-performance for more information.
The Russell 2500 Growth Index measures the performance of those Russell 2500 companies with higher price-to-book ratios and higher forecasted growth values.
Unlike mutual funds, indexes are not managed and do not incur fees or expenses. It is not possible to invest directly in an index.
The COVID-19 pandemic has adversely impacted economies and capital markets around the world in ways that will likely continue and may change in unforeseen ways for an indeterminate period. The COVID-19 pandemic may exacerbate pre-existing political, social and economic risks in certain countries and globally. Fund performance may be significantly negatively impacted by the economic impact of the COVID-19 pandemic.
Columbia Acorn Family of Funds | Annual Report 2021
| 3 |
Fund at a glance (continued)
Columbia Acorn® Fund
The Growth of a $10,000 Investment in Columbia Acorn® Fund Institutional Class Shares
December 31, 2011 through December 31, 2021
This chart shows the change in value of a hypothetical $10,000 investment in Institutional Class shares of the Fund during the stated time period. Although the index is provided for use in assessing the Fund’s performance, the Fund’s holdings may differ significantly from those in an index. Performance numbers reflect all Fund expenses.
| Portfolio breakdown (%) (at December 31, 2021) |
| Common Stocks | 97.4 |
| Money Market Funds | 1.8 |
| Securities Lending Collateral | 0.8 |
| Total | 100.0 |
Percentages indicated are based upon total investments excluding investments in derivatives, if any. The Fund’s portfolio composition is subject to change.
| Equity sector breakdown (%) (at December 31, 2021) |
| Communication Services | 3.5 |
| Consumer Discretionary | 19.0 |
| Consumer Staples | 2.3 |
| Energy | 1.5 |
| Financials | 4.4 |
| Health Care | 22.1 |
| Industrials | 14.6 |
| Information Technology | 28.3 |
| Materials | 2.6 |
| Real Estate | 1.7 |
| Total | 100.0 |
Percentages indicated are based upon total equity investments. The Fund’s portfolio composition is subject to change.
| 4 | Columbia Acorn Family of Funds | Annual Report 2021 |
Manager Discussion of Fund Performance
Columbia Acorn® Fund
Columbia Acorn® Fund Institutional Class shares returned 8.99% for the 12-month period ended December 31, 2021, outperforming the 5.04% return of the Fund’s primary benchmark, the Russell 2500 Growth Index.
Market overview
U.S. equities performed very well in 2021, with most aspects of the macroeconomic environment providing a tailwind for risk assets. Although COVID-19 remained persistent due to the emergence of new variants throughout the year, the rollout of multiple vaccines enabled a gradual return toward pre-pandemic business conditions. Economic growth surged as a result, leading to favorable comparisons versus the depressed levels of 2020. Corporate earnings rose in kind, with results tracking ahead of expectations in each of the year’s four quarters. Monetary and fiscal policy was also highly supportive, fueling a steady appetite for risk among investors.
Despite these positive developments, small- and mid-cap growth stocks trailed most other segments of the U.S. equity market in 2021. After performing reasonably well through mid-November, the asset class experienced considerable underperformance in the final six weeks of the year. The U.S. Federal Reserve’s indication of its intent to begin raising short-term interest rates in 2022 factored into the downturn late in the year. The prospect of higher interest rates is typically a headwind for small- to mid-sized growth stocks since it reduces the value of their expected future earnings when measured in current dollars.
The resulting sell-off represented one of the largest pullbacks in secular growth company investments that we have witnessed in many years. Believing this created some very attractive long-term opportunities, we remained on a sharp lookout for stocks that we believe have been unjustifiably beaten down by larger trends. As always, we stayed focused on seeking to invest in growing companies with outstanding business models and competitive advantages that we believe should strengthen over time.
The Fund’s broader investment strategy was an important reason for its outperformance in 2021. Lower quality companies, particularly those without current profits, lagged considerably during the downturn late in the year. On the other hand, the types of higher quality, profitable growers we seek held up much better than the overall small- and mid-cap category. We believe this helps illustrate the merits of emphasizing bottom-up company research rather than trying to predict macroeconomic developments such as inflation or the direction of Fed policy.
This steady approach helped the Fund meet or exceed the returns of the corresponding benchmark components in seven of the ten sectors in which it held a position.
The Fund’s notable contributors during the period
| • | Our process generated the best relative performance in the Fund’s information technology sector holdings. |
| ○ | Endava PLC, an IT consultant focused on helping its customers with digital transformations, was a top contributor in the sector. The company has effectively capitalized on the strong growth of its end markets, fueling an acceleration in revenues and bottom-line earnings. |
| ○ | Sprout Social, Inc., a provider of social media marketing management software, benefited from the rapid shift in corporate marketing budgets toward social media. |
| ○ | Bill.com Holdings, Inc. offers cloud-based software that helps small and mid-size businesses automate their back office financial operations. The shares rose due to an acquisition that is expected to help the company expand its customer base. |
| • | Our investments in financials also outpaced their sector peers by a wide margin. Upstart Holdings, Inc., which operates an artificial intelligence (AI)-based lending platform primarily serving the personal and auto loan market, was the leading contributor. The shares jumped as the company grew more quickly than expected since its December 2020 initial public offering. We sold the stock on the basis of valuation prior to its downturn late in the year. |
| • | Industrials was also an area of relative strength in 2021. |
Columbia Acorn Family of Funds | Annual Report 2021
| 5 |
Manager Discussion of Fund Performance (continued)
Columbia Acorn® Fund
| ○ | Atkor, Inc., a specialized producer of electrical products used in commercial and industrial end markets, is one of only a handful of vendors that supply a very fragmented customer base. This affords Atkor with what we call “niche dominance,” one of the key features we look for in our portfolio holdings. Broader trends were also at the company’s back in 2021, highlighted by rising prices for PVC pipe and steel. |
| ○ | Generac Holdings, Inc., a manufacturer of power-generation equipment, was another top performer in industrials. Generac’s offerings saw rapid adoption in recent years as the strained and aging U.S. power grid reinforced the value proposition of its products. |
| • | Sector allocations, while a residual effect of our bottom-up stock selection process, nonetheless contributed to performance in the annual period. Overweight positions in the strong-performing information technology and consumer discretionary sectors were the primary source of the positive results. |
The Fund’s notable detractors during the period
| • | Consumer discretionary was one of only three sectors in which our stock picks underperformed. |
| ○ | Chegg, Inc., a provider of online education-related content and support, was the largest detractor in both the sector and the Fund as a whole. Its growth rate moderated more than we expected following its pandemic-assisted gains in 2020, weighing on its shares. Still, we believe the company continues to offer the world’s leading online learning platform. |
| ○ | Vroom, Inc., an e-commerce platform for buying and selling new and used cars, also hurt relative performance in consumer discretionary. Vroom has a leading market position in this small but fast-growing area, but its stock lagged due in part to its announcement that it was increasing its investment in infrastructure. While investors focused on the effect this move would have on near-term profits, we believe it can help the company build its brand and achieve longer term scale benefits. |
| • | Our investments in health care trailed their sector peers as well. Amedisys, Inc., a home healthcare and hospice service provider, declined as the firm saw incrementally lower average length of patient stays. The downturn occurred despite positive trends in Amedisys’ core business segments and the broader backdrop of the aging U.S. population. |
Market risk may affect a single issuer, sector of the economy, industry or the market as a whole. Investments in small- and mid-cap companies involve risks and volatility and possible illiquidity greater than investments in larger, more established companies. Foreign investments subject the Fund to political, economic, market, social and other risks within a particular country, as well as to potential currency instabilities and less stringent financial and accounting standards generally applicable to U.S. issuers. Risks are enhanced for emerging market issuers. The Fund may invest significantly in issuers within a particular sector, which may be negatively affected by market, economic or other conditions, making the Fund more vulnerable to unfavorable developments in the sector. See the Fund’s prospectus for more information on these and other risks.
The views expressed in this report reflect the current views of the respective parties. These views are not guarantees of future performance and involve certain risks, uncertainties and assumptions that are difficult to predict, so actual outcomes and results may differ significantly from the views expressed. These views are subject to change at any time based upon economic, market or other conditions and the respective parties disclaim any responsibility to update such views. These views may not be relied on as investment advice and, because investment decisions for a Columbia Acorn Fund are based on numerous factors, may not be relied on as an indication of trading intent on behalf of any particular Columbia Acorn Fund. References to specific securities should not be construed as a recommendation or investment advice.
| 6 | Columbia Acorn Family of Funds | Annual Report 2021 |
Fund at a glance
Columbia Acorn International®
Investment objective
Columbia Acorn International® (the Fund) seeks long-term capital appreciation.
Portfolio management
Tae Han (Simon) Kim, CFA
Co-Portfolio Manager since 2017
Service with Fund since 2011
Hans F. Stege
Co-Portfolio Manager since 2020
Service with Fund since 2017
Morningstar style boxTM
The Morningstar Style Box is based on a fund’s portfolio holdings. For equity funds, the vertical axis shows the market capitalization of the stocks owned, and the horizontal axis shows investment style (value, blend, or growth). Information shown is based on the most recent data provided by Morningstar.
© 2022 Morningstar, Inc. All rights reserved. The Morningstar information contained herein: (1) is proprietary to Morningstar and/or its content providers; (2) may not be copied or distributed; and (3) is not warranted to be accurate, complete or timely. Neither Morningstar nor its content providers are responsible for any damages or losses arising from any use of this information.
| Average annual total returns (%) (for the period ended December 31, 2021) |
| | | Inception | 1 Year | 5 Years | 10 Years | Life of Fund |
| Class A | Excluding sales charges | 10/16/00 | 12.63 | 13.11 | 9.62 | 10.00 |
| | Including sales charges | | 6.17 | 11.78 | 8.98 | 9.78 |
| Advisor Class | 11/08/12 | 12.88 | 13.39 | 9.88 | 10.37 |
| Class C | Excluding sales charges | 10/16/00 | 11.76 | 12.26 | 8.80 | 9.18 |
| | Including sales charges | | 10.81 | 12.26 | 8.80 | 9.18 |
| Institutional Class | 09/23/92 | 12.89 | 13.39 | 9.91 | 10.38 |
| Institutional 2 Class | 08/02/11 | 12.97 | 13.46 | 9.97 | 10.39 |
| Institutional 3 Class | 11/08/12 | 13.00 | 13.51 | 10.01 | 10.42 |
| Class R | 08/02/11 | 12.34 | 12.83 | 9.29 | 9.71 |
| MSCI ACWI ex USA SMID Cap Growth Index (Net) | | 8.51 | 12.25 | 9.34 | - |
| MSCI ACWI ex USA SMID Cap Index (Net) | | 10.16 | 10.30 | 8.63 | - |
Performance numbers reflect all Fund expenses. Returns for Class A shares are shown with and without the maximum initial sales charge of 5.75%. Returns for Class C shares are shown with and without the maximum contingent deferred sales charge of 1.00% for the first year after purchase. The Fund’s other share classes are not subject to sales charges, but may be subject to other fees and expenses, and have limited eligibility. Please see the Fund’s prospectus for details. Performance for different share classes will vary based on differences in sales charges and certain fees and expenses associated with each share class.
As stated in the May 1, 2021 prospectus, as supplemented, the Fund’s annual operating expense ratio is 0.99% for Institutional Class shares and 1.24% for Class A shares.
All results shown assume reinvestment of distributions during the period. Returns do not reflect the deduction of taxes that a shareholder may pay on Fund distributions or on the redemption of Fund shares. Performance results reflect the effect of fee waivers or reimbursements of Fund expenses by the investment manager and/or its affiliates. Absent these fee waivers and/or expense reimbursement arrangements, performance results may have been lower.
The performance information shown represents past performance and is not a guarantee of future results. The investment return and principal value of your investment will fluctuate so that shares, when redeemed, may be worth more or less than their original cost. Current performance may be lower or higher than the performance data shown. You may obtain performance information current to the most recent month-end by contacting your financial intermediary, visiting columbiathreadneedleus.com/investor/ or calling 800.922.6769.
The returns shown for periods prior to the share class inception date (including returns for the Life of the Fund, if shown, which are since Fund inception) include the returns of the Fund’s oldest share class. These returns are adjusted to reflect any higher class-related operating expenses of the newer share classes, as applicable. Please visit columbiathreadneedleus.com/investor/investment-products/mutual-funds/appended-performance for more information.
The MSCI ACWI ex USA SMID Cap Growth Index (Net) captures a mid- and small-cap representation across 22 developed market countries and 25 emerging market countries.
The MSCI ACWI ex USA SMID Cap Index (Net) captures a mid- and small-cap representation across 22 of 23 developed market countries (excluding the United States) and 25 emerging market countries. The index covers approximately 28% of the free float-adjusted market capitalization in each country.
Unlike mutual funds, indexes are not managed and do not incur fees or expenses. It is not possible to invest directly in an index.
The COVID-19 pandemic has adversely impacted economies and capital markets around the world in ways that will likely continue and may change in unforeseen ways for an indeterminate period. The COVID-19 pandemic may exacerbate pre-existing political, social and economic risks in certain countries and globally. Fund performance may be significantly negatively impacted by the economic impact of the COVID-19 pandemic.
Columbia Acorn Family of Funds | Annual Report 2021
| 7 |
Fund at a glance (continued)
Columbia Acorn International®
The Growth of a $10,000 Investment in Columbia Acorn International® Institutional Class Shares
December 31, 2011 through December 31, 2021
This chart shows the change in value of a hypothetical $10,000 investment in Institutional Class shares of the Fund during the stated time period. Although the indexes are provided for use in assessing the Fund’s performance, the Fund’s holdings may differ significantly from those in an index. Performance numbers reflect all Fund expenses.
| Equity sector breakdown (%) (at December 31, 2021) |
| Communication Services | 4.4 |
| Consumer Discretionary | 12.6 |
| Consumer Staples | 2.7 |
| Financials | 8.6 |
| Health Care | 17.2 |
| Industrials | 21.2 |
| Information Technology | 25.1 |
| Materials | 4.4 |
| Real Estate | 3.8 |
| Total | 100.0 |
Percentages indicated are based upon total equity investments. The Fund’s portfolio composition is subject to change.
| Country breakdown (%) (at December 31, 2021) |
| Australia | 5.3 |
| Austria | 0.6 |
| Brazil | 1.8 |
| Canada | 2.6 |
| China | 2.4 |
| Denmark | 3.6 |
| Finland | 0.8 |
| France | 0.6 |
| Germany | 7.5 |
| Country breakdown (%) (at December 31, 2021) |
| Greece | 0.5 |
| Italy | 4.6 |
| Japan | 16.5 |
| Malta | 0.5 |
| Mexico | 1.1 |
| Netherlands | 4.3 |
| New Zealand | 1.9 |
| Russian Federation | 1.6 |
| Singapore | 1.1 |
| South Korea | 2.4 |
| Spain | 1.9 |
| Sweden | 9.8 |
| Switzerland | 3.6 |
| Taiwan | 5.4 |
| United Kingdom | 15.2 |
| United States(a) | 4.0 |
| Vietnam | 0.4 |
| Total | 100.0 |
| (a) | Includes investments in Money Market Funds. |
Country breakdown is based primarily on issuer’s place of organization/incorporation. Percentages indicated are based upon total investments excluding investments in derivatives, if any. The Fund’s portfolio composition is subject to change.
| 8 | Columbia Acorn Family of Funds | Annual Report 2021 |
Manager Discussion of Fund Performance
Columbia Acorn International®
Columbia Acorn International® Institutional Class shares returned 12.89% for the 12-month period ended December 31, 2021, outperforming the 8.51% return of the Fund’s primary benchmark, the MSCI ACWI ex USA SMID Cap Growth Index (Net). The Fund’s secondary benchmark, the MSCI ACWI ex USA SMID Cap Index (Net), ended the 12-month period with a return of 10.16%.
Market overview
International equities delivered robust total returns in 2021, as the gradual lifting of COVID-19-related restrictions led to a surge in economic growth and corporate earnings. Monetary policy was also supportive throughout the majority of the year, with central banks holding interest rates near zero and maintaining stimulative quantitative easing programs. Although concerns about new variants of the coronavirus, higher inflation, and the possibility of rising rates in 2022 weighed on sentiment at various points, most major world indexes closed the year at or near their all-time highs.
International small-cap growth stocks trailed the broader global markets in 2021. This reflected the underperformance of the foreign markets relative to the United States and the growth style compared to value. Still, the asset class continued to offer an abundance of opportunities for us to use our bottom-up approach to unearth higher quality, growing companies with pricing power, strong market positions, and capable management teams.
Since our emphasis is on individual stock selection, we don’t attempt to make macroeconomic forecasts. We believe we can add more value as managers by doing bottom-up research to identify compelling company-level ideas than we would by trying to anticipate the next market-moving headline. Moreover, we think the best way to navigate shifting market conditions is to maintain a steady focus on good companies that are executing well. The recent surge in inflation offers a prime example. We can’t predict which way inflation is going to trend in the year ahead, but we think our emphasis on companies with leading market positions and pricing power should hold the Fund in good stead across the full range of possible outcomes. Our belief that good companies can manage through any environment has been the foundation of our strategy over time. This steady approach worked well in 2021, as several of our longer term holdings delivered healthy returns on the strength of company-specific developments.
The Fund’s notable contributors during the period
| • | Our process generated strong relative performance in Fund holdings in the consumer staples sector. The luxury consumer products company Inter Parfums, Inc. accounted for nearly all of the contribution. While the company is based in France, the stock is listed in the United States. The valuation between the U.S. and French listings narrowed, benefiting the Fund. The market also recognized the potential for significant value creation from the company’s addition of two new luxury perfume brands. |
| • | The industrials sector was another area of strength for the Fund in the annual period. |
| ○ | IMCD NV, a Netherlands-based distributor of specialty chemicals, gained ground on the strength of better-than-expected results, rising market share, and improved pricing power. |
| ○ | AddTech AB, a Swedish provider of automation and manufacturing equipment, also made a sizable contribution to the Fund’s results. A larger, similar company went public late in the year, prompting investors to assign a higher valuation to AddTech. |
| • | Our stock picks also performed very well in the health care and communication services sectors. |
| ○ | Eckert & Ziegler Strahlen- und Medizintechnik AG, a German producer of radioactive isotopes and associated technology for use in medical, scientific and industrial end markets, was a top performer in health care. The company’s rapidly growing radiopharma segment benefited from the rise of precision oncology radiology treatments and associated advancements in PET/CT scan imaging systems. In addition, positive news flow around the use of these targeted therapies for prostate cancer raised expectations that the company could benefit from a large increase its addressable market. |
| ○ | Rightmove PLC, which operates the United Kingdom’s largest online real estate portal and property website, was the leading contributor in communication services. The stock rallied on the strength of the company’s sustained pricing power, rising revenue per user, and the general upswing in the nation’s property market. |
Columbia Acorn Family of Funds | Annual Report 2021
| 9 |
Manager Discussion of Fund Performance (continued)
Columbia Acorn International®
| • | Sector allocations, while a residual effect of our bottom-up stock selection process, nonetheless contributed to performance in the annual period. Overweight positions in information technology and financials aided results, as did an underweight in the defensive consumer staples sector and a lack of exposure to utilities stocks. |
The Fund’s notable detractors during the period
| • | The materials sector was one of only three sectors in which our stock picks underperformed. The shortfall was largely a result of weakness in the shares of the Swiss composite engineering company Gurit Holding AG. |
| • | The Fund also lost some ground in the consumer discretionary sector. Hikari Tsushin, Inc., a sales outsourcing company operating in Japan, was the largest detractor in the sector. The stock slid as volatility in its end markets caused investors to overlook the company’s ongoing shift to a recurring revenue model. |
| • | While the Fund’s information technology holdings lagged only slightly behind those in the benchmark, certain stocks finished among our largest detractors in 2021. |
| ○ | TeamViewer AG, based in Germany, was the Fund’s leading individual detractor. The stock was hurt by a management shuffle and weaker-than-expected profit margins. We became less enthusiastic on the company’s growth prospects, prompting us to sell the position. |
| ○ | Elecom Co., Ltd. is a Japanese producer of personal computer peripherals with an asset-light, e-commerce-driven business model. Although the firm has demonstrated prowess in development and execution, its shares experienced short-term weakness after its results came in below expectations. |
| ○ | SimCorp AS, a provider of investment management software solutions and services, also detracted due to slower new client signings stemming from COVID-related uncertainty. |
Market risk may affect a single issuer, sector of the economy, industry or the market as a whole. International investing involves certain risks and volatility due to potential political, economic or currency instabilities and different, potentially less stringent, financial and accounting standards than those generally applicable to U.S. issuers. Risks are enhanced for emerging market issuers. Investments in small- and mid-cap companies involve risks and volatility and possible illiquidity greater than investments in larger, more established companies. The Fund may invest significantly in issuers within a particular sector, which may be negatively affected by market, economic or other conditions, making the Fund more vulnerable to unfavorable developments in the sector. See the Fund’s prospectus for more information on these and other risks.
The views expressed in this report reflect the current views of the respective parties. These views are not guarantees of future performance and involve certain risks, uncertainties and assumptions that are difficult to predict, so actual outcomes and results may differ significantly from the views expressed. These views are subject to change at any time based upon economic, market or other conditions and the respective parties disclaim any responsibility to update such views. These views may not be relied on as investment advice and, because investment decisions for a Columbia Acorn Fund are based on numerous factors, may not be relied on as an indication of trading intent on behalf of any particular Columbia Acorn Fund. References to specific securities should not be construed as a recommendation or investment advice.
| 10 | Columbia Acorn Family of Funds | Annual Report 2021 |
Fund at a glance
Columbia Acorn USA®
Investment objective
Columbia Acorn USA® (the Fund) seeks long-term capital appreciation.
Portfolio management
Erika K. Maschmeyer, CFA
Co-Portfolio Manager since April 2021
Service with Fund since 2016
John L. Emerson, CFA
Co-Portfolio Manager since April 2021
Service with Fund since 2003
Effective May 1, 2022, Daniel Cole will be added as a Co-Portfolio Manager to the Fund.
Morningstar style boxTM
The Morningstar Style Box is based on a fund’s portfolio holdings. For equity funds, the vertical axis shows the market capitalization of the stocks owned, and the horizontal axis shows investment style (value, blend, or growth). Information shown is based on the most recent data provided by Morningstar.
© 2022 Morningstar, Inc. All rights reserved. The Morningstar information contained herein: (1) is proprietary to Morningstar and/or its content providers; (2) may not be copied or distributed; and (3) is not warranted to be accurate, complete or timely. Neither Morningstar nor its content providers are responsible for any damages or losses arising from any use of this information.
| Average annual total returns (%) (for the period ended December 31, 2021) |
| | | Inception | 1 Year | 5 Years | 10 Years | Life of Fund |
| Class A | Excluding sales charges | 10/16/00 | 8.74 | 15.46 | 13.96 | 11.00 |
| | Including sales charges | | 2.48 | 14.11 | 13.29 | 10.74 |
| Advisor Class | 11/08/12 | 8.92 | 15.75 | 14.25 | 11.34 |
| Class C | Excluding sales charges | 10/16/00 | 7.85 | 14.59 | 13.14 | 10.18 |
| | Including sales charges | | 7.02 | 14.59 | 13.14 | 10.18 |
| Institutional Class | 09/04/96 | 8.95 | 15.74 | 14.24 | 11.34 |
| Institutional 2 Class | 11/08/12 | 8.99 | 15.83 | 14.33 | 11.37 |
| Institutional 3 Class | 11/08/12 | 9.09 | 15.88 | 14.38 | 11.39 |
| Russell 2000 Growth Index | | 2.83 | 14.53 | 14.14 | - |
Performance numbers reflect all Fund expenses. Returns for Class A shares are shown with and without the maximum initial sales charge of 5.75%. Returns for Class C shares are shown with and without the maximum contingent deferred sales charge of 1.00% for the first year after purchase. The Fund’s other share classes are not subject to sales charges, but may be subject to other fees and expenses, and have limited eligibility. Please see the Fund’s prospectus for details. Performance for different share classes will vary based on differences in sales charges and certain fees and expenses associated with each share class.
As stated in the May 1, 2021 prospectus, as supplemented, the Fund’s annual operating expense ratio is 1.15% for Institutional Class shares and 1.40% for Class A shares.
All results shown assume reinvestment of distributions during the period. Returns do not reflect the deduction of taxes that a shareholder may pay on Fund distributions or on the redemption of Fund shares. Performance results reflect the effect of fee waivers or reimbursements of Fund expenses by the investment manager and/or its affiliates. Absent these fee waivers and/or expense reimbursement arrangements, performance results may have been lower.
The performance information shown represents past performance and is not a guarantee of future results. The investment return and principal value of your investment will fluctuate so that shares, when redeemed, may be worth more or less than their original cost. Current performance may be lower or higher than the performance data shown. You may obtain performance information current to the most recent month-end by contacting your financial intermediary, visiting columbiathreadneedleus.com/investor/ or calling 800.922.6769.
The returns shown for periods prior to the share class inception date (including returns for the Life of the Fund, if shown, which are since Fund inception) include the returns of the Fund’s oldest share class. These returns are adjusted to reflect any higher class-related operating expenses of the newer share classes, as applicable. Please visit columbiathreadneedleus.com/investor/investment-products/mutual-funds/appended-performance for more information.
The Russell 2000 Growth Index, an unmanaged index, measures the performance of those Russell 2000 Index companies with higher price-to-book ratios and higher forecasted growth values.
Effective May 1, 2022, the Fund will compare its performance to that of the Russell 2500 Growth Index. The Fund’s investment manager believes that the new index provides a more appropriate comparison than the Russell 2000 Growth Index for investors measuring the Fund’s relative performance. The Russell 2500 Growth Index measures the performance of those Russell 2500 companies with higher price-to-book ratios and higher forecasted growth values. Information on both the Russell 2000 Growth Index and the Russell 2500 Growth Index will be shown for a one-year transition period.
Unlike mutual funds, indexes are not managed and do not incur fees or expenses. It is not possible to invest directly in an index.
The COVID-19 pandemic has adversely impacted economies and capital markets around the world in ways that will likely continue and may change in unforeseen ways for an indeterminate period. The COVID-19 pandemic may exacerbate pre-existing political, social and economic risks in certain countries and globally. Fund performance may be significantly negatively impacted by the economic impact of the COVID-19 pandemic.
Columbia Acorn Family of Funds | Annual Report 2021
| 11 |
Fund at a glance (continued)
Columbia Acorn USA®
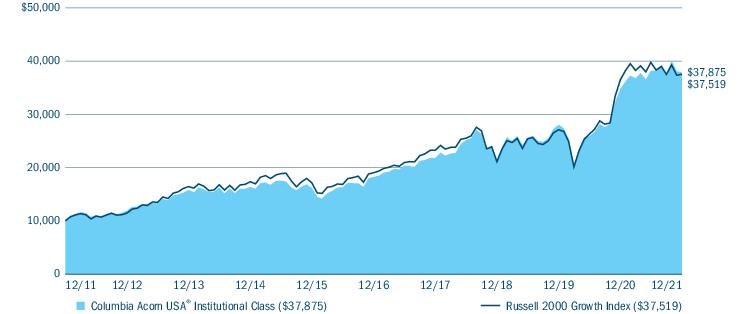
The Growth of a $10,000 Investment in Columbia Acorn USA® Institutional Class Shares
December 31, 2011 through December 31, 2021
This chart shows the change in value of a hypothetical $10,000 investment in Institutional Class shares of the Fund during the stated time period. Although the index is provided for use in assessing the Fund’s performance, the Fund’s holdings may differ significantly from those in an index. Performance numbers reflect all Fund expenses.
| Portfolio breakdown (%) (at December 31, 2021) |
| Common Stocks | 93.9 |
| Limited Partnerships | 1.5 |
| Money Market Funds | 2.9 |
| Securities Lending Collateral | 1.6 |
| Warrants | 0.1 |
| Total | 100.0 |
Percentages indicated are based upon total investments excluding investments in derivatives, if any. The Fund’s portfolio composition is subject to change.
| Equity sector breakdown (%) (at December 31, 2021) |
| Communication Services | 1.5 |
| Consumer Discretionary | 22.3 |
| Consumer Staples | 3.3 |
| Energy | 1.1 |
| Financials | 6.4 |
| Health Care | 26.5 |
| Industrials | 16.5 |
| Information Technology | 18.2 |
| Materials | 1.6 |
| Real Estate | 2.6 |
| Total | 100.0 |
Percentages indicated are based upon total equity investments. The Fund’s portfolio composition is subject to change.
| 12 | Columbia Acorn Family of Funds | Annual Report 2021 |
Manager Discussion of Fund Performance
Columbia Acorn USA®
Columbia Acorn USA® Institutional Class shares returned 8.95% for the 12-month period ended December 31, 2021, outperforming the 2.83% return of the Fund’s primary benchmark, the Russell 2000 Growth Index.
Market overview
U.S. equities performed very well in 2021, with most aspects of the macroeconomic environment providing a tailwind for risk assets. Although COVID-19 remained persistent due to the emergence of new variants throughout the year, the rollout of multiple vaccines enabled a gradual return toward pre-pandemic business conditions. Economic growth surged as a result, leading to favorable comparisons versus the depressed levels of 2020. Corporate earnings rose in kind, with results tracking ahead of expectations in each of the year’s four quarters. Monetary and fiscal policy was also highly supportive, fueling a steady appetite for risk among investors.
Despite these positive developments, small-cap growth stocks trailed most other segments of the U.S. equity market in 2021. After performing reasonably well through mid-November, the asset class experienced considerable underperformance in the final six weeks of the year. The U.S. Federal Reserve’s indication of its intent to begin raising short-term interest rates in 2022 factored into the downturn late in the year. The prospect of higher rates is typically a headwind for smaller growth stocks since it reduces the value of their expected future earnings when measured in current dollars.
The resulting sell-off represented one of the largest pullbacks in secular growth company investments that we have witnessed in many years. Believing this created some very attractive long-term opportunities, we remained on a sharp lookout for stocks that we believe have been unjustifiably beaten down by larger trends. As always, we stayed focused on seeking to invest in growing companies with outstanding business models and competitive advantages that we believe will strengthen over time.
The Fund’s broader investment strategy was an important reason for its outperformance in 2021. Lower quality companies, particularly those without current profits, lagged considerably during the downturn late in the year. On the other hand, the types of higher quality, profitable growers we seek held up much better than the overall small- and mid-cap category. We believe this helps illustrate the merits of emphasizing bottom-up company research rather than trying to predict macroeconomic developments such as inflation or the direction of Fed policy.
This steady approach helped the Fund meet or exceed the returns of the corresponding benchmark components in seven of the nine sectors in which it held a position.
The Fund’s notable contributors during the period
| • | Our process generated strong relative performance in Fund holdings in the industrials sector. |
| ○ | Atkor, Inc., a specialized producer of electrical products used in commercial and industrial end markets, is one of only a handful of vendors that supply a very fragmented customer base. This affords Atkor with what we call “niche dominance,” one of the key features we look for in our portfolio holdings. Broader trends were also at the company’s back in 2021, highlighted by rising prices for PVC pipe and steel. |
| ○ | SiteOne Landscape Supply, Inc. further contributed to results. The company benefited from its position as a distributor situated between a fragmented group of suppliers (equipment makers) and an equally fragmented customer base (landscapers). The company has both scale power and an excellent management team, and these traits fed through to performance. |
| • | The health care and consumer discretionary sectors were also areas in which our stock picks outperformed in 2021. |
| • | Upstart Holdings, Inc., a financial stock, was the leading individual contributor for the year. The company operates an artificial intelligence (AI)-based lending platform primarily serving the personal and auto loan market. The shares jumped as the company grew more quickly than expected since its December 2020 initial public offering. We sold the stock on the basis of valuation prior to its downturn late in the year. |
| • | Sprout Social, Inc., a provider of social media marketing management software that has benefited from the rapid shift in corporate marketing budgets toward to social media, was another top contributor in 2021. |
Columbia Acorn Family of Funds | Annual Report 2021
| 13 |
Manager Discussion of Fund Performance (continued)
Columbia Acorn USA®
| • | Sector allocations, while a residual effect of our bottom-up stock selection process, nonetheless contributed to performance. An overweight position in the industrials sector aided results, as did a zero weighting in the poor-performing communication services sector. |
The Fund’s notable detractors during the period
| • | Information technology, while home to a number of our top contributors, was a sector in which the Fund underperformed by a meaningful margin. Voyager Digital Ltd., an operator of a cryptocurrency trading app, and Olo, Inc., a software-as-a-service provider for restaurants, were two significant detractors. |
| • | Poshmark, Inc., an operator of an online marketplace for resellers of apparel and accessories, was the Fund’s largest individual detractor in 2021. The company’s initial results and conservative guidance weighed on the shares, as did the overall weakness in recent initial public offerings during the second half of the year. Nevertheless, we believe Poshmark possesses a compelling platform that effectively blends valuable aspects of social media with e-commerce to create a collaborative, highly engaged and growing network of buyers and sellers. |
| • | Vroom, Inc., an e-commerce platform for buying and selling new and used cars, was another notable detractor in consumer discretionary. Vroom has a leading market position in this small but fast-growing area, but its stock lagged due in part to its announcement that it was increasing its investment in infrastructure. While investors focused on the effect this move would have on near-term profits, we believe it can help the company build its brand and achieve longer term scale benefits. |
Market risk may affect a single issuer, sector of the economy, industry or the market as a whole. Investments in small- and mid-cap companies involve risks and volatility greater than investments in larger, more established companies. The Fund may invest significantly in issuers within a particular sector, which may be negatively affected by market, economic or other conditions, making the fund more vulnerable to unfavorable developments in the sector. See the Fund’s prospectus for more information on these and other risks.
The views expressed in this report reflect the current views of the respective parties. These views are not guarantees of future performance and involve certain risks, uncertainties and assumptions that are difficult to predict, so actual outcomes and results may differ significantly from the views expressed. These views are subject to change at any time based upon economic, market or other conditions and the respective parties disclaim any responsibility to update such views. These views may not be relied on as investment advice and, because investment decisions for a Columbia Acorn Fund are based on numerous factors, may not be relied on as an indication of trading intent on behalf of any particular Columbia Acorn Fund. References to specific securities should not be construed as a recommendation or investment advice.
| 14 | Columbia Acorn Family of Funds | Annual Report 2021 |
Fund at a glance
Columbia Acorn International SelectSM
Investment objective
Columbia Acorn International SelectSM (the Fund) seeks long-term capital appreciation.
Portfolio management
Stephen Kusmierczak, CFA
Lead Portfolio Manager or Co-Portfolio Manager since 2016
Service with Fund since 2001
Hans F. Stege
Co-Portfolio Manager since 2019
Service with Fund since 2017
Morningstar style boxTM
The Morningstar Style Box is based on a fund’s portfolio holdings. For equity funds, the vertical axis shows the market capitalization of the stocks owned, and the horizontal axis shows investment style (value, blend, or growth). Information shown is based on the most recent data provided by Morningstar.
© 2022 Morningstar, Inc. All rights reserved. The Morningstar information contained herein: (1) is proprietary to Morningstar and/or its content providers; (2) may not be copied or distributed; and (3) is not warranted to be accurate, complete or timely. Neither Morningstar nor its content providers are responsible for any damages or losses arising from any use of this information.
| Average annual total returns (%) (for the period ended December 31, 2021) |
| | | Inception | 1 Year | 5 Years | 10 Years | Life of Fund |
| Class A | Excluding sales charges | 10/16/00 | 10.49 | 15.59 | 10.31 | 9.16 |
| | Including sales charges | | 4.15 | 14.23 | 9.66 | 8.88 |
| Advisor Class | 11/08/12 | 10.78 | 15.89 | 10.60 | 9.49 |
| Class C | Excluding sales charges | 10/16/00 | 9.68 | 14.73 | 9.47 | 8.34 |
| | Including sales charges | | 8.68 | 14.73 | 9.47 | 8.34 |
| Institutional Class | 11/23/98 | 10.79 | 15.88 | 10.61 | 9.49 |
| Institutional 2 Class | 11/08/12 | 10.87 | 15.98 | 10.67 | 9.52 |
| Institutional 3 Class | 11/08/12 | 10.93 | 16.04 | 10.72 | 9.54 |
| MSCI ACWI ex USA Growth Index (Net) | | 5.09 | 13.06 | 9.13 | - |
| MSCI ACWI ex USA Index (Net) | | 7.82 | 9.61 | 7.28 | - |
Performance numbers reflect all Fund expenses. Returns for Class A shares are shown with and without the maximum initial sales charge of 5.75%. Returns for Class C shares are shown with and without the maximum contingent deferred sales charge of 1.00% for the first year after purchase. The Fund’s other share classes are not subject to sales charges, but may be subject to other fees and expenses, and have limited eligibility. Please see the Fund’s prospectus for details. Performance for different share classes will vary based on differences in sales charges and certain fees and expenses associated with each share class.
As stated in the May 1, 2021 prospectus, as supplemented, the Fund’s annual operating expense ratio is 0.99% for Institutional Class shares and 1.24% for Class A shares.
All results shown assume reinvestment of distributions during the period. Returns do not reflect the deduction of taxes that a shareholder may pay on Fund distributions or on the redemption of Fund shares. Performance results reflect the effect of fee waivers or reimbursements of Fund expenses by the investment manager and/or its affiliates. Absent these fee waivers and/or expense reimbursement arrangements, performance results may have been lower.
The performance information shown represents past performance and is not a guarantee of future results. The investment return and principal value of your investment will fluctuate so that shares, when redeemed, may be worth more or less than their original cost. Current performance may be lower or higher than the performance data shown. You may obtain performance information current to the most recent month-end by contacting your financial intermediary, visiting columbiathreadneedleus.com/investor/ or calling 800.922.6769.
The returns shown for periods prior to the share class inception date (including returns for the Life of the Fund, if shown, which are since Fund inception) include the returns of the Fund’s oldest share class. These returns are adjusted to reflect any higher class-related operating expenses of the newer share classes, as applicable. Please visit columbiathreadneedleus.com/investor/investment-products/mutual-funds/appended-performance for more information.
The MSCI ACWI ex USA Growth Index (Net) captures a large- and mid-cap representation across 22 developed market countries and 25 emerging market countries.
The MSCI ACWI ex USA Index (Net) captures a large- and mid-cap representation across 22 of 23 developed market countries (excluding the United States) and 25 emerging market countries. The index covers approximately 85% of the global equity opportunity set outside the United States.
Unlike mutual funds, indexes are not managed and do not incur fees or expenses. It is not possible to invest directly in an index.
The COVID-19 pandemic has adversely impacted economies and capital markets around the world in ways that will likely continue and may change in unforeseen ways for an indeterminate period. The COVID-19 pandemic may exacerbate pre-existing political, social and economic risks in certain countries and globally. Fund performance may be significantly negatively impacted by the economic impact of the COVID-19 pandemic.
Columbia Acorn Family of Funds | Annual Report 2021
| 15 |
Fund at a glance (continued)
Columbia Acorn International SelectSM
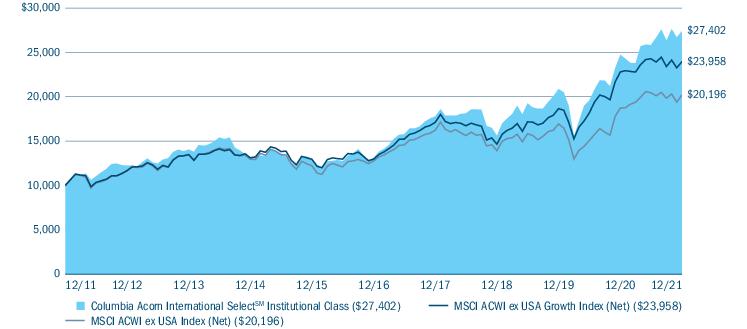
The Growth of a $10,000 Investment in Columbia Acorn International SelectSM Institutional Class Shares
December 31, 2011 through December 31, 2021
This chart shows the change in value of a hypothetical $10,000 investment in Institutional Class shares of the Fund during the stated time period. Although the indexes are provided for use in assessing the Fund’s performance, the Fund’s holdings may differ significantly from those in an index. Performance numbers reflect all Fund expenses.
| Equity sector breakdown (%) (at December 31, 2021) |
| Communication Services | 6.0 |
| Consumer Discretionary | 9.7 |
| Financials | 7.8 |
| Health Care | 20.7 |
| Industrials | 28.8 |
| Information Technology | 23.2 |
| Materials | 1.8 |
| Real Estate | 2.0 |
| Total | 100.0 |
Percentages indicated are based upon total equity investments. The Fund’s portfolio composition is subject to change.
| Country breakdown (%) (at December 31, 2021) |
| Australia | 2.1 |
| Brazil | 2.1 |
| Canada | 1.8 |
| China | 4.9 |
| Denmark | 3.0 |
| Finland | 2.2 |
| Germany | 4.2 |
| Italy | 4.8 |
| Japan | 13.5 |
| Malta | 0.0(a) |
| Netherlands | 6.5 |
| New Zealand | 3.4 |
| Singapore | 2.0 |
| South Korea | 1.6 |
| Sweden | 11.5 |
| Switzerland | 11.6 |
| Taiwan | 7.3 |
| United Kingdom | 16.6 |
| United States(b) | 0.9 |
| Total | 100.0 |
| (a) | Rounds to zero. |
| (b) | Includes investments in Money Market Funds. |
Country breakdown is based primarily on issuer’s place of organization/incorporation. Percentages indicated are based upon total investments excluding investments in derivatives, if any. The Fund’s portfolio composition is subject to change.
| 16 | Columbia Acorn Family of Funds | Annual Report 2021 |
Manager Discussion of Fund Performance
Columbia Acorn International SelectSM
Columbia Acorn International SelectSM Institutional Class shares returned 10.79% for the 12-month period ended December 31, 2021, outperforming the 5.09% return of the Fund’s primary benchmark, the MSCI ACWI ex USA Growth Index (Net). The Fund’s secondary benchmark, the MSCI ACWI ex USA Index (Net), ended the 12-month period with a return of 7.82%.
Market overview
International equities delivered robust total returns in 2021, as the gradual lifting of virus-related restrictions led to a surge in economic growth and corporate earnings. Monetary policy was also supportive throughout the majority of the year, with central banks holding interest rates near zero and maintaining stimulative quantitative easing programs. Although concerns about new variants of the coronavirus, higher inflation, and the possibility of rising rates in 2022 weighed on sentiment at various points, most major world indexes closed the year at or near their all-time highs.
International small-cap growth stocks trailed the broader global markets in 2021. This reflected the underperformance of the foreign markets relative to the United States and the growth style compared to value. Still, the asset class continued to offer an abundance of opportunities for us to use our bottom-up approach to unearth higher quality, growing companies with pricing power, strong market positions, and capable management teams.
Since our emphasis is on individual stock selection, we don’t attempt to make macroeconomic forecasts. We believe we can add more value as managers by doing bottom-up research to identify compelling company-level ideas than we would by trying to anticipate the next market-moving headline. Moreover, we think the best way to navigate shifting market conditions is to maintain a steady focus on good companies that are executing well. The recent surge in inflation offers a prime example. We can’t predict which way inflation is going to trend in the year ahead, but we think our emphasis on companies with leading market positions and pricing power should hold the Fund in good stead across the full range of possible outcomes. Our belief that good companies can manage through any environment has been the foundation of our strategy over time. This steady approach worked well in 2021, as several of our longer term holdings delivered healthy returns on the strength of company-specific developments.
The Fund’s notable contributors during the period
| • | Our process generated strong relative performance in Fund holdings in the communication services sector. |
| ○ | Rightmove PLC, which operates the United Kingdom’s largest online real estate portal and property website, was the leading contributor in communication services. The stock rallied on the strength of the company’s sustained pricing power, rising revenue per user, and the general upswing in the nation’s property market. |
| • | The industrials sector was a further area of strength for the Fund in the annual period. |
| ○ | IMCD NV, a Netherlands-based distributor of specialty chemicals, gained ground on the strength of better-than-expected results. The company’s introduction of new products, together with its successful pricing increases, helped it generate higher profit margins. |
| ○ | Belimo Holding AG, based in Switzerland, was also a top contributor in industrials. The company, which makes actuators and valves for HVAC systems, benefited from trends such as rising infrastructure spending, urbanization, and the shift toward energy efficiency. |
| • | Our stock picks also performed very well in health care and financials. |
| ○ | Dechra Pharmaceuticals PLC, a U.K.-based provider of pharmaceuticals and related health care products for animals, was a top contributor in the health care sector. The company continued to leverage a strong and diverse product portfolio to drive robust results. |
| ○ | Partners Group Holding AG was the leading contributor in financials. One of Europe’s largest private equity companies, Partners benefited from a very healthy environment for initial public offerings. Fundraising and investment levels were also quite strong, pointing to healthy fundamentals for the company. |
| • | The technology sector was home to two of the Fund’s top performing stocks for the year. |
Columbia Acorn Family of Funds | Annual Report 2021
| 17 |
Manager Discussion of Fund Performance (continued)
Columbia Acorn International SelectSM
| ○ | Shares of Nemetschek SE, a provider of building information modeling software that helps architects and builders improve efficiency and reduce costs, rallied on the strength of rising earnings and improving guidance. In addition, the broader construction software segment experienced valuation expansion amid growing investor interest in this area. |
| ○ | Parade Technologies Ltd., a Taiwanese semiconductor equipment company whose products enable higher speed connections between the chips on the motherboards in personal computers (PCs), also contributed. Parade was well positioned to capitalize on both the robust semiconductor cycle and better-than-expected global PC sales. |
| • | Sector allocations, while a residual effect of our bottom-up stock selection process, nonetheless contributed to performance in the annual period. Overweight positions in information technology, industrials, and health care aided results, as did an underweight in the consumer discretionary sector. |
The Fund’s notable detractors during the period
| • | Consumer discretionary was one area in which our stock picks underperformed to a meaningful degree. |
| ○ | New Oriental Education & Technology Group, Inc. was the largest detractor in both the sector and the Fund as a whole. The stock lagged in the first half of the year due to a significant increase in regulatory uncertainty, and we exited the position. Shortly after we sold the stock, China’s government announced a rule change that forced private tutoring companies to become non-profit entities. The stock plunged in response, so our decision to sell helped protect the Fund from additional downside. |
| ○ | Hikari Tsushin, Inc., a sales outsourcing company operating in Japan, was another notable detractor in consumer discretionary. The stock slid as volatility in its end markets caused investors to overlook the company’s ongoing shift to a recurring revenue model. |
| • | While the Fund’s holdings in information technology as a whole only slightly underperformed those in the benchmark, several stocks finished among our largest detractors in 2021. |
| ○ | TeamViewer AG, based in Germany, lagged due to a management shuffle and weaker-than-expected profit margins. We became less enthusiastic on the company’s growth prospects, prompting us to sell the stock from the portfolio. |
| ○ | SimCorp AS, a provider of investment management software solutions and services, also detracted due to slower new client signings stemming from COVID-related uncertainty. |
| ○ | Nexi SpA, an Italy-based payments-system provider and credit card payment processor, declined after a competitor reduced its guidance. We maintained the position on the basis of the company’s long-term growth potential. |
Market risk may affect a single issuer, sector of the economy, industry or the market as a whole. Foreign investments subject the Fund to political, economic, market, social and other risks within a particular country, as well as to potential currency instabilities and less stringent financial and accounting standards generally applicable to U.S. issuers. Risks are enhanced for emerging market issuers. Investments in small- and mid-cap companies involve risks and volatility and possible illiquidity greater than investments in larger, more established companies. The Fund may invest significantly in issuers within a particular sector, which may be negatively affected by market, economic or other conditions, making the Fund more vulnerable to unfavorable developments in the sector. See the Fund’s prospectus for more information on these and other risks.
The views expressed in this report reflect the current views of the respective parties. These views are not guarantees of future performance and involve certain risks, uncertainties and assumptions that are difficult to predict, so actual outcomes and results may differ significantly from the views expressed. These views are subject to change at any time based upon economic, market or other conditions and the respective parties disclaim any responsibility to update such views. These views may not be relied on as investment advice and, because investment decisions for a Columbia Acorn Fund are based on numerous factors, may not be relied on as an indication of trading intent on behalf of any particular Columbia Acorn Fund. References to specific securities should not be construed as a recommendation or investment advice.
| 18 | Columbia Acorn Family of Funds | Annual Report 2021 |
Fund at a glance
Columbia Thermostat FundSM
Investment objective
Columbia Thermostat FundSM (the Fund) seeks long-term capital appreciation.
Portfolio management
Anwiti Bahuguna, Ph.D.
Co-Portfolio Manager since 2018
Service with Fund since 2018
Joshua Kutin, CFA
Co-Portfolio Manager since 2018
Service with Fund since 2018
| Average annual total returns (%) (for the period ended December 31, 2021) |
| | | Inception | 1 Year | 5 Years | 10 Years | Life of Fund |
| Class A | Excluding sales charges | 03/03/03 | 6.16 | 10.63 | 8.47 | 7.88 |
| | Including sales charges | | 0.04 | 9.33 | 7.83 | 7.55 |
| Advisor Class | 11/08/12 | 6.43 | 10.91 | 8.74 | 8.15 |
| Class C | Excluding sales charges | 03/03/03 | 5.40 | 9.81 | 7.66 | 7.08 |
| | Including sales charges | | 4.47 | 9.81 | 7.66 | 7.08 |
| Institutional Class | 09/25/02 | 6.42 | 10.91 | 8.75 | 8.15 |
| Institutional 2 Class | 11/08/12 | 6.53 | 10.95 | 8.78 | 8.17 |
| Institutional 3 Class | 11/08/12 | 6.52 | 11.00 | 8.82 | 8.19 |
| Blended Benchmark | | 12.80 | 11.12 | 9.78 | - |
| S&P 500® Index | | 28.71 | 18.47 | 16.55 | - |
| Bloomberg U.S. Aggregate Bond Index | | -1.54 | 3.57 | 2.90 | - |
Performance numbers reflect all Fund expenses. Returns for Class A shares are shown with and without the maximum initial sales charge of 5.75%. Returns for Class C shares are shown with and without the maximum contingent deferred sales charge of 1.00% for the first year after purchase. The Fund’s other share classes are not subject to sales charges, but may be subject to other fees and expenses, and have limited eligibility. Please see the Fund’s prospectus for details. Performance for different share classes will vary based on differences in sales charges and certain fees and expenses associated with each share class.
As stated in the May 1, 2021 prospectus, as supplemented, the Fund’s annual operating expense ratio is 0.65% for Institutional Class shares and 0.90% for Class A shares.
All results shown assume reinvestment of distributions during the period. Returns do not reflect the deduction of taxes that a shareholder may pay on Fund distributions or on the redemption of Fund shares. Performance results reflect the effect of fee waivers or reimbursements of Fund expenses by the investment manager and/or its affiliates. Absent these fee waivers and/or expense reimbursement arrangements, performance results may have been lower.
The performance information shown represents past performance and is not a guarantee of future results. The investment return and principal value of your investment will fluctuate so that shares, when redeemed, may be worth more or less than their original cost. Current performance may be lower or higher than the performance data shown. You may obtain performance information current to the most recent month-end by contacting your financial intermediary, visiting columbiathreadneedleus.com/investor/ or calling 800.922.6769.
The returns shown for periods prior to the share class inception date (including returns for the Life of the Fund, if shown, which are since Fund inception) include the returns of the Fund’s oldest share class. These returns are adjusted to reflect any higher class-related operating expenses of the newer share classes, as applicable. Please visit columbiathreadneedleus.com/investor/investment-products/mutual-funds/appended-performance for more information.
The Fund’s performance prior to May 1, 2018 reflects returns achieved following a principal investment strategy pursuant to which day-to-day investment decisions for the Fund were made according to only one potential form of predetermined asset allocation table. Since May 1, 2018, the Fund has followed a principal investment strategy that calls for the Investment Manager, on at least an annual basis, to determine whether the Fund’s assets should be allocated according to one of two different forms of allocation table based on the Investment Manager’s assessment of the equity market. From the Fund’s inception through April 2020, the asset allocation table in place reflected the Investment Manager’s determination that the equity market was “expensive”. For a one-year period from May 1, 2020 through April 30, 2021, the Fund switched to the "normal" equity market table with a 50% equity floor because the Fund’s portfolio managers determined the market to be "normal." On May 1, 2021, the Fund moved back to the asset allocation table that was in place from the Fund’s inception in 2002 through April 30, 2020 based on the portfolio managers’ determination that the equity market is currently "expensive."
The Blended Benchmark, established by the Fund’s investment manager, is an equally weighted custom composite of the Fund’s primary equity and primary debt benchmarks, the S&P 500® Index and the Bloomberg U.S. Aggregate Bond Index, respectively. The percentage of the Fund’s assets allocated to underlying stock and bond portfolio funds will vary, and accordingly the composition of the Fund’s portfolio will not always reflect the composition of the Blended Benchmark.
The S&P 500® Index tracks the performance of 500 widely held, large-capitalization U.S. stocks.
Columbia Acorn Family of Funds | Annual Report 2021
| 19 |
Fund at a glance (continued)
Columbia Thermostat FundSM
The Bloomberg U.S. Aggregate Bond Index is a market value-weighted index that tracks the daily price, coupon, pay-downs and total return performance of fixed-rate, publicly placed, dollar-denominated and non-convertible investment-grade debt issues with at least $250 million par amount outstanding and with at least one year to final maturity. Effective August 24, 2021, the Bloomberg Barclays U.S. Aggregate Bond Index was re-branded as the Bloomberg U.S. Aggregate Bond Index.
Unlike mutual funds, indexes are not managed and do not incur fees or expenses. It is not possible to invest directly in an index.
The COVID-19 pandemic has adversely impacted economies and capital markets around the world in ways that will likely continue and may change in unforeseen ways for an indeterminate period. The COVID-19 pandemic may exacerbate pre-existing political, social and economic risks in certain countries and globally. Fund performance may be significantly negatively impacted by the economic impact of the COVID-19 pandemic.
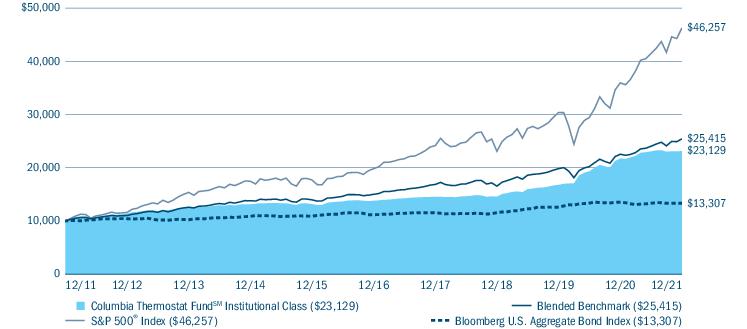
The Growth of a $10,000 Investment in Columbia Thermostat FundSM Institutional Class Shares
December 31, 2011 through December 31, 2021
This chart shows the change in value of a hypothetical $10,000 investment in Institutional Class shares of the Fund during the stated time period. Although the indexes are provided for use in assessing the Fund’s performance, the Fund’s holdings may differ significantly from those in an index. Performance numbers reflect all Fund expenses.
| Portfolio breakdown (%) (at December 31, 2021) |
| Equity Funds | 9.1 |
| Exchange-Traded Equity Funds | 0.8 |
| Exchange-Traded Fixed Income Funds | 9.0 |
| Fixed Income Funds | 80.9 |
| Money Market Funds | 0.2 |
| Total | 100.0 |
Percentages indicated are based upon total investments excluding investments in derivatives, if any. The Fund’s portfolio composition is subject to change.
| 20 | Columbia Acorn Family of Funds | Annual Report 2021 |
Manager Discussion of Fund Performance
Columbia Thermostat FundSM
Columbia Thermostat FundSM Institutional Class shares returned 6.42% for the 12-month period ended December 31, 2021. During the same time period, the Fund’s primary equity benchmark, the S&P 500® Index, returned 28.71%, and the Fund’s primary debt benchmark, the Bloomberg U.S. Aggregate Bond Index, returned -1.54%. The Fund underperformed its custom Blended Benchmark, which returned 12.80% during 2021. The Fund’s performance in 2021 was driven by a higher allocation to bonds during a period in which equities performed well.
Market overview
U.S. equities displayed remarkable resilience during the year, finishing with a solid gain despite a number of potential headwinds. Investors had to contend with the emergence of the omicron variant of COVID-19, which was contagious enough to raise concerns that a new wave of lockdowns could be necessary. The markets also faced a major shift in U.S. Federal Reserve (Fed) policy. Whereas the Fed had previously viewed rising inflation as a transitory development, continued price pressures caused the central bank to announce the tapering of its stimulative quantitative easing program. In addition, it began to prepare the financial markets for the likelihood of multiple interest rate increases in 2022. The failure of the Build Back Better bill removed a source of anticipated fiscal stimulus. Nevertheless, most major U.S. equity indices closed the year at or near their all-time highs on the strength of robust investment inflows and the lack of compelling total return potential in bonds.
As pandemic-related restrictions were eased over the period, robust economic growth and corporate earnings supported risk sentiment and credit-oriented segments of the bond market. The Fed maintained its benchmark overnight lending rate near zero while engaging in bond market purchases to keep longer term borrowing costs low. The fourth quarter of 2021 saw the Fed adopt a more hawkish tone in response to persistently high inflation, leading to increased market volatility. The Fed officially tightened policy in November as it began tapering its monthly bond purchases. December saw the Fed signal the likelihood of three increases in the federal funds rate in 2022. Bond market returns for the 12 months were muted given the move higher in U.S. Treasury yields. To illustrate, the 10-year Treasury note yield, which entered the year at 0.93%, reached as high as 1.74% at the end of the first quarter before drifting lower and ending 2021 at 1.52%. The best performing credit sector for the annual period was high-yield corporate bonds. The weakest performing credit sector was emerging markets debt.
Contributors and detractors
The Fund’s equity portfolio had a weighted average return of 23.5% in 2021. Six of seven underlying equity funds posted positive returns for the period. Columbia Research Enhanced Core ETF was the equity portfolio’s top performer, returning 33.1% for the year. Columbia Emerging Markets Fund was the equity portfolio’s worst performer, with a return of -7.2% for the year.
The Fund’s bond portfolio ended the year with a weighted average gain of -0.8%. Of the six underlying funds in the bond portfolio, Columbia Short Term Bond Fund was the strongest performer, returning 0.9% for the year. Columbia U.S. Treasury Index Fund was the worst performer in the bond portfolio, returning -2.6% for the year.
Portfolio reallocations
The Fund’s allocation table is updated annually. On May 1, 2021, based on the S&P 500® Index’s cyclically adjusted price-to-earnings ratio, the Fund rebalanced its allocation table and moved back from what the Fund defines as a normal market to what the Fund defines as an expensive market table. The expensive market allocation table utilizes stock allocations ranging from 10%-90% and will be in effect through at least April 30, 2022. On May 3, 2021 (due to May 1 falling on a Saturday), the Fund traded to a new allocation of 10% equity and 90% fixed income, from its allocation (prior to May 3, 2021) of 50% equity and 50% fixed income.
The Fund’s investments in the underlying funds may present certain risks, including the following: Market risk may affect a single issuer, sector of the economy, industry or the market as a whole. The Fund’s investment in other funds subjects it to the investment performance (positive or negative), risks and expenses of these underlying funds. Investments in small- and mid-cap companies involve risks and volatility and possible illiquidity greater than ininvestments in larger, more established companies. There are risks associated with fixed-income investments, including credit risk, market risk, interest rate risk and prepayment and extension risk. In general, bond prices fall when interest rates rise and vice versa. This effect is more pronounced for longer term securities. Non-investment-grade(high-yield or junk) securities present greater price volatility and more risk to principal and income than higher rated
Columbia Acorn Family of Funds | Annual Report 2021
| 21 |
Manager Discussion of Fund Performance (continued)
Columbia Thermostat FundSM
securities. Foreign investments subject the Fund to political, economic, market, social and other risks within a particular country, as well as to potential currency instabilities and less stringent financial and accounting standards generally applicable to U.S. issuers. Risks are enhanced for emerging market issuers. See the Fund’s prospectus for more information on these and other risks.
The views expressed in this report reflect the current views of the respective parties. These views are not guarantees of future performance and involve certain risks, uncertainties and assumptions that are difficult to predict, so actual outcomes and results may differ significantly from the views expressed. These views are subject to change at any time based upon economic, market or other conditions and the respective parties disclaim any responsibility to update such views. These views may not be relied on as investment advice and, because investment decisions for a Columbia Acorn Fund are based on numerous factors, may not be relied on as an indication of trading intent on behalf of any particular Columbia Acorn Fund. References to specific securities should not be construed as a recommendation or investment advice.
The value of an investment in the Fund is based primarily on the performance of the underlying funds in which it invests. The Fund is subject to the risk that the investment manager’s decisions regarding asset classes and underlying funds will not anticipate market trends successfully, resulting in a failure to reserve capital or lower total return. The Investment Manager may select an underlying fund in the Columbia Acorn Family of Funds or broader Columbia Funds complex over alternative investments. There can be no assurance that the Columbia Acorn Funds will outperform similar funds managed by the Investment Manager’s affiliates. This is not an offer of the shares of any other mutual fund mentioned herein.
| 22 | Columbia Acorn Family of Funds | Annual Report 2021 |
Fund at a glance
Columbia Acorn European FundSM
Investment objective
Columbia Acorn European FundSM (the Fund) seeks long-term capital appreciation.
Portfolio management
Stephen Kusmierczak, CFA
Portfolio Manager or Co-Portfolio Manager since 2011
Service with Fund since 2011
Sebastien Pigeon, CFA
Co-Portfolio Manager since May 2021
Service with Fund since 2015
Morningstar style boxTM
The Morningstar Style Box is based on a fund’s portfolio holdings. For equity funds, the vertical axis shows the market capitalization of the stocks owned, and the horizontal axis shows investment style (value, blend, or growth). Information shown is based on the most recent data provided by Morningstar.
© 2022 Morningstar, Inc. All rights reserved. The Morningstar information contained herein: (1) is proprietary to Morningstar and/or its content providers; (2) may not be copied or distributed; and (3) is not warranted to be accurate, complete or timely. Neither Morningstar nor its content providers are responsible for any damages or losses arising from any use of this information.
| Average annual total returns (%) (for the period ended December 31, 2021) |
| | | Inception | 1 Year | 5 Years | 10 Years | Life of Fund |
| Class A | Excluding sales charges | 08/19/11 | 21.47 | 19.52 | 14.26 | 13.16 |
| | Including sales charges | | 14.47 | 18.11 | 13.58 | 12.51 |
| Advisor Class | 06/25/14 | 21.75 | 19.83 | 14.55 | 13.45 |
| Class C | Excluding sales charges | 08/19/11 | 20.57 | 18.64 | 13.40 | 12.32 |
| | Including sales charges | | 19.57 | 18.64 | 13.40 | 12.32 |
| Institutional Class | 08/19/11 | 21.76 | 19.83 | 14.54 | 13.45 |
| Institutional 2 Class | 11/08/12 | 21.80 | 19.90 | 14.58 | 13.49 |
| Institutional 3 Class | 03/01/17 | 21.83 | 19.93 | 14.58 | 13.49 |
| MSCI AC Europe Small Cap Index (Net) | | 14.74 | 12.84 | 12.67 | - |
Performance numbers reflect all Fund expenses. Returns for Class A shares are shown with and without the maximum initial sales charge of 5.75%. Returns for Class C shares are shown with and without the maximum contingent deferred sales charge of 1.00% for the first year after purchase. The Fund’s other share classes are not subject to sales charges, but may be subject to other fees and expenses, and have limited eligibility. Please see the Fund’s prospectus for details. Performance for different share classes will vary based on differences in sales charges and certain fees and expenses associated with each share class.
As stated in the May 1, 2021 prospectus, as supplemented, the Fund’s annual operating expense ratio is 1.20% for Institutional Class shares and 1.45% for Class A shares.
All results shown assume reinvestment of distributions during the period. Returns do not reflect the deduction of taxes that a shareholder may pay on Fund distributions or on the redemption of Fund shares. Performance results reflect the effect of fee waivers or reimbursements of Fund expenses by the investment manager and/or its affiliates. Absent these fee waivers and/or expense reimbursement arrangements, performance results may have been lower.
The performance information shown represents past performance and is not a guarantee of future results. The investment return and principal value of your investment will fluctuate so that shares, when redeemed, may be worth more or less than their original cost. Current performance may be lower or higher than the performance data shown. You may obtain performance information current to the most recent month-end by contacting your financial intermediary, visiting columbiathreadneedleus.com/investor/ or calling 800.922.6769.
The returns shown for periods prior to the share class inception date (including returns for the Life of the Fund, if shown, which are since Fund inception) include the returns of the Fund’s oldest share class. These returns are adjusted to reflect any higher class-related operating expenses of the newer share classes, as applicable. Please visit columbiathreadneedleus.com/investor/investment-products/mutual-funds/appended-performance for more information.
The MSCI AC Europe Small Cap Index (Net) captures a small-cap representation across 21 markets in Europe. The index covers approximately 14% of the free float-adjusted market capitalization across each market country in Europe.
Unlike mutual funds, indexes are not managed and do not incur fees or expenses. It is not possible to invest directly in an index.
The COVID-19 pandemic has adversely impacted economies and capital markets around the world in ways that will likely continue and may change in unforeseen ways for an indeterminate period. The COVID-19 pandemic may exacerbate pre-existing political, social and economic risks in certain countries and globally. Fund performance may be significantly negatively impacted by the economic impact of the COVID-19 pandemic.
Columbia Acorn Family of Funds | Annual Report 2021
| 23 |
Fund at a glance (continued)
Columbia Acorn European FundSM
The Growth of a $10,000 Investment in Columbia Acorn European FundSM Institutional Class Shares
December 31, 2011 through December 31, 2021
This chart shows the change in value of a hypothetical $10,000 investment in Institutional Class shares of the Fund during the stated time period. Although the index is provided for use in assessing the Fund’s performance, the Fund’s holdings may differ significantly from those in an index. Performance numbers reflect all Fund expenses.
| Equity sector breakdown (%) (at December 31, 2021) |
| Communication Services | 5.7 |
| Consumer Discretionary | 5.3 |
| Consumer Staples | 4.7 |
| Financials | 8.7 |
| Health Care | 19.0 |
| Industrials | 29.7 |
| Information Technology | 21.7 |
| Materials | 3.0 |
| Real Estate | 2.2 |
| Total | 100.0 |
Percentages indicated are based upon total equity investments. The Fund’s portfolio composition is subject to change.
| Country breakdown (%) (at December 31, 2021) |
| Austria | 1.0 |
| Cyprus | 0.8 |
| Denmark | 5.1 |
| Finland | 1.8 |
| France | 1.3 |
| Germany | 12.8 |
| Greece | 0.9 |
| Italy | 9.1 |
| Malta | 1.1 |
| Netherlands | 5.5 |
| Spain | 2.8 |
| Sweden | 17.5 |
| Switzerland | 8.3 |
| United Kingdom | 27.1 |
| United States(a) | 4.9 |
| Total | 100.0 |
| (a) | Includes investments in Money Market Funds. |
Country breakdown is based primarily on issuer’s place of organization/incorporation. Percentages indicated are based upon total investments excluding investments in derivatives, if any. The Fund’s portfolio composition is subject to change.
| 24 | Columbia Acorn Family of Funds | Annual Report 2021 |
Manager Discussion of Fund Performance
Columbia Acorn European FundSM
Columbia Acorn European FundSM Institutional Class shares returned 21.76% for the 12-month period ended December 31, 2021, outperforming the 14.74% return of the Fund’s primary benchmark, the MSCI AC Europe Small Cap Index (Net).
Market overview
European small-cap stocks delivered robust total returns in 2021, as the gradual lifting of virus-related restrictions led to a surge in economic growth and corporate earnings. Monetary policy was also supportive throughout the majority of the year, with central banks holding interest rates near zero and maintaining stimulative quantitative easing programs. Together, these factors outweighed worries about new variants of the coronavirus, higher inflation, and the possibility of rising rates in 2022. European stocks outperformed the broader developed-market international category for the year, as the region was less exposed to the concerns about China that pressured performance across Asia.
We believe emphasizing bottom-up company research — rather than trying to navigate ever-changing headlines and shifts among the market’s style and sector preferences — remains the key to longer term performance. Our long tenure as managers has taught us that the European markets will be subject to frequent external disruptions. We therefore don’t attempt to predict macroeconomic events. Instead, we focus on identifying great franchises through analysis of sector competitive dynamics, due diligence of management teams, a focus on companies’ competitive advantages, and a thorough analysis of valuations. This approach has been the foundation of our strategy and a key factor in the Fund’s outperformance both in 2021 and on a longer term basis.
The Fund’s notable contributors during the period
| • | Our process generated the best relative performance in Fund holdings in the industrials sector during the annual period. |
| ○ | AddTech AB, a Swedish provider of automation and manufacturing equipment, made a sizable contribution to the Fund’s results. A larger, similar firm went public late in the year, prompting investors to assign a higher valuation to AddTech. |
| ○ | IMCD NV, a Netherlands-based distributor of specialty chemicals, gained ground on the strength of better-than-expected results, rising market share, and improved pricing power. |
| • | The Fund outperformed the benchmark in the consumer staples sector, where the luxury consumer products company Inter Parfums, Inc.accounted for nearly all of the contribution. While the company is based in France, the stock is listed in the United States. The valuation between the U.S. and French listings narrowed, benefiting the Fund. The market also recognized the potential for significant value creation from the company’s addition of two new luxury perfume brands. |
| • | Our stock picks also performed very well in the health care sector. |
| ○ | Eckert & Ziegler Strahlen- und Medizintechnik AG, a German producer of radioactive isotopes and associated technology for use in medical, scientific and industrial end markets, was a top performer in the sector. The company’s rapidly growing radiopharma segment benefited from the rise of precision oncology radiology treatments and associated advancements in PET/CT scan imaging systems. In addition, positive news flow around the use of these targeted therapies in prostate cancer raised expectations that the company could benefit from a large increase its addressable market. |
| ○ | Dechra Pharmaceuticals PLC is a U.K.-based provider of pharmaceuticals and related health care products for animals, with a primary focus on companion animals. The company continued to leverage a strong and diverse product portfolio to drive robust results. |
| • | The technology sector was home to one of the Fund’s top performing stocks for the year. Shares of Nemetschek SE, a provider of building information modeling software that helps architects and builders improve efficiency and reduce costs, rallied on the strength of rising earnings and improving guidance. In addition, the broader construction software segment experienced valuation expansion amid growing investor interest in this area. |
| • | Sector allocations, while a residual effect of our bottom-up stock selection process, nonetheless contributed to performance in the annual period. An overweight in the industrials sector, where we have found an abundance of companies that are well positioned for long-term growth, made the largest contribution. We believe there is an attractive and large opportunity set in European industrial companies that are global leaders in niche segments. Several of our |
Columbia Acorn Family of Funds | Annual Report 2021
| 25 |
Manager Discussion of Fund Performance (continued)
Columbia Acorn European FundSM
| | portfolio companies occupy strong positions in customer acquisition and retention through digital platforms, and they have key competitive advantages versus smaller players. We are also focusing on areas such as efficient climate control, factory automation, and the shift toward more environmentally friendly clean energy options. |
The Fund’s notable detractors during the period
| • | The materials sector was one of only two sectors where the Fund had holdings in which our stock picks underperformed. |
| ○ | The shortfall was largely a result of weakness in the shares of the Swiss composite engineering company Gurit Holding AG. |
| ○ | Vidrala SA, a Spain-based producer of glass packaging, was another notable detractor in the sector. |
| ○ | We sold the position in Gurit Holding, but Vidrala remained in the portfolio at year-end. |
| • | Despite the contribution from Nemetschek noted above, our overall stock selection in information technology detracted from the Fund’s 12-month performance results, as well. |
| ○ | TeamViewer AG, based in Germany, was the leading detractor in both the sector and the Fund as a whole. The stock was hurt by a management shuffle and weaker-than-expected profit margins. We became less enthusiastic on the company’s growth prospects, prompting us to sell the position. |
| ○ | Exasol AG, based in Germany, develops database software for analytics applications. While the firm has been successful in driving adoption of its real-time analytics offering in Europe, the process of gaining traction in the massive U.S. market has proved more gradual than investors expected. |
| ○ | SimCorp AS, a provider of investment management software solutions and services, also detracted due to slower new client signings stemming from COVID-19-related uncertainty. |
Market risk may affect a single issuer, sector of the economy, industry or the market as a whole. International investing involves certain risks and volatility due to potential political, economic or currency instabilities and different, potentially less stringent, financial and accounting standards than those generally applicable to U.S. issuers. Investments in small- and mid-cap companies involve risks and volatility and possible illiquidity greater than investments in larger, more established companies. See the Fund’s prospectus for more information on these and other risks.
The views expressed in this report reflect the current views of the respective parties. These views are not guarantees of future performance and involve certain risks, uncertainties and assumptions that are difficult to predict, so actual outcomes and results may differ significantly from the views expressed. These views are subject to change at any time based upon economic, market or other conditions and the respective parties disclaim any responsibility to update such views. These views may not be relied on as investment advice and, because investment decisions for a Columbia Acorn Fund are based on numerous factors, may not be relied on as an indication of trading intent on behalf of any particular Columbia Acorn Fund. References to specific securities should not be construed as a recommendation or investment advice.
| 26 | Columbia Acorn Family of Funds | Annual Report 2021 |
Understanding Your Fund’s Expenses
(Unaudited)
As a shareholder, you incur two types of costs. There are shareholder transaction costs, which generally include sales charges on purchases and may include redemption fees. There are also ongoing fund costs, which generally include investment advisory fees, distribution and service (Rule 12b-1) fees, and other Fund expenses. The following information is intended to help you understand your ongoing costs (in dollars) of investing in the Fund and to help you compare these costs with the ongoing costs of investing in other mutual funds.
Analyzing your Fund’s expenses
To illustrate these ongoing costs, we have provided examples and calculated the expenses paid by investors in each share class of the Funds during the period. The actual and hypothetical information in the tables is based on an initial investment of $1,000 at the beginning of the period indicated and held for the entire period. Expense information is calculated two ways and each method provides you with different information. The amount listed in the “Actual” column is calculated using the Funds’ actual operating expenses and total return for the period. You may use the Actual information, together with the amount invested, to estimate the expenses that you paid over the period. Simply divide your account value by $1,000 (for example, an $8,600 account value divided by $1,000 = 8.6), then multiply the results by the expenses paid during the period under the Actual column. The amount listed in the “Hypothetical” column assumes a 5% annual rate of return before expenses (which is not the Funds’ actual return) and then applies the Funds’ actual expense ratio for the period to the hypothetical return. You should not use the hypothetical account values and expenses to estimate either your actual account balance at the end of the period or the expenses you paid during the period. See “Compare with other funds” below for details on how to use the hypothetical data.
In addition to the ongoing expenses which the Funds bear directly, Columbia Thermostat FundSM’s shareholders indirectly bear the Fund’s allocable share of the costs and expenses of each underlying fund in which the Fund invests. You can also estimate the effective expenses paid during the period, which includes the indirect fees associated with investing in the underlying funds, by using the amounts listed in the effective expenses paid during the period column in the “Fund of Funds” table.
Compare with other funds
Since all mutual funds are required to include the same hypothetical calculations about expenses in shareholder reports, you can use this information to compare the ongoing cost of investing in the Funds with other funds. To do so, compare the hypothetical example with the 5% hypothetical examples that appear in the shareholder reports of other funds. As you compare hypothetical examples of other funds, it is important to note that hypothetical examples are meant to highlight the ongoing costs of investing in a fund only and do not reflect any transaction costs, such as sales charges, or redemption or exchange fees. Therefore, the hypothetical calculations are useful in comparing ongoing costs only, and will not help you determine the relative total costs of owning different funds. If transaction costs were included in these calculations, your costs would be higher.
| July 1, 2021 — December 31, 2021 |
| | Account value at the
beginning of the
period ($) | Account value at the
end of the
period ($) | Expenses paid during
the period ($) | Fund’s annualized
expense ratio (%) |
| | Actual | Hypothetical | Actual | Hypothetical | Actual | Hypothetical | Actual |
| Columbia Acorn® Fund |
| Class A | 1,000.00 | 1,000.00 | 1,009.90 | 1,019.76 | 5.47 | 5.50 | 1.08 |
| Advisor Class | 1,000.00 | 1,000.00 | 1,010.30 | 1,021.07 | 4.15 | 4.18 | 0.82 |
| Class C | 1,000.00 | 1,000.00 | 1,005.60 | 1,016.03 | 9.20 | 9.25 | 1.82 |
| Institutional Class | 1,000.00 | 1,000.00 | 1,010.30 | 1,021.02 | 4.21 | 4.23 | 0.83 |
| Institutional 2 Class | 1,000.00 | 1,000.00 | 1,011.00 | 1,021.17 | 4.06 | 4.08 | 0.80 |
| Institutional 3 Class | 1,000.00 | 1,000.00 | 1,011.30 | 1,021.42 | 3.80 | 3.82 | 0.75 |
Columbia Acorn Family of Funds | Annual Report 2021
| 27 |
Understanding Your Fund’s Expenses (continued)
(Unaudited)
| July 1, 2021 — December 31, 2021 |
| | Account value at the
beginning of the
period ($) | Account value at the
end of the
period ($) | Expenses paid during
the period ($) | Fund’s annualized
expense ratio (%) |
| | Actual | Hypothetical | Actual | Hypothetical | Actual | Hypothetical | Actual |
| Columbia Acorn International® |
| Class A | 1,000.00 | 1,000.00 | 1,040.60 | 1,019.06 | 6.27 | 6.21 | 1.22 |
| Advisor Class | 1,000.00 | 1,000.00 | 1,041.60 | 1,020.32 | 4.99 | 4.94 | 0.97 |
| Class C | 1,000.00 | 1,000.00 | 1,036.60 | 1,015.27 | 10.11 | 10.01 | 1.97 |
| Institutional Class | 1,000.00 | 1,000.00 | 1,041.70 | 1,020.32 | 4.99 | 4.94 | 0.97 |
| Institutional 2 Class | 1,000.00 | 1,000.00 | 1,042.00 | 1,020.57 | 4.74 | 4.69 | 0.92 |
| Institutional 3 Class | 1,000.00 | 1,000.00 | 1,042.10 | 1,020.77 | 4.53 | 4.48 | 0.88 |
| Class R | 1,000.00 | 1,000.00 | 1,039.00 | 1,017.80 | 7.55 | 7.48 | 1.47 |
| Columbia Acorn USA® |
| Class A | 1,000.00 | 1,000.00 | 990.50 | 1,018.20 | 6.97 | 7.07 | 1.39 |
| Advisor Class | 1,000.00 | 1,000.00 | 991.70 | 1,019.46 | 5.72 | 5.80 | 1.14 |
| Class C | 1,000.00 | 1,000.00 | 986.70 | 1,014.42 | 10.72 | 10.87 | 2.14 |
| Institutional Class | 1,000.00 | 1,000.00 | 991.50 | 1,019.46 | 5.72 | 5.80 | 1.14 |
| Institutional 2 Class | 1,000.00 | 1,000.00 | 991.80 | 1,019.76 | 5.42 | 5.50 | 1.08 |
| Institutional 3 Class | 1,000.00 | 1,000.00 | 992.40 | 1,019.96 | 5.22 | 5.30 | 1.04 |
| Columbia Acorn International SelectSM |
| Class A | 1,000.00 | 1,000.00 | 1,059.70 | 1,019.06 | 6.33 | 6.21 | 1.22 |
| Advisor Class | 1,000.00 | 1,000.00 | 1,061.10 | 1,020.32 | 5.04 | 4.94 | 0.97 |
| Class C | 1,000.00 | 1,000.00 | 1,055.80 | 1,015.27 | 10.21 | 10.01 | 1.97 |
| Institutional Class | 1,000.00 | 1,000.00 | 1,061.10 | 1,020.32 | 5.04 | 4.94 | 0.97 |
| Institutional 2 Class | 1,000.00 | 1,000.00 | 1,061.20 | 1,020.77 | 4.57 | 4.48 | 0.88 |
| Institutional 3 Class | 1,000.00 | 1,000.00 | 1,061.70 | 1,021.02 | 4.31 | 4.23 | 0.83 |
| Columbia Acorn European FundSM |
| Class A | 1,000.00 | 1,000.00 | 1,090.10 | 1,017.95 | 7.59 | 7.32 | 1.44 |
| Advisor Class | 1,000.00 | 1,000.00 | 1,091.40 | 1,019.21 | 6.27 | 6.06 | 1.19 |
| Class C | 1,000.00 | 1,000.00 | 1,086.30 | 1,014.17 | 11.52 | 11.12 | 2.19 |
| Institutional Class | 1,000.00 | 1,000.00 | 1,091.60 | 1,019.21 | 6.27 | 6.06 | 1.19 |
| Institutional 2 Class | 1,000.00 | 1,000.00 | 1,091.90 | 1,019.46 | 6.01 | 5.80 | 1.14 |
| Institutional 3 Class | 1,000.00 | 1,000.00 | 1,091.90 | 1,019.66 | 5.80 | 5.60 | 1.10 |
Fund of Funds—Columbia Thermostat FundSM
| July 1, 2021 — December 31, 2021 |
| | Account value at the
beginning of the
period ($) | Account value at the
end of the
period ($) | Expenses paid during
the period ($) | Fund’s annualized
expense ratio (%) | Effective expenses
paid during the
period ($) | Fund’s effective
annualized
expense ratio (%) |
| | Actual | Hypothetical | Actual | Hypothetical | Actual | Hypothetical | Actual | Actual | Hypothetical | Actual |
| Class A | 1,000.00 | 1,000.00 | 1,002.40 | 1,022.68 | 2.52 | 2.55 | 0.50 | 4.29 | 4.33 | 0.85 |
| Advisor Class | 1,000.00 | 1,000.00 | 1,003.30 | 1,023.95 | 1.26 | 1.28 | 0.25 | 3.03 | 3.06 | 0.60 |
| Class C | 1,000.00 | 1,000.00 | 998.60 | 1,018.90 | 6.30 | 6.36 | 1.25 | 8.06 | 8.14 | 1.60 |
| Institutional Class | 1,000.00 | 1,000.00 | 1,003.30 | 1,023.95 | 1.26 | 1.28 | 0.25 | 3.03 | 3.06 | 0.60 |
| Institutional 2 Class | 1,000.00 | 1,000.00 | 1,003.80 | 1,024.20 | 1.01 | 1.02 | 0.20 | 2.78 | 2.81 | 0.55 |
| Institutional 3 Class | 1,000.00 | 1,000.00 | 1,003.60 | 1,024.35 | 0.86 | 0.87 | 0.17 | 2.63 | 2.65 | 0.52 |
Expenses paid during the period are equal to the annualized expense ratio, multiplied by the average account value over the period and then multiplied by the number of days in the Fund’s most recent fiscal half year and divided by 365.
Except with respect to Columbia Thermostat FundSM, expenses do not include any fees and expenses incurred indirectly by a Fund from the underlying funds in which the Fund may invest (also referred to as “acquired funds”), including affiliated and non-affiliated pooled investments vehicles (including mutual funds and exchange traded funds).
| 28 | Columbia Acorn Family of Funds | Annual Report 2021 |
Understanding Your Fund’s Expenses (continued)
(Unaudited)
In the case of Columbia Thermostat FundSM, effective expenses paid during the period and the Fund’s effective annualized expense ratio include expenses borne directly by the class plus the Fund’s pro rata portion of the ongoing expenses charged by the underlying funds in which it invests using the expense ratio of each class of each underlying fund as of the underlying fund’s most recent shareholder report.
Had the investment manager and/or certain of its affiliates not waived/reimbursed certain fees and expenses for the Funds, account value at the end of the period would have been reduced.
Columbia Acorn Family of Funds | Annual Report 2021
| 29 |
Portfolio of Investments
Columbia Acorn® Fund, December 31, 2021
(Percentages represent value of investments compared to net assets)
Investments in securities
| Common Stocks 98.3% |
| Issuer | Shares | Value ($) |
| Communication Services 3.5% |
| Entertainment 3.5% |
| Roblox Corp., Class A(a) | 538,439 | 55,545,367 |
| Roku, Inc.(a) | 116,894 | 26,675,211 |
| Take-Two Interactive Software, Inc.(a) | 211,000 | 37,498,920 |
| Zynga, Inc., Class A(a) | 5,912,599 | 37,840,634 |
| Total | | 157,560,132 |
| Total Communication Services | 157,560,132 |
| Consumer Discretionary 18.7% |
| Auto Components 1.4% |
| Visteon Corp.(a) | 569,901 | 63,338,797 |
| Diversified Consumer Services 2.3% |
| Bright Horizons Family Solutions, Inc.(a) | 342,825 | 43,154,811 |
| Chegg, Inc.(a) | 1,965,290 | 60,334,403 |
| Total | | 103,489,214 |
| Hotels, Restaurants & Leisure 6.2% |
| Churchill Downs, Inc. | 227,000 | 54,684,300 |
| DraftKings, Inc., Class A(a) | 433,250 | 11,901,378 |
| Planet Fitness, Inc., Class A(a) | 1,422,769 | 128,874,416 |
| Wingstop, Inc. | 482,304 | 83,342,131 |
| Total | | 278,802,225 |
| Household Durables 1.5% |
| Skyline Champion Corp.(a) | 859,991 | 67,922,089 |
| Internet & Direct Marketing Retail 2.3% |
| Etsy, Inc.(a) | 430,740 | 94,306,216 |
| Poshmark, Inc., Class A(a),(b) | 580,349 | 9,883,343 |
| Total | | 104,189,559 |
| Leisure Products 0.5% |
| Brunswick Corp. | 202,371 | 20,384,831 |
| Specialty Retail 4.5% |
| Five Below, Inc.(a) | 416,030 | 86,072,447 |
| Floor & Decor Holdings, Inc.(a) | 518,000 | 67,345,180 |
| Vroom, Inc.(a),(c) | 1,932,383 | 20,850,412 |
| Williams-Sonoma, Inc. | 186,700 | 31,576,571 |
| Total | | 205,844,610 |
| Total Consumer Discretionary | 843,971,325 |
| Common Stocks (continued) |
| Issuer | Shares | Value ($) |
| Consumer Staples 2.2% |
| Food & Staples Retailing 1.2% |
| BJ’s Wholesale Club Holdings, Inc.(a) | 824,000 | 55,183,280 |
| Household Products 1.0% |
| WD-40 Co. | 184,759 | 45,199,442 |
| Total Consumer Staples | 100,382,722 |
| Energy 1.5% |
| Oil, Gas & Consumable Fuels 1.5% |
| Devon Energy Corp. | 669,600 | 29,495,880 |
| Diamondback Energy, Inc. | 247,600 | 26,703,660 |
| Matador Resources Co. | 339,948 | 12,550,880 |
| Total | | 68,750,420 |
| Total Energy | 68,750,420 |
| Financials 4.3% |
| Banks 1.3% |
| Lakeland Financial Corp. | 715,615 | 57,349,386 |
| Capital Markets 3.0% |
| Ares Management Corp., Class A | 459,290 | 37,326,498 |
| GCM Grosvenor, Inc., Class A(b) | 2,226,000 | 23,373,000 |
| Hamilton Lane, Inc., Class A(b) | 211,113 | 21,875,529 |
| Houlihan Lokey, Inc., Class A | 265,400 | 27,474,208 |
| Open Lending Corp., Class A(a) | 1,233,417 | 27,727,214 |
| Total | | 137,776,449 |
| Total Financials | 195,125,835 |
| Health Care 21.7% |
| Biotechnology 6.5% |
| Anika Therapeutics, Inc.(a) | 582,331 | 20,864,920 |
| Argenx SE, ADR(a) | 114,951 | 40,254,691 |
| Exact Sciences Corp.(a) | 341,400 | 26,571,162 |
| Fate Therapeutics, Inc.(a) | 213,689 | 12,502,943 |
| Horizon Therapeutics PLC(a) | 538,364 | 58,014,104 |
| Insmed, Inc.(a) | 1,675,370 | 45,637,079 |
| Intellia Therapeutics, Inc.(a) | 183,000 | 21,637,920 |
| Iovance Biotherapeutics, Inc.(a) | 650,700 | 12,421,863 |
The accompanying Notes to Financial Statements are an integral part of this statement.
| 30 | Columbia Acorn Family of Funds | Annual Report 2021 |
Portfolio of Investments (continued)
Columbia Acorn® Fund, December 31, 2021
| Common Stocks (continued) |
| Issuer | Shares | Value ($) |
| Mirati Therapeutics, Inc.(a) | 187,230 | 27,464,769 |
| Natera, Inc.(a) | 307,600 | 28,726,764 |
| Total | | 294,096,215 |
| Health Care Equipment & Supplies 3.3% |
| Align Technology, Inc.(a) | 102,250 | 67,196,655 |
| Globus Medical, Inc., Class A(a) | 433,100 | 31,269,820 |
| Masimo Corp.(a) | 168,910 | 49,453,470 |
| Total | | 147,919,945 |
| Health Care Providers & Services 4.5% |
| Amedisys, Inc.(a) | 650,005 | 105,222,810 |
| Chemed Corp. | 92,296 | 48,828,276 |
| Encompass Health Corp. | 479,663 | 31,302,807 |
| P3 Health Partners, Inc.(a),(d),(e),(f) | 2,500,000 | 16,550,000 |
| Total | | 201,903,893 |
| Health Care Technology 0.7% |
| Doximity, Inc., Class A(a),(c) | 681,102 | 34,143,643 |
| Life Sciences Tools & Services 6.7% |
| 10X Genomics, Inc., Class A(a) | 619,098 | 92,220,838 |
| Bio-Techne Corp. | 159,302 | 82,413,297 |
| Codexis, Inc.(a) | 310,586 | 9,712,024 |
| Pacific Biosciences of California, Inc.(a) | 1,316,600 | 26,937,636 |
| Repligen Corp.(a) | 354,199 | 93,806,063 |
| Total | | 305,089,858 |
| Total Health Care | 983,153,554 |
| Industrials 14.3% |
| Electrical Equipment 4.8% |
| AMETEK, Inc. | 343,667 | 50,532,796 |
| Atkor, Inc.(a) | 359,364 | 39,957,683 |
| Generac Holdings, Inc.(a) | 131,180 | 46,164,866 |
| Plug Power, Inc.(a) | 1,723,000 | 48,640,290 |
| Shoals Technologies Group, Inc., Class A(a) | 1,267,675 | 30,804,502 |
| Total | | 216,100,137 |
| Machinery 5.1% |
| IDEX Corp. | 133,500 | 31,548,720 |
| Ingersoll Rand, Inc. | 808,068 | 49,995,167 |
| Kornit Digital Ltd.(a) | 499,638 | 76,069,886 |
| SPX Corp.(a) | 1,233,872 | 73,637,481 |
| Total | | 231,251,254 |
| Common Stocks (continued) |
| Issuer | Shares | Value ($) |
| Professional Services 2.1% |
| CoStar Group, Inc.(a) | 655,860 | 51,832,616 |
| ICF International, Inc. | 441,000 | 45,224,550 |
| Total | | 97,057,166 |
| Trading Companies & Distributors 2.3% |
| SiteOne Landscape Supply, Inc.(a) | 430,151 | 104,216,984 |
| Total Industrials | 648,625,541 |
| Information Technology 27.8% |
| Communications Equipment 0.8% |
| Calix, Inc.(a) | 432,291 | 34,570,311 |
| Electronic Equipment, Instruments & Components 1.6% |
| CDW Corp. | 347,683 | 71,198,525 |
| IT Services 7.1% |
| Endava PLC, ADR(a) | 451,510 | 75,817,559 |
| EPAM Systems, Inc.(a) | 67,994 | 45,450,589 |
| MongoDB, Inc.(a) | 166,250 | 88,004,437 |
| Shift4 Payments, Inc., Class A(a) | 647,419 | 37,504,983 |
| VeriSign, Inc.(a) | 217,675 | 55,250,269 |
| Wix.com Ltd.(a) | 122,120 | 19,269,315 |
| Total | | 321,297,152 |
| Semiconductors & Semiconductor Equipment 2.9% |
| Enphase Energy, Inc.(a) | 304,253 | 55,660,044 |
| Teradyne, Inc. | 479,339 | 78,386,306 |
| Total | | 134,046,350 |
| Software 15.4% |
| Avalara, Inc.(a) | 496,000 | 64,038,560 |
| Bill.com Holdings, Inc.(a) | 410,636 | 102,309,959 |
| Blackline, Inc.(a) | 426,525 | 44,162,398 |
| Cadence Design Systems, Inc.(a) | 244,059 | 45,480,395 |
| Crowdstrike Holdings, Inc., Class A(a) | 162,291 | 33,229,082 |
| DocuSign, Inc.(a) | 130,620 | 19,894,732 |
| Elastic NV(a) | 213,424 | 26,270,360 |
| Five9, Inc.(a) | 419,315 | 57,580,336 |
| HubSpot, Inc.(a) | 52,050 | 34,308,758 |
| Olo, Inc., Class A(a) | 991,000 | 20,622,710 |
| Trade Desk, Inc. (The), Class A(a) | 1,357,784 | 124,427,326 |
| Voyager Digital Ltd.(a),(c) | 1,953,276 | 24,382,172 |
The accompanying Notes to Financial Statements are an integral part of this statement.
Columbia Acorn Family of Funds | Annual Report 2021
| 31 |
Portfolio of Investments (continued)
Columbia Acorn® Fund, December 31, 2021
| Common Stocks (continued) |
| Issuer | Shares | Value ($) |
| Zendesk, Inc.(a) | 362,877 | 37,844,442 |
| Zscaler, Inc.(a) | 202,044 | 64,922,799 |
| Total | | 699,474,029 |
| Total Information Technology | 1,260,586,367 |
| Materials 2.6% |
| Chemicals 2.6% |
| Albemarle Corp. | 268,600 | 62,790,622 |
| Avient Corp. | 958,000 | 53,600,100 |
| Total | | 116,390,722 |
| Total Materials | 116,390,722 |
| Real Estate 1.7% |
| Real Estate Management & Development 1.7% |
| Colliers International Group, Inc. | 336,817 | 50,067,847 |
| FirstService Corp. | 132,500 | 26,032,275 |
| Total | | 76,100,122 |
| Total Real Estate | 76,100,122 |
Total Common Stocks
(Cost $3,563,490,313) | 4,450,646,740 |
|
| Securities Lending Collateral 0.8% |
| Issuer | Shares | Value ($) |
| Dreyfus Government Cash Management Fund, Institutional Shares, 0.030%(g),(h) | 36,269,919 | 36,269,919 |
Total Securities Lending Collateral
(Cost $36,269,919) | 36,269,919 |
|
| Money Market Funds 1.8% |
| | Shares | Value ($) |
| Columbia Short-Term Cash Fund, 0.085%(b),(g) | 81,677,236 | 81,660,901 |
Total Money Market Funds
(Cost $81,660,223) | 81,660,901 |
Total Investments in Securities
(Cost: $3,681,420,455) | 4,568,577,560 |
| Obligation to Return Collateral for Securities Loaned | | (36,269,919) |
| Other Assets & Liabilities, Net | | (3,683,971) |
| Net Assets | 4,528,623,670 |
Notes to Portfolio of Investments
| (a) | Non-income producing investment. |
| (b) | As defined in the Investment Company Act of 1940, as amended, an affiliated company is one in which the Fund owns 5% or more of the company’s outstanding voting securities, or a company which is under common ownership or control with the Fund. The value of the holdings and transactions in these affiliated companies during the year ended December 31, 2021 are as follows: |
| Affiliated issuers | Beginning
of period($) | Purchases($) | Sales($) | Net change in
unrealized
appreciation
(depreciation)($) | End of
period($) | Realized gain
(loss)($) | Dividends($) | End of
period shares |
| Columbia Short-Term Cash Fund, 0.085% |
| | 39,795,717 | 1,744,139,977 | (1,702,270,267) | (4,526) | 81,660,901 | (1,213) | 58,825 | 81,677,236 |
| ePlus, Inc.‡,† |
| | — | 47,101,170 | (79,036,447) | — | — | 7,473,170 | — | — |
| GCM Grosvenor, Inc., Class A‡ |
| | — | — | — | 70,639 | 23,373,000 | — | 734,580 | 2,226,000 |
| Hamilton Lane, Inc., Class A‡,† |
| | — | 48,305,512 | (55,510,979) | — | — | 4,493,833 | 821,911 | — |
| Kiniksa Pharmaceuticals Ltd., Class A† |
| | 28,164,513 | — | (31,166,939) | 3,002,426 | — | (4,332,697) | — | — |
| Poshmark, Inc., Class A‡,† |
| | — | 57,202,730 | (25,734,533) | — | — | (15,581,834) | — | — |
| Total | 67,960,230 | | | 3,068,539 | 105,033,901 | (7,948,741) | 1,615,316 | |
| ‡ | Issuer was not an affiliate at the beginning of period. |
| † | Issuer was not an affiliate at the end of period. |
The accompanying Notes to Financial Statements are an integral part of this statement.
| 32 | Columbia Acorn Family of Funds | Annual Report 2021 |
Portfolio of Investments (continued)
Columbia Acorn® Fund, December 31, 2021
Notes to Portfolio of Investments (continued)
| (c) | All or a portion of this security was on loan at December 31, 2021. The total market value of securities on loan at December 31, 2021 was $33,010,589. |
| (d) | Represents fair value as determined in good faith under procedures approved by the Board of Trustees. At December 31, 2021, the total value of these securities amounted to $16,550,000, which represents 0.37% of total net assets. |
| (e) | Denotes a restricted security, which is subject to legal or contractual restrictions on resale under federal securities laws. Disposal of a restricted investment may involve time-consuming negotiations and expenses, and prompt sale at an acceptable price may be difficult to achieve. Private placement securities are generally considered to be restricted, although certain of those securities may be traded between qualified institutional investors under the provisions of Section 4(a)(2) and Rule 144A. The Fund will not incur any registration costs upon such a trade. These securities are valued at fair value determined in good faith under consistently applied procedures established by the Fund’s Board of Trustees. At December 31, 2021, the total market value of these securities amounted to $16,550,000, which represents 0.37% of total net assets. Additional information on these securities is as follows: |
| Security | Acquisition
Dates | Shares | Cost ($) | Value ($) |
| P3 Health Partners, Inc. | 05/26/2021 | 2,500,000 | 25,000,000 | 16,550,000 |
| (f) | Valuation based on significant unobservable inputs. |
| (g) | The rate shown is the seven-day current annualized yield at December 31, 2021. |
| (h) | Investment made with cash collateral received from securities lending activity. |
Abbreviation Legend
| ADR | American Depositary Receipt |
Fair value measurements
Various inputs are used in determining the value of the Fund’s investments, following the input prioritization hierarchy established by accounting principles generally accepted in the United States of America (GAAP). These inputs are summarized in the three broad levels listed below:
| ■ | Level 1 – quoted prices in active markets for identical securities |
| ■ | Level 2 – prices determined using other significant observable inputs (including quoted prices for similar securities, interest rates, prepayment speeds, credit risk and others) |
| ■ | Level 3 – prices determined using significant unobservable inputs where quoted prices or observable inputs are unavailable or less reliable (including management’s own assumptions about the factors market participants would use in pricing an investment) |
The inputs or methodology used for valuing securities are not necessarily an indication of the risk associated with investing in those securities.
Examples of the types of securities in which the Fund would typically invest and how they are classified within this hierarchy are as follows. Typical Level 1 securities include exchange traded domestic equities, mutual funds whose net asset values are published each day and exchange traded foreign equities that are not typically statistically fair valued. Typical Level 2 securities include exchange traded foreign equities that are traded in the European region or Asia Pacific region time zones which are typically statistically fair valued, forward foreign currency exchange contracts and short-term investments valued at amortized cost. Additionally, securities fair valued by Columbia Wanger Asset Management’s Valuation Committee (the Committee) that rely on significant observable inputs are also included in Level 2. Typical Level 3 securities include any security fair valued by the Committee that relies on significant unobservable inputs.
The Committee is responsible for applying the Columbia Acorn Trust Portfolio Pricing Policy and the Columbia Wanger Asset Management pricing procedures (the Policies), which are approved by and subject to the oversight of the Board of Trustees.
The Committee meets as necessary, and no less frequently than quarterly, to determine fair values for securities for which market quotations are not readily available or for which Columbia Wanger Asset Management believes that available market quotations are unreliable. The Committee also reviews the continuing appropriateness of the Policies. In circumstances where a security has been fair valued, the Committee will also review the continuing appropriateness of the current value of the security. The Policies address, among other things: circumstances under which market quotations will be deemed readily available; selection of third party pricing vendors; appropriate pricing methodologies; events that require fair valuation and fair value techniques; circumstances under which securities will be deemed to pose a potential for stale pricing, including when securities are illiquid, restricted, or in default; and certain delegations of authority to determine fair values to the Fund’s investment manager. The Committee may also meet to discuss additional valuation matters, which may include review of back-testing results, review of time-sensitive information or approval of other valuation related actions, and to review the appropriateness of the Policies.
The following table is a summary of the inputs used to value the Fund’s investments at December 31, 2021:
| | Level 1 ($) | Level 2 ($) | Level 3 ($) | Total ($) |
| Investments in Securities | | | | |
| Common Stocks | | | | |
| Communication Services | 157,560,132 | — | — | 157,560,132 |
| Consumer Discretionary | 843,971,325 | — | — | 843,971,325 |
| Consumer Staples | 100,382,722 | — | — | 100,382,722 |
| Energy | 68,750,420 | — | — | 68,750,420 |
| Financials | 195,125,835 | — | — | 195,125,835 |
| Health Care | 966,603,554 | — | 16,550,000 | 983,153,554 |
The accompanying Notes to Financial Statements are an integral part of this statement.
Columbia Acorn Family of Funds | Annual Report 2021
| 33 |
Portfolio of Investments (continued)
Columbia Acorn® Fund, December 31, 2021
Fair value measurements (continued)
| | Level 1 ($) | Level 2 ($) | Level 3 ($) | Total ($) |
| Industrials | 648,625,541 | — | — | 648,625,541 |
| Information Technology | 1,260,586,367 | — | — | 1,260,586,367 |
| Materials | 116,390,722 | — | — | 116,390,722 |
| Real Estate | 76,100,122 | — | — | 76,100,122 |
| Total Common Stocks | 4,434,096,740 | — | 16,550,000 | 4,450,646,740 |
| Securities Lending Collateral | 36,269,919 | — | — | 36,269,919 |
| Money Market Funds | 81,660,901 | — | — | 81,660,901 |
| Total Investments in Securities | 4,552,027,560 | — | 16,550,000 | 4,568,577,560 |
See the Portfolio of Investments for all investment classifications not indicated in the table.
The Fund does not hold any significant investments (greater than one percent of net assets) categorized as Level 3.
The accompanying Notes to Financial Statements are an integral part of this statement.
| 34 | Columbia Acorn Family of Funds | Annual Report 2021 |
Portfolio of Investments
Columbia Acorn International®, December 31, 2021
(Percentages represent value of investments compared to net assets)
Investments in securities
| Common Stocks 98.9% |
| Issuer | Shares | Value ($) |
| Australia 5.3% |
| Bapcor Ltd. | 8,198,062 | 41,787,728 |
| carsales.com Ltd. | 990,365 | 18,095,622 |
| IDP Education Ltd. | 1,459,389 | 36,765,335 |
| Pro Medicus Ltd. | 289,845 | 13,154,462 |
| Temple & Webster Group Ltd.(a) | 1,845,783 | 14,449,564 |
| Total | 124,252,711 |
| Austria 0.6% |
| S&T AG(b) | 878,104 | 14,588,437 |
| Brazil 1.8% |
| Notre Dame Intermedica Participacoes SA | 1,756,438 | 19,030,706 |
| TOTVS SA | 4,694,127 | 24,136,409 |
| Total | 43,167,115 |
| Canada 2.6% |
| Altus Group Ltd. | 456,750 | 25,625,952 |
| Osisko Gold Royalties Ltd. | 2,866,342 | 35,077,255 |
| Total | 60,703,207 |
| China 2.5% |
| Shenzhou International Group Holdings Ltd. | 1,145,600 | 22,183,034 |
| Silergy Corp. | 194,000 | 35,113,285 |
| Total | 57,296,319 |
| Denmark 3.6% |
| ALK-Abello AS(a) | 76,663 | 40,255,982 |
| SimCorp AS | 394,321 | 42,977,746 |
| Total | 83,233,728 |
| Finland 0.8% |
| Valmet OYJ | 419,361 | 17,980,387 |
| France 0.6% |
| Robertet SA | 12,149 | 13,485,846 |
| Germany 7.5% |
| Eckert & Ziegler Strahlen- und Medizintechnik AG | 249,713 | 26,686,191 |
| Hypoport SE(a) | 93,752 | 54,374,471 |
| Jenoptik AG | 1,073,686 | 45,306,306 |
| Nemetschek SE | 384,791 | 49,200,954 |
| Total | 175,567,922 |
| Common Stocks (continued) |
| Issuer | Shares | Value ($) |
| Greece 0.5% |
| JUMBO SA | 882,707 | 12,662,520 |
| Italy 4.7% |
| Amplifon SpA | 977,347 | 52,589,300 |
| Carel Industries SpA | 289,182 | 8,745,373 |
| GVS SpA | 1,147,087 | 13,768,727 |
| Nexi SpA(a) | 2,125,392 | 33,679,810 |
| Total | 108,783,210 |
| Japan 16.5% |
| Aruhi Corp. | 1,484,700 | 13,491,683 |
| CyberAgent, Inc. | 682,300 | 11,373,825 |
| Daifuku Co., Ltd. | 458,900 | 37,526,510 |
| Daiseki Co., Ltd. | 932,119 | 41,408,850 |
| Disco Corp. | 66,000 | 20,173,068 |
| Elecom Co., Ltd. | 1,180,700 | 15,539,751 |
| Fuso Chemical Co., Ltd. | 561,800 | 23,703,810 |
| Hikari Tsushin, Inc. | 424,828 | 65,426,745 |
| Hoshizaki Corp. | 149,200 | 11,225,489 |
| NSD Co., Ltd. | 588,100 | 10,682,687 |
| Obic Co., Ltd. | 139,100 | 26,032,456 |
| Seiren Co., Ltd. | 861,000 | 18,863,267 |
| Sekisui Chemical Co., Ltd. | 2,216,400 | 37,067,418 |
| Shima Seiki Manufacturing Ltd. | 325,900 | 5,590,745 |
| Simplex Holdings, Inc.(a) | 799,700 | 19,734,355 |
| Solasto Corp. | 1,803,300 | 19,374,629 |
| Valqua Ltd. | 407,600 | 9,607,063 |
| Total | 386,822,351 |
| Malta 0.5% |
| Kindred Group PLC | 1,069,580 | 12,671,973 |
| Mexico 1.1% |
| Corporación Inmobiliaria Vesta SAB de CV | 12,567,607 | 25,189,841 |
| Netherlands 4.3% |
| Argenx SE, ADR(a) | 114,759 | 40,187,454 |
| BE Semiconductor Industries NV | 144,137 | 12,253,484 |
| IMCD NV | 222,632 | 49,202,402 |
| Total | 101,643,340 |
The accompanying Notes to Financial Statements are an integral part of this statement.
Columbia Acorn Family of Funds | Annual Report 2021
| 35 |
Portfolio of Investments (continued)
Columbia Acorn International®, December 31, 2021
| Common Stocks (continued) |
| Issuer | Shares | Value ($) |
| New Zealand 1.9% |
| Fisher & Paykel Healthcare Corp., Ltd. | 1,978,513 | 44,325,753 |
| Russian Federation 1.6% |
| TCS Group Holding PLC, GDR(c) | 448,967 | 37,847,872 |
| Singapore 1.1% |
| Mapletree Logistics Trust | 17,732,544 | 25,008,848 |
| South Korea 2.4% |
| Koh Young Technology, Inc.(a) | 1,266,645 | 25,229,265 |
| Korea Investment Holdings Co., Ltd.(a) | 442,611 | 29,987,138 |
| Total | 55,216,403 |
| Spain 1.9% |
| Befesa SA | 308,579 | 23,677,972 |
| Vidrala SA | 213,082 | 21,008,628 |
| Total | 44,686,600 |
| Sweden 9.8% |
| AddTech AB, B Shares | 2,032,021 | 48,332,282 |
| Dometic Group AB | 2,163,171 | 28,396,471 |
| Hexagon AB, Class B | 4,274,829 | 67,715,642 |
| Munters Group AB | 3,142,036 | 24,322,770 |
| Sectra AB, Class B(a) | 996,824 | 22,084,965 |
| Sweco AB, Class B | 2,035,816 | 38,308,843 |
| Total | 229,160,973 |
| Switzerland 3.6% |
| Belimo Holding AG, Registered Shares | 66,374 | 42,146,582 |
| Inficon Holding AG | 18,546 | 27,113,314 |
| Montana Aerospace AG(a),(c) | 391,115 | 14,529,459 |
| Total | 83,789,355 |
| Taiwan 5.5% |
| Parade Technologies Ltd. | 756,000 | 57,516,566 |
| Sinbon Electronics Co., Ltd. | 2,393,000 | 24,513,062 |
| Universal Vision Biotechnology Co., Ltd. | 1,110,000 | 11,339,944 |
| Voltronic Power Technology Corp. | 613,408 | 34,220,807 |
| Total | 127,590,379 |
| Common Stocks (continued) |
| Issuer | Shares | Value ($) |
| United Kingdom 15.2% |
| Abcam PLC(a) | 625,142 | 14,663,969 |
| Auto Trader Group PLC | 2,123,901 | 21,270,608 |
| Dechra Pharmaceuticals PLC | 773,015 | 55,869,431 |
| Diploma PLC | 688,467 | 31,563,804 |
| Genus PLC | 368,303 | 24,700,928 |
| Halma PLC | 460,960 | 19,986,715 |
| Intermediate Capital Group PLC | 1,765,720 | 52,584,435 |
| Rentokil Initial PLC | 5,597,778 | 44,310,603 |
| Rightmove PLC | 4,790,311 | 51,691,274 |
| Safestore Holdings PLC | 645,592 | 12,312,420 |
| Spirax-Sarco Engineering PLC | 123,404 | 26,856,471 |
| Total | 355,810,658 |
| United States 2.6% |
| Inter Parfums, Inc. | 576,834 | 61,663,555 |
| Vietnam 0.4% |
| Asia Commercial Bank JSC(a) | 6,638,667 | 10,039,269 |
Total Common Stocks
(Cost $1,397,467,893) | 2,313,188,572 |
|
| Securities Lending Collateral 0.4% |
| | |
| Dreyfus Government Cash Management Fund, Institutional Shares, 0.030%(d),(e) | 10,493,519 | 10,493,519 |
Total Securities Lending Collateral
(Cost $10,493,519) | 10,493,519 |
|
| Money Market Funds 1.0% |
| | Shares | Value ($) |
| Columbia Short-Term Cash Fund, 0.085%(d),(f) | 22,668,846 | 22,664,312 |
Total Money Market Funds
(Cost $22,664,312) | 22,664,312 |
Total Investments in Securities
(Cost $1,430,625,724) | 2,346,346,403 |
| Obligation to Return Collateral for Securities Loaned | | (10,493,519) |
| Other Assets & Liabilities, Net | | 3,935,189 |
| Net Assets | $2,339,788,073 |
The accompanying Notes to Financial Statements are an integral part of this statement.
| 36 | Columbia Acorn Family of Funds | Annual Report 2021 |
Portfolio of Investments (continued)
Columbia Acorn International®, December 31, 2021
Notes to Portfolio of Investments
| (a) | Non-income producing investment. |
| (b) | All or a portion of this security was on loan at December 31, 2021. The total market value of securities on loan at December 31, 2021 was $10,018,113. |
| (c) | Represents privately placed and other securities and instruments exempt from Securities and Exchange Commission registration (collectively, private placements), such as Section 4(a)(2) and Rule 144A eligible securities, which are often sold only to qualified institutional buyers. At December 31, 2021, the total value of these securities amounted to $52,377,331, which represents 2.24% of total net assets. |
| (d) | The rate shown is the seven-day current annualized yield at December 31, 2021. |
| (e) | Investment made with cash collateral received from securities lending activity. |
| (f) | As defined in the Investment Company Act of 1940, as amended, an affiliated company is one in which the Fund owns 5% or more of the company’s outstanding voting securities, or a company which is under common ownership or control with the Fund. The value of the holdings and transactions in these affiliated companies during the year ended December 31, 2021 are as follows: |
| Affiliated issuers | Beginning
of period($) | Purchases($) | Sales($) | Net change in
unrealized
appreciation
(depreciation)($) | End of
period($) | Realized gain
(loss)($) | Dividends($) | End of
period shares |
| Columbia Short-Term Cash Fund, 0.085% |
| | 61,934,514 | 628,270,129 | (667,540,331) | — | 22,664,312 | (3,531) | 35,467 | 22,668,846 |
Abbreviation Legend
| ADR | American Depositary Receipt |
| GDR | Global Depositary Receipt |
Fair value measurements
Various inputs are used in determining the value of the Fund’s investments, following the input prioritization hierarchy established by accounting principles generally accepted in the United States of America (GAAP). These inputs are summarized in the three broad levels listed below:
| ■ | Level 1 – quoted prices in active markets for identical securities |
| ■ | Level 2 – prices determined using other significant observable inputs (including quoted prices for similar securities, interest rates, prepayment speeds, credit risk and others) |
| ■ | Level 3 – prices determined using significant unobservable inputs where quoted prices or observable inputs are unavailable or less reliable (including management’s own assumptions about the factors market participants would use in pricing an investment) |
The inputs or methodology used for valuing securities are not necessarily an indication of the risk associated with investing in those securities.
Examples of the types of securities in which the Fund would typically invest and how they are classified within this hierarchy are as follows. Typical Level 1 securities include exchange traded domestic equities, mutual funds whose net asset values are published each day and exchange traded foreign equities that are not typically statistically fair valued. Typical Level 2 securities include exchange traded foreign equities that are traded in the European region or Asia Pacific region time zones which are typically statistically fair valued, forward foreign currency exchange contracts and short-term investments valued at amortized cost. Additionally, securities fair valued by Columbia Wanger Asset Management’s Valuation Committee (the Committee) that rely on significant observable inputs are also included in Level 2. Typical Level 3 securities include any security fair valued by the Committee that relies on significant unobservable inputs.
The Committee is responsible for applying the Columbia Acorn Trust Portfolio Pricing Policy and the Columbia Wanger Asset Management pricing procedures (the Policies), which are approved by and subject to the oversight of the Board of Trustees.
The Committee meets as necessary, and no less frequently than quarterly, to determine fair values for securities for which market quotations are not readily available or for which Columbia Wanger Asset Management believes that available market quotations are unreliable. The Committee also reviews the continuing appropriateness of the Policies. In circumstances where a security has been fair valued, the Committee will also review the continuing appropriateness of the current value of the security. The Policies address, among other things: circumstances under which market quotations will be deemed readily available; selection of third party pricing vendors; appropriate pricing methodologies; events that require fair valuation and fair value techniques; circumstances under which securities will be deemed to pose a potential for stale pricing, including when securities are illiquid, restricted, or in default; and certain delegations of authority to determine fair values to the Fund’s investment manager. The Committee may also meet to discuss additional valuation matters, which may include review of back-testing results, review of time-sensitive information or approval of other valuation related actions, and to review the appropriateness of the Policies.
The following table is a summary of the inputs used to value the Fund’s investments at December 31, 2021:
| | Level 1 ($) | Level 2 ($) | Level 3 ($) | Total ($) |
| Investments in Securities | | | | |
| Common Stocks | | | | |
| Australia | — | 124,252,711 | — | 124,252,711 |
| Austria | — | 14,588,437 | — | 14,588,437 |
| Brazil | 43,167,115 | — | — | 43,167,115 |
| Canada | 60,703,207 | — | — | 60,703,207 |
| China | — | 57,296,319 | — | 57,296,319 |
The accompanying Notes to Financial Statements are an integral part of this statement.
Columbia Acorn Family of Funds | Annual Report 2021
| 37 |
Portfolio of Investments (continued)
Columbia Acorn International®, December 31, 2021
Fair value measurements (continued)
| | Level 1 ($) | Level 2 ($) | Level 3 ($) | Total ($) |
| Denmark | — | 83,233,728 | — | 83,233,728 |
| Finland | — | 17,980,387 | — | 17,980,387 |
| France | — | 13,485,846 | — | 13,485,846 |
| Germany | — | 175,567,922 | — | 175,567,922 |
| Greece | — | 12,662,520 | — | 12,662,520 |
| Italy | — | 108,783,210 | — | 108,783,210 |
| Japan | — | 386,822,351 | — | 386,822,351 |
| Malta | — | 12,671,973 | — | 12,671,973 |
| Mexico | 25,189,841 | — | — | 25,189,841 |
| Netherlands | 40,187,454 | 61,455,886 | — | 101,643,340 |
| New Zealand | — | 44,325,753 | — | 44,325,753 |
| Russian Federation | — | 37,847,872 | — | 37,847,872 |
| Singapore | — | 25,008,848 | — | 25,008,848 |
| South Korea | — | 55,216,403 | — | 55,216,403 |
| Spain | — | 44,686,600 | — | 44,686,600 |
| Sweden | — | 229,160,973 | — | 229,160,973 |
| Switzerland | — | 83,789,355 | — | 83,789,355 |
| Taiwan | — | 127,590,379 | — | 127,590,379 |
| United Kingdom | — | 355,810,658 | — | 355,810,658 |
| United States | 61,663,555 | — | — | 61,663,555 |
| Vietnam | — | 10,039,269 | — | 10,039,269 |
| Total Common Stocks | 230,911,172 | 2,082,277,400 | — | 2,313,188,572 |
| Securities Lending Collateral | 10,493,519 | — | — | 10,493,519 |
| Money Market Funds | 22,664,312 | — | — | 22,664,312 |
| Total Investments in Securities | 264,069,003 | 2,082,277,400 | — | 2,346,346,403 |
See the Portfolio of Investments for all investment classifications not indicated in the table.
The Fund’s assets assigned to the Level 2 input category are generally valued using a market approach, in which a security’s value is determined through its correlation to prices and information from observable market transactions for similar or identical assets. Foreign equities are generally valued at the last sale price on the foreign exchange or market on which they trade. The Fund may use a statistical fair valuation model, in accordance with the policy adopted by the Board of Trustees, provided by an independent third party to value securities principally traded in foreign markets in order to adjust for possible stale pricing that may occur between the close of the foreign exchanges and the time for valuation. These models take into account available market data including intraday index, ADR, and ETF movements.
The accompanying Notes to Financial Statements are an integral part of this statement.
| 38 | Columbia Acorn Family of Funds | Annual Report 2021 |
Portfolio of Investments
Columbia Acorn USA®, December 31, 2021
(Percentages represent value of investments compared to net assets)
Investments in securities
| Common Stocks 95.5% |
| Issuer | Shares | Value ($) |
| Communication Services 1.4% |
| Interactive Media & Services 1.4% |
| Ziff Davis, Inc.(a) | 39,592 | 4,389,169 |
| Total Communication Services | 4,389,169 |
| Consumer Discretionary 20.1% |
| Auto Components 3.6% |
| Dorman Products, Inc.(a) | 37,320 | 4,217,533 |
| LCI Industries | 23,146 | 3,607,767 |
| Visteon Corp.(a) | 27,625 | 3,070,243 |
| Total | | 10,895,543 |
| Diversified Consumer Services 1.7% |
| Bright Horizons Family Solutions, Inc.(a) | 22,625 | 2,848,035 |
| Chegg, Inc.(a) | 74,626 | 2,291,018 |
| Total | | 5,139,053 |
| Hotels, Restaurants & Leisure 8.2% |
| Churchill Downs, Inc. | 20,741 | 4,996,507 |
| First Watch Restaurant Group, Inc.(a) | 71,141 | 1,192,323 |
| Planet Fitness, Inc., Class A(a) | 102,132 | 9,251,117 |
| Wendy’s Co. (The) | 126,471 | 3,016,333 |
| Wingstop, Inc. | 36,835 | 6,365,088 |
| Total | | 24,821,368 |
| Household Durables 2.4% |
| Skyline Champion Corp.(a) | 91,970 | 7,263,790 |
| Internet & Direct Marketing Retail 0.6% |
| Poshmark, Inc., Class A(a) | 109,356 | 1,862,333 |
| Leisure Products 1.1% |
| Brunswick Corp. | 31,210 | 3,143,783 |
| Specialty Retail 2.5% |
| Five Below, Inc.(a) | 30,943 | 6,401,797 |
| Vroom, Inc.(a) | 109,388 | 1,180,297 |
| Total | | 7,582,094 |
| Total Consumer Discretionary | 60,707,964 |
| Consumer Staples 3.2% |
| Food & Staples Retailing 2.2% |
| BJ’s Wholesale Club Holdings, Inc.(a) | 99,903 | 6,690,504 |
| Common Stocks (continued) |
| Issuer | Shares | Value ($) |
| Household Products 1.0% |
| WD-40 Co. | 12,497 | 3,057,266 |
| Total Consumer Staples | 9,747,770 |
| Energy 1.1% |
| Oil, Gas & Consumable Fuels 1.1% |
| Matador Resources Co. | 87,600 | 3,234,192 |
| Total Energy | 3,234,192 |
| Financials 6.2% |
| Banks 1.7% |
| Lakeland Financial Corp. | 61,687 | 4,943,596 |
| Capital Markets 4.5% |
| GCM Grosvenor, Inc., Class A(b) | 399,884 | 4,198,782 |
| Hamilton Lane, Inc., Class A | 28,490 | 2,952,134 |
| Houlihan Lokey, Inc., Class A | 34,098 | 3,529,825 |
| Open Lending Corp., Class A(a) | 133,304 | 2,996,674 |
| Total | | 13,677,415 |
| Total Financials | 18,621,011 |
| Health Care 25.7% |
| Biotechnology 5.5% |
| Anika Therapeutics, Inc.(a) | 56,439 | 2,022,209 |
| Fate Therapeutics, Inc.(a) | 71,320 | 4,172,933 |
| Insmed, Inc.(a) | 140,494 | 3,827,057 |
| Intellia Therapeutics, Inc.(a) | 14,185 | 1,677,234 |
| Iovance Biotherapeutics, Inc.(a) | 43,100 | 822,779 |
| Mirati Therapeutics, Inc.(a) | 16,049 | 2,354,228 |
| Natera, Inc.(a) | 20,515 | 1,915,896 |
| Total | | 16,792,336 |
| Health Care Equipment & Supplies 1.3% |
| Glaukos Corp.(a) | 31,345 | 1,392,972 |
| Globus Medical, Inc., Class A(a) | 34,005 | 2,455,161 |
| Total | | 3,848,133 |
The accompanying Notes to Financial Statements are an integral part of this statement.
Columbia Acorn Family of Funds | Annual Report 2021
| 39 |
Portfolio of Investments (continued)
Columbia Acorn USA®, December 31, 2021
| Common Stocks (continued) |
| Issuer | Shares | Value ($) |
| Health Care Providers & Services 7.2% |
| Amedisys, Inc.(a) | 38,777 | 6,277,221 |
| Chemed Corp. | 13,474 | 7,128,285 |
| Encompass Health Corp. | 17,875 | 1,166,522 |
| National Research Corp., Class A | 89,928 | 3,733,811 |
| P3 Health Partners, Inc.(a),(b) | 484,027 | 3,407,550 |
| Total | | 21,713,389 |
| Health Care Technology 1.8% |
| Doximity, Inc., Class A(a),(b) | 74,307 | 3,725,010 |
| Schrodinger, Inc.(a) | 46,765 | 1,628,825 |
| Total | | 5,353,835 |
| Life Sciences Tools & Services 9.3% |
| 10X Genomics, Inc., Class A(a) | 25,835 | 3,848,381 |
| Bio-Techne Corp. | 5,335 | 2,760,009 |
| Codexis, Inc.(a) | 139,525 | 4,362,947 |
| DNA Script(a),(c),(d),(e) | 1,139 | 791,265 |
| NanoString Technologies, Inc.(a) | 54,507 | 2,301,830 |
| NeoGenomics, Inc.(a) | 70,000 | 2,388,400 |
| Pacific Biosciences of California, Inc.(a) | 160,030 | 3,274,214 |
| Repligen Corp.(a) | 31,921 | 8,453,958 |
| Total | | 28,181,004 |
| Pharmaceuticals 0.6% |
| Nuvation Bio, Inc.(a),(b) | 225,836 | 1,919,606 |
| Total Health Care | 77,808,303 |
| Industrials 16.0% |
| Electrical Equipment 5.3% |
| Atkor, Inc.(a) | 48,782 | 5,424,071 |
| Plug Power, Inc.(a) | 155,838 | 4,399,307 |
| Shoals Technologies Group, Inc., Class A(a) | 194,351 | 4,722,729 |
| Sunrun, Inc.(a) | 47,715 | 1,636,624 |
| Total | | 16,182,731 |
| Machinery 5.3% |
| ITT, Inc. | 40,315 | 4,119,790 |
| Kornit Digital Ltd.(a) | 33,162 | 5,048,914 |
| SPX Corp.(a) | 68,525 | 4,089,572 |
| Watts Water Technologies, Inc., Class A | 13,603 | 2,641,295 |
| Total | | 15,899,571 |
| Common Stocks (continued) |
| Issuer | Shares | Value ($) |
| Professional Services 1.3% |
| ICF International, Inc. | 37,423 | 3,837,729 |
| Road & Rail 0.8% |
| Saia, Inc.(a) | 7,395 | 2,492,337 |
| Trading Companies & Distributors 3.3% |
| SiteOne Landscape Supply, Inc.(a) | 40,720 | 9,865,641 |
| Total Industrials | 48,278,009 |
| Information Technology 17.7% |
| Communications Equipment 1.3% |
| Calix, Inc.(a) | 49,458 | 3,955,156 |
| Electronic Equipment, Instruments & Components 1.9% |
| Advanced Energy Industries, Inc. | 25,115 | 2,286,972 |
| Badger Meter, Inc. | 33,421 | 3,561,342 |
| Total | | 5,848,314 |
| IT Services 3.1% |
| Endava PLC, ADR(a) | 40,620 | 6,820,910 |
| Shift4 Payments, Inc., Class A(a) | 42,350 | 2,453,336 |
| Total | | 9,274,246 |
| Software 11.4% |
| Avalara, Inc.(a) | 30,690 | 3,962,386 |
| Blackline, Inc.(a) | 82,127 | 8,503,429 |
| Elastic NV(a) | 33,701 | 4,148,256 |
| Five9, Inc.(a) | 39,690 | 5,450,231 |
| Manhattan Associates, Inc.(a) | 18,114 | 2,816,546 |
| Olo, Inc., Class A(a) | 148,321 | 3,086,560 |
| Sprout Social, Inc., Class A(a) | 34,123 | 3,094,615 |
| Voyager Digital Ltd.(a) | 258,787 | 3,230,362 |
| Total | | 34,292,385 |
| Total Information Technology | 53,370,101 |
| Materials 1.6% |
| Chemicals 1.6% |
| Avient Corp. | 86,200 | 4,822,890 |
| Total Materials | 4,822,890 |
The accompanying Notes to Financial Statements are an integral part of this statement.
| 40 | Columbia Acorn Family of Funds | Annual Report 2021 |
Portfolio of Investments (continued)
Columbia Acorn USA®, December 31, 2021
| Common Stocks (continued) |
| Issuer | Shares | Value ($) |
| Real Estate 2.5% |
| Real Estate Management & Development 2.5% |
| Colliers International Group, Inc. | 33,829 | 5,028,681 |
| FirstService Corp. | 13,489 | 2,650,184 |
| Total | | 7,678,865 |
| Total Real Estate | 7,678,865 |
Total Common Stocks
(Cost $233,026,036) | 288,658,274 |
|
| Limited Partnerships 1.5% |
| | |
| Consumer Discretionary 1.5% |
| Hotels, Restaurants & Leisure 1.5% |
| Cedar Fair LP(a) | 92,580 | 4,634,555 |
| Total Consumer Discretionary | 4,634,555 |
Total Limited Partnerships
(Cost $3,167,884) | 4,634,555 |
|
| Securities Lending Collateral 1.7% |
| | |
| Dreyfus Government Cash Management Fund, Institutional Shares, 0.030%(f),(g) | 5,034,920 | 5,034,920 |
Total Securities Lending Collateral
(Cost $5,034,920) | 5,034,920 |
|
| Warrants 0.0% |
| Issuer | Shares | Value ($) |
| Financials 0.0% |
| Capital Markets 0.0% |
| P3 Health Partners, Inc.(a) | 161,342 | 169,409 |
| Total Financials | 169,409 |
Total Warrants
(Cost $232,971) | 169,409 |
|
| Money Market Funds 2.9% |
| | Shares | Value ($) |
| Columbia Short-Term Cash Fund, 0.085%(f),(h) | 8,760,878 | 8,759,126 |
Total Money Market Funds
(Cost $8,759,128) | 8,759,126 |
Total Investments in Securities
(Cost: $250,220,939) | 307,256,284 |
| Obligation to Return Collateral for Securities Loaned | | (5,034,920) |
| Other Assets & Liabilities, Net | | 80,546 |
| Net Assets | 302,301,910 |
Notes to Portfolio of Investments
| (a) | Non-income producing investment. |
| (b) | All or a portion of this security was on loan at December 31, 2021. The total market value of securities on loan at December 31, 2021 was $4,773,190. |
| (c) | Represents fair value as determined in good faith under procedures approved by the Board of Trustees. At December 31, 2021, the total value of these securities amounted to $791,265, which represents 0.26% of total net assets. |
| (d) | Denotes a restricted security, which is subject to legal or contractual restrictions on resale under federal securities laws. Disposal of a restricted investment may involve time-consuming negotiations and expenses, and prompt sale at an acceptable price may be difficult to achieve. Private placement securities are generally considered to be restricted, although certain of those securities may be traded between qualified institutional investors under the provisions of Section 4(a)(2) and Rule 144A. The Fund will not incur any registration costs upon such a trade. These securities are valued at fair value determined in good faith under consistently applied procedures established by the Fund’s Board of Trustees. At December 31, 2021, the total market value of these securities amounted to $791,265, which represents 0.26% of total net assets. Additional information on these securities is as follows: |
| Security | Acquisition
Dates | Shares | Cost ($) | Value ($) |
| DNA Script | 10/01/2021 | 1,139 | 990,759 | 791,265 |
| (e) | Valuation based on significant unobservable inputs. |
| (f) | The rate shown is the seven-day current annualized yield at December 31, 2021. |
| (g) | Investment made with cash collateral received from securities lending activity. |
The accompanying Notes to Financial Statements are an integral part of this statement.
Columbia Acorn Family of Funds | Annual Report 2021
| 41 |
Portfolio of Investments (continued)
Columbia Acorn USA®, December 31, 2021
Notes to Portfolio of Investments (continued)
| (h) | As defined in the Investment Company Act of 1940, as amended, an affiliated company is one in which the Fund owns 5% or more of the company’s outstanding voting securities, or a company which is under common ownership or control with the Fund. The value of the holdings and transactions in these affiliated companies during the year ended December 31, 2021 are as follows: |
| Affiliated issuers | Beginning
of period($) | Purchases($) | Sales($) | Net change in
unrealized
appreciation
(depreciation)($) | End of
period($) | Realized gain
(loss)($) | Dividends($) | End of
period shares |
| Columbia Short-Term Cash Fund, 0.085% |
| | 3,540,814 | 137,512,366 | (132,293,229) | (825) | 8,759,126 | 48 | 6,269 | 8,760,878 |
Abbreviation Legend
| ADR | American Depositary Receipt |
Fair value measurements
Various inputs are used in determining the value of the Fund’s investments, following the input prioritization hierarchy established by accounting principles generally accepted in the United States of America (GAAP). These inputs are summarized in the three broad levels listed below:
| ■ | Level 1 – quoted prices in active markets for identical securities |
| ■ | Level 2 – prices determined using other significant observable inputs (including quoted prices for similar securities, interest rates, prepayment speeds, credit risk and others) |
| ■ | Level 3 – prices determined using significant unobservable inputs where quoted prices or observable inputs are unavailable or less reliable (including management’s own assumptions about the factors market participants would use in pricing an investment) |
The inputs or methodology used for valuing securities are not necessarily an indication of the risk associated with investing in those securities.
Examples of the types of securities in which the Fund would typically invest and how they are classified within this hierarchy are as follows. Typical Level 1 securities include exchange traded domestic equities, mutual funds whose net asset values are published each day and exchange traded foreign equities that are not typically statistically fair valued. Typical Level 2 securities include exchange traded foreign equities that are traded in the European region or Asia Pacific region time zones which are typically statistically fair valued, forward foreign currency exchange contracts and short-term investments valued at amortized cost. Additionally, securities fair valued by Columbia Wanger Asset Management’s Valuation Committee (the Committee) that rely on significant observable inputs are also included in Level 2. Typical Level 3 securities include any security fair valued by the Committee that relies on significant unobservable inputs.
The Committee is responsible for applying the Columbia Acorn Trust Portfolio Pricing Policy and the Columbia Wanger Asset Management pricing procedures (the Policies), which are approved by and subject to the oversight of the Board of Trustees.
The Committee meets as necessary, and no less frequently than quarterly, to determine fair values for securities for which market quotations are not readily available or for which Columbia Wanger Asset Management believes that available market quotations are unreliable. The Committee also reviews the continuing appropriateness of the Policies. In circumstances where a security has been fair valued, the Committee will also review the continuing appropriateness of the current value of the security. The Policies address, among other things: circumstances under which market quotations will be deemed readily available; selection of third party pricing vendors; appropriate pricing methodologies; events that require fair valuation and fair value techniques; circumstances under which securities will be deemed to pose a potential for stale pricing, including when securities are illiquid, restricted, or in default; and certain delegations of authority to determine fair values to the Fund’s investment manager. The Committee may also meet to discuss additional valuation matters, which may include review of back-testing results, review of time-sensitive information or approval of other valuation related actions, and to review the appropriateness of the Policies.
The following table is a summary of the inputs used to value the Fund’s investments at December 31, 2021:
| | Level 1 ($) | Level 2 ($) | Level 3 ($) | Total ($) |
| Investments in Securities | | | | |
| Common Stocks | | | | |
| Communication Services | 4,389,169 | — | — | 4,389,169 |
| Consumer Discretionary | 60,707,964 | — | — | 60,707,964 |
| Consumer Staples | 9,747,770 | — | — | 9,747,770 |
| Energy | 3,234,192 | — | — | 3,234,192 |
| Financials | 18,621,011 | — | — | 18,621,011 |
| Health Care | 77,017,038 | — | 791,265 | 77,808,303 |
| Industrials | 48,278,009 | — | — | 48,278,009 |
| Information Technology | 53,370,101 | — | — | 53,370,101 |
The accompanying Notes to Financial Statements are an integral part of this statement.
| 42 | Columbia Acorn Family of Funds | Annual Report 2021 |
Portfolio of Investments (continued)
Columbia Acorn USA®, December 31, 2021
Fair value measurements (continued)
| | Level 1 ($) | Level 2 ($) | Level 3 ($) | Total ($) |
| Materials | 4,822,890 | — | — | 4,822,890 |
| Real Estate | 7,678,865 | — | — | 7,678,865 |
| Total Common Stocks | 287,867,009 | — | 791,265 | 288,658,274 |
| Limited Partnerships | | | | |
| Consumer Discretionary | 4,634,555 | — | — | 4,634,555 |
| Total Limited Partnerships | 4,634,555 | — | — | 4,634,555 |
| Securities Lending Collateral | 5,034,920 | — | — | 5,034,920 |
| Warrants | | | | |
| Financials | 169,409 | — | — | 169,409 |
| Total Warrants | 169,409 | — | — | 169,409 |
| Money Market Funds | 8,759,126 | — | — | 8,759,126 |
| Total Investments in Securities | 306,465,019 | — | 791,265 | 307,256,284 |
See the Portfolio of Investments for all investment classifications not indicated in the table.
The Fund does not hold any significant investments (greater than one percent of net assets) categorized as Level 3.
The accompanying Notes to Financial Statements are an integral part of this statement.
Columbia Acorn Family of Funds | Annual Report 2021
| 43 |
Portfolio of Investments
Columbia Acorn International SelectSM, December 31, 2021
(Percentages represent value of investments compared to net assets)
Investments in securities
| Common Stocks 99.0% |
| Issuer | Shares | Value ($) |
| Australia 2.1% |
| IDP Education Ltd. | 400,593 | 10,091,850 |
| Brazil 2.0% |
| TOTVS SA | 1,916,627 | 9,854,973 |
| Canada 1.8% |
| CCL Industries, Inc. | 160,856 | 8,625,529 |
| China 4.9% |
| NetEase, Inc., ADR | 100,870 | 10,266,549 |
| Shenzhou International Group Holdings Ltd. | 686,200 | 13,287,358 |
| Total | 23,553,907 |
| Denmark 3.0% |
| SimCorp AS | 134,165 | 14,622,882 |
| Finland 2.2% |
| Valmet OYJ | 247,415 | 10,608,085 |
| Germany 4.2% |
| Nemetschek SE | 157,608 | 20,152,405 |
| Italy 4.8% |
| Amplifon SpA | 218,529 | 11,758,656 |
| Nexi SpA(a) | 710,729 | 11,262,495 |
| Total | 23,021,151 |
| Japan 13.5% |
| Daifuku Co., Ltd. | 143,700 | 11,751,055 |
| Hikari Tsushin, Inc. | 76,600 | 11,796,983 |
| Obic Co., Ltd. | 53,800 | 10,068,628 |
| Recruit Holdings Co., Ltd. | 333,100 | 20,271,041 |
| Sekisui Chemical Co., Ltd. | 643,200 | 10,756,977 |
| Total | 64,644,684 |
| Malta 0.0% |
| BGP Holdings PLC(a),(b),(c) | 2,232,232 | 3 |
| Netherlands 6.5% |
| IMCD NV | 84,826 | 18,746,824 |
| Koninklijke Philips NV | 343,011 | 12,695,395 |
| Total | 31,442,219 |
| New Zealand 3.4% |
| Fisher & Paykel Healthcare Corp., Ltd. | 734,738 | 16,460,754 |
| Common Stocks (continued) |
| Issuer | Shares | Value ($) |
| Singapore 2.0% |
| Mapletree Logistics Trust | 6,796,400 | 9,585,209 |
| South Korea 1.6% |
| Korea Investment Holdings Co., Ltd.(a) | 113,871 | 7,714,822 |
| Sweden 11.5% |
| Hexagon AB, Class B | 1,543,356 | 24,447,607 |
| Sectra AB, Class B(a) | 736,044 | 16,307,298 |
| Sweco AB, Class B | 756,833 | 14,241,659 |
| Total | 54,996,564 |
| Switzerland 11.6% |
| Belimo Holding AG, Registered Shares | 28,026 | 17,796,127 |
| Lonza Group AG, Registered Shares | 24,445 | 20,352,622 |
| Partners Group Holding AG | 10,574 | 17,455,659 |
| Total | 55,604,408 |
| Taiwan 7.3% |
| Parade Technologies Ltd. | 264,000 | 20,085,150 |
| Voltronic Power Technology Corp. | 265,852 | 14,831,352 |
| Total | 34,916,502 |
| United Kingdom 16.6% |
| Dechra Pharmaceuticals PLC | 286,174 | 20,683,141 |
| Diploma PLC | 243,568 | 11,166,741 |
| Intermediate Capital Group PLC | 406,974 | 12,119,984 |
| Rentokil Initial PLC | 2,187,196 | 17,313,294 |
| Rightmove PLC | 1,705,190 | 18,400,359 |
| Total | 79,683,519 |
Total Common Stocks
(Cost $329,618,085) | 475,579,466 |
|
| Money Market Funds 0.9% |
| | Shares | Value ($) |
| Columbia Short-Term Cash Fund, 0.085%(d),(e) | 4,211,446 | 4,210,604 |
Total Money Market Funds
(Cost $4,210,604) | 4,210,604 |
Total Investments in Securities
(Cost $333,828,689) | 479,790,070 |
| Other Assets & Liabilities, Net | | 296,031 |
| Net Assets | $480,086,101 |
The accompanying Notes to Financial Statements are an integral part of this statement.
| 44 | Columbia Acorn Family of Funds | Annual Report 2021 |
Portfolio of Investments (continued)
Columbia Acorn International SelectSM, December 31, 2021
Notes to Portfolio of Investments
| (a) | Non-income producing investment. |
| (b) | Represents fair value as determined in good faith under procedures approved by the Board of Trustees. At December 31, 2021, the total value of these securities amounted to $3, which represents less than 0.01% of total net assets. |
| (c) | Valuation based on significant unobservable inputs. |
| (d) | The rate shown is the seven-day current annualized yield at December 31, 2021. |
| (e) | As defined in the Investment Company Act of 1940, as amended, an affiliated company is one in which the Fund owns 5% or more of the company’s outstanding voting securities, or a company which is under common ownership or control with the Fund. The value of the holdings and transactions in these affiliated companies during the year ended December 31, 2021 are as follows: |
| Affiliated issuers | Beginning
of period($) | Purchases($) | Sales($) | Net change in
unrealized
appreciation
(depreciation)($) | End of
period($) | Realized gain
(loss)($) | Dividends($) | End of
period shares |
| Columbia Short-Term Cash Fund, 0.085% |
| | 3,594,978 | 106,127,799 | (105,512,173) | — | 4,210,604 | (733) | 4,022 | 4,211,446 |
Abbreviation Legend
| ADR | American Depositary Receipt |
Fair value measurements
Various inputs are used in determining the value of the Fund’s investments, following the input prioritization hierarchy established by accounting principles generally accepted in the United States of America (GAAP). These inputs are summarized in the three broad levels listed below:
| ■ | Level 1 – quoted prices in active markets for identical securities |
| ■ | Level 2 – prices determined using other significant observable inputs (including quoted prices for similar securities, interest rates, prepayment speeds, credit risk and others) |
| ■ | Level 3 – prices determined using significant unobservable inputs where quoted prices or observable inputs are unavailable or less reliable (including management’s own assumptions about the factors market participants would use in pricing an investment) |
The inputs or methodology used for valuing securities are not necessarily an indication of the risk associated with investing in those securities.
Examples of the types of securities in which the Fund would typically invest and how they are classified within this hierarchy are as follows. Typical Level 1 securities include exchange traded domestic equities, mutual funds whose net asset values are published each day and exchange traded foreign equities that are not typically statistically fair valued. Typical Level 2 securities include exchange traded foreign equities that are traded in the European region or Asia Pacific region time zones which are typically statistically fair valued, forward foreign currency exchange contracts and short-term investments valued at amortized cost. Additionally, securities fair valued by Columbia Wanger Asset Management’s Valuation Committee (the Committee) that rely on significant observable inputs are also included in Level 2. Typical Level 3 securities include any security fair valued by the Committee that relies on significant unobservable inputs.
The Committee is responsible for applying the Columbia Acorn Trust Portfolio Pricing Policy and the Columbia Wanger Asset Management pricing procedures (the Policies), which are approved by and subject to the oversight of the Board of Trustees.
The Committee meets as necessary, and no less frequently than quarterly, to determine fair values for securities for which market quotations are not readily available or for which Columbia Wanger Asset Management believes that available market quotations are unreliable. The Committee also reviews the continuing appropriateness of the Policies. In circumstances where a security has been fair valued, the Committee will also review the continuing appropriateness of the current value of the security. The Policies address, among other things: circumstances under which market quotations will be deemed readily available; selection of third party pricing vendors; appropriate pricing methodologies; events that require fair valuation and fair value techniques; circumstances under which securities will be deemed to pose a potential for stale pricing, including when securities are illiquid, restricted, or in default; and certain delegations of authority to determine fair values to the Fund’s investment manager. The Committee may also meet to discuss additional valuation matters, which may include review of back-testing results, review of time-sensitive information or approval of other valuation related actions, and to review the appropriateness of the Policies.
The following table is a summary of the inputs used to value the Fund’s investments at December 31, 2021:
| | Level 1 ($) | Level 2 ($) | Level 3 ($) | Total ($) |
| Investments in Securities | | | | |
| Common Stocks | | | | |
| Australia | — | 10,091,850 | — | 10,091,850 |
| Brazil | 9,854,973 | — | — | 9,854,973 |
| Canada | 8,625,529 | — | — | 8,625,529 |
| China | 10,266,549 | 13,287,358 | — | 23,553,907 |
| Denmark | — | 14,622,882 | — | 14,622,882 |
| Finland | — | 10,608,085 | — | 10,608,085 |
| Germany | — | 20,152,405 | — | 20,152,405 |
| Italy | — | 23,021,151 | — | 23,021,151 |
The accompanying Notes to Financial Statements are an integral part of this statement.
Columbia Acorn Family of Funds | Annual Report 2021
| 45 |
Portfolio of Investments (continued)
Columbia Acorn International SelectSM, December 31, 2021
Fair value measurements (continued)
| | Level 1 ($) | Level 2 ($) | Level 3 ($) | Total ($) |
| Japan | — | 64,644,684 | — | 64,644,684 |
| Malta | — | — | 3 | 3 |
| Netherlands | — | 31,442,219 | — | 31,442,219 |
| New Zealand | — | 16,460,754 | — | 16,460,754 |
| Singapore | — | 9,585,209 | — | 9,585,209 |
| South Korea | — | 7,714,822 | — | 7,714,822 |
| Sweden | — | 54,996,564 | — | 54,996,564 |
| Switzerland | — | 55,604,408 | — | 55,604,408 |
| Taiwan | — | 34,916,502 | — | 34,916,502 |
| United Kingdom | — | 79,683,519 | — | 79,683,519 |
| Total Common Stocks | 28,747,051 | 446,832,412 | 3 | 475,579,466 |
| Money Market Funds | 4,210,604 | — | — | 4,210,604 |
| Total Investments in Securities | 32,957,655 | 446,832,412 | 3 | 479,790,070 |
See the Portfolio of Investments for all investment classifications not indicated in the table.
The Fund’s assets assigned to the Level 2 input category are generally valued using a market approach, in which a security’s value is determined through its correlation to prices and information from observable market transactions for similar or identical assets. Foreign equities are generally valued at the last sale price on the foreign exchange or market on which they trade. The Fund may use a statistical fair valuation model, in accordance with the policy adopted by the Board of Trustees, provided by an independent third party to value securities principally traded in foreign markets in order to adjust for possible stale pricing that may occur between the close of the foreign exchanges and the time for valuation. These models take into account available market data including intraday index, ADR, and ETF movements.
The Fund does not hold any significant investments (greater than one percent of net assets) categorized as Level 3.
The accompanying Notes to Financial Statements are an integral part of this statement.
| 46 | Columbia Acorn Family of Funds | Annual Report 2021 |
Portfolio of Investments
Columbia Thermostat FundSM, December 31, 2021
(Percentages represent value of investments compared to net assets)
Investments in securities
| Equity Funds 9.1% |
| | Shares | Value ($) |
| International 1.0% |
| Columbia Emerging Markets Fund, Institutional 3 Class(a) | 1,218,923 | 21,148,316 |
| U.S. Large Cap 6.1% |
| Columbia Contrarian Core Fund, Institutional 3 Class(a) | 921,681 | 31,401,672 |
| Columbia Large Cap Enhanced Core Fund, Institutional 3 Class(a) | 1,149,329 | 31,422,661 |
| Columbia Large Cap Index Fund, Institutional 3 Class(a) | 1,032,471 | 62,412,872 |
| Total | 125,237,205 |
| U.S. Mid Cap 1.0% |
| Columbia Select Mid Cap Value Fund, Institutional 3 Class(a) | 1,513,851 | 21,178,767 |
| U.S. Small Mid Cap 1.0% |
| Columbia Acorn® Fund, Institutional 3 Class(a) | 1,325,008 | 21,041,129 |
Total Equity Funds
(Cost $149,869,127) | 188,605,417 |
|
| Exchange-Traded Equity Funds 0.9% |
| | |
| U.S. Large Cap 0.9% |
| Columbia Research Enhanced Core ETF(a) | 670,118 | 18,034,082 |
Total Exchange-Traded Equity Funds
(Cost $13,490,445) | 18,034,082 |
|
| Exchange-Traded Fixed Income Funds 9.0% |
| | |
| Multisector 9.0% |
| Columbia Diversified Fixed Income Allocation ETF(a) | 8,763,915 | 186,759,029 |
Total Exchange-Traded Fixed Income Funds
(Cost $183,988,282) | 186,759,029 |
|
| Fixed Income Funds 81.0% |
| | Shares | Value ($) |
| Investment Grade 81.0% |
| Columbia Corporate Income Fund, Institutional 3 Class(a) | 17,545,432 | 186,858,848 |
| Columbia Quality Income Fund, Institutional 3 Class(a) | 16,954,146 | 373,669,379 |
| Columbia Short Term Bond Fund, Institutional 3 Class(a) | 27,950,303 | 280,062,035 |
| Columbia Total Return Bond Fund, Institutional 3 Class(a) | 5,014,417 | 186,937,454 |
| Columbia U.S. Treasury Index Fund, Institutional 3 Class(a) | 56,302,120 | 653,104,595 |
| Total | 1,680,632,311 |
Total Fixed Income Funds
(Cost $1,700,273,230) | 1,680,632,311 |
|
| Money Market Funds 0.2% |
| | |
| Columbia Short-Term Cash Fund, 0.085%(a),(b) | 3,640,895 | 3,640,167 |
Total Money Market Funds
(Cost $3,640,167) | 3,640,167 |
Total Investments in Securities
(Cost: $2,051,261,251) | 2,077,671,006 |
| Other Assets & Liabilities, Net | | (3,478,051) |
| Net Assets | 2,074,192,955 |
The accompanying Notes to Financial Statements are an integral part of this statement.
Columbia Acorn Family of Funds | Annual Report 2021
| 47 |
Portfolio of Investments (continued)
Columbia Thermostat FundSM, December 31, 2021
Notes to Portfolio of Investments
| (a) | As defined in the Investment Company Act of 1940, as amended, an affiliated company is one in which the Fund owns 5% or more of the company’s outstanding voting securities, or a company which is under common ownership or control with the Fund. The value of the holdings and transactions in these affiliated companies during the year ended December 31, 2021 are as follows: |
| Affiliated issuers | Beginning
of period($) | Purchases($) | Sales($) | Net change in
unrealized
appreciation
(depreciation)($) | End of
period($) | Capital gain
distributions($) | Realized gain
(loss)($) | Dividends —
affiliated
issuers ($) | End of
period shares |
| Columbia Acorn International®, Institutional 3 Class |
| | 86,086,340 | 7,937,567 | (75,823,509) | (18,200,398) | — | — | 24,867,255 | — | — |
| Columbia Acorn® Fund, Institutional 3 Class |
| | 84,751,736 | 19,884,132 | (66,175,727) | (17,419,012) | 21,041,129 | 4,111,522 | 18,503,455 | 153,944 | 1,325,008 |
| Columbia Contrarian Core Fund, Institutional 3 Class |
| | 85,172,403 | 8,894,443 | (52,629,114) | (10,036,060) | 31,401,672 | 3,737,024 | 20,716,448 | 174,275 | 921,681 |
| Columbia Corporate Income Fund, Institutional 3 Class |
| | 84,644,993 | 120,715,693 | (13,359,985) | (5,141,853) | 186,858,848 | 3,945,249 | (504,507) | 3,625,504 | 17,545,432 |
| Columbia Diversified Fixed Income Allocation ETF |
| | 84,444,150 | 118,421,250 | (12,692,092) | (3,414,279) | 186,759,029 | — | (256,624) | 3,871,931 | 8,763,915 |
| Columbia Dividend Income Fund, Institutional 3 Class |
| | 83,970,346 | 6,162,809 | (70,514,613) | (19,618,542) | — | — | 30,600,431 | 412,805 | — |
| Columbia Emerging Markets Fund, Institutional 3 Class |
| | — | 23,839,475 | (30,540) | (2,660,619) | 21,148,316 | 89,369 | (3,765) | 243,233 | 1,218,923 |
| Columbia Large Cap Enhanced Core Fund, Institutional 3 Class |
| | 84,343,847 | 13,537,278 | (55,119,307) | (11,339,157) | 31,422,661 | 7,336,130 | 20,438,268 | 390,412 | 1,149,329 |
| Columbia Large Cap Index Fund, Institutional 3 Class |
| | 254,114,521 | 29,753,623 | (181,218,240) | (40,237,032) | 62,412,872 | 9,398,738 | 71,200,310 | 756,389 | 1,032,471 |
| Columbia Quality Income Fund, Institutional 3 Class |
| | 169,430,970 | 238,733,385 | (23,820,420) | (10,674,556) | 373,669,379 | — | (526,918) | 7,349,279 | 16,954,146 |
| Columbia Research Enhanced Core ETF |
| | 83,125,929 | 6,453,488 | (59,885,938) | (11,659,397) | 18,034,082 | — | 24,043,526 | 3,722,968 | 670,118 |
| Columbia Select Mid Cap Value Fund, Institutional 3 Class |
| | 87,709,618 | 3,753,602 | (57,894,384) | (12,390,069) | 21,178,767 | 1,774,535 | 29,692,974 | 268,078 | 1,513,851 |
| Columbia Short Term Bond Fund, Institutional 3 Class |
| | 126,683,822 | 175,142,303 | (19,414,825) | (2,349,265) | 280,062,035 | — | (115,376) | 3,901,221 | 27,950,303 |
| Columbia Short-Term Cash Fund, 0.085% |
| | 6,901,030 | 382,639,146 | (385,900,007) | (2) | 3,640,167 | — | (498) | 5,270 | 3,640,895 |
| Columbia Total Return Bond Fund, Institutional 3 Class |
| | 84,645,589 | 118,872,388 | (12,919,767) | (3,660,756) | 186,937,454 | 436,881 | (477,168) | 4,541,210 | 5,014,417 |
| Columbia U.S. Treasury Index Fund, Institutional 3 Class |
| | 295,666,771 | 415,449,706 | (47,063,632) | (10,948,250) | 653,104,595 | 1,350,886 | (1,591,576) | 6,420,577 | 56,302,120 |
| Total | 1,701,692,065 | | | (179,749,247) | 2,077,671,006 | 32,180,334 | 236,586,235 | 35,837,096 | |
| (b) | The rate shown is the seven-day current annualized yield at December 31, 2021. |
Fair value measurements
Various inputs are used in determining the value of the Fund’s investments, following the input prioritization hierarchy established by accounting principles generally accepted in the United States of America (GAAP). These inputs are summarized in the three broad levels listed below:
| ■ | Level 1 – quoted prices in active markets for identical securities |
| ■ | Level 2 – prices determined using other significant observable inputs (including quoted prices for similar securities, interest rates, prepayment speeds, credit risk and others) |
| ■ | Level 3 – prices determined using significant unobservable inputs where quoted prices or observable inputs are unavailable or less reliable (including management’s own assumptions about the factors market participants would use in pricing an investment) |
The accompanying Notes to Financial Statements are an integral part of this statement.
| 48 | Columbia Acorn Family of Funds | Annual Report 2021 |
Portfolio of Investments (continued)
Columbia Thermostat FundSM, December 31, 2021
Fair value measurements (continued)
The inputs or methodology used for valuing securities are not necessarily an indication of the risk associated with investing in those securities.
Examples of the types of securities in which the Fund would typically invest and how they are classified within this hierarchy are as follows. Typical Level 1 securities include mutual funds whose net asset values are published each day.
The Committee is responsible for applying the Columbia Acorn Trust Portfolio Pricing Policy and the Columbia Wanger Asset Management pricing procedures (the Policies), which are approved by and subject to the oversight of the Board of Trustees.
The Committee meets as necessary, and no less frequently than quarterly, to determine fair values for securities for which market quotations are not readily available or for which Columbia Wanger Asset Management believes that available market quotations are unreliable. The Committee also reviews the continuing appropriateness of the Policies. In circumstances where a security has been fair valued, the Committee will also review the continuing appropriateness of the current value of the security. The Policies address, among other things: circumstances under which market quotations will be deemed readily available; selection of third party pricing vendors; appropriate pricing methodologies; events that require fair valuation and fair value techniques; circumstances under which securities will be deemed to pose a potential for stale pricing, including when securities are illiquid, restricted, or in default; and certain delegations of authority to determine fair values to the Fund’s investment manager. The Committee may also meet to discuss additional valuation matters, which may include review of back-testing results, review of time-sensitive information or approval of other valuation related actions, and to review the appropriateness of the Policies.
The following table is a summary of the inputs used to value the Fund’s investments at December 31, 2021:
| | Level 1 ($) | Level 2 ($) | Level 3 ($) | Total ($) |
| Investments in Securities | | | | |
| Equity Funds | 188,605,417 | — | — | 188,605,417 |
| Exchange-Traded Equity Funds | 18,034,082 | — | — | 18,034,082 |
| Exchange-Traded Fixed Income Funds | 186,759,029 | — | — | 186,759,029 |
| Fixed Income Funds | 1,680,632,311 | — | — | 1,680,632,311 |
| Money Market Funds | 3,640,167 | — | — | 3,640,167 |
| Total Investments in Securities | 2,077,671,006 | — | — | 2,077,671,006 |
See the Portfolio of Investments for all investment classifications not indicated in the table.
The accompanying Notes to Financial Statements are an integral part of this statement.
Columbia Acorn Family of Funds | Annual Report 2021
| 49 |
Portfolio of Investments
Columbia Acorn European FundSM, December 31, 2021
(Percentages represent value of investments compared to net assets)
Investments in securities
| Common Stocks 98.3% |
| Issuer | Shares | Value ($) |
| Austria 1.0% |
| S&T AG | 126,843 | 2,107,314 |
| Cyprus 0.8% |
| TCS Group Holding PLC GDR(a) | 19,600 | 1,652,278 |
| Denmark 5.0% |
| ALK-Abello AS(b) | 11,014 | 5,783,486 |
| SimCorp AS | 45,991 | 5,012,641 |
| Total | 10,796,127 |
| Finland 1.8% |
| Valmet OYJ | 88,836 | 3,808,904 |
| France 1.3% |
| Robertet SA | 2,492 | 2,766,213 |
| Germany 12.7% |
| Eckert & Ziegler Strahlen- und Medizintechnik AG | 24,036 | 2,568,666 |
| Hypoport SE(b) | 12,003 | 6,961,524 |
| Jenoptik AG | 140,427 | 5,925,595 |
| Nemetschek SE | 54,886 | 7,017,949 |
| Washtec AG | 76,811 | 4,796,511 |
| Total | 27,270,245 |
| Greece 0.9% |
| JUMBO SA | 140,864 | 2,020,708 |
| Italy 9.1% |
| Amplifon SpA | 108,560 | 5,841,420 |
| Carel Industries SpA | 129,950 | 3,929,917 |
| GVS SpA | 156,229 | 1,875,250 |
| Intercos SpA(b) | 142,235 | 2,276,800 |
| Nexi SpA(b) | 347,497 | 5,506,576 |
| Total | 19,429,963 |
| Malta 1.1% |
| Kindred Group PLC | 199,244 | 2,360,566 |
| Netherlands 5.5% |
| Argenx SE(b) | 5,539 | 1,969,713 |
| BE Semiconductor Industries NV | 21,146 | 1,797,680 |
| IMCD NV | 30,631 | 6,769,552 |
| Common Stocks (continued) |
| Issuer | Shares | Value ($) |
| Koninklijke Philips NV | 34,695 | 1,284,118 |
| Total | 11,821,063 |
| Spain 2.8% |
| Befesa SA | 30,087 | 2,308,644 |
| Vidrala SA | 36,799 | 3,628,164 |
| Total | 5,936,808 |
| Sweden 17.5% |
| AddTech AB, B Shares | 300,980 | 7,158,907 |
| Dometic Group AB | 267,059 | 3,505,748 |
| Dustin Group AB | 269,475 | 3,164,084 |
| Hexagon AB, Class B | 499,098 | 7,905,987 |
| Munters Group AB | 538,296 | 4,166,996 |
| Sectra AB, Class B(b) | 294,747 | 6,530,217 |
| Sweco AB, Class B | 263,918 | 4,966,261 |
| Total | 37,398,200 |
| Switzerland 8.3% |
| Belimo Holding AG, Registered Shares | 8,479 | 5,384,049 |
| Inficon Holding AG | 2,170 | 3,172,430 |
| Kardex Energy AG | 10,968 | 3,600,052 |
| Montana Aerospace AG(a),(b) | 67,731 | 2,516,127 |
| Partners Group Holding AG | 1,830 | 3,020,981 |
| Total | 17,693,639 |
| United Kingdom 27.0% |
| Abcam PLC(b) | 103,385 | 2,425,104 |
| Auto Trader Group PLC | 513,380 | 5,141,438 |
| Dechra Pharmaceuticals PLC | 107,588 | 7,775,891 |
| Diploma PLC | 139,482 | 6,394,762 |
| Genus PLC | 59,585 | 3,996,179 |
| Halma PLC | 74,854 | 3,245,587 |
| Intermediate Capital Group PLC | 221,628 | 6,600,244 |
| Rentokil Initial PLC | 759,235 | 6,009,913 |
| Rightmove PLC | 643,671 | 6,945,723 |
| Safestore Holdings PLC | 243,743 | 4,648,550 |
| Spirax-Sarco Engineering PLC | 21,210 | 4,615,942 |
| Total | 57,799,333 |
The accompanying Notes to Financial Statements are an integral part of this statement.
| 50 | Columbia Acorn Family of Funds | Annual Report 2021 |
Portfolio of Investments (continued)
Columbia Acorn European FundSM, December 31, 2021
| Common Stocks (continued) |
| Issuer | Shares | Value ($) |
| United States 3.5% |
| Inter Parfums, Inc. | 70,760 | 7,564,244 |
Total Common Stocks
(Cost $138,891,685) | 210,425,605 |
|
| Money Market Funds 1.4% |
| | Shares | Value ($) |
| Columbia Short-Term Cash Fund, 0.085%(c),(d) | 2,949,088 | 2,948,499 |
Total Money Market Funds
(Cost $2,948,499) | 2,948,499 |
Total Investments in Securities
(Cost $141,840,184) | 213,374,104 |
| Other Assets & Liabilities, Net | | 565,316 |
| Net Assets | $213,939,420 |
Notes to Portfolio of Investments
| (a) | Represents privately placed and other securities and instruments exempt from Securities and Exchange Commission registration (collectively, private placements), such as Section 4(a)(2) and Rule 144A eligible securities, which are often sold only to qualified institutional buyers. At December 31, 2021, the total value of these securities amounted to $4,168,405, which represents 1.95% of total net assets. |
| (b) | Non-income producing investment. |
| (c) | The rate shown is the seven-day current annualized yield at December 31, 2021. |
| (d) | As defined in the Investment Company Act of 1940, as amended, an affiliated company is one in which the Fund owns 5% or more of the company’s outstanding voting securities, or a company which is under common ownership or control with the Fund. The value of the holdings and transactions in these affiliated companies during the year ended December 31, 2021 are as follows: |
| Affiliated issuers | Beginning
of period($) | Purchases($) | Sales($) | Net change in
unrealized
appreciation
(depreciation)($) | End of
period($) | Realized gain
(loss)($) | Dividends($) | End of
period shares |
| Columbia Short-Term Cash Fund, 0.085% |
| | 2,989,602 | 95,831,533 | (95,872,636) | — | 2,948,499 | (482) | 2,437 | 2,949,088 |
Abbreviation Legend
| GDR | Global Depositary Receipt |
Fair value measurements
Various inputs are used in determining the value of the Fund’s investments, following the input prioritization hierarchy established by accounting principles generally accepted in the United States of America (GAAP). These inputs are summarized in the three broad levels listed below:
| ■ | Level 1 – quoted prices in active markets for identical securities |
| ■ | Level 2 – prices determined using other significant observable inputs (including quoted prices for similar securities, interest rates, prepayment speeds, credit risk and others) |
| ■ | Level 3 – prices determined using significant unobservable inputs where quoted prices or observable inputs are unavailable or less reliable (including management’s own assumptions about the factors market participants would use in pricing an investment) |
The inputs or methodology used for valuing securities are not necessarily an indication of the risk associated with investing in those securities.
Examples of the types of securities in which the Fund would typically invest and how they are classified within this hierarchy are as follows. Typical Level 1 securities include exchange traded domestic equities, mutual funds whose net asset values are published each day and exchange traded foreign equities that are not typically statistically fair valued. Typical Level 2 securities include exchange traded foreign equities that are traded in the European region or Asia Pacific region time zones which are typically statistically fair valued, forward foreign currency exchange contracts and short-term investments valued at amortized cost. Additionally, securities fair valued by Columbia Wanger Asset Management’s Valuation Committee (the Committee) that rely on significant observable inputs are also included in Level 2. Typical Level 3 securities include any security fair valued by the Committee that relies on significant unobservable inputs.
The accompanying Notes to Financial Statements are an integral part of this statement.
Columbia Acorn Family of Funds | Annual Report 2021
| 51 |
Portfolio of Investments (continued)
Columbia Acorn European FundSM, December 31, 2021
Fair value measurements (continued)
The Committee is responsible for applying the Columbia Acorn Trust Portfolio Pricing Policy and the Columbia Wanger Asset Management pricing procedures (the Policies), which are approved by and subject to the oversight of the Board of Trustees.
The Committee meets as necessary, and no less frequently than quarterly, to determine fair values for securities for which market quotations are not readily available or for which Columbia Wanger Asset Management believes that available market quotations are unreliable. The Committee also reviews the continuing appropriateness of the Policies. In circumstances where a security has been fair valued, the Committee will also review the continuing appropriateness of the current value of the security. The Policies address, among other things: circumstances under which market quotations will be deemed readily available; selection of third party pricing vendors; appropriate pricing methodologies; events that require fair valuation and fair value techniques; circumstances under which securities will be deemed to pose a potential for stale pricing, including when securities are illiquid, restricted, or in default; and certain delegations of authority to determine fair values to the Fund’s investment manager. The Committee may also meet to discuss additional valuation matters, which may include review of back-testing results, review of time-sensitive information or approval of other valuation related actions, and to review the appropriateness of the Policies.
The following table is a summary of the inputs used to value the Fund’s investments at December 31, 2021:
| | Level 1 ($) | Level 2 ($) | Level 3 ($) | Total ($) |
| Investments in Securities | | | | |
| Common Stocks | | | | |
| Austria | — | 2,107,314 | — | 2,107,314 |
| Cyprus | — | 1,652,278 | — | 1,652,278 |
| Denmark | — | 10,796,127 | — | 10,796,127 |
| Finland | — | 3,808,904 | — | 3,808,904 |
| France | — | 2,766,213 | — | 2,766,213 |
| Germany | — | 27,270,245 | — | 27,270,245 |
| Greece | — | 2,020,708 | — | 2,020,708 |
| Italy | — | 19,429,963 | — | 19,429,963 |
| Malta | — | 2,360,566 | — | 2,360,566 |
| Netherlands | — | 11,821,063 | — | 11,821,063 |
| Spain | — | 5,936,808 | — | 5,936,808 |
| Sweden | — | 37,398,200 | — | 37,398,200 |
| Switzerland | — | 17,693,639 | — | 17,693,639 |
| United Kingdom | — | 57,799,333 | — | 57,799,333 |
| United States | 7,564,244 | — | — | 7,564,244 |
| Total Common Stocks | 7,564,244 | 202,861,361 | — | 210,425,605 |
| Money Market Funds | 2,948,499 | — | — | 2,948,499 |
| Total Investments in Securities | 10,512,743 | 202,861,361 | — | 213,374,104 |
See the Portfolio of Investments for all investment classifications not indicated in the table.
The Fund’s assets assigned to the Level 2 input category are generally valued using a market approach, in which a security’s value is determined through its correlation to prices and information from observable market transactions for similar or identical assets. Foreign equities are generally valued at the last sale price on the foreign exchange or market on which they trade. The Fund may use a statistical fair valuation model, in accordance with the policy adopted by the Board of Trustees, provided by an independent third party to value securities principally traded in foreign markets in order to adjust for possible stale pricing that may occur between the close of the foreign exchanges and the time for valuation. These models take into account available market data including intraday index, ADR, and ETF movements.
The accompanying Notes to Financial Statements are an integral part of this statement.
| 52 | Columbia Acorn Family of Funds | Annual Report 2021 |
Statement of Assets and Liabilities
December 31, 2021
| | Columbia
Acorn®
Fund | Columbia
Acorn
International® | Columbia
Acorn
USA® |
| Assets | | | |
| Investments in securities, at value* | | | |
| Unaffiliated issuers (cost $3,576,457,871, $1,407,961,412, $241,461,811, respectively) | $4,463,543,659 | $2,323,682,091 | $298,497,158 |
| Affiliated issuers (cost $104,962,584, $22,664,312, $8,759,128, respectively) | 105,033,901 | 22,664,312 | 8,759,126 |
| Cash | — | 151 | — |
| Foreign currency (cost $—, $3,562,547, $—, respectively) | — | 3,596,758 | — |
| Receivable for: | | | |
| Investments sold | 585,815 | — | 56,788 |
| Capital shares sold | 586,477 | 264,948 | 331,740 |
| Dividends | 853,585 | 2,369,568 | 72,700 |
| Securities lending income | 21,794 | 62,798 | 3,011 |
| Foreign tax reclaims | 7,470 | 1,769,155 | 754 |
| Expense reimbursement due from Investment Manager | — | 588 | 40 |
| Prepaid expenses | 111,336 | 57,001 | 7,492 |
| Trustees’ deferred compensation plan | 4,847,548 | 2,349,222 | 425,133 |
| Total assets | 4,575,591,585 | 2,356,816,592 | 308,153,942 |
| Liabilities | | | |
| Foreign currency (cost $—, $ —, $27, respectively) | — | — | 27 |
| Due upon return of securities on loan | 36,269,919 | 10,493,519 | 5,034,920 |
| Payable for: | | | |
| Investments purchased | — | 2,220,186 | — |
| Capital shares purchased | 5,159,594 | 1,440,182 | 320,640 |
| Investment advisory fee | 83,624 | 50,746 | 7,674 |
| Distribution and/or service fees | 7,024 | 2,272 | 413 |
| Transfer agent fees | 410,278 | 176,452 | 28,590 |
| Administration fees | 5,997 | 3,071 | 399 |
| Trustees’ fees | 1,171 | 56,873 | 79 |
| Compensation of chief compliance officer | 8,236 | 4,097 | 546 |
| Other expenses | 174,524 | 231,899 | 33,611 |
| Trustees’ deferred compensation plan | 4,847,548 | 2,349,222 | 425,133 |
| Total liabilities | 46,967,915 | 17,028,519 | 5,852,032 |
| Net assets applicable to outstanding capital stock | $4,528,623,670 | $2,339,788,073 | $302,301,910 |
| Represented by | | | |
| Paid in capital | 3,497,529,921 | 1,492,284,211 | 238,282,462 |
| Total distributable earnings (loss) | 1,031,093,749 | 847,503,862 | 64,019,448 |
| Total - representing net assets applicable to outstanding capital stock | $4,528,623,670 | $2,339,788,073 | $302,301,910 |
| * Includes the value of securities on loan | 33,010,589 | 10,018,113 | 4,773,190 |
The accompanying Notes to Financial Statements are an integral part of this statement.
Columbia Acorn Family of Funds | Annual Report 2021
| 53 |
Statement of Assets and Liabilities (continued)
December 31, 2021
| | Columbia
Acorn®
Fund | Columbia
Acorn
International® | Columbia
Acorn
USA® |
| Class A | | | |
| Net assets | $919,642,819 | $282,125,290 | $53,016,033 |
| Shares outstanding | 91,904,408 | 8,500,228 | 5,229,995 |
| Net asset value per share(a) | $10.01 | $33.19 | $10.14 |
| Maximum sales charge | 5.75% | 5.75% | 5.75% |
| Maximum offering price per share(b) (calculated by dividing the net asset value per share by 1.0 minus the maximum sales charge for Class A shares) | $10.62 | $35.21 | $10.76 |
| Advisor Class | | | |
| Net assets | $39,676,453 | $9,279,494 | $24,058,165 |
| Shares outstanding | 2,580,959 | 274,353 | 1,469,372 |
| Net asset value per share(c) | $15.37 | $33.82 | $16.37 |
| Class C | | | |
| Net assets | $24,545,900 | $10,686,519 | $1,809,279 |
| Shares outstanding | 1,788,799 | 355,404 | 120,366 |
| Net asset value per share(a) | $13.72 | $30.07 | $15.03 |
| Institutional Class | | | |
| Net assets | $3,413,006,232 | $1,727,042,213 | $169,844,453 |
| Shares outstanding | 239,945,539 | 51,891,501 | 11,450,751 |
| Net asset value per share(c) | $14.22 | $33.28 | $14.83 |
| Institutional 2 Class | | | |
| Net assets | $52,797,296 | $126,972,704 | $3,271,060 |
| Shares outstanding | 3,381,171 | 3,818,843 | 197,351 |
| Net asset value per share(c) | $15.62 | $33.25 | $16.57 |
| Institutional 3 Class | | | |
| Net assets | $78,954,970 | $179,991,313 | $50,302,920 |
| Shares outstanding | 4,972,492 | 5,320,258 | 2,987,286 |
| Net asset value per share(c) | $15.88 | $33.83 | $16.84 |
| Class R | | | |
| Net assets | $— | $3,690,540 | $— |
| Shares outstanding | — | 111,182 | — |
| Net asset value per share(c) | $— | $33.19 | $— |
| (a) | Redemption price per share is equal to net asset value less any applicable contingent deferred sales charge. |
| (b) | On sales of $50,000 or more the offering price is reduced. |
| (c) | Redemption price per share is equal to net asset value. |
The accompanying Notes to Financial Statements are an integral part of this statement.
| 54 | Columbia Acorn Family of Funds | Annual Report 2021 |
Statement of Assets and Liabilities (continued)
December 31, 2021
| | Columbia
Acorn
International
SelectSM | Columbia
Thermostat
FundSM | Columbia
Acorn
European
FundSM |
| Assets | | | |
| Investments in securities, at value | | | |
| Unaffiliated issuers (cost $329,618,085, $—, $138,891,685, respectively) | $475,579,466 | $— | $210,425,605 |
| Affiliated issuers (cost $4,210,604, $2,051,261,251, $2,948,499, respectively) | 4,210,604 | 2,077,671,006 | 2,948,499 |
| Cash | 20,603 | — | — |
| Foreign currency (cost $—, $—, $29,378, respectively) | — | — | 29,494 |
| Receivable for: | | | |
| Investments sold | — | 1,612,924 | — |
| Capital shares sold | 34,970 | 5,418,593 | 564,207 |
| Dividends | 514,413 | 2,495,894 | 63,328 |
| Securities lending income | — | — | 1,231 |
| Foreign tax reclaims | 560,675 | — | 195,156 |
| Expense reimbursement due from Investment Manager | 2,491 | 2,150 | 989 |
| Prepaid expenses | 11,299 | 52,036 | 4,951 |
| Total assets | 480,934,521 | 2,087,252,603 | 214,233,460 |
| Liabilities | | | |
| Due to custodian | — | 3,553 | 1,741 |
| Foreign currency (cost $20,603, $ —, $—, respectively) | 20,729 | — | — |
| Payable for: | | | |
| Investments purchased | — | 2,495,620 | — |
| Capital shares purchased | 360,790 | 9,852,088 | 200,897 |
| Investment advisory fee | 11,694 | 5,716 | 6,163 |
| Distribution and/or service fees | 1,668 | 9,565 | 645 |
| Transfer agent fees | 44,854 | 200,011 | 18,113 |
| Administration fees | 631 | 2,745 | 280 |
| Trustees’ fees | 334,684 | 401,833 | 27,779 |
| Compensation of chief compliance officer | 832 | 3,661 | 353 |
| Audit fees | 14,750 | 5,500 | 14,750 |
| Other expenses | 57,788 | 79,356 | 23,319 |
| Total liabilities | 848,420 | 13,059,648 | 294,040 |
| Net assets applicable to outstanding capital stock | $480,086,101 | $2,074,192,955 | $213,939,420 |
| Represented by | | | |
| Paid in capital | 329,365,717 | 2,035,909,789 | 147,861,132 |
| Total distributable earnings (loss) | 150,720,384 | 38,283,166 | 66,078,288 |
| Total - representing net assets applicable to outstanding capital stock | $480,086,101 | $2,074,192,955 | $213,939,420 |
The accompanying Notes to Financial Statements are an integral part of this statement.
Columbia Acorn Family of Funds | Annual Report 2021
| 55 |
Statement of Assets and Liabilities (continued)
December 31, 2021
| | Columbia
Acorn
International
SelectSM | Columbia
Thermostat
FundSM | Columbia
Acorn
European
FundSM |
| Class A | | | |
| Net assets | $235,103,038 | $624,372,719 | $66,374,215 |
| Shares outstanding | 6,635,855 | 36,711,447 | 1,991,389 |
| Net asset value per share(a) | $35.43 | $17.01 | $33.33 |
| Maximum sales charge | 5.75% | 5.75% | 5.75% |
| Maximum offering price per share(b) (calculated by dividing the net asset value per share by 1.0 minus the maximum sales charge for Class A shares) | $37.59 | $18.05 | $35.36 |
| Advisor Class | | | |
| Net assets | $2,462,210 | $172,161,977 | $3,083,158 |
| Shares outstanding | 67,741 | 10,241,050 | 91,540 |
| Net asset value per share(c) | $36.35 | $16.81 | $33.68 |
| Class C | | | |
| Net assets | $2,145,925 | $189,990,435 | $7,077,565 |
| Shares outstanding | 67,363 | 11,086,332 | 218,813 |
| Net asset value per share(a) | $31.86 | $17.14 | $32.35 |
| Institutional Class | | | |
| Net assets | $159,876,324 | $902,840,759 | $111,462,246 |
| Shares outstanding | 4,440,042 | 54,099,020 | 3,326,095 |
| Net asset value per share(c) | $36.01 | $16.69 | $33.51 |
| Institutional 2 Class | | | |
| Net assets | $51,804,593 | $169,246,295 | $25,881,901 |
| Shares outstanding | 1,425,785 | 10,053,058 | 763,035 |
| Net asset value per share(c) | $36.33 | $16.84 | $33.92 |
| Institutional 3 Class | | | |
| Net assets | $28,694,011 | $15,580,770 | $60,335 |
| Shares outstanding | 790,337 | 927,381 | 1,807 |
| Net asset value per share(c) | $36.31 | $16.80 | $33.38(d) |
| (a) | Redemption price per share is equal to net asset value less any applicable contingent deferred sales charge. |
| (b) | On sales of $50,000 or more the offering price is reduced. |
| (c) | Redemption price per share is equal to net asset value. |
| (d) | Net asset value per share rounds to this amount due to fractional shares outstanding. |
The accompanying Notes to Financial Statements are an integral part of this statement.
| 56 | Columbia Acorn Family of Funds | Annual Report 2021 |
Statement of Operations
Year Ended December 31, 2021
| | Columbia
Acorn®
Fund | Columbia
Acorn
International® | Columbia
Acorn
USA® |
| Net investment income | | | |
| Income: | | | |
| Dividends — unaffiliated issuers | $9,836,968 | $33,079,359 | $987,408 |
| Dividends — affiliated issuers | 1,615,316 | 35,467 | 6,269 |
| Income from securities lending — net | 2,312,817 | 367,236 | 194,538 |
| Foreign taxes withheld | (24,613) | (2,425,919) | (2,492) |
| Total income | 13,740,488 | 31,056,143 | 1,185,723 |
| Expenses: | | | |
| Investment advisory fee | 32,530,585 | 19,533,295 | 3,011,389 |
| Distribution and/or service fees | | | |
| Class A | 2,470,521 | 724,440 | 146,378 |
| Class C | 362,402 | 139,535 | 21,508 |
| Class R | — | 17,201 | — |
| Transfer agent fees | | | |
| Class A | 790,130 | 280,799 | 60,040 |
| Advisor Class | 35,199 | 12,092 | 25,593 |
| Class C | 29,062 | 13,626 | 2,206 |
| Institutional Class | 2,902,980 | 1,723,130 | 184,432 |
| Institutional 2 Class | 32,971 | 76,392 | 2,126 |
| Institutional 3 Class | 6,206 | 12,265 | 3,090 |
| Class R | — | 3,331 | — |
| Administration fees | 2,324,934 | 1,179,111 | 156,104 |
| Trustees’ fees | 438,137 | 231,741 | 29,784 |
| Custodian fees | 32,637 | 380,591 | 9,327 |
| Printing and postage fees | 104,745 | 90,376 | 24,861 |
| Registration fees | 109,612 | 107,911 | 87,646 |
| Audit fees | 25,920 | 106,749 | 27,343 |
| Legal fees | 667,207 | 335,566 | 45,064 |
| Line of credit interest | — | — | 1,454 |
| Compensation of chief compliance officer | 16,953 | 7,978 | 1,182 |
| Other | 259,766 | 145,314 | 27,028 |
| Total expenses | 43,139,967 | 25,121,443 | 3,866,555 |
| Fees waived or expenses reimbursed by Investment Manager and its affiliates | — | (376,336) | (19,062) |
| Fees waived by transfer agent | | | |
| Institutional 2 Class | (3,081) | (21,001) | (674) |
| Institutional 3 Class | — | (12,265) | (3,090) |
| Expense reduction | (5,161) | (4,960) | (720) |
| Total net expenses | 43,131,725 | 24,706,881 | 3,843,009 |
| Net investment income (loss) | (29,391,237) | 6,349,262 | (2,657,286) |
| Realized and unrealized gain (loss) — net | | | |
| Net realized gain (loss) on: | | | |
| Investments — unaffiliated issuers | 1,099,695,646 | 296,531,448 | 86,736,519 |
| Investments — affiliated issuers | (7,948,741) | (3,531) | 48 |
| Foreign currency translations | 840 | (453,821) | (150) |
| Futures contracts | (2,338,271) | 654,234 | 142,295 |
| Net realized gain | 1,089,409,474 | 296,728,330 | 86,878,712 |
| Net change in unrealized appreciation (depreciation) on: | | | |
| Investments — unaffiliated issuers | (641,431,919) | (2,174,813) | (52,708,232) |
| Investments — affiliated issuers | 3,068,539 | — | (825) |
| Foreign currency translations | — | (88,396) | — |
| Futures contracts | — | (1,142,509) | — |
| Net change in unrealized appreciation (depreciation) | (638,363,380) | (3,405,718) | (52,709,057) |
| Net realized and unrealized gain | 451,046,094 | 293,322,612 | 34,169,655 |
| Net increase in net assets resulting from operations | $421,654,857 | $299,671,874 | $31,512,369 |
The accompanying Notes to Financial Statements are an integral part of this statement.
Columbia Acorn Family of Funds | Annual Report 2021
| 57 |
Statement of Operations (continued)
Year Ended December 31, 2021
| | Columbia
Acorn
International
SelectSM | Columbia
Thermostat
FundSM | Columbia
Acorn
European
FundSM |
| Net investment income | | | |
| Income: | | | |
| Dividends — unaffiliated issuers | $5,738,001 | $— | $1,738,420 |
| Dividends — affiliated issuers | 4,022 | 35,837,096 | 2,437 |
| Income from securities lending — net | 27,055 | — | 3,772 |
| Foreign taxes withheld | (505,494) | — | (159,885) |
| Total income | 5,263,584 | 35,837,096 | 1,584,744 |
| Expenses: | | | |
| Investment advisory fee | 4,342,199 | 2,037,101 | 1,796,167 |
| Distribution and/or service fees | | | |
| Class A | 587,856 | 1,514,500 | 137,142 |
| Class C | 24,577 | 1,955,747 | 58,318 |
| Transfer agent fees | | | |
| Class A | 347,749 | 592,008 | 48,977 |
| Advisor Class | 3,899 | 160,715 | 2,638 |
| Class C | 3,648 | 191,010 | 5,225 |
| Institutional Class | 234,751 | 851,331 | 75,365 |
| Institutional 2 Class | 33,841 | 102,778 | 9,220 |
| Institutional 3 Class | 1,402 | 1,189 | 13 |
| Administration fees | 232,872 | 972,231 | 78,489 |
| Trustees’ fees | 115,613 | 243,397 | 17,565 |
| Custodian fees | 88,788 | 2,576 | 37,781 |
| Printing and postage fees | 58,830 | 109,620 | 20,762 |
| Registration fees | 92,629 | 168,523 | 95,448 |
| Audit fees | 57,279 | 8,843 | 27,343 |
| Legal fees | 66,522 | 280,906 | 22,394 |
| Line of credit interest | 193 | 5,186 | 1,100 |
| Compensation of chief compliance officer | 1,730 | 7,002 | 565 |
| Other | 46,982 | 94,367 | 23,149 |
| Total expenses | 6,341,360 | 9,299,030 | 2,457,661 |
| Fees waived or expenses reimbursed by Investment Manager and its affiliates | (1,037,358) | (869,098) | (310,320) |
| Fees waived by transfer agent | | | |
| Institutional 2 Class | — | — | (2,745) |
| Institutional 3 Class | — | — | (13) |
| Expense reduction | (7,690) | (160) | (20) |
| Total net expenses | 5,296,312 | 8,429,772 | 2,144,563 |
| Net investment income (loss) | (32,728) | 27,407,324 | (559,819) |
| Realized and unrealized gain (loss) — net | | | |
| Net realized gain (loss) on: | | | |
| Investments — unaffiliated issuers | 33,780,732 | — | (171,276) |
| Investments — affiliated issuers | (733) | 236,586,235 | (482) |
| Capital gain distributions from underlying affiliated funds | — | 32,180,334 | — |
| Foreign currency translations | (123,730) | — | (9,711) |
| Net realized gain (loss) | 33,656,269 | 268,766,569 | (181,469) |
| Net change in unrealized appreciation (depreciation) on: | | | |
| Investments — unaffiliated issuers | 15,145,192 | — | 28,919,913 |
| Investments — affiliated issuers | — | (179,749,247) | — |
| Foreign currency translations | (37,786) | — | (9,952) |
| Net change in unrealized appreciation (depreciation) | 15,107,406 | (179,749,247) | 28,909,961 |
| Net realized and unrealized gain | 48,763,675 | 89,017,322 | 28,728,492 |
| Net increase in net assets resulting from operations | $48,730,947 | $116,424,646 | $28,168,673 |
The accompanying Notes to Financial Statements are an integral part of this statement.
| 58 | Columbia Acorn Family of Funds | Annual Report 2021 |
Statement of Changes in Net Assets
| | Columbia
Acorn® Fund | Columbia Acorn
International® |
| | Year Ended
December 31, 2021 | Year Ended
December 31, 2020 | Year Ended
December 31, 2021 | Year Ended
December 31, 2020 |
| Operations | | | | |
| Net investment income (loss) | $(29,391,237) | $(14,975,252) | $6,349,262 | $10,414,660 |
| Net realized gain | 1,089,409,474 | 680,585,296 | 296,728,330 | 271,270,947 |
| Net change in unrealized appreciation (depreciation) | (638,363,380) | 465,103,053 | (3,405,718) | 22,746,058 |
| Net increase in net assets resulting from operations | 421,654,857 | 1,130,713,097 | 299,671,874 | 304,431,665 |
| Distributions to shareholders | | | | |
| Net investment income and net realized gains | | | | |
| Class A | (263,150,366) | (150,373,734) | (40,052,526) | (34,334,393) |
| Advisor Class | (8,201,757) | (5,281,322) | (1,374,206) | (2,890,397) |
| Class C | (5,787,484) | (14,567,713) | (1,615,464) | (2,457,496) |
| Institutional Class | (758,479,695) | (438,953,007) | (254,146,337) | (221,646,811) |
| Institutional 2 Class | (10,983,732) | (6,996,582) | (20,003,620) | (18,032,639) |
| Institutional 3 Class | (16,278,812) | (16,279,584) | (26,466,011) | (33,290,405) |
| Class R | — | — | (491,746) | (402,136) |
| Total distributions to shareholders | (1,062,881,846) | (632,451,942) | (344,149,910) | (313,054,277) |
| Increase (decrease) in net assets from capital stock activity | 300,010,089 | 212,416,503 | (113,274,517) | (208,084,940) |
| Total increase (decrease) in net assets | (341,216,900) | 710,677,658 | (157,752,553) | (216,707,552) |
| Net assets at beginning of year | 4,869,840,570 | 4,159,162,912 | 2,497,540,626 | 2,714,248,178 |
| Net assets at end of year | $4,528,623,670 | $4,869,840,570 | $2,339,788,073 | $2,497,540,626 |
The accompanying Notes to Financial Statements are an integral part of this statement.
Columbia Acorn Family of Funds | Annual Report 2021
| 59 |
Statement of Changes in Net Assets (continued)
| | Columbia
Acorn USA® | Columbia Acorn
International SelectSM |
| | Year Ended
December 31, 2021 | Year Ended
December 31, 2020 | Year Ended
December 31, 2021 | Year Ended
December 31, 2020 |
| Operations | | | | |
| Net investment income (loss) | $(2,657,286) | $(1,924,191) | $(32,728) | $203,776 |
| Net realized gain (loss) | 86,878,712 | 17,300,637 | 33,656,269 | (3,009,188) |
| Net change in unrealized appreciation (depreciation) | (52,709,057) | 47,282,562 | 15,107,406 | 82,996,337 |
| Net increase in net assets resulting from operations | 31,512,369 | 62,659,008 | 48,730,947 | 80,190,925 |
| Distributions to shareholders | | | | |
| Net investment income and net realized gains | | | | |
| Class A | (17,031,591) | (3,334,546) | (10,962,872) | (137,241) |
| Advisor Class | (5,338,855) | (927,003) | (121,956) | (6,211) |
| Class C | (429,752) | (298,962) | (93,404) | (6,451) |
| Institutional Class | (41,782,773) | (7,684,936) | (7,965,017) | (262,018) |
| Institutional 2 Class | (727,072) | (135,059) | (2,689,582) | (225,716) |
| Institutional 3 Class | (10,854,053) | (3,102,308) | (1,456,872) | (53,063) |
| Total distributions to shareholders | (76,164,096) | (15,482,814) | (23,289,703) | (690,700) |
| Increase (decrease) in net assets from capital stock activity | 10,790,642 | (20,411,506) | (41,489,686) | 268,475,687 |
| Total increase (decrease) in net assets | (33,861,085) | 26,764,688 | (16,048,442) | 347,975,912 |
| Net assets at beginning of year | 336,162,995 | 309,398,307 | 496,134,543 | 148,158,631 |
| Net assets at end of year | $302,301,910 | $336,162,995 | $480,086,101 | $496,134,543 |
The accompanying Notes to Financial Statements are an integral part of this statement.
| 60 | Columbia Acorn Family of Funds | Annual Report 2021 |
Statement of Changes in Net Assets (continued)
| | Columbia
Thermostat FundSM | Columbia Acorn
European FundSM |
| | Year Ended
December 31, 2021 | Year Ended
December 31, 2020 | Year Ended
December 31, 2021 | Year Ended
December 31, 2020 |
| Operations | | | | |
| Net investment income (loss) | $27,407,324 | $17,824,496 | $(559,819) | $(367,657) |
| Net realized gain (loss) | 268,766,569 | 105,933,366 | (181,469) | 3,830,745 |
| Net change in unrealized appreciation (depreciation) | (179,749,247) | 162,365,695 | 28,909,961 | 11,494,745 |
| Net increase in net assets resulting from operations | 116,424,646 | 286,123,557 | 28,168,673 | 14,957,833 |
| Distributions to shareholders | | | | |
| Net investment income and net realized gains | | | | |
| Class A | (80,263,851) | (29,853,089) | (114,318) | (160,959) |
| Advisor Class | (22,778,179) | (7,487,768) | (12,346) | (7,030) |
| Class C | (23,284,536) | (11,618,991) | — | (30,429) |
| Institutional Class | (121,876,270) | (44,952,118) | (446,763) | (199,953) |
| Institutional 2 Class | (23,468,843) | (7,900,364) | (117,513) | (22,104) |
| Institutional 3 Class | (1,952,903) | (182,364) | (292) | (21) |
| Total distributions to shareholders | (273,624,582) | (101,994,694) | (691,232) | (420,496) |
| Increase in net assets from capital stock activity | 525,118,998 | 797,756,258 | 77,822,786 | 839,659 |
| Total increase in net assets | 367,919,062 | 981,885,121 | 105,300,227 | 15,376,996 |
| Net assets at beginning of year | 1,706,273,893 | 724,388,772 | 108,639,193 | 93,262,197 |
| Net assets at end of year | $2,074,192,955 | $1,706,273,893 | $213,939,420 | $108,639,193 |
The accompanying Notes to Financial Statements are an integral part of this statement.
Columbia Acorn Family of Funds | Annual Report 2021
| 61 |
Statement of Changes in Net Assets (continued)
| | Columbia
Acorn® Fund | Columbia Acorn
International® |
| | Year Ended | Year Ended | Year Ended | Year Ended |
| | December 31, 2021 | December 31, 2020 | December 31, 2021 | December 31, 2020 |
| | Shares | Dollars ($) | Shares(a) | Dollars ($) | Shares | Dollars ($) | Shares | Dollars ($) |
| Capital stock activity |
| Class A | | | | | | | | |
| Subscriptions | 5,982,210 | 71,946,347 | 4,688,264 | 54,407,624 | 525,959 | 18,837,295 | 435,640 | 13,349,899 |
| Fund reorganization | — | — | 7,633,122 | 86,559,646 | — | — | 401,457 | 12,160,120 |
| Distributions reinvested | 23,766,788 | 239,307,360 | 11,451,072 | 137,106,865 | 1,182,480 | 38,446,481 | 1,022,070 | 32,891,134 |
| Redemptions | (15,366,129) | (195,707,426) | (15,492,356) | (179,323,557) | (1,469,807) | (52,814,377) | (2,598,676) | (79,701,674) |
| Net increase (decrease) | 14,382,869 | 115,546,281 | 8,280,102 | 98,750,578 | 238,632 | 4,469,399 | (739,509) | (21,300,521) |
| Advisor Class | | | | | | | | |
| Subscriptions | 418,484 | 7,441,995 | 462,475 | 7,310,751 | 45,084 | 1,658,003 | 505,382 | 16,108,591 |
| Fund reorganization | — | — | 86,140 | 1,315,365 | — | — | 10,583 | 325,654 |
| Distributions reinvested | 456,762 | 6,995,207 | 279,871 | 4,586,563 | 41,395 | 1,374,206 | 88,709 | 2,890,336 |
| Redemptions | (794,625) | (14,613,929) | (1,179,579) | (18,249,135) | (457,336) | (16,418,304) | (326,695) | (10,135,796) |
| Net increase (decrease) | 80,621 | (176,727) | (351,093) | (5,036,456) | (370,857) | (13,386,095) | 277,979 | 9,188,785 |
| Class C | | | | | | | | |
| Subscriptions | 120,678 | 1,999,707 | 202,898 | 2,992,920 | 26,738 | 858,219 | 21,414 | 615,973 |
| Fund reorganization | — | — | 139,092 | 1,964,002 | — | — | 206,250 | 5,785,299 |
| Distributions reinvested | 418,581 | 5,742,544 | 965,200 | 14,020,819 | 54,287 | 1,610,276 | 81,909 | 2,439,825 |
| Redemptions | (2,211,079) | (37,166,378) | (2,038,003) | (30,727,957) | (361,954) | (11,928,781) | (260,624) | (7,549,238) |
| Net increase (decrease) | (1,671,820) | (29,424,127) | (730,813) | (11,750,216) | (280,929) | (9,460,286) | 48,949 | 1,291,859 |
| Institutional Class | | | | | | | | |
| Subscriptions | 4,017,788 | 66,770,286 | 4,362,457 | 64,578,049 | 1,856,604 | 64,984,126 | 2,231,454 | 67,688,698 |
| Fund reorganization | — | — | 8,169,626 | 117,887,709 | — | — | 435,556 | 13,232,202 |
| Distributions reinvested | 49,029,210 | 694,440,015 | 26,042,782 | 403,676,921 | 6,346,780 | 207,227,903 | 5,578,841 | 180,071,314 |
| Redemptions | (28,170,590) | (472,694,167) | (35,542,945) | (518,688,814) | (7,403,458) | (266,653,814) | (14,024,302) | (429,532,164) |
| Net increase (decrease) | 24,876,408 | 288,516,134 | 3,031,920 | 67,453,865 | 799,926 | 5,558,215 | (5,778,451) | (168,539,950) |
| Institutional 2 Class | | | | | | | | |
| Subscriptions | 499,108 | 9,331,106 | 817,139 | 12,495,019 | 769,576 | 27,594,261 | 642,789 | 20,785,644 |
| Fund reorganization | — | — | 204,341 | 3,157,067 | — | — | 8,252 | 250,540 |
| Distributions reinvested | 706,732 | 10,980,954 | 420,207 | 6,994,417 | 292,244 | 9,532,906 | 265,894 | 8,594,008 |
| Redemptions | (1,236,384) | (22,900,725) | (1,318,362) | (20,493,897) | (1,003,375) | (36,329,973) | (2,525,963) | (80,967,049) |
| Net increase (decrease) | (30,544) | (2,588,665) | 123,325 | 2,152,606 | 58,445 | 797,194 | (1,609,028) | (51,336,857) |
| Institutional 3 Class | | | | | | | | |
| Subscriptions | 1,316,568 | 24,299,474 | 6,783,381 | 92,424,393 | 1,798,774 | 66,229,977 | 3,467,150 | 93,267,502 |
| Fund reorganization | — | — | 367,453 | 5,746,856 | — | — | 20,109 | 619,153 |
| Distributions reinvested | 1,022,162 | 16,168,756 | 956,314 | 16,224,539 | 735,758 | 24,286,390 | 775,293 | 25,432,820 |
| Redemptions | (5,936,701) | (112,331,037) | (3,659,083) | (53,549,662) | (5,148,935) | (192,165,037) | (3,234,167) | (96,540,634) |
| Net increase (decrease) | (3,597,971) | (71,862,807) | 4,448,065 | 60,846,126 | (2,614,403) | (101,648,670) | 1,028,385 | 22,778,841 |
| Class R | | | | | | | | |
| Subscriptions | — | — | — | — | 17,904 | 666,373 | 12,442 | 384,006 |
| Distributions reinvested | — | — | — | — | 15,168 | 491,746 | 12,421 | 399,796 |
| Redemptions | — | — | — | — | (21,131) | (762,393) | (33,602) | (950,899) |
| Net increase (decrease) | — | — | — | — | 11,941 | 395,726 | (8,739) | (167,097) |
| Total net increase (decrease) | 34,039,563 | 300,010,089 | 14,801,506 | 212,416,503 | (2,157,245) | (113,274,517) | (6,780,414) | (208,084,940) |
| (a) | Share activity for Class C has been adjusted on a retroactive basis to reflect a 4 to 1 reverse stock split completed after the close of business on September 11, 2020. |
The accompanying Notes to Financial Statements are an integral part of this statement.
| 62 | Columbia Acorn Family of Funds | Annual Report 2021 |
Statement of Changes in Net Assets (continued)
| | Columbia
Acorn USA® | Columbia Acorn
International SelectSM |
| | Year Ended | Year Ended | Year Ended | Year Ended |
| | December 31, 2021 | December 31, 2020 | December 31, 2021 | December 31, 2020 |
| | Shares | Dollars ($) | Shares(a) | Dollars ($) | Shares | Dollars ($) | Shares | Dollars ($) |
| Capital stock activity |
| Class A | | | | | | | | |
| Subscriptions | 304,197 | 3,931,345 | 346,060 | 3,817,424 | 297,746 | 10,412,479 | 628,129 | 16,436,706 |
| Fund reorganization | — | — | — | — | — | — | 5,674,674 | 165,360,417 |
| Distributions reinvested | 1,601,884 | 16,216,954 | 266,526 | 3,190,992 | 296,896 | 10,055,469 | 5,030 | 134,560 |
| Redemptions | (1,023,646) | (14,153,596) | (1,104,170) | (11,907,742) | (805,715) | (28,236,000) | (771,815) | (20,777,304) |
| Net increase (decrease) | 882,435 | 5,994,703 | (491,584) | (4,899,326) | (211,073) | (7,768,052) | 5,536,018 | 161,154,379 |
| Advisor Class | | | | | | | | |
| Subscriptions | 129,536 | 2,717,808 | 219,087 | 3,501,300 | 13,489 | 488,352 | 34,327 | 949,659 |
| Fund reorganization | — | — | — | — | — | — | 13,886 | 415,049 |
| Distributions reinvested | 329,508 | 5,338,855 | 54,222 | 927,003 | 3,497 | 121,768 | 226 | 6,202 |
| Redemptions | (188,579) | (3,873,759) | (251,565) | (3,745,560) | (28,744) | (1,028,388) | (38,301) | (1,005,492) |
| Net increase (decrease) | 270,465 | 4,182,904 | 21,744 | 682,743 | (11,758) | (418,268) | 10,138 | 365,418 |
| Class C | | | | | | | | |
| Subscriptions | 11,681 | 227,915 | 20,827 | 297,879 | 7,563 | 241,176 | 11,506 | 302,527 |
| Fund reorganization | — | — | — | — | — | — | 51,121 | 1,349,083 |
| Distributions reinvested | 28,737 | 429,313 | 19,743 | 289,386 | 3,065 | 93,006 | 265 | 6,424 |
| Redemptions | (66,603) | (1,284,123) | (87,933) | (1,291,382) | (50,207) | (1,577,049) | (51,813) | (1,235,107) |
| Net increase (decrease) | (26,185) | (626,895) | (47,363) | (704,117) | (39,579) | (1,242,867) | 11,079 | 422,927 |
| Institutional Class | | | | | | | | |
| Subscriptions | 466,246 | 8,703,797 | 310,344 | 4,280,049 | 336,387 | 11,967,996 | 550,028 | 15,266,316 |
| Fund reorganization | — | — | — | — | — | — | 2,384,285 | 70,622,469 |
| Distributions reinvested | 2,718,115 | 39,971,652 | 466,504 | 7,368,960 | 206,883 | 7,130,545 | 8,639 | 234,705 |
| Redemptions | (1,266,859) | (22,954,249) | (1,704,651) | (24,375,489) | (632,053) | (22,509,312) | (1,480,207) | (42,408,722) |
| Net increase (decrease) | 1,917,502 | 25,721,200 | (927,803) | (12,726,480) | (88,783) | (3,410,771) | 1,462,745 | 43,714,768 |
| Institutional 2 Class | | | | | | | | |
| Subscriptions | 62,684 | 1,319,886 | 50,915 | 759,419 | 45,098 | 1,648,451 | 2,597,666 | 67,295,084 |
| Fund reorganization | — | — | — | — | — | — | 27,450 | 820,474 |
| Distributions reinvested | 44,190 | 726,755 | 7,827 | 135,002 | 77,216 | 2,689,582 | 8,235 | 225,716 |
| Redemptions | (81,033) | (1,693,362) | (118,538) | (1,926,685) | (935,896) | (33,189,189) | (509,998) | (14,522,127) |
| Net increase (decrease) | 25,841 | 353,279 | (59,796) | (1,032,264) | (813,582) | (28,851,156) | 2,123,353 | 53,819,147 |
| Institutional 3 Class | | | | | | | | |
| Subscriptions | 571,882 | 12,216,299 | 462,738 | 7,546,284 | 81,741 | 2,892,773 | 437,355 | 12,374,906 |
| Fund reorganization | — | — | — | — | — | — | 152,649 | 4,559,646 |
| Distributions reinvested | 650,390 | 10,837,536 | 177,436 | 3,099,067 | 41,832 | 1,454,524 | 1,931 | 52,896 |
| Redemptions | (2,150,296) | (47,888,384) | (804,052) | (12,377,413) | (116,418) | (4,145,869) | (283,180) | (7,988,400) |
| Net increase (decrease) | (928,024) | (24,834,549) | (163,878) | (1,732,062) | 7,155 | 201,428 | 308,755 | 8,999,048 |
| Total net increase (decrease) | 2,142,034 | 10,790,642 | (1,668,680) | (20,411,506) | (1,157,620) | (41,489,686) | 9,452,088 | 268,475,687 |
| (a) | Share activity for Class C has been adjusted on a retroactive basis to reflect a 4 to 1 reverse stock split completed after the close of business on September 11, 2020. |
The accompanying Notes to Financial Statements are an integral part of this statement.
Columbia Acorn Family of Funds | Annual Report 2021
| 63 |
Statement of Changes in Net Assets (continued)
| | Columbia
Thermostat FundSM | Columbia Acorn
European FundSM |
| | Year Ended | Year Ended | Year Ended | Year Ended |
| | December 31, 2021 | December 31, 2020 | December 31, 2021 | December 31, 2020 |
| | Shares | Dollars ($) | Shares | Dollars ($) | Shares | Dollars ($) | Shares | Dollars ($) |
| Capital stock activity |
| Class A | | | | | | | | |
| Subscriptions | 13,658,871 | 258,098,220 | 17,213,419 | 298,463,150 | 959,587 | 29,875,035 | 753,063 | 17,268,947 |
| Distributions reinvested | 4,372,709 | 75,185,933 | 1,520,872 | 27,445,861 | 3,639 | 114,289 | 7,687 | 160,744 |
| Redemptions | (8,921,161) | (167,460,803) | (6,025,996) | (102,931,026) | (501,562) | (15,663,044) | (712,243) | (14,706,843) |
| Net increase | 9,110,419 | 165,823,350 | 12,708,295 | 222,977,985 | 461,664 | 14,326,280 | 48,507 | 2,722,848 |
| Advisor Class | | | | | | | | |
| Subscriptions | 6,093,506 | 114,247,815 | 6,863,588 | 119,997,025 | 120,472 | 3,957,317 | 20,311 | 460,105 |
| Distributions reinvested | 1,338,083 | 22,736,494 | 415,096 | 7,440,017 | 388 | 12,325 | 332 | 7,010 |
| Redemptions | (4,415,649) | (82,862,865) | (1,136,463) | (18,534,553) | (93,445) | (2,989,540) | (40,465) | (719,702) |
| Net increase (decrease) | 3,015,940 | 54,121,444 | 6,142,221 | 108,902,489 | 27,415 | 980,102 | (19,822) | (252,587) |
| Class C | | | | | | | | |
| Subscriptions | 3,926,971 | 74,641,306 | 4,134,190 | 72,312,804 | 69,074 | 2,141,558 | 10,212 | 224,937 |
| Distributions reinvested | 1,266,735 | 21,949,471 | 597,023 | 10,828,046 | — | — | 1,483 | 30,396 |
| Redemptions | (5,444,288) | (102,926,754) | (3,641,561) | (62,976,289) | (62,866) | (1,823,948) | (78,350) | (1,572,649) |
| Net increase (decrease) | (250,582) | (6,335,977) | 1,089,652 | 20,164,561 | 6,208 | 317,610 | (66,655) | (1,317,316) |
| Institutional Class | | | | | | | | |
| Subscriptions | 23,405,839 | 433,982,285 | 26,620,852 | 453,014,337 | 1,874,052 | 58,837,993 | 810,554 | 18,752,767 |
| Distributions reinvested | 6,038,529 | 101,815,509 | 2,026,638 | 36,002,075 | 13,945 | 440,394 | 9,440 | 198,135 |
| Redemptions | (15,840,307) | (291,081,612) | (7,335,717) | (120,216,003) | (557,815) | (17,639,234) | (1,020,779) | (19,997,548) |
| Net increase (decrease) | 13,604,061 | 244,716,182 | 21,311,773 | 368,800,409 | 1,330,182 | 41,639,153 | (200,785) | (1,046,646) |
| Institutional 2 Class | | | | | | | | |
| Subscriptions | 8,585,734 | 161,733,267 | 6,788,489 | 114,076,072 | 965,317 | 31,689,444 | 221,913 | 4,629,697 |
| Distributions reinvested | 1,375,116 | 23,468,768 | 441,392 | 7,900,050 | 3,676 | 117,489 | 1,040 | 22,084 |
| Redemptions | (7,028,851) | (132,937,074) | (2,828,659) | (46,801,458) | (343,736) | (11,227,611) | (180,402) | (3,964,044) |
| Net increase | 2,931,999 | 52,264,961 | 4,401,222 | 75,174,664 | 625,257 | 20,579,322 | 42,551 | 687,737 |
| Institutional 3 Class | | | | | | | | |
| Subscriptions | 810,188 | 15,437,620 | 118,904 | 2,017,296 | 681 | 21,164 | 2,370 | 58,624 |
| Distributions reinvested | 115,933 | 1,952,462 | 10,200 | 182,140 | 9 | 265 | — | — |
| Redemptions | (156,737) | (2,861,044) | (27,055) | (463,286) | (1,377) | (41,110) | (742) | (13,001) |
| Net increase (decrease) | 769,384 | 14,529,038 | 102,049 | 1,736,150 | (687) | (19,681) | 1,628 | 45,623 |
| Total net increase (decrease) | 29,181,221 | 525,118,998 | 45,755,212 | 797,756,258 | 2,450,039 | 77,822,786 | (194,576) | 839,659 |
The accompanying Notes to Financial Statements are an integral part of this statement.
| 64 | Columbia Acorn Family of Funds | Annual Report 2021 |
[THIS PAGE INTENTIONALLY LEFT BLANK]
Columbia Acorn Family of Funds | Annual Report 2021
| 65 |
Financial Highlights
Columbia Acorn® Fund
The following tables are intended to help you understand the Funds’ financial performance. Certain information reflects financial results for a single share of a class held for the periods shown. Per share net investment income (loss) amounts are calculated based on average shares outstanding during the period. Total return assumes reinvestment of all dividends and distributions, if any. Total return does not reflect payment of sales charges, if any. Total return and portfolio turnover are not annualized for periods of less than one year. The portfolio turnover rate is calculated without regard to purchase and sales transactions of short-term instruments and certain derivatives, if any. If such transactions were included, a Fund’s portfolio turnover rate may be higher.
| | Net asset value,
beginning of
period | Net
investment
income
(loss) | Net
realized
and
unrealized
gain (loss) | Total from
investment
operations | Distributions
from net
investment
income | Distributions
from net
realized
gains | Total
distributions to
shareholders |
| Class A |
| Year Ended 12/31/2021 | $12.69 | (0.10) | 1.07 | 0.97 | (0.14) | (3.51) | (3.65) |
| Year Ended 12/31/2020 | $11.71 | (0.06) | 3.24 | 3.18 | — | (2.20) | (2.20) |
| Year Ended 12/31/2019 | $10.65 | (0.04) | 2.78 | 2.74 | — | (1.68) | (1.68) |
| Year Ended 12/31/2018 | $12.92 | (0.03) | (0.48) | (0.51) | — | (1.76) | (1.76) |
| Year Ended 12/31/2017 | $13.35 | (0.02) | 3.23 | 3.21 | — | (3.64) | (3.64) |
| Advisor Class |
| Year Ended 12/31/2021 | $17.65 | (0.10) | 1.54 | 1.44 | (0.13) | (3.59) | (3.72) |
| Year Ended 12/31/2020 | $15.52 | (0.05) | 4.38 | 4.33 | — | (2.20) | (2.20) |
| Year Ended 12/31/2019 | $13.63 | (0.01) | 3.58 | 3.57 | — | (1.68) | (1.68) |
| Year Ended 12/31/2018 | $16.06 | 0.01 | (0.64) | (0.63) | — | (1.80) | (1.80) |
| Year Ended 12/31/2017 | $15.83 | 0.02 | 3.85 | 3.87 | — | (3.64) | (3.64) |
| Class C(d) |
| Year Ended 12/31/2021 | $16.14 | (0.26) | 1.40 | 1.14 | (0.13) | (3.43) | (3.56) |
| Year Ended 12/31/2020 | $16.57 | (0.20) | 4.08 | 3.88 | — | (4.31) | (4.31) |
| Year Ended 12/31/2019 | $18.75 | (0.20) | 4.74 | 4.54 | — | (6.72) | (6.72) |
| Year Ended 12/31/2018 | $26.34 | (0.24) | (0.71) | (0.95) | — | (6.64) | (6.64) |
| Year Ended 12/31/2017 | $33.36 | (0.32) | 7.86 | 7.54 | — | (14.56) | (14.56) |
| Institutional Class |
| Year Ended 12/31/2021 | $16.60 | (0.09) | 1.43 | 1.34 | (0.13) | (3.59) | (3.72) |
| Year Ended 12/31/2020 | $14.70 | (0.04) | 4.14 | 4.10 | — | (2.20) | (2.20) |
| Year Ended 12/31/2019 | $12.98 | (0.01) | 3.41 | 3.40 | — | (1.68) | (1.68) |
| Year Ended 12/31/2018 | $15.39 | 0.01 | (0.62) | (0.61) | — | (1.80) | (1.80) |
| Year Ended 12/31/2017 | $15.29 | 0.02 | 3.72 | 3.74 | — | (3.64) | (3.64) |
| Institutional 2 Class |
| Year Ended 12/31/2021 | $17.88 | (0.10) | 1.57 | 1.47 | (0.13) | (3.60) | (3.73) |
| Year Ended 12/31/2020 | $15.69 | (0.04) | 4.43 | 4.39 | — | (2.20) | (2.20) |
| Year Ended 12/31/2019 | $13.76 | (0.00)(e) | 3.61 | 3.61 | — | (1.68) | (1.68) |
| Year Ended 12/31/2018 | $16.20 | 0.01 | (0.65) | (0.64) | — | (1.80) | (1.80) |
| Year Ended 12/31/2017 | $15.94 | 0.02 | 3.88 | 3.90 | — | (3.64) | (3.64) |
The accompanying Notes to Financial Statements are an integral part of this statement.
| 66 | Columbia Acorn Family of Funds | Annual Report 2021 |
Financial Highlights (continued)
Columbia Acorn® Fund
| | Net
asset
value,
end of
period | Total
return | Total gross
expense
ratio to
average
net assets(a) | Total net
expense
ratio to
average
net assets(a) | Net investment
income (loss)
ratio to
average
net assets | Portfolio
turnover | Net
assets,
end of
period
(000’s) |
| Class A |
| Year Ended 12/31/2021 | $10.01 | 8.79% | 1.08% | 1.08%(b) | (0.80%) | 75% | $919,643 |
| Year Ended 12/31/2020 | $12.69 | 29.18%(c) | 1.11% | 1.11%(b) | (0.56%) | 86% | $983,709 |
| Year Ended 12/31/2019 | $11.71 | 26.21%(c) | 1.11% | 1.10%(b) | (0.30%) | 101% | $810,966 |
| Year Ended 12/31/2018 | $10.65 | (5.22%)(c) | 1.10% | 1.08%(b) | (0.20%) | 66% | $768,031 |
| Year Ended 12/31/2017 | $12.92 | 24.91% | 1.09% | 1.08%(b) | (0.13%) | 72% | $830,454 |
| Advisor Class |
| Year Ended 12/31/2021 | $15.37 | 9.03% | 0.83% | 0.83%(b) | (0.55%) | 75% | $39,676 |
| Year Ended 12/31/2020 | $17.65 | 29.44%(c) | 0.86% | 0.86%(b) | (0.30%) | 86% | $44,139 |
| Year Ended 12/31/2019 | $15.52 | 26.58%(c) | 0.86% | 0.85%(b) | (0.05%) | 101% | $44,248 |
| Year Ended 12/31/2018 | $13.63 | (5.00%)(c) | 0.85% | 0.83%(b) | 0.05% | 66% | $40,425 |
| Year Ended 12/31/2017 | $16.06 | 25.19% | 0.84% | 0.83%(b) | 0.12% | 72% | $38,588 |
| Class C(d) |
| Year Ended 12/31/2021 | $13.72 | 7.95% | 1.83% | 1.83%(b) | (1.54%) | 75% | $24,546 |
| Year Ended 12/31/2020 | $16.14 | 28.27%(c) | 1.86% | 1.86%(b) | (1.30%) | 86% | $55,861 |
| Year Ended 12/31/2019 | $16.57 | 25.12%(c) | 1.86% | 1.85%(b) | (1.05%) | 101% | $69,471 |
| Year Ended 12/31/2018 | $18.75 | (5.86%)(c) | 1.85% | 1.82%(b) | (0.94%) | 66% | $81,149 |
| Year Ended 12/31/2017 | $26.34 | 23.88% | 1.84% | 1.83%(b) | (0.88%) | 72% | $246,450 |
| Institutional Class |
| Year Ended 12/31/2021 | $14.22 | 8.99% | 0.83% | 0.83%(b) | (0.55%) | 75% | $3,413,006 |
| Year Ended 12/31/2020 | $16.60 | 29.51%(c) | 0.86% | 0.86%(b) | (0.30%) | 86% | $3,569,794 |
| Year Ended 12/31/2019 | $14.70 | 26.60%(c) | 0.86% | 0.85%(b) | (0.05%) | 101% | $3,117,486 |
| Year Ended 12/31/2018 | $12.98 | (5.09%)(c) | 0.85% | 0.83%(b) | 0.05% | 66% | $2,816,948 |
| Year Ended 12/31/2017 | $15.39 | 25.24% | 0.84% | 0.83%(b) | 0.12% | 72% | $3,407,214 |
| Institutional 2 Class |
| Year Ended 12/31/2021 | $15.62 | 9.09%(c) | 0.80% | 0.80% | (0.52%) | 75% | $52,797 |
| Year Ended 12/31/2020 | $17.88 | 29.50%(c) | 0.83% | 0.82% | (0.27%) | 86% | $61,000 |
| Year Ended 12/31/2019 | $15.69 | 26.63%(c) | 0.83% | 0.82% | (0.02%) | 101% | $51,584 |
| Year Ended 12/31/2018 | $13.76 | (5.00%)(c) | 0.81% | 0.80% | 0.08% | 66% | $37,124 |
| Year Ended 12/31/2017 | $16.20 | 25.21% | 0.82% | 0.81% | 0.14% | 72% | $67,932 |
The accompanying Notes to Financial Statements are an integral part of this statement.
Columbia Acorn Family of Funds | Annual Report 2021
| 67 |
Financial Highlights (continued)
Columbia Acorn® Fund
| | Net asset value,
beginning of
period | Net
investment
income
(loss) | Net
realized
and
unrealized
gain (loss) | Total from
investment
operations | Distributions
from net
investment
income | Distributions
from net
realized
gains | Total
distributions to
shareholders |
| Institutional 3 Class |
| Year Ended 12/31/2021 | $18.12 | (0.09) | 1.60 | 1.51 | (0.14) | (3.61) | (3.75) |
| Year Ended 12/31/2020 | $15.87 | (0.04) | 4.49 | 4.45 | — | (2.20) | (2.20) |
| Year Ended 12/31/2019 | $13.89 | 0.00(e) | 3.66 | 3.66 | — | (1.68) | (1.68) |
| Year Ended 12/31/2018 | $16.34 | 0.02 | (0.66) | (0.64) | — | (1.81) | (1.81) |
| Year Ended 12/31/2017 | $16.04 | 0.03 | 3.91 | 3.94 | — | (3.64) | (3.64) |
| Notes to Financial Highlights |
| (a) | In addition to the fees and expenses that the Fund bears directly, the Fund indirectly bears a pro rata share of the fees and expenses of any other funds in which it invests, if any. Such indirect expenses are not included in the Fund’s reported expense ratios. |
| (b) | The benefits derived from expense reductions had an impact of less than 0.01%. |
| (c) | Had the Investment Manager and/or Transfer Agent not waived fees and/or reimbursed a portion of expenses, total return would have been reduced. |
| (d) | Per share amounts have been adjusted on a retroactive basis to reflect a 4 to 1 reverse stock split completed after the close of business on September 11, 2020. |
| (e) | Rounds to zero. |
The accompanying Notes to Financial Statements are an integral part of this statement.
| 68 | Columbia Acorn Family of Funds | Annual Report 2021 |
Financial Highlights (continued)
Columbia Acorn® Fund
| | Net
asset
value,
end of
period | Total
return | Total gross
expense
ratio to
average
net assets(a) | Total net
expense
ratio to
average
net assets(a) | Net investment
income (loss)
ratio to
average
net assets | Portfolio
turnover | Net
assets,
end of
period
(000’s) |
| Institutional 3 Class |
| Year Ended 12/31/2021 | $15.88 | 9.16% | 0.75% | 0.75% | (0.46%) | 75% | $78,955 |
| Year Ended 12/31/2020 | $18.12 | 29.54%(c) | 0.78% | 0.78% | (0.25%) | 86% | $155,338 |
| Year Ended 12/31/2019 | $15.87 | 26.74%(c) | 0.78% | 0.77% | 0.03% | 101% | $65,408 |
| Year Ended 12/31/2018 | $13.89 | (4.98%)(c) | 0.76% | 0.76% | 0.13% | 66% | $54,688 |
| Year Ended 12/31/2017 | $16.34 | 25.31% | 0.76% | 0.76% | 0.19% | 72% | $47,536 |
The accompanying Notes to Financial Statements are an integral part of this statement.
Columbia Acorn Family of Funds | Annual Report 2021
| 69 |
Financial Highlights
Columbia Acorn International®
| | Net asset value,
beginning of
period | Net
investment
income
(loss) | Net
realized
and
unrealized
gain (loss) | Total from
investment
operations | Distributions
from net
investment
income | Distributions
from net
realized
gains | Total
distributions to
shareholders |
| Class A |
| Year Ended 12/31/2021 | $34.31 | 0.01 | 4.08 | 4.09 | (0.38) | (4.83) | (5.21) |
| Year Ended 12/31/2020 | $34.20 | 0.06 | 4.51 | 4.57 | (0.20) | (4.26) | (4.46) |
| Year Ended 12/31/2019 | $29.48 | 0.25 | 8.19 | 8.44 | (0.65) | (3.07) | (3.72) |
| Year Ended 12/31/2018 | $46.51 | 0.23 | (7.41) | (7.18) | (0.29) | (9.56) | (9.85) |
| Year Ended 12/31/2017 | $37.71 | 0.25 | 11.71 | 11.96 | (0.67) | (2.49) | (3.16) |
| Advisor Class |
| Year Ended 12/31/2021 | $34.95 | 0.05 | 4.20 | 4.25 | (0.55) | (4.83) | (5.38) |
| Year Ended 12/31/2020 | $34.67 | 0.16 | 4.58 | 4.74 | (0.20) | (4.26) | (4.46) |
| Year Ended 12/31/2019 | $29.84 | 0.33 | 8.30 | 8.63 | (0.73) | (3.07) | (3.80) |
| Year Ended 12/31/2018 | $46.95 | 0.46 | (7.61) | (7.15) | (0.40) | (9.56) | (9.96) |
| Year Ended 12/31/2017 | $38.03 | 0.36 | 11.82 | 12.18 | (0.77) | (2.49) | (3.26) |
| Class C |
| Year Ended 12/31/2021 | $31.43 | (0.24) | 3.72 | 3.48 | (0.01) | (4.83) | (4.84) |
| Year Ended 12/31/2020 | $31.92 | (0.17) | 4.14 | 3.97 | (0.20) | (4.26) | (4.46) |
| Year Ended 12/31/2019 | $27.63 | 0.00(e) | 7.65 | 7.65 | (0.29) | (3.07) | (3.36) |
| Year Ended 12/31/2018 | $44.57 | (0.05) | (7.09) | (7.14) | (0.24) | (9.56) | (9.80) |
| Year Ended 12/31/2017 | $36.18 | (0.06) | 11.20 | 11.14 | (0.26) | (2.49) | (2.75) |
| Institutional Class |
| Year Ended 12/31/2021 | $34.47 | 0.10 | 4.09 | 4.19 | (0.55) | (4.83) | (5.38) |
| Year Ended 12/31/2020 | $34.25 | 0.14 | 4.54 | 4.68 | (0.20) | (4.26) | (4.46) |
| Year Ended 12/31/2019 | $29.51 | 0.33 | 8.21 | 8.54 | (0.73) | (3.07) | (3.80) |
| Year Ended 12/31/2018 | $46.57 | 0.34 | (7.44) | (7.10) | (0.40) | (9.56) | (9.96) |
| Year Ended 12/31/2017 | $37.74 | 0.37 | 11.73 | 12.10 | (0.78) | (2.49) | (3.27) |
| Institutional 2 Class |
| Year Ended 12/31/2021 | $34.46 | 0.12 | 4.09 | 4.21 | (0.59) | (4.83) | (5.42) |
| Year Ended 12/31/2020 | $34.22 | 0.16 | 4.54 | 4.70 | (0.20) | (4.26) | (4.46) |
| Year Ended 12/31/2019 | $29.49 | 0.35 | 8.20 | 8.55 | (0.75) | (3.07) | (3.82) |
| Year Ended 12/31/2018 | $46.54 | 0.37 | (7.43) | (7.06) | (0.43) | (9.56) | (9.99) |
| Year Ended 12/31/2017 | $37.72 | 0.38 | 11.72 | 12.10 | (0.79) | (2.49) | (3.28) |
| Institutional 3 Class |
| Year Ended 12/31/2021 | $34.99 | 0.15 | 4.14 | 4.29 | (0.62) | (4.83) | (5.45) |
| Year Ended 12/31/2020 | $34.67 | 0.19 | 4.59 | 4.78 | (0.20) | (4.26) | (4.46) |
| Year Ended 12/31/2019 | $29.83 | 0.37 | 8.30 | 8.67 | (0.76) | (3.07) | (3.83) |
| Year Ended 12/31/2018 | $46.95 | 0.51 | (7.62) | (7.11) | (0.45) | (9.56) | (10.01) |
| Year Ended 12/31/2017 | $38.02 | 0.40 | 11.83 | 12.23 | (0.81) | (2.49) | (3.30) |
The accompanying Notes to Financial Statements are an integral part of this statement.
| 70 | Columbia Acorn Family of Funds | Annual Report 2021 |
Financial Highlights (continued)
Columbia Acorn International®
| | Net
asset
value,
end of
period | Total
return | Total gross
expense
ratio to
average
net assets(a) | Total net
expense
ratio to
average
net assets(a) | Net investment
income (loss)
ratio to
average
net assets | Portfolio
turnover | Net
assets,
end of
period
(000’s) |
| Class A |
| Year Ended 12/31/2021 | $33.19 | 12.63%(b) | 1.24% | 1.23%(c) | 0.03% | 27% | $282,125 |
| Year Ended 12/31/2020 | $34.31 | 14.68%(b) | 1.28%(d) | 1.24%(c),(d) | 0.21% | 55% | $283,478 |
| Year Ended 12/31/2019 | $34.20 | 29.56%(b) | 1.27%(d) | 1.24%(c),(d) | 0.76% | 32% | $307,872 |
| Year Ended 12/31/2018 | $29.48 | (16.13%)(b) | 1.25%(d) | 1.24%(c),(d) | 0.51% | 32% | $296,349 |
| Year Ended 12/31/2017 | $46.51 | 31.91% | 1.23% | 1.20%(c) | 0.56% | 37% | $465,830 |
| Advisor Class |
| Year Ended 12/31/2021 | $33.82 | 12.88%(b) | 0.99% | 0.98%(c) | 0.14% | 27% | $9,279 |
| Year Ended 12/31/2020 | $34.95 | 14.98%(b) | 1.03%(d) | 0.99%(c),(d) | 0.52% | 55% | $22,549 |
| Year Ended 12/31/2019 | $34.67 | 29.86%(b) | 1.02%(d) | 0.99%(c),(d) | 1.00% | 32% | $12,733 |
| Year Ended 12/31/2018 | $29.84 | (15.90%)(b) | 1.00%(d) | 0.99%(c),(d) | 0.97% | 32% | $12,740 |
| Year Ended 12/31/2017 | $46.95 | 32.21% | 0.98% | 0.98%(c) | 0.81% | 37% | $99,578 |
| Class C |
| Year Ended 12/31/2021 | $30.07 | 11.76%(b) | 1.99% | 1.98%(c) | (0.74%) | 27% | $10,687 |
| Year Ended 12/31/2020 | $31.43 | 13.82%(b) | 2.02%(d) | 1.99%(c),(d) | (0.57%) | 55% | $19,998 |
| Year Ended 12/31/2019 | $31.92 | 28.61%(b) | 2.02%(d) | 2.00%(c),(d) | 0.01% | 32% | $18,749 |
| Year Ended 12/31/2018 | $27.63 | (16.76%)(b) | 2.00%(d) | 1.99%(c),(d) | (0.11%) | 32% | $22,817 |
| Year Ended 12/31/2017 | $44.57 | 30.93% | 1.98% | 1.97%(c) | (0.15%) | 37% | $63,787 |
| Institutional Class |
| Year Ended 12/31/2021 | $33.28 | 12.89%(b) | 0.99% | 0.98%(c) | 0.28% | 27% | $1,727,042 |
| Year Ended 12/31/2020 | $34.47 | 14.99%(b) | 1.03%(d) | 0.99%(c),(d) | 0.46% | 55% | $1,760,927 |
| Year Ended 12/31/2019 | $34.25 | 29.89%(b) | 1.02%(d) | 0.99%(c),(d) | 1.01% | 32% | $1,947,995 |
| Year Ended 12/31/2018 | $29.51 | (15.93%)(b) | 1.00%(d) | 0.99%(c),(d) | 0.76% | 32% | $1,824,055 |
| Year Ended 12/31/2017 | $46.57 | 32.24% | 0.98% | 0.98%(c) | 0.85% | 37% | $3,116,383 |
| Institutional 2 Class |
| Year Ended 12/31/2021 | $33.25 | 12.97%(b) | 0.95% | 0.92% | 0.34% | 27% | $126,973 |
| Year Ended 12/31/2020 | $34.46 | 15.06%(b) | 0.97%(d) | 0.92%(d) | 0.53% | 55% | $129,576 |
| Year Ended 12/31/2019 | $34.22 | 29.95%(b) | 0.97%(d) | 0.93%(d) | 1.06% | 32% | $183,763 |
| Year Ended 12/31/2018 | $29.49 | (15.85%)(b) | 0.93%(d) | 0.93%(d) | 0.81% | 32% | $160,488 |
| Year Ended 12/31/2017 | $46.54 | 32.27% | 0.93% | 0.93% | 0.87% | 37% | $422,916 |
| Institutional 3 Class |
| Year Ended 12/31/2021 | $33.83 | 13.00%(b) | 0.90% | 0.88% | 0.40% | 27% | $179,991 |
| Year Ended 12/31/2020 | $34.99 | 15.10%(b) | 0.93%(d) | 0.88%(d) | 0.60% | 55% | $277,614 |
| Year Ended 12/31/2019 | $34.67 | 30.04%(b) | 0.92%(d) | 0.89%(d) | 1.12% | 32% | $239,441 |
| Year Ended 12/31/2018 | $29.83 | (15.82%)(b) | 0.88%(d) | 0.88%(d) | 1.10% | 32% | $198,933 |
| Year Ended 12/31/2017 | $46.95 | 32.36% | 0.88% | 0.88% | 0.89% | 37% | $725,247 |
The accompanying Notes to Financial Statements are an integral part of this statement.
Columbia Acorn Family of Funds | Annual Report 2021
| 71 |
Financial Highlights (continued)
Columbia Acorn International®
| | Net asset value,
beginning of
period | Net
investment
income
(loss) | Net
realized
and
unrealized
gain (loss) | Total from
investment
operations | Distributions
from net
investment
income | Distributions
from net
realized
gains | Total
distributions to
shareholders |
| Class R |
| Year Ended 12/31/2021 | $34.24 | (0.08) | 4.07 | 3.99 | (0.21) | (4.83) | (5.04) |
| Year Ended 12/31/2020 | $34.22 | (0.01) | 4.49 | 4.48 | (0.20) | (4.26) | (4.46) |
| Year Ended 12/31/2019 | $29.44 | 0.06 | 8.27 | 8.33 | (0.48) | (3.07) | (3.55) |
| Year Ended 12/31/2018 | $46.51 | 0.12 | (7.39) | (7.27) | (0.24) | (9.56) | (9.80) |
| Year Ended 12/31/2017 | $37.71 | 0.21 | 11.63 | 11.84 | (0.55) | (2.49) | (3.04) |
| Notes to Financial Highlights |
| (a) | In addition to the fees and expenses that the Fund bears directly, the Fund indirectly bears a pro rata share of the fees and expenses of any other funds in which it invests, if any. Such indirect expenses are not included in the Fund’s reported expense ratios. |
| (b) | Had the Investment Manager and/or Transfer Agent not waived fees and/or reimbursed a portion of expenses, total return would have been reduced. |
| (c) | The benefits derived from expense reductions had an impact of less than 0.01%. |
| (d) | Ratios include line of credit interest expense which is less than 0.01%. |
| (e) | Rounds to zero. |
The accompanying Notes to Financial Statements are an integral part of this statement.
| 72 | Columbia Acorn Family of Funds | Annual Report 2021 |
Financial Highlights (continued)
Columbia Acorn International®
| | Net
asset
value,
end of
period | Total
return | Total gross
expense
ratio to
average
net assets(a) | Total net
expense
ratio to
average
net assets(a) | Net investment
income (loss)
ratio to
average
net assets | Portfolio
turnover | Net
assets,
end of
period
(000’s) |
| Class R |
| Year Ended 12/31/2021 | $33.19 | 12.34%(b) | 1.49% | 1.48%(c) | (0.22%) | 27% | $3,691 |
| Year Ended 12/31/2020 | $34.24 | 14.40%(b) | 1.53%(d) | 1.49%(c),(d) | (0.04%) | 55% | $3,398 |
| Year Ended 12/31/2019 | $34.22 | 29.21%(b) | 1.52%(d) | 1.50%(c),(d) | 0.19% | 32% | $3,696 |
| Year Ended 12/31/2018 | $29.44 | (16.32%)(b) | 1.50%(d) | 1.49%(c),(d) | 0.26% | 32% | $10,049 |
| Year Ended 12/31/2017 | $46.51 | 31.58% | 1.49% | 1.48%(c) | 0.46% | 37% | $13,218 |
The accompanying Notes to Financial Statements are an integral part of this statement.
Columbia Acorn Family of Funds | Annual Report 2021
| 73 |
Financial Highlights
Columbia Acorn USA®
| | Net asset value,
beginning of
period | Net
investment
income
(loss) | Net
realized
and
unrealized
gain (loss) | Total from
investment
operations | Distributions
from net
investment
income | Distributions
from net
realized
gains | Total
distributions to
shareholders |
| Class A |
| Year Ended 12/31/2021 | $13.58 | (0.15) | 1.20 | 1.05 | (0.12) | (4.37) | (4.49) |
| Year Ended 12/31/2020 | $11.69 | (0.10) | 2.76 | 2.66 | — | (0.77) | (0.77) |
| Year Ended 12/31/2019 | $10.28 | (0.05) | 3.14 | 3.09 | (0.01) | (1.67) | (1.68) |
| Year Ended 12/31/2018 | $12.48 | (0.07) | (0.04) | (0.11) | — | (2.09) | (2.09) |
| Year Ended 12/31/2017 | $14.95 | (0.09) | 2.84 | 2.75 | — | (5.22) | (5.22) |
| Advisor Class |
| Year Ended 12/31/2021 | $19.32 | (0.16) | 1.75 | 1.59 | (0.13) | (4.41) | (4.54) |
| Year Ended 12/31/2020 | $16.31 | (0.10) | 3.91 | 3.81 | — | (0.80) | (0.80) |
| Year Ended 12/31/2019 | $13.77 | (0.03) | 4.25 | 4.22 | (0.01) | (1.67) | (1.68) |
| Year Ended 12/31/2018 | $16.08 | (0.05) | (0.09) | (0.14) | — | (2.17) | (2.17) |
| Year Ended 12/31/2017 | $17.93 | (0.06) | 3.43 | 3.37 | — | (5.22) | (5.22) |
| Class C(e) |
| Year Ended 12/31/2021 | $18.14 | (0.34) | 1.64 | 1.30 | (0.13) | (4.28) | (4.41) |
| Year Ended 12/31/2020 | $16.47 | (0.25) | 3.60 | 3.35 | — | (1.68) | (1.68) |
| Year Ended 12/31/2019 | $18.07 | (0.24) | 5.32 | 5.08 | — | (6.68) | (6.68) |
| Year Ended 12/31/2018 | $26.22 | (0.36) | 0.17(f) | (0.19) | — | (7.96) | (7.96) |
| Year Ended 12/31/2017 | $40.19 | (0.52) | 7.43 | 6.91 | — | (20.88) | (20.88) |
| Institutional Class |
| Year Ended 12/31/2021 | $17.90 | (0.15) | 1.62 | 1.47 | (0.13) | (4.41) | (4.54) |
| Year Ended 12/31/2020 | $15.17 | (0.10) | 3.63 | 3.53 | — | (0.80) | (0.80) |
| Year Ended 12/31/2019 | $12.90 | (0.03) | 3.98 | 3.95 | (0.01) | (1.67) | (1.68) |
| Year Ended 12/31/2018 | $15.21 | (0.04) | (0.09) | (0.13) | — | (2.18) | (2.18) |
| Year Ended 12/31/2017 | $17.20 | (0.05) | 3.28 | 3.23 | — | (5.22) | (5.22) |
| Institutional 2 Class |
| Year Ended 12/31/2021 | $19.50 | (0.15) | 1.77 | 1.62 | (0.12) | (4.43) | (4.55) |
| Year Ended 12/31/2020 | $16.46 | (0.10) | 3.95 | 3.85 | — | (0.81) | (0.81) |
| Year Ended 12/31/2019 | $13.87 | (0.01) | 4.28 | 4.27 | (0.01) | (1.67) | (1.68) |
| Year Ended 12/31/2018 | $16.21 | (0.03) | (0.11) | (0.14) | — | (2.20) | (2.20) |
| Year Ended 12/31/2017 | $18.02 | (0.03) | 3.44 | 3.41 | — | (5.22) | (5.22) |
The accompanying Notes to Financial Statements are an integral part of this statement.
| 74 | Columbia Acorn Family of Funds | Annual Report 2021 |
Financial Highlights (continued)
Columbia Acorn USA®
| | Net
asset
value,
end of
period | Total
return | Total gross
expense
ratio to
average
net assets(a) | Total net
expense
ratio to
average
net assets(a) | Net investment
income (loss)
ratio to
average
net assets | Portfolio
turnover | Net
assets,
end of
period
(000’s) |
| Class A |
| Year Ended 12/31/2021 | $10.14 | 8.74%(b) | 1.40%(c) | 1.39%(c),(d) | (1.03%) | 69% | $53,016 |
| Year Ended 12/31/2020 | $13.58 | 23.70%(b) | 1.44% | 1.40%(d) | (0.91%) | 94% | $59,050 |
| Year Ended 12/31/2019 | $11.69 | 30.88%(b) | 1.45%(c) | 1.41%(c),(d) | (0.43%) | 91% | $56,578 |
| Year Ended 12/31/2018 | $10.28 | (2.15%)(b) | 1.44%(c) | 1.42%(c),(d) | (0.49%) | 86% | $49,179 |
| Year Ended 12/31/2017 | $12.48 | 19.14%(b) | 1.44% | 1.43%(d) | (0.55%) | 84% | $47,960 |
| Advisor Class |
| Year Ended 12/31/2021 | $16.37 | 8.92%(b) | 1.15%(c) | 1.14%(c),(d) | (0.78%) | 69% | $24,058 |
| Year Ended 12/31/2020 | $19.32 | 24.08%(b) | 1.19% | 1.15%(d) | (0.66%) | 94% | $23,158 |
| Year Ended 12/31/2019 | $16.31 | 31.27%(b) | 1.20%(c) | 1.16%(c),(d) | (0.18%) | 91% | $19,202 |
| Year Ended 12/31/2018 | $13.77 | (1.91%)(b) | 1.18%(c) | 1.17%(c),(d) | (0.27%) | 86% | $14,579 |
| Year Ended 12/31/2017 | $16.08 | 19.42%(b) | 1.21% | 1.20%(d) | (0.31%) | 84% | $16,355 |
| Class C(e) |
| Year Ended 12/31/2021 | $15.03 | 7.85%(b) | 2.15%(c) | 2.14%(c),(d) | (1.78%) | 69% | $1,809 |
| Year Ended 12/31/2020 | $18.14 | 22.79%(b) | 2.19% | 2.15%(d) | (1.66%) | 94% | $2,658 |
| Year Ended 12/31/2019 | $16.47 | 29.93%(b) | 2.20%(c) | 2.16%(c),(d) | (1.19%) | 91% | $3,195 |
| Year Ended 12/31/2018 | $18.07 | (2.92%)(b) | 2.19%(c) | 2.17%(c),(d) | (1.30%) | 86% | $4,608 |
| Year Ended 12/31/2017 | $26.22 | 18.30%(b) | 2.19% | 2.19%(d) | (1.31%) | 84% | $9,802 |
| Institutional Class |
| Year Ended 12/31/2021 | $14.83 | 8.95%(b) | 1.15%(c) | 1.14%(c),(d) | (0.78%) | 69% | $169,844 |
| Year Ended 12/31/2020 | $17.90 | 24.04%(b) | 1.19% | 1.15%(d) | (0.67%) | 94% | $170,650 |
| Year Ended 12/31/2019 | $15.17 | 31.28%(b) | 1.20%(c) | 1.16%(c),(d) | (0.18%) | 91% | $158,696 |
| Year Ended 12/31/2018 | $12.90 | (1.98%)(b) | 1.18%(c) | 1.17%(c),(d) | (0.26%) | 86% | $149,048 |
| Year Ended 12/31/2017 | $15.21 | 19.44%(b) | 1.16% | 1.16%(d) | (0.27%) | 84% | $189,408 |
| Institutional 2 Class |
| Year Ended 12/31/2021 | $16.57 | 8.99%(b) | 1.11%(c) | 1.08%(c) | (0.71%) | 69% | $3,271 |
| Year Ended 12/31/2020 | $19.50 | 24.10%(b) | 1.14% | 1.08% | (0.60%) | 94% | $3,344 |
| Year Ended 12/31/2019 | $16.46 | 31.41%(b) | 1.13%(c) | 1.08%(c) | (0.09%) | 91% | $3,806 |
| Year Ended 12/31/2018 | $13.87 | (1.89%)(b) | 1.11%(c) | 1.09%(c) | (0.19%) | 86% | $3,332 |
| Year Ended 12/31/2017 | $16.21 | 19.56%(b) | 1.08% | 1.08% | (0.17%) | 84% | $10,133 |
The accompanying Notes to Financial Statements are an integral part of this statement.
Columbia Acorn Family of Funds | Annual Report 2021
| 75 |
Financial Highlights (continued)
Columbia Acorn USA®
| | Net asset value,
beginning of
period | Net
investment
income
(loss) | Net
realized
and
unrealized
gain (loss) | Total from
investment
operations | Distributions
from net
investment
income | Distributions
from net
realized
gains | Total
distributions to
shareholders |
| Institutional 3 Class |
| Year Ended 12/31/2021 | $19.74 | (0.15) | 1.81 | 1.66 | (0.13) | (4.43) | (4.56) |
| Year Ended 12/31/2020 | $16.65 | (0.09) | 4.00 | 3.91 | — | (0.82) | (0.82) |
| Year Ended 12/31/2019 | $14.01 | (0.01) | 4.33 | 4.32 | (0.01) | (1.67) | (1.68) |
| Year Ended 12/31/2018 | $16.36 | (0.02) | (0.11) | (0.13) | — | (2.22) | (2.22) |
| Year Ended 12/31/2017 | $18.14 | (0.03) | 3.47 | 3.44 | — | (5.22) | (5.22) |
| Notes to Financial Highlights |
| (a) | In addition to the fees and expenses that the Fund bears directly, the Fund indirectly bears a pro rata share of the fees and expenses of any other funds in which it invests, if any. Such indirect expenses are not included in the Fund’s reported expense ratios. |
| (b) | Had the Investment Manager and/or Transfer Agent not waived fees and/or reimbursed a portion of expenses, total return would have been reduced. |
| (c) | Ratios include line of credit interest expense which is less than 0.01%. |
| (d) | The benefits derived from expense reductions had an impact of less than 0.01%. |
| (e) | Per share amounts have been adjusted on a retroactive basis to reflect a 4 to 1 reverse stock split completed after the close of business on September 11, 2020. |
| (f) | Calculation of the net gain (loss) per share (both realized and unrealized) does not correlate to the aggregate realized and unrealized gain (loss) presented in the Statements of Operations due to the timing of subscriptions and redemptions of Fund shares in relation to fluctuations in the market value of the portfolio. |
The accompanying Notes to Financial Statements are an integral part of this statement.
| 76 | Columbia Acorn Family of Funds | Annual Report 2021 |
Financial Highlights (continued)
Columbia Acorn USA®
| | Net
asset
value,
end of
period | Total
return | Total gross
expense
ratio to
average
net assets(a) | Total net
expense
ratio to
average
net assets(a) | Net investment
income (loss)
ratio to
average
net assets | Portfolio
turnover | Net
assets,
end of
period
(000’s) |
| Institutional 3 Class |
| Year Ended 12/31/2021 | $16.84 | 9.09%(b) | 1.05%(c) | 1.04%(c) | (0.69%) | 69% | $50,303 |
| Year Ended 12/31/2020 | $19.74 | 24.16%(b) | 1.09% | 1.04% | (0.55%) | 94% | $77,304 |
| Year Ended 12/31/2019 | $16.65 | 31.45%(b) | 1.08%(c) | 1.03%(c) | (0.05%) | 91% | $67,921 |
| Year Ended 12/31/2018 | $14.01 | (1.86%)(b) | 1.06%(c) | 1.04%(c) | (0.11%) | 86% | $55,248 |
| Year Ended 12/31/2017 | $16.36 | 19.60%(b) | 1.05% | 1.05% | (0.17%) | 84% | $49,019 |
The accompanying Notes to Financial Statements are an integral part of this statement.
Columbia Acorn Family of Funds | Annual Report 2021
| 77 |
Financial Highlights
Columbia Acorn International SelectSM
| | Net asset value,
beginning of
period | Net
investment
income
(loss) | Net
realized
and
unrealized
gain (loss) | Total from
investment
operations | Distributions
from net
investment
income | Distributions
from net
realized
gains | Total
distributions to
shareholders |
| Class A |
| Year Ended 12/31/2021 | $33.67 | (0.05) | 3.50 | 3.45 | (0.28) | (1.41) | (1.69) |
| Year Ended 12/31/2020 | $28.58 | (0.03) | 5.21 | 5.18 | (0.09) | — | (0.09) |
| Year Ended 12/31/2019 | $23.44 | 0.09 | 7.67 | 7.76 | (0.28) | (2.34) | (2.62) |
| Year Ended 12/31/2018 | $28.89 | 0.06 | (3.66) | (3.60) | — | (1.85) | (1.85) |
| Year Ended 12/31/2017 | $21.36 | 0.02 | 7.52 | 7.54 | (0.01) | — | (0.01) |
| Advisor Class |
| Year Ended 12/31/2021 | $34.56 | 0.04 | 3.59 | 3.63 | (0.43) | (1.41) | (1.84) |
| Year Ended 12/31/2020 | $29.26 | 0.04 | 5.35 | 5.39 | (0.09) | — | (0.09) |
| Year Ended 12/31/2019 | $24.00 | 0.18 | 7.84 | 8.02 | (0.42) | (2.34) | (2.76) |
| Year Ended 12/31/2018 | $29.46 | 0.09 | (3.70) | (3.61) | — | (1.85) | (1.85) |
| Year Ended 12/31/2017 | $21.77 | 0.08 | 7.68 | 7.76 | (0.07) | — | (0.07) |
| Class C |
| Year Ended 12/31/2021 | $30.40 | (0.30) | 3.17 | 2.87 | — | (1.41) | (1.41) |
| Year Ended 12/31/2020 | $26.00 | (0.23) | 4.72 | 4.49 | (0.09) | — | (0.09) |
| Year Ended 12/31/2019 | $21.48 | (0.10) | 6.99 | 6.89 | (0.03) | (2.34) | (2.37) |
| Year Ended 12/31/2018 | $26.85 | (0.12) | (3.40) | (3.52) | — | (1.85) | (1.85) |
| Year Ended 12/31/2017 | $19.99 | (0.15) | 7.01 | 6.86 | — | — | — |
| Institutional Class |
| Year Ended 12/31/2021 | $34.25 | 0.04 | 3.56 | 3.60 | (0.43) | (1.41) | (1.84) |
| Year Ended 12/31/2020 | $29.00 | 0.03 | 5.31 | 5.34 | (0.09) | — | (0.09) |
| Year Ended 12/31/2019 | $23.81 | 0.17 | 7.78 | 7.95 | (0.42) | (2.34) | (2.76) |
| Year Ended 12/31/2018 | $29.25 | 0.14 | (3.73) | (3.59) | — | (1.85) | (1.85) |
| Year Ended 12/31/2017 | $21.61 | 0.09 | 7.62 | 7.71 | (0.07) | — | (0.07) |
| Institutional 2 Class |
| Year Ended 12/31/2021 | $34.57 | 0.06 | 3.60 | 3.66 | (0.49) | (1.41) | (1.90) |
| Year Ended 12/31/2020 | $29.24 | 0.08 | 5.34 | 5.42 | (0.09) | — | (0.09) |
| Year Ended 12/31/2019 | $24.01 | 0.18 | 7.86 | 8.04 | (0.47) | (2.34) | (2.81) |
| Year Ended 12/31/2018 | $29.44 | 0.11 | (3.69) | (3.58) | — | (1.85) | (1.85) |
| Year Ended 12/31/2017 | $21.76 | 0.11 | 7.66 | 7.77 | (0.09) | — | (0.09) |
The accompanying Notes to Financial Statements are an integral part of this statement.
| 78 | Columbia Acorn Family of Funds | Annual Report 2021 |
Financial Highlights (continued)
Columbia Acorn International SelectSM
| | Net
asset
value,
end of
period | Total
return(a) | Total gross
expense
ratio to
average
net assets(b) | Total net
expense
ratio to
average
net assets(b) | Net investment
income (loss)
ratio to
average
net assets | Portfolio
turnover | Net
assets,
end of
period
(000’s) |
| Class A |
| Year Ended 12/31/2021 | $35.43 | 10.49% | 1.44%(c) | 1.23%(c),(d) | (0.15%) | 27% | $235,103 |
| Year Ended 12/31/2020 | $33.67 | 18.21% | 1.48% | 1.26%(d) | (0.10%) | 68% | $230,519 |
| Year Ended 12/31/2019 | $28.58 | 33.37% | 1.54%(c) | 1.35%(c),(d) | 0.34% | 46% | $37,461 |
| Year Ended 12/31/2018 | $23.44 | (12.46%) | 1.54% | 1.40%(d) | 0.20% | 48% | $26,073 |
| Year Ended 12/31/2017 | $28.89 | 35.30% | 1.54% | 1.40%(d) | 0.07% | 49% | $26,336 |
| Advisor Class |
| Year Ended 12/31/2021 | $36.35 | 10.78% | 1.19%(c) | 0.98%(c),(d) | 0.11% | 27% | $2,462 |
| Year Ended 12/31/2020 | $34.56 | 18.51% | 1.23% | 1.02%(d) | 0.12% | 68% | $2,748 |
| Year Ended 12/31/2019 | $29.26 | 33.73% | 1.29%(c) | 1.10%(c),(d) | 0.63% | 46% | $2,030 |
| Year Ended 12/31/2018 | $24.00 | (12.26%) | 1.29% | 1.15%(d) | 0.31% | 48% | $1,201 |
| Year Ended 12/31/2017 | $29.46 | 35.67% | 1.29% | 1.15%(d) | 0.30% | 49% | $1,820 |
| Class C |
| Year Ended 12/31/2021 | $31.86 | 9.68% | 2.19%(c) | 1.98%(c),(d) | (0.93%) | 27% | $2,146 |
| Year Ended 12/31/2020 | $30.40 | 17.37% | 2.23% | 2.02%(d) | (0.88%) | 68% | $3,251 |
| Year Ended 12/31/2019 | $26.00 | 32.31% | 2.29%(c) | 2.10%(c),(d) | (0.42%) | 46% | $2,493 |
| Year Ended 12/31/2018 | $21.48 | (13.11%) | 2.28% | 2.15%(d) | (0.43%) | 48% | $2,752 |
| Year Ended 12/31/2017 | $26.85 | 34.32% | 2.29% | 2.15%(d) | (0.64%) | 49% | $5,027 |
| Institutional Class |
| Year Ended 12/31/2021 | $36.01 | 10.79% | 1.19%(c) | 0.98%(c),(d) | 0.10% | 27% | $159,876 |
| Year Ended 12/31/2020 | $34.25 | 18.50% | 1.23% | 1.02%(d) | 0.12% | 68% | $155,133 |
| Year Ended 12/31/2019 | $29.00 | 33.71% | 1.29%(c) | 1.10%(c),(d) | 0.59% | 46% | $88,922 |
| Year Ended 12/31/2018 | $23.81 | (12.28%) | 1.28% | 1.15%(d) | 0.47% | 48% | $69,413 |
| Year Ended 12/31/2017 | $29.25 | 35.70% | 1.29% | 1.15%(d) | 0.36% | 49% | $89,266 |
| Institutional 2 Class |
| Year Ended 12/31/2021 | $36.33 | 10.87% | 1.10%(c) | 0.89%(c) | 0.17% | 27% | $51,805 |
| Year Ended 12/31/2020 | $34.57 | 18.63% | 1.15% | 0.93% | 0.27% | 68% | $77,420 |
| Year Ended 12/31/2019 | $29.24 | 33.82% | 1.22%(c) | 1.00%(c) | 0.65% | 46% | $3,392 |
| Year Ended 12/31/2018 | $24.01 | (12.16%) | 1.21% | 1.06% | 0.36% | 48% | $1,200 |
| Year Ended 12/31/2017 | $29.44 | 35.72% | 1.22% | 1.08% | 0.41% | 49% | $614 |
The accompanying Notes to Financial Statements are an integral part of this statement.
Columbia Acorn Family of Funds | Annual Report 2021
| 79 |
Financial Highlights (continued)
Columbia Acorn International SelectSM
| | Net asset value,
beginning of
period | Net
investment
income
(loss) | Net
realized
and
unrealized
gain (loss) | Total from
investment
operations | Distributions
from net
investment
income | Distributions
from net
realized
gains | Total
distributions to
shareholders |
| Institutional 3 Class |
| Year Ended 12/31/2021 | $34.56 | 0.09 | 3.59 | 3.68 | (0.52) | (1.41) | (1.93) |
| Year Ended 12/31/2020 | $29.22 | 0.07 | 5.36 | 5.43 | (0.09) | — | (0.09) |
| Year Ended 12/31/2019 | $24.00 | 0.20 | 7.86 | 8.06 | (0.50) | (2.34) | (2.84) |
| Year Ended 12/31/2018 | $29.42 | 0.17 | (3.74) | (3.57) | — | (1.85) | (1.85) |
| Year Ended 12/31/2017 | $21.74 | (0.07) | 7.86 | 7.79 | (0.11) | — | (0.11) |
| Notes to Financial Highlights |
| (a) | Had the Investment Manager and/or Transfer Agent not waived fees and/or reimbursed a portion of expenses, total return would have been reduced. |
| (b) | In addition to the fees and expenses that the Fund bears directly, the Fund indirectly bears a pro rata share of the fees and expenses of any other funds in which it invests, if any. Such indirect expenses are not included in the Fund’s reported expense ratios. |
| (c) | Ratios include line of credit interest expense which is less than 0.01%. |
| (d) | The benefits derived from expense reductions had an impact of less than 0.01%. |
The accompanying Notes to Financial Statements are an integral part of this statement.
| 80 | Columbia Acorn Family of Funds | Annual Report 2021 |
Financial Highlights (continued)
Columbia Acorn International SelectSM
| | Net
asset
value,
end of
period | Total
return(a) | Total gross
expense
ratio to
average
net assets(b) | Total net
expense
ratio to
average
net assets(b) | Net investment
income (loss)
ratio to
average
net assets | Portfolio
turnover | Net
assets,
end of
period
(000’s) |
| Institutional 3 Class |
| Year Ended 12/31/2021 | $36.31 | 10.93% | 1.05%(c) | 0.84%(c) | 0.24% | 27% | $28,694 |
| Year Ended 12/31/2020 | $34.56 | 18.67% | 1.09% | 0.89% | 0.24% | 68% | $27,064 |
| Year Ended 12/31/2019 | $29.22 | 33.90% | 1.16%(c) | 0.96%(c) | 0.72% | 46% | $13,861 |
| Year Ended 12/31/2018 | $24.00 | (12.14%) | 1.14% | 1.02% | 0.58% | 48% | $8,627 |
| Year Ended 12/31/2017 | $29.42 | 35.81% | 1.17% | 1.03% | (0.24%) | 49% | $7,732 |
The accompanying Notes to Financial Statements are an integral part of this statement.
Columbia Acorn Family of Funds | Annual Report 2021
| 81 |
Financial Highlights
Columbia Thermostat FundSM
| | Net asset value,
beginning of
period | Net
investment
income | Net
realized
and
unrealized
gain (loss) | Total from
investment
operations | Distributions
from net
investment
income | Distributions
from net
realized
gains | Total
distributions to
shareholders |
| Class A |
| Year Ended 12/31/2021 | $18.31 | 0.24 | 0.89 | 1.13 | (0.26) | (2.17) | (2.43) |
| Year Ended 12/31/2020 | $15.12 | 0.26 | 4.13 | 4.39 | (0.27) | (0.93) | (1.20) |
| Year Ended 12/31/2019 | $13.85 | 0.27 | 1.79 | 2.06 | (0.26) | (0.53) | (0.79) |
| Year Ended 12/31/2018 | $14.63 | 0.24 | (0.26) | (0.02) | (0.28) | (0.48) | (0.76) |
| Year Ended 12/31/2017 | $14.60 | 0.25 | 0.50 | 0.75 | (0.50) | (0.22) | (0.72) |
| Advisor Class |
| Year Ended 12/31/2021 | $18.12 | 0.28 | 0.88 | 1.16 | (0.30) | (2.17) | (2.47) |
| Year Ended 12/31/2020 | $14.97 | 0.36 | 4.04 | 4.40 | (0.32) | (0.93) | (1.25) |
| Year Ended 12/31/2019 | $13.72 | 0.31 | 1.77 | 2.08 | (0.30) | (0.53) | (0.83) |
| Year Ended 12/31/2018 | $14.50 | 0.28 | (0.27) | 0.01 | (0.31) | (0.48) | (0.79) |
| Year Ended 12/31/2017 | $14.47 | 0.29 | 0.50 | 0.79 | (0.54) | (0.22) | (0.76) |
| Class C |
| Year Ended 12/31/2021 | $18.43 | 0.09 | 0.90 | 0.99 | (0.11) | (2.17) | (2.28) |
| Year Ended 12/31/2020 | $15.23 | 0.12 | 4.16 | 4.28 | (0.15) | (0.93) | (1.08) |
| Year Ended 12/31/2019 | $13.96 | 0.16 | 1.79 | 1.95 | (0.15) | (0.53) | (0.68) |
| Year Ended 12/31/2018 | $14.74 | 0.13 | (0.26) | (0.13) | (0.17) | (0.48) | (0.65) |
| Year Ended 12/31/2017 | $14.62 | 0.14 | 0.51 | 0.65 | (0.31) | (0.22) | (0.53) |
| Institutional Class |
| Year Ended 12/31/2021 | $18.01 | 0.28 | 0.87 | 1.15 | (0.30) | (2.17) | (2.47) |
| Year Ended 12/31/2020 | $14.88 | 0.31 | 4.07 | 4.38 | (0.32) | (0.93) | (1.25) |
| Year Ended 12/31/2019 | $13.65 | 0.30 | 1.76 | 2.06 | (0.30) | (0.53) | (0.83) |
| Year Ended 12/31/2018 | $14.43 | 0.28 | (0.27) | 0.01 | (0.31) | (0.48) | (0.79) |
| Year Ended 12/31/2017 | $14.40 | 0.29 | 0.50 | 0.79 | (0.54) | (0.22) | (0.76) |
| Institutional 2 Class |
| Year Ended 12/31/2021 | $18.14 | 0.29 | 0.89 | 1.18 | (0.31) | (2.17) | (2.48) |
| Year Ended 12/31/2020 | $14.99 | 0.31 | 4.09 | 4.40 | (0.32) | (0.93) | (1.25) |
| Year Ended 12/31/2019 | $13.74 | 0.32 | 1.77 | 2.09 | (0.31) | (0.53) | (0.84) |
| Year Ended 12/31/2018 | $14.52 | 0.29 | (0.27) | 0.02 | (0.32) | (0.48) | (0.80) |
| Year Ended 12/31/2017 | $14.49 | 0.29 | 0.50 | 0.79 | (0.54) | (0.22) | (0.76) |
The accompanying Notes to Financial Statements are an integral part of this statement.
| 82 | Columbia Acorn Family of Funds | Annual Report 2021 |
Financial Highlights (continued)
Columbia Thermostat FundSM
| | Net
asset
value,
end of
period | Total
return(a) | Total gross
expense
ratio to
average
net assets(b) | Total net
expense
ratio to
average
net assets(b) | Net investment
income
ratio to
average
net assets | Portfolio
turnover | Net
assets,
end of
period
(000’s) |
| Class A |
| Year Ended 12/31/2021 | $17.01 | 6.16% | 0.54%(c) | 0.50%(c),(d) | 1.26% | 49% | $624,373 |
| Year Ended 12/31/2020 | $18.31 | 29.27% | 0.56%(c) | 0.50%(c),(d) | 1.53% | 97% | $505,238 |
| Year Ended 12/31/2019 | $15.12 | 14.94% | 0.58%(c) | 0.50%(c),(d) | 1.81% | 158% | $225,113 |
| Year Ended 12/31/2018 | $13.85 | (0.13%) | 0.56% | 0.50%(d) | 1.66% | 122% | $193,683 |
| Year Ended 12/31/2017 | $14.63 | 5.19% | 0.54% | 0.50%(d) | 1.70% | 33% | $257,752 |
| Advisor Class |
| Year Ended 12/31/2021 | $16.81 | 6.43% | 0.29%(c) | 0.25%(c),(d) | 1.51% | 49% | $172,162 |
| Year Ended 12/31/2020 | $18.12 | 29.58% | 0.32%(c) | 0.25%(c),(d) | 2.04% | 97% | $130,921 |
| Year Ended 12/31/2019 | $14.97 | 15.21% | 0.33%(c) | 0.25%(c),(d) | 2.08% | 158% | $16,208 |
| Year Ended 12/31/2018 | $13.72 | 0.12% | 0.31% | 0.25%(d) | 1.91% | 122% | $11,816 |
| Year Ended 12/31/2017 | $14.50 | 5.49% | 0.29% | 0.25%(d) | 1.98% | 33% | $16,227 |
| Class C |
| Year Ended 12/31/2021 | $17.14 | 5.40% | 1.29%(c) | 1.25%(c),(d) | 0.48% | 49% | $189,990 |
| Year Ended 12/31/2020 | $18.43 | 28.28% | 1.31%(c) | 1.25%(c),(d) | 0.72% | 97% | $208,937 |
| Year Ended 12/31/2019 | $15.23 | 14.02% | 1.33%(c) | 1.25%(c),(d) | 1.05% | 158% | $156,027 |
| Year Ended 12/31/2018 | $13.96 | (0.88%) | 1.31% | 1.25%(d) | 0.90% | 122% | $166,292 |
| Year Ended 12/31/2017 | $14.74 | 4.48% | 1.29% | 1.25%(d) | 0.96% | 33% | $250,784 |
| Institutional Class |
| Year Ended 12/31/2021 | $16.69 | 6.42% | 0.29%(c) | 0.25%(c),(d) | 1.52% | 49% | $902,841 |
| Year Ended 12/31/2020 | $18.01 | 29.63% | 0.31%(c) | 0.25%(c),(d) | 1.80% | 97% | $729,119 |
| Year Ended 12/31/2019 | $14.88 | 15.14% | 0.33%(c) | 0.25%(c),(d) | 2.06% | 158% | $285,444 |
| Year Ended 12/31/2018 | $13.65 | 0.12% | 0.31% | 0.25%(d) | 1.91% | 122% | $253,123 |
| Year Ended 12/31/2017 | $14.43 | 5.52% | 0.29% | 0.25%(d) | 1.97% | 33% | $320,483 |
| Institutional 2 Class |
| Year Ended 12/31/2021 | $16.84 | 6.53% | 0.25%(c) | 0.20%(c) | 1.53% | 49% | $169,246 |
| Year Ended 12/31/2020 | $18.14 | 29.59% | 0.27%(c) | 0.21%(c) | 1.82% | 97% | $129,197 |
| Year Ended 12/31/2019 | $14.99 | 15.25% | 0.28%(c) | 0.21%(c) | 2.16% | 158% | $40,759 |
| Year Ended 12/31/2018 | $13.74 | 0.16% | 0.26% | 0.21% | 1.97% | 122% | $16,478 |
| Year Ended 12/31/2017 | $14.52 | 5.51% | 0.26% | 0.23% | 1.97% | 33% | $13,464 |
The accompanying Notes to Financial Statements are an integral part of this statement.
Columbia Acorn Family of Funds | Annual Report 2021
| 83 |
Financial Highlights (continued)
Columbia Thermostat FundSM
| | Net asset value,
beginning of
period | Net
investment
income | Net
realized
and
unrealized
gain (loss) | Total from
investment
operations | Distributions
from net
investment
income | Distributions
from net
realized
gains | Total
distributions to
shareholders |
| Institutional 3 Class |
| Year Ended 12/31/2021 | $18.11 | 0.36 | 0.82 | 1.18 | (0.32) | (2.17) | (2.49) |
| Year Ended 12/31/2020 | $14.96 | 0.33 | 4.08 | 4.41 | (0.33) | (0.93) | (1.26) |
| Year Ended 12/31/2019 | $13.72 | 0.32 | 1.76 | 2.08 | (0.31) | (0.53) | (0.84) |
| Year Ended 12/31/2018 | $14.50 | 0.30 | (0.27) | 0.03 | (0.33) | (0.48) | (0.81) |
| Year Ended 12/31/2017 | $14.46 | 0.30 | 0.51 | 0.81 | (0.55) | (0.22) | (0.77) |
| Notes to Financial Highlights |
| (a) | Had the Investment Manager and/or Transfer Agent not waived fees and/or reimbursed a portion of expenses, total return would have been reduced. |
| (b) | In addition to the fees and expenses that the Fund bears directly, the Fund indirectly bears a pro rata share of the fees and expenses of any other funds in which it invests, if any. Such indirect expenses are not included in the Fund’s reported expense ratios. |
| (c) | Ratios include line of credit interest expense which is less than 0.01%. |
| (d) | The benefits derived from expense reductions had an impact of less than 0.01%. |
The accompanying Notes to Financial Statements are an integral part of this statement.
| 84 | Columbia Acorn Family of Funds | Annual Report 2021 |
Financial Highlights (continued)
Columbia Thermostat FundSM
| | Net
asset
value,
end of
period | Total
return(a) | Total gross
expense
ratio to
average
net assets(b) | Total net
expense
ratio to
average
net assets(b) | Net investment
income
ratio to
average
net assets | Portfolio
turnover | Net
assets,
end of
period
(000’s) |
| Institutional 3 Class |
| Year Ended 12/31/2021 | $16.80 | 6.52% | 0.21%(c) | 0.17%(c) | 1.94% | 49% | $15,581 |
| Year Ended 12/31/2020 | $18.11 | 29.69% | 0.24%(c) | 0.17%(c) | 1.89% | 97% | $2,862 |
| Year Ended 12/31/2019 | $14.96 | 15.24% | 0.25%(c) | 0.16%(c) | 2.13% | 158% | $837 |
| Year Ended 12/31/2018 | $13.72 | 0.21% | 0.22% | 0.16% | 2.04% | 122% | $461 |
| Year Ended 12/31/2017 | $14.50 | 5.64% | 0.21% | 0.18% | 2.04% | 33% | $521 |
The accompanying Notes to Financial Statements are an integral part of this statement.
Columbia Acorn Family of Funds | Annual Report 2021
| 85 |
Financial Highlights
Columbia Acorn European FundSM
| | Net asset value,
beginning of
period | Net
investment
income
(loss) | Net
realized
and
unrealized
gain (loss) | Total from
investment
operations | Distributions
from net
investment
income | Total
distributions to
shareholders |
| Class A |
| Year Ended 12/31/2021 | $27.49 | (0.14) | 6.04 | 5.90 | (0.06) | (0.06) |
| Year Ended 12/31/2020 | $22.52 | (0.12) | 5.22 | 5.10 | (0.13) | (0.13) |
| Year Ended 12/31/2019 | $15.56 | 0.06 | 7.09 | 7.15 | (0.19) | (0.19) |
| Year Ended 12/31/2018 | $19.27 | 0.11 | (3.70) | (3.59) | (0.12) | (0.12) |
| Year Ended 12/31/2017 | $14.12 | 0.06 | 5.28 | 5.34 | (0.19) | (0.19) |
| Advisor Class |
| Year Ended 12/31/2021 | $27.78 | (0.10) | 6.13 | 6.03 | (0.13) | (0.13) |
| Year Ended 12/31/2020 | $22.70 | (0.06) | 5.27 | 5.21 | (0.13) | (0.13) |
| Year Ended 12/31/2019 | $15.68 | 0.12 | 7.13 | 7.25 | (0.23) | (0.23) |
| Year Ended 12/31/2018 | $19.36 | 0.19 | (3.75) | (3.56) | (0.12) | (0.12) |
| Year Ended 12/31/2017 | $14.18 | 0.10 | 5.32 | 5.42 | (0.24) | (0.24) |
| Class C |
| Year Ended 12/31/2021 | $26.83 | (0.36) | 5.88 | 5.52 | — | — |
| Year Ended 12/31/2020 | $22.15 | (0.27) | 5.08 | 4.81 | (0.13) | (0.13) |
| Year Ended 12/31/2019 | $15.33 | (0.06) | 6.93 | 6.87 | (0.05) | (0.05) |
| Year Ended 12/31/2018 | $19.12 | (0.02) | (3.65) | (3.67) | (0.12) | (0.12) |
| Year Ended 12/31/2017 | $13.99 | (0.04) | 5.21 | 5.17 | (0.04) | (0.04) |
| Institutional Class |
| Year Ended 12/31/2021 | $27.64 | (0.06) | 6.06 | 6.00 | (0.13) | (0.13) |
| Year Ended 12/31/2020 | $22.59 | (0.06) | 5.24 | 5.18 | (0.13) | (0.13) |
| Year Ended 12/31/2019 | $15.60 | 0.12 | 7.10 | 7.22 | (0.23) | (0.23) |
| Year Ended 12/31/2018 | $19.27 | 0.15 | (3.70) | (3.55) | (0.12) | (0.12) |
| Year Ended 12/31/2017 | $14.11 | 0.14 | 5.26 | 5.40 | (0.24) | (0.24) |
| Institutional 2 Class |
| Year Ended 12/31/2021 | $27.98 | (0.12) | 6.21 | 6.09 | (0.15) | (0.15) |
| Year Ended 12/31/2020 | $22.84 | (0.05) | 5.32 | 5.27 | (0.13) | (0.13) |
| Year Ended 12/31/2019 | $15.78 | 0.14 | 7.17 | 7.31 | (0.25) | (0.25) |
| Year Ended 12/31/2018 | $19.46 | 0.19 | (3.75) | (3.56) | (0.12) | (0.12) |
| Year Ended 12/31/2017 | $14.25 | 0.20 | 5.25 | 5.45 | (0.24) | (0.24) |
The accompanying Notes to Financial Statements are an integral part of this statement.
| 86 | Columbia Acorn Family of Funds | Annual Report 2021 |
Financial Highlights (continued)
Columbia Acorn European FundSM
| | Net
asset
value,
end of
period | Total
return(a) | Total gross
expense
ratio to
average
net assets(b) | Total net
expense
ratio to
average
net assets(b) | Net investment
income (loss)
ratio to
average
net assets | Portfolio
turnover | Net
assets,
end of
period
(000’s) |
| Class A |
| Year Ended 12/31/2021 | $33.33 | 21.47% | 1.63%(c) | 1.44%(c),(d) | (0.45%) | 21% | $66,374 |
| Year Ended 12/31/2020 | $27.49 | 22.80% | 1.86%(c) | 1.45%(c) | (0.54%) | 45% | $42,059 |
| Year Ended 12/31/2019 | $22.52 | 45.96% | 1.88% | 1.44% | 0.33% | 30% | $33,361 |
| Year Ended 12/31/2018 | $15.56 | (18.78%) | 1.81%(c) | 1.45%(c) | 0.57% | 39% | $22,870 |
| Year Ended 12/31/2017 | $19.27 | 37.89% | 1.94% | 1.58%(d) | 0.33% | 34% | $32,487 |
| Advisor Class |
| Year Ended 12/31/2021 | $33.68 | 21.75% | 1.37%(c) | 1.19%(c),(d) | (0.32%) | 21% | $3,083 |
| Year Ended 12/31/2020 | $27.78 | 23.10% | 1.61%(c) | 1.20%(c) | (0.29%) | 45% | $1,781 |
| Year Ended 12/31/2019 | $22.70 | 46.30% | 1.63% | 1.19% | 0.60% | 30% | $1,906 |
| Year Ended 12/31/2018 | $15.68 | (18.53%) | 1.55%(c) | 1.19%(c) | 0.97% | 39% | $1,496 |
| Year Ended 12/31/2017 | $19.36 | 38.29% | 1.71% | 1.28%(d) | 0.55% | 34% | $2,942 |
| Class C |
| Year Ended 12/31/2021 | $32.35 | 20.57% | 2.39%(c) | 2.19%(c),(d) | (1.20%) | 21% | $7,078 |
| Year Ended 12/31/2020 | $26.83 | 21.87% | 2.61%(c) | 2.20%(c) | (1.27%) | 45% | $5,705 |
| Year Ended 12/31/2019 | $22.15 | 44.79% | 2.64% | 2.19% | (0.30%) | 30% | $6,186 |
| Year Ended 12/31/2018 | $15.33 | (19.34%) | 2.56%(c) | 2.20%(c) | (0.12%) | 39% | $8,770 |
| Year Ended 12/31/2017 | $19.12 | 36.95% | 2.69% | 2.31%(d) | (0.25%) | 34% | $13,965 |
| Institutional Class |
| Year Ended 12/31/2021 | $33.51 | 21.76% | 1.38%(c) | 1.19%(c),(d) | (0.21%) | 21% | $111,462 |
| Year Ended 12/31/2020 | $27.64 | 23.08% | 1.61%(c) | 1.20%(c) | (0.29%) | 45% | $55,171 |
| Year Ended 12/31/2019 | $22.59 | 46.35% | 1.63% | 1.19% | 0.64% | 30% | $49,616 |
| Year Ended 12/31/2018 | $15.60 | (18.57%) | 1.56%(c) | 1.20%(c) | 0.80% | 39% | $32,813 |
| Year Ended 12/31/2017 | $19.27 | 38.35% | 1.69% | 1.29%(d) | 0.77% | 34% | $48,965 |
| Institutional 2 Class |
| Year Ended 12/31/2021 | $33.92 | 21.80% | 1.32%(c) | 1.14%(c) | (0.38%) | 21% | $25,882 |
| Year Ended 12/31/2020 | $27.98 | 23.23% | 1.58%(c) | 1.14%(c) | (0.24%) | 45% | $3,855 |
| Year Ended 12/31/2019 | $22.84 | 46.33% | 1.60% | 1.13% | 0.73% | 30% | $2,175 |
| Year Ended 12/31/2018 | $15.78 | (18.44%) | 1.50%(c) | 1.13%(c) | 0.96% | 39% | $2,554 |
| Year Ended 12/31/2017 | $19.46 | 38.32% | 1.64% | 1.28% | 1.14% | 34% | $3,988 |
The accompanying Notes to Financial Statements are an integral part of this statement.
Columbia Acorn Family of Funds | Annual Report 2021
| 87 |
Financial Highlights (continued)
Columbia Acorn European FundSM
| | Net asset value,
beginning of
period | Net
investment
income
(loss) | Net
realized
and
unrealized
gain (loss) | Total from
investment
operations | Distributions
from net
investment
income | Total
distributions to
shareholders |
| Institutional 3 Class |
| Year Ended 12/31/2021 | $27.54 | (0.05) | 6.05 | 6.00 | (0.16) | (0.16) |
| Year Ended 12/31/2020 | $22.48 | (0.02) | 5.21 | 5.19 | (0.13) | (0.13) |
| Year Ended 12/31/2019 | $15.53 | 0.14 | 7.06 | 7.20 | (0.25) | (0.25) |
| Year Ended 12/31/2018 | $19.17 | (0.04) | (3.48) | (3.52) | (0.12) | (0.12) |
| Year Ended 12/31/2017(e) | $15.02 | 0.03 | 4.40 | 4.43 | (0.28) | (0.28) |
| Notes to Financial Highlights |
| (a) | Had the Investment Manager and/or Transfer Agent not waived fees and/or reimbursed a portion of expenses, total return would have been reduced. |
| (b) | In addition to the fees and expenses that the Fund bears directly, the Fund indirectly bears a pro rata share of the fees and expenses of any other funds in which it invests, if any. Such indirect expenses are not included in the Fund’s reported expense ratios. |
| (c) | Ratios include line of credit interest expense which is less than 0.01%. |
| (d) | The benefits derived from expense reductions had an impact of less than 0.01%. |
| (e) | Institutional 3 Class shares commenced operations on March 1, 2017. Per share data and total return reflect activity from that date. |
| (f) | Annualized. |
The accompanying Notes to Financial Statements are an integral part of this statement.
| 88 | Columbia Acorn Family of Funds | Annual Report 2021 |
Financial Highlights (continued)
Columbia Acorn European FundSM
| | Net
asset
value,
end of
period | Total
return(a) | Total gross
expense
ratio to
average
net assets(b) | Total net
expense
ratio to
average
net assets(b) | Net investment
income (loss)
ratio to
average
net assets | Portfolio
turnover | Net
assets,
end of
period
(000’s) |
| Institutional 3 Class |
| Year Ended 12/31/2021 | $33.38 | 21.83% | 1.32%(c) | 1.10%(c) | (0.15%) | 21% | $60 |
| Year Ended 12/31/2020 | $27.54 | 23.24% | 1.52%(c) | 1.10%(c) | (0.08%) | 45% | $69 |
| Year Ended 12/31/2019 | $22.48 | 46.42% | 1.54% | 1.09% | 0.74% | 30% | $19 |
| Year Ended 12/31/2018 | $15.53 | (18.51%) | 1.41%(c) | 1.08%(c) | (0.21%) | 39% | $3 |
| Year Ended 12/31/2017(e) | $19.17 | 29.55% | 1.58%(f) | 1.09%(f) | 0.17%(f) | 34% | $210 |
The accompanying Notes to Financial Statements are an integral part of this statement.
Columbia Acorn Family of Funds | Annual Report 2021
| 89 |
Notes to Financial Statements
December 31, 2021
Note 1. Organization
Columbia Acorn® Fund, Columbia Acorn International®, Columbia Acorn USA®, Columbia Acorn International SelectSM, Columbia Thermostat FundSM and Columbia Acorn European FundSM (each a Fund and collectively, the Funds) are each a series of Columbia Acorn Trust (the Trust). The Trust is registered under the Investment Company Act of 1940, as amended (the 1940 Act), as an open-end management investment company organized as a Massachusetts business trust. The investment objective of each Fund is to seek long-term capital appreciation.
Columbia Thermostat FundSM pursues its investment objective by investing in shares of other mutual funds and exchange-traded funds (ETFs). As a “fund of funds”, under normal circumstances, the Fund allocates at least 95% of its net assets among a selected group of affiliated funds (underlying funds) according to the current level of the Standard & Poor’s (S&P) 500 Index in relation to predetermined ranges set by Columbia Wanger Asset Management, LLC (the Investment Manager or CWAM). The Fund may invest up to 5% of its net assets plus any cash received that day in cash, repurchase agreements, high quality short-term paper and government securities. For information on the investment strategies, operations and risks of the underlying funds, please refer to the Fund’s current prospectus as well as the prospectuses and shareholder reports of the underlying funds, which are available from the Securities and Exchange Commission website at www.sec.gov or on the Funds’ website at columbiathreadneedleus.com/investor/.
The Funds’ Board of Trustees approved reverse stock splits of the issued and outstanding Class C shares of Columbia Acorn® Fund and Columbia Acorn USA® (the Reverse Stock Split). The Reverse Stock Split was completed after the close of business on September 11, 2020. The impact of the Reverse Stock Split was to decrease the number of Class C shares outstanding and increase the net asset value per share by the ratio of 4 to 1, resulting in no effect on the net assets or the value of each affected shareholder’s investment in Class C shares. Capital stock share activity reflected in the Statement of Changes in Net Assets and per share data in the Financial Highlights have been adjusted on a retroactive basis to reflect the impact of the Reverse Stock Split.
Fund shares
The Trust and each Fund may issue an unlimited number of shares (without par value). Each Fund currently offers each of the share classes listed in the Statement of Assets and Liabilities.
Although all share classes generally have identical voting, dividend and liquidation rights, each share class votes separately when required by the Trust’s organizational documents or by law. Different share classes pay shareholders different distribution amounts to the extent the expenses of the share classes differ, and the amount of distributions in the event of a Fund’s liquidation will be proportional to the net asset value of each share class of the Fund. Each share class has its own fees (sales charges), expenses and other features. These, together with information about certain conflicts of interest associated with the fees and expenses paid by certain share classes, are discussed fully in each Fund’s prospectus and Statement of Additional Information (SAI).
As described in each Fund’s prospectus, Class A and Class C shares are available to all investors. Effective April 1, 2021, Class C shares generally automatically convert to Class A shares of the same Fund 8 years after the Class C shares’ purchase date. Prior to April 1, 2021, Class C shares generally automatically converted to Class A shares of the same Fund 10 years after the Class C shares’ purchase date. Advisor Class, Institutional Class, Institutional 2 Class and Institutional 3 Class are available through authorized investment professionals to retirement plans and to certain other institutional investors described in each Fund’s prospectus. Class R shares are available to retirement and health savings plans and other institutional investors.
Investment income, realized and unrealized gains and losses, and certain fund-level expenses are allocated pro rata on the basis of the relative net assets of all classes, except that each class bears certain expenses specific to that class such as distribution services, transfer agent fees, and certain other class specific expenses. Differences in class expenses may result in payment of different dividend distributions for each class. All of the Funds’ share classes have equal rights with respect to voting, subject to Fund or class-specific matters.
| 90 | Columbia Acorn Family of Funds | Annual Report 2021 |
Notes to Financial Statements (continued)
December 31, 2021
Note 2. Summary of significant accounting policies
Basis of preparation
Each Fund is an investment company that applies the accounting and reporting guidance in the Financial Accounting Standards Board (FASB) Accounting Standards Codification Topic 946, Financial Services - Investment Companies (ASC 946). The financial statements are prepared in accordance with U.S. generally accepted accounting principles (GAAP), which requires management to make certain estimates and assumptions that affect the reported amounts of assets and liabilities, the disclosure of contingent assets and liabilities at the date of the financial statements and the reported amounts of income and expenses during the reporting period. Actual results could differ from those estimates.
The following is a summary of significant accounting policies followed by the Funds in the preparation of their financial statements.
Security valuation
Securities of the Funds are valued at market value or, if a market quotation for a security is not readily available or is deemed not to be reliable because of events or circumstances that have occurred between the market quotation and the time as of which the security is to be valued, the security is valued at a fair value determined in good faith under consistently applied procedures established by the Board of Trustees. Equity securities listed on an exchange are valued at the closing price or last trade on their primary exchange at the close of business of the New York Stock Exchange. Securities with a closing price not readily available or not listed on any exchange are valued at the mean between the closing bid and ask prices. Listed preferred stocks convertible into common stocks are valued using an evaluated price from a pricing service.
Foreign equity securities are valued based on the closing price or last trade on their primary exchange at the close of business of the New York Stock Exchange. Foreign currency exchange rates are determined at the scheduled closing time of the New York Stock Exchange. Many securities markets and exchanges outside the U.S. close prior to the close of the New York Stock Exchange; therefore, the closing prices for securities in such markets or on such exchanges may not fully reflect events that occur after such close but before the close of the New York Stock Exchange. In situations where foreign markets are closed, where a significant event has occurred after the foreign exchange closes but before the time at which the Fund’s share price is calculated, and in the event of significant movement in the trigger index for the statistical fair valuation process established by the Board of Trustees, foreign securities will be fair valued pursuant to a policy adopted by the Board of Trustees. Under the policy, the Fund may use an independent statistical fair value pricing service that employs a systematic methodology to assist in the fair valuation process for securities principally traded in a foreign market in order to adjust for possible changes in value that may occur between the close of the foreign market and the time as of which the securities are to be valued. If a security is valued at a fair value, that value may be different from the last quoted market price for the security.
Investments in open-end investment companies (other than exchange-traded funds (ETFs)), are valued at the latest net asset value reported by those companies as of the valuation time.
Foreign currency transactions and translations
Values of investments denominated in foreign currencies are converted into U.S. dollars using the New York spot market rate of exchange at the time of valuation. Purchases and sales of investments and dividend and interest income are translated into U.S. dollars using the spot market rate of exchange prevailing on the respective dates of such transactions. The gain or loss resulting from changes in foreign exchange rates is included with net realized and unrealized gain or loss from investments, as appropriate.
Derivative instruments
Derivatives may involve various risks, including the potential inability of the counterparty to fulfill its obligation under the terms of the contract, the potential for an illiquid secondary market (making it difficult for the Fund to sell, including at favorable prices) and the potential for market movements which may expose the Fund to gains or losses in excess of the amount shown in the Statements of Assets and Liabilities.
Columbia Acorn Family of Funds | Annual Report 2021
| 91 |
Notes to Financial Statements (continued)
December 31, 2021
For financial reporting purposes, the Funds do not offset derivative assets and derivative liabilities that are subject to contractual netting arrangements in the Statements of Assets and Liabilities.
Futures contracts
Futures contracts are exchange-traded and represent commitments for the future purchase or sale of an asset at a specified price on a specified date. Columbia Acorn® Fund, Columbia Acorn International® and Columbia Acorn USA® bought and sold futures contracts during the year ended December 31, 2021 to maintain appropriate equity market exposure while keeping sufficient cash to accommodate daily operations. These instruments may be used for other purposes in future periods. Upon entering into futures contracts, a Fund bears risks that it may not achieve the anticipated benefits of the futures contracts and may realize a loss. Additional risks include counterparty credit risk, the possibility of an illiquid market, and that a change in the value of the contract or option may not correlate with changes in the value of the underlying asset.
Upon entering into a futures contract, the Fund deposits cash or securities with the broker, known as a futures commission merchant (FCM), in an amount sufficient to meet the initial margin requirement. The initial margin deposit must be maintained at an established level over the life of the contract. Cash deposited as initial margin is recorded in the Statement of Assets and Liabilities as margin deposits. Securities deposited as initial margin are designated in the Portfolio of Investments. Subsequent payments (variation margin) are made or received by the Fund each day. The variation margin payments are equal to the daily change in the contract value and are recorded as variation margin receivable or payable and are offset in unrealized gains or losses. The Fund generally expects to earn interest income on its margin deposits. The Fund recognizes a realized gain or loss when the contract is closed or expires. Futures contracts involve, to varying degrees, risk of loss in excess of the variation margin disclosed in the Statement of Assets and Liabilities.
Effects of derivative transactions in the financial statements
The following tables are intended to provide additional information about the effect of derivatives on the financial statements of Columbia Acorn® Fund, Columbia Acorn International® and Columbia Acorn USA® including: the fair value of derivatives by risk category and the location of those fair values in the Statements of Assets and Liabilities; and the impact of derivative transactions over the period in the Statements of Operations, including realized gains or losses and unrealized gains or losses. The derivative schedules following the Portfolio of Investments present additional information regarding derivative instruments outstanding at the end of the period, if any.
Columbia Acorn® Fund
At December 31, 2021, the Fund had no outstanding derivatives.
The following table indicates the effect of derivative instruments (not considered to be hedging instruments for accounting disclosure purposes) in the Statement of Operations for the year ended December 31, 2021:
| Amount of realized gain (loss) on derivatives recognized in income |
| Risk exposure category | Futures
contracts
($) |
| Equity risk | (2,338,271) |
The following table is a summary of the average outstanding volume by derivative instrument for the year ended December 31, 2021:
| Derivative instrument | Average notional
amounts ($) |
| Futures contracts — long | 2,310,111* |
| * | Based on the ending daily outstanding amounts for the year ended December 31, 2021. |
Columbia Acorn International®
At December 31, 2021, the Fund had no outstanding derivatives.
| 92 | Columbia Acorn Family of Funds | Annual Report 2021 |
Notes to Financial Statements (continued)
December 31, 2021
The following table indicates the effect of derivative instruments (not considered to be hedging instruments for accounting disclosure purposes) in the Statement of Operations for the year ended December 31, 2021:
| Amount of realized gain (loss) on derivatives recognized in income |
| Risk exposure category | Futures
contracts
($) |
| Equity risk | 654,234 |
| |
| Change in unrealized appreciation (depreciation) on derivatives recognized in income |
| Risk exposure category | Futures
contracts
($) |
| Equity risk | (1,142,509) |
The following table is a summary of the average outstanding volume by derivative instrument for the year ended December 31, 2021:
| Derivative instrument | Average notional
amounts ($)* |
| Futures contracts — long | 33,841,428 |
| * | Based on the ending quarterly outstanding amounts for the year ended December 31, 2021. |
Columbia Acorn USA®
At December 31, 2021, the Fund had no outstanding derivatives.
The following table indicates the effect of derivative instruments (not considered to be hedging instruments for accounting disclosure purposes) in the Statement of Operations for the year ended December 31, 2021:
| Amount of realized gain (loss) on derivatives recognized in income |
| Risk exposure category | Futures
contracts
($) |
| Equity risk | 142,295 |
The following table is a summary of the average outstanding volume by derivative instrument for the year ended December 31, 2021:
| Derivative instrument | Average notional
amounts ($) |
| Futures contracts — long | 1,244,414* |
| * | Based on the ending daily outstanding amounts for the year ended December 31, 2021. |
Security transactions and investment income
Security transactions, investment income and shareholder fund transactions are accounted for on the trade date (date the order to buy or sell is executed) and dividend income and realized gain distributions from other funds are recorded on the ex-dividend date, except that certain dividends from foreign securities are recorded as soon as the information is available to the Funds. Interest income is recorded on the accrual basis and includes amortization of discounts on debt obligations when required for federal income tax purposes. Realized gains and losses from security transactions are recorded on an identified cost basis.
Awards, if any, from class action litigation related to securities owned may be recorded as a reduction of cost of those securities. If the applicable securities are no longer owned, the proceeds are recorded as realized gains.
Columbia Acorn Family of Funds | Annual Report 2021
| 93 |
Notes to Financial Statements (continued)
December 31, 2021
The Funds may receive distributions from holdings in exchange-traded funds (ETFs), limited partnerships (LPs), other regulated investment companies (RICs), and real estate investment trusts (REITs), which report information as to the character of their distributions annually. These distributions are allocated to dividend income, capital gain and return of capital based on actual information reported. To the extent actual information has not yet been reported by the REITs, estimates for return of capital may be made by the Funds’ management. Return of capital is recorded as a reduction of the cost basis of securities held. If the Funds no longer own the applicable securities, return of capital is recorded as a realized gain. Management’s estimates are subsequently adjusted when the actual character of the distributions is disclosed by the REITs, which could result in a proportionate change in return of capital to shareholders. No estimates are made for ETFs and RICs.
Fund share valuation
Fund shares are sold and redeemed on a daily basis at net asset value, subject to any applicable sales charge. Net asset value per share is determined daily as of the close of trading on the New York Stock Exchange (NYSE) on each day the NYSE is open for trading. Generally, income, expenses and realized and unrealized gain/(losses) of a Fund are allocated to each class proportionately on a daily basis for purposes of determining the net asset value of each class. The distribution and service fees and transfer agent fees are charged to each specific class as expenses are incurred. Redemption fees are accounted for as an addition to paid in capital for purposes of determining the net asset value of each class.
Securities lending
Each Fund, except Columbia Thermostat FundSM, may lend securities up to one-third of the value of its total assets to certain approved brokers, dealers, banks and or other institutional borrowers of securities that the Funds’ securities lending agent has determined are credit worthy under guidelines established by the Board of Trustees, to earn additional income. The Funds retain the benefits of owning the securities, including the economic equivalent of dividends or interest generated by the security. The Funds also receive a fee for the loan. The Funds have the ability to recall the loans at any time and could do so in order to vote proxies or to sell the loaned securities. Each loan is collateralized by cash that exceeds the value of the securities on loan. The market value of the loaned securities is determined daily at the close of business of a Fund and any additional required collateral is delivered to the Fund on the next business day. The Funds have elected to invest the cash collateral in the Dreyfus Government Cash Management Fund, a third-party institutional government money market fund in accordance with investment guidelines contained in the securities lending agreement and approved by the Board of Trustees. The income earned from the securities lending program is paid to each Fund, net of any fees remitted to Goldman Sachs Agency Lending, the Funds’ lending agent, and net of any borrower rebates. The Investment Manager does not retain any fees earned by the lending program. Generally, in the event of borrower default, a Fund has the right to use the collateral to offset any losses incurred. In the event a Fund is delayed or prevented from exercising its right to dispose of the collateral, there may be a potential loss to the Fund. Some of these losses may be indemnified by the lending agent. The Funds bear the risk of loss with respect to the investment of collateral. The net securities lending income earned as of December 31, 2021 by each Fund is included in the Statements of Operations.
Offsetting of assets and liabilities
The following table presents the Funds’ gross and net amount of assets and liabilities available for offset under netting agreements and under a securities lending agreement as well as the related collateral received by each Fund with securities on loan as of December 31, 2021:
| | Columbia
Acorn® Fund | Columbia Acorn
International® | Columbia
Acorn USA® |
| | Goldman
Sachs ($) | Goldman
Sachs ($) | Goldman
Sachs ($) |
| Liabilities | | | |
| Collateral on Securities Loaned | 36,269,919 | 10,493,519 | 5,034,920 |
| Total Liabilities | 36,269,919 | 10,493,519 | 5,034,920 |
| Total Financial and Derivative Net Assets | (36,269,919) | (10,493,519) | (5,034,920) |
| Financial Instruments | 33,010,589 | 10,018,113 | 4,773,190 |
| Net Amount (a) | (3,259,330) | (475,406) | (261,730) |
| 94 | Columbia Acorn Family of Funds | Annual Report 2021 |
Notes to Financial Statements (continued)
December 31, 2021
| (a) | Represents the net amount due from/(to) counterparties in the event of default. |
Securities lending transactions
The following table indicates the total amount of securities loaned by type, reconciled to gross liability payable upon return of the securities loaned by the Funds as of December 31, 2021:
| | Overnight and
continuous | Up to
30 days | 30-90
days | Greater than
90 days | Total |
| Columbia Acorn® Fund | | | | | |
| Securities lending transactions | | | | | |
| Equity securities | $33,010,589 | $— | $— | $— | $33,010,589 |
| Gross amount of recognized liabilities for securities lending (collateral received) | | | | | 36,269,919 |
| Amounts due to counterparty in the event of default | | | | | $3,259,330 |
| Columbia Acorn International® | | | | | |
| Securities lending transactions | | | | | |
| Equity securities | $10,018,113 | $— | $— | $— | $10,018,113 |
| Gross amount of recognized liabilities for securities lending (collateral received) | | | | | 10,493,519 |
| Amounts due to counterparty in the event of default | | | | | $475,406 |
| Columbia Acorn USA® | | | | | |
| Securities lending transactions | | | | | |
| Equity securities | $4,773,190 | $— | $— | $— | $4,773,190 |
| Gross amount of recognized liabilities for securities lending (collateral received) | | | | | 5,034,920 |
| Amounts due to counterparty in the event of default | | | | | $261,730 |
Federal income tax status
It is each Fund’s policy to comply with the provisions of the Internal Revenue Code available to regulated investment companies and, in the manner provided therein, distribute substantially all their taxable income, as well as any net realized gain on sales of investments and foreign currency transactions reportable for federal income tax purposes. Columbia Thermostat FundSM distributes all of its taxable income, as well as any net realized gain on sales of portfolio fund shares and any distributions of net realized gains received by the Fund from its portfolio funds, reportable for federal income tax purposes. Accordingly, the Funds paid no federal income taxes and no federal income tax provision was required.
Foreign taxes
Realized gains in certain countries may be subject to foreign taxes at the fund level. The Funds accrue for such foreign taxes on realized and unrealized gains at the appropriate rate for each jurisdiction. The amount, if any, is disclosed as a liability on the Statements of Assets and Liabilities.
Distributions to shareholders
Distributions to shareholders are recorded on the ex-dividend date.
Guarantees and indemnification
In the normal course of business, the Trust on behalf of the Funds enters into contracts that contain a variety of representations and warranties and that provide general indemnities. A Fund’s maximum exposure under these arrangements is unknown, as this would involve future claims against the Fund. Also, under the Trust’s organizational documents, the trustees and officers of the Trust are indemnified against certain liabilities that may arise out of their duties to the Trust. However, based on experience, the Funds expect the risk of loss due to these warranties and indemnities to be remote.
Columbia Acorn Family of Funds | Annual Report 2021
| 95 |
Notes to Financial Statements (continued)
December 31, 2021
Note 3. Fees and other transactions with affiliates
Investment management fees
CWAM is a wholly-owned subsidiary of Columbia Management Investment Advisers, LLC (Columbia Management), which is a wholly-owned subsidiary of Ameriprise Financial, Inc. (Ameriprise Financial). CWAM furnishes continuing investment supervision to the Funds and is responsible for the overall management of the Funds’ business affairs.
CWAM receives a monthly advisory fee based on each Fund’s daily net assets at the following annual rates:
| Columbia Acorn® Fund |
| Average daily net assets | Annual
fee rate |
| Up to $700 million | 0.74% |
| $700 million to $2 billion | 0.69% |
| $2 billion to $6 billion | 0.64% |
| $6 billion and over | 0.63% |
| Columbia Acorn International® |
| Average daily net assets | Annual
fee rate |
| Up to $100 million | 1.19% |
| $100 million to $500 million | 0.94% |
| $500 million and over | 0.74% |
| Columbia Acorn USA® |
| Average daily net assets | Annual
fee rate |
| Up to $200 million | 0.94% |
| $200 million to $500 million | 0.89% |
| $500 million to $2 billion | 0.84% |
| $2 billion to $3 billion | 0.80% |
| $3 billion and over | 0.70% |
| Columbia Acorn International SelectSM |
| Average daily net assets | Annual
fee rate |
| Up to $500 million | 0.89% |
| $500 million and over | 0.85% |
| Columbia Thermostat FundSM |
| | Annual
fee rate |
| All average daily net assets | 0.10% |
| Columbia Acorn European FundSM |
| Average daily net assets | Annual
fee rate |
| Up to $100 million | 1.19% |
| $100 million to $500 million | 0.94% |
| $500 million and over | 0.74% |
In February 2022, the Board approved a reduction in the advisory fee rates payable to the Investment Manager by Columbia Acorn USA®. The new advisory fee, which is effective May 1, 2022, is equal to a percentage of average daily net assets of Columbia Acorn USA®, equal to 0.740% on the first $700 million, 0.690% from $700 million to $2 billion, 0.640% from $2 billion to $6 billion, and 0.630% for $6 billion and over.
| 96 | Columbia Acorn Family of Funds | Annual Report 2021 |
Notes to Financial Statements (continued)
December 31, 2021
For the year ended December 31, 2021, the effective investment advisory fee rates were as follows:
| Fund | Effective investment advisory fee rate (%) |
| Columbia Acorn® Fund | 0.67 |
| Columbia Acorn International® | 0.79 |
| Columbia Acorn USA® | 0.92 |
| Columbia Acorn International SelectSM | 0.89 |
| Columbia Thermostat FundSM | 0.10 |
| Columbia Acorn European FundSM | 1.09 |
Advisory Affiliates
The Investment Manager and its investment advisory affiliates, including Columbia Management (Affiliates), may coordinate in providing services to their clients. These Affiliates, like the Investment Manager, are direct or indirect subsidiaries of Ameriprise Financial and are registered with the appropriate respective regulators and, where required, the Securities and Exchange Commission and the Commodity Futures Trading Commission in the United States. From time to time, the Investment Manager may engage employees of Affiliates to provide portfolio management services to certain accounts managed by the Investment Manager. These employees provide services to the Investment Manager pursuant to personnel-sharing agreements or other inter-company arrangements and the Funds pay no additional fees and expenses as a result of any such arrangements.
Pursuant to such arrangements, employees of Affiliates, including Columbia Management, may serve as “associated persons” of the Investment Manager and, in this capacity, may provide portfolio management services to a Fund on behalf of the Investment Manager subject to the oversight and supervision of the Investment Manager and the Funds’ Chief Compliance Officer, consistent with the investment objectives, policies and limitations set forth in the Fund’s prospectus and SAI, and the Investment Manager’s and the Funds’ compliance policies and procedures.
Administration fees
CWAM provides administrative services and receives an administration fee from the Funds at the following annual rates:
| Columbia Acorn Trust |
Aggregate average daily
net assets of the trust | Annual
fee rate |
| Up to $8 billion | 0.050% |
| $8 billion to $16 billion | 0.040% |
| $16 billion to $35 billion | 0.030% |
| $35 billion to $45 billion | 0.025% |
| $45 billion and over | 0.015% |
For the year ended December 31, 2021, the effective administration fee rate was 0.048% of each Fund’s average daily net assets. CWAM has contractually delegated to Columbia Management responsibility to provide certain sub-administrative services to the Funds.
Compensation of board members
Certain officers and trustees of the Trust are also officers of CWAM and/or Columbia Management. The Trust makes no direct payments to its officers and trustees who are affiliated with CWAM or Columbia Management. The Trust offers a Deferred Compensation Plan (the Deferred Plan) for its independent trustees. Under the Deferred Plan, a trustee may elect to defer all or a portion of his or her compensation. Amounts deferred are retained by the Trust and may represent an unfunded obligation of the Trust. The value of amounts deferred is determined by reference to the change in value of Institutional Class shares of one or more series of Columbia Acorn Trust and/or a money market fund as specified by the trustee. Benefits under the Deferred Plan are payable in accordance with the Deferred Plan. Effective January 1, 2022, the value of amounts deferred is determined by reference to the change in value of Institutional 3 Class shares of one or more series of Columbia Acorn Trust and/or a money market fund as specified by the trustee.
Columbia Acorn Family of Funds | Annual Report 2021
| 97 |
Notes to Financial Statements (continued)
December 31, 2021
Compensation of Chief Compliance Officer
The Board of Trustees has appointed a Chief Compliance Officer for the Funds in accordance with federal securities regulations. As disclosed in the Statement of Operations, a portion of the Chief Compliance Officer’s total compensation is allocated to the Funds, along with other allocations to affiliated registered investment companies managed by the Investment Manager and its affiliates, based on relative net assets.
Transfer agency fees
Under a Transfer, Dividend Disbursing and Shareholders’ Servicing Agent Agreement, Columbia Management Investment Services Corp. (the Transfer Agent), an affiliate of the Investment Manager and a wholly-owned subsidiary of Ameriprise Financial, is responsible for providing transfer agency, dividend disbursing and shareholder services to the Funds for which the Funds pay transfer agency fees. The Transfer Agent has contracted with DST Asset Manager Solutions, Inc. (DST) to provide certain services and assist the Transfer Agent carrying out its duties. The Transfer Agent pays the fees of DST for its services and DST is not entitled to reimbursement for such fees from the Fund (with the exception of out-of-pocket fees). In addition, the Transfer Agent enters into agreements with various financial intermediaries through which investors may hold Fund shares, including Ameriprise Financial and its affiliates. These intermediaries also may provide shareholder services (Additional Shareholder Services) for which they are compensated by the Transfer Agent, which is in turn compensated by the Funds. Additional Shareholder Services may include sub-accounting, sub-transfer agency, participant recordkeeping, shareholder or participant reporting, shareholder or participant transaction processing, shareholder or participant tax monitoring and reporting and/or the provision of call center support and other customer services.
The Funds pay the Transfer Agent a monthly transfer agency fee that varies by account type (on a per account or asset-based basis) based on the cost of servicing the Funds. In addition, subject to certain limitations described in the Funds’ prospectuses and except with respect to Institutional 3 Class shares, the Funds pay a fee to the Transfer Agent for the Additional Shareholder Services provided by financial intermediaries who maintain shares through omnibus or networked accounts in amounts that vary by share class and with the distribution channel, type of intermediary and type of services provided.
The Funds compensate the Transfer Agent for certain out-of-pocket expenses as approved by the Board of Trustees from time to time. Such out-of-pocket expenses may include networking account fees paid to dealer firms by the Transfer Agent with respect to shareholder accounts established or maintained pursuant to the National Securities Clearing Corporation’s (NSCC) networking system. A significant portion of such networking account fees are paid by the Transfer Agent to dealer firms affiliated with Ameriprise Financial and its affiliates.
The Transfer Agent also receives compensation from the Funds for various shareholder services and reimbursements for certain out-of-pocket fees. Total transfer agency fees for Institutional 2 Class and Institutional 3 Class shares are subject to an annual limitation of not more than 0.07% and 0.02%, respectively, of the average daily net assets attributable to each share class.
Please see Expenses waived/reimbursed by the Investment Manager and its affiliates below for information about the Transfer Agent’s contractual agreements to limit the fees payable to it by certain share classes of the Funds.
For the year ended December 31, 2021, the Funds’ effective transfer agency fee rates, which reflect the contractual limitations described below in Expenses waived/reimbursed by the Investment Manager, as a percentage of average daily net assets of each class were as follows:
| Fund | Class A
(%) | Advisor
Class (%) | Class C
(%) | Institutional
Class (%) | Institutional 2
Class (%) | Institutional 3
Class (%) | Class R
(%) |
| Columbia Acorn® Fund | 0.08 | 0.08 | 0.08 | 0.08 | 0.05 | 0.01 | — |
| Columbia Acorn International® | 0.10 | 0.10 | 0.10 | 0.10 | 0.04 | 0.00 | 0.10 |
| Columbia Acorn USA® | 0.10 | 0.10 | 0.10 | 0.10 | 0.04 | 0.00 | — |
| Columbia Acorn International SelectSM | 0.15 | 0.15 | 0.15 | 0.15 | 0.06 | 0.01 | — |
| Columbia Thermostat FundSM | 0.10 | 0.10 | 0.10 | 0.10 | 0.05 | 0.02 | — |
| Columbia Acorn European FundSM | 0.09 | 0.09 | 0.09 | 0.09 | 0.04 | 0.00 | — |
| 98 | Columbia Acorn Family of Funds | Annual Report 2021 |
Notes to Financial Statements (continued)
December 31, 2021
An annual minimum account balance fee of $20 may apply to certain accounts with a value below the applicable share class’s initial minimum investment requirements to reduce the impact of small accounts on transfer agency fees. These minimum account balance fees are remitted to the Funds and recorded as part of expense reductions in the Statement of Operations.
For the year ended December 31, 2021, these minimum account balance fees reduced total expenses as follows:
| Fund | Amount ($) |
| Columbia Acorn® Fund | 5,161 |
| Columbia Acorn International® | 4,960 |
| Columbia Acorn USA® | 720 |
| Columbia Acorn International SelectSM | 7,690 |
| Columbia Thermostat FundSM | 160 |
| Columbia Acorn European FundSM | 20 |
Distribution and service fees
Columbia Management Investment Distributors, Inc. (CMID), a wholly owned subsidiary of Ameriprise Financial, is the distributor of the Funds. Each Fund has adopted a distribution and service plan which requires it to pay CMID a monthly service fee equal to 0.25% annually of the average daily net assets attributable to Class A and Class C shares and a monthly distribution fee equal to 0.75% and 0.50%, annually, of the average daily net assets attributable to Class C and Class R shares, respectively. CMID receives no compensation with respect to Advisor Class, Institutional Class, Institutional 2 Class and Institutional 3 Class shares.
Sales charges (unaudited)
Sales charges, including front-end charges and contingent deferred sales charges (CDSCs), received by the Distributor for distributing Fund shares for the year ended December 31, 2021, if any, are listed below:
| | Front End (%) | CDSC (%) | Amount ($) |
| Fund | Class A | Class C | Class A | Class C | Class A | Class C |
| Columbia Acorn® Fund | 5.75 | — | 0.50 - 1.00(a) | 1.00(b) | 156,998 | 1,345 |
| Columbia Acorn International® | 5.75 | — | 0.50 - 1.00(a) | 1.00(b) | 53,199 | 565 |
| Columbia Acorn USA® | 5.75 | — | 0.50 - 1.00(a) | 1.00(b) | 13,766 | 6 |
| Columbia Acorn International SelectSM | 5.75 | — | 0.50 - 1.00(a) | 1.00(b) | 34,396 | 29 |
| Columbia Thermostat FundSM | 5.75 | — | 0.50 - 1.00(a) | 1.00(b) | 1,226,900 | 25,723 |
| Columbia Acorn European FundSM | 5.75 | — | 0.50 - 1.00(a) | 1.00(b) | 134,757 | 307 |
| (a) | This charge is imposed on certain investments of between $1 million and $50 million redeemed within 18 months after purchase, as follows: 1.00% if redeemed within 12 months after purchase, and 0.50% if redeemed more than 12, but less than 18, months after purchase, with certain limited exceptions. |
| (b) | This charge applies to redemptions within 12 months after purchase, with certain limited exceptions. |
The Fund’s other share classes are not subject to sales charges.
Expenses waived/reimbursed by the Investment Manager and its affiliates
Columbia Acorn® Fund
Effective May 1, 2021 through April 30, 2022, CWAM has contractually agreed to waive fees and/or reimburse expenses so that ordinary operating expenses (excluding transaction costs and certain other investment-related expenses, interest and fees on borrowing and expenses associated with the Fund’s investment in other investment companies, if any) paid by Columbia Acorn® Fund do not exceed the following annual rates as a percentage of each class’ average daily net assets:
| Fund | Class A | Advisor
Class | Class C | Institutional
Class | Institutional 2
Class | Institutional 3
Class |
| Columbia Acorn® Fund | 1.11% | 0.86% | 1.86% | 0.86% | 0.83% | 0.79% |
Columbia Acorn Family of Funds | Annual Report 2021
| 99 |
Notes to Financial Statements (continued)
December 31, 2021
This agreement may not be modified or terminated, without approval from the Fund’s Board of Trustees and CWAM. There is no guarantee that the agreement will continue after April 30, 2022.
Prior to May 1, 2021, CWAM contractually waived fees and/or reimbursed expenses so that ordinary operating expenses (excluding transaction costs and certain other investment-related expenses, interest and fees on borrowings, if any) paid by Columbia Acorn® Fund did not exceed the annual rates of 1.11% for Class A shares, 0.86% for Advisor Class shares, 1.86% for Class C shares, 0.86% for Institutional Class shares, 0.82% for Institutional 2 Class shares and 0.78% for Institutional 3 Class shares.
With respect to Columbia Acorn® Fund, the Transfer Agent contractually agreed to waive a portion of the fees payable by the Fund such that through April 30, 2021, fees paid by the Fund to the Transfer Agent did not exceed the annual rate of 0.05% of the average daily net assets of Institutional 2 Class shares of the Fund. The Transfer Agent has contractually agreed to extend this arrangement through April 30, 2022, unless sooner terminated at the sole discretion of the Fund’s Board of Trustees.
Columbia Acorn International®
Through April 30, 2022, CWAM has contractually agreed to waive fees and/or reimburse expenses so that ordinary operating expenses (excluding transaction costs and certain other investment-related expenses, interest and fees on borrowing and expenses associated with the Fund’s investment in other investment companies, if any) paid by Columbia Acorn International® do not exceed the following annual rates as a percentage of each class’ average daily net assets:
| Fund | Class A | Advisor
Class | Class C | Institutional
Class | Institutional 2
Class | Institutional 3
Class | Class R |
| Columbia Acorn International® | 1.24% | 0.99% | 1.99% | 0.99% | 0.92% | 0.88% | 1.49% |
This agreement extends the prior contractual arrangement that was in place through April 30, 2021. This agreement may not be modified or terminated, without approval from the Fund’s Board of Trustees and CWAM. There is no guarantee that the agreement will continue after April 30, 2022.
With respect to Columbia Acorn International®, the Transfer Agent contractually agreed to waive a portion of the fees payable by the Fund such that through April 30, 2021, fees paid by the Fund to the Transfer Agent did not exceed the annual rate of (i) 0.04% of the average daily net assets of Institutional 2 Class shares of the Fund and (ii) 0.00% of the average daily net assets of Institutional 3 Class shares of the Fund. The Transfer Agent has contractually agreed to extend this arrangement through April 30, 2022, unless sooner terminated at the sole discretion of the Fund’s Board of Trustees.
Columbia Acorn USA®
Effective May 1, 2021 through April 30, 2022, CWAM has contractually agreed to waive fees and/or reimburse expenses so that ordinary operating expenses (excluding transaction costs and certain other investment-related expenses, interest and fees on borrowings and expenses associated with the Fund’s investments in other investment companies, if any) paid by Columbia Acorn USA®do not exceed the following annual rates as a percentage of each class’ average daily net assets:
| Fund | Class A | Advisor
Class | Class C | Institutional
Class | Institutional 2
Class | Institutional 3
Class |
| Columbia Acorn USA® | 1.40% | 1.15% | 2.15% | 1.15% | 1.08% | 1.04% |
This agreement may not be modified or terminated, without approval from the Fund’s Board of Trustees and CWAM. There is no guarantee that the agreement will continue after April 30, 2022.
Prior to May 1, 2021, CWAM contractually waived fees and/or reimbursed expenses so that ordinary operating expenses (excluding transaction costs and certain other investment-related expenses, interest and fees on borrowing and expenses associated with the Fund’s investment in other investment companies, if any) paid by Columbia Acorn USA® did not exceed the annual rates of 1.41% for Class A shares, 1.16% for Advisor Class shares, 2.16% for Class C shares, 1.16% for Institutional Class shares, 1.08% for Institutional 2 Class shares and 1.04% for Institutional 3 Class shares.
| 100 | Columbia Acorn Family of Funds | Annual Report 2021 |
Notes to Financial Statements (continued)
December 31, 2021
With respect to Columbia Acorn USA®, the Transfer Agent contractually agreed to waive a portion of the fees payable by the Fund such that through April 30, 2021, fees paid by the Fund to the Transfer Agent did not exceed the annual rate of (i) 0.04% of the average daily net assets of Institutional 2 Class shares of the Fund and (ii) 0.00% of the average daily net assets of Institutional 3 Class shares of the Fund. The Transfer Agent has contractually agreed to extend this arrangement through April 30, 2022, unless sooner terminated at the sole discretion of the Fund’s Board of Trustees.
Columbia Acorn International SelectSM
Effective May 1, 2021 through April 30, 2022, CWAM contractually agreed to waive fees and/or reimburse expenses so that ordinary operating expenses (excluding any transaction costs and certain other investment-related expenses, interest and fees on borrowings and expenses associated with the Fund’s investments in other investment companies, if any) paid by Columbia Acorn International SelectSM do not exceed the following annual rates as a percentage of each class’ average daily net assets:
| Fund | Class A | Advisor
Class | Class C | Institutional
Class | Institutional 2
Class | Institutional 3
Class |
| Columbia Acorn International SelectSM | 1.24% | 0.99% | 1.99% | 0.99% | 0.89% | 0.84% |
This agreement may not be modified or terminated, without approval from the Fund’s Board of Trustees and CWAM. There is no guarantee that the agreement will continue after April 30, 2022.
Prior to May 1, 2021, CWAM contractually waived fees and/or reimbursed expenses so that ordinary operating expenses (excluding transaction costs and certain other investment-related expenses, interest and fees on borrowings and expenses associated with the Fund’s investments in other investment companies, if any) paid by Columbia Acorn International SelectSM did not exceed the annual rates of 1.28% for Class A shares, 1.03% for Advisor Class shares, 2.03% for Class C shares, 1.03% for Institutional Class shares, 0.90% for Institutional Class 2 shares and 0.85% for Institutional Class 3 shares.
Columbia Thermostat FundSM
Through April 30, 2022, CWAM has contractually agreed to waive fees and/or reimburse expenses so that ordinary operating expenses (excluding transaction costs and certain other investment-related expenses, interest and fees on borrowings and expenses associated with the Fund’s investments in its underlying portfolio funds) paid by Columbia Thermostat FundSM do not exceed the following annual rates as a percentage of each class’ average daily net assets:
| Fund | Class A | Advisor
Class | Class C | Institutional
Class | Institutional 2
Class | Institutional 3
Class |
| Columbia Thermostat FundSM | 0.50% | 0.25% | 1.25% | 0.25% | 0.21% | 0.17% |
This agreement extends the prior contractual arrangement that was in place through April 30, 2021. This agreement may not be modified or terminated, without approval from the Fund’s Board of Trustees and CWAM. There is no guarantee that the agreement will continue after April 30, 2022.
Columbia Acorn European FundSM
Through April 30, 2022, CWAM has contractually agreed to waive fees and/or reimburse expenses so that ordinary operating expenses (excluding transaction costs and certain other investment-related expenses, interest and fees on borrowings and expenses associated with the Fund’s investments in other investment companies, if any) paid by Columbia Acorn European FundSM do not exceed the following annual rates as a percentage of each class’ average daily net assets:
| Fund | Class A | Advisor
Class | Class C | Institutional
Class | Institutional 2
Class | Institutional 3
Class |
| Columbia Acorn European FundSM | 1.45% | 1.20% | 2.20% | 1.20% | 1.14% | 1.10% |
This agreement extends the prior contractual arrangement that was in place through April 30, 2021. This agreement may not be modified or terminated, without approval from the Fund’s Board of Trustees and CWAM. There is no guarantee that the agreement will continue after April 30, 2022.
Columbia Acorn Family of Funds | Annual Report 2021
| 101 |
Notes to Financial Statements (continued)
December 31, 2021
With respect to Columbia Acorn European FundSM, the Transfer Agent contractually agreed to waive a portion of the fees payable by the Fund such that through April 30, 2021, fees paid by the Fund to the Transfer Agent did not exceed the annual rate of (i) 0.04% of the average daily net assets of Institutional 2 Class shares of the Fund and (ii) 0.00% of the average daily net assets of Institutional 3 Class shares of the Fund. The Transfer Agent has contractually agreed to extend this arrangement through April 30, 2022, unless sooner terminated at the sole discretion of the Fund’s Board of Trustees.
Voluntary waivers and reimbursements
In addition to these contractual agreements, CWAM has voluntarily agreed to waive fees and/or reimburse Fund expenses (excluding transaction costs and certain other investment-related expenses, interest and fees on borrowings and expenses associated with the Fund’s investments in other investment companies, if any) so that Columbia Acorn International®, Columbia Acorn USA®, Columbia Acorn International SelectSM, Columbia Thermostat FundSM and Columbia Acorn European FundSM Fund level expenses (expenses directly attributable to the Fund and not to a specific share class) are waived proportionately across all share classes.
Any fees waived and/or expenses reimbursed under the contractual and voluntary fee waiver/expense reimbursement arrangements described above are not recoverable by the Investment Manager or its affiliates in future periods.
Note 4. Federal tax information
The timing and character of income and capital gain distributions are determined in accordance with income tax regulations, which may differ from GAAP because of temporary or permanent book to tax differences.
At December 31, 2021, these differences were primarily due to differing treatment for deferral/reversal of wash sale losses, trustees’ deferred compensation, derivative investments, post-October capital losses, capital loss carryforward, investments in partnerships, distribution reclassifications, re-characterization of distributions for investments, net operating loss reclassification, late-year ordinary losses, former passive foreign investment company (PFIC) holdings, excess distributions, earnings and profits distributed to shareholders on the redemption of shares, foreign currency transactions and PFIC holdings. To the extent these differences were permanent, reclassifications were made among the components of the Fund’s net assets. Temporary differences do not require reclassifications.
The following reclassifications were made:
| Fund | Undistributed net
investment
income ($) | Accumulated
net realized
gain (loss) ($) | Paid in capital
increase
(decrease) ($) |
| Columbia Acorn® Fund | 67,719,825 | (121,433,416) | 53,713,591 |
| Columbia Acorn International® | 14,466,556 | (14,466,556) | — |
| Columbia Acorn USA® | 6,707,858 | (12,010,942) | 5,303,084 |
| Columbia Acorn International SelectSM | 241,919 | (241,919) | — |
| Columbia Thermostat FundSM | 3,276,451 | (38,472,336) | 35,195,885 |
| Columbia Acorn European FundSM | 665,609 | (155,978) | (509,631) |
Net investment income (loss) and net realized gains (losses), as disclosed in the Statement of Operations, and net assets were not affected by these reclassifications.
| 102 | Columbia Acorn Family of Funds | Annual Report 2021 |
Notes to Financial Statements (continued)
December 31, 2021
The tax character of distributions paid during the years indicated was as follows:
| | Year Ended December 31, 2021 | Year Ended December 31, 2020 |
| Fund | Ordinary
income ($) | Long-term
capital gains ($) | Total ($) | Ordinary
income ($) | Long-term
capital gains ($) | Total ($) |
| Columbia Acorn® Fund | 78,584,909 | 984,296,937 | 1,062,881,846 | — | 632,451,942 | 632,451,942 |
| Columbia Acorn International® | 40,477,298 | 303,672,612 | 344,149,910 | 14,685,330 | 298,368,947 | 313,054,277 |
| Columbia Acorn USA® | 6,190,063 | 69,974,033 | 76,164,096 | 2,090,215 | 13,392,599 | 15,482,814 |
| Columbia Acorn International SelectSM | 4,850,979 | 18,438,724 | 23,289,703 | 690,700 | — | 690,700 |
| Columbia Thermostat FundSM | 100,826,478 | 172,798,104 | 273,624,582 | 64,049,306 | 37,945,388 | 101,994,694 |
| Columbia Acorn European FundSM | 691,232 | — | 691,232 | 420,496 | — | 420,496 |
Short-term capital gain distributions, if any, are considered ordinary income distributions for tax purposes.
At December 31, 2021, the components of distributable earnings on a tax basis were as follows:
| Fund | Undistributed
ordinary
income ($) | Undistributed
long-term
capital gains ($) | Capital loss
carryforwards ($) | Net unrealized
appreciation ($) |
| Columbia Acorn® Fund | 22,568,989 | 131,434,154 | — | 881,851,752 |
| Columbia Acorn International® | — | 44,648,525 | (73,745,642) | 883,383,296 |
| Columbia Acorn USA® | 221,425 | 7,878,468 | — | 56,337,176 |
| Columbia Acorn International SelectSM | — | 11,225,292 | — | 140,057,707 |
| Columbia Thermostat FundSM | 2,756,953 | 12,725,392 | — | 23,202,085 |
| Columbia Acorn European FundSM | — | — | (2,471,500) | 68,575,942 |
At December 31, 2021, the cost of all investments for federal income tax purposes along with the aggregate gross unrealized appreciation and depreciation based on that cost was:
| Fund | Tax cost ($) | Gross
unrealized
appreciation ($) | Gross
unrealized
(depreciation) ($) | Net unrealized
appreciation ($) |
| Columbia Acorn® Fund | 3,686,725,808 | 1,193,325,549 | (311,473,797) | 881,851,752 |
| Columbia Acorn International® | 1,462,963,107 | 927,178,914 | (43,795,618) | 883,383,296 |
| Columbia Acorn USA® | 250,919,108 | 81,460,047 | (25,122,871) | 56,337,176 |
| Columbia Acorn International SelectSM | 339,732,363 | 150,855,258 | (10,797,551) | 140,057,707 |
| Columbia Thermostat FundSM | 2,054,468,921 | 48,699,095 | (25,497,010) | 23,202,085 |
| Columbia Acorn European FundSM | 144,798,162 | 71,133,819 | (2,557,877) | 68,575,942 |
Tax cost of investments and unrealized appreciation/(depreciation) may also include timing differences that do not constitute adjustments to tax basis.
The following capital loss carryforwards, determined at December 31, 2021, may be available to reduce future net realized gains on investments, if any, to the extent permitted by the Internal Revenue Code. In addition, for the year ended December 31, 2021, capital loss carryforwards utilized, if any, were as follows:
| Fund | No expiration
short-term ($) | No expiration
long-term ($) | Total ($) | Utilized ($) |
| Columbia Acorn International® | (47,476,543) | (26,269,099) | (73,745,642) | 288,119 |
| Columbia Acorn International SelectSM | — | — | — | 3,759,384 |
| Columbia Acorn European FundSM | (2,471,500) | — | (2,471,500) | 501,564 |
Under current tax rules, regulated investment companies can elect to treat certain late-year ordinary losses incurred and post-October capital losses (capital losses realized after October 31) as arising on the first day of the following taxable year. As of December 31, 2021, the Funds will elect to treat the following late-year ordinary losses and post-October capital losses as arising on January 1, 2022.
Columbia Acorn Family of Funds | Annual Report 2021
| 103 |
Notes to Financial Statements (continued)
December 31, 2021
| Fund | Late year
ordinary losses ($) | Post-October
capital losses ($) |
| Columbia Acorn International® | — | 4,464,242 |
| Columbia Acorn International SelectSM | 239,817 | — |
Management of the Funds has concluded that there are no significant uncertain tax positions in the Funds that would require recognition in the financial statements. However, management’s conclusion may be subject to review and adjustment at a later date based on factors including, but not limited to, new tax laws, regulations, and administrative interpretations (including relevant court decisions). Generally, the Funds’ federal tax returns for the prior three fiscal years remain subject to examination by the Internal Revenue Service.
Note 5. Portfolio information
The aggregate cost of purchases and proceeds from sales, other than short-term obligations, for the year ended December 31, 2021, were:
| | Purchases
($) | Proceeds
from sales
($) |
| Columbia Acorn® Fund | 3,577,728,511 | 4,415,976,284 |
| Columbia Acorn International® | 647,243,793 | 1,044,213,112 |
| Columbia Acorn USA® | 217,990,026 | 291,164,803 |
| Columbia Acorn International SelectSM | 130,079,843 | 194,222,587 |
| Columbia Thermostat FundSM | 1,307,551,140 | 985,148,824 |
| Columbia Acorn European FundSM | 109,306,352 | 32,897,967 |
Note 6. Affiliated money market fund
Each Fund may invest in Columbia Short-Term Cash Fund, an affiliated money market fund established for the exclusive use by each Fund and other affiliated funds (the Affiliated MMF). The income earned by the Funds from such investments is included as Dividends - affiliated issuers in the Statement of Operations. As an investing fund, each Fund indirectly bears its proportionate share of the expenses of the Affiliated MMF. The Affiliated MMF prices its shares with a floating net asset value. In addition, the Board of Trustees of the Affiliated MMF may impose a fee on redemptions (sometimes referred to as a liquidity fee) or temporarily suspend redemptions (sometimes referred to as imposing a redemption gate) in the event its liquidity falls below regulatory limits.
Note 7. Line of credit
Each Fund has access to a revolving credit facility with a syndicate of banks led by JPMorgan Chase Bank, N.A., Citibank, N.A. and Wells Fargo Bank, N.A. whereby the Fund may borrow for the temporary funding of shareholder redemptions or for other temporary or emergency purposes. Pursuant to an October 28, 2021 amendment and restatement, the credit facility, which is a collective agreement between the Fund and certain other funds managed by the Investment Manager or an affiliated investment manager, severally and not jointly, permits collective borrowings up to $950 million. Interest is currently charged to each participating fund based on its borrowings at a rate equal to the higher of (i) the federal funds effective rate, (ii) the secured overnight financing rate plus 0.11448% and (iii) the overnight bank funding rate, plus in each case, 1.00%. Each borrowing under the credit facility matures no later than 60 days after the date of borrowing. The Fund also pays a commitment fee equal to its pro rata share of the unused amount of the credit facility at a rate of 0.15% per annum. The commitment fee is included in other expenses in the Statement of Operations. This agreement expires annually in October unless extended or renewed. Prior to the October 28, 2021 amendment and restatement, the Fund had access to a revolving credit facility with a syndicate of banks led by JPMorgan Chase Bank, N.A., Citibank, N.A. and Wells Fargo Bank, N.A. which permitted collective borrowings up to $950 million. Interest was charged to each participating fund based on its borrowings at a rate equal to the higher of (i) the federal funds effective rate, (ii) the one-month London Interbank Offered Rate (LIBOR) rate and (iii) the overnight bank funding rate, plus in each case, 1.25%.
| 104 | Columbia Acorn Family of Funds | Annual Report 2021 |
Notes to Financial Statements (continued)
December 31, 2021
During the year ended December 31, 2021, the following fund(s) had borrowings:
| Fund | Average loan
balance ($) | Weighted average
interest rate (%) | Days
outstanding |
| Columbia Acorn USA® | 19,150,000 | 1.37 | 2 |
| Columbia Acorn International SelectSM | 2,550,000 | 1.36 | 2 |
| Columbia Thermostat FundSM | 17,700,000 | 1.30 | 8 |
| Columbia Acorn European FundSM | 8,500,000 | 1.16 | 4 |
Interest expense incurred by the Funds is recorded as a line of credit interest expense in the Statement of Operations. The Funds had no outstanding borrowings at December 31, 2021.
Note 8. Significant risks
Consumer discretionary sector risk
Columbia Acorn USA® is more susceptible to the particular risks that may affect companies in the consumer discretionary sector than if it were invested in a wider variety of companies in unrelated sectors. Companies in the discretionary sector are subject to certain risks, including fluctuations in the performance of the overall domestic and international economy, interest rate changes, increased competition and consumer confidence. Performance of such companies may be affected by factors including reduced disposable household income, reduced consumer spending, changing demographics and consumer tastes.
Foreign securities and emerging market countries risk
Investing in foreign securities may involve certain risks not typically associated with investing in U.S. securities, such as increased currency volatility and risks associated with political, regulatory, economic, social, diplomatic and other conditions or events (Including, for example, military confrontations, war, terrorism, natural disasters and disease pandemics) occurring in the country or region, which may result in significant market volatility. In addition, certain foreign securities may not be as liquid as U.S. securities. Investing in emerging markets may increase these risks and expose the Funds to elevated risks associated with increased inflation, deflation or currency devaluation. To the extent that Columbia Acorn International®, Columbia Acorn International SelectSM and Columbia Acorn European FundSM concentrate their investment exposure to any one or a few specific countries, the Funds will be particularly susceptible to the risks associated with the conditions, events or other factors impacting those countries or regions and may, therefore, have a greater risk than that of a fund that is more geographically diversified. The financial information and disclosure made available by issuers of emerging market securities may be considerably less reliable than publicly available information about other foreign securities. The Public Company Accounting Oversight Board, which regulates auditors of U.S. public companies, is unable to inspect audit work papers in certain foreign companies. Investors in foreign countries often have limited rights and few practical remedies to pursue shareholder claims, including class actions or fraud claims, and the ability of the U.S. Securities and Exchange Commission, the U.S. Department of Justice and other authorities to bring and enforce actions against foreign issuers or foreign persons is limited.
Geographic focus risk
Columbia Acorn International®, Columbia Acorn International SelectSM and Columbia Acorn European FundSM may be particularly susceptible to economic, political, regulatory or other events or conditions affecting issuers and countries within the specific geographic regions in which the Funds invests. The Funds’ NAV may be more volatile than the NAV of a more geographically diversified fund.
Asia Pacific Region. Columbia Acorn International® and Columbia Acorn International SelectSM are particularly susceptible to economic, political, regulatory or other events or conditions affecting issuers and countries in the Asia Pacific region. Many of the countries in the region are considered underdeveloped or developing, including from a political, economic and/or social perspective, and may have relatively unstable governments and economies based on limited business, industries and/or natural resources or commodities. Events in any one country within the region may impact other countries in the region or the region as a whole. As a result, events in the region will generally have a greater effect on the Funds than if the Funds were
Columbia Acorn Family of Funds | Annual Report 2021
| 105 |
Notes to Financial Statements (continued)
December 31, 2021
more geographically diversified. This could result in increased volatility in the value of the Funds’ investments and losses for the Funds. Also, securities of some companies in the region can be less liquid than U.S. or other foreign securities, potentially making it difficult for the Funds to sell such securities at a desirable time and price.
Europe. Columbia Acorn International®, Columbia Acorn International SelectSM and Columbia Acorn European FundSM are particularly susceptible to economic, political, regulatory or other events or conditions affecting issuers and countries in Europe which are often closely connected and interdependent, and events in one European country can have an adverse impact on other European countries. In addition, the private and public sectors’ debt problems of a single European Union (EU) country can pose significant economic risks to the EU as a whole. As a result, the Funds’ NAV may be more volatile than the NAV of a more geographically diversified fund. If securities of issuers in Europe fall out of favor, it may cause the Funds to underperform other funds that do not focus their investments in this region of the world. The UK’s departure from the EU single market became effective January 1, 2021 with the end of the Brexit transition period and the post-Brexit trade deal between the UK and EU taking effect on December 31, 2020. The impact of Brexit on the UK and European economies and the broader global economy could be significant, resulting in negative impacts on currency and financial markets generally, such as increased volatility and illiquidity, and potentially lower economic growth in markets in Europe, which may adversely affect the value of your investments in the Funds.
Health care sector risk
Columbia Acorn® Fund, Columbia Acorn USA® and Columbia Acorn International SelectSM are more susceptible to the particular risks that may affect companies in the health care sector than if they were invested in a wider variety of companies in unrelated sectors. Companies in the health care sector are subject to certain risks, including restrictions on government reimbursement for medical expenses, government approval of medical products and services, competitive pricing pressures, and the rising cost of medical products and services (especially for companies dependent upon a relatively limited number of products or services). Performance of such companies may be affected by factors including government regulation, obtaining and protecting patents (or the failure to do so), product liability and other similar litigation as well as product obsolescence.
Industrial sector risk
Columbia Acorn International®, Columbia Acorn International SelectSM and Columbia Acorn European FundSM are more susceptible to the particular risks that may affect companies in the industrials sector than if they were invested in a wider variety of companies in unrelated sectors. Companies in the industrials sector are subject to certain risks, including changes in supply and demand for their specific product or service and for industrial sector products in general, including decline in demand for such products due to rapid technological developments and frequent new product introduction. Performance of such companies may be affected by factors including government regulation, world events and economic conditions and risks for environmental damage and product liability claims.
Information technology sector risk
Columbia Acorn® Fund, Columbia Acorn International®, Columbia Acorn International SelectSM and Columbia Acorn European FundSM are more susceptible to the particular risks that may affect companies in the information technology sector than if they were invested in a wider variety of companies in unrelated sectors. Companies in the information technology sector are subject to certain risks, including the risk that new services, equipment or technologies will not be accepted by consumers and businesses or will become rapidly obsolete. Performance of such companies may be affected by factors including obtaining and protecting patents (or the failure to do so) and significant competitive pressures, including aggressive pricing of their products or services, new market entrants, competition for market share and short product cycles due to an accelerated rate of technological developments. Such competitive pressures may lead to limited earnings and/or falling profit margins. As a result, the value of their securities may fall or fail to rise. In addition, many information technology sector companies have limited operating histories and prices of these companies’ securities historically have been more volatile than other securities, especially over the short term. Some companies in the information technology sector are facing increased government and regulatory scrutiny and may be subject to adverse government or regulatory action, which could negatively impact the value of their securities.
| 106 | Columbia Acorn Family of Funds | Annual Report 2021 |
Notes to Financial Statements (continued)
December 31, 2021
Market risk
The Funds may incur losses due to declines in the value of one or more securities in which they invest. These declines may be due to factors affecting a particular issuer, or the result of, among other things, political, regulatory, market, economic or social developments affecting the market(s) generally. In addition, turbulence in the financial markets generally and reduced liquidity in the equity, credit and/or fixed income markets more specifically may negatively affect many issuers, which could adversely affect the Funds, including by causing difficulty in pricing hard-to-value assets in thinly traded and closed markets, significant redemptions and operational challenges. Global economies and financial markets are increasingly interconnected, and conditions and events in one country, region, financial market or industry sector may adversely impact issuers in a different country, region, financial market or industry sector. These risks may be magnified if certain events or developments adversely interrupt the global supply chain; in these and other circumstances, such risks might affect companies worldwide. As a result, local, regional or global events such as terrorism, war, natural disasters, disease/virus outbreaks and epidemics or other public health crises, recessions, depressions or other events – or the potential for such events – could have a significant negative impact on global economic and market conditions.
The COVID-19 pandemic has resulted in, and may continue to result in, significant global economic and market volatility arising from disruptions in market access, resource availability, facilities operations, imposition of tariffs, export controls and supply chains, among other factors. These and related societal disruptions have been caused or exacerbated by, and may continue to be caused or exacerbated by, quarantines and travel restrictions, workforce displacement and loss in human and other resources. There is significant uncertainty surrounding the magnitude, duration, reach, costs and other effects of the COVID-19 global pandemic, including actions that have been or could be taken by governmental authorities or other third parties. The impacts, as well as the uncertainty over impacts yet to unfold, of COVID-19 – and any other infectious illness outbreaks, epidemics, pandemics or other public health crises that may arise in the future – could negatively affect global economies and markets in ways that cannot necessarily be foreseen. In addition, the impact of infectious illness outbreaks, and epidemics, pandemics and other public health crises in emerging market countries may be greater due to generally less established healthcare systems, governments and financial markets. Public health crises caused by the COVID-19 pandemic may exacerbate other pre-existing political, social and economic risks in certain countries or globally. The disruptions caused by COVID-19 could prevent the Investment Manager from executing advantageous investment decisions for the Funds in a timely manner and could negatively impact the Funds’ ability to achieve its investment objective. Any such event(s) could have a significant adverse impact on the value and risk profile of the Funds.
Shareholder concentration risk
At December 31, 2021, the table below details the affiliated and significant unaffiliated shareholder account ownership of outstanding shares of each Fund. The Funds have no knowledge about whether any portion of these unaffiliated shares were owned beneficially. Subscription and redemption activity of these accounts may have a significant effect on the operations of the Funds.
| Fund | Number of
unaffiliated
accounts | Percentage of
shares
outstanding
held —
unaffiliated (%) | Percentage of
shares
outstanding
held —
affiliated (%) |
| Columbia Acorn® Fund | — | — | — |
| Columbia Acorn International® | 1 | 11.2 | — |
| Columbia Acorn USA® | 1 | 18.6 | — |
| Columbia Acorn International SelectSM | 1 | 16.0 | 25.0 |
| Columbia Thermostat FundSM | 1 | 15.4 | 20.2 |
| Columbia Acorn European FundSM | 2 | 27.9 | 21.8 |
Small- and mid-cap company risk
Columbia Acorn® Fund, Columbia Acorn International®, Columbia Acorn USA®, Columbia Acorn International SelectSM and Columbia Acorn European FundSM investments in small- and mid-capitalization companies (small- and mid-cap companies) often involve greater risks than investments in larger, more established companies (larger companies) because small- and
Columbia Acorn Family of Funds | Annual Report 2021
| 107 |
Notes to Financial Statements (continued)
December 31, 2021
mid-cap companies tend to have less predictable earnings and may lack the management experience, financial resources, product diversification and competitive strengths of larger companies. Securities of small- and mid-cap companies may be less liquid and more volatile than the securities of larger companies.
Note 9. Subsequent events
Management has evaluated the events and transactions that have occurred through the date the financial statements were issued. Other than as noted in Note 3 and below, there were no items requiring adjustment of the financial statements or additional disclosure.
The Fund’s Board of Trustees approved changes to the principal investment strategy, and comparative benchmark of Columbia Acorn USA®. As a result, effective May 1, 2022, Columbia Acorn USA® will have an increase in the market capitalization range of the companies in which it invests a majority of its assets and its comparative benchmark will be changed to the Russell 2500 Growth Index. These changes are being made in advance of a likely future proposal to merge the Columbia Acorn USA® with and into Columbia Acorn® Fund.
Note 10. Information regarding pending and settled legal proceedings
Ameriprise Financial and certain of its affiliates have historically been involved in a number of legal, arbitration and regulatory proceedings, including routine litigation, class actions, and governmental actions, concerning matters arising in connection with the conduct of their business activities. Ameriprise Financial believes that the Funds are not currently the subject of, and that neither Ameriprise Financial nor any of its affiliates are the subject of, any pending legal, arbitration or regulatory proceedings that are likely to have a material adverse effect on the Funds or the ability of Ameriprise Financial or its affiliates to perform under their contracts with the Funds. Ameriprise Financial is required to make quarterly (10-Q), annual (10-K) and, as necessary, 8-K filings with the Securities and Exchange Commission (SEC) on legal and regulatory matters that relate to Ameriprise Financial and its affiliates. Copies of these filings may be obtained by accessing the SEC website at www.sec.gov.
There can be no assurance that these matters, or the adverse publicity associated with them, will not result in increased Fund redemptions, reduced sale of Fund shares or other adverse consequences to the Funds. Further, although we believe proceedings are not likely to have a material adverse effect on the Funds or the ability of Ameriprise Financial or its affiliates to perform under their contracts with the Funds, these proceedings are subject to uncertainties and, as such, we are unable to estimate the possible loss or range of loss that may result. An adverse outcome in one or more of these proceedings could result in adverse judgments, settlements, fines, penalties or other relief that could have a material adverse effect on the consolidated financial condition or results of operations of Ameriprise Financial or one or more of its affiliates that provides services to the Funds.
Note 11. Fund reorganization for Columbia Acorn® Fund
At the close of business on July 10, 2020, Columbia Acorn® Fund acquired the assets and assumed the identified liabilities of Columbia Acorn SelectSM (the Acquired Fund), a series of Columbia Acorn Trust. The reorganization was completed after the Board of Trustees of the Acquired Fund approved a plan of reorganization at a meeting held in February 2020. The purpose of the transaction was to combine two funds managed by the Investment Manager with comparable investment objectives and strategies.
The aggregate net assets of Columbia Acorn® Fund immediately before the reorganization were $3,945,929,243 and the combined net assets immediately after the reorganization were $4,162,559,888.
The reorganization was accomplished by a tax-free exchange of 17,982,620 shares of the Acquired Fund valued at $216,630,645 (including $45,240,007 of unrealized appreciation/(depreciation)).
In exchange for the Acquired Fund’s shares, Columbia Acorn® Fund issued the following number of shares:
| 108 | Columbia Acorn Family of Funds | Annual Report 2021 |
Notes to Financial Statements (continued)
December 31, 2021
| | Shares |
| Class A | 7,633,122 |
| Advisor Class | 86,140 |
| Class C | 139,092(a) |
| Institutional Class | 8,169,626 |
| Institutional 2 Class | 204,341 |
| Institutional 3 Class | 367,453 |
| (a) | Share activity for Class C has been adjusted on a retroactive basis to reflect a 4 to 1 reverse stock split completed after the close of business on September 11, 2020. |
For financial reporting purposes, net assets received and shares issued by Columbia Acorn® Fund were recorded at fair value; however, the Acquired Fund’s cost of investments was carried forward.
Columbia Acorn® Fund’s financial statements reflect both the operations of the Fund for the period prior to the reorganization and the combined Fund for the period subsequent to the reorganization. Because the combined investment portfolios have been managed as a single integrated portfolio since the reorganization was completed, it is not practicable to separate the amounts of revenue and earnings of the Acquired Fund that have been included in the combined Fund’s Statement of Operations since the reorganization was completed.
Assuming the reorganization had been completed on January 1, 2020, Columbia Acorn® Fund’s pro-forma results of operations for the year ended December 31, 2020 would have been approximately:
| | ($) |
| Net investment loss | (13,866,000) |
| Net realized gain | 692,024,000 |
| Net change in unrealized appreciation | 463,288,000 |
| Net increase in net assets from operations | 1,141,446,000 |
Note 12. Fund reorganization for Columbia Acorn International®
At the close of business on July 10, 2020, Columbia Acorn International® acquired the assets and assumed the identified liabilities of Columbia Acorn Emerging Markets FundSM (the Acquired Fund), a series of Columbia Acorn Trust. The reorganization was completed after the Board of Trustees of the Acquired Fund approved a plan of reorganization at a meeting held in February 2020. The purpose of the transaction was to combine two funds managed by the Investment Manager with comparable investment objectives and strategies.
The aggregate net assets of Columbia Acorn International® immediately before the reorganization were $2,289,446,759 and the combined net assets immediately after the reorganization were $2,321,819,727.
The reorganization was accomplished by a tax-free exchange of 2,827,715 shares of the Acquired Fund valued at $32,372,968 (including $3,368,388 of unrealized appreciation/(depreciation)).
In exchange for the Acquired Fund’s shares, Columbia Acorn International® issued the following number of shares:
| | Shares |
| Class A | 401,457 |
| Advisor Class | 10,583 |
| Class C | 206,250 |
| Institutional Class | 435,556 |
| Institutional 2 Class | 8,252 |
| Institutional 3 Class | 20,109 |
For financial reporting purposes, net assets received and shares issued by Columbia Acorn International® were recorded at fair value; however, the Acquired Fund’s cost of investments was carried forward.
Columbia Acorn Family of Funds | Annual Report 2021
| 109 |
Notes to Financial Statements (continued)
December 31, 2021
Columbia Acorn International®’s financial statements reflect both the operations of the Fund for the period prior to the reorganization and the combined Fund for the period subsequent to the reorganization. Because the combined investment portfolios have been managed as a single integrated portfolio since the reorganization was completed, it is not practicable to separate the amounts of revenue and earnings of the Acquired Fund that have been included in the combined Fund’s Statement of Operations since the reorganization was completed.
Assuming the reorganization had been completed on January 1, 2020, Columbia Acorn International®’s pro-forma results of operations for the year ended December 31, 2020 would have been approximately:
| | ($) |
| Net investment income | 10,398,000 |
| Net realized gain | 271,863,000 |
| Net change in unrealized appreciation | 13,902,000 |
| Net increase in net assets from operations | 296,163,000 |
Note 13. Fund reorganization for Columbia Acorn International SelectSM
At the close of business on August 7, 2020, Columbia Acorn International SelectSM acquired the assets and assumed the identified liabilities of Columbia Select International Equity Fund (the Acquired Fund), a series of Columbia Funds Series Trust. The reorganization was completed after the Board of Trustees of the Acquired Fund approved a plan of reorganization at a meeting held in June 2020. The purpose of the transaction was to combine two funds managed by the Investment Manager and its affiliates with comparable investment objectives and strategies.
The aggregate net assets of Columbia Acorn International SelectSM immediately before the reorganization were $221,813,610 and the combined net assets immediately after the reorganization were $464,940,748.
The reorganization was accomplished by a tax-free exchange of 18,460,726 shares of the Acquired Fund valued at $243,127,138 (including $9,281,109 of unrealized appreciation/(depreciation)).
In exchange for the Acquired Fund’s shares, Columbia Acorn International SelectSM issued the following number of shares:
| | Shares |
| Class A | 5,674,674(a) |
| Advisor Class | 13,886 |
| Class C | 51,121 |
| Institutional Class | 2,384,285 |
| Institutional 2 Class | 27,450 |
| Institutional 3 Class | 152,649 |
| (a) | 20,130 shares of Class A were issued in exchange of Class R shares of the Acquired Fund. |
For financial reporting purposes, net assets received and shares issued by Columbia Acorn International SelectSM were recorded at fair value; however, the Acquired Fund’s cost of investments was carried forward.
Columbia Acorn International SelectSM’s financial statements reflect both the operations of the Fund for the period prior to the reorganization and the combined Fund for the period subsequent to the reorganization. Because the combined investment portfolios have been managed as a single integrated portfolio since the reorganization was completed, it is not practicable to separate the amounts of revenue and earnings of the Acquired Fund that have been included in the combined Fund’s Statement of Operations since the reorganization was completed.
| 110 | Columbia Acorn Family of Funds | Annual Report 2021 |
Notes to Financial Statements (continued)
December 31, 2021
Assuming the reorganization had been completed on January 1, 2020, Columbia Acorn International SelectSM’s pro-forma results of operations for the year ended December 31, 2020 would have been approximately:
| | ($) |
| Net investment income | 1,375,000 |
| Net realized gain | 35,106,000 |
| Net change in unrealized appreciation | 38,903,000 |
| Net increase in net assets from operations | 75,384,000 |
Columbia Acorn Family of Funds | Annual Report 2021
| 111 |
Report of Independent Registered Public Accounting Firm
To the Board of Trustees of Columbia Acorn Trust and Shareholders of Columbia Acorn® Fund, Columbia Acorn International®, Columbia Acorn USA®, Columbia Acorn International SelectSM, Columbia Thermostat FundSM, and Columbia Acorn European FundSM
Opinions on the Financial Statements
We have audited the accompanying statements of assets and liabilities, including the portfolios of investments, of Columbia Acorn® Fund, Columbia Acorn International®, Columbia Acorn USA®, Columbia Acorn International SelectSM, Columbia Thermostat FundSM, and Columbia Acorn European FundSM (six of the funds constituting Columbia Acorn Trust, hereafter collectively referred to as the "Funds") as of December 31, 2021, the related statements of operations for the year ended December 31, 2021, the statements of changes in net assets for each of the two years in the period ended December 31, 2021, including the related notes, and the financial highlights for each of the periods indicated therein (collectively referred to as the "financial statements"). In our opinion, the financial statements present fairly, in all material respects, the financial position of each of the Funds as of December 31, 2021, the results of each of their operations for the year then ended, the changes in each of their net assets for each of the two years in the period ended December 31, 2021 and each of the financial highlights for each of the periods indicated therein in conformity with accounting principles generally accepted in the United States of America.
Basis for Opinions
These financial statements are the responsibility of the Funds’ management. Our responsibility is to express an opinion on the Funds’ financial statements based on our audits. We are a public accounting firm registered with the Public Company Accounting Oversight Board (United States) (PCAOB) and are required to be independent with respect to the Funds in accordance with the U.S. federal securities laws and the applicable rules and regulations of the Securities and Exchange Commission and the PCAOB.
We conducted our audits of these financial statements in accordance with the standards of the PCAOB. Those standards require that we plan and perform the audit to obtain reasonable assurance about whether the financial statements are free of material misstatement, whether due to error or fraud.
Our audits included performing procedures to assess the risks of material misstatement of the financial statements, whether due to error or fraud, and performing procedures that respond to those risks. Such procedures included examining, on a test basis, evidence regarding the amounts and disclosures in the financial statements. Our audits also included evaluating the accounting principles used and significant estimates made by management, as well as evaluating the overall presentation of the financial statements. Our procedures included confirmation of securities owned as of December 31, 2021 by correspondence with the custodian, transfer agent and brokers; when replies were not received from brokers, we performed other auditing procedures. We believe that our audits provide a reasonable basis for our opinions.
/s/PricewaterhouseCoopers LLP
Minneapolis, Minnesota
February 18, 2022
We have served as the auditor of one or more investment companies in the Columbia Acorn Trust since 2004.
| 112 | Columbia Acorn Family of Funds | Annual Report 2021 |
Federal Income Tax Information
(Unaudited)
The Funds hereby designate the following tax attributes for the fiscal year ended December 31, 2021. Shareholders were notified in early 2022 of the amounts for use in preparing 2021 income tax returns.
| | Qualified
dividend
income | Dividends
received
deduction | Section
199A
dividends | Capital
gain
dividend | Foreign
taxes paid
to foreign
countries | Foreign
taxes paid
per share
to foreign
countries | Foreign
source
income | Foreign
source
income per
share |
| Columbia Acorn® Fund | 42.83% | 41.48% | 0.00% | $1,035,605,564 | $0 | $0.0000 | $0 | $0.00 |
| Columbia Acorn International® | 87.57% | 1.55% | 0.00% | $296,056,088 | $2,173,379 | $0.0309 | $32,088,258 | $0.46 |
| Columbia Acorn USA® | 15.27% | 15.00% | 0.00% | $81,795,532 | $0 | $0.0000 | $0 | $0.00 |
| Columbia Acorn International SelectSM | 100.00% | 0.00% | 0.00% | $31,147,217 | $425,308 | $0.0317 | $5,277,262 | $0.39 |
| Columbia Thermostat FundSM | 3.54% | 3.30% | 0.06% | $200,334,164 | $46,074 | $0.0004 | $242,844 | $0.00 |
| Columbia Acorn European FundSM | 100.00% | 6.34% | 0.00% | $0 | $136,804 | $0.0214 | $1,598,335 | $0.25 |
Qualified dividend income. For taxable, non-corporate shareholders, the percentage of ordinary income distributed during the fiscal year that represents qualified dividend income subject to reduced tax rates.
Dividends received deduction. The percentage of ordinary income distributed during the fiscal year that qualifies for the corporate dividends received deduction.
Section 199A dividends. For taxable, non-corporate shareholders, the percentage of ordinary income distributed during the fiscal year that represents Section 199A dividends potentially eligible for a 20% deduction.
Capital gain dividend. The Fund designates as a capital gain dividend the amount reflected above, or if subsequently determined to be different, the net capital gain of such fiscal period.
Foreign taxes. The Fund makes the election to pass through to shareholders the foreign taxes paid. Eligible shareholders may claim a foreign tax credit. These taxes, and the corresponding foreign source income, are provided in the table above.
Columbia Acorn Family of Funds | Annual Report 2021
| 113 |
Board of Trustees and Management of the Columbia Acorn Family of Funds
Each trustee may serve a term of unlimited duration. The Trust’s Bylaws generally require that a trustee retire at the end of the calendar year in which the trustee attains the age of 75 years. The trustees appoint their own successors, provided that at least two-thirds of the trustees, after such appointment, have been elected by shareholders. Shareholders may remove a trustee, with or without cause, upon the vote of two-thirds of the Trust’s outstanding shares at any meeting called for that purpose. A trustee may be removed, with or without cause, upon the vote of a majority of the trustees. The names of the trustees and officers of the Trust, the date each was first elected or appointed to office and the principal business occupations of each during at least the last five years, and for the trustees, the number of portfolios in the fund complex they oversee and other directorships they hold, are shown below. Each trustee and officer serves in such capacity for each of the six series of Columbia Acorn Trust and for each of the three series of Wanger Advisors Trust.
The address for the trustees and officers of the Trust is Columbia Wanger Asset Management, LLC, 71 S Wacker Drive, Suite 2500, Chicago, Illinois 60606. The Funds’ Statement of Additional Information includes additional information about the Funds’ trustees and officers. You may obtain a free copy of the Statement of Additional Information by writing or calling toll-free:
Columbia Wanger Asset Management, LLC
Shareholder Services Group
71 S Wacker Drive, Suite 2500
Chicago, IL 60606
800.922.6769
Independent trustees
Name and age at
December 31, 2021 | Year first appointed or elected to a Board in the Columbia Funds Complex | Principal occupation(s)
during the past five years | Number of
Funds in the
Columbia
Funds
Complex
overseen (1) | Other directorships
held by the Trustee
during the past five years
in addition to
Columbia Acorn Trust and
Wanger Advisors Trust |
| Laura M. Born, 56* | 2007 | Adjunct Professor of Finance, University of Chicago Booth School of Business since 2007; Advisory Board Member, Driehaus Capital Management since 2018; Director and Audit Committee Chair, Carlson Inc. (private global travel company) since 2015; Managing Director – Investment Banking, JP Morgan Chase & Co. (broker-dealer) 2002-2007. | 9 | None. |
| Maureen M. Culhane, 73 | 2007 | Retired. Formerly, Vice President, Goldman Sachs Asset Management, L.P. (investment adviser), 2005-2007; Vice President (Consultant) – Strategic Relationship Management, Goldman, Sachs & Co., 1999-2005. | 9 | None. |
| Margaret M. Eisen, 68 | 2002 | Trustee, Smith College, 2012-2016; Chief Investment Officer, EAM International LLC (corporate finance and asset management), 2003-2013; Managing Director, CFA Institute, 2005-2008. | 9 | Chair, RMB Investors Trust (9 series). |
| John C. Heaton, 62 | 2010 | Joseph L. Gidwitz Professor of Finance, University of Chicago Booth School of Business since July 2000; Deputy Dean for Faculty, University of Chicago Booth School of Business, 2012-2019. | 9 | None. |
| Dianne Lob, 67 | 2021 | Retired. Formerly, Senior Vice President and Senior Managing Director, Global Head of Business and Product Development, AllianceBernstein Holding L.P. (asset management), 2014-2020; Chairman, Private Client Investment Policy Group, Alliance Bernstein Holding L.P., 2005-2014. | 9 | None. |
| 114 | Columbia Acorn Family of Funds | Annual Report 2021 |
Board of Trustees and Management of the Columbia Acorn Family of Funds (continued)
Independent trustees (continued)
Name and age at
December 31, 2021 | Year first appointed or elected to a Board in the Columbia Funds Complex | Principal occupation(s)
during the past five years | Number of
Funds in the
Columbia
Funds
Complex
overseen (1) | Other directorships
held by the Trustee
during the past five years
in addition to
Columbia Acorn Trust and
Wanger Advisors Trust |
| Charles R. Phillips, 65 | 2015 | Retired. Formerly, Vice Chairman, J.P. Morgan Private Bank, 2011-2014; Managing Director, J.P. Morgan Private Bank, 2001-2011; Managing Director, J.P. Morgan Private Bank, 2001-2011. | 9 | None. |
David J. Rudis, 66,
Chair | 2010 | Chief Executive Officer, Finger Rock, LLC (strategic consulting business). Formerly, National Checking and Debit Executive, and Illinois President, Bank of America, 2007-2009; President, Consumer Banking Group, LaSalle National Bank, 2004-2007. | 9 | None. |
Trustee Emeritus
Name and age at
December 31, 2021 | Year first
appointed or
elected to a
Board in the
Columbia
Funds
Complex | Principal occupation(s)
during the past five years | Number of
Funds in the
Columbia
Funds
Complex
overseen (1) | Other directorships
held by the Trustee
during the past five years
in addition to
Columbia Acorn Trust and
Wanger Advisors Trust |
| Ralph Wanger, 87 (2) | 1970 (3) | Founder, CWAM. Formerly, President, Chief Investment Officer and portfolio manager, CWAM or its predecessors, July 1992-September 2003; Director, Wanger Investment Company PLC; Consultant, CWAM or its predecessors, September 2003-September 2005. | 9 | None. |
| * | Ms. Born retired from the Board, effective December 31, 2021. |
| (1) | The Trustees oversee the series of Wanger Advisors Trust and Columbia Acorn Trust. |
| (2) | As permitted under the Trust’s Bylaws, Mr. Wanger serves as a non-voting Trustee Emeritus of Columbia Acorn Trust and Wanger Advisors Trust. Prior to September 2009, Mr. Wanger served as an “interested” trustee of the Columbia Acorn Trust and Wanger Advisors Trust. Mr. Wanger was considered an “interested person” of the Trusts and of CWAM within the meaning of the 1940 Act because of certain ownership interests. |
| (3) | Dates prior to April 1992 correspond to the date first elected as a director of The Acorn Fund, Inc., the Trust’s predecessor. |
Fund officers
Name and age at
December 31, 2021 | Position
held with
Columbia
Acorn
Trust and
Wanger
Advisors Trust | Year first
appointed
or elected
to office | Principal occupation(s) during
the past five years |
| Daniel Beckman, 60 | Co-President* | 2021 | Vice President, Head of North America Product, Columbia Management Investment Advisers, LLC (since April 2015); officer of Columbia Funds and affiliated funds since 2020. |
| Michael G. Clarke, 51 | Treasurer and Principal Accounting and Financial Officer | 2004 | Vice President, Head of North American Operations, and Tax Co-Head of Global Operations, Columbia Management since June 2019 (previously Vice President, Accounting and Tax, May 2010-May 2019); senior officer of Columbia Funds and affiliated funds since 2002. |
Columbia Acorn Family of Funds | Annual Report 2021
| 115 |
Board of Trustees and Management of the Columbia Acorn Family of Funds (continued)
Fund officers (continued)
Name and age at
December 31, 2021 | Position
held with
Columbia
Acorn
Trust and
Wanger
Advisors Trust | Year first
appointed
or elected
to office | Principal occupation(s) during
the past five years |
| John L. Emerson, 46 | Vice President | 2020 | Portfolio manager and/or analyst, CWAM or its predecessors since 2003. |
| Tae Han (Simon) Kim, 40 | Vice President | 2018 | Portfolio manager and/or analyst, CWAM since 2011. |
| Stephen Kusmierczak, 54 | Co-President | 2011 | Portfolio manager and/or analyst, CWAM or its predecessors since 2001. Vice President, Columbia Acorn Trust and Wanger Advisors Trust, 2011 - 2020. |
| Joseph C. LaPalm, 51 | Vice President | 2006 | Chief Compliance Officer, CWAM since 2005. |
| Ryan C. Larrenaga, 50 | Chief Legal Officer and Assistant Secretary | 2015 | Vice President and Chief Counsel, Ameriprise Financial, Inc. since August 2018 (previously, Vice President and Group Counsel, August 2011 - August 2018); officer of Columbia Funds and affiliated funds since 2005. |
| Erika K. Maschmeyer, 40 | Vice President | 2020 | Portfolio manager and/or analyst, CWAM or its predecessors since 2016. |
| Thomas P. McGuire, 48 | Chief Compliance Officer | 2015 | Senior Vice President and Chief Compliance Officer of the Columbia Funds since 2012; Vice President – Asset Management Compliance, Ameriprise Financial, Inc., since May 2010; Chief Compliance Officer, Ameriprise Certificate Company since September 2010. |
| Sebastien Pigeon, 49 | Vice President | 2021 | Portfolio manager and/or analyst, CWAM or its predecessors since 2017. |
| Julian Quero, 54 | Assistant Treasurer | 2015 | Vice President – Tax, Columbia Management Investment Advisers, LLC since 2009. |
| Martha A. Skinner, 46 | Assistant Treasurer | 2016 | Vice President of Financial Reporting and Administration, Columbia Management since November 2015; Director of Financial Reporting, Columbia Management, April 2013-November 2015. |
| Hans F. Stege, 37 | Vice President | 2020 | Portfolio manager and/or analyst, CWAM or its predecessors since 2017. |
| Linda Roth-Wiszowaty, 51 | Secretary | 2006 | Business support analyst, CWAM since April 2007. |
| * | Mr. Beckman also serves as the Principal Executive Officer of the Trust for purposes of the Sarbanes Oxley Act of 2002. |
| 116 | Columbia Acorn Family of Funds | Annual Report 2021 |
Board Approval of the Advisory Agreement
Columbia Acorn Trust (the “Trust”) has an investment advisory agreement (the “Advisory Agreement”) with Columbia Wanger Asset Management, LLC (“CWAM”) under which CWAM manages the Columbia Acorn Funds (each, a “Fund,” and together, the “Funds”). All of the voting trustees of the Trust are persons who have no direct or indirect interest in the Advisory Agreement and are not “interested persons” (as defined in the Investment Company Act of 1940, as amended (the “1940 Act”)) of the Trust (the “Independent Trustees”). The Independent Trustees oversee the management of each Fund and, as required by law, determine at least annually whether to continue the Advisory Agreement for each Fund.
The Contract Committee (the “Contract Committee”) of the Board of Trustees of the Trust (the “Board”), which is comprised solely of Independent Trustees, makes recommendations to the Board regarding any proposed continuation of the Advisory Agreement. After the Contract Committee has made its recommendations, the full Board determines whether to approve continuation of the Advisory Agreement. The Board also considers matters bearing on the Advisory Agreement at its various meetings throughout the year, meets at least quarterly with CWAM investment personnel (as does the Board’s Investment Performance Analysis Committee (the “Performance Committee”)), and receives monthly reports from CWAM on the performance of the Funds. In connection with their most recent consideration of the Advisory Agreement for the Funds, the members of the Contract Committee and all Independent Trustees received and reviewed a substantial amount of information provided by CWAM, Columbia Management Investment Advisers, LLC (“Columbia Management”) and Ameriprise Financial, Inc. (“Ameriprise”), the parent of CWAM and Columbia Management, in response to written requests from the Independent Trustees and their independent legal counsel. Throughout the process, the Independent Trustees had numerous opportunities to ask questions of and request additional materials from CWAM, Columbia Management and Ameriprise.
During each meeting at which the Contract Committee or the Independent Trustees considered the Advisory Agreement, they met in at least one executive session with their independent legal counsel. Members of the Contract Committee and their independent counsel also met with representatives of CWAM, Columbia Management and Ameriprise on several occasions. In all, the Contract Committee convened formally on seven separate occasions to consider the continuation of the Advisory Agreement. The Board and/or some or all of the Independent Trustees met on other occasions to receive the Contract Committee’s status reports and/or to discuss outstanding issues. In addition, the Performance Committee, which is also comprised exclusively of Independent Trustees, reviewed the performance of the Funds, met in joint meetings with the Contract Committee, and reported to the Board and/or the Contract Committee throughout the year. The chair of the Compliance Committee of the Board (the “Compliance Committee”) made available relevant information with respect to matters within the realm of the Compliance Committee’s oversight responsibilities.
The materials reviewed by the Contract Committee and the Independent Trustees included, among other items: (i) information on the investment performance of each Fund relative to independently selected peer groups of funds, peer groups of funds selected by Columbia Management and the Funds’ performance benchmarks over various periods, as presented and analyzed by an independent consultant; (ii) information on each Fund’s advisory fees and other expenses, including information comparing the Fund’s fees and expenses to those of peer groups of funds and information about any applicable expense limitations and fee breakpoints; (iii) data on sales and redemptions of Fund shares; and (iv) information on the profitability to CWAM and its affiliates, as well as potential “fall-out” or ancillary benefits that CWAM and its affiliates may receive as a result of their relationships with the Funds. The Contract Committee and the Board also took into account other information, such as: (i) CWAM’s financial condition; (ii) each Fund’s investment objective and strategies; (iii) the overall level of resources devoted to the Funds; (iv) the size, education, experience and resources of CWAM’s investment staff and its use of technology, including with respect to the liquidity risk management program and external research and trading cost measurement tools; (v) changes in investment and other personnel at CWAM; (vi) the portfolio manager compensation framework at CWAM; (vii) the allocation of the Funds’ brokerage, and the use of “soft” commission dollars to pay for research products and services; (viii) CWAM’s risk management program; (ix) the resources devoted to, and the record of compliance with, the Funds’ investment policies and restrictions, policies on personal securities transactions and other compliance policies and procedures; (x) CWAM’s and its affiliates’ conflicts of interest; and (xi) CWAM’s management of the Funds in light of market and operating conditions arising from the COVID-19 pandemic.
At meetings held on June 10, 2021 and July 21, 2021, the Board considered the continuation of the Advisory Agreement and unanimously approved the continuation of the Advisory Agreement for each Fund on July 21, 2021. In considering the continuation of the Advisory Agreement, the Independent Trustees reviewed and analyzed various factors that they
Columbia Acorn Family of Funds | Annual Report 2021
| 117 |
Board Approval of the Advisory Agreement (continued)
determined were relevant, none of which by itself was considered dispositive. The material factors and conclusions that formed the basis for the Independent Trustees’ determination to approve the continuation of the Advisory Agreement are discussed below.
Nature, quality and extent of services
The Independent Trustees reviewed the nature, quality and extent of the services provided by CWAM and its affiliates to the Funds under the Advisory Agreement, taking into account the investment objective and strategy of each Fund, its shareholder base and knowledge gained from meetings with management, which were held on at least a quarterly basis. They reviewed the available resources and key personnel of CWAM and its affiliates, especially those providing investment management services to the Funds. They also considered the resources dedicated specifically to CWAM by its parent company pursuant to the Advisory Agreement and the contribution of those resources to the portfolio management process. The Independent Trustees noted that these dedicated resources included the professionals responsible for Fund risk analysis and portfolio construction, the continuous development and maintenance of CWAM’s research base and the servicing and support of existing Fund shareholders.
The Independent Trustees also considered other services provided to the Funds by CWAM and its affiliates, including: managing the execution of portfolio transactions and selecting broker-dealers for those transactions; monitoring adherence to the Funds’ investment restrictions; monitoring and managing the Funds’ liquidity pursuant to the liquidity risk management program; providing support services for, and regular updates on the operations of the Funds to the Board and committees of the Board; managing the Funds’ securities lending program; communicating with shareholders; serving as the Funds’ administrator and fund accountant; and overseeing the activities of the Funds’ other service providers, including monitoring for compliance with various policies and procedures as well as applicable securities laws and regulations. The Independent Trustees also considered CWAM’s ability to operate from an almost complete remote working environment in connection with the COVID-19 pandemic without any adverse impact on the Funds or shareholders. The Independent Trustees also noted the quality of CWAM’s compliance record.
The Independent Trustees considered CWAM’s extensive and focused efforts to improve the performance of certain domestic and international Funds and believed they were reasonable and appropriate.
The Independent Trustees concluded that the nature, quality and extent of the services provided by CWAM and its affiliates to each Fund under the Advisory Agreement were appropriate for the Funds and that the Funds were likely to benefit from the continued provision of those services by CWAM. They also concluded that CWAM had sufficient personnel, with appropriate education and experience, to serve the Funds effectively. The Independent Trustees also considered that Ameriprise had committed to the Board that CWAM would have sufficient investment management resources to continue to improve performance, including but not limited to resources to hire investment personnel, as necessary.
Performance of the Funds
The Independent Trustees received and considered detailed performance information at various meetings of the Board, the Contract Committee and the Performance Committee throughout the year. They reviewed information comparing each Fund’s performance with that of its benchmarks and with the performance of comparable funds and peer groups as identified by independent consultant Broadridge Financial Solutions, Inc. (“Broadridge”). They also reviewed information comparing the performance of each Fund, except Columbia Thermostat Fund, with the performance of a peer group of funds selected by Columbia Management (each a “5P Group”). The Independent Trustees evaluated the performance and risk characteristics of the Funds over various periods, including over the one-, three- and five-year periods ended December 31, 2020. They also considered more recent peer and benchmark performance data for certain Funds in order to evaluate CWAM’s progress in improving Fund performance.
With respect to Columbia Acorn Fund, the Independent Trustees considered that the Fund’s performance was below its Broadridge peer group median, 5P Group median and primary benchmark for the one-, three- and five-year periods ended December 31, 2020. The Independent Trustees also took into account that Columbia Acorn Fund had underperformed its Broadridge peer group median and its primary benchmark for the one-, three- and five-year periods ended April 30, 2021. The Independent Trustees believed that CWAM was devoting appropriate attention to improving the Fund’s performance.
| 118 | Columbia Acorn Family of Funds | Annual Report 2021 |
Board Approval of the Advisory Agreement (continued)
The Independent Trustees observed that the performance of Columbia Acorn USA lagged that of its Broadridge peer group median and 5P Group median for the one-, three- and five-year periods ended December 31, 2020. They also considered that the Fund had outperformed its primary benchmark for the three- and five-year periods ended December 31, 2020, and underperformed its primary benchmark for the one-year period ended December 31, 2020. For the more recent one-, three- and five-year periods ended April 30, 2021, the Independent Trustees observed that the Fund had underperformed its Broadridge peer group median for the one-, three- and five-year periods and outperformed its primary benchmark for the three- and five-year periods.
In considering the performance of Columbia Thermostat Fund, the Independent Trustees observed that Broadridge could not construct an appropriate peer group for the Fund because of the Fund’s unique investment strategy. Accordingly, the Independent Trustees reviewed the Fund’s performance against a universe of retail and institutional flexible portfolio funds selected by Broadridge. They considered that the Fund had outperformed its Broadridge peer universe median for the one-, three- and five- periods ended December 31, 2020. The Independent Trustees also took into account that Columbia Thermostat Fund has both an equity and a debt primary benchmark, and they reviewed the performance of the Fund relative to an equally-weighted custom composite of the Fund’s primary benchmarks for equity and debt securities established by CWAM (the “Blended Benchmark”). The Independent Trustees observed that the Fund’s performance surpassed that of the Blended Benchmark for the one-, three- and five-year periods ended December 31, 2020. The Independent Trustees also considered that the Fund had outperformed the Blended Benchmark for the one-, three- and five-year periods ended April 30, 2021.
The Independent Trustees considered that Columbia Acorn International had underperformed the median of its Broadridge peer group and the median of its 5P Group for the one-, three- and five-year periods ended December 31, 2020. They also considered the Fund’s performance versus various benchmarks for the same periods and noted that the Fund had underperformed its primary benchmark for the one- and five-year periods ended December 31, 2020, and outperformed its primary benchmark for the three-year period ended December 31, 2020. For the more recent one-, three- and five-year periods ended April 30, 2021, the Independent Trustees considered that the Fund had underperformed its Broadridge peer group median and outperformed its primary benchmark for the one-, three- and five-year periods.
With respect to Columbia Acorn International Select, the Independent Trustees considered that the Fund’s performance exceeded the median of its Broadridge peer group and primary benchmark for the three- and five-year periods ended December 31, 2020, and lagged the median of its Broadridge peer group and primary benchmark for the one-year period ended December 31, 2020. They also considered that the Fund had underperformed the median of its 5P Group for the one-year period ended December 31, 2020, performed at the median of its 5P Group for the three-year period ended December 31, 2020 and outperformed the median of its 5P Group for the five-year period ended December 31, 2020. For the more recent one-, three- and five-year periods, the Independent Trustees observed that the Fund had outperformed its Broadridge peer group median and its primary benchmark for the one-, three- and five-year periods ended April 30, 2021.
The Independent Trustees observed that Columbia Acorn European Fund had outperformed its Broadridge peer group median, 5P Group median and primary benchmark for the one-, three- and five-year periods ended December 31, 2020. For the more recent one-, three- and five-year periods, the Independent Trustees considered that the Fund had outperformed its Broadridge peer group median for the one-, three- and five-year periods ended April 30, 2021. They also considered that the Fund had underperformed its primary benchmark for the one-year period and outperformed for the three- and five-year periods ended April 30, 2021.
The Independent Trustees concluded that CWAM had taken, and continued to take, a number of corrective steps to improve the performance of underperforming Funds and that the Performance Committee was monitoring the underperforming Funds’ performance closely. In addition, the Independent Trustees considered that CWAM’s Domestic and International Team Heads and Director of Research (U.S.) and Director of International Research had reported to them at numerous Contract Committee, Performance Committee and Board meetings on the corrective steps taken over the past several years to improve certain Funds’ performance.
Columbia Acorn Family of Funds | Annual Report 2021
| 119 |
Board Approval of the Advisory Agreement (continued)
Costs of services and profits realized by CWAM
The Independent Trustees examined detailed information on the fees and expenses of each Fund compared with information for similar funds provided by Broadridge. They also reviewed information on the fees and expenses of certain Funds compared with information for funds included in those Funds’ respective 5P Groups. Generally, the Independent Trustees considered that none of the Funds except for Columbia Thermostat Fund would experience a total net increase in operating expenses in 2021-2022, and that some of the Funds and/or their share classes would experience net decreases in operating expenses.
Specifically, the Independent Trustees considered that the actual advisory fees paid by Columbia Acorn Fund, Columbia Acorn International and Columbia Acorn European Fund were lower than their respective Broadridge peer group medians; the actual advisory fees paid by Columbia Acorn USA were equal to its Broadridge peer group median; and the actual advisory fees paid by Columbia Acorn International Select and Columbia Thermostat Fund were higher than their respective Broadridge peer group medians. The Independent Trustees also considered that the actual advisory fees paid by Columbia Acorn Fund, Columbia Acorn International, Columbia Acorn International Select and Columbia Acorn European Fund were lower than their respective 5P Group medians, while the actual advisory fees paid by Columbia Acorn USA were equal to its 5P Group median.
In addition, the Independent Trustees considered that CWAM had contractually agreed through April 30, 2022 to limit fees and expenses so that no Fund’s total expense ratio would increase from the prior year, except that total expenses of Columbia Thermostat Fund would increase by 0.01% due to acquired fund fees and expenses. They took into account that through April 30, 2022, CWAM had agreed to: extend the existing total expense caps in place for Columbia Acorn Fund and increase the expense caps by 0.01% for Institutional 2 Class and Institutional 3 Class shares, resulting in the total expenses remaining flat; extend the existing total expense caps in place for Columbia Acorn European Fund, Columbia Acorn International and Columbia Thermostat Fund; reduce the existing total expense caps in place for Columbia Acorn International Select; and extend the existing total expense caps in place for all share classes of Columbia Acorn USA except Institutional Class and reduce the existing total expense cap in place for Institutional Class shares of Columbia Acorn USA.
In considering the total expense levels of each Fund, the Independent Trustees also considered the total expenses of each Fund relative to its three- and five-year performance, as prepared by Broadridge.
The Independent Trustees took into account that CWAM did not manage other investment companies as a sub-adviser or other institutional separate accounts that had investment strategies similar to any of the Funds. They also noted that the advisory fees charged by Columbia Acorn USA and Columbia Acorn International were generally comparable to their Columbia Wanger Fund counterparts, which were managed similarly by CWAM, at similar asset levels.
The Independent Trustees reviewed an analysis of CWAM’s profitability in serving as each Fund’s investment manager and of CWAM and its affiliates in their relationships with each Fund. They considered that the Contract Committee and the Board met with representatives from Ameriprise to discuss its methodologies for calculating profitability and allocating costs. They considered that Ameriprise calculated profitability and allocated costs on a contract-by-contract and Fund-by-Fund basis. In addition, the Independent Trustees considered an analysis of CWAM’s anticipated profitability in serving as the investment manager to the Funds and the Columbia Wanger Funds at various hypothetical levels of total assets. They also reviewed the methodology used by CWAM and Ameriprise to determine the level of compensation payable to portfolio managers and the competitive market for investment management talent and whether the methodology was aligned with shareholders’ interests. The Independent Trustees were provided with profitability information from a third-party consultant, Strategic Insight, which compared CWAM’s profitability to other similar investment managers in the mutual fund industry. The Independent Trustees discussed, however, that profitability comparisons among fund managers may not always be meaningful due to the lack of consistency in data, small number of publicly-owned managers, and the fact that the profitability of any investment manager is affected by numerous factors, including its particular organizational structure, the types of funds and other accounts managed, other lines of business, expense allocation methodology, capital structure and other factors. The Independent Trustees evaluated CWAM’s profitability in light of the additional resources that had been, and would continue to be, provided to it by Ameriprise to assist in improving performance.
| 120 | Columbia Acorn Family of Funds | Annual Report 2021 |
Board Approval of the Advisory Agreement (continued)
Economies of scale
At various Committee and Board meetings and other informal meetings, the Independent Trustees also considered information about the extent to which CWAM realized economies of scale in connection with an increase in Fund assets. It was noted, however, that many of the Funds had lost assets over the past several years. The Independent Trustees noted that the advisory fee schedule for each Fund, other than Columbia Thermostat Fund, includes breakpoints in the rate of fees at various asset levels. In evaluating whether CWAM was sharing economies of scale with Fund shareholders, the Independent Trustees also took into account the various fee waivers/reimbursements and expense caps that CWAM had agreed to for many of the Funds for 2021 and 2022. The Independent Trustees concluded that the fee structure of the Advisory Agreement for each Fund reflected a sharing of economies of scale between CWAM and the Funds.
Other Benefits to CWAM
The Independent Trustees also reviewed benefits that accrued to CWAM and its affiliates from their relationships with the Funds, based upon information provided to them by Ameriprise. They noted that the Funds’ transfer agency services were performed by Columbia Management Investment Services Corp., an affiliate of Ameriprise, which received compensation from the Funds for its transfer agent services. They considered that another affiliate of Ameriprise, Columbia Management Investment Distributors, Inc. (“CMID”), served as the Funds’ distributor under a distribution agreement, and that it received fees under the Trust’s Rule 12b-1 Plan, most of which CMID paid to broker-dealers, but received no additional compensation for its services to the Funds. In addition, they considered that Columbia Management provided sub-administration services to the Funds. The Contract Committee and the Board received information regarding the profitability of these Fund agreements to the CWAM affiliates and also reviewed information about and discussed the capabilities of each affiliated entity in performing its respective duties.
The Independent Trustees considered other ways that the Funds and CWAM might potentially benefit from their relationship with each other. For example, the Independent Trustees considered CWAM’s use of commissions paid by each Fund on its portfolio brokerage transactions to obtain research products and services benefiting the Funds and/or other clients of CWAM. They noted that the Compliance Committee reviewed CWAM’s annual “soft dollar” report during the year and met with representatives from CWAM to review CWAM’s soft dollar spending. The Independent Trustees also considered that the Compliance Committee and/or Board regularly reviewed third-party prepared reports that evaluated the quality of CWAM’s execution of the Funds’ portfolio transactions. The Independent Trustees determined that CWAM’s use of the Funds’ “soft” commission dollars to obtain research products and services was consistent with current regulatory requirements and guidance. They also concluded that CWAM benefited from the receipt of proprietary research products and services acquired through commissions paid on portfolio transactions of the Funds, and that the Funds benefitted from CWAM’s receipt of those products and services as well as research products and services acquired through commissions paid by other clients of CWAM. Finally, the Independent Trustees considered that CWAM’s affiliates benefited from management fees received in connection with Columbia Thermostat Fund’s investment in other Columbia mutual funds.
After full consideration of the above factors, as well as other factors that were instructive in evaluating the Advisory Agreement, the Independent Trustees concluded that the advisory fees were reasonable and that the continuation of the Advisory Agreement was in the best interest of each Fund. At the Board meeting held on July 21, 2021, the Trustees approved continuation of the Advisory Agreement for each Fund through July 31, 2022.
Columbia Acorn Family of Funds | Annual Report 2021
| 121 |
If you elect to receive the shareholder report for the Funds in paper, mailed to you, the Funds mail one shareholder report to each shareholder address, unless such shareholder elects to receive shareholder reports from the Funds electronically via e-mail or by having a paper notice mailed to you (Postcard Notice) that your Funds’ shareholder report is available at the Funds’ website (columbiathreadneedleus.com/investor/). If you would like more than one report in paper to be mailed to you, or would like to elect to receive reports via e-mail or access them through Postcard Notice, please call shareholder services at 800.345.6611 and additional reports will be sent to you.
Proxy voting policies and procedures
The policy of the Board of Trustees is to vote the proxies of the companies in which the Funds hold investments consistent with the procedures as stated in the Statement of Additional Information (SAI). You may obtain a copy of the SAI without charge by calling 800.345.6611; contacting your financial intermediary; visiting columbiathreadneedleus.com/investor/; or searching the website of the Securities and Exchange Commission (SEC) at sec.gov. Information regarding how the Funds voted proxies relating to portfolio securities is filed with the SEC by August 31st for the most recent 12-month period ending June 30th of that year, and is available without charge by visiting columbiathreadneedleus.com/investor/, or searching the website of the SEC at sec.gov.
Quarterly schedule of investments
The Funds file a complete schedule of portfolio holdings with the SEC for the first and third quarters of each fiscal year on Form N-PORT. The Funds’ Form N-PORT filings are available on the SEC’s website at sec.gov. The Funds’ complete schedule of portfolio holdings, as filed on Form N-PORT, can also be obtained without charge, upon request, by calling 800.345.6611.
Additional Fund information
For more information about the Funds, please visit columbiathreadneedleus.com/investor/ or call 800.345.6611. Customer Service Representatives are available to answer your questions Monday through Friday from 8 a.m. to 7 p.m. Eastern time.
Fund investment manager
Columbia Wanger Asset Management, LLC
71 S. Wacker Drive, Suite 2500
Chicago, IL 60606
888.4.WANGER
(888.492.6437)
Fund distributor
Columbia Management Investment Distributors, Inc.
290 Congress Street
Boston, MA 02210
Fund transfer agent
Columbia Management Investment Services Corp.
P.O. Box 219104
Kansas City, MO 64121-9104
| 122 | Columbia Acorn Family of Funds | Annual Report 2021 |
[THIS PAGE INTENTIONALLY LEFT BLANK]
Columbia Acorn Family of Funds
P.O. Box 219104
Kansas City, MO 64121-9104
Please read and consider the investment objectives, risks, charges and expenses for any fund carefully before investing. For a prospectus and summary prospectus, which contains this and other important information about the Funds, go to columbiathreadneedleus.com/investor/. The Funds are distributed by Columbia Management Investment Distributors, Inc., member FINRA, and managed by Columbia Wanger Asset Management, LLC.
Columbia Threadneedle Investments (Columbia Threadneedle) is the global brand name of the Columbia and Threadneedle group of companies. All rights reserved. Columbia Management Investment Distributors, Inc., 290 Congress Street, Boston, MA 02210.
© 2022 Columbia Management Investment Advisers, LLC.
columbiathreadneedleus.com/investor/
Item 2. Code of Ethics.
(a)The registrant has adopted a code of ethics that applies to the registrant's principal executive officer, principal financial officer, principal accounting officer or controller, or persons performing similar functions, regardless of whether these individuals are employed by the registrant or a third party.
(b)During the period covered by this report, there were not any amendments to a provision of the code of ethics that applies to the registrant's principal executive officer, principal financial officer, principal accounting officer or controller, or persons performing similar functions, regardless of whether these individuals are employed by the registrant or a third party, and that relates to any element of the code of ethics definition enumerated in paragraph (b) of this Item.
(c)During the period covered by this report, there were no waivers, including any implicit waivers, from a provision of the code of ethics to the registrant's principal executive officer, principal financial officer, principal accounting officer or controller, or persons performing similar functions, regardless of whether these individuals are employed by the registrant or a third party that relates to one or more of the items set forth in paragraph (b) of this Item.
Item 3. Audit Committee Financial Expert.
The registrant's Board of Trustees has determined that Maureen Culhane, a member of the registrant's Board of Trustees and Audit Committee, qualifies as an audit committee financial expert. Ms. Culhane is an independent trustee, as defined in paragraph (a)(2) of this item's instructions
Item 4. Principal Accountant Fees and Services.
Fee information below is disclosed for the six series of the registrant whose reports to stockholders are included in this annual filing.
(a)Audit Fees. Aggregate Audit Fees billed by the principal accountant for professional services rendered during the fiscal years ended December 31, 2021 and December 31,
2020 are approximately as follows:
Audit Fees include amounts related to the audit of the registrant's annual financial statements or services that are normally provided by the accountant in connection with statutory and regulatory filings or engagements for those fiscal years.
(b)Audit-Related Fees. Aggregate Audit-Related Fees billed to the registrant by the principal accountant for professional services rendered during the fiscal years ended December 31, 2021 and December 31, 2020 are approximately as follows:
Audit-Related Fees, if any, include amounts for assurance and related services by the principal accountant that are reasonably related to the performance of the audit of the registrant's financial statements and are not reported in Audit Fees above. In both fiscal years 2021 and 2020, Audit-Related Fees consist of agreed-upon procedures performed for other audit-related additional testing.
During the fiscal years ended December 31, 2021 and December 31, 2020, there were no Audit-Related Fees billed by the registrant's principal accountant to the registrant's investment adviser (not including any sub-adviser whose role is primarily portfolio management and is subcontracted with or overseen by another investment adviser) and any entity controlling, controlled by, or under common control with the adviser that provides ongoing services to the registrant for an engagement that related directly to the operations and financial reporting of the registrant.
(c)Tax Fees. Aggregate Tax Fees billed by the principal accountant to the registrant for professional services rendered during the fiscal years ended December 31, 2021 and December 31, 2020 are approximately as follows:
Tax Fees, if any, incurred in both fiscal years 2021 and 2020 relate to the review of annual tax returns, the review of required shareholder distribution calculations and include amounts for professional services by the principal accountant for tax compliance, tax advice and tax planning.
During the fiscal years ended December 31, 2021 and December 31, 2020, there were no Tax Fees billed by the registrant's principal accountant to the registrant's investment adviser (not including any sub-adviser whose role is primarily portfolio management and is subcontracted with or overseen by another investment adviser) and any entity controlling, controlled by, or under common control with the adviser that provides ongoing services to the registrant for an engagement that related directly to the operations and financial reporting of the registrant.
(d)All Other Fees. Aggregate All Other Fees billed by the principal accountant to the registrant for professional services rendered during the fiscal years ended December 31,
2021 and December 31, 2020 are as follows:
All Other Fees, if any, include amounts for products and services provided by the principal accountant, other than the services reported in paragraphs (a) through (c) above. Aggregate All Other Fees billed by the registrant's principal accountant to the registrant's investment adviser (not including any sub-adviser whose role is primarily portfolio management and is subcontracted with or overseen by another investment adviser) and any entity controlling, controlled by, or under common control with the adviser that provides ongoing services to the registrant for an engagement that related directly to the operations and financial reporting of the registrant during the fiscal years ended December 31, 2021 and December 31, 2020 are approximately as follows:
In both fiscal years 2021 and 2020, All Other Fees primarily consist of professional services rendered for internal control reviews.
(e)(1) Audit Committee Pre-Approval Policies and Procedures
The policy of the registrant's Audit Committee is to specifically pre-approve (i) all audit and non-audit (including audit related, tax and all other) services provided by the registrant's independent auditor to the registrant and individual funds (collectively "Fund Services") and (ii) all non-audit services provided by the registrant's independent auditor to the funds' adviser or a control affiliate of the adviser, that relate directly to the funds' operations and financial reporting (collectively "Fund-related Adviser Services"). A "control affiliate" is an entity controlling, controlled by, or under common control with the adviser that provides ongoing services to the funds, and the term "adviser" is deemed to exclude any unaffiliated sub-adviser whose role is primarily portfolio management and is sub-contracted or overseen by another investment adviser.
If such Fund Services or Fund-related Adviser Services are required during the period between the Audit Committee's regularly scheduled meetings, the Chairman of the Audit Committee has the authority to pre-approve the service, with reporting to the full Audit Committee at the next regularly scheduled meeting.
The Audit Committee will waive pre-approval of Fund Services or Fund-related Adviser Services provided that the requirements under paragraph (c)(7)(i)(C) of Rule 2-01 of Regulation S-X are met.
(e)(2) None, or 0%, of the Audit-Related Fees, Tax Fees and All Other Fees paid by the Fund or affiliated entities relating directly to the operations and financial reporting of the Registrant disclosed above were approved by the audit committee pursuant to paragraphs (c)(7)(i)(C) of Rule 2-01 of Regulation S-X (which permits audit committee approval after the start of the engagement with respect to services other than audit, review or attest services, if certain conditions are satisfied).
(f)Not applicable.
(g)The aggregate non-audit fees billed by the registrant's accountant for services rendered to the registrant, and rendered to the registrant's investment adviser (not including any sub-adviser whose role is primarily portfolio management and is subcontracted with or overseen by another investment adviser), and any entity controlling, controlled by, or under common control with the adviser that provides ongoing services to the registrant for the fiscal years ended December 31, 2021 and December 31, 2020 are approximately as follows:
(h)The registrant's Audit Committee of the Board of Directors has considered whether the provision of non-audit services that were rendered to the registrant's adviser (not including any sub-adviser whose role is primarily portfolio management and is subcontracted with or overseen by another investment adviser), and any entity controlling, controlled by, or under common control with the investment adviser that provides ongoing services to the registrant that were not pre-approved pursuant to paragraph (c)(7)(ii) of Rule 2-01 of Regulation S-X, is compatible with maintaining the principal accountant's independence.
Item 5. Audit Committee of Listed Registrants.
Not applicable.
Item 6. Investments
(a)The registrant's "Schedule I – Investments in securities of unaffiliated issuers" (as set forth in 17 CFR 210.12-12) is included in Item 1 of this Form N-CSR.
(b)Not applicable
Item 7. Disclosure of Proxy Voting Policies and Procedures for Closed-End Management Investment Companies.
Not applicable.
Item 8. Portfolio Managers of Closed-End Management Investment Companies.
Not applicable.
Item 9. Purchases of Equity Securities by Closed-End Management Investment Company and Affiliated Purchasers.
Not applicable.
SIGNATURES
Pursuant to the requirements of the Securities Exchange Act of 1934 and the Investment Company Act of 1940, the registrant has duly caused this report to be signed on its behalf by the undersigned, thereunto duly authorized.
(registrant) | | Columbia Acorn Trust | |
By (Signature and Title) | /s/ Daniel J. Beckman | _______ |
| | | | Daniel J. Beckman, President and Principal Executive Officer |
Date | | February 18, 2022 | |
Pursuant to the requirements of the Securities Exchange Act of 1934 and the Investment Company Act of 1940, this report has been signed below by the following persons on behalf of the registrant and in the capacities and on the dates indicated.
| | | | | |
By (Signature and Title) | /s/ Daniel J. Beckman |
| | | Daniel J. Beckman, President and Principal Executive Officer | |
Date | | February 18, 2022 | |
By (Signature and Title) | /s/ Michael G. Clarke |
| | | Michael G. Clarke, Treasurer and Principal Accounting and Financial Officer |
Date | | February 18, 2022 | |