QuickLinks -- Click here to rapidly navigate through this document
Exhibit 99.1(C)(1)

• DECEMBER ECONOMIC AND FISCAL UPDATE 2001 •
18 DECEMBER 2001
© Crown Copyright Reserved
ISBN 0-478-11822-8
Typeset by the Treasury
Printed and bound by PrintLink
(A division of Blue Star Print Group Ltd)
Wellington
Internet
This document will be made available on the New Zealand Treasury's Internet site.
The URL for this site is http://www.treasury.govt.nz
December Economic and Fiscal Update
| | | |
| Statement of Responsibility | | |
| Economic and Fiscal Overview | | |
| | Economic Outlook | | |
| | Fiscal Outlook | | |
| | Summary Tables | | |
Economic Outlook |
|
|
| | Short-term outlook | | |
| | Longer term outlook—2003/04 and beyond | | |
Fiscal Outlook |
|
|
| | Introduction | | |
| | Influences on the Operating Balance | | |
| | Tax Revenue | | |
| | Expenses | | |
| | SOE and Crown Entity Surpluses | | |
| | Influences on Net Worth and Debt | | |
| | Fiscal Indicators—Comparison with 2001 Budget | | |
| | Operating Balance Changes Since the 2001 Budget | | |
| | Budget Policy Decisions | | |
| | Capital Provisions | | |
| | New Zealand Superannuation Fund Contributions | | |
| | Full line-by-line consolidation | | |
Risks and Scenarios |
|
|
| | Introduction | | |
| | Economic Risks | | |
| | Economic Scenarios | | |
| | Fiscal Scenarios | | |
| | Fiscal Sensitivities | | |
Specific Fiscal Risks |
|
|
| | Introduction | | |
| | Contingent liabilities | | |
| | Specific fiscal risks | | |
Generally Accepted Accounting Practice (GAAP) Series Tables |
|
|
| | Forecast Financial Statements | | |
| | Reporting Entity as at 26 November 2001 | | |
| | Statement of Accounting Policies and Forecast Assumptions | | |
| | Notes to the Forecast Financial Statements | | |
Annex A: Tax Revenue Tables |
|
|
Annex B: Expense Tables |
|
|
Glossary of Terms |
|
|
Statement of Responsibility
On the basis of the economic and fiscal information available to it, the Treasury has used its best professional judgement in supplying the Minister of Finance with this Economic and Fiscal Update. The Update incorporates the fiscal and economic implications both of Government decisions and circumstances as at 26 November 2001 that were communicated to me, and of other economic and fiscal information available to the Treasury in accordance with the provisions of the Fiscal Responsibility Act 1994.
Dr Alan Bollard
Secretary to the Treasury
12 December 2001
This Economic and Fiscal Update has been prepared in accordance with the Fiscal Responsibility Act 1994. I accept overall responsibility for the integrity of the disclosures contained in this Update, and the consistency and completeness of the Update information in accordance with the requirements of the Fiscal Responsibility Act 1994.
To enable the Treasury to prepare this Update, I have ensured that the Secretary to the Treasury has been advised of all Government decisions and other circumstances as at 26 November 2001 of which I was aware and that had material economic or fiscal implications.
Hon Dr Michael Cullen
Treasurer and Minister of Finance
12 December 2001
1
Economic and Fiscal Overview
Economic Outlook
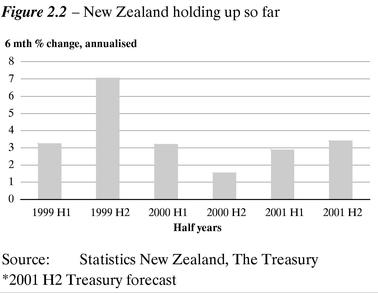
Despite the slowing global economy, New Zealand has continued to hold up well...
- •
- The extent of the global slowdown has been greater than anticipated. Despite this, the New Zealand economy has performed well through 2001.
- •
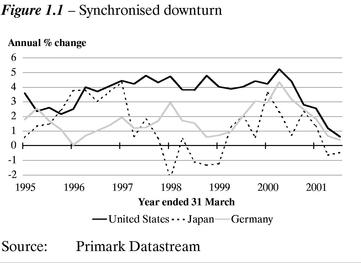
- Underlying the global weakness is the synchronised nature of the downturn, with both the US and Japanese economies slipping into recession, and growth slowing markedly across the Euro-zone. Following the terrorist attacks, sentiment around global growth prospects changed markedly for the worse.
- •
- Since the 2001 Budget was published, trading partner growth prospects have been revised down from 2.4% to 1.4% in 2001, and from 3.6% to 1.9% in 2002.
- •
- Consensus forecasts project a recovery in global growth in the second half of 2002.
- •
- Importantly for New Zealand, downward revisions to Australian growth prospects have been more moderate.
- •
- Looking forward, the New Zealand economy seems somewhat better positioned than in past downturns to cope with weaker world growth. Recent export success and employment and wage growth have led to strong farm and household income gains. Export commodity prices have held up well, the exchange rate is competitive, interest rates have been cut, and oil prices have fallen.
- •
- In the year to March 2002, we expect New Zealand's GDP growth of 3.1% to outperform the OECD average.
...although weaker world growth will affect export prices, volumes and domestic confidence
- •
- Nevertheless, New Zealand is beginning to feel the impact of weaker world growth with lower tourist arrivals, weaker export prices, and negative shocks to domestic business and consumer confidence.
- •
- Looking forward, we expect export demand and prices will continue to weaken over the short term, and for this drop in export income to flow through into the domestic economy. Underlying our Central Forecast is a considerable deterioration in the terms of trade as prices for our commodity exports are expected to fall away quicker than import prices.
- •
- Going into the first half of 2002, greater uncertainty and softening incomes have an impact on the willingness of both businesses and households to employ, spend and invest.

- •
- Firms may re-evaluate their investment decisions in light of increased uncertainty and expected lower income growth, and defer investment projects until global growth picks up from mid-2002. We therefore expect a fall in business investment over the next few quarters. However, recent high levels of capacity utilisation, healthy balance sheets, lower interest rates and the expectation of a recovery all provide some offset.
- •
- We also expect firms to be more cautious about taking on additional employees over the short term. However, the extent of the slowing in employment growth is likely to be more modest than in previous downturns given the relatively tight labour market. The unemployment rate is expected to peak at just under 6% in late 2002 and early 2003.
- •
- Households also adopt a "wait and see" attitude and consumption is expected to remain subdued throughout 2002 as the labour market weakens. However, recent income gains, falling interest rates and falling oil prices suggest that consumption should remain positive.
Growth is expected to pick up towards the end of 2002, as global growth recovers
- •
- As global growth begins to recover in the second half of 2002, the New Zealand economy regains momentum in late 2002 as export growth resumes and business investment picks up. While domestic confidence rebounds, we still expect firms to tread cautiously, and growth in market investment remains modest until 2003. As firms resume hiring, consumption also picks up strongly in 2003, reinforced by low interest rates. Together with inward migration, this provides support to residential investment.
The inflation outlook remains relatively benign
- •
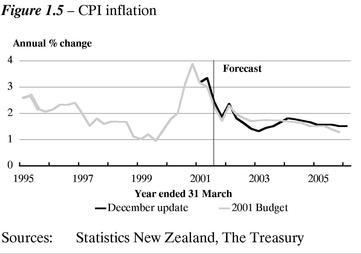
- With reduced growth and weaker global price pressures (including for oil) the outlook for inflation in the short term is relatively benign. Our Central Forecast has CPI inflation falling back to the mid-point of the Reserve Bank's target range by the end of 2002, as pricing pressures ease on the back of weaker unit labour costs and softer world export and import prices.
- •
- As growth picks up over 2002/03, the Reserve Bank is expected to steadily return the Official Cash Rate to our assumed neutral level of around 6.0%.
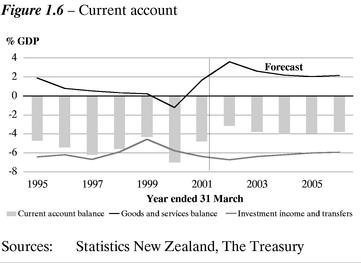
The rate of improvement slows in the current account deficit
- •
- Slower export volume growth in the short term, together with the expected fall in the terms of trade, sees a modest reversal in recent improvements in the current account deficit. The deficit is expected to improve to about 3% of GDP in the year to March 2002, largely on the back of recent good export volume and price growth. However, as weaker world growth begins to impact on export volumes and prices and investment flows, the current account deficit deteriorates, although this is slightly offset by lower imports as a result of weaker domestic demand. The deficit is expected to be about 4% of GDP in 2004 and 2005. Further out, a continued steady improvement in service exports underpins an improvement in the current account balance at the end of the forecast.
Nominal GDP growth is more cyclical in the short term
- •
- The profile for nominal GDP growth is more cyclical than in the 2001 Budget. Nominal growth in the year to March 2002 is forecast to be 5.9%, partly as a result of the strong June quarter outturn. In the year to March 2003, lower real growth and inflation leads nominal growth to fall to 2.6%, before picking up to solid growth of 4% to 5% further out. This increased cyclical nature of nominal GDP flows through to the profile for tax revenue.
Fiscal Outlook
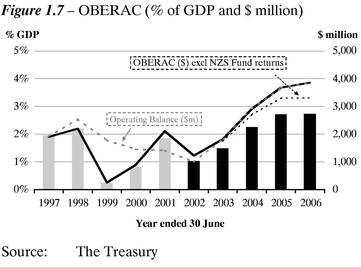
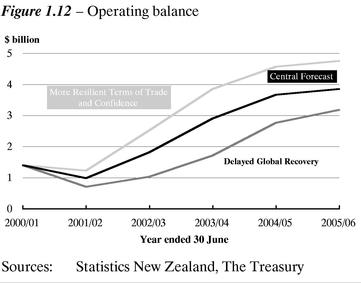
Operating balance rises over the forecast horizon...
- •
- The forecast 2001/02 operating balance is $1.0 billion (0.8% of GDP), including ACC and Government Superannuation Fund (GSF) liability movements of $200 million and $40 million respectively.
- •
- Excluding the ACC and GSF valuations, the OBERAC (operating balance excluding revaluations and accounting policy changes) for 2001/02 is $1.2 billion (1.0% of GDP).
- •
- While the operating balance decreases from 2000/01, over the forecast period, the operating balance is expected to rise to 2.7% of GDP in 2005/06 ($3.8 billion).
- •
- Updated operating balance forecasts are lower than 2001 Budget, with the biggest change occurring in 2002/03.
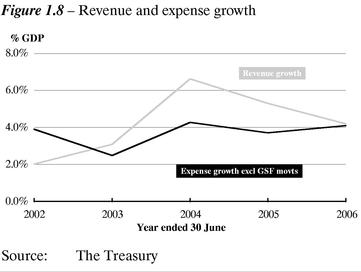
...due to tax revenue growth remaining higher than expense growth despite an economic downturn...
- •
- The forecast increase in tax revenue has reduced across all years relative to the 2001 Budget owing to lower forecast economic growth.
- •
- Lower tax revenue has been partly offset by lower benefit expenses of an average of around $250 million across all years, owing largely to lower unemployment benefit payments.
- •
- Health expenses are a key feature of the December Update with an extra $2.4 billion committed over the next three years. This is in addition to funding to meet demographic and other forecast changes.
- •
- Total revenue growth averages around 5% per annum, while expense growth averages around 4% per annum over the forecast period.
...enabling the Government to continue to apply surplus cash to its investment programme
- •
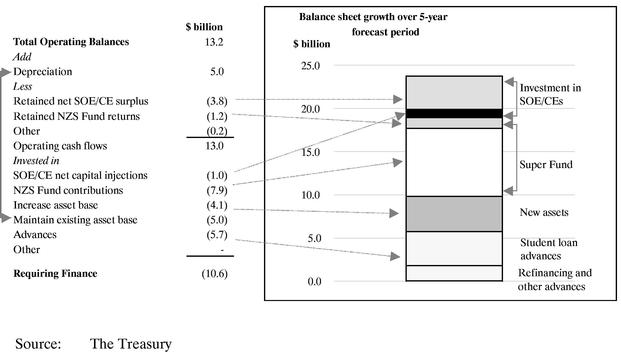
- The rising operating surplus translates to a similar level of cash flows from operations, generating approximately $13.2 billion operating cash surpluses over the forecast period to fund investing activity.
- •
- Investment outlays of $23.6 billion outweigh operating cash surpluses by $10.6 billion. These outlays include: maintaining and improving the existing asset base ($9.1 billion) and providing injections of around $1 billion (mostly related to hospitals and the establishment of Kiwibank); investing in the New Zealand Superannuation Fund ($7.9 billion); and funding advances ($5.7 billion). The advances comprise student loans of $3.9 billion with the remaining $1.8 billion relating to refinancing Crown entity private sector debt (DHBs and Housing New Zealand Corporation) and other miscellaneous advance activity.
- •
- Relative to the 2001 Budget, the forecast cash outflows for the period 2000/01 to 2004/05 have increased by around $1.5 billion. This primarily reflects the Air New Zealand recapitalisation package (around $1 billion), higher student loan advances and refinancing of DHB debt (around $0.7 billion combined), partially offset by higher than expected surplus cash position of $0.5 billion in 2000/01.
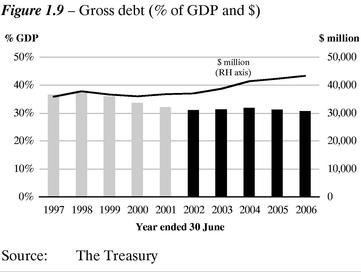
Debt as a percentage of GDP rises slightly, before falling again
- •
- Gross debt increases by $6.6 billion in nominal terms over the forecast period. This, in conjunction with a decrease in marketable securities and deposits of $3.9 billion, will fund the shortfall between operating cash flows and investment outlays.
- •
- Over the period, gross debt falls as a percentage of GDP from around 32% at the start of the forecast period to slightly under 31% by 2005/06. For the same period, net debt starts at 17.5% of GDP and is 17.6% by 2005/06.
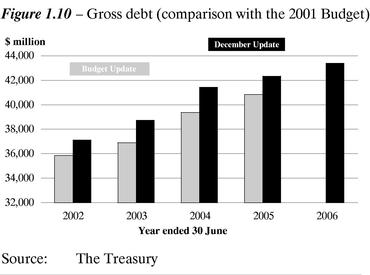
- •
- Gross and net debt rise slightly in the middle of the forecast period. This is mainly due to lower economic growth in earlier years and bringing forward capital spending to better meet expected demands (refer to page 54 for a fuller description).
- •
- Both gross and net debt increase relative to the 2001 Budget. The key changes in funding requirements for the comparable period (2001/02 to 2004/05) are due mainly to lower forecast cash generated from operating surpluses, higher than forecast student loans and the increase in the capital provisions to accommodate the Air New Zealand recapitalisation package.
- •
- The domestic bond programme has been revised from $3.5 billion to $4.1 billion for 2001/02. For a full explanation of the revision refer to page 56 of the Fiscal Outlook chapter.
Government policy decisions
- •
- In addition to the Health package mentioned earlier, the Government has allocated a further $176 million of the $6.126 billion three-year fiscal provision since the 2001 Budget. Table 1.1 provides a breakdown of the Government's three-year fiscal provision since 1999/2000 to 2002/03:
Table 1.1—Fiscal provisions
Fiscal provisions ($ million, GST inclusive)
| | 1999/2000
| | 2000/01
| | 2001/02
| | 2002/03
| | Total
|
|---|
| Budget 2000 decisions | | 420 | | 1,050 | | 1,060 | | 1,120 | | 3,650 |
| 2000 contingency decisions | | — | | 99 | | 74 | | 78 | | 251 |
| Budget 2001 decisions | | — | | 52 | | 532 | | 526 | | 1,110 |
| 2001 contingency decisions | | — | | — | | 51 | | 125 | | 176 |
| December 2001 Health package | | — | | — | | — | | 400 | | 400 |
| Budget 2002 provision1 | | — | | — | | 89 | | 450 | | 539 |
| | |
| |
| |
| |
| |
|
| Total | | 420 | | 1,201 | | 1,806 | | 2,699 | | 6,126 |
| | |
| |
| |
| |
| |
|
- 1
- $20 million of the Budget 2002 provision has been rephased from 2001/02 to 2002/03.
- •
- As part of the 2001 Budget, the Government set capital provisions of $850 million for 2003/04 and 2004/05 (and $550 million has been set for the new 2005/06 financial year). In addition, a further $1 billion has been added to the capital provisions to accommodate the Air New Zealand recapitalisation package.
- •
- Spending in 2004/05 and 2005/06 has, however, been rephased into 2002/03 and 2003/04 to better reflect planned commitments. The key capital pressures are in the social sector (hospitals and schools), prisons, developing the Government's transport strategy, re-equipping the Defence Force and recapitalising Air New Zealand.
Table 1.2—Capital provisions
Capital provisions ($ million, GST inclusive)
| | 2001/02
| | 2002/03
| | 2003/04
| | 2004/05
| | 2005/06
| | Total
|
|---|
| Capital provision—Budget 2001 | | 315 | | 360 | | 850 | | 850 | | — | | 2,375 |
| Establish 2005/06 provision | | | | | | | | | | 550 | | 550 |
| December Update decisions | | 76 | | 27 | | 1 | | — | | 5 | | 109 |
| | |
| |
| |
| |
| |
| |
|
| Remaining provision | | 239 | | 333 | | 849 | | 850 | | 545 | | 2,816 |
| Increase to provision for Air New Zealand | | 1,035 | | — | | — | | — | | — | | 1,035 |
| December Update rephasing of provision | | — | | 413 | | 89 | | (387 | ) | (115 | ) | — |
| | |
| |
| |
| |
| |
| |
|
| Capital provision—December Update | | 1,274 | | 746 | | 938 | | 463 | | 430 | | 3,851 |
| | |
| |
| |
| |
| |
| |
|
NOTE:
The amount of capital provision in Table 1.2 does not exactly reconcile to the level of capital provision contained in the fiscal forecasts due to rounding.
The fiscal forecasts are highly sensitive to risks around the economic forecasts
- •
- Underpinning our Central Forecast are the international assumptions of Consensus forecasts, and key judgements made about the "transmission mechanisms" through which weaker global growth is transmitted to New Zealand, including through lower export volumes and prices, and weaker confidence feeding into domestic demand.
- •
- However, events may turn out differently from our Central Forecast.

- •
- World growth may evolve differently from that currently built into Consensus forecasts. Growth may not rebound as quickly as expected and remain sub-trend for most of 2002, with a more accelerated pick-up in 2003 and 2004. In this scenario, weaker world demand would negatively affect export volumes and prices, with the lower export income feeding through into the domestic economy.
- •
- Alternatively, weaker world growth may have a less pronounced impact on the New Zealand economy. In this case, our export prices may not fall as much, and domestic confidence could rebound quickly, feeding into stronger domestic demand.
- •
- These effects will flow through into the Government's operating balance. Weaker world growth will lead to a lower operating balance, as lower economic growth and inflation both reduce nominal GDP relative to the Central Forecast, and expenses increase with higher unemployment.
However, if stronger domestic demand occurs the operating balance will be higher throughout the forecast period.
- •
- The changes in the operating balance will also have an impact on debt. A lower operating balance resulting from weaker world growth would lead to higher gross and net debt as a percentage of GDP, because both GDP and the operating surpluses would be lower. The converse is true in the case of stronger domestic demand.
Summary Tables
Table 1.3—Economic indicators1
| | 2001
Actual
| | 2002
Forecast
| | 2003
Forecast
| | 2004
Forecast
| | 2005
Forecast
| | 2006
Forecast
| |
|---|
| | (Annual Average % change, March years)
| |
|---|
| Consumption | | 0.3 | | 2.1 | | 1.7 | | 3.2 | | 2.4 | | 2.6 | |
| Investment | | (0.4 | ) | 4.5 | | (1.1 | ) | 7.4 | | 5.8 | | 3.3 | |
| | |
| |
| |
| |
| |
| |
| |
| Stock change2 | | (0.3 | ) | (1.1 | ) | 0.7 | | 0.1 | | 0.0 | | 0.0 | |
| Gross National Expenditure | | (0.2 | ) | 1.4 | | 1.7 | | 4.2 | | 3.1 | | 2.7 | |
| | |
| |
| |
| |
| |
| |
| |
| Exports | | 6.8 | | 2.9 | | 2.3 | | 7.3 | | 5.4 | | 4.5 | |
| Imports | | 0.4 | | 0.2 | | 1.4 | | 9.8 | | 7.3 | | 4.7 | |
| | |
| |
| |
| |
| |
| |
| |
| GDP (Production Measure) | | 2.6 | | 3.1 | | 1.9 | | 3.7 | | 2.6 | | 2.8 | |
| | |
| |
| |
| |
| |
| |
| |
| — annual % change | | 1.1 | | 2.8 | | 3.1 | | 3.2 | | 2.6 | | 2.8 | |
| Employment3 | | 2.2 | | 1.5 | | (0.1 | ) | 2.3 | | 1.5 | | 1.3 | |
| Unemployment4 | | 5.4 | | 5.6 | | 5.7 | | 5.2 | | 5.2 | | 5.2 | |
| Wages5 | | 2.4 | | 3.7 | | 3.7 | | 3.4 | | 3.5 | | 3.1 | |
| CPI inflation6 | | 3.1 | | 2.4 | | 1.3 | | 1.8 | | 1.6 | | 1.5 | |
| Current account balance7 | | (4.8 | ) | (3.1 | ) | (3.8 | ) | (4.0 | ) | (4.0 | ) | (3.8 | ) |
| TWI8 | | 50.5 | | 49.3 | | 51.3 | | 53.9 | | 55.0 | | 55.0 | |
| 90 day bank bill rate8 | | 6.4 | | 4.8 | | 5.8 | | 6.0 | | 6.0 | | 6.0 | |
Sources: Statistics New Zealand, Primark Datastream, The Treasury
- 1
- Finalised 21 November 2001.
- 2
- Contribution to GDP growth.
- 3
- Household Labour Force Survey, full-time equivalent employment.
- 4
- Household Labour Force Survey, percentage of the labour force, March quarter, seasonally adjusted.
- 5
- Quarterly Employment Survey, average hourly ordinary time earnings.
- 6
- This is the CPI-consistent series targeted by the Reserve Bank. Annual percentage change, March quarter.
- 7
- Year to 31 March, percentage of GDP.
- 8
- Average for the March quarter.
Table 1.4—Fiscal indicators
| | 2001
Actual
| | 2002
Forecast
| | 2003
Forecast
| | 2004
Forecast
| | 2005
Forecast
| | 2006
Forecast
| |
|---|
| | ($ million)
| |
|---|
| Operating Balance | | | | | | | | | | | | | |
| Revenue | | 39,492 | | 40,290 | | 41,531 | | 44,283 | | 46,630 | | 48,582 | |
| Expenses | | | | | | | | | | | | | |
| Allocated expenses | | (38,186 | ) | (39,513 | ) | (40,097 | ) | (41,301 | ) | (42,368 | ) | (43,263 | ) |
| Unallocated provisions for future initiatives | | — | | (90 | ) | (450 | ) | (975 | ) | (1,475 | ) | (2,376 | ) |
| SOE/CE surpluses | | 103 | | 298 | | 839 | | 901 | | 883 | | 911 | |
| | |
| |
| |
| |
| |
| |
| |
| Operating Balance | | 1,409 | | 985 | | 1,823 | | 2,908 | | 3,670 | | 3,854 | |
| Less revaluations | | 698 | | 243 | | — | | — | | — | | — | |
| | |
| |
| |
| |
| |
| |
| |
OBERAC |
|
2,107 |
|
1,228 |
|
1,823 |
|
2,908 |
|
3,670 |
|
3,854 |
|
| Less contributions and returns on NZS Fund | | — | | (614 | ) | (1,291 | ) | (2,010 | ) | (2,472 | ) | (2,709 | ) |
| | |
| |
| |
| |
| |
| |
| |
| Available after NZS Fund Requirements | | 2,107 | | 614 | | 532 | | 898 | | 1,198 | | 1,145 | |
Less |
|
|
|
|
|
|
|
|
|
|
|
|
|
| Unallocated capital provisions | | — | | (1,269 | ) | (740 | ) | (938 | ) | (463 | ) | (435 | ) |
| | Physical asset purchases and other | | (682 | ) | (1,077 | ) | (1,391 | ) | (1,285 | ) | (806 | ) | (878 | ) |
| Movement in Net Debt | | 1,425 | | (1,732 | ) | (1,599 | ) | (1,325 | ) | (71 | ) | (168 | ) |
| Net Debt | | 19,971 | | 21,703 | | 23,302 | | 24,627 | | 24,698 | | 24,866 | |
| Net Debt (% of GDP) | | 17.5 | % | 18.2 | % | 18.9 | % | 19.0 | % | 18.2 | % | 17.6 | % |
| Domestic Bond Programme1 | | 3,572 | | 4,100 | | 5,070 | | 5,620 | | 3,730 | | 874 | |
| Nominal GDP | | 114,275 | | 118,980 | | 123,271 | | 129,725 | | 135,373 | | 141,076 | |
| | |
| |
| |
| |
| |
| |
| |
| Fiscal Indicators as a % of GDP | | | | | | | | | | | | | |
| Gross debt | | 32.2 | % | 31.2 | % | 31.4 | % | 31.9 | % | 31.3 | % | 30.7 | % |
| Net debt | | 17.5 | % | 18.2 | % | 18.9 | % | 19.0 | % | 18.2 | % | 17.6 | % |
| Net worth | | 10.0 | % | 10.5 | % | 11.6 | % | 13.2 | % | 15.4 | % | 17.5 | % |
| Revenue | | 34.6 | % | 33.9 | % | 33.7 | % | 34.1 | % | 34.4 | % | 34.4 | % |
| Expense | | 33.4 | % | 33.3 | % | 32.9 | % | 32.6 | % | 32.4 | % | 32.4 | % |
| OBERAC | | 1.8 | % | 1.0 | % | 1.5 | % | 2.2 | % | 2.7 | % | 2.7 | % |
| Operating balance | | 1.2 | % | 0.8 | % | 1.5 | % | 2.2 | % | 2.7 | % | 2.7 | % |
| | |
| |
| |
| |
| |
| |
| |
| New Zealand Superannuation Fund | | | | | | | | | | | | | |
| Fund asset returns (after tax)2 | | — | | 14 | | 91 | | 210 | | 372 | | 559 | |
| Fund assets (year end) | | — | | 614 | | 1,904 | | 3,914 | | 6,379 | | 9,091 | |
| % of GDP | | 0.0 | % | 0.5 | % | 1.5 | % | 3.0 | % | 4.7 | % | 6.4 | % |
- 1
- The figure for 2002 is the face value of the bond programme. The actual cash raised by the programme is forecast to be $4,156 million, as the bonds are forecast to be issued at a premium. Further out the bond programme is an estimate of the cash expected to be raised. For the reconciliation between the bond programme and operating cash flows see the Statement of Cash Flows.
- 2
- Returns on fund assets are recorded as revenue from investments in the operating balance (see Note 3 of the fiscal forecasts). However only the "after tax" portion of investment income accumulates in the NZS Fund.
Stop press—additional policy decisions
Since the finalisation of the fiscal forecasts on 26 November 2001 the decisions outlined below have been finalised by the Government. These decisions have not been incorporated into the forecasts.
- •
- Paid Parental Leave—On 3 December, the Government formalised the arrangements for Paid Parental Leave, which will be implemented from 1 July 2002. The costs are expected to be around $40 million per year from 2002/03, which will be met by from the remaining fiscal provision (which is included in the forecasts and therefore have no impact on the operating balance or debt.
- •
- Teachers Pay Settlement—Agreement was reached on 6 December with the Post Primary Teachers Association on a new Secondary schools teachers collective employment contract. Although the costs have yet to be finalised they are expected to be around $30 million per year from 2002/03. The costs will be met from the remaining fiscal provision and therefore have no impact on the operating balance or debt.
2
Economic Outlook
Since our Budget forecasts global growth has been weaker than expected...

At the time the 2001 Budget was finalised, global growth was projected to ease but then recover. In the event, world growth will be considerably weaker than expected over the second half of 2001. The US economy has decelerated further and contracted in the September quarter. Japan recorded consecutive falls in GDP in the June and September quarters. Growth also slowed markedly across the Euro area, with Germany recording two quarters of modest falls in GDP up to the September quarter.
...but New Zealand has outperformed
While the world has tracked more in line with the "weaker world growth" scenario contained in the 2001 Budget, the New Zealand economy has developed in line with, or turned out better than, our Central Forecast:
- •
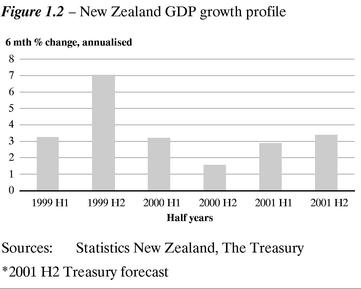
- GDP growth averaged just over 1% per quarter in the first half of 2001.
- •
- Unemployment fell to a 13-year low of 5.2% in the June quarter and remained there in the September quarter.
- •
- The annual current account deficit fell to 4% of GDP in the June 2001 quarter with a further fall expected in the September quarter.
- •
- The nominal economy grew by 6.4% over the year to June 2001, indicating strong income growth.
Table 2.1—Economic Outlook: Central Forecast1
| | 2001
Actual
| | 2002
Forecast
| | 2003
Forecast
| | 2004
Forecast
| | 2005
Forecast
| | 2006
Forecast
| |
|---|
| | (Annual Average % change, March years)
| |
|---|
| Private consumption | | 0.3 | | 1.9 | | 1.9 | | 3.1 | | 2.9 | | 3.0 | |
| Public consumption2 | | (3.0 | ) | 2.8 | | 1.0 | | 3.7 | | 0.8 | | 1.4 | |
| | |
| |
| |
| |
| |
| |
| |
| Total Consumption | | 0.3 | | 2.1 | | 1.7 | | 3.2 | | 2.4 | | 2.6 | |
| | |
| |
| |
| |
| |
| |
| |
| Residential investment | | (15.9 | ) | (4.6 | ) | 6.2 | | 11.6 | | 6.2 | | 4.9 | |
| Market Investment | | 7.2 | | 7.2 | | (3.7 | ) | 6.5 | | 5.8 | | 2.8 | |
| Non-Market Investment | | (6.6 | ) | (1.9 | ) | 3.3 | | 2.8 | | 2.8 | | 2.8 | |
| Total Investment | | (0.4 | ) | 4.5 | | (1.1 | ) | 7.4 | | 5.8 | | 3.3 | |
| | |
| |
| |
| |
| |
| |
| |
| Stocks3 | | (0.3 | ) | (1.1 | ) | 0.7 | | 0.1 | | 0.0 | | 0.0 | |
| Gross National Expenditure | | (0.2 | ) | 1.4 | | 1.7 | | 4.2 | | 3.1 | | 2.7 | |
| | |
| |
| |
| |
| |
| |
| |
| Exports | | 6.8 | | 2.9 | | 2.3 | | 7.3 | | 5.4 | | 4.5 | |
| Imports | | 0.4 | | 0.2 | | 1.4 | | 9.8 | | 7.3 | | 4.7 | |
| | |
| |
| |
| |
| |
| |
| |
| GDP (Production Measure) | | 2.6 | | 3.1 | | 1.9 | | 3.7 | | 2.6 | | 2.8 | |
| | |
| |
| |
| |
| |
| |
| |
| —annual % change, March qtr | | 1.1 | | 2.8 | | 3.1 | | 3.2 | | 2.6 | | 2.8 | |
| Nominal GDP (expenditure basis) | | 5.5 | | 5.9 | | 2.6 | | 5.5 | | 4.4 | | 4.2 | |
| GDP deflator | | 3.6 | | 3.6 | | 0.6 | | 1.9 | | 1.8 | | 1.5 | |
| Employment4 | | 2.2 | | 1.5 | | (0.1 | ) | 2.3 | | 1.5 | | 1.3 | |
| Unemployment5 | | 5.4 | | 5.6 | | 5.7 | | 5.2 | | 5.2 | | 5.2 | |
| Wages6 | | 2.4 | | 3.7 | | 3.7 | | 3.4 | | 3.5 | | 3.1 | |
| CPI inflation7 | | 3.1 | | 2.4 | | 1.3 | | 1.8 | | 1.6 | | 1.5 | |
| Export prices8 | | 19.6 | | 2.5 | | (8.2 | ) | (3.6 | ) | (1.4 | ) | (0.1 | ) |
| Import prices8 | | 15.3 | | (0.1 | ) | (2.9 | ) | (3.5 | ) | (2.6 | ) | (0.4 | ) |
Current account balance |
|
|
|
|
|
|
|
|
|
|
|
|
|
| —$million | | (5338 | ) | (3725 | ) | (4612 | ) | (5174 | ) | (5304 | ) | (5297 | ) |
| —% of GDP | | (4.8 | ) | (3.1 | ) | (3.8 | ) | (4.0 | ) | (4.0 | ) | (3.8 | ) |
| TWI9 | | 50.5 | | 49.3 | | 51.3 | | 53.9 | | 55.0 | | 55.0 | |
| 90 day bank bill rate9 | | 6.4 | | 4.8 | | 5.8 | | 6.0 | | 6.0 | | 6.0 | |
| 10 year bond rate9 | | 6.0 | | 6.3 | | 6.5 | | 6.2 | | 6.2 | | 6.2 | |
Sources: Statistics New Zealand, Primark Datastream, The Treasury
NOTES:
- 1
- Finalised 21 November 2001.
- 2
- The forecast profile for public consumption is influenced by government defence spending.
- 3
- Contribution to GDP growth.
- 4
- Household Labour Force Survey, full-time equivalent employment.
- 5
- Household Labour Force Survey, percentage of the labour force, March quarter, seasonally adjusted.
- 6
- Quarterly Employment Survey, average hourly ordinary time earnings.
- 7
- This is the CPI-consistent series targeted by the Reserve Bank. Annual percentage change, March quarter.
- 8
- Overseas Trade Index basis, annual average percentage change, March quarter.
- 9
- Average for the March quarter.
Assumptions Underlying the Central Forecast
Global economic activity is assumed to evolve in a politically benign environment where any future political or military actions do not have significant negative effects on the overall economic climate.
The international outlook conforms to that presented in the October and November Consensus forecasts, and Asia-Pacific Consensus forecasts.
Recent events leading to lower confidence and heightened uncertainty are assumed to result in temporary "wait and see" attitudes among both consumers and businesses.
The 2001/02 agricultural season is assumed to be an average or "normal" growing season.
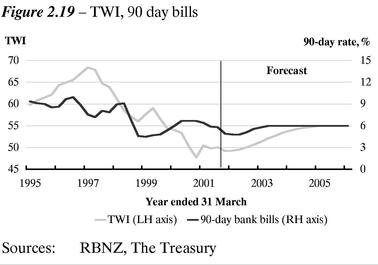
Our forecasts assume an equilibrium exchange rate of 55 on a Trade Weighted Index (TWI) basis, and an equilibrium short-term interest rate of 6.0%.
We have assumed no change in announced Government policy as of 21 November 2001.
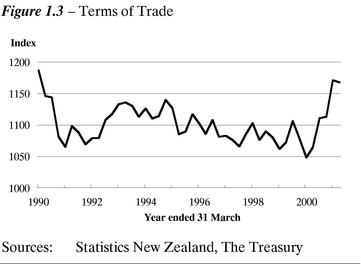
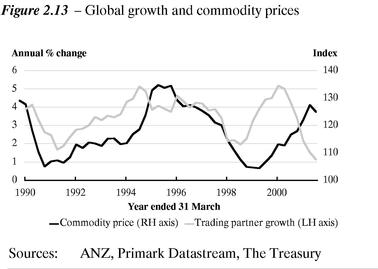
One of the principal reasons why New Zealand growth has not followed the world down and tracked the weaker world growth scenario outlined in the 2001 Budget has been our robust terms of trade. Throughout much of the year New Zealand export prices have remained at high levels, rather than fallen in line with world growth. With export volumes also holding up, this has provided an important offset to weaker world growth as the income gains have fed through into the broader economy. This has supported investment, employment and consumption over the first half of calendar 2001, and led to a lower current account deficit.
Overall, in the year to June 2001, New Zealand GDP grew at 3.2%. This was better than expected in the 2001 Budget forecast, largely as a result of the very strong growth of 2% in the June quarter. Some of this may reflect volatility in the data, particularly in business investment, given that the March quarter figure was surprisingly weak and at odds with most qualitative assessments of the underlying strength of the economy.
We estimate growth continued in the September quarter, although at a slower rate than in the June quarter. Private consumption and residential investment look to have made positive contributions to growth over the quarter, with market investment providing a negative offset while the contribution from net exports will likely be modest either way. Our estimate is for 0.6% growth for the September 2001 quarter, but an outturn slightly above or below this (perhaps reflecting some bringing forward of activity in the June quarter outturn) would not materially alter our underlying Central Forecast profile.
Looking forward, weak world growth also dominates the short-term outlook
Even before the events of 11 September, US and global growth prospects were being consistently revised down. Between the 2001 Budget in early May and September (compiled just prior to 11 September), forecast growth in our major trading partners was revised down 0.4 percentage points in calendar 2001 and 0.5 percentage points in calendar 2002.
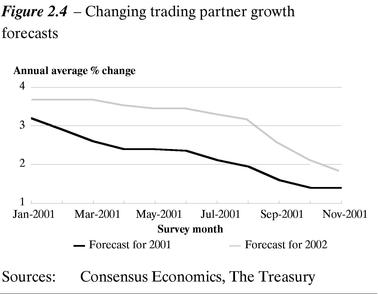
While there were signs in some economies the slowdown could be reaching a turning point prior to 11 September, it was also becoming clear that the expected recovery of trading partner growth was not underway in the second half of 2001. Following the terrorist attacks, sentiment around short-term global growth prospects changed markedly for the worse.
Altogether, since the 2001 Budget trading partner growth prospects have been revised down from 2.4% to 1.4% in 2001, and from 3.6% to 1.9% in 2002. Underlying this fall are the significant downward revisions to growth prospects in the US and Japan.
US economy a major driver
At the time the 2001 Budget was finalised in early May, Consensus forecasts were expecting economic recovery in the US in the second half of 2001, with a further pick-up in growth in 2002. Spending by US consumers was continuing to hold up, and marked reductions in interest rates together with impending tax cuts were expected to provide the basis for a recovery in growth.
A stream of weak economic data pointed to the end of the long-running US economic expansion prior to 11 September. At the same time, however, there were some signs of the economy nearing a turning point. The impact of the shock of 11 September on business and consumer confidence has led forecasters to significantly downgrade their outlook for the US economy, which is now expected to continue to contract in the final months of 2001. Little improvement is expected in the first quarter of 2002 before the economy begins to recover as the substantial monetary and fiscal stimulus put in place begins to take effect. The most recent Consensus forecasts have the US economy growing at 1.1% in calendar 2001 and 0.7% in calendar 2002. Growth in calendar 2003 is expected to return to over 3%.
The outlook for other countries has also weakened...
Consensus forecasts for Japan have been revised down sharply and are for annual contractions of -0.5% in calendar 2001 and -0.6% in calendar 2002. There is little sign of the world's second largest economy emerging from recession in the short term.
Elsewhere in the Asia-Pacific region, forecasts for most economies have been scaled back sharply, with the notable exception of China. Those countries with large electronic export sectors have been hit particularly hard by the global slowdown and the shake-out in the technology sector worldwide. Downward revisions have been particularly marked for Hong Kong, Singapore, South Korea and Taiwan, with an outright contraction in 2001 expected for all of these economies with the exception of South Korea.
Growth forecasts have also fallen across the Euro-zone amidst rising concern the region may not avoid recession as business confidence wanes, industrial production weakens and unemployment rises. Like many other central banks, the European Central Bank has cut interest rates by 150 basis points.
...although Australia continues to hold up in the short term
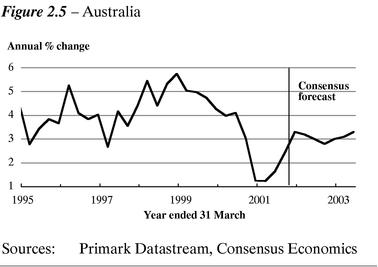
Importantly for New Zealand, revisions to Australian growth prospects have been more moderate in the wake of recent global events. Relatively robust growth is forecast to continue at 2.1% in 2001 and 3.2% in 2002, down from September mean growth forecasts of 2.5% in 2001 and 4.0% in 2002. The weaker world economy is expected to have an impact on growth, particularly through the external sector. Domestic demand, however, is expected to hold up in the short term on the back of buoyancy in the housing sector, despite a deterioration in confidence and weakening labour markets. Steady growth in our largest trading partner is likely to provide some offset to the downturn elsewhere.
World Growth
The world growth assumptions underpinning the Central Forecast are based on an average of private sector forecasts from Consensus Economics. As we noted in the body of the chapter, Consensus forecasts have declined significantly over the past year. Forecasts of global activity from the Organisation for Economic Cooperation and Development (OECD) and the International Monetary Fund (IMF), have similarly declined.
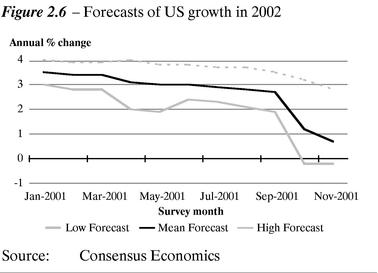
Despite this our reading of the current international data suggests that further falls in forecasts for 2002, albeit more modest than seen this year, cannot be ruled out. One illustration of this is the wide range of views on the outlook for growth in the US in 2002. Figure 2.6 tracks the low and high forecasts, as well as the average from Consensus. As can be seen, recent events have seen a greater range of views develop around the short-term outlook despite 2002 being upon us.
There are also downside risks to trading partner growth beyond 2002. The Consensus view implies a recovery in global growth to more satisfactory levels in the second half of 2002 and continuing into 2003. Even a short delay of a few quarters in US growth returning to around trend would likely see trading partner growth turn out materially lower. This possibility underpins the weaker world growth scenario in the Risks and Scenarios chapter.
The risks around global growth are not one way, however, particularly once the contraction in activity comes to a halt. Our current Consensus forecast assumptions of growth in calendar 2003 are essentially analysts' views of trend growth in trading partners—as such they do not build in any significant period of above-trend cyclical growth despite the current period of weakness.
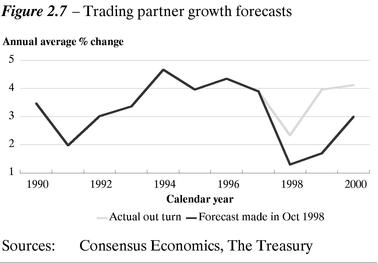
Moreover just as the Consensus has lagged the slowdown in global growth over the past year, Consensus forecasts may also lag any upturn in global growth. Figure 2.7 shows Consensus forecasts from October 1998 at the bottom of the Asian financial crisis for the period 1998–2000 against the eventual outturns.
Given the substantial fiscal and monetary stimulus injected into the US and other economies, we do expect to see economic recovery next year. The key uncertainty is the pace of the upturn. For the US, the 6 November 0.5% cut in the Federal Funds Rate by the Federal Reserve takes the benchmark US interest rate to its lowest level in 40 years, with further reductions possible. In terms of fiscal policy, the additional stimulus in 2002 could be in the order of 1.5%–2% of GDP.
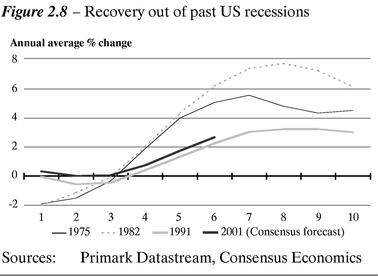
Figure 2.8 tracks the pace of recovery in US growth coming out of past recessions and compares this with the track implied by Consensus forecasts. Whether or not the US does recover more quickly will likely hinge on the extent of turnaround in investment and inventories.
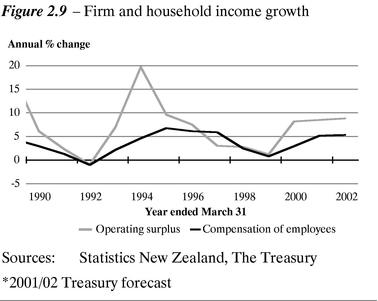
New Zealand is well positioned to cope with weaker world growth...
While the size of the external shock is significant, the actual impact on New Zealand of developments offshore is still uncertain. While New Zealand is unlikely to be immune to these external forces, a number of factors suggest the economy is somewhat better positioned to cope than it has been in similar instances in the past:
- •
- Many parts of the economy have recorded a second year of good income growth, while employment and wage growth has increased household incomes.
- •
- Firm's balance sheets appear healthy.
- •
- Unlike in some economies, there are few signs of any investment overhang, with residential investment at a cyclical low and capacity utilisation high.
- •
- New Zealand manufacturing exports have not been heavily exposed to the technology sector, which has driven the downturn in global industrial production.
- •
- The fall in oil prices is providing support to real income growth compared with a year ago.
- •
- The real exchange rate is at levels which provide stimulus to the export sector.
...and policy has also adjusted
Faced with a large external shock to demand, macroeconomic policy has also moved to a more accommodative stance since the beginning of the year. The current monetary policy cycle peaked over the second half of 2000 when the Official Cash Rate (OCR) stood at 6.5%. Since March this year the Reserve Bank has cut the OCR five times and 1.75% in total, initially in a series of 0.25% cuts before 11 September, followed by an unscheduled cut of 0.5% on 19 September, and another 0.5% cut in mid-November. At 4.75% the level of the OCR is significantly lower than projected in the 2001 Budget and is close to levels when it was first introduced in early 1999. Reflecting this, mortgage rates are close to 30-year lows.
With respect to fiscal policy, the progress made in fiscal consolidation over the past decade means automatic stabilisers are being allowed to operate fully.
Nevertheless, New Zealand is beginning to feel the effect of the global slowdown
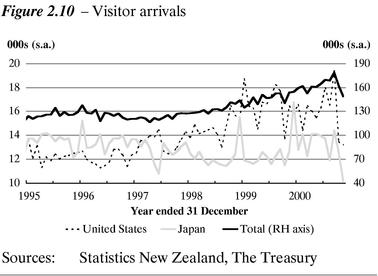
The impact of the global slowdown is starting to affect New Zealand through recent falls in tourism numbers, export prices, and business and consumer confidence.
Monthly visitor arrivals have fallen in both September and October, with the fall in arrivals greatest among the high-spending US and Japanese visitors.
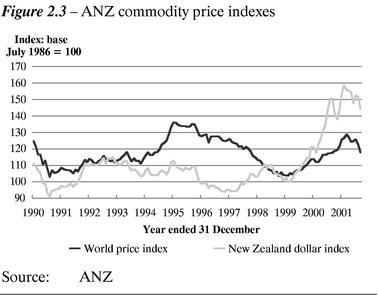
World prices for some of New Zealand's commodities are showing the effects of slowing demand. Nevertheless, while New Zealand export commodity prices have fallen from historic high levels, given that the global economy has been slowing since the start of the year these prices have surprised with their resilience. Furthermore, falls in world prices have been somewhat offset by the weakness of the New Zealand dollar. Import prices, notably for oil, have also weakened.
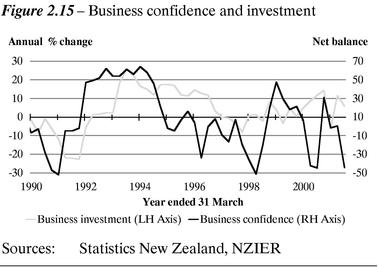
The picture around confidence has been a little more mixed. This is perhaps understandable given the difficulty of forming judgements about how shocks like 11 September will affect people's actions. The initial impact is of a strong negative shock to confidence and security, reinforced by the possibility of further terrorist attacks.

In times of greater uncertainty and insecurity, households and firms become more cautious and postpone spending decisions. During our business talks firms indicated that while they were still relatively optimistic, they had become more cautious since the events of 11 September. More formal surveys of consumer and business confidence show sharp falls since the events of 11 September. Businesses' own activity expectations and investment and employment intentions, are falling but remain in positive territory.
Short-term outlook
New Zealand is not immune from weaker world growth...
We expect the New Zealand economy to slow over the short term before picking up later in 2002 with the rebound in the global economy.
There are a number of direct and indirect "transmission channels" through which we expect weaker world growth to impact on New Zealand. Amongst the key ones are:
- •
- lower demand for New Zealand exports (including tourism)
- •
- lower export prices, only partially offset by lower import prices
- •
- heightened uncertainty and weaker sentiment over the short term leading to a lower domestic spending profile.
The key judgements in this set of forecasts concern the mechanisms through which the shock is transmitted to New Zealand, and the size and timing of the impact.
...as the global downturn hits export growth...
We expect the immediate impact of weak global growth to show up in weaker demand for exports, most notably for services as a result of declining tourist numbers. The negative effect of weaker global growth on incomes together with an aversion to international travel, particularly among American and Japanese tourists, is assumed to have a significant negative impact on total arrivals in New Zealand, relative to previous expectations, until mid-to-late 2002. This is in spite of a competitive exchange rate.
Visitor arrivals fell sharply in September and October, with US and Japanese arrivals clearly showing an impact from 11 September. Going forward into 2002, we expect this weakness to continue despite some potential offset from greater numbers of Australian and Asian tourists, which is helped by the perception of New Zealand as a safe travel destination. Service exports are expected to fall in both the December and March quarters. From the second half of 2002 we expect tourism numbers to pick up as incomes recover on the back of a rebound in global growth, and as people feel more comfortable about international air travel.
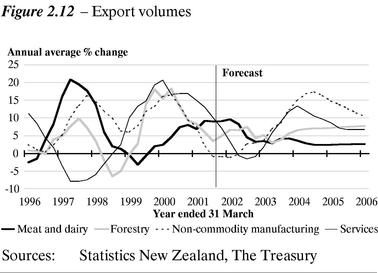
Merchandise export volumes are also expected to contract mildly in late 2001 and early 2002, with the global slowdown particularly impacting on the more demand-sensitive non-commodity manufacturing, crude materials and forestry export sectors. Nevertheless, robust growth in the Australian economy—our largest export destination—provides a significant offset to weak activity elsewhere. In particular, very strong growth in Australian residential investment is expected to provide support for New Zealand manufactured and forestry exports.
New Zealand's agricultural export volumes are largely driven by supply-side factors and hence tend to be less sensitive to fluctuations in international demand. Dairy exports are projected to ease in the near term as climatic conditions are assumed to return to "normal" this year following the rapid growth of the past two seasons. Meat exports also decline in the near term, partially reflecting the recent increase in slaughtering earlier in 2001 as a result of last season's dry conditions, before returning to steady growth.
Overall, we expect total export volumes to fall marginally over the short term, largely as a result of falling services and flat non-commodity manufactured exports. As trading partner growth recovers mid-2002, exports are expected to pick up from the end of 2002. Recovery in global growth will reinforce the competitive effect of the exchange rate for non-commodity manufactured exports. The lack of international demand over the past year is likely to be one of the reasons why manufacturing export growth has not performed as strongly over the past year, as might have been expected given the New Zealand exchange rate. Bilateral exchange rate movements are another.
Should weaker world growth continue throughout most of 2002, then there is downside risk to our Central Forecast, which is explored in one of our scenarios in the Risks and Scenarios chapter.
...and prices
Weaker world demand is also expected to have a significant negative impact on world prices for New Zealand exports towards the end of 2001 and throughout most of calendar 2002, before gradually recovering further out. However, we assumed that export prices would decline in the 2001 Budget, and so far they have held up surprisingly well.
Compared with previous downturns, New Zealand's world export prices have remained relatively strong in the face of slow world economic growth. This is primarily due to meat and dairy prices holding up at historically high levels owing to market specific factors like: constraints on lamb supply in the UK following the BSE and foot-and-mouth disease outbreaks; stronger beef prices in the US reflecting recent supply-driven US beef price rises; and higher dairy prices owing to cuts in European export subsidy rates. While our Central Forecast is based on a fall in export prices, one of the scenarios maps out the possibility of a more modest fall in export prices.
Consistent with previous global downturns, our Central Forecast therefore assumes that world export prices will fall, although not to the same extent due in part to the market specific factors discussed above. Overall, world prices for New Zealand exports are expected to fall by about 8% in the year to March 2003.
As global demand weakens import prices are also expected to moderate across the board. The fall in import prices reflects the historical relationship between weaker global growth and softer import prices. However, import prices are not expected to fall to the same extent as export prices. A larger import price fall would provide an important offset to export price falls.
Oil Prices
Oil prices have fallen dramatically since the 11 September attacks, from around US$27 a barrel in early September to US$19 a barrel more recently. The future oil price profile is a major uncertainty in our forecasts.
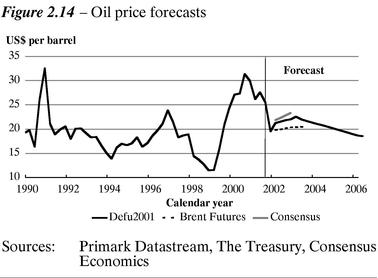
The methodology underlying the Treasury's oil price attempts to capture information from Consensus forecasts, Brent crude futures prices, and the perceived long-run equilibrium price of oil. Reflecting the trends shown by both the Consensus view and Brent Futures prices, our profile is for prices to steadily recover to around US$22.50 over the next 18 months before easing back towards our assumed "equilibrium" level for crude prices of US$18.50 (based on an historical average).
There are clear risks to this profile both on the upside and downside. Should OPEC prove successful in moving oil prices to the middle of its target range of US$22–28 per barrel, oil prices could rise considerably higher than our forecasts. Conversely, further deterioration in the world economic outlook, and consequently weaker demand for oil, could lead to prices remaining at or below current levels for some quarters to come.
In our Central Forecast we expect the terms of trade to deteriorate sharply going into the first half of 2002 as our prices for exports fall away quicker than import prices. Despite these falls, the terms of trade remain slightly above the lows reached in 1990/91 and 1997/98, supported by structural factors impacting New Zealand's key agricultural prices, as well as oil prices remaining below recent highs. The terms of trade subsequently recover over 2002/03 as global growth picks up and commodity prices recover.
Greater uncertainty negatively affects business confidence and feeds into investment...
The third principal channel we see operating over the short-term is from domestic confidence to spending. We see weaker confidence having an impact on the willingness of both firms and households to employ, spend and invest. However, it is very hard to quantify this impact. Assuming that further political or military actions do not have any significant effects on the international economic climate, we expect to see some of the uncertainty, insecurity and risk aversion associated with 11 September dissipate over time as firms and households become clearer about its lasting impacts, even if these are negative for a period of time.
In light of greater uncertainty around the outlook, firms will be more cautious about undertaking new investment. This will be reinforced by expectations of slower income growth over the short term as export growth falls away and domestic demand moderates. However, good balance sheets, lower interest rates, recent high levels of capacity utilisation, and the expectation of a recovery means that we do not expect to see large declines in investment. Overall, we expect market investment to fall around 4% in the year to March 2003 with a couple of negative quarters of investment spending in the December 2001 and the March 2002 quarters.
Going into 2003 investment growth begins to pick up as profit growth, and the need to undertake investment as the economy nears capacity, plus a relatively tight labour market going forward all provide support to business investment as deferred projects are brought back on line.
...the labour market...
We also expect firms to be more cautious about taking on additional employees. As a result, employment growth stops over the short term and for much of 2002 as firms delay hiring, and seasonal employment is more muted in selected industries, notably tourism. However, the extent of the slowing in employment growth is expected to be more modest than in previous downturns as firms look to maintain the bulk of their workforce given the relatively tight labour market. Demand for skilled labour is likely to hold up as firms seek to fill skilled vacancies as the opportunity arises.
As a consequence we therefore expect the unemployment rate to rise moderately until mid-2002, although continuing to remain under 6% as a softening in the labour participation rate offsets some of the impact of weaker employment growth.
As the economy regains momentum over 2002/03, firms resume hiring, employment growth resumes from mid-2002 leading to a pick-up in the labour market and a rise in the participation rate. Unemployment begins to fall towards 5.5% by the end of 2003.
...and households.
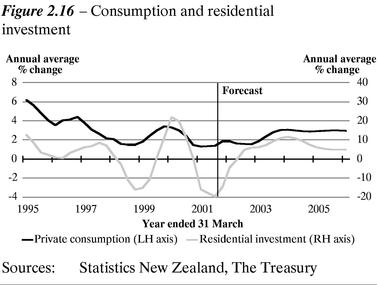
The "wait and see" attitude of firms is expected to be mirrored by households. Greater uncertainty leads households to be more cautious about their expenditure patterns over the short term as a weaker labour market, and slower global growth and aggregate demand lead to more modest farm and entrepreneurial income growth. With household net wealth also remaining flat, consumption growth is expected to moderate and remain subdued over the first half of 2002.
However, the turnaround in migration and the moderate pick-up in residential investment are expected to provide some support to consumption.
Activity in the housing sector and residential construction is expected to continue to increase modestly over the short term, as lower consumer confidence provides some offset to lower interest rates. Once consumer confidence turns around, lower interest rates and net inward migration should all provide support to a pick-up in residential investment in 2002/03, although not to the levels of the Auckland housing boom of the mid-1990s. The pick-up in the housing market also provides support for house prices, which in turn, bolsters household wealth.
GDP growth profile is more cyclical than expected in the 2001 Budget
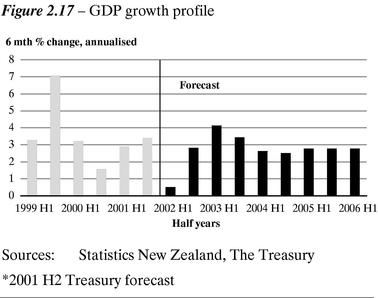
Overall, the short-term profile for real GDP growth is considerably more cyclical than forecast in the 2001 Budget. On an annual percent change basis growth falls to around 1.0% in the first half of calendar 2002 before rebounding to 3% in early 2003 and rising to 4% towards the end of 2003. Growth is expected to be weakest over the period December quarter 2001 to June quarter 2002—on average only slightly positive. Thereafter, growth recovers to above trend rates on a quarterly basis by the end of 2002 and in early 2003. In annual average terms, this sees real GDP growth of 3.1% in the year to March 2002 and 1.9% in the year to March 2003.
Such outturns would see New Zealand GDP growth matching or outperforming the OECD average over the period 1999-2003.
The profile for nominal GDP growth is also more cyclical, which has implications for our fiscal forecasts in the next chapter. Nominal growth in the year to March 2002 is forecast to be 5.9%, partly as a result of the strong June quarter outturn. In the year to March 2003, lower real growth and lower inflation leads nominal growth to fall to 2.6%, before picking up further out as growth rebounds.
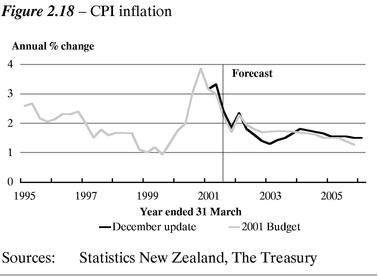
The inflation outlook looks benign over the short term
With reduced growth and weaker global price pressures (including for oil) the outlook for inflation in the short term is more moderate than we had assumed in the 2001 Budget. In the labour market, short-term wage pressure is diluted by concerns about the world economy and a rise in the unemployment rate. Our projections have CPI inflation falling back to the middle of the Reserve Bank's target range by the December 2002 quarter as pricing pressures ease on the back of weaker unit labour costs and weaker world export and import prices. Weaker demand also makes it more difficult for firms to pass on price rises.
As growth picks up over 2002/03, the Reserve Bank is assumed to steadily return the Official Cash Rate to around 6.0%, our current estimate of neutral short-term interest rates, to lean against any emerging inflationary pressures. This is also helped by a modest appreciation in the exchange rate.
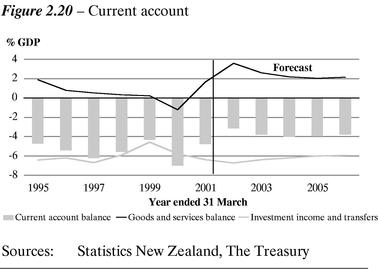
The current account will continue to improve in the short run, but weaker world demand will see it decline moderately in 2002/03
The current account has improved more than expected throughout the year, although slower export growth in the year ahead, together with the forecast fall in the terms of trade slows down the extent of further improvement. However, declines in business investment and consumption expenditure lead to a fall in imports. As global growth slows, profits from New Zealand subsidiaries offshore are expected to fall. In the year to March 2002, the current account is expected to fall to around 3% of GDP, before deteriorating in 2002/03 as the goods and services surplus retraces some of the recent gains. Government defence spending adds to imports over most of the forecast period.
Longer term outlook—2003/04 and beyond
Over the medium term the economy continues to post good growth
In the year to March 2004, the economy is forecast to enjoy growth of 3.7% as export growth accelerates markedly, and as the domestic economy recovers strongly. The forecast resumption of business investment growth, and the improvement in the labour market see a strong pickup in domestic demand. However, as economic growth and business investment recovers, imports also increase so that net exports make a negative contribution to growth towards the end of the forecast horizon.
The outer years of the forecast period see some slowing of the economy, with average annual growth falling back to around trend growth of around 2.75%. Rising interest rates from late 2002 slow some components of domestic demand and help close an emerging positive output gap, while a gradual appreciation of the TWI to its expected long term equilibrium level moderates export growth.
Exports continue to recover...
Over the medium term, exports continue to recover. In volume terms, agricultural exports are expected to steadily increase over the forecast horizon due to increased stock numbers as well as productivity improvements. Non-commodity exports continue to do well on the back of continuing world growth and the exchange rate converging to its assumed equilibrium level.
...as does domestic demand
Business investment remains fairly strong further out in the forecast period given a continued tight labour market. To overcome capacity and labour market constraints firms are expected to meet more of their output growth from capital rather than labour. This will also serve to underpin average labour productivity of around 1.5% over the forecast period.
Consistent with rising economic growth over the medium term, labour demand also picks up. Employment growth is expected to gain momentum going into 2003/04 with the unemployment rate returning to around current levels of just over 5% as the higher participation rate and continued moderate net migration inflows offset further employment growth.
Monetary conditions
In late 2003 and early 2004, inflation tracks marginally above the mid-point of the target band as unit labour costs pickup somewhat and a slightly positive output gap emerges. However, the impact of rising interest rates leans against any emerging inflation pressures and inflation tracks down toward the mid-point of the Reserve Bank's target inflation band.
Current account improves further out
Following the deterioration in the current account deficit to 3.8% of GDP in 2003, the deficit falls further to 4.0% of GDP as imports increase on the back of the pick-up in investment spending and domestic consumption. Further out, continued steady improvement in service exports underpins an improvement in the current account balance at the end of the forecast horizon.
Growth in the nominal economy rebounds
Over the last three years of the forecast horizon the nominal economy is forecast to record solid growth of 4% to 5%, owing to the combined contribution of relatively steady GDP growth and stable inflation around the middle of the Reserve Bank's target band. This growth in nominal GDP underpins solid revenue growth in our fiscal forecasts.
3
Fiscal Outlook
Introduction
This chapter discusses the trends, influences and assumptions behind the outlook for the Crown's finances. The discussion covers:
- •
- key components of the operating balance including tax revenue, expenses, and state-owned enterprises' and Crown entities' surpluses
- •
- net worth and net debt, including the relation between the operating balance and net worth and net debt, and details of revisions to the 2001/02 bond programme.
Following these sections are technical tables and information including fiscal indicators, OBERAC methodology, a reconciliation of the operating balance since the 2001 Budget, the Government's operating and capital provisions, the relationship between the operating balance and net debt, the Air New Zealand recapitalisation package and the NZS Fund assumptions.
Page 70 outlines the impending change to how the Crown will prepare its fiscal forecasts and Crown financial statements through the introduction of line-by-line consolidation of SOEs and Crown entities
Influences on the Operating Balance
Operating surpluses will continue to rise over the forecast period.
In 2001/02, the OBERAC is $1.2 billion once the operating balance is adjusted for ACC and GSF revaluations of around $250 million. Thereafter, both the OBERAC (see page 61) and operating balance grow from $1.8 billion in 2002/03 (1.5% of GDP) to $3.9 billion in 2005/06 (2.7% of GDP).
The following sections discuss the trends in the three main operating balance components (revenue, expenses and SOE/CE surpluses) and any significant changes in these components since the 2001 Budget.
For a detailed comparison of key fiscal indicators with the 2001 Budget, see Table 3.4 on pages 58 and 59.
Tax Revenue
The main driver of tax revenue is nominal economic growth
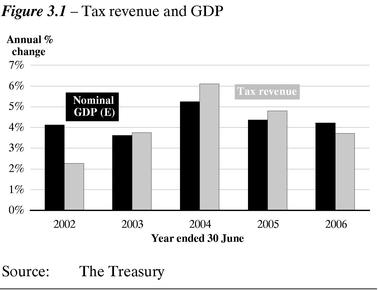
Tax revenue is expected to grow broadly in line with growth in nominal GDP, apart from in 2001/02.
An expected drop in corporate tax in 2001/02 is the major factor behind total tax revenue growth of 2.3% in 2001/02.
Tax forecasts across all years are lower compared with the 2001 Budget, with by far the biggest reduction ($840 million) occurring in 2002/03.
PAYE forecasts largely track wages and salaries, but...
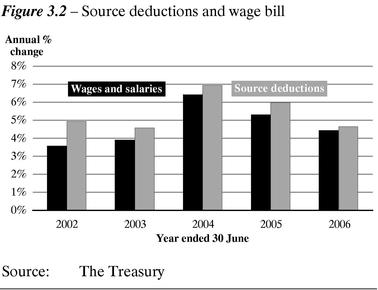
Source deductions (PAYE) is tax paid on wages and salary income and is the largest single component of tax revenue.
Source deductions' growth is usually slightly above growth in wages and salaries owing to the "fiscal drag" effect, where income growth over time moves more people into higher tax brackets.
However, in 2001/02, the gap between the two growth rates is larger than usual. This is because PAYE is also paid on social welfare benefits and NZ Superannuation and, in 2001/02, growth in benefits is expected to be slightly ahead of growth in wages and salaries.
...GST growth is well in excess of growth in domestic consumption
A substantial shift in GST revenue from the latter part of 2000/01 into the early part of 2001/02 has boosted growth in GST above growth in underlying domestic consumption.
This revenue shift prompted an increase to the GST forecast for 2001/02.
This increase in the forecast continues through later years as GST grows in line with domestic consumption.
Corporate tax dips, but recovers
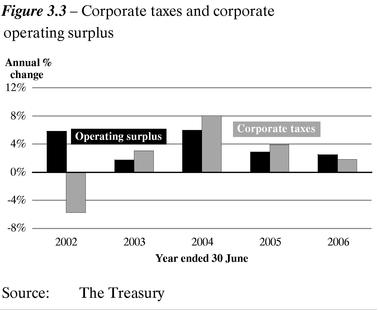
There is some downward pressure on the corporate tax forecast for 2001/02, with tax from the savings and investment sector expected to be lower than 2000/01 as a result of poor investment returns.
It is also expected that many large companies will reduce their estimates of tax liability, which is likely to have a negative effect on tax revenue in terms of both provisional tax and terminal tax.
On the other hand, the tax revenue of small companies to date is higher than last year's level, which puts upward pressure on the forecast.
On balance, corporate tax revenue is expected to decline by nearly 6% in 2001/02.
With profits expected to stagnate in 2003, corporate tax growth in the 2002/03 year is expected to be slight. However, tax growth recovers again in 2003/04 on the back of strong profit growth.
Other persons' tax is affected by fluctuations in terminal tax and refund payments
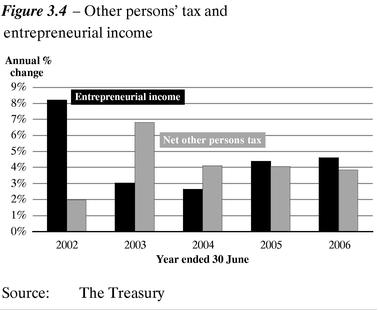
Net other persons' tax is tax paid mainly by the self-employed, farmers and investors, less refunds paid to all individuals.
The increased level of other persons' refunds to date in 2001/02 has a flow on to the level of terminal tax. This is likely to be down compared to last year, particularly since terminal tax was unusually high in 2000/01 when there was a great deal of terminal tax paid by individuals who had shifted income into the 2000 tax year to minimise the effects of the tax rate rise. Consequently, growth in net other persons' tax is well below growth in entrepreneurial income for 2001/02.
Terminal tax, mostly from farmers, is expected to boost other persons' tax growth in 2002/03, aided by a fall in refunds.
For the remainder of the forecast horizon, net other persons' tax is expected to grow broadly in line with growth in entrepreneurial income.
Risks around the tax forecasts from judgements made
As always, the main risks around the tax forecasts are economic. The macroeconomic forecasts are the primary input into the tax forecasts, which means that the accuracy of the tax forecasts depends, to a large extent, on the accuracy of the economic forecasts.
However, when formulating tax forecasts, many judgements need to be made. Having to make these judgements introduces further risks to the accuracy of the tax forecasts.
Particular risks in these forecasts stem from:
- •
- reconciling tensions between recent tax data and economic data, particularly for PAYE and GST
- •
- determining the incidence of revenue recognition, particularly in self-assessed tax types such as other persons and companies, where terminal tax and refunds can shift tax revenue between years
- •
- deciding how much of an effect tax losses will have on tax revenue over the next few years in corporate and other persons' tax.
Inland Revenue's Forecasts
In line with established practice, the Inland Revenue Department has prepared an independent set of tax forecasts, based in the short term on more detailed analysis of taxpayer information, and in the longer term reflecting the same underlying macroeconomic trends.
Aggregate differences between the two sets of forecasts in the 2001/02 and 2002/03 fiscal years are negligible. Over subsequent years, Inland Revenue projects total tax revenue to be somewhat lower than the Treasury's estimates. However, the differences between the total tax forecasts are less than 1%.
The two sets of forecasts are compared in Table A.1.
Expenses
Expenses as a percentage of GDP continue to trend down
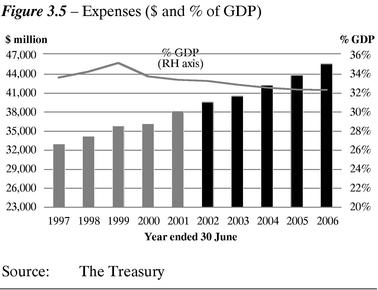
Expenses fall as a percentage of GDP from 33.4% in 2000/01 to 32.4% in 2005/06.
Over the same period, nominal expenses grow by around 4% each year, owing to both policy spending and demand-driven factors. This represents an increase of around $7.4 billion from $38.2 billion in 2000/01 to $45.6 billion in 2005/06.
Demand-driven factors outlined in Figure 3.6 account for around 40% ($3.2 billion) of the expense increase. These factors include demographic impacts and CPI indexation of benefits. They are not met from the fiscal provisions, as the Government has little direct influence over their movement.
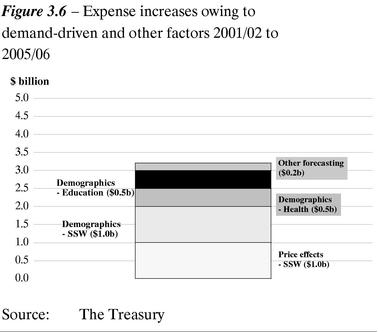
Over the five year forecast period:
- •
- CPI indexation averages 1.6%, increasing benefits expenses by around $1 billion
- •
- population growth increases the number of invalids and superannuitants by 47,500, this being the main demographic drivers for Social Security and Welfare (SSW) expenses
- •
- population ageing is the main driver for health demographics
- •
- school and tertiary rolls increase by around 25,000.
Other expense categories remain relatively static, except finance costs which increase slightly reflecting higher nominal debt levels.
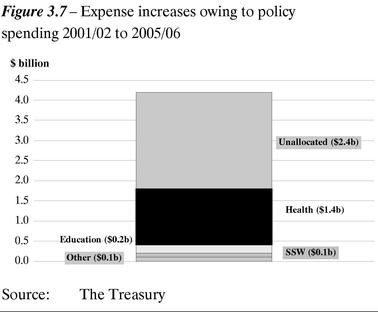
Around 60% ($4.2 billion) of increases in expenses is policy driven, comprising the Government's operating provisions (see Figure 3.7).
The bulk of the expenses allocated to date from the provisions has been directed towards Education, Health and Social Security and Welfare ($1.8 billion1). Around $2.4 billion remains unallocated. These amounts are intended to fund new initiatives, while managing cost pressures the Government can directly influence.
- 1
- Comprises $0.6 billion allocated in the 2001 Budget package, and $1.2 billion for the health package announced in December 2001.
Table 3.8 outlines the policy decisions affecting expenses since Budget 2001.
Health spending the key feature of expense growth since the 2001 Budget
The Government has announced an increase in cumulative health spending of $2.4 billion over the next three financial years, over and above funding for existing demographic and other forecasting items. The announcement represents a health package of $400 million growth in each year of 2002/03, 2003/04 and 2004/05.
Table 3.1 shows the growth of health spending year on year.
Table 3.1—Growth in health expenses
| | 2000/01
Actual1
| | 2001/02
Forecast
| | 2002/03
Forecast
| | 2003/04
Forecast
| | 2004/05
Forecast
| | 2005/06
Forecast
| |
|---|
| | ($ million)
| |
|---|
| Health spending | | 7,342 | | 7,797 | | 8,225 | | 8,744 | | 9,264 | | 9,385 | |
Sources of growth |
|
|
|
|
|
|
|
|
|
|
|
|
|
| Demographic adjustment | | | | 92 | | 94 | | 96 | | 98 | | 100 | |
| Budget 2000 initiatives profile difference | | | | 8 | | 30 | | 20 | | — | | — | |
| 2000 contingency (DEFU 2000) | | | | (22 | ) | 1 | | — | | — | | — | |
| Previous Budget decisions | | | | (14 | ) | 31 | | 20 | | — | | — | |
| Health payments to ACC | | | | 173 | | (17 | ) | 9 | | 22 | | 22 | |
| Expense transfers between years2 | | | | 62 | | (62 | ) | | | | | | |
| Budget 2001 initiatives | | | | 246 | | (7 | ) | — | | — | | — | |
| Health package announcement | | | | — | | 400 | | 400 | | 400 | | — | |
| Other (includes forecasting)1 | | | | (104 | ) | (11 | ) | (6 | ) | — | | (1 | ) |
| | |
| |
| |
| |
| |
| |
| |
| Total growth | | | | 455 | | 428 | | 519 | | 520 | | 121 | |
| | |
| |
| |
| |
| |
| |
| |
Source: The Treasury
NOTES:
- 1
- Included in 2000/01 is unappropriated expenditure on pharmaceuticals and laboratory services which does not flow through to future outyears.
- 2
- Expense transfers of $30 million were made from 2000/01 to 2001/02 which do not flow through to future outyears.
SOE and Crown Entity Surpluses
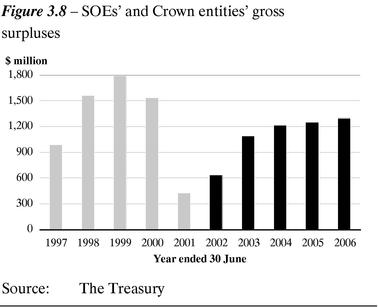
SOE and Crown entity surpluses have generally decreased from prior years (excluding 2000/01). In 2000/01 and 2001/02, the surplus is affected by increases in the ACC outstanding claims liability ($420 million and $205 million respectively).
Abstracting from the ACC liability valuation impacts, gross SOE and Crown entity surpluses are around $850 million in 2001/02, rising over the forecast period to $1.3 billion in 2005/06.
SOE and Crown entity surpluses are lower than the 2001 Budget forecasts for 2001/02. This is primarily due to two factors:
- •
- forecast revisions to the deficits for the DHBs. The current forecasts include a combined net deficit of $220 million. DHB deficits are forecast to be around zero by 2003/04
- •
- ACC valuation changes have resulted in an increase in the outstanding claims liability of around $205 million.
Surpluses are higher than those forecast in the 2001 Budget for the remainder of the forecast period owing to additional deficits in the DHBs being more than offset by improved surpluses from SOEs.
Influences on Net Worth and Debt
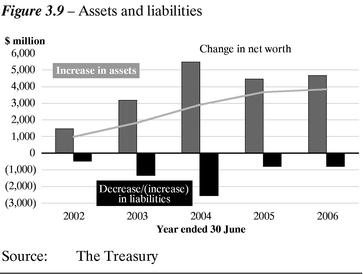
Operating surpluses increase net worth and generate cash...
Net worth increases by $13.2 billion from $11.5 billion to $24.7 billion between 2000/01 and 2005/06. This increase reflects the level of operating balances over the forecast period of around $13.2 billion.
Table 3.2 shows how the forecast operating surpluses flow through to the Statement of Financial Position over the five-year forecast period.
Some portions of the operating surplus are non-cash in nature, including:
- •
- depreciation of $5.0 billion, for which a broadly equivalent amount of cash is earmarked for maintaining existing physical asset levels; offset by
- •
- SOE and Crown entity net surpluses of $3.8 billion, which are retained by the SOEs and Crown entities and increase the Crown's investment in these entities
- •
- NZS Fund returns (after tax) of $1.2 billion, which are retained by the NZS Fund, and increase the Crown's investment in this asset.
Adjusting for these items, the rising operating surplus profile generates a similar level of operating cash flows ($13.0 billion). The Crown can use this cash to either invest in assets or repay debt.
Table 3.2—Impact of operating surpluses on the balance sheet from 2001/02 to 2005/06
In the 2001 Budget, the forecast financing requirement for the years 2000/01 to 2004/05 was $7.6 billion. The updated financing requirement for the comparative period is now around $1.5 billion higher. This primarily reflects the Air New Zealand recapitalisation package (around $1 billion), higher student loan advances and refinancing of DHB debt (around $0.7 billion combined), partially offset by a higher than expected surplus cash position of $0.5 billion in 2000/01.
...though investment claims outweigh available cash surpluses
The Crown invests $23.6 billion cash—$10.6 billion more than its operating cash flows over the forecast period, including2:
- 2
- The capital provisions are allocated across purchases of assets, SOE/Crown entity capital injections, and advances (see Tables 3.9 and 3.10 on pages 65 and 66).
- •
- maintaining and improving the existing asset base ($9.1 billion) and providing injections of $1 billion to DHBs and for establishing Kiwibank
- •
- investing in the NZS Fund ($7.9 billion)
- •
- funding advances ($5.7 billion). The advances comprise student loans of $3.9 billion with the remaining $1.8 billion relating to refinancing Crown entity private sector debt (DHBs and Housing New Zealand Corporation) and other miscellaneous advance activity.
To fund the difference of $10.6 billion between operating cash flows and investment programme requirements, existing levels of marketable securities and deposits (MSDs) will be run down and new debt will be required.
Gross debt increases by around $6.6 billion and MSDs decrease by around $3.9 billion over the forecast horizon. The change in these financial assets and liabilities, together with other working capital movements (for example, movements in accounts payable), funds the $10.6 billion additional investment in the balance sheet.
The increase in net debt over the forecast period is $4.9 billion, lower than the total funding requirement of $10.6 billion mentioned above. Net debt is not influenced by movements in advances (mainly student loans and refinancing Crown entity debt) or foreign exchange revaluations of overseas debt (which is fully hedged by movements in foreign currency denominated financial assets)3.
- 3
- Table 3.11 on page 66 outlines the relationship between the operating balance and net debt in detail.
Debt as a percentage of GDP rises slightly in the middle of the forecast period before falling again
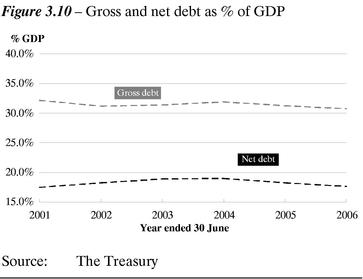
While both gross and net debt increase in nominal terms over the forecast period, of more relevance is how debt tracks with growth in the economy.
The Government's debt objective is established at a gross debt constraint of 30% of GDP. The associated net debt indicator is 20% of GDP.
Gross debt falls as a percentage of GDP from around 32% at the start of the forecast period to slightly below 31% by 2005/06.
Net debt increases from 17.5% in 2001 to 19% in 2003/04, before dropping back to 17.6% at the end of the forecast period.
Net debt and gross debt as a percentage of GDP rise in the middle of the forecast period mainly owing to lower economic growth in earlier years and the bringing forward of capital spending. Stronger economic growth towards the end of the period sees the trends moving downwards again.
Influences on gross and net debt

Generally, nominal gross debt increases relatively faster than net debt due to net student loan4 capital requirements, which average around $775 million per year.
- 4
- These are neutral from a net debt perspective as advances are included in the definition of "financial assets".
Additional factors causing the tracks to diverge over the forecast horizon include:
- •
- the bulk of the existing Housing and Health sector5 private sector debt refinancing, which takes place in 2001/02 ($700 million), $300 million in 2002.03 and 2003/04 ($770 million), which only impacts on gross debt
- 5
- The Crown has undertaken to refinance DHB and Housing New Zealand Corporation private sector debt with Crown-issued debt as it results in overall lower interest costs. This is a technical change that increases gross Crown-issued debt. Because it brings a financial asset onto the Crown's balance sheet, however, there is no impact on net debt. Since the 2001 Budget, revised forecasts from DHBs have increased the refinancing requirements by around $330 million.
- •
- in 2001/02 and 2002/03, funding requirements are partially met through a decrease in holdings of MSDs, which only impact on net debt.
Changes in debt relative to the 2001 Budget
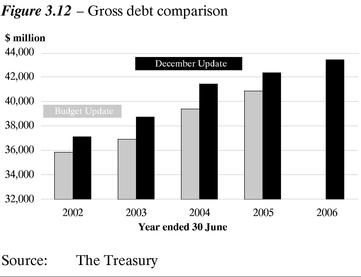
Both gross and net debt increase relative to the 2001 Budget. The key changes in funding requirements for the comparable period of 2000/01 to 2004/05 are:
- •
- lower forecast cash generated from operating balances from 2001/02 ($0.4 billion), offset by an improved surplus cash position in 2000/01 from forecast of around $0.5 billion
- •
- higher forecast demand for student loans, in tandem with revised forecast requirements to fund DHB debt refinancing ($0.7 billion combined)
- •
- increases in the capital provisions ($1 billion) for the Air New Zealand recapitalisation package.
Net debt (in nominal terms and as a percentage of GDP) is, on average, slightly higher across the forecast horizon than the 2001 Budget.
Net debt and the domestic bond programme
The domestic bond programme for 2001/02 is now $4.1 billion, a $600 million increase over the programme announced at the time of the 2001 Budget. The bond programme finances the Crown's operating, investing and financing cash flows.
Table 3.3 outlines the reconciliation of the change in the 2001/02 programme.
Table 3.3—Change in domestic bond programme
Change from the 2001 Budget
| | $ million
| | Explanation
| |
|
|---|
| Additional 2001/02 funding requirement | | (1,100) | | Additional operating and investing activity requiring finance6 — mainly to allow for the recapitalisation of Air New Zealand. | | |
| Funded from: | | | | | | |
| • Outturn from 2000/01 fiscal year | | 500 | | Additional cash available from the better than expected 2000/01 financial year. | | |
| • New Zealand Dollar swap programme provision | | 500 | | The original 2001/02 bond programme made some allowance for issuing domestic bonds to fund foreign currency reserves, via the swap market. Foreign currency reserves will now be funded entirely by borrowing directly in foreign currencies during 2001/02. This creates capacity in the domestic bond programme to fund the additional cash requirement.7 | | |
| Residual 2001/02 funding requirement | | (100) | | | | |
| Partial pre-funding of 2002/03 debt programme | | (500) | | A decision has been taken to partially pre-fund the 2002/03 borrowing requirement. This reduces the forecast 2002/03 bond programme to around the $5.1 billion shown in the fiscal forecasts (it would otherwise be $5.6 billion). | | |
| Increase in 2001/02 domestic debt programme | | (600) | | | | |
- 6
- The operating and investing cash flows incorporate cash flows from operations, net purchase of physical assets, net increase in advances, net purchase of investments (essentially capital injections/(withdrawals) to SOEs and Crown entities) and the capital provision.
- 7
- While this strategy alleviates the need to increase domestic borrowing, there will be an increase in foreign currency borrowing, therefore total Government debt increases.
Forecast increases in the level of the domestic bond programme
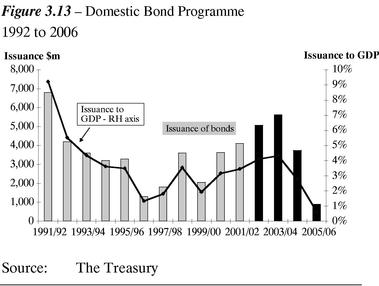
The forecasts indicate that the domestic bond programme is to increase in nominal terms over the next two years, at $5.1 billion and $5.6 billion for 2002/03 and 2003/04 respectively—which is somewhat larger than was experienced during the late 1990s.
However, the nominal increases should be viewed in context with the relative size of the economy. Growth in the New Zealand economy means that the $5.1 billion debt programme is forecast (in 2002/03) to be much smaller relative to GDP (4.1%) than was the case in 1991/92 (9.2%) when the domestic debt programme amounted to $6.8 billion.
Fiscal Indicators—Comparison with 2001 Budget
Table 3.4—Fiscal indicators—compares key fiscal information with the 2001 Budget
| | 2001
Actual
| | 2002
Budget
| | 2002
DEFU
| | 2003
Budget
| | 2003
DEFU
| |
|---|
| | ($ million, year ended 30 June)
| |
|---|
| Statement of Financial Performance | | | | | | | | | | | |
Revenue |
|
|
|
|
|
|
|
|
|
|
|
| Taxation revenue | | 36,738 | | 37,685 | | 37,571 | | 39,818 | | 38,978 | |
| Other revenue | | 2,754 | | 2,311 | | 2,719 | | 2,469 | | 2,553 | |
| | |
| |
| |
| |
| |
| |
| Total Revenue | | 39,492 | | 39,996 | | 40,290 | | 42,287 | | 41,531 | |
| | |
| |
| |
| |
| |
| |
| Ratio to GDP (%) | | 34.6 | % | 34.1 | % | 33.9 | % | 34.2 | % | 33.7 | % |
| Tax ratio to GDP (%) | | 32.1 | % | 32.1 | % | 31.6 | % | 32.2 | % | 31.6 | % |
Expenses |
|
|
|
|
|
|
|
|
|
|
|
| Functional expenses | | 35,750 | | 36,810 | | 37,186 | | 37,385 | | 37,775 | |
| Finance costs | | 2,483 | | 2,395 | | 2,345 | | 2,334 | | 2,322 | |
| Net foreign exchange gains | | (47 | ) | — | | (18 | ) | — | | — | |
| Provision for future initiatives | | — | | 160 | | 90 | | 955 | | 450 | |
| | |
| |
| |
| |
| |
| |
| Total Expenses | | 38,186 | | 39,365 | | 39,603 | | 40,674 | | 40,547 | |
| | |
| |
| |
| |
| |
| |
| Ratio to GDP (%) | | 33.4 | % | 33.6 | % | 33.3 | % | 32.9 | % | 32.9 | % |
Contribution of SOEs and CEs |
|
|
|
|
|
|
|
|
|
|
|
| Surplus attributable to SOEs and Ces | | 424 | | 953 | | 634 | | 1,050 | | 1,089 | |
| Dividends and other distributions | | (321 | ) | (208 | ) | (336 | ) | (222 | ) | (250 | ) |
| | |
| |
| |
| |
| |
| |
| Net Contribution of SOEs and CEs | | 103 | | 745 | | 298 | | 828 | | 839 | |
| | |
| |
| |
| |
| |
| |
| Operating Balance | | 1,409 | | 1,376 | | 985 | | 2,441 | | 1,823 | |
| | |
| |
| |
| |
| |
| |
| Ratio to GDP (%) | | 1.2 | % | 1.2 | % | 0.8 | % | 2.0 | % | 1.5 | % |
Statement of Financial Position |
|
|
|
|
|
|
|
|
|
|
|
| Assets (excluding NZS Fund assets) | | 65,081 | | 63,233 | | 65,934 | | 65,351 | | 67,817 | |
| NZS Fund assets | | — | | 617 | | 614 | | 1,888 | | 1,904 | |
| Liabilities | | (53,618 | ) | (51,893 | ) | (54,106 | ) | (52,841 | ) | (55,456 | ) |
| Crown Balance (net worth) | | 11,463 | | 11,957 | | 12,442 | | 14,398 | | 14,265 | |
| | |
| |
| |
| |
| |
| |
| Ratio to GDP (%) | | 10.0 | % | 10.2 | % | 10.5 | % | 11.7 | % | 11.6 | % |
Statement of Borrowings |
|
|
|
|
|
|
|
|
|
|
|
| Crown Debt | | | | | | | | | | | |
| Gross debt | | 36,761 | | 35,831 | | 37,105 | | 36,887 | | 38,708 | |
| less financial assets | | (16,790 | ) | (14,368 | ) | (15,402 | ) | (14,846 | ) | (15,406 | ) |
| | |
| |
| |
| |
| |
| |
| Net Crown Debt | | 19,971 | | 21,463 | | 21,703 | | 22,041 | | 23,302 | |
| | |
| |
| |
| |
| |
| |
| Net Crown debt to GDP (%) | | 17.5 | % | 18.3 | % | 18.2 | % | 17.8 | % | 18.9 | % |
| Gross debt to GDP (%) | | 32.2 | % | 30.5 | % | 31.2 | % | 29.9 | % | 31.4 | % |
| Net debt repayment/(increase) | | 1,425 | | (1,031 | ) | (1,732 | ) | (578 | ) | (1,599 | ) |
| Nominal GDP | | 114,275 | | 117,323 | | 118,980 | | 123,573 | | 123,271 | |
Source: The Treasury
| | 2004
Budget
| | 2004
DEFU
| | 2005
Budget
| | 2005
DEFU
| | 2006
DEFU
| |
|---|
| | ($ million, year ended 30 June)
| |
|---|
| Statement of Financial Performance | | | | | | | | | | | |
Revenue |
|
|
|
|
|
|
|
|
|
|
|
| Taxation revenue | | 41,661 | | 41,359 | | 43,468 | | 43,344 | | 44,952 | |
| Other revenue | | 2,770 | | 2,924 | | 3,085 | | 3,286 | | 3,630 | |
| | |
| |
| |
| |
| |
| |
| Total Revenue | | 44,431 | | 44,283 | | 46,553 | | 46,630 | | 48,582 | |
| | |
| |
| |
| |
| |
| |
| Ratio to GDP (%) | | 34.4 | % | 34.1 | % | 34.6 | % | 34.4 | % | 34.4 | % |
| Tax ratio to GDP (%) | | 32.3 | % | 31.9 | % | 32.3 | % | 32.0 | % | 31.9 | % |
Expenses |
|
|
|
|
|
|
|
|
|
|
|
| Functional expenses | | 38,026 | | 38,793 | | 38,633 | | 39,774 | | 40,622 | |
| Finance costs | | 2,409 | | 2,508 | | 2,431 | | 2,594 | | 2,641 | |
| Net foreign exchange gains | | — | | — | | — | | — | | — | |
| Provision for future initiatives | | 1,855 | | 975 | | 2,755 | | 1,475 | | 2,376 | |
| | |
| |
| |
| |
| |
| |
| Total Expenses | | 42,290 | | 42,276 | | 43,819 | | 43,843 | | 45,639 | |
| | |
| |
| |
| |
| |
| |
| Ratio to GDP (%) | | 32.7 | % | 32.6 | % | 32.6 | % | 32.4 | % | 32.4 | % |
Contribution of SOEs and CEs |
|
|
|
|
|
|
|
|
|
|
|
| Surplus attributable to SOEs and CEs | | 1,163 | | 1,214 | | 1,185 | | 1,248 | | 1,295 | |
| Dividends and other distributions | | (247 | ) | (313 | ) | (267 | ) | (365 | ) | (384 | ) |
| | |
| |
| |
| |
| |
| |
| Net Contribution of SOEs and CEs | | 916 | | 901 | | 918 | | 883 | | 911 | |
| | |
| |
| |
| |
| |
| |
| Operating Balance | | 3,057 | | 2,908 | | 3,652 | | 3,670 | | 3,854 | |
| | |
| |
| |
| |
| |
| |
| Ratio to GDP (%) | | 2.4 | % | 2.2 | % | 2.7 | % | 2.7 | % | 2.7 | % |
Statement of Financial Position |
|
|
|
|
|
|
|
|
|
|
|
| Assets (excluding NZS Fund assets) | | 68,753 | | 71,276 | | 70,844 | | 73,277 | | 75,223 | |
| NZS Fund assets | | 3,852 | | 3,914 | | 6,665 | | 6,379 | | 9,091 | |
| Liabilities | | (55,150 | ) | (58,017 | ) | (56,402 | ) | (58,813 | ) | (59,617 | ) |
| | |
| |
| |
| |
| |
| |
| Crown Balance (net worth) | | 17,455 | | 17,173 | | 21,107 | | 20,843 | | 24,697 | |
| | |
| |
| |
| |
| |
| |
| Ratio to GDP (%) | | 13.5 | % | 13.2 | % | 15.7 | % | 15.4 | % | 17.5 | % |
Statement of Borrowings |
|
|
|
|
|
|
|
|
|
|
|
| Crown Debt | | | | | | | | | | | |
| Gross debt | | 39,368 | | 41,400 | | 40,815 | | 42,326 | | 43,368 | |
| less financial assets | | (16,138 | ) | (16,773 | ) | (16,555 | ) | (17,628 | ) | (18,502 | ) |
| | |
| |
| |
| |
| |
| |
| Net Crown Debt | | 23,230 | | 24,627 | | 24,260 | | 24,698 | | 24,866 | |
| | |
| |
| |
| |
| |
| |
| Net Crown debt to GDP (%) | | 18.0 | % | 19.0 | % | 18.0 | % | 18.2 | % | 17.6 | % |
| Gross debt to GDP (%) | | 30.5 | % | 31.9 | % | 30.3 | % | 31.3 | % | 30.7 | % |
| Net debt repayment/(increase) | | (1,189 | ) | (1,325 | ) | (1,030 | ) | (71 | ) | (168 | ) |
| Nominal GDP | | 129,179 | | 129,725 | | 134,563 | | 135,373 | | 141,076 | |
Source: The Treasury
Operating Balance Excluding Revaluations and Accounting Policy Changes (OBERAC)
The OBERAC is an additional fiscal indicator that strips out revaluation movements and accounting policy changes to provide a measure of underlying financial stewardship. The OBERAC is not a measure of the controllable portion of the operating balance. As such, it does not isolate aspects of the operating balance (such as tax revenue and unemployment benefits) that arise from cyclical factors.
Revaluations have significantly affected the operating balance as it is a relatively small balancing item between two large numbers: total revenue and total expenses. Revaluation effects are not forecast beyond the current year as a matter of policy given their inherent uncertainty.
The OBERAC is calculated by adjusting for the following revaluation effects (unless the revaluation is a result of a policy decision):
- •
- Net Present Valued assets and liabilities such as the GSF pension liability, ACC outstanding claims liability and NZS Fund assets
- •
- market-valued financial assets and liabilities, such as tradeable MSDs
- •
- gains or losses on sale. Selling an asset for greater (or less) than its book value is a terminal revaluation
- •
- changes in accounting policy around the recognition of assets and liabilities. For example the recognition of the Public Trust reserves in 1999/2000 would be adjusted for had they met the materiality limit outlined below
The materiality limit for adjustments is $100 million. Materiality is from a Crown-wide, rather than an individual department perspective and applies for any one year.
The graph below indicates the extent to which the OBERAC has differed from the operating balance reported in the accounts over the past ten years.
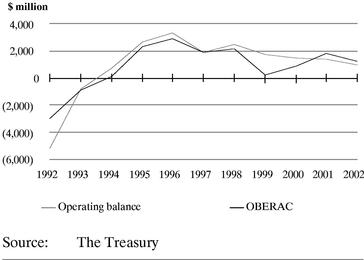
Table 3.5—Detail of OBERAC calculation
| | 1992
| | 1993
| | 1994
| | 1995
| | 1996
| | 1997
| | 1998
| | 1999
| | 2000
| | 2001
| | 2002
|
|---|
| Operating Balance | | (5,149 | ) | (819 | ) | 755 | | 2,695 | | 3,314 | | 1,908 | | 2,534 | | 1,777 | | 1,449 | | 1,409 | | 985 |
Adjustments |
|
|
|
|
|
|
|
|
|
|
|
|
|
|
|
|
|
|
|
|
|
|
| GSF pension liability movements | | 420 | | 664 | | 111 | | 155 | | 226 | | (4 | ) | (233 | ) | 429 | | (201 | ) | 164 | | 38 |
| ACC revaluation | | — | | — | | — | | — | | — | | — | | — | | — | | (519 | ) | 420 | | 205 |
| NPF liability movement | | — | | — | | — | | — | | — | | — | | — | | — | | — | | 253 | | — |
| Gain on sale of assets | | | | | | | | | | | | | | | | | | | | | | |
| Contact | | — | | — | | — | | — | | — | | — | | — | | (1,421 | ) | — | | — | | — |
| Airport companies | | — | | — | | — | | — | | — | | — | | — | | (204 | ) | — | | — | | — |
| Hydro stations | | — | | — | | — | | — | | — | | — | | — | | (195 | ) | — | | — | | — |
| Spectrum licences | | — | | — | | — | | — | | — | | — | | — | | — | | — | | (140 | ) | — |
| Other sales (BNZ, TVNZ shares, etc) | | — | | (283 | ) | (129 | ) | — | | — | | — | | — | | (140 | ) | — | | — | | — |
| Write-downs (Police and Defence) | | — | | — | | — | | — | | — | | — | | — | | — | | 155 | | 103 | | — |
| (Gains)/losses on marketable securities and deposits | | — | | — | | — | | — | | — | | — | | (110 | ) | — | | — | | (102 | ) | — |
| Unrealised forest revaluations | | — | | (766 | ) | 292 | | — | | — | | — | | — | | — | | — | | — | | — |
| Exchange rate movements | | 1,764 | | 296 | | (898 | ) | (551 | ) | (603 | ) | — | | — | | — | | — | | — | | — |
| | |
| |
| |
| |
| |
| |
| |
| |
| |
| |
| |
|
| Total adjustments | | 2,184 | | (89 | ) | (624 | ) | (396 | ) | (377 | ) | (4 | ) | (343 | ) | (1,531 | ) | (565 | ) | 698 | | 243 |
| | |
| |
| |
| |
| |
| |
| |
| |
| |
| |
| |
|
| OBERAC | | (2,965 | ) | (908 | ) | 131 | | 2,299 | | 2,937 | | 1,904 | | 2,191 | | 246 | | 884 | | 2,107 | | 1,228 |
| | |
| |
| |
| |
| |
| |
| |
| |
| |
| |
| |
|
Source: The Treasury
Operating Balance Changes Since the 2001 Budget
Table 3.6—Operating balance reconciliation (explains changes to the operating balance since the 2001 Budget)
| | 2001/02
Forecast
| | 2002/03
Forecast
| | 2003/04
Forecast
| | 2004/05
Forecast
| | 2005/06
Forecast
|
|---|
| | ($ million)
|
|---|
| Operating Balance 2001 Budget | | 1,376 | | 2,441 | | 3,057 | | 3,652 | | — |
Policy changes |
|
|
|
|
|
|
|
|
|
|
| Revenue initiatives | | 15 | | 25 | | 15 | | 15 | | |
| Net expense initiatives | | (66 | ) | (150 | ) | (93 | ) | (97 | ) | |
| Drawdown from Government's operating provisions | | 51 | | 125 | | 78 | | 82 | | |
| | |
| |
| |
| |
| |
|
| Total Policy Changes | | — | | — | | — | | — | | |
| Forecasting changes | | | | | | | | | | |
| Tax revenue forecasting changes | | (129 | ) | (850 | ) | (302 | ) | (124 | ) | |
| Other revenue changes | | 255 | | 42 | | 71 | | 88 | | |
| Welfare benefit indexation increases | | — | | 10 | | 44 | | 54 | | |
| Welfare benefit forecasting increases | | 188 | | 276 | | 281 | | 287 | | |
| Valuation changes (GSF and ACC liability movements) | | (294 | ) | — | | — | | — | | |
| Finance expenses | | 50 | | 12 | | (99 | ) | (163 | ) | |
| Higher Transport expenses | | (76 | ) | (93 | ) | (90 | ) | (78 | ) | |
| Change to SOEs and Crown entities (excluding ACC valuation change) | | (114 | ) | 39 | | 51 | | 63 | | |
| Other forecast changes | | (271 | ) | (54 | ) | (105 | ) | (109 | ) | |
| | |
| |
| |
| |
| |
|
| Total Forecasting Changes | | (391 | ) | (618 | ) | (149 | ) | 18 | | |
| | |
| |
| |
| |
| |
|
| Operating Balance—2001 December Update | | 985 | | 1,823 | | 2,908 | | 3,670 | | 3,854 |
| | |
| |
| |
| |
| |
|
Source: The Treasury
Explanations for key changes not covered elsewhere within this chapter include:
- •
- The increase in other revenue in 2001/02 is partially due to gains on MSDs of around $60 million. In addition, part of the increase in other revenue ($90 million) for 2001/02 is offset by increased expenses in Courts (previously Courts was recording net revenues, which should have been gross revenues with provisions in expenses).
- •
- The valuation impacts consist of increases in the ACC outstanding claims liability and GSF unfunded liability of around $200 million and $90 million respectively.
- •
- Higher transport costs are due to a change in the forecast split between operating and capital spending on roading improvements (no overall cash impact as capital spending reduces).
- •
- Other expense movements include provisions for the Maori Trustee Office debt and Maori Lessee court settlement.
Budget Policy Decisions
This section explains changes to the Government's operating and capital provisions.
Fiscal and indicative provisions
In addition to the health package mentioned earlier, the Government has allocated a further $176 million of the $6.126 billion three-year fiscal provision since the 2001 Budget. The table below provides a breakdown of the Government's three-year fiscal provision since 1999/2000 to 2002/03:
Table 3.7—The Government's fiscal provisions
Fiscal provisions ($ million, GST inclusive)
| | Actual
1999/2000
| | Actual
2000/01
| | 2001/02
| | 2002/03
| | Total
|
|---|
| Budget 2000 decisions | | 420 | | 1,050 | | 1,060 | | 1,120 | | 3,650 |
| 2000 contingency decisions | | — | | 99 | | 74 | | 78 | | 251 |
| Budget 2001 decisions | | — | | 52 | | 532 | | 526 | | 1,110 |
| 2001 contingency decisions | | — | | — | | 51 | | 125 | | 176 |
| December 2001 Health package | | — | | — | | — | | 400 | | 400 |
| Budget 2002 provision1 | | — | | — | | 89 | | 450 | | 539 |
| | |
| |
| |
| |
| |
|
| Total | | 420 | | 1,201 | | 1,806 | | 2,699 | | 6,126 |
| | |
| |
| |
| |
| |
|
- 1
- $20 million of the Budget 2002 provision has been rephased from 2001/02 to 2002/03.
Source: The Treasury
Beyond 2002/03 the forecasts use indicative operating spending allocations of $900 million for each year from 2003/04 to 2005/06, less the amounts already allocated as part of the health package. Therefore, the forecasts include operating provisions for each year of $500 million for 2003/04; $500 million for 2004/05; and $900 million for 2005/06.
Note 5 of the forecasts contained in the GAAP tables (page 141) outlines the cumulative provisions included in the forecasts.
The $176 million allocated as part of 2001/02 Contingency from the fiscal provisions listed in Table 3.7 is summarised in Table 3.8:
Table 3.8—Allocation of 2001/02 contingency
2001 Contingency decisions
| | 2001/02
| | 2002/03
| | Total 1
| | 2003/04
| | 2004/05
| | 2005/06
| |
|---|
| | ($ million, GST inclusive)
| |
|---|
| Revenue initiatives | | | | | | | | | | | | | |
| GST: Non-registered offshore warrantors | | (15 | ) | (10 | ) | (25 | ) | — | | — | | — | |
| Introduction of an Import Transaction Fee | | — | | (15 | ) | (15 | ) | (15 | ) | (15 | ) | (15 | ) |
| | |
| |
| |
| |
| |
| |
| |
| Total revenue initiatives | | (15 | ) | (25 | ) | (40 | ) | (15 | ) | (15 | ) | (15 | ) |
| | |
| |
| |
| |
| |
| |
| |
| Savings initiatives | | | | | | | | | | | | | |
| Partial moratorium on funding to private training providers | | (8 | ) | (11 | ) | (19 | ) | (14 | ) | (15 | ) | (15 | ) |
| Other education savings | | (30 | ) | (30 | ) | (60 | ) | (30 | ) | (30 | ) | (30 | ) |
| | |
| |
| |
| |
| |
| |
| |
| Total savings initiatives | | (38 | ) | (41 | ) | (79 | ) | (44 | ) | (45 | ) | (45 | ) |
| | |
| |
| |
| |
| |
| |
| |
| Expenditure initiatives | | | | | | | | | | | | | |
| Primary teachers' and primary principals' collective agreements | | 32 | | 59 | | 92 | | 59 | | 58 | | 58 | |
| School staffing improvements | | 9 | | 23 | | 32 | | 25 | | 25 | | 25 | |
| Police 2001 wage bargaining round | | — | | 30 | | 30 | | — | | — | | — | |
| Administration of the Australian Social Security Agreement | | 16 | | 9 | | 24 | | 4 | | 4 | | 4 | |
| Tertiary Education Strategic Change Fund | | — | | 19 | | 19 | | — | | — | | — | |
| Incursion of the Painted Apple Moth | | 5 | | 5 | | 10 | | 1 | | — | | — | |
| "More Time for Business" tax package | | 2 | | 8 | | 9 | | 9 | | 9 | | 9 | |
| Promotion of NZ associated with the America's Cup and Lord of the Rings | | 6 | | 3 | | 9 | | — | | — | | — | |
| Maori Television | | — | | 7 | | 7 | | 15 | | 22 | | 22 | |
| Funding for Customs Service capability needs | | — | | 6 | | 6 | | 7 | | 8 | | 8 | |
| E-government programme | | 1 | | 5 | | 6 | | 5 | | 5 | | 5 | |
| Injury Prevention and Rehabilitation Bill entitlements | | 1 | | 3 | | 4 | | 3 | | 3 | | 3 | |
| Managing the implications of the forecast prison population | | 1 | | 3 | | 3 | | 3 | | 3 | | 3 | |
| Other expenditure | | 31 | | 11 | | 42 | | 7 | | 6 | | 6 | |
| | |
| |
| |
| |
| |
| |
| |
| Total expense initiatives | | 104 | | 191 | | 295 | | 137 | | 143 | | 143 | |
| | |
| |
| |
| |
| |
| |
| |
| Net Impact on the 2001 Contingency | | 51 | | 125 | | 176 | | 78 | | 82 | | 82 | |
| | |
| |
| |
| |
| |
| |
| |
- 1
- The "Total" column relates to the contingency settings as shown in Table 3.7
Source: The Treasury
Capital Provisions
As part of the 2001 Budget, the Government set capital provisions of $850 million for 2003/04 and 2004/05 (and $550 million has been set for the new 2005/06 financial year).
Table 3.9 outlines the full extent of capital spending over the current term of Government (1999/2000 to 2002/03), and the movements in the provisions beyond 2002/03, including the rephasing over the entire forecast period.
Table 3.9—The Government's capital provisions8
Capital provisions ($ million, GST inclusive)
| | 1999/2000
| | 2000/01
| | 2001/02
| | 2002/03
| | 2003/04
| | 2004/05
| | 2005/06
| | Total
| |
|---|
| Capital provision — Budget Update | | (69 | ) | 639 | | 1,256 | | 1,172 | | 850 | | 850 | | — | | 4,698 | |
| Establish 2005/06 provision | | | | | | | | | | | | | | 550 | | 550 | |
Budget 2000 decisions |
|
(54 |
) |
827 |
|
576 |
|
568 |
|
— |
|
— |
|
— |
|
1,917 |
|
| December Update 2000 decisions | | (15 | ) | (58 | ) | (4 | ) | 40 | | — | | — | | — | | (37 | ) |
| Receipts from spectrum sale | | — | | (135 | ) | | | | | — | | — | | — | | (135 | ) |
| Budget 2001 decisions | | — | | 5 | | 369 | | 204 | | — | | — | | — | | 578 | |
| December Update 2001 decisions | | — | | — | | 76 | | 27 | | 1 | | — | | 5 | | 109 | |
| | |
| |
| |
| |
| |
| |
| |
| |
| |
| Total decisions to date | | (69 | ) | 639 | | 1,017 | | 839 | | 1 | | — | | 5 | | 2,432 | |
Remaining provision |
|
— |
|
— |
|
239 |
|
333 |
|
849 |
|
850 |
|
545 |
|
2,816 |
|
November 2001 increase to provision |
|
— |
|
— |
|
1,035 |
|
— |
|
— |
|
— |
|
— |
|
1,035 |
|
| December Update 2001 rephasing of provision | | — | | — | | | | 413 | | 89 | | (387 | ) | (115 | ) | — | |
| Remaining provision | | — | | — | | 1,274 | | 746 | | 938 | | 463 | | 430 | | 3,851 | |
| | |
| |
| |
| |
| |
| |
| |
| |
| |
| Total Provision | | (69 | ) | 639 | | 2,291 | | 1,585 | | 939 | | 463 | | 435 | | 6,133 | |
| | |
| |
| |
| |
| |
| |
| |
| |
| |
| Total Capital Provisions for the Current Term | | | | | | | | 4,446 | | | | | | | | | |
- 8
- Note that the remaining capital provision numbers do not exactly equal those contained in the fiscal forecasts owing to rounding.
Source: The Treasury
The capital provisions have increased since the 2001 Budget from $3 billion to $4.45 billion. This is due to the $1 billion for the Air New Zealand recapitalisation package and the bringing forward of around $500 million from 2004/05 and 2005/06 to 2002/03 and 2003/04 to better reflect planned commitments. The key capital pressures are in the social sector (hospitals and schools), prisons, developing a transport strategy, and re-equipping the Defence Force.
The capital provisions from 2003/04 onwards are the provisions established in the 2001 Budget, less the rephased amount.
Capital spending since Budget 2001 (across the forecast horizon) is detailed in Table 3.10:
Table 3.10—Capital spending since Budget 2001
2001 Post-Budget capital decisions ($ million, GST inclusive)
| | 2001/02
| | 2002/03
| | 2003/04
| | 2004/05
| | 2005/06
| | Total
| |
|---|
| Partial moratorium on funding to private training providers | | (7 | ) | (9 | ) | (11 | ) | (12 | ) | — | | (40 | ) |
| School staffing initiatives | | 22 | | — | | — | | — | | — | | 22 | |
| Tertiary Education Strategic Change Fund | | — | | 17 | | — | | — | | — | | 17 | |
| Managing the implications of the forecast prison population | | 11 | | 11 | | 2 | | — | | — | | 24 | |
| Te Wananga O Aotearoa | | 29 | | 9 | | 10 | | 12 | | 5 | | 65 | |
| Meridian Energy dividend | | (50 | ) | — | | — | | — | | — | | (50 | ) |
| | | | | — | | — | | — | | — | | — | |
| Capital injections to public hospitals | | 60 | | — | | — | | — | | — | | 60 | |
| Other decisions | | 11 | | — | | — | | — | | — | | 11 | |
| | |
| |
| |
| |
| |
| |
| |
| Net Impact on the Capital Provisions | | 76 | | 27 | | 1 | | — | | 5 | | 109 | |
Source: The Treasury
Table 3.11—Relationship between the operating balance and net debt
| | 2001
Actual
| | 2002
Forecast
| | 2003
Forecast
| | 2004
Forecast
| | 2005
Forecast
| | 2006
Forecast
| |
|---|
| | ($ million)
| |
|---|
| Operating balance | | 1,409 | | 985 | | 1,823 | | 2,908 | | 3,670 | | 3,854 | |
| Less/(plus) valuation items | | 698 | | 243 | | — | | — | | — | | — | |
| | |
| |
| |
| |
| |
| |
| |
| OBERAC | | 2,107 | | 1,228 | | 1,823 | | 2,908 | | 3,670 | | 3,854 | |
Less NZS Fund contributions |
|
— |
|
(600 |
) |
(1,200 |
) |
(1,800 |
) |
(2,100 |
) |
(2,150 |
) |
| Less after-tax income of the NZS Fund | | — | | (14 | ) | (91 | ) | (210 | ) | (372 | ) | (559 | ) |
| | |
| |
| |
| |
| |
| |
| |
| Available after NZS Fund requirements | | 2,107 | | 614 | | 532 | | 898 | | 1,198 | | 1,145 | |
| Decrease/(increase in net debt) | | 1,425 | | (1,732 | ) | (1,599 | ) | (1,325 | ) | (71 | ) | (168 | ) |
| | |
| |
| |
| |
| |
| |
| |
| Difference | | (682 | ) | (2,346 | ) | (2,131 | ) | (2,223 | ) | (1,269 | ) | (1,313 | ) |
| | |
| |
| |
| |
| |
| |
| |
This difference comprises: |
|
|
|
|
|
|
|
|
|
|
|
|
|
| Non-cash elements of the OBERAC | | | | | | | | | | | | | |
| SOE/CE retained surplus net of dividends (excluding valuation issues) | | (523 | ) | (503 | ) | (839 | ) | (901 | ) | (883 | ) | (911 | ) |
| Depreciation | | 925 | | 965 | | 1,000 | | 1,002 | | 1,033 | | 1,034 | |
| (Gain)/loss on sale of assets | | 8 | | 1 | | — | | — | | — | | — | |
| Commercial forests and net FX movements | | (40 | ) | (18 | ) | — | | — | | — | | — | |
| Student loan influences | | (61 | ) | (7 | ) | (53 | ) | (47 | ) | (39 | ) | (45 | ) |
| Cash elements not in the OBERAC | | | | | | | | | | | | | |
| Circulating currency | | 303 | | 126 | | — | | — | | — | | — | |
| Net purchase of physical assets including capital contingency provision | | (1,130 | ) | (2,631 | ) | (1,921 | ) | (2,039 | ) | (1,287 | ) | (1,277 | ) |
| Asset sale receipts | | 140 | | — | | — | | — | | — | | — | |
| Net capital injections | | 34 | | (440 | ) | (233 | ) | (220 | ) | (44 | ) | (44 | ) |
| Other working capital movements | | (338 | ) | 161 | | (85 | ) | (18 | ) | (49 | ) | (70 | ) |
| | |
| |
| |
| |
| |
| |
| |
| | | (682 | ) | (2,346 | ) | (2,131 | ) | (2,223 | ) | (1,269 | ) | (1,313 | ) |
| | |
| |
| |
| |
| |
| |
| |
Source: The Treasury
Air New Zealand: Impact on the December Update Forecasts
The Government has announced a recapitalisation package for Air New Zealand that has been agreed with the Air New Zealand Board.
The terms of the equity investment involve the Crown paying 27 cents a share for the $585 million second tranche of the $885 million Air New Zealand recapitalisation package, giving the Crown an 82% stake in the airline.
The first tranche—for $300 million—was paid over as a loan in October 2001 and will be converted, with accrued interest, into new convertible preference shares at 24 cents a share.
The Crown has also committed to provide up to $150 million in further funding before June 2003.
The necessary approvals for the second tranche will be sought from Air New Zealand shareholders at the Annual General Meeting scheduled for 19 December 2001.
How Air New Zealand is represented in the December forecasts
A specific investment in Air New Zealand is not shown in the December Update forecasts, as shareholder approval of the offer has yet to be obtained. Instead the capital provisions for 2001/02 have been increased by the full value of the package—$1.035 billion. This results in:
- •
- no immediate change to net worth as the increase in the capital provisions (the asset) are financed by movements in the borrowing statement (either reduced MSDs or increases in borrowings)
- •
- an increase in net debt
- •
- additional finance costs included in the operating statement.
If the proposal is accepted
If Air New Zealand shareholders agree to the package, Air New Zealand's operating results will be incorporated into future forecasts and Crown Financial Statements from the date of effective ownership. Including Air New Zealand into the Crown Financial Statements requires valuation issues to be considered.
Accounting issues around the fair value of assets and liabilities to be brought onto the Crown's Balance Sheet on acquisition are being considered at present. There is a risk that if there is a differential in the purchase price and the value of Air New Zealand's assets and liabilities, a write-down in the Crown Financial Statements would be required. It is likely to take some time to work through this issue and assess the probability of the risk crystallising.
New Zealand Superannuation Fund Contributions
Section 42 (2) of the New Zealand Superannuation Act 2001 requires that the Treasury must include in the Budget Economic and Fiscal Update:
- •
- the amount of the required annual capital contribution for the financial year
- •
- a statement of the assumptions and judgments on which the calculations are based.
The contribution to the Fund is calculated over a 40-year rolling horizon to ensure Superannuation entitlements over the next 40 years could be met, if the contribution rate were to be held constant at that level for 40 years.
In the first three years of the Fund's operation the Government plans to build towards making the full capital contribution as calculated by the formula set out in the NZSF Act. This transition period will prevent undue pressure being placed on the fiscal position while structural surpluses are raised to the required levels.
| | 2002
| | 2003
| | 2004
| | 2005
| | 2006
|
|---|
| | $ billion (June year end)
|
|---|
| Required contribution | | 1.573 | | 1.749 | | 1.973 | | 2.093 | | 2.169 |
| Actual contribution9 | | 0.600 | | 1.200 | | 1.800 | | 2.093 | | 2.169 |
- 9
- In the fiscal forecasts the level of contribution was rounded to the nearest $50 million.
The underlying assumptions in calculating the contribution are the:
- •
- GDP series to 2045
- •
- New Zealand Superannuation series to 2045
- •
- opening Fund balance (zero as at 1 July 2001)
- •
- expected net after-tax annual return of the Fund (7.5%)
The GDP series was projected following the assumptions stated on page 31. In calculating the required capital contribution to the NZS Fund the following explicit assumptions were made:
| | 2001 December Update
| | 2001 Budget
| |
|---|
| Expected nominal bond rate | | 6.2 | % | 6.5 | % |
| Equity premium | | 5.0 | % | — | |
| Portfolio composition (equities) | | 70.0 | % | — | |
| Management fees | | 0.3 | % | — | |
| Expected return before tax | | 9.4 | % | 9.0 | % |
| Tax | | 20.0 | % | 33.0 | % |
| Expected return after tax | | 7.52 | % | 6.0 | % |
When preparing the 2001 Budget there was less certainty about the future shape of the Fund, so the expected returns were assessed to the nearest whole percentage point, taking into account the ranges of views about their composition but without needing to make specific assumptions about each element.
The other key change from the 2001 Budget is the expected tax rate. The Fund is subject to New Zealand tax as if it were a body corporate. The current marginal rate of tax on assessable income is 33%. However, depending on the portfolio composition and investment style, a significant proportion of the returns might not be subject to tax. In particular, capital gains on equities, particularly if held as passive investments, attract less tax than bonds. For the purpose of this calculation, an average rate of 20% is assumed.
Sensitivity
The forecasts of capital contributions for 2004/05 and 2005/06 exhibit sensitivities to the various assumptions made above as follows:10
Variable
| | Marginal Change
| | Effect on Net Return After Tax
| | Effect on Capital Contribution
($ billion)
|
|---|
| | (% age points)
| | (% age points)
| | 2004/05
| | 2005/06
|
|---|
| Nominal bond rate | | +1 | % | +0.80 | % | -0.183 | | -0.196 |
| Equity premium | | +1 | % | +0.56 | % | -0.130 | | -0.139 |
| Portfolio composition (equities) | | +5 | % | +0.20 | % | -0.047 | | -0.050 |
| Management fees | | +0.1 | % | -0.08 | % | +0.019 | | +0.021 |
| Tax | | +5 | % | -0.47 | % | +0.112 | | +0.121 |
- 10
- The effects shown in this table are the marginal effects (that is, all else held equal). This overstates the effects for some variables that are interdependent. For example, a portfolio with a higher weighting in equities would be likely to have a lower average tax rate.
These sensitivities are well within the bounds of reasonable forecasting accuracy three to four years ahead.
Full line-by-line consolidation
Extracts from a discussion document Treasury published in February 2001, titled Implications of Line-by-Line Consolidation of State Owned Enterprises and Crown Entities for the Crown Financial Statements and for Setting Fiscal Objectives — a full version is contained on Treasury's website www.treasury.govt.nz
Current Obligations on the Crown
The Public Finance Act 1989 (PFA) and Fiscal Responsibility Act 1994 require a government to produce actual and forecast financial statements in accordance with Generally Accepted Accounting Practice (GAAP). This ensures that the financial statements and forecasts of the Crown are prepared on a basis consistent with other financial statements—providing a transparent and independently established set of principles on which to measure a government's financial activity.
GAAP is Changing
GAAP is refined over time in line with international and New Zealand specific accounting developments. GAAP will soon require the full line-by-line consolidation of State-owned enterprises (SOEs) and Crown entities.
The Crown financial statements and forecasts are currently prepared by:
- •
- the line-by-line consolidation of the revenues, expenses, assets and liabilities of all departments (and the activity they undertake on behalf of the Crown, for example benefit payments) and the Reserve Bank; and
- •
- consolidation of the SOEs and Crown entities—but ONLY their net results (net surplus in the operating balance and net investment/net worth in the balance sheet)—NOT the full revenues, expenses, assets and liabilities.
The Crown will continue to prepare consolidated financial statements—but the form of that consolidation will be changing to comply with forthcoming changes to GAAP.
From the 2003 financial year, the Crown financial statements and forecasts will FULLY consolidate line-by-line the revenues, expenses, assets and liabilities of ALL entities making up the Crown reporting entity. The change from current practice will be the inclusion of ALL revenues, expenses, assets and liabilities of SOEs and Crown entities. The forecasts in the 2002 Budget will be prepared under the new consolidation approach.
The change to how consolidation will operate will impact upon the composition and look of the financial statements (both forecast and actual financial statements). Although the net results for the Crown will be materially the same (ie, operating balance and net worth), the composition and total of items such as revenues, expenses, assets and liabilities will change.
In summary, as an illustration, the key fiscal aggregates (as at 30 June 2000) will change as follows:
Table: Illustration of change to fiscal aggregates (numbers updated since February 2001 version)
Headline fiscal
indicators (highlighted)
| | Impact of full consolidation
| | Current numbers
(30 June 2000)
$billion
| | New numbers11
$billion
| |
|---|
| Revenue | | Increase | | 36.5 | | 42.5 | |
| Expenses | | Increase | | (36.2 | ) | (41.6 | ) |
| Net SOE and CE surplus | | Removed | | 1.1 | | 0.0 | |
| Valuation movements | | New category | | 0.0 | | 0.5 | |
| Operating Balance | | No change | | 1.4 | | 1.4 | |
| Gross Debt | | Increase | | 36.0 | | 38.1 | |
| Net Debt | | Currently little change | | 21.4 | | 20.2 | |
| Total Assets | | Increase | | 60.4 | | 70.9 | |
| Physical Assets | | Increase | | 24.9 | | 43.5 | |
| Net Worth | | No change | | 8.6 | | 8.6 | |
- 11
- These are illustrative impacts to provide a likely indication of new numbers. A full set of fully consolidated results using 30 June 2001 data is in the process of being completed (including new internal eliminations that will be required). Once completed a more accurate indication of changes will be available.
The main drivers of the changes to the numbers are:
- •
- Expenses (and revenues) increase from including the expenses of SOEs (especially electricity SOEs), ACC, and additional expenses in the Education sector.
- •
- Net debt decreases, because the added debt (mainly from SOEs) is outweighed by the investment portfolios of ACC and EQC.
The increase in spending is not as simple as adding existing core Crown spending to all spending of SOEs and CEs. For example, a lot of the expenses of Crown entities are funded from the Crown, for example, health spending. In a set of fully consolidated financial statements, the health spending of District health boards would replace the current core Crown spending, so that the same expenses are not counted twice.
We will be providing further detail on the impacts of full line-by-line consolidation in the lead up to the 2002 Budget.
4
Risks and Scenarios
Introduction
There are a number of risks associated with economic forecasts. The actual growth path of the economy is likely to differ from the Central Forecast if some of the risks do eventuate.
The first part of this chapter discusses the main areas of risk that we see around the Central Forecast. The second section of the chapter discusses two alternative paths for the economy under different judgements from the Central Forecast. The scenarios are two of a number of possible examples, and do not represent upper or lower bounds for the Central Forecast. The actual magnitude of the difference from the Central Forecast or any given alternative scenario depends on uncertain alternative assumptions.
Economic Risks
The Central Forecast is determined by balancing risks facing the economy, on both the upside and the downside, to provide our best assessment of the way the economy is likely to evolve. Inevitably, some events will unfold differently over time from what we have assumed, which may result in the economy deviating from the Central Forecast.
In forming the Central Forecast we have assumed that future international political or military actions do not have significant negative effects on the international economic climate. The events of 11 September have clearly given rise to considerably more uncertainty than usual around the international economic outlook and the likely impact on the New Zealand economy. This makes an awareness of the risks surrounding the Central Forecast all the more important at this time.
In the Economic Outlook chapter, we highlighted the main channels through which we saw events in the rest of the world impacting on the New Zealand economy. Judgements around these represent three of the key risks to the Central Forecast:
- •
- Developments in the world economy, and the risk that the slowdown in trading partner growth may evolve in a way materially different from current expectations.
- •
- The impact of weaker international growth on the New Zealand economy through changes in export demand, import prices and export prices.
- •
- The impact of heightened uncertainty and risk aversion on domestic confidence, investment and consumption activity.
The Central Forecast embodies Consensus forecasts and assumes that trading partner growth remains weak through the first half of calendar 2002 before recovering back to around trend in the latter half of the year. However, recent events have created a wider than usual divergence of views among international analysts around this central world growth profile. A weaker or more prolonged economic slowdown among New Zealand's trading partners compared with current expectations would likely see lower New Zealand GDP growth over the first half of the forecast horizon.
However, the risks around the international outlook are not one-way. Despite projecting a sustained period of weakness between late 2000 and 2002, current Consensus forecasts do not embody a strong rebound above trend in 2003/04 for trading partner growth. Historically, periods of significant world economic slowdown have tended to be followed by a sharp pick-up in growth. This suggests that there may be an upside risk that the rebound in world growth could be larger and more rapid than assumed in the Central Forecast. The pattern of growth in the US over the next 18 months will likely be the key driver of international developments.
In the past, changes in demand and prices for New Zealand's exports have been among the primary transmission mechanisms through which the international economy has impacted the New Zealand economy. In the face of subdued world economic growth, our Central Forecast is for a sharp deterioration in export prices and the terms of trade over the next year from current historically high levels. Should export prices fall by more, or import prices remain higher than expected, the terms of trade could be hit harder. However, it is also worth noting that despite trading partner growth deteriorating by even more than assumed in the 2001 Budget Weaker World Growth scenario, New Zealand's terms of trade has remained considerably stronger to date than our 2001 Budget Central Forecast.
There are also significant risks around New Zealand's export volume growth, especially tourism. The 11 September terrorist attacks have severely curtailed international travel around the world. A key judgement in the Central Forecast is that the heightened aversion to travel among tourists in the wake of the attacks diminishes from mid-2002 and tourism flows revert to being driven by fundamentals. However, the nature of the shock is unusual historically and difficult to assess—there is a risk that the effects of heightened travel aversion (particularly in the Northern American and Japanese markets) will persist for longer than expected.
The risks around the indirect impact of the current international situation on the domestic economy primarily concern the extent to which recent weakness in confidence reflects non-economic forces (heightened insecurity and risk aversion). The Central Forecast is for firms and households to hold back on spending plans over the first few quarters of the forecast horizon until the outlook becomes clearer. Given recent strong income gains, if the domestic confidence shock proves lighter or more short-lived, domestic activity could be stronger than expected.
An additional risk surrounds the net migration assumptions of the Central Forecast. Recent large net migration outflows have begun to turn around and we have revised up our net migration inflow assumptions to a net inflow of 10,000 for the year ended June 2002, reducing to 5,000 in subsequent years. However, there is a risk that arrivals into New Zealand will increase and/or departures drop by more than expected into 2002 and that flows materially exceed the 10,000 level. The 11 September terrorist attacks may contribute to these risks by increasing the desirability of living in New Zealand relative to overseas, thus depressing long-term departures and increasing long-term arrivals. Such an outcome would act to support domestic demand by more than we have built into the Central Forecast, as well as boost labour supply.
Economic Scenarios
The scenarios below present two possible growth paths for the economy if some of the key judgements underlying the Central Forecast evolve differently. Both scenarios are based on changes to the demand side of the economy. The first scenario assumes a more prolonged slowdown in trading partner growth than is assumed in the Central Forecast. The second scenario assumes that the New Zealand economy is more resilient to the impact of the slowdown in the world economy than assumed in the Central Forecast.
Table 4.1—Alternative scenarios: summary
| | 2000/01
Actual
| | 2001/02
Forecast
| | 2002/03
Forecast
| | 2003/04
Forecast
| | 2004/05
Forecast
| | 2005/06
Forecast
|
|---|
| Production GDP (Annual average % change, March years) | | | | | | | | | | | | |
| Central Forecast | | 2.6 | | 3.1 | | 1.9 | | 3.7 | | 2.6 | | 2.8 |
| Delayed Global Recovery | | 2.6 | | 3.0 | | 1.2 | | 3.8 | | 3.0 | | 3.2 |
| More Resilient Terms of Trade and Confidence | | 2.6 | | 3.2 | | 2.9 | | 3.2 | | 2.4 | | 2.6 |
Nominal expenditure GDP (Annual average % change, March years) |
|
|
|
|
|
|
|
|
|
|
|
|
| Central Forecast | | 5.5 | | 5.9 | | 2.6 | | 5.5 | | 4.4 | | 4.2 |
| Delayed Global Recovery | | 5.5 | | 5.5 | | 0.9 | | 4.9 | | 5.1 | | 5.0 |
| More Resilient Terms of Trade and Confidence | | 5.5 | | 6.1 | | 4.4 | | 5.7 | | 4.2 | | 4.1 |
Operating balance ($ billion, June years) |
|
|
|
|
|
|
|
|
|
|
|
|
| Central Forecast | | 1.4 | | 1.0 | | 1.8 | | 2.9 | | 3.6 | | 3.8 |
| Delayed Global Recovery | | 1.3 | | 0.4 | | 0.7 | | 1.4 | | 2.4 | | 2.8 |
| More Resilient Terms of Trade and Confidence | | 1.3 | | 0.9 | | 2.2 | | 3.5 | | 4.2 | | 4.3 |
Sources: Statistics New Zealand, The Treasury
Delayed Global Economic Recovery
This scenario is based around world growth not rebounding as quickly as expected in the Central Forecast, but remaining sub-trend through the second half of calendar 2002, before a more accelerated pick-up and a period of above-trend growth in 2003 and 2004.
Under this scenario, the more prolonged period of weakness in the world economy reduces New Zealand's production GDP growth to 1.2% in 2002/03. However, growth recovers to 3.8% in 2003/04 on the back of a strong rebound in world economic growth.
More persistent weakness in the world economy directly impacts on the New Zealand economy through lower international demand for New Zealand's exports. As a result, growth in the volume of New Zealand's goods and services is more subdued through 2002/03 (+1.2%), before rebounding in 2003/04. In addition, export prices fall lower for longer than in the Central Forecast, but bounce back strongly as world growth picks up in 2003/04. Import prices also decline further, but to a lesser extent than export prices. Overall, the terms of trade troughs around 3% lower than the Central Forecast before recovering rapidly from the beginning of calendar 2004.
Table 4.2—Delayed Global Economic Recovery
(Annual average % change,
March years)
| | 2000/01
Actual
| | 2001/02
Forecast
| | 2002/03
Forecast
| | 2003/04
Forecast
| | 2004/05
Forecast
| | 2005/06
Forecast
| |
|---|
| Private consumption | | 1.3 | | 1.8 | | 1.4 | | 2.7 | | 3.3 | | 3.1 | |
| Business investment | | 7.2 | | 6.7 | | (7.5 | ) | 6.2 | | 5.7 | | 5.1 | |
| Gross national expenditure | | (0.2 | ) | 1.3 | | 1.0 | | 4.2 | | 3.2 | | 2.9 | |
Exports of goods and services |
|
6.8 |
|
2.9 |
|
1.2 |
|
7.0 |
|
6.1 |
|
5.8 |
|
| Imports of goods and services | | 0.4 | | 0.1 | | 0.3 | | 9.0 | | 7.0 | | 5.2 | |
| | |
| |
| |
| |
| |
| |
| |
| GDP (Production Measure) | | 2.6 | | 3.0 | | 1.2 | | 3.8 | | 3.0 | | 3.2 | |
| | |
| |
| |
| |
| |
| |
| |
| Unemployment rate1 | | 5.4 | | 5.6 | | 6.1 | | 5.4 | | 5.2 | | 5.0 | |
| 90-day rate2 | | 6.4 | | 4.3 | | 4.7 | | 5.5 | | 6.1 | | 6.2 | |
| TWI2 | | 50.5 | | 49.0 | | 50.2 | | 52.0 | | 53.1 | | 53.7 | |
| CPI3 | | 3.1 | | 2.3 | | 1.0 | | 1.3 | | 1.2 | | 1.5 | |
| Current account balance (% GDP) | | (4.8 | ) | (3.3 | ) | (4.9 | ) | (5.2 | ) | (4.1 | ) | (3.2 | ) |
| Nominal GDP (expenditure measure) | | 5.5 | | 5.5 | | 0.9 | | 4.9 | | 5.1 | | 5.0 | |
Source: Statistics New Zealand, Datastream, The Treasury
- 1
- Percentage of labour force, March quarter, seasonally adjusted.
- 2
- Average for March quarter.
- 3
- This is the CPI-consistent series targeted by the Reserve Bank. Annual percentage change, March quarter.
Although the effects of current uncertainty are still expected to dissipate within a few quarters, weaker export income and prospects in 2001/02 and 2002/03 have a significant negative impact on the New Zealand domestic business sector. Business investment reduces sharply by 7.5% in 2002/03. Lower demand for labour leads firms to also cut back on employment, resulting in an increase in the unemployment rate to 6.1% in 2002/03. This eases some of the pressure in the labour market and leads to softer wage increases across the forecast period.
Rising unemployment and lower income growth result in a moderation in household spending. Growth in private consumption falls to 1.4% in 2002/03 and remains weaker than the Central Forecast through until the end of the forecast horizon.
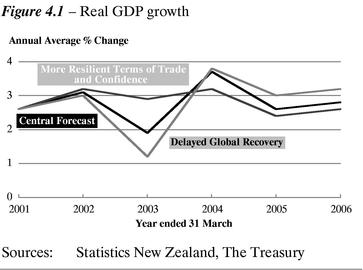
Together with lower business investment, the moderation in domestic consumption reduces import demand in 2002/03 and 2003/04. While the size of the fall in import volumes is similar to the fall in export volumes relative to the Central Forecast, the deterioration in the terms of trade means that the current account deficit worsens to -5.2% of GDP in 2003/04, but then improves as New Zealand's terms of trade strengthens further out.
The net impact of weaker exports, imports, investment and consumption expenditure is to reduce production GDP growth to 1.2% in 2002/03, compared to 1.9% in the Central Forecast.
The decrease in GDP growth widens the gap between actual and potential GDP growth in 2002/03 and thus further reduces inflationary pressure during this period. The rate of annual CPI inflation declines to 1.0% for 2002/03. The Reserve Bank is assumed to act quickly in cutting interest rates further, providing more stimulatory monetary conditions than assumed in the Central Forecast. However, the extent of the weakness in the world economy does surprise policy-makers, and hence the Reserve Bank is unable to fully offset the shock.
More stimulatory monetary conditions help support the rebound in GDP growth in 2003/04. In particular, residential investment picks up markedly from 2002/03 owing to the lower financing cost of housing. Production-based GDP grows by 3.8% in 2003/04 and 3.0% in 2004/05.
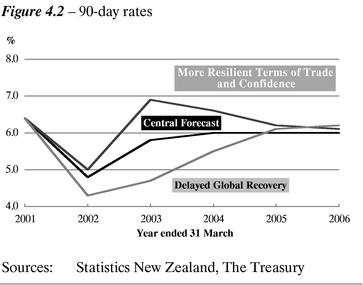
In the nominal economy, the combined effect of lower output and reduced inflation leads to substantial falls in nominal GDP growth over the short term. While the rebound in real economic activity increases nominal GDP, the permanent price level shock leads to a lower level of nominal GDP through to the end of the forecast horizon. The difference in nominal GDP compared with the Central Forecast is greatest in 2003/04 at -2.5% and narrows to -1.2% by the end of the forecast period.
More Resilient Terms of Trade and Confidence
In this alternative scenario the projected weakness in world growth has a less severe negative impact on the New Zealand economy than assumed in the Central Forecast. In some ways this mirrors the experience thus far in 2001. It is proxied by changes to two key judgements—the terms of trade and the "wait and see" attitudes of households and businesses.
Under this scenario GDP growth remains relatively robust at 2.9% in 2002/03. Although the economy is still adversely affected by the deterioration in the world outlook, the impact is more muted and the rebound in quarterly growth occurs during the first half of 2002. Growth strengthens to 3.2% in 2003/04, before easing back to trend in later years.
While still declining through until mid-2002, the fall in the terms of trade is more moderate and troughs around 2% higher than the Central Forecast. Such an outcome could occur because either New Zealand's export prices prove more resilient than expected, or import prices fall by more than expected in response to weaker world growth.
Table 4.3—More Resilient Terms of Trade and Confidence
(Annual average % change,
March years)
| | 2000/01
Actual
| | 2001/02
Forecast
| | 2002/03
Forecast
| | 2003/04
Forecast
| | 2004/05
Forecast
| | 2005/06
Forecast
| |
|---|
| Private consumption | | 1.3 | | 1.9 | | 2.6 | | 2.9 | | 2.8 | | 2.9 | |
| Business investment | | 7.2 | | 7.5 | | (0.8 | ) | 6.3 | | 4.6 | | 1.2 | |
| Gross national expenditure | | (0.2 | ) | 1.6 | | 3.0 | | 3.7 | | 3.0 | | 2.5 | |
Exports of goods and services |
|
6.8 |
|
2.9 |
|
2.7 |
|
8.0 |
|
4.8 |
|
4.0 |
|
| Imports of goods and services | | 0.4 | | 0.2 | | 2.4 | | 10.6 | | 7.1 | | 4.2 | |
| | |
| |
| |
| |
| |
| |
| |
| GDP (Production Measure) | | 2.6 | | 3.2 | | 2.9 | | 3.2 | | 2.4 | | 2.6 | |
| | |
| |
| |
| |
| |
| |
| |
| Unemployment rate1 | | 5.4 | | 5.6 | | 5.3 | | 4.9 | | 5.1 | | 5.2 | |
| 90-day rate2 | | 6.4 | | 5.0 | | 6.9 | | 6.6 | | 6.2 | | 6.1 | |
| TWI2 | | 50.5 | | 49.5 | | 52.4 | | 54.8 | | 55.3 | | 54.8 | |
| CPI3 | | 3.1 | | 2.4 | | 1.7 | | 2.4 | | 1.9 | | 1.6 | |
| Current account balance (% GDP) | | (4.8 | ) | (3.0 | ) | (3.4 | ) | (3.6 | ) | (4.1 | ) | (4.1 | ) |
| Nominal GDP (expenditure measure) | | 5.5 | | 6.1 | | 4.4 | | 5.7 | | 4.2 | | 4.1 | |
Source: Statistics New Zealand, Datastream, The Treasury
- 1
- Percentage of labour force, March quarter, seasonally adjusted.
- 2
- Average for March quarter.
- 3
- This is the CPI-consistent series targeted by the Reserve Bank. Annual percentage change, March quarter.
The negative impact of uncertainty on household spending decisions is shorter-lived than the Central Forecast, and leads to a rapid resumption of growth in consumption expenditure and residential investment from 2002/03. Private consumption growth lifts from 1.9% in 2001/02 to 2.6% in 2002/03.
Similarly, the rebound in domestic confidence together with stronger export income acts to support business investment. Nevertheless, business investment still declines by 0.8% in 2002/03, before picking up sharply in the following year.
Despite an increase in imports owing to stronger domestic demand, the more robust terms of trade results in a smaller current account deficit than the Central Forecast over the first three years of the forecast horizon. As a proportion of nominal GDP, the current account deficit is at its lowest (3.0%) in 2001/02 before gradually widening through the forecast period to 4.1% in 2005/06.
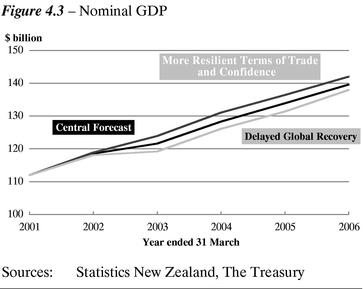
Stronger domestic demand results in an increase in employment and reduces the unemployment rate to 4.9% in 2003/04. The tight labour market puts more pressure on wages, which increase 4.2% in 2003/04. With the output gap remaining in positive territory over the medium term, CPI inflation also lifts from 1.7% in 2002/03 to 2.4% in 2003/04.
The Reserve Bank responds to the greater inflationary pressure by lifting the OCR from early in the 2002 calendar year, which sees the 90-day rate pick up to 6.9% in 2002/03, before easing in subsequent years as the rate of inflation tracks back towards the mid-point of the target band.
Higher output and prices, relative to the Central Forecast, result in higher nominal GDP. The difference in nominal GDP peaks at 2.1% in 2003/04 before declining to 1.7% in 2005/06.
Fiscal Scenarios
The main economic determinants of the fiscal position are:
- •
- nominal GDP—components of GDP are the main drivers of tax revenue
- •
- interest rates—higher interest rates increase revenue received from interest, but also increase finance costs paid on government borrowing. Changes in interest rates also affect the valuation of the GSF and ACC liabilities, which flow through the operating balance
- •
- the level of unemployment—an increase in the number of people unemployed will increase the number of unemployment beneficiaries and increase spending
- •
- CPI inflation—most benefits are indexed to CPI movements.
Table 4.4 shows the effects of the two scenarios on the operating balance and net debt.
Table 4.4—Alternative scenarios: operating balance and net Crown debt
($ billion June years)
| | 2000/01
Actual
| | 2001/02
Forecast
| | 2002/03
Forecast
| | 2003/04
Forecast
| | 2004/05
Forecast
| | 2005/06
Forecast
|
|---|
| Operating Balance | | | | | | | | | | | | |
| Central Forecast | | 1.4 | | 1.0 | | 1.8 | | 2.9 | | 3.7 | | 3.9 |
| Delayed Global Recovery | | 1.4 | | 0.7 | | 1.0 | | 1.7 | | 2.8 | | 3.2 |
| More Resilient Terms of Trade and Confidence | | 1.4 | | 1.2 | | 2.5 | | 3.9 | | 4.6 | | 4.8 |
Net Debt |
|
|
|
|
|
|
|
|
|
|
|
|
| Central Forecast | | 20.0 | | 21.7 | | 23.3 | | 24.6 | | 24.7 | | 24.9 |
| Delayed Global Recovery | | 20.0 | | 22.0 | | 24.4 | | 26.9 | | 27.9 | | 28.7 |
| More Resilient Terms of Trade and Confidence | | 20.0 | | 21.5 | | 22.3 | | 22.7 | | 21.9 | | 21.1 |
% GDP June years |
|
|
|
|
|
|
|
|
|
|
|
|
| Operating Balance | | | | | | | | | | | | |
| Central Forecast | | 1.2 | | 0.8 | | 1.5 | | 2.2 | | 2.7 | | 2.7 |
| Delayed Global Recovery | | 1.2 | | 0.6 | | 0.9 | | 1.4 | | 2.1 | | 2.3 |
| More Resilient Terms of Trade and Confidence | | 1.2 | | 1.0 | | 2.0 | | 2.9 | | 3.3 | | 3.3 |
Net debt |
|
|
|
|
|
|
|
|
|
|
|
|
| Central Forecast | | 17.5 | | 18.2 | | 18.9 | | 19.0 | | 18.2 | | 17.6 |
| Delayed Global Recovery | | 17.5 | | 18.6 | | 20.2 | | 21.3 | | 20.9 | | 20.6 |
| More Resilient Terms of Trade and Confidence | | 17.5 | | 17.9 | | 17.8 | | 17.2 | | 15.9 | | 14.7 |
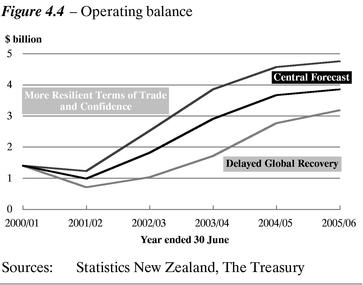
In the Delayed Global Recovery scenario, the operating balance is lower in every year compared with the Central Forecast. However, the impact lessens over time, as higher real economic growth increases growth in nominal GDP relative to the Central Forecast, and as expenses decrease as unemployment falls.
In the More Resilient Terms of Trade and Confidence scenario, the operating balance is higher than the Central Forecast throughout the forecast horizon. The drivers of the higher operating balance are higher output, higher prices and lower unemployment relative to the Central Forecast Track.
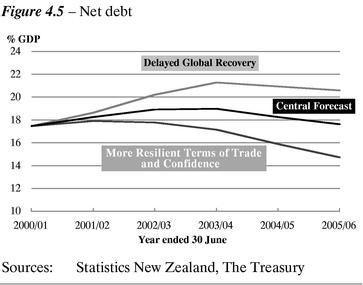
The changes in the operating balance impact on net debt. In the Delayed Global Recovery scenario, net debt is around 3% of GDP higher than in the Central Forecast by the end of the forecast period. Net debt is around 3% of GDP lower by the end of the forecast period in the More Resilient Terms of Trade and Confidence scenario than in the Central Forecast.
Fiscal Sensitivities
The scenarios above indicate the sensitivity of fiscal aggregates to changes in economic conditions. Table 4.5 provides some "rules of thumb" on the sensitivities of the fiscal position to changes in specific variables.
Table 4.5—Sensitivity analysis
| | 2002
Forecast
| | 2003
Forecast
| | 2004
Forecast
| | 2005
Forecast
| | 2006
Forecast
| |
|---|
| | ($ million)
| |
|---|
| 1% higher nominal GDP growth per annum | | | | | | | | | | | |
| Tax Revenue | | (380 | ) | (790 | ) | (1,240 | ) | (1,730 | ) | (2,230 | ) |
| Expenses (mainly debt servicing) | | (10 | ) | (50 | ) | (120 | ) | (200 | ) | (290 | ) |
| Impact on the operating balance | | (390 | ) | (840 | ) | (1,360 | ) | (1,930 | ) | (2,520 | ) |
Revenue impact of a 1% increase in the growth rate of: |
|
|
|
|
|
|
|
|
|
|
|
| Wages and salaries | | 160 | | 330 | | 530 | | 740 | | 960 | |
| Taxable business profits | | 70 | | 170 | | 280 | | 400 | | 520 | |
One percentage point lower interest rates |
|
|
|
|
|
|
|
|
|
|
|
| Interest income | | (10 | ) | (40 | ) | (50 | ) | (60 | ) | (60 | ) |
| Expenses | | 40 | | 130 | | 210 | | 280 | | 310 | |
| Impact on the operating balance | | 30 | | 90 | | 160 | | 220 | | 250 | |
One percentage point lower real interest rates |
|
|
|
|
|
|
|
|
|
|
|
| ACC liability (SOE and Crown entity surpluses) | | (500 | ) | — | | — | | — | | — | |
| GSF liability (expenses) | | (1,700 | ) | — | | — | | — | | — | |
| Impact on the operating balance | | (2,200 | ) | — | | — | | — | | — | |
Source: The Treasury
5
Specific Fiscal Risks
Introduction
This chapter describes the specific fiscal risks of the Crown, including contingent liabilities and other specific fiscal risks. The risks are disclosed as either quantifiable or unquantifiable, depending on their characteristics. Only contingent liabilities and other specific fiscal risks involving amounts of $10 million or more in any one year are separately disclosed. Contingent liabilities below $10 million are included in the "other quantifiable contingent liabilities" total. Comparatives have been adjusted where appropriate to align with the disclosure of new "material" contingent liabilities. The total amount of contingent liabilities remains unchanged.
Contingent liabilities
Contingent liabilities are costs which the Crown will have to face if a particular event occurs. Typically, contingent liabilities consist of guarantees and indemnities, legal disputes and claims, and uncalled capital. The contingent liabilities facing the Crown are a mixture of operating and balance sheet risks, and they can vary greatly in magnitude and likelihood of realisation. In general, if a contingent liability were realised it would reduce the operating balance and net worth, and increase net Crown debt. However, in the case of contingencies for uncalled capital, the negative impact would be restricted to net Crown debt.
Where contingent liabilities have arisen as a consequence of legal action being taken against the Crown, the amount shown is the amount claimed and thus the maximum potential cost. It does not represent either an admission that the claim is valid or an estimation of the possible amount of any award against the Crown.
Contingent liabilities have been stated as at 31 October 2001, being the last set of published contingent liabilities.
Quantifiable Contingent Liabilities
Guarantees and indemnities
| | Status12
| | ($ million)
|
|---|
| Cook Islands—Asian Development Bank loans | | Changed | | 25 |
| Huntly East mine subsidence | | Unchanged | | 22 |
| Indemnification of receivers and managers—Terralink Limited | | Unchanged | | 10 |
| Post Office Bank—guaranteed deposits | | Unchanged | | 16 |
| Guarantees and indemnities of state-owned enterprises and Crown entities | | Changed | | 272 |
| Other guarantees and indemnities | | Changed | | 49 |
| | | | |
|
| | | | | 394 |
Uncalled capital |
|
|
|
|
| Asian Development Bank | | Changed | | 1,522 |
| European Bank for Reconstruction and Development | | Unchanged | | 15 |
| International Bank for Reconstruction and Development | | Changed | | 1,985 |
| | | | |
|
| | | | | 3,522 |
Legal proceedings and disputes |
|
|
|
|
| Agriculture and Forestry—legal claims | | Changed | | 23 |
| Education—legal claims | | Changed | | 11 |
| Health—legal claims | | Changed | | 126 |
| Maori Development—Maori Reserved Land | | Unchanged | | 94 |
| New Zealand Defence Force—legal claims | | Changed | | 10 |
| Police—legal claims | | Changed | | 61 |
| Tax in dispute | | Changed | | 79 |
| Treasury—legal claim | | Unchanged | | 21 |
| Other legal claims | | Changed | | 94 |
| | | | |
|
| | | | | 519 |
Other quantifiable contingent liabilities |
|
|
|
|
| International finance organisations | | Changed | | 1,839 |
| Reserve Bank—demonetised currency | | Unchanged | | 24 |
| Other quantifiable contingent liabilities | | Changed | | 99 |
| | | | |
|
| | | | | 1,962 |
| | | | |
|
| Total quantifiable contingent liabilities | | | | 6,397 |
- 12
- Relative to reporting in the 30 June 2001 Crown Financial Statements.
Unquantifiable Contingent Liabilities
Institutional guarantees
| | Status
|
|---|
| Commerce Commission—indemnity for damages | | Unchanged |
| District Court Judges, Justices of the Peace, Coroners and Disputes Tribunal | | Unchanged |
| Earthquake Commission | | Unchanged |
| Fletcher Challenge Limited | | Unchanged |
| Maori Trustee | | Unchanged |
| Ministry of Fisheries—indemnity provided for delivery of registry services | | New |
| National Provident Fund | | Unchanged |
| Persons exercising investigating powers | | Unchanged |
| Public Trust Office | | Unchanged |
| Reserve Bank of New Zealand | | Unchanged |
Other unquantified contingent liabilities |
|
|
| Accident Compensation Corporation | | New |
| Bank of New Zealand | | Unchanged |
| Contaminated sites | | Unchanged |
| Crown research institutes | | Unchanged |
| DFC New Zealand Limited (under statutory management) | | Unchanged |
| District health boards | | Unchanged |
| Electricity Corporation of New Zealand Limited | | Unchanged |
| Housing New Zealand Corporation | | Unchanged |
| Indemnities against acts of war and terrorism | | New |
| Pharmaceutical Management Agency Limited—indemnity | | Unchanged |
| Purchasers of Crown operations | | Unchanged |
| Sale of Crown assets | | Unchanged |
| Tax liabilities | | Changed |
| Treaty of Waitangi claims | | Unchanged |
| Treaty of Waitangi claims—settlement relativity payments | | Unchanged |
| Works Civil Construction | | Unchanged |
| Works Consultancy Services | | Unchanged |
Quantifiable Contingent Liabilities
Guarantees and indemnities
Cook Islands—Asian Development Bank (ADB) loans
Before 1992, the New Zealand Government guaranteed the Cook Islands' borrowing from the ADB. These guarantees have first call on New Zealand's Official Development Assistance to the Cook Islands.
$25 million at 31 October 2001 ($26 million at 30 June 2001).
Huntly East mine subsidence
Claims from private landowners concerning property damage or loss of value.
$22 million at 31 October 2001 ($22 million at 30 June 2001).
Indemnification of receivers and managers—Terralink Limited
The Crown has issued a Deed of Receivership indemnity to the appointed receivers of Terralink Limited.
$10 million at 31 October 2001 ($10 million at 30 June 2001).
Post Office Bank (PostBank)—guaranteed deposits
In the sale of PostBank to ANZ Banking Group Limited (ANZ), the Crown agreed to continue its guarantee, under the Post Office Bank Act 1987, for certain PostBank deposits lodged with the Bank before 1 July 1988. ANZ agreed to indemnify the Crown for the cost of any liability that may arise from the Crown guarantee. The amount guaranteed reduces as deposits mature.
$16 million at 31 October 2001 ($16 million at 30 June 2001).
Guarantees and indemnities of state-owned enterprises and Crown entities
$272 million at 31 October 2001 ($243 million at 30 June 2001).
Other guarantees and indemnities
$49 million at 31 October 2001 ($54 million at 30 June 2001).
Uncalled capital
The Crown's uncalled capital subscriptions are as follows:
| | Uncalled Capital at
31 October 2001
| | Uncalled Capital at
30 June 2001
|
|---|
| | ($ million)
|
|---|
| Asian Development Bank | | 1,522 | | 1,553 |
| European Bank for Reconstruction and Development | | 15 | | 15 |
| International Bank for Reconstruction and Development | | 1,985 | | 2,026 |
Legal proceedings and disputes
The amounts under quantifiable contingent liabilities for legal proceedings and disputes are shown exclusive of any interest and costs that may be claimed if these cases were decided against the Crown.
Where contingent liabilities have arisen as a consequence of legal action being taken against the Crown, the amount shown is the amount claimed and thus the maximum potential cost. It does not represent either an admission that the claim is valid or an estimation of the possible amount of any award against the Crown.
Agriculture and Forestry—legal claims
Claims against the Ministry of Agriculture and Forestry for alleged legal or administrative faults.
$23 million at 31 October 2001 ($26 million at 30 June 2001).
Education—legal claims
Claims against the Crown in respect of the reduction of dental subsidies.
$11 million at 31 October 2001 ($10 million at 30 June 2001).
Health—legal claims
Claims against the Crown in respect of people allegedly contracting Hepatitis C through contaminated blood and blood products, and claims arising from the Gisborne inquiry.
$126 million at 31 October 2001 ($72 million at 30 June 2001).
Maori Development—Maori Reserved Land
The Maori Reserved Land Amendment Act 1997 provides for compensation to lessees for the move to market rents for land, for shorter review periods and for additional transaction costs. In addition, Schedule 5 to the Act recognises that Maori have not been obtaining fair market rents for their land and that this issue will be dealt with by the Government as part of its consideration of historical grievances.
$94 million at 31 October 2001 ($94 million at 30 June 2001).
New Zealand Defence Force—legal claims
Claims against the New Zealand Defence Force for alleged legal or administrative faults.
$10 million at 31 October 2001 ($15 million at 30 June 2001).
Police—legal claims
Claims against the Police for alleged legal or administrative faults.
$61 million at 31 October 2001 ($56 million at 30 June 2001).
Tax in dispute
Represents 50% of the outstanding debt of those tax assessments raised, against which an objection has been lodged and legal action is proceeding.
$79 million at 31 October 2001 ($77 million at 30 June 2001).
Treasury—legal claim
A claim against the Crown relating to a dispute involving the supply of gas in 1987/88.
$21 million at 31 October 2001 ($21 million at 30 June 2001).
Other legal claims
$94 million at 31 October 2001 ($200 million at 30 June 2001).
Other quantifiable contingent liabilities
International finance organisations
The Crown has lodged promissory notes with the following international finance organisations:
| | 31 October 2001
| | 30 June 2001
|
|---|
| | ($ million)
|
|---|
| Asian Development Bank | | nil | | 12 |
| International Monetary Fund | | 1,839 | | 1,810 |
Payment of the notes depends upon the operation of the rules of the individual organisations.
Reserve Bank—demonetised currency
The Crown has a contingent liability for the face value of the demonetised $1 and $2 notes issued which have yet to be repatriated.
$24 million at 31 October 2001 ($24 million at 30 June 2001).
Other quantifiable contingent liabilities
$99 million at 31 October 2001 ($124 million at 30 June 2001).
Unquantifiable Contingent Liabilities
This part of the chapter provides details of those contingent liabilities of the Crown that cannot be quantified.
Institutional guarantees
The following institutional guarantees have been provided through legislation.
Commerce Commission—indemnity for damages
Under a Deed of Indemnity dated 12 November 1991, the Minister of Finance agreed to indemnify the Commission when it gives an undertaking as to damages when seeking injunctions under the Fair Trading Act, and subsequently the Court orders the Commission to pay damages. The sum payable under this Deed is limited to an amount up to $40 million per case taken to Court.
District Court Judges, Justices of the Peace, Coroners and Disputes Tribunals
Section 119 of the District Courts Act 1947 indemnifies District Court Judges acting in their civil jurisdiction. Section 196A of the Summary Proceedings Act 1957 also indemnifies District Court Judges for any liabilities arising as a result of an act done by a Judge in excess of, or without, jurisdiction.
Section 35 of the Coroners Act 1988 confers on Coroners acting within the Coroners Act 1988 the same privileges and immunities as District Court Judges under the Summary Proceedings Act 1957.
Under section 197 of the Summary Proceedings Act 1957, Justices of the Peace are similarly covered as long as a High Court Judge certifies that they have acted in good faith and ought to be indemnified.
Section 58 of the Disputes Tribunals Act 1988 confers on Disputes Tribunal referees acting within the Disputes Tribunals Act 1988 the same protection as Justices of the Peace under the Summary Proceedings Act 1957.
Earthquake Commission
The Crown is liable to meet any deficiency in the Earthquake Commission's assets in meeting the Commission's financial liabilities (section 16 of the Earthquake Commission Act 1993).
Fletcher Challenge Limited (FCL)
Under the Sale and Purchase Agreement for the sale of Forestry Corporation of New Zealand Limited, the Crown has indemnified FCL for the cost of cleaning up on-site environmental contamination incurred up to settlement date (27 September 1996). The Crown is to pay for half of any cost over $30 million and for all costs over $50 million. The on-site indemnity runs until 1 January 2020. The Crown has also indemnified FCL in respect of off-site environmental costs and losses incurred up until settlement date. The off-site indemnity is unlimited as to amount and time.
Maori Trustee
The Crown is liable to meet any deficiency in the Maori Trustee's Common Fund (section 27(1) of the Maori Trustee Act 1953).
Ministry of Fisheries—indemnity provided for delivery of registry services
The Crown has indemnified Commercial Fisheries Services Limited against claims made by third parties arising from Commercial Fisheries Services undertaking registry services under contract to the Chief Executive of the Ministry of Fisheries. This indemnity, provided under the Fisheries Acts 1983 and 1996 expires on 30 October 2006 unless varied, in which case it will expire on 30 September 2008.
National Provident Fund
The Crown guarantees the benefits payable by all National Provident Fund Board schemes (section 60 of the National Provident Fund Restructuring Act 1990). The Crown also guarantees investments and interest thereon deposited with the National Provident Fund Board prior to 1 April 1991 (section 61 of the same Act).
A provision has been made in these Financial Statements in respect of the actuarially assessed deficit in the DBP (Annuitants') Scheme (refer Note 12 of the Financial Statements).
Persons exercising investigating powers
Section 63 of the Corporations (Investigation and Management) Act 1989 indemnifies the Securities Commission, the Registrar and Deputy Registrar of Companies, members of advising committees within the Act, every statutory manager of a corporation, and persons appointed pursuant to sections 17 to 19 of the Act, in the exercise of investigating powers, unless the power has been exercised in bad faith.
Public Trust Office
The Crown is liable to meet any deficiency in the Public Trust Office's Common Fund (section 36 of the Public Trust Office Act 1957).
Reserve Bank of New Zealand (the Reserve Bank)
Under section 146 of the Reserve Bank of New Zealand Act 1989, every statutory manager of a Registered Bank, every person appointed under section 99 or section 101 of the Act and every member of an advisory committee, shall be indemnified by the Crown in respect of any liability arising from the exercise, purported exercise or omission to exercise of any power conferred by Part V of the Act, unless that power has been exercised in bad faith.
The Crown pays to the Reserve Bank any exchange losses incurred by the Reserve Bank as a result of dealing in foreign exchange under sections 17, 18 and 21(2) of the Act.
Other unquantifiable contingent liabilities
Accident Compensation Corporation (ACC)
A court decision has determined that the ACC practice, prior to the Accident Insurance Act 1998, of allowing for familial responsibility when determining attendant care entitlements was not legitimate. The decision is likely to apply to a number of seriously injured claimants.
Bank of New Zealand (BNZ)
A deed, entered into by the Crown, Fay Richwhite and Company Limited and National Australia Group Limited (the purchaser of BNZ), provides for the sharing of certain costs arising from defined risks that pre-date the sale of the BNZ. These risks are associated with New Zealand taxation and specified litigation.
Contaminated sites
Under common law and various statutes, the Crown may have responsibility to remedy adverse effects on the environment arising from Crown activities. The Discussion Document on Contaminated Sites Management discusses the possibility of the Crown contributing to funding the clean-up of "orphan" contaminated sites.
Crown research institutes (CRIs)
The Crown has indemnified the CRIs for any costs arising from certain third-party claims that are the result of acts or omissions prior to the transfer date, for costs of complying with statutes, ordinances and bylaws which relate to or affect certain buildings, and (subject to certain limitations) for the costs of obtaining title to land.
DFC New Zealand Limited (under statutory management) (DFC)
DFC and the National Provident Fund have been indemnified for certain potential tax liabilities.
District health boards (DHBs)
The Crown has provided transitional indemnities to directors and officers of some DHBs, for liabilities arising from inherited assets and business practices under the Building Act 1991 and the Health and Safety in Employment Act 1992.
Electricity Corporation of New Zealand Limited (ECNZ)
The ECNZ Sale and Purchase Agreement provides for compensation to ECNZ for any tax, levy, royalty or impost imposed on ECNZ for the use of water or geothermal energy for plants in existence or under construction at the date of the Sale and Purchase Agreement. The Agreement also provides for compensation for any net costs to ECNZ arising from resumption of assets pursuant to the Treaty of Waitangi (State Enterprises) Act 1988.
The Deed of Assumption and Release between ECNZ, Contact Energy Limited and the Crown provides that the Crown is no longer liable to ECNZ in respect of those assets transferred to Contact Energy. As a result of the split of ECNZ in 1999, Ministers have transferred the benefits of the Deed to ECNZ's successors—Meridian Energy Limited, Mighty River Power Limited, and Genesis Power Limited.
Under the Transpower New Zealand Limited Sale and Purchase and Debt Assumption Agreements, the Crown has indemnified ECNZ for any losses resulting from changes in tax rules applicable to transactions listed in the Agreements. Additionally, the Crown has indemnified the directors and officers of ECNZ for any liability they may incur in their personal capacities as a result of the Transpower separation process.
Following the split of ECNZ in 1999 into three new companies, the Crown has indemnified ECNZ in relation to all ECNZ's pre-split liabilities, including:
- •
- existing debt and swap obligations
- •
- hedge contracts and obligations
- •
- any liabilities that arise out of the split itself.
Housing New Zealand Corporation (HNZC)
The Crown has indemnified the following entities in respect of the accuracy of information provided on the sale of various parcels of HNZC (formerly Housing Corporation of New Zealand) mortgages: Countrywide Bank, TSB Bank, and Westpac Banking Corporation.
Under the sale of mortgages to Westpac, HNZC has insured the purchaser against certain credit losses with the Crown standing behind this obligation.
Legal proceedings have been initiated against a number of defendants, including the Crown, alleging breach of fiduciary duties in respect of the transfer of the Agreement for Sale and Purchase and mortgage agreements to HNZC under the Housing Assets Transfer Act 1993.
In addition, the Crown has provided a warranty in respect of title to the assets transferred to HNZC (formerly Housing New Zealand) and has indemnified the company against any breach of this warranty. The Crown has indemnified the company against any third party claims that are as a result of acts or omissions prior to 1 November 1992. It has also indemnified the directors and officers of the company against any liability consequent upon the assets not complying with statutory requirements, provided they are taking steps to rectify any non-compliance.
Indemnities against acts of war and terrorism
The Crown has indemnified Air New Zealand against claims arising from acts of war and terrorism that cannot be met from insurance, up to a limit of US$2 billion in respect of any one claim.
The Crown has offered non-airline aviation companies indemnities against acts of war, terrorism and related causes where commercial cover has been withdrawn following the events in the USA on 11 September 2001. The indemnities are for a maximum of US$200 million for each party. At 31 October 2001, indemnities had been signed with Airways Corporation, Auckland International Airport, Christchurch International Airport, and Wellington International Airport. Further indemnities may be offered to eligible parties.
Pharmaceutical Management Agency Limited (Pharmac)—indemnity
Section 99 of the Social Security Act 1964 provided for the fixing of prices for pharmaceutical products by way of a list specified by the Minister of Health ("the Drug Tariff"). This list was superseded by a list ("the Pharmaceutical Schedule") developed and issued by Pharmac, a company owned by the Crown and having various powers under the New Zealand Public Health and Disability Act 2000.
Under the Transfer Agreement between Pharmac and the Crown, the Crown has indemnified Pharmac against any liability in respect of operations, activities, decisions and policies relating to the Drug Tariff and the Pharmaceutical Schedule.
A number of legal claims have been lodged against Pharmac. If these claims are successful, the Crown's financial position may be adversely affected by any damages arising either directly through the indemnity, or indirectly through its ownership of Pharmac.
Purchasers of Crown operations
The Crown has indemnified the purchasers of various Crown operations for losses owing to changes in legislation which uniquely and adversely affect those purchasers.
Sale of Crown assets
On the sale of Crown assets and the corporatisation of Crown assets into SOEs and Crown entities, the Crown has generally provided a warranty that the Crown was the rightful owner of the assets transferred, and that the assets were free of encumbrances.
Tax liabilities
The Crown has granted to the purchasers of the State Insurance Office Limited, and the Rural Banking and Finance Corporation Limited an indemnity for certain potential tax liabilities.
Treaty of Waitangi claims
Under the Treaty of Waitangi Act 1975, any Maori may lodge claims relating to land or actions counter to the principles of the Treaty with the Waitangi Tribunal. Where the Tribunal finds a claim is well founded, it may recommend to the Crown that action be taken to compensate those affected. The Tribunal can make recommendations that are binding on the Crown with respect to land which has been transferred by the Crown to an SOE or tertiary institution, or is subject to the Crown Forest Assets Act 1989.
Settlement relativity payments
The Deeds of Settlement negotiated with Waikato-Tainui and Ngai Tahu include a relativity mechanism. The mechanism provides that, where the total redress amount for all historical Treaty settlements exceeds $1 billion in 1994 present-value terms, the Crown is liable to make payments to maintain the real value of Ngai Tahu's and Waikato-Tainui's settlements as a proportion of all Treaty settlements. The agreed relativity proportions are 17% for Waikato-Tainui and approximately 16% for Ngai Tahu. The non-quantifiable contingent liability relates to the risk that total settlement redress, including binding recommendations from the Waitangi Tribunal, will trigger these relativity payments.
Works Civil Construction
The Crown has provided an indemnity to the purchasers of Works Civil Construction in relation to the activities of the Ministry of Works and Development prior to 1 April 1989. In addition, an indemnity has been provided against certain costs, claims or damages in relation to the Clyde and Ohaaki power projects.
Works Consultancy Services
The Crown has provided an indemnity to the purchasers of Works Consultancy Services in relation to the activities of the Ministry of Works and Development prior to 1 April 1989.
Specific fiscal risks
Specific fiscal risks (excluding contingent liabilities) are a category of Government decisions or circumstances that may have a material impact on the fiscal position. The risks have not been included in the main forecasts because their fiscal impact cannot be reasonably quantified, the likelihood of realisation is uncertain and/or the timing is uncertain. The risks disclosed may not eventuate into Government policy and the final cost or saving may differ from the amount disclosed if the policy is developed.
To ensure a practicable and consistent disclosure approach, risks have been reported that have an expected cost or saving of over $10 million in any one forecast year; and either:
- •
- reflect Government decisions or legislative commitments with uncertain fiscal consequences or timing, or
- •
- are generally being actively considered by the Minister of Finance and responsible Ministers, or
- •
- are decisions that have been deferred until a later date.
The forecasts incorporate operating and capital provisions to accommodate policy initiatives on which decisions have yet to be made. Some risks outlined in this chapter, if they eventuate, would be covered by these provisions and therefore have no impact on the forecasts. These risks have been disclosed to provide an indication of the pressure the risks place upon the fiscal provisions.
There are a number of other "pressures" on the fiscal position that have not been included as risks. These "pressures" comprise proposals largely generated within individual departments and not yet considered by the Minister of Finance and responsible Ministers. Such items are also expected to be managed within the provisions noted above.
Specific fiscal risks do not include:
- •
- normal forecasting risks, such as uncertainty around welfare benefits, SOE/Crown entity surpluses or finance costs
- •
- possible changes to the interpretation of accounting policies, such as the changes to revenue recognition rules and recognition of liabilities
- •
- discussion documents containing proposals that the Minister of Finance and responsible Ministers will not actively consider until the consultation process has been completed.
The Fiscal Responsibility Act 1994 requires that all specific fiscal risks be disclosed, except where it is determined by the Minister of Finance that disclosing a risk is likely to:
- •
- prejudice the substantial economic interests of New Zealand, or
- •
- prejudice the security or defence of New Zealand or international relations of the Government, or
- •
- compromise the Crown in a material way in negotiation, litigation or commercial activity, or
- •
- result in a material loss of value to the Crown.
In addition, the Minister of Finance has to determine that there is no reasonable or prudent way the Government can avoid this prejudice, compromise or material loss by making a decision on the fiscal risk before the finalisation of the forecasts, or by disclosing the fiscal risk without reference to its fiscal implications.
The fiscal risks included in the Statement of Specific Fiscal Risks were finalised as at 26 November 2001.
Quantified Risks13
Risks as at 26 November 2001
| | Operating Balance
| | Net Debt
| | Net Worth
| | ($ million)
|
|---|
Accident Insurance—
Treatment Cost Review | | Decrease | | Increase | | Decrease | | -7 from 2002/03. |
| Child, Youth and Family Services—Potential Underpayment of Care Allowances | | Decrease | | Increase | | Decrease | | -15 in 2001/02. |
| Conservation—Asset Maintenance | | Decrease | | Increase | | Decrease | | Up to -100 split between operating and capital. |
| Corrections—Capital Projects | | Decrease | | Increase | | Decrease | | -475 capital and -152 operating across the outyears. |
| Defence—Capital Injections | | Decrease | | Increase | | Decrease | | -1,000 over the next five to ten years. |
| Defence—East Timor | | Decrease | | Increase | | Decrease | | -16 operating in 2002/03. |
| Education—Centres of Research Excellence | | Decrease | | Increase | | Decrease | | -20 capital. |
| Education—School Property | | Decrease | | Increase | | Decrease | | -68 in 2001/02, -200 in 2002/03, -160 in 2003/04 and subsequent outyears for capital; and -10 in 2001/02, -20 in 2002/03, -30 in 2003/04 and -40 in 2004/05 for operating. |
| Energy Efficiency and Conservation—National Strategy | | Decrease | | Increase | | Decrease | | -78 operating over five years. |
| Environment—Genetic Modification | | Decrease | | Increase | | Decrease | | -10 in 2003/04 and outyears. |
| Finance—Air New Zealand | | Unclear | | Increase | | Unclear | | -885 capital in 2001/02 and -150 before June 2003. |
| Finance—Purchase of Auckland Rail Network | | Decrease | | Increase | | Decrease | | -81 capital. |
| Health—Budget Allocation | | N/A | | N/A | | N/A | | N/A14 |
| Inland Revenue—Tax Simplification | | Decrease | | Increase | | Decrease | | -25 to 30 operating. |
| Labour—Paid Parental Leave | | Decrease | | Increase | | Decrease | | -40 operating from 2002/03 |
| Responses to Terrorism | | Decrease | | Increase | | Decrease | | -2 in 2001/02, -12 in 2002/03 and -14 in 2003/04. |
| Social Development—Making Work Pay | | Decrease | | Increase | | Decrease | | -16 operating ongoing. |
| Social Development—Benefit Payment Systems | | Decrease | | Increase | | Decrease | | Up to -95 split between operating and capital. |
| Transport—Transport Strategy | | Decrease | | Increase | | Decrease | | -250 per year split between operating and capital. |
- 13
- In the summary tables listing specific risks:
- •
- negative numbers indicate a deterioration in the Crown's financial position
- •
- "N/A" means no effect
- •
- "Unclear" means insufficient information is available to determine the risk's effect.
- 14
- The impact of decisions to be funded from the Health Budget Allocation has already been included in the forecasts.
Unquantified Risks
Risks as at 26 November 2001
| | Operating Balance
| | Net Debt
| | Net Worth
|
|---|
| Accident Insurance—Medical Misadventure | | Unclear | | Unclear | | Unclear |
| Education—Capital Injections for Tertiary Eduction Institutions | | Decrease | | Increase | | Decrease |
| Education—Collective Employment Agreements | | Decrease | | Increase | | Decrease |
| Education—ECE Strategic Plan | | Unclear | | Unclear | | Unclear |
| Education—Pay Parity for Kindergarten Teachers | | Decrease | | Increase | | Decrease |
| Education—Review of School Staffing | | Decrease | | Increase | | Decrease |
| Education—School and Early Childhood Operational Funding | | Decrease | | Increase | | Decrease |
| Education—School Property Code | | Decrease | | Increase | | Decrease |
| Education—Stabilisation of Tertiary Fees | | Decrease | | Increase | | Decrease |
| Education—Tertiary Education Advisory Commission | | Decrease | | Increase | | Decrease |
| Education—Wananga Capital Injection | | N/A | | Increase | | N/A |
| Environment—Climate Change | | Unclear | | Unclear | | Unclear |
| Health—District Health Board Debt Financing | | N/A | | Increase | | N/A |
| Health—Meningococcal Vaccine | | Decrease | | Increase | | Decrease |
| Inland Revenue—Gaming Review | | Unclear | | Unclear | | Unclear |
| Inland Revenue—GST and Imported Services and Financial Services Review | | Unclear | | Unclear | | Unclear |
| Inland Revenue—Taxation of Savings and Investment Vehicles, Including Superannuation Funds | | Decrease | | Increase | | Decrease |
| Inland Revenue—Tax Review of International Issues | | Unclear | | Unclear | | Unclear |
| Inland Revenue—Trans-Tasman Triangular Tax Relief | | Decrease | | Increase | | Decrease |
| Police—Capital Projects | | Decrease | | Increase | | Decrease |
| Social Development—Families and Work | | | | | | |
| TVNZ—Change of Direction | | Unclear | | Unclear | | Unclear |
Risks Removed since the 2001 Budget
Risk
| | In Forecasts
| | Comment
|
|---|
| Accident Insurance—Seriously Injured Claimants | | No | | Now considered to be a contingent liability |
| Agriculture and Forestry—South Island Landless Maori | | No | | No longer greater than $10 million |
| Economic Development—Sale of Spectrum Licences | | Yes | | Baselines |
| Maori Trustee—Payment of Services | | Yes | | Baselines |
| Public Trust Office—Modernisation | | Yes | | Baselines |
| Rating Exemption on Crown Land | | No | | No longer under active consideration |
| Work and Income—Review of Information Systems for International Agreements | | Yes | | Baselines |
Quantified Fiscal Risks
Accident Insurance—Treatment Cost Review (changed risk)
The Department of Labour is currently undertaking a review of the subsidies paid for accident-related treatment costs. Some of these subsidies are paid out of the Non-Earners' Account, which is funded by the Crown. The outcome of this review is likely to increase subsidies by up to $7 million per year from 2002/03, which would decrease the operating balance.
The Minister of Finance has yet to fully consider the quantum of this risk.
Source: Department of Labour
Child, Youth and Family Services—Potential Underpayment of Care Allowances (new risk)
The Department of Child, Youth and Family Services faces a potential liability related to historical under payment of board payments and associated allowances to caregivers. The cost of retrospectively compensating for these underpayments and ensuring that future payments are at acceptable levels is estimated at up to $15 million in 2001/02, which would decrease the operating balance.
The Minister of Finance has yet to fully consider the quantum of this risk.
Source: Child, Youth and Family Services
Conservation—Asset Maintenance (changed risk)
The Department of Conservation provides a range of recreational facilities including campsites, tracks and huts. Many of these facilities are rundown, due in part to maintenance issues. These facilities require further maintenance and possibly upgrading to meet more rigorous building standards introduced recently.
The associated operating and capital cost pressures are currently being assessed, but additional costs could range up to $100 million per annum. The operating and capital split is unclear at this stage, but operating funding would decrease the operating balance and any capital injection would increase net debt.
The Minister of Finance has yet to fully consider the quantum of this risk.
Source: Department of Conservation
Corrections—Capital Projects (changed risk)
The Department of Corrections has estimated that a total of $475 million ($188 million 2001 Budget) in capital costs and $152 million ($78 million 2001 Budget) in operating costs may be required over the forecast period for capital projects as a result of higher prison musters. Operating funding would decrease the operating balance and any capital injections would increase net debt.
These estimates include consideration of funding for:
- •
- future options for South Auckland Men's Corrections Facility (including options for Mt Eden Prison)
- •
- Otago Men's Corrections Facility
- •
- Bay of Plenty Corrections Facility
- •
- Auckland Women's Corrections Facility and
- •
- expansion of Waikeria Corrections Facility.
The Minister of Finance has yet to fully consider the quantum of the risks identified above.
Source: Department of Corrections
Defence—Capital Injections (unchanged risk)
Implementing the Government's decisions on the future force structure of the New Zealand Defence Force will involve a series of capital acquisitions across all three armed services to achieve the required capability upgrades. It is anticipated that capital injections of up to $1 billion over the next 10 years may be necessary, with the bulk likely to be required within the next five years. The actual expenditure profile will depend on the specification and timing of the individual projects, the contracted prices, and the prevailing exchange rate at the time of purchase. Any capital injections would increase net debt.
The Minister of Finance has yet to fully consider the quantum of this risk.
Defence—East Timor (changed risk)
Funding was agreed in the 2001 Budget for New Zealand's contribution to the United Nations Transitional Administration of East Timor until 31 May 2002. The future contribution by the Government to the United Nations operation is dependent on the nature of New Zealand's involvement. The estimated additional cost of extending New Zealand's involvement at its current level for an additional six months is $33 million. It is expected that the United Nations will reimburse a proportion of the in-theatre costs of the deployment. The level of reimbursement is estimated at $17 million (based on the mission remaining "peace-making"), although the timing of the payment is unknown.
The net costs of operating funding would decrease the operating balance.
The Minister of Finance has yet to fully consider the quantum of this risk.
Source: New Zealand Defence Force
Education—Centres of Research Excellence (unchanged risk)
The Government provided operational funding in the 2001 Budget for the establishment and support of Centres of Research Excellence within the tertiary education sector. Capital injections will be required to fund these Centres, which would increase net debt. The Ministry of Education estimates $20 million of capital injections may be required.
The Minister of Finance has yet to fully consider the quantum of this risk.
Source: Ministry of Education
Education—School Property (changed risk)
The Government has provided $120 million in 2001/02 for school accommodation ($98 million 2001 Budget). Additional capital injections for school accommodation are likely to be required later this financial year and in future years to meet roll growth. Capital injections are estimated to be up to $68 million ($90 million 2001 Budget) in 2001/02, $200 million in 2002/03 and $160 million in 2003/04 and each subsequent outyear, which would increase net debt.
In addition to capital injections, consequential operating costs are likely to be incurred, which would decrease the operating balance. These are estimated at $10 million in 2002/03, $20 million in 2003/04, $30 million in 2004/05 and $40 million in 2005/06.
The Minister of Finance has yet to fully consider the quantum of this risk.
Source: Ministry of Education
Energy Efficiency and Conservation—National Strategy (new risk)
The National Energy Efficiency and Conservation Strategy was launched in September 2001. It includes an economy-wide energy efficiency target and a renewable energy target range. Implementation of specific policy measures to achieve these targets has been estimated at up to $78 million over five years, which would decrease the operating balance.
The Minister of Finance has yet to fully consider the quantum of this risk.
Source: Ministry for the Environment
Environment—Genetic Modification (new risk)
The Government has recently taken decisions in response to the recommendations of the Royal Commission on Genetic Modification. Most of these decisions require further work before the final policy changes can be designed and implemented. The ongoing fiscal cost of these policy changes has been estimated at up to $10 million per annum from 2003/04, which would decrease the operating balance. The final cost will depend on what policy and implementation options are chosen.
The Minister of Finance has yet to fully consider the quantum of this risk.
Source: Ministry for the Environment
Finance—Air New Zealand (new risk)
The Government has announced a recapitalisation package for Air New Zealand (Air NZ) that has been agreed with the Air NZ Board, being immediate capital of $885 million (tranches A and B) and a further commitment by the Government to provide $150 million before June 2003 in a form that is appropriate for Air NZ's capital structure at the time the money is required.
The capital provision in the forecasts has been increased to allow for the announced recapitalisation package, though any impacts of the package are not included in forecasts as shareholder approval of the offer has yet to be obtained. If the package is agreed to by Air NZ shareholders, Air NZ's operating results will be incorporated into the forecasts and Crown Financial Statements from the date of effective ownership.
Accounting issues around the fair value of assets and liabilities to be brought onto the Crown's Balance Sheet on acquisition are being considered at present. There is a risk that if there is a differential in the purchase price and the value of Air NZ's assets and liabilities, a write-down in the Crown Financial Statements would be required. It is likely to take some time to work through this issue and assess the probability of the risk crystallising.
Further information on the recapitalisation package is included in the Fiscal Outlook chapter on page 67.
Source: The Treasury
Finance—Purchase of Auckland Rail Network (changed risk)
The Government has commenced negotiations with the objective of purchasing Tranz Rail's Auckland rail lease and infrastructure assets. While no agreement has yet been reached, indicative terms included a price of $81 million, which would increase net debt.
Source: The Treasury
Health—Budget Allocation (new risk)
The Government has agreed to increase Health operating expenditure by approximately $50 million in 2001/02, $450 million in 2002/03, $850 million in 2003/04 and $1,250 million in 2004/05. These amounts have been included in the forecast financial statements in the Health functional classification.
This allocation is to fund and manage risks and pressures in Vote Health for the period 2001/02 to 2004/05, as well as any new policy initiatives the Government may want to undertake over this timeframe, including:
- •
- Funding Forecast Track (FFT)
The purpose of the FFT is to sustain purchasing power in the health sector. The cost of the FFT in 2002/03 and subsequent outyears is expected to be $148 million. Decisions regarding the various components of the FFT for outyears have yet to be taken
- •
- Maintaining Services at Existing Levels
An additional $120 million per annum from 2002/03 onwards is expected to be allocated to DHBs to maintain services at existing levels
- •
- GP and Referred Services
The Crown is expected to contribute to a shortfall in General Practitioner and Referred Services (Pharmaceuticals and Laboratory Services) of approximately $50 million in 2001/02 and outyears
- •
- Health Funding Authority (HFA) Contracts
A review of HFA contracts has found an expected $20 million in ongoing commitments per annum
- •
- Health—Residential Care Prices
The Government has agreed to negotiate a price increase for residential services providers. The cost is $13 million from 2002/03 onwards
The timing, value and implementation of the Primary Care Strategy is contingent upon other fiscal risks and pressures being managed within the overall allocation to Vote Health
The Government is considering a proposal to remove asset testing on all forms of long-stay geriatric care, including public and private hospitals and rest homes. The proposal costs have yet to be finalised.
Any decisions that are funded from the additional allocation will not impact on the operating balance as this has already been forecast.
Source: Ministry of Health
Inland Revenue—Tax Simplification (changed risk)
The Government is considering further tax simplification measures that were outlined in the discussion document More Time for Business. Measures already approved by the Government and to be included in the December Tax Bill have been removed from this specific fiscal risk. The further measures include the possibility of providing a vehicle for some provisional taxpayers to reduce their risks around estimating provisional tax and the possibility of basing provisional tax on GST returns.
The estimated costs are unclear at this stage, as they depend on which measures are introduced. The impact could range from an operating balance increase of up to $30 million per year to a decrease of up to $25 million per year in tax revenue. If all measures are introduced they will likely offset each other to be fiscally neutral once initial timing impacts have occurred.
The Minister of Finance has yet to fully consider the quantum of this risk.
Source: Inland Revenue Department
Labour—Paid Parental Leave (changed risk)
The Government has agreed to broad policy parameters for paid parental leave, although some detailed issues and cost implications are still being considered. Following the passage of legislation, paid parental leave is expected to be implemented from 1 July 2002 and the cost is estimated at about $40 million per annum.
Source: Department of Labour
Responses to Terrorism (new risk)
The Government is considering a package of measures across a number of departments in response to heightened security risks following the events of 11 September 2001. The operating costs of the total package are estimated at $2 million in 2001/02, $12 million in 2002/03 and $14 million in 2003/04, which would decrease the operating balance.
Source: Department of Prime Minister and Cabinet
Social Development—Making Work Pay (new risk)
The Government is currently considering a package of "Making Work Pay" policies, which if fully implemented could cost up to $16 million per annum. This would decrease the operating balance.
The Minister of Finance has yet to fully consider the quantum of this risk.
Source: Ministry of Social Development
Social Development—Benefit Payment Systems (new risk)
The Ministry of Social Development is undertaking an evaluation of options for the upgrading of benefit payment systems SWIFTT and TRACE. The evaluation is expected in April 2002.
If the evaluation recommends improvement of the existing systems, the development cost is estimated at $25 million to $40 million. If the review recommends replacement of systems, the development cost is estimated at $95 million. Operating funding would decrease the operating balance and capital injections would increase net debt.
The Minister of Finance has yet to fully consider the quantum of this risk.
Source: Ministry of Social Development
Transport—Transport Strategy (changed risk)
Officials are developing a New Zealand Land Transport Strategy and a Safety Strategy for consideration by Ministers, which if implemented could cost up to $250 million per year (split between operating and capital).
The Minister of Finance has yet to fully consider the quantum of this risk.
The Government will consider options to fund these proposals, including the possibility of a contribution from third party revenue, so the impact on the operating balance and net debt is unclear.
Source: Ministry of Transport
Unquantified Fiscal Risks
Accident Insurance—Medical Misadventure (changed risk)
The Medical Misadventure Account is currently funded partly from the Earners' Account and partly by the Crown through the Non-Earners' Account. A review of the Medical Misadventure Account is about to take place, which will consider the scope of the Account and potential funding options. The net impact of the review is unquantified and may either increase or decrease the operating balance.
Education—Capital Injections for Tertiary Education Institutions (unchanged risk)
Several tertiary education institutions are facing financial pressure. They may seek assistance from the Government as they develop their plans for the future. The risk is unquantified as the amount or timing of any request for financial assistance is unclear, but any capital injection would increase net debt.
Education—Collective Employment Agreements (changed risk)
The primary, secondary and area schools' teachers' and principals' collective employment contracts expired on 30 April 2001. The primary and area schools' agreements have now been settled, but the secondary agreements have not been completed. The Crown will need to meet any fiscal impact in 2001/02 and beyond owing to the renegotiation of these contracts and any adjustments to individual employment agreements, which would decrease the operating balance.
This risk is unquantified as disclosure could compromise the Crown in negotiations.
Education—ECE Strategic Plan (unchanged risk)
The Early Childhood Education Strategic Plan Working Group submitted its final report to the Government in October 2001. The Government will develop its response to this report during the next 12 months. The impacts on the operating balance and net debt are unclear at this point.
Education—Pay Parity for Kindergarten Teachers (changed risk)
The Ministerial Working Group on Pay Parity for Kindergarten Teachers will recommend to the Minister of Education in December 2001 a phased approach to the implementation of pay parity for kindergarten teachers. The costs associated with this approach are unclear at this stage but would decrease the operating balance.
Education—Review of School Staffing (changed risk)
Since the 2001 Budget, the Government has decided to increase school staffing levels in response to a report from the School Staffing Review Working Group. However, further decisions about school staffing are expected, which are likely to decrease the operating balance.
Education—School and Early Childhood Operational Funding (unchanged risk)
The Government has previously made annual adjustments to school and early childhood education operational funding to reflect inflation. This risk is unquantified but is likely to decrease the operating balance. As an indication of cost, a 1% adjustment would increase annual operational funding by around $10 million for schools from the 2003 school year and $4 million for early childhood education from 2002/03.
Education—School Property Code (unchanged risk)
The Ministry of Education is developing a new intermediate school property code that will allow the property entitlement of each school to be defined explicitly. It is expected that the existing entitlements of many schools will be below the new code. Additional capital injections may be required to upgrade schools to the new code level and would increase net debt. Associated operating costs, including depreciation and maintenance, would decrease the operating balance.
This risk is unquantified because the implementation process for the code has yet to be considered.
Education—Stabilisation of Tertiary Fees (unchanged risk)
In the 2001 Budget, additional funding was provided to offset the increasing costs faced by the tertiary education sector. This funding allowed for the stabilisation of student fees. Additional funding for the same purpose may be considered as part of the 2002 Budget process, depending on final decisions taken in response to the Tertiary Education Advisory Commission's recommendations. Any additional operating funding would decrease the operating balance.
Education—Tertiary Education Advisory Commission (changed risk)
The Tertiary Education Advisory Commission was established in April 2000 to provide advice on aspects of the tertiary education sector; it has provided four reports. In response to the Commission's reports, the Government has decided to establish a Tertiary Education Commission and to introduce charters and profiles for tertiary education providers. The Government will develop its final response to the Commission's recommendations, including funding policy, during 2002. The likely impacts will be a decrease in the operating balance and an increase in net debt.
Education—Wananga Capital Injection (changed risk)
Ministers are currently negotiating with two wananga (Maori tertiary institutions) over settlement of their Waitangi Tribunal claim, having reached a settlement with one wananga (Te Whare Wananga o Aotearoa) since the 2001 Budget. The Waitangi Tribunal has recommended that the wananga be compensated for capital expenditure that has been incurred on facilities to date, and be provided funding to bring their facilities up to a standard comparable with other tertiary institutions and to meet additional capital requirements over the next three years. Any capital injection would increase net debt.
This risk is unquantified as disclosure could compromise the Crown in negotiations.
Environment—Climate Change (changed risk)
The Government has indicated its intention to ratify the Kyoto Protocol by September 2002, and is in the process of consulting on the issue of ratification, and the policy options required to meet commitments under the Protocol.
At this stage, it is unclear what impact the decision to ratify the Protocol would have on the operating balance, either positive or negative, since this is closely related to which policy options are accepted.
Health—District Health Board Debt Financing (new risk)
The Government is considering a number of DHB major capital projects, including Southland DHB and Capital and Coast DHB. These capital projects are expected to involve a mixture of debt and equity financing, both predominantly sourced from the Crown. The size of the risk has not been quantified and will depend upon approval of the projects, their final cost, and the extent to which Crown debt and equity can be met from the existing capital baselines in Vote Health.
Capital injections to DHBs over the existing baseline will increase net debt.
Health—Meningococcal Vaccine (new risk)
The Government is considering the development of a vaccine for a Meningococcal strain that is specific to New Zealand, the cost of which would decrease the operating balance. Final decisions and negotiations have yet to be undertaken.
This risk is unquantified as disclosure could compromise the Crown in negotiations.
Inland Revenue—Gaming Review (new risk)
During 2001 the Government has undertaken a review of the regulation of gaming, including the taxation of gaming. This review is largely complete, and the Government expects to make final decisions and introduce legislation in December 2001.
Any changes to the taxation structure of the gaming industry would impact on the operating balance. At this stage it is unclear what impact, either positive or negative, the outcome of the review will have.
Inland Revenue—GST and Imported Services and Financial Services Review (changed risk)
In March 1999 a discussion document entitled GST: A Review outlined potential longer-term changes to the Goods and Services Act 1985 of taxing financial services and imported services. The Government issued a discussion document on GST and imported services (including electronic commerce) in June 2001, proposing GST be applied to some imported services, and is considering submissions at present. The Government is reviewing the treatment of financial services and is likely to issue a discussion document on GST and financial services next year. Both reviews are expected to result in amendments to the GST Act that will impact on the operating balance. The impact is unclear at this stage.
Inland Revenue—Taxation of Savings and Investment Vehicles, Including Superannuation Funds (changed risk)
The Government is considering its response to the recommendations on the taxation of savings and investment vehicles of the Tax Review 2001.
The Government is interested in stimulating savings through the use of tax incentives. While the design of such a scheme has not been finalised, it is likely that it would provide a saving incentive by introducing a rebate on contributions to superannuation funds or by reducing the tax on the earnings of such funds.
Any new regime would not be implemented prior to the 2003/04 year.
The impact of any tax incentive (if accepted) is likely to reduce the operating balance.
Inland Revenue—Tax Review of International Issues (new risk)
The Government is considering its response to the International Tax Recommendations of the Tax Review 2001. Details of the Government's response will be included in the 2002 Budget; the impact on the operating balance, whether positive or negative, is unclear.
Inland Revenue—Trans-Tasman Triangular Tax Relief (unchanged risk)
Imputation credits generated by a New Zealand subsidiary company with a non-resident parent company cannot be passed on to New Zealand shareholders of the parent company. As such, New Zealand taxes residents twice on their New Zealand-sourced income. The Government is considering providing relief for this aspect of double taxation, in a trans-Tasman context only.
This risk is unquantified as no clear estimate of this proposal has been finalised, but is likely to decrease the operating balance.
Police—Capital Projects (changed risk)
The new strategic plan for the New Zealand Police identifies scope for improvement in access and use of information through additional investments in technology and upgrades to the Police communications infrastructure. In addition, New Zealand Police has identified a number of Police stations that require capital work to bring them up to a modern operating standard.
The timing, scale and funding for new technology are unclear at this stage, but any capital injections would increase net debt.
Social Development—Families and Work (new risk)
The Government has decided to remove the current work test for those receiving the Domestic Purposes Benefit and the Widows Benefit, introduce enhanced case management and replace the current dual abatement regime with a single abatement regime.
This risk is unquantified as the impacts have not yet been finalised, but it is likely to decrease the operating balance.
TVNZ—Change of Direction (unchanged risk)
The Government is implementing its work programme for development of future directions and priorities for public service broadcasting. TVNZ's objective, for the television part of its business, will be to give effect to its charter while it maintains its commercial performance. This change in structure and direction may impact on TVNZ's surplus, which would impact on the operating balance, and dividends paid to the Crown, which would impact on net debt.
This risk is unquantified as the impact of the change and how it will be funded have not yet been determined.
Generally Accepted Accounting Practice (GAAP) Series Tables
Forecast Financial Statements
These forecasts have been prepared in accordance with the Fiscal Responsibility Act 1994.
They are based on the accounting policies and assumptions that follow on pages 125–138. As with all such assumptions, there is a degree of uncertainty surrounding them. This uncertainty increases as the forecast horizon extends.
The forecasts have been prepared in accordance with the Statement of Responsibility and reflect the judgements and information known at the time they were prepared. They reflect all Government decisions and circumstances communicated to 26 November 2001.
| | Finalisation Dates
|
|---|
| Fiscal forecasts | | 26 November |
| Tax revenue forecasts | | 26 November |
| Economic outlook | | 21 November |
| Government decisions and circumstances | | 26 November |
| Actual asset revaluations | | 31 October |
| Foreign-exchange rates | | 31 October |
| Specific fiscal risks | | 26 November |
| Contingent liabilities and commitments | | 31 October |
Reporting Entity as at 26 November 2001
These Forecast Financial Statements are for the Crown reporting entity as specified in Part III of the Public Finance Act 1989. This comprises Ministers of the Crown and the following entities:
Offices of Parliament
| | Departments
| | State-owned enterprises
|
|---|
Office of the Controller and
Auditor-General
Office of the Ombudsmen
Parliamentary Commissioner
for the Environment | | Agriculture and Forestry
Archives New Zealand
Child, Youth and Family Services
Conservation
Corrections
Courts
Crown Law
Culture and Heritage
Customs
Defence
Economic Development
Education
Education Review Office
Environment
Fisheries
Foreign Affairs and Trade
Government Communications Security Bureau
Health
Housing
Inland Revenue
Internal Affairs
Justice | | Agriquality New Zealand Limited
Airways Corporation of New Zealand Limited
Asure New Zealand Limited
Crown Forestry Management Limited
Electricity Corporation of New Zealand Limited
Genesis Power Limited
Landcorp Farming Limited
Meridian Energy Limited
Meteorological Service of New Zealand Limited
Mighty River Power Limited
New Zealand Post Limited
New Zealand Railways Corporation
Solid Energy New Zealand Limited
Television New Zealand Limited
Terralink New Zealand Limited
Timberlands West Coast Limited
Transpower New Zealand Limited |
|
|
Labour
Land Information New Zealand
Maori Development
National Library
New Zealand Defence Force
Office of the Clerk
Pacific Island Affairs
Parliamentary Counsel Office
Parliamentary Service
Police
Prime Minister and Cabinet
Research, Science and Technology
Security Intelligence Service
Serious Fraud Office
Social Development
State Services Commission
Statistics
Transport
Treasury
Women's Affairs
Youth Affairs |
|
|
Crown entities
|
|---|
Accident Compensation Corporation
Accounting Standards Review Board
Agriculture and Marketing Research and Development Trust
Alcoholic Advisory Council of New Zealand
Animal Control Products Limited
Arts Council of New Zealand Toi Aotearoa
Asia 2000 Foundation of New Zealand
Broadcasting Commission
Broadcasting Standards Authority
Building Industry Authority
Career Services
Casino Control Authority
Civil Aviation Authority of New Zealand
Commerce Commission
Commissioner for Children
Crown research institutes (9)
District health boards (21)
Early Childhood Development Board
Earthquake Commission
Electoral Commission
Energy Efficiency and Conservation Authority
Environmental Risk Management Authority
Fish and game councils (13)
Foundation for Research, Science and Technology
Government Property Services Limited
Government Superannuation Fund Authority
Health and Disability Commissioner
Health Research Council of New Zealand
Health Sponsorship Council
Hillary Commission for Sport, Fitness and Leisure
Housing New Zealand Corporation
Human Rights Commission
Industry New Zealand
Land Transport Safety Authority of New Zealand
Law Commission
Learning Media Limited
Legal Services Agency
Management Development Centre Trust
Maritime Safety Authority of New Zealand
Mental Health Commission
Museum of New Zealand Te Papa Tongarewa
New Zealand Antarctic Institute
New Zealand Artificial Limb Board
New Zealand Blood Services
New Zealand Business Development Board
New Zealand Film Commission
New Zealand Fire Service Commission |
New Zealand Fish and Game Council
New Zealand Game Bird Habitat Trust Board
New Zealand Government Property Corporation
New Zealand Lotteries Commission
New Zealand Lottery Grants Board
New Zealand Qualifications Authority
New Zealand Sports Drug Agency
New Zealand Symphony Orchestra Limited
New Zealand Tourism Board
New Zealand Trade Development Board
Ngai Tahu Ancillary Claims Trust
Office of Film and Literature Classification
Pacific Business Trust
Pharmaceutical Management Agency
Police Complaints Authority
Privacy Commissioner
Quotable Value New Zealand Limited
Race Relations Conciliator
Radio New Zealand Limited
Reserve boards (51)
Residual Health Management Unit
Retirement Commissioner
Road Safety Trust
School boards of trustees (2,664)
Securities Commission
Skill New Zealand (Education and Training Support Agency)
Specialist Education Services Board
Standards Council
Takeovers Panel
Te Reo Whakapuaki Irirangi (Te Mangai Paho)
Te Taura Whiri I Te Reo Maori (Maori Language Commission)
Teacher Registration Board
Tertiary education institutions (39)
Testing Laboratory Registration Council
Transfund New Zealand
Transit New Zealand
Transport Accident Investigation Commission
Trustees of the National Library |
Reserve Bank of New Zealand |
Public Trust Office |
Forecast Statement of Financial Performance
for the years ending 30 June
| | Note
| | 2001
Actual
| | 2002
Previous
Budget
| | 2002
Forecast
| | 2003
Forecast
| | 2004
Forecast
| | 2005
Forecast
| | 2006
Forecast
| |
|---|
| |
| | ($ million)
| |
|---|
| Revenue | | | | | | | | | | | | | | | | | |
Levied through the Crown's Sovereign Power |
|
|
|
|
|
|
|
|
|
|
|
|
|
|
|
|
|
| Direct taxation | | 1 | | 23,863 | | 24,505 | | 24,226 | | 25,257 | | 26,999 | | 28,390 | | 29,482 | |
| Indirect taxation | | 2 | | 12,875 | | 13,180 | | 13,345 | | 13,721 | | 14,360 | | 14,954 | | 15,470 | |
| | | | |
| |
| |
| |
| |
| |
| |
| |
| Total taxation revenue | | | | 36,738 | | 37,685 | | 37,571 | | 38,978 | | 41,359 | | 43,344 | | 44,952 | |
| Compulsory fees, fines, penalties and levies | | | | 385 | | 418 | | 519 | | 485 | | 508 | | 520 | | 533 | |
| | | | |
| |
| |
| |
| |
| |
| |
| |
| Total Revenue Levied through the Crown's Sovereign Power | | | | 37,123 | | 38,103 | | 38,090 | | 39,463 | | 41,867 | | 43,864 | | 45,485 | |
Earned through the Crown's Operations |
|
|
|
|
|
|
|
|
|
|
|
|
|
|
|
|
|
| Investment income | | 3 | | 1,369 | | 934 | | 1,207 | | 1,109 | | 1,493 | | 1,846 | | 2,175 | |
| Sales of goods and services | | | | 659 | | 654 | | 670 | | 655 | | 628 | | 629 | | 629 | |
| Other operational revenue | | 4 | | 381 | | 305 | | 323 | | 304 | | 295 | | 291 | | 293 | |
| Unrealised losses arising from changes in the value of commercial forests | | | | (40 | ) | — | | — | | — | | — | | — | | — | |
| | | | |
| |
| |
| |
| |
| |
| |
| |
| Total Revenue Earned through the Crown's Operations | | | | 2,369 | | 1,893 | | 2,200 | | 2,068 | | 2,416 | | 2,766 | | 3,097 | |
| | | | |
| |
| |
| |
| |
| |
| |
| |
| Total Revenue | | | | 39,492 | | 39,996 | | 40,290 | | 41,531 | | 44,283 | | 46,630 | | 48,582 | |
| | | | |
| |
| |
| |
| |
| |
| |
| |
| Expenses | | | | | | | | | | | | | | | | | |
By Functional Classification |
|
|
|
|
|
|
|
|
|
|
|
|
|
|
|
|
|
Social security and welfare |
|
|
|
13,216 |
|
13,826 |
|
13,649 |
|
13,933 |
|
14,308 |
|
14,721 |
|
15,291 |
|
| GSF pension expenses | | | | 855 | | 667 | | 748 | | 597 | | 649 | | 668 | | 703 | |
| Health | | | | 7,342 | | 7,684 | | 7,797 | | 8,225 | | 8,744 | | 9,264 | | 9,385 | |
| Education | | | | 6,690 | | 7,056 | | 7,041 | | 7,257 | | 7,334 | | 7,396 | | 7,464 | |
| Core government services | | | | 1,817 | | 1,552 | | 1,611 | | 1,570 | | 1,539 | | 1,545 | | 1,575 | |
| Law and order | | | | 1,560 | | 1,640 | | 1,737 | | 1,687 | | 1,661 | | 1,657 | | 1,650 | |
| Defence | | | | 1,267 | | 1,153 | | 1,162 | | 1,157 | | 1,157 | | 1,117 | | 1,117 | |
| Transport and communications | | | | 1,026 | | 1,027 | | 1,103 | | 1,125 | | 1,149 | | 1,179 | | 1,203 | |
| Economic and industrial services | | | | 1,141 | | 1,225 | | 1,258 | | 1,262 | | 1,267 | | 1,225 | | 1,223 | |
| Primary services | | | | 424 | | 320 | | 337 | | 317 | | 303 | | 302 | | 301 | |
| Heritage, culture and recreation | | | | 287 | | 456 | | 495 | | 465 | | 503 | | 525 | | 535 | |
| Housing and community development | | | | 50 | | 90 | | 92 | | 87 | | 86 | | 82 | | 82 | |
| Other | | | | 75 | | 114 | | 137 | | 93 | | 93 | | 93 | | 93 | |
| Finance costs | | 5 | | 2,483 | | 2,395 | | 2,345 | | 2,322 | | 2,508 | | 2,594 | | 2,641 | |
| Net foreign-exchange gains | | | | (47 | ) | — | | 1 | | — | | — | | — | | — | |
| Provision for future initiatives | | 5 | | — | | 160 | | 90 | | 450 | | 975 | | 1,475 | | 2,376 | |
| | | | |
| |
| |
| |
| |
| |
| |
| |
| Total Expenses | | 5 | | 38,186 | | 39,365 | | 39,603 | | 40,547 | | 42,276 | | 43,843 | | 45,639 | |
| | | | |
| |
| |
| |
| |
| |
| |
| |
| Revenue less Expenses | | | | 1,306 | | 631 | | 687 | | 984 | | 2,007 | | 2,787 | | 2,943 | |
Surplus attributable to state-owned enterprises and Crown entities (excl. ACC liability valuation) |
|
9 |
|
844 |
|
953 |
|
839 |
|
1,089 |
|
1,214 |
|
1,248 |
|
1,295 |
|
| ACC outstanding claims liability valuation | | | | (420 | ) | — | | (205 | ) | — | | — | | — | | — | |
| Dividends and other distributions | | 9 | | (321 | ) | (208 | ) | (336 | ) | (250 | ) | (313 | ) | (365 | ) | (384 | ) |
| | | | |
| |
| |
| |
| |
| |
| |
| |
| Net Surplus Attributable to State-owned Enterprises and Crown Entities | | | | 103 | | 745 | | 298 | | 839 | | 901 | | 883 | | 911 | |
| | | | |
| |
| |
| |
| |
| |
| |
| |
| Operating Balance | | | | 1,409 | | 1,376 | | 985 | | 1,823 | | 2,908 | | 3,670 | | 3,854 | |
| | | | |
| |
| |
| |
| |
| |
| |
| |
The accompanying Notes are in integral part of these Statements.
Forecast Statement of Financial Position
as at 30 June
| | Note
| | 2001
Actual
| | 2002
Previous
Budget
| | 2002
Forecast
| | 2003
Forecast
| | 2004
Forecast
| | 2005
Forecast
| | 2006
Forecast
|
|---|
| |
| | ($ million)
|
|---|
| Assets | | | | | | | | | | | | | | | | |
| Cash and bank balances | | | | 115 | | 45 | | 169 | | 66 | | 67 | | 97 | | 40 |
| Marketable securities and deposits1 | | | | 12,060 | | 9,067 | | 9,821 | | 10,254 | | 12,106 | | 14,551 | | 17,268 |
| Advances | | 7 | | 4,615 | | 5,873 | | 6,026 | | 6,990 | | 8,514 | | 9,359 | | 10,285 |
| Receivables | | 8 | | 6,197 | | 5,439 | | 6,125 | | 6,070 | | 6,036 | | 6,023 | | 5,970 |
| Inventories | | | | 193 | | 280 | | 207 | | 213 | | 221 | | 219 | | 217 |
| State-owned enterprises and Crown entities | | 9 | | 14,077 | | 15,114 | | 14,713 | | 15,794 | | 16,933 | | 17,883 | | 18,860 |
| Other investments | | | | 354 | | 432 | | 471 | | 453 | | 440 | | 425 | | 411 |
| Physical assets | | 10 | | 16,102 | | 16,076 | | 16,303 | | 16,394 | | 16,406 | | 16,120 | | 15,795 |
| Commercial forests | | | | 310 | | 359 | | 310 | | 310 | | 310 | | 310 | | 310 |
| State highways | | 11 | | 11,055 | | 10,847 | | 11,131 | | 11,165 | | 11,207 | | 11,256 | | 11,310 |
| Intangible assets | | 3 | | 3 | | 3 | | 3 | | 3 | | 3 | | 3 | | |
| Capital contingency provision | | | | — | | 315 | | 1,269 | | 2,009 | | 2,947 | | 3,410 | | 3,845 |
| | | | |
| |
| |
| |
| |
| |
| |
|
| Total Assets | | | | 65,081 | | 63,850 | | 66,548 | | 69,721 | | 75,190 | | 79,656 | | 84,314 |
| | | | |
| |
| |
| |
| |
| |
| |
|
| Liabilities | | | | | | | | | | | | | | | | |
| Payables and provisions | | 12 | | 5,831 | | 4,758 | | 5,811 | | 5,699 | | 5,670 | | 5,641 | | 5,493 |
| Currency issued | | | | 2,539 | | 2,570 | | 2,665 | | 2,665 | | 2,665 | | 2,665 | | 2,665 |
| Borrowings | | | | 36,761 | | 35,831 | | 37,105 | | 38,708 | | 41,400 | | 42,326 | | 43,368 |
| Pension liabilities | | | | 8,487 | | 8,734 | | 8,525 | | 8,384 | | 8,282 | | 8,181 | | 8,091 |
| | | | |
| |
| |
| |
| |
| |
| |
|
| Total Liabilities | | | | 53,618 | | 51,893 | | 54,106 | | 55,456 | | 58,017 | | 58,813 | | 59,617 |
| | | | |
| |
| |
| |
| |
| |
| |
|
| Total Assets less Total Liabilities | | | | 11,463 | | 11,957 | | 12,442 | | 14,265 | | 17,173 | | 20,843 | | 24,697 |
| | | | |
| |
| |
| |
| |
| |
| |
|
| Crown Balance | | | | | | | | | | | | | | | | |
| Accumulated operating balance | | | | 3,456 | | 4,058 | | 4,442 | | 6,265 | | 9,173 | | 12,843 | | 16,697 |
| Revaluation reserve | | 13 | | 8,007 | | 7,899 | | 8,000 | | 8,000 | | 8,000 | | 8,000 | | 8,000 |
| | | | |
| |
| |
| |
| |
| |
| |
|
| Crown Balance | | | | 11,463 | | 11,957 | | 12,442 | | 14,265 | | 17,173 | | 20,843 | | 24,697 |
| | | | |
| |
| |
| |
| |
| |
| |
|
- 1
- Marketable securities and deposits
| | Note
| | 2001
Actual
| | 2002
Previous
Budget
| | 2002
Forecast
| | 2003
Forecast
| | 2004
Forecast
| | 2005
Forecast
| | 2006
Forecast
|
|---|
| |
| | ($ million)
|
|---|
| New Zealand Superannuation (NZS) Fund | | | | — | | 617 | | 614 | | 1,904 | | 3,914 | | 6,379 | | 9,091 |
| Other marketable securities and deposits | | 6 | | 12,060 | | 8,450 | | 9,207 | | 8,350 | | 8,192 | | 8,172 | | 8,177 |
| | | | |
| |
| |
| |
| |
| |
| |
|
| Total Marketable securities and deposits | | | | 12,060 | | 9,067 | | 9,821 | | 10,254 | | 12,106 | | 14,551 | | 17,268 |
| | | | |
| |
| |
| |
| |
| |
| |
|
The accompanying Notes are in integral part of these Statements.
Forecast Statement of Movements in Equity
for the years ending 30 June
| | Note
| | 2001
Actual
| | 2002
Previous
Budget
| | 2002
Forecast
| | 2003
Forecast
| | 2004
Forecast
| | 2005
Forecast
| | 2006
Forecast
|
|---|
| |
| | ($ million)
|
|---|
| Opening Crown Balance | | | | 8,583 | | 10,581 | | 11,463 | | 12,442 | | 14,265 | | 17,173 | | 20,843 |
| Operating balance for the year | | | | 1,409 | | 1,376 | | 985 | | 1,823 | | 2,908 | | 3,670 | | 3,854 |
| Net revaluations | | 13 | | (179 | ) | — | | (6 | ) | — | | — | | — | | — |
| | | | |
| |
| |
| |
| |
| |
| |
|
| Total Recognised Revenues and Expenses | | | | 1,230 | | 1,376 | | 979 | | 1,823 | | 2,908 | | 3,670 | | 3,854 |
State highway recognition policy change |
|
11 |
|
1,650 |
|
— |
|
— |
|
— |
|
— |
|
— |
|
— |
| | | | |
| |
| |
| |
| |
| |
| |
|
| Closing Crown Balance | | | | 11,463 | | 11,957 | | 12,442 | | 14,265 | | 17,173 | | 20,843 | | 24,697 |
| | | | |
| |
| |
| |
| |
| |
| |
|
The accompanying Notes are in integral part of these Statements.
Forecast Statement of Cash Flows
for the years ending 30 June
| | 2001
Actual
| | 2002
Previous
Budget
| | 2002
Forecast
| | 2003
Forecast
| | 2004
Forecast
| | 2005
Forecast
| | 2006
Forecast
| |
|---|
| | ($ million)
| |
|---|
| Cash Flows from Operations | | | | | | | | | | | | | | | |
Cash was Provided from |
|
|
|
|
|
|
|
|
|
|
|
|
|
|
|
Direct Taxation |
|
|
|
|
|
|
|
|
|
|
|
|
|
|
|
Individuals |
|
|
|
|
|
|
|
|
|
|
|
|
|
|
|
| Source deductions | | 13,748 | | 14,358 | | 14,380 | | 15,040 | | 16,083 | | 17,046 | | 17,837 | |
| Other persons | | 4,221 | | 4,319 | | 4,300 | | 4,475 | | 4,604 | | 4,766 | | 4,916 | |
| Refunds | | (1,175 | ) | (1,094 | ) | (1,158 | ) | (1,119 | ) | (1,110 | ) | (1,130 | ) | (1,140 | ) |
| Fringe benefit tax | | 338 | | 324 | | 340 | | 365 | | 360 | | 355 | | 351 | |
| | |
| |
| |
| |
| |
| |
| |
| |
| Total Individuals | | 17,132 | | 17,907 | | 17,862 | | 18,761 | | 19,937 | | 21,037 | | 21,964 | |
Corporate |
|
|
|
|
|
|
|
|
|
|
|
|
|
|
|
| Gross companies | | 5,377 | | 5,518 | | 5,255 | | 5,373 | | 5,790 | | 5,975 | | 6,088 | |
| Refunds | | (785 | ) | (701 | ) | (692 | ) | (638 | ) | (628 | ) | (613 | ) | (613 | ) |
| Non-resident withholding tax | | 738 | | 679 | | 714 | | 699 | | 742 | | 762 | | 781 | |
| Foreign-source dividend withholding payment | | 98 | | 36 | | 108 | | 56 | | 56 | | 56 | | 56 | |
| | |
| |
| |
| |
| |
| |
| |
| |
| Total Corporate | | 5,428 | | 5,532 | | 5,385 | | 5,490 | | 5,960 | | 6,180 | | 6,312 | |
Other withholding taxes |
|
1,043 |
|
1,046 |
|
1,009 |
|
978 |
|
1,110 |
|
1,170 |
|
1,222 |
|
| Other direct taxation | | 2 | | 2 | | 2 | | 2 | | 2 | | 2 | | 2 | |
| | |
| |
| |
| |
| |
| |
| |
| |
| Total Direct Taxation | | 23,605 | | 24,487 | | 24,258 | | 25,231 | | 27,009 | | 28,389 | | 29,500 | |
Indirect Taxation |
|
|
|
|
|
|
|
|
|
|
|
|
|
|
|
Goods and Services Tax |
|
|
|
|
|
|
|
|
|
|
|
|
|
|
|
| Gross goods and services tax | | 14,604 | | 14,754 | | 15,257 | | 15,527 | | 16,189 | | 16,807 | | 17,472 | |
| Refunds | | (5,657 | ) | (5,418 | ) | (5,846 | ) | (5,690 | ) | (5,774 | ) | (5,861 | ) | (6,075 | ) |
| | |
| |
| |
| |
| |
| |
| |
| |
| Total Goods and Services Tax | | 8,947 | | 9,336 | | 9,411 | | 9,837 | | 10,415 | | 10,946 | | 11,397 | |
| Other indirect taxation | | 3,698 | | 3,858 | | 3,851 | | 3,882 | | 3,943 | | 4,008 | | 4,073 | |
| | |
| |
| |
| |
| |
| |
| |
| |
| Total Indirect Taxation | | 12,645 | | 13,194 | | 13,262 | | 13,719 | | 14,358 | | 14,954 | | 15,470 | |
| | |
| |
| |
| |
| |
| |
| |
| |
| Total Taxation Receipts | | 36,250 | | 37,681 | | 37,520 | | 38,950 | | 41,367 | | 43,343 | | 44,970 | |
Compulsory Fees, Fines, Penalties and Levies |
|
324 |
|
349 |
|
345 |
|
383 |
|
394 |
|
405 |
|
418 |
|
Other Receipts |
|
|
|
|
|
|
|
|
|
|
|
|
|
|
|
| Interest, profits and dividends | | 892 | | 755 | | 1,017 | | 811 | | 1,053 | | 1,221 | | 1,342 | |
| Sales of goods and services | | 622 | | 644 | | 647 | | 646 | | 605 | | 606 | | 606 | |
| Other operating receipts | | 383 | | 301 | | 362 | | 304 | | 294 | | 289 | | 305 | |
| | |
| |
| |
| |
| |
| |
| |
| |
| Total Other Receipts | | 1,897 | | 1,700 | | 2,026 | | 1,761 | | 1,952 | | 2,116 | | 2,253 | |
| | |
| |
| |
| |
| |
| |
| |
| |
| Total Cash Provided from Operations | | 38,471 | | 39,730 | | 39,891 | | 41,094 | | 43,713 | | 45,864 | | 47,641 | |
Cash was Disbursed to |
|
|
|
|
|
|
|
|
|
|
|
|
|
|
|
| Departmental outputs | | 4,749 | | 5,040 | | 5,107 | | 4,928 | | 4,858 | | 4,832 | | 4,871 | |
| Other outputs | | 16,008 | | 16,610 | | 16,802 | | 17,498 | | 17,994 | | 18,566 | | 18,811 | |
| Finance costs | | 2,499 | | 2,402 | | 2,311 | | 2,278 | | 2,573 | | 2,645 | | 2,684 | |
| Subsidies | | 133 | | 181 | | 168 | | 184 | | 200 | | 150 | | 150 | |
| Current transfers | | | | | | | | | | | | | | | |
| Social assistance grants | | 12,910 | | 13,610 | | 13,502 | | 13,715 | | 14,108 | | 14,546 | | 15,130 | |
| Other transfers | | 250 | | 255 | | 258 | | 254 | | 255 | | 255 | | 255 | |
| Provision for future initiatives | | — | | 160 | | 90 | | 450 | | 975 | | 1,475 | | 2,376 | |
| | |
| |
| |
| |
| |
| |
| |
| |
| Total Cash Disbursed to Operations | | 36,549 | | 38,258 | | 38,238 | | 39,307 | | 40,963 | | 42,469 | | 44,277 | |
| | |
| |
| |
| |
| |
| |
| |
| |
| Net Cash Flows from Operations | | 1,922 | | 1,472 | | 1,653 | | 1,787 | | 2,750 | | 3,395 | | 3,364 | |
| | |
| |
| |
| |
| |
| |
| |
| |
| Cash Flows from Investing Activities | | | | | | | | | | | | | | | |
Cash was Provided from |
|
|
|
|
|
|
|
|
|
|
|
|
|
|
|
| Sale of physical assets | | 75 | | 91 | | 94 | | 53 | | 47 | | 43 | | 33 | |
| | |
| |
| |
| |
| |
| |
| |
| |
| Total Cash Provided | | 75 | | 91 | | 94 | | 53 | | 47 | | 43 | | 33 | |
Cash was Disbursed to |
|
|
|
|
|
|
|
|
|
|
|
|
|
|
|
| Purchase of physical assets | | 1,205 | | 1,288 | | 1,456 | | 1,234 | | 1,148 | | 867 | | 875 | |
| Net increase in advances | | 617 | | 1,318 | | 1,323 | | 993 | | 1,549 | | 860 | | 955 | |
| Net purchase of investments | | (174 | ) | 294 | | 440 | | 233 | | 220 | | 44 | | 44 | |
| Purchase of marketable securities and deposits by NZS Fund | | — | | 600 | | 600 | | 1,200 | | 1,800 | | 2,100 | | 2,150 | |
| Other net purchase/(sale) of marketable securities and deposits | | 1,001 | | (3,185 | ) | (2,889 | ) | (863 | ) | (159 | ) | (20 | ) | 5 | |
| Capital contingency provision | | — | | 315 | | 1,269 | | 740 | | 938 | | 463 | | 435 | |
| | |
| |
| |
| |
| |
| |
| |
| |
| Total Cash Disbursed | | 2,649 | | 630 | | 2,199 | | 3,537 | | 5,496 | | 4,314 | | 4,464 | |
| | |
| |
| |
| |
| |
| |
| |
| |
| Net Cash Flows from Investing Activities | | (2,574 | ) | (539 | ) | (2,105 | ) | (3,484 | ) | (5,449 | ) | (4,271 | ) | (4,431 | ) |
| | |
| |
| |
| |
| |
| |
| |
| |
| Net Cash Flows from Operating and Investing Activities | | (652 | ) | 933 | | (452 | ) | (1,697 | ) | (2,699 | ) | (876 | ) | (1,067 | ) |
| | |
| |
| |
| |
| |
| |
| |
| |
| Cash Flows from Financing Activities | | | | | | | | | | | | | | | |
Cash was Provided from |
|
|
|
|
|
|
|
|
|
|
|
|
|
|
|
| Issue of circulating currency | | 303 | | — | | 126 | | — | | — | | — | | — | |
| Net issue of Government stock | | 1,066 | | 391 | | 1,056 | | 1,647 | | 2,576 | | 908 | | 874 | |
| | |
| |
| |
| |
| |
| |
| |
| |
| Total Cash Provided | | 1,369 | | 391 | | 1,182 | | 1,647 | | 2,576 | | 908 | | 874 | |
Cash was Disbursed to |
|
|
|
|
|
|
|
|
|
|
|
|
|
|
|
| Net repayment/(issue) of foreign-currency borrowing | | 514 | | 853 | | 596 | | 86 | | (1 | ) | (1 | ) | — | |
| Net repayment/(issue) of other New Zealand-dollar borrowing | | 305 | | 479 | | 103 | | (33 | ) | (123 | ) | 3 | | (136 | ) |
| | |
| |
| |
| |
| |
| |
| |
| |
| Total Cash Disbursed | | 819 | | 1,332 | | 699 | | 53 | | (124 | ) | 2 | | (136 | ) |
| | |
| |
| |
| |
| |
| |
| |
| |
| Net Cash Flows from Financing Activities | | 550 | | (941 | ) | 483 | | 1,594 | | 2,700 | | 906 | | 1,010 | |
| | |
| |
| |
| |
| |
| |
| |
| |
| Net Movement in Cash | | (102 | ) | (8 | ) | 31 | | (103 | ) | 1 | | 30 | | (57 | ) |
Opening Cash Balance |
|
210 |
|
53 |
|
115 |
|
169 |
|
66 |
|
67 |
|
97 |
|
Foreign-exchange gains on opening cash balances |
|
7 |
|
— |
|
23 |
|
— |
|
— |
|
— |
|
— |
|
| | |
| |
| |
| |
| |
| |
| |
| |
| Closing Cash Balance | | 115 | | 45 | | 169 | | 66 | | 67 | | 97 | | 40 | |
| | |
| |
| |
| |
| |
| |
| |
| |
The accompanying Notes are in integral part of these Statements.
| | 2001
Actual
| | 2002
Previous
Budget
| | 2002
Forecast
| | 2003
Forecast
| | 2004
Forecast
| | 2005
Forecast
| | 2006
Forecast
| |
|---|
| | ($ million)
| |
|---|
| Reconciliation Between the Forecast Net Cash Flows from Operations and the Operating Balance | | | | | | | | | | | | | | | |
| Net Cash Flows from Operations | | 1,922 | | 1,472 | | 1,653 | | 1,787 | | 2,750 | | 3,395 | | 3,364 | |
| Items included in the operating balance but not in net cash flows from operations | | | | | | | | | | | | | | | |
| Valuation Changes | | | | | | | | | | | | | | | |
| Increase in National Provident Fund guarantee liability | | (253 | ) | — | | — | | — | | — | | — | | — | |
| (Increase)/decrease in pension liabilities | | (164 | ) | 51 | | (38 | ) | — | | — | | — | | — | |
| Unrealised net foreign exchange gains | | 100 | | — | | — | | — | | — | | — | | — | |
| Unrealised losses arising from changes in the value of commercial forests | | (40 | ) | — | | — | | — | | — | | — | | — | |
| | |
| |
| |
| |
| |
| |
| |
| |
| Total Valuation Changes | | (357 | ) | 51 | | (38 | ) | — | | — | | — | | — | |
| Physical Asset Movements | | | | | | | | | | | | | | | |
| Depreciation | | (925 | ) | (879 | ) | (965 | ) | (1,000 | ) | (1,002 | ) | (1,033 | ) | (1,034 | ) |
| (Loss)/gain on sale of assets | | (7 | ) | — | | (1 | ) | — | | — | | — | | — | |
| | |
| |
| |
| |
| |
| |
| |
| |
| Total Physical Asset Movements | | (932 | ) | (879 | ) | (966 | ) | (1,000 | ) | (1,002 | ) | (1,033 | ) | (1,034 | ) |
| Other Non-cash Items | | | | | | | | | | | | | | | |
| Net surplus attributable to state-owned enterprises and Crown entities | | 103 | | 745 | | 298 | | 839 | | 901 | | 883 | | 911 | |
| Accrued income from NZS Fund | | — | | — | | 14 | | 91 | | 210 | | 372 | | 559 | |
| Loss on writedown of defence equipment | | (103 | ) | — | | — | | — | | — | | — | | — | |
| Student Loans | | (61 | ) | (99 | ) | (7 | ) | (50 | ) | (47 | ) | (39 | ) | (45 | ) |
| Other | | 55 | | 17 | | — | | — | | — | | — | | — | |
| | |
| |
| |
| |
| |
| |
| |
| |
| Total Other Non-cash Items | | (6 | ) | 663 | | 305 | | 880 | | 1,064 | | 1,216 | | 1,425 | |
| Total Other Investing and Financing Items | | 177 | | — | | — | | — | | — | | — | | — | |
| Movements in Working Capital | | | | | | | | | | | | | | | |
| Increase/(decrease) in taxes receivable | | 737 | | 25 | | (1 | ) | 29 | | (7 | ) | 3 | | (9 | ) |
| Decrease/(increase) in payables | | 11 | | 62 | | 89 | | 142 | | 122 | | 107 | | 154 | |
| (Decrease)/increase in other receivables | | (62 | ) | (84 | ) | (71 | ) | (21 | ) | (27 | ) | (16 | ) | (44 | ) |
| (Decrease)/increase in inventories | | (81 | ) | 66 | | 14 | | 6 | | 8 | | (2 | ) | (2 | ) |
| | |
| |
| |
| |
| |
| |
| |
| |
| Total Movements in Working Capital | | 605 | | 69 | | 31 | | 156 | | 96 | | 92 | | 99 | |
| | |
| |
| |
| |
| |
| |
| |
| |
| Operating Balance | | 1,409 | | 1,376 | | 985 | | 1,823 | | 2,908 | | 3,670 | | 3,854 | |
| | |
| |
| |
| |
| |
| |
| |
| |
The accompanying Notes are in integral part of these Statements.
| | 2001
Actual
| | 2002
Previous
Budget
| | 2002
Forecast
| | 2003
Forecast
| | 2004
Forecast
| | 2005
Forecast
| | 2006
Forecast
| |
|---|
| | ($ million)
| |
|---|
| Reconciliation of Forecast Net Cash Flows from Operations with Forecast Net Cash Proceeds from Domestic Bonds | | | | | | | | | | | | | | | |
| Net Cash Flows from Operations | | 1,922 | | 1,472 | | 1,653 | | 1,787 | | 2,750 | | 3,395 | | 3,364 | |
| Net purchase of physical assets | | (1,130 | ) | (1,197 | ) | (1,362 | ) | (1,181 | ) | (1,101 | ) | (824 | ) | (842 | ) |
| Net increase in advances | | (617 | ) | (1,318 | ) | (1,323 | ) | (993 | ) | (1,549 | ) | (860 | ) | (955 | ) |
| Net sale/(purchase) of investments | | 174 | | (294 | ) | (440 | ) | (233 | ) | (220 | ) | (44 | ) | (44 | ) |
| Purchase of marketable securities and deposits by NZS Fund | | — | | (600 | ) | (600 | ) | (1,200 | ) | (1,800 | ) | (2,100 | ) | (2,150 | ) |
| Capital contingency provision | | — | | (315 | ) | (1,269 | ) | (740 | ) | (938 | ) | (463 | ) | (435 | ) |
| | |
| |
| |
| |
| |
| |
| |
| |
| Available to Repay Debt/(Required to be Financed) | | 349 | | (2,252 | ) | (3,341 | ) | (2,560 | ) | (2,858 | ) | (896 | ) | (1,062 | ) |
| Financed by: | | | | | | | | | | | | | | | |
| Other net (purchase)/sale of marketable securities and deposits | | (1,001 | ) | 3,185 | | 2,889 | | 863 | | 159 | | 20 | | (5 | ) |
| | |
| |
| |
| |
| |
| |
| |
| |
| Total Investing Activities | | (652 | ) | 933 | | (452 | ) | (1,697 | ) | (2,699 | ) | (876 | ) | (1,067 | ) |
| Used in: | | | | | | | | | | | | | | | |
| Net (repayment)/issue of other New Zealand-dollar borrowing | | (305 | ) | (479 | ) | (103 | ) | 33 | | 123 | | (3 | ) | 136 | |
| Decrease/(increase) in cash | | 102 | | 8 | | (31 | ) | 103 | | (1 | ) | (30 | ) | 57 | |
| Issue of circulating currency | | 303 | | — | | 126 | | — | | — | | — | | — | |
| Net (repayment)/issue of foreign-currency borrowing | | (514 | ) | (853 | ) | (596 | ) | (86 | ) | 1 | | 1 | | — | |
| | |
| |
| |
| |
| |
| |
| |
| |
| | | (414 | ) | (1,324 | ) | (604 | ) | 50 | | 123 | | (32 | ) | 193 | |
| | |
| |
| |
| |
| |
| |
| |
| |
| Net Cash (Outflow)/Inflow to be Offset by Domestic Bonds | | (1,066 | ) | (391 | ) | (1,056 | ) | (1,647 | ) | (2,576 | ) | (908 | ) | (874 | ) |
| | |
| |
| |
| |
| |
| |
| |
| |
| Gross Cash Proceeds from Domestic Bonds | | | | | | | | | | | | | | | |
| Domestic bonds (market) | | 3,572 | | 3,570 | | 4,156 | | 5,070 | | 5,620 | | 3,730 | | 874 | |
| Domestic bonds (non-market) | | 661 | | — | | 98 | | — | | 478 | | 143 | | — | |
| Inflation bonds | | — | | — | | — | | — | | — | | — | | — | |
| | |
| |
| |
| |
| |
| |
| |
| |
| Total Gross Cash Proceeds from Domestic Bonds | | 4,233 | | 3,570 | | 4,254 | | 5,070 | | 6,098 | | 3,873 | | 874 | |
| Repayment of domestic bonds (market) | | (2,651 | ) | (2,582 | ) | (2,590 | ) | (2,823 | ) | (3,044 | ) | (2,822 | ) | — | |
| Repayment of domestic bonds (non-market) | | (516 | ) | (597 | ) | (608 | ) | (600 | ) | (478 | ) | (143 | ) | — | |
| | |
| |
| |
| |
| |
| |
| |
| |
| Net Cash Proceeds from/(Repayments of) Domestic Bonds | | 1,066 | | 391 | | 1,056 | | 1,647 | | 2,576 | | 908 | | 874 | |
| | |
| |
| |
| |
| |
| |
| |
| |
The accompanying Notes are in integral part of these Statements.
Forecast Statement of Borrowings
as at 30 June
| | Note
| | 2001
Actual
| | 2002
Previous
Budget
| | 2002
Forecast
| | 2003
Forecast
| | 2004
Forecast
| | 2005
Forecast
| | 2006
Forecast
| |
|---|
| |
| | ($ million)
| |
|---|
| Outstanding Debt | | | | | | | | | | | | | | | | | |
| New Zealand-Dollar Debt | | | | | | | | | | | | | | | | | |
| Government stock | | | | 23,331 | | 23,788 | | 24,406 | | 26,062 | | 28,630 | | 29,561 | | 30,465 | |
| Treasury bills | | | | 5,558 | | 5,388 | | 5,466 | | 5,549 | | 5,560 | | 5,573 | | 5,587 | |
| Loans and foreign-exchange contracts | | | | (272 | ) | (763 | ) | (342 | ) | (392 | ) | (280 | ) | (299 | ) | (175 | ) |
| Retail stock | | | | 498 | | 475 | | 527 | | 527 | | 527 | | 527 | | 527 | |
| | | | |
| |
| |
| |
| |
| |
| |
| |
| Total New Zealand-Dollar Debt | | | | 29,115 | | 28,888 | | 30,057 | | 31,746 | | 34,437 | | 35,362 | | 36,404 | |
| Foreign-Currency Debt | | | | | | | | | | | | | | | | | |
| United States dollars | | | | 4,780 | | 3,799 | | 4,170 | | 4,083 | | 4,083 | | 4,083 | | 4,083 | |
| Japanese yen | | | | 1,432 | | 1,562 | | 1,079 | | 1,080 | | 1,080 | | 1,080 | | 1,080 | |
| European and other currencies | | | | 1,434 | | 1,582 | | 1,799 | | 1,799 | | 1,800 | | 1,801 | | 1,801 | |
| | | | |
| |
| |
| |
| |
| |
| |
| |
| Total Foreign-Currency Debt | | | | 7,646 | | 6,943 | | 7,048 | | 6,962 | | 6,963 | | 6,964 | | 6,964 | |
| | | | |
| |
| |
| |
| |
| |
| |
| |
| Total Outstanding Debt | | | | 36,761 | | 35,831 | | 37,105 | | 38,708 | | 41,400 | | 42,326 | | 43,368 | |
| | | | |
| |
| |
| |
| |
| |
| |
| |
| Less | | | | | | | | | | | | | | | | | |
Financial Assets |
|
|
|
|
|
|
|
|
|
|
|
|
|
|
|
|
|
Marketable Securities and Deposits1 |
|
|
|
|
|
|
|
|
|
|
|
|
|
|
|
|
|
| New Zealand dollars | | | | 3,971 | | 1,154 | | 1,862 | | 1,186 | | 1,031 | | 1,024 | | 1,035 | |
| United States dollars | | | | 5,093 | | 3,909 | | 4,358 | | 4,171 | | 4,167 | | 4,153 | | 4,147 | |
| Japanese yen | | | | 1,548 | | 1,775 | | 1,105 | | 1,106 | | 1,106 | | 1,106 | | 1,106 | |
| European and other currencies | | | | 1,448 | | 1,612 | | 1,882 | | 1,887 | | 1,888 | | 1,889 | | 1,889 | |
| | | | |
| |
| |
| |
| |
| |
| |
| |
| Total Marketable Securities and Deposits | | 6 | | 12,060 | | 8,450 | | 9,207 | | 8,350 | | 8,192 | | 8,172 | | 8,177 | |
Advances and Cash |
|
|
|
|
|
|
|
|
|
|
|
|
|
|
|
|
|
| Advances to state-owned enterprises and Crown entities | | 7 | | 261 | | 939 | | 922 | | 1,199 | | 1,965 | | 2,042 | | 2,204 | |
| Student loans | | 7 | | 4,143 | | 4,776 | | 4,870 | | 5,600 | | 6,352 | | 7,116 | | 7,877 | |
| Other advances | | | | 211 | | 158 | | 234 | | 191 | | 197 | | 201 | | 204 | |
| Cash | | | | 115 | | 45 | | 169 | | 66 | | 67 | | 97 | | 40 | |
| | | | |
| |
| |
| |
| |
| |
| |
| |
| Total Advances and Cash | | | | 4,730 | | 5,918 | | 6,195 | | 7,056 | | 8,581 | | 9,456 | | 10,325 | |
| | | | |
| |
| |
| |
| |
| |
| |
| |
| Total Financial Assets | | | | 16,790 | | 14,368 | | 15,402 | | 15,406 | | 16,773 | | 17,628 | | 18,502 | |
| | | | |
| |
| |
| |
| |
| |
| |
| |
| Net Crown Debt | | | | 19,971 | | 21,463 | | 21,703 | | 23,302 | | 24,627 | | 24,698 | | 24,866 | |
| | | | |
| |
| |
| |
| |
| |
| |
| |
| Net New Zealand-dollar debt | | | | 20,495 | | 21,816 | | 22,000 | | 23,504 | | 24,825 | | 24,882 | | 25,044 | |
| Net foreign-currency debt | | | | (524 | ) | (353 | ) | (297 | ) | (202 | ) | (198 | ) | (184 | ) | (178 | ) |
| | | | |
| |
| |
| |
| |
| |
| |
| |
| Net Crown Debt | | | | 19,971 | | 21,463 | | 21,703 | | 23,302 | | 24,627 | | 24,698 | | 24,866 | |
| | | | |
| |
| |
| |
| |
| |
| |
| |
- 1
- Marketable securities and deposits held by the NZS Fund are excluded from the calculation of net Crown debt.
The accompanying Notes are in integral part of these Statements.
Statement of Actual Commitments
as at 31 October 2001
| | As at
31 October
2001
| | As at
30 June
2001
|
|---|
| | ($ million)
|
|---|
| By Type | | | | |
| Capital Commitments | | | | |
| Specialist military equipment | | 617 | | 639 |
| Land and buildings | | 519 | | 383 |
| Other plant and equipment | | 35 | | 41 |
| Investments | | 19 | | 15 |
| Commitments of state-owned enterprises and Crown entities | | 588 | | 619 |
| | |
| |
|
| Total Capital Commitments | | 1,778 | | 1,697 |
| Operating Commitments | | | | |
| Non-cancellable accommodation leases | | 840 | | 842 |
| Other non-cancellable leases | | 1,791 | | 1,713 |
| Non-cancellable contracts for the supply of goods and services | | 1,004 | | 367 |
| Other operating commitments | | 1,557 | | 2,213 |
| Commitments of state-owned enterprises and Crown entities | | 2,459 | | 2,471 |
| | |
| |
|
| Total Operating Commitments | | 7,651 | | 7,606 |
| | |
| |
|
| Total Commitments | | 9,429 | | 9,303 |
| | |
| |
|
| By Term | | | | |
| One year or less | | 4,102 | | 3,618 |
| From one to two years | | 1,771 | | 2,051 |
| From two to five years | | 1,706 | | 1,754 |
| Over five years | | 1,850 | | 1,880 |
| | |
| |
|
| Total Commitments | | 9,429 | | 9,303 |
| | |
| |
|
The Statement of Actual Commitments includes commitments which are also included in the Forecast Statement of Financial Performance and Financial Position.
The accompanying Notes are in integral part of these Statements.
Statement of Actual Specific Fiscal Risks
Quantifiable contingent liabilities
| | As at
31 October
2001
| | As at
30 June
2001
|
|---|
| | ($ million)
|
|---|
| Guarantees and indemnities | | 394 | | 371 |
| Uncalled capital | | 3,522 | | 3,594 |
| Legal proceedings and disputes | | 519 | | 571 |
| Other quantifiable contingent liabilities | | 1,962 | | 1,965 |
| | |
| |
|
| Total Quantifiable Contingent Liabilities | | 6,397 | | 6,501 |
| | |
| |
|
Contingent liabilities of the Reserve Bank of New Zealand, state-owned enterprises and Crown entities are included in quantifiable contingent liabilities. Contingent liabilities to sub-entities are excluded.
Unquantified contingent liabilities
This part of the Statement lists those contingent liabilities of the Crown which cannot be quantified.
Institutional Guarantees
Commerce Commission—indemnity for damages
District Court Judges and Justices of the Peace
Fletcher Challenge Limited
Maori Trustee
Ministry of Fisheries—indemnity provided for delivery of registry services
National Provident Fund
Persons exercising investigating powers
Public Trust Office
Reserve Bank of New Zealand
Other Unquantified Contingent Liabilities
Accident Compensation Corporation
Bank of New Zealand
Contaminated sites
Crown research institutes
Development Finance Corporation New Zealand Limited (under statutory management)
District health boards
Electricity Corporation of New Zealand Limited
Housing New Zealand Corporation
Pharmaceutical Management Agency Limited—indemnity
Purchasers of Crown operations
Sale of Crown assets
Tax liabilities
Treaty of Waitangi claims
Treaty of Waitangi claims—settlement relativity payments
Works Civil Construction
Works Consultancy Services
Actual contingent liabilities are discussed in detail in Chapter 5.
Quantified risks
| | ($ million)
|
|---|
| Accident Insurance—treatment cost review | | (7) from 2002/03 |
Child, Youth and Family Services—potential underpayment of care allowances |
|
(15) in 2001/02 |
Conservation—asset maintenance |
|
up to (100) split between operating and capital |
Corrections—capital projects |
|
(475) capital and (152) operating across the outyears |
Defence—capital injections |
|
(1,000) over the next five years to ten years |
Defence—East Timor |
|
(16) operating in 2002/03 |
Education—centres of research excellence |
|
(20) capital |
Education—school property |
|
(68) in 2001/02, (200) in 2002/03, (160) in 2003/04 and subsequent outyears for capital and (10) in 2001/02, (20) in 2002/03, (30) in 2003/04 and (40) in 2004/05 for operating |
Energy Efficiency and Conservation—national strategy |
|
(78) operating over five years |
Environment—genetic modification |
|
(10) in 2003/04 and outyears |
Finance—Air New Zealand |
|
(885) capital in 2001/02 and (150) before June 2003 |
Finance—purchase of Auckland rail network |
|
(81) capital |
Health—budget allocation |
|
included in baselines |
Inland Revenue—tax simplification |
|
30 to (25) operating |
Labour—paid parental leave |
|
(40) operating from 2002/03 |
Responses to Terrorism |
|
(2) in 2001/02, (12) in 2002/03 and (14) in 2003/04 |
Social Development—making work pay |
|
(16) operating ongoing |
Social Development—benefit payment system |
|
up to (95) split between operating and capital |
Transport—transport strategy |
|
(250) per year split between operating and capital |
Many of these risks, if they crystallise, are covered by the provisions for future initiatives and therefore have no impact on the forecasts.
Unquantified risks
Accident Insurance—medical misadventure
Education—capital injections for tertiary education institutions
Education—collective employment contracts
Education—ECE strategic plan
Education—pay parity for kindergarten teachers
Education—review of school staffing
Education—school and early childhood operational funding
Education—school property code
Education—stabilisation of tertiary fees
Education—Tertiary Education Advisory Commission
Education—Wananga capital injections
Environment—climate change policy
Health—District health board financing
Health—meningococcal vaccine
Inland Revenue—gaming review
Inland Revenue—GST and imported services and financial services review
Inland Revenue—taxation of savings and investment vehicles, including superannuation funds
Inland Revenue—tax review of international issues
Inland Revenue—trans-Tasman triangular tax relief
Police—capital projects
Social Development—families and work
TVNZ—change of direction
Risks are stated as at 26 November 2001.
Actual specific fiscal risks are discussed in detail in Chapter 5.
Statement of Accounting Policies and Forecast Assumptions
General Accounting Policies and Forecast Assumptions
General Accounting Policies
Accounting policy
These Forecast Financial Statements comply with generally accepted accounting practice. The measurement base applied is historical cost adjusted for revaluations of physical assets (where appropriate), state highways, commercial forests and marketable securities and deposits held for trading purposes.
Revaluations are made to reflect the forecast service potential or economic benefit obtained through control of the assets. The accrual basis of accounting has been used.
Forecast assumptions
For forecast purposes, no revaluations are projected beyond the current year.
General Forecast Assumptions
Finalisation dates
The Forecast Financial Statements were finalised on 26 November 2001 and incorporate all Government decisions and circumstances communicated up to 26 November 2001.
Macroeconomic assumptions
A summary of the economic assumptions that are particularly relevant to the fiscal forecasts (along with the 2001/02 assumptions used in the 2001 Budget Economic and Fiscal Update) are provided in the following table:
Key economic assumptions
| | 2001/02
| |
| |
| |
| |
|
|---|
June years
| | Previous
Budget
| | DEFU
| | 2002/03
DEFU
| | 2003/04
DEFU
| | 2004/05
DEFU
| | 2005/06
DEFU
|
|---|
| Real GDP (production based measure) | | | | | | | | | | | | |
| | (annual average % change) | | 2.7 | | 2.6 | | 2.6 | | 3.4 | | 2.6 | | 2.8 |
| Nominal GDP ($ million) | | 117,323 | | 118,980 | | 123,271 | | 129,725 | | 135,373 | | 141,076 |
| Consumer Price Index | | | | | | | | | | | | |
| | (annual average %) | | 2.1 | | 2.1 | | 1.4 | | 1.7 | | 1.6 | | 1.5 |
| Interest rates | | | | | | | | | | | | |
| | Government 10-year bonds | | | | | | | | | | | | |
| | (quarterly average %) | | 6.1 | | 6.4 | | 6.4 | | 6.2 | | 6.2 | | 6.2 |
| | 90-day bill rate | | | | | | | | | | | | |
| | (quarterly average %) | | 6.1 | | 4.8 | | 6.0 | | 6.0 | | 6.0 | | 6.0 |
| Household Labour Force Survey | | | | | | | | | | | | |
| | Survey unemployment rate | | | | | | | | | | | | |
| | (annual average %) | | 5.4 | | 5.6 | | 5.7 | | 5.2 | | 5.2 | | 5.2 |
| Full-time equivalent employment | | | | | | | | | | | | |
| | (annual average % change) | | 0.6 | | 0.6 | | 0.4 | | 2.4 | | 1.4 | | 1.3 |
| Wages—hourly earnings | | | | | | | | | | | | |
| | (annual average % change) | | 3.8 | | 3.8 | | 3.6 | | 3.4 | | 3.5 | | 3.0 |
| Trade Weighted Index | | | | | | | | | | | | |
| | (quarterly average) | | 52.9 | | 49.6 | | 52.1 | | 54.3 | | 55 | | 55 |
Source: The Treasury
For the purposes of calculating net debt, the forecasts assume that the nominal exchange rate remains fixed at 31 October 2001 exchange rates. Projected exchange rate losses or gains are not included in the forecasts.
Specific Accounting Policies and Forecast Assumptions
Forecast periods
Accounting policy
The reporting periods covered by these Forecast Financial Statements are the years ending 30 June 2002, 30 June 2003, 30 June 2004, 30 June 2005 and 30 June 2006.
Certain state-owned enterprises and Crown entities have different reporting periods from the Crown. These entities have been combined on the basis of the balance dates outlined in Note 9 of the Forecast Financial Statements.
Forecast assumptions
The forecasts for 30 June 2002 have been prepared using actual data to 31 October 2001. Transactions for the remainder of the year are forecast in accordance with these accounting policies and forecast assumptions.
Basis of Combination
Accounting policy
Ministers of the Crown, departments, offices of Parliament and the Reserve Bank of New Zealand are combined using the purchase method of combination. Corresponding assets, liabilities, revenues and expenses are added together line by line. Transactions and balances between these sub-entities are eliminated on combination.
State-owned enterprises and Crown entities are combined using the modified equity method of combination. This records the Crown's share of these entities' forecast net assets, including their surpluses and deficits. Unrealised surpluses and deficits on inter-entity transactions and balances not carried out on an arm's-length basis are eliminated. Other inter-entity transactions and balances are not eliminated.
Commitments and contingent liabilities of state-owned enterprises and Crown entities are reported in the Statement of Commitments and the Statement of Specific Fiscal Risks.
Revenue
Revenue levied through the Crown's sovereign power
Accounting policy
The Crown provides many services and benefits that do not give rise to revenue. Further, payment of tax does not of itself entitle a taxpayer to an equivalent value of services or benefits, as there is no direct relationship between paying tax and receiving Crown services and transfers.
Such revenue is received through the exercise of the Crown's sovereign power.
Where possible, revenue is recognised at the time the debt to the Crown arises, as identified in the following table:
| Revenue Type | | Revenue Recognition Point |
Source deductions (PAYE) |
|
When an individual is forecast to earn income that is subject to PAYE |
Residents' withholding taxes1 |
|
When an individual is forecast to receive interest or dividends subject to deduction at source |
Fringe benefit tax (FBT) |
|
When forecast benefits are provided that give rise to FBT |
Provisional tax2 |
|
Forecast payment due date |
Terminal tax2 |
|
Forecast assessment filed date |
Goods and services tax |
|
When the liability to the Crown is forecast to be incurred |
Excise duty |
|
When goods are forecast to be subject to duty |
Road user charges and motor vehicle fees |
|
When payment for the fee or charge is forecast to be made |
Stamp, cheque and credit card duties |
|
When the liability to the Crown is forecast to be incurred |
Other indirect taxes |
|
When the debt to the Crown is forecast to arise |
- 1
- Corresponds to forecast withholding taxes on residents' interest and dividend income in Note 1 to the Forecast Financial Statements.
- 2
- Provisional and terminal taxes are paid by "other persons" and companies (refer to Note 1 to the Forecast Financial Statements).
Revenue earned through operations
Accounting policy
Where revenue will be earned by the Crown in exchange for the provision of outputs (products or services) to third parties, the Crown earns its revenue through operations. This revenue is recognised when it is forecast to be earned.
Investment income
Accounting policy
Investment income is recognised in the period in which it is forecast to be earned.
Premiums
Accounting policy
Premiums arising on the issue of a debt instrument, up to the forecast finalisation date, are treated as a reduction in the cost of borrowing. Premiums are recognised in the Forecast Statement of Financial Position on issue, and are amortised over the period of the instrument on a yield-to-maturity basis.
Premiums on forecast bond sales with the same maturity date and coupon rate as bonds already on issue are calculated using the same maturity and coupon rate information. These premiums are treated on issue as a reduction in the cost of borrowing, and in general are amortised over the period of the instrument on a yield-to-maturity basis.
The forward margin associated with forward foreign-exchange contracts is amortised over the period of the contract on a straight-line basis.
Forecast assumption
Forecast bond sales with new maturity dates are assumed to be issued at par value, and therefore no premiums are forecast for these instruments.
Gains
General
Accounting policy
Realised gains arising from the sale of assets or the early repurchase of liabilities are recognised in the Forecast Statement of Financial Performance in the period in which the transactions are forecast to occur.
Foreign-currency monetary assets and liabilities
Accounting policy
Unrealised gains are recognised in the Forecast Statement of Financial Performance.
Forecast assumption
Forecasts of foreign-currency monetary assets and liabilities for the year ending 30 June 2002 and the other forecast periods use the exchange rates prevailing on 31 October 2001. As a consequence, no realised or unrealised exchange gains are forecast for the entire forecast period.
Physical assets
Accounting policy
To the extent that a forecast gain reverses a loss previously charged to the Statement of Financial Performance, the gain is credited to the Forecast Statement of Financial Performance.
Forecast assumption
The 30 June 2002 forecasts for the value of physical assets use the valuations as recorded in the Crown Financial Statements for the year ended 30 June 2001 and any additional actual valuations that have occurred up to 31 October 2001.
The value of physical assets for the other forecast periods is forecast using the same valuation as that used for the 30 June 2002 forecasts. As a consequence, no realised or unrealised gains are forecast for the entire forecast period.
Investments and marketable securities held for investment
Forecast assumption
All investments and marketable securities held for investment that are forecast to be held after the forecast finalisation date are assumed to be held to maturity. Therefore, no gains are forecast for these assets.
Expenses
General
Accounting policy
Expenses are recognised in the financial periods to which they are forecast to relate.
Welfare benefits
Accounting policy
Welfare benefits are recognised in the reporting periods during which it is forecast an application for a benefit has been received and the eligibility criteria met.
Grants and subsidies
Accounting policy
Where grants and subsidies are discretionary until payment, the expense is recognised when the payment is forecast to be made. Otherwise, the expense is recognised when it is forecast that the specific criteria will be fulfilled and notice given to the Crown.
Treaty of Waitangi settlements
Forecast assumption
There is a multi-year appropriation (MYA) established for the payment of claims associated with Treaty of Waitangi settlements. The actual amount expensed in any one year may be greater or less than the amount forecast for that particular year, since actual expenses depend on the settlements reached.
Discounts
Accounting policy
Discounts arising on the issue of debt instruments up to the forecast finalisation date are treated as an increase in the cost of borrowings. Discounts are recognised in the Forecast Statement of Financial Position on issue, and are amortised over the period of the instrument on a yield-to-maturity basis.
Discounts on forecast bond sales with the same maturity date and coupon rate as bonds already on issue are calculated using the same maturity and coupon rate information. These discounts are treated on issue as an increase in the cost of borrowing, and in general are amortised over the period of the instrument on a yield-to-maturity basis.
Forecast assumption
Forecast bond sales with new maturity dates are assumed to be issued at par value, and therefore no discounts are forecast for these instruments.
Losses
General
Accounting policy
Forecast realised losses arising from the sale of assets or the early repurchase of liabilities are recognised in the Forecast Statement of Financial Performance in the period in which the transaction is forecast to occur.
Foreign-currency monetary assets and liabilities
Accounting policy
Unrealised losses are recognised in the Forecast Statement of Financial Performance.
Forecast assumption
The 30 June 2002 forecasts for foreign-currency monetary assets and liabilities use the exchange rates prevailing on 31 October 2001.
Forecasts of foreign-currency monetary assets and liabilities for the other forecast periods are based on the exchange rates used for the 30 June 2002 forecast. As a consequence, no realised or unrealised exchange losses are forecast for these years.
Physical assets and liabilities
Accounting policy
Unrealised losses are first applied against the revaluation reserve for that class of asset. The balance, if any, is charged to the Forecast Statement of Financial Performance.
Forecast assumption
The 30 June 2002 forecasts for the value of physical assets use valuations as recorded in the Crown Financial Statements for the year ended 30 June 2001, and any additional actual valuations that have occurred up to 31 October 2001.
The value of physical assets for the other forecast periods is forecast using the same valuation used for the 30 June 2002 forecasts. As a consequence, no realised or unrealised losses are forecast beyond the current year.
Investments and marketable securities held for investment
Forecast assumption
All investments and marketable securities held for investment that are forecast to be held after the forecast finalisation date are assumed to be held to maturity. Therefore, no losses are forecast for these assets.
Foreign-currency transactions
Accounting policy
Short-term transactions covered by forward exchange contracts are translated into New Zealand dollars using the forward rates specified in those contracts.
Other transactions in foreign currencies are translated into New Zealand dollars using the exchange rates prevailing on 31 October 2001. Forecast exchange gains or losses arising on translation of these transactions are recognised in the Forecast Statement of Financial Performance.
The resulting exchange gains or losses are included in the Forecast Statement of Financial Performance in the period in which they are forecast to arise. The forward margin associated with existing forward exchange contracts is amortised over the period of the contract on a straight-line basis.
Forecast assumption
Outstanding foreign-exchange contracts are translated using the exchange rate prevailing on 31 October 2001.
For forecasting purposes, the exchange rates prevailing on 31 October 2001 are assumed to prevail throughout the other forecast periods.
Depreciation
Accounting policy
Depreciation is charged on a straight-line basis at rates calculated to allocate the cost or valuation of an asset, less any forecast residual value, over its estimated useful life. Typically, the estimated useful lives of different classes of assets are as follows:
| Freehold buildings | | 25 to 60 years |
| Specialist military equipment | | 5 to 25 years |
| Other plant and equipment | | 3 to 25 years |
| State highways: | | |
| | Pavement (surfacing) | | 7 years |
| | Pavement (other) | | 36 years |
| | Bridges | | 90 to 100 years |
Assets
Foreign monetary assets
Accounting policy
Foreign monetary assets existing at the forecast finalisation date and subject to forward exchange contracts are translated at the contract rate. Other foreign-currency monetary assets are translated at the exchange rates prevailing on 31 October 2001.
Forecast assumption
For forecasting purposes, the exchange rates on 31 October 2001 are assumed to prevail throughout the other forecast periods.
Receivables and advances
Accounting policy
Receivables and advances are recorded at the amounts forecast to be collected in cash.
Inventories
Accounting policy
Inventories, except for unissued currency stocks, existing at the forecast finalisation date are recorded at the lower of cost and net realisable value. Inventories forecast to be acquired after that date are recorded at the forecast cost.
Unissued currency stocks are recorded as inventory at the cost of acquisition and expensed when issued.
Investments
Marketable securities held for trading purposes
Accounting policy
Marketable securities held for trading purposes at the forecast finalisation date are recorded at fair value.
Marketable securities that are forecast to be acquired after that date and held for trading purposes are recorded at forecast cost of acquisition.
Equity investments
Accounting policy
Equity investments existing at the forecast finalisation date (other than those forming part of the reporting entity) are recorded at the lower of forecast cost and fair value.
Equity investments which are forecast to be purchased after that date are recorded at the forecast cost.
Other investments
Accounting policy
Other investments existing at the forecast finalisation date, including marketable securities held for investment, are recorded at the lower of cost and fair value.
Other investments that are forecast to be purchased after that date are valued at the forecast cost.
Investment sales
Forecast assumption
The proceeds from sales of investments or entities are only included in the forecasts when those sales have been contractually confirmed at the forecast finalisation date.
Physical assets
Accounting policy
Revaluations are made to reflect the service potential or economic benefit obtained through control of assets. Revaluation to fair value is based on the fair value of the asset less estimated disposal costs. Where an asset is recorded at its depreciated replacement cost, depreciated replacement cost is based on the estimated present cost of construction, reduced by factors for age and deterioration of the asset.
Physical assets are revalued at least every three years where appropriate.
Land and buildings
Accounting policy
Holdings of land and buildings at the forecast finalisation date are recorded at the latest available valuation calculated on a fair value basis. In cases where valuations conducted in accordance with New Zealand Institute of Valuers' standards are not available, valuations conducted in accordance with the Rating Valuation Act 1998 have been used.
Land and buildings forecast to be purchased after the forecast finalisation date are valued at their forecast cost.
Forecast assumption
Valuations are assumed to remain constant over the forecast period.
Specialist military equipment
Accounting policy
Specialist military equipment existing at the forecast finalisation date is valued at depreciated replacement cost established through specialist assessment by New Zealand Defence Force advisers.
Specialist military equipment forecast to be purchased after that date is valued at forecast cost.
Other plant and equipment
Accounting policy
Other plant and equipment (including motor vehicles and office equipment) existing at forecast finalisation date is recorded at cost less accumulated depreciation.
Other plant and equipment forecast to be purchased after that date is recorded at forecast cost.
Other physical assets for which an objective estimate of market value is difficult to obtain
Accounting policy
Such assets (national parks, for example) existing at the forecast finalisation date are recorded at the best estimate of fair value.
Any such assets forecast to be acquired after that date are valued at forecast cost.
Forecast assumption
The value is assumed to be constant over the other forecast periods.
State highways
Accounting policy
State highways existing at the forecast finalisation date are recorded at depreciated replacement cost, based on the estimated present cost of constructing the existing asset by the most appropriate method of construction. State highways forecast to be developed after that date are valued at forecast cost.
Land associated with the state highways is valued using an opportunity cost based on adjacent use, as an approximation of fair value.
Forecast assumption
The value is assumed to be constant over the other forecast periods.
Commercial forests
Accounting policy
Commercial forests are recorded at forecast fair value. This takes into account age, quality of timber, market expectations and the forest management plan.
Forecast assumption
Commercial forests are valued at an estimate of fair value using discounted cash flow techniques. Post-tax cash flows and three-year rolling average log prices have been used. Log prices are assumed to be constant over the forecast period.
Intangible assets
Accounting policy
Identifiable intangible assets existing at the forecast finalisation date are recorded at cost less accumulated amortisation and accumulated impairment losses or if an active market exists identifiable intangible assets are recorded at fair value.
Forecast assumption
The value is assumed to be constant over the other forecast periods.
Liabilities
Borrowings
Accounting policy
In the Forecast Statement of Financial Position, borrowings, including currency swaps existing at the forecast finalisation date, are recorded at nominal value adjusted for the unamortised portion of the premium or discount on issue.
Borrowings forecast to be raised after that date are recorded at forecast cost.
Forecast assumption
Forecasts of borrowings incorporate a number of technical assumptions regarding the use of the Crown's fiscal surplus for domestic debt reduction. These assumptions may not reflect the actual future composition of the domestic debt programmes, as these decisions have yet to be made.
Foreign monetary liabilities
Accounting policy
Foreign monetary liabilities existing at the forecast finalisation date and subject to forward exchange contracts are translated at contract rates. Other foreign-currency monetary liabilities are translated at exchange rates prevailing on 31 October 2001.
Forecast assumption
For forecasting purposes, the exchange rates prevailing on 31 October 2001 are assumed to prevail throughout the other forecast periods.
Pension liabilities
Forecast assumption
Forecasts of Government Superannuation Fund pension liabilities in respect of the contributory service of superannuation scheme members are based on financial assumptions applied to the latest actuarial value of the Crown's liability for pension payments net of the scheme's assets, adjusted in future years for any projected changes in demographic assumptions.
Currency issued
Accounting policy
Currency (including demonetised currency) issued at the forecast finalisation date or forecast to be issued after that date is recognised at face value.
The face value of collectors' currency is recorded as a contingent liability.
Leases
Accounting policy
Finance leases transfer to the Crown as lessee substantially all the risks and rewards incident on the ownership of a leased asset. The obligations under such forecast leases are capitalised at the forecast present value of the minimum lease payments. The capitalised values are amortised over the period forecast for benefits from their use to arise.
Forecast operating leases, where the lessors substantially retain the risks and rewards of ownership, are recognised in a systematic manner over the forecast term of the lease.
The cost of forecast leasehold improvements is capitalised and amortised over the forecast unexpired period of the lease or the estimated useful life of the improvements, whichever is the shorter.
Employee entitlements
Accounting policy
Forecast liabilities for annual leave are recognised as they are forecast to accrue to employees. Provision is also made for forecast long-service and retiring leave obligations to employees.
Other liabilities
Accounting policy
All other liabilities are recorded at the forecast obligation to pay.
Commitments
The commitments reported in these Forecast Financial Statements are actual commitments at 31 October 2001.
Existing commitments include operating and capital commitments arising from non-cancellable contractual or statutory obligations. Interest commitments on debts and commitments relating to employment contracts are not included.
Specific Fiscal Risks
Accounting policy
The specific fiscal risks reported in these Forecast Financial Statements are the actual risks existing at 26 November 2001 and contingent liabilities as at 31 October 2001. They include existing contingent liabilities, which are recognised at the point the contingency is evident. The Statement of Specific Fiscal Risks has been prepared in accordance with sections 10(3)(b) and 11 of the Fiscal Responsibility Act 1994.
Changes in Accounting Policies
All policies have been applied on a consistent basis during the forecast period. There have been no changes in accounting policies during the period.
Changes in Forecast Assumptions
Changes to the forecast assumptions used for the last set of forecasts published in the 2001 Budget Economic and Fiscal Update are outlined on page 126.
Notes to the Forecast Financial Statements
| | 2001
Actual
| | 2002
Previous
Budget
| | 2002
Forecast
| | 2003
Forecast
| | 2004
Forecast
| | 2005
Forecast
| | 2006
Forecast
| |
|---|
| | ($ million)
| |
|---|
| NOTE 1: Direct Taxation | | | | | | | | | | | | | | | |
| Income Tax | | | | | | | | | | | | | | | |
| Individuals | | | | | | | | | | | | | | | |
| Source deductions | | 13,703 | | 14,358 | | 14,380 | | 15,040 | | 16,083 | | 17,046 | | 17,837 | |
| Other persons | | 3,871 | | 3,881 | | 3,921 | | 4,108 | | 4,240 | | 4,396 | | 4,542 | |
| Refunds | | (790 | ) | (656 | ) | (779 | ) | (752 | ) | (746 | ) | (760 | ) | (766 | ) |
| Fringe benefit tax | | 342 | | 336 | | 349 | | 363 | | 359 | | 354 | | 350 | |
| | |
| |
| |
| |
| |
| |
| |
| |
| Total Individuals | | 17,126 | | 17,919 | | 17,871 | | 18,759 | | 19,936 | | 21,036 | | 21,963 | |
Corporate Tax |
|
|
|
|
|
|
|
|
|
|
|
|
|
|
|
| Gross companies tax | | 4,954 | | 4,938 | | 4,625 | | 4,877 | | 5,290 | | 5,509 | | 5,606 | |
| Refunds | | (123 | ) | (121 | ) | (115 | ) | (122 | ) | (133 | ) | (139 | ) | (143 | ) |
| Non-resident withholding tax | | 760 | | 685 | | 715 | | 699 | | 742 | | 762 | | 781 | |
| Foreign-source dividend withholding payment | | 71 | | 36 | | 123 | | 56 | | 56 | | 56 | | 56 | |
| | |
| |
| |
| |
| |
| |
| |
| |
| Total Corporate Tax | | 5,662 | | 5,538 | | 5,348 | | 5,510 | | 5,955 | | 6,188 | | 6,300 | |
Other Income Tax |
|
|
|
|
|
|
|
|
|
|
|
|
|
|
|
| Resident withholding tax on interest income | | 990 | | 993 | | 982 | | 940 | | 1,060 | | 1,117 | | 1,169 | |
| Resident withholding tax on dividend income | | 83 | | 53 | | 23 | | 46 | | 46 | | 47 | | 48 | |
| Estate and gift duties | | 2 | | 2 | | 2 | | 2 | | 2 | | 2 | | 2 | |
| | |
| |
| |
| |
| |
| |
| |
| |
| Total Other Income Tax | | 1,075 | | 1,048 | | 1,007 | | 988 | | 1,108 | | 1,166 | | 1,219 | |
| | |
| |
| |
| |
| |
| |
| |
| |
| Total Direct Taxation | | 23,863 | | 24,505 | | 24,226 | | 25,257 | | 26,999 | | 28,390 | | 29,482 | |
| | |
| |
| |
| |
| |
| |
| |
| |
NOTE 2: Indirect Taxation |
|
|
|
|
|
|
|
|
|
|
|
|
|
|
|
| Goods and Services Tax | | | | | | | | | | | | | | | |
| Gross goods and services tax | | 15,133 | | 15,054 | | 15,517 | | 15,727 | | 16,339 | | 16,907 | | 17,522 | |
| Refunds | | (6,007 | ) | (5,718 | ) | (6,046 | ) | (5,890 | ) | (5,924 | ) | (5,961 | ) | (6,125 | ) |
| | |
| |
| |
| |
| |
| |
| |
| |
| Total Goods and Services Tax | | 9,126 | | 9,336 | | 9,471 | | 9,837 | | 10,415 | | 10,946 | | 11,397 | |
Other Indirect Taxation |
|
|
|
|
|
|
|
|
|
|
|
|
|
|
|
| Petroleum fuels | | 810 | | 806 | | 825 | | 828 | | 837 | | 847 | | 859 | |
| Tobacco products | | 764 | | 802 | | 806 | | 787 | | 783 | | 780 | | 777 | |
| Customs duty | | 648 | | 649 | | 656 | | 667 | | 686 | | 701 | | 719 | |
| Road user charges | | 532 | | 575 | | 551 | | 553 | | 572 | | 597 | | 617 | |
| Alcoholic beverages | | 436 | | 447 | | 446 | | 441 | | 444 | | 448 | | 452 | |
| Gaming duties | | 206 | | 220 | | 239 | | 262 | | 276 | | 288 | | 300 | |
| Motor vehicle fees | | 181 | | 181 | | 180 | | 182 | | 184 | | 185 | | 186 | |
| Energy resources levies | | 111 | | 96 | | 107 | | 101 | | 97 | | 93 | | 91 | |
| Stamp, cheque and credit card duties | | 61 | | 68 | | 64 | | 63 | | 66 | | 69 | | 72 | |
| | |
| |
| |
| |
| |
| |
| |
| |
| Total Other Indirect Taxation | | 3,749 | | 3,844 | | 3,874 | | 3,884 | | 3,945 | | 4,008 | | 4,073 | |
| | |
| |
| |
| |
| |
| |
| |
| |
| Total Indirect Taxation | | 12,875 | | 13,180 | | 13,345 | | 13,721 | | 14,360 | | 14,954 | | 15,470 | |
| | |
| |
| |
| |
| |
| |
| |
| |
NOTE 3: Investment Income |
|
|
|
|
|
|
|
|
|
|
|
|
|
|
|
| Interest Income | | | | | | | | | | | | | | | |
| Marketable securities, deposits, mortgages and cash balances | | 463 | | 305 | | 351 | | 278 | | 336 | | 371 | | 389 | |
| Advances | | | | | | | | | | | | | | | |
| Student loans | | 289 | | 326 | | 334 | | 381 | | 438 | | 498 | | 550 | |
| Other entities | | 48 | | 66 | | 80 | | 84 | | 139 | | 143 | | 148 | |
| | |
| |
| |
| |
| |
| |
| |
| |
| Total Interest Income | | 800 | | 697 | | 765 | | 743 | | 913 | | 1,012 | | 1,087 | |
Dividend Income |
|
|
|
|
|
|
|
|
|
|
|
|
|
|
|
| State-owned enterprises | | 304 | | 199 | | 267 | | 216 | | 279 | | 329 | | 348 | |
| Other | | 21 | | 13 | | 98 | | 37 | | 39 | | 40 | | 41 | |
| | |
| |
| |
| |
| |
| |
| |
| |
| Total Dividend Income | | 325 | | 212 | | 365 | | 253 | | 318 | | 369 | | 389 | |
Other Investment Income |
|
|
|
|
|
|
|
|
|
|
|
|
|
|
|
| Gain/(loss) on marketable securities and deposits | | 102 | | — | | 62 | | — | | — | | — | | — | |
| NZS Fund investment income | | — | | 25 | | 14 | | 113 | | 262 | | 465 | | 699 | |
| Gain on sale of 2GHz radio spectrum licences | | 140 | | — | | — | | — | | — | | — | | — | |
| Other | | 2 | | — | | 1 | | — | | — | | — | | — | |
| | |
| |
| |
| |
| |
| |
| |
| |
| Total Other Investment Income | | 244 | | 25 | | 77 | | 113 | | 262 | | 465 | | 699 | |
| | |
| |
| |
| |
| |
| |
| |
| |
| Total Investment Income | | 1,369 | | 934 | | 1,207 | | 1,109 | | 1,493 | | 1,846 | | 2,175 | |
| | |
| |
| |
| |
| |
| |
| |
| |
NOTE 4: Other Operational Revenue |
|
|
|
|
|
|
|
|
|
|
|
|
|
|
|
| Recoveries from the Accident Compensation Corporation | | 106 | | 97 | | 105 | | 101 | | 101 | | 101 | | 101 | |
| Petroleum royalties | | 82 | | 32 | | 42 | | 33 | | 25 | | 24 | | 24 | |
| Cost recovery income from Fisheries | | 29 | | 27 | | 30 | | 27 | | 27 | | 27 | | 27 | |
| Contributions to Government Superannuation Fund | | 16 | | 25 | | 50 | | 50 | | 47 | | 44 | | 44 | |
| Income from Earthquake Commission | | 10 | | 10 | | 10 | | 10 | | 10 | | 10 | | 10 | |
| Other | | 138 | | 114 | | 86 | | 83 | | 85 | | 85 | | 87 | |
| | |
| |
| |
| |
| |
| |
| |
| |
| Total Other Operational Revenue | | 381 | | 305 | | 323 | | 304 | | 295 | | 291 | | 293 | |
| | |
| |
| |
| |
| |
| |
| |
| |
| NOTE 5: Expenses by Input Type | | | | | | | | | | | | | | | |
| Subsidies and transfer payments (see analysis below) | | 13,274 | | 13,886 | | 13,740 | | 14,060 | | 14,472 | | 14,864 | | 15,447 | |
| Operating expenses (see analysis below) | | 17,719 | | 18,307 | | 18,619 | | 19,072 | | 19,635 | | 20,183 | | 20,394 | |
| Personnel | | | | | | | | | | | | | | | |
| Personnel expenses (excluding pension expenses) | | 2,632 | | 2,762 | | 2,783 | | 2,740 | | 2,732 | | 2,722 | | 2,740 | |
| GSF pension expenses | | 691 | | 718 | | 710 | | 597 | | 649 | | 668 | | 703 | |
| Movement in unfunded pension liability | | 164 | | (51 | ) | 38 | | — | | — | | — | | — | |
| Other pension expenses | | 56 | | 53 | | 53 | | 53 | | 53 | | 53 | | 53 | |
| Depreciation | | | | | | | | | | | | | | | |
| Physical assets | | 751 | | 785 | | 786 | | 812 | | 806 | | 827 | | 818 | |
| State highways | | 174 | | 94 | | 179 | | 188 | | 196 | | 206 | | 216 | |
| Rental and leasing costs | | 282 | | 256 | | 258 | | 253 | | 250 | | 251 | | 251 | |
| Loss/(gain) on sale of assets | | 7 | | — | | 1 | | — | | — | | — | | — | |
| Finance costs (see analysis below) | | 2,483 | | 2,395 | | 2,345 | | 2,322 | | 2,508 | | 2,594 | | 2,641 | |
| Net foreign-exchange losses on liabilities | | 404 | | — | | 11 | | — | | — | | — | | — | |
| Net foreign-exchange gains on assets | | (451 | ) | — | | (10 | ) | — | | — | | — | | — | |
| Provision for future initiatives (see analysis below) | | — | | 160 | | 90 | | 450 | | 975 | | 1,475 | | 2,376 | |
| | |
| |
| |
| |
| |
| |
| |
| |
| Total Expenses | | 38,186 | | 39,365 | | 39,603 | | 40,547 | | 42,276 | | 43,843 | | 45,639 | |
| | |
| |
| |
| |
| |
| |
| |
| |
| Analysis of Subsidies and Transfer Payments | | | | | | | | | | | | | | | |
| Social assistance grants | | | | | | | | | | | | | | | |
| New Zealand Superannuation | | 5,273 | | 5,472 | | 5,452 | | 5,621 | | 5,816 | | 6,045 | | 6,388 | |
| Community Wage | | 1,849 | | 1,527 | | — | | — | | — | | — | | — | |
| Unemployment Benefit | | — | | — | | 1,450 | | 1,460 | | 1,496 | | 1,533 | | 1,580 | |
| Domestic Purposes Benefit | | 1,444 | | 1,489 | | 1,484 | | 1,514 | | 1,550 | | 1,584 | | 1,623 | |
| Family Support | | 878 | | 899 | | 879 | | 874 | | 876 | | 878 | | 880 | |
| Student allowances | | 391 | | 428 | | 417 | | 447 | | 464 | | 478 | | 492 | |
| Other social assistance grants | | 3,073 | | 3,692 | | 3,653 | | 3,739 | | 3,845 | | 3,961 | | 4,099 | |
| Subsidies | | 115 | | 125 | | 145 | | 145 | | 164 | | 124 | | 124 | |
| Other transfer payments | | | | | | | | | | | | | | | |
| Official development assistance | | 226 | | 227 | | 227 | | 227 | | 227 | | 227 | | 227 | |
| Other | | 25 | | 27 | | 33 | | 33 | | 34 | | 34 | | 34 | |
| | |
| |
| |
| |
| |
| |
| |
| |
| Total Subsidies and Transfer Payments | | 13,274 | | 13,886 | | 13,740 | | 14,060 | | 14,472 | | 14,864 | | 15,447 | |
| | |
| |
| |
| |
| |
| |
| |
| |
| Analysis of Operating Expenses | | | | | | | | | | | | | | | |
| Education purchases | | | | | | | | | | | | | | | |
| Early childhood education | | 331 | | 357 | | 356 | | 375 | | 377 | | 378 | | 381 | |
| Primary and secondary education | | 3,505 | | 3,677 | | 3,683 | | 3,729 | | 3,755 | | 3,758 | | 3,768 | |
| Tertiary education and training | | 1,508 | | 1,635 | | 1,685 | | 1,739 | | 1,772 | | 1,796 | | 1,814 | |
| Health purchases | | 6,807 | | 6,967 | | 7,072 | | 7,562 | | 8,079 | | 8,577 | | 8,677 | |
| Science purchases | | 467 | | 478 | | 478 | | 480 | | 480 | | 482 | | 482 | |
| Other operating expenses | | 5,101 | | 5,193 | | 5,345 | | 5,187 | | 5,172 | | 5,192 | | 5,272 | |
| | |
| |
| |
| |
| |
| |
| |
| |
| Total Operating Expenses | | 17,719 | | 18,307 | | 18,619 | | 19,072 | | 19,635 | | 20,183 | | 20,394 | |
| | |
| |
| |
| |
| |
| |
| |
| |
| Analysis of Finance Costs | | | | | | | | | | | | | | | |
| Interest | | | | | | | | | | | | | | | |
| New Zealand dollars | | 2,035 | | 2,044 | | 2,011 | | 2,040 | | 2,196 | | 2,254 | | 2,298 | |
| Foreign currencies | | 428 | | 328 | | 304 | | 259 | | 289 | | 317 | | 320 | |
| Other finance costs | | 20 | | 23 | | 30 | | 23 | | 23 | | 23 | | 23 | |
| | |
| |
| |
| |
| |
| |
| |
| |
| Total Finance Costs | | 2,483 | | 2,395 | | 2,345 | | 2,322 | | 2,508 | | 2,594 | | 2,641 | |
| | |
| |
| |
| |
| |
| |
| |
| |
| Analysis of Provision for Future Initiatives | | | | | | | | | | | | | | | |
| 2001/02 contingency provision | | — | | — | | 90 | | 35 | | 60 | | 60 | | 61 | |
| 2002/03 Budget provision | | — | | — | | — | | 415 | | 415 | | 415 | | 415 | |
| 2003/04 indicative provision | | — | | — | | — | | — | | 500 | | 500 | | 500 | |
| 2004/05 indicative provision | | — | | — | | — | | — | | — | | 500 | | 500 | |
| 2005/06 indicative provision | | — | | — | | — | | — | | — | | — | | 900 | |
| | |
| |
| |
| |
| |
| |
| |
| |
| Total Provision for Future Initiatives | | — | | — | | 90 | | 450 | | 975 | | 1,475 | | 2,376 | |
| | |
| |
| |
| |
| |
| |
| |
| |
NOTE 6: Marketable Securities and Deposits |
|
|
|
|
|
|
|
|
|
|
|
|
|
|
|
| Marketable securities held for trading purposes | | 6,100 | | 3,272 | | 3,534 | | 2,701 | | 2,446 | | 2,307 | | 2,184 | |
| Marketable securities held for investment purposes | | 2,491 | | 1,356 | | 1,768 | | 1,652 | | 1,628 | | 1,615 | | 1,601 | |
| Foreign-currency deposits | | 2,082 | | 2,359 | | 1,956 | | 1,929 | | 1,919 | | 1,905 | | 1,899 | |
| New Zealand-dollar deposits | | 441 | | 557 | | 733 | | 734 | | 732 | | 735 | | 730 | |
| Reserve position at the International Monetary Fund | | 946 | | 906 | | 1,216 | | 1,334 | | 1,467 | | 1,610 | | 1,763 | |
| | |
| |
| |
| |
| |
| |
| |
| |
| Total Marketable Securities and Deposits | | 12,060 | | 8,450 | | 9,207 | | 8,350 | | 8,192 | | 8,172 | | 8,177 | |
| | |
| |
| |
| |
| |
| |
| |
| |
NOTE 7: Advances |
|
|
|
|
|
|
|
|
|
|
|
|
|
|
|
| Advances to State-owned Enterprises and Crown Entities | | | | | | | | | | | | | | | |
| Housing New Zealand Corporation | | 163 | | 643 | | 645 | | 726 | | 1,070 | | 1,102 | | 1,134 | |
| District health boards/Residual Health Management Unit | | 53 | | 296 | | 274 | | 470 | | 892 | | 937 | | 1,067 | |
| Other state-owned enterprises and Crown entities | | 45 | | — | | 3 | | 3 | | 3 | | 3 | | 3 | |
| | |
| |
| |
| |
| |
| |
| |
| |
| Total Advances to State-owned Enterprises and Crown Entities | | 261 | | 939 | | 922 | | 1,199 | | 1,965 | | 2,042 | | 2,204 | |
| Other Advances | | | | | | | | | | | | | | | |
| Student loans | | 4,143 | | 4,776 | | 4,870 | | 5,600 | | 6,352 | | 7,116 | | 7,877 | |
| Contact Energy Limited | | 118 | | 48 | | 48 | | — | | — | | — | | — | |
| Maori development rural lending | | 38 | | 58 | | 43 | | 47 | | 51 | | 55 | | 59 | |
| Forestry encouragement loans | | 29 | | 30 | | 30 | | 28 | | 27 | | 27 | | 26 | |
| Other | | 26 | | 22 | | 113 | | 116 | | 119 | | 119 | | 119 | |
| | |
| |
| |
| |
| |
| |
| |
| |
| Total Other Advances | | 4,354 | | 4,934 | | 5,104 | | 5,791 | | 6,549 | | 7,317 | | 8,081 | |
| | |
| |
| |
| |
| |
| |
| |
| |
| Total Advances | | 4,615 | | 5,873 | | 6,026 | | 6,990 | | 8,514 | | 9,359 | | 10,285 | |
| | |
| |
| |
| |
| |
| |
| |
| |
| Analysis of Student Loans | | | | | | | | | | | | | | | |
| Outstanding balance | | | | | | | | | | | | | | | |
| Total loans outstanding (including interest) | | 4,655 | | 5,355 | | 5,439 | | 6,254 | | 7,088 | | 7,936 | | 8,782 | |
| Total provisions (capital and interest) | | (512 | ) | (579 | ) | (569 | ) | (654 | ) | (736 | ) | (820 | ) | (905 | ) |
| | |
| |
| |
| |
| |
| |
| |
| |
| Total Student Loans | | 4,143 | | 4,776 | | 4,870 | | 5,600 | | 6,352 | | 7,116 | | 7,877 | |
| | |
| |
| |
| |
| |
| |
| |
| |
| Movement during the year | | | | | | | | | | | | | | | |
| Opening balance | | 3,523 | | 4,155 | | 4,143 | | 4,870 | | 5,600 | | 6,352 | | 7,116 | |
| Amount advanced in current year | | 867 | | 963 | | 963 | | 1,047 | | 1,110 | | 1,162 | | 1,211 | |
| Interest accrued on outstanding loan balances | | 289 | | 326 | | 334 | | 381 | | 438 | | 498 | | 550 | |
| Repayment of base capital | | (198 | ) | (250 | ) | (236 | ) | (275 | ) | (320 | ) | (367 | ) | (414 | ) |
| Repayment of accrued interest | | (123 | ) | (157 | ) | (145 | ) | (175 | ) | (206 | ) | (240 | ) | (274 | ) |
| Interest written off and movement in provision for interest write-offs and doubtful debts | | (227 | ) | (269 | ) | (196 | ) | (256 | ) | (279 | ) | (297 | ) | (321 | ) |
| Other movements | | 12 | | 8 | | 7 | | 8 | | 9 | | 8 | | 9 | |
| | |
| |
| |
| |
| |
| |
| |
| |
| Closing Balance | | 4,143 | | 4,776 | | 4,870 | | 5,600 | | 6,352 | | 7,116 | | 7,877 | |
| | |
| |
| |
| |
| |
| |
| |
| |
NOTE 8: Receivables |
|
|
|
|
|
|
|
|
|
|
|
|
|
|
|
| Taxes receivable | | 4,962 | | 4,437 | | 4,961 | | 4,990 | | 4,983 | | 4,986 | | 4,977 | |
| Accounts receivable | | 1,024 | | 856 | | 950 | | 900 | | 881 | | 872 | | 828 | |
| Receivable from the sale and purchase of Maui gas | | 111 | | 103 | | 116 | | 89 | | 75 | | 58 | | 47 | |
| Prepayments | | 100 | | 43 | | 98 | | 91 | | 97 | | 107 | | 118 | |
| | |
| |
| |
| |
| |
| |
| |
| |
| Total Receivables | | 6,197 | | 5,439 | | 6,125 | | 6,070 | | 6,036 | | 6,023 | | 5,970 | |
| | |
| |
| |
| |
| |
| |
| |
| |
NOTE 9: Financial Interest in State-Owned Enterprises and Crown Entities |
|
|
|
|
|
|
|
|
|
|
|
|
|
|
|
| Surplus | | | | | | | | | | | | | | | |
| State-owned enterprises | | 432 | | 307 | | 326 | | 428 | | 501 | | 513 | | 543 | |
| Crown entities | | (8 | ) | 646 | | 308 | | 661 | | 713 | | 735 | | 752 | |
| | |
| |
| |
| |
| |
| |
| |
| |
| Total Surplus | | 424 | | 953 | | 634 | | 1,089 | | 1,214 | | 1,248 | | 1,295 | |
| | |
| |
| |
| |
| |
| |
| |
| |
| Dividends and Other Distributions | | | | | | | | | | | | | | | |
| State-owned enterprises | | 304 | | 199 | | 267 | | 216 | | 279 | | 329 | | 348 | |
| Crown entities | | 17 | | 9 | | 69 | | 34 | | 34 | | 36 | | 36 | |
| | |
| |
| |
| |
| |
| |
| |
| |
| Total Dividends and Other Distributions | | 321 | | 208 | | 336 | | 250 | | 313 | | 365 | | 384 | |
| | |
| |
| |
| |
| |
| |
| |
| |
| Net Equity | | | | | | | | | | | | | | | |
| State-owned enterprises | | 5,554 | | 5,643 | | 5,683 | | 5,902 | | 6,131 | | 6,323 | | 6,527 | |
| Crown entities | | 8,523 | | 9,471 | | 9,030 | | 9,892 | | 10,802 | | 11,560 | | 12,333 | |
| | |
| |
| |
| |
| |
| |
| |
| |
| Total Net Equity | | 14,077 | | 15,114 | | 14,713 | | 15,794 | | 16,933 | | 17,883 | | 18,860 | |
| | |
| |
| |
| |
| |
| |
| |
| |
| Balance dates | | | | | | | | | | | | | | | |
All state-owned enterprises and significant Crown entities have a balance date of 30 June except for the following:
| State-owned enterprises | | |
| Timberlands West Coast Limited | | 31 March |
| Significant Crown entities | | |
| School boards of trustees | | 31 December |
| Tertiary education institutions | | 31 December |
Minority Interests
All state-owned enterprises and Crown entities are 100% owned by the Crown.
| |
| |
| |
| |
| |
| |
| |
| |
|---|
| NOTE 10: Physical Assets | | | | | | | | | | | | | | | |
| By Type | | | | | | | | | | | | | | | |
| Cost or Valuation | | | | | | | | | | | | | | | |
| Land | | 1,844 | | 1,887 | | 1,840 | | 1,821 | | 1,805 | | 1,787 | | 1,769 | |
| Properties intended for sale | | 464 | | 446 | | 447 | | 446 | | 440 | | 436 | | 437 | |
| Buildings | | 8,654 | | 9,066 | | 9,156 | | 9,498 | | 9,836 | | 10,119 | | 10,313 | |
| Specialist military equipment | | 2,686 | | 2,780 | | 2,829 | | 3,079 | | 3,314 | | 3,360 | | 3,358 | |
| Other assets | | 2,688 | | 2,639 | | 2,442 | | 2,620 | | 2,786 | | 2,902 | | 3,014 | |
| Other plant and equipment | | 2,213 | | 2,571 | | 2,683 | | 2,680 | | 2,687 | | 2,694 | | 2,701 | |
| | |
| |
| |
| |
| |
| |
| |
| |
| Total Cost or Valuation | | 18,549 | | 19,389 | | 19,397 | | 20,144 | | 20,868 | | 21,298 | | 21,592 | |
Accumulated Depreciation |
|
|
|
|
|
|
|
|
|
|
|
|
|
|
|
| Buildings | | 729 | | 1,085 | | 1,076 | | 1,353 | | 1,703 | | 2,050 | | 2,310 | |
| Specialist military equipment | | 421 | | 594 | | 590 | | 770 | | 939 | | 1,124 | | 1,305 | |
| Other assets | | 5 | | 5 | | 7 | | 9 | | 11 | | 13 | | 15 | |
| Other plant and equipment | | 1,292 | | 1,629 | | 1,421 | | 1,618 | | 1,809 | | 1,991 | | 2,167 | |
| | |
| |
| |
| |
| |
| |
| |
| |
| Total Accumulated Depreciation | | 2,447 | | 3,313 | | 3,094 | | 3,750 | | 4,462 | | 5,178 | | 5,797 | |
Net Book Value |
|
|
|
|
|
|
|
|
|
|
|
|
|
|
|
| Land | | 1,844 | | 1,887 | | 1,840 | | 1,821 | | 1,805 | | 1,787 | | 1,769 | |
| Properties intended for sale | | 464 | | 446 | | 447 | | 446 | | 440 | | 436 | | 437 | |
| Buildings | | 7,925 | | 7,981 | | 8,080 | | 8,145 | | 8,133 | | 8,069 | | 8,003 | |
| Specialist military equipment | | 2,265 | | 2,186 | | 2,239 | | 2,309 | | 2,375 | | 2,236 | | 2,053 | |
| Other assets | | 2,683 | | 2,634 | | 2,435 | | 2,611 | | 2,775 | | 2,889 | | 2,999 | |
| Other plant and equipment | | 921 | | 942 | | 1,262 | | 1,062 | | 878 | | 703 | | 534 | |
| | |
| |
| |
| |
| |
| |
| |
| |
| Total Net Book Value | | 16,102 | | 16,076 | | 16,303 | | 16,394 | | 16,406 | | 16,120 | | 15,795 | |
| | |
| |
| |
| |
| |
| |
| |
| |
| Movements | | | | | | | | | | | | | | | |
| Cost or Valuation | | | | | | | | | | | | | | | |
| Opening balance | | 18,507 | | 18,534 | | 18,549 | | 19,397 | | 20,144 | | 20,868 | | 21,298 | |
| Net additions | | 905 | | 855 | | 848 | | 747 | | 724 | | 430 | | 294 | |
| Revaluations | | (863 | ) | — | | — | | — | | — | | — | | — | |
| | |
| |
| |
| |
| |
| |
| |
| |
| Total Cost or Valuation | | 18,549 | | 19,389 | | 19,397 | | 20,144 | | 20,868 | | 21,298 | | 21,592 | |
Accumulated Depreciation |
|
|
|
|
|
|
|
|
|
|
|
|
|
|
|
| Opening balance | | 2,535 | | 2,568 | | 2,447 | | 3,094 | | 3,750 | | 4,462 | | 5,178 | |
| Disposals | | (145 | ) | (40 | ) | (145 | ) | (156 | ) | (94 | ) | (111 | ) | (199 | ) |
| Depreciation charged for the period | | 751 | | 785 | | 786 | | 812 | | 806 | | 827 | | 818 | |
| Revaluations | | (694 | ) | — | | 6 | | — | | — | | — | | — | |
| | |
| |
| |
| |
| |
| |
| |
| |
| Total Accumulated Depreciation | | 2,447 | | 3,313 | | 3,094 | | 3,750 | | 4,462 | | 5,178 | | 5,797 | |
| | |
| |
| |
| |
| |
| |
| |
| |
| Net Physical Assets | | 16,102 | | 16,076 | | 16,303 | | 16,394 | | 16,406 | | 16,120 | | 15,795 | |
| | |
| |
| |
| |
| |
| |
| |
| |
| By Holding | | | | | | | | | | | | | | | |
| Freehold assets | | 16,062 | | 16,037 | | 16,273 | | 16,366 | | 16,378 | | 16,092 | | 15,767 | |
| Leasehold assets | | 40 | | 39 | | 30 | | 28 | | 28 | | 28 | | 28 | |
| | |
| |
| |
| |
| |
| |
| |
| |
| Net Physical Assets | | 16,102 | | 16,076 | | 16,303 | | 16,394 | | 16,406 | | 16,120 | | 15,795 | |
| | |
| |
| |
| |
| |
| |
| |
| |
| NOTE 11: State Highways | | | | | | | | | | | | | | | |
| Cost or Valuation | | | | | | | | | | | | | | | |
| Opening balance | | 8,911 | | 10,788 | | 11,055 | | 11,310 | | 11,532 | | 11,770 | | 12,025 | |
| Recognition adjustment | | 1,650 | | — | | — | | — | | — | | — | | — | |
| Net additions | | 300 | | 245 | | 255 | | 222 | | 238 | | 255 | | 270 | |
| Revaluations | | 194 | | — | | — | | — | | — | | — | | — | |
| | |
| |
| |
| |
| |
| |
| |
| |
| Total Cost or Valuation | | 11,055 | | 11,033 | | 11,310 | | 11,532 | | 11,770 | | 12,025 | | 12,295 | |
Accumulated Depreciation |
|
|
|
|
|
|
|
|
|
|
|
|
|
|
|
| Opening balance | | — | | 92 | | — | | 179 | | 367 | | 563 | | 769 | |
| Depreciation charged for the period | | 174 | | 94 | | 179 | | 188 | | 196 | | 206 | | 216 | |
| Revaluations | | (174 | ) | — | | — | | — | | — | | — | | — | |
| | |
| |
| |
| |
| |
| |
| |
| |
| Total Accumulated Depreciation | | — | | 186 | | 179 | | 367 | | 563 | | 769 | | 985 | |
| | |
| |
| |
| |
| |
| |
| |
| |
| Total State Highways | | 11,055 | | 10,847 | | 11,131 | | 11,165 | | 11,207 | | 11,256 | | 11,310 | |
| | |
| |
| |
| |
| |
| |
| |
| |
| NOTE 12: Payables and Provisions | | | | | | | | | | | | | | | |
| Accounts payable | | 1,631 | | 1,780 | | 2,397 | | 2,272 | | 2,310 | | 2,343 | | 2,271 | |
| Accruals and provisions | | 1,193 | | 409 | | 382 | | 407 | | 354 | | 295 | | 225 | |
| Taxes repayable | | 1,907 | | 1,711 | | 1,938 | | 1,933 | | 1,928 | | 1,928 | | 1,928 | |
| National Provident Fund guarantee | | 686 | | 480 | | 686 | | 686 | | 686 | | 686 | | 686 | |
| Provisions for employee entitlements | | 414 | | 378 | | 408 | | 401 | | 392 | | 389 | | 383 | |
| | |
| |
| |
| |
| |
| |
| |
| |
| Total Payables and Provisions | | 5,831 | | 4,758 | | 5,811 | | 5,699 | | 5,670 | | 5,641 | | 5,493 | |
| | |
| |
| |
| |
| |
| |
| |
| |
| NOTE 13: Revaluation Reserve | | | | | | | | | | | | | | | |
| Opening Balance | | 8,201 | | 7,899 | | 8,007 | | 8,000 | | 8,000 | | 8,000 | | 8,000 | |
| Net revaluations | | | | | | | | | | | | | | | |
| State-owned enterprises and Crown entities | | 368 | | — | | — | | — | | — | | — | | — | |
| Land and buildings | | 85 | | — | | (6 | ) | — | | — | | — | | — | |
| State highways | | (258 | ) | — | | — | | — | | — | | — | | — | |
| Specialist military equipment | | 4 | | — | | — | | — | | — | | — | | — | |
| Other assets | | (378 | ) | — | | — | | — | | — | | — | | — | |
| | |
| |
| |
| |
| |
| |
| |
| |
| Total Net Revaluations | | (179 | ) | — | | (6 | ) | — | | — | | — | | — | |
| Transfer to accumulated operating balance | | (15 | ) | — | | (1 | ) | — | | — | | — | | — | |
| | |
| |
| |
| |
| |
| |
| |
| |
| Closing Revaluation Reserve | | 8,007 | | 7,899 | | 8,000 | | 8,000 | | 8,000 | | 8,000 | | 8,000 | |
| | |
| |
| |
| |
| |
| |
| |
| |
Annex A: Tax Revenue Tables
Table A.1—Treasury and Inland Revenue forecasts of tax revenue
Revenue
| |
| | 2001/02
Forecast
| | 2002/03
Forecast
| | 2003/04
Forecast
| | 2004/05
Forecast
| | 2005/06
Forecast
| |
|---|
| | 2000/01
Actual
| |
|---|
| | Treasury
| | IRD
| | Treasury
| | IRD
| | Treasury
| | IRD
| | Treasury
| | IRD
| | Treasury
| | IRD
| |
|---|
| | ($ million)
| |
|---|
| Direct Tax | | | | | | | | | | | | | | | | | | | | | | | |
| Individuals | | | | | | | | | | | | | | | | | | | | | | | |
| Source deductions | | 13,703 | | 14,380 | | 14,360 | | 15,040 | | 15,013 | | 16,083 | | 15,998 | | 17,046 | | 16,961 | | 17,837 | | 17,762 | |
| Other persons | | 3,871 | | 3,921 | | 3,910 | | 4,108 | | 4,025 | | 4,240 | | 4,135 | | 4,396 | | 4,330 | | 4,542 | | 4,535 | |
| Refunds | | (790 | ) | (779 | ) | (755 | ) | (752 | ) | (705 | ) | (746 | ) | (705 | ) | (760 | ) | (700 | ) | (766 | ) | (705 | ) |
| Fringe benefit tax | | 342 | | 349 | | 357 | | 363 | | 367 | | 359 | | 355 | | 354 | | 351 | | 350 | | 348 | |
| | |
| |
| |
| |
| |
| |
| |
| |
| |
| |
| |
| |
| Subtotal: Individuals | | 17,126 | | 17,871 | | 17,872 | | 18,759 | | 18,700 | | 19,936 | | 19,783 | | 21,036 | | 20,942 | | 21,963 | | 21,940 | |
| Company Tax (net) | | 4,831 | | 4,510 | | 4,531 | | 4,755 | | 4,777 | | 5,157 | | 5,132 | | 5,370 | | 5,285 | | 5,463 | | 5,500 | |
| Withholding Tax | | | | | | | | | | | | | | | | | | | | | | | |
| Resident interest income | | 990 | | 982 | | 997 | | 940 | | 937 | | 1,060 | | 1,036 | | 1,117 | | 1,093 | | 1,169 | | 1,153 | |
| Non-resident income | | 760 | | 715 | | 680 | | 699 | | 697 | | 742 | | 728 | | 762 | | 742 | | 781 | | 764 | |
| Resident dividend income | | 71 | | 23 | | 17 | | 46 | | 45 | | 46 | | 45 | | 47 | | 45 | | 48 | | 45 | |
| Foreign-source dividends | | 83 | | 123 | | 123 | | 56 | | 80 | | 56 | | 80 | | 56 | | 80 | | 56 | | 80 | |
| | |
| |
| |
| |
| |
| |
| |
| |
| |
| |
| |
| |
| Subtotal: Withholding Tax | | 1,904 | | 1,843 | | 1,817 | | 1,741 | | 1,759 | | 1,904 | | 1,889 | | 1,982 | | 1,960 | | 2,054 | | 2,042 | |
| Total Income Tax | | 23,861 | | 24,224 | | 24,220 | | 25,255 | | 25,236 | | 26,997 | | 26,804 | | 28,388 | | 28,187 | | 29,480 | | 29,482 | |
| Other Direct Tax | | | | | | | | | | | | | | | | | | | | | | | |
| Estate and gift duties | | 2 | | 2 | | 2 | | 2 | | 2 | | 2 | | 2 | | 2 | | 2 | | 2 | | 2 | |
| Total Direct Tax | | 23,863 | | 24,226 | | 24,222 | | 25,257 | | 25,238 | | 26,999 | | 26,806 | | 28,390 | | 28,189 | | 29,482 | | 29,484 | |
| Indirect Tax | | | | | | | | | | | | | | | | | | | | | | | |
| GST | | | | | | | | | | | | | | | | | | | | | | | |
| GST (Customs) | | 4,099 | | 4,050 | | 3,985 | | 4,023 | | 4,030 | | 4,279 | | 4,209 | | 4,467 | | 4,375 | | 4,630 | | 4,597 | |
| GST (IRD) | | 5,027 | | 5,421 | | 5,479 | | 5,814 | | 5,765 | | 6,136 | | 6,065 | | 6,479 | | 6,323 | | 6,767 | | 6,565 | |
| | |
| |
| |
| |
| |
| |
| |
| |
| |
| |
| |
| |
| Subtotal: GST | | 9,126 | | 9,471 | | 9,464 | | 9,837 | | 9,795 | | 10,415 | | 10,274 | | 10,946 | | 10,698 | | 11,397 | | 11,162 | |
| Excise duties on: | | | | | | | | | | | | | | | | | | | | | | | |
| Alcoholic drinks | | 436 | | 446 | | 455 | | 441 | | 452 | | 444 | | 457 | | 448 | | 463 | | 452 | | 468 | |
| Tobacco products | | 764 | | 806 | | 809 | | 787 | | 798 | | 783 | | 800 | | 780 | | 800 | | 777 | | 800 | |
| Petroleum fuels | | 810 | | 825 | | 825 | | 828 | | 830 | | 837 | | 837 | | 847 | | 842 | | 859 | | 848 | |
| | |
| |
| |
| |
| |
| |
| |
| |
| |
| |
| |
| |
| Subtotal: Excise Duties | | 2,010 | | 2,077 | | 2,089 | | 2,056 | | 2,080 | | 2,064 | | 2,094 | | 2,075 | | 2,105 | | 2,088 | | 2,116 | |
| Other Indirect Tax | | | | | | | | | | | | | | | | | | | | | | | |
| Customs duty | | 648 | | 656 | | 641 | | 667 | | 651 | | 686 | | 691 | | 701 | | 721 | | 719 | | 753 | |
| Road user charges | | 532 | | 551 | | 552 | | 553 | | 568 | | 572 | | 593 | | 597 | | 614 | | 617 | | 635 | |
| Motor vehicle fees | | 181 | | 180 | | 181 | | 182 | | 182 | | 184 | | 184 | | 185 | | 185 | | 186 | | 187 | |
| Stamp and cheque duties | | 61 | | 64 | | 65 | | 63 | | 65 | | 66 | | 65 | | 69 | | 65 | | 72 | | 65 | |
| Gaming duties | | 206 | | 239 | | 238 | | 262 | | 265 | | 276 | | 279 | | 288 | | 294 | | 300 | | 305 | |
| Energy resources levy | | 111 | | 107 | | 115 | | 101 | | 110 | | 97 | | 105 | | 93 | | 100 | | 91 | | 100 | |
| Other | | — | | — | | — | | — | | — | | — | | — | | — | | — | | — | | — | |
| | |
| |
| |
| |
| |
| |
| |
| |
| |
| |
| |
| |
| Subtotal: Other Indirect Tax | | 1,739 | | 1,797 | | 1,792 | | 1,828 | | 1,841 | | 1,881 | | 1,917 | | 1,933 | | 1,979 | | 1,985 | | 2,045 | |
| Total Indirect Tax | | 12,875 | | 13,345 | | 13,345 | | 13,721 | | 13,716 | | 14,360 | | 14,285 | | 14,954 | | 14,782 | | 15,470 | | 15,323 | |
| | |
| |
| |
| |
| |
| |
| |
| |
| |
| |
| |
| |
| Total Tax | | 36,738 | | 37,571 | | 37,567 | | 38,978 | | 38,954 | | 41,359 | | 41,091 | | 43,344 | | 42,971 | | 44,952 | | 44,807 | |
| | |
| |
| |
| |
| |
| |
| |
| |
| |
| |
| |
| |
| Tax-to-GDP | | 32.1 | % | 31.6 | % | 31.6 | % | 31.6 | % | 31.6 | % | 31.9 | % | 31.7 | % | 32.0 | % | 31.7 | % | 31.9 | % | 31.8 | % |
| GDP | | 114,275 | | 118,980 | | 118,980 | | 123,271 | | 123,271 | | 129,725 | | 129,725 | | 135,373 | | 135,373 | | 141,076 | | 141,076 | |
Sources: Inland Revenue, The Treasury
NOTE: Numbers are after elimination of GST on departmental outputs and tax paid on the income of the NZS Fund.
Table A.2—Treasury and Inland Revenue forecasts of tax receipts (cash)
Receipts
| |
| | 2001/02
Forecast
| | 2002/03
Forecast
| | 2003/04
Forecast
| | 2004/05
Forecast
| | 2005/06
Forecast
| |
|---|
| | 2000/01
Actual
| |
|---|
| | Treasury
| | IRD
| | Treasury
| | IRD
| | Treasury
| | IRD
| | Treasury
| | IRD
| | Treasury
| | IRD
| |
|---|
| | ($ million)
| |
|---|
| Direct Tax | | | | | | | | | | | | | | | | | | | | | | | |
| Individuals | | | | | | | | | | | | | | | | | | | | | | | |
| Source deductions | | 13,748 | | 14,380 | | 14,360 | | 15,040 | | 15,013 | | 16,083 | | 15,998 | | 17,046 | | 16,961 | | 17,837 | | 17,762 | |
| Other persons | | 4,221 | | 4,300 | | 4,315 | | 4,475 | | 4,450 | | 4,604 | | 4,550 | | 4,766 | | 4,740 | | 4,916 | | 4,930 | |
| Refunds | | (1,175 | ) | (1,158 | ) | (1,160 | ) | (1,119 | ) | (1,130 | ) | (1,110 | ) | (1,120 | ) | (1,130 | ) | (1,110 | ) | (1,140 | ) | (1,100 | ) |
| Fringe benefit tax | | 338 | | 340 | | 342 | | 365 | | 365 | | 360 | | 357 | | 355 | | 352 | | 351 | | 348 | |
| | |
| |
| |
| |
| |
| |
| |
| |
| |
| |
| |
| |
| Subtotal: Individuals | | 17,132 | | 17,862 | | 17,857 | | 18,761 | | 18,698 | | 19,937 | | 19,785 | | 21,037 | | 20,943 | | 21,964 | | 21,940 | |
| Company Tax (net) | | 4,592 | | 4,563 | | 4,488 | | 4,735 | | 4,777 | | 5,162 | | 5,132 | | 5,362 | | 5,285 | | 5,475 | | 5,500 | |
| Withholding Tax | | | | | | | | | | | | | | | | | | | | | | | |
| Resident interest income | | 971 | | 986 | | 995 | | 932 | | 935 | | 1,064 | | 1,038 | | 1,123 | | 1,095 | | 1,174 | | 1,155 | |
| Non-resident income | | 738 | | 714 | | 686 | | 699 | | 697 | | 742 | | 728 | | 762 | | 742 | | 781 | | 764 | |
| Resident dividend income | | 72 | | 23 | | 20 | | 46 | | 45 | | 46 | | 45 | | 47 | | 45 | | 48 | | 45 | |
| Foreign-source dividends | | 98 | | 108 | | 117 | | 56 | | 80 | | 56 | | 80 | | 56 | | 80 | | 56 | | 80 | |
| | |
| |
| |
| |
| |
| |
| |
| |
| |
| |
| |
| |
| Subtotal: Withholding Tax | | 1,879 | | 1,831 | | 1,818 | | 1,733 | | 1,757 | | 1,908 | | 1,891 | | 1,988 | | 1,962 | | 2,059 | | 2,044 | |
| Total Income Tax | | 23,603 | | 24,256 | | 24,163 | | 25,229 | | 25,232 | | 27,007 | | 26,808 | | 28,387 | | 28,190 | | 29,498 | | 29,484 | |
| Other Direct Tax | | | | | | | | | | | | | | | | | | | | | | | |
| Estate and gift duties | | 2 | | 2 | | 2 | | 2 | | 2 | | 2 | | 2 | | 2 | | 2 | | 2 | | 2 | |
| Total Direct Tax | | 23,605 | | 24,258 | | 24,165 | | 25,231 | | 25,234 | | 27,009 | | 26,810 | | 28,389 | | 28,192 | | 29,500 | | 29,486 | |
| Indirect Tax | | | | | | | | | | | | | | | | | | | | | | | |
| GST | | | | | | | | | | | | | | | | | | | | | | | |
| GST (Customs) | | 4,063 | | 4,030 | | 3,985 | | 4,023 | | 4,030 | | 4,279 | | 4,209 | | 4,467 | | 4,375 | | 4,630 | | 4,597 | |
| GST (IRD) | | 4,884 | | 5,381 | | 5,419 | | 5,814 | | 5,765 | | 6,136 | | 6,065 | | 6,479 | | 6,323 | | 6,767 | | 6,565 | |
| | |
| |
| |
| |
| |
| |
| |
| |
| |
| |
| |
| |
| Subtotal: GST | | 8,947 | | 9,411 | | 9,404 | | 9,837 | | 9,795 | | 10,415 | | 10,274 | | 10,946 | | 10,698 | | 11,397 | | 11,162 | |
| Excise duties on: | | | | | | | | | | | | | | | | | | | | | | | |
| Alcoholic drinks | | 430 | | 436 | | 445 | | 441 | | 452 | | 444 | | 457 | | 448 | | 463 | | 452 | | 468 | |
| Tobacco products | | 735 | | 796 | | 799 | | 787 | | 798 | | 783 | | 800 | | 780 | | 800 | | 777 | | 800 | |
| Petroleum fuels | | 820 | | 825 | | 825 | | 828 | | 830 | | 837 | | 837 | | 847 | | 842 | | 859 | | 848 | |
| | |
| |
| |
| |
| |
| |
| |
| |
| |
| |
| |
| |
| Subtotal: Excise Duties | | 1,985 | | 2,057 | | 2,069 | | 2,056 | | 2,080 | | 2,064 | | 2,094 | | 2,075 | | 2,105 | | 2,088 | | 2,116 | |
| Other Indirect Tax | | | | | | | | | | | | | | | | | | | | | | | |
| Customs duty | | 628 | | 656 | | 641 | | 667 | | 651 | | 686 | | 691 | | 701 | | 721 | | 719 | | 753 | |
| Road user charges | | 532 | | 547 | | 552 | | 551 | | 568 | | 570 | | 593 | | 597 | | 614 | | 617 | | 635 | |
| Motor vehicle fees | | 174 | | 181 | | 181 | | 182 | | 182 | | 184 | | 184 | | 185 | | 185 | | 186 | | 187 | |
| Stamp and cheque duties | | 63 | | 64 | | 65 | | 63 | | 65 | | 66 | | 65 | | 69 | | 65 | | 72 | | 65 | |
| Gaming duties | | 205 | | 239 | | 238 | | 262 | | 265 | | 276 | | 279 | | 288 | | 294 | | 300 | | 305 | |
| Energy resources levy | | 110 | | 107 | | 115 | | 101 | | 110 | | 97 | | 105 | | 93 | | 100 | | 91 | | 100 | |
| Other | | 1 | | — | | — | | — | | — | | — | | — | | — | | — | | — | | — | |
| | |
| |
| |
| |
| |
| |
| |
| |
| |
| |
| |
| |
| Subtotal: Other Indirect Tax | | 1,713 | | 1,794 | | 1,792 | | 1,826 | | 1,841 | | 1,879 | | 1,917 | | 1,933 | | 1,979 | | 1,985 | | 2,045 | |
| Total Indirect Tax | | 12,645 | | 13,262 | | 13,265 | | 13,719 | | 13,716 | | 14,358 | | 14,285 | | 14,954 | | 14,782 | | 15,470 | | 15,323 | |
| | |
| |
| |
| |
| |
| |
| |
| |
| |
| |
| |
| |
| Total Tax | | 36,250 | | 37,520 | | 37,430 | | 38,950 | | 38,950 | | 41,367 | | 41,095 | | 43,343 | | 42,974 | | 44,970 | | 44,809 | |
| | |
| |
| |
| |
| |
| |
| |
| |
| |
| |
| |
| |
| Tax-to-GDP | | 31.7 | % | 31.5 | % | 31.5 | % | 31.6 | % | 31.6 | % | 31.9 | % | 31.7 | % | 32.0 | % | 31.7 | % | 31.9 | % | 31.8 | % |
| GDP | | 114,275 | | 118,980 | | 118,980 | | 123,271 | | 123,271 | | 129,725 | | 129,725 | | 135,373 | | 135,373 | | 141,076 | | 141,076 | |
Sources: Inland Revenue, The Treasury
NOTE: Numbers are after elimination of GST on departmental outputs and tax paid on the income of the NZS Fund.
Annex B: Expense Tables
Table B.1—Expenses by category
| | 1998/99
Actual
| | 1999/2000
Actual
| | 2000/01
Actual
| | 2001/02
Forecast
| | 2002/03
Forecast
| | 2003/04
Forecast
| | 2004/05
Forecast
| | 2005/06
Forecast
|
|---|
| | ($ million)
|
|---|
| Social security and welfare | | 12,906 | | 12,896 | | 13,216 | | 13,649 | | 13,933 | | 14,308 | | 14,721 | | 15,291 |
| GSF Pension expense | | 1,132 | | 478 | | 855 | | 748 | | 597 | | 649 | | 668 | | 703 |
| Health | | 6,573 | | 6,874 | | 7,342 | | 7,797 | | 8,225 | | 8,744 | | 9,264 | | 9,385 |
| Education | | 5,899 | | 6,310 | | 6,690 | | 7,041 | | 7,257 | | 7,334 | | 7,396 | | 7,464 |
| Core government services | | 1,705 | | 1,710 | | 1,817 | | 1,611 | | 1,570 | | 1,539 | | 1,545 | | 1,575 |
| Law and order | | 1,499 | | 1,531 | | 1,560 | | 1,737 | | 1,687 | | 1,661 | | 1,657 | | 1,650 |
| Defence | | 1,030 | | 1,247 | | 1,267 | | 1,162 | | 1,157 | | 1,157 | | 1,117 | | 1,117 |
| Transport and communications | | 1,029 | | 1,036 | | 1,026 | | 1,103 | | 1,125 | | 1,149 | | 1,179 | | 1,203 |
| Economic and industrial services | | 858 | | 944 | | 1,141 | | 1,258 | | 1,262 | | 1,267 | | 1,225 | | 1,223 |
| Primary services | | 334 | | 265 | | 287 | | 337 | | 317 | | 303 | | 302 | | 301 |
| Heritage, culture and recreation | | 316 | | 456 | | 424 | | 495 | | 465 | | 503 | | 525 | | 535 |
| Housing and community | | 41 | | 68 | | 50 | | 92 | | 87 | | 86 | | 82 | | 82 |
| Other | | 34 | | 45 | | 75 | | 137 | | 93 | | 93 | | 93 | | 93 |
| Finance costs | | 2,516 | | 2,373 | | 2,483 | | 2,345 | | 2,322 | | 2,508 | | 2,594 | | 2,641 |
| Net foreign exchange losses/(gains) | | (47 | ) | (62 | ) | (47 | ) | 1 | | — | | — | | — | | — |
| Provision for future initiatives | | — | | — | | — | | 90 | | 450 | | 975 | | 1,475 | | 2,376 |
| | |
| |
| |
| |
| |
| |
| |
| |
|
| Total Expenses | | 35,825 | | 36,171 | | 38,186 | | 39,603 | | 40,547 | | 42,276 | | 43,843 | | 45,639 |
| | |
| |
| |
| |
| |
| |
| |
| |
|
| Less | | | | | | | | | | | | | | | | |
| Foreign exchange gains/(losses) | | 47 | | 62 | | 47 | | (1 | ) | — | | — | | — | | — |
| Unfunded GSF liability revaluation | | (429 | ) | 201 | | (164 | ) | (38 | ) | — | | — | | — | | — |
| NPF revaluation | | 28 | | (10 | ) | (253 | ) | — | | — | | — | | — | | — |
| | |
| |
| |
| |
| |
| |
| |
| |
|
| Adjusted Total Expenses | | 35,471 | | 36,424 | | 37,816 | | 39,564 | | 40,547 | | 42,276 | | 43,843 | | 45,639 |
| | |
| |
| |
| |
| |
| |
| |
| |
|
Source: The Treasury
Table B.2—Social security and welfare
| | 1998/99
Actual
| | 1999/2000
Actual
| | 2000/01
Actual
| | 2001/02
Forecast
| | 2002/03
Forecast
| | 2003/04
Forecast
| | 2004/05
Forecast
| | 2005/06
Forecast
|
|---|
| | ($ million)
|
|---|
| Welfare benefits | | 12,006 | | 12,072 | | 12,385 | | 12,742 | | 13,033 | | 13,406 | | 13,823 | | 14,388 |
| Social rehabilitation & compensation | | 91 | | 70 | | 62 | | 91 | | 103 | | 106 | | 108 | | 110 |
| Departmental expenses | | 654 | | 634 | | 618 | | 649 | | 628 | | 623 | | 622 | | 622 |
| Other non-departmental expenses | | 155 | | 120 | | 151 | | 167 | | 169 | | 173 | | 168 | | 171 |
| | |
| |
| |
| |
| |
| |
| |
| |
|
| Total Social Security and Welfare | | 12,906 | | 12,896 | | 13,216 | | 13,649 | | 13,933 | | 14,308 | | 14,721 | | 15,291 |
| | |
| |
| |
| |
| |
| |
| |
| |
|
Source: The Treasury
Table B.3—New Zealand superannuation and welfare benefits
| | 1998/99
Actual
| | 1999/2000
Actual
| | 2000/01
Actual
| | 2001/02
Forecast
| | 2002/03
Forecast
| | 2003/04
Forecast
| | 2004/05
Forecast
| | 2005/06
Forecast
|
|---|
| | ($ million)
|
|---|
| New Zealand Superannuation | | 5,071 | | 5,068 | | 5,273 | | 5,452 | | 5,621 | | 5,816 | | 6,045 | | 6,388 |
| Domestic Purposes Benefit | | 1,451 | | 1,433 | | 1,444 | | 1,484 | | 1,514 | | 1,550 | | 1,584 | | 1,623 |
| Unemployment Benefit | | 369 | | — | | — | | 1,450 | | 1,460 | | 1,496 | | 1,533 | | 1,580 |
| Community Wage | | 1,486 | | 1,937 | | 1,849 | | — | | — | | — | | — | | — |
| Accommodation Supplement | | 843 | | 867 | | 795 | | 731 | | 759 | | 797 | | 832 | | 872 |
| Invalids Benefit | | 630 | | 677 | | 745 | | 835 | | 905 | | 975 | | 1,040 | | 1,103 |
| Sickness Benefit | | 97 | | — | | — | | 379 | | 403 | | 423 | | 439 | | 451 |
| Disability Allowance | | 204 | | 204 | | 210 | | 224 | | 237 | | 251 | | 265 | | 283 |
| Transitional Retirement Benefit | | 116 | | 125 | | 127 | | 97 | | 54 | | 11 | | — | | — |
| Income Related Rents | | — | | — | | 161 | | 275 | | 286 | | 296 | | 304 | | 313 |
| Family Support | | 912 | | 899 | | 878 | | 879 | | 874 | | 876 | | 878 | | 880 |
| Child Tax Credit | | 164 | | 167 | | 161 | | 168 | | 168 | | 168 | | 169 | | 169 |
| Special Benefit | | 44 | | 35 | | 40 | | 52 | | 64 | | 66 | | 65 | | 65 |
| Benefits paid in Australia | | 146 | | 147 | | 171 | | 163 | | 128 | | 112 | | 100 | | 90 |
| Other benefits | | 473 | | 513 | | 531 | | 553 | | 560 | | 569 | | 569 | | 571 |
| | |
| |
| |
| |
| |
| |
| |
| |
|
| Total Welfare Benefits | | 12,006 | | 12,072 | | 12,385 | | 12,742 | | 13,033 | | 13,406 | | 13,823 | | 14,388 |
| | |
| |
| |
| |
| |
| |
| |
| |
|
Source: The Treasury
Table B.4—Beneficiary numbers
| | 1998/99
Actual
| | 1999/2000
Actual
| | 2000/01
Actual
| | 2001/02
Forecast
| | 2002/03
Forecast
| | 2003/04
Forecast
| | 2004/05
Forecast
| | 2005/06
Forecast
|
|---|
| | (Thousands)
|
|---|
| New Zealand Superannuation | | 464 | | 456 | | 449 | | 448 | | 454 | | 461 | | 470 | | 482 |
| Domestic Purposes Benefit | | 113 | | 111 | | 110 | | 110 | | 110 | | 111 | | 112 | | 113 |
| Unemployment Benefit | | — | | — | | — | | 142 | | 139 | | 140 | | 141 | | 143 |
| Community Wage | | 204 | | 200 | | 189 | | — | | — | | — | | — | | — |
| Accommodation Supplement | | 320 | | 324 | | 297 | | 274 | | 280 | | 286 | | 294 | | 301 |
| Invalids Benefit | | 50 | | 53 | | 58 | | 62 | | 66 | | 70 | | 73 | | 76 |
| Sickness Benefit | | — | | — | | — | | 35 | | 37 | | 38 | | 38 | | 39 |
Source: The Treasury
Table B.5—GSF pension expense
| | 1998/99
Actual
| | 1999/2000
Actual
| | 2000/01
Actual
| | 2001/02
Forecast
| | 2002/03
Forecast
| | 2003/04
Forecast
| | 2004/05
Forecast
| | 2005/06
Forecast
|
|---|
| | ($ million)
|
|---|
| Pension expenses | | 703 | | 679 | | 691 | | 710 | | 597 | | 649 | | 668 | | 703 |
| Revaluation of Unfunded Liability | | 429 | | (201 | ) | 164 | | 38 | | — | | — | | — | | — |
| | |
| |
| |
| |
| |
| |
| |
| |
|
| Total GSF pension expense | | 1,132 | | 478 | | 855 | | 748 | | 597 | | 649 | | 668 | | 703 |
| | |
| |
| |
| |
| |
| |
| |
| |
|
Source: The Treasury
Table B.6—Health
| | 1998/99
Actual
| | 1999/2000
Actual
| | 2000/01
Actual
| | 2001/02
Forecast
| | 2002/03
Forecast
| | 2003/04
Forecast
| | 2004/05
Forecast
| | 2005/06
Forecast
|
|---|
| | ($ million)
|
|---|
| Departmental outputs | | 58 | | 59 | | 116 | | 153 | | 122 | | 118 | | 118 | | 116 |
| Health service purchasing | | 6,107 | | 6,401 | | 6,807 | | 7,021 | | 7,112 | | 7,225 | | 7,321 | | 7,426 |
| Other non-departmental outputs | | 135 | | 121 | | 101 | | 81 | | 82 | | 74 | | 72 | | 72 |
| Health payments to ACC | | 237 | | 264 | | 291 | | 464 | | 447 | | 456 | | 478 | | 500 |
| 2002 Budget Allocation | | — | | — | | — | | — | | 400 | | 800 | | 1,200 | | 1,200 |
| Other expenses | | 36 | | 29 | | 27 | | 78 | | 62 | | 71 | | 75 | | 71 |
| | |
| |
| |
| |
| |
| |
| |
| |
|
| Total Health Expenses | | 6,573 | | 6,874 | | 7,342 | | 7,797 | | 8,225 | | 8,744 | | 9,264 | | 9,385 |
| | |
| |
| |
| |
| |
| |
| |
| |
|
Source: The Treasury
Table B.7—Health service purchasing
| | 1998/99
Actual
| | 1999/2000
Actual
| | 2000/01
Actual
| | 2001/02
Forecast
| | 2002/03
Forecast
| | 2003/04
Forecast
| | 2004/05
Forecast
| | 2005/06
Forecast
|
|---|
| | ($ million)
|
|---|
| Personal health services: | | | | | | | | | | | | | | | | |
| Northern | | 1,452 | | 1,582 | | 1,671 | | — | | — | | — | | — | | — |
| Midland | | 890 | | 936 | | 997 | | — | | — | | — | | — | | — |
| Central | | 1,047 | | 1,104 | | 1,174 | | — | | — | | — | | — | | — |
| Southern | | 1,004 | | 1,015 | | 1,097 | | — | | — | | — | | — | | — |
| Additional elective services | | 70 | | — | | — | | — | | — | | — | | — | | — |
| | |
| |
| |
| |
| |
| |
| |
| |
|
| Total Personal Health | | 4,463 | | 4,637 | | 4,939 | | — | | — | | — | | — | | — |
| | |
| |
| |
| |
| |
| |
| |
| |
|
| Disability support services | | | | | | | | | | | | | | | | |
| Northern | | 495 | | 520 | | 557 | | — | | — | | — | | — | | — |
| Midland | | 303 | | 306 | | 332 | | — | | — | | — | | — | | — |
| Central | | 383 | | 411 | | 428 | | — | | — | | — | | — | | |
| Southern | | 355 | | 410 | | 426 | | — | | — | | — | | — | | — |
| | |
| |
| |
| |
| |
| |
| |
| |
|
| Total Disability Support | | 1,536 | | 1,647 | | 1,743 | | — | | — | | — | | — | | — |
| | |
| |
| |
| |
| |
| |
| |
| |
|
| Payments to District Health Boards | | — | | — | | — | | 5,415 | | 5,473 | | 5,552 | | 5,614 | | 5,719 |
| National Disability Support Services | | — | | — | | — | | 1,374 | | 1,409 | | 1,443 | | 1,477 | | 1,477 |
| Public Health Service Purchasing | | 108 | | 117 | | 125 | | 232 | | 230 | | 230 | | 230 | | 230 |
| | |
| |
| |
| |
| |
| |
| |
| |
|
| Total | | 6,107 | | 6,401 | | 6,807 | | 7,021 | | 7,112 | | 7,225 | | 7,321 | | 7,426 |
| | |
| |
| |
| |
| |
| |
| |
| |
|
Source: The Treasury
Table B.8—Health-related payments to ACC
| | 1998/99
Actual
| | 1999/2000
Actual
| | 2000/01
Actual
| | 2001/02
Forecast
| | 2002/03
Forecast
| | 2003/04
Forecast
| | 2004/05
Forecast
| | 2005/06
Forecast
|
|---|
| | ($ million)
|
|---|
| Petrol excise | | 66 | | 67 | | 67 | | 68 | | 60 | | 60 | | 61 | | 61 |
| Medical treatment | | 171 | | 197 | | 224 | | 396 | | 387 | | 396 | | 417 | | 439 |
| | |
| |
| |
| |
| |
| |
| |
| |
|
| Total | | 237 | | 264 | | 291 | | 464 | | 447 | | 456 | | 478 | | 500 |
| | |
| |
| |
| |
| |
| |
| |
| |
|
Source: The Treasury
Table B.9—Education
| | 1998/99
Actual
| | 1999/2000
Actual
| | 2000/01
Actual
| | 2001/02
Forecast
| | 2002/03
Forecast
| | 2003/04
Forecast
| | 2004/05
Forecast
| | 2005/06
Forecast
|
|---|
| | ($ million)
|
|---|
| Early childhood education | | 294 | | 325 | | 331 | | 356 | | 375 | | 377 | | 378 | | 381 |
| Primary and secondary schools | | 3,147 | | 3,405 | | 3,505 | | 3,684 | | 3,730 | | 3,755 | | 3,758 | | 3,768 |
| Tertiary funding | | 1,843 | | 1,913 | | 2,133 | | 2,303 | | 2,449 | | 2,523 | | 2,579 | | 2,634 |
| Departmental expenses | | 360 | | 396 | | 419 | | 445 | | 432 | | 427 | | 426 | | 428 |
| Other education expenses | | 255 | | 271 | | 302 | | 253 | | 271 | | 252 | | 255 | | 253 |
| | |
| |
| |
| |
| |
| |
| |
| |
|
| Total Education Expenses | | 5,899 | | 6,310 | | 6,690 | | 7,041 | | 7,257 | | 7,334 | | 7,396 | | 7,464 |
| | |
| |
| |
| |
| |
| |
| |
| |
|
Source: The Treasury
Table B.10—Primary and secondary education
| | 1998/99
Actual
| | 1999/2000
Actual
| | 2000/01
Actual
| | 2001/02
Forecast
| | 2002/03
Forecast
| | 2003/04
Forecast
| | 2004/05
Forecast
| | 2005/06
Forecast
|
|---|
| | ($ million)
|
|---|
| Primary | | 1,624 | | 1,731 | | 1,780 | | 1,860 | | 1,870 | | 1,870 | | 1,855 | | 1,849 |
| Secondary | | 1,155 | | 1,312 | | 1,333 | | 1,315 | | 1,349 | | 1,373 | | 1,391 | | 1,407 |
| School transport | | 93 | | 100 | | 106 | | 110 | | 113 | | 114 | | 115 | | 115 |
| Special needs support | | 275 | | 262 | | 286 | | 291 | | 291 | | 293 | | 293 | | 293 |
| Professional Development | | — | | — | | — | | 92 | | 91 | | 89 | | 88 | | 88 |
| Schooling Improvement | | — | | — | | | | 16 | | 16 | | 16 | | 16 | | 16 |
| | |
| |
| |
| |
| |
| |
| |
| |
|
| Total Schools Funding | | 3,147 | | 3,405 | | 3,505 | | 3,684 | | 3,730 | | 3,755 | | 3,758 | | 3,768 |
| | |
| |
| |
| |
| |
| |
| |
| |
|
| Places (year) | | 1999 | | 2000 | | 2001 | | 2002 | | 2003 | | 2004 | | 2005 | | 2006 |
| Primary | | 466,500 | | 465,863 | | 463,000 | | 459,000 | | 454,000 | | 448,000 | | 446,000 | | 443,000 |
| Secondary | | 248,800 | | 249,905 | | 251,000 | | 254,000 | | 260,000 | | 267,400 | | 272,000 | | 274,000 |
Sources: Ministry of Education, The Treasury
Table B.11—Tertiary education
| | 1998/99
Actual
| | 1999/2000
Actual
| | 2000/01
Actual
| | 2001/02
Forecast
| | 2002/03
Forecast
| | 2003/04
Forecast
| | 2004/05
Forecast
| | 2005/06
Forecast
|
|---|
| | ($ million)
|
|---|
| Tuition | | 1,236 | | 1,219 | | 1,362 | | 1,506 | | 1,542 | | 1,575 | | 1,598 | | 1,615 |
| Other tertiary funding | | 128 | | 161 | | 153 | | 184 | | 204 | | 205 | | 206 | | 206 |
| | |
| |
| |
| |
| |
| |
| |
| |
|
| Total Tertiary Education and Training | | 1,364 | | 1,380 | | 1,515 | | 1,690 | | 1,746 | | 1,780 | | 1,804 | | 1,821 |
| | |
| |
| |
| |
| |
| |
| |
| |
|
| Tertiary student allowances | | 378 | | 376 | | 391 | | 417 | | 447 | | 464 | | 478 | | 492 |
| Student loan provision and write-offs | | 101 | | 157 | | 227 | | 196 | | 256 | | 279 | | 297 | | 321 |
| | |
| |
| |
| |
| |
| |
| |
| |
|
| Total Tertiary Funding | | 1,843 | | 1,913 | | 2,133 | | 2,303 | | 2,449 | | 2,523 | | 2,579 | | 2,634 |
| | |
| |
| |
| |
| |
| |
| |
| |
|
| Places (year) | | 1999 | | 2000 | | 2001 | | 2002 | | 2003 | | 2004 | | 2005 | | 2006 |
| EFT Students | | 169,469 | | 175,166 | | 192,000 | | 199,000 | | 205,000 | | 209,000 | | 211,000 | | 214,000 |
Sources: Ministry of Education, The Treasury
Table B.12—Core government services
| | 1998/99
Actual
| | 1999/2000
Actual
| | 2000/01
Actual
| | 2001/02
Forecast
| | 2002/03
Forecast
| | 2003/04
Forecast
| | 2004/05
Forecast
| | 2005/06
Forecast
|
|---|
| | ($ million)
|
|---|
| Official development assistance | | 204 | | 219 | | 226 | | 227 | | 227 | | 227 | | 227 | | 227 |
| Indemnity and guarantee expenses | | (28 | ) | 10 | | 253 | | — | | — | | — | | — | | — |
| Departmental expenses | | 892 | | 867 | | 901 | | 973 | | 946 | | 924 | | 918 | | 950 |
| Science expenses | | 405 | | 424 | | 247 | | 254 | | 257 | | 257 | | 258 | | 258 |
| Other expenses | | 232 | | 190 | | 190 | | 157 | | 140 | | 131 | | 142 | | 140 |
| | |
| |
| |
| |
| |
| |
| |
| |
|
| Total Core Government Services | | 1,705 | | 1,710 | | 1,817 | | 1,611 | | 1,570 | | 1,539 | | 1,545 | | 1,575 |
| | |
| |
| |
| |
| |
| |
| |
| |
|
Source: The Treasury
Table B.13—Law and order
| | 1998/99
Actual
| | 1999/2000
Actual
| | 2000/01
Actual
| | 2001/02
Forecast
| | 2002/03
Forecast
| | 2003/04
Forecast
| | 2004/05
Forecast
| | 2005/06
Forecast
|
|---|
| | ($ million)
|
|---|
| Departmental expenses: | | | | | | | | | | | | | | | | |
| Police | | 708 | | 762 | | 724 | | 773 | | 803 | | 773 | | 774 | | 774 |
| Ministry of Justice | | 11 | | 12 | | 13 | | 15 | | 15 | | 14 | | 14 | | 15 |
| Department of Corrections | | 324 | | 328 | | 369 | | 390 | | 384 | | 388 | | 383 | | 376 |
| Department for Courts | | 206 | | 174 | | 181 | | 184 | | 177 | | 177 | | 177 | | 177 |
| Other departments | | 99 | | 65 | | 67 | | 68 | | 68 | | 68 | | 68 | | 68 |
| | |
| |
| |
| |
| |
| |
| |
| |
|
| Total Departments | | 1,348 | | 1,341 | | 1,354 | | 1,430 | | 1,447 | | 1,420 | | 1,416 | | 1,410 |
| | |
| |
| |
| |
| |
| |
| |
| |
|
| Non-departmental outputs | | 114 | | 150 | | 177 | | 199 | | 190 | | 185 | | 194 | | 190 |
| Other expenses | | 37 | | 40 | | 29 | | 108 | | 50 | | 56 | | 47 | | 50 |
| | |
| |
| |
| |
| |
| |
| |
| |
|
| Total Law and Order Expenses | | 1,499 | | 1,531 | | 1,560 | | 1,737 | | 1,687 | | 1,661 | | 1,657 | | 1,650 |
| | |
| |
| |
| |
| |
| |
| |
| |
|
Source: The Treasury
Table B.14—Defence
| | 1998/99
Actual
| | 1999/2000
Actual
| | 2000/01
Actual
| | 2001/02
Forecast
| | 2002/03
Forecast
| | 2003/04
Forecast
| | 2004/05
Forecast
| | 2005/06
Forecast
|
|---|
| | ($ million)
|
|---|
| NZDF Core expenses | | 986 | | 996 | | 1,058 | | 1,072 | | 1,072 | | 1,085 | | 1,084 | | 1,084 |
| NZDF write-offs | | 5 | | 77 | | 104 | | — | | — | | — | | — | | — |
| NZDF East Timor deployment | | — | | 22 | | 22 | | 20 | | — | | — | | — | | — |
| DWI East Timor deployment | | — | | 17 | | 22 | | 20 | | — | | — | | — | | — |
| Other departments | | 31 | | 51 | | 36 | | 36 | | 33 | | 32 | | 33 | | 33 |
| GST on defence acquistions | | 8 | | 84 | | 25 | | 14 | | 52 | | 40 | | — | | — |
| | |
| |
| |
| |
| |
| |
| |
| |
|
| Total Defence Expenses | | 1,030 | | 1,247 | | 1,267 | | 1,162 | | 1,157 | | 1,157 | | 1,117 | | 1,117 |
| | |
| |
| |
| |
| |
| |
| |
| |
|
Source: The Treasury
Table B.15—Transport and communications
| | 1998/99
Actual
| | 1999/2000
Actual
| | 2000/01
Actual
| | 2001/02
Forecast
| | 2002/03
Forecast
| | 2003/04
Forecast
| | 2004/05
Forecast
| | 2005/06
Forecast
|
|---|
| | ($ million)
|
|---|
| Transfund | | 880 | | 903 | | 890 | | 961 | | 986 | | 1,010 | | 1,038 | | 1,063 |
| Departmental outputs | | 71 | | 70 | | 75 | | 82 | | 80 | | 80 | | 80 | | 80 |
| Other non-departmental expenses | | 61 | | 57 | | 52 | | 56 | | 54 | | 54 | | 54 | | 54 |
| Other expenses | | 17 | | 6 | | 9 | | 4 | | 5 | | 5 | | 7 | | 6 |
| | |
| |
| |
| |
| |
| |
| |
| |
|
| Total Transport and Communications | | 1,029 | | 1,036 | | 1,026 | | 1,103 | | 1,125 | | 1,149 | | 1,179 | | 1,203 |
| | |
| |
| |
| |
| |
| |
| |
| |
|
Source: The Treasury
Table B.16—Economic and industrial
| | 1998/99
Actual
| | 1999/2000
Actual
| | 2000/01
Actual
| | 2001/02
Forecast
| | 2002/03
Forecast
| | 2003/04
Forecast
| | 2004/05
Forecast
| | 2005/06
Forecast
|
|---|
| | ($ million)
|
|---|
| Departmental outputs | | 450 | | 374 | | 422 | | 437 | | 423 | | 418 | | 414 | | 414 |
| Employment initiatives | | 166 | | 209 | | 204 | | 247 | | 252 | | 268 | | 228 | | 228 |
| Non-departmental outputs | | 176 | | 198 | | 423 | | 445 | | 468 | | 468 | | 469 | | 469 |
| Other expenses | | 66 | | 163 | | 92 | | 129 | | 119 | | 113 | | 114 | | 112 |
| | |
| |
| |
| |
| |
| |
| |
| |
|
| Total Economic and Industrial Services | | 858 | | 944 | | 1,141 | | 1,258 | | 1,262 | | 1,267 | | 1,225 | | 1,223 |
| | |
| |
| |
| |
| |
| |
| |
| |
|
Source: The Treasury
Table B.17—Employment initiatives
| | 1998/99
Actual
| | 1999/2000
Actual
| | 2000/01
Actual
| | 2001/02
Forecast
| | 2002/03
Forecast
| | 2003/04
Forecast
| | 2004/05
Forecast
| | 2005/06
Forecast
|
|---|
| | ($ million)
|
|---|
| Training benefit (including tax) | | 22 | | — | | — | | — | | — | | — | | — | | — |
| Training incentive allowance | | 30 | | 35 | | 36 | | 45 | | 43 | | 43 | | 43 | | 43 |
| Community employment projects | | 15 | | 18 | | 17 | | 22 | | 22 | | 19 | | 19 | | 19 |
| Subsidised work | | 77 | | 103 | | 95 | | 118 | | 131 | | 149 | | 109 | | 109 |
| Employment support for disabled | | 17 | | 50 | | 53 | | 60 | | 53 | | 55 | | 55 | | 55 |
| Other employment assistance schemes | | 5 | | 3 | | 3 | | 2 | | 3 | | 2 | | 2 | | 2 |
| | |
| |
| |
| |
| |
| |
| |
| |
|
| Total Employment Initiative Expenses | | 166 | | 209 | | 204 | | 247 | | 252 | | 268 | | 228 | | 228 |
| | |
| |
| |
| |
| |
| |
| |
| |
|
Source: The Treasury
Table B.18—Primary services
| | 1998/99
Actual
| | 1999/2000
Actual
| | 2000/01
Actual
| | 2001/02
Forecast
| | 2002/03
Forecast
| | 2003/04
Forecast
| | 2004/05
Forecast
| | 2005/06
Forecast
|
|---|
| | ($ million)
|
|---|
| Departmental expenses | | 233 | | 182 | | 194 | | 220 | | 201 | | 197 | | 195 | | 195 |
| Non-departmental outputs | | 68 | | 63 | | 69 | | 93 | | 95 | | 98 | | 99 | | 98 |
| Other expenses | | 33 | | 20 | | 24 | | 24 | | 21 | | 8 | | 8 | | 8 |
| | |
| |
| |
| |
| |
| |
| |
| |
|
| Total Primary Services Expenses | | 334 | | 265 | | 287 | | 337 | | 317 | | 303 | | 302 | | 301 |
| | |
| |
| |
| |
| |
| |
| |
| |
|
Source: The Treasury
Table B.19—Heritage, culture and recreation
| | 1998/99
Actual
| | 1999/2000
Actual
| | 2000/01
Actual
| | 2001/02
Forecast
| | 2002/03
Forecast
| | 2003/04
Forecast
| | 2004/05
Forecast
| | 2005/06
Forecast
|
|---|
| | ($ million)
|
|---|
| Community grants | | 20 | | 18 | | 18 | | 6 | | 6 | | 6 | | 6 | | 6 |
| Departmental outputs | | 208 | | 199 | | 206 | | 224 | | 222 | | 224 | | 228 | | 228 |
| Non-departmental outputs | | 70 | | 158 | | 181 | | 209 | | 211 | | 245 | | 263 | | 273 |
| Other expenses | | 18 | | 81 | | 19 | | 56 | | 26 | | 28 | | 28 | | 28 |
| | |
| |
| |
| |
| |
| |
| |
| |
|
| Total Heritage, Culture and Recreation | | 316 | | 456 | | 424 | | 495 | | 465 | | 503 | | 525 | | 535 |
| | |
| |
| |
| |
| |
| |
| |
| |
|
Source: The Treasury
Table B.20—Housing and community development
| | 1998/99
Actual
| | 1999/2000
Actual
| | 2000/01
Actual
| | 2001/02
Forecast
| | 2002/03
Forecast
| | 2003/04
Forecast
| | 2004/05
Forecast
| | 2005/06
Forecast
|
|---|
| | ($ million)
|
|---|
| Housing subsidies | | 1 | | 1 | | — | | 21 | | 21 | | 21 | | 19 | | 19 |
| Departmental outputs | | 29 | | 27 | | 35 | | 52 | | 51 | | 52 | | 50 | | 50 |
| Other non-departmental expenses | | 11 | | 40 | | 15 | | 19 | | 15 | | 13 | | 13 | | 13 |
| | |
| |
| |
| |
| |
| |
| |
| |
|
| Total Housing and Community Development | | 41 | | 68 | | 50 | | 92 | | 87 | | 86 | | 82 | | 82 |
| | |
| |
| |
| |
| |
| |
| |
| |
|
Source: The Treasury
Glossary of Terms
ACC unfunded liability
The future cost of past ACC claims, less the asset reserves held to meet these claims. The ACC outstanding claims obligation is the gross liability of the future cost of past ACC claims.
Baselines
The level of funding approved for any given spending area (eg, Education). All amounts within baselines are included in the forecasts.
Capital provision
An amount provided in the forecasts to represent the balance sheet impact of capital initiatives expected to be introduced over the forecast period.
Contingent liability
Contingent liabilities are costs which the Crown will have to face if a particular event occurs. Typically, contingent liabilities consist of guarantees and indemnities, legal disputes and claims, and uncalled capital.
Corporate tax
The sum of net company tax, non-resident withholding tax (NRWT) and foreign dividend withholding payments (FDWP).
Current account
A measure of the flows of income between New Zealand and the rest of the world. A net inflow to New Zealand is a current account surplus, while a net outflow is a deficit. The current account balance is usually expressed as a percentage of GDP (see below), rather than a dollar amount.
Customs duty
Duty levied on the imports of certain goods.
Cyclically adjusted or structural fiscal balance
An estimate of the operating balance adjusted for short-term fluctuations of actual GDP around the productive potential of the economy. The estimate provides a picture of the underlying trend fiscal position and an indication of the effects of policy decisions. Because it is based on a number of assumptions and is sensitive to new information, the estimate is subject to some uncertainty. Trends in the cyclically adjusted balance are, however, more reliable.
Demographic changes
Changes to structure of the population, for example the age, sex or ethnic make-up of the population.
Domestic bond programme
The amount of new government stock (taking into account the repayment of maturing government stock) expected to be issued over the financial year to fund the Government's cash flow requirements.
Excise duties
Tax levied on the domestic production of alcohol, tobacco and light petroleum products (CNG, LPG and petrol).
Financial assets
Either cash or shares (equity) or a right to receive a financial instrument, which can be converted to cash (see net Crown debt).
Fiscal allowance
The amount included in the Fiscal Strategy Report and Budget Policy Statement projections for Government decisions on new spending and cost pressures.
Fiscal provisions
A system used by the Government to record the cost of policy decisions. The framework distinguishes situations where the Government is able to control the cost from those that are beyond immediate control (eg, tax forecasts). The fiscal provision is used to measure the aggregate cost of policy initiatives against the limits for operating and capital policies (which are referred to as the provision for future initiatives and capital provision).
Fringe benefit tax (FBT)
Tax levied on non-cash benefits provided to employees as part of remuneration packages.
Gross Crown debt
Total borrowings (financial liabilities).
Gross domestic product (GDP)
A measure of the value of all goods and services produced in New Zealand; changes in GDP measure growth in economic activity or output. GDP can be measured as the actual dollar value of goods and services measured at today's prices (nominal GDP), or excluding the effects of price changes over time (real GDP).
Gross domestic product (expenditure)
This is the sum of total final expenditures on goods and services in the economy.
Gross national expenditure (GNE)
Measures total expenditure on goods and services by New Zealand residents.
Labour productivity
Measures output per input of labour (where labour inputs might be measured as hours worked or people).
Marketable securities and deposits
Assets held with financial institutions. These assets are held for both cash flow and investment purposes, and include any funds the Government has invested in the International Monetary Fund.
Monetary conditions
The combination of short-term interest rates and the exchange rate. Tightening monetary conditions refers to actions taken by the Reserve Bank to raise interest rates (which also influences the exchange rate) in order to moderate demand pressures to reduce inflationary pressures.
Monetary policy
Action taken by the Reserve Bank to affect interest rates and the exchange rate in order to control inflation.
Net Crown debt
Borrowings (financial liabilities) less cash and bank balances, marketable securities and deposits, and advances (financial assets). Net debt excludes the assets of the NZS Fund.
Net worth
Assets less liabilities (also referred to as Crown balance).
Objectives (long-term)
The Government's long-term goals for operating expenses, operating revenue, the operating balance, debt and net worth, as required by the Fiscal Responsibility Act 1994. The objectives must be consistent with the principles of responsible fiscal management outlined in the Act.
Operating balance
The operating balance is the residual of revenues less expenses plus surpluses from state-owned enterprises and Crown entities. It is the Government's profit or loss.
Operating balance excluding revaluation and accounting policy changes (OBERAC)
The OBERAC is the operating balance adjusted for revaluation movements and accounting policy changes. It provides a measure of underlying stewardship.
Participation rate
Measures the percentage of the working age population in work or actively looking for work.
Projections
Tracks of the key fiscal indicators for a further five years beyond the five-year forecast period. The tracks are based on long-run economic assumptions and current fiscal policy settings. For example, the projections assume no economic cycle with constant long-run interest rate, inflation rate and unemployment assumptions.
Provision for future initiatives
An amount included in the forecasts to provide for the operating balance impact of policy initiatives expected to be introduced over the forecast period. This represents the remaining fiscal provision of the Government not yet allocated to initiatives.
Provisional tax
A thrice-yearly payment of tax on income that has not been taxed, or been under-taxed, at source (relates only to company tax and other persons' tax).
Scenarios
Tracks of the key fiscal indicators based on long-run economic and fiscal assumptions. For example growth in expense categories reflects the sum of the change in the appropriate population cohort, inflation and a real growth factor (to reflect rising real wages and technology costs).
Short-term intentions
In the Budget Policy Statement the Government must, under the Fiscal Responsibility Act 1994, indicate explicitly its planned track for operating expenses, operating revenues, the operating balance, debt and net worth over the Government's planning horizon (defined as the two financial years following the current financial year).
Source deductions
Tax withheld on wages, salaries, social welfare benefits, bonuses, lump-sum payments and superannuation fund contributions. About 80% of source deductions come from PAYE on wages and salaries. Source deductions is the biggest single tax type.
Specific fiscal risks
These are a category of Government decisions or circumstances which may have a material impact on the fiscal position (excluding contingent liabilities). They are not included in the main forecasts because their fiscal impact cannot be reasonably quantified, the likelihood of realisation is uncertain and/or the timing is uncertain.
Stock change
The change in the value of stocks (raw materials, work in progress, and finished goods) during a given period.
System of National Accounts (SNA)
SNA is a comprehensive, consistent and flexible set of macroeconomic accounts to meet the needs of government and private sector analysts, policy-makers, and decision-takers. See www.imf.org for further information.
Tax revenue
The accrual, rather than the cash ("tax receipts") measure of taxation. It is a measure of tax due, regardless of whether or not it has actually been paid.
Trade weighted index (TWI)
A measure of movements in the New Zealand dollar against the currencies of our major trading partners. The currencies comprise the US dollar, the Australian dollar, the Japanese yen, the euro and the UK pound.
Unit labour costs
The wages and other costs associated with employment per unit of output.
Year ended
Graphs and tables use different expressions of the timeframe. For example, 2000/01 or 2001 will generally mean "year ended 30 June" unless otherwise stated.
QuickLinks
December Economic and Fiscal UpdateStatement of Responsibility1 Economic and Fiscal Overview2 Economic Outlook3 Fiscal Outlook4 Risks and Scenarios5 Specific Fiscal RisksGenerally Accepted Accounting Practice (GAAP) Series TablesAnnex A: Tax Revenue TablesAnnex B: Expense TablesGlossary of Terms