QuickLinks -- Click here to rapidly navigate through this document
EXHIBIT 99.5
budget
2002
BUDGET SPEECH
EXHIBIT 99.5(E)(1)
FISCAL STRATEGY REPORT
EXHIBIT 99.5(E)(2)
ECONOMIC AND FISCAL UPDATE
EXHIBIT 99.5(E)(3)
23 May 2002
Hon Dr Michael Cullen
Treasurer
Minister of Finance
ISBN 0-478-11829-5
© Crown Copyright Reserved
ISBN 0-478-11829-5
Typeset by The Treasury
Printed and bound by PrintLink
(A division of Blue Star Print Group Ltd)
Wellington
Internet
This document will be made available on the New Zealand Treasury's Internet site.
The URL for this site is http://www.treasury.govt.nz
Contents
| | | |
| Budget Speech | | |
Fiscal Strategy Report |
|
|
| | Fiscal policy overview | | |
| | A coherent approach to fiscal, economic and social policy | | |
| | A solid foundation for the next parliamentary term | | |
| | Longer-term fiscal objectives on target | | |
| | Conclusion: On track looking forward | | |
| | Annex 1: Short-term fiscal intentions | | |
| | Annex 2: Long-term fiscal objectives | | |
| | Annex 3: Assumptions used in the forecasts and projections | | |
| | Annex 4: Full line-by-line consolidation | | |
Budget Economic and Fiscal Update |
|
|
| | Statement of Responsibility | | |
| | Economic and Fiscal Overview | | |
| | | Economic Outlook | | |
| | | Fiscal Outlook | | |
| |
Economic Outlook |
|
|
| | | Short-term Outlook | | |
| | | Longer-term Outlook—2003/04 and Beyond | | |
| |
Fiscal Outlook |
|
|
| | | Introduction | | |
| | | Tax Revenue | | |
| | | Expenses | | |
| | | SOE and Crown Entity Surpluses | | |
| | | Influences on Net Worth and Debt | | |
| | | Operating Balance Changes Since the December Update | | |
| | | Fiscal Indicators—Comparison with December Update | | |
| | | Budget Policy Decisions | | |
| | | Capital Provisions | | |
| | | Forecast Future New Spending Past 2002/03 | | |
| | | New Zealand Superannuation Fund Contributions | | |
| | | Full Line-by-Line Consolidation | | |
| |
Risks and Scenarios |
|
|
| | | Introduction | | |
| | | Economic Risks | | |
| | | Economic Scenarios | | |
| | | Fiscal Scenarios | | |
| | | Fiscal Sensitivities | | |
| |
Specific Fiscal Risks |
|
|
| | | Introduction | | |
| | | Contingent Liabilities | | |
| | | Specific Fiscal Risks | | |
| | Generally Accepted Accounting Practice (GAAP) Series Tables | | |
| | | Forecast Financial Statements | | |
| | | Reporting Entity as at 10 May 2002 | | |
| | | Statement of Accounting Policies and Forecast Assumptions | | |
| | | Changes in Accounting Policies | | |
| | | Notes to the Forecast Financial Statements | | |
| | | GAAP Tables—Line-by-Line Consolidation | | |
| | | Annex A: Tax Revenue Tables | | |
| | | Annex B: Expense Tables | | |
| | | Glossary of Terms | | |
EXHIBIT 99.5(E)(1)
budget
2002
BUDGET SPEECH
Hon Dr Michael Cullen
TREASURER
MINISTER OF FINANCE
23 May 2002
Budget Speech
Mr Speaker, I move that the Appropriations (2002/2003 Estimates) Bill be now read a second time.
Budget 2002 represents the completion of the fiscal aspects of the programme announced in the Speech from the Throne at the start of this Parliament. It is, therefore, appropriate in presenting this Budget to look back over the last two and a half years as well as to look forward to the framework for growth and innovation which will help drive the lifting of New Zealand's long-term economic performance.
On entering office, the Labour-Alliance Government made it clear that it had certain key policy commitments which it was determined to implement quickly to keep faith with the electorate. This would require significant front-end loading of expenditure during the parliamentary term. A counting limit for the period of $5.9 billion was initially set, and was raised to $6.125 billion in Budget 2001. That revised counting limit has been adhered to in Budget 2002 with net new spending totalling $6.124 billion, excluding some limited spending on new security measures arising out of the events of last September.
The most important commitments that drove that front-end loading were related to New Zealand Superannuation, income-related state housing rents, and tertiary student loans and fees.
With respect to New Zealand Superannuation, the previous National Government had determined to lower the wage-relativity floor from the 65 percent base relativity level set in the 1993 multiparty accord to 60 percent. Restoration of that level to 65 percent by the present Government will cost some $684 million during the period over which the counting limit applies. The result is that a married couple on New Zealand Superannuation is now receiving $21 more a week than would have been the case under the policies we inherited.
The restoration of income-related rents for state housing has cost an estimated $257 million over the same period. The Government regards this as quality expenditure. It has significantly increased the disposable income of many low-income households as well as exerting some downwards pressure on rental prices at the lower end of the housing market.
Finally, the abolition of interest payments on student loans while students are still in full-time study, other changes to the loans scheme, and funding to enable tertiary fees to be held at constant levels instead of the large annual increases to which students had been subjected have a fiscal cost of $490 million over the same period.
These three key elements, which contribute to social equity, economic development and a restoration of faith in the integrity of government, thus account for nearly a quarter of the total net new spending of $6.124 billion. The remainder, $4.7 billion, represents a tight net new expenditure level for all other priorities.
This emphasises how sound and prudent the Government's fiscal management has been. At the beginning of this term of office, in the March 2000 Budget Policy Statement, I forecast that Government spending would be 33.5 percent of GDP in the 2002/03 year that this Budget covers. The actual estimate of spending for 2002/03 is 33 percent of GDP. Gross debt was forecast to be 30 percent of GDP and net debt 18.9 percent. Gross debt is now estimated at 28.6 percent and net debt 16.8 percent.
Thus, despite the concerns expressed by many at the start of the Government's first term in office that expenditure would not be well managed, it has been and within sound parameters. There has been but one modest increase in the counting limit, and that was to cater for unavoidable pressures associated with preserving our national and regional security.
The Government is clearly on track to meet the operating balance and debt goals that it has set for the term. Indeed the operating balances now forecast are stronger than previously anticipated. The operating outturn for the 2001/02 year is now expected to be an operating surplus of $2.6 billion. The more meaningful measure, the Operating Balance Excluding Revaluations and Accounting Changes, is estimated for 2001/02 at $2.3 billion. This is more than adequate to cover the transfer into the New Zealand Superannuation Fund of $600 million in the current year.
For the fiscal year 2002/03 the operating balance is forecast to be $2.3 billion compared with the transfer into the Fund of $1.2 billion. For the outyears the operating balances forecast are $3.1 billion and $3.9 billion compared with Fund transfers of $1.8 billion and $2 billion.
The Government will, therefore, be placing New Zealand in a much stronger position for the future. Net Crown debt is forecast to be around 17 percent of GDP at 30 June 2003 and around 15.5 percent at 30 June 2006. The accumulated assets in the New Zealand Superannuation Fund will be $1.9 billion or 1.5 percent of GDP at 30 June 2003 and $8.9 billion or 6.3 percent of GDP at 30 June 2006.
Consequently, net debt minus the Super Fund assets will, at the end of the forecast period, be down to 9.3 percent of GDP. It will continue to fall rapidly thereafter with the surplus in the Fund forecast to equal net debt by 2009/10.
The Government set itself responsible but tough fiscal goals on assuming office. It has met them and provided for the future in a way which no previous New Zealand Government has. We could be fiscally feckless now—governments have always found that to be an easy option—but only at the cost of substantially increased future fiscal strain.
Mr Speaker, by far the single largest item of increased expenditure is Vote Health. In each of the next three years $400 million is being added cumulatively to health expenditure, to a total of $2.4 billion. This is in addition to baseline adjustments for demographic change, which average around $100 million a year. It is also in addition to special funding of $149 million spread over the next three years (with the bulk allocated for 2003/04) to provide for meningococcal vaccination to deal with the scourge which has afflicted so many young New Zealanders in particular, in recent years.
The major increase in Vote Health is an additional $1,220 million over the next three years for district health boards. But the Government lays greater stress on the significance of the $410 million that has been set aside for the progressive implementation of its Primary Health Care Strategy.
With other factors pushing health expenditure, the result is that forecast Vote Health operating expenditure rises from $7.4 billion in 2001/02 to $7.9 billion in 2002/03, $8.5 billion in 2003/04, and $8.9 billion in 2004/05.
To put it another way, total health expenditure has risen from 5.2 percent of GDP in 1989/90 to 6.4 percent in 1999/2000 and is expected to be 6.8 percent in 2004/05. As a proportion of government spending it is forecast to have gone from 13.9 percent to 21 percent over the same period.
This strong upward trend is not matched in any other major area of government expenditure during this period. It is driven by a continuation of circumstances such as the ageing of the population and the availability of new surgical procedures and new pharmaceuticals.
Clearly there is a limit to the extent to which Vote Health can grow much faster than nominal GDP without placing excessive fiscal pressure on future governments. In this period, it is crucial that those in the health sector understand that the building into the expenditure baseline of substantial increases does not represent an opening bid to which they may respond with higher bids. The sector and the Government will need to cooperate to ensure spending is kept within the forecast path.
Internationally, there is generally a very close relationship between GDP per capita and the proportion of GDP spent on health per head. New Zealand is, and has been for some years, pretty well exactly on the trend line. On the basis of current projections the health funding path will keep us there.
Mr Speaker, from this two conclusions flow. The first is that to increase substantially the proportion of GDP spent on health we will need to lift our sustainable growth rate beyond the rate to which we have been accustomed, and which is still embedded in current long-term forecasts. The second is that our capacity to do that will not be assisted by excessive growth in expenditure which squeezes out opportunities for contributing directly to economic development.
Budget 2002 reflects the new commitment that this Government has brought to assisting economic development. This was signalled in Budget 2000 with the initial funding for Industry New Zealand.
The growth and innovation framework, released in February, marked a further stage in this reorientation of the role of government away from that of simply being a neutral referee disinterested in the outcome. For it is on the outcome that our social and economic fortunes depend.
The growth and innovation framework does not envisage yet another bout of theory-driven restructuring. It sets out a comprehensive programme aimed at lifting our game and raising our sustainable growth rate through innovation. Innovation, however, transforms at the margin. It is no substitute for, and indeed relies on, a strengthening of our economic foundations.
The framework is different in two crucial respects. It does not simply place the emphasis on economic results, with social dividends to flow at a future undefined time when they can be afforded. It lays out a pathway where social development and environmental protection not only rank alongside economic growth, but become agents of that growth. It thus expresses this Government's firm commitment to sustainable economic development.
Secondly, it blends the vertical and horizontal dimensions of change.
The vertical dimension can be seen as a chain of innovation. In order for innovation to take place routinely and often, we cannot have missing links or weak links in the chain. It starts with the basic ideas that will eventually underpin new enterprises and industries. Ideas have to be nurtured through appropriate support systems, in order to convert them into profitable enterprises.
Production has to be funded and marketed. We need to fill any gaps that might exist or emerge in the venture capital market, encourage an inflow of foreign direct investment to leverage the potential of the embryonic industries, and expand market opportunities by both forging new trading partnerships and exploiting the full potential of those that already exist. In doing this, we intend to use the network of talented and well connected Kiwis who reside abroad to tap ideas, sources of capital and market opportunities. Highly skilled people have to be available to supply the needs of an increasingly sophisticated economic system, and so education, training and immigration policies need to be recalibrated around the requirements of an innovative culture.
On the horizontal level, we recognise that there are advantages of environment and national aptitude and attitude that need special attention if we are to deepen activity and avoid too thin a spread of activity. There is no point in a focus on an area of advantage unless it is also an area where the potential of the global market coincides with the potential of New Zealand to sell into it.
We have identified three areas where there is a good fit: biotechnology, information and communications technology, and creative industries. It is important to stress that we are not trying to pick industries as winners. Innovative advances in these areas have the potential to complement each other and to thicken value added in a number of industries that use the technologies. They are sectoral competencies that have multi-industry applications.
In constructing Budget 2002, Cabinet agreed that economic transformation, the process of implementing the growth and innovation framework, should be one of three priorities along with health and education. Indeed, a good part of the resources flowing to education are central to that transformation, which will not be sustained except with an increase in the quality and quantity of human capital.
Budget 2002 forecasts solid, sustained growth over the current year and the two following, averaging 3 percent. This will put New Zealand growth rates in the top half of the OECD over this period should present forecasts translate into reality.
This is consistent with New Zealand performing at the upper end of its presently assumed 3 percent sustainable growth rate. There is now a broad consensus that there is a need to lift that sustainable growth rate, in the first instance to somewhere around the 4 percent mark if we are to see a long-term rise in our standard of living relative to the rest of the developed world. There is far less consensus about the means to achieve that lift in performance.
In achieving such a consensus we need to recognise three facts which are all too often ignored. The first is that New Zealand's long-term growth performance has been by no means calamitous. The absolute standard of living of the average New Zealander is far higher than it was some 50 years ago. This is reflected in such key indices as life expectancy, infant mortality, and ownership of a wide range of key consumer goods. New Zealand has not seen a declining standard of living: its growth has simply not been as fast as in some other countries. This should serve to avoid the bouts of panic which sometimes seem to afflict at least some commentators.
The second fact which must be recognised is that this long-term underperformance—for such is its real nature—is due to a complex interrelationship of factors which do not lend themselves to simplistic bumper sticker solutions.
The third fact is that there is little evidence to support what are sometimes portrayed as the key reasons for that underperformance and therefore the guides to its improvement.
The most frequently asserted of these is the contention that New Zealand is highly taxed by developed country standards. This assertion usually rests upon a misrepresentation, wilful or otherwise, of the comparative tax rates and structures of different countries. New Zealand is highly unusual in having very little by way of social security taxes or levies on either individuals or businesses. Even in comparison with Australia, with its Medicare levies and compulsory superannuation payments, this can give a very misleading picture if comparisons are made without taking all such factors into account.
That New Zealanders themselves make such comparisons to the detriment of our image overseas in order to support partisan arguments domestically is a sad commentary on our inability to deal rationally with taxation issues.
A recent Economist article compared the total cost to business of corporate taxes, social security levies, local body rates, and excise duties. In the six countries studied the total burden varied from 9.5 percent of GDP (for the USA) to 19 percent of GDP (for France). The comparative figure for New Zealand is about 7 percent of GDP.
A more broadly based study of the tax wedge on labour carried out by the OECD showed that New Zealand had the third lowest tax wedge out of 29 OECD nations. Only Korea and Mexico had lower figures. The New Zealand figure was less than half of that of 15 of the OECD nations.
Thirdly, tax plus our only social security levy, ACC contributions, for a single person on the average full-time wage represents about 20.5 percent of gross income in New Zealand. This is lower than 12 out of 15 countries in another recent Economist study.
Finally, New Zealand has more experience of the effects of major cuts to tax rates than almost any other developed nation in the last 15 years or so. Significant cuts to personal taxes in 1986, 1988, 1996 and 1998 and a massive cut to the corporate tax rate in 1988 all failed to lift the sustainable growth rate.
There are significant revenue losses that result from tax cuts, with consequential pressure on either expenditure or the Government's operating balance. Therefore, the onus of proof rests upon the proponents of such cuts to demonstrate that they will lead to anything other than the unsustainable and inflationary lift in the growth rate that would come from any fiscal loosening. So far their failure to do anything more than offer repeated assertions is apparent to the great majority of New Zealanders.
There is very little point in taking bold steps in the wrong direction. This is not to say that there are not ways in which addressing problems in the tax system can contribute to improving economic efficiency and performance.
The Government has given particular priority to simplifying the tax system, especially for small to medium-sized enterprises. We have been tackling the issue on two fronts—the policy front and the operational front.
Inland Revenue is reviewing its operations so as to provide better services to taxpayers targeted at the specific needs of different industries and variations over time in those needs.
On the policy side, the Government moved quickly to legislate clear laws in the priority areas identified by the private sector. This included clarifying the tax treatment of expenditure on research and development and removing complex rules on company interest deductions.
Tax legislation now in front of Parliament includes further major areas of simplification. They include clarification on over- and underpayments, reducing the number of taxpayers exposed to use-of-money interest and allowing the pooling of tax payments.
We will be doing further work on simplifying the tax obligations of small to medium-sized enterprises. We will be examining whether current legal forms available to small business are appropriate, and developing ways of reducing the tax impact on businesses during different phases of their life cycles.
The Government is also reviewing the existing rules to see whether income can be calculated on a cash rather than an accrual basis for small taxpayers.
The second area of great interest to the Government is the taxation regime on superannuation. Considerable discussion has occurred on this matter. It now seems clear that the largest amount of leverage over savings behaviour at reasonable fiscal cost is likely to be achieved in relation to employment-based superannuation. As a first step, I am considering two options.
The first is to reduce the employers' specified superannuation contributions withholding tax for those earning under $38,000 to their statutory marginal tax rate. The alternative is to extend the present 6 percent concessional rate enjoyed by those earning over $60,000 a year to all income earners. It is my intention that one or other of these changes will be introduced from 1 April 2004.
The Government is not considering upfront tax incentives. These are likely to have to be very large—with fiscal costs running to many hundreds of millions of dollars a year—before they have any desirable effect on overall savings. Their abolition in the mid-1980s represented sensible tax policy on both equity and efficiency grounds.
The third area of the tax system which requires attention to assist economic transformation are those aspects of the international tax regime and related matters which may encourage investment and skilled migration. The recommendations of the McLeod Committee in this area are under intensive study.
Possible avenues for exploration are the introduction of a time-limited exemption for overseas earnings for new migrants and the application of the risk-free return method to the broad area of offshore equity investment on capital account outside a business context. Officials have concluded that significantly lower rates of tax could not be restricted to new foreign direct investment except as a transitional measure. As a consequence, it seems unlikely that such a reduction would produce sufficient benefits to New Zealand to offset the welfare costs of raising revenue on other productive activity in New Zealand.
No decisions have yet been taken in these respects and given the complexity and likely controversial nature of any changes in the international tax regime, a further round of consultation with the private sector will be undertaken.
Underpinning all of these tax issues is the need to lift investment in the New Zealand economy. This, along with increasing our human capital, promoting exports, encouraging innovation, and transforming that innovation into successful businesses are surely the basic elements of economic transformation.
Budget 2002 incorporates a major new initiative to attract investment. The Government has decided to merge the Investment New Zealand arm of Trade New Zealand and Industry New Zealand's Major Investment Service into a single world-class investment promotion agency operating under the wing of Industry New Zealand. The budget for the new agency will initially be $14.5 million. I anticipate that, as the agency gets underway, it will be able to make use of substantially increased funding to generate greater investment consistent with the Government's overall economic strategy.
Alongside this initiative the Budget provides the resources for expanding the number of investment promotion teams.
The Government's renewed efforts to complement the investment drive will be creating offshore platforms for exporters and the expansion of export networks. These will provide facilities offshore to assist market entry by exporters as well as providing links with expatriate New Zealanders.
Offshore export promotion services will be enhanced to provide greater accuracy of relevant information directed to clients in the timeframes in which they require it. Trade New Zealand will, at the same time, be mounting a series of marketing campaigns targeted at engaging priority sectors and markets through e-business channels.
Supporting the export drive will be a new emphasis on the promotion of brand New Zealand, creating higher-level brand values positioning New Zealand as an exciting, innovative producer of high-quality goods and services.
For such a branding to have substance it is essential that New Zealand is at the forefront in terms of being a networked nation. The Government is putting resources into implementing recommendations arising out of the Boston Consulting Group and LEK reports which were part of the background to the development of the growth and innovation framework.
This includes resourcing of membership of the Global Biodiversity facility—a network of biodiversity databases and information technology databases that enables the use of global biodiversity information to produce national economic, environmental and social benefits. There is a range of other initiatives provided for in Budget 2002, the most important of which relates to the introduction of broadband technology throughout New Zealand.
Tens of millions of dollars have been set aside over two years for a major initiative in this respect. The initiative is funded jointly from Vote Education and Vote Economic, Industry and Regional Development. While the early beneficiaries of broadband deployment will be schools, once it is deployed local businesses and most government departments will also start to benefit.
Broadband is the nervous system of the new economy and is as important to New Zealand as the roads, power lines, railways, and telephone cables were last century.
The Government's objective is to ensure that the majority of schools have access to high-speed two-way internet by the end of 2003, with infrastructure being made available to more remote schools by the end of 2004. This objective will be attained in a way that optimises opportunities for communities to access broadband services as well. Today's funding is a major step towards that goal.
The Government has already funded studies in rural and provincial New Zealand on the impact of broadband on economic development. In addition, the Government has, in partnership with local communities, funded five regional pilots to test a demand aggregation model whereby communities and schools, health centres, tourist operations, transport companies, libraries, marae and others bundle up their demand for the new telecommunications technology and offer that demand by way of competitive tender to telecommunications companies.
The financial resources will be used for a centrally managed series of regional tenders for the provision of broadband infrastructure. There will be opportunities for regional and local government and private sector businesses to work in partnership with the Government, to ensure that their priorities and interests are met through the rollout of broadband to their area.
This initiative emphasises the growing importance of the links between education and economic development in the new economy. If New Zealand needs to be a networked nation, it equally needs to be a learning nation.
This Budget represents the culmination of a reform process to bring about much stronger links between the tertiary education sector and the rest of the economy and society.
The intention is to shift away from a single focus on attracting students to centring much more on contributing to the nation's development through increasing quality, building system capability, and encouraging stronger relationships with the sectors and communities that the system serves.
This is the reason the Government is establishing the Tertiary Education Commission to provide leadership to steer the tertiary education sector and to ensure that all parts of that sector are contributing in a coordinated manner to growth and innovation in New Zealand. This encompasses all learning beyond the school system including industry training, foundation education programmes such as Training Opportunities and Youth Training, adult literacy initiatives, and adult and community education.
A five-year Tertiary Education Strategy will set the strategic direction for the tertiary education sector's contribution to economic and social development through teaching, learning and research.
The Tertiary Education Commission's role is to ensure the Tertiary Education Strategy is implemented. In this it will be guided by the Government's annual Statement of Tertiary Education Priorities, which will establish specific goals, actions and performance measures for the following one to three years.
The Strategy and the Statement of Tertiary Education Priorities will allow the Commission to make an assessment of strategic relevance with regard to courses, programmes and providers. Those that cannot demonstrate strategic relevance will not be funded.
This will become apparent in the short term for private training establishments. Overall funding to private training establishments will be capped next year with new courses, programmes and providers being funded from a strategic pool within the overall cap.
As the information base and experience of the Commission increase, assessments of strategic relevance will be applied increasingly in both the public and private sectors. This will take place as part of a new process of approving organisational profiles for funding purposes.
Together, charters, profiles and the assessment of strategic relevance will ensure that funding to providers is aligned with the key directions in the Tertiary Education Strategy.
The strategic focus will be reinforced through the design of a new, integrated funding framework for all tertiary education, with three broad elements. The first will be funding for teaching and learning through a combination of mechanisms. The second will be funding for research through the Performance-Based Research Fund, Centres of Research Excellence, and existing research top-ups. Finally, there will be targeted funding, through a Strategic Development Fund.
Within the funding for teaching and learning a new Student Component will replace the existing Universal Tertiary Tuition Allowance or "EFTS system". This will balance a commitment to wide participation with performance and strategic considerations. It will contain a performance-related element and will be set on the basis of a rolling funding triennium from 2004 onwards. The Student Component will ensure limits on tuition fees from 2004 through a fee maximum system.
The Performance-Based Research Fund will focus on increasing the average quality of research and improving the quality of information on research output, while underpinning the core strengths of tertiary education research.
The Strategic Development Fund to be established from January 2003 will assist tertiary education organisations to develop capacity in key areas, align better with national development goals, and put in place sustainable long-term strategies.
The Government is committed to lifting the skills of New Zealanders and, in so doing, lifting the profitability of enterprises and the competitiveness of the New Zealand economy. Our prosperity relies on the skills and knowledge of our people and how successfully these skills and knowledge can be applied to generate economic growth. This requires an effective labour market coupled with a healthy tertiary education and training system that achieves a good match between the skills demanded in the labour market and those delivered via education and training.
The record of the Government in this regard is an impressive one.
A total of 95,263 trainees participated in industry training in 2001 compared with 81,343 in 2000—an increase of 17 percent. A total of 66,225 trainees were registered with Industry Training Organisations at December 2001—a 5 percent increase over the course of the year. Trainees achieved a total of 9,498 National Certificates during the year—a 52 percent increase.
In our first 100 days in office the Government rehabilitated the notion of apprenticeship and launched the Modern Apprenticeships Programme. Targeted primarily at young people, this initiative applied the traditional strengths of apprenticeship—mentored work-based training—to a wider range of industries including those at the cutting edge of growth and innovation.
There are now over 2,500 young New Zealanders employed as Modern Apprentices in a wide and growing range of industries.
Today I am announcing a commitment by the Government to provide sufficient funding to double the numbers of Modern Apprentices so that we will have 6,000 in employment by December 2003. That represents an additional investment of $41 million over the next four years.
The Government is also introducing a pilot Maori Trade Training programme which will assist young Maori to make the transition from school to programmes like Modern Apprenticeships.
Modern Apprenticeships also signals the Government's commitment to lifting the rate of participation and the profile of industry training across the board.
�� In this Budget we make a further investment in the future skills and prosperity of this nation. The Government is to increase the level of the Industry Training Fund by $14 million over the next four years. This is on top of the additional $56 million over four years that I announced in last year's Budget and represents an unprecedented investment in industry training.
Industry training is highly cost effective because it attracts a significant industry contribution—currently 30 percent of the cash cost is met by industry. The Government remains committed to a partnership approach to industry training, with Industry Training Organisations being funded to purchase training in line with the needs of industry.
Industry training needs to address the upskilling of those who are in work, as well as provide pathways into learning and employment for those making the transition from school. Over the past year the Government has been piloting the Gateway programme, which gives students workplace experience and opportunities to begin to acquire qualifications. The evaluation of the pilot has been extremely positive and I am announcing today $7.2 million of new funding over the next four years to enable a continuation and extension of this programme. More schools will now have the opportunity to develop links with local employers and offer a wider range of learning options for their students.
Change in the tertiary education system is already underway with new programmes such as Centres of Research Excellence, Modern Apprenticeships and the Gateway initiative in schools. Changes will build progressively from here. The Strategic Development Fund will come into effect from 2003, charters and profiles will be in place from 2004, and the Performance-Based Research Fund will be phased in gradually throughout the period until 2007. Tertiary education organisations have already started changing their behaviour. Within five years, the system will have changed dramatically in terms of both its composition and its outlook.
The other key element of the integration of tertiary education and economic development is research, science, and technology. Budget 2002 provides for an additional $27 million in operating expenses and $20 million in capital over the next three years for Centres of Research Excellence, with ongoing funding of $11 million a year.
The Government is committing more than $100 million of new investment to Vote Research, Science and Technology over the next four years, almost half of which is focused on funding partnerships with industry.
An extra $48 million will be invested in such partnerships over the next four years, mostly through funding of research consortia by the Foundation for Research, Science and Technology. These consortia bring industry and public institutions together for research programmes that are jointly funded, with shared decisions about the direction and focus of the research.
The funding available for consortia will increase by $6.3 million in each of the next four years.
Such partnerships produce more relevant research and more immediate application of the results. Examples include meat industry research into bioactive compounds for new "functional foods", such as dietary iron supplements, and research into new forms of wood products and pasture.
Partnership funding is also delivered through Technology New Zealand, which accelerates business uptake of new technology. The Technology for Business Growth programme will be increased by almost $4 million a year for the next four years. One million dollars a year will support a new "one stop shop" service to coordinate the support that Industry New Zealand, Trade New Zealand and the Foundation for Research, Science and Technology provide to business.
In health research, a partnership for the future has been forged with the Wellcome Trust, which will contribute half of a five-year $17.5 million research fund focused on improving the health of Pacific peoples. The fund will open in 2003, but the Government's funding commitment has been made now to secure the Wellcome Trust's contribution.
Because we recognise that basic research underpins all scientific and technological progress, it receives a substantial funding increase. More than $34 million extra will be invested in basic research over the next four years, primarily through the Marsden Fund and the New Economy Research Fund. This is the third successive increase in funding for basic research.
The Government is following through on the Royal Commission on Genetic Modification with funding of $9.5 million over the next four years for the Biotechnology Strategy and for research into the environmental and social impacts of genetic modification. A further $8 million over four years from Vote Environment will enable us to establish the Bioethics Council and develop necessary law changes.
We will continue supporting excellence in science education with $1.7 million a year from 2003 for the science, mathematics and technology teacher fellowships.
Total funding for research, science and technology has now increased by $77 million under this Government, an improvement of 18 percent since we took office.
We are also focused on extracting more value from the public investment in science. Funding is being redirected from mature fields of research, where the private sector can take more responsibility, towards higher-risk opportunities that promise innovation and new business. Public funds are being used more for investigation of new fields such as biopharmaceuticals and natural New Zealand-sourced agrochemicals. We are delivering, in other words, smarter as well as greater investment in science.
Mr Speaker, the emphasis in Budget 2002 has been very much on health, education, and economic transformation. This does not mean that other priorities have been ignored. The Budget contains initiatives covering the entire range of government activity. I want, in the remainder of my speech, to single out four areas: law and order, conservation and the environment, housing, and social services and employment.
Safety and security in the community is a concern to all New Zealanders. The Government has moved to work with the Police, justice, and other government agencies along with the community, to reduce criminal offending.
The latest Police summary of recorded and resolved criminal offences highlights encouraging results. Recorded offences per 10,000 population were down to a 13-year low during 2001. Recorded burglaries were at a 20-year low in 2001.
This year's Budget includes initiatives that allow the Police to continue critical Police operations. Counter-terrorism programmes include increased operational funding for counter-terrorism initiatives at domestic airports and additional resources for counter-terrorism investigation and intelligence-gathering activities.
Second, as the Minister of Police has already announced, an additional $2.5 million each year is being allocated to assist the Police in Auckland.
The Government has also approved changes to appropriations for 2002/03 and outyears to enhance initiatives jointly organised by the Police and Ministry of Justice to reduce youth offending and violent crime committed by young people. These programmes will be developed in consultation with local authorities and community groups in up to five high-crime areas, including South Auckland and Auckland City.
The Government has developed two new programmes which focus on intensive rehabilitation of serious young offenders. The programmes include the establishment of new Day Reporting Centres. These will provide individualised, intensive, relatively long-term programmes at centres administered by the Department of Corrections and by Child, Youth and Family Services. The programmes will focus on meeting education and vocational needs. Two Centres catering for approximately 130 offenders per year are to be established initially, with $12 million over four years provided in Budget 2002.
The Government is also creating a new serious recidivist young offenders' programme. This is an 18-month, three-stage programme incorporating a residential period of up to one year. Budget 2002 will provide $2.85 million (including $700,000 capital expenditure) over three years. Initially involving one centre, the programme may be expanded to four others if evaluation proves positive.
In Vote Conservation the key feature is the largest increase in funding ever for outdoor recreation on public conservation land.
Over the next 10 years the Government will increase the Department of Conservation's maintenance budget for recreational facilities from $37 million a year to more than $80 million a year. DoC will be funded to provide properly for depreciation starting with $3 million in 2002/03 and rising to $24.9 million in 2007/08 while also providing for accumulated depreciation at the rate of $18 million a year for 15 years starting in 2007/08. This means that by 2009/10 DoC's annual recreation budget will be more than double its present level. This will progressively address the scandalous under-maintenance of DoC's recreational facilities.
This funding will ensure that New Zealanders and overseas visitors will be able to enjoy our world-class network of national parks and reserves and our unique flora and fauna. It will ensure that Kiwi kids will be able to explore safely our country and learn about and experience kiwi and kereru, kauri and kahikatea. And because walking and tramping are healthy activities, a spin-off benefit from this investment will be fitter and healthier people.
Budget 2002 is again investing in the protection of New Zealand's natural heritage with funding of $38 million for this year's Biodiversity Strategy projects. This is the third consecutive annual funding boost for the Strategy, which is designed to prevent the extinction and promote the restoration of our endangered native species.
The Government's $187 million five-year funding commitment to conservation through the Biodiversity Strategy is the most substantial ever made and provides the investment necessary to turn the tide on the decline of our biological diversity.
The National Energy Efficiency and Conservation Strategy receives a boost of more than $3 million a year. As we move towards implementation of the Kyoto Protocol substantial additional investment may be required in this area. Other funding boosts to promote environmental concerns occur with respect to the New Zealand Waste Strategy, national policy statements and national environmental standards, clean-up of orphan sites (with $7.4 million over three years), and reducing business compliance costs under the Resource Management Act 1991.
The present Government has laid great emphasis on improving access to quality housing, especially for low-income New Zealanders. The restoration of income-related rents has been by far the largest cost item in that respect.
Over the next three years $54 million has been allocated for the expansion of the rental housing acquisition programme, resulting in a total investment of $262 million for adding to the state rental stock over the period.
The "Healthy Housing" programme will be expanded by $21 million over the next three years, leading to total expenditure on the programme of $46 million over the period.
New spending in this year's Budget also includes $36 million capital expenditure plus associated operating costs over the next three years to address substandard housing in Northland and the East Coast/Bay of Plenty regions. This will help to generate local employment and community pride in those regions.
In the social services and employment package there are some 50 new initiatives. These range from increased funding for the Community Organisation Grants Scheme to the development of an electronic labour market portal.
The largest increases in spending are structured around making it easier for beneficiaries to move into paid employment. These include: an additional $24.5 million over three years for employment support for people with disabilities, rising to $15.5 million a year in outyears; $41.8 million over three years for enhanced case management; and $27 million over three years for increased funding for out-of-school care and recreation.
Mr Speaker, it will not have escaped the House's notice that 2002 is an election year. Traditionally, election year Budgets have been occasions when Ministers of Finance engage in a mixture of substantial new spending or the promise of tax cuts to come. Often both are fiscally unsustainable and followed by the inevitable reversal of policy the following year.
Instead, the Government has continued to balance prudent fiscal management with innovative policy promises. We chose deliberately to commit resources early in this three-year term to keep faith with the people's expectation of early delivery of key election promises.
The superannuitants on their restored wage relativity, the low-income state house tenant on an income-related rental, the student who is not paying interest on their loan and has not had a fee increase over the past two years all have reason to remember that the Government kept faith with them in those respects.
As the 2002 Fiscal Strategy Report notes, we are proud of our achievements. We continue to deliver as promised on our policy commitments, keeping within our spending provision for the term while building up New Zealand's infrastructure.
Yet, at the same time, we have put an unprecedented focus on the future. We have done this in many ways—through our Biodiversity Strategy, our intention to ratify the Kyoto Protocol, our reforms to tertiary education, our creation of new agencies and the provision of new funding for business development, investment attraction, and trade promotion. Above all, in that respect, we have begun to build up financial assets to help fund the longer-term costs of an ageing population. And we have done this while continuing to meet our long-term fiscal objectives and, indeed, exceeding them in many key respects.
It is crucial that New Zealand does not revert to a short term view of life. Tax cuts for a few now which will be paid for by a reduced standard of living for the many later makes neither fiscal, economic, nor social sense.
In Budget 2002 the Government's focus has clearly shifted to the task of economic transformation. This nation has no reason to wallow in either self-pity or self-recrimination about its past performance. Any New Zealander who travels overseas quickly recognises that we are securely part of the democratic, developed world.
But we can do better. Lifting our game as a nation is not just about rewarding a few at the expense of the many. It is about enlisting the support of the many in the interest of improving our standard of living for all. After years of bitter debate over the direction of economic and social change there is now a greater awareness of the need to lift our skills, attract more investment, promote our exports, grow more businesses, and become an innovative, knowledge-based nation known for its excellence and quality.
Budget 2002 contributes to this task in two simple ways. First, it provides an underpinning of sound fiscal management, which puts us in the premier division of the international league for fiscal prudence and predictability.
Second, it prioritises new spending and reprioritises existing spending to those areas which underpin the Government's growth strategy. It is a Budget with its eye firmly focused on the long-term, not just the next six months. It is, most definitely, not an election-buying Budget. It may well be an election-winning one.
EXHIBIT 99.5(E)(2)
budget
2002
FISCAL STRATEGY REPORT
Hon Dr Michael Cullen
TREASURER
MINISTER OF FINANCE
23 May 2002
The Fiscal Responsibility Act 1994 and the Fiscal Strategy Report
The Fiscal Responsibility Act 1994 requires the Government to show that it is acting in accordance with the principles of responsible fiscal management through a series of reports presented to the House of Representatives at various times during the financial year. The Fiscal Strategy Report is one of these reports and is required to:
- •
- assess the extent to which the fiscal forecasts in the Budget Update are consistent with the short-term fiscal intentions given in the Budget Policy Statement, and explain the reasons for any departures from those intentions (see Annex 1)
- •
- include progress outlooks for 10 or more years that:
- —
- include projections for the variables specified for long-term fiscal objectives, illustrating the likely future progress towards achieving those objectives
- —
- explain the reasons for any significant differences from previous progress outlooks (see Annex 2)
- •
- assess the consistency of the progress outlooks with the long-term fiscal objectives given in the Budget Policy Statement, and explain the reasons for any departures of the progress outlooks from those objectives
- •
- include an amended version of the Government's short-term fiscal intentions and long-term fiscal objectives where they have changed from those given in the Budget Policy Statement (see Annexes 1 and 2).
Fiscal Strategy Report
Fiscal policy overview
The 2002 Fiscal Strategy Report (FSR) confirms the Government's fiscal policy approach over the parliamentary term, and demonstrates that we are continuing to balance prudent fiscal management with innovative policy progress.
We are proud of our achievements. We continue to deliver as promised on our policy commitments, and to build up New Zealand's infrastructure. We are putting a strong focus on the future—building up financial assets now to fund the longer-term costs of an ageing population. We are doing this whilst continuing to meet our long-term fiscal objectives.
Our key objective—to run operating surpluses to meet New Zealand Superannuation (NZS) Fund contributions, while meeting capital pressures and priorities and managing debt at prudent levels—continues to drive our fiscal strategy.
A coherent approach to fiscal, economic and social policy
Throughout our term the Government has successfully balanced fiscal prudence with delivering on policy commitments, and designing a framework to raise New Zealand's sustainable growth rate. The 2002 Budget builds on our success.
Prudent fiscal management to achieve objectives
At the start of the parliamentary term, we set ourselves a suite of long-term fiscal policy goals. In 2001 we updated these objectives to make our strategy even clearer.
Progress toward these objectives has generally been faster than was anticipated in the 2000 Budget Policy Statement (BPS), despite a number of significant surprises. Ongoing operating surpluses will support contributions to the NZS Fund as planned, while the size of government (and therefore services delivered) remains in line with expectations in the 2000 BPS.
Over the term, the Government has been confronted with some unexpected challenges. Not only have we dealt with them head on, we have also improved monitoring and reporting systems to reduce the likelihood of future surprises. For example, we have increased the robustness of our fiscal management tools, restored realistic baselines for departments, and put a greater focus on capital spending. Of course, there will always be events that can't be anticipated, such as the recapitalisation of Air New Zealand. However, with the improvements in the fiscal position over the term, the Government is well placed to deal with any such surprises in the future.
Despite the recapitalisation of Air New Zealand, progress towards our gross debt objective has been faster than anticipated in the 2000 BPS. Net debt and expenses are also lower as a percentage of GDP than anticipated at the start of the term.
The better than expected net debt position largely reflects stronger growth in both revenue and nominal GDP. Nominal GDP in 2003 is now expected to be 3.6% higher than was forecast in the 2000 BPS. Stronger nominal revenue growth, particularly in 2001, was carried through into later years. This helped net and gross debt to fall faster than expected. However, the nominal gross debt improvement was almost completely offset by the cost of the Air NZ recapitalisation. Consequently, in 2003 nominal gross debt remains similar to that forecast in the 2000 BPS, although it is lower as a percentage of GDP.
Table 1—Forecasts of key fiscal indicators in 2002/031
% GDP
| | 2000 BPS
| | 2002 FSR
| | Difference
| |
|---|
| Revenue | | 34.8 | | 34.4 | | (0.4 | ) |
| Expenses | | 33.5 | | 33.0 | | (0.5 | ) |
| OBERAC1 | | 1.8 | | 1.8 | | 0.0 | |
Net debt |
|
18.9 |
|
16.8 |
|
(2.1 |
) |
| Gross debt | | 30.0 | | 28.6 | | (1.4 | ) |
Source: The Treasury
- 1
- Operating balance excluding revaluations and accounting changes. See the 2002 Budget Update for further information on how the OBERAC is calculated.
We promised to meet our objectives with a fiscal policy approach that lets automatic stabilisers even out the impact of swings in the economic cycle. Our decision against providing a fiscal stimulus to boost the economy in response to the expected international slowdown and the effects of the 11 September terrorist attacks proved to be correct. Latest forecasts show economic growth staying close to potential.
Continuing to deliver on our policy commitments
Fiscal progress has not been at the expense of policy goals. Looking back to 2000, we worked to implement our policy commitments—creating a fairer student loan scheme, restoring income-related rents for state housing, reducing waiting times for surgery and restoring the 65% wage floor for New Zealand Superannuation.
We continue to focus on coherent policy change, planning for the challenges facing New Zealanders in the future. The most important example of this is the NZS Fund. Another example is our work to position New Zealand for the impact of global warming, meet our obligations under the Kyoto Protocol, and act to minimise the impact on vulnerable sectors of our economy.
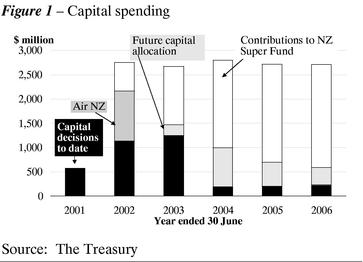
In addition, the Government is addressing the tendency for the focus to be on operating activities, by building a more complete picture of government expenses and investment. This means looking at revenues, expenses, partial pre-funding and investing requirements as parts of a coherent picture.
We have strengthened processes for capital decision-making, and as Figure 1 shows, we are planning for a period of significant capital investment.
Consistent with an ongoing emphasis on economic growth
Sustainable growth has also been a key focus for the Government, along with fiscal responsibility and meeting our policy commitments. We continue to push for sustainable economic growth that will make New Zealanders better off in the long-term, while protecting the environment and enhancing inclusive economy principles.
Policies such as the growth and innovation framework will help to cultivate industries that are economically, socially and environmentally sustainable. The Government has also made changes to improve market functioning and to benefit consumers and small shareholders (such as improvements to the regulatory framework).
Budget 2002 builds from a sound base, and focuses on planning ahead
Building on our progress over the past two years, and as indicated in our 2002 BPS, our priorities for Budget 2002 are health, education and economic transformation. We are delivering on these priorities within the $6.1 billion operating provision set for the term.
A significant proportion of spending in Budget 2002 aims to put health expenditure on a firm footing, providing district health boards with the certainty they need to undertake financial planning, as well as implementing the primary care strategy. This approach balances the need to provide certainty with a realistic funding track that requires all those in the health sector to contribute to making it work.
While the cost this year of the Budget 2002 decisions is $715 million (excluding the contingency allowance of $230 million), this will rise to close to $900 million in following years. The rising cost reflects the necessary phase-in period for some initiatives, such as the meningococcal meningitis vaccination programme. We can accommodate this increase without changing the allocation for future Budgets or compromising progress towards our fiscal objectives.
Budget 2002 commits an additional $407 million in capital spending, bringing our total new capital spending over the term to just over $4.2 billion. Our focus continues to be in the health, education and housing sectors, with the single biggest area of new investment over the term being education (which includes improvements to the student loan scheme).
Table 2—Forecasts of long-term fiscal objectives and indicators (% GDP)
| | Actual
| | Forecast
|
|---|
Year end June
|
|---|
| | 1999
| | 2000
| | 2001
| | 2002
| | 2003
| | 2004
| | 2005
| | 2006
|
|---|
| Financial performance | | | | | | | | | | | | | | | | |
| Revenue | | 35.7 | | 34.1 | | 34.6 | | 34.2 | | 34.4 | | 34.4 | | 34.5 | | 34.4 |
| Expenses | | 35.2 | | 33.8 | | 33.5 | | 32.5 | | 33.0 | | 32.7 | | 32.4 | | 32.3 |
| Operating balance | | 1.7 | | 1.4 | | 1.2 | | 2.2 | | 1.8 | | 2.3 | | 2.9 | | 3.0 |
| OBERAC | | 0.2 | | 0.8 | | 1.8 | | 1.9 | | 1.8 | | 2.3 | | 2.9 | | 3.0 |
| Operating expenses + contributions | | 35.2 | | 33.8 | | 33.5 | | 33.0 | | 33.9 | | 34.1 | | 33.9 | | 33.8 |
| OBERAC ex fund returns | | 0.2 | | 0.8 | | 1.8 | | 1.9 | | 1.8 | | 2.2 | | 2.6 | | 2.6 |
| Financial position | | | | | | | | | | | | | | | | |
| Net worth | | 5.9 | | 8.0 | | 10.0 | | 11.8 | | 13.2 | | 14.9 | | 17.2 | | 19.4 |
| Gross debt | | 36.1 | | 33.7 | | 32.2 | | 30.2 | | 28.6 | | 29.2 | | 28.8 | | 28.4 |
| Net debt | | 21.3 | | 20.0 | | 17.5 | | 16.8 | | 16.8 | | 16.8 | | 16.2 | | 15.5 |
| Net debt with NZS Fund assets | | 21.3 | | 20.0 | | 17.5 | | 16.3 | | 15.2 | | 13.9 | | 11.6 | | 9.3 |
| NZS Fund | | | | | | | | | | | | | | | | |
| Contributions | | — | | — | | — | | 0.5 | | 1.0 | | 1.4 | | 1.5 | | 1.5 |
| NZS Fund returns (after tax) | | — | | — | | — | | 0.0 | | 0.1 | | 0.2 | | 0.3 | | 0.4 |
| Accumulated assets | | — | | — | | — | | 0.5 | | 1.5 | | 3.0 | | 4.6 | | 6.3 |
Source: The Treasury
All tracks are presented under the current accounting method. Annex 3 contains tracks by total Crown and core Crown presentation.
A solid foundation for the next parliamentary term
Over the next parliamentary term the Government will continue its fiscal strategy of running structural operating surpluses sufficient to meet the required contributions to the New Zealand Superannuation Fund (NZS Fund). In addition, we will continue to balance capital and operating expenditure to ensure we remain on track to meet our gross debt target.
Balancing expenditure within realistic constraints
The sound fiscal outlook for the medium term and our policy achievements to date place the Government on firm ground as we look to the next parliamentary term.
However, we are aware of a number of challenges in the next parliamentary term, in part reflecting our ambitious fiscal strategy. Over the next couple of years, we require expenses to grow more slowly than GDP to build up structural operating surpluses to meet NZS Fund contributions. This is despite inevitable pressures in a number of areas, such as health. We will manage this constraint through proactive oversight to ensure value for money in spending public resources, and through continual review of expenditure in conjunction with our fiscal tracks. Changes to our fiscal management tools, outlined below, will further support this approach.
Given the anticipated operating surpluses ahead, we have some flexibility in how we balance the operating and capital spending components alongside the NZS Fund contributions in the next term.
The operating balance forecasts include a budget allowance for core operating expense growth of around 2.5% per year, and capital investment on average of around $500 million to $600 million per year.2 We are comfortable with this level of spending as the resulting tracks are consistent with achieving our fiscal strategy.
|
|
|---|
| 2 | As capital spending is one-off in nature, the spending profile is unlikely to smooth. This capital spending is in addition to purchases of physical assets to maintain the asset base, which average around $1 billion per year over the next five years. |
We are signalling here the significant scope for investment in New Zealand's infrastructure and assets over the next parliamentary term, within which our priorities continue to be hospitals, schools, defence and housing. Additionally, $175 million has been allocated to the transport strategy, for projects with both operating and capital components, which are yet to be finalised.
Ensuring progress by revising our fiscal management approach
The process of setting spending intentions will change in the next parliamentary term. The changes will mean that:
- •
- the focus will be on the operating and debt tracks and their consistency with our fiscal objectives. This compares with the current focus on a set nominal limit for the parliamentary term
- •
- spending intentions remain relevant as the economic and fiscal outlook changes.
To achieve this, we plan to review spending intentions twice yearly with reference to updated economic and fiscal forecasts and our long-term fiscal objectives. We will look through major volatilities such as revaluations and cyclical tax re-forecasts. The changes will also allow high-level trade-offs between operating spending and investment.
Revising the framework will sharpen the focus on our fiscal strategy, which remains unaffected by these changes.
Spending intentions to take account of uncertainties and economic outlook
Future spending intentions will be set with regard to progress towards our fiscal objectives, but also take into account:
- •
- the uncertainty in the economic and fiscal forecasts around the economic cycle and underlying structural growth
- •
- the likely impact of any change in spending intentions on the macro-economy.
While the global uncertainty associated with the events of 11 September 2001 has abated, risks around the domestic and international economic outlook remain. Examples of alternative economic tracks and their impact on debt and the operating balance are shown in the Risks and Scenarios chapter of the Budget Update. These show a debt impact of up to 3% of GDP.
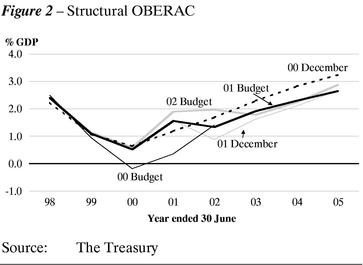
The Government is also cognisant of uncertainties in calculating the structural OBERAC. Even over the current parliamentary term, where fiscal policy has been relatively stable, estimates of the structural OBERAC have altered significantly. The uncertainty appears to be greatest over the period one to two years ahead.
In addition, an increase in government spending over and above that forecast may make the Reserve Bank's job of controlling inflation harder. A spending increase will generally increase demand, and as the economy is forecast to grow at close to its potential rate, the supply response is likely to be limited in the short-run, leading to pressure on prices.
Line-by-line Consolidation of the Crown Financial Statements
Richer information, but fiscal policy is unchanged
As set out in the 2002 BPS, changes to accounting standards require changes to the way the Crown financial statements are prepared from the Budget 2002. These changes are required for consistency with generally accepted accounting principles (GAAP) and do not alter the Government's fiscal policy.
In the future, the Crown financial statements will record the revenues, expenses, assets and liabilities of all Crown-controlled entities (eg, departments, state-owned enterprises (SOEs) and Crown entities). Currently, only the net surplus, net investment and net worth of SOEs and Crown entities are recorded. Future statements will also remove the GST on Crown expenses. Net worth and the operating balance are unaffected.
The Crown will publish fully consolidated ("total Crown") accounts, as described above, but will split out "core Crown" information. The core Crown revenues and expenses are similar to the current accounts, except that they remove GST on Crown expenses.
This change means that the Government needs to alter the presentation of its fiscal objectives, as noted in the 2002 BPS and the 2001 FSR. The new presentation ensures ongoing compliance with the Fiscal Responsibility Act 1994, and the clear articulation of existing fiscal policy (refer Annex 2).
Aggregates look different, but consistent with Government objectives.
The table below outlines how expenses as a percentage of GDP are presented currently, and how changes impact on both core Crown expenses (eg, removal of GST on Crown expenses) and fully line-by-line consolidated Crown expenses (eg, including SOE and Crown entity expenses). Refer Annex 4 for the effect on other fiscal variables.
Expenses to GDP ratios
| | 2001
| | 2002
| | 2003
| | 2004
| | 2005
| | 2006
|
|---|
| Current accounting treatment | | 33.5 | | 32.5 | | 33.0 | | 32.7 | | 32.4 | | 32.3 |
| Core Crown (eg, GST excl) | | 32.2 | | 31.2 | | 31.7 | | 31.4 | | 31.0 | | 30.9 |
| Total Crown (eg, including SOE and Crown entity expenses, less internal transactions) | | 39.7 | | 40.3 | | 41.4 | | 41.0 | | 40.5 | | 40.3 |
Source: The Treasury
Giving effect to the Government's fiscal objectives
The Government's fiscal objectives are for total Crown. However, to give effect to our objectives, we focus on core expenses, core revenues, and net SOE and Crown entity results.
Reflecting this, we are maintaining our focus on expenses (35% of GDP) at the core Crown level (refer table 3) and gross sovereign-issued debt (30% of GDP). While there is little change in the measured level of gross sovereign-issued debt, core Crown expenses are expected to be around 1.3% lower than under the current accounting treatment.
Changes arising from the new accounting treatment do not increase spending headroom because the Government will continue to be constrained by the gross debt and operating balance objectives. As a result the Government is not changing its focus on a target of core expenses at 35%. The expense target is a means by which the primary objectives of operating balance and gross debt—as articulated in our fiscal strategy—are met. Increasing expenses would impact negatively on both the operating balance and gross debt, and thus be inconsistent with our strategy.
In addition this target is set as an average over a long, 40-year horizon. In the years in which the NZS Fund builds up, expenses excluding Fund contributions will be less than the target. In years when the Fund is being drawn down, expenses, excluding contributions from the Fund, will be more than the target. It is not meant to be a point-to-point reference target, and changing the level of the expense target would imply a degree of specificity that is simply not there.
Longer-term fiscal objectives on target
Looking out over a 10-year horizon, we are on target to meet our fiscal objectives.
Progress towards meeting our objectives is better than expected in the 2001 FSR. For example, we now expect to reach the 30% gross debt objective by 2002/03, rather than in 2008/09 as expected in the 2001 FSR. This progress largely reflects normal variability in the economic and fiscal forecasts, and actual progress may be different.
The tracks beyond the five-year forecast period are projections based on the technical and policy assumptions outlined in Annex 3.
All 10-year tracks are presented under the current accounting method. The fiscal aggregates under total Crown and core Crown are in Annex 3.
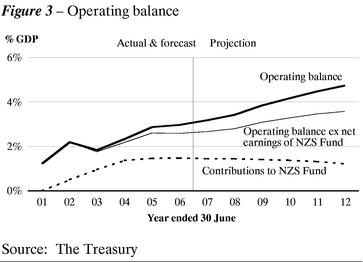
Operating surpluses more than cover contributions to the NZS Fund
Looking ahead, operating surpluses (excluding retained NZS Fund earnings) cover the Government's annual contributions to the NZS Fund.
The rising operating balance over 2006/07 and 2011/12 reflects revenue growth greater than nominal GDP, while expenses grow at 3.7% per year, in line with demographic changes and an annual budget allowance of around 2.2% of expenses.3
- 3
- The allowance is cumulative, meaning the amount, adjusted for inflation and a real growth factor, is added to government spending in each projected year. This provides the Government with fiscal flexibility, as it may be used for spending and revenue initiatives, increasing contributions to the NZS Fund or responding to developments in the economic and fiscal position.
The wedge between the operating balance excluding net NZS Fund returns and the NZS Fund contributions grows from 1.7% of GDP in 2001/02 to 2.4% by 2011/12 as the operating surplus grows and NZS Fund contributions plateau and then fall. This wedge will be used to meet capital pressures and priorities at a level consistent with our gross debt objective.
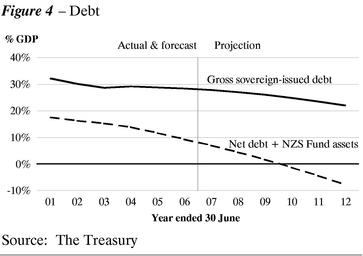
On track to achieve debt objectives
Gross sovereign-issued debt is expected to be below our goal of 30% of GDP by 2002/03. It is projected to fall to 22% of GDP by 2011/12.
Continuing emphasis on investment means that debt does not fall as quickly initially as it might otherwise. Investment is central to our plans, but we continue to balance it against our debt objective. Net debt plus the NZS Fund assets falls much faster as the NZS Fund assets grow. By 2009/10 we expect to be in a net financial asset position.
Expense growth more muted
Over 2006/07 to 2011/12, expense growth is 3.7%, compared with revenue growth of 4.6%.
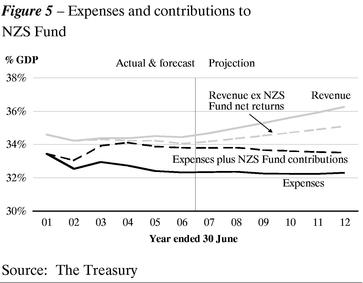
Over the forecast period, expenses grow more slowly than GDP, reflecting the Government's commitment to building structural surpluses to meet NZS Fund contributions. Beyond the forecast period, expenses grow in line with GDP out to 2011/12.
Revenue rises as a percent of GDP over 2006/07 to 2010/11, reflecting the assumption of fixed tax rate boundaries. As incomes grow, taxpayers will move into higher tax brackets.
Forward planning for future superannuation costs reflected in growing net worth
Net worth rises throughout the projection period, reflecting the forecast operating surpluses, which include the rising surplus of the NZS Fund. The Fund's assets are expected to reach over 17% of GDP by 2011/12.
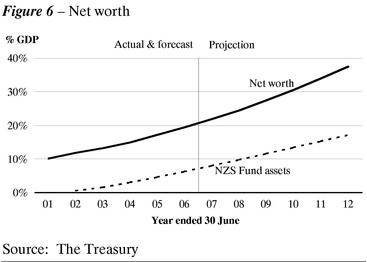
Table 3—Long-term fiscal objectives
Long-term fiscal objectives
| | To achieve the objectives of fiscal policy, the Government's high level focus is on:
|
|---|
Operating balance:
Operating surplus on average over the economic cycle sufficient to meet the requirements for contributions to the NZS Fund and ensure consistency with the long-term debt objective.
Revenue:
Ensure sufficient revenue to meet the operating balance objective.
Expenses:
Ensure expenses are consistent with the operating balance objective. | | • Rising surpluses4 (measured by the OBERAC) during the transition dn build up phase of the NZS Fund, with a focus on core Crown revenue and expenses, including:
— tax-to-GDP around current levels
— core Crown expenses (plus the net payment/withdrawal to the NZS Fund) averaging around 35% of GDP over the horizon used to calculate NZS Fund contributions.
• A robust, broad-based tax system that raises revenue in a fair and efficient way.
• SOEs and Crown entities contributing to surpluses consistent with their enabling legislation and Government policy. |
Net worth:
Increase net worth consistent with the operating balance objective.
Debt:
Manage total debt at prudent levels. In the longer term, gross sovereign-issued debt below 30% of GDP on average over the economic cycle.5 | | • Focus on building the NZS Fund assets rather than reducing debt. Increasing net worth consistent with the operating balance objective will see net worth at around 30% of GDP by 2011.
• Consistent with the net worth objective, there will also be a focus on quality investment.
• SOEs will have debt structures that reflect best commercial practice. Changes in the level of debt will reflect specific circumstances.
• Net debt will be at levels that are consistent with the gross debt objective and the Government policy of holding financial assets. Net debt, including NZS Fund assets, is expected to fall below 0% of GDP by the end of the decade. |
Table 2 outlines our progress against these objectives.
- 4
- The surplus includes the net (after tax) return on the NZS Fund will retain. Effectively the Government is targeting operating surpluses excluding the NZS Fund's retains investment returns.
- 5
- Sovereign-issued debt is issued by the New Zealand Debt Management Office (NZDMO) and the Reserve Bank; it excludes debt issued by SOEs and Crown entities and the sovereign-guaranteed debt of SOEs and Crown entities. Gross sovereign-issued debt includes any New Zealand government stock held by the NZS Fund.
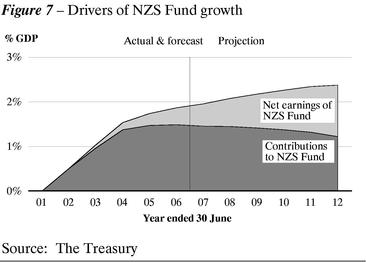
While Government contributions drive initial NZS Fund growth, by 2011/12 retained after-tax earnings on the Fund contribute to half the annual Fund growth.
Beyond the 10-year outlook, the Government recognises that an ageing population will increase demand for New Zealand Superannuation and health services. While there are alternative ways to deal with future cost pressures, the NZS Fund is less likely to require future policy change.
For example, significant changes are more likely to be required if tax cuts are used. In the first instance, tax cuts weaken the fiscal position through a declining operating balance. And, even if they bear a growth dividend (on which empirical evidence is unclear), changes to New Zealand Superannuation would still be required, as it is wage indexed and wages would be expected to increase with economic growth.
Fiscal position affected by trend economic growth
While there are always uncertainties in forecasts, the 10-year projections confirm that the Government's current fiscal policy is consistent with our long-term objectives. We are investing in areas that will help to grow the New Zealand economy and acting now to meet future expense pressures.
The Government will continue to evaluate fiscal policy over a 10-year rolling horizon to ensure that we take account of changing fiscal and economic conditions. This incremental approach to change enhances stability in both economic and fiscal settings.
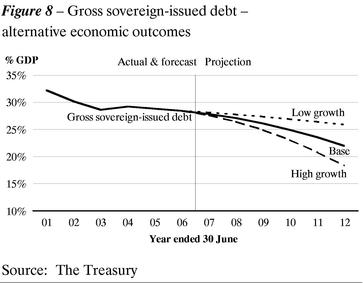
If, for example, trend economic growth is consistently lower than assumed, and fiscal policy is not changed, gross debt will be about 4% of GDP higher than under the base scenario in 2011/12.
Even in this circumstance, the Government would still expect to achieve the debt objective. A change in fiscal settings would only be required if short-run economic growth was significantly less than projected in the low growth scenario and the ability to achieve the objectives was threatened.
On the other hand, if trend economic growth is higher than expected, this would allow the Government a wider set of fiscal choices. Initiatives such as reducing taxes, increasing spending, accelerating contributions to the NZS Fund, reducing debt, or a combination of some or all of these, could be pursued.
Conclusion: On track looking forward
Looking forward, the Government is well placed to build on the sound base established over the past three years. We will continue to make incremental policy changes as we work to achieve our goal of an innovative, inclusive economy, whilst retaining consistency with our long-term fiscal objectives.
We acknowledge the challenges ahead, and our strategy is to take the steps now that will position us well to meet them in the future. We will continue to be constrained by our gross debt objective over the next 10 years, and we are conscious of continuing expense pressure—particularly in the health and education sectors.
Forward planning, combined with a continuing focus on ensuring value for money, means we can manage these pressures into the future.
This pragmatic approach to fiscal policy places New Zealand well to face the challenges that lie ahead and to take full advantage of the opportunities created by higher economic growth in the future.
Hon Dr Michael Cullen
Treasurer and Minister of Finance
14 May 2002
Annex 1
Short-term fiscal intentions
In accordance with the Fiscal Responsibility Act 1994, the Government's updated short-term fiscal intentions are listed below. These are compared with those given in the 2002 Budget Policy Statement.
Short-term fiscal intentions
| | 2002 Fiscal Strategy Report
| | 2002 Budget Policy Statement
|
|---|
| Operating balance | | On current forecasts, operating balances will be:
• $2.6 billion in 2001/02
• $2.3 billion in 2002/03
• $3.1 billion in 2003/04
• $3.9 billion in 2004/05
• $4.2 billion in 2005/06. | | On current forecasts, operating balances will be:
• $1.0 billion in 2001/02
• $1.8 billion in 2002/03
• $2.9 billion in 2003/04
• $3.7 billion in 2004/05
• $3.9 billion in 2005/06. |
Crown debt |
|
If forecast economic conditions prevail, gross Crown debt will be:
• $36.3 billion in 2001/02
• $35.8 billion in 2002/03
• $38.4 billion in 2003/04
• $39.5 billion in 2004/05
• $40.7 billion in 2005/06.
In 2005/06 gross Crown debt will be 28.4% of GDP. |
|
If forecast economic conditions prevail, gross Crown debt will be:
• $37.1 billion in 2001/02
• $38.7 billion in 2002/03
• $41.4 billion in 2003/04
• $42.3 billion in 2004/05
• $43.4 billion in 2005/06.
In 2005/06 gross Crown debt will be 30.7% of GDP. |
Operating expenses |
|
On current forecasts, operating expenses will be:
• $39.1 billion in 2001/02
• $41.2 billion in 2002/03
• $43.0 billion in 2003/04
• $44.5 billion in 2004/05
• $46.2 billion in 2005/06.
If forecast economic conditions prevail, expenses will be 32.3% of GDP, and NZS Fund contributions will be 1.5% of GDP, in 2005/06. |
|
On current forecasts, operating expenses will be:
• $39.6 billion in 2001/02
• $40.5 billion in 2002/03
• $42.3 billion in 2003/04
• $43.8 billion in 2004/05
• $45.6 billion in 2005/06.
If forecast economic conditions prevail, expenses will be 32.4% of GDP, and NZS Fund contributions will be 1.5% of GDP, in 2005/06. |
Operating revenues |
|
On current forecasts, operating revenues will be:
• $41.2 billion in 2001/02
• $43.0 billion in 2002/03
• $45.1 billion in 2003/04
• $47.3 billion in 2004/05
• $49.3 billion in 2005/06. |
|
On current forecasts, operating revenues will be:
• $40.3 billion in 2001/02
• $41.5 billion in 2002/03
• $44.3 billion in 2003/04
• $46.6 billion in 2004/05
• $48.6 billion in 2005/06. |
Crown net worth |
|
Subject to forecast economic conditions prevailing, net worth will be:
• $14.2 billion in 2001/02
• $16.5 billion in 2002/03
• $19.6 billion in 2003/04
• $23.5 billion in 2004/05
• $27.8 billion in 2005/06.
If forecast economic conditions prevail, net worth will be 19.4% of GDP, including NZA Fund assets of 6.3% of GDP, in 2005/06 |
|
Subject to forecast economic conditions prevailing, net worth will be:
• $12.4 billion in 2001/02
• $14.3 billion in 2002/03
• $17.2 billion in 2003/04
• $20.8 billion in 2004/05
• $24.7 billion in 2005/06.
If forecast economic conditions prevail, net worth will be 17.5% of GDP, including NZA Fund assets of 6.4% of GDP, in 2005/06 |
Fiscal forecasts and consistency with short-term intentions in the Budget Policy Statement
The Fiscal Responsibility Act 1994 requires the Fiscal Strategy Report to assess the extent to which the fiscal forecasts in the Budget Update are consistent with the short-term fiscal intentions given in the Budget Policy Statement, and explain the reasons for any departures from those intentions.
The differences between the fiscal forecasts in the Budget Update and the short-term fiscal intentions given in the Budget Policy Statement are shown in table A1.1.
Table A1.1—Changes in fiscal forecasts since the 2002 Budget Policy Statement (June years)
Change
| | 2001/02
| | 2002/03
| | 2003/04
| | 2004/05
| | 2005/06
| |
|---|
| $ million | | | | | | | | | | | |
| Revenue | | 882 | | 1,421 | | 859 | | 699 | | 677 | |
| Expenses | | (455 | ) | 640 | | 709 | | 634 | | 587 | |
| Operating balance | | 1,651 | | 465 | | 170 | | 267 | | 388 | |
Gross debt |
|
(806 |
) |
(2,927 |
) |
(3,009 |
) |
(2,783 |
) |
(2,712 |
) |
| Net debt | | (1,541 | ) | (2,367 | ) | (2,540 | ) | (2,454 | ) | (2,636 | ) |
| Net worth | | 1,796 | | 2,261 | | 2,431 | | 2,698 | | 3,086 | |
% GDP |
|
|
|
|
|
|
|
|
|
|
|
| Revenue | | 0.3 | % | 0.7 | % | 0.3 | % | 0.1 | % | 0.0 | % |
| Expenses | | (0.8 | %) | 0.1 | % | 0.1 | % | 0.0 | % | (0.1 | %) |
| Operating balance | | 1.4 | % | 0.3 | % | 0.1 | % | 0.2 | % | 0.3 | % |
Gross debt |
|
(1.0 |
%) |
(2.8 |
%) |
(2.7 |
%) |
(2.5 |
%) |
(2.3 |
%) |
| Net debt | | (1.4 | %) | (2.1 | %) | (2.2 | %) | (2.0 | %) | (2.1 | %) |
| Net worth | | 1.3 | % | 1.6 | % | 1.7 | % | 1.8 | % | 1.9 | % |
Source: The Treasury
The differences in nominal terms and as a percentage of GDP reflect changes in the economic and fiscal forecasts. The specific changes to the fiscal aggregates in nominal terms, as compared with those in the 2002 Budget Policy Statement (BPS), include:
- •
- operating revenues—Revenue is higher in all years, predominately driven by higher tax revenue forecasts. The tax forecasts have been increased by at least $600 million in each year compared with the 2002 BPS, with the biggest forecast increase of $1.2 billion in 2002/03. This largely represents an unwinding of the downward revisions of the 2002 BPS compared with the previous FSR, and the effect of policy changes.
- •
- operating expenses—Expenses are lower in 2001/02 than in the 2002 BPS, largely reflecting the change in the GSF liability revaluation of $400 million. Expenses are higher in 2002/03 and beyond due to demographic movements in education and welfare recipient numbers, and the indexing of benefits to the CPI. The Budget 2002 decisions carry cost increases of around $200 million beyond 2002/03 year in excess of the $715 million budget package.
- •
- operating balance—Higher in all years. In 2001/02 higher tax revenue, combined with lower expenses due to revaluations, causes an upward revision of $1.65 billion to the operating balance. In future years increased expense growth lessens the impact of expected higher revenue, resulting in upwards revisions in the operating balance of between $170 million and $465 million.
- •
- net debt—Lower in all years. This is largely due to higher forecast cash from operating balances of around $2.5 billion over the forecast period.
- •
- gross debt—Lower in all years as a result of the higher cash operating balances. Overall the change has resulted in the scaling back of the 2001/02 bond programme by $350 million and a lower 2002/03 bond programme at $3.4 billion than that signalled in the 2002 BPS.
- •
- net worth—higher in every year due to the higher expected operating balances.
These changes are explained in more detail in the Budget Update.
Annex 2
Long-term fiscal objectives
In accordance with the Fiscal Responsibility Act 1994, the Government's updated long-term objectives are given below. These are compared with the long-term objectives specified in the 2002 Budget Policy Statement.
Long-term fiscal objectives
| | 2002 Fiscal Strategy Report
| | Budget Policy Statement 2002
|
|---|
| Operating balance | | Operating surplus on average over the economic cycle sufficient to meet the requirements for contributions to the NZS Fund and ensure consistency with the long-term debt objective. | | Operating surplus on average over the economic cycle sufficient to meet the requirements for contributions toward future NZS costs and ensure consistency with the debt objective. |
Crown debt |
|
Manage total debt at prudent levels. In the longer term, gross sovereign-issued debt below 30% of GDP on average over the economic cycle.6 |
|
Gross debt below 30% of GDP on average over the economic cycle. |
Operating expenses |
|
Ensure expenses are consistent with the operating balance objective. |
|
Expenses will average around 35% of GDP over the horizon used to calculate contributions toward future New Zealand Superannuation costs. During the build-up of assets to meet future New Zealand Superannuation costs, expenses plus contributions will be around 35% of GDP. In the longer term, expenses less withdrawals to meet New Zealand Superannuation costs will be around 35% of GDP. |
Operating Revenues |
|
Ensure sufficient revenue to meet the operating balance objective. |
|
Raise sufficient revenue to meet the operating balance objective.
A robust, broad-based tax system that raises revenue in a fair and efficient way. |
Crown net worth |
|
Increase net worth consistent with the operating balance objective. |
|
Increase net worth consistent with the operating balance objective. This will be achieved through a build-up of assets to meet future New Zealand Superannuation costs. |
- 6
- Sovereign-issued debt is issued by the New Zealand Debt Management Office (DMO) and the Reserve Bank. It excludes debt issued by SOEs and Crown entitles and the sovereign-guaranteed debt of SOEs and Crown entitles. Gross sovereign-issed debt includes any NZ government stock held by the NZS Fund.
The Government's fiscal objectives, outlined above, are for total Crown. However, to give effect to our objectives we will focus on coreexpenses, core revenue and net SOE and Crown entity results. This reflects the arms-length relationship that the Government has with SOEs and Crown entities. Further detail on the Government's core Crown focus is outlined in Table 3.
The change in the objectives was signalled in the 2001 Fiscal Strategy Report and the 2002 Budget Policy Statement. They are unchanged from the proposed objectives outlined in the 2002 Budget Policy Statement.
The objectives are re-specified to ensure:
- •
- ongoing compliance with the Fiscal Responsibility Act 1994, while
- •
- outlining more explicitly the underlying nature of the Government's fiscal policy approach as it relates to the various components of the Crown (ie, departments, SOEs and Crown entities). Refer to Table 3 for more details.
The changes to the presentation of the fiscal objectives present a clearer articulation of existing fiscal policy, while ensuring that the re-specified Crown financial statements do not alter the Government's fiscal policy approach.
Annex 3
Assumptions used in the forecasts and projections
This Annex summarises the assumptions used in producing the four-year forecasts and the projections beyond these. It also meets the Fiscal Responsibility Act 1994 requirement to explain the reasons for any significant differences from the previous projections. The projections, which are beyond 2005/06, are based on long-run technical and policy assumptions, not forecasts.
Economic and demographic assumptions
From 2002/03 to 2005/06, all projections incorporate the economic and fiscal forecasts detailed in the Budget Update. The following assumptions apply beyond 2005/06:
- •
- Nominal GDP grows with labour productivity (average annual rate of 1.5%), projected changes in the labour force (from Statistics New Zealand) and inflation (annual average rate of 1.5%).
- •
- Demographic trends are based on Statistics New Zealand population projections with medium fertility, medium mortality and net migration of 5,000 a year.
As a result, the projections beyond 2005/06 are not forecasts—but the result of bottom-up assumptions about the long-run economic drivers of growth. For example, slower projections of labour force growth (from Statistics New Zealand) will, with unchanged assumptions for labour productivity, lead to a lower projection of real GDP growth.
Table A3.1—Summary of economic assumptions*
| | Forecasts
| | Projections
|
|---|
June year7
|
|---|
| | 2003
| | 2004
| | 2005
| | 2006
| | 2007
| | 2008
| | 2009
| | 2010
| | 2011
| | 2012
|
|---|
| Labour productivity growth | | 2.3 | | 1.9 | | 1.3 | | 1.0 | | 1.5 | | 1.5 | | 1.5 | | 1.5 | | 1.5 | | 1.5 |
| Labour force growth | | 1.7 | | 1.0 | | 1.3 | | 1.3 | | 1.0 | | 0.9 | | 0.8 | | 0.8 | | 0.6 | | 0.5 |
| Unemployment rate | | 5.4 | | 5.2 | | 5.1 | | 5.2 | | 5.4 | | 5.4 | | 5.5 | | 5.5 | | 5.5 | | 5.5 |
| Employment growth | | 1.6 | | 1.2 | | 1.4 | | 1.2 | | 0.9 | | 0.8 | | 0.8 | | 0.7 | | 0.6 | | 0.5 |
| Real GDP | | 3.1 | | 3.1 | | 2.8 | | 2.8 | | 2.4 | | 2.3 | | 2.3 | | 2.2 | | 2.1 | | 2.0 |
| Consumer price index (annual % change) | | 2.0 | | 1.7 | | 1.6 | | 1.5 | | 1.5 | | 1.5 | | 1.5 | | 1.5 | | 1.5 | | 1.5 |
| Government 10-year bonds (quarterly average %) | | 6.4 | | 6.2 | | 6.2 | | 6.2 | | 6.2 | | 6.2 | | 6.2 | | 6.2 | | 6.2 | | 6.2 |
| Nominal average hourly wage growth | | 3.7 | | 3.5 | | 3.5 | | 2.9 | | 3.0 | | 3.0 | | 3.0 | | 3.0 | | 3.0 | | 3.0 |
- *
- Annual average % change unless otherwise stated.
- 7
- Note that the economic forecasts in the Budget Update are based on a March Year.
Source: The Treasury, Statistics New Zealand
Fiscal assumptions beyond 2005/06
Fiscal policy settings in the projections are an extension of current policy settings (for example, no change in tax brackets, CPI indexing of benefits only).
Table A3.2—Summary of fiscal assumptions
| | 10-year projections
|
|---|
| Tax revenue | | GDP linked, constant tax rate boundaries assumed. |
| NZS | | Demographically adjusted and linked to nominal wages after reaching 65% wage floor. |
| Other benefits | | Demographically adjusted and linked to inflation. |
| Health and education | | Demographically adjusted. |
| Finance costs | | A function of debt levels and interest rates. |
| Other | | Not demographically adjusted. |
| Fiscal allowance | | $1.2 billion (GST inclusive) in 2006/07, increasing with CPI and real wages. |
| Capital allowance | | $550 million in 2006/07, increasing with CPI and real wages. |
| NZS Fund | | Contributions to the proposed Fund are assumed to be consistent with the New Zealand Superannuation Fund Act 20018. Returns are assumed at 9.4% per annum (7.52% per annum after tax). |
Source: The Treasury
- 8
- A more detailed review of the assumptions involved in projecting the NZS Fund contributions and earnings can be found on pages 68 and 69 of the 2002 Budget Policy Statement, which was released with the 2001 December Economic and Fiscal Update. Further details can be found in Financing New Zealand Superannuation, a Treasury Working Paper by McCulloch and Frances, available at www.treasury.govt.nz.
Further details of the modelling approach can be found in Treasury Working Paper 00/02 Manual for the Long-term Fiscal Model, available at www.treasury.govt.nz.
Consistency of 10-year projections with those in the 2001 Fiscal Strategy Report
The fiscal projections show a significant improvement in progress towards achieving our long-term objectives. This improvement reflects a combination of factors including the much stronger fiscal forecasts from which the projections are driven, an increase in the expected rate of return on the NZS Fund to better reflect more likely outcomes, and a reduction in the long-run unemployment rate.
The largest driver is the improved economic and fiscal position at the end of the forecast period—which improves the debt position by around 2.0% of GDP by 2011/12. This is within the range of normal variability in the projections. The change in the NZS Fund returns accounts for lower debt of 1.5% of GDP by 2011/12, while the change in the unemployment rate accounts for around 1.5% of GDP.
The assumed long-run unemployment rate was reduced to 5.5% from 6.0%. The Treasury general equilibrium model of the New Zealand economy incorporates a steady state assumption of 5.5%. In addition, recent labour market outturns appear consistent with a fall in the structural unemployment rate, and the unemployment rate at the forecast period is expected to be in the range of 5% to 5.5%. The effect of this change is to increase the average economic growth rate (real) over 2006/07 to 2011/12 from 2.2% to 2.3%.
The average return on the NZS Fund was increased to 7.52% after tax from 6.0% to more fully reflect the likely investment profile of the Fund and tax liability. Further details of this change can be found on page 68 of the 2001 December Update.
Annex 4
Full line-by-line consolidation
This Annex compares the tracks for the key fiscal variables under:
- •
- the current presentation of the forecasts (net surplus and net equity of SOEs/Crown entities)
- •
- the future presentation of the total Crown as measured by line-by-line consolidation
- •
- the future presentation of the core Crown.
The operating balance and net worth are the same under the current presentation and future presentation under line-by-line consolidation. However the components of gross revenues, expenses, assets and liabilities do alter as the SOEs and Crown entities are line-by-line consolidated rather than just having their net surpluses and net worth included.9
- 9
- A detailed section is included in the Fiscal Outlook chapter of the 2002 Budget Update, which explains the change to the presentation of the Crown financial statements.
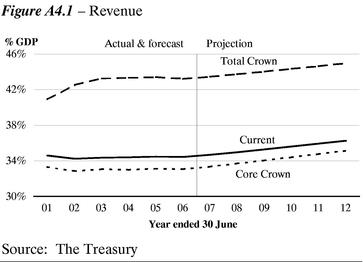
Revenue is around 9% of GDP higher under the total Crown measure than under the current measure, reflecting the inclusion of third-party revenue from SOEs and Crown entities. Revenue received by SOEs and Crown entities from parts of the Crown is excluded. For example, New Zealand Post revenue from the sale of stamps to the private sector is included, but government research funding provided to CRIs is excluded.
Revenue is around 1% of GDP lower under the core Crown measure than under the current measure, largely reflecting the elimination of GST on Crown spending. For example the GST on health funding is excluded from GST revenue.
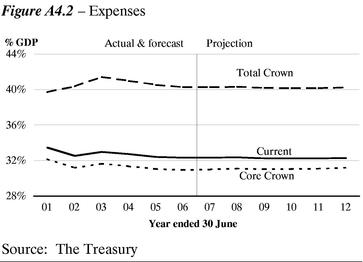
Expenses are around 8% of GDP higher under the total Crown measure than under the current measure. As with revenue, this largely reflects the inclusion of the expenses of SOEs and Crown entities. For example the payroll costs of NZ Post are included.
Expenses are around 1% of GDP lower under the core Crown measure than under the current method largely reflecting the elimination of GST.
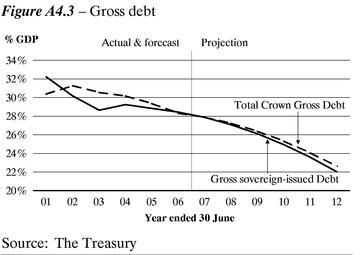
Gross sovereign-issued debt appears to be only marginally different from total Crown gross debt. This may not occur in the future. It reflects that the additional debt held by SOEs and Crown entities is largely offset by their current cross holdings of government stock.
EXHIBIT 99.5(E)(3)
budget
2002
ECONOMIC AND FISCAL UPDATE
Hon Dr Michael Cullen
TREASURER
MINISTER OF FINANCE
23 May 2002
Statement of Responsibility
On the basis of the economic and fiscal information available to it, the Treasury has used its best professional judgement in supplying the Minister of Finance with this Economic and Fiscal Update. The Update incorporates the fiscal and economic implications both of Government decisions and circumstances as at 10 May 2002 that were communicated to me, and of other economic and fiscal information available to the Treasury in accordance with the provisions of the Fiscal Responsibility Act 1994.
Dr Alan Bollard
Secretary to the Treasury
14 May 2002
This Economic and Fiscal Update has been prepared in accordance with the Fiscal Responsibility Act 1994. I accept overall responsibility for the integrity of the disclosures contained in this Update, and the consistency and completeness of the Update information in accordance with the requirements of the Fiscal Responsibility Act 1994.
To enable the Treasury to prepare this Update, I have ensured that the Secretary to the Treasury has been advised of all Government decisions and other circumstances as at 10 May 2002 of which I was aware and that had material economic or fiscal implications.
Hon Dr Michael Cullen
Treasurer and Minister of Finance
14 May 2002
1
Economic and Fiscal Overview
Economic Outlook
The New Zealand economy has weathered the slowdown in global growth well
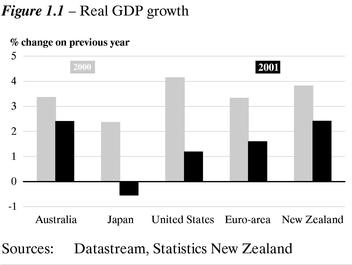
- •
- The New Zealand economy has evolved somewhat better than expected at the 2001 December Economic and Fiscal Update (December Update).
- •
- Quarterly GDP growth averaged around 0.4% over the second half of 2001, with the economy growing 2.4% in the year to December 2001. Growth in both the September and December quarters was characterised by strong domestic demand, partially offset by a weaker external sector.
- •
- The economy looks to have grown by around 1% in the March quarter, driven by household spending and a rebound in exports.
- •
- Since the December Update, expected trading partner growth for 2002 has been revised up from 1.9% to 2.6%, owing to a better than expected end to last year and start to 2002, rather than stronger growth going forward. While growth for 2002 is expected to be stronger than actual growth in 2001, trading partner growth remains below trend.
Economic growth is set to remain robust...
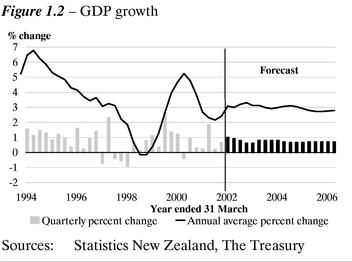
- •
- Looking forward, New Zealand's GDP growth is expected to be 3.1% to March 2003, which is significantly better than the 1.9% expected in the December Update.
- •
- One of the key changes since December is a substantial turnaround in net migration. In the short term, the impact is likely to be more on demand than supply, putting pressure on the economy's capacity. Over the medium term, the demand and supply effects of the increase in net migration will become more balanced as migrants enter the labour force.
...although domestic demand is expected to slow
- •
- After displaying strong growth over the second half of 2001 and the first quarter of 2002, employment growth is forecast to slow over the rest of 2002 as some of the drivers over the past year are not repeated and as firms seek to improve productivity. Nevertheless, the labour market is expected to remain tight by historical standards, with the unemployment rate staying close to current levels. Wage growth is expected to rise slightly.
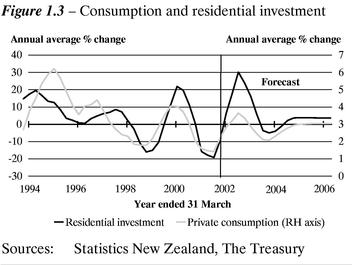
- •
- After accelerating over the year to March 2002, quarterly consumption growth is expected to moderate over the year ahead, reflecting slower growth in labour income, a decline in farm income and rising interest rates.
- •
- Residential investment is expected to display ongoing growth over much of 2002, before contracting over late 2002 and early 2003.
- •
- Business investment is forecast to accelerate over 2002 and early 2003, growing at around 2% in the year to March 2003 underpinned by two good years of economy-wide profit growth and strong growth in domestic demand. Investment growth loses momentum in the second half of 2003 as profit growth slows.
Solid export volume growth in the year ahead
- •
- The recent recovery of merchandise export volumes, largely in dairy and meat exports, will become more modest in the year ahead. Non-commodity manufactured exports are projected to display robust quarterly growth, benefiting from the delayed impact of the depreciation in the currency and stronger trading partner growth.
- •
- The projected strength in services exports in the year ahead reflects tourism picking up after the fall following 11 September, as "normal" travel patterns resume more quickly than was assumed in the December Update.
- •
- The full impact of the sharp drop in global growth on export prices has still to be felt, with world export prices forecast to decline through until the second half of 2002, and New Zealand dollar export prices expected to fall by 12% in the March 2003 year.
Inflation remains persistently high over 2002
- •
- Annual CPI inflation has been strong recently, and is expected to remain at or above 2.5% over the remainder of 2002. This reflects some one-off price increases, recent wage growth in excess of productivity, together with strong GDP growth in the year ahead which allows some room for firms to rebuild margins. Inflation is likely to reduce going into 2003, largely because of slowing unit labour cost growth.
- •
- With growth set to remain strong in the year to March 2003, the Reserve Bank is assumed to move monetary policy back to a more neutral footing, by taking the Official Cash Rate (OCR) to 6% by the end of 2002.
GDP growth remains robust in the medium term
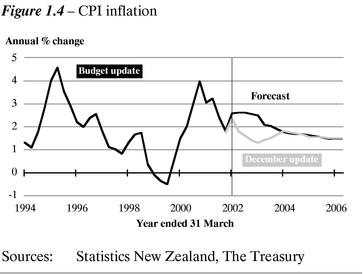
- •
- With trading partner growth accelerating to 3.6% in 2003, as well as the economy benefiting from business investment and employment growth, GDP growth of 3% is expected in the year to March 2004. Growth converges back to around the economy's long-run trend towards the end of the forecast period.
The current account deficit is expected to increase over the short term
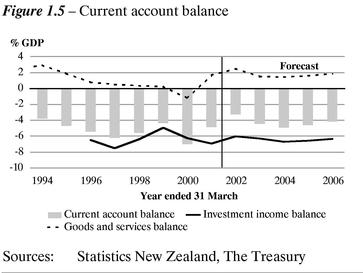
- •
- Despite total export volumes gaining some momentum in the year ahead, the current account deficit is expected to increase to around 4.5% of GDP in the second half of 2002 and to around 5% in 2003/04. This is largely due to the impact of stronger consumption and investment on import growth over the March 2003 year. Government defence spending also adds to the import profile over the forecast horizon.
- •
- Following the forecast increase in the current account deficit over the March 2003 and 2004 years, the current account deficit is expected to reduce somewhat towards the end of the forecast horizon. The initial improvement in the deficit is driven by a slowdown in import growth, as consumption and investment growth slows in the March 2004 year and into 2005. A continued steady improvement in services exports also helps to underpin the decrease in the current account deficit.
Nominal GDP growth is more cyclical
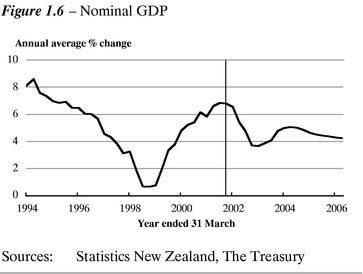
- •
- While the near-term profile for GDP growth is relatively flat, nominal GDP growth is considerably more cyclical, owing to movements in the GDP deflator accentuating the cycle in GDP.
- •
- After growing 6.6% in the year to March 2002, nominal GDP growth is forecast to slow to 3.7% in the year to March 2003, before rising to 5% in the year to March 2004.
- •
- Over the last two years of the forecast horizon the nominal economy is expected to grow at around 4% to 5%, owing to the combination of steady GDP growth and inflation around the mid-point of the Reserve Bank's target band. The higher level of nominal GDP throughout the entire forecast period, compared with the December Update, underpins the solid growth in tax revenue feeding through to an improved fiscal position.
Fiscal Outlook
The fiscal outlook has improved since the December Update
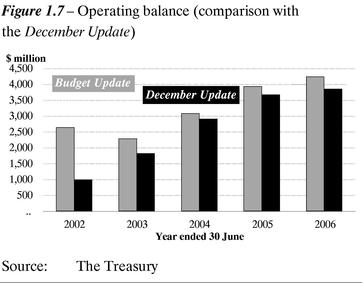
- •
- The December Update forecasts reflected a weaker position from the 2001 Budget Economic and Fiscal Update, largely reflecting changes to the economic forecasts, particularly the world outlook. The fiscal forecasts are much improved on those in the December Update, driven in large part by the economic forecasts discussed in the previous section.
- •
- Tax revenues are higher by at least $600 million per year, largely representing the unwinding of the downwards revisions in the December Update, driven by changes to the nominal economy forecasts. The forecasts for nominal GDP are between 1–1.5% higher than they were in the December Update.
- •
- Benefit expenses continue to fall but are more than offset by increases in education expenses owing to demographic forecast changes, and a $200 million impact on the operating balance from 2003/04 resulting from Budget 2002 decisions.
- •
- Positive net ACC and GSF valuation changes of $570 million since the December Update have also increased the operating balance in the 2001/02 year.
- •
- Relative to the December Update the forecast cash outflows for the period 2001/02 to 2005/06 have reduced by a net $2.4 billion, reflecting improved cash flows from operations. As a result, both gross and net debt decrease relative to the December Update.
- •
- A consequence of the cash flow improvements is that the 2001/02 bond programme has been reduced by $350 million (accommodated by the cancellation of the 20 June 2002 bond tender). The 2002/03 bond programme has been established at $3.4 billion, significantly lower than the $5.1 billion signalled in the December Update.
- •
- Much of the change to the fiscal forecasts since the December Update bring the operating balance forecasts broadly back to the levels in the 2001 Budget Update from 2002/03.
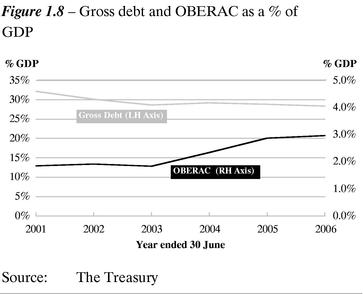
- •
- Other key features relative to the 2001 Budget Update are:
- —
- The operating balance for the 2001/02 year is higher, mainly owing to higher tax revenue and GSF valuation movements ($420 million).
- —
- Debt is lower in all years reflecting the stronger 2001/02 year and the improved opening debt position reflected in the actual 30 June 2001 Crown financial statements.
- •
- The positive operating balances are sufficient to enable gross debt to remain just below the Government's debt target of 30% of GDP, given the level of investment activity. The factors contributing to this are discussed in the following sections.
Operating balance rises over the forecast horizon ...
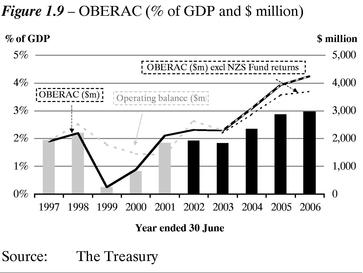
- •
- The forecast 2001/02 operating balance is $2.6 billion (2.2% of GDP).
- •
- Excluding the ACC and GSF valuations, the OBERAC (operating balance excluding revaluations and accounting policy changes) for 2001/02 is $2.3 billion (1.9% of GDP).
- •
- The OBERAC falls in 2002/03 as a percentage of GDP.
- •
- The operating balance is expected to rise to 3% of GDP by 2005/06 ($4.2 billion).
... due to tax revenue growth remaining higher than expense growth ...
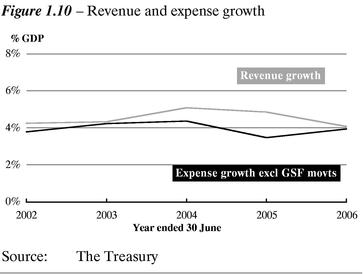
- •
- Tax continues to grow by an average of 4.5% across the forecast period. The strong growth continues in line with previous updates, but is moderated by reduced (but still positive) growth in business tax in 2001/02.
- •
- Expense growth averages around 4% per annum over the forecast period.
- •
- Health and education demographics continue to be a key driver in expense growth in addition to the forecast new spending.
... enabling the Government to continue to apply surplus cash to its investment programme
- •
- The rising operating surplus translates to a similar level of cash flows from operations, generating approximately $15.8 billion operating cash surpluses over the period 2001/02 to 2005/06 to fund investing activity.
- •
- Investment outlays of $24.1 billion outweigh operating cash surpluses by $8.3 billion. These outlays include: maintaining and improving the existing asset base and providing injections (e.g. for the Air New Zealand recapitalisation package); investing in the New Zealand Superannuation Fund (NZS Fund); and funding advances (which mainly include student loans and Crown entity private debt refinancing).
Debt is relatively flat as a percentage of GDP, although rises in nominal terms
- •
- Over the period, gross debt falls as a percentage of GDP from around 32% at 30 June 2001 to 30.2% in 2001/02. Thereafter it averages around 29% and is 28.4% by 2005/06. For the same period, net debt averages around 17% of GDP before falling to 15.5% by 2005/06.
- •
- Gross and net debt rise slightly in the middle of the forecast period. This is mainly due to the timing of planned capital spending.

- •
- Gross debt increases by $3.9 billion in nominal terms from 30 June 2001 to the end of the forecast period. This, in conjunction with a decrease in marketable securities and deposits of $4.8 billion, funds the shortfall between operating cash flows and investment outlays.
- •
- The domestic bond programme for 2002/03 has been set at $3.4 billion, down from the forecast $5.1 billion in the December Update. For a full explanation of the revision refer to page 84 of the Fiscal Outlook chapter.
Government Budget decisions
- •
- The Government has allocated all but $230 million of the $6.1 billion fiscal provision since Budget 2000. The $230 million is set aside as a contingency to manage risks in between the 2002 and 2003 Budgets. The tables below provide a breakdown of the Government's three-year fiscal provision from 1999/2000 to 2002/03 for both operating and capital:
Table 1.1—Fiscal provisions to 2002/03
Fiscal provisions
| | 1999/2000
| | 2000/01
| | 2001/02
| | 2002/03
| | Total
|
|---|
| | ($ million, GST inclusive)
|
|---|
| Budget 2000 decisions | | 420 | | 1,050 | | 1,060 | | 1,120 | | 3,650 |
| 2000 contingency decisions | | — | | 99 | | 74 | | 78 | | 251 |
| Budget 2001 decisions | | — | | 52 | | 532 | | 526 | | 1,110 |
| 2001 contingency decisions | | — | | — | | 51 | | 125 | | 176 |
| Budget 2002 decisions | | — | | — | | (7 | ) | 715 | | 707 |
| 2002 contingency provision | | — | | — | | — | | 230 | | 230 |
| | |
| |
| |
| |
| |
|
| Total | | 420 | | 1,201 | | 1,710 | | 2,794 | | 6,124 |
| | |
| |
| |
| |
| |
|
Source: The Treasury
Table 1.2—Capital spending to 2002/03
Capital provisions
| | 1999/2000
| | 2000/01
| | 2001/02
| | 2002/03
| |
|---|
| | ($ million, GST inclusive)
| |
|---|
| Capital provision—December Update | | (69 | ) | 639 | | 2,291 | | 1,585 | |
| Budget 2000 decisions | | (54 | ) | 827 | | 576 | | 568 | |
| December Update 2000 decisions | | (15 | ) | (58 | ) | (4 | ) | 40 | |
| Receipts from spectrum sale | | — | | (135 | ) | | | | |
| Budget 2001 decisions | | — | | 5 | | 369 | | 204 | |
| December Update 2001 decisions | | — | | — | | 76 | | 27 | |
| Budget 2002 Decisions | | — | | — | | 1,151 | | 407 | |
| | |
| |
| |
| |
| |
| Total decisions to date | | (69 | ) | 639 | | 2,168 | | 1,246 | |
| Planned commitments pre-Budget 2002 | | — | | — | | 123 | | 339 | |
| Budget 2002 rephasing of commitments | | — | | — | | (123 | ) | (119 | ) |
| Budget 2002 increase to forecast commitments | | — | | — | | — | | — | |
| Forecast capital commitments | | — | | — | | — | | 220 | |
| | |
| |
| |
| |
| |
| Total provision for to 2002/03 | | (69 | ) | 639 | | 2,168 | | 1,466 | |
| | |
| |
| |
| |
| |
Source: The Treasury
- •
- In the next parliamentary term, the Government plans to revise the provisions framework to ensure the focus will be on the operating and debt tracks and their consistency with the fiscal objectives. This compares with the current focus on a set nominal limit for the electoral term.
- •
- Looking forward, the Government will balance the operating and capital components alongside NZS Fund contributions.
- •
- Under current operating balance projections, the Government could accommodate core operating expense growth of around 2.5% per year and capital investment on average of around $500 million to $600 million per year. This is consistent with making contributions to the NZS Fund as planned. The forecasts reflect amounts for forecast future new spending consistent with this approach.
The fiscal forecasts are highly sensitive to risks around the economic forecasts
- •
- The Central Forecast is determined by balancing both the upside and downside risks facing the economy, to provide the best assessment of the way the economy is likely to evolve. Some of the key judgements or risks may evolve differently, resulting in the economy deviating from the Central Forecast.
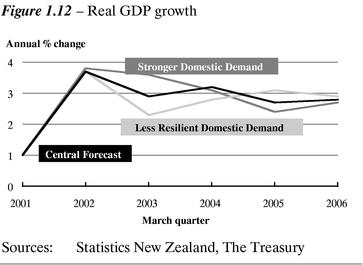
- •
- If domestic demand is stronger than assumed in the Central Forecast, a possible growth path for the economy is one where private consumption and residential investment hold up through 2002/03 by more than anticipated, and where the turnaround in net migration adds less to productive capacity. This would see GDP growth accelerate to 3.5% in 2002/03 compared with 3.1% in the Central Forecast. However, with the economy growing above capacity, inflationary pressures would build up and monetary conditions tighten to bring inflation to within the target band. This would lead to slower growth in the following years.
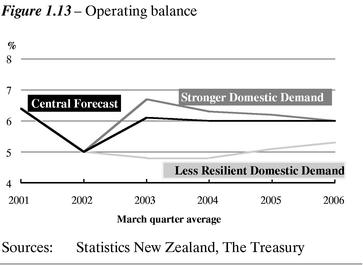
- •
- Alternatively, domestic demand may lose its momentum more quickly, with lower consumption, residential investment and employment growth in the near term compared with the Central Forecast. Under this scenario, GDP growth would slow to 2.7% in 2002/03 and 2.3% in 2003/04. Growth would recover to 3.3% in 2004/05 as monetary conditions remain stimulatory for longer.
- •
- These effects will flow through into the Government's operating balance. Under a Stronger Domestic Demand scenario, a higher nominal GDP relative to the Central Forecast will result in a higher operating balance throughout the forecast period. However, if domestic demand were less resilient, the operating balance would be lower throughout the forecast period compared with the Central Forecast.
- •
- The changes in the operating balance will also have an impact on gross debt. A higher operating balance would lead to lower gross debt as a percentage of GDP, because both GDP and
operating surpluses would be higher. The converse is true in the case of a lower operating balance.
Table 1.3—Economic indicators1
(Annual Average % change, March years)
| | 2001
Actual
| | 2002
Forecast
| | 2003
Forecast
| | 2004
Forecast
| | 2005
Forecast
| | 2006
Forecast
| |
|---|
| Consumption | | 0.7 | | 2.7 | | 2.8 | | 2.7 | | 2.6 | | 2.7 | |
| Investment | | (0.1 | ) | 7.8 | | 5.5 | | 4.1 | | 4.2 | | 3.0 | |
| Stock change2 | | (0.4 | ) | (0.3 | ) | (0.1 | ) | 0.2 | | 0.0 | | 0.0 | |
| | |
| |
| |
| |
| |
| |
| |
| Gross National Expenditure | | 0.2 | | 3.3 | | 3.3 | | 3.2 | | 2.9 | | 2.7 | |
| | |
| |
| |
| |
| |
| |
| |
| Exports | | 6.8 | | 1.8 | | 6.6 | | 6.1 | | 4.7 | | 3.8 | |
| Imports | | 0.4 | | 3.5 | | 5.9 | | 6.7 | | 5.2 | | 3.9 | |
| | |
| |
| |
| |
| |
| |
| |
| GDP (Production Measure) | | 2.7 | | 3.1 | | 3.1 | | 3.0 | | 2.9 | | 2.8 | |
| | |
| |
| |
| |
| |
| |
| |
| —annual % change, March qtr | | 1.0 | | 3.7 | | 2.9 | | 3.2 | | 2.7 | | 2.8 | |
Employment3 |
|
2.2 |
|
2.5 |
|
2.0 |
|
1.0 |
|
1.5 |
|
1.3 |
|
| Unemployment4 | | 5.4 | | 5.3 | | 5.4 | | 5.1 | | 5.2 | | 5.3 | |
Wages5 |
|
2.4 |
|
3.5 |
|
3.8 |
|
3.5 |
|
3.6 |
|
3.0 |
|
| CPI inflation | | 3.1 | | 2.6 | | 2.5 | | 1.8 | | 1.6 | | 1.5 | |
Current account balance |
|
(4.8 |
) |
(3.2 |
) |
(4.4 |
) |
(4.9 |
) |
(4.6 |
) |
(4.1 |
) |
TWI6 |
|
50.5 |
|
51.6 |
|
54.0 |
|
54.6 |
|
55.0 |
|
55.0 |
|
| 90 day bank bill rate6 | | 6.4 | | 5.0 | | 6.1 | | 6.0 | | 6.0 | | 6.0 | |
Sources: Statistics New Zealand, Datastream, The Treasury
- 1
- Finalised 10 May 2002.
- 2
- Contribution to GDP growth.
- 3
- Household Labour Force Survey, full-time equivalent employment.
- 4
- Household Labour Force Survey, percentage of the labour force, March quarter, seasonally adjusted.
- 5
- Quarterly Employment Survey, average hourly ordinary time earnings.
- 6
- Average for the March quarter.
Table 1.4—Fiscal indicators (current presentation)
| | 2001
Actual
| | 2002
Forecast
| | 2003
Forecast
| | 2004
Forecast
| | 2005
Forecast
| | 2006
Forecast
| |
|---|
| | ($ million)
| |
|---|
| Operating Balance | | | | | | | | | | | | | |
| Revenue | | 39,492 | | 41,172 | | 42,952 | | 45,142 | | 47,329 | | 49,259 | |
| Expenses | | | | | | | | | | | | | |
| | Allocated expenses | | (38,186 | ) | (39,148 | ) | (40,957 | ) | (42,285 | ) | (43,297 | ) | (44,146 | ) |
| | Forecast for new spending | | — | | — | | (230 | ) | (700 | ) | (1,180 | ) | (2,080 | ) |
| SOE/CE surpluses | | 103 | | 612 | | 523 | | 921 | | 1,085 | | 1,209 | |
| | |
| |
| |
| |
| |
| |
| |
| Operating Balance | | 1,409 | | 2,636 | | 2,288 | | 3,078 | | 3,937 | | 4,242 | |
| | Less revaluations | | 698 | | (326 | ) | — | | — | | — | | — | |
| | |
| |
| |
| |
| |
| |
| |
| OBERAC | | 2,107 | | 2,310 | | 2,288 | | 3,078 | | 3,937 | | 4,242 | |
| Less contributions and returns on NZS Fund | | — | | (600 | ) | (1,290 | ) | (2,009 | ) | (2,379 | ) | (2,667 | ) |
| | |
| |
| |
| |
| |
| |
| |
| Available after NZS Fund Requirements | | 2,107 | | 1,710 | | 998 | | 1,069 | | 1,558 | | 1,575 | |
Less |
|
|
|
|
|
|
|
|
|
|
|
|
|
| | Forecast new capital investment | | — | | — | | (220 | ) | (800 | ) | (500 | ) | (360 | ) |
| | Physical asset purchases and other | | (682 | ) | (1,901 | ) | (1,551 | ) | (1,421 | ) | (1,215 | ) | (1,201 | ) |
| | |
| |
| |
| |
| |
| |
| |
| Movement in Net Crown Debt | | 1,425 | | (191 | ) | (773 | ) | (1,152 | ) | (157 | ) | 14 | |
| | |
| |
| |
| |
| |
| |
| |
| Net Crown Debt | | 19,971 | | 20,162 | | 20,935 | | 22,087 | | 22,244 | | 22,230 | |
| Net Crown Debt (% of GDP) | | 17.5 | % | 16.8 | % | 16.8 | % | 16.8 | % | 16.2 | % | 15.5 | % |
| Domestic Bond Programme1 | | 3,572 | | 3,703 | | 3,400 | | 5,559 | | 3,933 | | 3,822 | |
| Nominal GDP | | 114,145 | | 120,309 | | 124,964 | | 131,293 | | 137,201 | | 143,026 | |
| | |
| |
| |
| |
| |
| |
| |
| Fiscal Indicators as a % of GDP | | | | | | | | | | | | | |
| Gross debt | | 32.2 | % | 30.2 | % | 28.6 | % | 29.2 | % | 28.8 | % | 28.4 | % |
| Net Crown debt | | 17.5 | % | 16.8 | % | 16.8 | % | 16.8 | % | 16.2 | % | 15.5 | % |
| Net Crown debt plus assets of NZS Fund | | 17.5 | % | 16.3 | % | 15.2 | % | 13.9 | % | 11.6 | % | 9.3 | % |
| Net worth | | 10.0 | % | 11.8 | % | 13.2 | % | 14.9 | % | 17.2 | % | 19.4 | % |
| Revenue | | 34.6 | % | 34.2 | % | 34.4 | % | 34.4 | % | 34.5 | % | 34.4 | % |
| Expense | | 33.5 | % | 32.5 | % | 33.0 | % | 32.7 | % | 32.4 | % | 32.3 | % |
| OBERAC | | 1.8 | % | 1.9 | % | 1.8 | % | 2.3 | % | 2.9 | % | 3.0 | % |
| Operating balance | | 1.2 | % | 2.2 | % | 1.8 | % | 2.3 | % | 2.9 | % | 3.0 | % |
New Zealand Superannuation Fund |
|
|
|
|
|
|
|
|
|
|
|
|
|
| Fund asset returns (after tax)2 | | — | | 14 | | 90 | | 209 | | 368 | | 550 | |
| Fund assets (year end) | | — | | 600 | | 1,890 | | 3,898 | | 6,277 | | 8,944 | |
| % of GDP | | 0.0 | % | 0.5 | % | 1.5 | % | 3.0 | % | 4.6 | % | 6.3 | % |
- 1
- The figure for 2003 is the face value of the bond programme. The actual cash raised by the programme is forecast to be $3,392 million, as the bonds are forecast to be issued at a discount. Further out the bond programme is an estimate of the cash expected to be raised. For the reconciliation between the bond programme and operating cash flows see the Statement of Cash Flows.
- 2
- Returns on fund assets are recorded as revenue from investments in the operating balance (see Note 3 of the fiscal forecasts). However only the "after tax" portion of investment income accumulates in the NZS Fund.
2
Economic Outlook
Our December Update was set against the global backdrop of weak growth and a high degree of uncertainty
The economic forecasts for the December Update, which were finalised in mid-November, were prepared against the backdrop of slowing trading partner growth and a high degree of uncertainty surrounding the global outlook. Reflecting the perceived weakness of the global economy, New Zealand's trading partner growth was forecast at 1.9% for calendar 2002, although, importantly for New Zealand, Australian growth was expected to remain resilient at 3.2% for calendar 2002.
However, we also pointed out that the New Zealand economy was in a relatively good position to weather the slowdown in trading partner growth. A number of sectors in the New Zealand economy had experienced two years of strong income growth, the real exchange rate was at historically stimulatory levels, and firms' balance sheets were reasonably healthy. Moreover, largely in response to developments in the external environment, the Reserve Bank had cut the Official Cash Rate (OCR) by 175 basis points over 2001, including an unscheduled 50 basis point cut about a week after the events of 11 September. These factors were expected to help buffer the New Zealand economy from slowing global growth.
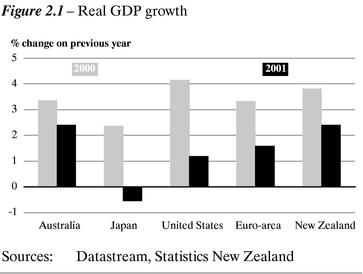
Nonetheless, we still expected weaker global growth to transmit through to the New Zealand economy, via the following three key channels:
- •
- lower demand for New Zealand exports (including tourism)
- •
- lower export prices, only partially offset by lower import prices
- •
- heightened uncertainty and weak business and consumer confidence, resulting in a weak short-term domestic expenditure profile, particularly over the first half of 2002.
Table 2.1—Economic Outlook: Central Forecast1
(Annual Average % change, March years)
| | 2001
Actual
| | 2002
Forecast
| | 2003
Forecast
| | 2004
Forecast
| | 2005
Forecast
| | 2006
Forecast
| |
|---|
| Private consumption | | 1.6 | | 2.8 | | 2.9 | | 2.3 | | 3.0 | | 3.0 | |
| Public consumption2 | | (2.2 | ) | 2.1 | | 2.4 | | 4.1 | | 1.1 | | 1.3 | |
| | |
| |
| |
| |
| |
| |
| |
| Total Consumption | | 0.7 | | 2.7 | | 2.8 | | 2.7 | | 2.6 | | 2.7 | |
| | |
| |
| |
| |
| |
| |
| |
| Residential investment | | (15.9 | ) | 6.2 | | 16.1 | | (4.1 | ) | 3.8 | | 3.6 | |
| Market Investment | | 7.4 | | 9.0 | | 2.0 | | 6.8 | | 4.3 | | 2.9 | |
| Non-Market Investment | | (5.0 | ) | (2.8 | ) | (1.7 | ) | 5.9 | | 5.0 | | 1.9 | |
| Total Investment | | (0.1 | ) | 7.8 | | 5.5 | | 4.1 | | 4.2 | | 3.0 | |
| | |
| |
| |
| |
| |
| |
| |
| Stock Change3 | | (0.4 | ) | (0.3 | ) | (0.1 | ) | 0.2 | | 0.0 | | 0.0 | |
| Gross National Expenditure | | 0.2 | | 3.3 | | 3.3 | | 3.2 | | 2.9 | | 2.7 | |
| | |
| |
| |
| |
| |
| |
| |
| Exports | | 6.8 | | 1.8 | | 6.6 | | 6.1 | | 4.7 | | 3.8 | |
| Imports | | 0.4 | | 3.5 | | 5.9 | | 6.7 | | 5.2 | | 3.9 | |
| | |
| |
| |
| |
| |
| |
| |
| GDP (Production Measure) | | 2.7 | | 3.1 | | 3.1 | | 3.0 | | 2.9 | | 2.8 | |
| | |
| |
| |
| |
| |
| |
| |
| —annual % change, March qtr | | 1.0 | | 3.7 | | 2.9 | | 3.2 | | 2.7 | | 2.8 | |
| Nominal GDP (expenditure basis) | | 5.8 | | 6.6 | | 3.7 | | 5.0 | | 4.6 | | 4.3 | |
| GDP deflator | | 3.6 | | 3.7 | | 0.3 | | 1.9 | | 1.8 | | 1.6 | |
| Employment4 | | 2.2 | | 2.5 | | 2.0 | | 1.0 | | 1.5 | | 1.3 | |
| Unemployment5 | | 5.4 | | 5.3 | | 5.4 | | 5.1 | | 5.2 | | 5.3 | |
| Wages6 | | 2.4 | | 3.5 | | 3.8 | | 3.5 | | 3.6 | | 3.0 | |
| CPI inflation | | 3.1 | | 2.6 | | 2.5 | | 1.8 | | 1.6 | | 1.5 | |
| Export prices7 | | 19.6 | | 3.0 | | (10.4 | ) | 0.4 | | 0.0 | | 0.2 | |
| Import prices7 | | 15.3 | | (0.9 | ) | (5.1 | ) | 0.0 | | (0.5 | ) | (0.5 | ) |
| Current account balance | | | | | | | | | | | | | |
| —$ million | | (5412 | ) | (3867 | ) | (5467 | ) | (6370 | ) | (6257 | ) | (5875 | ) |
| —% of GDP | | (4.8 | ) | (3.2 | ) | (4.4 | ) | (4.9 | ) | (4.6 | ) | (4.1 | ) |
| TWI8 | | 50.5 | | 51.6 | | 54.0 | | 54.6 | | 55.0 | | 55.0 | |
| 90 day bank bill rate8 | | 6.4 | | 5.0 | | 6.1 | | 6.0 | | 6.0 | | 6.0 | |
| 10 year bond rate8 | | 6.0 | | 6.7 | | 6.6 | | 6.2 | | 6.2 | | 6.2 | |
Sources: Statistics New Zealand, Datastream, The Treasury
- 1
- Forecasts finalised 10 May 2002.
- 2
- The forecast profile for public consumption is influenced by government defence spending.
- 3
- Contribution to GDP growth.
- 4
- Household Labour Force Survey, full-time equivalent employment.
- 5
- Household Labour Force Survey, percentage of the labour force, March quarter, seasonally adjusted.
- 6
- Quarterly Employment Survey, average hourly ordinary time earnings.
- 7
- Overseas Trade Index basis, annual average percentage change, March quarter.
- 8
- Average for the March quarter.
Assumptions Underlying the Central Forecast
Global economic activity is assumed to evolve in an environment where any future political or military actions do not have significant negative effects on the overall economic climate.
The international outlook conforms to that presented in the March and April Consensus Forecasts, and Asia-Pacific Consensus Forecasts.
The 2002/03 agricultural season is assumed to be an average or "normal" growing season.
Our forecasts assume an equilibrium exchange rate of 55 on a Trade Weighted Index (TWI) basis, and an equilibrium short-term interest rate of 6.0%.
We have assumed no change in announced Government policy as of 10 May 2002.
The world economy has been weak...
Since the December Update economic forecasts were finalised, the world economy has turned out to be stronger than embodied in our Consensus Forecasts-based assumptions of trading partner growth. Nevertheless, global growth was still weak at the end of 2001. The US economy grew by a modest 0.3% in the December quarter, while a number of Euro-area countries—notably Germany, France and Italy—all posted declines in GDP. While growth in non-Japan Asia recovered somewhat in the December quarter, Japan posted its third consecutive quarterly decline in GDP. In contrast, the Australian economy posted growth of 1.3% in the December quarter, on the back of robust domestic demand.
Perhaps even more significant than the actual GDP outturns for New Zealand's trading partners is that the downside risks surrounding the global outlook appear to have reduced substantially since late last year, although undoubtedly downside risks remain. Reflecting this change in sentiment, the global monetary policy easing cycle is generally perceived to have ended, with central banks in the US and the Euro-area expected to begin raising interest rates in the second half of 2002.
...but the New Zealand economy continued to outperform
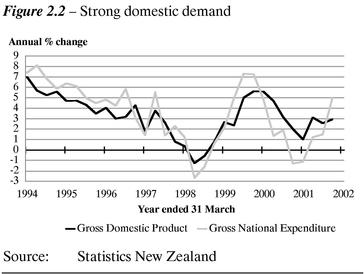
In the event, overall economic activity has also been somewhat better than embodied in the Central Forecast at the December Update, although the composition of growth has been different from the composition we were expecting in November:
- •
- Quarterly GDP growth averaged around 0.4% over the second half of 2001, with the economy growing 2.4% in the year to December 2001. Growth in the September and December quarters was characterised by strong domestic demand, partially offset by a weaker external sector.
- •
- Employment grew by 1.3% in the March quarter, continuing the strong growth displayed in the second half of 2001. The unemployment rate fell to 5.3%, with strong employment growth largely offset by a further large increase in the participation rate.
- •
- The annual current account deficit fell to 3.2% of GDP in the December 2001 quarter and looks to have remained at this in the March 2002 quarter.
Of the three key channels through which slowing global growth was expected to impact on the New Zealand economy, the first two channels of weaker demand for New Zealand's exports and declining commodity prices have largely operated as expected, albeit with greater volatility on the volume side. The fall in export volumes in the December 2001 quarter provided a clear indication that slowing global growth was having an impact on New Zealand's external sector. The decline in crude material exports was reportedly due to a lower wool clip with wet weather resulting in shearing delays. The fall in dairy exports—and the corresponding build-up in primary stocks—likely reflected dairy producers holding back product owing to unfavourable world prices and weaker world demand. Moreover, the large decline in tourist arrivals in late 2001 resulted in a significant contraction in services exports in the December 2001 quarter. Furthermore, export incomes have also suffered from falling prices owing to declining world prices for New Zealand's key commodities and, to a lesser extent, a modest appreciation in the New Zealand dollar over the second half of 2001.
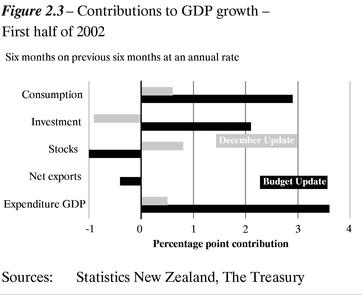
In contrast, the third transmission channel of heightened uncertainty resulting in a lower profile for domestic expenditure does not appear to have worked as expected. Initial falls in both consumer and business confidence towards the end of 2001 proved to be short lived, and rather than recording weaker growth, some components of domestic demand accelerated. Indeed, in some respects data outturns for the components of domestic demand have been closer to the "More Resilient Terms of Trade and Confidence" scenario outlined at the December Update.
Some key assumptions have evolved differently
There are a number of possible reasons why domestic expenditure has outperformed our expectations. One of the key reasons is likely to be that the "non-economic" factors we saw depressing sentiment look to have unwound relatively quickly. As a result, the robust "fundamentals" we saw limiting the downside to growth reasserted themselves, and in some instances turned out to be stronger than expected. In the latter camp must be put the surprising strength of the labour market over the second half of 2001. This, coupled with lower oil prices, strengthening house prices and a historically low level of interest rates have served to boost consumption and residential investment spending over the last nine months. In addition, our assessment is that the turnaround in net migration has already begun to have an impact on household expenditure, and will continue to do so over the year ahead.
The substantial turnaround in net migration over the second half of 2001 has caused us to revise up our net migration assumption to 30,000 in the year to June 2002—20,000 more than we assumed at the December Update. This is one of the key changes to our forecast assumptions.The turnaround in net migration to date is due to both an increase in arrivals, particularly from China and other Asian countries, and to a sharp drop in departures. Given that a significant number of arrivals to date have been in the 15-19 age group, it would appear that a large proportion of arrivals have been students. Forming a view on the likely impact of the increase in net migration on the New Zealand economy is one of the key judgements underlying our Budget Update economic forecasts. Our view is that over the year ahead, the turnaround in net migration is likely to add more to demand than it does to supply, putting some degree of pressure on the economy's capacity. Over the medium term, the demand and supply effects of the increase in net migration will become more balanced, as migrants integrate into the labour force.
The Impact of Net Migration on the Economy
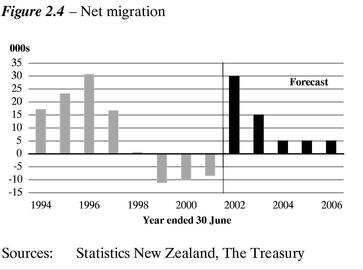
Permanent and long-term migration flows in New Zealand have turned from an outflow of 12,600 in the year to March 2001 to an inflow of 25,600 in the March 2002 year. The turnaround is made up as much by a reduction in departures (21% decline or 16,300 fewer departures) as an increase in arrivals (33% increase or 21,900 more arrivals). The increase in arrivals of young people, many of whom are students, has been especially pronounced, as shown in the table below.
| | 0-14
| | 15-19
| | 20-24
| | 25-39
| | 40-59
| | 60+
| |
|---|
| Contribution to net gain | | 5,263 | | 7,829 | | 849 | | 8,086 | | 2,270 | | 1,338 | |
| Percentage of net gain | | 20.5 | % | 30.5 | % | 3.3 | % | 31.5 | % | 8.9 | % | 5.2 | % |
At the time of the December Update we had anticipated a net migration gain of 10,000 in the year to June 2002, followed by gains of 5,000 in future years. The Central Forecast in this Budget Update incorporates a net flow into New Zealand of 30,000 in the year to June 2002, before a slowing to a net gain of 15,000 in 2003 and 5,000 thereafter. While there is substantial uncertainty around the migration flows in future years, the change in migration forecasts between the December Update and the Budget Update is large. The turnaround in net migration could have substantial demand and supply impacts over the next couple of years.
Demand impacts are likely to hit the economy relatively quickly, as migrants buy consumption goods and seek housing. Our estimates suggest that additional demand growth of around 0.5% to 1% in the 2002/03 year could eventuate from the additional population gains relative to that anticipated at the time of the December Update.10
- 10
- This impact excludes the spending of international students whose expenditure under the System of National Accounts (SNA) is treated as services exports in the same way as that of international tourists if education is the main purpose of their stay in New Zealand.
In the Central Forecast, demand is not expected to increase at the rate seen during the migration inflows of the 1990s. The smaller impact is due to the duration of the gains being substantially shorter than during the 1990s and the demographic make-up of the migration gains. The number of young people in the migration numbers, including students, means that the demand impacts are likely to be somewhat less than during the 1990s. Young people are likely to bring with them less accumulated wealth and have less earning power once in New Zealand than the relatively older cohort in the 1990s. To date, the level of migrant transfers is only half the peak recorded in 1995/96, although this figure does not capture money brought into the country by international students.
We also expect the flow of people into New Zealand to add to labour supply. The Central Forecast sees the working age population growing at between 1.6% to 1.8% over 2002/03, compared with growth of 1.1% in the December Update, equivalent to approximately an extra 16,000 people. While the high number of arrivals of 15-19 year olds should depress the participation rate of the people making up the gain in net migration, we estimate that the combined impact of the fall in departures and the low number of older migrants relative to the rest of the population, should result in a labour market participation rate for the net migration gain that is similar to the rest of the population. However, there is the likelihood of an initial period of lower participation as migrants adapt to the labour market and establish themselves in New Zealand. We estimate net migration to add at most 0.4% to 0.5% to labour force growth in the 2002 calendar year compared with our December Update forecasts. Lower labour force participation rates of immigrants pose the most substantial risk to this estimate.
Once in the labour market, migrants may face a further adjustment period before obtaining work and/or adjusting to a new working environment. In addition, a number of studies suggest new immigrants have a sustained period of average earnings below the rest of the population, pointing to lower marginal productivity. Such lags may lessen the initial contribution of immigration to the productive capacity of the economy. However, it is difficult to believe that the current cohort of people that are being added to the labour force have consistently lower productivity than those already in the labour force.
The lag in adapting to the labour market means that the demand impact from migration is likely to be more immediate than the supply impact.
Growth has picked up in the March quarter
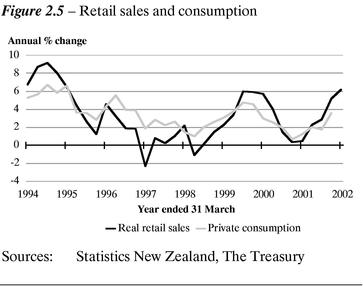
Our assessment is that quarterly economic growth has accelerated going into 2002, with GDP growing at around 1% in the March quarter. We see some upside risk to this forecast, particularly given the strong employment growth recorded in the March quarter. We estimate that private consumption and residential investment left off where they did in the December 2001 quarter, making positive contributions to growth in March. Moreover, exports also appear to have added to growth in the March quarter, on the back of a partial unwind of primary stocks, continuing growth in manufactured exports, and a significant rebound in services exports, the latter reflecting the large increase in tourist arrivals seen in the March quarter. In contrast, market investment and stocks are expected to detract from growth. Reflecting the relative strength of domestic demand, imports are also expected to record ongoing growth in the March quarter and, therefore, subtract from growth.
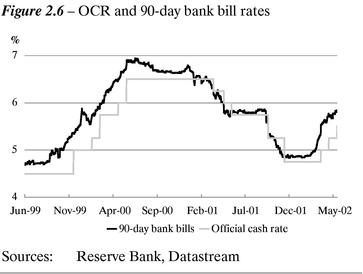
The strength of domestic demand, and the resultant impact on capacity and the outlook for inflation, coupled with the general improvement in the global outlook, have seen the Reserve Bank begin to remove the interest rate stimulus. There have been three consecutive 25 basis point increases in the OCR in March, April and May of this year taking the OCR to 5.5%. At the time of finalisation, 90-day bank bill rates are trading between 25 to 50 basis points higher than the OCR, reflecting the market's expectation of further OCR increases.
Trading partner growth is forecast to pick up but will remain weak
Since our December Update forecasts were finalised, forecast trading partner growth for calendar 2002 has been revised up from 1.9% to 2.6%. To a large extent, the upward revision to trading partner growth in calendar 2002 is because of a higher starting point rather than stronger growth going forward. While up on calendar 2001, trading partner growth in 2002 is forecast to remain modest and only in 2003 is growth expected to approach trend.
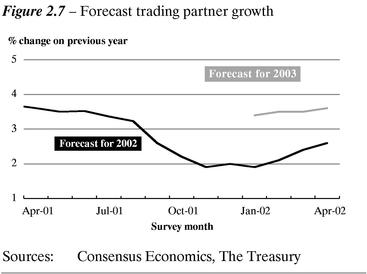
At the time of our December Update, Consensus Forecasts had the US economy growing at 1.1% for calendar 2001. In the event, GDP growth was 1.2% following stronger than expected growth in December. Consensus Forecasts for 2002 have been revised up from 0.7% in November to 2.6% in April. Analysts expect private consumption, aided by low interest rates and tax cuts, and a more rapid corporate adjustment than previously expected, to drive growth in the year ahead. Growth in the US for calendar 2003 is expected to reach 3.5%. Growth for a number of Euro-area economies is expected to be weaker in 2002 than in 2001, however this masks what is generally expected to be a pick-up in quarterly growth in the second half of 2002.
Despite current signs of stabilisation, the economic outlook for Japan continues to look fragile. While the Japanese economy is expected to resume growth on a quarterly basis, growth for the year as a whole is expected to be negative again in 2002. Since the November edition of Consensus Forecasts, the mean GDP forecast has been revised down from -0.6% to -1.1%. Private consumption growth is expected to remain weak in the face of what is an historically weak labour market, with the unemployment rate forecast to reach 5.8% by the end of 2002.
Growth in non-Japan Asia is projected to pick up reasonably rapidly during the next year as exports benefit from the rebound in global growth and as the recovery spreads to the less tech-oriented economies.
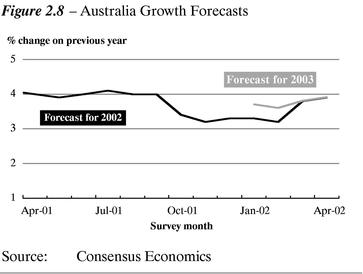
Importantly for New Zealand, the Australian economy is expected to continue to grow strongly, with GDP growth of around 4% forecast for both calendar 2002 and 2003. While Australian residential investment is expected to moderate this year, this is expected to be offset by robust consumption growth, a pick-up in business investment and a recovery in export growth. Robust growth in our largest trading partner will help to support growth in the New Zealand economy over the forecast period.
Along with the increase in trading partner growth forecasts, the nature of risks around the outlook also appears to have altered. In particular, the "non-economic" factors that were impacting on sentiment have dissipated considerably. Many of the risks around the outlook for trading partner growth now appear to relate to more traditional economic factors that impact on the pace and durability of growth. While these could lead to growth proceeding at either a slower or faster pace than currently expected, overall we see the risks around the external environment being more balanced and less extreme than at the time of the December Update.
Table 2.2—Trading partner growth forecasts
| | 2001
| | 2002
| | 2003
| | 2004-2006
|
|---|
| Australia | | 2.4 | | 3.9 | | 3.9 | | 3.8 |
| Japan | | (0.5 | ) | (1.1 | ) | 1.1 | | 1.6 |
| US | | 1.2 | | 2.6 | | 3.5 | | 3.3 |
| Europe* | | 1.8 | | 1.6 | | 2.7 | | 2.5 |
| Non-Japan Asia** | | 1.9 | | 4.5 | | 5.6 | | 5.5 |
- *
- UK, Germany, Italy, France (weighted by NZ export share).
- **
- Korea, Taiwan, China, Malaysia, Hong Kong, Singapore (weighted by NZ export share).
Source: Consensus Economics
In the US, should household expenditure—which has shown a high degree of resilience to date—weaken and/or business investment recover more slowly, perhaps in response to concerns about corporate earnings and equity returns, the recovery in economic growth could be more sluggish than embodied in Consensus Forecasts. On the other hand, after what will be two years of sub-trend growth over 2001 and 2002, current projections do not have the US recording growth above trend. Closer to home, and perhaps of equal importance to the New Zealand outlook, the timing of the projected pick-up in business investment and rebound in exports is also important for the Australian outlook. A delayed pick-up in these areas could see activity falter in the second half of the year as residential investment slows. Conversely, an earlier acceleration would see them reinforcing what is already strong household spending, leading to even stronger growth over the short term.
Short-term Outlook
Economic growth is set to remain robust ...
Despite the majority of New Zealand's trading partners growing below trend over calendar 2002, the New Zealand economy is expected to post solid growth of 3.1% in the year to March 2003. This is a significant change from our December Update forecast for GDP growth of 1.9% in the year to March 2003, and is largely due to the change in the profile for domestic demand. Quarterly growth is forecast to be relatively robust in the March and June quarters, reflecting some of the momentum already evident in the domestic components of GDP, averaging around 0.9% before slowing moderately over the second half of 2002 and early 2003. While growth in domestic demand remains robust over the year to March 2003, strong quarterly growth in exports owing to reversals in dairy and meat stocks and a strengthening world environment, means the composition of growth becomes more balanced than at the end of 2001.
... but employment growth is expected to slow ...
After displaying strong growth in the year to March 2002, employment growth is forecast to slow from mid-2002. In part this reflects a view that a significant amount of the employment growth that took place in the education, health and community services sectors is unlikely to continue over the next year. More generally, firms are expected to seek productivity gains, following the significant growth in employment over the last year, to help offset pressure on profitability elsewhere.
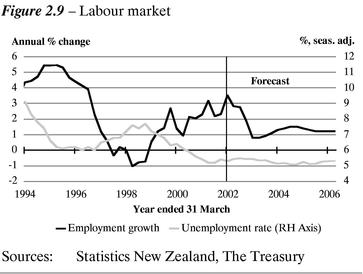
Owing to both a rising participation rate and the turnaround in net migration, labour force growth is currently around 2.4%, providing a temporary boost to the economy's potential growth rate and helping to offset some of the demand pressure. Because employment growth is expected to slow over 2002, the participation rate is also expected to ease back slightly. Nonetheless, we still expect the participation rate to remain at high levels. Given our forecasts for both employment and labour force growth, the unemployment rate is forecast to remain relatively static at around 51/2% over the year to March 2003. Reflecting a historically tight labour market, wage growth is forecast to hold up in the year ahead.
... as is household spending, after a strong start to the year
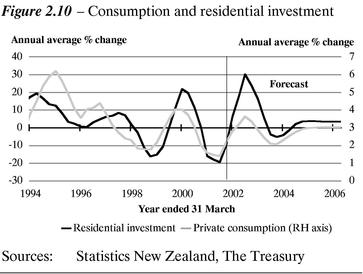
After accelerating over the year to March 2002, quarterly consumption growth is expected to moderate over the year ahead, as disposable income growth slows markedly owing to slowing employment growth. A significant slowdown in labour income growth in conjunction with a decline in farm incomes, leads to a modest slowing in consumption growth over the second half of 2002 and the first half of 2003. Rising interest rates and the current level of oil prices are also expected to operate in the same direction.
Providing some support to household spending in the year ahead, however, is the substantial turnaround in net migration. As discussed in the box on net migration, all else held constant, we estimate that the extra 10,000 to 12,000 people added to New Zealand's population since our December Update forecasts were finalised will probably add between 0.5% to 1% to demand growth over the next year. The profile for both housing activity and residential investment will also support consumption growth over the near term, with rising house prices increasing household wealth and new house building boosting durables consumption.
Reflecting both the recent and the expected growth in house sales and consents, residential investment is expected to display ongoing growth over the first three quarters of 2002, before contracting over late 2002 and early 2003, as income growth slows and activity feels the impact of rising interest rates. The turnaround in net migration is also expected to reinforce the residential investment profile.
One of the key judgements underlying our forecast for the household sector is the willingness of households to take on more debt, especially over the year ahead. Although the forecast accumulation of debt is significantly slower than was the case during the 1990s, our Central Forecast implies that households will take on more debt than they did over the 2000-2002 period—a period where the household dis-saving reduced markedly on the back of strong income growth and subdued growth in residential investment. Should households display greater or less willingness to take on debt than we have assumed, the profile for household expenditure may evolve somewhat differently from that portrayed in our Central Forecast. This could be accentuated by changes in key determinants of household expenditure, such as oil prices (which we explore in the Oil Prices box below). Two alternative paths for consumption and residential investment are developed in more detail in the Risks and Scenarios chapter.
Oil Prices
After fluctuating around the US$20 mark in the wake of the events of 11 September, Brent spot prices have trended upwards since the beginning of March 2002 to around $26 a barrel recently—significantly higher than our December Update forecast for an increase to around $22.50. The recent surge in international oil prices has primarily been driven by three factors: (i) the OPEC commitment to maintaining current production targets until June, (ii) the market factoring in the increasing tensions in the Middle East, and (iii) improved prospects of global recovery.
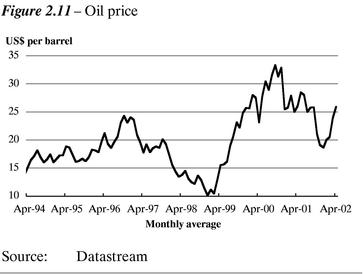
Our assumption for this forecast round is for Brent spot prices to remain around $25 a barrel over 2002, before easing back towards our assumed "equilibrium" level of crude prices of US$18.50 (based on historical average). We attempt to capture information from Consensus Forecasts, Brent crude futures prices, and our perceived long-run equilibrium price of oil. However, both the Brent futures curve and the Consensus view fluctuate considerably, reflecting volatile spot price movements, and hence the outlook for international oil prices is a key uncertainty of our forecasts.
Rising international oil prices have a direct impact on domestic inflation via petrol prices, which in turn has an effect on domestic consumption. There is also a less direct impact on consumption through the confidence channel, although this is more difficult to quantify. The petrol price component accounts for 3% of the CPI index. Higher oil prices impact directly on headline CPI through the increase in the retail price of petrol. Our estimate is that for every US$1 increase in international oil prices, all else constant, retail petrol prices increase around 1.6 c/litre. (This calculation is based on a constant margin assumption.) Recent strength in the New Zealand dollar has ameliorated some of the recent rises in international oil prices. If the New Zealand dollar had stayed where it was relative to the US dollar since early March, we estimate that petrol prices could have been around 3 c/litre higher than the current pump price. If international oil prices were to spike up to US$30 a barrel—approximately the average price in 2000—retail petrol prices may increase by 6 to 7 c/litre, adding 0.2% to headline inflation.
Since the demand for petrol is largely inelastic in the short term, large spikes in oil prices can be viewed as a tax on consumers as they reduce household discretionary income and result in lower expenditure on other goods and services. The effect is compounded if consumer confidence is affected as well. New Zealand households spend approximately $2 billion per annum or almost 4% of their total expenditure on petrol. In the event that international oil prices increase to US$30 a barrel, we estimate that household discretionary income would be reduced by around 0.25%.
Investment spending is looking robust ...
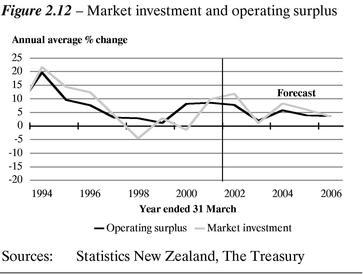
Quarterly growth in market investment is forecast to accelerate over 2002 and early 2003, growing at around 2% in the year to March 2003. This contrasts with our December Update forecast where we expected market investment growth to fall around 4% in the March 2003 year.
Two years of good growth in economy-wide profits and strong growth in domestic demand, exhausting some of the spare capacity in the economy, are two key factors behind the investment profile in the next year. The delayed impact of falling interest rates through 2001 is also forecast to support investment growth in the next year. Although we have largely removed the negative shock to market investment emanating from weak sentiment, the profile for investment still builds in a degree of delayed investment given that the lead times between investment decisions and when investment actually takes place can be reasonably long for some investment projects. Owing to slowing profit growth in the year to March 2003, quarterly market investment growth is expected to lose some of its momentum in the second half of 2003, but still remain at relatively robust rates.
... and solid export volume growth will rebalance growth in the year ahead
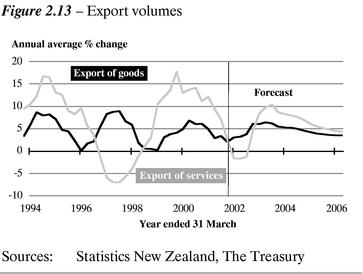
The short-term profile for merchandise export volumes is largely dominated by developments in dairy and meat exports. Following a large build-up in dairy stocks over the latter part of 2001, quarterly growth in dairy exports is forecast to be strongest over 2002, as some of the build-up in stocks of dairy products is unwound. Further out, dairy export growth is expected to ease as stock levels fall back into line with production. An upward revision in cow numbers and consequently milk fat production also reinforces the profile for dairy exports in the year to March 2003. Like dairy exports, growth in meat exports is forecast to be strongest during the first three quarters of 2002. This is due to delayed slaughtering during the recent wet summer. Non-commodity manufactured exports are projected to display robust quarterly growth, as this export category benefits from the lagged impact of the depreciation in the TWI and stronger—but still below-trend—trading partner growth.
The projected strength in services exports in the year ahead reflects a reversal of the significant fall in travel exports at the end of 2001, together with a judgement that "normal" travel patterns will resume more quickly than was the case at the December Update. More generally, services exports are expected to benefit from the lagged impact of the depreciation in the currency and a pick up in trading partner growth.
The overall profile for exports is for growth of 6.6% in the year ahead, following growth of around 1.8% in the year to March 2002.
However, export prices will continue to fall throughout 2002
The full impact of the sharp drop in global growth on export prices has still to be felt, with world export prices forecast to decline through until the second half of 2002, with New Zealand dollar export prices to fall by 12% in the March 2003 year. Behind the falls in the aggregate world export price are sharp declines in world dairy prices, reflecting both weaker world demand and increases in EU and US subsidies, together with ongoing weakness in crude material and manufactured goods prices. Although world export prices are expected to begin to pick up from late 2002, on the back of increases in forestry, manufactured and crude material goods prices, our assumption of an appreciating exchange rate essentially offsets world price gains. Hence, New Zealand dollar prices do not start increasing until mid-2003. As has been the case since late last year, meat exporters are expected to continue to benefit from market-specific factors in the beef and lamb markets, with meat prices remaining at current levels for approximately the next two years.
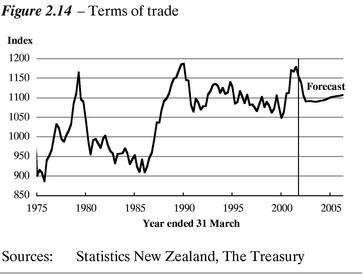
Largely on the back of higher international oil prices, world import prices are expected to post modest quarterly growth over the year ahead. However, given the assumed appreciation in the TWI, New Zealand dollar import prices are expected to decline around 7%.
Consistent with most previous episodes of slowing trading partner growth, New Zealand's terms of trade is forecast to post a significant fall. Our Budget Update forecast embodies an estimated 7% decline in the terms of trade from its peak in March 2001 to our forecast trough in mid-2002. What is perhaps unique is that compared with previous downturns in global growth, the terms of trade is expected to bottom at a considerably higher level, highlighting how several market-specific factors have helped to support New Zealand's terms of trade. In turn, this has helped to support the New Zealand economy in the face of a large external demand shock.
Inflation will remain near the top end of the Reserve Bank's target band
Reflecting high unit labour cost growth, where wage inflation is expected to significantly outstrip productivity growth, and strong GDP growth over the year ahead, annual CPI inflation is forecast to remain persistently at or above 2.5% over the remainder of 2002, before ameliorating somewhat going into 2003. While we expect an appreciating exchange rate to place some downward pressure on inflation, we also expect firms to take the opportunity of robust demand to seek to rebuild margins, particularly over the first part of 2002.
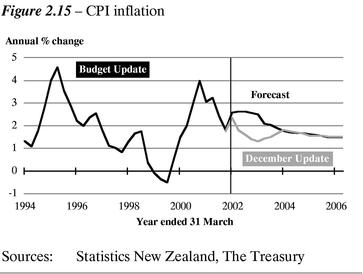
Even though we see inflationary pressures subsiding somewhat from the second half of 2002, there is a degree of upside risk to this inflation profile, particularly around the near term. Although our Budget Update forecast embodies a strong 0.9% increase in the Consumers Price Index (CPI) in the June 2002 quarter, there is a risk that the outturn may be stronger than this forecast, taking inflation to the upper end of the Reserve Bank's 0% to 3% target band. This may occur because of substantial one-off price increases in the non-tradeable sector of the economy. Looking further ahead, there is also a risk that with inflation staying near the top end of the target band for an extended period of time, inflation expectations will increase, making the Reserve Bank's job of bringing back inflation to the mid-point of the target band somewhat more difficult. However, our view is that inflation expectations are reasonably well anchored, with the 2000 to 2001 period being a case in point, where higher CPI inflation did not appear to feed substantially into wage-setting behaviour.
The Reserve Bank removes the interest rate stimulus
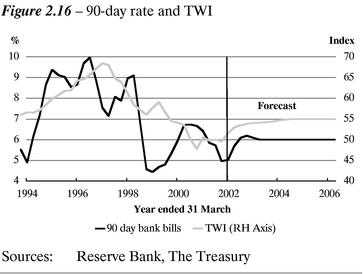
With growth set to remain strong in the year to March 2003, the Reserve Bank is assumed to remove the stimulus emanating from 90-day rates by taking the OCR to 6% by the end of 2002, with 90-day rates peaking just above our assumed neutral level of 6%. Past monetary tightening cycles would suggest there is upside risk to our 90-day profile and that rates could go above the level currently forecast, particularly in the event that domestic demand proves to be stronger than embodied in our Central Forecast. However, our view is that 90-day rates peaking at just over 6% should be enough to curtail inflationary pressures, given that other factors are at work to slow growth and check inflationary pressures over the next year. More specifically, the fall in disposable income growth over the year ahead should help to dampen domestic demand. Moreover, because household debt levels are now higher than during previous tightening cycles, interest rates will not need to rise to the same extent before having a comparable impact on household spending.
The current account will increase in the year ahead
Despite export volume growth gaining some momentum in the year ahead, the current account deficit is expected to increase to around 4.5% of GDP in the second half of 2002. This largely reflects our stronger consumption and investment profiles resulting in strong import growth over the March 2003 year. Government defence spending also adds to the import profile over the forecast horizon. Reflecting a strengthening world economy and, importantly for New Zealand, robust economic growth in Australia, income flows from offshore are expected to be stronger compared with what we were projecting late last year, albeit partly offset by slightly stronger income flows from New Zealand to the rest of the world. Our flow of funds analysis suggests that a significant amount of the deterioration in the current account in the near-term is due to activity in the household sector.
The profile for nominal GDP remains cyclical
While the near term profile for GDP growth is relatively flat, nominal GDP growth is considerably more cyclical, owing to movements in the GDP deflator accentuating the movements in real GDP. After growing 6.6% in the year to March 2002, nominal GDP growth is forecast to slow to 3.7% in the year to March 2003, before rising to 5% in the year after. Compared with the December Update forecast, the level of nominal GDP is around $2 billion higher in the year to June 2006. The higher level of nominal GDP throughout the entire forecast period underpins the solid growth in tax revenue feeding through to an improved fiscal position.
Longer-term Outlook—2003/04 and Beyond
We expect GDP to grow 3% in the year to March 2004, with trading partner growth returning to around trend (31/2%) in calendar 2003, as well as the economy benefiting from business investment and employment growth. Further out, growth converges back to around the economy's long-run trend in the outer years of the forecast period.
Household spending will pick up ...
After slowing over the second half of 2002 and the first half of 2003, quarterly consumption growth is forecast to pick up in late 2003 as disposable income growth begins to gain some momentum over the year to March 2004. Ongoing household wealth increases, supported by modest growth in house prices, are also expected to reinforce the consumption profile during this period.
While residential investment contracts in the March 2004 year, growth returns to levels that are consistent with what is required to house New Zealand's population in the medium term.
Our household sector forecast embodies further increases in household debt (as a percentage of disposable income) over the forecast period. This projection is largely due to households taking on debt to finance residential investment. However, in contrast to the 1990s, the rate of accumulation in debt is significantly slower, although it is somewhat greater than was seen during the 2000-2002 period. Households' willingness to take on debt is a key judgement looking forward.
... and investment and employment will support growth
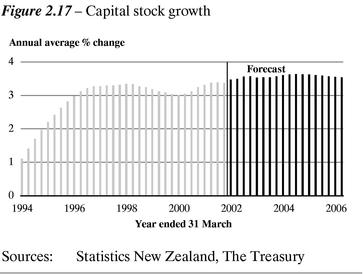
Market investment remains reasonably strong over the out years of the forecast period. This reflects a reasonably tight labour market—with firms using capital to meet more of their output growth—and the need for firms to provide additional capital to newly employed workers. The capital stock is forecast to grow at around its recent pace of 31/2% in the out years of the forecast period. This serves to underpin labour productivity growth over a period where employment growth is relatively strong. We expect a significant amount of investment to go into the manufacturing sector, in support of ongoing growth in non-commodity manufactured exports.
Non-market investment is also expected to add to growth in both the March 2004 and 2005 years, reflecting expected capital expenditure in the road and education sectors. In contrast, public consumption expenditure growth (excluding military equipment) is expected to slow in the out years of the forecast horizon as the Government seeks to build up structural surpluses.
Consistent with robust economic growth in the medium term, employment growth begins to pick up somewhat from the March 2004 year onwards. As employment growth increases, the unemployment rate is forecast to fall over 2003 and 2004, bottoming at around 5% in March 2005.
Export growth remains robust
Export growth is forecast to remain fairly robust over the medium term. Agricultural exports are expected to continue to grow owing to growth in livestock numbers and ongoing productivity gains. Non-commodity manufactured exports are expected to post ongoing robust growth, benefiting from solid external demand and an exchange rate that is assumed not to overshoot its equilibrium level.
Inflation falls to the mid-point of the target band
Going into 2003, inflation is expected to fall back quite quickly towards the mid-point of the Reserve Bank's 0% to 3% target band, as inflation pressures moderate on the back of interest rate increases and an appreciating currency keeping inflationary pressures in check over the medium term. Even though the economy grows at a higher rate than its recent trend of around 23/4% from March 2003 through to March 2005, in a cyclical sense potential growth is seen to benefit from both robust labour force and capital stock growth. This means that the capacity is in place to meet demand without leading to the emergence of substantial inflationary pressure. If the extra labour supply adds less to productive capacity then the pressure would likely be greater.
The current account deficit improves in the outer years of the forecast period
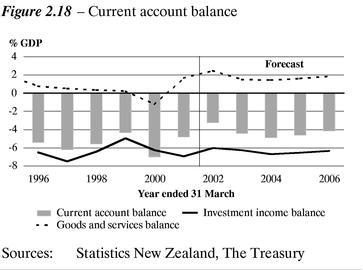
Following the deterioration in the current account deficit over the March 2003 and 2004 years, the current account deficit is expected to reduce in the out years of the forecast horizon, reaching 4.1% of GDP by March 2006. The initial improvement in the deficit is driven by a slowdown in import growth, as consumption and investment growth slow in the March 2004 year and into 2005. A continued steady improvement in services exports also helps to underpin the current account improvement.
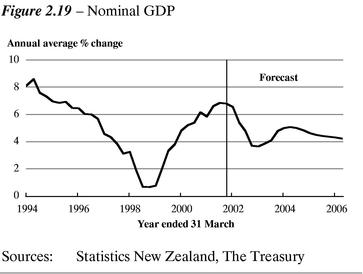
Over the last three years of the forecast horizon the nominal economy is expected to grow at around 4% to 5%, owing to the combination of steady GDP growth and inflation around the mid-point of the Reserve Bank's target band.
3
Fiscal Outlook
Introduction
This chapter discusses the trends, influences and assumptions behind the outlook for the Crown's finances. The discussion covers:
- •
- key components of the operating balance including tax revenue, expenses, and state-owned enterprises' and Crown entities' surpluses
- •
- net worth and debt, including the relation between the operating balance and net worth and debt, and details of revisions to the 2001/02 and 2002/03 bond programme.
Each section starts with a summary table of the relevant indicators under the current presentation of the Crown forecasts and how, in future, they will look under the full consolidation of SOEs and Crown entities. A detailed section is provided at the end of the chapter (pages 97 to 105) that outlines how the Crown financial statements presentation is changing, what the impacts will be, and what drives the change in each of the key fiscal indicators.
In this time of transition, the discussion in the body of this chapter is based on the existing presentation of the forecasts.
Following the main body of the chapter are technical tables and information including fiscal indicators, a reconciliation of the operating balance since the December Update, the Government's budget decisions, a box on the Crown's investment in Air New Zealand, and the NZS Fund assumptions. Further detailed tables are also provided on the Treasury's website.11
- 11
- These tables include expense tables that cover a longer time period than those within this chapter and details of the OBERAC calculation.
Tax Revenue
Table 3.1—Tax and sovereign revenue indicators
Taxation and total sovereign revenue (% of GDP)
| | 2001
Actual
| | 2002
Forecast
| | 2003
Forecast
| | 2004
Forecast
| | 2005
Forecast
| | 2006
Forecast
| |
|---|
| Taxation revenue | | | | | | | | | | | | | |
| Current presentation | | 32.2 | % | 31.9 | % | 32.1 | % | 32.1 | % | 32.1 | % | 31.9 | % |
| Future presentation of Core Crown | | 30.7 | % | 30.3 | % | 30.5 | % | 30.4 | % | 30.4 | % | 30.2 | % |
| Future presentation of Total Crown | | 30.4 | % | 30.1 | % | 30.3 | % | 30.1 | % | 30.1 | % | 29.9 | % |
| Total sovereign revenue (taxation plus other fees, fines and levies) | | | | | | | | | | | | | |
| Current presentation | | 32.5 | % | 32.3 | % | 32.5 | % | 32.4 | % | 32.4 | % | 32.2 | % |
| Future presentation of Total Crown | | 32.4 | % | 32.2 | % | 32.3 | % | 32.1 | % | 32.0 | % | 31.8 | % |
Source: The Treasury
Treasury forecasts have improved since the December Update ...
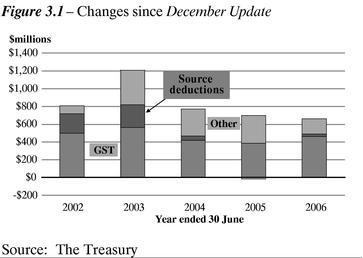
The total tax forecasts have been increased by at least $600 million in each year compared with the December Update, with the biggest forecast increase of around $1.2 billion occurring in 2002/03. The changes primarily comprise:
- •
- increases to the GST forecasts in the order of $400 million to $500 million
- •
- increases to the source deductions' forecasts of around $200 million in 2001/02 and 2002/03
- •
- additional tax revenue resulting from revenue initiatives such as the Transport package and improved IRD audit coverage.
Ignoring the effects of the revenue initiatives, the increases to the forecast broadly represent an unwinding of the downward revisions of the December Update plus a significant increase to the GST forecast for 2001/02.
... broadly tracking GDP through the forecast period.
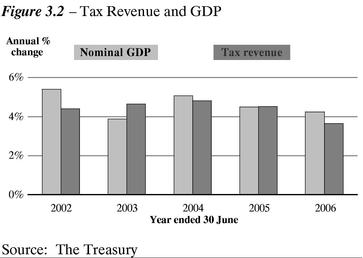
Consistent with the last two forecast updates, tax revenue growth is forecast to be slightly below nominal economic growth for 2001/02. While the two largest tax types, source deductions and GST, are growing strongly, aggregate tax growth is moderated by the unwinding of the strong growth in business taxes in 2000/01.
Tax revenue growth accelerates in 2002/03 as corporate taxes start to grow again. Thereafter, tax growth is similar to economic growth, although the growth is not uniform across all tax types.
Income growth drives source deductions ...
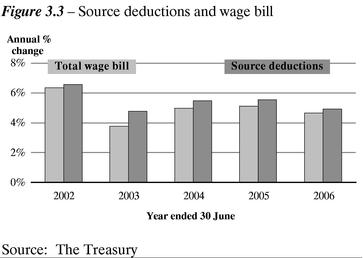
Source deductions (mainly PAYE) are forecast to grow slightly ahead of growth in the underlying wage bill, chiefly a result of the progressivity of the personal income tax scale. The current robust growth in the labour market is pushing source deductions up by more than 6% in 2001/02. Income growth slows a little in later years so that source deductions' growth drops to around 5% for 2002/03 and later years.
... and flows through to GST
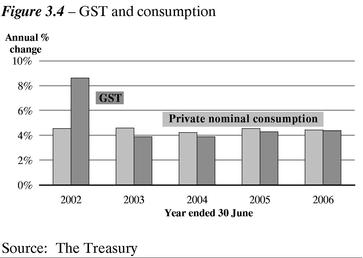
The large growth in the wage bill is putting more money into the pockets of New Zealanders. This is fuelling strong growth in spending which, in turn, translates into growth in GST. It is now expected to grow by more than 8% in 2001/02, after a relatively slow start to the year. A tailing off in income growth results in more modest GST growth in later years.
GST outturns in recent months have been unusually high, especially in April. The forecasts of GST incorporate judgements around how much of this growth is due to one-off factors and how much of it is genuine growth in the consumption base that will persist into later years. Not all of the recent high growth has been included in outyear forecasts so there are both upside and downside risks to the GST forecasts.
Corporate tax take reduces ...
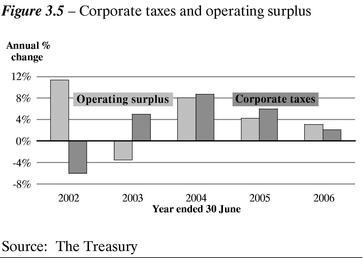
Coming off a couple of years of high growth, corporate tax is declining in 2001/02 as conditions for exporters are not quite as favourable as they were in 2000/01 and the investment sector is experiencing a prolonged period of poor returns. Growth is expected to resume in 2002/03 as the savings and investment sector rebounds off the back of a global economic recovery.
This presents what is probably the biggest risk to the corporate tax forecast: continued poor investment returns could retard corporate tax growth. Also, there may have been some significant tax losses built up within investment funds over the last couple of years that may take some time to work their way through the tax system. On the positive side, a swifter than expected global upturn could see company profits, and hence corporate taxes, exceed expectations.
... and other business taxes are only slightly better
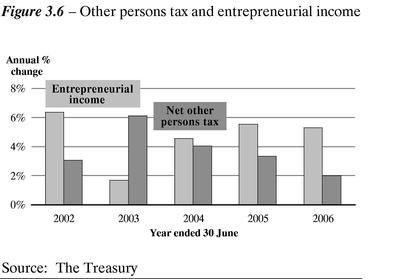
Growth in net other persons tax is relatively subdued for 2001/02 with the growth in terminal tax being nowhere near as high as it was in 2000/01. A continuing trend toward incorporation, as formerly self-employed taxpayers form companies in response to the 39% tax rate, is also subduing other persons tax growth in 2001/02, although it is contributing to growth in the tax paid by small companies.
Farm incomes have continued to grow rapidly through 2001/02, but much of the tax on this income is not expected to crystallise until 2002/03 with under-payment of tax being picked up at terminal tax time. A fall-off in returns to agriculture later in the forecast period means that other persons tax growth gradually decelerates.
Collectively, farmers make up one of the biggest groups within other persons tax. Thus, a fluctuation in farm incomes could mean that the other persons tax forecasts are either under- or over-stated. Also, as we have seen over the last couple of years, tax planning activity can have a marked effect on other persons tax. Although the tax planning environment has been addressed through legislation and enforcement activity, it still has the potential to cause some volatility in other persons tax throughout the forecast period.
Inland Revenue's tax forecasts are close to the Treasury's
In line with established practice, Inland Revenue has prepared an independent set of tax forecasts, based in the short term on more detailed analysis of taxpayer information, and in the longer term reflecting the same underlying macroeconomic trends that underpin the Treasury's tax forecasts.
In aggregate, the two sets of forecasts are close to each other in 2001/02. From 2002/03 onwards, the forecasts differ by less than $300 million each year, with the Treasury's forecasts being slightly higher than Inland Revenue's. The main area of difference is the estimate of GST. In 2003/04 and 2004/05, there are also significant differences in company income tax estimates.
The two sets of forecasts are compared in Table A.1 and A.2 on pages 193-194.
Expenses
Table 3.2—Total expenses indicators
Total revenue(% of GDP)
| | 2001
Actual
| | 2002
Forecast
| | 2003
Forecast
| | 2004
Forecast
| | 2005
Forecast
| | 2006
Forecast
| |
|---|
| Current presentation | | 34.6 | % | 34.2 | % | 34.4 | % | 34.4 | % | 34.5 | % | 34.4 | % |
| Future presentation of Core Crown | | 33.3 | % | 32.9 | % | 33.1 | % | 33.0 | % | 33.1 | % | 33.1 | % |
| Future presentation of Total Crown | | 40.9 | % | 42.5 | % | 43.3 | % | 43.3 | % | 43.4 | % | 43.2 | % |
Source: The Treasury
Expenses as a percentage of nominal GDP continue to trend down
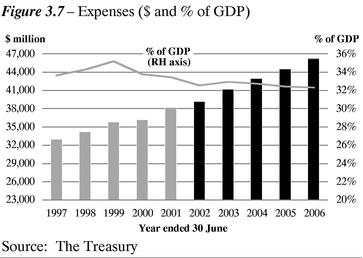
Expenses fall as a percentage of GDP from 33.4% in 2000/01 to 32.3% in 2005/06.
Over the same period, nominal expenses grow by an average of 4% each year, owing to both new Budget spending and demand-driven factors. This represents an increase of around $8 billion from $38.2 billion in 2000/01 to $46.2 billion in 2005/06.
The $8 billion forecast new spending over the forecast period is made up of a number of key factors.
Demand-driven factors outlined in Figure 3.8 account for around 40% ($3 billion) of the forecast increase. These factors include demographic impacts and CPI indexation of benefits.
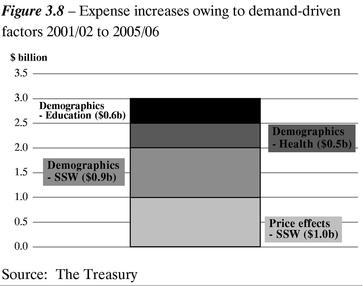
Over the five-year forecast period:
- •
- CPI indexation averages 1.8%, increasing benefits expenses by around $1 billion
- •
- increases in the number of invalids beneficiaries and superannuitants of around 51,000 are the main demographic drivers for Social Security and Welfare (SSW) expenses
- •
- demographic changes in invalids benefit and superannuation are offset by reductions in unemployment benefit
- •
- population ageing is the main driver for health demographics
- •
- school and tertiary rolls increase by around 68,000. This is an increase of 43,000 on the December Update owing to revised population projections anticipating much higher net migration, combined with strong participation growth in the tertiary education sector. This flows through to a total extra cost of $705 million over the forecast period since the December Update.
Policy decisions already announced during the forecast period constitute 35% or $2.8 billion of the $8 billion forecast new spending.
Health ($1.6 billion), education ($500 million) and welfare ($100 million) are the main components of the $2.8 billion already committed for policy spending over the forecast period. Other key features of new Budget spending over the forecast period include:
- •
- the transport package ($175 million), which adds to expenses relative to the December Update forecasts
- •
- economic transformation initiatives ($33 million)
- •
- paid parental leave ($41 million).
The remaining 25% ($2.2 billion) of the forecast increases in expenses is made up of forecasts for future new spending to manage future Budgets and future changes to demographic forecasts. This includes a $230 million contingency to manage risks and essential additional spending between the 2002 and 2003 Budgets.
Beyond 2002/03, expense growth will be managed using a revised provisions framework that ensures the focus is on the operating and debt tracks and their consistency with the fiscal objectives. This compares with the current focus on a set nominal limit for the electoral term.
Under current operating balance projections, the Government could accommodate core operating expense growth of around 2.5% per year. This is consistent with making contributions to the NZS Fund as planned. The forecasts reflect the amounts for forecast future new spending consistent with this approach.
SOE and Crown Entity Surpluses
Table 3.3—Gross SOE and Crown entity surplus indicators
Gross SOE and Crown entity surpluses
| | 2001
Actual
| | 2002
Forecast
| | 2003
Forecast
| | 2004
Forecast
| | 2005
Forecast
| | 2006
Forecast
| |
|---|
| | ($ million)
| |
|---|
| Current presentation | | | | | | | | | | | | | |
| Gross surplus of SOEs and Crown entities | | 424 | | 1,015 | | 984 | | 1,284 | | 1,408 | | 1,560 | |
| Less dividends | | (321 | ) | (403 | ) | (461 | ) | (363 | ) | (323 | ) | (351 | ) |
| | |
| |
| |
| |
| |
| |
| |
| Net surplus of SOEs and Crown entities | | 103 | | 612 | | 523 | | 921 | | 1,085 | | 1,209 | |
| | |
| |
| |
| |
| |
| |
| |
Future presentation |
|
|
|
|
|
|
|
|
|
|
|
|
|
| Gross revenues | | 20,164 | | 25,084 | | 26,859 | | 28,104 | | 28,971 | | 29,845 | |
| Gross expenses | | 19,740 | | 24,069 | | 25,875 | | 26,820 | | 27,563 | | 28,285 | |
| | |
| |
| |
| |
| |
| |
| |
| Gross surplus of SOEs and Crown entities | | 424 | | 1,015 | | 984 | | 1,284 | | 1,408 | | 1,560 | |
| | |
| |
| |
| |
| |
| |
| |
Source: The Treasury
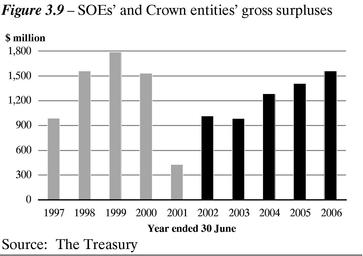
SOE and Crown entity surpluses have generally decreased from prior years. In 2000/01, the surplus was affected by increases in the ACC outstanding claims liability ($420 million).
Gross SOE and Crown entity surpluses are around $1 billion in 2001/02, rising over the forecast period to $1.6 billion in 2005/06.
SOE and Crown entity surpluses are higher than the December Update forecasts. This is primarily due to two factors:
- •
- The forecast change in 2001/02 of the ACC outstanding claims liability is now $42 million ($205 million in the December Update).
- •
- Better than expected surpluses across a number of SOEs and Crown entities in most years.
Influences on Net Worth and Debt
Table 3.4—Balance sheet indicators
Key balance sheet indicators
| | 2001
Actual
| | 2002
Forecast
| | 2003
Forecast
| | 2004
Forecast
| | 2005
Forecast
| | 2006
Forecast
| |
|---|
| | (% of GDP)
| |
|---|
| Gross debt | | | | | | | | | | | | | |
| Current presentation | | 32.2 | % | 30.2 | % | 28.6 | % | 29.2 | % | 28.8 | % | 28.4 | % |
| Future presentation of Core Crown | | 29.6 | % | 28.9 | % | 28.4 | % | 29.0 | % | 28.6 | % | 28.2 | % |
| Future presentation of Total Crown | | 30.4 | % | 31.3 | % | 30.5 | % | 30.2 | % | 29.4 | % | 28.3 | % |
Gross sovereign-issued debt (no change) |
|
32.2 |
% |
30.2 |
% |
28.6 |
% |
29.2 |
% |
28.8 |
% |
28.4 |
% |
Net Crown debt |
|
|
|
|
|
|
|
|
|
|
|
|
|
| Current presentation | | 17.5 | % | 16.8 | % | 16.8 | % | 16.8 | % | 16.2 | % | 15.5 | % |
| Future presentation | | 14.9 | % | 15.5 | % | 16.5 | % | 16.6 | % | 16.0 | % | 15.3 | % |
Net worth (no change) |
|
10.0 |
% |
11.8 |
% |
13.2 |
% |
14.9 |
% |
17.2 |
% |
19.4 |
% |
Source: The Treasury
Operating surpluses increase net worth and generate cash...
Net worth increases by $16.3 billion from $11.5 billion to $27.8 billion between 2000/01 and 2005/06. This increase reflects the level of operating balances over the forecast period of around $16.2 billion.
Table 3.5 shows how the forecast operating surpluses flow through to the Statement of Financial Position over the five-year forecast period.
Some portions of the operating surplus are non-cash in nature, including:
- •
- depreciation of $5.2 billion, for which a broadly equivalent amount of cash is earmarked for maintaining existing physical asset levels; offset by
- •
- SOE and Crown entity net surpluses of $4.4 billion, which are retained by the SOEs and Crown entities and increase the Crown's investment in these entities
- •
- NZS Fund returns (after tax) of $1.2 billion, which are retained by the NZS Fund, and increase the Crown's investment in this asset.
Adjusting for these items, the rising operating surplus profile generates a similar level of operating cash flows ($15.8 billion). The Crown can use this cash to either invest in assets or repay debt.
Table 3.5—Impact of operating surpluses on the balance sheet from 2001/02 to 2005/06
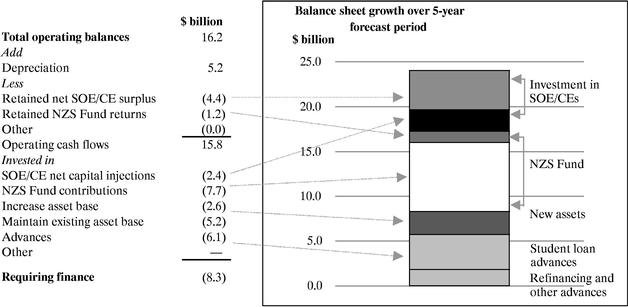
Source: The Treasury
The forecast financing requirement is $8.3 billion, $2.4 billion lower than forecast in the December Update. This decrease is primarily due to improved operating cash flows (owing to higher operating balances) partially offset by increased debt financing requirements for hospitals.
...though investment claims outweigh available cash surpluses
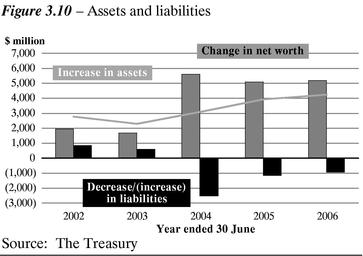
The Crown invests $24.1 billion cash, $8.3 billion more than its operating cash flows over the forecast period, including12:
- 12
- The capital provisions are allocated across purchases of assets, SOE/Crown entity capital injections, and advances (see Tables 3.12 and 3.13 on page 92)
- •
- maintaining and improving the existing asset base ($7.8 billion), providing injections ($2.4 billion) to DHBs and Air New Zealand, for example, and investing in the NZS Fund ($7.7 billion)
- •
- funding advances ($6.1 billion). The advances comprise student loans of $3.9 billion with the remaining $2.2 billion relating to refinancing Crown entity private sector debt (DHBs and Housing New Zealand Corporation) and other miscellaneous advance activity.
To fund the difference of $8.3 billion between operating cash flows and investment programme requirements, existing levels of marketable securities and deposits (MSDs) will be run down by $4.8 billion and new debt of $3.9 billion will be required.
The increase in net debt over the forecast period is $2.3 billion, lower than the total funding requirement of $8.3 billion mentioned above. Net debt is not influenced by movements in advances (mainly student loans and refinancing Crown entity debt) or foreign exchange revaluations of overseas debt (which is fully hedged by movements in foreign currency denominated financial assets).
Gross debt as a percentage of GDP is consistent with the Government's long-term objective
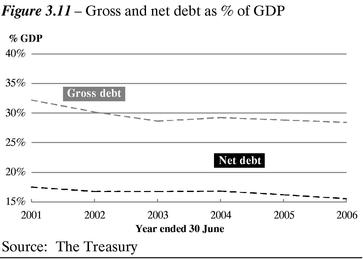
While both gross and net debt increase in nominal terms over the forecast period, of more relevance is how debt tracks with growth in the economy.
The Government's long-term debt objective is established at a gross sovereign-issued debt constraint of 30% of GDP. The associated net debt indicator is 20% of GDP.
Over the period, gross debt falls as a percentage of GDP from around 32% at 30 June 2001 to 30.2% in 2001/02. Thereafter it averages around 29%, and is 28.4% by 2005/06.
For the same period, net debt averages 17% of GDP, before lowering in the last two years to 15.5% by 2005/06.
Net debt and gross debt rise slightly in the middle of the forecast period primarily owing to the timing of investments. The 2003/04 year is expected to be higher relative to other years owing to the timing of large defence purchases and higher Crown entity debt refinancing requirements.
Influences on gross and net debt
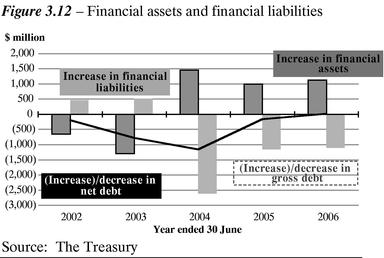
Generally, nominal gross debt increases relatively faster than net debt owing to net student loan13 capital requirements, which average around $780 million per year.
- 13
- These are neutral from a net debt prospective as advances are included in the definition of "Financial assets"
Additional factors causing the tracks to diverge over the forecast horizon include:
- •
- the bulk of the existing housing and health sector14 private sector debt refinancing, which takes place in 2001/02 ($625 million), 2002/03 ($285 million) and 2003/04 ($645 million), which only impacts on gross debt
- 14
- The Crown has undertaken to refinance DHB and Housing New Zealand Corporation private sector debt with Crown-issued debt as it results in overall lower interest costs. This is a technical change that increases gross Crown-issued debt. Because it brings a financial asset onto the Crown's balance sheet, however, there is no impact on net debt.
- •
- in 2001/02 and 2002/03, funding requirements are partially met through a decrease in holdings of MSDs, which only impact on net debt.
Changes in debt relative to the December Update
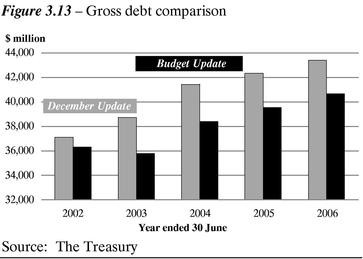
Both gross and net debt decrease relative to the December Update. The key changes in funding requirements for the comparable period of 2001/02 to 2005/06 are:
- •
- higher forecast cash generated from operating balances of $2.8 billion; partially offset by
- •
- increases in investment activity ($200 million extra capital provision) and changes to forecasts of refinancing existing Crown entity debt (which only impacts on gross debt).
Overall, the finance requirements are lower by $2.4 billion relative to the December Update.
Debt and the domestic bond programme
The 2001/02 domestic bond programme has been reduced by $350 million to $3.75 billion, as a result of forecast improvements in the Crown's cash flows. To accommodate this reduction the bond tender scheduled for 20 June 2002 has been cancelled.
The domestic bond programme for 2002/03 has been set at $3.4 billion. The bond programme finances the Crown's operating, investing and financing cash flows.
During 2002/03, the Crown will repay maturing domestic bonds of around $2.8 billion, finance operating and investing (excluding MSDs activity) cash flows of around $1.9 billion15 and undertake other financing activity of around $1.2 billion.
- 15
- The $1.9 billion incorporates cash flows from operations, net purchase of physical assets, net increase in advances, net purchase of investments (essentially capital injections/(withdrawals) to SOEs and Crown entitles) and the capital provision.
The overall funding requirement is reduced by around $2.5 billion from reductions in the Government's holdings of MSDs.
The domestic bond programme of $3.4 billion is substantially lower than the $5.1 billion forecast in the December Update. The change is largely a consequence of the forecast improvement in cash flows from operations, reducing the Government's financing requirement through to June 2003.
Forecast increases in the level of the domestic bond programme
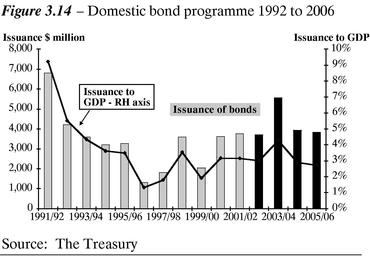
The forecasts indicate a domestic bond programme of $5.6 billion is expected in 2003/04, which is somewhat larger than was experienced through most of the 1990s. This reflects the timing of planned capital spending, with the 2003/04 year expecting substantial acquisition of defence equipment and relatively higher refinancing requirements of existing Crown entity private sector debt.
However, the nominal increases should be viewed in context with the relative size of the economy. Growth in the New Zealand economy means that the $5.6 billion debt programme is forecast (in 2003/04) to be much smaller relative to GDP (4.3%) than was the case in 1991/92 (9.2%) when the domestic debt programme amounted to $6.8 billion.
Operating Balance Changes Since the December Update
Table 3.6—Operating balance reconciliation (explains changes to the operating balance since the December Update)
| | 2001/02
Forecast
| | 2002/03
Forecast
| | 2003/04
Forecast
| | 2004/05
Forecast
| | 2005/06
Forecast
| |
|---|
| | ($ million)
| |
|---|
| Operating Balance 2001 December Update | | 985 | | 1,823 | | 2,908 | | 3,670 | | 3,854 | |
| Budget decision impacts | | | | | | | | | | | |
| Revenue initiatives | | 50 | | 280 | | 296 | | 302 | | 306 | |
| Net expense initiatives | | (43 | ) | (594 | ) | (790 | ) | (752 | ) | (761 | ) |
| Drawdown from Government's operating provisions | | 87 | | 220 | | 271 | | 273 | | 263 | |
| Total Budget decision impacts | | 94 | | (94 | ) | (223 | ) | (177 | ) | (192 | ) |
| Other forecasting changes | | | | | | | | | | | |
| Tax revenue forecasting changes | | 507 | | 804 | | 433 | | 343 | | 325 | |
| Other revenue changes | | 97 | | 45 | | 80 | | 95 | | 79 | |
| Welfare benefit indexation increases | | (3 | ) | (39 | ) | (118 | ) | (104 | ) | (54 | ) |
| Welfare benefit forecasting increases | | 56 | | 129 | | 131 | | 107 | | 144 | |
| Valuation changes (GSF and ACC liability movements) | | 569 | | — | | — | | — | | — | |
| Education Demographics | | (51 | ) | (124 | ) | (150 | ) | (177 | ) | (203 | ) |
| Finance expenses | | 42 | | (17 | ) | 83 | | 93 | | 69 | |
| Transport expenses | | (3 | ) | 62 | | 24 | | 30 | | 43 | |
| Change to SOEs and Crown entities (excluding ACC valuation change) | | 218 | | (105 | ) | 70 | | 160 | | 265 | |
| Other forecast changes | | (125 | ) | (276 | ) | (160 | ) | (103 | ) | (88 | ) |
| Total other forecasting changes | | 1,307 | | 479 | | 393 | | 444 | | 580 | |
| Operating Balance—2002 Budget Update | | 2,386 | | 2,208 | | 3,078 | | 3,937 | | 4,242 | |
Source: The Treasury
Explanations for key changes not covered elsewhere within this chapter include:
- •
- Lower transport costs are due to a change in the forecast split between operating and capital spending on roading improvements (no overall cash impact as capital spending increases).
- •
- Valuation changes mainly reflect an increase in average discount rates.
Fiscal Indicators—Comparison with December Update
Table 3.7—Fiscal indicators—compares key fiscal information with the December Update (current presentation of forecasts)
| | 2001
Actual
| | 2002
DEFU
| | 2002
Budget
| | 2003
DEFU
| | 2003
Budget
| |
|---|
| | ($ million, year ended 30 June)
| |
|---|
| Statement of Financial Performance | | | | | | | | | | | |
| Revenue | | | | | | | | | | | |
| Taxation revenue | | 36,738 | | 37,571 | | 38,377 | | 38,978 | | 40,141 | |
| Other revenue | | 2,754 | | 2,719 | | 2,795 | | 2,553 | | 2,811 | |
| Total Revenue | | 39,492 | | 40,290 | | 41,172 | | 41,531 | | 42,952 | |
| Ratio to GDP (%) | | 34.6 | % | 33.9 | % | 34.2 | % | 33.7 | % | 34.4 | % |
| Tax ratio to GDP (%) | | 32.2 | % | 31.6 | % | 31.9 | % | 31.6 | % | 32.1 | % |
Expenses |
|
|
|
|
|
|
|
|
|
|
|
| Functional expenses | | 35,750 | | 37,186 | | 36,781 | | 37,775 | | 38,618 | |
| Finance costs | | 2,483 | | 2,345 | | 2,303 | | 2,322 | | 2,339 | |
| Net foreign exchange gains | | (47 | ) | (18 | ) | 64 | | — | | — | |
| Provision for future initiatives | | — | | — | | — | | — | | 230 | |
| Total Expenses | | 38,186 | | 39,513 | | 39,148 | | 40,097 | | 41,187 | |
| Ratio to GDP (%) | | 33.5 | % | 33.2 | % | 32.5 | % | 32.5 | % | 33.0 | % |
Contribution of SOEs and CEs |
|
|
|
|
|
|
|
|
|
|
|
| Surplus attributable | | | | | | | | | | | |
| to SOEs and CEs | | 424 | | 634 | | 1,015 | | 1,089 | | 984 | |
| Dividends and other distributions | | (321 | ) | (336 | ) | (403 | ) | (250 | ) | (461 | ) |
| Net Contribution of SOEs and CEs | | 103 | | 298 | | 612 | | 839 | | 523 | |
Operating Balance |
|
1,409 |
|
985 |
|
2,636 |
|
1,823 |
|
2,288 |
|
| Ratio to GDP (%) | | 1.2 | % | 0.8 | % | 2.2 | % | 1.5 | % | 1.8 | % |
Statement of Financial Position |
|
|
|
|
|
|
|
|
|
|
|
| Assets (excluding NZS Fund assets) | | 65,081 | | 65,934 | | 66,421 | | 67,817 | | 66,816 | |
| NZS Fund assets | | — | | 614 | | 600 | | 1,904 | | 1,890 | |
| Liabilities | | (53,618 | ) | (54,106 | ) | (52,783 | ) | (55,456 | ) | (52,180 | ) |
| Crown Balance (net worth) | | 11,463 | | 12,442 | | 14,238 | | 14,265 | | 16,526 | |
| Ratio to GDP (%) | | 10.0 | % | 10.5 | % | 11.8 | % | 11.6 | % | 13.2 | % |
Statement of Borrowings |
|
|
|
|
|
|
|
|
|
|
|
| Crown Debt | | | | | | | | | | | |
| Gross debt | | 36,761 | | 37,105 | | 36,299 | | 38,708 | | 35,781 | |
| less financial assets | | (16,790 | ) | (15,402 | ) | (16,137 | ) | (15,406 | ) | (14,846 | ) |
| Net Crown Debt | | 19,971 | | 21,703 | | 20,162 | | 23,302 | | 20,935 | |
| Net Crown debt to GDP (%) | | 17.5 | % | 18.3 | % | 16.8 | % | 18.9 | % | 16.8 | % |
| Gross debt to GDP (%) | | 32.2 | % | 31.2 | % | 30.2 | % | 31.4 | % | 28.6 | % |
| Net debt repayment/(increase) | | 1,425 | | (1,732 | ) | (1,031 | ) | (1,599 | ) | (773 | ) |
| Nominal GDP | | 114,145 | | 118,890 | | 120,309 | | 123,271 | | 124,964 | |
Source: The Treasury
| | 2004
DEFU
| | 2004
Budget
| | 2005
DEFU
| | 2005
Budget
| | 2006
DEFU
| | 2006
Budget
| |
|---|
| | ($ million, year ended 30 June)
| |
|---|
| Statement of Financial Performance | | | | | | | | | | | | | |
| Revenue | | | | | | | | | | | | | |
| Taxation revenue | | 41,359 | | 42,084 | | 43,344 | | 43,981 | | 44,952 | | 45,570 | |
| Other revenue | | 2,924 | | 3,058 | | 3,286 | | 3,348 | | 3,630 | | 3,689 | |
| Total Revenue | | 44,283 | | 45,142 | | 46,630 | | 47,329 | | 48,582 | | 49,259 | |
| Ratio to GDP (%) | | 34.1 | % | 34.4 | % | 34.4 | % | 34.5 | % | 35.9 | % | 34.4 | % |
| Tax ratio to GDP (%) | | 31.9 | % | 32.1 | % | 32.0 | % | 32.1 | % | 33.2 | % | 31.9 | % |
Expenses |
|
|
|
|
|
|
|
|
|
|
|
|
|
| Functional expenses | | 38,793 | | 39,860 | | 39,774 | | 40,796 | | 40,622 | | 41,574 | |
| Finance costs | | 2,508 | | 2,425 | | 2,594 | | 2,501 | | 2,641 | | 2,572 | |
| Net foreign exchange gains | | — | | — | | — | | — | | — | | — | |
| Provision for future initiatives | | — | | 700 | | — | | 1,180 | | — | | 2,080 | |
| Total Expenses | | 41,301 | | 42,985 | | 42,368 | | 44,477 | | 43,263 | | 46,226 | |
| Ratio to GDP (%) | | 31.8 | % | 32.7 | % | 31.3 | % | 32.4 | % | 32.0 | % | 32.3 | % |
Contribution of SOEs and CEs |
|
|
|
|
|
|
|
|
|
|
|
|
|
| Surplus attributable to SOEs and CEs | | 1,214 | | 1,284 | | 1,248 | | 1,408 | | 1,295 | | 1,560 | |
| Dividends and other distributions | | (313 | ) | (363 | ) | (365 | ) | (323 | ) | (384 | ) | (351 | ) |
| Net Contribution of SOEs and CEs | | 901 | | 921 | | 883 | | 1,085 | | 911 | | 1,209 | |
Operating Balance |
|
2,908 |
|
3,078 |
|
3,670 |
|
3,937 |
|
3,854 |
|
4,242 |
|
| Ratio to GDP (%) | | 2.2 | % | 2.3 | % | 2.7 | % | 2.9 | % | 2.8 | % | 3.0 | % |
Statement of Financial Position |
|
|
|
|
|
|
|
|
|
|
|
|
|
| Assets (excluding NZS Fund assets) | | 71,276 | | 70,407 | | 73,277 | | 73,114 | | 75,223 | | 75,640 | |
| NZS Fund assets | | 3,914 | | 3,898 | | 6,379 | | 6,277 | | 9,091 | | 8,944 | |
| Liabilities | | (58,017 | ) | (54,701 | ) | (58,813 | ) | (55,850 | ) | (59,617 | ) | (56,801 | ) |
| Crown Balance (net worth) | | 17,173 | | 19,604 | | 20,843 | | 23,541 | | 24,697 | | 27,783 | |
| Ratio to GDP (%) | | 13.2 | % | 14.9 | % | 15.4 | % | 17.2 | % | 18.2 | % | 19.4 | % |
Statement of Borrowings |
|
|
|
|
|
|
|
|
|
|
|
|
|
| Crown Debt | | | | | | | | | | | | | |
| Gross debt | | 41,400 | | 38,391 | | 42,326 | | 39,543 | | 43,368 | | 40,656 | |
| less financial assets | | (16,773 | ) | (16,304 | ) | (17,628 | ) | (17,299 | ) | (18,502 | ) | (18,426 | ) |
| Net Crown Debt | | 24,627 | | 22,087 | | 24,698 | | 22,244 | | 24,866 | | 22,230 | |
| Net Crown debt to GDP (%) | | 19.0 | % | 16.8 | % | 18.2 | % | 16.2 | % | 18.4 | % | 15.5 | % |
| Gross debt to GDP (%) | | 31.9 | % | 29.2 | % | 31.3 | % | 28.8 | % | 32.0 | % | 28.4 | % |
| Net debt repayment/(increase) | | (1,325 | ) | (1,152 | ) | (71 | ) | (157 | ) | (168 | ) | 14 | |
| Nominal GDP | | 129,725 | | 131,293 | | 135,373 | | 137,201 | | 135,373 | | 143,026 | |
Source: The Treasury
Budget Policy Decisions
This section explains changes to the Government's new operating and capital spending.
Fiscal provisions for the current term
The Government has allocated all but $230 million of the $6.1 billion three-year fiscal provision since the 2000 Budget. The remaining amount is set aside as a contingency to manage risks between the 2002 and 2003 Budgets. The table below provides a breakdown of the Government's three-year fiscal provision since 1999/2000 to 2002/03:
Table 3.8—The Government's fiscal provisions
Fiscal provisions
| | 1999/2000
| | 2000/01
| | 2001/02
| | 2002/03
| | Total
|
|---|
| | ($ million, GST inclusive)
|
|---|
| Budget 2000 decisions | | 420 | | 1,050 | | 1,060 | | 1,120 | | 3,650 |
| 2000 contingency decisions | | — | | 99 | | 74 | | 78 | | 251 |
| Budget 2001 decisions | | — | | 52 | | 532 | | 526 | | 1,110 |
| 2001 contingency decisions | | — | | — | | 51 | | 125 | | 176 |
| Budget 2002 decisions | | — | | — | | (7 | ) | 715 | | 707 |
| 2002 contingency provision | | — | | — | | — | | 230 | | 230 |
| | |
| |
| |
| |
| |
|
| Total | | 420 | | 1,201 | | 1,710 | | 2,794 | | 6,124 |
| | |
| |
| |
| |
| |
|
Source: The Treasury
The 2001 Budget Update signalled an allocation of $815 million for Budget 2002. There was also a contingency of $300 million for decisions between the 2001 and 2002 Budgets (giving a total of $1,115 million available for new spending). At the time of the December Update, $176 million of the contingency had been committed, leaving $938 available for new spending. Budget 2002 commits $707 million of new spending over 2001/02 and 2002/03, and sets aside a contingency of $230 million for a total of $937 million.
Table 3.9—Decisions within the $6.125 billion fiscal provision
| | 1999/2000
| | 2000/01
| | 2001/02
| | 2002/03
| | Total
| |
|---|
| Revenue initiatives | | | | | | | | | | | |
| Tobacco excise increase | | (20 | ) | (110 | ) | (78 | ) | (82 | ) | (290 | ) |
| Improved IRD audit coverage | | — | | — | | (78 | ) | (183 | ) | (261 | ) |
| Cancellation of tariff reductions | | — | | (35 | ) | (80 | ) | (85 | ) | (200 | ) |
| Transport package—extra revenue | | — | | — | | (50 | ) | (175 | ) | (225 | ) |
| Multi-rate fringe benefit tax | | — | | 80 | | 65 | | 65 | | 210 | |
| Other revenue | | — | | (11 | ) | (57 | ) | (57 | ) | (125 | ) |
| | |
| |
| |
| |
| |
| |
| Total revenue initiatives | | (20 | ) | (76 | ) | (278 | ) | (517 | ) | (891 | ) |
| | |
| |
| |
| |
| |
| |
Expense initiatives |
|
|
|
|
|
|
|
|
|
|
|
| Health | | 32 | | 158 | | 315 | | 779 | | 1,284 | |
| Education | | 9 | | 111 | | 272 | | 490 | | 882 | |
| Increase in NZ Super rates | | 52 | | 208 | | 212 | | 212 | | 684 | |
| Student loan changes | | 32 | | 92 | | 103 | | 110 | | 337 | |
| Social Services | | (2 | ) | 59 | | 106 | | 108 | | 271 | |
| Police | | 27 | | 64 | | 74 | | 106 | | 271 | |
| Income-related rents | | — | | 55 | | 98 | | 104 | | 257 | |
| Environment/Conservation/Biosecurity | | 2 | | 41 | | 90 | | 122 | | 255 | |
| Changes to Housing NZ | | 30 | | 79 | | 70 | | 70 | | 249 | |
| Economic, Industry and Regional Development | | — | | 37 | | 65 | | 111 | | 214 | |
| Defence | | — | | 24 | | 62 | | 80 | | 166 | |
| Inland Revenue | | — | | 36 | | 52 | | 77 | | 165 | |
| Arts Culture and Heritage | | 55 | | 16 | | 22 | | 44 | | 137 | |
| Research Science and Technology | | — | | 30 | | 50 | | 55 | | 135 | |
| West Coast package | | 135 | | — | | — | | — | | 135 | |
| Cancellation of border charging | | — | | 29 | | 29 | | 29 | | 87 | |
| Corrections | | — | | 14 | | 32 | | 40 | | 86 | |
| Justice | | 5 | | 22 | | 19 | | 22 | | 68 | |
| Maori Affairs | | 14 | | 19 | | 15 | | 15 | | 63 | |
| Foreign Affairs/TradeNZ | | — | | 18 | | 16 | | 24 | | 58 | |
| Paid Parental Leave | | — | | — | | 1 | | 39 | | 40 | |
| Transport Package | | — | | — | | 50 | | 178 | | 228 | |
| Other initiatives | | 49 | | 165 | | 259 | | 290 | | 763 | |
| GSF diversification | | — | | — | | (25 | ) | (25 | ) | (50 | ) |
| 2002 Contingency | | — | | — | | — | | 230 | | 230 | |
| | |
| |
| |
| |
| |
| |
| Total initiatives | | 440 | | 1,277 | | 1,988 | | 3,310 | | 7,015 | |
| | |
| |
| |
| |
| |
| |
| Total net impact on the provisions | | 420 | | 1,201 | | 1,710 | | 2,793 | | 6,124 | |
| | |
| |
| |
| |
| |
| |
Source: The Treasury
The $707 million allocated from the fiscal provisions as part of Budget 2002 is summarised in the following table:
Table 3.10—Allocation of the remaining fiscal provision in the 2002 Budget
| | 2001/02
| | 2002/03
| | Tota11
| | 2003/04
| | 2004/05
| | 2005/06
| |
|---|
| | ($ million, GST inclusive)
| |
|---|
| Revenue initiatives | | | | | | | | | | | | | |
| Revenue initiatives | | — | | (105 | ) | (105 | ) | (118 | ) | (120 | ) | (120 | ) |
| Transport package—extra revenue | | (50 | ) | (175 | ) | (225 | ) | (175 | ) | (175 | ) | (175 | ) |
| Courts—extra revenue | | — | | — | | — | | (3 | ) | (7 | ) | (11 | ) |
| | |
| |
| |
| |
| |
| |
| |
| Total revenue initiatives | | (50 | ) | (280 | ) | (330 | ) | (296 | ) | (302 | ) | (306 | ) |
| | |
| |
| |
| |
| |
| |
| |
| Expenditure initiatives | | | | | | | | | | | | | |
| Health funding package | | — | | 400 | | 400 | | 800 | | 1,200 | | 1,200 | |
| Other health spending | | 7 | | 46 | | 53 | | 115 | | 71 | | 83 | |
| Education initiatives | | 7 | | 111 | | 118 | | 189 | | 174 | | 176 | |
| Social Services initiatives | | 1 | | 51 | | 51 | | 56 | | 58 | | 59 | |
| Social Services savings | | (26 | ) | (21 | ) | (47 | ) | (23 | ) | (18 | ) | (23 | ) |
| Paid Parental Leave | | 1 | | 39 | | 40 | | 41 | | 41 | | 41 | |
| Inland Revenue | | 3 | | 28 | | 31 | | 38 | | 40 | | 40 | |
| Arts, Culture and Heritage | | — | | 21 | | 21 | | 28 | | 28 | | 28 | |
| Environmental initiatives | | 1 | | 18 | | 19 | | 23 | | 26 | | 32 | |
| Defence | | 3 | | 23 | | 26 | | 22 | | 19 | | 19 | |
| Police | | (8 | ) | (3 | ) | (10 | ) | 27 | | 27 | | 27 | |
| Research, Science and Technology | | — | | 10 | | 10 | | 15 | | 16 | | 18 | |
| Courts | | 3 | | 13 | | 16 | | 11 | | 11 | | 11 | |
| Foreign Affairs and Trade | | — | | 12 | | 12 | | 12 | | 12 | | 12 | |
| Land Transport package | | 50 | | 178 | | 228 | | 188 | | 187 | | 181 | |
| Security agencies | | — | | 6 | | 6 | | 7 | | 7 | | 8 | |
| Food Safety | | — | | 5 | | 5 | | 6 | | 5 | | 5 | |
| Labour | | — | | 6 | | 6 | | 5 | | 3 | | 3 | |
| Corrections | | — | | 2 | | 2 | | 2 | | 6 | | 6 | |
| Energy Efficiency | | — | | 3 | | 3 | | 3 | | 3 | | 3 | |
| Other expenditure | | — | | 47 | | 47 | | 24 | | 33 | | 30 | |
| | |
| |
| |
| |
| |
| |
| |
| Total expense initiatives | | 43 | | 994 | | 1,037 | | 1,590 | | 1,952 | | 1,961 | |
| | |
| |
| |
| |
| |
| |
| |
| Net Impact on the provisions | | (7 | ) | 714 | | 707 | | 1,294 | | 1,649 | | 1,654 | |
| | |
| |
| |
| |
| |
| |
| |
Source: The Treasury
- 1
- The "Total" column relates to the impact on the $6.125 billion fiscal provisions.
Capital Provisions
Table 3.11 outlines the full extent of capital spending over the current term of Government (1999/2000 to 2002/03).
Table 3.11—The Government's capital provisions16
Capital provisions ($ million, GST inclusive)
| | 1999/2000
| | 2000/01
| | 2001/02
| | 2002/03
| |
|---|
| Capital provision—December Update | | (69 | ) | 639 | | 2,291 | | 1,585 | |
| Budget 2000 decisions | | (54 | ) | 827 | | 576 | | 568 | |
| December Update 2000 decisions | | (15 | ) | (58 | ) | (4 | ) | 40 | |
| Receipts from spectrum sale | | — | | (135 | ) | | | | |
| Budget 2001 decisions | | — | | 5 | | 369 | | 204 | |
| December Update 2001 decisions | | — | | — | | 76 | | 27 | |
| Budget 2002 decisions | | — | | — | | 1,151 | | 407 | |
| | |
| |
| |
| |
| |
| Total decisions to date | | (69 | ) | 639 | | 2,168 | | 1,246 | |
| Planned commitments pre-Budget 2002 | | — | | — | | 123 | | 339 | |
| Budget 2002 rephasing of commitments | | — | | — | | (123 | ) | (119 | ) |
| Budget 2002 increase to forecast commitments | | — | | — | | — | | — | |
| Forecast capital commitments | | — | | — | | — | | 220 | |
| Total provision to 2002/03 | | (69 | ) | 639 | | 2,168 | | 1,466 | |
| | |
| |
| |
| |
| |
| Total Capital Provisions for the Current Term | | | | | | | | 4,204 | |
- 16
- Note that the remaining capital provision numbers do not exactly equal those contained in the fiscal forecasts owing to rounding.
Source: The Treasury
Since the December Update, the planned capital commitments have been revised. Underspends of $123 million in 2001/02 and $119 million in 2002/03 have been rephased to reflect timing of future capital demands.
Table 3.12—Capital Spending over the current parliamentary term
Total capital spending in the current term
| | 1999/2000
| | 2000/01
| | 2001/02
| | 2002/03
| | Total
| |
|---|
| | ($ million)
| |
|---|
| Student loans | | 169 | | 295 | | 330 | | 333 | | 1,127 | |
| Air NZ1 | | — | | — | | 1,035 | | — | | 1,035 | |
| Health | | (117 | ) | 73 | | 235 | | 379 | | 570 | |
| Housing | | — | | 208 | | 143 | | 202 | | 553 | |
| Education | | — | | 219 | | 174 | | 146 | | 539 | |
| Corrections | | — | | 55 | | 70 | | 84 | | 209 | |
| Seed capital fund | | — | | — | | 100 | | — | | 100 | |
| Auckland rail | | — | | — | | 91 | | — | | 91 | |
| NZ Post—banking | | — | | — | | 78 | | — | | 78 | |
| Culture and Heritage | | 32 | | 12 | | 10 | | 10 | | 64 | |
| Parliamentary Services | | — | | 6 | | 11 | | 9 | | 26 | |
| Child, Youth and Family | | — | | — | | — | | 23 | | 23 | |
| Receipts from spectrum sale | | — | | (135 | ) | — | | — | | (135 | ) |
| Withdrawals from Crown entities | | (120 | ) | (120 | ) | (150 | ) | — | | (390 | ) |
| Other | | (33 | ) | 26 | | 41 | | 60 | | 94 | |
| Remaining capital provision | | — | | — | | — | | 220 | | 220 | |
| | |
| |
| |
| |
| |
| |
| Total | | (69 | ) | 639 | | 2,168 | | 1,466 | | 4,204 | |
| | |
| |
| |
| |
| |
| |
- 1
- This consists of $885 million already provided and a further commitment by the Government to provide $150 million before June 2003 in a form that is appropriate for Air New Zealand's capital structure at the time required. Air NZ has indicated that it will not require the additional capital prior to 30 June 2002.
Source: The Treasury
Table 3.13—Capital spending since the December Update
Budget 2002 decisions
| | 2001/02
| | 2002/03
| | 2003/04
| | 2004/05
| | 2005/06
| | Total
| |
|---|
| | ($ million)
| |
|---|
| Education | | 25 | | 148 | | 5 | | 6 | | 6 | | 191 | |
| Housing | | — | | 42 | | 46 | | 51 | | 39 | | 178 | |
| Health | | (16 | ) | 154 | | 137 | | 152 | | 194 | | 621 | |
| Justice | | — | | 12 | | 18 | | 5 | | — | | 35 | |
| Partial moratorium on PTEs | | — | | (9 | ) | (17 | ) | (18 | ) | (19 | ) | (62 | ) |
| Air NZ1 | | 1,035 | | — | | — | | — | | — | | 1,035 | |
| Auckland Rail | | 91 | | — | | — | | — | | — | | 91 | |
| Conservation | | — | | 4 | | 4 | | 4 | | 4 | | 16 | |
| Other capital initiatives | | 16 | | 56 | | 1 | | — | | — | | 73 | |
| | |
| |
| |
| |
| |
| |
| |
| Net Impact on the Capital Provisions | | 1,151 | | 407 | | 194 | | 200 | | 224 | | 2,177 | |
| | |
| |
| |
| |
| |
| |
| |
- 1
- This consists of $885 million already provided and a further commitment by the Government to provide $150 million before June 2003 in a form that is appropriate for Air New Zealand's capital structure at the time required. Air NZ has indicated that it will not require the additional capital prior to 30 June 2002.
Source: The Treasury
Forecast future new spending past 2002/03
In the next parliamentary term, the Government plans to revise the provisions framework to ensure the focus will be on the operating and debt tracks and their consistency with the fiscal objectives. This compares with the current focus on a set nominal limit for the electoral term.
Looking forward, the Government will balance the operating and capital components alongside NZS Fund contributions.
Under current operating balance projections, the Government could accommodate core operating expense growth of around 2.5% per year. This is consistent with making contributions to the NZS Fund as planned. The forecasts reflect amounts consistent with this approach.
In future years, the Government can accommodate capital investment of around $500 million to $600 million per year within the 30% gross debt objective.17
- 17
- This capital spending is in addition to purchases of physical assets to maintain the asset base, which averages around $1 billion per year over the next five years.
Note 5 of the forecasts contained in the GAAP tables (page 171) outlines the cumulative impact of the forecasts for future new spending.
Air New Zealand: Impact on the 2002 Budget Forecasts
In January 2002 details of the Crown's recapitalisation package were finalised with Air New Zealand. The end result is an investment by the Crown of a total $892 million, resulting in an 82% stake in Air New Zealand. The Crown has also committed to provide up to $150 million in further funding before June 2003.
Goodwill Component of Acquisition Price
As was mentioned in the 2001 December Update, the fair value of assets and liabilities of Air New Zealand need to be consolidated onto the Crown's balance sheet with the acquisition of Air New Zealand.
The deemed acquisition date of Air New Zealand is 1 January 2002. The following table outlines the fair value of the net assets and liabilities of Air New Zealand as at 1 January 2002, calculated at 82% ownership. The difference between the fair value of $423 million and the purchase price of $892 million is goodwill on acquisition of $469 million. Goodwill on acquisition represents the amount by which the Crown's share of the value of the business exceeds the value of the individual assets and liabilities.
Balance sheet
| | Air New Zealand
accounts as at
31 December 2001
including Crown
recapitalisation
| | Fair value
adjustments
| | Air New
Zealand fair
value of
assets and
liabilities
| |
|---|
| | ($ million)
| |
|---|
| Assets | | 4,083 | | (502 | ) | 3,581 | |
| Liabilities | | (3,065 | ) | — | | (3,065 | ) |
| | |
| |
| |
| |
| Net assets | | 1,018 | | (502 | ) | 516 | |
| Crown's share @ 82% | | 423 | |
| Purchase price ($885 million injection and $7 million shares from capitalised interest on original $300 million advance) | | 892 | |
| Difference between purchase price and share of the "fair value" of Air New Zealand net assets—goodwill | | 469 | |
The Crown is required to recognise the individual assets and liabilities of Air New Zealand at fair value (market value) at a specific point in time. This is normal acquisition accounting that is common in the private sector. The fair value adjustment made to the balance sheet of Air New Zealand (on consolidation in the Crown financial statements) reflects the market value of the aircraft fleet as at 1 January 2002. It does not mean that the balance sheet of Air New Zealand is overstated. Air New Zealand is required under FRS 3: Accounting for Property, Plant and Equipment to value its aircraft at the lower of carrying value or recoverable amount, the latter being defined as the higher of market value or value-in-use. Accordingly, Air New Zealand considers disclosure of the carrying amount of its aircraft to be appropriate.
The goodwill component of the investment is disclosed within the Crown balance sheet as part of the intangible assets classification. The rest of the investment is contained within the net investment of SOEs and Crown entities. Goodwill will be amortised over a 10-year period. This results in a $23 million (non-cash) expense in 2001/02 and $47 million in each subsequent year until goodwill is fully expensed.
The forecasts also incorporate the forecast financial performance of Air New Zealand over the forecast period.
New Zealand Superannuation Fund Contributions
Section 42 (2) of the New Zealand Superannuation Act 2001 requires that the Treasury must include in the Budget Economic and Fiscal Update:
- •
- the amount of the required annual capital contribution for the financial year
- •
- a statement of the assumptions and judgements on which the calculations are based.
Required annual contribution
The required annual contribution to the New Zealand Superannuation Fund for the year ending 30 June 2003 is $1.666 billion.
The contribution to the Fund is calculated over a 40-year rolling horizon to ensure Superannuation entitlements over the next 40 years could be met, if the contribution rate were to be held constant at that level for 40 years.
In the first three years of the Fund's operation the Government plans to build towards making the full capital contribution as calculated by the formula set out in the NZS Fund Act. This transition period will prevent undue pressure being placed on the fiscal position while structural surpluses are raised to the required levels.
$ billion (June year end)
| | 2002
| | 2003
| | 2004
| | 2005
| | 2006
|
|---|
| Required contribution | | N/A | | 1.666 | | 1.850 | | 2.011 | | 2.117 |
| Actual contribution | | 0.600 | | 1.200 | | 1.800 | | 2.011 | | 2.117 |
Statement of assumptions
The underlying assumptions in calculating the contribution are the:
- •
- GDP series to 2046
- •
- New Zealand Superannuation series to 2046
- •
- opening Fund balance ($600 million as at 1 July 2002)
- •
- expected net after-tax annual return of the Fund (7.5%).
The GDP series was projected following the assumptions stated in the annex to the Fiscal Strategy Report. In calculating the required capital contribution to the NZS Fund the following explicit assumptions were made:
| | 2002 Budget
| | 2001 December Update
| | 2001 Budget
| |
|---|
| Expected nominal bond rate | | 6.2 | % | 6.2 | % | 6.5 | % |
| Equity premium | | 5.0 | % | 5.0 | % | — | |
| Portfolio composition (equities) | | 70.0 | % | 70.0 | % | — | |
| Management fees | | 0.3 | % | 0.3 | % | — | |
| Expected return before tax | | 9.4 | % | 9.4 | % | 9.0 | % |
| Tax | | 20.0 | % | 20.0 | % | 33.0 | % |
| Expected return after tax | | 7.52 | % | 7.52 | % | 6.0 | % |
There are no changes to the assumptions from the December Update. The Treasury website contains further information on the rate of return and calculation methods. These papers can be found at: www.treasury.govt.nz/release/super/default.asp
The Fund is subject to New Zealand tax as if it were a body corporate. The current marginal rate of tax on assessable income is 33%. However, depending on the portfolio composition and investment style, a significant proportion of the returns might not be subject to tax. In particular, capital gains on equities, particularly if held as passive investments, attract less tax than bonds. For the purpose of this calculation, an average rate of 20% is assumed.
Sensitivity
The forecasts of capital contributions for 2004/05 and 2005/06 exhibit sensitivities to the various assumptions made above as follows:18
| |
| |
| | Effect on capital
contribution ($ billion)
|
|---|
Variable
| | Marginal change
(%age points)
| | Effect on net return
after tax
(%age points)
|
|---|
| | 2004/05
| | 2005/06
|
|---|
| Nominal bond rate | | +1 | % | +0.80 | % | -0.176 | | -0.190 |
| Equity premium | | +1 | % | +0.56 | % | -0.125 | | -0.135 |
| Portfolio composition (equities) | | +5 | % | +0.20 | % | -0.046 | | -0.050 |
| Management fees | | +0.1 | % | -0.08 | % | +0.019 | | +0.020 |
| Tax | | +5 | % | -0.47 | % | +0.111 | | +0.119 |
These sensitivities are well within the bounds of reasonable forecasting accuracy three to four years ahead.
- 18
- The effects shown in this table are the marginal effects (that is, all else held equal). This overstates the effects for some variables that are interdependent. For example, a portfolio with a higher weighting in equities would be likely to have a lower average tax rate.
Full line-by-line consolidation
Current Obligations on the Crown
The Public Finance Act 1989 and Fiscal Responsibility Act 1994 require the government to produce actual and forecast financial statements in accordance with generally accepted accounting practice (GAAP). This ensures that the financial statements and forecasts of the Crown are prepared on a basis familiar to readers of private sector financial statements—providing a transparent and independently established set of principles on which to measure a government's financial activity.
GAAP is Changing
GAAP is refined over time in line with international and New Zealand-specific accounting developments. While the Crown will continue to prepare consolidated financial statements the form of that consolidation will be changing to comply with forthcoming changes to GAAP.
GAAP will soon require the full line-by-line consolidation of SOEs and Crown entities (currently the accounts only consolidate the net surplus in the operating balance and net investment/net worth in the balance sheet). In addition, there are some adjustments that will impact on "core Crown" (defined below) results owing to changes to the treatment of GST on Crown spending and the treatment of the Government Superannuation Fund (GSF).
The following table outlines the presentation and how that is changing. It defines the key terms that are used throughout the Budget documents. A second table outlines how line-by-line consolidation impacts on the key fiscal indicators.
Current presentation of consolidation
| | Future presentation of consolidation
|
The current presentation shows:
• Crown expenses and revenues with net SOE and Crown entity results
• Crown assets, liabilities, net Crown debt, gross Crown debt and net worth. The Crown balance sheet only includes a net investment in SOEs and Crown entities. | | The future presentation will show the three institutional forms of:
• "core Crown" (existing information on revenues and expenses less GST on Crown expenses plus inclusion of full GSF numbers)
• SOE revenues, expenses, assets, liabilities
• Crown entity revenues, expenses, assets, liabilities.
The sum of these three segments (less internal transactions) is the "total Crown".
The core Crown is different from the current presentation owing to the removal of GST on Crown expenses and the inclusion of the full accounts of the GSF. These changes are explained in more detail in the next section. |
While the presentation is changing it is important to note that the net results for the Crown will be materially the same (ie, operating balance and net worth), although the composition and total of items such as revenues, expenses, assets and liabilities will change.
Impact on presentation of fiscal indicators
Current key fiscal indicators
| | Future key fiscal indicators
|
| Crown revenue (revenue collected by departments) | | • Core Crown revenue (Crown revenue less GST paid by Crown)
• Total Crown revenue (core Crown + SOEs + Crown entities less internal transactions) |
Crown expenses |
|
• Core Crown expenses (Crown expenses less GST)
• Total Crown expenses (core Crown + SOE + Crown entity expenses less internal transactions) |
Operating balance |
|
• Operating balance (no change) |
Gross Crown debt |
|
• Gross sovereign-issued debt (essentially the same as gross Crown debt)19
• Core Crown gross debt (gross Crown debt less cross-holdings with NZS Fund and GSF)
• Total Crown gross debt (core Crown gross debt + debt of SOEs and Crown entities less cross-holdings) |
Net Crown debt |
|
• Net Crown debt (same as current presentation less cross-holdings with NZS Fund and GSF) |
Net worth |
|
• Net worth (no change) |
- 19
- Sovereign-issued debt is debt issued by the New Zealand Debt Management Office (NZDMO) and will also be defined to include the Reserve Bank given it is integral to the debt management of the Crown; it will exclude debt issued by SOEs and Crown entities and any sovereign-guaranteed debt of SOEs and Crown entities. Gross sovereign-issued debt includes any New Zealand Government stock held by the GSF and NZS Fund. This is essentially the same as the current presentation of gross Crown debt.
As noted in the 2002 Fiscal Strategy Report, full consolidation does not alter the Government's fiscal policy approach. The box on page 28 outlines how the presentation of long-term objectives changes, but it is important to note that the underlying focus does not. The focus is a mixture of core Crown and total Crown, reflecting the institutional arrangements by which the Crown is organised, and those elements over which the Government chooses to have day-to-day control, as well as the whole-of-government position.
As part of the transition to full consolidation, the GAAP tables are presented on the existing approach (refer pages 141 to 175) and also on a fully consolidated basis (refer pages 176 to 192). The fully consolidated basis contains disclosure of the "core Crown", SOEs and Crown entities segments to provide relevant information for fiscal objectives and indicators. The manner in which the fully consolidated information is presented will mean that, going forward, no information within the current presentation will be lost.
Illustration of Changes
The following table outlines how the Crown financial statements differ from the current presentation. It highlights the changes to the headline fiscal indicators. The table has been prepared to show the Crown indicators as they are currently calculated (ie, as shown in the 2001 Crown financial statements, which is the core Crown plus equity accounting the SOEs and Crown entities)—column (A), to the new core Crown—column (B) and then to total Crown (full consolidation)—column (C). The last column is the overall change from the status quo to full consolidation.
Table 3.14—Illustration of full consolidation on presentation of key fiscal indicators
Core Crown comparison and total Crown aggregates as a percentage of GDP as at 30 June 2001
Table may not add owing to rounding
| | Crown as currently disclosed
| | Changes to core Crown only (GST removed, GSF added in)
| | New core Crown
| | Changes from new Core Crown to total Crown
| | Total Crown (full consolidation)
| | Change between current Crown and total Crown
| |
|---|
| | (A)
| |
| | (B)
| |
| | (C)
| |
| |
|---|
| Revenue | | 34.6% | | (1.3% | ) | 33.3% | | 7.6% | | 40.9% | | 6.3% | |
| Tax revenue | | 32.1% | | (1.4% | ) | 30.7% | | 1.5% | | 32.2% | | 0.1% | |
| Expenses | | 33.4% | | (1.3% | ) | 32.1% | | 7.5% | | 39.6% | | 6.2% | |
| Net SOEs and Crown entities | | 0.1% | | (0.1% | ) | N/A | | N/A | | N/A | | (0.1% | ) |
| | |
| |
| |
| |
| |
| |
| |
| Operating balance | | 1.2% | | (0.1% | ) | 1.1% | | 0.1% | | 1.2% | | 0.0% | |
Physical assets |
|
23.8% |
|
0.0% |
|
23.8% |
|
16.4% |
|
40.2% |
|
16.4% |
|
| Financial assets | | 14.7% | | 0.5% | | 15.2% | | 4.2% | | 19.4% | | 4.7% | |
| Other assets | | 18.5% | | (6.4% | ) | 12.1% | | (4.1% | ) | 7.9% | | (10.6% | ) |
| | |
| |
| |
| |
| |
| |
| |
| Total assets | | 57.0% | | (6.0% | ) | 51.0% | | 16.5% | | 67.5% | | 10.5% | |
| Gross debt | | 32.2% | | (2.6% | ) | 29.6% | | 0.7% | | 30.3% | | (1.8% | ) |
| Other liabilities | | 14.8% | | 3.1% | | 17.9% | | 9.3% | | 27.1% | | 12.4% | |
| | |
| |
| |
| |
| |
| |
| |
| Total liabilities | | 46.9% | | 0.5% | | 47.5% | | 10.0% | | 57.5% | | 10.5% | |
| | |
| |
| |
| |
| |
| |
| |
| Net worth | | 10.0% | | (6.5% | ) | 3.5% | | 6.5% | | 10.0% | | (0.0% | ) |
Gross sovereign-issued debt |
|
32.2% |
|
(0.0% |
) |
32.2% |
|
0.0% |
|
32.2% |
|
0.0% |
|
| Net Crown debt | | 17.5% | | (2.6% | ) | 14.9% | | N/A | | N/A | | N/A | |
| Net Crown debt (+ assets of NZSF & GSF) | | 17.5% | | (3.0% | ) | 14.4% | | (3.5% | ) | 11.0% | | (6.5% | ) |
The core Crown
The key change between the current presentation of Crown revenues and expenses and the new "core Crown" (that is, excluding SOEs and Crown entities) is that the GST on Crown spending will be removed (reducing reported tax revenues and expenses with no change to the operating balance). When preparing consolidated financial statements, transactions between entities within the group are removed. From an external viewpoint, GST is a tax paid by the Crown to itself—an internal transaction for the purposes of financial reporting. This change has the impact of lowering the presented revenue-and expense-to-GDP tracks by around 1.3%.
A second impact of the difference between the current presentation and the new "core Crown" relates to the treatment of the net liability of the GSF. At present only the net unfunded liability of the GSF is disclosed as a liability. The new consolidation requirements mean that the Crown is required to disclose the full activity of the GSF within the Crown financial statements. The material impact is on the balance sheet where the existing GSF financial assets of around $3.5 billion are added in and the total liability is also shown (an increase to pension liabilities of $3.5 billion)20. There is no overall impact on net worth but it does alter the net Crown debt indicator.
- 20
- While GAAP requires the inclusion of GSF in the Crown financial statements, the financial assets of the GSF can only be used for the payment of GSF benefits, ie, they are restricted in nature (in much the same way that the assets of the NZS Fund are restricted). As such, the net assets of GSF are also excluded when calculating the net Crown debt indicator.
Total Crown—full line-by-line consolidation
The key change of full line-by-line consolidation is to include within the consolidated Crown results the line-by-line results of SOEs and Crown entities (ie, gross-up revenue, expenses, assets and liabilities). Between the current Crown financial statements and fully consolidated results there is no material change to the total operating balance and net worth. Key movements to the components of the operating balance and net worth include:
- •
- overall gross revenues and expenses increase from the inclusion of SOE and Crown entity third party revenue (eg, ACC levies, sales of goods and services by the SOEs, Lotteries income, etc). The increase in sovereign revenue is mainly due to the inclusion of ACC levies, offset by the removal of GST revenue
- •
- the major expense category that increases is Other Economic (many of the SOE expenses), Social Welfare (ACC payments) and Education (expenses funded from third party revenue of schools and tertiary education institutions). The following table indicates at a summary level
where the expenses of the material SOEs and Crown entities are allocated. Page 182 shows function classifications of core Crown and consolidated Crown
| | Functional classification
| | Allocation of material SOEs and Crown entities
|
|
Social security and welfare |
|
ACC payments, Public Trust |
|
Health |
|
DHBs, Crown Financing Agency (RHMU) |
|
Education |
|
Schools, Skill NZ, Tertiary education institutes |
|
Core government services |
|
Human Rights Commission, Privacy Commissioner |
|
Law and order |
|
Law Commission, Legal Service Agency, NZ Fire Service |
|
Defence |
|
None |
|
Transport and communication |
|
Airways, Air New Zealand, NZ Post, TVNZ, Land Transport Safety Authority, Transfund, Transit |
|
Economic and industrial services |
|
Genesis Power, Meridian Energy, Mighty River Power, Transpower, Solid Energy, Earthquake Commission (EQC), Foundation for Research, Science and Technology, Industry NZ, NZ Trade Development Board, NZ Tourism Board |
|
Primary services |
|
Landcorp, Timberlands, Agriquality NZ, Asure NZ, CRIs |
|
Heritage, culture and recreation |
|
Arts Council, NZ on Air, Hillary Commission, Te Papa, Radio NZ |
|
Housing and community development |
|
Housing NZ Corporation, Quotable Value NZ |
|
Finance costs |
|
Interest costs of entities with debt |
- •
- physical assets increase significantly owing to the Housing New Zealand Corporation housing portfolio, the electricity distribution and generation assets of Transpower, Meridian Energy, Mighty River Power and Genesis Power and, from 2001/02, the assets of Air New Zealand. Other assets reduce as the net investment in SOEs and Crown entities is removed
- •
- borrowings alter by the inclusion of the debt of SOEs and Crown entities less any cross-holdings of Government stock held by ACC, EQC and other Crown entities (as it reduces further the debt of the core Crown)
- •
- other liabilities increase largely from the inclusion of the ACC outstanding claims obligation.
The indicator of gross sovereign-issued debt is unchanged as a result of changing the presentation of the Crown financial statements. This is because gross sovereign-issued debt does not remove any cross-holdings of Government stock.
The increase in revenues and expenses is not as simple as adding existing Crown spending to all spending of SOEs and Crown entities. For example, a lot of the expenses of the core Crown go towards the provision of funding to Crown entities, for example health funding to hospitals. In a set of fully consolidated financial statements, the health expenses of the Crown are replaced with the expenses of the DHBs, so that the same expenses are not counted twice. The following table illustrates how the components of the consolidated Crown operating statement "add up" to the total Crown numbers for the 2001/02 year (pages 188 to 192 show the situation for each of the forecast years).
Table 3.15—Components of the total Crown
Forecast Statement of Financial Performance (institutional form)
for the year ended 30 June 2002
| | Core Crown
2002
| | Crown
entities
2002
| | State-owned
enterprises
2002
| | Inter-segment
eliminations
2002
| | Total Crown
2002
|
|---|
| | ($ million)
|
|---|
| Revenue | | | | | | | | | | |
| Taxation revenue | | 36,430 | | — | | — | | (225 | ) | 36,205 |
| Other sovereign levied income | | 493 | | 2,000 | | — | | (14 | ) | 2,479 |
| Sales of goods and services | | 687 | | 3,270 | | 6,583 | | (873 | ) | 9,667 |
| Investment income | | 1,303 | | 571 | | 31 | | (722 | ) | 1,183 |
| Other revenues | | 613 | | 12,252 | | 377 | | (11,598 | ) | 1,644 |
| | |
| |
| |
| |
| |
|
| Total revenue | | 39,526 | | 18,093 | | 6,991 | | (13,432 | ) | 51,178 |
| | |
| |
| |
| |
| |
|
| Expenses by functional classification | | | | | | | | | | |
| Social security and welfare | | 14,210 | | 2,223 | | — | | (449 | ) | 15,984 |
| Health | | 7,019 | | 5,409 | | — | | (4,943 | ) | 7,485 |
| Education | | 6,499 | | 6,052 | | — | | (4,366 | ) | 8,185 |
| Other functional classifications | | 7,534 | | 3,584 | | 6,355 | | (2,960 | ) | 14,513 |
| Forecast for future new spending | | — | | — | | — | | — | | — |
| Finance costs and FX losses/(gains) | | 2,240 | | 205 | | 241 | | (311 | ) | 2,375 |
| | |
| |
| |
| |
| |
|
| Total expenses | | 37,502 | | 17,473 | | 6,596 | | (13,029 | ) | 48,542 |
| | |
| |
| |
| |
| |
|
| Operating balance | | 2,024 | | 620 | | 395 | | (403 | ) | 2,636 |
| | |
| |
| |
| |
| |
|
Outstanding Issues
While the fully consolidated Crown forecasts shown with the Budget 2002 forecasts provide an illustration of the impending changes, there are two issues still to be worked through prior to the first audited set of Crown financial statements under line-by-line for the 30 June 2003 financial year. These issues may impact on the final form of the fully consolidated Crown forecasts and Crown financial statements. The two issues are:
- •
- the issue of whether to consolidate tertiary education institutes (TEIs) in the Crown financial statements is not clear-cut. The Treasury and the Ministry of Education are currently working through the issue. In the interim the forecasts are continuing with the status quo of consolidating TEIs (they are currently equity accounted as agreed by the Finance and Expenditure Select Committee as part of the original decisions taken on implementing accrual accounting back in the early 1990s). Not consolidating the TEIs would have a material impact on the forecasts and Crown financial statements as TEIs currently represent an investment in excess of $2 billion
- •
- at present the Crown financial statements record as a net liability the guarantee the Crown has provided to the DBP Annuitants Scheme. The Treasury and the Audit Office have yet to finalise a view on whether components of the National Provident Fund (if any) should be consolidated. Any change from the status quo would result in an increase to assets and liabilities. Such a change would be unlikely to be material.
Ten-Year Summary Information
To provide a summary of key indicators, the following table outlines a 10-year time series (five-year history and the forecasts). The Treasury is in the process of compiling the time series back to the start of accrual accounting in the Crown financial statements (early 1990s).
Table 3.16—Summary of key fiscal indicators
Summary indicators
| | 1997
Actual
| | 1998
Actual
| | 1999
Actual
| | 2000
Actual
| | 2001
Actual
| | 2002
Estimated
Actual
| | 2003
Forecast
| | 2004
Forecast
| | 2005
Forecast
| | 2006
Forecast
| |
|---|
| | (% of GDP)
| |
|---|
| Revenue | | | | | | | | | | | | | | | | | | | | | |
| Current presentation | | 35.5 | % | 35.7 | % | 35.7 | % | 34.1 | % | 34.6 | % | 34.2 | % | 34.4 | % | 34.4 | % | 34.5 | % | 34.4 | % |
| Future presentation of Core Crown | | 34.2 | % | 34.3 | % | 33.8 | % | 32.3 | % | 33.3 | % | 32.9 | % | 33.1 | % | 33.0 | % | 33.1 | % | 33.1 | % |
| Future presentation of Total Crown | | 41.5 | % | 42.1 | % | 42.1 | % | 39.7 | % | 40.9 | % | 42.5 | % | 43.3 | % | 43.3 | % | 43.4 | % | 43.2 | % |
| Expenses | | | | | | | | | | | | | | | | | | | | | |
| Current presentation | | 33.6 | % | 34.3 | % | 35.2 | % | 33.8 | % | 33.5 | % | 32.5 | % | 33.0 | % | 32.7 | % | 32.4 | % | 32.3 | % |
| Future presentation of Core Crown | | 32.4 | % | 32.9 | % | 33.8 | % | 32.3 | % | 32.2 | % | 31.2 | % | 31.7 | % | 31.4 | % | 31.0 | % | 30.9 | % |
| Future presentation of Total Crown | | 39.5 | % | 40.0 | % | 40.3 | % | 38.3 | % | 39.7 | % | 40.3 | % | 41.4 | % | 41.0 | % | 40.5 | % | 40.3 | % |
| Operating balance | | | | | | | | | | | | | | | | | | | | | |
| Current presentation | | 1.9 | % | 2.5 | % | 1.7 | % | 1.4 | % | 1.2 | % | 2.2 | % | 1.8 | % | 2.3 | % | 2.9 | % | 3.0 | % |
| Future presentation | | 1.9 | % | 2.1 | % | 1.7 | % | 1.4 | % | 1.2 | % | 2.2 | % | 1.8 | % | 2.3 | % | 2.9 | % | 3.0 | % |
| OBERAC (no changes) | | 1.9 | % | 2.2 | % | 0.2 | % | 0.8 | % | 1.8 | % | 1.9 | % | 1.8 | % | 2.3 | % | 2.9 | % | 3.0 | % |
| Gross debt | | | | | | | | | | | | | | | | | | | | | |
| Current presentation | | 36.7 | % | 38.0 | % | 36.1 | % | 33.7 | % | 32.2 | % | 30.2 | % | 28.6 | % | 29.2 | % | 28.8 | % | 28.4 | % |
| Future presentation of Core Crown | | 35.0 | % | 36.1 | % | 33.8 | % | 31.6 | % | 29.6 | % | 28.9 | % | 28.4 | % | 29.0 | % | 28.6 | % | 28.2 | % |
| Future presentation of Total Crown | | 37.8 | % | 38.2 | % | 35.2 | % | 32.4 | % | 30.4 | % | 31.3 | % | 30.5 | % | 30.2 | % | 29.4 | % | 28.3 | % |
| Gross sovereign-issued debt (no change) | | 36.7 | % | 38.0 | % | 36.1 | % | 33.7 | % | 32.2 | % | 30.2 | % | 28.6 | % | 29.2 | % | 28.8 | % | 28.4 | % |
| Net Crown debt | | | | | | | | | | | | | | | | | | | | | |
| Current presentation | | 25.9 | % | 24.1 | % | 21.3 | % | 20.0 | % | 17.5 | % | 16.8 | % | 16.8 | % | 16.8 | % | 16.2 | % | 15.5 | % |
| Future presentation | | 24.1 | % | 22.2 | % | 19.1 | % | 17.9 | % | 14.9 | % | 15.5 | % | 16.5 | % | 16.6 | % | 16.0 | % | 15.3 | % |
| Net worth (no change) | | 7.6 | % | 9.9 | % | 5.9 | % | 8.0 | % | 10.0 | % | 11.8 | % | 13.2 | % | 14.9 | % | 17.2 | % | 19.4 | % |
| Nominal GDP ($million) | | 97,933 | | 99,790 | | 101,761 | | 107,064 | | 114,145 | | 120,309 | | 124,964 | | 131,293 | | 137,201 | | 143,026 | |
Key interpretational points include:
- •
- the operating balance is generally the same under the current approach and full line-by-line consolidation. There is one point of difference in the historical series. The assets of Transpower are revalued each year and devaluations currently flow through Transpower's operating result. This had been absorbed through an asset revaluation reserve in the Crown financial statements. Because Transpower's assets are a separate class of asset within the new Crown financial statements, the Crown will adopt the same treatment as Transpower in the future. The operating balance has been altered in the above historical series.
- •
- OBERAC is not impacted by the change in treatment to Transpower's annual revaluation of assets. Net worth also remains the same because while the Transpower revaluation did not impact on the Crown's operating balance it still did reduce net worth.
- •
- gross debt and net debt of the new core Crown differ from the current presentation because of the change in treatment of the GSF. Because the GSF is in the process of diversifying its Government stock holdings into other financial assets, the size of the adjustment is much smaller from 2003/04 forward. At that stage the GSF is expected to have diversified out of much of its current Government stock portfolio, making the cross-holdings with the GSF much smaller.
Explanation of Key Fiscal Indicators
Total revenue and expenses—effects of line-by-line consolidation
Total revenue
Total revenue
| | 2001
Actual
| | 2002
Forecast
| | 2003
Forecast
| | 2004
Forecast
| | 2005
Forecast
| | 2006
Forecast
| |
|---|
| | (% of GDP)
| |
|---|
| Current presentation | | 34.6 | % | 34.2 | % | 34.4 | % | 34.4 | % | 34.5 | % | 34.4 | % |
| Future presentation of Core Crown | | 33.3 | % | 32.9 | % | 33.1 | % | 33.0 | % | 33.1 | % | 33.1 | % |
| Future presentation of Total Crown | | 40.9 | % | 42.5 | % | 43.3 | % | 43.3 | % | 43.4 | % | 43.2 | % |
Total expenses
Total revenue
| | 2001
Actual
| | 2002
Forecast
| | 2003
Forecast
| | 2004
Forecast
| | 2005
Forecast
| | 2006
Forecast
| |
|---|
| | (% of GDP)
| |
|---|
| Current presentation | | 33.5 | % | 32.5 | % | 33.0 | % | 32.7 | % | 32.4 | % | 32.3 | % |
| Future presentation of Core Crown | | 32.2 | % | 31.2 | % | 31.7 | % | 31.4 | % | 31.0 | % | 30.9 | % |
| Future presentation of Total Crown | | 39.7 | % | 40.3 | % | 41.4 | % | 41.0 | % | 40.5 | % | 40.3 | % |
Over the forest period, the revenue-to-GDP ratio is reasonably stable, while the expense-to-GDP ratio is slowly declining. These trends are not changed (from 2003/04 onwards) as a result of the change to line-by-line consolidation, although there is a level change to the relevant indicators:
- •
- The "core Crown" revenues and expenses decrease around 1.3% from the current presentation, mainly reflecting the removal of GST from Crown revenues.
- •
- The "total Crown" revenues increase by around 10.2% on average, and "total Crown" expenses increase by around 9.4% on average. These increases reflect the inclusion of expenses of SOEs and Crown entities funded from sources (ie, revenue) other than Crown funding, less internal flows between the entities consolidated. The majority of the increase is due to the revenues/expenses of SOEs, ACC and the education sector. The level shift between from 2000/01 and 2001/02 forward is due mainly to the inclusion of Air New Zealand from 1 January 2002.
Because of the nature of the SOEs (including Air New Zealand) and those Crown entities that generate their own revenue (for example ACC levies, housing rentals, New Zealand Lotteries Commission sales, CRIs, tertiary fees, etc), the nominal revenue growth broadly mirrors the nominal GDP growth. As such the revenue-to-GDP trend of the total Crown is driven mainly from the trend in "core Crown" revenue forecasts.
The inclusion of SOE and Crown entity expenses does not represent an increase in government spending. It is simply the effect of fully recognising the underlying entities' expenses (and revenue) rather than including only their net results.
Tax revenue—effects of line-by-line consolidation
Taxation and total sovereign revenue
| | 2001
Actual
| | 2002
Forecast
| | 2003
Forecast
| | 2004
Forecast
| | 2005
Forecast
| | 2006
Forecast
| |
|---|
| | (% of GDP)
| |
|---|
| Taxation revenue | | | | | | | | | | | | | |
| Current presentation | | 32.2 | % | 31.9 | % | 32.1 | % | 32.1 | % | 32.1 | % | 31.9 | % |
| Future presentation of Core Crown | | 30.7 | % | 30.3 | % | 30.5 | % | 30.4 | % | 30.4 | % | 30.2 | % |
| Future presentation of Total Crown | | 30.4 | % | 30.1 | % | 30.3 | % | 30.1 | % | 30.1 | % | 29.9 | % |
| Total sovereign revenue (taxation plus other fees, fines and levies) | | | | | | | | | | | | | |
| Current presentation | | 32.5 | % | 32.3 | % | 32.5 | % | 32.4 | % | 32.4 | % | 32.2 | % |
| Future presentation of Total Crown | | 32.4 | % | 32.2 | % | 32.3 | % | 32.1 | % | 32.0 | % | 31.8 | % |
Two tax types are affected by line-by-line consolidation: GST and net company tax:
- •
- The Government, via departments, SOEs and Crown entities, pays a significant amount of GST to itself, so all of this is now eliminated. This accounts for the decrease between the current presentation and the new "core Crown".
- •
- Company income tax paid by SOEs and several Crown entities is eliminated at the "total Crown" level and accounts for the decrease in the tax-to-GDP track between "core Crown" and "total Crown".
If total sovereign revenue is considered (that is, tax revenue plus other sovereign-generated fees, fines and levies such as ACC levies), then the change between the current presentation and full consolidation is minimal. This is because the removal of GST, and SOE and Crown entity company income tax is broadly offset by the inclusion of Crown entity levies (eg, ACC levies, Fire Service levies, etc).
SOE and Crown entity surpluses—effects of line-by-line consolidation
Gross SOE and Crown entity surpluses
| | 2001
Actual
| | 2002
Forecast
| | 2003
Forecast
| | 2004
Forecast
| | 2005
Forecast
| | 2006
Forecast
| |
|---|
| | ($ million)
| |
|---|
| Current presentation | | | | | | | | | | | | | |
| Gross surplus of SOEs and Crown entities | | 424 | | 1,015 | | 984 | | 1,284 | | 1,408 | | 1,560 | |
| Less dividends | | (321 | ) | (403 | ) | (461 | ) | (363 | ) | (323 | ) | (351 | ) |
| | |
| |
| |
| |
| |
| |
| |
| Net surplus of SOEs and Crown entities | | 103 | | 612 | | 523 | | 921 | | 1,085 | | 1,209 | |
| | |
| |
| |
| |
| |
| |
| |
| Future presentation | | | | | | | | | | | | | |
| Gross revenues | | 20,164 | | 25,084 | | 26,859 | | 28,104 | | 28,971 | | 29,845 | |
| Gross expenses | | 19,740 | | 24,069 | | 25,875 | | 26,820 | | 27,563 | | 28,285 | |
| | |
| |
| |
| |
| |
| |
| |
| Gross surplus of SOEs and Crown entities | | 424 | | 1,015 | | 984 | | 1,284 | | 1,408 | | 1,560 | |
| | |
| |
| |
| |
| |
| |
| |
Bringing SOEs and Crown entities fully into the Crown's accounts is the biggest change under line-by-line consolidation. Their actual revenues and expenses replace the net surpluses of SOEs and Crown entities. This has no effect on the overall operating balance since the removal of the net surpluses from the accounts is matched by the changes to revenue and expenses.
The revenues and expenses of SOEs and Crown entities include revenue received in the form of Crown funding. The two largest sectors that receive Crown funding are the health and education sectors. The growth in revenues and expenses of SOEs and Crown entities reflects both the growth due to the nominal economy and increased funding provided by the core Crown to Crown entities (reflected in core Crown expense growth).
Net worth and debt—effects of line-by-line consolidation
The components of the balance sheet under line-by-line consolidation do change significantly, though there is no overall change to net worth as assets and liabilities increase by equal amounts.
Key indicators in terms of change from the existing presentation are shown in the following table:
Key balance sheet indicators
| | 2001
Actual
| | 2002
Forecast
| | 2003
Forecast
| | 2004
Forecast
| | 2005
Forecast
| | 2006
Forecast
| |
|---|
| | (% of GDP)
| |
|---|
| Gross debt | | | | | | | | | | | | | |
| Current presentation | | 32.2 | % | 30.2 | % | 28.6 | % | 29.2 | % | 28.8 | % | 28.4 | % |
| Future presentation of Core Crown | | 29.6 | % | 28.9 | % | 28.4 | % | 29.0 | % | 28.6 | % | 28.2 | % |
| Future presentation of Total Crown | | 30.4 | % | 31.3 | % | 30.5 | % | 30.2 | % | 29.4 | % | 28.3 | % |
| Gross sovereign-issued debt (no change) | | 32.2 | % | 30.2 | % | 28.6 | % | 29.2 | % | 28.8 | % | 28.4 | % |
| Net Crown debt | | | | | | | | | | | | | |
| Current presentation | | 17.5 | % | 16.8 | % | 16.8 | % | 16.8 | % | 16.2 | % | 15.5 | % |
| Future presentation | | 14.9 | % | 15.5 | % | 16.5 | % | 16.6 | % | 16.0 | % | 15.3 | % |
| Net worth (no change) | | 10.0 | % | 11.8 | % | 13.2 | % | 14.9 | % | 17.2 | % | 19.4 | % |
Broadly, there is currently little change in the presented debt results. This reflects the current debt positions and cross-holdings of Government stock:
- •
- The new core Crown debt indicator changes because of the impact of the GSF. Even though the assets of the GSF are excluded from net debt (for the same reasons as the assets of the NZS Fund, ie, restricted in their purpose) the removal of cross-holdings of Government stock impacts on the level of gross debt. This impact is muted across the forecast period as the GSF diversifies
out of Government stock (resulting in a smaller adjustment across the latter half of the forecast period).
- •
- Total Crown debt indicators are impacted by the inclusion of the financial assets and debt of SOEs and Crown entities less internal-cross holdings.
- •
- Gross sovereign-issued debt is an indicator that does not eliminate cross-holdings of Government stock and so is the same amount irrespective of consolidation approach.
- •
- Net worth does not alter between the current presentation and fully consolidated Crown presentation.
4
Risks and Scenarios
Introduction
As with any economic forecasts, there are a number of risks surrounding the Central Forecast. If some of the risks eventuate, the actual growth path of the economy is likely to differ from the Central Forecast.
The first part of this chapter discusses the main areas of risk that we see around the Central Forecast. The second section of the chapter discusses two alternative paths for the economy under different judgements from the Central Forecast. The scenarios are two of a number of possible examples, and do not represent upper or lower bounds for the Central Forecast. More extreme paths are certainly possible. The actual magnitude of the difference from the Central Forecast or any given alternative scenario depends on uncertain alternative assumptions.
Economic Risks
The Central Forecast is determined by balancing both the upside and downside risks facing the economy, to provide our best assessment of the way the economy is likely to evolve. Some of the key judgements we have applied may evolve differently, resulting in the economy deviating from the Central Forecast.
In forming the Central Forecast we have assumed that the "non-economic" factors driving sentiment following the events of 11 September have largely dissipated, and any possible future international political or military tensions will not have any material effect on the global economic recovery. This is not to say that the risks surrounding the external environment have largely disappeared. The cyclical risks around the pace of the recovery in the global economy were discussed in the Economic Outlook chapter.
Over the medium term the global economy could also develop differently from that underpinning our Central Forecast. The key downside risks have been canvassed in recent editions of the IMF World Economic Outlook, and include: the US current account deficit and its counterpart surpluses elsewhere; the apparent overvaluation of the US dollar and undervaluation of the Euro; the extent of optimism built into equity prices; and the structural issues facing the Japanese economy. On the other hand, current medium-term Consensus Forecasts tend to build in lower trend growth for key economies like the US than they have experienced over the recent past. Recent strong productivity figures in the US tend to lend support to the view that the average growth recorded in the second half of the 1990s may be more realistic, and represents more of a trend shift than may have been thought midway through last year. How these issues develop, will form an important backdrop for the New Zealand economic outlook over the medium term, and certainly for the drivers of growth.
With the risks around the external environment now more balanced than previously, many of the key risks to the Central Forecast look to be around the domestic sector, particularly in household spending.
As discussed in the Economic Outlook chapter, the domestic economy has over the recent past been more buoyant than expected. This has been driven by a quick recovery in consumer confidence, strong employment and farm income growth, the large net migration inflow, and stimulatory monetary conditions. Assessments of the relative contribution to household spending emanating from each of these drivers are amongst the key judgements for this set of forecasts.
The household spending path in the Central Forecast is predicated on solid income growth over the medium term, monetary conditions that are around neutral on average, sustained but diminishing net migration inflows, and a willingness to take on more debt, albeit at a more gradual pace than during the early 1990s. If developments in these areas evolve differently, then household spending patterns are also likely to differ, perhaps markedly:
- •
- A greater willingness to take on debt, perhaps as a result of faster than expected growth in house and other asset prices, would likely see household spending growing more strongly for longer.
- •
- Households may respond more to the forecast slowdown in disposable income, cutting back their spending and investment in housing in order to maintain their current financial position, perhaps prompted by rising interest rates and higher petrol prices.
Developments such as these could see the economy develop quite differently from that outlined in the Central Forecast.
The size of the turnaround in net migration has been one of the key differences between the December Update and this Budget Update. This highlights the risk looking forward. Migration flows have historically been volatile, and there is a risk that the upswing in net migration inflows may unwind faster than expected. The implications of an unexpected reversal in net migration would be to reduce domestic demand and subtract from labour supply. However, there are also potential upside risks to the migration judgement, including the current net migration inflows persisting for longer periods, or that the demand impacts from migration have been underestimated in the Central Forecast. These upsides could see the current strength in domestic demand persisting for longer or even accelerate in the short term.
The Central Forecast assumes normal growing seasons throughout the forecast period, which sees agricultural production driven by livestock numbers and productivity improvements. Variability in climatic conditions, and the effect of these fluctuations on agricultural production, has been a significant influence on economic growth in recent years. Less favourable climatic conditions, such as those experienced in the late 1990s, would pose downside risks to the Central Forecast. There is growing evidence of an El Nino weather pattern emerging, although it is still too early to predict whether drought conditions will appear. Similar risks of droughts were being aired this time last year. Should drought materialise for this coming growing season, lower agricultural production could occur at the same time as export prices are declining, the reverse of the experience of the past few years. This would further reduce farm incomes, affect rural confidence, and potentially flow through to other parts of the economy.
Economic Scenarios
The following scenarios present two possible growth paths for the economy if some of the key judgements underlying the Central Forecast evolve differently. Both scenarios are based on changes to the demand side of the economy, and assume that the world economy evolves as expected in the Central Forecast. The first scenario assumes stronger domestic demand than is assumed in the Central Forecast. The second scenario assumes less resilient domestic demand over the remainder of the year with lower consumption growth and residential investment.
Table 4.1—Alternative scenarios: summary
| | 2000/01
Actual
| | 2001/02
Forecast
| | 2002/03
Forecast
| | 2003/04
Forecast
| | 2004/05
Forecast
| | 2005/06
Forecast
|
|---|
Production GDP (annual
average % change, March years) | | | | | | | | | | | | |
| Central Forecast | | 2.7 | | 3.1 | | 3.1 | | 3.0 | | 2.9 | | 2.8 |
| Stronger Domestic Demand | | 2.7 | | 3.1 | | 3.5 | | 3.3 | | 2.6 | | 2.7 |
| Less Resilient Domestic Demand | | 2.7 | | 3.1 | | 2.7 | | 2.3 | | 3.3 | | 2.8 |
Nominal expenditure GDP (annual average % change, March years) |
|
|
|
|
|
|
|
|
|
|
|
|
| Central Forecast | | 5.8 | | 6.6 | | 3.7 | | 5.0 | | 4.6 | | 4.3 |
| Stronger Domestic Demand | | 5.8 | | 6.6 | | 4.1 | | 5.7 | | 4.8 | | 4.4 |
| Less Resilient Domestic Demand | | 5.8 | | 6.5 | | 3.2 | | 3.9 | | 4.2 | | 3.8 |
Operating balance ($ billion, June years) |
|
|
|
|
|
|
|
|
|
|
|
|
| Central Forecast | | 1.4 | | 2.6 | | 2.3 | | 3.1 | | 3.9 | | 4.2 |
| Stronger Domestic Demand | | 1.4 | | 2.7 | | 2.6 | | 3.7 | | 4.7 | | 5.1 |
| Less Resilient Domestic Demand | | 1.4 | | 2.6 | | 2.1 | | 2.4 | | 3.0 | | 3.0 |
Sources: Statistics New Zealand, The Treasury
Stronger Domestic Demand
This scenario presents a possible growth path for the economy where private consumption and residential investment hold up through 2002/03 by more than anticipated in the Central Forecast, and where the turnaround in net migration adds less to productive capacity. In some ways, this mirrors the experience over recent quarters. Under this scenario, GDP growth accelerates to 3.5% in 2002/03 compared with 3.1% in the Central Forecast. However, with the economy growing materially above capacity, inflationary pressures quickly build up and monetary conditions are tightened to keep inflation within the target band. This leads to slower growth in the following years.
Table 4.2—Stronger Domestic Demand
| | 2000/01
Actual
| | 2001/02
Forecast
| | 2002/03
Forecast
| | 2003/04
Forecast
| | 2004/05
Forecast
| | 2005/06
Forecast
| |
|---|
(Annual average % change,
March years) | | | | | | | | | | | | | |
| Private consumption | | 1.6 | | 2.8 | | 3.7 | | 3.0 | | 1.7 | | 2.2 | |
| Residential investment | | (15.9 | ) | 6.8 | | 20.4 | | (4.3 | ) | 1.4 | | 3.5 | |
| Gross national expenditure | | 0.2 | | 3.4 | | 4.0 | | 3.7 | | 2.1 | | 2.2 | |
| Exports of goods and services | | 6.8 | | 1.8 | | 6.8 | | 6.4 | | 5.4 | | 4.1 | |
| Imports of goods and services | | 0.4 | | 3.5 | | 7.1 | | 7.7 | | 4.2 | | 3.0 | |
| | |
| |
| |
| |
| |
| |
| |
| GDP (production measure) | | 2.7 | | 3.1 | | 3.5 | | 3.3 | | 2.6 | | 2.7 | |
| | |
| |
| |
| |
| |
| |
| |
| Unemployment rate1 | | 5.4 | | 5.4 | | 5.1 | | 4.7 | | 4.8 | | 4.9 | |
| 90-day rate2 | | 6.4 | | 5.0 | | 6.7 | | 6.3 | | 6.2 | | 6.0 | |
| TWI2 | | 50.5 | | 51.6 | | 53.6 | | 53.0 | | 53.1 | | 53.6 | |
| CPI3 | | 3.1 | | 2.6 | | 2.5 | | 2.1 | | 2.0 | | 1.6 | |
| Current account balance (% GDP) | | (4.8 | ) | (3.2 | ) | (4.7 | ) | (5.5 | ) | (4.6 | ) | (3.7 | ) |
| Nominal GDP (expenditure measure) | | 5.8 | | 6.6 | | 4.1 | | 5.7 | | 4.8 | | 4.4 | |
Sources: Statistics New Zealand, Datastream, The Treasury
- Notes
- 1
- Percentage of labour force, March quarter, seasonally adjusted.
- 2
- Average for March quarter.
- 3
- Annual percentage change, March quarter.
Strong income growth and declining interest rates together with relatively low unemployment rates provided a favourable environment for household spending in the 2001/02 year. Under the Stronger Domestic Demand scenario, the current momentum in domestic demand accelerates into 2002/03. There are various reasons for domestic demand to be stronger than the Central Forecast. A greater willingness by households to take on more debt to fund consumption and residential investment would have the effect of stronger near-term demand. In addition, the demand impacts from the current net migration inflows could be greater than assumed in the Central Forecast, with most of the additional demand for consumption and housing being met by stronger migrant transfer inflows.
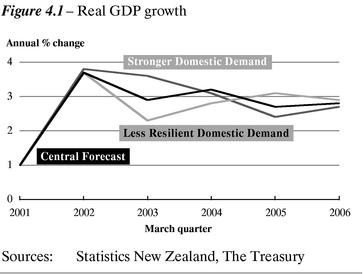
The stronger near-term domestic demand results in consumption growth increasing to 3.7% in 2002/03 and residential investment growth rising to 20.4%. With the economy already operating at close to capacity in 2001/02, and migration not adding as much to capacity as in the Central Forecast, the bigger acceleration in domestic demand cannot be met out of spare capacity. As a result inflationary pressures build. Real GDP growth reaches 3.5% in 2002/03, compared with 3.1% in the Central Forecast, and CPI inflation reaches 2.5% in 2002/03. The unemployment rate falls to 5.1% in 2002/03, creating upward pressure on wages. The current account deficit worsens relative to the Central Forecast to -4.7% of GDP, as the strong consumption growth feeds through into higher imports.
The Reserve Bank is assumed to respond by tightening monetary conditions, and moving beyond neutral in an attempt to bring inflation down. Ninety-day bill rates reach 6.7% in 2002/03, causing a slowdown in consumption spending as household debt servicing costs increase and residential investment slumps. Consumption growth eases to 3.0% in 2003/04 and slows to 1.7% in 2004/05. Residential investment contracts by 4.3% in 2003/04.
Nominal GDP is consistently higher relative to the Central Forecast owing to the combined effect of higher output and inflation. The difference in nominal GDP increases throughout the forecast period from $0.6 billion greater than the Central Forecast in 2002/03 to $2.0 billion greater in 2005/06.
Less Resilient Domestic Demand
In this alternative scenario, domestic demand growth loses momentum more quickly with lower consumption, residential investment and employment growth in the near term compared with the Central Forecast. Under this scenario, GDP growth slows to 2.7% in 2002/03 and 2.3% in 2003/04. Growth recovers to 3.3% in 2004/05 as monetary conditions remain stimulatory for longer.
Table 4.3—Less Resilient Domestic Demand
| | 2000/01
Actual
| | 2001/02
Forecast
| | 2002/03
Forecast
| | 2003/04
Forecast
| | 2004/05
Forecast
| | 2005/06
Forecast
| |
|---|
(Annual average % change,
March years) | | | | | | | | | | | | | |
| Private consumption | | 1.6 | | 2.8 | | 2.2 | | 1.4 | | 3.2 | | 3.2 | |
| Residential investment | | (15.9 | ) | 6.6 | | 15.6 | | (8.3 | ) | 5.7 | | 5.2 | |
| Gross national expenditure | | 0.2 | | 3.3 | | 2.9 | | 2.2 | | 3.5 | | 3.0 | |
| Exports of goods and services | | 6.8 | | 1.8 | | 6.6 | | 6.1 | | 3.9 | | 3.6 | |
| Imports of goods and services | | 0.4 | | 3.5 | | 5.8 | | 5.8 | | 4.9 | | 4.5 | |
| | |
| |
| |
| |
| |
| |
| |
| GDP (production measure) | | 2.7 | | 3.1 | | 2.7 | | 2.3 | | 3.3 | | 2.8 | |
| | |
| |
| |
| |
| |
| |
| |
| Unemployment rate1 | | 5.4 | | 5.4 | | 5.4 | | 6.0 | | 6.0 | | 5.9 | |
| 90-day rate2 | | 6.4 | | 5.0 | | 4.8 | | 4.8 | | 5.1 | | 5.3 | |
| TWI2 | | 50.5 | | 51.6 | | 54.1 | | 55.5 | | 56.6 | | 56.8 | |
| CPI3 | | 3.1 | | 2.6 | | 2.2 | | 0.9 | | 1.1 | | 1.1 | |
| Current account balance (% GDP) | | (4.8 | ) | (3.2 | ) | (4.4 | ) | (4.5 | ) | (4.4 | ) | (4.3 | ) |
| Nominal GDP (expenditure measure) | | 5.8 | | 6.5 | | 3.2 | | 3.9 | | 4.2 | | 3.8 | |
Sources: Statistics New Zealand, Datastream, The Treasury
- 1
- Percentage of labour force, March quarter, seasonally adjusted.
- 2
- Average for March quarter.
- 3
- Annual percentage change, March quarter.
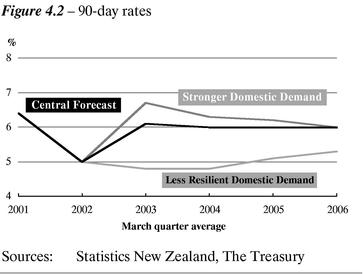
This scenario assumes that households respond more to the prospect of much lower growth in household income, particularly from the farming sector. Higher oil prices and the consequent effect of eroding household discretionary income also work in the same direction. With household debt levels at record highs relative to disposable income, households could be less willing to smooth their consumption or take on more debt. As this feeds into weaker consumption and residential investment growth, GDP growth slows compared with the Central Forecast. As a consequence, business investment and employment growth are also lower, resulting in higher unemployment rates throughout most of the forecast period compared with the Central Forecast, and exacerbating the slowdown in household incomes.
Overall, economic growth slows to 2.7% in 2002/03 and 2.3% in 2003/04, compared with 3.1% and 3.0% respectively in the Central Forecast. The unemployment rate rises to 6.0% in 2003/04 and wage growth eases throughout the forecast period. Consumption growth slows to 1.4% and residential investment contracts by 8.3% in 2003/04 as the slowdown in domestic demand reaches its trough.
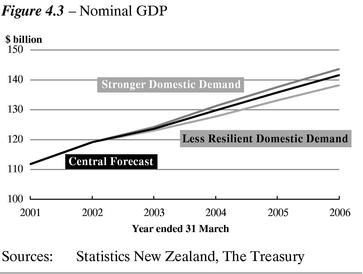
With the economy operating below potential, wage and inflationary pressures are reduced. CPI inflation drops to 0.9% in 2003/04 compared with 1.8% in the Central Forecast. The much more benign outlook for inflation causes the Reserve Bank to ease interest rates and maintain stimulatory monetary conditions for longer. The extended period of low interest rates eventually provides some relief for the domestic sector. Consumption and investment recover over the latter part of the forecast period, boosting GDP growth above that in the Central Forecast in 2004/05.
Weaker near-term consumption demand lowers import growth, resulting in a lower current account deficit over most of the forecast period relative to the Central Forecast.
Under this scenario, the nominal economy is around $0.6 billion smaller in 2002/03 owing to the combination of weaker growth and lower inflation compared with the Central Forecast. The gap in nominal GDP between this scenario and the Central Forecast widens to around $3.4 billion by 2005/06, driven by the sustained gap in CPI inflation.
Fiscal Scenarios
The main economic determinants of the fiscal position are:
- •
- nominal GDP—components of GDP are the main drivers of tax revenue
- •
- interest rates—higher interest rates increase revenue received from interest, but also increase finance costs paid on government borrowing. Changes in interest rates also affect the valuation of the GSF and ACC liabilities, which flow through the operating balance
- •
- the level of unemployment—an increase in the number of people unemployed will increase the number of unemployment beneficiaries and increase spending
- •
- CPI inflation—most benefits are indexed to CPI movements.
Table 4.4 shows the effects of the two scenarios on the operating balance and gross debt.
Table 4.4—Alternative scenarios: operating balance and gross Crown debt
(June years)
| | 2000/01
Actual
| | 2001/02
Forecast
| | 2002/03
Forecast
| | 2003/04
Forecast
| | 2004/05
Forecast
| | 2005/06
Forecast
|
|---|
| Operating Balance ($ billion) | | | | | | | | | | | | |
| Central Forecast | | 1.4 | | 2.6 | | 2.3 | | 3.1 | | 3.9 | | 4.2 |
| Stronger Domestic Demand | | 1.4 | | 2.7 | | 2.6 | | 3.7 | | 4.7 | | 5.1 |
| Less Resilient Domestic Demand | | 1.4 | | 2.6 | | 2.1 | | 2.4 | | 3.0 | | 3.0 |
Gross debt ($ billion) |
|
|
|
|
|
|
|
|
|
|
|
|
| Central Forecast | | 36.8 | | 36.3 | | 35.8 | | 38.4 | | 39.5 | | 40.7 |
| Stronger Domestic Demand | | 36.8 | | 36.3 | | 35.4 | | 37.4 | | 37.8 | | 38.1 |
| Less Resilient Domestic Demand | | 36.8 | | 36.3 | | 36.0 | | 39.3 | | 41.4 | | 43.8 |
% GDP June years |
|
|
|
|
|
|
|
|
|
|
|
|
| Operating Balance (%) | | | | | | | | | | | | |
| Central Forecast | | 1.2 | | 2.2 | | 1.8 | | 2.3 | | 2.9 | | 3.0 |
| Stronger Domestic Demand | | 1.2 | | 2.2 | | 2.1 | | 2.8 | | 3.4 | | 3.5 |
| Less Resilient Domestic Demand | | 1.2 | | 2.2 | | 1.7 | | 1.9 | | 2.2 | | 2.1 |
Gross debt (%) |
|
|
|
|
|
|
|
|
|
|
|
|
| Central Forecast | | 32.2 | | 30.2 | | 28.6 | | 29.2 | | 28.8 | | 28.4 |
| Stronger Domestic Demand | | 32.2 | | 30.1 | | 28.1 | | 28.2 | | 27.2 | | 26.3 |
| Less Resilient Domestic Demand | | 32.2 | | 30.2 | | 29.1 | | 30.4 | | 30.8 | | 31.4 |
Sources: Statistics New Zealand, The Treasury
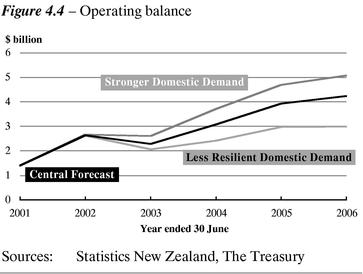
In the Stronger Domestic Demand scenario, the higher nominal GDP relative to the Central Forecast results in higher tax revenues. The higher CPI inflation increases benefit indexation costs, but the lower unemployment rate helps offset some of the increase. The higher interest rates through most of the forecast period compared with the Central Forecast increase the Government's financing costs.
Overall, the operating balance is higher under the Stronger Domestic Demand scenario than under the Central Forecast throughout the forecast period. At the end of the forecast period, the operating balance reaches $5.1 billion compared with $4.2 billion in the Central Forecast.
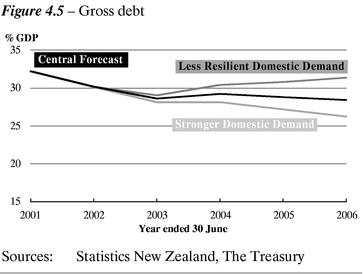
In the Less Resilient Domestic Demand scenario, the operating balance is lower than the Central Forecast throughout the forecast period. The lower nominal GDP leads to lower tax revenue, while the higher unemployment rate increases expenditure on benefits, although this is offset somewhat by a reduction in indexation costs owing to lower CPI inflation. Lower financing costs from the lower interest rates throughout the forecast period compared with the Central Forecast help offset some of the reduced tax revenue. At the end of the forecast period, the operating balance is $3 billion under the Less Resilient Domestic Demand scenario.
The changes in the operating balance impact on gross debt. In the Stronger Domestic Demand scenario, gross debt is 2.1% of GDP lower than in the Central Forecast by the end of the forecast period. Gross debt is 3% of GDP higher by the end of the forecast period in the Less Resilient Domestic Demand scenario than in the Central Forecast.
Fiscal Sensitivities
The scenarios above indicate the sensitivity of fiscal aggregates to changes in economic conditions. Table 4.5 provides some "rules of thumb" on the sensitivities of the fiscal position to changes in specific variables.
Table 4.5—Sensitivity analysis
| | 2002/03
Forecast
| | 2003/04
Forecast
| | 2004/05
Forecast
| | 2005/06
Forecast
| |
|---|
| | ($ million)
| |
|---|
| 1% higher nominal GDP growth per annum | | | | | | | | | |
| Tax Revenue | | 390 | | 810 | | 1,280 | | 1,770 | |
| Expenses (mainly debt servicing) | | (10 | ) | (60 | ) | (130 | ) | (210 | ) |
| | |
| |
| |
| |
| |
| Impact on the operating balance | | 400 | | 870 | | 1,410 | | 1,980 | |
| | |
| |
| |
| |
| |
| Revenue impact of a 1% increase in the growth rate of: | | | | | | | | | |
| Wages and salaries | | 170 | | 360 | | 570 | | 800 | |
| Taxable business profits | | 70 | | 170 | | 280 | | 390 | |
One percentage point lower interest rates |
|
|
|
|
|
|
|
|
|
| Interest income | | (20 | ) | (50 | ) | (50 | ) | (60 | ) |
| Expenses | | (100 | ) | (170 | ) | (240 | ) | (290 | ) |
| | |
| |
| |
| |
| |
| Impact on the operating balance | | 80 | | 120 | | 190 | | 230 | |
| | |
| |
| |
| |
| |
| One percentage point lower real interest rates | | | | | | | | | |
| ACC liability (SOE and Crown entity surpluses) | | (500 | ) | — | | — | | — | |
| GSF liability (expenses) | | (1,700 | ) | — | | — | | — | |
| | |
| |
| |
| |
| |
| Impact on the operating balance | | (2,200 | ) | — | | — | | — | |
| | |
| |
| |
| |
| |
Source: The Treasury
5
Specific Fiscal Risks
Introduction
This chapter describes the specific fiscal risks of the Crown, including contingent liabilities and other specific fiscal risks. The risks are disclosed as either quantifiable or unquantifiable, depending on their characteristics. Only contingent liabilities and other specific fiscal risks involving amounts of $10 million or more in any one year are separately disclosed. Contingent liabilities below $10 million are included in the "other quantifiable contingent liabilities" total. Comparatives have been adjusted where appropriate to align with the disclosure of new "material" contingent liabilities. The total amount of contingent liabilities remains unchanged.
Contingent Liabilities
Contingent liabilities are costs that the Crown will have to face if a particular event occurs. Typically, contingent liabilities consist of guarantees and indemnities, legal disputes and claims, and uncalled capital. The contingent liabilities facing the Crown are a mixture of operating and balance sheet risks, and they can vary greatly in magnitude and likelihood of realisation. In general, if a contingent liability were realised it would reduce the operating balance and net worth, and increase net Crown debt. However, in the case of contingencies for uncalled capital, the negative impact would be restricted to net Crown debt.
Where contingent liabilities have arisen as a consequence of legal action being taken against the Crown, the amount shown is the amount claimed and thus the maximum potential cost. It does not represent either an admission that the claim is valid or an estimation of the possible amount of any award against the Crown.
Contingent liabilities have been stated as at 31 March 2002, being the last set of published contingent liabilities.
Quantifiable Contingent Liabilities
| | Status21
| | ($ million)
|
|---|
| Guarantees and indemnities | | | | |
| Cook Islands—Asian Development Bank loans | | Changed | | 24 |
| Huntly East mine subsidence | | Unchanged | | 22 |
| Ministry of Transport—funding guarantee | | Unchanged | | 10 |
| Post Office Bank—guaranteed deposits | | Changed | | 15 |
| Guarantees and indemnities of state-owned enterprises and Crown entities | | Changed | | 258 |
| Other guarantees and indemnities | | Changed | | 58 |
| | | | |
|
| | | | | 387 |
| Uncalled capital | | | | |
| Asian Development Bank | | Changed | | 1,428 |
| European Bank for Reconstruction and Development | | Changed | | 14 |
| International Bank for Reconstruction and Development | | Changed | | 1,863 |
| | | | |
|
| | | | | 3,305 |
| Legal proceedings and disputes | | | | |
| Agriculture and Forestry—legal claims | | Unchanged | | 19 |
| Education—legal claims | | Unchanged | | 16 |
| Health—legal claims | | Changed | | 121 |
| Maori Development—Maori Reserved Land | | Unchanged | | 94 |
| New Zealand Defence Force—legal claims | | Unchanged | | 10 |
| Police—legal claims | | Unchanged | | 49 |
| Tax in dispute | | Changed | | 67 |
| Other legal claims | | Changed | | 103 |
| | | | |
|
| | | | | 479 |
| Other quantifiable contingent liabilities | | | | |
| International finance organisations | | Changed | | 1,626 |
| Reserve Bank—demonetised currency | | Unchanged | | 25 |
| Other quantifiable contingent liabilities | | Changed | | 126 |
| | | | |
|
| | | | | 1,777 |
| | | | |
|
| Total quantifiable contingent liabilities | | | | 5,948 |
| | | | |
|
- 21
- Relative to reporting in the 31 December 2001 Crown financial statements.
Unquantified Contingent Liabilities
| | Status
|
|---|
| Institutional guarantees | | |
| Commerce Commission—indemnity for damages | | Unchanged |
| District Court Judges, Justices of the Peace, Coroners and Disputes Tribunal | | Unchanged |
| Earthquake Commission | | Unchanged |
| Fletcher Challenge Limited | | Unchanged |
| Ministry of Fisheries—indemnity provided for delivery of registry services | | Unchanged |
| National Provident Fund | | Unchanged |
| Persons exercising investigating powers | | Unchanged |
| Public Trust | | Changed |
| Reserve Bank of New Zealand | | Unchanged |
Other unquantified contingent liabilities |
|
|
| Accident Compensation Corporation | | Unchanged |
| Air New Zealand | | New |
| Bank of New Zealand | | Unchanged |
| Contaminated sites | | Unchanged |
| Crown research institutes | | Unchanged |
| DFC New Zealand Limited (under statutory management) | | Unchanged |
| District health boards | | Unchanged |
| Education—legal claim | | New |
| Electricity Corporation of New Zealand Limited | | Unchanged |
| Housing New Zealand Corporation | | Unchanged |
| Indemnities against acts of war and terrorism | | Changed |
| Maui Gas Partners | | New |
| New Zealand Railways Corporation | | New |
| Pharmaceutical Management Agency Limited—indemnity | | Unchanged |
| Purchasers of Crown operations | | Unchanged |
| Sale of Crown assets | | Unchanged |
| Tax liabilities | | Changed |
| Treaty of Waitangi claims | | Unchanged |
| Treaty of Waitangi claims—settlement relativity payments | | Unchanged |
| Works Civil Construction | | Unchanged |
| Works Consultancy Services | | Unchanged |
Quantifiable Contingent Liabilities
Guarantees and indemnities
Cook Islands—Asian Development Bank (ADB) Loans
Before 1992, the New Zealand Government guaranteed the Cook Islands' borrowing from the ADB. These guarantees have first call on New Zealand's Official Development Assistance to the Cook Islands.
$24 million at 31 March 2002 ($25 million at 31 December 2001).
Huntly East mine subsidence
Claims from private landowners concerning property damage or loss of value.
$22 million at 31 March 2002 ($22 million at 31 December 2001).
Ministry of Transport—funding guarantee
The Minister of Finance has issued a guarantee of $10 million to the Transport Accident Investigation Commission. The guarantee allows the Commission to assure payment to suppliers of specialist salvage equipment in the event of the Commission initiating an urgent investigation of any future significant transport accident.
$10 million at 31 March 2002 ($10 million at 31 December 2001).
Post Office Bank (PostBank)—guaranteed deposits
In the sale of PostBank to ANZ Banking Group Limited (ANZ), the Crown agreed to continue its guarantee, under the Post Office Bank Act 1987, for certain PostBank deposits lodged with the Bank before 1 July 1988. ANZ agreed to indemnify the Crown for the cost of any liability that may arise from the Crown guarantee. The amount guaranteed reduces as deposits mature.
$15 million at 31 March 2002 ($16 million at 31 December 2001).
Guarantees and indemnities of state-owned enterprises and Crown entities
$258 million at 31 March 2002 ($266 million at 31 December 2001).
Other guarantees and indemnities
$58 million at 31 March 2002 ($61 million at 31 December 2001).
Uncalled capital
The Crown's uncalled capital subscriptions are as follows:
| | Uncalled
capital at
31 March 2002
| | Uncalled
capital at
31 December 2001
|
|---|
| | ($ million)
|
|---|
| Asian Development Bank | | 1,428 | | 1,514 |
| European Bank for Reconstruction and Development | | 14 | | 15 |
| International Bank for Reconstruction and Development | | 1,863 | | 1,975 |
Legal proceedings and disputes
The amounts under quantifiable contingent liabilities for legal proceedings and disputes are shown exclusive of any interest and costs that may be claimed if these cases were decided against the Crown.
Where contingent liabilities have arisen as a consequence of legal action being taken against the Crown, the amount shown is the amount claimed and thus the maximum potential cost. It does not represent either an admission that the claim is valid or an estimation of the possible amount of any award against the Crown.
Agriculture and Forestry—legal claims
Claims against the Ministry of Agriculture and Forestry for alleged legal or administrative faults.
$19 million at 31 March 2002 ($19 million at 31 December 2001).
Education—legal claims
Claims against the Crown in respect of the reduction of tuition subsidies to the Otago University School of Dentistry. On 26 April 2002 the High Court issued its judgment, which ruled that the Crown's decision to reduce dental subsidies was ultra vires, invalid and of no effect. The Crown is considering its response to this judgment.
$16 million at 31 March 2002 ($16 million at 31 December 2001).
Health—legal claims
Claims against the Crown in respect of people allegedly contracting hepatitis C through contaminated blood and blood products, claims arising from the Gisborne inquiry, and claims relating to the cervical screening inquiry.
$121 million at 31 March 2002 ($124 million at 31 December 2001).
Maori Development—Maori Reserved Land
The Maori Reserved Land Amendment Act 1997 provides for compensation to lessees for the move to market rents for land, for shorter review periods and for additional transaction costs. In addition, Schedule 5 to the Act recognises that Maori have not been obtaining fair market rents for their land and that this issue will be dealt with by the Government as part of its consideration of historical grievances. Since 31 March 2002 negotiations have been completed and the Crown has agreed to settlement and has included this amount in the forecasts.
$94 million at 31 March 2002 ($94 million at 31 December 2001).
New Zealand Defence Force—legal claims
Claims against the New Zealand Defence Force for alleged legal or administrative faults.
$10 million at 31 March 2002 ($10 million at 31 December 2001).
Police—legal claims
Claims against the Police for alleged legal or administrative faults.
$49 million at 31 March 2002 ($49 million at 31 December 2001).
Tax in dispute
Represents 50% of the outstanding debt of those tax assessments raised, against which an objection has been lodged and legal action is proceeding.
$67 million at 31 March 2002 ($68 million at 31 December 2001).
Other legal claims
$103 million at 31 March 2002 ($87 million at 31 December 2001).
Other quantifiable contingent liabilities
International finance organisations
The Crown has lodged promissory notes with the following international finance organisation:
| | 31 March
2002
| | 31 December
2001
|
|---|
| | ($ million)
|
|---|
| International Monetary Fund | | 1,626 | | 1,788 |
Payment of the notes depends upon the operation of the rules of the organisation.
Reserve Bank—demonetised currency
The Crown has a contingent liability for the face value of the demonetised $1 and $2 notes issued which have yet to be repatriated.
$25 million at 31 March 2002 ($25 million at 31 December 2001).
Other quantifiable contingent liabilities
$126 million at 31 March 2002 ($96 million at 31 December 2001).
Unquantifiable Contingent Liabilities
This part of the Statement provides details of those contingent liabilities of the Crown which cannot be quantified.
Institutional guarantees
The following institutional guarantees have been provided through legislation.
Commerce Commission—indemnity for damages
Under a Deed of Indemnity dated 12 November 1991, the Minister of Finance agreed to indemnify the Commission when it gives an undertaking as to damages when seeking injunctions under the Fair Trading and Commerce Acts, and subsequently the Court orders the Commission to pay damages. The sum payable under this Deed is limited to an amount up to $40 million per case taken to Court. The Commerce Act was amended with effect from 26 May 2001, to remove the need for the Commission to provide such undertakings.
District Court Judges, Justices of the Peace, Coroners and Dispute Tribunals
Section 119 of the District Courts Act 1947 indemnifies District Court Judges acting in their civil jurisdiction. Section 196A of the Summary Proceedings Act 1957 also indemnifies District Court Judges for any liabilities arising as a result of an act done by a Judge in excess of, or without, jurisdiction.
Section 35 of the Coroners Act 1988 confers on Coroners acting within the Coroner Act 1988 the same privileges and immunities as District Court Judges under the Summary Proceedings Act 1957.
Under section 197 of the Summary Proceedings Act 1957, Justices of the Peace are similarly covered as long as a High Court Judge certifies that they have acted in good faith and ought to be indemnified.
Section 58 of the Disputes Tribunal Act 1988 confers on Disputes Tribunal referees acting within the Disputes Tribunal Act 1988 the same protection as Justices of the Peace under the Summary Proceedings Act 1957.
Earthquake Commission
The Crown is liable to meet any deficiency in the Earthquake Commission's assets in meeting the Commission's financial liabilities (section 16 of the Earthquake Commission Act 1993).
Fletcher Challenge Limited (FCL)
Under the Sale and Purchase Agreement with FCL for the sale of the Forestry Corporation of New Zealand Limited, the Crown has indemnified FCL for the costs of cleaning up environmental contamination. In respect of on-site environmental costs and losses incurred up to settlement date (27 September 1996), FCL will pay the first $30 million of any clean-up and half of the next $20 million. The Crown will pay for half of any cost over $30 million and for all costs over $50 million. The on-site indemnity runs until 1 January 2020.
The Crown has also indemnified FCL in respect of off-site environmental costs and losses incurred up until settlement date. The off-site indemnity is unlimited as to amount and time.
Ministry of Fisheries—indemnity provided for delivery of registry services
The Crown has indemnified Commercial Fisheries Services Limited against claims made by third parties arising from Commercial Fisheries Services undertaking registry services under contract to the Chief Executive of the Ministry of Fisheries. This indemnity, provided under the Fisheries Acts 1983 and 1996, expires on 30 October 2006 unless varied, in which case it will expire on 30 September 2008.
National Provident Fund
The Crown guarantees the benefits payable by all National Provident Fund Board schemes (section 60 of the National Provident Fund Restructuring Act 1990). The Crown also guarantees investments and interest thereon deposited with the National Provident Fund Board prior to 1 April 1991 (section 61 of the same Act).
A provision has been made in these financial statements in respect of the actuarially assessed deficit in the DBP (Annuitants') Scheme (refer Note 11 of the financial statements).
Persons exercising investigating powers
Section 63 of the Corporations (Investigation and Management) Act 1989 indemnifies the Securities Commission, the Registrar and Deputy Registrar of Companies, members of advising committees within the Act, every statutory manager of a corporation, and persons appointed pursuant to sections 17 to 19 of the Act, in the exercise of investigating powers, unless the power has been exercised in bad faith.
Public Trust
The Crown is liable to meet any deficiency in the Public Trust's Common Fund (section 52 of the Public Trust Act 2001).
Reserve Bank of New Zealand (the Reserve Bank)
Under section 146 of the Reserve Bank of New Zealand Act 1989, every statutory manager of a Registered Bank, every person appointed under section 99 or section 101 of the Act and every member of an advisory committee, shall be indemnified by the Crown in respect of any liability arising from the exercise, purported exercise or omission to exercise of any power conferred by Part V of the Act, unless that power has been exercised in bad faith.
The Crown pays to the Reserve Bank any exchange losses incurred by the Reserve Bank as a result of dealing in foreign exchange under sections 17, 18 and 21(2) of the Act.
Other unquantifiable contingent liabilities
Accident Compensation Corporation (ACC)
A Court decision has determined that the ACC practice, prior to the Accident Insurance Act 1998, of allowing for familial responsibility when determining attendant care entitlements was not legitimate. The decision is likely to apply to a number of seriously injured claimants.
Air New Zealand
The Crown indemnified the directors of Air New Zealand against any liability arising from breaches of sections 135 and 136 of the Companies Act 1993. The indemnities expired on 18 January 2002, but it is possible that claims could arise retrospectively.
As part of the Air New Zealand settlement with the Voluntary Administrator for the Ansett Group, the Minister of Finance provided the Voluntary Administrator with an indemnity that would be triggered if Air New Zealand were liquidated within two years of the settlement and the settlement monies were sought by the liquidator at that time. The indemnity expires on 3 October 2003 and is for a maximum of AU$150 million.
Bank of New Zealand (BNZ)
A deed, entered into by the Crown, Fay Richwhite and Company Limited and National Australia Group Limited (the purchaser of BNZ), provides for the sharing of certain costs arising from defined risks that pre-date the sale of BNZ. These risks are associated with New Zealand taxation and specified litigation.
Contaminated sites
Under common law and various statutes, the Crown may have responsibility to remedy adverse effects on the environment arising from Crown activities.
The Discussion Document on Contaminated Sites Management discusses the possibility of the Crown contributing to funding the clean-up of "orphan" contaminated sites.
Crown research institutes (CRIs)
The Crown has indemnified the CRIs for any costs arising from certain third-party claims that are the result of acts or omissions prior to the transfer date, for costs of complying with statutes, ordinances and bylaws which relate to or affect certain buildings, and (subject to certain limitations) for the costs of obtaining title to land.
DFC New Zealand Limited (under statutory management) (DFC)
DFC and the National Provident Fund have been indemnified for certain potential tax liabilities.
District health boards (DHBs)
The Crown has provided transitional indemnities to directors and officers of some DHBs, for liabilities arising from inherited assets and business practices under the Building Act 1991 and the Health and Safety in Employment Act 1992.
Education—legal claim
The judgment in Daniels and Others v Attorney-General has found that some parts of the policy known as Special Education 2000 are inconsistent with the Education Acts 1964 and 1989. There are potential implications of the judgment:
- •
- in relation to its application to students with special needs
- •
- in relation to remedies and policy initiatives required for education more generally and beyond students with special needs
- •
- regarding remedies for the plaintiffs in relation to the High Court judgment on Special Education.
The Crown has decided to appeal this judgment.
Electricity Corporation of New Zealand Limited (ECNZ)
The ECNZ Sale and Purchase Agreement provides for compensation to ECNZ for any tax, levy, royalty or impost imposed on ECNZ for the use of water or geothermal energy for plants in existence or under construction at the date of the Sale and Purchase Agreement. The Agreement also provides for compensation for any net costs to ECNZ arising from resumption of assets pursuant to the Treaty of Waitangi (State Enterprises) Act 1988.
The Deed of Assumption and Release between ECNZ, Contact Energy Limited and the Crown provides that the Crown is no longer liable to ECNZ in respect of those assets transferred to Contact Energy. As a result of the split of ECNZ in 1999, Ministers have transferred the benefits of the Deed to ECNZ's successors—Meridian Energy Limited, Mighty River Power Limited, and Genesis Power Limited.
Under the Transpower New Zealand Limited (Transpower) Sale and Purchase and Debt Assumption Agreements, the Crown has indemnified ECNZ for any losses resulting from changes in tax rules applicable to transactions listed in the Agreements. Additionally, the Crown has indemnified the directors and officers of ECNZ for any liability they may incur in their personal capacities as a result of the Transpower separation process.
Following the split of ECNZ in 1999 into three new companies, the Crown has indemnified ECNZ in relation to all ECNZ's pre-split liabilities, including:
- •
- existing debt and swap obligations
- •
- hedge contracts and obligations
- •
- any liabilities that arise out of the split itself.
Housing New Zealand Corporation (HNZC)
The Crown has indemnified the following entities in respect of the accuracy of information provided on the sale of various parcels of HNZC (formerly Housing Corporation of New Zealand) mortgages: Countrywide Bank, TSB Bank, and Westpac Banking Corporation.
The Crown has indemnified the directors and officers of HNZC against any liabilities in respect of the sale of mortgages to ANZ Bank and Mortgage Corporation.
Under the sale of mortgages to Westpac, HNZC has insured the purchaser against certain credit losses with the Crown standing behind this obligation.
Legal proceedings have been initiated against a number of defendants, including the Crown, alleging breach of fiduciary duties in respect of the transfer of the Agreement for Sale and Purchase and mortgage agreements to HNZC under the Housing Assets Transfer Act 1993.
In addition, the Crown has provided a warranty in respect of title to the assets transferred to HNZC (formerly Housing New Zealand) and has indemnified the company against any breach of this warranty. The Crown has indemnified the company against any third-party claims that are a result of acts or omissions prior to 1 November 1992. It has also indemnified the directors and officers of the company against any liability consequent upon the assets not complying with statutory requirements, provided it is taking steps to rectify any non-compliance.
Indemnities against acts of war and terrorism
The Crown has indemnified Air New Zealand against claims arising from acts of war and terrorism, that cannot be met from insurance, up to a limit of US$2 billion in respect of any one claim.
The Crown has offered non-airline aviation companies indemnities against acts of war, terrorism and related causes where commercial cover has been withdrawn following the events in the United States on 11 September 2001. The indemnities are for a maximum of US$200 million for each party. At 31 March 2002, indemnities had been signed with the Civil Aviation Authority (US$100 million), the Aviation Security Service of New Zealand (US$200 million), Auckland International Airport (US$50 million), Christchurch International Airport (US$50 million), and Wellington International Airport (US$50 million). Further indemnities may be offered to eligible parties.
Maui Gas Partners
The Crown has signed a Deed of Confidentiality with the Maui Gas Partners relating to the provision of information to assist in the redetermination of Maui gas reserves. The deed contains an indemnity against any losses arising from a breach of the deed.
New Zealand Railways Corporation
The Crown has indemnified the directors of the New Zealand Railways Corporation against any liability arising from the surrender of the licence and lease of the Auckland rail corridor.
Pharmaceutical Management Agency Limited (Pharmac)—indemnity
Section 99 of the Social Security Act 1964 provided for the fixing of prices for pharmaceutical products by way of a list specified by the Minister of Health ("the Drug Tariff"). This list was superseded by a list ("the Pharmaceutical Schedule") developed and issued by Pharmac, a company owned by the Crown and having various powers under the New Zealand Public Health and Disability Act 2000.
Under the Transfer Agreement between Pharmac and the Crown, the Crown has indemnified Pharmac against any liability in respect of operations, activities, decisions and policies relating to the Drug Tariff and the Pharmaceutical Schedule.
A number of legal claims have been lodged against Pharmac. If these claims are successful, the Crown's financial position may be adversely affected by any damages arising either directly through the indemnity, or indirectly through its ownership of Pharmac.
Purchasers of Crown operations
The Crown has indemnified the purchasers of various Crown operations for losses owing to changes in legislation which uniquely and adversely affect those purchasers.
Sale of Crown assets
On the sale of Crown assets and the corporatisation of Crown assets into SOEs and Crown entities, the Crown has generally provided a warranty that the Crown was the rightful owner of the assets transferred, and that the assets were free of encumbrances.
Tax liabilities
The Crown has granted to the purchasers of the State Insurance Office Limited and the Rural Banking and Finance Corporation Limited an indemnity for certain potential tax liabilities.
Treaty of Waitangi claims
Under the Treaty of Waitangi Act 1975, any Maori may lodge claims relating to land or actions counter to the principles of the Treaty with the Waitangi Tribunal. Where the Tribunal finds a claim is well founded, it may recommend to the Crown that action be taken to compensate those affected. The Tribunal can make recommendations that are binding on the Crown with respect to land which has been transferred by the Crown to an SOE or tertiary institution, or is subject to the Crown Forest Assets Act 1989.
Settlement relativity payments
The Deeds of Settlement negotiated with Waikato-Tainui and Ngai Tahu include a relativity mechanism. The mechanism provides that, where the total redress amount for all historical Treaty settlements exceeds $1 billion in 1994 present-value terms, the Crown is liable to make payments to maintain the real value of Ngai Tahu's and Waikato-Tainui's settlements as a proportion of all Treaty settlements. The agreed relativity proportions are 17% for Waikato-Tainui and approximately 16% for Ngai Tahu. The non-quantifiable contingent liability relates to the risk that total settlement redress, including binding recommendations from the Waitangi Tribunal, will trigger these relativity payments.
Works Civil Construction
The Crown has provided an indemnity to the purchasers of Works Civil Construction in relation to the activities of the Ministry of Works and Development prior to 1 April 1989. In addition, an indemnity has been provided against certain costs, claims or damages in relation to the Clyde and Ohaaki power projects.
Works Consultancy Services
The Crown has provided an indemnity to the purchasers of Works Consultancy Services in relation to the activities of the Ministry of Works and Development prior to 1 April 1989.
Specific Fiscal Risks
Specific fiscal risks (excluding contingent liabilities) are a category of Government decisions or circumstances that may have a material impact on the fiscal position. The risks have not been included in the main forecasts because their fiscal impact cannot be reasonably quantified, the likelihood of realisation is uncertain and/or the timing is uncertain. The risks disclosed may not eventuate into Government policy and the final cost or saving may differ from the amount disclosed if the policy is developed.
To ensure a practicable and consistent disclosure approach, risks have been reported that have an expected cost or saving of over $10 million in any one forecast year; and either:
- •
- reflect Government decisions or legislative commitments with uncertain fiscal consequences or timing, or
- •
- are generally being actively considered by the Minister of Finance and responsible Ministers, or
- •
- are decisions that have been deferred until a later date.
The forecasts incorporate operating and capital provisions to accommodate policy initiatives on which decisions have yet to be made. Some risks outlined in this chapter, if they eventuate, would be covered by these provisions and therefore have no impact on the forecasts. These risks have been disclosed to provide an indication of the pressure the risks place upon the fiscal provisions.
There are a number of other "pressures" on the fiscal position that have not been included as risks. These "pressures" comprise proposals largely generated within individual departments and not yet considered by the Minister of Finance and responsible Ministers. Such items are also expected to be managed within the provisions noted above.
Specific fiscal risks do not include:
- •
- normal forecasting risks, such as uncertainty around welfare benefits, SOE/Crown entity surpluses or finance costs
- •
- possible changes to the interpretation of accounting policies, such as the changes to revenue recognition rules and recognition of liabilities
- •
- discussion documents containing proposals that the Minister of Finance and responsible Ministers will not actively consider until the consultation process has been completed.
The Fiscal Responsibility Act 1994 requires that all specific fiscal risks be disclosed, except where it is determined by the Minister of Finance that disclosing a risk is likely to:
- •
- prejudice the substantial economic interests of New Zealand, or
- •
- prejudice the security or defence of New Zealand or international relations of the Government, or
- •
- compromise the Crown in a material way in negotiation, litigation or commercial activity, or
- •
- result in a material loss of value to the Crown.
In addition, the Minister of Finance has to determine that there is no reasonable or prudent way the Government can avoid this prejudice, compromise or material loss by making a decision on the fiscal risk before the finalisation of the forecasts, or by disclosing the fiscal risk without reference to its fiscal implications.
The fiscal risks included in the Statement of Specific Fiscal Risks were finalised as at 10 May 2002.
Quantified Risks22
Risks as at 10 May 2002
| | Operating
Balance
| | Gross Debt
| | Net Worth
| | ($ million)
|
|---|
| Corrections—capital projects | | Decrease | | Increase | | Decrease | | -391 capital and -188 operating across the outyears. |
| Defence—capital injections | | Decrease | | Increase | | Decrease | | -1,000 over the next five to ten years. |
| Education—Auckland University Business School | | Decrease | | Increase | | Decrease | | -25 capital in 2002/03. |
| Education—e-learning | | Decrease | | Increase | | Decrease | | -11 in 2002/03 and -7 in outyears for capital. |
| Education—school property | | Decrease | | Increase | | Decrease | | -90 in 2002/03, -200 in 2003/04 and subsequent outyears for capital; and -1 in 2002/03, -8 in 2003/04, -18 in 2004/05, and -29 in 2005/06 for operating. |
| Energy Efficiency and Conservation—renewables policy | | Decrease | | Increase | | Decrease | | -1 in 2002/03, increasing to -20 in 2005/06 |
| Energy Efficiency and Conservation—national strategy | | Decrease | | Increase | | Decrease | | -63 operating over four years. |
| Health—Southern Saltmarsh Mosquito | | Decrease | | Increase | | Decrease | | -30 operating over five years. |
| Inland Revenue—GST and imported services and financial services review | | Decrease | | Increase | | Decrease | | -20 operating from 2003/04. |
Inland Revenue—
trans-Tasman triangular tax relief | | Decrease | | Increase | | Decrease | | -10 operating from 2004/05. |
| Social Development—benefit payment systems | | Decrease | | Increase | | Decrease | | Up to -95 split between operating and capital. |
- 22
- In the summary tables listing specific risks:
- •
- negative numbers indicate a deterioration in the Crown's financial position
- •
- "N/A" means no effect
- •
- "Unclear" means insufficient information is available to determine the risk's effect.
- The
- "Gross Debt" column replaces the "Net Debt" column used in the December Update.
Unquantified Risks
Risks as at 10 May 2002
| | Operating
balance
| | Gross
debt
| | Net
worth
|
|---|
| Accident Insurance—Medical Misadventure | | Unclear | | Unclear | | Unclear |
| Agriculture and Forestry—painted apple moth | | Decrease | | Increase | | Decrease |
| Courts—Supreme Court | | Decrease | | Increase | | Decrease |
| Defence—sale of Skyhawks and Aermacchi trainers | | Increase | | Decrease | | Increase |
| Education—capital injections for tertiary education institutions | | N/A | | Increase | | N/A |
| Education—Centres of Research Excellence | | Decrease | | Increase | | Decrease |
| Education—collective employment agreements | | Decrease | | Increase | | Decrease |
| Education—ECE Strategic Plan | | Unclear | | Unclear | | Unclear |
| Education—improved internet access | | Decrease | | Increase | | Decrease |
| Education—Partnerships for Excellence | | N/A | | Increase | | N/A |
| Education—pay parity for kindergarten teachers | | Decrease | | Increase | | Decrease |
| Education—review of school staffing | | Decrease | | Increase | | Decrease |
| Education—school and early childhood operational funding | | Decrease | | Increase | | Decrease |
| Education—school property code | | Decrease | | Increase | | Decrease |
| Education—tertiary education funding | | Decrease | | Increase | | Decrease |
| Education—wananga capital injection | | N/A | | Increase | | N/A |
| Health—district health board deficits | | Unclear | | Unclear | | Unclear |
| Health—population-based funding | | Decrease | | Increase | | Decrease |
| Health—remove asset testing from long-stay care | | Decrease | | Increase | | Decrease |
| Inland Revenue—exemption for overseas earnings | | Unclear | | Unclear | | Unclear |
| Inland Revenue—Gaming Review | | Unclear | | Unclear | | Unclear |
| Inland Revenue—Risk Free Return Method | | Unclear | | Unclear | | Unclear |
| Inland Revenue—taxation of savings and investment vehicles, including superannuation funds | | Decrease | | Increase | | Decrease |
| Police—capital projects | | Decrease | | Increase | | Decrease |
| Prime Minister and Cabinet—climate change | | Unclear | | Unclear | | Unclear |
| Social Development—response to Joychild Report | | Decrease | | Increase | | Decrease |
| Transport—lease of rail assets | | Unclear | | Unclear | | Unclear |
Risks Removed Since the 2001 December Update
Risk
| | In forecasts
| | Comment
|
|---|
| Accident Insurance—treatment cost review | | No | | No longer greater than $10m |
| Child Youth and Family Service—potential underpayment of care allowances | | Yes | | Baselines |
| Conservation—asset maintenance | | Yes | | Baselines |
| Defence—East Timor | | Yes | | Baselines |
| Education—stabilisation of tertiary fees | | Yes | | Baselines |
| Environment—genetic modification | | Yes | | Baselines |
| Finance—Air New Zealand | | Yes | | Baselines |
| Finance—purchase of Auckland rail network | | Yes | | Baselines |
| Health—Budget allocation | | Yes | | Baselines |
| Health—district health board debt financing | | Yes | | Baselines |
| Health—meningococcal vaccine | | Yes | | Baselines |
| Inland Revenue—tax simplification | | Yes | | Baselines |
| Social Development—families and work | | Yes | | Baselines |
| Social Development—making work pay | | Yes | | Baselines |
| Transport—Transport Strategy | | Yes | | Baselines |
Quantified Fiscal Risks
Corrections—capital projects (changed risk)
The Department of Corrections has estimated that a total of $391 million ($475 million in December Update) of capital injections and operating funding of $188 million ($152 million in December Update) will be required over the forecasting periods for capital projects to meet future prison muster forecasts.
The actual amounts will depend on the specification and timing of the individual projects and the contracted prices.
These estimates include consideration of funding for the:
- •
- South Auckland Men's Corrections Facility
- •
- Otago Men's Corrections Facility
- •
- Bay of Plenty Men's Corrections Facility
- •
- Auckland Women's Corrections Facility.
In addition, the Department is reviewing options for the future of Mount Eden prison.
Capital injections would increase gross debt while operating funding would decrease the operating balance.
The Minister of Finance has yet to fully consider the quantum of these risks.
Source: Department of Corrections
Defence—capital injections (unchanged risk)
Implementing the Government's decisions on the future force structure of the New Zealand Defence Force will involve a series of capital acquisitions across all three armed services to achieve the required capability upgrades.
It is anticipated that capital injections of up to $1 billion over the next 10 years may be necessary, with the bulk likely to be required within the next five years.
The actual profile will depend on the specification and timing of the individual projects, the contracted prices, and the prevailing exchange rate at the time of purchase. Any capital injections would increase gross debt.
The Minister of Finance has yet to fully consider the individual projects that make up this risk.
Source: New Zealand Defence Force
Education—Auckland University Business School (new risk)
The Government has agreed to provide a capital injection of up to $25 million to the proposed Auckland University Business School, subject to a number of conditions being met. The injection is likely to be provided in 2002/03. The actual amount of the capital injection has yet to be confirmed, but any injection would increase gross debt.
Source: Ministry of Education
Education—e-learning (new risk)
The Government has made a commitment to improve e-learning capability in the tertiary education sector through the provision of advice and through assistance to e-learning providers. Capital injections are estimated to be $11 million in 2002/03 and $7 million in outyears, which would increase gross debt.
The Minister of Finance has yet to fully consider the quantum of this risk.
Source: Ministry of Education
Education—school property (changed risk)
The Government has provided $168 million in 2002/03 for school accommodation as part of the 2002 Budget. Additional capital injections for school accommodation are likely to be required in future years to meet roll growth. Capital injections are estimated to be up to $90 million in 2002/03 ($200 million in December Update) and $200 million in 2003/04 and outyears ($160 million in December Update).
In addition to capital injections, consequential operating costs are likely to be incurred. These are estimated at $1 million in 2002/03, $8 million in 2003/04, $18 million in 2004/05 and $29 million in 2005/06 ($10 million, $20 million, $30 million, $40 million respectively in December Update).
Any capital injection would increase gross debt while operating funding would decrease the operating balance.
The Minister of Finance has yet to fully consider the quantum of this risk.
Source: Ministry of Education
Energy Efficiency and Conservation—renewables policy (new risk)
The National Energy Efficiency and Conservation Strategy was launched in September 2001. It contains an energy efficiency target and a renewables target. The Government is still considering issues related to implementing a renewables policy package, including a contestable project fund.
The policy and programme for the strategy overlap with climate change policy work, and are being consulted on alongside the climate change preferred policy package. Final decisions on renewables are expected in July 2002. Initial estimates of the investment required to achieve the target indicate this could range from around $1 million in 2002/03 to around $20 million per annum from 2005/06, which would decrease the operating balance.
The Minister of Finance has yet to fully consider the quantum of this risk.
Source: Ministry for the Environment
Energy Efficiency and Conservation—national strategy (changed risk)
The National Energy Efficiency and Conservation Strategy was launched in September 2001. It includes an economy-wide energy efficiency target and a renewable energy target range.
Implementation of further policy measures to achieve these targets has been estimated at up to $63 million over four years (December Update: $78 million over five years), which would decrease the operating balance. The final cost will depend on what policy and implementation options are chosen.
The Minister of Finance has yet to fully consider the quantum of this risk.
Source: Ministry for the Environment
Health—southern saltmarsh mosquito (new risk)
The Government is considering possible responses to the incursion of the southern saltmarsh mosquito into the Kaipara Harbour, Tairawhiti, Porangahau and Mahia. The cost of responding to the virus is estimated at $30 million over five years, with the majority of the cost in 2002/03 and 2003/04. Any funding would decrease the operating balance.
The Minister of Finance has yet to fully consider the quantum of this risk.
Source: Ministry of Health
Inland Revenue—GST and imported services and financial services review (changed risk)
In June 2001 the Government issued a discussion document proposing that GST be applied to some imported services. In 2002 the Government also intends to release a discussion document on the treatment of GST on financial services. As part of that document the Government will propose zero-rating GST on financial services supplied by the financial services sector to registered businesses. It is intended that, following consultation on the financial services proposal, both measures would apply from 1 April 2004.
The net effect of both measures together is expected to be a decrease in the operating balance of up to $20 million per year.
The Minister of Finance has yet to fully consider the quantum of this risk.
Source: Inland Revenue Department
Inland Revenue—trans-Tasman triangular tax relief (changed risk)
Imputation credits generated by a New Zealand subsidiary company with an Australian parent company cannot be passed on to New Zealand shareholders of that parent company. Consequently, New Zealand residents are taxed twice on their New Zealand-sourced income. The New Zealand and the Australian Governments have agreed in principle to provide relief on this double taxation using a method known as pro rata allocation.
At this stage the estimated fiscal cost is $10 million per year from 2004/05 onwards, which would decrease the operating balance.
The Minister of Finance has yet to fully consider the quantum of this risk.
Source: Inland Revenue Department
Social Development—benefit payment systems (unchanged risk)
The Ministry of Social Development is undertaking an assessment of options for the upgrading of benefit payment systems SWIFTT and TRACE. The assessment is expected in June 2002.
If the assessment leads to improvement of the existing systems, the development cost is estimated at $25 million to $40 million. If the assessment leads to replacement of systems, the development cost is estimated at $95 million. Operating funding would decrease the operating balance and capital injections would increase gross debt.
The Minister of Finance has yet to fully consider the quantum of this risk.
Source: Ministry of Social Development
Unquantified Fiscal Risks
Accident Insurance—Medical Misadventure (unchanged risk)
The Medical Misadventure Account is currently funded partly from the Earners' Account and partly by the Crown through the Non-Earners' Account. A review of the Medical Misadventure Account is underway, considering all aspects of the Account. The net impact of the review is unquantified and may either increase or decrease the operating balance.
Agriculture and Forestry—painted apple moth (new risk)
The Ministry of Agriculture and Forestry will report by June 2002 on progress with the painted apple moth eradication programme. The report will present options for the future management of the pest. The costs associated with these responses depend on the options chosen, but any further funding would decrease the operating balance.
Courts—Supreme Court (new risk)
The Government has announced that it intends to establish a New Zealand-domiciled Supreme Court as the court of final appeal.
The timing, scale and funding for a new court are unclear at this stage, but any capital injections would increase gross debt, while associated operating costs would decrease the operating balance.
Defence—sale of Skyhawks and Aermacchi trainers (new risk)
As a result of the Government's decisions on the future force structure of the New Zealand Defence Force (NZDF), the NZDF is in the process of selling its Skyhawks and Aermacchi trainers. The proceeds from the sale would increase the operating balance and decrease gross debt.
This risk is unquantified as disclosure could compromise the Crown in the sale process.
Education—capital injections for tertiary education institutions (unchanged risk)
Several tertiary education institutions are facing financial pressure. They may seek assistance from the Government as they develop their plans for the future. The risk is unquantified as the amount or timing of any request for financial assistance is unclear, but any capital injections will increase gross debt.
Education—Centres of Research Excellence (changed risk)
The Government has provided funding for the establishment and support of Centres of Research Excellence. Since the December Update, the Government has provided an additional $38 million in operating funding, and $20 million in capital injections over the forecast period. Further funding may be required in 2002/03 for these Centres, however the amount is unclear at this stage. Any additional operating funding would decrease the operating balance while capital injections would increase gross debt.
Education—collective employment agreements (changed risk)
The secondary teachers' and principals' collective employment agreements expired on 30 April 2001. The Crown will need to meet any fiscal impact in 2002/03 and beyond, owing to the renegotiation of these agreements and any adjustments to individual employment agreements, which would decrease the operating balance.
This risk is unquantified, as disclosure could compromise the Crown in negotiations.
Education—ECE Strategic Plan (unchanged risk)
The Early Childhood Education (ECE) Strategic Plan working group submitted its final report to the Government in October 2001. The Government will develop its response to this report during the next six months. The impact of the response depends on the options chosen, but any additional operating funding would decrease the operating balance and capital injections would increase gross debt.
Education—improved internet access (new risk)
The Government is considering options to improve high-speed internet access to rural communities and their schools from 2002/03. This risk is unquantified as negotiations with providers are currently in progress. The costs associated with this proposal would decrease the operating balance.
Education—Partnerships for Excellence (new risk)
The Government has established "Partnerships for Excellence", whereby the Crown matches private sector investment in the tertiary sector. Funds will be allocated on an annual basis, subject to budgetary pressures from 2002/03. Any capital injections will increase gross debt.
Education—pay parity for kindergarten teachers (changed risk)
The Ministerial Working Group on Pay Parity for Kindergarten Teachers recommended to the Minister of Education in December 2001 a phased approach to the implementation of pay parity for kindergarten teachers. The Government is currently developing its response. Any costs associated with the response are unclear at this stage, but would decrease the operating balance.
Education—review of school staffing (changed risk)
The Government has included further funding in Budget 2002 to increase school staffing levels in response to a report from the School Staffing Review Working Group. The Government is considering further response options; any additional funding would decrease the operating balance.
Education—school and early childhood operational funding (unchanged risk)
The Government has previously made annual adjustments to school and early childhood education operational funding to reflect inflation. This risk is unquantified, but would decrease the operating balance. However, as an indication of cost, a 1% adjustment would increase annual operational funding by around $10 million for schools from the 2004 school year and $4 million for early childhood education providers from 2003/04.
Education—school property code (unchanged risk)
The Ministry of Education is developing a new intermediate school property code that will allow the property entitlement of each school to be defined explicitly. It is expected that the existing entitlements of many schools will be below the new code. Additional capital injections may be required to upgrade schools to the new code level and would increase gross debt. Associated operating costs, including depreciation and maintenance, would decrease the operating balance.
This risk is unquantified because the implementation process for the code has yet to be considered.
Education—tertiary education funding (changed risk)
The Government will be considering its new tertiary education funding system during 2002. This will include consideration of the Integrated Funding Framework and the release of a discussion document on student support. The individual components of these reforms may have positive or negative fiscal impacts, but the overall impact is likely to be a decrease in the operating balance and an increase in gross debt.
Education—wananga capital injection (unchanged risk)
The Government is currently negotiating with two wananga (Maori tertiary institutions) over settlement of a Waitangi Tribunal claim. The Waitangi Tribunal has recommended that the wananga be compensated for capital expenditure that has been incurred on facilities to date, and be provided funding to bring their facilities up to a standard comparable with other tertiary institutions and to meet additional capital requirements over the next three financial years. Any capital injection would increase gross debt.
The fiscal risk is unquantified as disclosure could compromise the Crown in negotiations.
Health—District health board deficits (new risk)
Included in the Health funding allocation announced in December 2001 is an implied deficit track for District health boards (DHBs) of $80 million in 2002/03, declining to zero by 2005/06. The DHBs have submitted draft annual plans to the Ministry of Health that have combined deficits of around $200 million in each year from 2002/03. The Government has rejected these deficit forecasts as being unacceptable and is actively discussing actions and cost-containment measures with the DHBs to manage back the deficits to the deficit track implicit in the funding allocations announced in December 2001.
The impact on the operating balance, if any, is unclear. Any deficits above that provided for within the health funding allocation will decrease the operating balance and increase gross debt.
Health—population-based funding (new risk)
The Government is considering funding DHBs on the basis of a population-based formula. This could result in changes to DHB funding to reflect the impact of inter-regional patient flows—patients from one DHB being treated in another. The costs of this proposal, if any, are unclear at this stage, but any increased funding would decrease the operating balance.
Health—remove asset testing from long-stay care (unchanged risk)
The Government is considering a proposal to remove asset testing on all forms of long-stay geriatric care, including public and private hospital and rest homes. The proposal costs have yet to be finalised but will decrease the operating balance.
Inland Revenue—exemption for overseas earnings (new risk)
The Government is considering options to encourage skilled migrants to come to New Zealand, including the introduction of a time-limited exemption for overseas earnings for new migrants.
Details of the proposal need to be further developed and the proposal will be subject to consultation, so it is not expected to be implemented before 2003/04.
The impact, if any, of this proposal on the operating balance is unclear as it depends on the options chosen.
Inland Revenue—Gaming Review (changed risk)
The Gaming Review was completed and the Responsible Gambling Bill is before Parliament. The Government will consider the taxation of gaming in 2003. Any impact on the operating balance arising from a response, whether positive or negative, is unclear.
Inland Revenue—Risk Free Return Method (new risk)
The Government is considering the application of the Risk Free Return Method of taxation to equity investments on capital account outside a business context. A number of details of the proposal need to be further developed and the proposal will be subject to full consultation, so it is not expected to be implemented before 2003/04.
The impact on the operating balance is unclear at this stage as this will depend on the specific measures introduced.
Inland Revenue—taxation of savings and investment vehicles, including superannuation funds (changed risk)
The Government is considering its response to the recommendations on the taxation of savings and investment vehicles of the Tax Review 2001.
The Government is examining options to improve the tax environment for savings through changes to employer contribution schemes. The options under review are:
- •
- to match the withholding tax paid by employers to the statutory marginal tax rate paid by the worker, or
- •
- to extend the 6% concessional rate now enjoyed by those earning over $60,000 a year to all income earners.
Any new regime would not be implemented prior to the 2003/04 year.
The overall impact of the measures if adopted would be to reduce the operating balance.
Police—capital projects (changed risk)
New Zealand Police have identified a number of Police stations that require capital work to bring them up to a modern operating standard.The timing, scale and funding for new assets are unclear at this stage, but any capital injections would increase gross debt.
Prime Minister and Cabinet—climate change (changed risk)
The Government has indicated its intention to ratify the Kyoto Protocol by August 2002, and is in the process of consulting on the issue of ratification, and the policy options required to meet commitments under the Protocol. The package to be consulted on includes the following elements, which will be targeted at different sectors as appropriate:
- •
- existing policies aimed at greenhouse gas reduction—waste strategy, renewables strategy, energy efficiency and conservation strategy
- •
- negotiated greenhouse agreement and/or emissions charges
- •
- emissions reduction projects
- •
- methane and nitrous oxide mitigation research (including option of compulsory levy)
- •
- voluntary containment and handling standards for synthetic gases
- •
- mechanisms to incentivise establishment and enhancement of carbon sinks.
Following the consultation process, the Government will consider these policies in July 2002.
At this stage, it is unclear what impact the decision to ratify the Protocol would have on the operating balance, either positive or negative, since this is closely related to which policy options are accepted.
Social Development—response to Joychild Report (new risk)
The Government intends to review 15,000 cases where a debt was established against a Domestic Purposes Benefit recipient between November 1996 and December 2000, to ensure that appropriate legal tests were used in establishing the debts.
The potential costs of reviewing the cases, and of rectifying any cases where the review finds that a debt was improperly established, cannot be determined until decisions are made on the nature of the review. Any operating funding required would decrease the operating balance.
Transport—lease of rail assets (new risk)
The Government has purchased the Auckland rail lease and infrastructure assets, and intends to lease them to an Auckland Local Authority Trading Enterprise in 2002/03. Details of the lease are uncertain at this stage, and therefore the impacts on the operating balance are unclear.
Generally Accepted Accounting Practice (GAAP) Series Tables
Forecast Financial Statements
These forecasts have been prepared in accordance with the Fiscal Responsibility Act 1994.
They are based on the accounting policies and assumptions that follow on pages 155-168. As with all such assumptions, there is a degree of uncertainty surrounding them. This uncertainty increases as the forecast horizon extends.
The forecasts have been prepared in accordance with the Statement of Responsibility and reflect the judgements and information known at the time they were prepared. They reflect all Government decisions and circumstances communicated to 10 May 2002.
| | Finalisation Dates
|
|---|
| Fiscal forecasts | | 10 May |
| Tax revenue forecasts | | 10 May |
| Economic outlook | | 10 May |
| Government decisions and circumstances | | 10 May |
| Actual asset revaluations | | 31 March |
| Foreign-exchange rates | | 31 March |
| Specific fiscal risks | | 10 May |
| Contingent liabilities and commitments | | 31 March |
Reporting Entity as at 10 May 2002
These Forecast Financial Statements are for the Crown reporting entity as specified in Part III of the Public Finance Act 1989. This comprises Ministers of the Crown and the following entities:
Offices of Parliament
| | Departments
| | State-owned enterprises
|
|---|
Office of the Controller and
Auditor-General
Office of the Ombudsmen
Parliamentary Commissioner
for the Environment | | Agriculture and Forestry
Archives New Zealand
Child, Youth and Family Services
Conservation
Corrections
Courts
Crown Law
Culture and Heritage
Customs
Defence
Economic Development
Education
Education Review Office
Environment
Fisheries
Foreign Affairs and Trade
Government Communications Security Bureau
Health
Housing
Inland Revenue
Internal Affairs
Justice | | Agriquality New Zealand Limited
Airways Corporation of New Zealand Limited
Asure New Zealand Limited
Electricity Corporation of New Zealand Limited
Genesis Power Limited
Landcorp Farming Limited
Meridian Energy Limited
Meteorological Service of New Zealand Limited
Mighty River Power Limited
New Zealand Post Limited
New Zealand Railways Corporation
Solid Energy New Zealand Limited
Television New Zealand Limited
Terralink New Zealand Limited
Timberlands West Coast Limited
Transpower New Zealand Limited
Air New Zealand Limited (is included for disclosure purposes as if it were a SOE) |
|
|
Labour
Land Information New Zealand
Maori Development
National Library
New Zealand Defence Force
Office of the Clerk
Pacific Island Affairs
Parliamentary Counsel Office
Parliamentary Service
Police
Prime Minister and Cabinet
Research, Science and Technology
Security Intelligence Service
Serious Fraud Office
Social Development
State Services Commission
Statistics
Tourism
Transport
Treasury
Women's Affairs
Youth Affairs |
|
|
Crown entities
|
|---|
Accident Compensation Corporation
Accounting Standards Review Board
Agriculture and Marketing Research and Development Trust
Alcoholic Advisory Council of New Zealand
Animal Control Products Limited
Arts Council of New Zealand Toi Aotearoa
Asia 2000 Foundation of New Zealand
Broadcasting Commission
Broadcasting Standards Authority
Building Industry Authority
Career Services
Casino Control Authority
Civil Aviation Authority of New Zealand
Commerce Commission
Commissioner for Children
Crown research institutes (9)
District health boards (21)
Early Childhood Development Board
Earthquake Commission
Electoral Commission
Energy Efficiency and Conservation Authority
Environmental Risk Management Authority
Fish and game councils (13)
Foundation for Research, Science and Technology
Government Property Services Limited
Government Superannuation Fund Authority
Health and Disability Commissioner
Health Research Council of New Zealand
Health Sponsorship Council
Hillary Commission for Sport, Fitness and Leisure
Housing New Zealand Corporation
Human Rights Commission
Industry New Zealand
Land Transport Safety Authority of New Zealand
Law Commission
Learning Media Limited
Legal Services Agency
Management Development Centre Trust
Maritime Safety Authority of New Zealand
Mental Health Commission
Museum of New Zealand Te Papa Tongarewa
New Zealand Antarctic Institute
New Zealand Artificial Limb Board
New Zealand Blood Services
New Zealand Business Development Board
New Zealand Film Commission
New Zealand Fire Service Commission |
New Zealand Fish and Game Council
New Zealand Game Bird Habitat Trust Board
New Zealand Government Property Corporation
New Zealand Lotteries Commission
New Zealand Lottery Grants Board
New Zealand Qualifications Authority
New Zealand Sports Drug Agency
New Zealand Symphony Orchestra Limited
New Zealand Teachers Council
New Zealand Tourism Board
New Zealand Trade Development Board
Ngai Tahu Ancillary Claims Trust
Office of Film and Literature Classification
Pacific Business Trust
Pharmaceutical Management Agency
Police Complaints Authority
Privacy Commissioner
Public Trust
Quotable Value New Zealand Limited
Radio New Zealand Limited
Reserve boards (51)
Residual Health Management Unit
Retirement Commissioner
Road Safety Trust
School boards of trustees (2,664)
Securities Commission
Skill New Zealand
Standards Council
Takeovers Panel
Te Reo Whakapuaki Irirangi (Te Mangai Paho)
Te Taura Whiri I Te Reo Maori (Maori Language Commission)
Tertiary education institutions (39)
Testing Laboratory Registration Council
The Guardians of New Zealand Superannuation
Transfund New Zealand
Transit New Zealand
Transport Accident Investigation Commission
Trustees of the National Library |
Reserve Bank of New Zealand |
Forecast Statement of Financial Performance
for the years ending 30 June
| |
| |
| | 2002
| |
| |
| |
| |
| |
|---|
| | Note
| | 2001
Actual
| | Previous
Budget
| | Estimated
Actual
| | 2003
Forecast
| | 2004
Forecast
| | 2005
Forecast
| | 2006
Forecast
| |
|---|
| |
| | ($ million)
| |
|---|
| Revenue | | | | | | | | | | | | | | | | | |
Levied through the Crown's Sovereign Power |
|
|
|
|
|
|
|
|
|
|
|
|
|
|
|
|
|
| Direct taxation | | 1 | | 23,863 | | 24,505 | | 24,478 | | 25,697 | | 27,139 | | 28,478 | | 29,479 | |
| Indirect taxation | | 2 | | 12,875 | | 13,180 | | 13,899 | | 14,444 | | 14,945 | | 15,503 | | 16,091 | |
| | | | |
| |
| |
| |
| |
| |
| |
| |
| Total taxation revenue | | | | 36,738 | | 37,685 | | 38,377 | | 40,141 | | 42,084 | | 43,981 | | 45,570 | |
| Compulsory fees, fines, penalties and levies | | | | 385 | | 418 | | 493 | | 472 | | 487 | | 493 | | 506 | |
| | | | |
| |
| |
| |
| |
| |
| |
| |
| Total Revenue Levied through the Crown's Sovereign Power | | | | 37,123 | | 38,103 | | 38,870 | | 40,613 | | 42,571 | | 44,474 | | 46,076 | |
Earned through the Crown's Operations |
|
|
|
|
|
|
|
|
|
|
|
|
|
|
|
|
|
| Investment income | | 3 | | 1,369 | | 934 | | 1,219 | | 1,337 | | 1,615 | | 1,904 | | 2,232 | |
| Sales of goods and services | | | | 659 | | 654 | | 685 | | 705 | | 665 | | 665 | | 667 | |
| Other operational revenue | | 4 | | 381 | | 305 | | 398 | | 297 | | 291 | | 286 | | 284 | |
| Unrealised losses arising from changes in the value of commercial forests | | | | (40 | ) | — | | — | | — | | — | | — | | — | |
| | | | |
| |
| |
| |
| |
| |
| |
| |
| Total Revenue Earned through the Crown's Operations | | | | 2,369 | | 1,893 | | 2,302 | | 2,339 | | 2,571 | | 2,855 | | 3,183 | |
| | | | |
| |
| |
| |
| |
| |
| |
| |
| Total Revenue | | | | 39,492 | | 39,996 | | 41,172 | | 42,952 | | 45,142 | | 47,329 | | 49,259 | |
| | | | |
| |
| |
| |
| |
| |
| |
| |
Expenses |
|
|
|
|
|
|
|
|
|
|
|
|
|
|
|
|
|
By Functional Classification |
|
|
|
|
|
|
|
|
|
|
|
|
|
|
|
|
|
| Social security and welfare | | | | 13,216 | | 13,826 | | 13,615 | | 13,936 | | 14,407 | | 14,805 | | 15,273 | |
| GSF pension expenses | | | | 855 | | 667 | | 339 | | 671 | | 680 | | 680 | | 719 | |
| Health | | | | 7,342 | | 7,684 | | 7,733 | | 8,370 | | 8,873 | | 9,347 | | 9,475 | |
| Education | | | | 6,690 | | 7,056 | | 7,150 | | 7,494 | | 7,674 | | 7,747 | | 7,850 | |
| Core government services | | | | 1,817 | | 1,552 | | 1,611 | | 1,641 | | 1,616 | | 1,628 | | 1,658 | |
| Law and order | | | | 1,560 | | 1,640 | | 1,771 | | 1,734 | | 1,737 | | 1,734 | | 1,727 | |
| Defence | | | | 1,267 | | 1,153 | | 1,188 | | 1,166 | | 1,208 | | 1,159 | | 1,146 | |
| Transport and communications | | | | 1,026 | | 1,027 | | 1,156 | | 1,238 | | 1,300 | | 1,324 | | 1,335 | |
| Economic and industrial services | | | | 1,141 | | 1,225 | | 1,187 | | 1,275 | | 1,268 | | 1,261 | | 1,272 | |
| Primary services | | | | 424 | | 320 | | 327 | | 343 | | 330 | | 326 | | 323 | |
| Heritage, culture and recreation | | | | 287 | | 456 | | 500 | | 533 | | 558 | | 584 | | 595 | |
| Housing and community development | | | | 50 | | 90 | | 95 | | 103 | | 99 | | 91 | | 91 | |
| Other | | | | 75 | | 114 | | 109 | | 114 | | 110 | | 110 | | 110 | |
Finance costs |
|
5 |
|
2,483 |
|
2,395 |
|
2,303 |
|
2,339 |
|
2,425 |
|
2,501 |
|
2,572 |
|
| Net foreign-exchange gains/(losses) | | | | (47 | ) | — | | 64 | | — | | — | | — | | — | |
| Forecast for future new spending | | 5 | | — | | 160 | | — | | 230 | | 700 | | 1,180 | | 2,080 | |
| | | | |
| |
| |
| |
| |
| |
| |
| |
| Total Expenses | | 5 | | 38,186 | | 39,365 | | 39,148 | | 41,187 | | 42,985 | | 44,477 | | 46,226 | |
| | | | |
| |
| |
| |
| |
| |
| |
| |
Revenue less Expenses |
|
|
|
1,306 |
|
631 |
|
2,024 |
|
1,765 |
|
2,157 |
|
2,852 |
|
3,033 |
|
| Surplus attributable to state-owned enterprises and Crown entities (excl. ACC liability valuation) | | 8 | | 844 | | 953 | | 1,057 | | 984 | | 1,284 | | 1,408 | | 1,560 | |
| ACC outstanding claims liability valuation | | | | (420 | ) | — | | (42 | ) | — | | — | | — | | — | |
| Dividends and other distributions | | 8 | | (321 | ) | (208 | ) | (403 | ) | (461 | ) | (363 | ) | (323 | ) | (351 | ) |
| | | | |
| |
| |
| |
| |
| |
| |
| |
| Net Surplus Attributable to State-owned Enterprises and Crown Entities | | | | 103 | | 745 | | 612 | | 523 | | 921 | | 1,085 | | 1,209 | |
| | | | |
| |
| |
| |
| |
| |
| |
| |
| Operating Balance | | | | 1,409 | | 1,376 | | 2,636 | | 2,288 | | 3,078 | | 3,937 | | 4,242 | |
| | | | |
| |
| |
| |
| |
| |
| |
| |
The accompanying Notes are an integral part of these Statements.
Forecast Statement of Financial Position
as at 30 June
| |
| |
| | 2002
| |
| |
| |
| |
|
|---|
| | Note
| | 2001
Actual
| | Previous
Budget
| | Estimated
Actual
| | 2003
Forecast
| | 2004
Forecast
| | 2005
Forecast
| | 2006
Forecast
|
|---|
| |
| | ($ million)
|
|---|
| Assets | | | | | | | | | | | | | | | | |
| Cash and bank balances | | | | 115 | | 45 | | 191 | | 239 | | 315 | | 432 | | 556 |
| Marketable securities and deposits1 | | | | 12,060 | | 9,067 | | 10,650 | | 9,486 | | 11,272 | | 13,589 | | 16,215 |
| Advances | | 6 | | 4,615 | | 5,873 | | 5,896 | | 7,011 | | 8,615 | | 9,555 | | 10,599 |
| Receivables | | 7 | | 6,197 | | 5,439 | | 6,037 | | 6,111 | | 6,024 | | 6,108 | | 6,058 |
| Inventories | | | | 193 | | 280 | | 220 | | 223 | | 231 | | 229 | | 227 |
| State-owned enterprises and Crown entities | | 8 | | 14,077 | | 15,114 | | 15,628 | | 16,614 | | 17,812 | | 19,119 | | 20,424 |
| Other investments | | | | 354 | | 432 | | 306 | | 396 | | 383 | | 369 | | 355 |
| Physical assets | | 9 | | 16,102 | | 16,076 | | 16,187 | | 16,417 | | 16,592 | | 16,371 | | 16,092 |
| Commercial forests | | | | 310 | | 359 | | 310 | | 310 | | 311 | | 311 | | 311 |
| State highways | | 10 | | 11,055 | | 10,847 | | 11,148 | | 11,278 | | 11,376 | | 11,481 | | 11,607 |
| Intangible assets | | | | 3 | | 3 | | 448 | | 401 | | 354 | | 307 | | 260 |
| Forecast for future new capital spending | | | | — | | 315 | | — | | 220 | | 1,020 | | 1,520 | | 1,880 |
| | | | |
| |
| |
| |
| |
| |
| |
|
| Total Assets | | | | 65,081 | | 63,850 | | 67,021 | | 68,706 | | 74,305 | | 79,391 | | 84,584 |
| | | | |
| |
| |
| |
| |
| |
| |
|
Liabilities |
|
|
|
|
|
|
|
|
|
|
|
|
|
|
|
|
| Payables and provisions | | 11 | | 5,831 | | 4,758 | | 5,428 | | 5,409 | | 5,397 | | 5,491 | | 5,410 |
| Currency issued | | | | 2,539 | | 2,570 | | 2,937 | | 2,937 | | 2,937 | | 2,937 | | 2,937 |
| Borrowings | | | | 36,761 | | 35,831 | | 36,299 | | 35,781 | | 38,391 | | 39,543 | | 40,656 |
| Pension liabilities | | | | 8,487 | | 8,734 | | 8,119 | | 8,053 | | 7,976 | | 7,879 | | 7,798 |
| | | | |
| |
| |
| |
| |
| |
| |
|
| Total Liabilities | | | | 53,618 | | 51,893 | | 52,783 | | 52,180 | | 54,701 | | 55,850 | | 56,801 |
| | | | |
| |
| |
| |
| |
| |
| |
|
| Total Assets less Total Liabilities | | | | 11,463 | | 11,957 | | 14,238 | | 16,526 | | 19,604 | | 23,541 | | 27,783 |
| | | | |
| |
| |
| |
| |
| |
| |
|
Crown Balance |
|
|
|
|
|
|
|
|
|
|
|
|
|
|
|
|
| Accumulated operating balance | | | | 3,456 | | 4,058 | | 6,199 | | 8,487 | | 11,565 | | 15,502 | | 19,744 |
| Revaluation reserve | | 12 | | 8,007 | | 7,899 | | 8,039 | | 8,039 | | 8,039 | | 8,039 | | 8,039 |
| | | | |
| |
| |
| |
| |
| |
| |
|
| Crown Balance | | | | 11,463 | | 11,957 | | 14,238 | | 16,526 | | 19,604 | | 23,541 | | 27,783 |
| | | | |
| |
| |
| |
| |
| |
| |
|
- 1
- Marketable securities and deposits
| |
| | 2002
| |
| |
| |
| |
|
|---|
| | 2001
Actual
| | Previous
Budget
| | Estimated
Actual
| | 2003
Forecast
| | 2004
Forecast
| | 2005
Forecast
| | 2006
Forecast
|
|---|
| | ($ million)
|
|---|
| New Zealand Superannuation (NZS) Fund | | — | | 617 | | 600 | | 1,890 | | 3,898 | | 6,277 | | 8,944 |
| Other marketable securities and deposits | | 12,060 | | 8,450 | | 10,050 | | 7,596 | | 7,374 | | 7,312 | | 7,271 |
| | |
| |
| |
| |
| |
| |
| |
|
| Total Marketable securities and deposits | | 12,060 | | 9,067 | | 10,650 | | 9,486 | | 11,272 | | 13,589 | | 16,215 |
| | |
| |
| |
| |
| |
| |
| |
|
Forecast Statement of Movements in Equity
for the years ending 30 June
| |
| |
| | 2002
| |
| |
| |
| |
|
|---|
| | Note
| | 2001
Actual
| | Previous
Budget
| | Estimated
Actual
| | 2003
Forecast
| | 2004
Forecast
| | 2005
Forecast
| | 2006
Forecast
|
|---|
| |
| | ($ million)
|
|---|
| Opening Crown Balance | | | | 8,583 | | 10,581 | | 11,463 | | 14,238 | | 16,526 | | 19,604 | | 23,541 |
Operating balance for the year |
|
|
|
1,409 |
|
1,376 |
|
2,636 |
|
2,288 |
|
3,078 |
|
3,937 |
|
4,242 |
| Net revaluations | | 12 | | (179 | ) | — | | 36 | | — | | — | | — | | — |
| | | | |
| |
| |
| |
| |
| |
| |
|
| Total Recognised Revenues and Expenses | | | | 1,230 | | 1,376 | | 2,672 | | 2,288 | | 3,078 | | 3,937 | | 4,242 |
Recognition policy change |
|
|
|
1,650 |
|
— |
|
103 |
|
— |
|
— |
|
— |
|
— |
| | | | |
| |
| |
| |
| |
| |
| |
|
| Closing Crown Balance | | | | 11,463 | | 11,957 | | 14,238 | | 16,526 | | 19,604 | | 23,541 | | 27,783 |
| | | | |
| |
| |
| |
| |
| |
| |
|
The accompanying Notes are an integral part of these Statements.
Forecast Statement of Cash Flows
for the years ending 30 June
| |
| | 2002
| |
| |
| |
| |
| |
|---|
| | 2001
Actual
| | Previous
Budget
| | Estimated
Actual
| | 2003
Forecast
| | 2004
Forecast
| | 2005
Forecast
| | 2006
Forecast
| |
|---|
| | ($ million)
| |
|---|
| Cash Flows from Operations | | | | | | | | | | | | | | | |
| Cash was Provided from | | | | | | | | | | | | | | | |
Direct Taxation |
|
|
|
|
|
|
|
|
|
|
|
|
|
|
|
| Individuals | | | | | | | | | | | | | | | |
| Source deductions | | 13,748 | | 14,358 | | 14,602 | | 15,298 | | 16,133 | | 17,029 | | 17,865 | |
| Other persons | | 4,221 | | 4,319 | | 4,385 | | 4,516 | | 4,638 | | 4,743 | | 4,853 | |
| Refunds | | (1,175 | ) | (1,094 | ) | (1,210 | ) | (1,146 | ) | (1,133 | ) | (1,121 | ) | (1,159 | ) |
| Fringe benefit tax | | 338 | | 324 | | 344 | | 380 | | 384 | | 389 | | 394 | |
| | |
| |
| |
| |
| |
| |
| |
| |
| Total Individuals | | 17,132 | | 17,907 | | 18,121 | | 19,048 | | 20,022 | | 21,040 | | 21,953 | |
Corporate |
|
|
|
|
|
|
|
|
|
|
|
|
|
|
|
| Gross companies | | 5,377 | | 5,518 | | 5,353 | | 5,401 | | 5,898 | | 6,175 | | 6,272 | |
| Refunds | | (785 | ) | (701 | ) | (707 | ) | (650 | ) | (646 | ) | (640 | ) | (628 | ) |
| Non-resident withholding tax | | 738 | | 697 | | 634 | | 638 | | 692 | | 716 | | 737 | |
| Foreign-source dividend withholding payment | | 98 | | 36 | | 149 | | 122 | | 56 | | 56 | | 56 | |
| | |
| |
| |
| |
| |
| |
| |
| |
| Total Corporate | | 5,428 | | 5,532 | | 5,429 | | 5,511 | | 6,000 | | 6,307 | | 6,437 | |
| Other withholding taxes | | 1,043 | | 1,046 | | 1,013 | | 1,075 | | 1,084 | | 1,084 | | 1,085 | |
| Other direct taxation | | 2 | | 2 | | 2 | | 2 | | 2 | | 2 | | 2 | |
| | |
| |
| |
| |
| |
| |
| |
| |
| Total Direct Taxation | | 23,605 | | 24,487 | | 24,565 | | 25,636 | | 27,108 | | 28,433 | | 29,477 | |
Indirect Taxation |
|
|
|
|
|
|
|
|
|
|
|
|
|
|
|
| Goods and Services Tax | | | | | | | | | | | | | | | |
| Gross goods and services tax | | 14,604 | | 14,754 | | 16,146 | | 16,446 | | 16,914 | | 17,678 | | 18,484 | |
| Refunds | | (5,657 | ) | (5,418 | ) | (6,180 | ) | (6,092 | ) | (6,127 | ) | (6,391 | ) | (6,670 | ) |
| | |
| |
| |
| |
| |
| |
| |
| |
| Total Goods and Services Tax | | 8,947 | | 9,336 | | 9,966 | | 10,354 | | 10,787 | | 11,287 | | 11,814 | |
| Other indirect taxation | | 3,698 | | 3,858 | | 3,908 | | 4,088 | | 4,156 | | 4,216 | | 4,282 | |
| | |
| |
| |
| |
| |
| |
| |
| |
| Total Indirect Taxation | | 12,645 | | 13,194 | | 13,874 | | 14,442 | | 14,943 | | 15,503 | | 16,096 | |
| | |
| |
| |
| |
| |
| |
| |
| |
| Total Taxation Receipts | | 36,250 | | 37,681 | | 38,439 | | 40,078 | | 42,051 | | 43,936 | | 45,573 | |
| | |
| |
| |
| |
| |
| |
| |
| |
| Compulsory Fees, Fines, Penalties and Levies | | 324 | | 349 | | 327 | | 372 | | 386 | | 399 | | 419 | |
Other Receipts |
|
|
|
|
|
|
|
|
|
|
|
|
|
|
|
| Interest, profits and dividends | | 892 | | 755 | | 1,175 | | 1,012 | | 1,132 | | 1,224 | | 1,398 | |
| Sales of goods and services | | 622 | | 644 | | 653 | | 674 | | 628 | | 624 | | 626 | |
| Other operating receipts | | 383 | | 301 | | 370 | | 300 | | 291 | | 284 | | 285 | |
| | |
| |
| |
| |
| |
| |
| |
| |
| Total Other Receipts | | 1,897 | | 1,700 | | 2,198 | | 1,986 | | 2,051 | | 2,132 | | 2,309 | |
| | |
| |
| |
| |
| |
| |
| |
| |
| Total Cash Provided from Operations | | 38,471 | | 39,730 | | 40,964 | | 42,436 | | 44,488 | | 46,467 | | 48,301 | |
Cash was Disbursed to |
|
|
|
|
|
|
|
|
|
|
|
|
|
|
|
| Departmental outputs | | 4,749 | | 5,040 | | 5,173 | | 5,328 | | 5,243 | | 5,199 | | 5,222 | |
| Other outputs | | 16,008 | | 16,610 | | 16,912 | | 17,781 | | 18,435 | | 19,055 | | 19,325 | |
| Finance costs | | 2,499 | | 2,402 | | 2,240 | | 2,264 | | 2,390 | | 2,471 | | 2,549 | |
| Subsidies | | 133 | | 181 | | 147 | | 173 | | 178 | | 155 | | 155 | |
| Current transfers | | | | | | | | | | | | | | | |
| | Social assistance grants | | 12,910 | | 13,610 | | 13,432 | | 13,689 | | 14,188 | | 14,614 | | 15,099 | |
| | Other transfers | | 250 | | 255 | | 256 | | 260 | | 257 | | 256 | | 256 | |
| Forecast for future new spending | | — | | 160 | | — | | 230 | | 700 | | 1,180 | | 2,080 | |
| | |
| |
| |
| |
| |
| |
| |
| |
| Total Cash Disbursed to Operations | | 36,549 | | 38,258 | | 38,160 | | 39,725 | | 41,391 | | 42,930 | | 44,686 | |
| | |
| |
| |
| |
| |
| |
| |
| |
| Net Cash Flows from Operations | | 1,922 | | 1,472 | | 2,804 | | 2,711 | | 3,097 | | 3,537 | | 3,615 | |
| | |
| |
| |
| |
| |
| |
| |
| |
Cash Flows from Investing Activities |
|
|
|
|
|
|
|
|
|
|
|
|
|
|
|
Cash was Provided from |
|
|
|
|
|
|
|
|
|
|
|
|
|
|
|
| Sale of physical assets | | 75 | | 91 | | 124 | | 83 | | 56 | | 39 | | 31 | |
| | |
| |
| |
| |
| |
| |
| |
| |
| Total Cash Provided | | 75 | | 91 | | 124 | | 83 | | 56 | | 39 | | 31 | |
Cash was Disbursed to |
|
|
|
|
|
|
|
|
|
|
|
|
|
|
|
| Purchase of physical assets | | 1,205 | | 1,288 | | 1,271 | | 1,508 | | 1,417 | | 1,020 | | 1,025 | |
| Net increase in advances | | 617 | | 1,318 | | 1,264 | | 1,193 | | 1,632 | | 957 | | 1,060 | |
| Net (sale)/purchase of investments | | (174 | ) | 294 | | 1,367 | | 543 | | 265 | | 163 | | 83 | |
| Purchase of marketable securities and deposits by NZS Fund | | — | | 600 | | 586 | | 1,200 | | 1,800 | | 2,011 | | 2,117 | |
| Other net purchase/(sale) of marketable securities and deposits | | 1,001 | | (3,185 | ) | (1,232 | ) | (2,453 | ) | (222 | ) | 28 | | (15 | ) |
| Forecast for future new capital spending | | — | | 315 | | — | | 220 | | 800 | | 500 | | 360 | |
| | |
| |
| |
| |
| |
| |
| |
| |
| Total Cash Disbursed | | 2,649 | | 630 | | 3,256 | | 2,211 | | 5,692 | | 4,679 | | 4,630 | |
| | |
| |
| |
| |
| |
| |
| |
| |
| Net Cash Flows from Investing Activities | | (2,574 | ) | (539 | ) | (3,132 | ) | (2,128 | ) | (5,636 | ) | (4,640 | ) | (4,599 | ) |
| | |
| |
| |
| |
| |
| |
| |
| |
| Net Cash Flows from Operating and Investing Activities | | (652 | ) | 933 | | (328 | ) | 583 | | (2,539 | ) | (1,103 | ) | (984 | ) |
| | |
| |
| |
| |
| |
| |
| |
| |
Cash Flows from Financing Activities |
|
|
|
|
|
|
|
|
|
|
|
|
|
|
|
Cash was Provided from |
|
|
|
|
|
|
|
|
|
|
|
|
|
|
|
| Issue of circulating currency | | 303 | | — | | 398 | | — | | — | | — | | — | |
| Net issue/(repayment) of Government stock | | 1,066 | | 391 | | 746 | | (31 | ) | 2,515 | | 1,136 | | 947 | |
| | |
| |
| |
| |
| |
| |
| |
| |
| Total Cash Provided | | 1,369 | | 391 | | 1,144 | | (31 | ) | 2,515 | | 1,136 | | 947 | |
Cash was Disbursed to |
|
|
|
|
|
|
|
|
|
|
|
|
|
|
|
| Net repayment/(issue) of foreign currency borrowing | | 514 | | 853 | | 451 | | 140 | | — | | (2 | ) | — | |
| Net repayment/(issue) of other New Zealand-dollar borrowing | | 305 | | 479 | | 282 | | 364 | | (100 | ) | (82 | ) | (161 | ) |
| | |
| |
| |
| |
| |
| |
| |
| |
| Total Cash Disbursed | | 819 | | 1,332 | | 733 | | 504 | | (100 | ) | (84 | ) | (161 | ) |
| | |
| |
| |
| |
| |
| |
| |
| |
| Net Cash Flows from Financing Activities | | 550 | | (941 | ) | 411 | | (535 | ) | 2,615 | | 1,220 | | 1,108 | |
| | |
| |
| |
| |
| |
| |
| |
| |
| Net Movement in Cash | | (102 | ) | (8 | ) | 83 | | 48 | | 76 | | 117 | | 124 | |
| Opening Cash Balance | | 210 | | 53 | | 115 | | 191 | | 239 | | 315 | | 432 | |
| Foreign-exchange gains/(losses) on opening cash balances | | 7 | | — | | (7 | ) | — | | — | | — | | — | |
| | |
| |
| |
| |
| |
| |
| |
| |
| Closing Cash Balance | | 115 | | 45 | | 191 | | 239 | | 315 | | 432 | | 556 | |
| | |
| |
| |
| |
| |
| |
| |
| |
| |
| |
| |
| |
| |
| |
| |
| |
|---|
Reconciliation Between the Forecast Net Cash Flows from Operations and the Operating Balance |
|
|
|
|
|
|
|
|
|
|
|
|
|
|
|
Net Cash Flows from Operations |
|
1,922 |
|
1,472 |
|
2,804 |
|
2,711 |
|
3,097 |
|
3,537 |
|
3,615 |
|
Items included in the operating balance but not in net cash flows from operations |
|
|
|
|
|
|
|
|
|
|
|
|
|
|
|
Valuation Changes |
|
|
|
|
|
|
|
|
|
|
|
|
|
|
|
| Increase in National Provident Fund guarantee liability | | (253 | ) | — | | — | | — | | — | | — | | — | |
| (Increase)/decrease in pension liabilities | | (164 | ) | 51 | | 368 | | — | | — | | — | | — | |
| Unrealised net foreign exchange gains/(losses) | | 100 | | — | | (17 | ) | — | | — | | — | | — | |
| Unrealised losses arising from changes in the value of commercial forests | | (40 | ) | — | | — | | — | | — | | — | | — | |
| | |
| |
| |
| |
| |
| |
| |
| |
| Total Valuation Changes | | (357 | ) | 51 | | 351 | | — | | — | | — | | — | |
Physical Asset Movements |
|
|
|
|
|
|
|
|
|
|
|
|
|
|
|
| Depreciation | | (925 | ) | (879 | ) | (943 | ) | (1,013 | ) | (1,059 | ) | (1,084 | ) | (1,106 | ) |
| (Loss)/gain on sale of assets | | (7 | ) | — | | (2 | ) | — | | — | | — | | — | |
| | |
| |
| |
| |
| |
| |
| |
| |
| Total Physical Asset Movements | | (932 | ) | (879 | ) | (945 | ) | (1,013 | ) | (1,059 | ) | (1,084 | ) | (1,106 | ) |
Other Non-cash Items |
|
|
|
|
|
|
|
|
|
|
|
|
|
|
|
| Net surplus attributable to state-owned enterprises and Crown entities | | 103 | | 745 | | 612 | | 523 | | 921 | | 1,085 | | 1,209 | |
| Accrued income from NZS Fund | | — | | 17 | | 14 | | 90 | | 208 | | 368 | | 550 | |
| Loss on writedown of defence equipment | | (103 | ) | — | | — | | — | | — | | — | | — | |
| Student Loans | | (61 | ) | (99 | ) | (67 | ) | (47 | ) | (44 | ) | (37 | ) | (41 | ) |
| Other | | 55 | | — | | (23 | ) | (47 | ) | (47 | ) | (47 | ) | (47 | ) |
| | |
| |
| |
| |
| |
| |
| |
| |
| Total Other Non-cash Items | | (6 | ) | 663 | | 536 | | 519 | | 1,038 | | 1,369 | | 1,671 | |
Total Other Investing and Financing Items |
|
177 |
|
— |
|
(22 |
) |
— |
|
— |
|
— |
|
— |
|
Movements in Working Capital |
|
|
|
|
|
|
|
|
|
|
|
|
|
|
|
| Increase/(decrease) in taxes receivable | | 737 | | 25 | | (27 | ) | 62 | | 25 | | 33 | | (5 | ) |
| Decrease/(increase) in payables | | 11 | | 62 | | 45 | | (6 | ) | 81 | | 33 | | 114 | |
| (Decrease)/increase in other receivables | | (62 | ) | (84 | ) | (133 | ) | 12 | | (112 | ) | 51 | | (45 | ) |
| (Decrease)/increase in inventories | | (81 | ) | 66 | | 27 | | 3 | | 8 | | (2 | ) | (2 | ) |
| | |
| |
| |
| |
| |
| |
| |
| |
| Total Movements in Working Capital | | 605 | | 69 | | (88 | ) | 71 | | 2 | | 115 | | 62 | |
| | |
| |
| |
| |
| |
| |
| |
| |
| Operating Balance | | 1,409 | | 1,376 | | 2,636 | | 2,288 | | 3,078 | | 3,937 | | 4,242 | |
| | |
| |
| |
| |
| |
| |
| |
| |
Reconciliation of Forecast Net Cash Flows from Operations with Forecast Net Cash Proceeds from Domestic Bonds |
|
|
|
|
|
|
|
|
|
|
|
|
|
|
|
Net Cash Flows from Operations |
|
1,922 |
|
1,472 |
|
2,804 |
|
2,711 |
|
3,097 |
|
3,537 |
|
3,615 |
|
Net purchase of physical assets |
|
(1,130 |
) |
(1,197 |
) |
(1,147 |
) |
(1,425 |
) |
(1,361 |
) |
(981 |
) |
(994 |
) |
| Net increase in advances | | (617 | ) | (1,318 | ) | (1,264 | ) | (1,193 | ) | (1,632 | ) | (957 | ) | (1,060 | ) |
| Net sale/(purchase) of investments | | 174 | | (294 | ) | (1,367 | ) | (543 | ) | (265 | ) | (163 | ) | (83 | ) |
| Purchase of marketable securities and deposits by NZS Fund | | — | | (600 | ) | (586 | ) | (1,200 | ) | (1,800 | ) | (2,011 | ) | (2,117 | ) |
| Capital contingency provision | | — | | (315 | ) | — | | (220 | ) | (800 | ) | (500 | ) | (360 | ) |
| | |
| |
| |
| |
| |
| |
| |
| |
| Available to Repay Debt/(Required to be Financed) | | 349 | | (2,252 | ) | (1,560 | ) | (1,870 | ) | (2,761 | ) | (1,075 | ) | (999 | ) |
Financed by: |
|
|
|
|
|
|
|
|
|
|
|
|
|
|
|
| Other net (purchase)/sale of marketable securities and deposits | | (1,001 | ) | 3,185 | | 1,232 | | 2,453 | | 222 | | (28 | ) | 15 | |
| | |
| |
| |
| |
| |
| |
| |
| |
| Total Investing Activities | | (652 | ) | 933 | | (328 | ) | 583 | | (2,539 | ) | (1,103 | ) | (984 | ) |
Used in: |
|
|
|
|
|
|
|
|
|
|
|
|
|
|
|
| Net (repayment)/issue of other | | | | | | | | | | | | | | | |
| New Zealand-dollar borrowing | | (305 | ) | (479 | ) | (282 | ) | (364 | ) | 100 | | 82 | | 161 | |
| Decrease/(increase) in cash | | 102 | | 8 | | (83 | ) | (48 | ) | (76 | ) | (117 | ) | (124 | ) |
| Issue of circulating currency | | 303 | | — | | 398 | | — | | — | | — | | — | |
| Net (repayment)/issue of foreign-currency borrowing | | (514 | ) | (853 | ) | (451 | ) | (140 | ) | — | | 2 | | — | |
| | |
| |
| |
| |
| |
| |
| |
| |
| | | (414 | ) | (1,324 | ) | (418 | ) | (552 | ) | 24 | | (33 | ) | 37 | |
| | |
| |
| |
| |
| |
| |
| |
| |
| Net Cash (Outflow)/Inflow to be Offset by Domestic Bonds | | (1,066 | ) | (391 | ) | (746 | ) | 31 | | (2,515 | ) | (1,136 | ) | (947 | ) |
| | |
| |
| |
| |
| |
| |
| |
| |
Gross Cash Proceeds from Domestic Bonds |
|
|
|
|
|
|
|
|
|
|
|
|
|
|
|
| Domestic bonds (market) | | 3,572 | | 3,570 | | 3,703 | | 3,392 | | 5,559 | | 3,933 | | 3,822 | |
| Domestic bonds (non-market) | | 661 | | — | | 199 | | — | | 478 | | 213 | | — | |
| | |
| |
| |
| |
| |
| |
| |
| |
| Total Gross Cash Proceeds from Domestic Bonds | | 4,233 | | 3,570 | | 3,902 | | 3,392 | | 6,037 | | 4,146 | | 3,822 | |
Repayment of domestic bonds (market) |
|
(2,651 |
) |
(2,582 |
) |
(2,593 |
) |
(2,823 |
) |
(3,044 |
) |
(2,797 |
) |
(2,875 |
) |
| Repayment of domestic bonds (non-market) | | (516 | ) | (579 | ) | (563 | ) | (600 | ) | (478 | ) | (213 | ) | — | |
| | |
| |
| |
| |
| |
| |
| |
| |
| Net Cash Proceeds from/(Repayments of) Domestic Bonds | | 1,066 | | 391 | | 746 | | (31 | ) | 2,515 | | 1,136 | | 947 | |
| | |
| |
| |
| |
| |
| |
| |
| |
Forecast Statement of Borrowings
as at 30 June
| |
| |
| | 2002
| |
| |
| |
| |
| |
|---|
| | Note
| | 2001
Actual
| | Previous
Budget
| | Estimated
Actual
| | 2003
Forecast
| | 2004
Forecast
| | 2005
Forecast
| | 2006
Forecast
| |
|---|
| |
| | ($ million)
| |
|---|
| Outstanding Debt | | | | | | | | | | | | | | | | | |
| New Zealand-Dollar Debt | | | | | | | | | | | | | | | | | |
| Government stock | | | | 23,331 | | 23,788 | | 24,106 | | 24,100 | | 26,611 | | 27,772 | | 28,752 | |
| Treasury bills | | | | 5,558 | | 5,388 | | 5,405 | | 5,484 | | 5,471 | | 5,479 | | 5,488 | |
| Loans and foreign-exchange contracts | | | | (272 | ) | (763 | ) | (374 | ) | (823 | ) | (711 | ) | (730 | ) | (606 | ) |
| Retail stock | | | | 498 | | 475 | | 512 | | 510 | | 510 | | 510 | | 510 | |
| | | | |
| |
| |
| |
| |
| |
| |
| |
| Total New Zealand-Dollar Debt | | | | 29,115 | | 28,888 | | 29,649 | | 29,271 | | 31,881 | | 33,031 | | 34,144 | |
| Foreign-Currency Debt | | | | | | | | | | | | | | | | | |
| United States dollars | | | | 4,780 | | 3,799 | | 4,249 | | 4,278 | | 4,276 | | 4,277 | | 4,277 | |
| Japanese yen | | | | 1,432 | | 1,562 | | 448 | | 279 | | 279 | | 279 | | 279 | |
| European and other currencies | | | | 1,434 | | 1,582 | | 1,953 | | 1,953 | | 1,955 | | 1,956 | | 1,956 | |
| | | | |
| |
| |
| |
| |
| |
| |
| |
| Total Foreign-Currency Debt | | | | 7,646 | | 6,943 | | 6,650 | | 6,510 | | 6,510 | | 6,512 | | 6,512 | |
| | | | |
| |
| |
| |
| |
| |
| |
| |
| Total Outstanding Debt | | | | 36,761 | | 35,831 | | 36,299 | | 35,781 | | 38,391 | | 39,543 | | 40,656 | |
| | | | |
| |
| |
| |
| |
| |
| |
| |
| Less | | | | | | | | | | | | | | | | | |
| Financial Assets | | | | | | | | | | | | | | | | | |
| Marketable Securities and Deposits1 | | | | | | | | | | | | | | | | | |
| New Zealand dollars | | | | 3,971 | | 1,154 | | 3,352 | | 1,053 | | 836 | | 781 | | 744 | |
| United States dollars | | | | 5,093 | | 3,909 | | 4,304 | | 4,373 | | 4,367 | | 4,362 | | 4,359 | |
| Japanese yen | | | | 1,548 | | 1,775 | | 487 | | 268 | | 268 | | 268 | | 268 | |
| European and other currencies | | | | 1,448 | | 1,612 | | 1,907 | | 1,902 | | 1,903 | | 1,901 | | 1,900 | |
| | | | |
| |
| |
| |
| |
| |
| |
| |
| Total Marketable Securities and Deposits | | | | 12,060 | | 8,450 | | 10,050 | | 7,596 | | 7,374 | | 7,312 | | 7,271 | |
| Advances and Cash | | | | | | | | | | | | | | | | | |
| Advances to state-owned enterprises and Crown entities | | 6 | | 261 | | 939 | | 890 | | 1,314 | | 2,148 | | 2,300 | | 2,536 | |
| Student loans | | 6 | | 4,143 | | 4,776 | | 4,798 | | 5,531 | | 6,295 | | 7,075 | | 7,863 | |
| Other advances | | | | 211 | | 158 | | 208 | | 166 | | 172 | | 180 | | 200 | |
| Cash | | | | 115 | | 45 | | 191 | | 239 | | 315 | | 432 | | 556 | |
| | | | |
| |
| |
| |
| |
| |
| |
| |
| Total Advances and Cash | | | | 4,730 | | 5,918 | | 6,087 | | 7,250 | | 8,930 | | 9,987 | | 11,155 | |
| | | | |
| |
| |
| |
| |
| |
| |
| |
| Total Financial Assets | | | | 16,790 | | 14,368 | | 16,137 | | 14,846 | | 16,304 | | 17,299 | | 18,426 | |
| | | | |
| |
| |
| |
| |
| |
| |
| |
| Net Crown Debt | | | | 19,971 | | 21,463 | | 20,162 | | 20,935 | | 22,087 | | 22,244 | | 22,230 | |
| | | | |
| |
| |
| |
| |
| |
| |
| |
| Net New Zealand-dollar debt | | | | 20,495 | | 21,816 | | 20,210 | | 20,968 | | 22,115 | | 22,263 | | 22,245 | |
| Net foreign-currency debt | | | | (524 | ) | (353 | ) | (48 | ) | (33 | ) | (28 | ) | (19 | ) | (15 | ) |
| | | | |
| |
| |
| |
| |
| |
| |
| |
| Net Crown Debt | | | | 19,971 | | 21,463 | | 20,162 | | 20,935 | | 22,087 | | 22,244 | | 22,230 | |
| | | | |
| |
| |
| |
| |
| |
| |
| |
- 1
- Marketable securities and deposits held by the NZS Fund are excluded from the calculation of net Crown debt.
Statement of Actual Commitments
as at 31 March 2002
| | As at
31 March
2002
| | As at
30 June
2001
|
|---|
| | ($ million)
|
|---|
| By Type | | | | |
| Capital Commitments | | | | |
| Specialist military equipment | | 549 | | 639 |
| Land and buildings | | 370 | | 383 |
| Other plant and equipment | | 26 | | 41 |
| Investments | | 266 | | 15 |
| Commitments of state-owned enterprises and Crown entities | | 798 | | 619 |
| | |
| |
|
| Total Capital Commitments | | 2,009 | | 1,697 |
| Operating Commitments | | | | |
| Non-cancellable accommodation leases | | 797 | | 842 |
| Other non-cancellable leases | | 1,730 | | 1,713 |
| Non-cancellable contracts for the supply of goods and services | | 1,872 | | 367 |
| Other operating commitments | | 814 | | 2,213 |
| Commitments of state-owned enterprises and Crown entities | | 3,343 | | 2,471 |
| | |
| |
|
| Total Operating Commitments | | 8,556 | | 7,606 |
| | |
| |
|
| Total Commitments | | 10,565 | | 9,303 |
| | |
| |
|
| By Term | | | | |
| One year or less | | 4,099 | | 3,618 |
| From one to two years | | 2,524 | | 2,051 |
| From two to five years | | 1,927 | | 1,754 |
| Over five years | | 2,015 | | 1,880 |
| | |
| |
|
| Total Commitments | | 10,565 | | 9,303 |
| | |
| |
|
The Statement of Actual Commitments includes commitments which are also included in the Forecast Statements of Financial Performance and Financial Position.
The accompanying Notes are an integral part of these Statements.
Statement of Actual Specific Fiscal Risks
Quantifiable contingent liabilities
| | As at
31 March
2002
| | As at
30 June
2001
|
|---|
| | ($ million)
|
|---|
| Guarantees and indemnities | | 387 | | 371 |
| Uncalled capital | | 3,305 | | 3,594 |
| Legal proceedings and disputes | | 479 | | 571 |
| Other quantifiable contingent liabilities | | 1,777 | | 1,965 |
| | |
| |
|
| Total Quantifiable Contingent Liabilities | | 5,948 | | 6,501 |
| | |
| |
|
Contingent liabilities of the Reserve Bank of New Zealand, state-owned enterprises and Crown entities are included in quantifiable contingent liabilities. Contingent liabilities to sub-entities are excluded.
Unquantified contingent liabilities
This part of the Statement lists those contingent liabilities of the Crown which cannot be quantified.
Institutional Guarantees
Commerce Commission—indemnity for damages
District Court Judges, Justices of the Peace, Coroners and Disputes Tribunal
Earthquake Commission
Fletcher Challenge Limited
Ministry of Fisheries—indemnity provided for delivery of registry services
National Provident Fund
Persons exercising investigating powers
Public Trust
Reserve Bank of New Zealand
Other Unquantified Contingent Liabilities
Accident Compensation Corporation
Air New Zealand
Bank of New Zealand
Contaminated sites
Crown research institutes
Development Finance Corporation New Zealand Limited (under statutory management)
District health boards
Education—legal claims
Electricity Corporation of New Zealand Limited
Housing New Zealand Corporation
Indemnities against acts of war and terrorism
Maui Gas Partners
New Zealand Railways Corporation
Pharmaceutical Management Agency Limited—indemnity
Purchasers of Crown operations
Sale of Crown assets
Tax liabilities
Treaty of Waitangi claims
Treaty of Waitangi claims—settlement relativity payments
Works Civil Construction
Works Consultancy Services
Actual contingent liabilities are discussed in detail in Chapter 5.
Statement of Actual Specific Fiscal Risks (continued)
Quantified risks
| | ($ million)
|
|---|
| Corrections—Capital Projects | | (391) capital and (188) operating across the outyears |
| Defence—Capital Injections | | (1,000) over the next five years to ten years |
| Education—Auckland University Business School | | (25) capital in 2002/03 |
| Education—E-Learning | | (11) in 2002/03 and (7) in outyears for capital |
| Education—School Property | | (90) in 2002/03, (200) in 2003/04, and subsequent outyears for capital and (1) in 2002/03, (8) in 2003/04, (18) in 2004/05 and (29) in 2005/06 for operating |
| Energy Efficiency and Conservation—Renewables Policy | | (1) in 2002/03, increasing to (20) in 2005/06 and outyears |
| Energy Efficiency and Conservation—National Strategy | | (63) operating over four years |
| Health—Southern Saltmarsh Mosquito | | (30) operating over five years |
| Inland Revenue—GST and Imported Services and Financial Services Review | | (20) operating from 2003/04 |
| Inland Revenue—Trans-Tasman Triangular | | (10) operating from 2004/05 |
| Tax Relief | | |
| Social Development—Benefit Payment Systems | | up to (95) split between operating and capital |
Many of these risks, if they crystallise, are covered by the forecast for future new spending and therefore have no impact on the forecasts.
Unquantified risks
Accident Insurance—Medical Misadventure
Agriculture and Forestry—Painted Apple Moth
Courts—Supreme Court
Defence—Sale of Skyhawks and Aermacchi Trainers
Education—Capital Injections for Tertiary Education Institutions
Education—Centres of Research Excellence
Education—Collective Employment Agreements
Education—ECE Strategic Plan
Education—Improved Internet Access
Education—Partnerships for Excellence
Education—Pay Parity for Kindergarten Teachers
Education—Review of School Staffing
Education—School and Early Childhood Operational Funding
Education—School Property Code
Education—Tertiary Education Funding
Education—Wananga capital injection
Health—District health board deficits
Health—Population Based Funding
Health—Remove Asset Testing from Long Stay Care
Inland Revenue—Exemption for Overseas Earnings
Inland Revenue—Gaming Review
Inland Revenue—Risk Free Return Method
Inland Revenue—Taxation of Savings and Investment Vehicles, including Superannuation Funds
Inland Revenue—Tax Review of International Issues
Police—Capital Projects
Prime Minister and Cabinet—Climate Change
Social Development—Response to Joychild Report
Transport—Lease of Rail Assets
Risks are stated as at 10 May 2002.
Actual specific fiscal risks are discussed in detail in Chapter 5.
Statement of Accounting Policies and Forecast Assumptions
General Accounting Policies and Forecast Assumptions
General Accounting Policies
Accounting policy
These Forecast Financial Statements comply with generally accepted accounting practice. The measurement base applied is historical cost adjusted for revaluations of physical assets (where appropriate), state highways, commercial forests and marketable securities and deposits held for trading purposes.
Revaluations are made to reflect the forecast service potential or economic benefit obtained through control of the assets. The accrual basis of accounting has been used.
Forecast assumptions
For forecast purposes, no revaluations are projected beyond the current year.
General Forecast Assumptions
Finalisation dates
The Forecast Financial Statements were finalised on 10 May 2002 and incorporate all Government decisions and circumstances communicated up to 10 May 2002.
Macroeconomic assumptions
A summary of the economic assumptions that are particularly relevant to the fiscal forecasts (along with the 2001/02 assumptions used in the 2001 Budget Economic and Fiscal Update) are provided in the following table:
Key economic assumptions
| | 2001/02
| |
| |
| |
| |
|
|---|
June years
| | Previous
Budget
| | Budget
| | 2002/03
Budget
| | 2003/04
Budget
| | 2004/05
Budget
| | 2005/06
Budget
|
|---|
| Real GDP (production based measure) | | | | | | | | | | | | |
| | (annual average % change) | | 2.7 | | 3.0 | | 3.1 | | 3.1 | | 2.8 | | 2.8 |
| Nominal GDP ($ million) | | 117,323 | | 120,309 | | 124,964 | | 131,293 | | 137,201 | | 143,026 |
| Consumer Price Index | | | | | | | | | | | | |
| | (annual average %) | | 2.1 | | 2.4 | | 2.4 | | 1.9 | | 1.6 | | 1.5 |
| Interest rates | | | | | | | | | | | | |
| | Government 10-year bonds | | | | | | | | | | | | |
| | (quarterly average %) | | 6.1 | | 6.9 | | 6.4 | | 6.2 | | 6.2 | | 6.2 |
| | 90-day bill rate | | | | | | | | | | | | |
| | (quarterly average %) | | 6.1 | | 5.7 | | 6.0 | | 6.0 | | 6.0 | | 6.0 |
| Household Labour Force Survey | | | | | | | | | | | | |
| | Survey unemployment rate | | | | | | | | | | | | |
| | (annual average %) | | 5.4 | | 5.3 | | 5.4 | | 5.2 | | 5.1 | | 5.2 |
| Full-time equivalent employment | | | | | | | | | | | | |
| | (annual average % change) | | 0.6 | | 2.7 | | 1.6 | | 1.2 | | 1.4 | | 1.2 |
| Wages—hourly earnings | | | | | | | | | | | | |
| | (annual average % change) | | 3.8 | | 3.6 | | 3.7 | | 3.5 | | 3.5 | | 2.9 |
| Trade Weighted Index | | | | | | | | | | | | |
| | (quarterly average) | | 52.9 | | 53.0 | | 54.1 | | 54.8 | | 55.0 | | 55.0 |
Source: The Treasury
For the purposes of calculating net debt, the forecasts assume that the nominal exchange rate remains fixed at 31 March 2002 exchange rates. Projected exchange rate losses or gains are not included in the forecasts.
Specific Accounting Policies and Forecast Assumptions
Forecast periods
Accounting policy
The reporting periods covered by these Forecast Financial Statements are the years ending 30 June 2002, 30 June 2003, 30 June 2004, 30 June 2005 and 30 June 2006.
Certain state-owned enterprises and Crown entities have different reporting periods from the Crown. These entities have been combined on the basis of the balance dates outlined in Note 8 of the Forecast Financial Statements.
Forecast assumptions
The forecasts for 30 June 2002 have been prepared using actual data to 31 March 2002. Transactions for the remainder of the year are forecast in accordance with these accounting policies and forecast assumptions.
Basis of Combination
Accounting policy
Ministers of the Crown, departments, offices of Parliament and the Reserve Bank of New Zealand are combined using the purchase method of combination. Corresponding assets, liabilities, revenues and expenses are added together line by line. Transactions and balances between these sub-entities are eliminated on combination.
State-owned enterprises and Crown entities are combined using the modified equity method of combination. This records the Crown's share of these entities' forecast net assets, including their surpluses and deficits. Unrealised surpluses and deficits on inter-entity transactions and balances not carried out on an arm's-length basis are eliminated. Other inter-entity transactions and balances are not eliminated.
Commitments and contingent liabilities of state-owned enterprises and Crown entities are reported in the Statement of Commitments and the Statement of Specific Fiscal Risks.
Revenue
Revenue levied through the Crown's sovereign power
Accounting policy
The Crown provides many services and benefits that do not give rise to revenue. Further, payment of tax does not of itself entitle a taxpayer to an equivalent value of services or benefits, as there is no direct relationship between paying tax and receiving Crown services and transfers.
Such revenue is received through the exercise of the Crown's sovereign power.
Where possible, revenue is recognised at the time the debt to the Crown arises, as identified in the following table:
Revenue Type
| | Revenue Recognition Point
|
Source deductions (PAYE) |
|
When an individual is forecast to earn income that is subject to PAYE |
Residents' withholding taxes1 |
|
When an individual is forecast to receive interest or dividends subject to deduction at source |
Fringe benefit tax (FBT) |
|
When forecast benefits are provided that give rise to FBT |
Provisional tax2 |
|
Forecast payment due date |
Terminal tax2 |
|
Forecast assessment filed date |
Goods and services tax |
|
When the liability to the Crown is forecast to be incurred |
Excise duty |
|
When goods are forecast to be subject to duty |
Road user charges and motor vehicle fees |
|
When payment for the fee or charge is forecast to be made |
Stamp, cheque and credit card duties |
|
When the liability to the Crown is forecast to be incurred |
Other indirect taxes |
|
When the debt to the Crown is forecast to arise |
- 1
- Corresponds to forecast withholding taxes on residents' interest and dividend income in Note 1 to the Forecast Financial Statements.
- 2
- Provisional and terminal taxes are paid by "other persons" and companies (refer to Note 1 to the Forecast Financial Statements).
Revenue earned through operations
Accounting policy
Where revenue will be earned by the Crown in exchange for the provision of outputs (products or services) to third parties, the Crown earns its revenue through operations. This revenue is recognised when it is forecast to be earned.
Investment income
Accounting policy
Investment income is recognised in the period in which it is forecast to be earned.
Premiums
Accounting policy
Premiums arising on the issue of a debt instrument, up to the forecast finalisation date, are treated as a reduction in the cost of borrowing. Premiums are recognised in the Forecast Statement of Financial Position on issue, and are amortised over the period of the instrument on a yield-to-maturity basis.
Premiums on forecast bond sales with the same maturity date and coupon rate as bonds already on issue are calculated using the same maturity and coupon rate information. These premiums are treated on issue as a reduction in the cost of borrowing, and in general are amortised over the period of the instrument on a yield-to-maturity basis.
The forward margin associated with forward foreign-exchange contracts is amortised over the period of the contract on a straight-line basis.
Forecast assumption
Forecast bond sales with new maturity dates are assumed to be issued at par value, and therefore no premiums are forecast for these instruments.
Gains
General
Accounting policy
Realised gains arising from the sale of assets or the early repurchase of liabilities are recognised in the Forecast Statement of Financial Performance in the period in which the transactions are forecast to occur.
Foreign-currency monetary assets and liabilities
Accounting policy
Unrealised gains are recognised in the Forecast Statement of Financial Performance.
Forecast assumption
Forecasts of foreign-currency monetary assets and liabilities for the year ending 30 June 2002 and the other forecast periods use the exchange rates prevailing on 31 March 2002. As a consequence, no realised or unrealised exchange gains are forecast for the entire forecast period.
Physical assets
Accounting policy
To the extent that a forecast gain reverses a loss previously charged to the Statement of Financial Performance, the gain is credited to the Forecast Statement of Financial Performance.
Forecast assumption
The 30 June 2002 forecasts for the value of physical assets use the valuations as recorded in the Crown Financial Statements for the year ended 30 June 2001 and any additional actual valuations that have occurred up to 31 March 2002.
The value of physical assets for the other forecast periods is forecast using the same valuation as that used for the 30 June 2002 forecasts. As a consequence, no realised or unrealised gains are forecast for the entire forecast period.
Investments and marketable securities held for investment
Forecast assumption
All investments and marketable securities held for investment that are forecast to be held after the forecast finalisation date are assumed to be held to maturity. Therefore, no gains are forecast for these assets.
Expenses
General
Accounting policy
Expenses are recognised in the financial periods to which they are forecast to relate.
Welfare benefits
Accounting policy
Welfare benefits are recognised in the reporting periods during which it is forecast an application for a benefit has been received and the eligibility criteria met.
Grants and subsidies
Accounting policy
Where grants and subsidies are discretionary until payment, the expense is recognised when the payment is forecast to be made. Otherwise, the expense is recognised when it is forecast that the specific criteria will be fulfilled and notice given to the Crown.
Treaty of Waitangi settlements
Forecast assumption
There is a multi-year appropriation (MYA) established for the payment of claims associated with Treaty of Waitangi settlements. The actual amount expensed in any one year may be greater or less than the amount forecast for that particular year, since actual expenses depend on the settlements reached.
Discounts
Accounting policy
Discounts arising on the issue of debt instruments up to the forecast finalisation date are treated as an increase in the cost of borrowings. Discounts are recognised in the Forecast Statement of Financial Position on issue, and are amortised over the period of the instrument on a yield-to-maturity basis.
Discounts on forecast bond sales with the same maturity date and coupon rate as bonds already on issue are calculated using the same maturity and coupon rate information. These discounts are treated on issue as an increase in the cost of borrowing, and in general are amortised over the period of the instrument on a yield-to-maturity basis.
Forecast assumption
Forecast bond sales with new maturity dates are assumed to be issued at par value, and therefore no discounts are forecast for these instruments.
Losses
General
Accounting policy
Forecast realised losses arising from the sale of assets or the early repurchase of liabilities are recognised in the Forecast Statement of Financial Performance in the period in which the transaction is forecast to occur.
Foreign-currency monetary assets and liabilities
Accounting policy
Unrealised losses are recognised in the Forecast Statement of Financial Performance.
Forecast assumption
The 30 June 2002 forecasts for foreign-currency monetary assets and liabilities use the exchange rates prevailing on 31 March 2002.
Forecasts of foreign-currency monetary assets and liabilities for the other forecast periods are based on the exchange rates used for the 30 June 2002 forecast. As a consequence, no realised or unrealised exchange losses are forecast for these years.
Physical assets and liabilities
Accounting policy
Unrealised losses are first applied against the revaluation reserve for that class of asset. The balance, if any, is charged to the Forecast Statement of Financial Performance.
Forecast assumption
The 30 June 2002 forecasts for the value of physical assets use valuations as recorded in the Crown Financial Statements for the year ended 30 June 2001, and any additional actual valuations that have occurred up to 31 March 2002.
The value of physical assets for the other forecast periods is forecast using the same valuation used for the 30 June 2002 forecasts. As a consequence, no realised or unrealised losses are forecast beyond the current year.
Investments and marketable securities held for investment
Forecast assumption
All investments and marketable securities held for investment that are forecast to be held after the forecast finalisation date are assumed to be held to maturity. Therefore, no losses are forecast for these assets.
Foreign-currency transactions
Accounting policy
Short-term transactions covered by forward exchange contracts are translated into New Zealand dollars using the forward rates specified in those contracts.
Other transactions in foreign currencies are translated into New Zealand dollars using the exchange rates prevailing on 31 March 2002. Forecast exchange gains or losses arising on translation of these transactions are recognised in the Forecast Statement of Financial Performance.
The resulting exchange gains or losses are included in the Forecast Statement of Financial Performance in the period in which they are forecast to arise. The forward margin associated with existing forward exchange contracts is amortised over the period of the contract on a straight-line basis.
Forecast assumption
Outstanding foreign-exchange contracts are translated using the exchange rate prevailing on 31 March 2002.
For forecasting purposes, the exchange rates prevailing on 31 March 2002 are assumed to prevail throughout the other forecast periods.
Depreciation
Accounting policy
Depreciation is charged on a straight-line basis at rates calculated to allocate the cost or valuation of an asset, less any forecast residual value, over its estimated useful life. Typically, the estimated useful lives of different classes of assets are as follows:
| Freehold buildings | | 25 to 60 years |
| Specialist military equipment | | 5 to 25 years |
| Other plant and equipment | | 3 to 25 years |
| State highways: | | |
| | Pavement (surfacing) | | 7 years |
| | Pavement (other) | | 36 years |
| | Bridges | | 90 to 100 years |
Assets
Foreign monetary assets
Accounting policy
Foreign monetary assets existing at the forecast finalisation date and subject to forward exchange contracts are translated at the contract rate. Other foreign-currency monetary assets are translated at the exchange rates prevailing on 31 March 2002.
Forecast assumption
For forecasting purposes, the exchange rates on 31 March 2002 are assumed to prevail throughout the other forecast periods.
Receivables and advances
Accounting policy
Receivables and advances are recorded at the amounts forecast to be collected in cash.
Inventories
Accounting policy
Inventories, except for unissued currency stocks, existing at the forecast finalisation date are recorded at the lower of cost and net realisable value. Inventories forecast to be acquired after that date are recorded at the forecast cost.
Unissued currency stocks are recorded as inventory at the cost of acquisition and expensed when issued.
Investments
Marketable securities held for trading purposes
Accounting policy
Marketable securities held for trading purposes at the forecast finalisation date are recorded at fair value.
Marketable securities that are forecast to be acquired after that date and held for trading purposes are recorded at forecast cost of acquisition.
Equity investments
Accounting policy
Equity investments existing at the forecast finalisation date (other than those forming part of the reporting entity) are recorded at the lower of forecast cost and fair value.
Equity investments which are forecast to be purchased after that date are recorded at the forecast cost.
Other investments
Accounting policy
Other investments existing at the forecast finalisation date, including marketable securities held for investment, are recorded at the lower of cost and fair value.
Other investments that are forecast to be purchased after that date are valued at the forecast cost.
Investment sales
Forecast assumption
The proceeds from sales of investments or entities are only included in the forecasts when those sales have been contractually confirmed at the forecast finalisation date.
Physical assets
Accounting policy
Revaluations are made to reflect the service potential or economic benefit obtained through control of assets. Revaluation to fair value is based on the fair value of the asset less estimated disposal costs. Where an asset is recorded at its depreciated replacement cost, depreciated replacement cost is based on the estimated present cost of construction, reduced by factors for age and deterioration of the asset.
�� Physical assets are revalued at least every three years where appropriate.
Land and buildings
Accounting policy
Holdings of land and buildings at the forecast finalisation date are recorded at the latest available valuation calculated on a fair value basis. In cases where valuations conducted in accordance with New Zealand Institute of Valuers' standards are not available, valuations conducted in accordance with the Rating Valuation Act 1998 have been used.
Land and buildings forecast to be purchased after the forecast finalisation date are valued at their forecast cost.
Forecast assumption
Valuations are assumed to remain constant over the forecast period.
Specialist military equipment
Accounting policy
Specialist military equipment existing at the forecast finalisation date is valued at depreciated replacement cost established through specialist assessment by New Zealand Defence Force advisers.
Specialist military equipment forecast to be purchased after that date is valued at forecast cost.
Other plant and equipment
Accounting policy
Other plant and equipment (including motor vehicles and office equipment) existing at forecast finalisation date is recorded at cost less accumulated depreciation.
Other plant and equipment forecast to be purchased after that date is recorded at forecast cost.
Other physical assets for which an objective estimate of market value is difficult to obtain
Accounting policy
Such assets (national parks, for example) existing at the forecast finalisation date are recorded at the best estimate of fair value.
Any such assets forecast to be acquired after that date are valued at forecast cost.
Forecast assumption
The value is assumed to be constant over the other forecast periods.
State highways
Accounting policy
State highways existing at the forecast finalisation date are recorded at depreciated replacement cost, based on the estimated present cost of constructing the existing asset by the most appropriate method of construction. State highways forecast to be developed after that date are valued at forecast cost.
Land associated with the state highways is valued using an opportunity cost based on adjacent use, as an approximation of fair value.
Forecast assumption
The value is assumed to be constant over the other forecast periods.
Commercial forests
Accounting policy
Commercial forests are recorded at forecast fair value. This takes into account age, quality of timber, market expectations and the forest management plan.
Forecast assumption
Commercial forests are valued at an estimate of fair value using discounted cash flow techniques. Post-tax cash flows and three-year rolling average log prices have been used. Log prices are assumed to be constant over the forecast period.
Intangible assets
Accounting policy
Identifiable intangible assets existing at the forecast finalisation date are recorded at cost less accumulated amortisation and accumulated impairment losses or if an active market exists identifiable intangible assets are recorded at fair value.
Forecast assumption
The value is assumed to be constant over the other forecast periods.
Liabilities
Borrowings
Accounting policy
In the Forecast Statement of Financial Position, borrowings, including currency swaps existing at the forecast finalisation date, are recorded at nominal value adjusted for the unamortised portion of the premium or discount on issue.
Borrowings forecast to be raised after that date are recorded at forecast cost.
Forecast assumption
Forecasts of borrowings incorporate a number of technical assumptions regarding the use of the Crown's fiscal surplus for domestic debt reduction. These assumptions may not reflect the actual future composition of the domestic debt programmes, as these decisions have yet to be made.
Foreign monetary liabilities
Accounting policy
Foreign monetary liabilities existing at the forecast finalisation date and subject to forward exchange contracts are translated at contract rates. Other foreign-currency monetary liabilities are translated at exchange rates prevailing on 31 March 2002.
Forecast assumption
For forecasting purposes, the exchange rates prevailing on 31 March 2002 are assumed to prevail throughout the other forecast periods.
Pension liabilities
Forecast assumption
Forecasts of Government Superannuation Fund pension liabilities in respect of the contributory service of superannuation scheme members are based on financial assumptions applied to the latest actuarial value of the Crown's liability for pension payments net of the scheme's assets, adjusted in future years for any projected changes in demographic assumptions.
Currency issued
Accounting policy
Currency (including demonetised currency) issued at the forecast finalisation date or forecast to be issued after that date is recognised at face value.
The face value of collectors' currency is recorded as a contingent liability.
Leases
Accounting policy
Finance leases transfer to the Crown as lessee substantially all the risks and rewards incident on the ownership of a leased asset. The obligations under such forecast leases are capitalised at the forecast present value of the minimum lease payments. The capitalised values are amortised over the period forecast for benefits from their use to arise.
Forecast operating leases, where the lessors substantially retain the risks and rewards of ownership, are recognised in a systematic manner over the forecast term of the lease.
The cost of forecast leasehold improvements is capitalised and amortised over the forecast unexpired period of the lease or the estimated useful life of the improvements, whichever is the shorter.
Employee entitlements
Accounting policy
Forecast liabilities for annual leave are recognised as they are forecast to accrue to employees. Provision is also made for forecast long-service and retiring leave obligations to employees.
Other liabilities
Accounting policy
All other liabilities are recorded at the forecast obligation to pay.
Commitments
The commitments reported in these Forecast Financial Statements are actual commitments at 31 March 2002.
Existing commitments include operating and capital commitments arising from non-cancellable contractual or statutory obligations. Interest commitments on debts and commitments relating to employment contracts are not included.
Specific Fiscal Risks
Accounting policy
The specific fiscal risks reported in these Forecast Financial Statements are the actual risks existing at 10 May 2002 and contingent liabilities as at 31 March 2002. They include existing contingent liabilities, which are recognised at the point the contingency is evident. The Statement of Specific Fiscal Risks has been prepared in accordance with sections 10(3)(b) and 11 of the Fiscal Responsibility Act 1994.
Changes in Accounting Policies
All policies have been applied on a consistent basis during the forecast period. There have been no changes in accounting policies during the period.
New accounting standards
Financial Reporting Standard 3: Accounting for property, plant and equipment (FRS 3), takes effect from the 2001/02 financial year. The principles of FRS 3 were applied early to the state highway network resulting in an adjustment to the 2000/01 Crown financial statements. Other components of physical assets will be revalued in accordance with FRS 3 as at 30 June 2002 and beyond. There are likely to be some substantial revaluation movements resulting from the revaluation exercises as they occur.
Financial Reporting Standard 15: Provisions, contingent liabilities and contingent assets (FRS 15) also takes effect from the 2001/02 financial year. Application of the requirements of FRS 15 will likely result in some adjustments to reported liabilities.
Recognition of Department of Conservation visitor assets
The Crown financial statements as at 30 June 2002 will recognise, for the first time, Department of Conservation visitor assets (conservation estate huts and tracks for example). To recognise these assets for the first time an adjustment within the Estimated Actual forecasts has been made to equity (i.e. the Crown balance/net worth) in accordance with FRS 3.
Changes in Forecast Assumptions
Changes to the forecast assumptions used for the forecasts published in the 2001 Budget Economic and Fiscal Update are outlined on page 156.
Notes to the Forecast Financial Statements
| |
| | 2002
| |
| |
| |
| |
| |
|---|
| | 2001
Actual
| | Previous
Budget
| | Estimated Acutal
| | 2003
Forecast
| | 2004
Forecast
| | 2005
Forecast
| | 2006
Forecast
| |
|---|
| | ($ million)
| |
|---|
| NOTE 1: Direct Taxation | | | | | | | | | | | | | | | |
| Income Tax | | | | | | | | | | | | | | | |
| Individuals | | | | | | | | | | | | | | | |
| Source deductions | | 13,703 | | 14,358 | | 14,602 | | 15,298 | | 16,133 | | 17,029 | | 17,865 | |
| Other persons | | 3,871 | | 3,881 | | 3,989 | | 4,140 | | 4,267 | | 4,376 | | 4,473 | |
| Refunds | | (790 | ) | (656 | ) | (814 | ) | (771 | ) | (762 | ) | (754 | ) | (779 | ) |
| Fringe benefit tax | | 342 | | 336 | | 356 | | 381 | | 385 | | 390 | | 395 | |
| | |
| |
| |
| |
| |
| |
| |
| |
| Total Individuals | | 17,126 | | 17,919 | | 18,133 | | 19,048 | | 20,023 | | 21,041 | | 21,954 | |
Corporate Tax |
|
|
|
|
|
|
|
|
|
|
|
|
|
|
|
| Gross companies tax | | 4,954 | | 4,938 | | 4,719 | | 4,932 | | 5,416 | | 5,722 | | 5,791 | |
| Refunds | | (123 | ) | (121 | ) | (195 | ) | (122 | ) | (134 | ) | (143 | ) | (146 | ) |
| Non-resident withholding tax | | 760 | | 685 | | 657 | | 640 | | 692 | | 716 | | 737 | |
| Foreign-source dividend withholding payment | | 71 | | 36 | | 149 | | 122 | | 56 | | 56 | | 56 | |
| | |
| |
| |
| |
| |
| |
| |
| |
| Total Corporate Tax | | 5,662 | | 5,538 | | 5,330 | | 5,572 | | 6,030 | | 6,351 | | 6,438 | |
Other Income Tax |
|
|
|
|
|
|
|
|
|
|
|
|
|
|
|
| Resident withholding tax on interest income | | 990 | | 993 | | 986 | | 1,026 | | 1,039 | | 1,038 | | 1,038 | |
| Resident withholding tax on dividend income | | 83 | | 53 | | 27 | | 49 | | 45 | | 46 | | 47 | |
| Estate and gift duties | | 2 | | 2 | | 2 | | 2 | | 2 | | 2 | | 2 | |
| | |
| |
| |
| |
| |
| |
| |
| |
| Total Other Income Tax | | 1,075 | | 1,048 | | 1,015 | | 1,077 | | 1,086 | | 1,086 | | 1,087 | |
| | |
| |
| |
| |
| |
| |
| |
| |
| Total Direct Taxation | | 23,863 | | 24,505 | | 24,478 | | 25,697 | | 27,139 | | 28,478 | | 29,479 | |
| | |
| |
| |
| |
| |
| |
| |
| |
NOTE 2: Indirect Taxation |
|
|
|
|
|
|
|
|
|
|
|
|
|
|
|
| Goods and Services Tax | | | | | | | | | | | | | | | |
| Gross goods and services tax | | 15,133 | | 15,054 | | 16,511 | | 16,796 | | 17,214 | | 17,878 | | 18,584 | |
| Refunds | | (6,007 | ) | (5,718 | ) | (6,545 | ) | (6,442 | ) | (6,427 | ) | (6,591 | ) | (6,770 | ) |
| | |
| |
| |
| |
| |
| |
| |
| |
| Total Goods and Services Tax | | 9,126 | | 9,336 | | 9,966 | | 10,354 | | 10,787 | | 11,287 | | 11,814 | |
Other Indirect Taxation |
|
|
|
|
|
|
|
|
|
|
|
|
|
|
|
| Petroleum fuels | | 810 | | 806 | | 846 | | 938 | | 943 | | 949 | | 957 | |
| Tobacco products | | 764 | | 802 | | 818 | | 807 | | 808 | | 806 | | 802 | |
| Customs duty | | 648 | | 649 | | 657 | | 680 | | 697 | | 708 | | 719 | |
| Road user charges | | 532 | | 575 | | 570 | | 602 | | 623 | | 646 | | 672 | |
| Alcoholic beverages | | 436 | | 447 | | 451 | | 452 | | 462 | | 469 | | 475 | |
| Gaming duties | | 206 | | 220 | | 242 | | 266 | | 279 | | 292 | | 304 | |
| Motor vehicle fees | | 181 | | 181 | | 181 | | 182 | | 184 | | 185 | | 186 | |
| Energy resources levies | | 111 | | 96 | | 107 | | 101 | | 97 | | 93 | | 91 | |
| Stamp, cheque and credit card duties | | 61 | | 68 | | 61 | | 62 | | 65 | | 68 | | 71 | |
| | |
| |
| |
| |
| |
| |
| |
| |
| Total Other Indirect Taxation | | 3,749 | | 3,844 | | 3,933 | | 4,090 | | 4,158 | | 4,216 | | 4,277 | |
| | |
| |
| |
| |
| |
| |
| |
| |
| Total Indirect Taxation | | 12,875 | | 13,180 | | 13,899 | | 14,444 | | 14,945 | | 15,503 | | 16,091 | |
| | |
| |
| |
| |
| |
| |
| |
| |
NOTE 3: Investment Income |
|
|
|
|
|
|
|
|
|
|
|
|
|
|
|
| Interest Income | | | | | | | | | | | | | | | |
| Marketable securities, deposits, mortgages and cash balances | | 463 | | 305 | | 377 | | 255 | | 330 | | 364 | | 382 | |
| Advances | | | | | | | | | | | | | | | |
| | Student loans | | 289 | | 326 | | 332 | | 386 | | 451 | | 512 | | 569 | |
| | Other entities | | 48 | | 66 | | 80 | | 104 | | 190 | | 232 | | 222 | |
| | |
| |
| |
| |
| |
| |
| |
| |
| Total Interest Income | | 800 | | 697 | | 789 | | 745 | | 971 | | 1,108 | | 1,173 | |
Dividend Income |
|
|
|
|
|
|
|
|
|
|
|
|
|
|
|
| State-owned enterprises | | 304 | | 199 | | 333 | | 412 | | 347 | | 303 | | 333 | |
| Other | | 21 | | 13 | | 74 | | 53 | | 21 | | 25 | | 23 | |
| | |
| |
| |
| |
| |
| |
| |
| |
| Total Dividend Income | | 325 | | 212 | | 407 | | 465 | | 368 | | 328 | | 356 | |
Other Investment Income |
|
|
|
|
|
|
|
|
|
|
|
|
|
|
|
| Gain/(loss) on marketable securities and deposits | | 102 | | — | | (2 | ) | — | | — | | — | | — | |
| NZS Fund investment income | | — | | 25 | | 14 | | 112 | | 261 | | 459 | | 688 | |
| Gain on sale of 2GHz radio spectrum licences | | 140 | | — | | — | | — | | — | | — | | — | |
| Other | | 2 | | — | | 11 | | 15 | | 15 | | 9 | | 15 | |
| | |
| |
| |
| |
| |
| |
| |
| |
| Total Other Investment Income | | 244 | | 25 | | 23 | | 127 | | 276 | | 468 | | 703 | |
| | |
| |
| |
| |
| |
| |
| |
| |
| Total Investment Income | | 1,369 | | 934 | | 1,219 | | 1,337 | | 1,615 | | 1,904 | | 2,232 | |
| | |
| |
| |
| |
| |
| |
| |
| |
NOTE 4: Other Operational Revenue |
|
|
|
|
|
|
|
|
|
|
|
|
|
|
|
| Recoveries from the Accident Compensation Corporation | | 106 | | 97 | | 105 | | 101 | | 101 | | 101 | | 101 | |
| Petroleum royalties | | 82 | | 32 | | 42 | | 33 | | 25 | | 24 | | 24 | |
| Cost recovery income from Fisheries | | 29 | | 27 | | 31 | | 34 | | 33 | | 31 | | 30 | |
| Income from Earthquake Commission | | 10 | | 10 | | 10 | | 10 | | 10 | | 10 | | 10 | |
| Other | | 154 | | 139 | | 210 | | 119 | | 122 | | 120 | | 119 | |
| | |
| |
| |
| |
| |
| |
| |
| |
| Total Other Operational Revenue | | 381 | | 305 | | 398 | | 297 | | 291 | | 286 | | 284 | |
| | |
| |
| |
| |
| |
| |
| |
| |
NOTE 5: Expenses by Input Type |
|
|
|
|
|
|
|
|
|
|
|
|
|
|
|
| Subsidies and transfer payments (see analysis below) | | 13,274 | | 13,886 | | 13,656 | | 13,972 | | 14,476 | | 14,880 | | 15,363 | |
| Operating expenses (see analysis below) | | 17,719 | | 18,307 | | 18,681 | | 19,681 | | 20,370 | | 20,880 | | 21,081 | |
| Personnel | | | | | | | | | | | | | | | |
| Personnel expenses (excluding pension expenses) | | 2,632 | | 2,762 | | 2,829 | | 2,954 | | 2,950 | | 2,946 | | 2,978 | |
| GSF pension expenses | | 691 | | 718 | | 707 | | 671 | | 680 | | 680 | | 719 | |
| Movement in unfunded pension liability | | 164 | | (51 | ) | (368 | ) | — | | — | | — | | — | |
| Other pension expenses | | 56 | | 53 | | 53 | | 50 | | 50 | | 51 | | 51 | |
| Depreciation | | | | | | | | | | | | | | | |
| Physical assets | | 751 | | 785 | | 764 | | 823 | | 857 | | 869 | | 877 | |
| State highways | | 174 | | 94 | | 179 | | 190 | | 202 | | 215 | | 229 | |
| Rental and leasing costs | | 282 | | 256 | | 278 | | 277 | | 275 | | 275 | | 276 | |
| Loss/(gain) on sale of assets | | 7 | | — | | 2 | | — | | — | | — | | — | |
| Finance costs (see analysis below) | | 2,483 | | 2,395 | | 2,303 | | 2,339 | | 2,425 | | 2,501 | | 2,572 | |
| Net foreign-exchange losses/(gains) on liabilities | | 404 | | — | | (575 | ) | — | | — | | — | | — | |
| Net foreign-exchange (gains)/losses on assets | | (451 | ) | — | | 639 | | — | | — | | — | | — | |
| Forecast for future new spending (see analysis below) | | — | | 160 | | — | | 230 | | 700 | | 1,180 | | 2,080 | |
| | |
| |
| |
| |
| |
| |
| |
| |
| Total Expenses | | 38,186 | | 39,365 | | 39,148 | | 41,187 | | 42,985 | | 44,477 | | 46,226 | |
| | |
| |
| |
| |
| |
| |
| |
| |
Analysis of Subsidies and Transfer Payments |
|
|
|
|
|
|
|
|
|
|
|
|
|
|
|
| Social assistance grants | | | | | | | | | | | | | | | |
| New Zealand Superannuation | | 5,273 | | 5,472 | | 5,457 | | 5,645 | | 5,888 | | 6,112 | | 6,399 | |
| Community Wage | | 1,849 | | — | | — | | — | | — | | — | | — | |
| Unemployment Benefit | | — | | 1,527 | | 1,406 | | 1,364 | | 1,419 | | 1,451 | | 1,468 | |
| Domestic Purposes Benefit | | 1,444 | | 1,489 | | 1,486 | | 1,521 | | 1,570 | | 1,599 | | 1,631 | |
| Family Support | | 878 | | 899 | | 870 | | 870 | | 872 | | 874 | | 876 | |
| Student allowances | | 391 | | 428 | | 411 | | 441 | | 458 | | 473 | | 490 | |
| Other social assistance grants | | 3,073 | | 3,692 | | 3,644 | | 3,738 | | 3,871 | | 3,985 | | 4,113 | |
| Subsidies | | 115 | | 125 | | 125 | | 127 | | 135 | | 125 | | 125 | |
| Other transfer payments | | | | | | | | | | | | | | | |
| Official development assistance | | 226 | | 227 | | 223 | | 230 | | 227 | | 226 | | 226 | |
| Other | | 25 | | 27 | | 34 | | 36 | | 36 | | 35 | | 35 | |
| | |
| |
| |
| |
| |
| |
| |
| |
| Total Subsidies and Transfer Payments | | 13,274 | | 13,886 | | 13,656 | | 13,972 | | 14,476 | | 14,880 | | 15,363 | |
| | |
| |
| |
| |
| |
| |
| |
| |
Analysis of Operating Expenses |
|
|
|
|
|
|
|
|
|
|
|
|
|
|
|
| Education purchases | | | | | | | | | | | | | | | |
| Early childhood education | | 331 | | 357 | | 362 | | 387 | | 393 | | 395 | | 398 | |
| Primary and secondary education | | 3,505 | | 3,677 | | 3,642 | | 3,653 | | 3,698 | | 3,700 | | 3,712 | |
| Tertiary education and training | | 1,508 | | 1,635 | | 1,733 | | 1,892 | | 1,958 | | 2,022 | | 2,065 | |
| Health purchases | | 6,807 | | 6,967 | | 7,011 | | 7,639 | | 8,100 | | 8,608 | | 8,716 | |
| Science purchases | | 467 | | 478 | | 463 | | 490 | | 507 | | 511 | | 524 | |
| Other operating expenses | | 5,101 | | 5,193 | | 5,470 | | 5,620 | | 5,714 | | 5,644 | | 5,666 | |
| | |
| |
| |
| |
| |
| |
| |
| |
| Total Operating Expenses | | 17,719 | | 18,307 | | 18,681 | | 19,681 | | 20,370 | | 20,880 | | 21,081 | |
| | |
| |
| |
| |
| |
| |
| |
| |
Analysis of Finance Costs |
|
|
|
|
|
|
|
|
|
|
|
|
|
|
|
| Interest | | | | | | | | | | | | | | | |
| New Zealand dollars | | 2,035 | | 2,044 | | 1,966 | | 2,064 | | 2,127 | | 2,181 | | 2,248 | |
| Foreign currencies | | 428 | | 328 | | 295 | | 245 | | 268 | | 295 | | 301 | |
| Other finance costs | | 20 | | 23 | | 42 | | 30 | | 30 | | 25 | | 23 | |
| | |
| |
| |
| |
| |
| |
| |
| |
| Total Finance Costs | | 2,483 | | 2,395 | | 2,303 | | 2,339 | | 2,425 | | 2,501 | | 2,572 | |
| | |
| |
| |
| |
| |
| |
| |
| |
Analysis of Forecast for Future New Spending |
|
|
|
|
|
|
|
|
|
|
|
|
|
|
|
| 2001/02 contingency provision | | — | | 160 | | — | | — | | — | | — | | — | |
| 2002/03 Budget contingency provision | | — | | — | | — | | 230 | | 200 | | 180 | | 180 | |
| 2003/04 indicative new spending | | — | | — | | — | | — | | 500 | | 500 | | 500 | |
| 2004/05 indicative new spending | | — | | — | | — | | — | | — | | 500 | | 500 | |
| 2005/06 indicative new spending | | — | | — | | — | | — | | — | | — | | 900 | |
| | |
| |
| |
| |
| |
| |
| |
| |
| Total Forecast for Future New Spending | | — | | 160 | | — | | 230 | | 700 | | 1,180 | | 2,080 | |
| | |
| |
| |
| |
| |
| |
| |
| |
NOTE 6: Advances |
|
|
|
|
|
|
|
|
|
|
|
|
|
|
|
| Advances to State-owned Enterprises and Crown Entities | | | | | | | | | | | | | | | |
| Housing New Zealand Corporation | | 163 | | 643 | | 639 | | 737 | | 1,091 | | 1,137 | | 1,177 | |
| District health boards/Residual Health Management Unit | | 53 | | 296 | | 224 | | 549 | | 1,057 | | 1,163 | | 1,359 | |
| Other state-owned enterprises and Crown entities | | 45 | | — | | 27 | | 28 | | — | | — | | — | |
| | |
| |
| |
| |
| |
| |
| |
| |
| Total Advances to State-owned Enterprises and Crown Entities | | 261 | | 939 | | 890 | | 1,314 | | 2,148 | | 2,300 | | 2,536 | |
| | |
| |
| |
| |
| |
| |
| |
| |
Other Advances |
|
|
|
|
|
|
|
|
|
|
|
|
|
|
|
| Student loans | | 4,143 | | 4,776 | | 4,798 | | 5,531 | | 6,295 | | 7,075 | | 7,863 | |
| Contact Energy Limited | | 118 | | 48 | | 48 | | — | | — | | — | | — | |
| Maori development rural lending | | 38 | | 58 | | 42 | | 42 | | 42 | | 42 | | 42 | |
| Forestry encouragement loans | | 29 | | 30 | | 30 | | 28 | | 27 | | 27 | | 26 | |
| Other | | 26 | | 22 | | 88 | | 96 | | 103 | | 111 | | 132 | |
| | |
| |
| |
| |
| |
| |
| |
| |
| Total Other Advances | | 4,354 | | 4,934 | | 5,006 | | 5,697 | | 6,467 | | 7,255 | | 8,063 | |
| | |
| |
| |
| |
| |
| |
| |
| |
| Total Advances | | 4,615 | | 5,873 | | 5,896 | | 7,011 | | 8,615 | | 9,555 | | 10,599 | |
| | |
| |
| |
| |
| |
| |
| |
| |
Analysis of Student Loans |
|
|
|
|
|
|
|
|
|
|
|
|
|
|
|
| Outstanding balance | | | | | | | | | | | | | | | |
| Total loans outstanding (including interest) | | 4,655 | | 5,355 | | 5,368 | | 6,187 | | 7,035 | | 7,900 | | 8,779 | |
| Total provisions (capital and interest) | | (512 | ) | (579 | ) | (570 | ) | (656 | ) | (740 | ) | (825 | ) | (916 | ) |
| | |
| |
| |
| |
| |
| |
| |
| |
| Total Student Loans | | 4,143 | | 4,776 | | 4,798 | | 5,531 | | 6,295 | | 7,075 | | 7,863 | |
| | |
| |
| |
| |
| |
| |
| |
| |
| Movement during the year | | | | | | | | | | | | | | | |
| Opening balance | | 3,523 | | 4,155 | | 4,143 | | 4,798 | | 5,531 | | 6,295 | | 7,075 | |
| Amount advanced in current year | | 867 | | 963 | | 959 | | 1,052 | | 1,124 | | 1,182 | | 1,240 | |
| Interest accrued on outstanding loan balances | | 289 | | 326 | | 333 | | 386 | | 451 | | 512 | | 569 | |
| Repayment of base capital | | (198 | ) | (250 | ) | (243 | ) | (279 | ) | (324 | ) | (372 | ) | (419 | ) |
| Repayment of accrued interest | | (123 | ) | (157 | ) | (148 | ) | (175 | ) | (206 | ) | (240 | ) | (274 | ) |
| Interest written off and movement in provision for interest write-offs and doubtful debts | | (227 | ) | (269 | ) | (253 | ) | (259 | ) | (289 | ) | (310 | ) | (336 | ) |
| Other movements | | 12 | | 8 | | 7 | | 8 | | 8 | | 8 | | 8 | |
| | |
| |
| |
| |
| |
| |
| |
| |
| Closing Balance | | 4,143 | | 4,776 | | 4,798 | | 5,531 | | 6,295 | | 7,075 | | 7,863 | |
| | |
| |
| |
| |
| |
| |
| |
| |
NOTE 7: Receivables |
|
|
|
|
|
|
|
|
|
|
|
|
|
|
|
| Taxes receivable | | 4,962 | | 4,437 | | 4,935 | | 4,997 | | 5,022 | | 5,055 | | 5,050 | |
| Accounts receivable | | 1,024 | | 856 | | 923 | | 951 | | 844 | | 875 | | 865 | |
| Receivable from the sale and purchase of Maui gas | | 111 | | 103 | | 109 | | 97 | | 98 | | 118 | | 83 | |
| Prepayments | | 100 | | 43 | | 70 | | 66 | | 60 | | 60 | | 60 | |
| | |
| |
| |
| |
| |
| |
| |
| |
| Total Receivables | | 6,197 | | 5,439 | | 6,037 | | 6,111 | | 6,024 | | 6,108 | | 6,058 | |
| | |
| |
| |
| |
| |
| |
| |
| |
NOTE 8: Financial Interest in State-Owned Enterprises and Crown Entities |
|
|
|
|
|
|
|
|
|
|
|
|
|
|
| Surplus | | | | | | | | | | | | | | |
| State-owned enterprises | | 432 | | 307 | | 395 | | 486 | | 586 | | 614 | | 700 |
| Crown entities | | (8 | ) | 646 | | 620 | | 498 | | 698 | | 794 | | 860 |
| | |
| |
| |
| |
| |
| |
| |
|
| Total Surplus | | 424 | | 953 | | 1,015 | | 984 | | 1,284 | | 1,408 | | 1,560 |
| | |
| |
| |
| |
| |
| |
| |
|
Dividends and Other Distributions |
|
|
|
|
|
|
|
|
|
|
|
|
|
|
| State-owned enterprises | | 304 | | 199 | | 333 | | 412 | | 347 | | 303 | | 333 |
| Crown entities | | 17 | | 9 | | 70 | | 49 | | 16 | | 20 | | 18 |
| | |
| |
| |
| |
| |
| |
| |
|
| Total Dividends and Other Distributions | | 321 | | 208 | | 403 | | 461 | | 363 | | 323 | | 351 |
| | |
| |
| |
| |
| |
| |
| |
|
Net Equity |
|
|
|
|
|
|
|
|
|
|
|
|
|
|
| State-owned enterprises | | 5,554 | | 5,643 | | 6,253 | | 6,327 | | 6,566 | | 6,924 | | 7,291 |
| Crown entities | | 8,523 | | 9,471 | | 9,375 | | 10,287 | | 11,246 | | 12,195 | | 13,133 |
| | |
| |
| |
| |
| |
| |
| |
|
| Total Net Equity | | 14,077 | | 15,114 | | 15,628 | | 16,614 | | 17,812 | | 19,119 | | 20,424 |
| | |
| |
| |
| |
| |
| |
| |
|
| Balance dates | | | | | | | | | | | | | | |
All state-owned enterprises and significant Crown entities have a balance date of 30 June except for the following:
| State-owned enterprises | | |
| Timberlands West Coast Limited | | 31 March |
| Significant Crown entities | | |
| School boards of trustees | | 31 December |
| Tertiary education institutions | | 31 December |
Minority Interests
All state-owned enterprises and Crown entities are 100% owned by the Crown. The ownership interest in Air New Zealand is 82%. Air New Zealand forecast information is included within the total SOE forecast information.
| NOTE 9: Physical Assets | | | | | | | | | | | | | | | |
| By Type | | | | | | | | | | | | | | | |
| Cost or Valuation | | | | | | | | | | | | | | | |
| Land | | 1,844 | | 1,887 | | 1,871 | | 1,888 | | 1,881 | | 1,882 | | 1,885 | |
| Properties intended for sale | | 464 | | 446 | | 441 | | 425 | | 419 | | 416 | | 417 | |
| Buildings | | 8,654 | | 9,066 | | 9,179 | | 9,761 | | 10,185 | | 10,428 | | 10,750 | |
| Specialist military equipment | | 2,686 | | 2,780 | | 2,828 | | 3,022 | | 3,369 | | 3,437 | | 3,352 | |
| Other assets | | 2,688 | | 2,639 | | 2,686 | | 2,676 | | 2,695 | | 2,703 | | 2,711 | |
| Other plant and equipment | | 2,213 | | 2,571 | | 2,475 | | 2,685 | | 2,856 | | 2,988 | | 3,112 | |
| | |
| |
| |
| |
| |
| |
| |
| |
| Total Cost or Valuation | | 18,549 | | 19,389 | | 19,480 | | 20,457 | | 21,405 | | 21,854 | | 22,227 | |
Accumulated Depreciation |
|
|
|
|
|
|
|
|
|
|
|
|
|
|
|
| Buildings | | 729 | | 1,085 | | 1,300 | | 1,671 | | 2,049 | | 2,340 | | 2,723 | |
| Specialist military equipment | | 421 | | 594 | | 580 | | 759 | | 955 | | 1,155 | | 1,243 | |
| Other assets | | 5 | | 5 | | 9 | | 11 | | 13 | | 15 | | 17 | |
| Other plant and equipment | | 1,292 | | 1,629 | | 1,404 | | 1,599 | | 1,796 | | 1,973 | | 2,152 | |
| | |
| |
| |
| |
| |
| |
| |
| |
| Total Accumulated Depreciation | | 2,447 | | 3,313 | | 3,293 | | 4,040 | | 4,813 | | 5,483 | | 6,135 | |
Net Book Value |
|
|
|
|
|
|
|
|
|
|
|
|
|
|
|
| Land | | 1,844 | | 1,887 | | 1,871 | | 1,888 | | 1,881 | | 1,882 | | 1,885 | |
| Properties intended for sale | | 464 | | 446 | | 441 | | 425 | | 419 | | 416 | | 417 | |
| Buildings | | 7,925 | | 7,981 | | 7,879 | | 8,090 | | 8,136 | | 8,088 | | 8,027 | |
| Specialist military equipment | | 2,265 | | 2,186 | | 2,248 | | 2,263 | | 2,414 | | 2,282 | | 2,109 | |
| Other assets | | 2,683 | | 2,634 | | 2,677 | | 2,665 | | 2,682 | | 2,688 | | 2,694 | |
| Other plant and equipment | | 921 | | 942 | | 1,071 | | 1,086 | | 1,060 | | 1,015 | | 960 | |
| | |
| |
| |
| |
| |
| |
| |
| |
| Total Net Book Value | | 16,102 | | 16,076 | | 16,187 | | 16,417 | | 16,592 | | 16,371 | | 16,092 | |
| | |
| |
| |
| |
| |
| |
| |
| |
Movements |
|
|
|
|
|
|
|
|
|
|
|
|
|
|
|
| Cost or Valuation | | | | | | | | | | | | | | | |
| Opening balance | | 18,507 | | 18,534 | | 18,549 | | 19,480 | | 20,457 | | 21,405 | | 21,854 | |
| Net additions | | 905 | | 855 | | 887 | | 977 | | 948 | | 449 | | 373 | |
| Revaluations | | (863 | ) | — | | 44 | | — | | — | | — | | — | |
| | |
| |
| |
| |
| |
| |
| |
| |
| Total Cost or Valuation | | 18,549 | | 19,389 | | 19,480 | | 20,457 | | 21,405 | | 21,854 | | 22,227 | |
Accumulated Depreciation |
|
|
|
|
|
|
|
|
|
|
|
|
|
|
|
| Opening balance | | 2,535 | | 2,568 | | 2,447 | | 3,293 | | 4,040 | | 4,813 | | 5,483 | |
| Disposals | | (145 | ) | (40 | ) | 92 | | (76 | ) | (84 | ) | (199 | ) | (225 | ) |
| Depreciation charged for the period | | 751 | | 785 | | 764 | | 823 | | 857 | | 869 | | 877 | |
| Revaluations | | (694 | ) | — | | (10 | ) | — | | — | | — | | — | |
| | |
| |
| |
| |
| |
| |
| |
| |
| Total Accumulated Depreciation | | 2,447 | | 3,313 | | 3,293 | | 4,040 | | 4,813 | | 5,483 | | 6,135 | |
| | |
| |
| |
| |
| |
| |
| |
| |
| Net Physical Assets | | 16,102 | | 16,076 | | 16,187 | | 16,417 | | 16,592 | | 16,371 | | 16,092 | |
| | |
| |
| |
| |
| |
| |
| |
| |
By Holding |
|
|
|
|
|
|
|
|
|
|
|
|
|
|
|
| Freehold assets | | 16,062 | | 16,037 | | 16,144 | | 16,376 | | 16,551 | | 16,330 | | 16,051 | |
| Leasehold assets | | 40 | | 39 | | 43 | | 41 | | 41 | | 41 | | 41 | |
| | |
| |
| |
| |
| |
| |
| |
| |
| Net Physical Assets | | 16,102 | | 16,076 | | 16,187 | | 16,417 | | 16,592 | | 16,371 | | 16,092 | |
| | |
| |
| |
| |
| |
| |
| |
| |
| NOTE 10: State Highways | | | | | | | | | | | | | | |
| Cost or Valuation | | | | | | | | | | | | | | |
| Opening balance | | 8,911 | | 10,788 | | 11,055 | | 11,327 | | 11,647 | | 11,947 | | 12,267 |
| Recognition adjustment | | 1,650 | | — | | — | | — | | — | | — | | — |
| Net additions | | 300 | | 245 | | 272 | | 320 | | 300 | | 320 | | 355 |
| Revaluations | | 194 | | — | | — | | — | | — | | — | | — |
| | |
| |
| |
| |
| |
| |
| |
|
| Total Cost or Valuation | | 11,055 | | 11,033 | | 11,327 | | 11,647 | | 11,947 | | 12,267 | | 12,622 |
Accumulated Depreciation |
|
|
|
|
|
|
|
|
|
|
|
|
|
|
| Opening balance | | — | | 92 | | — | | 179 | | 369 | | 571 | | 786 |
| Depreciation charged for the period | | 174 | | 94 | | 179 | | 190 | | 202 | | 215 | | 229 |
| Revaluations | | (174 | ) | — | | — | | — | | — | | — | | — |
| | |
| |
| |
| |
| |
| |
| |
|
| Total Accumulated Depreciation | | — | | 186 | | 179 | | 369 | | 571 | | 786 | | 1,015 |
| | |
| |
| |
| |
| |
| |
| |
|
| Total State Highways | | 11,055 | | 10,847 | | 11,148 | | 11,278 | | 11,376 | | 11,481 | | 11,607 |
| | |
| |
| |
| |
| |
| |
| |
|
NOTE 11: Payables and Provisions |
|
|
|
|
|
|
|
|
|
|
|
|
|
|
| Accounts payable | | 1,631 | | 1,780 | | 2,198 | | 2,192 | | 2,023 | | 2,253 | | 2,112 |
| Accruals and provisions | | 1,193 | | 409 | | 194 | | 193 | | 360 | | 234 | | 300 |
| Taxes repayable | | 1,907 | | 1,711 | | 1,943 | | 1,938 | | 1,933 | | 1,928 | | 1,928 |
| National Provident Fund guarantee | | 686 | | 480 | | 686 | | 686 | | 686 | | 686 | | 686 |
| Provisions for employee entitlements | | 414 | | 378 | | 407 | | 400 | | 395 | | 390 | | 384 |
| | |
| |
| |
| |
| |
| |
| |
|
| Total Payables and Provisions | | 5,831 | | 4,758 | | 5,428 | | 5,409 | | 5,397 | | 5,491 | | 5,410 |
| | |
| |
| |
| |
| |
| |
| |
|
NOTE 12: Revaluation Reserve |
|
|
|
|
|
|
|
|
|
|
|
|
|
|
| Opening Balance | | 8,201 | | 7,899 | | 8,007 | | 8,039 | | 8,039 | | 8,039 | | 8,039 |
| Net revaluations | | | | | | | | | | | | | | |
| State-owned enterprises and Crown entities | | 368 | | — | | (18 | ) | — | | — | | — | | — |
| Land and buildings | | 85 | | — | | 50 | | — | | — | | — | | — |
| State highways | | (258 | ) | — | | — | | — | | — | | — | | — |
| Specialist military equipment | | 4 | | — | | — | | — | | — | | — | | — |
| Other assets | | (378 | ) | — | | 4 | | — | | — | | — | | — |
| | |
| |
| |
| |
| |
| |
| |
|
| Total Net Revaluations | | (179 | ) | — | | 36 | | — | | — | | — | | — |
Transfer to accumulated operating balance |
|
(15 |
) |
— |
|
(4 |
) |
— |
|
— |
|
— |
|
— |
| | |
| |
| |
| |
| |
| |
| |
|
| Closing Revaluation Reserve | | 8,007 | | 7,899 | | 8,039 | | 8,039 | | 8,039 | | 8,039 | | 8,039 |
| | |
| |
| |
| |
| |
| |
| |
|
GAAP Tables—Line-by-Line Consolidation
The financial statements presentation is changing
The Public Finance Act 1989 and Fiscal Responsibility Act 1994 require the government to produce actual and forecast financial statements in accordance with generally accepted accounting practice (GAAP). This ensures that the financial statements and forecasts of the Crown are prepared on a basis familiar to readers of private sector financial statements—providing a transparent and independently established set of principles on which to measure a government's financial activity.
GAAP will soon require the full line-by-line consolidation of SOEs and Crown entities (currently the accounts only consolidate the net surplus in the operating balance and net investment/net worth in the balance sheet). In addition, there are some adjustments that will impact on "core Crown" (defined below) results owing to changes to the treatment of GST on Crown spending and the treatment of the Government Superannuation Fund (GSF).
The following table outlines the presentation and how it is changing. It defines the key terms that are used within the following summary financial statements.
Current presentation of consolidation
| | Future presentation of consolidation
|
|---|
| The current presentation shows: | | The future presentation will show the three institutional forms of: |
•
• | | Crown expenses and revenues with net SOE and Crown entity results
Crown assets, liabilities, net Crown debt, gross Crown debt and net worth. The Crown balance sheet only includes a net investmen in SOEs and Crown entities. | |
•
•
•
| |
"core Crown" (existing information on revenues and expenses less GST on Crown expenses plus inclusion of full GSF numbers)
SOE revenues, expenses, assets, liabilities
Crown entity revenues, expenses, assets, liabilities. |
|
|
|
|
The sum of these three segments (less internal transactions) is the "total Crown". |
|
|
|
|
The core Crown is different from the current presentation owing to the removal of GST on Crown expenses and the inclusion of the full accounts of the GSF. |
While the presentation is changing it is important to note that the net results for the Crown will be materially the same (ie, operating balance and net worth), although the composition and total of items such as revenues, expenses, assets and liabilities will change.
A full explanation of the presentation change, what the impacts are and how to interpret the new information is outlined in a section contained at the end of the Fiscal Outlook chapter.
Accounting and Forecast Policies
The accounting and forecast policies are outlined in the previous set of GAAP tables. The substantive difference between the existing accounting policies and those underpinning the preparation of the future presentation is the consolidation policy itself. This change is outlined on the previous page.
Other than the consolidation policy, there are no substantive alterations to the existing accounting and forecast policies as a result of implementing full line-by-line consolidation of SOEs and Crown entities.
There is, however, a need for additional policies because of the inclusion of new classes of property, plant and equipment (physical assets). Essentially the new specific accounting policies relate to the valuation approach to electricity distribution equipment, electricity generation equipment and aircraft. These policies will be finalised as part of the 30 June 2003 Crown financial statements (the first set of fully consolidated accounts).
Contents and Definitions
Because of the different presentation used in the following summary financial statements, there are some new terms used to classify components of the statement of financial position and statement of borrowings. The following outlines a summary to the content and definitions of each section. More detailed notes are published on Treasury's website.
Financial performance (operating statement): The statement of financial performance is accompanied by a breakdown of both total Crown and core Crown expenses. There are no new classifications from those contained in the existing set of fiscal forecasts.
Financial position (balance sheet): The statement of financial performance is accompanied by some analysis of key components. In terms of new definitions:
- •
- Borrowings are split between sovereign-guaranteed and non-sovereign-guaranteed. Essentially the debt of SOEs and Crown entities is not guaranteed explicitly by the Crown and so a distinction is made from the debt issued by the sovereign (eg, NZDMO and the Reserve Bank).
- •
- Another term is gross sovereign-issued debt. This is debt issued by the sovereign and so is a measure that does not eliminate any cross-holdings of Government stock held by entities such as the NZS Fund, GSF, ACC or EQC. The Government's debt objective uses this measure.
- •
- The ACC outstanding claims liability is shown separately in the balance sheet.
Cash flow statement:
- •
- The cash flow has been summarised.
- •
- There is no substantive change to the reconciliation of cash flows to the movement in domestic bonds. While there are cross-holdings of Government stock held by other entities within the consolidated accounts, these are not eliminated for the purposes of this statement as it provides a reference point for the Government's domestic debt programme.
Borrowing statement: The borrowings statement reflects the sovereign-guaranteed and non-sovereign-guaranteed split to borrowings (or debt). It includes ALL financial assets, including those of the GSF and the NZS Fund.
The measure of net Crown debt cannot be directly derived from the information in the borrowings statement. This is contained in more specific notes that outline the core Crown, SOE and Crown entity information separately.
Segment notes: These notes provide a summary of the operating statement, balance sheet and borrowings statement information by each of the three institutional segments that make up the Crown financial statements. These segments are the core Crown, SOEs and Crown entities — adding to total Crown after elimination of internal transactions.
Summary Table
The following summary tables outline the key fiscal variables, comparing from the current presentation to those contained in the following GAAP tables prepared using the future presentation. The first table is expressed as a percentage of GDP. The second table is expressed in nominal dollars.
Summary indicators
| | 1997
Actual
| | 1998
Actual
| | 1999
Actual
| | 2000
Actual
| | 2001
Actual
| | 2002
Estimated
Actual
| | 2003
Forecast
| | 2004
Forecast
| | 2005
Forecast
| | 2006
Forecast
| |
|---|
| | (% of GDP)
| |
|---|
| Revenue | | | | | | | | | | | | | | | | | | | | | |
| Current presentation | | 35.5 | % | 35.7 | % | 35.7 | % | 34.1 | % | 34.6 | % | 34.2 | % | 34.4 | % | 34.4 | % | 34.5 | % | 34.4 | % |
| Future presentation of Core Crown | | 34.2 | % | 34.3 | % | 33.8 | % | 32.3 | % | 33.3 | % | 32.9 | % | 33.1 | % | 33.0 | % | 33.1 | % | 33.1 | % |
| Future presentation of Total Crown | | 41.5 | % | 42.1 | % | 42.1 | % | 39.7 | % | 40.9 | % | 42.5 | % | 43.3 | % | 43.3 | % | 43.4 | % | 43.2 | % |
| Expenses | | | | | | | | | | | | | | | | | | | | | |
| Current presentation | | 33.6 | % | 34.3 | % | 35.2 | % | 33.8 | % | 33.5 | % | 32.5 | % | 33.0 | % | 32.7 | % | 32.4 | % | 32.3 | % |
| Future presentation of Core Crown | | 32.4 | % | 32.9 | % | 33.8 | % | 32.3 | % | 32.2 | % | 31.2 | % | 31.7 | % | 31.4 | % | 31.0 | % | 30.9 | % |
| Future presentation of Total Crown | | 39.5 | % | 40.0 | % | 40.3 | % | 38.3 | % | 39.7 | % | 40.3 | % | 41.4 | % | 41.0 | % | 40.5 | % | 40.3 | % |
| Operating balance | | | | | | | | | | | | | | | | | | | | | |
| Current presentation | | 1.9 | % | 2.5 | % | 1.7 | % | 1.4 | % | 1.2 | % | 2.2 | % | 1.8 | % | 2.3 | % | 2.9 | % | 3.0 | % |
| Future presentation | | 1.9 | % | 2.1 | % | 1.7 | % | 1.4 | % | 1.2 | % | 2.2 | % | 1.8 | % | 2.3 | % | 2.9 | % | 3.0 | % |
| OBERAC (no changes) | | 1.9 | % | 2.2 | % | 0.2 | % | 0.8 | % | 1.8 | % | 1.9 | % | 1.8 | % | 2.3 | % | 2.9 | % | 3.0 | % |
| Gross debt | | | | | | | | | | | | | | | | | | | | | |
| Current presentation | | 36.7 | % | 38.0 | % | 36.1 | % | 33.7 | % | 32.2 | % | 30.2 | % | 28.6 | % | 29.2 | % | 28.8 | % | 28.4 | % |
| Future presentation of Core Crown | | 35.0 | % | 36.1 | % | 33.8 | % | 31.6 | % | 29.6 | % | 28.9 | % | 28.4 | % | 29.0 | % | 28.6 | % | 28.2 | % |
| Future presentation of Total Crown | | 37.8 | % | 38.2 | % | 35.2 | % | 32.4 | % | 30.4 | % | 31.3 | % | 30.5 | % | 30.2 | % | 29.4 | % | 28.3 | % |
| Gross sovereign-issued debt (no change) | | 36.7 | % | 38.0 | % | 36.1 | % | 33.7 | % | 32.2 | % | 30.2 | % | 28.6 | % | 29.2 | % | 28.8 | % | 28.4 | % |
| Net Crown debt | | | | | | | | | | | | | | | | | | | | | |
| Current presentation | | 25.9 | % | 24.1 | % | 21.3 | % | 20.0 | % | 17.5 | % | 16.8 | % | 16.8 | % | 16.8 | % | 16.2 | % | 15.5 | % |
| Future presentation | | 24.1 | % | 22.2 | % | 19.1 | % | 17.9 | % | 14.9 | % | 15.5 | % | 16.5 | % | 16.6 | % | 16.0 | % | 15.3 | % |
| Net worth (no change) | | 7.6 | % | 9.9 | % | 5.9 | % | 8.0 | % | 10.0 | % | 11.8 | % | 13.2 | % | 14.9 | % | 17.2 | % | 19.4 | % |
Tax and Sovereign revenue |
|
|
|
|
|
|
|
|
|
|
|
|
|
|
|
|
|
|
|
|
|
| Tax revenue | | | | | | | | | | | | | | | | | | | | | |
| Current presentation | | 32.6 | % | 33.1 | % | 31.6 | % | 31.8 | % | 32.2 | % | 31.9 | % | 32.1 | % | 32.1 | % | 32.1 | % | 31.9 | % |
| Future presentation of Core Crown | | 31.0 | % | 31.5 | % | 30.0 | % | 30.1 | % | 30.7 | % | 30.3 | % | 30.5 | % | 30.4 | % | 30.4 | % | 30.2 | % |
| Future presentation of Total Crown | | 30.8 | % | 31.2 | % | 29.7 | % | 29.9 | % | 30.4 | % | 30.1 | % | 30.3 | % | 30.1 | % | 30.1 | % | 29.9 | % |
| Total sovereign revenue (i.e. levies) | | | | | | | | | | | | | | | | | | | | | |
| Current presentation | | 32.9 | % | 33.3 | % | 31.9 | % | 32.1 | % | 32.5 | % | 32.3 | % | 32.5 | % | 32.4 | % | 32.4 | % | 32.2 | % |
| Future presentation of Core Crown | | 31.3 | % | 31.8 | % | 30.3 | % | 30.5 | % | 31.0 | % | 30.7 | % | 30.9 | % | 30.7 | % | 30.8 | % | 30.5 | % |
| Future presentation of Core Crown | | 33.0 | % | 33.5 | % | 31.8 | % | 31.5 | % | 32.4 | % | 32.2 | % | 32.3 | % | 32.1 | % | 32.0 | % | 31.8 | % |
| Nominal GDP ($ million) | | 97,933 | | 99,790 | | 101,761 | | 107,064 | | 114,145 | | 120,309 | | 124,964 | | 131,293 | | 137,201 | | 143,026 | |
Notes:
- •
- Net Crown debt is a measure of core Crown borrowings less financial assets. It is defined to exclude the assets of the NZS Fund and the GSF as these can only be used for very specific purposes.
- •
- Explanation of what causes the changes between the various measures is discussed in the detailed consolidation section contained at the end of the Fiscal Outlook chapter.
Summary indicators
| | 1997
Actual
| | 1998
Actual
| | 1999
Actual
| | 2000
Actual
| | 2001
Actual
| | 2002
Estimated
Actual
| | 2003
Forecast
| | 2004
Forecast
| | 2005
Forecast
| | 2006
Forecast
|
|---|
| | ($ million)
|
|---|
| Revenue | | | | | | | | | | | | | | | | | | | | |
| Current presentation | | 34,778 | | 35,581 | | 36,357 | | 36,526 | | 39,492 | | 41,172 | | 42,952 | | 45,142 | | 47,329 | | 49,259 |
| Future presentation of Core Crown | | 33,533 | | 34,222 | | 34,367 | | 34,536 | | 38,005 | | 39,526 | | 41,319 | | 43,330 | | 45,451 | | 47,280 |
| Future presentation of Total Crown | | 40,595 | | 41,997 | | 42,807 | | 42,513 | | 46,686 | | 51,178 | | 54,052 | | 56,873 | | 59,544 | | 61,825 |
Expenses |
|
|
|
|
|
|
|
|
|
|
|
|
|
|
|
|
|
|
|
|
| Current presentation | | 32,953 | | 34,211 | | 35,825 | | 36,171 | | 38,186 | | 39,148 | | 41,187 | | 42,985 | | 44,477 | | 46,226 |
| Future presentation of Core Crown | | 31,708 | | 32,852 | | 34,367 | | 34,536 | | 36,699 | | 37,502 | | 39,554 | | 41,173 | | 42,599 | | 44,247 |
| Future presentation of Total Crown | | 38,687 | | 39,870 | | 41,044 | | 41,010 | | 45,328 | | 48,542 | | 51,764 | | 53,795 | | 55,607 | | 57,583 |
Operating balance |
|
|
|
|
|
|
|
|
|
|
|
|
|
|
|
|
|
|
|
|
| Current presentation | | 1,908 | | 2,534 | | 1,777 | | 1,449 | | 1,409 | | 2,636 | | 2,288 | | 3,078 | | 3,937 | | 4,242 |
| Future presentation | | 1,908 | | 2,127 | | 1,763 | | 1,503 | | 1,358 | | 2,636 | | 2,288 | | 3,078 | | 3,937 | | 4,242 |
OBERAC (no changes) |
|
1,904 |
|
2,191 |
|
246 |
|
884 |
|
2,107 |
|
2,310 |
|
2,288 |
|
3,078 |
|
3,937 |
|
4,242 |
Gross debt |
|
|
|
|
|
|
|
|
|
|
|
|
|
|
|
|
|
|
|
|
| Current presentation | | 35,972 | | 37,892 | | 36,712 | | 36,041 | | 36,761 | | 36,299 | | 35,781 | | 38,391 | | 39,543 | | 40,656 |
| Future presentation of Core Crown | | 34,267 | | 36,002 | | 34,425 | | 33,812 | | 33,811 | | 34,799 | | 35,441 | | 38,041 | | 39,193 | | 40,306 |
| Future presentation of Total Crown | | 36,999 | | 38,125 | | 35,777 | | 34,675 | | 34,652 | | 37,623 | | 38,159 | | 39,600 | | 40,277 | | 40,492 |
Gross sovereign-issued debt (no change) |
|
35,972 |
|
37,892 |
|
36,712 |
|
36,041 |
|
36,761 |
|
36,299 |
|
35,781 |
|
38,391 |
|
39,543 |
|
40,656 |
Net Crown debt |
|
|
|
|
|
|
|
|
|
|
|
|
|
|
|
|
|
|
|
|
| Current presentation | | 25,324 | | 24,069 | | 21,701 | | 21,396 | | 19,971 | | 20,162 | | 20,935 | | 22,087 | | 22,244 | | 22,230 |
| Future presentation | | 23,619 | | 22,179 | | 19,414 | | 19,167 | | 17,021 | | 18,662 | | 20,595 | | 21,737 | | 21,894 | | 21,880 |
Net worth (no change) |
|
7,470 |
|
9,921 |
|
6,022 |
|
8,583 |
|
11,463 |
|
14,238 |
|
16,526 |
|
19,604 |
|
23,541 |
|
27,783 |
Tax and Sovereign revenue |
|
|
|
|
|
|
|
|
|
|
|
|
|
|
|
|
|
|
|
|
| Tax revenue | | | | | | | | | | | | | | | | | | | | |
| Current presentation | | 31,916 | | 32,982 | | 32,156 | | 34,035 | | 36,738 | | 38,377 | | 40,141 | | 42,084 | | 43,981 | | 45,570 |
| Future presentation of Core Crown | | 30,387 | | 31,429 | | 30,525 | | 32,248 | | 34,995 | | 36,430 | | 38,104 | | 39,870 | | 41,701 | | 43,188 |
| Future presentation of Total Crown | | 30,160 | | 31,161 | | 30,227 | | 32,000 | | 34,744 | | 36,205 | | 37,902 | | 39,530 | | 41,335 | | 42,771 |
| Total sovereign revenue (i.e. levies) | | | | | | | | | | | | | | | | | | | | |
| Current presentation | | 32,179 | | 33,240 | | 32,456 | | 34,411 | | 37,123 | | 38,870 | | 40,613 | | 42,571 | | 44,474 | | 46,076 |
| Future presentation of Core Crown | | 30,650 | | 31,687 | | 30,825 | | 32,624 | | 35,380 | | 36,923 | | 38,576 | | 40,357 | | 42,194 | | 43,694 |
| Future presentation of Total Crown | | 32,304 | | 33,477 | | 32,381 | | 33,686 | | 37,013 | | 38,684 | | 40,356 | | 42,084 | | 43,965 | | 45,484 |
Statement of Financial Performance—total Crown
for the years ending 30 June
| | 2001
Actual
| | 2002
Estimated
Actual
| | 2003
Forecast
| | 2004
Forecast
| | 2005
Forecast
| | 2006
Forecast
|
|---|
| | ($ million)
|
|---|
| Revenue | | | | | | | | | | | | |
| Taxation revenue | | 34,744 | | 36,205 | | 37,902 | | 39,530 | | 41,335 | | 42,771 |
| Levies, fees, fines and penalties | | 2,269 | | 2,479 | | 2,454 | | 2,554 | | 2,630 | | 2,713 |
| | |
| |
| |
| |
| |
| |
|
| Total Revenue Levied through the Crown's Sovereign Power | | 37,013 | | 38,684 | | 40,356 | | 42,084 | | 43,965 | | 45,484 |
| Sales of goods and services | | 7,234 | | 9,667 | | 10,690 | | 11,419 | | 11,916 | | 12,355 |
| Investment income | | 1,217 | | 1,183 | | 1,360 | | 1,781 | | 2,118 | | 2,469 |
| Other revenue | | 1,222 | | 1,644 | | 1,646 | | 1,589 | | 1,545 | | 1,517 |
| | |
| |
| |
| |
| |
| |
|
| Total Crown Revenue | | 46,686 | | 51,178 | | 54,052 | | 56,873 | | 59,544 | | 61,825 |
| | |
| |
| |
| |
| |
| |
|
Expenses |
|
|
|
|
|
|
|
|
|
|
|
|
| Subsidies and transfer payments | | 14,484 | | 14,986 | | 15,452 | | 15,890 | | 16,369 | | 16,927 |
| Personnel expenses | | 10,679 | | 11,992 | | 12,638 | | 12,855 | | 13,012 | | 13,300 |
| Operating expenses | | 16,885 | | 19,515 | | 20,938 | | 21,837 | | 22,551 | | 22,844 |
| Forecast for future new spending | | — | | — | | 204 | | 622 | | 1,049 | | 1,849 |
| Finance costs | | 2,646 | | 2,289 | | 2,532 | | 2,591 | | 2,626 | | 2,663 |
| Net foreign-exchange losses/(gains) | | 50 | | 86 | | — | | — | | — | | — |
| Revaluation movement in GSF liability | | 164 | | (368 | ) | — | | — | | — | | — |
| Revaluation movement in ACC liability | | 420 | | 42 | | — | | — | | — | | — |
| | |
| |
| |
| |
| |
| |
|
| Total Crown expenses | | 45,328 | | 48,542 | | 51,764 | | 53,795 | | 55,607 | | 57,583 |
| | |
| |
| |
| |
| |
| |
|
| Operating Balance | | 1,358 | | 2,636 | | 2,288 | | 3,078 | | 3,937 | | 4,242 |
| | |
| |
| |
| |
| |
| |
|
The Notes to the financial statements are contained on Treasury's website.
Statement of Financial Performance (continued)—analysis of expenses
for the years ending 30 June
Following is an analysis of total Crown expenses and core Crown expenses by functional classification. This information reconciles to segmental information within the notes to the forecasts.
| | 2001
Actual
| | 2002
Estimated
Actual
| | 2003
Forecast
| | 2004
Forecast
| | 2005
Forecast
| | 2006
Forecast
|
|---|
| | ($ million)
|
|---|
| Total Crown expenses by functional classification | | | | | | | | | | | | |
| Social security and welfare (includes GSF) | | 16,323 | | 15,984 | | 16,706 | | 17,286 | | 17,781 | | 18,386 |
| Health | | 6,802 | | 7,485 | | 7,833 | | 8,229 | | 8,596 | | 8,713 |
| Education | | 7,719 | | 8,185 | | 8,556 | | 8,650 | | 8,801 | | 8,914 |
| Core government services | | 1,688 | | 1,460 | | 1,498 | | 1,477 | | 1,492 | | 1,522 |
| Law and order | | 1,796 | | 1,952 | | 1,926 | | 1,935 | | 1,926 | | 1,921 |
| Defence | | 1,225 | | 1,114 | | 1,112 | | 1,105 | | 1,098 | | 1,101 |
| Transport and communications | | 2,335 | | 4,362 | | 6,051 | | 6,318 | | 6,604 | | 6,729 |
| Economic and industrial services | | 2,404 | | 3,008 | | 2,672 | | 2,862 | | 2,855 | | 2,936 |
| Primary services | | 919 | | 1,002 | | 1,018 | | 1,015 | | 1,031 | | 1,045 |
| Heritage, culture and recreation | | 975 | | 1,017 | | 1,006 | | 1,043 | | 1,079 | | 1,120 |
| Housing and community development | | 445 | | 489 | | 536 | | 552 | | 559 | | 574 |
| Other | | 75 | | 109 | | 114 | | 110 | | 110 | | 110 |
| Finance costs | | 2,572 | | 2,289 | | 2,532 | | 2,591 | | 2,626 | | 2,663 |
| Net foreign-exchange losses/(gains) | | 50 | | 86 | | — | | — | | — | | — |
| Forecast for future new spending | | — | | — | | 204 | | 622 | | 1,049 | | 1,849 |
| | |
| |
| |
| |
| |
| |
|
| Total Expenses | | 45,328 | | 48,542 | | 51,764 | | 53,795 | | 55,607 | | 57,583 |
| | |
| |
| |
| |
| |
| |
|
Core Crown expenses by functional classification |
|
|
|
|
|
|
|
|
|
|
|
|
| Social security and welfare (includes GSF) | | 14,319 | | 14,210 | | 14,863 | | 15,343 | | 15,741 | | 16,248 |
| Health | | 6,660 | | 7,019 | | 7,595 | | 8,037 | | 8,461 | | 8,588 |
| Education | | 6,136 | | 6,499 | | 6,817 | | 6,982 | | 7,052 | | 7,148 |
| Core government services | | 1,798 | | 1,547 | | 1,596 | | 1,575 | | 1,591 | | 1,622 |
| Law and order | | 1,541 | | 1,765 | | 1,728 | | 1,731 | | 1,728 | | 1,721 |
| Defence | | 1,242 | | 1,152 | | 1,154 | | 1,149 | | 1,146 | | 1,146 |
| Transport and communications | | 905 | | 1,027 | | 1,096 | | 1,155 | | 1,175 | | 1,182 |
| Economic and industrial services | | 1,037 | | 1,045 | | 1,128 | | 1,118 | | 1,107 | | 1,115 |
| Primary services | | 279 | | 315 | | 330 | | 318 | | 314 | | 312 |
| Heritage, culture and recreation | | 400 | | 479 | | 508 | | 530 | | 554 | | 564 |
| Housing and community development | | 50 | | 95 | | 103 | | 99 | | 91 | | 91 |
| Other | | 75 | | 109 | | 114 | | 110 | | 110 | | 110 |
| Finance costs | | 2,304 | | 2,176 | | 2,318 | | 2,404 | | 2,480 | | 2,551 |
| Net foreign-exchange (gains)/losses | | (47 | ) | 64 | | — | | — | | — | | — |
| Forecast for future new spending | | — | | — | | 204 | | 622 | | 1,049 | | 1,849 |
| | |
| |
| |
| |
| |
| |
|
| Total Expenses | | 36,699 | | 37,502 | | 39,554 | | 41,173 | | 42,599 | | 44,247 |
| | |
| |
| |
| |
| |
| |
|
The Notes to the financial statements are contained on Treasury's website.
Statement of Financial Position—total Crown
as at 30 June
| | Note
| | 2001
Actual
| | 2002
Estimated
Actual
| | 2003
Forecast
| | 2004
Forecast
| | 2005
Forecast
| | 2006
Forecast
|
|---|
| |
| | ($ million)
|
|---|
| Assets | | | | | | | | | | | | | | |
| Cash and bank balances | | 7 | | 1,187 | | 1,136 | | 1,088 | | 1,237 | | 1,434 | | 1,653 |
| Marketable securities, deposits & equity investments | | 7 | | 16,616 | | 18,134 | | 19,156 | | 21,537 | | 24,658 | | 28,261 |
| Advances | | 8 | | 4,326 | | 5,086 | | 5,778 | | 6,532 | | 7,319 | | 8,127 |
| Receivables | | 9 | | 7,629 | | 8,723 | | 8,855 | | 9,000 | | 9,247 | | 9,354 |
| Inventories | | | | 671 | | 844 | | 821 | | 878 | | 897 | | 906 |
| Other investments | | 10 | | 281 | | 306 | | 397 | | 383 | | 369 | | 355 |
| Property, plant and equipment | | 11 | | 45,875 | | 48,494 | | 49,544 | | 50,326 | | 50,614 | | 50,372 |
| Commercial forests | | 12 | | 380 | | 380 | | 380 | | 381 | | 381 | | 381 |
| Intangible assets | | 13 | | 168 | | 752 | | 679 | | 604 | | 532 | | 461 |
| Forecast for future new capital spending | | | | — | | — | | 220 | | 1,020 | | 1,520 | | 1,880 |
| | | | |
| |
| |
| |
| |
| |
|
| Total Assets | | | | 77,133 | | 83,855 | | 86,918 | | 91,898 | | 96,971 | | 101,750 |
| | | | |
| |
| |
| |
| |
| |
|
Liabilities |
|
|
|
|
|
|
|
|
|
|
|
|
|
|
| Payables and provisions | | 14 | | 9,359 | | 9,855 | | 9,831 | | 9,898 | | 9,980 | | 9,898 |
| Borrowings—sovereign guaranteed | | | | 29,090 | | 30,476 | | 31,348 | | 33,579 | | 34,298 | | 34,944 |
| Borrowings—non-sovereign guaranteed | | | | 5,562 | | 7,147 | | 6,811 | | 6,021 | | 5,979 | | 5,548 |
| Provision for ACC outstanding claims liability | | 15 | | 7,141 | | 7,500 | | 7,806 | | 8,264 | | 8,735 | | 9,228 |
| Provision for GSF pension liability | | 16 | | 11,979 | | 11,702 | | 11,659 | | 11,595 | | 11,501 | | 11,412 |
| Currency issued | | | | 2,539 | | 2,937 | | 2,937 | | 2,937 | | 2,937 | | 2,937 |
| | | | |
| |
| |
| |
| |
| |
|
| Total Liabilities | | | | 65,670 | | 69,617 | | 70,392 | | 72,294 | | 73,430 | | 73,967 |
| | | | |
| |
| |
| |
| |
| |
|
| Total Assets less Total Liabilities | | | | 11,463 | | 14,238 | | 16,526 | | 19,604 | | 23,541 | | 27,783 |
| | | | |
| |
| |
| |
| |
| |
|
Crown Balance |
|
|
|
|
|
|
|
|
|
|
|
|
|
|
| Taxpayer funds | | 17 | | 3,405 | | 6,148 | | 8,436 | | 11,514 | | 15,451 | | 19,693 |
| Revaluation reserve | | 17 | | 8,058 | | 8,090 | | 8,090 | | 8,090 | | 8,090 | | 8,090 |
| | | | |
| |
| |
| |
| |
| |
|
| Crown Balance | | | | 11,463 | | 14,238 | | 16,526 | | 19,604 | | 23,541 | | 27,783 |
| | | | |
| |
| |
| |
| |
| |
|
The Notes to the financial statements are contained on Treasury's website.
Statement of Financial Position (continued)—analysis of NZS Fund and Debt
as at 30 June
| | 2001
Actual
| | 2002
Estimated
Actual
| | 2003
Forecast
| | 2004
Forecast
| | 2005
Forecast
| | 2006
Forecast
|
|---|
| | ($ million)
|
|---|
| New Zealand Superannuation Fund | | | | | | | | | | | | |
| Within MSDs and equity investments is the NZS Fund | | | | | | | | | | | | |
| Opening balance | | — | | — | | 600 | | 1,890 | | 3,898 | | 6,277 |
| Gross contribution | | — | | 586 | | 1,200 | | 1,800 | | 2,011 | | 2,117 |
| Retained income (after tax) | | — | | 14 | | 90 | | 208 | | 368 | | 550 |
| | |
| |
| |
| |
| |
| |
|
| NZS Fund balance | | — | | 600 | | 1,890 | | 3,898 | | 6,277 | | 8,944 |
| | |
| |
| |
| |
| |
| |
|
| Gross and Net Debt Information | | | | | | | | | | | | |
| Total Crown Debt | | | | | | | | | | | | |
| Total Crown gross debt | | 34,652 | | 37,623 | | 38,159 | | 39,600 | | 40,227 | | 40,492 |
| Total sovereign-issued debt | | 36,761 | | 36,299 | | 35,781 | | 38,391 | | 39,543 | | 40,656 |
Definitions of debt:
Total Crown gross debt is the total borrowings (both sovereign-guaranteed and non- sovereign guaranteed) of the total Crown.This equates to the amount in the total Crown balance sheet and represents the complete picture of whole-of-Crown debt obligations to external parties.
The balance sheet splits total Crown debt into sovereign-guaranteed and non-sovereign-guaranteed debt. This split reflects the fact that debt held by SOEs and Crown entities is not explicitly guaranteed by the Crown. Any such debt that may be guaranteed is included in the sovereign-guaranteed total.No debt of SOEs and Crown entities is currently guaranteed by the Crown.
Total sovereign-issued debt is debt issued by the sovereign (i.e., core Crown) and includes Government stock held by the NZS Fund, GSF, ACC or EQC for example. In other words, the total sovereign-issued debt does not eliminate any internal cross-holdings. The Government's debt objective uses this measure of debt.
| Core Crown | | | | | | | | | | | | | |
| Gross Crown debt | | 33,811 | | 34,799 | | 35,441 | | 38,041 | | 39,193 | | 40,306 | |
| Financial assets | | (17,319 | ) | (18,737 | ) | (19,896 | ) | (23,362 | ) | (26,736 | ) | (30,530 | ) |
| | |
| |
| |
| |
| |
| |
| |
| Borrowings less Financial Assets | | 16,492 | | 16,062 | | 15,545 | | 14,679 | | 12,457 | | 9,776 | |
| NZS Fund assets | | — | | 600 | | 1,890 | | 3,898 | | 6,277 | | 8,944 | |
| GSF assets | | 3,479 | | 3,500 | | 3,500 | | 3,510 | | 3,510 | | 3,510 | |
| GSF cross-holdings of Government stock | | (2,950 | ) | (1,500 | ) | (340 | ) | (350 | ) | (350 | ) | (350 | ) |
| | |
| |
| |
| |
| |
| |
| |
| Net Crown Debt | | 17,021 | | 18,662 | | 20,595 | | 21,737 | | 21,894 | | 21,880 | |
| | |
| |
| |
| |
| |
| |
| |
Statement of Movement in Equity—total Crown
for the years ending 30 June
| | Note
| | 2001
Actual
| | 2002
Estimated
Actual
| | 2003
Forecast
| | 2004
Forecast
| | 2005
Forecast
| | 2006
Forecast
|
|---|
| |
| | ($ million)
|
|---|
| Opening Crown Balance | | | | 8,583 | | 11,463 | | 14,238 | | 16,526 | | 19,604 | | 23,541 |
| Operating balance for the year | | | | 1,358 | | 2,636 | | 2,288 | | 3,078 | | 3,937 | | 4,242 |
| Net revaluations | | 17 | | (128 | ) | 36 | | — | | — | | — | | — |
| | | | |
| |
| |
| |
| |
| |
|
| Total Recognised Revenues and Expenses | | | | 1,230 | | 2,672 | | 2,288 | | 3,078 | | 3,937 | | 4,242 |
| State highway recognition policy change | | | | 1,650 | | — | | — | | — | | — | | — |
| Conservation visitor asset recognition | | | | — | | 103 | | — | | — | | — | | — |
| | | | |
| |
| |
| |
| |
| |
|
| Closing Crown Balance | | | | 11,463 | | 14,238 | | 16,526 | | 19,604 | | 23,541 | | 27,783 |
| | | | |
| |
| |
| |
| |
| |
|
The Notes to the financial statements are contained on Treasury's website.
Statement of Cash Flow—total Crown
for the years ending 30 June
| | Note
| | 2001
Actual
| | 2002
Estimated
Actual
| | 2003
Forecast
| | 2004
Forecast
| | 2005
Forecast
| | 2006
Forecast
| |
|---|
| |
| | ($ million)
| |
|---|
| Cash Flows from Operations | | | | | | | | | | | | | | | |
| Cash was Provided from | | | | | | | | | | | | | | | |
| Total tax receipts (refer Note 1) | | 1 | | 34,272 | | 36,404 | | 37,884 | | 39,645 | | 41,466 | | 42,989 | |
| Total other sovereign receipts (refer Note 1) | | 1 | | 2,503 | | 2,107 | | 2,449 | | 2,521 | | 2,608 | | 2,695 | |
| Interest | | | | 1,129 | | 1,479 | | 1,436 | | 1,545 | | 1,632 | | 1,802 | |
| Dividends | | | | 37 | | 38 | | 41 | | 46 | | 50 | | 55 | |
| Sales of goods and services | | | | 7,772 | | 9,085 | | 10,214 | | 10,510 | | 11,088 | | 11,530 | |
| Other operating receipts | | | | 923 | | 965 | | 1,630 | | 1,602 | | 1,597 | | 1,455 | |
| | | | |
| |
| |
| |
| |
| |
| |
| Total Cash Provided from Operations | | | | 46,636 | | 50,078 | | 53,654 | | 55,869 | | 58,441 | | 60,526 | |
| Cash was Disbursed to | | | | | | | | | | | | | | | |
| Subsidies and transfer payments | | | | 14,416 | | 14,999 | | 15,472 | | 15,985 | | 16,439 | | 17,020 | |
| Personnel and operating payments | | | | 25,527 | | 28,339 | | 29,968 | | 30,887 | | 31,860 | | 32,280 | |
| Finance costs | | | | 2,685 | | 2,229 | | 2,517 | | 2,509 | | 2,583 | | 2,661 | |
| Forecast for future new spending | | | | — | | — | | 204 | | 622 | | 1,049 | | 1,849 | |
| | | | |
| |
| |
| |
| |
| |
| |
| Total Cash Disbursed to Operations | | | | 42,628 | | 45,567 | | 48,161 | | 50,003 | | 51,931 | | 53,810 | |
| | | | |
| |
| |
| |
| |
| |
| |
| Net Cash Flows from Operations | | | | 4,008 | | 4,511 | | 5,493 | | 5,866 | | 6,510 | | 6,716 | |
| | | | |
| |
| |
| |
| |
| |
| |
| Cash Flows from Investing Activities | | | | | | | | | | | | | | | |
| Cash was Provided from | | | | | | | | | | | | | | | |
| Sale of physical assets | | | | 191 | | 247 | | 127 | | 94 | | 71 | | 64 | |
| | | | |
| |
| |
| |
| |
| |
| |
| Total Cash Provided | | | | 191 | | 247 | | 127 | | 94 | | 71 | | 64 | |
| Cash was Disbursed to | | | | | | | | | | | | | | | |
| Purchase of physical assets | | | | 2,702 | | 2,999 | | 3,420 | | 3,357 | | 2,914 | | 2,532 | |
| Net increase in advances | | | | 603 | | 839 | | 768 | | 759 | | 794 | | 849 | |
| Other net purchase/(sale) of marketable securities & deposits and other equity investments | | | | 1,263 | | 2,661 | | 1,310 | | 2,332 | | 3,066 | | 3,245 | |
| Capitalised interest paid | | | | 21 | | 20 | | 4 | | 4 | | 4 | | 4 | |
| Forecast for future new capital spending | | | | — | | — | | 220 | | 800 | | 500 | | 360 | |
| | | | |
| |
| |
| |
| |
| |
| |
| Total Cash Disbursed | | | | 4,589 | | 6,519 | | 5,722 | | 7,252 | | 7,278 | | 6,990 | |
| | | | |
| |
| |
| |
| |
| |
| |
| Net Cash Flows from Investing Activities | | | | (4,398 | ) | (6,272 | ) | (5,595 | ) | (7,158 | ) | (7,207 | ) | (6,926 | ) |
| | | | |
| |
| |
| |
| |
| |
| |
| Net Cash Flows from Operating and Investing Activities | | | | (390 | ) | (1,761 | ) | (102 | ) | (1,292 | ) | (697 | ) | (210 | ) |
| | | | |
| |
| |
| |
| |
| |
| |
| Cash Flows from Financing Activities | | | | | | | | | | | | | | | |
| Cash was Provided from | | | | | | | | | | | | | | | |
| Issue of circulating currency | | | | 303 | | 398 | | — | | — | | — | | — | |
| Net issue of Government stock | | 19 | | 1,067 | | 1,627 | | 1,025 | | 2,160 | | 760 | | 546 | |
| | | | |
| |
| |
| |
| |
| |
| |
| Total Cash Provided | | | | 1,370 | | 2,025 | | 1,025 | | 2,160 | | 760 | | 546 | |
| Cash was Disbursed to | | | | | | | | | | | | | | | |
| Net repayment/(issue) of foreign-currency borrowing | | | | 1,030 | | (227 | ) | 358 | | 182 | | 7 | | 73 | |
| Net repayment/(issue) of other | | | | | | | | | | | | | | | |
| New Zealand-dollar borrowing | | | | 350 | | 533 | | 613 | | 537 | | (141 | ) | 44 | |
| | | | |
| |
| |
| |
| |
| |
| |
| Total Cash Disbursed | | | | 1,380 | | 306 | | 971 | | 719 | | (134 | ) | 117 | |
| | | | |
| |
| |
| |
| |
| |
| |
| Net Cash Flows from Financing Activities | | | | (10 | ) | 1,719 | | 54 | | 1,441 | | 894 | | 429 | |
| | | | |
| |
| |
| |
| |
| |
| |
| Net Movement in Cash | | | | (400 | ) | (42 | ) | (48 | ) | 149 | | 197 | | 219 | |
| Opening Cash Balance | | | | 1,587 | | 1,187 | | 1,136 | | 1,088 | | 1,237 | | 1,434 | |
| Foreign-exchange gains on opening cash balances | | | | — | | (9 | ) | — | | — | | — | | — | |
| | | | |
| |
| |
| |
| |
| |
| |
| Closing Cash Balance | | 18 | | 1,187 | | 1,136 | | 1,088 | | 1,237 | | 1,434 | | 1,653 | |
| | | | |
| |
| |
| |
| |
| |
| |
The Notes to the financial statements are contained on Treasury's website.
Statement of Borrowings—total Crown
as at 30 June
| | Note
| | 2001
Actual
| | 2002
Estimated
Actual
| | 2003
Forecast
| | 2004
Forecast
| | 2005
Forecast
| | 2006
Forecast
| |
|---|
| |
| | ($ million)
| |
|---|
| Sovereign Guaranteed Debt | | | | | | | | | | | | | | | |
| New Zealand-Dollar Debt | | | | | | | | | | | | | | | |
| Government stock | | | | 15,979 | | 18,796 | | 19,821 | | 21,981 | | 22,741 | | 23,287 | |
| Treasury bills | | | | 5,239 | | 4,892 | | 5,330 | | 5,290 | | 5,266 | | 5,243 | |
| Loans and foreign-exchange contracts | | | | (272 | ) | (374 | ) | (823 | ) | (711 | ) | (730 | ) | (606 | ) |
| Retail stock and other | | | | 498 | | 512 | | 510 | | 509 | | 509 | | 509 | |
| | | | |
| |
| |
| |
| |
| |
| |
| Total New Zealand-Dollar Debt | | | | 21,444 | | 23,826 | | 24,838 | | 27,069 | | 27,786 | | 28,433 | |
| Foreign-Currency Debt | | | | | | | | | | | | | | | |
| United States dollars | | | | 4,780 | | 4,249 | | 4,278 | | 4,276 | | 4,277 | | 4,277 | |
| Japanese yen | | | | 1,432 | | 448 | | 279 | | 279 | | 279 | | 279 | |
| European and other currencies | | | | 1,434 | | 1,953 | | 1,953 | | 1,955 | | 1,956 | | 1,955 | |
| | | | |
| |
| |
| |
| |
| |
| |
| Total Foreign-Currency Debt | | | | 7,646 | | 6,650 | | 6,510 | | 6,510 | | 6,512 | | 6,511 | |
| | | | |
| |
| |
| |
| |
| |
| |
| Total Sovereign Guaranteed Debt | | | | 29,090 | | 30,476 | | 31,348 | | 33,579 | | 34,298 | | 34,944 | |
| | | | |
| |
| |
| |
| |
| |
| |
| Non-Sovereign Guaranteed Debt | | | | | | | | | | | | | | | |
| New Zealand | | | | 4,621 | | 4,936 | | 4,736 | | 4,128 | | 4,184 | | 3,858 | |
| United States dollars | | | | 474 | | 1,765 | | 1,623 | | 1,409 | | 1,293 | | 1,188 | |
| Japanese yen | | | | 147 | | 140 | | 142 | | 152 | | 158 | | 158 | |
| European and other currencies | | | | 320 | | 306 | | 310 | | 332 | | 344 | | 344 | |
| | | | |
| |
| |
| |
| |
| |
| |
| Total Non-Sovereign Guaranteed Debt | | | | 5,562 | | 7,147 | | 6,811 | | 6,021 | | 5,979 | | 5,548 | |
| | | | |
| |
| |
| |
| |
| |
| |
| Total Borrowings (Gross Debt) | | | | 34,652 | | 37,623 | | 38,159 | | 39,600 | | 40,277 | | 40,492 | |
| | | | |
| |
| |
| |
| |
| |
| |
| Less | | | | | | | | | | | | | | | |
| Financial Assets (including restricted assets) Marketable Securities, Deposits and Equity Investments | | | | | | | | | | | | | | | |
| New Zealand dollars | | | | 7,058 | | 9,225 | | 9,514 | | 11,525 | | 14,262 | | 17,462 | |
| United States dollars | | | | 5,282 | | 4,504 | | 4,600 | | 4,633 | | 4,671 | | 4,713 | |
| Japanese yen | | | | 1,549 | | 489 | | 269 | | 270 | | 270 | | 270 | |
| European and other currencies | | | | 506 | | 878 | | 759 | | 631 | | 491 | | 343 | |
| Reserve Position at IMF | | | | 946 | | 1,032 | | 1,147 | | 1,276 | | 1,414 | | 1,561 | |
| Equity investments New Zealand dollars | | | | 687 | | 746 | | 845 | | 963 | | 1,083 | | 1,206 | |
| Equity investments foreign-currency | | | | 588 | | 1,260 | | 2,022 | | 2,239 | | 2,467 | | 2,706 | |
| | | | |
| |
| |
| |
| |
| |
| |
| Total | | 6 | | 16,616 | | 18,134 | | 19,156 | | 21,537 | | 24,658 | | 28,261 | |
| Advances and Cash | | | | | | | | | | | | | | | |
| Student loans | | 7 | | 4,143 | | 4,799 | | 5,531 | | 6,295 | | 7,074 | | 7,863 | |
| Other advances | | | | 183 | | 287 | | 247 | | 237 | | 245 | | 264 | |
| Cash | | | | 1,187 | | 1,136 | | 1,088 | | 1,237 | | 1,434 | | 1,653 | |
| | | | |
| |
| |
| |
| |
| |
| |
| Total | | | | 5,513 | | 6,222 | | 6,866 | | 7,769 | | 8,753 | | 9,780 | |
| | | | |
| |
| |
| |
| |
| |
| |
| Total Financial Assets | | | | 22,129 | | 24,356 | | 26,022 | | 29,306 | | 33,411 | | 38,041 | |
| | | | |
| |
| |
| |
| |
| |
| |
| Borrowings less Financial Assets | | | | 12,523 | | 13,267 | | 12,137 | | 10,294 | | 6,866 | | 2,451 | |
| | | | |
| |
| |
| |
| |
| |
| |
| Net New Zealand-dollar debt | | | | 12,807 | | 12,569 | | 12,349 | | 10,940 | | 7,872 | | 3,843 | |
| Net foreign-currency debt | | | | (284 | ) | 698 | | (212 | ) | (646 | ) | (1,006 | ) | (1,392 | ) |
| | | | |
| |
| |
| |
| |
| |
| |
| Borrowings less Financial Assets | | | | 12,523 | | 13,267 | | 12,137 | | 10,294 | | 6,866 | | 2,451 | |
| | | | |
| |
| |
| |
| |
| |
| |
The Notes to the financial statements are contained on Treasury's website.
- •
- The financial assets includes the assets of the NZS Fund and the GSF. The total of borrowings less financial assets is not a measure of net Crown debt.
- •
- Net Crown debt is shown in the following segmental notes. It is defined as core Crown borrowings less financial assets (not including the assets of the NZS Fund and the GSF).
Segment Notes to the Financial Statements—total Crown
| | Core Crown
2002
| | Crown entities
2002
| | State-owned
enterprises
2002
| | Inter-segment
eliminations
2002
| | Total Crown
2002
| |
|---|
| | ($ million)
| |
|---|
| Revenue | | | | | | | | | | | |
| Taxation revenue | | 36,430 | | — | | — | | (225 | ) | 36,205 | |
| Other sovereign levied income | | 493 | | 2,000 | | — | | (14 | ) | 2,479 | |
| Sales of goods and services | | 687 | | 3,270 | | 6,583 | | (873 | ) | 9,667 | |
| Investment income | | 1,303 | | 571 | | 31 | | (722 | ) | 1,183 | |
| Other revenues | | 613 | | 12,252 | | 377 | | (11,598 | ) | 1,644 | |
| | |
| |
| |
| |
| |
| |
| Total revenue | | 39,526 | | 18,093 | | 6,991 | | (13,432 | ) | 51,178 | |
| | |
| |
| |
| |
| |
| |
| Expenses by input type | | | | | | | | | | | |
| Subsidies and transfer payments | | 13,656 | | 1,330 | | — | | — | | 14,986 | |
| Personnel expenses | | 3,846 | | 7,019 | | 1,132 | | (5 | ) | 11,992 | |
| Operating expenses | | 18,128 | | 8,877 | | 5,222 | | (12,712 | ) | 19,515 | |
| Finance costs | | 2,176 | | 205 | | 220 | | (312 | ) | 2,289 | |
| FX losses/(gains) | | 64 | | — | | 22 | | — | | 86 | |
| GSF and ACC liability revaluation movements | | (368 | ) | 42 | | — | | — | | (326 | ) |
| | |
| |
| |
| |
| |
| |
| Total expenses | | 37,502 | | 17,473 | | 6,596 | | (13,029 | ) | 48,542 | |
| | |
| |
| |
| |
| |
| |
| Expenses by functional classification | | | | | | | | | | | |
| Social security and welfare | | 14,210 | | 2,223 | | — | | (449 | ) | 15,984 | |
| Health | | 7,019 | | 5,409 | | — | | (4,943 | ) | 7,485 | |
| Education | | 6,499 | | 6,052 | | — | | (4,366 | ) | 8,185 | |
| Other functional classifications | | 7,534 | | 3,584 | | 6,355 | | (2,960 | ) | 14,513 | |
| Forecast for future new spending | | — | | — | | — | | — | | — | |
| Finance costs and FX losses/(gains) | | 2,240 | | 205 | | 241 | | (311 | ) | 2,375 | |
| | |
| |
| |
| |
| |
| |
| Total expenses | | 37,502 | | 17,473 | | 6,596 | | (13,029 | ) | 48,542 | |
| | |
| |
| |
| |
| |
| |
| Operating balance | | 2,024 | | 620 | | 395 | | (403 | ) | 2,636 | |
| | |
| |
| |
| |
| |
| |
Forecast Statement of Financial Position (institutional form)
as at 30 June 2002
| | Core Crown
2002
| | Crown entities
2002
| | State-owned
enterprises
2002
| | Inter-segment
eliminations
2002
| | Total Crown
2002
|
|---|
| | ($ million)
|
|---|
| Assets | | | | | | | | | | |
| Financial assets | | 18,737 | | 9,831 | | 1,001 | | (5,213 | ) | 24,356 |
| Physical assets | | 27,335 | | 11,352 | | 9,807 | | — | | 48,494 |
| Investment in SOEs and CEs | | 7,662 | | — | | — | | (7,662 | ) | — |
| Other assets | | 7,420 | | 1,846 | | 2,448 | | (709 | ) | 11,005 |
| | |
| |
| |
| |
| |
|
| Total assets | | 61,154 | | 23,029 | | 13,256 | | (13,584 | ) | 83,855 |
| | |
| |
| |
| |
| |
|
| Liabilities | | | | | | | | | | |
| Borrowings | | 34,799 | | 3,450 | | 4,587 | | (5,213 | ) | 37,623 |
| Other liabilities | | 20,083 | | 10,204 | | 2,416 | | (709 | ) | 31,994 |
| | |
| |
| |
| |
| |
|
| Total liabilities | | 54,882 | | 13,654 | | 7,003 | | (5,922 | ) | 69,617 |
| | |
| |
| |
| |
| |
|
| Net worth | | 6,272 | | 9,375 | | 6,253 | | (7,662 | ) | 14,238 |
| | |
| |
| |
| |
| |
|
| Taxpayer funds | | 1,937 | | 6,369 | | 5,509 | | (7,667 | ) | 6,148 |
| Revaluation reserves | | 4,335 | | 3,006 | | 744 | | 5 | | 8,090 |
| | |
| |
| |
| |
| |
|
| Net worth | | 6,272 | | 9,375 | | 6,253 | | (7,662 | ) | 14,238 |
| | |
| |
| |
| |
| |
|
| Analysis of financial assets and borrowings | | | | | | | | | | |
| Advances and cash | | 6,087 | | 878 | | 147 | | (890 | ) | 6,222 |
| MSDs and equity investments | | 12,650 | | 8,953 | | 854 | | (4,323 | ) | 18,134 |
| | |
| |
| |
| |
| |
|
| Total financial assets | | 18,737 | | 9,831 | | 1,001 | | (5,213 | ) | 24,356 |
| | |
| |
| |
| |
| |
|
| Borrowings—Sovereign guaranteed | | 34,799 | | — | | — | | (4,323 | ) | 30,476 |
| Borrowings—Non-sovereign guaranteed | | — | | 3,450 | | 4,587 | | (890 | ) | 7,147 |
| | |
| |
| |
| |
| |
|
| Total borrowings | | 34,799 | | 3,450 | | 4,587 | | (5,213 | ) | 37,623 |
| | |
| |
| |
| |
| |
|
| Borrowings less financial assets | | 16,062 | | (6,381 | ) | 3,586 | | — | | 13,267 |
| | |
| |
| |
| |
| |
|
| Net Crown debt | | 18,662 | | Net Crown debt and gross sovereign-issued |
| Gross sovereign-issued debt | | 36,299 | | debt differ from the analysis above due to |
| | | | | elimination of cross-holdings of Govt stock and adding back the NZS Fund and GSF assets. |
| | Core Crown
2003
| | Crown entities
2003
| | State-owned
enterprises
2003
| | Inter-segment
eliminations
2003
| | Total Crown
2003
|
|---|
| | ($ million)
|
|---|
| Revenue | | | | | | | | | | |
| Taxation revenue | | 38,104 | | — | | — | | (202 | ) | 37,902 |
| Other sovereign levied income | | 472 | | 1,998 | | — | | (16 | ) | 2,454 |
| Sales of goods and services | | 704 | | 3,082 | | 7,671 | | (767 | ) | 10,690 |
| Investment income | | 1,527 | | 636 | | 31 | | (834 | ) | 1,360 |
| Other revenues | | 512 | | 12,898 | | 543 | | (12,307 | ) | 1,646 |
| | |
| |
| |
| |
| |
|
| Total revenue | | 41,319 | | 18,614 | | 8,245 | | (14,126 | ) | 54,052 |
| | |
| |
| |
| |
| |
|
| Expenses by input type | | | | | | | | | | |
| Subsidies and transfer payments | | 13,972 | | 1,480 | | — | | — | | 15,452 |
| Personnel expenses | | 3,932 | | 7,191 | | 1,518 | | (3 | ) | 12,638 |
| Operating expenses | | 19,332 | | 9,224 | | 5,917 | | (13,331 | ) | 21,142 |
| Finance costs | | 2,318 | | 221 | | 324 | | (331 | ) | 2,532 |
| FX losses/(gains) | | — | | — | | — | | — | | — |
| GSF and ACC liability revaluation movements | | — | | — | | — | | — | | — |
| | |
| |
| |
| |
| |
|
| Total expenses | | 39,554 | | 18,116 | | 7,759 | | (13,665 | ) | 51,764 |
| | |
| |
| |
| |
| |
|
| Expenses by functional classification | | | | | | | | | | |
| Social security and welfare | | 14,863 | | 2,318 | | — | | (475 | ) | 16,706 |
| Health | | 7,595 | | 5,457 | | — | | (5,219 | ) | 7,833 |
| Education | | 6,817 | | 6,316 | | — | | (4,577 | ) | 8,556 |
| Other functional classifications | | 7,757 | | 3,804 | | 7,435 | | (3,063 | ) | 15,933 |
| Forecast for future new spending | | 204 | | — | | — | | — | | 204 |
| Finance costs and FX losses/(gains) | | 2,318 | | 221 | | 324 | | (331 | ) | 2,532 |
| | |
| |
| |
| |
| |
|
| Total expenses | | 39,554 | | 18,116 | | 7,759 | | (13,665 | ) | 51,764 |
| | |
| |
| |
| |
| |
|
| Operating balance | | 1,765 | | 498 | | 486 | | (461 | ) | 2,288 |
| | |
| |
| |
| |
| |
|
Forecast Statement of Financial Position (institutional form)
as at 30 June 2003
| | Core Crown
2003
| | Crown entities
2003
| | State-owned
enterprises
2003
| | Inter-segment
eliminations
2003
| | Total Crown
2003
|
|---|
| | ($ million)
|
|---|
| Assets | | | | | | | | | | |
| Financial assets | | 19,896 | | 10,685 | | 848 | | (5,407 | ) | 26,022 |
| Physical assets | | 27,695 | | 11,917 | | 9,932 | | — | | 49,544 |
| Investment in SOEs and CEs | | 8,125 | | — | | — | | (8,125 | ) | — |
| Other assets | | 7,783 | | 1,902 | | 2,377 | | (710 | ) | 11,352 |
| | |
| |
| |
| |
| |
|
| Total assets | | 63,499 | | 24,504 | | 13,157 | | (14,242 | ) | 86,918 |
| | |
| |
| |
| |
| |
|
| Liabilities | | | | | | | | | | |
| Borrowings | | 35,441 | | 3,548 | | 4,577 | | (5,407 | ) | 38,159 |
| Other liabilities | | 20,021 | | 10,669 | | 2,253 | | (710 | ) | 32,233 |
| | |
| |
| |
| |
| |
|
| Total liabilities | | 55,462 | | 14,217 | | 6,830 | | (6,117 | ) | 70,392 |
| | |
| |
| |
| |
| |
|
| Net worth | | 8,037 | | 10,287 | | 6,327 | | (8,125 | ) | 16,526 |
| | |
| |
| |
| |
| |
|
| Taxpayer Funds | | 3,702 | | 7,281 | | 5,578 | | (8,125 | ) | 8,436 |
| Revaluation reserves | | 4,335 | | 3,006 | | 749 | | — | | 8,090 |
| | |
| |
| |
| |
| |
|
| Net worth | | 8,037 | | 10,287 | | 6,327 | | (8,125 | ) | 16,526 |
| | |
| |
| |
| |
| |
|
| Analysis of financial assets and borrowings | | | | | | | | | | |
| Advances and cash | | 7,250 | | 856 | | 74 | | (1,314 | ) | 6,866 |
| MSDs and equity investments | | 12,646 | | 9,829 | | 774 | | (4,093 | ) | 19,156 |
| | |
| |
| |
| |
| |
|
| Total financial assets | | 19,896 | | 10,685 | | 848 | | (5,407 | ) | 26,022 |
| | |
| |
| |
| |
| |
|
| Borrowings—Sovereign guaranteed | | 35,441 | | — | | — | | (4,093 | ) | 31,348 |
| Borrowings—Non-sovereign guaranteed | | — | | 3,548 | | 4,577 | | (1,314 | ) | 6,811 |
| | |
| |
| |
| |
| |
|
| Total borrowings | | 35,441 | | 3,548 | | 4,577 | | (5,407 | ) | 38,159 |
| | |
| |
| |
| |
| |
|
| Borrowings less financial assets | | 15,545 | | (7,137 | ) | 3,729 | | — | | 12,137 |
| | |
| |
| |
| |
| |
|
| Net Crown debt | | 20,595 | | Net Crown debt and gross sovereign-issued |
| Gross sovereign-issued borrowings | | 35,781 | | debt differ from the analysis above due to |
| | | | | elimination of cross-holdings of Govt stock and adding back the NZS Fund and GSF assets. |
| | Core Crown
2004
| | Crown entities
2004
| | State-owned
enterprises
2004
| | Inter-segment
eliminations
2004
| | Total Crown
2004
|
|---|
| | ($ million)
|
|---|
| Revenue | | | | | | | | | | |
| Taxation revenue | | 39,870 | | — | | — | | (340 | ) | 39,530 |
| Other sovereign levied income | | 487 | | 2,085 | | — | | (18 | ) | 2,554 |
| Sales of goods and services | | 662 | | 3,132 | | 8,375 | | (750 | ) | 11,419 |
| Investment income | | 1,805 | | 733 | | 31 | | (788 | ) | 1,781 |
| Other revenues | | 506 | | 13,282 | | 466 | | (12,665 | ) | 1,589 |
| | |
| |
| |
| |
| |
|
| Total revenue | | 43,330 | | 19,232 | | 8,872 | | (14,561 | ) | 56,873 |
| | |
| |
| |
| |
| |
|
| Expenses by input type | | | | | | | | | | |
| Subsidies and transfer payments | | 14,476 | | 1,414 | | — | | — | | 15,890 |
| Personnel expenses | | 3,937 | | 7,331 | | 1,591 | | (4 | ) | 12,855 |
| Operating expenses | | 20,356 | | 9,544 | | 6,381 | | (13,822 | ) | 22,459 |
| Finance costs | | 2,404 | | 245 | | 314 | | (372 | ) | 2,591 |
| FX losses/(gains) | | — | | — | | — | | — | | — |
| GSF and ACC liability revaluation movements | | — | | — | | — | | — | | — |
| | |
| |
| |
| |
| |
|
| Total expenses | | 41,173 | | 18,534 | | 8,286 | | (14,198 | ) | 53,795 |
| | |
| |
| |
| |
| |
|
| Expenses by functional classification | | | | | | | | | | |
| Social security and welfare | | 15,343 | | 2,411 | | — | | (468 | ) | 17,286 |
| Health | | 8,037 | | 5,603 | | — | | (5,411 | ) | 8,229 |
| Education | | 6,982 | | 6,425 | | — | | (4,757 | ) | 8,650 |
| Other functional classifications | | 7,785 | | 3,850 | | 7,972 | | (3,190 | ) | 16,417 |
| Forecast for future new spending | | 622 | | — | | — | | — | | 622 |
| Finance costs and FX losses/(gains) | | 2,404 | | 245 | | 314 | | (372 | ) | 2,591 |
| | |
| |
| |
| |
| |
|
| Total expenses | | 41,173 | | 18,534 | | 8,286 | | (14,198 | ) | 53,795 |
| | |
| |
| |
| |
| |
|
| Operating balance | | 2,157 | | 698 | | 586 | | (363 | ) | 3,078 |
| | |
| |
| |
| |
| |
|
Forecast Statement of Financial Position (institutional form)
as at 30 June 2004
| | Core Crown
2004
| | Crown entities
2004
| | State-owned
enterprises
2004
| | Inter-segment
eliminations
2004
| | Total Crown
2004
|
|---|
| | ($ million)
|
|---|
| Assets | | | | | | | | | | |
| Financial assets | | 23,362 | | 11,749 | | 805 | | (6,610 | ) | 29,306 |
| Physical assets | | 27,968 | | 12,203 | | 10,155 | | — | | 50,326 |
| Investment in SOEs and CEs | | 8,402 | | — | | — | | (8,402 | ) | — |
| Other assets | | 8,448 | | 1,997 | | 2,572 | | (751 | ) | 12,266 |
| | |
| |
| |
| |
| |
|
| Total assets | | 68,180 | | 25,949 | | 13,532 | | (15,763 | ) | 91,898 |
| | |
| |
| |
| |
| |
|
| Liabilities | | | | | | | | | | |
| Borrowings | | 38,041 | | 3,576 | | 4,593 | | (6,610 | ) | 39,600 |
| Other liabilities | | 19,945 | | 11,127 | | 2,373 | | (751 | ) | 32,694 |
| | |
| |
| |
| |
| |
|
| Total liabilities | | 57,986 | | 14,703 | | 6,966 | | (7,361 | ) | 72,294 |
| | |
| |
| |
| |
| |
|
| Net worth | | 10,194 | | 11,246 | | 6,566 | | (8,402 | ) | 19,604 |
| | |
| |
| |
| |
| |
|
| Taxpayer Funds | | 5,859 | | 8,240 | | 5,817 | | (8,402 | ) | 11,514 |
| Revaluation reserves | | 4,335 | | 3,006 | | 749 | | — | | 8,090 |
| | |
| |
| |
| |
| |
|
| Net worth | | 10,194 | | 11,246 | | 6,566 | | (8,402 | ) | 19,604 |
| | |
| |
| |
| |
| |
|
| Analysis of financial assets and borrowings | | | | | | | | | | |
| Advances and cash | | 8,930 | | 920 | | 67 | | (2,148 | ) | 7,769 |
| MSDs and equity investments | | 14,432 | | 10,829 | | 738 | | (4,462 | ) | 21,537 |
| | |
| |
| |
| |
| |
|
| Total financial assets | | 23,362 | | 11,749 | | 805 | | (6,610 | ) | 29,306 |
| | |
| |
| |
| |
| |
|
| Borrowings—Sovereign guaranteed | | 38,041 | | — | | — | | (4,462 | ) | 33,579 |
| Borrowings—Non-sovereign guaranteed | | — | | 3,576 | | 4,593 | | (2,148 | ) | 6,021 |
| | |
| |
| |
| |
| |
|
| Total borrowings | | 38,041 | | 3,576 | | 4,593 | | (6,610 | ) | 39,600 |
| | |
| |
| |
| |
| |
|
| Borrowings less financial assets | | 14,679 | | (8,173 | ) | 3,788 | | — | | 10,294 |
| | |
| |
| |
| |
| |
|
| Net Crown debt | | 21,737 | | Net Crown debt and gross sovereign-issued |
| Gross sovereign-issued borrowings | | 38,391 | | debt differ from the analysis above due to |
| | | | | elimination of cross-holdings of Govt stock and adding back the NZS Fund and GSF assets. |
| | Core Crown
2005
| | Crown
entities
2005
| | State-owned
enterprises
2005
| | Inter-segment
eliminations
2005
| | Total Crown
2005
|
|---|
| | ($ million)
|
|---|
| Revenue | | | | | | | | | | |
| Taxation revenue | | 41,701 | | — | | — | | (366 | ) | 41,335 |
| Other sovereign levied income | | 493 | | 2,155 | | — | | (18 | ) | 2,630 |
| Sales of goods and services | | 662 | | 3,194 | | 8,825 | | (765 | ) | 11,916 |
| Investment income | | 2,094 | | 807 | | 31 | | (814 | ) | 2,118 |
| Other revenues | | 501 | | 13,537 | | 422 | | (12,915 | ) | 1,545 |
| | |
| |
| |
| |
| |
|
| Total revenue | | 45,451 | | 19,693 | | 9,278 | | (14,878 | ) | 59,544 |
| | |
| |
| |
| |
| |
|
| Expenses by input type | | | | | | | | | | |
| Subsidies and transfer payments | | 14,880 | | 1,489 | | — | | — | | 16,369 |
| Personnel expenses | | 3,934 | | 7,420 | | 1,662 | | (4 | ) | 13,012 |
| Operating expenses | | 21,305 | | 9,726 | | 6,680 | | (14,111 | ) | 23,600 |
| Finance costs | | 2,480 | | 264 | | 322 | | (440 | ) | 2,626 |
| FX losses/(gains) | | — | | — | | — | | — | | — |
| GSF and ACC liability revaluation movements | | — | | — | | — | | — | | — |
| | |
| |
| |
| |
| |
|
| Total expenses | | 42,599 | | 18,899 | | 8,664 | | (14,555 | ) | 55,607 |
| | |
| |
| |
| |
| |
|
| Expenses by functional classification | | | | | | | | | | |
| Social security and welfare | | 15,741 | | 2,516 | | — | | (476 | ) | 17,781 |
| Health | | 8,461 | | 5,730 | | — | | (5,595 | ) | 8,596 |
| Education | | 7,052 | | 6,464 | | — | | (4,715 | ) | 8,801 |
| Other functional classifications | | 7,816 | | 3,925 | | 8,342 | | (3,329 | ) | 16,754 |
| Forecast for future new spending | | 1,049 | | — | | — | | — | | 1,049 |
| Finance costs and FX losses/(gains) | | 2,480 | | 264 | | 322 | | (440 | ) | 2,626 |
| | |
| |
| |
| |
| |
|
| Total expenses | | 42,599 | | 18,899 | | 8,664 | | (14,555 | ) | 55,607 |
| | |
| |
| |
| |
| |
|
| Operating balance | | 2,852 | | 794 | | 614 | | (323 | ) | 3,937 |
| | |
| |
| |
| |
| |
|
Forecast Statement of Financial Position (institutional form)
as at 30 June 2005
| | Core Crown
2005
| | Crown
entities
2005
| | State-owned
enterprises
2005
| | Inter-segment
eliminations
2005
| | Total Crown
2005
|
|---|
| | ($ million)
|
|---|
| Assets | | | | | | | | | | |
| Financial assets | | 26,736 | | 12,897 | | 973 | | (7,195 | ) | 33,411 |
| Physical assets | | 27,852 | | 12,351 | | 10,411 | | — | | 50,614 |
| Investment in SOEs and CEs | | 8,626 | | — | | — | | (8,626 | ) | — |
| Other assets | | 8,970 | | 2,090 | | 2,680 | | (794 | ) | 12,946 |
| | |
| |
| |
| |
| |
|
| Total assets | | 72,184 | | 27,338 | | 14,064 | | (16,615 | ) | 96,971 |
| | |
| |
| |
| |
| |
|
| Liabilities | | | | | | | | | | |
| Borrowings | | 39,193 | | 3,554 | | 4,725 | | (7,195 | ) | 40,277 |
| Other liabilities | | 19,943 | | 11,589 | | 2,415 | | (794 | ) | 33,153 |
| | |
| |
| |
| |
| |
|
| Total liabilities | | 59,136 | | 15,143 | | 7,140 | | (7,989 | ) | 73,430 |
| | |
| |
| |
| |
| |
|
| Net worth | | 13,048 | | 12,195 | | 6,924 | | (8,626 | ) | 23,541 |
| | |
| |
| |
| |
| |
|
| Taxpayer Funds | | 8,713 | | 9,189 | | 6,175 | | (8,626 | ) | 15,451 |
| Revaluation reserves | | 4,335 | | 3,006 | | 749 | | — | | 8,090 |
| | |
| |
| |
| |
| |
|
| Net worth | | 13,048 | | 12,195 | | 6,924 | | (8,626 | ) | 23,541 |
| | |
| |
| |
| |
| |
|
| Analysis of financial assets and borrowings | | | | | | | | | | |
| Advances and cash | | 9,987 | | 979 | | 87 | | (2,300 | ) | 8,753 |
| MSDs and equity investments | | 16,749 | | 11,918 | | 886 | | (4,895 | ) | 24,658 |
| | |
| |
| |
| |
| |
|
| Total financial assets | | 26,736 | | 12,897 | | 973 | | (7,195 | ) | 33,411 |
| | |
| |
| |
| |
| |
|
| Borrowings—Sovereign guaranteed | | 39,193 | | — | | — | | (4,895 | ) | 34,298 |
| Borrowings—Non-sovereign guaranteed | | — | | 3,554 | | 4,725 | | (2,300 | ) | 5,979 |
| | |
| |
| |
| |
| |
|
| Total borrowings | | 39,193 | | 3,554 | | 4,725 | | (7,195 | ) | 40,277 |
| | |
| |
| |
| |
| |
|
| Borrowings less financial assets | | 12,457 | | (9,343 | ) | 3,752 | | — | | 6,866 |
| | |
| |
| |
| |
| |
|
| Net Crown debt | | 21,894 | | Net Crown debt and gross sovereign-issued debt differ from the analysis above due to elimination of |
| Gross sovereign-issued borrowings | | 39,543 | | cross-holdings of Govt stock and adding back the NZS Fund and GSF assets. |
| | Core Crown
2006
| | Crown
entities
2006
| | State-owned
enterprises
2006
| | Inter-segment
eliminations
2006
| | Total Crown
2006
|
|---|
| | ($ million)
|
|---|
| Revenue | | | | | | | | | | |
| Taxation revenue | | 43,188 | | — | | — | | (417 | ) | 42,771 |
| Other sovereign levied income | | 506 | | 2,224 | | — | | (17 | ) | 2,713 |
| Sales of goods and services | | 665 | | 3,459 | | 9,204 | | (973 | ) | 12,355 |
| Investment income | | 2,422 | | 885 | | 31 | | (869 | ) | 2,469 |
| Other revenues | | 499 | | 13,664 | | 378 | | (13,024 | ) | 1,517 |
| | |
| |
| |
| |
| |
|
| Total revenue | | 47,280 | | 20,232 | | 9,613 | | (15,300 | ) | 61,825 |
| | |
| |
| |
| |
| |
|
| Expenses by input type | | | | | | | | | | |
| Subsidies and transfer payments | | 15,363 | | 1,564 | | — | | — | | 16,927 |
| Personnel expenses | | 4,005 | | 7,602 | | 1,697 | | (4 | ) | 13,300 |
| Operating expenses | | 22,328 | | 9,940 | | 6,892 | | (14,467 | ) | 24,693 |
| Finance costs | | 2,551 | | 266 | | 324 | | (478 | ) | 2,663 |
| FX losses/(gains) | | — | | — | | — | | — | | — |
| GSF and ACC liability revaluation movements | | — | | — | | — | | — | | — |
| | |
| |
| |
| |
| |
|
| Total expenses | | 44,247 | | 19,372 | | 8,913 | | (14,949 | ) | 57,583 |
| | |
| |
| |
| |
| |
|
| Expenses by functional classification | | | | | | | | | | |
| Social security and welfare | | 16,248 | | 2,620 | | — | | (482 | ) | 18,386 |
| Health | | 8,588 | | 5,931 | | — | | (5,806 | ) | 8,713 |
| Education | | 7,148 | | 6,528 | | — | | (4,762 | ) | 8,914 |
| Other functional classifications | | 7,863 | | 4,027 | | 8,589 | | (3,421 | ) | 17,058 |
| Forecast for future new spending | | 1,849 | | — | | — | | — | | 1,849 |
| Finance costs and FX losses/(gains) | | 2,551 | | 266 | | 324 | | (478 | ) | 2,663 |
| | |
| |
| |
| |
| |
|
| Total expenses | | 44,247 | | 19,372 | | 8,913 | | (14,949 | ) | 57,583 |
| | |
| |
| |
| |
| |
|
| Operating balance | | 3,033 | | 860 | | 700 | | (351 | ) | 4,242 |
| | |
| |
| |
| |
| |
|
Forecast Statement of Financial Position (institutional form)
as at 30 June 2006
| | Core Crown
2006
| | Crown
entities
2006
| | State-owned
enterprises
2006
| | Inter-segment
eliminations
2006
| | Total Crown
2006
|
|---|
| | ($ million)
|
|---|
| Assets | | | | | | | | | | |
| Financial assets | | 30,530 | | 14,133 | | 1,276 | | (7,898 | ) | 38,041 |
| Physical assets | | 27,699 | | 12,421 | | 10,252 | | — | | 50,372 |
| Investment in SOEs and CEs | | 8,720 | | — | | — | | (8,720 | ) | — |
| Other assets | | 9,207 | | 2,193 | | 2,776 | | (839 | ) | 13,337 |
| | |
| |
| |
| |
| |
|
| Total assets | | 76,156 | | 28,747 | | 14,304 | | (17,457 | ) | 101,750 |
| | |
| |
| |
| |
| |
|
| Liabilities | | | | | | | | | | |
| Borrowings | | 40,306 | | 3,593 | | 4,491 | | (7,898 | ) | 40,492 |
| Other liabilities | | 19,771 | | 12,021 | | 2,522 | | (839 | ) | 33,475 |
| | |
| |
| |
| |
| |
|
| Total liabilities | | 60,077 | | 15,614 | | 7,013 | | (8,737 | ) | 73,967 |
| | |
| |
| |
| |
| |
|
| Net worth | | 16,079 | | 13,133 | | 7,291 | | (8,720 | ) | 27,783 |
| | |
| |
| |
| |
| |
|
| Taxpayer Funds | | 11,744 | | 10,127 | | 6,542 | | (8,720 | ) | 19,693 |
| Revaluation reserves | | 4,335 | | 3,006 | | 749 | | — | | 8,090 |
| Net worth | | 16,079 | | 13,133 | | 7,291 | | (8,720 | ) | 27,783 |
| Analysis of financial assets and borrowings | | | | | | | | | | |
| Advances and cash | | 11,155 | | 1,069 | | 92 | | (2,536 | ) | 9,780 |
| MSDs and equity investments | | 19,375 | | 13,064 | | 1,184 | | (5,362 | ) | 28,261 |
| | |
| |
| |
| |
| |
|
| Total financial assets | | 30,530 | | 14,133 | | 1,276 | | (7,898 | ) | 38,041 |
| | |
| |
| |
| |
| |
|
| Borrowings—Sovereign guaranteed | | 40,306 | | — | | — | | (5,362 | ) | 34,944 |
| Borrowings—Non-sovereign guaranteed | | — | | 3,593 | | 4,491 | | (2,536 | ) | 5,548 |
| | |
| |
| |
| |
| |
|
| Total borrowings | | 40,306 | | 3,593 | | 4,491 | | (7,898 | ) | 40,492 |
| | |
| |
| |
| |
| |
|
| Borrowings less financial assets | | 9,776 | | (10,540 | ) | 3,215 | | — | | 2,451 |
| | |
| |
| |
| |
| |
|
| Net Crown debt | | 21,880 | | Net Crown debt and gross sovereign-issued debt differ from the analysis above due to elimination of |
| Gross sovereign-issued borrowings | | 40,656 | | cross-holdings of Govt stock and adding back the NZS Fund and GSF assets. |
.
Annex A: Tax Revenue Tables
Table A.1—Treasury and Inland Revenue forecasts of tax revenue
| |
| | 2001/02
Forecast
| | 2002/03
Forecast
| | 2003/04
Forecast
| | 2004/05
Forecast
| | 2005/06
Forecast
| |
|---|
| | 2000/01
Actual
| |
|---|
| | Treasury
| | IRD
| | Treasury
| | IRD
| | Treasury
| | IRD
| | Treasury
| | IRD
| | Treasury
| | IRD
| |
|---|
| | ($ million)
| |
|---|
| CURRENT PRESENTATION This is the same format under which tax forecasts were presented in the December Update | |
| Direct Tax | | | | | | | | | | | | | | | | | | | | | | | |
| Individuals | | | | | | | | | | | | | | | | | | | | | | | |
| Source deductions | | 13,703 | | 14,602 | | 14,618 | | 15,298 | | 15,289 | | 16,133 | | 16,110 | | 17,029 | | 17,005 | | 17,865 | | 17,856 | |
| Other persons tax | | 3,871 | | 3,989 | | 3,955 | | 4,140 | | 4,094 | | 4,267 | | 4,180 | | 4,376 | | 4,325 | | 4,473 | | 4,530 | |
| Refunds | | (790 | ) | (814 | ) | (755 | ) | (771 | ) | (705 | ) | (762 | ) | (705 | ) | (754 | ) | (700 | ) | (779 | ) | (705 | ) |
| Fringe benefit tax | | 342 | | 356 | | 360 | | 381 | | 378 | | 385 | | 374 | | 390 | | 379 | | 395 | | 382 | |
| | |
| | | | | |
| |
| | | | | |
| |
| | | | | |
| Subtotal: Individuals | | 17,126 | | 18,133 | | 18,178 | | 19,048 | | 19,056 | | 20,023 | | 19,959 | | 21,041 | | 21,009 | | 21,954 | | 22,063 | |
| Company Tax (net) | | 4,831 | | 4,524 | | 4,530 | | 4,810 | | 4,777 | | 5,282 | | 5,148 | | 5,579 | | 5,397 | | 5,645 | | 5,530 | |
| Withholding taxes on: | | | | | | | | | | | | | | | | | | | | | | | |
| Resident interest income | | 990 | | 986 | | 978 | | 1,026 | | 994 | | 1,039 | | 1,036 | | 1,038 | | 1,058 | | 1,038 | | 1,086 | |
| Non-resident income | | 760 | | 657 | | 670 | | 640 | | 647 | | 692 | | 688 | | 716 | | 720 | | 737 | | 734 | |
| Resident dividend income | | 71 | | 27 | | 20 | | 49 | | 45 | | 45 | | 45 | | 46 | | 45 | | 47 | | 45 | |
| Foreign-source dividends | | 83 | | 149 | | 143 | | 122 | | 120 | | 56 | | 80 | | 56 | | 80 | | 56 | | 80 | |
| | |
| | | | | |
| |
| | | | | |
| |
| | | | | |
| Subtotal: Withholding Tax | | 1,904 | | 1,819 | | 1,811 | | 1,837 | | 1,806 | | 1,832 | | 1,849 | | 1,856 | | 1,903 | | 1,878 | | 1,945 | |
| Total Income Tax | | 23,861 | | 24,476 | | 24,519 | | 25,695 | | 25,639 | | 27,137 | | 26,956 | | 28,476 | | 28,309 | | 29,477 | | 29,538 | |
| Other Direct Tax | | | | | | | | | | | | | | | | | | | | | | | |
| Estate and gift duties | | 2 | | 2 | | 2 | | 2 | | 2 | | 2 | | 2 | | 2 | | 2 | | 2 | | 2 | |
| Total Direct Tax | | 23,863 | | 24,478 | | 24,521 | | 25,697 | | 25,641 | | 27,139 | | 26,958 | | 28,478 | | 28,311 | | 29,479 | | 29,540 | |
| Indirect Tax | | | | | | | | | | | | | | | | | | | | | | | |
| GST | | | | | | | | | | | | | | | | | | | | | | | |
| GST (Customs) | | 4,099 | | 4,149 | | 4,150 | | 4,301 | | 4,265 | | 4,587 | | 4,525 | | 4,757 | | 4,680 | | 4,909 | | 4,835 | |
| GST (IRD) | | 5,027 | | 5,817 | | 5,760 | | 6,053 | | 5,914 | | 6,200 | | 6,133 | | 6,530 | | 6,447 | | 6,905 | | 6,771 | |
| | |
| | | | | |
| |
| | | | | |
| |
| | | | | |
| Subtotal: GST | | 9,126 | | 9,966 | | 9,910 | | 10,354 | | 10,179 | | 10,787 | | 10,658 | | 11,287 | | 11,127 | | 11,814 | | 11,606 | |
| Excise duties on: | | | | | | | | | | | | | | | | | | | | | | | |
| Alcoholic drinks | | 436 | | 451 | | 447 | | 452 | | 457 | | 462 | | 462 | | 469 | | 468 | | 475 | | 473 | |
| Tobacco products | | 764 | | 818 | | 815 | | 807 | | 811 | | 808 | | 812 | | 806 | | 813 | | 802 | | 813 | |
| Petroleum fuels | | 810 | | 846 | | 855 | | 938 | | 940 | | 943 | | 947 | | 949 | | 955 | | 957 | | 963 | |
| | |
| | | | | |
| |
| | | | | |
| |
| | | | | |
| Subtotal: Excise Duties | | 2,010 | | 2,115 | | 2,117 | | 2,197 | | 2,208 | | 2,213 | | 2,221 | | 2,224 | | 2,236 | | 2,234 | | 2,249 | |
| Other Indirect Tax | | | | | | | | | | | | | | | | | | | | | | | |
| Customs duty | | 648 | | 657 | | 650 | | 680 | | 659 | | 697 | | 701 | | 708 | | 729 | | 719 | | 754 | |
| Road user charges | | 532 | | 570 | | 568 | | 602 | | 613 | | 623 | | 637 | | 646 | | 661 | | 672 | | 684 | |
| Motor vehicle fees | | 181 | | 181 | | 187 | | 182 | | 179 | | 184 | | 182 | | 185 | | 185 | | 186 | | 187 | |
| Stamp and cheque duties | | 61 | | 61 | | 60 | | 62 | | 62 | | 65 | | 65 | | 68 | | 68 | | 71 | | 71 | |
| Gaming duties | | 206 | | 242 | | 242 | | 266 | | 266 | | 279 | | 285 | | 292 | | 300 | | 304 | | 317 | |
| Energy resources levy | | 111 | | 107 | | 110 | | 101 | | 105 | | 97 | | 105 | | 93 | | 105 | | 91 | | 105 | |
| Other | | — | | — | | — | | — | | — | | — | | — | | — | | — | | — | | — | |
| | |
| | | | | |
| |
| | | | | |
| |
| | | | | |
| Subtotal: Other Indirect Tax | | 1,739 | | 1,818 | | 1,817 | | 1,893 | | 1,884 | | 1,945 | | 1,975 | | 1,992 | | 2,048 | | 2,043 | | 2,118 | |
| Total Indirect Tax | | 12,875 | | 13,899 | | 13,844 | | 14,444 | | 14,271 | | 14,945 | | 14,854 | | 15,503 | | 15,411 | | 16,091 | | 15,973 | |
| | |
| | | | | |
| |
| | | | | |
| |
| | | | | |
| Total Tax | | 36,738 | | 38,377 | | 38,365 | | 40,141 | | 39,912 | | 42,084 | | 41,812 | | 43,981 | | 43,722 | | 45,570 | | 45,513 | |
| | |
| | | | | |
| |
| | | | | |
| |
| | | | | |
| Tax-to-GDP | | 32.2 | % | 31.9 | % | 31.9 | % | 32.1 | % | 31.9 | % | 32.1 | % | 31.8 | % | 32.1 | % | 31.9 | % | 31.9 | % | 31.8 | % |
| Eliminations The above figures are net of the following eliminations | |
| Income tax from NZSF | | — | | — | | — | | 23 | | 23 | | 52 | | 52 | | 93 | | 93 | | 140 | | 140 | |
| GST on departmental outputs | | 759 | | 771 | | 771 | | 799 | | 799 | | 798 | | 798 | | 796 | | 796 | | 798 | | 798 | |
| FUTURE PRESENTATION OF CORE CROWN | | | | | | | | | | | | | | | | | | | | | | | |
| Eliminations GST on Crown expenses and income tax paid by GSF are further eliminated from the above to arrive at the future Core Crown format | |
| GST on Crown expenses & tax from GSF | | 1,743 | | 1,947 | | 1,947 | | 2,037 | | 2,037 | | 2,214 | | 2,214 | | 2,280 | | 2,280 | | 2,382 | | 2,382 | |
| | |
| | | | | |
| |
| | | | | |
| |
| | | | | |
| Total Tax | | 34,995 | | 36,430 | | 36,418 | | 38,104 | | 37,875 | | 39,870 | | 39,598 | | 41,701 | | 41,442 | | 43,188 | | 43,131 | |
| | |
| | | | | |
| |
| | | | | |
| |
| | | | | |
| Tax-to-GDP | | 30.7 | % | 30.3 | % | 30.3 | % | 30.5 | % | 30.3 | % | 30.4 | % | 30.2 | % | 30.4 | % | 30.2 | % | 30.2 | % | 30.2 | % |
| FUTURE PRESENTATION OF TOTAL CROWN | | | | | | | | | | | | | | | | | | | | | | | |
| Eliminations Income tax paid by SOEs and CEs is further eliminated from Core Crown to arrive at the Total Crown position | |
| Income tax from SOEs and CEs | | 251 | | 225 | | 225 | | 202 | | 202 | | 340 | | 340 | | 366 | | 366 | | 417 | | 417 | |
| | |
| | | | | |
| |
| | | | | |
| |
| | | | | |
| Total Tax | | 34,744 | | 36,205 | | 36,193 | | 37,902 | | 37,673 | | 39,530 | | 39,258 | | 41,335 | | 41,076 | | 42,771 | | 42,714 | |
| | |
| | | | | |
| |
| | | | | |
| |
| | | | | |
| Tax-to-GDP | | 30.4 | % | 30.1 | % | 30.1 | % | 30.3 | % | 30.1 | % | 30.1 | % | 29.9 | % | 30.1 | % | 29.9 | % | 29.9 | % | 29.9 | % |
| GDP | | 114,145 | | 120,309 | | 120,309 | | 124,964 | | 124,964 | | 131,293 | | 131,293 | | 137,201 | | 137,201 | | 143,026 | | 143,026 | |
Sources: Inland Revenue, The Treasury
Table A.2—Treasury and Inland Revenue forecasts of tax receipts (cash)
| |
| | 2001/02
Forecast
| | 2002/03
Forecast
| | 2003/04
Forecast
| | 2004/05
Forecast
| | 2005/06
Forecast
| |
|---|
| | 2000/01 Actual
| |
|---|
| | Treasury
| | IRD
| | Treasury
| | IRD
| | Treasury
| | IRD
| | Treasury
| | IRD
| | Treasury
| | IRD
| |
|---|
| | ($ million)
| |
|---|
| CURRENT PRESENTATION This is the same format under which tax forecasts were presented in the December Update | |
| Direct Tax | | | | | | | | | | | | | | | | | | | | | | | |
| Individuals | | | | | | | | | | | | | | | | | | | | | | | |
| Source deductions | | 13,748 | | 14,602 | | 14,618 | | 15,298 | | 15,289 | | 16,133 | | 16,110 | | 17,029 | | 17,005 | | 17,865 | | 17,856 | |
| Other persons tax | | 4,221 | | 4,385 | | 4,390 | | 4,516 | | 4,519 | | 4,638 | | 4,595 | | 4,743 | | 4,735 | | 4,853 | | 4,925 | |
| Refunds | | (1,175 | ) | (1,210 | ) | (1,190 | ) | (1,146 | ) | (1,130 | ) | (1,133 | ) | (1,120 | ) | (1,121 | ) | (1,110 | ) | (1,159 | ) | (1,100 | ) |
| Fringe benefit tax | | 338 | | 344 | | 345 | | 380 | | 377 | | 384 | | 373 | | 389 | | 378 | | 394 | | 382 | |
| | |
| |
| |
| |
| |
| |
| |
| |
| |
| |
| |
| |
| Subtotal: Individuals | | 17,132 | | 18,121 | | 18,163 | | 19,048 | | 19,055 | | 20,022 | | 19,958 | | 21,040 | | 21,008 | | 21,953 | | 22,063 | |
| Company Tax (net) | | 4,592 | | 4,646 | | 4,650 | | 4,751 | | 4,777 | | 5,252 | | 5,148 | | 5,535 | | 5,397 | | 5,644 | | 5,530 | |
| Withholding taxes on: | | | | | | | | | | | | | | | | | | | | | | | |
| Resident interest income | | 971 | | 986 | | 976 | | 1,026 | | 992 | | 1,039 | | 1,036 | | 1,038 | | 1,057 | | 1,038 | | 1,085 | |
| Non-resident income | | 738 | | 634 | | 625 | | 638 | | 647 | | 692 | | 688 | | 716 | | 720 | | 737 | | 734 | |
| Resident dividend income | | 72 | | 27 | | 20 | | 49 | | 45 | | 45 | | 45 | | 46 | | 45 | | 47 | | 45 | |
| Foreign-source dividends | | 98 | | 149 | | 143 | | 122 | | 120 | | 56 | | 80 | | 56 | | 80 | | 56 | | 80 | |
| | |
| |
| |
| |
| |
| |
| |
| |
| |
| |
| |
| |
| Subtotal: Withholding Tax | | 1,879 | | 1,796 | | 1,764 | | 1,835 | | 1,804 | | 1,832 | | 1,849 | | 1,856 | | 1,902 | | 1,878 | | 1,944 | |
| Total Income Tax | | 23,603 | | 24,563 | | 24,577 | | 25,634 | | 25,636 | | 27,106 | | 26,955 | | 28,431 | | 28,307 | | 29,475 | | 29,537 | |
| Other Direct Tax | | | | | | | | | | | | | | | | | | | | | | | |
| Esttate and gift duties | | 2 | | 2 | | 2 | | 2 | | 2 | | 2 | | 2 | | 2 | | 2 | | 2 | | 2 | |
| Total Direct Tax | | 23,605 | | 24,565 | | 24,579 | | 25,636 | | 25,638 | | 27,108 | | 26,957 | | 28,433 | | 28,309 | | 29,477 | | 29,539 | |
| Indirect Tax | | | | | | | | | | | | | | | | | | | | | | | |
| GST | | | | | | | | | | | | | | | | | | | | | | | |
| GST (Customs) | | 4,063 | | 4,182 | | 4,150 | | 4,301 | | 4,265 | | 4,587 | | 4,525 | | 4,757 | | 4,680 | | 4,909 | | 4,835 | |
| GST (IRD) | | 4,884 | | 5,784 | | 5,760 | | 6,053 | | 5,914 | | 6,200 | | 6,133 | | 6,530 | | 6,447 | | 6,905 | | 6,771 | |
| | |
| |
| |
| |
| |
| |
| |
| |
| |
| |
| |
| |
| Subtotal: GST | | 8,947 | | 9,966 | | 9,910 | | 10,354 | | 10,179 | | 10,787 | | 10,658 | | 11,287 | | 11,127 | | 11,814 | | 11,606 | |
| Excise duties on: | | | | | | | | | | | | | | | | | | | | | | | |
| Alcoholic drinks | | 430 | | 446 | | 447 | | 452 | | 457 | | 462 | | 462 | | 469 | | 468 | | 475 | | 473 | |
| Tobacco products | | 735 | | 803 | | 805 | | 807 | | 811 | | 808 | | 812 | | 806 | | 813 | | 802 | | 813 | |
| Petroleum fuels | | 820 | | 851 | | 850 | | 938 | | 940 | | 943 | | 947 | | 949 | | 955 | | 957 | | 963 | |
| | |
| |
| |
| |
| |
| |
| |
| |
| |
| |
| |
| |
| Subtotal: Excise Duties | | 1,985 | | 2,100 | | 2,102 | | 2,197 | | 2,208 | | 2,213 | | 2,221 | | 2,224 | | 2,236 | | 2,234 | | 2,249 | |
| Other Indirect Tax | | | | | | | | | | | | | | | | | | | | | | | |
| Customs duty | | 628 | | 657 | | 645 | | 680 | | 659 | | 697 | | 701 | | 708 | | 729 | | 719 | | 754 | |
| Road user charges | | 532 | | 565 | | 568 | | 600 | | 613 | | 621 | | 637 | | 646 | | 661 | | 672 | | 684 | |
| Motor vehicle fees | | 174 | | 176 | | 177 | | 182 | | 179 | | 184 | | 182 | | 185 | | 185 | | 191 | | 187 | |
| Stamp and cheque duties | | 63 | | 61 | | 60 | | 62 | | 62 | | 65 | | 65 | | 68 | | 68 | | 71 | | 71 | |
| Gaming duties | | 205 | | 242 | | 242 | | 266 | | 266 | | 279 | | 285 | | 292 | | 300 | | 304 | | 317 | |
| Energy resources levy | | 110 | | 107 | | 110 | | 101 | | 105 | | 97 | | 105 | | 93 | | 105 | | 91 | | 10 | |
| Other | | 1 | | — | | — | | — | | — | | — | | — | | — | | — | | — | | — | |
| | |
| |
| |
| |
| |
| |
| |
| |
| |
| |
| |
| |
| Subtotal: Other Indirect Tax | | 1,713 | | 1,808 | | 1,802 | | 1,891 | | 1,884 | | 1,943 | | 1,975 | | 1,992 | | 2,048 | | 2,048 | | 2,118 | |
| Total Indirect Tax | | 12,645 | | 13,874 | | 13,814 | | 14,442 | | 14,271 | | 14,943 | | 14,854 | | 15,503 | | 15,411 | | 16,096 | | 15,973 | |
| | |
| |
| |
| |
| |
| |
| |
| |
| |
| |
| |
| |
| Total Tax | | 36,250 | | 38,439 | | 38,393 | | 40,078 | | 39,90 | | 42,051 | | 41,811 | | 43,936 | | 43,720 | | 45,573 | | 45,512 | |
| | |
| |
| |
| |
| |
| |
| |
| |
| |
| |
| |
| |
| Tax-to-GDP | | 31.8 | % | 32.0 | % | 31.9 | % | 32.1 | % | 31.9 | % | 32.0 | % | 31.8 | % | 32.0 | % | 31.9 | % | 31.9 | % | 31.8 | % |
| Eliminations The above figures are net of the following eliminations | | | |
| Income tax from NZSF | | — | | — | | — | | 23 | | 23 | | 52 | | 52 | | 93 | | 93 | | 140 | | 140 | |
| GST on departmental outputs | | 759 | | 771 | | 771 | | 799 | | 799 | | 798 | | 798 | | 796 | | 796 | | 798 | | 798 | |
| FUTURE PRESENTATION OF CORE CROWN | | | | | | | | | | | | | | | | | | | | | | | |
| Eliminations GST on Crown expenses and income tax paid by GSF are further eliminated from the above to arrive at the future Core Crown format | |
| GST on Crown expenses & tax from GSF | | 1,743 | | 1,947 | | 1,947 | | 2,037 | | 2,037 | | 2,214 | | 2,214 | | 2,280 | | 2,280 | | 2,382 | | 2,382 | |
| | |
| |
| |
| |
| |
| |
| |
| |
| |
| |
| |
| |
| Total Tax | | 34,507 | | 36,492 | | 36,446 | | 38,041 | | 37,872 | | 39,837 | | 39,597 | | 41,656 | | 41,440 | | 43,191 | | 43,130 | |
| | |
| |
| |
| |
| |
| |
| |
| |
| |
| |
| |
| |
| Tax-to-GDP | | 30.2 | % | 30.3 | % | 30.3 | % | 30.4 | % | 30.3 | % | 30.3 | % | 30.2 | % | 30.4 | % | 30.2 | % | 30.2 | % | 30.2 | % |
| FUTURE PRESENTATION OF TOTAL CROWN | | | | | | | | | | | | | | | | | | | | | | | |
| Eliminations Income tax paid by SOEs and CEs is further eliminated from Core Crown to arrive at the Total Crown position | |
| Income tax from SOEs and CEs | | 251 | | 174 | | 174 | | 195 | | 195 | | 331 | | 331 | | 357 | | 357 | | 412 | | 412 | |
| | |
| |
| |
| |
| |
| |
| |
| |
| |
| |
| |
| |
| Total Tax | | 34,256 | | 36,318 | | 36,272 | | 37,846 | | 37,677 | | 39,506 | | 39,266 | | 41,299 | | 41,083 | | 42,779 | | 42,718 | |
| | |
| |
| |
| |
| |
| |
| |
| |
| |
| |
| |
| |
| Tax-to-GDP | | 30.0 | % | 30.2 | % | 30.1 | % | 30.3 | % | 30.2 | % | 30.1 | % | 29.9 | % | 30.1 | % | 29.9 | % | 29.9 | % | 29.9 | % |
Sources: Inland Revenue, The Treasury
Annex B: Expense Tables
The expense tables are based on the current presentation of the Crown forecasts. At the bottom of each table is the adjustment required to reconcile to core Crown as reported under the future presentation (ie, line-by-line consolidation).
Table B.1—Expenses by category
| | 2000/01
Actual
| | 2001/02
Forecast
| | 2002/03
Forecast
| | 2003/04
Forecast
| | 2004/05
Forecast
| | 2005/06
Forecast
| |
|---|
| | ($ million)
| |
|---|
| Social security and welfare | | 13,216 | | 13,615 | | 13,936 | | 14,407 | | 14,805 | | 15,273 | |
| GSF Pension expense | | 855 | | 339 | | 671 | | 680 | | 680 | | 719 | |
| Health | | 7,342 | | 7,733 | | 8,370 | | 8,873 | | 9,347 | | 9,475 | |
| Education | | 6,690 | | 7,150 | | 7,494 | | 7,674 | | 7,747 | | 7,850 | |
| Core government services | | 1,817 | | 1,611 | | 1,641 | | 1,616 | | 1,628 | | 1,658 | |
| Law and order | | 1,560 | | 1,771 | | 1,734 | | 1,737 | | 1,734 | | 1,727 | |
| Defence | | 1,267 | | 1,188 | | 1,166 | | 1,208 | | 1,159 | | 1,146 | |
| Transport and communications | | 1,026 | | 1,156 | | 1,238 | | 1,300 | | 1,324 | | 1,335 | |
| Economic and industrial services | | 1,141 | | 1,187 | | 1,275 | | 1,268 | | 1,261 | | 1,272 | |
| Primary services | | 287 | | 327 | | 343 | | 330 | | 326 | | 323 | |
| Heritage, culture and recreation | | 424 | | 500 | | 533 | | 558 | | 584 | | 595 | |
| Housing and community | | 50 | | 95 | | 103 | | 99 | | 91 | | 91 | |
| Other | | 75 | | 109 | | 114 | | 110 | | 110 | | 110 | |
| Finance costs | | 2,483 | | 2,303 | | 2,339 | | 2,425 | | 2,501 | | 2,572 | |
| Net foreign exchange losses/(gains) | | (47 | ) | 64 | | — | | — | | — | | — | |
| Forecast for future new spending | | — | | — | | 230 | | 700 | | 1,180 | | 2,080 | |
| | |
| |
| |
| |
| |
| |
| |
| Total Expenses (current presentation) | | 38,186 | | 39,148 | | 41,187 | | 42,985 | | 44,477 | | 46,226 | |
| | |
| |
| |
| |
| |
| |
| |
| Less | | | | | | | | | | | | | |
| Foreign exchange gains/(losses) | | 47 | | (64 | ) | — | | — | | — | | — | |
| Unfunded GSF liability revaluation | | (164 | ) | 368 | | — | | — | | — | | — | |
| NPF revaluation | | (253 | ) | — | | — | | — | | — | | — | |
| | |
| |
| |
| |
| |
| |
| |
| Adjusted Total Expenses | | 37,816 | | 39,452 | | 41,187 | | 42,985 | | 44,477 | | 46,226 | |
| | |
| |
| |
| |
| |
| |
| |
| Core Crown Expenses (future presentation) | | | | | | | | | | | | | |
Less GST on Crown spending |
|
(1,661 |
) |
(1,863 |
) |
(1,956 |
) |
(2,135 |
) |
(2,201 |
) |
(2,302 |
) |
| Plus GSF expenses | | 257 | | 257 | | 257 | | 257 | | 257 | | 257 | |
| Other Eliminations | | (94 | ) | (40 | ) | 66 | | 66 | | 66 | | 66 | |
| | |
| |
| |
| |
| |
| |
| |
| Total Core Crown Expenses | | 36,688 | | 37,502 | | 39,554 | | 41,173 | | 42,599 | | 44,247 | |
| | |
| |
| |
| |
| |
| |
| |
Source: The Treasury
Table B.2—Social security and welfare
| | 2000/01
Actual
| | 2001/02
Forecast
| | 2002/03
Forecast
| | 2003/04
Forecast
| | 2004/05
Forecast
| | 2005/06
Forecast
|
|---|
| | ($ million)
|
|---|
| Welfare benefits | | 12,385 | | 12,685 | | 12,991 | | 13,474 | | 13,877 | | 14,342 |
| Social rehabilitation & compensation | | 62 | | 91 | | 103 | | 106 | | 108 | | 110 |
| Departmental expenses | | 618 | | 669 | | 656 | | 635 | | 634 | | 633 |
| Other non-departmental expenses | | 151 | | 170 | | 186 | | 192 | | 186 | | 188 |
| | |
| |
| |
| |
| |
| |
|
| Total Social Security and Welfare | | 13,216 | | 13,615 | | 13,936 | | 14,407 | | 14,805 | | 15,273 |
| | |
| |
| |
| |
| |
| |
|
| Less GST on Crown Spending | | 9 | | 1 | | 1 | | 1 | | 1 | | 1 |
| | |
| |
| |
| |
| |
| |
|
| Core Crown Social Security and Welfare (excluding GSF) | | 13,207 | | 13,614 | | 13,935 | | 14,406 | | 14,804 | | 15,272 |
| | |
| |
| |
| |
| |
| |
|
Source: The Treasury
Table B.3—New Zealand superannuation and welfare benefits
| | 2000/01
Actual
| | 2001/02
Forecast
| | 2002/03
Forecast
| | 2003/04
Forecast
| | 2004/05
Forecast
| | 2005/06
Forecast
|
|---|
| | ($ million)
|
|---|
| New Zealand Superannuation | | 5,273 | | 5,457 | | 5,645 | | 5,888 | | 6,112 | | 6,399 |
| Domestic Purposes Benefit | | 1,444 | | 1,486 | | 1,521 | | 1,570 | | 1,599 | | 1,631 |
| Unemployment Benefit | | — | | 1,406 | | 1,364 | | 1,419 | | 1,451 | | 1,468 |
| Community Wage | | 1,849 | | — | | — | | — | | — | | — |
| Accommodation Supplement | | 795 | | 723 | | 744 | | 784 | | 820 | | 856 |
| Invalids Benefit | | 745 | | 835 | | 912 | | 995 | | 1,060 | | 1,124 |
| Sickness Benefit | | — | | 382 | | 409 | | 433 | | 448 | | 462 |
| Disability Allowance | | 210 | | 223 | | 235 | | 247 | | 259 | | 273 |
| Transitional Retirement Benefit | | 127 | | 97 | | 50 | | 10 | | — | | — |
| Income Related Rents | | 161 | | 276 | | 286 | | 296 | | 305 | | 314 |
| Family Support | | 878 | | 870 | | 870 | | 872 | | 874 | | 876 |
| Child Tax Credit | | 161 | | 159 | | 159 | | 159 | | 160 | | 160 |
| Special Benefit | | 40 | | 50 | | 59 | | 63 | | 65 | | 66 |
| Benefits paid in Australia | | 171 | | 161 | | 126 | | 111 | | 101 | | 90 |
| Paid Parental Leave | | — | | — | | 41 | | 44 | | 45 | | 46 |
| Other benefits | | 531 | | 560 | | 570 | | 583 | | 578 | | 577 |
| | |
| |
| |
| |
| |
| |
|
| Total Welfare Benefits | | 12,385 | | 12,685 | | 12,991 | | 13,474 | | 13,877 | | 14,342 |
| | |
| |
| |
| |
| |
| |
|
Source: The Treasury
Table B.4—Beneficiary numbers
| | 2000/01
Actual
| | 2001/02
Forecast
| | 2002/03
Forecast
| | 2003/04
Forecast
| | 2004/05
Forecast
| | 2005/06
Forecast
|
|---|
| | (Thousands)
|
|---|
| New Zealand Superannuation | | 449 | | 448 | | 454 | | 462 | | 472 | | 484 |
| Domestic Purposes Benefit | | 110 | | 110 | | 110 | | 111 | | 112 | | 112 |
| Unemployment Benefit | | — | | 141 | | 134 | | 136 | | 137 | | 136 |
| Community Wage | | 189 | | — | | — | | — | | — | | — |
| Accommodation Supplement | | 297 | | 270 | | 267 | | 273 | | 279 | | 284 |
| Invalids Benefit | | 58 | | 62 | | 67 | | 71 | | 74 | | 77 |
| Sickness Benefit | | — | | 35 | | 37 | | 38 | | 39 | | 39 |
Source: The Treasury
Table B.5—GSF pension expense
| | 2000/01
Actual
| | 2001/02
Forecast
| | 2002/03
Forecast
| | 2003/04
Forecast
| | 2004/05
Forecast
| | 2005/06
Forecast
|
|---|
| | ($ million)
|
|---|
| Pension expenses | | 691 | | 707 | | 671 | | 680 | | 680 | | 719 |
| Revaluation of Unfunded Liability | | 164 | | (368 | ) | — | | — | | — | | — |
| | |
| |
| |
| |
| |
| |
|
| Total GSF pension expense | | 855 | | 339 | | 671 | | 680 | | 680 | | 719 |
| | |
| |
| |
| |
| |
| |
|
| Additional Pension Expenses (offset by revenue) | | 257 | | 257 | | 257 | | 257 | | 257 | | 257 |
| | |
| |
| |
| |
| |
| |
|
| Core Crown GSF | | 1,112 | | 596 | | 928 | | 937 | | 937 | | 976 |
| | |
| |
| |
| |
| |
| |
|
Source: The Treasury
Table B.6—Health
| | 2000/01
Actual
| | 2001/02
Forecast
| | 2002/03
Forecast
| | 2003/04
Forecast
| | 2004/05
Forecast
| | 2005/06
Forecast
|
|---|
| | ($ million)
|
|---|
| Departmental outputs | | 116 | | 139 | | 150 | | 135 | | 134 | | 133 |
| Health service purchasing | | 6,807 | | 7,011 | | 7,639 | | 8,100 | | 8,608 | | 8,716 |
| Other non-departmental outputs | | 101 | | 73 | | 102 | | 142 | | 93 | | 96 |
| Health payments to ACC | | 291 | | 478 | | 457 | | 478 | | 502 | | 519 |
| Other expenses | | 27 | | 32 | | 22 | | 18 | | 10 | | 11 |
| | |
| |
| |
| |
| |
| |
|
| Total Health Expenses | | 7,342 | | 7,733 | | 8,370 | | 8,873 | | 9,347 | | 9,475 |
| | |
| |
| |
| |
| |
| |
|
| Less GST on Crown Spending | | 778 | | 801 | | 862 | | 923 | | 973 | | 974 |
| Plus Other Eliminations | | 96 | | 87 | | 87 | | 87 | | 87 | | 87 |
| | |
| |
| |
| |
| |
| |
|
| Core Crown Health Expenses | | 6,660 | | 7,019 | | 7,595 | | 8,037 | | 8,461 | | 8,588 |
| | |
| |
| |
| |
| |
| |
|
Source: The Treasury
Table B.7—Health service purchasing
| | 2000/01
Actual
| | 2001/02
Forecast
| | 2002/03
Forecast
| | 2003/04
Forecast
| | 2004/05
Forecast
| | 2005/06
Forecast
|
|---|
| | ($ million)
|
|---|
| Personal health services: | | | | | | | | | | | | |
| Northern | | 1,671 | | — | | — | | — | | — | | — |
| Midland | | 997 | | — | | — | | — | | — | | — |
| Central | | 1,174 | | — | | — | | — | | — | | — |
| Southern | | 1,097 | | — | | — | | — | | — | | — |
| | |
| |
| |
| |
| |
| |
|
| Total Personal Health | | 4,939 | | — | | — | | — | | — | | - |
| | |
| |
| |
| |
| |
| |
|
| Disability support services: | | | | | | | | | | | | |
| Northern | | 557 | | — | | — | | — | | — | | — |
| Midland | | 332 | | — | | — | | — | | — | | — |
| Central | | 428 | | — | | — | | — | | — | | — |
| Southern | | 426 | | — | | — | | — | | — | | — |
| | |
| |
| |
| |
| |
| |
|
| Total Disability Support | | 1,743 | | — | | — | | — | | — | | — |
| | |
| |
| |
| |
| |
| |
|
| Payments to District Health Boards | | — | | 5,460 | | 5,843 | | 6,080 | | 6,300 | | 6,408 |
| National Disability Support Services | | — | | 1,345 | | 1,422 | | 1,466 | | 1,530 | | 1,530 |
| Public Health Service Purchasing | | 125 | | 206 | | 374 | | 554 | | 778 | | 778 |
| | |
| |
| |
| |
| |
| |
|
| Total Health Servicing Purchasing | | 6,807 | | 7,011 | | 7,639 | | 8,100 | | 8,608 | | 8,716 |
| | |
| |
| |
| |
| |
| |
|
Source: The Treasury
Table B.8—Health-related payments to ACC
| | 2000/01
Actual
| | 2001/02
Forecast
| | 2002/03
Forecast
| | 2003/04
Forecast
| | 2004/05
Forecast
| | 2005/06
Forecast
|
|---|
| | ($ million)
|
|---|
| Petrol excise | | 67 | | 69 | | 69 | | 70 | | 71 | | 71 |
| Medical treatment | | 224 | | 409 | | 388 | | 408 | | 431 | | 448 |
| | |
| |
| |
| |
| |
| |
|
| Total Health related payments | | 291 | | 478 | | 457 | | 478 | | 502 | | 519 |
| | |
| |
| |
| |
| |
| |
|
Source: The Treasury
Table B.9—Education
| | 2000/01
Actual
| | 2001/02
Forecast
| | 2002/03
Forecast
| | 2003/04
Forecast
| | 2004/05
Forecast
| | 2005/06
Forecast
|
|---|
| | ($ million)
|
|---|
| Early childhood education | | 331 | | 362 | | 387 | | 393 | | 395 | | 398 |
| Primary and secondary schools | | 3,505 | | 3,642 | | 3,653 | | 3,698 | | 3,700 | | 3,712 |
| Tertiary funding | | 2,133 | | 2,397 | | 2,592 | | 2,705 | | 2,805 | | 2,891 |
| Departmental expenses | | 419 | | 476 | | 556 | | 568 | | 565 | | 566 |
| Other education expenses | | 302 | | 273 | | 306 | | 310 | | 282 | | 283 |
| | |
| |
| |
| |
| |
| |
|
| Total Education Expenses | | 6,690 | | 7,150 | | 7,494 | | 7,674 | | 7,747 | | 7,850 |
| | |
| |
| |
| |
| |
| |
|
| Less GST on Crown Spending | | 554 | | 651 | | 677 | | 692 | | 695 | | 702 |
| | |
| |
| |
| |
| |
| |
|
| Core Crown Education | | 6,136 | | 6,499 | | 6,817 | | 6,982 | | 7,052 | | 7,148 |
| | |
| |
| |
| |
| |
| |
|
Source: The Treasury
Table B.10—Primary and secondary education
| | 2000/01
Actual
| | 2001/02
Forecast
| | 2002/03
Forecast
| | 2003/04
Forecast
| | 2004/05
Forecast
| | 2005/06
Forecast
|
|---|
| | ($ million)
|
|---|
| Primary | | 1,780 | | 1,845 | | 1,877 | | 1,904 | | 1,890 | | 1,884 |
| Secondary | | 1,333 | | 1,301 | | 1,303 | | 1,333 | | 1,354 | | 1,371 |
| Secondary allowances | | | | | | | | | | | | |
| School transport | | 106 | | 109 | | 112 | | 112 | | 113 | | 114 |
| Special needs support | | 286 | | 284 | | 247 | | 235 | | 235 | | 236 |
| Professional Development | | — | | 87 | | 97 | | 97 | | 91 | | 90 |
| Schooling Improvement | | 16 | | 17 | | 17 | | 17 | | 17 | | |
| | |
| |
| |
| |
| |
| |
|
| Total Schools Funding | | 3,505 | | 3,642 | | 3,653 | | 3,698 | | 3,700 | | 3,712 |
| | |
| |
| |
| |
| |
| |
|
Places
| | 2001
| | 2002
| | 2003
| | 2004
| | 2005
| | 2006
|
|---|
| Primary | | 463,000 | | 465,000 | | 464,000 | | 459,000 | | 458,000 | | 455,000 |
| Secondary | | 251,000 | | 256,000 | | 264,000 | | 272,000 | | 278,000 | | 280,000 |
Sources: Ministry of Education, The Treasury
Table B.11—Tertiary education
| | 2000/01
Actual
| | 2001/02
Forecast
| | 2002/03
Forecast
| | 2003/04
Forecast
| | 2004/05
Forecast
| | 2005/06
Forecast
|
|---|
| | ($ million)
|
|---|
| Tuition | | 1,362 | | 1,550 | | 1,672 | | 1,725 | | 1,788 | | 1,831 |
| Other tertiary funding | | 153 | | 183 | | 220 | | 233 | | 234 | | 234 |
| | |
| |
| |
| |
| |
| |
|
| Total Tertiary Education and Training | | 1,515 | | 1,733 | | 1,892 | | 1,958 | | 2,022 | | 2,065 |
| | |
| |
| |
| |
| |
| |
|
| Tertiary student allowances | | 391 | | 411 | | 441 | | 458 | | 473 | | 490 |
| Student loan provision and write-offs | | 227 | | 253 | | 259 | | 289 | | 310 | | 336 |
| | |
| |
| |
| |
| |
| |
|
| Total Tertiary Funding | | 2,133 | | 2,397 | | 2,592 | | 2,705 | | 2,805 | | 2,891 |
| | |
| |
| |
| |
| |
| |
|
Places (year)
| | 2001
| | 2002
| | 2003
| | 2004
| | 2005
| | 2006
|
|---|
| EFT Students | | 192,000 | | 213,000 | | 223,000 | | 230,000 | | 236,000 | | 242,000 |
Sources: Ministry of Education, The Treasury
Table B.12—Core government services
| | 2000/01
Actual
| | 2001/02
Forecast
| | 2002/03
Forecast
| | 2003/04
Forecast
| | 2004/05
Forecast
| | 2005/06
Forecast
|
|---|
| | ($ million)
|
|---|
| Official development assistance | | 226 | | 223 | | 230 | | 227 | | 226 | | 226 |
| Indemnity and guarantee expenses | | 253 | | — | | — | | — | | — | | — |
| Departmental expenses | | 901 | | 938 | | 1,006 | | 986 | | 984 | | 1,017 |
| Science expenses | | 247 | | 244 | | 261 | | 275 | | 281 | | 296 |
| Other expenses | | 190 | | 206 | | 144 | | 128 | | 137 | | 119 |
| | |
| |
| |
| |
| |
| |
|
| Total Core Government Services | | 1,817 | | 1,611 | | 1,641 | | 1,616 | | 1,628 | | 1,658 |
| | |
| |
| |
| |
| |
| |
|
| Less GST on Crown Spending | | 19 | | 64 | | 45 | | 41 | | 37 | | 36 |
| | |
| |
| |
| |
| |
| |
|
| Total Core Crown Core Government Services | | 1,798 | | 1,547 | | 1,596 | | 1,575 | | 1,591 | | 1,622 |
| | |
| |
| |
| |
| |
| |
|
Source: The Treasury
Table B.13—Law and order
| | 2000/01
Actual
| | 2001/02
Forecast
| | 2002/03
Forecast
| | 2003/04
Forecast
| | 2004/05
Forecast
| | 2005/06
Forecast
|
|---|
| | ($ million)
|
|---|
| Departmental expenses: | | | | | | | | | | | | |
| Police | | 724 | | 765 | | 795 | | 796 | | 797 | | 797 |
| Ministry of Justice | | 13 | | 15 | | 15 | | 15 | | 15 | | 15 |
| Department of Corrections | | 369 | | 416 | | 402 | | 406 | | 402 | | 395 |
| Department for Courts | | 181 | | 190 | | 200 | | 198 | | 201 | | 204 |
| Other departments | | 67 | | 70 | | 75 | | 76 | | 76 | | 76 |
| | |
| |
| |
| |
| |
| |
|
| Total Departments | | 1,354 | | 1,456 | | 1,487 | | 1,491 | | 1,491 | | 1,487 |
| | |
| |
| |
| |
| |
| |
|
| Non-departmental outputs | | 177 | | 205 | | 203 | | 195 | | 207 | | 204 |
| Other expenses | | 29 | | 110 | | 44 | | 51 | | 36 | | 36 |
| | |
| |
| |
| |
| |
| |
|
| Total Law and Order Expenses | | 1,560 | | 1,771 | | 1,734 | | 1,737 | | 1,734 | | 1,727 |
| | |
| |
| |
| |
| |
| |
|
| Less GST on Crown Spending | | 19 | | 6 | | 6 | | 6 | | 6 | | 6 |
| | |
| |
| |
| |
| |
| |
|
| Core Crown Law and Order | | 1,541 | | 1,765 | | 1,728 | | 1,731 | | 1,728 | | 1,721 |
| | |
| |
| |
| |
| |
| |
|
Source: The Treasury
Table B.14—Defence
| | 2000/01
Actual
| | 2001/02
Forecast
| | 2002/03
Forecast
| | 2003/04
Forecast
| | 2004/05
Forecast
| | 2005/06
Forecast
|
|---|
| | ($ million)
|
|---|
| NZDF Core expenses | | 1,058 | | 1,072 | | 1,103 | | 1,108 | | 1,107 | | 1,107 |
| NZDF write-offs | | 104 | | — | | — | | — | | — | | — |
| NZDF East Timor deployment | | 22 | | 20 | | — | | — | | — | | — |
| DWI East Timor deployment | | 22 | | 23 | | 9 | | — | | — | | — |
| Other departments | | 36 | | 38 | | 42 | | 42 | | 39 | | 39 |
| GST on defence acquisitions | | 25 | | 35 | | 12 | | 58 | | 13 | | — |
| | |
| |
| |
| |
| |
| |
|
| Total Defence Expenses | | 1,267 | | 1,188 | | 1,166 | | 1,208 | | 1,159 | | 1,146 |
| | |
| |
| |
| |
| |
| |
|
| Less GST on Crown Spending | | 25 | | 36 | | 12 | | 59 | | 13 | | - |
| | |
| |
| |
| |
| |
| |
|
| Core Crown Defence | | 1,242 | | 1,152 | | 1,154 | | 1,149 | | 1,146 | | 1,146 |
| | |
| |
| |
| |
| |
| |
|
Source: The Treasury
Table B.15—Transport and communications
| | 2000/01
Actual
| | 2001/02
Forecast
| | 2002/03
Forecast
| | 2003/04
Forecast
| | 2004/05
Forecast
| | 2005/06
Forecast
|
|---|
| | ($ million)
|
|---|
| Transfund | | 890 | | 1,012 | | 1,096 | | 1,158 | | 1,181 | | 1,192 |
| Departmental outputs | | 75 | | 80 | | 83 | | 83 | | 83 | | 83 |
| Other non-departmental expenses | | 52 | | 56 | | 54 | | 54 | | 54 | | 54 |
| Other expenses | | 9 | | 8 | | 5 | | 5 | | 6 | | 6 |
| | |
| |
| |
| |
| |
| |
|
| Total Transport and Communications | | 1,026 | | 1,156 | | 1,238 | | 1,300 | | 1,324 | | 1,335 |
| | |
| |
| |
| |
| |
| |
|
| Less GST on Crown Spending | | 121 | | 129 | | 142 | | 145 | | 149 | | 153 |
| | |
| |
| |
| |
| |
| |
|
| Core Crown Transport | | 905 | | 1,027 | | 1,096 | | 1,155 | | 1,175 | | 1,182 |
| | |
| |
| |
| |
| |
| |
|
Source: The Treasury
Table B.16—Economic and industrial
| | 2000/01
Actual
| | 2001/02
Forecast
| | 2002/03
Forecast
| | 2003/04
Forecast
| | 2004/05
Forecast
| | 2005/06
Forecast
|
|---|
| | ($ million)
|
|---|
| Departmental outputs | | 422 | | 420 | | 445 | | 437 | | 432 | | 431 |
| Employment initiatives | | 204 | | 221 | | 241 | | 244 | | 241 | | 244 |
| Non-departmental outputs | | 423 | | 424 | | 432 | | 441 | | 445 | | 456 |
| Other expenses | | 92 | | 122 | | 157 | | 146 | | 143 | | 141 |
| | |
| |
| |
| |
| |
| |
|
| Total Economic and Industrial Services | | 1,141 | | 1,187 | | 1,275 | | 1,268 | | 1,261 | | 1,272 |
| | |
| |
| |
| |
| |
| |
|
| Less GST on Crown Spending | | 104 | | 142 | | 147 | | 150 | | 154 | | 157 |
| | |
| |
| |
| |
| |
| |
|
| Core Crown Economic and Industrial Services | | 1,037 | | 1,045 | | 1,128 | | 1,118 | | 1,107 | | 1,115 |
| | |
| |
| |
| |
| |
| |
|
Source: The Treasury
Table B.17—Employment initiatives
| | 2000/01
Actual
| | 2001/02
Forecast
| | 2002/03
Forecast
| | 2003/04
Forecast
| | 2004/05
Forecast
| | 2005/06
Forecast
|
|---|
| | ($ million)
|
|---|
| Training benefit (including tax) | | — | | — | | — | | — | | — | | — |
| Training incentive allowance | | 36 | | 45 | | 43 | | 43 | | 43 | | 43 |
| Community employment projects | | 17 | | 22 | | 22 | | 19 | | 19 | | 19 |
| Subsidised work | | 95 | | 94 | | 112 | | 119 | | 109 | | 109 |
| Employment support for disabled | | 53 | | 58 | | 61 | | 61 | | 68 | | 70 |
| Other employment assistance schemes | | 3 | | 2 | | 3 | | 2 | | 2 | | 3 |
| | |
| |
| |
| |
| |
| |
|
| Total Employment Initiative Expenses | | 204 | | 221 | | 241 | | 244 | | 241 | | 244 |
| | |
| |
| |
| |
| |
| |
|
Source: The Treasury
Table B.18—Primary services
| | 2000/01
Actual
| | 2001/02
Forecast
| | 2002/03
Forecast
| | 2003/04
Forecast
| | 2004/05
Forecast
| | 2005/06
Forecast
|
|---|
| | ($ million)
|
|---|
| Departmental expenses | | 194 | | 214 | | 226 | | 224 | | 220 | | 219 |
| Non-departmental outputs | | 69 | | 95 | | 96 | | 97 | | 98 | | 97 |
| Other expenses | | 24 | | 18 | | 21 | | 9 | | 8 | | 7 |
| | |
| |
| |
| |
| |
| |
|
| Total Primary Services Expenses | | 287 | | 327 | | 343 | | 330 | | 326 | | 323 |
| | |
| |
| |
| |
| |
| |
|
| Less GST on Crown Spending | | 8 | | 12 | | 13 | | 12 | | 12 | | 11 |
| | |
| |
| |
| |
| |
| |
|
| Core Crown Primary Services | | 279 | | 315 | | 330 | | 318 | | 314 | | 312 |
| | |
| |
| |
| |
| |
| |
|
Source: The Treasury
Table B.19—Heritage, culture and recreation
| | 2000/01
Actual
| | 2001/02
Forecast
| | 2002/03
Forecast
| | 2003/04
Forecast
| | 2004/05
Forecast
| | 2005/06
Forecast
|
|---|
| | ($ million)
|
|---|
| Community grants | | 18 | | 6 | | 6 | | 6 | | 6 | | 6 |
| Departmental outputs | | 206 | | 219 | | 253 | | 249 | | 253 | | 255 |
| Non-departmental outputs | | 181 | | 173 | | 194 | | 206 | | 205 | | 204 |
| Other expenses | | 19 | | 102 | | 80 | | 97 | | 120 | | 130 |
| | |
| |
| |
| |
| |
| |
|
| Total Heritage, Culture and Recreation | | 424 | | 500 | | 533 | | 558 | | 584 | | 595 |
| | |
| |
| |
| |
| |
| |
|
| Less GST on Crown Spending | | 24 | | 21 | | 25 | | 28 | | 30 | | 31 |
| | |
| |
| |
| |
| |
| |
|
| Core Crown Heritage, Culture and Recreation | | 400 | | 479 | | 508 | | 530 | | 554 | | 564 |
| | |
| |
| |
| |
| |
| |
|
Source: The Treasury
Table B.20—Housing and community development
| | 2000/01
Actual
| | 2001/02
Forecast
| | 2002/03
Forecast
| | 2003/04
Forecast
| | 2004/05
Forecast
| | 2005/06
Forecast
|
|---|
| | ($ million)
|
|---|
| Housing subsidies | | — | | 22 | | 26 | | 26 | | 21 | | 22 |
| Departmental outputs | | 35 | | 52 | | 55 | | 53 | | 52 | | 52 |
| Other non-departmental expenses | | 15 | | 21 | | 22 | | 20 | | 18 | | 17 |
| | |
| |
| |
| |
| |
| |
|
| Core Crown Housing and Community Development | | 50 | | 95 | | 103 | | 99 | | 91 | | 91 |
| | |
| |
| |
| |
| |
| |
|
Source: The Treasury
Glossary of Terms
ACC unfunded liability
The future cost of past ACC claims, less the asset reserves held to meet these claims. The ACC outstanding claims liability is the gross liability of the future cost of past ACC claims.
Baselines
The level of funding approved for any given spending area (eg, Education). All amounts within baselines are included in the forecasts.
Capital provision (or forecast for future new capital spending)
An amount provided in the forecasts to represent the balance sheet impact of capital initiatives expected to be introduced over the forecast period.
Contingent liability
Contingent liabilities are costs which the Crown will have to face if a particular event occurs. Typically, contingent liabilities consist of guarantees and indemnities, legal disputes and claims, and uncalled capital.
Core Crown
Under the future presentation of the Crown accounts, the core Crown represents the revenues, expenses, assets and liabilities of departments, the Reserve Bank and the GSF.
Corporate tax
The sum of net company tax, non-resident withholding tax (NRWT) and foreign dividend withholding payments (FDWP).
Current account
A measure of the flows of income between New Zealand and the rest of the world. A net inflow to New Zealand is a current account surplus, while a net outflow is a deficit. The current account balance is usually expressed as a percentage of GDP (see below), rather than a dollar amount.
Customs duty
Duty levied on the imports of certain goods.
Cyclically adjusted or structural fiscal balance
An estimate of the operating balance adjusted for short-term fluctuations of actual GDP around the productive potential of the economy. The estimate provides a picture of the underlying trend fiscal position and an indication of the effects of policy decisions. Because it is based on a number of assumptions and is sensitive to new information, the estimate is subject to some uncertainty. Trends in the cyclically adjusted balance are, however, more reliable.
Demographic changes
Changes to structure of the population, for example the age, sex or ethnic make-up of the population.
Domestic bond programme
The amount of new government stock (taking into account the repayment of maturing government stock) expected to be issued over the financial year to fund the Government's cash flow requirements.
Excise duties
Tax levied on the domestic production of alcohol, tobacco and light petroleum products (CNG, LPG and petrol).
Financial assets
Either cash or shares (equity) or a right to receive a financial instrument, which can be converted to cash (see net Crown debt).
Fiscal allowance
The amount included in the Fiscal Strategy Report and Budget Policy Statement projections for Government decisions on new spending and cost pressures.
Fiscal provisions
A system used by the Government to record the cost of policy decisions. The framework distinguishes situations where the Government is able to control the cost from those that are beyond immediate control (eg, tax forecasts). The fiscal provision is used to measure the aggregate cost of policy initiatives against the limits for operating and capital policies (which are referred to as the provision for future initiatives and capital provision). This is to be revised in the new parliamentary term.
Forecast for future new spending
An amount included in the forecasts to provide for the operating balance impact of policy initiatives and changes to demographics expected to occur over the forecast period. This represents the forecast for future new spending not yet allocated to initiatives for example.
Fringe benefit tax (FBT)
Tax levied on non-cash benefits provided to employees as part of remuneration packages.
Gross Crown debt
Total borrowings (financial liabilities).
Gross domestic product (GDP)
A measure of the value of all goods and services produced in New Zealand; changes in GDP measure growth in economic activity or output. GDP can be measured as the actual dollar value of goods and services measured at today's prices (nominal GDP), or excluding the effects of price changes over time (real GDP).
Gross domestic product (expenditure)
This is the sum of total final expenditures on goods and services in the economy.
Gross national expenditure (GNE)
Measures total expenditure on goods and services by New Zealand residents.
Labour productivity
Measures output per input of labour (where labour inputs might be measured as hours worked or people).
Line-by-line consolidation
This is a term used to refer to the change required to the presentation of the Crown financial statements. It means that the revenues, expenses, assets and liabilities of all departments, the Reserve Bank, SOEs and Crown entities will be included in the Crown financial statements.
Marketable securities and deposits
Assets held with financial institutions. These assets are held for both cash flow and investment purposes, and include any funds the Government has invested in the International Monetary Fund.
Monetary conditions
The combination of short-term interest rates and the exchange rate. Tightening monetary conditions refers to actions taken by the Reserve Bank to raise interest rates (which also influences the exchange rate) in order to moderate demand pressures to reduce inflationary pressures.
Monetary policy
Action taken by the Reserve Bank to affect interest rates and the exchange rate in order to control inflation.
Net Crown debt
Borrowings (financial liabilities) less cash and bank balances, marketable securities and deposits, and advances (financial assets). Net debt excludes the assets of the NZS Fund.
Net worth
Assets less liabilities (also referred to as Crown balance).
Objectives (long-term)
The Government's long-term goals for operating expenses, operating revenue, the operating balance, debt and net worth, as required by the Fiscal Responsibility Act 1994. The objectives must be consistent with the principles of responsible fiscal management outlined in the Act.
Operating balance
The operating balance is the residual of revenues less expenses plus surpluses from state-owned enterprises and Crown entities. It is the Government's profit or loss.
Operating balance excluding revaluation and accounting policy changes (OBERAC)
The OBERAC is the operating balance adjusted for revaluation movements and accounting policy changes. It provides a measure of underlying stewardship.
Participation rate
Measures the percentage of the working age population in work or actively looking for work.
Projections
Tracks of the key fiscal indicators for a further five years beyond the five-year forecast period. The tracks are based on long-run economic assumptions and current fiscal policy settings. For example, the projections assume no economic cycle with constant long-run interest rate, inflation rate and unemployment assumptions.
Provisional tax
A thrice-yearly payment of tax on income that has not been taxed, or been under-taxed, at source (relates only to company tax and other persons' tax).
Scenarios
Tracks of the key fiscal indicators based on long-run economic and fiscal assumptions. For example growth in expense categories reflects the sum of the change in the appropriate population cohort, inflation and a real growth factor (to reflect rising real wages and technology costs).
Short-term intentions
In the Budget Policy Statement the Government must, under the Fiscal Responsibility Act 1994, indicate explicitly its planned track for operating expenses, operating revenues, the operating balance, debt and net worth over the Government's planning horizon (defined as the two financial years following the current financial year).
Source deductions
Tax withheld on wages, salaries, social welfare benefits, bonuses, lump-sum payments and superannuation fund contributions. About 80% of source deductions come from PAYE on wages and salaries. Source deductions is the biggest single tax type.
Specific fiscal risks
These are a category of Government decisions or circumstances which may have a material impact on the fiscal position (excluding contingent liabilities). They are not included in the main forecasts because their fiscal impact cannot be reasonably quantified, the likelihood of realisation is uncertain and/or the timing is uncertain.
Stock change
The change in the value of stocks (raw materials, work in progress, and finished goods) during a given period.
System of National Accounts (SNA)
SNA is a comprehensive, consistent and flexible set of macroeconomic accounts to meet the needs of government and private sector analysts, policy-makers, and decision-takers. See www.imf.org for further information.
Tax revenue
The accrual, rather than the cash ("tax receipts") measure of taxation. It is a measure of tax due, regardless of whether or not it has actually been paid.
Trade weighted index (TWI)
A measure of movements in the New Zealand dollar against the currencies of our major trading partners. The currencies comprise the US dollar, the Australian dollar, the Japanese yen, the euro and the UK pound.
Unit labour costs
The wages and other costs associated with employment per unit of output.
Year ended
Graphs and tables use different expressions of the timeframe. For example, 2000/01 or 2001 will generally mean "year ended 30 June" unless otherwise stated.
QuickLinks
budget 2002BUDGET SPEECH EXHIBIT 99.5(E)(1)FISCAL STRATEGY REPORT EXHIBIT 99.5(E)(2)ECONOMIC AND FISCAL UPDATE EXHIBIT 99.5(E)(3)Contentsbudget 2002BUDGET SPEECHBudget Speechbudget 2002FISCAL STRATEGY REPORTFiscal Strategy ReportAnnex 1: Short-term fiscal intentionsAnnex 2: Long-term fiscal objectivesAnnex 3: Assumptions used in the forecasts and projectionsAnnex 4: Full line-by-line consolidationbudget 2002ECONOMIC AND FISCAL UPDATEStatement of Responsibility1 Economic and Fiscal Overview2 Economic Outlook3 Fiscal Outlook4 Risks and Scenarios5 Specific Fiscal RisksGenerally Accepted Accounting Practice (GAAP) Series TablesStatement of Accounting Policies and Forecast AssumptionsGAAP Tables—Line-by-Line Consolidation