QuickLinks -- Click here to rapidly navigate through this document
EXHIBIT 99.6(E)(4)
25 June 2002
PRE-ELECTION
ECONOMIC AND
FISCAL UPDATE
2002
Hon Dr Michael Cullen
Treasurer
Minister of Finance
© Crown Copyright Reserved
ISBN 0-478-11832-5
Typeset by The Treasury
Printed and bound by PrintLink
(A division of Blue Star Print Group Ltd)
Wellington
Internet
This document will be made available on the New Zealand Treasury's Internet site.
The URL for this site is http://www.treasury.govt.nz
Contents
| Statement of Responsibility | | |
Ministerial Statement |
|
|
Economic and Fiscal Outlook |
|
|
| |
Executive Summary |
|
|
| |
Economic Outlook |
|
|
| |
Fiscal Outlook |
|
|
Specific Fiscal Risks |
|
|
| |
Introduction |
|
|
| |
Contingent Liabilities |
|
|
| |
Specific Fiscal Risks |
|
|
Generally Accepted Accounting Practice (GAAP) Series Tables |
|
|
| |
Forecast Financial Statements |
|
|
| |
Crown Reporting Entity as at 17 June 2002 |
|
|
| |
Accounting Policies and Forecast Assumptions |
|
|
| |
GAAP Tables—Line-by-Line Consolidation |
|
|
Statement of Responsibility
On the basis of the economic and fiscal information available to it, the Treasury has used its best professional judgement in supplying the Minister of Finance with this Economic and Fiscal Update. The Update incorporates the fiscal and economic implications both of Government decisions and circumstances as at 17 June 2002 that were communicated to me, and of other economic and fiscal information available to the Treasury in accordance with the provisions of the Fiscal Responsibility Act 1994.
Dr Alan Bollard
Secretary to the Treasury
19 June 2002
This Economic and Fiscal Update has been prepared in accordance with the Fiscal Responsibility Act 1994. I accept overall responsibility for the integrity of the disclosures contained in this Update, and the consistency and completeness of the Update information in accordance with the requirements of the Fiscal Responsibility Act 1994.
To enable the Treasury to prepare this Update, I have ensured that the Secretary to the Treasury has been advised of all Government decisions and other circumstances as at 17 June 2002 of which I was aware and that had material economic or fiscal implications.
Hon Dr Michael Cullen
Treasurer and Minister of Finance
19 June 2002
Ministerial Statement
Hon Dr Michael Cullen
Very little time has elapsed between the presentation of Budget 2002 and the preparation of the Pre-election Economic and Fiscal Update. In those circumstances, it is to be expected that the outlook in the Pre-EFU will be little changed from that in the Budget.
This update repeats and confirms the two primary messages from the Budget:
- •
- that it is possible to attend to issues of social equity, to fund an improvement in the performance of the economy, and to keep the books in the black; and
- •
- that the Government remains determined to take the longer view: in addition to putting aside funds to meet the future costs of New Zealand Superannuation, it has laid out a three-year, rising funding path for health, committed itself to a bold land transport strategy, and increased capital allocations in a range of areas from schools, to hospitals, defence and prisons.
More time has elapsed between the publication of the 1999 Pre-election Update and this one. This does allow a comparison to be made between the sort of economic and fiscal position the government inherited and the one it leaves behind. On all fronts, there has been a material improvement. The economy is much healthier and the Crown financial statements are much stronger than they were three years ago.
- •
- The 1999 Pre-EFU forecast growth of 2.3 percent, an unemployment rate of 7.0 percent and a current account deficit of 8.3 percent of GDP in the year to March 2000. The 2002 Pre-EFU forecasts growth of 3.1 percent, an unemployment rate of 5.4 percent and a current account deficit of 4.4 percent of GDP in the year to March 2003.
- •
- The 1999 Pre-EFU forecast a zero operating surplus, expenses at 34.8 percent of GDP, gross debt at 34.1 percent and net debt at 22.4 percent in the year to June 2000. The 2002 Pre-EFU forecasts an operating surplus of 1.8 percent of GDP, expenses at 32.9 percent, gross debt at 28.3 and net debt at 17 percent in the year to 30 June 2003.
This is in spite of the economy having had to trade through one of the most widespread and pronounced global economic slowdowns in recent years, absorb the shocks and disruptions of the events of 11 September, and cope with the drought-induced reduction of electricity generating capacity last winter. It also takes no account of the rising balances in the New Zealand Superannuation Fund in estimating net debt.
In addition, the government has restored entitlements and funding in crucial areas of social security such as superannuation, education, health and housing, and reversed the dangerous rundown of public sector investment in the provision of essential services.
At a technical level, this statement continues the government's programme of expanding the suite of fiscal indicators available to the public and improving transparency in the presentation of the fiscal outlook.
The publication of this update is a requirement of the Fiscal Responsibility Act, and was originally intended to prevent governments from concealing embarrassing economic or financial information during an election period. In this case, full disclosure merely confirms an excellent record of fiscal and economic management, and that New Zealanders can have confidence in facing the future.
Hon Dr Michael Cullen
Treasurer and Minister of Finance
19 June 2002
Treasury Forecast Update Process
The Pre-election Economic and Fiscal Update (Pre-EFU) is required by the Fiscal Responsibility Act. A Pre-EFU is generally required to be released between 28-42 days prior to an election.
With the announcement of the election date on 11 June 2002, there has been limited time available for Treasury to update its 2002 Budget Economic and Fiscal Update (Budget Update) macroeconomic and fiscal forecasts (which were finalised on 10 May 2002).
The macroeconomic and fiscal forecasts contained in the Pre-EFU were finalised on 17 June.
As a result of the limited time, the approach Treasury has adopted in reconsidering its macroeconomic forecasts involved a reassessment of key assumptions and judgements in light of additional economic data available since the finalisation of the Budget Update forecasts on 10 May.
We have not undertaken the usual process of drawing on information from many private sector businesses and government organisations, and no independent panel has reviewed this set of macroeconomic forecasts.
The preparation of the fiscal forecasts have involved:
- •
- Reassessing tax revenue (in conjunction with IRD) and benefit expense forecasts in light of the revisions to the macroeconomic forecast changes
- •
- Seeking updates to operating results or expense forecasts from the larger SOEs, Crown entities and departments, and
- •
- Considering the impact of additional actual financial information that has occurred since the finalisation of the Budget Update forecasts on 10 May.
Forecasts of the GSF and ACC liabilities have not been updated. These will be updated in the 30 June 2002 Crown financial statements.
The Pre-EFU does not contain a separate discussion on risks and scenarios.
The Specific Fiscal Risks have been updated to reflect developments since the Budget Update. Also contained in the Specific Fiscal Risks section is additional disclosure of Government initiatives that have a specific end point within the forecast period.
The next Economic and Fiscal Update is scheduled to be released in December 2002.
1
Economic and Fiscal Outlook
Executive Summary
The economic outlook remains similar to that presented in the Budget Update...
- •
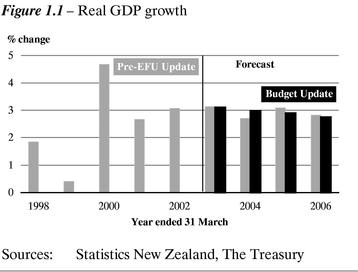
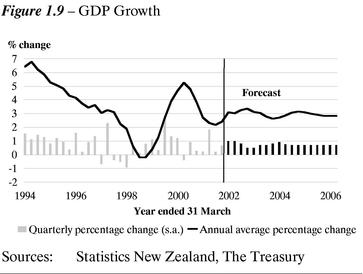
- Real economic growth averaging around 3% per annum is forecast over the next 4 years, broadly unchanged from the economic forecasts published in the 2002 Budget Economic and Fiscal Update (Budget Update).
- •
- Since the Budget Update forecasts were finalised on 10 May, economic data has evolved much as expected, and similarly most of the judgements also appear on-track.
- •
- We estimate that the economy grew by around 1% in the March quarter, driven by household spending and a rebound in exports. The June quarter also looks to be on track for GDP growth at a similar pace.
...although the exchange rate is one area of divergence
- •
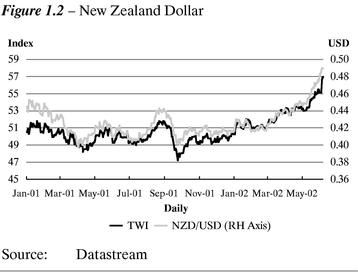
- The major economic development over the past month has been the rapid appreciation of the exchange rate, to a level above the assumption underpinning the Budget Update.
- •
- These forecasts assume the exchange rate will remain at around current levels, 561/2 on a Trade Weighted Index basis, over the forecast period. A much more cyclical and less benign exchange rate path represents one of the key risks to this set of forecasts.
- •
- Overall, given the exchange rate path assumed in these forecasts, the impact of the recent appreciation on GDP growth and the current account is modest relative to the Budget Update.
After growing at above trend in the first half of 2002, growth is expected to moderate
- •
- Most of the economic forces we saw driving the economy at Budget time still underpin this set of forecasts:
- —
- The recovery in global growth underway underpins a rebound in export growth.
- —
- The additional stimulus to demand coming from the turnaround in net migration will moderate.
- —
- Slower growth in labour income, a decline in farm incomes and higher interest rates, are expected to moderate both household consumption and investment.
- •
- GDP growth of 3.1% is expected over the year to March 2003 unchanged from the Budget Update. Quarterly growth is forecast to slow from its current 1% pace to 1/2% in late 2002/early 2003.
The recent appreciation in the exchange rate will impact on the outlook through a number of channels
- •
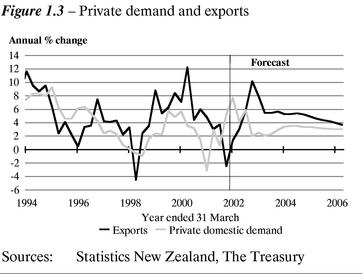
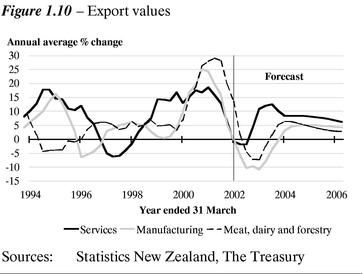
- Relative to the Budget Update, we expect somewhat lower export volume growth over the next year and a half, driven primarily by lower growth in manufactured goods and services. However, overall export volume growth is expected to remain solid.
- •
- The higher exchange rate will directly reduce export receipts relative to previous expectations, including farm incomes. However, firms that source some of their inputs or capital goods from overseas will get some offset, reducing or even eliminating the adverse impact on profitability. Import volume growth will be somewhat higher than previously expected due to both stronger domestic demand and the relatively lower cost of imports.
- •
- The higher exchange rate will directly impact on inflation. While we expect domestically sourced inflation to remain a source of upward pressure, the higher TWI is expected to operate alongside slowing unit labour cost growth to reduce quarterly CPI inflation over the 2nd half of
2002 and into 2003. In annual terms, inflation is expected to be close to the mid-point of the 0%-3% target range by the end of 2003.
- •
- Lower inflation will act to boost the real incomes of wage and salary earners particularly over the next year and a half. As a result, we expect somewhat stronger household spending over the two years to March 2003 and 2004 than in the Budget Update.
- •
- Adding these up we expect GDP growth to be slightly lower in 2003/04 at 2.7% and the the current account deficit somewhat higher than forecast in the Budget Update.
- •
- The level of nominal GDP is lower throughout the forecast period due to a combination of lower real GDP growth in the year to March 2004 and a lower GDP deflator throughout the forecast period. Compared with the Budget Update, the level of nominal GDP is around $0.4 billion lower in the year to June 2006.
The fiscal position is substantially the same as the 2002 Budget forecasts...
- •
- As a result of the modest revisions to the macroeconomic forecasts and more up-to-date actual outturn information, there has been little change to the fiscal forecasts.
- •
- Overall, the modest reduction in nominal GDP results in lower tax revenue forecasts, and thereby reducing the operating balance forecasts since the Budget Update.
- •
- As a result, the total impact on financing requirements is an increase of around $450 million for the 2001/02 to 2005/06 period (mainly reflecting minor changes to the tax forecasts).
- •
- No change has been made to the 2002/03 domestic debt programme.
... with the operating balance rising over the forecast horizon, and debt stable
- •
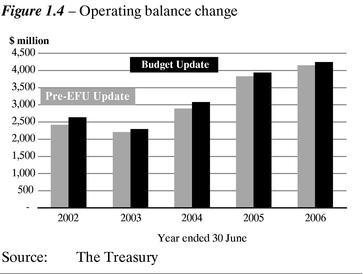
- The OBERAC (operating balance excluding revaluation and accounting policy changes) continues to rise.
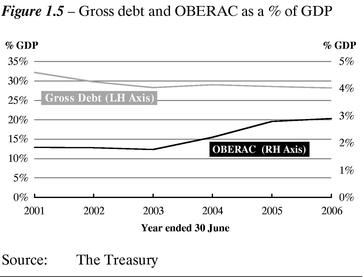
- •
- The operating balance is $2.4 billion in 2001/02 (2% of GDP). For the same year, the OBERAC is $2.2 billion (1.8% of GDP).
- •
- The operating balance is expected to rise to around 3% of GDP by 2005/06 ($4.2 billion).
- •
- Operating balance levels are sufficient to make contributions to the NZS Fund and finance enough of the capital programme so that gross debt (as a percentage of GDP) remains stable just below 30% of GDP. This is consistent with the Government's long-term fiscal objectives.
- •
- Information on the key fiscal indicators as they will appear under full line-by-line consolidated accounts is provided at the end of this chapter.
Table 1.1—2002 Pre-EFU Economic Indicators
| | 2001
Actual
| | 2002
Forecast
| | 2003
Forecast
| | 2004
Forecast
| | 2005
Forecast
| | 2006
Forecast
| |
|---|
| | (Annual Average % change, March years)
| |
|---|
| GDP (Production Measure) | | 2.7 | | 3.1 | | 3.1 | | 2.7 | | 3.1 | | 2.8 | |
| —annual % change | | 1.0 | | 3.7 | | 2.8 | | 3.1 | | 2.9 | | 2.8 | |
| CPI inflation | | 3.1 | | 2.6 | | 2.3 | | 1.6 | | 1.5 | | 1.5 | |
| Current account balance | | (4.8 | ) | (3.2 | ) | (4.4 | ) | (5.3 | ) | (4.9 | ) | (4.3 | ) |
| TWI | | 50.5 | | 51.6 | | 56.5 | | 56.5 | | 56.5 | | 56.5 | |
| 90 day bank bill rate | | 6.4 | | 5.0 | | 6.0 | | 6.0 | | 6.0 | | 6.0 | |
Table 1.2—2002 Budget Update Economic Indicators
| | 2001
Actual
| | 2002
Forecast
| | 2003
Forecast
| | 2004
Forecast
| | 2005
Forecast
| | 2006
Forecast
| |
|---|
| | (Annual Average % change, March years)
| |
|---|
| GDP (Production Measure) | | 2.7 | | 3.1 | | 3.1 | | 3.0 | | 2.9 | | 2.8 | |
| —annual % change | | 1.0 | | 3.7 | | 2.9 | | 3.2 | | 2.7 | | 2.8 | |
| CPI inflation | | 3.1 | | 2.6 | | 2.5 | | 1.8 | | 1.6 | | 1.5 | |
| Current account balance | | (4.8 | ) | (3.2 | ) | (4.4 | ) | (4.9 | ) | (4.6 | ) | (4.1 | ) |
| TWI | | 50.5 | | 51.6 | | 54.0 | | 54.6 | | 55.0 | | 55.0 | |
| 90 day bank bill rate | | 6.4 | | 5.0 | | 6.1 | | 6.0 | | 6.0 | | 6.0 | |
Table 1.3—2002 Pre-EFU Fiscal Indicators
Fiscal Indicators
| | 2001
Actual
| | 2002
Est. Actuals
| | 2003
Forecast
| | 2004
Forecast
| | 2005
Forecast
| | 2006
Forecast
| |
|---|
| | ($ million)
| |
|---|
| Revenue | | 39,492 | | 41,087 | | 42,925 | | 44,935 | | 47,199 | | 49,131 | |
| Expenses | | 38,186 | | 39,173 | | 41,217 | | 42,941 | | 44,427 | | 46,168 | |
| Operating balance | | 1,409 | | 2,419 | | 2,204 | | 2,891 | | 3,830 | | 4,142 | |
| OBERAC | | 2,107 | | 2,212 | | 2,204 | | 2,891 | | 3,830 | | 4,142 | |
| Gross debt | | 36,761 | | 35,939 | | 35,421 | | 38,031 | | 39,183 | | 40,296 | |
| Net Crown debt | | 19,971 | | 20,223 | | 21,265 | | 22,595 | | 22,847 | | 22,903 | |
| Net worth | | 11,463 | | 14,014 | | 16,218 | | 19,109 | | 22,939 | | 27,081 | |
| Domestic Bond Programme | | 3,572 | | 3,703 | | 3,400 | | 5,559 | | 3,933 | | 3,822 | |
| Nominal GDP | | 114,145 | | 120,543 | | 125,125 | | 130,659 | | 136,804 | | 142,631 | |
| | |
| |
| |
| |
| |
| |
| |
| Fiscal Indicators as a % of GDP | | | | | | | | | | | | | |
| Revenue | | 34.6 | % | 34.1 | % | 34.3 | % | 34.4 | % | 34.5 | % | 34.4 | % |
| Expenses | | 33.5 | % | 32.5 | % | 32.9 | % | 32.9 | % | 32.5 | % | 32.4 | % |
| Operating balance | | 1.2 | % | 2.0 | % | 1.8 | % | 2.2 | % | 2.8 | % | 2.9 | % |
| OBERAC | | 1.8 | % | 1.8 | % | 1.8 | % | 2.2 | % | 2.8 | % | 2.9 | % |
| Gross debt | | 32.2 | % | 29.8 | % | 28.3 | % | 29.1 | % | 28.6 | % | 28.3 | % |
| Net Crown debt | | 17.5 | % | 16.8 | % | 17.0 | % | 17.3 | % | 16.7 | % | 16.1 | % |
| Net Crown debt plus assets of NZS Fund | | 17.5 | % | 16.3 | % | 15.5 | % | 14.3 | % | 12.1 | % | 9.8 | % |
| Net worth | | 10.0 | % | 11.6 | % | 13.0 | % | 14.6 | % | 16.8 | % | 19.0 | % |
| | |
| |
| |
| |
| |
| |
| |
| New Zealand Superannuation Fund | | | | | | | | | | | | | |
| Fund asset returns (after tax) | | — | | 15 | | 90 | | 208 | | 368 | | 550 | |
| Fund assets (year end) | | — | | 615 | | 1,905 | | 3,913 | | 6,292 | | 8,959 | |
| % of GDP | | 0.0 | % | 0.5 | % | 1.5 | % | 3.0 | % | 4.6 | % | 6.3 | % |
Table 1.4—2002 Budget Update Fiscal Indicators
Fiscal Indicators
| | 2001
Actual
| | 2002
Est. Actuals
| | 2003
Forecast
| | 2004
Forecast
| | 2005
Forecast
| | 2006
Forecast
| |
|---|
| | ($ million)
| |
|---|
| Revenue | | 39,492 | | 41,172 | | 42,952 | | 45,142 | | 47,329 | | 49,259 | |
| Expenses | | 38,186 | | 39,148 | | 41,187 | | 42,985 | | 44,477 | | 46,226 | |
| Operating balance | | 1,409 | | 2,636 | | 2,288 | | 3,078 | | 3,937 | | 4,242 | |
| OBERAC | | 2,107 | | 2,310 | | 2,288 | | 3,078 | | 3,937 | | 4,242 | |
| Gross debt | | 36,761 | | 36,299 | | 35,781 | | 38,391 | | 39,543 | | 40,656 | |
| Net Crown debt | | 19,971 | | 20,162 | | 20,935 | | 22,087 | | 22,244 | | 22,230 | |
| Net worth | | 11,463 | | 14,238 | | 16,526 | | 19,604 | | 23,541 | | 27,783 | |
| Domestic Bond Programme | | 3,572 | | 3,703 | | 3,400 | | 5,559 | | 3,933 | | 3,822 | |
| Nominal GDP | | 114,145 | | 120,309 | | 124,964 | | 131,293 | | 137,201 | | 143,026 | |
| | |
| |
| |
| |
| |
| |
| |
| Fiscal Indicators as a % of GDP | | | | | | | | | | | | | |
| Revenue | | 34.6 | % | 34.2 | % | 34.4 | % | 34.4 | % | 34.5 | % | 34.4 | % |
| Expenses | | 33.5 | % | 32.5 | % | 33.0 | % | 32.7 | % | 32.4 | % | 32.3 | % |
| Operating balance | | 1.2 | % | 2.2 | % | 1.8 | % | 2.3 | % | 2.9 | % | 3.0 | % |
| OBERAC | | 1.8 | % | 1.9 | % | 1.8 | % | 2.3 | % | 2.9 | % | 3.0 | % |
| Gross debt | | 32.2 | % | 30.2 | % | 28.6 | % | 29.2 | % | 28.8 | % | 28.4 | % |
| Net Crown debt | | 17.5 | % | 16.8 | % | 16.8 | % | 16.8 | % | 16.2 | % | 15.5 | % |
| Net Crown debt plus assets of NZS Fund | | 17.5 | % | 16.3 | % | 15.2 | % | 13.9 | % | 11.6 | % | 9.3 | % |
| Net worth | | 10.0 | % | 11.8 | % | 13.2 | % | 14.9 | % | 17.2 | % | 19.4 | % |
| | |
| |
| |
| |
| |
| |
| |
| New Zealand Superannuation Fund | | | | | | | | | | | | | |
| Fund asset returns (after tax) | | — | | 14 | | 90 | | 208 | | 368 | | 550 | |
| Fund assets (year end) | | — | | 600 | | 1,890 | | 3,898 | | 6,277 | | 8,944 | |
| % of GDP | | 0.0 | % | 0.5 | % | 1.5 | % | 3.0 | % | 4.6 | % | 6.3 | % |
Economic Outlook
Recent Developments
Outturns have largely been in line with the 2002 Budget Update
This set of forecasts has been produced only five weeks since finalising the 2002 Budget Update, which was published on 23 May. Most of the data released since the Budget Update economic forecasts were finalised on 10 May relates to the March and June 2002 quarters.
Overall, there have been few surprises with partial indicators for the March quarter suggesting our Budget Update estimate of quarterly GDP growth of around 1% is on track, with a similar result expected for the June quarter.
Moreover, at this early stage, many of the judgements built into the forecasts have developed as expected. This includes signs of some margin rebuilding by firms, net migration tracking in line with our assumption for this year, world commodity prices continuing to ease and domestic demand growth remaining strong
Where outturns have differed from our Budget Update expectations, they largely offset each other or there is reason to believe they will reverse out. An example of this is residential construction activity which surprised on the downside in the March 2002 quarter. Following a very large increase in the December quarter, the real value of residential building work put in place fell 10.8% in contrast to our expectations of a small increase. We expect a strong bounce back in residential construction activity in the June 2002 quarter given the level of consent and house sales activity in the first half of 2002.
One area where a recent outturn is not expected to be fully reversed is the merchandise terms of trade. This increased 1.5% in the March 2002 quarter against our expectation of a further fall in line with developments with international commodity prices. While we expect some reversal of this result in the June 2002 quarter, our view is that the merchandise terms of trade will remain higher than our Budget Update forecast over the next few quarters supported by lower than previously expected oil prices.
On the inflation front, we assess the recent falls in both food and oil prices as lessening the upside risks around our CPI forecast for the June 2002 quarter of 0.9%, rather than changing our central view.
Table 1.5—Economic Outlook1
| | 2001
Actual
| | 2002
Forecast
| | 2003
Forecast
| | 2004
Forecast
| | 2005
Forecast
| | 2006
Forecast
| |
|---|
| | (Annual Average % change, March years)
| |
|---|
| Private consumption | | 1.6 | | 2.9 | | 3.1 | | 2.4 | | 2.9 | | 3.0 | |
| Public consumption2 | | (2.2 | ) | 1.9 | | 2.9 | | 3.8 | | 1.1 | | 1.3 | |
| | |
| |
| |
| |
| |
| |
| |
| Total Consumption | | 0.7 | | 2.7 | | 3.1 | | 2.7 | | 2.5 | | 2.7 | |
| | |
| |
| |
| |
| |
| |
| |
| Residential investment | | (15.9 | ) | 3.6 | | 16.9 | | (4.1 | ) | 3.8 | | 3.6 | |
| Market Investment | | 7.4 | | 9.5 | | 1.8 | | 5.8 | | 5.4 | | 3.4 | |
| Non-Market Investment | | (5.0 | ) | (2.8 | ) | (1.7 | ) | 5.9 | | 5.0 | | 1.9 | |
| Total Investment | | (0.1 | ) | 7.6 | | 5.4 | | 3.4 | | 5.0 | | 3.4 | |
| | |
| |
| |
| |
| |
| |
| |
| Stocks3 | | (0.4 | ) | (0.2 | ) | (0.1 | ) | 0.2 | | 0.0 | | (0.1 | ) |
| Gross National Expenditure | | 0.2 | | 3.4 | | 3.5 | | 3.0 | | 3.0 | | 2.7 | |
| | |
| |
| |
| |
| |
| |
| |
| Exports | | 6.8 | | 1.4 | | 6.7 | | 5.5 | | 5.2 | | 4.3 | |
| Imports | | 0.4 | | 3.2 | | 6.9 | | 6.8 | | 4.8 | | 3.9 | |
| | |
| |
| |
| |
| |
| |
| |
| GDP (Production Measure) | | 2.7 | | 3.1 | | 3.1 | | 2.7 | | 3.1 | | 2.8 | |
| | |
| |
| |
| |
| |
| |
| |
| —annual % change, March qtr | | 1.0 | | 3.7 | | 2.8 | | 3.1 | | 2.9 | | 2.8 | |
| Nominal GDP (expenditure basis) | | 5.8 | | 6.6 | | 3.9 | | 4.2 | | 4.7 | | 4.4 | |
| GDP deflator | | 3.6 | | 3.7 | | 0.5 | | 1.6 | | 1.5 | | 1.5 | |
| Employment4 | | 2.2 | | 2.5 | | 2.0 | | 0.8 | | 1.7 | | 1.3 | |
| Unemployment5 | | 5.4 | | 5.3 | | 5.4 | | 5.3 | | 5.2 | | 5.3 | |
| Wages6 | | 2.4 | | 3.5 | | 3.8 | | 3.5 | | 3.4 | | 3.0 | |
| CPI inflation | | 3.1 | | 2.6 | | 2.3 | | 1.6 | | 1.5 | | 1.5 | |
| Export prices7 | | 20.5 | | 3.3 | | (13.1 | ) | (0.4 | ) | 0.0 | | (0.2 | ) |
| Import prices7 | | 15.3 | | (0.6 | ) | (8.9 | ) | 0.7 | | 0.3 | | (0.7 | ) |
| Current account balance | | | | | | | | | | | | | |
| —$million | | (5412 | ) | (3859 | ) | (5417 | ) | (6840 | ) | (6654 | ) | (6140 | ) |
| —% of GDP | | (4.8 | ) | (3.2 | ) | (4.4 | ) | (5.3 | ) | (4.9 | ) | (4.3 | ) |
| TWI8 | | 50.5 | | 51.6 | | 56.5 | | 56.5 | | 56.5 | | 56.5 | |
| 90 day bank bill rate8 | | 6.4 | | 5.0 | | 6.0 | | 6.0 | | 6.0 | | 6.0 | |
| 10 year bond rate8 | | 6.0 | | 6.7 | | 6.5 | | 6.2 | | 6.2 | | 6.2 | |
Sources: Statistics New Zealand, Datastream, The Treasury
- 1
- Forecasts finalised 17 June 2002. Text finalised 20 June 2002.
- 2
- The forecast profile for public consumption is influenced by government defence spending.
- 3
- Contribution to GDP growth.
- 4
- Household Labour Force Survey, full-time equivalent employment.
- 5
- Household Labour Force Survey, percentage of the labour force, March quarter, seasonally adjusted.
- 6
- Quarterly Employment Survey, average hourly ordinary time earnings.
- 7
- Overseas Trade Index basis, annual average percentage change, March quarter.
- 8
- Average for the March quarter.
The major change has been the exchange rate
The major divergence between our Budget Update forecasts and economic data outturns has been the rapid appreciation in the exchange rate. Over the past month, the level of the New Zealand Dollar (NZD) has risen above the level assumed in the Budget Update forecasts. Since the start of the year the NZD has appreciated against all major currencies, but particularly against the United States Dollar (USD) and Sterling (GBP). The TWI is around 12% higher than at the beginning of the year, while the NZD/USD rate is around 17% higher.
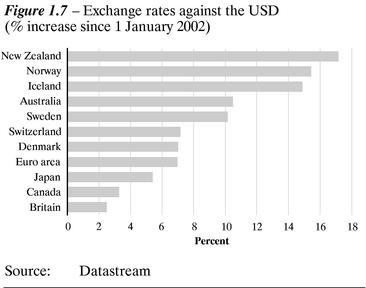
This appreciation appears to reflect a combination of domestic and global factors coming into line, including:
- •
- A fall in the USD against most currencies (see Figure 1.7). This, at least in part, seems to reflect changing sentiment around holding US denominated assets, but could also reflect the unwinding of some of the economic and geopolitical risk at play during 2001.
- •
- Global investors steering away from equities (especially in the US) towards less risky and higher yielding government bonds and cash.
- •
- The recent and expected future widening in the interest rate differential between New Zealand and overseas countries.
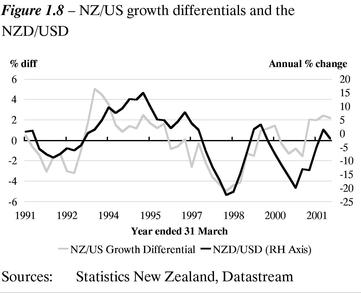
- •
- A relatively well performing New Zealand economy. This has seen GDP growth outstrip most other OECD countries, including the US (see figure opposite), a substantial reduction in the
current account deficit, and an expectation the economy will benefit from a rebound in commodity prices as the global economy rebounds.
Given that some of these factors—such as New Zealand's favourable interest rate and growth rate differentials—are not new, it would appear that their recent alignment with global factors has been important in the turnaround in sentiment and momentum in the NZD.
Given the pace of recent exchange rate movements and some of the factors behind it, the balance of risks may be for further appreciation of the TWI over the short-term. However, looking further out we expect some of the domestic factors currently supporting the rise in the NZD to unwind. As global economic growth picks up and other central banks begin to raise interest rates, the positive New Zealand growth and interest rate differential is likely to reduce significantly. New Zealand's current account deficit is also expected to increase from current levels.
The appreciation in the exchange rate has taken the TWI above the level assumed in the Budget Update. At that time we considered the TWI to be well below its medium term "equilibrium"1. The TWI path assumed in the Budget Update therefore reflected a view that some appreciation of the exchange rate toward this equilibrium was likely over the forecast period, without attempting to be precise about when and by how much the exchange rate would move.
- 1
- In broad terms the equilbrium exchange rate is the level at which the economy is in balance. The equilibrium exchange rate will tend to vary from round to round depending on what happens to other forecast variables, such as the terms of trade, relative inflation and desired external debt levels.
At current levels, we think the TWI is more likely to be within the range of plausible values for its equilibrium even if some individual cross-rates may not. Given this, our forecasts assume a flat profile for the TWI of 56.5 over the forecast period rather than the appreciation seen in the Economic and Fiscal Updates over the last few years.
World Growth Assumptions
Between the December Update and Budget Update the outlook for the global economy improved. Since April, Consensus based forecasts of trading partner growth in 2002 have continued to be revised up, although not nearly by as much as occurred earlier in the year. A less negative 2002 forecast for Japan was the major driver of the further improvement in June. The US forecast for 2002 was downgraded, albeit modestly, for the first time in 7 months. Trading partner growth forecasts using the June Consensus Forecasts are summarised in the following table.
Calendar Years
| | 2001
| | 2002
| | 2003
| | 2004-2006
|
|---|
| Trading Partner Growth | | 1.6 | | 2.9 | | 3.6 | | 3.5 |
| Australia | | 2.4 | | 4.0 | | 3.9 | | 3.8 |
| Japan | | (0.6 | ) | (0.5 | ) | 1.1 | | 1.6 |
| US | | 1.2 | | 2.7 | | 3.6 | | 3.3 |
| Europe* | | 1.8 | | 1.5 | | 2.7 | | 2.5 |
| Non-Japan Asia** | | 1.9 | | 4.9 | | 5.7 | | 5.5 |
- *
- UK, Germany, Italy, France (weighted by export share)
- **
- Korea, Taiwan, China, Malaysia, Hong Kong, Singapore (weighted by export share)
However, we do not think the increase in trading partner growth prospects since the Budget Update is significant, especially since most of the upward revision reflects better than expected March quarter outturns rather than a reassessment of growth prospects going forward. Moreover, ongoing weakness in equity markets and concerns about corporate earnings in the US provide some offset to higher headline growth figures. Thus, we see the international backdrop to our forecasts as being similar to that underpinning the Budget Update.
Short-term Outlook
The stronger exchange rate leads to some changes to the outlook relative to the Budget Update...
The above developments represent the starting point for assessing the outlook. Overall, the real economy looks to have tracked largely as expected. In addition, we have left unchanged the migration assumptions2 underpinning the forecasts and there has not been any material change to our assessment of the outlook for trading partner growth.
- 2
- Net migration is assumed to be 30,000 in the year to June 2002, 15,000 in the year to June 2003 and 5,000 thereafter.
However, the higher starting point and assumed path for the TWI relative to the Budget Update suggests some changes to both the path and drivers of the economy over the forecast period, via:
- •
- lower NZD export prices that contribute to reduced export receipts
- •
- decreased demand for exports reflecting reduced price competitiveness
- •
- lower NZD import prices that contribute to increased demand for imports.
...but the overall impact is modest
Given that the magnitude of the change to the assumed exchange rate path is modest relative to past exchange rate cycles, we expect that the impact on both GDP growth and the current account deficit to be modest. GDP growth of 3.1% is forecast for the year ended March 2003, unchanged from the Budget Update. Reflecting slower export and investment growth and stronger import growth we expect GDP growth to slow to 2.7% in the year ended March 2004 before recovering to around 3% in the following year.
A more cyclical profile for the exchange rate, with significant periods above or below our assumed equilibrium would have implications for the outlook, with perhaps a more pronounced cyclical profile for overall GDP growth as well as different drivers.
Export volume growth is likely to be lower...
The higher exchange rate is likely to impact on both export volumes and prices over the forecast period. However, we expect that the degree of impact on export volumes will be moderate. Compared with the Budget Update we are not forecasting any change to primary export volume growth over the forecast period, since production of these goods is largely driven by supply side factors such as the weather. Growth in these exports is expected to remain solid. We examine the risk of weather disruptions in the Climate box.
Nevertheless, merchandise export volumes are forecast to display more of a slowdown over the March 2004 year than forecast in the Budget Update. The slowdown is driven by manufactured exports. However, the degree of slowdown we are forecasting for manufactured exports is tempered somewhat through the more subdued appreciation we have witnessed against the Australian Dollar (AUD)—our largest market for these goods.
We expect that the impact of the higher exchange rate will materialise more quickly in weaker service export volume growth, largely tourism, as New Zealand becomes a less attractive holiday destination in terms of price.
While we are forecasting more of a slowdown in the growth rates of manufactured and service exports than contained in the Budget Update, these rates of growth remain solid. Past competitiveness gains support growth in the short term and a rebound in world incomes provide the stimulus for the strengthening growth profile in the latter part of the forecast period.
...as are export receipts...
The combination of lower New Zealand dollar export prices and slowing export volumes leads to a reasonably significant decline in export receipts over the March 2004 year. Lower export receipts can be expected to flow through to exporters' income and profitability, although some may get some offset to the latter if exporters import some of their inputs. We expect the largest decline in income to be recorded by farmers, where, as discussed in the Budget Update, foreign currency prices for some key commodities are expected to remain soft over much of the forecast period. This weaker outlook for farm incomes would be reinforced to the extent that agricultural production was adversely affected by climate thereby reducing volume growth below that currently expected. Such a mix occurred in 1998/99. However, farmers are in a much better position to deal with such a scenario following a number of very good years of income growth.
....with a corresponding lift in import volumes...
The higher level of the exchange rate lowers the price of imported goods and services. This change in relative price suggests a switch to imports and hence stronger growth for import volumes over the year to March 2004.
We expect that import volumes will respond more quickly to the higher exchange rate than export volumes. This effect is supported in the short-term by stronger domestic demand as real spending power rises. The combination of these two forces sees a higher penetration of imports over the forecast period and a switch in income from exporting to importing businesses.
Climate
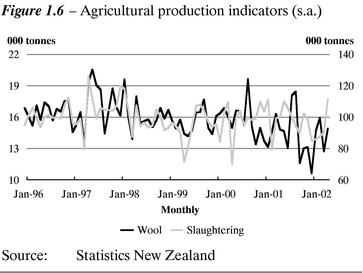
Climate conditions have a significant effect on New Zealand's agricultural sector. Indeed, severe droughts during 1997/98 and 1998/99 caused a reduction in agricultural production and contributed to a slowing of New Zealand's economic growth over that period. In contrast, relatively benign climate conditions during the last couple of seasons have supported solid growth in the agricultural sector.
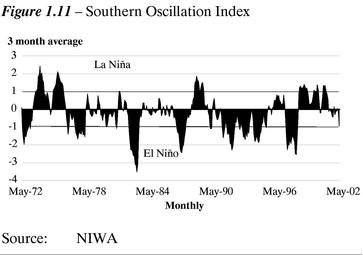
Recently there have been increasing signs that New Zealand's climatic conditions are changing from relatively 'neutral' to an El Niño pattern. El Niños correspond with anomalously negative values of the Southern Oscillation Index (SOI), which measures changes in atmospheric pressures across the pacific. The mean SOI decreased to—0.9 for autumn, and climate scientists expect the emergence of a weak to moderate El Niño by spring. However the strength and characteristics of the likely El Niño are still uncertain.
During El Niño years, New Zealand tends to experience stronger or more frequent winds from the west in summer, which can lead to drought in east coast areas and more rain in the west. In winter, the winds tend to be more from the south, bringing colder conditions to both the land areas and surrounding ocean.
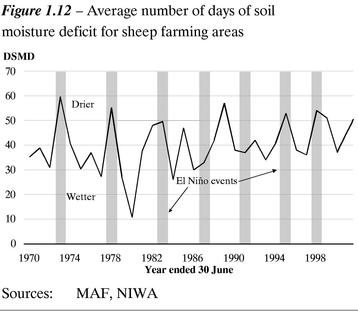
As shown by Figure 1.12, recent El Niño years have tended to be drier than average as measured by days of soil moisture deficit3. Moreover, more severe El Niño events (as indicated by the extent of the negative deviation from zero in the SOI) appear to correspond with more severe droughts. However, it is noteworthy that not all El Niño events have resulted in drier than average conditions (see 1987, 1992).
- 3
- Defined as days when pasture growth is restricted due to insufficient soil moisture.
Given the current uncertainties regarding the likelihood and characteristics of an El Niño event, our central forecast is for 'average growing conditions' to prevail over the 2002/03 agricultural season. However, as the winter develops we will be monitoring climatic developments and drought prospects closely.
...all adding up to a slightly larger current account deficit
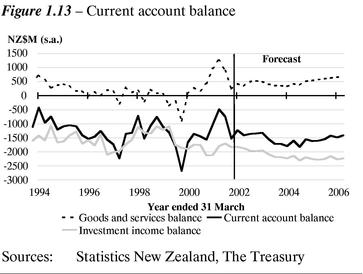
With a different picture for export and import volumes, due to the higher currency, the current account deficit is expected to peak at a higher level than forecast in the Budget Update. However, over the first year of the forecasts the trade balance is little changed from the Budget Update, reflecting a higher level for the terms of trade offsetting the initial volume deterioration. The higher terms of trade for this year reflects a better than expected outturn for the March 2002 quarter and the prospects of somewhat lower than expected oil prices over the next few quarters.
Inflationary pressures are expected to be less persistent than in the Budget Update
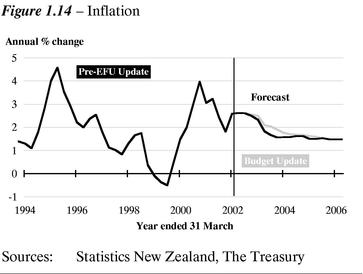
As already discussed, the higher level of the exchange rate reduces the degree of imported price pressure over the forecast horizon, which is reinforced by lower oil prices. Given that our view on the degree of margin rebuilding by firms has not substantially changed since the Budget Update, this leads to firms passing these lower goods prices on to the consumer. The lower import price profile reinforces the declining profile for unit labour costs as discussed in the Budget Update. Inflation is forecast to be 2.3% in March 2003, slightly less than in the Budget Update, before easing to 1.6% in March 2004. This inflation profile is now less persistent than contained in the Budget Update.
Households to benefit over this year
Household spending is expected to remain strong over the forecast horizon. As outlined in the Budget Update, factors such as solid net migration inflows, recent strong income growth and low interest rates all combine to fuel household spending. With a weaker profile for inflation this also helps to boost real wage and salary income growth over the year to March 2003. We expect this real income gain to lead to a small increase in spending over the year. Further out, as the negative impact of the exchange rate to exporters starts to feed through to economic growth and firms' hiring decisions, consumption growth is expected to slow. As in the Budget Update, we expect a degree of consumption smoothing through this period of volatility in incomes.
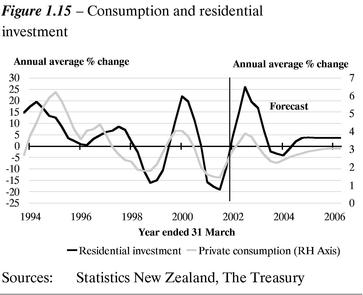
The outlook for residential investment remains largely unchanged from the Budget Update. The drivers for residential investment remain intact with the lagged interest rate stimulation, strong net migration inflows and solid income growth all combining to boost residential investment this year. The March 2002 quarter outturn looks to have subtracted from GDP growth despite the positive activity outlook for this sector but we expect that this is merely a reflection of the volatile nature of this series. Given the level of consent and house sale activity, we expect residential investment to bounce back in the June quarter.
We are still of the view that the risks outlined in the Risks and Scenarios section of the Budget Update around the sustainability of household spending and the flow through to the rest of the economy and monetary policy remain valid.
Business investment remains solid
As in the Budget Update we expect investment spending to remain solid over the forecast horizon. Growth in investment will still be boosted this year from recent growth in business profits and the strong growth in domestic demand at the end of last year and over 2002. The delayed impact of lower interest rates will also support investment spending. However, given the impact of weaker exports growth forecast through 2003 we now expect more of a slowdown in business investment over the latter part of 2003.
Business investment growth remains solid over the latter part of the forecast period reflecting the Budget Update story of firms meeting more of their output growth through capital, in addition to supplying new capital for a growing workforce.
Monetary conditions have tightened sooner than assumed in the Budget Update
The profile for interest rates is little changed from that contained in the Budget Update. The Reserve Bank is assumed to continue to move interest rates back to neutral, increasing the OCR by a total of 50 basis points over the remainder of this year. 90-day bank bills follow this pattern, peaking at around 6%.
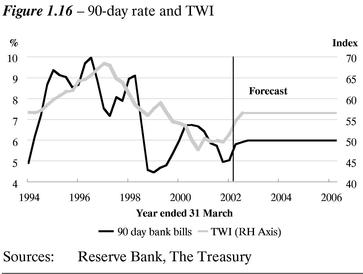
However, with the recent appreciation of the exchange rate overall monetary conditions have tightened earlier than expected. This contributes to the lower inflation track and slower GDP growth in 2003/04 we have just described. While at the time of the Budget Update, the risks to 90-day interest rate path were probably more to the upside, the higher exchange rate and better inflation outlook suggest the risks around the 90-day profile now look more balanced.
Lower profile for nominal GDP growth
The near-term profile for nominal GDP is largely unchanged from the Budget Update. Further out, nominal GDP growth is lower due to a combination of lower real GDP growth in the year to March 2004 and a lower GDP deflator throughout the forecast period. Compared with the Budget Update, the level of nominal GDP is around $0.4 billion lower in the year to June 2006.
Fiscal Outlook
The overall trend of the fiscal forecasts is relatively unchanged from that outlined in the 2002 Budget Update (see pages 47 to 50, and pages 73 to 105). And as with any set of forecasts, there are risks on both the upside and downside that may affect the actual results. The Budget Update provides information on sensitivities to the fiscal forecasts.
Changes to the fiscal forecasts since the Budget Update
There has been a small overall reduction to the operating balance forecasts since the 2002 Budget Update. The operating balance has decreased by between $0.1 billion and $0.2 billion in each of the years from 2001/02 to 2005/06. These changes include:
- •
- minor reductions to tax revenue of $70 million in 2001/02, $25 million in 2002/03, $210 million in 2003/04 and around $130 million in 2004/05 and 2005/06 (these changes are less than 0.5% of total revenues)
- •
- an increase in net FX expenses of $55 million (due to the impact of the higher FX rates) and lower SOE/CE net surpluses of $100 million in 2001/02, partially offset by
- •
- a reduction in benefit expense forecasts of around $50 million in each year from 2003/04 onwards.
Other changes to the forecasts that impact on debt levels (but not the operating balance) include:
- •
- some shift in the expected timing of payments from the 2001/02 year to the 2002/03 year (for example the $150 million available to Air New Zealand until 30 June 2003 will not be paid in 2001/02)
- •
- issues of circulating currency have reduced subsequent to the 2002 Budget Update, which increases net debt by around $150 million.
The increase in foreign-exchange rates since the Budget Update also impact by reducing both gross debt and financial assets by around $400 million. As the overall changes are minor, no change has been made to the 2002/03 domestic debt programme.
All these changes taken together are illustrated in the section following the fiscal indicators comparison table on the following pages.
Fiscal Indicators—Comparison with 2002 Budget Update
Table 1.6—Fiscal indicators—compares key fiscal information with the 2002 Budget Update (current presentation of forecasts)
| | 2001
Actual
| | 2002
Budget
| | 2002
Pre-EFU
| | 2003
Budget
| | 2003
Pre-EFU
| |
|---|
| | ($ million, year ended 30 June)
| |
|---|
| Statement of Financial Performance | | | | | | | | | | | |
| Revenue | | | | | | | | | | | |
| Taxation revenue | | 36,738 | | 38,377 | | 38,307 | | 40,141 | | 40,114 | |
| Other revenue | | 2,754 | | 2,795 | | 2,780 | | 2,811 | | 2,811 | |
| Total Revenue | | 39,492 | | 41,172 | | 41,087 | | 42,952 | | 42,925 | |
| Ratio to GDP (%) | | 34.6 | % | 34.2 | % | 34.1 | % | 34.4 | % | 34.3 | % |
| Tax ratio to GDP (%) | | 32.2 | % | 31.9 | % | 31.8 | % | 32.1 | % | 32.1 | % |
Expenses |
|
|
|
|
|
|
|
|
|
|
|
| Functional expenses | | 35,750 | | 36,781 | | 36,751 | | 38,618 | | 38,648 | |
| Finance costs | | 2,483 | | 2,303 | | 2,303 | | 2,339 | | 2,339 | |
| Net foreign exchange gains | | (47 | ) | 64 | | 119 | | — | | — | |
| Forecast expense growth | | — | | — | | — | | 230 | | 230 | |
| Total Expenses | | 38,186 | | 39,148 | | 39,173 | | 41,187 | | 41,217 | |
| Ratio to GDP (%) | | 33.5 | % | 32.5 | % | 32.5 | % | 33.0 | % | 32.9 | % |
Contribution of SOEs and CEs |
|
|
|
|
|
|
|
|
|
|
|
| Surplus attributable to SOEs and CEs | | 424 | | 1,015 | | 908 | | 984 | | 957 | |
| Dividends and other distributions | | (321 | ) | (403 | ) | (403 | ) | (461 | ) | (461 | ) |
| Net Contribution of SOEs and CEs | | 103 | | 612 | | 505 | | 523 | | 496 | |
Operating Balance |
|
1,409 |
|
2,636 |
|
2,419 |
|
2,288 |
|
2,204 |
|
| Ratio to GDP (%) | | 1.2 | % | 2.2 | % | 2.0 | % | 1.8 | % | 1.8 | % |
Statement of Financial Position |
|
|
|
|
|
|
|
|
|
|
|
| Assets (excluding NZS Fund assets) | | 65,081 | | 66,421 | | 65,764 | | 66,816 | | 66,013 | |
| NZS Fund assets | | — | | 600 | | 615 | | 1,890 | | 1,905 | |
| Liabilities | | (53,618 | ) | (52,783 | ) | (52,365 | ) | (52,180 | ) | (51,700 | ) |
| Crown Balance (net worth) | | 11,463 | | 14,238 | | 14,014 | | 16,526 | | 16,218 | |
| Ratio to GDP (%) | | 10.0 | % | 11.8 | % | 11.6 | % | 13.2 | % | 13.0 | % |
Statement of Borrowings |
|
|
|
|
|
|
|
|
|
|
|
| Crown Debt | | | | | | | | | | | |
| Gross debt | | 36,761 | | 36,299 | | 35,939 | | 35,781 | | 35,421 | |
| less financial assets | | (16,790 | ) | (16,137 | ) | (15,716 | ) | (14,846 | ) | (14,156 | ) |
| Net Crown Debt | | 19,971 | | 20,162 | | 20,223 | | 20,935 | | 21,265 | |
| Net Crown debt to GDP (%) | | 17.5 | % | 16.8 | % | 16.8 | % | 16.8 | % | 17.0 | % |
| Gross debt to GDP (%) | | 32.2 | % | 30.2 | % | 29.8 | % | 28.6 | % | 28.3 | % |
| Net debt repayment/(increase) | | 1,425 | | (191 | ) | (252 | ) | (773 | ) | (1,042 | ) |
| Nominal GDP | | 114,145 | | 120,309 | | 120,543 | | 124,964 | | 125,125 | |
Source: The Treasury
| | 2004
Budget
| | 2004
Pre-EFU
| | 2005
Budget
| | 2005
Pre-EFU
| | 2006
Budget
| | 2006
Pre-EFU
| |
|---|
| | ($ million, year ended 30 June)
| |
|---|
| Statement of Financial Performance | | | | | | | | | | | | | |
| Revenue | | | | | | | | | | | | | |
| Taxation revenue | | 42,084 | | 41,877 | | 43,981 | | 43,851 | | 45,570 | | 45,442 | |
| Other revenue | | 3,058 | | 3,058 | | 3,348 | | 3,348 | | 3,689 | | 3,689 | |
| Total Revenue | | 45,142 | | 44,935 | | 47,329 | | 47,199 | | 49,259 | | 49,131 | |
| Ratio to GDP (%) | | 34.4 | % | 34.4 | % | 34.5 | % | 34.5 | % | 34.4 | % | 34.4 | % |
| Tax ratio to GDP (%) | | 32.1 | % | 32.1 | % | 32.1 | % | 32.1 | % | 31.9 | % | 31.9 | % |
Expenses |
|
|
|
|
|
|
|
|
|
|
|
|
|
| Functional expenses | | 39,860 | | 39,816 | | 40,796 | | 40,746 | | 41,574 | | 41,516 | |
| Finance costs | | 2,425 | | 2,425 | | 2,501 | | 2,501 | | 2,572 | | 2,572 | |
| Net foreign exchange gains | | — | | — | | — | | — | | — | | — | |
| Forecast expense growth | | 700 | | 700 | | 1,180 | | 1,180 | | 2,080 | | 2,080 | |
| Total Expenses | | 42,985 | | 42,941 | | 44,477 | | 44,427 | | 46,226 | | 46,168 | |
| Ratio to GDP (%) | | 32.7 | % | 32.9 | % | 32.4 | % | 32.5 | % | 32.3 | % | 32.4 | % |
Contribution of SOEs and CEs |
|
|
|
|
|
|
|
|
|
|
|
|
|
| Surplus attributable to SOEs and CEs | | 1,284 | | 1,260 | | 1,408 | | 1,381 | | 1,560 | | 1,530 | |
| Dividends and other distributions | | (363 | ) | (363 | ) | (323 | ) | (323 | ) | (351 | ) | (351 | ) |
| Net Contribution of SOEs and CEs | | 921 | | 897 | | 1,085 | | 1,058 | | 1,209 | | 1,179 | |
Operating Balance |
|
3,078 |
|
2,891 |
|
3,937 |
|
3,830 |
|
4,242 |
|
4,142 |
|
| Ratio to GDP (%) | | 2.3 | % | 2.2 | % | 2.9 | % | 2.8 | % | 3.0 | % | 2.9 | % |
Statement of Financial Position |
|
|
|
|
|
|
|
|
|
|
|
|
|
| Assets (excluding NZS Fund assets) | | 70,407 | | 69,402 | | 73,114 | | 71,987 | | 75,640 | | 74,413 | |
| NZS Fund assets | | 3,898 | | 3,913 | | 6,277 | | 6,292 | | 8,944 | | 8,959 | |
| Liabilities | | (54,701 | ) | (54,206 | ) | (55,850 | ) | (55,340 | ) | (56,801 | ) | (56,291 | ) |
| Crown Balance (net worth) | | 19,604 | | 19,109 | | 23,541 | | 22,939 | | 27,783 | | 27,081 | |
| Ratio to GDP (%) | | 14.9 | % | 14.6 | % | 17.2 | % | 16.8 | % | 19.4 | % | 19.0 | % |
Statement of Borrowings |
|
|
|
|
|
|
|
|
|
|
|
|
|
| Crown Debt | | | | | | | | | | | | | |
| Gross debt | | 38,391 | | 38,031 | | 39,543 | | 39,183 | | 40,656 | | 40,296 | |
| less financial assets | | (16,304 | ) | (15,436 | ) | (17,299 | ) | (16,336 | ) | (18,426 | ) | (17,393 | ) |
| Net Crown Debt | | 22,087 | | 22,595 | | 22,244 | | 22,847 | | 22,230 | | 22,903 | |
| Net Crown debt to GDP (%) | | 16.8 | % | 17.3 | % | 16.2 | % | 16.7 | % | 15.5 | % | 16.1 | % |
| Gross debt to GDP (%) | | 29.2 | % | 29.1 | % | 28.8 | % | 28.6 | % | 28.4 | % | 28.3 | % |
| Net debt repayment/(increase) | | (1,152 | ) | (1,330 | ) | (157 | ) | (252 | ) | 14 | | (56 | ) |
| Nominal GDP | | 131,293 | | 130,659 | | 137,201 | | 136,804 | | 143,026 | | 142,631 | |
Source: The Treasury
Operating Balance Impact on the Balance Sheet
The following section outlines the updated impact of the operating surplus on the balance sheet and the position of gross and net debt as a percentage of GDP. As noted, these are substantially the same as the forecasts outlined in the 2002 Budget Update.
Operating surpluses increase net worth and generate cash
Net worth increases by $15.6 billion from $11.5 billion to $27.1 billion between 2000/01 and 2005/06. This increase reflects the level of operating balances over the forecast period of around $15.5 billion.
Table 1.7 shows how the forecast operating surpluses flow through to the Statement of Financial Position over the five-year period. Some portions of the operating surplus are non-cash in nature, including:
- •
- depreciation of $5.2 billion, for which a broadly equivalent amount of cash is earmarked for maintaining existing physical asset levels, offset by
- •
- SOE and Crown entity net surpluses of $4.1 billion, which are retained by the SOEs and Crown entities and increase the Crown's investment in these entities
- •
- NZS Fund returns (after tax) of $1.2 billion, which are retained by the NZS Fund, and increase the Crown's investment in this asset.
Adjusting for these items, the rising operating surplus profile generates a similar level of operating cash flows ($15.3 billion). The Crown can use this cash to either invest in assets or repay debt.
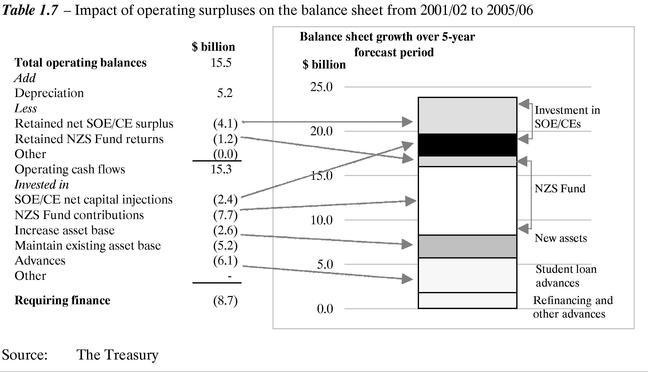
The forecast financing requirement is $8.7 billion, which is $0.4 billion higher than forecast in the recent 2002 Budget Update. This small change reflects the impact of the minor revisions made to the tax revenue and benefit expenses forecasts, coupled with changes to circulating currency forecasts.
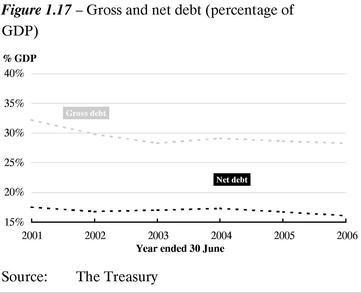
While additional nominal borrowing is forecast to occur, as a percentage of GDP, both gross and net debt are stable at just under 30% and around 16% respectively.
Line-by-Line Consolidation
There have been only small changes to the forecasts associated with SOEs and Crown entities from those presented in the 2002 Budget Update. As a result, the changes to the Pre-EFU forecasts to tax revenues, benefit expenses and other items impact on the core-Crown and total-Crown disclosures—but not substantially. The summary table below updates the key fiscal indicators as presented under full line-by-line consolidation.
Details of the impending change to how the Crown financial statements are to be compiled from the 2002/03 year onward are outlined in the 2002 Budget Update on pages 97 to 105. The GAAP tables at the end of the Pre-EFU contain tables of the key indicators in nominal dollars and as a percentage of GDP.
Table 1.8—Fiscal indicators under future presentation of the Crown financial statements
Summary indicators
(% of GDP)
| | 1997
Actual
| | 1998
Actual
| | 1999
Actual
| | 2000
Actual
| | 2001
Actual
| | 2002
Estimated
Actual
| | 2003
Forecast
| | 2004
Forecast
| | 2005
Forecast
| | 2006
Forecast
| |
|---|
| Revenue | | | | | | | | | | | | | | | | | | | | | |
| Current presentation | | 35.5 | % | 35.7 | % | 35.7 | % | 34.1 | % | 34.6 | % | 34.1 | % | 34.3 | % | 34.4 | % | 34.5 | % | 34.4 | % |
| Future presentation of Core Crown | | 34.2 | % | 34.3 | % | 33.8 | % | 32.3 | % | 33.3 | % | 32.7 | % | 33.0 | % | 33.0 | % | 33.1 | % | 33.1 | % |
| Future presentation of Total Crown | | 41.5 | % | 42.1 | % | 42.1 | % | 39.7 | % | 40.9 | % | 42.4 | % | 43.2 | % | 43.4 | % | 43.4 | % | 43.2 | % |
Expenses |
|
|
|
|
|
|
|
|
|
|
|
|
|
|
|
|
|
|
|
|
|
| Current presentation | | 33.6 | % | 34.3 | % | 35.2 | % | 33.8 | % | 33.5 | % | 32.5 | % | 32.9 | % | 32.9 | % | 32.5 | % | 32.4 | % |
| Future presentation of Core Crown | | 32.4 | % | 32.9 | % | 33.8 | % | 32.3 | % | 32.2 | % | 31.1 | % | 31.6 | % | 31.5 | % | 31.1 | % | 31.0 | % |
| Future presentation of Total Crown | | 39.5 | % | 40.0 | % | 40.3 | % | 38.3 | % | 39.7 | % | 40.4 | % | 41.4 | % | 41.1 | % | 40.6 | % | 40.3 | % |
Operating balance |
|
|
|
|
|
|
|
|
|
|
|
|
|
|
|
|
|
|
|
|
|
| Current presentation | | 1.9 | % | 2.5 | % | 1.7 | % | 1.4 | % | 1.2 | % | 2.0 | % | 1.8 | % | 2.2 | % | 2.8 | % | 2.9 | % |
| Future presentation | | 1.9 | % | 2.1 | % | 1.7 | % | 1.4 | % | 1.2 | % | 2.0 | % | 1.8 | % | 2.2 | % | 2.8 | % | 2.9 | % |
| OBERAC (no changes) | | 1.9 | % | 2.2 | % | 0.2 | % | 0.8 | % | 1.8 | % | 1.8 | % | 1.8 | % | 2.2 | % | 2.8 | % | 2.9 | % |
Gross debt |
|
|
|
|
|
|
|
|
|
|
|
|
|
|
|
|
|
|
|
|
|
| Current presentation | | 36.7 | % | 38.0 | % | 36.1 | % | 33.7 | % | 32.2 | % | 29.8 | % | 28.3 | % | 29.1 | % | 28.6 | % | 28.3 | % |
| Future presentation of Core Crown | | 35.0 | % | 36.1 | % | 33.8 | % | 31.6 | % | 29.6 | % | 28.6 | % | 28.0 | % | 28.8 | % | 28.4 | % | 28.0 | % |
| Future presentation of Total Crown | | 37.8 | % | 38.2 | % | 35.2 | % | 32.4 | % | 30.4 | % | 30.9 | % | 30.2 | % | 30.0 | % | 29.2 | % | 28.1 | % |
Gross sovereign-issued debt (no change) |
|
36.7 |
% |
38.0 |
% |
36.1 |
% |
33.7 |
% |
32.2 |
% |
29.8 |
% |
28.3 |
% |
29.1 |
% |
28.6 |
% |
28.3 |
% |
Net Crown debt |
|
|
|
|
|
|
|
|
|
|
|
|
|
|
|
|
|
|
|
|
|
| Current presentation | | 25.9 | % | 24.1 | % | 21.3 | % | 20.0 | % | 17.5 | % | 16.8 | % | 17.0 | % | 17.3 | % | 16.7 | % | 16.1 | % |
| Future presentation | | 24.1 | % | 22.2 | % | 19.1 | % | 17.9 | % | 14.9 | % | 15.5 | % | 16.7 | % | 17.0 | % | 16.4 | % | 15.8 | % |
| Net worth (no change) | | 7.6 | % | 9.9 | % | 5.9 | % | 8.0 | % | 10.0 | % | 11.6 | % | 13.0 | % | 14.6 | % | 16.8 | % | 19.0 | % |
| | |
| |
| |
| |
| |
| |
| |
| |
| |
| |
| |
| Nominal GDP ($ million) | | 97,933 | | 99,790 | | 101,761 | | 107,064 | | 114,145 | | 120,543 | | 125,125 | | 130,659 | | 136,804 | | 142,631 | |
2
Specific Fiscal Risks
Introduction
This chapter describes the specific fiscal risks of the Crown, including contingent liabilities and other specific fiscal risks. The risks are disclosed as either quantifiable or unquantifiable, depending on their characteristics. Only contingent liabilities and other specific fiscal risks involving amounts of $10 million or more in any one year are separately disclosed. Contingent liabilities below $10 million are included in the "other quantifiable contingent liabilities" total. Comparatives have been adjusted where appropriate to align with the disclosure of new "material" contingent liabilities. The total amount of contingent liabilities remains unchanged.
Contingent Liabilities
Contingent liabilities are costs that the Crown will have to face if a particular event occurs. Typically, contingent liabilities consist of guarantees and indemnities, legal disputes and claims, and uncalled capital. The contingent liabilities facing the Crown are a mixture of operating and balance sheet risks, and they can vary greatly in magnitude and likelihood of realisation. In general, if a contingent liability were realised it would reduce the operating balance and net worth, and increase net Crown debt. However, in the case of contingencies for uncalled capital, the negative impact would be restricted to net Crown debt.
Where contingent liabilities have arisen as a consequence of legal action being taken against the Crown, the amount shown is the amount claimed and thus the maximum potential cost. It does not represent either an admission that the claim is valid or an estimation of the possible amount of any award against the Crown.
Contingent liabilities have been stated as at 31 May 2002.
Quantifiable Contingent Liabilities
Guarantees and indemnities
| | Status4
| | ($ million)
|
|---|
| Cook Islands—Asian Development Bank loans | | Unchanged | | 24 |
| Huntly East mine subsidence | | Unchanged | | 22 |
| Ministry of Transport—funding guarantee | | Unchanged | | 10 |
| Post Office Bank—guaranteed deposits | | Unchanged | | 15 |
| Guarantees and indemnities of state-owned enterprises and Crown entities | | Changed | | 256 |
| Other guarantees and indemnities | | Unchanged | | 58 |
| | | | |
|
| | | | | 385 |
Uncalled capital |
|
|
|
|
| Asian Development Bank | | Changed | | 1,315 |
| European Bank for Reconstruction and Development | | Unchanged | | 14 |
| International Bank for Reconstruction and Development | | Changed | | 1,715 |
| | | | |
|
| | | | | 3,044 |
Legal proceedings and disputes |
|
|
|
|
| Agriculture and Forestry—legal claims | | Changed | | 10 |
| Health—legal claims | | Unchanged | | 121 |
| New Zealand Defence Force—legal claims | | Changed | | 29 |
| Police—legal claims | | Changed | | 46 |
| Tax in dispute | | Unchanged | | 67 |
| Other legal claims | | Changed | | 61 |
| | | | |
|
| | | | | 334 |
Other quantifiable contingent liabilities |
|
|
|
|
| International finance organisations | | Changed | | 1,627 |
| Reserve Bank—demonetised currency | | Unchanged | | 25 |
| Other quantifiable contingent liabilities | | Changed | | 125 |
| | | | |
|
| | | | | 1,777 |
| | | | |
|
| Total quantifiable contingent liabilities | | | | 5,540 |
- 4
- Relative to reporting in the 2002 Budget Update.
Unquantified Contingent Liabilities
Institutional guarantees
| | Status
|
|---|
| | | |
| Commerce Commission—indemnity for damages | | Unchanged |
| District Court Judges, Justices of the Peace, Coroners and Disputes Tribunal | | Unchanged |
| Earthquake Commission | | Unchanged |
| Fletcher Challenge Limited | | Unchanged |
| Ministry of Fisheries—indemnity provided for delivery of registry services | | Unchanged |
| National Provident Fund | | Unchanged |
| Persons exercising investigating powers | | Unchanged |
| Public Trust | | Unchanged |
| Reserve Bank of New Zealand | | Unchanged |
Other unquantified contingent liabilities |
|
|
| Accident Compensation Corporation | | Unchanged |
| Air New Zealand | | Unchanged |
| Bank of New Zealand | | Unchanged |
| Contaminated sites | | Unchanged |
| Crown research institutes | | Unchanged |
| DFC New Zealand Limited (under statutory management) | | Unchanged |
| District health boards | | Unchanged |
| Education—legal claim | | Unchanged |
| Electricity Corporation of New Zealand Limited | | Unchanged |
| Housing New Zealand Corporation | | Unchanged |
| Indemnities against acts of war and terrorism | | Unchanged |
| Maui Gas Partners | | Unchanged |
| New Zealand Railways Corporation | | Unchanged |
| Pharmaceutical Management Agency Limited—indemnity | | Unchanged |
| Purchasers of Crown operations | | Unchanged |
| Sale of Crown assets | | Unchanged |
| Tax liabilities | | Unchanged |
| Terralink Ltd | | New |
| Treaty of Waitangi claims | | Unchanged |
| Treaty of Waitangi claims—settlement relativity payments | | Unchanged |
| Works Civil Construction | | Unchanged |
| Works Consultancy Services | | Unchanged |
Specific Fiscal Risks
Specific fiscal risks (excluding contingent liabilities) are a category of Government decisions or circumstances that may have a material impact on the fiscal position. The risks have not been included in the main forecasts because their fiscal impact cannot be reasonably quantified, the likelihood of realisation is uncertain and/or the timing is uncertain. The risks disclosed may not eventuate into Government policy and the final cost or saving may differ from the amount disclosed if the policy is developed.
To ensure a practicable and consistent disclosure approach, risks have been reported that have an expected cost or saving of over $10 million in any one forecast year; and either:
- •
- reflect Government decisions or legislative commitments with uncertain fiscal consequences or timing, or
- •
- are generally being actively considered by the Minister of Finance and responsible Ministers, or
- •
- are decisions that have been deferred until a later date.
The forecasts incorporate operating and capital provisions to accommodate policy initiatives on which decisions have yet to be made. Some risks outlined in this chapter, if they eventuate, would be covered by these provisions and therefore have no impact on the forecasts. These risks have been disclosed to provide an indication of the pressure the risks place upon the fiscal provisions.
There are a number of other "pressures" on the fiscal position that have not been included as risks. These "pressures" comprise proposals largely generated within individual departments and not yet considered by the Minister of Finance and responsible Ministers. Such items are also expected to be managed within the provisions noted above.
Specific fiscal risks do not include:
- •
- normal forecasting risks, such as uncertainty around welfare benefits, SOE/Crown entity surpluses or finance costs
- •
- possible changes to the interpretation of accounting policies, such as the changes to revenue recognition rules and recognition of liabilities
- •
- discussion documents containing proposals that the Minister of Finance and responsible Ministers will not actively consider until the consultation process has been completed.
The Fiscal Responsibility Act 1994 requires that all specific fiscal risks be disclosed, except where it is determined by the Minister of Finance that disclosing a risk is likely to:
- •
- prejudice the substantial economic interests of New Zealand, or
- •
- prejudice the security or defence of New Zealand or international relations of the Government, or
- •
- compromise the Crown in a material way in negotiation, litigation or commercial activity, or
- •
- result in a material loss of value to the Crown.
The Minister of Finance also has to determine that there is no reasonable or prudent way the Government can avoid this prejudice, compromise or material loss by making a decision on the fiscal risk before the finalisation of the forecasts, or by disclosing the fiscal risk without reference to its fiscal implications.
Time-limited Funding
In addition to disclosing specific fiscal risks in accordance with the Fiscal Responsibility Act, the following table outlines those areas where initiatives have time-limited funding that decreases or ceases at some point, using a $5 million materiality threshold. These decreases total less than $35 million in any given year.
Vote
| | Description of initiative
| | Impact ($ million)
|
|---|
| Agriculture and Forestry | | Sustainable Resource Development Fund | | 10 from 2004/05 |
| Education | | Microsoft software licensing | | 2 in 2004/05, 5 in 2005/06 |
| Education | | Tertiary Education Commission | | 8 from 2004/05 |
| Social Development | | Subsidised work | | 10 from 2004/05 |
If operating funding was to be appropriated to maintain funding levels for these four initiatives (ie, extend the initiative beyond its scheduled completion date), the total impact would be up to $30 million in 2004/05 and $32 million in 2005/06, which would impact on the operating balance.
Because of the limited time for preparation of the 2002 Pre-EFU, the material was prepared by undertaking a high-level review of departmental baseline information. This is an area of greater transparency that will continue to evolve over time as we review our processes to compile this information.
Statement of Specific Fiscal Risks
The fiscal risks included in the following tables were finalised as at 17 June 2002. Details are provided after the tables for all new or changed specific fiscal risks. Please see the 2002 Budget Update for all unchanged specific fiscal risks.
Quantified Risks5
Risks as at 17 June 2002
| | Operating
Balance
| | Gross
Debt
| | Net
Worth
| | ($ million)
|
|---|
| Corrections—capital projects | | Decrease | | Increase | | Decrease | | -391 capital and -188 operating across the outyears. |
| Defence—capital injections | | Decrease | | Increase | | Decrease | | -1,000 over the next five to ten years. |
| Education—Auckland University Business School | | Decrease | | Increase | | Decrease | | -25 capital in 2002/03. |
| Education—e-learning | | Decrease | | Increase | | Decrease | | -11 in 2002/03 and -7 in outyears for capital. |
| Education—school property | | Decrease | | Increase | | Decrease | | -90 in 2002/03, -200 in 2003/04 and subsequent outyears for capital; and -1 in 2002/03, -8 in 2003/04, -18 in 2004/05, and -29 in 2005/06 for operating. |
| Energy Efficiency and Conservation—renewables policy | | Decrease | | Increase | | Decrease | | -1 in 2002/03, increasing to -20 in 2005/06. |
| Energy Efficiency and Conservation—national strategy | | Decrease | | Increase | | Decrease | | -63 operating over four years. |
| Health—remove asset testing from long-stay care | | Decrease | | Increase | | Decrease | | -25 operating from 2004/05 |
| Health—Southern Saltmarsh Mosquito | | Decrease | | Increase | | Decrease | | -30 operating over five years. |
| Inland Revenue—GST and imported services and financial services review | | Decrease | | Increase | | Decrease | | -20 operating from 2003/04. |
Inland Revenue—trans-
Tasman triangular tax relief | | Decrease | | Increase | | Decrease | | -10 operating from 2004/05. |
| Social Development—benefit payment systems | | Decrease | | Increase | | Decrease | | Up to -95 split between operating and capital. |
- 5
- In the summary tables listing specific risks:
- •
- negative numbers indicate a deterioration in the Crown's financial position
- •
- "N/A" means no effect
- •
- "Unclear" means insufficient information is available to determine the risk's effect.
Unquantified Risks
Risks as at 17 June 2002
| | Operating
balance
| | Gross debt
| | Net worth
|
|---|
| Accident Insurance—Medical Misadventure | | Unclear | | Unclear | | Unclear |
| Agriculture and Forestry—painted apple moth | | Decrease | | Increase | | Decrease |
| Courts—Supreme Court | | Decrease | | Increase | | Decrease |
| Defence—sale of Skyhawks and Aermacchi trainers | | Increase | | Decrease | | Increase |
| Education—capital injections for tertiary education institutions | | N/A | | Increase | | N/A |
| Education—collective employment agreements | | Decrease | | Increase | | Decrease |
| Education—ECE Strategic Plan | | Unclear | | Unclear | | Unclear |
| Education—improved internet access | | Decrease | | Increase | | Decrease |
| Education—Partnerships for Excellence | | N/A | | Increase | | N/A |
| Education—pay parity for kindergarten teachers | | Decrease | | Increase | | Decrease |
| Education—review of school staffing | | Decrease | | Increase | | Decrease |
| Education—school and early childhood operational funding | | Decrease | | Increase | | Decrease |
| Education—school property code | | Decrease | | Increase | | Decrease |
| Education—tertiary education funding | | Decrease | | Increase | | Decrease |
| Education—wananga capital injection | | N/A | | Increase | | N/A |
| Health—district health board deficits | | Unclear | | Unclear | | Unclear |
| Health—population-based funding | | Decrease | | Increase | | Decrease |
| Housing—Auckland City Council Rental Stock | | Decrease | | Increase | | Decrease |
| Inland Revenue—exemption for overseas earnings | | Unclear | | Unclear | | Unclear |
| Inland Revenue—Gaming Review | | Unclear | | Unclear | | Unclear |
| Inland Revenue—Risk Free Return Method | | Unclear | | Unclear | | Unclear |
| Inland Revenue—taxation of savings and investment vehicles, including superannuation funds | | Decrease | | Increase | | Decrease |
| Police—capital projects | | Decrease | | Increase | | Decrease |
| Prime Minister and Cabinet—climate change | | Unclear | | Unclear | | Unclear |
| Social Development—response to Joychild Report | | Decrease | | Increase | | Decrease |
| Transport—lease of rail assets | | Unclear | | Unclear | | Unclear |
Risks Removed Since the 2002 Budget Update
Risk
| | In forecasts
| | Comment
|
|---|
| Education—Centres of Research Excellence | | Yes | | Baselines |
Quantified Fiscal Risks
The following quantified fiscal risk is changed since the 2002 Budget Update (previously unquantified). Please see the 2002 Budget Update for details of unchanged quantified fiscal risks.
Health—remove asset testing from long-stay care (changed risk)
The Government is considering the introduction of legislation to gradually remove asset testing, over time, on all forms of long-stay geriatric care, including public and private hospitals and rest homes. The finalised details of this proposed policy are still being developed, but the costs are estimated at approximately $25 million in 2004/05 and outyears, which would decrease the operating balance.
The Minister of Finance has yet to fully consider the quantum of this risk.
Source: Ministry of Health
Unquantified Fiscal Risks
The following unquantified fiscal risks are new or changed since the 2002 Budget Update. Please see the 2002 Budget Update for details of unchanged unquantified fiscal risks.
Agriculture and Forestry—painted apple moth (changed risk)
The Government is considering progress with the painted apple moth eradication programme, including options for the future management of the pest. Since the Budget Update, the moth has been discovered outside the spray zone, which will need to be taken into account when assessing options. The costs associated with these responses depend on the options chosen, but any further funding would decrease the operating balance.
Housing—Auckland City Council Rental Stock (new risk)
Auckland City Council has decided to sell its rental housing stock, comprising around 1,600 pensioner units (let at less-than-market rates) and 120 other properties (let at market rates). The Government is exploring a range of responses to keep the stock available for social housing purposes, although it is not committed to any particular response or strategy.
The impact of the response depends on the options chosen, but any additional operating funding would decrease the operating balance and capital injections would increase gross debt.
Generally Accepted Accounting Practice (GAAP) Series Tables
Forecast Financial Statements
These forecasts have been prepared in accordance with the Fiscal Responsibility Act 1994. They are based on the accounting policies and assumptions that are outlined on pages155 to 168 of the 2002 Budget Economic and Fiscal Update, except for updated economic assumptions outlined on the following page. As with all such assumptions, there is a degree of uncertainty surrounding them. This uncertainty increases as the forecast horizon extends.
The forecasts have been prepared in accordance with the Statement of Responsibility and reflect the judgements and information known at the time they were prepared. They reflect all Government decisions and circumstances communicated to 17 June 2002.
| | Finalisation Dates
|
|---|
| Fiscal forecasts (including tax revenue) | | 17 June |
| Economic outlook | | 17 June |
| Government decisions and circumstances | | 17 June |
| Actual asset revaluations | | 31 May |
| Foreign-exchange rates | | 31 May |
| Specific fiscal risks | | 17 June |
| Contingent liabilities and commitments | | 31 May |
Crown Reporting Entity as at 17 June 2002
These Forecast Financial Statements are for the Crown reporting entity as specified in Part III of the Public Finance Act 1989. This comprises Ministers of the Crown, Offices of Parliament, Departments, state-owned enterprises, and Crown entities. The reporting entity is unchanged from that used to compile the 2002 Budget Economic and Fiscal Update as outlined on pages 142 and 143 of that document.
Accounting Policies and Forecast Assumptions
The general and specific accounting and forecast policies used to compile this set of forecasts are the same as those used to compile the 2002 Budget Economic and Fiscal Update as outlined on pages 155 to 168 of that document, except for:
Macroeconomic assumptions
A summary of the economic assumptions that are particularly relevant to the fiscal forecasts (along with the 2001/02 assumptions used in the 2001 Budget Economic and Fiscal Update) are provided in the following table:
| | 2001/02
| |
| |
| |
| |
|
|---|
June years
| | Previous
Budget
| | Pre-EFU
| | 2002/03
Pre-EFU
| | 2003/04
Pre-EFU
| | 2004/05
Pre-EFU
| | 2005/06
Pre-EFU
|
|---|
| Real GDP (production based measure) | | | | | | | | | | | | |
| (annual average % change) | | 2.7 | | 3.0 | | 3.0 | | 2.9 | | 3.0 | | 2.8 |
| Nominal GDP ($ million) | | 117,323 | | 120,543 | | 125,125 | | 130,659 | | 136,804 | | 142,631 |
| Consumer Price Index | | | | | | | | | | | | |
| (annual average %) | | 2.1 | | 2.4 | | 2.3 | | 1.6 | | 1.6 | | 1.5 |
| Interest rates | | | | | | | | | | | | |
| Government 10-year bonds (quarterly average %) | | 6.1 | | 6.8 | | 6.3 | | 6.2 | | 6.2 | | 6.2 |
| 90-day bill rate (quarterly average %) | | 6.1 | | 5.8 | | 6.0 | | 6.0 | | 6.0 | | 6.0 |
| Household Labour Force Survey | | | | | | | | | | | | |
| Survey unemployment rate (annual average %) | | 5.4 | | 5.3 | | 5.4 | | 5.4 | | 5.1 | | 5.2 |
| Full-time equivalent employment | | | | | | | | | | | | |
| (annual average % change) | | 0.6 | | 2.4 | | 1.5 | | 1.0 | | 1.6 | | 1.3 |
| Wages—hourly earnings | | | | | | | | | | | | |
| (annual average % change) | | 3.8 | | 3.6 | | 3.7 | | 3.5 | | 3.4 | | 2.9 |
| Trade Weighted Index | | | | | | | | | | | | |
| (quarterly average) | | 52.9 | | 54.7 | | 56.5 | | 56.5 | | 56.5 | | 56.5 |
Source: The Treasury
Specific accounting policy and forecast assumptions
For the purposes of calculating net debt, the forecasts assume that the nominal exchange rate remains fixed at 31 May 2002 exchange rates. Projected exchange rate losses or gains are not included in the forecasts.
The forecasts have not been updated for changes to the discount rates applied to the GSF and ACC liabilities (rates as at 31 March were applied to the forecasts used in the 2002 Budget Economic and Fiscal Update).
Forecast Statement of Financial Performance
for the years ending 30 June
| |
| |
| | 2002
| |
| |
| |
| |
| |
|---|
| | Note
| | 2001
Actual
| | Previous
Budget
| | Estimated
Actual
| | 2003
Forecast
| | 2004
Forecast
| | 2005
Forecast
| | 2006
Forecast
| |
|---|
| |
| | ($ million)
| |
|---|
| Revenue | | | | | | | | | | | | | | | | | |
| Levied through the Crown's Sovereign Power | | | | | | | | | | | | | | | | | |
| Direct taxation | | 1 | | 23,863 | | 24,505 | | 24,485 | | 25,720 | | 26,932 | | 28,348 | | 29,351 | |
| Indirect taxation | | 2 | | 12,875 | | 13,180 | | 13,822 | | 14,394 | | 14,945 | | 15,503 | | 16,091 | |
| | | | |
| |
| |
| |
| |
| |
| |
| |
| Total taxation revenue | | | | 36,738 | | 37,685 | | 38,307 | | 40,114 | | 41,877 | | 43,851 | | 45,442 | |
| Compulsory fees, fines, penalties and levies | | | | 385 | | 418 | | 493 | | 472 | | 487 | | 493 | | 506 | |
| Total Revenue Levied through the Crown's Sovereign Power | | | | 37,123 | | 38,103 | | 38,800 | | 40,586 | | 42,364 | | 44,344 | | 45,948 | |
| Earned through the Crown's Operations | | | | | | | | | | | | | | | | | |
| Investment income | | 3 | | 1,369 | | 934 | | 1,250 | | 1,337 | | 1,615 | | 1,904 | | 2,232 | |
| Sales of goods and services | | | | 659 | | 654 | | 684 | | 705 | | 665 | | 665 | | 667 | |
| Other operational revenue | | 4 | | 381 | | 305 | | 353 | | 297 | | 291 | | 286 | | 284 | |
| Unrealised losses arising from changes in the value of commercial forests | | | | (40 | ) | — | | — | | — | | — | | — | | — | |
| Total Revenue Earned through the Crown's Operations | | | | 2,369 | | 1,893 | | 2,287 | | 2,339 | | 2,571 | | 2,855 | | 3,183 | |
| | | | |
| |
| |
| |
| |
| |
| |
| |
| Total Revenue | | | | 39,492 | | 39,996 | | 41,087 | | 42,925 | | 44,935 | | 47,199 | | 49,131 | |
| | | | |
| |
| |
| |
| |
| |
| |
| |
| Expenses | | | | | | | | | | | | | | | | | |
| By Functional Classification | | | | | | | | | | | | | | | | | |
| Social security and welfare | | | | 13,216 | | 13,826 | | 13,615 | | 13,936 | | 14,363 | | 14,755 | | 15,215 | |
| GSF pension expenses | | | | 855 | | 667 | | 339 | | 671 | | 680 | | 680 | | 719 | |
| Health | | | | 7,342 | | 7,684 | | 7,713 | | 8,390 | | 8,873 | | 9,347 | | 9,475 | |
| Education | | | | 6,690 | | 7,056 | | 7,150 | | 7,494 | | 7,674 | | 7,747 | | 7,850 | |
| Core government services | | | | 1,817 | | 1,552 | | 1,611 | | 1,641 | | 1,616 | | 1,628 | | 1,658 | |
| Law and order | | | | 1,560 | | 1,640 | | 1,761 | | 1,744 | | 1,737 | | 1,734 | | 1,727 | |
| Defence | | | | 1,267 | | 1,153 | | 1,188 | | 1,166 | | 1,208 | | 1,159 | | 1,146 | |
| Transport and communications | | | | 1,026 | | 1,027 | | 1,156 | | 1,238 | | 1,300 | | 1,324 | | 1,335 | |
| Economic and industrial services | | | | 1,141 | | 1,225 | | 1,187 | | 1,275 | | 1,268 | | 1,261 | | 1,272 | |
| Heritage, culture and recreation | | | | 424 | | 456 | | 500 | | 533 | | 558 | | 584 | | 595 | |
| Primary services | | | | 287 | | 320 | | 327 | | 343 | | 330 | | 326 | | 323 | |
| Housing and community development | | | | 50 | | 90 | | 95 | | 103 | | 99 | | 91 | | 91 | |
| Other | | | | 75 | | 114 | | 109 | | 114 | | 110 | | 110 | | 110 | |
| Finance costs | | 5 | | 2,483 | | 2,395 | | 2,303 | | 2,339 | | 2,425 | | 2,501 | | 2,572 | |
| Net foreign-exchange (gains)/losses | | | | (47 | ) | — | | 119 | | — | | — | | — | | — | |
| Contingency provision | | | | — | | 160 | | — | | 230 | | 200 | | 180 | | 180 | |
| Forecast for future new spending | | 5 | | — | | — | | — | | — | | 500 | | 1,000 | | 1,900 | |
| | | | |
| |
| |
| |
| |
| |
| |
| |
| Total Expenses | | 5 | | 38,186 | | 39,365 | | 39,173 | | 41,217 | | 42,941 | | 44,427 | | 46,168 | |
| | | | |
| |
| |
| |
| |
| |
| |
| |
| Revenue less Expenses | | | | 1,306 | | 631 | | 1,914 | | 1,708 | | 1,994 | | 2,772 | | 2,963 | |
| Surplus attributable to state-owned enterprises and Crown entities (excl. ACC liability valuation) | | 8 | | 844 | | 953 | | 950 | | 957 | | 1,260 | | 1,381 | | 1,530 | |
| ACC outstanding claims liability valuation | | | | (420 | ) | — | | (42 | ) | — | | — | | — | | — | |
| Dividends and other distributions | | 8 | | (321 | ) | (208 | ) | (403 | ) | (461 | ) | (363 | ) | (323 | ) | (351 | ) |
| | | | |
| |
| |
| |
| |
| |
| |
| |
| Net Surplus Attributable to State-owned Enterprises and Crown Entities | | | | 103 | | 745 | | 505 | | 496 | | 897 | | 1,058 | | 1,179 | |
| | | | |
| |
| |
| |
| |
| |
| |
| |
| Operating Balance | | | | 1,409 | | 1,376 | | 2,419 | | 2,204 | | 2,891 | | 3,830 | | 4,142 | |
| | | | |
| |
| |
| |
| |
| |
| |
| |
The accompanying Notes are an integral part of these Statements.
Forecast Statement of Financial Position
as at 30 June
| |
| |
| | 2002
| |
| |
| |
| |
|
|---|
| | Note
| | 2001
Actual
| | Previous
Budget
| | Estimated
Actual
| | 2003
Forecast
| | 2004
Forecast
| | 2005
Forecast
| | 2006
Forecast
|
|---|
| |
| | ($ million)
|
|---|
| Assets | | | | | | | | | | | | | | | | |
| Cash and bank balances | | | | 115 | | 45 | | 185 | | 239 | | 137 | | 159 | | 213 |
| Marketable securities and deposits1 | | | | 12,060 | | 9,067 | | 10,250 | | 8,811 | | 10,597 | | 12,914 | | 15,540 |
| Advances | | 6 | | 4,615 | | 5,873 | | 5,896 | | 7,011 | | 8,615 | | 9,555 | | 10,599 |
| Receivables | | 7 | | 6,197 | | 5,439 | | 6,065 | | 6,139 | | 6,052 | | 6,136 | | 6,086 |
| Inventories | | | | 193 | | 280 | | 220 | | 223 | | 231 | | 229 | | 227 |
| State-owned enterprises and Crown entities | | 8 | | 14,077 | | 15,114 | | 15,371 | | 16,500 | | 17,674 | | 18,954 | | 20,229 |
| Other investments | | | | 354 | | 432 | | 306 | | 396 | | 383 | | 369 | | 355 |
| Physical assets | | 9 | | 16,102 | | 16,076 | | 16,180 | | 16,410 | | 16,585 | | 16,364 | | 16,085 |
| Commercial forests | | | | 310 | | 359 | | 310 | | 310 | | 311 | | 311 | | 311 |
| State highways | | 10 | | 11,055 | | 10,847 | | 11,148 | | 11,278 | | 11,376 | | 11,481 | | 11,607 |
| Intangible assets | | | | 3 | | 3 | | 448 | | 401 | | 354 | | 307 | | 260 |
| Forecast for future new capital spending | | | | — | | 315 | | — | | 200 | | 1,000 | | 1,500 | | 1,860 |
| | | | |
| |
| |
| |
| |
| |
| |
|
| Total Assets | | | | 65,081 | | 63,850 | | 66,379 | | 67,918 | | 73,315 | | 78,279 | | 83,372 |
| | | | |
| |
| |
| |
| |
| |
| |
|
| Liabilities | | | | | | | | | | | | | | | | |
| Payables and provisions | | 11 | | 5,831 | | 4,758 | | 5,520 | | 5,439 | | 5,412 | | 5,491 | | 5,410 |
| Currency issued | | | | 2,539 | | 2,570 | | 2,787 | | 2,787 | | 2,787 | | 2,787 | | 2,787 |
| Borrowings | | | | 36,761 | | 35,831 | | 35,939 | | 35,421 | | 38,031 | | 39,183 | | 40,296 |
| Pension liabilities | | | | 8,487 | | 8,734 | | 8,119 | | 8,053 | | 7,976 | | 7,879 | | 7,798 |
| | | | |
| |
| |
| |
| |
| |
| |
|
| Total Liabilities | | | | 53,618 | | 51,893 | | 52,365 | | 51,700 | | 54,206 | | 55,340 | | 56,291 |
| | | | |
| |
| |
| |
| |
| |
| |
|
| Total Assets less Total Liabilities | | | | 11,463 | | 11,957 | | 14,014 | | 16,218 | | 19,109 | | 22,939 | | 27,081 |
| | | | |
| |
| |
| |
| |
| |
| |
|
| Crown Balance | | | | | | | | | | | | | | | | |
| Accumulated operating balance | | | | 3,456 | | 4,058 | | 5,967 | | 8,171 | | 11,062 | | 14,892 | | 19,034 |
| Revaluation reserve | | 12 | | 8,007 | | 7,899 | | 8,047 | | 8,047 | | 8,047 | | 8,047 | | 8,047 |
| | | | |
| |
| |
| |
| |
| |
| |
|
| Crown Balance | | | | 11,463 | | 11,957 | | 14,014 | | 16,218 | | 19,109 | | 22,939 | | 27,081 |
| | | | |
| |
| |
| |
| |
| |
| |
|
| |
| | 2002
| |
| |
| |
| |
|
|---|
1 Marketable securities and deposits
| | 2001
Actual
| | Previous
Budget
| | Estimated
Actual
| | 2003
Forecast
| | 2004
Forecast
| | 2005
Forecast
| | 2006
Forecast
|
|---|
| | ($ million)
|
|---|
| New Zealand Superannuation (NZS) Fund | | — | | 617 | | 615 | | 1,905 | | 3,913 | | 6,292 | | 8,959 |
| Other marketable securities and deposits | | 12,060 | | 8,450 | | 9,635 | | 6,906 | | 6,684 | | 6,622 | | 6,581 |
| | |
| |
| |
| |
| |
| |
| |
|
| Total Marketable securities and deposits | | 12,060 | | 9,067 | | 10,250 | | 8,811 | | 10,597 | | 12,914 | | 15,540 |
| | |
| |
| |
| |
| |
| |
| |
|
The accompanying Notes are an integral part of these Statements.
Forecast Statement of Movements in Equity
for the years ending 30 June
| |
| |
| | 2002
| |
| |
| |
| |
|
|---|
| | Note
| | 2001
Actual
| | Previous
Budget
| | Estimated
Actual
| | 2003
Forecast
| | 2004
Forecast
| | 2005
Forecast
| | 2006
Forecast
|
|---|
| |
| | ($ million)
|
|---|
| Opening Crown Balance | | | | 8,583 | | 10,581 | | 11,463 | | 14,014 | | 16,218 | | 19,109 | | 22,939 |
| Operating balance for the year | | | | 1,409 | | 1,376 | | 2,419 | | 2,204 | | 2,891 | | 3,830 | | 4,142 |
| Net revaluations | | 12 | | (179 | ) | — | | 29 | | — | | — | | — | | — |
| | | | |
| |
| |
| |
| |
| |
| |
|
| Total Recognised Revenues and Expenses | | | | 1,230 | | 1,376 | | 2,448 | | 2,204 | | 2,891 | | 3,830 | | 4,142 |
| Recognition policy change | | | | 1,650 | | — | | 103 | | — | | — | | — | | — |
| | | | |
| |
| |
| |
| |
| |
| |
|
| Closing Crown Balance | | | | 11,463 | | 11,957 | | 14,014 | | 16,218 | | 19,109 | | 22,939 | | 27,081 |
| | | | |
| |
| |
| |
| |
| |
| |
|
The accompanying Notes are an integral part of these Statements.
Forecast Statement of Cash Flows
for the years ending 30 June
| |
| | 2002
| |
| |
| |
| |
| |
|---|
| | 2001
Actual
| | Previous
Budget
| | Estimated
Actual
| | 2003
Forecast
| | 2004
Forecast
| | 2005
Forecast
| | 2006
Forecast
| |
|---|
| | ($ million)
| |
|---|
| Cash Flows from Operations | | | | | | | | | | | | | | | |
| Cash was Provided from | | | | | | | | | | | | | | | |
Direct Taxation |
|
|
|
|
|
|
|
|
|
|
|
|
|
|
|
| Individuals | | | | | | | | | | | | | | | |
| Source deductions | | 13,748 | | 14,358 | | 14,648 | | 15,321 | | 16,133 | | 17,029 | | 17,865 | |
| Other persons | | 4,221 | | 4,319 | | 4,456 | | 4,516 | | 4,596 | | 4,722 | | 4,828 | |
| Refunds | | (1,175 | ) | (1,094 | ) | (1,280 | ) | (1,146 | ) | (1,210 | ) | (1,210 | ) | (1,210 | ) |
| Fringe benefit tax | | 338 | | 324 | | 344 | | 380 | | 384 | | 389 | | 394 | |
| | |
| |
| |
| |
| |
| |
| |
| |
| Total Individuals | | 17,132 | | 17,907 | | 18,168 | | 19,071 | | 19,903 | | 20,930 | | 21,877 | |
| Corporate | | | | | | | | | | | | | | | |
| Gross companies | | 5,377 | | 5,518 | | 5,375 | | 5,401 | | 5,810 | | 6,155 | | 6,220 | |
| Refunds | | (785 | ) | (701 | ) | (753 | ) | (650 | ) | (646 | ) | (640 | ) | (628 | ) |
| Non-resident withholding tax | | 738 | | 679 | | 621 | | 638 | | 692 | | 716 | | 737 | |
| Foreign-source dividend withholding payment | | 98 | | 36 | | 124 | | 122 | | 56 | | 56 | | 56 | |
| | |
| |
| |
| |
| |
| |
| |
| |
| Total Corporate | | 5,428 | | 5,532 | | 5,367 | | 5,511 | | 5,912 | | 6,287 | | 6,385 | |
| Other withholding taxes | | 1,043 | | 1,046 | | 1,013 | | 1,075 | | 1,084 | | 1,084 | | 1,085 | |
| Other direct taxation | | 2 | | 2 | | 2 | | 2 | | 2 | | 2 | | 2 | |
| | |
| |
| |
| |
| |
| |
| |
| |
| Total Direct Taxation | | 23,605 | | 24,487 | | 24,550 | | 25,659 | | 26,901 | | 28,303 | | 29,349 | |
Indirect Taxation |
|
|
|
|
|
|
|
|
|
|
|
|
|
|
|
| Goods and Services Tax | | | | | | | | | | | | | | | |
| Gross goods and services tax | | 14,604 | | 14,754 | | 16,037 | | 16,396 | | 16,914 | | 17,678 | | 18,484 | |
| Refunds | | (5,657 | ) | (5,418 | ) | (6,188 | ) | (6,092 | ) | (6,127 | ) | (6,391 | ) | (6,670 | ) |
| | |
| |
| |
| |
| |
| |
| |
| |
| Total Goods and Services Tax | | 8,947 | | 9,336 | | 9,849 | | 10,304 | | 10,787 | | 11,287 | | 11,814 | |
| Other indirect taxation | | 3,698 | | 3,858 | | 3,942 | | 4,088 | | 4,156 | | 4,216 | | 4,282 | |
| | |
| |
| |
| |
| |
| |
| |
| |
| Total Indirect Taxation | | 12,645 | | 13,194 | | 13,791 | | 14,392 | | 14,943 | | 15,503 | | 16,096 | |
| | |
| |
| |
| |
| |
| |
| |
| |
| Total Taxation Receipts | | 36,250 | | 37,681 | | 38,341 | | 40,051 | | 41,844 | | 43,806 | | 45,445 | |
| Compulsory Fees, Fines, Penalties and Levies | | 324 | | 349 | | 327 | | 372 | | 386 | | 399 | | 419 | |
| Other Receipts | | | | | | | | | | | | | | | |
| Interest, profits and dividends | | 892 | | 755 | | 1,204 | | 1,012 | | 1,132 | | 1,224 | | 1,398 | |
| Sales of goods and services | | 622 | | 644 | | 653 | | 674 | | 628 | | 624 | | 626 | |
| Other operating receipts | | 383 | | 301 | | 370 | | 285 | | 276 | | 269 | | 285 | |
| | |
| |
| |
| |
| |
| |
| |
| |
| Total Other Receipts | | 1,897 | | 1,700 | | 2,227 | | 1,971 | | 2,036 | | 2,117 | | 2,309 | |
| | |
| |
| |
| |
| |
| |
| |
| |
| Total Cash Provided from Operations | | 38,471 | | 39,730 | | 40,895 | | 42,394 | | 44,266 | | 46,322 | | 48,173 | |
Cash was Disbursed to |
|
|
|
|
|
|
|
|
|
|
|
|
|
|
|
| Departmental outputs | | 4,749 | | 5,040 | | 5,173 | | 5,328 | | 5,243 | | 5,199 | | 5,222 | |
| Other outputs | | 16,008 | | 16,610 | | 16,835 | | 17,858 | | 18,435 | | 19,055 | | 19,325 | |
| Finance costs | | 2,499 | | 2,402 | | 2,240 | | 2,264 | | 2,390 | | 2,471 | | 2,549 | |
| Subsidies | | 133 | | 181 | | 147 | | 173 | | 178 | | 155 | | 155 | |
| Current transfers | | | | | | | | | | | | | | | |
| Social assistance grants | | 12,910 | | 13,610 | | 13,432 | | 13,689 | | 14,144 | | 14,564 | | 15,041 | |
| Other transfers | | 250 | | 255 | | 256 | | 260 | | 257 | | 256 | | 256 | |
| Forecast for future new spending | | — | | 160 | | — | | 230 | | 700 | | 1,180 | | 2,080 | |
| | |
| |
| |
| |
| |
| |
| |
| |
| Total Cash Disbursed to Operations | | 36,549 | | 38,258 | | 38,083 | | 39,802 | | 41,347 | | 42,880 | | 44,628 | |
| | |
| |
| |
| |
| |
| |
| |
| |
| Net Cash Flows from Operations | | 1,922 | | 1,472 | | 2,812 | | 2,592 | | 2,919 | | 3,442 | | 3,545 | |
| | |
| |
| |
| |
| |
| |
| |
| |
| Cash Flows from Investing Activities | | | | | | | | | | | | | | | |
| Cash was Provided from | | | | | | | | | | | | | | | |
| Sale of physical assets | | 75 | | 91 | | 124 | | 83 | | 56 | | 39 | | 31 | |
| | |
| |
| |
| |
| |
| |
| |
| |
| Total Cash Provided | | 75 | | 91 | | 124 | | 83 | | 56 | | 39 | | 31 | |
| Cash was Disbursed to | | | | | | | | | | | | | | | |
| Purchase of physical assets | | 1,205 | | 1,288 | | 1,271 | | 1,508 | | 1,417 | | 1,020 | | 1,025 | |
| Net increase in advances | | 617 | | 1,318 | | 1,264 | | 1,193 | | 1,632 | | 957 | | 1,060 | |
| Net (sale)/purchase of investments | | (174 | ) | 294 | | 1,217 | | 713 | | 265 | | 163 | | 83 | |
| Purchase of marketable securities and deposits by NZS Fund | | — | | 600 | | 600 | | 1,200 | | 1,800 | | 2,011 | | 2,117 | |
| Other net purchase/(sale) of marketable securities and deposits | | 1,001 | | (3,185 | ) | (1,232 | ) | (2,728 | ) | (222 | ) | 28 | | (15 | ) |
| Forecast for future new capital spending | | — | | 315 | | — | | 200 | | 800 | | 500 | | 360 | |
| | |
| |
| |
| |
| |
| |
| |
| |
| Total Cash Disbursed | | 2,649 | | 630 | | 3,120 | | 2,086 | | 5,692 | | 4,679 | | 4,630 | |
| | |
| |
| |
| |
| |
| |
| |
| |
| Net Cash Flows from Investing Activities | | (2,574 | ) | (539 | ) | (2,996 | ) | (2,003 | ) | (5,636 | ) | (4,640 | ) | (4,599 | ) |
| | |
| |
| |
| |
| |
| |
| |
| |
| Net Cash Flows from Operating and Investing Activities | | (652 | ) | 933 | | (184 | ) | 589 | | (2,717 | ) | (1,198 | ) | (1,054 | ) |
| | |
| |
| |
| |
| |
| |
| |
| |
| Cash Flows from Financing Activities | | | | | | | | | | | | | | | |
| Cash was Provided from | | | | | | | | | | | | | | | |
| Issue of circulating currency | | 303 | | — | | 248 | | — | | — | | — | | — | |
| Net issue/(repayment) of Government stock | | 1,066 | | 391 | | 746 | | (31 | ) | 2,515 | | 1,136 | | 947 | |
| | |
| |
| |
| |
| |
| |
| |
| |
| Total Cash Provided | | 1,369 | | 391 | | 994 | | (31 | ) | 2,515 | | 1,136 | | 947 | |
| Cash was Disbursed to | | | | | | | | | | | | | | | |
| Net repayment/(issue) of foreign-currency borrowing | | 514 | | 853 | | 451 | | 140 | | — | | (2 | ) | — | |
| Net repayment/(issue) of other New Zealand-dollar borrowing | | 305 | | 479 | | 282 | | 364 | | (100 | ) | (82 | ) | (161 | ) |
| | |
| |
| |
| |
| |
| |
| |
| |
| Total Cash Disbursed | | 819 | | 1,332 | | 733 | | 504 | | (100 | ) | (84 | ) | (161 | ) |
| | |
| |
| |
| |
| |
| |
| |
| |
| Net Cash Flows from Financing Activities | | 550 | | (941 | ) | 261 | | (535 | ) | 2,615 | | 1,220 | | 1,108 | |
| | |
| |
| |
| |
| |
| |
| |
| |
| Net Movement in Cash | | (102 | ) | (8 | ) | 77 | | 54 | | (102 | ) | 22 | | 54 | |
| Opening Cash Balance | | 210 | | 53 | | 115 | | 185 | | 239 | | 137 | | 159 | |
| FX gains/(losses) on opening cash balances | | 7 | | — | | (7 | ) | — | | — | | — | | — | |
| | |
| |
| |
| |
| |
| |
| |
| |
| Closing Cash Balance | | 115 | | 45 | | 185 | | 239 | | 137 | | 159 | | 213 | |
| | |
| |
| |
| |
| |
| |
| |
| |
The accompanying Notes are an integral part of these Statements.
| |
| | 2002
| |
| |
| |
| |
| |
|---|
| | 2001
Actual
| | Previous
Budget
| | Estimated
Actual
| | 2003
Forecast
| | 2004
Forecast
| | 2005
Forecast
| | 2006
Forecast
| |
|---|
| | ($ million)
| |
|---|
| Reconciliation Between the Forecast Net Cash Flows from Operations and the Operating Balance | | | | | | | | | | | | | | | |
| Net Cash Flows from Operations | | 1,922 | | 1,472 | | 2,812 | | 2,592 | | 2,919 | | 3,442 | | 3,545 | |
| Items included in the operating balance but not in net cash flows from operations | | | | | | | | | | | | | | | |
| Valuation Changes | | | | | | | | | | | | | | | |
| Increase in National Provident Fund guarantee liability | | (253 | ) | — | | — | | — | | — | | — | | — | |
| (Increase)/decrease in pension liabilities | | (164 | ) | 51 | | 368 | | — | | — | | — | | — | |
| Unrealised net foreign exchange gains/(losses) | | 100 | | — | | (72 | ) | — | | — | | — | | — | |
| Unrealised losses arising from changes in the value of commercial forests | | (40 | ) | — | | — | | — | | — | | — | | — | |
| | |
| |
| |
| |
| |
| |
| |
| |
| Total Valuation Changes | | (357 | ) | 51 | | 296 | | — | | — | | — | | — | |
Physical Asset Movements |
|
|
|
|
|
|
|
|
|
|
|
|
|
|
|
| Depreciation | | (925 | ) | (879 | ) | (943 | ) | (1,013 | ) | (1,059 | ) | (1,084 | ) | (1,106 | ) |
| (Loss)/gain on sale of assets | | (7 | ) | — | | (2 | ) | — | | — | | — | | — | |
| | |
| |
| |
| |
| |
| |
| |
| |
| Total Physical Asset Movements | | (932 | ) | (879 | ) | (945 | ) | (1,013 | ) | (1,059 | ) | (1,084 | ) | (1,106 | ) |
Other Non-cash Items |
|
|
|
|
|
|
|
|
|
|
|
|
|
|
|
| Net surplus attributable to state-owned enterprises and Crown entities | | 103 | | 745 | | 505 | | 496 | | 897 | | 1,058 | | 1,179 | |
| Accrued income from NZS Fund | | — | | 17 | | 15 | | 90 | | 208 | | 368 | | 550 | |
| Loss on writedown of defence equipment | | (103 | ) | — | | — | | — | | — | | — | | — | |
| Student Loans | | (61 | ) | (99 | ) | (67 | ) | (47 | ) | (44 | ) | (37 | ) | (41 | ) |
| Other | | 55 | | — | | (23 | ) | (47 | ) | (47 | ) | (47 | ) | (47 | ) |
| | |
| |
| |
| |
| |
| |
| |
| |
| Total Other Non-cash Items | | (6 | ) | 663 | | 430 | | 492 | | 1,014 | | 1,342 | | 1,641 | |
Total Other Investing and Financing Items |
|
177 |
|
— |
|
(22 |
) |
— |
|
— |
|
— |
|
— |
|
Movements in Working Capital |
|
|
|
|
|
|
|
|
|
|
|
|
|
|
|
| Increase/(decrease) in taxes receivable | | 737 | | 25 | | 1 | | 62 | | 25 | | 33 | | (5 | ) |
| Decrease/(increase) in payables | | 11 | | 62 | | (47 | ) | 56 | | 96 | | 48 | | 114 | |
| (Decrease)/increase in other receivables | | (62 | ) | (84 | ) | (133 | ) | 12 | | (112 | ) | 51 | | (45 | ) |
| (Decrease)/increase in inventories | | (81 | ) | 66 | | 27 | | 3 | | 8 | | (2 | ) | (2 | ) |
| | |
| |
| |
| |
| |
| |
| |
| |
| Total Movements in Working Capital | | 605 | | 69 | | (152 | ) | 133 | | 17 | | 130 | | 62 | |
| | |
| |
| |
| |
| |
| |
| |
| |
| Operating Balance | | 1,409 | | 1,376 | | 2,419 | | 2,204 | | 2,891 | | 3,830 | | 4,142 | |
| | |
| |
| |
| |
| |
| |
| |
| |
The accompanying Notes are an integral part of these Statements.
| |
| | 2002
| |
| |
| |
| |
| |
|---|
| | 2001
Actual
| | Previous
Budget
| | Estimated
Actual
| | 2003
Forecast
| | 2004
Forecast
| | 2005
Forecast
| | 2006
Forecast
| |
|---|
| | ($ million)
| |
|---|
| Reconciliation of Forecast Net Cash Flows from Operations with Forecast Net Cash Proceeds from Domestic Bonds | | | | | | | | | | | | | | | |
| Net Cash Flows from Operations | | 1,922 | | 1,472 | | 2,812 | | 2,592 | | 2,919 | | 3,442 | | 3,545 | |
| Net purchase of physical assets | | (1,130 | ) | (1,197 | ) | (1,147 | ) | (1,425 | ) | (1,361 | ) | (981 | ) | (994 | ) |
| Net increase in advances | | (617 | ) | (1,318 | ) | (1,264 | ) | (1,193 | ) | (1,632 | ) | (957 | ) | (1,060 | ) |
| Net sale/(purchase) of investments | | 174 | | (294 | ) | (1,217 | ) | (713 | ) | (265 | ) | (163 | ) | (83 | ) |
| Purchase of marketable securities and deposits by NZS Fund | | — | | (600 | ) | (600 | ) | (1,200 | ) | (1,800 | ) | (2,011 | ) | (2,117 | ) |
| Forecast for future new capital spending | | — | | (315 | ) | — | | (200 | ) | (800 | ) | (500 | ) | (360 | ) |
| | |
| |
| |
| |
| |
| |
| |
| |
| Available to Repay Debt/(Required to be Financed) | | 349 | | (2,252 | ) | (1,416 | ) | (2,139 | ) | (2,939 | ) | (1,170 | ) | (1,069 | ) |
| Financed by: | | | | | | | | | | | | | | | |
| Other net (purchase)/sale of marketable securities and deposits | | (1,001 | ) | 3,185 | | 1,232 | | 2,728 | | 222 | | (28 | ) | 15 | |
| | |
| |
| |
| |
| |
| |
| |
| |
| Total Investing Activities | | (652 | ) | 933 | | (184 | ) | 589 | | (2,717 | ) | (1,198 | ) | (1,054 | ) |
| Used in: | | | | | | | | | | | | | | | |
| Net (repayment)/issue of other New Zealand-dollar borrowing | | (305 | ) | (479 | ) | (282 | ) | (364 | ) | 100 | | 82 | | 161 | |
| Decrease/(increase) in cash | | 102 | | 8 | | (77 | ) | (54 | ) | 102 | | (22 | ) | (54 | ) |
| Issue of circulating currency | | 303 | | — | | 248 | | — | | — | | — | | — | |
| Net (repayment)/issue of foreign-currency borrowing | | (514 | ) | (853 | ) | (451 | ) | (140 | ) | — | | 2 | | — | |
| | |
| |
| |
| |
| |
| |
| |
| |
| | | (414 | ) | (1,324 | ) | (562 | ) | (558 | ) | 202 | | 62 | | 107 | |
| Net Cash (Outflow)/Inflow to be Offset by Domestic Bonds | | (1,066 | ) | (391 | ) | (746 | ) | 31 | | (2,515 | ) | (1,136 | ) | (947 | ) |
| | |
| |
| |
| |
| |
| |
| |
| |
| Gross Cash Proceeds from Domestic Bonds | | | | | | | | | | | | | | | |
| Domestic bonds (market) | | 3,572 | | 3,570 | | 3,703 | | 3,392 | | 5,559 | | 3,933 | | 3,822 | |
| Domestic bonds (non-market) | | 661 | | — | | 199 | | — | | 478 | | 213 | | — | |
| | |
| |
| |
| |
| |
| |
| |
| |
| Total Gross Cash Proceeds from Domestic Bonds | | 4,233 | | 3,570 | | 3,902 | | 3,392 | | 6,037 | | 4,146 | | 3,822 | |
| Repayment of domestic bonds (market) | | (2,651 | ) | (2,582 | ) | (2,593 | ) | (2,823 | ) | (3,044 | ) | (2,797 | ) | (2,875 | ) |
| Repayment of domestic bonds (non-market) | | (516 | ) | (597 | ) | (563 | ) | (600 | ) | (478 | ) | (213 | ) | — | |
| | |
| |
| |
| |
| |
| |
| |
| |
| Net Cash Proceeds from/(Repayments of) Domestic Bonds | | 1,066 | | 391 | | 746 | | (31 | ) | 2,515 | | 1,136 | | 947 | |
| | |
| |
| |
| |
| |
| |
| |
| |
The accompanying Notes are an integral part of these Statements.
Forecast Statement of Borrowings
as at 30 June
| |
| |
| | 2002
| |
| |
| |
| |
| |
|---|
| | Note
| | 2001
Actual
| | Previous
Budget
| | Estimated
Actual
| | 2003
Forecast
| | 2004
Forecast
| | 2005
Forecast
| | 2006
Forecast
| |
|---|
| |
| | ($ million)
| |
|---|
| Outstanding Debt | | | | | | | | | | | | | | | | | |
| New Zealand-Dollar Debt | | | | | | | | | | | | | | | | | |
| Government stock | | | | 23,331 | | 23,788 | | 24,106 | | 24,100 | | 26,611 | | 27,772 | | 28,752 | |
| Treasury bills | | | | 5,558 | | 5,388 | | 5,405 | | 5,484 | | 5,471 | | 5,479 | | 5,488 | |
| Loans and foreign-exchange contracts | | | | (272 | ) | (763 | ) | (374 | ) | (823 | ) | (711 | ) | (730 | ) | (606 | ) |
| Retail stock | | | | 498 | | 475 | | 512 | | 510 | | 510 | | 510 | | 510 | |
| | | | |
| |
| |
| |
| |
| |
| |
| |
| Total New Zealand-Dollar Debt | | | | 29,115 | | 28,888 | | 29,649 | | 29,271 | | 31,881 | | 33,031 | | 34,144 | |
Foreign-Currency Debt |
|
|
|
|
|
|
|
|
|
|
|
|
|
|
|
|
|
| United States dollars | | | | 4,780 | | 3,799 | | 3,889 | | 3,918 | | 3,916 | | 3,917 | | 3,917 | |
| Japanese yen | | | | 1,432 | | 1,562 | | 448 | | 279 | | 279 | | 279 | | 279 | |
| European and other currencies | | | | 1,434 | | 1,582 | | 1,953 | | 1,953 | | 1,955 | | 1,956 | | 1,956 | |
| | | | |
| |
| |
| |
| |
| |
| |
| |
| Total Foreign-Currency Debt | | | | 7,646 | | 6,943 | | 6,290 | | 6,150 | | 6,150 | | 6,152 | | 6,152 | |
| | | | |
| |
| |
| |
| |
| |
| |
| |
| Total Outstanding Debt | | | | 36,761 | | 35,831 | | 35,939 | | 35,421 | | 38,031 | | 39,183 | | 40,296 | |
| | | | |
| |
| |
| |
| |
| |
| |
| |
Less |
|
|
|
|
|
|
|
|
|
|
|
|
|
|
|
|
|
| Financial Assets | | | | | | | | | | | | | | | | | |
| Marketable Securities and Deposits1 | | | | | | | | | | | | | | | | | |
| New Zealand dollars | | | | 3,971 | | 1,154 | | 3,352 | | 778 | | 561 | | 506 | | 469 | |
| United States dollars | | | | 5,093 | | 3,909 | | 3,889 | | 3,958 | | 3,952 | | 3,947 | | 3,944 | |
| Japanese yen | | | | 1,548 | | 1,775 | | 487 | | 268 | | 268 | | 268 | | 268 | |
| European and other currencies | | | | 1,448 | | 1,612 | | 1,907 | | 1,902 | | 1,903 | | 1,901 | | 1,900 | |
| | | | |
| |
| |
| |
| |
| |
| |
| |
| Total Marketable Securities and Deposits | | | | 12,060 | | 8,450 | | 9,635 | | 6,906 | | 6,684 | | 6,622 | | 6,581 | |
Advances and Cash |
|
|
|
|
|
|
|
|
|
|
|
|
|
|
|
|
|
| Advances to state-owned enterprises and Crown entities | | 6 | | 261 | | 939 | | 890 | | 1,314 | | 2,148 | | 2,300 | | 2,536 | |
| Student loans | | 6 | | 4,143 | | 4,776 | | 4,798 | | 5,531 | | 6,295 | | 7,075 | | 7,863 | |
| Other advances | | | | 211 | | 158 | | 208 | | 166 | | 172 | | 180 | | 200 | |
| Cash | | | | 115 | | 45 | | 185 | | 239 | | 137 | | 159 | | 213 | |
| | | | |
| |
| |
| |
| |
| |
| |
| |
| Total Advances and Cash | | | | 4,730 | | 5,918 | | 6,081 | | 7,250 | | 8,752 | | 9,714 | | 10,812 | |
| | | | |
| |
| |
| |
| |
| |
| |
| |
| Total Financial Assets | | | | 16,790 | | 14,368 | | 15,716 | | 14,156 | | 15,436 | | 16,336 | | 17,393 | |
| | | | |
| |
| |
| |
| |
| |
| |
| |
| Net Crown Debt | | | | 19,971 | | 21,463 | | 20,223 | | 21,265 | | 22,595 | | 22,847 | | 22,903 | |
| | | | |
| |
| |
| |
| |
| |
| |
| |
| Net New Zealand-dollar debt | | | | 20,495 | | 21,816 | | 20,216 | | 21,243 | | 22,568 | | 22,811 | | 22,863 | |
| Net foreign-currency debt | | | | (524 | ) | (353 | ) | 7 | | 22 | | 27 | | 36 | | 40 | |
| | | | |
| |
| |
| |
| |
| |
| |
| |
| Net Crown Debt | | | | 19,971 | | 21,463 | | 20,223 | | 21,265 | | 22,595 | | 22,847 | | 22,903 | |
| | | | |
| |
| |
| |
| |
| |
| |
| |
- 1
- Marketable securities and deposits held by the NZS Fund are excluded from the calculation of net Crown debt.
The accompanying Notes are an integral part of these Statements.
Statement of Actual Commitments
as at 31 May 2002
| | As at
31 May
2002
| | As at
30 June
2001
|
|---|
| | ($ million)
|
|---|
| By Type | | | | |
| Capital Commitments | | | | |
| Specialist military equipment | | 538 | | 639 |
| Land and buildings | | 411 | | 383 |
| Other plant and equipment | | 22 | | 41 |
| Investments | | 238 | | 15 |
| Commitments of state-owned enterprises and Crown entities | | 848 | | 619 |
| | |
| |
|
| Total Capital Commitments | | 2,057 | | 1,697 |
| Operating Commitments | | | | |
| Non-cancellable accommodation leases | | 808 | | 842 |
| Other non-cancellable leases | | 1,717 | | 1,713 |
| Non-cancellable contracts for the supply of goods and services | | 2,625 | | 367 |
| Other operating commitments | | 791 | | 2,213 |
| Commitments of state-owned enterprises and Crown entities | | 3,266 | | 2,471 |
| | |
| |
|
| Total Operating Commitments | | 9,207 | | 7,606 |
| | |
| |
|
| Total Commitments | | 11,264 | | 9,303 |
| | |
| |
|
| By Term | | | | |
| One year or less | | 3,209 | | 3,618 |
| From one to two years | | 3,993 | | 2,051 |
| From two to five years | | 2,048 | | 1,754 |
| Over five years | | 2,014 | | 1,880 |
| | |
| |
|
| Total Commitments | | 11,264 | | 9,303 |
| | |
| |
|
The Statement of Actual Commitments includes commitments which are also included in the Forecast Statements of Financial Performance and Financial Position.
The accompanying Notes are an integral part of these Statements.
Statement of Actual Specific Fiscal Risks
The Statement of Contingent Liabilities is outlined on pages 27 to 29 of the Specific Fiscal Risks chapter.
The Statement of Specific Fiscal Risks (quantified and unquantified) is outlined on pages 30 to 34 of the Specific Fiscal Risks chapter.
Notes to the Forecast Financial Statements
The notes to the financial statements can be viewed on the Treasury website.
Tax and Expense Tables
The tax and expense tables can be viewed on the Treasury website.
GAAP Tables—Line-by-Line Consolidation
The Public Finance Act 1989 and Fiscal Responsibility Act 1994 require the government to produce actual and forecast financial statements in accordance with generally accepted accounting practice (GAAP). This ensures that the financial statements and forecasts of the Crown are prepared on a basis familiar to readers of private sector financial statements—providing a transparent and independently established set of principles on which to measure a government's financial activity.
GAAP will soon require the full line-by-line consolidation of SOEs and Crown entities (currently the accounts only consolidate the net surplus in the operating balance and net investment/net worth in the balance sheet). In addition, there are some adjustments that will impact on "core Crown" (defined below) results owing to changes to the treatment of GST on Crown spending and the treatment of the Government Superannuation Fund (GSF).
Pages 97 to 105 and pages 176 to 192 of the 2002 Budget Economic and Fiscal Update outline the impact of the changes in detail with reference to the forecasts at that time.
Summary Tables—Line-by-Line Consolidation
The following summary tables outline the key fiscal variables, comparing from the current presentation to those contained in the following GAAP tables prepared using the future presentation. The first table is expressed as a percentage of GDP. The second table is expressed in nominal dollars.
More detailed full consolidation GAAP financial statements can be viewed on the Treasury website.
Summary indicators
| | 1997
Actual
| | 1998
Actual
| | 1999
Actual
| | 2000
Actual
| | 2001
Actual
| | 2002
Estimated
Actual
| | 2003
Forecast
| | 2004
Forecast
| | 2005
Forecast
| | 2006
Forecast
| |
|---|
| | (% of GDP)
| |
|---|
| Revenue | | | | | | | | | | | | | | | | | | | | | |
| Current presentation | | 35.5 | % | 35.7 | % | 35.7 | % | 34.1 | % | 34.6 | % | 34.1 | % | 34.3 | % | 34.4 | % | 34.5 | % | 34.4 | % |
| Future presentation of Core Crown | | 34.2 | % | 34.3 | % | 33.8 | % | 32.3 | % | 33.3 | % | 32.7 | % | 33.0 | % | 33.0 | % | 33.1 | % | 33.1 | % |
| Future presentation of Total Crown | | 41.5 | % | 42.1 | % | 42.1 | % | 39.7 | % | 40.9 | % | 42.4 | % | 43.2 | % | 43.4 | % | 43.4 | % | 43.2 | % |
| Expenses | | | | | | | | | | | | | | | | | | | | | |
| Current presentation | | 33.6 | % | 34.3 | % | 35.2 | % | 33.8 | % | 33.5 | % | 32.5 | % | 32.9 | % | 32.9 | % | 32.5 | % | 32.4 | % |
| Future presentation of Core Crown | | 32.4 | % | 32.9 | % | 33.8 | % | 32.3 | % | 32.2 | % | 31.1 | % | 31.6 | % | 31.5 | % | 31.1 | % | 31.0 | % |
| Future presentation of Total Crown | | 39.5 | % | 40.0 | % | 40.3 | % | 38.3 | % | 39.7 | % | 40.4 | % | 41.4 | % | 41.1 | % | 40.6 | % | 40.3 | % |
| Operating balance | | | | | | | | | | | | | | | | | | | | | |
| Current presentation | | 1.9 | % | 2.5 | % | 1.7 | % | 1.4 | % | 1.2 | % | 2.0 | % | 1.8 | % | 2.2 | % | 2.8 | % | 2.9 | % |
| Future presentation | | 1.9 | % | 2.1 | % | 1.7 | % | 1.4 | % | 1.2 | % | 2.0 | % | 1.8 | % | 2.2 | % | 2.8 | % | 2.9 | % |
| OBERAC (no changes) | | 1.9 | % | 2.2 | % | 0.2 | % | 0.8 | % | 1.8 | % | 1.8 | % | 1.8 | % | 2.2 | % | 2.8 | % | 2.9 | % |
| Gross debt | | | | | | | | | | | | | | | | | | | | | |
| Current presentation | | 36.7 | % | 38.0 | % | 36.1 | % | 33.7 | % | 32.2 | % | 29.8 | % | 28.3 | % | 29.1 | % | 28.6 | % | 28.3 | % |
| Future presentation of Core Crown | | 35.0 | % | 36.1 | % | 33.8 | % | 31.6 | % | 29.6 | % | 28.6 | % | 28.0 | % | 28.8 | % | 28.4 | % | 28.0 | % |
| Future presentation of Total Crown | | 37.8 | % | 38.2 | % | 35.2 | % | 32.4 | % | 30.4 | % | 30.9 | % | 30.2 | % | 30.0 | % | 29.2 | % | 28.1 | % |
Gross sovereign-issued debt
(no change) | | 36.7 | % | 38.0 | % | 36.1 | % | 33.7 | % | 32.2 | % | 29.8 | % | 28.3 | % | 29.1 | % | 28.6 | % | 28.3 | % |
| Net Crown debt | | | | | | | | | | | | | | | | | | | | | |
| Current presentation | | 25.9 | % | 24.1 | % | 21.3 | % | 20.0 | % | 17.5 | % | 16.8 | % | 17.0 | % | 17.3 | % | 16.7 | % | 16.1 | % |
| Future presentation | | 24.1 | % | 22.2 | % | 19.1 | % | 17.9 | % | 14.9 | % | 15.5 | % | 16.7 | % | 17.0 | % | 16.4 | % | 15.8 | % |
| Net worth (no change) | | 7.6 | % | 9.9 | % | 5.9 | % | 8.0 | % | 10.0 | % | 11.6 | % | 13.0 | % | 14.6 | % | 16.8 | % | 19.0 | % |
| Tax and Sovereign revenue | | | | | | | | | | | | | | | | | | | | | |
| Tax revenue | | | | | | | | | | | | | | | | | | | | | |
| Current presentation | | 32.6 | % | 33.1 | % | 31.6 | % | 31.8 | % | 32.2 | % | 31.8 | % | 32.1 | % | 32.1 | % | 32.1 | % | 31.9 | % |
| Future presentation of Core Crown | | 31.0 | % | 31.5 | % | 30.0 | % | 30.1 | % | 30.7 | % | 30.2 | % | 30.4 | % | 30.4 | % | 30.4 | % | 30.2 | % |
| Future presentation of Total Crown | | 30.8 | % | 31.2 | % | 29.7 | % | 29.9 | % | 30.4 | % | 30.0 | % | 30.3 | % | 30.1 | % | 30.1 | % | 29.9 | % |
| Total sovereign revenue (includes levies) | | | | | | | | | | | | | | | | | | | | | |
| Current presentation | | 32.9 | % | 33.3 | % | 31.9 | % | 32.1 | % | 32.5 | % | 32.2 | % | 32.4 | % | 32.4 | % | 32.4 | % | 32.2 | % |
| Future presentation of Core Crown | | 31.3 | % | 31.8 | % | 30.3 | % | 30.5 | % | 31.0 | % | 30.6 | % | 30.8 | % | 30.7 | % | 30.7 | % | 30.5 | % |
| Future presentation of Total Crown | | 33.0 | % | 33.5 | % | 31.8 | % | 31.5 | % | 32.4 | % | 32.0 | % | 32.2 | % | 32.1 | % | 32.0 | % | 31.8 | % |
| Nominal GDP ($ million) | | 97,933 | | 99,790 | | 101,761 | | 107,064 | | 114,145 | | 120,543 | | 125,125 | | 130,659 | | 136,804 | | 142,631 | |
- •
- Net Crown debt is a measure of core Crown borrowings less financial assets. It is defined to exclude the assets of the NZS Fund and the GSF as these can only be used for very specific purposes.
Summary indicators
| | 1997
Actual
| | 1998
Actual
| | 1999
Actual
| | 2000
Actual
| | 2001
Actual
| | 2002
Estimated
Actual
| | 2003
Forecast
| | 2004
Forecast
| | 2005
Forecast
| | 2006
Forecast
|
|---|
| | ($ million)
|
|---|
| Revenue | | | | | | | | | | | | | | | | | | | | |
| Current presentation | | 34,778 | | 35,581 | | 36,357 | | 36,526 | | 39,492 | | 41,087 | | 42,925 | | 44,935 | | 47,199 | | 49,131 |
| Future presentation of Core Crown | | 33,533 | | 34,222 | | 34,367 | | 34,536 | | 38,005 | | 39,441 | | 41,292 | | 43,123 | | 45,321 | | 47,152 |
| Future presentation of Total Crown | | 40,595 | | 41,997 | | 42,807 | | 42,513 | | 46,686 | | 51,062 | | 53,998 | | 56,642 | | 59,387 | | 61,667 |
| Expenses | | | | | | | | | | | | | | | | | | | | |
| Current presentation | | 32,953 | | 34,211 | | 35,825 | | 36,171 | | 38,186 | | 39,173 | | 41,217 | | 42,941 | | 44,427 | | 46,168 |
| Future presentation of Core Crown | | 31,708 | | 32,852 | | 34,367 | | 34,536 | | 36,699 | | 37,527 | | 39,584 | | 41,129 | | 42,549 | | 44,189 |
| Future presentation of Total Crown | | 38,687 | | 39,870 | | 41,044 | | 41,010 | | 45,328 | | 48,643 | | 51,794 | | 53,751 | | 55,557 | | 57,525 |
| Operating balance | | | | | | | | | | | | | | | | | | | | |
| Current presentation | | 1,908 | | 2,534 | | 1,777 | | 1,449 | | 1,409 | | 2,419 | | 2,204 | | 2,891 | | 3,830 | | 4,142 |
| Future presentation | | 1,908 | | 2,127 | | 1,763 | | 1,503 | | 1,358 | | 2,419 | | 2,204 | | 2,891 | | 3,830 | | 4,142 |
| OBERAC (no changes) | | 1,904 | | 2,191 | | 246 | | 884 | | 2,107 | | 2,212 | | 2,204 | | 2,891 | | 3,830 | | 4,142 |
| Gross debt | | | | | | | | | | | | | | | | | | | | |
| Current presentation | | 35,972 | | 37,892 | | 36,712 | | 36,041 | | 36,761 | | 35,939 | | 35,421 | | 38,031 | | 39,183 | | 40,296 |
| Future presentation of Core Crown | | 34,267 | | 36,002 | | 34,425 | | 33,812 | | 33,811 | | 34,439 | | 35,081 | | 37,681 | | 38,833 | | 39,946 |
| Future presentation of Total Crown | | 36,999 | | 38,125 | | 35,777 | | 34,675 | | 34,652 | | 37,263 | | 37,799 | | 39,240 | | 39,917 | | 40,132 |
| Gross sovereign-issued debt (no change) | | 35,972 | | 37,892 | | 36,712 | | 36,041 | | 36,761 | | 35,939 | | 35,421 | | 38,031 | | 39,183 | | 40,296 |
| Net Crown debt | | | | | | | | | | | | | | | | | | | | |
| Current presentation | | 25,324 | | 24,069 | | 21,701 | | 21,396 | | 19,971 | | 20,223 | | 21,265 | | 22,595 | | 22,847 | | 22,903 |
| Future presentation | | 23,619 | | 22,179 | | 19,414 | | 19,167 | | 17,021 | | 18,723 | | 20,925 | | 22,245 | | 22,497 | | 22,553 |
| Net worth (no change) | | 7,470 | | 9,921 | | 6,022 | | 8,583 | | 11,463 | | 14,014 | | 16,218 | | 19,109 | | 22,939 | | 27,081 |
| Tax and Sovereign revenue | | | | | | | | | | | | | | | | | | | | |
| Tax revenue | | | | | | | | | | | | | | | | | | | | |
| Current presentation | | 31,916 | | 32,982 | | 32,156 | | 34,035 | | 36,738 | | 38,307 | | 40,114 | | 41,877 | | 43,851 | | 45,442 |
| Future presentation of Core Crown | | 30,387 | | 31,429 | | 30,525 | | 32,248 | | 34,995 | | 36,360 | | 38,077 | | 39,663 | | 41,571 | | 43,060 |
| Future presentation of Total Crown | | 30,160 | | 31,161 | | 30,227 | | 32,000 | | 34,744 | | 36,135 | | 37,875 | | 39,323 | | 41,205 | | 42,643 |
| Total sovereign revenue (includes levies) | | | | | | | | | | | | | | | | | | | | |
| Current presentation | | 32,179 | | 33,240 | | 32,456 | | 34,411 | | 37,123 | | 38,800 | | 40,586 | | 42,364 | | 44,344 | | 45,948 |
| Future presentation of Core Crown | | 30,650 | | 31,687 | | 30,825 | | 32,624 | | 35,380 | | 36,853 | | 38,549 | | 40,150 | | 42,064 | | 43,566 |
| Future presentation of Total Crown | | 32,304 | | 33,477 | | 32,381 | | 33,686 | | 37,013 | | 38,614 | | 40,329 | | 41,877 | | 43,835 | | 45,356 |
QuickLinks
PRE-ELECTION ECONOMIC AND FISCAL UPDATE 2002InternetContentsStatement of ResponsibilityMinisterial Statement1 Economic and Fiscal Outlook2 Specific Fiscal RisksGenerally Accepted Accounting Practice (GAAP) Series Tables