CERTIFIED SHAREHOLDER REPORT OF REGISTERED MANAGEMENT INVESTMENT COMPANIES
Investment Company Act file number: 811-02736 -------------------------------------------------------------------------
PETROLEUM & RESOURCES CORPORATION ------------------------------------------------------------------------- (Exact name of registrant as specified in charter)
7 Saint Paul Street, Suite 1140, Baltimore, Maryland 21202 ------------------------------------------------------------------------- (Address of principal executive offices)
Lawrence L. Hooper, Jr. Petroleum & Resources Corporation 7 Saint Paul Street, Suite 1140 Baltimore, Maryland 21202 ------------------------------------------------------------------------- (Name and address of agent for service)
Registrant's telephone number, including area code: (410) 752-5900 Date of fiscal year end: December 31 Date of reporting period: June 30, 2014
Item 1. Reports to Stockholders.
LETTER TO SHAREHOLDERS
We are pleased to present the summary financial information of Petroleum & Resources Corporation (the Fund) for the six months ended June 30, 2014.
Net assets of the Fund at June 30, 2014 were $36.62 per share on 26,660,966 shares outstanding, compared with $32.26 per share at December 31, 2013 on 26,775,228 shares outstanding. On March 3, 2014, a distribution of $0.10 per share was paid, consisting of $0.02 of net investment income, $0.02 short-term capital gain, and $0.06 long-term capital gain, all realized in 2013 and taxable in 2014. A 2014 net investment income dividend of $0.10 per share was paid June 2, 2014, and another $0.10 per share net investment income dividend has been declared to shareholders of record August 14, 2014, payable September 2, 2014. These constitute the first three payments toward our annual 6% minimum distribution rate commitment.
Net investment income for the six months ended June 30, 2014 amounted to $6,546,009, compared with $5,112,274 for the same six month period in 2013, equal to $0.25 and $0.19 per share, respectively. Net capital gain realized on investments for the six months ended June 30, 2014 amounted to $28,436,901, or $1.07 per share.
The Fund repurchased 125,200 shares of its Common Stock during the six months ended June 30, 2014. The shares were repurchased at an average price of $28.45 and a weighted average discount to net asset value (“NAV”) of 15.1%, resulting in a $0.02 increase to NAV per share.
For the six months ended June 30, 2014, the total return on the Fund’s NAV per share (with dividends and capital gains reinvested) was 14.3%. The total return on the market price of the Fund’s shares for the period was 14.7%. These compare to a 12.5% total return for the Lipper Global Natural Resources Funds Index over the same period of time.
For the twelve months ended June 30, 2014, the Fund’s total return on NAV was 32.6% and on market price was 30.1%. The comparable figure for the Lipper Global Natural Resources Funds Index was 28.4%.
Energy equities delivered market-leading returns during the second quarter of 2014. U.S. crude oil production averaged over 8 million barrels per day, driven by strong production increases in the Eagle Ford, Bakken, and Permian basin areas. Several of the Fund’s larger holdings, including EOG Resources and Pioneer Natural Resources, are very active in those basins and were among the top contributors to performance. Companies providing equipment and services to oil and gas companies, including Weatherford International and Schlumberger, also yielded outsized returns for the Fund. Domestic oil prices averaged above $102 per barrel, providing an underpinning for investment opportunities. New names added to the portfolio during the quarter that benefit from rising production and higher oil prices include Suncor, a Canadian-based integrated oil sands producer, and Whiting Petroleum, an oil and gas producer operating in the Permian and other attractive domestic basins. We believe both names have multi-year opportunities ahead of them to add value to the portfolio.
Investors can find the daily NAV per share, the market price, the discount/premium to the NAV per share of the Fund, and quarterly changes in the portfolio securities on our website at www.peteres.com. Also available there are a brief history of the Fund, historical financial information, links for electronic delivery of shareholder reports, and other useful content.
By order of the Board of Directors,
Mark E. Stoeckle
Chief Executive Officer
July 10, 2014
PORTFOLIO REVIEW
June 30, 2014
(unaudited)
TEN LARGEST EQUITY PORTFOLIO HOLDINGS
Market Value
% of Net Assets
Exxon Mobil Corp.
$
136,766,732
14.0
%
Chevron Corp.
97,024,760
9.9
Schlumberger Ltd.
66,052,000
6.8
Halliburton Co.
43,377,879
4.4
EOG Resources, Inc.
41,835,880
4.3
Occidental Petroleum Corp.
41,565,150
4.3
Phillips 66
34,687,448
3.6
LyondellBasell Industries N.V. (Class A)
34,568,100
3.5
Anadarko Petroleum Corp.
30,104,250
3.1
Noble Energy, Inc.
28,931,310
3.0
Total
$
554,913,509
56.9
%
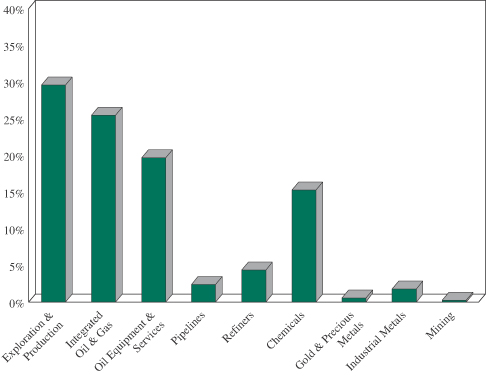
INDUSTRY WEIGHTINGS
2
STATEMENT OF ASSETS AND LIABILITIES
June 30, 2014
(unaudited)
Assets
Investments* at value:
Common stocks (cost $478,507,902)
$
967,699,682
Short-term investments (cost $12,799,120)
12,799,120
Securities lending collateral (cost $6,037,500)
6,037,500
$
986,536,302
Cash
241,341
Receivables:
Investment securities sold
65,489
Dividends and interest
791,797
Prepaid pension cost
627,703
Prepaid expenses and other assets
1,237,032
Total Assets
989,499,664
Liabilities
Investment securities purchased
4,050,665
Open written option contracts* at value (proceeds $543,977)
756,195
Obligations to return securities lending collateral
6,037,500
Accrued pension liabilities
1,363,240
Accrued expenses and other liabilities
835,840
Total Liabilities
13,043,440
Net Assets
$
976,456,224
Net Assets
Common Stock at par value $0.001 per share, authorized 50,000,000 shares; issued and outstanding 26,660,966 shares (includes 42,046 restricted shares, 11,200 nonvested or deferred restricted stock units, and 10,271 deferred stock units) (note 6)
$
26,661
Additional capital surplus
456,396,649
Accumulated other comprehensive income (note 5)
(995,200
)
Undistributed net investment income
3,925,921
Undistributed net realized gain on investments
28,122,631
Unrealized appreciation on investments
488,979,562
Net Assets Applicable to Common Stock
$
976,456,224
Net Asset Value Per Share of Common Stock
$36.62
* See Schedule of Investments on page 11 and Schedule of Outstanding Written Option Contracts on page 13.
The accompanying notes are an integral part of the financial statements.
3
STATEMENT OF OPERATIONS
Six Months Ended June 30, 2014
(unaudited)
Investment Income
Income:
Dividends
$
9,249,734
Interest and other income
66,526
Total income
9,316,260
Expenses:
Investment research
1,256,802
Administration and operations
676,782
Directors’ fees
226,131
Travel, training, and other office expenses
166,227
Reports and shareholder communications
89,012
Transfer agent, registrar, and custodian
78,585
Investment data services
78,454
Occupancy
69,125
Audit and accounting services
50,711
Insurance
34,177
Legal services
30,059
Other
14,186
Total expenses
2,770,251
Net Investment Income
6,546,009
Realized Gain and Change in Unrealized Appreciation on Investments
Net realized gain on security transactions
27,541,773
Net realized gain on written option contracts
895,128
Change in unrealized appreciation on investments
86,323,018
Change in unrealized appreciation on written option contracts
172,800
Net Gain on Investments
114,932,719
Other Comprehensive Income (note 5)
Defined benefit pension plans:
Amortization of net loss
48,154
Other Comprehensive Income
48,154
Change in Net Assets Resulting from Operations
$
121,526,882
The accompanying notes are an integral part of the financial statements.
4
STATEMENTS OF CHANGES IN NET ASSETS
(unaudited) Six Months Ended June 30, 2014
Year Ended December 31, 2013
From Operations:
Net investment income
$
6,546,009
$
11,590,396
Net realized gain on investments
28,436,901
37,428,311
Change in unrealized appreciation on investments
86,495,818
118,292,094
Change in accumulated other comprehensive income (note 5)
48,154
899,149
Increase in net assets resulting from operations
121,526,882
168,209,950
Distributions to Shareholders from:
Net investment income
(3,206,026
)
(12,044,136
)
Net realized gain from investment transactions
(2,141,249
)
(37,060,004
)
Decrease in net assets from distributions
(5,347,275
)
(49,104,140
)
From Capital Share Transactions:
Value of shares issued in payment of distributions (note 4)
6,673
18,698,338
Cost of shares purchased (note 4)
(3,562,559
)
(7,441,145
)
Deferred compensation (notes 4, 6)
142,670
338,368
Change in net assets from capital share transactions
(3,413,216
)
11,595,561
Total Increase in Net Assets
112,766,391
130,701,371
Net Assets:
Beginning of period
863,689,833
732,988,462
End of period (including undistributed net investment income of $3,925,921 and $585,938 respectively)
$
976,456,224
$
863,689,833
The accompanying notes are an integral part of the financial statements.
5
NOTES TO FINANCIAL STATEMENTS (UNAUDITED)
1. SIGNIFICANT ACCOUNTING POLICIES
Petroleum & Resources Corporation (the Fund) is registered under the Investment Company Act of 1940 as a non-diversified investment company. The Fund is an internally-managed closed-end fund specializing in petroleum and other natural resource investments. The investment objectives of the Fund are preservation of capital, the attainment of reasonable income from investments, and an opportunity for capital appreciation.
The accompanying financial statements were prepared in accordance with accounting principles generally accepted in the United States of America, which require the use of estimates made by Fund management. Management believes that estimates and security valuations are appropriate; however, actual results may differ from those estimates, and the security valuations reflected in the financial statements may differ from the value the Fund ultimately realizes upon sale of the securities.
Expenses—The Fund shares certain costs for investment research and data services, administration and operations, travel, training, office expenses, occupancy, accounting and legal services, insurance, and other miscellaneous items with its non-controlling affiliate, The Adams Express Company. Expenses that are not solely attributable to one fund are allocated to each fund based on relative net asset values or, in the case of investment research staff and related costs, relative market values of portfolio securities in the particular sector of coverage. Expense allocations are updated quarterly, as appropriate, except those related to payroll, which are updated annually.
Security Transactions and Investment Income—Investment transactions are accounted for on the trade date. Gain or loss on sales of securities and options is determined on the basis of specific identification. Dividend income and distributions to shareholders are recognized on the ex-dividend date, and interest income is recognized on the accrual basis.
Security Valuation—The Fund’s investments are reported at fair value as defined under accounting principles generally accepted in the United States of America. Investments in securities traded on national security exchanges are valued at the last reported sale price on the day of valuation. Over-the-counter and listed securities for which a sale price is not available are valued at the last quoted bid price. Short-term investments (excluding purchased options and money market funds) are valued at amortized cost, which approximates fair value. Purchased and written options are valued at the last quoted bid and asked price, respectively. Money market funds are valued at net asset value on the day of valuation.
Various inputs are used to determine the fair value of the Fund’s investments. These inputs are summarized in the following three levels:
•
Level 1 — fair value is determined based on market data obtained from independent sources; for example, quoted prices in active markets for identical investments,
•
Level 2 — fair value is determined using other assumptions obtained from independent sources; for example, quoted prices for similar investments,
•
Level 3 — fair value is determined using the Fund’s own assumptions, developed based on the best information available in the circumstances.
The Fund’s investments at June 30, 2014 were classified as follows:
Level 1
Level 2
Level 3
Total
Common stocks
$
967,699,682
$
—
$
—
$
967,699,682
Short-term investments
12,799,120
—
—
12,799,120
Securities lending collateral
6,037,500
—
—
6,037,500
Total investments
$
986,536,302
$
—
$
—
$
986,536,302
Written options
$
(756,195
)
$
—
$
—
$
(756,195
)
There were no transfers into or from Level 1 or Level 2 during the six months ended June 30, 2014.
2. FEDERAL INCOME TAXES
No federal income tax provision is required since the Fund’s policy is to qualify as a regulated investment company under the Internal Revenue Code and to distribute substantially all of its taxable income to its shareholders. Additionally, management has analyzed and concluded that tax positions included in federal income tax returns from the previous three years that remain subject to examination do not require any provision. Any income tax-related interest or penalties would be recognized as income tax expense. As of June 30, 2014, the identified cost of securities for federal income tax purposes was $497,344,522 and net unrealized appreciation aggregated $489,191,780, consisting of gross unrealized appreciation of $502,290,792 and gross unrealized depreciation of $13,099,012.
Distributions are determined in accordance with our annual 6% minimum distribution rate commitment, based on the Fund’s average market price, and income tax regulations, which may differ from generally accepted accounting principles. Such differences are primarily related to the Fund’s retirement plans and equity-based compensation. Differences that are permanent are reclassified in the capital accounts of
6
NOTES TO FINANCIAL STATEMENTS (CONTINUED)
the Fund’s financial statements and have no impact on net assets.
3. INVESTMENT TRANSACTIONS
The Fund’s investment decisions are made by the portfolio management team with recommendations from the research staff. Purchases and sales of portfolio securities, other than options and short-term investments, during the six months ended June 30, 2014 were $91,719,159 and $101,971,109, respectively.
The Fund is subject to changes in the value of equity securities held (equity price risk) in the normal course of pursuing its investment objectives. The Fund may purchase and write option contracts to increase or decrease its equity price risk exposure or may write option contracts to generate additional income. Option contracts generally entail risks associated with counterparty credit, liquidity, and unfavorable equity price movements. The Fund has mitigated counterparty credit and liquidity risks by trading its options through an exchange. The risk of unfavorable equity price movements is limited for purchased options to the premium paid and for written options by writing only covered call or collateralized put option contracts, which require the Fund to segregate certain securities or cash at its custodian when the option is written. A schedule of outstanding written option contracts as of June 30, 2014 can be found on page 13.
When the Fund writes (purchases) an option, an amount equal to the premium received (paid) by the Fund is recorded as a liability (asset) and is subsequently marked to market daily in the Statement of Assets and Liabilities, with any related change recorded as an unrealized gain or loss in the Statement of Operations. Premiums received (paid) from unexercised options are treated as realized gains (losses) on the expiration date and are separately identified in the Statement of Operations. Upon the exercise of written put (purchased call) option contracts, premiums received (paid) are deducted from (added to) the cost basis of the underlying securities purchased. Upon the exercise of written call (purchased put) option contracts, premiums received (paid) are added to (deducted from) the proceeds from the sale of underlying securities in determining whether there is a realized gain or loss.
Transactions in written covered call and collateralized put options during the six months ended June 30, 2014 were as follows:
Covered Calls
Collateralized Puts
Contracts
Premiums
Contracts
Premiums
Options outstanding, December 31, 2013
4,540
$
592,957
3,650
$
409,185
Options written
6,407
632,244
4,901
563,857
Options terminated in closing purchase transactions
(1,650
)
(290,910
)
(207
)
(12,213
)
Options expired
(3,340
)
(432,560
)
(5,685
)
(675,567
)
Options exercised
(3,000
)
(237,529
)
(93
)
(5,487
)
Options outstanding, June 30, 2014
2,957
$
264,202
2,566
$
279,775
4. CAPITAL STOCK
The Fund has 5,000,000 authorized and unissued preferred shares, $0.001 par value.
During 2014, the Fund issued 241 shares of its Common Stock at a weighted average price of $27.60 per share as dividend equivalents to holders of deferred stock units and restricted stock units under the 2005 Equity Incentive Compensation Plan.
On December 27, 2013, the Fund issued 705,273 shares of its Common Stock at a price of $26.48 per share (the average market price on December 9, 2013) to shareholders of record on November 25, 2013 who elected to take stock in payment of the distribution from 2013 capital gain and investment income. During 2013, 870 shares were issued at a weighted average price of $26.43 per share as dividend equivalents to holders of deferred stock units and restricted stock units under the 2005 Equity Incentive Compensation Plan.
The Fund may purchase shares of its Common Stock from time to time at such prices and amounts as the Board of Directors may deem advisable. Transactions in Common Stock for 2014 and 2013 were as follows:
Shares
Amount
Six months ended June 30, 2014
Year ended December 31, 2013
Six months ended June 30, 2014
Year ended December 31, 2013
Shares issued in payment of distributions
241
706,143
$
6,673
$
18,698,338
Shares purchased (at an average discount from net asset value of 15.1% and 14.5%, respectively)
(125,200
)
(278,744
)
(3,562,559
)
(7,441,145
)
Net activity under the 2005 Equity Incentive Compensation Plan
10,697
22,228
142,670
338,368
Net change
��
(114,262
)
449,627
$
(3,413,216
)
$
11,595,561
7
NOTES TO FINANCIAL STATEMENTS (CONTINUED)
5. RETIREMENT PLANS
Defined Contribution Plans — The Fund sponsors a qualified defined contribution plans for all employees with at least six months of service and a nonqualified defined contribution plan for eligible employees to supplement the qualified plan. The Fund expensed contributions to the plans in the amount of $134,575, a portion thereof based on company performance, for the six months ended June 30, 2014. The Fund does not provide postretirement medical benefits.
Defined Benefit Plans — On October 1, 2009, the Fund froze its non-contributory qualified and nonqualified defined benefit pension plans. Benefits are based on length of service and compensation during the last five years of employment through September 30, 2009, with no additional benefits being accrued beyond that date. In 2014, the Fund filed with the appropriate agencies to obtain approval to terminate the plans. Upon receiving the required regulatory approvals, all benefits under the plans will be paid out and all related pension liabilities will be relieved.
The funded status of the plans is recognized as an asset (overfunded plan) or a liability (underfunded plan) in the Statement of Assets and Liabilities. Changes in the prior service costs and accumulated actuarial gains and losses are recognized as accumulated other comprehensive income, a component of net assets, in the year in which the changes occur and are subsequently amortized into net periodic pension cost. Non-recurring settlement costs are recognized in net periodic pension cost when a plan participant receives a lump-sum benefit payment and includes any unamortized actuarial losses attributable to the portion of the projected benefit obligation being satisfied.
The Fund’s policy is to contribute annually to the plans those amounts that can be deducted for federal income tax purposes, plus additional amounts as the Fund deems appropriate in order to provide assets sufficient to meet benefits to be paid to plan participants. The Fund contributed $0 to the qualified plan and $57,433 to the nonqualified plan during the six months ended June 30, 2014, and anticipates making additional nonqualified plan contributions of $41,024 in 2014.
Items impacting the Fund’s net periodic pension cost included in investment research and administration expenses and accumulated other comprehensive income were:
Six months ended June 30, 2014
Year ended December 31, 2013
Components of net periodic pension cost
Interest cost
$
93,850
$
219,235
Expected return on plan assets
(11,123
)
(206,382
)
Net loss component
48,154
278,362
Effect of settlement (non-recurring)
—
641,408
Net periodic pension cost
$
130,881
$
932,623
Six months ended June 30, 2014
Year ended December 31, 2013
Accumulated other comprehensive income
Defined benefit pension plans:
Balance at beginning of period
$
(1,043,354
)
$
(1,942,503
)
Net actuarial loss arising during period
—
(20,621
)
Reclassifications to net periodic pension cost:
Amortization of net loss
48,154
278,362
Effect of settlement (non-recurring)
—
641,408
Balance at end of period
$
(995,200
)
$
(1,043,354
)
6. EQUITY-BASED COMPENSATION
The 2005 Equity Incentive Compensation Plan (“2005 Plan”), adopted at the 2005 Annual Meeting and re-approved at the 2010 Annual Meeting, permits the grant of restricted stock awards (both performance and nonperformance based), as well as stock options and other stock incentives, to all employees and non-employee directors. Performance-based restricted stock awards vest at the end of a specified three year period, with the ultimate number of shares earned contingent on achieving certain performance targets. If performance targets are not achieved, all or a portion of the performance-based restricted shares are forfeited and become available for future grants. Nonperformance-based restricted stock awards typically vest ratably over a three year period and nonperformance-based restricted stock units (granted to non-employee directors) vest over a one year period. Payment of awards may be deferred, if elected. The 2005 Plan provides for accelerated vesting in the event of death or retirement. Non-employee directors also may elect to defer a portion of their cash compensation, with such deferred amount to be paid by delivery of deferred stock units. Outstanding awards were granted at fair market value on grant date (determined by the average of the high and low price on that date). The 2005 Plan provides for the issuance of up to 872,639 shares of the Fund’s Common Stock, of which 740,845 shares remain available for future grants at June 30, 2014.
A summary of the status of the Fund’s awards granted under the 2005 Plan as of June 30, 2014, and changes during the six month period then ended is presented below:
Awards
Shares/ Units
Weighted Average Grant-Date Fair Value
Balance at December 31, 2013
61,728
$
27.41
Granted:
Restricted stock
11,057
27.04
Restricted stock units
2,800
27.98
Deferred stock units
1,478
27.55
Vested & issued
(13,546
)
27.00
Forfeited
—
—
Balance at June 30, 2014 (includes 15,295 performance-based awards and 48,222 nonperformance-based awards)
63,517
$
27.46
8
NOTES TO FINANCIAL STATEMENTS (CONTINUED)
Compensation cost resulting from awards granted under the 2005 Plan are based on the fair market value of the award on grant date and recognized on a straight-line basis over the requisite service period. For those awards with performance conditions, compensation costs are based on the most probable outcome and, if such goals are not met, compensation cost is not recognized and any previously recognized compensation cost is reversed. The total compensation cost for restricted stock granted to employees for the period ended June 30, 2014 was $193,569. The total compensation cost for restricted stock units granted to non-employee directors for the period ended June 30, 2014 was $31,631. As of June 30, 2014, there were total unrecognized compensation costs of $759,957, a component of additional capital surplus, related to nonvested equity-based compensation arrangements granted under the 2005 Plan. That cost is expected to be recognized over a weighted average period of 1.66 years. The total fair value of shares and units vested and issued during the six month period ended June 30, 2014 was $360,195.
7. OFFICER AND DIRECTOR COMPENSATION
The aggregate remuneration paid during the six months ended June 30, 2014 to officers and directors amounted to $1,824,396, of which $188,434 was paid as fees and compensation to directors who were not officers. These amounts represent the taxable income to the Fund’s officers and directors and therefore differ from the amounts reported in the accompanying Statement of Operations that are recorded and expensed in accordance with generally accepted accounting principles.
8. PORTFOLIO SECURITIES LOANED
The Fund makes loans of securities to approved brokers to earn additional income. It receives as collateral cash deposits, U.S. Government securities, or bank letters of credit valued at 102% of the value of the securities on loan. The market value of the loaned securities is calculated based upon the most recent closing prices and any additional required collateral is delivered to the Fund on the next business day. Cash deposits are placed in a registered money market fund. The Fund accounts for securities lending transactions as secured financing and receives compensation in the form of fees or retains a portion of interest on the investment of any cash received as collateral. The Fund also continues to receive interest or dividends on the securities loaned. Gain or loss in the fair value of securities loaned that may occur during the term of the loan will be for the account of the Fund. At June 30, 2014, the Fund had securities on loan of $5,992,500 and held cash collateral of $6,037,500; additional collateral was delivered the next business day in accordance with the procedure described above. The Fund is indemnified by the Custodian, serving as lending agent, for loss of loaned securities and has the right under the lending agreement to recover the securities from the borrower on demand.
9. OPERATING LEASE COMMITMENTS
The Fund leases office space and equipment under operating lease agreements expiring at various dates through the year 2019. The Fund recognized rental expense of $66,208 in the first half of 2014, and its minimum rental commitments are as follows:
2014
$
70,934
2015
142,133
2016
89,848
2017
41,018
2018
42,130
2019
3,519
Total
$
389,582
9
FINANCIAL HIGHLIGHTS
(unaudited) Six Months Ended
June 30, 2014
June 30, 2013
Year Ended December 31
2013
2012
2011
2010
2009
Per Share Operating Performance
Net asset value, beginning of period
$32.26
$27.84
$27.84
$28.58
$30.73
$26.75
$22.49
Net investment income
0.25
0.19
0.44
0.48
0.41
0.35
0.28
Net realized gains and increase (decrease) in unrealized appreciation
4.29
1.69
5.93
0.48
(0.42)
4.97
5.37
Change in accumulated other comprehensive income (note 5)
—
0.04
0.03
—
(0.03)
0.01
0.10
Total from investment operations
4.54
1.92
6.40
0.96
(0.04)
5.33
5.75
Less distributions
Dividends from net investment income
(0.12)
(0.13)
(0.46)
(0.42)
(0.39)
(0.32)
(0.37)
Distributions from net realized gains
(0.08)
(0.07)
(1.42)
(1.18)
(1.58)
(0.95)
(1.03)
Total distributions
(0.20)
(0.20)
(1.88)
(1.60)
(1.97)
(1.27)
(1.40)
Capital share repurchases (note 4)
0.02
0.02
0.05
—
—
—
0.02
Reinvestment of distributions
—
—
(0.15)
(0.10)
(0.14)
(0.08)
(0.11)
Total capital share transactions
0.02
0.02
(0.10)
(0.10)
(0.14)
(0.08)
(0.09)
Net asset value, end of period
$36.62
$29.58
$32.26
$27.84
$28.58
$30.73
$26.75
Market price, end of period
$31.18
$25.68
$27.38
$23.92
$24.48
$27.01
$23.74
Total Investment Return
Based on market price
14.7%
8.2%
22.7%
4.3%
(2.3)%
19.6%
30.3%
Based on net asset value
14.3%
7.1%
24.2%
4.0%
0.3%
20.8%
26.7%
Ratios/Supplemental Data
Net assets, end of period (in 000’s)
$976,456
$776,225
$863,690
$732,988
$732,811
$761,736
$650,718
Ratio of expenses to average net assets*
0.62%
†
0.97%
†
0.78%
0.65%
0.56%
0.64%
0.96%
Ratio of net investment income to average net assets**
1.47%
†
1.32%
†
1.44%
1.67%
1.29%
1.32%
1.18%
Portfolio turnover
20.7%
†
15.7%
†
18.7%
11.7%
16.4%
16.8%
14.4%
Number of shares outstanding at end of period (in 000’s)
26,661
26,243
26,775
26,326
25,641
24,790
24,327
*
For the six months ended in 2013, the annualized ratio of expenses to average net assets was 0.76% after adjusting for non-recurring pension expenses as described in footnote 5. For calendar years 2013, 2012, and 2009, the adjusted ratios were 0.70%, 0.64%, and 0.78%, respectively.
**
For the six months ended in 2013, the annualized ratio of net investment income to average net assets was 1.53%, after adjusting for non-recurring pension expenses as described in footnote 5. For calendar years 2013, 2012, and 2009, the adjusted ratios were 1.52%, 1.68%, and 1.36%, respectively.
Cash, receivables, prepaid expenses and other assets, less liabilities — (1.0)%
(10,080,078)
)
Net Assets — 100.0%
$
976,456,224
Notes:
(A)
Common stocks are listed on the New York Stock Exchange or the NASDAQ and are valued at the last reported sale price on the day of valuation. See note 1 to financial statements.
(B)
A portion of shares held are on loan. See note 8 to financial statements.
(C)
Presently non-dividend paying.
(D)
Rate presented is as of period-end and represents the annualized yield earned over the previous seven days.
(E)
All or a portion of this security is pledged to cover open written call option contracts. Aggregate market value of such pledged securities is $29,303,625.
(F)
All or a portion of this security is pledged to collateralize open written put option contracts with an aggregate market value to deliver upon exercise of $17,426,250.
12
SCHEDULE OF OUTSTANDING WRITTEN OPTION CONTRACTS
June 30, 2014 (unaudited)
Contracts (100 shares each)
Security
Strike Price
Contract Expiration Date
Value
COVERED CALLS
250
Anadarko Petroleum Corp.
$ 115
Aug
14
$
75,000
250
Chevron Corp.
135
Dec
14
68,750
27
Eastman Chemical Co.
97.50
Sep
14
1,080
480
Halliburton Co.
75
Oct
14
96,480
500
Nabors Industries Ltd.
29
Sep
14
94,000
500
National Oilwell Varco, Inc.
82.50
Aug
14
116,500
250
Occidental Petroleum Corp.
110
Aug
14
19,250
250
Pioneer Natural Resources Co.
240
Jul
14
50,000
150
SPDR Gold Trust
143
Mar
15
27,300
150
SPDR Gold Trust
143
Sep
14
4,500
150
SPDR Gold Trust
140
Dec
14
20,400
2,957
573,260
COLLATERALIZED PUTS
297
Baker Hughes, Inc.
62.50
Jul
14
4,455
400
Baker Hughes, Inc.
62.50
Oct
14
30,400
500
Cabot Oil & Gas Corp.
30
Oct
14
32,500
66
CF Industries Holdings, Inc.
190
Aug
14
2,640
30
Dow Chemical Co.
44
Sep
14
930
250
Energen Corp.
70
Jul
14
7,500
250
Exxon Mobil Corp.
85
Jul
14
750
223
Marathon Petroleum Corp.
80
Jul
14
71,360
250
Oasis Petroleum, Inc.
43
Aug
14
7,500
150
SPDR Gold Trust
115
Oct
14
8,550
150
SPDR Gold Trust
115
Dec
14
16,350
2,566
182,935
Total Option Liability (Unrealized Loss of $212,218)
$756,195
HISTORICAL FINANCIAL STATISTICS
(unaudited)
Year
Value Of Net Assets
Shares Outstanding
Net Asset Value Per Share
Market Value Per Share
Income Dividends Per Share
Capital Gains Distributions Per Share
Total Dividends and Distributions Per Share
Annual Distribution Rate*
2004
$
618,887,401
21,979,676
$
28.16
$
25.78
$
.44
$
.88
$
1.32
5.4
%
2005
761,913,652
21,621,072
35.24
32.34
.56
1.22
1.78
5.9
2006
812,047,239
22,180,867
36.61
33.46
.47
3.33
3.80
11.2
2007
978,919,829
22,768,250
42.99
38.66
.49
3.82
4.31
11.6
2008
538,936,942
23,958,656
22.49
19.41
.38
2.61
2.99
8.9
2009
650,718,323
24,327,307
26.75
23.74
.37
1.03
1.40
6.6
2010
761,735,503
24,789,698
30.73
27.01
.32
.95
1.27
5.5
2011
732,810,692
25,641,018
28.58
24.48
.39
1.58
1.97
7.1
2012
732,988,462
26,325,601
27.84
23.92
.42
1.18
1.60
6.4
2013
863,689,833
26,775,228
32.26
27.38
.46
1.42
1.88
7.2
June 30, 2014
976,456,224
26,660,966
36.62
31.18
.22
†
.08
†
.30
—
*
The annual distribution rate is the total dividends and distributions per share divided by the Fund’s average month-end stock price. For years prior to 2012, the average month-end stock price is determined for the calendar year. For 2012 and later, the average month-end stock price is determined for the twelve months ended October 31, which is consistent with the calculation used for the annual 6% minimum distribution rate commitment adopted in September 2012.
†
Paid or declared.
13
OTHER INFORMATION
DIVIDEND PAYMENT SCHEDULE
The Fund presently pays dividends four times a year, as follows: (a) three interim distributions on or about March 1, June 1, and September 1, and (b) a “year-end” distribution, payable in late December, consisting of the estimated balance of the net investment income for the year, the net realized capital gains earned through October 31 and, if applicable, a return of capital. Shareholders may elect to receive the year-end distribution in stock or cash. In connection with this distribution, all shareholders of record are sent a dividend announcement notice and an election card in mid-November. Shareholders holding shares in “street” or brokerage accounts may make their elections by notifying their brokerage house representative.
STATEMENT ON QUARTERLY FILING OF COMPLETE PORTFOLIO SCHEDULE
In addition to publishing its complete schedule of portfolio holdings in the First and Third Quarter Reports to shareholders, the Fund also files its complete schedule of portfolio holdings with the Securities and Exchange Commission for the first and third quarters of each fiscal year on Form N-Q. The Fund’s Forms N-Q are available on the Commission’s website: www.sec.gov. The Fund’s Forms N-Q may be reviewed and copied at the Commission’s Public Reference Room, and information on the operation of the Public Reference Room may be obtained by calling 1-800-SEC-0330. The Fund also posts a link to its Forms N-Q on its website: www.peteres.com under the headings “Investment Information”, “Financial Reports” and then “SEC Filings”.
PROXY VOTING POLICIES AND RECORD
A description of the policies and procedures that the Fund uses to determine how to vote proxies relating to portfolio securities owned by the Fund and the Fund’s proxy voting record for the 12-month period ended June 30, 2014 are available (i) without charge, upon request, by calling the Fund’s toll free number at (800) 638-2479; (ii) on the Fund’s website: www.peteres.com under the headings “About Petroleum & Resources” and “Corporate Information”;and (iii) on the Securities and Exchange Commission’s website: www.sec.gov.
ELECTRONIC DELIVERY OF SHAREHOLDER REPORTS
The Fund offers shareholders the benefits and convenience of viewing Quarterly and Annual Reports and other shareholder materials on-line. With your consent, paper copies of these documents will cease with the next mailing and will be provided via e-mail. Reduce paper mailed to your home and help lower the Fund’s printing and mailing costs. To enroll, please visit the following websites:
Registered shareholders with AST: www.amstock.com/main
Shareholders using brokerage accounts: http://enroll.icsdelivery.com/PEO
FORWARD-LOOKING STATEMENTS
This report contains “forward-looking statements” within the meaning of the Securities Act of 1933 and the Securities Exchange Act of 1934. By their nature, all forward-looking statements involve risks and uncertainties, and actual results could differ materially from those contemplated by the forward-looking statements. Several factors that could materially affect the Fund’s actual results are the performance of the portfolio of stocks held by the Fund, the conditions in the U.S. and international financial, petroleum and other markets, the price at which shares of the Fund will trade in the public markets, and other factors discussed in the Fund’s periodic filings with the Securities and Exchange Commission.
14
15
ANNUAL MEETING OF SHAREHOLDERS
The Annual Meeting of Shareholders was held on April 10, 2014. The following votes were cast for directors:
Votes For
Votes Withheld
Enrique R. Arzac
21,624,393
1,403,255
Phyllis O. Bonanno
21,581,179
1,446,469
Kenneth J. Dale
21,771,146
1,256,502
Frederic A. Escherich
21,770,612
1,257,036
Roger W. Gale
21,740,852
1,286,796
Kathleen T. McGahran
21,691,673
1,335,975
Craig R. Smith
21,735,564
1,292,084
Mark E. Stoeckle
21,641,900
1,385,748
A proposal to approve and ratify the selection of PricewaterhouseCoopers LLP as the independent registered public accounting firm for the Fund for 2014 was approved with 22,610,382 votes for, 244,702 votes against, and 172,566 shares abstaining.
This report, including the financial statements herein, is transmitted to the shareholders of Petroleum & Resources Corporation for their information. It is not a prospectus, circular or representation intended for use in the purchase or sale of shares of the Fund or of any securities mentioned in the report. The rates of return will vary and the principal value of an investment will fluctuate. Shares, if sold, may be worth more or less than their original cost. Past performance is no guarantee of future investment results.
Petroleum & Resources Corporation
Seven St. Paul Street, Suite 1140, Baltimore, MD 21202
(410) 752-5900 (800) 638-2479
Website: www.peteres.com
E-mail: contact@peteres.com
Counsel: Chadbourne & Parke LLP
Independent Registered Public Accounting Firm: PricewaterhouseCoopers LLP
Custodian of Securities: Brown Brothers Harriman & Co.
Transfer Agent & Registrar: American Stock Transfer & Trust Company, LLC
Stockholder Relations Department
6201 15th Avenue
Brooklyn, NY 11219
(866) 723-8330
Website: www.amstock.com
E-mail: info@amstock.com
PETROLEUM & RESOURCES CORPORATION
Board of Directors
Enrique R. Arzac1,3,5
Roger W. Gale1,3,4,5
Phyllis O. Bonanno1,2,5
Kathleen T. McGahran 1,6
Kenneth J. Dale 2,3,4
Craig R. Smith 1,2,5
Frederic A. Escherich 2,3,4
Mark E. Stoeckle 1
1.
Member of Executive Committee
2.
Member of Audit Committee
3.
Member of Compensation Committee
4.
Member of Retirement Benefits Committee
5.
Member of Nominating and Governance Committee
6.
Chair of the Board
Officers
Mark E. Stoeckle
Chief Executive Officer
Nancy J.F. Prue, CFA
President
James P. Haynie, CFA
Executive Vice President
Brian S. Hook, CFA, CPA
Vice President, Chief Financial Officer and Treasurer
Lawrence L. Hooper, Jr.
Vice President, General Counsel and Secretary
Michael A. Kijesky, CFA
Vice President—Research
Christine M. Sloan, CPA
Assistant Treasurer
Stock Data
Market Price (6/30/14)
$
31.18
Net Asset Value (6/30/14)
$
36.62
Discount
14.9%
New York Stock Exchange ticker symbol: PEO
NASDAQ Quotation Symbol for NAV: XPEOX
Distributions in 2014
From Investment Income (paid or declared)
$
0.22
From Net Realized Gains
0.08
Total
$
0.30
2014 Dividend Payment Dates
March 3, 2014
June 2, 2014
September 2, 2014
December 29, 2014*
*Anticipated
Item 2. Code of Ethics.
Item not applicable to semi-annual report.
Item 3. Audit Committee Financial Expert.
Item not applicable to semi-annual report.
Item 4. Principal Accountant Fees and Services.
Item not applicable to semi-annual report.
Item 5. Audit Committee of Listed Registrants.
Item not applicable to semi-annual report.
Item 6. Investments.
(a) This schedule is included as part of the Report to Stockholders filed under Item 1 of this form.
(b) Not applicable.
Item 7. Disclosure of Proxy Voting Policies and Procedures for Closed-End Management Investment Companies.
Item not applicable to semi-annual report.
Item 8. Portfolio Managers of Closed-End Management Investment Companies.
Item not applicable to semi-annual report.
Item 9. Purchases of Equity Securities by Closed-End Management Investment Company and Affiliated Purchasers.
Total Number of Shares (or Units Purchased)
Average Price Paid per Share (or Unit)
Total Number of Shares (or Units) Purchased as Part of Publicly Announced Plans or Programs
Maximum Number of Shares (or Units) That May Yet Be Purchased Under the Plans or Programs
----------------------------------
----------------------------------
----------------------------------
----------------------------------
January 2014
12,000
$26.72
12,000
1,292,473
February 2014
15,600
$26.62
15,600
1,276,873
March 2014
26,200
$27.42
26,200
1,250,673
April 2014
15,400
$28.26
15,400
1,235,273
May 2014
29,400
$29.29
29,400
1,205,873
June 2014
26,600
$30.53
26,600
1,179,273
(2c)
----------------------------------
----------------------------------
----------------------------------
Total
125,200
(1)
$28.45
125,200
(2a) (2b)
(1) There were no shares purchased other than through a publicly announced plan or program.
(2.a) The Plan was announced on November 15, 2013.
(2.b) The share amount approved in 2013 was 5% of outstanding shares, or 1,304,473 shares.
(2.c) Unless reapproved, the Plan will expire on December 31, 2014.
(2.d) None.
(2.e) None.
Item 10. Submission of Matters to a Vote of Security Holders.
There were no material changes to the procedures by which shareholders may recommend nominees to the registrant's Board of Directors made or implemented after the registrant last provided disclosure in response to the requirements of Item 407(c)(2)(iv) of Regulation S-K (as required by Item 22(b)(15) of Schedule 14A), or this Item.
Item 11. Controls and Procedures.
(a) The registrant's principal executive officer and principal financial officer have concluded that the registrant's disclosure controls and procedures (as defined in Rule 30a-3(c) under the Investment Company Act of 1940) are effective based on their evaluation of the disclosure controls and procedures as of a date within 90 days of the filing date of this report.
(b) There have been no significant changes in the registrant's internal control over financial reporting (as defined in Rule 30a-3(d) under the Investment Company Act of 1940) that occurred during the registrant's second fiscal quarter of the period covered by this report that has materially affected, or is reasonably likely to materially affect, the registrant's internal control over financial reporting.
Item 12. Exhibits.
(a)
(1)
Not applicable. See registrant's response to Item 2 above.
(2)
Separate certifications by the registrant's principal executive officer and principal financial officer, pursuant to Section 302 of the Sarbanes-Oxley Act of 2002 and required by Rule 30a-2(a) under the Investment Company Act of 1940, are attached.
(3)
Written solicitation to purchases securities: not applicable.
(b) A certification by the registrant's principal executive officer and principal financial officer, pursuant to Section 906 of the Sarbanes-Oxley Act of 2002 and required by Rule 30a-2(b) under the Investment Company Act of 1940, is attached.
SIGNATURES
Pursuant to the requirements of the Securities Exchange Act of 1934 and the Investment Company Act of 1940, the registrant has duly caused this
report to be signed on its behalf by the undersigned, thereunto duly authorized.
Petroleum & Resources Corporation
By:
/s/ Mark E. Stoeckle
Mark E. Stoeckle
Chief Executive Officer
(Principal Executive Officer)
Date:
July 18, 2014
Pursuant to the requirements of the Securities Exchange Act of 1934 and the Investment Company Act of 1940, the registrant has duly caused this
report to be signed on its behalf by the undersigned, thereunto duly authorized.
By:
/s/ Mark E. Stoeckle
Mark E. Stoeckle
Chief Executive Officer
(Principal Executive Officer)
Date:
July 18, 2014
By:
/s/ Brian S. Hook
Brian S. Hook
Vice President, Chief Financial Officer and Treasurer
(Principal Financial Officer)
Date:
July 18, 2014
We use cookies on this site to provide a more responsive and personalized service. Continuing to browse, clicking I Agree, or closing this banner indicates agreement. See our Cookie Policy for more information.