CERTIFIED SHAREHOLDER REPORT OF REGISTERED MANAGEMENT INVESTMENT COMPANIES
Investment Company Act file number: 811-02736 -------------------------------------------------------------------------
ADAMS NATURAL RESOURCES FUND, INC. ------------------------------------------------------------------------- (Exact name of registrant as specified in charter)
500 East Pratt Street, Suite 1300, Baltimore, Maryland 21202 ------------------------------------------------------------------------- (Address of principal executive offices)
Lawrence L. Hooper, Jr. Adams Natural Resources Fund, Inc. 500 East Pratt Street, Suite 1300 Baltimore, Maryland 21202 ------------------------------------------------------------------------- (Name and address of agent for service)
Registrant's telephone number, including area code: (410) 752-5900 Date of fiscal year end: December 31 Date of reporting period: June 30, 2017
Item 1. Reports to Stockholders.
ADAMS
NATURAL RESOURCES
FUND
SEMI-ANNUAL REPORT
JUNE 30, 2017
LETTERTO SHAREHOLDERS
Dear Fellow Shareholders,
The year started off strong with the broad stock market generating solid gains driven by continued confidence in the ongoing economic recovery and expectations stemming from the proposed pro-business policies of the Trump administration. The strength of the economy, particularly the labor market, led the Federal Reserve to raise short-term interest rates a quarter point at both its March and June meetings. The stock market continued to move higher, reaching record levels during the second quarter despite signs that it will take longer than expected to realize the potential benefits from proposed policies on tax reform, health care, and infrastructure spending.
The Energy sector did not participate in the gains of the broader markets due to lower oil and gas prices. Energy was the worst performing sector in the S&P 500, declining 12.6% in the first six months of 2017. Your Fund, which was down 9.5% during the period, benefited from exposure to Basic Materials stocks and diversification across Energy that together helped to mitigate the deterioration in oil and gas stock prices.
Crude oil (WTI) prices fell 20% from the beginning of the year, hitting a 10-month low of $42.31 in June. This correction marked the largest decline for the first half of the year in 20 years. The decline was driven by oversupply concerns as already high U.S. crude oil inventory levels were met with rising production. OPEC’s decision in November 2016 to curtail production had little impact on prices, as U.S. shale production largely offset the OPEC cuts. Advances in technology have enabled American shale drillers to be profitable at significantly lower oil prices. Also, Libya ramped production to a three-year high after resolving supply disruptions earlier in the year, contributing to the oversupplied condition. U.S. crude inventories continued to rise despite OPEC’s announcement in May to extend cuts through March 2018.
The Dow Jones U.S. Oil & Gas Index declined 13.4% in the first six months of the year. Within the sector, integrated oil and gas companies declined 9.2%, while oil service stocks declined 20.0%. Exploration & production (E&P) companies declined 19.7%. The Dow Jones U.S. Basic Materials Index rose 8.6%, led by chemical stocks, which benefited from strength in the automotive and housing sectors.
Within the E&P industry, we adjusted the portfolio to reflect our preference for pure-play companies with exposure to U.S. shale production, particularly in the Permian basin, a drilling field in West Texas. We initiated positions in Diamondback Energy, Energen Corporation, and Parsley Energy. These companies have strong, low-cost asset bases, enabling each to profitably operate wells at relatively low oil prices. In addition, these companies are positioned well with high-quality balance sheets, strong management teams, and significant room for production growth. These purchases were funded with proceeds from the sale of the Fund’s position in Anadarko Petroleum. We sold the stock following a well explosion in April that has the potential to adversely impact drilling restrictions in the Colorado market.
Drillers were the worst performing industry, declining 38.0% during the period. Concerns over the longer-term implications of low oil prices were most pronounced on the shares of offshore drillers. We had no exposure to these stocks.
The Fund’s Basic Materials exposure performed well, increasing 9.4% and exceeding its benchmark. The best performer in the group was Packaging Corporation of America, which benefited from strong containerboard pricing and continued synergies from prior acquisitions. Coatings and materials company PPG Industries reported solid volume and margin gains and contributed to our positive returns in the sector. Despite PPG’s unsuccessful attempts to acquire Dutch competitor Akzo Nobel, we view PPG as a
1
LETTERTO SHAREHOLDERS (CONTINUED)
compelling investment given its leadership position in the global paints and coatings market combined with its significant cash position. We believe that PPG is committed to using its strong balance sheet to create shareholder value through M&A and/or share buybacks.
For the six months ended June 30, 2017, the total return on the Fund’s net asset value (“NAV”) per share (with dividends and capital gains reinvested) was -9.5%. This compares to total returns of -13.4% for Dow Jones U.S. Oil & Gas Index, 8.6% for Dow Jones U.S. Basic Materials Index, and -6.9% for Lipper Global Natural Resources Funds Average over the same time period. The total return on the market price of the Fund’s shares for the period was -6.3%.
For the twelve months ended June 30, 2017, the Fund’s total return on NAV was -0.2%. Comparable returns for Dow Jones U.S. Oil & Gas Index, Dow Jones U.S. Basic Materials Index, and Lipper Global Natural Resources Funds Average were -5.0%, 20.3%, and 1.7%, respectively. The Fund’s total return on market price was -1.7%.
During the first half of this year, the Fund paid distributions to shareholders in the amount of $5.7 million, or $.20 per share, consisting of $.04 net investment income and $.04 long-term capital gain, realized in 2016, and $.12 of net investment income realized in 2017, all taxable in 2017. On July 13, 2017, an additional net investment income distribution of $.10 per share was declared for payment on September 1, 2017. These constitute the first three payments toward our annual 6% minimum distribution rate commitment.
On June 8, 2017, Ms. Nancy J. Floyd Prue retired from the Fund after 35 years of service. Ms. Prue held a variety of senior-level positions at Adams Funds and served as President of PEO from 2012 to 2015. Most recently, she served as Executive Vice President and Director of Shareholder Communications. We thank her for the many contributions she made over the years and wish her well in retirement.
By order of the Board of Directors,
Mark E. Stoeckle
Chief Executive Officer
July 13, 2017
Disclaimers
This report contains “forward-looking statements” within the meaning of the Securities Act of 1933 and the Securities Exchange Act of 1934. By their nature, all forward-looking statements involve risks and uncertainties, and actual results could differ materially from those contemplated by the forward-looking statements. Several factors that could materially affect the Fund’s actual results are the performance of the portfolio of stocks held by the Fund, the conditions in the U.S. and international financial markets, the price at which shares of the Fund will trade in the public markets, and other factors discussed in the Fund’s periodic filings with the Securities and Exchange Commission.
This report is transmitted to the shareholders of the Fund for their information. It is not a prospectus, circular or representation intended for use in the purchase or sale of shares of the Fund or of any securities mentioned in the report. The rates of return will vary and the principal value of an investment will fluctuate. Shares, if sold, may be worth more or less than their original cost. Past performance is no guarantee of future investment results.
2
PORTFOLIO HIGHLIGHTS
June 30, 2017
(unaudited)
Ten Largest Equity Portfolio Holdings
Market Value
Percent of Net Assets
Exxon Mobil Corp.
$122,332,591
19.9
%
Chevron Corp.
62,264,144
10.1
Schlumberger Ltd.
34,592,336
5.6
Dow Chemical Co.
28,094,910
4.6
ConocoPhillips
24,068,100
3.9
Occidental Petroleum Corp.
21,044,305
3.4
Halliburton Co.
20,192,007
3.3
Monsanto Co.
17,801,344
2.9
EOG Resources, Inc.
17,207,852
2.8
LyondellBasell Industries N.V. (Class A)
17,080,536
2.8
$364,678,125
59.3
%
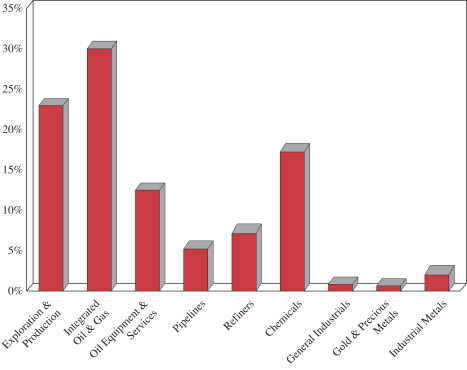
Industry Weightings
3
STATEMENTOF ASSETSAND LIABILITIES
June 30, 2017
(unaudited)
Assets
Investments* at value:
Common stocks (cost $480,968,746)
$
609,301,854
Short-term investments (cost $6,354,099)
6,354,099
Securities lending collateral (cost $66,068,663)
66,068,663
$
681,724,616
Cash
33,358
Dividends and interest receivable
874,208
Prepaid expenses and other assets
515,357
Total Assets
683,147,539
Liabilities
Obligations to return securities lending collateral
66,068,663
Net unrealized loss on open total return swap agreements*
978,647
Accrued expenses and other liabilities
1,374,559
Total Liabilities
68,421,869
Net Assets
614,725,670
Net Assets
Common Stock at par value $0.001 per share, authorized 50,000,000 shares; issued and outstanding 28,551,049 shares (includes 16,054 restricted shares and 23,805 deferred stock units) (note 7)
$
28,551
Additional capital surplus
496,572,944
Undistributed net investment income
1,401,799
Undistributed net realized loss
(10,632,085
)
Unrealized appreciation
127,354,461
Net Assets Applicable to Common Stock
$
614,725,670
Net Asset Value Per Share of Common Stock
$21.53
*
See Schedule of Investments beginning on page 14.
The accompanying notes are an integral part of the financial statements.
4
STATEMENTOF OPERATIONS
Six Months Ended June 30, 2017
(unaudited)
Investment Income
Income:
Dividends
$
8,276,725
Interest and other income
47,149
Total Income
8,323,874
Expenses:
Investment research compensation and benefits
1,078,631
Administration and operations compensation and benefits
573,253
Directors’ compensation
221,250
Occupancy and other office expenses
142,972
Accounting, recordkeeping and other professional fees
125,022
Shareholder reports and communications
116,301
Investment data services
110,361
Transfer agent, custody, and listing fees
64,036
Audit and tax services
42,948
Insurance
29,321
Legal services
16,334
Total Expenses
2,520,429
Net Investment Income
5,803,445
Realized Loss and Change in Unrealized Appreciation
Net realized loss on security transactions
(10,346,823
)
Change in unrealized appreciation on investments
(59,940,210
)
Change in unrealized appreciation on total return swap agreements
(978,647
)
Net Loss on Investments
(71,265,680
)
Change in Net Assets Resulting from Operations
$
(65,462,235
)
The accompanying notes are an integral part of the financial statements.
5
STATEMENTSOF CHANGESIN NET ASSETS
(unaudited) Six Months Ended June 30, 2017
Year Ended December 31, 2016
From Operations:
Net investment income
$
5,803,445
$
11,536,954
Net realized (loss) gain
(10,346,823
)
20,350,872
Change in unrealized appreciation
(60,918,857
)
93,554,697
Change in Net Assets Resulting from Operations
(65,462,235
)
125,442,523
Distributions to Shareholders from:
Net investment income
(4,568,280
)
(11,517,771
)
Net realized gain
(1,142,069
)
(20,506,783
)
Decrease in Net Assets from Distributions
(5,710,349
)
(32,024,554
)
From Capital Share Transactions:
Value of shares issued in payment of distributions (note 5)
2,819
9,574,317
Deferred compensation (notes 5, 7)
13,406
212,932
Increase in Net Assets from Capital Share Transactions
16,225
9,787,249
Total Change in Net Assets
(71,156,359
)
103,205,218
Net Assets:
Beginning of period
685,882,029
582,676,811
End of period (including undistributed net investment income of $1,401,799 and $166,634, respectively)
$
614,725,670
$
685,882,029
The accompanying notes are an integral part of the financial statements.
6
NOTESTO FINANCIAL STATEMENTS (UNAUDITED)
Adams Natural Resources Fund, Inc. (the “Fund”) is registered under the Investment Company Act of 1940 (“1940 Act”) as a non-diversified investment company. The Fund is an internally-managed closed-end fund specializing in energy and other natural resources stocks. The investment objectives of the Fund are preservation of capital, the attainment of reasonable income from investments, and an opportunity for capital appreciation.
1. SIGNIFICANT ACCOUNTING POLICIES
Basis of Presentation—The accompanying financial statements were prepared in accordance with accounting principles generally accepted in the United States of America (“GAAP”) for investment companies, which require the use of estimates by Fund management. Management believes that estimates and valuations are appropriate; however, actual results may differ from those estimates and the valuations reflected in the financial statements may differ from the value the Fund ultimately realizes.
Affiliates—Adams Diversified Equity Fund, Inc. (“ADX”), a diversified, closed-end investment company, owns 8% of the Fund’s outstanding shares and is, therefore, an “affiliated company” as defined by the 1940 Act. During 2017, the Fund paid dividends and long-term capital gain distributions of $437,355 to ADX. Directors of the Fund are also directors of ADX. The Fund, ADX, and Adams Funds Advisers, LLC (“AFA”), an ADX-affiliated investment adviser to external parties, have a shared management team.
Expenses—The Fund shares personnel, systems, and other infrastructure items with ADX and AFA and are charged a portion of the shared expenses. To protect the Fund from potential conflicts of interest, policies and procedures are in place covering the sharing of expenses among the entities. Expenses solely attributable to an entity are charged to that entity. Expenses that are not solely attributable to one entity are allocated in accordance with the Fund’s expense sharing policy. The Fund’s policy dictates that expenses, other than those related to personnel, are attributed to AFA based on the average percentage of time spent by all personnel on AFA-related activities relative to overall job functions; the remaining portion is attributed to the Fund and ADX based on relative net assets. Personnel-related expenses are attributed to AFA based on the individual’s time spent on AFA-related activities; the remaining portion is attributed to the Fund and ADX based on relative time spent for portfolio managers, relative market values of portfolio securities covered for research staff, and relative net assets for all others. Expense allocations are updated quarterly, except for those related to payroll, which are updated annually. Estimates related to time spent are reviewed on an annual basis, or more frequently if warranted by a change in job function.
For the period ended June 30, 2017, expenses of $1,246,306 and $335,633 were charged to ADX and AFA, respectively, in accordance with the Fund’s expense sharing policy. There were no amounts due to, or due from, affiliated companies as of June 30, 2017.
Investment Transactions, Investment Income, and Distributions—The Fund’s investment decisions are made by the portfolio management team with recommendations from the research staff. Policies and procedures are in place covering the allocation of investment opportunities among the Fund, ADX, and AFA to protect the Fund from potential conflicts of interest. Investment transactions are accounted for on
7
NOTESTO FINANCIAL STATEMENTS (CONTINUED)
trade date. Realized gains and losses on sales of investments are recorded on the basis of specific identification. Dividend income and distributions to shareholders are recognized on the ex-dividend date. Interest income is recognized on the accrual basis.
Valuation—The Fund’s financial instruments are reported at fair value, which is defined as the price that would be received to sell an asset or paid to transfer a liability in an orderly transaction between market participants at the measurement date. The Fund has a Valuation Committee (“Committee”) so that financial instruments are appropriately priced at fair value in accordance with GAAP and the 1940 Act. Subject to oversight by the Board of Directors, the Committee establishes methodologies and procedures to value securities for which market quotations are not readily available.
GAAP establishes the following fair value hierarchy that categorizes the inputs used to measure fair value:
•
Level 1—fair value is determined based on market data obtained from independent sources; for example, quoted prices in active markets for identical investments;
•
Level 2—fair value is determined using other assumptions obtained from independent sources; for example, quoted prices for similar investments;
•
Level 3—fair value is determined using the Fund’s own assumptions, developed based on the best information available under the circumstances.
Investments in securities traded on national security exchanges are valued at the last reported sale price as of the close of regular trading on the relevant exchange on the day of valuation. Over-the-counter and listed securities for which a sale price is not available are valued at the last quoted bid price. Money market funds are valued at net asset value. These securities are generally categorized as Level 1 in the hierarchy.
Short-term investments (excluding money market funds) are valued at amortized cost, which approximates fair value. Total return swap agreements are valued using independent, observable inputs, including underlying security prices, dividends, and interest rates. These securities are generally categorized as Level 2 in the hierarchy.
At June 30, 2017, the Fund’s financial instruments were classified as follows:
Level 1
Level 2
Level 3
Total
Assets:
Common stocks
$
609,301,854
$
—
$
—
$
609,301,854
Short-term investments
6,354,099
—
—
6,354,099
Securities lending collateral
66,068,663
66,068,663
Total investments
$
681,724,616
$
—
$
—
$
681,724,616
Liabilities:
Total return swap agreements*
$
—
$
(978,647
)
$
—
$
(978,647
)
*
Unrealized appreciation (depreciation)
There were no transfers between levels during the period ended June 30, 2017.
Recent Accounting Pronouncement—In October 2016, the U.S. Securities and Exchange Commission adopted new rules and amended existing rules (together, the “final rules”) intended to modernize the reporting and disclosure of information by registered investment companies. In part, the final rules amend Regulation S-X and
8
NOTESTO FINANCIAL STATEMENTS (CONTINUED)
require standardized, enhanced disclosure about derivatives in investment company financial statements, as well as other amendments. The compliance date for the amendments to Regulation S-X is August 1, 2017. Management is currently evaluating the impact that the adoption of the amendments to Regulation S-X will have on the Fund’s financial statements and related disclosures.
2. FEDERAL INCOME TAXES
No federal income tax provision is required since the Fund’s policy is to qualify as a regulated investment company under the Internal Revenue Code and to distribute substantially all of its taxable income and gains to its shareholders. Additionally, management has analyzed and concluded that tax positions included in federal income tax returns from the previous three years that remain subject to examination do not require any provision. Any income tax-related interest or penalties would be recognized as income tax expense. As of June 30, 2017, the identified cost of securities for federal income tax purposes was $553,391,508 and net unrealized appreciation aggregated $128,333,108, consisting of gross unrealized appreciation of $182,130,490 and gross unrealized depreciation of $53,797,382.
Distributions are determined in accordance with the Fund’s annual 6% minimum distribution rate commitment, based on the Fund’s average market price, and income tax regulations, which may differ from generally accepted accounting principles. Such differences are primarily related to the Fund’s retirement plans and equity-based compensation. Differences that are permanent are reclassified in the capital accounts of the Fund’s financial statements and have no impact on net assets.
3. INVESTMENT TRANSACTIONS
Purchases and sales of portfolio investments, other than short-term investments and derivative transactions, during the period ended June 30, 2017 were $73,893,549 and $65,952,117 respectively.
4. DERIVATIVES
During the period ended June 30, 2017, the Fund invested in derivative instruments. The Fund may use derivatives for a variety of purposes, including, but not limited to, the ability to obtain leverage, to gain or limit exposure to particular market sectors or securities, to provide additional income, and/or to limit equity price risk in the normal course of pursuing its investment objectives. The financial derivative instruments outstanding as of period-end and the amounts of realized gains and losses and changes in unrealized gains and losses on financial derivative instruments during the period indicate the volume of financial derivative activity for the period.
Total Return Swap Agreements—The Fund may use total return swap agreements to manage exposure to certain risks and/or to enhance performance. Total return swap agreements are bilateral contracts between the Fund and a counterparty in which the Fund, in the case of a long contract, agrees to receive the positive total return (and pay the negative total return) of an underlying equity security and to receive or pay a financing amount, based on a notional amount and a referenced interest rate, over the term of the contract. In the case of a short contract, the Fund agrees to pay the positive total return (and receive the negative total return) of the underlying equity security and
9
NOTESTO FINANCIAL STATEMENTS (CONTINUED)
to receive or pay a financing rate, based on a notional amount and a referenced interest rate, over the term of the contract. The fair value of each total return swap agreement is determined daily with the change in the fair value recorded as an unrealized gain or loss in the Statement of Operations. Upon termination of a swap agreement, the Fund recognizes a realized gain (loss) on total return swap agreements in the Statement of Operations equal to the net receivable (payable) amount under the terms of the agreement.
Total return swap agreements entail risks associated with counterparty credit, liquidity, and equity price risk. Such risks include that the Fund or the counterparty may default on its obligation, that there is no liquid market for these agreements, and that there may be unfavorable changes in the price of the underlying equity security. To mitigate the Fund’s counterparty credit risk, the Fund enters into master netting and collateral arrangements with the counterparty. A master netting agreement allows either party to terminate the contract prior to termination date and to net amounts due across multiple contracts upon settlement, providing for a single net settlement with a counterparty. Pursuant to master netting arrangements, the net cumulative unrealized gain (asset) on open total return swap agreements and net cumulative unrealized loss (liability) on open total return swap agreements are presented in the Statement of Assets and Liabilities. The Fund’s policy is to net all derivative instruments subject to a netting agreement. The fair value of each outstanding total return swap contract is presented on the Schedule of Investments.
A collateral arrangement requires each party to provide collateral with a value, adjusted daily and subject to a minimum transfer amount, equal to the net amount owed to the other party under the contract. The counterparty provides cash collateral to the Fund and the Fund provides collateral by segregating portfolio securities, subject to a valuation allowance, into a tri-party account at its custodian. As of June 30, 2017, securities, as denoted on the Schedule of Investments, with a value of $2,697,810 were pledged by the Fund, providing $1,348,905 in collateral value after the required valuation allowance was applied. No cash collateral was held by the Fund as of June 30, 2017.
5. CAPITAL STOCK
The Fund has 5,000,000 authorized and unissued preferred shares, $0.001 par value.
During the period ended June 30, 2017, the Fund issued 145 shares of its Common Stock at a weighted average price of $19.51 per share as dividend equivalents to holders of deferred stock units under the 2005 Equity Income Compensation Plan.
On December 23, 2016, the Fund issued 462,680 shares of its Common Stock at a price of $20.66 per share (the average market price on December 12, 2016) to shareholders of record on November 25, 2016, who elected to take stock in payment of the year-end distribution from 2016 capital gain and investment income. During 2016, the Fund issued 765 shares of its Common Stock at a weighted average price of $20.08 per share as dividend equivalents to holders of deferred stock units under the 2005 Equity Income Compensation Plan.
The Fund may purchase shares of its Common Stock from time to time, in accordance with parameters set by the Board of Directors, at such prices and amounts as the portfolio management team may deem appropriate. There were no shares repurchased
10
NOTESTO FINANCIAL STATEMENTS (CONTINUED)
by the Fund in 2017 or 2016. Transactions in Common Stock for 2017 and 2016 were as follows:
Shares
Amount
Six months ended June 30, 2017
Year ended December 31, 2016
Six months ended June 30, 2017
Year ended December 31, 2016
Shares issued in payment of distributions
145
463,445
$
2,819
$
9,574,317
Net activity under the 2005 Equity Incentive Compensation Plan
(4,401
)
(4,791
)
13,406
212,932
Net change
(4,256
)
458,654
$
16,225
$
9,787,249
6. RETIREMENT PLANS
The Fund sponsors a qualified defined contribution plan for all employees with at least six months of service and a nonqualified defined contribution plan for eligible employees to supplement the qualified plan. The Fund matches employee contributions made to the plans and, subject to Board approval, may also make a discretionary contribution to the plans. During 2017, the Fund recorded matching contributions of $83,520. As of June 30, 2017, the Fund recorded a liability in the amount of $52,841, included in Accrued expenses and other liabilities in the accompanying Statement of Assets and Liabilities, representing the 2017 discretionary contribution.
7. EQUITY-BASED COMPENSATION
The Fund’s 2005 Equity Incentive Compensation Plan, adopted at the 2005 Annual Meeting and reapproved at the 2010 Annual Meeting, expired on April 27, 2015. Restricted stock awards granted prior to the Plan’s expiration remain outstanding as of June 30, 2017 and vest on various dates through September 2, 2018, provided the service condition set forth in the award at grant is satisfied. Also outstanding are restricted stock units granted to nonemployee directors that are 100% vested, but payment of which has been deferred at the election of the director.
Outstanding awards were granted at fair market value on grant date (determined by the average of the high and low price on that date). Awards earn an amount equal to the Fund’s per share distribution, payable in either cash (employees) or reinvested shares (non-employee directors). Reinvested shares are fully vested and paid concurrently with the payment of the original share grant. A summary of the activity related to nonvested restricted shares and deferred stock units for the period ended June 30, 2017 is as follows:
Awards
Shares/Units
Weighted Average Grant-Date Fair Value
Balance at December 31, 2016
52,603
$
26.59
Reinvested dividend equivalents
145
19.51
Vested & issued
(12,889
)
26.43
Balance at June 30, 2017
39,859
$
26.61
11
NOTESTO FINANCIAL STATEMENTS (CONTINUED)
Compensation cost is based on the fair market value of the award on grant date and recognized on a straight-line basis over the vesting period. Any compensation cost recognized related to an award that is subsequently forfeited due to unmet service conditions is reversed. Total compensation cost related to equity-based compensation for the period ended June 30, 2017 was $101,833. As of June 30, 2017, the Fund had unrecognized compensation cost of $71,553, a component of additional capital surplus, related to nonvested awards that will be recognized over a weighted average period of 0.51 years. The total fair value of awards vested and issued during the period ended June 30, 2017 was $259,079.
8. OFFICER AND DIRECTOR COMPENSATION
The aggregate remuneration paid by the Fund during the period ended June 30, 2017 to officers and directors amounted to $2,299,071, of which $221,250 was paid to directors who were not officers. These amounts represent the taxable income to the Fund’s officers and directors and, therefore, may differ from the amounts reported in the accompanying Statement of Operations that are recorded and expensed in accordance with GAAP.
9. PORTFOLIO SECURITIES LOANED
The Fund makes loans of securities to approved brokers to earn additional income. It receives as collateral cash deposits valued at 102% of the value of the securities on loan. The market value of the loaned securities is calculated based upon the most recent closing prices and any additional required collateral is delivered to the Fund on the next business day. Cash deposits are placed in a registered money market fund. The Fund accounts for securities lending transactions as secured financing and retains a portion of the income from lending fees and interest on the investment of cash collateral. The Fund also continues to receive dividends on the securities loaned. Gain or loss in the fair value of the securities loaned that may occur during the term of the loan will be for the account of the Fund. At June 30, 2017, the Fund had securities on loan of $64,366,264 and held cash collateral of $66,068,663. The Fund is indemnified by the Custodian, serving as lending agent, for the loss of loaned securities and has the right under the lending agreement to recover the securities from the borrower on demand.
10. OPERATING LEASE COMMITMENTS
The Fund and its affiliated companies lease office space and equipment under operating lease agreements expiring at various dates through the year 2026. The Fund recognized rental expense of $63,555 for the period ended June 30, 2017, and its estimated portion of the minimum rental commitments are as follows:
Remainder of 2017
$
60,068
2018
122,877
2019
96,967
2020
98,607
2021
96,790
Thereafter
511,810
Total
$
987,119
12
FINANCIAL HIGHLIGHTS
(unaudited) Six Months Ended
June 30, 2017
June 30, 2016
Year Ended December 31
2016
2015
2014
2013
2012
Per Share Operating Performance
Net asset value, beginning of period
$24.02
$20.74
20.74
$27.56
$32.26
$27.84
$28.58
Net investment income
0.20
0.21
0.41
0.37
0.50
0.44
0.48
Net realized gain and change in unrealized appreciation
(2.49)
2.04
4.07
(5.80)
(3.23)
5.93
0.48
Change in accumulated other comprehensive income
—
—
—
0.05
(0.01)
0.03
—
Total from operations
(2.29)
2.25
4.48
(5.38)
(2.74)
6.40
0.96
Less distributions from:
Net investment income
(0.16)
(0.15)
(0.41)
(0.38)
(0.51)
(0.46)
(0.42)
Net realized gain
(0.04)
(0.05)
(0.73)
(1.00)
(1.38)
(1.42)
(1.18)
Total distributions
(0.20)
(0.20)
(1.14)
(1.38)
(1.89)
(1.88)
(1.60)
Capital share repurchases (note 5)
—
—
—
—
0.03
0.05
—
Reinvestment of distributions
—
—
(0.06)
(0.06)
(0.10)
(0.15)
(0.10)
Total capital share transactions
—
—
(0.06)
(0.06)
(0.07)
(0.10)
(0.10)
Net asset value, end of period
$21.53
$22.79
$24.02
$20.74
$27.56
$32.26
$27.84
Market price, end of period
$18.70
$20.11
$20.17
$17.74
$23.84
$27.38
$23.92
Total Investment Return*
Based on market price
(6.3)%
14.6%
20.2%
(20.0)%
(6.3)%
22.7%
4.3%
Based on net asset value
(9.5)%
11.1%
22.5%
(19.1)%
(8.0)%
24.2%
4.0%
Ratios/Supplemental Data**
Net assets, end of period (in millions)
$615
$640
$686
$583
$755
$864
$733
Ratio of expenses to average net assets
0.78%
0.85%
0.82%
1.26%
†
0.63%
0.78%
†
0.65%
†
Ratio of net investment income to average net assets
1.80%
1.94%
1.85%
1.49%
†
1.53%
1.44%
†
1.67%
†
Portfolio turnover
20.6%
18.2%
19.0%
16.0%
19.6%
18.7%
11.7%
Number of shares outstanding at end of period (in 000’s)
28,551
28,093
28,555
28,097
27,381
26,775
26,326
*
Total investment return assumes reinvestment of all distributions at the price received in the Fund’s dividend reinvestment plan.
**
Ratios and portfolio turnover presented on an annualized basis.
†
Ratios of expenses to average net assets were 0.86%, 0.70%, and 0.64% in 2015, 2013, and 2012, respectively, after adjusting for non-recurring pension-related settlement charges. The adjusted ratios of net investment income to average net assets were 1.89%, 1.52%, and 1.68% in 2015, 2013, and 2012, respectively.
Total Investments — 110.9% of Net Assets (Cost $553,391,508)
$
681,724,616
15
SCHEDULEOF INVESTMENTS (CONTINUED)
June 30, 2017
(unaudited)
Total Return Swap Agreements — (0.2)%
Type of Contract
Counterparty
Termination Date
Notional Amount
Unrealized Appreciation (Assets)
Unrealized Depreciation (Liabilities)
Receive positive total return (pay negative total return) on 131,700 shares of Apache Corp. common stock and pay financing amount based on notional amount and daily U.S. Federal Funds rate plus 0.55%.
Long
Morgan Stanley
2/24/2018
$
8,271,945
$
—
$
(1,978,529
)
Receive negative total return (pay positive total return) on 110,400 shares of Energy Select Sector SPDR Fund and receive financing amount based on notional amount and daily U.S. Federal Funds rate less 0.51%.
Short
Morgan Stanley
2/24/2018
(8,254,299
)
999,882
—
Gross unrealized gain (loss) on open total return swap agreements
$
999,882
$
(1,978,529
)
Net unrealized loss on open total return swap agreements (F)
$
(978,647
)
Notes:
(A)
Common stocks are listed on the New York Stock Exchange or the NASDAQ and are valued at the last reported sale price on the day of valuation. See note 1 to financial statements.
(B)
All or a portion of shares held are on loan. See note 9 to financial statements.
(C)
Presently non-dividend paying.
(D)
Rate presented is as of period-end and represents the annualized yield earned over the previous seven days.
(E)
A portion of the position is pledged as collateral for open swap agreements. The aggregate market value of pledged securities is $2,697,810, which provides $1,348,905 in collateral value after required valuation allowance is applied.
(F)
Value is disclosed on the Statement of Assets and Liabilities under the caption Net unrealized loss on open total return swap agreements.
16
PRINCIPAL CHANGESIN PORTFOLIO SECURITIES
During the six months ended June 30, 2017
(unaudited)
Purchases (Cost)
Sales (Proceeds)
Market Value Held at June 30, 2017
Anadarko Petroleum Corp.
$
3,617,110
$
16,617,184
$
—
Chevron Corp.
5,432,420
3,382,938
62,264,144
Diamondback Energy, Inc.
7,385,671
6,651,869
Energen Corp.
1,904,690
1,688,454
Exxon Mobil Corp.
8,749,058
122,332,591
Noble Energy, Inc.
3,477,780
10,204,980
Parsley Energy, Inc. (Class A)
6,587,199
6,041,175
Phillips 66
3,242,354
7,655,027
Range Resources Corp.
5,362,091
7,463,057
SPDR S&P Oil & Gas ETF
8,826,335
8,958,477
—
Steel Dynamics, Inc.
2,660,316
4,794,959
Targa Resources Corp.
5,599,187
8,750,720
Williams Companies, Inc.
5,638,030
13,341,368
Arconic Inc.
2,259,781
—
Kinder Morgan Inc.
7,801,542
5,542,988
LyondellBasell Industries N.V. (Class A)
2,098,603
17,080,536
Marathon Oil Corp.
9,742,028
—
Materials Select Sector SPDR Fund
3,123,472
—
Valero Energy Corp.
3,192,041
17,053,888
Note:
The transactions presented above are those purchases or sales during the period that exceeded .30% of period-end net assets.
17
HISTORICAL FINANCIAL STATISTICS
(unaudited)
Year
(000’s)
Value Of Net Assets
(000’s)
Shares Outstanding
Net Asset Value Per Share
Market Value Per Share
Income Dividends Per Share
Capital Gains Distributions Per Share
Return of Capital Per Share
Total Dividends and Distributions Per Share
Annual Distribution Rate*
2007
$
978,920
22,768
$
42.99
$
38.66
$
.49
$
3.82
$
—
$
4.31
11.6
%
2008
538,937
23,959
22.49
19.41
.38
2.61
—
2.99
8.9
2009
650,718
24,327
26.75
23.74
.37
1.03
—
1.40
6.6
2010
761,736
24,790
30.73
27.01
.32
.95
—
1.27
5.5
2011
732,811
25,641
28.58
24.48
.39
1.58
—
1.97
7.1
2012
732,988
26,326
27.84
23.92
.42
1.18
—
1.60
6.4
2013
863,690
26,775
32.26
27.38
.46
1.42
—
1.88
7.2
2014
754,506
27,381
27.56
23.84
.51
1.38
—
1.89
6.6
2015
582,677
28,097
20.74
17.74
.38
1.00
—
1.38
6.2
2016
685,882
28,555
24.02
20.17
.41
.73
—
1.14
6.1
June 30, 2017
614,726
28,551
21.53
18.70
.26
†
.04
†
—
.30
—
*
The annual distribution rate is the total dividends and distributions per share divided by the Fund’s average month-end stock price. For years prior to 2012, the average month-end stock price is determined for the calendar year. For 2012 and later, the average month-end stock price is determined for the twelve months ended October 31, which is consistent with the calculation used for the annual 6% minimum distribution rate commitment adopted in September 2012.
†
Paid or declared
18
ANNUAL MEETINGOF STOCKHOLDERS
The Annual Meeting of Stockholders was held on April 21, 2017. The following votes were cast for directors:
Votes For
Votes Withheld
Enrique R. Arzac
23,562,074
1,053,225
Phyllis O. Bonanno
23,452,509
1,162,790
Kenneth J. Dale
23,780,434
834,865
Frederic A. Escherich
23,742,351
872,948
Roger W. Gale
23,606,747
1,008,552
Kathleen T. McGahran
23,696,499
918,800
Craig R. Smith
23,574,323
1,040,976
Mark E. Stoeckle
23,800,971
814,328
A proposal to approve and ratify the selection of PricewaterhouseCoopers LLP as the independent registered public accounting firm for the Fund for 2017 was approved with 23,984,729 votes for, 403,000 votes against, and 227,570 shares abstaining.
19
OTHER INFORMATION
Distribution Payment Schedule
The Fund presently pays distributions four times a year, as follows: (a) three interim distributions on or about March 1, June 1, and September 1, and (b) a “year-end” distribution, payable in late December, consisting of the estimated balance of the net investment income for the year, the net realized capital gains earned through October 31 and, if applicable, a return of capital. Shareholders may elect to receive the year-end distribution in stock or cash. In connection with this distribution, all shareholders of record are sent a distribution announcement notice and an election card in mid-November. Shareholders holding shares in “street” or brokerage accounts make their elections by notifying their brokerage house representative.
Electronic Delivery of Shareholder Reports
The Fund offers shareholders the benefits and convenience of viewing Quarterly and Annual Reports and other shareholder materials on-line. With your consent, paper copies of these documents will cease with the next mailing and will be provided via e-mail. Reduce paper mailed to your home and help lower the Fund’s printing and mailing costs. To enroll, please visit the following websites:
Registered shareholders with AST: www.astfinancial.com
Shareholders using brokerage accounts: http://enroll.icsdelivery.com/PEO
Proxy Voting Policies and Record
A description of the policies and procedures that the Fund uses to determine how to vote proxies relating to portfolio securities owned by the Fund and the Fund’s proxy voting record for the 12-month period ended June 30, 2017 are available (i) without charge, upon request, by calling the Fund’s toll free number at (800) 638-2479; (ii) on the Fund’s website: www.adamsfunds.com under the headings “Funds” and then “Reports & Literature”;and (iii) on the Securities and Exchange Commission’s website: www.sec.gov.
Statement on Quarterly Filing of Complete Portfolio Schedule
In addition to publishing its complete schedule of portfolio holdings in the First and Third Quarter Reports to Shareholders, the Fund also files its complete schedule of portfolio holdings with the Securities and Exchange Commission for the first and third quarters of each fiscal year on Form N-Q. The Fund’s Forms N-Q are available on the Commission’s website: www.sec.gov. The Fund’s Forms N-Q may be reviewed and copied at the Commission’s Public Reference Room, and information on the operation of the Public Reference Room may be obtained by calling 1-800-SEC-0330. The Fund also posts a link to its Forms N-Q on its website: www.adamsfunds.com; select Fund name and click the headings “Funds” and then “Reports & Literature”.
Website Information
Investors can find the Fund’s daily NAV per share, the market price, the discount/premium to NAV per share, and quarterly changes in portfolio securities on our website at www.adamsfunds.com. Also available there are a history of the Fund, historical financial information, links for electronic delivery of shareholder reports, and other useful content.
Vice President, General Counsel, Secretary & Chief Compliance Officer
Gregory W. Buckley
Vice President—Research
Michael A. Kijesky, CFA
Vice President—Research
Michael E. Rega, CFA
Vice President—Research
Christine M. Sloan, CPA
Assistant Treasurer
500 East Pratt Street, Suite 1300, Baltimore, MD 21202
410.752.5900 800.638.2479
Website: www.adamsfunds.com
Email: contact@adamsfunds.com
Tickers: PEO (NYSE), XPEOX (NASDAQ)
Counsel: Norton Rose Fulbright US LLP
Independent Registered Public Accounting Firm: PricewaterhouseCoopers LLP
Custodian of Securities: The Northern Trust Company
Transfer Agent & Registrar: American Stock Transfer & Trust Company, LLC
Stockholder Relations Department
6201 15th Avenue
Brooklyn, NY 11219
(866) 723-8330
Website: www.astfinancial.com
Email: info@astfinancial.com
Item 2. Code of Ethics.
Item not applicable to semi-annual report.
Item 3. Audit Committee Financial Expert.
Item not applicable to semi-annual report.
Item 4. Principal Accountant Fees and Services.
Item not applicable to semi-annual report.
Item 5. Audit Committee of Listed Registrants.
Item not applicable to semi-annual report.
Item 6. Investments.
(a) This schedule is included as part of the Report to Stockholders filed under Item 1 of this form.
(b) Not applicable.
Item 7. Disclosure of Proxy Voting Policies and Procedures for Closed-End Management Investment Companies.
Item not applicable to semi-annual report.
Item 8. Portfolio Managers of Closed-End Management Investment Companies.
Item not applicable to semi-annual report.
Item 9. Purchases of Equity Securities by Closed-End Management Investment Company and Affiliated Purchasers.
Total Number of Shares (or Units Purchased)
Average Price Paid per Share (or Unit)
Total Number of Shares (or Units) Purchased as Part of Publicly Announced Plans or Programs
Maximum Number of Shares (or Units) That May Yet Be Purchased Under the Plans or Programs
----------------------------------
----------------------------------
----------------------------------
----------------------------------
January 2017
0
--
0
1,332,000
February 2017
0
--
0
1,332,000
March 2017
0
--
0
1,332,000
April 2017
0
--
0
1,332,000
May 2017
0
--
0
1,332,000
June 2017
0
--
0
1,332,000
(2c)
----------------------------------
----------------------------------
----------------------------------
Total
0
(1)
$0
0
(2a)
(2b)
(1) There were no shares purchased other than through a publicly announced plan or program.
(2a) The Plan was announced on December 11, 2014.
(2b) The share amount approved in 2014 was 5% of outstanding shares, or 1,332,000 shares.
(2c) The Plan has no expiration date.
(2d) None.
(2e) None.
Item 10. Submission of Matters to a Vote of Security Holders.
There were no material changes to the procedures by which shareholders may recommend nominees to the registrant's Board of Directors made or implemented after the registrant last provided disclosure in response to the requirements of Item 407(c)(2)(iv) of Regulation S-K (as required by Item 22(b)(15) of Schedule 14A), or this Item.
Item 11. Controls and Procedures.
(a) The registrant's principal executive officer and principal financial officer have concluded that the registrant's disclosure controls and procedures (as defined in Rule 30a-3(c) under the Investment Company Act of 1940) are effective based on their evaluation of the disclosure controls and procedures as of a date within 90 days of the filing date of this report.
(b) There have been no significant changes in the registrant's internal control over financial reporting (as defined in Rule 30a-3(d) under the Investment Company Act of 1940) that occurred during the registrant's second fiscal quarter of the period covered by this report that has materially affected, or is reasonably likely to materially affect, the registrant's internal control over financial reporting.
Item 12. Exhibits.
(a)
(1)
Not applicable. See registrant's response to Item 2 above.
(2)
Separate certifications by the registrant's principal executive officer and principal financial officer, pursuant to Section 302 of the Sarbanes-Oxley Act of 2002 and required by Rule 30a-2(a) under the Investment Company Act of 1940, are attached.
(3)
Written solicitation to purchases securities: not applicable.
(b) A certification by the registrant's principal executive officer and principal financial officer, pursuant to Section 906 of the Sarbanes-Oxley Act of 2002 and required by Rule 30a-2(b) under the Investment Company Act of 1940, is attached.
SIGNATURES
Pursuant to the requirements of the Securities Exchange Act of 1934 and the Investment Company Act of 1940, the registrant has duly caused this
report to be signed on its behalf by the undersigned, thereunto duly authorized.
Adams Natural Resources Fund, Inc.
By:
/s/ Mark E. Stoeckle
Mark E. Stoeckle
Chief Executive Officer
(Principal Executive Officer)
Date:
July 21, 2017
Pursuant to the requirements of the Securities Exchange Act of 1934 and the Investment Company Act of 1940, the registrant has duly caused this
report to be signed on its behalf by the undersigned, thereunto duly authorized.
We use cookies on this site to provide a more responsive and personalized service. Continuing to browse, clicking I Agree, or closing this banner indicates agreement. See our Cookie Policy for more information.