CERTIFIED SHAREHOLDER REPORT OF REGISTERED MANAGEMENT INVESTMENT COMPANIES
Investment Company Act file number: 811-02736 -------------------------------------------------------------------------
ADAMS NATURAL RESOURCES FUND, INC. ------------------------------------------------------------------------- (Exact name of registrant as specified in charter)
500 East Pratt Street, Suite 1300, Baltimore, Maryland 21202 ------------------------------------------------------------------------- (Address of principal executive offices)
Lawrence L. Hooper, Jr. Adams Natural Resources Fund, Inc. 500 East Pratt Street, Suite 1300 Baltimore, Maryland 21202 ------------------------------------------------------------------------- (Name and address of agent for service)
Registrant's telephone number, including area code: (410) 752-5900 Date of fiscal year end: December 31 Date of reporting period: June 30, 2016
Item 1. Reports to Stockholders.
ADAMS
NATURAL RESOURCES
FUND
SEMI-ANNUAL REPORT
JUNE 30, 2016
LETTERTO SHAREHOLDERS
Dear Fellow Shareholders,
After enduring market turbulence for most of the period, U.S. equity markets finished the first half of 2016 slightly higher. Similar to last year, volatility was driven by elevated economic uncertainty and global macro events.
The first half uncertainty was punctuated in the fourth week of June when Britain held its referendum vote and elected to leave the European Union. The vote took markets by surprise, triggering a wave of selling around the world. Global financial markets lost $3 trillion during the trading sessions after the vote, marking the biggest two-day sell-off on record. However, over the following few days, the markets recovered most of the decline as “Brexit” fears abated and the currency market stabilized.
Similar volatility was experienced earlier in the year as the S&P 500 declined 9% in the first three weeks of January. Fears of an extended slowdown in China and decelerating economic growth in the U.S. led to the sharp decline. These worries faded and, by the end of March, the S&P 500 returned to its starting point for the year. Equity markets continued to move higher in the second quarter, reacting to the delay of anticipated interest rate hikes by the Fed and to signs of economic stability. But lackluster corporate earnings stalled the market’s advance. While surpassing expectations, reported earnings for the S&P 500 declined 7%, as weak earnings results in the Materials and Energy sectors weighed on total performance.
Despite the Energy sector’s earnings decline, stock prices moved up in response to a higher oil price. After dropping to $26 per barrel in February, crude oil prices rebounded, reaching a high of $51 per barrel in June. Markets began to reflect a rebalancing of supply and demand. Reported data indicated that global supply is declining, especially in the United States. Unforeseen events also influenced the market. A massive wildfire in Canada led to the closure of fields and facilities, curtailing production significantly. At the peak, total outages in Canada exceeded one million barrels per day. Geopolitical issues also contributed to moderating supply as continued attacks on pipelines in Nigeria decimated its oil production. While both events are expected to be temporary, they did highlight a tighter supply/demand environment.
The Dow Jones U.S. Oil & Gas Index advanced 15% in the first six months of the year, exceeding the 4% return of the broader market S&P 500. Within the sector, integrated oil & gas companies returned 18% while exploration & production companies advanced 17%. Equipment & services stocks rose 10%. Although not as strong as the Energy sector, the Dow Jones U.S. Basic Materials Index increased 9%.
Pump prices for gasoline reflected the move in crude oil but still reside near 10-year lows, supporting continued growth in demand. Within refining, we adjusted our holdings to take advantage of the strong gasoline market. We favor companies with refinery flexibility to maximize gasoline production as needed to accommodate demand. We also prefer companies that operate refineries in locations with access to a variety of crude suppliers, substantial existing infrastructure, and the most options for end-market distribution. To this end, we initiated a position in PBF Energy, a company that through recent acquisitions has emerged as one of the largest independent refiners. PBF’s asset base has the ability to process crudes of different qualities, geographic diversity, and higher-than-average gasoline yield. We also added to our positions in Valero Energy and Marathon Petroleum. Valero is the largest and most diverse refiner in the segment. In addition to attractive geographic diversity and high exposure to the gasoline market, new management has exhibited capital discipline, which has yielded above-average
1
LETTERTO SHAREHOLDERS (CONTINUED)
cash returns to shareholders. Recent underperformance of Marathon Petroleum following an acquisition provided an opportunity to increase our position. The company has a strong, strategically located refining system as well as the flexibility to maximize margins through a sophisticated logistics network and its retail business.
M&A activity often provides a source of return. This was the case in the Materials sector. Monsanto rose substantially when Bayer made an offer to buy the company. While indicating a willingness to discuss a merger, the company officially rejected a $122 per share bid. While we continue to like Monsanto, we reduced our overweight position in response to the move higher in the stock and uncertainty regarding the outcome of the negotiations.
For the six months ended June 30, 2016, the total return on the Fund’s net asset value (“NAV”) per share (with dividends and capital gains reinvested) was 11.1%. This compares to total returns of 15.0% for Dow Jones U.S. Oil & Gas Index, 8.6% for Dow Jones U.S. Basic Materials Index, and 21.8% for Lipper Global Natural Resources Funds Index over the same time period. The total return on the market price of the Fund’s shares for the period was 14.6%.
For the twelve months ended June 30, 2016, the Fund’s total return on NAV was -6.8%. Comparable returns for Dow Jones U.S. Oil & Gas Index, Dow Jones U.S. Basic Materials Index, and Lipper Global Natural Resources Funds Index were -6.6%, -3.6%, and -3.1%. The Fund’s total return on market price was -3.0%.
During the first half of this year, the Fund paid distributions to shareholders in the amount of $5.6 million, or $.20 per share, consisting of $.03 net investment income and $.05 long-term capital gain, realized in 2015, and $.12 of net investment income realized in 2016, all taxable in 2016. On July 13, 2016, an additional net investment income dividend of $.10 per share was declared for payment on September 1, 2016. These constitute the first three payments toward our annual 6% minimum distribution rate commitment.
By order of the Board of Directors,
Mark E. Stoeckle
Chief Executive Officer
July 13, 2016
Disclaimers
This report contains “forward-looking statements” within the meaning of the Securities Act of 1933 and the Securities Exchange Act of 1934. By their nature, all forward-looking statements involve risks and uncertainties, and actual results could differ materially from those contemplated by the forward-looking statements. Several factors that could materially affect the Fund’s actual results are the performance of the portfolio of stocks held by the Fund, the conditions in the U.S. and international financial markets, the price at which shares of the Fund will trade in the public markets, and other factors discussed in the Fund’s periodic filings with the Securities and Exchange Commission.
This report is transmitted to the shareholders of the Fund for their information. It is not a prospectus, circular or representation intended for use in the purchase or sale of shares of the Fund or of any securities mentioned in the report. The rates of return will vary and the principal value of an investment will fluctuate. Shares, if sold, may be worth more or less than their original cost. Past performance is no guarantee of future investment results.
2
PORTFOLIO HIGHLIGHTS
June 30, 2016
(unaudited)
Ten Largest Equity Portfolio Holdings
Market Value
Percent of Net Assets
Exxon Mobil Corp.
$131,679,390
20.6
%
Chevron Corp.
61,975,496
9.7
Schlumberger Ltd.
44,506,224
7.0
EOG Resources, Inc.
26,886,266
4.2
Occidental Petroleum Corp.
24,300,096
3.8
Halliburton Co.
22,951,613
3.6
Dow Chemical Co.
22,322,574
3.5
ConocoPhillips
21,411,960
3.3
LyondellBasell Industries N.V. (Class A)
17,935,220
2.8
Spectra Energy Corp.
16,717,932
2.6
Total
$390,686,771
61.1
%
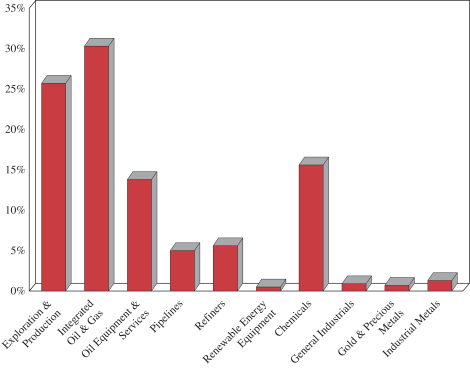
Industry Weightings
3
STATEMENTOF ASSETSAND LIABILITIES
June 30, 2016
(unaudited)
Assets
Investments* at value:
Common stocks (cost $496,369,761)
$
636,104,501
Short-term investments (cost $6,491,675)
6,491,675
$
642,596,176
Cash
271,798
Dividends and interest receivable
829,530
Prepaid expenses and other assets
386,045
Total Assets
644,083,549
Liabilities
Investment securities purchased
2,624,005
Accrued expenses and other liabilities
1,242,005
Total Liabilities
3,866,010
Net Assets
$
640,217,539
Net Assets
Common Stock at par value $0.001 per share, authorized 50,000,000 shares; issued and outstanding 28,092,864 shares (includes 31,462 restricted shares, 9,600 nonvested or deferred restricted stock units, and 13,443 deferred stock units) (note 6)
$
28,093
Additional capital surplus
486,989,345
Undistributed net investment income
1,630,804
Undistributed net realized gain
11,834,557
Unrealized appreciation
139,734,740
Net Assets Applicable to Common Stock
$
640,217,539
Net Asset Value Per Share of Common Stock
$22.79
*
See Schedule of Investments on page 13.
The accompanying notes are an integral part of the financial statements.
4
STATEMENTOF OPERATIONS
Six Months Ended June 30, 2016
(unaudited)
Investment Income
Income:
Dividends
$
8,363,870
Interest and other income
24,084
Total Income
8,387,954
Expenses:
Investment research compensation and benefits
1,158,838
Administration and operations compensation and benefits
599,027
Directors’ compensation
220,042
Occupancy and other office expenses
180,431
Shareholder reports and communications
119,652
Investment data services
78,167
Transfer agent, custody, and listing fees
75,349
Audit and tax services
38,744
Accounting, recordkeeping and other professional fees
37,680
Insurance
37,649
Legal services
16,401
Total Expenses
2,561,980
Net Investment Income
5,825,974
Realized Gain and Change in Unrealized Appreciation
Net realized gain on security transactions
12,226,741
Change in unrealized appreciation on investments
45,016,119
Net Gain on Investments
57,242,860
Change in Net Assets Resulting from Operations
$
63,068,834
The accompanying notes are an integral part of the financial statements.
5
STATEMENTSOF CHANGESIN NET ASSETS
(unaudited) Six Months Ended June 30, 2016
Year Ended December 31, 2015
From Operations:
Net investment income
$
5,825,974
$
10,258,582
Net realized gain
12,226,741
27,921,844
Change in unrealized appreciation
45,016,119
(186,647,414
)
Change in accumulated other comprehensive income (note 5)
—
1,432,315
Change in Net Assets Resulting from Operations
63,068,834
(147,034,673
)
Distributions to Shareholders from:
Net investment income
(4,213,753
)
(10,408,624
)
Net realized gain
(1,404,172
)
(27,390,564
)
Decrease in Net Assets from Distributions
(5,617,925
)
(37,799,188
)
From Capital Share Transactions:
Value of shares issued in payment of distributions (note 4)
2,667
12,630,987
Deferred compensation (notes 4, 6)
87,152
373,946
Increase in Net Assets from Capital Share Transactions
89,819
13,004,933
Total Change in Net Assets
57,540,728
(171,828,928
)
Net Assets:
Beginning of period
582,676,811
754,505,739
End of period (including undistributed net investment income of $1,630,804 and $18,583, respectively)
$
640,217,539
$
582,676,811
The accompanying notes are an integral part of the financial statements.
6
NOTESTO FINANCIAL STATEMENTS (UNAUDITED)
Adams Natural Resources Fund, Inc. (the “Fund”) is registered under the Investment Company Act of 1940 (“1940 Act”) as a non-diversified investment company. The Fund is an internally-managed closed-end fund specializing in energy and other natural resources stocks. The investment objectives of the Fund are preservation of capital, the attainment of reasonable income from investments, and an opportunity for capital appreciation.
1. SIGNIFICANT ACCOUNTING POLICIES
Basis of Presentation—The accompanying financial statements were prepared in accordance with accounting principles generally accepted in the United States of America (“GAAP”) for investment companies, which require the use of estimates by Fund management. Management believes that estimates and valuations are appropriate; however, actual results may differ from those estimates and the valuations reflected in the financial statements may differ from the value the Fund ultimately realizes.
Affiliated Companies—Adams Diversified Equity Fund, Inc. (ADX), a diversified, closed-end investment company, owns 8% of the Fund’s outstanding shares and is, therefore, an “affiliated company” as defined by the 1940 Act.
Expenses—The Fund shares personnel, systems, and other infrastructure items with ADX and Adams Funds Advisers, LLC (AFA), an ADX-affiliated investment adviser to external parties, and is charged a portion of the shared expenses. To protect the Fund from potential conflicts of interest, policies and procedures are in place covering the sharing of expenses among the entities. Expenses that are not solely attributable to the Fund are allocated in accordance with the Fund’s policy, which dictates that such expenses be attributed to each Fund based on the relative net assets of the Funds, or, in the case of AFA, the net assets under management. Investment research compensation and benefits are attributed to each entity based on the relative market values of the portfolio securities covered in each respective entity. Expense allocations are updated quarterly, except for those related to payroll, which are updated annually.
For the period ended June 30, 2016, expenses of $1,093,912 and $2,731 were charged to ADX and AFA, respectively, in accordance with the Fund’s expense sharing policy. There are no amounts due to, or due from, ADX or AFA as of June 30, 2016.
Investment Transactions, Investment Income, and Distributions—The Fund’s investment decisions are made by the portfolio management team with recommendations from the research staff. Policies and procedures are in place covering the allocation of investment opportunities among the Fund, ADX, and AFA to protect the Fund from potential conflicts of interests. Investment transactions are accounted for on the trade date. Realized gains and losses on sales of investments are recorded on the basis of specific identification. Dividend income and distributions to shareholders are recognized on the ex-dividend date. Interest income is recognized on the accrual basis.
Valuation—The Fund’s financial instruments are reported at fair value, which is defined as the price that would be received to sell an asset or paid to transfer a liability in an orderly transaction between market participants at the measurement date. The Fund has a Valuation Committee (“Committee”) to ensure that financial instruments are appropriately priced at fair value in accordance with GAAP and the 1940 Act. Subject to
7
NOTESTO FINANCIAL STATEMENTS (CONTINUED)
oversight by the Board of Directors, the Committee establishes methodologies and procedures to value securities for which market quotations are not readily available.
GAAP establishes the following fair value hierarchy that categorizes the inputs used to measure fair value:
•
Level 1—fair value is determined based on market data obtained from independent sources; for example, quoted prices in active markets for identical investments;
•
Level 2—fair value is determined using other assumptions obtained from independent sources; for example, quoted prices for similar investments;
•
Level 3—fair value is determined using the Fund’s own assumptions, developed based on the best information available in the circumstances.
Investments in securities traded on national security exchanges are valued at the last reported sale price as of the close of regular trading on the primary exchange on the day of valuation. Over-the-counter and listed securities for which a sale price is not available are valued at the last quoted bid price. Money market funds are valued at net asset value. These securities are generally categorized as Level 1 in the hierarchy.
Short-term investments (excluding money market funds) are valued at amortized cost, which approximates fair value. Total return swap agreements are valued using independent, observable inputs, including underlying security prices, dividends, and interest rates. These securities are generally categorized as Level 2 in the hierarchy.
At June 30, 2016, the Fund’s financial instruments were classified as follows:
Level 1
Level 2
Level 3
Total
Assets:
Common stocks
$
636,104,501
$
—
$
—
$
636,104,501
Short-term investments
6,491,675
—
—
6,491,675
Total investments
$
642,596,176
$
—
$
—
$
642,596,176
There were no transfers between levels during the period ended June 30, 2016.
2. FEDERAL INCOME TAXES
No federal income tax provision is required since the Fund’s policy is to qualify as a regulated investment company under the Internal Revenue Code and to distribute substantially all of its taxable income and gains to its shareholders. Additionally, management has analyzed and concluded that tax positions included in federal income tax returns from the previous three years that remain subject to examination do not require any provision. Any income tax-related interest or penalties would be recognized as income tax expense. As of June 30, 2016, the identified cost of securities for federal income tax purposes was $502,861,436 and net unrealized appreciation aggregated $139,734,740, consisting of gross unrealized appreciation of $208,441,687 and gross unrealized depreciation of $68,706,947.
Distributions are determined in accordance with the Fund’s annual 6% minimum distribution rate commitment, based on the Fund’s average market price, and income tax regulations, which may differ from generally accepted accounting principles. Such differences are primarily related to the Fund’s retirement plans and equity-based compensation. Differences that are permanent are reclassified in the capital accounts of the Fund’s financial statements and have no impact on net assets.
8
NOTESTO FINANCIAL STATEMENTS (CONTINUED)
3. INVESTMENT TRANSACTIONS
Purchases and sales of portfolio investments, other than short-term investments and derivative transactions, during the period ended June 30, 2016 were $56,492,032 and $54,221,702 respectively.
4. CAPITAL STOCK
The Fund has 5,000,000 authorized and unissued preferred shares, $0.001 par value.
During the period ended June 30, 2016, the Fund issued 148 shares of its Common Stock at a weighted average price of $18.03 per share as dividend equivalents to holders of deferred stock units and restricted stock units under the 2005 Equity Income Compensation Plan.
On December 22, 2015, the Fund issued 702,985 shares of its Common Stock at a price of $17.93 per share (the average market price on December 9, 2015) to shareholders of record on November 25, 2015, who elected to take stock in payment of the year-end distribution from 2015 capital gain and investment income. During 2015, 1,311 shares were issued at a weighted average price of $20.15 per share as dividend equivalents to holders of deferred stock units and restricted stock units under the 2005 Equity Income Compensation Plan.
The Fund may purchase shares of its Common Stock from time to time, in accordance with parameters set by the Board of Directors, at such prices and amounts as the portfolio management team may deem appropriate. Transactions in Common Stock for 2016 and 2015 were as follows:
Shares
Amount
Six months ended June 30, 2016
Year ended December 31, 2015
Six months ended June 30, 2016
Year ended December 31, 2015
Shares issued in payment of distributions
148
704,296
$
2,667
$
12,630,987
Net activity under the 2005 Equity Incentive Compensation Plan
(3,935
)
11,435
87,152
373,946
Net change
(3,787
)
715,731
$
89,819
$
13,004,933
5. RETIREMENT PLANS
Defined Contribution Plans—The Fund sponsors a qualified defined contribution plan for all employees with at least six months of service and a nonqualified defined contribution plan for eligible employees to supplement the qualified plan. The Fund expensed contributions to the plans in the amount of $180,888, a portion thereof based on Fund performance, for the period ended June 30, 2016.
Defined Benefit Plans—The Fund completed the termination of its qualified defined benefit plan in 2015 and has no further defined benefit obligations.
9
NOTESTO FINANCIAL STATEMENTS (CONTINUED)
Items impacting the Fund’s pension cost and accumulated other comprehensive income were:
Six months ended June 30, 2016
Year ended December 31, 2015
Components of pension cost
Interest cost
$
—
$
76,010
Expected return on plan assets
—
(18,557
)
Net loss component
—
82,336
Effect of settlement (non-recurring)
—
2,762,816
Pension cost
$
—
$
2,902,605
Six months ended June 30, 2016
Year ended December 31, 2015
Change in accumulated other comprehensive income
Reclassifications to net periodic pension cost:
Amortization of net loss
$
—
$
82,336
Effect of settlement (non-recurring)
—
1,349,979
Change during the year
$
—
$
1,432,315
6. EQUITY-BASED COMPENSATION
The Fund’s 2005 Equity Incentive Compensation Plan, adopted at the 2005 Annual Meeting and reapproved at the 2010 Annual Meeting, expired on April 27, 2015. Restricted stock awards granted prior to the Plan’s expiration remain outstanding as of June 30, 2016 and vest on various dates through September 2, 2018, provided the service condition set forth in the award at grant is satisfied. Also outstanding are restricted stock units granted to nonemployee directors that are 100% vested, but payment of which has been deferred by the election of the director.
Outstanding awards were granted at fair market value on grant date (determined by the average of the high and low price on that date). Awards earn an amount equal to the Fund’s per share distribution, payable in either cash (employees) or reinvested shares (non-employee directors). Reinvested shares are fully vested and paid concurrently with the payment of the original share grant. A summary of the activity related to nonvested restricted shares and restricted stock units for the period ended June 30, 2016 is as follows:
Awards
Shares/Units
Weighted Average Grant-Date Fair Value
Balance at December 31, 2015
66,162
$27.09
Reinvested dividend equivalents
148
19.45
Vested & issued
(11,655
)
25.41
Forfeited
(150
)
24.86
Balance at June 30, 2016
54,505
$26.66
Compensation cost is based on the fair market value of the award on grant date and recognized on a straight-line basis over the vesting period. Any compensation cost recognized related to an award that is subsequently forfeited due to unmet service conditions is reversed. Total compensation cost related to equity-based compensation for the period ended June 30, 2016 was $147,562. As of June 30, 2016, the Fund had
10
NOTESTO FINANCIAL STATEMENTS (CONTINUED)
unrecognized compensation cost of $316,408, a component of additional capital surplus, related to nonvested awards that will be recognized over a weighted average period of 1.14 years. The total fair value of awards vested and issued during the period ended June 30, 2016 was $185,636.
7. OFFICER AND DIRECTOR COMPENSATION
The aggregate remuneration paid during the period ended June 30, 2016 to officers and directors amounted to $2,396,896, of which $220,042 was paid to directors who were not officers. These amounts represent the taxable income to the Fund’s officers and directors and, therefore, differ from the amounts reported in the accompanying Statement of Operations that are recorded and expensed in accordance with GAAP.
8. PORTFOLIO SECURITIES LOANED
The Fund makes loans of securities to approved brokers to earn additional income. It receives as collateral cash deposits valued at 102% of the value of the securities on loan. The market value of the loaned securities is calculated based upon the most recent closing prices and any additional required collateral is delivered to the Fund on the next business day. Cash deposits are placed in a registered money market fund. The Fund accounts for securities lending transactions as secured financing and retains a portion of the income from lending fees and interest on the investment of cash collateral. The Fund also continues to receive dividends on the securities loaned. Gain or loss in the fair value of the securities loaned that may occur during the term of the loan will be for the account of the Fund. At June 30, 2016, the Fund had no securities on loan and held no cash collateral. The Fund is indemnified by the Custodian, serving as lending agent, for the loss of loaned securities and has the right under the lending agreement to recover the securities from the borrower on demand.
9. OPERATING LEASE COMMITMENTS
The Fund leases office space and equipment under operating lease agreements expiring at various dates through the year 2026. The Fund recognized rental expense of $93,897 for the period ended June 30, 2016, and its minimum rental commitments are as follows:
Remainder of 2016
$
18,186
2017
138,074
2018
141,442
2019
114,333
2020
113,498
Thereafter
708,520
Total
$
1,234,053
11
FINANCIAL HIGHLIGHTS
(unaudited) Six Months Ended
June 30, 2016
June 30, 2015
Year Ended December 31
2015
2014
2013
2012
2011
Per Share Operating Performance
Net asset value, beginning of period
$20.74
$27.56
$27.56
$32.26
$27.84
$28.58
$30.73
Net investment income
0.21
0.13
0.37
0.50
0.44
0.48
0.41
Net realized gains and increase (decrease) in unrealized appreciation
2.04
(1.19)
(5.80)
(3.23)
5.93
0.48
(0.42)
Change in accumulated other comprehensive income (note 5)
—
0.05
0.05
(0.01)
0.03
—
(0.03)
Total from investment operations
2.25
(1.01)
(5.38)
(2.74)
6.40
0.96
(0.04)
Less distributions
Dividends from net investment income
(0.15)
(0.14)
(0.38)
(0.51)
(0.46)
(0.42)
(0.39)
Distributions from net realized gains
(0.05)
(0.06)
(1.00)
(1.38)
(1.42)
(1.18)
(1.58)
Total distributions
(0.20)
(0.20)
(1.38)
(1.89)
(1.88)
(1.60)
(1.97)
Capital share repurchases (note 4)
—
—
—
0.03
0.05
—
—
Reinvestment of distributions
—
—
(0.06)
(0.10)
(0.15)
(0.10)
(0.14)
Total capital share transactions
—
—
(0.06)
(0.07)
(0.10)
(0.10)
(0.14)
Net asset value, end of period
$22.79
$26.35
$20.74
$27.56
$32.26
$27.84
$28.58
Market price, end of period
$20.11
$22.33
$17.74
$23.84
$27.38
$23.92
$24.48
Total Investment Return*
Based on market price
14.6%
(5.6)%
(20.0)%
(6.3)%
22.7%
4.3%
(2.3)%
Based on net asset value
11.1%
(3.6)%
(19.1)%
(8.0)%
24.2%
4.0%
0.3%
Ratios/Supplemental Data**
Net assets, end of period (in millions)
$640
$722
$583
$755
$864
$733
$733
Ratio of expenses to average net assets
0.85%
1.20%
†
1.26%
††
0.63%
0.78%
††
0.65%
††
0.56%
Ratio of net investment income to average net assets
1.94%
1.36%
†
1.49%
††
1.53%
1.44%
††
1.67%
††
1.29%
Portfolio turnover
18.2%
12.6%
16.0%
19.6%
18.7%
11.7%
16.4%
Number of shares outstanding at end of period (in 000’s)
28,093
27,394
28,097
27,381
26,775
26,326
25,641
*
Total investment return assumes reinvestment of all distributions at the price received in the Fund’s dividend reinvestment plan.
**
Ratios and portfolio turnover presented on an annualized basis.
†
Ratio of expenses to average net assets was 0.83%, excluding the one-time charge of $2,762,816 related to the termination of the defined benefit plans (note 5), and the ratio of net investment income to average net assets was 1.73%.
††
Ratios of expenses to average net assets were 0.86%, 0.70%, and 0.64% in 2015, 2013, and 2012, respectively, after adjusting for non-recurring pension-related settlement charges. The adjusted ratios of net investment income to average net assets were 1.89%, 1.52%, and 1.68% in 2015, 2013, and 2012, respectively.
Total Investments — 100.4% of Net Assets (Cost $502,861,436)
$
642,596,176
Notes:
(A)
Common stocks are listed on the New York Stock Exchange or the NASDAQ and are valued at the last reported sale price on the day of valuation. See note 1 to financial statements.
(B)
Presently non-dividend paying.
(C)
Rate presented is as of period-end and represents the annualized yield earned over the previous seven days.
14
CHANGESIN PORTFOLIO SECURITIES
During the six months ended June 30, 2016
(unaudited)
Purchases (Cost)
Sales (Proceeds)
Market Value Held at June 30, 2016
Concho Resources Inc.
$
2,433,223
$
12,332,518
ConocoPhillips
9,065,819
21,411,960
E.I. du Pont de Nemours & Co.
9,042,953
9,577,440
H.B. Fuller Co.
7,125,646
7,817,023
Marathon Oil Corp.
2,624,005
11,147,927
Marathon Petroleum Corp.
3,182,261
13,396,084
PBF Energy Inc.
5,770,262
4,258,998
Valero Energy Corp.
14,188,950
15,998,700
Weatherford International, plc
3,058,913
6,769,890
Baker Hughes, Inc.
$
3,093,665
4,066,213
California Resources Corp. (1)
31,035
—
CF Industries Holdings, Inc.
1,812,908
6,356,254
Chevron Corp.
2,929,793
61,975,496
Eastman Chemical Co.
1,454,563
8,100,470
Exxon Mobil Corp.
5,941,714
131,679,390
LyondellBasell Industries N.V. (Class A)
1,475,696
17,935,220
Monsanto Co.
6,384,019
13,701,825
Noble Energy, Inc.
2,415,407
10,843,501
Packaging Corp. of America
3,746,247
5,515,032
Phillips 66
23,749,688
2,473,425
SPDR Gold Trust
1,186,967
4,453,504
(1)
Received in spinoff transaction.
15
HISTORICAL FINANCIAL STATISTICS
(unaudited)
Year
(000’s)
Value Of Net Assets
(000’s)
Shares Outstanding
Net Asset Value Per Share
Market Value Per Share
Income Dividends Per Share
Capital Gains Distributions Per Share
Total Dividends and Distributions Per Share
Annual Distribution Rate*
2006
$
812,047
22,181
$
36.61
$
33.46
$
.47
$
3.33
$
3.80
11.2
%
2007
978,920
22,768
42.99
38.66
.49
3.82
4.31
11.6
2008
538,937
23,959
22.49
19.41
.38
2.61
2.99
8.9
2009
650,718
24,327
26.75
23.74
.37
1.03
1.40
6.6
2010
761,736
24,790
30.73
27.01
.32
.95
1.27
5.5
2011
732,811
25,641
28.58
24.48
.39
1.58
1.97
7.1
2012
732,988
26,326
27.84
23.92
.42
1.18
1.60
6.4
2013
863,690
26,775
32.26
27.38
.46
1.42
1.88
7.2
2014
754,506
27,381
27.56
23.84
.51
1.38
1.89
6.6
2015
582,677
28,097
20.74
17.74
.38
1.00
1.38
6.2
June 30, 2016
640,218
28,093
22.79
20.11
.25
†
.05
†
.30
—
*
The annual distribution rate is the total dividends and distributions per share divided by the Fund’s average month-end stock price. For years prior to 2012, the average month-end stock price is determined for the calendar year. For 2012 and later, the average month-end stock price is determined for the twelve months ended October 31, which is consistent with the calculation used for the annual 6% minimum distribution rate commitment adopted in September 2012.
†
Paid or declared
ANNUAL MEETINGOF STOCKHOLDERS
The Annual Meeting of Stockholders was held on April 14, 2016. The following votes were cast for directors:
Votes For
Votes Withheld
Enrique R. Arzac
23,108,741
1,179,563
Phyllis O. Bonanno
22,958,530
1,329,774
Kenneth J. Dale
23,532,972
755,332
Frederic A. Escherich
23,273,036
1,015,269
Roger W. Gale
23,151,631
1,136,674
Kathleen T. McGahran
23,225,358
1,062,946
Craig R. Smith
23,132,854
1,155,451
Mark E. Stoeckle
23,269,963
1,018,341
A proposal to approve and ratify the selection of PricewaterhouseCoopers LLP as the independent registered public accounting firm for the Fund for 2016 was approved with 23,738,739 votes for, 232,874 votes against, and 316,691 shares abstaining.
16
OTHER INFORMATION
Dividend Payment Schedule
The Fund presently pays dividends four times a year, as follows: (a) three interim distributions on or about March 1, June 1, and September 1, and (b) a “year-end” distribution, payable in late December, consisting of the estimated balance of the net investment income for the year, the net realized capital gains earned through October 31 and, if applicable, a return of capital. Shareholders may elect to receive the year-end distribution in stock or cash. In connection with this distribution, all shareholders of record are sent a dividend announcement notice and an election card in mid-November. Shareholders holding shares in “street” or brokerage accounts make their elections by notifying their brokerage house representative.
Electronic Delivery of Shareholder Reports
The Fund offers shareholders the benefits and convenience of viewing Quarterly and Annual Reports and other shareholder materials on-line. With your consent, paper copies of these documents will cease with the next mailing and will be provided via e-mail. Reduce paper mailed to your home and help lower the Fund’s printing and mailing costs. To enroll, please visit the following websites:
Registered shareholders with AST: www.amstock.com/main
Shareholders using brokerage accounts: http://enroll.icsdelivery.com/PEO
Proxy Voting Policies and Record
A description of the policies and procedures that the Fund uses to determine how to vote proxies relating to portfolio securities owned by the Fund and the Fund’s proxy voting record for the 12-month period ended June 30, 2016 are available (i) without charge, upon request, by calling the Fund’s toll free number at (800) 638-2479; (ii) on the Fund’s website: www.adamsfunds.com under the headings “Funds” and then “Reports & Literature”;and (iii) on the Securities and Exchange Commission’s website: www.sec.gov.
Statement on Quarterly Filing of Complete Portfolio Schedule
In addition to publishing its complete schedule of portfolio holdings in the First and Third Quarter Reports to Shareholders, the Fund also files its complete schedule of portfolio holdings with the Securities and Exchange Commission for the first and third quarters of each fiscal year on Form N-Q. The Fund’s Forms N-Q are available on the Commission’s website: www.sec.gov. The Fund’s Forms N-Q may be reviewed and copied at the Commission’s Public Reference Room, and information on the operation of the Public Reference Room may be obtained by calling 1-800-SEC-0330. The Fund also posts a link to its Forms N-Q on its website: www.adamsfunds.com; select Fund name and click the headings “Funds” and then “Reports & Literature”.
Website Information
Investors can find the Fund’s daily NAV per share, the market price, the discount/premium to NAV per share, and quarterly changes in portfolio securities on our website at www.adamsfunds.com. Also available there are a history of the Fund, historical financial information, links for electronic delivery of shareholder reports, and other useful content.
ADAMS NATURAL RESOURCES FUND, INC.
Board of Directors
Enrique R. Arzac2,4
Frederic A. Escherich 1,2,3
Craig R. Smith 1,2,4
Phyllis O. Bonanno3,4
Roger W. Gale2,3
Mark E. Stoeckle 1
Kenneth J. Dale 1,3,4
Kathleen T. McGahran 1,5
1.
Member of Executive Committee
2.
Member of Audit Committee
3.
Member of Compensation Committee
4.
Member of Nominating and Governance Committee
5.
Chair of the Board
Officers
Mark E. Stoeckle
Chief Executive Officer
James P. Haynie, CFA
President
Nancy J.F. Prue, CFA
Executive Vice President, Director of Shareholder Communications
500 East Pratt Street, Suite 1300, Baltimore, MD 21202
410.752.5900 800.638.2479
Website: www.adamsfunds.com
Email: contact@adamsfunds.com
Tickers: PEO (NYSE), XPEOX (NASDAQ)
Counsel: Chadbourne & Parke LLP
Independent Registered Public Accounting Firm: PricewaterhouseCoopers LLP
Custodian of Securities: The Northern Trust Company
Transfer Agent & Registrar: American Stock Transfer & Trust Company, LLC
Stockholder Relations Department
6201 15th Avenue
Brooklyn, NY 11219
(866) 723-8330
Website: www.amstock.com
Email: info@amstock.com
Item 2. Code of Ethics.
Item not applicable to semi-annual report.
Item 3. Audit Committee Financial Expert.
Item not applicable to semi-annual report.
Item 4. Principal Accountant Fees and Services.
Item not applicable to semi-annual report.
Item 5. Audit Committee of Listed Registrants.
Item not applicable to semi-annual report.
Item 6. Investments.
(a) This schedule is included as part of the Report to Stockholders filed under Item 1 of this form.
(b) Not applicable.
Item 7. Disclosure of Proxy Voting Policies and Procedures for Closed-End Management Investment Companies.
Item not applicable to semi-annual report.
Item 8. Portfolio Managers of Closed-End Management Investment Companies.
Item not applicable to semi-annual report.
Item 9. Purchases of Equity Securities by Closed-End Management Investment Company and Affiliated Purchasers.
Total Number of Shares (or Units Purchased)
Average Price Paid per Share (or Unit)
Total Number of Shares (or Units) Purchased as Part of Publicly Announced Plans or Programs
Maximum Number of Shares (or Units) That May Yet Be Purchased Under the Plans or Programs
----------------------------------
----------------------------------
----------------------------------
----------------------------------
January 2016
0
--
0
1,332,000
February 2016
0
--
0
1,332,000
March 2016
0
--
0
1,332,000
April 2016
0
--
0
1,332,000
May 2016
0
--
0
1,332,000
June 2016
0
--
0
1,332,000
----------------------------------
----------------------------------
----------------------------------
Total
0
--
0
(1) There were no shares purchased other than through a publicly announced plan or program.
(2.a) The Plan was announced on December 11, 2014.
(2.b) The share amount approved in 2014 was 5% of outstanding shares, or 1,332,000 shares.
(2.c) The Plan has no expiration date.
(2.d) None.
(2.e) None.
Item 10. Submission of Matters to a Vote of Security Holders.
There were no material changes to the procedures by which shareholders may recommend nominees to the registrant's Board of Directors made or implemented after the registrant last provided disclosure in response to the requirements of Item 407(c)(2)(iv) of Regulation S-K (as required by Item 22(b)(15) of Schedule 14A), or this Item.
Item 11. Controls and Procedures.
(a) The registrant's principal executive officer and principal financial officer have concluded that the registrant's disclosure controls and procedures (as defined in Rule 30a-3(c) under the Investment Company Act of 1940) are effective based on their evaluation of the disclosure controls and procedures as of a date within 90 days of the filing date of this report.
(b) There have been no significant changes in the registrant's internal control over financial reporting (as defined in Rule 30a-3(d) under the Investment Company Act of 1940) that occurred during the registrant's second fiscal quarter of the period covered by this report that has materially affected, or is reasonably likely to materially affect, the registrant's internal control over financial reporting.
Item 12. Exhibits.
(a)
(1)
Not applicable. See registrant's response to Item 2 above.
(2)
Separate certifications by the registrant's principal executive officer and principal financial officer, pursuant to Section 302 of the Sarbanes-Oxley Act of 2002 and required by Rule 30a-2(a) under the Investment Company Act of 1940, are attached.
(3)
Written solicitation to purchases securities: not applicable.
(b) A certification by the registrant's principal executive officer and principal financial officer, pursuant to Section 906 of the Sarbanes-Oxley Act of 2002 and required by Rule 30a-2(b) under the Investment Company Act of 1940, is attached.
SIGNATURES
Pursuant to the requirements of the Securities Exchange Act of 1934 and the Investment Company Act of 1940, the registrant has duly caused this
report to be signed on its behalf by the undersigned, thereunto duly authorized.
Adams Natural Resources Fund, Inc.
By:
/s/ Mark E. Stoeckle
Mark E. Stoeckle
Chief Executive Officer
(Principal Executive Officer)
Date:
July 22, 2016
Pursuant to the requirements of the Securities Exchange Act of 1934 and the Investment Company Act of 1940, the registrant has duly caused this
report to be signed on its behalf by the undersigned, thereunto duly authorized.
We use cookies on this site to provide a more responsive and personalized service. Continuing to browse, clicking I Agree, or closing this banner indicates agreement. See our Cookie Policy for more information.