UNITED STATES
SECURITIES AND EXCHANGE COMMISSION
Washington, D.C. 20549
FORM N-CSR
CERTIFIED SHAREHOLDER REPORT OF REGISTERED MANAGEMENT INVESTMENT COMPANIES
Investment Company Act file number 811- 02753
SBL Fund
(Exact name of registrant as specified in charter)
805 King Farm Boulevard, Suite 600
Rockville, Maryland 20850
(Address of principal executive offices) (Zip code)
Donald C. Cacciapaglia
SBL Fund
805 King Farm Boulevard, Suite 600
Rockville, Maryland 20850
(Name and address of agent for service)
Registrant's telephone number, including area code: 1-301-296-5100
Date of fiscal year end: December 31
Date of reporting period: December 31, 2013
Form N-CSR is to be used by management investment companies to file reports with the Commission not later than 10 days after the transmission to stockholders of any report that is required to be transmitted to stockholders under Rule 30e-1 under the Investment Company Act of 1940 (17 CFR 270.30e-1). The Commission may use the information provided on Form N-CSR in its regulatory, disclosure review, inspection, and policymaking roles.
A registrant is required to disclose the information specified by Form N-CSR, and the Commission will make this information public. A registrant is not required to respond to the collection of information contained in Form N-CSR unless the Form displays a currently valid Office of Management and Budget (“OMB”) control number. Please direct comments concerning the accuracy of the information collection burden estimate and any suggestions for reducing the burden to Secretary, Securities and Exchange Commission, 450 Fifth Street, NW, Washington, DC 20549-0609. The OMB has reviewed this collection of information under the clearance requirements of 44 U.S.C. §3507.
Item 1. Reports to Stockholders.
SERIES A (STYLEPLUS–LARGE CORE SERIES)
| (Formerly, Large Cap Core Series) | |
| SERIES B (LARGE CAP VALUE SERIES) | |
| SERIES C (MONEY MARKET SERIES) | |
| SERIES D (WORLD EQUITY INCOME SERIES) | |
| (Formerly, MSCI EAFE Equal Weight Series) | |
| SERIES E (TOTAL RETURN BOND SERIES) | |
| (Formerly, U.S. Intermediate Bond Series) | |
| SERIES F (FLOATING RATE STRATEGIES SERIES) | |
| SERIES J (STYLEPLUS–MID GROWTH SERIES) | |
| (Formerly, Mid Cap Growth Series) | |
| SERIES M (MACRO OPPORTUNITIES SERIES) | |
| SERIES N (MANAGED ASSET ALLOCATION SERIES) | |
| SERIES O (ALL CAP VALUE SERIES) | |
| SERIES P (HIGH YIELD SERIES) | |
| SERIES Q (SMALL CAP VALUE SERIES) | |
| SERIES V (MID CAP VALUE SERIES) | |
| SERIES X (STYLEPLUS–SMALL GROWTH SERIES) | |
| (Formerly, Small Cap Growth Series) | |
| SERIES Y (STYLEPLUS–LARGE GROWTH SERIES) | |
| (Formerly, Large Cap Concentrated Growth Series) | |
| SERIES Z (ALPHA OPPORTUNITY SERIES) | 460425800 |
This report and the financial statements contained herein are submitted for the general information of our shareholders. The report is not authorized for distribution to prospective investors unless preceded or accompanied by an effective prospectus.
Distributed by Guggenheim Distributors, LLC.
| TABLE OF CONTENTS |
| The GUGGENHEIM FUNDS annual report | 1 |
| December 31, 2013 |
Security Investors, LLC and Guggenheim Partners Investment Management (the “Investment Advisers”) is pleased to present the annual shareholder report for 16 of our variable insurance funds. This report covers performance of the Funds for the annual period ended December 31, 2013. Series F (Floating Rate Strategies Series) and M (Macro Opportunities Series) were both launched on April 24, 2013.
The Investment Advisers is a part of Guggenheim Investments, which represents the investment management businesses of Guggenheim Partners, LLC, a global, diversified financial services firm.
Guggenheim Distributors, LLC is the distributor of the Funds. Guggenheim Distributors, LLC is affiliated with Guggenheim Partners, LLC and Security Investors, LLC.
We encourage you to read the Economic and Market Overview section of the report, which follows this letter, and then the Manager’s Commentary for each Fund.
We are committed to providing innovative investment solutions and appreciate the trust you place in us.
Sincerely,

Donald C. Cacciapaglia
President
January 31, 2014
Read a prospectus and summary prospectus (if available) carefully before investing. It contains the investment objectives, risks, charges, expenses and other information, which should be considered carefully before investing. Obtain a prospectus and summary prospectus (if available) at guggenheiminvestments.com or call 800.820.0888.
The Series StylePlus Funds may not be suitable for all investors. Investments in large capitalization stocks may underperform other segments of the equity market or the equity market as a whole. • Investments in small-sized company securities may present additional risks such as less predictable earnings, higher volatility and less liquidity than larger, more established companies. • Growth stocks may be more volatile than other stocks because they are more sensitive to investor perceptions regarding the growth potential of the issuing companies. • The Funds may invest in derivative instruments, which may be more volatile and less liquid, increasing the risk of loss when compared to traditional securities. Certain of the derivative instruments are also subject to the risks of counterparty default and adverse tax treatment. • The Funds’ use of leverage, through borrowings or instruments such as derivatives, may cause the Funds to be more volatile than if it had not been leveraged. • The Funds’ investments in other investment vehicles subject the Funds to those risks and expenses affecting the investment vehicle. • The Funds may invest in foreign securities which carry additional risks when compared to U.S. securities, due to the impact of diplomatic, political or economic developments in the country in question (investments in emerging markets securities are generally subject to an even greater level of risks). • The Funds may invest in fixed income securities whose market value will change in response to interest rate changes and market conditions among other factors. In general, bond prices rise when interest rates fall and vice versa. • The Fund’s exposure to high yield securities may subject the Fund to greater volatility. • The Funds may invest in bank loans and asset-backed securities, including mortgage backed, which involve special types of risks. • The Funds may invest in restricted securities which may involve financial and liquidity risk. • You may have a gain or loss when you sell your shares. • It is important to note that the Funds are not guaranteed by the U.S. government. • Please read the prospectus for more detailed information regarding these and other risks.
The Series Value Funds may not be suitable for all investors. • An investment in the Funds will fluctuate and is subject to investment risks, which means investors could lose money. The intrinsic value of the underlying stocks may never be realized or the stocks may decline in value. Investments in small- and/ or mid-sized company securities may present additional risks such as less predictable earnings, higher volatility and less liquidity than larger, more established companies. Please read the prospectus for more detailed information regarding these and other risks.
| 2 | the GUGGENHEIM FUNDS annual report |
| December 31, 2013 |
The Series C (Money Market Series) may not be suitable for all investors. • An investment in the Fund is not a deposit of a bank and is not insured or guaranteed by the Federal Deposit Insurance Corporation or any other governmental agency. • It is possible to lose money by investing in the Fund. The principal risks of investing in the Fund are listed below. • The Fund could lose money if the issuer of a bond is unable to repay interest and principal on time or defaults. • The issuer of a bond could also suffer a decrease in quality rating, which would affect the volatility and liquidity of the bond. • Investments in fixed-income securities are subject to the possibility that interest rates could rise sharply, causing the value of the Fund’s securities and share price to decline. • Fixed income securities with longer durations are subject to more volatility than those with shorter durations. • Regulations of money market funds are evolving. • New regulations may affect negatively the Fund’s performance, yield and cost.
The Series D (World Equity Income Series) may not be suitable for all investors. • Investments in securities in general are subject to market risks that may cause their prices to fluctuate over time. • The Fund’s investments in foreign securities carry additional risks when compared to U.S. securities, due to the impact of diplomatic, political or economic developments in the country in question (investments in emerging markets are generally subject to an even greater level of risks). Additionally, the Fund’s exposure to foreign currencies subjects the Fund to the risk that those currencies will decline in value relative to the U.S. Dollar. • The Fund’s investments in derivatives may pose risks in addition to those associated with investing directly in securities or other investments, including illiquidity of the derivatives, imperfect correlations with underlying investments or the Fund’s other portfolio holdings, lack of availability and counterparty risk. • The Fund’s use of leverage, through instruments such as derivatives, may cause the fund to be more volatile than if it had not been leveraged. • The Fund’s investments in other investment vehicles subject the Fund to those risks and expenses affecting the investment vehicle. • The Fund may have significant exposure to securities in a particular capitalization range e.g., large-, mid- or small-cap securities. As a result, the Fund may be subject to the risk that the pre-denominate capitalization range may underperform other segments of the equity market or the equity market as a whole. • Please read the prospectus for more detailed information regarding these and other risks.
The Series E (Total Return Bond Series) may not be suitable for all investors. • The Fund’s market value will change in response to interest rate changes and market conditions among other factors. In general, bond prices rise when interest rates fall and vice versa. • The Fund’s exposure to high yield securities may subject the Fund to greater volatility. • When market conditions are deemed appropriate, the Fund will leverage to the full extent permitted by its investment policies and restrictions and applicable law. Leveraging will exaggerate the effect on net asset value of any increase or decrease in the market value of the Fund’s portfolio. • The Fund may invest in derivative instruments, which may be more volatile and less liquid, increasing the risk of loss when compared to traditional securities. Certain of the derivative instruments are also subject to the risks of counterparty default and adverse tax treatment. • Instruments and strategies (such as borrowing transactions and reverse repurchase agreements) may provide leveraged exposure to a particular investment, which will magnify any gains or losses on those investments. • Investments in reverse repurchase agreements expose the Fund to the many of the same risks as investments in derivatives. • The Fund’s investments in other investment vehicles subject the Fund to those risks and expenses affecting the investment vehicle. • The Fund’s investments in foreign securities carry additional risks when compared to U.S. securities, due to the impact of diplomatic, political or economic developments in the country in question (investments in emerging markets securities are generally subject to an even greater level of risks). • Investments in syndicated bank loans generally offer a floating interest rate and involve special types of risks. • The Fund’s investments in municipal securities can be affected by events that affect the municipal bond market. • The Fund’s investments in real estate securities subject the Fund to the same risks as direct investments in real estate, which is particularly sensitive to economic downturns. • The Fund’s investments in restricted securities may involve financial and liquidity risk. • You may have a gain or loss when you sell your shares. • It is important to note that the Fund is not guaranteed by the U.S. government. • Please read the prospectus for more detailed information regarding these and other risks.
The Series F (Floating Rate Strategies Series) may not be suitable for all investors. • Investments in floating rate senior secured syndicated bank loans and other floating rate securities involve special types of risks, including credit rate risk, interest rate risk, liquidity risk and prepayment risk. • The Fund’s market value will change in response to interest rate changes and market conditions among other factors. In general, bond prices rise when interest rates fall and vice versa. • The Fund’s exposure to high yield securities may subject the Fund to greater volatility. • When market conditions are deemed appropriate, the Fund will leverage to the full extent permitted by its investment policies and restrictions and applicable law. Leveraging will exaggerate the effect on net asset value of any increase or decrease in the market value of the Fund’s portfolio. • The Fund may invest in derivative instruments, which may be more volatile and less liquid, increasing the risk of loss when compared to traditional securities. Certain of the derivative instruments are also subject to the risks of counterparty default and adverse tax treatment. • Instruments and strategies (such as borrowing transactions and reverse repurchase agreements) may provide leveraged exposure to a particular investment, which will magnify any gains or losses on those investments. • Investments in reverse repurchase agreements and synthetic instruments (such as synthetic collateralized debt obligations) expose the Fund to the many of the same risks as investments in derivatives. • The Fund’s investments in other investment vehicles subject the Fund to those risks and expenses affecting the investment vehicle. • The Fund’s investments in foreign securities carry additional risks when compared to U.S. securities, due to the impact of diplomatic, political or economic developments in the country in question (investments in emerging markets securities are generally subject to an even greater level of risks). • The Fund’s investments in real estate securities subject the Fund to the same risks as direct investments in real estate, which is particularly sensitive to economic downturns. • The Fund’s investments in restricted securities may involve financial and liquidity risk. • The Fund is subject to active trading risks that may increase volatility and impact its ability to achieve its investment objective. • You may have a gain or loss when you sell your shares. • It is important to note that the Fund is not guaranteed by the U.S. government. • Please read the prospectus for more detailed information regarding these and other risks.
The Series M (Macro Opportunities Series) may not be suitable for all investors. • The Fund’s market value will change in response to interest rate changes and market conditions among other factors. In general, bond prices rise when interest rates fall and vice versa. • The Fund’s exposure to high yield securities may subject the Fund to greater volatility. • The intrinsic value of the underlying stocks in which the Fund invests may never be realized or the stock may decline in value. • When market conditions are deemed appropriate, the Fund will leverage to the full extent permitted by its investment policies and restrictions and applicable law. Leveraging will exaggerate the effect on net asset value of any increase or decrease in the market value of the Fund’s portfolio. • The use of short selling involves increased risks and costs. You risk paying more for a security than you received from its sale. Theoretically, stocks sold short have the risk of unlimited losses. • The Fund may invest in derivative instruments, which may be more volatile and less liquid, increasing the risk of loss when compared to traditional securities. Certain of the derivative instruments are also subject to the risks of counterparty default and adverse tax treatment. • Instruments and strategies (such as borrowing transactions and reverse repurchase agreements) may provide leveraged exposure to a particular investment, which will magnify any gains or losses on those investments. • Investments in reverse repurchase agreements expose the Fund to the many of the same risks as investments in derivatives. • The Fund’s investments in other investment vehicles subject the Fund to those risks and expenses affecting the investment vehicle. • The Fund’s
| the GUGGENHEIM FUNDS annual report | 3 |
| December 31, 2013 |
investments in foreign securities carry additional risks when compared to U.S. securities, due to the impact of diplomatic, political or economic developments in the country in question (investments in emerging markets securities are generally subject to an even greater level of risks). • Investments in syndicated bank loans generally offer a floating interest rate and involve special types of risks. • A highly liquid secondary market may not exist for the commodity-linked structured notes the Fund invests in, and there can be no assurance that a highly liquid secondary market will develop. • The Fund’s exposure to the commodity markets may subject the Fund to greater volatility as commodity-linked investments may be affected by changes in overall market movements, commodity index volatility, changes in interest rates or factors affecting a particular industry or commodity. • The Fund’s investments in municipal securities can be affected by events that affect the municipal bond market. • The Fund’s investments in real estate securities subject the Fund to the same risks as direct investments in real estate, which is particularly sensitive to economic downturns. • The Fund’s investments in restricted securities may involve financial and liquidity risk. • You may have a gain or loss when you sell your shares. • It is important to note that the Fund is not guaranteed by the U.S. government. • Please read the prospectus for more detailed information regarding these and other risks.
The Series N (Managed Asset Allocation Series) may not be suitable for all investors. • The value of an investment in the Fund will fluctuate and is subject to investment risks, which means investors could lose money. • The Fund could lose money if the issuer of a bond or a counterparty to a derivatives transaction or other transaction is unable to repay interest and principal on time or defaults. • The issuer of a bond could also suffer a decrease in quality rating, which would affect the volatility and liquidity of the bond. • Derivatives may pose risks in addition to those associated with investing directly in securities or other investments, including the risk that the Fund will be unable to sell, unwind or value the derivative because of an illiquid market, the risk that the derivative is not well correlated with underlying investments or the Fund’s other portfolio holdings, and the risk that the counterparty is unwilling or unable to meet its obligation. • The use of derivatives by the Fund to hedge risk may reduce the opportunity for gain by offsetting the positive effect of favorable price movements. • Furthermore, if the Investment Manager is incorrect about its expectations of market conditions, the use of derivatives could result in a loss, which in some cases may be unlimited. • Foreign securities carry additional risks when compared to U.S. securities, including currency fluctuations, adverse political and economic developments, unreliable or untimely information, less liquidity, limited legal recourse and higher transactional costs. • The Investment Manager may not be able to cause certain of the underlying funds’ performance to match or correlate to that of the underlying funds’ respective underlying index or benchmark, either on a daily or aggregate basis. • Factors such as underlying fund expenses, imperfect correlation between an underlying fund’s investments and those of its underlying index or underlying benchmark, rounding of share prices, changes to the composition of the underlying index or underlying benchmark, regulatory policies, high portfolio turnover rate, and the use of leverage all contribute to tracking error. • Tracking error may cause an underlying fund’s and, thus the Fund’s, performance to be less than you expect. • Please read the prospectus for more detailed information regarding these and other risks.
The Series P (High Yield Series) may not be suitable for all investors. • The Fund’s market value will change in response to interest rate changes and market conditions among other factors. In general, bond prices rise when interest rates fall and vice versa. • The Fund’s exposure to high yield securities may subject the Fund to greater volatility. • The Fund may invest in derivative instruments, which may be more volatile and less liquid, increasing the risk of loss when compared to traditional securities. Certain of the derivative instruments are also subject to the risks of counterparty default and adverse tax treatment. • The Fund’s use of leverage, through borrowings or instruments such as derivatives, may cause the Fund to be more volatile than if it had not been leveraged. • Instruments and strategies (such as borrowing transactions and reverse repurchase agreements) may provide leveraged exposure to a particular investment, which will magnify any gains or losses on those investments. • The Fund may invest in foreign securities which carry additional risks when compared to U.S. securities, due to the impact of diplomatic, political or economic developments in the country in question (investments in emerging markets securities are generally subject to an even greater level of risks). • Investments in syndicated bank loans generally offer a floating interest rate and involve special types of risks. • The Fund’s investments in other investment vehicles subject the Fund to those risks and expenses affecting the investment vehicle. • The Fund’s investments in restricted securities may involve financial and liquidity risk. • You may have a gain or loss when you sell your shares. • It is important to note that the Fund is not guaranteed by the U.S. government. • Please read the prospectus for more detailed information regarding these and other risks.
The Series Z (Alpha Opportunity Series) may not be suitable for all investors. • Value stocks are subject to the risk that the intrinsic value of the stock may never be realized by the market, or that the stock’s price will decline in value. • Growth stocks may be more volatile than other stocks because they are more sensitive to investor perceptions regarding the growth potential of the issuing company. Please read the prospectus for more detailed information regarding these and other risks.
| 4 | the GUGGENHEIM FUNDS annual report |
| Economic and Market Overview (Unaudited) | December 31, 2013 |
The year ended December 31, 2013 wound down with a series of stronger-than-expected economic data releases. ISM manufacturing data (historically indicative of expansion or contraction) rose to its highest levels in over two years, consumer confidence rebounded following the government shutdown, housing starts surged, and the job market strengthened. Citing improved labor market conditions and a sustainable economic expansion, the U.S. Federal Reserve (the “Fed”) announced in December that it would reduce its monthly bond purchases by $10 billion, to $75 billion, starting in January 2014. Yet, at the same time, the Fed lengthened the time frame before which it will raise rates by promising to keep the Fed funds target rate at 0-0.25% at least as long as the unemployment rate remains above 6.5% and perhaps “well past” the time this target is reached. For the first time, the Fed also added a lower-bound target for inflation of 2%–lengthening the expected time frame before rates rise.
As the U.S. economy slowly strengthens, we may return to an environment where taking credit risk is not just a consequence of staying within duration targets or reaching for yield, but rather a proactive choice driven by a positive outlook on the economy. To sustain optimism, the Fed will need to monitor the unintended consequences of tapering and avoid negative economic repercussions, as happened in the summer of 2013 when a spike in 10-year Treasury yields dampened home sales. For markets, the Fed must convince investors that the economy is strong enough to withstand steady reductions of its asset purchases. These will likely be Janet Yellen’s top priorities as she takes over the helm of the Fed.
Last January, the global economy faced myriad headwinds, choppiness lay ahead, and we expected plenty of volatility in 2013. Nevertheless, we believed at that point that risk assets were the best choice for investors. Now, the headwinds of 2013 have largely dissipated, and the outlook appears benign for risk assets for the first three to six months of 2014, if not longer.
Many pundits may have underestimated the strength of the U.S. economy, with both third quarter and fourth quarter economic growth beating expectations. The final three months of 2013 were exceptionally good for U.S. equities, which produced a wealth effect that probably boosted holiday sales. All of this bodes well for the first quarter of 2014.
Market conditions could be even stronger in Europe. Economic data from the euro area’s periphery is improving faster than from the core, where inflation is also rising at a faster pace, giving the peripheral nations a competitive advantage. In Asia, markets have priced for a more negative scenario that now appears less likely. With the U.S. and Europe now out of recession, they are ready to underpin a recovery in export growth in the Asian region. As a synchronous global expansion gets under way, investors may become more comfortable with taking risk, and this should be reflected in asset prices in many regions around the globe.
For 2014, investors should bear in mind that the Fed will continue injecting liquidity into financial markets even as it tapers its asset purchases. Assuming that the Fed continues the same pace of reductions at each Federal Open Market Committee meeting, it would still purchase more than $500 billion of bonds in 2014–nearly the size of the Fed’s QE2 from November 2010 to June 2011. This should help support credit spreads. An accelerated pace of tapering from the Fed would signal faster-than-expected economic growth and spark higher demand for risk assets. On balance, we expect the impact of tapering to be neutral. Barring economic weakness, we expect relatively benign market conditions with no major spike in volatility.
For the year ended December 31, 2013, the Standard & Poor’s 500® (“S&P 500”) Index* returned 32.39%. Foreign markets were also strong: the Morgan Stanley Capital International (“MSCI”) Europe-Australasia-Far East (“EAFE”) Index* returned 22.78%. The return of the MSCI Emerging Markets Index* was -2.60%.
In the bond market, the Barclays U.S. Aggregate Bond Index* posted a -2.02% return for the period, while the Barclays U.S. Corporate High Yield Index* returned 7.44%. The return of the Bank of America Merrill Lynch 3-Month U.S. Treasury Bill Index* was 0.07% for the 12-month period.
The opinions and forecasts expressed may not actually come to pass. This information is subject to change at any time, based on market and other conditions, and should not be construed as a recommendation of any specific security or strategy.
| the GUGGENHEIM FUNDS annual report | 5 |
| Economic and Market Overview (Unaudited) (concluded) | December 31, 2013 |
*Index Definitions:
The following indices are referenced throughout this report. Indices are unmanaged and not available for direct investment. Index performance does not reflect transaction costs, fees, or expenses.
Barclays U.S. Aggregate Bond Index is a broad-based benchmark that measures the investment grade, U.S. dollar denominated, fixed-rate taxable bond market, including U.S. Treasuries, government-related and corporate securities, MBS (agency fixed-rate and hybrid ARM pass-throughs), ABS, and CMBS.
Barclays U.S. Corporate High Yield Index measures the market of USD-denominated, non-investment grade, fixed-rate, taxable corporate bonds. Securities are classified as high yield if the middle rating of Moody’s, Fitch, and S&P is Ba1/BB+/BB+ or below.
Barclays U.S. Intermediate Government/Credit Bond Index measures the performance of U.S. Dollar denominated U.S. Treasuries, government-related and investment grade U.S. corporate securities that have a remaining maturity of greater than one year and less than ten years.
Bank of America Merrill Lynch 3-Month U.S. Treasury Bill Index is an unmanaged market index of U.S. Treasury securities maturing in 90 days that assumes reinvestment of all income.
Credit Suisse Leveraged Loan Index is designed to mirror the investable universe of the U.S. dollar-denominated leveraged loan market.
MSCI EAFE Index is a free float-adjusted market capitalization index that is designed to measure the equity market performance of developed markets, excluding the U.S. & Canada.
MSCI Emerging Markets Index is a free float-adjusted market capitalization weighted index that is designed to measure equity market performance in the global emerging markets.
MSCI EAFE Equal Weighted Index equally weights the issuers in the MSCI EAFE Index, which is a free float-adjusted market capitalization index that is designed to measure the equity market performance of developed markets, excluding the U.S. and Canada. The MSCI EAFE Equal Weighted Index is rebalanced quarterly so that each issuer has the same weight on each rebalancing date. The MSCI EAFE Index consists of the following 22 developed market country indices: Australia, Austria, Belgium, Denmark, Finland, France, Germany, Greece, Hong Kong, Ireland, Israel, Italy, Japan, the Netherlands, New Zealand, Norway, Portugal, Singapore, Spain, Sweden, Switzerland and the United Kingdom.
MSCI World Index is a free float-adjusted market capitalization weighted index that is designed to measure the equity market performance of developed markets.
S&P 500® Index is a capitalization-weighted index of 500 stocks designed to measure the performance of the broad economy, representing all major industries and is considered a representation of the U.S. stock market.
Russell 3000® Value Index measures the performance of the broad value segment of the U.S. equity value universe. It includes those Russell 3000 companies with lower price-to-book ratios and lower forecasted growth values.
Russell 2500® Value Index measures the performance of the small- to mid-cap value segment of the U.S. equity universe. It includes those Russell 2500 companies with lower price-to-book ratios and lower forecasted growth values.
Russell 2000® Growth Index measures the performance of the small-cap growth segment of the U.S. equity universe. It includes those Russell 2000 companies with higher price-to-book ratios and higher forecasted growth values.
Russell 2000® Value Index measures the performance of the small-cap value segment of the U.S. equity universe. It includes those Russell 2000 companies with lower price-to-book ratios and lower forecasted growth values.
Russell 1000® Growth Index measures the performance of the large-cap growth segment of the U.S. equity universe. It includes those Russell 1000 companies with higher price-to-book ratios and higher forecasted growth value.
Russell 1000® Value Index measures the performance for the large-cap value segment of the U.S. equity universe. It includes those Russell 1000 companies with lower price-to-book ratios and lower expected growth values.
Russell Midcap® Growth Index measures the performance of the mid-cap growth segment of the U.S. equity universe. It includes those Russell Midcap Index companies with higher price-to-book ratios and higher forecasted growth values.
| 6 | the GUGGENHEIM FUNDS annual report |
| ABOUT SHAREHOLDERS’ FUND EXPENSES (Unaudited) |
All mutual funds have operating expenses and it is important for our shareholders to understand the impact of costs on their investments. Shareholders of a Fund incur two types of costs: (i) transaction costs, including sales charges (loads) on purchase payments, reinvested dividends, or other distributions; and exchange fees; and (ii) ongoing costs, including management fees, administrative services, and shareholder reports, among others. These ongoing costs, or operating expenses, are deducted from a fund’s gross income and reduce the investment return of the fund.
A fund’s expenses are expressed as a percentage of its average net assets, which is known as the expense ratio. The following examples are intended to help investors understand the ongoing costs (in dollars) of investing in a Fund and to compare these costs with the ongoing costs of investing in other mutual funds.
The examples are based on an investment of $1,000 made at the beginning of the period and held for the entire six-month period beginning June 30, 2013 and ending December 31, 2013.
The following tables illustrate a Fund’s costs in two ways:
Table 1. Based on actual Fund return. This section helps investors estimate the actual expenses paid over the period. The “Ending Account Value” shown is derived from the Fund’s actual return, and the fourth column shows the dollar amount that would have been paid by an investor who started with $1,000 in the Fund. Investors may use the information here, together with the amount invested, to estimate the expenses paid over the period. Simply divide the Fund’s account value by $1,000 (for example, an $8,600 account value divided by $1,000 = 8.6), then multiply the result by the number provided under the heading “Expenses Paid During Period.”
Table 2. Based on hypothetical 5% return. This section is intended to help investors compare a Fund’s cost with those of other mutual funds. The table provides information about hypothetical account values and hypothetical expenses based on the Fund’s actual expense ratio and an assumed rate of return of 5% per year before expenses, which is not the Fund’s actual return. The hypothetical account values and expenses may not be used to estimate the actual ending account balance or expenses paid during the period. The example is useful in making comparisons because the U.S. Securities and Exchange Commission (the “SEC”) requires all mutual funds to calculate expenses based on the 5% return. Investors can assess a Fund’s costs by comparing this hypothetical example with the hypothetical examples that appear in shareholder reports of other funds.
The calculations illustrated above assume no shares were bought or sold during the period. Actual costs may have been higher or lower, depending on the amount of investment and the timing of any purchases or redemptions.
Please note that the expenses shown in the table are meant to highlight your ongoing costs only and do not reflect any transactional costs, such as sales charges (loads) on purchase payments, and contingent deferred sales charges (“CDSC”) on redemptions, if any. Therefore, the second table is useful in comparing ongoing costs only, and will not help you determine the relative total costs of owning different funds. In addition, if these transactional costs were included, your costs would have been higher.
More information about a Fund’s expenses, including annual expense ratios for the past five years, can be found in the Financial Highlights section of this report. For additional information on operating expenses and other shareholder costs, please refer to the appropriate Fund prospectus.
| the GUGGENHEIM FUNDS annual report | 7 |
| ABOUT SHAREHOLDERS’ FUND EXPENSES (Unaudited) (concluded) |
| Beginning | Ending | Expenses | ||||||||||||||||||
| Expense | Fund | Account Value | Account Value | Paid During | ||||||||||||||||
| Ratio1,4 | Return | June 30, 2013 | December 31, 2013 | Period2 | ||||||||||||||||
| Table 1. Based on actual Fund return3 | ||||||||||||||||||||
| Series A (StylePlus–Large Core Series) | 0.98 | % | 16.78 | % | $1,000.00 | $1,167.80 | $ 5.35 | |||||||||||||
| Series B (Large Cap Value Series) | 0.84 | % | 14.29 | % | 1,000.00 | 1,142.90 | 4.54 | |||||||||||||
| Series C (Money Market Series) | 0.57 | % | (0.23 | %) | 1,000.00 | 997.70 | 2.87 | |||||||||||||
| Series D (World Equity Income Series) | 1.12 | % | 13.96 | % | 1,000.00 | 1,139.60 | 6.04 | |||||||||||||
| Series E (Total Return Bond Series) | 0.91 | % | 2.37 | % | 1,000.00 | 1,023.70 | 4.64 | |||||||||||||
| Series F (Floating Rate Strategies Series) | 1.19 | % | 3.10 | % | 1,000.00 | 1,031.00 | 6.09 | |||||||||||||
| Series J (StylePlus–Mid Growth Series) | 1.02 | % | 19.37 | % | 1,000.00 | 1,193.70 | 5.64 | |||||||||||||
| Series M (Macro Opportunities Series) | 1.53 | % | 3.49 | % | 1,000.00 | 1,034.90 | 7.85 | |||||||||||||
| Series N (Managed Asset Allocation Series) | 1.05 | % | 10.20 | % | 1,000.00 | 1,102.00 | 5.56 | |||||||||||||
| Series O (All Cap Value Series) | 0.92 | % | 14.94 | % | 1,000.00 | 1,149.40 | 4.98 | |||||||||||||
| Series P (High Yield Series) | 1.11 | % | 4.53 | % | 1,000.00 | 1,045.30 | 5.72 | |||||||||||||
| Series Q (Small Cap Value Series) | 1.18 | % | 18.82 | % | 1,000.00 | 1,188.20 | 6.51 | |||||||||||||
| Series V (Mid Cap Value Series) | 0.95 | % | 15.44 | % | 1,000.00 | 1,154.40 | 5.16 | |||||||||||||
| Series X (StylePlus–Small Growth Series) | 1.33 | % | 22.48 | % | 1,000.00 | 1,224.80 | 7.46 | |||||||||||||
| Series Y (StylePlus–Large Growth Series) | 1.18 | % | 19.65 | % | 1,000.00 | 1,196.50 | 6.53 | |||||||||||||
| Series Z (Alpha Opportunity Series) | 2.43 | % | 16.23 | % | 1,000.00 | 1,162.30 | 13.24 | |||||||||||||
| Table 2. Based on hypothetical 5% return (before expenses) | ||||||||||||||||||||
| Series A (StylePlus–Large Core Series) | 0.98 | % | 5.00 | % | $1,000.00 | $1,020.27 | $ 4.99 | |||||||||||||
| Series B (Large Cap Value Series) | 0.84 | % | 5.00 | % | 1,000.00 | 1,020.97 | 4.28 | |||||||||||||
| Series C (Money Market Series) | 0.57 | % | 5.00 | % | 1,000.00 | 1,022.33 | 2.91 | |||||||||||||
| Series D (World Equity Income Series) | 1.12 | % | 5.00 | % | 1,000.00 | 1,019.56 | 5.70 | |||||||||||||
| Series E (Total Return Bond Series) | 0.91 | % | 5.00 | % | 1,000.00 | 1,020.62 | 4.63 | |||||||||||||
| Series F (Floating Rate Strategies Series) | 1.19 | % | 5.00 | % | 1,000.00 | 1,019.21 | 6.06 | |||||||||||||
| Series J (StylePlus–Mid Growth Series) | 1.02 | % | 5.00 | % | 1,000.00 | 1,020.06 | 5.19 | |||||||||||||
| Series M (Macro Opportunities Series) | 1.53 | % | 5.00 | % | 1,000.00 | 1,017.49 | 7.78 | |||||||||||||
| Series N (Managed Asset Allocation Series) | 1.05 | % | 5.00 | % | 1,000.00 | 1,019.91 | 5.35 | |||||||||||||
| Series O (All Cap Value Series) | 0.92 | % | 5.00 | % | 1,000.00 | 1,020.57 | 4.69 | |||||||||||||
| Series P (High Yield Series) | 1.11 | % | 5.00 | % | 1,000.00 | 1,019.61 | 5.65 | |||||||||||||
| Series Q (Small Cap Value Series) | 1.18 | % | 5.00 | % | 1,000.00 | 1,019.26 | 6.01 | |||||||||||||
| Series V (Mid Cap Value Series) | 0.95 | % | 5.00 | % | 1,000.00 | 1,020.42 | 4.84 | |||||||||||||
| Series X (StylePlus–Small Growth Series) | 1.33 | % | 5.00 | % | 1,000.00 | 1,018.50 | 6.77 | |||||||||||||
| Series Y (StylePlus–Large Growth Series) | 1.18 | % | 5.00 | % | 1,000.00 | 1,019.26 | 6.01 | |||||||||||||
| Series Z (Alpha Opportunity Series) | 2.43 | % | 5.00 | % | 1,000.00 | 1,012.96 | 12.33 | |||||||||||||
| 1 | Annualized and excludes expenses of the underlying funds in which the Fund invests. |
| 2 | Expenses are equal to the Fund’s annualized expense ratio, net of any applicable fee waivers, multiplied by the average account value over the period, multiplied by 184/365 (to reflect the one-half year period). Expenses shown do not include fees charged by insurance companies. |
| 3 | Actual cumulative return at net asset value for the period June 30, 2013 to December 31, 2013. |
| 4 | This ratio represents annualized net expenses which includes extraordinary expenses. Excluding these expenses, the operating expense ratios would be 0.55% for Series C (Money Market Series), 0.81% for Series E (Total Return Bond Series), 1.16% for Series F (Floating Rate Strategies Series), 1.47% for Series M (Macro Opportunities Series) and 2.35% for Series Z (Alpha Opportunity Series). |
| 8 | the GUGGENHEIM FUNDS annual report |
| Manager’S Commentary (Unaudited) | December 31, 2013 |
To Our Shareholders:
The Series A (StylePlus–Large Core Series, formerly Large Cap Core Series) is managed by a team of seasoned professionals, including B. Scott Minerd, Global Chief Investment Officer; Farhan Sharaff, Senior Managing Director and Assistant Chief Investment Officer, Equities; Jayson Flowers, Senior Managing Director and Head of Equity and Derivative Strategies; and Scott Hammond, Managing Director and Portfolio Manager. In the following paragraphs, the investment team discusses performance and changes to the Fund that occurred during the fiscal year ended December 31, 2013.
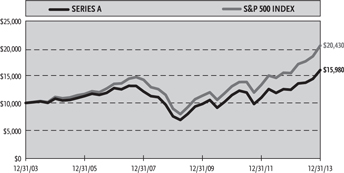
For the fiscal year ended December 31, 2013, the Series A (StylePlus–Large Core Series, formerly Large Cap Core Series) returned 28.87%. The benchmark, the S&P 500® Index, returned 32.39%.
The Fund’s Board of Directors approved the following changes, which became effective on April 30, 2013: a new Fund name, new principal investment strategies and new portfolio management team.
The Fund’s investment objective is to deliver long-term growth of capital in excess of that produced by the total return of the S&P 500 Index. The Fund seeks to add alpha above the target index by leveraging Guggenheim’s competencies in fixed income and systematic stock selection. To accomplish this, the StylePlus strategy allocates to quantitative selection models when stock picking opportunities in the market are high. When stock selection opportunities are less attractive, the Fund invests in derivatives based on the target index, backed by a diversified portfolio of fixed income instruments. In this way, the Fund believes it will deliver the target index return plus an alpha component commensurate with the yield achieved on the active fixed income portfolio.
The Fund’s underperformance for the 12 months came predominantly during the four months it was being managed according to the legacy strategy. Specifically—from January 1, 2013 through April 30, 2013—the Fund underperformed the benchmark by almost four percentage points, largely due to poor stock selection in the Information Technology. The Fund’s cash position was also a drag on performance. A sector overweight and stock selection in Consumer Discretionary contributed most to the Fund’s performance.
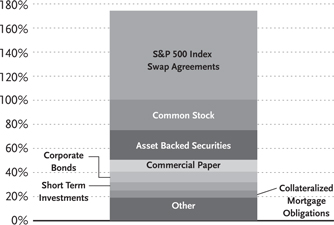
For the time the Fund was being managed according to the new strategy, the eight months from April 30, 2013 through December 31, 2013, the Fund performed slightly better than the benchmark. During much of this period, the Fund maintained an approximate allocation of 20% to systematic equity selection, 80% allocated to the passive equity position, which was maintained with swap agreements and futures contracts and 53% allocated to fixed income investments (excluding short term). Beginning in December 2013, due to a more favorable outlook for active stock selection, the equity sleeve was increased to 25%, with 74% allocated to the passive equity position.
The equity sleeve was additive over the period, delivering the strongest returns during the months of May, June and December.
The fixed income allocation also contributed to performance over the eight months, after detracting from performance during the substantial debt selloff that began at the end of May and lasted in to June. The swap agreements also contributed to performance.
Performance displayed represents past performance, which is no guarantee of future results.
The opinions and forecast expressed may not actually come to pass. This information is subject to change at any time, based on market and other conditions, and should not be construed as a recommendation of any specific security or strategy.
| The Guggenheim Funds annual REPORT | 9 |
| performance report and FUND PROFILE (Unaudited) | December 31, 2013 |
SERIES A (STYLEPLUS–LARGE CORE SERIES)
OBJECTIVE: Seeks long-term growth of capital.
Cumulative Fund Performance*,†
Average Annual Returns*
Periods Ended December 31, 2013†
| 1 Year | 5 Year | 10 Year | ||||||||||
| Series A (StylePlus–Large Core Series) | 28.87 | % | 16.14 | % | 4.80 | % | ||||||
| S&P 500 Index | 32.39 | % | 17.94 | % | 7.41 | % | ||||||
Ten Largest Holdings (% of Total Net Assets)
| Dreyfus Treasury Prime Cash Management Fund | 6.8 | % | ||
| U.S. Treasury Bill | 3.0 | % | ||
| Guggenheim BulletShares 2016 High Yield Corporate Bond ETF | 2.0 | % | ||
| Guggenheim BulletShares 2015 High Yield Corporate Bond ETF | 2.0 | % | ||
| Guggenheim BulletShares 2014 High Yield Corporate Bond ETF | 1.9 | % | ||
| Floating Rate Strategies Fund Institutional Class | 1.7 | % | ||
| Macro Opportunities Fund Institutional Class | 1.7 | % | ||
| New York City Water & Sewer System Revenue Bonds | 1.3 | % | ||
| Duane Street CLO IV Ltd. — Class A1T | 1.3 | % | ||
| HSI Asset Securitization Corporation Trust 2007-WF1 — Class 2A3 | 1.2 | % | ||
| Top Ten Total | 22.9 | % |
Holdings Diversification (Market Exposure as % of Net Assets)
Inception Date: May 1, 1979
| Portfolio Composition by Quality Rating** |
| Rating |
| Fixed Income Instruments | ||||
| AAA | 10.8 | % | ||
| AA | 3.9 | % | ||
| A | 7.4 | % | ||
| BBB | 21.9 | % | ||
| BB | 3.0 | % | ||
| B | 4.6 | % | ||
| CCC | 5.2 | % | ||
| NR | 2.1 | % | ||
| Other Instruments | ||||
| Common Stock | 25.3 | % | ||
| Short Term Investments | 6.8 | % | ||
| Exchange Traded Funds | 5.9 | % | ||
| Mutual Funds | 3.4 | % | ||
| Total Investments | 100.3 | % |
The chart above reflects percentages of the value of total investments.
| * | The performance data above represents past performance that is not predictive of future results. The investment return and principal value of an investment in the Fund will fluctuate so that an investor’s shares, when redeemed, may be worth more or less than their original cost. Returns are historical and include changes in principal and reinvested dividends and capital gains and do not reflect the effect of taxes. The S&P 500 Index is an unmanaged index and, unlike the Fund, has no management fees or operating expenses to reduce its reported return. |
| ** | Source: Factset. Credit quality ratings are measured on a scale that generally ranges from AAA (highest) to D (lowest). All rated securities have been rated by Moody’s, Standard & Poor’s (“S&P”), or Fitch, which are all a Nationally Recognized Statistical Rating Organization (“NRSRO”). For purposes of this presentation, when ratings are available from more than one agency, the highest rating is used. Guggenheim Investments has converted Moody’s and Fitch ratings to the equivalent S&P rating. Unrated securities do not necessarily indicate low credit quality. Security ratings are determined at the time of purchase and may change thereafter. |
| † | Performance figures do not reflect fees and expenses associated with an investment in variable insurance products. If returns had taken into account these fees and expenses, performance would have been lower. Shares of a series of SBL Fund are available only through the purchase of such products. |
| 10 | the GUGGENHEIM FUNDS annual report |
| Schedule of Investments | December 31, 2013 |
| Series A (styleplus–large Core Series) |
| Shares | Value | |||||||
| COMMON STOCKS† - 25.3% | ||||||||
| Information Technology - 5.1% | ||||||||
| Apple, Inc. | 2,910 | $ | 1,632,830 | |||||
| International Business Machines Corp. | 6,919 | 1,297,796 | ||||||
| Microsoft Corp. | 26,620 | 996,387 | ||||||
| Cisco Systems, Inc. | 40,904 | 918,295 | ||||||
| Hewlett-Packard Co. | 27,970 | 782,601 | ||||||
| Oracle Corp. | 20,381 | 779,777 | ||||||
| EMC Corp. | 30,566 | 768,735 | ||||||
| Corning, Inc. | 38,511 | 686,266 | ||||||
| TE Connectivity Ltd. | 11,910 | 656,360 | ||||||
| Google, Inc. — Class A* | 463 | 518,889 | ||||||
| Western Digital Corp. | 6,059 | 508,350 | ||||||
| Texas Instruments, Inc. | 10,466 | 459,562 | ||||||
| Intel Corp. | 15,873 | 412,063 | ||||||
| QUALCOMM, Inc. | 5,511 | 409,192 | ||||||
| Seagate Technology plc | 6,603 | 370,824 | ||||||
| Accenture plc — Class A | 3,703 | 304,461 | ||||||
| Symantec Corp. | 7,786 | 183,594 | ||||||
| Total Information Technology | 11,685,982 | |||||||
| Health Care - 5.0% | ||||||||
| Pfizer, Inc. | 43,814 | 1,342,023 | ||||||
| Merck & Company, Inc. | 21,016 | 1,051,851 | ||||||
| Johnson & Johnson | 10,139 | 928,631 | ||||||
| Express Scripts Holding Co.* | 11,410 | 801,438 | ||||||
| Abbott Laboratories | 20,581 | 788,869 | ||||||
| Medtronic, Inc. | 13,298 | 763,172 | ||||||
| UnitedHealth Group, Inc. | 9,606 | 723,331 | ||||||
| Covidien plc | 9,695 | 660,230 | ||||||
| Cardinal Health, Inc. | 9,856 | 658,480 | ||||||
| Eli Lilly & Co. | 12,011 | 612,561 | ||||||
| WellPoint, Inc. | 5,930 | 547,873 | ||||||
| Aetna, Inc. | 7,790 | 534,316 | ||||||
| McKesson Corp. | 3,083 | 497,596 | ||||||
| Cigna Corp. | 5,349 | 467,931 | ||||||
| Amgen, Inc. | 3,457 | 394,651 | ||||||
| Thermo Fisher Scientific, Inc. | 3,212 | 357,656 | ||||||
| Stryker Corp. | 2,904 | 218,207 | ||||||
| Becton Dickinson and Co. | 1,591 | 175,790 | ||||||
| Total Health Care | 11,524,606 | |||||||
| Industrials - 4.7% | ||||||||
| General Electric Co. | 57,642 | 1,615,705 | ||||||
| United Technologies Corp. | 8,270 | 941,126 | ||||||
| United Parcel Service, Inc. — Class B | 8,127 | 853,985 | ||||||
| Caterpillar, Inc. | 8,832 | 802,034 | ||||||
| FedEx Corp. | 5,208 | 748,754 | ||||||
| General Dynamics Corp. | 7,354 | 702,675 | ||||||
| Waste Management, Inc. | 15,541 | 697,325 | ||||||
| Northrop Grumman Corp. | 6,002 | 687,889 | ||||||
| CSX Corp. | 23,771 | 683,892 | ||||||
| Boeing Co. | 4,802 | 655,425 | ||||||
| Delta Air Lines, Inc. | 19,092 | 524,457 | ||||||
| Emerson Electric Co. | 6,606 | 463,609 | ||||||
| Raytheon Co. | 3,707 | 336,225 | ||||||
| Union Pacific Corp. | 1,851 | 310,968 | ||||||
| Lockheed Martin Corp. | 1,372 | 203,962 | ||||||
| Norfolk Southern Corp. | 2,040 | 189,373 | ||||||
| Republic Services, Inc. — Class A | 5,236 | 173,835 | ||||||
| Stanley Black & Decker, Inc. | 2,144 | 172,999 | ||||||
| Total Industrials | 10,764,238 | |||||||
| Energy - 3.3% | ||||||||
| Exxon Mobil Corp. | 12,009 | 1,215,311 | ||||||
| ConocoPhillips | 11,007 | 777,644 | ||||||
| Anadarko Petroleum Corp. | 9,067 | 719,194 | ||||||
| Marathon Oil Corp. | 19,224 | 678,607 | ||||||
| Phillips 66 | 8,153 | 628,841 | ||||||
| Occidental Petroleum Corp. | 6,466 | 614,917 | ||||||
| Baker Hughes, Inc. | 10,811 | 597,416 | ||||||
| Chevron Corp. | 4,732 | 591,074 | ||||||
| Apache Corp. | 4,847 | 416,551 | ||||||
| EOG Resources, Inc. | 2,289 | 384,186 | ||||||
| Valero Energy Corp. | 7,410 | 373,464 | ||||||
| Devon Energy Corp. | 4,406 | 272,599 | ||||||
| Nabors Industries Ltd. | 10,848 | 184,308 | ||||||
| Kinder Morgan, Inc. | 4,964 | 178,704 | ||||||
| Total Energy | 7,632,816 | |||||||
| Consumer Staples - 3.2% | ||||||||
| Wal-Mart Stores, Inc. | 14,272 | 1,123,064 | ||||||
| CVS Caremark Corp. | 14,062 | 1,006,418 | ||||||
| PepsiCo, Inc. | 9,349 | 775,406 | ||||||
| Walgreen Co. | 13,175 | 756,772 | ||||||
| Kimberly-Clark Corp. | 6,797 | 710,014 | ||||||
| General Mills, Inc. | 13,782 | 687,859 | ||||||
| Procter & Gamble Co. | 6,453 | 525,339 | ||||||
| Mondelez International, Inc. — Class A | 14,836 | 523,711 | ||||||
| Philip Morris International, Inc. | 4,908 | 427,634 | ||||||
| Kroger Co. | 8,881 | 351,066 | ||||||
| Archer-Daniels-Midland Co. | 7,531 | 326,845 | ||||||
| Kellogg Co. | 3,199 | 195,363 | ||||||
| Total Consumer Staples | 7,409,491 | |||||||
| Financials - 1.8% | ||||||||
| Citigroup, Inc. | 20,145 | 1,049,757 | ||||||
| JPMorgan Chase & Co. | 15,353 | 897,843 | ||||||
| Wells Fargo & Co. | 9,245 | 419,723 | ||||||
| MetLife, Inc. | 7,484 | 403,537 | ||||||
| Berkshire Hathaway, Inc. — Class B* | 2,882 | 341,690 | ||||||
| American International Group, Inc. | 5,993 | 305,943 | ||||||
| Regions Financial Corp. | 23,982 | 237,182 | ||||||
| Capital One Financial Corp. | 2,551 | 195,432 | ||||||
| Aflac, Inc. | 2,864 | 191,315 | ||||||
| Allstate Corp. | 3,391 | 184,945 | ||||||
| Total Financials | 4,227,367 | |||||||
| Consumer Discretionary - 1.6% | ||||||||
| Comcast Corp. — Class A | 20,780 | 1,079,832 | ||||||
| Time Warner, Inc. | 11,801 | 822,766 | ||||||
| Target Corp. | 11,314 | 715,837 | ||||||
| Ford Motor Co. | 34,291 | 529,110 | ||||||
| Macy’s, Inc. | 6,057 | 323,444 | ||||||
| The Gap, Inc. | 4,476 | 174,922 | ||||||
| Time Warner Cable, Inc. | 1,035 | 140,243 | ||||||
| Total Consumer Discretionary | 3,786,154 | |||||||
| See Notes to Financial Statements. | The GUGGENHEIM FUNDS annual report | 11 |
| Schedule of Investments (continued) | December 31, 2013 |
| Series A (styleplus–large Core Series) |
| Shares | Value | |||||||
| Utilities - 0.4% | ||||||||
| Exelon Corp. | 22,205 | $ | 608,195 | |||||
| American Electric Power Company, Inc. | 4,997 | 233,560 | ||||||
| Total Utilities | 841,755 | |||||||
| Telecommunication Services - 0.2% | ||||||||
| CenturyLink, Inc. | 15,772 | 502,338 | ||||||
| Total Common Stocks | ||||||||
| (Cost $53,671,807) | 58,374,747 | |||||||
| EXCHANGE TRADED FUNDS†,4 - 5.9% | ||||||||
| Guggenheim BulletShares 2016 | ||||||||
| High Yield Corporate Bond ETF | 169,000 | 4,566,380 | ||||||
| Guggenheim BulletShares 2015 | ||||||||
| High Yield Corporate Bond ETF | 168,800 | 4,520,464 | ||||||
| Guggenheim BulletShares 2014 | ||||||||
| High Yield Corporate Bond ETF | 169,100 | 4,509,897 | ||||||
| Total Exchange Traded Funds | ||||||||
| (Cost $13,569,434) | 13,596,741 | |||||||
| MUTUAL FUNDS†,5 - 3.4% | ||||||||
| Floating Rate Strategies Fund | ||||||||
| Institutional Class | 150,653 | 4,029,967 | ||||||
| Macro Opportunities Fund | ||||||||
| Institutional Class | 146,257 | 3,910,920 | ||||||
| Total Mutual Funds | ||||||||
| (Cost $8,137,283) | 7,940,887 | |||||||
| SHORT TERM INVESTMENTS† - 6.8% | ||||||||
| Dreyfus Treasury Prime Cash | ||||||||
| Management Fund | 15,627,652 | 15,627,652 | ||||||
| Total Short Term Investments | ||||||||
| (Cost $15,627,652) | 15,627,652 | |||||||
| Face | ||||||||
| Amount | ||||||||
| ASSET BACKED SECURITIES†† - 24.6% | ||||||||
| Duane Street CLO IV Ltd. | ||||||||
| 2007-4A, 0.47% due 11/14/211,2 | $ | 3,109,214 | 3,047,652 | |||||
| HSI Asset Securitization | ||||||||
| Corporation Trust | ||||||||
| 2007-WF1, 0.33% due 05/25/371 | 3,100,693 | 2,848,173 | ||||||
| JP Morgan Mortgage Acquisition Trust | ||||||||
| 2006-CH2, 0.26% due 10/25/361 | 2,752,754 | 2,702,813 | ||||||
| Garrison Funding 2013-2 Ltd. | ||||||||
| 2013-2A, 2.13% due 09/25/231,2 | 2,400,000 | 2,390,400 | ||||||
| Argent Securities Incorporated | ||||||||
| Asset-Backed Pass-Through | ||||||||
| Certificates Series | ||||||||
| 2005-W3, 0.50% due 11/25/351 | 2,281,357 | 2,138,025 | ||||||
| JP Morgan Mortgage | ||||||||
| Acquisition Trust | ||||||||
| 2007-CH3, 0.31% due 03/25/371 | 2,135,248 | 2,031,578 | ||||||
| Brentwood CLO Corp. | ||||||||
| 2006-1A, 0.51% due 02/01/221,2 | 1,511,565 | 1,479,822 | ||||||
| 2006-1A, 1.06% due 02/01/221,2 | 600,000 | 531,780 | ||||||
| Foothill CLO Ltd. | ||||||||
| 2007-1A, 0.48% due 02/22/211,2 | 1,890,230 | 1,853,371 | ||||||
| Cornerstone CLO Ltd. | ||||||||
| 2007-1A, 0.46% due 07/15/211,2 | 1,850,000 | 1,803,750 | ||||||
| NewStar Commercial Loan Trust | ||||||||
| 2006-1A, 0.63% due 03/30/221,2 | 1,100,000 | 1,073,490 | ||||||
| 2006-1A, 0.52% due 03/30/221,2 | 739,436 | 728,344 | ||||||
| Goldman Sachs Asset Management CLO plc | ||||||||
| 2007-1A, 2.99% due 08/01/221,2 | 1,800,000 | 1,726,380 | ||||||
| Salus CLO 2012-1 Ltd. | ||||||||
| 2013-1AN, 2.49% due 03/05/211,2 | 1,700,000 | 1,700,000 | ||||||
| Halcyon Structured Asset Management | ||||||||
| Long Secured/Short Unsecured 2007-2 Ltd. | ||||||||
| 2007-2A, 3.99% due 10/29/211,2 | 1,700,000 | 1,683,510 | ||||||
| Cerberus Onshore II CLO LLC | ||||||||
| 2014-1A, 2.94% due 10/15/231,2 | 1,350,000 | 1,338,120 | ||||||
| 2014-1A, 2.24% due 10/15/231,2 | 250,000 | 250,200 | ||||||
| Lehman XS Trust | ||||||||
| 2007-9, 0.28% due 06/25/371 | 1,818,997 | 1,579,777 | ||||||
| Central Park CLO Ltd. | ||||||||
| 2011-1A, 3.44% due 07/23/221,2 | 1,580,000 | 1,527,544 | ||||||
| Aegis Asset Backed Securities Trust | ||||||||
| 2005-3, 0.63% due 08/25/351 | 1,600,000 | 1,522,638 | ||||||
| N-Star REL CDO VIII Ltd. | ||||||||
| 2006-8A, 0.46% due 02/01/411,2 | 1,487,458 | 1,355,818 | ||||||
| Wells Fargo Home Equity Asset-Backed | ||||||||
| Securities 2006-2 Trust | ||||||||
| 2006-3, 0.31% due 01/25/371 | 1,487,672 | 1,345,766 | ||||||
| KKR Financial CLO Corp. | ||||||||
| 2007-1A, 2.49% due 05/15/211,2 | 1,400,000 | 1,318,240 | ||||||
| Black Diamond CLO Delaware Corp. | ||||||||
| 2005-1A, 2.15% due 06/20/171,2 | 1,350,000 | 1,299,240 | ||||||
| Newcastle CDO Ltd. | ||||||||
| 2007-9A, 0.42% due 05/25/52 | 1,317,869 | 1,287,031 | ||||||
| West Coast Funding Ltd. | ||||||||
| 2006-1A, 0.39% due 11/02/411,2 | 1,308,657 | 1,262,069 | ||||||
| GreenPoint Mortgage Funding Trust | ||||||||
| 2005-HE4, 0.87% due 07/25/301 | 1,400,000 | 1,246,123 | ||||||
| Symphony CLO VII Ltd. | ||||||||
| 2011-7A, 3.44% due 07/28/211,2 | 1,250,000 | 1,239,500 | ||||||
| Popular ABS Mortgage | ||||||||
| Pass-Through Trust | ||||||||
| 2005-A, 0.59% due 06/25/351 | 1,248,943 | 1,189,674 | ||||||
| FM Leveraged Capital Fund II | ||||||||
| 2006-2A, 1.84% due 11/15/201,2 | 1,180,000 | 1,165,604 | ||||||
| GSC Group CDO Fund VIII Ltd. | ||||||||
| 2007-8A, 0.62% due 04/17/211,2 | 1,250,000 | 1,158,125 | ||||||
| Global Leveraged Capital | ||||||||
| Credit Opportunity Fund | ||||||||
| 2006-1A, 0.54% due 12/20/181,2 | 1,054,234 | 1,042,215 | ||||||
| California Republic Auto Receivables Trust | ||||||||
| 2013-2, 1.23% due 03/15/19 | 1,000,000 | 999,249 | ||||||
| TICC CLO LLC | ||||||||
| 2011-1A, 2.49% due 07/25/211,2 | 1,000,000 | 995,400 | ||||||
| Black Diamond CLO 2006-1 Luxembourg S.A. | ||||||||
| 2007-1A, 0.63% due 04/29/191,2 | 1,000,000 | 912,400 | ||||||
| Northwoods Capital VII Ltd. | ||||||||
| 2006-7A, 1.79% due 10/22/211,2 | 960,000 | 902,592 | ||||||
| Golub Capital Partners Fundings Ltd. | ||||||||
| 2007-1A, 0.49% due 03/15/221,2 | 683,761 | 671,658 | ||||||
| ACS 2007-1 Pass Through Trust | ||||||||
| 2007-1A, 0.48% due 06/14/371,2 | 645,125 | 599,966 | ||||||
| Ares XVI CLO Ltd. | ||||||||
| 2011-16A, 3.54% due 05/17/211,2 | 500,000 | 497,500 | ||||||
| 12 | the GUGGENHEIM FUNDS annual report | See Notes to Financial Statements. |
| Schedule of Investments (continued) | December 31, 2013 |
| Series A (styleplus–large Core Series) |
| Face | ||||||||
| Amount | Value | |||||||
| Race Point IV CLO Ltd. | ||||||||
| 2007-4A, 0.99% due 08/01/211,2 | $ | 500,000 | $ | 470,500 | ||||
| NewStar Commercial Loan Trust 2007-1 | ||||||||
| 2007-1A, 1.54% due 09/30/221,2 | 500,000 | 459,200 | ||||||
| Riverside Park CLO Ltd. | ||||||||
| 2011-1A, 3.00% due 09/27/211,2 | 450,000 | 450,000 | ||||||
| Accredited Mortgage Loan Trust | ||||||||
| 2007-1, 0.29% due 02/25/371 | 477,329 | 441,165 | ||||||
| DIVCORE CLO Ltd. | ||||||||
| 2013-1A B, 4.10% due 11/15/32 | 400,000 | 398,800 | ||||||
| Legg Mason Real Estate CDO I Ltd. | ||||||||
| 2006-1A, 0.45% due 03/25/381,2 | 186,381 | 183,809 | ||||||
| Total Asset Backed Securities | ||||||||
| (Cost $56,951,385) | 56,849,011 | |||||||
| CORPORATE BONDS†† - 8.9% | ||||||||
| Financials - 3.6% | ||||||||
| Icahn Enterprises Limited Partnership / | ||||||||
| Icahn Enterprises Finance Corp. | ||||||||
| 8.00% due 01/15/18 | 1,220,000 | 1,268,800 | ||||||
| 7.75% due 01/15/16 | 620,000 | 632,400 | ||||||
| Ford Motor Credit Company LLC | ||||||||
| 7.00% due 04/15/15 | 1,630,000 | 1,754,478 | ||||||
| Citigroup, Inc. | ||||||||
| 1.20% due 07/25/161 | 1,510,000 | 1,525,692 | ||||||
| International Lease Finance Corp. | ||||||||
| 2.19% due 06/15/161 | 1,100,000 | 1,105,500 | ||||||
| Nationstar Mortgage LLC / | ||||||||
| Nationstar Capital Corp. | ||||||||
| 6.50% due 08/01/18 | 700,000 | 712,250 | ||||||
| Mack-Cali Realty, LP | ||||||||
| 5.13% due 02/15/14 | 680,000 | 682,998 | ||||||
| WEA Finance LLC / WT Finance Aust Pty Ltd. | ||||||||
| 5.75% due 09/02/152 | 450,000 | 485,381 | ||||||
| Emigrant Bancorp, Inc. | ||||||||
| 6.25% due 06/15/142 | 400,000 | 405,371 | ||||||
| Total Financials | 8,572,870 | |||||||
| Materials - 1.9% | ||||||||
| Glencore Funding LLC | ||||||||
| 1.40% due 05/27/161,2 | 2,210,000 | 2,199,659 | ||||||
| Rio Tinto Finance USA plc | ||||||||
| 1.08% due 06/17/161 | 1,570,000 | 1,581,139 | ||||||
| Anglo American Capital plc | ||||||||
| 9.38% due 04/08/142 | 700,000 | 715,518 | ||||||
| Total Materials | 4,496,316 | |||||||
| Telecommunication Services - 1.3% | ||||||||
| Level 3 Financing, Inc. | ||||||||
| 3.85% due 01/15/181,2 | 1,700,000 | 1,710,625 | ||||||
| WPP Finance UK | ||||||||
| 8.00% due 09/15/14 | 1,200,000 | 1,259,713 | ||||||
| Total Telecommunication Services | 2,970,338 | |||||||
| Energy - 1.2% | ||||||||
| Ras Laffan Liquefied Natural | ||||||||
| Gas Company Limited III | ||||||||
| 5.83% due 09/30/162 | 1,902,560 | 2,021,470 | ||||||
| Petroleos Mexicanos | ||||||||
| 2.27% due 07/18/181 | 660,000 | 679,800 | ||||||
| Total Energy | 2,701,270 | |||||||
| Consumer Staples - 0.3% | ||||||||
| Harbinger Group, Inc. | ||||||||
| 7.88% due 07/15/192 | 590,000 | 633,513 | ||||||
| Consumer Discretionary - 0.3% | ||||||||
| Vail Resorts, Inc. | ||||||||
| 6.50% due 05/01/19 | 300,000 | 318,000 | ||||||
| Sabre, Inc. | ||||||||
| 8.50% due 05/15/192 | 240,000 | 266,400 | ||||||
| Total Consumer Discretionary | 584,400 | |||||||
| Information Technology - 0.2% | ||||||||
| iGATE Corp. | ||||||||
| 9.00% due 05/01/16 | 340,000 | 361,250 | ||||||
| Industrials - 0.1% | ||||||||
| Victor Technologies Group, Inc. | ||||||||
| 9.00% due 12/15/17 | 180,000 | 192,600 | ||||||
| Total Corporate Bonds | ||||||||
| (Cost $20,480,021) | 20,512,557 | |||||||
| COLLATERALIZED MORTGAGE OBLIGATIONS†† - 5.1% | ||||||||
| Boca Hotel Portfolio Trust | ||||||||
| 2013-BOCA, 3.22% due 08/15/261,2 | 1,900,000 | 1,902,276 | ||||||
| Hilton USA Trust | ||||||||
| 2013-HLF, 2.92% due 11/05/301,2 | 1,700,000 | 1,700,122 | ||||||
| Wachovia Bank Commercial Mortgage | ||||||||
| Trust Series 2007-WHALE 8 | ||||||||
| 2007-WHL8, 0.25% due 06/15/201,2 | 1,421,546 | 1,407,186 | ||||||
| SRERS-2011 Funding Ltd. | ||||||||
| 2011-RS, 0.42% due 05/09/461,2 | 1,505,762 | 1,364,823 | ||||||
| COMM 2007-FL14 Mortgage Trust | ||||||||
| 2007-FL14, 0.92% due 06/15/221,2 | 1,340,253 | 1,322,788 | ||||||
| HarborView Mortgage Loan Trust | ||||||||
| 2006-12, 0.36% due 01/19/381 | 1,368,628 | 1,112,696 | ||||||
| Banc of America Merrill Lynch | ||||||||
| Commercial Mortgage, Inc. | ||||||||
| 2005-6, 6.13% due 09/10/471,2 | 1,075,200 | 1,109,172 | ||||||
| GCCFC Commercial Mortgage Trust | ||||||||
| 2006-FL4A C, 0.40% due 11/05/21 | 1,000,000 | 985,223 | ||||||
| Banc of America Large Loan Trust | ||||||||
| 2007-BMB1, 1.27% due 08/15/291,2 | 950,000 | 942,567 | ||||||
| Total Collateralized Mortgage Obligations | ||||||||
| (Cost $11,781,296) | 11,846,853 | |||||||
| SENIOR FLOATING RATE INTERESTS††,1 - 3.9% | ||||||||
| Industrials - 1.1% | ||||||||
| Travelport Holdings Ltd. | ||||||||
| 6.25% due 06/26/19 | 1,880,550 | 1,926,002 | ||||||
| Thermasys Corp. | ||||||||
| 5.26% due 05/03/19 | 765,188 | 752,432 | ||||||
| Total Industrials | 2,678,434 | |||||||
| Financials - 1.0% | ||||||||
| National Financial Partners | ||||||||
| 5.25% due 07/01/20 | 1,512,400 | 1,526,268 | ||||||
| Knight/Getco | ||||||||
| 5.75% due 11/30/17 | 603,972 | 604,727 | ||||||
| First Data Corp. | ||||||||
| 4.16% due 03/23/18 | 150,000 | 150,104 | ||||||
| See Notes to Financial Statements. | The GUGGENHEIM FUNDS annual report | 13 |
| Schedule of Investments (concluded) | December 31, 2013 |
| Series A (styleplus–large Core Series) | |
| Face | ||||||||
| Amount | Value | |||||||
| Cunningham Lindsey U.S., Inc. | ||||||||
| 5.00% due 12/10/19 | $ | 138,947 | $ | 138,774 | ||||
| Total Financials | 2,419,873 | |||||||
Energy - 0.7% | ||||||||
| Pacific Drilling 4.50% due 05/18/18 | 776,100 | 784,350 | ||||||
| Ocean Rig ASA 5.50% due 07/15/16 | 748,125 | 757,791 | ||||||
| Total Energy | 1,542,141 | |||||||
| Consumer Discretionary - 0.6% | ||||||||
| Pinnacle Entertainment, Inc. | ||||||||
| 3.75% due 08/15/16 | 646,518 | 650,966 | ||||||
| Go Daddy Operating Company LLC | ||||||||
| 4.00% due 12/16/18 | 285,268 | 285,328 | ||||||
| Sears Holdings Corp. | ||||||||
| 5.50% due 06/30/18 | 240,000 | 241,318 | ||||||
| Laureate Education, Inc. | ||||||||
| 5.00% due 06/16/18 | 124,366 | 124,911 | ||||||
| Total Consumer Discretionary | 1,302,523 | |||||||
| Information Technology - 0.4% | ||||||||
| Blue Coat Systems, Inc. | ||||||||
| 4.50% due 05/31/19 | 887,775 | 889,719 | ||||||
| Health Care - 0.1% | ||||||||
| Apria Healthcare Group, Inc. | ||||||||
| 6.75% due 04/06/20 | 179,100 | 179,473 | ||||||
| Total Senior Floating Rate Interests | ||||||||
| (Cost $8,875,794) | 9,012,163 | |||||||
| U.S. TREASURY BILLS† - 3.0% | ||||||||
| U.S. Treasury Bill6 | ||||||||
| due 02/20/14 | 7,000,000 | 6,999,783 | ||||||
| Total U.S. Treasury Bills | ||||||||
| (Cost $6,999,810) | 6,999,783 | |||||||
| MUNICIPAL BONDS†† - 2.7% | ||||||||
| New York - 2.5% | ||||||||
| New York City Water & Sewer | ||||||||
| System Revenue Bonds | ||||||||
| 0.30% due 06/15/331 | 3,120,000 | 3,120,000 | ||||||
| City of New York New York | ||||||||
| General Obligation Unlimited | ||||||||
| 0.30% due 04/01/351 | 1,550,000 | 1,550,000 | ||||||
| 0.30% due 11/01/261 | 1,220,000 | 1,220,000 | ||||||
| Total New York | 5,890,000 | |||||||
| Michigan - 0.2% | ||||||||
| Michigan Finance Authority | ||||||||
| Revenue Notes | ||||||||
| 4.38% due 08/20/14 | 375,000 | 378,911 | ||||||
| Total Municipal Bonds | ||||||||
| (Cost $6,265,000) | 6,268,911 | |||||||
| MORTGAGE BACKED SECURITIES†† - 0.8% | ||||||||
| Resource Capital Corporation | ||||||||
| CRE Notes 2013 Ltd. | ||||||||
| 3.02% due 12/15/281,2 | 1,900,000 | 1,901,520 | ||||||
| Total Mortgage Backed Securities | ||||||||
| (Cost $1,900,000) | 1,901,520 | |||||||
| COMMERCIAL PAPER†† - 9.9% | ||||||||
| Centrica plc | ||||||||
| 0.22% due 01/03/14 | 2,200,000 | 2,199,968 | ||||||
| FMC Technologies Inc. | ||||||||
| 0.23% due 01/14/14 | 2,000,000 | 1,999,835 | ||||||
| Diageo Capital plc | ||||||||
| 0.08% due 01/02/14 | 1,700,000 | 1,699,992 | ||||||
| Tesco Treasury Services plc | ||||||||
| 0.13% due 01/06/142 | 1,700,000 | 1,699,965 | ||||||
| Kellogg Co. | ||||||||
| 0.12% due 01/08/14 | 1,700,000 | 1,699,957 | ||||||
| Northeast Utilities | ||||||||
| 0.18% due 01/08/14 | 1,700,000 | 1,699,941 | ||||||
| Kinder Morgan Energy Partners, LP | ||||||||
| 0.23% due 01/07/142 | 1,700,000 | 1,699,935 | ||||||
| VW Credit, Inc. | ||||||||
| 0.22% due 01/13/142 | 1,700,000 | 1,699,875 | ||||||
| Ryder System, Inc. | ||||||||
| 0.20% due 01/15/14 | 1,700,000 | 1,699,868 | ||||||
| BAT International Finance | ||||||||
| 0.25% due 01/13/14 | 1,700,000 | 1,699,858 | ||||||
| Potomac Electric Power Co. | ||||||||
| 0.25% due 01/13/14 | 1,700,000 | 1,699,858 | ||||||
| Nissan Motor Acceptance | ||||||||
| 0.30% due 01/13/14 | 1,700,000 | 1,699,830 | ||||||
| CBS Corp. | ||||||||
| 0.24% due 01/24/142 | 1,700,000 | 1,699,739 | ||||||
| Total Commercial Paper | ||||||||
| (Cost $22,898,621) | 22,898,621 | |||||||
| Total Investments - 100.3% | ||||||||
| (Cost $227,158,103) | $ | 231,829,446 | ||||||
| Other Assets & Liabilities, net - (0.3)% | (635,348 | ) | ||||||
| Total Net Assets - 100.0% | $ | 231,194,098 | ||||||
| Unrealized | ||||||||
| Units | Gain | |||||||
| OTC EQUITY INDEX SWAP AGREEMENTS†† | ||||||||
| Morgan Stanley Capital Services, Inc. | ||||||||
| February 2014 S&P 500 Index Swap, | ||||||||
| Terminating 02/03/143 | ||||||||
| (Notional Value $170,799,554) | 92,406 | $ | — | |||||
| * | Non-income producing security. |
| † | Value determined based on Level 1 inputs — See Note 4. |
| †† | Value determined based on Level 2 inputs — See Note 4. |
| 1 | Variable rate security. Rate indicated is rate effective at December 31, 2013. |
| 2 | Security is a 144A or Section 4(a)(2) security. The total market value of 144A or Section 4(a)(2) securities is $64,006,104 (cost $64,052,387), or 27.7% of total net assets. |
| 3 | Total Return based on S&P 500 Index +/- financing at a variable rate. |
| 4 | Investment in a product that pays a management fee to a party related to the advisor. |
| 5 | Affiliated funds. |
| 6 | Zero coupon rate security. |
| plc — Public Limited Company |
| 14 | the GUGGENHEIM FUNDS annual report | See Notes to Financial Statements. |
| Series A (styleplus–large Core Series) |
| STATEMENT OF ASSETS |
| AND LIABILITIES |
December 31, 2013
| Assets: | ||||
| Investments in unaffiliated issuers, at value | ||||
| (cost $219,020,820) | $ | 223,888,559 | ||
| Investments in affiliated issuers, at value | ||||
| (cost $8,137,283) | 7,940,887 | |||
| Total investments | ||||
| (cost $227,158,103) | 231,829,446 | |||
| Receivable for swap settlement | 4,671,296 | |||
| Cash | 95,002 | |||
| Prepaid expenses | 18,823 | |||
| Receivables: | ||||
| Interest | 432,128 | |||
| Securities sold | 320,800 | |||
| Dividends | 202,375 | |||
| Fund shares sold | 3,940 | |||
| Foreign taxes reclaim | 115 | |||
| Total assets | 237,573,925 | |||
| Liabilities: | ||||
| Due to broker | 4,039,162 | |||
| Payable for: | ||||
| Securities purchased | 1,907,263 | |||
| Fund shares redeemed | 203,402 | |||
| Management fees | 144,960 | |||
| Fund accounting/administration fees | 18,361 | |||
| Transfer agent/maintenance fees | 3,698 | |||
| Directors’ fees* | 2,111 | |||
| Miscellaneous | 60,870 | |||
| Total liabilities | 6,379,827 | |||
| Net assets | $ | 231,194,098 | ||
| Net assets consist of: | ||||
| Paid in capital | $ | 200,600,696 | ||
| Undistributed net investment income | 1,196,673 | |||
| Accumulated net realized gain on investments | 24,725,386 | |||
| Net unrealized appreciation on investments | 4,671,343 | |||
| Net assets | $ | 231,194,098 | ||
| Capital shares outstanding | 7,113,720 | |||
| Net asset value per share | $ | 32.50 |
| STATEMENT OF |
| OPERATIONS |
Year Ended December 31, 2013
| Investment Income: | ||||
| Dividends from securities of unaffiliated issuers | $ | 1,936,841 | ||
| Interest | 1,090,682 | |||
| Dividends from securities of affiliated issuers | 264,423 | |||
| Total investment income | 3,291,946 | |||
| Expenses: | ||||
| Management fees | 1,623,772 | |||
| Transfer agent/maintenance fees | 25,455 | |||
| Fund accounting/administration fees | 206,448 | |||
| Directors’ fees* | 22,227 | |||
| Custodian fees | 15,049 | |||
| Tax expense | 6 | |||
| Miscellaneous | 175,888 | |||
| Total expenses | 2,068,845 | |||
| Net investment income | 1,223,101 | |||
| Net Realized and Unrealized Gain (Loss): | ||||
| Net realized gain (loss) on: | ||||
| Investments in unaffiliated issuers | 42,552,123 | |||
| Investments in affiliated issuers | 3,744 | |||
| Swap agreements | 26,517,485 | |||
| Futures contracts | 371,912 | |||
| Net realized gain | 69,445,264 | |||
| Net change in unrealized appreciation (depreciation) on: | ||||
| Investments in unaffiliated issuers | (15,664,656 | ) | ||
| Investments in affiliated issuers | (196,396 | ) | ||
| Net change in unrealized appreciation (depreciation) | (15,861,052 | ) | ||
| Net realized and unrealized gain | 53,584,212 | |||
| Net increase in net assets resulting from operations | $ | 54,807,313 |
| * | Relates to Directors not deemed “interested persons” within the meaning of Section 2(a)(19) of the 1940 Act. |
| See Notes to Financial Statements. | The GUGGENHEIM FUNDS annual report | 15 |
| Series A (styleplus–large Core Series) |
| STATEMENTS OF CHANGES IN NET ASSETS |
| Year Ended | Year Ended | |||||||
| December 31, | December 31, | |||||||
| 2013 | 2012 | |||||||
| Increase (Decrease) In Net Assets From Operations: | ||||||||
| Net investment income | $ | 1,223,101 | $ | 1,952,226 | ||||
| Net realized gain on investments | 69,445,264 | 13,722,503 | ||||||
| Net change in unrealized appreciation (depreciation) on investments | (15,861,052 | ) | 10,476,312 | |||||
| Net increase in net assets resulting from operations | 54,807,313 | 26,151,041 | ||||||
| Capital share transactions: | ||||||||
| Proceeds from sale of shares | 13,501,310 | 8,284,929 | ||||||
| Cost of shares redeemed | (35,729,632 | ) | (42,815,935 | ) | ||||
| Net decrease from capital share transactions | (22,228,322 | ) | (34,531,006 | ) | ||||
| Net increase (decrease) in net assets | 32,578,991 | (8,379,965 | ) | |||||
| Net assets: | ||||||||
| Beginning of year | 198,615,107 | 206,995,072 | ||||||
| End of year | $ | 231,194,098 | $ | 198,615,107 | ||||
| Undistributed net investment income at end of year | $ | 1,196,673 | $ | 1,952,226 | ||||
| Capital share activity: | ||||||||
| Shares sold | 476,713 | 335,217 | ||||||
| Shares redeemed | (1,236,898 | ) | (1,738,927 | ) | ||||
| Net decrease in shares | (760,185 | ) | (1,403,710 | ) | ||||
| 16 | the GUGGENHEIM FUNDS annual report | See Notes to Financial Statements. |
| Series A (styleplus–large Core Series) |
| FINANCIAL HIGHLIGHTS |
This table is presented to show selected data for a share outstanding throughout each period and to assist shareholders in evaluating a Fund’s performance for the periods presented.
| Year Ended | Year Ended | Year Ended | Year Ended | Year Ended | ||||||||||||||||
| December 31, | December 31, | December 31, | December 31, | December 31, | ||||||||||||||||
| 2013 | 2012 | 2011 | 2010 | 2009 | ||||||||||||||||
| Per Share Data | ||||||||||||||||||||
| Net asset value, beginning of period | $ | 25.22 | $ | 22.31 | $ | 23.24 | $ | 19.97 | $ | 15.38 | ||||||||||
| Income (loss) from investment operations: | ||||||||||||||||||||
| Net investment incomea | .16 | .23 | .13 | .18 | .11 | |||||||||||||||
| Net gain (loss) on investments (realized and unrealized) | 7.12 | 2.68 | (1.06 | ) | 3.09 | 4.48 | ||||||||||||||
| Total from investment operations | 7.28 | 2.91 | (.93 | ) | 3.27 | 4.59 | ||||||||||||||
| Net asset value, end of period | $ | 32.50 | $ | 25.22 | $ | 22.31 | $ | 23.24 | $ | 19.97 | ||||||||||
| Total Returnb | 28.87 | % | 13.04 | % | (4.00 | %) | 16.37 | % | 29.84 | % | ||||||||||
| Ratios/Supplemental Data | ||||||||||||||||||||
| Net assets, end of period (in thousands) | $ | 231,194 | $ | 198,615 | $ | 206,995 | $ | 243,820 | $ | 186,007 | ||||||||||
| Ratios to average net assets: | ||||||||||||||||||||
| Net investment income | 0.56 | % | 0.92 | % | 0.57 | % | 0.89 | % | 0.68 | % | ||||||||||
| Total expensesc | 0.96 | % | 0.94 | % | 0.90 | % | 0.92 | % | 0.92 | % | ||||||||||
| Portfolio turnover rate | 267 | % | 103 | % | 87 | % | 111 | % | 78 | % | ||||||||||
| a | Net investment income per share was computed using average shares outstanding throughout the period. |
| b | Total return does not take into account any of the expenses associated with an investment in variable insurance products. If total return had taken into account these expenses, performance would have been lower. Shares of a series of SBL Fund are available only through the purchase of such products. |
| c | Does not include expenses of the underlying funds in which the Fund invests. |
| See Notes to Financial Statements. | The GUGGENHEIM FUNDS annual report | 17 |
| Manager’S Commentary (Unaudited) | December 31, 2013 |
To Our Shareholders:
The Series B (Large Cap Value Series) is managed by a team of seasoned professionals led by Mark A. Mitchell, CFA, Portfolio Manager. In the following paragraphs, he discusses performance of the Fund for the fiscal year ended December 31, 2013.
For the fiscal year ended December 31, 2013, the Series B (Large Cap Value Series) returned 31.96%, compared with the Russell 1000® Value Index, which returned 32.53%.
The strategy is to select securities of companies that appear undervalued by the overall market relative to assets, earnings, growth potential or cash flows. The investment approach is a defined and disciplined process with three key philosophical tenets that drive our investment decisions: a valuation focus, a long-term investment horizon and an opportunistic approach.
The portfolio’s performance for the period was helped by stock selection in the Financials, Consumer Discretionary and Energy sectors, and an underweight in the Telecommunications Services sector. The Fund’s holdings in the Consumer Discretionary sector benefited from broad recoveries in both the auto and housing industries.
The largest detractor from performance was stock selection in the Industrials sector, which was overweight relative to the benchmark. Stock selection in the Materials sector was also a detractor.
The holdings contributing most to portfolio performance over the period were Harman International Industries, Inc., a maker and marketer of audio and electronic systems; and Aetna, Inc., a managed care company that specializes in corporate health plans.
The main detractors were McDermott International, Inc., which missed earnings early in 2013 and guided earnings down for other quarters and is no longer held in the portfolio; and Coeur Mining, Inc., which underperformed due to the selloff in gold earlier in 2013.
Sector positioning in the Fund is mostly a result of stock selection decisions where the Fund believes it is finding the most attractive valuations or investment opportunities. The largest changes in positioning from a year ago were an increase in the Energy sector exposure and a decrease in the Industrials sector exposure.
Nonetheless, for the period, the Fund had its largest overweight relative to the benchmark in Industrials, primarily in the engineering and construction industry. Opportunities appear attractive in investing in maintaining U.S. infrastructure and grids for distributing oil, gas and electricity.
The Fund was most underweight relative to the benchmark in Utilities and Health Care. In Health Care, the underweight was mostly in the large pharmaceuticals industry, which has been underperforming lately due to patent expirations and lack of reinvestment opportunities in new drug therapies. The Fund is overweight in the managed-care-provider industry, which was a boost to performance for the period. High valuations in the Utilities sector currently make this sector unattractive.
The Fund was also underweight relative to the benchmark in the Financials sector, the largest in both the Fund and the benchmark. This stance was a source of positive performance for the period, as was the Fund’s stock selection in the sector. The Fund continues to favor the insurance industry within Financials, and has no weighting in REITs, which make up a large part of the sector in the benchmark. The Fund’s underweight in REITs is because they appear expensive, prices having been driven up by yield-hungry investors searching for bond substitutes.
The slow-growth economy is making it more challenging to find investments with attractive growth prospects. While either a more powerful recovery or a significant market pullback could change this scenario, investors are currently finding it difficult to get paid for taking risk.
The Fund continues to focus on searching for companies it believes have good long-term fundamental prospects and attractive valuations that are likely to generate strong performance relative to the broader market, regardless of macroeconomic events.
Performance displayed represents past performance, which is no guarantee of future results.
The opinions and forecast expressed may not actually come to pass. This information is subject to change at any time, based on market and other conditions, and should not be construed as a recommendation of any specific security or strategy.
| 18 | The Guggenheim Funds annual REPORT |
| performance report and FUND PROFILE (Unaudited) | December 31, 2013 |
SERIES B (LARGE CAP VALUE SERIES)
OBJECTIVE: Seeks long-term growth of capital.
Cumulative Fund Performance*,†
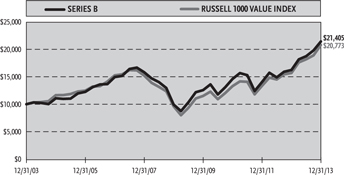
Average Annual Returns*
Periods Ended December 31, 2013†
| 1 Year | 5 Year | 10 Year | ||||||||||
| Series B (Large Cap Value Series) | 31.96 | % | 16.60 | % | 7.91 | % | ||||||
| Russell 1000 Value Index | 32.53 | % | 16.67 | % | 7.58 | % | ||||||
Holdings Diversification (Market Exposure as % of Net Assets)
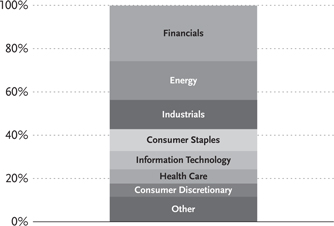
Inception Date: May 1, 1979
Ten Largest Holdings (% of Total Net Assets)
| Wells Fargo & Co. | 4.4 | % | ||
| CVS Caremark Corp. | 3.5 | % | ||
| American International Group, Inc. | 3.2 | % | ||
| Dow Chemical Co. | 3.2 | % | ||
| Chevron Corp. | 3.2 | % | ||
| JPMorgan Chase & Co. | 3.0 | % | ||
| Time Warner, Inc. | 3.0 | % | ||
| Dreyfus Treasury Prime Cash Management Fund | 2.9 | % | ||
| Computer Sciences Corp. | 2.9 | % | ||
| Aetna, Inc. | 2.8 | % | ||
| Top Ten Total | 32.1 | % |
| * | The performance data above represents past performance that is not predictive of future results. The investment return and principal value of an investment in the Fund will fluctuate so that an investor’s shares, when redeemed, may be worth more or less than their original cost. Returns are historical and include changes in principal and reinvested dividends and capital gains and do not reflect the effect of taxes. The Russell 1000 Value Index is an unmanaged index and, unlike the Fund, has no management fees or operating expenses to reduce its reported return. |
| † | Performance figures do not reflect fees and expenses associated with an investment in variable insurance products. If returns had taken into account these fees and expenses, performance would have been lower. Shares of a series of SBL Fund are available only through the purchase of such products. |
| the GUGGENHEIM FUNDS annual report | 19 |
| Schedule of Investments | December 31, 2013 |
| Series B (Large Cap Value Series) |
| Shares | Value | |||||||
| COMMON STOCKS† - 96.2% | ||||||||
| Financials - 25.7% | ||||||||
| Wells Fargo & Co. | 272,825 | $ | 12,386,255 | |||||
| American International Group, Inc. | 179,839 | 9,180,781 | ||||||
| JPMorgan Chase & Co. | 146,300 | 8,555,624 | ||||||
| Allstate Corp. | 127,050 | 6,929,307 | ||||||
| Aon plc | 56,750 | 4,760,758 | ||||||
| Reinsurance Group of America, Inc. — | ||||||||
| Class A | 56,330 | 4,360,505 | ||||||
| Bank of America Corp. | 241,100 | 3,753,927 | ||||||
| Citigroup, Inc. | 67,030 | 3,492,933 | ||||||
| Berkshire Hathaway, Inc. — Class A* | 19 | 3,380,100 | ||||||
| Bank of New York Mellon Corp. | 82,970 | 2,898,972 | ||||||
| U.S. Bancorp | 66,546 | 2,688,458 | ||||||
| CME Group, Inc. — Class A | 33,340 | 2,615,856 | ||||||
| Franklin Resources, Inc. | 42,730 | 2,466,803 | ||||||
| Ocwen Financial Corp.* | 36,940 | 2,048,323 | ||||||
| Home Loan Servicing Solutions Ltd. | 74,450 | 1,710,117 | ||||||
| NASDAQ OMX Group, Inc. | 42,020 | 1,672,396 | ||||||
| Total Financials | 72,901,115 | |||||||
| Energy - 17.9% | ||||||||
| Chevron Corp. | 72,770 | 9,089,700 | ||||||
| Apache Corp. | 75,022 | 6,447,390 | ||||||
| Halliburton Co. | 109,840 | 5,574,380 | ||||||
| Whiting Petroleum Corp.* | 88,590 | 5,481,063 | ||||||
| Cameco Corp. | 261,200 | 5,425,124 | ||||||
| Phillips 66 | 61,220 | 4,721,899 | ||||||
| Exxon Mobil Corp. | 36,690 | 3,713,028 | ||||||
| Marathon Oil Corp. | 94,300 | 3,328,790 | ||||||
| ConocoPhillips | 35,510 | 2,508,782 | ||||||
| Suncor Energy, Inc. | 65,570 | 2,298,229 | ||||||
| Superior Energy Services, Inc.* | 79,890 | 2,125,873 | ||||||
| Total Energy | 50,714,258 | |||||||
| Industrials - 13.5% | ||||||||
| URS Corp. | 146,620 | 7,769,394 | ||||||
| Parker Hannifin Corp. | 58,660 | 7,546,022 | ||||||
| Republic Services, Inc. — Class A | 191,700 | 6,364,440 | ||||||
| United Technologies Corp. | 55,680 | 6,336,384 | ||||||
| Quanta Services, Inc.* | 188,580 | 5,951,585 | ||||||
| Covanta Holding Corp. | 162,770 | 2,889,168 | ||||||
| General Cable Corp. | 48,900 | 1,438,149 | ||||||
| Total Industrials | 38,295,142 | |||||||
| Consumer Staples - 10.1% | ||||||||
| CVS Caremark Corp. | 139,120 | 9,956,817 | ||||||
| Wal-Mart Stores, Inc. | 79,650 | 6,267,659 | ||||||
| Bunge Ltd. | 69,650 | 5,718,962 | ||||||
| Mondelez International, Inc. — Class A | 136,300 | 4,811,390 | ||||||
| Kraft Foods Group, Inc. | 35,743 | 1,927,263 | ||||||
| Total Consumer Staples | 28,682,091 | |||||||
| Information Technology - 8.5% | ||||||||
| Computer Sciences Corp. | 145,020 | 8,103,717 | ||||||
| TE Connectivity Ltd. | 122,760 | 6,765,304 | ||||||
| Cisco Systems, Inc. | 268,290 | 6,023,111 | ||||||
| Global Payments, Inc. | 24,466 | 1,590,045 | ||||||
| NetApp, Inc. | 37,400 | 1,538,636 | ||||||
| Total Information Technology | 24,020,813 | |||||||
| Health Care - 6.6% | ||||||||
| Aetna, Inc. | 115,830 | 7,944,780 | ||||||
| UnitedHealth Group, Inc. | 49,170 | 3,702,501 | ||||||
| Teva Pharmaceutical Industries Ltd. ADR | 73,390 | 2,941,471 | ||||||
| Pfizer, Inc. | 65,290 | 1,999,833 | ||||||
| Covidien plc | 29,000 | 1,974,900 | ||||||
| Mallinckrodt plc* | 3,923 | 205,016 | ||||||
| Total Health Care | 18,768,501 | |||||||
| Consumer Discretionary - 6.1% | ||||||||
| Time Warner, Inc. | 120,653 | 8,411,927 | ||||||
| Lowe’s Companies, Inc. | 95,520 | 4,733,016 | ||||||
| DeVry Education Group, Inc. | 73,500 | 2,609,250 | ||||||
| Kohl’s Corp. | 25,860 | 1,467,555 | ||||||
| Total Consumer Discretionary | 17,221,748 | |||||||
| Materials - 4.7% | ||||||||
| Dow Chemical Co. | 205,350 | 9,117,540 | ||||||
| Coeur Mining, Inc.* | 284,400 | 3,085,740 | ||||||
| Potash Corporation of Saskatchewan, Inc. | 36,620 | 1,206,995 | ||||||
| Total Materials | 13,410,275 | |||||||
| Utilities - 2.4% | ||||||||
| Edison International | 149,030 | 6,900,089 | ||||||
| TELECOMMUNICATION SERVICES - 0.7% | ||||||||
| Windstream Holdings, Inc. | 232,532 | 1,855,605 | ||||||
| Total Common Stocks | ||||||||
| (Cost $190,451,542) | 272,769,637 | |||||||
| EXCHANGE TRADED FUNDS† - 0.8% | ||||||||
| iShares Russell 1000 Value ETF | 24,930 | 2,347,409 | ||||||
| Total Exchange Traded Funds | ||||||||
| (Cost $2,044,469) | 2,347,409 | |||||||
| SHORT TERM INVESTMENTS† - 2.9% | ||||||||
| Dreyfus Treasury Prime Cash | ||||||||
| Management Fund | 8,217,629 | 8,217,629 | ||||||
| Total Short Term Investments | ||||||||
| (Cost $8,217,629) | 8,217,629 | |||||||
| Total Investments - 99.9% | ||||||||
| (Cost $200,713,640) | $ | 283,334,675 | ||||||
| Other Assets & Liabilities, net - 0.1% | 192,336 | |||||||
| Total Net Assets - 100.0% | $ | 283,527,011 | ||||||
| * | Non-income producing security. |
| † | Value determined based on Level 1 inputs — See Note 4. |
ADR — American Depositary Receipt
plc — Public Limited Company
| 20 | the GUGGENHEIM FUNDS annual report | See Notes to Financial Statements. |
| Series B (Large Cap Value Series) |
| STATEMENT OF ASSETS |
| AND LIABILITIES |
December 31, 2013
| Assets: | ||||
| Investments, at value | ||||
| (cost $200,713,640) | $ | 283,334,675 | ||
| Prepaid expenses | 7,655 | |||
| Receivables: | ||||
| Dividends | 571,442 | |||
| Fund shares sold | 21,109 | |||
| Foreign taxes reclaim | 6,969 | |||
| Total assets | 283,941,850 | |||
| Liabilities: | ||||
| Overdraft due to custodian bank | 2 | |||
| Payable for: | ||||
| Fund shares redeemed | 180,004 | |||
| Management fees | 153,462 | |||
| Fund accounting/administration fees | 22,429 | |||
| Transfer agent/maintenance fees | 4,233 | |||
| Directors’ fees* | 901 | |||
| Miscellaneous | 53,808 | |||
| Total liabilities | 414,839 | |||
| Net assets | $ | 283,527,011 | ||
| Net assets consist of: | ||||
| Paid in capital | $ | 216,091,843 | ||
| Undistributed net investment income | 2,829,968 | |||
| Accumulated net realized loss on investments | (18,015,835 | ) | ||
| Net unrealized appreciation on investments | 82,621,035 | |||
| Net assets | $ | 283,527,011 | ||
| Capital shares outstanding | 7,496,812 | |||
| Net asset value per share | $ | 37.82 |
| STATEMENT OF |
| OPERATIONS |
Year Ended December 31, 2013
| Investment Income: | ||||
| Dividends (net of foreign withholding tax of $17,515) | $ | 5,067,657 | ||
| Interest | 861 | |||
| Total investment income | 5,068,518 | |||
| Expenses: | ||||
| Management fees | 1,756,103 | |||
| Transfer agent/maintenance fees | 25,626 | |||
| Fund accounting/administration fees | 256,658 | |||
| Directors’ fees* | 26,394 | |||
| Custodian fees | 7,783 | |||
| Tax expense | 8 | |||
| Miscellaneous | 165,978 | |||
| Total expenses | 2,238,550 | |||
| Net investment income | 2,829,968 | |||
| Net Realized and Unrealized Gain (Loss): | ||||
| Net realized gain (loss) on: | ||||
| Investments | 31,731,371 | |||
| Net realized gain | 31,731,371 | |||
| Net change in unrealized appreciation (depreciation) on: | ||||
| Investments | 39,490,698 | |||
| Net change in unrealized appreciation (depreciation) | 39,490,698 | |||
| Net realized and unrealized gain | 71,222,069 | |||
| Net increase in net assets resulting from operations | $ | 74,052,037 |
| * | Relates to Directors not deemed “interested persons” within the meaning of Section 2(a)(19) of the 1940 Act. |
| See Notes to Financial Statements. | The GUGGENHEIM FUNDS annual report | 21 |
| Series B (Large Cap Value Series) |
| STATEMENTS OF CHANGES IN NET ASSETS |
| Year Ended | Year Ended | |||||||
| December 31, | December 31, | |||||||
| 2013 | 2012 | |||||||
| Increase (Decrease) In Net Assets From Operations: | ||||||||
| Net investment income | $ | 2,829,968 | $ | 3,229,551 | ||||
| Net realized gain on investments | 31,731,371 | 10,161,128 | ||||||
| Net change in unrealized appreciation (depreciation) on investments | 39,490,698 | 23,246,913 | ||||||
| Net increase in net assets resulting from operations | 74,052,037 | 36,637,592 | ||||||
| Capital share transactions: | ||||||||
| Proceeds from sale of shares | 21,372,678 | 14,915,262 | ||||||
| Cost of shares redeemed | (58,004,399 | ) | (54,897,141 | ) | ||||
| Net decrease from capital share transactions | (36,631,721 | ) | (39,981,879 | ) | ||||
| Net increase (decrease) in net assets | 37,420,316 | (3,344,287 | ) | |||||
| Net assets: | ||||||||
| Beginning of year | 246,106,695 | 249,450,982 | ||||||
| End of year | $ | 283,527,011 | $ | 246,106,695 | ||||
| Undistributed net investment income at end of year | $ | 2,829,968 | $ | 3,229,551 | ||||
| Capital share activity: | ||||||||
| Shares sold | 651,050 | 550,498 | ||||||
| Shares redeemed | (1,740,993 | ) | (2,025,731 | ) | ||||
| Net decrease in shares | (1,089,943 | ) | (1,475,233 | ) | ||||
| 22 | the GUGGENHEIM FUNDS annual report | See Notes to Financial Statements. |
| Series B (Large Cap Value Series) |
|
| FINANCIAL HIGHLIGHTS |
This table is presented to show selected data for a share outstanding throughout each period and to assist shareholders in evaluating a Fund’s performance for the periods presented.
| Year Ended | Year Ended | Year Ended | Year Ended | Year Ended | ||||||||||||||||
| December 31, | December 31, | December 31, | December 31, | December 31, | ||||||||||||||||
| 2013 | 2012 | 2011 | 2010 | 2009 | ||||||||||||||||
| Per Share Data | ||||||||||||||||||||
| Net asset value, beginning of period | $ | 28.66 | $ | 24.79 | $ | 25.79 | $ | 22.20 | $ | 17.55 | ||||||||||
| Income (loss) from investment operations: | ||||||||||||||||||||
| Net investment incomea | .35 | .35 | .26 | .19 | .19 | |||||||||||||||
| Net gain (loss) on investments (realized and unrealized) | 8.81 | 3.52 | (1.26 | ) | 3.40 | 4.46 | ||||||||||||||
| Total from investment operations | 9.16 | 3.87 | (1.00 | ) | 3.59 | 4.65 | ||||||||||||||
| Net asset value, end of period | $ | 37.82 | $ | 28.66 | $ | 24.79 | $ | 25.79 | $ | 22.20 | ||||||||||
| Total Returnb | 31.96 | % | 15.61 | % | (3.88 | %) | 16.17 | % | 26.50 | % | ||||||||||
| Ratios/Supplemental Data | ||||||||||||||||||||
| Net assets, end of period (in thousands) | $ | 283,527 | $ | 246,107 | $ | 249,451 | $ | 298,181 | $ | 280,473 | ||||||||||
| Ratios to average net assets: | ||||||||||||||||||||
| Net investment income | 1.05 | % | 1.28 | % | 1.00 | % | 0.81 | % | 1.03 | % | ||||||||||
| Total expensesc | 0.83 | % | 0.83 | % | 0.80 | % | 0.80 | % | 0.81 | % | ||||||||||
| Portfolio turnover rate | 26 | % | 17 | % | 19 | % | 17 | % | 16 | % | ||||||||||
| a | Net investment income per share was computed using average shares outstanding throughout the period. |
| b | Total return does not take into account any of the expenses associated with an investment in variable insurance products. If total return had taken into account these expenses, performance would have been lower. Shares of a series of SBL Fund are available only through the purchase of such products. |
| c | Does not include expenses of the underlying funds in which the Fund invests. |
| See Notes to Financial Statements. | The GUGGENHEIM FUNDS annual report | 23 |
| Manager’S Commentary (Unaudited) | December 31, 2013 |
To Our Shareholders:
The Series C (Money Market Series) is managed by a team of seasoned professionals led by Steve McFeely, CFA, Portfolio Manager. In the following paragraphs, he discusses performance of the Fund for the fiscal year ended December 31, 2013.
For the fiscal year ended December 31, 2013, the Series C (Money Market Series) returned -0.52%. The Federal Reserve Board continues to hold rates near 0%, making it a challenge to maintain a positive yield. The Fed has signaled that it will continue to keep rates low for the near future.
Composition of Portfolio Assets
At December 31, 2013, the Money Market Series’ assets were concentrated in commercial paper and the Dreyfus Treasury Prime Cash Management Fund.
Market Review
The Federal Reserve has begun tapering to its quantitative easing program. However, the Fed continues to state its intentions to keep rates low for the near future. As a result, the investment environment for money market funds will continue to be challenging, as yields continue to be depressed. Because of the historically low yields, returns in the Money Market Series turned negative after the application of management fees.
The Money Market Series focused on high quality issuers and shorter maturities due to the relatively flat yield curve, which provided no incentive to increase the Fund’s duration. In addition, we invested in asset-backed commercial paper of large, well-diversified programs that offer multiple layers of protection.
Outlook
Our philosophy in managing the Money Market Series is to take a conservative approach that doesn’t add risk to the portfolio by reaching for marginal gains in yield. With the yield environment likely to remain low in the short term, we will continue to manage the Money Market Series conservatively with expectations of low returns. As always, we will continue to monitor the economic and market conditions when deciding portfolio strategies and will adjust the asset mix and maturity structure in the portfolio accordingly.
Performance displayed represents past performance, which is no guarantee of future results.
The opinions and forecast expressed may not actually come to pass. This information is subject to change at any time, based on market and other conditions, and should not be construed as a recommendation of any specific security or strategy.
| 24 | The Guggenheim Funds annual REPORT |
| performance report and FUND PROFILE (Unaudited) | December 31, 2013 |
SERIES C (MONEY MARKET SERIES)
OBJECTIVE: Seeks as high a level of current income as is consistent with preservation of capital by investing in money market securities with varying maturities.
Holdings Diversification (Market Exposure as % of Net Assets)
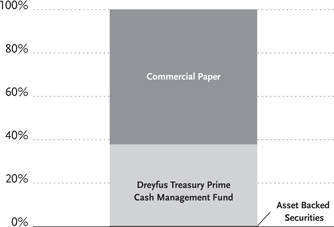
Inception Date: May 1, 1979
The Fund invests principally in money market instruments such as commercial paper.
Average Annual Returns*
Periods Ended December 31, 2013†
| 1 Year | 5 Year | 10 Year | ||||||||||
| Series C (Money Market Series) | -0.52 | % | -0.47 | % | 1.21 | % | ||||||
| * | The performance data above represents past performance that is not predictive of future results. The investment return and principal value of an investment in the Fund will fluctuate so that an investor’s shares, when redeemed, may be worth more or less than their original cost. Returns are historical and include changes in principal and reinvested dividends and capital gains and do not reflect the effect of taxes. |
| † | Performance figures do not reflect fees and expenses associated with an investment in variable insurance products. If returns had taken into account these fees and expenses, performance would have been lower. Shares of a series of SBL Fund are available only through the purchase of such products. |
| the GUGGENHEIM FUNDS annual report | 25 |
| Schedule of Investments | December 31, 2013 |
| Series C (Money Market Series) |
| Shares | Value | |||||||
| SHORT TERM INVESTMENTS† - 37.6% | ||||||||
| Dreyfus Treasury Prime Cash | ||||||||
| Management Fund | 28,695,559 | $ | 28,695,559 | |||||
| Total Short Term Investments | ||||||||
| (Cost $28,695,559) | 28,695,559 | |||||||
| Face | ||||||||
| Amount | ||||||||
| ASSET BACKED SECURITIES†† - 0.2% | ||||||||
| Small Business Administration Pools | ||||||||
| #503303, 0.75% due 04/25/211 | $ | 71,383 | 71,285 | |||||
| #503295, 0.75% due 04/25/211 | 44,956 | 44,894 | ||||||
| #502353, 1.00% due 09/25/181 | 17,575 | 17,627 | ||||||
| Total Asset Backed Securities | ||||||||
| (Cost $133,934) | 133,806 | |||||||
| COMMERCIAL PAPER†† - 62.3% | ||||||||
| Prudential plc | ||||||||
| 0.25% due 01/02/142 | 2,000,000 | 1,999,990 | ||||||
| 0.20% due 03/07/142 | 1,900,000 | 1,899,387 | ||||||
| Total Prudential plc | 3,899,377 | |||||||
| Societe Generale North America, Inc. | ||||||||
| 0.20% due 01/31/14 | 3,400,000 | 3,399,615 | ||||||
| 0.40% due 01/31/14 | 400,000 | 399,955 | ||||||
| Total Societe Generale North America, Inc. | 3,799,570 | |||||||
| Coca-Cola Co. | ||||||||
| 0.11% due 03/31/142 | 2,000,000 | 1,999,450 | ||||||
| 0.09% due 03/06/142 | 1,700,000 | 1,699,715 | ||||||
| Total Coca-Cola Co. | 3,699,165 | |||||||
| ING US Funding LLC | ||||||||
| 0.33% due 03/12/14 | 3,000,000 | 2,998,929 | ||||||
| 0.23% due 04/11/14 | 700,000 | 699,578 | ||||||
| Total ING US Funding LLC | 3,698,507 | |||||||
| Jupiter Securitization Company LLC | ||||||||
| 0.15% due 03/19/142 | 3,000,000 | 2,998,895 | ||||||
| 0.26% due 01/03/142 | 600,000 | 599,997 | ||||||
| Total Jupiter Securitization Company LLC | 3,598,892 | |||||||
| Sheffield Receivables Corp. | ||||||||
| 0.18% due 01/23/142 | 2,000,000 | 1,999,844 | ||||||
| 0.18% due 02/20/142 | 1,500,000 | 1,499,673 | ||||||
| Total Sheffield Receivables Corp. | 3,499,517 | |||||||
| Toyota Motor Credit Corp. | ||||||||
| 0.14% due 01/09/14 | 3,300,000 | 3,299,942 | ||||||
| General RE Corp. | ||||||||
| 0.08% due 02/12/14 | 3,000,000 | 2,999,609 | ||||||
| AstraZeneca plc | ||||||||
| 0.09% due 02/18/142 | 3,000,000 | 2,999,518 | ||||||
| American Honda Finance Corp. | ||||||||
| 0.11% due 03/05/14 | 3,000,000 | 2,999,387 | ||||||
| General Electric Capital Corp. | ||||||||
| 0.15% due 06/18/14 | 2,000,000 | 1,998,592 | ||||||
| 0.14% due 01/14/14 | 1,000,000 | 999,984 | ||||||
| Total General Electric Capital Corp. | 2,998,576 | |||||||
| BNP Paribas Finance, Inc. | ||||||||
| 0.26% due 04/21/14 | 3,000,000 | 2,997,891 | ||||||
| Barton Capital LLC | ||||||||
| 0.18% due 03/13/142 | 2,000,000 | 1,999,496 | ||||||
| 0.18% due 02/03/142 | 900,000 | 899,852 | ||||||
| Total Barton Capital LLC | 2,899,348 | |||||||
| Wal-Mart Stores, Inc. | ||||||||
| 0.06% due 01/06/142 | 2,000,000 | 1,999,983 | ||||||
| Abbott Laboratories | ||||||||
| 0.09% due 03/17/142 | 1,600,000 | 1,599,760 | ||||||
| Westpac Banking Corp. | ||||||||
| 0.12% due 01/23/142 | 550,000 | 549,976 | ||||||
| Total Commercial Paper | ||||||||
| (Cost $47,537,219) | 47,539,018 | |||||||
| Total Investments - 100.1% | ||||||||
| (Cost $76,366,712) | $ | 76,368,383 | ||||||
| Other Assets & Liabilities, Net - (0.1)% | (64,172 | ) | ||||||
| Total Net Assets - 100.0% | $ | 76,304,211 | ||||||
| † | Value determined based on Level 1 inputs — See Note 4. |
| †† | Value determined based on Level 2 inputs — See Note 4. |
| 1 | Variable rate security. Rate indicated is rate effective at December 31, 2013. |
| 2 | Security is a 144A or Section 4(a)(2) security. The total market value of 144A or Section 4(a)(2) securities is $24,745,536 (cost $24,745,086), or 32.4% of total net assets. |
| plc — Public Limited Company |
| 26 | the GUGGENHEIM FUNDS annual report | See Notes to Financial Statements. |
| Series C (Money Market Series) |
| STATEMENT OF ASSETS |
| AND LIABILITIES |
December 31, 2013
| Assets: | ||||
| Investments, at value | ||||
| (cost $76,366,712) | $ | 76,368,383 | ||
| Prepaid expenses | 2,491 | |||
| Receivables: | ||||
| Fund shares sold | 26,386 | |||
| Investment advisor | 14,174 | |||
| Interest | 175 | |||
| Total assets | 76,411,609 | |||
| Liabilities: | ||||
| Payable for: | ||||
| Fund shares redeemed | 37,123 | |||
| Management fees | 32,058 | |||
| Transfer agent/maintenance fees | 9,945 | |||
| Fund accounting/administration fees | 6,091 | |||
| Directors’ fees* | 169 | |||
| Miscellaneous | 22,012 | |||
| Total liabilities | 107,398 | |||
| Net assets | $ | 76,304,211 | ||
| Net assets consist of: | ||||
| Paid in capital | $ | 76,302,540 | ||
| Undistributed net investment income | — | |||
| Accumulated net realized gain on investments | — | |||
| Net unrealized appreciation on investments | 1,671 | |||
| Net assets | $ | 76,304,211 | ||
| Capital shares outstanding | 5,741,444 | |||
| Net asset value per share | $ | 13.29 |
| STATEMENT OF |
| OPERATIONS |
Year Ended December 31, 2013
| Investment Income: | ||||
| Interest | $ | 107,400 | ||
| Total investment income | 107,400 | |||
| Expenses: | ||||
| Management fees | 394,055 | |||
| Transfer agent/maintenance fees | 29,078 | |||
| Fund accounting/administration fees | 74,870 | |||
| Directors’ fees* | 4,691 | |||
| Proxy expense | 4,616 | |||
| Custodian fees | 2,177 | |||
| Tax expense | 2 | |||
| Miscellaneous | 47,156 | |||
| Total expenses | 556,645 | |||
| Less: | ||||
| Expenses waived by Advisor | (54,066 | ) | ||
| Net expenses | 502,579 | |||
| Net investment loss | (395,179 | ) | ||
| Net Realized and Unrealized Gain (Loss): | ||||
| Net realized gain (loss) on: | ||||
| Investments | 1,246 | |||
| Net realized gain | 1,246 | |||
| Net change in unrealized appreciation (depreciation) on: | ||||
| Investments | (1,813 | ) | ||
| Net change in unrealized appreciation (depreciation) | (1,813 | ) | ||
| Net realized and unrealized loss | (567 | ) | ||
| Net decrease in net assets resulting from operations | $ | (395,746 | ) |
| * | Relates to Directors not deemed “interested persons” within the meaning of Section 2(a)(19) of the 1940 Act. |
| See Notes to Financial Statements. | The GUGGENHEIM FUNDS annual report | 27 |
| Series C (Money Market Series) |
| STATEMENTS OF CHANGES IN NET ASSETS |
| Year Ended | Year Ended | |||||||
| December 31, | December 31, | |||||||
| 2013 | 2012 | |||||||
| Increase (Decrease) In Net Assets From Operations: | ||||||||
| Net investment loss | $ | (395,179 | ) | $ | (465,869 | ) | ||
| Net realized gain on investments | 1,246 | — | ||||||
| Net change in unrealized appreciation (depreciation) on investments | (1,813 | ) | 2,224 | |||||
| Net decrease in net assets resulting from operations | (395,746 | ) | (463,645 | ) | ||||
| Capital share transactions: | ||||||||
| Proceeds from sale of shares | 99,294,222 | 77,832,972 | ||||||
| Cost of shares redeemed | (95,965,272 | ) | (112,615,282 | ) | ||||
| Net increase (decrease) from capital share transactions | 3,328,950 | (34,782,310 | ) | |||||
| Net increase (decrease) in net assets | 2,933,204 | (35,245,955 | ) | |||||
| Net assets: | ||||||||
| Beginning of year | 73,371,007 | 108,616,962 | ||||||
| End of year | $ | 76,304,211 | $ | 73,371,007 | ||||
| Undistributed net investment income at end of year | $ | — | $ | — | ||||
| Capital share activity: | ||||||||
| Shares sold | 7,454,058 | 5,809,813 | ||||||
| Shares redeemed | (7,205,162 | ) | (8,405,645 | ) | ||||
| Net increase (decrease) in shares | 248,896 | (2,595,832 | ) | |||||
| 28 | the GUGGENHEIM FUNDS annual report | See Notes to Financial Statements. |
| Series C (Money Market Series) |
| Financial Highlights |
This table is presented to show selected data for a share outstanding throughout each period and to assist shareholders in evaluating a Fund’s performance for the periods presented.
| Year Ended | Year Ended | Year Ended | Year Ended | Year Ended | ||||||||||||||||
| December 31, | December 31, | December 31, | December 31, | December 31, | ||||||||||||||||
| 2013 | 2012 | 2011 | 2010 | 2009 | ||||||||||||||||
| Per Share Data | ||||||||||||||||||||
| Net asset value, beginning of period | $ | 13.36 | $ | 13.43 | $ | 13.50 | $ | 13.56 | $ | 13.61 | ||||||||||
| Income (loss) from investment operations: | ||||||||||||||||||||
| Net investment lossa | (.07 | ) | (.07 | ) | (.08 | ) | (.06 | ) | (.03 | ) | ||||||||||
| Net gain (loss) on investments (realized and unrealized) | (— | )c | (— | )c | .01 | (— | )c | (.02 | ) | |||||||||||
| Total from investment operations | (.07 | ) | (.07 | ) | (.07 | ) | (.06 | ) | (.05 | ) | ||||||||||
| Net asset value, end of period | $ | 13.29 | $ | 13.36 | $ | 13.43 | $ | 13.50 | $ | 13.56 | ||||||||||
| Total Returnb | (0.52 | %) | (0.52 | %) | (0.52 | %) | (0.44 | %) | (0.37 | %) | ||||||||||
| Ratios/Supplemental Data | ||||||||||||||||||||
| Net assets, end of period (in thousands) | $ | 76,304 | $ | 73,371 | $ | 108,617 | $ | 106,191 | $ | 153,262 | ||||||||||
| Ratios to average net assets: | ||||||||||||||||||||
| Net investment loss | (0.50 | %) | (0.53 | %) | (0.57 | %) | (0.46 | %) | (0.23 | %) | ||||||||||
| Total expenses | 0.71 | % | 0.71 | % | 0.70 | % | 0.70 | % | 0.67 | % | ||||||||||
| Net expensesd | 0.64 | % | 0.71 | % | 0.70 | % | 0.70 | % | 0.67 | % | ||||||||||
| Portfolio turnover rate | — | — | — | — | — | |||||||||||||||
| a | Net investment loss per share was computed using average shares outstanding throughout the period. |
| b | Total return does not take into account any of the expenses associated with an investment in variable insurance products. If total return had taken into account these expenses, performance would have been lower. Shares of a series of SBL Fund are available only through the purchase of such products. |
| c | Less than $0.01 per share. |
| d | Net expense information reflects the expense ratios after expense waivers and includes extraordinary expenses. Excluding extraordinary expenses, the operating expense ratio for the year ended would be: |
| 12/31/13 | |
| 0.63% |
| See Notes to Financial Statements. | The GUGGENHEIM FUNDS annual report | 29 |
| Manager’S Commentary (Unaudited) | December 31, 2013 |
To Our Shareholders:
The Series D (World Equity Income Series, formerly, MSCI EAFE Equal Weight Series) is managed by a team of seasoned professionals, including Farhan Sharaff, Senior Managing Director and Assistant Chief Investment Officer, Equities; Nardin Baker, CFA, Managing Director and Portfolio Manager; Ole Jakob Wold, Managing Director and Portfolio Manager; and Scott Hammond, Managing Director and Portfolio Manager. In the following paragraphs, the investment team discusses performance and changes to the Fund that occurred in the fiscal year ended December 31, 2013.
For the one-year period ended December 31, 2013, the Series D (World Equity Income Series, formerly, MSCI EAFE Equal Weight Series) returned 19.28%, compared with the 26.68% return of its benchmark, the MSCI World Index. However, the Fund was managed for the first seven and a half months of the period to the MSCI Equal Weighted Index, the prior benchmark, which returned 23.10% for the period. A blended benchmark return for the year was 23.17%.
Several changes, approved by the Fund’s Board of Directors, occurred on August 15, 2013: a new Fund name, new investment objective, new principal investment strategies and new portfolio management team. The changes were designed to provide an actively managed, differentiated strategy that seeks to provide lower downside risk with the opportunity to outperform the strategy’s capitalization-weighted benchmark over time while delivering attractive income.
The portfolio is constructed to take advantage of empirical evidence that supports the outperformance of low-volatility stocks relative to their high-volatility counterparts. This inefficiency is referred to as the “minimum volatility effect,” and Portfolio Manager Nardin Baker was among the first people to demonstrate its existence in a 1991 research paper.
The portfolio also seeks exposure to higher-yielding equity securities throughout the world. Over the past 20 years dividends paid to shareholders have comprised a significant portion of investor’s overall equity return. The characteristics of companies that have paid a consistent dividend are analogous to that seen in a typical low-volatility stock. As such, a yield tilt provides a powerful complement to the “minimum volatility effect.”
Prior to these changes, the Fund’s name was the MSCI EAFE Equal Weight Fund, which sought performance that corresponded, before fees and expenses, to the price and yield performance of the MSCI EAFE Equal Weighted Index, the Fund’s benchmark between May 2, 2011 and August 15, 2013.
Fund performance for the 12 months can be broken down into the period during which the Fund was being managed according to the legacy strategy and the period during which it was being managed according to the new strategy.
For the period beginning January 1, 2013, and ending August 14, 2013, the Fund performed in line with its benchmark. For the period beginning August 15, 2013, and ending December 31, 2013, the Fund underperformed its benchmark.
Beginning with the changes to the Fund’s investment objective and investment strategies, the new management team repositioned the portfolio to align with the new investment philosophy and process. This included purchasing stocks that have historically demonstrated low volatility and appear likely to continue doing so. To make these purchases, the Fund liquidated those holdings in the MSCI EAFE Equal Weight portfolio that did not meet the team’s minimum-volatility standards.
Over the last few months of 2013, the MSCI World Index delivered strong returns. A fair portion of this return was realized after a December announcement by the U.S. Federal Reserve to reduce bond purchases by $10 billion per month, beginning in January 2014. The positive market reaction to a reduction of monetary stimulus bodes well and is suggestive of a market capable of standing on its own merits.
Against a backdrop of a strongly appreciating market, the portfolio underperformed relative to its benchmark. The portfolio’s two largest factor bets, low-volatility and higher equity yield, both experienced negative payouts during the quarter.
This was most pronounced in the Utilities sector, where company characteristics generally display both low-volatility and higher yields properties relative to the broad market. These attributes resulted in an overweight to Utilities within the portfolio. While Utilities as a whole gained
| 30 | The Guggenheim Funds annual REPORT |
| Manager’S Commentary (Unaudited) (concluded) | December 31, 2013 |
during the period, they did so at a substantially slower rate than that of the broad market. In total, the performance within the Utilities sector accounted for approximately one third of the Fund’s underperformance.
The continuing synchronous global expansion, combined with the strong market activity witnessed in the fourth quarter, provides substantial momentum as we head into 2014.
In Europe, the financial and sovereign debt crises have abated. Attractive relative valuation and improving macro conditions should set the stage for even higher returns. This will likely benefit European risk assets, which face reduced fiscal headwinds, supportive monetary policy and an uptick in economic growth. Opportunities for price appreciation aside, European markets offer an attractive dividend yield of 3.3%.
Japan’s currency devaluation program should continue to fuel export growth, although the consumer portion of the economy will face headwinds resulting from a hike in the consumption tax. Despite the strong gains posted during 2013, valuation of about 15.5x forward earnings looks reasonable and well below the average of more than 25x since 1996. While the “easy” money in Japan has likely been made, another year of solid performance appears likely.
One of the primary stories for investors to follow in 2014 will likely be the reduction of quantitative stimulus by the U.S. Federal Reserve Bank. Thus far, markets appear to have taken this policy change in stride.
Performance displayed represents past performance, which is no guarantee of future results.
The opinions and forecast expressed may not actually come to pass. This information is subject to change at any time, based on market and other conditions, and should not be construed as a recommendation of any specific security or strategy.
| The Guggenheim Funds annual REPORT | 31 |
| performance report and FUND PROFILE (Unaudited) | December 31, 2013 |
SERIES D (WORLD EQUITY INCOME SERIES)
OBJECTIVE: Seeks to provide total return, comprised of capital appreciation and income.
Cumulative Fund Performance*,†
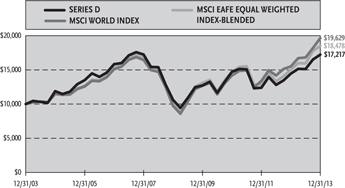
Effective August 15, 2013, the Fund changed its principal investment strategy. As a result of the investment strategy change, the Fund’s new benchmark is the MSCI World Index. 0% The Fund’s performance was previously compared to the MSCI EAFE Equal Weighted MSCI World Index from 12/31/03 to 04/28/11, and the MSCI EAFE Equal Weighted Index from 04/29/11 to 12/31/13.
Average Annual Returns*
Periods Ended December 31, 2013†
| 1 Year | 5 Year | 10 Year | ||||||||||
| Series D (World Equity Income Series) | 19.28 | % | 10.15 | % | 5.58 | % | ||||||
| MSCI EAFE Equal Weighted Index | 23.10 | % | 14.29 | % | N/A | |||||||
| MSCI EAFE Equal Weighted Index-Blended | 23.10 | % | 13.06 | % | 6.33 | % | ||||||
| MSCI World Index | 26.68 | % | 15.02 | % | 6.98 | % | ||||||
INVESTMENT CONCENTRATION
At December 31, 2013, the investment diversification of the series by country was as follows:
| Country | % of Net Assets | Value | |||||||
| United States | 46.2 | % | $ | 89,521,710 | |||||
| Japan | 9.9 | % | 19,220,314 | ||||||
| Australia | 9.2 | % | 17,755,989 | ||||||
| Canada | 7.1 | % | 13,653,603 | ||||||
| Britain | 4.9 | % | 9,468,230 | ||||||
| Germany | 4.7 | % | 9,073,900 | ||||||
| Hong Kong | 4.2 | % | 8,136,020 | ||||||
| France | 3.2 | % | 6,214,448 | ||||||
| Other | 10.1 | % | 19,662,088 | ||||||
| Total Investments | 99.5 | % | $ | 192,706,303 | |||||
Holdings Diversification (Market Exposure as % of Net Assets)
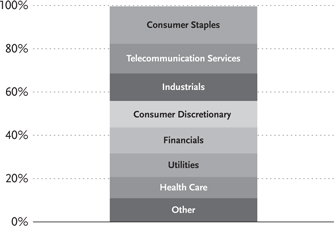
Inception Date: April 19, 1984
Ten Largest Holdings (% of Total Net Assets)
| Lockheed Martin Corp. | 3.2 | % | ||
| Deutsche Telekom AG | 3.1 | % | ||
| Altria Group, Inc. | 3.1 | % | ||
| General Mills, Inc. | 2.4 | % | ||
| AstraZeneca plc | 2.4 | % | ||
| Wal-Mart Stores, Inc. | 2.3 | % | ||
| GDF Suez | 2.2 | % | ||
| Canon, Inc. | 2.2 | % | ||
| Kimberly-Clark Corp. | 1.9 | % | ||
| Goldman Sachs Financial Square Funds - Treasury Instruments Fund | 1.8 | % | ||
| Top Ten Total | 24.6 | % |
| * | The performance data above represents past performance that is not predictive of future results. The investment return and principal value of an investment in the Fund will fluctuate so that an investor’s shares, when redeemed, may be worth more or less than their original cost. Returns are historical and include changes in principal and reinvested dividends and capital gains and do not reflect the effect of taxes. The MSCI EAFE Equal Weighted Index and MSCI World Index are unmanaged indices and, unlike the Fund, have no management fees or operating expenses to reduce their reported returns. |
| † | Performance figures do not reflect fees and expenses associated with an investment in variable insurance products. If returns had taken into account these fees and expenses, performance would have been lower. Shares of a series of SBL Fund are available only through the purchase of such products. |
| 32 | THE GUGGENHEIM FUNDS ANNUAL REPORT |
| Schedule of Investments | December 31, 2013 |
| Series D (world equity income Series) |
| Shares | Value | |||||||
| COMMON STOCKS† - 97.7% | ||||||||
| CONSUMER STAPLES - 17.2% | ||||||||
| Altria Group, Inc. | 155,300 | $ | 5,961,967 | |||||
| General Mills, Inc. | 94,700 | 4,726,477 | ||||||
| Wal-Mart Stores, Inc. | 57,800 | 4,548,282 | ||||||
| Kimberly-Clark Corp. | 34,900 | 3,645,654 | ||||||
| Dr Pepper Snapple Group, Inc. | 45,000 | 2,192,400 | ||||||
| Campbell Soup Co. | 45,300 | 1,960,584 | ||||||
| Safeway, Inc. | 50,300 | 1,638,271 | ||||||
| Metcash Ltd. | 543,500 | 1,533,652 | ||||||
| Lawson, Inc. | 18,300 | 1,367,786 | ||||||
| Woolworths Ltd. | 43,100 | 1,302,795 | ||||||
| PepsiCo, Inc. | 12,200 | 1,011,868 | ||||||
| Lorillard, Inc. | 19,500 | 988,260 | ||||||
| Tyson Foods, Inc. — Class A | 26,200 | 876,652 | ||||||
| Hershey Co. | 7,300 | 709,779 | ||||||
| Costco Wholesale Corp. | 4,400 | 523,644 | ||||||
| Kellogg Co. | 7,300 | 445,811 | ||||||
| Total Consumer Staples | 33,433,882 | |||||||
| Telecommunication Services - 13.7% | ||||||||
| Deutsche Telekom AG | 349,100 | 5,970,024 | ||||||
| Telstra Corporation Ltd. | 746,300 | 3,498,750 | ||||||
| Elisa Oyj | 79,600 | 2,109,233 | ||||||
| Belgacom S.A. | 69,200 | 2,047,391 | ||||||
| Frontier Communications Corp. | 428,300 | 1,991,595 | ||||||
| Bezeq The Israeli Telecommunication | ||||||||
| Corporation Ltd. | 1,082,500 | 1,834,772 | ||||||
| NTT DOCOMO, Inc. | 109,800 | 1,798,803 | ||||||
| BCE, Inc. | 39,600 | 1,714,851 | ||||||
| Telecom Corporation of New Zealand Ltd. | 882,700 | 1,673,417 | ||||||
| Windstream Holdings, Inc. | 198,900 | 1,587,222 | ||||||
| BT Group plc | 158,000 | 992,717 | ||||||
| Telenor ASA | 32,000 | 762,978 | ||||||
| AT&T, Inc. | 13,200 | 464,112 | ||||||
| Total Telecommunication Services | 26,445,865 | |||||||
| Industrials - 12.7% | ||||||||
| Lockheed Martin Corp. | 41,100 | 6,109,927 | ||||||
| Sumitomo Corp. | 194,600 | 2,441,394 | ||||||
| Bouygues S.A. | 52,200 | 1,969,215 | ||||||
| Hopewell Holdings Ltd. | 528,000 | 1,787,405 | ||||||
| Raytheon Co. | 17,200 | 1,560,040 | ||||||
| L-3 Communications Holdings, Inc. | 14,500 | 1,549,470 | ||||||
| Northrop Grumman Corp. | 13,000 | 1,489,930 | ||||||
| ALS Ltd. | 187,600 | 1,475,873 | ||||||
| ITOCHU Corp. | 118,800 | 1,465,608 | ||||||
| ANA Holdings, Inc. | 723,900 | 1,443,744 | ||||||
| Adecco S.A. | 16,000 | 1,266,240 | ||||||
| Mitsui & Company Ltd. | 46,800 | 651,142 | ||||||
| NWS Holdings Ltd. | 335,900 | 512,020 | ||||||
| Sojitz Corp. | 258,800 | 459,619 | ||||||
| AP Moeller - Maersk A/S — Class B | 19 | 206,212 | ||||||
| Auckland International Airport Ltd. | 32,590 | 94,619 | ||||||
| AP Moeller - Maersk A/S — Class A | 8 | 82,474 | ||||||
| TNT Express N.V. | 89 | 826 | ||||||
| Total Industrials | 24,565,758 | |||||||
| Consumer Discretionary - 12.3% | ||||||||
| McDonald’s Corp. | 30,000 | 2,910,900 | ||||||
| Target Corp. | 42,000 | 2,657,340 | ||||||
| Darden Restaurants, Inc. | 42,700 | 2,321,599 | ||||||
| Shaw Communications, Inc. — Class B | 87,400 | 2,126,891 | ||||||
| Kohl’s Corp. | 36,200 | 2,054,350 | ||||||
| Sankyo Company Ltd. | 39,900 | 1,837,837 | ||||||
| Family Dollar Stores, Inc. | 26,000 | 1,689,220 | ||||||
| Gildan Activewear, Inc. | 26,000 | 1,385,606 | ||||||
| Singapore Press Holdings Ltd. | 412,500 | 1,346,725 | ||||||
| Magna International, Inc. | 15,700 | 1,287,333 | ||||||
| Garmin Ltd. | 26,500 | 1,224,830 | ||||||
| Li & Fung Ltd. | 665,000 | 857,593 | ||||||
| Tatts Group Ltd. | 265,500 | 734,965 | ||||||
| Sharp Corp.* | 130,400 | 413,634 | ||||||
| McDonald’s Holdings Company Japan Ltd. | 15,000 | 382,782 | ||||||
| TJX Companies, Inc. | 4,800 | 305,904 | ||||||
| ProSiebenSat.1 Media AG | 4,989 | 247,099 | ||||||
| Total Consumer Discretionary | 23,784,608 | |||||||
| Financials - 12.0% | ||||||||
| Banco Santander S.A. | 274,900 | 2,460,617 | ||||||
| Hannover Rueck SE | 24,900 | 2,136,977 | ||||||
| ICAP plc | 266,100 | 1,989,636 | ||||||
| Bendigo and Adelaide Bank Ltd. | 187,300 | 1,965,241 | ||||||
| Insurance Australia Group Ltd. | 370,500 | 1,925,535 | ||||||
| Annaly Capital Management, Inc. | 188,600 | 1,880,342 | ||||||
| American Capital Agency Corp. | 95,000 | 1,832,550 | ||||||
| Stockland | 513,200 | 1,654,375 | ||||||
| CFS Retail Property Trust Group | 926,400 | 1,609,008 | ||||||
| Intact Financial Corp. | 22,400 | 1,462,827 | ||||||
| National Australia Bank Ltd. | 39,700 | 1,234,764 | ||||||
| T&D Holdings, Inc. | 82,000 | 1,144,005 | ||||||
| Progressive Corp. | 26,400 | 719,928 | ||||||
| RSA Insurance Group plc | 466,000 | 704,962 | ||||||
| Zurich Insurance Group AG | 1,600 | 463,630 | ||||||
| Total Financials | 23,184,397 | |||||||
| Utilities - 10.9% | ||||||||
| GDF Suez | 180,500 | 4,245,232 | ||||||
| Consolidated Edison, Inc. | 39,700 | 2,194,616 | ||||||
| Entergy Corp. | 34,400 | 2,176,487 | ||||||
| CLP Holdings Ltd. | 234,500 | 1,853,800 | ||||||
| Southern Co. | 44,900 | 1,845,839 | ||||||
| Power Assets Holdings Ltd. | 208,400 | 1,656,878 | ||||||
| TransAlta Corp. | 123,000 | 1,560,876 | ||||||
| Pepco Holdings, Inc. | 79,100 | 1,513,183 | ||||||
| Cheung Kong Infrastructure Holdings Ltd. | 232,600 | 1,468,325 | ||||||
| National Grid plc | 85,600 | 1,116,337 | ||||||
| SP AusNet | 738,500 | 821,032 | ||||||
| E.ON SE | 39,000 | 719,798 | ||||||
| Total Utilities | 21,172,403 | |||||||
| Health Care - 9.8% | ||||||||
| AstraZeneca plc | 78,800 | 4,664,579 | ||||||
| Cardinal Health, Inc. | 49,800 | 3,327,138 | ||||||
| WellPoint, Inc. | 35,900 | 3,316,801 | ||||||
| Bristol-Myers Squibb Co. | 50,400 | 2,678,760 | ||||||
| See Notes to Financial Statements. | The GUGGENHEIM FUNDS annual report | 33 |
| Schedule of Investments (concluded) | December 31, 2013 |
| Series D (world equity income Series) |
| Shares | Value | |||||||
| Eli Lilly & Co. | 32,400 | $ | 1,652,400 | |||||
| UnitedHealth Group, Inc. | 21,100 | 1,588,830 | ||||||
| Coloplast A/S — Class B | 20,000 | 1,324,156 | ||||||
| Eisai Company Ltd. | 9,900 | 383,138 | ||||||
| Total Health Care | 18,935,802 | |||||||
| Information Technology - 4.3% | ||||||||
| Canon, Inc. | 133,500 | 4,221,996 | ||||||
| Apple, Inc. | 4,000 | 2,244,440 | ||||||
| Intel Corp. | 37,100 | 963,116 | ||||||
| CGI Group, Inc. — Class A* | 26,400 | 883,272 | ||||||
| Total Information Technology | 8,312,824 | |||||||
| Energy - 4.1% | ||||||||
| Seadrill Ltd. | 67,700 | 2,763,967 | ||||||
| Exxon Mobil Corp. | 21,000 | 2,125,200 | ||||||
| Canadian Oil Sands Ltd. | 100,000 | 1,880,913 | ||||||
| TonenGeneral Sekiyu K.K. | 131,900 | 1,208,828 | ||||||
| Total Energy | 7,978,908 | |||||||
| Materials - 0.7% | ||||||||
| Agnico Eagle Mines Ltd. | 51,200 | 1,351,034 | ||||||
| Total Common Stocks | ||||||||
| (Cost $181,309,123) | 189,165,481 | |||||||
| SHORT TERM INVESTMENTS† - 1.8% | ||||||||
| Goldman Sachs Financial Square | ||||||||
| Funds - Treasury Instruments Fund | 3,540,822 | 3,540,822 | ||||||
| Total Short Term Investments | ||||||||
| (Cost $3,540,822) | 3,540,822 | |||||||
| Total Investments - 99.5% | ||||||||
| (Cost $184,849,945) | $ | 192,706,303 | ||||||
| Other Assets & Liabilities, net - 0.5% | 887,894 | |||||||
| Total Net Assets - 100.0% | $ | 193,594,197 | ||||||
| * | Non-income producing security. |
| † | Value determined based on Level 1 inputs — See Note 4. |
plc — Public Limited Company
| 34 | the GUGGENHEIM FUNDS annual report | See Notes to Financial Statements. |
| Series D (world equity income Series) |
| STATEMENT OF ASSETS |
| AND LIABILITIES |
December 31, 2013
| Assets: | ||||
| Investments, at value | ||||
| (cost $184,849,945) | $ | 192,706,303 | ||
| Foreign currency, at value | ||||
| (cost $18,588) | 18,641 | |||
| Cash | 253,958 | |||
| Prepaid expenses | 5,026 | |||
| Receivables: | ||||
| Dividends | 726,780 | |||
| Foreign taxes reclaim | 220,851 | |||
| Fund shares sold | 9,288 | |||
| Total assets | 193,940,847 | |||
| Liabilities: | ||||
| Payable for: | ||||
| Management fees | 113,354 | |||
| Custodian fees | 112,397 | |||
| Fund shares redeemed | 55,689 | |||
| Fund accounting/administration fees | 24,290 | |||
| Transfer agent/maintenance fees | 4,242 | |||
| Directors’ fees* | 2,599 | |||
| Miscellaneous | 34,079 | |||
| Total liabilities | 346,650 | |||
| Net assets | $ | 193,594,197 | ||
| Net assets consist of: | ||||
| Paid in capital | $ | 243,793,398 | ||
| Undistributed net investment income | 5,045,200 | |||
| Accumulated net realized loss on investments | (63,105,490 | ) | ||
| Net unrealized appreciation on investments | 7,861,089 | |||
| Net assets | $ | 193,594,197 | ||
| Capital shares outstanding | 16,137,956 | |||
| Net asset value per share | $ | 12.00 |
| STATEMENT OF |
| OPERATIONS |
Year Ended December 31, 2013
| Investment Income: | ||||
| Dividends (net of foreign withholding tax of $794,818) | $ | 6,898,695 | ||
| Interest | 16 | |||
| Total investment income | 6,898,711 | |||
| Expenses: | ||||
| Management fees | 1,324,566 | |||
| Transfer agent/maintenance fees | 25,588 | |||
| Fund accounting/administration fees | 283,836 | |||
| Custodian fees | 170,745 | |||
| Directors’ fees* | 16,904 | |||
| Tax expense | 5,213 | |||
| Miscellaneous | 333,380 | |||
| Total expenses | 2,160,232 | |||
| Net investment income | 4,738,479 | |||
| Net Realized and Unrealized Gain (Loss): | ||||
| Net realized gain (loss) on: | ||||
| Investments | 20,811,402 | |||
| Foreign currency | (142,405 | ) | ||
| Net realized gain | 20,668,997 | |||
| Net change in unrealized appreciation (depreciation) on: | ||||
| Investments | 7,863,699 | |||
| Foreign currency | 7,600 | |||
| Net change in unrealized appreciation (depreciation) | 7,871,299 | |||
| Net realized and unrealized gain | 28,540,296 | |||
| Net increase in net assets resulting from operations | $ | 33,278,775 |
| * | Relates to Directors not deemed “interested persons” within the meaning of Section 2(a)(19) of the 1940 Act. |
| See Notes to Financial Statements. | The GUGGENHEIM FUNDS annual report | 35 |
| Series D (world equity income Series) |
| STATEMENTs OF CHANGES IN NET ASSETS |
| Year Ended | Year Ended | |||||||
| December 31, | December 31, | |||||||
| 2013 | 2012 | |||||||
| Increase (Decrease) In Net Assets From Operations: | ||||||||
| Net investment income | $ | 4,738,479 | $ | 3,712,163 | ||||
| Net realized gain (loss) on investments | 20,668,997 | (14,531,759 | ) | |||||
| Net change in unrealized appreciation (depreciation) on investments | 7,871,299 | 39,101,676 | ||||||
| Net increase in net assets resulting from operations | 33,278,775 | 28,282,080 | ||||||
| Capital share transactions: | ||||||||
| Proceeds from sale of shares | 10,130,604 | 9,335,815 | ||||||
| Cost of shares redeemed | (35,047,932 | ) | (38,131,911 | ) | ||||
| Net decrease from capital share transactions | (24,917,328 | ) | (28,796,096 | ) | ||||
| Net increase (decrease) in net assets | 8,361,447 | (514,016 | ) | |||||
| Net assets: | ||||||||
| Beginning of year | 185,232,750 | 185,746,766 | ||||||
| End of year | $ | 193,594,197 | $ | 185,232,750 | ||||
| Undistributed net investment income at end of year | $ | 5,045,200 | $ | 8,169,335 | ||||
| Capital share activity: | ||||||||
| Shares sold | 918,433 | 1,002,338 | ||||||
| Shares redeemed | (3,199,531 | ) | (4,113,445 | ) | ||||
| Net decrease in shares | (2,281,098 | ) | (3,111,107 | ) | ||||
| 36 | the GUGGENHEIM FUNDS annual report | See Notes to Financial Statements. |
| Series D (world equity income Series) |
| FINANCIAL HIGHLIGHTS |
This table is presented to show selected data for a share outstanding throughout each period and to assist shareholders in evaluating a Fund’s performance for the periods presented.
| Year Ended | Year Ended | Year Ended | Year Ended | Year Ended | ||||||||||||||||
| December 31, | December 31, | December 31, | December 31, | December 31, | ||||||||||||||||
| 2013 | 2012 | 2011 | 2010 | 2009 | ||||||||||||||||
| Per Share Data | ||||||||||||||||||||
| Net asset value, beginning of period | $ | 10.06 | $ | 8.63 | $ | 10.25 | $ | 8.86 | $ | 7.40 | ||||||||||
| Income (loss) from investment operations: | ||||||||||||||||||||
| Net investment incomea | .28 | .19 | .12 | .04 | .09 | |||||||||||||||
| Net gain (loss) on investments (realized and unrealized) | 1.66 | 1.24 | (1.74 | ) | 1.35 | 1.37 | ||||||||||||||
| Total from investment operations | 1.94 | 1.43 | (1.62 | ) | 1.39 | 1.46 | ||||||||||||||
| Net asset value, end of period | $ | 12.00 | $ | 10.06 | $ | 8.63 | $ | 10.25 | $ | 8.86 | ||||||||||
| Total Returnb | 19.28 | % | 16.57 | % | (15.80 | %) | 15.69 | % | 19.73 | % | ||||||||||
| Ratios/Supplemental Data | ||||||||||||||||||||
| Net assets, end of period (in thousands) | $ | 193,594 | $ | 185,233 | $ | 185,747 | $ | 269,645 | $ | 270,081 | ||||||||||
| Ratios to average net assets: | ||||||||||||||||||||
| Net investment income | 2.50 | % | 2.03 | % | 1.23 | % | 0.49 | % | 1.12 | % | ||||||||||
| Total expensesc | 1.14 | % | 1.17 | % | 1.21 | % | 1.26 | % | 1.27 | % | ||||||||||
| Portfolio turnover rate | 150 | % | 36 | % | 171 | % | 283 | % | 317 | % | ||||||||||
| a | Net investment income per share was computed using average shares outstanding throughout the period. |
| b | Total return does not take into account any of the expenses associated with an investment in variable insurance products. If total return had taken into account these expenses, performance would have been lower. Shares of a series of SBL Fund are available only through the purchase of such products. |
| c | Does not include expenses of the underlying funds in which the Fund invests. |
| See Notes to Financial Statements. | The GUGGENHEIM FUNDS annual report | 37 |
| Manager’S Commentary (Unaudited) | December 31, 2013 |
To Our Shareholders:
The Series E (Total Return Bond Series, formerly, U.S. Intermediate Bond Series) is managed by a team of seasoned professionals, including B. Scott Minerd, Global Chief Investment Officer; Anne B. Walsh, Senior Managing Director; Jeffrey B. Abrams, Senior Managing Director and Portfolio Manager; and James W. Michal, Managing Director and Portfolio Manager. In the following paragraphs, the investment team discusses the market environment and the Fund’s performance for the 12-month period ended December 31, 2013. On January 28, 2013, the Series name and benchmark changed to Total Return Bond Series and the Barclays U.S. Aggregate Bond Index.
For the one-year period ended December 31, 2013, the Series E (Total Return Bond Series, formerly, U.S. Intermediate Bond Series) returned 1.73%, compared with the -2.02% return of its benchmark, the Barclays U.S. Aggregate Bond Index. The previous benchmark, the Barclays U.S. Intermediate Government/Credit Bond Index, returned -0.87%.
Several changes approved by the Board of Directors took effect in January 2013. The Fund’s investment objective changed to: “seeks to provide total return, comprised of current income and capital appreciation.” The Fund’s name changed to Series E (Total Return Bond Series) and its benchmark changed to the Barclays U.S. Aggregate Index.
For the period, the Fund benefitted from positive performance in asset-backed securities (ABS)—primarily mezzanine collateralized loan obligations (CLOs) and commercial real estate collateralized debt obligations (CRE CDOs)—and high yield bonds and loans. While risk assets continued to outperform in 2013, the Fund was cautious to reduce risk to assets that were perceived as overvalued or overly sensitive to increases in interest rates. The Fund has been opportunistic by taking gains in lower yielding assets and redeploying proceeds into more attractive assets such as longer duration preferred debt. The Fund maintains a lower duration target; however, we will continue to look to opportunistically add fixed-rate assets during periods of interest rate volatility.
Detractors to performance for the period included higher duration assets such as fixed rate corporate bonds and preferred debt securities.
The Fund may seek certain exposures through derivative transactions, which may also create economic leverage in the Fund. The Fund may engage in derivative transactions for speculative purposes to enhance total return, to seek to hedge against fluctuations in securities prices, interest rates or currency rates, to change the effective duration of its portfolio, to manage certain investment risks and/or as a substitute for the purchase or sale of securities or currencies. Derivative use contributed slightly positive performance to the Fund.
Performance displayed represents past performance, which is no guarantee of future results.
The opinions and forecast expressed may not actually come to pass. This information is subject to change at any time, based on market and other conditions, and should not be construed as a recommendation of any specific security or strategy.
| 38 | THE GUGGENHEIM FUNDS ANNUAL REPORT |
| performance report and FUND PROFILE (Unaudited) | December 31, 2013 |
SERIES E (TOTAL RETURN BOND SERIES)
OBJECTIVE: Seeks to provide total return, comprised of current income and capital appreciation.
Cumulative Fund Performance*,†
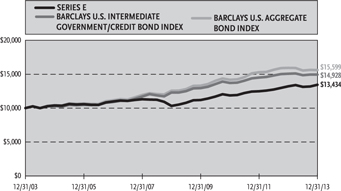
Average Annual Returns*
Periods Ended December 31, 2013†
| 1 Year | 5 Year | 10 Year | ||||||||||
| Series E (Total Return Bond Series) | 1.73 | % | 5.42 | % | 3.00 | % | ||||||
| Barclays U.S. Aggregate Bond Index | -2.02 | % | 4.44 | % | 4.55 | % | ||||||
| Barclays U.S. Intermediate Government/Credit Bond Index | -0.87 | % | 3.96 | % | 4.09 | % | ||||||
| Ten Largest Holdings (% of Total Net Assets) | ||||
| Dreyfus Treasury Prime Cash Management Fund | 10.1 | % | ||
| Willis Engine Securitization Trust II — Class A | 2.2 | % | ||
| Argent Securities Incorporated Asset-Backed Pass-Through Certificates Series — Class A2D | 1.8 | % | ||
| Northwoods Capital VIII Ltd. — Class D | 1.8 | % | ||
| Infinity Property & Casualty Corp. | 1.6 | % | ||
| Prudential Financial, Inc. | 1.6 | % | ||
| T2 Income Fund CLO Ltd. — Class C | 1.5 | % | ||
| JPMorgan Chase & Co. | 1.4 | % | ||
| Penske Truck Leasing Company Lp / PTL Finance Corp. | 1.4 | % | ||
| Emerald Aviation Finance Ltd. — Class A | 1.3 | % | ||
| Top Ten Total | 24.7 | % | ||
The chart above reflects percentages of the value of total investments.
Holdings Diversification (Market Exposure as % of Net Assets)
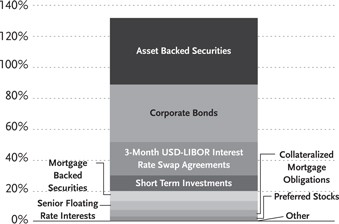
Inception Date: April 26, 1985
| Portfolio Composition by Quality Rating** |
| Rating |
| Fixed Income Instruments | ||||
| AAA | 2.3 | % | ||
| AA | 8.6 | % | ||
| A | 21.1 | % | ||
| BBB | 34.7 | % | ||
| BB | 2.8 | % | ||
| B | 10.7 | % | ||
| CCC | 2.9 | % | ||
| NR | 5.3 | % | ||
| Other Instruments | ||||
| Short Term Investments | 9.2 | % | ||
| Preferred Stocks | 2.3 | % | ||
| Unit Investment Trusts | 0.1 | % | ||
| Total Investments | 100.0 | % |
The chart above reflects percentages of the value of total investments.
| * | The performance data above represents past performance that is not predictive of future results. The investment return and principal value of an investment in the Fund will fluctuate so that an investor’s shares, when redeemed, may be worth more or less than their original cost. Returns are historical and include changes in principal and reinvested dividends and capital gains and do not reflect the effect of taxes. The Barclays U.S. Aggregate Bond Index and Barclays U.S. Intermediate Government/Credit Bond Index are unmanaged indices and, unlike the Fund, have no management fees or operating expenses to reduce their reported returns. |
| ** | Source: Factset. Credit quality ratings are measured on a scale that generally ranges from AAA (highest) to D (lowest). All rated securities have been rated by Moody’s, Standard & Poor’s (“S&P”), or Fitch, which are all a Nationally Recognized Statistical Rating Organization (“NRSRO”). For purposes of this presentation, when ratings are available from more than one agency, the highest rating is used. Guggenheim Investments has converted Moody’s and Fitch ratings to the equivalent S&P rating. Unrated securities do not necessarily indicate low credit quality. Security ratings are determined at the time of purchase and may change thereafter. |
| † | Performance figures do not reflect fees and expenses associated with an investment in variable insurance products. If returns had taken into account these fees and expenses, performance would have been lower. Shares of a series of SBL Fund are available only through the purchase of such products. |
| the GUGGENHEIM FUNDS annual report | 39 |
| Schedule of Investments | December 31, 2013 |
| Series E (TOTAL RETURN Bond Series) |
| Shares | Value | |||||||
| PREFERRED STOCKS†† - 2.6% | ||||||||
| Aspen Insurance Holdings Ltd. | ||||||||
| 5.95%†,1,2 | 40,000 | $ | 906,800 | |||||
| Wells Fargo & Co. | ||||||||
| 5.85%†,1,2 | 15,000 | 353,550 | ||||||
| Morgan Stanley | ||||||||
| 7.13%†,1,2 | 10,000 | 261,400 | ||||||
| Woodbourne Capital Trust IV | ||||||||
| 0.00%*,1,2,4 | 300,000 | 158,760 | ||||||
| Woodbourne Capital Trust III | ||||||||
| 0.00%*,1,2,4 | 300,000 | 158,760 | ||||||
| Woodbourne Capital Trust I | ||||||||
| 0.00%*,1,2,4 | 300,000 | 157,350 | ||||||
| Woodbourne Capital Trust II | ||||||||
| 0.00%*,1,2,4 | 300,000 | 151,320 | ||||||
| AgriBank FCB | ||||||||
| 6.88%†,1,2 | 1,500 | 150,375 | ||||||
| City National Corp. | ||||||||
| 6.75%1,2 | 4,000 | 105,120 | ||||||
| Total Preferred Stocks | ||||||||
| (Cost $3,080,796) | 2,403,435 | |||||||
| UNIT INVESTMENT TRUSTS† - 0.1% | ||||||||
| Rescap Liquidating Trust | 9,656 | 77,603 | ||||||
| Total Unit Investment Trusts | ||||||||
| (Cost $487,524) | 77,603 | |||||||
| SHORT TERM INVESTMENTS† - 10.1% | ||||||||
| Dreyfus Treasury Prime Cash | ||||||||
| Management Fund | 9,509,291 | 9,509,291 | ||||||
| Total Short Term Investments | ||||||||
| (Cost $9,509,291) | 9,509,291 | |||||||
| Face | ||||||||
| Amount | ||||||||
| ASSET BACKED SECURITIES†† - 42.8% | ||||||||
| Willis Engine Securitization Trust II | ||||||||
| 2012-A, 5.50% due 09/15/374 | $ | 2,138,156 | 2,118,271 | |||||
| Argent Securities Incorporated | ||||||||
| Asset-Backed Pass-Through | ||||||||
| Certificates Series | ||||||||
| 2005-W3, 0.50% due 11/25/351 | 1,833,234 | 1,718,055 | ||||||
| Northwoods Capital VIII Ltd. | ||||||||
| 2007-8A, 2.24% due 07/28/221,4 | 1,750,000 | 1,666,349 | ||||||
| Emerald Aviation Finance Ltd. | ||||||||
| 2013-1, 4.65% due 10/15/384 | 1,236,979 | 1,247,865 | ||||||
| 2013-1, 6.35% due 10/15/384 | 247,396 | 248,930 | ||||||
| T2 Income Fund CLO Ltd. | ||||||||
| 2007-1A, 1.74% due 07/15/191,4 | 1,450,000 | 1,383,444 | ||||||
| MCF CLO LLC | ||||||||
| 3.79% due 04/20/23 | 750,000 | 734,250 | ||||||
| 3.21% due 01/20/24 | 500,000 | 479,000 | ||||||
| CKE Restaurant Holdings, Inc. | ||||||||
| 2013-1A, 4.47% due 03/20/434 | 1,137,063 | 1,135,771 | ||||||
| Garanti Diversified Payment | ||||||||
| Rights Finance Co. | ||||||||
| 2007-A, 0.43% due 07/09/17 | 1,200,000 | 1,133,040 | ||||||
| Grayson CLO Ltd. | ||||||||
| 2006-1A, 0.65% due 11/01/211,4 | 1,250,000 | 1,132,250 | ||||||
| West Coast Funding Ltd. | ||||||||
| 2006-1A, 0.39% due 11/02/411,4 | 1,090,547 | 1,051,724 | ||||||
| Telos CLO 2007-2 Ltd. | ||||||||
| 2007-2A, 2.44% due 04/15/221,4 | 1,100,000 | 1,012,660 | ||||||
| Great Lakes CLO 2012-1 Ltd. | ||||||||
| 2012-1A, 4.34% due 01/15/231,4 | 1,000,000 | 1,004,500 | ||||||
| Fraser Sullivan CLO VI Ltd. | ||||||||
| 2011-6A, 4.74% due 11/22/22†,1,4 | 1,000,000 | 1,000,591 | ||||||
| ALM VII R-2 Ltd. | ||||||||
| 2013-7R2A, 2.86% due 04/24/241,4 | 1,000,000 | 981,900 | ||||||
| Telos CLO Ltd. | ||||||||
| 2013-3A, 3.24% due 01/17/241,4 | 1,000,000 | 980,400 | ||||||
| KKR Financial CLO 2007-1 Corp. | ||||||||
| 2007-1A, 2.49% due 05/15/211,4 | 1,000,000 | 941,600 | ||||||
| RAIT CRE CDO I Ltd. | ||||||||
| 2006-1X, 0.50% due 11/20/461 | 1,146,606 | 923,018 | ||||||
| N-Star Real Estate CDO IX Ltd. | ||||||||
| 0.51% due 02/01/413 | 991,638 | 901,498 | ||||||
| Turbine Engines Securitization Ltd. | ||||||||
| 5.13% due 12/13/484 | 900,000 | 880,020 | ||||||
| Drug Royalty II Limited Partnership 1 | ||||||||
| 2012-1, 4.24% due 01/15/251,4 | 787,073 | 800,532 | ||||||
| Rockwall CDO II Ltd. | ||||||||
| 2007-1A, 0.79% due 08/01/241,4 | 900,000 | 772,560 | ||||||
| CGRBS_13-VNO5 | ||||||||
| 3.70% due 03/15/35 | 900,000 | 771,100 | ||||||
| ARES XII CLO Ltd. | ||||||||
| 2007-12A, 3.49% due 11/25/201,4 | 750,000 | 735,675 | ||||||
| Acis CLO 2013-2 Ltd. | ||||||||
| 3.47% due 10/14/221,4 | 750,000 | 733,950 | ||||||
| ICE EM CLO | ||||||||
| 2007-1A, 1.00% due 08/15/221,4 | 750,000 | 709,575 | ||||||
| Newcastle Cdo Viii 1 Ltd. | ||||||||
| 2006-8A, 0.44% due 11/25/521,4 | 733,227 | 694,073 | ||||||
| Ivy Hill Middle Market Credit Fund VII Ltd. | ||||||||
| 2013-7A, 3.69% due 10/20/251,4 | 600,000 | 589,020 | ||||||
| Black Diamond CLO 2012-1 Ltd. | ||||||||
| 2013-1A, 3.49% due 02/01/231,4 | 550,000 | 549,945 | ||||||
| Halcyon Structured Asset Management Long | ||||||||
| Secured/Short Unsecured 2007-2 Ltd. | ||||||||
| 2007-2A, 3.99% due 10/29/211,4 | 550,000 | 544,665 | ||||||
| Avis Budget Rental Car Funding AESOP LLC | ||||||||
| 2013-2A, 4.00% due 05/21/184 | 500,000 | 525,000 | ||||||
| Structured Asset Securities Corporation | ||||||||
| Mortgage Loan Trust | ||||||||
| 2006-OPT1, 0.42% due 04/25/361 | 600,000 | 511,835 | ||||||
| Gramercy Real Estate CDO 2007-1 Ltd. | ||||||||
| 2007-1A, 0.52% due 08/15/561,4 | 617,281 | 508,763 | ||||||
| 40 | the GUGGENHEIM FUNDS annual report | See Notes to Financial Statements. |
| Schedule of Investments (continued) | December 31, 2013 |
| Series E (TOTAL RETURN Bond Series) |
| Face | ||||||||
| Amount | Value | |||||||
| Galaxy X CLO Ltd. | ||||||||
| 2008-10A, 4.69% due 01/14/201,4 | $ | 500,000 | $ | 504,050 | ||||
| Apidos CDO IX | ||||||||
| 2012-9A, 3.99% due 07/15/231,4 | 500,000 | 502,400 | ||||||
| Newstar Trust | ||||||||
| 2012-2A, 3.49% due 01/20/231,4 | 500,000 | 501,150 | ||||||
| Latitude CLO II Corp. | ||||||||
| 2006-2A, 1.04% due 12/15/181,4 | 500,000 | 477,050 | ||||||
| Wachovia Asset Securitization | ||||||||
| Issuance II LLC Trust | ||||||||
| 2007-HE1, 0.30% due 07/25/371,4 | 560,926 | 473,983 | ||||||
| Golub Capital Partners Fundings Ltd. | ||||||||
| 2007-1A, 0.99% due 03/15/221,4 | 500,000 | 452,900 | ||||||
| Lehman XS Trust | ||||||||
| 2007-9, 0.28% due 06/25/371 | 510,985 | 443,785 | ||||||
| N-Star REL CDO VIII Ltd. | ||||||||
| 2006-8A, 0.53% due 02/01/411,4 | 500,000 | 389,450 | ||||||
| Acis CLO 2013-1 Ltd. | ||||||||
| 2013-1A, 3.22% due 04/18/241,4 | 400,000 | 388,440 | ||||||
| Eastland CLO Ltd. | ||||||||
| 2007-1A, 0.64% due 05/01/221,4 | 400,000 | 355,360 | ||||||
| Halcyon Loan Advisors Funding 2012-2 Ltd. | ||||||||
| 2012-2A, 4.75% due 12/20/241,4 | 350,000 | 352,030 | ||||||
| Cerberus Offshore Levered I, LP | ||||||||
| 2012-1A, 4.99% due 11/30/181,4 | 350,000 | 349,405 | ||||||
| Newstar Commercial Loan | ||||||||
| Funding 2013-1 LLC | ||||||||
| 2013-1A, 4.95% due 09/20/231,4 | 350,000 | 346,220 | ||||||
| Northwoods Capital VII Ltd. | ||||||||
| 2006-7A, 1.79% due 10/22/211,4 | 350,000 | 329,070 | ||||||
| Salus CLO 2012-1 Ltd. | ||||||||
| 2013-1AN, 3.99% due 03/05/211,4 | 300,000 | 299,970 | ||||||
| DIVCORE CLO Ltd. | ||||||||
| 2013-1A B, 4.10% due 11/15/32 | 300,000 | 299,100 | ||||||
| Westwood CDO I Ltd. | ||||||||
| 2007-1A, 0.92% due 03/25/211,4 | 300,000 | 275,820 | ||||||
| GreenPoint Mortgage Funding Trust | ||||||||
| 2005-HE4, 0.87% due 07/25/301 | 300,000 | 267,026 | ||||||
| TICC CLO 2012-1 LLC | ||||||||
| 2012-1A, 4.99% due 08/25/231,4 | 250,000 | 251,175 | ||||||
| Ivy Hill Middle Market Credit Fund Ltd. | ||||||||
| 2011-3A, 6.24% due 01/15/221,4 | 250,000 | 251,075 | ||||||
| Golub Capital Partners CLO Ltd. | ||||||||
| 2013-17A, 3.99% due 11/21/251,4 | 250,000 | 249,250 | ||||||
| Garrison Funding 2013-2 Ltd. | ||||||||
| 2013-2A, 3.73% due 09/25/231,4 | 250,000 | 248,775 | ||||||
| Carlyle Global Market | ||||||||
| Strategies CLO 2012-3 Ltd. | ||||||||
| 2012-3A, 0.00% due 10/14/244,6 | 250,000 | 238,900 | ||||||
| STORE Master Funding LLC | ||||||||
| 2013-2A, 4.37% due 07/20/434 | 99,394 | 99,354 | ||||||
| 2013-1A, 4.16% due 03/20/434 | 98,850 | 98,567 | ||||||
| GSAA Home Equity Trust | ||||||||
| 2007-7, 0.43% due 07/25/371 | 227,178 | 192,881 | ||||||
| Newcastle CDO Ltd. | ||||||||
| 2007-9A, 0.42% due 05/25/521 | 175,716 | 171,604 | ||||||
| New Century Home Equity Loan Trust Series | ||||||||
| 2005-1, 0.88% due 03/25/351 | 183,476 | 159,323 | ||||||
| Aircraft Certificate Owner Trust 2003 | ||||||||
| 2003-1A, 6.46% due 09/20/223,4 | 124,392 | 124,380 | ||||||
| Credit-Based Asset Servicing and | ||||||||
| Securitization LLC | ||||||||
| 2005-CB5, 0.42% due 08/25/351 | 71,932 | 71,396 | ||||||
| First Frankin Mortgage Loan Trust | ||||||||
| 2006-FF1, 0.50% due 01/25/361 | 50,000 | 43,237 | ||||||
| Legg Mason Real Estate CDO I Ltd. | ||||||||
| 2006-1A, 0.45% due 03/25/381,4 | 29,658 | 29,249 | ||||||
| Total Asset Backed Securities | ||||||||
| (Cost $39,802,487) | 40,358,204 | |||||||
| CORPORATE BONDS†† - 37.1% | ||||||||
| Financials - 20.9% | ||||||||
| Infinity Property & Casualty Corp. | ||||||||
| 5.00% due 09/19/227 | 1,500,000 | 1,501,381 | ||||||
| Prudential Financial, Inc. | ||||||||
| 5.63% due 06/15/431,7 | 1,500,000 | 1,470,000 | ||||||
| JPMorgan Chase & Co. | ||||||||
| 5.15% due 12/31/491,2,7 | 1,500,000 | 1,346,249 | ||||||
| EPR Properties | ||||||||
| 5.25% due 07/15/237 | 1,000,000 | 976,904 | ||||||
| 5.75% due 08/15/22 | 100,000 | 101,955 | ||||||
| Susquehanna Bancshares, Inc. | ||||||||
| 5.38% due 08/15/22 | 1,100,000 | 1,056,633 | ||||||
| First American Financial Corp. | ||||||||
| 4.30% due 02/01/237 | 1,100,000 | 1,047,739 | ||||||
| Amtrust Financial Services, Inc. | ||||||||
| 6.13% due 08/15/234 | 1,000,000 | 1,005,000 | ||||||
| PNC Financial Services Group, Inc. | ||||||||
| 4.85% due 05/29/491,2 | 1,100,000 | 985,050 | ||||||
| Hospitality Properties Trust | ||||||||
| 4.50% due 06/15/23 | 900,000 | 869,324 | ||||||
| 5.00% due 08/15/22 | 100,000 | 101,624 | ||||||
| General Electric Capital Corp. | ||||||||
| 5.25% due 06/29/491,2 | 750,000 | 705,000 | ||||||
| 7.13% due 12/15/491,2 | 230,000 | 257,025 | ||||||
| Macquarie Group Ltd. | ||||||||
| 6.25% due 01/14/214 | 750,000 | 829,019 | ||||||
| Leucadia National Corp. | ||||||||
| 5.50% due 10/18/237 | 800,000 | 799,534 | ||||||
| Fifth Third Bancorp | ||||||||
| 5.10% due 12/31/491,2 | 870,000 | 769,950 | ||||||
| Icahn Enterprises Limited Partnership / | ||||||||
| Icahn Enterprises Finance Corp. | ||||||||
| 6.00% due 08/01/204 | 700,000 | 721,000 | ||||||
| See Notes to Financial Statements. | The GUGGENHEIM FUNDS annual report | 41 |
| Schedule of Investments (continued) | December 31, 2013 |
| Series E (TOTAL RETURN Bond Series) |
| Face | ||||||||
| Amount | Value | |||||||
| Lancashire Holdings Ltd. | ||||||||
| 5.70% due 10/01/224 | $ | 700,000 | $ | 706,846 | ||||
| Jones Lang LaSalle, Inc. | ||||||||
| 4.40% due 11/15/22 | 700,000 | 672,321 | ||||||
| StanCorp Financial Group, Inc. | ||||||||
| 5.00% due 08/15/227 | 600,000 | 589,440 | ||||||
| Nuveen Investments, Inc. | ||||||||
| 9.13% due 10/15/174 | 565,000 | 565,000 | ||||||
| Credit Suisse AG | ||||||||
| 6.50% due 08/08/234 | 500,000 | 531,875 | ||||||
| Navigators Group, Inc. | ||||||||
| 5.75% due 10/15/23 | 500,000 | 525,688 | ||||||
| National Rural Utilities Cooperative | ||||||||
| Finance Corp. | ||||||||
| 4.75% due 04/30/431 | 500,000 | 465,625 | ||||||
| Bank of New York Mellon Corp. | ||||||||
| 4.50% due 12/31/491,2 | 440,000 | 399,300 | ||||||
| Allstate Corp. | ||||||||
| 5.75% due 08/15/531 | 250,000 | 251,875 | ||||||
| Credit Suisse Group AG | ||||||||
| 7.50% due 12/11/231,2,4 | 100,000 | 105,625 | ||||||
| Emigrant Bancorp, Inc. | ||||||||
| 6.25% due 06/15/144 | 100,000 | 101,343 | ||||||
| Prosight Global Inc. | ||||||||
| 7.50% due 11/20/203 | 100,000 | 98,510 | ||||||
| Total Financials | 19,556,835 | |||||||
| Consumer Discretionary - 5.9% | ||||||||
| Sabre, Inc. | ||||||||
| 8.50% due 05/15/194,7 | 1,000,000 | 1,110,000 | ||||||
| US Airways 2013-1 Class A | ||||||||
| Pass Through Trust | ||||||||
| 3.95% due 11/15/25 | 1,000,000 | 972,501 | ||||||
| Hawaiian Airlines 2013-1 Class A | ||||||||
| Pass Through Certificates | ||||||||
| 3.90% due 01/15/26 | 800,000 | 743,000 | ||||||
| Northern Group Housing LLC | ||||||||
| 6.80% due 08/15/534 | 600,000 | 598,236 | ||||||
| GLP Capital Limited Partnership / | ||||||||
| GLP Financing II, Inc. | ||||||||
| 4.88% due 11/01/204 | 350,000 | 350,000 | ||||||
| 4.38% due 11/01/184 | 150,000 | 153,375 | ||||||
| Continental Airlines 2012-2 Class B | ||||||||
| Pass Through Trust | ||||||||
| 5.50% due 10/29/20 | 400,000 | 412,000 | ||||||
| AmeriGas Finance LLC / | ||||||||
| AmeriGas Finance Corp. | ||||||||
| 7.00% due 05/20/22 | 320,000 | 347,200 | ||||||
| GRD Holdings III Corp. | ||||||||
| 10.75% due 06/01/194 | 250,000 | 272,500 | ||||||
| International Game Technology | ||||||||
| 5.35% due 10/15/23 | 250,000 | 257,396 | ||||||
| Stanadyne Corp. | ||||||||
| 10.00% due 08/15/14 | 180,000 | 174,600 | ||||||
| Continental Airlines 2012-1 Class B | ||||||||
| Pass Through Trust | ||||||||
| 6.25% due 04/11/20 | 118,665 | 124,005 | ||||||
| Total Consumer Discretionary | 5,514,813 | |||||||
| Energy - 3.7% | ||||||||
| Legacy Reserves Limited Partnership / | ||||||||
| Legacy Reserves Finance Corp. | ||||||||
| 8.00% due 12/01/204,7 | 1,100,000 | 1,144,000 | ||||||
| BreitBurn Energy Partners Limited | ||||||||
| Partnership / BreitBurn Finance Corp. | ||||||||
| 7.88% due 04/15/22 | 550,000 | 572,000 | ||||||
| Midstates Petroleum Company | ||||||||
| Incorporated / Midstates | ||||||||
| Petroleum Co LLC | ||||||||
| 10.75% due 10/01/20 | 500,000 | 543,750 | ||||||
| Eagle Rock Energy Partners | ||||||||
| Limited Partnership / | ||||||||
| Eagle Rock Energy Finance Corp. | ||||||||
| 8.38% due 06/01/19 | 415,000 | 452,350 | ||||||
| SESI LLC | ||||||||
| 7.13% due 12/15/21 | 250,000 | 278,750 | ||||||
| Hiland Partners Limited | ||||||||
| Partnership / Hiland Partners | ||||||||
| Finance Corp. | ||||||||
| 7.25% due 10/01/204 | 250,000 | 268,125 | ||||||
| Penn Virginia Resource Partners | ||||||||
| Limited Partnership / Penn Virginia | ||||||||
| Resource Finance Corporation II | ||||||||
| 8.38% due 06/01/20 | 126,000 | 138,915 | ||||||
| Crestwood Midstream Partners | ||||||||
| Limited Partnership / Crestwood | ||||||||
| Midstream Finance Corp. | ||||||||
| 7.75% due 04/01/19 | 110,000 | 119,350 | ||||||
| Total Energy | 3,517,240 | |||||||
| Materials - 2.9% | ||||||||
| Newcrest Finance Pty Ltd. | ||||||||
| 4.20% due 10/01/224 | 1,100,000 | 878,896 | ||||||
| 4.45% due 11/15/214 | 500,000 | 415,922 | ||||||
| AngloGold Ashanti Holdings plc | ||||||||
| 5.13% due 08/01/22 | 1,050,000 | 905,624 | ||||||
| Barrick Gold Corp. | ||||||||
| 4.10% due 05/01/23 | 625,000 | 564,932 | ||||||
| Total Materials | 2,765,374 | |||||||
| Industrials - 2.6% | ||||||||
| Penske Truck Leasing Company Lp / | ||||||||
| PTL Finance Corp. | ||||||||
| 4.88% due 07/11/224,7 | 1,300,000 | 1,333,644 | ||||||
| Chicago Bridge & Iron Co. | ||||||||
| 5.15% due 12/27/22 | 750,000 | 704,625 | ||||||
| SBM Baleia Azul Sarl | ||||||||
| 5.50% due 09/15/27 | 477,550 | 452,813 | ||||||
| 42 | the GUGGENHEIM FUNDS annual report | See Notes to Financial Statements. |
| Schedule of Investments (continued) | December 31, 2013 |
| Series E (TOTAL RETURN Bond Series) |
| Face | ||||||||
| Amount | Value | |||||||
| RR Donnelley & Sons Co. | ||||||||
| 6.50% due 11/15/23 | $ | 3,000 | $ | 3,030 | ||||
| Total Industrials | 2,494,112 | |||||||
| Telecommunication Services - 0.6% | ||||||||
| Avaya, Inc. | ||||||||
| 7.00% due 04/01/194 | 600,000 | 588,000 | ||||||
| Information Technology - 0.5% | ||||||||
| First Data Corp. | ||||||||
| 8.75% due 01/15/224 | 250,000 | 266,875 | ||||||
| VeriSign, Inc. | ||||||||
| 4.63% due 05/01/23 | 200,000 | 191,000 | ||||||
| Total Information Technology | 457,875 | |||||||
| Total Corporate Bonds | ||||||||
| (Cost $35,917,837) | 34,894,249 | |||||||
| MORTGAGE BACKED SECURITIES†† - 6.4% | ||||||||
| Fannie Mae5 | ||||||||
| 2013-28, 3.00% due 04/25/43 | 916,613 | 718,048 | ||||||
| 2013-34, 3.00% due 04/25/43 | 351,761 | 303,784 | ||||||
| 2013-17, 2.50% due 03/25/43 | 271,374 | 237,702 | ||||||
| 1990-68, 6.95% due 07/25/20 | 1,090 | 1,199 | ||||||
| 1990-103, 7.50% due 09/25/20 | 292 | 320 | ||||||
| VNDO 2012-6AVE Mortgage Trust | ||||||||
| 2012-6AVE, 3.34% due 11/15/301,4 | 1,100,000 | 951,614 | ||||||
| Madison Avenue Trust | ||||||||
| 2013-650M, 4.03% due 10/12/201,4 | 875,000 | 850,870 | ||||||
| BBCMS Trust | ||||||||
| 2013-TYSN, 3.71% due 09/05/324 | 900,000 | 811,338 | ||||||
| COMM 2006-FL12 Mortgage Trust | ||||||||
| 2006-FL12, 0.46% due 12/15/201,4 | 487,429 | 475,066 | ||||||
| 2006-FL12, 0.40% due 12/15/201,4 | 324,953 | 316,781 | ||||||
| Freddie Mac5 | ||||||||
| 2013-4180, 3.00% due 03/15/43 | 338,253 | 318,795 | ||||||
| 2013-4184, 3.00% due 03/15/43 | 383,842 | 315,781 | ||||||
| 2013-4224, 3.00% due 07/15/43 | 100,598 | 78,317 | ||||||
| 1990-188, 7.00% due 09/15/21 | 484 | 538 | ||||||
| Ginnie Mae | ||||||||
| 2013-145, 2.75% due 09/16/44 | 349,119 | 327,578 | ||||||
| #518436, 7.25% due 09/15/29 | 9,679 | 11,259 | ||||||
| T2 Income Fund CLO Ltd. | ||||||||
| 2007-1X,1.74% due 07/15/191 | 250,000 | 238,525 | ||||||
| JP Morgan Mortgage Trust | ||||||||
| 2006-A3, 2.72% due 04/25/361 | 76,765 | 66,823 | ||||||
| Total Mortgage Backed Securities | ||||||||
| (Cost $6,392,917) | 6,024,338 | |||||||
| SENIOR FLOATING RATE INTERESTS††,1 - 5.9% | ||||||||
| Industrials - 2.2% | ||||||||
| ServiceMaster Co. | ||||||||
| 4.25% due 01/31/17 | 990,000 | 979,852 | ||||||
| Travelport Holdings Ltd. | ||||||||
| 6.25% due 06/26/19 | 497,500 | 509,525 | ||||||
| AABS Ltd. | ||||||||
| 4.87% due 01/12/38 | 471,409 | 472,588 | ||||||
| Emerald Expositions | ||||||||
| 5.50% due 06/12/20 | 99,500 | 99,749 | ||||||
| Total Industrials | 2,061,714 | |||||||
| Consumer Discretionary - 1.7% | ||||||||
| Landry’s, Inc. | ||||||||
| 4.00% due 04/24/18 | 673,659 | 678,078 | ||||||
| Ollies Bargain Outlet | ||||||||
| 5.26% due 09/28/19 | 445,502 | 447,729 | ||||||
| Neiman Marcus Group, Inc. | ||||||||
| 5.00% due 10/25/20 | 350,000 | 354,036 | ||||||
| NES Global Talent | ||||||||
| 6.50% due 10/02/19 | 150,000 | 149,250 | ||||||
| Total Consumer Discretionary | 1,629,093 | |||||||
| Financials - 1.1% | ||||||||
| Digital Insight | ||||||||
| 4.75% due 10/16/19 | 500,000 | 500,000 | ||||||
| Magic Newco, LLC | ||||||||
| 5.00% due 12/12/18 | 248,741 | 250,296 | ||||||
| National Financial Partners | ||||||||
| 5.25% due 07/01/20 | 199,000 | 200,825 | ||||||
| American Stock Transfer & Trust | ||||||||
| 5.75% due 06/26/20 | 99,500 | 99,873 | ||||||
| Total Financials | 1,050,994 | |||||||
| Telecommunication Services - 0.5% | ||||||||
| Asurion Corp. | ||||||||
| 4.50% due 05/24/19 | 470,250 | 469,897 | ||||||
| Information Technology - 0.4% | ||||||||
| Greenway Medical Technologies | ||||||||
| 6.00% due 11/04/20 | 350,000 | 348,250 | ||||||
| Total Senior Floating Rate Interests | ||||||||
| (Cost $5,499,721) | 5,559,948 | |||||||
| COLLATERALIZED MORTGAGE OBLIGATIONS†† - 4.2% | ||||||||
| Alternative Loan Trust | ||||||||
| 2003-18CB, 5.25% due 09/25/33 | 1,159,319 | 1,186,731 | ||||||
| Boca Hotel Portfolio Trust | ||||||||
| 2013-BOCA, 3.22% due 08/15/261,4 | 1,000,000 | 1,001,197 | ||||||
| Hilton USA Trust | ||||||||
| 2013-HLT, 4.41% due 11/05/304 | 800,000 | 800,653 | ||||||
| SRERS-2011 Funding Ltd. | ||||||||
| 2011-RS, 0.42% due 05/09/461,4 | 376,441 | 341,206 | ||||||
| Nomura Resecuritization Trust | ||||||||
| 2012-1R, 0.61% due 08/27/471,4 | 345,513 | 318,321 | ||||||
| Credit Suisse Mortgage Capital Certificates | ||||||||
| 2006-TF2A, 0.57% due 10/15/211,4 | 250,000 | 241,551 | ||||||
| Spirit Master Funding LLC | ||||||||
| 2006-1A, 5.76% due 03/20/244 | 82,968 | 84,901 | ||||||
| Total Collateralized Mortgage Obligations | ||||||||
| (Cost $3,966,222) | 3,974,560 | |||||||
| See Notes to Financial Statements. | The GUGGENHEIM FUNDS annual report | 43 |
| Schedule of Investments (concluded) | December 31, 2013 |
| Series E (TOTAL RETURN Bond Series) |
| Face | ||||||||
| Amount | Value | |||||||
| MUNICIPAL BONDS†† - 0.2% | ||||||||
| CALIFORNIA - 0.1% | ||||||||
| County of Sacramento California | ||||||||
| Revenue Bonds | ||||||||
| 7.25% due 08/01/25 | $ | 100,000 | $ | 100,778 | ||||
| MICHIGAN - 0.1% | ||||||||
| City of Detroit Michigan Sewage Disposal | ||||||||
| System Revenue Revenue Bonds | ||||||||
| 5.50% due 07/01/22 | 100,000 | 99,065 | ||||||
| Total Municipal Bonds | ||||||||
| (Cost $197,825) | 199,843 | |||||||
| Total Investments - 109.4% | ||||||||
| (Cost $104,854,620) | $ | 103,001,471 | ||||||
| Other Assets & Liabilities, net - (9.4)% | (8,878,421 | ) | ||||||
| Total Net Assets - 100.0% | $ | 94,123,050 | ||||||
centrally cleared INterest rate swap agreements††
| Unrealized | ||||||||||||||||||||||
| Floating | Floating | Fixed | Maturity | Notional | Market | Appreciation/ | ||||||||||||||||
| Counterparty | Rate | Rate Index | Rate | Date | Amount | Value | (Depreciation) | |||||||||||||||
| Merrill Lynch | Pay | 3-Month USD-LIBOR | 1.97 | % | 09/09/18 | $ | 4,650,000 | $ | 95,325 | $ | 95,325 | |||||||||||
| Merrill Lynch | Pay | 3-Month USD-LIBOR | 1.70 | % | 08/29/18 | 4,950,000 | 42,570 | 42,570 | ||||||||||||||
| Merrill Lynch | Pay | 3-Month USD-LIBOR | 1.59 | % | 09/26/18 | 8,750,000 | 4,375 | 4,375 | ||||||||||||||
| Merrill Lynch | Pay | 3-Month USD-LIBOR | 3.89 | % | 09/09/43 | 250,000 | 550 | 550 | ||||||||||||||
| Merrill Lynch | Pay | 3-Month USD-LIBOR | 3.65 | % | 09/26/43 | 400,000 | (17,360 | ) | (17,360 | ) | ||||||||||||
| Merrill Lynch | Pay | 3-Month USD-LIBOR | 3.68 | % | 08/29/43 | 1,200,000 | (41,760 | ) | (41,760 | ) | ||||||||||||
| $ | 83,700 | |||||||||||||||||||||
| * | Non-income producing security. |
| † | Value determined based on Level 1 inputs — See Note 4. |
| †† | Value determined based on Level 2 inputs, unless otherwise noted — See Note 4. |
| 1 | Variable rate security. Rate indicated is rate effective at December 31, 2013. |
| 2 | Perpetual maturity. |
| 3 | Illiquid security. |
| 4 | Security is a 144A or Section 4(a)(2) security. The total market value of 144A or Section 4(a)(2) securities is $50,303,025 (cost $50,322,641), or 53.4% of total net assets. |
| 5 | On September 7, 2008, the issuer was placed in conservatorship by the Federal Housing Finance Agency (FHFA). As conservator, the FHFA has full powers to control the assets and operations of the firm. |
| 6 | Zero coupon rate security. |
| 7 | Security or a portion thereof is held as collateral for reverse repurchase agreements — See Note 14. |
plc — Public Limited Company
REIT — Real Estate Investment Trust
| 44 | the GUGGENHEIM FUNDS annual report | See Notes to Financial Statements. |
| Series E (TOTAL RETURN Bond Series) |
| STATEMENT OF ASSETS |
| AND LIABILITIES |
December 31, 2013
| Assets: | ||||
| Investments, at value | ||||
| (cost $104,854,620) | $ | 103,001,471 | ||
| Segregated cash with broker | 557,527 | |||
| Cash | 183,305 | |||
| Unrealized appreciation on swap agreements | 142,820 | |||
| Prepaid expenses | 8,188 | |||
| Receivables: | ||||
| Securities sold | 1,222,425 | |||
| Interest | 699,182 | |||
| Investment advisor | 21,690 | |||
| Dividends | 21,675 | |||
| Fund shares sold | 2,067 | |||
| Total assets | 105,860,350 | |||
| Liabilities: | ||||
| Reverse Repurchase Agreements | 10,824,468 | |||
| Due to broker | 207,472 | |||
| Unrealized depreciation on swap agreements | 59,120 | |||
| Payable for: | ||||
| Securities purchased | 478,000 | |||
| Management fees | 60,290 | |||
| Fund shares redeemed | 40,763 | |||
| Fund accounting/administration fees | 7,637 | |||
| Directors’ fees* | 4,745 | |||
| Transfer agent/maintenance fees | 4,332 | |||
| Miscellaneous | 50,473 | |||
| Total liabilities | 11,737,300 | |||
| Net assets | $ | 94,123,050 | ||
| Net assets consist of: | ||||
| Paid in capital | $ | 101,360,819 | ||
| Undistributed net investment income | 3,078,802 | |||
| Accumulated net realized loss on investments | (8,547,122 | ) | ||
| Net unrealized depreciation on investments | (1,769,449 | ) | ||
| Net assets | $ | 94,123,050 | ||
| Capital shares outstanding | 6,402,208 | |||
| Net asset value per share | $ | 14.70 |
| STATEMENT OF |
| OPERATIONS |
| Year Ended December 31, 2013 |
| Investment Income: | ||||
| Interest | $ | 4,747,774 | ||
| Dividends | 87,693 | |||
| Total investment income | 4,835,467 | |||
| Expenses: | ||||
| Management fees | 795,345 | |||
| Transfer agent/maintenance fees | 25,550 | |||
| Fund accounting/administration fees | 100,742 | |||
| Interest expense | 41,992 | |||
| Custodian fees | 8,530 | |||
| Line of credit fees | 20,864 | |||
| Proxy expense | 5,225 | |||
| Directors’ fees* | 14,947 | |||
| Tax expense | 3 | |||
| Miscellaneous | 122,024 | |||
| Total expenses | 1,135,222 | |||
| Less: | ||||
| Expenses waived by Advisor | (208,040 | ) | ||
| Net expenses | 927,182 | |||
| Net investment income | 3,908,285 | |||
| Net Realized and Unrealized Gain (Loss): | ||||
| Net realized gain (loss) on: | ||||
| Investments | 4,218,847 | |||
| Swap agreements | (7,274 | ) | ||
| Net realized gain | 4,211,573 | |||
| Net change in unrealized appreciation (depreciation) on: | ||||
| Investments | (6,511,041 | ) | ||
| Swap agreements | 83,700 | |||
| Net change in unrealized appreciation (depreciation) | (6,427,341 | ) | ||
| Net realized and unrealized loss | (2,215,768 | ) | ||
| Net increase in net assets resulting from operations | $ | 1,692,517 |
| * | Relates to Directors not deemed “interested persons” within the meaning of Section 2(a)(19) of the 1940 Act. |
| See Notes to Financial Statements. | The GUGGENHEIM FUNDS annual report | 45 |
| Series E (TOTAL RETURN Bond Series) |
| STATEMENTs OF CHANGES IN NET ASSETS |
| Year Ended | Year Ended | |||||||
| December 31, | December 31, | |||||||
| 2013 | 2012 | |||||||
| Increase (Decrease) In Net Assets From Operations: | ||||||||
| Net investment income | $ | 3,908,285 | $ | 3,240,411 | ||||
| Net realized gain on investments | 4,211,573 | 3,617,000 | ||||||
| Net change in unrealized appreciation (depreciation) on investments | (6,427,341 | ) | (279,472 | ) | ||||
| Net increase in net assets resulting from operations | 1,692,517 | 6,577,939 | ||||||
| Capital share transactions: | ||||||||
| Proceeds from sale of shares | 31,425,503 | 21,460,693 | ||||||
| Cost of shares redeemed | (51,786,447 | ) | (38,822,059 | ) | ||||
| Net decrease from capital share transactions | (20,360,944 | ) | (17,361,366 | ) | ||||
| Net decrease in net assets | (18,668,427 | ) | (10,783,427 | ) | ||||
| Net assets: | ||||||||
| Beginning of year | 112,791,477 | 123,574,904 | ||||||
| End of year | $ | 94,123,050 | $ | 112,791,477 | ||||
| Undistributed net investment income at end of year | $ | 3,078,802 | $ | 2,472,337 | ||||
| Capital share activity: | ||||||||
| Shares sold | 2,168,510 | 1,532,362 | ||||||
| Shares redeemed | (3,573,041 | ) | (2,778,441 | ) | ||||
| Net decrease in shares | (1,404,531 | ) | (1,246,079 | ) | ||||
| 46 | the GUGGENHEIM FUNDS annual report | See Notes to Financial Statements. |
| SERIES E (TOTAL RETURN BOND SERIES) |
| FINANCIAL HIGHLIGHTS |
This table is presented to show selected data for a share outstanding throughout each period and to assist shareholders in evaluating a Fund’s performance for the periods presented.
| Year Ended | Year Ended | Year Ended | Year Ended | Year Ended | ||||||||||||||||
| December 31, | December 31, | December 31, | December 31, | December 31, | ||||||||||||||||
| 2013 | 2012 | 2011 | 2010 | 2009 | ||||||||||||||||
| Per Share Data | ||||||||||||||||||||
| Net asset value, beginning of period | $ | 14.45 | $ | 13.65 | $ | 12.98 | $ | 12.24 | $ | 11.29 | ||||||||||
| Income (loss) from investment operations: | ||||||||||||||||||||
| Net investment incomea | .54 | .38 | .34 | .35 | .37 | |||||||||||||||
| Net gain (loss) on investments (realized and unrealized) | (.29 | ) | .42 | .33 | .39 | .58 | ||||||||||||||
| Total from investment operations | .25 | .80 | .67 | .74 | .95 | |||||||||||||||
| Net asset value, end of period | $ | 14.70 | $ | 14.45 | $ | 13.65 | $ | 12.98 | $ | 12.24 | ||||||||||
| Total Returnb | 1.73 | % | 5.86 | % | 5.16 | % | 6.05 | % | 8.41 | % | ||||||||||
| Ratios/Supplemental Data | ||||||||||||||||||||
| Net assets, end of period (in thousands) | $ | 94,123 | $ | 112,791 | $ | 123,575 | $ | 127,091 | $ | 130,569 | ||||||||||
| Ratios to average net assets: | ||||||||||||||||||||
| Net investment income | 3.69 | % | 2.75 | % | 2.57 | % | 2.72 | % | 3.08 | % | ||||||||||
| Total expenses | 1.07 | % | 0.94 | % | 0.92 | % | 0.92 | % | 0.92 | % | ||||||||||
| Net expensesc | 0.87 | % | 0.81 | % | 0.81 | % | 0.79 | % | 0.77 | % | ||||||||||
| Portfolio turnover rate | 109 | % | 79 | % | 49 | % | 38 | % | 76 | % | ||||||||||
| a | Net investment income per share was computed using average shares outstanding throughout the period. |
| b | Total return does not take into account any of the expenses associated with an investment in variable insurance products. If total return had taken into account these expenses, performance would have been lower. Shares of a series of SBL Fund are available only through the purchase of such products. Does not include expenses of the underlying funds in which the Fund invests. |
| c | Net expense information reflects the expense ratios after expense waivers and may include extraordinary expenses. Excluding extraordinary expenses, the operating expense ratio for the year ended would be: |
| 12/31/13 | ||
| 0.81% | ||
| See Notes to Financial Statements. | The GUGGENHEIM FUNDS annual report | 47 |
| Manager’S Commentary (Unaudited) | December 31, 2013 |
To Our Shareholders:
The Series F (Floating Rate Strategies Series) is managed by a team of seasoned professionals, including B. Scott Minerd, Global Chief Investment Officer; Michael P. Damaso, Senior Managing Director and Portfolio Manager; Anne B. Walsh, Senior Managing Director; Kevin H. Gundersen, Senior Managing Director and Portfolio Manager; and James W. Michal, Managing Director and Portfolio Manager. In the following paragraphs, the investment team discusses the market environment and the Fund’s performance for the abbreviated fiscal year ended December 31, 2013.
For the abbreviated fiscal year from the inception date of April 24, 2013, through December 31, 2013, the Series F (Floating Rate Strategies Series) returned 2.48%, compared with the 3.10% return of its benchmark, the Credit Suisse Leveraged Loan Index.
The Fund seeks to provide a high level of current income while maximizing total return. The Fund pursues its objective by normally investing at least 80% of its assets in floating rate securities, including senior secured syndicated bank loans and asset-backed securities (ABS).
Bank loans posted their fifth consecutive year of positive returns in 2013 amid rate volatility, reflected in 77 consecutive weeks of positive flows, totaling $65 billion over that period. Strong loan demand also stemmed from robust issuance in collateralized loan obligations (CLOs). Institutional bank loans set a new record with $578 billion of gross issuance, outpacing the previous record in 2007 by 26%. Refinancing represented 42% of primary market activity, limiting net new supply, which was positive for prices and spreads as investors were forced into the secondary markets. The current default rate for senior loans is 2.2%, well below the historical average of 3.4%.
Interest rate risk was the dominant focus of fixed income investors as positive economic momentum and dovish statements by the Federal Reserve (the “Fed”) led to rising interest rates. The yield on the 10-year Treasury note hit a two-year high of 3.0% to close 2013. The Fed’s decision to taper its bond purchases in December was largely driven by the strength of economic momentum as evidenced by a number of data releases in recent months. Risk markets responded positively as dovish Fed statements have continued to propel asset prices higher. While we believe that many risk assets are fully valued, credit assets have potential for continued spread compression in the near-term. It remains an optimal time to take prudent credit risk, though we are cautious with respect to aggressive pricing and weaker structures from issuers. While we still like bank loans as an asset class, technical factors, such as the potential for lower demand from the CLO origination market and mutual fund flows, suggest that market events over the next few months should be monitored carefully.
The Fund’s performance stemmed from good credit selection, portfolio trading decisions and tactical allocations to the ABS and high yield sectors. In connection with trading, the Fund put money to work opportunistically, as near-term catalysts drove seemingly out-of-favor assets to levels that were attractive for purchase. The Fund has consistently maintained a lower-duration target, but selectively added duration amid lower rates following the Fed’s decision to not taper in late September. The Fund also took gains in floating rate assets that were less sensitive to interest rate movements and had less upside with respect to spread duration, such as CLOs and shorter-maturity bank loans. We continue to exercise prudent credit research on deals in which we are willing to invest.
The ABS sector was a positive contributor to Fund returns, as CLOs and floating rate ABS saw minimal mark-to-market weakness while positive carry from coupon, spread tightening and gains from amortization of discount securities helped offset some of the mark-to-market weakness experienced from fixed rate ABS. The ABS market benefited from interest rate volatility that led to increased demand for floating rate securities, which maintained a positive technical bid for floating rate ABS and CLOs. Despite the negative effects of increased interest rate volatility and the subsequent impact on housing data, the non-Agency RMBS market also maintained positive performance for the period.
Performance displayed represents past performance, which is no guarantee of future results.
The opinions and forecast expressed may not actually come to pass. This information is subject to change at any time, based on market and other conditions, and should not be construed as a recommendation of any specific security or strategy.
| 48 | The Guggenheim Funds annual REPORT |
| performance report and FUND PROFILE (Unaudited) | December 31, 2013 |
SERIES F (FLOATING RATE STRATEGIES SERIES)
OBJECTIVE: Seeks to provide a high level of current income while maximizing total return.
Cumulative Fund Performance*,†
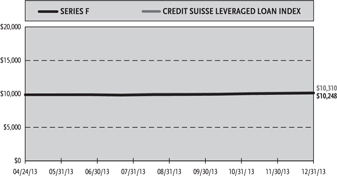
Annual Returns*
Period Ended December 31, 2013†
| Since Inception | ||||
| (04/24/13) | ||||
| Series F (Floating Rate Strategies Series) | 2.48% | |||
| Credit Suisse Leveraged Loan Index | 3.10% | |||
| Ten Largest Holdings (% of Total Net Assets) | ||||
| Federated U.S. Treasury Cash Reserve Fund | 8.1 | % | ||
| Infor (US), Inc. | 1.6 | % | ||
| AlixPartners, LLP | 1.5 | % | ||
| Travelport Holdings Ltd. | 1.3 | % | ||
| Harvard Drug | 1.3 | % | ||
| Grocery Outlet, Inc. | 1.3 | % | ||
| HUB International Ltd. | 1.1 | % | ||
| Sears Holdings Corp. | 1.1 | % | ||
| CHG Healthcare Services, Inc. | 1.1 | % | ||
| Laureate Education, Inc. | 1.1 | % | ||
| Top Ten Total | 19.5 | % | ||
Holdings Diversification (Market Exposure as % of Net Assets)
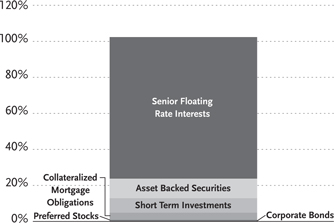
Inception Date: April 24, 2013
Portfolio Composition by Quality Rating**
| Rating | ||||
| Fixed Income Instruments | ||||
| AA | 1.0 | % | ||
| A | 1.9 | % | ||
| BBB | 6.1 | % | ||
| BB | 17.9 | % | ||
| B | 57.4 | % | ||
| CCC | 6.8 | % | ||
| NR | 0.5 | % | ||
| Other Instruments | ||||
| Short Term Investments | 7.9 | % | ||
| Preferred Stocks | 0.5 | % | ||
| Total Investments | 100.0 | % | ||
The chart above reflects percentages of the value of total investments.
| * | The performance data above represents past performance that is not predictive of future results. The investment return and principal value of an investment in the Fund will fluctuate so that an investor’s shares, when redeemed, may be worth more or less than their original cost. Returns are historical and include changes in principal and reinvested dividends and capital gains and do not reflect the effect of taxes. The CSFB Leveraged Loan Index is an unmanaged index and, unlike the Fund, has no management fees or operating expenses to reduce its reported return. |
| ** | Source: Factset. Credit quality ratings are measured on a scale that generally ranges from AAA (highest) to D (lowest). All rated securities have been rated by Moody’s, Standard & Poor’s (“S&P”), or Fitch, which are all a Nationally Recognized Statistical Rating Organization (“NRSRO”). For purposes of this presentation, when ratings are available from more than one agency, the highest rating is used. Guggenheim Investments has converted Moody’s and Fitch ratings to the equivalent S&P rating. Unrated securities do not necessarily indicate low credit quality. Security ratings are determined at the time of purchase and may change thereafter. |
| † | Performance figures do not reflect fees and expenses associated with an investment in variable insurance products. If returns had taken into account these fees and expenses, performance would have been lower. Shares of a series of SBL Fund are available only through the purchase of such products. |
| the GUGGENHEIM FUNDS annual report | 49 |
| Schedule of Investments | December 31, 2013 |
| Series F (FLOATING RATE STRATEGIES Series) |
| Shares | Value | |||||||
| PREFERRED STOCKS† - 0.5% | ||||||||
| Aspen Insurance Holdings Ltd. | ||||||||
| 5.95%1,2 | 10,000 | $ | 226,700 | |||||
| Total Preferred Stocks | ||||||||
| (Cost $250,000) | 226,700 | |||||||
| SHORT TERM INVESTMENTS† - 8.1% | ||||||||
| Federated U.S. Treasury Cash | ||||||||
| Reserve Fund | 3,733,293 | 3,733,293 | ||||||
| Total Short Term Investments | ||||||||
| (Cost $3,733,293) | 3,733,293 | |||||||
| Face | ||||||||
| Amount | ||||||||
| SENIOR FLOATING RATE INTERESTS††,1 - 77.6% | ||||||||
| Consumer Discretionary - 19.1% | ||||||||
| AlixPartners, LLP | ||||||||
| 5.00% due 07/10/20 | $ | 690,508 | 694,609 | |||||
| Sears Holdings Corp. | ||||||||
| 5.50% due 06/30/18 | 500,000 | 502,745 | ||||||
| CHG Healthcare Services, Inc. | ||||||||
| 4.25% due 11/19/19 | 500,000 | 501,875 | ||||||
| Laureate Education, Inc. | ||||||||
| 5.00% due 06/16/18 | 498,352 | 500,534 | ||||||
| NES Global Talent | ||||||||
| 6.50% due 10/02/19 | 500,000 | 497,500 | ||||||
| Steinway Musical Instruments, Inc. | ||||||||
| 9.25% due 09/18/20 | 200,000 | 206,500 | ||||||
| 4.75% due 09/19/19 | 199,500 | 201,122 | ||||||
| Hudson’s Bay Co. | ||||||||
| 4.75% due 11/04/20 | 400,000 | 406,152 | ||||||
| Rite Aid Corp. | ||||||||
| 4.88% due 06/21/21 | 400,000 | 405,332 | ||||||
| Neiman Marcus Group, Inc. | ||||||||
| 5.00% due 10/25/20 | 400,000 | 404,612 | ||||||
| Playa Resorts Holdings | ||||||||
| 4.75% due 08/09/19 | 399,000 | 402,491 | ||||||
| Lions Gate Entertainment Corp. | ||||||||
| 5.00% due 07/18/20 | 400,000 | 401,000 | ||||||
| Information Resources, Inc. | ||||||||
| 4.75% due 09/26/20 | 399,000 | 400,664 | ||||||
| ValleyCrest Companies LLC | ||||||||
| 5.50% due 06/13/19 | 398,000 | 399,493 | ||||||
| Smart & Final Stores LLC | ||||||||
| 4.75% due 11/15/19 | 396,995 | 396,002 | ||||||
| Fleetpride Corp. | ||||||||
| 5.25% due 11/19/19 | 396,992 | 391,784 | ||||||
| Guitar Center, Inc. | ||||||||
| 6.25% due 04/09/17 | 397,900 | 387,455 | ||||||
| Totes Isotoner Corp. | ||||||||
| 7.25% due 07/07/17 | 362,332 | 363,014 | ||||||
| Go Daddy Operating Company LLC | ||||||||
| 4.00% due 12/16/18 | 347,843 | 347,917 | ||||||
| IntraWest Holdings S.à r.l. | ||||||||
| 7.75% due 12/10/18 | 300,000 | 288,066 | ||||||
| Horseshoe Baltimore | ||||||||
| 8.25% due 07/02/20 | 250,000 | 257,970 | ||||||
| Party City Holdings, Inc. | ||||||||
| 4.25% due 07/27/19 | 198,496 | 199,179 | ||||||
| Arby’s | ||||||||
| 5.00% due 11/15/20 | 175,000 | 175,767 | ||||||
| Ollies Bargain Outlet | ||||||||
| 5.26% due 09/28/19 | 149,247 | 149,993 | ||||||
| Total Consumer Discretionary | 8,881,776 | |||||||
| Industrials - 12.3% | ||||||||
| Travelport Holdings Ltd. | ||||||||
| 6.25% due 06/26/19 | 596,950 | 611,379 | ||||||
| US Shipping Corp. | ||||||||
| 9.00% due 04/30/18 | 398,000 | 406,956 | ||||||
| Doncasters Group Ltd. | ||||||||
| 9.50% due 10/09/20 | 400,000 | 405,000 | ||||||
| US Infrastructure Corp. | ||||||||
| 4.75% due 07/10/20 | 398,000 | 399,743 | ||||||
| Minimax Viking | ||||||||
| 4.50% due 08/14/20 | 398,000 | 399,660 | ||||||
| Sabre, Inc. | ||||||||
| 4.50% due 02/19/19 | 399,000 | 399,499 | ||||||
| Dematic S.A. | ||||||||
| 5.25% due 12/28/19 | 396,992 | 398,731 | ||||||
| ServiceMaster Co. | ||||||||
| 4.25% due 01/31/17 | 396,992 | 392,923 | ||||||
| Thermasys Corp. | ||||||||
| 5.26% due 05/03/19 | 397,500 | 390,874 | ||||||
| Emerald Expositions | ||||||||
| 5.50% due 06/12/20 | 298,500 | 299,246 | ||||||
| Power Borrower, LLC | ||||||||
| 4.25% due 05/06/20 | 233,195 | 229,696 | ||||||
| NaNa Development Corp. | ||||||||
| 8.00% due 03/15/18 | 212,500 | 214,625 | ||||||
| Filtration Group Corp. | ||||||||
| 4.50% due 11/20/20 | 200,000 | 201,876 | ||||||
| Crosby Worldwide | ||||||||
| 4.00% due 11/23/20 | 200,000 | 200,062 | ||||||
| syncreon | ||||||||
| 5.25% due 10/28/20 | 200,000 | 198,876 | ||||||
| MRC Global, Inc. | ||||||||
| 5.00% due 11/08/19 | 179,550 | 181,794 | ||||||
| Mast Global | ||||||||
| 8.25% due 09/12/19††† | 150,000 | 148,500 | ||||||
| Evergreen Tank Solutions, Inc. | ||||||||
| 9.50% due 09/28/18 | 136,201 | 135,520 | ||||||
| Mitchell International, Inc. | ||||||||
| 8.50% due 10/11/21 | 100,000 | 101,313 | ||||||
| Total Industrials | 5,716,273 | |||||||
| 50 | the GUGGENHEIM FUNDS annual report | See Notes to Financial Statements. |
| Schedule of Investments (continued) | December 31, 2013 |
| SERIES F (FLOATING RATE STRATEGIES SERIES) | |
| Face | ||||||||
| Amount | Value | |||||||
| FINANCIALS - 11.5% | ||||||||
| Magic Newco, LLC | ||||||||
| 12.00% due 06/12/19 | $ | 250,000 | $ | 286,562 | ||||
| 5.00% due 12/12/18 | 248,993 | 250,549 | ||||||
| HUB International Ltd. | ||||||||
| 4.75% due 10/02/20 | 498,750 | 504,361 | ||||||
| Cetera Financial Group, Inc. | ||||||||
| 6.50% due 08/07/19 | 397,500 | 401,972 | ||||||
| National Financial Partners | ||||||||
| 5.25% due 07/01/20 | 398,000 | 401,650 | ||||||
| Ceridian Corp. | ||||||||
| 4.41% due 05/09/17 | 400,000 | 401,124 | ||||||
| Digital Insight | ||||||||
| 4.75% due 10/16/19 | 400,000 | 400,000 | ||||||
| Nuveen Investments, Inc. | ||||||||
| 4.17% due 05/13/17 | 400,000 | 398,084 | ||||||
| First Advantage Corp. | ||||||||
| 6.25% due 02/28/19 | 398,000 | 397,256 | ||||||
| Cunningham Lindsey U.S., Inc. | ||||||||
| 5.00% due 12/10/19 | 396,992 | 396,496 | ||||||
| HDV Holdings | ||||||||
| 5.75% due 12/18/18 | 395,000 | 392,038 | ||||||
| Fly Leasing Ltd. | ||||||||
| 4.50% due 08/08/19 | 300,000 | 301,800 | ||||||
| American Stock Transfer & Trust | ||||||||
| 5.75% due 06/26/20 | 298,500 | 299,619 | ||||||
| CNO Financial Group, Inc. | ||||||||
| 3.75% due 09/28/18 | 145,517 | 145,578 | ||||||
| Knight/Getco | ||||||||
| 5.75% due 11/30/17 | 131,776 | 131,940 | ||||||
| Santander Asset Management | ||||||||
| 4.25% due 12/17/20 | 100,000 | 100,125 | ||||||
| Grosvenor Capital Management | ||||||||
| Holdings, LLLP | ||||||||
| 3.75% due 11/25/20 | 100,000 | 99,875 | ||||||
| Total Financials | 5,309,029 | |||||||
| Information Technology - 11.3% | ||||||||
| Infor (US), Inc. | ||||||||
| 3.75% due 06/03/20 | 921,555 | 919,408 | ||||||
| Active Network, Inc., The | ||||||||
| 5.50% due 11/13/20 | 450,000 | 451,687 | ||||||
| Activision Blizzard | ||||||||
| 3.25% due 10/12/20 | 399,000 | 401,290 | ||||||
| LANDesk Group, Inc. | ||||||||
| 5.25% due 08/09/19 | 398,000 | 399,493 | ||||||
| Deltek, Inc. | ||||||||
| 5.00% due 10/10/18 | 397,990 | 398,985 | ||||||
| EIG Investors Corp. | ||||||||
| 5.00% due 11/09/19 | 397,000 | 398,739 | ||||||
| Greenway Medical Technologies | ||||||||
| 6.00% due 11/04/20 | 400,000 | 398,000 | ||||||
| Aspect Software, Inc. | ||||||||
| 7.00% due 05/07/16 | 390,000 | 390,733 | ||||||
| SumTotal Systems | ||||||||
| 6.28% due 11/16/18 | 375,317 | 369,687 | ||||||
| ION Trading Technologies Ltd. | ||||||||
| 4.50% due 05/22/20 | 199,000 | 200,244 | ||||||
| 8.25% due 05/21/21 | 150,000 | 152,720 | ||||||
| P2 Energy Solutions | ||||||||
| 5.00% due 10/30/20 | 260,000 | 260,975 | ||||||
| Kronos, Inc. | ||||||||
| 4.50% due 10/30/19 | 249,289 | 251,315 | ||||||
| CCC Information Services, Inc. | ||||||||
| 4.00% due 12/20/19 | 248,120 | 248,225 | ||||||
| Total Information Technology | 5,241,501 | |||||||
| Telecommunication Services - 7.7% | ||||||||
| Univision Communications, Inc. | ||||||||
| 4.50% due 03/01/20 | 496,250 | 498,423 | ||||||
| Live Nation Worldwide, Inc. | ||||||||
| 3.50% due 08/14/20 | 399,000 | 400,165 | ||||||
| Hemisphere Media Group, Inc. | ||||||||
| 6.25% due 07/30/20 | 398,000 | 399,493 | ||||||
| Alcatel-Lucent, Inc. | ||||||||
| 5.75% due 01/30/19 | 397,367 | 398,757 | ||||||
| Asurion Corp. | ||||||||
| 4.50% due 05/24/19 | 396,992 | 396,695 | ||||||
| Expert Global Solutions | ||||||||
| 8.50% due 04/03/18 | 374,687 | 375,156 | ||||||
| Mitel Networks Corp. | ||||||||
| 7.00% due 02/27/19 | 357,895 | 357,895 | ||||||
| Zayo Group LLC | ||||||||
| 4.00% due 07/02/19 | 299,241 | 299,310 | ||||||
| Avaya, Inc. | ||||||||
| 8.00% due 03/31/18 | 247,830 | 251,114 | ||||||
| Cumulus Media, Inc. | ||||||||
| 4.25% due 12/18/20 | 200,000 | 201,000 | ||||||
| Total Telecommunication Services | 3,578,008 | |||||||
| Consumer Staples - 5.7% | ||||||||
| Grocery Outlet, Inc. | ||||||||
| 5.50% due 12/17/18 | 597,101 | 598,224 | ||||||
| DS Waters of America, Inc. | ||||||||
| 5.25% due 08/30/20 | 400,000 | 405,500 | ||||||
| CTI Foods Holding Co. LLC | ||||||||
| 4.50% due 06/28/20 | 299,250 | 298,876 | ||||||
| 8.25% due 06/28/21 | 100,000 | 100,500 | ||||||
| Arctic Glacier Holdings, Inc. | ||||||||
| 6.00% due 05/10/19 | 398,000 | 398,000 | ||||||
| Reddy Ice Holdings, Inc. | ||||||||
| 6.75% due 04/01/19 | 397,995 | 397,497 | ||||||
| Performance Food Group | ||||||||
| 6.25% due 11/14/19 | 248,750 | 249,889 | ||||||
| Dole Food Company, Inc. | ||||||||
| 4.50% due 11/01/18 | 200,000 | 200,666 | ||||||
| Total Consumer Staples | 2,649,152 | |||||||
| See Notes to Financial Statements. | The GUGGENHEIM FUNDS annual report | 51 |
| Schedule of Investments (continued) | December 31, 2013 |
| Series F (FLOATING RATE STRATEGIES Series) |
| Face | ||||||||
| Amount | Value | |||||||
| MATERIALS - 3.6% | ||||||||
| Chromaflo Technologies | ||||||||
| 4.50% due 12/02/19 | $ | 450,000 | $ | 449,721 | ||||
| CPG International, Inc. | ||||||||
| 4.75% due 09/30/20 | 399,000 | 399,998 | ||||||
| Royal Adhesives and Sealants | ||||||||
| 5.50% due 07/31/18 | 396,734 | 399,709 | ||||||
| Ennis-Flint | ||||||||
| 6.25% due 03/30/18 | 300,000 | 301,500 | ||||||
| Oxbow Carbon | ||||||||
| 8.00% due 01/18/20 | 100,000 | 101,688 | ||||||
| Total Materials | 1,652,616 | |||||||
| Energy - 3.1% | ||||||||
| Rice Energy | ||||||||
| 8.50% due 10/25/18 | 397,995 | 404,960 | ||||||
| Ocean Rig ASA | ||||||||
| 5.50% due 07/15/16 | 399,000 | 404,155 | ||||||
| State Class Tankers | ||||||||
| 6.75% due 06/19/20 | 400,000 | 403,000 | ||||||
| EquiPower Resources Holdings LLC | ||||||||
| 4.25% due 12/31/19 | 208,750 | 209,272 | ||||||
| Total Energy | 1,421,387 | |||||||
| Health Care - 1.8% | ||||||||
| Harvard Drug | ||||||||
| 5.00% due 08/16/20 | 597,000 | 601,107 | ||||||
| Learning Care Group (US), Inc. | ||||||||
| 6.00% due 05/08/19 | 248,750 | 249,683 | ||||||
| Total Health Care | 850,790 | |||||||
| Utilities - 1.5% | ||||||||
| Astoria Generating Company | ||||||||
| Acquisitions LLC | ||||||||
| 8.50% due 10/26/17 | 390,000 | 401,700 | ||||||
| Linden Cogeneration Power | ||||||||
| 3.75% due 12/17/20 | 300,000 | 301,875 | ||||||
| Total Utilities | 703,575 | |||||||
| Total Senior Floating Rate Interests | ||||||||
| (Cost $35,736,761) | 36,004,107 | |||||||
| ASSET BACKED SECURITIES†† - 10.9% | ||||||||
| Gramercy Real Estate CDO 2007-1 Ltd. | ||||||||
| 2007-1A, 0.52% due 08/15/561,4 | 548,694 | 452,233 | ||||||
| Northwoods Capital VII Ltd. | ||||||||
| 2006-7A, 3.74% due 10/22/211,4 | 250,000 | 232,825 | ||||||
| 2006-7A, 1.79% due 10/22/211,4 | 200,000 | 188,040 | ||||||
| N-Star Real Estate CDO IX Ltd. | ||||||||
| 0.51% due 02/01/413 | 450,745 | 409,772 | ||||||
| Cedar Woods CRE CDO Ltd. | ||||||||
| 0.43% due 07/25/51 | 461,665 | 375,149 | ||||||
| GreenPoint Mortgage Funding Trust | ||||||||
| 2005-HE4, 0.87% due 07/25/301 | 350,000 | 311,531 | ||||||
| RAIT CRE CDO I Ltd. | ||||||||
| 2006-1X, 0.50% due 11/20/461 | 352,867 | 284,058 | ||||||
| Structured Asset Securities Corporation | ||||||||
| Mortgage Loan Trust | ||||||||
| 2006-OPT1, 0.42% due 04/25/361 | 300,000 | 255,918 | ||||||
| Salus CLO 2012-1 Ltd. | ||||||||
| 2013-1AN, 4.99% due 03/05/211,4 | 250,000 | 249,975 | ||||||
| DIVCORE CLO Ltd. | ||||||||
| 2013-1A B, 4.10% due 11/15/32 | 250,000 | 249,250 | ||||||
| Garrison Funding 2013-2 Ltd. | ||||||||
| 2013-2A, 4.98% due 09/25/231,4 | 250,000 | 248,750 | ||||||
| Newstar Commercial Loan | ||||||||
| Funding 2013-1 LLC | ||||||||
| 2013-1A, 4.95% due 09/20/231,4 | 250,000 | 247,300 | ||||||
| Acis CLO 2013-2 Ltd. | ||||||||
| 4.11% due 10/14/221,4 | 250,000 | 238,750 | ||||||
| Cerberus Onshore II CLO LLC | ||||||||
| 2014-1A, 4.24% due 10/15/231,4 | 250,000 | 238,575 | ||||||
| Jasper CLO Ltd. | ||||||||
| 2005-1A, 1.14% due 08/01/171,4 | 250,000 | 232,558 | ||||||
| GSAA Home Equity Trust | ||||||||
| 2007-7, 0.43% due 07/25/371 | 189,315 | 160,735 | ||||||
| Wachovia Asset Securitization | ||||||||
| Issuance II LLC Trust | ||||||||
| 2007-HE1, 0.30% due 07/25/371,4 | 158,865 | 134,241 | ||||||
| Lehman XS Trust | ||||||||
| 2007-9, 0.28% due 06/25/371 | 152,740 | 132,653 | ||||||
| New Century Home Equity | ||||||||
| Loan Trust Series | ||||||||
| 2004-4, 0.96% due 02/25/351 | 102,164 | 92,623 | ||||||
| Home Equity Asset Trust | ||||||||
| 2006-3, 0.47% due 07/25/361 | 100,000 | 90,133 | ||||||
| West Coast Funding Ltd. | ||||||||
| 2006-1A, 0.39% due 11/02/411,4 | 92,277 | 88,992 | ||||||
| Newcastle CDO Ltd. | ||||||||
| 2007-9A, 0.42% due 05/25/52 | 73,215 | 71,502 | ||||||
| Accredited Mortgage Loan Trust | ||||||||
| 2007-1, 0.29% due 02/25/371 | 75,767 | 70,026 | ||||||
| Total Asset Backed Securities | ||||||||
| (Cost $5,053,533) | 5,055,589 | |||||||
| COLLATERALIZED MORTGAGE OBLIGATIONS†† - 3.8% | ||||||||
| Lehman XS Trust Series | ||||||||
| 2006-16N, 0.35% due 11/25/461 | 293,484 | 233,717 | ||||||
| 2005-7N, 0.43% due 12/25/351 | 249,423 | 228,813 | ||||||
| SRERS-2011 Funding Ltd. | ||||||||
| 2011-RS, 0.42% due 05/09/461,4 | 376,441 | 341,206 | ||||||
| GreenPoint Mortgage Funding Trust | ||||||||
| 2006-AR1, 0.45% due 02/25/361 | 262,813 | 208,911 | ||||||
| COMM 2006-FL12 Mortgage Trust | ||||||||
| 2006-FL12, 0.46% due 12/15/201,4 | 129,981 | 126,684 | ||||||
| 2006-FL12, 0.51% due 12/15/201,4 | 64,998 | 62,705 | ||||||
| Nomura Resecuritization Trust | ||||||||
| 2012-1R, 0.61% due 08/27/471,4 | 191,952 | 176,845 | ||||||
| 52 | the GUGGENHEIM FUNDS annual report | See Notes to Financial Statements. |
| Schedule of Investments (concluded) | December 31, 2013 |
| Series F (FLOATING RATE STRATEGIES Series) |
| Face | ||||||||
| Amount | Value | |||||||
| IndyMac INDX Mortgage Loan Trust | ||||||||
| 2006-AR4, 0.37% due 05/25/461 | $ | 186,885 | $ | 156,535 | ||||
| Bear Stearns Mortgage Funding Trust | ||||||||
| 2007-AR5, 0.33% due 06/25/471 | 164,538 | 132,876 | ||||||
| Structured Asset Mortgage | ||||||||
| Investments II Trust | ||||||||
| 2006-AR1, 0.39% due 02/25/361 | 95,605 | 72,290 | ||||||
| Total Collateralized Mortgage Obligations | ||||||||
| (Cost $1,742,902) | 1,740,582 | |||||||
| CORPORATE BONDS†† - 0.5% | ||||||||
| Financials - 0.5% | ||||||||
| PNC Financial Services Group, Inc. | ||||||||
| 4.85% due 05/29/491,2 | 250,000 | 223,875 | ||||||
| Total Corporate Bonds | ||||||||
| (Cost $250,000) | 223,875 | |||||||
| Total Investments - 101.4% | ||||||||
| (Cost $46,766,489) | $ | 46,984,146 | ||||||
| Other Assets & Liabilities, net - (1.4)% | (641,631 | ) | ||||||
| Total Net Assets - 100.0% | $ | 46,342,515 | ||||||
| † | Value determined based on Level 1 inputs — See Note 4. |
| †† | Value determined based on Level 2 inputs, unless otherwise noted — See Note 4. |
| ††† | Value determined based on Level 3 inputs — See Note 4. |
| 1 | Variable rate security. Rate indicated is rate effective at December 31, 2013. |
| 2 | Perpetual maturity. |
| 3 | Illiquid security. |
| 4 | Security is a 144A or Section 4(a)(2) security. The total market value of 144A or Section 4(a)(2) securities is $3,259,679 (cost $3,244,656), or 7.0% of total net assets. |
| See Notes to Financial Statements. | The GUGGENHEIM FUNDS annual report | 53 |
| Series F (FLOATING RATE STRATEGIES Series) |
| STATEMENT OF ASSETS |
| AND LIABILITIES |
December 31, 2013
| Assets: | ||||
| Investments, at value | ||||
| (cost $46,766,489) | $ | 46,984,146 | ||
| Cash | 172,072 | |||
| Prepaid expenses | 3,431 | |||
| Receivables: | ||||
| Securities sold | 1,340,731 | |||
| Interest | 159,773 | |||
| Fund shares sold | 23,872 | |||
| Investment advisor | 22,634 | |||
| Dividends | 3,719 | |||
| Total assets | 48,710,378 | |||
| Liabilities: | ||||
| Unfunded loan commitments, at value (commitment fees received $79) | 72 | |||
| Payable for: | ||||
| Securities purchased | 2,314,526 | |||
| Management fees | 24,536 | |||
| Distribution and service fees | 9,437 | |||
| Fund accounting/administration fees | 3,586 | |||
| Transfer agent/maintenance fees | 2,125 | |||
| Fund shares redeemed | 214 | |||
| Directors’ fees* | 147 | |||
| Miscellaneous | 13,220 | |||
| Total liabilities | 2,367,863 | |||
| Net assets | $ | 46,342,515 | ||
| Net assets consist of: | ||||
| Paid in capital | $ | 45,257,278 | ||
| Undistributed net investment income | 794,675 | |||
| Accumulated net realized gain on investments | 72,898 | |||
| Net unrealized appreciation on investments | 217,664 | |||
| Net assets | $ | 46,342,515 | ||
| Capital shares outstanding | 1,809,292 | |||
| Net asset value per share | $ | 25.61 |
| STATEMENT OF |
| OPERATIONS |
Period Ended December 31, 2013**
| Investment Income: | ||||
| Interest | $ | 1,072,621 | ||
| Dividends | 9,876 | |||
| Total investment income | 1,082,497 | |||
| Expenses: | ||||
| Management fees | 175,334 | |||
| Transfer agent/maintenance fees | 17,202 | |||
| Distribution and service fees | 67,436 | |||
| Fund accounting/administration fees | 25,627 | |||
| Professional fees | 26,927 | |||
| Printing expenses | 22,243 | |||
| Custodian fees | 665 | |||
| Line of credit fees | 6,713 | |||
| Directors’ fees* | 2,529 | |||
| Proxy expense | 1,017 | |||
| Miscellaneous | 22,135 | |||
| Total expenses | 367,828 | |||
| Less: | ||||
| Expenses waived by Advisor | (48,535 | ) | ||
| Net expenses | 319,293 | |||
| Net investment income | 763,204 | |||
| Net Realized and Unrealized Gain (Loss): | ||||
| Net realized gain (loss) on: | ||||
| Investments | 85,624 | |||
| Net realized gain | 85,624 | |||
| Net change in unrealized appreciation (depreciation) on: | ||||
| Investments | 217,664 | |||
| Net change in unrealized appreciation (depreciation) | 217,664 | |||
| Net realized and unrealized gain | 303,288 | |||
| Net increase in net assets resulting from operations | $ | 1,066,492 |
| * | Relates to Directors not deemed “interested persons” within the meaning of Section 2(a)(19) of the 1940 Act. |
| ** | Since commencement of operations: April 24, 2013. |
| 54 | the GUGGENHEIM FUNDS annual report | See Notes to Financial Statements. |
| Series F (FLOATING RATE STRATEGIES Series) |
| STATEMENT OF CHANGES IN NET ASSETS |
| Period Ended | ||||
| December 31, | ||||
| 2013a | ||||
| Increase (Decrease) In Net Assets From Operations: | ||||
| Net investment income | $ | 763,204 | ||
| Net realized gain on investments | 85,624 | |||
| Net change in unrealized appreciation (depreciation) on investments | 217,664 | |||
| Net increase in net assets resulting from operations | 1,066,492 | |||
| Capital share transactions: | ||||
| Proceeds from sale of shares | 62,571,845 | |||
| Cost of shares redeemed | (17,295,822 | ) | ||
| Net increase from capital share transactions | 45,276,023 | |||
| Net increase in net assets | 46,342,515 | |||
| Net assets: | ||||
| Beginning of period | — | |||
| End of period | $ | 46,342,515 | ||
| Undistributed net investment income at end of period | $ | 794,675 | ||
| Capital share activity: | �� | |||
| Shares sold | 2,495,635 | |||
| Shares redeemed | (686,343 | ) | ||
| Net increase in shares | 1,809,292 | |||
| a | Since commencement of operations: April 24, 2013. |
| See Notes to Financial Statements. | The GUGGENHEIM FUNDS annual report | 55 |
| Series F (FLOATING RATE STRATEGIES Series) |
| FINANCIAL HIGHLIGHTS |
This table is presented to show selected data for a share outstanding throughout each period and to assist shareholders in evaluating a Fund’s performance for the periods presented.
| Period Ended | ||||
| December 31, | ||||
| 2013c | ||||
| Per Share Data | ||||
| Net asset value, beginning of period | $ | 25.00 | ||
| Income (loss) from investment operations: | ||||
| Net investment incomea | .49 | |||
| Net gain on investments (realized and unrealized) | .12 | |||
| Total from investment operations | .61 | |||
| Net asset value, end of period | $ | 25.61 | ||
| Total Returnb | 2.48 | % | ||
| Ratios/Supplemental Data | ||||
| Net assets, end of period (in thousands) | $ | 46,343 | ||
| Ratios to average net assets: | ||||
| Net investment income | 2.81 | % | ||
| Total expensesd | 1.35 | % | ||
| Net expensesd,e | 1.17 | % | ||
| Portfolio turnover rate | 53 | % | ||
| a | Net investment income per share was computed using average shares outstanding throughout the period. |
| b | Total return does not take into account any of the expenses associated with an investment in variable insurance products. If total return had taken into account these expenses, performance would have been lower. Shares of a series of SBL Fund are available only through the purchase of such products. |
| c | Since commencement of operations: April 24, 2013. Percentage amounts for the period, except total return and portfolio turnover rate, have been annualized. |
| d | Due to limited length of Fund operations, ratios for this period may not be indicative of future performance. |
| e | Net expense information reflects the expense ratios after expense waivers and may include extraordinary expenses. Excluding extraordinary expenses, the operating expense ratio for the period would be: |
| 12/31/13 | ||
| 1.15% | ||
| 56 | the GUGGENHEIM FUNDS annual report | See Notes to Financial Statements. |
| Manager’S Commentary (Unaudited) | December 31, 2013 |
To Our Shareholders:
The Series J (StylePlus–Mid Growth Series, formerly Mid Cap Growth Series) is managed by a team of seasoned professionals, including B. Scott Minerd, Global Chief Investment Officer; Farhan Sharaff, Senior Managing Director and Assistant Chief Investment Officer, Equities; Jayson Flowers, Senior Managing Director and Head of Equity and Derivative Strategies; and Scott Hammond, Managing Director and Portfolio Manager. In the following paragraphs, the investment team discusses performance and changes to the Fund that occurred during the fiscal year ended December 31, 2013.
For the 12-month period ended December 31, 2013, the Series J (StylePlus–Mid Growth Series, formerly, Mid Cap Growth Series) returned 30.52%, compared with the benchmark, the Russell Midcap® Growth Index, which returned 35.74%.
The Fund’s Board of Directors approved the following changes, which became effective on April 30, 2013: a new Fund name, new principal investment strategies and new portfolio management team.
The Fund’s investment objective is to seek long-term growth of capital in excess of that produced by the total return of the Russell Midcap Growth Index. The Fund seeks to add alpha above the target index by leveraging Guggenheim’s competencies in fixed and systematic stock selection. To accomplish this, the StylePlus strategy allocates to quantitative selection models when stock picking opportunities in the market are high. When stock selection opportunities are less attractive, the Fund invests in derivatives based on the target index, backed by a diversified portfolio of fixed income instruments. In this way, the Fund believes it will deliver the target index return plus an alpha component commensurate with the yield achieved on the active fixed income portfolio.
The Fund’s underperformance for the 12 months came predominantly during the four months it was being managed according to the legacy strategy. Specifically, from January 1, 2013, through April 30, 2013, the Fund underperformed the benchmark by about four percentage points, largely due to poor stock selection in the Energy and Information Technology sectors, as well as poor stock selection and an underweight in the Consumer Staples sector. The Fund’s cash position was also a drag on performance.
For the time the Fund was being managed according to the new strategy, the eight months from April 30, 2013 through September 30, 2013, the Fund performed slightly better than the benchmark. During much of this period, the Fund maintained an approximate allocation of 20% to systematic equity selection, 80% allocated to the passive equity position, which was maintained with swap agreements and futures contracts, and 52% allocated to fixed income investments (excluding short term). Beginning in December 2013, due to a more favorable outlook for active stock selection, the equity sleeve was increased to 25%, with 75% allocated to the passive equity position.
The equity sleeve was additive over the period, delivering the strongest returns during the months of May, June and December.
The fixed income allocation also contributed to performance over the eight months, after detracting from performance during the substantial debt selloff that began at the end of May and lasted in to June. The swap agreements also contributed to performance.
Performance displayed represents past performance, which is no guarantee of future results.
The opinions and forecast expressed may not actually come to pass. This information is subject to change at any time, based on market and other conditions, and should not be construed as a recommendation of any specific security or strategy.
| The Guggenheim Funds annual REPORT | 57 |
| performance report and FUND PROFILE (Unaudited) | December 31, 2013 |
SERIES J (STYLEPLUS–MID GROWTH SERIES)
OBJECTIVE: Seeks long-term growth of capital.
Cumulative Fund Performance*,†
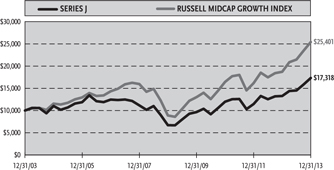
Average Annual Returns*
Periods Ended December 31, 2013†
| 1 Year | 5 Year | 10 Year | ||||||||||
| Series J (StylePlus–Mid Growth Series) | 30.52 | % | 20.92 | % | 5.64 | % | ||||||
| Russell Midcap Growth Index | 35.74 | % | 23.37 | % | 9.77 | % | ||||||
Ten Largest Holdings (% of Total Net Assets)
| Dreyfus Treasury Prime Cash Management Fund | 9.2 | % | ||
| Guggenheim BulletShares 2016 High Yield Corporate Bond ETF | 1.9 | % | ||
| Guggenheim BulletShares 2015 High Yield Corporate Bond ETF | 1.9 | % | ||
| Guggenheim BulletShares 2014 High Yield Corporate Bond ETF | 1.9 | % | ||
| Floating Rate Strategies Fund Institutional Class | 1.7 | % | ||
| Macro Opportunities Fund Institutional Class | 1.7 | % | ||
| New York City Water & Sewer System Revenue Bonds | 1.4 | % | ||
| Duane Street CLO IV Ltd. — Class A1T | 1.3 | % | ||
| U.S. Treasury Bill | 1.3 | % | ||
| HIS Asset Securitization Corporation Trust 2007-WF1—Class 2A3 | 1.2 | % | ||
| Top Ten Total | 23.5 | % |
Holdings Diversification (Market Exposure as % of Net Assets)
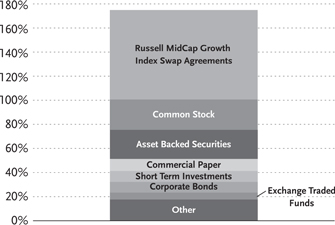
| Inception Date: October 1, 1992 |
| Portfolio Composition by Quality Rating** |
| Rating |
| Fixed Income Instruments | ||||
| AAA | 8.9 | % | ||
| AA | 3.7 | % | ||
| A | 7.7 | % | ||
| BBB | 21.8 | % | ||
| BB | 2.8 | % | ||
| B | 4.5 | % | ||
| CCC | 5.0 | % | ||
| NR | 2.1 | % | ||
| Other Instruments | ||||
| Common Stock | 25.1 | % | ||
| Short Term Investments | 9.2 | % | ||
| Exchange Traded Funds | 5.8 | % | ||
| Mutual Funds | 3.4 | % | ||
| Total Investments | 100.0 | % |
| * | The performance data above represents past performance that is not predictive of future results. The investment return and principal value of an investment in the Fund will fluctuate so that an investor’s shares, when redeemed, may be worth more or less than their original cost. Returns are historical and include changes in principal and reinvested dividends and capital gains and do not reflect the effect of taxes. The Russell Midcap Growth Index is an unmanaged index and, unlike the Fund, has no management fees or operating expenses to reduce its reported return. |
| ** | Source: Factset. Credit quality ratings are measured on a scale that generally ranges from AAA (highest) to D (lowest). All rated securities have been rated by Moody’s, Standard & Poor’s (“S&P”), or Fitch, which are all a Nationally Recognized Statistical Rating Organization (“NRSRO”). For purposes of this presentation, when ratings are available from more than one agency, the highest rating is used. Guggenheim Investments has converted Moody’s and Fitch ratings to the equivalent S&P rating. Unrated securities do not necessarily indicate low credit quality. Security ratings are determined at the time of purchase and may change thereafter. |
| † | Performance figures do not reflect fees and expenses associated with an investment in variable insurance products. If returns had taken into account these fees and expenses, performance would have been lower. Shares of a series of SBL Fund are available only through the purchase of such products. |
| 58 | the GUGGENHEIM FUNDS annual report |
| Schedule of Investments | December 31, 2013 |
| Series J (STYLEPLUS–MID GROWTH SERIES) |
| Shares | Value | |||||||
| COMMON STOCKS† - 25.1% | ||||||||
| Health Care - 5.6% | ||||||||
| DaVita HealthCare Partners, Inc.* | 9,165 | $ | 580,786 | |||||
| Laboratory Corporation of | ||||||||
| America Holdings* | 5,903 | 539,357 | ||||||
| Endo Health Solutions, Inc.* | 7,526 | 507,705 | ||||||
| CR Bard, Inc. | 3,759 | 503,481 | ||||||
| AmerisourceBergen Corp. — Class A | 6,653 | 467,773 | ||||||
| HCA Holdings, Inc.* | 9,198 | 438,837 | ||||||
| Aetna, Inc. | 5,901 | 404,749 | ||||||
| Quest Diagnostics, Inc. | 7,265 | 388,968 | ||||||
| Universal Health Services, Inc. — Class B | 4,709 | 382,653 | ||||||
| Cigna Corp. | 4,235 | 370,478 | ||||||
| Actavis plc* | 2,013 | 338,184 | ||||||
| St. Jude Medical, Inc. | 5,424 | 336,017 | ||||||
| Becton Dickinson and Co. | 2,912 | 321,747 | ||||||
| Pharmacyclics, Inc.* | 2,753 | 291,212 | ||||||
| Henry Schein, Inc.* | 2,290 | 261,655 | ||||||
| Zoetis, Inc. | 7,673 | 250,830 | ||||||
| Mylan, Inc.* | 5,768 | 250,331 | ||||||
| BioMarin Pharmaceutical, Inc.* | 3,442 | 241,869 | ||||||
| Cerner Corp.* | 3,939 | 219,560 | ||||||
| Alexion Pharmaceuticals, Inc.* | 1,433 | 190,675 | ||||||
| Hologic, Inc.* | 8,478 | 189,483 | ||||||
| Zimmer Holdings, Inc. | 2,018 | 188,057 | ||||||
| Catamaran Corp.* | 3,216 | 152,696 | ||||||
| Vertex Pharmaceuticals, Inc.* | 1,819 | 135,152 | ||||||
| Varian Medical Systems, Inc.* | 1,732 | 134,559 | ||||||
| Edwards Lifesciences Corp.* | 1,941 | 127,640 | ||||||
| Tenet Healthcare Corp.* | 3,025 | 127,413 | ||||||
| ResMed, Inc. | 2,704 | 127,304 | ||||||
| Waters Corp.* | 1,252 | 125,200 | ||||||
| Myriad Genetics, Inc.* | 5,948 | 124,789 | ||||||
| Mettler-Toledo International, Inc.* | 504 | 122,265 | ||||||
| Total Health Care | 8,841,425 | |||||||
| Industrials - 5.5% | ||||||||
| Ingersoll-Rand plc | 9,948 | 612,797 | ||||||
| Delta Air Lines, Inc. | 16,215 | 445,425 | ||||||
| Fluor Corp. | 5,379 | 431,880 | ||||||
| Dover Corp. | 4,400 | 424,776 | ||||||
| Waste Management, Inc. | 9,452 | 424,112 | ||||||
| United Continental Holdings, Inc.* | 10,962 | 414,692 | ||||||
| Avis Budget Group, Inc.* | 9,959 | 402,543 | ||||||
| AECOM Technology Corp.* | 13,564 | 399,189 | ||||||
| Hertz Global Holdings, Inc.* | 13,815 | 395,385 | ||||||
| Cummins, Inc. | 2,774 | 391,051 | ||||||
| Stanley Black & Decker, Inc. | 4,172 | 336,639 | ||||||
| Waste Connections, Inc. | 7,434 | 324,345 | ||||||
| Masco Corp. | 13,947 | 317,573 | ||||||
| Southwest Airlines Co. | 16,736 | 315,306 | ||||||
| Alaska Air Group, Inc. | 3,988 | 292,600 | ||||||
| Nielsen Holdings N.V. | 5,983 | 274,560 | ||||||
| WW Grainger, Inc. | 948 | 242,139 | ||||||
| Iron Mountain, Inc. | 7,635 | 231,722 | ||||||
| Carlisle Companies, Inc. | 2,877 | 228,434 | ||||||
| MRC Global, Inc.* | 6,251 | 201,657 | ||||||
| RR Donnelley & Sons Co. | 9,666 | 196,026 | ||||||
| United Rentals, Inc.* | 2,412 | 188,015 | ||||||
| Rockwell Automation, Inc. | 1,589 | 187,756 | ||||||
| IHS, Inc. — Class A* | 1,498 | 179,311 | ||||||
| Colfax Corp.* | 2,291 | 145,914 | ||||||
| IDEX Corp. | 1,899 | 140,241 | ||||||
| Cintas Corp. | 2,207 | 131,515 | ||||||
| TransDigm Group, Inc. | 806 | 129,782 | ||||||
| Equifax, Inc. | 1,845 | 127,471 | ||||||
| Rockwell Collins, Inc. | 1,714 | 126,699 | ||||||
| Quanta Services, Inc.* | 3,974 | 125,419 | ||||||
| Total Industrials | 8,784,974 | |||||||
| Consumer Discretionary - 5.4% | ||||||||
| Macy’s, Inc. | 11,405 | 609,027 | ||||||
| Best Buy Company, Inc. | 10,909 | 435,051 | ||||||
| Discovery Communications, Inc. — | ||||||||
| Class A* | 4,443 | 401,736 | ||||||
| The Gap, Inc. | 9,591 | 374,816 | ||||||
| Coach, Inc. | 6,363 | 357,155 | ||||||
| Bed Bath & Beyond, Inc.* | 4,429 | 355,649 | ||||||
| Charter Communications, Inc. — Class A* | 2,548 | 348,465 | ||||||
| Whirlpool Corp. | 2,111 | 331,131 | ||||||
| DISH Network Corp. — Class A* | 5,570 | 322,614 | ||||||
| Genuine Parts Co. | 3,791 | 315,373 | ||||||
| Delphi Automotive plc | 5,108 | 307,144 | ||||||
| Liberty Interactive Corp. — Class A* | 10,132 | 297,374 | ||||||
| Harley-Davidson, Inc. | 4,236 | 293,301 | ||||||
| Omnicom Group, Inc. | 3,856 | 286,770 | ||||||
| Interpublic Group of Companies, Inc. | 16,088 | 284,758 | ||||||
| Nordstrom, Inc. | 4,342 | 268,336 | ||||||
| Expedia, Inc. | 3,850 | 268,191 | ||||||
| Wynn Resorts Ltd. | 1,222 | 237,325 | ||||||
| Dollar General Corp.* | 3,934 | 237,299 | ||||||
| VF Corp. | 3,520 | 219,437 | ||||||
| Mattel, Inc. | 4,340 | 206,497 | ||||||
| Netflix, Inc.* | 552 | 203,230 | ||||||
| O’Reilly Automotive, Inc.* | 1,349 | 173,630 | ||||||
| Service Corporation International | 9,554 | 173,214 | ||||||
| International Game Technology | 9,482 | 172,193 | ||||||
| Ross Stores, Inc. | 2,058 | 154,206 | ||||||
| Wyndham Worldwide Corp. | 1,929 | 142,147 | ||||||
| Marriott International, Inc. — Class A | 2,696 | 133,075 | ||||||
| Darden Restaurants, Inc. | 2,339 | 127,171 | ||||||
| Starwood Hotels & Resorts Worldwide, Inc. | 1,584 | 125,849 | ||||||
| L Brands, Inc. | 2,030 | 125,556 | ||||||
| AutoNation, Inc.* | 2,410 | 119,753 | ||||||
| Total Consumer Discretionary | 8,407,473 | |||||||
| Information Technology - 4.9% | ||||||||
| Symantec Corp. | 24,946 | 588,226 | ||||||
| NetApp, Inc. | 13,561 | 557,899 | ||||||
| SanDisk Corp. | 7,464 | 526,511 | ||||||
| Vantiv, Inc. — Class A* | 13,629 | 444,441 | ||||||
| Western Union Co. | 22,603 | 389,901 | ||||||
| ARRIS Group, Inc.* | 12,412 | 302,418 | ||||||
| Intuit, Inc. | 3,873 | 295,587 | ||||||
| See Notes to Financial Statements. | The GUGGENHEIM FUNDS annual report | 59 |
| Schedule of Investments (continued) | December 31, 2013 |
| Series J (STYLEPLUS–MID GROWTH SERIES) |
| Shares | Value | |||||||
| Alliance Data Systems Corp.* | 1,061 | $ | 278,969 | |||||
| LinkedIn Corp. — Class A* | 1,184 | 256,727 | ||||||
| Fidelity National Information Services, Inc. | 4,713 | 252,994 | ||||||
| Teradata Corp.* | 5,364 | 244,008 | ||||||
| Broadcom Corp. — Class A | 7,816 | 231,743 | ||||||
| Harris Corp. | 3,155 | 220,251 | ||||||
| FLIR Systems, Inc. | 7,216 | 217,202 | ||||||
| ON Semiconductor Corp.* | 25,262 | 208,159 | ||||||
| F5 Networks, Inc.* | 2,273 | 206,525 | ||||||
| Maxim Integrated Products, Inc. | 7,333 | 204,664 | ||||||
| DST Systems, Inc. | 2,085 | 189,193 | ||||||
| Motorola Solutions, Inc. | 2,778 | 187,515 | ||||||
| Rovi Corp.* | 8,720 | 171,697 | ||||||
| Skyworks Solutions, Inc.* | 5,342 | 152,568 | ||||||
| Applied Materials, Inc. | 8,404 | 148,667 | ||||||
| IAC/InterActiveCorp | 2,132 | 146,447 | ||||||
| Citrix Systems, Inc.* | 2,207 | 139,593 | ||||||
| Altera Corp. | 4,167 | 135,553 | ||||||
| j2 Global, Inc. | 2,686 | 134,327 | ||||||
| Booz Allen Hamilton Holding Corp. | 7,005 | 134,146 | ||||||
| Lam Research Corp.* | 2,422 | 131,878 | ||||||
| Atmel Corp.* | 16,820 | 131,701 | ||||||
| NeuStar, Inc. — Class A* | 2,637 | 131,481 | ||||||
| Equinix, Inc.* | 729 | 129,361 | ||||||
| Xilinx, Inc. | 2,798 | 128,484 | ||||||
| Take-Two Interactive Software, Inc.* | 6,994 | 121,486 | ||||||
| Total Information Technology | 7,740,322 | |||||||
CONSUMER STAPLES - 1.8% | ||||||||
| Lorillard, Inc. | 8,460 | 428,753 | ||||||
| Campbell Soup Co. | 9,377 | 405,837 | ||||||
| ConAgra Foods, Inc. | 10,643 | 358,669 | ||||||
| JM Smucker Co. | 2,900 | 300,498 | ||||||
| Whole Foods Market, Inc. | 5,014 | 289,960 | ||||||
| Kroger Co. | 7,297 | 288,450 | ||||||
| Coca-Cola Enterprises, Inc. | 5,403 | 238,434 | ||||||
| Hershey Co. | 2,249 | 218,670 | ||||||
| Dr Pepper Snapple Group, Inc. | 3,873 | 188,693 | ||||||
| Kellogg Co. | 2,687 | 164,095 | ||||||
| Total Consumer Staples | 2,882,059 | |||||||
| Energy - 1.6% | ||||||||
| Baker Hughes, Inc. | 7,748 | 428,155 | ||||||
| Pioneer Natural Resources Co. | 2,305 | 424,281 | ||||||
| Noble Energy, Inc. | 4,374 | 297,913 | ||||||
| Equities Corp. | 2,993 | 268,712 | ||||||
| Cameron International Corp.* | 3,776 | 224,785 | ||||||
| Southwestern Energy Co.* | 5,609 | 220,602 | ||||||
| Seadrill Ltd. | 4,671 | 191,885 | ||||||
| Concho Resources, Inc.* | 1,340 | 144,720 | ||||||
| Kosmos Energy Ltd.* | 12,134 | 135,658 | ||||||
| SM Energy Co. | 1,519 | 126,244 | ||||||
| Total Energy | 2,462,955 | |||||||
| Telecommunication Services - 0.1% | ||||||||
| Crown Castle International Corp.* | 2,453 | 180,124 | ||||||
| Financials - 0.1% | ||||||||
| Progressive Corp. | 6,436 | 175,510 | ||||||
| Materials - 0.1% | ||||||||
| Eastman Chemical Co. | 2,147 | 173,263 | ||||||
| Total Common Stocks | ||||||||
| (Cost $36,577,380) | 39,648,105 | |||||||
| EXCHANGE TRADED FUNDS†,4 - 5.8% | ||||||||
| Guggenheim BulletShares 2016 | ||||||||
| High Yield Corporate Bond ETF | 112,800 | 3,047,856 | ||||||
| Guggenheim BulletShares 2015 | ||||||||
| High Yield Corporate Bond ETF | 112,900 | 3,023,462 | ||||||
| Guggenheim BulletShares 2014 | ||||||||
| High Yield Corporate Bond ETF | 113,100 | 3,016,377 | ||||||
| Total Exchange Traded Funds | ||||||||
| (Cost $9,070,288) | 9,087,695 | |||||||
| MUTUAL FUNDS†,5 - 3.4% | ||||||||
| Floating Rate Strategies Fund | ||||||||
| Institutional Class | 102,024 | 2,729,155 | ||||||
| Macro Opportunities Fund | ||||||||
| Institutional Class | 99,048 | 2,648,534 | ||||||
| Total Mutual Funds | ||||||||
| (Cost $5,510,691) | 5,377,689 | |||||||
| SHORT TERM INVESTMENTS† - 9.2% | ||||||||
| Dreyfus Treasury Prime Cash | ||||||||
| Management Fund | 14,394,863 | 14,394,863 | ||||||
| Total Short Term Investments | ||||||||
| (Cost $14,394,863) | 14,394,863 | |||||||
| Face | ||||||||
| Amount | ||||||||
| ASSET BACKED SECURITIES†† - 24.1% | ||||||||
| Duane Street CLO IV Ltd. | ||||||||
| 2007-4A, 0.47% due 11/14/211,2 | $ | 2,040,422 | 2,000,022 | |||||
| HSI Asset Securitization | ||||||||
| Corporation Trust | ||||||||
| 2007-WF1, 0.33% due 05/25/371 | 2,039,930 | 1,873,799 | ||||||
| JP Morgan Mortgage Acquisition Trust | ||||||||
| 2006-CH2, 0.26% due 10/25/361 | 1,778,702 | 1,746,433 | ||||||
| Garrison Funding 2013-2 Ltd. | ||||||||
| 2013-2A, 2.13% due 09/25/231,2 | 1,570,000 | 1,563,720 | ||||||
| JP Morgan Mortgage Acquisition Trust | ||||||||
| 2007-CH3, 0.31% due 03/25/371 | 1,451,969 | 1,381,473 | ||||||
| Argent Securities Incorporated | ||||||||
| Asset-Backed Pass-Through | ||||||||
| Certificates Series | ||||||||
| 2005-W3, 0.50% due 11/25/351 | 1,466,587 | 1,374,444 | ||||||
| Brentwood CLO Corp. | ||||||||
| 2006-1A, 0.51% due 02/01/221,2 | 1,015,230 | 993,910 | ||||||
| 2006-1A, 1.06% due 02/01/221,2 | 400,000 | 354,520 | ||||||
| Foothill CLO Ltd. | ||||||||
| 2007-1A, 0.48% due 02/22/211,2 | 1,243,573 | 1,219,323 | ||||||
| Cornerstone CLO Ltd. | ||||||||
| 2007-1A, 0.46% due 07/15/211,2 | 1,200,000 | 1,170,000 | ||||||
| Goldman Sachs Asset | ||||||||
| Management CLO plc | ||||||||
| 2007-1A, 2.99% due 08/01/221,2 | 1,200,000 | 1,150,920 | ||||||
| 60 | the GUGGENHEIM FUNDS annual report | See Notes to Financial Statements. |
| Schedule of Investments (continued) | December 31, 2013 |
| Series J (STYLEPLUS–MID GROWTH SERIES) |
| Face | ||||||||
| Amount | Value | |||||||
| Salus CLO 2012-1 Ltd. | ||||||||
| 2013-1AN, 2.49% due 03/05/211,2 | $ | 1,100,000 | $ | 1,100,000 | ||||
| Cerberus Onshore II CLO LLC | ||||||||
| 2014-1A, 2.94% due 10/15/231,2 | 850,000 | 842,520 | ||||||
| 2014-1A, 2.24% due 10/15/231,2 | 250,000 | 250,200 | ||||||
| Halcyon Structured Asset Management | ||||||||
| Long Secured/Short | ||||||||
| Unsecured 2007-2 Ltd. | ||||||||
| 2007-2A, 3.99% due 10/29/211,2 | 1,100,000 | 1,089,330 | ||||||
| NewStar Commercial Loan Trust | ||||||||
| 2006-1A, 0.63% due 03/30/221,2 | 600,000 | 585,540 | ||||||
| 2006-1A, 0.52% due 03/30/221,2 | 497,697 | 490,232 | ||||||
| N-Star REL CDO VIII Ltd. | ||||||||
| 2006-8A, 0.46% due 02/01/411,2 | 1,171,936 | 1,068,220 | ||||||
| Aegis Asset Backed Securities Trust | ||||||||
| 2005-3, 0.63% due 08/25/351 | 1,100,000 | 1,046,814 | ||||||
| Lehman XS Trust | ||||||||
| 2007-9, 0.28% due 06/25/371 | 1,199,705 | 1,041,929 | ||||||
| Central Park CLO Ltd. | ||||||||
| 2011-1A, 3.44% due 07/23/221,2 | 1,040,000 | 1,005,472 | ||||||
| Newcastle CDO Ltd. | ||||||||
| 2007-9A, 0.42% due 05/25/52 | 937,152 | 915,222 | ||||||
| KKR Financial CLO 2007-1 Corp. | ||||||||
| 2007-1A, 2.49% due 05/15/211,2 | 950,000 | 894,520 | ||||||
| Wells Fargo Home Equity Asset-Backed | ||||||||
| Securities 2006-2 Trust | ||||||||
| 2006-3, 0.31% due 01/25/371 | 976,285 | 883,159 | ||||||
| Black Diamond CLO 2005-1 | ||||||||
| Delaware Corp. | ||||||||
| 2005-1A, 2.15% due 06/20/171,2 | 900,000 | 866,160 | ||||||
| West Coast Funding Ltd. | ||||||||
| 2006-1A, 0.39% due 11/02/411,2 | 864,049 | 833,289 | ||||||
| GreenPoint Mortgage Funding Trust | ||||||||
| 2005-HE4, 0.87% due 07/25/301 | 900,000 | 801,079 | ||||||
| FM Leveraged Capital Fund II | ||||||||
| 2006-2A, 1.84% due 11/15/201,2 | 800,000 | 790,240 | ||||||
| GSC Group CDO Fund VIII Ltd. | ||||||||
| 2007-8A, 0.62% due 04/17/211,2 | 850,000 | 787,525 | ||||||
| Popular ABS Mortgage Pass-Through Trust | ||||||||
| 2005-A, 0.59% due 06/25/351 | 826,507 | 787,284 | ||||||
| Symphony CLO VII Ltd. | ||||||||
| 2011-7A, 3.44% due 07/28/211,2 | 750,000 | 743,700 | ||||||
| Global Leveraged Capital Credit | ||||||||
| Opportunity Fund | ||||||||
| 2006-1A, 0.54% due 12/20/181,2 | 702,822 | 694,810 | ||||||
| TICC CLO LLC | ||||||||
| 2011-1A, 2.49% due 07/25/211,2 | 650,000 | 647,010 | ||||||
| Black Diamond CLO 2006-1 Luxembourg S.A. | ||||||||
| 2007-1A, 0.63% due 04/29/191,2 | 700,000 | 638,680 | ||||||
| Northwoods Capital VII Ltd. | ||||||||
| 2006-7A, 1.79% due 10/22/211,2 | 650,000 | 611,130 | ||||||
| California Republic Auto Receivables Trust | ||||||||
| 2013-2, 1.23% due 03/15/19 | 600,000 | 599,549 | ||||||
| Ares XVI CLO Ltd. | ||||||||
| 2011-16A, 3.54% due 05/17/211,2 | 500,000 | 497,500 | ||||||
| NewStar Commercial Loan Trust | ||||||||
| 2007-1A, 1.54% due 09/30/221,2 | 500,000 | 459,200 | ||||||
| Golub Capital Partners Fundings Ltd. | ||||||||
| 2007-1A, 0.49% due 03/15/221,2 | 444,445 | 436,578 | ||||||
| DIVCORE CLO Ltd. | ||||||||
| 2013-1A B, 4.10% due 11/15/32 | 400,000 | 398,800 | ||||||
| ACS 2007-1 Pass Through Trust | ||||||||
| 2007-1A, 0.48% due 06/14/371,2 | 412,880 | 383,978 | ||||||
| Accredited Mortgage Loan Trust | ||||||||
| 2007-1, 0.29% due 02/25/371 | 318,219 | 294,110 | ||||||
| Race Point IV CLO Ltd. | ||||||||
| 2007-4A, 0.99% due 08/01/211,2 | 300,000 | 282,300 | ||||||
| Riverside Park CLO Ltd. | ||||||||
| 2011-1A, 3.00% due 09/27/211,2 | 250,000 | 250,000 | ||||||
| Legg Mason Real Estate CDO I Ltd. | ||||||||
| 2006-1A, 0.45% due 03/25/381,2 | 125,933 | 124,195 | ||||||
| Total Asset Backed Securities | ||||||||
| (Cost $38,047,595) | 37,968,839 | |||||||
| CORPORATE BONDS†† - 8.8% | ||||||||
| Financials - 3.5% | ||||||||
| Icahn Enterprises Limited Partnership / | ||||||||
| Icahn Enterprises Finance Corp. | ||||||||
| 8.00% due 01/15/18 | 810,000 | 842,400 | ||||||
| 7.75% due 01/15/16 | 420,000 | 428,400 | ||||||
| Ford Motor Credit Company LLC | ||||||||
| 7.00% due 04/15/15 | 1,100,000 | 1,184,003 | ||||||
| Citigroup, Inc. | ||||||||
| 1.20% due 07/25/161 | 1,020,000 | 1,030,600 | ||||||
| International Lease Finance Corp. | ||||||||
| 2.19% due 06/15/161 | 730,000 | 733,650 | ||||||
| 6.50% due 08/01/18 | 450,000 | 457,875 | ||||||
| Mack-Cali Realty, LP | ||||||||
| 5.13% due 02/15/14 | 450,000 | 451,984 | ||||||
| WEA Finance LLC / WT Finance Aust Pty Ltd. | ||||||||
| 5.75% due 09/02/152 | 310,000 | 334,374 | ||||||
| Emigrant Bancorp, Inc. | ||||||||
| 6.25% due 06/15/142 | 260,000 | 263,491 | ||||||
| Total Financials | 5,726,777 | |||||||
| Materials - 1.9% | ||||||||
| Glencore Funding LLC | ||||||||
| 1.40% due 05/27/161,2 | 1,520,000 | 1,512,888 | ||||||
| Rio Tinto Finance USA plc | ||||||||
| 1.08% due 06/17/161 | 1,050,000 | 1,057,450 | ||||||
| Anglo American Capital plc | ||||||||
| 9.38% due 04/08/142 | 470,000 | 480,419 | ||||||
| Total Materials | 3,050,757 | |||||||
| Telecommunication Services - 1.3% | ||||||||
| Level 3 Financing, Inc. | ||||||||
| 3.85% due 01/15/181,2 | 1,120,000 | 1,127,000 | ||||||
| WPP Finance UK | ||||||||
| 8.00% due 09/15/14 | 800,000 | 839,809 | ||||||
| Total Telecommunication Services | 1,966,809 | |||||||
| See Notes to Financial Statements. | The GUGGENHEIM FUNDS annual report | 61 |
| Schedule of Investments (continued) | December 31, 2013 |
| Series J (STYLEPLUS–MID GROWTH SERIES) |
| Face | ||||||||
| Amount | Value | |||||||
| Energy - 1.2% | ||||||||
| Ras Laffan Liquefied Natural Gas | ||||||||
| Company Limited III | ||||||||
| 5.83% due 09/30/162 | $ | 1,276,990 | $ | 1,356,802 | ||||
| Petroleos Mexicanos | ||||||||
| 2.27% due 07/18/181 | 450,000 | 463,500 | ||||||
| Total Energy | 1,820,302 | |||||||
| Consumer Staples - 0.3% | ||||||||
| Harbinger Group, Inc. | ||||||||
| 7.88% due 07/15/192 | 400,000 | 429,500 | ||||||
| Consumer Discretionary - 0.3% | ||||||||
| Vail Resorts, Inc. | ||||||||
| 6.50% due 05/01/19 | 200,000 | 212,000 | ||||||
| Sabre, Inc. | ||||||||
| 8.50% due 05/15/192 | 170,000 | 188,700 | ||||||
| Total Consumer Discretionary | 400,700 | |||||||
| Information Technology - 0.2% | ||||||||
| iGATE Corp. | ||||||||
| 9.00% due 05/01/16 | 230,000 | 244,375 | ||||||
| Industrials - 0.1% | ||||||||
| Victor Technologies Group, Inc. | ||||||||
| 9.00% due 12/15/17 | 118,000 | 126,260 | ||||||
| Total Corporate Bonds | ||||||||
| (Cost $13,743,966) | 13,765,480 | |||||||
| COLLATERALIZED MORTGAGE OBLIGATIONS†† - 5.0% | ||||||||
| Boca Hotel Portfolio Trust | ||||||||
| 2013-BOCA, 3.22% | ||||||||
| due 08/15/261,2 | 1,250,000 | 1,251,498 | ||||||
| Hilton USA Trust | ||||||||
| 2013-HLF, 2.92% due 11/05/301,2 | 1,100,000 | 1,100,079 | ||||||
| SRERS-2011 Funding Ltd. | ||||||||
| 2011-RS, 0.42% due 05/09/461,2 | 1,054,033 | 955,376 | ||||||
| Wachovia Bank Commercial Mortgage | ||||||||
| Trust Series 2007-WHALE 8 | ||||||||
| 2007-WHL8, 0.25% due 06/15/201,2 | 938,585 | 929,103 | ||||||
| COMM 2007-FL14 Mortgage Trust | ||||||||
| 2007-FL14, 0.92% due 06/15/221,2 | 880,738 | 869,261 | ||||||
| Banc of America Merrill Lynch | ||||||||
| Commercial Mortgage, Inc. | ||||||||
| 2005-6, 6.13% due 09/10/471,2 | 716,800 | 739,448 | ||||||
| HarborView Mortgage Loan Trust | ||||||||
| 2006-12, 0.36% due 01/19/381 | 868,970 | 706,474 | ||||||
| Banc of America Large Loan Trust | ||||||||
| 2007-BMB1, 1.27% due 08/15/291,2 | 650,000 | 644,914 | ||||||
| GCCFC Commercial Mortgage Trust | ||||||||
| 2006-FL4A C, 0.40% due 11/05/21 | 650,000 | 640,395 | ||||||
| Total Collateralized Mortgage Obligations | ||||||||
| (Cost $7,790,977) | 7,836,548 | |||||||
| SENIOR FLOATING RATE INTERESTS††,1 - 3.8% | ||||||||
| Industrials - 1.1% | ||||||||
| Travelport Holdings Ltd. | ||||||||
| 6.25% due 06/26/19 | 1,253,700 | 1,284,002 | ||||||
| Thermasys Corp. | ||||||||
| 5.26% due 05/03/19 | 536,625 | 527,679 | ||||||
| Total Industrials | 1,811,681 | |||||||
| Financials - 1.0% | ||||||||
| National Financial Partners | ||||||||
| 5.25% due 07/01/20 | 1,024,850 | 1,034,248 | ||||||
| Knight/Getco | ||||||||
| 5.75% due 11/30/17 | 386,542 | 387,025 | ||||||
| First Data Corp. | ||||||||
| 4.16% due 03/23/18 | 100,000 | 100,069 | ||||||
| Cunningham Lindsey U.S., Inc. | ||||||||
| 5.00% due 12/10/19 | 99,248 | 99,124 | ||||||
| Total Financials | 1,620,466 | |||||||
| Energy - 0.7% | ||||||||
| Pacific Drilling | ||||||||
| 4.50% due 05/18/18 | 517,400 | 522,900 | ||||||
| Ocean Rig ASA | ||||||||
| 5.50% due 07/15/16 | 498,750 | 505,194 | ||||||
| Total Energy | 1,028,094 | |||||||
| Consumer Discretionary - 0.5% | ||||||||
| Pinnacle Entertainment, Inc. | �� | |||||||
| 3.75% due 08/15/16 | 424,277 | 427,197 | ||||||
| Go Daddy Operating Company LLC | ||||||||
| 4.00% due 12/16/18 | 166,939 | 166,974 | ||||||
| Sears Holdings Corp. | ||||||||
| 5.50% due 06/30/18 | 160,000 | 160,878 | ||||||
| Total Consumer Discretionary | 755,049 | |||||||
| Information Technology - 0.4% | ||||||||
| Blue Coat Systems, Inc. | ||||||||
| 4.50% due 05/31/19 | 598,500 | 599,811 | ||||||
| Health Care - 0.1% | ||||||||
| Apria Healthcare Group, Inc. | ||||||||
| 6.75% due 04/06/20 | 119,400 | 119,648 | ||||||
| Total Senior Floating Rate Interests | ||||||||
| (Cost $5,843,686) | 5,934,749 | |||||||
| MUNICIPAL BONDS†† - 2.7% | ||||||||
| New York - 2.5% | ||||||||
| New York City Water & Sewer System | ||||||||
| Revenue Bonds | ||||||||
| 0.30% due 06/15/331 | 2,130,000 | 2,130,000 | ||||||
| City of New York New York | ||||||||
| General Obligation Unlimited | ||||||||
| 0.30% due 04/01/351 | 1,000,000 | 1,000,000 | ||||||
| 0.30% due 11/01/261 | 850,000 | 850,000 | ||||||
| Total New York | 3,980,000 | |||||||
| Michigan - 0.2% | ||||||||
| Michigan Finance Authority | ||||||||
| Revenue Notes | ||||||||
| 4.38% due 08/20/14 | 230,000 | 232,399 | ||||||
| Total Municipal Bonds | ||||||||
| (Cost $4,210,000) | 4,212,399 | |||||||
| 62 | the GUGGENHEIM FUNDS annual report | See Notes to Financial Statements. |
| Schedule of Investments (concluded) | December 31, 2013 |
| Series J (STYLEPLUS–MID GROWTH SERIES) |
| Face | ||||||||
| Amount | Value | |||||||
| U.S. TREASURY BILLS† - 1.3% | ||||||||
| U.S. Treasury Bill6 | ||||||||
| due 02/20/14 | $ | 2,000,000 | $ | 1,999,938 | ||||
| Total U.S. Treasury Bills | ||||||||
| (Cost $1,999,946) | 1,999,938 | |||||||
| MORTGAGE BACKED SECURITIES†† - 0.8% | ||||||||
| Resource Capital Corporation | ||||||||
| CRE Notes 2013 Ltd. | ||||||||
| 3.02% due 12/15/281,2 | 1,250,000 | 1,251,000 | ||||||
| Total Mortgage Backed Securities | ||||||||
| (Cost $1,250,000) | 1,251,000 | |||||||
| COMMERCIAL PAPER†† - 10.0% | ||||||||
| Centrica plc | ||||||||
| 0.22% due 01/03/14 | 1,300,000 | 1,299,984 | ||||||
| Diageo Capital plc | ||||||||
| 0.09% due 01/02/14 | 1,200,000 | 1,199,997 | ||||||
| Tesco Treasury Services plc | ||||||||
| 0.13% due 01/06/142 | 1,200,000 | 1,199,979 | ||||||
| Kellogg Co. | ||||||||
| 0.12% due 01/08/14 | 1,200,000 | 1,199,973 | ||||||
| Northeast Utilities | ||||||||
| 0.18% due 01/08/14 | 1,200,000 | 1,199,958 | ||||||
| Kinder Morgan Energy Partners, LP | ||||||||
| 0.23% due 01/07/142 | 1,200,000 | 1,199,954 | ||||||
| VW Credit, Inc. | ||||||||
| 0.22% due 01/13/142 | 1,200,000 | 1,199,912 | ||||||
| Ryder System, Inc. | ||||||||
| 0.20% due 01/15/14 | 1,200,000 | 1,199,907 | ||||||
| FMC Technologies Inc. | ||||||||
| 0.23% due 01/14/14 | 1,200,000 | 1,199,900 | ||||||
| BAT International Finance | ||||||||
| 0.25% due 01/13/14 | 1,200,000 | 1,199,900 | ||||||
| Potomac Electric Power Co. | ||||||||
| 0.25% due 01/13/14 | 1,200,000 | 1,199,900 | ||||||
| Nissan Motor Acceptance | ||||||||
| 0.30% due 01/13/14 | 1,200,000 | 1,199,880 | ||||||
| CBS Corp. | ||||||||
| 0.24% due 01/24/142 | 1,200,000 | 1,199,816 | ||||||
| Total Commercial Paper | ||||||||
| (Cost $15,699,060) | 15,699,060 | |||||||
| Total Investments - 100.0% | ||||||||
| (Cost $154,138,452) | $ | 157,176,365 | ||||||
| Other Assets & Liabilities, net - 0.0% | (45,444 | ) | ||||||
| Total Net Assets - 100.0% | $ | 157,130,921 | ||||||
| Unrealized | ||||||||
| Contracts | Gain | |||||||
| EQUITY FUTURES CONTRACTS PURCHASED† | ||||||||
| March 2014 S&P MidCap 400 Index | ||||||||
| Mini Futures Contracts | ||||||||
| (Aggregate Value of | ||||||||
| Contracts $536,360) | 4 | $ | 17,487 | |||||
| March 2014 Russell 2000 Index | ||||||||
| Mini Futures Contracts | ||||||||
| (Aggregate Value of | ||||||||
| Contracts $232,120) | 2 | 8,924 | ||||||
| March 2014 S&P 500 Index | ||||||||
| Mini Futures Contracts | ||||||||
| (Aggregate Value of | ||||||||
| Contracts $92,213) | 1 | 3,192 | ||||||
| (Total Aggregate Value of Contracts $860,693) | $ | 29,603 | ||||||
| Units | ||||||||
| OTC EQUITY INDEX SWAP AGREEMENTS†† | ||||||||
| Morgan Stanley Capital Services, Inc. | ||||||||
| February 2014 Russell MidCap Growth | ||||||||
| Index Swap, Terminating 02/03/143 | ||||||||
| (Notional Value $116,699,458) | 172,755 | $ | — | |||||
| * | Non-income producing security. |
| † | Value determined based on Level 1 inputs — See Note 4. |
| †† | Value determined based on Level 2 inputs — See Note 4. |
| 1 | Variable rate security. Rate indicated is rate effective at December 31, 2013. |
| 2 | Security is a 144A or Section 4(a)(2) security. The total market value of 144A or Section 4(a)(2) securities is $43,058,258 (cost $43,097,055), or 27.4% of total net assets. |
| 3 | Total Return based on Russell MidCap Growth Index +/- financing at a variable rate. |
| 4 | Investment in a product that pays a management fee to a party related to the advisor. |
| 5 | Affiliated funds. |
| 6 | Zero coupon rate security. |
plc — Public Limited Company
| See Notes to Financial Statements. | The GUGGENHEIM FUNDS annual report | 63 |
| Series J (STYLEPLUS–MID GROWTH SERIES) |
| STATEMENT OF ASSETS |
| AND LIABILITIES |
December 31, 2013
| Assets: | ||||
| Investments in unaffiliated issuers, at value | ||||
| (cost $148,627,761) | $ | 151,798,676 | ||
| Investments in affiliated issuers, at value | ||||
| (cost $5,510,691) | 5,377,689 | |||
| Total investments | ||||
| (cost $154,138,452) | 157,176,365 | |||
| Receivable for swap settlement | 3,821,139 | |||
| Cash | 362,271 | |||
| Segregated cash with broker | 34,700 | |||
| Prepaid expenses | 12,912 | |||
| Receivables: | ||||
| Interest | 287,458 | |||
| Securities sold | 210,525 | |||
| Dividends | 112,430 | |||
| Fund shares sold | 7,207 | |||
| Variation margin | 3,278 | |||
| Foreign taxes reclaim | 353 | |||
| Total assets | 162,028,638 | |||
| Liabilities: | ||||
| Due to broker | 3,357,730 | |||
| Payable for: | ||||
| Securities purchased | 1,302,001 | |||
| Management fees | 97,484 | |||
| Fund shares redeemed | 85,691 | |||
| Fund accounting/administration fees | 12,348 | |||
| Transfer agent/maintenance fees | 3,612 | |||
| Directors’ fees* | 1,607 | |||
| Miscellaneous | 37,244 | |||
| Total liabilities | 4,897,717 | |||
| Net assets | $ | 157,130,921 | ||
| Net assets consist of: | ||||
| Paid in capital | $ | 144,040,065 | ||
| Undistributed net investment income | 249,176 | |||
| Accumulated net realized gain on investments | 9,774,164 | |||
| Net unrealized appreciation on investments | 3,067,516 | |||
| Net assets | $ | 157,130,921 | ||
| Capital shares outstanding | 3,616,702 | |||
| Net asset value per share | $ | 43.45 |
| STATEMENT OF |
| OPERATIONS |
Year Ended December 31, 2013
| Investment Income: | ||||
| Dividends from securities of unaffiliated issuers | $ | 781,235 | ||
| Interest | 729,400 | |||
| Dividends from securities of affiliated issuers | 179,071 | |||
| Total investment income | 1,689,706 | |||
| Expenses: | ||||
| Management fees | 1,099,486 | |||
| Transfer agent/maintenance fees | 25,436 | |||
| Fund accounting/administration fees | 139,267 | |||
| Printing expenses | 76,196 | |||
| Directors’ fees* | 15,467 | |||
| Custodian fees | 11,854 | |||
| Tax expense | 5 | |||
| Miscellaneous | 72,819 | |||
| Total expenses | 1,440,530 | |||
| Net investment income | 249,176 | |||
| Net Realized and Unrealized Gain (Loss): | ||||
| Net realized gain (loss) on: | ||||
| Investments in unaffiliated issuers | 22,108,840 | |||
| Investments in affiliated issuers | 2,536 | |||
| Swap agreements | 20,377,425 | |||
| Futures contracts | 96,531 | |||
| Net realized gain | 42,585,332 | |||
| Net change in unrealized appreciation (depreciation) on: | ||||
| Investments in unaffiliated issuers | (3,619,687 | ) | ||
| Investments in affiliated issuers | (133,002 | ) | ||
| Futures contracts | 29,603 | |||
| Net change in unrealized appreciation (depreciation) | (3,723,086 | ) | ||
| Net realized and unrealized gain | 38,862,246 | |||
| Net increase in net assets resulting from operations | $ | 39,111,422 |
| * | Relates to Directors not deemed “interested persons” within the meaning of Section 2(a)(19) of the 1940 Act. |
| 64 | the GUGGENHEIM FUNDS annual report | See Notes to Financial Statements. |
| Series J (STYLEPLUS–MID GROWTH SERIES) |
| STATEMENTs OF CHANGES IN NET ASSETS |
| Year Ended | Year Ended | |||||||
| December 31, | December 31, | |||||||
| 2013 | 2012 | |||||||
| Increase (Decrease) In Net Assets From Operations: | ||||||||
| Net investment income | $ | 249,176 | $ | 205,098 | ||||
| Net realized gain on investments | 42,585,332 | 18,104,274 | ||||||
| Net change in unrealized appreciation (depreciation) on investments | (3,723,086 | ) | 2,314,116 | |||||
| Net increase in net assets resulting from operations | 39,111,422 | 20,623,488 | ||||||
| Capital share transactions: | ||||||||
| Proceeds from sale of shares | 5,825,753 | 10,267,365 | ||||||
| Cost of shares redeemed | (26,061,600 | ) | (29,104,216 | ) | ||||
| Net decrease from capital share transactions | (20,235,847 | ) | (18,836,851 | ) | ||||
| Net increase in net assets | 18,875,575 | 1,786,637 | ||||||
| Net assets: | ||||||||
| Beginning of year | 138,255,346 | 136,468,709 | ||||||
| End of year | $ | 157,130,921 | $ | 138,255,346 | ||||
| Undistributed net investment income at end of year | $ | 249,176 | $ | 205,098 | ||||
| Capital share activity: | ||||||||
| Shares sold | 151,861 | 318,863 | ||||||
| Shares redeemed | (688,120 | ) | (913,102 | ) | ||||
| Net decrease in shares | (536,259 | ) | (594,239 | ) | ||||
| See Notes to Financial Statements. | The GUGGENHEIM FUNDS annual report | 65 |
| SERIES J (STYLEPLUS–MID GROWTH SERIES) |
| FINANCIAL HIGHLIGHTS |
This table is presented to show selected data for a share outstanding throughout each period and to assist shareholders in evaluating a Fund’s performance for the periods presented.
| Year Ended | Year Ended | Year Ended | Year Ended | Year Ended | ||||||||||||||||
| December 31, | December 31, | December 31, | December 31, | December 31, | ||||||||||||||||
| 2013 | 2012 | 2011 | 2010 | 2009 | ||||||||||||||||
| Per Share Data | ||||||||||||||||||||
| Net asset value, beginning of period | $ | 33.29 | $ | 28.75 | $ | 30.05 | $ | 24.20 | $ | 16.81 | ||||||||||
| Income (loss) from investment operations: | ||||||||||||||||||||
| Net investment income (loss)a | .06 | .05 | (.03 | ) | (.02 | ) | (.03 | ) | ||||||||||||
| Net gain (loss) on investments (realized and unrealized) | 10.10 | 4.49 | (1.27 | ) | 5.87 | 7.42 | ||||||||||||||
| Total from investment operations | 10.16 | 4.54 | (1.30 | ) | 5.85 | 7.39 | ||||||||||||||
| Net asset value, end of period | $ | 43.45 | $ | 33.29 | $ | 28.75 | $ | 30.05 | $ | 24.20 | ||||||||||
| Total Returnb | 30.52 | % | 15.79 | % | (4.33 | %) | 24.17 | % | 43.96 | % | ||||||||||
| Ratios/Supplemental Data | ||||||||||||||||||||
| Net assets, end of period (in thousands) | $ | 157,131 | $ | 138,255 | $ | 136,469 | $ | 169,388 | $ | 154,273 | ||||||||||
| Ratios to average net assets: | ||||||||||||||||||||
| Net investment income (loss) | 0.17 | % | 0.14 | % | (0.10 | %) | (0.10 | %) | (0.13 | %) | ||||||||||
| Total expensesc | 0.98 | % | 0.95 | % | 0.91 | % | 0.91 | % | 0.92 | % | ||||||||||
| Portfolio turnover rate | 245 | % | 150 | % | 155 | % | 130 | % | 136 | % | ||||||||||
| a | Net investment income (loss) per share was computed using average shares outstanding throughout the period. |
| b | Total return does not take into account any of the expenses associated with an investment in variable insurance products. If total return had taken into account these expenses, performance would have been lower. Shares of a series of SBL Fund are available only through the purchase of such products. |
| c | Does not include expenses of the underlying funds in which the Fund invests. |
| 66 | the GUGGENHEIM FUNDS annual report | See Notes to Financial Statements. |
| Manager’S Commentary (Unaudited) | December 31, 2013 |
To Our Shareholders:
The Series M (Macro Opportunities Series) is managed by a team of seasoned professionals, including B. Scott Minerd, Global Chief Investment Officer; Anne B. Walsh, Senior Managing Director; Kevin H. Gundersen, Senior Managing Director and Portfolio Manager; and James W. Michal, Managing Director and Portfolio Manager. In the following paragraphs, the investment team discusses the market environment and the Fund’s performance for the abbreviated fiscal year ended December 31, 2013.
For the abbreviated fiscal year from the inception date of April 24, 2013, through December 31, 2013, the Series M returned 0.96%, compared with the 0.05% return of its benchmark, the Bank of America Merrill Lynch 3-Month U.S. Treasury Bill Index.
The Fund seeks to provide total return, comprised of current income and capital appreciation. The Fund pursues its investment objective by investing in a wide range of fixed income and other debt and equity securities selected from a variety of sectors and credit qualities.
The Fund may engage in derivative transactions for speculative purposes to enhance total return, seek to hedge against fluctuations in securities prices, interest rates or currency rates, change the effective duration of its portfolio, manage certain investment risks and/or as a substitute for the purchase or sale of securities or currencies. Throughout the fiscal year, the Fund utilized a number of macro and derivative trades to take a position based on the Chief Investment Officer’s views on a certain segment of the market or to hedge against a change in interest rates, equity prices and improve diversification to lower portfolio correlation.
For the period, the Fund benefitted from positive performance in asset-backed securities (ABS)—primarily mezzanine collateralized loan obligations (CLOs) and commercial real estate collateralized debt obligations (CRE CDOs)—and high yield bonds and loans. While risk assets continued to outperform in 2013, the Fund was cautious to reduce risk to assets that were perceived as overvalued or overly sensitive to increases in interest rates. The Fund has been opportunistic by taking gains in lower yielding assets and redeploying proceeds into more attractive assets such as longer duration preferred debt. Additional contributors included macroeconomic themed trades including exposure to European equities through two ETFs as Europe continues its economic recovery and exposure to a basket of U.S. equities in the for-profit education sector. The Fund maintains a lower duration target; however, we will continue to look to opportunistically add fixed-rate assets during periods of interest rate volatility.
Detractors to performance for the period included a few higher duration assets such as fixed rate corporate bonds and preferred debt securities. Macroeconomic themed trades that intended to hedge against a decline in U.S. equity markets were a minor detractor to performance.
Performance displayed represents past performance, which is no guarantee of future results.
The opinions and forecast expressed may not actually come to pass. This information is subject to change at any time, based on market and other conditions, and should not be construed as a recommendation of any specific security or strategy.
| The Guggenheim Funds annual REPORT | 67 |
| performance report and FUND PROFILE (Unaudited) | December 31, 2013 |
SERIES M (MACRO OPPORTUNITIES SERIES)
OBJECTIVE: Seeks to provide total return, comprised of current income and capital appreciation.
Cumulative Fund Performance*,†
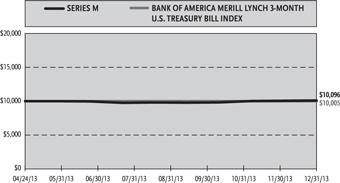
Annual Returns*
Period Ended December 31, 2013†
| Since Inception | ||||
| (04/24/13) | ||||
| Series M (Macro Opportunities Series) | 0.96% | |||
| Bank of America Merrill Lynch 3-Month U.S. Treasury Bill Index | 0.05% | |||
| Ten Largest Holdings (% of Total Net Assets) | ||||
| Federated U.S. Treasury Cash Reserve Fund | 5.6 | % | ||
| West Coast Funding Ltd. — Class A1A | 1.6 | % | ||
| N-Star Real Estate CDO IX Ltd. | 1.6 | % | ||
| Nomura Resecuritization Trust 2012-1R — Class A | 1.4 | % | ||
| Cedar Woods CRE CDO Ltd. | 1.3 | % | ||
| SRERS-2011 Funding Ltd. — Class A1B1 | 1.3 | % | ||
| Vector Group Ltd. | 1.2 | % | ||
| Travelport Holdings Ltd. | 1.2 | % | ||
| Gramercy Real Estate CDO 2007-1 Ltd. — Class A1 | 1.1 | % | ||
| iShares MSCI Spain Capped ETF | 1.1 | % | ||
| Top Ten Total | 17.4 | % | ||
Holdings Diversification (Market Exposure as % of Net Assets)
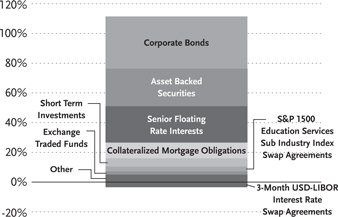
Inception Date: April 24, 2013
| Portfolio Composition by Quality Rating** |
| Rating |
| Fixed Income Instruments | ||||
| AAA | 0.9 | % | ||
| AA | 2.9 | % | ||
| A | 4.9 | % | ||
| BBB | 19.0 | % | ||
| BB | 15.7 | % | ||
| B | 36.6 | % | ||
| CCC | 9.9 | % | ||
| NR | 0.9 | % | ||
| Other Instruments | ||||
| Short Term Investments | 5.3 | % | ||
| Interest Rate Swap Agreements | 3.0 | % | ||
| Exchange Traded Funds | 2.1 | % | ||
| Preferred Stocks | 1.9 | % | ||
| Currency Futures Swap Agreements | 1.7 | % | ||
| Options Purchased | 0.0 | % | ||
| Options Written | 0.0 | % | ||
| Total Investments | 104.8 | % |
The chart above reflects percentages of the value of total investments.
| * | The performance data above represents past performance that is not predictive of future results. The investment return and principal value of an investment in the Fund will fluctuate so that an investor’s shares, when redeemed, may be worth more or less than their original cost. Returns are historical and include changes in principal and reinvested dividends and capital gains and do not reflect the effect of taxes. The BofA Merrill Lynch 3-Month U.S. Treasury Bill Index is an unmanaged index and, unlike the Fund, has no management fees or operating expenses to reduce its reported return. |
| ** | Source: Factset. Credit quality ratings are measured on a scale that generally ranges from AAA (highest) to D (lowest). All rated securities have been rated by Moody’s, Standard & Poor’s (“S&P”), or Fitch, which are all a Nationally Recognized Statistical Rating Organization (“NRSRO”). For purposes of this presentation, when ratings are available from more than one agency, the highest rating is used. Guggenheim Investments has converted Moody’s and Fitch ratings to the equivalent S&P rating. Unrated securities do not necessarily indicate low credit quality. Security ratings are determined at the time of purchase and may change thereafter. |
| † | Performance figures do not reflect fees and expenses associated with an investment in variable insurance products. If returns had taken into account these fees and expenses, performance would have been lower. Shares of a series of SBL Fund are available only through the purchase of such products. |
| 68 | the GUGGENHEIM FUNDS annual report |
| Schedule of Investments | December 31, 2013 |
| Series M (MACRO OPPORTUNITIES SERIES) |
| Shares | Value | |||||||
| PREFERRED STOCKS†† - 2.1% | ||||||||
| Aspen Insurance Holdings Ltd. | ||||||||
| 5.95%†,1,2 | 10,000 | $ | 226,700 | |||||
| Morgan Stanley | ||||||||
| 7.13%†,1,2 | 8,000 | 209,120 | ||||||
| City National Corp. | ||||||||
| 6.75%1,2 | 4,000 | 105,120 | ||||||
| Total Preferred Stocks | ||||||||
| (Cost $550,000) | 540,940 | |||||||
| EXCHANGE TRADED FUNDS† - 2.2% | ||||||||
| iShares MSCI Spain Capped ETF | 7,500 | 289,275 | ||||||
| SPDR EURO STOXX 50 ETF | 6,700 | 282,740 | ||||||
| Total Exchange Traded Funds | ||||||||
| (Cost $500,258) | 572,015 | |||||||
| SHORT TERM INVESTMENTS† - 5.6% | ||||||||
| Federated U.S. Treasury | ||||||||
| Cash Reserve Fund | 1,470,593 | 1,470,593 | ||||||
| Total Short Term Investments | ||||||||
| (Cost $1,470,593) | 1,470,593 | |||||||
| Face | ||||||||
| Amount | ||||||||
| CORPORATE BONDS†† - 35.1% | ||||||||
| Financials - 11.4% | ||||||||
| EPR Properties | ||||||||
| 5.75% due 08/15/226 | $ | 250,000 | 254,887 | |||||
| 5.25% due 07/15/236 | 250,000 | 244,226 | ||||||
| Nationstar Mortgage LLC / | ||||||||
| Nationstar Capital Corp. | ||||||||
| 6.50% due 06/01/22 | 250,000 | 234,375 | ||||||
| 6.50% due 08/01/18 | 100,000 | 101,750 | ||||||
| ING US, Inc. | ||||||||
| 5.65% due 05/15/531 | 250,000 | 243,125 | ||||||
| General Electric Capital Corp. | ||||||||
| 5.25% due 06/29/491,2 | 250,000 | 235,000 | ||||||
| PNC Financial Services Group, Inc. | ||||||||
| 4.85% due 05/29/491,2 | 250,000 | 223,875 | ||||||
| Fifth Third Bancorp | ||||||||
| 5.10% due 12/31/491,2 | 250,000 | 221,249 | ||||||
| Bank of America Corp. | ||||||||
| 5.20% due 12/29/491,2 | 250,000 | 220,000 | ||||||
| Bank of New York Mellon Corp. | ||||||||
| 4.50% due 12/31/491,2 | 210,000 | 190,575 | ||||||
| Icahn Enterprises Limited Partnership / | ||||||||
| Icahn Enterprises Finance Corp. | ||||||||
| 8.00% due 01/15/18 | 150,000 | 156,000 | ||||||
| Credit Suisse Group AG | ||||||||
| 7.50% due 12/11/231,2,3 | 100,000 | 105,625 | ||||||
| Barclays plc | ||||||||
| 8.25% due 12/15/181,2 | 100,000 | 103,250 | ||||||
| Emigrant Bancorp, Inc. | ||||||||
| 6.25% due 06/15/143 | 100,000 | 101,343 | ||||||
| Opal Acquisition, Inc. | ||||||||
| 8.88% due 12/15/213 | 100,000 | 99,500 | ||||||
| Jefferies LoanCore LLC / | ||||||||
| JLC Finance Corp. | ||||||||
| 6.88% due 06/01/203 | 100,000 | 99,000 | ||||||
| Prosight Global Inc. | ||||||||
| 7.50% due 11/20/205 | 100,000 | 98,510 | ||||||
| American Equity Investment Life | ||||||||
| Holding Co. | ||||||||
| 6.63% due 07/15/21 | 50,000 | 52,250 | ||||||
| Total Financials | 2,984,540 | |||||||
| Energy - 6.1% | ||||||||
| Pacific Drilling S.A. | ||||||||
| 5.38% due 06/01/203,6 | 250,000 | 251,250 | ||||||
| Atlas Pipeline Partners Limited Partnership / | ||||||||
| Atlas Pipeline Finance Corp. | ||||||||
| 4.75% due 11/15/213 | 250,000 | 228,750 | ||||||
| Gibson Energy, Inc. | ||||||||
| 6.75% due 07/15/213 | 200,000 | 211,500 | ||||||
| Penn Virginia Resource Partners | ||||||||
| Limited Partnership / Penn Virginia | ||||||||
| Resource Finance Corporation II | ||||||||
| 6.50% due 05/15/213 | 100,000 | 103,500 | ||||||
| 8.38% due 06/01/20 | 50,000 | 55,125 | ||||||
| Legacy Reserves Limited Partnership / | ||||||||
| Legacy Reserves Finance Corp. | ||||||||
| 6.63% due 12/01/213 | 150,000 | 145,125 | ||||||
| BreitBurn Energy Partners | ||||||||
| Limited Partnership / BreitBurn | ||||||||
| Finance Corp. | ||||||||
| 7.88% due 04/15/22 | 100,000 | 104,000 | ||||||
| Bill Barrett Corp. | ||||||||
| 7.00% due 10/15/22 | 100,000 | 103,750 | ||||||
| Memorial Production Partners | ||||||||
| Limited Partnership / Memorial | ||||||||
| Production Finance Corp. | ||||||||
| 7.63% due 05/01/213 | 100,000 | 102,750 | ||||||
| Crestwood Midstream Partners | ||||||||
| Limited Partnership / Crestwood | ||||||||
| Midstream Finance Corp. | ||||||||
| 6.13% due 03/01/223 | 100,000 | 102,500 | ||||||
| Atlas Energy Holdings | ||||||||
| Operating Company LLC / Atlas | ||||||||
| Resource Finance Corp. | ||||||||
| 9.25% due 08/15/213 | 100,000 | 102,250 | ||||||
| Endeavor Energy Resources | ||||||||
| Limited Partnership / EER | ||||||||
| Finance, Inc. | ||||||||
| 7.00% due 08/15/213 | 100,000 | 101,000 | ||||||
| Total Energy | 1,611,500 | |||||||
| Materials - 3.7% | ||||||||
| TPC Group, Inc. | ||||||||
| 8.75% due 12/15/203,6 | 250,000 | 265,625 | ||||||
| KGHM International Ltd. | ||||||||
| 7.75% due 06/15/193 | 250,000 | 263,750 | ||||||
| Barrick Gold Corp. | ||||||||
| 4.10% due 05/01/23 | 250,000 | 225,973 | ||||||
| See Notes to Financial Statements. | The GUGGENHEIM FUNDS annual report | 69 |
| Schedule of Investments (continued) | December 31, 2013 |
| Series M (MACRO OPPORTUNITIES SERIES) |
| Face | ||||||||
| Amount | Value | |||||||
| Pretium Packaging LLC / | ||||||||
| Pretium Finance, Inc. | ||||||||
| 11.50% due 04/01/166 | $ | 200,000 | $ | 213,500 | ||||
| Total Materials | 968,848 | |||||||
| Consumer Staples - 3.2% | ||||||||
| Vector Group Ltd. | ||||||||
| 7.75% due 02/15/216 | 300,000 | 317,250 | ||||||
| Harbinger Group, Inc. | ||||||||
| 7.88% due 07/15/193 | 200,000 | 214,750 | ||||||
| Central Garden and Pet Co. | ||||||||
| 8.25% due 03/01/186 | 200,000 | 194,500 | ||||||
| KeHE Distributors LLC / | ||||||||
| KeHE Finance Corp. | ||||||||
| 7.63% due 08/15/213 | 100,000 | 106,000 | ||||||
| Total Consumer Staples | 832,500 | |||||||
| Telecommunication Services - 3.0% | ||||||||
| Alcatel-Lucent USA, Inc. | ||||||||
| 8.88% due 01/01/203 | 200,000 | 222,999 | ||||||
| 6.75% due 11/15/203 | 200,000 | 207,750 | ||||||
| Sitel LLC / Sitel Finance Corp. | ||||||||
| 11.00% due 08/01/173 | 125,000 | 133,438 | ||||||
| Expo Event Transco, Inc. | ||||||||
| 9.00% due 06/15/213 | 125,000 | 127,188 | ||||||
| UPCB Finance VI Ltd. | ||||||||
| 6.88% due 01/15/223 | 100,000 | 106,250 | ||||||
| Total Telecommunication Services | 797,625 | |||||||
| Consumer Discretionary - 2.3% | ||||||||
| Seminole Hard Rock Entertainment | ||||||||
| Incorporated / Seminole Hard | ||||||||
| Rock International LLC | ||||||||
| 5.88% due 05/15/213 | 250,000 | 245,625 | ||||||
| GRD Holdings III Corp. | ||||||||
| 10.75% due 06/01/193 | 100,000 | 109,000 | ||||||
| CPG Merger Sub LLC | ||||||||
| 8.00% due 10/01/213 | 100,000 | 104,000 | ||||||
| GLP Capital Limited Partnership / | ||||||||
| GLP Financing II, Inc. | ||||||||
| 4.88% due 11/01/203 | 100,000 | 100,000 | ||||||
| MDC Partners, Inc. | ||||||||
| 6.75% due 04/01/203 | 50,000 | 52,313 | ||||||
| Total Consumer Discretionary | 610,938 | |||||||
| Industrials - 2.2% | ||||||||
| USG Corp. | ||||||||
| 5.88% due 11/01/213 | 200,000 | 208,000 | ||||||
| ADT Corp. | ||||||||
| 6.25% due 10/15/213 | 150,000 | 157,500 | ||||||
| Quality Distribution LLC / QD Capital Corp. | ||||||||
| 9.88% due 11/01/18 | 100,000 | 110,750 | ||||||
| Marquette Transportation Company LLC / | ||||||||
| Marquette Transportation Finance Corp. | ||||||||
| 10.88% due 01/15/17 | 95,000 | 100,225 | ||||||
| RR Donnelley & Sons Co. | ||||||||
| 6.50% due 11/15/23 | 2,000 | 2,020 | ||||||
| Total Industrials | 578,495 | |||||||
| Information Technology - 1.8% | ||||||||
| Audatex North America, Inc. | ||||||||
| 6.00% due 06/15/213,6 | 250,000 | 261,875 | ||||||
| Eagle Midco, Inc. | ||||||||
| 9.00% due 06/15/183 | 100,000 | 104,250 | ||||||
| IAC | ||||||||
| 4.88% due 11/30/183 | 100,000 | 102,250 | ||||||
| Total Information Technology | 468,375 | |||||||
| Utilities - 1.4% | ||||||||
| LBC Tank Terminals Holding | ||||||||
| Netherlands BV | ||||||||
| 6.88% due 05/15/233 | 250,000 | 258,438 | ||||||
| NGL Energy Partners Limited | ||||||||
| Partnership / NGL Energy | ||||||||
| Finance Corp. | ||||||||
| 6.88% due 10/15/213 | 100,000 | 102,500 | ||||||
| Total Utilities | 360,938 | |||||||
| Total Corporate Bonds | ||||||||
| (Cost $9,345,073) | 9,213,759 | |||||||
| ASSET BACKED SECURITIES†† - 25.3% | ||||||||
| Northwoods Capital VII Ltd. | ||||||||
| 2006-7A, 3.74% due 10/22/211,3 | 250,000 | 232,825 | ||||||
| 2006-7A, 1.79% due 10/22/211,3 | 200,000 | 188,040 | ||||||
| West Coast Funding Ltd. | ||||||||
| 2006-1A, 0.39% due 11/02/411,3 | 427,830 | 412,599 | ||||||
| N-Star Real Estate CDO IX Ltd. | ||||||||
| 0.51% due 02/01/415 | 450,745 | 409,772 | ||||||
| Cedar Woods CRE CDO Ltd. | ||||||||
| 0.43% due 07/25/51 | 426,152 | 346,291 | ||||||
| Gramercy Real Estate CDO 2007-1 Ltd. | ||||||||
| 2007-1A, 0.52% due 08/15/561,3 | 365,796 | 301,489 | ||||||
| GreenPoint Mortgage Funding Trust | ||||||||
| 2005-HE4, 0.87% due 07/25/301 | 300,000 | 267,026 | ||||||
| NewStar Commercial Loan Trust 2006-1 | ||||||||
| 2006-1A, 0.93% due 03/30/221,3 | 275,000 | 263,505 | ||||||
| Structured Asset Securities Corporation | ||||||||
| Mortgage Loan Trust | ||||||||
| 2006-OPT1, 0.42% due 04/25/361 | 300,000 | 255,918 | ||||||
| Salus CLO 2012-1 Ltd. | ||||||||
| 2013-1AN, 6.99% due 03/05/211,3 | 250,000 | 249,950 | ||||||
| DIVCORE CLO Ltd. | ||||||||
| 2013-1A B, 4.10% due 11/15/32 | 250,000 | 249,250 | ||||||
| Emerald Aviation Finance Ltd. | ||||||||
| 2013-1, 6.35% due 10/15/383 | 247,396 | 248,930 | ||||||
| Garrison Funding 2013-2 Ltd. | ||||||||
| 2013-2A, 4.98% due 09/25/231,3 | 250,000 | 248,750 | ||||||
| RAIT CRE CDO I Ltd. | ||||||||
| 2006-1X, 0.50% due 11/20/461 | 308,758 | 248,550 | ||||||
| Newstar Commercial Loan | ||||||||
| Funding 2013-1 LLC | ||||||||
| 2013-1A, 5.70% due 09/20/231,3 | 250,000 | 246,500 | ||||||
| Turbine Engines Securitization Ltd. | ||||||||
| 6.38% due 12/13/483 | 250,000 | 242,900 | ||||||
| 70 | the GUGGENHEIM FUNDS annual report | See Notes to Financial Statements. |
| Schedule of Investments (continued) | December 31, 2013 |
| SERIES M (MACRO OPPORTUNITIES SERIES) |
| Face | ||||||||
| Amount | Value | |||||||
| Telos CLO Ltd. | ||||||||
| 2013-3A, 4.49% due 01/17/241,3 | $ | 250,000 | $ | 241,650 | ||||
| Acis CLO 2013-2 Ltd. | ||||||||
| 4.11% due 10/14/221,3 | 250,000 | 238,750 | ||||||
| Cerberus Onshore II CLO LLC | ||||||||
| 2014-1A, 4.24% due 10/15/231,3 | 250,000 | 238,575 | ||||||
| Jasper CLO Ltd. | ||||||||
| 2005-1A, 1.14% due 08/01/171,3 | 250,000 | 232,558 | ||||||
| First Frankin Mortgage Loan Trust | ||||||||
| 2006-FF1, 0.50% due 01/25/361 | 250,000 | 216,183 | ||||||
| New Century Home Equity | ||||||||
| Loan Trust Series | ||||||||
| 2004-4, 0.96% due 02/25/351 | 102,164 | 92,623 | ||||||
| 2005-1, 0.88% due 03/25/351 | 91,738 | 79,661 | ||||||
| GSAA Home Equity Trust | ||||||||
| 2007-7, 0.43% due 07/25/371 | 189,315 | 160,735 | ||||||
| Lehman XS Trust | ||||||||
| 2007-9, 0.28% due 06/25/371 | 152,740 | 132,653 | ||||||
| Park Place Securities Incorporated Series | ||||||||
| 2005-WHQ2, 0.62% due 05/25/351 | 140,000 | 116,978 | ||||||
| CIT Mortgage Loan Trust | ||||||||
| 2007-1, 1.61% due 10/25/371,3 | 125,000 | 108,558 | ||||||
| Genesis Funding Ltd. | ||||||||
| 2006-1A, 0.41% due 12/19/321,3 | 102,316 | 92,596 | ||||||
| Wachovia Asset Securitization | ||||||||
| Issuance II LLC 2007-HE1 Trust | ||||||||
| 2007-HE1, 0.30% due 07/25/371,3 | 90,780 | 76,709 | ||||||
| Newcastle CDO Ltd. | ||||||||
| 2007-9A, 0.42% due 05/25/52 | 73,215 | 71,502 | ||||||
| Accredited Mortgage Loan Trust | ||||||||
| 2007-1, 0.29% due 02/25/371 | 75,767 | 70,026 | ||||||
| Aircraft Certificate Owner Trust 2003 | ||||||||
| 2003-1A, 6.46% due 09/20/223,5 | 66,980 | 66,974 | ||||||
| Total Asset Backed Securities | ||||||||
| (Cost $6,666,062) | 6,649,026 | |||||||
| SENIOR FLOATING RATE INTERESTS††,1 - 24.1% | ||||||||
| Industrials - 5.0% | ||||||||
| Travelport Holdings Ltd. | ||||||||
| 6.25% due 06/26/19 | 298,500 | 305,715 | ||||||
| Emerald Expositions | ||||||||
| 5.50% due 06/12/20 | 248,750 | 249,372 | ||||||
| Power Borrower, LLC | ||||||||
| 8.25% due 11/06/20 | 125,000 | 122,500 | ||||||
| 4.25% due 05/06/20 | 116,597 | 114,848 | ||||||
| Thermasys Corp. | ||||||||
| 5.26% due 05/03/19 | 124,219 | 122,148 | ||||||
| Mitchell International, Inc. | ||||||||
| 8.50% due 10/11/21 | 100,000 | 101,313 | ||||||
| MRC Global, Inc. | ||||||||
| 5.00% due 11/08/19 | 99,750 | 100,997 | ||||||
| syncreon | ||||||||
| 5.25% due 10/28/20 | 100,000 | 99,438 | ||||||
| NaNa Development Corp. | ||||||||
| 8.00% due 03/15/18 | 85,000 | 85,850 | ||||||
| Total Industrials | 1,302,181 | |||||||
| Consumer Discretionary - 4.9% | ||||||||
| Ollies Bargain Outlet | ||||||||
| 5.26% due 09/28/19 | 248,744 | 249,989 | ||||||
| Lions Gate Entertainment Corp. | ||||||||
| 5.00% due 07/18/20 | 200,000 | 200,500 | ||||||
| ValleyCrest Companies LLC | ||||||||
| 5.50% due 06/13/19 | 199,000 | 199,746 | ||||||
| Horseshoe Baltimore | ||||||||
| 8.25% due 07/02/20 | 125,000 | 128,985 | ||||||
| Fleetpride Corp. | ||||||||
| 5.25% due 11/19/19 | 119,098 | 117,535 | ||||||
| Neiman Marcus Group, Inc. | ||||||||
| 5.00% due 10/25/20 | 100,000 | 101,153 | ||||||
| Sears Holdings Corp. | ||||||||
| 5.50% due 06/30/18 | 100,000 | 100,549 | ||||||
| NES Global Talent | ||||||||
| 6.50% due 10/02/19 | 100,000 | 99,500 | ||||||
| Go Daddy Operating Company LLC | ||||||||
| 4.00% due 12/16/18 | 98,734 | 98,755 | ||||||
| Total Consumer Discretionary | 1,296,712 | |||||||
| Information Technology - 4.1% | ||||||||
| EIG Investors Corp. | ||||||||
| 5.00% due 11/09/19 | 248,125 | 249,212 | ||||||
| Deltek, Inc. | ||||||||
| 5.00% due 10/10/18 | 198,496 | 198,992 | ||||||
| SumTotal Systems | ||||||||
| 6.28% due 11/16/18 | 140,744 | 138,633 | ||||||
| P2 Energy Solutions | ||||||||
| 5.00% due 10/30/20 | 100,000 | 100,375 | ||||||
| Active Network, Inc., The | ||||||||
| 5.50% due 11/13/20 | 100,000 | 100,375 | ||||||
| LANDesk Group, Inc. | ||||||||
| 5.25% due 08/09/19 | 99,500 | 99,873 | ||||||
| Greenway Medical Technologies | ||||||||
| 6.00% due 11/04/20 | 100,000 | 99,500 | ||||||
| Aspect Software, Inc. | ||||||||
| 7.00% due 05/07/16 | 97,500 | 97,683 | ||||||
| Total Information Technology | 1,084,643 | |||||||
| Financials - 3.6% | ||||||||
| First Data Corp. | ||||||||
| 4.16% due 03/23/18 | 250,000 | 250,173 | ||||||
| American Stock Transfer & Trust | ||||||||
| 5.75% due 06/26/20 | 199,000 | 199,747 | ||||||
| First Advantage Corp. | ||||||||
| 6.25% due 02/28/19 | 149,250 | 148,971 | ||||||
| Magic Newco, LLC | ||||||||
| 12.00% due 06/12/19 | 125,000 | 143,281 | ||||||
| National Financial Partners | ||||||||
| 5.25% due 07/01/20 | 99,500 | 100,412 | ||||||
| HDV Holdings | ||||||||
| 5.75% due 12/18/18 | 98,750 | 98,009 | ||||||
| Total Financials | 940,593 | |||||||
| See Notes to Financial Statements. | The GUGGENHEIM FUNDS annual report | 71 |
| Schedule of Investments (continued) | December 31, 2013 |
| Series M (MACRO OPPORTUNITIES SERIES) |
| Face | ||||||||
| Amount | Value | |||||||
| Consumer Staples - 2.4% | ||||||||
| Arctic Glacier Holdings, Inc. | �� | |||||||
| 6.00% due 05/10/19 | $ | 199,000 | $ | 199,000 | ||||
| Grocery Outlet, Inc. | ||||||||
| 5.50% due 12/17/18 | 198,610 | 198,984 | ||||||
| Performance Food Group | ||||||||
| 6.25% due 11/14/19 | 124,375 | 124,945 | ||||||
| Reddy Ice Holdings, Inc. | ||||||||
| 6.75% due 04/01/19 | 99,499 | 99,374 | ||||||
| Total Consumer Staples | 622,303 | |||||||
| Telecommunication Services - 1.3% | ||||||||
| Avaya, Inc. | ||||||||
| 8.00% due 03/31/18 | 247,830 | 251,114 | ||||||
| Mitel Networks Corp. | ||||||||
| 7.00% due 02/27/19 | 89,474 | 89,474 | ||||||
| Total Telecommunication Services | 340,588 | |||||||
| Health Care - 0.8% | ||||||||
| Learning Care Group (US), Inc. | ||||||||
| 6.00% due 05/08/19 | 124,375 | 124,841 | ||||||
| Nextech Systems LLC | ||||||||
| 6.00% due 10/28/18 | 100,000 | 98,000 | ||||||
| Total Health Care | 222,841 | |||||||
| Energy - 0.8% | ||||||||
| Atlas Energy LP | ||||||||
| 6.50% due 07/31/19 | 99,750 | 101,994 | ||||||
| Ocean Rig ASA | ||||||||
| 5.50% due 07/15/16 | 99,750 | 101,039 | ||||||
| Total Energy | 203,033 | |||||||
| Materials - 0.8% | ||||||||
| Oxbow Carbon | ||||||||
| 8.00% due 01/18/20 | 100,000 | 101,688 | ||||||
| Royal Adhesives and Sealants | ||||||||
| 5.50% due 07/31/18 | 99,183 | 99,927 | ||||||
| Total Materials | 201,615 | |||||||
| Utilities - 0.4% | ||||||||
| Astoria Generating Company | ||||||||
| Acquisitions LLC | ||||||||
| 8.50% due 10/26/17 | 97,500 | 100,425 | ||||||
| Total Senior Floating Rate Interests | ||||||||
| (Cost $6,256,990) | 6,314,934 | |||||||
| COLLATERALIZED MORTGAGE OBLIGATIONS†† - 10.6% | ||||||||
| Lehman XS Trust Series | ||||||||
| 2006-16N, 0.35% due 11/25/461 | 293,484 | 233,717 | ||||||
| 2005-7N, 0.43% due 12/25/351 | 249,423 | 228,813 | ||||||
| Nomura Resecuritization Trust | ||||||||
| 2012-1R, 0.61% due 08/27/471,3 | 383,903 | 353,690 | ||||||
| SRERS-2011 Funding Ltd. | ||||||||
| 2011-RS, 0.42% due 05/09/461,3 | 376,441 | 341,207 | ||||||
| IndyMac INDX Mortgage Loan Trust | ||||||||
| 2006-AR4, 0.37% due 05/25/461 | 280,328 | 234,803 | ||||||
| COMM 2006-FL12 Mortgage Trust | ||||||||
| 2006-FL12, 0.40% due 12/15/201,3 | 97,486 | 95,034 | ||||||
| 2006-FL12, 0.46% due 12/15/201,3 | 64,991 | 63,342 | ||||||
| 2006-FL12, 0.51% due 12/15/201,3 | 64,998 | 62,705 | ||||||
| American Home Mortgage Assets Trust | ||||||||
| 2006-4, 0.35% due 10/25/461 | 339,614 | 218,413 | ||||||
| GreenPoint Mortgage Funding Trust | ||||||||
| 2006-AR1, 0.45% due 02/25/361 | 262,697 | 208,820 | ||||||
| Bear Stearns Mortgage Funding Trust | ||||||||
| 2007-AR5, 0.33% due 06/25/471 | 246,807 | 199,313 | ||||||
| Fannie Mae4 | ||||||||
| 2013-54, 3.00% due 06/25/43 | 114,140 | 88,521 | ||||||
| 2013-52, 3.00% due 06/25/43 | 114,963 | 87,150 | ||||||
| Banc of America Merrill Lynch | ||||||||
| Commercial Mortgage, Inc. | ||||||||
| 2005-6, 6.13% due 09/10/471,3 | 161,280 | 166,376 | ||||||
| Structured Asset Mortgage | ||||||||
| Investments II Trust | ||||||||
| 2006-AR1, 0.39% due 02/25/361 | 133,847 | 101,206 | ||||||
| Wachovia Bank Commercial | ||||||||
| Mortgage Trust Series | ||||||||
| 2007-WHALE 8 | ||||||||
| 2007-WHL8, 0.87% due 06/15/201,3 | 97,374 | 92,018 | ||||||
| Total Collateralized Mortgage Obligations | ||||||||
| (Cost $2,841,930) | 2,775,128 | |||||||
| MUNICIPAL BONDS†† - 0.8% | ||||||||
| Michigan - 0.8% | ||||||||
| City of Detroit Michigan | ||||||||
| Water Supply System | ||||||||
| Revenue Revenue Bonds | ||||||||
| 5.00% due 07/01/16 | 110,000 | 110,560 | ||||||
| Michigan Finance Authority | ||||||||
| Revenue Notes | ||||||||
| 4.38% due 08/20/14 | 100,000 | 101,043 | ||||||
| Total Michigan | 211,603 | |||||||
| Total Municipal Bonds | ||||||||
| (Cost $210,110) | 211,603 | |||||||
| MORTGAGE BACKED SECURITIES†† - 0.3% | ||||||||
| Freddie Mac4 | ||||||||
| 2013-4204, 3.00% due 05/15/43 | 96,290 | 74,735 | ||||||
| Total Mortgage Backed Securities | ||||||||
| (Cost $93,641) | 74,735 | |||||||
| 72 | the GUGGENHEIM FUNDS annual report | See Notes to Financial Statements. |
| Schedule of Investments (concluded) | December 31, 2013 |
| Series M (MACRO OPPORTUNITIES SERIES) |
| Contracts | Value | |||||||
| OPTIONS PURCHASED† - 0.0% | ||||||||
| Call options on: | ||||||||
| iShares 20+ Year Treasury Bond | ||||||||
| ETF Expiring March 2014 | ||||||||
| with strike price of $112.00 | 565 | $ | 4,520 | |||||
| Total Options Purchased | ||||||||
| (Cost $29,380) | 4,520 | |||||||
| Total Investments - 106.1% | ||||||||
| (Cost $27,964,037) | $ | 27,827,253 | ||||||
| OPTIONS WRITTEN†† - 0.0% | ||||||||
| Call options on: | ||||||||
| iShares 20+ Year Treasury Bond | ||||||||
| ETF Expiring March 2014 with | ||||||||
| strike price of $118.00 | 565 | (1,695 | ) | |||||
| Total Options Written | ||||||||
| (Premiums received $4,520) | (1,695 | ) | ||||||
| Other Assets & Liabilities, net - (6.1)% | (1,575,968 | ) | ||||||
| Total Net Assets - 100.0% | $ | 26,249,590 | ||||||
| Unrealized | ||||||||
| Units | Gain | |||||||
| OTC CURRENCY FUTURES SWAP AGREEMENTS†† | ||||||||
| Bank of America | ||||||||
| March 2014 U.S. Dollar Index | ||||||||
| Futures Swap, | ||||||||
| Terminating 03/17/14 | ||||||||
| (National Value $481,770) | 6 | $ | 1,578 | |||||
| OTC EQUITY INDEX SWAP AGREEMENTS†† | ||||||||
| Bank of America | ||||||||
| February 2014 S&P 1500 Education | ||||||||
| Services Sub Industry Index Swap, | ||||||||
| Terminating 02/05/14 | ||||||||
| (Notional Value $844,282) | 15,966 | $ | 94,302 | |||||
centrally cleared INterest rate swap agreements††
| Unrealized | ||||||||||||||||||||||||
| Floating | Fixed | Maturity | Notional | Market | Appreciation/ | |||||||||||||||||||
| Counterparty | Floating Rate | Rate Index | Rate | Date | Amount | Value | (Depreciation) | |||||||||||||||||
| Merrill Lynch | Receive | 3-Month USD-LIBOR | 2.70 | % | 07/05/23 | $ | 50,000 | $ | 730 | $ | 730 | |||||||||||||
| Merrill Lynch | Receive | 3-Month USD-LIBOR | 1.56 | % | 07/05/18 | 850,000 | (5,525 | ) | (5,525 | ) | ||||||||||||||
| $ | (4,795 | ) | ||||||||||||||||||||||
| † | Value determined based on Level 1 inputs — See Note 4. |
| †† | Value determined based on Level 2 inputs, unless otherwise noted — See Note 4. |
| 1 | Variable rate security. Rate indicated is rate effective at December 31, 2013. |
| 2 | Perpetual maturity. |
| 3 | Security is a 144A or Section 4(a)(2) security. The total market value of 144A or Section 4(a)(2) securities is $10,313,824 (cost $10,230,884), or 39.3% of total net assets. |
| 4 | On September 7, 2008, the issuer was placed in conservatorship by the Federal Housing Finance Agency (FHFA). As conservator, the FHFA has full powers to control the assets and operations of the firm. |
| 5 | Illiquid security. |
| 6 | Security or a portion thereof is held as collateral for reverse repurchase agreements — See Note 14. |
plc — Public Limited Company
REIT — Real Estate Investment Trust
| See Notes to Financial Statements. | The GUGGENHEIM FUNDS annual report | 73 |
| Series M (MACRO OPPORTUNITIES SERIES) |
| STATEMENT OF ASSETS |
| AND LIABILITIES |
| December 31, 2013 |
| Assets: | ||||
| Investments, at value | ||||
| (cost $27,964,037) | $ | 27,827,253 | ||
| Unrealized appreciation on swap agreements | 96,610 | |||
| Cash | 28,038 | |||
| Segregated cash with broker | 17,179 | |||
| Prepaid expenses | 2,014 | |||
| Receivables: | ||||
| Securities sold | 321,900 | |||
| Interest | 193,140 | |||
| Investment advisor | 28,342 | |||
| Dividends | 9,136 | |||
| Total assets | 28,523,612 | |||
| Liabilities: | ||||
| Reverse Repurchase Agreements | 1,637,100 | |||
| Unrealized depreciation on swap agreements | 5,525 | |||
| Options written, at value (premiums received $4,520) | 1,695 | |||
| Unfunded loan commitments, at value (commitment fees received $39) | 36 | |||
| Payable for: | ||||
| Securities purchased | 560,466 | |||
| Management fees | 19,737 | |||
| Distribution and service fees | 5,544 | |||
| Transfer agent/maintenance fees | 2,123 | |||
| Fund accounting/administration fees | 2,107 | |||
| Directors’ fees* | 244 | |||
| Fund shares redeemed | 51 | |||
| Miscellaneous | 39,394 | |||
| Total liabilities | 2,274,022 | |||
| Net assets | $ | 26,249,590 | ||
| Net assets consist of: | ||||
| Paid in capital | $ | 25,984,656 | ||
| Undistributed net investment income | 453,620 | |||
| Accumulated net realized loss on investments | (145,815 | ) | ||
| Net unrealized depreciation on investments | (42,871 | ) | ||
| Net assets | $ | 26,249,590 | ||
| Capital shares outstanding | 1,039,906 | |||
| Net asset value per share | $ | 25.24 |
| STATEMENT OF |
| OPERATIONS |
Period Ended December 31, 2013**
| Investment Income: | ||||
| Interest | $ | 679,467 | ||
| Dividends | 20,263 | |||
| Total investment income | 699,730 | |||
| Expenses: | ||||
| Management fees | 155,732 | |||
| Transfer agent/maintenance fees | 17,208 | |||
| Distribution and service fees | 43,753 | |||
| Fund accounting/administration fees | 16,626 | |||
| Professional fees | 35,196 | |||
| Legal fees | 20,711 | |||
| Custodian fees | 6,345 | |||
| Directors’ fees* | 1,927 | |||
| Interest expense | 1,552 | |||
| Miscellaneous | 19,219 | |||
| Total expenses | 318,269 | |||
| Less: | ||||
| Expenses waived by Advisor | (55,226 | ) | ||
| Net expenses | 263,043 | |||
| Net investment income | 436,687 | |||
| Net Realized and Unrealized Gain (Loss): | ||||
| Net realized gain (loss) on: | ||||
| Investments | (159,022 | ) | ||
| Swap agreements | 25,286 | |||
| Options purchased | (9,600 | ) | ||
| Net realized loss | (143,336 | ) | ||
| Net change in unrealized appreciation (depreciation) on: | ||||
| Investments | (111,921 | ) | ||
| Swap agreements | 91,085 | |||
| Options purchased | (24,860 | ) | ||
| Options written | 2,825 | |||
| Net change in unrealized appreciation (depreciation) | (42,871 | ) | ||
| Net realized and unrealized loss | (186,207 | ) | ||
| Net increase in net assets resulting from operations | $ | 250,480 |
| * | Relates to Directors not deemed “interested persons” within the meaning of Section 2(a)(19) of the 1940 Act. |
| ** | Since commencement of operations: April 24, 2013. |
| 74 | the GUGGENHEIM FUNDS annual report | See Notes to Financial Statements. |
| Series M (MACRO OPPORTUNITIES SERIES) |
| STATEMENT OF CHANGES IN NET ASSETS |
| Period Ended | ||||
| December 31, | ||||
| 2013a | ||||
| Increase (Decrease) In Net Assets From Operations: | ||||
| Net investment income | $ | 436,687 | ||
| Net realized loss on investments | (143,336 | ) | ||
| Net change in unrealized appreciation (depreciation) on investments | (42,871 | ) | ||
| Net increase in net assets resulting from operations | 250,480 | |||
| Capital share transactions: | ||||
| Proceeds from sale of shares | 27,126,005 | |||
| Cost of shares redeemed | (1,126,895 | ) | ||
| Net increase from capital share transactions | 25,999,110 | |||
| Net increase in net assets | 26,249,590 | |||
| Net assets: | ||||
| Beginning of period | — | |||
| End of period | $ | 26,249,590 | ||
| Undistributed net investment income at end of period | $ | 453,620 | ||
| Capital share activity: | ||||
| Shares sold | 1,085,488 | |||
| Shares redeemed | (45,582 | ) | ||
| Net increase in shares | 1,039,906 | |||
| a | Since commencement of operations: April 24, 2013. |
| See Notes to Financial Statements. | The GUGGENHEIM FUNDS annual report | 75 |
| Series M (MACRO OPPORTUNITIES SERIES) |
| FINANCIAL HIGHLIGHTS |
This table is presented to show selected data for a share outstanding throughout each period and to assist shareholders in evaluating a Fund’s performance for the periods presented.
| Period Ended | ||||
| December 31, | ||||
| 2013c | ||||
| Per Share Data | ||||
| Net asset value, beginning of period | $ | 25.00 | ||
| Income (loss) from investment operations: | ||||
| Net investment incomea | .42 | |||
| Net loss on investments (realized and unrealized) | (.18 | ) | ||
| Total from investment operations | .24 | |||
| Net asset value, end of period | $ | 25.24 | ||
| Total Returnb | 0.96 | % | ||
| Ratios/Supplemental Data | ||||
| Net assets, end of period (in thousands) | $ | 26,250 | ||
| Ratios to average net assets: | ||||
| Net investment income | 2.48 | % | ||
| Total expensesd,e | 1.80 | % | ||
| Net expensesd,e,f | 1.49 | % | ||
| Portfolio turnover rate | 49 | % | ||
| a | Net investment income per share was computed using average shares outstanding throughout the period. |
| b | Total return does not take into account any of the expenses associated with an investment in variable insurance products. If total return had taken into account these expenses, performance would have been lower. Shares of a series of SBL Fund are available only through the purchase of such products. |
| c | Since commencement of operations: April 24, 2013. Percentage amounts for the period, except total return and portfolio turnover rate, have been annualized. |
| d | Due to limited length of Fund operations, ratios for this period may not be indicative of future performance. |
| e | Does not include expenses of the underlying funds in which the Fund invests. |
| f | Net expense information reflects the expense ratios after expense waivers and may include extraordinary expenses. Excluding extraordinary expenses, the operating expense ratio for the period would be: |
| 12/31/13 | ||
| 1.44% | ||
| 76 | the GUGGENHEIM FUNDS annual report | See Notes to Financial Statements. |
| Manager’S Commentary (Unaudited) | December 31, 2013 |
To Our Shareholders:
The Series N (Managed Asset Allocation Series) is managed by a team of seasoned professionals, including Michael P. Byrum, CFA, Portfolio Manager; Michael Dellapa, CFA, CAIA, Portfolio Manager; Ryan Harder, CFA, Portfolio Manager; and Matthew Wu, Ph.D., CFA, Portfolio Manager. In the following paragraphs, the team discusses changes to the Fund and performance of the Fund for the fiscal year ended December 31, 2013.
For the fiscal year ended December 31, 2013, the Series N (Managed Asset Allocation Series) rose 14.33%, underperforming its weighted benchmark that is 60% S&P® 500 Index and 40% Barclays U.S. Aggregate Bond Index, which returned 17.56%. The S&P 500® Index rose 32.39% over the year and the Barclays U.S. Aggregate Bond Index returned -2.02%.
The investment objective of the Fund is to seek to provide growth of capital and, secondarily, preservation of capital. The Fund pursues its objective by investing principally in equity, fixed income and money market assets through investing in a diversified portfolio of futures contracts and exchange-traded funds and other pooled investment vehicles that track major equity indexes and fixed income indexes.
Under normal market conditions, the Fund’s investments are expected to achieve a moderate allocation of equity, fixed income and money market assets in approximately the following amounts: (1) 60% of assets in equity securities, which may include stock of small capitalization U.S. companies, mid-capitalization U.S. companies, large capitalization U.S. companies and non-U.S. companies; (2) 35% of assets in fixed income securities, which may include short and long term corporate and government bonds; and (3) 5% of assets in cash. However, the Investment Manager intends to utilize dynamic asset allocation techniques that will allow rapid shifts between asset classes to attempt to exploit current market trends, and the Fund may invest fully in any asset class at any time.
PERFORMANCE REVIEW
The global economy ended 2013 on a firm footing and growth is broad-based across almost all main developed economies. All the major central banks are offering accommodative monetary policy. With this backdrop of growth, equity markets overcame such negative influences from expiration of payroll tax cuts, Cyprus bank insolvency crisis, and US government shutdown. The prospect of QE tapering by the Fed only brought short-term volatility as equity markets never had a 5% fall in the year, instead they gradually price in the information. However, QE tapering and strong macroeconomic numbers pushed up the treasury yields, with 10-year yield rising from less than 2% to 3% by year end.
Our dynamically managed tactical overlay was over cautious toward equity at the beginning of the year. It started to catch up gains later in the year, although it was not enough to cover up the loss made earlier. As the result, the SBL-N portfolio underperformed its composite benchmark for the year.
In this period, the best performing holdings were Russell 2000 futures, the S&P Mid Cap ETF and S&P 500 futures, while 10-year futures, the investment grade bond ETF and Barclays U.S. Aggregate ETF detracted the performance.
Performance displayed represents past performance, which is no guarantee of future results.
The opinions and forecast expressed may not actually come to pass. This information is subject to change at any time, based on market and other conditions, and should not be construed as a recommendation of any specific security or strategy.
| THE GUGGENHEIM FUNDS ANNUAL REPORT | 77 |
| PERFORMANCE REPORT AND FUND PROFILE (Unaudited) | December 31, 2013 |
SERIES N (MANAGED ASSET ALLOCATION SERIES)
OBJECTIVE: Seeks growth of capital and, secondarily, preservation of capital.
Cumulative Fund Performance*,†
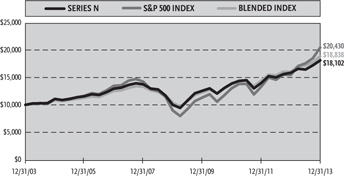
Average Annual Returns*
Periods Ended December 31, 2013†
| 1 Year | 5 Year | 10 Year | ||||||||||
| Series N (Managed Asset Allocation Series) | 14.33 | % | 12.61 | % | 6.11 | % | ||||||
| Blended Index** | 17.56 | % | 12.71 | % | 6.54 | % | ||||||
| S&P 500 Index | 32.39 | % | 17.94 | % | 7.41 | % | ||||||
Inception Date: June 1, 1995
| Holdings (% of Total Net Assets) | ||||
| Dreyfus Treasury Prime Cash Management Fund | 38.2 | % | ||
| iShares Core Total US Bond Market ETF | 16.0 | % | ||
| SPDR S&P 500 ETF Trust | 13.2 | % | ||
| Vanguard S&P 500 ETF | 13.2 | % | ||
| iShares iBoxx $ Investment Grade Corporate Bond ETF | 7.6 | % | ||
| iShares Core S&P Mid-Capital ETF | 6.4 | % | ||
| iShares MSCI EAFE ETF | 3.8 | % | ||
| iShares Core S&P 500 ETF | 0.0 | % | ||
| Total | 98.4 | % | ||
Holdings Diversification (Market Exposure as % of Net Assets)
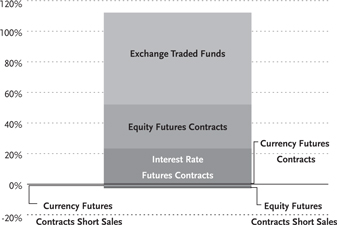
“Holdings Diversification (Market Exposure as % of Net Assets)” excludes any temporary cash investments.
| * | The performance data above represents past performance that is not predictive of future results. The investment return and principal value of an investment in the Fund will fluctuate so that an investor’s shares, when redeemed, may be worth more or less than their original cost. Returns are historical and include changes in principal and reinvested dividends and capital gains and do not reflect the effect of taxes. The S&P 500 Index and the Barclays U.S. Aggregate Bond Index are unmanaged indices and, unlike the Fund, have no management fees or operating expenses to reduce their reported returns. |
| ** | The Blended Index is 60% S&P 500 Index and 40% Barclays U.S. Aggregate Bond Index. |
| † | Performance figures do not reflect fees and expenses associated with an investment in variable insurance products. If returns had taken into account these fees and expenses, performance would have been lower. Shares of a series of SBL Fund are available only through the purchase of such products. |
| 78 | THE GUGGENHEIM FUNDS ANNUAL REPORT |
| SCHEDULE OF INVESTMENTS | December 31, 2013 |
| SERIES N (MANAGED ASSET ALLOCATION SERIES) | |
| Shares | Value | |||||||
| EXCHANGE TRADED FUNDS† - 60.2% | ||||||||
| iShares Core Total US Bond Market ETF | 98,443 | $ | 10,477,287 | |||||
| SPDR S&P 500 ETF Trust | 46,804 | 8,643,295 | ||||||
| Vanguard S&P 500 ETF | 50,892 | 8,608,382 | ||||||
| iShares iBoxx $ Investment Grade | ||||||||
| Corporate Bond ETF | 43,517 | 4,970,077 | ||||||
| iShares Core S&P Mid-Capital ETF | 31,102 | 4,162,692 | ||||||
| iShares MSCI EAFE ETF | 37,530 | 2,516,762 | ||||||
| iShares Core S&P 500 ETF | 2 | 371 | ||||||
| Total Exchange Traded Funds | ||||||||
| (Cost $33,433,858) | 39,378,866 | |||||||
| SHORT TERM INVESTMENTS† - 38.2% | ||||||||
| Dreyfus Treasury Prime Cash | ||||||||
| Management Fund | 24,974,975 | 24,974,975 | ||||||
| Total Short Term Investments | ||||||||
| (Cost $24,974,975) | 24,974,975 | |||||||
| Total Investments - 98.4% | ||||||||
| (Cost $58,408,833) | $ | 64,353,841 | ||||||
| Other Assets & Liabilities, net - 1.6% | 1,020,991 | |||||||
| Total Net Assets - 100.0% | $ | 65,374,832 | ||||||
| Unrealized | ||||||||
| Contracts | Gain (Loss) | |||||||
| EQUITY FUTURES CONTRACTS PURCHASED† | ||||||||
| March 2014 MSCI EAFE Index Mini | ||||||||
| Futures Contracts | ||||||||
| (Aggregate Value of | ||||||||
Contracts $8,151,500) | 85 | $ | 405,672 | |||||
| March 2014 S&P 500 Index Mini | ||||||||
| Futures Contracts | ||||||||
| (Aggregate Value of | ||||||||
Contracts $7,192,575) | 78 | 161,944 | ||||||
| March 2014 Russell 2000 Index Mini | ||||||||
| Futures Contracts | ||||||||
| (Aggregate Value of | ||||||||
Contracts $3,017,560) | 26 | 159,063 | ||||||
| March 2014 FTSE 100 Index | ||||||||
| Futures Contracts†† | ||||||||
| (Aggregate Value of | ||||||||
| Contracts $222,588) | 2 | 9,096 | ||||||
| March 2014 SPI 200 Index | ||||||||
| Futures Contracts†† | ||||||||
| (Aggregate Value of | ||||||||
| Contracts $119,214) | 1 | 5,273 | ||||||
| January 2014 Hang Seng Index | ||||||||
| Futures Contracts†† | ||||||||
| (Aggregate Value of | ||||||||
| Contracts $151,264) | 1 | 3,612 | ||||||
| (Total Aggregate Value of Contracts $18,854,701) | $ | 744,660 | ||||||
| CURRENCY FUTURES CONTRACTS PURCHASED† | ||||||||
| March 2014 British Pound | ||||||||
| Futures Contracts | ||||||||
| (Aggregate Value of | ||||||||
| Contracts $103,450) | 1 | $ | 835 | |||||
| March 2014 Australian Dollar | ||||||||
| Futures Contracts | ||||||||
| (Aggregate Value of | ||||||||
| Contracts $177,680) | 2 | (3,285 | ) | |||||
| (Total Aggregate Value of Contracts $281,130) | $ | (2,450 | ) | |||||
| INTEREST RATE FUTURES CONTRACTS PURCHASED† | ||||||||
| March 2014 U.S. Treasury 2 Year | ||||||||
| Note Futures Contracts | ||||||||
| (Aggregate Value of | ||||||||
| Contracts $6,155,188) | 28 | $ | (12,291 | ) | ||||
| March 2014 U.S. Treasury 10 Year | ||||||||
| Note Futures Contracts | ||||||||
| (Aggregate Value of | ||||||||
| Contracts $8,724,126) | 71 | (154,227 | ) | |||||
| (Total Aggregate Value of Contracts $14,879,314) | $ | (166,518 | ) | |||||
| CURRENCY FUTURES CONTRACTS SOLD SHORT† | ||||||||
| March 2014 Japanese Yen | ||||||||
| Futures Contracts | ||||||||
| (Aggregate Value of | ||||||||
| Contracts $237,550) | 2 | $ | 3,780 | |||||
| March 2014 Euro FX | ||||||||
| Futures Contracts | ||||||||
| (Aggregate Value of | ||||||||
| Contracts $171,975) | 1 | (246 | ) | |||||
| March 2014 Canadian Dollar | ||||||||
| Futures Contracts | ||||||||
| (Aggregate Value of | ||||||||
| Contracts $281,880) | 3 | (1,468 | ) | |||||
| (Total Aggregate Value of Contracts $691,405) | $ | 2,066 | ||||||
| EQUITY FUTURES CONTRACTS SOLD SHORT† | ||||||||
| January 2014 CAC40 10 Euro Index | ||||||||
| Futures Contracts†† | ||||||||
| (Aggregate Value of | ||||||||
| Contracts $118,629) | 2 | $ | (5,394 | ) | ||||
| March 2014 S&P/TSX 60 IX Index | ||||||||
| Futures Contracts†† | ||||||||
| (Aggregate Value of | ||||||||
| Contracts $147,065) | 1 | (5,741 | ) | |||||
| March 2014 Nikkei 225 (CME) Index | ||||||||
| Futures Contracts | ||||||||
| (Aggregate Value of | ||||||||
| Contracts $164,050) | 2 | (6,007 | ) | |||||
| March 2014 DAX Index | ||||||||
| Futures Contracts†† | ||||||||
| (Aggregate Value of | ||||||||
| Contracts $332,167) | 1 | (16,359 | ) | |||||
| (Total Aggregate Value of Contracts $761,911) | $ | (33,501 | ) | |||||
| † | Value determined based on Level 1 inputs, unless otherwise noted — See Note 4. |
| †† | Value determined based on Level 2 inputs — See Note 4. |
| SEE NOTES TO FINANCIAL STATEMENTS. | THE GUGGENHEIM FUNDS ANNUAL REPORT | 79 |
| SERIES N (MANAGED ASSET ALLOCATION SERIES) |
| STATEMENT OF ASSETS |
| AND LIABILITIES |
| December 31, 2013 |
| Assets: | ||||
| Investments, at value | ||||
| (cost $58,408,833) | $ | 64,353,841 | ||
| Segregated cash with broker | 1,051,182 | |||
| Prepaid expenses | 1,725 | |||
| Cash | 1,612 | |||
| Receivables: | ||||
| Dividends | 81,706 | |||
| Variation margin | 47,982 | |||
| Foreign taxes reclaim | 7,063 | |||
| Fund shares sold | 259 | |||
| Total assets | 65,545,370 | |||
| Liabilities: | ||||
| Overdraft due to custodian foreign currency, at value (cost $1,054) | 1,022 | |||
| Payable for: | ||||
| Fund shares redeemed | 43,003 | |||
| Management fees | 35,823 | |||
| Legal fees | 22,537 | |||
| Fund accounting/administration fees | 8,267 | |||
| Transfer agent/maintenance fees | 5,577 | |||
| Directors’ fees* | 1,194 | |||
| Miscellaneous | 53,115 | |||
| Total liabilities | 170,538 | |||
| Net assets | $ | 65,374,832 | ||
| Net assets consist of: | ||||
| Paid in capital | $ | 60,318,325 | ||
| Accumulated net investment loss | (194,717 | ) | ||
| Accumulated net realized loss on investments | (1,238,260 | ) | ||
| Net unrealized appreciation on investments | 6,489,484 | |||
| Net assets | $ | 65,374,832 | ||
| Capital shares outstanding | 2,521,466 | |||
| Net asset value per share | $ | 25.93 |
| STATEMENT OF |
| OPERATIONS |
| Year Ended December 31, 2013 |
| Investment Income: | ||||
| Dividends (net of foreign withholding tax of $1,740) | $ | 878,904 | ||
| Interest | 639 | |||
| Total investment income | 879,543 | |||
| Expenses: | ||||
| Management fees | 412,995 | |||
| Transfer agent/maintenance fees | 26,374 | |||
| Fund accounting/administration fees | 95,307 | |||
| Legal fees | 72,125 | |||
| Custodian fees | 7,353 | |||
| Directors’ fees* | 6,930 | |||
| Tax expense | 598 | |||
| Miscellaneous | 56,692 | |||
| Total expenses | 678,374 | |||
| Net investment income | 201,169 | |||
| Net Realized and Unrealized Gain (Loss): | ||||
| Net realized gain (loss) on: | ||||
| Investments | 174,179 | |||
| Futures contracts | 3,235,943 | |||
| Foreign currency | 1,077 | |||
| Net realized gain | 3,411,199 | |||
| Net change in unrealized appreciation (depreciation) on: | ||||
| Investments | 4,525,144 | |||
| Futures contracts | 383,271 | |||
| Foreign currency | 183 | |||
| Net change in unrealized appreciation (depreciation) | 4,908,598 | |||
| Net realized and unrealized gain | 8,319,797 | |||
| Net increase in net assets resulting from operations | $ | 8,520,966 |
* Relates to Directors not deemed “interested persons” within the meaning of Section 2(a)(19) of the 1940 Act.
| 80 | THE GUGGENHEIM FUNDS ANNUAL REPORT | SEE NOTES TO FINANCIAL STATEMENTS. |
| SERIES N (MANAGED ASSET ALLOCATION SERIES) |
| STATEMENTS OF CHANGES IN NET ASSETS |
| Year Ended | Year Ended | |||||||
| December 31, | December 31, | |||||||
| 2013 | 2012 | |||||||
| Increase (Decrease) In Net Assets From Operations: | ||||||||
| Net investment income | $ | 201,169 | $ | 455,380 | ||||
| Net realized gain on investments | 3,411,199 | 10,340,153 | ||||||
| Net change in unrealized appreciation (depreciation) on investments | 4,908,598 | (2,777,439 | ) | |||||
| Net increase in net assets resulting from operations | 8,520,966 | 8,018,094 | ||||||
| Capital share transactions: | ||||||||
| Proceeds from sale of shares | 5,341,219 | 3,496,605 | ||||||
| Cost of shares redeemed | (10,668,816 | ) | (13,108,279 | ) | ||||
| Net decrease from capital share transactions | (5,327,597 | ) | (9,611,674 | ) | ||||
| Net increase (decrease) in net assets | 3,193,369 | (1,593,580 | ) | |||||
| Net assets: | ||||||||
| Beginning of year | 62,181,463 | 63,775,043 | ||||||
| End of year | $ | 65,374,832 | $ | 62,181,463 | ||||
| (Accumulated)/Undistributed net investment (loss)/income at end of year | $ | (194,717 | ) | $ | 214,734 | |||
| Capital share activity: | ||||||||
| Shares sold | 221,536 | 160,776 | ||||||
| Shares redeemed | (441,361 | ) | (604,361 | ) | ||||
| Net decrease in shares | (219,825 | ) | (443,585 | ) | ||||
| SEE NOTES TO FINANCIAL STATEMENTS. | THE GUGGENHEIM FUNDS ANNUAL REPORT | 81 |
| SERIES N (MANAGED ASSET ALLOCATION SERIES) |
| FINANCIAL HIGHLIGHTS |
This table is presented to show selected data for a share outstanding throughout each period and to assist shareholders in evaluating a Fund’s performance for the periods presented.
| Year Ended | Year Ended | Year Ended | Year Ended | Year Ended | ||||||||||||||||
| December 31, | December 31, | December 31, | December 31, | December 31, | ||||||||||||||||
| 2013 | 2012 | 2011 | 2010 | 2009 | ||||||||||||||||
| Per Share Data | ||||||||||||||||||||
| Net asset value, beginning of period | $ | 22.68 | $ | 20.02 | $ | 19.89 | $ | 17.99 | $ | 14.31 | ||||||||||
| Income (loss) from investment operations: | ||||||||||||||||||||
| Net investment incomea | .08 | .15 | .28 | .26 | .27 | |||||||||||||||
| Net gain (loss) on investments (realized and unrealized) | 3.17 | 2.51 | (.15 | ) | 1.64 | 3.41 | ||||||||||||||
| Total from investment operations | 3.25 | 2.66 | .13 | 1.90 | 3.68 | |||||||||||||||
| Net asset value, end of period | $ | 25.93 | $ | 22.68 | $ | 20.02 | $ | 19.89 | $ | 17.99 | ||||||||||
| Total Returnb | 14.33 | % | 13.29 | % | 0.65 | % | 10.56 | % | 25.63 | % | ||||||||||
| Ratios/Supplemental Data | ||||||||||||||||||||
| Net assets, end of period (in thousands) | $ | 65,375 | $ | 62,181 | $ | 63,775 | $ | 78,734 | $ | 79,432 | ||||||||||
| Ratios to average net assets: | ||||||||||||||||||||
| Net investment income | 0.32 | % | 0.71 | % | 1.40 | % | 1.40 | % | 1.71 | % | ||||||||||
| Total expensesc | 1.07 | % | 1.31 | % | 1.56 | % | 1.50 | % | 1.66 | % | ||||||||||
| Portfolio turnover rate | 3 | % | 162 | % | 44 | % | 52 | % | 46 | % | ||||||||||
| a | Net investment income per share was computed using average shares outstanding throughout the period. |
| b | Total return does not take into account any of the expenses associated with an investment in variable insurance products. If total return had taken into account these expenses, performance would have been lower. Shares of a series of SBL Fund are available only through the purchase of such products. |
| c | Does not include expenses of the underlying funds in which the Fund invests. |
| 82 | THE GUGGENHEIM FUNDS ANNUAL REPORT | SEE NOTES TO FINANCIAL STATEMENTS. |
| MANAGER’S COMMENTARY (Unaudited) | December 31, 2013 |
To Our Shareholders:
The Series O (All Cap Value Series) is managed by a team of seasoned professionals led by James Schier, CFA, Portfolio Manager, and Mark A. Mitchell, CFA, Portfolio Manager. In the following paragraphs, they discuss performance of the Fund for the fiscal year ended December 31, 2013.
For the fiscal year ended December 31, 2013, the Series O (All Cap Value Series) returned 33.21%, while the benchmark, the Russell 3000® Value Index, returned 32.69%.
The strategy is to select securities of companies that appear undervalued by the overall market relative to assets, earnings, growth potential or cash flows. The investment approach is a defined and disciplined process with three key philosophical tenets that drive our investment decisions: a valuation focus, a long-term investment horizon and an opportunistic approach.
The portfolio’s performance for the period was helped by stock selection in the Financials, Energy and Consumer Discretionary sectors, and an underweight in the Utilities and Telecommunications Services sector.
The largest detractor from performance was stock selection in the Industrials sector, which was overweight relative to the benchmark. Stock selection in the Materials sector was also a detractor.
The holdings contributing most to portfolio performance over the period were oil giant Exxon Mobil Corp., and Cree, Inc., the LED lighting maker.
The main detractors were Coeur Mining, Inc., which underperformed due to the selloff in gold earlier in 2013; and McDermott International, Inc., which missed earnings early in 2013 and guided earnings down for other quarters and is no longer held in the portfolio.
Sector positioning in the Fund is mostly a result of stock selection decisions where the Fund believes it is finding the most attractive valuations or investment opportunities. The largest changes in positioning from a year ago were an increase in the Materials sector exposure and a decrease in the Industrials sector exposure.
Nonetheless, for the period the Fund had its largest overweight relative to the benchmark in Industrials, primarily in the engineering and construction industry. Opportunities appear attractive in investing in maintaining U.S. infrastructure and grids for distributing oil, gas and electricity.
The Fund was most underweight relative to the benchmark in Health Care and Utilities. In Health Care, the underweight was mostly in the large pharmaceuticals industry, which has been underperforming lately due to patent expirations and lack of reinvestment opportunities in new drug therapies. The Fund is overweight in the managed-care-provider industry, which was a boost to performance for the period. High valuations in the Utilities sector currently make this sector unattractive.
The Fund was also underweight relative to the benchmark in the Financials sector, the largest in both the Fund and the benchmark. This stance was a source of positive performance for the period, as was the Fund’s stock selection in the sector. The Fund continues to favor the insurance industry within Financials, and has no weighting in REITs, which make up a large part of the sector in the benchmark. The Fund’s underweight in REITs is because they appear expensive, prices having been driven up by yield-hungry investors searching for bond substitutes.
The slow-growth economy is making it more challenging to find investments with attractive growth prospects. While either a more powerful recovery or a significant market pullback could change this scenario, investors are currently finding it difficult to get paid for taking risk.
The Fund continues to focus on searching for companies it believes have good long-term fundamental prospects and attractive valuations that are likely to generate strong performance relative to the broader market, regardless of macroeconomic events.
Performance displayed represents past performance, which is no guarantee of future results.
The opinions and forecast expressed may not actually come to pass. This information is subject to change at any time, based on market and other conditions, and should not be construed as a recommendation of any specific security or strategy.
| The Guggenheim Funds annual REPORT | 83 |
| PERFORMANCE REPORT AND FUND PROFILE (Unaudited) | December 31, 2013 |
SERIES O (ALL CAP VALUE SERIES)
OBJECTIVE: Seeks long-term growth of capital.
Cumulative Fund Performance*,†
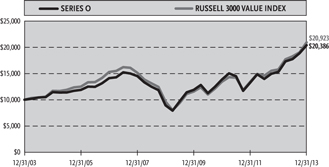
Average Annual Returns*
Periods Ended December 31, 2013†
| 1 Year | 5 Year | 10 Year | ||||||||||
| Series O (All Cap Value Series) | 33.21 | % | 17.95 | % | 7.38 | % | ||||||
| Russell 3000 Value Index | 32.69 | % | 16.75 | % | 7.66 | % | ||||||
Holdings Diversification (Market Exposure as % of Net Assets)
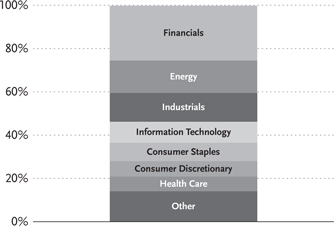
Inception Date: June 1, 1995
| Ten Largest Holdings (% of Total Net Assets) | ||||
| Dreyfus Treasury Prime Cash | ||||
| Management Fund | 4.1 | % | ||
| Computer Sciences Corp. | 3.3 | % | ||
| Wells Fargo & Co. | 3.0 | % | ||
| Chevron Corp. | 2.6 | % | ||
| CVS Caremark Corp. | 2.4 | % | ||
| JPMorgan Chase & Co. | 2.3 | % | ||
| Dow Chemical Co. | 2.3 | % | ||
| American International Group, Inc. | 2.2 | % | ||
| Cameco Corp. | 2.2 | % | ||
| Time Warner, Inc. | 2.1 | % | ||
| Top Ten Total | 26.5 | % | ||
| * | The performance data above represents past performance that is not predictive of future results. The investment return and principal value of an investment in the Fund will fluctuate so that an investor’s shares, when redeemed, may be worth more or less than their original cost. Returns are historical and include changes in principal and reinvested dividends and capital gains and do not reflect the effect of taxes. The Russell 3000 Value Index is an unmanaged index and, unlike the Fund, has no management fees or operating expenses to reduce its reported return. |
| † | Performance figures do not reflect fees and expenses associated with an investment in variable insurance products. If returns had taken into account these fees and expenses, performance would have been lower. Shares of a series of SBL Fund are available only through the purchase of such products. |
| 84 | THE GUGGENHEIM FUNDS ANNUAL REPORT |
| SCHEDULE OF INVESTMENTS | December 31, 2013 |
| SERIES O (ALL CAP VALUE SERIES) | |
| Shares | Value | |||||||
| COMMON STOCKS† - 95.8% | ||||||||
| FINANCIALS - 25.3% | ||||||||
| Wells Fargo & Co. | 102,633 | $ | 4,659,538 | |||||
| JPMorgan Chase & Co. | 60,650 | 3,546,812 | ||||||
| American International Group, Inc. | 67,292 | 3,435,257 | ||||||
| Hanover Insurance Group, Inc. | 44,320 | 2,646,346 | ||||||
| Allstate Corp. | 42,470 | 2,316,314 | ||||||
| Reinsurance Group of America, | ||||||||
| Inc. — Class A | 26,545 | 2,054,849 | ||||||
| WR Berkley Corp. | 41,850 | 1,815,872 | ||||||
| Aon plc | 20,860 | 1,749,945 | ||||||
| American Financial Group, Inc. | 23,270 | 1,343,144 | ||||||
| Berkshire Hathaway, Inc. — Class B* | 10,360 | 1,228,282 | ||||||
| Citigroup, Inc. | 23,260 | 1,212,079 | ||||||
| Bank of America Corp. | 77,670 | 1,209,322 | ||||||
| Home Loan Servicing Solutions Ltd. | 49,192 | 1,129,940 | ||||||
| Bank of New York Mellon Corp. | 31,380 | 1,096,417 | ||||||
| CME Group, Inc. — Class A | 12,920 | 1,013,703 | ||||||
| Franklin Resources, Inc. | 15,090 | 871,146 | ||||||
| Endurance Specialty Holdings Ltd. | 13,640 | 800,259 | ||||||
| U.S. Bancorp | 17,567 | 709,707 | ||||||
| NASDAQ OMX Group, Inc. | 15,540 | 618,492 | ||||||
| Huntington Bancshares, Inc. | 61,170 | 590,290 | ||||||
| Alexandria Real Estate Equities, Inc. | 8,170 | 519,776 | ||||||
| BioMed Realty Trust, Inc. | 27,420 | 496,850 | ||||||
| Ocwen Financial Corp.*,1 | 8,660 | 480,197 | ||||||
| Employers Holdings, Inc. | 14,620 | 462,723 | ||||||
| Wintrust Financial Corp. | 8,780 | 404,934 | ||||||
| SVB Financial Group* | 3,860 | 404,760 | ||||||
| First Niagara Financial Group, Inc. | 35,659 | 378,699 | ||||||
| City National Corp. | 4,550 | 360,451 | ||||||
| Zions Bancorporation | 11,800 | 353,528 | ||||||
| FirstMerit Corp. | 15,254 | 339,096 | ||||||
| First Midwest Bancorp, Inc. | 18,845 | 330,353 | ||||||
| Alleghany Corp.* | 643 | 257,174 | ||||||
| Redwood Trust, Inc. | 97 | 1,879 | ||||||
| Total Financials | 38,838,134 | |||||||
| ENERGY - 15.0% | ||||||||
| Chevron Corp. | 31,700 | 3,959,647 | ||||||
| Cameco Corp. | 165,150 | 3,430,166 | ||||||
| Apache Corp. | 28,310 | 2,432,961 | ||||||
| Whiting Petroleum Corp.* | 34,800 | 2,153,076 | ||||||
| Halliburton Co. | 40,940 | 2,077,705 | ||||||
| Phillips 66 | 22,440 | 1,730,797 | ||||||
| ConocoPhillips | 21,010 | 1,484,357 | ||||||
| Marathon Oil Corp. | 34,900 | 1,231,970 | ||||||
| Exxon Mobil Corp. | 11,020 | 1,115,224 | ||||||
| Superior Energy Services, Inc.* | 31,580 | 840,344 | ||||||
| Suncor Energy, Inc. | 23,040 | 807,552 | ||||||
| Oasis Petroleum, Inc.* | 13,520 | 635,034 | ||||||
| Resolute Energy Corp.* | 46,000 | 415,380 | ||||||
| Patterson-UTI Energy, Inc. | 14,920 | 377,774 | ||||||
| C&J Energy Services, Inc.* | 15,450 | 356,895 | ||||||
| Total Energy | 23,048,882 | |||||||
| INDUSTRIALS - 13.3% | ||||||||
| Parker Hannifin Corp. | 21,990 | 2,828,794 | ||||||
| Quanta Services, Inc.* | 86,660 | 2,734,989 | ||||||
| United Technologies Corp. | 23,750 | 2,702,750 | ||||||
| URS Corp. | 49,860 | 2,642,081 | ||||||
| Republic Services, Inc. — Class A | 77,100 | 2,559,720 | ||||||
| Covanta Holding Corp. | 110,070 | 1,953,743 | ||||||
| Orbital Sciences Corp.* | 48,821 | 1,137,529 | ||||||
| Navigant Consulting, Inc.* | 58,500 | 1,123,200 | ||||||
| Aegion Corp. — Class A* | 42,010 | 919,599 | ||||||
| Towers Watson & Co. — Class A | 3,816 | 486,960 | ||||||
| General Cable Corp. | 16,107 | 473,707 | ||||||
| ICF International, Inc.* | 11,100 | 385,281 | ||||||
| United Stationers, Inc. | 4,320 | 198,245 | ||||||
| AZZ, Inc. | 3,900 | 190,554 | ||||||
| Saia, Inc.* | 4,685 | 150,154 | ||||||
| Total Industrials | 20,487,306 | |||||||
| INFORMATION TECHNOLOGY - 9.7% | ||||||||
| Computer Sciences Corp. | 90,800 | 5,073,904 | ||||||
| Cisco Systems, Inc. | 108,840 | 2,443,458 | ||||||
| TE Connectivity Ltd. | 43,580 | 2,401,694 | ||||||
| IXYS Corp. | 176,300 | 2,286,611 | ||||||
| RF Micro Devices, Inc.* | 119,150 | 614,814 | ||||||
| NetApp, Inc. | 13,970 | 574,726 | ||||||
| Maxwell Technologies, Inc.* | 68,700 | 533,799 | ||||||
| Global Payments, Inc. | 7,875 | 511,796 | ||||||
| Semtech Corp.* | 17,140 | 433,299 | ||||||
| Total Information Technology | 14,874,101 | |||||||
| CONSUMER STAPLES - 8.6% | ||||||||
| CVS Caremark Corp. | 51,720 | 3,701,599 | ||||||
| Wal-Mart Stores, Inc. | 31,750 | 2,498,408 | ||||||
| Bunge Ltd. | 29,100 | 2,389,401 | ||||||
| Mondelez International, Inc. — Class A | 53,700 | 1,895,610 | ||||||
| Kraft Foods Group, Inc. | 17,900 | 965,168 | ||||||
| Hormel Foods Corp. | 18,480 | 834,742 | ||||||
| Darling International, Inc.* | 27,525 | 574,722 | ||||||
| Ingredion, Inc. | 5,610 | 384,061 | ||||||
| Total Consumer Staples | 13,243,711 | |||||||
| CONSUMER DISCRETIONARY - 7.1% | ||||||||
| Time Warner, Inc. | 46,886 | 3,268,891 | ||||||
| Lowe’s Companies, Inc. | 43,550 | 2,157,903 | ||||||
| DeVry Education Group, Inc. | 28,700 | 1,018,850 | ||||||
| Brown Shoe Company, Inc. | 29,722 | 836,377 | ||||||
| Kohl’s Corp. | 9,790 | 555,583 | ||||||
| Gentex Corp. | 14,970 | 493,860 | ||||||
| Scholastic Corp. | 14,500 | 493,145 | ||||||
| Cabela’s, Inc.* | 7,360 | 490,618 | ||||||
| Jack in the Box, Inc.* | 9,290 | 464,686 | ||||||
| Jones Group, Inc. | 29,473 | 440,916 | ||||||
| Guess?, Inc. | 13,843 | 430,102 | ||||||
| Chico’s FAS, Inc. | 16,870 | 317,831 | ||||||
| Total Consumer Discretionary | 10,968,762 | |||||||
| SEE NOTES TO FINANCIAL STATEMENTS. | THE GUGGENHEIM FUNDS ANNUAL REPORT | 85 |
| SCHEDULE OF INVESTMENTS (concluded) | December 31, 2013 |
| SERIES O (ALL CAP VALUE SERIES) | |
| Shares | Value | |||||||
| HEALTH CARE - 6.8% | ||||||||
| Aetna, Inc. | 36,470 | $ | 2,501,478 | |||||
| MEDNAX, Inc.* | 35,000 | 1,868,300 | ||||||
| UnitedHealth Group, Inc. | 19,390 | 1,460,067 | ||||||
| Teva Pharmaceutical Industries Ltd. ADR | 29,810 | 1,194,785 | ||||||
| Covidien plc | 10,690 | 727,989 | ||||||
| Pfizer, Inc. | 23,470 | 718,886 | ||||||
| Kindred Healthcare, Inc. | 29,594 | 584,185 | ||||||
| Hologic, Inc.* | 24,443 | 546,301 | ||||||
| Alere, Inc.* | 12,771 | 462,310 | ||||||
| Edwards Lifesciences Corp.* | 4,020 | 264,355 | ||||||
| Universal Health Services, Inc. Class B | 1,480 | 120,265 | ||||||
| Mallinckrodt plc* | 1,475 | 77,084 | ||||||
| Total Health Care | 10,526,005 | |||||||
| MATERIALS - 6.7% | ||||||||
| Dow Chemical Co. | 79,610 | 3,534,683 | ||||||
| Owens-Illinois, Inc.* | 47,630 | 1,704,201 | ||||||
| Coeur Mining, Inc.* | 123,200 | 1,336,720 | ||||||
| Sonoco Products Co. | 29,900 | 1,247,428 | ||||||
| Zoltek Companies, Inc.* | 30,900 | 517,575 | ||||||
| Potash Corporation of Saskatchewan, Inc. | 13,530 | 445,949 | ||||||
| Landec Corp.* | 36,480 | 442,138 | ||||||
| Olin Corp. | 13,436 | 387,629 | ||||||
| Royal Gold, Inc. | 5,860 | 269,970 | ||||||
| Allied Nevada Gold Corp.* | 68,500 | 243,175 | ||||||
| Globe Specialty Metals, Inc. | 6,587 | 118,632 | ||||||
| Total Materials | 10,248,100 | |||||||
| UTILITIES - 2.9% | ||||||||
| Edison International | 58,310 | 2,699,753 | ||||||
| Black Hills Corp. | 13,950 | 732,515 | ||||||
| Great Plains Energy, Inc. | 23,922 | 579,869 | ||||||
| MDU Resources Group, Inc. | 13,819 | 422,170 | ||||||
| Total Utilities | 4,434,307 | |||||||
| TELECOMMUNICATION SERVICES - 0.4% | ||||||||
| Windstream Holdings, Inc. | 80,380 | 641,432 | ||||||
| Total Common Stocks | ||||||||
| (Cost $106,761,282) | 147,310,740 | |||||||
| SHORT TERM INVESTMENTS† - 4.1% | ||||||||
| Dreyfus Treasury Prime Cash | ||||||||
| Management Fund | 6,225,822 | 6,225,822 | ||||||
| Total Short Term Investments | ||||||||
| (Cost $6,225,822) | 6,225,822 | |||||||
| Total investments - 99.9% | ||||||||
| (Cost $112,987,104) | $ | 153,536,562 | ||||||
| Contracts | ||||||||
| OPTIONS WRITTEN† - 0.0% | ||||||||
| Call options on: | ||||||||
| Ocwen Financial Corp. Expiring | ||||||||
| January 2014 with strike | ||||||||
| price of $60.00 | 86 | (3,010 | ) | |||||
| Total Options Written | ||||||||
| (Premiums received $29,068) | (3,010 | ) | ||||||
| Other Assets & Liabilities, net - 0.1% | 168,043 | |||||||
| Total Net Assets - 100.0% | $ | 153,701,595 | ||||||
| * | Non-income producing security. |
| † | Value determined based on Level 1 inputs — See Note 4. |
| 1 | All or a portion of this security is pledged as collateral for open options written contracts at December 31, 2013. |
| ADR — American Depositary Receipt |
| plc — Public Limited Company |
| 86 | THE GUGGENHEIM FUNDS ANNUAL REPORT | SEE NOTES TO FINANCIAL STATEMENTS. |
| SERIES O (ALL CAP VALUE SERIES) |
| STATEMENT OF ASSETS |
| AND LIABILITIES |
| December 31, 2013 |
| Assets: | ||||
| Investments, at value | ||||
| (cost $112,987,104) | $ | 153,536,562 | ||
| Prepaid expenses | 3,878 | |||
| Receivables: | ||||
| Dividends | 276,541 | |||
| Securities sold | 61,489 | |||
| Fund shares sold | 2,674 | |||
| Foreign taxes reclaim | 2,604 | |||
| Total assets | 153,883,748 | |||
| Liabilities: | ||||
| Options written, at value (premiums received $29,068) | 3,010 | |||
| Overdraft due to custodian bank | 1,860 | |||
| Payable for: | ||||
| Management fees | 89,458 | |||
| Fund shares redeemed | 30,366 | |||
| Fund accounting/administration fees | 12,140 | |||
| Transfer agent/maintenance fees | 4,572 | |||
| Directors’ fees* | 1,029 | |||
| Securities purchased | 53 | |||
| Miscellaneous | 39,665 | |||
| Total liabilities | 182,153 | |||
| Net assets | $ | 153,701,595 | ||
| Net assets consist of: | ||||
| Paid in capital | $ | 118,125,205 | ||
| Undistributed net investment income | 1,168,649 | |||
| Accumulated net realized loss on investments | (6,167,775 | ) | ||
| Net unrealized appreciation on investments | 40,575,516 | |||
| Net assets | $ | 153,701,595 | ||
| Capital shares outstanding | 4,678,671 | |||
| Net asset value per share | $ | 32.85 |
| STATEMENT OF |
| OPERATIONS |
| Year Ended December 31, 2013 |
| Investment Income: | ||||
| Dividends (net of foreign withholding tax of $8,990) | $ | 2,472,744 | ||
| Interest | 241 | |||
| Total investment income | 2,472,985 | |||
| Expenses: | ||||
| Management fees | 1,008,879 | |||
| Transfer agent/maintenance fees | 25,702 | |||
| Fund accounting/administration fees | 136,917 | |||
| Directors’ fees* | 14,630 | |||
| Custodian fees | 11,257 | |||
| Tax expense | 4 | |||
| Miscellaneous | 106,369 | |||
| Total expenses | 1,303,758 | |||
| Net investment income | 1,169,227 | |||
| Net Realized and Unrealized Gain (Loss): | ||||
| Net realized gain (loss) on: | ||||
| Investments | 13,561,132 | |||
| Options written | 29,947 | |||
| Net realized gain | 13,591,079 | |||
| Net change in unrealized appreciation (depreciation) on: | ||||
| Investments | 25,900,185 | |||
| Options written | 26,058 | |||
| Net change in unrealized appreciation (depreciation) | 25,926,243 | |||
| Net realized and unrealized gain | 39,517,322 | |||
| Net increase in net assets resulting from operations | $ | 40,686,549 |
* Relates to Directors not deemed “interested persons” within the meaning of Section 2(a)(19) of the 1940 Act.
| SEE NOTES TO FINANCIAL STATEMENTS. | THE GUGGENHEIM FUNDS ANNUAL REPORT | 87 |
| SERIES O (ALL CAP VALUE SERIES) |
| STATEMENTS OF CHANGES IN NET ASSETS |
| Year Ended | Year Ended | |||||||
| December 31, | December 31, | |||||||
| 2013 | 2012 | |||||||
| Increase (Decrease) In Net Assets From Operations: | ||||||||
| Net investment income | $ | 1,169,227 | $ | 1,256,228 | ||||
| Net realized gain on investments | 13,591,079 | 5,177,119 | ||||||
| Net change in unrealized appreciation (depreciation) on investments | 25,926,243 | 13,473,366 | ||||||
| Net increase in net assets resulting from operations | 40,686,549 | 19,906,713 | ||||||
| Capital share transactions: | ||||||||
| Proceeds from sale of shares | 11,634,385 | 4,708,037 | ||||||
| Cost of shares redeemed | (28,853,446 | ) | (32,174,771 | ) | ||||
| Net decrease from capital share transactions | (17,219,061 | ) | (27,466,734 | ) | ||||
| Net increase (decrease) in net assets | 23,467,488 | (7,560,021 | ) | |||||
| Net assets: | ||||||||
| Beginning of year | 130,234,107 | 137,794,128 | ||||||
| End of year | $ | 153,701,595 | $ | 130,234,107 | ||||
| Undistributed net investment income at end of year | $ | 1,168,649 | $ | 1,256,228 | ||||
| Capital share activity: | ||||||||
| Shares sold | 399,098 | 203,910 | ||||||
| Shares redeemed | (1,001,349 | ) | (1,377,712 | ) | ||||
| Net decrease in shares | (602,251 | ) | (1,173,802 | ) | ||||
| 88 | THE GUGGENHEIM FUNDS ANNUAL REPORT | SEE NOTES TO FINANCIAL STATEMENTS. |
| SERIES O (ALL CAP VALUE SERIES) |
| FINANCIAL HIGHLIGHTS |
This table is presented to show selected data for a share outstanding throughout each period and to assist shareholders in evaluating a Fund’s performance for the periods presented.
| Year Ended | Year Ended | Year Ended | Year Ended | Year Ended | ||||||||||||||||
| December 31, | December 31, | December 31, | December 31, | December 31, | ||||||||||||||||
| 2013 | 2012 | 2011 | 2010 | 2009 | ||||||||||||||||
| Per Share Data | ||||||||||||||||||||
| Net asset value, beginning of period | $ | 24.66 | $ | 21.35 | $ | 22.32 | $ | 19.14 | $ | 14.39 | ||||||||||
| Income (loss) from investment operations: | ||||||||||||||||||||
| Net investment incomea | .24 | .21 | .15 | .14 | .16 | |||||||||||||||
| Net gain (loss) on investments (realized and unrealized) | 7.95 | 3.10 | (1.12 | ) | 3.04 | 4.59 | ||||||||||||||
| Total from investment operations | 8.19 | 3.31 | (.97 | ) | 3.18 | 4.75 | ||||||||||||||
| Net asset value, end of period | $ | 32.85 | $ | 24.66 | $ | 21.35 | $ | 22.32 | $ | 19.14 | ||||||||||
| Total Returnb | 33.21 | % | 15.50 | % | (4.35 | %) | 16.61 | % | 33.01 | % | ||||||||||
| Ratios/Supplemental Data | ||||||||||||||||||||
| Net assets, end of period (in thousands) | $ | 153,702 | $ | 130,234 | $ | 137,794 | $ | 165,722 | $ | 161,918 | ||||||||||
| Ratios to average net assets: | ||||||||||||||||||||
| Net investment income | 0.81 | % | 0.91 | % | 0.69 | % | 0.68 | % | 1.00 | % | ||||||||||
| Total expenses | 0.90 | % | 0.89 | % | 0.86 | % | 0.86 | % | 0.87 | % | ||||||||||
| Net expensesc | 0.90 | % | 0.89 | % | 0.86 | % | 0.86 | % | 0.85 | % | ||||||||||
| Portfolio turnover rate | 22 | % | 14 | % | 19 | % | 11 | % | 19 | % | ||||||||||
| a | Net investment income per share was computed using average shares outstanding throughout the period. |
| b | Total return does not take into account any of the expenses associated with an investment in variable insurance products. If total return had taken into account these expenses, performance would have been lower. Shares of a series of SBL Fund are available only through the purchase of such products. |
| c | Net expense information reflects the expense ratios after expense waivers. |
| SEE NOTES TO FINANCIAL STATEMENTS. | THE GUGGENHEIM FUNDS ANNUAL REPORT | 89 |
| MANAGER’S COMMENTARY (Unaudited) | December 31, 2013 |
To Our Shareholders
The Series P (High Yield Series) is managed by a team of seasoned professionals, including B. Scott Minerd, Global Chief Investment Officer; Jeffrey B. Abrams, Senior Managing Director and Portfolio Manager; and Kevin H. Gundersen, Senior Managing Director and Portfolio Manager. In the following paragraphs, the investment team discusses the market environment and the Fund’s performance for the 12-month period ended December 31, 2013.
For the fiscal year ended December 31, 2013, the Series P (High Yield Series) returned 7.38%, compared with the 7.44% return of its benchmark, the Barclays U.S. Corporate High Yield Index.
High yield bonds posted their fifth consecutive year of positive returns in 2013. But Treasury-rate volatility mid-year spread into fixed-rate sectors and more than $11 billion was withdrawn from high-yield bond funds in June alone. Spreads widened over the summer, but then high-yield bonds posted four consecutive months of positive returns following the Fed decision not to taper QE in September, and spreads tightened by 60 basis points to close the year at 436 basis points, their tightest post-financial crisis level. Though spreads remain above historical lows, the same cannot be said for yields, which set a new record low of 5.1% in May 2013. Despite fund flow volatility, gross issuance in high-yield bonds totaled $340 billion, the second best issuance ever after $347 billion gross issuance in 2012.
Interest rate risk was the dominant focus of fixed income investors as positive economic momentum and dovish statements by the Federal Reserve (the “Fed”) led to rising interest rates. The yield on the 10-year Treasury note hit a two-year high of 3.0 percent to close 2013. The Fed’s decision to taper its bond purchases in December was largely driven by the strength of economic momentum as evidenced by a number of data releases in recent months. Risk markets responded positively as dovish Fed statements have continued to propel asset prices higher. While we believe that many risk assets are fully valued, credit assets have potential for continued spread compression in the near-term. It remains an optimal time to take prudent credit risk, though we are cautious with respect to aggressive pricing and weaker structures from issuers. High yield coupons should continue to serve as a cushion for leveraged credit performance, but investors may need to temper return expectations for 2014.
The Fund kept pace with its benchmark for the period, largely due to individual credit selection and its underweight stances relative to the benchmark in BB-rated bonds and longer-duration assets, which served the Fund particularly well during the summer volatility when rates rose sharply. Conversely, the underweight in longer-duration assets detracted from performance when rates fell in September.
In underweighting BB bonds, the Fund moved down the credit spectrum to purchase high yield bonds with higher yields but without a commensurate level of risk. The Fund also remained focused on a market sweet spot: middle-market issuers, tranches between $300 and $750 million. Issuers in this range are generally small but growing companies in newer, yet fundamentally sound, industries accounting for about 40% of the high yield market.
Another important factor in Fund performance for the period was increasing its allocation to bank loans, many of the loans in the single B category. This increased allocation is a defensive measure; as the credit cycle matures, the potential for interest rate volatility increases. When the market sells off, as it did in May, June and August, the allocation benefits performance. But the allocation can be a drag on performance when rates are falling or remain low. While we still like bank loans as an asset class, technical factors, such as the potential for lower demand from the CLO origination market and mutual fund flows, suggest that market events over the next few months should be monitored carefully.
Performance displayed represents past performance, which is no guarantee of future results.
The opinions and forecast expressed may not actually come to pass. This information is subject to change at any time, based on market and other conditions, and should not be construed as a recommendation of any specific security or strategy.
| 90 | The Guggenheim Funds annual REPORT |
| PERFORMANCE REPORT AND FUND PROFILE (Unaudited) | December 31, 2013 |
SERIES P (HIGH YIELD SERIES)
OBJECTIVE: Seeks high current income. Capital appreciation is a secondary objective.
Cumulative Fund Performance*,†
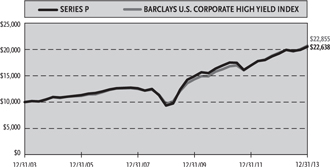
Average Annual Returns*
Periods Ended December 31, 2013†
| 1 Year | 5 Year | 10 Year | ||||||||||
| Series P (High Yield Series) | 7.38 | % | 19.71 | % | 8.51 | % | ||||||
| Barclays U.S. Corporate High Yield Index | 7.44 | % | 18.93 | % | 8.62 | % | ||||||
| Ten Largest Holdings (% of Total Net Assets) | ||||
| Dreyfus Treasury Prime Cash Management Fund | 2.8 | % | ||
| TPC Group, Inc. | 1.5 | % | ||
| Nationstar Mortgage LLC / Nationstar Capital Corp. | 1.5 | % | ||
| MDC Partners, Inc. | 1.5 | % | ||
| GRD Holdings III Corp. | 1.5 | % | ||
| First Data Corp. | 1.4 | % | ||
| Sabre, Inc. | 1.3 | % | ||
| Checkers Drive-In Restaurants, Inc. | 1.3 | % | ||
| Central Garden and Pet Co. | 1.3 | % | ||
| BreitBurn Energy Partners Limited Partnership / BreitBurn Finance Corp. | 1.3 | % | ||
| Top Ten Total | 15.4 | % | ||
Holdings Diversification (Market Exposure as % of Net Assets)
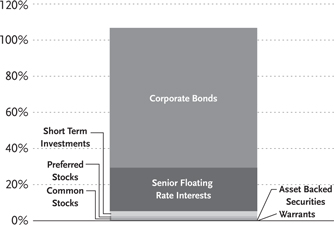
Inception Date: August 5, 1996
| Portfolio Composition by Quality Rating** | ||||
| Rating | ||||
| Fixed Income Instruments | ||||
| AA | 0.4 | % | ||
| BBB | 4.5 | % | ||
| BB | 25.5 | % | ||
| B | 50.1 | % | ||
| CCC | 14.7 | % | ||
| CC | 0.1 | % | ||
| D | 0.1 | % | ||
| NR | 0.1 | % | ||
| Other Instruments | ||||
| Short Term Investments | 2.6 | % | ||
| Preferred Stocks | 1.0 | % | ||
| Common Stocks | 0.9 | % | ||
| Warrants | 0.0 | % | ||
| Total Investments | 100.0 | % | ||
The chart above reflects percentages of the value of total investments.
| * | The performance data above represents past performance that is not predictive of future results. The investment return and principal value of an investment in the Fund will fluctuate so that an investor’s shares, when redeemed, may be worth more or less than their original cost. Returns are historical and include changes in principal and reinvested dividends and capital gains and do not reflect the effect of taxes. The Barclays U.S. Corporate High Yield Index is an unmanaged index and, unlike the Fund, has no management fees or operating expenses to reduce its reported return. |
| ** | Source: Factset. Credit quality ratings are measured on a scale that generally ranges from AAA (highest) to D (lowest). All rated securities have been rated by Moody’s, Standard & Poor’s (“S&P”), or Fitch, which are all a Nationally Recognized Statistical Rating Organization (“NRSRO”). For purposes of this presentation, when ratings are available from more than one agency, the highest rating is used. Guggenheim Investments has converted Moody’s and Fitch ratings to the equivalent S&P rating. Unrated securities do not necessarily indicate low credit quality. Security ratings are determined at the time of purchase and may change thereafter. |
| † | Performance figures do not reflect fees and expenses associated with an investment in variable insurance products. If returns had taken into account these fees and expenses, performance would have been lower. Shares of a series of SBL Fund are available only through the purchase of such products. |
| THE GUGGENHEIM FUNDS ANNUAL REPORT | 91 |
| SCHEDULE OF INVESTMENTS | December 31, 2013 |
| SERIES P (HIGH YIELD SERIES) | |
| Shares | Value | |||||||
| COMMON STOCKS† - 1.0% | ||||||||
| ENERGY - 0.4% | ||||||||
| Stallion Oilfield Holdings Ltd.†† | 19,265 | $ | 443,095 | |||||
| FINANCIALS - 0.3% | ||||||||
| CIT Group, Inc. | 7,613 | 396,865 | ||||||
| Leucadia National Corp. | 247 | 7,000 | ||||||
| Adelphia Recovery Trust*,†††,1 | 5,270 | 53 | ||||||
| Total Financials | 403,918 | |||||||
| CONSUMER DISCRETIONARY - 0.3% | ||||||||
| Sonic Automotive, Inc. — Class A | 15,103 | 369,721 | ||||||
| Aimia, Inc. | 5 | 92 | ||||||
| MEDIQ, Inc.*,†††,1 | 92 | 1 | ||||||
| Total Consumer Discretionary | 369,814 | |||||||
| CONSUMER STAPLES - 0.0% | ||||||||
| Crimson Wine Group Ltd.* | 24 | 212 | ||||||
| INDUSTRIALS - 0.0% | ||||||||
| Delta Air Lines, Inc. | 1 | 28 | ||||||
| Chorus Aviation, Inc. | 3 | 11 | ||||||
| Total Industrials | 39 | |||||||
| Total Common Stocks | ||||||||
| (Cost $837,375) | 1,217,078 | |||||||
| PREFERRED STOCKS† - 1.1% | ||||||||
| Citigroup Capital XIII | ||||||||
| 7.88% due 10/30/402 | 25,000 | 681,250 | ||||||
| Aspen Insurance Holdings Ltd. | ||||||||
| 5.95% due 07/01/232,3 | 30,000 | 680,100 | ||||||
| U.S. Shipping Corp.*,†† | 24,529 | 12,265 | ||||||
| Total Preferred Stocks | ||||||||
| (Cost $2,000,000) | 1,373,615 | |||||||
| WARRANTS††† - 0.0% | ||||||||
| Reader’s Digest Association, Inc. | ||||||||
| $1.00, 02/19/141 | 478 | 5 | ||||||
| Total Warrants | ||||||||
| (Cost $—) | 5 | |||||||
| SHORT TERM INVESTMENTS† - 2.8% | ||||||||
| Dreyfus Treasury Prime Cash | ||||||||
| Management Fund | 3,412,551 | 3,412,551 | ||||||
| Total Short Term Investments | ||||||||
| (Cost $3,412,551) | 3,412,551 | |||||||
| Face | ||||||||
| Amount | ||||||||
| CORPORATE BONDS†† - 77.4% | ||||||||
| ENERGY - 14.9% | ||||||||
| BreitBurn Energy Partners Limited | ||||||||
| Partnership / BreitBurn Finance Corp. | ||||||||
| 7.88% due 04/15/227 | $ | 1,550,000 | 1,611,999 | |||||
| 8.63% due 10/15/20 | 250,000 | 268,750 | ||||||
| Crestwood Midstream Partners | ||||||||
| Limited Partnership / Crestwood | ||||||||
| Midstream Finance Corp. | ||||||||
| 7.75% due 04/01/197 | 1,200,000 | 1,302,000 | ||||||
| 6.13% due 03/01/224 | 500,000 | 512,500 | ||||||
| Hiland Partners Limited Partnership / | ||||||||
| Hiland Partners Finance Corp. | ||||||||
| 7.25% due 10/01/204 | 1,500,000 | 1,608,749 | ||||||
| Bill Barrett Corp. | ||||||||
| 7.00% due 10/15/227 | 1,250,000 | 1,296,875 | ||||||
| 7.63% due 10/01/19 | 200,000 | 215,000 | ||||||
| Gibson Energy, Inc. | ||||||||
| 6.75% due 07/15/214 | 1,400,000 | 1,480,500 | ||||||
| Eagle Rock Energy Partners | ||||||||
| Limited Partnership / Eagle Rock | ||||||||
| Energy Finance Corp. | ||||||||
| 8.38% due 06/01/19 | 1,215,000 | 1,324,350 | ||||||
| Legacy Reserves Limited Partnership / | ||||||||
| Legacy Reserves Finance Corp. | ||||||||
| 6.63% due 12/01/214 | 725,000 | 701,438 | ||||||
| 8.00% due 12/01/204 | 505,000 | 525,200 | ||||||
| Penn Virginia Resource Partners | ||||||||
| Limited Partnership / Penn Virginia | ||||||||
| Resource Finance Corp. | ||||||||
| 8.25% due 04/15/18 | 1,100,000 | 1,166,000 | ||||||
| Endeavor Energy Resources Limited | ||||||||
| Partnership / EER Finance, Inc. | ||||||||
| 7.00% due 08/15/214 | 1,150,000 | 1,161,500 | ||||||
| Atlas Energy Holdings Operating | ||||||||
| Company LLC / Atlas Resource | ||||||||
| Finance Corp. | ||||||||
| 7.75% due 01/15/214 | 700,000 | 672,000 | ||||||
| 9.25% due 08/15/214 | 250,000 | 255,625 | ||||||
| Midstates Petroleum Company | ||||||||
| Incorporated / Midstates | ||||||||
| Petroleum Co LLC | ||||||||
| 10.75% due 10/01/20 | 700,000 | 761,250 | ||||||
| Memorial Production Partners | ||||||||
| Limited Partnership / Memorial | ||||||||
| Production Finance Corp. | ||||||||
| 7.63% due 05/01/214 | 709,000 | 728,498 | ||||||
| SESI LLC | ||||||||
| 7.13% due 12/15/21 | 500,000 | 557,500 | ||||||
| Ultra Petroleum Corp. | ||||||||
| 5.75% due 12/15/184 | 450,000 | 462,375 | ||||||
| Unit Corp. | ||||||||
| 6.63% due 05/15/21 | 400,000 | 422,000 | ||||||
| Rosetta Resources, Inc. | ||||||||
| 5.88% due 06/01/22 | 350,000 | 347,375 | ||||||
| Pacific Drilling S.A. | ||||||||
| 5.38% due 06/01/204 | 325,000 | 326,625 | ||||||
| SandRidge Energy, Inc. | ||||||||
| 8.75% due 01/15/20 | 200,000 | 215,500 | ||||||
| Exterran Partners Limited | ||||||||
| Partnership / EXLP Finance Corp. | ||||||||
| 6.00% due 04/01/214 | 175,000 | 173,688 | ||||||
| 92 | THE GUGGENHEIM FUNDS ANNUAL REPORT | SEE NOTES TO FINANCIAL STATEMENTS. |
| SCHEDULE OF INVESTMENTS (continued) | December 31, 2013 |
| SERIES P (HIGH YIELD SERIES) |
| Face | ||||||||
| Amount | Value | |||||||
| Carrizo Oil & Gas, Inc. | ||||||||
| 7.50% due 09/15/20 | $ | 150,000 | $ | 164,250 | ||||
| IronGate Energy Services LLC | ||||||||
| 11.00% due 07/01/184 | 125,000 | 121,250 | ||||||
| SemGroup, LP | ||||||||
| 8.75% due 11/15/15†††,1,6 | 1,700,000 | — | ||||||
| Total Energy | 18,382,797 | |||||||
| CONSUMER DISCRETIONARY - 13.6% | ||||||||
| MDC Partners, Inc. | ||||||||
| 6.75% due 04/01/204 | 1,750,000 | 1,830,938 | ||||||
| GRD Holdings III Corp. | ||||||||
| 10.75% due 06/01/194 | 1,650,000 | 1,798,499 | ||||||
| Sabre, Inc. | ||||||||
| 8.50% due 05/15/194 | 1,500,000 | 1,664,999 | ||||||
| Checkers Drive-In Restaurants, Inc. | ||||||||
| 11.00% due 12/01/171,4 | 1,500,000 | 1,657,500 | ||||||
| AmeriGas Finance LLC / | ||||||||
| AmeriGas Finance Corp. | ||||||||
| 7.00% due 05/20/22 | 1,420,000 | 1,540,700 | ||||||
| Laureate Education, Inc. | ||||||||
| 9.25% due 09/01/194 | 1,300,000 | 1,413,750 | ||||||
| Travelport LLC / Travelport Holdings, Inc. | ||||||||
| 13.88% due 03/01/164 | 770,657 | 816,896 | ||||||
| Stanadyne Corp. | ||||||||
| 10.00% due 08/15/14 | 785,000 | 761,450 | ||||||
| CPG Merger Sub LLC | ||||||||
| 8.00% due 10/01/214 | 700,000 | 728,000 | ||||||
| INTCOMEX, Inc. | ||||||||
| 13.25% due 12/15/14 | 720,000 | 699,300 | ||||||
| WMG Acquisition Corp. | ||||||||
| 11.50% due 10/01/18 | 480,000 | 552,000 | ||||||
| Continental Airlines 2012-2 Class B | ||||||||
| Pass Through Trust | ||||||||
| 5.50% due 10/29/20 | 500,000 | 515,000 | ||||||
| Vail Resorts, Inc. | ||||||||
| 6.50% due 05/01/19 | 450,000 | 477,000 | ||||||
| DreamWorks Animation SKG, Inc. | ||||||||
| 6.88% due 08/15/204 | 450,000 | 475,875 | ||||||
| GLP Capital Limited Partnership / | ||||||||
| GLP Financing II, Inc. | ||||||||
| 4.88% due 11/01/204 | 400,000 | 400,000 | ||||||
| Cablevision Systems Corp. | ||||||||
| 7.75% due 04/15/18 | 300,000 | 334,875 | ||||||
| Sirius XM Holdings, Inc. | ||||||||
| 5.88% due 10/01/204 | 300,000 | 306,000 | ||||||
| Suburban Propane Partners | ||||||||
| Limited Partnership/Suburban | ||||||||
| Energy Finance Corp. | ||||||||
| 7.50% due 10/01/18 | 253,000 | 271,343 | ||||||
| Snoqualmie Entertainment Authority | ||||||||
| 9.13% due 02/01/154 | 265,000 | 262,350 | ||||||
| Stanadyne Holdings, Inc. | ||||||||
| 11.99% due 02/15/155 | 225,000 | 140,625 | ||||||
| Gibson Brands, Inc. | ||||||||
| 8.88% due 08/01/184 | 100,000 | 105,500 | ||||||
| Seminole Hard Rock Entertainment | ||||||||
| Incorporated / Seminole Hard Rock | ||||||||
| International LLC | ||||||||
| 5.88% due 05/15/214 | 100,000 | 98,250 | ||||||
| Total Consumer Discretionary | 16,850,850 | |||||||
| FINANCIALS - 10.3% | ||||||||
| Nationstar Mortgage LLC / | ||||||||
| Nationstar Capital Corp. | ||||||||
| 6.50% due 08/01/18 | 1,800,000 | 1,831,500 | ||||||
| Icahn Enterprises Limited | ||||||||
| Partnership / Icahn Enterprises | ||||||||
| Finance Corp. | ||||||||
| 6.00% due 08/01/204 | 950,000 | 978,500 | ||||||
| 8.00% due 01/15/187 | 500,000 | 520,000 | ||||||
| Kennedy-Wilson, Inc. | ||||||||
| 8.75% due 04/01/197 | 1,175,000 | 1,289,563 | ||||||
| Lancashire Holdings Ltd. | ||||||||
| 5.70% due 10/01/224 | 1,260,000 | 1,272,322 | ||||||
| Opal Acquisition, Inc. | ||||||||
| 8.88% due 12/15/214 | 1,250,000 | 1,243,750 | ||||||
| Wilton Re Finance LLC | ||||||||
| 5.88% due 03/30/332,4 | 900,000 | 886,500 | ||||||
| Credit Acceptance Corp. | ||||||||
| 9.13% due 02/01/17 | 800,000 | 840,000 | ||||||
| Ally Financial, Inc. | ||||||||
| 2.75% due 01/30/17 | 800,000 | 803,000 | ||||||
| American Equity Investment Life | ||||||||
| Holding Co. | ||||||||
| 6.63% due 07/15/21 | 700,000 | 731,500 | ||||||
| Nielsen Company Luxembourg SARL | ||||||||
| 5.50% due 10/01/214 | 650,000 | 659,750 | ||||||
| Jefferies Finance LLC / | ||||||||
| JFIN Company-Issuer Corp. | ||||||||
| 7.38% due 04/01/204 | 455,000 | 473,200 | ||||||
| Oxford Finance LLC / Oxford Finance | ||||||||
| Company-Issuer, Inc. | ||||||||
| 7.25% due 01/15/184 | 400,000 | 421,000 | ||||||
| Majid AL Futtaim Holding | ||||||||
| 7.12% due 12/31/49 | 300,000 | 303,063 | ||||||
| Jefferies LoanCore LLC / | ||||||||
| JLC Finance Corp. | ||||||||
| 6.88% due 06/01/204 | 300,000 | 297,000 | ||||||
| Fidelity & Guaranty Life Holdings, Inc. | ||||||||
| 6.38% due 04/01/214 | 225,000 | 236,250 | ||||||
| Total Financials | 12,786,898 | |||||||
| INDUSTRIALS - 9.6% | ||||||||
| CEVA Group plc | ||||||||
| 8.38% due 12/01/174,7 | 1,250,000 | 1,306,249 | ||||||
| Deutsche Raststatten | ||||||||
| 6.75% due 12/30/20 | 900,000 | 1,292,008 | ||||||
| Reynolds Group Issuer Incorporated / | ||||||||
| Reynolds Group Issuer LLC / | ||||||||
| Reynolds Group Issuer Lu | ||||||||
| 7.13% due 04/15/19 | 500,000 | 532,500 | ||||||
| 6.88% due 02/15/21 | 400,000 | 431,000 | ||||||
| SEE NOTES TO FINANCIAL STATEMENTS. | THE GUGGENHEIM FUNDS ANNUAL REPORT | 93 |
| SCHEDULE OF INVESTMENTS (continued) | December 31, 2013 |
| SERIES P (HIGH YIELD SERIES) | |
| Face Amount/Shares | Value | |||||||
| Marquette Transportation Company | ||||||||
| LLC / Marquette Transportation | ||||||||
| Finance Corp. | ||||||||
| 10.88% due 01/15/17 | $ | 860,000 | $ | 907,300 | ||||
| Virgin Media Finance plc | ||||||||
| 6.38% due 04/15/234 | 800,000 | 814,000 | ||||||
| ADT Corp. | ||||||||
| 6.25% due 10/15/214 | 600,000 | 630,000 | ||||||
| Victor Technologies Group, Inc. | ||||||||
| 9.00% due 12/15/17 | 569,000 | 608,830 | ||||||
| Jaguar Holding Company II / | ||||||||
| Jaguar Merger Sub, Inc. | ||||||||
| 9.50% due 12/01/194 | 500,000 | 562,500 | ||||||
| Briggs & Stratton Corp. | ||||||||
| 6.88% due 12/15/207 | 500,000 | 549,375 | ||||||
| Building Materials Corporation of America | ||||||||
| 6.75% due 05/01/214 | 500,000 | 541,250 | ||||||
| Virgin Media Secured Finance plc | ||||||||
| 6.50% due 01/15/18 | 500,000 | 518,125 | ||||||
| NCR Escrow Corp. | ||||||||
| 6.38% due 12/15/234 | 250,000 | 255,312 | ||||||
| 5.88% due 12/15/214 | 250,000 | 254,688 | ||||||
| Amsted Industries, Inc. | ||||||||
| 8.13% due 03/15/184 | 450,000 | 474,188 | ||||||
| Checkers & Rally’s Restaurants, Inc. | ||||||||
| 11.63% due 11/01/164 | 375,000 | 382,500 | ||||||
| Prestige Brands, Inc. | ||||||||
| 5.38% due 12/15/214 | 350,000 | 353,500 | ||||||
| Level 3 Financing, Inc. | ||||||||
| 6.13% due 01/15/214 | 300,000 | 303,000 | ||||||
| Darling Escrow Corp. | ||||||||
| 5.38% due 01/15/224 | 300,000 | 302,250 | ||||||
| AmeriGas Finance LLC / | ||||||||
| AmeriGas Finance Corp. | ||||||||
| 6.75% due 05/20/20 | 250,000 | 273,125 | ||||||
| USG Corp. | ||||||||
| 5.88% due 11/01/214 | 200,000 | 208,000 | ||||||
| Audatex North America, Inc. | ||||||||
| 6.13% due 11/01/234 | 200,000 | 206,000 | ||||||
| International Lease Finance Corp. | ||||||||
| 8.25% due 12/15/20 | 100,000 | 117,000 | ||||||
| Travelport LLC | ||||||||
| 11.88% due 09/01/16 | 100,000 | 101,500 | ||||||
| RR Donnelley & Sons Co. | ||||||||
| 6.50% due 11/15/23 | 11,000 | 11,110 | ||||||
| Total Industrials | 11,935,310 | |||||||
| INFORMATION TECHNOLOGY - 6.6% | ||||||||
| First Data Corp. | ||||||||
| 8.75% due 01/15/224 | 1,625,000 | 1,734,688 | ||||||
| 6.75% due 11/01/204 | 100,000 | 104,000 | ||||||
| Eagle Midco, Inc. | ||||||||
| 9.00% due 06/15/184 | 1,250,000 | 1,303,125 | ||||||
| Aspect Software, Inc. | ||||||||
| 10.63% due 05/15/17 | 1,040,000 | 1,047,800 | ||||||
| Audatex North America, Inc. | ||||||||
| 6.00% due 06/15/214 | 1,000,000 | 1,047,500 | ||||||
| Activision Blizzard, Inc. | ||||||||
| 5.63% due 09/15/214,7 | 969,000 | 1,002,915 | ||||||
| IAC | ||||||||
| 4.88% due 11/30/184 | 500,000 | 511,250 | ||||||
| 4.75% due 12/15/22 | 450,000 | 419,625 | ||||||
| Stratus Technologies Bermuda Limited / | ||||||||
| Stratus Technologies, Inc. | ||||||||
| 12.00% due 03/29/15 | 561 | 561,000 | ||||||
| iGATE Corp. | ||||||||
| 9.00% due 05/01/16 | 396,000 | 420,750 | ||||||
| Total Information Technology | 8,152,653 | |||||||
| CONSUMER STAPLES - 5.8% | ||||||||
| Central Garden and Pet Co. | ||||||||
| 8.25% due 03/01/18 | 1,700,000 | 1,653,250 | ||||||
| Vector Group Ltd. | ||||||||
| 7.75% due 02/15/21 | 1,485,000 | 1,570,388 | ||||||
| Harbinger Group, Inc. | ||||||||
| 7.88% due 07/15/194,7 | 1,250,000 | 1,342,188 | ||||||
| Bumble Bee Holdings, Inc. | ||||||||
| 9.00% due 12/15/174 | 831,000 | 909,944 | ||||||
| KeHE Distributors LLC / | ||||||||
| KeHE Finance Corp. | ||||||||
| 7.63% due 08/15/214 | 700,000 | 742,000 | ||||||
| Bumble Bee Holdco SCA | ||||||||
| 9.63% due 03/15/184 | 600,000 | 633,000 | ||||||
| US Foods, Inc. | ||||||||
| 8.50% due 06/30/19 | 350,000 | 383,250 | ||||||
| Total Consumer Staples | 7,234,020 | |||||||
| TELECOMMUNICATION SERVICES - 5.4% | ||||||||
| Sitel LLC / Sitel Finance Corp. | ||||||||
| 11.00% due 08/01/174 | 1,190,000 | 1,270,325 | ||||||
| Alcatel-Lucent USA, Inc. | ||||||||
| 8.88% due 01/01/204 | 500,000 | 557,500 | ||||||
| 6.75% due 11/15/204 | 400,000 | 415,500 | ||||||
| UPCB Finance V Ltd. | ||||||||
| 7.25% due 11/15/214 | 800,000 | 868,000 | ||||||
| Zayo Group LLC / Zayo Capital, Inc. | ||||||||
| 8.13% due 01/01/20 | 600,000 | 657,000 | ||||||
| DISH DBS Corp. | ||||||||
| 6.75% due 06/01/21 | 600,000 | 636,000 | ||||||
| Expo Event Transco, Inc. | ||||||||
| 9.00% due 06/15/214 | 575,000 | 585,063 | ||||||
| CyrusOne Limited Partnership / | ||||||||
| CyrusOne Finance Corp. | ||||||||
| 6.38% due 11/15/22 | 500,000 | 517,500 | ||||||
| Unitymedia Hessen GmbH & Company KG / | ||||||||
| Unitymedia NRW GmbH | ||||||||
| 5.50% due 01/15/234 | 500,000 | 485,000 | ||||||
| GXS Worldwide, Inc. | ||||||||
| 9.75% due 06/15/15 | 400,000 | 413,000 | ||||||
| CommScope, Inc. | ||||||||
| 8.25% due 01/15/194 | 224,000 | 245,560 | ||||||
| Total Telecommunication Services | 6,650,448 | |||||||
| MATERIALS - 4.4% | ||||||||
| TPC Group, Inc. | ||||||||
| 8.75% due 12/15/204 | 1,730,000 | 1,838,125 | ||||||
| 94 | THE GUGGENHEIM FUNDS ANNUAL REPORT | SEE NOTES TO FINANCIAL STATEMENTS. |
| SCHEDULE OF INVESTMENTS (continued) | December 31, 2013 |
| SERIES P (HIGH YIELD SERIES) | |
| Face Amount | Value | |||||||
| KGHM International Ltd. | ||||||||
| 7.75% due 06/15/194 | $ | 1,275,000 | $ | 1,345,125 | ||||
| Steel Dynamics, Inc. | ||||||||
| 7.63% due 03/15/20 | 900,000 | 976,500 | ||||||
| Pretium Packaging LLC / Pretium Finance, Inc. | ||||||||
| 11.50% due 04/01/16 | 600,000 | 640,500 | ||||||
| Eldorado Gold Corp. | ||||||||
| 6.13% due 12/15/204 | 465,000 | 447,563 | ||||||
| Mirabela Nickel Ltd. | ||||||||
| 8.75% due 04/15/181,4 | 610,000 | 152,500 | ||||||
| 3.50% due 03/28/141,4 | 111,305 | 111,305 | ||||||
| Total Materials | 5,511,618 | |||||||
| Utilities - 3.8% | ||||||||
| Elwood Energy LLC | ||||||||
| 8.16% due 07/05/26 | 1,090,250 | 1,169,293 | ||||||
| Atlas Pipeline Partners Limited | ||||||||
| Partnership / Atlas Pipeline | ||||||||
| Finance Corp. | ||||||||
| 6.63% due 10/01/20 | 1,000,000 | 1,045,000 | ||||||
| LBC Tank Terminals Holding | ||||||||
| Netherlands BV | ||||||||
| 6.88% due 05/15/234 | 850,000 | 878,688 | ||||||
| NGL Energy Partners Limited | ||||||||
| Partnership / NGL Energy | ||||||||
| Finance Corp. | ||||||||
| 6.88% due 10/15/214 | 700,000 | 717,500 | ||||||
| Crestwood Midstream Partners | ||||||||
| Limited Partnership / Crestwood | ||||||||
| Midstream Finance Corp. | ||||||||
| 6.00% due 12/15/20 | 600,000 | 618,000 | ||||||
| Midstates Petroleum Company | ||||||||
| Incorporated / Midstates | ||||||||
| Petroleum Co LLC | ||||||||
| 9.25% due 06/01/21 | 300,000 | 313,500 | ||||||
| Total Utilities | 4,741,981 | |||||||
| Health Care - 2.7% | ||||||||
| Catalent Pharma Solutions, Inc. | ||||||||
| 7.88% due 10/15/18 | 1,250,000 | 1,271,875 | ||||||
| Valeant Pharmaceuticals International, Inc. | ||||||||
| 5.63% due 12/01/214 | 700,000 | 703,500 | ||||||
| Symbion, Inc. | ||||||||
| 8.00% due 06/15/16 | 550,000 | 583,000 | ||||||
| Valeant Pharmaceuticals International | ||||||||
| 6.75% due 08/15/184 | 500,000 | 549,375 | ||||||
| Physio-Control International, Inc. | ||||||||
| 9.88% due 01/15/194 | 200,000 | 224,000 | ||||||
| Total Health Care | 3,331,750 | |||||||
| Real Estate - 0.3% | ||||||||
| DuPont Fabros Technology, LP | ||||||||
| 5.88% due 09/15/21 | 400,000 | 413,000 | ||||||
| Total Corporate Bonds | ||||||||
| (Cost $93,906,136) | 95,991,325 | |||||||
| SENIOR FLOATING RATE INTERESTS††,2 - 23.5% | ||||||||
| Consumer Discretionary - 5.2% | ||||||||
| GCA Services Group, Inc. | ||||||||
| 9.25% due 11/01/20 | 1,200,000 | 1,214,256 | ||||||
| Steinway Musical Instruments, Inc. | ||||||||
| 9.25% due 09/18/20 | 1,000,000 | 1,032,500 | ||||||
| IntraWest Holdings S.à r.l. | ||||||||
| 5.50% due 11/26/20 | 700,000 | 706,125 | ||||||
| Lions Gate Entertainment Corp. | ||||||||
| 5.00% due 07/18/20 | 700,000 | 701,750 | ||||||
| NES Global Talent | ||||||||
| 6.50% due 10/02/19 | 700,000 | 696,500 | ||||||
| Fleetpride Corp. | ||||||||
| 9.25% due 05/15/20 | 600,000 | 570,498 | ||||||
| Hilton Worldwide Holdings, Inc. | ||||||||
| 3.75% due 10/26/20 | 560,526 | 564,730 | ||||||
| Transtar Industries, Inc. | ||||||||
| 9.75% due 10/09/19 | 350,000 | 332,500 | ||||||
| Applied Systems, Inc. | ||||||||
| 8.25% due 06/08/17 | 250,000 | 250,313 | ||||||
| Neiman Marcus Group, Inc. | ||||||||
| 5.00% due 10/25/20 | 200,000 | 202,306 | ||||||
| Totes Isotoner Corp. | ||||||||
| 7.25% due 07/07/17 | 181,166 | 181,507 | ||||||
| Total Consumer Discretionary | 6,452,985 | |||||||
| Industrials - 4.6% | ||||||||
| Travelport Holdings Ltd. | ||||||||
| 9.50% due 01/31/16 | 1,185,100 | 1,223,616 | ||||||
| 6.25% due 06/26/19 | 298,201 | 305,408 | ||||||
| Mitchell International, Inc. | ||||||||
| 8.50% due 10/11/21 | 1,350,000 | 1,367,727 | ||||||
| syncreon | ||||||||
| 5.25% due 10/28/20 | 730,000 | 725,897 | ||||||
| SIRVA Worldwide, Inc. | ||||||||
| 7.50% due 03/27/19 | 595,500 | 607,410 | ||||||
| US Shipping Corp. | ||||||||
| 9.00% due 04/30/18 | 497,500 | 508,694 | ||||||
| Mast Global | ||||||||
| 8.25% due 09/12/19†††,1 | 300,000 | 297,000 | ||||||
| Panolam Industries International, Inc. | ||||||||
| 7.25% due 08/23/17 | 269,663 | 258,202 | ||||||
| Sutherland Global Services, Inc. | ||||||||
| 7.25% due 03/06/19 | 240,625 | 240,023 | ||||||
| NaNa Development Corp. | ||||||||
| 8.00% due 03/15/18 | 127,500 | 128,775 | ||||||
| Total Industrials | 5,662,752 | |||||||
| Information Technology - 3.6% | ||||||||
| SumTotal Systems | ||||||||
| 6.28% due 11/16/18 | 1,403,919 | 1,382,859 | ||||||
| Greenway Medical Technolgies | ||||||||
| 9.25% due 11/04/21 | 500,000 | 502,500 | ||||||
| 6.00% due 11/04/20 | 400,000 | 398,000 | ||||||
| Wall Street Systems | ||||||||
| 9.25% due 10/25/20 | 750,000 | 755,625 | ||||||
| EIG Investors Corp. | ||||||||
| 5.00% due 11/09/19 | 498,750 | 500,935 | ||||||
| SEE NOTES TO FINANCIAL STATEMENTS. | THE GUGGENHEIM FUNDS ANNUAL REPORT | 95 |
| SCHEDULE OF INVESTMENTS (concluded) | December 31, 2013 |
| SERIES P (HIGH YIELD SERIES) | |
| Face | ||||||||
| Amount | Value | |||||||
| Infor (US), Inc. | ||||||||
| 3.75% due 06/03/20 | $ | 450,000 | $ | 448,970 | ||||
| GlobalLogic Holdings, Inc. | ||||||||
| 6.25% due 06/03/19 | 250,000 | 249,375 | ||||||
| P2 Energy Solutions | ||||||||
| 5.00% due 10/30/20 | 220,000 | 220,825 | ||||||
| Total Information Technology | 4,459,089 | |||||||
| FINANCIALS - 2.7% | ||||||||
| Cunningham Lindsey U.S., Inc. | ||||||||
| 9.25% due 06/10/20 | 935,455 | 928,439 | ||||||
| Magic Newco, LLC | ||||||||
| 12.00% due 06/12/19 | 700,000 | 802,375 | ||||||
| 5.00% due 12/12/18 | 99,748 | 100,371 | ||||||
| Digital Insight | ||||||||
| 8.75% due 08/01/20 | 370,000 | 377,400 | ||||||
| 4.75% due 10/16/19 | 270,000 | 270,000 | ||||||
| Cetera Financial Group, Inc. | ||||||||
| 6.50% due 08/07/19 | 496,875 | 502,465 | ||||||
| First Advantage Corp. | ||||||||
| 6.25% due 02/28/19 | 298,500 | 297,942 | ||||||
| Knight/Getco | ||||||||
| 5.75% due 11/30/17 | 87,850 | 87,960 | ||||||
| Total Financials | 3,366,952 | |||||||
| TELECOMMUNICATION SERVICES - 2.2% | ||||||||
| Associated Partners, Inc. | ||||||||
| 6.67% due 12/21/15†††,1 | 1,400,000 | 1,403,499 | ||||||
| Avaya, Inc. | ||||||||
| 8.00% due 03/31/18 | 642,501 | 651,014 | ||||||
| Hemisphere Media Group, Inc. | ||||||||
| 6.25% due 07/30/20 | 258,700 | 259,670 | ||||||
| Cumulus Media, Inc. | ||||||||
| 4.25% due 12/18/20 | 250,000 | 251,250 | ||||||
| Cengage Learning Acquisitions, Inc. | ||||||||
| 7.75% due 07/31/176 | 139,630 | 108,476 | ||||||
| Total Telecommunication Services | 2,673,909 | |||||||
| CONSUMER STAPLES - 2.1% | ||||||||
| AdvancePierre Foods, Inc. | ||||||||
| 9.50% due 10/10/17 | 1,550,000 | 1,488,000 | ||||||
| Reddy Ice Holdings, Inc. | ||||||||
| 10.75% due 10/01/19 | 530,000 | 511,450 | ||||||
| CTI Foods Holding Co. LLC | ||||||||
| 8.25% due 06/28/21 | 350,000 | 351,750 | ||||||
| Performance Food Group | ||||||||
| 6.25% due 11/14/19 | 248,750 | 249,889 | ||||||
| Total Consumer Staples | 2,601,089 | |||||||
| HEALTH CARE - 1.2% | ||||||||
| Apria Healthcare Group, Inc. | ||||||||
| 6.75% due 04/06/20 | 621,875 | 623,169 | ||||||
| Nextech Systems LLC | ||||||||
| 6.00% due 10/28/18 | 400,000 | 392,000 | ||||||
| Merge Healthcare, Inc. | ||||||||
| 6.00% due 04/23/19 | 304,257 | 282,959 | ||||||
| Learning Care Group (US), Inc. | ||||||||
| 6.00% due 05/08/19 | 248,750 | 249,683 | ||||||
| Total Health Care | 1,547,811 | |||||||
| UTILITIES - 1.2% | ||||||||
| Astoria Generating Company | ||||||||
| Acquisitions LLC | ||||||||
| 8.50% due 10/26/17 | 1,462,500 | 1,506,375 | ||||||
| ENERGY - 0.7% | ||||||||
| Panda Sherman | ||||||||
| 9.00% due 09/14/18 | 650,000 | 666,250 | ||||||
| Rice Energy | ||||||||
| 8.50% due 10/25/18 | 248,125 | 252,467 | ||||||
| Total Energy | 918,717 | |||||||
| Total Senior Floating Rate Interests | ||||||||
| (Cost $28,820,554) | 29,189,679 | |||||||
| ASSET BACKED SECURITIES†† - 0.4% | ||||||||
| Bristol Bay Funding Ltd. | ||||||||
| 2004-1A, 1.24% due 02/01/162,4 | 483,374 | 480,087 | ||||||
| Total Asset Backed securities | ||||||||
| (Cost $478,736) | 480,087 | |||||||
| Total Investments - 106.2% | ||||||||
| (Cost $129,455,352) | $ | 131,664,340 | ||||||
| Other Assets & Liabilities, net - (6.2)% | (7,681,184 | ) | ||||||
| Total Net Assets - 100.0% | $ | 123,983,156 | ||||||
FORWARD FOREIGN CURRENCY EXCHANGE CONTRACTS††
| Settlement | Settlement | Value at | Net Unrealized | |||||||||||||||||
| Contracts to Sell | Currency | Counterparty | Date | Value | 12/31/13 | Depreciation | ||||||||||||||
| 1,230,000 | Euro | BNY Mellon | 01/03/14 | $ | 1,230,300 | $ | 1,238,262 | $ | (7,962 | ) | ||||||||||
| * | Non-income producing security. |
| † | Value determined based on Level 1 inputs, unless otherwise noted — See Note 4. |
| †† | Value determined based on Level 2 inputs, unless otherwise noted — See Note 4. |
| ††† | Value determined based on Level 3 inputs — See Note 4. |
| 1 | Illiquid security. |
| 2 | Variable rate security. Rate indicated is rate effective at December 31, 2013. |
| 3 | Perpetual maturity. |
| 4 | Security is a 144A or Section 4(a)(2) security. The total market value of 144A or Section 4(a)(2) securities is $54,443,542 (cost $53,103,423), or 43.9% of total net assets. |
| 5 | Security is a step up/step down bond. The coupon increases or decreases at regular intervals until the bond reaches full maturity. |
| 6 | Security is in default of interest and/or principal obligations. |
| 7 | Security or a portion thereof is held as collateral for reverse repurchase agreements — See Note 14. |
| plc — Public Limited Company |
| REIT — Real Estate Investment Trust |
| 96 | THE GUGGENHEIM FUNDS ANNUAL REPORT | SEE NOTES TO FINANCIAL STATEMENTS. |
| SERIES P (HIGH YIELD SERIES) |
| STATEMENT OF ASSETS |
| AND LIABILITIES |
| December 31, 2013 |
| Assets: | ||||
| Investments, at value | ||||
| (cost $129,455,352) | $ | 131,664,340 | ||
| Cash | 129,339 | |||
| Prepaid expenses | 9,273 | |||
| Receivables: | ||||
| Interest | 2,051,094 | |||
| Securities sold | 51,938 | |||
| Dividends | 11,535 | |||
| Fund shares sold | 8,322 | |||
| Total assets | 133,925,841 | |||
| Liabilities: | ||||
| Reverse Repurchase Agreements | 7,687,057 | |||
| Unrealized depreciation on forward foreign currency exchange contracts | 7,962 | |||
| Payable for: | ||||
| Securities purchased | 1,735,825 | |||
| Fund shares redeemed | 351,762 | |||
| Management fees | 80,120 | |||
| Fund accounting/administration fees | 10,148 | |||
| Transfer agent/maintenance fees | 3,450 | |||
| Directors’ fees* | 879 | |||
| Miscellaneous | 65,482 | |||
| Total liabilities | 9,942,685 | |||
| Net assets | $ | 123,983,156 | ||
| Net assets consist of: | ||||
| Paid in capital | $ | 111,635,665 | ||
| Undistributed net investment income | 9,702,576 | |||
| Accumulated net realized gain on investments | 443,877 | |||
| Net unrealized appreciation on investments | 2,201,038 | |||
| Net assets | $ | 123,983,156 | ||
| Capital shares outstanding | 3,755,295 | |||
| Net asset value per share | $ | 33.02 |
| STATEMENT OF |
| OPERATIONS |
| Year Ended December 31, 2013 |
| Investment Income: | ||||
| Interest | $ | 9,331,505 | ||
| Dividends (net of foreign withholding tax of $1) | 327,723 | |||
| Other income | 8,943 | |||
| Total investment income | 9,668,171 | |||
| Expenses: | ||||
| Management fees | 913,602 | |||
| Transfer agent/maintenance fees | 25,702 | |||
| Fund accounting/administration fees | 115,721 | |||
| Printing expenses | 73,618 | |||
| Custodian fees | 40,810 | |||
| Directors’ fees* | 12,846 | |||
| Short interest expense | 5,923 | |||
| Tax expense | 4 | |||
| Miscellaneous | 118,821 | |||
| Total expenses | 1,307,047 | |||
| Net investment income | 8,361,124 | |||
| Net Realized and Unrealized Gain (Loss): | ||||
| Net realized gain (loss) on: | ||||
| Investments | 526,652 | |||
| Foreign currency | (10,470 | ) | ||
| Securities sold short | 17,500 | |||
| Net realized gain | 533,682 | |||
| Net change in unrealized appreciation (depreciation) on: | ||||
| Investments | 292,699 | |||
| Foreign currency | (7,950 | ) | ||
| Net change in unrealized appreciation (depreciation) | 284,749 | |||
| Net realized and unrealized gain | 818,431 | |||
| Net increase in net assets resulting from operations | $ | 9,179,555 |
* Relates to Directors not deemed “interested persons” within the meaning of Section 2(a)(19) of the 1940 Act.
| SEE NOTES TO FINANCIAL STATEMENTS. | THE GUGGENHEIM FUNDS ANNUAL REPORT | 97 |
| SERIES P (HIGH YIELD SERIES) |
| STATEMENTS OF CHANGES IN NET ASSETS |
| Year Ended | Year Ended | |||||||
| December 31, | December 31, | |||||||
| 2013 | 2012 | |||||||
| Increase (Decrease) In Net Assets From Operations: | ||||||||
| Net investment income | $ | 8,361,124 | $ | 8,959,071 | ||||
| Net realized gain on investments | 533,682 | 4,777,534 | ||||||
| Net change in unrealized appreciation (depreciation) on investments | 284,749 | 3,950,334 | ||||||
| Net increase in net assets resulting from operations | 9,179,555 | 17,686,939 | ||||||
| Capital share transactions: | ||||||||
| Proceeds from sale of shares | 60,438,050 | 67,473,900 | ||||||
| Cost of shares redeemed | (83,887,297 | ) | (65,064,117 | ) | ||||
| Net increase (decrease) from capital share transactions | (23,449,247 | ) | 2,409,783 | |||||
| Net increase (decrease) in net assets | (14,269,692 | ) | 20,096,722 | |||||
| Net assets: | ||||||||
| Beginning of year | 138,252,848 | 118,156,126 | ||||||
| End of year | $ | 123,983,156 | $ | 138,252,848 | ||||
| Undistributed net investment income at end of year | $ | 9,702,576 | $ | 10,720,118 | ||||
| Capital share activity: | ||||||||
| Shares sold | 1,885,864 | 2,354,539 | ||||||
| Shares redeemed | (2,627,041 | ) | (2,272,280 | ) | ||||
| Net increase (decrease) in shares | (741,177 | ) | 82,259 | |||||
| 98 | THE GUGGENHEIM FUNDS ANNUAL REPORT | SEE NOTES TO FINANCIAL STATEMENTS. |
| SERIES P (HIGH YIELD SERIES) |
| FINANCIAL HIGHLIGHTS |
This table is presented to show selected data for a share outstanding throughout each period and to assist shareholders in evaluating a Fund’s performance for the periods presented.
| Year Ended | Year Ended | Year Ended | Year Ended | Year Ended | ||||||||||||||||
| December 31, | December 31, | December 31, | December 31, | December 31, | ||||||||||||||||
| 2013 | 2012 | 2011 | 2010 | 2009 | ||||||||||||||||
| Per Share Data | ||||||||||||||||||||
| Net asset value, beginning of period | $ | 30.75 | $ | 26.77 | $ | 26.78 | $ | 23.20 | $ | 13.37 | ||||||||||
| Income (loss) from investment operations: | ||||||||||||||||||||
| Net investment incomea | 2.20 | 2.01 | 2.00 | 2.02 | 1.89 | |||||||||||||||
| Net gain (loss) on investments (realized and unrealized) | .07 | 1.97 | (2.01 | ) | 1.56 | 7.94 | ||||||||||||||
| Total from investment operations | 2.27 | 3.98 | (.01 | ) | 3.58 | 9.83 | ||||||||||||||
| Net asset value, end of period | $ | 33.02 | $ | 30.75 | $ | 26.77 | $ | 26.78 | $ | 23.20 | ||||||||||
| Total Returnb | 7.38 | % | 14.87 | % | (0.04 | %) | 15.43 | % | 73.52 | % | ||||||||||
| Ratios/Supplemental Data | ||||||||||||||||||||
| Net assets, end of period (in thousands) | $ | 123,983 | $ | 138,253 | $ | 118,156 | $ | 138,449 | $ | 139,132 | ||||||||||
| Ratios to average net assets: | ||||||||||||||||||||
| Net investment income | 6.86 | % | 6.95 | % | 7.34 | % | 8.16 | % | 10.24 | % | ||||||||||
| Total expenses | 1.07 | % | 0.95 | % | 0.93 | % | 0.94 | % | 0.94 | % | ||||||||||
| Portfolio turnover rate | 100 | % | 95 | % | 64 | % | 56 | % | 48 | % | ||||||||||
| a | Net investment income per share was computed using average shares outstanding throughout the period. |
| b | Total return does not take into account any of the expenses associated with an investment in variable insurance products. If total return had taken into account these expenses, performance would have been lower. Shares of a series of SBL Fund are available only through the purchase of such products. |
| SEE NOTES TO FINANCIAL STATEMENTS. | THE GUGGENHEIM FUNDS ANNUAL REPORT | 99 |
| MANAGER’S COMMENTARY (Unaudited) | December 31, 2013 |
To Our Shareholders:
The Series Q (Small Cap Value Series) is managed by a team of seasoned professionals led by James Schier, CFA, Portfolio Manager. In the following paragraphs, he discusses performance of the Fund for the fiscal year ended December 31, 2013.
For the fiscal year ended December 31, 2013, the Series Q (Small Cap Value Series) returned 36.79%, compared with the Russell 2000® Value Index, which returned 34.52%.
The strategy is to select securities of companies that appear undervalued by the overall market relative to assets, earnings, growth potential or cash flows. The investment approach is a defined and disciplined process with three key philosophical tenets that drive our investment decisions: a valuation focus, a long-term investment horizon and an opportunistic approach.
The portfolio’s performance for the period was helped most by stock selection in the Energy and Financials sectors. The largest detractor from performance was stock selection in the Materials and Consumer Discretionary sectors.
The holdings contributing most to portfolio performance over the period were Cree, Inc., a maker of LED lighting; and Goodrich Petroleum, the U.S. explorer and producer of oil and natural gas properties.
The largest detractors were two precious metals mining companies, Coeur Mining, Inc., and Allied Nevada Gold Corp., which underperformed due to the selloff in gold earlier in 2013.
Sector positioning in the Fund is largely a result of stock selection decisions where the Fund believes it is finding the most attractive investment opportunities. The largest changes in positioning from a year ago were an increase in the Financials sector exposure and a decrease in the Consumer Staples sector exposure.
The Fund had its largest overweight relative to the benchmark in Industrials, primarily in the engineering and construction industry. Investment opportunities appear attractive in maintaining U.S. infrastructure and grids for distributing oil, gas and electricity.
The Financials sector was the largest in both the Fund and the benchmark. However, the Fund is most underweight in this sector relative to its benchmark. This is mostly due to a zero weight in the REIT industry, which is a significant part of the Financials sector. REITs appear expensive, prices having been driven up by yield-hungry investors searching for bond substitutes. The Fund instead continues to favor the insurance industry, which is non-interest-sensitive, and the mortgage servicing industry.
The Fund continues to focus on searching for companies with good long-term fundamental prospects and attractive valuations that are more likely to generate strong performance relative to the broader market, regardless of macroeconomic events.
Performance displayed represents past performance, which is no guarantee of future results.
The opinions and forecast expressed may not actually come to pass. This information is subject to change at any time, based on market and other conditions, and should not be construed as a recommendation of any specific security or strategy.
| 100 | The Guggenheim Funds annual REPORT |
| PERFORMANCE REPORT AND FUND PROFILE (Unaudited) | December 31, 2013 |
SERIES Q (SMALL CAP VALUE SERIES)
OBJECTIVE: Seeks long-term capital appreciation.
Cumulative Fund Performance*,†
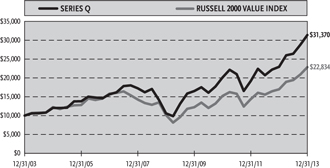
Average Annual Returns*
Periods Ended December 31, 2013†
| 1 Year | 5 Year | 10 Year | ||||||||||
| Series Q (Small Cap Value Series) | 36.79 | % | 24.27 | % | 12.11 | % | ||||||
| Russell 2000 Value Index | 34.52 | % | 17.64 | % | 8.61 | % | ||||||
Holdings Diversification (Market Exposure as % of Net Assets)
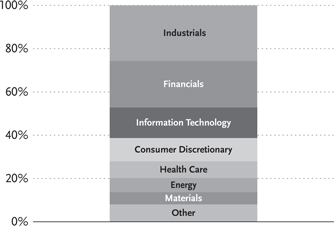
Inception Date: May 1, 2000
| Ten Largest Holdings (% of Total Net Assets) | ||||
| Hanover Insurance Group, Inc. | 4.0 | % | ||
| PMFG, Inc. | 2.5 | % | ||
| Covanta Holding Corp. | 2.5 | % | ||
| Reinsurance Group of America, Inc. — Class A | 2.4 | % | ||
| Global Cash Access Holdings, Inc. | 1.8 | % | ||
| Dreyfus Treasury Prime Cash Management Fund | 1.8 | % | ||
| UGI Corp. | 1.8 | % | ||
| Invacare Corp. | 1.7 | % | ||
| Home Loan Servicing Solutions Ltd. | 1.7 | % | ||
| Curtiss-Wright Corp. | 1.7 | % | ||
| Top Ten Total | 21.9 | % | ||
| * | The performance data above represents past performance that is not predictive of future results. The investment return and principal value of an investment in the Fund will fluctuate so that an investor’s shares, when redeemed, may be worth more or less than their original cost. Returns are historical and include changes in principal and reinvested dividends and capital gains and do not reflect the effect of taxes. The Russell 2000 Value Index is an unmanaged index and, unlike the Fund, has no management fees or operating expenses to reduce its reported return. |
| † | Performance figures do not reflect fees and expenses associated with an investment in variable insurance products. If returns had taken into account these fees and expenses, performance would have been lower. Shares of a series of SBL Fund are available only through the purchase of such products. |
| THE GUGGENHEIM FUNDS ANNUAL REPORT | 101 |
| SCHEDULE OF INVESTMENTS | December 31, 2013 |
| SERIES Q (SMALL CAP VALUE SERIES) | |
| Shares | Value | |||||||
| COMMON STOCKS† - 97.5% | ||||||||
| INDUSTRIALS - 25.2% | ||||||||
| PMFG, Inc.* | 387,847 | $ | 3,510,015 | |||||
| Covanta Holding Corp.1 | 196,500 | 3,487,875 | ||||||
| Curtiss-Wright Corp. | 37,120 | 2,309,977 | ||||||
| ABM Industries, Inc. | 73,010 | 2,087,356 | ||||||
| ICF International, Inc.* | 59,690 | 2,071,840 | ||||||
| Navigant Consulting, Inc.* | 102,340 | 1,964,928 | ||||||
| Celadon Group, Inc. | 97,759 | 1,904,345 | ||||||
| Powell Industries, Inc. | 24,843 | 1,664,233 | ||||||
| Great Lakes Dredge & Dock Corp.* | 180,083 | 1,656,764 | ||||||
| General Cable Corp. | 55,605 | 1,635,343 | ||||||
| KEYW Holding Corp.* | 119,772 | 1,609,736 | ||||||
| Sterling Construction Company, Inc.* | 136,358 | 1,599,479 | ||||||
| Orbital Sciences Corp.* | 67,621 | 1,575,569 | ||||||
| Energy Recovery, Inc.* | 270,940 | 1,506,426 | ||||||
| Aegion Corp. — Class A* | 66,688 | 1,459,800 | ||||||
| Dynamic Materials Corp. | 61,136 | 1,329,097 | ||||||
| DigitalGlobe, Inc.* | 17,977 | 739,754 | ||||||
| Rand Logistics, Inc.* | 127,400 | 735,098 | ||||||
| Marten Transport Ltd. | 34,888 | 704,389 | ||||||
| Global Power Equipment Group, Inc. | 35,030 | 685,537 | ||||||
| Saia, Inc.*,1 | 19,660 | 630,103 | ||||||
| AZZ, Inc. | 8,720 | 426,059 | ||||||
| Total Industrials | 35,293,723 | |||||||
| FINANCIALS - 21.5% | ||||||||
| Hanover Insurance Group, Inc. | 94,470 | 5,640,804 | ||||||
| Reinsurance Group of America, | ||||||||
| Inc. — Class A | 42,575 | 3,295,731 | ||||||
| Home Loan Servicing Solutions Ltd. | 102,810 | 2,361,546 | ||||||
| Endurance Specialty Holdings Ltd. | 38,970 | 2,286,370 | ||||||
| Horace Mann Educators Corp. | 66,160 | 2,086,686 | ||||||
| 1st Source Corp. | 54,280 | 1,733,704 | ||||||
| Safeguard Scientifics, Inc.* | 76,600 | 1,538,894 | ||||||
| Campus Crest Communities, Inc. | 137,770 | 1,296,416 | ||||||
| Ocwen Financial Corp.*,1 | 23,201 | 1,286,495 | ||||||
| Berkshire Hills Bancorp, Inc. | 45,440 | 1,239,149 | ||||||
| Employers Holdings, Inc. | 33,720 | 1,067,238 | ||||||
| AMERISAFE, Inc. | 24,704 | 1,043,497 | ||||||
| BancFirst Corp. | 18,507 | 1,037,502 | ||||||
| Solar Senior Capital Ltd. | 49,174 | 895,950 | ||||||
| Navigators Group, Inc.* | 13,420 | 847,607 | ||||||
| Lexington Realty Trust | 77,080 | 786,987 | ||||||
| PrivateBancorp, Inc. — Class A | 26,452 | 765,256 | ||||||
| Redwood Trust, Inc. | 39,084 | 757,057 | ||||||
| Simmons First National Corp. — | ||||||||
| Class A | 3,722 | 138,272 | ||||||
| Total Financials | 30,105,161 | |||||||
| INFORMATION TECHNOLOGY - 14.1% | ||||||||
| Global Cash Access Holdings, Inc.* | 254,110 | 2,538,558 | ||||||
| Insight Enterprises, Inc.* | 85,149 | 1,933,734 | ||||||
| IXYS Corp. | 126,240 | 1,637,332 | ||||||
| Maxwell Technologies, Inc.* | 205,229 | 1,594,629 | ||||||
| Digi International, Inc.* | 125,839 | 1,525,169 | ||||||
| Global Payments, Inc. | 23,380 | 1,519,466 | ||||||
| RF Micro Devices, Inc.* | 232,400 | 1,199,184 | ||||||
| Semtech Corp.* | 43,970 | 1,111,562 | ||||||
| Newport Corp.* | 59,450 | 1,074,262 | ||||||
| Spansion, Inc. — Class A* | 75,380 | 1,047,028 | ||||||
| Carbonite, Inc.* | 80,250 | 949,358 | ||||||
| Silicon Graphics International Corp.* | 67,470 | 904,773 | ||||||
| Rubicon Technology, Inc.* | 75,850 | 754,708 | ||||||
| Higher One Holdings, Inc.* | 75,500 | 736,880 | ||||||
| Mercury Systems, Inc.* | 58,760 | 643,422 | ||||||
| Multi-Fineline Electronix, Inc.* | 40,480 | 562,267 | ||||||
| Total Information Technology | 19,732,332 | |||||||
| CONSUMER DISCRETIONARY - 10.8% | ||||||||
| Brown Shoe Company, Inc. | 79,540 | 2,238,257 | ||||||
| International Speedway Corp. — Class A | 62,060 | 2,202,509 | ||||||
| DeVry Education Group, Inc. | 49,650 | 1,762,575 | ||||||
| iRobot Corp.* | 50,295 | 1,748,757 | ||||||
| Cabela’s, Inc.* | 21,000 | 1,399,860 | ||||||
| Scholastic Corp. | 33,764 | 1,148,314 | ||||||
| Guess?, Inc. | 34,178 | 1,061,910 | ||||||
| Jones Group, Inc. | 70,065 | 1,048,172 | ||||||
| Gentex Corp. | 30,850 | 1,017,742 | ||||||
| Chico’s FAS, Inc. | 49,260 | 928,058 | ||||||
| Stage Stores, Inc. | 21,841 | 485,307 | ||||||
| Total Consumer Discretionary | 15,041,461 | |||||||
| HEALTH CARE - 7.4% | ||||||||
| Invacare Corp. | 101,950 | 2,366,259 | ||||||
| Emergent Biosolutions, Inc.* | 87,240 | 2,005,648 | ||||||
| Greatbatch, Inc.* | 44,591 | 1,972,705 | ||||||
| Kindred Healthcare, Inc. | 59,290 | 1,170,385 | ||||||
| Tornier N.V.* | 58,740 | 1,103,725 | ||||||
| Alere, Inc.* | 27,045 | 979,029 | ||||||
| Discovery Laboratories, Inc.* | 347,320 | 781,470 | ||||||
| Total Health Care | 10,379,221 | |||||||
| ENERGY - 6.6% | ||||||||
| Resolute Energy Corp.* | 240,990 | 2,176,139 | ||||||
| Clayton Williams Energy, Inc.* | 25,227 | 2,067,353 | ||||||
| Oasis Petroleum, Inc.* | 33,380 | 1,567,859 | ||||||
| Patterson-UTI Energy, Inc. | 40,010 | 1,013,053 | ||||||
| Sanchez Energy Corp.* | 33,250 | 814,958 | ||||||
| C&J Energy Services, Inc.* | 32,430 | 749,133 | ||||||
| Energy XXI Bermuda Ltd. | 26,620 | 720,337 | ||||||
| Emerald Oil, Inc.* | 23,050 | 176,563 | ||||||
| Total Energy | 9,285,395 | |||||||
| MATERIALS - 5.7% | ||||||||
| Zoltek Companies, Inc.* | 123,060 | 2,061,256 | ||||||
| Coeur Mining, Inc.* | 125,000 | 1,356,250 | ||||||
| Allied Nevada Gold Corp.* | 344,730 | 1,223,791 | ||||||
| Landec Corp.* | 98,054 | 1,188,414 | ||||||
| Olin Corp. | 35,201 | 1,015,549 | ||||||
| Royal Gold, Inc. | 15,580 | 717,771 | ||||||
| Globe Specialty Metals, Inc. | 18,629 | 335,508 | ||||||
| Total Materials | 7,898,539 | |||||||
| 102 | THE GUGGENHEIM FUNDS ANNUAL REPORT | SEE NOTES TO FINANCIAL STATEMENTS. |
| SCHEDULE OF INVESTMENTS (concluded) | December 31, 2013 |
| SERIES Q (SMALL CAP VALUE SERIES) |
| Shares | Value | |||||||
| UTILITIES - 5.4% | ||||||||
| UGI Corp. | 59,140 | $ | 2,451,944 | |||||
| Laclede Group, Inc. | 40,110 | 1,826,609 | ||||||
| Black Hills Corp. | 29,180 | 1,532,242 | ||||||
| South Jersey Industries, Inc. | 19,650 | 1,099,614 | ||||||
| MDU Resources Group, Inc. | 23,105 | 705,858 | ||||||
| Total Utilities | 7,616,267 | |||||||
| CONSUMER STAPLES - 0.8% | ||||||||
| Darling International, Inc.* | 51,346 | 1,072,104 | ||||||
| Total Common Stocks | ||||||||
| (Cost $99,615,485) | 136,424,203 | |||||||
| CONVERTIBLE PREFERRED STOCKS††† - 0.0% | ||||||||
| Thermoenergy Corp.*,2,3 | 116,667 | 9,879 | ||||||
| Total Convertible Preferred Stocks | ||||||||
| (Cost $111,410) | 9,879 | |||||||
| WARRANTS†† - 0.2% | ||||||||
| Horizon Pharma, Inc. | ||||||||
| $4.58, 09/20/17 | 98,150 | 317,025 | ||||||
| Total Warrants | ||||||||
| (Cost $—) | 317,025 | |||||||
| SHORT TERM INVESTMENTS† - 1.8% | ||||||||
| Dreyfus Treasury Prime Cash | ||||||||
| Management Fund | 2,474,271 | 2,474,271 | ||||||
| Total Short Term Investments | ||||||||
| (Cost $2,474,271) | 2,474,271 | |||||||
| Face | ||||||||
| Amount | ||||||||
| CONVERTIBLE BONDS†† - 0.4% | ||||||||
| INDUSTRIALS - 0.4% | ||||||||
| DryShips, Inc. | ||||||||
| 5.00% due 12/01/14 | $ | 600,000 | 606,375 | |||||
| Total Convertible Bonds | ||||||||
| (Cost $546,597) | 606,375 | |||||||
| Total Investments - 99.9% | ||||||||
| (Cost $102,747,763) | $ | 139,831,753 | ||||||
| Contracts | ||||||||
| OPTIONS WRITTEN† - 0.0% | ||||||||
| Call options on: | ||||||||
| Ocwen Financial Corp. | ||||||||
| Expiring January 2014 | ||||||||
| with strike price of $60.00 | 116 | (4,060 | ) | |||||
| Saia Inc.†† | ||||||||
| Expiring March 2014 | ||||||||
| with strike price of $35.00 | 162 | (19,440 | ) | |||||
| Total Call options | (23,500 | ) | ||||||
| Put options on: | ||||||||
| Covanta Holding Corp. | ||||||||
| Expiring March 2014 | ||||||||
| with strike price of $17.50 | 168 | (15,120 | ) | |||||
| Total Options Written | ||||||||
| (Premiums received $101,463) | (38,620 | ) | ||||||
| Other Assets & Liabilities, net - 0.1% | 149,883 | |||||||
| Total Net Assets - 100.0% | $ | 139,943,016 |
| * | Non-income producing security. |
| † | Value determined based on Level 1 inputs, unless otherwise noted — See Note 4. |
| †† | Value determined based on Level 2 inputs — See Note 4. |
| 1 | All or a portion of this security is pledged as collateral for open options written contracts at December 31, 2013. |
| 2 | PIPE (Private Investment in Public Equity) — Stock issued by a company in the secondary market as a means of raising capital more quickly and less expensively than through registration of a secondary public offering. |
| 3 | Illiquid security. |
| SEE NOTES TO FINANCIAL STATEMENTS. | THE GUGGENHEIM FUNDS ANNUAL REPORT | 103 |
| SERIES Q (SMALL CAP VALUE SERIES) |
| STATEMENT OF ASSETS |
| AND LIABILITIES |
| December 31, 2013 |
| Assets: | ||||
| Investments, at value | ||||
| (cost $102,747,763) | $ | 139,831,753 | ||
| Prepaid expenses | 3,422 | |||
| Receivables: | ||||
| Dividends | 198,582 | |||
| Securities sold | 140,448 | |||
| Fund shares sold | 67,548 | |||
| Interest | 2,555 | |||
| Total assets | 140,244,308 | |||
| Liabilities: | ||||
| Options written, at value (premiums received $101,463) | 38,620 | |||
| Overdraft due to custodian bank | 20,808 | |||
| Payable for: | ||||
| Management fees | 109,400 | |||
| Fund shares redeemed | 82,288 | |||
| Fund accounting/administration fees | 10,940 | |||
| Transfer agent/maintenance fees | 4,404 | |||
| Directors’ fees* | 349 | |||
| Miscellaneous | 34,483 | |||
| Total liabilities | 301,292 | |||
| Net assets | $ | 139,943,016 | ||
| Net assets consist of: | ||||
| Paid in capital | $ | 89,206,850 | ||
| Accumulated net investment loss | (309,867 | ) | ||
| Accumulated net realized gain on investments | 13,899,200 | |||
| Net unrealized appreciation on investments | 37,146,833 | |||
| Net assets | $ | 139,943,016 | ||
| Capital shares outstanding | 2,667,420 | |||
| Net asset value per share | $ | 52.46 |
| STATEMENT OF |
| OPERATIONS |
| Year Ended December 31, 2013 |
| Investment Income: | ||||
| Dividends | $ | 1,407,186 | ||
| Interest | 80,483 | |||
| Total investment income | 1,487,669 | |||
| Expenses: | ||||
| Management fees | 1,194,350 | |||
| Transfer agent/maintenance fees | 25,626 | |||
| Fund accounting/administration fees | 119,433 | |||
| Directors’ fees* | 12,304 | |||
| Custodian fees | 10,667 | |||
| Tax expense | 4 | |||
| Miscellaneous | 95,570 | |||
| Total expenses | 1,457,954 | |||
| Net investment income | 29,715 | |||
| Net Realized and Unrealized Gain (Loss): | ||||
| Net realized gain (loss) on: | ||||
| Investments | 13,974,069 | |||
| Options written | 127,910 | |||
| Net realized gain | 14,101,979 | |||
| Net change in unrealized appreciation (depreciation) on: | ||||
| Investments | 24,908,882 | |||
| Options written | 62,843 | |||
| Net change in unrealized appreciation (depreciation) | 24,971,725 | |||
| Net realized and unrealized gain | 39,073,704 | |||
| Net increase in net assets resulting from operations | $ | 39,103,419 |
* Relates to Directors not deemed “interested persons” within the meaning of Section 2(a)(19) of the 1940 Act.
| 104 | THE GUGGENHEIM FUNDS ANNUAL REPORT | SEE NOTES TO FINANCIAL STATEMENTS. |
| SERIES Q (SMALL CAP VALUE SERIES) |
| STATEMENTS OF CHANGES IN NET ASSETS |
| Year Ended | Year Ended | |||||||
| December 31, | December 31, | |||||||
| 2013 | 2012 | |||||||
| Increase (Decrease) In Net Assets From Operations: | ||||||||
| Net investment income (loss) | $ | 29,715 | $ | (216 | ) | |||
| Net realized gain on investments | 14,101,979 | 13,132,892 | ||||||
| Net change in unrealized appreciation (depreciation) on investments | 24,971,725 | 6,581,360 | ||||||
| Net increase in net assets resulting from operations | 39,103,419 | 19,714,036 | ||||||
| Capital share transactions: | ||||||||
| Proceeds from sale of shares | 18,249,589 | 24,611,705 | ||||||
| Cost of shares redeemed | (28,811,632 | ) | (40,510,807 | ) | ||||
| Net decrease from capital share transactions | (10,562,043 | ) | (15,899,102 | ) | ||||
| Net increase in net assets | 28,541,376 | 3,814,934 | ||||||
| Net assets: | ||||||||
| Beginning of year | 111,401,640 | 107,586,706 | ||||||
| End of year | $ | 139,943,016 | $ | 111,401,640 | ||||
| (Accumulated)/Undistributed net investment (loss)/income at end of year | $ | (309,867 | ) | $ | 4,846 | |||
| Capital share activity: | ||||||||
| Shares sold | 402,298 | 684,270 | ||||||
| Shares redeemed | (639,709 | ) | (1,132,592 | ) | ||||
| Net decrease in shares | (237,411 | ) | (448,322 | ) | ||||
| SEE NOTES TO FINANCIAL STATEMENTS. | THE GUGGENHEIM FUNDS ANNUAL REPORT | 105 |
| SERIES Q (SMALL CAP VALUE SERIES) |
| FINANCIAL HIGHLIGHTS |
This table is presented to show selected data for a share outstanding throughout each period and to assist shareholders in evaluating a Fund’s performance for the periods presented.
| Year Ended | Year Ended | Year Ended | Year Ended | Year Ended | ||||||||||||||||
| December 31, | December 31, | December 31, | December 31, | December 31, | ||||||||||||||||
| 2013 | 2012 | 2011 | 2010 | 2009e | ||||||||||||||||
| Per Share Data | ||||||||||||||||||||
| Net asset value, beginning of period | $ | 38.35 | $ | 32.09 | $ | 33.64 | $ | 27.60 | $ | 17.70 | ||||||||||
| Income (loss) from investment operations: | ||||||||||||||||||||
| Net investment income (loss)a | 0.01 | (— | )b | (.10 | ) | (.06 | ) | (.01 | ) | |||||||||||
| Net gain (loss) on investments (realized and unrealized) | 14.10 | 6.26 | (1.45 | ) | 6.10 | 9.91 | ||||||||||||||
| Total from investment operations | 14.11 | 6.26 | (1.55 | ) | 6.04 | 9.90 | ||||||||||||||
| Net asset value, end of period | $ | 52.46 | $ | 38.35 | $ | 32.09 | $ | 33.64 | $ | 27.60 | ||||||||||
| Total Returnc | 36.79 | % | 19.51 | % | (4.61 | %) | 21.88 | % | 55.93 | % | ||||||||||
| Ratios/Supplemental Data | ||||||||||||||||||||
| Net assets, end of period (in thousands) | $ | 139,943 | $ | 111,402 | $ | 107,587 | $ | 126,827 | $ | 125,460 | ||||||||||
| Ratios to average net assets: | ||||||||||||||||||||
| Net investment income (loss) | 0.02 | % | (0.00 | %)d | (0.29 | %) | (0.22 | %) | (0.02 | %) | ||||||||||
| Total expenses | 1.16 | % | 1.15 | % | 1.12 | % | 1.12 | % | 1.14 | % | ||||||||||
| Portfolio turnover rate | 30 | % | 44 | % | 51 | % | 38 | % | 126 | % | ||||||||||
| a | Net investment income (loss) per share was computed using average shares outstanding throughout the period. |
| b | Net investment income is less than $0.01 per share. |
| c | Total return does not take into account any of the expenses associated with an investment in variable insurance products. If total return had taken into account these expenses, performance would have been lower. Shares of a series of SBL Fund are available only through the purchase of such products. |
| d | Net investment loss ratio is less than 0.01%. |
| e | Security Investors, LLC became the advisor of Series Q effective February 9, 2009. Prior to February 9, 2009, Wells Capital Management, Inc. sub-advised the Series. |
| 106 | THE GUGGENHEIM FUNDS ANNUAL REPORT | SEE NOTES TO FINANCIAL STATEMENTS. |
| MANAGER’S COMMENTARY (Unaudited) | December 31, 2013 |
To Our Shareholders:
The Series V (Mid Cap Value Series) is managed by a team of seasoned professionals led by James Schier, CFA, Portfolio Manager. In the following paragraphs, he discusses performance of the Fund for the fiscal year ended December 31, 2013.
For the fiscal year ended December 31, 2013, the Series V (Mid Cap Value Series) returned 33.32%, compared with the Russell 2500® Value Index, which returned 33.32%.
The strategy is to select securities of companies that appear undervalued by the overall market relative to assets, earnings, growth potential or cash flows. The investment approach is a defined and disciplined process with three key philosophical tenets that drive our investment decisions: a valuation focus, a long-term investment horizon and an opportunistic approach.
The portfolio’s performance for the period was helped most by stock selection in the Financials and Energy sectors. The largest detractor from performance was stock selection in the Materials and Industrials sectors.
The holdings contributing most to portfolio performance over the period were Cree, Inc., a maker of LED lighting; and Goodrich Petroleum, the U.S. explorer and producer of oil and natural gas properties.
The main detractors were two precious metals mining companies, Allied Nevada Gold Corp. and Coeur Mining, Inc., which underperformed due to the selloff in gold earlier in 2013.
Sector positioning in the Fund is largely a result of stock selection decisions where the Fund believes it is finding the most attractive investment opportunities. The largest changes in positioning from a year ago were an increase in the Financials sector exposure and a decrease in the Industrials sector exposure.
The Fund had its largest overweight relative to the benchmark in Industrials, primarily in the engineering and construction industry. Investment opportunities appear attractive in maintaining U.S. infrastructure and grids for distributing oil, gas and electricity.
The Financials sector was the largest in both the Fund and the benchmark. However, the Fund is most underweight in this sector relative to its benchmark. This is mostly due to a zero weight in the REIT industry, which is a significant part of the Financials sector. REITs appear expensive, prices having been driven up by yield-hungry investors searching for bond substitutes. The Fund instead continues to favor the insurance industry, which is non-interest-sensitive, and the mortgage servicing industry. After Financials, the Fund was most underweight relative to the benchmark in Utilities, where current high valuations make this sector unattractive.
The Fund continues to focus on searching for companies with good long-term fundamental prospects and attractive valuations that are more likely to generate strong performance relative to the broader market, regardless of macroeconomic events.
Performance displayed represents past performance, which is no guarantee of future results.
The opinions and forecast expressed may not actually come to pass. This information is subject to change at any time, based on market and other conditions, and should not be construed as a recommendation of any specific security or strategy.
| THE GUGGENHEIM FUNDS ANNUAL REPORT | 107 |
| PERFORMANCE REPORT AND FUND PROFILE (Unaudited) | December 31, 2013 |
SERIES V (MID CAP VALUE SERIES)
OBJECTIVE: Seeks long-term growth of capital.
Cumulative Fund Performance*,†

Average Annual Returns*
Periods Ended December 31, 2013†
| 1 Year | 5 Year | 10 Year | ||||||||||
| Series V (Mid Cap Value Series) | 33.32 | % | 19.62 | % | 11.68 | % | ||||||
| Russell 2500 Value Index | 33.32 | % | 19.61 | % | 9.29 | % | ||||||
Holdings Diversification (Market Exposure as % of Net Assets)
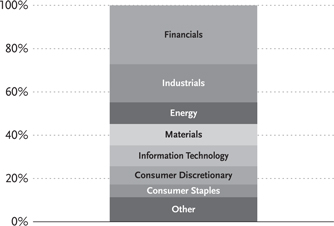
Inception Date: May 1, 1997
| Ten Largest Holdings (% of Total Net Assets) | ||||
| Hanover Insurance Group, Inc. | 4.5 | % | ||
| Computer Sciences Corp. | 3.6 | % | ||
| Owens-Illinois, Inc. | 3.0 | % | ||
| Reinsurance Group of America, Inc. — Class A | 2.6 | % | ||
| Covanta Holding Corp. | 2.6 | % | ||
| Bunge Ltd. | 2.4 | % | ||
| American Financial Group, Inc. | 2.4 | % | ||
| Cameco Corp. | 2.3 | % | ||
| Navigant Consulting, Inc. | 2.2 | % | ||
| Quanta Services, Inc. | 2.2 | % | ||
| Top Ten Total | 27.8 | % | ||
| * | The performance data above represents past performance that is not predictive of future results. The investment return and principal value of an investment in the Fund will fluctuate so that an investor’s shares, when redeemed, may be worth more or less than their original cost. Returns are historical and include changes in principal and reinvested dividends and capital gains and do not reflect the effect of taxes. The Russell 2500 Value Index is an unmanaged index and, unlike the Fund, has no management fees or operating expenses to reduce its reported return. |
| † | Performance figures do not reflect fees and expenses associated with an investment in variable insurance products. If returns had taken into account these fees and expenses, performance would have been lower. Shares of a series of SBL Fund are available only through the purchase of such products. |
| 108 | THE GUGGENHEIM FUNDS ANNUAL REPORT |
| SCHEDULE OF INVESTMENTS | December 31, 2013 |
| SERIES V (MID CAP VALUE SERIES) | |
| Shares | Value | |||||||
| COMMON STOCKS† - 98.1% | ||||||||
| FINANCIALS - 27.2% | ||||||||
| Hanover Insurance Group, Inc. | 227,500 | $ | 13,584,024 | |||||
| Reinsurance Group of America, | ||||||||
| Inc. — Class A | 100,987 | 7,817,404 | ||||||
| American Financial Group, Inc. | 123,690 | 7,139,387 | ||||||
| WR Berkley Corp. | 147,080 | 6,381,801 | ||||||
| Northern Trust Corp. | 78,400 | 4,852,176 | ||||||
| Endurance Specialty Holdings Ltd. | 72,896 | 4,276,808 | ||||||
| Huntington Bancshares, Inc. | 357,220 | 3,447,173 | ||||||
| Alexandria Real Estate Equities, Inc. | 46,580 | 2,963,420 | ||||||
| Employers Holdings, Inc. | 91,760 | 2,904,204 | ||||||
| Ocwen Financial Corp.*,1 | 51,871 | 2,876,247 | ||||||
| BioMed Realty Trust, Inc. | 156,300 | 2,832,156 | ||||||
| Lexington Realty Trust | 254,053 | 2,593,881 | ||||||
| Wintrust Financial Corp. | 52,810 | 2,435,597 | ||||||
| Home Loan Servicing Solutions Ltd. | 98,753 | 2,268,356 | ||||||
| SVB Financial Group* | 21,020 | 2,204,157 | ||||||
| City National Corp. | 24,780 | 1,963,072 | ||||||
| First Niagara Financial Group, Inc. | 181,874 | 1,931,502 | ||||||
| Zions Bancorporation | 64,180 | 1,922,833 | ||||||
| FirstMerit Corp. | 83,015 | 1,845,423 | ||||||
| First Midwest Bancorp, Inc. | 102,473 | 1,796,352 | ||||||
| Alleghany Corp.* | 3,767 | 1,506,649 | ||||||
| Redwood Trust, Inc. | 61,435 | 1,189,996 | ||||||
| Investors Real Estate Trust | 133,340 | 1,144,057 | ||||||
| Campus Crest Communities, Inc. | 59,950 | 564,130 | ||||||
| Total Financials | 82,440,805 | |||||||
| INDUSTRIALS - 17.1% | ||||||||
| Covanta Holding Corp.1 | 438,080 | 7,775,920 | ||||||
| Navigant Consulting, Inc.* | 347,040 | 6,663,168 | ||||||
| Quanta Services, Inc.* | 207,260 | 6,541,126 | ||||||
| URS Corp. | 116,500 | 6,173,335 | ||||||
| Orbital Sciences Corp.* | 209,464 | 4,880,511 | ||||||
| Aegion Corp. — Class A* | 200,700 | 4,393,323 | ||||||
| General Cable Corp. | 125,549 | 3,692,396 | ||||||
| ICF International, Inc.* | 88,000 | 3,054,480 | ||||||
| Towers Watson & Co. — | ||||||||
| Class A | 18,451 | 2,354,532 | ||||||
| DigitalGlobe, Inc.* | 53,813 | 2,214,405 | ||||||
| United Stationers, Inc. | 34,800 | 1,596,972 | ||||||
| Saia, Inc.*,1 | 43,840 | 1,405,072 | ||||||
| AZZ, Inc. | 19,570 | 956,190 | ||||||
| Thermoenergy Corp.* | 905,961 | 26,273 | ||||||
| Total Industrials | 51,727,703 | |||||||
| ENERGY - 10.0% | ||||||||
| Cameco Corp. | 331,370 | 6,882,555 | ||||||
| Whiting Petroleum Corp.* | 87,050 | 5,385,783 | ||||||
| Superior Energy Services, Inc.* | 171,410 | 4,561,220 | ||||||
| Oasis Petroleum, Inc.* | 75,550 | 3,548,584 | ||||||
| Resolute Energy Corp.* | 254,600 | 2,299,038 | ||||||
| Patterson-UTI Energy, Inc. | 87,830 | 2,223,856 | ||||||
| Sanchez Energy Corp.* | 75,291 | 1,845,382 | ||||||
| C&J Energy Services, Inc.* | 74,630 | 1,723,953 | ||||||
| Energy XXI Bermuda Ltd. | 60,410 | 1,634,695 | ||||||
| Total Energy | 30,105,066 | |||||||
| MATERIALS - 9.9% | ||||||||
| Owens-Illinois, Inc.* | 256,010 | 9,160,037 | ||||||
| Sonoco Products Co. | 134,490 | 5,610,923 | ||||||
| Zoltek Companies, Inc.* | 214,990 | 3,601,083 | ||||||
| Coeur Mining, Inc.* | 286,480 | 3,108,308 | ||||||
| Landec Corp.* | 216,800 | 2,627,616 | ||||||
| Olin Corp. | 78,846 | 2,274,707 | ||||||
| Royal Gold, Inc. | 34,140 | 1,572,830 | ||||||
| Allied Nevada Gold Corp.* | 367,720 | 1,305,406 | ||||||
| Globe Specialty Metals, Inc. | 41,542 | 748,171 | ||||||
| Total Materials | 30,009,081 | |||||||
| INFORMATION TECHNOLOGY - 9.7% | ||||||||
| Computer Sciences Corp. | 192,100 | 10,734,548 | ||||||
| IXYS Corp. | 488,690 | 6,338,309 | ||||||
| Global Payments, Inc. | 58,780 | 3,820,112 | ||||||
| Maxwell Technologies, Inc.* | 387,650 | 3,012,041 | ||||||
| RF Micro Devices, Inc.* | 580,670 | 2,996,257 | ||||||
| Semtech Corp.* | 98,410 | 2,487,805 | ||||||
| Total Information Technology | 29,389,072 | |||||||
| CONSUMER DISCRETIONARY - 8.4% | ||||||||
| Brown Shoe Company, Inc. | 177,271 | 4,988,406 | ||||||
| DeVry Education Group, Inc. | 91,507 | 3,248,499 | ||||||
| Cabela’s, Inc.* | 48,720 | 3,247,675 | ||||||
| Scholastic Corp. | 78,384 | 2,665,840 | ||||||
| Jones Group, Inc. | 175,439 | 2,624,567 | ||||||
| Guess?, Inc. | 79,069 | 2,456,674 | ||||||
| Gentex Corp. | 71,730 | 2,366,372 | ||||||
| Chico’s FAS, Inc. | 110,940 | 2,090,110 | ||||||
| Jack in the Box, Inc.* | 31,540 | 1,577,631 | ||||||
| HydroGen Corp.*,3 | 672,346 | 1 | ||||||
| Total Consumer Discretionary | 25,265,775 | |||||||
| CONSUMER STAPLES - 5.9% | ||||||||
| Bunge Ltd. | 87,810 | 7,210,078 | ||||||
| Hormel Foods Corp. | 86,300 | 3,898,171 | ||||||
| Darling International, Inc.* | 117,037 | 2,443,733 | ||||||
| Ingredion, Inc. | 33,050 | 2,262,603 | ||||||
| JM Smucker Co. | 18,080 | 1,873,450 | ||||||
| Total Consumer Staples | 17,688,035 | |||||||
| UTILITIES - 5.3% | ||||||||
| Black Hills Corp. | 84,250 | 4,423,968 | ||||||
| Great Plains Energy, Inc. | 154,315 | 3,740,596 | ||||||
| UGI Corp. | 79,029 | 3,276,542 | ||||||
| Pepco Holdings, Inc. | 134,040 | 2,564,185 | ||||||
| MDU Resources Group, Inc. | 63,731 | 1,946,982 | ||||||
| Total Utilities | 15,952,273 | |||||||
| HEALTH CARE - 4.6% | ||||||||
| MEDNAX, Inc.* | 63,270 | 3,377,353 | ||||||
| Kindred Healthcare, Inc. | 160,530 | 3,168,862 | ||||||
| Hologic, Inc.* | 125,474 | 2,804,344 | ||||||
| SEE NOTES TO FINANCIAL STATEMENTS. | THE GUGGENHEIM FUNDS ANNUAL REPORT | 109 |
| SCHEDULE OF INVESTMENTS (concluded) | December 31, 2013 |
| SERIES V (MID CAP VALUE SERIES) |
| Shares | Value | |||||||
| Alere, Inc.* | 61,986 | $ | 2,243,893 | |||||
| Edwards Lifesciences Corp.* | 23,450 | 1,542,072 | ||||||
| Universal Health Services, Inc. — | ||||||||
| Class B | 9,150 | 743,529 | ||||||
| Total Health Care | 13,880,053 | |||||||
| Total Common Stocks | ||||||||
| (Cost $220,491,562) | 296,457,863 | |||||||
| CONVERTIBLE PREFERRED STOCKS††† - 0.0% | ||||||||
| Thermoenergy Corp.*,2,4 | 308,333 | 26,110 | ||||||
| Total Convertible Preferred Stocks | ||||||||
| (Cost $294,438) | 26,110 | |||||||
| SHORT TERM INVESTMENTS†- 1.4% | ||||||||
| Dreyfus Treasury Prime Cash | ||||||||
| Management Fund | 4,157,482 | 4,157,482 | ||||||
| Total Short Term Investments | ||||||||
| (Cost $4,157,482) | 4,157,482 | |||||||
| Face | ||||||||
| Amount | ||||||||
| CONVERTIBLE BONDS†† - 0.5% | ||||||||
| INDUSTRIALS - 0.5% | ||||||||
| DryShips, Inc. | ||||||||
| 5.00% due 12/01/14 | $ | 1,450,000 | 1,465,406 | |||||
| Total Convertible Bonds | ||||||||
| (Cost $1,327,188) | 1,465,406 | |||||||
| Total Investments - 100.0% | ||||||||
| (Cost $226,270,670) | 302,106,861 | |||||||
| Contracts | ||||||||
| OPTIONS WRITTEN† - 0.0% | ||||||||
| Call options on: | ||||||||
| Ocwen Financial Corp. | ||||||||
| Expiring January 2014 | ||||||||
| with strike price of $60.00 | 259 | (9,065 | ) | |||||
| Saia Inc.†† | ||||||||
| Expiring March 2014 | ||||||||
| with strike price of $35.00 | 362 | (43,440 | ) | |||||
| Total Call options | (52,505 | ) | ||||||
| Put options on: | ||||||||
| Covanta Holding Corp. | ||||||||
| Expiring March 2014 | ||||||||
| with strike price of $17.50 | 384 | (34,560 | ) | |||||
| Total Options Written | ||||||||
| (Premiums received $227,815) | (87,065 | ) | ||||||
| Other Assets & Liabilities, net - 0.0% | 146,193 | |||||||
| Total Net Assets - 100.0% | $ | 302,165,989 |
| * | Non-income producing security. |
| † | Value determined based on Level 1 inputs, unless otherwise noted — See Note 4. |
| †† | Value determined based on Level 2 inputs — See Note 4. |
| 1 | All or a portion of this security is pledged as collateral for open options written contracts at December 31, 2013. |
| 2 | PIPE (Private Investment in Public Equity) — Stock issued by a company in the secondary market as a means of raising capital more quickly and less expensively than through registration of a secondary public offering. |
| 3 | Affiliated issuer — See Note 10. |
| 4 | Illiquid security. |
| 110 | THE GUGGENHEIM FUNDS ANNUAL REPORT | SEE NOTES TO FINANCIAL STATEMENTS. |
| SERIES V (MID CAP VALUE SERIES) |
| STATEMENT OF ASSETS |
| AND LIABILITIES |
| December 31, 2013 |
| Assets: | ||||
| Investments in unaffiliated issuers, at value | ||||
| (cost $223,699,094) | $ | 302,106,860 | ||
| Investments in affiliated issuers, at value | ||||
| (cost $2,571,576) | 1 | |||
| Total investments | ||||
| (cost $226,270,670) | 302,106,861 | |||
| Prepaid expenses | 7,835 | |||
| Receivables: | ||||
| Dividends | 529,143 | |||
| Securities sold | 300,021 | |||
| Fund shares sold | 7,340 | |||
| Interest | 6,174 | |||
| Foreign taxes reclaim | 2,979 | |||
| Total assets | 302,960,353 | |||
| Liabilities: | ||||
| Overdraft due to custodian bank | 33,638 | |||
| Options written, at value (premiums received $227,815) | 87,065 | |||
| Payable for: | ||||
| Fund shares redeemed | 190,910 | |||
| Management fees | 189,131 | |||
| Fund accounting/administration fees | 23,956 | |||
| Transfer agent/maintenance fees | 3,964 | |||
| Directors’ fees* | 997 | |||
| Securities purchased | 348 | |||
| Miscellaneous | 264,355 | |||
| Total liabilities | 794,364 | |||
| Net assets | $ | 302,165,989 | ||
| Net assets consist of: | ||||
| Paid in capital | $ | 195,018,646 | ||
| Undistributed net investment income | 1,496,196 | |||
| Accumulated net realized gain on investments | 29,674,206 | |||
| Net unrealized appreciation on investments | 75,976,941 | |||
| Net assets | $ | 302,165,989 | ||
| Capital shares outstanding | 3,620,518 | |||
| Net asset value per share | $ | 83.46 |
| STATEMENT OF |
| OPERATIONS |
| Year Ended December 31, 2013 |
| Investment Income: | ||||
| Dividends (net of foreign withholding tax of $13,861) | $ | 3,813,860 | ||
| Interest | 193,759 | |||
| Total investment income | 4,007,619 | |||
| Expenses: | ||||
| Management fees | 2,129,975 | |||
| Transfer agent/maintenance fees | 25,588 | |||
| Fund accounting/administration fees | 269,793 | |||
| Directors’ fees* | 27,842 | |||
| Custodian fees | 15,666 | |||
| Tax expense | 8 | |||
| Miscellaneous | 178,947 | |||
| Total expenses | 2,647,819 | |||
| Net investment income | 1,359,800 | |||
| Net Realized and Unrealized Gain (Loss): | ||||
| Net realized gain (loss) on: | ||||
| Investments | 29,577,805 | |||
| Options written | 129,114 | |||
| Net realized gain | 29,706,919 | |||
| Net change in unrealized appreciation (depreciation) on: | ||||
| Investments in unaffiliated issuers | 48,957,621 | |||
| Investments in affiliated issuers | (8,336 | ) | ||
| Options written | 140,750 | |||
| Net change in unrealized appreciation (depreciation) | 49,090,035 | |||
| Net realized and unrealized gain | 78,796,954 | |||
| Net increase in net assets resulting from operations | $ | 80,156,754 |
* Relates to Directors not deemed “interested persons” within the meaning of Section 2(a)(19) of the 1940 Act.
| SEE NOTES TO FINANCIAL STATEMENTS. | THE GUGGENHEIM FUNDS ANNUAL REPORT | 111 |
| SERIES V (MID CAP VALUE SERIES) |
| STATEMENTS OF CHANGES IN NET ASSETS |
| Year Ended | Year Ended | |||||||
| December 31, | December 31, | |||||||
| 2013 | 2012 | |||||||
| Increase (Decrease) In Net Assets From Operations: | ||||||||
| Net investment income | $ | 1,359,800 | $ | 1,085,462 | ||||
| Net realized gain on investments | 29,706,919 | 17,394,677 | ||||||
| Net change in unrealized appreciation (depreciation) on investments | 49,090,035 | 21,887,847 | ||||||
| Net increase in net assets resulting from operations | 80,156,754 | 40,367,986 | ||||||
| Capital share transactions: | ||||||||
| Proceeds from sale of shares | 15,835,127 | 18,437,679 | ||||||
| Cost of shares redeemed | (43,631,962 | ) | (59,619,776 | ) | ||||
| Net decrease from capital share transactions | (27,796,835 | ) | (41,182,097 | ) | ||||
| Net increase (decrease) in net assets | 52,359,919 | (814,111 | ) | |||||
| Net assets: | ||||||||
| Beginning of year | 249,806,070 | 250,620,181 | ||||||
| End of year | $ | 302,165,989 | $ | 249,806,070 | ||||
| Undistributed net investment income at end of year | $ | 1,496,196 | $ | 1,085,462 | ||||
| Capital share activity: | ||||||||
| Shares sold | 217,418 | 310,203 | ||||||
| Shares redeemed | (587,402 | ) | (1,008,533 | ) | ||||
| Net decrease in shares | (369,984 | ) | (698,330 | ) | ||||
| 112 | THE GUGGENHEIM FUNDS ANNUAL REPORT | SEE NOTES TO FINANCIAL STATEMENTS. |
| SERIES V (MID CAP VALUE SERIES) |
| FINANCIAL HIGHLIGHTS |
This table is presented to show selected data for a share outstanding throughout each period and to assist shareholders in evaluating a Fund’s performance for the periods presented.
| Year Ended | Year Ended | Year Ended | Year Ended | Year Ended | ||||||||||||||||
| December 31, | December 31, | December 31, | December 31, | December 31, | ||||||||||||||||
| 2013 | 2012 | 2011 | 2010 | 2009 | ||||||||||||||||
| Per Share Data | ||||||||||||||||||||
| Net asset value, beginning of period | $ | 62.60 | $ | 53.45 | $ | 57.78 | $ | 49.05 | $ | 34.08 | ||||||||||
| Income (loss) from investment operations: | ||||||||||||||||||||
| Net investment incomea | .36 | .25 | .15 | .39 | .38 | |||||||||||||||
| Net gain (loss) on investments (realized and unrealized) | 20.50 | 8.90 | (4.48 | ) | 8.34 | 14.59 | ||||||||||||||
| Total from investment operations | 20.86 | 9.15 | (4.33 | ) | 8.73 | 14.97 | ||||||||||||||
| Net asset value, end of period | $ | 83.46 | $ | 62.60 | $ | 53.45 | $ | 57.78 | $ | 49.05 | ||||||||||
| Total Returnb | 33.32 | % | 17.12 | % | (7.49 | %) | 17.80 | % | 43.93 | % | ||||||||||
| Ratios/Supplemental Data | ||||||||||||||||||||
| Net assets, end of period (in thousands) | $ | 302,166 | $ | 249,806 | $ | 250,620 | $ | 316,418 | $ | 304,730 | ||||||||||
| Ratios to average net assets: | ||||||||||||||||||||
| Net investment income | 0.48 | % | 0.43 | % | 0.26 | % | 0.75 | % | 0.97 | % | ||||||||||
| Total expenses | 0.93 | % | 0.93 | % | 0.90 | % | 0.90 | % | 0.91 | % | ||||||||||
| Portfolio turnover rate | 22 | % | 24 | % | 28 | % | 25 | % | 29 | % | ||||||||||
| a | Net investment income per share was computed using average shares outstanding throughout the period. |
| b | Total return does not take into account any of the expenses associated with an investment in variable insurance products. If total return had taken into account these expenses, performance would have been lower. Shares of a series of SBL Fund are available only through the purchase of such products. |
| SEE NOTES TO FINANCIAL STATEMENTS. | THE GUGGENHEIM FUNDS ANNUAL REPORT | 113 |
| MANAGER’S COMMENTARY (Unaudited) | December 31, 2013 |
To Our Shareholders:
The Series X (StylePlus—Small Growth Series, formerly Small Cap Growth Series) is managed by a team of seasoned professionals, including B. Scott Minerd, Global Chief Investment Officer; Farhan Sharaff, Senior Managing Director and Assistant Chief Investment Officer, Equities; Jayson Flowers, Senior Managing Director and Head of Equity and Derivative Strategies; and Scott Hammond, Managing Director and Portfolio Manager. In the following paragraphs, the investment team discusses performance and changes to the Fund that occurred during the fiscal year ended December 31, 2013.
For the fiscal year ended December 31, 2013, the Series X (StylePlus—Small Growth Series, formerly, Small Cap Growth Series) returned 41.34%, compared with the benchmark, the Russell 2000® Growth Index, which returned 43.30%.
The Fund’s Board of Directors approved the following changes, which became effective on April 30, 2013: a new Fund name, new principal investment strategies and new portfolio management team.
The Fund’s new investment objective is to seek long-term growth of capital in excess of that produced by the total return of the Russell 2000 Growth Index. The Fund seeks to add alpha above the target index by leveraging Guggenheim’s competencies in fixed and systematic stock selection. To accomplish this, the StylePlus strategy allocates to quantitative selection models when stock picking opportunities in the market are high. When stock selection opportunities are less attractive, the Fund invests in derivatives based on the target index, backed by a diversified portfolio of fixed income instruments. In this way, the Fund believes it will deliver the target index return plus an alpha component commensurate with the yield achieved on the active fixed income portfolio.
The Fund’s underperformance for the 12 months came predominantly during the four months it was being managed according to the legacy strategy. Specifically, from January 1, 2013, through April 30, 2013, the Fund underperformed the benchmark by about two percentage points, largely due to poor stock selection in the Information Technology and Health Care sectors. The Fund’s cash position was also a drag on performance. Good stock selection in the Consumer Discretionary sector was the main contributor to performance.
For the time the Fund was being managed according to the new strategy, the eight months from April 30, 2013 through September 30, 2013, the Fund performed slightly better than the benchmark. During much of this period, the Fund maintained an approximate allocation of 20% to systematic equity selection, 80% allocated to the passive equity position, which was maintained with swap agreements and futures contracts, and 55% allocated to fixed income investments (excluding short-term). Beginning in December 2013, due to a more favorable outlook for active stock selection, the equity sleeve was increased to 25%, with 74% allocated to the passive equity position.
The equity sleeve was additive over the period, delivering the strongest returns during the months of May, June and December.
The fixed income allocation also contributed to performance over the eight months, after detracting from performance during the substantial debt selloff that began at the end of May and lasted in to June. The swap agreements also contributed to performance.
Performance displayed represents past performance, which is no guarantee of future results.
The opinions and forecast expressed may not actually come to pass. This information is subject to change at any time, based on market and other conditions, and should not be construed as a recommendation of any specific security or strategy.
| 114 | THE GUGGENHEIM FUNDS ANNUAL REPORT |
| PERFORMANCE REPORT AND FUND PROFILE (Unaudited) | December 31, 2013 |
SERIES X (STYLEPLUS–SMALL GROWTH SERIES)
OBJECTIVE: Seeks long-term growth of capital.
Cumulative Fund Performance*,†

Average Annual Returns*
Periods Ended December 31, 2013†
| 1 Year | 5 Year | 10 Year | ||||||||||
| Series X (StylePlus–Small Growth Series) | 41.34 | % | 22.15 | % | 7.21 | % | ||||||
| Russell 2000 Growth Index | 43.30 | % | 22.58 | % | 9.41 | % | ||||||
| Ten Largest Holdings (% of Total Net Assets) | ||||
| Dreyfus Treasury Prime Cash Management Fund | 9.2 | % | ||
| Floating Rate Strategies Fund Institutional Class | 1.9 | % | ||
| Macro Opportunities Fund Institutional Class | 1.9 | % | ||
| Guggenheim BulletShares 2016 High Yield Corporate Bond ETF | 1.9 | % | ||
| Guggenheim BulletShares 2015 High Yield Corporate Bond ETF | 1.8 | % | ||
| Guggenheim BulletShares 2014 High Yield Corporate Bond ETF | 1.8 | % | ||
| New York City Water & Sewer System Revenue Bonds | 1.3 | % | ||
| Goldman Sachs Asset Management CLO plc — 2007-1A | 1.2 | % | ||
| Duane Street CLO IV Ltd. — 2007-4A | 1.2 | % | ||
| KKR Financial CLO 2007-1 Corp. — 2007-1A | 1.2 | % | ||
| Top Ten Total | 23.4 | % | ||
Holdings Diversification (Market Exposure as % of Net Assets)
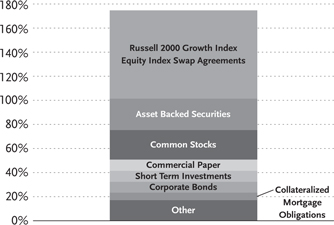
Inception Date: October 15, 1997
| Portfolio Composition by Quality Rating** | ||||
| Rating | ||||
| Fixed Income Instruments | ||||
| AAA | 6.8 | % | ||
| AA | 4.4 | % | ||
| A | 8.9 | % | ||
| BBB | 22.4 | % | ||
| BB | 3.6 | % | ||
| B | 4.0 | % | ||
| CCC | 4.9 | % | ||
| NR | 2.3 | % | ||
| Other Instruments | ||||
| Common Stocks | 24.5 | % | ||
| Short Term Investments | 9.2 | % | ||
| Exchange Traded Funds | 5.5 | % | ||
| Mutual Funds | 3.8 | % | ||
| Rights | 0.0 | % | ||
| Total Investments | 100.3 | % | ||
The chart above reflects percentages of the value of total investments.
| * | The performance data above represents past performance that is not predictive of future results. The investment return and principal value of an investment in the Fund will fluctuate so that an investor’s shares, when redeemed, may be worth more or less than their original cost. Returns are historical and include changes in principal and reinvested dividends and capital gains and do not reflect the effect of taxes. The Russell 2000 Growth Index is an unmanaged index and, unlike the Fund, has no management fees or operating expenses to reduce its reported return. |
| ** | Source: Factset. Credit quality ratings are measured on a scale that generally ranges from AAA (highest) to D (lowest). All rated securities have been rated by Moody’s, Standard & Poor’s (“S&P”), or Fitch, which are all a Nationally Recognized Statistical Rating Organization (“NRSRO”). For purposes of this presentation, when ratings are available from more than one agency, the highest rating is used. Guggenheim Investments has converted Moody’s and Fitch ratings to the equivalent S&P rating. Unrated securities do not necessarily indicate low credit quality. Security ratings are determined at the time of purchase and may change thereafter. |
| † | Performance figures do not reflect fees and expenses associated with an investment in variable insurance products. If returns had taken into account these fees and expenses, performance would have been lower. Shares of a series of SBL Fund are available only through the purchase of such products. |
| THE GUGGENHEIM FUNDS ANNUAL REPORT | 115 |
| SCHEDULE OF INVESTMENTS | December 31, 2013 |
| SERIES X (STYLEPLUS–SMALL GROWTH SERIES) | |
| Shares | Value | |||||||
| COMMON STOCKS† - 24.5% | ||||||||
| HEALTH CARE - 6.5% | ||||||||
| Centene Corp.* | 2,304 | $ | 135,821 | |||||
| athenahealth, Inc.* | 1,003 | 134,903 | ||||||
| Molina Healthcare, Inc.* | 3,720 | 129,270 | ||||||
| MedAssets, Inc.* | 5,887 | 116,739 | ||||||
| HealthSouth Corp. | 3,092 | 103,025 | ||||||
| AMN Healthcare Services, Inc.* | 6,813 | 100,150 | ||||||
| Medicines Co.* | 2,585 | 99,833 | ||||||
| Team Health Holdings, Inc.* | 1,936 | 88,185 | ||||||
| Owens & Minor, Inc. | 2,331 | 85,221 | ||||||
| Prestige Brands Holdings, Inc.* | 2,284 | 81,767 | ||||||
| PAREXEL International Corp.* | 1,803 | 81,460 | ||||||
| NPS Pharmaceuticals, Inc.* | 2,677 | 81,275 | ||||||
| Chemed Corp. | 1,001 | 76,697 | ||||||
| HMS Holdings Corp.* | 3,364 | 76,464 | ||||||
| Isis Pharmaceuticals, Inc.* | 1,881 | 74,939 | ||||||
| STERIS Corp. | 1,389 | 66,741 | ||||||
| Cepheid, Inc.* | 1,209 | 56,484 | ||||||
| Align Technology, Inc.* | 944 | 53,950 | ||||||
| Ensign Group, Inc. | 1,077 | 47,679 | ||||||
| NuVasive, Inc.* | 1,356 | 43,839 | ||||||
| Amsurg Corp. — Class A* | 925 | 42,476 | ||||||
| West Pharmaceutical Services, Inc. | 840 | 41,210 | ||||||
| Arena Pharmaceuticals, Inc.* | 6,779 | 39,657 | ||||||
| Analogic Corp. | 428 | 37,904 | ||||||
| HeartWare International, Inc.* | 402 | 37,772 | ||||||
| Gentiva Health Services, Inc.* | 2,979 | 36,969 | ||||||
| Nektar Therapeutics* | 3,078 | 34,935 | ||||||
| Aegerion Pharmaceuticals, Inc.* | 490 | 34,770 | ||||||
| Landauer, Inc. | 634 | 33,355 | ||||||
| Alliance HealthCare Services, Inc.* | 1,332 | 32,954 | ||||||
| Emeritus Corp.* | 1,514 | 32,748 | ||||||
| Alnylam Pharmaceuticals, Inc.* | 504 | 32,422 | ||||||
| Volcano Corp.* | 1,482 | 32,382 | ||||||
| Celldex Therapeutics, Inc.* | 1,318 | 31,909 | ||||||
| Exact Sciences Corp.* | 2,686 | 31,399 | ||||||
| Infinity Pharmaceuticals, Inc.* | 2,218 | 30,631 | ||||||
| PDL BioPharma, Inc. | 3,626 | 30,603 | ||||||
| Opko Health, Inc.* | 3,600 | 30,384 | ||||||
| ICU Medical, Inc.* | 472 | 30,071 | ||||||
| Thoratec Corp.* | 793 | 29,024 | ||||||
| Genomic Health, Inc.* | 980 | 28,685 | ||||||
| Array BioPharma, Inc.* | 5,640 | 28,256 | ||||||
| Vivus, Inc.* | 3,110 | 28,239 | ||||||
| Quality Systems, Inc. | 1,334 | 28,094 | ||||||
| Total Health Care | 2,531,291 | |||||||
| INFORMATION TECHNOLOGY - 6.2% | ||||||||
| SunEdison, Inc.* | 8,803 | 114,879 | ||||||
| ARRIS Group, Inc.* | 4,342 | 105,792 | ||||||
| j2 Global, Inc. | 2,053 | 102,670 | ||||||
| Take-Two Interactive Software, Inc.* | 5,770 | 100,225 | ||||||
| Microsemi Corp.* | 3,925 | 97,929 | ||||||
| Qlik Technologies, Inc.* | 3,486 | 92,831 | ||||||
| SS&C Technologies Holdings, Inc.* | 1,880 | 83,209 | ||||||
| PTC, Inc.* | 2,337 | 82,706 | ||||||
| CSG Systems International, Inc. | 2,598 | 76,382 | ||||||
| comScore, Inc.* | 2,665 | 76,246 | ||||||
| ViaSat, Inc.* | 1,201 | 75,243 | ||||||
| Guidewire Software, Inc.* | 1,370 | 67,226 | ||||||
| RF Micro Devices, Inc.* | 12,878 | 66,450 | ||||||
| Comverse, Inc.* | 1,641 | 63,671 | ||||||
| Yelp, Inc. — Class A* | 895 | 61,710 | ||||||
| Dealertrack Technologies, Inc.* | 1,231 | 59,186 | ||||||
| CoStar Group, Inc.* | 289 | 53,344 | ||||||
| Ciena Corp.* | 2,212 | 52,933 | ||||||
| BroadSoft, Inc.* | 1,922 | 52,547 | ||||||
| Zillow, Inc. — Class A* | 641 | 52,389 | ||||||
| Cardtronics, Inc.* | 1,154 | 50,141 | ||||||
| ACI Worldwide, Inc.* | 758 | 49,270 | ||||||
| FEI Co. | 536 | 47,897 | ||||||
| Aruba Networks, Inc.* | 2,452 | 43,891 | ||||||
| Cabot Microelectronics Corp.* | 907 | 41,450 | ||||||
| Belden, Inc. | 569 | 40,086 | ||||||
| iGATE Corp.* | 980 | 39,357 | ||||||
| Unisys Corp.* | 1,133 | 38,035 | ||||||
| Trulia, Inc.* | 1,036 | 36,540 | ||||||
| Silicon Image, Inc.* | 5,887 | 36,205 | ||||||
| ValueClick, Inc.* | 1,542 | 36,037 | ||||||
| RealD, Inc.* | 4,186 | 35,748 | ||||||
| Infoblox, Inc.* | 1,046 | 34,539 | ||||||
| Fair Isaac Corp. | 546 | 34,311 | ||||||
| AVG Technologies N.V.* | 1,978 | 34,041 | ||||||
| Blackbaud, Inc. | 900 | 33,885 | ||||||
| Plantronics, Inc. | 729 | 33,862 | ||||||
| Fusion-io, Inc.* | 3,735 | 33,279 | ||||||
| Travelzoo, Inc.* | 1,469 | 31,319 | ||||||
| Cavium, Inc.* | 907 | 31,301 | ||||||
| Ultimate Software Group, Inc.* | 196 | 30,031 | ||||||
| Ixia* | 2,196 | 29,229 | ||||||
| InterDigital, Inc. | 987 | 29,107 | ||||||
| Semtech Corp.* | 1,136 | 28,718 | ||||||
| Total Information Technology | 2,415,847 | |||||||
| INDUSTRIALS - 4.4% | ||||||||
| Swift Transportation Co. — Class A* | 5,777 | 128,307 | ||||||
| Titan International, Inc. | 6,840 | 122,982 | ||||||
| EnPro Industries, Inc.* | 1,326 | 76,444 | ||||||
| Matson, Inc. | 2,737 | 71,463 | ||||||
| Brink’s Co. | 1,867 | 63,739 | ||||||
| Kaman Corp. | 1,580 | 62,773 | ||||||
| USG Corp.* | 2,168 | 61,528 | ||||||
| SkyWest, Inc. | 3,855 | 57,170 | ||||||
| RPX Corp.* | 3,238 | 54,723 | ||||||
| AZZ, Inc. | 1,046 | 51,108 | ||||||
| MasTec, Inc.* | 1,541 | 50,421 | ||||||
| Watsco, Inc. | 516 | 49,567 | ||||||
| Albany International Corp. — Class A | 1,315 | 47,248 | ||||||
| Tetra Tech, Inc.* | 1,625 | 45,468 | ||||||
| Polypore International, Inc.* | 1,163 | 45,241 | ||||||
| Standex International Corp. | 647 | 40,683 | ||||||
| Mueller Water Products, Inc. — Class A | 4,267 | 39,982 | ||||||
| Lindsay Corp. | 482 | 39,886 | ||||||
| Corporate Executive Board Co. | 515 | 39,876 | ||||||
| 116 | THE GUGGENHEIM FUNDS ANNUAL REPORT | SEE NOTES TO FINANCIAL STATEMENTS. |
| SCHEDULE OF INVESTMENTS (continued) | December 31, 2013 |
| SERIES X (STYLEPLUS–SMALL GROWTH SERIES) |
| Shares | Value | |||||||
| Acuity Brands, Inc. | 359 | $ | 39,246 | |||||
| Woodward, Inc. | 852 | 38,860 | ||||||
| EnerSys, Inc. | 535 | 37,498 | ||||||
| CIRCOR International, Inc. | 462 | 37,320 | ||||||
| Herman Miller, Inc. | 1,263 | 37,284 | ||||||
| Steelcase, Inc. — Class A | 2,238 | 35,495 | ||||||
| West Corp. | 1,354 | 34,811 | ||||||
| Moog, Inc. — Class A* | 504 | 34,242 | ||||||
| Cubic Corp. | 639 | 33,650 | ||||||
| Chart Industries, Inc.* | 346 | 33,091 | ||||||
| Spirit Airlines, Inc.* | 718 | 32,604 | ||||||
| Aircastle Ltd. | 1,700 | 32,572 | ||||||
| Dycom Industries, Inc.* | 1,154 | 32,070 | ||||||
| General Cable Corp. | 1,086 | 31,939 | ||||||
| Applied Industrial Technologies, Inc. | 615 | 30,190 | ||||||
| Acacia Research Corp. | 2,035 | 29,589 | ||||||
| Total Industrials | 1,699,070 | |||||||
| CONSUMER DISCRETIONARY - 3.1% | ||||||||
| Tenneco, Inc.* | 2,081 | 117,722 | ||||||
| Dana Holding Corp.6 | 5,591 | 109,695 | ||||||
| Sinclair Broadcast Group, Inc. — Class A | 2,261 | 80,786 | ||||||
| Sotheby’s | 1,448 | 77,034 | ||||||
| Crocs, Inc.* | 3,650 | 58,108 | ||||||
| CEC Entertainment, Inc. | 1,300 | 57,564 | ||||||
| Bloomin’ Brands, Inc.* | 2,239 | 53,758 | ||||||
| Iconix Brand Group, Inc.* | 1,281 | 50,856 | ||||||
| DineEquity, Inc. | 595 | 49,712 | ||||||
| Vail Resorts, Inc. | 638 | 47,997 | ||||||
| Cracker Barrel Old Country Store, Inc. | 343 | 37,754 | ||||||
| Cooper Tire & Rubber Co. | 1,430 | 34,377 | ||||||
| Wolverine World Wide, Inc. | 998 | 33,892 | ||||||
| National CineMedia, Inc. | 1,687 | 33,673 | ||||||
| Restoration Hardware Holdings, Inc.* | 490 | 32,977 | ||||||
| Buckle, Inc. | 627 | 32,955 | ||||||
| Brown Shoe Company, Inc. | 1,163 | 32,727 | ||||||
| Express, Inc.* | 1,728 | 32,262 | ||||||
| Shutterfly, Inc.* | 629 | 32,035 | ||||||
| Orbitz Worldwide, Inc.* | 4,436 | 31,850 | ||||||
| ANN, Inc.* | 866 | 31,661 | ||||||
| Ethan Allen Interiors, Inc. | 1,040 | 31,637 | ||||||
| Hillenbrand, Inc. | 1,065 | 31,332 | ||||||
| Brunswick Corp. | 680 | 31,321 | ||||||
| Children’s Place Retail Stores, Inc.* | 534 | 30,422 | ||||||
| Total Consumer Discretionary | 1,194,107 | |||||||
| CONSUMER STAPLES - 2.8% | ||||||||
| Sanderson Farms, Inc. | 1,659 | 119,997 | ||||||
| Elizabeth Arden, Inc.* | 3,092 | 109,611 | ||||||
| Spectrum Brands Holdings, Inc. | 1,374 | 96,936 | ||||||
| Rite Aid Corp.* | 18,956 | 95,917 | ||||||
| Susser Holdings Corp.* | 1,419 | 92,931 | ||||||
| TreeHouse Foods, Inc.* | 1,212 | 83,532 | ||||||
| Casey’s General Stores, Inc. | 1,112 | 78,118 | ||||||
| Pilgrim’s Pride Corp.* | 4,756 | 77,285 | ||||||
| Vector Group Ltd. | 4,475 | 73,256 | ||||||
| Pantry, Inc.* | 3,253 | 54,585 | ||||||
| SUPERVALU, Inc.* | 5,777 | 42,114 | ||||||
| Cal-Maine Foods, Inc. | 618 | 37,222 | ||||||
| United Natural Foods, Inc.* | 480 | 36,187 | ||||||
| Hain Celestial Group, Inc.* | 362 | 32,862 | ||||||
| Coca-Cola Bottling Company Consolidated | 439 | 32,130 | ||||||
| Total Consumer Staples | 1,062,683 | |||||||
| ENERGY - 1.4% | ||||||||
| Western Refining, Inc. | 1,309 | 55,514 | ||||||
| ION Geophysical Corp.* | 16,514 | 54,496 | ||||||
| Kodiak Oil & Gas Corp.* | 3,930 | 44,056 | ||||||
| CARBO Ceramics, Inc. | 373 | 43,466 | ||||||
| Bill Barrett Corp.* | 1,623 | 43,465 | ||||||
| Vaalco Energy, Inc.* | 5,051 | 34,801 | ||||||
| Delek US Holdings, Inc. | 999 | 34,376 | ||||||
| Goodrich Petroleum Corp.* | 1,971 | 33,546 | ||||||
| SemGroup Corp. — Class A | 509 | 33,202 | ||||||
| Clean Energy Fuels Corp.* | 2,532 | 32,612 | ||||||
| Renewable Energy Group, Inc.* | 2,776 | 31,813 | ||||||
| EXCO Resources, Inc. | 5,922 | 31,446 | ||||||
| Rosetta Resources, Inc.* | 647 | 31,082 | ||||||
| SEACOR Holdings, Inc.* | 322 | 29,366 | ||||||
| Total Energy | 533,241 | |||||||
| TELECOMMUNICATION SERVICES - 0.1% | ||||||||
| magicJack VocalTec Ltd.* | 2,920 | 34,806 | ||||||
| Total Common Stocks | ||||||||
| (Cost $8,660,395) | 9,471,045 | |||||||
| RIGHTS†† - 0.0% | ||||||||
| EXCO Resources Inc. | ||||||||
| Expires 01/09/14* | 1,480 | 237 | ||||||
| Total Rights | ||||||||
| (Cost $460) | 237 | |||||||
| EXCHANGE TRADED FUNDS†,5 - 5.5% | ||||||||
| Guggenheim BulletShares 2016 | ||||||||
| High Yield Corporate Bond ETF | 26,400 | 713,328 | ||||||
| Guggenheim BulletShares 2015 | ||||||||
| High Yield Corporate Bond ETF | 26,300 | 704,314 | ||||||
| Guggenheim BulletShares 2014 | ||||||||
| High Yield Corporate Bond ETF | 26,300 | 701,421 | ||||||
| Total Exchange Traded Funds | ||||||||
| (Cost $2,115,782) | 2,119,063 | |||||||
| MUTUAL FUNDS†,4 - 3.8% | ||||||||
| Floating Rate Strategies Fund | ||||||||
| Institutional Class | 27,651 | 739,678 | ||||||
| Macro Opportunities Fund | ||||||||
| Institutional Class | 26,845 | 717,827 | ||||||
| Total Mutual Funds | ||||||||
| (Cost $1,493,552) | 1,457,505 | |||||||
| SHORT TERM INVESTMENTS† - 9.2% | ||||||||
| Dreyfus Treasury Prime Cash | ||||||||
| Management Fund | 3,550,089 | 3,550,089 | ||||||
| Total Short Term Investments | ||||||||
| (Cost $3,550,089) | 3,550,089 | |||||||
| SEE NOTES TO FINANCIAL STATEMENTS. | THE GUGGENHEIM FUNDS ANNUAL REPORT | 117 |
| SCHEDULE OF INVESTMENTS (continued) | December 31, 2013 |
| SERIES X (STYLEPLUS–SMALL GROWTH SERIES) | |
| Face Amount | Value | |||||||
| ASSET BACKED SECURITIES†† - 26.1% | ||||||||
| Brentwood CLO Corp. | ||||||||
| 2006-1A, 0.51% due 02/01/221,2 | $ | 270,728 | $ | 265,043 | ||||
| 2006-1A, 1.06% due 02/01/221,2 | 250,000 | 221,575 | ||||||
| Goldman Sachs Asset Management CLO plc | ||||||||
| 2007-1A, 2.99% due 08/01/221,2 | 500,000 | 479,549 | ||||||
| Duane Street CLO IV Ltd. | ||||||||
| 2007-4A, 0.47% due 11/14/211,2 | 485,815 | 476,195 | ||||||
| KKR Financial CLO 2007-1 Corp. | ||||||||
| 2007-1A, 2.49% due 05/15/211,2 | 500,000 | 470,799 | ||||||
| HSI Asset Securitization | ||||||||
| Corporation Trust | ||||||||
| 2007-WF1, 0.33% due 05/25/371 | 489,583 | 449,712 | ||||||
| JP Morgan Mortgage | ||||||||
| Acquisition Trust | ||||||||
| 2006-CH2, 0.26% due 10/25/361 | 423,501 | 415,817 | ||||||
| N-Star REL CDO VIII Ltd. | ||||||||
| 2006-8A, 0.46% due 02/01/411,2 | 450,745 | 410,854 | ||||||
| Garrison Funding 2013-2 Ltd. | ||||||||
| 2013-2A, 2.13% due 09/25/231,2 | 380,000 | 378,480 | ||||||
| NewStar Commercial Loan Trust 2006-1 | ||||||||
| 2006-1A, 0.63% due 03/30/221,2 | 250,000 | 243,975 | ||||||
| 2006-1A, 0.52% due 03/30/221,2 | 113,759 | 112,053 | ||||||
| Argent Securities Incorporated Asset-Backed | ||||||||
| Pass-Through Certificates Series | ||||||||
| 2005-W3, 0.50% due 11/25/351 | 366,647 | 343,612 | ||||||
| JP Morgan Mortgage | ||||||||
| Acquisition Trust | ||||||||
| 2007-CH3, 0.31% due 03/25/371 | 341,640 | 325,052 | ||||||
| Foothill CLO Ltd. | ||||||||
| 2007-1A, 0.48% due 02/22/211,2 | 298,457 | 292,638 | ||||||
| Salus CLO 2012-1 Ltd. | ||||||||
| 2013-1AN, 2.49% due 03/05/211,2 | 270,000 | 270,000 | ||||||
| Central Park CLO Ltd. | ||||||||
| 2011-1A, 3.44% due 07/23/221,2 | 260,000 | 251,368 | ||||||
| Lehman XS Trust 2007-9 | ||||||||
| 2007-9, 0.28% due 06/25/371 | 288,818 | 250,835 | ||||||
| DIVCORE CLO Ltd. | ||||||||
| 2013-1A B, 4.10% due 11/15/32 | 250,000 | 249,250 | ||||||
| Newcastle CDO Ltd. | ||||||||
| 2007-9A, 0.42% due 05/25/52 | 254,788 | 248,826 | ||||||
| Symphony CLO VII Ltd. | ||||||||
| 2011-7A, 3.44% due 07/28/211,2 | 250,000 | 247,900 | ||||||
| Cerberus Onshore II CLO LLC | ||||||||
| 2014-1A, 2.94% due 10/15/231,2 | 250,000 | 247,800 | ||||||
| Halcyon Structured Asset Management Long | ||||||||
| Secured/Short Unsecured 2007-2 Ltd. | ||||||||
| 2007-2A, 3.99% due 10/29/211,2 | 250,000 | 247,575 | ||||||
| FM Leveraged Capital Fund II | ||||||||
| 2006-2A, 1.84% due 11/15/201,2 | 250,000 | 246,950 | ||||||
| Cornerstone CLO Ltd. | ||||||||
| 2007-1A, 0.46% due 07/15/211,2 | 250,000 | 243,750 | ||||||
| Black Diamond CLO 2005-1 Delaware Corp. | ||||||||
| 2005-1A, 2.15% due 06/20/171,2 | 250,000 | 240,600 | ||||||
| Aegis Asset Backed Securities Trust | ||||||||
| 2005-3, 0.63% due 08/25/351 | 250,000 | 237,912 | ||||||
| Race Point IV CLO Ltd. | ||||||||
| 2007-4A, 0.99% due 08/01/211,2 | 250,000 | 235,250 | ||||||
| GSC Group CDO Fund VIII Ltd. | ||||||||
| 2007-8A, 0.62% due 04/17/211,2 | 250,000 | 231,625 | ||||||
| Black Diamond CLO 2006-1 Luxembourg S.A. | ||||||||
| 2007-1A, 0.63% due 04/29/191,2 | 250,000 | 228,100 | ||||||
| Wells Fargo Home Equity Asset-Backed | ||||||||
| Securities 2006-2 Trust | ||||||||
| 2006-3, 0.31% due 01/25/371 | 232,449 | 210,276 | ||||||
| West Coast Funding Ltd. | ||||||||
| 2006-1A, 0.39% due 11/02/411,2 | 209,721 | 202,255 | ||||||
| Popular ABS Mortgage | ||||||||
| Pass-Through Trust | ||||||||
| 2005-A, 0.59% due 06/25/351 | 202,035 | 192,447 | ||||||
| GreenPoint Mortgage | ||||||||
| Funding Trust | ||||||||
| 2005-HE4, 0.87% due 07/25/301 | 200,000 | 178,018 | ||||||
| Global Leveraged Capital | ||||||||
| Credit Opportunity Fund | ||||||||
| 2006-1A, 0.54% due 12/20/181,2 | 175,706 | 173,703 | ||||||
| Northwoods Capital VII Ltd. | ||||||||
| 2006-7A, 1.79% due 10/22/211,2 | 180,000 | 169,236 | ||||||
| California Republic Auto Receivables Trust | ||||||||
| 2013-2, 1.23% due 03/15/19 | 150,000 | 149,887 | ||||||
| ACS 2007-1 Pass Through Trust | ||||||||
| 2007-1A, 0.48% due 06/14/371,2 | 129,025 | 119,993 | ||||||
| Accredited Mortgage Loan Trust | ||||||||
| 2007-1, 0.29% due 02/25/371 | 90,920 | 84,031 | ||||||
| Legg Mason Real Estate CDO I Ltd. | ||||||||
| 2006-1A, 0.45% due 03/25/381,2 | 34,002 | 33,533 | ||||||
| Total Asset Backed Securities | ||||||||
| (Cost $10,106,506) | 10,076,474 | |||||||
| CORPORATE BONDS†† - 9.0% | ||||||||
| FINANCIALS - 3.8% | ||||||||
| Ford Motor Credit Company LLC | ||||||||
| 7.00% due 04/15/15 | 300,000 | 322,909 | ||||||
| Icahn Enterprises Limited Partnership / | ||||||||
| Icahn Enterprises Finance Corp. | ||||||||
| 8.00% due 01/15/18 | 190,000 | 197,600 | ||||||
| 7.75% due 01/15/16 | 120,000 | 122,400 | ||||||
| Citigroup, Inc. | ||||||||
| 1.20% due 07/25/161 | 240,000 | 242,494 | ||||||
| International Lease Finance Corp. | ||||||||
| 2.19% due 06/15/161 | 200,000 | 201,000 | ||||||
| Mack-Cali Realty, LP | ||||||||
| 5.13% due 02/15/14 | 120,000 | 120,529 | ||||||
| Nationstar Mortgage LLC / | ||||||||
| Nationstar Capital Corp. | ||||||||
| 6.50% due 08/01/18 | 100,000 | 101,750 | ||||||
| 118 | THE GUGGENHEIM FUNDS ANNUAL REPORT | SEE NOTES TO FINANCIAL STATEMENTS. |
| SCHEDULE OF INVESTMENTS (continued) | December 31, 2013 |
| SERIES X (STYLEPLUS–SMALL GROWTH SERIES) | |
| Face | ||||||||
| Amount | Value | |||||||
| WEA Finance LLC / | ||||||||
| WT Finance Aust Pty Ltd. | ||||||||
| 5.75% due 09/02/152 | $ | 90,000 | $ | 97,076 | ||||
| Emigrant Bancorp, Inc. | ||||||||
| 6.25% due 06/15/142 | 60,000 | 60,806 | ||||||
| Total Financials | 1,466,564 | |||||||
| MATERIALS - 2.1% | ||||||||
| Glencore Funding LLC | ||||||||
| 1.40% due 05/27/161,2 | 405,000 | 403,105 | ||||||
| Rio Tinto Finance USA plc | ||||||||
| 1.08% due 06/17/161 | 280,000 | 281,986 | ||||||
| Anglo American Capital plc | ||||||||
| 9.38% due 04/08/142 | 130,000 | 132,882 | ||||||
| Total Materials | 817,973 | |||||||
| TELECOMMUNICATION SERVICES - 1.2% | ||||||||
| Level 3 Financing, Inc. | ||||||||
| 3.85% due 01/15/181,2 | 280,000 | 281,750 | ||||||
| WPP Finance UK | ||||||||
| 8.00% due 09/15/14 | 190,000 | 199,455 | ||||||
| Total Telecommunication Services | 481,205 | |||||||
| ENERGY - 1.0% | ||||||||
| Ras Laffan Liquefied Natural Gas | ||||||||
| Company Limited III | ||||||||
| 5.83% due 09/30/162 | 351,560 | 373,533 | ||||||
| CONSUMER STAPLES - 0.3% | ||||||||
| Harbinger Group, Inc. | ||||||||
| 7.88% due 07/15/192 | 110,000 | 118,113 | ||||||
| CONSUMER DISCRETIONARY - 0.3% | ||||||||
| Sabre, Inc. | ||||||||
| 8.50% due 05/15/192 | 50,000 | 55,500 | ||||||
| Vail Resorts, Inc. | ||||||||
| 6.50% due 05/01/19 | 50,000 | 53,000 | ||||||
| Total Consumer Discretionary | 108,500 | |||||||
| INFORMATION TECHNOLOGY - 0.2% | ||||||||
| iGATE Corp. | ||||||||
| 9.00% due 05/01/16 | 65,000 | 69,063 | ||||||
| INDUSTRIALS - 0.1% | ||||||||
| Victor Technologies Group, Inc. | ||||||||
| 9.00% due 12/15/17 | 30,000 | 32,100 | ||||||
| Total Corporate Bonds | ||||||||
| (Cost $3,465,594) | 3,467,051 | |||||||
| COLLATERALIZED MORTGAGE OBLIGATIONS†† - 5.4% | ||||||||
| SRERS-2011 Funding Ltd. | ||||||||
| 2011-RS, 0.42% due 05/09/461,2 | 376,441 | 341,205 | ||||||
| Boca Hotel Portfolio Trust | ||||||||
| 2013-BOCA, 3.22% due 08/15/261,2 | 300,000 | 300,359 | ||||||
| Hilton USA Trust | ||||||||
| 2013-HLF, 2.92% due 11/05/301,2 | 300,000 | 300,022 | ||||||
| Wachovia Bank Commercial Mortgage | ||||||||
| Trust Series | ||||||||
| 2007-WHL8, 0.25% due 06/15/201,2 | 227,812 | 225,511 | ||||||
| COMM Mortgage Trust | ||||||||
| 2007-FL14, 0.92% due 06/15/221,2 | 210,611 | 207,867 | ||||||
| Banc of America Merrill Lynch | ||||||||
| Commercial Mortgage, Inc. | ||||||||
| 2005-6, 6.13% due 09/10/471,2 | 179,200 | 184,862 | ||||||
| Banc of America Large | ||||||||
| Loan Trust | ||||||||
| 2007-BMB1, 1.27% due 08/15/291,2 | 180,000 | 178,592 | ||||||
| GCCFC Commercial Mortgage Trust | ||||||||
| 2006-FL4A C, 0.40% due 11/05/21 | 180,000 | 177,340 | ||||||
| HarborView Mortgage Loan Trust | ||||||||
| 2006-12, 0.36% due 01/19/381 | 217,243 | 176,618 | ||||||
| Total Collateralized Mortgage Obligations | ||||||||
| (Cost $2,075,451) | 2,092,376 | |||||||
| SENIOR FLOATING RATE INTERESTS††,1 - 4.1% | ||||||||
| FINANCIALS - 1.6% | ||||||||
| National Financial Partners | ||||||||
| 5.25% due 07/01/20 | 278,600 | 281,155 | ||||||
| Cunningham Lindsey U.S., Inc. | ||||||||
| 5.00% due 12/10/19 | 124,060 | 123,905 | ||||||
| First Data Corp. | ||||||||
| 4.16% due 03/23/18 | 100,000 | 100,069 | ||||||
| Knight/Getco | ||||||||
| 5.75% due 11/30/17 | 98,832 | 98,955 | ||||||
| Total Financials | 604,084 | |||||||
| INDUSTRIALS - 0.9% | ||||||||
| Travelport Holdings Ltd. | ||||||||
| 6.25% due 06/26/19 | 218,900 | 224,191 | ||||||
| Thermasys Corp. | ||||||||
| 5.26% due 05/03/19 | 139,125 | 136,806 | ||||||
| Total Industrials | 360,997 | |||||||
| CONSUMER DISCRETIONARY - 0.6% | ||||||||
| Pinnacle Entertainment, Inc. | ||||||||
| 3.75% due 08/15/16 | 101,018 | 101,714 | ||||||
| Sears Holdings Corp. | ||||||||
| 5.50% due 06/30/18 | 100,000 | 100,549 | ||||||
| Go Daddy Operating Company LLC | ||||||||
| 4.00% due 12/16/18 | 35,091 | 35,098 | ||||||
| Total Consumer Discretionary | 237,361 | |||||||
| INFORMATION TECHNOLOGY - 0.4% | ||||||||
| Blue Coat Systems, Inc. | ||||||||
| 4.50% due 05/31/19 | 159,600 | 159,950 | ||||||
| ENERGY - 0.3% | ||||||||
| Pacific Drilling | ||||||||
| 4.50% due 05/18/18 | 109,450 | 110,613 | ||||||
| HEALTH CARE - 0.3% | ||||||||
| Apria Healthcare Group, Inc. | ||||||||
| 6.75% due 04/06/20 | 99,500 | 99,707 | ||||||
| Total Senior Floating Rate Interests | ||||||||
| (Cost $1,556,259) | 1,572,712 | |||||||
| SEE NOTES TO FINANCIAL STATEMENTS. | THE GUGGENHEIM FUNDS ANNUAL REPORT | 119 |
| SCHEDULE OF INVESTMENTS (concluded) | December 31, 2013 | |
| SERIES X (STYLEPLUS–SMALL GROWTH SERIES) | ||
| Face | ||||||||
| Amount | Value | |||||||
| MUNICIPAL BONDS†† - 2.5% | ||||||||
| NEW YORK - 2.4% | ||||||||
| New York City Water & Sewer | ||||||||
| System Revenue Bonds | ||||||||
| 0.30% due 06/15/331 | $ | 490,000 | $ | 490,000 | ||||
| City of New York New York | ||||||||
| General Obligation Unlimited | ||||||||
| 0.30% due 04/01/351 | 240,000 | 240,000 | ||||||
| 0.30% due 11/01/261 | 200,000 | 200,000 | ||||||
| Total New York | 930,000 | |||||||
| MICHIGAN - 0.1% | ||||||||
| Michigan Finance Authority | ||||||||
| Revenue Notes | ||||||||
| 4.38% due 08/20/14 | 50,000 | 50,522 | ||||||
| Total Municipal Bonds | ||||||||
| (Cost $980,000) | 980,522 | |||||||
| MORTGAGE BACKED SECURITIES†† - 0.8% | ||||||||
| Resource Capital Corporation | ||||||||
| CRE Notes 2013 Ltd., | ||||||||
| 3.02% due 12/15/281,2 | 300,000 | 300,240 | ||||||
| Total Mortgage Backed securities | ||||||||
| (Cost $300,000) | 300,240 | |||||||
| COMMERCIAL PAPER†† - 9.4% | ||||||||
| Centrica plc | ||||||||
| 0.22% due 01/03/14 | 325,000 | 324,995 | ||||||
| VW Credit, Inc. | ||||||||
| 0.22% due 01/13/142 | 300,000 | 299,978 | ||||||
| Ryder System, Inc. | ||||||||
| 0.20% due 01/15/14 | 300,000 | 299,977 | ||||||
| FMC Technologies Inc. | ||||||||
| 0.23% due 01/14/14 | 300,000 | 299,975 | ||||||
| BAT International Finance | ||||||||
| 0.25% due 01/13/14 | 300,000 | 299,975 | ||||||
| Nissan Motor Acceptance | ||||||||
| 0.30% due 01/13/14 | 300,000 | 299,970 | ||||||
| CBS Corp. | ||||||||
| 0.24% due 01/24/142 | 300,000 | 299,954 | ||||||
| Diageo Capital plc | ||||||||
| 0.08% due 01/02/14 | 250,000 | 249,999 | ||||||
| Tesco Treasury Services plc | ||||||||
| 0.13% due 01/06/142 | 250,000 | 249,995 | ||||||
| Kellogg Co. | ||||||||
| 0.12% due 01/08/14 | 250,000 | 249,994 | ||||||
| Northeast Utilities | ||||||||
| 0.18% due 01/08/14 | 250,000 | 249,991 | ||||||
| Kinder Morgan Energy Partners, LP | ||||||||
| 0.23% due 01/07/142 | 250,000 | 249,990 | ||||||
| Potomac Electric Power Co. | ||||||||
| 0.25% due 01/13/14 | 250,000 | 249,979 | ||||||
| Total Commercial Paper | ||||||||
| (Cost $3,624,772) | 3,624,772 | |||||||
| Total investments - 100.3% | ||||||||
| (Cost $37,928,860) | $ | 38,712,086 | ||||||
| Other Assets & Liabilities, net - (0.3)% | (126,528 | ) | ||||||
| Total Net Assets - 100.0% | $ | 38,585,558 | ||||||
| Unrealized | ||||||||
| Contracts | Gain | |||||||
| EQUITY FUTURES CONTRACTS PURCHASED† | ||||||||
| March 2014 Russell 2000 Index | ||||||||
| Mini Futures Contracts | ||||||||
| (Aggregate Value of | ||||||||
| Contracts $348,180) | 3 | $ | 13,385 | |||||
| March 2014 NASDAQ-100 Index | ||||||||
| Mini Futures Contracts | ||||||||
| (Aggregate Value of | ||||||||
| Contracts $71,780) | 1 | 2,376 | ||||||
| (Total Aggregate Value of | ||||||||
| Contracts $419,960) | $ | 15,761 |
| Units | ||||||||
| OTC EQUITY INDEX SWAP AGREEMENTS†† | ||||||||
| Morgan Stanley Capital Services, Inc. | ||||||||
| February 2014 Russell 2000 Growth | ||||||||
| Index Swap, Terminating 02/03/143 | ||||||||
| (Notional Value $28,299,758) | 41,125 | $ | — |
| * | Non-income producing security. |
| † | Value determined based on Level 1 inputs — See Note 4. |
| †† | Value determined based on Level 2 inputs — See Note 4. |
| 1 | Variable rate security. Rate indicated is rate effective at December 31, 2013. |
| 2 | Security is a 144A or Section 4(a)(2) security. The total market value of 144A or Section 4(a)(2) securities is $11,402,139 (cost $11,418,209), or 29.6% of total net assets. |
| 3 | Total Return based on Russell 2000 Growth Index +/- financing at a variable rate. |
| 4 | Affiliated funds. |
| 5 | Investment in a product that pays a management fee to a party related to the advisor. |
| 6 | Illiquid security. |
| plc — Public Limited Company |
| 120 | THE GUGGENHEIM FUNDS ANNUAL REPORT | SEE NOTES TO FINANCIAL STATEMENTS. |
| SERIES X (STYLEPLUS–SMALL GROWTH SERIES) |
| STATEMENT OF ASSETS |
| AND LIABILITIES |
| December 31, 2013 |
| Assets: | ||||
| Investments in unaffiliated issuers, at value | ||||
| (cost $36,435,308) | $ | 37,254,581 | ||
| Investments in affiliated issuers, at value | ||||
| (cost $1,493,552) | 1,457,505 | |||
| Total investments | ||||
| (cost $37,928,860) | 38,712,086 | |||
| Receivable for swap settlement | 881,403 | |||
| Segregated cash with broker | 15,700 | |||
| Cash | 10,535 | |||
| Prepaid expenses | 3,244 | |||
| Receivables: | ||||
| Interest | 72,725 | |||
| Fund shares sold | 40,255 | |||
| Dividends | 28,850 | |||
| Variation margin | 1,665 | |||
| Total assets | 39,766,463 | |||
| Liabilities: | ||||
| Due to broker | 835,000 | |||
| Payable for: | ||||
| Securities purchased | 247,493 | |||
| Fund shares redeemed | 36,404 | |||
| Management fees | 27,156 | |||
| Transfer agent/maintenance fees | 4,399 | |||
| Fund accounting/administration fees | 3,035 | |||
| Directors’ fees* | 703 | |||
| Miscellaneous | 26,715 | |||
| Total liabilities | 1,180,905 | |||
| Net assets | $ | 38,585,558 | ||
| Net assets consist of: | ||||
| Paid in capital | $ | 31,496,382 | ||
| Accumulated net investment loss | (3,781 | ) | ||
| Accumulated net realized gain on investments | 6,293,970 | |||
| Net unrealized appreciation on investments | 798,987 | |||
| Net assets | $ | 38,585,558 | ||
| Capital shares outstanding | 1,321,257 | |||
| Net asset value per share | $ | 29.20 |
| STATEMENT OF |
| OPERATIONS |
| Year Ended December 31, 2013 |
| Investment Income: | ||||
| Interest | $ | 197,469 | ||
| Dividends from securities of unaffiliated issuers | 124,812 | |||
| Dividends from securities of affiliated issuers | 48,534 | |||
| Total investment income | 370,815 | |||
| Expenses: | ||||
| Management fees | 309,504 | |||
| Transfer agent/maintenance fees | 25,626 | |||
| Fund accounting/administration fees | 34,591 | |||
| Printing expenses | 28,241 | |||
| Professional fees | 22,795 | |||
| Custodian fees | 4,863 | |||
| Directors’ fees* | 3,390 | |||
| Tax expense | 1 | |||
| Miscellaneous | 18,282 | |||
| Total expenses | 447,293 | |||
| Net investment loss | (76,478 | ) | ||
| Net Realized and Unrealized Gain (Loss): | ||||
| Net realized gain (loss) on: | ||||
| Investments in unaffiliated issuers | 6,995,748 | |||
| Investments in affiliated issuers | 687 | |||
| Swap agreements | 6,791,493 | |||
| Futures contracts | 3,539 | |||
| Net realized gain | 13,791,467 | |||
| Net change in unrealized appreciation (depreciation) on: | ||||
| Investments in unaffiliated issuers | (1,276,922 | ) | ||
| Investments in affiliated issuers | (36,047 | ) | ||
| Futures contracts | 15,761 | |||
| Net change in unrealized appreciation (depreciation) | (1,297,208 | ) | ||
| Net realized and unrealized gain | 12,494,259 | |||
| Net increase in net assets resulting from operations | $ | 12,417,781 |
* Relates to Directors not deemed “interested persons” within the meaning of Section 2(a)(19) of the 1940 Act.
| SEE NOTES TO FINANCIAL STATEMENTS. | THE GUGGENHEIM FUNDS ANNUAL REPORT | 121 |
| SERIES X (STYLEPLUS–SMALL GROWTH SERIES) |
| STATEMENTS OF CHANGES IN NET ASSETS |
| Year Ended | Year Ended | |||||||
| December 31, | December 31, | |||||||
| 2013 | 2012 | |||||||
| Increase (Decrease) In Net Assets From Operations: | ||||||||
| Net investment loss | $ | (76,478 | ) | $ | (194,441 | ) | ||
| Net realized gain on investments | 13,791,467 | 4,568,903 | ||||||
| Net change in unrealized appreciation (depreciation) on investments | (1,297,208 | ) | (544,759 | ) | ||||
| Net increase in net assets resulting from operations | 12,417,781 | 3,829,703 | ||||||
| Capital share transactions: | ||||||||
| Proceeds from sale of shares | 9,379,728 | 2,875,146 | ||||||
| Cost of shares redeemed | (15,249,191 | ) | (10,378,761 | ) | ||||
| Net decrease from capital share transactions | (5,869,463 | ) | (7,503,615 | ) | ||||
| Net increase (decrease) in net assets | 6,548,318 | (3,673,912 | ) | |||||
| Net assets: | ||||||||
| Beginning of year | 32,037,240 | 35,711,152 | ||||||
| End of year | $ | 38,585,558 | $ | 32,037,240 | ||||
| Accumulated net investment loss at end of year | $ | (3,781 | ) | $ | — | |||
| Capital share activity: | ||||||||
| Shares sold | 398,406 | 141,633 | ||||||
| Shares redeemed | (627,534 | ) | (519,758 | ) | ||||
| Net decrease in shares | (229,128 | ) | (378,125 | ) | ||||
| 122 | THE GUGGENHEIM FUNDS ANNUAL REPORT | SEE NOTES TO FINANCIAL STATEMENTS. |
| SERIES X (STYLEPLUS–SMALL GROWTH SERIES) |
| FINANCIAL HIGHLIGHTS |
This table is presented to show selected data for a share outstanding throughout each period and to assist shareholders in evaluating a Fund’s performance for the periods presented.
| Year Ended | Year Ended | Year Ended | Year Ended | Year Ended | ||||||||||||||||
| December 31, | December 31, | December 31, | December 31, | December 31, | ||||||||||||||||
| 2013 | 2012 | 2011 | 2010 | 2009 | ||||||||||||||||
| Per Share Data | ||||||||||||||||||||
| Net asset value, beginning of period | $ | 20.66 | $ | 18.52 | $ | 18.89 | $ | 14.52 | $ | 10.74 | ||||||||||
| Income (loss) from investment operations: | ||||||||||||||||||||
| Net investment lossa | (.05 | ) | (.11 | ) | (.12 | ) | (.10 | ) | (.04 | ) | ||||||||||
| Net gain (loss) on investments (realized and unrealized) | 8.59 | 2.25 | (.25 | ) | 4.47 | 3.82 | ||||||||||||||
| Total from investment operations | 8.54 | 2.14 | (.37 | ) | 4.37 | 3.78 | ||||||||||||||
| Net asset value, end of period | $ | 29.20 | $ | 20.66 | $ | 18.52 | $ | 18.89 | $ | 14.52 | ||||||||||
| Total Returnb | 41.34 | % | 11.56 | % | (1.96 | %) | 30.10 | % | 35.20 | % | ||||||||||
| Ratios/Supplemental Data | ||||||||||||||||||||
| Net assets, end of period (in thousands) | $ | 38,586 | $ | 32,037 | $ | 35,711 | $ | 46,149 | $ | 35,396 | ||||||||||
| Ratios to average net assets: | ||||||||||||||||||||
| Net investment loss | (0.21 | %) | (0.56 | %) | (0.63 | %) | (0.65 | %) | (0.30 | %) | ||||||||||
| Total expensesc | 1.23 | % | 1.14 | % | 1.08 | % | 1.09 | % | 1.10 | % | ||||||||||
| Portfolio turnover rate | 255 | % | 72 | % | 91 | % | 88 | % | 100 | % | ||||||||||
| a | Net investment loss per share was computed using average shares outstanding throughout the period. |
| b | Total return does not take into account any of the expenses associated with an investment in variable insurance products. If total return had taken into account these expenses, performance would have been lower. Shares of a series of SBL Fund are available only through the purchase of such products. |
| c | Does not include expenses of the underlying funds in which the Fund invests. |
| SEE NOTES TO FINANCIAL STATEMENTS. | THE GUGGENHEIM FUNDS ANNUAL REPORT | 123 |
| MANAGER’S COMMENTARY (Unaudited) | December 31, 2013 |
To Our Shareholders:
The Series Y (StylePlus—Large Growth Series, formerly Large Cap Concentrated Growth Series) is managed by a team of seasoned professionals, including B. Scott Minerd, Global Chief Investment Officer; Farhan Sharaff, Senior Managing Director and Assistant Chief Investment Officer, Equities; Jayson Flowers, Senior Managing Director and Head of Equity and Derivative Strategies; and Scott Hammond, Managing Director and Portfolio Manager. In the following paragraphs, the investment team discusses performance and changes to the Fund that occurred during the fiscal year ended December 31, 2013.
For the fiscal year ended December 31, 2013, the Series Y (StylePlus—Large Growth Series, formerly Large Cap Concentrated Growth Series) returned 28.27%, compared with benchmark, the Russell 1000® Growth Index, which gained 33.48%.
The Fund’s Board of Directors approved the following changes, which became effective on April 30, 2013: a new Fund name, new principal investment strategies and new portfolio management team.
The Fund’s new investment objective is to seek long-term growth of capital in excess of that produced by the total return of the Russell 1000 Growth Index. The Fund seeks to add alpha above the target index by leveraging Guggenheim’s competencies in fixed and systematic stock selection. To accomplish this, the StylePlus strategy allocates to quantitative selection models when stock picking opportunities in the market are high. When stock selection opportunities are less attractive, the Fund invests in derivatives based on the target index, backed by a diversified portfolio of fixed income instruments. In this way, the Fund believes it will deliver the target index return plus an alpha component commensurate with the yield achieved on the active fixed income portfolio.
The Fund’s underperformance for the 12 months came predominantly during the four months it was being managed according to the legacy strategy. Specifically, from January 1, 2013, through April 30, 2013, the Fund underperformed the benchmark by about five percentage points, largely due to poor stock selection in the Information Technology and Energy sectors. The Fund’s cash position was also a drag on performance. A sector overweight and stock selection in Consumer Discretionary contributed most to the Fund’s performance.
For the time the Fund was being managed according to the new strategy, the eight months from April 30, 2013 through September 30, 2013, the Fund performed slightly better than the benchmark. During much of this period, the Fund maintained an approximate allocation of 20% to systematic equity selection, 80% allocated to the passive equity position, which was maintained with swap agreements and futures contracts, and 51% allocated to fixed income investments (excluding short-term). Beginning in December 2013, due to a more favorable outlook for active stock selection, the equity sleeve was increased to 25%, with 75% allocated to the passive equity position.
The equity sleeve was additive over the period, delivering the strongest returns during the months of May, June and December.
The fixed income allocation also contributed to performance over the eight months, after detracting from performance during the substantial debt selloff that began at the end of May and lasted in to June. The swap agreements also contributed to performance.
Performance displayed represents past performance, which is no guarantee of future results.
The opinions and forecast expressed may not actually come to pass. This information is subject to change at any time, based on market and other conditions, and should not be construed as a recommendation of any specific security or strategy.
| 124 | THE GUGGENHEIM FUNDS ANNUAL REPORT |
| PERFORMANCE REPORT AND FUND PROFILE (Unaudited) | December 31, 2013 |
SERIES Y (STYLEPLUS–LARGE GROWTH SERIES)
OBJECTIVE: Seeks long-term growth of capital.
Cumulative Fund Performance*,†
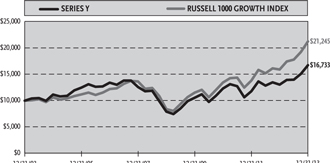
Average Annual Returns*
Periods Ended December 31, 2013†
| 1 Year | 5 Year | 10 Year | ||||||||||
| Series Y (StylePlus Large Growth Series) | 28.27 | % | 16.13 | % | 5.28 | % | ||||||
| Russell 1000 Growth Index | 33.48 | % | 20.39 | % | 7.83 | % | ||||||
| Ten Largest Holdings (% of Total Net Assets) | ||||
| Dreyfus Treasury Prime Cash Management Fund | 8.6 | % | ||
| U.S. Treasury Bill | 4.9 | % | ||
| Guggenheim BulletShares 2016 High Yield Corporate Bond ETF | 2.0 | % | ||
| Guggenheim BulletShares 2014 High Yield Corporate Bond ETF | 1.9 | % | ||
| Guggenheim BulletShares 2015 High Yield Corporate Bond ETF | 1.9 | % | ||
| Floating Rate Strategies Fund Institutional Class | 1.7 | % | ||
| Macro Opportunities Fund Institutional Class | 1.7 | % | ||
| New York City Water & Sewer System Revenue Bonds | 1.2 | % | ||
| Goldman Sachs Asset Management CLO plc — 2007-1A | 1.2 | % | ||
| KKR Financial CLO 2007-1 Corp. — 2007-1A | 1.2 | % | ||
| Top Ten Total | 26.3 | % | ||
Holdings Diversification (Market Exposure as % of Net Assets)
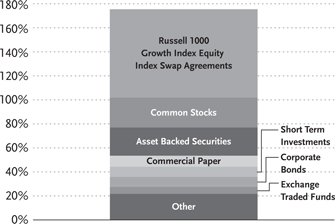
Inception Date: May 3, 1999
| Portfolio Composition by Quality Rating** | ||||
| Rating | ||||
| Fixed Income Instruments | ||||
| AAA | 10.9 | % | ||
| AA | 4.0 | % | ||
| A | 8.4 | % | ||
| BBB | 21.0 | % | ||
| BB | 3.3 | % | ||
| B | 3.9 | % | ||
| CCC | 4.4 | % | ||
| NR | 1.8 | % | ||
| Other Instruments | ||||
| Common Stocks | 24.8 | % | ||
| Short Term Investments | 8.6 | % | ||
| Exchange Traded Funds | 5.8 | % | ||
| Mutual Funds | 3.4 | % | ||
| Total Investments | 100.3 | % | ||
The chart above reflects percentages of the value of total investments.
| * | The performance data above represents past performance that is not predictive of future results. The investment return and principal value of an investment in the Fund will fluctuate so that an investor’s shares, when redeemed, may be worth more or less than their original cost. Returns are historical and include changes in principal and reinvested dividends and capital gains and do not reflect the effect of taxes. The Russell 1000 Growth Index is an unmanaged index and, unlike the Fund, has no management fees or operating expenses to reduce its reported return. |
| ** | Source: Factset. Credit quality ratings are measured on a scale that generally ranges from AAA (highest) to D (lowest). All rated securities have been rated by Moody’s, Standard & Poor’s (“S&P”), or Fitch, which are all a Nationally Recognized Statistical Rating Organization (“NRSRO”). For purposes of this presentation, when ratings are available from more than one agency, the highest rating is used. Guggenheim Investments has converted Moody’s and Fitch ratings to the equivalent S&P rating. Unrated securities do not necessarily indicate low credit quality. Security ratings are determined at the time of purchase and may change thereafter. |
| † | Performance figures do not reflect fees and expenses associated with an investment in variable insurance products. If returns had taken into account these fees and expenses, performance would have been lower. Shares of a series of SBL Fund are available only through the purchase of such products. |
| THE GUGGENHEIM FUNDS ANNUAL REPORT | 125 |
| SCHEDULE OF INVESTMENTS | December 31, 2013 |
| SERIES Y (STYLEPLUS–LARGE GROWTH SERIES) | |
| Shares | Value | |||||||
| COMMON STOCKS† - 24.8% | ||||||||
| INFORMATION TECHNOLOGY - 7.4% | ||||||||
| Apple, Inc. | 757 | $ | 424,761 | |||||
| Microsoft Corp. | 10,820 | 404,994 | ||||||
| International Business Machines Corp. | 1,734 | 325,247 | ||||||
| Oracle Corp. | 6,898 | 263,917 | ||||||
| Google, Inc. — Class A* | 201 | 225,263 | ||||||
| QUALCOMM, Inc. | 2,644 | 196,317 | ||||||
| Accenture plc — Class A | 2,017 | 165,838 | ||||||
| Texas Instruments, Inc. | 3,653 | 160,403 | ||||||
| EMC Corp. | 5,743 | 144,436 | ||||||
| Automatic Data Processing, Inc. | 1,194 | 96,487 | ||||||
| Intuit, Inc. | 1,186 | 90,515 | ||||||
| Motorola Solutions, Inc. | 1,254 | 84,645 | ||||||
| Intel Corp. | 3,145 | 81,644 | ||||||
| Applied Materials, Inc. | 3,954 | 69,946 | ||||||
| MasterCard, Inc. — Class A | 65 | 54,305 | ||||||
| eBay, Inc.* | 953 | 52,310 | ||||||
| Salesforce.com, Inc.* | 919 | 50,720 | ||||||
| Cisco Systems, Inc. | 1,992 | 44,720 | ||||||
| Visa, Inc. — Class A | 143 | 31,843 | ||||||
| Facebook, Inc. — Class A* | 574 | 31,375 | ||||||
| Total Information Technology | 2,999,686 | |||||||
| INDUSTRIALS - 4.4% | ||||||||
| United Technologies Corp. | 1,916 | 218,040 | ||||||
| United Parcel Service, Inc. — Class B | 1,820 | 191,246 | ||||||
| Boeing Co. | 1,240 | 169,248 | ||||||
| Emerson Electric Co. | 2,095 | 147,027 | ||||||
| Union Pacific Corp. | 857 | 143,975 | ||||||
| CSX Corp. | 4,315 | 124,143 | ||||||
| Ingersoll-Rand plc | 2,008 | 123,693 | ||||||
| Caterpillar, Inc. | 1,318 | 119,688 | ||||||
| Waste Management, Inc. | 2,421 | 108,630 | ||||||
| Lockheed Martin Corp. | 690 | 102,575 | ||||||
| Delta Air Lines, Inc. | 3,527 | 96,887 | ||||||
| Norfolk Southern Corp. | 855 | 79,370 | ||||||
| Deere & Co. | 779 | 71,146 | ||||||
| FedEx Corp. | 299 | 42,987 | ||||||
| Fluor Corp. | 402 | 32,277 | ||||||
| Total Industrials | 1,770,932 | |||||||
| CONSUMER STAPLES - 4.1% | ||||||||
| PepsiCo, Inc. | 3,047 | 252,717 | ||||||
| Wal-Mart Stores, Inc. | 2,393 | 188,305 | ||||||
| Philip Morris International, Inc. | 2,038 | 177,572 | ||||||
| Walgreen Co. | 2,611 | 149,976 | ||||||
| Kimberly-Clark Corp. | 1,347 | 140,708 | ||||||
| Kellogg Co. | 1,996 | 121,896 | ||||||
| CVS Caremark Corp. | 1,653 | 118,305 | ||||||
| General Mills, Inc. | 2,240 | 111,798 | ||||||
| Coca-Cola Co. | 2,332 | 96,335 | ||||||
| Lorillard, Inc. | 1,555 | 78,807 | ||||||
| Archer-Daniels-Midland Co. | 1,809 | 78,511 | ||||||
| Kroger Co. | 1,886 | 74,554 | ||||||
| Altria Group, Inc. | 1,483 | 56,932 | ||||||
| Total Consumer Staples | 1,646,416 | |||||||
| CONSUMER DISCRETIONARY - 4.0% | ||||||||
| Comcast Corp. — Class A | 4,762 | 247,457 | ||||||
| Target Corp. | 2,232 | 141,219 | ||||||
| Lowe’s Companies, Inc. | 2,818 | 139,632 | ||||||
| Viacom, Inc. — Class B | 1,469 | 128,303 | ||||||
| Macy’s, Inc. | 2,338 | 124,849 | ||||||
| CBS Corp. — Class B | 1,789 | 114,031 | ||||||
| Ford Motor Co. | 6,360 | 98,135 | ||||||
| Liberty Global plc — Class A* | 984 | 87,566 | ||||||
| Home Depot, Inc. | 1,035 | 85,222 | ||||||
| Starbucks Corp. | 862 | 67,572 | ||||||
| McDonald’s Corp. | 576 | 55,889 | ||||||
| The Gap, Inc. | 1,380 | 53,930 | ||||||
| Amazon.com, Inc.* | 129 | 51,444 | ||||||
| Time Warner Cable, Inc. | 320 | 43,360 | ||||||
| Netflix, Inc.* | 112 | 41,235 | ||||||
| DIRECTV* | 558 | 38,552 | ||||||
| Walt Disney Co. | 473 | 36,137 | ||||||
| Omnicom Group, Inc. | 444 | 33,020 | ||||||
| DISH Network Corp. — Class A* | 567 | 32,841 | ||||||
| Total Consumer Discretionary | 1,620,394 | |||||||
| HEALTH CARE - 3.7% | ||||||||
| Amgen, Inc. | 1,757 | 200,579 | ||||||
| Express Scripts Holding Co.* | 2,329 | 163,589 | ||||||
| Johnson & Johnson | 1,375 | 125,936 | ||||||
| Stryker Corp. | 1,629 | 122,403 | ||||||
| Eli Lilly & Co. | 2,309 | 117,759 | ||||||
| McKesson Corp. | 705 | 113,787 | ||||||
| Becton Dickinson and Co. | 989 | 109,275 | ||||||
| HCA Holdings, Inc.* | 2,043 | 97,472 | ||||||
| Aetna, Inc. | 1,359 | 93,214 | ||||||
| Cigna Corp. | 1,003 | 87,742 | ||||||
| Baxter International, Inc. | 1,202 | 83,599 | ||||||
| Bristol-Myers Squibb Co. | 1,374 | 73,028 | ||||||
| Agilent Technologies, Inc. | 948 | 54,216 | ||||||
| Actavis plc* | 206 | 34,608 | ||||||
| Total Health Care | 1,477,207 | |||||||
| ENERGY - 1.1% | ||||||||
| Anadarko Petroleum Corp. | 1,344 | 106,606 | ||||||
| Baker Hughes, Inc. | 1,892 | 104,552 | ||||||
| EOG Resources, Inc. | 517 | 86,773 | ||||||
| Kinder Morgan, Inc. | 1,509 | 54,324 | ||||||
| Halliburton Co. | 990 | 50,243 | ||||||
| Schlumberger Ltd. | 359 | 32,349 | ||||||
| Total Energy | 434,847 | |||||||
| TELECOMMUNICATION SERVICES - 0.1% | ||||||||
| Verizon Communications, Inc. | 989 | 48,599 | ||||||
| Total Common Stocks | ||||||||
| (Cost $9,358,992) | 9,998,081 | |||||||
| 126 | THE GUGGENHEIM FUNDS ANNUAL REPORT | SEE NOTES TO FINANCIAL STATEMENTS. |
| SCHEDULE OF INVESTMENTS (continued) | December 31, 2013 |
| SERIES Y (STYLEPLUS–LARGE GROWTH SERIES) | |
| Shares | Value | |||||||
| EXCHANGE TRADED FUNDS†,6 - 5.8% | ||||||||
| Guggenheim BulletShares 2016 | ||||||||
| High Yield Corporate Bond ETF | 28,900 | $ | 780,878 | |||||
| Guggenheim BulletShares 2014 | ||||||||
| High Yield Corporate Bond ETF | 29,100 | 776,097 | ||||||
| Guggenheim BulletShares 2015 | ||||||||
| High Yield Corporate Bond ETF | 28,800 | 771,264 | ||||||
| Total Exchange Traded Funds | ||||||||
| (Cost $2,325,897) | 2,328,239 | |||||||
| MUTUAL FUNDS†,4 - 3.4% | ||||||||
| Floating Rate Strategies Fund | ||||||||
| Institutional Class | 25,744 | 688,665 | ||||||
| Macro Opportunities Fund | ||||||||
| Institutional Class | 24,993 | 668,322 | ||||||
| Total Mutual Funds | ||||||||
| (Cost $1,390,548) | 1,356,987 | |||||||
| SHORT TERM INVESTMENTS† - 8.6% | ||||||||
| Dreyfus Treasury Prime Cash | ||||||||
| Management Fund | 3,490,394 | 3,490,394 | ||||||
| Total Short Term Investments | ||||||||
| (Cost $3,490,394) | 3,490,394 | |||||||
| Face | ||||||||
| Amount | ||||||||
| ASSET BACKED SECURITIES†† - 23.5% | ||||||||
| Goldman Sachs Asset Management CLO plc | ||||||||
| 2007-1A, 2.99% due 08/01/221,2 | $ | 500,000 | 479,549 | |||||
| KKR Financial CLO 2007-1 Corp. | ||||||||
| 2007-1A, 2.49% due 05/15/211,2 | 500,000 | 470,799 | ||||||
| Brentwood CLO Corp. | ||||||||
| 2006-1A, 0.51% due 02/01/221,2 | 248,167 | 242,956 | ||||||
| 2006-1A, 1.06% due 02/01/221,2 | 250,000 | 221,575 | ||||||
| Duane Street CLO IV Ltd. | ||||||||
| 2007-4A, 0.47% due 11/14/211,2 | 437,233 | 428,576 | ||||||
| HSI Asset Securitization Corporation | ||||||||
| Trust | ||||||||
| 2007-WF1, 0.33% due 05/25/371 | 448,785 | 412,236 | ||||||
| N-Star REL CDO VIII Ltd. | ||||||||
| 2006-8A, 0.46% due 02/01/411,2 | 450,745 | 410,854 | ||||||
| JP Morgan Mortgage Acquisition | ||||||||
| Trust | ||||||||
| 2006-CH2, 0.26% due 10/25/361 | 381,151 | 374,236 | ||||||
| NewStar Commercial Loan Trust | ||||||||
| 2006-1A, 0.63% due 03/30/221,2 | 250,000 | 243,975 | ||||||
| 2006-1A, 0.52% due 03/30/221,2 | 113,759 | 112,053 | ||||||
| Garrison Funding 2013-2 Ltd. | ||||||||
| 2013-2A, 2.13% due 09/25/231,2 | 340,000 | 338,640 | ||||||
| JP Morgan Mortgage Acquisition | ||||||||
| Trust | ||||||||
| 2007-CH3, 0.31% due 03/25/371 | 341,640 | 325,052 | ||||||
| Argent Securities Incorporated Asset-Backed | ||||||||
| Pass-Through Certificates Series | ||||||||
| 2005-W3, 0.50% due 11/25/351 | 325,908 | 305,432 | ||||||
| Foothill CLO Ltd. | ||||||||
| 2007-1A, 0.48% due 02/22/211,2 | 268,612 | 263,374 | ||||||
| DIVCORE CLO Ltd. 2013-1A B, | ||||||||
| 4.10% due 11/15/32 | 250,000 | 249,250 | ||||||
| Symphony CLO VII Ltd. | ||||||||
| 2011-7A, 3.44% due 07/28/211,2 | 250,000 | 247,900 | ||||||
| Cerberus Onshore II CLO LLC | ||||||||
| 2014-1A, 2.94% due 10/15/231,2 | 250,000 | 247,800 | ||||||
| Halcyon Structured Asset Management | ||||||||
| Long Secured/Short Unsecured 2007-2 Ltd. | ||||||||
| 2007-2A, 3.99% due 10/29/211,2 | 250,000 | 247,575 | ||||||
| FM Leveraged Capital Fund II | ||||||||
| 2006-2A, 1.84% due 11/15/201,2 | 250,000 | 246,950 | ||||||
| Cornerstone CLO Ltd. | ||||||||
| 2007-1A, 0.46% due 07/15/211,2 | 250,000 | 243,750 | ||||||
| Central Park CLO Ltd. | ||||||||
| 2011-1A, 3.44% due 07/23/221,2 | 250,000 | 241,700 | ||||||
| Black Diamond CLO 2005-1 Delaware Corp. | ||||||||
| 2005-1A, 2.15% due 06/20/171,2 | 250,000 | 240,600 | ||||||
| Race Point IV CLO Ltd. | ||||||||
| 2007-4A, 0.99% due 08/01/211,2 | 250,000 | 235,250 | ||||||
| GSC Group CDO Fund VIII Ltd. | ||||||||
| 2007-8A, 0.62% due 04/17/211,2 | 250,000 | 231,625 | ||||||
| Salus CLO 2012-1 Ltd. | ||||||||
| 2013-1AN, 2.49% due 03/05/211,2 | 230,000 | 230,000 | ||||||
| Newcastle CDO Ltd. | ||||||||
| 2007-9A, 0.42% due 05/25/52 | 234,288 | 228,806 | ||||||
| Black Diamond CLO 2006-1 Luxembourg S.A. | ||||||||
| 2007-1A, 0.63% due 04/29/191,2 | 250,000 | 228,100 | ||||||
| Lehman XS Trust | ||||||||
| 2007-9, 0.28% due 06/25/371 | 261,047 | 226,716 | ||||||
| Aegis Asset Backed Securities Trust | ||||||||
| 2005-3, 0.63% due 08/25/351 | 200,000 | 190,330 | ||||||
| Wells Fargo Home Equity Asset-Backed | ||||||||
| Securities 2006-2 Trust | ||||||||
| 2006-3, 0.31% due 01/25/371 | 209,204 | 189,248 | ||||||
| West Coast Funding Ltd. | ||||||||
| 2006-1A, 0.39% due 11/02/411,2 | 188,749 | 182,029 | ||||||
| GreenPoint Mortgage Funding | ||||||||
| Trust | ||||||||
| 2005-HE4, 0.87% due 07/25/301 | 200,000 | 178,018 | ||||||
| Popular ABS Mortgage Pass-Through | ||||||||
| Trust 2005-A | ||||||||
| 2005-A, 0.59% due 06/25/351 | 183,668 | 174,952 | ||||||
| Northwoods Capital VII Ltd. | ||||||||
| 2006-7A, 1.79% due 10/22/211,2 | 160,000 | 150,432 | ||||||
| Global Leveraged Capital Credit | ||||||||
| Opportunity Fund | ||||||||
| 2006-1A, 0.54% due 12/20/181,2 | 131,779 | 130,277 | ||||||
| ACS 2007-1 Pass Through Trust | ||||||||
| 2007-1A, 0.48% due 06/14/371,2 | 129,025 | 119,993 | ||||||
| California Republic Auto Receivables Trust | ||||||||
| 2013-2, 1.23% due 03/15/19 | 100,000 | 99,925 | ||||||
| Accredited Mortgage Loan Trust | ||||||||
| 2007-1, 0.29% due 02/25/371 | 83,343 | 77,029 | ||||||
| Legg Mason Real Estate CDO I Ltd. | ||||||||
| 2006-1A, 0.45% due 03/25/381,2 | 31,483 | 31,049 | ||||||
| Total Asset Backed Securities | ||||||||
| (Cost $9,528,110) | 9,498,611 | |||||||
| SEE NOTES TO FINANCIAL STATEMENTS. | THE GUGGENHEIM FUNDS ANNUAL REPORT | 127 |
| SCHEDULE OF INVESTMENTS (continued) | December 31, 2013 |
| SERIES Y (STYLEPLUS–LARGE GROWTH SERIES) |
| Face | ||||||||
| Amount | Value | |||||||
| CORPORATE BONDS†† - 8.3% | ||||||||
| FINANCIALS - 3.5% | ||||||||
| Ford Motor Credit Company LLC | ||||||||
| 7.00% due 04/15/15 | $ | 280,000 | $ | 301,382 | ||||
| Icahn Enterprises Limited Partnership / | ||||||||
| Icahn Enterprises Finance Corp. | ||||||||
| 8.00% due 01/15/18 | 180,000 | 187,200 | ||||||
| 7.75% due 01/15/16 | 100,000 | 102,000 | ||||||
| Citigroup, Inc. | ||||||||
| 1.20% due 07/25/161 | 260,000 | 262,702 | ||||||
| International Lease Finance Corp. | ||||||||
| 2.19% due 06/15/161 | 190,000 | 190,950 | ||||||
| Mack-Cali Realty, LP | ||||||||
| 5.13% due 02/15/14 | 110,000 | 110,485 | ||||||
| Nationstar Mortgage LLC / | ||||||||
| Nationstar Capital Corp. | ||||||||
| 6.50% due 08/01/18 | 100,000 | 101,750 | ||||||
| WEA Finance LLC / WT Finance Aust Pty Ltd. | ||||||||
| 5.75% due 09/02/152 | 80,000 | 86,290 | ||||||
| Emigrant Bancorp, Inc. | ||||||||
| 6.25% due 06/15/142 | 60,000 | 60,806 | ||||||
| Total Financials | 1,403,565 | |||||||
| MATERIALS - 1.9% | ||||||||
| Glencore Funding LLC | ||||||||
| 1.40% due 05/27/161,2 | 380,000 | 378,222 | ||||||
| Rio Tinto Finance USA plc | ||||||||
| 1.08% due 06/17/161 | 260,000 | 261,845 | ||||||
| Anglo American Capital plc | ||||||||
| 9.38% due 04/08/142 | 120,000 | 122,660 | ||||||
| Total Materials | 762,727 | |||||||
| ENERGY - 1.1% | ||||||||
| Ras Laffan Liquefied Natural Gas | ||||||||
| Company Limited III | ||||||||
| 5.83% due 09/30/162 | 325,710 | 346,067 | ||||||
| Petroleos Mexicanos | ||||||||
| 2.27% due 07/18/181 | 110,000 | 113,300 | ||||||
| Total Energy | 459,367 | |||||||
| TELECOMMUNICATION SERVICES - 1.0% | ||||||||
| Level 3 Financing, Inc. | ||||||||
| 3.85% due 01/15/181,2 | 250,000 | 251,562 | ||||||
| WPP Finance UK | ||||||||
| 8.00% due 09/15/14 | 160,000 | 167,962 | ||||||
| Total Telecommunication Services | 419,524 | |||||||
| CONSUMER STAPLES - 0.3% | ||||||||
| Harbinger Group, Inc. | ||||||||
| 7.88% due 07/15/192 | 100,000 | 107,375 | ||||||
| CONSUMER DISCRETIONARY - 0.2% | ||||||||
| Vail Resorts, Inc. | ||||||||
| 6.50% due 05/01/19 | 50,000 | 53,000 | ||||||
| Sabre, Inc. | ||||||||
| 8.50% due 05/15/192 | 40,000 | 44,400 | ||||||
| Total Consumer Discretionary | 97,400 | |||||||
| INFORMATION TECHNOLOGY - 0.2% | ||||||||
| iGATE Corp. | ||||||||
| 9.00% due 05/01/16 | 60,000 | 63,750 | ||||||
| INDUSTRIALS - 0.1% | ||||||||
| Victor Technologies Group, Inc. | ||||||||
| 9.00% due 12/15/17 | 28,000 | 29,960 | ||||||
| Total Corporate Bonds | ||||||||
| (Cost $3,338,276) | 3,343,668 | |||||||
| COLLATERALIZED MORTGAGE OBLIGATIONS†† - 4.6% | ||||||||
| SRERS-2011 Funding Ltd. | ||||||||
| 2011-RS, 0.42% due 05/09/461,2 | 376,441 | 341,206 | ||||||
| Boca Hotel Portfolio Trust | ||||||||
| 2013-BOCA, 3.22% due 08/15/261,2 | 250,000 | 250,300 | ||||||
| COMM 2007-FL14 Mortgage Trust | ||||||||
| 2007-FL14, 0.92% due 06/15/221,2 | 210,611 | 207,867 | ||||||
| Hilton USA Trust | ||||||||
| 2013-HLF, 2.92% due 11/05/301,2 | 200,000 | 200,014 | ||||||
| Wachovia Bank Commercial Mortgage | ||||||||
| Trust Series | ||||||||
| 2007-WHL8, 0.25% due 06/15/201,2 | 200,474 | 198,449 | ||||||
| HarborView Mortgage Loan Trust | ||||||||
| 2006-12, 0.36% due 01/19/381 | 217,243 | 176,618 | ||||||
| GCCFC Commercial Mortgage Trust | ||||||||
| 2006-FL4A C, 0.40% due 11/05/21 | 170,000 | 167,488 | ||||||
| Banc of America Merrill Lynch | ||||||||
| Commercial Mortgage, Inc. | ||||||||
| 2005-6, 6.13% due 09/10/471,2 | 161,280 | 166,376 | ||||||
| Banc of America Large Loan | ||||||||
| Trust | ||||||||
| 2007-BMB1, 1.27% due 08/15/291,2 | 160,000 | 158,748 | ||||||
| Total Collateralized Mortgage Obligations | ||||||||
| (Cost $1,850,305) | 1,867,066 | |||||||
| U.S. TREASURY BILLS† - 4.9% | ||||||||
| U.S. Treasury Bill | ||||||||
| due 02/20/145 | 2,000,000 | 1,999,938 | ||||||
| Total U.S. Treasury Bills | ||||||||
| (Cost $1,999,946) | 1,999,938 | |||||||
| SENIOR FLOATING RATE INTERESTS††,1 - 4.1% | ||||||||
| FINANCIALS - 1.4% | ||||||||
| National Financial Partners | ||||||||
| 5.25% due 07/01/20 | 258,700 | 261,073 | ||||||
| Cunningham Lindsey U.S., Inc. | ||||||||
| 5.00% due 12/10/19 | 124,060 | 123,905 | ||||||
| First Data Corp. | ||||||||
| 4.16% due 03/23/18 | 100,000 | 100,069 | ||||||
| Knight/Getco | ||||||||
| 5.75% due 11/30/17 | 87,850 | 87,960 | ||||||
| Total Financials | 573,007 | |||||||
| INDUSTRIALS - 0.8% | ||||||||
| Travelport Holdings Ltd. | ||||||||
| 6.25% due 06/26/19 | 208,950 | 214,000 | ||||||
| Thermasys Corp. | ||||||||
| 5.26% due 05/03/19 | 129,188 | 127,034 | ||||||
| Total Industrials | 341,034 | |||||||
| ENERGY - 0.6% | ||||||||
| Ocean Rig ASA | ||||||||
| 5.50% due 07/15/16 | 149,625 | 151,558 | ||||||
| 128 | THE GUGGENHEIM FUNDS ANNUAL REPORT | SEE NOTES TO FINANCIAL STATEMENTS. |
| SCHEDULE OF INVESTMENTS (concluded) | December 31, 2013 |
| SERIES Y (STYLEPLUS–LARGE GROWTH SERIES) | |
| Face | ||||||||
| Amount | Value | |||||||
| Pacific Drilling | ||||||||
| 4.50% due 05/18/18 | $ | 99,500 | $ | 100,558 | ||||
| Total Energy | 252,116 | |||||||
| CONSUMER DISCRETIONARY - 0.6% | ||||||||
| Pinnacle Entertainment, Inc. | ||||||||
| 3.75% due 08/15/16 | 101,018 | 101,713 | ||||||
| Sears Holdings Corp. | ||||||||
| 5.50% due 06/30/18 | 100,000 | 100,549 | ||||||
| Go Daddy Operating Company LLC | ||||||||
| 4.00% due 12/16/18 | 19,343 | 19,347 | ||||||
| Total Consumer Discretionary | 221,609 | |||||||
| INFORMATION TECHNOLOGY - 0.4% | ||||||||
| Blue Coat Systems, Inc. | ||||||||
| 4.50% due 05/31/19 | 149,625 | 149,953 | ||||||
| HEALTH CARE - 0.3% | ||||||||
| Apria Healthcare Group, Inc. | ||||||||
| 6.75% due 04/06/20 | 99,500 | 99,707 | ||||||
| Total Senior Floating Rate Interests | ||||||||
| (Cost $1,617,403) | 1,637,426 | |||||||
| MUNICIPAL BONDS†† - 2.5% | ||||||||
| NEW YORK - 2.4% | ||||||||
| New York City Water & Sewer System | ||||||||
| Revenue Bonds | ||||||||
| 0.30% due 06/15/331 | 510,000 | 510,000 | ||||||
| City of New York New York General | ||||||||
| Obligation Unlimited | ||||||||
| 0.30% due 04/01/351 | 260,000 | 260,000 | ||||||
| 0.30% due 11/01/261 | 210,000 | 210,000 | ||||||
| Total New York | 980,000 | |||||||
| MICHIGAN - 0.1% | ||||||||
| Michigan Finance Authority Revenue Notes | ||||||||
| 4.38% due 08/20/14 | 50,000 | 50,522 | ||||||
| Total Municipal Bonds | ||||||||
| (Cost $1,030,000) | 1,030,522 | |||||||
| MORTGAGED BACKED SECURITIES†† - 0.8% | ||||||||
| Resource Capital Corporation | ||||||||
| CRE Notes 2013 Ltd. | ||||||||
| 2013-CRE1, 3.02% due 12/15/281,2 | 250,000 | 250,200 | ||||||
| Total Mortgaged Backed Securities | ||||||||
| (Cost $250,000) | 250,200 | |||||||
| COMMERCIAL PAPER†† - 9.2% | ||||||||
| Centrica plc | ||||||||
| 0.22% due 01/03/14 | 325,000 | 324,994 | ||||||
| Diageo Capital plc | ||||||||
| 0.09% due 01/02/14 | 300,000 | 299,999 | ||||||
| Tesco Treasury Services plc | ||||||||
| 0.13% due 01/06/142 | 300,000 | 299,994 | ||||||
| Kellogg Co. | ||||||||
| 0.12% due 01/08/14 | 300,000 | 299,992 | ||||||
| Northeast Utilities | ||||||||
| 0.18% due 01/08/14 | 300,000 | 299,990 | ||||||
| Kinder Morgan Energy Partners, LP | ||||||||
| 0.23% due 01/07/142 | 300,000 | 299,989 | ||||||
| FMC Technologies Inc. | ||||||||
| 0.23% due 01/14/14 | 300,000 | 299,975 | ||||||
| Potomac Electric Power Co. | ||||||||
| 0.25% due 01/13/14 | 300,000 | 299,975 | ||||||
| CBS Corp. | ||||||||
| 0.24% due 01/24/142 | 300,000 | 299,954 | ||||||
| VW Credit, Inc. | ||||||||
| 0.22% due 01/13/142 | 250,000 | 249,982 | ||||||
| Ryder System, Inc. | ||||||||
| 0.20% due 01/15/14 | 250,000 | 249,981 | ||||||
| BAT International Finance | ||||||||
| 0.25% due 01/13/14 | 250,000 | 249,979 | ||||||
| Nissan Motor Acceptance | ||||||||
| 0.30% due 01/13/14 | 250,000 | 249,975 | ||||||
| Total Commercial Paper | ||||||||
| (Cost $3,724,779) | 3,724,779 | |||||||
| Total Investments - 100.3% | ||||||||
| (Cost $39,904,650) | $ | 40,525,911 | ||||||
| Other Assets & Liabilities, net - (0.3)% | (108,631 | ) | ||||||
| Total Net Assets - 100.0% | $ | 40,417,280 | ||||||
| Unrealized | ||||||||
| Contracts | Gain | |||||||
| EQUITY FUTURES CONTRACTS PURCHASED† | ||||||||
| March 2014 S&P 500 Index | ||||||||
| Mini Futures Contracts | ||||||||
| (Aggregate Value of | ||||||||
| Contracts $368,850) | 4 | $ | 12,767 | |||||
| March 2014 NASDAQ-100 Index | ||||||||
| Mini Futures Contracts | ||||||||
| (Aggregate Value of | ||||||||
| Contracts $215,340) | 3 | 7,128 | ||||||
| (Total Aggregate Value of Contracts $584,190) | $ | 19,895 | ||||||
| Units | ||||||||
| OTC EQUITY INDEX SWAP AGREEMENTS†† | ||||||||
| Morgan Stanley Capital Services, Inc. | ||||||||
| February 2014 Russell 1000 Growth | ||||||||
| Index Swap, Terminating 02/03/143 | ||||||||
| (Notional Value $29,799,717) | 34,498 | $ | — | |||||
| * | Non-income producing security. |
| † | Value determined based on Level 1 inputs — See Note 4. |
| †† | Value determined based on Level 2 inputs — See Note 4. |
| 1 | Variable rate security. Rate indicated is rate effective at December 31, 2013. |
| 2 | Security is a 144A or Section 4(a)(2) security. The total market value of 144A or Section 4(a)(2) securities is $10,787,842 (cost $10,803,934), or 26.7% of total net assets. |
| 3 | Total Return based on Russell 1000 Growth Index +/- financing at a variable rate. |
| 4 | Affiliated funds. |
| 5 | Zero coupon rate security. |
| 6 | Investment in a product that pays a management fee to a party related to the advisor. |
plc — Public Limited Company
| SEE NOTES TO FINANCIAL STATEMENTS. | THE GUGGENHEIM FUNDS ANNUAL REPORT | 129 |
| SERIES Y (STYLEPLUS–LARGE GROWTH SERIES) |
| STATEMENT OF ASSETS |
| AND LIABILITIES |
December 31, 2013
| Assets: | ||||
| Investments in unaffiliated issuers, at value | ||||
| (cost $38,514,102) | $ | 39,168,924 | ||
| Investments in affiliated issuers, at value | ||||
| (cost $1,390,548) | 1,356,987 | |||
| Total investments | ||||
| (cost $39,904,650) | 40,525,911 | |||
| Receivable for swap settlement | 907,335 | |||
| Segregated cash with broker | 24,800 | |||
| Cash | 11,771 | |||
| Prepaid expenses | 3,187 | |||
| Receivables: | ||||
| Interest | 70,216 | |||
| Dividends | 33,430 | |||
| Variation margin | 3,305 | |||
| Fund shares sold | 836 | |||
| Total assets | 41,580,791 | |||
| Liabilities: | ||||
| Due to broker | 791,466 | |||
| Payable for: | ||||
| Securities purchased | 247,493 | |||
| Fund shares redeemed | 68,736 | |||
| Management fees | 24,891 | |||
| Transfer agent/maintenance fees | 4,406 | |||
| Fund accounting/administration fees | 3,153 | |||
| Directors’ fees* | 967 | |||
| Miscellaneous | 22,399 | |||
| Total liabilities | 1,163,511 | |||
| Net assets | $ | 40,417,280 | ||
| Net assets consist of: | ||||
| Paid in capital | $ | 37,595,766 | ||
| Undistributed net investment income | 137,646 | |||
| Accumulated net realized gain on investments | 2,042,712 | |||
| Net unrealized appreciation on investments | 641,156 | |||
| Net assets | $ | 40,417,280 | ||
| Capital shares outstanding | 2,990,540 | |||
| Net asset value per share | $ | 13.52 |
| STATEMENT OF |
| OPERATIONS |
| Year Ended December 31, 2013 |
| Investment Income: | ||||
| Dividends from securities of unaffiliated issuers | $ | 284,537 | ||
| Interest | 191,599 | |||
| Dividends from securities of affiliated issuers | 45,187 | |||
| Total investment income | 521,323 | |||
| Expenses: | ||||
| Management fees | 274,132 | |||
| Transfer agent/maintenance fees | 25,626 | |||
| Fund accounting/administration fees | 34,723 | |||
| Printing expenses | 25,813 | |||
| Custodian fees | 6,229 | |||
| Directors’ fees* | 4,495 | |||
| Tax expense | 1 | |||
| Miscellaneous | 30,596 | |||
| Total expenses | 401,615 | |||
| Net investment income | 119,708 | |||
| Net Realized and Unrealized Gain (Loss): | ||||
| Net realized gain (loss) on: | ||||
| Investments in unaffiliated issuers | 5,303,531 | |||
| Investments in affiliated issuers | 640 | |||
| Swap agreements | 4,746,974 | |||
| Futures contracts | 54,458 | |||
| Net realized gain | 10,105,603 | |||
| Net change in unrealized appreciation (depreciation) on: | ||||
| Investments in unaffiliated issuers | (1,197,396 | ) | ||
| Investments in affiliated issuers | (33,561 | ) | ||
| Futures contracts | 19,895 | |||
| Net change in unrealized appreciation (depreciation) | (1,211,062 | ) | ||
| Net realized and unrealized gain | 8,894,541 | |||
| Net increase in net assets resulting from operations | $ | 9,014,249 |
* Relates to Directors not deemed “interested persons” within the meaning of Section 2(a)(19) of the 1940 Act.
| 130 | THE GUGGENHEIM FUNDS ANNUAL REPORT | SEE NOTES TO FINANCIAL STATEMENTS. |
| SERIES Y (STYLEPLUS–LARGE GROWTH SERIES) |
| STATEMENTS OF CHANGES IN NET ASSETS |
| Year Ended | Year Ended | |||||||
| December 31, | December 31, | |||||||
| 2013 | 2012 | |||||||
| Increase (Decrease) In Net Assets From Operations: | ||||||||
| Net investment income | $ | 119,708 | $ | 242,457 | ||||
| Net realized gain on investments | 10,105,603 | 3,474,207 | ||||||
| Net change in unrealized appreciation (depreciation) on investments | (1,211,062 | ) | 225,235 | |||||
| Net increase in net assets resulting from operations | 9,014,249 | 3,941,899 | ||||||
| Capital share transactions: | ||||||||
| Proceeds from sale of shares | 10,465,661 | 8,568,903 | ||||||
| Cost of shares redeemed | (15,306,317 | ) | (14,397,614 | ) | ||||
| Net decrease from capital share transactions | (4,840,656 | ) | (5,828,711 | ) | ||||
| Net increase (decrease) in net assets | 4,173,593 | (1,886,812 | ) | |||||
| Net assets: | ||||||||
| Beginning of year | 36,243,687 | 38,130,499 | ||||||
| End of year | $ | 40,417,280 | $ | 36,243,687 | ||||
| Undistributed net investment income at end of year | $ | 137,646 | $ | 242,457 | ||||
| Capital share activity: | ||||||||
| Shares sold | 864,085 | 814,296 | ||||||
| Shares redeemed | (1,310,714 | ) | (1,382,567 | ) | ||||
| Net decrease in shares | (446,629 | ) | (568,271 | ) | ||||
| SEE NOTES TO FINANCIAL STATEMENTS. | THE GUGGENHEIM FUNDS ANNUAL REPORT | 131 |
| SERIES Y (STYLEPLUS–LARGE GROWTH SERIES) |
| FINANCIAL HIGHLIGHTS |
This table is presented to show selected data for a share outstanding throughout each period and to assist shareholders in evaluating a Fund’s performance for the periods presented.
| Year Ended | Year Ended | Year Ended | Year Ended | Year Ended | ||||||||||||||||
| December 31, | December 31, | December 31, | December 31, | December 31, | ||||||||||||||||
| 2013 | 2012 | 2011 | 2010 | 2009 | ||||||||||||||||
| Per Share Data | ||||||||||||||||||||
| Net asset value, beginning of period | $ | 10.54 | $ | 9.52 | $ | 9.95 | $ | 8.53 | $ | 6.40 | ||||||||||
| Income (loss) from investment operations: | ||||||||||||||||||||
| Net investment incomeb | .04 | .07 | .02 | .08 | .03 | |||||||||||||||
| Net gain (loss) on investments (realized and unrealized) | 2.94 | .95 | (.45 | ) | 1.34 | 2.10 | ||||||||||||||
| Total from investment operations | 2.98 | 1.02 | (.43 | ) | 1.42 | 2.13 | ||||||||||||||
| Net asset value, end of period | $ | 13.52 | $ | 10.54 | $ | 9.52 | $ | 9.95 | $ | 8.53 | ||||||||||
| Total Returna | 28.27 | % | 10.71 | % | (4.32 | %) | 16.65 | % | 33.28 | % | ||||||||||
| Ratios/Supplemental Data | ||||||||||||||||||||
| Net assets, end of period (in thousands) | $ | 40,417 | $ | 36,244 | $ | 38,130 | $ | 43,571 | $ | 41,338 | ||||||||||
| Ratios to average net assets: | ||||||||||||||||||||
| Net investment income | 0.33 | % | 0.63 | % | 0.20 | % | 0.96 | % | 0.37 | % | ||||||||||
| Total expensesc | 1.10 | % | 1.01 | % | 0.98 | % | 0.96 | % | 1.00 | % | ||||||||||
| Portfolio turnover rate | 247 | % | 187 | % | 153 | % | 182 | % | 151 | % | ||||||||||
| a | Total return does not take into account any of the expenses associated with an investment in variable insurance products. If total return had taken into account these expenses, performance would have been lower. Shares of a series of SBL Fund are available only through the purchase of such products. |
| b | Net investment income per share was computed using average shares outstanding throughout the period. |
| c | Does not include expenses of the underlying funds in which the Fund invests. |
| 132 | THE GUGGENHEIM FUNDS ANNUAL REPORT | SEE NOTES TO FINANCIAL STATEMENTS. |
| MANAGER’S COMMENTARY (Unaudited) | December 31, 2013 |
To Our Shareholders:
The Series Z (Alpha Opportunity Series) is managed by a team of seasoned professionals, including Michael P. Byrum, CFA, Portfolio Manager; Michael Dellapa, CFA, CAIA, Portfolio Manager; and Ryan Harder, CFA, Portfolio Manager. In the following paragraphs, the team discusses changes to the Fund and performance of the Fund for the fiscal year ended December 31, 2013.
For the fiscal year ended December 31, 2013, the Series Z (Alpha Opportunity Series) gained 27.83%, compared with its benchmark, the S&P 500® Index, which gained 32.39%.
The Fund is closed to new investors because it remains subject to proceedings associated with the bankruptcy filing of Lehman Brothers, Inc., in 2008, which has made certain assets illiquid.
During the period, Mainstream Investment Advisors, LLC, the Fund sub-adviser for Domestic Long/Short Sub-Portfolio, resigned effective September 30, 2013. The Fund’s Board of Directors approved certain changes to the Fund’s investment program as a result of the resignation.
The first change was that the Fund’s current investment manager, Security Investors, LLC, an affiliate of Guggenheim Investments, assumed investment management responsibility for the Domestic Long/Short Sub-Portfolio as of September 30, 2013. Security Investors was already responsible for management of the other two Sub-Portfolios.
The second change was, in conjunction with the adviser change in the Domestic Long/Short Sub-Portfolio, new principal investment strategies.
The Fund’s strategies now are to pursue its objective by investing, under normal market conditions, approximately 37.5% of its total assets according to a long/short strategy with an emphasis on securities of non-U.S. issuers (the “Global Long/Short Sub-Portfolio”); approximately 37.5% of its total assets according to a long/short strategy with an emphasis on securities of domestic issuers (the “Domestic Long/Short Sub-Portfolio”); and 25% of its total assets in a portfolio of equity securities, equity derivatives and fixed income securities (the “Indexed Sub-Portfolio”) that is intended to closely track the performance of the S&P 500 Index.
Global Long/Short Sub-Portfolio
This sleeve has exposure to Lehman Brothers International Europe (LBIE) through a collateral account held by the Fund’s custodian that consists of short-sale proceeds and long positions in U.S. securities. While Guggenheim Investments seeks to resolve certain outstanding short-sale transactions with LBIE, the collateral remains illiquid.
Release of the collateral requires the consent of LBIE and Lehman Brothers, Inc., which is currently in bankruptcy. Due to the valuations assigned to the short positions, which are based on certain assumptions, resolution could ultimately result in the Fund’s realizing values that are materially different from those indicated in this report, which would materially affect the Fund’s net asset value. Guggenheim Investments is uncertain when the issues surrounding the collateral account will be resolved.
The long positions in U.S. securities contributed positive performance to the Fund over the past year.
Domestic Long/Short Sub-Portfolio
Effective September 30, 2013, Mainstream Investment Advisers, LLC was no longer sub-adviser to the domestic long/short strategy allocation.
During September 2013, Mainstream began to liquidate its allocation in anticipation of its resignation and completed the liquidation by the close of September 25. As the allocation was converted to cash, the new investment manager, Security Investors, LLC, began investing it in equity futures in order to gain exposure to the U.S. equity market.
The new Investment Manager’s strategy is to seek to respond to the dynamically changing economy by moving its investments among different industries and styles, making its allocation according to several measures of momentum. Companies associated with industries and/or styles demonstrating positive momentum are favored while those experiencing negative momentum are disfavored. The Fund may hold both long and short positions.
| THE GUGGENHEIM FUNDS ANNUAL REPORT | 133 |
| MANAGERS’ COMMENTARY (Unaudited) (concluded) | December 31, 2012 |
Equity positions are determined based on their associated industry and style momentum, risk characteristics and liquidity. The Fund invests in domestic equity securities, including small-, mid- and large-capitalization securities, such as U.S. traded common stocks and ADRs, but also may invest in derivative instruments which primarily consist of equity index swaps, futures contracts and options on securities, futures contracts and stock indices giving exposure to the U.S. markets.
The Fund may invest in derivatives to hedge or gain leveraged exposure to a particular sector, industry or company depending on market conditions.
The Fund also may enter into short sales of broad-based stock indices for hedging purposes in an effort to reduce the Fund’s risk or volatility.
While the Fund anticipates investing in these instruments to seek to achieve its investment objective, the extent of the Fund’s investment in these instruments may vary day to day depending on a number of different factors, including price, availability and general market conditions.
The Sub-Portfolio may focus its investments in a limited number of issuers, even though the Fund as a whole operates as a diversified fund.
For the part of the period during which Mainstream managed the allocation, it used a domestic long/short strategy which applied fundamental and technical methods of analysis to identify quality securities trading at attractive valuations. This strategy used a top-down perspective to formulate long-term themes and a bottom-up approach to identify individual securities.
Favorable stock selection in the Industrials and Energy sectors was offset by the hedged allocation (primarily cash, which averaged near 26% as the sub-adviser transitioned the portfolio to cash near the end of the period).
Indexed Sub-Portfolio
The investment manager for this portion of the portfolio seeks investment returns that are similar to those of the S&P 500 Index by primarily investing in equity derivatives, such as futures contracts, options on futures contracts and equity options. The results of derivatives use during the period were within expectations and contributed to the Fund’s performance.
The Fund primarily used S&P 500 e-mini futures for the portion of Fund assets that is intended to track the S&P 500 Index. Equity markets rallied strongly throughout the past 12 months in response to continued central bank accommodation. The S&P 500 Index reached an all-time high during the period.
Performance displayed represents past performance, which is no guarantee of future results.
The opinions and forecast expressed may not actually come to pass. This information is subject to change at any time, based on market and other conditions, and should not be construed as a recommendation of any specific security or strategy.
| 134 | THE GUGGENHEIM FUNDS ANNUAL REPORT |
| PERFORMANCE REPORT AND FUND PROFILE (Unaudited) | December 31, 2013 |
SERIES Z (ALPHA OPPORTUNITY SERIES)
OBJECTIVE: Seeks long-term growth of capital.
Cumulative Fund Performance*,†
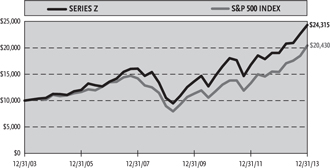
Average Annual Returns*
Periods Ended December 31, 2013†
| 1 Year | 5 Year | 10 Year | ||||||||||
| Series Z (Alpha Opportunity Series) | 27.83 | % | 18.27 | % | 9.29 | % | ||||||
| S&P 500 Index | 32.39 | % | 17.94 | % | 7.41 | % | ||||||
Holdings Diversification (Market Exposure as % of Net Assets)
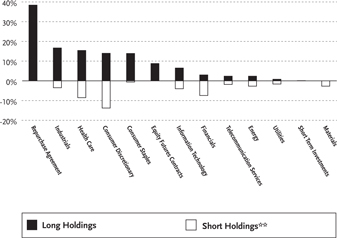
| ** | All of the short holdings were fair valued by the Valuation Committee at December 31, 2013 due to exposure to LBIE — See Note 12. The total market value of fair valued securities amounts to (46.6%) of total net assets. |
Inception Date: July 7, 2003
| Ten Largest Holdings (% of Total Net Assets) | ||||
| State Street | 38.3 | % | ||
| Philip Morris International, Inc. | 5.5 | % | ||
| Altria Group, Inc. | 4.1 | % | ||
| Lockheed Martin Corp. | 3.6 | % | ||
| Trinity Industries, Inc. | 3.5 | % | ||
| ViroPharma, Inc. | 3.1 | % | ||
| CA, Inc. | 3.0 | % | ||
| AO Smith Corp. | 2.9 | % | ||
| Johnson & Johnson | 2.9 | % | ||
| TJX Companies, Inc. | 2.9 | % | ||
| Top Ten Total | 69.8 | % | ||
| * | The performance data above represents past performance that is not predictive of future results. The investment return and principal value of an investment in the Fund will fluctuate so that an investor’s shares, when redeemed, may be worth more or less than their original cost. Returns are historical and include changes in principal and reinvested dividends and capital gains and do not reflect the effect of taxes. The S&P 500 Index is an unmanaged index and, unlike the Fund, has no management fees or operating expenses to reduce its reported return. |
| † | Performance figures do not reflect fees and expenses associated with an investment in variable insurance products. If returns had taken into account these fees and expenses, performance would have been lower. Shares of a series of SBL Fund are available only through the purchase of such products. |
| THE GUGGENHEIM FUNDS ANNUAL REPORT | 135 |
| SCHEDULE OF INVESTMENTS | December 31, 2013 |
| SERIES Z (ALPHA OPPORTUNITY SERIES) | |
| Shares | Value | |||||||
| COMMON STOCKS† - 75.1% | ||||||||
| INDUSTRIALS - 16.7% | ||||||||
| Lockheed Martin Corp.1,2 | 3,993 | $ | 593,599 | |||||
| Trinity Industries, Inc.1,2 | 10,800 | 588,816 | ||||||
| AO Smith Corp.1,2 | 9,000 | 485,460 | ||||||
| Towers Watson & Co. — Class A1,2 | 2,400 | 306,264 | ||||||
| Joy Global, Inc.1,2 | 4,800 | 280,752 | ||||||
| Watts Water Technologies, Inc. — | ||||||||
| Class A1,2 | 3,000 | 185,611 | ||||||
| General Electric Co.1,2 | 4,500 | 126,135 | ||||||
| Northrop Grumman Corp.1,2 | 1,100 | 126,071 | ||||||
| Con-way, Inc.1,2 | 1,800 | 71,478 | ||||||
| Huntington Ingalls Industries, Inc.1,2 | 183 | 16,472 | ||||||
| Total Industrials | 2,780,658 | |||||||
| HEALTH CARE - 15.4% | ||||||||
| ViroPharma, Inc.*,1,2 | 10,500 | 523,426 | ||||||
| Johnson & Johnson1,2 | 5,300 | 485,427 | ||||||
| Life Technologies Corp.*,1,2 | 3,000 | 227,400 | ||||||
| Amgen, Inc.1,2 | 1,900 | 216,903 | ||||||
| Forest Laboratories, Inc.*,1,2 | 3,600 | 216,108 | ||||||
| WellCare Health Plans, Inc.*,1,2 | 2,400 | 169,008 | ||||||
| AstraZeneca plc1,2 | 2,800 | 165,746 | ||||||
| GlaxoSmithKline plc1,2 | 5,500 | 146,779 | ||||||
| Baxter International, Inc.1,2 | 1,900 | 132,145 | ||||||
| Charles River Laboratories | ||||||||
| International, Inc.*,1,2 | 2,100 | 111,384 | ||||||
| Owens & Minor, Inc.1,2 | 2,800 | 102,368 | ||||||
| Kindred Healthcare, Inc.1,2 | 4,100 | 80,934 | ||||||
| Total Health Care | 2,577,628 | |||||||
| CONSUMER DISCRETIONARY - 14.0% | ||||||||
| TJX Companies, Inc.1,2 | 7,600 | 484,348 | ||||||
| Ross Stores, Inc.1,2 | 4,600 | 344,678 | ||||||
| L Brands, Inc.1,2 | 5,400 | 333,990 | ||||||
| Walt Disney Co.1,2 | 4,322 | 330,201 | ||||||
| Family Dollar Stores, Inc.1,2 | 3,900 | 253,383 | ||||||
| The Gap, Inc.1,2 | 6,300 | 246,204 | ||||||
| Jack in the Box, Inc.*,1,2 | 4,200 | 210,084 | ||||||
| PVH Corp.1,2 | 900 | 122,418 | ||||||
| RadioShack Corp.*,1,2 | 5,500 | 14,300 | ||||||
| Total Consumer Discretionary | 2,339,606 | |||||||
| CONSUMER STAPLES - 13.9% | ||||||||
| Philip Morris International, Inc.1,2 | 10,500 | 914,866 | ||||||
| Altria Group, Inc.1,2 | 17,800 | 683,342 | ||||||
| Herbalife Ltd.1,2 | 5,200 | 409,240 | ||||||
| Wal-Mart Stores, Inc.1,2 | 2,300 | 180,987 | ||||||
| Safeway, Inc.1,2 | 4,200 | 136,794 | ||||||
| Total Consumer Staples | 2,325,229 | |||||||
| INFORMATION TECHNOLOGY - 6.5% | ||||||||
| CA, Inc.1,2 | 14,900 | 501,384 | ||||||
| Arrow Electronics, Inc.*,1,2 | 2,800 | 151,900 | ||||||
| Symantec Corp.1,2 | 6,300 | 148,554 | ||||||
| Avnet, Inc.1,2 | 3,200 | 141,152 | ||||||
| Harmonic, Inc.*,1,2 | 11,700 | 86,346 | ||||||
| Amkor Technology, Inc.*,1,2 | 9,800 | 60,074 | ||||||
| Total Information Technology | 1,089,410 | |||||||
| FINANCIALS - 3.0% | ||||||||
| Amtrust Financial Services, Inc.1,2 | 7,623 | 249,196 | ||||||
| Endurance Specialty Holdings Ltd.1,2 | 3,200 | 187,744 | ||||||
| Genworth Financial, Inc. — Class A*,1,2 | 4,200 | 65,226 | ||||||
| Irish Bank Resolution | ||||||||
| Corporation Ltd.*,†††,3 | 16,638 | — | ||||||
| Total Financials | 502,166 | |||||||
| TELECOMMUNICATION SERVICES - 2.4% | ||||||||
| AT&T, Inc.1,2 | 11,300 | 397,308 | ||||||
| ENERGY - 2.4% | ||||||||
| Anadarko Petroleum Corp.1,2 | 2,930 | 232,407 | ||||||
| ConocoPhillips1,2 | 1,500 | 105,975 | ||||||
| Phillips 661,2 | 750 | 57,848 | ||||||
| Total Energy | 396,230 | |||||||
| UTILITIES - 0.8% | ||||||||
| Exelon Corp.1,2 | 5,022 | 137,553 | ||||||
| Total Common Stocks | ||||||||
| (Cost $7,940,553) | 12,545,788 | |||||||
| SHORT TERM INVESTMENTS† - 0.1% | ||||||||
| State Street General Account | ||||||||
| U.S. Government Fund | 23,239 | 23,239 | ||||||
| Total Short Term Investments | ||||||||
| (Cost $23,239) | 23,239 | |||||||
| Face | ||||||||
| Amount | ||||||||
| REPURCHASE AGREEMENT††,4 - 38.4% | ||||||||
| State Street | ||||||||
| issued 12/31/13 at 0.00% | ||||||||
| due 01/02/14 | $ | 6,405,684 | 6,405,684 | |||||
| Total Repurchase Agreement | ||||||||
| (Cost $6,405,684) | 6,405,684 | |||||||
| Total Investments - 113.2% | ||||||||
| (Cost $14,369,476) | $ | 18,974,711 | ||||||
| Shares | ||||||||
| COMMON STOCKS SOLD SHORT - (46.6)% | ||||||||
| CONSUMER STAPLES - (0.6)% | ||||||||
| Monster Beverage Corp.*,†††,3,5 | 3,270 | (96,825 | ) | |||||
| UTILITIES - (1.6)% | ||||||||
| Korea Electric Power Corp. ADR*,†††,3,5 | 19,460 | (263,293 | ) | |||||
| TELECOMMUNICATION SERVICES - (1.8)% | ||||||||
| Clearwire Corp. — Class A*,†††,3,5 | 2,660 | (30,138 | ) | |||||
| Global Crossing Ltd.*,†††,3,5 | 2,520 | (40,244 | ) | |||||
| Leap Wireless International, Inc.*,†††,3,5 | 1,600 | (69,440 | ) | |||||
| 136 | THE GUGGENHEIM FUNDS ANNUAL REPORT | SEE NOTES TO FINANCIAL STATEMENTS. |
| SCHEDULE OF INVESTMENTS (continued) | December 31, 2013 |
| SERIES Z (ALPHA OPPORTUNITY SERIES) | |
| Shares | Value | |||||||
| SBA Communications Corp. — | ||||||||
| Class A*,†††,3,5 | 2,600 | $ | (74,854 | ) | ||||
| Savvis, Inc.*,†††,3,5 | 5,900 | (86,966 | ) | |||||
| Total Telecommunication Services | (301,642 | ) | ||||||
| MATERIALS - (2.7)% | ||||||||
| China National Building Material | ||||||||
| Company Ltd. — Class H†††,3,5 | 17,300 | (23,432 | ) | |||||
| Anhui Conch Cement Company | ||||||||
| Ltd. — Class H†††,3,5 | 5,500 | (24,761 | ) | |||||
| Shougang Fushan Resources | ||||||||
| Group Ltd.†††,3,5 | 70,000 | (25,165 | ) | |||||
| Sino Gold Mining Ltd.*,†††,3,5 | 9,100 | (37,425 | ) | |||||
| Turquoise Hill Resources Ltd.*,†††,3,5 | 4,780 | (39,865 | ) | |||||
| Western Areas Ltd.†††,3,5 | 6,600 | (47,325 | ) | |||||
| Zoltek Companies, Inc.*,†††,3,5 | 2,900 | (52,867 | ) | |||||
| Silver Wheaton Corp.†††,3,5 | 6,500 | (68,246 | ) | |||||
| Agnico Eagle Mines Ltd.†††,3,5 | 1,900 | (125,612 | ) | |||||
| Total Materials | (444,698 | ) | ||||||
| ENERGY - (2.7)% | ||||||||
| Aquila Resources Ltd.*,†††,3,5 | 2,860 | (22,783 | ) | |||||
| Arrow Energy Holdings Pty Ltd.*,†††,3,5 | 9,500 | (24,514 | ) | |||||
| Modec, Inc.†††,3,5 | 1,000 | (25,772 | ) | |||||
| Sevan Marine ASA*,†††,3,5 | 6,300 | (33,049 | ) | |||||
| Trican Well Service Ltd.†††,3,5 | 2,200 | (37,448 | ) | |||||
| QGC Pty Ltd.*,†††,3,5 | 13,600 | (52,898 | ) | |||||
| Rio Tinto Coal Mozambique*,†††,3,5 | 7,100 | (54,029 | ) | |||||
| Imperial Energy Corporation plc*,†††,3,5 | 4,200 | (83,657 | ) | |||||
| BPZ Resources, Inc.*,†††,3,5 | 6,000 | (112,800 | ) | |||||
| Total Energy | (446,950 | ) | ||||||
| INDUSTRIALS - (3.5)% | ||||||||
| China Communications Construction | ||||||||
| Company Ltd. — Class H†††,3,5 | 16,000 | (16,571 | ) | |||||
| China Merchants Holdings International | ||||||||
| Company Ltd.†††,3,5 | 4,900 | (17,461 | ) | |||||
| China National Materials Company | ||||||||
| Ltd. — Class H†††,3,5 | 37,600 | (19,168 | ) | |||||
| Japan Steel Works Ltd.†††,3,5 | 1,600 | (22,196 | ) | |||||
| Ausenco Ltd.†††,3,5 | 2,300 | (24,817 | ) | |||||
| Toyo Tanso Company Ltd.†††,3,5 | 600 | (32,408 | ) | |||||
| Ryanair Holdings plc*,†††,3,5 | 10,200 | (38,219 | ) | |||||
| Meyer Burger Technology AG*,†††,3,5 | 200 | (49,879 | ) | |||||
| USG Corp.*,†††,3,5 | 5,580 | (160,258 | ) | |||||
| Beijing Capital International Airport | ||||||||
| Company Ltd. — Class H†††,3,5 | 232,000 | (200,659 | ) | |||||
| Total Industrials | (581,636 | ) | ||||||
| INFORMATION TECHNOLOGY - (4.0)% | ||||||||
| Varian Semiconductor Equipment | ||||||||
| Associates, Inc.*,†††,3,5 | 1,270 | (33,299 | ) | |||||
| VeriSign, Inc.*,†††,3,5 | 1,300 | (33,319 | ) | |||||
| Access Company Ltd.*,†††,3,5 | 18 | (34,682 | ) | |||||
| Electronic Arts, Inc.*,†††,3,5 | 900 | (36,720 | ) | |||||
| Intermec, Inc.*,†††,3,5 | 2,570 | (50,937 | ) | |||||
| Baidu, Inc. ADR*,†††,3,5 | 200 | (53,726 | ) | |||||
| Riverbed Technology, Inc.*,†††,3,5 | 4,100 | (54,530 | ) | |||||
| Rambus, Inc.*,†††,3,5 | 3,680 | (56,451 | ) | |||||
| Red Hat, Inc.*,†††,3,5 | 3,300 | (58,905 | ) | |||||
| VMware, Inc. — Class A*,†††,3,5 | 2,500 | (71,450 | ) | |||||
| Equinix, Inc.*,†††,3,5 | 1,000 | (79,940 | ) | |||||
| Cree, Inc.*,†††,3,5 | 4,200 | (115,332 | ) | |||||
| Total Information Technology | (679,291 | ) | ||||||
| FINANCIALS - (7.4)% | ||||||||
| C C Land Holdings Ltd.†††,3,5 | 53,000 | (14,782 | ) | |||||
| Franshion Properties China Ltd.†††,3,5 | 84,600 | (23,552 | ) | |||||
| Mizuho Trust & Banking | ||||||||
| Company Ltd.*,†††,3,5 | 18,800 | (26,216 | ) | |||||
| Aozora Bank Ltd.†††,3,5 | 17,300 | (27,861 | ) | |||||
| Monex Group, Inc.†††,3,5 | 83 | (29,140 | ) | |||||
| Mizuho Financial Group, Inc.†††,3,5 | 12,000 | (49,593 | ) | |||||
| Aeon Mall Company Ltd.†††,3,5 | 1,900 | (58,221 | ) | |||||
| PrivateBancorp, Inc. — Class A†††,3,5 | 2,400 | (103,200 | ) | |||||
| Erste Group Bank AG†††,3,5 | 5,500 | (337,971 | ) | |||||
| Wells Fargo & Co.†††,3,5 | 12,937 | (565,622 | ) | |||||
| Total Financials | (1,236,158 | ) | ||||||
| HEALTH CARE - (8.5)% | ||||||||
| Sepracor, Inc.*,†††,3,5 | 1,350 | (23,625 | ) | |||||
| Exelixis, Inc.*,†††,3,5 | 4,700 | (30,127 | ) | |||||
| Intuitive Surgical, Inc.*,†††,3,5 | 200 | (56,100 | ) | |||||
| Zeltia S.A.*,†††,3,5 | 8,500 | (57,969 | ) | |||||
| Savient Pharmaceuticals, Inc.*,†††,3,5 | 3,240 | (64,282 | ) | |||||
| Sequenom, Inc.*,†††,3,5 | 3,140 | (64,715 | ) | |||||
| Luminex Corp.*,†††,3,5 | 2,700 | (68,823 | ) | |||||
| Auxilium Pharmaceuticals, Inc.*,†††,3,5 | 1,960 | (72,167 | ) | |||||
| Vertex Pharmaceuticals, Inc.*,†††,3,5 | 2,700 | (74,709 | ) | |||||
| Align Technology, Inc.*,†††,3,5 | 6,300 | (76,860 | ) | |||||
| Acorda Therapeutics, Inc.*,†††,3,5 | 2,900 | (77,575 | ) | |||||
| Intercell AG*,†††,3,5 | 2,000 | (78,778 | ) | |||||
| Rigel Pharmaceuticals, Inc.*,†††,3,5 | 3,070 | (78,838 | ) | |||||
| XenoPort, Inc.*,†††,3,5 | 1,790 | (82,036 | ) | |||||
| Regeneron Pharmaceuticals, Inc.*,†††,3,5 | 3,810 | (82,715 | ) | |||||
| AMAG Pharmaceuticals, Inc.*,†††,3,5 | 1,900 | (82,954 | ) | |||||
| Basilea Pharmaceutica†††,3,5 | 500 | (83,364 | ) | |||||
| Cepheid, Inc.*,†††,3,5 | 5,500 | (84,700 | ) | |||||
| Alnylam Pharmaceuticals, Inc.*,†††,3,5 | 3,000 | (88,230 | ) | |||||
| athenahealth, Inc.*,†††,3,5 | 2,700 | (96,795 | ) | |||||
| Total Health Care | (1,425,362 | ) | ||||||
| CONSUMER DISCRETIONARY - (13.8)% | ||||||||
| Tokyo Broadcasting System | ||||||||
| Holdings, Inc.†††,3,5 | 1,300 | (21,836 | ) | |||||
| Genting Singapore plc†††,3,5 | 132,800 | (43,724 | ) | |||||
| bwin Interactive Entertainment AG*,†††,3,5 | 1,700 | (48,431 | ) | |||||
| Bwin.Party Digital | ||||||||
| Entertainment plc*,†††,3,5 | 16,200 | (60,974 | ) | |||||
| Sky Deutschland AG*,†††,3,5 | 4,200 | (68,951 | ) | |||||
| Focus Media Holding Ltd. ADR*,†††,3,5 | 2,500 | (75,000 | ) | |||||
| Marui Group Company Ltd.†††,3,5 | 31,000 | (233,861 | ) | |||||
| Pool Corp.†††,3,5 | 12,350 | (305,663 | ) | |||||
| SEE NOTES TO FINANCIAL STATEMENTS. | THE GUGGENHEIM FUNDS ANNUAL REPORT | 137 |
| SCHEDULE OF INVESTMENTS (concluded) | December 31, 2013 |
| SERIES Z (ALPHA OPPORTUNITY SERIES) | |
| Shares | Value | |||||||
| Electrolux AB†††,3,5 | 32,100 | $ | (422,058 | ) | ||||
| Brisa Auto-Estradas de | ||||||||
| Portugal S.A.*,†††,3,5 | 47,200 | (490,927 | ) | |||||
| Volkswagen AG†††,3,5 | 1,300 | (539,374 | ) | |||||
| Total Consumer Discretionary | (2,310,799 | ) | ||||||
| Total Common Stock Sold Short | ||||||||
| (Proceeds $7,620,060) | (7,786,654 | ) | ||||||
| Total Securities Sold Short- (46.2)% | ||||||||
| (Proceeds $7,620,060) | $ | (7,786,654 | ) | |||||
| Other Assets & Liabilities, net - 33.0% | 5,519,064 | |||||||
| Total Net Assets - 100.0% | $ | 16,707,121 | ||||||
| EQUITY FUTURES CONTRACTS PURCHASED† | ||||||||
| March 2014 S&P 500 Index | ||||||||
| Mini Futures Contracts | ||||||||
| (Aggregate Value of | ||||||||
| Contracts $1,475,400) | 16 | $ | 55,718 | |||||
| * | Non-income producing security. |
| † | Value determined based on Level 1 inputs, unless otherwise noted — See Note 4. |
| †† | Value determined based on Level 2 inputs — See Note 4. |
| ††† | Value determined based on Level 3 inputs — See Note 4. |
| 1 | All or a portion of this security is pledged as short security collateral at December 31, 2013. |
| 2 | This security is deemed illiquid due to the Fund’s exposure to Lehman Brothers International Europe (“LBIE”) prime brokerage services. The total market value of illiquid securities is $12,545,788 (cost $7,940,553), or 75.1% of total net assets. The security was deemed liquid at the time of purchase. |
| 3 | Illiquid security. |
| 4 | Repurchase Agreement — See Note 5. |
| 5 | This security was fair valued by the Valuation Committee at December 31, 2013. The total market value of fair valued securities amounts to $(7,786,654) (proceeds $7,620,060), or (46.6%) of total net assets. |
ADR — American Depositary Receipt
plc — Public Limited Company
| 138 | THE GUGGENHEIM FUNDS ANNUAL REPORT | SEE NOTES TO FINANCIAL STATEMENTS. |
| SERIES Z (ALPHA OPPORTUNITY SERIES) |
| STATEMENT OF ASSETS |
| AND LIABILITIES (Unaudited) |
| December 31, 2013 |
| Assets: | ||||
| Investments, at value | ||||
| (cost $7,963,792)† | $ | 12,569,027 | ||
| Repurchase agreements, at value | ||||
| (cost $6,405,684) | 6,405,684 | |||
| Total investments | ||||
| (cost $14,369,476) | 18,974,711 | |||
| Foreign currency, at value | ||||
| (cost $3,622,003)† | 3,747,876 | |||
| Restricted cash† | 2,025,019 | |||
| Segregated cash with broker | 65,600 | |||
| Prepaid expenses | 443 | |||
| Cash | 77 | |||
| Receivables: | ||||
| Dividends | 30,121 | |||
| Investment advisor | 10,293 | |||
| Variation margin | 7,640 | |||
| Total assets | 24,861,780 | |||
| Liabilities: | ||||
| Securities sold short, at value | ||||
| (proceeds $7,620,060)† | 7,786,654 | |||
| Accrued Lehman settlement costs† | 299,670 | |||
| Payable for: | ||||
| Management fees | 17,574 | |||
| Transfer agent/maintenance fees | 4,423 | |||
| Fund accounting/administration fees | 2,673 | |||
| Directors’ fees* | 1,070 | |||
| Fund shares redeemed | 322 | |||
| Miscellaneous | 42,273 | |||
| Total liabilities | 8,154,659 | |||
| Net assets | $ | 16,707,121 | ||
| Net assets consist of: | ||||
| Paid in capital | $ | 15,395,734 | ||
| Undistributed net investment income | 62 | |||
| Accumulated net realized loss on investments | (2,918,798 | ) | ||
| Net unrealized appreciation on investments | 4,230,123 | |||
| Net assets | $ | 16,707,121 | ||
| Capital shares outstanding | 668,402 | |||
| Net asset value per share | $ | 25.00 |
| STATEMENT OF |
| OPERATIONS (Unaudited) |
| Year Ended December 31, 2013 |
| Investment Income: | ||||
| Dividends (net of foreign withholding tax of $1,708) | $ | 283,195 | ||
| Interest | 1,260 | |||
| Total investment income | 284,455 | |||
| Expenses: | ||||
| Management fees | 203,629 | |||
| Transfer agent/maintenance fees | 25,626 | |||
| Fund accounting/administration fees | 25,000 | |||
| Legal fees | 111,749 | |||
| Custodian fees | 57,324 | |||
| Prime broker interest expense | 10,834 | |||
| Directors’ fees* | 2,423 | |||
| Short sales dividend expense | 2,194 | |||
| Miscellaneous | 56,440 | |||
| Total expenses | 495,219 | |||
| Less: | ||||
| Expenses waived by Advisor | (98,175 | ) | ||
| Net expenses | 397,044 | |||
| Net investment loss | (112,589 | ) | ||
| Net Realized and Unrealized Gain (Loss): | ||||
| Net realized gain (loss) on: | ||||
| Investments | 936,501 | |||
| Futures contracts | 467,700 | |||
| Foreign currency | (846 | ) | ||
| Securities sold short | (375,766 | ) | ||
| Net realized gain | 1,027,589 | |||
| Net change in unrealized appreciation (depreciation) on: | ||||
| Investments | 3,466,097 | |||
| Securities sold short | (297,514 | ) | ||
| Futures contracts | 36,383 | |||
| Foreign currency | (125,781 | ) | ||
| Net change in unrealized appreciation (depreciation) | 3,079,185 | |||
| Net realized and unrealized gain | 4,106,774 | |||
| Net increase in net assets resulting from operations | $ | 3,994,185 |
† All or a portion of this amount represents values related to Lehman Brothers International Europe prime brokerage services — See Note 12.
* Relates to Directors not deemed “interested persons” within the meaning of Section 2(a)(19) of the 1940 Act.
| SEE NOTES TO FINANCIAL STATEMENTS. | THE GUGGENHEIM FUNDS ANNUAL REPORT | 139 |
| SERIES Z (ALPHA OPPORTUNITY SERIES) |
| STATEMENTS OF CHANGES IN NET ASSETS |
| Year Ended | Year Ended | |||||||
| December 31, | December 31, | |||||||
| 2013 | 2012 | |||||||
| Increase (Decrease) In Net Assets From Operations: | ||||||||
| Net investment loss | $ | (112,589 | ) | $ | (69,014 | ) | ||
| Net realized gain on investments | 1,027,589 | 1,806,623 | ||||||
| Net change in unrealized appreciation (depreciation) on investments | 3,079,185 | 371,161 | ||||||
| Net increase from payments by affiliates | — | 26,975 | ||||||
| Net increase in net assets resulting from operations | 3,994,185 | 2,135,745 | ||||||
| Capital share transactions: | ||||||||
| Proceeds from sale of shares | — | — | ||||||
| Cost of shares redeemed | (2,858,472 | ) | (3,724,902 | ) | ||||
| Net decrease from capital share transactions | (2,858,472 | ) | (3,724,902 | ) | ||||
| Net increase (decrease) in net assets | 1,135,713 | (1,589,157 | ) | |||||
| Net assets: | ||||||||
| Beginning of year | 15,571,408 | 17,160,565 | ||||||
| End of year | $ | 16,707,121 | $ | 15,571,408 | ||||
| Undistributed net investment income at end of year | $ | 62 | $ | — | ||||
| Capital share activity: | ||||||||
| Shares sold | — | — | ||||||
| Shares redeemed | (127,960 | ) | (198,873 | ) | ||||
| Net decrease in shares | (127,960 | ) | (198,873 | ) | ||||
| 140 | THE GUGGENHEIM FUNDS ANNUAL REPORT | SEE NOTES TO FINANCIAL STATEMENTS. |
| SERIES Z (ALPHA OPPORTUNITY SERIES) |
| FINANCIAL HIGHLIGHTS |
This table is presented to show selected data for a share outstanding throughout each period and to assist shareholders in evaluating a Fund’s performance for the periods presented.
| Year Ended | Year Ended | Year Ended | Year Ended | Year Ended | ||||||||||||||||
| December 31, | December 31, | December 31, | December 31, | December 31, | ||||||||||||||||
| 2013 | 2012 | 2011 | 2010 | 2009 | ||||||||||||||||
| Per Share Data | ||||||||||||||||||||
| Net asset value, beginning of period | $ | 19.55 | $ | 17.24 | $ | 16.98 | $ | 14.03 | $ | 10.76 | ||||||||||
| Income (loss) from investment operations: | ||||||||||||||||||||
| Net investment lossb | (.15 | ) | (.08 | ) | (.12 | ) | (.10 | ) | (.06 | ) | ||||||||||
| Net gain on investments (realized and unrealized) | 5.60 | 2.36 | .38 | 3.05 | 3.33 | |||||||||||||||
| Net increase from payments by affiliates | — | .03 | f | — | — | — | ||||||||||||||
| Total from investment operations | 5.45 | 2.31 | .26 | 2.95 | 3.27 | |||||||||||||||
| Net asset value, end of period | $ | 25.00 | $ | 19.55 | $ | 17.24 | $ | 16.98 | $ | 14.03 | ||||||||||
| Total Returna | 27.83 | % | 13.40 | %f | 1.77 | % | 20.74 | % | 30.39 | % | ||||||||||
| Ratios/Supplemental Data | ||||||||||||||||||||
| Net assets, end of period (in thousands) | $ | 16,707 | $ | 15,571 | $ | 17,161 | $ | 21,149 | $ | 22,633 | ||||||||||
| Ratios to average net assets: | ||||||||||||||||||||
| Net investment loss | (0.69 | %) | (0.41 | %) | (0.66 | %) | (0.89 | %) | (0.52 | %) | ||||||||||
| Total expensesd | 3.03 | % | 2.22 | % | 2.29 | % | 2.27 | % | 2.85 | % | ||||||||||
| Net expensesc,e | 2.44 | % | 2.22 | % | 2.29 | % | 2.07 | % | 1.74 | % | ||||||||||
| Portfolio turnover rate | 548 | % | 720 | % | 730 | % | 768 | % | 555 | % | ||||||||||
| a | Total return does not take into account any of the expenses associated with an investment in variable insurance products. If total return had taken into account these expenses, performance would have been lower. Shares of a series of SBL Fund are available only through the purchase of such products. |
| b | Net investment loss per share was computed using average shares outstanding throughout the period. |
| c | Net expense information reflects the expense ratios after expense waivers, and may include interest or dividend expense. |
| d | Does not include expenses of the underlying funds in which the Fund invests. |
| e | Excluding interest and dividend expense related to short sales, the operating expense ratios for the years ended December 31 would be: |
| 2013 | 2012 | 2011 | 2010 | 2009 | ||||||||||||||
| 2.35 | % | 2.06 | % | 2.21 | % | 1.90 | % | 1.69 | % | |||||||||
| f | For the year ended December 31, 2012, 0.17% of the Series total return consisted of a voluntary reimbursement by the advisor for losses incurred during fund trading. Excluding this item, total return would have been 13.23% for the Series. |
| SEE NOTES TO FINANCIAL STATEMENTS. | THE GUGGENHEIM FUNDS ANNUAL REPORT | 141 |
| NOTES TO FINANCIAL STATEMENTS |
1. Organization and Significant Accounting Policies Organization
SBL Fund (the “Trust”), a Kansas business trust, is registered with the SEC under the Investment Company Act of 1940 (“1940 Act”), as a non-diversified, open-ended investment company of the series type. Each series, in effect, is representing a separate Fund (collectively the “Funds”). The Trust is authorized to issue an unlimited number of shares. The Trust accounts for the assets of each Fund separately. Security Benefit Life Insurance Company (“SBL”) and SBL’s affiliated life insurance company as well as unaffiliated life insurance companies purchase shares of the Funds for their variable annuity and variable life insurance separate accounts.
At December 31, 2013, the Trust consisted of sixteen separate Funds.
Guggenheim Investments (“GI”) provides advisory services to the Funds. Rydex Fund Services, LLC (“RFS”) acts as the transfer agent and provides administrative and accounting services to the Funds. Guggenheim Distributors, LLC (“GDL”) acts as principal underwriter to the Funds. GI, RFS and GDL are affiliated entities.
Prior to September 30, 2013, Mainstream Investment Advisers, LLC (“Mainstream”) acted as sub-adviser to Series Z (Alpha Opportunity Series). Pursuant to an investment sub-advisory agreement, Mainstream furnished investment advisory services, supervised and arranged for the purchase and sale of securities on behalf of a portion of the assets of Series Z and provided for the compilation and maintenance of records pertaining to such investment advisory services, subject to the control and supervision of the Fund’s Board of Directors and the Investment Manager. For such services, the Investment Manager paid Mainstream an annual fee equal to 1.45% of that portion of Series Z’s average daily net assets managed by Mainstream. Effective September 30, 2013, Mainstream resigned as sub-adviser to Series Z and the Investment Manager assumed all advisory obligations and responsibilities.
Significant Accounting Policies
The following significant accounting policies are in conformity with U.S. generally accepted accounting principles (“U.S. GAAP”) and are consistently followed by the Trust. This requires management to make estimates and assumptions that affect the reported amount of assets and liabilities and disclosure of contingent assets and liabilities at the date of the financial statements and the reported amounts of revenues and expenses during the reporting period. Actual results could differ from these estimates. All time references are based on Eastern Time.
A. Valuations of the Funds’ securities are supplied primarily by pricing services approved by the Board of Directors. The Trust’s officers, through the Valuation Committee under the general supervision of the Board of Directors, regularly review procedures used by, and valuations provided by, the pricing services.
Equity securities listed on an exchange (New York Stock Exchange (“NYSE”) or American Stock Exchange) are valued at the last quoted sales price as of the close of business on the NYSE, usually 4:00 p.m. on the valuation date. Equity securities listed on the NASDAQ market system are valued at the NASDAQ Official Closing Price on the valuation date, which may not necessarily represent the last sale price. If there has been no sale on such exchange or NASDAQ on such day, the security is valued at the closing bid price on such day.
Open-end investment companies (“Mutual Funds”) are valued at their net asset value per share (“NAV”) as of the close of business on the valuation date. Exchange Traded Funds (“ETFs”) and closed-end investment companies are valued at the last quoted sales price.
Debt securities with a maturity of greater than 60 days at acquisition are valued at prices that reflect broker/dealer supplied valuations or are obtained from independent pricing services, which may consider the trade activity, treasury spreads, yields or price of bonds of comparable quality, coupon, maturity, and type, as well as prices quoted by dealers who make markets in such securities. Short-term debt securities with a maturity of 60 days or less at acquisition and repurchase agreements are valued at amortized cost, which approximates market value.
Listed options are valued at the Official Settlement Price listed by the exchange, usually as of 4:00 p.m. Long options are valued using the bid price and short options are valued using the ask price. In the event that a settlement price is not available, fair valuation is enacted. Over-the-counter options are valued using the average bid price (for long options), or average ask price (for short options) obtained from one or more security dealers.
Premiums received from options written are entered in the Fund’s accounting records as an asset and equivalent liability. The amount of the liability is subsequently marked-to-market to reflect the current value of the option written. When an option written expires, or if a Fund enters into a closing purchase transaction, it realizes a gain (or loss if the cost of a closing purchase transaction exceeds the premium received when the option was sold).
| 142 | THE GUGGENHEIM FUNDS ANNUAL REPORT |
| NOTES TO FINANCIAL STATEMENTS (continued) |
The senior floating rate interests (loans) in which certain Funds invest are not listed on any securities exchange or board of trade. Accordingly, determinations of the value of loans may be based on infrequent and dated trades. Typically loans are valued using information provided by an independent third party pricing service which uses broker quotes in a non-active market, or price derived from significant observable inputs and is also compared to broker quote (matrixed). If the pricing service cannot or does not provide a valuation for a particular loan or such valuation is deemed unreliable, such loan is fair valued by the Valuation Committee. In determining fair value, consideration is given to several factors, which may include, among others, one or more of the following: the fundamental business data relating to the issuer or borrower; an evaluation of the forces which influence the market in which these loans are purchased and sold; type of holding; financial statements of the borrower; cost at date of purchase; size of holding; credit worthiness and cash flow of issuer; information as to any transactions in, or offers for, the holding; price and extent of public trading in similar securities (or equity securities) of the issuer/borrower, or comparable companies; coupon payments; quality, value and salability of collateral securing the loan; business prospects of the issuer/borrower, including any ability to obtain money or resources from a parent or affiliate; the portfolio manager’s and/or the market’s assessment of the borrower’s management; prospects for the borrower’s industry, and multiples (of earnings and/or cash flow) being paid for similar businesses in that industry; borrower’s competitive position within the industry; borrower’s ability to access additional liquidity through public and/or private markets; and other relevant factors.
The value of futures contracts is accounted for using the unrealized gain or loss on the contracts that is determined by marking the contracts to their current realized settlement prices. Financial futures contracts are valued at the 4:00 p.m. price on the valuation date. In the event that the exchange for a specific futures contract closes earlier than 4:00 p.m., the futures contract is valued at the Official Settlement Price of the exchange. However, the underlying securities from which the futures contract value is derived are monitored until 4:00 p.m. to determine if fair valuation would provide a more accurate valuation.
The value of index swap agreements entered into by a Fund is accounted for using the unrealized gain or loss on the agreements that is determined using the last quoted value of the index that the swap pertains to at the close of the NYSE, adjusted to include dividends accrued, and financing charges and/or interest associated with the swap agreements.
Interest rate swap agreements entered into by a Fund are accounted for using the unrealized gain or loss on the agreements that is determined using the spread priced off the previous day’s CME price.
The value of a forward foreign currency exchange contract is adjusted daily based on the applicable exchange rate of the underlying currency.
Generally, trading in foreign securities markets is substantially completed each day at various times prior to the close of the NYSE. The values of foreign securities are determined as of the close of such foreign markets or the close of the NYSE, if earlier. All investments quoted in foreign currency are valued in U.S. dollars on the basis of the foreign currency exchange rates prevailing at the close of business. Investments in foreign securities may involve risks not present in domestic investments. The Valuation Committee will determine the current value of such foreign securities by taking into consideration certain factors which may include those discussed above, as well as the following factors, among others: the value of the securities traded on other foreign markets, ADR trading, closed-end fund trading, foreign currency exchange activity, and the trading prices of financial products that are tied to foreign securities such as World Equity Benchmark Securities. In addition, the Board of Directors has authorized the Valuation Committee and GI to use prices and other information supplied by a third party pricing vendor in valuing foreign securities.
Investments for which market quotations are not readily available are fair valued as determined in good faith by GI under the direction of the Board of Directors using methods established or ratified by the Board of Directors. These methods include, but are not limited to: (i) obtaining general information as to how these securities and assets trade; (ii) in connection with futures contracts and options thereupon, and other derivative investments, obtaining information as to how (a) these contracts and other derivative investments trade in the futures or other derivative markets, respectively, and (b) the securities underlying these contracts and other derivative investments trade in the cash market; and (iii) obtaining other information and considerations, including current values in related markets.
B. Senior loans in which the Funds invest generally pay interest rates which are periodically adjusted by reference to a base short-term, floating rate plus a premium. These base lending rates are generally (I) the lending rate offered by one or more major European banks, such as the London Inter-Bank Offered Rate (LIBOR), (ii) the prime rate offered by one or more major United States banks, or (iii) the bank’s certificate of deposit rate. Senior floating rate interests often require prepayments from excess cash flows or permit the borrower to repay at its election. The rate at which the borrower repays cannot be predicted with accuracy. As a result, the actual remaining maturity may be substantially less than the stated maturities shown. The interest rate indicated is the rate in effect at December 31, 2013.
| THE GUGGENHEIM FUNDS ANNUAL REPORT | 143 |
| NOTES TO FINANCIAL STATEMENTS (continued) |
C. Securities transactions are recorded on the trade date for financial reporting purposes. Realized gains and losses from securities transactions are recorded using the identified cost basis. Proceeds from lawsuits related to investment holdings are recorded as realized gains in the respective Fund. Dividend income is recorded on the ex-dividend date, net of applicable taxes withheld by foreign countries. Taxable non-cash dividends are recorded as dividend income. Interest income, including amortization of premium and accretion of discount, is accrued on a daily basis. Distributions received from investments in REITs are recorded as dividend income on the ex-dividend date, subject to reclassification upon notice of the character of such distribution by the issuer. Interest income also includes paydown gains and losses on mortgage-backed and asset-backed securities and senior and subordinated loans. Amendment fees are earned as compensation for evaluating and accepting changes to the original loan agreement and are recognized when received.
D. The Funds may purchase and sell interests in securities on a when-issued and delayed delivery basis, with payment and delivery scheduled for a future date. No income accrues to the Fund on such interests or securities in connection with such transactions prior to the date the Funds actually take delivery of such interests or securities. These transactions are subject to market fluctuations and are subject to the risk that the value at delivery may be more or less than the trade date purchase price. Although the Funds will generally purchase these securities with the intention of acquiring such securities, they may sell such securities before the settlement date.
E. The accounting records of the Fund are maintained in U.S. dollars. All assets and liabilities initially expressed in foreign currencies are converted into U.S. dollars at prevailing exchange rates. Purchases and sales of investment securities, dividend and interest income, and certain expenses are translated at the rates of exchange prevailing on the respective dates of such transactions. Changes in the relationship of these foreign currencies to the U.S. dollar can significantly affect the value of the investments and earnings of the Funds. Foreign investments may also subject the Funds to foreign government exchange restrictions, expropriation, taxation or other political, social or economic developments, all of which could affect the market and/or credit risk of the investments.
The Funds do not isolate that portion of the results of operations resulting from changes in the foreign exchange rates on investments from the fluctuations arising from changes in the market prices of securities held. Such fluctuations are included with the net realized and unrealized gain or loss on investments.
Reported net realized foreign exchange gains and losses arise from sales of foreign currencies and currency gains or losses realized between the trade and settlement dates on investment transactions. Net unrealized exchange gains and losses arise from changes in the fair values of assets and liabilities other than investments in securities at the fiscal period end, resulting from changes in exchange rates.
F. The Funds are required by the Internal Revenue Code to distribute substantially all income and capital gains to shareholders. Each year, the Funds determine whether to declare and pay actual dividends or whether to secure consent of its shareholders to report and deduct a consent dividend. A consent dividend is treated for tax purposes as a distribution to shareholders occurring on the last day of the Fund’s taxable year and a shareholder contribution to capital occurring on the same day. It is the Trust’s current practice to utilize the consent dividend procedures. The character of any distributions made from net investment income and net realized gains may differ from their ultimate characterization for income tax purposes.
G. When a Fund engages in a short sale of a security, an amount equal to the proceeds is reflected as an asset and an equivalent liability. The amount of the liability is subsequently marked-to-market to reflect the market value of the short sale. The Fund maintains a segregated account of cash and/or securities as collateral for short sales. The Fund is exposed to market risk based on the amount, if any, that the market value of the security exceeds the market value of the securities in the segregated account.
Fees, if any, paid to brokers to borrow securities in connection with short sales are recorded as interest expense. In addition, the Fund must pay out the dividend rate of the equity or coupon rate of the treasury obligation to the lender and record this as an expense. Short dividend or interest expense is a cost associated with the investment objective of short sales transactions, rather than an operational cost associated with the day-to-day management of any mutual fund. The Funds may also receive rebate income from the broker resulting from the investment of the proceeds from securities sold short.
| 144 | THE GUGGENHEIM FUNDS ANNUAL REPORT |
| NOTES TO FINANCIAL STATEMENTS (continued) |
H. Upon entering into a futures contract, a Fund deposits and maintains as collateral such initial margin as required by the exchange on which the transaction is affected. Pursuant to the contract, the Fund agrees to receive from or pay to the broker an amount of cash equal to the daily fluctuation in value of the contract. Such receipts or payments are known as variation margin and are recorded by the Fund as unrealized gains or losses. When the contract is closed, the Fund records a realized gain or loss equal to the difference between the value of the contract at the time it was opened and the value at the time it was closed.
I. Swap agreements are marked-to-market daily and the change, if any, is recorded as unrealized gain or loss. Payments received or made as a result of an agreement or termination of the agreement are recognized as realized gains or losses.
J. Forward foreign currency exchange contracts are valued daily based on the applicable exchange rate of the underlying currency. The change in value of the contract is recorded as unrealized appreciation or depreciation until the forward foreign currency contract is closed. When the forward foreign currency contract is closed, the Fund records a realized gain or loss equal to the difference between the value at the time the contract was opened and the value at the time it was closed.
K. Expenses directly attributable to a Fund are charged directly to the Fund. Other expenses common to various funds within the fund complex are generally allocated amongst such funds on the basis of average net assets.
L. Under the fee arrangement with the custodian, the Funds may earn credits based on overnight custody cash balances. These credits are utilized to reduce related custodial expenses. The custodian fees disclosed in the Statement of Operations are before the reduction in expense from the related earnings credits, if any. For the year ended December 31, 2013, there were no earnings credits received.
The Funds may leave cash overnight in their cash account with the custodian, U.S. Bank. Periodically, a Fund may have cash due to the custodian bank as an overdraft balance. A fee is incurred on this overdraft, calculated by multiplying the overdraft by a rate based on the federal funds rate.
Segregated cash with broker is held as collateral for investments in derivative instruments such as futures contracts or swap agreements.
M. Under the Trust organizational documents, its Officers and Directors are indemnified against certain liabilities arising out of the performance of their duties to the Trust. In addition, throughout the normal course of business, the Funds enter into contracts that contain a variety of representations and warranties which provide general indemnifications. The Funds’ maximum exposure under these arrangements is unknown, as this would involve future claims that may be made against the Funds and/ or their affiliates that have not yet occurred. However, based on experience, the Funds expect the risk of loss to be remote.
2. Financial Instruments
As part of their investment strategy, the Funds utilize short sales and a variety of derivative instruments including futures, options, forwards and swap agreements. These investments involve, to varying degrees, elements of market risk and risks in excess of the amounts recognized in the Statements of Assets and Liabilities.
Series Z (Alpha Opportunity Series) may make short sales “against the box,” in which the Fund enters into a short sale of a security it owns. At no time will more than 15% of the value of the Fund’s net assets be in deposits on short sales against the box. When a Fund makes a short sale, the Fund does not immediately deliver the securities sold from its own account, or receive the proceeds from the sale. To complete the sale, the Fund must borrow the security (generally from the broker through which the short sale is made) in order to make delivery to the buyer. The Fund must replace the security borrowed by purchasing it at the market price at the time of replacement or delivering the security from its own portfolio. The Fund is said to have a “short position” in securities sold until it delivers them to the broker, at which time it receives the proceeds of the sale. Certain Funds may make short sales that are not “against the box,” which create opportunities to increase the Funds’ return but, at the same time, involve specific risk considerations and may be considered a speculative technique. Such short sales theoretically involve unlimited loss potential, as the market price of securities sold short may continually increase, although a Fund may mitigate such losses by replacing the securities sold short before the market price has increased significantly. Subsequent fluctuations in the market prices of securities sold, but not yet purchased, may require purchasing the securities at prices which differ from the market value reflected on the Statements of Assets and Liabilities. The Funds are liable for any dividends or interest payable on securities while those securities are in a short position. As collateral for its short positions, the Fund is required under the 1940 Act to maintain segregated assets consisting of cash, cash equivalents or liquid securities. These segregated assets are valued consistent with Note 1A and are required to be adjusted daily to reflect changes in the market value of the securities sold short.
| THE GUGGENHEIM FUNDS ANNUAL REPORT | 145 |
| NOTES TO FINANCIAL STATEMENTS (continued) |
A futures contract is an agreement to purchase (long) or sell (short) an agreed amount of securities or other instruments at a set price for delivery at a future date. There are significant risks associated with a Fund’s or an underlying fund’s use of futures contracts and related options, including (i) there may be an imperfect or no correlation between the changes in market value of the underlying asset and the prices of futures contracts; (ii) there may not be a liquid secondary market for a futures contract; (iii) trading restrictions or limitations may be imposed by an exchange; and (iv) government regulations may restrict trading in futures contracts. When investing in futures, there is minimal counterparty credit risk to the Fund because futures are exchange-traded and the exchange’s clearinghouse, as counterparty to all exchange-traded futures, guarantees against default. Cash deposits are shown as restricted cash on the Statement of Assets and Liabilities; securities held as collateral are noted on the Schedule of Investments.
An option on a security gives the purchaser of the option the right to sell, and the writer of the option the obligation to buy, the underlying security (put option) or the purchaser of the option the right to buy, and the writer of the option the obligation to sell, the underlying security (call option) at any time during the option period. The risk associated with purchasing options is limited to the premium originally paid. The risk in writing a call option is that a Fund may incur a loss if the market price of the underlying security increases and the option is exercised. The risk in writing a put option is that a Fund may incur a loss if the market price of the underlying security decreases and the option is exercised. In addition, there may be an imperfect correlation between the movement in prices of options and the underlying securities and a Fund may not be able to enter into a closing transaction because of an illiquid secondary market or, for over-the-counter options, because of the counterparty’s inability to perform.
A swap is an agreement that obligates two parties to exchange a series of cash flows at specified intervals based upon or calculated by reference to changes in specified prices or rates for a specified amount of an underlying asset. A Fund utilizing OTC swaps bears the risk of loss of the amount expected to be received under a swap agreement in the event of the default or bankruptcy of a swap agreement counterparty. For Funds utilizing interest rate swaps, the exchange bears the risk of loss. Additionally, there is no guarantee that a Fund or an underlying fund could eliminate its exposure under an outstanding swap agreement by entering into an offsetting swap agreement with the same or another party.
StylePlus—Large Core Series, StylePlus—Mid Growth Series, StylePlus—Small Growth Series and StylePlus—Large Growth Series utilized derivatives to achieve leveraged exposure. The use of derivative instruments by a Fund to achieve leveraged exposure to the underlying index creates leveraging risk. The more a Fund invests in leveraged instruments, the more this leverage will magnify any losses on those investments. A Fund’s investment in these instruments generally requires a small investment relative to the amount of investment exposure assumed. As a result, such investments may give rise to losses that exceed the amount invested in those instruments. Since a Fund’s investment strategy involves consistently applied leverage, the value of the Fund’s shares will tend to increase or decrease more than the value of any increase or decrease in the underlying index. Leverage also will have the effect of magnifying tracking error.
In conjunction with the use of short sales, futures, options and swap agreements, the Funds are required to maintain collateral in various forms. The Funds use, where appropriate, depending on the financial instrument utilized and the broker involved, margin deposits at the broker, cash and/or securities segregated at the custodian bank, discount notes, or the repurchase agreements allocated to each Fund.
A forward foreign currency exchange contract is an agreement between two parties to exchange two designated currencies at a specific time in the future. The contracts can be used to hedge or manage exposure to foreign currency risks with portfolio investments or to gain exposure to foreign currencies.
The Trust has established counterparty credit guidelines and enters into transactions only with financial institutions of investment grade or better. The Trust monitors the counterparty credit risk.
| 146 | THE GUGGENHEIM FUNDS ANNUAL REPORT |
| NOTES TO FINANCIAL STATEMENTS (continued) |
3. Fees and Other Transactions with Affiliates
Management fees are paid monthly to GI, based on the following annual rates.
| Management Fees | ||||
| (as a % of net assets) | ||||
| Series A (StylePlus–Large Core Series) | 0.75 | % | ||
| Series B (Large Cap Value Series) | 0.65 | % | ||
| Series C (Money Market Series) | 0.50 | % | ||
| Series D (World Equity Income Series) | 0.70 | % | ||
| Series E (Total Return Bond Series) | 0.75 | % | ||
| Series F (Floating Rate Strategies Series) | 0.65 | % | ||
| Series J (StylePlus–Mid Growth Series) | 0.75 | % | ||
| Series M (Macro Opportunities Series) | 0.89 | % | ||
| Series N (Managed Asset Allocation Series) | 0.65 | % | ||
| Series O (All Cap Value Series) | 0.70 | % | ||
| Series P (High Yield Series) | 0.75 | % | ||
| Series Q (Small Cap Value Series) | 0.95 | % | ||
| Series V (Mid Cap Value Series) | 0.75 | % | ||
| Series X (StylePlus–Small Growth Series) | 0.85 | % | ||
| Series Y (StylePlus–Large Growth Series) | 0.75 | % | ||
| Series Z (Alpha Opportunity Series) | 1.25 | % | ||
RFS also acts as the administrative agent for the Funds, and as such performs administrative functions and the bookkeeping, accounting and pricing functions for each Fund. For these services, RFS receives the following:
| Fund Accounting/ | ||||
| Administrative Fees | ||||
| (as a % of net assets)* | ||||
| Series A (StylePlus–Large Core Series) | 0.095 | % | ||
| Series B (Large Cap Value Series) | 0.095 | % | ||
| Series C (Money Market Series) | 0.095 | % | ||
| Series D (World Equity Income Series) | 0.150 | % | ||
| Series E (Total Return Bond Series) | 0.095 | % | ||
| Series F (Floating Rate Strategies Series) | 0.095 | % | ||
| Series J (StylePlus–Mid Growth Series) | 0.095 | % | ||
| Series M (Macro Opportunities Series) | 0.095 | % | ||
| Series N (Managed Asset Allocation Series) | 0.150 | % | ||
| Series O (All Cap Value Series) | 0.095 | % | ||
| Series P (High Yield Series) | 0.095 | % | ||
| Series Q (Small Cap Value Series) | 0.095 | % | ||
| Series V (Mid Cap Value Series) | 0.095 | % | ||
| Series X (StylePlus–Small Growth Series) | 0.095 | % | ||
| Series Y (StylePlus–Large Growth Series) | 0.095 | % | ||
| Series Z (Alpha Opportunity Series) | 0.150 | % | ||
| * | The minimum annual charge for administrative fees is $25,000 for Series A, B, C, E, F, J, M, O, P, Q, V, X, Y and Z and $60,000 for Series D and N. |
RFS is paid the following for providing transfer agent services to the Funds:
| Annual charge per account | $5.00 – $8.00 |
| Transaction fee | $0.60 – $1.10 |
| Minimum annual charge per Fund† | $25,000 |
| Certain out-of-pocket charges | Varies |
| † | Not subject to Funds during first twelve months of operations. |
Series F and Series M have adopted a Distribution and Shareholder Services Plan pursuant to Rule 12b-1 under the 1940 Act that allows those Series to pay distribution and shareholder services fees to GDL. The Series will pay distribution and shareholder services fees to GDL at an annual rate not to exceed 0.25% of average daily net assets. GDL may, in turn, pay all or a portion of the proceeds from the distribution and shareholder services fees to insurance companies or their affiliates and qualified plan administrators (“intermediaries”) for services they provide on behalf of the Series to current and prospective variable contract owners and qualified plan participants that invest in the Series through the intermediaries.
The investment advisory contracts for the following Funds provide that the total expenses be limited to a percentage of average net assets for each Fund, exclusive of brokerage costs, dividends on securities sold short, expenses of other investment companies in which a Fund invests, interest, taxes, litigation, indemnification and extraordinary expenses. The limits are listed below:
| Contract | |||
| Limit | Effective Date | End Date | |
| Series C (Money Market Series) | 0.50% | 08/22/2013 | 05/01/2014 |
| Series E (Total Return Bond Series) | 0.81% | 11/30/2012 | 05/01/2014 |
| Series F (Floating Rate Strategies Series) | 1.15% | 04/22/2013 | 05/01/2014 |
| Series M (Macro Opportunities Series) | 1.45% | 04/22/2013 | 05/01/2014 |
| Series O (All Cap Value Series) | 1.00% | 11/30/2012 | 05/01/2014 |
| Series Z (Alpha Opportunity Series) | 2.35% | 11/30/2012 | 05/01/2014 |
GI is entitled to reimbursement by the Series for fees waived or expenses reimbursed during any of the previous 36 months, beginning on the date of the expense limitation agreement, if on any day the estimated operating expenses are less than the indicated percentages. At December 31, 2013, the amount of fees waived or expenses reimbursed that are subject to recoupment are presented in the following table:
| Expires | Expires | Expires | Fund | |||||||||||||
| Fund | 2014 | 2015 | 2016 | Total | ||||||||||||
| Series C (Money Market Series) | $ | — | $ | — | $ | 54,066 | $ | 54,066 | ||||||||
| Series E (Total Return Bond Series) | 142,582 | 154,822 | 208,040 | 505,444 | ||||||||||||
| Series F (Floating Rate Strategies Series) | — | — | 48,535 | 48,535 | ||||||||||||
| Series M (Macro Opportunities Series) | — | — | 55,226 | 55,226 | ||||||||||||
| Series O (All Cap Value Series) | — | — | — | — | ||||||||||||
| Series Z (Alpha Opportunity Series) | — | — | 98,175 | 98,175 | ||||||||||||
For the year ended December 31, 2013, no amounts were recouped by GI.
Certain officers and directors of the Trust are also officers of GI, RFS and GDL.
| THE GUGGENHEIM FUNDS ANNUAL REPORT | 147 |
| NOTES TO FINANCIAL STATEMENTS (continued) |
At December 31, 2013, Security Benefit Life Insurance Company, through its insurance company separate accounts, owned shares of the Funds, as follows:
| Percent of outstanding | ||||
| shares owned | ||||
| Series A (StylePlus–Large Core Series) | 100 | % | ||
| Series B (Large Cap Value Series) | 100 | % | ||
| Series C (Money Market Series) | 100 | % | ||
| Series D (World Equity Income Series) | 99 | % | ||
| Series E (Total Return Bond Series) | 98 | % | ||
| Series F (Floating Rate Strategies Series) | 57 | % | ||
| Series J (StylePlus–Mid Growth Series) | 99 | % | ||
| Series M (Macro Opportunities Series) | 96 | % | ||
| Series N (Managed Asset Allocation Series) | 98 | % | ||
| Series O (All Cap Value Series) | 99 | % | ||
| Series P (High Yield Series) | 93 | % | ||
| Series Q (Small Cap Value Series) | 96 | % | ||
| Series V (Mid Cap Value Series) | 98 | % | ||
| Series X (StylePlus–Small Growth Series) | 98 | % | ||
| Series Y (StylePlus–Large Growth Series) | 98 | % | ||
| Series Z (Alpha Opportunity Series) | 100 | % | ||
4. Fair Value Measurement
In accordance with U.S. GAAP, fair value is defined as the price that the Fund would receive to sell an investment or pay to transfer a liability in an orderly transaction with an independent buyer in the principal market, or in the absence of a principal market the most advantageous market for the investment or liability. A three-tier hierarchy is utilized to distinguish between (1) inputs that reflect the assumptions market participants would use in pricing an asset or liability developed based on market data obtained from sources independent of the reporting entity (observable inputs) and (2) inputs that reflect the reporting entity’s own assumptions about the assumptions market participants would use in pricing an asset or liability developed based on the best information available in the circumstances (unobservable inputs) and to establish classification of fair value measurements for disclosure purposes. Various inputs are used in determining the value of the Funds’ investments. The inputs are summarized in the three broad levels listed below:
Level 1 — quoted prices in active markets for identical securities.
Level 2 — other significant observable inputs (including quoted prices for similar securities, interest rates, prepayment speeds, credit risk, etc.).
Level 3 — significant unobservable inputs (including the fund’s own assumptions used to determine the fair value of investments).
The inputs or methodologies used for valuing securities are not necessarily an indication of the risk associated with investing in those securities.
| 148 | THE GUGGENHEIM FUNDS ANNUAL REPORT |
| NOTES TO FINANCIAL STATEMENTS (continued) |
The following table summarizes the inputs used to value the Funds’ net assets at December 31, 2013:
| Level 1 | Level 1 | Level 2 | Level 2 | Level 3 | ||||||||||||||||||||
| Investments | Other Financial | Investments | Other Financial | Investments | ||||||||||||||||||||
| In Securities | Instruments* | In Securities | Instruments* | In Securities | Total | |||||||||||||||||||
| Assets | ||||||||||||||||||||||||
| Series A (StylePlus–Large Core Series) | $ | 102,539,810 | $ | — | $ | 129,289,636 | $ | — | $ | — | $ | 231,829,446 | ||||||||||||
| Series B (Large Cap Value Series) | 283,334,675 | — | — | — | — | 283,334,675 | ||||||||||||||||||
| Series C (Money Market Series) | 28,695,559 | — | 47,672,824 | — | — | 76,368,383 | ||||||||||||||||||
| Series D (World Equity Income Series) | 192,706,303 | — | — | — | — | 192,706,303 | ||||||||||||||||||
| Series E (Total Return Bond Series) | 12,259,610 | — | 90,741,861 | 142,820 | — | 103,144,291 | ||||||||||||||||||
| Series F (Floating Rate Strategies Series) | 3,959,993 | — | 42,875,653 | — | 148,500 | 46,984,146 | ||||||||||||||||||
| Series J (StylePlus–Mid Growth Series) | 70,508,290 | 29,603 | 86,668,075 | — | — | 157,205,968 | ||||||||||||||||||
| Series M (Macro Opportunities Series) | 2,482,948 | — | 25,344,305 | 96,610 | — | 27,923,863 | ||||||||||||||||||
| Series N (Managed Asset Allocation Series) | 64,353,841 | 731,294 | — | 17,981 | — | 65,103,116 | ||||||||||||||||||
| Series O (All Cap Value Series) | 153,536,562 | — | — | — | — | 153,536,562 | ||||||||||||||||||
| Series P (High Yield Series) | 5,547,830 | — | 124,415,952 | — | 1,700,558 | 131,664,340 | ||||||||||||||||||
| Series Q (Small Cap Value Series) | 138,898,474 | — | 923,400 | — | 9,879 | 139,831,753 | ||||||||||||||||||
| Series V (Mid Cap Value Series) | 300,615,345 | — | 1,465,406 | — | 26,110 | 302,106,861 | ||||||||||||||||||
| Series X (StylePlus–Small Growth Series) | 16,597,702 | 15,761 | 22,114,384 | — | — | 38,727,847 | ||||||||||||||||||
| Series Y (StylePlus–Large Growth Series) | 19,173,639 | 19,895 | 21,352,272 | — | — | 40,545,806 | ||||||||||||||||||
| Series Z (Alpha Opportunity Series) | 12,569,027 | 55,718 | 6,405,684 | — | — | 19,030,429 | ||||||||||||||||||
| Liabilities | ||||||||||||||||||||||||
| Series E (Total Return Bond Series) | $ | — | $ | — | $ | — | $ | 59,120 | $ | — | $ | 59,120 | ||||||||||||
| Series M (Macro Opportunities Series) | — | — | — | 7,220 | — | 7,220 | ||||||||||||||||||
| Series N (Managed Asset Allocation Series) | — | 177,524 | — | 27,494 | — | 205,018 | ||||||||||||||||||
| Series O (All Cap Value Series) | — | 3,010 | — | — | — | 3,010 | ||||||||||||||||||
| Series P (High Yield Series) | — | — | — | 7,962 | — | 7,962 | ||||||||||||||||||
| Series Q (Small Cap Value Series) | — | 19,180 | — | 19,440 | — | 38,620 | ||||||||||||||||||
| Series V (Mid Cap Value Series) | — | 43,625 | — | 43,440 | — | 87,065 | ||||||||||||||||||
| Series Z (Alpha Opportunity Series) | — | — | — | — | 7,786,654 | 7,786,654 | ||||||||||||||||||
| * | Other financial instruments may include written options, forward foreign currency exchange contracts, futures contracts and/or swaps, which are reported as unrealized gain/loss at period end. |
Financial assets and liabilities categorized as Level 2 consist primarily of fixed income investments. Fixed income investments generally have bid and ask prices that can be observed in the marketplace. Bid prices reflect the highest price that the Funds and others are willing to pay for an asset. Ask prices represent the lowest price that the Funds and others are willing to accept for an asset. For financial assets and liabilities whose inputs are based on bid-ask prices obtained from third party pricing services, fair value may not always be a predetermined point in the bid-ask range. The Funds’ policy is to allow for mid-market pricing and adjusting to the point within the bid-ask range that meets the Funds’ best estimate of fair value.
The following is a summary of significant unobservable inputs used in the fair valuation of assets and liabilities categorized within Level 3 of the fair value hierarchy:
| Category and | Ending Balance | Valuation | Unobservable | |||||||||
| Fund | Subcategory | at 12/31/13 | Technique | Inputs | Input Value | |||||||
| Investments, at value | ||||||||||||
| Series P (High Yield Series) | Senior Floating Rate Interests | $ | 1,700,499 | Market Comparable | EV/EBITDA multiple | 3.5 - 21.5 | ||||||
| Companies | ||||||||||||
The significant unobservable inputs used in the fair value measurement of the Fund’s senior floating rate securities are earnings before interest, taxes, depreciation and amortization (“EBITDA”) multiples, comparable public company enterprise values (“EV”) and underlying portfolio information. The Fund uses EBITDA multiples on public comparables applied to expected cash flows of the security. Significant increases or decreases in these inputs in isolation would result in a significantly lower or higher fair value measurement.
The remaining level 3 securities held by Series P (High Yield Series) were not considered significant to that Fund.
Transfers between investment levels may occur as the markets fluctuate and/or the availability of data used in the investment’s valuation changes. The Funds recognize transfers between the levels as of the beginning of the period. As of December 31, 2013, Series P (High Yield Series) had securities with a total value of $603,346 transfer from Level 3 to Level 2 due to changes in the securities valuation method. Series D (World Equity Income Series) had transfers between Level 1 and Level 2 due to utilizing international fair value pricing during the period. There were no other securities that transferred between levels.
| THE GUGGENHEIM FUNDS ANNUAL REPORT | 149 |
| NOTES TO FINANCIAL STATEMENTS (continued) |
Summary of Fair Value Level 3 Activity
Following is a reconciliation of Level 3 assets and liabilities for which significant unobservable inputs were used to determine fair value for the year ended December 31, 2013:
LEVEL 3 – Fair value measurement using significant unobservable inputs
| Total | ||||
| Series P (High Yield Series) | ||||
| Assets: | ||||
| Beginning Balance | $ | 603,405 | ||
| Transfer into Level 3 | 1,700,499 | |||
| Transfer out of Level 3 | (603,346 | ) | ||
| Ending Balance | $ | 1,700,558 | ||
| Series Z (Alpha Opportunities Series) (See Note 12) | ||||
| Liabilities: | ||||
| Beginning Balance | $ | (7,786,654 | ) | |
| Ending Balance | $ | (7,786,654 | ) | |
5. Repurchase Agreements
In connection with transactions in repurchase agreements, it is the Funds’ policy that their custodian takes possession of the underlying collateral. The collateral is in the possession of the Funds’ custodian and is evaluated to ensure that its market value exceeds, at a minimum, 102% of the original face amount of the repurchase agreements.
At December 31, 2013, the collateral for the repurchase agreements was as follows:
| Counterparty and | Repurchase | |||||||||||||||||||
| Fund | Terms of Agreement | Face Value | Price | Collateral | Par Value | Fair Value | ||||||||||||||
| SBL Z (Alpha Opportunity Series) | State Street | Freddie Mac | ||||||||||||||||||
| 0.00% | 2.00% | |||||||||||||||||||
| Due 01/02/14 | $ | 6,405,684 | $ | 6,405,684 | 01/30/23 | $ | 7,300,000 | $ | 6,538,194 | |||||||||||
In the event of counterparty default, the Funds have the right to collect the collateral to offset losses incurred. There is potential loss to the Funds in the event the Funds are delayed or prevented from exercising their rights to dispose of the collateral securities, including the risk of a possible decline in the value of the underlying securities during the period while the Funds seek to assert their rights. The Funds’ investment advisor, acting under the supervision of the Board of Directors, reviews the value of the collateral and the creditworthiness of those banks and dealers with which the Funds enter into repurchase agreements to evaluate potential risks.
6. Derivative Investment Holdings Categorized by Risk Exposure
U.S. GAAP requires disclosures to enable investors to better understand how and why the Funds use derivative instruments, how these derivative instruments are accounted for and their effects on the Funds’ financial position and results of operations.
Certain Funds utilized options to minimally hedge the Fund’s portfolio to increase returns, to maintain exposure to the equity markets, and create liquidity.
The following Funds utilized futures and swap agreements for the following purposes:
| Fund | Index Exposure | Income | Duration | Speculation |
| Series A (StylePlus–Large Core Series) | x | |||
| Series J (StylePlus–Mid Growth Series) | x | |||
| Series M (Macro Opportunities Series) | x | x | x | x |
| Series N (Managed Asset Allocation Series) | x | x | ||
| Series X (StylePlus–Small Growth Series) | x | |||
| Series Y (StylePlus–Large Growth Series) | x | |||
| Series Z (Alpha Opportunity Series) | x |
| 150 | THE GUGGENHEIM FUNDS ANNUAL REPORT |
| NOTES TO FINANCIAL STATEMENTS (continued) |
The following table represents the notional amount of futures and swap agreements outstanding, as an approximate percentage of the Funds’ net assets on a daily basis.
| Approximate percentage of | ||||||||
| Fund’s net assets on a daily basis | ||||||||
| Fund | Long | Short | ||||||
| Series A (StylePlus–Large Core Series) | 75 | % | — | |||||
| Series E (Total Return Bond Series) | 20 | % | — | |||||
| Series J (StylePlus–Mid Growth Series) | 75 | % | — | |||||
| Series M (Macro Opportunities Series) | 10 | % | — | |||||
| Series N (Managed Asset Allocation Series) | 55 | % | 5 | % | ||||
| Series X (StylePlus–Small Growth Series) | 75 | % | — | |||||
| Series Y (StylePlus–Large Growth Series) | 75 | % | — | |||||
| Series Z (Alpha Opportunity Series) | 10 | % | — | |||||
The following is a summary of the location of derivative investments on the Funds’ Statements of Assets and Liabilities as of December 31, 2013:
| Derivative Investment Type | Asset Derivatives | Liability Derivatives |
| Equity/Interest Rate/Currency contracts | Variation margin | Options written, at value |
| Investments, at value | ||
| Unrealized appreciation on swap agreements | Unrealized depreciation on swap agreements | |
| Unrealized appreciation on forward | Unrealized depreciation on forward | |
| foreign currency exchange contracts | foreign currency exchange contracts |
The following table sets forth the fair value of the Funds’ derivative investments categorized by primary risk exposure at December 31, 2013:
| Asset Derivative Investments Value | ||||||||||||||||||||||||||||||||
| Options | Options | |||||||||||||||||||||||||||||||
| Futures | Swaps | Swaps | Swaps | Futures | Purchased | Purchased | Total Value at | |||||||||||||||||||||||||
| Equity | Equity | Interest Rate | Currency | Currency | Equity | Interest Rate | December 31, | |||||||||||||||||||||||||
| Fund | Contracts* | Contracts | Contracts | Contracts | Contracts* | Contracts | Contracts | 2013 | ||||||||||||||||||||||||
| Series E (Total Return Bond Series) | $ | — | $ | — | $ | 142,820 | $ | — | $ | — | $ | — | $ | — | $ | 142,820 | ||||||||||||||||
| Series J (StylePlus–Mid Growth Series) | 29,603 | — | — | — | — | — | — | 29,603 | ||||||||||||||||||||||||
| Series M (Macro Opportunities Series) | — | 94,302 | 730 | 1,578 | — | — | 4,520 | 101,130 | ||||||||||||||||||||||||
| Series N (Managed Asset Allocation Series) | 744,660 | — | — | — | 4,615 | — | — | 749,275 | ||||||||||||||||||||||||
| Series X (StylePlus–Small Growth Series) | 15,761 | — | — | — | — | — | — | 15,761 | ||||||||||||||||||||||||
| Series Y (StylePlus–Large Growth Series) | 19,895 | — | — | — | — | — | — | 19,895 | ||||||||||||||||||||||||
| Series Z (Alpha Opportunity Series) | 55,718 | — | — | — | — | — | — | 55,718 | ||||||||||||||||||||||||
| Liability Derivative Investments Value | ||||||||||||||||||||||||||||||||||||
| Forward | ||||||||||||||||||||||||||||||||||||
| Foreign | Options | Options | ||||||||||||||||||||||||||||||||||
| Futures | Swaps | Swaps | Futures | Futures | Currency | Written | Written | Total Value at | ||||||||||||||||||||||||||||
| Equity | Interest Rate | Currency | Currency | Interest Rate | Exchange | Equity | Interest Rate | December 31, | ||||||||||||||||||||||||||||
| Fund | Contracts* | Contracts | Contracts | Contracts* | Contracts* | Contracts | Contracts | Contracts | 2013 | |||||||||||||||||||||||||||
| Series E (Total Return Bond Series) | $ | — | $ | 59,120 | $ | — | $ | — | $ | — | $ | — | $ | — | $ | — | $ | 59,120 | ||||||||||||||||||
| Series M (Macro Opportunities Series) | — | 5,525 | — | — | — | — | — | 1,695 | 7,220 | |||||||||||||||||||||||||||
| Series N (Managed Asset Allocation Series) | 33,501 | — | — | 4,999 | 166,518 | — | — | — | 205,018 | |||||||||||||||||||||||||||
| Series O (All Cap Value Series) | — | — | — | — | — | — | 3,010 | — | 3,010 | |||||||||||||||||||||||||||
| Series P (High Yield Series) | — | — | — | — | — | 7,962 | — | — | 7,962 | |||||||||||||||||||||||||||
| Series Q (Small Cap Value Series) | — | — | — | — | — | — | 38,620 | — | 38,620 | |||||||||||||||||||||||||||
| Series V (Mid Cap Value Series) | — | — | — | — | — | — | 87,065 | — | 87,065 | |||||||||||||||||||||||||||
| * | Includes cumulative appreciation (depreciation) of futures contracts as reported on the Schedules of Investments. Only current day’s variation margin is reported within the Statements of Assets and Liabilities. |
| THE GUGGENHEIM FUNDS ANNUAL REPORT | 151 |
| NOTES TO FINANCIAL STATEMENTS (continued) |
The following is a summary of the location of derivative investments on the Funds’ Statements of Operations for the year ended December 31, 2013:
| Derivative Investment Type | Location of Gain (Loss) on Derivatives |
| Equity/Interest Rate/Currency contracts | Net realized gain (loss) on forward foreign currency exchange contracts |
| Net change in unrealized appreciation (depreciation on forward foreign currency exchange contracts | |
| Net realized gain (loss) on futures contracts | |
| Net change in unrealized appreciation (depreciation) on futures contracts | |
| Net realized gain (loss) on options purchased | |
| Net change in unrealized appreciation (depreciation) on options purchased | |
| Net realized gain (loss) on options written | |
| Net change in unrealized appreciation (depreciation) on options written | |
| Net realized gain (loss) on swap agreements | |
| Net change in unrealized appreciation (depreciation) on swap agreements |
The following is a summary of the Funds’ realized gain (loss) and change in unrealized appreciation (depreciation) on derivative investments recognized on the Statements of Operations categorized by primary risk exposure for the year ended December 31, 2013:
| Realized Gain (Loss) on Derivative Investments Recognized on the Statements of Operations | ||||||||||||||||||||||||||||||||||||||||
| Forward | Options | Options | ||||||||||||||||||||||||||||||||||||||
| Swaps | Futures | Foreign | Purchased/ | Purchased/ | ||||||||||||||||||||||||||||||||||||
| Futures | Swaps | Interest | Swaps | Futures | Interest | Currency | Written | Written | ||||||||||||||||||||||||||||||||
| Equity | Equity | Rate | Currency | Currency | Rate | Exchange | Equity | Interest Rate | ||||||||||||||||||||||||||||||||
| Fund | Contracts | Contracts | Contracts | Contracts | Contracts | Contracts | Contracts | Contracts | Contracts | Total | ||||||||||||||||||||||||||||||
| Series A (StylePlus–Large Core Series) | $ | 371,912 | $ | 26,517,485 | $ | — | $ | — | $ | — | $ | — | $ | — | $ | — | $ | — | $ | 26,889,397 | ||||||||||||||||||||
| Series E (Total Return Bond Series) | — | — | (7,274 | ) | — | — | — | — | — | — | (7,274 | ) | ||||||||||||||||||||||||||||
| Series J (StylePlus–Mid Growth Series) | 96,531 | 20,377,425 | — | — | — | — | — | — | — | 20,473,956 | ||||||||||||||||||||||||||||||
| Series M (Macro Opportunities Series) | — | — | 27,814 | (2,528 | ) | — | — | — | — | (9,600 | ) | 15,686 | ||||||||||||||||||||||||||||
| Series N (Managed Asset Allocation Series) | 3,747,923 | — | — | — | (178,952 | ) | (333,028 | ) | — | — | — | 3,235,943 | ||||||||||||||||||||||||||||
| Series O (All Cap Value Series) | — | — | — | — | — | — | — | 29,947 | — | 29,947 | ||||||||||||||||||||||||||||||
| Series P (High Yield Series) | — | — | — | — | — | — | (1,265 | ) | — | — | (1,265 | ) | ||||||||||||||||||||||||||||
| Series Q (Small Cap Value Series) | — | — | — | — | — | — | — | 127,910 | — | 127,910 | ||||||||||||||||||||||||||||||
| Series V (Mid Cap Value Series) | — | — | — | — | — | — | — | 129,114 | — | 129,114 | ||||||||||||||||||||||||||||||
| Series X (StylePlus–Small Growth Series) | 3,539 | 6,791,493 | — | — | — | — | — | — | — | 6,795,032 | ||||||||||||||||||||||||||||||
| Series Y (StylePlus–Large Growth Series) | 54,458 | 4,746,974 | — | — | — | — | — | — | — | 4,801,432 | ||||||||||||||||||||||||||||||
| Series Z (Alpha Opportunity Series) | 467,700 | — | — | — | — | — | — | — | — | 467,700 | ||||||||||||||||||||||||||||||
| Change in Unrealized Appreciation (Depreciation) on Derivative Investments Recognized on the Statements of Operations | ||||||||||||||||||||||||||||||||||||||||
| Forward | Options | Options | ||||||||||||||||||||||||||||||||||||||
| Swaps | Foreign | Purchased/ | Purchased/ | |||||||||||||||||||||||||||||||||||||
| Futures | Swaps | Interest | Swaps | Futures | Futures | Currencies | Written | Written | ||||||||||||||||||||||||||||||||
| Equity | Equity | Rate | Currency | Currency | Interest Rate | Exchange | Equity | Interest Rate | ||||||||||||||||||||||||||||||||
| Fund | Contracts | Contracts | Contracts | Contracts | Contracts | Contracts | Contracts | Contracts | Contracts | Total | ||||||||||||||||||||||||||||||
| Series E (Total Return Bond Series) | $ | — | $ | — | $ | 83,700 | $ | — | $ | — | $ | — | $ | — | $ | — | $ | — | $ | 83,700 | ||||||||||||||||||||
| Series J (StylePlus–Mid Growth Series) | 29,603 | — | — | — | — | — | — | — | — | 29,603 | ||||||||||||||||||||||||||||||
| Series M (Macro Opportunities Series) | — | 94,302 | (4,795 | ) | 1,578 | — | — | — | — | (22,035 | ) | 69,050 | ||||||||||||||||||||||||||||
| Series N (Managed Asset Allocation Series) | 453,983 | — | — | — | 1,140 | (71,852 | ) | — | — | — | 383,271 | |||||||||||||||||||||||||||||
| Series O (All Cap Value Series) | — | — | — | — | — | — | — | 26,058 | — | 26,058 | ||||||||||||||||||||||||||||||
| Series P (High Yield Series) | — | — | — | — | — | — | (7,962 | ) | — | — | (7,962 | ) | ||||||||||||||||||||||||||||
| Series Q (Small Cap Value Series) | — | — | — | — | — | — | — | 62,843 | — | 62,843 | ||||||||||||||||||||||||||||||
| Series V (Mid Cap Value Series) | — | — | — | — | — | — | — | 140,750 | — | 140,750 | ||||||||||||||||||||||||||||||
| Series X (StylePlus–Small Growth Series) | 15,761 | — | — | — | — | — | — | — | — | 15,761 | ||||||||||||||||||||||||||||||
| Series Y (StylePlus–Large Growth Series) | 19,895 | — | — | — | — | — | — | — | — | 19,895 | ||||||||||||||||||||||||||||||
| Series Z (Alpha Opportunity Series) | 36,383 | — | — | — | — | — | — | — | — | 36,383 | ||||||||||||||||||||||||||||||
7. Federal Income Tax Information
The Funds intend to comply with the provisions of Subchapter M of the Internal Revenue Code applicable to regulated investment companies and distribute substantially all taxable net investment income and capital gains sufficient to relieve the Funds from all, or substantially all, federal income, excise and state income taxes. Therefore, no provision for federal or state income tax is required.
| 152 | THE GUGGENHEIM FUNDS ANNUAL REPORT |
| NOTES TO FINANCIAL STATEMENTS (continued) |
Tax positions taken or expected to be taken in the course of preparing the Funds’ tax returns are evaluated to determine whether the tax positions are “more-likely-than-not” of being sustained by the applicable tax authority. Tax positions not deemed to meet the more-likely-than-not threshold would be recorded as a tax benefit or expense in the current year. Management has analyzed the Funds’ tax positions taken, or to be taken, on Federal income tax returns for all open tax years, and has concluded that no provision for income tax is required in the Funds’ financial statements. The Fund’s federal tax returns are subject to examination by the Internal Revenue Service for a period of three fiscal years after they are filed.
The RIC Modernization Act of 2010 was signed into law on December 22, 2010 and seeks to simplify some of the tax provisions applicable to regulated investment companies, the tax reporting to their shareholders and to improve the tax efficiency of certain fund structures. The greatest impact to the disclosure in the financial reports for the Funds was on the treatment of net capital losses, effective for tax years beginning after December 22, 2010.
One of the more prominent changes addresses capital loss carryforwards. Funds are permitted to carry forward capital losses incurred in taxable years beginning after December 22, 2010 for an unlimited period. However, any losses incurred during those future taxable years will be required to be utilized prior to the losses incurred in pre-enactment taxable years. Under pre-enactment law, capital losses could be carried forward for eight years, and carried forward as short-term capital, irrespective of the character of the original loss. As a result of this ordering rule, pre-enactment capital carryforwards may potentially expire unused. Additionally, post-enactment capital losses that are carried forward will retain their character as either short-term or long-term capital losses rather than being considered all short-term as under previous law.
Tax basis capital losses in excess of capital gains are carried forward to offset future net capital gains. For the year ended December 31, 2013, the following capital loss carryforward amounts expired, were used, or were permanently lost due to loss limitation rules in Section 382 of the Internal Revenue Code:
| Fund | Amount | |||
| Series A (StylePlus–Large Core Series) | $ | 8,855,698 | ||
| Series B (Large Cap Value Series) | 12,615,624 | |||
| Series D (World Equity Income Series) | 20,160,998 | |||
| Series E (Total Return Bond Series) | 4,045,469 | |||
| Series J (StylePlus–Mid Growth Series) | 5,795,514 | |||
| Series N (Managed Asset Allocation Series) | 2,942,348 | |||
| Series O (All Cap Value Series) | 9,320,353 | |||
| Series X (StylePlus–Small Growth Series) | 1,455,499 | |||
| Series Y (StylePlus–Large Growth Series) | 1,598,274 | |||
| Series Z (Alpha Opportunity Series) | 2,342,209 | |||
During 2013, the Funds declared ordinary and long-term capital gain consent dividends, effective for the year ended December 31, 2012, as shown below:
| Ordinary | Long-Term | |||||||||||
| Income | Capital Gain | Total | ||||||||||
| Consent | Consent | Consent | ||||||||||
| Fund | Dividends | Dividends | Dividends | |||||||||
| Series A (StylePlus–Large Core Series) | $ | 1,952,226 | $ | 2,471,434 | $ | 4,423,660 | ||||||
| Series B (Large Cap Value Series) | 3,229,551 | — | 3,229,551 | |||||||||
| Series D (World Equity Income Series) | 8,768,672 | — | 8,768,672 | |||||||||
| Series E (Total Return Bond Series) | 3,491,775 | — | 3,491,775 | |||||||||
| Series J (StylePlus–Mid Growth Series) | 205,098 | 12,523,200 | 12,728,298 | |||||||||
| Series N (Managed Asset Allocation Series) | 483,836 | 6,386,032 | 6,869,868 | |||||||||
| Series O (All Cap Value Series) | 1,256,228 | — | 1,256,228 | |||||||||
| Series P (High Yield Series) | 9,468,472 | 2,295,806 | 11,764,278 | |||||||||
| Series Q (Small Cap Value Series) | 425,400 | 13,279,921 | 13,705,321 | |||||||||
| Series V (Mid Cap Value Series) | 1,085,462 | 17,399,679 | 18,485,141 | |||||||||
| Series X (StylePlus–Small Growth Series) | — | 3,127,824 | 3,127,824 | |||||||||
| Series Y (StylePlus–Large Growth Series) | 242,457 | 1,219,245 | 1,461,702 | |||||||||
| Series Z (Alpha Opportunity Series) | — | 87,336 | 87,336 | |||||||||
Note: For federal income tax purposes, short-term capital gain distributions are treated as ordinary income distributions.
| THE GUGGENHEIM FUNDS ANNUAL REPORT | 153 |
| NOTES TO FINANCIAL STATEMENTS (continued) |
The tax character of distributable earnings/(accumulated losses) at December 31, 2013 was as follows:
| Undistributed | Undistributed | Net Unrealized | Capital Loss | |||||||||||||
| Ordinary | Long-Term | Appreciation/ | Carryforward | |||||||||||||
| Fund | Income | Capital Gain | Depreciation | and Other Losses | ||||||||||||
| Series A (StylePlus–Large Core Series) | $ | 32,049,304 | $ | 29,186,762 | $ | 4,573,354 | $ | (35,216,018 | )1 | |||||||
| Series B (Large Cap Value Series) | 2,824,543 | 18,148,077 | 81,838,120 | (35,375,572 | )1 | |||||||||||
| Series C (Money Market Series) | — | — | 1,671 | — | ||||||||||||
| Series D (World Equity Income Series) | 5,046,941 | — | 7,332,989 | (62,579,131 | )1 | |||||||||||
| Series E (Total Return Bond Series) | 5,070,905 | — | (3,785,402 | ) | (8,523,272 | )1 | ||||||||||
| Series F (Floating Rate Strategies Series) | 1,011,946 | — | 73,291 | — | ||||||||||||
| Series J (StylePlus–Mid Growth Series) | 30,401,590 | 5,563,131 | 3,025,435 | (25,899,300 | )1 | |||||||||||
| Series M (Macro Opportunities Series) | 594,281 | — | (163,075 | ) | (166,272 | )1 | ||||||||||
| Series N (Managed Asset Allocation Series) | 120,031 | 961,653 | 5,622,042 | (1,647,219 | )1 | |||||||||||
| Series O (All Cap Value Series) | 1,318,989 | 3,850,183 | 40,150,670 | (9,743,452 | )1 | |||||||||||
| Series P (High Yield Series) | 10,064,590 | 142,710 | 2,140,191 | — | ||||||||||||
| Series Q (Small Cap Value Series) | 1,657,378 | 12,786,477 | 36,292,311 | — | ||||||||||||
| Series V (Mid Cap Value Series) | 2,030,694 | 29,302,295 | 75,814,354 | — | ||||||||||||
| Series X (StylePlus–Small Growth Series) | 8,922,477 | 3,253,287 | 735,406 | (5,821,995 | )1 | |||||||||||
| Series Y (StylePlus–Large Growth Series) | 6,938,503 | 1,705,356 | 570,751 | (6,393,097 | )1 | |||||||||||
| Series Z (Alpha Opportunity Series) | — | 228,520 | 4,207,682 | (3,124,815 | )1 | |||||||||||
| 1 | A summary of the expiration of the aforementioned Capital Loss Carryforward is as follows: |
| Expires in | Expires in | Expires in | Unlimited | Capital Loss | ||||||||||||||||||||
| Fund | 2016 | 2017 | 2018 | Short-Term | Long-Term | Carryforward | ||||||||||||||||||
| Series A (StylePlus–Large Core Series) | $ | — | $ | (35,216,018 | ) | $ | — | $ | — | $ | — | $ | (35,216,018 | )* | ||||||||||
| Series B (Large Cap Value Series) | (7,474,497 | ) | (27,901,075 | ) | — | — | — | (35,375,572 | )* | |||||||||||||||
| Series D (World Equity Income Series) | (43,071,596 | ) | (15,850,751 | ) | — | (1,400,308 | ) | (2,256,476 | ) | (62,579,131 | )* | |||||||||||||
| Series E (Total Return Bond Series) | (8,163,116 | ) | (360,156 | ) | — | — | (8,523,272 | )* | ||||||||||||||||
| Series J (StylePlus–Mid Growth Series) | (13,884,382 | ) | (12,014,918 | ) | — | — | — | (25,899,300 | )* | |||||||||||||||
| Series M (Macro Opportunities Series) | — | — | — | (152,481 | ) | (13,791 | ) | (166,272 | ) | |||||||||||||||
| Series N (Managed Asset Allocation Series) | — | (1,647,219 | ) | — | — | — | (1,647,219 | )* | ||||||||||||||||
| Series O (All Cap Value Series) | — | (9,743,452 | ) | — | — | — | (9,743,452 | )* | ||||||||||||||||
| Series X (StylePlus–Small Growth Series) | (4,366,496 | ) | (1,455,499 | ) | — | — | — | (5,821,995 | )* | |||||||||||||||
| Series Y (StylePlus–Large Growth Series) | (4,794,823 | ) | (1,598,274 | ) | — | — | — | (6,393,097 | )* | |||||||||||||||
| Series Z (Alpha Opportunity Series) | (3,122,945 | ) | — | — | — | — | (3,122,945 | )* | ||||||||||||||||
* In accordance with Section 382 of the Internal Revenue Code, a portion of certain fund losses are subject to an annual limitation. Note, this annual limitation is generally applicable to all of the capital loss carryforwards shown with respect to each Fund.
Net investment income and net realized gains (losses) may differ for financial statement and tax purposes because of temporary or permanent book/tax differences. These differences are primarily due to wash sales, and mark-to-market of passive foreign investment companies and futures contracts. Additional differences may result from the tax treatment of net investment losses and expired capital loss carryforwards. To the extent these differences are permanent, reclassifications are made to the appropriate equity accounts in the period that the differences arise. These reclassifications have no effect on net assets or NAV per share.
| 154 | THE GUGGENHEIM FUNDS ANNUAL REPORT |
| NOTES TO FINANCIAL STATEMENTS (continued) |
On the Statements of Assets and Liabilities the following adjustments were made for permanent book/tax differences:
| Undistributed | Accumulated | |||||||||||
| Paid In | Net Investment | Net Realized | ||||||||||
| Fund | Capital | Income | Gain (Loss) | |||||||||
| Series A (StylePlus–Large Core Series) | $ | 4,423,660 | $ | (1,978,654 | ) | $ | (2,445,006) | |||||
| Series B (Large Cap Value Series) | 3,229,551 | (3,229,551 | ) | — | ||||||||
| Series C (Money Market Series) | (393,933 | ) | 395,179 | (1,246 | ) | |||||||
| Series D (World Equity Income Series) | 8,768,672 | (7,862,614 | ) | (906,058 | ) | |||||||
| Series E (Total Return Bond Series) | 3,491,774 | (3,301,820 | ) | (189,954 | ) | |||||||
| Series F (Floating Rate Strategies Series) | (18,745 | ) | 31,471 | (12,726 | ) | |||||||
| Series J (StylePlus–Mid Growth Series) | 12,712,327 | (205,098 | ) | (12,507,229 | ) | |||||||
| Series M (Macro Opportunities Series) | (14,454 | ) | 16,933 | (2,479 | ) | |||||||
| Series N (Managed Asset Allocation Series) | 6,869,868 | (610,620 | ) | (6,259,248 | ) | |||||||
| Series O (All Cap Value Series) | 1,256,228 | (1,256,806 | ) | 578 | ||||||||
| Series P (High Yield Series) | 11,764,279 | (9,378,666 | ) | (2,385,613 | ) | |||||||
| Series Q (Small Cap Value Series) | 13,701,348 | (344,428 | ) | (13,356,920 | ) | |||||||
| Series V (Mid Cap Value Series) | 18,340,107 | (949,066 | ) | (17,391,041 | ) | |||||||
| Series X (StylePlus–Small Growth Series) | 3,127,826 | 72,697 | (3,200,523 | ) | ||||||||
| Series Y (StylePlus–Large Growth Series) | 1,461,702 | (224,519 | ) | (1,237,183 | ) | |||||||
| Series Z (Alpha Opportunity Series) | (29,778 | ) | 112,651 | (82,873 | ) | |||||||
At December 31, 2013, the cost of securities for Federal income tax purposes, the aggregate gross unrealized gain for all securities for which there was an excess of value over tax cost and the aggregate gross unrealized loss for all securities for which there was an excess of tax cost over value, were as follows:
| Tax | Tax | Net | ||||||||||||||
| Tax | Unrealized | Unrealized | Unrealized | |||||||||||||
| Fund | Cost | Gain | Loss | Gain (Loss) | ||||||||||||
| Series A (StylePlus–Large Core Series) | $ | 227,256,092 | $ | 5,574,855 | $ | (1,001,501 | ) | $ | 4,573,354 | |||||||
| Series B (Large Cap Value Series) | 201,496,555 | 87,237,997 | (5,399,877 | ) | 81,838,120 | |||||||||||
| Series C (Money Market Series) | 76,366,712 | 2,219 | (548 | ) | 1,671 | |||||||||||
| Series D (World Equity Income Series) | 185,378,045 | 12,292,784 | (4,964,526 | ) | 7,328,258 | |||||||||||
| Series E (Total Return Bond Series) | 106,870,573 | 748,327 | (4,617,429 | ) | (3,869,102 | ) | ||||||||||
| Series F (Floating Rate Strategies Series) | 46,910,862 | 291,220 | (217,936 | ) | 73,284 | |||||||||||
| Series J (StylePlus–Mid Growth Series) | 154,159,853 | 3,735,902 | (719,390 | ) | 3,016,512 | |||||||||||
| Series M (Macro Opportunities Series) | 28,104,698 | 288,313 | (565,758 | ) | (277,445 | ) | ||||||||||
| Series N (Managed Asset Allocation Series) | 58,726,320 | 6,328,280 | (700,759 | ) | 5,627,521 | |||||||||||
| Series O (All Cap Value Series) | 113,385,892 | 44,073,392 | (3,922,722 | ) | 40,150,670 | |||||||||||
| Series P (High Yield Series) | 129,524,161 | 3,775,516 | (1,635,337 | ) | 2,140,179 | |||||||||||
| Series Q (Small Cap Value Series) | 103,602,285 | 42,395,702 | (6,166,234 | ) | 36,229,468 | |||||||||||
| Series V (Mid Cap Value Series) | 226,433,257 | 90,284,362 | (14,610,758 | ) | 75,673,604 | |||||||||||
| Series X (StylePlus–Small Growth Series) | 37,976,679 | 1,022,015 | (286,608 | ) | 735,407 | |||||||||||
| Series Y (StylePlus–Large Growth Series) | 39,955,160 | 755,415 | (184,664 | ) | 570,751 | |||||||||||
| Series Z (Alpha Opportunity Series) | 14,336,199 | 5,172,149 | (533,637 | ) | 4,638,512 | |||||||||||
8. Other Liabilities
Series A (StylePlus–Large Core Series) and Series V (Mid Cap Value Series) each wrote put option contracts through Lehman Brothers, Inc. (“Lehman”) that were exercised prior to the option contracts expiration and prior to the bankruptcy filing by Lehman, during September 2008. However, these transactions have not settled and the securities have not been delivered to the Funds as of December 31, 2013.
Although the ultimate resolution of these transactions is uncertain, the Funds have recorded a liability on their respective books equal to the difference between the strike price on the put options and the market prices of the underlying security on the exercise date. The amount of liability recorded by the Funds as of December 31, 2013 was $18,615 for Series A (StylePlus–Large Core Series) and $205,716 for Series V (Mid Cap Value Series).
| THE GUGGENHEIM FUNDS ANNUAL REPORT | 155 |
| NOTES TO FINANCIAL STATEMENTS (continued) |
9. Securities Transactions
During the year ended December 31, 2013, purchases and sales of investment securities, excluding government and short-term investments, were as follows:
| Fund | Purchases | Sales | ||||||
| Series A (StylePlus–Large Core Series) | $ | 414,408,965 | $ | 458,480,870 | ||||
| Series B (Large Cap Value Series) | 68,411,794 | 105,179,053 | ||||||
| Series C (Money Market Series) | — | 29,035 | ||||||
| Series D (World Equity Income Series) | 280,365,338 | 304,028,423 | ||||||
| Series E (Total Return Bond Series) | 108,541,179 | 125,292,416 | ||||||
| Series F (Floating Rate Strategies Series) | 58,242,200 | 16,318,613 | ||||||
| Series J (StylePlus–Mid Growth Series) | 259,576,461 | 292,214,732 | ||||||
| Series M (Macro Opportunities Series) | 34,579,637 | 9,222,535 | ||||||
| Series N (Managed Asset Allocation Series) | 1,150,227 | 2,300,352 | ||||||
| Series O (All Cap Value Series) | 30,534,439 | 51,303,746 | ||||||
| Series P (High Yield Series) | 116,929,139 | 123,373,028 | ||||||
| Series Q (Small Cap Value Series) | 37,299,129 | 49,261,491 | ||||||
| Series V (Mid Cap Value Series) | 61,086,158 | 91,330,696 | ||||||
| Series X (StylePlus–Small Growth Series) | 67,574,131 | 74,513,998 | ||||||
| Series Y (StylePlus–Large Growth Series) | 66,495,327 | 75,861,439 | ||||||
| Series Z (Alpha Opportunity Series) | 34,629,578 | 39,366,504 | ||||||
10. Affiliated Transactions
Investments representing 5% or more of the outstanding voting shares of a portfolio company of a fund, or control of or by, or common control under GI, result in that portfolio company being considered an affiliated company of such fund, as defined in the 1940 Act. Transactions during the year ended December 31, 2013 in which the portfolio company is an “affiliated person” are as follows:
| Value | Value | Shares | Investment | Realized | ||||||||||||||||||||||||||
| Fund | Security | 12/31/12 | Additions | Reductions | 12/31/13 | 12/31/13 | Income | Gains | ||||||||||||||||||||||
| Series A (StylePlus–Large Core Series) | Mutual Fund: | |||||||||||||||||||||||||||||
| Floating Rate Strategies Fund Institutional Class | $ | — | $ | 4,067,843 | $ | — | $ | 4,029,967 | 150,653 | $ | 127,609 | $ | 3,744 | |||||||||||||||||
| Macro Opportunities Fund Institutional Class | — | 4,069,440 | — | 3,910,920 | 146,257 | 136,814 | — | |||||||||||||||||||||||
| Series J (StylePlus–Mid Growth Series) | Mutual Fund: | |||||||||||||||||||||||||||||
| Floating Rate Strategies Fund Institutional Class | — | 2,754,805 | — | 2,729,155 | 102,024 | 86,419 | 2,536 | |||||||||||||||||||||||
| Macro Opportunities Fund Institutional Class | — | 2,755,886 | — | 2,648,534 | 99,048 | 92,652 | — | |||||||||||||||||||||||
| Series V (Mid Cap Value Series) | Common Stock: | |||||||||||||||||||||||||||||
| HydroGen Corp. | 8,337 | — | — | 1 | 672,346 | — | — | |||||||||||||||||||||||
| Series X (StylePlus–Small Growth Series) | Mutual Fund: | |||||||||||||||||||||||||||||
| Floating Rate Strategies Fund Institutional Class | — | 746,630 | — | 739,678 | 27,651 | 23,422 | 687 | |||||||||||||||||||||||
| Macro Opportunities Fund Institutional Class | — | 746,922 | — | 717,827 | 26,845 | 25,112 | — | |||||||||||||||||||||||
| Series Y (StylePlus–Large Growth Series) | Mutual Fund: | |||||||||||||||||||||||||||||
| Floating Rate Strategies Fund Institutional Class | — | 695,138 | — | 688,665 | 25,744 | 21,807 | 640 | |||||||||||||||||||||||
| Macro Opportunities Fund Institutional Class | — | 695,410 | — | 668,322 | 24,993 | 23,380 | — | |||||||||||||||||||||||
11. Options Written
Transactions in options written during the year ended December 31, 2013 were as follows:
Written Call Options
| Series M (Macro Opportunities Series) | Series O (All Cap Value Series) | Series Q (Small Cap Value Series) | Series V (Mid Cap Value Series) | |||||||||||||||||||||||||||||
| Number of | Premium | Number of | Premium | Number of | Premium | Number of | Premium | |||||||||||||||||||||||||
| contracts | amount | contracts | amount | contracts | amount | contracts | amount | |||||||||||||||||||||||||
| Balance at December 31, 2012 | — | $ | — | — | $ | — | — | $ | — | — | $ | — | ||||||||||||||||||||
| Options Written | 565 | 4,520 | 275 | 68,666 | 722 | 178,164 | 1,283 | 309,660 | ||||||||||||||||||||||||
| Options terminated in closing purchase transactions | — | — | — | — | — | — | — | — | ||||||||||||||||||||||||
| Options expired | — | — | (67 | ) | (14,606 | ) | (298 | ) | (69,396 | ) | (312 | ) | (61,842 | ) | ||||||||||||||||||
| Options exercised | — | — | (122 | ) | (24,992 | ) | (146 | ) | (29,845 | ) | (350 | ) | (71,524 | ) | ||||||||||||||||||
| Balance at December 31, 2013 | 565 | $ | 4,520 | 86 | $ | 29,068 | 278 | $ | 78,923 | 621 | $ | 176,294 | ||||||||||||||||||||
| 156 | THE GUGGENHEIM FUNDS ANNUAL REPORT |
NOTES TO FINANCIAL STATEMENTS (continued)
Written Put Options
| Series M (Macro Opportunities Series) | Series O (All Cap Value Series) | Series Q (Small Cap Value Series) | Series V (Mid Cap Value Series) | |||||||||||||||||||||||||||||
| Number of | Premium | Number of | Premium | Number of | Premium | Number of | Premium | |||||||||||||||||||||||||
| contracts | amount | contracts | amount | contracts | amount | contracts | amount | |||||||||||||||||||||||||
| Balance at December 31, 2012 | — | $ | — | — | $ | — | — | $ | — | — | $ | — | ||||||||||||||||||||
| Options Written | — | — | 289 | 29,316 | 995 | 94,021 | 1,117 | 148,561 | ||||||||||||||||||||||||
| Options terminated in closing purchase transactions | — | — | — | — | — | — | — | — | ||||||||||||||||||||||||
| Options expired | — | — | (52 | ) | (15,342 | ) | (607 | ) | (58,513 | ) | (228 | ) | (67,272 | ) | ||||||||||||||||||
| Options exercised | — | — | (237 | ) | (13,974 | ) | (220 | ) | (12,968 | ) | (505 | ) | (29,768 | ) | ||||||||||||||||||
| Balance at December 31, 2013 | — | $ | — | — | $ | — | 168 | $ | 22,540 | 384 | $ | 51,521 | ||||||||||||||||||||
12. Series Z
The Fund contracted with Lehman Brothers International Europe (“LBIE”) to provide prime brokerage services related to the Fund’s short selling. On September 15, 2008, LBIE was placed into administration and a third party administrator was named (the “Administrator”). The Fund’s exposure to LBIE consists of short sale proceeds held by LBIE, and restricted long positions held at the Fund’s custodian, as collateral for said short sales. Release of the collateral requires the consent of LBIE and Lehman Brothers Inc. (“LBI”), an entity that is subject to a liquidation proceeding. The Fund delivered a Notice of Termination of Loans to LBIE and the Administrator. The Fund has worked to resolve these issues with LBIE and the Administrator. As of December 31, 2013, included in the Statement of Assets and Liabilities are the value of restricted long positions of $12,545,788, cash collateral of $1,417,530, restricted cash representing the value of short sale proceeds of $4,355,365 and liabilities for short sales of $7,786,654, representing the value of securities sold short at the date the short sales were deemed by the Fund to have been terminated. If these short sales had not been terminated, the value of the liability related to these securities sold short would have been $10,670,064 as of December 31, 2013 resulting in a decrease in net assets of $2,883,410 or (17.3)%. Until such time as the liability for short sales is settled and all restrictions are removed by LBIE and LBI, the Fund cannot sell such restricted long positions and/or utilize the restricted cash balances to achieve the Fund’s investment objectives and/or meet Fund redemption or other Fund obligations. During the year ended December 31, 2013, the Fund accrued $299,670 of estimated settlement costs. Based on the ultimate terms of such settlement, the value assigned to these positions may ultimately differ from the fair valuations assigned to them by the Fund and there is no guaranty that the Fund will ultimately recover the full value of the assets that are subject to restrictions. Accordingly, a settlement could ultimately result in the Fund realizing values that are materially different from those indicated herein, which would materially impact the Fund’s net asset value. As of the close of business on October 3, 2008, and until further notice, the Fund is not accepting subscriptions for shares from either new or existing shareholders.
Effective as of August 1, 2011, Security Investors, LLC has agreed to purchase shares of the Fund from time to time to provide the Fund with liquidity if needed to meet redemptions. The intent of the agreement is to provide liquidity to the Fund in the event that shareholders seek to redeem shares of the Fund at a time that there are not sufficient unrestricted assets.
13. Loan Commitments
Pursuant to the terms of certain loan agreements, certain Funds held unfunded loan commitments as of December 31, 2013. The Funds are obligated to fund these loan commitments at the borrower’s discretion.
| THE GUGGENHEIM FUNDS ANNUAL REPORT | 157 |
NOTES TO FINANCIAL STATEMENTS (continued)
The unfunded loan commitments as of December 31, 2013 were as follows:
Series F (Floating Rate Strategies Series)
| Borrower | Maturity Date | Amount | ||||
| Darling International | 04/01/14 | $ | 400,000 | |||
| Power Borrower LLC | 05/06/20 | 15,694 | ||||
| $ | 415,694 | |||||
| Series M (Macro Opportunities Series) | ||||||
| Borrower | Maturity Date | Amount | ||||
| Darling International | 04/01/14 | $ | 125,000 | |||
| Power Borrower LLC | 05/06/20 | 7,847 | ||||
| $ | 132,847 | |||||
| Series P (High Yield Series) | ||||||
| Borrower | Maturity Date | Amount | ||||
| Darling International | 04/01/14 | $ | 700,000 | |||
14. Reverse Repurchase Agreements
Each of the Funds may enter into reverse repurchase agreements. Under a reverse repurchase agreement, a Fund sells securities and agrees to repurchase them at a particular price at a future date. In the event the buyer of securities under a reverse repurchase agreement files for bankruptcy or becomes insolvent, such buyer or its trustee or receiver may receive an extension of time to determine whether to enforce the Fund’s obligation to repurchase the securities, and the Fund’s use of the proceeds of the reverse repurchase agreement may effectively be restricted pending such decision.
For the period ended December 31, 2013, the following Funds entered into reverse repurchase agreements:
| Number of | Balance at | Average | Average | |||||||||||||
| Fund | Days Outstanding | December 31, 2013 | balance outstanding | interest rate | ||||||||||||
| Series E (Total Return Bond Series) | 252 | $ | 10,824,468 | $ | 7,296,071 | 0.83 | % | |||||||||
| Series M (Macro Opportunities Series) | 41 | 1,637,100 | 1,336,214 | 1.03 | % | |||||||||||
| Series P (High Yield Series) | 49 | 7,687,057 | 4,134,071 | 1.07 | % | |||||||||||
15. Line of Credit
On December 14, 2012, Series E (Total Return Bond Series) and Series P (High Yield Series) (the “Funds”) entered into an unlimited credit facility agreement with an approved counterparty whereby the counterparty has agreed to provide secured financing to the Funds and the Funds will provide pledged collateral to the counterparty. At December 31, 2013, there was $50,000,000 of credit facility. The Funds did not have any borrowings under this agreement as of or for the year ended December 31, 2013.
16. Legal Proceedings
Tribune Company
SBL Fund has been named as a defendant in the case entitled Marc S. Kirscher, as Litigation Trustee for the Tribune Litigation Trust v. FitzSimons, No. 12-2652 (S.D.N.Y.) (formerly Official Committee of Unsecured Creditors of Tribune Co. v. FitzSimons, Adv. Pro. No. 10-54010 (Bankr. D. Del.)) (the “FitzSimons” action), as a result of the ownership of shares in the Tribune Company (“Tribune”) in 2007 by certain series of the SBL Fund when Tribune effected a leveraged buyout transaction (“LBO”) by which Tribune converted to a privately-held company. The plaintiff has alleged that, in connection with the LBO, insiders and shareholders were paid for their Tribune stock using financing that the insiders knew would, and ultimately did, leave the Tribune insolvent. The plaintiff has asserted claims against certain insiders, shareholders, professional advisers, and others involved in the LBO, and is attempting to obtain from these individuals and entities the proceeds paid out in connection with the LBO.
SBL Fund also has been named as a defendant in one or more of a group of lawsuits filed by a group of Tribune creditors that allege state law constructive fraudulent conveyance claims against former Tribune shareholders (the “SLCFC actions”).
The FitzSimons action and the SLCFC actions have been consolidated with the majority of the other Tribune LBO-related lawsuits in a multidistrict litigation proceeding captioned In re Tribune Company Fraudulent Conveyance Litig., No. 11-md-2696 (S.D.N.Y.) (the “MDL Proceeding”).
| 158 | THE GUGGENHEIM FUNDS ANNUAL REPORT |
| NOTES TO FINANCIAL STATEMENTS (continued) |
On September 23, 2013, the District Court granted the defendants’ omnibus motion to dismiss the SLCFC actions, on the basis that the creditors lacked standing. On September 30, 2013, the creditors filed a notice of appeal of the September 23 order. On October 28, 2013, the defendants filed a joint notice of cross-appeal of that same order.
On November 20, 2013, the District Court ordered the parties in the FitzSimons action to meet and confer regarding a potential protocol for the briefing and argument of motions to dismiss to be filed in that action. On January 24, 2014, the Court extended the time for service of summonses and complaints in the FitzSimons action to February 28, 2014.
None of these lawsuits allege any wrongdoing on the part of SBL Fund. The following series of SBL Fund held shares of Tribune and tendered these shares as part of Tribune’s LBO: Series H (Enhanced Index Series), Series N (Managed Asset Allocation Series) and Series O (All Cap Value Series) (the “Funds”). The value of the proceeds received by the foregoing Funds was $158,950, $51,000 and $3,774,000, respectively. At this stage of the proceedings, SBL Fund is not able to make a reliable predication as to the outcome of these lawsuits or the effect, if any, on a Fund’s net asset value.
Lyondell Chemical Company
SBL Fund may be a putative member of the proposed defendant class in Weisfelner, as Trustee of the LB Creditor Trust, v. Reichman (In re Lyondell Chemical Co.), Adversary Proceeding No. 12-1570 (Bankr. S.D.N.Y.).
Similar to the claims made in the Tribune matter, the Weisfelner complaint seeks to have set aside and recovered as fraudulent transfers from former Lyondell Chemical Company (“Lyondell”) shareholders the consideration paid to them pursuant to the cash out merger of Lyondell shareholders in connection with the combination of Lyondell and Basell AF in 2007. Lyondell filed for bankruptcy in 2008.
This lawsuit initially was filed in New York Supreme Court, Case No. 653522/2011, on December 19, 2011. On April 25, 2012, it was removed to the United States District Court for the Southern District of New York, Case No. 12-3273, and on April 26, 2012, it was referred to the United States Bankruptcy Court for the Southern District of New York.
This lawsuit does not allege any wrongdoing on the part of SBL Fund. The following series of SBL Fund received cash proceeds from the cash out merger in the following amounts: Series N (Managed Asset Allocation Series) - $28,800. At this stage of the proceedings, SBL Fund is not able to make a reliable predication as to the outcome of this lawsuit or the effect, if any, on a Fund’s net asset value.
17. Offsetting
In the normal course of business, the Funds enter into transactions subject to enforceable master netting arrangements or other similar arrangements. Generally, the right to offset in those agreements allows the Funds to counteract the exposure to a specific counterparty with collateral received or delivered to that counterparty based on the terms of the arrangements. These arrangements provide for the right to liquidate upon the occurrence of an event of default, credit event upon merger or additional termination event.
In order to better define their contractual rights and to secure rights that will help the Funds mitigate their counterparty risk, the Funds may enter into an International Swaps and Derivatives Association, Inc. Master Agreement (“ISDA Master Agreement”) or similar agreement with their derivative contract counterparties. An ISDA Master Agreement is a bilateral agreement between a Fund and a counterparty that governs OTC derivatives, including foreign exchange contracts, and typically contains, among other things, collateral posting terms and netting provisions in the event of a default and/or termination event. The provisions of the ISDA Master Agreement typically permit a single net payment in the event of a default (close-out netting) or similar event, including the bankruptcy or insolvency of the counterparty.
For derivatives traded under an ISDA Master Agreement, the collateral requirements are typically calculated by netting the mark to market amount for each transaction under such agreement and comparing that amount to the value of any collateral currently pledged by the Funds and the counterparty. For financial reporting purposes, cash collateral that has been pledged to cover obligations of the Funds and cash collateral received from the counterparty, if any, is reported separately on the Statement of Assets and Liabilities as segregated cash with broker/ receivable for variation margin, or payable for swap settlement/variation margin. Generally, the amount of collateral due from or to a counterparty must exceed a minimum transfer amount threshold (e.g., $300,000) before a transfer is required to be made. To the extent amounts due to the Funds from their counterparties are not fully collateralized, contractually or otherwise, the Funds bear the risk of loss from counterparty nonperformance. The Funds attempt to mitigate counterparty risk by only entering into agreements with counterparties that they believe to be of good standing and by monitoring the financial stability of those counterparties.
| THE GUGGENHEIM FUNDS ANNUAL REPORT | 159 |
| NOTES TO FINANCIAL STATEMENTS (concluded) |
For financial reporting purposes, the Funds do not offset derivative assets and derivative liabilities that are subject to netting arrangements in the Statement of Assets and Liabilities.
The following tables present derivative financial instruments and secured financing transactions that are subject to enforceable netting arrangements and offset in the Statements of Assets and Liabilities in conformity with U.S. GAAP.
| Gross Amounts Not Offset | ||||||||||||||||||||||||||
| in the Statements of Assets | ||||||||||||||||||||||||||
| and Liabilities | ||||||||||||||||||||||||||
| Net Amount of Assets | ||||||||||||||||||||||||||
| Gross Amounts of | Gross Amounts Offset | Presented on the | Cash | |||||||||||||||||||||||
| Recognized | in the Statements of | Statements of Assets | Financial | Collateral | Net | |||||||||||||||||||||
| Fund | Instrument | Assets1 | Assets and Liabilities | and Liabilities | Instruments | Received2 | Amount | |||||||||||||||||||
| Series M (Macro Opportunities Series) | Swap currency contracts | $ | 1,578 | $ | — | $ | 1,578 | $ | — | $ | — | $ | 1,578 | |||||||||||||
| Swap equity contracts | 94,302 | — | 94,302 | — | — | 94,302 | ||||||||||||||||||||
| Options interest rate contracts | 4,520 | — | 4,520 | — | — | 4,520 | ||||||||||||||||||||
| Total | $ | 100,400 | $ | — | $ | 100,400 | $ | — | $ | — | $ | 100,400 | ||||||||||||||
| Series X (StylePlus–Small Growth Series) | Swap equity contracts | $ | 881,403 | $ | — | $ | 881,403 | $ | — | $ | — | $ | 881,403 | |||||||||||||
| Series Y (StylePlus–Large Growth Series) | Swap equity contracts | $ | 907,335 | $ | — | $ | 907,335 | $ | — | $ | — | $ | 907,335 | |||||||||||||
| Gross Amounts Not Offset | ||||||||||||||||||||||||||
| in the Statements of Assets | ||||||||||||||||||||||||||
| and Liabilities | ||||||||||||||||||||||||||
| Net Amount of | ||||||||||||||||||||||||||
| Gross Amounts of | Gross Amounts Offset | Liabilities Presented | Cash | |||||||||||||||||||||||
| Recognized | in the Statements of | on the Statements of | Financial | Collateral | Net | |||||||||||||||||||||
| Fund | Instrument | Liabilities1 | Assets and Liabilities | Assets and Liabilities | Instruments | Pledged2 | Amount | |||||||||||||||||||
| Series M (Macro Opportunities Series) | Options interest rate contracts | $ | 1,695 | $ | — | $ | 1,695 | $ | — | $ | — | $ | 1,695 | |||||||||||||
| 1 | Exchange traded futures are excluded from these reported amounts. |
| 2 | Excludes maintenance margin deposits held at the broker related to derivatives. These amounts are reflected as Segregated cash with broker on the Statements of Assets and Liabilities. |
| 160 | THE GUGGENHEIM FUNDS ANNUAL REPORT |
REPORT OF INDEPENDENT REGISTERED PUBLIC ACCOUNTING FIRM
To the Board of Directors and Shareholders
of SBL Fund:
We have audited the accompanying statements of assets and liabilities, including the schedules of investments, of SBL Fund (comprising, Series A—StylePlus-Large Core Series, Series B—Large Cap Value Series, Series C—Money Market Series, Series D—World Equity Income Series, Series E—Total Return Bond Series, Series F – Floating Rate Strategies Series, Series J—StylePlus-Mid Growth Series, Series M—Macro Opportunities Series, Series N— Managed Asset Allocation Series, Series O—All Cap Value Series, Series P—High Yield Series, Series Q—Small Cap Value Series, Series V—Mid Cap Value Series, Series X— StylePlus-Small Growth Series, Series Y—StylePlus-Large Growth Series and Series Z—Alpha Opportunity Series) (the “Funds”) as of December 31, 2013, and the related statements of operations, the statements of changes in net assets, and the financial highlights for each of the years or periods indicated therein. These financial statements and financial highlights are the responsibility of the Funds’ management. Our responsibility is to express an opinion on these financial statements and financial highlights based on our audits.
We conducted our audits in accordance with the standards of the Public Company Accounting Oversight Board (United States). Those standards require that we plan and perform the audit to obtain reasonable assurance about whether the financial statements and financial highlights are free of material misstatement. We were not engaged to perform an audit of the Funds’ internal control over financial reporting. Our audits included consideration of internal control over financial reporting as a basis for designing audit procedures that are appropriate in the circumstances, but not for the purpose of expressing an opinion on the effectiveness of the Funds’ internal control over financial reporting. Accordingly, we express no such opinion. An audit also includes examining, on a test basis, evidence supporting the amounts and disclosures in the financial statements and financial highlights, assessing the accounting principles used and significant estimates made by management, and evaluating the overall financial statement presentation. Our procedures included confirmation of securities owned as of December 31, 2013, by correspondence with the custodian, agent banks and brokers or by other appropriate auditing procedures where replies from agent banks or brokers were not received. We believe that our audits provide a reasonable basis for our opinion.
As more fully discussed in Note 12 to the financial statements, Series Z–Alpha Opportunity Series has ongoing exposure to Lehman Brothers International Europe, which was placed into administration in September 2008. Significant uncertainly exists regarding the ultimate timing and manner of settlement of this exposure and the difference between amounts currently recorded and that which may ultimately be settled may be material.
In our opinion, the financial statements and financial highlights referred to above present fairly, in all material respects, the financial position of each of the respective portfolios constituting the SBL Fund at December 31, 2013, and the results of their operations, the changes in their net assets, and their financial highlights for each of the years or periods indicated therein, in conformity with U.S. generally accepted accounting principles.
 |
McLean, Virginia
February 27, 2014
| THE GUGGENHEIM FUNDS ANNUAL REPORT | 161 |
| OTHER INFORMATION (Unaudited) |
Tax Information
This information is being provided as required by the Internal Revenue Code. Amounts shown may differ from those elsewhere in the report because of differences in tax and financial reporting practice.
Of the ordinary income distributions paid during the year, the following funds had the corresponding percentages qualify for the dividends received deduction for corporations:
| Fund | % Qualifying | |||
| Series A (StylePlus–Large Core Series) | 4.82 | % | ||
| Series B (Large Cap Value Series) | 100.00 | % | ||
| Series D (World Equity Income Series) | 19.79 | % | ||
| Series E (Total Return Bond Series) | 0.27 | % | ||
| Series J (StylePlus–Mid Growth Series) | 1.61 | % | ||
| Series M (Macro Opportunities Series) | 1.75 | % | ||
| Series N (Managed Asset Allocation Series) | 100.00 | % | ||
| Series O (All Cap Value Series) | 100.00 | % | ||
| Series P (High Yield Series) | 2.47 | % | ||
| Series Q (Small Cap Value Series) | 56.23 | % | ||
| Series V (Mid Cap Value Series) | 100.00 | % | ||
| Series X (StylePlus–Small Growth Series) | 0.90 | % | ||
| Series Y (StylePlus–Large Growth Series) | 2.91 | % | ||
With respect to the taxable year ended December 31, 2013, the Funds hereby designate as capital gain dividends the amounts listed below, or, if subsequently determined to be different, the net capital gain of such year:
| From long-term capital gains, | ||||
| Fund | subject to the 15% rate gains category: | |||
| Series A (StylePlus–Large Core Series) | $ 29,186,762 | |||
| Series B (Large Cap Value Series) | 18,148,077 | |||
| Series J (StylePlus–Mid Growth Series) | 5,563,131 | |||
| Series N (Managed Asset Allocation Series) | 961,653 | |||
| Series O (All Cap Value Series) | 3,850,183 | |||
| Series P (High Yield Series) | 142,710 | |||
| Series Q (Small Cap Value Series) | 12,786,477 | |||
| Series V (Mid Cap Value Series) | 29,302,295 | |||
| Series X (StylePlus–Small Growth Series) | 3,253,287 | |||
| Series Y (StylePlus–Large Growth Series) | 1,705,356 | |||
| Series Z (Alpha Opportunity Series) | 228,520 | |||
Series D (World Equity Income Series) designates $727,264 of foreign tax paid and gross foreign sourced income earned of $4,853,419 for regular Federal income tax purposes.
Proxy Voting Information
A description of the policies and procedures that the Trust uses to determine how to vote proxies relating to securities held in the Funds’ portfolios is available, without charge and upon request, by calling 1.800.820.0888. This information is also available from the EDGAR database on the SEC’s website at http://www.sec.gov.
Information regarding how the Funds voted proxies relating to portfolio securities during the most recent 12-month period ended June 30 is available without charge, upon request, by calling 1.800.820.0888. This information is also available from the EDGAR database on the SEC’s website at http://www.sec.gov.
| 162 | THE GUGGENHEIM FUNDS ANNUAL REPORT |
| OTHER INFORMATION (Unaudited) (continued) |
At a special meeting of shareholders held on January 8, 2014, the shareholders of the Funds voted on whether to approve the election of nominees to the Board of Directors of each corporation. A description of the number of shares voted is as follows:
| For | Withhold | Total | ||||||||||
| Randall C. Barnes | 69,100,633 | 2,809,458 | 71,910,091 | |||||||||
| Roman Friedrich III | 68,817,726 | 3,092,365 | 71,910,091 | |||||||||
| Robert B. Karn III | 68,958,541 | 2,951,550 | 71,910,091 | |||||||||
| Ronald A. Nyberg | 69,128,618 | 2,781,473 | 71,910,091 | |||||||||
| Ronald E. Toupin, Jr. | 69,096,279 | 2,813,812 | 71,910,091 | |||||||||
At a special meeting of shareholders held on January 8, 2014, the shareholders of the Funds also voted on whether to approve the Funds from a Kansas Corporation into a Delaware Statutory Trust. A description of the number of shares voted is as follows:
| Fund | Shares For | Shares Against | Shares Abstained | |||||||||
| Series A (StylePlus–Large Core Series) | 6,905,073 | 283,578 | 37,400 | |||||||||
| Series B (Large Cap Value Series) | 7,248,889 | 159,643 | 167,051 | |||||||||
| Series C (Money Market Series) | 5,603,746 | 8,821 | 110,257 | |||||||||
| Series D (World Equity Income Series) | 15,173,441 | 542,493 | 520,329 | |||||||||
| Series E (Total Return Bond Series) | 6,017,580 | 79,107 | 254,406 | |||||||||
| Series F (Floating Rate Strategies Series) | 1,702,489 | 26,750 | 8,884 | |||||||||
| Series J (StylePlus–Mid Growth Series) | 3,470,204 | 44,591 | 123,224 | |||||||||
| Series M (Macro Opportunities Series) | 1,036,353 | — | — | |||||||||
| Series N (Managed Asset Allocation Series) | 2,462,572 | 1,192 | 77,360 | |||||||||
| Series O (All Cap Value Series) | 4,533,182 | 66,442 | 99,772 | |||||||||
| Series P (High Yield Series) | 3,758,838 | 18,268 | 57,999 | |||||||||
| Series Q (Small Cap Value Series) | 2,566,859 | 47,011 | 56,417 | |||||||||
| Series V (Mid Cap Value Series) | 3,393,814 | 70,858 | 205,071 | |||||||||
| Series X (StylePlus–Small Growth Series) | 1,191,113 | 32,339 | 106,284 | |||||||||
| Series Y (StylePlus–Large Growth Series) | 2,949,850 | 13,230 | 19,584 | |||||||||
| Series Z (Alpha Opportunity Series) | 610,627 | 4,825 | 42,277 | |||||||||
At a special meeting of shareholders held on January 8, 2014, the shareholders of the Funds also voted on whether to approve changes to the fundamental investment policies. A description of the number of shares voted is as follows:
Diversification
| Fund | Shares For | Shares Against | Shares Abstained | |||||||||
| Series A (StylePlus–Large Core Series) | 6,927,723 | 146,977 | 151,350 | |||||||||
| Series B (Large Cap Value Series) | 7,215,544 | 141,202 | 218,837 | |||||||||
| Series C (Money Market Series) | 5,599,767 | 12,800 | 110,257 | |||||||||
| Series D (World Equity Income Series) | 14,986,441 | 672,584 | 577,238 | |||||||||
| Series E (Total Return Bond Series) | 6,019,174 | 20,315 | 311,604 | |||||||||
| Series F (Floating Rate Strategies Series) | 1,702,489 | 26,750 | 8,884 | |||||||||
| Series J (StylePlus–Mid Growth Series) | 3,435,991 | 69,836 | 132,192 | |||||||||
| Series M (Macro Opportunities Series) | 1,036,353 | — | — | |||||||||
| Series N (Managed Asset Allocation Series) | 2,462,001 | — | 79,121 | |||||||||
| Series O (All Cap Value Series) | 4,491,335 | 75,033 | 133,028 | |||||||||
| Series P (High Yield Series) | 3,755,310 | 10,720 | 69,076 | |||||||||
| Series Q (Small Cap Value Series) | 2,555,165 | 44,652 | 70,470 | |||||||||
| Series V (Mid Cap Value Series) | 3,358,273 | 77,903 | 233,567 | |||||||||
| Series X (StylePlus–Small Growth Series) | 1,222,402 | 20,674 | 86,660 | |||||||||
| Series Y (StylePlus–Large Growth Series) | 2,961,493 | 16,433 | 4,738 | |||||||||
| Series Z (Alpha Opportunity Series) | 611,717 | 4,825 | 41,187 | |||||||||
| THE GUGGENHEIM FUNDS ANNUAL REPORT | 163 |
| OTHER INFORMATION (Unaudited) (continued) |
Underwriting
| Fund | Shares For | Shares Against | Shares Abstained | |||||||||
| Series A (StylePlus–Large Core Series) | 6,921,617 | 153,604 | 150,830 | |||||||||
| Series B (Large Cap Value Series) | 7,194,618 | 147,328 | 233,637 | |||||||||
| Series C (Money Market Series) | 5,490,790 | 12,800 | 219,234 | |||||||||
| Series D (World Equity Income Series) | 14,985,537 | 673,857 | 576,870 | |||||||||
| Series E (Total Return Bond Series) | 5,914,437 | 34,173 | 402,483 | |||||||||
| Series F (Floating Rate Strategies Series) | 1,702,489 | 26,750 | 8,884 | |||||||||
| Series J (StylePlus–Mid Growth Series) | 3,420,822 | 86,649 | 130,548 | |||||||||
| Series M (Macro Opportunities Series) | 1,036,353 | — | — | |||||||||
| Series N (Managed Asset Allocation Series) | 2,459,787 | — | 81,336 | |||||||||
| Series O (All Cap Value Series) | 4,486,926 | 76,803 | 135,667 | |||||||||
| Series P (High Yield Series) | 3,754,328 | 10,720 | 70,058 | |||||||||
| Series Q (Small Cap Value Series) | 2,554,997 | 44,820 | 70,470 | |||||||||
| Series V (Mid Cap Value Series) | 3,337,780 | 94,542 | 237,421 | |||||||||
| Series X (StylePlus–Small Growth Series) | 1,183,303 | 58,139 | 88,295 | |||||||||
| Series Y (StylePlus–Large Growth Series) | 2,945,163 | 32,578 | 4,923 | |||||||||
| Series Z (Alpha Opportunity Series) | 611,717 | 4,825 | 41,187 | |||||||||
Industry Concentration
| Fund | Shares For | Shares Against | Shares Abstained | |||||||||
| Series A (StylePlus–Large Core Series) | 6,937,903 | 139,937 | 148,211 | |||||||||
| Series B (Large Cap Value Series) | 7,220,693 | 145,484 | 209,406 | |||||||||
| Series C (Money Market Series) | 5,478,650 | 15,167 | 229,007 | |||||||||
| Series D (World Equity Income Series) | 14,999,256 | 663,037 | 573,970 | |||||||||
| Series E (Total Return Bond Series) | 5,997,408 | 42,081 | 311,604 | |||||||||
| Series F (Floating Rate Strategies Series) | 1,702,489 | 26,750 | 8,884 | |||||||||
| Series J (StylePlus–Mid Growth Series) | 3,438,854 | 68,617 | 130,548 | |||||||||
| Series M (Macro Opportunities Series) | 1,036,353 | — | — | |||||||||
| Series N (Managed Asset Allocation Series) | 2,444,934 | 495 | 95,694 | |||||||||
| Series O (All Cap Value Series) | 4,457,932 | 81,568 | 159,895 | |||||||||
| Series P (High Yield Series) | 3,750,286 | 15,744 | 69,076 | |||||||||
| Series Q (Small Cap Value Series) | 2,545,777 | 54,040 | 70,470 | |||||||||
| Series V (Mid Cap Value Series) | 3,321,159 | 116,311 | 232,273 | |||||||||
| Series X (StylePlus–Small Growth Series) | 1,190,415 | 54,174 | 85,147 | |||||||||
| Series Y (StylePlus–Large Growth Series) | 2,961,032 | 19,303 | 2,329 | |||||||||
| Series Z (Alpha Opportunity Series) | 611,717 | 4,825 | 41,187 | |||||||||
Real Estate
| Fund | Shares For | Shares Against | Shares Abstained | |||||||||
| Series A (StylePlus–Large Core Series) | 6,933,385 | 143,928 | 148,738 | |||||||||
| Series B (Large Cap Value Series) | 7,218,069 | 156,595 | 200,919 | |||||||||
| Series C (Money Market Series) | 5,568,137 | 31,706 | 122,981 | |||||||||
| Series D (World Equity Income Series) | 14,940,750 | 721,543 | 573,970 | |||||||||
| Series E (Total Return Bond Series) | 5,994,368 | 45,120 | 311,604 | |||||||||
| Series F (Floating Rate Strategies Series) | 1,702,489 | 26,750 | 8,884 | |||||||||
| Series J (StylePlus–Mid Growth Series) | 3,414,029 | 93,442 | 130,548 | |||||||||
| Series M (Macro Opportunities Series) | 1,036,353 | — | — | |||||||||
| Series N (Managed Asset Allocation Series) | 2,430,928 | 26,164 | 84,030 | |||||||||
| Series O (All Cap Value Series) | 4,441,600 | 99,438 | 158,358 | |||||||||
| Series P (High Yield Series) | 3,749,575 | 16,455 | 69,076 | |||||||||
| Series Q (Small Cap Value Series) | 2,538,904 | 60,913 | 70,470 | |||||||||
| Series V (Mid Cap Value Series) | 3,313,844 | 121,212 | 234,688 | |||||||||
| Series X (StylePlus–Small Growth Series) | 1,186,450 | 58,139 | 85,147 | |||||||||
| Series Y (StylePlus–Large Growth Series) | 2,946,722 | 32,578 | 3,364 | |||||||||
| Series Z (Alpha Opportunity Series) | 610,261 | 6,281 | 41,187 | |||||||||
| 164 | THE GUGGENHEIM FUNDS ANNUAL REPORT |
| OTHER INFORMATION (Unaudited) (continued) |
Commodities
| Fund | Shares For | Shares Against | Shares Abstained | |||||||||
| Series A (StylePlus–Large Core Series) | 6,913,573 | 163,392 | 149,086 | |||||||||
| Series B (Large Cap Value Series) | 7,220,063 | 145,321 | 210,199 | |||||||||
| Series C (Money Market Series) | 5,587,207 | 25,360 | 110,257 | |||||||||
| Series D (World Equity Income Series) | 14,942,023 | 720,270 | 573,970 | |||||||||
| Series E (Total Return Bond Series) | 5,995,733 | 41,026 | 314,334 | |||||||||
| Series F (Floating Rate Strategies Series) | 1,702,489 | 26,750 | 8,884 | |||||||||
| Series J (StylePlus–Mid Growth Series) | 3,406,266 | 100,503 | 131,250 | |||||||||
| Series M (Macro Opportunities Series) | 1,036,353 | — | — | |||||||||
| Series N (Managed Asset Allocation Series) | 2,447,283 | 11,312 | 82,527 | |||||||||
| Series O (All Cap Value Series) | 4,463,801 | 96,937 | 138,658 | |||||||||
| Series P (High Yield Series) | 3,747,051 | 15,730 | 72,325 | |||||||||
| Series Q (Small Cap Value Series) | 2,539,072 | 60,745 | 70,470 | |||||||||
| Series V (Mid Cap Value Series) | 3,341,327 | 94,716 | 233,699 | |||||||||
| Series X (StylePlus–Small Growth Series) | 1,187,148 | 57,441 | 85,147 | |||||||||
| Series Y (StylePlus–Large Growth Series) | 2,963,902 | 16,433 | 2,329 | |||||||||
| Series Z (Alpha Opportunity Series) | 610,261 | 6,281 | 41,187 | |||||||||
Loans
| Fund | Shares For | Shares Against | Shares Abstained | |||||||||
| Series A (StylePlus–Large Core Series) | 6,847,524 | 228,704 | 149,822 | |||||||||
| Series B (Large Cap Value Series) | 7,114,769 | 222,547 | 238,267 | |||||||||
| Series C (Money Market Series) | 5,355,354 | 141,708 | 225,762 | |||||||||
| Series D (World Equity Income Series) | 14,925,036 | 734,357 | 576,870 | |||||||||
| Series E (Total Return Bond Series) | 5,904,659 | 43,951 | 402,483 | |||||||||
| Series F (Floating Rate Strategies Series) | 1,702,489 | 26,750 | 8,884 | |||||||||
| Series J (StylePlus–Mid Growth Series) | 3,391,165 | 116,306 | 130,548 | |||||||||
| Series M (Macro Opportunities Series) | 1,036,353 | — | — | |||||||||
| Series N (Managed Asset Allocation Series) | 2,445,544 | 11,548 | 84,030 | |||||||||
| Series O (All Cap Value Series) | 4,454,528 | 104,015 | 140,853 | |||||||||
| Series P (High Yield Series) | 3,746,055 | 19,974 | 69,076 | |||||||||
| Series Q (Small Cap Value Series) | 2,539,072 | 60,745 | 70,470 | |||||||||
| Series V (Mid Cap Value Series) | 3,301,173 | 130,888 | 237,682 | |||||||||
| Series X (StylePlus–Small Growth Series) | 1,184,396 | 59,077 | 86,263 | |||||||||
| Series Y (StylePlus–Large Growth Series) | 2,944,589 | 34,710 | 3,364 | |||||||||
| Series Z (Alpha Opportunity Series) | 610,261 | 6,281 | 41,187 | |||||||||
Borrowing
| Fund | Shares For | Shares Against | Shares Abstained | |||||||||
| Series A (StylePlus–Large Core Series) | 6,871,260 | 205,902 | 148,889 | |||||||||
| Series B (Large Cap Value Series) | 7,171,852 | 169,200 | 234,531 | |||||||||
| Series C (Money Market Series) | 5,354,476 | 142,586 | 225,762 | |||||||||
| Series D (World Equity Income Series) | 14,982,808 | 679,484 | 573,970 | |||||||||
| Series E (Total Return Bond Series) | 5,907,894 | 40,716 | 402,483 | |||||||||
| Series F (Floating Rate Strategies Series) | 1,702,489 | 26,750 | 8,884 | |||||||||
| Series J (StylePlus–Mid Growth Series) | 3,400,342 | 107,129 | 130,548 | |||||||||
| Series M (Macro Opportunities Series) | 1,036,353 | — | — | |||||||||
| Series N (Managed Asset Allocation Series) | 2,446,039 | 11,053 | 84,030 | |||||||||
| Series O (All Cap Value Series) | 4,449,985 | 113,356 | 136,055 | |||||||||
| Series P (High Yield Series) | 3,745,905 | 20,124 | 69,076 | |||||||||
| Series Q (Small Cap Value Series) | 2,531,764 | 68,052 | 70,470 | |||||||||
| Series V (Mid Cap Value Series) | 3,286,379 | 146,798 | 236,566 | |||||||||
| Series X (StylePlus–Small Growth Series) | 1,185,512 | 59,077 | 85,147 | |||||||||
| Series Y (StylePlus–Large Growth Series) | 2,944,589 | 34,710 | 3,364 | |||||||||
| Series Z (Alpha Opportunity Series) | 610,261 | 6,281 | 41,187 | |||||||||
| THE GUGGENHEIM FUNDS ANNUAL REPORT | 165 |
| OTHER INFORMATION (Unaudited) (concluded) |
Senior Securities
| Fund | Shares For | Shares Against | Shares Abstained | |||||||||
| Series A (StylePlus–Large Core Series) | 6,825,246 | 250,230 | 150,574 | |||||||||
| Series B (Large Cap Value Series) | 7,203,478 | 146,745 | 225,359 | |||||||||
| Series C (Money Market Series) | 5,585,708 | 26,119 | 110,998 | |||||||||
| Series D (World Equity Income Series) | 14,999,448 | 662,845 | 573,970 | |||||||||
| Series E (Total Return Bond Series) | 5,980,782 | 58,707 | 311,604 | |||||||||
| Series F (Floating Rate Strategies Series) | 1,702,489 | 26,750 | 8,884 | |||||||||
| Series J (StylePlus–Mid Growth Series) | 3,437,799 | 69,672 | 130,548 | |||||||||
| Series M (Macro Opportunities Series) | 1,036,353 | — | — | |||||||||
| Series N (Managed Asset Allocation Series) | 2,445,331 | 1,192 | 94,600 | |||||||||
| Series O (All Cap Value Series) | 4,483,122 | 82,631 | 133,642 | |||||||||
| Series P (High Yield Series) | 3,751,079 | 13,969 | 70,058 | |||||||||
| Series Q (Small Cap Value Series) | 2,547,857 | 51,959 | 70,470 | |||||||||
| Series V (Mid Cap Value Series) | 3,327,519 | 85,668 | 256,557 | |||||||||
| Series X (StylePlus–Small Growth Series) | 1,190,990 | 53,476 | 85,270 | |||||||||
| Series Y (StylePlus–Large Growth Series) | 2,946,221 | 30,485 | 5,958 | |||||||||
| Series Z (Alpha Opportunity Series) | 611,717 | 4,825 | 41,187 | |||||||||
Quarterly Portfolio Schedules Information
The Trust files its complete schedule of portfolio holdings with the SEC for the first and third quarters of each fiscal year on Form N-Q; which are available on the SEC’s website at http://www.sec.gov. The Funds’ Forms N-Q may be reviewed and copied at the SEC’s Public Reference Room in Washington, DC, and that information on the operation of the Public Reference Room may be obtained by calling 1-800-SEC-0330. Copies of the portfolio holdings are also available to shareholders, without charge and upon request, by calling 1.800.820.0888.
Office Locations
The offices of Guggenheim Investments can be found in the following locations:
330 Madison Avenue
10th Floor
New York, NY 10017
(Headquarters)
Four Irvington Centre
805 King Farm Boulevard
Suite 600
Rockville, MD 20850
9401 Indian Creek Parkway
40 Corporate Woods
Suite 850
Overland Park, KS 66210
| 166 | THE GUGGENHEIM FUNDS ANNUAL REPORT |
| INFORMATION ON BOARD OF DIRECTORS AND OFFICERS (Unaudited) |
DIRECTORS
All Directors and Officers may be reached c/o Guggenheim Investments, 805 King Farm Blvd., Suite 600, Rockville, MD 20850
| Name | ||||||
| (Date of Birth) | Principal Occupations | Other Directorships | ||||
| Year Elected*** | During Past Five Years | Held by Director | ||||
Donald A. Chubb, Jr.** (12-14-46) 1994 | Current: Business broker and manager of commercial real estate, Griffith & Blair, Inc. Realtors | None | ||||
Harry W. Craig, Jr.** (05-11-39) 2004 | Current: Chairman, CEO, & Director, The Craig Group, Inc.; Managing Member of Craig Family Investments, LLC Previous: Prior to November 2009, Chairman, CEO, Secretary and Director, Martin Tractor Company | None | ||||
Jerry B. Farley** (09-20-46) 2005 | Current: President, Washburn University | Director, Westar Energy, Inc. | ||||
Penny A. Lumpkin** (08-20-39) 1993 | Current: Partner, Vivian’s Gift Shop (Corporate Retail); Vice President, Palmer Companies, Inc. (Small Business and Shopping Center Development); PLB (Real Estate Equipment Leasing) | None | ||||
Maynard F. Oliverius** (12-18-43) 1998 | Retired. Formerly, President and Chief Executive Officer, Stormont-Vail HealthCare until 2012 | None | ||||
Donald C. Cacciapaglia* (07-01-51) 2012 (President) | Current: Guggenheim Investments: President and Chief Administrative Officer from February 2010 to present Previous: Channel Capital Group, Inc.; Chairman and CEO from April 2002 to February 2010 | None | ||||
| * | This Director is deemed to be an “interested person” of the Funds under the 1940 Act, as amended, by reason of his position with the Funds’ Investment Manager and/or the parent of the Investment Manager. This Director is also an officer of the funds. |
| ** | These Directors serve on the Fund’s joint audit committee, the purpose of which is to meet with the independent registered public accounting firm, to review the work of the independent registered public accounting firm, and to oversee the handling by Security Investors of the accounting and financial reporting functions for the Funds. |
| *** | Each Director oversees 32 portfolios in the fund complex (213 funds are overseen by Mr. Cacciapaglia) and serves until the next annual meeting, or until a successor has been duly elected and qualified. |
| THE GUGGENHEIM FUNDS ANNUAL REPORT | 167 |
| INFORMATION ON BOARD OF DIRECTORS AND OFFICERS (Unaudited) (concluded) |
OFFICERS*
| Name | ||||
| (Date of Birth) | Principal Occupations | |||
| Title – Year Elected | During Past Five Years | |||
Elisabeth Miller (06-06-68) Chief Compliance Officer - 2012 | Current: Chief Compliance Officer, Rydex Series Funds, Rydex ETF Trust, Rydex Dynamic Funds, and Rydex Variable Trust; Chief Compliance Officer, Security Equity Fund, Security Income Fund, Security Large Cap Value Fund, Security Mid Cap Growth Fund, and SBL Fund; Chief Compliance Officer, Security Investors, LLC; and Chief Compliance Officer, Guggenheim Distributors, LLC (f/k/a Rydex Distributors, LLC) Previous: Senior Manager, Security Investors, LLC and Guggenheim Distributors, LLC (f/k/a Rydex Distributors, LLC) (2004–2009) | |||
Nikolaos Bonos (05-30-63) Treasurer - 2010 | Current: Senior Vice President, Security Investors, LLC; Chief Executive Officer & Manager, Rydex Specialized Products, LLC; Chief Executive Officer & President, Rydex Fund Services, LLC; Vice President, Rydex Holdings, LLC; Vice President & Treasurer, Rydex Series Funds; Rydex ETF Trust; Rydex Dynamic Funds; and Rydex Variable Trust; and Vice President, Security Benefit Asset Management Holdings, LLC Previous: Senior Vice President, Security Global Investors, LLC (2010–2011); and Senior Vice President, Rydex Advisors, LLC (f/k/a PADCO Advisors, Inc.) and Rydex Advisors II, LLC (f/k/a PADCO Advisors II, Inc.) | |||
Joseph M. Arruda (09-05-66) Assistant Treasurer - 2010 | Current: Vice President, Security Investors, LLC; Chief Financial Officer & Manager, Rydex Specialized Products, LLC; and Assistant Treasurer, Rydex Series Funds; Rydex Dynamic Funds; Rydex ETF Trust; and Rydex Variable Trust Previous: Vice President, Security Global Investors, LLC (2010–2011); and Vice President, Rydex Advisors, LLC (f/k/a PADCO Advisors, Inc.) and Rydex Advisors II, LLC (f/k/a PADCO Advisors II, Inc.) (2010) | |||
Amy J. Lee (06-05-61) Vice President – 2007 Secretary – 1987 | Current: Secretary and Senior Vice President, Security Investors, LLC (2004–present) Previous: Vice President, Associate General Counsel and Assistant Secretary, Security Benefit Life Insurance Company and Security Benefit Corporation (2004–2012) | |||
Mark A. Mitchell (08-24-64) Vice President - 2003 | Current: Portfolio Manager, Security Investors, LLC Previous: Vice President and Portfolio Manager, Security Benefit Life Insurance Company (2003–2010) | |||
James P. Schier (12-28-57) Vice President - 1998 | Current: Senior Portfolio Manager, Security Investors, LLC Previous: Vice President and Senior Portfolio Manager, Security Benefit Life Insurance Company (1998–2010) | |||
* Officers serve until the next annual meeting or until a successor has been duly elected and qualified.
| 168 | THE GUGGENHEIM FUNDS ANNUAL REPORT |
| GUGGENHEIM INVESTMENTS PRIVACY POLICIES (Unaudited) |
Rydex Funds, Guggenheim Funds, Rydex Investments, Guggenheim Distributors, LLC, Security Investors, LLC, Security Distributors, Inc. and Rydex Advisory Services (Collectively “Guggenheim Investments”).
Our Commitment to You
When you become a Guggenheim Investments investor, you entrust us with not only your hard-earned money but also with personal and financial information about you. We recognize that your relationship with us is based on trust and that you expect us to act responsibly and in your best interests. Because we have access to this private information about you, we hold ourselves to the highest standards in its safekeeping and use. This means, most importantly, that we do not sell client information to anyone—whether it is your personal information or if you are a current or former Guggenheim Investments client.
The Information We Collect About You
In the course of doing business with shareholders and investors, we collect nonpublic personal information about you. You typically provide personal information when you complete a Guggenheim Investments account application or when you request a transaction that involves Rydex and Guggenheim Investments funds or one of the Guggenheim Investments affiliated companies. “Nonpublic personal information” is personally identifiable private information about you. For example, it includes information regarding your name and address, Social Security or taxpayer identification number, assets, income, account balance, bank account information and investment activity (e.g., purchase and redemption history).
How We Handle Your Personal Information
As emphasized above, we do not sell information about current or former clients or their accounts to third parties. Nor do we share such information, except when necessary to complete transactions at your request or to make you aware of related investment products and services that we offer. Additional details about how we handle your personal information are provided below. To complete certain transactions or account changes that you direct, it may be necessary to provide identifying information to companies, individuals or groups that are not affiliated with Guggenheim Investments. For example, if you ask to transfer assets from another financial institution to Guggenheim Investments, we will need to provide certain information about you to that company to complete the transaction. To alert you to other Guggenheim Investments investment products and services, we may share your information within the Guggenheim Investments family of affiliated companies. This would include, for example, sharing your information within Guggenheim Investments so we can make you aware of new Rydex and Guggenheim Investments funds or the services offered through another Guggenheim Investments affiliated company. In certain instances, we may contract with nonaffiliated companies to perform services for us. Where necessary, we will disclose information we have about you to these third parties. In all such cases, we provide the third party with only the information necessary to carry out its assigned responsibilities and only for that purpose. And we require these third parties to treat your private information with the same high degree of confidentiality that we do. In certain instances, we may share information with other financial institutions regarding individuals and entities in response to the U.S.A. Patriot Act. Finally, we will release information about you if you direct us to do so, if we are compelled by law to do so or in other circumstances permitted by law.
Opt Out Provisions
We do not sell your personal information to anyone. The law allows you to “opt out” of only certain kinds of information sharing with third parties. The firm does not share personal information about you with any third parties that triggers this opt-out right. This means YOU ARE ALREADY OPTED OUT.
How We Protect Privacy Online
Our concern for the privacy of our shareholders also extends to those who use our web site, guggenheiminvestments.com. Our web site uses some of the most secure forms of online communication available, including encryption technology, Secure Socket Layer (SSL) protocol, firewalls and user names and passwords. These technologies provide a high level of security and privacy when you access your account information or initiate online transactions. The Guggenheim Investments web site offers customized features that require our use of “http cookies”— tiny pieces of information that we ask your browser to store. However, we make very limited use of these cookies. We only use cookies for session management and security features on the Guggenheim Investments web site. We do not use them to pull data from your hard drive, to learn your email address, or to view data in cookies created by other web sites. We will not share the information in our cookies or give others access to it. See the legal information area on our web site for more details about web site security and privacy features.
| THE GUGGENHEIM FUNDS ANNUAL REPORT | 169 |
| GUGGENHEIM INVESTMENTS PRIVACY POLICIES (Unaudited) (concluded) |
How We Safeguard Your Personal Information
We restrict access to nonpublic personal information about shareholders to our employees and in some cases to third parties (for example, the service providers described above) as permitted by law. We maintain strict physical, electronic and procedural safeguards that comply with federal standards to guard your nonpublic personal information.
We’ll Keep You Informed
As required by federal law, we will notify shareholders of our privacy policy annually. We reserve the right to modify this policy at any time, but rest assured that if we do change it, we will tell you promptly. You will also be able to access our privacy policy from our web site at guggenheiminvestments.com. Should you have any questions regarding our privacy policy, contact us at 800.820.0888 or 301.296.5100.
| 170 | THE GUGGENHEIM FUNDS ANNUAL REPORT |
This page intentionally left blank.
This page intentionally left blank.
This page intentionally left blank.
Item 2. Code of Ethics.
The registrant’s Board of Directors has adopted a code of ethics that applies to the registrant’s principal executive officer and principal financial officer. No substantive amendments were approved or waivers were granted to the Code during the period covered by this report. The Code is filed as an exhibit to this Form N-CSR.
Item 3. Audit Committee Financial Expert.
The registrant's Board of Directors has determined that Jerry Farley, an "independent" Director serving on the registrant's audit committee, is an "audit committee financial expert," as defined in Item 3 of Form N-CSR. Under applicable securities laws, a person who is determined to be an audit committee financial expert will not be deemed an "expert" for any purpose, including without limitation for the purposes of Section 11 of the Securities Act of 1933, as a result of being designated or identified as an audit committee financial expert. The designation or identification of a person as an audit committee financial expert does not impose on such person any duties, obligations, or liabilities that are greater than the duties, obligations, and liabilities imposed on such person as a member of the audit committee and Board of Directors in the absence of such designation or identification.
Item 4. Principal Accountant Fees and Services.
(a) Audit Fees. The aggregate Audit Fees billed by the registrant’s principal accountant, for the audit of the annual financial statements in connection with statutory and regulatory filings for the fiscal years ended December 31, 2013 and December 31, 2012 were $319,400 and $242,520, respectively.
(b) Audit-Related Fees. The aggregate Audit Related Fees billed by the registrant’s principal accountant for the fiscal years ended December 31, 2013 and December 31, 2012 were $0 and $10,297, respectively.
The aggregate fees billed in the Reporting Periods for assurance and related services by the Auditor to the registrant’s investment adviser (not including any sub-investment adviser whose role is primarily portfolio management and is subcontracted with or overseen by another investment adviser), and any entity controlling, controlled by or under common control with the investment adviser that provides ongoing services to the Registrant (“Service Affiliates”) which required pre-approval by the Audit Committee which related to the review of the transfer agent function for the fiscal years ended December 31, 2013 and December 31, 2012 were $35,000 and $35,000, respectively.
(c) Tax Fees. The aggregate Tax Fees billed by the registrant’s principal accountant for professional services rendered for tax compliance, tax advice, and tax planning, including preparation of tax returns and distribution assistance, for the fiscal years ended December 31, 2013 and December 31, 2012 were $71,153 and $35,689, respectively.
(d) All Other Fees. The aggregate All Other Fees billed by the registrant’s principal accountant for products and services provided by the Auditor, other than the services reported in paragraphs (a) through (c) of this Item, for the fiscal years ended December 31, 2013 and December 31, 2012 were $0 and $0, respectively.
(e) Audit Committee Pre-Approval Policies and Procedures. The audit committee has adopted a policy whereby audit and non-audit services performed by the registrant’s principal accountant for the registrant, its investment advisor, and any entity controlling, controlled by, or under common control with the investment advisor that provides ongoing services to the registrant require pre-approval in advance at regularly scheduled audit committee meetings. If such service is required between regularly scheduled audit committee meetings, the chairman of the audit committee, Penny Lumpkin, is authorized to pre-approve the service with full committee approval at the next scheduled meeting. There shall be no waivers of the pre-approval process. No services described in (b)-(d) above were approved pursuant to paragraph (c)(7)(i)(C) of Rule 2-01 of Regulation S-X.
(f) Not applicable.
(g) Non-Audit Fees. The aggregate non-audit fees billed by the registrant’s accountant for the most recent fiscal year and the preceding fiscal year for services rendered to the registrant, the investment advisor, and any entity controlling, controlled by, or under common control with the advisor that provides ongoing services to the registrant were $106,153 and $70,689, respectively. These aggregate fees were less than the aggregate fees billed for the same periods by the registrant’s principal accountant for audit services rendered to the registrant, the investment advisor, and any entity controlling, controlled by, or under common control with the advisor that provides ongoing services to the registrant.
(h) Auditor Independence. All non-audit services rendered in (g) above were pre-approved by the registrant’s audit committee. As such, the audit committee has considered these services in maintaining the principal accountant’s independence.
Item 5. Audit Committee of Listed Registrants.
Not applicable.
Item 6. Investments.
Schedule of Investments is included as part of the report to shareholders filed under Item 1 of this form.
Item 7. Disclosure of Proxy Voting Policies and Procedures for Closed-End Management Investment Companies.
Not applicable.
Item 8. Portfolio Mangers of Closed-end Management Investment Companies
Not applicable
Item 9. Purchases of Equity Securities by Closed-End Management Investment Company and Affiliated Purchasers.
Not applicable.
Item 10. Submission of Matters to a Vote of Security Holders.
The registrant does not currently have in place procedures by which shareholders may recommend nominees to the registrant’s board.
There have been no changes to the procedures by which shareholders may recommend nominees to the registrant’s board.
Item 11. Controls and Procedures.
(a) The registrant’s President (principal executive officer) and Treasurer (principal financial officer) have evaluated the registrant’s disclosure controls and procedures within 90 days of this filing and have concluded that the registrant’s disclosure controls and procedures were effective as of that date in ensuring that information required to be disclosed by the registrant in this Form N-CSR was recorded, processed, summarized, and reported timely.
(b) The registrant’s principal executive officer and principal financial officer are aware of no change in the registrant’s internal control over financial reporting that occurred during the registrant’s second fiscal quarter covered by this report that has materially affected, or is reasonably likely to materially affect, the registrant’s internal control over financial reporting.
Item 12. Exhibits.
(a)(1) The registrant’s code of ethics pursuant to Item 2 of Form N-CSR is attached.
(a)(2) Separate certifications by the President (principal executive officer) and Treasurer (principal financial officer) of the registrant as required by Rule 30a-2(a) under the Act (17 CFR 270.30a-2(a)) are attached.
(b) A certification by the registrant’s President (principal executive officer) and Treasurer (principal financial officer) as required by Rule 30a-2(b) under the Act (17 CFR 270.30a-2(b)) is attached.
SIGNATURES
Pursuant to the requirements of the Securities Exchange Act of 1934 and the Investment Company Act of 1940, the registrant has duly caused this report to be signed on its behalf by the undersigned, thereunto duly authorized.
(Registrant) SBL Fund
By (Signature and Title)* /s/ Donald C. Cacciapaglia
Donald C. Cacciapaglia, President
Date March 10, 2014
Pursuant to the requirements of the Securities Exchange Act of 1934 and the Investment Company Act of 1940, this report has been signed below by the following persons on behalf of the registrant and in the capacities and on the dates indicated.
By (Signature and Title)* /s/ Donald C. Cacciapaglia
Donald C. Cacciapaglia, President
Date March 10, 2014
By (Signature and Title)* /s/ Nikolaos Bonos
Nikolaos Bonos, Treasurer
Date March 10, 2014
* Print the name and title of each signing officer under his or her signature.