CERTIFIED SHAREHOLDER REPORT OF REGISTERED MANAGEMENT INVESTMENT COMPANIES
Investment Company Act file number: 811-00248 -------------------------------------------------------------------------
ADAMS DIVERSIFIED EQUITY FUND, INC. ------------------------------------------------------------------------- (Exact name of registrant as specified in charter)
500 East Pratt Street, Suite 1300, Baltimore, Maryland 21202 ------------------------------------------------------------------------- (Address of principal executive offices)
Lawrence L. Hooper, Jr. Adams Diversified Equity Fund, Inc. 500 East Pratt Street, Suite 1300 Baltimore, Maryland 21202 ------------------------------------------------------------------------- (Name and address of agent for service)
Registrant's telephone number, including area code: (410) 752-5900 Date of fiscal year end: December 31 Date of reporting period: December 31, 2016
Item 1. Reports to Stockholders.
ADAMS FUND
ADAMS
DIVERSIFIED EQUITY FUND
ANNUAL REPORT
2016
SIGN UP
GET THE LATEST NEWS AND INFORMATION
adamsfunds.com/sign-up
2016ATA GLANCE
The Fund
•
a closed-end equity investment company
•
objectives: preservation of capital
reasonable income
opportunity for capital gain
•
internally-managed
•
annual distribution rate of at least 6%
Stock Data (12/31/16)
NYSE Symbol ADX
Market Price $12.71
52-Week Range $10.96 – $13.35
Discount 16.5%
Shares Outstanding 99,436,824
Summary Financial Information
Year Ended December 31,
2016
2015
Net asset value per share (NASDAQ: XADEX)
$
15.22
$
15.04
Total net assets
1,513,497,727
1,472,144,157
Unrealized appreciation on investments
415,249,779
394,480,793
Net investment income
18,908,616
12,063,999
Net realized gain
77,925,100
74,763,845
Total return (based on market price)
6.9%
0.7%
Total return (based on net asset value)
9.2%
1.8%
Ratio of expenses to average net assets
0.64%
0.96%
*
Annual distribution rate
7.8%
6.8%
* Excluding non-recurring charge for termination of defined benefit plans, ratio was 0.67%.
2016 Dividends and Distributions
Paid
Amount (per share)
Type
March 1, 2016
$
0.02
Long-term capital gain
March 1, 2016
0.03
Investment income
June 1, 2016
0.05
Investment income
September 1, 2016
0.05
Investment income
December 28, 2016
0.79
Long-term capital gain
December 28, 2016
0.05
Investment income
$
0.99
2017 Annual Meeting of Shareholders
Location: Adams Funds, 500 East Pratt Street, Suite 1300, Baltimore, MD 21202
Date: April 21, 2017
Time: 9:00 a.m.
Letter from Chief Executive Officer and President,
Mark E. Stoeckle
Dear Fellow Shareholders,
Uncertainty and a 10% stock market decline ushered in the first few weeks of 2016. The ensuing rebound in equities set the tone for what proved to be a year marked by resiliency in the face of the unexpected. Despite macroeconomic and political events ranging from concerns about China’s growth in January to the Brexit vote in June and the U.S. election in November, financial markets defied expectations. The majority of 2016’s gains came in the second half of the year. A rebound in corporate earnings, accelerating U.S. economic growth, and stabilizing oil prices supported investor enthusiasm for stocks. The rally gathered steam after the U.S. election with the S&P 500 advancing 5.0% and finishing 2016 with a total return of 12.0%. This year’s rally extends a bull market that has seen the S&P 500 triple in value since March of 2009, which marked the trough of the financial crisis.
Against this backdrop, Adams Diversified Equity Fund, Inc. generated a total return on net asset value of 9.2% and a total return on market price of 6.9%. The Lipper Large-Cap Core Mutual Funds Average, our peer group, returned 10.1%. The Fund distributed 7.8% to shareholders in 2016, exceeding its 6% commitment.
“Despite the political and economic unknowns, we see opportunities in the U.S. equity markets.”
2016 Market Recap
The year’s surprises began in the opening trading session of the year when markets declined on concerns that China faced a hard landing after years of rapid growth. Fears that additional rate hikes were forthcoming, building on the December 2015 Federal Reserve interest rate increase, added additional pressure. U.S. crude (West Texas Intermediate) prices also fell to a decade low of $26.21 a barrel. By February 11th, the market had suffered its worst-ever start to a year. However, investor worries subsided quickly, and the markets assumed an upward trajectory.
The primary catalysts for the market rebound were economic fundamentals that fueled a more-supportive stance for financial markets. The labor market continued to strengthen as did the housing outlook and motor vehicle sales. Economic activity began expanding at a moderate pace during the summer and accelerated later in the year. Oil prices also found a floor as supply and demand moved closer to balance and U.S. inflation escalated. Some sectors that were hardest hit during the retreat at the beginning of the year, including Energy and Materials, embarked on sustained rallies and finished the year significantly higher.
The year was not without volatility. In June, the markets reacted adversely to the news that voters in the U.K. had passed the referendum forcing Britain to leave the European Union. The following two trading sessions wiped $3 trillion out of global markets. However, the market upheaval was short-lived. Fears about the U.S. economy diminished causing consumer confidence to rise in the second-half of the year. The unemployment rate fell to 4.6% and U.S. corporate earnings grew after several quarters of declines. In the strongest reading in two years, U.S. GDP advanced 3.5% in the third quarter.
November delivered the second political shock, as Donald Trump proved the predictive models and polling numbers wrong and emerged victorious in the U.S. Presidential election. Market pundits also missed the mark, as expectations for a selloff in the event of a GOP win never materialized. To the
1
1
LETTERTO SHAREHOLDERS (CONTINUED)
contrary, stocks in the U.S. hit record highs, fueled by the anticipated business-friendly policies of the new administration. Prospects for tax cuts and a cash repatriation plan strengthened domestic equities, as did expectations of an easier regulatory environment and increased infrastructure spending.
Post-election tailwinds contributed to the superior returns in the Energy, Financials, and Industrials sectors relative to the overall market’s advance of 12.0%. Energy stocks also benefited from OPEC’s first agreement to curtail production since December of 2008. Elsewhere, the Consumer Discretionary sector advanced in the final months of the year thanks to expectations for strong economic growth and improving wages.
The Federal Reserve held off on raising interest rates for most of the year until improvements in the labor market and inflation justified the move. The December increase was the first since December 2015 and just the second rate increase in a decade. Officials also signaled that future hikes would likely proceed at a faster pace than previously projected reflecting optimism about the U.S. economy.
Portfolio Performance
While we are always pleased to generate a positive total return, the Fund’s performance relative to the S&P 500 was disappointing. The shortfall primarily reflected a significant rotation in the market in the first six months of 2016. Investors rewarded lower-quality, out-of-favor companies based on the expectation that their prospects would improve and the performance of the high-quality names we prefer suffered. We have experienced these swings in the past and, while not something we either enjoy or take lightly, we have found that staying true to our investment process will ultimately be rewarded. In the latter half of the year, there was a more balanced perspective in the market and the portfolio’s performance improved. For the year, Technology and Health Care were the most costly sectors versus the S&P 500. Strong performance in the Energy and Financials sectors helped to offset some of the relative performance shortfall.
While still up 13.9% for the year, the Technology sector lagged during the post-election rally. Investors sold long-term winners in Technology to fund more cyclical and interest rate-sensitive names. Our position in Apple contributed to the relative underperformance. Though aided by Samsung’s well-publicized product recall, a lukewarm reception to the iPhone 7 product cycle hurt the stock. Our exposure to Visa was also a detractor as debit card market share concerns pressured the stock in the short-term. But we continue to believe that Visa will benefit from the secular trend toward cashless transactions.
Health Care stocks struggled for most of 2016. Post-election, the sector initially moved higher on President-elect Trump’s pledge to reform existing health care programs. However, investor interest in the sector waned reflecting uncertainty surrounding the timing of changes and the future state of health care laws. Our stock selection and weightings in the sector detracted from the Fund’s return. The weakest performer in Health Care was Allergan, a diversified pharmaceutical company. In April, Pfizer called off its acquisition of Allergan following new rules designed to curb “tax-inversion” deals. Allergan’s stock bore the brunt of the dropped merger. Despite sector-wide pricing concerns, Allergan’s growth profile remains among the best of all large drug companies.
Energy was the strongest performing sector in the S&P 500 in 2016 as supply and demand fundamentals for oil and gas improved. Oil prices rose 45% during the year and natural gas advanced 59%. President-elect Trump’s promise of reduced regulation as well as the OPEC agreement to limit production added further optimism, contributing to a market-leading return of 27.4% for the sector. The Fund’s holding in Adams Natural Resources Fund, our sister diversified energy and materials fund, was the top contributor to the sector’s performance. Our overweight positon in Halliburton, one of the world’s largest providers of products and services to the energy industry, also delivered solid results.
2
LETTERTO SHAREHOLDERS (CONTINUED)
The Financial sector experienced the largest post-election “bounce” in performance. Financial stocks soared following the election and advanced 22.8% for the year. The sector is a major beneficiary of rising interest rates, easing regulatory headwinds, and corporate tax reform. Our stock selection and weightings in the capital markets industry contributed significantly to the portfolio. The Fund’s holdings in Goldman Sachs Group and Raymond James Financial delivered solid earnings growth throughout the year. Bank stocks, including your Fund’s positions in Bank of America and Wells Fargo, were the best-performing industry group within Financials.
Outlook for 2017
The year kicks off with a new U.S. President, stocks near an all-time high, rising interest rates, and rebounding oil prices. GDP growth is accelerating and U.S. corporate earnings are showing continued growth. We expect the relative economic strength in the U.S. to continue. The U.S. consumer is benefiting from employment gains, modestly improving wages, and favorable housing conditions. Interest rates, though expected to rise, remain at historically low levels. Further economic growth could be forthcoming if plans to lower corporate taxes and loosen regulations materialize.
However, the year also begins with risks and opportunities arising from the shifting political landscape. Politics will likely be a major market driver over the next several years. A new administration is coming in with a very different agenda than the one put forth by the Obama White House. Financial markets will be paying close attention to how President Trump will reduce regulatory restrictions, increase fiscal stimulus, reduce taxes, and boost infrastructure spending.
Outside the U.S., macroeconomic and political risks persist. The implementation of Britain’s exit, elections in France and Germany, and the effects of changing U.S. trade policy create uncertainty. Apart from this, there are signs of a pickup in global growth led by an improving economic cycle in China.
Despite the political and economic unknowns, we see opportunities in the U.S. equity markets. Companies that benefit from rising interest rates, less regulation, higher commodity prices, and innovation offer great potential.
The Energy sector, which served the Fund well last year, should continue to benefit from higher oil and gas prices and the more benign regulatory environment anticipated during President Trump’s term. As commodity prices rise, companies that operate “closest to the well,” including oil service and exploration and production companies, often outperform. Quality exploration and production companies including Concho Resources and Anadarko Petroleum, a recent addition to the portfolio, reflect that posture. Trading at a discount to its peers, Anadarko generates strong production and cash flow growth at competitive rates of return. Recent asset transactions by management positions the company well and plans to accelerate activity in the Delaware and Denver-Julesburg Basins should result in double-digit oil production growth through 2020. Halliburton also remains a favored holding and our preferred vehicle to play an accelerating U.S. onshore recovery.
Though rising significantly since the election, we continue to be optimistic about the Financials sector. We are entering a period of rising interest rates, a time when Financials often outperform. Additionally, the election of Donald Trump could translate into reduced regulation and improving growth prospects for the sector. Companies could benefit from lower compliance costs and a loosening of capital constraints. In the fourth quarter we initiated a position in American Express Company, a global payments and credit card company. After two years of significantly underperforming the sector, we find the stock to be attractively valued as the company is showing signs of becoming more competitive.
We also continue to be optimistic about the Technology sector as ongoing innovation and disruptive technologies shape the global economy. Cloud computing, mobility, and “big data” are secular shifts that
3
LETTERTO SHAREHOLDERS (CONTINUED)
should continue to attract an increasing portion of corporate technology spending. Our portfolio is positioned to capture these trends through companies like Microsoft, Alphabet, Facebook, and Adobe Systems.
Consumer confidence rebounded in 2016 and consumer spending could be the beneficiary of lower taxes and increases in disposable income in the coming year. The consumer recently has demonstrated a preference for spending more on experiences rather than things. An addition to our portfolio in the last quarter captures that trend. Priceline, an online travel agent with a vast global footprint of properties and services, offers an attractive growth profile and should continue to benefit from the growing consumer preference for travel and adventure.
Investors were rewarded with attractive returns in 2016, resulting in an eight-year move higher in the S&P 500. The combination of strong fundamentals and a significantly changing political landscape both domestically and abroad present a unique environment for investors. The Fund’s long-term focus and proven strategy help us find opportunities during periods of uncertainty. Our search for high-quality companies that are executing well and trading at the right prices is unwavering.
By order of the Board of Directors,
Mark E. Stoeckle
Chief Executive Officer & President
January 20, 2017
Disclaimers
This report contains “forward-looking statements” within the meaning of the Securities Act of 1933 and the Securities Exchange Act of 1934. By their nature, all forward-looking statements involve risks and uncertainties, and actual results could differ materially from those contemplated by the forward-looking statements. Several factors that could materially affect the Fund’s actual results are the performance of the portfolio of stocks held by the Fund, the conditions in the U.S. and international financial markets, the price at which shares of the Fund will trade in the public markets, and other factors discussed in the Fund’s periodic filings with the Securities and Exchange Commission.
This report is transmitted to the shareholders of the Fund for their information. It is not a prospectus, circular or representation intended for use in the purchase or sale of shares of the Fund or of any securities mentioned in the report. The rates of return will vary and the principal value of an investment will fluctuate. Shares, if sold, may be worth more or less than their original cost. Past performance is no guarantee of future investment results.
4
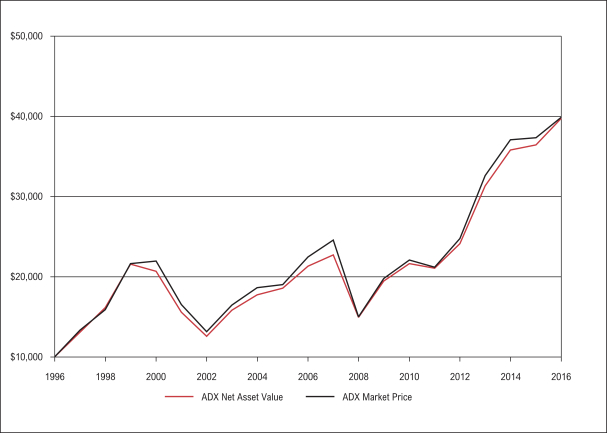
INVESTMENT GROWTH
(unaudited)
This chart shows the value of hypothetical $10,000 investments in the Fund at net asset value and market price over the past 20 years. All Fund distributions are reinvested at the price received in the Fund’s dividend reinvestment plan. Returns do not reflect taxes paid by shareholders on distributions or the sale of shares.
AVERAGE ANNUAL TOTAL RETURNS AS OF 12/31/16
Years
1
3
5
10
ADX NAV
9.2
%
8.3
%
13.6
%
6.4
%
ADX Market Price
6.9
%
7.0
%
13.6
%
5.9
%
Lipper Large-Cap Core Funds Average*
10.1
%
6.8
%
13.1
%
6.1
%
* Source: Thomson Reuters
5
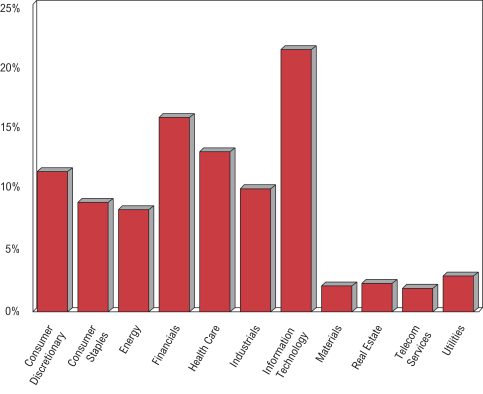
PORTFOLIO HIGHLIGHTS
December 31, 2016
(unaudited)
Ten Largest Equity Portfolio Holdings
Market Value
Percent of Net Assets
Apple Inc.
$
55,651,510
3.7
%
Alphabet Inc. (Class A & Class C)
55,606,452
3.7
Microsoft Corp.
51,998,752
3.4
Adams Natural Resources Fund, Inc.*
44,107,232
2.9
Comcast Corp. (Class A)
38,654,190
2.6
Wells Fargo & Co.
36,978,810
2.4
Facebook, Inc. (Class A)
34,894,665
2.3
Amazon.com, Inc.
33,069,267
2.2
Exxon Mobil Corp.
32,340,158
2.1
Boeing Co.
31,914,400
2.1
$
415,215,436
27.4
%
*
Non-controlled affiliated closed-end fund
Sector Weightings
6
STATEMENTOF ASSETSAND LIABILITIES
December 31, 2016
Assets
Investments* at value:
Common stocks:
Unaffiliated issuers (cost $1,029,937,890)
$
1,437,094,357
Non-controlled affiliate (cost $34,735,404)
44,107,232
Other investment in controlled affiliate (cost $150,000)
233,000
Short-term investments (cost $34,509,811)
34,509,811
Securities lending collateral (cost $26,702,449)
26,702,449
$
1,542,646,849
Cash
368,648
Dividends and interest receivable
1,752,165
Prepaid expenses and other assets
736,281
Total Assets
1,545,503,943
Liabilities
Obligations to return securities lending collateral
26,702,449
Net unrealized loss on open total return swap agreements*
1,361,516
Accrued expenses and other liabilities
3,942,251
Total Liabilities
32,006,216
Net Assets
$
1,513,497,727
Net Assets
Common Stock at par value $0.001 per share, authorized 150,000,000 shares; issued and outstanding 99,436,824 shares (includes 83,143 nonvested restricted shares, 18,750 nonvested or deferred restricted stock units, and 36,773 deferred stock units) (note 7)
$
99,437
Additional capital surplus
1,097,157,919
Undistributed net investment income
261,115
Undistributed net realized gain on investments
729,477
Unrealized appreciation on investments
415,249,779
Net Assets Applicable to Common Stock
$
1,513,497,727
Net Asset Value Per Share of Common Stock
$15.22
* See Schedule of Investments beginning on page 18.
The accompanying notes are an integral part of the financial statements.
7
STATEMENTOF OPERATIONS
Year Ended December 31, 2016
Investment Income
Income:
Dividends (includes $896,577 from affiliates and net of $50,063 in foreign taxes)
$
28,056,202
Interest and other income
218,498
Total Income
28,274,700
Expenses:
Investment research compensation and benefits
4,388,466
Administration and operations compensation and benefits
2,266,840
Occupancy and other office expenses
734,081
Directors’ compensation
442,500
Investment data services
425,110
Transfer agent, custody, and listing fees
336,468
Shareholder reports and communications
309,681
Accounting, recordkeeping, and other professional fees
161,776
Insurance
147,994
Audit and tax services
98,414
Legal services
54,754
Total Expenses
9,366,084
Net Investment Income
18,908,616
Realized Gain (Loss) and Change in Unrealized Appreciation on Investments
Net realized gain on security transactions
77,092,534
Net realized loss on total return swap agreements
(763,779
)
Net realized gain distributed by non-controlled affiliate
1,596,345
Change in unrealized appreciation on investments (includes $5,229,861 from affiliates)
20,768,986
Net Gain on Investments
98,694,086
Change in Net Assets Resulting from Operations
$
117,602,702
The accompanying notes are an integral part of the financial statements.
8
STATEMENTSOF CHANGESIN NET ASSETS
For the Year Ended December 31,
2016
2015
From Operations:
Net investment income
$
18,908,616
$
12,063,999
Net realized gain
77,925,100
74,763,845
Change in unrealized appreciation
20,768,986
(75,235,059
)
Change in accumulated other comprehensive income (note 6)
—
2,375,650
Increase in Net Assets Resulting from Operations
117,602,702
13,968,435
Distributions to Shareholders from:
Net investment income
(17,520,894
)
(13,398,646
)
Net realized gain
(78,538,326
)
(75,358,557
)
Decrease in Net Assets from Distributions
(96,059,220
)
(88,757,203
)
From Capital Share Transactions:
Value of shares issued in payment of distributions (note 5)
32,024,245
32,287,094
Cost of shares purchased (note 5)
(12,436,299
)
(13,600,866
)
Deferred compensation (notes 5, 7)
222,142
474,036
Increase in Net Assets from Capital Share Transactions
19,810,088
19,160,264
Total Change in Net Assets
41,353,570
(55,628,504
)
Net Assets:
Beginning of year
$
1,472,144,157
1,527,772,661
End of year (including undistributed net investment income of $261,115 and distributions in excess of net investment income of $710,116, respectively)
$
1,513,497,727
$
1,472,144,157
The accompanying notes are an integral part of the financial statements.
9
NOTES TO FINANCIAL STATEMENTS
Adams Diversified Equity Fund, Inc. (the “Fund”) is registered under the Investment Company Act of 1940 (“1940 Act”) as a diversified investment company. The Fund is an internally-managed closed-end fund whose investment objectives are preservation of capital, the attainment of reasonable income from investments, and an opportunity for capital appreciation.
1. SIGNIFICANT ACCOUNTING POLICIES
Basis of Presentation — The accompanying financial statements were prepared in accordance with accounting principles generally accepted in the United States of America (“GAAP”) for investment companies, which require the use of estimates by Fund management. Management believes that estimates and valuations are appropriate; however, actual results may differ from those estimates, and the valuations reflected in the financial statements may differ from the value the Fund ultimately realizes.
Affiliates — The 1940 Act defines “affiliated companies” as those companies in which the Fund owns 5% or more of the outstanding voting securities. Additionally, those companies in which the Fund owns more than 25% of the outstanding voting securities are considered to be “controlled” by the Fund. The Fund and its affiliates, Adams Natural Resources Fund, Inc. (“PEO”) and Adams Funds Advisers, LLC (“AFA”) have a shared management team.
PEO — The Fund owns 2,186,774 shares of PEO, a non-diversified, closed-end investment company, representing 8% of its outstanding shares. The Fund accounts for PEO as a portfolio investment that meets the definition of a non-controlled affiliate. During 2016, the Fund received dividends and long-term capital gain distributions of $896,577 and $1,596,345, respectively, from its investment in PEO and recognized a change in unrealized appreciation on its investment in PEO of $5,313,861. Directors of the Fund are also directors of PEO.
AFA — In April 2015, Fund shareholders authorized the Fund to provide investment advisory services to external parties, and the Securities and Exchange Commission granted no action relief under section 12(d)(3) of the 1940 Act to allow the Fund to create a separate, wholly-owned entity for this purpose. The Fund provided the initial capital for the start-up costs of AFA, a Maryland limited liability company, and the Fund is the sole member and General Manager, as provided by the Operating Agreement between AFA and the Fund. This structure mitigates the risk of potential liabilities for the Fund associated with any claims that may arise from AFA during the ordinary course of conducting its business. Given that AFA is an operating company that provides no services to the Fund, the Fund accounts for AFA as a portfolio investment that meets the definition of a controlled affiliate.
In October 2015, AFA began providing advisory services to an external party. AFA earns advisory fee revenue based on assets under management. AFA’s profit can fluctuate due to the level of assets under management, as driven by the number of client relationships, level of client investment activity, and client investment performance, and will impact the Fund’s valuation of its investment in AFA. As of December 31, 2016, AFA had assets under management of $134 million invested entirely from one client; failure to maintain this existing relationship or to develop new relationships could impact AFA’s ability to generate revenue. To the extent that AFA’s operating costs exceed its revenue earned, the Fund may be required to provide additional capital to AFA. For tax purposes, AFA’s revenues and expenses are consolidated with those of the Fund and, as such, the advisory fee revenue generated by AFA is monitored closely to ensure that it does not exceed an amount that would jeopardize the Fund’s status as a regulated investment company. During 2016, the Fund recognized a change in unrealized appreciation on its investment in AFA of $(84,000).
Expenses — The Fund and its affiliates share personnel, systems, and other infrastructure items and are charged a portion of the shared expenses. To protect the Fund from potential conflicts of interest, policies and procedures are in place covering the sharing of expenses among the entities. Expenses that are not solely attributable to one entity are allocated in accordance with the Fund’s policy, which dictates that
10
NOTES TO FINANCIAL STATEMENTS (CONTINUED)
such expenses be attributed to each entity based on the relative net assets of the Funds, or, in the case of AFA, the net assets under management. Investment research compensation and benefits are attributed to each entity based on the relative market values of the portfolio securities covered in each respective entity. Expense allocations are updated quarterly, except for those related to payroll, which are updated annually.
For the year ended December 31, 2016, expenses of $3,529,116 and $442,604 were charged to PEO and AFA, respectively, in accordance with the Fund’s expense sharing policy. There were no amounts due to, or due from, its affiliates as of December 31, 2016.
Investment Transactions, Investment Income, and Distributions — The Fund’s investment decisions are made by the portfolio management team with recommendations from the research staff. Policies and procedures are in place covering the allocation of investment opportunities among the Fund and its affiliates to protect the Fund from potential conflicts of interests. Investment transactions are accounted for on trade date. Realized gains and losses on sales of investments are recorded on the basis of specific identification. Dividend income and distributions to shareholders are recognized on the ex-dividend date. Interest income is recognized on an accrual basis.
Valuation — The Fund’s financial instruments are reported at fair value, which is defined as the price that would be received to sell an asset or paid to transfer a liability in an orderly transaction between market participants at the measurement date. The Fund has a Valuation Committee (“Committee”) to ensure that financial instruments are appropriately priced at fair value in accordance with GAAP and the 1940 Act. Subject to oversight by the Board of Directors, the Committee establishes methodologies and procedures to value securities for which market quotations are not readily available.
GAAP establishes the following fair value hierarchy that categorizes the inputs used to measure fair value:
•
Level 1 — fair value is determined based on market data obtained from independent sources; for example, quoted prices in active markets for identical investments;
•
Level 2 — fair value is determined using other assumptions obtained from independent sources; for example, quoted prices for similar investments;
•
Level 3 — fair value is determined using the Fund’s own assumptions, developed based on the best information available in the circumstances.
Investments in securities traded on national security exchanges are valued at the last reported sale price as of the close of regular trading on the relevant exchange on the day of valuation. Over-the-counter and listed securities for which a sale price is not available are valued at the last quoted bid price. Money market funds are valued at net asset value. These securities are generally categorized as Level 1 in the hierarchy.
Short-term investments (excluding money market funds) are valued at amortized cost, which approximates fair value. Total return swap agreements are valued using independent, observable inputs, including underlying security prices, dividends, and interest rates. These securities are generally categorized as Level 2 in the hierarchy.
The Fund’s investment in its controlled affiliate, AFA, is valued by methods deemed reasonable in good faith by the Committee. The Fund generally uses market-based valuation multiples, including price-to-earnings and price-to-book value, and discounted free cash flow analysis, or a combination thereof to estimate fair value. The Committee also considers discounts for illiquid investments, such as AFA. Fair value determinations are reviewed on a regular basis and updated as needed. Due to the inherent uncertainty of the value of Level 3 assets, estimated fair value may differ significantly from the value that would have been used had an active market existed. Any change in the estimated fair value of Level 3 investments is recognized in the Fund’s Statement of Operations in Change in unrealized appreciation on investments.
11
NOTES TO FINANCIAL STATEMENTS (CONTINUED)
Given the absence of market quotations or observable inputs, the Fund’s investment in AFA is categorized as Level 3 in the hierarchy.
At December 31, 2016, the Fund’s financial instruments were classified as follows:
Level 1
Level 2
Level 3
Total
Assets:
Common stocks
$
1,481,201,589
$
—
$
—
$
1,481,201,589
Other investments
—
—
233,000
233,000
Short-term investments
34,509,811
—
—
34,509,811
Securities lending collateral
26,702,449
—
—
26,702,449
Total investments
$
1,542,646,849
$
—
$
233,000
$
1,542,646,849
Liabilities:
Total return swap agreements*
$
—
$
(1,361,516
)
$
—
$
(1,361,516
)
* Unrealized appreciation (depreciation)
The following is a reconciliation of the change in the value of Level 3 investments:
Balance as of December 31, 2015
$
317,000
Purchases
—
Change in unrealized appreciation on investments
(84,000
)
Balance as of December 31, 2016
$
233,000
There were no transfers between levels during the year ended December 31, 2016.
2. FEDERAL INCOME TAXES
No federal income tax provision is required since the Fund’s policy is to qualify as a regulated investment company under the Internal Revenue Code and to distribute substantially all of its taxable income and gains to its shareholders. Additionally, management has analyzed and concluded that tax positions included in federal income tax returns from the previous three years that remain subject to examination do not require any provision. Any income tax-related interest or penalties would be recognized as income tax expense. As of December 31, 2016, the identified cost of securities for federal income tax purposes was $1,126,011,451 and net unrealized appreciation aggregated $416,635,398, consisting of gross unrealized appreciation of $432,450,604 and gross unrealized depreciation of $15,815,206.
Distributions are determined in accordance with the Fund’s annual 6% minimum distribution rate commitment, based on the Fund’s average market price, and income tax regulations, which may differ from generally accepted accounting principles. Such differences are primarily related to the Fund’s retirement plans, equity-based compensation, and investment in AFA. Differences that are permanent, while not material for the year ended December 31, 2016, are reclassified in the capital accounts of the Fund’s financial statements and have no impact on net assets. For tax purposes, distributions paid by the Fund during the years ended December 31, 2016 and December 31, 2015 were classified as ordinary income of $17,518,194 and $14,361,548, respectively, and as long-term capital gain of $78,513,621 and $74,376,524, respectively. The tax basis of distributable earnings at December 31, 2016 was $2,399,504 of undistributed ordinary income and $561,150 of undistributed long-term capital gain.
3. INVESTMENT TRANSACTIONS
The Fund’s investment decisions are made by the portfolio management team with recommendations from the research staff. Purchases and sales of portfolio investments, other than short-term investments, during the year ended December 31, 2016 were $462,873,857 and $534,093,696, respectively.
4. DERIVATIVES
During the year ended December 31, 2016, the Fund invested in derivative instruments. The Fund may use derivatives for a variety of purposes, including, but not limited to, the ability to obtain leverage, to gain
12
NOTES TO FINANCIAL STATEMENTS (CONTINUED)
or limit exposure to particular market sectors or securities, to provide additional income, and/or to limit equity price risk in the normal course of pursuing its investment objectives. The financial derivative instruments outstanding as of year-end and the amounts of realized and changes in unrealized gains and losses on financial derivative instruments during the year indicate the volume of financial derivative activity for the period.
Total Return Swap Agreements — The Fund may use total return swap agreements to manage exposure to certain risks and/or to enhance performance. Total return swap agreements are bilateral contracts between the Fund and a counterparty in which the Fund, in the case of a long contract, agrees to receive the positive total return (and pay the negative total return) of an underlying equity security and to pay a financing amount, based on a notional amount and a referenced interest rate, over the term of the contract. In the case of a short contract, the Fund agrees to pay the positive total return (and receive the negative total return) of the underlying equity security and to receive or pay a financing rate, based on a notional amount and a referenced interest rate, over the term of the contract. The fair value of each total return swap agreement is determined daily with the change in the fair value recorded as an unrealized gain or loss in the Statement of Operations. Upon termination of a swap agreement, the Fund recognizes a realized gain (loss) on total return swap agreements in the Statement of Operations equal to the net receivable (payable) amount under the terms of the agreement.
Total return swap agreements entail risks associated with counterparty credit, liquidity, and equity price risk. Such risks include that the Fund or the counterparty may default on its obligation, that there is no liquid market for these agreements, and that there may be unfavorable changes in the price of the underlying equity security. To mitigate the Fund’s counterparty credit risk, the Fund enters into master netting and collateral arrangements with the counterparty. A master netting agreement allows either party to terminate the contract prior to termination date and to net amounts due across multiple contracts upon settlement, providing for a single net settlement with a counterparty. Pursuant to master netting arrangements, the net cumulative unrealized gain (asset) on open total return swap agreements and net cumulative unrealized loss (liability) on open total return swap agreements are presented in the Statement of Assets and Liabilities. The Fund’s policy is to net all derivative instruments subject to a netting agreement. The fair value of each outstanding total return swap contract is presented on the Schedule of Investments.
A collateral arrangement requires each party to provide collateral with a value, adjusted daily and subject to a minimum transfer amount, equal to the net amount owed to the other party under the contract. The counterparty provides cash collateral to the Fund and the Fund provides collateral by segregating portfolio securities, subject to a valuation allowance, into a tri-party account at its custodian. As of December 31, 2016, securities, as denoted on the Schedule of Investments, with a value of $1,899,408 were pledged by the Fund and no cash collateral was held by the Fund.
5. CAPITAL STOCK
The Fund has 10,000,000 authorized and unissued preferred shares, $0.001 par value.
On December 28, 2016, the Fund issued 2,516,928 shares of its Common Stock at a price of $12.71 per share (the average market price on December 12, 2016) to shareholders of record November 25, 2016, who elected to take stock in payment of the year-end distribution from 2016 capital gain and investment income. During 2016, the Fund issued 2,684 shares of Common Stock at a weighted average price of $12.71 per share as dividend equivalents to holders of deferred stock units and restricted stock units under the 2005 Equity Incentive Compensation Plan.
On December 28, 2015, the Fund issued 2,586,293 shares of its Common Stock at a price of $12.47 per share (the average market price on December 14, 2015) to shareholders of record on November 25, 2015, who elected to take stock in payment of the year-end distribution from 2015 capital gain and
13
NOTES TO FINANCIAL STATEMENTS (CONTINUED)
investment income. During 2015, the Fund issued 2,795 shares of Common Stock at a weighted average price of $12.87 per share as dividend equivalents to holders of deferred stock units and restricted stock units under the 2005 Equity Income Compensation Plan.
The Fund may purchase shares of its Common Stock from time to time, in accordance with parameters set by the Board of Directors, at such prices and amounts as the portfolio management team may deem appropriate. Transactions in Common Stock for 2016 and 2015 were as follows:
Shares
Amount
2016
2015
2016
2015
Shares issued in payment of distributions
2,519,612
2,589,088
$
32,024,245
$
32,287,094
Shares purchased (at a weighted average discount from net asset value of 15.8% and 13.9%, respectively)
(974,904
)
(977,800
)
(12,436,299
)
(13,600,866
)
Net activity under the 2005 Equity Incentive Compensation Plan
(21,830
)
16,002
222,142
474,036
Net change
1,522,878
1,627,290
$
19,810,088
$
19,160,264
6. RETIREMENT PLANS
Defined Contribution Plans — The Fund sponsors a qualified defined contribution plan for all employees with at least six months of service and a nonqualified defined contribution plan for eligible employees to supplement the qualified plan. The Fund matches employee contributions made to the plan and, subject to Board approval, may also make a discretionary contribution to the plans. During 2016, the Fund recorded matching contributions of $291,588. As of December 31, 2016, the Fund recorded a liability in the amount of $225,245, included in Accrued expenses and other liabilities in the accompanying Statement of Assets and Liabilities, representing the 2016 discretionary contribution.
Defined Benefit Plans — The Fund terminated its qualified and nonqualified defined benefit plans in 2015 and has no further defined benefit obligations. In terminating these plans, the Fund incurred settlement costs in 2015 representing the amount of the pension obligation in excess of the previously-recorded pension liability and any unamortized actuarial losses remaining in accumulated other comprehensive income at the time of termination.
A December 31 measurement date was used for its defined benefit plans. Details in aggregate for the plans were as follows:
2016
2015
Change in benefit obligation
Benefit obligation at beginning of year
$
—
$
9,232,545
Interest cost
—
134,198
Benefits paid (qualified and nonqualified plans)
—
(11,618,512
)
Effect of settlement
—
2,251,769
Benefit obligation at end of year
$
—
$
—
Change in qualified plan assets
Fair value of qualified plan assets at beginning of year
$
—
$
7,044,299
Actual return on plan assets
—
39,466
Contributions
—
858,979
Qualified plan benefits paid
—
(7,942,744
)
Fair value of qualified plan assets at end of year
$
—
$
—
Funded status
$
—
$
—
14
NOTES TO FINANCIAL STATEMENTS (CONTINUED)
Items impacting the Fund’s pension cost and accumulated other comprehensive income were:
2016
2015
Components of pension cost
Interest cost
$
—
$
134,198
Expected return on plan assets
—
(36,871
)
Net loss component
—
155,995
Effect of settlement
—
4,471,424
Pension cost
$
—
$
4,724,746
Change in accumulated other comprehensive income
Reclassifications to net periodic pension cost:
Amortization of net loss
$
—
$
155,995
Effect of settlement
—
2,219,655
Change during the year
$
—
$
2,375,650
Assumptions used to determine benefit obligations and net periodic pension cost were:
2016
2015
Discount rate (net periodic pension cost)
—
%
3.33
%
Expected return on plan assets
—
%
1.80
%
The assumption used to determine expected return on plan assets was based on historical and future expected returns of multiple asset classes in order to develop a risk-free real rate of return and risk premiums for each asset class. The overall rate for each asset class was developed by combining a long-term inflation component, the risk-free real rate of return, and the associated risk premium. A weighted average rate was developed based on those overall rates and the target asset allocation of the plan.
7. EQUITY-BASED COMPENSATION
The Fund’s 2005 Equity Incentive Compensation Plan, adopted at the 2005 Annual Meeting and reapproved at the 2010 Annual Meeting, expired on April 27, 2015. Restricted stock awards granted prior to the Plan’s expiration remain outstanding as of December 31, 2016 and vest on various dates through September 2, 2018, provided the service condition set forth in the award at grant is satisfied. Also outstanding are restricted stock units granted to nonemployee directors that are 100% vested, but payment of which has been deferred by the election of the director.
Outstanding awards were granted at fair market value on grant date (determined by the average of the high and low price on that date). Awards earn an amount equal to the Fund’s per share distribution, payable in either cash (employees) or reinvested shares (non-employee directors). Reinvested shares are fully vested and paid concurrently with the payment of the original share grant. A summary of the activity related to nonvested restricted shares and restricted stock units for the year ended December 31, 2016 is as follows:
Awards
Shares/Units
Weighted Average Grant-Date Fair Value
Balance at December 31, 2015
186,921
$
12.62
Reinvested dividend equivalents
2,684
12.71
Vested & issued
(43,405
)
11.55
Forfeited
(7,534
)
11.04
Balance at December 31, 2016 (includes 0 performance-based awards and 138,666 nonperformance-based awards)
138,666
$
12.76
15
NOTES TO FINANCIAL STATEMENTS (CONTINUED)
Compensation cost is based on the fair market value of the award on grant date and recognized on a straight-line basis over the vesting period. Any compensation cost recognized related to an award that is subsequently forfeited due to unmet service conditions is reversed. Total compensation cost related to equity-based compensation for the year ended December 31, 2016 was $394,528. As of December 31, 2016, the Fund had unrecognized compensation cost of $271,785, a component of additional capital surplus, related to nonvested awards that will be recognized over a weighted average period of 0.90 years. The total fair value of awards vested and issued during the year ended December 31, 2016 was $523,685.
8. OFFICER AND DIRECTOR COMPENSATION
The aggregate remuneration paid by the Fund during the year ended December 31, 2016 to officers and directors amounted to $4,975,140, of which $442,500 was paid to directors who were not officers. These amounts represent the taxable income to the Fund’s officers and directors and, therefore, differ from the amounts reported in the accompanying Statement of Operations that are recorded and expensed in accordance with generally accepted accounting principles.
9. PORTFOLIO SECURITIES LOANED
The Fund makes loans of securities to approved brokers to earn additional income. It receives as collateral cash deposits valued at 102% of the value of the securities on loan. The market value of the loaned securities is calculated based upon the most recent closing prices and any additional required collateral is delivered to the Fund on the next business day. Cash deposits are placed in a registered money market fund. The Fund accounts for securities lending transactions as secured financing and retains a portion of the income from lending fees and interest on the investment of cash collateral. The Fund also continues to receive dividends on the securities loaned. Gain or loss in the fair value of the securities loaned that may occur during the term of the loan will be for the account of the Fund. At December 31, 2016, the Fund had securities on loan of $26,175,124 and held cash collateral of $26,702,449. The Fund is indemnified by the Custodian, serving as lending agent, for the loss of loaned securities and has the right under the lending agreement to recover the securities from the borrower on demand.
10. OPERATING LEASE COMMITMENTS
The Fund and its affiliates lease office space and equipment under operating lease agreements expiring at various dates through the year 2026. The Fund recognized rental expense of $352,712 in 2016, and its estimated portion of the minimum rental commitments are as follows:
2017
$
299,276
2018
306,573
2019
247,805
2020
246,029
2021
241,469
Thereafter
1,300,136
Total
$
2,641,288
16
FINANCIAL HIGHLIGHTS
Year Ended December 31,
2016
2015
2014
2013
2012
Per Share Operating Performance
Net asset value, beginning of year
$15.04
$15.87
$15.09
$12.43
$11.54
Net investment income
0.19
0.13
0.20
0.20
0.19
Net realized gain and change in unrealized appreciation
1.03
—
1.83
3.32
1.41
Change in accumulated other comprehensive income (note 6)
—
0.02
(0.01
)
0.01
—
Total from operations
1.22
0.15
2.02
3.53
1.60
Less distributions from:
Net investment income
(0.18
)
(0.14
)
(0.20
)
(0.22
)
(0.18
)
Net realized gain
(0.81
)
(0.79
)
(0.98
)
(0.62
)
(0.49
)
Total distributions
(0.99
)
(0.93
)
(1.18
)
(0.84
)
(0.67
)
Capital share repurchases (note 5)
0.02
0.02
0.02
0.02
—
Reinvestment of distributions
(0.07
)
(0.07
)
(0.08
)
(0.05
)
(0.04
)
Total capital share transactions
(0.05
)
(0.05
)
(0.06
)
(0.03
)
(0.04
)
Net asset value, end of year
$15.22
$15.04
$15.87
$15.09
$12.43
Market price, end of year
$12.71
$12.83
$13.68
$13.07
$10.59
Total Investment Return*
Based on market price
6.9%
0.7%
13.7%
31.8%
16.9%
Based on net asset value
9.2%
1.8%
14.3%
29.7%
14.7%
Ratios/Supplemental Data
Net assets, end of year (in millions)
$1,513
$1,472
$1,528
$1,422
$1,156
Ratio of expenses to average net assets
0.64%
0.96%
†
0.58%
0.69%
††
0.65%
††
Ratio of net investment income to average net assets
1.29%
0.79%
†
1.29%
1.44%
††
1.54%
††
Portfolio turnover
32.0%
22.0%
26.6%
55.9%
27.4%
Number of shares outstanding at end of year (in 000’s)
99,437
97,914
96,287
94,224
93,030
*
Total investment return assumes reinvestment of all distributions at the price received in the Fund’s dividend reinvestment plan.
†
Ratio of expenses to average net assets was 0.67%, excluding the one-time charge of $4,471,424 related to the termination of the defined benefit plans (note 6), and the ratio of net investment income to average net assets was 1.08%.
††
Ratios of expenses to average net assets were 0.63% in both 2013 and 2012, excluding non-recurring pension-related settlement charges. The adjusted ratios of net investment income to average net assets were 1.50% and 1.56% in 2013 and 2012, respectively.
17
SCHEDULEOF INVESTMENTS
December 31, 2016
Shares
Value (A)
Common Stocks — 97.9%
Consumer Discretionary — 11.4%
Amazon.com, Inc. (B)(C)
44,100
$
33,069,267
Comcast Corp. (Class A)
559,800
38,654,190
Consumer Discretionary Select Sector SPDR Fund (B)
Total Investments — 101.9% of Net Assets (Cost $1,126,035,554)
$
1,542,646,849
20
SCHEDULEOF INVESTMENTS (CONTINUED)
December 31, 2016
Total Return Swap Agreements — (0.1)%
Type of Contract
Counterparty
Termination Date
Notional Amount
Unrealized Appreciation (Assets)
Unrealized Depreciation (Liabilities)
Receive positive total return (pay negative total return) on 200,200 shares of Salesforce.com Inc. common stock and pay financing amount based on notional amount and daily U.S. Federal Funds rate plus 0.55%.
Long
Morgan Stanley
10/13/2017
15,020,742
$
—
$
(1,361,516
)
Gross unrealized loss on open total return swap agreements
$
—
$
(1,361,516
)
Net unrealized loss on open total return swap agreements(H)
$
(1,361,516
)
Notes:
(A)
Common stocks are listed on the New York Stock Exchange or the NASDAQ and are valued at the last reported sale price on the day of valuation. See note 1 to financial statements.
(B)
All or a portion of shares are on loan. See note 9 to financial statements.
(C)
Presently non-dividend paying.
(D)
Non-controlled affiliate, a closed-end sector fund, registered as an investment company under the Investment Company Act of 1940.
(E)
Controlled affiliate valued using fair value procedures.
(F)
Rate presented is as of period-end and represents the annualized yield earned over the previous seven days.
(G)
A portion of the position is pledged as collateral for open swap agreements. The aggregate market value of pledged securities is $1,899,408.
(H)
Value is disclosed on the Statement of Assets and Liabilities under the caption Net unrealized loss on open total return swap agreements.
21
REPORTOF INDEPENDENT REGISTERED PUBLIC ACCOUNTING FIRM
To the Board of Directors and Shareholders of Adams Diversified Equity Fund, Inc.:
In our opinion, the accompanying statement of assets and liabilities, including the schedule of investments in securities, and the related statements of operations and of changes in net assets and the financial highlights present fairly, in all material respects, the financial position of Adams Diversified Equity Fund, Inc. (the “Fund”) at December 31, 2016, the results of its operations for the year then ended, the changes in its net assets for each of the two years in the period then ended and the financial highlights for each of the five years in the period then ended, in conformity with accounting principles generally accepted in the United States of America. These financial statements and financial highlights (hereafter referred to as “financial statements”) are the responsibility of the Fund’s management. Our responsibility is to express an opinion on these financial statements based on our audits. We conducted our audits of these financial statements in accordance with the standards of the Public Company Accounting Oversight Board (United States). Those standards require that we plan and perform the audit to obtain reasonable assurance about whether the financial statements are free of material misstatement. An audit includes examining, on a test basis, evidence supporting the amounts and disclosures in the financial statements, assessing the accounting principles used and significant estimates made by management, and evaluating the overall financial statement presentation. We believe that our audits, which included confirmation of securities at December 31, 2016 by correspondence with the custodians and brokers, provide a reasonable basis for our opinion.
PricewaterhouseCoopers LLP
Baltimore, MD
February 10, 2017
22
PRINCIPAL CHANGESIN PORTFOLIO SECURITIES
During the Six Months Ended December 31, 2016
(unaudited)
Purchases (Cost)
Sales (Proceeds)
Market Value Held at December 31, 2016
American Express Co.
$
11,639,484
$
11,682,416
American International Group, Inc.
7,444,422
$
6,267,604
18,482,730
Amgen Inc.
15,370,487
15,278,945
Anadarko Petroleum Corp.
12,125,820
13,290,538
AvalonBay Communities, Inc.
8,913,568
9,530,670
Bristol-Myers Squibb Co.
14,579,396
10,770,711
—
Broadcom Ltd
15,826,733
15,697,176
CenterPoint Energy, Inc.
9,041,409
9,880,640
Coca-Cola Co.
12,163,926
19,278,900
Consumer Discretionary Select Sector SPDR Fund
18,179,938
15,809,714
2,637,360
Consumer Staples Select Sector SPDR Fund
9,122,697
8,955,984
—
Dow Chemical Co.
8,360,885
7,799,086
Exxon Mobil Corp.
24,156,245
32,340,158
Health Care Select Sector SPDR Fund
23,893,939
21,643,941
1,882,062
Hewlett Packard Enterprise Co.
9,908,474
5,138,075
6,233,916
Industrial Select Sector SPDR Fund
16,717,449
9,188,278
7,827,276
Pfizer Inc.
7,649,637
22,831,491
Priceline Group Inc.
15,136,447
15,100,418
Raymond James Financial, Inc.
10,489,773
7,467,081
7,148,664
Robert Half International Inc.
7,511,596
9,877,950
SPDR S&P Regional Banking ETF
7,460,688
9,452,457
Walmart Stores, Inc.
20,862,176
20,210,688
Waters Corp.
9,753,501
8,359,058
Allstate Corp.
17,144,637
—
Amazon.com, Inc.
4,824,026
33,069,267
Apple Inc.
9,759,843
55,651,510
Boston Properties, Inc.
10,499,433
—
Capital One Financial Corp.
15,068,066
—
CF Industries Holdings, Inc.
4,905,233
—
Chevron Corp.
24,023,915
—
Cigna Corp.
17,745,116
—
Citrix Systems, Inc.
9,586,968
—
CVS Health Corp.
5,895,080
19,522,334
DTE Energy Co.
11,376,892
—
Edwards Lifesciences Corp.
5,184,708
14,008,150
EOG Resources, Inc.
14,299,791
—
Gilead Sciences, Inc.
14,384,740
3,974,355
Hanesbrands Inc.
15,244,228
—
Honeywell International Inc.
9,184,660
24,258,990
JPMorgan Chase & Co.
9,041,751
20,813,148
Kroger Co.
16,386,707
—
Merck & Co., Inc.
7,547,848
20,692,805
NXP Semiconductors N.V.
11,824,240
—
PepsiCo, Inc.
12,074,394
24,106,752
Southwest Airlines Co.
7,708,416
—
Spectrum Brands Holdings, Inc.
5,587,940
10,777,273
Note:
The transactions presented above are those purchases or sales during the period that exceeded .30% of period-end net assets.
23
HISTORICAL FINANCIAL STATISTICS
(unaudited)
Year
(000s)
Value of Net Assets
(000s)
Shares Outstanding
Net Asset Value Per Share
Market Value Per Share
Income Dividends Per Share
Capital Gains Distributions Per Share
Return of Capital Per Share
Total Dividends and Distributions Per Share
Annual Distribution Rate*
2002
$
1,024,810
84,536
$
12.12
$
10.57
$
.19
$
.57
$
—
$
.76
6.2
%
2003
1,218,862
84,886
14.36
12.41
.17
.61
—
.78
6.8
2004
1,295,549
86,135
15.04
13.12
.24
.66
—
.90
7.1
2005
1,266,729
86,100
14.71
12.55
.22
.64
—
.86
6.7
2006
1,377,418
86,838
15.86
13.87
.23
.67
—
.90
6.8
2007
1,378,480
87,669
15.72
14.12
.32
.71
—
1.03
7.1
2008
840,012
87,406
9.61
8.03
.26
.38
—
.64
5.7
2009
1,045,027
87,415
11.95
10.10
.15
.30
—
.45
5.2
2010
1,124,672
88,885
12.65
10.72
.14
.37
—
.51
5.1
2011
1,050,734
91,074
11.54
9.64
.15
.50
—
.65
6.1
2012
1,155,997
93,030
12.43
10.59
.18
.49
—
.67
6.3
2013
1,421,551
94,224
15.09
13.07
.22
.62
—
.84
7.1
2014
1,527,773
96,287
15.87
13.68
.20
.98
—
1.18
8.8
2015
1,472,144
97,914
15.04
12.83
.14
.79
—
.93
6.8
2016
1,513,498
99,437
15.22
12.71
.18
.81
—
.99
7.8
*
The annual distribution rate is the total dividends and capital gain distributions during the year divided by the Fund’s average month-end stock price. For years prior to 2011, the average month-end stock price is determined for the calendar year. For 2011 and later, the average month-end stock price is determined for the twelve months ended October 31, which is consistent with the calculation used for the annual 6% minimum distribution rate commitment adopted in September 2011.
24
OTHER INFORMATION
Annual Certification
The Fund’s CEO has submitted to the New York Stock Exchange the annual CEO certification as required by Section 303A.12(a) of the NYSE Listed Company Manual.
Dividend Payment Schedule
The Fund presently pays dividends four times a year, as follows: (a) three interim distributions on or about March 1, June 1, and September 1, and (b) a “year-end” distribution, payable in late December, consisting of the estimated balance of the net investment income for the year, the net realized capital gains earned through October 31 and, if applicable, a return of capital. Shareholders may elect to receive the year-end distribution in stock or cash. In connection with this distribution, all shareholders of record are sent a dividend announcement notice and an election card in mid-November. Shareholders holding shares in “street” or brokerage accounts may make their election by notifying their brokerage house representative.
Electronic Delivery of Shareholder Reports
The Fund offers shareholders the benefits and convenience of viewing Quarterly and Annual Reports and other shareholder materials on-line. With your consent, paper copies of these documents will cease with the next mailing and will be provided via e-mail. Reduce paper mailed to your home and help lower the Fund’s printing and mailing costs. To enroll, please visit the following websites:
Registered shareholders with AST: www.amstock.com/main
Shareholders using brokerage accounts: http://enroll.icsdelivery.com/ADX
Privacy Policy
In order to conduct its business, the Fund, through its transfer agent, American Stock Transfer & Trust Company, collects and maintains certain nonpublic personal information about our shareholders of record with respect to their transactions in shares of our securities. This information includes the shareholder’s address, tax identification or Social Security number, share balances, and dividend elections. We do not collect or maintain personal information about shareholders whose shares of our securities are held in “street name” by a financial institution such as a bank or broker.
We do not disclose any nonpublic personal information about you, our other shareholders or our former shareholders to third parties unless necessary to process a transaction, service an account or as otherwise permitted by law.
To protect your personal information internally, we restrict access to nonpublic personal information about our shareholders to those employees who need to know that information to provide services to our shareholders. We also maintain certain other safeguards to protect your nonpublic personal information.
Proxy Voting Policies and Record
A description of the policies and procedures that the Fund uses to determine how to vote proxies relating to portfolio securities owned by the Fund and the Fund’s proxy voting record for the 12-month period ended June 30, 2016 are available (i) without charge, upon request, by calling the Fund’s toll free number at (800) 638-2479; (ii) on the Fund’s website: www.adamsfunds.com under the headings “Funds” and then “Reports & Literature”; and (iii) on the Securities and Exchange Commission’s website: www.sec.gov.
25
OTHER INFORMATION (CONTINUED)
Statement on Quarterly Filing of Complete Portfolio Schedule
In addition to publishing its complete schedule of portfolio holdings in the First and Third Quarter Reports to shareholders, the Fund also files its complete schedule of portfolio holdings with the Securities and Exchange Commission for the first and third quarters of each fiscal year on Form N-Q. The Fund’s Forms N-Q are available on the Commission’s website: www.sec.gov. The Fund’s Forms N-Q may be reviewed and copied at the Commission’s Public Reference Room, and information on the operation of the Public Reference Room may be obtained by calling 1-800-SEC-0330. The Fund also posts a link to its Forms N-Q on its website: www.adamsfunds.com under the headings “Funds” and then “Reports & Literature”.
INVESTORS CHOICE
INVESTORS CHOICE is a direct stock purchase and sale plan, as well as a dividend reinvestment plan, sponsored and administered by our transfer agent, American Stock Transfer & Trust Company (AST). The Plan provides registered shareholders and interested first time investors an affordable alternative for buying, selling, and reinvesting in Fund shares. A brochure which further details the benefits and features of INVESTORS CHOICE as well as an enrollment form may be obtained by contacting AST.
The costs to participants in administrative service fees and brokerage commissions for each type of transaction are listed below. Fees are subject to change at any time.
Fees
Initial Enrollment and Optional Cash
Investments:
Service Fee $2.50 per investment
Brokerage Commission $0.05 per share
Reinvestment of Dividends*:
Service Fee 2% of amount invested (maximum of $2.50 per investment) Brokerage Commission $0.05 per share
Sale of Shares:
Service Fee $10.00
Brokerage Commission $0.05 per share
Deposit of Certificates for safekeeping $7.50 (waived if sold)
Book to Book Transfers Included
To transfer shares to another participant or to a new participant
* The year-end dividend and capital gain distribution will usually be made in newly issued shares of Common Stock. There are no fees or commissions in connection with this dividend and capital gain distribution when made in newly issued shares.
For shareholders whose stock is held by a broker in “street” name, the AST INVESTORS CHOICE Direct Stock Purchase and Sale Plan remains available through many registered investment security dealers. If your shares are currently held in a “street” name or brokerage account, please contact your broker for details about how you can participate in AST’s Plan or contact AST.
26
DIRECTORS
Name (Age)
Director Since
Principal Occupation(s)
During Past 5 Years
Number of
Portfolios
in Fund
Complex
Overseen
by Director
Other Current Directorships
Independent Directors
Enrique R. Arzac, Ph.D. (75)
1983
Professor Emeritus
Graduate School of Business, Columbia University
Two
Aberdeen Asset Management Funds
(6 closed-end funds)
Credit Suisse Asset Management Funds
(2 closed-end, 8 open-end funds)
Mirae Asset Discovery Funds
(6 open-end funds)
Phyllis O. Bonanno (73)
2003
Retired President & CEO
International Trade Solutions, Inc. (consultants) (until 2009)
Two
Kenneth J. Dale (60)
2008
Senior Vice President and
Chief Financial Officer
The Associated Press
Two
Frederic A. Escherich (64)
2006
Private Investor
Two
Roger W. Gale, Ph.D. (70)
2005
President & CEO
GF Energy, LLC (electric power consultants)
Two
Kathleen T. McGahran, Ph.D., J.D., CPA (66)
2003
Chair of the Board
President & CEO
Pelham Associates, Inc. (executive education provider)
Adjunct Professor
Tuck School of Business,
Dartmouth College
Two
Scor Global Life Reinsurance
Scor Reinsurance of New York
Craig R. Smith, M.D. (70)
2005
Retired President
Williston Consulting LLC (pharmaceutical and biotechnology consulting)
Chief Operating Officer
Algenol LLC (ethanol manufacturing) (until 2014)
Two
Interested Director
Mark E. Stoeckle (60)
2013
Chief Executive Officer
(since 2013)
Adams Diversified Equity Fund, Inc.
Adams Natural Resources Fund, Inc.
President (since 2015)
Adams Diversified Equity Fund, Inc.
Chief Investment Officer, US Equities and Global Sector Funds
BNP Paribas Investment Partners (prior to 2013)
Two
All Directors serve for a term of one year upon their election at the Annual Meeting of Shareholders. The address for each Director is the Fund’s office.
27
OFFICERS
Name (Age)
Employee Since
Principal Occupation(s) During Past 5 Years
Mark E. Stoeckle (60)
2013
Chief Executive Officer of the Fund and Adams Natural Resources Fund, Inc. since 2013 and President of the Fund since 2015; Chief Investment Officer, U.S. Equities and Global Sector Funds, BNP Paribas Investment Partners (prior to 2013)
James P. Haynie, CFA (54)
2013
Executive Vice President of the Fund and President of Adams Natural Resources Fund, Inc. since 2015; President of the Fund and Executive Vice President of Adams Natural Resources Fund, Inc. (2013-2015); Chief Investment Officer, US Equities and Global Sector Funds, BNP Paribas Investment Partners (2013); Senior Portfolio Manager, BNP Paribas Investment Partners (prior to 2013)
D. Cotton Swindell, CFA (53)
2002
Executive Vice President since 2015; Vice President-Research (prior to 2015)
Nancy J. F. Prue, CFA (62)
1982
Executive Vice President, Director of Shareholder Communications of the Fund and Adams Natural Resources Fund, Inc. since 2015; Executive Vice President of the Fund (prior to 2015); President of Adams Natural Resources Fund, Inc. (2012-2015); Executive Vice President of Adams Natural Resources Fund, Inc. (prior to 2012)
Brian S. Hook, CFA, CPA (47)
2008
Vice President, Chief Financial Officer and Treasurer of the Fund and Adams Natural Resources Fund, Inc. since 2013; Chief Financial Officer and Treasurer of the Fund and Adams Natural Resources Fund, Inc. (2012-2013); Treasurer of the Fund and Adams Natural Resources Fund, Inc. (prior to 2012)
Lawrence L. Hooper, Jr. (64)
1997
Vice President, General Counsel, Secretary and Chief Compliance Officer of the Fund and Adams Natural Resources Fund, Inc.
Steven R. Crain, CFA (45)
2012
Vice President-Research since 2014; Senior Research Analyst (2012-2014); Equity Analyst and Portfolio Manager, MTB Investment Advisors (prior to 2012)
Michael E. Rega, CFA (57)
2014
Vice President-Research of the Fund and Adams Natural Resources Fund, Inc. since 2014; Senior Equity Analyst and Portfolio Manager, BNP Paribas Investment Partners (prior to 2014)
David R. Schiminger, CFA (45)
2002
Vice President-Research
Christine M. Sloan, CPA (44)
1999
Assistant Treasurer of the Fund and Adams Natural Resources Fund, Inc.
All officers serve for a term of one year upon their election by the Board of Directors at the annual organization meeting. The address for each officer is the Fund’s office.
SERVICE PROVIDERS
Counsel
Chadbourne & Parke LLP
Independent Registered Public Accounting Firm
PricewaterhouseCoopers LLP
Custodian of Securities
The Northern Trust Company
Transfer Agent & Registrar
American Stock Transfer & Trust Company, LLC
Stockholder Relations Department
6201 15th Avenue
Brooklyn, NY 11219
(877) 260-8188
Website: www.amstock.com
E-mail: info@amstock.com
28
Item 2. Code of Ethics.
On June 12, 2003, the Board of Directors adopted a code of ethics that applies to the registrant's principal executive officer and principal financial officer. The code of ethics is available on the registrant's website at: www.adamsfunds.com.
Item 3. Audit Committee Financial Expert.
The Board of Directors has determined that at least one of the members of the registrant's audit committee meets the definition of audit committee financial expert as that term is defined by the Securities and Exchange Commission. The directors on the registrant's audit committee whom the Board of Directors has determined meet such definition are Frederic A. Escherich and Enrique R. Arzac, who are independent pursuant to paragraph (a)(2) of this Item.
Item 4. Principal Accountant Fees and Services.
(a) Audit Fees. The aggregate fees for professional services rendered by the registrant's independent registered public accounting firm, PricewaterhouseCoopers LLP, for the audit of the registrant's annual financial statements and review of the registrant's semi-annual financial statements for 2016 and 2015 were $80,482 and $78,138, respectively.
(b) Audit-Related Fees. There were no audit-related fees in 2016 and 2015.
(c) Tax Fees. The aggregate fees for professional services rendered to the registrant by PricewaterhouseCoopers LLP for the review of the registrant's excise tax calculations and preparations of federal, state, and excise tax returns for 2016 and 2015 were $9,746 and $9,462, respectively.
(d) All Other Fees. The aggregate fees for services rendered to the registrant by PricewaterhouseCoopers LLP, other than for the services referenced above, for 2016 and 2015 were $0 and $4,315, respectively, which related to the review of the registrant's procedures for calculating the amounts granted and vested for the registrant's employees in accordance with the registrant's 2005 Equity Incentive Compensation Plan, review of the registrant's calculations related to that plan, and preparation of a related report to the registrant's Compensation Committee.
(e)
(1)
The audit committee's policy is to pre-approve all audit and permissible non-audit services provided by the independent accountants. In assessing requests for services by the independent accountants, the audit committee considers whether such services are consistent with the auditor's independence; whether the independent accountants are likely to provide the most effective and efficient service based upon their familiarity with the registrant; and whether the service could enhance the registrant's ability to manage or control risk or improve financial statement audit and review quality. The audit committee may delegate pre-approval authority to its Chair. Any pre-approvals by the Chair under this delegation are to be reported to the audit committee at its next scheduled meeting. All services performed in 2016 and 2015 were pre-approved by the audit committee.
(2)
Not applicable.
(f) Not applicable.
(g) The aggregate fees for non-audit professional services rendered by PricewaterhouseCoopers LLP to the registrant for 2016 and 2015 were $9,746 and $13,777, respectively.
(h) The registrant's audit committee has considered the provision by PricewaterhouseCoopers LLP of the non-audit services described above and found that they are compatible with maintaining PricewaterhouseCoopers LLP's independence.
Item 5. Audit Committee of Listed Registrants.
(a) The registrant has a standing audit committee established in accordance with Section 3(a)(58)(A) of the Securities Exchange Act of 1934. The members of the Audit Committee are: Frederic A. Escherich, Enrique R. Arzac, Roger W. Gale, and Craig R. Smith.
(b) Not applicable.
Item 6. Investments.
(a) This schedule is included as part of the Report to Stockholders filed under Item 1 of this form.
(b) Not applicable.
Item 7. Disclosure of Proxy Voting Policies and Procedures for Closed-End Management Investment Companies.
PROXY VOTING GUIDELINES
The registrant follows long-standing general guidelines for the voting of portfolio company proxies and takes very seriously its responsibility to vote all such proxies. The portfolio company proxies are evaluated by our research staff and voted by our portfolio management team, and we annually provide the Board of Directors with a report on how proxies were voted during the previous year. We do not use an outside service to assist us in voting our proxies.
While the policy is to vote all of the proxies for portfolio companies, as a general matter, securities that the registrant has loaned will not be recalled to facilitate proxy voting (in which case the borrower of the security is entitled to vote the proxy). However, if the registrant's management becomes aware of a material vote with respect to the loaned securities in time to recall the security and has determined in good faith that the importance of the matter to be voted on outweighs the loss in lending revenue that would result from recalling the security (i.e., a controversial upcoming merger or acquisition, or some other significant matter), the security will be recalled for voting.
As an internally-managed investment company, the registrant uses its own staff of research analysts and portfolio managers. In making the decision to invest in a company for the portfolio, among the factors the research team analyses is the integrity and competency of the company's management. We must be satisfied that the companies we invest in are run by managers with integrity. Therefore, having evaluated this aspect of our portfolio companies' managements, we give significant weight to the recommendations of the company's management in voting on proxy issues.
We vote proxies on a case-by-case basis according to what we deem to be the best long-term interests of our shareholders. The key over-riding principle in any proxy vote is that stockholders be treated fairly and equitably by the portfolio company's management. In general, on the election of directors and on routine issues that we do not believe present the possibility of an adverse impact upon our investment, after reviewing whether applicable corporate governance requirements as to board and committee composition have been met, we will vote in accordance with the recommendations of the company's management. When we believe that the management's recommendation is not in the best interests of our stockholders, we will vote against that recommendation.
Our general guidelines for when we will vote contrary to the portfolio company management's recommendation are:
Stock Options
Our general guideline is to vote against stock option plans that we believe are unduly dilutive of our stock holdings in the company. We use a general guideline that we will vote against any stock option plan that results in dilution in shares outstanding exceeding 4%. Most stock option plans are established to motivate and retain key employees and to reward them for their achievement. An analysis of a stock option plan cannot be made in a vacuum but must be made in the context of the company's overall compensation scheme. In voting on stock option plans, we give consideration to whether the stock option plan is broad-based in the number of employees who are eligible to receive grants under the plan. We generally vote against plans that permit re-pricing of grants or the issuance of options with exercise prices below the grant date value of the company's stock.
Executive Compensation
On proposals relating to executive compensation, we generally vote against proposals that fail to require or demonstrate effective linkage between pay and the company's performance over time, and for proposals that require or demonstrate such effective linkage.
It is our general policy to vote against proposals relating to future employment contracts that provide that compensation will be paid to any director, officer or employee that is contingent upon a merger or acquisition of the company.
Corporate Control/Governance Issues
Unless we conclude that the proposal is favorable to our interests as a long-term shareholder in the company, we have a long-standing policy of voting against proposals to create a staggered board of directors. In conformance with that policy, we will generally vote in favor of shareholder proposals to eliminate the staggered election of directors.
Unless we conclude that the proposal is favorable to our interests as a long-term shareholder in the company, our general policy is to vote against amendments to a company's charter that can be characterized as blatant anti-takeover provisions.
We generally vote for proposals to require that the majority of a board of directors consist of independent directors and vote against proposals to establish a retirement plan for non-employee directors.
We generally vote for proposals to require that all members of the company's Audit, Compensation, and Nominating committees be independent of management.
We have found that most stockholder proposals relating to social issues focus on very narrow issues that either fall within the authority of the company's management, under the oversight of its board of directors, to manage the day-to-day operations of the company or concern matters that are more appropriate for global solutions rather than company-specific ones. We consider these proposals on a case-by-case basis but usually are persuaded if management's position is reasonable and vote in accordance with management's recommendation on these types of proposals.
Item 8. Portfolio Managers of Closed-End Management Investment Companies.
(a)
(1) As of the date of this filing, Mark E. Stoeckle, Chief Executive Officer and President, James P. Haynie, Executive Vice President, and D. Cotton Swindell, Executive Vice President, comprise the three-person portfolio management team for the registrant. Mr. Stoeckle has served as portfolio manager for the registrant since February 11, 2013; prior thereto, he served as Chief Investment Officer, U.S. Equities and Global Sector Funds, for BNP Paribas Investment Partners. Mr. Haynie has been a member of the portfolio management team since August 19, 2013, serving as President until January 21, 2015; prior thereto, Mr. Haynie served as Chief Investment Officer, U.S. Equities, for BNP Paribas Investment Partners from February 2013 and was Senior Portfolio Manager at BNP Paribas Investment Partners from 2005 to 2013. D. Cotton Swindell has served as Executive Vice President and on the portfolio management team since January 21, 2015; prior thereto, Mr. Swindell served as Vice President- Research for the registrant from 2004 and a research analyst for the registrant from 2002 to 2004. Mr. Stoeckle is the lead member of the portfolio management team. Messrs. Stoeckle, Haynie and Swindell receive investment recommendations from a team of research analysts and make decisions jointly about any investment transactions in the portfolio.
(2) As of the date of this filing, Messrs. Stoeckle and Haynie also serve on the portfolio management team for the registrant's non-controlled affiliate, Adams Natural Resources Fund, Inc. ("PEO"), a registered investment company with total net assets of $685,882,029 as of December 31, 2016. Mr. Stoeckle is Chief Executive Officer of PEO and Mr. Haynie is President. PEO is a non-diversified fund specializing in the energy and natural resources sectors and the registrant is a diversified fund with a different focus. There are few material conflicts of interest that may arise in connection with the portfolio management of both funds. The funds do not buy or sell securities or other portfolio holdings to or from the other, and policies and procedures are in place covering the sharing of expenses and the allocation of investment opportunities, including bunched orders and investments in initial public offerings, between the funds.
(3) As of December 31, 2016, the registrant's portfolio managers are compensated through a plan consisting of salary and annual cash incentive compensation, of which the amount in any year is determined by the Compensation Committee, comprised solely of independent director members of the Board of Directors ("Committee"). The Committee has periodically employed a compensation consultant to review the plan. The structure and methods used to determine the compensation of the portfolio managers were as follows: Salaries are determined by using appropriate industry surveys and information about the local market. Incentive compensation is based on a combination of relative fund performance of the registrant and PEO, with 70% weighting, and individual performance, with a 30% weighting. Target incentives are set annually based on aggregate compensation less salary for each position. Fund performance used in determining incentive compensation is measured over a one-year period, accounting for one-fourth of the calculation, a three-year period, which accounts for one-half, and a five-year period, which accounts for one-fourth. The registrant's total return on net asset value ("NAV") over each of these periods is used to determine performance relative to a 50/50 blend of the S&P 500 Index and the Lipper Large-Cap Core Funds Average universe. Using these calculations, the incentive compensation can be less than or exceed the established target.
The registrant's Equity Incentive Compensation Plan, approved by shareholders in 2005 and reapproved in 2010, expired on April 27, 2015. The registrant's portfolio managers are no longer compensated with grants of equity compensation.
As of December 31, 2016, the structure of the compensation that the portfolio managers receive from PEO is the same as that for the registrant with the exception that the portfolio managers' incentive compensation is based on a comparison with the performance of an 80/20 blend of the Dow Jones U.S. Oil and Gas Index and the Dow Jones U.S. Basic Materials Index.
(4) Using a valuation date of December 31, 2016, Mr. Haynie beneficially owned equity securities in the registrant valued between $500,001 and $1,000,000. Messrs. Stoeckle and Swindell each beneficially owned equity securities in the registrant valued between $100,001 and $500,000.
(b)
Not applicable.
Item 9. Purchases of Equity Securities by Closed-End Management Investment Company and Affiliated Purchasers.
Total Number of Shares (or Units Purchased)
Average Price Paid per Share (or Unit)
Total Number of Shares (or Units) Purchased as Part of Publicly Announced Plans or Programs
Maximum Number of Shares (or Units) That May Yet Be Purchased Under the Plans or Programs
-----------------------------------
-----------------------------------
----------------------------------
-----------------------------------
January 2016
45,500
$12.20
45,500
3,546,200
February 2016
49,200
$11.83
49,200
3,497,000
March 2016
108,100
$12.43
108,100
3,388,900
April 2016
65,100
$12.68
65,100
3,323,800
May 2016
120,800
$12.64
120,800
3,203,000
June 2016
144,960
$12.70
144,960
3,058,040
July 2016
76,243
$12.91
76,243
2,981,797
August 2016
138,920
$13.21
138,920
2,842,877
September 2016
126,840
$13.07
126,840
2,716,037
October 2016
41,991
$13.08
41,991
2,674,046
November 2016
13,850
$12.78
13,850
2,660,196
December 2016
43,400
$12.87
43,400
2,616,796
(2c)
-----------------------------------
-----------------------------------
-----------------------------------
Total
974,904
(1)
$12.76
974,904
(2a)(2b)
(1) There were no shares purchased other than through a publicly announced plan or program.
(2a) The Plan was announced on December 11, 2014.
(2b) The share amount approved in 2014 was 5% of outstanding shares, or 4,667,000 shares.
(2c) The Plan has no expiration date.
(2d) None.
(2e) None.
Item 10. Submission of Matters to a Vote of Security Holders.
There were no material changes to the procedures by which shareholders may recommend nominees to the registrant's Board of Directors made or implemented after the registrant last provided disclosure in response to the requirements of Item 407(c)(2)(iv) of Regulation S-K (as required by Item 22(b)(15) of Schedule 14A), or this Item.
Item 11. Controls and Procedures.
(a) The registrant's principal executive officer and principal financial officer have concluded that the registrant's disclosure controls and procedures (as defined in Rule 30a-3(c) under the Investment Company Act of 1940) are effective based on their evaluation of the disclosure controls and procedures as of a date within 90 days of the filing date of this report.
(b) There have been no significant changes in the registrant's internal control over financial reporting (as defined in Rule 30a-3(d) under the Investment Company Act of 1940) that occurred during the registrant's second fiscal quarter of the period covered by this report that has materially affected, or is reasonably likely to materially affect, the registrant's internal control over financial reporting.
Item 12. Exhibits.
(a)
(1)
Not applicable. See registrant's response to Item 2 above.
(2)
Separate certifications by the registrant's principal executive officer and principal financial officer, pursuant to Section 302 of the Sarbanes-Oxley Act of 2002 and required by Rule 30a-2(a) under the Investment Company Act of 1940, are attached.
(3)
Written solicitation to purchase securities: not applicable.
(b) A certification by the registrant's principal executive officer and principal financial officer, pursuant to Section 906 of the Sarbanes-Oxley Act of 2002 and required by Rule 30a-2(b) under the Investment Company Act of 1940, is attached.
SIGNATURES
Pursuant to the requirements of the Securities Exchange Act of 1934 and the Investment Company Act of 1940, the registrant has duly caused this
report to be signed on its behalf by the undersigned, thereunto duly authorized.
Adams Diversified Equity Fund, Inc.
By:
/s/ Mark E. Stoeckle
Mark E. Stoeckle
Chief Executive Officer and President
(Principal Executive Officer)
Date:
February 24, 2017
Pursuant to the requirements of the Securities Exchange Act of 1934 and the Investment Company Act of 1940, this report has been signed below
by the following persons on behalf of the registrant and in the capacities and on the dates indicated.
By:
/s/ Mark E. Stoeckle
Mark E. Stoeckle
Chief Executive Officer and President
(Principal Executive Officer)
Date:
February 24, 2017
By:
/s/ Brian S. Hook
Brian S. Hook
Vice President, Chief Financial Officer and Treasurer
(Principal Financial Officer)
Date:
February 24, 2017
We use cookies on this site to provide a more responsive and personalized service. Continuing to browse, clicking I Agree, or closing this banner indicates agreement. See our Cookie Policy for more information.