CERTIFIED SHAREHOLDER REPORT OF REGISTERED MANAGEMENT INVESTMENT COMPANIES
Investment Company Act file number: 811-00248 -------------------------------------------------------------------------
THE ADAMS EXPRESS COMPANY ------------------------------------------------------------------------- (Exact name of registrant as specified in charter)
7 Saint Paul Street, Suite 1140, Baltimore, Maryland 21202 ------------------------------------------------------------------------- (Address of principal executive offices)
Lawrence L. Hooper, Jr. The Adams Express Company 7 Saint Paul Street, Suite 1140 Baltimore, Maryland 21202 ------------------------------------------------------------------------- (Name and address of agent for service)
Registrant's telephone number, including area code: (410) 752-5900 Date of fiscal year end: December 31 Date of reporting period: December 31, 2013
Item 1. Reports to Stockholders.
2013ATA GLANCE
The Fund
Ÿ
a closed-end equity investment company
Ÿ
objectives: preservation of capital
reasonable income
opportunity for capital gain
Ÿ
internally-managed
Ÿ
annual distribution rate of at least 6%
Stock Data (12/31/13)
NYSE Symbol ........... ADX
Market Price ............. $13.07
52-Week Range ........ $10.72– $13.32
Discount .................... 13.4%
Shares Outstanding .... 94,223,617
Summary Financial Information
Year Ended December 31,
2013
2012
Net asset value per share
$
15.09
$
12.43
Total net assets
1,421,550,920
1,155,997,037
Unrealized appreciation on investments
393,843,628
143,061,370
Net investment income
18,656,769
17,547,510
Net realized gain
57,371,366
47,997,411
Total return (based on market price)
31.8%
16.9%
Total return (based on net asset value)
29.7%
14.7%
Ratio of expenses to average net assets
0.69%
0.65%
Annual distribution rate
7.1%
6.3%
2013 Dividends and Distributions
Paid
Amount (per share)
Type
March 1, 2013
$
0.01
Long-term capital gain
March 1, 2013
0.01
Short-term capital gain
March 1, 2013
0.03
Investment income
June 3, 2013
0.05
Investment income
September 3, 2013
0.05
Investment income
December 27, 2013
0.44
Long-term capital gain
December 27, 2013
0.16
Short-term capital gain
December 27, 2013
0.09
Investment income
$
0.84
2014 Annual Meeting of Shareholders
Location: Four Seasons Hotel, Baltimore, Maryland
Date: April 10, 2014
Time: 9:00 a.m.
PORTFOLIO REVIEW
December 31, 2013
(unaudited)
Ten Largest Equity Portfolio Holdings
Market Value
% of Net Assets
Petroleum & Resources Corp.*
$
59,873,872
4.2
%
Apple Inc.
55,157,113
3.9
JPMorgan Chase & Co.
35,088,000
2.5
Pfizer Inc.
32,274,831
2.3
Gilead Sciences, Inc.
31,112,100
2.2
Citigroup Inc.
30,744,900
2.1
Wells Fargo & Co.
30,418,000
2.1
Chevron Corp.
29,353,850
2.1
Walt Disney Co.
28,848,640
2.0
Google Inc. (Class A)
28,578,105
2.0
$
361,449,411
25.4
%
* Non-controlled affiliated closed-end fund
Sector Weightings
1
LETTERTO SHAREHOLDERS
Dear Fellow Shareholders,
By any measure, 2013 was a banner year for the U.S. stock market. Few would have expected such a robust stock market in the face of the many things that transpired during 2013. Markets experienced a strong start to 2013 as the “fiscal cliff” and the potential consequences of federal spending cuts and tax increases were averted. Concerns of a weakening U.S. economy subsided with the flow of solid corporate earnings growth and a modest economic recovery. High unemployment rates and low inflation reinforced the Federal Reserve’s (Fed) resolve to continue accommodative monetary policy, keeping a lid on interest rates. Stabilization in Europe and a managed slowdown in China fostered optimism for investors.
The rally was sustained in February, but at a significantly reduced rate. Investor enthusiasm was tempered as retailers expressed caution, economic growth slowed in China, and many European countries were in a recession. However, slow but positive growth in the U.S. was sufficient to offset sequestration cuts and the Fed’s meeting minutes that revealed discussions of winding down asset purchases. The S&P 500 gained 10.6% through the first quarter as cash flowed back into the equity markets.
The second quarter presented a different story. Despite weakened labor markets, slowing retail sales, and an easing in manufacturing growth, investor sentiment remained bullish through April. The market’s exuberance started to diminish as China’s growth rate continued to contract. Investors balanced economic news with a myopic focus on the Fed’s stimulus program. Comments in May suggesting an end to the stimulus program roiled markets. By the end of the second quarter, dovish comments by the Fed had calmed investor uncertainty.
U.S. equities hit record highs in July as positive earnings reports by companies coincided with improving economic indicators. The unemployment rate fell to the lowest level in five years and interest rates remained low. The S&P 500 exited July with a 19.6% year-to-date gain.
Turbulence quickly followed as investors struggled to balance Fed comments, economic news, and escalating worldwide geopolitical tensions. Volatility stemmed from civil war in Syria and violence in Egypt following a military coup. Rising geopolitical instability in the Middle East/North Africa region put upward pressure on oil prices, creating a headwind for global economic growth. By late September, violence in Egypt subsided and Syria’s risks diminished, supporting a recovery in U.S. markets back to July levels. Europe showed evidence of an upturn, China’s growth stabilized, and the Fed’s tapering was delayed.
The fall also brought the roll-out of the Affordable Care Act (ACA). Rarely has a law been as divisive as the ACA. While the problems with the online exchange grabbed most of the headlines, the reimbursement cuts and additional fees mandated by the ACA had a larger impact on health care companies. Specifically, the Managed Care companies suffered, at least initially, as these new costs were not offset by the promised increase in individuals covered.
A 16-day shutdown by the U.S. Government in early October and concerns of a budget resolution did little to slow the rise of the markets for the remainder of the year. Stocks hit a new high as government funding was restored. Key economic data, corporate earnings, and labor market results buoyed investors’ sentiment. Reflected in the equity market gains was approval of Janet Yellen’s nomination to head the Fed. As a Bernanke loyalist, she makes continuity at the Fed likely in 2014. The passing by Congress of a two-year budget deal near year-end enhanced the outlook, contributing to the full year gain of 32.4% for the S&P 500.
Against this backdrop, Adams Express had a good 2013, distributing 7.1% to shareholders and generating a total return on market price of 31.8%. The Lipper Large-Cap Core Mutual Fund Average, our peer group, returned 31.4%. The Adams Express total return on net asset value was 29.7%.
The two best performing sectors in the Fund were Health Care and Industrials. Increased investor appetite for biotechnology stocks powered the Health Care sector again in 2013, rising 46.2%. Our overweight in the Aerospace and Defense industry group within Industrials paced the Fund’s holdings in that sector, with additional help from our Electrical Equipment holdings, allowing that sector to advance 45.1%. While Utilities underperformed the S&P 500, our holdings outperformed the sector and contributed positively to the Fund’s performance. A conscious decision to have more of a mid-cap focus with our Utilities stock selection served the Fund well as those holdings were up 19.0% for the year.
The Fund’s Consumer Discretionary holdings were up 35.4% during the year but trailed their sector peer group. Good calls in Lowe’s Companies and Dollar General Corporation helped limit the relative shortfall. Our holding in The Walt Disney Company, advancing 55.3%, was also helpful in the Media industry group that had a remarkable year. Although advancing 30.3% and 23.7%, respectfully, our holdings in Financials and Information Technology trailed the market.
2
LETTERTO SHAREHOLDERS (CONTINUED)
Portfolio holdings in Diversified Financials and Capital Markets disappointed, while our Insurance names offset some of the disappointing stock selection. Difficulty in Software & Services and Semiconductors contributed to our underperformance in Information Technology. A bright spot was the Fund’s position in MasterCard Incorporated within IT Services.
Looking Forward to 2014
As we look forward to 2014, there are several themes in the portfolio to keep an eye on. First, we remain convinced that the earnings growth in biotechnology is real and that we should have an overweight in that Health Care industry group. As of this writing, Gilead Sciences, Inc., Celgene Corp. and Biogen Idec Inc. remain compelling opportunities for us. Each addresses complex issues, with Gilead a leader in Hepatitis C, Celgene in multiple myeloma, and Biogen in multiple sclerosis. It is very difficult to find the kind of revenue and earnings growth within Health Care that biotechnology offers. Despite strong gains recently, we believe the market continues to underappreciate the opportunities these stocks provide. As we look out over the horizon, another area that appears promising is the immuno-oncology arena. We are intrigued with the breakthrough in cancer treatment that this opportunity suggests and will look for attractive investments in this arena.
Within Industrials, we benefited during 2013 by an overweight in Aerospace and Defense and believe that theme continues to be warranted. The Boeing Company again will play a meaningful role in our Industrials exposure. Boeing has many years of increasing free cash flow growth in front of it and also continues to enjoy a record production backlog. New growth in emerging markets and established market replacement demand gives us comfort that Boeing has a long runway of opportunity.
Although the Consumer Discretionary sector has enjoyed an unprecedented four-year run of outperformance, we believe there are a few areas that should continue to be a positive source of excess return. One such area is home improvement. Our investment in Lowe’s Companies addresses this thought. The home improvement market remains quite good as the housing market continues to move in a positive direction. Our belief is that Lowe’s has a number of drivers for increased margins and, with a commitment to increased service levels and merchandising, they could deliver strong earnings growth in 2014. Building on this theme is our recent investment in Whirlpool Corporation. We expect a powerful household appliance replacement cycle in North America as well as in international markets. With the supportive fundamentals, we believe Whirlpool will deliver strong free cash flow and earnings beyond what investors are expecting.
Financials is a sector that has gotten a great deal of scrutiny and bears watching as more reforms make their way to reality. A good bit has been made of the work that JP Morgan Chase & Co. has done to put its legal issues behind it. We think this is very positive and positions the nation’s largest bank well for 2014. The global depth and breadth of its businesses gives us comfort that the bank will continue to execute and drive earnings per share growth in the coming year. In addition to JP Morgan, we see a compelling investment opportunity in the Life Insurance industry group within Financials. We believe these stocks will benefit from the upward pressure on interest rates resulting from continued tapering by the Fed.
The Fund was active in repurchasing its shares in 2013 and repurchased a total of 948,339 shares. The Board of Directors has approved the repurchase of up to 5% of the outstanding shares for 2014.
Our investment philosophy and process is very focused on free cash flow generation, earnings growth, valuation, and being properly paid for the risks we are taking. Within this framework, we strive to identify high quality companies we can own for an extended period of time. With that said, we also look for opportunities to take advantage of market anomalies for the benefit of our shareholders. We are encouraged by the increasing strength in the economy, both home and abroad, and remain optimistic about what that will mean for the Fund in 2014.
Open written option contracts* at value (proceeds $7,300)
29,320
Accrued pension liabilities
2,733,408
Accrued expenses and other liabilities
1,902,201
Total Liabilities
9,262,760
Net Assets
$
1,421,550,920
Net Assets
Common Stock at par value $0.001 per share, authorized 150,000,000 shares; issued and outstanding 94,223,617 shares (includes 159,401 nonvested restricted shares, 18,000 nonvested or deferred restricted stock units, and 17,964 deferred stock units) (note 6)
$
94,224
Additional capital surplus
1,029,332,121
Accumulated other comprehensive income (note 5)
(1,535,718
)
Undistributed net investment income
734,051
Undistributed net realized gain on investments
(917,386
)
Unrealized appreciation on investments
393,843,628
Net Assets Applicable to Common Stock
$
1,421,550,920
Net Asset Value Per Share of Common Stock
$15.09
*See Schedule of Investments on page 14 and Schedule of Outstanding Written Option Contracts on page 17.
The accompanying notes are an integral part of the financial statements.
4
STATEMENTOF OPERATIONS
Year Ended December 31, 2013
Investment Income
Income:
Dividends:
From unaffiliated issuers (net of $46,048 in foreign taxes)
$
25,502,274
From non-controlled affiliate
1,246,462
Other income
781,225
Total income
27,529,961
Expenses:
Investment research
4,617,083
Administration and operations
1,949,761
Travel, training, and other office expenses
589,829
Directors’ fees
379,030
Transfer agent, registrar, and custodian
321,712
Reports and shareholder communications
279,177
Investment data services
216,676
Occupancy
155,017
Audit and accounting services
128,763
Insurance
107,563
Legal services
94,010
Other
34,571
Total expenses
8,873,192
Net Investment Income
18,656,769
Realized Gain and Change in Unrealized Appreciation on Investments
Net realized gain on security transactions
53,717,544
Net realized gain distributed by regulated investment company (non-controlled affiliate)
2,864,674
Net realized gain on written option contracts
789,148
Change in unrealized appreciation on securities
251,052,425
Change in unrealized appreciation on written option contracts
(270,167
)
Net Gain on Investments
308,153,624
Other Comprehensive Income (note 5)
Defined benefit pension plans:
Net actuarial gain arising during period
345,260
Amortization of net loss
260,068
Effect of settlement (non-recurring)
740,825
Other Comprehensive Income
1,346,153
Change in Net Assets Resulting from Operations
$
328,156,546
The accompanying notes are an integral part of the financial statements.
5
STATEMENTSOF CHANGESIN NET ASSETS
For the Year Ended December 31,
2013
2012
From Operations:
Net investment income
$
18,656,769
$
17,547,510
Net realized gain on investments
57,371,366
47,997,411
Change in unrealized appreciation on investments
250,782,258
80,550,174
Change in accumulated other comprehensive income (note 5)
1,346,153
(243,338
)
Increase in net assets resulting from operations
328,156,546
145,851,757
Distributions to Shareholders from:
Net investment income
(20,354,079
)
(16,392,876
)
Net realized gain from investment transactions
(57,121,286
)
(44,625,641
)
Decrease in net assets from distributions
(77,475,365
)
(61,018,517
)
From Capital Share Transactions:
Value of shares issued in payment of distributions (note 4)
26,419,945
20,118,651
Cost of shares purchased (note 4)
(11,659,522
)
—
Deferred compensation (notes 4, 6)
112,279
311,468
Increase in net assets from capital share transactions
14,872,702
20,430,119
Total Increase in Net Assets
265,553,883
105,263,359
Net Assets:
Beginning of year
1,155,997,037
1,050,733,678
End of year (including undistributed net investment income of $734,051 and $2,836,318, respectively)
$
1,421,550,920
$
1,155,997,037
The accompanying notes are an integral part of the financial statements.
6
NOTES TO FINANCIAL STATEMENTS
1. Significant Accounting Policies
The Adams Express Company (the Fund) is registered under the Investment Company Act of 1940 as a diversified investment company. The Fund is an internally-managed closed-end fund whose investment objectives are preservation of capital, the attainment of reasonable income from investments, and an opportunity for capital appreciation.
The accompanying financial statements were prepared in accordance with accounting principles generally accepted in the United States of America, which require the use of estimates made by Fund management. Management believes that estimates and security valuations are appropriate; however, actual results may differ from those estimates, and the security valuations reflected in the financial statements may differ from the value the Fund ultimately realizes upon sale of the securities.
Affiliated Companies — Investments in companies 5% or more of whose outstanding voting securities are held by the Fund are defined as “Affiliated Companies” in Section 2(a)(3) of the Investment Company Act of 1940.
Expenses — The Fund shares certain costs for investment research and data services, administration and operations, travel, training, office expenses, occupancy, accounting and legal services, insurance, and other miscellaneous items with its non-controlled affiliate, Petroleum & Resources Corporation. Shared expenses that are not solely attributable to one fund are allocated to each fund based on relative net asset values or, in the case of investment research staff and related costs, relative market values of portfolio securities in the particular sector of coverage. Changes in expense allocations are updated quarterly, as appropriate, except for those related to payroll, which are updated annually.
Security Transactions and Investment Income — Investment transactions are accounted for on the trade date. Gain or loss on sales of securities and options is determined on the basis of specific identification. Dividend income and distributions to shareholders are recognized on the ex-dividend date, and interest income is recognized on the accrual basis.
Security Valuation — The Fund’s investments are reported at fair value as defined under accounting principles generally accepted in the United States of America. Investments in securities traded on national security exchanges are valued at the last reported sale price on the day of valuation. Over-the-counter and listed securities for which a sale price is not available are valued at the last quoted bid price. Short-term investments (excluding purchased options and money market funds) are valued at amortized cost, which approximates fair value. Purchased and written options are valued at the last quoted bid and asked price, respectively. Money market funds are valued at net asset value on the day of valuation.
Various inputs are used to determine the fair value of the Fund’s investments. These inputs are summarized in the following three levels:
•
Level 1 — fair value is determined based on market data obtained from independent sources; for example, quoted prices in active markets for identical investments,
•
Level 2 — fair value is determined using other assumptions obtained from independent sources; for example, quoted prices for similar investments,
•
Level 3 — fair value is determined using the Fund’s own assumptions, developed based on the best information available in the circumstances.
The Fund’s investments at December 31, 2013 were classified as follows:
Level 1
Level 2
Level 3
Total
Common stocks
$
1,413,334,011
$
—
$
—
$
1,413,334,011
Short-term investments
9,819,486
—
—
9,819,486
Total investments
$
1,423,153,497
$
—
$
—
$
1,423,153,497
Written options
$
(29,320
)
$
—
$
—
$
(29,320
)
There were no transfers into or from Level 1 or Level 2 during the year ended December 31, 2013.
New Accounting Pronouncements — In February 2013, the Financial Accounting Standards Board issued new guidance, effective for annual and interim periods beginning after December 15, 2012, requiring disclosure of items reclassified out of accumulated other comprehensive income. Adoption of this guidance had no effect on Fund net assets or results of operations and no material impact on the financial statements.
7
NOTES TO FINANCIAL STATEMENTS (CONTINUED)
2. Federal Income Taxes
No federal income tax provision is required since the Fund’s policy is to qualify as a regulated investment company under the Internal Revenue Code and to distribute substantially all of its taxable income to its shareholders. Additionally, management has analyzed and concluded that tax positions included in federal income tax returns from the previous three years that remain subject to examination do not require any provision. Any income tax-related interest or penalties would be recognized as income tax expense. As of December 31, 2013, the identified cost of securities for federal income tax purposes was $1,031,804,342 and net unrealized appreciation aggregated $391,349,155, consisting of gross unrealized appreciation of $397,654,046 and gross unrealized depreciation of $6,304,891.
Distributions are determined in accordance with our annual 6% minimum distribution rate commitment, based on the Fund’s average market price, and income tax regulations, which may differ from generally accepted accounting principles. Such differences are primarily related to the Fund’s retirement plans, equity-based compensation, and loss deferrals for wash sales. Differences that are permanent, while not material for the year ended December 31, 2013, are reclassified in the capital accounts of the Fund’s financial statements and have no impact on net assets. For tax purposes, distributions paid by the Fund during the years ended December 31, 2013 and December 31, 2012 were classified as ordinary income of $36,005,425 and $25,489,925, respectively, and as long-term capital gain of $41,470,068 and $35,504,402, respectively. The tax basis of distributable earnings at December 31, 2013 was $1,404,905 of undistributed ordinary income and $1,405,220 of undistributed long-term capital gain.
3. Investment Transactions
The Fund’s investment decisions are made by the portfolio management team with recommendations from the research staff. Purchases and sales of portfolio securities, other than options and short-term investments, during the year ended December 31, 2013 were $720,527,760 and $765,212,378, respectively.
The Fund is subject to changes in the value of equity securities held (“equity price risk”) in the normal course of pursuing its investment objectives. The Fund may purchase and write option contracts to increase or decrease its equity price risk exposure or may write option contracts to generate additional income. Option contracts generally entail risks associated with counterparty credit, liquidity, and unfavorable equity price movements. The Fund has mitigated counterparty credit and liquidity risks by trading its options through an exchange. The risk of unfavorable equity price movements is limited for purchased options to the premium paid and for written options by writing only covered call or collateralized put option contracts, which require the Fund to segregate certain securities or cash at its custodian when the option is written. A schedule of outstanding option contracts as of December 31, 2013 can be found on page 17.
When the Fund writes (purchases) an option, an amount equal to the premium received (paid) by the Fund is recorded as a liability (asset) and is subsequently marked to market daily in the Statement of Assets and Liabilities, with any related change recorded as an unrealized gain or loss in the Statement of Operations. Premiums received (paid) from unexercised options are treated as realized gains (losses) on the expiration date and are separately identified in the Statement of Operations. Upon the exercise of written put (purchased call) option contracts, premiums received (paid) are deducted from (added to) the cost basis of the underlying securities purchased. Upon the exercise of written call (purchased put) option contracts, premiums received (paid) are added to (deducted from) the proceeds from the sale of underlying securities in determining whether there is a realized gain or loss.
Transactions in written covered call and collateralized put options during the year ended December 31, 2013 were as follows:
Covered Calls
Collateralized Puts
Contracts
Premiums
Contracts
Premiums
Options outstanding, December 31, 2012
1,775
$
212,261
1,946
$
310,460
Options written
4,217
342,499
3,755
471,526
Options terminated in closing purchase transactions
(1,905
)
(157,740
)
—
—
Options expired
(3,704
)
(369,221
)
(5,561
)
(765,796
)
Options exercised
(343
)
(25,239
)
(100
)
(11,450
)
Options outstanding, December 31, 2013
40
$
2,560
40
$
4,740
8
NOTES TO FINANCIAL STATEMENTS (CONTINUED)
4. Capital Stock
The Fund has 10,000,000 authorized and unissued preferred shares, $0.001 par value.
On December 27, 2013, the Fund issued 2,093,644 shares of its Common Stock at a price of $12.61 per share (the average market price on December 9, 2013) to shareholders of record November 25, 2013 who elected to take stock in payment of the distribution from 2013 capital gain and investment income. During 2013, 1,567 shares were issued at a weighted average price of $12.15 per share as dividend equivalents to holders of deferred stock units and restricted stock units under the 2005 Equity Incentive Compensation Plan.
On December 27, 2012, the Fund issued 1,923,171 shares of its Common Stock at a price of $10.455 per share (the average market price on December 10, 2012) to shareholders of record November 19, 2012 who elected to take stock in payment of the distribution from 2012 capital gain and investment income. During 2012, 1,125 shares were issued at a weighted average price of $10.53 per share as dividend equivalents to holders of deferred stock units and restricted stock units under the 2005 Equity Incentive Compensation Plan.
The Fund may purchase shares of its Common Stock from time to time at such prices and amounts as the Board of Directors may deem advisable. In 2013, the Fund purchased 948,339 shares of its Common Stock, including 66,191 shares from the Fund’s defined benefit plan trust and 26,271 shares from Petroleum & Resources Corporation’s defined benefit plan trust. The cost of the shares purchased from the trusts was $1,163,172, based on the closing market price on the date of the transaction. Transactions in Common Stock for 2013 and 2012 were as follows:
Shares
Amount
2013
2012
2013
2012
Shares issued in payment of distributions
2,095,211
1,924,296
$26,419,945
$20,118,651
Shares purchased (at a weighted average discount from net asset value of 13.6%)
(948,339
)
—
(11,659,522
)
—
Net activity under the 2005 Equity Incentive Compensation Plan
47,021
31,529
112,279
311,468
Net change
1,193,893
1,955,825
$14,872,702
$20,430,119
5. Retirement Plans
Defined Contribution Plans — The Fund sponsors a qualified defined contribution plan for all employees with at least six months of service and a nonqualified defined contribution plan for eligible employees to supplement the qualified plan. The Fund expensed contributions to the plans in the amount of $252,260, a portion thereof based on company performance, for the year ended December 31, 2013. The Fund does not provide postretirement medical benefits.
Defined Benefit Plans — On October 1, 2009, the Fund froze its non-contributory qualified and nonqualified defined benefit pension plans. Benefits are based on length of service and compensation during the last five years of employment through September 30, 2009, with no additional benefits being accrued beyond that date. The process of terminating the plans will begin in 2014. Upon receiving the required regulatory approvals, all benefits under the plans will be paid out and all related pension liabilities will be relieved.
The funded status of the plans is recognized as an asset (overfunded plan) or a liability (underfunded plan) in the Statement of Assets and Liabilities. Changes in the prior service costs and accumulated actuarial gains and losses are recognized as accumulated other comprehensive income, a component of net assets, in the year in which the changes occur and are subsequently amortized into net periodic pension cost. Non-recurring settlement costs are recognized in net periodic pension cost when a plan participant receives a lump-sum benefit payment and includes the amount of which is in excess of the present value of the projected benefit and any unamortized actuarial losses attributable to the portion of the projected benefit obligation being satisfied.
The Fund’s policy is to contribute annually to the plans those amounts that can be deducted for federal income tax purposes, plus additional amounts as the Fund deems appropriate in order to provide assets sufficient to meet benefits to be paid to plan participants. The Fund contributed $0 to the qualified plan and $85,167 to the nonqualified plan in 2013 and anticipates making contributions of $198,394 to the nonqualified plan in 2014.
9
NOTES TO FINANCIAL STATEMENTS (CONTINUED)
The Fund uses a December 31 measurement date for its plans. Details in aggregate for the plans were as follows:
2013
2012
Change in benefit obligation
Benefit obligation at beginning of year
$
10,865,411
$
10,207,237
Interest cost
319,801
359,366
Actuarial (gain) loss
(430,184
)
1,029,954
Benefits paid
(200,120
)
(177,079
)
Effect of settlement (non-recurring)
(2,276,773
)
(554,067
)
Benefit obligation at end of year
$
8,278,135
$
10,865,411
Change in qualified plan assets
Fair value of qualified plan assets at beginning of year
$
9,304,946
$
8,148,262
Actual return on plan assets
246,307
615,406
Employer contributions
—
1,225,000
Benefits paid
(114,953
)
(129,655
)
Settlement (non-recurring)
(2,276,773
)
(554,067
)
Fair value of qualified plan assets at end of year
$
7,159,527
$
9,304,946
Funded status
$
(1,118,608
)
$
(1,560,465
)
The accumulated benefit obligation for all defined benefit pension plans was $8,278,135 and $10,865,411 at December 31, 2013 and 2012, respectively.
The primary investment objective of the Fund’s qualified pension plan assets is capital preservation, achieved through a portfolio of mutual funds and pooled separate accounts (“PSA”). PSAs, like mutual funds, are made up of a wide variety of underlying investments in securities. The Fund’s targeted asset allocation for 2014 is to maintain approximately 60% of plan assets invested in short-term fixed income securities and approximately 40% of plan assets invested in cash and money market securities.
The net asset value of mutual funds and PSAs are based on the fair value of its underlying investments. The fair value of the plan assets is determined using various inputs, summarized into the three levels described in footnote 1. The plan assets at December 31, 2013 were classified as follows:
Level 1
Level 2
Level 3
Total
Fixed income securities
$
—
$
4,185,736
$
—
$
4,185,736
Money market securities
2,964,212
9,579
—
2,973,791
Total
$
2,964,212
$
4,195,315
$
—
$
7,159,527
Items impacting the Fund’s net investment income and accumulated other comprehensive income were:
2013
2012
Components of net periodic pension cost
Interest cost
$
319,801
$
359,366
Expected return on plan assets
(323,274
)
(278,506
)
Net loss component
260,068
268,331
Effect of settlement (non-recurring)
740,825
187,740
Net periodic pension cost
$
997,420
$
536,931
2013
2012
Accumulated other comprehensive income
Defined benefit pension plans:
Balance at beginning of year
$
(2,881,871
)
$
(2,638,533
)
Net actuarial gain/(loss) arising during period
345,260
(699,409
)
Reclassifications to net periodic pension cost:
Amortization of net loss
260,068
268,331
Effect of settlement (non-recurring)
740,825
187,740
Balance at end of year
$
(1,535,718
)
$
(2,881,871
)
Accumulated other comprehensive income was comprised of net actuarial losses of $(1,535,718) and $(2,881,871) at December 31, 2013 and 2012, respectively. In 2014, the Fund estimates that $151,830 of net losses will be amortized from accumulated other comprehensive income into net periodic pension cost. Any remaining net losses will be recognized upon termination of the plans.
Assumptions used to determine benefit obligations were:
2013
2012
Discount rate
4.25%
3.75%
Rate of compensation increase
—
—
The assumptions used to determine net periodic pension cost were:
2013
2012
Discount rate
3.58%
4.20%
Expected long-term return on plan assets
4.00%
4.00%
Rate of compensation increase
—
—
The assumption used to determine expected long-term return on plan assets was based on historical and future expected returns of multiple asset classes in order to develop a risk-free real rate of return and risk premiums for each asset class. The overall rate for each asset class was developed by combining a long-term inflation component, the risk-free real rate of return, and the associated risk premium. A weighted average rate was developed based on those overall rates and the target asset allocation of the plan.
10
NOTES TO FINANCIAL STATEMENTS (CONTINUED)
The following benefit payments are eligible to be paid in the years indicated:
Pension Benefits
2014
$
960,000
2015
990,000
2016
320,000
2017
1,240,000
2018
690,000
Years 2019-2023
1,590,000
6. Equity-Based Compensation
The 2005 Equity Incentive Compensation Plan (“2005 Plan”), adopted at the 2005 Annual Meeting and re-approved at the 2010 Annual Meeting, permits the grant of restricted stock awards (both performance and nonperformance-based), as well as stock options and other stock incentives, to all employees and non-employee directors. Performance-based restricted stock awards vest at the end of a specified three year period, with the ultimate number of shares earned contingent on achieving certain performance targets. If performance targets are not achieved, all or a portion of the performance-based restricted shares are forfeited and become available for future grants. Nonperformance-based restricted stock awards typically vest ratably over a three year period and nonperformance-based restricted stock units (granted to non-employee directors) vest over a one year period. Payment of awards may be deferred, if elected. The 2005 Plan provides for accelerated vesting in the event of death or retirement. Non-employee directors also may elect to defer a portion of their cash compensation, with such deferred amount to be paid by delivery of deferred stock units. Outstanding awards are granted at fair market value on grant date. The 2005 Plan provides for the issuance of up to 3,413,131 shares of the Fund’s Common Stock, of which 3,060,320 remain available for future grants at December 31, 2013.
A summary of the status of the Fund’s awards granted under the 2005 Plan as of December 31, 2013, and changes during the year then ended, is presented below:
Awards
Shares/Units
Weighted Average Grant-Date Fair Value
Balance at December 31, 2012
170,199
$
10.57
Granted:
Restricted stock
136,418
11.51
Restricted stock units
5,250
11.67
Deferred stock units
6,020
11.87
Vested & issued
(31,003
)
10.58
Forfeited
(91,519
)
10.57
Balance at December 31, 2013 (includes 71,531 performance-based awards and 123,834 nonperformance-based awards)
195,365
$
11.27
Compensation cost resulting from awards granted under the 2005 Plan are based on the fair value of the award on grant date (determined by the average of the high and low price on grant date) and recognized on a straight-line basis over the requisite service period. For those awards with performance conditions, compensation cost is based on the most probable outcome and, if such goals are not met, compensation cost is not recognized and any previously recognized compensation cost is reversed. The total compensation cost for restricted stock granted to employees for the year ended December 31, 2013 was $83,019. The total compensation cost for restricted stock units granted to non-employee directors for the year ended December 31, 2013 was $62,030. As of December 31, 2013, there was total unrecognized compensation cost of $1,060,650, a component of additional capital surplus, related to nonvested equity-based compensation arrangements granted under the 2005 Plan. That cost is expected to be recognized over a weighted average period of 1.63 years. The total fair value of shares and units vested during the year ended December 31, 2013 was $349,076.
7. Officer and Director Compensation
The aggregate remuneration paid during the year ended December 31, 2013 to officers and directors amounted to $3,619,501, of which $337,752 was paid to directors who were not officers. These amounts represent the taxable compensation to the Fund’s officers and directors and therefore differ from the amounts reported in the accompanying Statement of Operations that are recorded and expensed in accordance with generally accepted accounting principles.
8. Portfolio Securities Loaned
The Fund makes loans of securities to approved brokers to earn additional income. It receives as collateral cash deposits, U.S. Government securities, or bank letters of credit valued at 102% of the value of the securities on loan. The market value of the loaned securities is calculated based upon the most recent closing prices and any additional required collateral is delivered to the Fund on the next business day. Cash deposits are placed in a registered money market fund. The Fund accounts for securities lending transactions as secured financing and receives compensation in the form of fees or retains a portion of interest on the investment of any cash received as collateral. The
11
NOTES TO FINANCIAL STATEMENTS (CONTINUED)
Fund also continues to receive interest or dividends on the securities loaned. Gain or loss in the fair value of the securities loaned that may occur during the term of the loan will be for the account of the Fund. At December 31, 2013, the Fund had no securities on loan. The Fund is indemnified by the Custodian, serving as lending agent, for loss of loaned securities and has the right under the lending agreement to recover the securities from the borrower on demand.
9. Operating Lease Commitments
The Fund leases office space and equipment under operating lease agreements expiring at various dates through the year 2019. The Fund recognized rental expense of $160,317 in 2013, and its minimum rental commitments are as follows:
2014
$
215,365
2015
222,165
2016
140,434
2017
64,157
2018 & 2019
71,398
Total
$
713,519
12
FINANCIAL HIGHLIGHTS
Year Ended December 31,
2013
2012
2011
2010
2009
Per Share Operating Performance
Net asset value, beginning of year
$12.43
$11.54
$12.65
$11.95
$9.61
Net investment income
0.20
0.19
0.16
0.15
0.13
Net realized gains and increase (decrease) in unrealized appreciation
3.32
1.41
(0.56)
1.10
2.64
Change in accumulated other comprehensive income (note 5)
0.01
—
(0.01)
—
0.04
Total from investment operations
3.53
1.60
(0.41)
1.25
2.81
Less distributions
Dividends from net investment income
(0.22)
(0.18)
(0.15)
(0.14)
(0.15)
Distributions from net realized gains
(0.62)
(0.49)
(0.50)
(0.37)
(0.30)
Total distributions
(0.84)
(0.67)
(0.65)
(0.51)
(0.45)
Capital share repurchases
0.02
—
—
—
0.02
Reinvestment of distributions
(0.05)
(0.04)
(0.05)
(0.04)
(0.04)
Total capital share transactions
(0.03)
(0.04)
(0.05)
(0.04)
(0.02)
Net asset value, end of year
$15.09
$12.43
$11.54
$12.65
$11.95
Market price, end of year
$13.07
$10.59
$ 9.64
$10.72
$10.10
Total Investment Return
Based on market price
31.8%
16.9%
(4.2)%
11.5%
32.1%
Based on net asset value
29.7%
14.7%
(2.8)%
11.2%
30.6%
Ratios/Supplemental Data
Net assets, end of year (in 000’s)
$1,421,551
$1,155,997
$1,050,734
$1,124,672
$1,045,027
Ratio of expenses to average net assets*
0.69%
0.65%
0.55%
0.58%
0.90%
Ratio of net investment income to average net assets**
1.44%
1.54%
1.25%
1.29%
1.30%
Portfolio turnover
55.9%
27.4%
21.5%
16.2%
15.1%
Number of shares outstanding at end of year (in 000’s)
94,224
93,030
91,074
88,885
87,415
*
The ratios of expenses to average net assets were 0.63%, 0.63%, and 0.76% in 2013, 2012, and 2009, respectively, after adjusting for non-recurring pension expenses as described in footnote 5.
**
The ratios of net investment income to average net assets were 1.50%, 1.56%, and 1.44% in 2013, 2012, and 2009, respectively, after adjusting for non-recurring pension expenses as described in footnote 5.
RBC U.S. Government Money Market (Institutional Class I), 0.01% (D)
10,000
10,000
Vanguard Federal Money Market, 0.01% (D)
10,000
10,000
Western Asset Institutional Government Reserves (Institutional Class), 0.04% (D)
10,000
10,000
130,000
Total Short-Term Investments (Cost $9,819,486)
9,819,486
Total Investments — 100.1% (Cost $1,029,287,849)
1,423,153,497
Cash, receivables, prepaid expenses and other assets, less liabilities – (0.1)%
(1,602,577
)
Net Assets — 100.0%
$
1,421,550,920
Notes:
(A)
Common stocks are listed on the New York Stock Exchange or the NASDAQ and are valued at the last reported sale price on the day of valuation. See note 1 to financial statements.
(B)
Presently non-dividend paying.
(C)
Non-controlled affiliate, a closed-end sector fund, registered as an investment company under the Investment Company Act of 1940.
(D)
Rate presented is as of period-end and represents the annualized yield earned over the previous seven days.
(E)
All or a portion of this security is pledged to cover open written call option contracts. Aggregate market value of such pledged securities is $404,800.
(F)
A portion of this security or cash is pledged to collateralize open written put option contracts with an aggregate value to deliver upon exercise of $300,000.
CHANGESIN PORTFOLIO SECURITIES
The unaudited list of quarterly changes in the Fund’s portfolio securities can be found on the Fund’s website at www.adamsexpress.com under “Investment Information”.
16
SCHEDULEOF OUTSTANDING WRITTEN OPTION CONTRACTS
December 31, 2013
Contracts
(100 shares
each)
Security
Strike
Price
Contract
Expiration Date
Value
COVERED CALLS
40
Exxon Mobil Corp.
$
95
Apr 14
$
28,800
COLLATERALIZED PUTS
40
Exxon Mobil Corp.
75
Apr 14
520
Total Option Liability (Unrealized Loss of $22,020)
$
29,320
17
REPORTOF INDEPENDENT REGISTERED PUBLIC ACCOUNTING FIRM
To the Board of Directors and Shareholders of The Adams Express Company:
In our opinion, the accompanying statement of assets and liabilities, including the schedule of investments, and the related statements of operations and of changes in net assets and the financial highlights present fairly, in all material respects, the financial position of The Adams Express Company (the “Fund”) at December 31, 2013, the results of its operations for the year then ended, the changes in its net assets for each of the two years in the period then ended and the financial highlights for each of the five years in the period then ended, in conformity with accounting principles generally accepted in the United States of America. These financial statements and financial highlights (hereafter referred to as “financial statements”) are the responsibility of the Fund’s management; our responsibility is to express an opinion on these financial statements based on our audits. We conducted our audits of these financial statements in accordance with the auditing standards of the Public Company Accounting Oversight Board (United States). Those standards require that we plan and perform the audit to obtain reasonable assurance about whether the financial statements are free of material misstatement. An audit includes examining, on a test basis, evidence supporting the amounts and disclosures in the financial statements, assessing the accounting principles used and significant estimates made by management, and evaluating the overall financial statement presentation. We believe that our audits, which included confirmation of securities at December 31, 2013 by correspondence with the custodian and brokers, provide a reasonable basis for our opinion.
PricewaterhouseCoopers LLP
Baltimore, Maryland
February 14, 2014
18
HISTORICAL FINANCIAL STATISTICS
(unaudited)
Year
Value of Net Assets
Shares Outstanding*
Net Asset Value Per Share*
Market Value Per Share*
Income Dividends Per Share*
Capital Gains Distributions Per Share*
Total Dividends and Distributions Per Share*
Annual Distribution Rate**
1999
$
2,170,801,875
80,842,241
$
26.85
$
22.38
$
.26
$
1.37
$
1.63
8.5
%
2000
1,951,562,978
82,292,262
23.72
21.00
.22
1.63
1.85
7.8
2001
1,368,366,316
85,233,262
16.05
14.22
.26
1.39
1.65
9.6
2002
1,024,810,092
84,536,250
12.12
10.57
.19
.57
.76
6.2
2003
1,218,862,456
84,886,412
14.36
12.41
.17
.61
.78
6.8
2004
1,295,548,900
86,135,292
15.04
13.12
.24
.66
.90
7.1
2005
1,266,728,652
86,099,607
14.71
12.55
.22
.64
.86
6.7
2006
1,377,418,310
86,838,223
15.86
13.87
.23
.67
.90
6.8
2007
1,378,479,527
87,668,847
15.72
14.12
.32
.71
1.03
7.1
2008
840,012,143
87,406,443
9.61
8.03
.26
.38
.64
5.7
2009
1,045,027,339
87,415,193
11.95
10.10
.15
.30
.45
5.2
2010
1,124,671,966
88,885,186
12.65
10.72
.14
.37
.51
5.1
2011
1,050,733,678
91,073,899
11.54
9.64
.15
.50
.65
6.1
2012
1,155,997,037
93,029,724
12.43
10.59
.18
.49
.67
6.3
2013
1,421,550,920
94,223,617
15.09
13.07
.22
.62
.84
7.1
*
Adjusted to reflect the 3-for-2 stock split effected in October 2000.
**
The annual distribution rate is the total dividends and capital gain distributions during the year divided by the average month-end market price of the Fund’s Common Stock for the calendar year in years prior to 2011 and for the twelve months ended October 31 beginning in 2011, which is consistent with the calculation to determine the annual minimum distribution rate commitment announced in September 2011.
19
THE ADAMS EXPRESS COMPANY
(unaudited)
Calendar year- end
Market value of original investment
Cumulative market value of shares from capital gains distributions
Cumulative market value of shares from income dividends
Total market value
Net asset value of total shares
1999
$
12,567
$
825
$
167
$
13,559
$
16,272
2000
11,795
1,723
272
13,790
15,576
2001
7,987
2,075
325
10,387
11,724
2002
5,937
1,948
358
8,243
9,451
2003
6,970
2,785
559
10,314
11,935
2004
7,369
3,487
811
11,667
13,375
2005
7,049
3,903
964
11,916
13,967
2006
7,790
4,944
1,310
14,044
16,058
2007
7,931
5,768
1,655
15,354
17,093
2008
4,510
3,691
1,173
9,374
11,219
2009
5,673
5,037
1,665
12,375
14,642
2010
6,021
5,819
1,954
13,794
16,276
2011
5,414
5,873
1,929
13,216
15,820
2012
5,948
7,139
2,363
15,450
18,135
2013
7,341
9,762
3,257
20,360
23,507
Illustration of an assumed
15 year investment of $10,000
Investment income dividends and capital gains distributions are taken in additional shares. This chart covers the years 1999–2013. Fees for the reinvestment of interim dividends are assumed as 2% of the amount reinvested (maximum of $2.50) and commissions of $0.05 per share. There is no charge for reinvestment of year-end distributions. No adjustment has been made for any income taxes payable by shareholders on income dividends, capital gains distributions, or the sale of any shares. These results should not be considered representative of the dividend income or capital gain or loss which may be realized in the future.
20
SHAREHOLDER INFORMATIONAND SERVICES
DIVIDEND PAYMENT SCHEDULE
The Fund presently pays dividends four times a year, as follows: (a) three interim distributions on or about March 1, June 1, and September 1, and (b) a “year-end” distribution, payable in late December, consisting of the estimated balance of the net investment income for the year and the net realized capital gain earned through October 31 and, if applicable, a return of capital. Shareholders may elect to receive the year-end distribution in stock or cash. In connection with this distribution, all shareholders of record are sent a dividend announcement notice and an election card in mid-November. Shareholders holding shares in “street” or brokerage accounts may make their election by notifying their brokerage house representative.
INVESTORS CHOICE
INVESTORS CHOICE is a direct stock purchase and sale plan, as well as a dividend reinvestment plan, sponsored and administered by our transfer agent, American Stock Transfer & Trust Corporation (AST). The Plan provides registered shareholders and interested first time investors an affordable alternative for buying, selling, and reinvesting in Fund shares. A brochure which further details the benefits and features of INVESTORS CHOICE as well as an enrollment form may be obtained by contacting AST.
The costs to participants in administrative service fees and brokerage commissions for each type of transaction are listed below. Fees are subject to change at any time.
Fees:
Initial Enrollment and Optional Cash Investments:
Service Fee $2.50 per investment
Brokerage Commission $0.05 per share
Reinvestment of Dividends*:
Service Fee 2% of amount invested
(maximum of $2.50 per investment)
Brokerage Commission $0.05 per share
Sale of Shares:
Service Fee $10.00
Brokerage Commission $0.05 per share
Deposit of Certificates for safekeeping $7.50
(waived if sold)
Book to Book Transfers Included
To transfer shares to another participant or to a new participant
* The year-end dividend and capital gain distribution will usually be made in newly issued shares of Common Stock. There are no fees or commissions in connection with this dividend and capital gain distribution when made in newly issued shares.
For shareholders whose stock is held by a broker in “street” name, the AST INVESTORS CHOICE Direct Stock Purchase and Sale Plan remains available through many registered investment security dealers. If your shares are currently held in a “street” name or brokerage account, please contact your broker for details about how you can participate in AST’s Plan or contact AST.
ELECTRONIC DELIVERY OF SHAREHOLDER REPORTS
The Fund offers shareholders the benefits and convenience of viewing Quarterly and Annual Reports and other shareholder materials on-line. With your consent, paper copies of these documents will cease with the next mailing and will be provided via e-mail. Reduce paper mailed to your home and help lower the Fund’s printing and mailing costs. To enroll, please visit the following websites:
Registered shareholders with AST: www.amstock.com/main
Shareholders using brokerage accounts: http://enroll.icsdelivery.com/ADX
21
BOARDOF DIRECTORS
Personal Information
Position
Held with
the Fund
Term
of
Office
Length
of Time
Served
Principal Occupations
Number of Portfolios in Fund Complex Overseen by Director
Other Directorships
Independent Directors
Enrique R. Arzac, Ph.D. 7 St. Paul Street, Suite 1140 Baltimore, MD 21202 Age 72
Director
One Year
Since 1983
Professor of Finance and Economics at the Graduate School of Business, Columbia University, formerly Vice Dean of Academic Affairs.
Two
Director of Petroleum & Resources Corporation (closed-end fund), Aberdeen Asset Management Funds (6 closed-end funds), Credit Suisse Asset Management Funds (2 closed-end funds and 9 open-end funds), and Mirae Asset Discovery Funds (6 open-end funds). In addition, within the past five years, Dr. Arzac served as a director of Epoch Holdings Corporation (an investment management and investment advisory services company) and Starcomms Plc (telecommunications company).
Phyllis O. Bonanno
7 St. Paul Street,
Suite 1140 Baltimore, MD 21202
Age 70
Director
One Year
Since 2003
Retired President & CEO of International Trade Solutions, Inc. (consultants). Formerly, President of Columbia College, Columbia, South Carolina, and Corporate Vice President of Warnaco, Inc. (apparel).
Two
Director of Petroleum & Resources Corporation (closed-end fund) and Borg-Warner Inc. (industrial). In addition, within the past five years, Ms. Bonanno served as Director of Mohawk Industries, Inc. (carpets and flooring).
Kenneth J. Dale
7 St. Paul Street,
Suite 1140 Baltimore, MD 21202
Age 57
Director
One Year
Since 2008
Senior Vice President and Chief Financial Officer of The Associated Press. Formerly, Vice President, J.P. Morgan Chase & Co. Inc.
Two
Director of Petroleum & Resources Corporation (closed-end fund).
Frederic A. Escherich
7 St. Paul Street,
Suite 1140
Baltimore, MD 21202
Age 61
Director
One Year
Since 2006
Private Investor. Formerly, Managing Director and head of Mergers and Acquisitions Research and the Financial Advisory Department with JPMorgan & Co. Inc.
Two
Director of Petroleum & Resources Corporation (closed-end fund).
Roger W. Gale, Ph.D.
7 St. Paul Street,
Suite 1140
Baltimore, MD 21202
Age 67
Director
One Year
Since 2005
President & CEO of GF Energy, LLC (consultants to electric power companies). Formerly, member of management group of PA Consulting Group (energy consultants).
Two
Director of Petroleum & Resources Corporation (closed-end fund) and during the past five years also served as a director of Ormat Technologies, Inc. (geothermal and renewable energy).
22
BOARDOF DIRECTORS (CONTINUED)
Personal Information
Position
Held with
the Fund
Term
of
Office
Length
of Time
Served
Principal Occupations
Number of Portfolios in Fund Complex Overseen by Director
Other Directorships
Independent Directors (continued)
Kathleen T. McGahran,
Ph.D., J.D., CPA
7 St. Paul Street,
Suite 1140
Baltimore, MD 21202
Age 63
Director, Chair of the Board
One Year
Since 2003
President & CEO of Pelham Associates, Inc. (an executive education provider) and Senior Lecturer at Yale University’s School of Management. Formerly, Associate Dean and Director of Executive Education and Associate Professor, Columbia University, and Adjunct Associate Professor, Stern School of Business, New York University and Tuck School of Business, Dartmouth College.
Two
Director of Petroleum & Resources Corporation (closed-end fund).
Craig R. Smith, M.D.
7 St. Paul Street,
Suite 1140
Baltimore, MD 21202
Age 67
Director
One Year
Since 2005
Chief Operating Officer and Manager of Algenol LLC (ethanol manufacturing). Formerly, President, Williston Consulting LLC (consultants to pharmaceutical and biotechnology industries) and Chairman, President & CEO of Guilford Pharmaceuticals (pharmaceuticals & biotechnology).
Two
Director of Petroleum & Resources Corporation (closed-end fund) and during the past five years also served as a director of LaJolla Pharmaceutical Company, Depomed, Inc. (specialty pharmaceuticals), and Algenol Biofuels, Inc. (ethanol manufacturing).
Interested Director
Mark E. Stoeckle
7 St. Paul Street,
Suite 1140
Baltimore, MD 21202
Age 57
Director and CEO
One Year
Since 2013
CEO of the Fund and CEO of Petroleum & Resources Corporation.
Two
Director of Petroleum & Resources Corporation (closed-end fund).
This report, including the financial statements herein, is transmitted to the shareholders of The Adams Express Company for their information. It is not a prospectus, circular or representation intended for use in the purchase or sale of shares of the Fund’s or of any securities mentioned in the report. The rates of return will vary and the principal value of an investment will fluctuate. Shares, if sold, may be worth more or less than their original cost. Past performance is no guarantee of future investment results.
23
OTHER INFORMATION
Statement on Quarterly Filing of Complete Portfolio Schedule
In addition to publishing its complete schedule of portfolio holdings in the First and Third Quarter Reports to shareholders, the Fund also files its complete schedule of portfolio holdings with the Securities and Exchange Commission for the first and third quarters of each fiscal year on Form N-Q. The Fund’s Forms N-Q are available on the Commission’s website at www.sec.gov. The Company’s Forms N-Q may be reviewed and copied at the Commission’s Public Reference Room, and information on the operation of the Public Reference Room may be obtained by calling 1-800-SEC-0330. The Fund also posts a link to its Forms N-Q on its website: www.adamsexpress.com under the headings “Investment Information”, “Financial Reports” and then “SEC Filings”.
Annual Certification
The Fund’s CEO has submitted to the New York Stock Exchange the annual CEO certification as required by Section 303A.12(a) of the NYSE Listed Company Manual.
Proxy Voting Policies and Record
A description of the policies and procedures that the Fund uses to determine how to vote proxies relating to portfolio securities owned by the Fund and the Fund’s proxy voting record for the 12-month period ended June 30, 2013 are available (i) without charge, upon request, by calling the Fund’s toll free number at (800) 638-2479; (ii) on the Fund’s website: www.adamsexpress.com under the headings “About Adams Express” and “Corporate Information”; and (iii) on the Securities and Exchange Commission’s website: www.sec.gov.
Forward-Looking Statements
This report contains “forward-looking statements” within the meaning of the Securities Act of 1933 and the Securities Exchange Act of 1934. By their nature, all forward-looking statements involve risks and uncertainties, and actual results could differ materially from those contemplated by the forward-looking statements. Several factors that could materially affect the Fund’s actual results are the performance of the portfolio of stocks held by the Fund, the conditions in the U.S. and international financial markets, the price at which shares of the Fund will trade in the public markets, and other factors discussed in the Fund’s periodic filings with the Securities and Exchange Commission.
Privacy Policy
In order to conduct its business, the Fund, through its transfer agent, American Stock Transfer & Trust Company, collects and maintains certain nonpublic personal information about our shareholders of record with respect to their transactions in shares of our securities. This information includes the shareholder’s address, tax identification or Social Security number, share balances, and dividend elections. We do not collect or maintain personal information about shareholders whose shares of our securities are held in “street name” by a financial institution such as a bank or broker.
We do not disclose any nonpublic personal information about you, our other shareholders or our former shareholders to third parties unless necessary to process a transaction, service an account or as otherwise permitted by law.
To protect your personal information internally, we restrict access to nonpublic personal information about our shareholders to those employees who need to know that information to provide services to our shareholders. We also maintain certain other safeguards to protect your nonpublic personal information.
24
THE ADAMS EXPRESS COMPANY
Board Of Directors
Enrique R. Arzac 1,3,5
Phyllis O. Bonanno 1,3,5
Kenneth J. Dale 2,4
Frederic A. Escherich 1,4,5
Roger W. Gale 2,4
Kathleen T. McGahran 1,2,3,5,6
Craig R. Smith 3,5
Mark E. Stoeckle 1
1. Member of Executive Committee
2. Member of Audit Committee
3. Member of Compensation Committee
4. Member of Retirement Benefits Committee
5. Member of Nominating and Governance Committee
6. Chair of the Board
Officers
Mark E. Stoeckle
Chief Executive Officer
James P. Haynie, CFA
President
Nancy J.F. Prue, CFA
Executive Vice President
Brian S. Hook, CFA, CPA
Vice President, Chief Financial Officer and Treasurer
Lawrence L. Hooper, Jr.
Vice President, General Counsel and Secretary
David R. Schiminger, CFA
Vice President — Research
D. Cotton Swindell, CFA
Vice President — Research
Christine M. Sloan, CPA
Assistant Treasurer
The Adams Express Company
Seven St. Paul Street, Suite 1140, Baltimore, MD 21202
(410) 752-5900 (800) 638-2479
Website: www.adamsexpress.com
E-mail: contact@adamsexpress.com
Counsel: Chadbourne & Parke LLP
Independent Registered Public Accounting Firm: PricewaterhouseCoopers LLP
Custodian of Securities: Brown Brothers Harriman & Co.
Transfer Agent & Registrar: American Stock Transfer & Trust Company, LLC
Stockholder Relations Department
6201 15th Avenue
Brooklyn, NY 11219
(877) 260-8188
Website: www.amstock.com
E-mail: info@amstock.com
amsexpress.com
Item 2. Code of Ethics.
On June 12, 2003, the Board of Directors adopted a code of ethics that applies to the registrant's principal executive officer and principal financial officer. The code of ethics is available on the registrant's website at: www.adamsexpress.com. Since the code of ethics was adopted, there have been no amendments to it nor have any waivers from any of its provisions been granted.
Item 3. Audit Committee Financial Expert.
The Board of Directors has determined that at least one of the members of the registrant's audit committee meets the definition of audit committee financial expert as that term is defined by the Securities and Exchange Commission. The directors on the registrant's audit committee whom the Board of Directors has determined meet such definition are Kenneth J. Dale and Kathleen T. McGahran, who are independent pursuant to paragraph (a)(2) of this Item.
Item 4. Principal Accountant Fees and Services.
(a) Audit Fees. The aggregate fees for professional services rendered by the registrant's independent registered public accounting firm, PricewaterhouseCoopers LLP, for the audit of the registrant's annual financial statements and review of the registrant's semi-annual financial statements for 2013 and 2012 were $73,967 and $71,167, respectively.
(b) Audit-Related Fees. There were no audit-related fees in 2013 and 2012.
(c) Tax Fees. The aggregate fees for professional services rendered to the registrant by PricewaterhouseCoopers LLP for the review of the registrant's excise tax calculations and preparations of federal, state, and excise tax returns for 2013 and 2012 were $8,581 and $7,521, respectively.
(d) All Other Fees. The aggregate fees for services rendered to the registrant by PricewaterhouseCoopers LLP, other than for the services referenced above, for 2013 and 2012 were $5,477 and $6,617, respectively, which related to the review of the registrant's procedures for calculating the amounts to be paid or granted to the registrant's officers in accordance with the registrant's cash incentive plan and the 2005 Equity Incentive Compensation Plan, review of the registrant's calculations related to those plans, and preparation of a related report to the registrant's Compensation Committee. Services in 2012 also included the review of the documentation relating to compliance by the registrant's employees and directors with the requirements of the registrant's Code of Ethics pertaining to personal stock trading, and presentation of a related report to the Chief Executive Officer.
(e)
(1)
The audit committee's policy is to pre-approve all audit and permissible non-audit services provided by the independent accountants. In assessing requests for services by the independent accountants, the audit committee considers whether such services are consistent with the auditor's independence; whether the independent accountants are likely to provide the most effective and efficient service based upon their familiarity with the registrant; and whether the service could enhance the registrant's ability to manage or control risk or improve financial statement audit and review quality. The audit committee may delegate pre-approval authority to its Chair. Any pre-approvals by the Chair under this delegation are to be reported to the audit committee at its next scheduled meeting. All services performed in 2013 were pre-approved by the audit committee.
(2)
Not applicable.
(f) Not applicable.
(g) The aggregate fees for non-audit professional services rendered by PricewaterhouseCoopers LLP to the registrant for 2013 and 2012 were $14,058 and $14,138, respectively.
(h) The registrant's audit committee has considered the provision by PricewaterhouseCoopers LLP of the non-audit services described above and found that they are compatible with maintaining PricewaterhouseCoopers LLP's independence.
Item 5. Audit Committee of Listed Registrants.
(a) The registrant has a standing audit committee established in accordance with Section 3(a)(58)(A) of the Securities Exchange Act of 1934. The members of the Audit Committee are: Kenneth J. Dale, Chair, Roger W. Gale, Kathleen T. McGahran, and Craig R. Smith.
(b) Not applicable.
Item 6. Investments.
(a) This schedule is included as part of the Report to Stockholders filed under Item 1 of this form.
(b) Not applicable.
Item 7. Disclosure of Proxy Voting Policies and Procedures for Closed-End Management Investment Companies.
PROXY VOTING GUIDELINES
The Adams Express Company ("Adams") follows long-standing general guidelines for the voting of portfolio company proxies and takes very seriously its responsibility to vote all such proxies. The portfolio company proxies are evaluated by our research staff and voted by our portfolio management team, and we annually provide the Board of Directors with a report on how proxies were voted during the previous year. We do not use an outside service to assist us in voting our proxies.
As an internally-managed investment company, Adams uses its own staff of research analysts and portfolio managers. In making the decision to invest in a company for the portfolio, among the factors the research team analyses is the integrity and competency of the company's management. We must be satisfied that the companies we invest in are run by managers with integrity. Therefore, having evaluated this aspect of our portfolio companies' managements, we give significant weight to the recommendations of the company's management in voting on proxy issues.
We vote proxies on a case-by-case basis according to what we deem to be the best long-term interests of our shareholders. The key over-riding principle in any proxy vote is that stockholders be treated fairly and equitably by the portfolio company's management. In general, on the election of directors and on routine issues that we do not believe present the possibility of an adverse impact upon our investment, after reviewing whether applicable corporate governance requirements as to board and committee composition have been met, we will vote in accordance with the recommendations of the company's management. When we believe that the management's recommendation is not in the best interests of our stockholders, we will vote against that recommendation.
Our general guidelines for when we will vote contrary to the recommendation of the portfolio company management's recommendation are:
Stock Options
Our general guideline is to vote against stock option plans that we believe are unduly dilutive of our stock holdings in the company. We use a general guideline that we will vote against any stock option plan that results in dilution in shares outstanding exceeding 4%. Most stock option plans are established to motivate and retain key employees and to reward them for their achievement. An analysis of a stock option plan cannot be made in a vacuum but must be made in the context of the company's overall compensation scheme. In voting on stock option plans, we give consideration to whether the stock option plan is broad-based in the number of employees who are eligible to receive grants under the plan. We generally vote against plans that permit re-pricing of grants or the issuance of options with exercise prices below the grant date value of the company's stock.
Corporate Control/Governance Issues
Unless we conclude that the proposal is favorable to our interests as a long-term shareholder in the company, we have a long-standing policy of voting against proposals to create a staggered board of directors. In conformance with that policy, we will generally vote in favor of shareholder proposals to eliminate the staggered election of directors.
Unless we conclude that the proposal is favorable to our interests as a long-term shareholder in the company, our general policy is to vote against amendments to a company's charter that can be characterized as blatant anti-takeover provisions.
With respect to so-called golden parachutes and other severance packages, it is our general policy to vote against proposals relating to future employment contracts that provide that compensation will be paid to any director, officer or employee that is contingent upon a merger or acquisition of the company.
We generally vote for proposals to require that the majority of a board of directors consist of independent directors and vote against proposals to establish a retirement plan for non-employee directors.
We have found that most stockholder proposals relating to social issues focus on very narrow issues that either fall within the authority of the company's management, under the oversight of its board of directors, to manage the day-to- day operations of the company or concern matters that are more appropriate for global solutions rather than company- specific ones. We consider these proposals on a case-by-case basis but usually are persuaded management's position is reasonable and vote in accordance with management's recommendation on these types of proposals.
Item 8. Portfolio Managers of Closed-End Management Investment Companies.
(a)
(1) As of the date of this filing, Mark E. Stoeckle, Chief Executive Officer, James P. Haynie, President, and Nancy J.F. Prue, Executive Vice President, comprise the three-person portfolio management team for the registrant. Mr. Stoeckle has served as portfolio manager for the registrant since February 11, 2013; prior thereto, he served as Chief Investment Officer, U.S. Equities and Global Sector Funds, for BNP Paribas Investment Partners. Mr. Haynie has been a member of the portfolio management team since August 19, 2013; prior thereto, Mr. Haynie served as Chief Investment Officer, U.S. Equities and Global Sector Funds, for BNP Paribas Investment Partners from February 2013 and was Senior Portfolio Manager at BNP Paribas Investment Partners from 2005 to 2013. Ms. Prue has been a member of the portfolio management team since March 2010, serving as Executive Vice President; prior thereto, Ms. Prue served as a research analyst for the registrant and as an officer of Petroleum & Resources Corporation (Petroleum). Mr. Stoeckle is the lead member of the portfolio management team. Messrs. Stoeckle and Haynie and Ms. Prue receive investment recommendations from a team of research analysts and make decisions jointly about any investment transactions in the portfolio. Concurrence of the portfolio managers is required for an investment recommendation to be approved.
(2) As of the date of this filing, Messrs. Stoeckle and Haynie and Ms. Prue also serve on the portfolio management team for the registrant's non-controlled affiliate, Petroleum, a registered investment company with total net assets of $863,689,833 as of December 31, 2013. Mr. Stoeckle is Chief Executive Officer of Petroleum, Ms. Prue is President and Mr. Haynie is Executive Vice President. The Petroleum fund is a non-diversified fund specializing in the energy and natural resources sectors and the registrant is a diversified fund with a different focus. There are few material conflicts of interest that may arise in connection with the portfolio management of both funds. The funds do not buy or sell securities or other portfolio holdings to or from the other, and policies and procedures are in place covering the sharing of expenses and the allocation of investment opportunities, including bunched orders and investments in initial public offerings, between the funds.
(3) As of December 31, 2013, the registrant's portfolio managers are compensated through a three-component plan, consisting of salary, annual cash incentive compensation, and equity incentive compensation. The value of each component in any year is determined by the Compensation Committee, comprised solely of independent director members of the Board of Directors ("Committee"). The Committee has periodically employed a compensation consultant to review the plan and its components. For their first year of service in 2013, the salary amounts paid to Messrs. Stoeckle and Haynie by the registrant and Petroleum were negotiated as part of their hiring process, and their cash incentive compensation amounts were subject to contractual minimums. Upon commencing service with the registrant in 2013, Mr. Stoeckle also received a sign-on cash bonus. With the exceptions noted for Messrs. Stoeckle and Haynie, the structure and methods used as of December 31, 2013 to determine the compensation of the Portfolio Managers were as follows: Salaries are determined by using appropriate industry surveys and information about the local market as well as general inflation statistics. Cash incentive compensation is based on a combination of absolute and relative fund performance, with a three-fourths weighting for the Chief Executive Officer and a two-thirds weighting for other portfolio managers, and individual performance, with a one-fourth weighting for the Chief Executive Officer and a one-third weighting for other portfolio managers. Target incentives are set annually based on 80% of salary for the Chief Executive Officer and 60% of salary for the President and the Executive Vice President. Fund performance used in determining cash incentive compensation is measured over both a one-year period, accounting for two-thirds of the calculation, and a three-year period, which accounts for one-third. The registrant's total return on net asset value ("NAV") over each of the two periods is used to determine a base percentage of target, which is then adjusted by performance relative to the S&P 500 Index. Using these calculations, the cash incentive compensation can range from 0% to a maximum of 200% of the established target.
Equity incentive compensation, based on a plan approved by shareholders in 2005 and reapproved in 2010, can take several forms. During 2013, a grant of the registrant's restricted stock was made to Ms. Prue on January 10, 2013, which vest three years after grant, but only upon the achievement of specified performance criteria. The target number of restricted shares granted to Ms. Prue will vest if, on the January 1 prior to the vest date ("measurement date"), the registrant's three-year average annual NAV total return meets or exceeds the three-year average annual total return of a hypothetical portfolio comprised of a 50/50 blend of the S&P 500 Index and the Lipper Large-Cap Core Mutual Funds Average ("Hypothetical Portfolio"). Depending on the level of registrant's outperformance or underperformance of the Hypothetical Portfolio on the measurement date, an additional number of shares, a lesser percentage, or no shares will be earned and will vest. Upon commencing service with the registrant in 2013, Mr. Stoeckle received two equity incentive sign-on grants comprised of the registrant's restricted stock, the first of which will vest one year from the date of grant and the second of which will vest in one-third tranches on each of the next three anniversaries of the grant date, provided that he remains in the registrant's employ on those dates. Upon commencing service with the registrant in 2013, Mr. Haynie received an equity incentive sign-on grant comprised of the registrant's restricted shares that will vest in one-fourth tranches on each of the next four anniversaries of the grant date, provided that he remains in the registrant's employ on those dates.
As of December 31, 2013, the structure of the compensation that the portfolio managers receive from Petroleum is the same as that for the registrant with the exceptions that (a) the portfolio managers' cash incentive compensation is based on a comparison with the performance of an 80/20 blend of the Dow Jones U.S. Oil and Gas Index and the Dow Jones U.S. Basic Materials Index and (b) for the equity incentive compensation granted to Ms. Prue, the Hypothetical Portfolio that is used for determining the number of shares of restricted stock that will vest is comprised of a 50/50 blend of (1) an 80/20 blend of the Dow Jones U.S. Oil and Gas Index and the Dow Jones U.S. Basic Materials Index (for 50%) and (2) the Lipper Global Natural Resources Fund Index (for 50%).
(4) Using a valuation date of December 31, 2013, Messrs. Stoeckle and Haynie each beneficially owned equity securities in the registrant valued between $500,001 and $1,000,000. Ms. Prue beneficially owned equity securities in the registrant valued between $100,001 and $500,000.
(b)
Not applicable.
Item 9. Purchases of Equity Securities by Closed-End Management Investment Company and Affiliated Purchasers.
Total Number of Shares (or Units Purchased)
Average Price Paid per Share (or Unit)
Total Number of Shares (or Units) Purchased as Part of Publicly Announced Plans or Programs
Maximum Number of Shares (or Units) That May Yet Be Purchased Under the Plans or Programs
-----------------------------------
-----------------------------------
----------------------------------
-----------------------------------
January 2013
0
$0.00
0
4,555,295
February 2013
0
$0.00
0
4,555,295
March 2013
0
$0.00
0
4,555,295
April 2013
0
$0.00
0
4,555,295
May 2013
184,105
$12.26
184,105
4,371,190
June 2013
205,717
$12.00
205,717
4,165,473
July 2013
24,131
$12.01
24,131
4,141,342
August 2013
166,302
$12.29
166,302
3,975,040
September 2013
279,790
$12.46
187,328
3,787,712
October 2013
51,485
$12.47
51,485
3,736,227
November 2013
17,000
$13.07
17,000
3,719,227
December 2013
19,809
$12.67
19,809
4,607,443
(2c)
-----------------------------------
-----------------------------------
-----------------------------------
Total
948,339
(1)
$12.29
855,877
(2a)(2b)
(1) There were 92,462 shares purchased directly in September 2013, at the closing market price on the date of the transaction, from the registrant's and Petroleum's defined benefit retirement plans in two transactions that were other than through a publicly announced plan or program.
(2.a) The Plan was announced on December 13, 2012.
(2.b) The share amount approved in 2012 was 5% of outstanding shares, or 4,555,295 shares.
(2.c) The Plan was set to expire on December 31, 2013, but was extended by the Board on November 15, 2013, authorizing purchases of up to 5% of the outstanding shares, or 4,607,443 shares, through December 31, 2014.
(2.d) None.
(2.e) None.
Item 10. Submission of Matters to a Vote of Security Holders.
There were no material changes to the procedures by which shareholders may recommend nominees to the registrant's Board of Directors made or implemented after the registrant last provided disclosure in response to the requirements of Item 407(c)(2)(iv) of Regulation S-K (as required by Item 22(b)(15) of Schedule 14A), or this Item.
Item 11. Controls and Procedures.
(a) The registrant's principal executive officer and principal financial officer have concluded that the registrant's disclosure controls and procedures (as defined in Rule 30a-3(c) under the Investment Company Act of 1940) are effective based on their evaluation of the disclosure controls and procedures as of a date within 90 days of the filing date of this report.
(b) There have been no significant changes in the registrant's internal control over financial reporting (as defined in Rule 30a-3(d) under the Investment Company Act of 1940) that occurred during the registrant's second fiscal quarter of the period covered by this report that has materially affected, or is reasonably likely to materially affect, the registrant's internal control over financial reporting.
Item 12. Exhibits.
(a)
(1)
Not applicable. See registrant's response to Item 2 above.
(2)
Separate certifications by the registrant's principal executive officer and principal financial officer, pursuant to Section 302 of the Sarbanes-Oxley Act of 2002 and required by Rule 30a-2(a) under the Investment Company Act of 1940, are attached.
(3)
Written solicitation to purchases securities: not applicable.
(b) A certification by the registrant's principal executive officer and principal financial officer, pursuant to Section 906 of the Sarbanes-Oxley Act of 2002 and required by Rule 30a-2(b) under the Investment Company Act of 1940, is attached.
SIGNATURES
Pursuant to the requirements of the Securities Exchange Act of 1934 and the Investment Company Act of 1940, the registrant has duly caused this
report to be signed on its behalf by the undersigned, thereunto duly authorized.
The Adams Express Company
By:
/s/ Mark E. Stoeckle
Mark E. Stoeckle
Chief Executive Officer
(Principal Executive Officer)
Date:
February 26, 2014
Pursuant to the requirements of the Securities Exchange Act of 1934 and the Investment Company Act of 1940, this report has been signed below
by the following persons on behalf of the registrant and in the capacities and on the dates indicated.
By:
/s/ Mark E. Stoeckle
Mark E. Stoeckle
Chief Executive Officer
(Principal Executive Officer)
Date:
February 26, 2014
By:
/s/ Brian S. Hook
Brian S. Hook
Vice President, Chief Financial Officer and Treasurer
(Principal Financial Officer)
Date:
February 26, 2014
We use cookies on this site to provide a more responsive and personalized service. Continuing to browse, clicking I Agree, or closing this banner indicates agreement. See our Cookie Policy for more information.

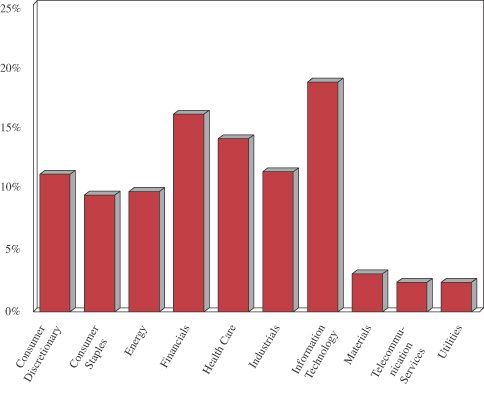
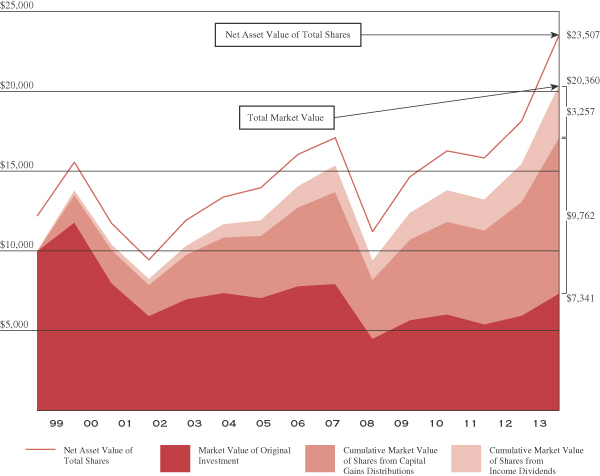
 amsexpress.com