CERTIFIED SHAREHOLDER REPORT OF REGISTERED MANAGEMENT INVESTMENT COMPANIES
Investment Company Act file number: 811-00248 -------------------------------------------------------------------------
THE ADAMS EXPRESS COMPANY ------------------------------------------------------------------------- (Exact name of registrant as specified in charter)
7 Saint Paul Street, Suite 1140, Baltimore, Maryland 21202 ------------------------------------------------------------------------- (Address of principal executive offices)
Lawrence L. Hooper, Jr. The Adams Express Company 7 Saint Paul Street, Suite 1140 Baltimore, Maryland 21202 ------------------------------------------------------------------------- (Name and address of agent for service)
Registrant's telephone number, including area code: (410) 752-5900 Date of fiscal year end: December 31 Date of reporting period: December 31, 2014
Item 1. Reports to Stockholders.
2014ATA GLANCE
The Fund
Ÿ
a closed-end equity investment company
Ÿ
objectives: preservation of capital
reasonable income
opportunity for capital gain
Ÿ
internally-managed
Ÿ
annual distribution rate of at least 6%
Stock Data (12/31/14)
NYSE Symbol ADX
Market Price $13.68
52-Week Range $12.14 – $14.90
Discount 13.8%
Shares Outstanding 96,286,656
Summary Financial Information
Year Ended December 31,
2014
2013
Net asset value per share
$
15.87
$
15.09
Total net assets
1,527,772,661
1,421,550,920
Unrealized appreciation on investments
469,715,852
393,843,628
Net investment income
19,120,191
18,656,769
Net realized gain
93,558,308
57,371,366
Total return (based on market price)
13.7%
31.8%
Total return (based on net asset value)
14.3%
29.7%
Ratio of expenses to average net assets
0.58%
0.69%
Annual distribution rate
8.8%
7.1%
2014 Dividends and Distributions
Paid
Amount (per share)
Type
March 3, 2014
$
0.02
Long-term capital gain
March 3, 2014
0.01
Short-term capital gain
March 3, 2014
0.02
Investment income
June 2, 2014
0.05
Investment income
September 2, 2014
0.05
Investment income
December 29, 2014
0.90
Long-term capital gain
December 29, 2014
0.05
Short-term capital gain
December 29, 2014
0.08
Investment income
$
1.18
2015 Annual Meeting of Shareholders
Location: Belmond Charleston Place, Charleston, South Carolina
Date: April 30, 2015
Time: 9:00 a.m.
PORTFOLIO REVIEW
December 31, 2014
(unaudited)
Ten Largest Equity Portfolio Holdings
Market Value
Percent of Net Assets
Apple Inc.
$
72,089,178
4.7
Petroleum & Resources Corp.*
52,132,692
3.4
Wells Fargo & Co.
39,415,580
2.6
Google Inc. (Class A & Class C)
37,525,630
2.5
Walt Disney Co.
35,566,144
2.3
Gilead Sciences, Inc.
35,432,334
2.3
Lowe’s Companies, Inc.
33,712,000
2.2
Citigroup Inc.
33,385,870
2.2
Union Pacific Corp.
33,118,140
2.2
CVS Health Corp.
30,241,340
2.0
$
402,618,908
26.4
%
* Non-controlled affiliated closed-end fund
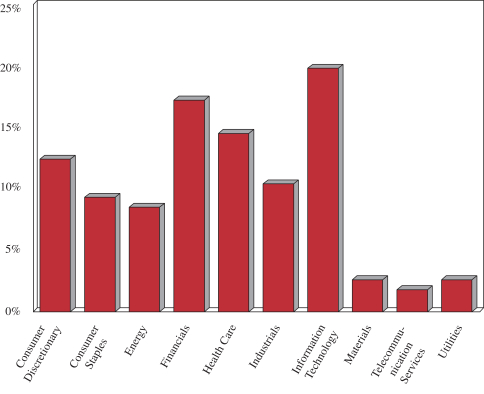
Sector Weightings
1
LETTERTO SHAREHOLDERS
Dear Fellow Shareholders:
After a slow start to 2014, the S&P 500 reached an all-time high in December, marking the sixth consecutive year of gains. The rocky start to the year reflected soft U.S. economic data and fears that economic growth might be slowing in China, Japan and Europe. The Federal Reserve’s decision in December 2013 to taper its bond-buying campaign raised fears of slowing the U.S. economy’s momentum. Weather also took a heavy toll with unusually cold temperatures and heavy snow storms cutting into consumer spending, construction and industrial activity. Internationally, sharp declines in the currencies of Argentina and Turkey and tensions in Russia and the Ukraine heightened fears. Markets overcame these fears and, after the sell-off in January, recovered to finish in positive territory by the end of the first quarter.
Spring ushered in confidence that the U.S. economic recovery would gather pace despite the decline of 2.1% in Gross Domestic Product (“GDP”) for the first quarter. Earnings season was strong and reported job gains were broad-based, recovering to pre-recession levels. Strong manufacturing data, coupled with positive momentum in the housing market and robust merger and acquisition (“M&A”) activity, confirmed that the economy had begun an upswing from both a difficult winter and the long, subpar expansion. Markets discounted the tepid international economic data and geopolitical risks in the Ukraine and Iraq, and though volume and volatility were low, markets rallied for the eighth consecutive quarter. In the months that followed, investors continued to observe positive economic data, but were less certain regarding market direction. Volatility returned after an extended period of calm as solid U.S. economic reports and potential rising interest rates contrasted sharply with weaker foreign markets and central bank initiatives. This dynamic also caused the U.S. dollar to move higher against most currencies.
Building toward year-end, risk aversion became apparent. Falling oil prices and disappointing European data along with ongoing geopolitical risks tested the market’s conviction and led to a 7.0% correction in the S&P 500. However, markets bounced back quickly as solid corporate earnings and guidance, a 5% rise in GDP, and surging U.S. economic data combined with monetary easing in Japan and interest rate cuts in China, assuaging investor concerns. During the year, a key theme that influenced investor decisions was the unfettered growth in domestic energy production. U.S. shale oil production accounted for virtually all of the increase in world production growth outside of OPEC in 2014. Subsequently, oil shale opportunities and the capital spending to develop them played an important role in the U.S. recovery. Jobs growth was significant and related industries prospered. That theme began to unravel by mid-year on the strength of the U.S. dollar and slowing demand growth, but the sell-off gained pace after Thanksgiving Day when OPEC decided to keep its output target unchanged. The decision not to cut production quotas stunned markets and oil prices plunged, taking with them many ancillary businesses. Market participants quickly identified beneficiaries of the downward move in oil prices. This helped to sustain the upward march of the broader markets, leading to an annual return on the S&P 500 of 13.7%.
We are pleased to report the Fund’s return on net asset value last year exceeded that of the S&P 500, a result very few active managers achieved. Adams Express distributed 8.8% to shareholders and generated a total return on net asset value of 14.3%, surpassing the S&P 500’s return of 13.7%. Our peer group, as measured by the Lipper Large-Cap Core Mutual Fund Average, returned 11.3%. On market price, the Fund’s return was 13.7%.
The two largest contributors to the Fund’s success were the health care and consumer discretionary sectors. As we expressed last year, two themes we felt would be successful in 2014 were biotechnology and companies exposed to the home improvement market. Biotech stocks continued to provide market-beating returns in 2014 as their groundbreaking drugs began to move from the approval stage into actual use. Looking beyond biotech, our position in Allergan, the manufacturer of the cosmetic drug Botox, benefited the portfolio when it agreed to be acquired by Actavis. Turning to the home improvement theme, both Lowe’s and Whirlpool generated significant excess returns in 2014, rising 41.2% and 24.1%, respectively. Both companies enjoyed the dual tailwind of a steadily improving housing market and company-specific measures taken to improve profitability. While energy was the worst performing sector within the S&P 500, our focus on larger, high quality companies led to outperformance versus the sector.
2
LETTERTO SHAREHOLDERS (CONTINUED)
The Fund’s technology holdings were up 18.3% for the year but trailed the sector peer group. The semiconductor industry group was the strongest performer in 2014. The Fund was underweight this volatile group, which detracted from performance. Strong performance from Apple and Cisco Systems helped mitigate the shortfall. Our holdings in the consumer staples sector also trailed the market. Many of our staples positions have extensive exposure to overseas markets and, as a result, saw their profits impacted by the strength of the U.S. dollar. This was somewhat offset by the strong performance of CVS Health within food & staples retailing.
The Fund repurchased 1,011,600 shares of its Common Stock in 2014. At the end of the year, the Board of Directors reapproved the repurchase of up to 5% of the outstanding shares of the Fund. There is no time limit set on the repurchase authorization.
Looking Forward to 2015
Moving into the new year, market volatility has increased, reflecting uncertainty around the globe and a sharp contrast between the U.S. economy and the rest of the world. The U.S. stands out with its relatively strong economy and normalizing monetary policy. Domestic GDP growth appears likely as the markets closely watch for potential interest rate increases by the Fed. By contrast, Europe and Japan are growth-challenged and China’s growth rate is slowing. Central banks in these countries are looking to quantitative easing or other actions to stimulate their economies. The impact of falling oil prices and the shift in power from oil-producing to oil-consuming countries may have unintended consequences and will add to an already tense geopolitical landscape. Fears of global deflation are also a concern. The strength of the U.S. dollar against other currencies adds complexity and challenges to the forecast.
Today’s equity landscape also brings opportunities. We remain convinced that the growth at the end of last year will continue and the foundation for the U.S. equity market remains solid. Building on a theme we focused on in 2014, we continue to favor the biotechnology group into 2015. Valuations remain modest relative to sector leading growth. Ongoing innovation should provide future upside catalysts and drive positive estimate revisions in the group. While we see biotech having another strong year, we also expect other areas within health care to contribute to performance. Research and development productivity appears to have improved across the sector, leading to new product introductions and above-average growth. Corporate restructuring and M&A were catalysts for outperformance last year and are expected to have a continued favorable impact in 2015. An important trend that bears watching is healthcare costs. We believe companies that are able to control or lower costs to the healthcare system should be favored by investors and offer interesting investment opportunities.
Technology also continues to offer above-average returns. Within the sector, we like companies that enable positive secular trends like cloud computing and mobile advertising. The continued growth of cloud-based storage solutions provides an attractive environment for storage drive manufacturers such as Seagate Technology and Western Digital. Our positions in both Google and Facebook should do well as internet advertising, and especially mobile advertising, continues to take wallet share from other media.
Select investments in telecom are attractive. We favor wireless tower companies like American Tower and SBA Communications. Towers are the best way to capitalize on the exponential growth of wireless data. In addition, strict zoning rules in the U.S. help limit new tower supply growth. Robust demand and limited supply set up a long-term positive outlook for wireless towers.
We also believe the transportation industry group within industrials provides compelling opportunities as we head into 2015. With consistent end-market demand, solid pricing power and lower input costs, we feel that Union Pacific has one of the strongest business models in the sector. Both Delta and FedEx should benefit from the recent decline in the price of oil as well as strong demand profiles for their services.
Market volatility has increased significantly during the past year, which has proven challenging for active managers. A steadfast commitment to our philosophy and process has served us well. We strive to identify high quality companies that we can own for multiple years. We also look for near-term opportunities that can benefit our shareholders. Looking over the horizon, we are optimistic about the outlook for the Fund in 2015.
3
LETTERTO SHAREHOLDERS (CONTINUED)
On January 21, 2015, we announced changes to the management of the Fund. I will take on the additional role of President, replacing Jim Haynie, who was elected President of Petroleum & Resources Corporation. Jim will continue to serve as Executive Vice President of the Fund and a member of its portfolio management team. In addition, Cotton Swindell has been elected Executive Vice President of the Fund. He will join Jim and me on the portfolio management team. Cotton has been a research analyst with the Fund since 2002, most recently covering the industrials sector. Nancy Prue, Executive Vice President, will be leaving the portfolio management team to assume the new role of Executive Vice President, Director of Shareholder Communications. We want to thank Nancy for her invaluable service to the portfolio management team. In her new role, she will be responsible for the content and delivery of information about the Funds to shareholders and the investment community.
During the past year, we completed a rebranding study for the Fund. Our objective was to remember our proud history but to more accurately reflect what we offer to investors today. Therefore, the decision was made to rebrand both Adams Express and our non-controlled affiliate, Petroleum & Resources Corporation, under the Adams Funds platform. By bringing these Funds together under the Adams Funds platform, we are acknowledging the shared value proposition these Funds bring to shareholders through their longstanding history, unwavering commitment to serving generations of investors, and strong track records.
Beginning March 31, 2015, Adams Express will change its name to Adams Diversified Equity Fund to increase investor awareness of what we do and what we offer. The Fund’s ticker symbol will remain the same. Similarly, the name of Petroleum & Resources Corporation will change to Adams Natural Resources Fund. Our values and commitment to you will not change. The Funds will continue to share a Board of Directors and be managed by the experienced team of portfolio managers dedicated to employing a disciplined approach to identifying investment opportunities and carefully managing risk. Look for additional information in the coming weeks.
Common Stock at par value $0.001 per share, authorized 150,000,000 shares; issued and outstanding 96,286,656 shares (includes 148,236 nonvested restricted shares, 21,000 nonvested or deferred restricted stock units, and 29,939 deferred stock units) (note 6)
$
96,287
Additional capital surplus
1,058,228,177
Accumulated other comprehensive income (note 5)
(2,375,650
)
Undistributed net investment income
966,604
Undistributed net realized gain on investments
1,141,391
Unrealized appreciation on investments
469,715,852
Net Assets Applicable to Common Stock
$
1,527,772,661
Net Asset Value Per Share of Common Stock
$15.87
*See Schedule of Investments on page 14.
The accompanying notes are an integral part of the financial statements.
5
STATEMENTOF OPERATIONS
Year Ended December 31, 2014
Investment Income
Income:
Dividends:
From unaffiliated issuers (net of $28,728 in foreign taxes)
$
26,137,352
From non-controlled affiliate
1,377,668
Other income
196,691
Total income
27,711,711
Expenses:
Investment research
4,327,418
Administration and operations
1,719,309
Directors’ compensation
442,926
Travel, training, and other office expenses
442,445
Transfer agent, registrar, and custodian
320,561
Investment data services
272,272
Reports and shareholder communications
270,656
Occupancy
231,969
Legal services
228,309
Audit and accounting services
141,895
Insurance
116,430
Other
77,330
Total expenses
8,591,520
Net Investment Income
19,120,191
Realized Gain and Change in Unrealized Appreciation on Investments
Net realized gain on security transactions
90,753,306
Net realized gain distributed by regulated investment company (non-controlled affiliate)
2,755,335
Net realized gain on written option contracts
49,667
Change in unrealized appreciation on securities
75,850,204
Change in unrealized appreciation on written option contracts
22,020
Net Gain on Investments
169,430,532
Other Comprehensive Income (note 5)
Defined benefit pension plans:
Net actuarial loss arising during period
(991,762
)
Amortization of net loss
151,830
Other Comprehensive Income
(839,932
)
Change in Net Assets Resulting from Operations
$
187,710,791
The accompanying notes are an integral part of the financial statements.
6
STATEMENTSOF CHANGESIN NET ASSETS
For the Year Ended December 31,
2014
2013
From Operations:
Net investment income
$
19,120,191
$
18,656,769
Net realized gain on investments
93,558,308
57,371,366
Change in unrealized appreciation on investments
75,872,224
250,782,258
Change in accumulated other comprehensive income (note 5)
(839,932
)
1,346,153
Increase in net assets resulting from operations
187,710,791
328,156,546
Distributions to Shareholders from:
Net investment income
(18,731,249
)
(20,354,079
)
Net realized gain from investment transactions
(91,506,911
)
(57,121,286
)
Decrease in net assets from distributions
(110,238,160
)
(77,475,365
)
From Capital Share Transactions:
Value of shares issued in payment of distributions (note 4)
42,002,202
26,419,945
Cost of shares purchased (note 4)
(13,744,866
)
(11,659,522
)
Deferred compensation (notes 4, 6)
491,774
112,279
Increase in net assets from capital share transactions
28,749,110
14,872,702
Total Increase in Net Assets
106,221,741
265,553,883
Net Assets:
Beginning of year
1,421,550,920
1,155,997,037
End of year (including undistributed net investment income of $966,604 and $734,051, respectively)
$
1,527,772,661
$
1,421,550,920
The accompanying notes are an integral part of the financial statements.
7
NOTES TO FINANCIAL STATEMENTS
1. Significant Accounting Policies
The Adams Express Company is registered under the Investment Company Act of 1940 as a diversified investment company (the Fund). The Fund is an internally-managed closed-end fund whose investment objectives are preservation of capital, the attainment of reasonable income from investments, and an opportunity for capital appreciation.
The accompanying financial statements were prepared in accordance with accounting principles generally accepted in the United States of America, which require the use of estimates made by Fund management. Management believes that estimates and security valuations are appropriate; however, actual results may differ from those estimates, and the security valuations reflected in the financial statements may differ from the value the Fund ultimately realizes upon sale of the securities.
Affiliated Companies — Investments in companies 5% or more of whose outstanding voting securities are held by the Fund are defined as “Affiliated Companies” in Section 2(a)(3) of the Investment Company Act of 1940.
Expenses — The Fund shares certain costs for investment research and data services, administration and operations, travel, training, office expenses, occupancy, accounting and legal services, insurance, and other miscellaneous items with its non-controlled affiliate, Petroleum & Resources Corporation. Expenses that are not solely attributable to one fund are allocated to each fund based on relative net asset values or, in the case of investment research staff and related costs, relative market values of portfolio securities in the particular sector of coverage. Expense allocations are updated quarterly, as appropriate, except for those related to payroll, which are updated annually.
Security Transactions and Investment Income — Investment transactions are accounted for on the trade date. Gain or loss on sales of securities and options is determined on the basis of specific identification. Dividend income and distributions to shareholders are recognized on the ex-dividend date, and interest income is recognized on the accrual basis.
Security Valuation — The Fund’s investments are reported at fair value as defined under accounting principles generally accepted in the United States of America. Investments in securities traded on national security exchanges are valued at the last reported sale price on the day of valuation. Over-the-counter and listed securities for which a sale price is not available are valued at the last quoted bid price. Short-term investments (excluding purchased options and money market funds) are valued at amortized cost, which approximates fair value. Purchased and written options are valued at the last quoted bid and asked price, respectively. Money market funds are valued at net asset value on the day of valuation.
Various inputs are used to determine the fair value of the Fund’s investments. These inputs are summarized in the following three levels:
•
Level 1 — fair value is determined based on market data obtained from independent sources; for example, quoted prices in active markets for identical investments,
•
Level 2 — fair value is determined using other assumptions obtained from independent sources; for example, quoted prices for similar investments,
•
Level 3 — fair value is determined using the Fund’s own assumptions, developed based on the best information available in the circumstances.
The Fund’s investments at December 31, 2014 were classified as follows:
Level 1
Level 2
Level 3
Total
Common stocks
$
1,514,246,798
$
—
$
—
$
1,514,246,798
Short-term investments
13,439,474
—
—
13,439,474
Total investments
$
1,527,686,272
$
—
$
—
$
1,527,686,272
There were no transfers into or from Level 1 or Level 2 during the year ended December 31, 2014.
2. Federal Income Taxes
No federal income tax provision is required since the Fund’s policy is to qualify as a regulated investment company under the Internal Revenue Code and to distribute substantially all of its taxable income to its shareholders. Additionally, management has analyzed and concluded that tax positions included in federal income tax returns from the previous three years that remain subject to examination do not require any provision. Any income tax-related interest or penalties would be recognized as income tax expense. As of December 31, 2014, the identified cost of securities for federal income tax purposes was $1,057,970,420 and net unrealized appreciation aggregated $469,715,852, consisting of gross unrealized appreciation of $482,083,955 and gross unrealized depreciation of $12,368,103.
Distributions are determined in accordance with our annual 6% minimum distribution rate commitment, based on the Fund’s average market price, and income tax regulations, which may differ from generally accepted accounting principles. Such differences are primarily related to the Fund’s retirement plans and equity-based compensation. Differences that are permanent, while not material for the year ended December 31, 2014, are reclassified in the capital accounts of the Fund’s financial statements and have no impact on net assets. For tax purposes, distributions paid by the Fund during the years ended December 31, 2014 and December 31, 2013 were classified as ordinary income of $24,330,351 and $36,005,425, respectively, and as long-term capital gain of $85,850,856 and $41,470,068, respectively. The tax basis of distributable earnings at December 31, 2014 was $2,441,797 of undistributed ordinary income and $714,524 of undistributed long-term capital gain.
8
NOTES TO FINANCIAL STATEMENTS (CONTINUED)
3. Investment Transactions
The Fund’s investment decisions are made by the portfolio management team with recommendations from the research staff. Purchases and sales of portfolio securities, other than options and short-term investments, during the year ended December 31, 2014 were $391,567,137 and $456,525,586, respectively.
The Fund is subject to changes in the value of equity securities held (“equity price risk”) in the normal course of pursuing its investment objectives. The Fund may purchase and write option contracts to increase or decrease its equity price risk exposure or may write option contracts to generate additional income. Option contracts generally entail risks associated with counterparty credit, liquidity, and unfavorable equity price movements. The Fund has mitigated counterparty credit and liquidity risks by trading its options through an exchange. The risk of unfavorable equity price movements is limited for purchased options to the premium paid and for written options by writing only covered call or collateralized put option contracts, which require the Fund to segregate certain securities or cash at its custodian when the option is written. There were no outstanding option contracts as of December 31, 2014.
When the Fund writes (purchases) an option, an amount equal to the premium received (paid) by the Fund is recorded as a liability (asset) and is subsequently marked to market daily in the Statement of Assets and Liabilities, with any related change recorded as an unrealized gain or loss in the Statement of Operations. Premiums received (paid) from unexercised options are treated as realized gains (losses) on the expiration date and are separately identified in the Statement of Operations. Upon the exercise of written put (purchased call) option contracts, premiums received (paid) are deducted from (added to) the cost basis of the underlying securities purchased. Upon the exercise of written call (purchased put) option contracts, premiums received (paid) are added to (deducted from) the proceeds from the sale of underlying securities in determining whether there is a realized gain or loss.
Transactions in written covered call and collateralized put options during the year ended December 31, 2014 were as follows:
Covered Calls
Collateralized Puts
Contracts
Premiums
Contracts
Premiums
Options outstanding, December 31, 2013
40
$
2,560
40
$
4,740
Options written
210
38,909
34
6,018
Options terminated in closing purchase transactions
—
—
—
—
Options expired
(210
)
(38,909
)
(74
)
(10,758
)
Options exercised
(40
)
(2,560
)
—
—
Options outstanding, December 31, 2014
—
$
—
—
$
—
4. Capital Stock
The Fund has 10,000,000 authorized and unissued preferred shares, $0.001 par value.
On December 29, 2014, the Fund issued 3,043,254 shares of its Common Stock at a price of $13.79 per share (the average market price on December 8, 2014) to shareholders of record November 24, 2014 who elected to take stock in payment of the year-end distribution from 2014 capital gain and investment income. During 2014, 2,612 shares were issued at a weighted average price of $13.67 per share as dividend equivalents to holders of deferred stock units and restricted stock units under the 2005 Equity Incentive Compensation Plan.
On December 27, 2013, the Fund issued 2,093,644 shares of its Common Stock at a price of $12.61 per share (the average market price on December 9, 2013)
9
NOTES TO FINANCIAL STATEMENTS (CONTINUED)
to shareholders of record November 25, 2013 who elected to take stock in payment of the year-end distribution from 2013 capital gain and investment income. During 2013, 1,567 shares were issued at a weighted average price of $12.15 per share as dividend equivalents to holders of deferred stock units and restricted stock units under the 2005 Equity Incentive Compensation Plan.
The Fund may purchase shares of its Common Stock from time to time, in accordance with parameters set by the Board of Directors, at such prices and amounts as the portfolio management team may deem appropriate.
Transactions in Common Stock for 2014 and 2013 were as follows:
Shares
Amount
2014
2013
2014
2013
Shares issued in payment of distributions
3,045,866
2,095,211
$42,002,202
$26,419,945
Shares purchased (at a weighted average discount from net asset value of 14.0% and 13.6%, respectively)
(1,011,600
)
(948,339
)
(13,744,866
)
(11,659,522
)
Net activity under the 2005 Equity Incentive Compensation Plan
28,773
47,021
491,774
112,279
Net change
2,063,039
1,193,893
$28,749,110
$14,872,702
5. Retirement Plans
Defined Contribution Plans — The Fund sponsors a qualified defined contribution plan for all employees with at least six months of service and a nonqualified defined contribution plan for eligible employees to supplement the qualified plan. The Fund expensed contributions to the plans in the amount of $311,364, a portion thereof based on Fund performance, for the year ended December 31, 2014. The Fund does not provide postretirement medical benefits.
Defined Benefit Plans — On October 1, 2009, the Fund froze its non-contributory qualified and nonqualified defined benefit pension plans. Benefits are based on length of service and compensation during the last five years of employment through September 30, 2009, with no additional benefits being accrued beyond that date. In 2014, the Fund filed with the appropriate agencies to obtain approval to terminate the plans. Upon receiving the required regulatory approvals, all benefits under the plans will be paid out and all related pension liabilities will be relieved.
The funded status of the plans is recognized as an asset (overfunded plan) or a liability (underfunded plan) in the Statement of Assets and Liabilities. Changes in the prior service costs and accumulated actuarial gains and losses are recognized as accumulated other comprehensive income, a component of net assets, in the year in which the changes occur and are subsequently amortized into net periodic pension cost. Non-recurring settlement costs are recognized in net periodic pension cost when a plan participant receives a lump-sum benefit payment and includes the amount of which is in excess of the present value of the projected benefit and any unamortized actuarial losses attributable to the portion of the projected benefit obligation being satisfied.
The Fund’s policy is to contribute annually to the plans those amounts that can be deducted for federal income tax purposes, plus additional amounts as the Fund deems appropriate in order to provide assets sufficient to meet benefits to be paid to plan participants. The Fund contributed $0 to the qualified plan and $198,394 to the nonqualified plan in 2014. In 2015, the Fund anticipates making contributions to the plans to the extent that pension liabilities exceed assets available for plan benefits upon the termination of the plans.
The Fund uses a December 31 measurement date for its plans. Details in aggregate for the plans were as follows:
2014
2013
Change in benefit obligation
Benefit obligation at beginning of year
$
8,278,135
$
10,865,411
Interest cost
331,489
319,801
Actuarial (gain) loss
963,964
(430,184
)
Benefits paid
(341,043
)
(200,120
)
Effect of settlement (non-recurring)
—
(2,276,773
)
Benefit obligation at end of year
$
9,232,545
$
8,278,135
Change in qualified plan assets
Fair value of qualified plan assets at beginning of year
$
7,159,527
$
9,304,946
Actual return on plan assets
27,421
246,307
Benefits paid
(142,649
)
(114,953
)
Settlement (non-recurring)
—
(2,276,773
)
Fair value of qualified plan assets at end of year
$
7,044,299
$
7,159,527
Funded status
$
(2,188,246
)
$
(1,118,608
)
The accumulated benefit obligation for all defined benefit pension plans was $9,232,545 and $8,278,135 at December 31, 2014 and 2013, respectively.
The primary investment objective of the Fund’s qualified pension plan assets is capital preservation, achieved through a portfolio of mutual funds and pooled separate accounts (“PSAs”). PSAs, like mutual funds, are made up of a wide variety of underlying investments in securities. The Fund’s targeted asset allocation for 2015 is to maintain approximately 60% of plan assets invested in short-term fixed income securities and approximately 40% of plan assets invested in cash and money market securities.
10
NOTES TO FINANCIAL STATEMENTS (CONTINUED)
The net asset value of mutual funds and PSAs are based on the fair value of its underlying investments. The fair value of the plan assets is determined using various inputs, summarized into the three levels described in footnote 1. The plan assets at December 31, 2014 were classified as follows:
Level 1
Level 2
Level 3
Total
Fixed income securities
$
4,183,961
$
—
$
—
$
4,183,961
Money market securities
2,850,303
10,035
—
2,860,338
Total
$
7,034,264
$
10,035
$
—
$
7,044,299
Items impacting the Fund’s net investment income and accumulated other comprehensive income were:
2014
2013
Components of net periodic pension cost
Interest cost
$
331,489
$
319,801
Expected return on plan assets
(57,754
)
(323,274
)
Net loss component
151,830
260,068
Effect of settlement (non-recurring)
—
740,825
Net periodic pension cost
$
425,565
$
997,420
2014
2013
Accumulated other comprehensive income
Defined benefit pension plans:
Balance at beginning of year
$
(1,535,718
)
$
(2,881,871
)
Net actuarial gain/(loss) arising during period
(991,762
)
345,260
Reclassifications to net periodic pension cost:
Amortization of net loss
151,830
260,068
Effect of settlement (non-recurring)
—
740,825
Balance at end of year
$
(2,375,650
)
$
(1,535,718
)
Accumulated other comprehensive income was comprised of net actuarial losses of $(2,375,650) and $(1,535,718) at December 31, 2014 and 2013, respectively. In 2015, the Fund estimates that $243,533 of net losses will be amortized from accumulated other comprehensive income into net periodic pension cost and the remaining balance of net losses will be recognized upon termination of the plans.
Assumptions used to determine benefit obligations were:
2014
2013
Discount rate
3.33%
4.25%
Rate of compensation increase
—
—
The assumptions used to determine net periodic pension cost were:
2014
2013
Discount rate
4.25%
3.58%
Expected long-term return on plan assets
1.20%
4.00%
Rate of compensation increase
—
—
The assumption used to determine expected long-term return on plan assets was based on historical and future expected returns of multiple asset classes in order to develop a risk-free real rate of return and risk premiums for each asset class. The overall rate for each asset class was developed by combining a long-term inflation component, the risk-free real rate of return, and the associated risk premium. A weighted average rate was developed based on those overall rates and the target asset allocation of the plan.
The following benefit payments are eligible to be paid in the years indicated:
Pension Benefits
2015
$
2,020,000
2016
300,000
2017
1,500,000
2018
770,000
2019
275,000
Years 2020-2024
1,400,000
6. Equity-Based Compensation
The 2005 Equity Incentive Compensation Plan (“2005 Plan”), adopted at the 2005 Annual Meeting and re-approved at the 2010 Annual Meeting, permits the grant of restricted stock awards (both performance and nonperformance-based), as well as stock options and other stock incentives, to all employees and non-employee directors. Performance-based restricted stock awards vest at the end of a specified three-year period, with the ultimate number of shares earned contingent on achieving certain performance targets. If performance targets are not achieved, all or a portion of the performance-based restricted shares are forfeited and become available for future grants. Nonperformance-based restricted stock awards typically vest ratably over a three-year period and nonperformance-based restricted stock units (granted to non-employee directors) vest over a one-year period. Payment of awards may be deferred, if elected. The 2005 Plan provides for accelerated vesting in the event of death or retirement. Non-employee directors also may elect to defer a portion of their cash compensation, with such deferred amount to be paid by delivery of deferred stock units. Outstanding awards are granted at fair market value on grant date (determined by the average of the high and low price on that date). The 2005 Plan provides for the issuance of up to 3,413,131 shares of the Fund’s Common Stock, of which 3,033,885 remain available for future grants at December 31, 2014.
11
NOTES TO FINANCIAL STATEMENTS (CONTINUED)
A summary of the status of the Fund’s awards granted under the 2005 Plan as of December 31, 2014, and changes during the year then ended, is presented below:
Awards
Shares/Units
Weighted Average Grant-Date Fair Value
Balance at December 31, 2013
195,365
$
11.27
Granted:
Restricted stock
40,408
13.10
Restricted stock units
5,250
12.88
Deferred stock units
11,975
13.44
Vested & issued
(41,259
)
11.46
Forfeited
(12,564
)
11.06
Balance at December 31, 2014 (includes 49,656 performance-based awards and 149,519 nonperformance-based awards)
199,175
$
12.36
Compensation cost resulting from awards granted under the 2005 Plan is based on the fair market value of the award on grant date and recognized on a straight-line basis over the requisite service period. For those awards with performance conditions, compensation cost is based on the most probable outcome and, if such goals are not met, compensation cost is not recognized and any previously recognized compensation cost is reversed. The total compensation cost for restricted stock granted to employees for the year ended December 31, 2014 was $484,208. The total compensation cost for restricted stock units granted to non-employee directors for the year ended December 31, 2014 was $60,926. As of December 31, 2014, there was total unrecognized compensation cost of $973,539, a component of additional capital surplus, related to nonvested equity-based compensation arrangements granted under the 2005 Plan. That cost is expected to be recognized over a weighted average period of 1.50 years. The total fair value of shares and units vested during the year ended December 31, 2014 was $538,711.
7. Officer and Director Compensation
The aggregate remuneration paid during the year ended December 31, 2014 to officers and directors amounted to $3,917,886, of which $282,268 was paid as fees and compensation to directors who were not officers. These amounts represent the taxable compensation to the Fund’s officers and directors and therefore differ from the amounts reported in the accompanying Statement of Operations that are recorded and expensed in accordance with generally accepted accounting principles.
8. Portfolio Securities Loaned
The Fund makes loans of securities to approved brokers to earn additional income. It receives as collateral cash deposits, U.S. Government securities, or bank letters of credit valued at 102% of the value of the securities on loan. The market value of the loaned securities is calculated based upon the most recent closing prices and any additional required collateral is delivered to the Fund on the next business day. Cash deposits are placed in a registered money market fund. The Fund accounts for securities lending transactions as secured financing and receives compensation in the form of fees or retains a portion of interest on the investment of any cash received as collateral. The Fund also continues to receive interest or dividends on the securities loaned. Gain or loss in the fair value of the securities loaned that may occur during the term of the loan will be for the account of the Fund. At December 31, 2014, the Fund had no securities on loan. The Fund is indemnified by the Custodian, serving as lending agent, for loss of loaned securities and has the right under the lending agreement to recover the securities from the borrower on demand.
9. Operating Lease Commitments
The Fund leases office space and equipment under operating lease agreements expiring at various dates through the year 2026. The Fund recognized rental expense of $207,111 in 2014, and its minimum rental commitments are as follows:
2015
$
319,733
2016
152,050
2017
291,434
2018
298,843
2019
239,171
Thereafter
1,804,140
Total
$
3,105,371
12
FINANCIAL HIGHLIGHTS
Year Ended December 31,
2014
2013
2012
2011
2010
Results Per Share Outstanding For Each Period
Net asset value, beginning of year
$15.09
$12.43
$11.54
$12.65
$11.95
Net investment income
0.20
0.20
0.19
0.16
0.15
Net realized gains and increase (decrease) in unrealized appreciation
1.83
3.32
1.41
(0.56)
1.10
Change in accumulated other comprehensive income (note 5)
(0.01)
0.01
—
(0.01)
—
Total from investment operations
2.02
3.53
1.60
(0.41)
1.25
Less distributions
Dividends from net investment income
(0.20)
(0.22)
(0.18)
(0.15)
(0.14)
Distributions from net realized gains
(0.98)
(0.62)
(0.49)
(0.50)
(0.37)
Total distributions
(1.18)
(0.84)
(0.67)
(0.65)
(0.51)
Capital share repurchases
0.02
0.02
—
—
—
Reinvestment of distributions
(0.08)
(0.05)
(0.04)
(0.05)
(0.04)
Total capital share transactions
(0.06)
(0.03)
(0.04)
(0.05)
(0.04)
Net asset value, end of year
$15.87
$15.09
$12.43
$11.54
$12.65
Market price, end of year
$13.68
$13.07
$10.59
$ 9.64
$10.72
Total Investment Return*
Based on market price
13.7%
31.8%
16.9%
(4.2)%
11.5%
Based on net asset value
14.3%
29.7%
14.7%
(2.8)%
11.2%
Ratios/Supplemental Data
Net assets, end of year (in 000’s)
$1,527,773
$1,421,551
$1,155,997
$1,050,734
$1,124,672
Ratio of expenses to average net assets**
0.58%
0.69%
0.65%
0.55%
0.58%
Ratio of net investment income to average net assets***
1.29%
1.44%
1.54%
1.25%
1.29%
Portfolio turnover
26.6%
55.9%
27.4%
21.5%
16.2%
Number of shares outstanding at end of year (in 000’s)
96,287
94,224
93,030
91,074
88,885
*
Total investment return assumes reinvestment of all distributions at the price received in the Fund’s dividend reinvestment plan.
**
The ratios of expenses to average net assets were 0.63% and 0.63% in 2013 and 2012, respectively, after adjusting for non-recurring pension expenses as described in footnote 5.
***
The ratios of net investment income to average net assets were 1.50% and 1.56% in 2013 and 2012, respectively, after adjusting for non-recurring pension expenses as described in footnote 5.
Cash, receivables, prepaid expenses and other assets, less liabilities – 0.0%
86,389
Net Assets — 100.0%
$
1,527,772,661
Notes:
(A)
Common stocks are listed on the New York Stock Exchange or the NASDAQ and are valued at the last reported sale price on the day of valuation. See note 1 to financial statements.
(B)
Presently non-dividend paying.
(C)
Non-controlled affiliate, a closed-end sector fund, registered as an investment company under the Investment Company Act of 1940.
(D)
Rate presented is as of period-end and represents the annualized yield earned over the previous seven days.
16
REPORTOF INDEPENDENT REGISTERED PUBLIC ACCOUNTING FIRM
To the Board of Directors and Shareholders of The Adams Express Company:
In our opinion, the accompanying statement of assets and liabilities, including the schedule of investments in securities, and the related statements of operations and of changes in net assets and the financial highlights present fairly, in all material respects, the financial position of The Adams Express Company (the “Fund”) at December 31, 2014, the results of its operations for the year then ended, the changes in its net assets for each of the two years in the period then ended and the financial highlights for each of the five years in the period then ended, in conformity with accounting principles generally accepted in the United States of America. These financial statements and financial highlights (hereafter referred to as “financial statements”) are the responsibility of the Fund’s management. Our responsibility is to express an opinion on these financial statements based on our audits. We conducted our audits of these financial statements in accordance with the standards of the Public Company Accounting Oversight Board (United States). Those standards require that we plan and perform the audit to obtain reasonable assurance about whether the financial statements are free of material misstatement. An audit includes examining, on a test basis, evidence supporting the amounts and disclosures in the financial statements, assessing the accounting principles used and significant estimates made by management, and evaluating the overall financial statement presentation. We believe that our audits, which included confirmation of securities at December 31, 2014 by correspondence with the custodians and brokers, provide a reasonable basis for our opinion.
PricewaterhouseCoopers LLP
Baltimore, MD
February 17, 2015
17
CHANGESIN PORTFOLIO SECURITIES
During the Three Months Ended December 31, 2014
(unaudited)
Shares
Additions
Reductions
Held Dec. 31, 2014
CF Industries Holdings, Inc.
11,500
50,031
Delta Air Lines, Inc.
60,000
265,000
FedEx Corp.
80,000
80,000
Johnson & Johnson
165,000
165,000
Lam Research Corp.
65,000
65,000
Las Vegas Sands Corp.
150,000
150,000
Marathon Petroleum Corp.
83,000
83,000
Schlumberger Ltd.
33,000
171,300
CDK Global, Inc.
36,333
(1)
36,333
—
AbbVie Inc.
260,000
20,000
Cisco Systems, Inc.
179,000
446,000
Eastman Chemical Co.
85,000
—
Eaton Corp. plc
205,000
—
Halliburton Co.
170,801
—
JPMorgan Chase & Co.
20,000
450,000
Lowe’s Companies, Inc.
60,000
490,000
McDonald’s Corp.
180,000
—
Oracle Corp.
220,000
306,000
Pfizer Inc.
634,300
385,400
Procter & Gamble Co.
43,150
131,850
SLM Corp.
520,000
—
Union Pacific Corp.
33,000
278,000
United Technologies Corp.
35,000
139,500
Verizon Communications Inc.
31,000
389,000
(1)
By spinoff
18
HISTORICAL FINANCIAL STATISTICS
(unaudited)
Year
Value of Net Assets
Shares Outstanding
Net Asset Value Per Share
Market Value Per Share
Income Dividends Per Share
Capital Gains Distributions Per Share
Total Dividends and Distributions Per Share
Annual Distribution Rate*
2000**
$
1,951,562,978
82,292,262
$
23.72
$
21.00
$
.22
$
1.63
$
1.85
7.8
%
2001
1,368,366,316
85,233,262
16.05
14.22
.26
1.39
1.65
9.6
2002
1,024,810,092
84,536,250
12.12
10.57
.19
.57
.76
6.2
2003
1,218,862,456
84,886,412
14.36
12.41
.17
.61
.78
6.8
2004
1,295,548,900
86,135,292
15.04
13.12
.24
.66
.90
7.1
2005
1,266,728,652
86,099,607
14.71
12.55
.22
.64
.86
6.7
2006
1,377,418,310
86,838,223
15.86
13.87
.23
.67
.90
6.8
2007
1,378,479,527
87,668,847
15.72
14.12
.32
.71
1.03
7.1
2008
840,012,143
87,406,443
9.61
8.03
.26
.38
.64
5.7
2009
1,045,027,339
87,415,193
11.95
10.10
.15
.30
.45
5.2
2010
1,124,671,966
88,885,186
12.65
10.72
.14
.37
.51
5.1
2011
1,050,733,678
91,073,899
11.54
9.64
.15
.50
.65
6.1
2012
1,155,997,037
93,029,724
12.43
10.59
.18
.49
.67
6.3
2013
1,421,550,920
94,223,617
15.09
13.07
.22
.62
.84
7.1
2014
1,527,772,661
96,286,656
15.87
13.68
.20
.98
1.18
8.8
*
The annual distribution rate is the total dividends and capital gain distributions during the year divided by the Fund’s average month-end stock price. For years prior to 2011, the average month-end stock price is determined for the calendar year. For 2011 and later, the average month-end stock price is determined for the twelve months ended October 31, which is consistent with the calculation used for the annual 6% minimum distribution rate commitment adopted in September 2011.
**
Adjusted to reflect the 3-for-2 stock split effected in October 2000.
19
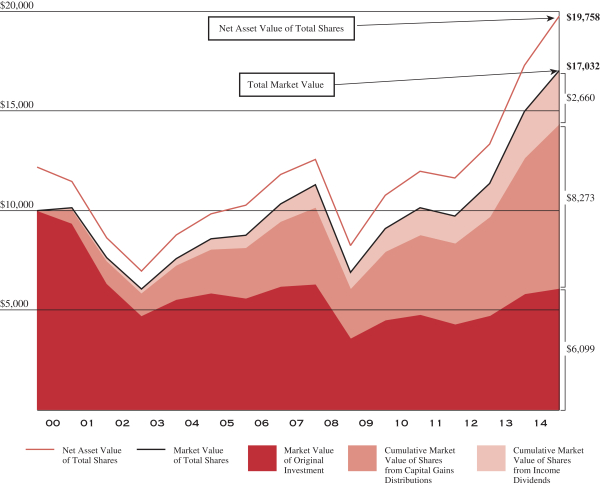
THE ADAMS EXPRESS COMPANY
(unaudited)
Calendar year- end
Market value of original investment
Cumulative market value of shares from capital gains distributions
Cumulative market value of shares from income dividends
Total market value
Net asset value of total shares
2000
$
9,362
$
698
$
85
$
10,145
$
11,458
2001
6,340
1,141
161
7,642
8,624
2002
4,712
1,146
205
6,063
6,953
2003
5,533
1,712
343
7,588
8,780
2004
5,849
2,209
525
8,583
9,839
2005
5,595
2,531
640
8,766
10,275
2006
6,184
3,260
887
10,331
11,813
2007
6,295
3,860
1,140
11,295
12,574
2008
3,580
2,497
819
6,896
8,253
2009
4,503
3,431
1,169
9,103
10,771
2010
4,779
3,989
1,378
10,146
11,974
2011
4,298
4,058
1,366
9,722
11,638
2012
4,721
4,964
1,680
11,365
13,340
2013
5,827
6,827
2,325
14,979
17,293
2014
6,099
8,273
2,660
17,032
19,758
Illustration of an assumed
15 year investment of $10,000
Investment income dividends and capital gains distributions are taken in additional shares. This chart covers the years 2000–2014. Fees for the reinvestment of interim dividends are assumed as 2% of the amount reinvested (maximum of $2.50) and commissions of $0.05 per share. There is no charge for reinvestment of year-end distributions. No adjustment has been made for any income taxes payable by shareholders on income dividends, capital gains distributions, or the sale of any shares. These results should not be considered representative of the dividend income or capital gain or loss which may be realized in the future.
20
SHAREHOLDER INFORMATIONAND SERVICES
DIVIDEND PAYMENT SCHEDULE
The Fund presently pays dividends four times a year, as follows: (a) three interim distributions on or about March 1, June 1, and September 1, and (b) a year-end distribution, payable in late December, consisting of the estimated balance of the net investment income for the year and the net realized capital gain earned through October 31 and, if applicable, a return of capital. Shareholders may elect to receive the year-end distribution in stock or cash. In connection with this distribution, all shareholders of record are sent a dividend announcement notice and an election card in mid-November. Shareholders holding shares in “street” or brokerage accounts may make their election by notifying their brokerage house representative.
INVESTORS CHOICE
INVESTORS CHOICE is a direct stock purchase and sale plan, as well as a dividend reinvestment plan, sponsored and administered by our transfer agent, American Stock Transfer & Trust Corporation (AST). The Plan provides registered shareholders and interested first time investors an affordable alternative for buying, selling, and reinvesting in Fund shares. A brochure which further details the benefits and features of INVESTORS CHOICE as well as an enrollment form may be obtained by contacting AST.
The costs to participants in administrative service fees and brokerage commissions for each type of transaction are listed below. Fees are subject to change at any time.
Fees:
Initial Enrollment and Optional Cash Investments:
Service Fee $2.50 per investment
Brokerage Commission $0.05 per share
Reinvestment of Dividends*:
Service Fee 2% of amount invested
(maximum of $2.50 per investment)
Brokerage Commission $0.05 per share
Sale of Shares:
Service Fee $10.00
Brokerage Commission $0.05 per share
Deposit of Certificates for safekeeping $7.50
(waived if sold)
Book to Book Transfers Included
To transfer shares to another participant or to a new participant
* The year-end dividend and capital gain distribution will usually be made in newly issued shares of Common Stock. There are no fees or commissions in connection with this dividend and capital gain distribution when made in newly issued shares.
For shareholders whose stock is held by a broker in “street” name, the AST INVESTORS CHOICE Direct Stock Purchase and Sale Plan remains available through many registered investment security dealers. If your shares are currently held in a “street” name or brokerage account, please contact your broker for details about how you can participate in AST’s Plan or contact AST.
ELECTRONIC DELIVERY OF SHAREHOLDER REPORTS
The Fund offers shareholders the benefits and convenience of viewing Quarterly and Annual Reports and other shareholder materials on-line. With your consent, paper copies of these documents will cease with the next mailing and will be provided via e-mail. Reduce paper mailed to your home and help lower the Fund’s printing and mailing costs. To enroll, please visit the following websites:
Registered shareholders with AST: www.amstock.com/main
Shareholders using brokerage accounts: http://enroll.icsdelivery.com/ADX
21
BOARDOF DIRECTORS
Personal Information
Position
Held with
the Fund
Term
of
Office
Length
of Time
Served
Principal Occupations
Number of Portfolios in Fund Complex Overseen by Director
Other Directorships
Independent Directors
Enrique R. Arzac, Ph.D. 7 St. Paul Street, Suite 1140 Baltimore, MD 21202 Age 73
Director
One Year
Since 1983
Professor of Finance and Economics at the Graduate School of Business, Columbia University, formerly Vice Dean of Academic Affairs.
Two
Director of Petroleum Resources Corporation (closed-end fund), Aberdeen Asset Management Funds (6 closed-end funds), Credit Suisse Asset Management Funds (2 closed-end funds and 9 open-end funds), and Mirae Asset Discovery Funds (6 open-end funds). In addition, within the past five years, Dr. Arzac served as a director of Epoch Holdings Corporation (an investment management and investment advisory services company) and Starcomms Plc (telecommunications company).
Phyllis O. Bonanno
7 St. Paul Street,
Suite 1140 Baltimore, MD 21202
Age 71
Director
One Year
Since 2003
Retired President & CEO of International Trade Solutions, Inc. (consultants). Formerly, President of Columbia College, Columbia, South Carolina, and Corporate Vice President of Warnaco, Inc. (apparel).
Two
Director of Petroleum Resources Corporation (closed-end fund) and Borg-Warner Inc. (industrial). In addition, within the past five years, Ms. Bonanno served as Director of Mohawk Industries, Inc. (carpets and flooring).
Kenneth J. Dale
7 St. Paul Street,
Suite 1140 Baltimore, MD 21202
Age 58
Director
One Year
Since 2008
Senior Vice President and Chief Financial Officer of The Associated Press. Formerly, Vice President, J.P. Morgan Chase & Co. Inc.
Two
Director of Petroleum Resources Corporation (closed-end fund).
Frederic A. Escherich
7 St. Paul Street,
Suite 1140
Baltimore, MD 21202
Age 62
Director
One Year
Since 2006
Private Investor. Formerly, Managing Director and head of Mergers and Acquisitions Research and the Financial Advisory Department with JPMorgan & Co. Inc.
Two
Director of Petroleum Resources Corporation (closed-end fund).
Roger W. Gale, Ph.D.
7 St. Paul Street,
Suite 1140
Baltimore, MD 21202
Age 68
Director
One Year
Since 2005
President & CEO of GF Energy, LLC (consultants to electric power companies). Formerly, member of management group of PA Consulting Group (energy consultants).
Two
Director of Petroleum Resources Corporation (closed-end fund) and during the past five years also served as a director of Ormat Technologies, Inc. (geothermal and renewable energy).
22
BOARDOF DIRECTORS (CONTINUED)
Personal Information
Position
Held with
the Fund
Term
of
Office
Length
of Time
Served
Principal Occupations
Number of Portfolios in Fund Complex Overseen by Director
Other Directorships
Independent Directors (continued)
Kathleen T. McGahran,
Ph.D., J.D., CPA
7 St. Paul Street,
Suite 1140
Baltimore, MD 21202
Age 64
Director, Chair of the Board
One Year
Since 2003
President & CEO of Pelham Associates, Inc. (an executive education provider). Formerly, Associate Dean and Director of Executive Education and Associate Professor, Columbia University, and Adjunct Associate Professor, Stern School of Business, New York University and Tuck School of Business, Dartmouth College.
Two
Director of Petroleum Resources Corporation (closed-end fund).
Craig R. Smith, M.D.
7 St. Paul Street,
Suite 1140
Baltimore, MD 21202
Age 68
Director
One Year
Since 2005
Retired Chief Operating Officer of Algenol LLC (ethanol manufacturing). Formerly, President, Williston Consulting LLC (consultants to pharmaceutical and biotechnology industries) and Chairman, President & CEO of Guilford Pharmaceuticals (pharmaceuticals & biotechnology).
Two
Director of Petroleum Resources Corporation (closed-end fund) and a Manager of Algenol LLC. In addition, within the past five years, Dr. Smith served as a director of Algenol Biofuels, Inc. (ethanol manufacturing), Depomed, Inc. (specialty pharmaceuticals), and LaJolla Pharmaceutical Company.
Interested Director
Mark E. Stoeckle
7 St. Paul Street,
Suite 1140
Baltimore, MD 21202
Age 58
Director and CEO
One Year
Since 2013
CEO of the Fund and CEO of Petroleum Resources Corporation.
Two
Director of Petroleum Resources Corporation (closed-end fund).
This report, including the financial statements herein, is transmitted to the shareholders of The Adams Express Company for their information. It is not a prospectus, circular or representation intended for use in the purchase or sale of shares of the Fund’s or of any securities mentioned in the report. The rates of return will vary and the principal value of an investment will fluctuate. Shares, if sold, may be worth more or less than their original cost. Past performance is no guarantee of future investment results.
23
OTHER INFORMATION
Statement on Quarterly Filing of Complete Portfolio Schedule
In addition to publishing its complete schedule of portfolio holdings in the First and Third Quarter Reports to shareholders, the Fund also files its complete schedule of portfolio holdings with the Securities and Exchange Commission for the first and third quarters of each fiscal year on Form N-Q. The Fund’s Forms N-Q are available on the Commission’s website: www.sec.gov. The Company’s Forms N-Q may be reviewed and copied at the Commission’s Public Reference Room, and information on the operation of the Public Reference Room may be obtained by calling 1-800-SEC-0330. The Fund also posts a link to its Forms N-Q on its website: www.adamsexpress.com under the headings “Investment Information”, “Financial Reports” and then “SEC Filings”.
Annual Certification
The Fund’s CEO has submitted to the New York Stock Exchange the annual CEO certification as required by Section 303A.12(a) of the NYSE Listed Company Manual.
Proxy Voting Policies and Record
A description of the policies and procedures that the Fund uses to determine how to vote proxies relating to portfolio securities owned by the Fund and the Fund’s proxy voting record for the 12-month period ended June 30, 2014 are available (i) without charge, upon request, by calling the Fund’s toll free number at (800) 638-2479; (ii) on the Fund’s website: www.adamsexpress.com under the headings “About Adams Express” and “Corporate Information”; and (iii) on the Securities and Exchange Commission’s website: www.sec.gov.
Forward-Looking Statements
This report contains “forward-looking statements” within the meaning of the Securities Act of 1933 and the Securities Exchange Act of 1934. By their nature, all forward-looking statements involve risks and uncertainties, and actual results could differ materially from those contemplated by the forward-looking statements. Several factors that could materially affect the Fund’s actual results are the performance of the portfolio of stocks held by the Fund, the conditions in the U.S. and international financial markets, the price at which shares of the Fund will trade in the public markets, and other factors discussed in the Fund’s periodic filings with the Securities and Exchange Commission.
Privacy Policy
In order to conduct its business, the Fund, through its transfer agent, American Stock Transfer & Trust Company, collects and maintains certain nonpublic personal information about our shareholders of record with respect to their transactions in shares of our securities. This information includes the shareholder’s address, tax identification or Social Security number, share balances, and dividend elections. We do not collect or maintain personal information about shareholders whose shares of our securities are held in “street name” by a financial institution such as a bank or broker.
We do not disclose any nonpublic personal information about you, our other shareholders or our former shareholders to third parties unless necessary to process a transaction, service an account or as otherwise permitted by law.
To protect your personal information internally, we restrict access to nonpublic personal information about our shareholders to those employees who need to know that information to provide services to our shareholders. We also maintain certain other safeguards to protect your nonpublic personal information.
24
THE ADAMS EXPRESS COMPANY
Board Of Directors
Enrique R. Arzac 1,3,5
Phyllis O. Bonanno 1,2,5
Kenneth J. Dale 2,3,4
Frederic A. Escherich 2,3,4
Roger W. Gale 1,3,4,5
Kathleen T. McGahran 1,6
Craig R. Smith 1,2,5
Mark E. Stoeckle 1
1. Member of Executive Committee
2. Member of Audit Committee
3. Member of Compensation Committee
4. Member of Retirement Benefits Committee
5. Member of Nominating and Governance Committee
6. Chair of the Board
Officers
Mark E. Stoeckle
Chief Executive Officer
James P. Haynie, CFA
President
Nancy J.F. Prue, CFA
Executive Vice President
Brian S. Hook, CFA, CPA
Vice President, Chief Financial Officer and Treasurer
Lawrence L. Hooper, Jr.
Vice President, General Counsel and Secretary
Steven R. Crain, CFA
Vice President — Research
Michael E. Rega, CFA
Vice President — Research
David R. Schiminger, CFA
Vice President — Research
D. Cotton Swindell, CFA
Vice President �� Research
Christine M. Sloan, CPA
Assistant Treasurer
The Adams Express Company
Seven St. Paul Street, Suite 1140, Baltimore, MD 21202
(410) 752-5900 (800) 638-2479
Website: www.adamsexpress.com
E-mail: contact@adamsexpress.com
Counsel: Chadbourne & Parke LLP
Independent Registered Public Accounting Firm: PricewaterhouseCoopers LLP
Custodian of Securities: Brown Brothers Harriman & Co.
Transfer Agent & Registrar: American Stock Transfer & Trust Company, LLC
Stockholder Relations Department
6201 15th Avenue
Brooklyn, NY 11219
(877) 260-8188
Website: www.amstock.com
E-mail: info@amstock.com
Item 2. Code of Ethics.
On June 12, 2003, the Board of Directors adopted a code of ethics that applies to the registrant's principal executive officer and principal financial officer. The code of ethics is available on the registrant's website at: www.adamsexpress.com. Since the code of ethics was adopted, there have been no amendments to it nor have any waivers from any of its provisions been granted.
Item 3. Audit Committee Financial Expert.
The Board of Directors has determined that at least one of the members of the registrant's audit committee meets the definition of audit committee financial expert as that term is defined by the Securities and Exchange Commission. The director on the registrant's audit committee whom the Board of Directors has determined meets such definition is Kenneth J. Dale, who is independent pursuant to paragraph (a)(2) of this Item.
Item 4. Principal Accountant Fees and Services.
(a) Audit Fees. The aggregate fees for professional services rendered by the registrant's independent registered public accounting firm, PricewaterhouseCoopers LLP, for the audit of the registrant's annual financial statements and review of the registrant's semi-annual financial statements for 2014 and 2013 were $75,403 and $78,935, as adjusted for subsequent billing, respectively.
(b) Audit-Related Fees. There were no audit-related fees in 2014 and 2013.
(c) Tax Fees. The aggregate fees for professional services rendered to the registrant by PricewaterhouseCoopers LLP for the review of the registrant's excise tax calculations and preparations of federal, state, and excise tax returns for 2014 and 2013 were $9,646 and $8,581, respectively.
(d) All Other Fees. The aggregate fees for services rendered to the registrant by PricewaterhouseCoopers LLP, other than for the services referenced above, for 2014 and 2013 were $4,190 and $5,477, respectively, which related to the review of the registrant's procedures for calculating the amounts granted and vested for the registrant's employees in accordance with the registrant's cash incentive plan for 2013 and the 2005 Equity Incentive Compensation Plan for 2014 and 2013, review of the registrant's calculations related to those plans, and preparation of a related report to the registrant's Compensation Committee.
(e)
(1)
The audit committee's policy is to pre-approve all audit and permissible non-audit services provided by the independent accountants. In assessing requests for services by the independent accountants, the audit committee considers whether such services are consistent with the auditor's independence; whether the independent accountants are likely to provide the most effective and efficient service based upon their familiarity with the registrant; and whether the service could enhance the registrant's ability to manage or control risk or improve financial statement audit and review quality. The audit committee may delegate pre-approval authority to its Chair. Any pre-approvals by the Chair under this delegation are to be reported to the audit committee at its next scheduled meeting. All services performed in 2014 were pre-approved by the audit committee.
(2)
Not applicable.
(f) Not applicable.
(g) The aggregate fees for non-audit professional services rendered by PricewaterhouseCoopers LLP to the registrant for 2014 and 2013 were $13,836 and $14,058, respectively.
(h) The registrant's audit committee has considered the provision by PricewaterhouseCoopers LLP of the non-audit services described above and found that they are compatible with maintaining PricewaterhouseCoopers LLP's independence.
Item 5. Audit Committee of Listed Registrants.
(a) The registrant has a standing audit committee established in accordance with Section 3(a)(58)(A) of the Securities Exchange Act of 1934. The members of the Audit Committee are: Kenneth J. Dale, Chair, Phyllis O. Bonanno, Frederic A. Escherich, and Craig R. Smith.
(b) Not applicable.
Item 6. Investments.
(a) This schedule is included as part of the Report to Stockholders filed under Item 1 of this form.
(b) Not applicable.
Item 7. Disclosure of Proxy Voting Policies and Procedures for Closed-End Management Investment Companies.
PROXY VOTING GUIDELINES
The Adams Express Company ("Adams") follows long-standing general guidelines for the voting of portfolio company proxies and takes very seriously its responsibility to vote all such proxies. The portfolio company proxies are evaluated by our research staff and voted by our portfolio management team, and we annually provide the Board of Directors with a report on how proxies were voted during the previous year. We do not use an outside service to assist us in voting our proxies.
As an internally-managed investment company, Adams uses its own staff of research analysts and portfolio managers. In making the decision to invest in a company for the portfolio, among the factors the research team analyses is the integrity and competency of the company's management. We must be satisfied that the companies we invest in are run by managers with integrity. Therefore, having evaluated this aspect of our portfolio companies' managements, we give significant weight to the recommendations of the company's management in voting on proxy issues.
We vote proxies on a case-by-case basis according to what we deem to be the best long-term interests of our shareholders. The key over-riding principle in any proxy vote is that stockholders be treated fairly and equitably by the portfolio company's management. In general, on the election of directors and on routine issues that we do not believe present the possibility of an adverse impact upon our investment, after reviewing whether applicable corporate governance requirements as to board and committee composition have been met, we will vote in accordance with the recommendations of the company's management. When we believe that the management's recommendation is not in the best interests of our stockholders, we will vote against that recommendation.
Our general guidelines for when we will vote contrary to the recommendation of the portfolio company management's recommendation are:
Stock Options
Our general guideline is to vote against stock option plans that we believe are unduly dilutive of our stock holdings in the company. We use a general guideline that we will vote against any stock option plan that results in dilution in shares outstanding exceeding 4%. Most stock option plans are established to motivate and retain key employees and to reward them for their achievement. An analysis of a stock option plan cannot be made in a vacuum but must be made in the context of the company's overall compensation scheme. In voting on stock option plans, we give consideration to whether the stock option plan is broad-based in the number of employees who are eligible to receive grants under the plan. We generally vote against plans that permit re-pricing of grants or the issuance of options with exercise prices below the grant date value of the company's stock.
Corporate Control/Governance Issues
Unless we conclude that the proposal is favorable to our interests as a long-term shareholder in the company, we have a long-standing policy of voting against proposals to create a staggered board of directors. In conformance with that policy, we will generally vote in favor of shareholder proposals to eliminate the staggered election of directors.
Unless we conclude that the proposal is favorable to our interests as a long-term shareholder in the company, our general policy is to vote against amendments to a company's charter that can be characterized as blatant anti-takeover provisions.
With respect to so-called golden parachutes and other severance packages, it is our general policy to vote against proposals relating to future employment contracts that provide that compensation will be paid to any director, officer or employee that is contingent upon a merger or acquisition of the company.
We generally vote for proposals to require that the majority of a board of directors consist of independent directors and vote against proposals to establish a retirement plan for non-employee directors.
We have found that most stockholder proposals relating to social issues focus on very narrow issues that either fall within the authority of the company's management, under the oversight of its board of directors, to manage the day-to- day operations of the company or concern matters that are more appropriate for global solutions rather than company- specific ones. We consider these proposals on a case-by-case basis but usually are persuaded management's position is reasonable and vote in accordance with management's recommendation on these types of proposals.
Item 8. Portfolio Managers of Closed-End Management Investment Companies.
(a)
(1) As of the date of this filing, Mark E. Stoeckle, Chief Executive Officer and President, James P. Haynie, Executive Vice President, and D. Cotton Swindell, Executive Vice President, comprise the three-person portfolio management team for the registrant. Mr. Stoeckle has served as portfolio manager for the registrant since February 11, 2013; prior thereto, he served as Chief Investment Officer, U.S. Equities and Global Sector Funds, for BNP Paribas Investment Partners. Mr. Haynie has been a member of the portfolio management team since August 19, 2013, serving as President until January 16, 2015; prior thereto, Mr. Haynie served as Chief Investment Officer, U.S. Equities and Global Sector Funds, for BNP Paribas Investment Partners from February 2013 and was Senior Portfolio Manager at BNP Paribas Investment Partners from 2005 to 2013. D. Cotton Swindell was elected as Executive Vice President on January 16, 2015 and joined the portfolio management team; prior thereto, Mr. Swindell served as Vice President-Research for the registrant from 2004 and a research analyst for the registrant from 2002 to 2004. Mr. Stoeckle is the lead member of the portfolio management team. Messrs. Stoeckle, Haynie and Swindell receive investment recommendations from a team of research analysts and make decisions jointly about any investment transactions in the portfolio.
(2) As of the date of this filing, Messrs. Stoeckle and Haynie also serve on the portfolio management team for the registrant's non-controlled affiliate, Petroleum & Resources Corporation (Petroleum), a registered investment company with total net assets of $754,505,739 as of December 31, 2014. Mr. Stoeckle is Chief Executive Officer of Petroleum and Mr. Haynie is President. Petroleum is a non-diversified fund specializing in the energy and natural resources sectors and the registrant is a diversified fund with a different focus. There are few material conflicts of interest that may arise in connection with the portfolio management of both funds. The funds do not buy or sell securities or other portfolio holdings to or from the other, and policies and procedures are in place covering the sharing of expenses and the allocation of investment opportunities, including bunched orders and investments in initial public offerings, between the funds.
(3) As of December 31, 2014, the registrant's portfolio managers are compensated through a three-component plan, consisting of salary, annual cash incentive compensation, and annual equity incentive compensation. The aggregate compensation and value of each component in any year is determined by the Compensation Committee, comprised solely of independent director members of the Board of Directors ("Committee"). The Committee has periodically employed a compensation consultant to review the plan and its components. The structure and methods used to determine the compensation of the Portfolio Managers were as follows: Salaries are determined by using appropriate industry surveys and information about the local market. Incentive compensation is based on a combination of relative fund performance of the registrant and Petroleum, with 70% weighting, and individual performance, with a 30% weighting. Target incentives are set annually based on aggregate compensation less salary for each position. Fund performance used in determining incentive compensation is measured over a one-year period, accounting for one-fourth of the calculation, a three-year period, which accounts for one-half, and a five-year period, which accounts for one-fourth. The registrant's total return on net asset value ("NAV") over each of these periods is used to determine performance relative to a 50/50 blend of the S&P 500 Index and Lipper Large-Cap Core peer group. Using these calculations, the incentive compensation can be less than or exceed the established target and is divided between cash and equity.
Equity incentive compensation, based on a plan approved by shareholders in 2005 and reapproved in 2010, can take several forms. During 2014, grants of the registrant's restricted stock were made to Messrs. Stoeckle, Haynie and Swindell on January 9, 2014, which vest three years after grant date.
As of December 31, 2014, the structure of the compensation that the portfolio managers receive from Petroleum is the same as that for the registrant with the exception that the portfolio managers' incentive compensation is based on a comparison with the performance of an 80/20 blend of the Dow Jones U.S. Oil and Gas Index and the Dow Jones U.S. Basic Materials Index.
(4) Using a valuation date of December 31, 2014, Messrs. Stoeckle and Haynie each beneficially owned equity securities in the registrant valued between $500,001 and $1,000,000. Mr. Swindell beneficially owned equity securities in the registrant valued between $100,001 and $500,000.
(b)
Not applicable.
Item 9. Purchases of Equity Securities by Closed-End Management Investment Company and Affiliated Purchasers.
Total Number of Shares (or Units Purchased)
Average Price Paid per Share (or Unit)
Total Number of Shares (or Units) Purchased as Part of Publicly Announced Plans or Programs
Maximum Number of Shares (or Units) That May Yet Be Purchased Under the Plans or Programs
-----------------------------------
-----------------------------------
----------------------------------
-----------------------------------
January 2014
42,000
$12.82
42,000
4,565,443
February 2014
54,600
$12.68
54,600
4,510,843
March 2014
94,200
$13.00
94,200
4,416,643
April 2014
59,400
$13.02
59,400
4,357,243
May 2014
113,400
$13.28
113,400
4,243,843
June 2014
102,600
$13.68
102,600
4,141,243
July 2014
59,400
$13.90
59,400
4,081,843
August 2014
113,400
$13.87
113,400
3,968,443
September 2014
102,600
$14.13
102,600
3,865,843
October 2014
90,000
$13.88
90,000
3,775,843
November 2014
60,000
$14.41
60,000
3,715,843
December 2014
120,000
$13.71
120,000
4,569,500
(2c)
-----------------------------------
-----------------------------------
-----------------------------------
Total
1,011,600
(1)
$13.59
1,011,600
(2a)(2b)
(1) There were no shares purchased other than through a publicly announced plan or program.
(2.a) The Plan was announced on November 15, 2013.
(2.b) The share amount approved in 2013 was 5% of outstanding shares, or 4,607,443 shares.
(2.c) The Plan was set to expire on December 31, 2014, but was extended by the Board on December 11, 2014, authorizing purchases of up to 5% of the outstanding shares, or approximately 4,667,000 shares.
(2.d) None.
(2.e) None.
Item 10. Submission of Matters to a Vote of Security Holders.
There were no material changes to the procedures by which shareholders may recommend nominees to the registrant's Board of Directors made or implemented after the registrant last provided disclosure in response to the requirements of Item 407(c)(2)(iv) of Regulation S-K (as required by Item 22(b)(15) of Schedule 14A), or this Item.
Item 11. Controls and Procedures.
(a) The registrant's principal executive officer and principal financial officer have concluded that the registrant's disclosure controls and procedures (as defined in Rule 30a-3(c) under the Investment Company Act of 1940) are effective based on their evaluation of the disclosure controls and procedures as of a date within 90 days of the filing date of this report.
(b) There have been no significant changes in the registrant's internal control over financial reporting (as defined in Rule 30a-3(d) under the Investment Company Act of 1940) that occurred during the registrant's second fiscal quarter of the period covered by this report that has materially affected, or is reasonably likely to materially affect, the registrant's internal control over financial reporting.
Item 12. Exhibits.
(a)
(1)
Not applicable. See registrant's response to Item 2 above.
(2)
Separate certifications by the registrant's principal executive officer and principal financial officer, pursuant to Section 302 of the Sarbanes-Oxley Act of 2002 and required by Rule 30a-2(a) under the Investment Company Act of 1940, are attached.
(3)
Written solicitation to purchase securities: not applicable.
(b) A certification by the registrant's principal executive officer and principal financial officer, pursuant to Section 906 of the Sarbanes-Oxley Act of 2002 and required by Rule 30a-2(b) under the Investment Company Act of 1940, is attached.
SIGNATURES
Pursuant to the requirements of the Securities Exchange Act of 1934 and the Investment Company Act of 1940, the registrant has duly caused this
report to be signed on its behalf by the undersigned, thereunto duly authorized.
The Adams Express Company
By:
/s/ Mark E. Stoeckle
Mark E. Stoeckle
Chief Executive Officer
(Principal Executive Officer)
Date:
February 27, 2015
Pursuant to the requirements of the Securities Exchange Act of 1934 and the Investment Company Act of 1940, this report has been signed below
by the following persons on behalf of the registrant and in the capacities and on the dates indicated.
By:
/s/ Mark E. Stoeckle
Mark E. Stoeckle
Chief Executive Officer
(Principal Executive Officer)
Date:
February 27, 2015
By:
/s/ Brian S. Hook
Brian S. Hook
Vice President, Chief Financial Officer and Treasurer
(Principal Financial Officer)
Date:
February 27, 2015
We use cookies on this site to provide a more responsive and personalized service. Continuing to browse, clicking I Agree, or closing this banner indicates agreement. See our Cookie Policy for more information.