UNITED STATES
SECURITIES AND EXCHANGE COMMISSION
Washington, D.C. 20549
FORM N-CSR
CERTIFIED SHAREHOLDER REPORT OF REGISTERED MANAGEMENT
INVESTMENT COMPANIES
Investment Company Act File Number: 811-3493
American Federation of Labor and
Congress of Industrial Organizations
Housing Investment Trust
(Exact name of registrant as specified in charter)
2401 Pennsylvania Avenue, N.W., Suite 200
Washington, D.C. 20037
(Address of principal executive offices) (Zip code)
Corey F. Rose, Esq.
Dechert LLP
1900 K Street, NW
Washington, DC 20006-1110
(Name and address of agent for service)
(202) 331-8055
(Registrant’s telephone number, including area code)
Date of fiscal year end: December 31
Date of reporting period: January 1, 2019 – June 30, 2019
| Item 1. | Reports to Stockholders. |
A copy of the 2019 Semi-Annual Report (the “Report”) of the AFL-CIO Housing Investment Trust (the “Trust” or “Registrant”) transmitted to Trust participants pursuant to Rule 30e-1 under the Investment Company Act of 1940, as amended (17 CFR 270.30e-1) (the “Act”), is included herewith.

TO OUR INVESTORS
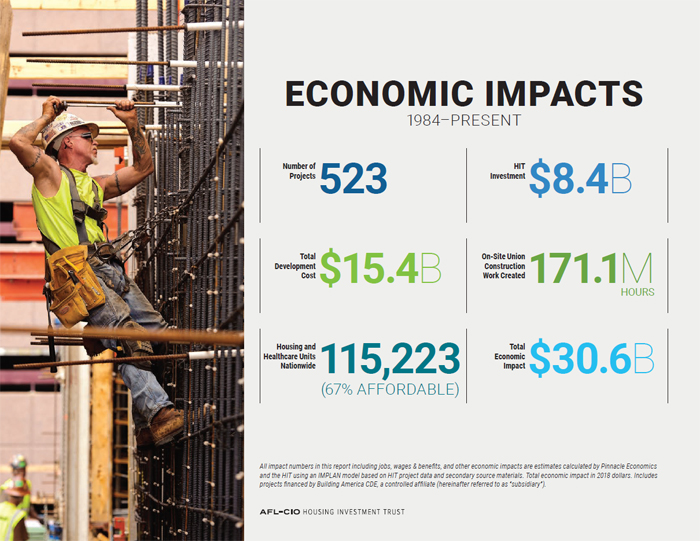
 | The AFL-CIO Housing Investment Trust (“HIT”) is off to a strong start for the first half of 2019. The HIT posted its highest asset level in firm history—$6.4 billion. The HIT’s core strategy of overweighting its portfolio with high credit quality multifamily investments has continued to produce competitive, risk-adjusted returns. The HIT’s absolute and relative returns were both strong with a year-to-date net return of 6.02%, versus 6.11% for the its benchmark, the Bloomberg Barclays U.S. Aggregate Bond Index. The declining interest rate environment and corresponding tightening of spreads benefitted the HIT and fixed income markets generally in the first six months of the year. |
The HIT has continued to produce competitive fixed income returns while creating union construction jobs and investing in affordable housing projects. The HIT’s management team spent the first half of 2019 focused on strengthening its operations and enhancing the HIT’s investment authorities with the objective of building on its core competencies and expanding opportunities. We identified and implemented many operational efficiencies and have significantly reduced our operating costs which contributed to a reduction in the HIT’s expense ratio as reflected in the current prospectus. Also in the first half of 2019, the HIT obtained approval to modify its existing direct and bridge lending authorities so that the HIT will be able to deploy additional capital to investments that are intended to increase its yield and create more union construction jobs while financing additional housing projects. These changes are designed to benefit our investors by making the HIT a more competitive financier of multifamily housing while staying true to our strategy.
At the end of the second quarter, the U.S. economy marked a milestone—the current economic expansion is now the longest on record. However, continued U.S. economic expansion may be at risk as global growth appears to be slowing, combined with heightened geopolitical uncertainty. Investors seeking diversification and capital protection as part of their portfolio strategy could benefit from HIT’s strategy. We expect that investors will continue to benefit from the HIT’s unique strategy and ability to prudently invest pension capital while furthering employment opportunities for union workers. The HIT is proud of its history of generating positive impacts for communities throughout the country by investing in much needed affordable and workforce housing. Thank you for your continued support as we work to do more.
In solidarity,

Chang Suh
Chief Executive Officer and Co-Chief Portfolio Manager


PERFORMANCE OVERVIEW
(UNAUDITED)
STRONG START TO 2019
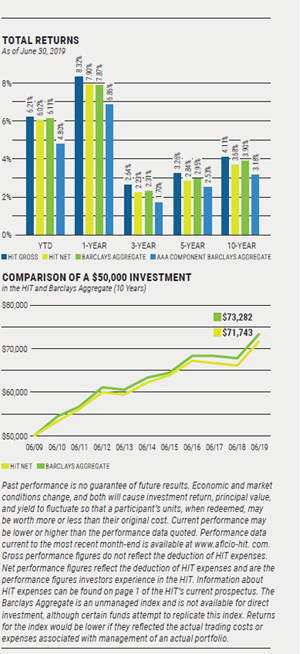
The AFL-CIO Housing Investment Trust (HIT) produced strong absolute and relative returns for the first half of 2019. For the first six months of the year, the HIT produced a gross return of 6.21% and a net return of 6.02% compared to 6.11% for the Bloomberg Barclays U.S. Aggregate Bond Index (Barclays Aggregate or Benchmark). For the one-year period ended June 30, the HIT produced a gross return of 8.32% and a net return of 7.90% compared to 7.87% for the Benchmark. When compared to the AAA component of the Benchmark, the HIT outperformed on a net basis for the year-to-date, 1-, 3-, 5- and 10-year periods by 122, 104, 53, 31 and 50 basis points, respectively. We believe that this component, which has similar duration and credit quality to the HIT, evidences the longer-term value of the HIT’s strategy of significantly overweighting multifamily mortgage-backed securities (MBS).
PERFORMANCE IN A RISK-SEEKING ENVIRONMENT.
Despite the erosion of global economic fundamentals in the first half of 2019, investors continued to seek higher-yielding, riskier assets. This resulted in lower interest rates and tightening of spreads, including multifamily MBS spreads, which benefitted the HIT’s relative performance. The HIT’s overweight to spread-based assets also benefitted its performance as swap spreads tightened across all maturities. At the end of June, 93.5% of the HIT’s portfolio was invested in spread-based assets, compared to 60.5% in the Benchmark. The HIT’s underweight to single-family MBS also contributed positively to its relative performance, as it was the worst-performing major sector in the Benchmark.
The HIT was able to outperform its benchmark on a gross basis even though corporate bonds posted excess returns of 391 basis points, their fourth best semiannual return relative to U.S. Treasuries on record. Corporate bonds represented 25.0% of the Barclays Aggregate, while the HIT does not invest in this sector. The HIT’s relative performance was also negatively impacted by its slightly short relative duration and its overweight to the highest credit quality sector of the investment grade universe, whose excess returns were the lowest among the four credit rating buckets (AAA, AA, A and BBB).
MARKET ENVIRONMENT IN FIRST HALF OF 2019
The U.S. economy is now in its longest expansion on record, but momentum appears to be cooling. Economic data in the first half of the year showed a slowdown in global trade, business investment and manufacturing production. While the impacts of the fiscal stimulus and tax cuts have waned, the labor market remained healthy. The unemployment rate remained below 4% and the economy added approximately one million jobs so far year-to-date.1 More importantly, inflation and inflation expectations have fallen well below the Federal Reserve’s (Fed) target forecast of 2% and are likely to remain so in the near term. While the Fed kept the Fed Funds Rate constant at 2.25-2.5% in the first half of the year, comments by Fed Governors appear to reveal their continued commitment to near-term dovish monetary policy.
The divergence between risk-free Treasury yields and equity prices continues to widen, largely driven by two main factors. First was the prospect of the Fed easing
1. Bureau of Labor Statistics
| 2 |  |
PERFORMANCE OVERVIEW
(UNAUDITED) continued
monetary policy. The market is currently pricing in multiple rate cuts this year to mitigate the economic risks ahead, as inflation remains at bay. Comments by Fed Governors point to increasing amounts of uncertainty in global growth. Lack of progress around trade negotiations has also become a source of anxiety in the interest rate markets. Second, record amounts of negative-yielding global debt impacted investors’search for yield as the stock of negative-yielding global debt exceeded $13 trillion.2 With the International Monetary Fund lowering their global growth forecast for the second time within the year, central banks around the world appear ready to join the U.S. in injecting some form of monetary stimulus to support growth in the second half of the year.
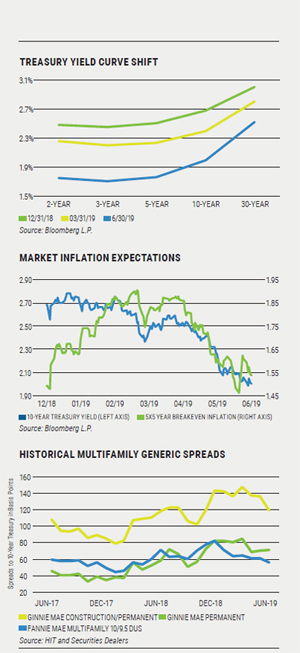
MULTIFAMILY MARKET CONDITIONS REMAIN STRONG
Demand for U.S. apartments spiked to a five-year high in the second quarter of 2019. This follows two quarters of slower-than-usual leasing and represents an 11% increase over the second quarter of 2018.3 U.S. average rents also increased by 3.2% in June compared to a year earlier.4 A significant factor fueling demand is more young adults choosing to rent rather than purchase homes. This has been attributed to various factors, including high student debt levels, the desire for mobility and flexibility, the lack of affordable homeownership options in metropolitan areas and a preference to live in or close to urban cores. All current signs indicate that demand for multifamily housing will remain strong.
SPREADS.The HIT’s government/agency multifamily MBS performed well as spreads to Treasuries tightened during the first half of 2019. Ginne Mae construction loan
2. Bloomberg L.P.
3. RealPage Inc.
4. Yardi
certificates tightened by 25 basis points and permanent loan certificates tightened by 42 basis points. Fannie Mae Delegated Underwriting and Servicing (DUS) security spreads tightened on longer maturity structures, with the benchmark 10/9.5s tightening by 6 basis points. The HIT had a combined 17.5% of its portfolio in fixed-rate single-asset Federal Housing Authority (FHA)/Ginnie Mae securities and 23.0% in fixed-rate single-asset DUS securities of various structures at the end of June, while there were no such securities in the Barclays Aggregate.
HIT’S DIRECTLY SOURCED MULTIFAMILY INVESTMENTS.
The HIT’s significant overweight to multifamily MBS (72.5% at June 30, 2019, compared to 0.8% in the Benchmark) distinguishes the fund from its core bond competitors. Construction-related securities continue to contribute to the HIT’s ability to generate competitive risk-adjusted returns and increase the HIT’s relative yield advantage compared to the Barclays Aggregate. In addition, these investments generate hours of union construction work, rehabilitate and develop affordable housing, and generate economic impacts that support the broader community.
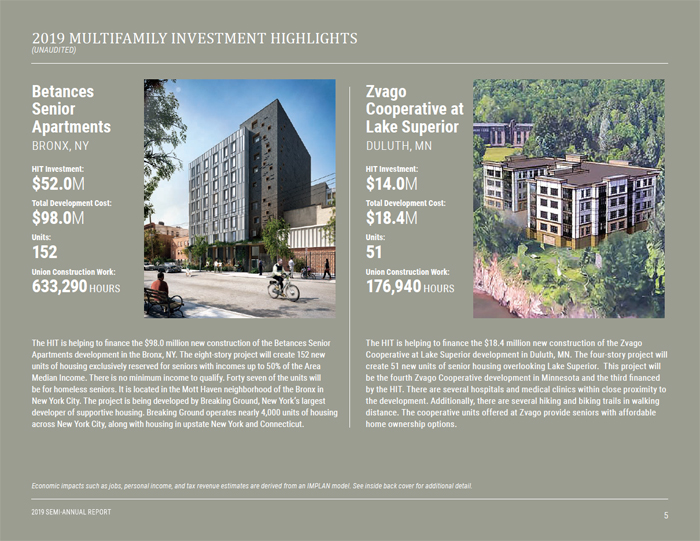
The HIT committed $151.6 million to construction-related securities during the first half of the year. While the government shutdown in the first quarter halted U.S. Department of Housing and Urban Development approval of FHA/Ginnie Mae mortgage-backed loans, the HIT committed to four construction-related projects in the second quarter. These investments are expected to contribute positively to the portfolio while creating 1.6 million hours of union construction work and building 457 housing units, with 167 of those being affordable or workforce housing units.
| 3 |

PERFORMANCE OVERVIEW
(UNAUDITED) continued
STRATEGIC ENHANCEMENTS
In the first half of 2019, the HIT identified many operational efficiencies and made structural changes in the organization, with the intent of significantly reducing its operating costs while continuing to execute its long-standing strategy of delivering value to its participants. These changes contributed to a reduction in the HIT’s expense ratio as reflected in the current prospectus. During this time, the HIT obtained approval to modify its existing bridge lending authority to more effectively finance projects that utilize Low Income Housing Tax Credits. The modifications will give the HIT increased flexibility to fund construction-related investments and are intended to help generate additional yield for the portfolio without materially altering the HIT’s risk or credit profile. In our opinion, combining a higher relative yield target with efficiencies in costs results in an attractive investment profile.
LOOKING AHEAD
We believe the HIT is well-positioned to weather heightened future volatility and a global growth slowdown given its lack of corporate credit and overweight to government/agency/AAA credit. With FHA multifamily products trading at attractive levels, both relative to Treasuries and credit-equivalent corporate bonds, they remain a prudent opportunity to enhance yield and spread without adding any appreciable credit risk. We believe that the HIT’s specialization in agency multifamily bonds should continue to provide diversification away from corporate bonds at a time when over 50% of investment-grade corporate bonds are now BBB-rated (as a percentage of investment grade corporate bonds in the Barclays Aggregate) and earnings growth is declining.
| 4 | |
OTHER IMPORTANT INFORMATION
(UNAUDITED)
EXPENSE EXAMPLE
| | Beginning | Ending | Expenses Paid During |
| | Account Value | Account Value | Six-Month Period Ended |
| | January 1, 2019 | June 30, 2019 | June 30, 2019* |
| Actual Expenses | $1,000.00 | $1,060.22 | $1.79 |
| Hypothetical Expenses | $1,000.00 | $1,023.06 | $1.76 |
| * | Expenses are equal to the HIT’s annualized six-month expense ratio of 0.35%, multiplied by the average account value over the period, multiplied by 181/365 (to reflect the one-half year period). |
Participants in the HIT incur ongoing expenses related to the management and distribution activities of the HIT, as well as certain other expenses. The expense example in the table above is intended to help participants understand the ongoing costs (in dollars) of investing in the HIT and to compare these costs with the ongoing costs of investing in other mutual funds. The example is based on an investment of $1,000 invested at the beginning of the period, January 1, 2019, and held for the entire period ended June 30, 2019.
Actual Expenses: The first line of the table above provides information about actual account values and actual expenses. Participants may use the information in this line, together with the amount they invested, to estimate the expenses that they paid over the period. Simply divide the account value by $1,000 (for example, an $800,000 account value divided by $1,000 = 800), then multiply the result by the number in the first line under the heading entitled “Expenses Paid During Six-Month Period Ended June 30, 2019” to estimate the expenses paid on a particular account during this period.
Hypothetical Expenses(for Comparison Purposes Only): The second line of the table above provides information about hypothetical account values and hypothetical expenses based on the HIT’s actual expense ratio and an assumed rate of return of 5% per year before expenses, which is not the HIT’s actual return. The hypothetical account values and expenses may not be used to estimate the actual ending account balance or expenses a participant paid for the period. Participants may use this information to compare the ongoing costs of investing in the HIT and other mutual funds. To do so, compare this 5% hypothetical example with the 5% hypothetical examples that appear in the shareholder reports of the other mutual funds.
Please note that this example is useful in comparing funds’ ongoing costs only. It does not include any transactional costs, such as sales charges (loads), redemption fees, or exchange fees. The HIT does not have such transactional costs, but many other funds do.
AVAILABILITY OF QUARTERLY PORTFOLIO SCHEDULE
In addition to disclosure in its Annual and Semi-Annual Reports to Participants, the HIT also files its complete schedule of portfolio holdings with the Securities and Exchange Commission (SEC) for the first and third quarters of each fiscal year as an exhibit to its reports on Form N-PORT. Previously, the HIT filed a complete schedule of portfolio holdings with the SEC for the first and third quarters of each fiscal year on Form N-Q. The HIT’s Forms N-PORT and N-Q are available on the SEC’s website atsec.gov. Participants may also obtain copies of the HIT’s Forms N-PORT and N-Q, without charge, upon request, by calling the HIT collect at 202-331-8055.
PROXY VOTING
Except for its shares in its wholly owned subsidiary, HIT Advisers LLC, and shares in mutual funds holding short-term or overnight cash, if applicable, the HIT invests exclusively in nonvoting securities and has not deemed it necessary to adopt policies and procedures for the voting of portfolio securities. The HIT has reported information regarding how it voted in matters related to its subsidiary in its most recent filing with the SEC on Form N-PX. This filing is available on the SEC’s website atsec.gov. Participants may also obtain a copy of the HIT’s report on Form N-PX, without charge, upon request, by calling the HIT collect at 202-331-8055.
2019 SPECIAL MEETING OF PARTICIPANTS
A Special Meeting of the Participants was held in Washington, D.C. on May 14, 2019. The following matter was put to a vote of the Participants at the meeting through the solicitation of proxies: to elect Harry W. Thompson as a Class II Management Trustee, to serve until the 2021 Annual Meeting of Participants or until his successor is elected and qualifies. Votes for: 3,044,596.714; votes against: 0.000; votes abstaining: 75,624.815; votes not cast: 2,342,540.297.
| 6 | |

STATEMENT OF ASSETS AND LIABILITIES
June 30, 2019 (Dollars in thousands, except per share data; unaudited)
| Assets | | |
| Investments, at value (cost $6,313,854) | $6,458,605 |
| Cash | 1,244 |
| Accrued interest receivable | 19,107 |
| Receivables for investments sold | 154 |
| Right-of-use asset | 1,571 |
| Other assets | 2,088 |
| Total assets | 6,482,769 |
| | |
| | | |
| Liabilities | | |
| Payables for investments purchased | 29,753 |
| Redemptions payable | 24,229 |
| Income distribution and capital gains payable, net of dividends reinvested of $13,338 | 1,450 |
| Refundable deposits | 498 |
| Accrued salaries and fringe benefits | 3,286 |
| Lease liability | 1,745 |
| Other liabilities and accrued expenses | 1,043 |
| Total liabilities | 62,004 |
| | | |
| | |
| Other commitments and contingencies (Note 4 of financial statements) | — |
| | |
| | | |
| Net assets applicable to participants’ equity— | | |
| Certificates of participation—authorized unlimited; | |
| Outstanding 5,647,940 units | $6,420,765 |
| | | |
| | |
| Net asset value per unit of participation (in dollars) | | $ 1,136.83 |
| | |
| | |
| | | |
| Participants’ equity | | |
| Participants’ equity consisted of the following: | |
| Amount invested and reinvested by current participants | $6,283,443 |
| Distributable earnings (accumulated losses) | 137,322 |
| Total participants’ equity | $6,420,765 |
See accompanying Notes to Financial Statements (unaudited).
| | |
| 8 | |
SCHEDULE OF PORTFOLIO INVESTMENTS
June 30, 2019 (dollars in thousands; unaudited)
| FHA PERMANENT SECURITIES(2.2% OF NET ASSETS) | |
| | | | | | | | |
| | | Interest Rate | Maturity Date | Face Amount | Amortized Cost | Value | |
| Multifamily | | 3.65 | % | | Dec-2037 | | $ 8,738 | | | $ 8,908 | | | $ 8,770 | | |
| | | 3.75 | % | | Aug-2048 | | 3,860 | | | 3,856 | | | 3,838 | | |
| | | 4.00 | % | | Dec-2053 | | 62,910 | | | 62,885 | | | 64,027 | | |
| | | 4.79 | % | | May-2053 | | 5,128 | | | 5,355 | | | 5,350 | | |
| | | 5.17 | % | | Feb-2050 | | 7,789 | | | 8,356 | | | 8,373 | | |
| | | 5.35 | % | | Mar-2047 | | 7,054 | | | 7,063 | | | 7,070 | | |
| | | 5.55 | % | | Aug-2042 | | 7,530 | | | 7,532 | | | 7,550 | | |
| | | 5.60 | % | | Jun-2038 | | 2,274 | | | 2,278 | | | 2,280 | | |
| | | 5.80 | % | | Jan-2053 | | 1,996 | | | 2,006 | | | 2,242 | | |
| | | 5.87 | % | | May-2044 | | 1,702 | | | 1,701 | | | 1,705 | | |
| | | 5.89 | % | | Apr-2038 | | 4,278 | | | 4,282 | | | 4,292 | | |
| | | 6.20 | % | | Apr-2052 | | 11,280 | | | 11,277 | | | 12,961 | | |
| | | 6.40 | % | | Aug-2046 | | 3,674 | | | 3,676 | | | 3,850 | | |
| | | 6.60 | % | | Jan-2050 | | 3,280 | | | 3,305 | | | 3,712 | | |
| | | 7.20 | % | | Oct-2039 | | 2,695 | | | 2,699 | | | 2,709 | | |
| | | 7.50 | % | | Sep-2032 | | 1,196 | | | 1,193 | | | 1,203 | | |
| Total FHA Permanent Securities | | | $135,384 | | | $136,372 | | | $139,932 | | |
| | | | | | | | | | | | | | |
| | | | | | | | | | | | | | |
| | | | | | | | | | | | | | |
| | | | | | | | | | | | | | |
| | | | | | | | | | | | | | |
| | | | | | | | | | | | | | |
| | | | | | | | | | | | | | |
| | | | | | | | | | | | | | |
| | | | | | | | | | | | | | |
| | | | | | | | | | | | | | |
| | | | | | | | | | | | | | |
FHA CONSTRUCTION SECURITIES(0.2% OF NET ASSETS)
| Interest Rates1 | | Maturity | | Unfunded | | Face | | Amortized | | |
| Permanent | Construction | | Date | | Commitments2 | | Amount | | Cost | | Value |
| Multifamily | 4.10% | 2.50% | | Oct-2060 | | $11,000 | | $11,000 | | $11,009 | | $10,137 |
| Total FHA Construction Securities | | | $11,000 | | $11,000 | | $11,009 | | $10,137 |
| | |
| 9 |
SCHEDULE OF PORTFOLIO INVESTMENTScontinued
June 30, 2019 (dollars in thousands; unaudited)
| GINNIE MAE SECURITIES(23.9% OF NET ASSETS) | |
| | | | | | | |
| | Interest Rate | Maturity Date | Face Amount | Amortized Cost | Value | |
| Single Family | 4.00% | Feb-2040–Jun-2040 | $ 2,859 | | $ 2,889 | | $ 3,015 | | |
| | 4.50% | Aug-2040 | 1,806 | | 1,840 | | 1,945 | | |
| | 5.50% | Jan-2033 –Jun-2037 | 1,871 | | 1,867 | | 2,083 | | |
| | 6.00% | Jan-2032–Aug-2037 | 1,198 | | 1,199 | | 1,363 | | |
| | 6.50% | Jul-2028 | 49 | | 49 | | 55 | | |
| | 7.00% | Apr-2026–Jan-2030 | 771 | | 774 | | 869 | | |
| | 7.50% | Aug-2025–Aug-2030 | 386 | | 388 | | 433 | | |
| | 8.00% | Sep-2026–Nov-2030 | 323 | | 327 | | 369 | | |
| | 8.50% | Jun-2022–Aug-2027 | 190 | | 190 | | 207 | | |
| | 9.00% | Dec-2022–Jun-2025 | 14 | | 14 | | 14 | | |
| | 9.50% | Sep-2021–Sep-2030 | 21 | | 21 | | 24 | | |
| | | | 9,488 | | 9,558 | | 10,377 | | |
| Multifamily | 1.73% | May-2042 | 1,757 | | 1,760 | | 1,741 | | |
| | 2.15% | May-2056 | 7,031 | | 7,017 | | 6,918 | | |
| | 2.18% | May-2039 | 1,674 | | 1,685 | | 1,668 | | |
| | 2.20% | Jun-2056 | 7,505 | | 7,488 | | 7,351 | | |
| | 2.25% | Dec-2048 | 9,711 | | 9,633 | | 9,589 | | |
| | 2.30% | Mar-2056–Oct-2056 | 75,252 | | 74,800 | | 73,907 | | |
| | 2.31% | Nov-2051 | 7,076 | | 7,076 | | 6,855 | | |
| | 2.35% | Dec-2040–Nov-2056 | 16,269 | | 16,321 | | 15,997 | | |
| | 2.40% | Aug-2047 | 11,004 | | 11,024 | | 10,870 | | |
| | 2.43% | Nov-2038 | 12,012 | | 12,058 | | 11,989 | | |
| | 2.50% | Jul-2045–Mar-2057 | 35,761 | | 35,768 | | 35,152 | | |
| | 2.50% | Sep-2058 | 38,405 | | 37,726 | | 37,668 | | |
| | 2.53% | Jul-2038–Feb-2040 | 23,818 | | 24,105 | | 23,675 | | |
| | 2.60% | Apr-2048–Apr-2056 | 50,373 | | 50,638 | | 50,141 | | |
| | 2.61% | Jan-2053 | 51,015 | | 51,416 | | 50,423 | | |
| | 2.70% | May-2048–Jul-2058 | 57,832 | | 58,209 | | 57,994 | | |
| | 2.72% | Feb-2044 | 505 | | 519 | | 505 | | |
| | 2.79% | Apr-2049 | 16,542 | | 16,710 | | 16,577 | | |
| | 2.80% | Feb-2053 | 60,000 | | 56,979 | | 58,482 | | |
| GINNIE MAE SECURITIEScontinued | | | |
| | | | | | | | | | |
| Interest Rate | | Maturity Date | | Face Amount | Amortized Cost | Value |
| 2.80% | | Dec-2059 | | $ 25,713 | | $ 25,345 | | $ 25,983 | |
| 2.82% | | Apr-2050 | | 1,500 | | 1,531 | | 1,509 | |
| 2.87% | | Feb-2036–Dec-2043 | | 21,268 | | 21,483 | | 21,307 | |
| 2.89% | | Mar-2046 | | 32,000 | | 32,201 | | 32,227 | |
| 3.00% | | Feb-2041–Mar-2051 | | 25,484 | | 25,571 | | 25,565 | |
| 3.05% | | May-2044 | | 29,244 | | 29,423 | | 29,294 | |
| 3.05% | | May-2054 | | 11,545 | | 11,600 | | 11,703 | |
| 3.10% | | Jan-2044–May-2059 | | 47,960 | | 48,152 | | 48,567 | |
| 3.11% | | Jan-2049 | | 17,025 | | 17,655 | | 17,314 | |
| 3.13% | | Nov-2040 | | 42 | | 43 | | 42 | |
| 3.20% | | Jul-2041–Sep-2051 | | 15,000 | | 14,900 | | 15,289 | |
| 3.25% | | Sep-2054 | | 35,000 | | 34,693 | | 36,038 | |
| 3.25% | | Apr-2059 | | 45,000 | | 43,113 | | 45,788 | |
| 3.26% | | Nov-2043 | | 20,000 | | 20,032 | | 20,548 | |
| 3.30% | | May-2055–Nov-2058 | | 30,388 | | 30,475 | | 31,720 | |
| 3.33% | | Jun-2043 | | 15,000 | | 15,470 | | 15,268 | |
| 3.35% | | Nov-2042–Mar-2044 | | 25,000 | | 24,516 | | 25,582 | |
| 3.36% | | Jul-2046 | | 7,760 | | 7,997 | | 7,985 | |
| 3.37% | | Dec-2046 | | 19,200 | | 19,444 | | 19,678 | |
| 3.40% | | Mar-2057 | | 5,099 | | 5,141 | | 5,417 | |
| 3.49% | | Feb-2044–Aug-2058 | | 15,281 | | 15,753 | | 16,176 | |
| 3.50% | | Feb-2051–Apr-2057 | | 78,989 | | 80,412 | | 83,228 | |
| 3.51% | | Sep-2041 | | 5,044 | | 5,337 | | 5,093 | |
| 3.52% | | May-2042–Apr-2051 | | 13,805 | | 14,084 | | 14,226 | |
| 3.53% | | Apr-2042 | | 17,376 | | 17,995 | | 18,558 | |
| 3.55% | | Apr-2057 | | 42,259 | | 43,372 | | 44,440 | |
| 3.57% | | Nov-2044 | | 13,693 | | 14,071 | | 13,880 | |
| 3.60% | | Jun-2057 | | 14,002 | | 14,531 | | 15,066 | |
| 3.61% | | Sep-2052 | | 6,500 | | 6,740 | | 6,785 | |
| 3.62% | | Dec-2057 | | 29,269 | | 29,820 | | 31,296 | |
| 3.67% | | Nov-2035 | | 15,541 | | 16,128 | | 16,553 | |
| | |
| 10 | |
SCHEDULE OF PORTFOLIO INVESTMENTScontinued
June 30, 2019 (dollars in thousands; unaudited)
| GINNIE MAE SECURITIEScontinued | | |
| | | | | | | | | | | | | |
| | | Interest Rate | | Maturity Date | | Face Amount | Amortized Cost | Value | |
| | | 3.68% | | Jun-2057 | | $ 27,159 | | $ 27,946 | | $ 29,260 | | |
| | | 3.68% | | Aug-2057 | | 14,466 | | 14,803 | | 15,597 | | |
| | | 3.72% | | Sep-2051 | | 6,475 | | 6,735 | | 6,562 | | |
| | | 3.73% | | Dec-2045 | | 8,583 | | 8,226 | | 9,183 | | |
| | | 3.75% | | Apr-2046 | | 6,836 | | 6,853 | | 7,035 | | |
| | | 3.80% | | Sep-2046 | | 3,756 | | 4,016 | | 3,778 | | |
| | | 3.81% | | Jun-2045 | | 17,200 | | 17,411 | | 17,555 | | |
| | | 3.85% | | Jan-2056 | | 31,952 | | 32,245 | | 34,460 | | |
| | | 3.91% | | May-2049 | | 4,091 | | 4,377 | | 4,106 | | |
| | | 3.92% | | Aug-2039 | | 45,045 | | 47,924 | | 47,890 | | |
| | | 4.10% | | May-2051 | | 3,969 | | 4,324 | | 4,335 | | |
| | | 4.25% | | Sep-2038 | | 34,316 | | 34,489 | | 36,200 | | |
| | | 4.29% | | Mar-2053 | | 47,116 | | 47,393 | | 52,005 | | |
| | | 4.45% | | Jun-2055 | | 2,553 | | 2,454 | | 2,792 | | |
| | | 4.50% | | May-2038 | | 18,210 | | 19,648 | | 19,275 | | |
| | | 4.63%3 | | Sep-2037 | | 1,500 | | 1,465 | | 1,503 | | |
| | | 4.70% | | Oct-2056 | | 3,323 | | 3,490 | | 3,711 | | |
| | | 4.90%3 | | Mar-2044 | | 1,000 | | 991 | | 1,003 | | |
| | | 5.25% | | Apr-2037 | | 18,365 | | 18,360 | | 19,314 | | |
| | | 5.34% | | Jul-2040 | | 5,827 | | 5,757 | | 5,984 | | |
| | | | | | | 1,466,271 | | 1,476,867 | | 1,501,175 | | |
| When Issued4 | | 3.53% | | Jul-2054 | | 24,000 | | 25,695 | | 25,750 | | |
| Total Ginnie Mae Securities | | | | $1,499,759 | | $1,512,120 | | $1,537,302 | | |
| | | | | | | | | | | | | |
| | | | | | | | | | | | | |
| | | | | | | | | | | | | |
| | | | | | | | | | | | | |
| | | | | | | | | | | | | |
| | | | | | | | | | | | | |
| | | | | | | | | | | | | |
| | | | | | | | | | | | | |
GINNIE MAE CONSTRUCTION SECURITIES(6.1% OF NET ASSETS)
| | | Interest Rates1 | | Maturity | | Unfunded | Face | Amortized | | |
| | | Permanent | | Construction | | Date | | Commitments2 | Amount | Cost | Value |
| Multifamily | | 3.25% | | 3.25% | | Jun-2059 | | $ 2,691 | | $ 28,809 | | $ 29,443 | | $ 30,367 | |
| | | 3.34% | | 3.34% | | Sep-2059 | | 5,052 | | 37,711 | | 38,567 | | 40,156 | |
| | | 3.35% | | 3.35% | | Aug-2059 | | 1,553 | | 5,134 | | 5,337 | | 5,472 | |
| | | 3.38% | | 3.38% | | Aug-2059 | | 16,577 | | 18,958 | | 19,848 | | 20,457 | |
| | | 3.38% | | 3.38% | | Aug-2059 | | 3,550 | | 41,135 | | 42,033 | | 43,894 | |
| | | 3.38% | | 3.38% | | Jan-2060 | | 7,631 | | 52,773 | | 52,784 | | 56,323 | |
| | | 3.39% | | 3.39% | | Feb-2059 | | 857 | | 13,818 | | 14,113 | | 14,724 | |
| | | 3.48% | | 3.48% | | May-2059 | | 1,014 | | 13,564 | | 13,869 | | 14,545 | |
| | | 3.57% | | 3.57% | | Nov-2059 | | 15,995 | | 33,765 | | 34,513 | | 37,168 | |
| | | 3.60% | | 3.60% | | May-2061 | | 33,859 | | — | | 1,185 | | 1,074 | |
| | | 3.65% | | 3.65% | | Nov-2058 | | 159 | | 10,437 | | 10,602 | | 11,060 | |
| | | 3.74% | | 4.24% | | Aug-2059 | | 1,299 | | 14,636 | | 14,955 | | 15,981 | |
| | | 3.75% | | 3.75% | | Dec-2060 | | 14,034 | | — | | 421 | | 631 | |
| | | 3.78% | | 7.00% | | Aug-2060 | | 39,915 | | 25 | | 329 | | 2,527 | |
| | | 4.15% | | 4.15% | | Sep-2051 | | 455 | | 17,412 | | 17,474 | | 17,511 | |
| | | 4.15% | | 4.15% | | Apr-2060 | | 6,333 | | 20,991 | | 21,679 | | 24,154 | |
| | | 4.19% | | 4.19% | | May-2060 | | 23,941 | | 4,649 | | 5,035 | | 7,254 | |
| | | 4.20% | | 4.20% | | Aug-2060 | | 21,937 | | 25,822 | | 26,782 | | 30,790 | |
| | | 4.21% | | 4.21% | | Jun-2061 | | 51,940 | | — | | 260 | | 4,304 | |
| | | 4.29% | | 4.29% | | Jan-2060 | | 1,322 | | 5,603 | | 5,752 | | 6,404 | |
| | | 4.35% | | 4.35% | | Feb-2061 | | 11,890 | | — | | 238 | | 238 | |
| | | 4.35% | | 4.35% | | Dec-2060 | | 2,185 | | 115 | | 157 | | 327 | |
| | | 4.40% | | 4.40% | | Sep-2060 | | 8,700 | | 500 | | 709 | | 1,439 | |
| | | 4.53% | | 4.53% | | Jan-2061 | | 12,313 | | 2,602 | | 3,058 | | 4,259 | |
| Total Ginnie Mae Construction Securities | | | | $285,202 | | $348,459 | | $359,143 | | $391,059 | |
| | |
| 11 |
SCHEDULE OF PORTFOLIO INVESTMENTScontinued
June 30, 2019 (dollars in thousands; unaudited)
FANNIE MAE SECURITIES(42.4% OF NET ASSETS)
| | | | | | Maturity | | Face | Amortized | | | |
| | | Interest Rate5 | | Date | | Amount | Cost | Value | |
| Single Family | | 2.58% | 12M LIBOR+169 | | Oct-2042 | | $ 8,201 | | $ 8,378 | | $ 8,405 | | |
| | | 2.65% | 1M LIBOR+25 | | Mar-2037 | | 244 | | 241 | | 242 | | |
| | | 2.70% | 1M LIBOR+30 | | Jul-2043 | | 10,267 | | 10,204 | | 10,161 | | |
| | | 2.72% | 1M LIBOR+32 | | Jun-2037 | | 1,301 | | 1,302 | | 1,296 | | |
| | | 2.75% | 1M LIBOR+35 | | Mar-2043–Nov-2047 | | 41,441 | | 41,458 | | 41,115 | | |
| | | 2.78% | 1M LIBOR+38 | | Nov-2042 | | 5,176 | | 5,177 | | 5,145 | | |
| | | 2.80% | 1M LIBOR+40 | | Apr-2037–Oct-2044 | | 13,712 | | 13,734 | | 13,655 | | |
| | | 2.85% | 1M LIBOR+45 | | Oct-2042 | | 7,473 | | 7,514 | | 7,460 | | |
| | | 2.86% | 1M LIBOR+46 | | Oct-2042 | | 4,502 | | 4,521 | | 4,507 | | |
| | | 2.90% | 1M LIBOR+50 | | Dec-2040–Feb-2043 | | 27,296 | | 27,229 | | 27,327 | | |
| | | 2.92% | 1M LIBOR+52 | | Jun-2042 | | 3,149 | | 3,165 | | 3,154 | | |
| | | 2.95% | 1M LIBOR+55 | | Mar-2042 | | 7,108 | | 7,120 | | 7,130 | | |
| | | 2.99% | 1M LIBOR+59 | | Mar-2041 | | 4,379 | | 4,411 | | 4,402 | | |
| | | 3.00% | 1M LIBOR+60 | | Apr-2031–Jun-2046 | | 63,001 | | 64,644 | | 63,880 | | |
| | | 3.10% | 1M LIBOR+70 | | Dec-2040 | | 2,190 | | 2,196 | | 2,204 | | |
| | | 3.50% | | | Oct-2026–Jan-2048 | | 200,663 | | 205,792 | | 206,986 | | |
| | | 4.00% | | | May-2020–Jun-2048 | | 146,115 | | 151,020 | | 152,492 | | |
| | | 4.14% | 12M LIBOR+153 | | Feb-2045 | | 7,296 | | 7,436 | | 7,509 | | |
| | | 4.20% | 6M LIBOR+155 | | Nov-2033 | | 1,435 | | 1,435 | | 1,477 | | |
| | | 4.29% | | | Jul-2033 | | 206 | | 206 | | 215 | | |
| | | 4.43% | 1Y UST+222 | | Jul-2033 | | 1,107 | | 1,110 | | 1,166 | | |
| | | 4.47% | 1Y UST+222 | | Aug-2033 | | 534 | | 533 | | 562 | | |
| | | 4.48% | 6M LIBOR+161 | | Aug-2033 | | 142 | | 142 | | 147 | | |
| | | 4.49% | 12M LIBOR+156 | | Apr-2034 | | 699 | | 713 | | 730 | | |
| | | 4.50% | | | May-2024–Dec-2048 | | 111,446 | | 115,559 | | 117,706 | | |
| | | 4.52% | | | Aug-2033 | | 794 | | 793 | | 836 | | |
| | | 4.54% | 12M LIBOR+167 | | Nov-2034 | | 626 | | 639 | | 655 | | |
| | | 4.63% | 1Y UST+211 | | May-2033 | | 345 | | 346 | | 363 | | |
| | | 5.00% | | | Nov-2019–Apr-2041 | | 11,392 | | 11,725 | | 12,342 | | |
| | | 5.50% | | | May-2020–Jun-2038 | | 5,392 | | 5,409 | | 5,982 | | |
| | | 6.00% | | | Nov-2028–Nov-2037 | | 3,800 | | 3,815 | | 4,331 | | |
| | | 6.50% | | | Sep-2028–Jul-2036 | | 610 | | 623 | | 692 | | |
| | | 7.00% | | | Sep-2027–May-2032 | | 736 | | 736 | | 837 | | |
| | | 7.50% | | | Jan-2027–Sep-2031 | | 264 | | 264 | | 294 | | |
| | | 8.00% | | | Apr-2030–May-2031 | | 48 | | 49 | | 49 | | |
| | | | | | | | 693,090 | | 709,639 | | 715,454 | | |
FANNIE MAE SECURITIEScontinued
| | | | | | Maturity | | Face | Amortized | | |
| | | Interest Rate5 | | Date | | Amount | Cost | Value |
| Multifamily | | 2.21% | | | Dec-2022 | | $ 29,255 | | $ 29,260 | | $ 29,432 | |
| | | 2.24% | | | Dec-2022 | | 29,486 | | 29,491 | | 29,693 | |
| | | 2.26% | | | Nov-2022 | | 6,147 | | 6,154 | | 6,195 | |
| | | 2.34% | | | Sep-2026 | | 28,500 | | 28,618 | | 28,561 | |
| | | 2.38% | | | Jul-2026 | | 21,840 | | 21,869 | | 21,945 | |
| | | 2.44% | | | Aug-2026 | | 22,400 | | 22,400 | | 22,526 | |
| | | 2.46% | | | Aug-2026 | | 25,830 | | 25,838 | | 25,619 | |
| | | 2.48% | | | Oct-2028 | | 24,990 | | 25,074 | | 25,069 | |
| | | 2.49% | | | Dec-2026 | | 16,324 | | 16,359 | | 16,537 | |
| | | 2.50% | | | Jun-2026 | | 60,000 | | 60,000 | | 60,621 | |
| | | 2.50% | | | Jul-2026 | | 37,680 | | 37,745 | | 37,954 | |
| | | 2.57% | | | Sep-2028 | | 40,100 | | 40,572 | | 40,621 | |
| | | 2.70% | | | Nov-2025 | | 15,540 | | 15,554 | | 15,956 | |
| | | 2.71% | 1M LIBOR+28 | | Mar-2028 | | 35,971 | | 35,971 | | 36,031 | |
| | | 2.72% | 1M LIBOR+29 | | Feb-2028 | | 30,420 | | 30,427 | | 30,473 | |
| | | 2.72% | | | Jul-2028 | | 36,400 | | 36,751 | | 37,174 | |
| | | 2.74% | 1M LIBOR+31 | | Mar-2028 | | 38,275 | | 38,289 | | 38,340 | |
| | | 2.75% | | | Jul-2028 | | 15,522 | | 15,686 | | 15,886 | |
| | | 2.77% | 1M LIBOR+34 | | Dec-2024 | | 60,000 | | 60,006 | | 60,036 | |
| | | 2.77% | 1M LIBOR+34 | | Jan-2028 | | 22,425 | | 22,430 | | 22,446 | |
| | | 2.78% | 1M LIBOR+35 | | Dec-2027–Jan-2028 | | 52,050 | | 52,060 | | 52,115 | |
| | | 2.80% | | | Apr-2025 | | 15,714 | | 15,858 | | 15,867 | |
| | | 2.81% | | | Sep-2027 | | 12,400 | | 12,484 | | 12,709 | |
| | | 2.83% | 1M LIBOR+40 | | Sep-2028 | | 26,082 | | 26,086 | | 26,133 | |
| | | 2.84% | 1M LIBOR+40 | | Oct-2024 | | 8,490 | | 8,484 | | 8,434 | |
| | | 2.85% | | | Mar-2022 | | 33,000 | | 33,000 | | 33,654 | |
| | | 2.85% | | | Dec-2027 | | 23,590 | | 23,649 | | 24,345 | |
| | | 2.85% | 1M LIBOR+42 | | Aug-2027 | | 35,483 | | 35,491 | | 35,525 | |
| | | 2.87% | 1M LIBOR+44 | | May-2027 | | 16,840 | | 16,842 | | 16,864 | |
| | | 2.87% | | | Oct-2027 | | 9,425 | | 9,522 | | 9,699 | |
| | | 2.91% | | | Jun-2031 | | 25,000 | | 25,189 | | 25,648 | |
| | | 2.92% | | | Jun-2027 | | 69,940 | | 70,047 | | 72,192 | |
| | | 2.92% | | | Apr-2028 | | 15,950 | | 16,044 | | 16,463 | |
| | | 2.94% | | | Jun-2027 | | 29,000 | | 29,046 | | 29,796 | |
| | | 2.94% | | | Jul-2039 | | 11,276 | | 11,417 | | 11,557 | |
| | |
| 12 | |
SCHEDULE OF PORTFOLIO INVESTMENTScontinued
June 30, 2019 (dollars in thousands; unaudited)
| FANNIE MAE SECURITIEScontinued | | | | | | | | |
| | | | | | | | | | | | | | |
| | | | | | | | Face | Amortized | | | |
| | | Interest Rate5 | | Maturity Date | | Amount | Cost | Value | |
| | | 2.97% | | | May-2026–Nov-2032 | | $ 33,055 | | $ 33,452 | | $ 33,962 | | |
| | | 2.99% | | | Jun-2025 | | 2,707 | | 2,712 | | 2,832 | | |
| | | 3.00% | | | May-2027–Mar-2028 | | 16,003 | | 16,032 | | 16,655 | | |
| | | 3.01% | 1M LIBOR+58 | | May-2029 | | 25,000 | | 25,015 | | 25,015 | | |
| | | 3.02% | | | Jun-2027–Nov-2029 | | 40,007 | | 40,185 | | 41,652 | | |
| | | 3.02% | 1M LIBOR+58 | | Jun-2029 | | 41,302 | | 41,351 | | 41,365 | | |
| | | 3.04% | | | Sep-2027 | | 30,000 | | 30,189 | | 30,940 | | |
| | | 3.04% | | | Apr-2030 | | 25,100 | | 25,192 | | 25,999 | | |
| | | 3.05% | | | Apr-2030 | | 27,684 | | 27,718 | | 28,873 | | |
| | | 3.10% | | | Sep-2029 | | 8,515 | | 8,556 | | 8,897 | | |
| | | 3.12% | | | Mar-2025–Apr-2030 | | 26,180 | | 26,311 | | 26,759 | | |
| | | 3.14% | | | Apr-2029 | | 7,889 | | 7,911 | | 8,296 | | |
| | | 3.15% | | | Jan-2027 | | 20,183 | | 20,212 | | 21,225 | | |
| | | 3.17% | | | Jun-2029–Sep-2029 | | 61,557 | | 61,965 | | 64,443 | | |
| | | 3.18% | | | Sep-2029–May-2035 | | 22,179 | | 22,510 | | 22,937 | | |
| | | 3.20% | | | Oct-2027 | | 10,367 | | 10,425 | | 10,962 | | |
| | | 3.21% | | | May-2030 | | 6,960 | | 7,074 | | 7,302 | | |
| | | 3.24% | | | Aug-2027 | | 9,386 | | 9,516 | | 9,741 | | |
| | | 3.25% | | | Nov-2027 | | 10,361 | | 10,419 | | 10,995 | | |
| | | 3.26% | | | Jan-2027 | | 7,470 | | 7,493 | | 7,923 | | |
| | | 3.29% | 1M LIBOR+85 | | Jan-2023 | | 8,044 | | 8,042 | | 8,077 | | |
| | | 3.31% | | | Oct-2027 | | 15,921 | | 16,076 | | 16,957 | | |
| | | 3.32% | | | Apr-2029 | | 20,080 | | 20,183 | | 21,194 | | |
| | | 3.33% | | | May-2026 | | 11,085 | | 11,139 | | 11,791 | | |
| | | 3.34% | | | Dec-2029–Jan-2030 | | 29,350 | | 29,828 | | 30,760 | | |
| | | 3.35% | | | Feb-2029 | | 19,590 | | 19,855 | | 20,966 | | |
| | | 3.36% | | | Dec-2023–Oct-2029 | | 42,415 | | 43,952 | | 45,232 | | |
| | | 3.40% | | | Oct-2026 | | 2,951 | | 2,965 | | 3,142 | | |
| | | 3.41% | | | Sep-2023–Apr-2029 | | 55,375 | | 55,828 | | 58,839 | | |
| | | 3.42% | | | Apr-2035 | | 5,363 | | 5,450 | | 5,586 | | |
| | | 3.46% | | | Dec-2023–Apr-2031 | | 16,221 | | 16,330 | | 17,436 | | |
| | | 3.54% | | | Oct-2021 | | 6,882 | | 6,885 | | 7,092 | | |
| | | 3.61% | | | Sep-2023 | | 6,320 | | 6,345 | | 6,714 | | |
| | | 3.63% | | | Jul-2035 | | 21,986 | | 22,021 | | 23,436 | | |
| | | 3.65% | | | Apr-2031 | | 9,700 | | 9,829 | | 10,609 | | |
FANNIE MAE SECURITIEScontinued
| | | | | | | | Face | Amortized | | |
| | | Interest Rate5 | | Maturity Date | | Amount | Cost | Value |
| | | 3.66% | | | Oct-2023 | | $ 4,638 | | $ 4,659 | | $ 4,942 | |
| | | 3.67% | | | Mar-2028 | | 14,080 | | 14,306 | | 15,105 | |
| | | 3.69% | | | Jun-2030 | | 24,862 | | 24,863 | | 27,260 | |
| | | 3.77% | | | Dec-2033 | | 10,500 | | 10,706 | | 11,258 | |
| | | 3.87% | | | Sep-2023 | | 2,441 | | 2,464 | | 2,612 | |
| | | 4.06% | | | Oct-2025 | | 23,138 | | 23,186 | | 25,397 | |
| | | 4.15% | | | Jun-2021 | | 8,772 | | 8,773 | | 9,067 | |
| | | 4.25% | | | May-2021 | | 3,942 | | 3,942 | | 4,067 | |
| | | 4.27% | | | Jan-2034 | | 75,058 | | 75,369 | | 84,055 | |
| | | 4.32% | | | Nov-2019 | | 735 | | 735 | | 738 | |
| | | 4.33% | | | Nov-2019 –Mar-2021 | | 10,412 | | 10,414 | | 10,555 | |
| | | 4.44% | | | May-2020 | | 5,531 | | 5,531 | | 5,597 | |
| | | 4.50% | | | Feb-2020 | | 3,895 | | 3,895 | | 3,924 | |
| | | 4.52% | | | May-2021 | | 3,876 | | 3,878 | | 4,021 | |
| | | 4.69% | | | Jan-2020–Jun-2035 | | 12,880 | | 12,896 | | 13,043 | |
| | | 4.71% | | | Mar-2021 | | 5,436 | | 5,438 | | 5,630 | |
| | | 4.73% | | | Feb-2021 | | 1,432 | | 1,432 | | 1,481 | |
| | | 5.15% | | | Oct-2022 | | 1,164 | | 1,166 | | 1,222 | |
| | | 5.25% | | | Jan-2020 | | 6,258 | | 6,259 | | 6,324 | |
| | | 5.29% | | | May-2022 | | 4,837 | | 4,837 | | 5,199 | |
| | | 5.30% | | | Aug-2029 | | 5,080 | | 5,023 | | 5,844 | |
| | | 5.60% | | | Jan-2024 | | 9,273 | | 9,273 | | 9,875 | |
| | | 5.69% | | | Jun-2041 | | 4,516 | | 4,626 | | 5,203 | |
| | | 5.75% | | | Jun-2041 | | 2,191 | | 2,253 | | 2,526 | |
| | | 5.91% | | | Mar-2037 | | 1,737 | | 1,764 | | 1,891 | |
| | | 5.96% | | | Jan-2029 | | 303 | | 303 | | 307 | |
| | | 6.15% | | | Jan-2023 | | 3,395 | | 3,395 | | 3,433 | |
| | | 6.23% | | | Sep-2034 | | 1,179 | | 1,208 | | 1,204 | |
| | | 6.38% | | | Jul-2021 | | 4,757 | | 4,758 | | 5,032 | |
| | | 7.20% | | | Aug-2029 | | 671 | | 666 | | 680 | |
| | | 7.75% | | | Dec-2024 | | 965 | | 965 | | 976 | |
| | | 8.40% | | | Jul-2023 | | 212 | | 211 | | 214 | |
| | | | | | | | 1,942,699 | | 1,951,873 | | 2,005,402 | |
| Total Fannie Mae Securities | | | | $2,635,789 | | $2,661,512 | | $2,720,856 | |
| | |
| 13 |
SCHEDULE OF PORTFOLIO INVESTMENTScontinued
June 30, 2019 (dollars in thousands; unaudited)
| FREDDIE MAC SECURITIES(12.2% OF NET ASSETS) | | | | | | |
| | | | | | | | | | | | | |
| | | | | | | Face | Amortized | | | |
| | | Interest Rate5 | Maturity Date | | Amount | Cost | Value | |
| Single Family | | 2.50% | | Jan-2043–Aug-2046 | | $ 16,139 | | $ 16,361 | | $ 16,062 | | |
| | | 2.69% 1M LIBOR+30 | | Feb-2036 | | 846 | | 846 | | 844 | | |
| | | 2.72% 1M LIBOR+33 | | May-2037 | | 79 | | 79 | | 78 | | |
| | | 2.74% 1M LIBOR+35 | | Apr-2036–Mar-2045 | | 23,038 | | 23,054 | | 22,858 | | |
| | | 2.79% 1M LIBOR+40 | | Aug-2043 | | 4,314 | | 4,312 | | 4,294 | | |
| | | 2.87% 1M LIBOR+48 | | Oct-2040 | | 3,458 | | 3,456 | | 3,458 | | |
| | | 2.89% 1M LIBOR+50 | | Oct-2040–Jun-2044 | | 30,696 | | 30,709 | | 30,725 | | |
| | | 2.94% 1M LIBOR+55 | | Nov-2040 | | 4,109 | | 4,145 | | 4,122 | | |
| | | 3.00% | | Aug-2042 –Sep-2046 | | 65,762 | | 67,204 | | 66,856 | | |
| | | 3.06% 1M LIBOR+67 | | Aug-2037 | | 3,483 | | 3,521 | | 3,509 | | |
| | | 3.50% | | Jan-2026–Oct-2046 | | 162,824 | | 166,918 | | 168,249 | | |
| | | 4.00% | | Aug-2020–Aug-2047 | | 147,923 | | 154,095 | | 154,428 | | |
| | | 4.00% | | Sep-2045 | | 27,161 | | 28,367 | | 28,354 | | |
| | | 4.50% | | Jan-2038–Dec-2044 | | 45,004 | | 47,028 | | 48,148 | | |
| | | 4.52% 12M LIBOR+177 | | Jul-2035 | | 117 | | 117 | | 123 | | |
| | | 4.60% 1Y UST+223 | | Oct-2033 | | 405 | | 403 | | 426 | | |
| | | 4.72% 1Y UST+222 | | Jun-2033 | | 191 | | 191 | | 201 | | |
| | | 5.00% | | Nov-2019–Mar-2041 | | 5,439 | | 5,456 | | 5,850 | | |
| | | 5.50% | | May-2020–Jul-2038 | | 2,992 | | 2,982 | | 3,333 | | |
| | | 6.00% | | Jul-2021–Feb-2038 | | 4,292 | | 4,335 | | 4,888 | | |
| | | 6.50% | | Apr-2028–Nov-2037 | | 620 | | 626 | | 716 | | |
| | | 7.00% | | Apr-2028–Mar-2030 | | 49 | | 46 | | 57 | | |
| | | 7.50% | | Aug-2029–Apr-2031 | | 47 | | 45 | | 53 | | |
| | | 8.00% | | Dec-2029 | | 1 | | 1 | | 1 | | |
| | | 8.50% | | Jul-2024 –Jan-2025 | | 55 | | 55 | | 60 | | |
| | | 9.00% | | Mar-2025 | | 29 | | 29 | | 32 | | |
| | | | | | | 549,073 | | 564,381 | | 567,725 | | |
| Multifamily | | 2.76% 1M LIBOR+33 | | Sep-2024 | | 18,632 | | 18,632 | | 18,594 | | |
| | | 2.85% 1M LIBOR+42 | | May-2027 | | 15,314 | | 15,313 | | 15,278 | | |
| | | 2.96% 1M LIBOR+53 | | Jan-2029 | | 15,000 | | 15,000 | | 15,005 | | |
| | | 3.08% 1M LIBOR+65 | | Jan-2023 | | 4,208 | | 4,208 | | 4,210 | | |
FREDDIE MAC SECURITIEScontinued
| | | | | | | | Face | Amortized | | |
| | | Interest Rate5 | | Maturity Date | | Amount | Cost | Value |
| | | 3.13% | 1M LIBOR+70 | | Sep-2022 | | $7,114 | | $ 7,110 | | $ 7,120 | |
| | | 3.28% | | | Dec-2029 | | 16,684 | | 16,993 | | 17,710 | |
| | | 3.34% | | | Dec-2029 | | 9,797 | | 10,022 | | 10,450 | |
| | | 3.35% | | | Oct-2033 | | 33,450 | | 33,266 | | 34,796 | |
| | | 3.38% | | | Apr-2030 | | 14,447 | | 14,823 | | 15,470 | |
| | | 3.48% | | | Jun-2030 | | 18,856 | | 19,489 | | 20,362 | |
| | | 3.50% | | | Jan-2026 | | 18,000 | | 18,160 | | 19,104 | |
| | | 3.60% | | | Apr-2030 | | 25,804 | | 26,894 | | 28,110 | |
| | | 3.68% | | | Oct-2025 | | 10,000 | | 10,214 | | 10,700 | |
| | | | | | | | 207,306 | | 210,124 | | 216,909 | |
| Total Freddie Mac Securities | | | $756,379 | | $774,505 | | $784,634 | |
| | |
| 14 | |
SCHEDULE OF PORTFOLIO INVESTMENTScontinued
June 30, 2019 (dollars in thousands; unaudited)
STATE HOUSING FINANCE AGENCY SECURITIES(4.7% OF NET ASSETS)
| | | Interest Rates1 | | Unfunded | | Amortized | |
| | Issuer | Permanent | | Construction | Maturity Date | Commitments2 | Face Amount | Cost | Value |
| Multifamily | Connecticut Housing Finance Auth6 | — | | 3.25% | Nov-2019 | $1,265 | | $ 21,235 | | $ 21,196 | | $ 21,175 | |
| | NYC Housing Development Corp | 2.95% | | — | Nov-2045 | — | | 5,000 | | 5,000 | | 5,235 | |
| | NYC Housing Development Corp | 3.10% | | — | Oct-2046 | — | | 24,451 | | 24,451 | | 24,275 | |
| | NYC Housing Development Corp | 3.25% | | — | Nov-2049 | — | | 12,000 | | 12,000 | | 12,038 | |
| | Connecticut Housing Finance Auth | 3.25% | | — | May-2050 | — | | 12,500 | | 12,385 | | 12,374 | |
| | NYC Housing Development Corp | 3.35% | | — | Nov-2054 | — | | 20,000 | | 20,000 | | 20,064 | |
| | NYC Housing Development Corp | 3.45% | | — | May-2059 | — | | 20,000 | | 20,000 | | 20,057 | |
| | NYC Housing Development Corp | 3.75% | | — | May-2035 | — | | 4,405 | | 4,405 | | 4,569 | |
| | Mass Housing6 | 3.85% | | — | Dec-2058 | — | | 9,895 | | 9,892 | | 9,903 | |
| | NYC Housing Development Corp | 3.95% | | — | Nov-2043 | — | | 15,000 | | 15,000 | | 15,721 | |
| | NYC Housing Development Corp | 4.00% | | — | Dec-2028–Nov-2048 | — | | 15,000 | | 15,103 | | 15,777 | |
| | MassHousing | 4.04% | | — | Nov-2032 | — | | 1,305 | | 1,305 | | 1,338 | |
| | MassHousing | 4.13% | | — | Dec-2036 | — | | 5,000 | | 5,000 | | 5,218 | |
| | NYC Housing Development Corp | 4.13% | | — | Nov-2053 | — | | 10,000 | | 10,000 | | 10,619 | |
| | NYC Housing Development Corp | 4.20% | | — | Dec-2039 | — | | 8,305 | | 8,305 | | 8,605 | |
| | NYC Housing Development Corp | 4.25% | | — | Nov-2025 | — | | 1,150 | | 1,150 | | 1,160 | |
| | NYC Housing Development Corp | 4.29% | | — | Nov-2037 | — | | 1,190 | | 1,190 | | 1,222 | |
| | Chicago Housing Authority | 4.36% | | — | Jan-2038 | — | | 25,000 | | 25,000 | | 27,426 | |
| | NYC Housing Development Corp | 4.44% | | — | Nov-2041 | — | | 1,120 | | 1,120 | | 1,152 | |
| | NYC Housing Development Corp | 4.49% | | — | Nov-2044 | — | | 455 | | 455 | | 467 | |
| | NYC Housing Development Corp | 4.50% | | — | Nov-2030 | — | | 1,680 | | 1,682 | | 1,698 | |
| | MassHousing | 4.50% | | — | Jun-2056 | — | | 45,000 | | 45,000 | | 46,468 | |
| | NYC Housing Development Corp | 4.60% | | — | Nov-2030 | — | | 4,665 | | 4,665 | | 4,709 | |
| | NYC Housing Development Corp | 4.70% | | — | Nov-2035 | — | | 1,685 | | 1,685 | | 1,705 | |
| | NYC Housing Development Corp | 4.78% | | — | Aug-2026 | — | | 12,500 | | 12,502 | | 12,930 | |
| | NYC Housing Development Corp | 4.80% | | — | Nov-2040 | — | | 2,860 | | 2,862 | | 2,892 | |
| | NYC Housing Development Corp | 4.90% | | — | Nov-2041 | — | | 3,800 | | 3,800 | | 3,840 | |
| | NYC Housing Development Corp | 4.95% | | — | Nov-2043–May-2047 | — | | 7,800 | | 7,802 | | 7,894 | |
| Total State Housing Finance Agency Securities | | | | | $1,265 | | $293,001 | | $292,955 | | $300,531 | |
| | |
| 15 |
SCHEDULE OF PORTFOLIO INVESTMENTScontinued
June 30, 2019 (dollars in thousands; unaudited)
OTHER MULTIFAMILY INVESTMENTS(0.2% OF NET ASSETS) |
| | | | | | | |
| | Interest Rates1 | Maturity | Face | Amortized | |
| Issuer | Permanent | Construction | Date | Amount | Cost | Value | |
| Privately Insured Construction/Permanent Mortgages7 | | | | | | |
| IL Housing Development Authority | 5.40% | — | Mar-2047 | $ 7,897 | | $ 7,900 | | $ 7,880 | |
| IL Housing Development Authority | 6.20% | — | Dec-2047 | 3,008 | | 3,017 | | 2,998 | |
| IL Housing Development Authority | 6.40% | — | Nov-2048 | 912 | | 922 | | 909 | |
| Total Other Multifamily Investments | | | $11,817 | | $11,839 | | $11,787 | |
| | | | | | | | | | |
| | | | | | | | | | |
| | | | | | | | | | |
| | | | | | | | | | |
| | | | | | | | | | |
| | | | | | | | | | |
| | | | | | | | | | |
| | | | | | | | | | |
| | | | | | | | | | |
| | | | | | | | | | |
| | | | | | | | | | |
| | | | | | | | | | |
| | | | | | | | | | |
| | | | | | | | | | |
| | | | | | | | | | |
| | | | | | | | | | |
COMMERCIAL MORTGAGE-BACKED SECURITIES(1.9% OF NET ASSETS) | |
| | | | | | | | | |
| | | Maturity | Face | Amortized | | |
| Issuer | Interest Rate | Date | Amount | Cost | Value | |
| Nomura | 2.77% | Dec-2045 | $ 10,000 | | $ 10,148 | | $ 10,167 | |
| Nomura | 3.19% | Mar-2046 | 20,000 | | 20,355 | | 20,578 | |
| JP Morgan | 3.48% | Jun-2045 | 10,000 | | 10,421 | | 10,234 | |
| Citigroup | 3.62% | Jul-2047 | 8,000 | | 8,193 | | 8,457 | |
| Barclays/JP Morgan | 3.81% | Jul-2047 | 2,250 | | 2,304 | | 2,386 | |
| RBS/Wells Fargo | 3.82% | Aug-2050 | 5,000 | | 5,125 | | 5,307 | |
| Deutsche Bank/UBS | 3.96% | Mar-2047 | 5,000 | | 5,121 | | 5,321 | |
| Barclays/JP Morgan | 4.00% | Apr-2047 | 5,000 | | 5,121 | | 5,332 | |
| Cantor/Deutsche Bank | 4.01% | Apr-2047 | 20,000 | | 20,483 | | 21,356 | |
| Barclays/JP Morgan | 4.08% | Feb-2047 | 6,825 | | 7,144 | | 7,302 | |
| Cantor/Deutsche Bank | 4.24% | Feb-2047 | 7,000 | | 7,167 | | 7,536 | |
| Deutsche Bank | 5.00% | Nov-2046 | 18,990 | | 19,407 | | 19,527 | |
| Total Commercial Mortgage Backed Securities | | $118,065 | | $120,989 | | $123,503 | |
| | |
| 16 | |
SCHEDULE OF PORTFOLIO INVESTMENTScontinued
June 30, 2019 (dollars in thousands; unaudited)
UNITED STATES TREASURY SECURITIES(4.3% OF NET ASSETS) | |
| | | | | | | | | |
| | | Maturity | Face | | Amortized | | | |
| | Interest Rate | Date | Amount | | Cost | | Value | |
| | 1.63% | May-2026 | $ 10,000 | | $ 10,067 | | $ 9,841 | |
| | 2.13% | May-2025 | 15,000 | | 14,898 | | 15,253 | |
| | 2.25% | Nov-2024 | 30,000 | | 30,505 | | 30,696 | |
| | 2.25% | Nov-2025 | 5,000 | | 5,079 | | 5,120 | |
| | 2.38% | Aug-2024 | 50,000 | | 50,314 | | 51,457 | |
| | 2.38% | May-2029 | 60,000 | | 61,571 | | 62,006 | |
| | 2.63% | Feb-2029 | 65,000 | | 67,024 | | 68,546 | |
| | 2.88% | Aug-2028 | 10,000 | | 9,826 | | 10,747 | |
| | 3.13% | Nov-2028 | 20,000 | | 20,469 | | 21,937 | |
| Total United States Treasury Securities | $ 265,000 | | $ 269,753 | | $ 275,603 | |
| | | | | | | | |
| Total Fixed-Income Investments | | $6,074,653 | | $6,150,197 | | $6,295,344 | |
| | | | | | | | |
| | | | | | | | |
| | | | | | | | |
| | | | | | | | |
| | | | | | | | |
| | | | | | | | |
| | | | | | | | |
| | | | | | | | |
| | | | | | | | |
| | | | | | | | |
| | | | | | | | |
| | | | | | | | |
| | | | | | | | |
| | | | | | | | |
EQUITY INVESTMENT IN WHOLLY-OWNED SUBSIDIARY
(LESS THAN 0.01% OF NET ASSETS) |
| | | | |
| Issuer | Amount of Dividends or
Interest | Face Amount
(Cost) | Value |
| HIT Advisers8(Level 3) | $ — | $1 | $(395) |
| Total Equity Investment | $— | $1 | $(395) |
SHORT-TERM INVESTMENTS(2.5% OF NET ASSETS) | |
| | | | | | | | | |
| | | Maturity | Face | Amortized | | |
| Issuer | Interest Rate | Date | Amount | Cost | Value |
| Commercial Paper | | | | | | | | |
| Halkin Finance, LLC | 2.38%9 | Jul-2019 | $ 40,000 | | $ 40,000 | | $ 40,000 | |
| Institution Secured Funding, LLC | 2.50%9 | Jul-2019 | 40,000 | | 40,000 | | 40,000 | |
| | | | | | | | | |
| Blackrock Federal Funds | 2.35%10 | Jul-2019 | 83,656 | | 83,656 | | 83,656 | |
| Total Short-Term Investments | $ 163,656 | | $ 163,656 | | $ 163,656 | |
| | | | | | | | | |
| Total Investments | $6,238,310 | | $6,313,854 | | $6,458,605 | |
| | |
| 17 |
SCHEDULE OF PORTFOLIO INVESTMENTScontinued
June 30, 2019
FOOTNOTES | |
| | | |
| 1. | Construction interest rates are the rates charged to the borrower during the construction phase of the project. The permanent interest rates are charged to the borrower during the amortization period of the loan, unless the U.S. Department of Housing and Urban Development requires that such rates be charged earlier. | |
| 2. | The HIT may make commitments in securities or loans that fund over time on a draw basis or forward commitments that fund at a single point in time. The unfunded amount of these commitments totaled $297.5 million at period end. Generally, GNMA construction securities fund over a 12- to 24-month period. Funding periods for State Housing Finance Agency construction securities and Direct Loans vary by project, but generally fund over a one- to 48-month period. Forward commitments generally settle within 12 months of the original commitment date. | |
| 3. | Federally tax-exempt bonds collateralized by Ginnie Mae securities. | |
| 4. | The HIT records when issued securities on the trade date and maintains security positions such that sufficient liquid assets will be available to make payment for the securities purchased. Securities purchased on a when issued basis are marked to market monthly and begin earning interest on the settlement date. Losses may occur on these transactions due to changes in market conditions or the failure of counterparties to perform under the contract. | |
| 5. | For floating and variable rate securities, the rate indicated is for the period end. With respect to these securities, the schedule also includes the reference rate and spread in basis points. | |
| 6. | Securities exempt from registration under the Securities Act of 1933 and were privately placed directly by a state housing agency (a not-for-profit public agency) with the HIT. The securities are backed by mortgages and are general obligations of the state housing agency, and therefore secured by the full faith and credit of said agency. These securities may be resold in transactions exempt from registration, normally to qualified institutional buyers. These securities are considered liquid, under procedures established by and under the general supervision of the HIT’s Board of Trustees. | |
| 7. | Loans insured by Ambac Assurance Corporation are additionally backed by a repurchase option from the mortgagee for the benefit of the HIT. The repurchase price is defined as the unpaid principal balance of the loan plus all accrued unpaid interest due through the remittance date. The repurchase option can be exercised by the HIT in the event of a payment failure by Ambac Assurance Corporation. | |
| 8. | The HIT has a participation interest in HIT Advisers, a Delaware limited liability company. HIT Advisers is a New York based adviser currently exempt from investment adviser registration in New York. The investment in HIT Advisers is valued by the HIT’s Valuation Committee in accordance with the fair value procedures adopted by the HIT’s Board of Trustees, and approximates carrying value of HIT Advisers and its subsidiary on a consolidated basis. The participation interest is not registered under the federal securities laws. | |
| 9. | Rate indicated is the effective yield at the time of purchase. | |
| 10. | Rate indicated is the annualized 1-day yield as of June 30, 2019. | |
| | | |
| | | |
| | | |
| | | |
| LIBOR | London Interbank Offered Rate |
| | |
| 18 | |
| STATEMENT OF OPERATIONS |
| For the Six Months Ended June 30, 2019 (Dollars in thousands; unaudited) |
| |
| Investment income | | $ | 93,869 | |
| | | | | |
| Expenses | | | | |
| | Non-officer salaries and fringe benefits | | 4,109 | |
| | Officer salaries and fringe benefits | | 2,787 | |
| | Investment management | | 668 | |
| | Marketing and sales promotion (12b-1) | | 489 | |
| | Consulting fees | | 282 | |
| | Legal fees | | 262 | |
| | Auditing, tax and accounting fees | | 256 | |
| | Insurance | | 202 | |
| | Trustee expenses | | 21 | |
| | Rental expenses | | 575 | |
| | General expenses | | 870 | |
| | Total expenses | | 10,521 | |
| | | | | |
| Net investment income | | | 83,348 | |
| | | | | |
| Net realized and unrealized gains (losses) on investments | | | | |
| | Net realized gains (losses) on investments | | 4,669 | |
| | Net change in unrealized appreciation (depreciation) on investments | | 269,141 | |
| | Net realized and unrealized gains (losses) on investments | | 273,810 | |
| | | | | |
| Net increase (decrease) in net assets resulting from operations | | $ | 357,158 | |
See accompanying Notes to Financial Statements (unaudited).
| | |
| 19 |
| STATEMENT OF CHANGES IN NET ASSETS |
| (Dollars in thousands) |
| |
| | | | | | | | | | | | | | |
| Increase (decrease) in net assets from operations | | | | Six Months Ended
June 30, 2019
(unaudited) | | Year Ended
December 31, 2018 | |
| | | Net investment income | | | $ | 83,348 | | | | $ | 160,964 | | |
| | | Net realized gains (losses) on investments | | | | 4,669 | | | | | 2,077 | | |
| | | Net change in unrealized appreciation (depreciation) on investments | | | | 269,141 | | | | | (158,325 | ) | |
| | | Net increase in net assets resulting from operations | | | | 357,158 | | | | | 4,716 | | |
| | | | | | | | | | | | | | |
| Decrease in net assets from distributions | | | | | | | | | | | | | |
| | | Distributions to participants or reinvested | | | | (87,911 | ) | | | | (169,064 | ) | |
| | | | | | | | | | | | | | |
| Increase (decrease) in net assets from unit transactions | | | | | | | | | | | | | |
| | | Proceeds from the sale of units of participation | | | | 247,504 | | | | | 99,566 | | |
| | | Dividend reinvestment of units of participation | | | | 79,147 | | | | | 151,449 | | |
| | | Payments for redemption of units of participation | | | | (64,583 | ) | | | | (396,442 | ) | |
| | | Net increase (decrease) from unit transactions | | | | 262,068 | | | | | (145,427 | ) | |
| | | | | | | | | | | | | | |
| | | | | | | | | | | | | | |
| Total increase (decrease) in net assets | | | | | | 531,315 | | | | | (309,775 | ) | |
| | | | | | | | | | | | | | |
| Net assets | | | | | | | | | | | | | |
| | | Beginning of period | | | $ | 5,889,450 | | | | $ | 6,199,225 | | |
| | | End of period | | | $ | 6,420,765 | | | | $ | 5,889,450 | | |
| | | | | | | | | | | | | | |
| Unit information | | | | | | | | | | | | | |
| | | Units sold | | | | 220,559 | | | | | 91,811 | | |
| | | Distributions reinvested | | | | 71,273 | | | | | 139,684 | | |
| | | Units redeemed | | | | (57,736 | ) | | | | (365,943 | ) | |
| | | Increase (decrease) in units outstanding | | | | 234,096 | | | | | (134,448 | ) | |
See accompanying Notes to Financial Statements (unaudited).
| | |
| 20 | |
| NOTES TO FINANCIAL STATEMENTS |
| |
NOTE 1.SUMMARY OF SIGNIFICANT ACCOUNTING POLICIES
The American Federation of Labor and Congress of Industrial Organizations (AFL-CIO) Housing Investment Trust (HIT) is a common law trust created under the laws of the District of Columbia and is registered under the Investment Company Act of 1940, as amended (the Investment Company Act), as a no-load, open-end investment company. The HIT has obtained certain exemptions from the requirements of the Investment Company Act that are described in the HIT’s Prospectus and Statement of Additional Information.
Participation in the HIT is limited to eligible pension plans and labor organizations, including health and welfare, general, voluntary employees’ benefit associations, and other funds that have beneficiaries who are represented by labor organizations.
The following is a summary of significant accounting policies followed by the HIT in the preparation of its financial statements. The policies are in conformity with generally accepted accounting principles (GAAP) in the United States. The HIT follows the investment company accounting and reporting guidance of the Financial Accounting Standards Board (FASB) Accounting Standards Codification Topic 946 Financial Services—Investment Companies.
INVESTMENT VALUATION
Net asset value per share (NAV) is calculated as of the close of business of the major bond markets in New York City on the last business day of each month. The HIT’s Board of Trustees is responsible for the valuation process and has delegated the supervision of the valuation process to a Valuation Committee. The Valuation Committee, in accordance with the policies and procedures adopted by the HIT’s Board of Trustees, is responsible for evaluating the effectiveness of the HIT’s pricing policies, determining the reliability of third-party pricing information, and reporting to the Board of Trustees on valuation matters, including fair value determinations. Following is a description of the valuation methods and inputs applied to the HIT’s major categories of assets.
Portfolio securities for which market quotations are readily available are valued by using independent pricing services. For U.S. Treasury securities, independent pricing services generally base prices on actual transactions as well as dealer-supplied market information. For state housing finance agency securities, independent pricing services generally base prices using models that utilize trading spreads, new issue scales, verified bid information, and credit ratings. For commercial mortgage-backed securities, independent pricing services generally base prices on cash flow models that take into consideration benchmark yields and utilize available trade information, dealer quotes, and market color.
For U.S. agency and government-sponsored enterprise securities, including single family and multifamily mortgage-backed securities, construction mortgage securities and loans, and collateralized mortgage obligations, independent pricing services generally base prices on an active TBA (“to-be-announced”) market for mortgage pools, discounted cash flow models, or option-adjusted spread models. Independent pricing services examine reference data and use observable inputs such as issue name, issue size, ratings, maturity, call type, and spread/ benchmark yields, as well as dealer-supplied market information. The discounted cash flow or option-adjusted spread models utilize inputs from matrix pricing, which consider observable market-based discount and prepayment rates, attributes of the collateral, and yield or price of bonds of comparable quality, coupon, maturity, and type.
Investments in registered open-end investment management companies are valued based upon the NAV of such investments.
When the HIT finances the construction and permanent securities or participation interests, value is determined based upon the total amount, funded and/or unfunded, of the commitment.
Portfolio investments for which market quotations are not readily available or deemed unreliable are valued at their fair value determined in good faith by the HIT’s Valuation Committee using consistently applied procedures adopted by the HIT’s Board of Trustees. In determining fair market value, the Valuation Committee will employ a valuation method that it believes reflects fair value for that asset, which may include the use of an independent valuation consultant or the utilization of a discounted cash flow model based on broker and/or other market inputs. The frequency with which these fair value procedures may be used cannot be predicted. However, on June 30, 2019, the Valuation Committee fair valued less than 0.01% of the HIT’s net assets utilizing internally derived unobservable inputs.
Short-term investments acquired with a stated maturity of 60 days or less are generally valued at amortized cost, which approximates fair market value.
The HIT holds a 100% ownership interest, either directly or indirectly in HIT Advisers LLC (HIT Advisers). HIT Advisers is valued at its fair value determined in good faith under consistently applied procedures adopted by the HIT’s Board of Trustees, which approximates its respective carrying value.
GAAP establishes a disclosure hierarchy that categorizes the inputs to valuation techniques used to value assets and liabilities at measurement date. The HIT classifies its assets and liabilities into three levels based on the method used to value the assets or liabilities. Level 1 values are based on quoted prices in active markets for identical securities. Level 2 values are
| | |
| 21 |
NOTES TO FINANCIAL STATEMENTScontinued
based on significant observable market inputs, such as quoted prices for similar securities, interest rates, prepayment speeds, credit risk, and quoted prices in inactive markets. Level 3 values are based on significant unobservable inputs that reflect the HIT’s determination of assumptions that market participants might reasonably use in valuing the securities.
The following table presents the HIT’s valuation levels as of June 30, 2019:
| | | Investment Securities | |
| (dollars in thousands) | | Level 1 | | Level 2 | | Level 3 | | Total | |
| FHA Permanent Securities | | $ | — | | $ | 139,932 | | $ | — | | $ | 139,932 | |
| FHA Construction Securities | | | — | | | 10,137 | | | — | | | 10,137 | |
| Ginnie Mae Securities | | | — | | | 1,511,552 | | | — | | | 1,511,552 | |
| Ginnie Mae Construction Securities | | | — | | | 391,059 | | | — | | | 391,059 | |
| Fannie Mae Securities | | | — | | | 2,720,856 | | | — | | | 2,720,856 | |
| Freddie Mac Securities | | | — | | | 784,634 | | | — | | | 784,634 | |
| Commercial Mortgage-Backed Securities | | | — | | | 123,503 | | | — | | | 123,503 | |
| State Housing Finance Agency Securities | | | — | | | 300,531 | | | — | | | 300,531 | |
| Other Multifamily Investments | | | — | | | 11,787 | | | — | | | 11,787 | |
| United States Treasury Securities | | | — | | | 275,603 | | | — | | | 275,603 | |
| Equity Investments | | | — | | | — | | | (395 | ) | | (395 | ) |
| Short-Term Investments | | | 163,656 | | | — | | | — | | | 163,656 | |
| Other Financial Instruments* | | | — | | | 25,750 | | | — | | | 25,750 | |
| Total | | $ | 163,656 | | $ | 6,295,344 | | $ | (395 | ) | $ | 6,458,605 | |
| * | If held in the portfolio at report date, other financial instruments includes forward commitments, TBA and when-issued securities. |
The following table reconciles the valuation of the HIT’s Level 3 investment securities and related transactions for the period ended June 30, 2019:
| | | Investments in Securities | |
| (dollars in thousands) | | Other Multifamily
Investments | | Equity
Investment | | Total | |
| Beginning Balance, 12/31/2018 | | | $ | 4,867 | | | | $ | (367 | ) | | | $ | 4,500 | | |
| Paydown/Settlements | | | | (5,411 | ) | | | | — | | | | | (5,411 | ) | |
| Total Unrealized Gain (Loss)* | | | | 544 | | | | | (28 | ) | | | | 516 | | |
| Ending Balance, 6/30/2019 | | | $ | — | | | | $ | (395 | ) | | | $ | (395 | ) | |
| * | Net change in unrealized gain (loss) attributable to Level 3 securities held at June 30, 2019 totaled $(28,000) and is included on the accompanying Statement of Operations. |
For the six months ended June 30, 2019, there were no transfers in levels.
Level 3 securities consists of an investment in a wholly owned subsidiary that is fair valued in good faith under consistently applied procedures adopted by the HIT’s Board of Trustees, which approximates its respective carrying value.
USE OF ESTIMATES
The preparation of financial statements in conformity with GAAP requires management to make estimates and assumptions that affect the reported amounts of assets and liabilities at the date of the financial statements and the reported amounts of revenues and expenses during the period. Actual results could differ from those estimates.
FEDERAL INCOME TAXES
The HIT’s policy is to comply with the requirements of the Internal Revenue Code of 1986, as amended (the Internal Revenue Code), that are applicable to regulated investment companies, and to distribute all of its taxable income to its participants. Therefore, no federal income tax provision is required.
Tax positions taken or expected to be taken in the course of preparing the HIT’s tax returns are evaluated to determine whether the tax positions are “more-likely-than-not” of being sustained by the applicable tax authority. Tax positions not deemed to meet the more-likely-than-not threshold would be recorded as a tax benefit or expense in the current year. Management has analyzed for all open years the HIT’s tax positions taken on federal income tax returns and has concluded that no provision for income tax is required in the HIT’s financial statements.
| | |
| 22 | |
NOTES TO FINANCIAL STATEMENTScontinued
The HIT files U.S. federal, state, and local tax returns as required. The HIT’s tax returns are subject to examination by the relevant tax authorities until the expiration of the applicable statutes of limitations, which is generally three years after the filing of the tax return but could be longer in certain circumstances.
DISTRIBUTIONS TO PARTICIPANTS
At the end of each calendar month, a pro-rata distribution is made to participants of the net investment income earned during the month. This pro-rata distribution is based on the participant’s number of units held as of the immediately preceding month-end and excludes realized gains (losses) which are distributed at year-end.
Participants redeeming their investments are paid their pro-rata share of undistributed net income accrued through the month-end of the month in which they redeem. The HIT offers a reinvestment plan that permits current participants to automatically reinvest their distributions of income and capital gains, if any, into the HIT’s units of participation. Total reinvestment was approximately 90% of distributed income for the six months ended June 30, 2019.
INVESTMENT TRANSACTIONS AND INCOME
For financial reporting purposes, security transactions are accounted for as of the trade date. Gains and losses on securities sold are determined on the basis of amortized cost. Realized gains (losses) on paydowns of mortgage- and asset-backed securities are classified as interest income. Interest income, which includes amortization of premium and accretion of discount on debt securities, is accrued as earned.
12b-1 PLAN OF DISTRIBUTION
The HIT’s Board of Trustees has approved a Plan of Distribution under Rule 12b-1 under the Investment Company Act to pay for marketing and sales promotion expenses incurred in connection with the offer and sale of units and related distribution activities (12b-1 expenses). For the six months ended June 30, 2019, the HIT was authorized to pay 12b-1 expenses in an annual amount up to $600,000 or 0.05% of its average net assets on an annualized basis per fiscal year, whichever was greater. During the six months ended June 30, 2019, the HIT incurred approximately $489,000, or 0.01% of its average monthly net assets, in 12b-1 expenses.
NOTE 2.INVESTMENT RISK
INTEREST RATE RISK
As with any fixed-income investment, the market value of the HIT’s investments will generally fall at times when market interest rates rise. Rising interest rates may also reduce prepayment rates, causing the average life of the HIT’s investments to increase. This could in turn further reduce the value of the HIT’s portfolio.
PREPAYMENT AND EXTENSION RISK
The HIT invests in certain fixed-income securities whose value is derived from an underlying pool of mortgage loans that are subject to prepayment and extension risk.
Prepayment risk is the risk that a security will pay more quickly than its assumed payment rate, shortening its expected average life. In such an event, the HIT may be required to reinvest the proceeds of such prepayments in other investments bearing lower interest rates. The majority of the HIT’s securities backed by loans for multifamily projects include restrictions on prepayments for specified periods to mitigate this risk or include prepayment penalties to compensate the HIT. Prepayment penalties, when received, are included in realized gains.
Extension risk is the risk that a security will pay more slowly than its assumed payment rate, extending its expected average life. When this occurs, the HIT’s ability to reinvest principal repayments in higher returning investments may be limited.
These two risks may increase the sensitivity of the HIT’s portfolio to fluctuations in interest rates and negatively affect the value of the HIT’s portfolio.
NOTE 3.TRANSACTIONS WITH RELATED ENTITIES
HIT ADVISERS
HIT Advisers, a Delaware limited liability company, was formed by the HIT to operate as an investment adviser and be registered, as appropriate under applicable federal or state law. HIT Advisers is owned by HIT directly (99.9%), and indirectly through HIT Advisers Managing Member (0.1%) which is also wholly owned by the HIT. This ownership structure is intended to insulate the HIT from any potential liabilities associated with the conduct of HIT Advisers business. The HIT receives no services from HIT Advisers and carries it as a portfolio investment that meets the definition of a controlled affiliate.
| | |
| 23 |
NOTES TO FINANCIAL STATEMENTScontinued
In accordance with a contract, in addition to its membership interest, the HIT provides HIT Advisers advances to assist with its operations and cash flow management as needed. Advances are expected to be repaid as cash becomes available. However, as with many start-up operations, there is no certainty that HIT Advisers will generate sufficient revenue to cover its operations and liabilities. Also in accordance with the contract, the HIT provides the time of certain personnel and allocates operational expenses to HIT Advisers on a cost-reimbursement basis. As of June 30, 2019, HIT Advisers had no assets under management.
A rollforward of advances to HIT Advisers by the HIT is included in the table below:
| Advances to HIT Advisers by HIT | | (dollars in thousands) |
| Beginning Balance, 12/31/2018 | | $ | 808 | |
| Advances in 2019 | | | 52 | |
| Repayment by HIT Advisers LLC in 2019 | | | (50 | ) |
| Ending Balance, 6/30/2019 | | $ | 810 | |
BUILDING AMERICA
Building America, a wholly owned subsidiary of HIT Advisers, is a Community Development Entity, certified by the Community Development Financial Institutions Fund (CDFI Fund) of the U.S. Department of the Treasury.
In accordance with a contract, the HIT provides the time of certain personnel to Building America and allocates operational expenses on a cost-reimbursement basis. Also, in accordance with the contract, the HIT provides Building America advances to assist with its operations and cash flow management as needed. Advances are repaid as cash becomes available.
A rollforward of advances to Building America by the HIT is included in the table below:
| Advances to BACDE by HIT | | (dollars in thousands) |
| Beginning Balance, 12/31/2018 | | $ | 64 | |
| Advances in 2019 | | | 559 | |
| Repayment by BACDE in 2019 | | | (557 | ) |
| Ending Balance, 6/30/2019 | | $ | 66 | |
Summarized financial information on a consolidated basis for HIT Advisers and Building America is included in the table below:
| | | (dollars in thousands) |
| As of June 30, 2019 |
| Assets | | $ | 737 | |
| Liabilities | | $ | 1,132 | |
| Equity | | $ | (395 | ) |
| For the six months ended June 30, 2019 |
| Income | | $ | 674 | |
| Expenses | | | (671 | ) |
| Tax Expenses | | | (12 | ) |
| Net Income (Loss) | | $ | (9 | ) |
NOTE 4.LEASES
In February 2016, the FASB issued Accounting Standards Update (“ASU”) ASU No. 2016-02, Leases (Topic 842) (“ASU 2016-02”). ASU 2016-02 is intended to improve financial reporting of leasing transactions by requiring organizations that lease assets to recognize assets and liabilities for the rights and obligations created by leases that extend more than twelve months on the balance sheet. This accounting update also requires additional disclosures surrounding the amount, timing, and uncertainty of cash flows arising from leases. ASU 2016-02 is effective for financial statements issued for annual and interim periods beginning after December 15, 2018 for public business entities.
The HIT adopted ASU No. 2016-02 with prospective application and elected the package of practical expedients permitted in Topic 842. As a result of the adoption of the new lease accounting guidance, the HIT recognized on January 1, 2019 (a) a lease liability of approximately $2,328,000 which represents the present value of the remaining lease payments of approximately $2,424,000 discounted using the HIT’s incremental borrowing rate of 3.73%, and (b) a right-of-use (ROU) asset of approximately $2,093,000. This standard did not have a material impact on the HIT statement of assets and liabilities and had no impact on the HIT’s operating results. The most significant impact was the recognition of ROU assets and lease obligations.
| | |
| 24 | |
NOTES TO FINANCIAL STATEMENTScontinued
The HIT determines if an arrangement is a lease at inception. Leases are included in ROU assets on the HIT’s statement of assets and liabilities. ROU assets represent the HIT’s right to use an underlying asset for the lease term and lease obligations represent the HIT’s obligation to make lease payments arising from the lease. ROU assets and obligations are recognized at the commencement date based on the present value of lease payments over the lease term. As most of the HIT’s leases do not provide an implicit rate, the HIT uses its incremental borrowing rate based on the information available at the commencement date of the lease in determining the present value of lease payments. The HIT’s lease terms may include options to extend or terminate the lease when it is reasonably certain that the HIT will exercise that option. Lease expense and amortization expense are recognized on a straight-line basis over the lease term.
| (dollars in thousands) | | Operating Lease | | Financing Lease | | Total |
| ROU Asset, 1/1/2019 | | $ | 1,846 | | | $ | 247 | | | $ | 2,093 | |
| Addition of ROU Asset | | | — | | | | 32 | | | | 32 | |
| Reduction/Amortization of ROU Asset | | $ | (515 | ) | | $ | (39 | ) | | $ | (554 | ) |
| ROU Asset, 6/30/2019 | | $ | 1,331 | | | $ | 240 | | | $ | 1,571 | |
| | | | | | | | | | | | | |
| Lease Liability, 1/1/2019 | | $ | 2,081 | | | $ | 247 | | | $ | 2,328 | |
| | | | | | | | | | | | | |
| Addition of Lease Liability | | | — | | | | 32 | | | | 32 | |
| | | | | | | | | | | | | |
| Lease Payments Made | | $ | (604 | ) | | $ | (42 | ) | | $ | (646 | ) |
| Imputed Interest | | | 26 | | | | 5 | | | | 31 | |
| Reduction of Lease Liability | | $ | (578 | ) | | $ | (37 | ) | | $ | (615 | ) |
| Lease Liability, 6/30/2019 | | $ | 1,503 | | | $ | 242 | | | $ | 1,745 | |
| | | | | | | | | | | | | |
| Lease Expense | | $ | (541 | ) | | $ | (44 | ) | | $ | (585 | ) |
| Weighted Average Discount Rate | | | 3.73 | % | | | 3.68 | % | | | | |
| Weighted Average Remaining Term (Years) | | | 1.4 | | | | 2.7 | | | | | |
NOTE 5.COMMITMENTS
The HIT may make commitments in securities or loans that fund over time on a draw basis or forward commitments that fund at a single point in time. The HIT agrees to an interest rate and purchase price for these securities or loans when the commitment to purchase is originated.
Certain assets of the HIT are invested in liquid investments until they are required to fund these purchase commitments. As of June 30, 2019, the HIT had outstanding unfunded purchase commitments of approximately $297.5 million. The HIT maintains a sufficient level of liquid
securities of no less than the total of the outstanding unfunded purchase commitments. As of June 30, 2019, the value of liquid securities, less short-term investments, maintained in a custodial trading account was approximately $6.1 billion.
NOTE 6.INVESTMENT TRANSACTIONS
Purchases and sales of investments, excluding short-term securities and U.S. Treasury securities, for the six months ended June 30 2019, were $547.5 million and $114.4 million, respectively.
NOTE 7.INCOME TAXES
No provision for federal income taxes is required since the HIT intends to continue to qualify as a regulated investment company under Subchapter M of the Internal Revenue Code and distribute to shareholders all of its taxable income and gains. Federal income tax regulations differ from GAAP; therefore, distributions determined in accordance with tax regulations may differ in amount or character from net investment income and realized gains for financial reporting purposes. Financial reporting records were adjusted for permanent book/tax differences of $4.6 million as of June 30, 2019 to reflect tax character. The amount and character of tax-basis distributions and composition of the net assets are finalized at fiscal year-end; accordingly, tax-basis balances have not been determined as of June 30, 2019.
At June 30, 2019, the cost of investments for federal income tax purposes was $6,313,854,000, which approximated book cost at amortized cost. Net unrealized gain aggregated $144,751,000 at period-end, of which $159,067,000 related to appreciated investments and $14,316,000 related to depreciated investments.
NOTE 8.RETIREMENT AND DEFERRED COMPENSATION PLANS
The HIT participates in the AFL-CIO Staff Retirement Plan (Plan), which is a multiemployer defined benefit pension plan, under the terms of a collective bargaining agreement. The Plan covers substantially all employees, including non-bargaining unit employees. The risks of participating in a multiemployer plan are different from a single-employer plan in the following aspects:
| a. | Assets contributed to a multiemployer plan by one employer may be used to provide benefits to employees of other participating employers. |
| b. | If a participating employer stops contributing to the plan, the unfunded obligations of the plan may be borne by the remaining participating employers based on their level of contributions to the plan. |
| | |
| 25 |
NOTES TO FINANCIAL STATEMENTScontinued
| c. | If the HIT chooses to stop participating in its multiemployer plan, the HIT may be required to pay the plan an amount based on the HIT’s share of the underfunded status of the plan, referred to as a withdrawal liability. |
The HIT’s participation in the Plan for the six months ended June 30, 2019, is outlined in the table below. The “EIN/Pension Plan Number” line provides the Employer Identification Number (EIN) and the three-digit plan number. The most recent Pension Protection Act (PPA) zone status available as of June 30, 2019 is for the 2017 Plan year ended at June 30, 2018. The zone status is based on information that the HIT received from the Plan and is certified by the Plan’s actuary. Among other factors, plans in the red zone are generally less than 65% funded, plans in the yellow zone are less than 80% funded, and plans in the green zone are at least 80% funded. The “FIP/RP Status Pending/Implemented” line indicates whether a financial improvement plan (FIP) or a rehabilitation plan (RP) is either pending or has been implemented.
| Pension Fund: AFL-CIO Staff Retirement Plan |
| EIN/Pension Plan Number | 53-0228172 / 001 |
| 2017 Plan Year PPA Zone Status | Green |
| FIP/RP Status Pending/ Implemented | No |
| 2019 Contributions | $938,131 |
| 2019 Contribution Rate | 24% |
| Surcharge Imposed | No |
| Expiration Date of Collective Bargaining Agreement | 03/31/2022 |
The HIT was listed in the Plan’s Form 5500 as providing more than 5% of the total contributions for the following plan year:
| Pension Fund | Years Contributions to
Plan Exceeded More
Than 5 Percent of
Total Contributions |
| AFL-CIO Staff Retirement Plan | 20171 |
1. The 2017 plan year ended at June 30, 2018.
At the date the HIT financial statements were issued, the Plan’s Form 5500 was not available for the plan year ended June 30, 2019.
The HIT also sponsors a deferred compensation plan, referred to as a 401(k) plan, covering all employees. This plan permits employees to defer the lesser of 100% of their total compensation or the applicable Internal Revenue Service limit. During 2019, the HIT matched dollar for dollar
the first $6,200 of each employee’s contributions. The HIT’s 401(k) contribution for the six months ended June 30, 2019, was approximately $287,000.
NOTE 9.LOAN FACILITY
The HIT has a $15 million uncommitted loan facility that expires on June 8, 2020. Under this facility, borrowings bear interest per annum equal to 1.25% plus the highest of (a) the Federal Funds Effective Rate, (b) the Overnight Eurodollar Rate, or (c) the one-month LIBOR. The HIT did not borrow against the facility and had no outstanding balance under the facility for the six months ended June 30, 2019. No compensating balances are required.
NOTE 10.CONTRACT OBLIGATIONS
In the ordinary course of business, the HIT enters into contracts that contain a variety of indemnifications. The HIT’s maximum exposure under these arrangements is unknown. However, the HIT has not had any prior claims or losses pursuant to these contracts and expects the risk of loss to be low.
NOTE 11.NEW ACCOUNTING PRONOUNCEMENT
In March 2017, the FASB issued ASU No. 2017-08, Receivables—Nonrefundable Fees and Other Costs (Subtopic 310-20): Premium Amortization on Purchased Callable Debt Securities. This new standard shortens the amortization period for the premium on certain purchased callable debt securities to the earliest call date. ASU 2017-08 is effective for financial statements issued for annual and interim periods beginning after December 15, 2018. The HIT has adopted this pronouncement and has determined there is no material impact on its financial statements.
| | |
| 26 | |
FINANCIAL HIGHLIGHTS
Selected Per Share Data and Ratios
| | | | Six Months Ended | | Year Ended December 31, | |
| | | | June 30, 2019 | | | | | | | | | | | | | | | |
| Per share data | | (unaudited) | | 2018 | | | 2017 | | | 2016 | | | 2015 | | | 2014 | |
| | Net asset value, beginning of period | | $ | 1,087.85 | | | $ | 1,117.32 | | | $ | 1,113.29 | | | $ | 1,121.13 | | | $ | 1,140.10 | | | $ | 1,107.45 | |
| | | | | | | | | | | | | | | | | | | | | | | | | | |
| | Income from investment operations: |
| | Net investment income* | | | 15.21 | | | | 29.25 | | | | 27.36 | | | | 27.46 | | | | 29.41 | | | | 32.48 | |
| | Net realized and unrealized gains (losses) on investments | | | 49.82 | | | | (27.99 | ) | | | 7.58 | | | | (5.33 | ) | | | (16.43 | ) | | | 34.38 | |
| | Total income (loss) from investment operations | | | 65.03 | | | | 1.26 | | | | 34.94 | | | | 22.13 | | | | 12.98 | | | | 66.86 | |
| | Less distributions from: |
| | Net investment income | | | (16.05 | ) | | | (30.73 | ) | | | (30.23 | ) | | | (29.97 | ) | | | (31.95 | ) | | | (34.21 | ) |
| | Net realized gains on investments | | | — | | | | — | | | | (0.68 | ) | | | — | | | | — | | | | — | |
| | Total distributions | | | (16.05 | ) | | | (30.73 | ) | | | (30.91 | ) | | | (29.97 | ) | | | (31.95 | ) | | | (34.21 | ) |
| | | | | | | | | | | | | | | | | | | | | | | | | | |
| | Net asset value, end of period | | $ | 1,136.83 | | | $ | 1,087.85 | | | $ | 1,117.32 | | | $ | 1,113.29 | | | $ | 1,121.13 | | | $ | 1,140.10 | |
| | | | | | | | | | | | | | | | | | | | | | | | | | |
| Total return | | | 6.02 | % | | | 0.16 | % | | | 3.17 | % | | | 1.94 | % | | | 1.13 | % | | | 6.10 | % |
| | | | | | | | | | | | | | | | | | | | | | | | | |
| Net assets, end of period(in thousands) | | $ | 6,420,765 | | | $ | 5,889,450 | | | $ | 6,199,225 | | | $ | 5,790,753 | | | $ | 5,455,282 | | | $ | 4,859,337 | |
| | | | | | | | | | | | | | | | | | | | | | | | | |
| Ratios/supplemental data** |
| | Ratio of expenses to average net assets | | | 0.35 | % | | | 0.42 | % | | | 0.40 | % | | | 0.41 | % | | | 0.43 | % | | | 0.43 | % |
| | Ratio of net investment income to average net assets | | | 2.7 | % | | | 2.7 | % | | | 2.4 | % | | | 2.4 | % | | | 2.6 | % | | | 2.9 | % |
| | Portfolio turnover rate | | | 18.0 | % | | | 15.3 | % | | | 24.6 | % | | | 20.3 | % | | | 18.9 | % | | | 18.3 | % |
*The average shares outstanding method has been applied for this per share information.
**Percentage amounts have been annualized.
See accompanying Notes to Financial Statements (unaudited).
| | |
| 27 |
BOARD OF TRUSTEES
*Executive Committee Member
Helen R. Kanovsky*Chair General Counsel and Senior Vice President, Mortgage Bankers Association | Vincent Alvarez President, New York City Central Labor Council | James Boland President, International Union of Bricklayers & Allied Craftworkers | Kenneth W. Cooper International Secretary-Treasurer, International Brotherhood of Electrical Workers |
David B. Durkee International President, Bakery, Confectionery, Tobacco Workers and Grain Millers’ International Union | Sean McGarvey President, North America’s Building Trades Unions | Kenneth Rigmaiden* General President, International Union of Painters & Allied Trades for the United States and Canada | Liz Shuler* Secretary-Treasurer, AFL-CIO |
Richard L. Trumka* President, AFL-CIO | Bridget Gainer Cook County Commissioner and Vice President of Global Affairs, Aon | The Honorable Jack F. Quinn, Jr.* Senior Advisor for Public & Community Relations, Barclay Damon | Jamie S. Rubin North American CEO, Meridiam Infrastructure |
Deidre L. Schmidt President & CEO, CommonBond Communities | Tony Stanley* Director, TransCon Builders, Inc. | Harry W. Thompson Consultant, Harry Thompson Associates | William C. Thompson, Jr. Senior Managing Director/Chief Administrative Officer, Siebert, Cisneros, Shank & Co., LLC |
OFFICERS
Chang Suh, CFA Chief Executive Officer/Co-Chief Portfolio Manager | Thalia B. Lankin Chief Operating Officer | Erica Khatchadourian Chief Financial Officer | Nicholas C. Milano General Counsel |
Lesyllee White Chief Marketing Officer | Michael Cook, CFA, FRM Co-Chief Portfolio Manager | Theodore S. Chandler Managing Director, Regional Operations | Christopher Kaiser, CFA Chief Compliance Officer and Deputy General Counsel |
Harpreet Singh Peleg, CFA Controller |
SERVICE PROVIDERS
Independent Registered Public Accounting Firm Ernst & Young LLP Tysons, Virginia | Corporate Counsel Dechert LLP Washington, D.C. | Transfer Agent BNY Mellon Investment Servicing (US) Inc. Wilmington, Delaware | Custodian Bank of New York Mellon New York, New York |
| | |
| 28 | |

AFL-CIO HOUSING INVESTMENT TRUST
2401 Pennsylvania Avenue, NW | Suite 200 | Washington, D.C. 20037 | 202-331-8055
www.aflcio-hit.com

Item 2. Code of Ethics.
Not applicable for semi-annual reports.
Item 3. Audit Committee Financial Expert.
Not applicable for semi-annual reports.
Item 4. Principal Accountant Fees and Services.
Not applicable for semi-annual reports.
Item 5. Audit Committee of Listed Registrants.
Not applicable to open-end investment companies.
Item 6. Investments.
| (a) | Included herein under Item 1. |
Item 7. Disclosure of Proxy Voting Policies and Procedures for Closed-End Management Investment Companies.
Not applicable to open-end investment companies.
Item 8. Portfolio Managers of Closed-End Management Investment Companies.
Not applicable to open-end investment companies.
Item 9. Purchases of Equity Securities by Closed-End Management Investment Company and Affiliated Purchasers.
Not applicable to open-end investment companies.
Item 10. Submission of Matters to a Vote of Security Holders.
No material changes have been made to the procedures by which participants may recommend nominees to the Board of Trustees of the Registrant, where those changes were implemented after the Registrant last provided disclosure in response to the requirements of Item 407(c)(2)(iv) of Regulation S-K (per Item 22(b)(15) of Schedule 14A) or this Item.
Item 11. Controls and Procedures.
| (a) | The Registrant’s Chief Executive Officer (the principal executive officer) and Chief Financial Officer (the principal financial officer) have concluded that the Registrant’s disclosure controls and procedures (as defined in Rule 30a-3(c) under the Act (17 CFR 270.30a-3(c))) are effective to ensure that material information relating to the Registrant is made known to them by appropriate persons, based on their evaluation of such controls and procedures as of a date within 90 days of the filing of this report. |
| (b) | There were no changes in the Registrant’s internal control over financial reporting (as defined in Rule 30a-3(d) under the Act (17 CFR 270.30a-3(d)) that occurred during the period covered by this report that have materially affected, or are reasonably likely to materially affect, the Registrant’s internal control over financial reporting. |
Item 12. Disclosure of Securities Lending Activities for Closed-End Management Investment Companies.
Not applicable to open-end investment companies.
Item 13. Exhibits.
| (a) | (1) | Not applicable for semi-annual reports. |
| (4) | There was no change in the Registrant’s independent public accountant for the period covered by this report. |
SIGNATURES
Pursuant to the requirements of the Securities Exchange Act of 1934 and the Investment Company Act of 1940, the AFL-CIO Housing Investment Trust has duly caused this report to be signed on its behalf by the undersigned, thereunto duly authorized.
AFL-CIO HOUSING INVESTMENT TRUST
By:
/s/ Chang Suh
Chang Suh
Chief Executive Officer
Date: September 4, 2019
Pursuant to the requirements of the Securities Exchange Act of 1934 and the Investment Company Act of 1940, this report has been signed below by the following persons on behalf of the AFL-CIO Housing Investment Trust and in the capacities and on the dates indicated.
/s/ Chang Suh
Chang Suh
Chief Executive Officer
(Principal Executive Officer)
AFL-CIO Housing Investment Trust
Date: September 4, 2019
/s/ Erica Khatchadourian
Erica Khatchadourian,
Chief Financial Officer
(Principal Financial Officer)
AFL-CIO Housing Investment Trust
Date: September 4, 2019