UNITED STATES
SECURITIES AND EXCHANGE COMMISSION
Washington, D.C. 20549
FORM N-CSR
CERTIFIED SHAREHOLDER REPORT OF REGISTERED MANAGEMENT
INVESTMENT COMPANIES
Investment Company Act File Number: 811-3493
American Federation of Labor and
Congress of Industrial Organizations
Housing Investment Trust
(Exact name of registrant as specified in charter)
1227 25th Street, N.W., Suite 500
Washington, D.C. 20037
(Address of principal executive offices) (Zip code)
Corey F. Rose, Esq.
Dechert LLP
1900 K Street, NW
Washington, DC 20006-1110
(Name and address of agent for service)
(202) 331-8055
(Registrant’s telephone number, including area code)
Date of fiscal year end: December 31
Date of reporting period: January 1, 2023 – June 30, 2023
| Item 1. | Reports to Stockholders. |
| (a) | A copy of the 2023 Semi-Annual Report (the “Report”) of the AFL-CIO Housing Investment Trust (the “Trust” or “Registrant”) transmitted to Trust participants pursuant to Rule 30e-1 under the Investment Company Act of 1940, as amended (17 CFR 270.30e-1) (the “Act”), is included herewith. |

| TO OUR INVESTORS |  |
Investment grade fixed income returns were positive for the first half of 2023 as long-term interest rates stabilized following their historic rise in 2022. The AFL-CIO Housing Investment Trust’s (HIT) return for the first six months of 2023 was 2.11% on a gross of fees basis and 1.94% on a net of fees basis, compared to 2.09% for its benchmark, the Bloomberg U.S. Aggregate Bond Index* (Benchmark or Bloomberg Aggregate). The HIT has delivered competitive returns for the year to date despite a macroeconomic backdrop highlighted by elevated inflation and tightening Federal Reserve monetary policy.
We believe that the HIT is especially attractive in the current market environment. As of June 30, 2023, the HIT had a yield to worst of 5.54%, a 73 basis points (bps) yield advantage relative to the Benchmark, and the highest yield offered by HIT since late 2008. The HIT’s attractive risk-return profile, given its yield advantage and an 86% agency/government credit portfolio as of June 30, 2023, has resonated with investors. The HIT is on pace to have a strong year of positive inflows and raised over $240 million in new capital in the first half of 2023.
Higher mortgage rates, higher rents and limited supply have contributed to the most significant drop in housing affordability in years. We believe that the persisting national affordable housing shortage highlights the importance of pension investments taking
the lead in developing and renovating affordable and workforce housing. The HIT continues to deliver on its mission and in the first half of 2023 committed $188.7 million in financing to five projects with total development costs of $989.2 million. Despite higher interest rates, the HIT will continue to source investments that finance new housing development, as we expect the demand for additional affordable housing will only accelerate. In this higher interest rate environment, we have determined that there is a need for efficient financing and external subsidies to fill bigger financing gaps. We believe that the HIT’s ability to provide flexible and creative financing should allow it to mitigate some of the challenges posed by higher mortgage rates.
We believe the HIT is positioned well, offering investors attractive yield, high credit quality, liquidity, and diversification away from corporate credit. The HIT will strive to continue to execute on its proven, longstanding strategy of generating competitive returns for its investors while also positively impacting communities and generating good union construction jobs.

Chang Suh
Chief Executive Officer and Chief Investment Officer
*Source: Bloomberg L.P.
DISCUSSION OF FUND PERFORMANCE
(unaudited)
2023 OVERVIEW
Higher yields and stabilizing longer term interest rates have made fixed income investments attractive for market participants. This has led to strong inflows of capital for the AFL-CIO Housing Investment Trust (HIT), raising over $240 million in the first half of 2023. The HIT generated positive returns of 2.11% gross and 1.94% net of fees for the six months ended June 30, 2023. Against a backdrop of rising rates and still elevated inflation in the first six months of 2023, the HIT performed in line with its benchmark, the Bloomberg US Aggregate Bond Index* (Bloomberg Aggregate or Benchmark) while ending the period with a 73 basis points (bps) yield advantage relative to the Benchmark. The HIT offers an attractive risk-return profile with a yield to worst of 5.54% and an 86% agency/government credit portfolio as of June 30, 2023. As of the same date, the HIT had a 98 bps yield advantage compared to the credit equivalent AAA Component of the Bloomberg Aggregate (AAA Index). In the first half of 2023, the HIT continued to put labor’s capital to work, committing $188.7 million to finance five projects in communities throughout the U.S. These investments, with a total development cost of $989.2 million, were expected to generate 6.1 million hours of union construction work and create or rehabilitate 1,266 housing units, including 457 units of much-needed affordable housing.
Relative Returns
As of June 30, 2023, periods over one year are annualized

The AAA Index represents the AAA Component of the Bloomberg U.S. Aggregate Bond Index.
2023 RETURNS
For the first half of 2023, the HIT returned 2.11% gross and 1.94% net of fees, amid a higher yield environment, relative to the Benchmark’s 2.09% return. The HIT delivered competitive returns for the first six months of 2023 despite a macroeconomic backdrop highlighted by elevated inflation and tightening of Federal Reserve monetary policy. Interest rates were relatively flat over the past six months while investment grade fixed income spreads tightened.
PERFORMANCE ATTRIBUTION SUMMARY
Total returns for investment grade fixed income strategies were positive for the first half of 2023 as the yield curve inverted on certain parts. The HIT delivered a positive return and performed in line with the Benchmark as fixed income spreads tightened relative to U.S. Treasuries given the higher yield offered by the sector and the anticipated conclusion of the Federal Reserve’s hiking cycle.
The HIT’s relative performance for the first half of 2023 benefitted from HIT’s short relative duration, overweight to adjustable-rate investments, and underweight to U.S. Treasuries, which was the worst performing asset class in the Benchmark on both an excess and total return basis. However, the HIT’s structural underweight to corporates
Comparison of a $50,000 Investment
in the HIT and Bloomberg Aggregate (10 Years)
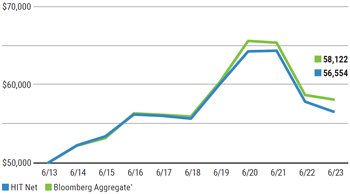
Past performance is no guarantee of future results. Economic and market conditions change, and both will cause investment return, principal value, and yield to fluctuate so that a participant’s units, when redeemed, may be worth more or less than their original cost. Current performance may be lower or higher than the performance data quoted. Performance data current to the most recent month-end is available at www.aflcio -hit.com. Gross performance figures do not reflect the deduction of HIT expenses. Net performance figures reflect the deduction of HIT expenses and are the performance figures investors experience in the HIT. Information about HIT expenses can be found on page 1 of the HIT’s current prospectus. The Bloomberg Aggregate is an unmanaged index and is not available for direct investment, although certain funds attempt to replicate this index. Returns for the index would be lower if they reflected the actual trading costs or expenses associated with management of an actual portfolio.
*Source: Bloomberg Index Services Limited. BLOOMBERG® is a trademark and service mark of Bloomberg Finance L.P. and its affiliates (collectively “Bloomberg”). Bloomberg or Bloomberg’s licensors own all proprietary rights in the Bloomberg Indices. Bloomberg does not approve or endorse this material or guarantee the accuracy or completeness of any information herein, nor does Bloomberg make any warranty, express or implied, as to the results to be obtained therefrom, and, to the maximum extent allowed by law, Bloomberg shall not have any liability or responsibility for injury or damages arising in connection therewith.
| 2 |  |
DISCUSSION OF FUND PERFORMANCE
continued
hindered relative performance as it was the best performing asset class in the Benchmark on both an excess and total return basis. The HIT’s performance exceeded that of the AAA component of the Bloomberg Aggregate (which has a more comparable credit profile to the HIT than the Benchmark) by 42 bps on a gross basis, and 25 bps on a net basis, due in part to the fact that U.S. Treasuries were the worst performing sector in the Benchmark and make up over 50% of the AAA index.
2023 MARKET OVERVIEW
Global economic activity continued to soften in the first half of the year as the effects of past monetary tightening and more restrictive credit conditions weighed on growth. Bank failures in March added to market uncertainty, but the contagion effects appear to be contained for the sector. The high U.S. inflation has been falling in the first half of the year but remained above the Fed’s 2% target. The Federal Reserve hiked rates 75 basis points by midyear, bringing the federal funds rate to a 22-year high, and then paused at their June meeting to assess economic conditions in wake of the bank failures and tightening credit conditions. Employment growth slowed in the second quarter relative to 2022, but the unemployment rate remained low, ending the second quarter at 3.6% as the labor force participation rate rose.1
Treasury Yield Curve Shift
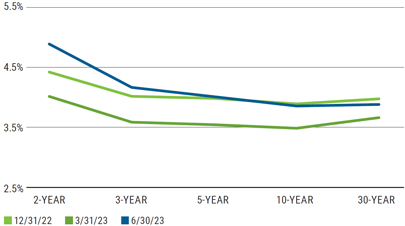
Source: Bloomberg L.P.
The affordable housing crisis in the U.S. continued to impact homeowners and renters as rising housing costs, in conjunction with income losses from COVID-19, has produced the most significant drop in affordability in years. The number of cost-burdened renters hit a record high of 21.6 million households2, and the Homebuyer Affordability Fixed Mortgage Index value of 93.80 remained only just above the all-time low of 91.30 achieved in October 2022.3
LOOKING AHEAD
The outlook for the U.S. economy remains highly uncertain, with risks continued to be weighted to the downside. While the Fed paused at its June meeting, it was widely expected to raise rates again at the July meeting and then assess economic conditions. The lagged effects of previous hikes will continue to soften economic activity in the second half of the year. Consumer spending has been resilient but is expected to weaken as higher borrowing costs and tighter financial conditions weigh on household spending.
The multifamily housing sector continues to play a vital role in the economy with nearly one million units under construction nationally.4 In addition, while apartment vacancies rose to 5% in the first quarter, they remained flat in the second quarter.5 With slow single family housing activity and households’ budgets impacted by still elevated
S&P vs 10-Year Treasury
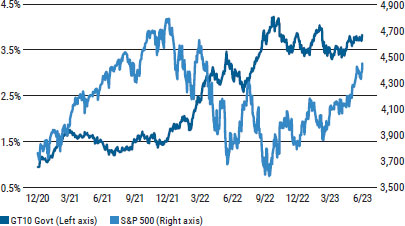
Source: Bloomberg L.P.
1. Bureau of Labor Statistics
2. Joint Center for Housing Studies of Harvard University, U.S. Census Bureau
3. National Association of Realtors
4. U.S. Census Bureau
5. Moody’s Analytics
DISCUSSION OF FUND PERFORMANCE
continued
Historical Multifamily Spreads
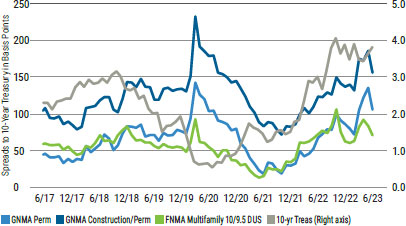
Source: HIT and Securities Dealers
Sector Allocation
As of June 30, 2023
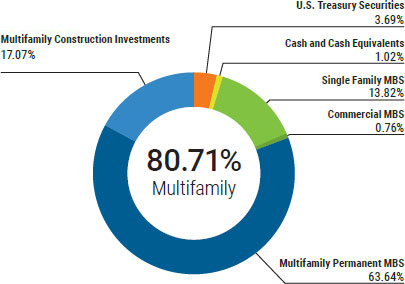
Based on value of total investments, including unfunded commitments, but does not include U.S. Treasury futures contracts.
Risk Comparison
As of June 30, 2023
| | HIT | Bloomberg Aggregate* | | HIT | Bloomberg Aggregate* |
| CREDIT PROFILE | | | | | |
| U.S. Government/Agency/AAA/Cash | 88.07% | 72.75% | A & Below/Not Rated | 6.36% | 24.17% |
| YIELD | | | | | |
| Current Yield | 3.82% | 3.21% | Yield to Worst | 5.54% | 4.81% |
| INTEREST RATE RISK | | | | | |
| Effective Duration | 6.02 | 6.16 | Convexity | 0.26 | 0.31 |
| CALL RISK | | | | | |
| Call Protected | 74% | 73% | Not Call Protected | 26% | 27% |
Source: HIT and Bloomberg US Aggregate Bond Index
inflation, multifamily rental housing is expected to remain in high demand.
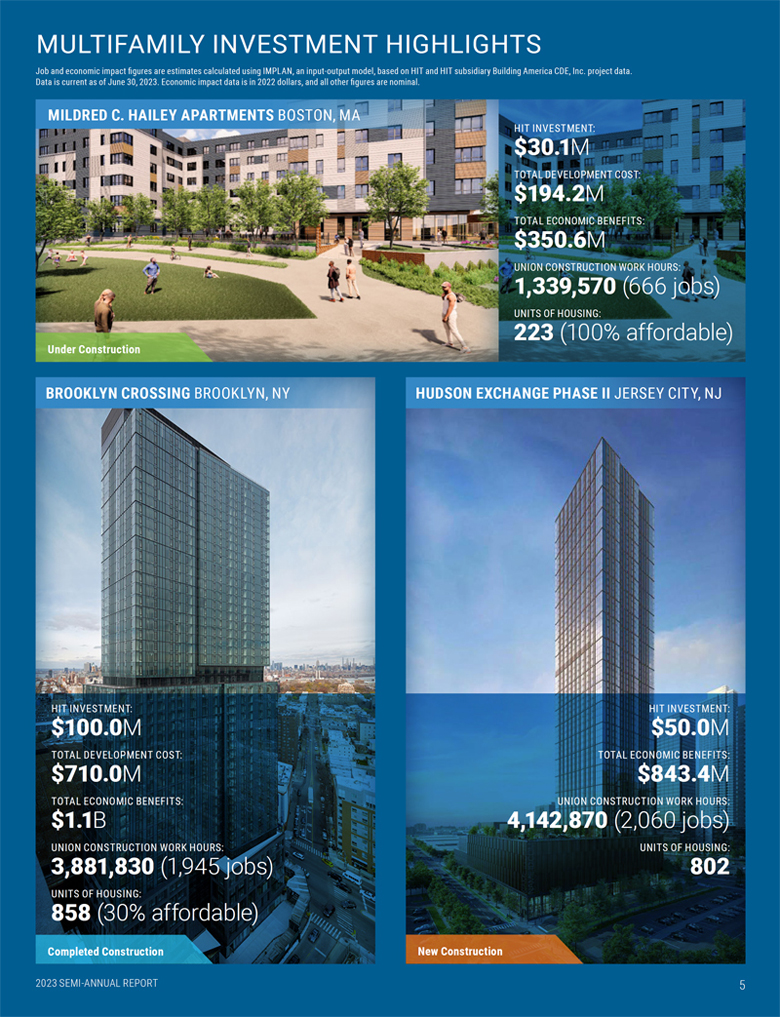
HIT’S MULTIFAMILY INVESTMENTS
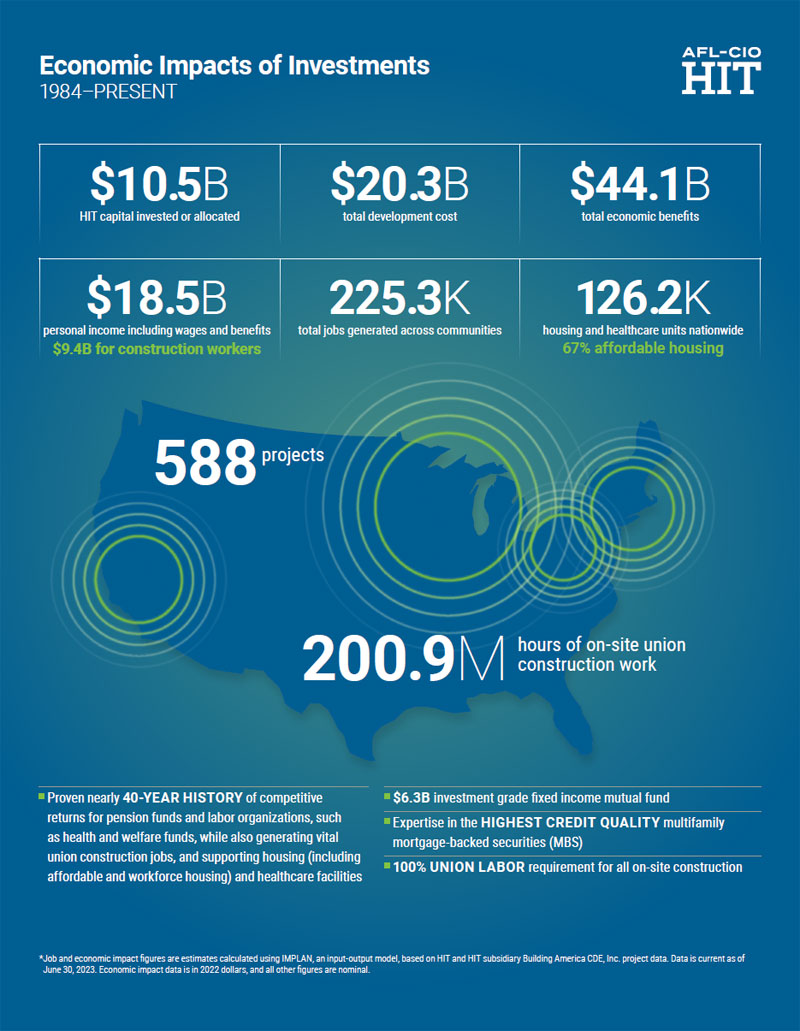
The HIT committed to five new projects in the first half of 2023, committing $188.7 million in financing.6 With total development costs of $989.2 million, these investments are expected to contribute positively to HIT’s portfolio’s yield while generating 6.1 million hours of union construction work and financing the creation, rehabilitation or preservation of affordability of 1,266 housing units, of which 457 units will be affordable. These developments will help revitalize their communities as the construction impacts ripple through local economies, generating an estimated $1.3 billion in economic impacts.7 As of June 30, 2023, 38 projects receiving HIT financing were under construction, providing significant economic benefits and positively impacting communities in 23 cities across 12 states.
Rising interest rates and construction costs have slowed production for developers across the nation. However, the persisting national housing shortage highlights the importance of pension and public investments for creating new and renovated affordable and workforce housing, and it continues to provide opportunities for the HIT. Despite the high interest rate environment, the HIT is tracking a pipeline of projects and will continue to work with lending partners to finance affordable, workforce and market rate housing developments and to seek opportunities to invest at higher yields. We believe the ability to offer multiple financing structures for both construction and permanent loans for multifamily developments gives the HIT a competitive advantage over traditional fixed income managers. The HIT works to build an attractive portfolio consisting of strong construction-related multifamily investments that generate attractive yield spreads over U.S. Treasuries and other credit-equivalent mortgage investments.
| 6. | This includes New Markets Tax Credits allocated by HIT subsidiary Building America CDE, Inc. |
| 7. | Job and economic impact figures are estimates calculated using IMPLAN, an input-output model, based on HIT and HIT subsidiary Building America CDE, Inc. project data. Data is current as of June 30, 2023. Economic impact data is in 2022 dollars, and all other figures are nominal. |
| 4 | |
Other Important Information
(unaudited)
| Expense Example | | Beginning
Account Value
January 1, 2023 | | Ending
Account Value
June 30, 2023 | | Expenses Paid During
Six Month Period Ended
June 30, 2023* |
| Actual Expenses | | $1,000.00 | | $1,019.45 | | $1.60 |
Hypothetical Expenses
(5% annual return before expenses) | | $1,000.00 | | $1,023.21 | | $1.61 |
| * | Expenses are equal to the HIT’s annualized six-month expense ratio of 0.32%, as of June 30, 2023, multiplied by the average account value over the period, multiplied by 181/365 (to reflect the one-half year period). |
Participants in the HIT incur ongoing expenses related to the management and distribution activities of the HIT, as well as certain other expenses. The expense example in the table above is intended to help participants understand the ongoing costs (in dollars) of investing in the HIT and to compare these costs with the ongoing costs of investing in other mutual funds. The example is based on an investment of $1,000 invested at the beginning of the period, January 1, 2023, and held for the entire period ended June 30, 2023.
Actual Expenses The first line of the table above provides information about actual account values and actual expenses. Participants may use the information in this line, together with the amount they invested, to estimate the expenses that they paid over the period. Simply divide the account value by $1,000 (for example, an $800,000 account value divided by $1,000 = 800), then multiply the result by the number in the first line under the heading entitled “Expenses Paid During Six Month Period Ended June 30, 2023” to estimate the expenses paid on a particular account during this period.
Hypothetical Expenses (for Comparison Purposes Only): The second line of the table above provides information about hypothetical account values and hypothetical expenses based on the HIT’s actual expense ratio and an assumed rate of return of 5% per year before expenses, which is not the HIT’s actual return. The hypothetical account values and expenses may not be used to estimate the actual ending account balance or expenses a participant paid for the period. Participants may use this information to compare the ongoing costs of investing in the HIT and other mutual funds. To do so, compare this 5% hypothetical example with the 5% hypothetical examples that appear in the shareholder reports of the other mutual funds.
Please note that this example is useful in comparing funds’ ongoing costs only. It does not include any transactional costs, such as sales charges (loads), redemption fees, or exchange fees. The HIT does not have such transactional costs, but many other funds do.
AVAILABILITY OF QUARTERLY PORTFOLIO SCHEDULE
In addition to disclosure in its Annual and Semi-Annual Reports to Participants, the HIT also files its complete schedule of portfolio holdings with the Securities and Exchange Commission (SEC) for the first and third
quarters of each fiscal year as an exhibit to its reports on Form N-PORT. The HIT’s Form N-PORT Part F is available on the SEC’s website at sec.gov. Participants may also obtain copies of the HIT’s Form N-PORT, without charge, upon request, by calling the HIT collect at 202-331-8055.
PROXY VOTING
Except for its shares in its wholly owned subsidiary, HIT Advisers LLC, and shares in mutual funds holding short-term or overnight cash, if applicable, the HIT invests exclusively in nonvoting securities and has not deemed it necessary to adopt policies and procedures for the voting of portfolio securities. The HIT has reported information regarding how it voted in matters related to its subsidiary in its most recent filing with the SEC on Form N-PX. This filing is available on the SEC’s website at sec.gov. Participants may also obtain a copy of the HIT’s report on Form N-PX, without charge, upon request, by calling the HIT collect at 202-331-8055.
Statement Regarding Liquidity Risk Management Program
The HIT Board of Trustees (the Board) has previously approved and implemented policies and procedures for a Liquidity Risk Management Program (the Program) consistent with Rule 22e-4 under the Investment Company Act of 1940. The Program seeks to assess and manage the HIT’s liquidity risk. The Board designated the HIT’s Valuation Committee to serve as the Liquidity Program Administrator (the Administrator), which, among other duties, is required to provide a written report to the Board, at least annually, in order to assist the Board in assessing the adequacy and effectiveness of the Program. Certain aspects of the Program rely on third parties to perform certain functions, including the provision of liquidity classification determinations. The Program is comprised of various components designed to support the assessment and/or management of liquidity risk, including: (1) the periodic assessment (no less frequently than annually) of certain factors that influence the HIT’s liquidity risk; (2) the periodic classification of the HIT’s investments into one of four liquidity categories that reflect an estimate of their liquidity under current market conditions; (3) a 15% limit on the acquisition of “illiquid investments” (as defined under Rule 22e-4); (4) the determination of whether the HIT requires a “highly liquid investment minimum” (as defined under Rule 22e-4); and, (5) periodic reporting to the Board.
At a March 16, 2023 meeting of the Board, the Administrator provided a written report to the Board addressing the operation and the adequacy and effectiveness of the implementation of the Program for the 2022 calendar year (the Reporting Period). Among other things, the report discussed liquidity classifications of the HIT’s portfolio and provided an assessment of the HIT’s liquidity risk and evaluation of the Program. The report concluded that the Program continues to be reasonably designed to assess and manage liquidity risk and was adequately and effectively implemented during the Reporting Period.
| 6 | |

Statement of Assets and Liabilities
June 30, 2023 (dollars in thousands, except per share data; unaudited)
| Assets |
| | Investments, at value (cost $7,184,557) | | $ | 6,287,821 | |
| | | Cash | | | 13,967 | |
| | | Accrued interest receivable | | | 24,383 | |
| | | Receivables for investments sold | | | 183 | |
| | | Cash collateral held with broker | | | 2,015 | |
| | | Variation margin due from broker | | | 477 | |
| | | Right of use asset | | | 4,067 | |
| | | Other assets | | | 4,273 | |
| | | Total assets | | | 6,337,186 | |
| | | | | | | |
| Liabilities |
| | | Payables for investments purchased | | | 47,903 | |
| | | Redemptions payable | | | 693 | |
| | | Income distribution and capital gains payable, net of dividends reinvested of $16,859 | | | 1,313 | |
| | | Refundable deposits | | | 962 | |
| | | Accrued salaries and fringe benefits | | | 5,737 | |
| | | Lease Liability | | | 4,604 | |
| | | Other liabilities and accrued expenses | | | 1,011 | |
| | | Total liabilities | | | 62,223 | |
| | | | | | | |
| | | Other commitments and contingencies (Note 5 of financial statements) | | | – | |
| | | | | | | |
| Net assets applicable to participants’ equity — |
| | | Certificates of participation—authorized unlimited; | | | | |
| | | Outstanding 6,527,862 units | | $ | 6,274,963 | |
| | | | | | | |
Net asset value per unit of participation
(in dollars) | | | | $ | 961.26 | |
| | | | | | | |
| | | | | | | |
| Participants’ equity |
| | | Participants’ equity consisted of the following: | | | | |
| | | Amount invested and reinvested by current participants | | $ | 7,259,170 | |
| | | Distributable earnings (accumulated losses) | | | (984,207 | ) |
| | | Total participants’ equity | | $ | 6,274,963 | |
See accompanying Notes to Financial Statements (unaudited).
| 8 | |
Schedule of Portfolio Investments
June 30, 2023 (dollars in thousands; unaudited)
FHA Permanent Securities | 1.9% of net assets
| | | | Interest Rate | | | Maturity Date | | Unfunded Commitments1 | | Face Amount | | Amortized Cost | | Value | |
| Multifamily | | | 3.65% | | | Dec-2037 | | | $ | – | | | | $ | 7,314 | | | | $ | 7,408 | | | | $ | 7,278 | | |
| | | 3.72% | | | Feb-2062 | | | | – | | | | | 4,408 | | | | | 4,417 | | | | | 3,855 | | |
| | | | 3.90% | | | Mar-2062 | | | | – | | | | | 3,070 | | | | | 3,073 | | | | | 2,720 | | |
| | | | 4.00% | | | Dec-2053 | | | | – | | | | | 59,540 | | | | | 59,516 | | | | | 55,453 | | |
| | | | 4.10% | | | Dec-2060 | | | | – | | | | | 21,407 | | | | | 21,426 | | | | | 19,010 | | |
| | | | 4.70% | | | May-2053 | | | | – | | | | | 4,513 | | | | | 4,686 | | | | | 3,699 | | |
| | | | 5.17% | | | Feb-2050 | | | | – | | | | | 7,327 | | | | | 7,775 | | | | | 7,158 | | |
| | | | 5.35% | | | Mar-2047 | | | | – | | | | | 6,560 | | | | | 6,569 | | | | | 6,545 | | |
| | | | 5.60% | | | Jun-2038 | | | | – | | | | | 1,972 | | | | | 1,975 | | | | | 1,969 | | |
| | | | 5.80% | | | Jan-2053 | | | | – | | | | | 1,910 | | | | | 1,917 | | | | | 1,914 | | |
| | | | 5.87% | | | May-2044 | | | | – | | | | | 1,567 | | | | | 1,566 | | | | | 1,564 | | |
| | | | 5.89% | | | Apr-2038 | | | | – | | | | | 3,718 | | | | | 3,720 | | | | | 3,713 | | |
| | | | 6.40% | | | Aug-2046 | | | | – | | | | | 3,445 | | | | | 3,446 | | | | | 3,442 | | |
| | | | 6.60% | | | Jan-2050 | | | | – | | | | | 3,128 | | | | | 3,146 | | | | | 3,104 | | |
| | | | | | | | | | | – | | | | | 129,879 | | | | | 130,640 | | | | | 121,424 | | |
| Forward Commitments | | | 2.50% | | | Sep-2063 | | | | 5,702 | | | | | – | | | | | – | | | | | (1,335 | ) | |
| Total FHA Permanent Securities | | | $ | 5,702 | | | | $ | 129,879 | | | | $ | 130,640 | | | | $ | 120,089 | | |
Ginnie Mae Securities | 26.7% of net assets
| | | | Interest Rate | | | Maturity Date | | Face Amount | | Amortized Cost | | Value | |
| Single Family | | | 4.00% | | | Feb-2040–Jun-2040 | | | $ | 1,015 | | | | $ | 1,023 | | | | $ | 971 | | |
| | | | 4.50% | | | Aug-2040 | | | | 515 | | | | | 522 | | | | | 503 | | |
| | | | 5.50% | | | Jan-2033–Jun-2037 | | | | 785 | | | | | 785 | | | | | 791 | | |
| | | | 6.00% | | | Jan-2032–Aug-2037 | | | | 565 | | | | | 565 | | | | | 578 | | |
| | | | 6.50% | | | Jul-2028 | | | | 31 | | | | | 31 | | | | | 32 | | |
| | | | 7.00% | | | Apr-2026–Jan-2030 | | | | 285 | | | | | 285 | | | | | 288 | | |
| | | | 7.50% | | | Aug-2025–Aug-2030 | | | | 126 | | | | | 126 | | | | | 130 | | |
| | | | 8.00% | | | Sep-2026–Nov-2030 | | | | 122 | | | | | 122 | | | | | 124 | | |
| | | | 8.50% | | | Aug-2024–Aug-2027 | | | | 30 | | | | | 30 | | | | | 31 | | |
| | | | 9.00% | | | Sep-2024–Jun-2025 | | | | 2 | | | | | 2 | | | | | 2 | | |
| | | | | | | | | | | 3,476 | | | | | 3,491 | | | | | 3,450 | | |
| Multifamily | | | 1.90% | | | Feb-2061 | | | | 22,712 | | | | | 20,542 | | | | | 13,289 | | |
| | | | 1.95% | | | Mar-2064 | | | | 34,377 | | | | | 34,837 | | | | | 27,259 | | |
| | | | 1.95% | | | Mar-2064 | | | | 37,845 | | | | | 37,366 | | | | | 30,145 | | |
| | | | 2.00% | | | Oct-2062 | | | | 53,399 | | | | | 55,163 | | | | | 43,485 | | |
| | | | 2.00% | | | Apr-2063 | | | | 48,989 | | | | | 49,995 | | | | | 39,035 | | |
| | | | 2.00% | | | Apr-2063 | | | | 51,729 | | | | | 52,582 | | | | | 42,115 | | |
| | | | 2.00% | | | Jul-2063 | | | | 44,696 | | | | | 45,088 | | | | | 35,736 | | |
| | | | 2.00% | | | Oct-2063 | | | | 42,376 | | | | | 41,970 | | | | | 33,876 | | |
| | | | 2.00% | | | Apr-2062–Mar-2064 | | | | 302,991 | | | | | 306,433 | | | | | 239,705 | | |
| | | | 2.08% | | | Nov-2056 | | | | 51,388 | | | | | 53,298 | | | | | 41,985 | | |
| | | | 2.15% | | | May-2056 | | | | 458 | | | | | 457 | | | | | 447 | | |
| | | | 2.20% | | | Jun-2056 | | | | 862 | | | | | 861 | | | | | 825 | | |
| | | | 2.25% | | | Dec-2048 | | | | 2,898 | | | | | 2,878 | | | | | 2,687 | | |
| | | | 2.30% | | | Mar-2056–Oct-2056 | | | | 3,391 | | | | | 3,363 | | | | | 3,204 | | |
| | | | 2.31% | | | Nov-2051 | | | | 7,076 | | | | | 7,076 | | | | | 6,240 | | |
Schedule of Portfolio Investments
June 30, 2023 (dollars in thousands; unaudited) continued
Ginnie Mae Securities continued
| | | Interest Rate | | | Maturity Date | | Face Amount | | Amortized Cost | | Value | |
| | | 2.32% | | | Sep-2060 | | | | 26,622 | | | | | 27,995 | | | | | 22,194 | | |
| | | | 2.35% | | | Nov-2056–Feb-2061 | | | | 28,525 | | | | | 29,348 | | | | | 24,502 | | |
| | | | 2.40% | | | Aug-2047–Dec-2057 | | | | 46,034 | | | | | 46,618 | | | | | 40,460 | | |
| | | | 2.45% | | | Apr-2062 | | | | 14,505 | | | | | 14,733 | | | | | 11,852 | | |
| | | | 2.50% | | | Mar-2057–Apr-2062 | | | | 53,881 | | | | | 54,664 | | | | | 46,046 | | |
| | | | 2.58% | | | May-2063 | | | | 28,468 | | | | | 29,360 | | | | | 23,787 | | |
| | | | 2.60% | | | Dec-2055–Jun-2059 | | | | 8,780 | | | | | 8,802 | | | | | 8,105 | | |
| | | | 2.64% | | | Jan-2063 | | | | 18,239 | | | | | 18,757 | | | | | 15,279 | | |
| | | | 2.65% | | | Oct-2062 | | | | 6,412 | | | | | 6,565 | | | | | 5,506 | | |
| | | | 2.67% | | | Mar-2062 | | | | 34,842 | | | | | 35,633 | | | | | 29,489 | | |
| | | | 2.70% | | | May-2048–Jul-2058 | | | | 5,484 | | | | | 5,491 | | | | | 5,202 | | |
| | | | 2.72% | | | Feb-2044 | | | | 102 | | | | | 104 | | | | | 99 | | |
| | | | 2.74% | | | Apr-2057 | | | | 23,491 | | | | | 25,428 | | | | | 20,241 | | |
| | | | 2.78% | | | Aug-2058 | | | | 10,513 | | | | | 11,390 | | | | | 9,085 | | |
| | | | 2.79% | | | Apr-2049 | | | | 4,524 | | | | | 4,560 | | | | | 4,193 | | |
| | | | 2.80% | | | Feb-2053 | | | | 60,000 | | | | | 57,339 | | | | | 47,308 | | |
| | | | 2.80% | | | Dec-2059 | | | | 4,567 | | | | | 4,509 | | | | | 4,373 | | |
| | | | 2.82% | | | Apr-2050 | | | | 780 | | | | | 793 | | | | | 737 | | |
| | | | 2.94% | | | Nov-2059 | | | | 46,910 | | | | | 51,978 | | | | | 40,092 | | |
| | | | 3.00% | | | May-2062 | | | | 59,503 | | | | | 64,142 | | | | | 52,772 | | |
| | | | 3.03% | | | Jan-2056 | | | | 29,743 | | | | | 31,570 | | | | | 26,593 | | |
| | | | 3.05% | | | May-2054 | | | | 11,545 | | | | | 11,589 | | | | | 10,235 | | |
| | | | 3.12% | | | Sep-2051 | | | | 20 | | | | | 20 | | | | | 20 | | |
| | | | 3.17% | | | Aug-2059 | | | | 33,866 | | | | | 37,317 | | | | | 30,270 | | |
| | | | 3.20% | | | Jul-2041 | | | | 15 | | | | | 15 | | | | | 15 | | |
| | | | 3.25% | | | Sep-2054 | | | | 17,626 | | | | | 17,490 | | | | | 16,624 | | |
| | | | 3.25% | | | Apr-2059 | | | | 32,547 | | | | | 31,335 | | | | | 30,539 | | |
| | | | 3.26% | | | Nov-2043 | | | | 191 | | | | | 191 | | | | | 190 | | |
| | | | 3.27% | | | Apr-2046 | | | | 23,836 | | | | | 25,028 | | | | | 20,421 | | |
| | | | 3.30% | | | Sep-2060 | | | | 7,743 | | | | | 7,925 | | | | | 7,021 | | |
| | | | 3.33% | | | May-2055 | | | | 6,833 | | | | | 6,507 | | | | | 6,130 | | |
| | | | 3.34% | | | Sep-2059 | | | | 16,631 | | | | | 16,928 | | | | | 15,070 | | |
| | | | 3.35% | | | Mar-2044 | | | | 10,000 | | | | | 9,656 | | | | | 9,566 | | |
| | | | 3.36% | | | May-2061 | | | | 50,814 | | | | | 56,242 | | | | | 45,198 | | |
| | | | 3.38% | | | Jan-2060 | | | | 58,030 | | | | | 58,035 | | | | | 52,816 | | |
| | | | 3.39% | | | Feb-2059 | | | | 13,912 | | | | | 14,165 | | | | | 12,706 | | |
| | | | 3.41% | | | Sep-2061 | | | | 41,280 | | | | | 42,817 | | | | | 37,152 | | |
| | | | 3.43% | | | Nov-2061 | | | | 52,042 | | | | | 53,604 | | | | | 46,820 | | |
| | | | 3.48% | | | Sep-2052 | | | | 2,919 | | | | | 3,009 | | | | | 2,733 | | |
| | | | 3.50% | | | Jan-2054 | | | | 3,443 | | | | | 3,428 | | | | | 3,374 | | |
| | | | 3.53% | | | Apr-2042 | | | | 15,305 | | | | | 15,705 | | | | | 14,210 | | |
| | | | 3.60% | | | Jun-2057 | | | | 13,299 | | | | | 13,732 | | | | | 12,512 | | |
| | | | 3.60% | | | Apr-2061 | | | | 33,372 | | | | | 34,405 | | | | | 30,329 | | |
| | | | 3.62% | | | Dec-2057 | | | | 27,841 | | | | | 28,295 | | | | | 25,820 | | |
| | | | 3.63% | | | Dec-2045 | | | | 8,583 | | | | | 8,299 | | | | | 8,432 | | |
| | | | 3.65% | | | Oct-2058 | | | | 10,032 | | | | | 10,173 | | | | | 9,347 | | |
| | | | 3.67% | | | Nov-2035 | | | | 12,625 | | | | | 12,916 | | | | | 11,899 | | |
| | | | 3.74% | | | Aug-2059 | | | | 15,265 | | | | | 15,540 | | | | | 14,103 | | |
| | | | 3.75% | | | Nov-2060 | | | | 11,065 | | | | | 11,395 | | | | | 10,148 | | |
| 10 | |
Schedule of Portfolio Investments
June 30, 2023 (dollars in thousands; unaudited) continued
| Ginnie Mae Securities continued | | | | | |
| Interest Rate | Maturity Date | Face Amount | Amortized Cost | Value | |
| 3.78% | Aug-2060 | 38,734 | 39,002 | 35,516 | |
| 3.92% | Aug-2039 | 38,840 | 40,564 | 36,723 | |
| 4.00% | Nov-2057 | 24,320 | 25,285 | 22,682 | |
| 4.10% | May-2051 | 3,718 | 3,995 | 3,599 | |
| 4.25% | Sep-2038 | 29,401 | 29,502 | 29,283 | |
| 4.35% | Dec-2060 | 2,247 | 2,286 | 2,188 | |
| 4.37% | Feb-2034 | 23,432 | 25,331 | 22,368 | |
| 4.45% | Jun-2055 | 2,436 | 2,353 | 2,433 | |
| 4.53% | Jan-2061 | 14,604 | 15,030 | 14,337 | |
| 4.63%2 | Sep-2037 | 1,500 | 1,470 | 1,501 | |
| 4.90%2 | Mar-2044 | 1,000 | 992 | 1,000 | |
| 5.25% | Apr-2037 | 15,670 | 15,666 | 15,638 | |
| | | 1,943,694 | 1,988,925 | 1,668,916 | |
| Total Ginnie Mae Securities | | $1,947,170 | $1,992,416 | $1,672,366 | |
Ginnie Mae Construction Securities | 1.5% of net assets
| | | | | | | | | |
| | | Interest Rates3 | | | | Unfunded | | | | | | |
| | | Permanent | | Construction | | Maturity Date | | Commitments1 | | Face Amount | | Amortized Cost | | Value |
| Multifamily | | 2.25% | | 4.10% | | Apr-2064 | | $ 51,441 | | | $ 14,487 | | | $ 16,503 | | | $ 629 | |
| | | 2.59% | �� | 3.59% | | Aug-2064 | | 39,551 | | | 2,761 | | | 3,774 | | | (6,692 | ) |
| | | 2.62% | | 2.62% | | Feb-2063 | | 549 | | | 13,251 | | | 13,740 | | | 10,915 | |
| | | 2.75% | | 2.75% | | Apr-2063 | | 546 | | | 21,117 | | | 22,003 | | | 17,639 | |
| | | 2.98% | | 2.98% | | Jun-2063 | | – | | | 31,703 | | | 32,883 | | | 27,211 | |
| | | 3.05% | | 3.05% | | Dec-2063 | | 77,774 | | | 26,972 | | | 28,016 | | | 16,610 | |
| | | 3.24% | | 3.24% | | Jan-2064 | | 17,057 | | | 9,374 | | | 9,917 | | | 5,195 | |
| | | 3.60% | | 5.70% | | Dec-2063 | | 259 | | | 4,649 | | | 4,817 | | | 4,322 | |
| | | 3.69% | | 4.75% | | Nov-2063 | | 10,363 | | | 2,140 | | | 2,312 | | | 862 | |
| | | 3.75% | | 5.35% | | Jan-2064 | | 290 | | | 5,512 | | | 5,707 | | | 5,157 | |
| | | 4.08% | | 4.08% | | Feb-2064 | | 12,205 | | | 3,222 | | | 3,568 | | | 2,023 | |
| | | 4.14% | | 4.14% | | Sep-2063 | | 307 | | | 10,889 | | | 11,093 | | | 10,133 | |
| Total Ginnie Mae Construction Securities | | | | $210,342 | | | $146,077 | | | $154,333 | | | $94,004 | |
Fannie Mae Securities | 43.6% of net assets
| | | | | | | Unfunded | | | | | | |
| | | Interest Rate4 | | Maturity Date | | Commitments1 | | Face Amount | | Amortized Cost | | Value |
| Single Family | | 2.50% | | May-2050–Jan-2052 | | $ – | | | $ 116,254 | | | $ 120,636 | | | $ 98,923 | |
| | | 2.50% | | Jan-2052 | | – | | | 44,931 | | | 45,095 | | | 38,339 | |
| | | 3.00% | | Apr-2031–Mar-2052 | | – | | | 134,360 | | | 139,075 | | | 119,456 | |
| | | 3.00% | | Oct-2051 | | – | | | 44,595 | | | 46,727 | | | 39,350 | |
| | | 3.50% | | Jan-2042–Jan-2052 | | – | | | 96,623 | | | 99,461 | | | 89,029 | |
| | | 3.50% | | Jan-2052 | | – | | | 38,267 | | | 39,225 | | | 34,900 | |
| | | 3.74% 12M LIBOR+149 | | Jul-2033 | | – | | | 101 | | | 101 | | | 102 | |
| | | 3.82% 12M LIBOR+152 | | Feb-2045 | | – | | | 1,826 | | | 1,852 | | | 1,848 | |
| | | 3.86% 6M LIBOR+161 | | Aug-2033 | | – | | | 110 | | | 109 | | | 110 | |
| 2023 SEMI-ANNUAL REPORT | 11 |
Schedule of Portfolio Investments
June 30, 2023 (dollars in thousands; unaudited) continued
Fannie Mae Securities continued
| | | | | | | | | | |
| | | | | | Unfunded | | | | | | |
| | Interest Rate4 | | Maturity Date | | Commitments1 | | Face Amount | | Amortized Cost | | Value |
| | | 3.87% 12M LIBOR+163 | | Nov-2034 | | – | | | 131 | | | 133 | | | 132 | |
| | | 3.98% 12M LIBOR+169 | | Oct-2042 | | – | | | 1,505 | | | 1,529 | | | 1,535 | |
| | | 4.00% | | Jul-2024–Jul-2052 | | – | | | 48,171 | | | 48,840 | | | 45,736 | |
| | | 4.00% | | Jun-2052 | | – | | | 33,449 | | | 33,022 | | | 31,400 | |
| | | 4.21% 1Y UST+220 | | Aug-2033 | | – | | | 362 | | | 362 | | | 370 | |
| | | 4.22% 1Y UST+222 | | Aug-2033 | | – | | | 163 | | | 163 | | | 168 | |
| | | 4.26% 1Y UST+222 | | Jul-2033 | | – | | | 275 | | | 275 | | | 281 | |
| | | 4.50% | | May-2024–Oct-2052 | | – | | | 144,374 | | | 143,815 | | | 139,474 | |
| | | 4.77% 6M LIBOR+155 | | Apr-2034 | | – | | | 368 | | | 373 | | | 370 | |
| | | 5.00% | | May-2034–May-2053 | | – | | | 137,231 | | | 138,025 | | | 134,944 | |
| | | 5.23% 1Y UST+223 | | May-2033 | | – | | | 116 | | | 116 | | | 117 | |
| | | 5.40% 1M LIBOR+25 | | Mar-2037 | | – | | | 100 | | | 99 | | | 97 | |
| | | 5.47% 1M LIBOR+32 | | Jun-2037 | | – | | | 480 | | | 480 | | | 476 | |
| | | 5.50% | | Sep-2032–Jun-2038 | | – | | | 25,682 | | | 25,768 | | | 25,680 | |
| | | 5.55% 1M LIBOR+40 | | Apr-2037 | | – | | | 225 | | | 224 | | | 219 | |
| | | 5.61% 1M LIBOR+46 | | Oct-2042 | | – | | | 1,344 | | | 1,348 | | | 1,298 | |
| | | 5.65% 1M LIBOR+50 | | Jun-2042 | | – | | | 3,054 | | | 3,056 | | | 2,962 | |
| | | 5.70% 1M LIBOR+55 | | Mar-2042 | | – | | | 1,591 | | | 1,593 | | | 1,551 | |
| | | 5.75% 1M LIBOR+60 | | Oct-2043 | | – | | | 3,189 | | | 3,201 | | | 3,102 | |
| | | 6.00% | | Nov-2028–Nov-2037 | | – | | | 1,256 | | | 1,262 | | | 1,287 | |
| | | 6.37% 6M LIBOR+155 | | Nov-2033 | | – | | | 657 | | | 657 | | | 670 | |
| | | 6.50% | | Sep-2028–Jul-2036 | | – | | | 249 | | | 252 | | | 257 | |
| | | 7.00% | | Sep-2027–May-2032 | | – | | | 411 | | | 412 | | | 426 | |
| | | 7.50% | | Jun-2030–Sep-2031 | | – | | | 5 | | | 5 | | | 5 | |
| | | 8.00% | | Aug-2030–May-2031 | | – | | | 31 | | | 31 | | | 32 | |
| | | | | | | – | | | 881,486 | | | 897,322 | | | 814,646 | |
| Multifamily | | 1.06% | | Dec-2027 | | – | | | 21,192 | | | 21,198 | | | 18,111 | |
| | | 1.17% | | Aug-2030–Nov-2030 | | – | | | 34,388 | | | 34,390 | | | 27,302 | |
| | | 1.22% | | Aug-2028–Jul-2030 | | – | | | 35,610 | | | 35,691 | | | 29,032 | |
| | | 1.25% | | Jul-2030 | | – | | | 37,950 | | | 38,045 | | | 30,420 | |
| | | 1.26% | | Jan-2031 | | – | | | 25,000 | | | 24,995 | | | 20,100 | |
| | | 1.27% | | Jul-2030 | | – | | | 14,235 | | | 14,311 | | | 11,449 | |
| | | 1.31% | | Aug-2030 | | – | | | 4,347 | | | 4,394 | | | 3,527 | |
| | | 1.32% | | Aug-2030 | | – | | | 21,000 | | | 21,211 | | | 17,010 | |
| | | 1.38% | | Jul-2030 | | – | | | 10,500 | | | 10,608 | | | 8,512 | |
| | | 1.41% | | Jul-2030 | | – | | | 3,203 | | | 3,228 | | | 2,640 | |
| | | 1.46% | | Jul-2030 | | – | | | 7,332 | | | 7,408 | | | 6,071 | |
| | | 1.47% | | Jul-2030–Dec-2030 | | – | | | 15,425 | | | 15,528 | | | 12,261 | |
| | | 1.50% | | Aug-2030 | | – | | | 1,134 | | | 1,155 | | | 939 | |
| | | 1.52% | | Jul-2032 | | – | | | 14,158 | | | 14,255 | | | 11,178 | |
| | | 1.53% | | Jul-2032 | | – | | | 10,500 | | | 10,627 | | | 8,334 | |
| | | 1.55% | | Jul-2032 | | – | | | 20,500 | | | 20,748 | | | 16,385 | |
| | | 1.57% | | Aug-2037 | | – | | | 46,525 | | | 46,707 | | | 33,315 | |
| | | 1.57% | | Jan-2031 | | – | | | 21,950 | | | 22,008 | | | 17,877 | |
| | | 1.58% | | Oct-2031 | | – | | | 57,950 | | | 58,167 | | | 45,399 | |
| | | 1.65% | | Jul-2030 | | – | | | 1,228 | | | 1,250 | | | 1,028 | |
| | | 1.71% | | Sep-2035–Nov-2035 | | – | | | 25,605 | | | 25,865 | | | 18,833 | |
| | | 1.74% | | Mar-2033 | | – | | | 6,160 | | | 6,230 | | | 4,839 | |
| | | 1.76% | | Aug-2031–Dec-2036 | | – | | | 53,555 | | | 53,694 | | | 43,136 | |
| | | 1.77% | | Sep-2035 | | – | | | 3,270 | | | 3,328 | | | 2,422 | |
| | | 1.82% | | Jul-2035 | | – | | | 4,545 | | | 4,577 | | | 3,514 | |
| | | 1.88% | | Nov-2031 | | – | | | 25,400 | | | 25,430 | | | 20,417 | |
| 12 | |
Schedule of Portfolio Investments
June 30, 2023 (dollars in thousands; unaudited) continued
Fannie Mae Securities continued
| | | | | | | | | | | | |
| | | | | | Unfunded | | | | | | |
| | Interest Rate4 | | Maturity Date | | Commitments1 | | Face Amount | | Amortized Cost | | Value |
| | 1.94% | | Apr-2035 | | – | | | 6,400 | | | 6,485 | | | 5,039 | |
| | | 2.00% | | Apr-2031 | | – | | | 18,000 | | | 18,495 | | | 15,024 | |
| | | 2.09% | | May-2032–Jul-2050 | | – | | | 21,793 | | | 22,013 | | | 16,190 | |
| | | 2.16% | | Sep-2050 | | – | | | 14,200 | | | 14,350 | | | 8,379 | |
| | | 2.33% | | Nov-2029–Feb-2030 | | – | | | 17,892 | | | 17,924 | | | 15,559 | |
| | | 2.41% | | Apr-2051 | | – | | | 3,678 | | | 3,714 | | | 2,620 | |
| | | 2.43% | | Nov-2031 | | – | | | 18,655 | | | 18,661 | | | 15,806 | |
| | | 2.46% | | Aug-2026–Jan-2038 | | – | | | 56,078 | | | 56,153 | | | 48,803 | |
| | | 2.47% | | Dec-2051 | | – | | | 13,253 | | | 13,432 | | | 9,532 | |
| | | 2.49% | | Dec-2026–Nov-2031 | | – | | | 26,894 | | | 26,934 | | | 23,959 | |
| | | 2.53% | | Jan-2030 | | – | | | 20,550 | | | 20,646 | | | 17,878 | |
| | | 2.55% | | Sep-2026–Mar-2030 | | – | | | 25,295 | | | 25,342 | | | 22,894 | |
| | | 2.56% | | Dec-2051 | | – | | | 12,451 | | | 12,480 | | | 9,089 | |
| | | 2.57% | | Mar-2042 | | – | | | 25,155 | | | 25,166 | | | 18,053 | |
| | | 2.61% | | Nov-2026 | | – | | | 9,800 | | | 9,826 | | | 9,060 | |
| | | 2.67% | | Aug-2029 | | – | | | 37,700 | | | 37,903 | | | 33,964 | |
| | | 2.70% | | Nov-2025 | | – | | | 14,172 | | | 14,173 | | | 13,424 | |
| | | 2.76% | | Oct-2031 | | – | | | 10,189 | | | 10,294 | | | 9,011 | |
| | | 2.85% | | Aug-2031 | | – | | | 8,760 | | | 8,794 | | | 7,688 | |
| | | 2.91% | | Jun-2031 | | – | | | 25,000 | | | 25,085 | | | 22,335 | |
| | | 2.92% | | Apr-2028 | | – | | | 15,343 | | | 15,368 | | | 14,235 | |
| | | 2.92% | | Jun-2027 | | – | | | 64,753 | | | 64,775 | | | 60,567 | |
| | | 2.93% | | Sep-2027–Apr-2038 | | – | | | 35,861 | | | 35,881 | | | 29,414 | |
| | | 2.94% | | Jun-2027–Jul-2039 | | – | | | 29,143 | | | 29,168 | | | 27,306 | |
| | | 2.96% | | Sep-2034 | | – | | | 20,000 | | | 20,586 | | | 16,828 | |
| | | 2.97% | | Sep-2034 | | – | | | 12,894 | | | 13,051 | | | 11,270 | |
| | | 2.99% | | Jun-2025 | | – | | | 2,514 | | | 2,514 | | | 2,408 | |
| | | 3.00% | | May-2027 | | – | | | 6,243 | | | 6,247 | | | 5,834 | |
| | | 3.01% | | Apr-2052 | | – | | | 7,357 | | | 7,361 | | | 5,668 | |
| | | 3.02% | | Jun-2027 | | – | | | 3,553 | | | 3,556 | | | 3,337 | |
| | | 3.03% | | Sep-2027 | | – | | | 22,827 | | | 22,869 | | | 21,317 | |
| | | 3.04% | | Apr-2030 | | – | | | 24,599 | | | 24,635 | | | 22,536 | |
| | | 3.05% | | Apr-2030 | | – | | | 25,349 | | | 25,362 | | | 23,213 | |
| | | 3.12% | | Apr-2030 | | – | | | 12,457 | | | 12,459 | | | 11,386 | |
| | | 3.13% | | May-2026 | | – | | | 3,130 | | | 3,144 | | | 2,992 | |
| | | 3.14% | | Apr-2029 | | – | | | 7,487 | | | 7,495 | | | 6,961 | |
| | | 3.17% | | Jun-2029 | | – | | | 22,345 | | | 22,409 | | | 20,700 | |
| | | 3.18% | | May-2035 | | – | | | 8,841 | | | 8,921 | | | 8,082 | |
| | | 3.21% | | May-2030 | | – | | | 6,333 | | | 6,375 | | | 5,821 | |
| | | 3.24% | | May-2052 | | – | | | 6,387 | | | 6,512 | | | 5,068 | |
| | | 3.31% | | Oct-2027 | | – | | | 14,822 | | | 14,858 | | | 14,033 | |
| | | 3.33% | | May-2029 | | – | | | 6,441 | | | 6,603 | | | 6,019 | |
| | | 3.36% | | Oct-2029 | | – | | | 10,360 | | | 10,362 | | | 9,725 | |
| | | 3.40% | | Oct-2026 | | – | | | 2,691 | | | 2,693 | | | 2,575 | |
| | | 3.41% | | Sep-2023 | | – | | | 9,798 | | | 9,798 | | | 9,733 | |
| | | 3.42% | | Apr-2035 | | – | | | 4,955 | | | 5,003 | | | 4,494 | |
| | | 3.46% | | Apr-2031 | | – | | | 12,714 | | | 12,762 | | | 11,685 | |
| | | 3.50% | | Aug-2039 | | – | | | 13,089 | | | 13,089 | | | 11,365 | |
| | | 3.61% | | Sep-2023 | | – | | | 5,781 | | | 5,781 | | | 5,759 | |
| | | 3.63% | | Jul-2035 | | – | | | 21,026 | | | 21,046 | | | 19,245 | |
| | | 3.66% | | Oct-2023 | | – | | | 4,236 | | | 4,236 | | | 4,220 | |
| | | 3.68% | | Jul-2028 | | – | | | 11,856 | | | 12,135 | | | 11,217 | |
| 2023 SEMI-ANNUAL REPORT | 13 |
Schedule of Portfolio Investments
June 30, 2023 (dollars in thousands; unaudited) continued
| Fannie Mae Securities continued | | | | | | | | | | |
| | | | | | | Unfunded | | | | | | |
| | | Interest Rate4 | | Maturity Date | | Commitments1 | | Face Amount | | Amortized Cost | | Value |
| | | 3.70% | | Oct-2033 | | – | | | 19,865 | | | 19,924 | | | 18,658 | |
| | | 3.91% | | Aug-2032 | | – | | | 26,250 | | | 26,539 | | | 25,154 | |
| | | 4.05% | | Jun-2030 | | – | | | 10,632 | | | 10,507 | | | 10,315 | |
| | | 4.11% | | Aug-2032 | | – | | | 15,627 | | | 15,696 | | | 15,034 | |
| | | 4.31% | | Jun-2033 | | – | | | 8,587 | | | 8,614 | | | 8,490 | |
| | | 4.32% | | Mar-2028 | | – | | | 41,709 | | | 41,838 | | | 40,705 | |
| | | 4.37% | | Jun-2033 | | – | | | 21,805 | | | 21,832 | | | 21,663 | |
| | | 4.39% | | Feb-2030 | | – | | | 21,148 | | | 21,091 | | | 20,600 | |
| | | 4.56% | | Feb-2028 | | – | | | 29,835 | | | 29,901 | | | 29,410 | |
| | | 4.69% | | Feb-2030–Jun-2035 | | – | | | 19,358 | | | 19,409 | | | 19,333 | |
| | | 4.80% | | Oct-2052 | | – | | | 12,385 | | | 12,423 | | | 11,741 | |
| | | 4.86% | | Jun-2033 | | – | | | 10,000 | | | 10,084 | | | 10,086 | |
| | | 4.99% | | Apr-2033 | | – | | | 22,738 | | | 23,083 | | | 23,161 | |
| | | 5.06% 1M SOFR+20 | | Dec-2032 | | – | | | 27,805 | | | 28,903 | | | 29,059 | |
| | | 5.24% 1M SOFR+21 | | Nov-2031 | | – | | | 40,943 | | | 40,948 | | | 40,976 | |
| | | 5.25% 1M SOFR+22 | | Mar-2031 | | – | | | 23,855 | | | 23,855 | | | 23,848 | |
| | | 5.26% 1M SOFR+23 | | Mar-2031 | | – | | | 10,075 | | | 10,075 | | | 10,076 | |
| | | 5.27% | | Apr-2031 | | – | | | 17,500 | | | 17,500 | | | 17,449 | |
| | | 5.30% | | Aug-2029 | | – | | | 3,444 | | | 3,429 | | | 3,480 | |
| | | 5.33% 1M SOFR+29 | | Feb-2029 | | – | | | 20,000 | | | 20,004 | | | 19,920 | |
| | | 5.35% | | Dec-2032 | | – | | | 11,954 | | | 12,649 | | | 12,561 | |
| | | 5.48% 1M LIBOR+29 | | Feb-2028 | | – | | | 30,257 | | | 30,257 | | | 30,212 | |
| | | 5.50% 1M LIBOR+31 | | Mar-2028 | | – | | | 38,114 | | | 38,114 | | | 38,085 | |
| | | 5.51% 1M SOFR+47 | | Jun-2029 | | – | | | 70,000 | | | 70,016 | | | 69,965 | |
| | | 5.53% 1M SOFR+49 | | May-2032 | | – | | | 28,526 | | | 28,530 | | | 28,610 | |
| | | 5.53% 1M LIBOR+34 | | Jan-2028 | | – | | | 22,425 | | | 22,425 | | | 22,335 | |
| | | 5.54% 1M LIBOR+35 | | Dec-2027 | | – | | | 17,914 | | | 17,914 | | | 17,916 | |
| | | 5.56% 1M SOFR+52 | | Jun-2032 | | – | | | 30,975 | | | 30,975 | | | 30,997 | |
| | | 5.67% 1M SOFR+60 | | Apr-2034 | | – | | | 24,924 | | | 24,368 | | | 24,426 | |
| | | 5.69% | | Jun-2041 | | – | | | 4,133 | | | 4,211 | | | 4,171 | |
| | | 5.75% | | Jun-2041 | | – | | | 2,008 | | | 2,051 | | | 2,029 | |
| | | 5.77% 1M LIBOR+58 | | May-2029 | | – | | | 19,938 | | | 19,943 | | | 19,932 | |
| | | 5.77% 1M LIBOR+58 | | Jun-2029 | | – | | | 41,302 | | | 41,302 | | | 41,290 | |
| | | 5.89% 1M SOFR+85 | | Nov-2032 | | – | | | 15,800 | | | 15,804 | | | 15,804 | |
| | | 5.96% | | Jan-2029 | | – | | | 200 | | | 200 | | | 199 | |
| | | 8.40% | | Jul-2023 | | – | | | 5 | | | 5 | | | 5 | |
| | | | | | | – | | | 2,125,798 | | | 2,134,391 | | | 1,911,066 | |
| Forward Commitments | | 2.21% | | Dec-2039 | | 41,587 | | | – | | | – | | | (11,554 | ) |
| | | 2.56% | | Jul-2038 | | 10,774 | | | – | | | – | | | (2,348 | ) |
| | | 2.58% | | Jan-2040 | | 11,700 | | | – | | | – | | | (2,705 | ) |
| | | 2.59% | | Feb-2039–Mar-2039 | | 35,409 | | | – | | | – | | | (8,140 | ) |
| | | 2.72% | | Jul-2040 | | 27,794 | | | – | | | 278 | | | (6,531 | ) |
| | | 4.47% | | Jul-2041 | | 10,058 | | | – | | | – | | | (792 | ) |
| | | | | | | 137,322 | | | – | | | 278 | | | (32,070 | ) |
| When Issued5 | | 4.48% | | Jul-2030 | | – | | | 21,624 | | | 21,624 | | | 21,565 | |
| | | 4.55% | | Jul-2030 | | – | | | 10,467 | | | 10,491 | | | 10,479 | |
| | | 4.88% | | Jul-2030 | | – | | | 11,665 | | | 11,875 | | | 11,793 | |
| | | | | | | – | | | 43,756 | | | 43,990 | | | 43,837 | |
| Total Fannie Mae Securities | | | | | | $137,322 | | | $3,051,040 | | | $3,075,981 | | | $2,737,479 | |
| 14 | |
Schedule of Portfolio Investments
June 30, 2023 (dollars in thousands; unaudited) continued
Freddie Mac Securities | 8.2% of net assets
| | | | | | | Unfunded | | | | | | |
| | | Interest Rate4 | | Maturity Date | | Commitments1 | | Face Amount | | Amortized Cost | | Value |
| Single Family | | 2.50% | | Jan-2043–Aug-2046 | | $ – | | | $ 5,587 | | | $ 5,644 | | | $ 4,818 | |
| | | 3.00% | | Aug-2042–Sep-2046 | | – | | | 22,923 | | | 23,293 | | | 20,761 | |
| | | 3.50% | | Jan-2026–Oct-2046 | | – | | | 42,371 | | | 43,195 | | | 39,471 | |
| | | 4.00% | | Nov-2024–Aug-2047 | | – | | | 40,089 | | | 41,469 | | | 38,310 | |
| | | 4.02% 12M LIBOR+178 | | Jul-2035 | | – | | | 94 | | | 94 | | | 95 | |
| | | 4.34% 1Y UST+223 | | Oct-2033 | | – | | | 140 | | | 139 | | | 142 | |
| | | 4.50% | | Jan-2038–Dec-2044 | | – | | | 11,022 | | | 11,419 | | | 10,841 | |
| | | 5.00% | | Jun-2026–Mar-2041 | | – | | | 1,674 | | | 1,668 | | | 1,678 | |
| | | 5.35% 1Y UST+223 | | Jun-2033 | | – | | | 30 | | | 30 | | | 30 | |
| | | 5.49% 1M LIBOR+30 | | Feb-2036 | | – | | | 238 | | | 238 | | | 235 | |
| | | 5.50% | | Apr-2033–Jul-2038 | | – | | | 1,568 | | | 1,563 | | | 1,591 | |
| | | 5.52% 1M LIBOR+33 | | May-2037 | | – | | | 67 | | | 67 | | | 66 | |
| | | 5.54% 1M LIBOR+35 | | Apr-2036 | | – | | | 221 | | | 221 | | | 217 | |
| | | 5.54% 1M LIBOR+35 | | Jan-2043 | | – | | | 1,802 | | | 1,804 | | | 1,730 | |
| | | 5.59% 1M LIBOR+40 | | Aug-2043 | | – | | | 1,880 | | | 1,879 | | | 1,812 | |
| | | 5.67% 1M LIBOR+48 | | Oct-2040 | | – | | | 1,412 | | | 1,411 | | | 1,388 | |
| | | 5.69% 1M LIBOR+50 | | Oct-2040–Dec-2043 | | – | | | 5,046 | | | 5,050 | | | 4,893 | |
| | | 5.74% 1M LIBOR+55 | | Nov-2040 | | – | | | 1,303 | | | 1,310 | | | 1,268 | |
| | | 5.86% 1M LIBOR+67 | | Aug-2037 | | – | | | 1,564 | | | 1,576 | | | 1,574 | |
| | | 6.00% | | Dec-2033–Oct-2037 | | – | | | 2,178 | | | 2,192 | | | 2,230 | |
| | | 6.50% | | Apr-2028–Nov-2037 | | – | | | 277 | | | 280 | | | 291 | |
| | | 7.00% | | Apr-2028–Mar-2030 | | – | | | 17 | | | 16 | | | 18 | |
| | | 7.50% | | Aug-2029–Apr-2031 | | – | | | 15 | | | 15 | | | 15 | |
| | | 8.50% | | Jul-2024 | | – | | | 6 | | | 6 | | | 6 | |
| | | | | | | – | | | 141,524 | | | 144,579 | | | 133,480 | |
| Multifamily | | 2.04% | | May-2050 | | – | | | 19,894 | | | 20,346 | | | 13,779 | |
| | | 2.40% | | Jun-2031 | | – | | | 7,444 | | | 7,511 | | | 6,429 | |
| | | 2.42% | | Jun-2031 | | – | | | 11,768 | | | 11,888 | | | 10,179 | |
| | | 3.28% | | Dec-2029 | | – | | | 15,689 | | | 15,805 | | | 14,512 | |
| | | 3.34% | | Dec-2029 | | – | | | 9,299 | | | 9,384 | | | 8,631 | |
| | | 3.35% | | Oct-2033 | | – | | | 33,450 | | | 33,340 | | | 30,624 | |
| | | 3.50% | | Jan-2026 | | – | | | 17,814 | | | 17,839 | | | 17,091 | |
| | | 3.60% | | Apr-2030 | | – | | | 24,314 | | | 24,736 | | | 23,156 | |
| | | 3.68% | | Oct-2025 | | – | | | 10,000 | | | 10,031 | | | 9,600 | |
| | | 4.25% | | Jan-2028 | | – | | | 93,650 | | | 92,606 | | | 91,070 | |
| | | 4.36% | | Dec-2029 | | – | | | 9,198 | | | 9,139 | | | 9,085 | |
| | | 4.83% | | Jan-2039 | | – | | | 9,979 | | | 10,076 | | | 10,040 | |
| | | 4.90% | | Dec-2032 | | – | | | 10,207 | | | 10,184 | | | 10,232 | |
| | | 5.24% 1M SOFR+20 | | Aug-2031 | | – | | | 26,747 | | | 26,747 | | | 26,218 | |
| | | 5.27% 1M SOFR+23 | | Jul-2027 | | – | | | 3,886 | | | 3,887 | | | 3,872 | |
| | | 5.28% 1M SOFR+24 | | Jan-2031–Jun-2031 | | – | | | 50,362 | | | 50,362 | | | 49,744 | |
| | | 5.29% 1M SOFR+25 | | Dec-2030 | | – | | | 15,179 | | | 15,179 | | | 15,011 | |
| | | 5.32% 1M LIBOR+13 | | Nov-2027 | | – | | | 10,924 | | | 10,924 | | | 10,816 | |
| | | 5.34% 1M SOFR+30 | | Dec-2030 | | – | | | 12,249 | | | 12,249 | | | 12,128 | |
| | | 5.40% 1M SOFR+36 | | Oct-2030 | | – | | | 6,572 | | | 6,572 | | | 6,512 | |
| | | 5.45% 1M LIBOR+26 | | Nov-2030 | | – | | | 11,793 | | | 11,793 | | | 11,692 | |
| | | 5.52% 1M LIBOR+33 | | Oct-2030 | | – | | | 3,724 | | | 3,724 | | | 3,688 | |
| | | | | | | – | | | 414,142 | | | 414,322 | | | 394,109 | |
| Forward Commitments | | 2.38% | | Feb-2034 | | 43,500 | | | – | | | 163 | | | (7,655 | ) |
| | | 3.86% | | Apr-2040 | | 27,450 | | | – | | | – | | | (2,914 | ) |
| | | | | | | 70,950 | | | – | | | 163 | | | (10,569 | ) |
| Total Freddie Mac Securities | | | | | | $70,950 | | | $555,666 | | | $559,064 | | | $517,020 | |
| 2023 SEMI-ANNUAL REPORT | 15 |
Schedule of Portfolio Investments
June 30, 2023 (dollars in thousands; unaudited) continued
State Housing Finance Agency Securities | 8.0% of net assets
| | | | | Interest Rates3 | | | | | | | | |
| | | Issuer | | Permanent | | Construction | | Maturity Date | | Face Amount | | Amortized Cost | | Value |
| Multifamily | | Illinois Housing Development Auth | | – | | | 0.40% | | | Dec-2024 | | $ 470 | | | $ 470 | | | $ 453 | |
| | | MassHousing | | – | | | 0.50% | | | Dec-2023 | | 3,810 | | | 3,810 | | | 3,767 | |
| | | MassHousing | | – | | | 2.15% | | | Sep-2023 | | 32,282 | | | 32,282 | | | 32,038 | |
| | | MassHousing | | – | | | 2.15% | | | Sep-2023 | | 4,465 | | | 4,465 | | | 4,431 | |
| | | City of St. Louis Park, MN | | – | | | 2.93% | | | Jan-2026 | | 20,577 | | | 20,575 | | | 20,085 | |
| | | Illinois Housing Development Auth | | 2.06% | | | – | | | Jan-2042 | | 27,455 | | | 27,458 | | | 19,673 | |
| | | Illinois Housing Development Auth | | 2.07% | | | – | | | Jul-2041 | | 84,895 | | | 84,894 | | | 59,103 | |
| | | MassHousing | | 2.60% | | | – | | | Jun-2063 | | 26,375 | | | 26,375 | | | 15,480 | |
| | | Illinois Housing Development Auth | | 2.65% | | | – | | | Jul-2062 | | 21,610 | | | 21,640 | | | 13,725 | |
| | | NYC Housing Development Corp | | 2.95% | | | – | | | Nov-2041–Nov-2045 | | 11,275 | | | 11,275 | | | 9,435 | |
| | | NYC Housing Development Corp | | 3.05% | | | – | | | Nov-2046 | | 13,000 | | | 13,000 | | | 8,810 | |
| | | NYC Housing Development Corp | | 3.10% | | | – | | | Oct-2046 | | 20,340 | | | 20,340 | | | 16,805 | |
| | | NYC Housing Development Corp | | 3.25% | | | – | | | May-2050 | | 11,965 | | | 11,987 | | | 9,251 | |
| | | Connecticut Housing Finance Auth | | 3.25% | | | – | | | Nov-2049 | | 12,000 | | | 12,000 | | | 9,469 | |
| | | MassHousing6 | | 3.30% | | | – | | | Dec-2059 | | 8,340 | | | 8,345 | | | 6,084 | |
| | | NYC Housing Development Corp | | 3.35% | | | – | | | Nov-2054 | | 20,000 | | | 20,000 | | | 15,678 | |
| | | NYC Housing Development Corp | | 3.45% | | | – | | | May-2059 | | 20,000 | | | 20,000 | | | 15,687 | |
| | | NYC Housing Development Corp | | 3.75% | | | – | | | May-2035 | | 3,200 | | | 3,200 | | | 3,146 | |
| | | MassHousing6 | | 3.85% | | | – | | | Dec-2058 | | 9,450 | | | 9,447 | | | 7,454 | |
| | | NYC Housing Development Corp | | 3.95% | | | – | | | Nov-2043 | | 12,800 | | | 12,800 | | | 11,901 | |
| | | NYC Housing Development Corp | | 4.00% | | | – | | | Dec-2028–Nov-2048 | | 14,315 | | | 14,418 | | | 13,924 | |
| | | MassHousing | | 4.13% | | | – | | | Dec-2036 | | 5,000 | | | 5,000 | | | 5,000 | |
| | | NYC Housing Development Corp | | 4.13% | | | – | | | Nov-2040–Nov-2053 | | 13,305 | | | 13,306 | | | 12,806 | |
| | | NYC Housing Development Corp | | 4.20% | | | – | | | Dec-2039 | | 8,305 | | | 8,305 | | | 8,154 | |
| | | NYC Housing Development Corp | | 4.30% | | | – | | | Nov-2045 | | 3,000 | | | 3,000 | | | 2,858 | |
| | | Chicago Housing Authority | | 4.36% | | | – | | | Jan-2038 | | 25,000 | | | 25,000 | | | 23,054 | |
| | | MassHousing | | 4.50% | | | – | | | Jun-2056 | | 45,000 | | | 45,000 | | | 43,853 | |
| | | MassHousing | | 4.50% | | | – | | | Dec-2065 | | 30,060 | | | 30,082 | | | 28,799 | |
| | | MassHousing6 | | 4.90% | | | – | | | Jun-2066 | | 26,645 | | | 26,672 | | | 26,644 | |
| | | MassHousing6 | | 5.11% | | | – | | | Jun-2066 | | 53,425 | | | 53,465 | | | 54,228 | |
| Total State Housing Finance Agency Securities | | $588,364 | | | $588,611 | | | $501,795 | |
| 16 | |
Schedule of Portfolio Investments
June 30, 2023 (dollars in thousands; unaudited) continued
Other Mutifamily Investments | 4.5% of net assets
| | | Interest Rates3,4 | | | | Unfunded | | | | | | |
| Issuer | | Permanent | | Construction | | Maturity Date | | Commitments1 | | Face Amount | | Amortized Cost | | Value |
| Direct Loans | | | | | | | | | | | | | | | | | | | | | | | | | |
| Wilder Square (Level 3) | | – | | | 3.25% | | | | Sep-2023 | | $ | – | | | $ | 8,272 | | | $ | 8,271 | | | $ | 8,218 | |
| University and Fairview (Level 3) | | – | | | 3.45% | | | | Jun-2024 | | | – | | | | 15,000 | | | | 14,969 | | | | 14,398 | |
| University and Fairview (Level 3) | | – | | | 3.45% | | | | Dec-2023 | | | – | | | | 22,513 | | | | 22,449 | | | | 21,844 | |
| Old Cedar (Level 3) | | – | | | 3.50% | | | | Dec-2023 | | | – | | | | 11,000 | | | | 10,993 | | | | 10,820 | |
| Peregrine Apartments (Level 3) | | – | | | 3.60% | | | | Jun-2024–Dec-2024 | | | 11,543 | | | | 16,250 | | | | 16,198 | | | | 15,027 | |
| The Crest Apartments (Level 3) | | – | | | 3.75% | | | | Dec-2023–Jun-2024 | | | 2,916 | | | | 10,400 | | | | 10,362 | | | | 9,994 | |
| Ladder 260 (Level 3) | | – | | | 4.04% | | | | Nov-2025 | | | 5,638 | | | | 2,523 | | | | 2,537 | | | | 2,118 | |
| 99 Ocean (Level 3) | | – | | | 4.05% | | | | Oct-2024 | | | 9,096 | | | | 42,903 | | | | 42,604 | | | | 41,730 | |
| Hudson Exchange (Level 3) | | – | | | 5.50% | | | | Jun-2027 | | | 43,106 | | | | 6,894 | | | | 6,734 | | | | 6,797 | |
| 53 Colton Street (Level 3) | | – | | | 6.95% | | Prime Rate-105 | | Dec-2023 | | | – | | | | 16,017 | | | | 15,994 | | | | 15,870 | |
| Soul (Level 3) | | – | | | 7.07% | | 1M SOFR+225 | | Apr-2025 | | | 20,869 | | | | 3,881 | | | | 3,701 | | | | 3,575 | |
| 53 Colton Street (Level 3) | | – | | | 7.15% | | Prime Rate-85 | | Dec-2023 | | | 867 | | | | 2,176 | | | | 2,167 | | | | 2,029 | |
| San Cristina (Level 3) | | – | | | 7.42% | | 1M SOFR+260 | | Sep-2024 | | | 9,224 | | | | 8,248 | | | | 8,165 | | | | 8,141 | |
| 18 Sixth Ave at Pacific Park (Level 3) | | – | | | 7.35% | | 1M LIBOR+220 | | Dec-2024 | | | 2,829 | | | | 14,393 | | | | 14,373 | | | | 14,232 | |
| 18 Sixth Ave at Pacific Park (Level 3) | | – | | | 7.35% | | 1M LIBOR+220 | | Dec-2024 | | | 7,254 | | | | 75,524 | | | | 75,399 | | | | 74,750 | |
| 311 W 42nd Street (Level 3) | | – | | | 8.22% | | 1M LIBOR+300 | | Nov-2024 | | | 33,192 | | | | 16,808 | | | | 16,650 | | | | 16,772 | |
| Granada (Level 3) | | – | | | 11.17% | | 1M SOFR+635 | | Jan-2024 | | | 109 | | | | 12,891 | | | | 12,873 | | | | 12,834 | |
| | | | | | | | | | | | | 146,643 | | | | 285,693 | | | | 284,439 | | | | 279,149 | |
| Forward Commitments (Direct Loans) | | | | | | | | | | |
| Soul (Level 3) | | – | | | 7.67% | | 1M SOFR+285 | | Apr-2025 | | | 12,501 | | | | – | | | | (101 | ) | | | (42 | ) |
| | | | | | | | | | | | | 12,501 | | | | – | | | | (101 | ) | | | (42 | ) |
| Privately Insured Construction/Permanent Mortgages7 | | |
| Illinois Housing Development Auth | | 6.20% | | | – | | | | Dec-2047 | | | – | | | | 2,833 | | | | 2,840 | | | | 2,812 | |
| Illinois Housing Development Auth | | 6.40% | | | – | | | | Nov-2048 | | | – | | | | 864 | | | | 872 | | | | 858 | |
| | | | | | | | | | | | | – | | | | 3,697 | | | | 3,712 | | | | 3,670 | |
| Total Other Multifamily Investments | | $ | 159,144 | | | $ | 289,390 | | | $ | 288,050 | | | $ | 282,777 | |
Commercial Mortgage-Backed Securities | 0.8% of net assets
| Issuer | | Interest Rate | | Maturity Date | | Face Amount | | Amortized Cost | | Value |
| Citigroup | | 3.62% | | Jul-2047 | | $ | 8,000 | | | $ | 8,156 | | | $ | 7,737 | |
| Barclays/JP Morgan | | 3.80% | | Jul-2047 | | | 2,250 | | | | 2,294 | | | | 2,212 | |
| Deutsche Bank/UBS | | 3.96% | | Mar-2047 | | | 5,000 | | | | 5,098 | | | | 4,931 | |
| Barclays/JP Morgan | | 4.00% | | Apr-2047 | | | 3,792 | | | | 3,867 | | | | 3,722 | |
| Cantor/Deutsche Bank | | 4.01% | | Apr-2047 | | | 20,000 | | | | 20,393 | | | | 19,726 | |
| Barclays/JP Morgan | | 4.08% | | Feb-2047 | | | 6,825 | | | | 7,083 | | | | 6,667 | |
| Cantor/Deutsche Bank | | 4.24% | | Feb-2047 | | | 7,000 | | | | 7,136 | | | | 6,920 | |
| Total Commercial Mortgage-Backed Securities | | $ | 52,867 | | | $ | 54,027 | | | $ | 51,915 | |
| 2023 SEMI-ANNUAL REPORT | 17 |
Schedule of Portfolio Investments
June 30, 2023 (dollars in thousands; unaudited) continued
United States Treasury Securities | 4.1% of net assets
| | Interest Rate | | Maturity Date | | Face Amount | | Amortized Cost | | Value |
| | | 1.13% | | Feb-2031 | | $ | 25,000 | | | $ | 24,224 | | | $ | 20,547 | |
| | | 1.75% | | Aug-2041 | | | 20,000 | | | | 19,487 | | | | 14,038 | |
| | | 1.88% | | Feb-2032 | | | 15,000 | | | | 14,107 | | | | 12,839 | |
| | | 2.00% | | Nov-2041 | | | 7,000 | | | | 6,667 | | | | 5,118 | |
| | | 2.25% | | May-2041 | | | 42,000 | | | | 43,263 | | | | 32,315 | |
| | | 2.38% | | Feb-2042 | | | 15,000 | | | | 15,288 | | | | 11,672 | |
| | | 2.88% | | May-2032 | | | 15,000 | | | | 14,894 | | | | 13,899 | |
| | | 3.00% | | Aug-2052 | | | 20,000 | | | | 18,150 | | | | 16,980 | |
| | | 3.63% | | Feb-2053 | | | 10,000 | | | | 9,693 | | | | 9,584 | |
| | | 3.88% | | Feb-2043 | | | 105,000 | | | | 105,193 | | | | 102,297 | |
| | | 4.00% | | Nov-2042 | | | 15,000 | | | | 14,762 | | | | 14,894 | |
| Total United States Treasury Securities | | $ | 289,000 | | | $ | 285,728 | | | $ | 254,183 | |
| | | | | | | | | | | | | | | | | |
| Total Fixed income Investments | | $ | 7,049,453 | | | $ | 7,128,850 | | | $ | 6,231,628 | |
Equity Investment in Wholly-Owned Subsidiary | Less than 0.01% of net assets
| Issuer | | Face Amount (Cost) | | Amount of Dividends or Interest | | Value |
| HIT Advisers8 (Level 3) | | $1 | | $— | | $487 |
| Total Equity Investment | | $1 | | $— | | $487 |
Short-Term Investments | 0.9% of net assets
| Issuer | | Interest Rate | | Maturity Date | | Face Amount | | Amortized Cost | | Value |
| Commercial Paper | | | | | | | | | | | | | | | | |
| Halkin Finance | | 5.08%9 | | Jul-2023 | | $ | 40,000 | | | $ | 39,977 | | | $ | 39,977 | |
| | | | | | | | | | | | | | | | | |
| Blackrock Federal Funds | | 4.97%10 | | Jul-2023 | | | 15,729 | | | | 15,729 | | | | 15,729 | |
| Total Short-Term Investments | | | | | | $ | 55,729 | | | $ | 55,706 | | | $ | 55,706 | |
| | | | | | | | | | | | | | | | | |
| Total Investments | | | | | | $ | 7,105,183 | | | $ | 7,184,557 | | | $ | 6,287,821 | |
Futures Contracts | Notional Amount 1.2% of net assets
Description | | Number of Contracts | | Expiration Date | | Notional Amount | | Market Value | | Unrealized Appreciation
(Depreciation) |
| Futures Short | | | | | | | | | | | | | | | | |
| CBOT Ultra 10-Year U.S. Treasury | | 650 | | Sep-2023 | | $77,871 | | $76,985 | | $(886) |
| Total Futures Contracts | | | | | | | | | | | | | | $(886) |
| 18 | |
Schedule of Portfolio Investments
June 30, 2023 (dollars in thousands; unaudited) continued
Footnotes
| 1. | The HIT may make commitments in securities or loans that fund over time on a draw basis or forward commitments that fund at a single point in time. The unfunded amount of these commitments totaled $583.5 million at period end. Generally, GNMA construction securities fund over a 12- to 24-month period. Funding periods for State Housing Finance Agency construction securities and Direct Loans vary by project, but generally fund over a one- to 48-month period. Forward commitments generally settle within 12 months of the original commitment date. |
| 2. | Federally tax-exempt bonds collateralized by Ginnie Mae securities. |
| 3. | Construction interest rates are the rates charged to the borrower during the construction phase of the project. The permanent interest rates are charged to the borrower during the amortization period of the loan, unless the U.S. Department of Housing and Urban Development requires that such rates be charged earlier. |
| 4. | For floating and variable rate securities the rate indicated is for the period end. With respect to these securities, the schedule also includes the reference rate and spread in basis points. |
| 5. | The HIT records when issued securities on the trade date and maintains security positions such that sufficient liquid assets will be available to make payment for the securities purchased. Securities purchased on a when issued basis are marked to market monthly and begin earning interest on the settlement date. Losses may occur on these transactions due to changes in market conditions or the failure of counterparties to perform under the contract. |
| 6. | Securities exempt from registration under the Securities Act of 1933 and were privately placed directly by a state housing agency (a not-for-profit public agency) with the HIT. The securities are backed by mortgages and are general obligations of the state housing agency, and therefore secured by the full faith and credit of said agency. These securities may be resold in transactions exempt from registration, normally to qualified institutional buyers. These securities are considered liquid, under procedures established by and under the general supervision of the HIT’s Board of Trustees. |
| 7. | Loans insured by Ambac Assurance Corporation, are additionally backed by a repurchase option from the mortgagee for the benefit of the HIT. The repurchase price is defined as the unpaid principal balance of the loan plus all accrued unpaid interest due through the remittance date. The repurchase option can be exercised by the HIT in the event of a payment failure by Ambac Assurance Corporation. |
| 8. | The HIT has a participation interest in HIT Advisers, a Delaware limited liability company. HIT Advisers is a New York based adviser currently exempt from investment adviser registration in New York. The investment in HIT Advisers is valued by the HIT’s valuation committee in accordance with the fair value procedures adopted by the HIT’s Board of Trustees, and approximates carrying value of HIT Advisors and its subsidiary on a consolidated basis. The participation interest is not registered under the federal securities laws. |
| 9. | Rate indicated is the effective yield at the time of purchase. |
| 10. | Rate indicated is the annualized 1-day yield as of June 30, 2023. |
Key to Abbreviations
| M | Month |
| Y | Year |
| LIBOR | London Interbank Offered Rate |
| UST | U.S. Treasury |
| SOFR | Secured Overnight Financing Rate |
| 2023 SEMI-ANNUAL REPORT | 19 |
Statement of Operations
For the Six Months Ended June 30, 2023 (dollars in thousands; unaudited)
| Investment income | | $ | 109,535 | |
| | | | | | |
| Expenses | | | | | | |
| | Non-officer salaries and fringe benefits | | | 4,157 | |
| | | Officer salaries and fringe benefits | | | 2,419 | |
| | | Investment management | | | 708 | |
| | | Marketing and sales promotion (12b-1) | | | 506 | |
| | | Legal fees | | | 239 | |
| | | Auditing, tax and accounting fees | | | 220 | |
| | | Consulting fees | | | 194 | |
| | | Insurance | | | 170 | |
| | | Trustee expenses | | | 50 | |
| | | Rental expenses | | | 295 | |
| | | General expenses | | | 966 | |
| | | Total expenses | | | 9,924 | |
| | | | | | | |
| Net investment income | | | 99,611 | |
| | | | | | | |
| Net realized and unrealized gains (losses) on investments | | | | |
| | | Net realized gains (losses) on investments | | | (23,394 | ) |
| | | Net realized gains (losses) on futures | | | 1,224 | |
| | | Total net realized gains (losses) | | | (22,170 | ) |
| | | | | | | |
| | | Net change in unrealized appreciation (depreciation) on investments | | | 41,861 | |
| | | Net change in unrealized appreciation (depreciation) on futures | | | (2,077 | ) |
| | | Total net change in unrealized gains (losses) | | | 39,784 | |
| | | Net realized and unrealized gains (losses) on investments | | | 17,614 | |
| | | | | | | |
| Net increase (decrease) in net assets resulting from operations | | $ | 117,225 | |
See accompanying Notes to Financial Statements (unaudited).
| 20 | |
Statement of Changes in Net Assets
(dollars in thousands)
| Increase (decrease) in net assets from operations | | Six Months Ended
June 30, 2023 (unaudited) | | Year Ended
December 31, 2022 |
| | Net investment income | | $ | 99,611 | | | $ | 145,844 | |
| | | Net realized gains (losses) | | | (22,170 | ) | | | (46,299 | ) |
| | | Net change in unrealized appreciation (depreciation) | | | 39,784 | | | | (1,062,497 | ) |
| | | Net increase (decrease) in net assets resulting from operations | | | 117,225 | | | | (962,952 | ) |
| | | | | | | | | | | |
| Distributions to participants or reinvested | | | (101,958 | ) | | | (160,154 | ) |
| | | | | | | | | | | |
| Increase (decrease) in net assets from unit transactions | | | | | | | | |
| | | Proceeds from the sale of units of participation | | | 191,250 | | | | 93,068 | |
| | | Dividend reinvestment of units of participation | | | 94,658 | | | | 148,507 | |
| | | Payments for redemption of units of participation | | | (51,275 | ) | | | (199,962 | ) |
| | | Net increase (decrease) from unit transactions | | | 234,633 | | | | 41,613 | |
| | | | | | | | | | | |
| | | | | | | | | | | |
| Total increase (decrease) in net assets | | | 249,900 | | | | (1,081,493 | ) |
| | | | | | | | | | | |
| Net assets | | | | | | | | |
| | | Beginning of period | | $ | 6,025,063 | | | $ | 7,106,556 | |
| | | End of period | | $ | 6,274,963 | | | $ | 6,025,063 | |
| | | | | | | | | | | |
| Unit information | | | | | | | | |
| | | Units sold | | | 197,597 | | | | 92,026 | |
| | | Distributions reinvested | | | 97,414 | | | | 147,014 | |
| | | Units redeemed | | | (52,973 | ) | | | (203,171 | ) |
| | | Increase in units outstanding | | | 242,038 | | | | 35,869 | |
See accompanying Notes to Financial Statements (unaudited).
| 2023 SEMI-ANNUAL REPORT | 21 |
Notes to Financial Statements
(unaudited)
Note 1. Summary of Significant Accounting Policies
The American Federation of Labor and Congress of Industrial Organizations (AFL-CIO) Housing Investment Trust (HIT) is a common law trust created under the laws of the District of Columbia and is registered under the Investment Company Act of 1940, as amended (Investment Company Act), as a no-load, open-end investment company. The HIT has obtained certain exemptions from the requirements of the Investment Company Act that are described in the HIT’s Prospectus and Statement of Additional Information. Participation in the HIT is limited to eligible pension plans and labor organizations, including health and welfare, general, voluntary employees’ benefit associations and other funds that have beneficiaries who are represented by labor organizations. The following is a summary of significant accounting policies followed by the HIT in the preparation of its financial statements. The policies are in conformity with generally accepted accounting principles (GAAP) in the United States. The HIT follows the investment company accounting and reporting guidance of the Financial Accounting Standards Board (FASB) Accounting Standards Codification Topic 946 Financial Services—Investment Companies.
Investment Valuation
Net asset value per share (NAV) is determined as of the close of regular trading (normally 4:00 p.m.) of the New York Stock Exchange on the Net asset value per share (NAV) is determined as of the close of regular trading (normally 4:00 p.m.) of the New York Stock Exchange on the last business day of each calendar month. The HIT’s Board of Trustees is responsible for the valuation process. The HIT’s Board of Trustees has designated the officers of the HIT that comprise the HIT’s Valuation Committee as the “valuation designee” to perform fair valuations of the HIT’s investments pursuant to Rule 2a-5 under the Investment Company Act. The Valuation Committee, in accordance with the policies and procedures approved by the HIT’s Board of Trustees, is also responsible for evaluating the effectiveness of the HIT’s pricing policies, determining the reliability of third-party pricing information and reporting to the Board of Trustees on valuation matters, including fair value determinations. Following is a description of the valuation methods and inputs applied to the HIT’s major categories of assets. The majority of the HIT’s assets are valued using evaluated prices provided by independent third-party pricing services that are approved by the Board of Trustees. Portfolio securities for which market quotations are readily available are valued through exchange determined market pricing. For U.S. Treasury securities, independent pricing services generally base evaluated prices on actual transactions as well as dealer-supplied market information. For State Housing Finance Agency securities, independent pricing services generally base evaluated prices using models that utilize trading spreads, new issue scales, verified bid information and credit ratings. For commercial mortgage-backed securities, independent pricing services generally base evaluated prices on cash flow models that take into consideration benchmark yields and utilize available trade information, dealer quotes and market color.
For U.S. agency and government-sponsored enterprise securities, including single family and multifamily mortgage-backed securities, construction mortgage securities and loans and collateralized mortgage obligations, independent pricing services generally base evaluated prices on an active TBA (to-be-announced) market for mortgage pools, discounted cash flow models, or option-adjusted spread models. Independent pricing services examine reference data and use observable inputs such as issue name, issue size, ratings, maturity, call type and spread/benchmark yields, as well as dealer-supplied market information. The discounted cash flow or option-adjusted spread models utilize inputs from matrix pricing, which consider observable market-based discount and prepayment rates, attributes of the collateral, and yield or price of bonds of comparable quality, coupon, maturity and type.
Investments in registered open-end investment management companies are valued based upon the NAV of such investments.
When the HIT finances the construction and permanent securities or participation interests, value is determined based upon the total amount, funded and/or unfunded, of the commitment.
Portfolio investments for which market quotations or independent third-party provider evaluated prices are deemed unreliable or not available are valued at their fair value determined in good faith by the HIT’s Valuation Committee, as valuation designee, pursuant to procedures approved by the HIT’s Board of Trustees. In determining fair market value, the Valuation Committee will employ a valuation method that it believes reflects fair value for that asset, which may include the use of an independent valuation consultant or the utilization of a discounted cash flow model based on broker and/or other market inputs. The frequency with which these fair value procedures may be used cannot be predicted. However, on June 30, 2023 the Valuation Committee fair valued less than 0.01% of the HIT’s net assets utilizing internally derived unobservable inputs.
Futures contracts are valued at the settlement price established each day by the board of trade or exchange on which they are traded.
Short-term investments acquired with a stated maturity of 60 days or less are generally valued at amortized cost, which approximates fair market value.
The HIT holds a 100% ownership interest, either directly or indirectly in HIT Advisers LLC (HIT Advisers). HIT Advisers is valued at its fair value determined in good faith under consistently applied procedures approved by the HIT’s Board of Trustees, which approximates its respective carrying value.
| 22 | |
Notes to Financial Statements
(unaudited) continued
GAAP establishes a disclosure hierarchy that categorizes the inputs to valuation techniques used to value assets and liabilities at measurement date. The HIT classifies its assets and liabilities into three levels based on the method used to value the assets or liabilities. Level 1 values are based on quoted prices in active markets for identical securities. Level 2 values are based on significant observable market inputs, such as quoted prices for similar securities, interest rates, prepayment speeds, credit risk and quoted prices in inactive markets. Level 3 values are based on significant unobservable inputs that reflect the HIT’s determination of assumptions that market participants might reasonably use in valuing the securities..
The following table presents the HIT’s valuation levels as of June 30, 2023:
| | | Investment Securities | |
| (dollars in thousands) | | Level 1 | | Level 2 | | Level 3 | | Total |
| Investments in Securities: | | | | | | | | | | | | | | | | |
| FHA Permanent Securities | | $ | – | | | $ | 121,424 | | | $ | – | | | $ | 121,424 | |
| Ginnie Mae Securities | | | – | | | | 1,672,366 | | | | – | | | | 1,672,366 | |
| Ginnie Mae Construction Securities | | | – | | | | 94,004 | | | | – | | | | 94,004 | |
| Fannie Mae Securities | | | – | | | | 2,725,712 | | | | – | | | | 2,725,712 | |
| Freddie Mac Securities | | | – | | | | 527,589 | | | | – | | | | 527,589 | |
| State Housing Finance Agency Securities | | | – | | | | 501,795 | | | | – | | | | 501,795 | |
| Other Multifamily Investments | | | | | | | | | | | | | | | | |
| Direct Loans | | | – | | | | – | | | | 279,149 | | | | 279,149 | |
| Privately Insured Construction/Permanent Mortgages | | | – | | | | 3,670 | | | | – | | | | 3,670 | |
| Total Other Multifamily Investments | | | – | | | | 3,670 | | | | 279,149 | | | | 282,819 | |
| Commercial Mortgage-Backed Securities | | | – | | | | 51,915 | | | | – | | | | 51,915 | |
| United States Treasury Securities | | | – | | | | 254,183 | | | | – | | | | 254,183 | |
| Equity Investments | | | – | | | | – | | | | 487 | | | | 487 | |
| Short-Term Investments | | | 55,706 | | | | – | | | | – | | | | 55,706 | |
| Other Financial Instruments1 | | | – | | | | (137 | ) | | | (42 | ) | | | (179 | ) |
| Total Investments in Securities | | $ | 55,706 | | | $ | 5,952,521 | | | $ | 279,594 | | | $ | 6,287,821 | |
| | | | | | | | | | | | | | | | | |
| Derivatives Investments: | | | | | | | | | | | | | | | | |
| Assets | | | | | | | | | | | | | | | | |
| Futures Contracts2 | | | (886 | ) | | | – | | | | – | | | | (886 | ) |
| Total Derivatives Investments | | | (886 | ) | | | – | | | | – | | | | (886 | ) |
| 1. | If held in the portfolio at report date, other financial instruments includes forward commitments, TBA and when-issued securities. |
| 2. | Amounts shown represent unrealized appreciation (depreciation) at period end as presented in the Schedule of Investments. Only initial margin and variation margin on exchange-traded and centrally cleared derivatives, if any, are reported in the Statement of Assets and Liabilities. |
The following table reconciles the valuation of the HIT’s Level 3 investment securities and related transactions for the period ended June 30, 2023:
| | | Investments in Securities | |
(dollars in thousands) | | Other Multifamly
Investments | | Equity
Investment | | Other Financial
Instruments | | Total |
| Beginning Balance, 12/31/2022 | | $ | 217,373 | | | $ | 236 | | | $ | (174 | ) | | $ | 217,435 | |
| Total Unrealized Gain (Loss)* | | | 1,867 | | | | 251 | | | | 132 | | | | 2,250 | |
| Cost of Purchases | | | 59,909 | | | | – | | | | – | | | | 59,909 | |
| Ending Balance, 06/30/2023 | | $ | 279,149 | | | $ | 487 | | | $ | (42 | ) | | $ | 279,594 | |
* Net change in unrealized gain (loss) attributable to Level 3 securities held at June 30, 2023 totaled $2,250,000 and is included on the accompanying Statement of Operations.
For the six months ended June 30, 2023, there were no transfers in levels.
Level 3 securities primarily consist of Direct Loans which were valued using evaluated prices provided by an independent, third-party pricing service as of June 30, 2023 employing a discounted cash flow model. Weighted average lives for the loans ranged from 0.16 to 3.96 years. Unobservable inputs include spreads to relevant U.S. Treasuries ranging from 432 to 545 basis points. A change in unobservable inputs may impact the value of the loans.
| 2023 SEMI-ANNUAL REPORT | 23 |
Notes to Financial Statements
(unaudited) continued
Use of Estimates
The preparation of financial statements in conformity with GAAP requires management to make estimates and assumptions that affect the reported amounts of assets and liabilities at the date of the financial statements and the reported amounts of revenues and expenses during the period. Actual results could differ from those estimates.
Federal Income Taxes
The HIT’s policy is to comply with the requirements of the Internal Revenue Code of 1986, as amended (Internal Revenue Code), that are applicable to regulated investment companies, and to distribute all of its taxable income to its participants. Therefore, no federal income tax provision is required.
Tax positions taken or expected to be taken in the course of preparing the HIT’s tax returns are evaluated to determine whether the tax positions are “more-likely-than-not” of being sustained by the applicable tax authority. Tax positions not deemed to meet the more-likely-than-not threshold would be recorded as a tax benefit or expense in the current year. Management has analyzed for all open years the HIT’s tax positions taken on federal income tax returns and has concluded that no provision for income tax is required in the HIT’s financial statements.
The HIT files U.S. federal, state and local tax returns as required. The HIT’s tax returns are subject to examination by the relevant tax authorities until the expiration of the applicable statutes of limitations, which is generally three years after the filing of the tax return but could be longer in certain circumstances.
Distributions to Participants
At the end of each calendar month, a pro-rata distribution is made to participants of the net investment income earned during the month. This pro-rata distribution is based on the participant’s number of units held as of the immediately preceding month-end and excludes realized gains (losses) which are distributed at year-end. Participants redeeming their investments are paid their pro-rata share of undistributed net income accrued through the month-end of the month in which they redeem. The HIT offers a reinvestment plan that permits current participants to automatically reinvest their distributions of income and capital gains, if any, into the HIT’s units of participation. Total reinvestment was approximately 93% of distributed income for the six months ended June 30, 2023.
Investment Transactions and Income
For financial reporting purposes, security transactions are accounted for as of the trade date. Gains and losses on securities sold are determined on the basis of amortized cost. Realized gains (losses) on paydowns of mortgage- and asset-backed securities are classified as interest income.
Interest income is accrued as earned. Premiums, purchase discounts, and loan origination discounts, including related direct costs, are amortized as adjustments to the related loan’s yield over the contractual life of the loan using the effective interest method. In connection with the prepayment of a loan or security, any remaining unamortized amounts are recognized into income as a gain or loss and, depending upon the terms of the loan, there may be additional income that is earned based upon the prepayment and recognized in the period of the prepayment.
12b-1 Plan of Distribution
The HIT’s Board of Trustees has approved a Plan of Distribution under Rule 12b-1 under the Investment Company Act to pay for marketing and sales promotion expenses incurred in connection with the offer and sale of units and related distribution activities (12b-1 expenses). For the six months ended June 30, 2023, the HIT was authorized to pay 12b-1 expenses in an annual amount up to $600,000 or 0.05% of its average net assets on an annualized basis per fiscal year, whichever was greater. During the six months ended June 30, 2023, the HIT incurred approximately $506,168, or 0.02% of its average monthly net assets on an annualized basis, in 12b-1 expenses.
| 24 | |
Notes to Financial Statements
(unaudited) continued
Note 2. Investment Risk
Interest Rate Risk
As with any fixed income investment, the market value of the HIT’s investments will generally fall at times when market interest rates rise. Rising interest rates may also reduce prepayment rates, causing the average life of the HIT’s investments to increase. This could in turn further reduce the value of the HIT’s portfolio.
Certain instruments held by the HIT pay an interest rate based on the London Interbank Offered Rate (LIBOR), which is the average offered rate for various maturities of short-term loans between certain major international banks. LIBOR retired as of June 30, 2023 and LIBOR based instruments held by the HIT will transition to SOFR (Secured Overnight Financing Rate) as the new reference rate effective July 1, 2023. The bulk of LIBOR based instruments held by the HIT are issued and backed by government-sponsored enterprises and will be subject to an industry-wide transition on July 1, 2023. With regard to other such instruments held by the HIT, which are related to its direct loans, the HIT has included language in its investment loan documentations to provide for an agreed upon methodology to calculate a new benchmark rate spread. It is possible that the transition to a new reference rate may cause increased volatility and illiquidity in the markets for instruments with terms tied to LIBOR or other adverse consequences for these instruments. These events, if they occur, may adversely affect the HIT and its investments in such instruments.
Prepayment and Extension Risk
The HIT invests in certain fixed income securities whose value is derived from an underlying pool of mortgage loans that are subject to prepayment and extension risk.
Prepayment risk is the risk that a security will pay more quickly than its assumed payment rate, shortening its expected average life. In such an event, the HIT may be required to reinvest the proceeds of such prepayments in other investments bearing lower interest rates. The majority of the HIT’s securities backed by loans for multifamily projects include restrictions on prepayments for specified periods to mitigate this risk or include prepayment penalties to compensate the HIT. Prepayment penalties, when received, are included in realized gains.
Extension risk is the risk that a security will pay more slowly than its assumed payment rate, extending its expected average life. When this occurs, the HIT’s ability to reinvest principal repayments in higher returning investments may be limited.
These two risks may increase the sensitivity of the HIT’s portfolio to fluctuations in interest rates and negatively affect the value of the HIT’s portfolio.
Credit Risk
A majority of HIT’s investments have a form of credit enhancement to protect against losses in the event of a default. However, in the event of a default of an underlying mortgage loan where the investment does not have credit enhancement or that an entity providing credit enhancement for an investment fails to meet its obligations under the credit enhancement, the HIT would be subject to the risks that apply to real estate investments generally with respect to that investment. Certain real estate risks include construction failure, loan non-repayment, foreclosure, and environmental and litigation risk.
Futures Contracts
A futures contract is a standardized, exchange-traded agreement to buy or sell a specific quantity of an underlying asset at a specified price on a specified day or days in the future. The HIT may use U.S. Treasury futures contracts to manage the interest rate risk of the HIT portfolio. Upon entering into a futures contract, the HIT is required to deposit either cash or securities (Initial Margin) with a clearing broker. Non-cash collateral pledged by the HIT, if any, is disclosed in the Schedule of Investments, and cash collateral, if any, is held in a segregated account with the broker, which is reflected as Cash collateral held with broker in the Statement of Assets and Liabilities. Positions taken in the futures market are not normally held to maturity, but are instead liquidated through offsetting transactions which may result in a profit or a loss. While the HIT will usually liquidate futures contracts in this manner, the HIT may instead make or take delivery of the underlying asset whenever it appears economically advantageous for the HIT to do so.
The HIT may invest up to 5% of its net assets, measured using notional value, in U.S. Treasury futures contracts for duration management purposes. Investments in U.S. Treasury futures contracts may add leverage because the HIT would be subject to investment exposure on the notional amount of the futures contracts. Investments in derivatives can increase the volatility of the HIT’s NAV and may expose it to significant additional costs. The use of derivatives is a highly specialized activity that involves investment techniques and risks different from those associated with investments in more traditional securities and instruments. There is no guarantee that the use of derivatives will achieve their intended result.
Any open futures contracts at period end are presented in the Schedule of Investments, which reflects unrealized cumulative appreciation (depreciation). The notional amount at value reflects each contract’s exposure to the underlying instrument at period end. The period end variation margin is reflected as Variation margin due from broker in the Statement of Assets and Liabilities, and the net cumulative appreciation (depreciation) is included in Net realized and change in unrealized gains (losses) on futures in the Statement of Operations. The average month-end notional amount of short and long futures contracts held was $14.9 million and $32.0 million, respectively, for the period ended June 30, 2023.
| 2023 SEMI-ANNUAL REPORT | 25 |
Notes to Financial Statements
(unaudited) continued
Note 3. Transactions with Related Entities
HIT Advisers
HIT Advisers, a Delaware limited liability company, was formed by the HIT to operate as an investment adviser and be registered, as appropriate under applicable federal or state law. HIT Advisers is owned by HIT directly (99.9%), and indirectly through HIT Advisers Managing Member (0.1%) which is also wholly owned by the HIT. This ownership structure is intended to insulate the HIT from any potential liabilities associated with the conduct of HIT Advisers’ business. The HIT receives no services from HIT Advisers and carries it as a portfolio investment that meets the definition of a controlled affiliate.
In accordance with a contract, in addition to its membership interest, the HIT provides HIT Advisers advances to assist with its operations and cash flow management as needed. Advances are expected to be repaid as cash becomes available. HIT maintains an allowance for doubtful receivable due to aging balances. Also in accordance with the contract, the HIT may provide the time of certain personnel and allocates operational expenses to HIT Advisers on a cost-reimbursement basis. As of June 30, 2023, HIT Advisers had no assets under management.
A rollforward of advances to HIT Advisers by the HIT is included in the table below:
| Advances to HIT Advisers by HIT | | (dollars in thousands) |
| Ending Balance, 12/31/2022 | | $ | 500 | |
| Advances in 2023 | | | 22 | |
| Repayment by HIT Advisers in 2023 | | | – | |
| Ending Balance, 06/30/2023 | | $ | 522 | |
Building America
Building America CDE, Inc. (Building America), a wholly owned subsidiary of HIT Advisers, is a Community Development Entity, certified by the Community Development Financial Institutions Fund (CDFI Fund) of the U.S. Department of the Treasury.
In accordance with a contract, the HIT provides the time of certain personnel to Building America and allocates operational expenses on a cost-reimbursement basis. Also, in accordance with the contract, the HIT provides Building America advances to assist with its operations and cash flow management as needed. Advances are repaid as cash becomes available.
A rollforward of advances to Building America by the HIT is included in the table below:
| Advances to BACDE by HIT | | (dollars in thousands) |
| Ending Balance, 12/31/2022 | | $ | 100 | |
| Advances in 2023 | | | 753 | |
| Repayment by BACDE in 2023 | | | (853 | ) |
| Ending Balance, 06/30/2023 | | $ | – | |
Summarized financial information on a consolidated basis for HIT Advisers and Building America included in the table below:
| | | (dollars in thousands) |
| As of June 30, 2023 | | | | |
| Assets | | $ | 2,062 | |
| Liabilities | | $ | 1,575 | |
| Equity | | $ | 487 | |
| For the period ended ended June 30, 2023 | | | | |
| Income | | $ | 1,062 | |
| Expenses | | | (694 | ) |
| Tax Expenses | | | (103 | ) |
| Net Income (Loss) | | $ | 265 | |
| 26 | |
Notes to Financial Statements
(unaudited) continued
Note 4. Leases
The HIT leases certain real estate properties for office space which are classified as operating leases. The HIT also leases equipment which is classified as a financing lease. The leases are included in right-of-use (ROU) assets on the HIT’s statement of assets and liabilities. ROU assets represent the HIT’s right to use an underlying asset for the lease term and lease obligations represent the HIT’s obligation to make lease payments arising from the lease. ROU assets and obligations are recognized at the commencement date based on the present value of lease payments over the lease term. As most of the HIT’s leases do not provide an implicit rate, the HIT uses its incremental borrowing rate based on the information available at the commencement date of the lease in determining the present value of lease payments. The HIT determines if an arrangement is a lease at inception. The HIT’s lease terms may include options to extend or terminate the lease when it is reasonably certain that the HIT will exercise that option. Lease expense and amortization expense are recognized on a straight-line basis over the lease term.
| (dollars in thousands) | | Operating Lease | | Financing Lease | | Total |
| ROU Asset, 1/1/2023 | | $ | 4,313 | | | $ | 2 | | | $ | 4,315 | |
| Reduction/Amortization of ROU Asset | | | (247 | ) | | | (1 | ) | | | (248 | ) |
| Right-of-Use Asset, 06/30/2023 | | $ | 4,066 | | | $ | 1 | | | $ | 4,067 | |
| | | | | | | | | | | | | |
| Lease Liability, 1/1/2023 | | $ | 4,850 | | | $ | 2 | | | $ | 4,852 | |
| Lease Payments | | | (289 | ) | | | (1 | ) | | | (290 | ) |
| Imputed Interest | | | 42 | | | | – | | | | 42 | |
| Reduction of Lease Liability | | | (247 | ) | | | (1 | ) | | | (248 | ) |
| Lease Liability, 06/30/2023 | | $ | 4,603 | | | $ | 1 | | | $ | 4,604 | |
| | | | | | | | | | | | | |
| Lease Expense | | | (289 | ) | | | (1 | ) | | | (290 | ) |
| Weighted Average Discount Rate | | | 1.94 | % | | | 5.09 | % | | | | |
| Weighted Average Remaining Term (Years) | | | 7.9 | | | | 3.7 | | | | | |
Note 5. Commitments
The HIT may make commitments in securities or loans that fund over time on a draw basis or forward commitments that fund at a single point in time. The HIT agrees to an interest rate and purchase price for these securities or loans when the commitment to purchase is originated.
Certain assets of the HIT are invested in liquid investments until they are required to fund these purchase commitments. As June 30, 2023, the HIT had outstanding unfunded purchase commitments of approximately $583.5 million. The HIT maintains a sufficient level of liquid securities of no less than the total of the outstanding unfunded purchase commitments. As of June 30, 2023, the value of liquid securities, less short- term investments, maintained in a custodial trading account was approximately $5.9 billion.
Note 6. Investment Transactions
Purchases and sales of investments, excluding short-term securities and U.S. Treasury securities, for the six months ended June 30, 2023, were $563.3 million and $164.6 million, respectively.
| 2023 SEMI-ANNUAL REPORT | 27 |
Notes to Financial Statements
(unaudited) continued
Note 7. Income Taxes
No provision for federal income taxes is required since the HIT intends to continue to qualify as a regulated investment company under Subchapter M of the Internal Revenue Code and distribute to shareholders all of its taxable income and gains. Federal income tax regulations differ from GAAP; therefore, distributions determined in accordance with tax regulations may differ in amount or character from net investment income and realized gains for financial reporting purposes. Financial reporting records were adjusted for permanent book/tax differences of $2.3 million as of June 30, 2023 to reflect tax character. The amount and character of tax -basis distributions and composition of the net assets are finalized at fiscal year-end; accordingly, tax-basis balances have not been determined as of June 30, 2023.
At June 30, 2023, the cost of investments for federal income tax purposes was $7,184,557,000. Net unrealized loss aggregated $896,736,000 at period-end, of which $2,648,000 related to appreciated investments and $899,384,000 related to depreciated investments.
Note 8. Retirement and Deferred Compensation Plans
The HIT participates in the AFL-CIO Staff Retirement Plan (Plan), which is a multiemployer defined benefit pension plan, under the terms of a collective bargaining agreement. The Plan covers substantially all employees, including non-bargaining unit employees. The risks of participating in a multiemployer plan are different from a single-employer plan in the following aspects:
| a. | Assets contributed to a multiemployer plan by one employer may be used to provide benefits to employees of other participating employers. |
| b. | If a participating employer stops contributing to the plan, the unfunded obligations of the plan may be borne by the remaining participating employers based on their level of contributions to the plan. |
| c. | If the HIT chooses to stop participating in its multiemployer plan, the HIT may be required to pay the plan an amount based on the HIT’s share of the underfunded status of the plan, referred to as a withdrawal liability. |
The HIT’s participation in the Plan for the six months ended June 30, 2023, is outlined in the table below. The “EIN/Pension Plan Number” line provides the Employer Identification Number (EIN) and the three-digit plan number. The most recent Pension Protection Act (PPA) zone status available as of June 30, 2023 is for the 2021 Plan year ended at June 30, 2022. The zone status is based on information that the HIT received from the Plan and is certified by the Plan’s actuary. Among other factors, plans in the red zone are generally less than 65% funded, plans in the yellow zone are less than 80% funded, and plans in the green zone are at least 80% funded. The “FIP/RP Status Pending/Implemented” line indicates whether a financial improvement plan (FIP) or a rehabilitation plan (RP) is either pending or has been implemented. The HIT was listed in the Plan’s Form 5500 as providing more than 5% of the total contributions for the following plan year:
Pension Fund: AFL-CIO Staff Retirement Plan
| EIN/Pension Plan Number | 53-0228172 / 001 |
| 2021 Plan Year PPA Zone Status | Green |
| FIP/RP Status Pending/Implemented | No |
| 2023 Contributions | $1,088,555 |
| 2023 Contribution Rate | 24% |
| Surcharge Imposed | No |
| Expiration Date of Collective Bargaining Agreement | 04/01/2024 |
The HIT was listed in the Plan’s Form 5500 as providing more than 5% of the total contributions for the following plan year:
| | Year Contributions to Plan Exceeded |
| Pension Fund | 5 Percent of Total Contributions |
| AFL-CIO Staff Retirement Plan | 20211 |
1. The 2021 plan year ended at June 30, 2022.
At the date the HIT financial statements were issued, the Plan’s Form 5500 was not available for the plan year ended June 30, 2023.
The HIT also sponsors a deferred compensation plan, referred to as a 401(k) plan, covering all employees. This plan permits employees to defer the lesser of 100% of their total compensation or the applicable Internal Revenue Service limit. During 2023, the HIT will match dollar for dollar the first $6,400 of each employee’s contributions. The HIT’s 401(k) contribution for the six months ended June 30, 2023 was approximately $202,400.
| 28 | |
Notes to Financial Statements
(unaudited) continued
Note 9. Contract Obligations
In the ordinary course of business, the HIT enters into contracts that contain a variety of indemnifications. The HIT’s maximum exposure under these arrangements is unknown. However, the HIT has not had any prior claims or losses pursuant to these contracts and expects the risk of loss to be low.
Note 10. Subsequent Events
The HIT evaluated subsequent events through the date the financial statements were available for issue and determined there were no additional material events that would require adjustment to or disclosure in the HIT’s financial statements.
| 2023 SEMI-ANNUAL REPORT | 29 |
Financial Highlights
Selected Per Share Data and Ratios
| | | Six Months Ended | | | Years Ended December 31 | |
| Per share data | | June 30, 2023 (unaudited) | | | 2022 | | | 2021 | | | 2020 | | | 2019 | | | 2018 | |
| Net asset value, beginning of period | | $ | 958.52 | | | $ | 1,137.06 | | | $ | 1,176.64 | | | $ | 1,140.24 | | | $ | 1,087.85 | | | $ | 1,117.32 | |
| Income from investment operations: | | | | | | | | | | | | | | | | | | | | | | | | |
| Net investment income* | | | 15.60 | | | | 23.21 | | | | 20.20 | | | | 25.13 | | | | 29.65 | | | | 29.25 | |
| Net realized and unrealized gains (losses) on investments | | | 3.10 | | | | (176.26 | ) | | | (32.43 | ) | | | 45.18 | | | | 54.26 | | | | (27.99 | ) |
| Total income (loss) from investment operations | | | 18.70 | | | | (153.05 | ) | | | (12.23 | ) | | | 70.31 | | | | 83.91 | | | | 1.26 | |
| Less distributions from: | | | | | | | | | | | | | | | | | | | | | | | | |
| Net investment income | | | (15.96 | ) | | | (25.49 | ) | | | (24.29 | ) | | | (28.41 | ) | | | (31.52 | ) | | | (30.73 | ) |
| Net realized gains on investments | | | – | | | | – | | | | (3.06 | ) | | | (5.50 | ) | | | – | | | | – | |
| Total distributions | | | (15.96 | ) | | | (25.49 | ) | | | (27.35 | ) | | | (33.91 | ) | | | (31.52 | ) | | | (30.73 | ) |
| | | | | | | | | | | | | | | | | | | | | | | | | |
| Net asset value, end of period | | $ | 961.26 | | | $ | 958.52 | | | $ | 1,137.06 | | | $ | 1,176.64 | | | $ | 1,140.24 | | | $ | 1,087.85 | |
| | | | | | | | | | | | | | | | | | | | | | | | | |
| Total return | | | 1.94 | % | | | -13.55 | % | | | -1.04 | % | | | 6.20 | % | | | 7.78 | % | | | 0.16 | % |
| | | | | | | | | | | | | | | | | | | | | | | | | |
| Net assets, end of period (in thousands) | | $ | 6,274,963 | | | $ | 6,025,063 | | | $ | 7,106,556 | | | $ | 6,749,288 | | | $ | 6,554,926 | | | $ | 5,889,450 | |
| | | | | | | | | | | | | | | | | | | | | | | | | |
| Ratios/supplemental data** | | | | | | | | | | | | | | | | | | | | | | | | |
| Ratio of expenses to average net assets | | | 0.32 | % | | | 0.32 | % | | | 0.31 | % | | | 0.32 | % | | | 0.34 | % | | | 0.42 | % |
| Ratio of net investment income to average net assets | | | 3.2 | % | | | 2.3 | % | | | 1.7 | % | | | 2.1 | % | | | 2.6 | % | | | 2.7 | % |
| Portfolio turnover rate | | | 15.0 | % | | | 25.3 | % | | | 30.4 | % | | | 30.3 | % | | | 17.6 | % | | | 15.2 | % |
*The average shares outstanding method has been applied for this per share information.
**Percentage amounts for the period, except total return, have been annualized.
See accompanying Notes to Financial Statements (unaudited).
| 30 | |
Board of Trustees
*Executive Committee Member
| Chris Coleman* Chair | Vincent Alvarez | Timothy J. Driscoll | Sean McGarvey* |
| President & CEO, Twin Cities Habitat for Humanity | President, New York City Central Labor Council | President, International Union of Bricklayers and Allied Craftworkers | President, North America’s Building Trades Unions |
| | | | |
| Paul A. Noble | Terry O’Sullivan | Fred Redmond | Anthony Shelton |
| International Secretary-Treasurer, International Brotherhood of Electrical Workers | General President Emeritus, Laborers’ International Union of North America | Secretary-Treasurer, AFL-CIO | International President, Bakery, Confectionery, Tobacco Workers and Grain Millers’ International Union |
| | | | |
| Elizabeth Shuler* | Kevin Filter | Bridget Gainer | The Honorable Jack F. Quinn, Jr.* |
| President, AFL-CIO | Managing Principal, GFW Equities LLC & Mad Duck Capital LLC | Cook County Commissioner and Vice President of Global Affairs, Aon | Senior Advisor for Public & Community Relations, Barclay Damon |
| | | | |
| Deidre L. Schmidt | Tony Stanley* | Harry W. Thompson* | William C. Thompson, Jr. |
| President & CEO, CommonBond Communities | Director, TransCon Builders, Inc. | Consultant, Harry Thompson & Associates | Senior Managing Director/Chief Administrative Officer, Siebert, Cisneros, Shank & Co. |
Officers
| Chang Suh, CFA | Lesyllee White | Erica Khatchadourian | William K. Pierce, CFA |
| Chief Executive Officer and Chief Investment Officer | Chief Marketing Officer | Chief Operating Officer | Senior Portfolio Manager |
| | | | |
| Nicholas C. Milano | Harpreet S. Peleg, CFA | Theodore S. Chandler | John Hanley |
| General Counsel | Chief Financial Officer | Senior Managing Director— Strategic Initiatives | Senior Managing Director—Multifamily Origination |
| | | | |
| Julissa Bautista Servello | | | |
| Managing Director—Investor Relations | | | |
Service Providers
| Independent Registered | Corporate Counsel | Transfer Agent | Custodian |
| Public Accounting Firm | Dechert LLP | BNY Mellon Investment | Bank of New York Mellon |
| Ernst & Young LLP | Washington, D.C. | Servicing (US) Inc. | New York, New York |
| Tysons, Virginia | | Wilmington, Delaware | |
| 2023 SEMI-ANNUAL REPORT | 31 |
Investors should consider the HIT’s investment objectives, risks and expenses carefully before investing. A prospectus containing more complete information may be obtained from the HIT by calling the Marketing and Investor Relations Department collect at (202) 331-8055 or by viewing the HIT’s website at www.aflcio- hit.com. The prospectus should be read carefully before investing. The calculations of the HIT yield herein represent widely accepted portfolio characteristics information based on coupon rate, current price and, for yield to worst, certain prepayment assumptions, and are not current yield or other performance data as defined by the SEC in Rule 482.
Job and economic impact figures are estimates calculated using IMPLAN, an input-output model, based on HIT and HIT subsidiary Building America CDE, Inc. project data. Data is current as of June 30, 2023. Economic impact data is in 2022 dollars, and all other figures are nominal.
This document contains forecasts, estimates, opinions and/or other information that is subjective. Statements concerning economic, financial, or market trends are based on current conditions, which will fluctuate. There is no guarantee that such statements will be applicable under all market conditions, especially during periods of downturn. Actual outcomes and results may differ significantly from the views expressed. It should not be considered as investment advice or a recommendation of any kind.
| 32 | |
AFL-CIO HOUSING INVESTMENT TRUST
NATIONAL OFFICE | 1227 25th Street, NW, Suite 500 | Washington, D.C. 20037 | (202) 331-8055
www.aflcio-hit.com


Item 2. Code of Ethics.
Not applicable for semi-annual reports.
Item 3. Audit Committee Financial Expert.
Not applicable for semi-annual reports.
Item 4. Principal Accountant Fees and Services.
Not applicable for semi-annual reports.
Item 5. Audit Committee of Listed Registrants.
Not applicable to open-end investment companies.
Item 6. Investments.
| (a) | Included herein under Item 1. |
Item 7. Disclosure of Proxy Voting Policies and Procedures for Closed-End Management Investment Companies.
Not applicable to open-end investment companies.
Item 8. Portfolio Managers of Closed-End Management Investment Companies.
Not applicable to open-end investment companies.
Item 9. Purchases of Equity Securities by Closed-End Management Investment Company and Affiliated Purchasers.
Not applicable to open-end investment companies.
Item 10. Submission of Matters to a Vote of Security Holders.
No material changes have been made to the procedures by which participants may recommend nominees to the Board of Trustees of the Registrant, where those changes were implemented after the Registrant last provided disclosure in response to the requirements of Item 407(c)(2)(iv) of Regulation S-K (per Item 22(b)(15) of Schedule 14A) or this Item.
Item 11. Controls and Procedures.
| (a) | The Registrant’s Chief Executive Officer (the principal executive officer) and Chief Financial Officer (the principal financial officer) have concluded that the Registrant’s disclosure controls and procedures (as defined in Rule 30a-3(c) under the Act (17 CFR 270.30a-3(c))) are effective to ensure that material information relating to the Registrant is made known to them by appropriate persons, based on their evaluation of such controls and procedures as of a date within 90 days of the filing of this report. |
| (b) | There were no changes in the Registrant’s internal control over financial reporting (as defined in Rule 30a-3(d) under the Act (17 CFR 270.30a-3(d)) that occurred during the period covered by this report that have materially affected, or are reasonably likely to materially affect, the Registrant’s internal control over financial reporting. |
Item 12. Disclosure of Securities Lending Activities for Closed-End Management Investment Companies.
Not applicable to open-end investment companies.
Item 13. Exhibits.
| (a) | (1) | Not applicable for semi-annual reports. |
| (4) | There was no change in the Registrant’s independent public accountant for the period covered by this report. |
SIGNATURES
Pursuant to the requirements of the Securities Exchange Act of 1934 and the Investment Company Act of 1940, the AFL-CIO Housing Investment Trust has duly caused this report to be signed on its behalf by the undersigned, thereunto duly authorized.
AFL-CIO HOUSING INVESTMENT TRUST
| By: | | |
| | | |
| /s/ Chang Suh | | |
| Chang Suh | | |
| Chief Executive Officer | | |
| AFL-CIO Housing Investment Trust | |
Date: August 30, 2023
Pursuant to the requirements of the Securities Exchange Act of 1934 and the Investment Company Act of 1940, this report has been signed below by the following persons on behalf of the AFL-CIO Housing Investment Trust and in the capacities and on the dates indicated.
| /s/ Chang Suh | | |
| Chang Suh | | |
| Chief Executive Officer | | |
| AFL-CIO Housing Investment Trust | |
Date: August 30, 2023
| /s/ Harpreet S. Peleg | | |
| Harpreet S. Peleg | | |
| Chief Financial Officer | | |
| (Principal Financial Officer) | | |
| AFL-CIO Housing Investment Trust | |
Date: August 30, 2023