UNITED STATES
SECURITIES AND EXCHANGE COMMISSION
Washington, D.C. 20549
FORM N-CSR
CERTIFIED SHAREHOLDER REPORT OF REGISTERED MANAGEMENT
INVESTMENT COMPANIES
Investment Company Act File Number: 811-3493
American Federation of Labor and
Congress of Industrial Organizations
Housing Investment Trust
(Exact name of registrant as specified in charter)
1227 25th Street, N.W., Suite 500
Washington, D.C. 20037
(Address of principal executive offices) (Zip code)
Corey F. Rose, Esq.
Dechert LLP
1900 K Street, NW
Washington, DC 20006-1110
(Name and address of agent for service)
(202) 331-8055
(Registrant’s telephone number, including area code)
Date of fiscal year end: December 31
Date of reporting period: January 1, 2020 – June 30, 2020
| Item 1. | Reports to Stockholders. |
A copy of the 2020 Semi-Annual Report (the “Report”) of the AFL-CIO Housing Investment Trust (the “Trust” or “Registrant”) transmitted to Trust participants pursuant to Rule 30e-1 under the Investment Company Act of 1940, as amended (17 CFR 270.30e-1) (the “Act”), is included herewith.

2020 SEMI-ANNUAL REPORT Investing for a better future
ECONOMIC IMPACTS OF INVESTMENTS 1984–2020 HIT is an actively managed fixed-income mutual fund focused on high credit quality securities, primarily multifamily mortgage-backed securities (MBS). 534 projects • A $6.5 billion investment grade fixed-income mutual fund • Over 35-year history of generating competitive returns for pension funds and labor organizations, such as health and welfare funds, while also creating vital union construction jobs, affordable and workforce housing, and healthcare facilities • 100% union labor requirement for all on-site construction 178.5M hours of on-site union construction work

To Our Investors As our nation grapples with the interrelated COVID-19 and social justice crises, I have never been more proud of the mission of the AFL-CIO Housing Investment Trust (HIT) to generate competitive returns by financing impact investments that change lives and help communities work towards economic equality. In the first half of 2020, at a time when the headlines were filled with dark and bleak stories, the HIT performed well, generating competitive returns and committing to new investments that are anticipated to create much needed jobs and affordable housing. With $6.54 billion in net assets, the HIT’s gross and net returns for the semi-annual period ended June 30, 2020 were 5.45% and 5.29%, respectively. The HIT’s operations have been running seamlessly and its employees have been kept safe through remote work since March 10, 2020. Looking ahead to the second half of 2020, we expect that investors will continue to benefit from the HIT’s unique strategy and ability to prudently invest pension capital and create employment opportunities for union workers. While we expect many financial institutions to pull back their capital for development projects, the HIT seeks to increase its level of construction related investments. The HIT is proud of its history of generating positive returns and impact in communities throughout the country by investing in much needed affordable and workforce housing. The COVID-19 pandemic and the fault lines of racial and economic inequities that it revealed, together with nationwide protests demanding racial justice, have brought heightened attention to the unemployment and affordable housing crises. Many of the HIT’s housing projects now in construction are in underserved communities, where quality job creation and affordable housing are critical pathways to economic opportunities. As in the periods following the Great Recession and September 11, 2001, we believe that the HIT’s investment strategy and mission uniquely position it to be an important contributor to the recovery. The HIT’s portfolio will continue to strive to provide competitive returns for union pension fund investors, and we believe that the union jobs created will provide secure wages and benefits today and secure retirement in the future for working families. We commit to redouble our efforts. Thank you for your continued support. In solidarity, Chang Suh Chief Executive Officer and Co-Chief Portfolio Manager 1
RELATIVE RETURNS As of June 30, 2020, periods over one year are annualized Past performance is no guarantee of future results. Economic and market conditions change, and both will cause investment return, principal value, and yield to fluctuate so that a participant’s units, when redeemed, may be worth more or less than their original cost. Current performance may be lower or higher than the performance data quoted. Performance data current to the most recent month-end is available at www.aflcio-hit. com. Gross performance figures do not reflect the deduction of HIT expenses. Net performance figures reflect the deduction of HIT expenses and are the performance figures investors experience in the HIT. Information about HIT expenses can be found on page 1 of the HIT’s current prospectus. The Barclays Aggregate is an unmanaged index and is not available for direct investment, although certain funds attempt to replicate this index. Returns for the index would be lower if they reflected the actual trading costs or expenses associated with management of an actual portfolio. COMPARISON OF A $50,000 INVESTMENT in the HIT and Barclays Aggregate (10 Years) $80,000 $70,000 $60,000 $50,000 10% 8% 6% 4% 2% 0% 8.74% $72,775 8.46% $71,353 7.38% 7.03% 6.56% 6.14% 5.45% 5.32% 5.29% 5.10% 4.94% 4.71% 4.30% 4.19% 4.04% 3.82% 3.75% 3.78% 3.62% 3.25% 1-YEAR YTD 06/19 3-YEAR 06/20 06/19 06/16 06/12 5-YEAR 06/18 06/15 06/11 06/17 10-YEAR 06/14 06/10 06/13 HIT Gross HIT Net Barclays Aggregate AAA Index The AAA Index represents the AAA Component of the Bloomberg Barclays U.S. Aggregate Bond Index. HIT Net Barclays Aggregate Source: Bloomberg L.P. PERFORMANCE OVERVIEW (unaudited) STRONG HIT PERFORMANCE IN A VOLATILE ENVIRONMENT As the COVID-19 pandemic took hold of the economy and financial markets, the AFL-CIO Housing Investment Trust (HIT) strategy and high credit quality profile delivered positive returns and provided investors with diversification from riskier corporate debt. As of June 30, 2020, the HIT’s gross and net year-to-date returns stood at 5.45% and 5.29%, respectively, as compared to 6.14% for the Bloomberg Barclays US Aggregate Bond Index (Barclay’s Aggregate or Benchmark). As of that date, the HIT offered an annualized yield advantage of 36 basis points (bps) to the Benchmark, and 78 bps to the AAA component of the Barclay’s Aggregate. The devastation to economic output caused by the COVID-19 pandemic posed distinctly different challenges to financial markets in the first and second quarters of 2020. The HIT outperformed the Benchmark in the first quarter, with gross and net returns of 3.50% and 3.43%, respectively, compared to 3.15% for the Benchmark, in large part because corporate bonds experienced their worst quarter on record. By contrast, in the second quarter, corporate bonds experienced their second best quarter on record, as Federal Reserve actions and fiscal stimulus led to historic recoveries. The HIT portfolio excludes corporate bonds and strategically underweights Treasuries relative to the Benchmark to specialize in housing related investments, generally providing investors a yield advantage with superior credit quality compared to the Benchmark. The HIT had second quarter gross and net returns of 1.88% and 1.80%, respectively, compared to 2.90% for the Benchmark. While central bank and federal government action had a positive economic impact in the immediate term, these may not be sustainable. The HIT’s strong overall performance year to date demonstrated the importance of diversification in a volatile environment. MARKET CONTEXT AND CHALLENGES In the first half of 2020, the United States saw Depression era unemployment rates as businesses shuttered. The Federal Reserve took historic steps to inject liquidity in capital markets and the federal government provided support to stabilize the economy. Interest rates fell to record lows during a historic flight to quality and remained there through the second quarter as the Federal Reserve supported low interest rates across the curve. While cutting interest rates to zero, the central bank ballooned its balance sheet to a record $7 trillion providing liquidity and credit to fixed income markets including securitized mortgage assets. Overall, HIT and fixed income assets benefited from falling yields, but Treasuries, driven by central bank policy and increased demand, outperformed all investment grade sectors. For the first time, the Federal Reserve expanded eligible asset purchases to include agency commercial mortgage 2
backed securities (MBS), enhancing the sector’s liquidity and supporting spreads in multifamily valuations. This allowed agency multifamily MBS to outperform relative to lower credit quality corporate bonds, benefitting the HIT’s portfolio in the first quarter. Multifamily securities in HIT’s portfolio offered attractive yield spread with prepayment protection and cash flow stability. The HIT had a combined 16.9% of its portfolio in fixed-rate single-asset FHA/Ginnie Mae securities and 25.7% in fixed-rate single-asset delegated underwriting and servicing securities of various structures at the end of June, while there were no such securities in the Barclays Aggregate. Despite the strong relative performance of multifamily MBS, agency multifamily MBS ultimately underperformed Treasuries along with the broader fixed income market. For the semiannual period, HIT performance was challenged by the superior returns of Treasuries that comprise 37.2% of the Benchmark, compared to 5.2% in the HIT portfolio as of June 30, 2020. MULTIFAMILY MARKET DEMAND AND HIT INVESTMENTS Even before the COVID-19 pandemic, demand for multifamily rental housing had been significantly increasing. An estimated 4.6 million new multifamily rental units will be needed by 2030, shaped by demographic factors including delays in household formation, millennials’ attitudes towards home ownership and the retirement of baby boomers.1 The potential long-term negative economic impact of the pandemic, with permanent job losses in industries such as travel and hospitality almost certain, will intensify the affordable housing crisis and, we believe, add to the demand for more multifamily housing. In the first half of 2020, planned multifamily projects experienced delays, due to, among other things, slowed approvals for permits and plans and construction delays caused by COVID-19-related shutdowns. Most of the affordable housing projects receiving HIT financing were considered essential and were not interrupted. Work has now resumed at all these projects under construction. In the second quarter, the HIT committed to finance $35 million of the $40.9 million total development costs of the Wrigleyville North Apartments, its 104th construction project in Illinois. Wrigleyville is expected to contribute positively to the portfolio and to create close to 289,900 hours of union construction work and 120 units of much needed housing, with 12 units earmarked for individuals earning 60% of area median income. The project is expected to generate $77.2 million in total economic benefits and has environmentally friendly features.2 With its active pipeline (including projects that had been delayed in the first two quarters) we expect the HIT to be well positioned to invest in housing finance for the remainder of 2020 and into 2021. 1. National Multifamily Housing Council and the National Apartment Association.2. Job and economic impact figures are estimates calculated using IMPLAN, an input-output model, based on HIT and HIT subsidiary Building America CDE, Inc. project data. Data is current as of June 30, 2020. 10-Year Treasury Yield 3 2020 SEMI-ANNUAL REPORT
HIT SMOOTH REMOTE OPERATIONS IN COVID-19 ENVIRONMENT To protect its staff and public health in the COVID-19 pandemic, the HIT has conducted all operations, including the execution of portfolio transactions, remotely since March 10, 2020. Work has continued smoothly, securely and without interruption, including all transactions with key vendors and counterparties. The HIT is prepared to continue its remote operations seamlessly for as long as necessary given the COVID-19 risks. When circumstances permit a prudent return to in-office operations, the HIT will do so, following a careful plan that will protect staff and all those with whom the HIT interacts. Meanwhile, the HIT relocated to new office space as of August 1, 2020. Its new office space plan pivoted effectively to adjust the design, layout, finishings and furnishings to maximize COVID-19 protective features in a cost-effective and versatile manner. LOOKING AHEAD—HIT’S PROVEN STRATEGY IN AN UNCERTAIN TIME The full extent of the COVID-19 pandemic cannot yet be determined. While the country weighs the need to reopen against continued COVID-19 risks without a vaccine, it is experiencing slow job and economic growth. The U.S. may suffer long-term effects from the pandemic and some businesses and even industries may be unable to survive. In the face of this uncertainty, the HIT has continued to execute its investment strategy effectively and to maintain smooth and secure operations. We believe that the HIT’s strategic value is as a diversifier away from corporate credit exposure and into high credit grade multifamily MBS that offer attractive yield spreads relative to historically lower yielding credit equivalent Treasuries. We believe that the importance of capital preservation through high credit quality assets in the current environment cannot be overstated. The HIT will carry out its mission and seek to generate competitive returns and create critically needed union construction jobs and housing nationwide. The HIT is in a unique position to contribute to economic recovery, helping sectors, communities and individuals harmed by the COVID-19 pandemic. With expected strong demand for capital to finance more rental housing and a growing pipeline of multifamily investments, the HIT is well-positioned for an active second half of 2020 and early 2021. PORTFOLIO DISTRIBUTION As of June 30, 2020 RISK COMPARISON As of June 30, 2020 HIT Barclays HIT Barclays CREDIT QUALITY U.S. Government/Agency/AAA/Cash 93.75% 69.72% A & Below/Not Rated 1.83% 26.79% YIELD Current Yield 2.78% 2.77% Yield to Worst 1.64% 1.28% INTEREST RATE RISK Effective Duration 5.71 6.10 Convexity 0.30 0.23 CALL RISK Call Protected 77% 73% Not Call Protected 23% 27% Source: HIT and Bloomberg Barclays US Aggregate Bond Index The calculations of the HIT yield herein represent widely accepted portfolio characteristics information based on coupon rate, current price and, for yield to worst, certain prepayment assumptions, and are not current yield or other performance data as defined by the SEC in Rule 482. 4

2020 MULTIFAMILY INVESTMENT HIGHLIGHTS (UNAUDITED) Wrigleyville North Apartments CHICAGO, IL HIT Investment: $35.0M Total Economic Benefit: $77.2M Units: 120 Union Construction Work: 289,900 HOURS HIT is financing $35 million of the new construction of the Wrigleyville North Apartments, a seven-story, mixed-income/mixed-use development located in Chicago, Illinois. Wrigleyville North is the HIT’s 52nd project in Chicago. The union construction jobs, rental housing and additional economic value that the project will create will contribute to Chicago’s recovery from the hardships caused by the COVID-19 pandemic. Wrigleyville North is located in Chicago’s Lakeview neighborhood, close to Wrigley Field, home of the Chicago Cubs baseball team. The project will help meet the essential need for rental housing in the Chicago area and comply with the City of Chicago’s affordability requirements for new multifamily construction projects. It will offer a total of 120 units. Of these, 112 units will be market-rate, with the remaining 8 units earmarked for individuals earning 60% of area median income. The development will offer a mix of one- and two-bedroom floorplans and will contain almost 14,500 square feet of commercial space. The project will create approximately 289,900 hours of union construction work and generate $77.2 million in total economic benefits. It will be green-certified, is expected to achieve Energy Star status and is well-served by public transportation. The HIT will purchase $35 million in Ginnie Mae construction loan certificates and a permanent loan certificate from Gershman Investment Corporation (the issuer/servicer) to finance this development. Job and economic impact figures are estimates calculated using IMPLAN, an input-output model, based on HIT and HIT subsidiary Building America CDE, Inc. project data. Data is current as of June 30, 2020. 5
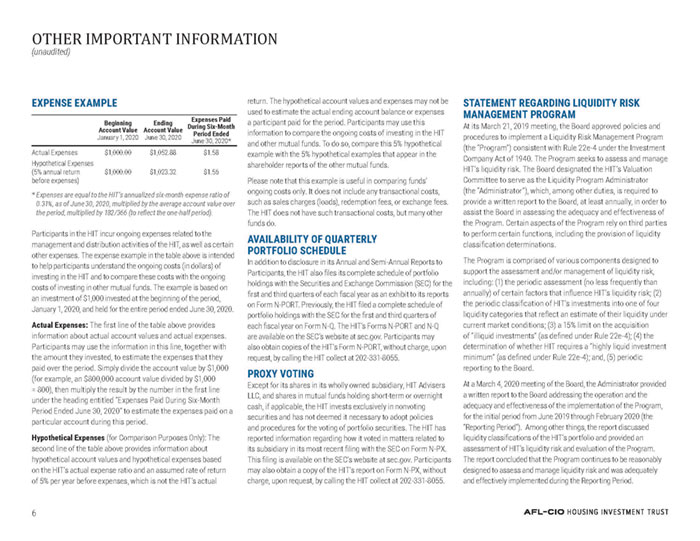
OTHER IMPORTANT INFORMATION (unaudited) EXPENSE EXAMPLE Beginning Account Value January 1, 2020 Ending Account Value June 30, 2020 Expenses Paid During Six-Month Period Ended June 30, 2020* Actual Expenses $1,000.00 $1,052.88 $1.58 Hypothetical Expenses (5% annual return before expenses) $1,000.00 $1,023.32 $1.56 Participants in the HIT incur ongoing expenses related to the management and distribution activities of the HIT, as well as certain other expenses. The expense example in the table above is intended to help participants understand the ongoing costs (in dollars) of investing in the HIT and to compare these costs with the ongoing costs of investing in other mutual funds. The example is based on an investment of $1,000 invested at the beginning of the period, January 1, 2020, and held for the entire period ended June 30, 2020. Actual Expenses: The first line of the table above provides information about actual account values and actual expenses. Participants may use the information in this line, together with the amount they invested, to estimate the expenses that they paid over the period. Simply divide the account value by $1,000 (for example, an $800,000 account value divided by $1,000 = 800), then multiply the result by the number in the first line under the heading entitled “Expenses Paid During Six-Month Period Ended June 30, 2020” to estimate the expenses paid on a particular account during this period. Hypothetical Expenses (for Comparison Purposes Only): The second line of the table above provides information about hypothetical account values and hypothetical expenses based on the HIT’s actual expense ratio and an assumed rate of return of 5% per year before expenses, which is not the HIT’s actual return. The hypothetical account values and expenses may not be used to estimate the actual ending account balance or expenses a participant paid for the period. Participants may use this information to compare the ongoing costs of investing in the HIT and other mutual funds. To do so, compare this 5% hypothetical example with the 5% hypothetical examples that appear in the shareholder reports of the other mutual funds. Please note that this example is useful in comparing funds’ ongoing costs only. It does not include any transactional costs, such as sales charges (loads), redemption fees, or exchange fees. The HIT does not have such transactional costs, but many other funds do. AVAILABILITY OF QUARTERLY PORTFOLIO SCHEDULE In addition to disclosure in its Annual and Semi-Annual Reports to Participants, the HIT also files its complete schedule of portfolio holdings with the Securities and Exchange Commission (SEC) for the first and third quarters of each fiscal year as an exhibit to its reports on Form N-PORT. Previously, the HIT filed a complete schedule of portfolio holdings with the SEC for the first and third quarters of each fiscal year on Form N-Q. The HIT’s Forms N-PORT and N-Q are available on the SEC’s website at sec.gov. Participants may also obtain copies of the HIT’s Form N-PORT, without charge, upon request, by calling the HIT collect at 202-331-8055. PROXY VOTING Except for its shares in its wholly owned subsidiary, HIT Advisers LLC, and shares in mutual funds holding short-term or overnight cash, if applicable, the HIT invests exclusively in nonvoting securities and has not deemed it necessary to adopt policies and procedures for the voting of portfolio securities. The HIT has reported information regarding how it voted in matters related to its subsidiary in its most recent filing with the SEC on Form N-PX. This filing is available on the SEC’s website at sec.gov. Participants may also obtain a copy of the HIT’s report on Form N-PX, without charge, upon request, by calling the HIT collect at 202-331-8055. STATEMENT REGARDING LIQUIDITY RISK MANAGEMENT PROGRAM At its March 21, 2019 meeting, the Board approved policies and procedures to implement a Liquidity Risk Management Program (the “Program”) consistent with Rule 22e-4 under the Investment Company Act of 1940. The Program seeks to assess and manage HIT’s liquidity risk. The Board designated the HIT’s Valuation Committee to serve as the Liquidity Program Administrator (the “Administrator”), which, among other duties, is required to provide a written report to the Board, at least annually, in order to assist the Board in assessing the adequacy and effectiveness of the Program. Certain aspects of the Program rely on third parties to perform certain functions, including the provision of liquidity classification determinations. The Program is comprised of various components designed to support the assessment and/or management of liquidity risk, including: (1) the periodic assessment (no less frequently than annually) of certain factors that influence HIT’s liquidity risk; (2) the periodic classification of HIT’s investments into one of four liquidity categories that reflect an estimate of their liquidity under current market conditions; (3) a 15% limit on the acquisition of “illiquid investments” (as defined under Rule 22e-4); (4) the determination of whether HIT requires a “highly liquid investment minimum” (as defined under Rule 22e-4); and, (5) periodic reporting to the Board. At a March 4, 2020 meeting of the Board, the Administrator provided a written report to the Board addressing the operation and the adequacy and effectiveness of the implementation of the Program, for the initial period from June 2019 through February 2020 (the “Reporting Period”). Among other things, the report discussed liquidity classifications of the HIT’s portfolio and provided an assessment of HIT’s liquidity risk and evaluation of the Program. The report concluded that the Program continues to be reasonably designed to assess and manage liquidity risk and was adequately and effectively implemented during the Reporting Period. 6

FINANCIAL STATEMENTS JUNE 30, 2020 (unaudited) 7 2020 SEMI-ANNUAL REPORT
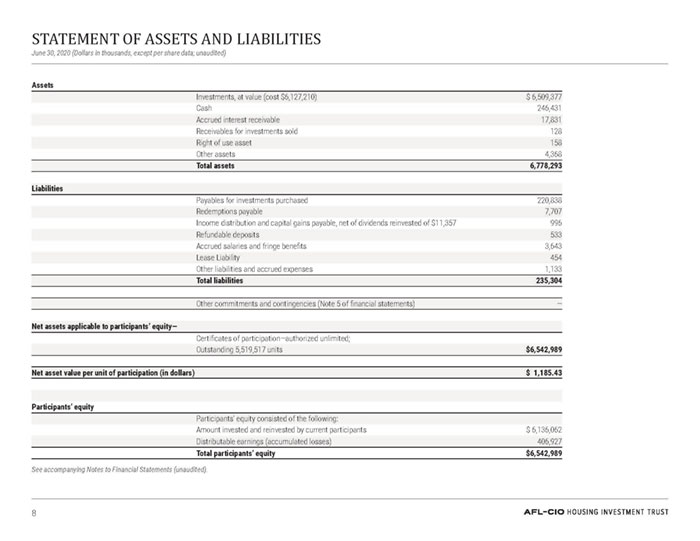
STATEMENT OF ASSETS AND LIABILITIES June 30, 2020 (Dollars in thousands, except per share data; unaudited) Assets Investments, at value (cost $6,127,210) $ 6,509,377 Cash 246,431 Accrued interest receivable 17,831 Receivables for investments sold 128 Right of use asset 158 Other assets 4,368 Total assets 6,778,293 Liabilities Payables for investments purchased 220,838 Redemptions payable 7,707 Income distribution and capital gains payable, net of dividends reinvested of $11,357 996 Refundable deposits 533 Accrued salaries and fringe benefits 3,643 Lease Liability 454 Other liabilities and accrued expenses 1,133 Total liabilities 235,304 Other commitments and contingencies (Note 5 of financial statements) — Net assets applicable to participants’ equity— Certificates of participation—authorized unlimited; Outstanding 5,519,517 units $6,542,989 Net asset value per unit of participation (in dollars) $ 1,185.43 Participants’ equity Participants’ equity consisted of the following: Amount invested and reinvested by current participants $ 6,136,062 Distributable earnings (accumulated losses) 406,927 Total participants’ equity $6,542,989 See accompanying Notes to Financial Statements (unaudited). 8
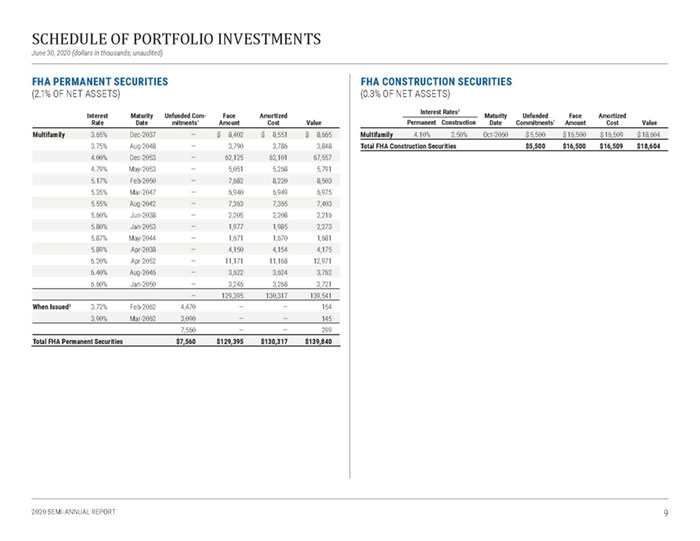
SCHEDULE OF PORTFOLIO INVESTMENTS June 30, 2020 (dollars in thousands; unaudited) FHA PERMANENT SECURITIES (2.1% OF NET ASSETS) FHA CONSTRUCTION SECURITIES (0.3% OF NET ASSETS) Interest Rate Maturity Date Unfunded Commitments1 Face Amount Amortized Cost Value Multifamily 3.65% Dec-2037 — $ 8,402 $ 8,551 $ 8,665 3.75% Aug-2048 — 3,790 3,786 3,848 4.00% Dec-2053 — 62,125 62,101 67,557 4.79% May-2053 — 5,051 5,268 5,791 5.17% Feb-2050 — 7,682 8,220 8,503 5.35% Mar-2047 — 6,940 6,949 6,975 5.55% Aug-2042 — 7,363 7,365 7,403 5.60% Jun-2038 — 2,205 2,208 2,216 5.80% Jan-2053 — 1,977 1,985 2,273 5.87% May-2044 — 1,671 1,670 1,681 5.89% Apr-2038 — 4,150 4,154 4,175 6.20% Apr-2052 — 11,171 11,168 12,971 6.40% Aug-2046 — 3,622 3,624 3,762 6.60% Jan-2050 — 3,246 3,268 3,721 — 129,395 130,317 139,541 When Issued2 3.72% Feb-2062 4,470 — — 154 3.90% Mar-2062 3,090 — — 145 7,560 — — 299 Total FHA Permanent Securities $7,560 $129,395 $130,317 $139,840 Interest Rates3 MaturityDate Unfunded Commitments1 FaceAmount Amortized Cost Value Permanent Construction Multifamily 4.10% 2.50% Oct-2060 $5,500 $16,500 $16,509 $18,604 Total FHA Construction Securities $5,500 $16,500 $16,509 $18,604 9

SCHEDULE OF PORTFOLIO INVESTMENTS June 30, 2020 (dollars in thousands; unaudited)—continued GINNIE MAE SECURITIES (26.2% OF NET ASSETS) Interest Rate Maturity Date Face Amount Amortized Cost Value Single Family 4.50% Aug-2040 $ 1,390 $ 1,415 $ 1,556 5.50% Jan-2033–Jun-2037 1,520 1,517 1,755 6.50% Jul-2028 45 45 51 6.00% Jan-2032–Aug-2037 946 947 1,109 7.50% Aug-2025–Aug-2030 320 320 362 7.00% Apr-2026–Jan-2030 655 659 746 8.50% Jun-2022–Aug-2027 123 123 134 4.00% Feb-2040–Jun-2040 2,376 2,399 2,628 8.00% Sep-2026–Nov-2030 271 274 311 9.00% Dec-2022–Jun-2025 7 7 8 7,653 7,706 8,660 Multifamily 1.73% May-2042 723 724 724 2.15% May-2056 5,211 5,202 5,312 2.20% Jun-2056 5,666 5,654 5,803 2.25% Dec-2048 6,100 6,052 6,254 2.30% Mar-2056–Oct-2056 50,992 50,706 52,356 2.31% Nov-2051 7,076 7,076 7,342 2.35% Dec-2040–Nov-2056 14,142 14,182 14,549 2.40% Aug-2047 7,052 7,062 7,264 2.43% Nov-2038 218 219 218 2.50% Jul-2045–Mar-2057 27,968 27,965 28,906 2.50% Sep-2058 36,686 36,055 38,251 2.53% Jul-2038–Feb-2040 19,067 19,280 19,490 2.55% Jan-2053 51,015 51,393 52,906 2.60% Apr-2048–Jun-2059 53,711 53,944 55,641 2.70% May-2048–Jul-2058 45,396 45,676 47,201 2.72% Feb-2044 436 448 449 2.79% Apr-2049 15,242 15,387 15,992 2.80% Feb-2053 60,000 57,066 64,573 2.80% Dec-2059 20,879 20,587 21,687 2.82% Apr-2050 1,500 1,529 1,573 Interest Rate Maturity Date Face Amount Amortized Cost Value 2.87% Dec-2043 $ 120 $ 121 $ 120 2.89% Mar-2046 32,000 32,190 32,905 3.00% Feb-2041–Mar-2051 21,002 21,089 22,075 3.00% May-2062 104,000 112,937 113,258 3.03% Jan-2056 31,481 33,676 34,370 3.05% May-2054 11,545 11,597 12,505 3.10% Jan-2044–May-2059 44,306 44,459 45,269 3.11% Jan-2049 17,025 17,621 18,094 3.20% Jul-2041–Sep-2051 22,760 22,890 24,030 3.25% Sep-2054 35,000 34,700 37,601 3.25% Jun-2059 31,133 31,753 34,438 3.25% Apr-2059 45,000 43,164 49,896 3.26% Nov-2043 18,334 18,362 19,272 3.30% May-2055 10,000 9,491 10,983 3.33% Jun-2043 11,790 12,136 12,143 3.34% Sep-2059 17,389 17,735 19,120 3.35% Nov-2042–Aug-2059 31,624 31,364 34,020 3.37% Dec-2046 19,200 19,429 19,788 3.38% Aug-2059 44,267 45,144 47,754 3.38% Jan-2060 60,131 60,142 66,199 3.39% Feb-2059 14,453 14,746 15,953 3.40% Mar-2057 5,025 5,065 5,526 3.46% Apr-2051 1,962 2,026 2,003 3.48% Feb-2044–May-2059 14,633 15,024 15,977 3.49% May-2042–Aug-2058 21,102 21,511 23,034 3.50% Feb-2051–Apr-2057 78,407 79,757 84,060 3.51% Mar-2053 46,486 50,260 51,587 3.53% Apr-2042 16,887 17,449 18,436 3.55% Apr-2057 41,748 42,809 42,431 3.57% Sep-2052 6,501 6,730 7,147 3.57% Nov-2059 49,346 50,082 55,416 10
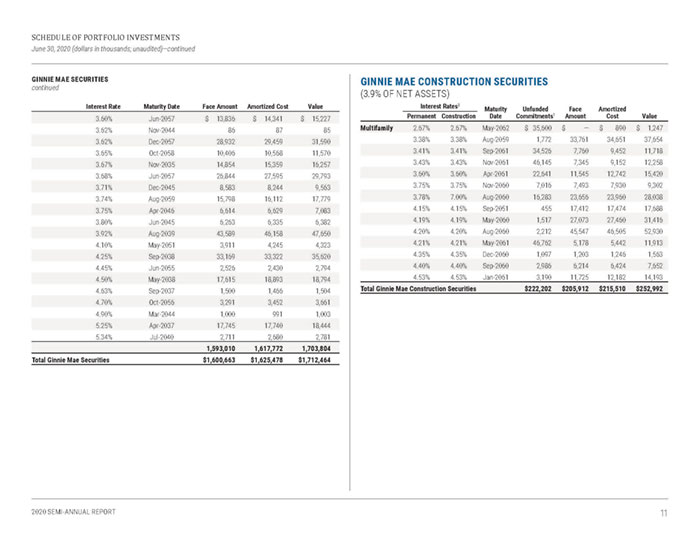
SCHEDULE OF PORTFOLIO INVESTMENTS June 30, 2020 (dollars in thousands; unaudited)—continued GINNIE MAE SECURITIES continued Interest Rate Maturity Date Face Amount Amortized Cost Value 3.60% Jun-2057 $ 13,836 $ 14,341 $ 15,227 3.62% Nov-2044 86 87 85 3.62% Dec-2057 28,932 29,459 31,590 3.65% Oct-2058 10,406 10,568 11,570 3.67% Nov-2035 14,854 15,359 16,257 3.68% Jun-2057 26,844 27,595 29,793 3.71% Dec-2045 8,583 8,244 9,563 3.74% Aug-2059 15,798 16,112 17,779 3.75% Apr-2046 6,614 6,629 7,083 3.80% Jun-2045 6,263 6,335 6,382 3.92% Aug-2039 43,589 46,158 47,650 4.10% May-2051 3,911 4,245 4,323 4.25% Sep-2038 33,169 33,322 35,620 4.45% Jun-2055 2,526 2,430 2,794 4.50% May-2038 17,615 18,893 18,794 4.63% Sep-2037 1,500 1,466 1,504 4.70% Oct-2056 3,291 3,452 3,661 4.90% Mar-2044 1,000 991 1,003 5.25% Apr-2037 17,745 17,740 18,444 5.34% Jul-2040 2,711 2,680 2,781 1,593,010 1,617,772 1,703,804 Total Ginnie Mae Securities $1,600,663 $1,625,478 $1,712,464 GINNIE MAE CONSTRUCTION SECURITIES (3.9% OF NET ASSETS) Interest Rates3 MaturityDate Unfunded Commitments1 FaceAmount Amortized Cost Value Permanent Construction Multifamily 2.67% 2.67% May-2062 $ 35,600 $ — $ 890 $ 1,247 3.38% 3.38% Aug-2059 1,772 33,761 34,651 37,654 3.41% 3.41% Sep-2061 34,526 7,760 9,452 11,718 3.43% 3.43% Nov-2061 46,145 7,345 9,152 12,258 3.60% 3.60% Apr-2061 22,641 11,545 12,742 15,420 3.75% 3.75% Nov-2060 7,016 7,493 7,930 9,302 3.78% 7.00% Aug-2060 16,283 23,656 23,960 28,038 4.15% 4.15% Sep-2051 455 17,412 17,474 17,688 4.19% 4.19% May-2060 1,517 27,073 27,460 31,416 4.20% 4.20% Aug-2060 2,212 45,547 46,505 52,930 4.21% 4.21% May-2061 46,762 5,178 5,442 11,913 4.35% 4.35% Dec-2060 1,097 1,203 1,246 1,563 4.40% 4.40% Sep-2060 2,986 6,214 6,424 7,652 4.53% 4.53% Jan-2061 3,190 11,725 12,182 14,193 Total Ginnie Mae Construction Securities $222,202 $205,912 $215,510 $252,992 11 2020 SEMI-ANNUAL REPORT
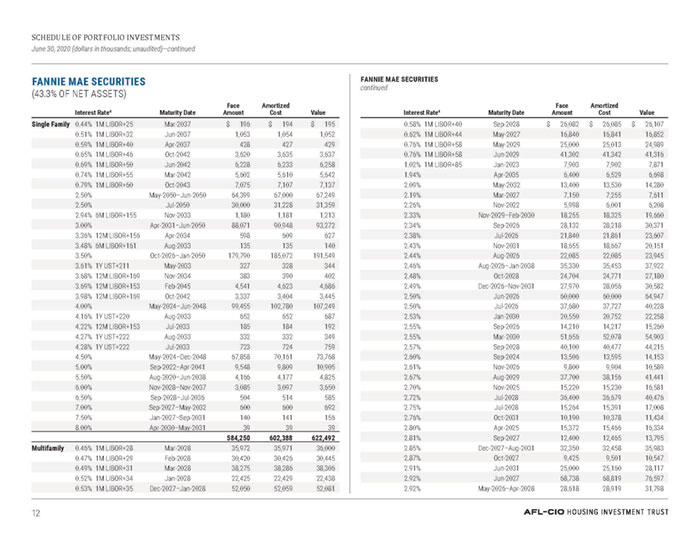
SCHEDULE OF PORTFOLIO INVESTMENTS June 30, 2020 (dollars in thousands; unaudited)—continued FANNIE MAE SECURITIES (43.3% OF NET ASSETS) FANNIE MAE SECURITIES continued Interest Rate4 Maturity Date FaceAmount AmortizedCost Value Single Family 0.44% 1M LIBOR+25 Mar-2037 $ 196 $ 194 $ 195 0.51% 1M LIBOR+32 Jun-2037 1,053 1,054 1,052 0.59% 1M LIBOR+40 Apr-2037 428 427 429 0.65% 1M LIBOR+46 Oct-2042 3,620 3,635 3,637 0.69% 1M LIBOR+50 Jun-2042 6,228 6,233 6,258 0.74% 1M LIBOR+55 Mar-2042 5,602 5,610 5,642 0.79% 1M LIBOR+60 Oct-2043 7,075 7,107 7,137 2.50% May-2050–Jun-2050 64,399 67,000 67,249 2.50% Jul-2050 30,000 31,228 31,359 2.94% 6M LIBOR+155 Nov-2033 1,180 1,181 1,213 3.00% Apr-2031–Jun-2050 88,071 90,948 93,272 3.36% 12M LIBOR+156 Apr-2034 598 609 627 3.48% 6M LIBOR+161 Aug-2033 135 135 140 3.50% Oct-2026–Jan-2050 179,790 185,072 191,549 3.61% 1Y UST+211 May-2033 327 328 344 3.68% 12M LIBOR+169 Nov-2034 383 390 402 3.69% 12M LIBOR+153 Feb-2045 4,541 4,623 4,686 3.98% 12M LIBOR+169 Oct-2042 3,337 3,404 3,445 4.00% May-2024–Jun-2048 99,455 102,780 107,249 4.16% 1Y UST+220 Aug-2033 652 652 687 4.22% 12M LIBOR+153 Jul-2033 185 184 192 4.27% 1Y UST+222 Aug-2033 332 332 349 4.28% 1Y UST+222 Jul-2033 723 724 759 4.50% May-2024–Dec-2048 67,858 70,161 73,768 5.00% Sep-2022–Apr-2041 9,548 9,809 10,905 5.50% Aug-2020–Jun-2038 4,166 4,177 4,825 6.00% Nov-2028–Nov-2037 3,085 3,097 3,650 6.50% Sep-2028–Jul-2036 504 514 585 7.00% Sep-2027–May-2032 600 600 692 7.50% Jan-2027–Sep-2031 140 141 156 8.00% Apr-2030–May-2031 39 39 39 584,250 602,388 622,492 Multifamily 0.46% 1M LIBOR+28 Mar-2028 35,972 35,971 36,000 0.47% 1M LIBOR+29 Feb-2028 30,420 30,426 30,445 0.49% 1M LIBOR+31 Mar-2028 38,275 38,286 38,306 0.52% 1M LIBOR+34 Jan-2028 22,425 22,429 22,438 0.53% 1M LIBOR+35 Dec-2027–Jan-2028 52,050 52,059 52,081 Interest Rate4 Maturity Date FaceAmount AmortizedCost Value 0.58% 1M LIBOR+40 Sep-2028 $ 26,082 $ 26,085 $ 26,107 0.62% 1M LIBOR+44 May-2027 16,840 16,841 16,852 0.76% 1M LIBOR+58 May-2029 25,000 25,013 24,989 0.76% 1M LIBOR+58 Jun-2029 41,302 41,342 41,316 1.02% 1M LIBOR+85 Jan-2023 7,903 7,902 7,871 1.94% Apr-2035 6,400 6,529 6,698 2.09% May-2032 13,400 13,530 14,280 2.19% Mar-2027 7,150 7,255 7,611 2.26% Nov-2022 5,998 6,001 6,208 2.33% Nov-2029–Feb-2030 18,255 18,325 19,660 2.34% Sep-2026 28,132 28,218 30,371 2.38% Jul-2026 21,840 21,861 23,607 2.43% Nov-2031 18,655 18,667 20,151 2.44% Aug-2026 22,085 22,085 23,945 2.46% Aug-2026–Jan-2038 35,330 35,453 37,922 2.48% Oct-2028 24,704 24,771 27,180 2.49% Dec-2026–Nov-2031 27,970 28,056 30,582 2.50% Jun-2026 60,000 60,000 64,947 2.50% Jul-2026 37,680 37,727 40,228 2.53% Jan-2030 20,550 20,752 22,258 2.55% Sep-2026 14,210 14,217 15,260 2.55% Mar-2030 51,656 52,078 54,903 2.57% Sep-2028 40,100 40,477 44,215 2.60% Sep-2024 13,506 13,595 14,153 2.61% Nov-2026 9,800 9,904 10,589 2.67% Aug-2029 37,700 38,156 41,441 2.70% Nov-2025 15,220 15,230 16,581 2.72% Jul-2028 36,400 36,679 40,476 2.75% Jul-2028 15,264 15,391 17,008 2.76% Oct-2031 10,190 10,378 11,434 2.80% Apr-2025 15,372 15,466 16,334 2.81% Sep-2027 12,400 12,465 13,795 2.85% Dec-2027–Aug-2031 32,350 32,458 35,983 2.87% Oct-2027 9,425 9,501 10,547 2.91% Jun-2031 25,000 25,160 28,117 2.92% Jun-2027 68,738 68,819 76,597 2.92% May-2026–Apr-2028 28,618 28,919 31,798 12
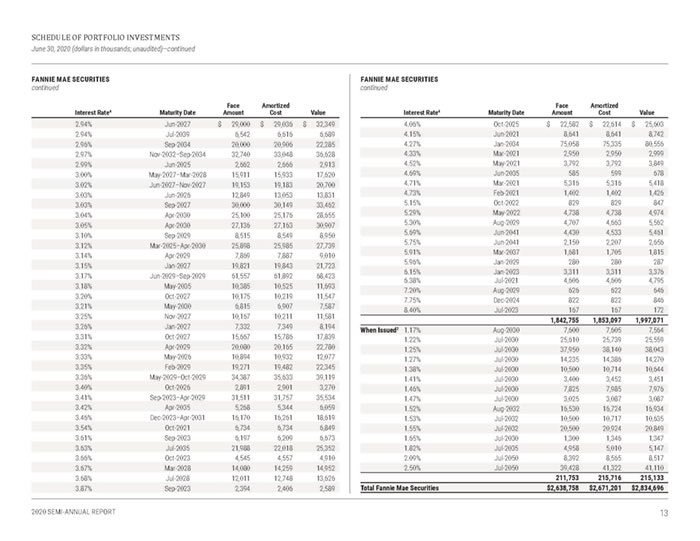
Interest Rate4 Maturity Date FaceAmount AmortizedCost Value 2.94% Jun-2027 $ 29,000 $ 29,036 $ 32,349 2.94% Jul-2039 6,542 6,616 6,689 2.96% Sep-2034 20,000 20,906 22,285 2.97% Nov-2032–Sep-2034 32,740 33,048 36,628 2.99% Jun-2025 2,662 2,666 2,913 3.00% May-2027–Mar-2028 15,911 15,933 17,620 3.02% Jun-2027–Nov-2027 19,153 19,183 20,700 3.03% Jun-2026 12,849 13,053 13,831 3.03% Sep-2027 30,000 30,149 33,462 3.04% Apr-2030 25,100 25,176 28,655 3.05% Apr-2030 27,136 27,163 30,907 3.10% Sep-2029 8,515 8,549 8,950 3.12% Mar-2025–Apr-2030 25,898 25,985 27,739 3.14% Apr-2029 7,869 7,887 9,010 3.15% Jan-2027 19,821 19,843 21,723 3.17% Jun-2029–Sep-2029 61,557 61,892 68,423 3.18% May-2035 10,385 10,525 11,693 3.20% Oct-2027 10,175 10,219 11,547 3.21% May-2030 6,815 6,907 7,587 3.25% Nov-2027 10,167 10,211 11,581 3.26% Jan-2027 7,332 7,349 8,194 3.31% Oct-2027 15,667 15,786 17,839 3.32% Apr-2029 20,080 20,165 22,780 3.33% May-2026 10,894 10,932 12,077 3.35% Feb-2029 19,271 19,482 22,345 3.36% May-2029–Oct-2029 34,387 35,633 39,119 3.40% Oct-2026 2,891 2,901 3,270 3.41% Sep-2023–Apr-2029 31,511 31,757 35,534 3.42% Apr-2035 5,268 5,344 6,059 3.46% Dec-2023–Apr-2031 16,170 16,261 18,619 3.54% Oct-2021 6,734 6,734 6,849 3.61% Sep-2023 6,197 6,209 6,673 3.63% Jul-2035 21,988 22,018 25,352 3.66% Oct-2023 4,545 4,557 4,910 3.67% Mar-2028 14,080 14,259 14,952 3.68% Jul-2028 12,011 12,748 13,626 3.87% Sep-2023 2,394 2,406 2,589 Interest Rate4 Maturity Date FaceAmount AmortizedCost Value 4.06% Oct-2025 $ 22,582 $ 22,614 $ 25,603 4.15% Jun-2021 8,641 8,641 8,742 4.27% Jan-2034 75,058 75,335 80,556 4.33% Mar-2021 2,950 2,950 2,999 4.52% May-2021 3,792 3,792 3,849 4.69% Jun-2035 585 599 678 4.71% Mar-2021 5,316 5,316 5,418 4.73% Feb-2021 1,402 1,402 1,426 5.15% Oct-2022 829 829 847 5.29% May-2022 4,738 4,738 4,974 5.30% Aug-2029 4,707 4,663 5,562 5.69% Jun-2041 4,430 4,533 5,461 5.75% Jun-2041 2,150 2,207 2,656 5.91% Mar-2037 1,681 1,705 1,815 5.96% Jan-2029 280 280 287 6.15% Jan-2023 3,311 3,311 3,376 6.38% Jul-2021 4,606 4,606 4,795 7.20% Aug-2029 626 622 646 7.75% Dec-2024 822 822 846 8.40% Jul-2023 167 167 172 1,842,755 1,853,097 1,997,071 When Issued2 1.17% Aug-2030 7,600 7,605 7,564 1.22% Jul-2030 25,610 25,739 25,559 1.25% Jul-2030 37,950 38,140 38,043 1.27% Jul-2030 14,235 14,386 14,270 1.38% Jul-2030 10,500 10,714 10,644 1.41% Jul-2030 3,400 3,452 3,451 1.46% Jul-2030 7,825 7,985 7,976 1.47% Jul-2030 3,025 3,087 3,087 1.52% Aug-2032 16,530 16,724 16,934 1.53% Jul-2032 10,500 10,717 10,635 1.55% Jul-2032 20,500 20,924 20,849 1.65% Jul-2030 1,300 1,346 1,347 1.82% Jul-2035 4,958 5,010 5,147 2.09% Jul-2050 8,392 8,565 8,517 2.50% Jul-2050 39,428 41,322 41,110 211,753 215,716 215,133 Total Fannie Mae Securities $2,638,758 $2,671,201 $2,834,696 13
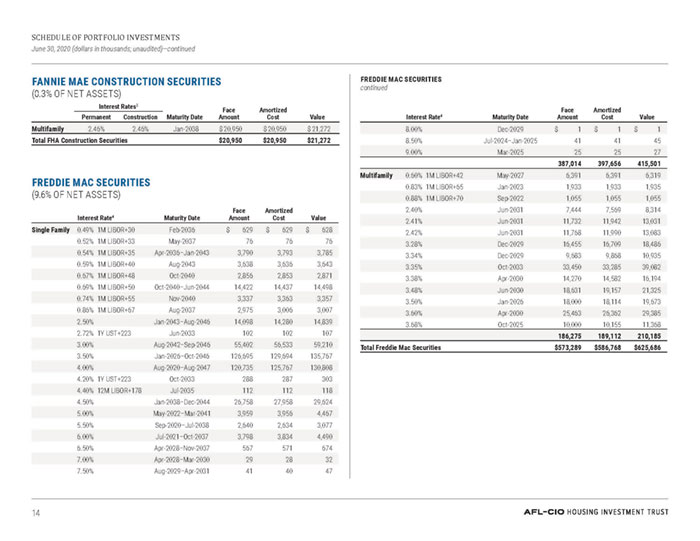
SCHEDULE OF PORTFOLIO INVESTMENTS June 30, 2020 (dollars in thousands; unaudited)—continued FREDDIE MAC SECURITIES continued FANNIE MAE CONSTRUCTION SECURITIES (0.3% OF NET ASSETS) Interest Rates3 Maturity Date FaceAmount AmortizedCost Value Permanent Construction Multifamily 2.46% 2.46% Jan-2038 $20,950 $20,950 $21,272 Total FHA Construction Securities $20,950 $20,950 $21,272 FREDDIE MAC SECURITIES (9.6% OF NET ASSETS) Interest Rate4 Maturity Date FaceAmount AmortizedCost Value Single Family 0.49% 1M LIBOR+30 Feb-2036 $ 629 $ 629 $ 628 0.52% 1M LIBOR+33 May-2037 76 76 76 0.54% 1M LIBOR+35 Apr-2036–Jan-2043 3,790 3,793 3,785 0.59% 1M LIBOR+40 Aug-2043 3,638 3,636 3,643 0.67% 1M LIBOR+48 Oct-2040 2,856 2,853 2,871 0.69% 1M LIBOR+50 Oct-2040–Jun-2044 14,422 14,437 14,498 0.74% 1M LIBOR+55 Nov-2040 3,337 3,363 3,357 0.86% 1M LIBOR+67 Aug-2037 2,975 3,006 3,007 2.50% Jan-2043–Aug-2046 14,098 14,280 14,839 2.72% 1Y UST+223 Jun-2033 102 102 107 3.00% Aug-2042–Sep-2046 55,402 56,533 59,210 3.50% Jan-2026–Oct-2046 126,695 129,694 135,767 4.00% Aug-2020–Aug-2047 120,735 125,767 130,808 4.20% 1Y UST+223 Oct-2033 288 287 303 4.40% 12M LIBOR+178 Jul-2035 112 112 118 4.50% Jan-2038–Dec-2044 26,758 27,958 29,624 5.00% May-2022–Mar-2041 3,959 3,956 4,467 5.50% Sep-2020–Jul-2038 2,640 2,634 3,077 6.00% Jul-2021–Oct-2037 3,798 3,834 4,490 6.50% Apr-2028–Nov-2037 567 571 674 7.00% Apr-2028–Mar-2030 29 28 32 7.50% Aug-2029–Apr-2031 41 40 47 FREDDIE MAC SECURITIES continued Interest Rate4 Maturity Date FaceAmount AmortizedCost Value 8.00% Dec-2029 $ 1 $ 1 $ 1 8.50% Jul-2024–Jan-2025 41 41 45 9.00% Mar-2025 25 25 27 387,014 397,656 415,501 Multifamily 0.60% 1M LIBOR+42 May-2027 6,391 6,391 6,319 0.83% 1M LIBOR+65 Jan-2023 1,933 1,933 1,935 0.88% 1M LIBOR+70 Sep-2022 1,055 1,055 1,055 2.40% Jun-2031 7,444 7,569 8,314 2.41% Jun-2031 11,732 11,942 13,031 2.42% Jun-2031 11,768 11,990 13,083 3.28% Dec-2029 16,455 16,709 18,486 3.34% Dec-2029 9,683 9,868 10,935 3.35% Oct-2033 33,450 33,285 39,082 3.38% Apr-2030 14,270 14,582 16,194 3.48% Jun-2030 18,631 19,157 21,325 3.50% Jan-2026 18,000 18,114 19,673 3.60% Apr-2030 25,463 26,362 29,385 3.68% Oct-2025 10,000 10,155 11,368 186,275 189,112 210,185 Total Freddie Mac Securities $573,289 $586,768 $625,686 14
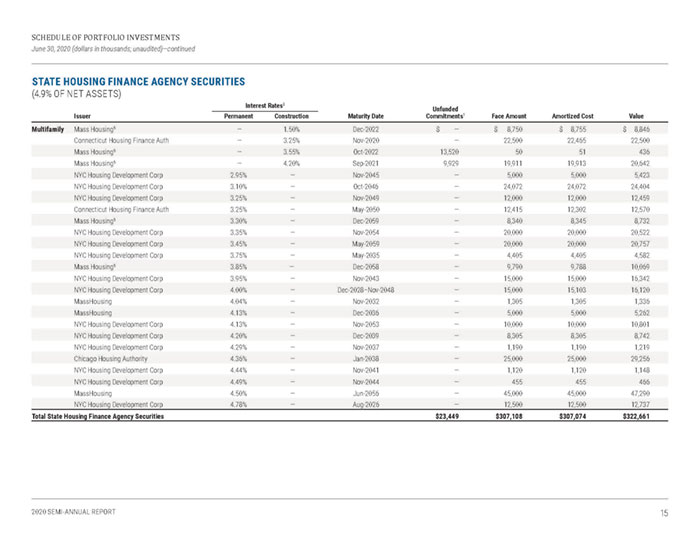
SCHEDULE OF PORTFOLIO INVESTMENTS June 30, 2020 (dollars in thousands; unaudited)—continued STATE HOUSING FINANCE AGENCY SECURITIES (4.9% OF NET ASSETS) Interest Rates3 Unfunded Commitments1 Issuer Permanent Construction Maturity Date Face Amount Amortized Cost Value Multifamily Mass Housing5 — 1.50% Dec-2022 $ — $ 8,750 $ 8,755 $ 8,846 Connecticut Housing Finance Auth — 3.25% Nov-2020 — 22,500 22,465 22,500 Mass Housing5 — 3.55% Oct-2022 13,520 50 51 436 Mass Housing5 — 4.20% Sep-2021 9,929 19,911 19,913 20,642 NYC Housing Development Corp 2.95% — Nov-2045 — 5,000 5,000 5,423 NYC Housing Development Corp 3.10% — Oct-2046 — 24,072 24,072 24,404 NYC Housing Development Corp 3.25% — Nov-2049 — 12,000 12,000 12,459 Connecticut Housing Finance Auth 3.25% — May-2050 — 12,415 12,302 12,570 Mass Housing5 3.30% — Dec-2059 — 8,340 8,345 8,732 NYC Housing Development Corp 3.35% — Nov-2054 — 20,000 20,000 20,522 NYC Housing Development Corp 3.45% — May-2059 — 20,000 20,000 20,757 NYC Housing Development Corp 3.75% — May-2035 — 4,405 4,405 4,582 Mass Housing5 3.85% — Dec-2058 — 9,790 9,788 10,069 NYC Housing Development Corp 3.95% — Nov-2043 — 15,000 15,000 16,342 NYC Housing Development Corp 4.00% — Dec-2028–Nov-2048 — 15,000 15,103 16,120 MassHousing 4.04% — Nov-2032 — 1,305 1,305 1,336 MassHousing 4.13% — Dec-2036 — 5,000 5,000 5,262 NYC Housing Development Corp 4.13% — Nov-2053 — 10,000 10,000 10,801 NYC Housing Development Corp 4.20% — Dec-2039 — 8,305 8,305 8,742 NYC Housing Development Corp 4.29% — Nov-2037 — 1,190 1,190 1,219 Chicago Housing Authority 4.36% — Jan-2038 — 25,000 25,000 29,256 NYC Housing Development Corp 4.44% — Nov-2041 — 1,120 1,120 1,148 NYC Housing Development Corp 4.49% — Nov-2044 — 455 455 466 MassHousing 4.50% — Jun-2056 — 45,000 45,000 47,290 NYC Housing Development Corp 4.78% — Aug-2026 — 12,500 12,500 12,737 Total State Housing Finance Agency Securities $23,449 $307,108 $307,074 $322,661 15
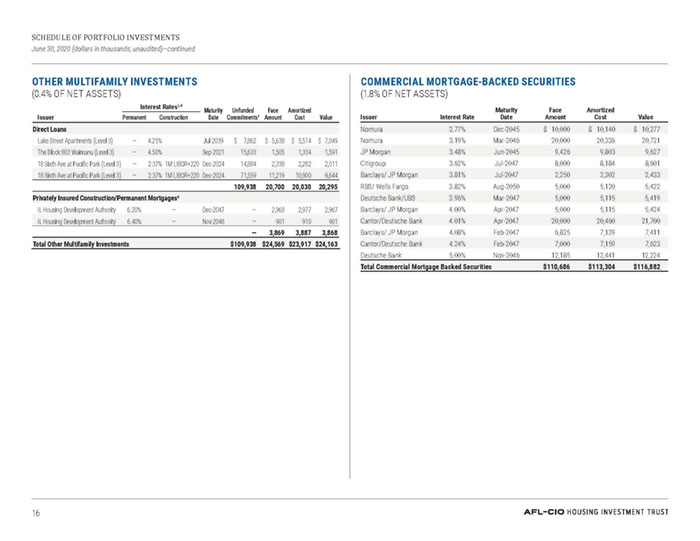
SCHEDULE OF PORTFOLIO INVESTMENTS June 30, 2020 (dollars in thousands; unaudited)—continued COMMERCIAL MORTGAGE-BACKED SECURITIES (1.8% OF NET ASSETS) OTHER MULTIFAMILY INVESTMENTS (0.4% OF NET ASSETS) Interest Rates3,4 MaturityDate Unfunded Commitments1 FaceAmount AmortizedCost Issuer Permanent Construction Value Direct Loans Lake Street Apartments (Level 3) — 4.25% Jul-2039 $ 7,862 $ 5,638 $ 5,514 $ 7,049 The Block 803 Waimanu (Level 3) — 4.50% Sep-2021 15,633 1,505 1,334 1,591 18 Sixth Ave at Pacific Park (Level 3) — 2.37% 1M LIBOR+220 Dec-2024 14,884 2,338 2,282 2,011 18 Sixth Ave at Pacific Park (Level 3) — 2.37% 1M LIBOR+220 Dec-2024 71,559 11,219 10,900 9,644 109,938 20,700 20,030 20,295 Privately Insured Construction/Permanent Mortgages6 IL Housing Development Authority 6.20% — Dec-2047 — 2,968 2,977 2,967 IL Housing Development Authority 6.40% — Nov-2048 — 901 910 901 — 3,869 3,887 3,868 Total Other Multifamily Investments $109,938 $24,569 $23,917 $24,163 Issuer Interest Rate Maturity Date Face Amount Amortized Cost Value Nomura 2.77% Dec-2045 $ 10,000 $ 10,140 $ 10,277 Nomura 3.19% Mar-2046 20,000 20,336 20,721 JP Morgan 3.48% Jun-2045 9,426 9,803 9,627 Citigroup 3.62% Jul-2047 8,000 8,184 8,601 Barclays/ JP Morgan 3.81% Jul-2047 2,250 2,302 2,433 RBS/ Wells Fargo 3.82% Aug-2050 5,000 5,120 5,422 Deutsche Bank/UBS 3.96% Mar-2047 5,000 5,115 5,419 Barclays/ JP Morgan 4.00% Apr-2047 5,000 5,115 5,424 Cantor/Deutsche Bank 4.01% Apr-2047 20,000 20,460 21,700 Barclays/ JP Morgan 4.08% Feb-2047 6,825 7,129 7,411 Cantor/Deutsche Bank 4.24% Feb-2047 7,000 7,159 7,623 Deutsche Bank 5.00% Nov-2046 12,185 12,441 12,224 Total Commercial Mortgage Backed Securities $110,686 $113,304 $116,882 16

SCHEDULE OF PORTFOLIO INVESTMENTS June 30, 2020 (dollars in thousands; unaudited)—continued UNITED STATES TREASURY SECURITIES (5.7% OF NET ASSETS) EQUITY INVESTMENT IN WHOLLY-OWNED SUBSIDIARY (LESS THAN 0.01% OF NET ASSETS) Interest Rate Maturity Date Face Amount Amortized Cost Value 0.63% May-2030 $ 43,000 $ 42,366 $ 42,887 1.13% May-2040 27,000 26,828 26,754 1.50% Feb-2030 35,000 36,756 37,838 1.63% Aug-2029 45,000 44,747 49,101 1.75% Nov-2029 30,000 30,036 33,122 2.00% Feb-2050 75,000 83,386 85,912 2.25% Aug-2049 25,000 26,182 30,063 2.63% Feb-2029 25,000 26,242 29,294 2.88% Aug-2028 10,000 9,842 11,844 3.13% Nov-2028 20,000 20,425 24,180 Total United States Treasury Securities $ 335,000 $ 346,810 $ 370,995 Total Fixed-Income Investments $5,962,830 $6,057,838 $6,440,255 Issuer Face Amount (Cost) Amount of Dividends or Interest Value HIT Advisers7 (Level 3) $1 $— $(249) Total Equity Investment $1 $— $(249) SHORT-TERM INVESTMENTS (1.1% OF NET ASSETS) Issuer Interest Rate Maturity Date Face Amount Amortized Cost Value Blackrock Federal Funds 0.10%8 Jul-2020 29,371 29,371 29,371 Commercial Paper Halkin Finance LLC 0.10%9 Jul-2020 $ 40,000 $ 40,000 $ 40,000 Total Short-Term Investments $ 69,371 $ 69,371 $ 69,371 Total Investments $6,032,202 $6,127,210 $6,509,377 17
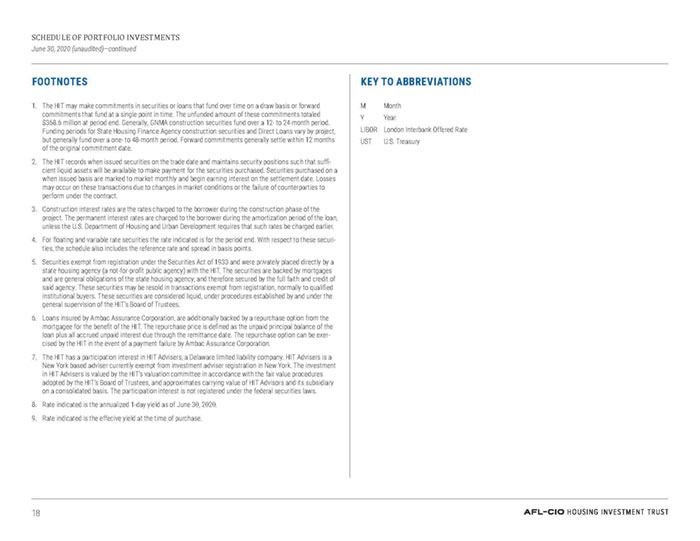
SCHEDULE OF PORTFOLIO INVESTMENTS June 30, 2020 (unaudited)—continued FOOTNOTES KEY TO ABBREVIATIONS 1. The HIT may make commitments in securities or loans that fund over time on a draw basis or forward commitments that fund at a single point in time. The unfunded amount of these commitments totaled $368.6 million at period end. Generally, GNMA construction securities fund over a 12- to 24-month period. Funding periods for State Housing Finance Agency construction securities and Direct Loans vary by project, but generally fund over a one- to 48-month period. Forward commitments generally settle within 12 months of the original commitment date. 2. The HIT records when issued securities on the trade date and maintains security positions such that sufficient liquid assets will be available to make payment for the securities purchased. Securities purchased on a when issued basis are marked to market monthly and begin earning interest on the settlement date. Losses may occur on these transactions due to changes in market conditions or the failure of counterparties to perform under the contract. 3. Construction interest rates are the rates charged to the borrower during the construction phase of the project. The permanent interest rates are charged to the borrower during the amortization period of the loan, unless the U.S. Department of Housing and Urban Development requires that such rates be charged earlier. 4. For floating and variable rate securities the rate indicated is for the period end. With respect to these securities, the schedule also includes the reference rate and spread in basis points. 5. Securities exempt from registration under the Securities Act of 1933 and were privately placed directly by a state housing agency (a not-for-profit public agency) with the HIT. The securities are backed by mortgages and are general obligations of the state housing agency, and therefore secured by the full faith and credit of said agency. These securities may be resold in transactions exempt from registration, normally to qualified institutional buyers. These securities are considered liquid, under procedures established by and under the general supervision of the HIT’s Board of Trustees. 6. Loans insured by Ambac Assurance Corporation, are additionally backed by a repurchase option from the mortgagee for the benefit of the HIT. The repurchase price is defined as the unpaid principal balance of the loan plus all accrued unpaid interest due through the remittance date. The repurchase option can be exercised by the HIT in the event of a payment failure by Ambac Assurance Corporation. 7. The HIT has a participation interest in HIT Advisers, a Delaware limited liability company. HIT Advisers is a New York based adviser currently exempt from investment adviser registration in New York. The investment in HIT Advisers is valued by the HIT’s valuation committee in accordance with the fair value procedures adopted by the HIT’s Board of Trustees, and approximates carrying value of HIT Advisors and its subsidiary on a consolidated basis. The participation interest is not registered under the federal securities laws. 8. Rate indicated is the annualized 1-day yield as of June 30, 2020. 9. Rate indicated is the effecive yield at the time of purchase. M Month Y Year LIBOR London Interbank Offered Rate UST U.S. Treasury 18
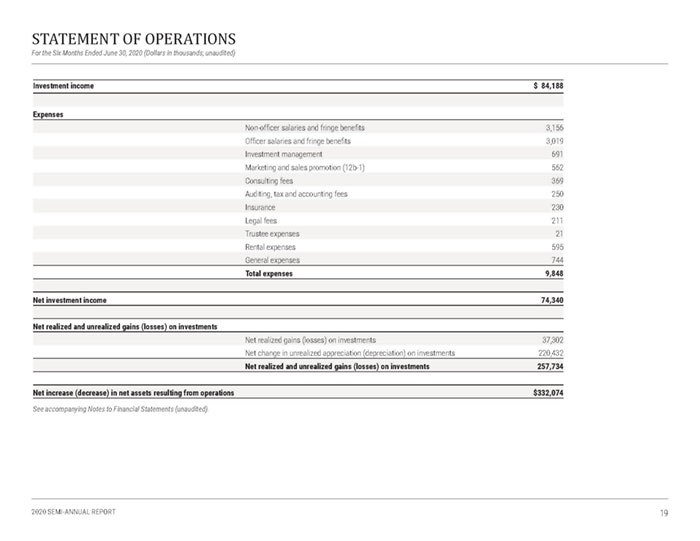
STATEMENT OF OPERATIONS For the Six Months Ended June 30, 2020 (Dollars in thousands; unaudited) Investment income $ 84,188 Expenses Non-officer salaries and fringe benefits 3,156 Officer salaries and fringe benefits 3,019 Investment management 691 Marketing and sales promotion (12b-1) 562 Consulting fees 369 Auditing, tax and accounting fees 250 Insurance 230 Legal fees 211 Trustee expenses 21 Rental expenses 595 General expenses 744 Total expenses 9,848 Net investment income 74,340 Net realized and unrealized gains (losses) on investments Net realized gains (losses) on investments 37,302 Net change in unrealized appreciation (depreciation) on investments 220,432 Net realized and unrealized gains (losses) on investments 257,734 Net increase (decrease) in net assets resulting from operations $332,074 See accompanying Notes to Financial Statements (unaudited). 19
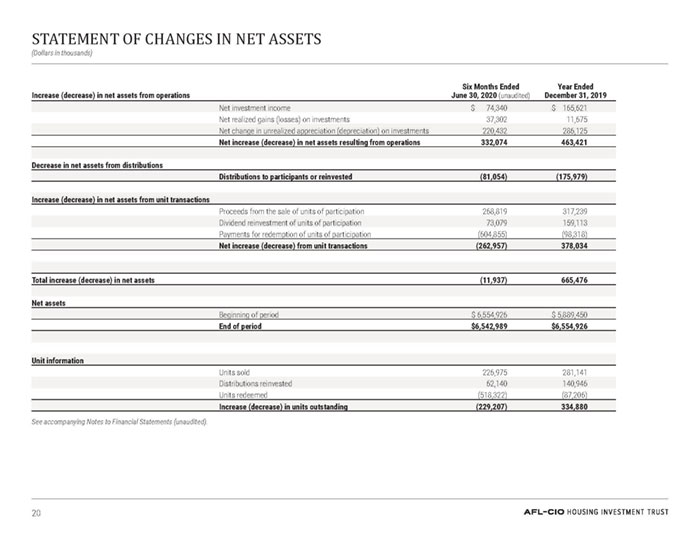
STATEMENT OF CHANGES IN NET ASSETS (Dollars in thousands) Increase (decrease) in net assets from operations Six Months Ended June 30, 2020 (unaudited) Year Ended December 31, 2019 Net investment income $ 74,340 $ 165,621 Net realized gains (losses) on investments 37,302 11,675 Net change in unrealized appreciation (depreciation) on investments 220,432 286,125 Net increase (decrease) in net assets resulting from operations 332,074 463,421 Decrease in net assets from distributions Distributions to participants or reinvested (81,054) (175,979) Increase (decrease) in net assets from unit transactions Proceeds from the sale of units of participation 268,819 317,239 Dividend reinvestment of units of participation 73,079 159,113 Payments for redemption of units of participation (604,855) (98,318) Net increase (decrease) from unit transactions (262,957) 378,034 Total increase (decrease) in net assets (11,937) 665,476 Net assets Beginning of period $ 6,554,926 $ 5,889,450 End of period $6,542,989 $6,554,926 Unit information Units sold 226,975 281,141 Distributions reinvested 62,140 140,946 Units redeemed (518,322) (87,206) Increase (decrease) in units outstanding (229,207) 334,880 20
NOTES TO FINANCIAL STATEMENTS (unaudited) NOTE 1. SUMMARY OF SIGNIFICANT ACCOUNTING POLICIES The American Federation of Labor and Congress of Industrial Organizations (AFL-CIO) Housing Investment Trust (HIT) is a common law trust created under the laws of the District of Columbia and is registered under the Investment Company Act of 1940, as amended (the Investment Company Act), as a no-load, open-end investment company. The HIT has obtained certain exemptions from the requirements of the Investment Company Act that are described in the HIT’s Prospectus and Statement of Additional Information. Participation in the HIT is limited to eligible pension plans and labor organizations, including health and welfare, general, voluntary employees’ benefit associations and other funds that have beneficiaries who are represented by labor organizations. The following is a summary of significant accounting policies followed by the HIT in the preparation of its financial statements. The policies are in conformity with generally accepted accounting principles (GAAP) in the United States. The HIT follows the investment company accounting and reporting guidance of the Financial Accounting Standards Board (FASB) Accounting Standards Codification Topic 946 Financial Services—Investment Companies. INVESTMENT VALUATION Net asset value per share (NAV) is calculated as of the close of business of the major bond markets in New York City on the last business day of each month. The HIT’s Board of Trustees is responsible for the valuation process and has delegated the supervision of the valuation process to a Valuation Committee. The Valuation Committee, in accordance with the policies and procedures adopted by the HIT’s Board of Trustees, is responsible for evaluating the effectiveness of the HIT’s pricing policies, determining the reliability of third-party pricing information and reporting to the Board of Trustees on valuation matters, including fair value determinations. Following is a description of the valuation methods and inputs applied to the HIT’s major categories of assets. Portfolio securities for which market quotations are readily available are valued by using independent pricing services. For U.S. Treasury securities, independent pricing services generally base prices on actual transactions as well as dealer-supplied market information. For state housing finance agency securities, independent pricing services generally base prices using models that utilize trading spreads, new issue scales, verified bid information and credit ratings. For commercial mortgage-backed securities, independent pricing services generally base prices on cash flow models that take into consideration benchmark yields and utilize available trade information, dealer quotes and market color. For U.S. agency and government-sponsored enterprise securities, including single family and multifamily mortgage-backed securities, construction mortgage securities and loans and collateralized mortgage obligations, independent pricing services generally base prices on an active TBA (“to-be-announced”) market for mortgage pools, discounted cash flow models, or option-adjusted spread models. Independent pricing services examine reference data and use observable inputs such as issue name, issue size, ratings, maturity, call type and spread/benchmark yields, as well as dealer-supplied market information. The discounted cash flow or option-adjusted spread models utilize inputs from matrix pricing, which consider observable market-based discount and prepayment rates, attributes of the collateral, and yield or price of bonds of comparable quality, coupon, maturity and type. Investments in registered open-end investment management companies are valued based upon the NAV of such investments. When the HIT finances the construction and permanent securities or participation interests, value is determined based upon the total amount, funded and/or unfunded, of the commitment. Portfolio investments for which market quotations are not readily available or deemed unreliable are valued at their fair value determined in good faith by the HIT’s Valuation Committee using consistently applied procedures adopted by the HIT’s Board of Trustees. In determining fair market value, the Valuation Committee will employ a valuation method that it believes reflects fair value for that asset, which may include the use of an independent valuation consultant or the utilization of a discounted cash flow model based on broker and/or other market inputs. The frequency with which these fair value procedures may be used cannot be predicted. However, on June 30, 2020, the Valuation Committee fair valued less than 0.01% of the HIT’s net assets utilizing internally derived unobservable inputs. Short-term investments acquired with a stated maturity of 60 days or less are generally valued at amortized cost, which approximates fair market value. The HIT holds a 100% ownership interest, either directly or indirectly in HIT Advisers LLC (HIT Advisers). HIT Advisers is valued at its fair value determined in good faith under consistently applied procedures adopted by the HIT’s Board of Trustees, which approximates its respective carrying value. GAAP establishes a disclosure hierarchy that categorizes the inputs to valuation techniques used to value assets and liabilities at measurement date. The HIT classifies its assets and liabilities into three levels based on the method used to value the assets or liabilities. Level 1 values are based on quoted prices in active markets for identical securities. Level 2 values are based on significant observable market inputs, such as quoted prices for similar securities, interest rates, prepayment speeds, credit risk and quoted prices in inactive markets. Level 3 21
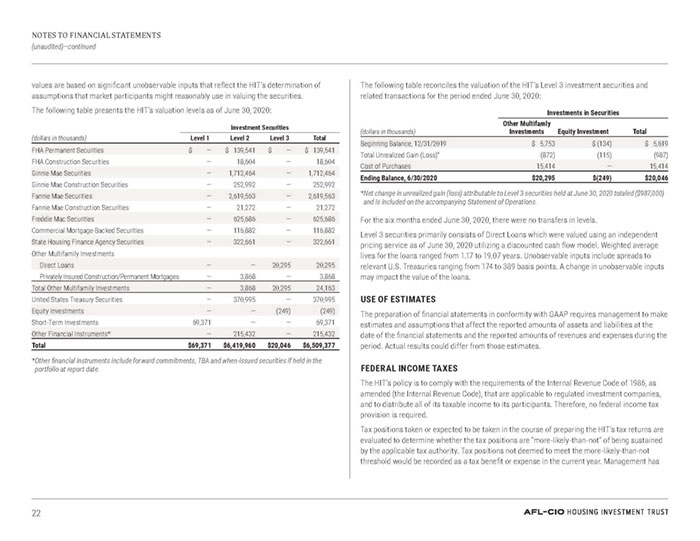
NOTES TO FINANCIAL STATEMENTS (unaudited)—continued values are based on significant unobservable inputs that reflect the HIT’s determination of assumptions that market participants might reasonably use in valuing the securities. The following table presents the HIT’s valuation levels as of June 30, 2020: (dollars in thousands) Investment Securities Level 1 Level 2 Level 3 Total FHA Permanent Securities $ — $ 139,541 $ — $ 139,541 FHA Construction Securities — 18,604 — 18,604 Ginnie Mae Securities — 1,712,464 — 1,712,464 Ginnie Mae Construction Securities — 252,992 — 252,992 Fannie Mae Securities — 2,619,563 — 2,619,563 Fannie Mae Construction Securities — 21,272 — 21,272 Freddie Mac Securities — 625,686 — 625,686 Commercial Mortgage-Backed Securities — 116,882 — 116,882 State Housing Finance Agency Securities — 322,661 — 322,661 Other Multifamily Investments Direct Loans — — 20,295 20,295 Privately Insured Construction/Permanent Mortgages — 3,868 — 3,868 Total Other Multifamily Investments — 3,868 20,295 24,163 United States Treasury Securities — 370,995 — 370,995 Equity Investments — — (249) (249) Short-Term Investments 69,371 — — 69,371 Other Financial Instruments* — 215,432 — 215,432 Total $69,371 $6,419,960 $20,046 $6,509,377 * Other financial instruments include forward commitments, TBA and when-issued securities if held in the portfolio at report date. The following table reconciles the valuation of the HIT’s Level 3 investment securities and related transactions for the period ended June 30, 2020: Investments in Securities (dollars in thousands) Other Multifamly Investments Equity Investment Total Beginning Balance, 12/31/2019 $ 5,753 $ (134) $ 5,619 Total Unrealized Gain (Loss)* (872) (115) (987) Cost of Purchases 15,414 — 15,414 Ending Balance, 6/30/2020 $20,295 $(249) $20,046 * Net change in unrealized gain (loss) attributable to Level 3 securities held at June 30, 2020 totaled ($987,000) and is included on the accompanying Statement of Operations. For the six months ended June 30, 2020, there were no transfers in levels. Level 3 securities primarily consists of Direct Loans which were valued using an independent pricing service as of June 30, 2020 utilizing a discounted cash flow model. Weighted average lives for the loans ranged from 1.17 to 19.07 years. Unobservable inputs include spreads to relevant U.S. Treasuries ranging from 174 to 389 basis points. A change in unobservable inputs may impact the value of the loans. USE OF ESTIMATES The preparation of financial statements in conformity with GAAP requires management to make estimates and assumptions that affect the reported amounts of assets and liabilities at the date of the financial statements and the reported amounts of revenues and expenses during the period. Actual results could differ from those estimates. FEDERAL INCOME TAXES The HIT’s policy is to comply with the requirements of the Internal Revenue Code of 1986, as amended (the Internal Revenue Code), that are applicable to regulated investment companies, and to distribute all of its taxable income to its participants. Therefore, no federal income tax provision is required. Tax positions taken or expected to be taken in the course of preparing the HIT’s tax returns are evaluated to determine whether the tax positions are “more-likely-than-not” of being sustained by the applicable tax authority. Tax positions not deemed to meet the more-likely-than-not threshold would be recorded as a tax benefit or expense in the current year. Management has 22
NOTES TO FINANCIAL STATEMENTS (unaudited)—continued analyzed for all open years the HIT’s tax positions taken on federal income tax returns and has concluded that no provision for income tax is required in the HIT’s financial statements. The HIT files U.S. federal, state and local tax returns as required. The HIT’s tax returns are subject to examination by the relevant tax authorities until the expiration of the applicable statutes of limitations, which is generally three years after the filing of the tax return but could be longer in certain circumstances. DISTRIBUTIONS TO PARTICIPANTS At the end of each calendar month, a pro-rata distribution is made to participants of the net investment income earned during the month. This pro-rata distribution is based on the participant’s number of units held as of the immediately preceding month-end and excludes realized gains (losses) which are distributed at year-end. Participants redeeming their investments are paid their pro-rata share of undistributed net income accrued through the month-end of the month in which they redeem. The HIT offers a reinvestment plan that permits current participants to automatically reinvest their distributions of income and capital gains, if any, into the HIT’s units of participation. Total reinvestment was approximately 90% of distributed income for the six months ended June 30, 2020. INVESTMENT TRANSACTIONS AND INCOME For financial reporting purposes, security transactions are accounted for as of the trade date. Gains and losses on securities sold are determined on the basis of amortized cost. Realized gains (losses) on paydowns of mortgage- and asset-backed securities are classified as interest income. Interest income, which includes amortization of premium and accretion of discount on debt securities, is accrued as earned. 12B-1 PLAN OF DISTRIBUTION The HIT’s Board of Trustees has approved a Plan of Distribution under Rule 12b-1 under the Investment Company Act to pay for marketing and sales promotion expenses incurred in connection with the offer and sale of units and related distribution activities (12b-1 expenses). For the six months ended June 30, 2020, the HIT was authorized to pay 12b-1 expenses in an annual amount up to $600,000 or 0.05% of its average net assets on an annualized basis per fiscal year, whichever was greater. During the six months ended June 30, 2020, the HIT incurred approximately $562,000, or 0.02% of its average monthly net assets, in 12b-1 expenses. NOTE 2. INVESTMENT RISK INTEREST RATE RISK As with any fixed-income investment, the market value of the HIT’s investments will generally fall at times when market interest rates rise. Rising interest rates may also reduce prepayment rates, causing the average life of the HIT’s investments to increase. This could in turn further reduce the value of the HIT’s portfolio. Certain instruments held by the HIT pay an interest rate based on the London Interbank Offered Rate (“LIBOR”), which is the average offered rate for various maturities of short-term loans between certain major international banks. LIBOR is expected to be phased out by the end of 2021. While the effect of the phase out cannot yet be determined, it may result in, among other things, increased volatility or illiquidity in markets for instruments based on LIBOR and changes in the value of such instruments. PREPAYMENT AND EXTENSION RISK The HIT invests in certain fixed-income securities whose value is derived from an underlying pool of mortgage loans that are subject to prepayment and extension risk. Prepayment risk is the risk that a security will pay more quickly than its assumed payment rate, shortening its expected average life. In such an event, the HIT may be required to reinvest the proceeds of such prepayments in other investments bearing lower interest rates. The majority of the HIT’s securities backed by loans for multifamily projects include restrictions on prepayments for specified periods to mitigate this risk or include prepayment penalties to compensate the HIT. Prepayment penalties, when received, are included in realized gains. Extension risk is the risk that a security will pay more slowly than its assumed payment rate, extending its expected average life. When this occurs, the HIT’s ability to reinvest principal repayments in higher returning investments may be limited. These two risks may increase the sensitivity of the HIT’s portfolio to fluctuations in interest rates and negatively affect the value of the HIT’s portfolio. NOTES TO FINANCIAL STATEMENTS (unaudited)—continued 23
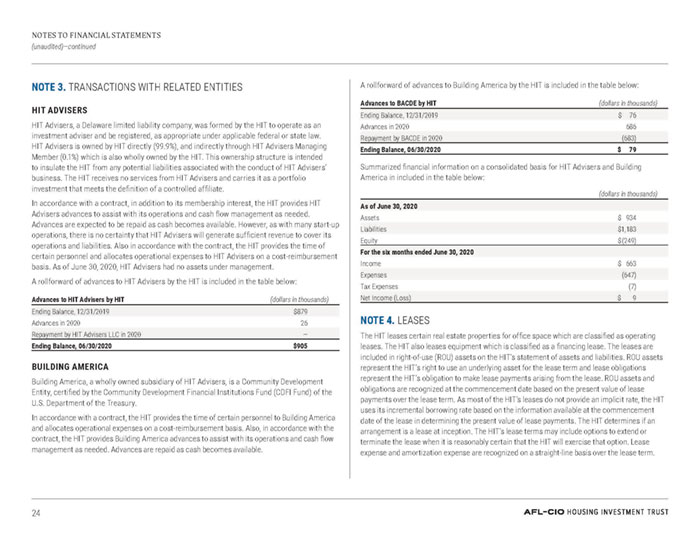
NOTES TO FINANCIAL STATEMENTS (unaudited)—continued NOTE 3. TRANSACTIONS WITH RELATED ENTITIES HIT ADVISERS HIT Advisers, a Delaware limited liability company, was formed by the HIT to operate as an investment adviser and be registered, as appropriate under applicable federal or state law. HIT Advisers is owned by HIT directly (99.9%), and indirectly through HIT Advisers Managing Member (0.1%) which is also wholly owned by the HIT. This ownership structure is intended to insulate the HIT from any potential liabilities associated with the conduct of HIT Advisers’ business. The HIT receives no services from HIT Advisers and carries it as a portfolio investment that meets the definition of a controlled affiliate. In accordance with a contract, in addition to its membership interest, the HIT provides HIT Advisers advances to assist with its operations and cash flow management as needed. Advances are expected to be repaid as cash becomes available. However, as with many start-up operations, there is no certainty that HIT Advisers will generate sufficient revenue to cover its operations and liabilities. Also in accordance with the contract, the HIT provides the time of certain personnel and allocates operational expenses to HIT Advisers on a cost-reimbursement basis. As of June 30, 2020, HIT Advisers had no assets under management. A rollforward of advances to HIT Advisers by the HIT is included in the table below: Advances to HIT Advisers by HIT (dollars in thousands) Ending Balance, 12/31/2019 $879 Advances in 2020 26 Repayment by HIT Advisers LLC in 2020 — Ending Balance, 06/30/2020 $905 BUILDING AMERICA Building America, a wholly owned subsidiary of HIT Advisers, is a Community Development Entity, certified by the Community Development Financial Institutions Fund (CDFI Fund) of the U.S. Department of the Treasury. In accordance with a contract, the HIT provides the time of certain personnel to Building America and allocates operational expenses on a cost-reimbursement basis. Also, in accordance with the contract, the HIT provides Building America advances to assist with its operations and cash flow management as needed. Advances are repaid as cash becomes available. A rollforward of advances to Building America by the HIT is included in the table below: Advances to BACDE by HIT (dollars in thousands) Ending Balance, 12/31/2019 $ 76 Advances in 2020 686 Repayment by BACDE in 2020 (683) Ending Balance, 06/30/2020 $ 79 Summarized financial information on a consolidated basis for HIT Advisers and Building America in included in the table below: (dollars in thousands) As of June 30, 2020 Assets $ 934 Liabilities $1,183 Equity $(249) For the six months ended June 30, 2020 Income $ 663 Expenses (647) Tax Expenses (7) Net Income (Loss) $ 9 NOTE 4. LEASES The HIT leases certain real estate properties for office space which are classified as operating leases. The HIT also leases equipment which is classified as a financing lease. The leases are included in right-of-use (ROU) assets on the HIT’s statement of assets and liabilities. ROU assets represent the HIT’s right to use an underlying asset for the lease term and lease obligations represent the HIT’s obligation to make lease payments arising from the lease. ROU assets and obligations are recognized at the commencement date based on the present value of lease payments over the lease term. As most of the HIT’s leases do not provide an implicit rate, the HIT uses its incremental borrowing rate based on the information available at the commencement date of the lease in determining the present value of lease payments. The HIT determines if an arrangement is a lease at inception. The HIT’s lease terms may include options to extend or terminate the lease when it is reasonably certain that the HIT will exercise that option. Lease expense and amortization expense are recognized on a straight-line basis over the lease term. 24
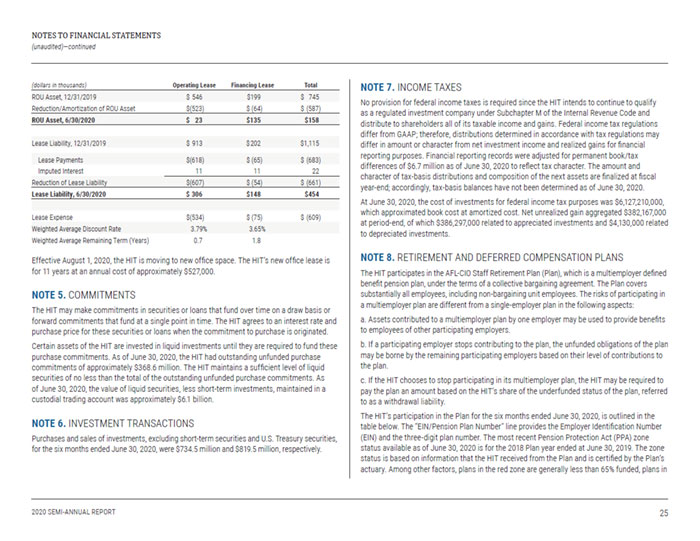
NOTES TO FINANCIAL STATEMENTS (unaudited)—continued (dollars in thousands) Operating Lease Financing Lease Total ROU Asset, 12/31/2019 $ 546 $199 $ 745 Reduction/Amortization of ROU Asset $(523) $ (64) $ (587) ROU Asset, 6/30/2020 $ 23 $135 $158 Lease Liability, 12/31/2019 $ 913 $202 $1,115 Lease Payments $(618) $ (65) $ (683) Imputed Interest 11 11 22 Reduction of Lease Liability $(607) $ (54) $ (661) Lease Liability, 6/30/2020 $ 306 $148 $454 Lease Expense $(534) $ (75) $ (609) Weighted Average Discount Rate 3.79% 3.65% Weighted Average Remaining Term (Years) 0.7 1.8 Effective August 1, 2020, the HIT is moving to new office space. The HIT’s new office lease is for 11 years at an annual cost of approximately $527,000. NOTE 5. COMMITMENTS The HIT may make commitments in securities or loans that fund over time on a draw basis or forward commitments that fund at a single point in time. The HIT agrees to an interest rate and purchase price for these securities or loans when the commitment to purchase is originated. Certain assets of the HIT are invested in liquid investments until they are required to fund these purchase commitments. As of June 30, 2020, the HIT had outstanding unfunded purchase commitments of approximately $368.6 million. The HIT maintains a sufficient level of liquid securities of no less than the total of the outstanding unfunded purchase commitments. As of June 30, 2020, the value of liquid securities, less short-term investments, maintained in a custodial trading account was approximately $6.1 billion. NOTE 6. INVESTMENT TRANSACTIONS Purchases and sales of investments, excluding short-term securities and U.S. Treasury securities, for the six months ended June 30, 2020, were $734.5 million and $819.5 million, respectively. NOTE 7. INCOME TAXES No provision for federal income taxes is required since the HIT intends to continue to qualify as a regulated investment company under Subchapter M of the Internal Revenue Code and distribute to shareholders all of its taxable income and gains. Federal income tax regulations differ from GAAP; therefore, distributions determined in accordance with tax regulations may differ in amount or character from net investment income and realized gains for financial reporting purposes. Financial reporting records were adjusted for permanent book/tax differences of $6.7 million as of June 30, 2020 to reflect tax character. The amount and character of tax-basis distributions and composition of the next assets are finalized at fiscal year-end; accordingly, tax-basis balances have not been determined as of June 30, 2020. At June 30, 2020, the cost of investments for federal income tax purposes was $6,127,210,000, which approximated book cost at amortized cost. Net unrealized gain aggregated $382,167,000 at period-end, of which $386,297,000 related to appreciated investments and $4,130,000 related to depreciated investments. NOTE 8. RETIREMENT AND DEFERRED COMPENSATION PLANS The HIT participates in the AFL-CIO Staff Retirement Plan (Plan), which is a multiemployer defined benefit pension plan, under the terms of a collective bargaining agreement. The Plan covers substantially all employees, including non-bargaining unit employees. The risks of participating in a multiemployer plan are different from a single-employer plan in the following aspects: a. Assets contributed to a multiemployer plan by one employer may be used to provide benefits to employees of other participating employers. b. If a participating employer stops contributing to the plan, the unfunded obligations of the plan may be borne by the remaining participating employers based on their level of contributions to the plan. c. If the HIT chooses to stop participating in its multiemployer plan, the HIT may be required to pay the plan an amount based on the HIT’s share of the underfunded status of the plan, referred to as a withdrawal liability. The HIT’s participation in the Plan for the six months ended June 30, 2020, is outlined in the table below. The “EIN/Pension Plan Number” line provides the Employer Identification Number (EIN) and the three-digit plan number. The most recent Pension Protection Act (PPA) zone status available as of June 30, 2020 is for the 2018 Plan year ended at June 30, 2019. The zone status is based on information that the HIT received from the Plan and is certified by the Plan’s actuary. Among other factors, plans in the red zone are generally less than 65% funded, plans in 25
NOTES TO FINANCIAL STATEMENTS (unaudited)—continued the yellow zone are less than 80% funded, and plans in the green zone are at least 80% funded. The “FIP/RP Status Pending/Implemented” line indicates whether a financial improvement plan (FIP) or a rehabilitation plan (RP) is either pending or has been implemented. Pension Fund: AFL-CIO Staff Retirement Plan EIN/Pension Plan Number 53-0228172 / 001 2018 Plan Year PPA Zone Status Green FIP/RP Status Pending/ Implemented No 2020 Contributions $1,048,450 2020 Contribution Rate 24% Surcharge Imposed No Expiration Date of Collective Bargaining Agreement 03/31/2022 The HIT was listed in the Plan’s Form 5500 as providing more than 5% of the total contributions for the following plan year: Pension Fund Years Contributions to Plan Exceeded More Than 5 Percent of Total Contributions AFL-CIO Staff Retirement Plan 20181 1 The 2018 plan year ended at June 30, 2019. At the date the HIT financial statements were issued, the Plan’s Form 5500 was not available for the plan year ended June 30, 2020. The HIT also sponsors a deferred compensation plan, referred to as a 401(k) plan, covering all employees. This plan permits employees to defer the lesser of 100% of their total compensation or the applicable Internal Revenue Service limit. During 2020, the HIT matched dollar for dollar the first $6,200 of each employee’s contributions. The HIT’s 401(k) contribution for the six months ended June 30, 2020, was approximately $190,000. NOTE 9. LOAN FACILITY The HIT has a $15 million uncommitted loan facility that expires on June 7, 2021. Under this facility, borrowings bear interest per annum equal to 1.25% plus the highest of (a) the Federal Funds Effective Rate, (b) the Overnight Eurodollar Rate, (c) the one-month LIBOR, or (d) 0.00%. The HIT did not borrow against the facility and had no outstanding balance under the facility for the six months ended June 30, 2020. No compensating balances are required. NOTE 10. CONTRACT OBLIGATIONS In the ordinary course of business, the HIT enters into contracts that contain a variety of indemnifications. The HIT’s maximum exposure under these arrangements is unknown. However, the HIT has not had any prior claims or losses pursuant to these contracts and expects the risk of loss to be low. NOTE 11. COVID-19 The outbreak of COVID-19 has caused a global ongoing crisis materially reducing economic output, disrupting supply chains, and resulting in market closures. Investors should be aware that in light of the current uncertainty and distress in economies and financial markets, the value of HIT’s investments is subject to volatility and other adverse events. The HIT, its service providers, the markets in which it invests and market intermediaries are also impacted by quarantines and similar measures intended to contain the ongoing pandemic, which can obstruct their functioning and subject them to heightened operational risks. NOTE 12. SUBSEQUENT EVENTS The HIT evaluated subsequent events through the date the financial statements were available for issue and determined there were no additional material events that would require adjustment to or disclosure in the HIT’s financial statements. 26
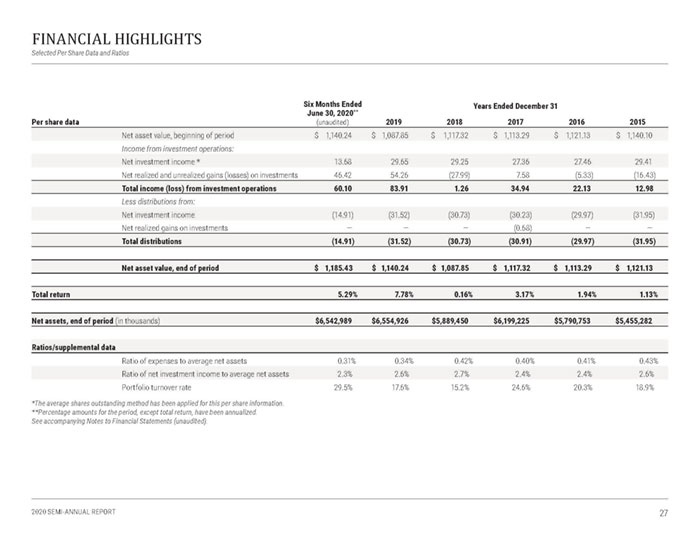
FINANCIAL HIGHLIGHTS Selected Per Share Data and Ratios Per share data Six Months Ended June 30, 2020** (unaudited) Years Ended December 31 2019 2018 2017 2016 2015 Net asset value, beginning of period $ 1,140.24 $ 1,087.85 $ 1,117.32 $ 1,113.29 $ 1,121.13 $ 1,140.10 Income from investment operations: Net investment income * 13.68 29.65 29.25 27.36 27.46 29.41 Net realized and unrealized gains (losses) on investments 46.42 54.26 (27.99) 7.58 (5.33) (16.43) Total income (loss) from investment operations 60.10 83.91 1.26 34.94 22.13 12.98 Less distributions from: Net investment income (14.91) (31.52) (30.73) (30.23) (29.97) (31.95) Net realized gains on investments — — — (0.68) — — Total distributions (14.91) (31.52) (30.73) (30.91) (29.97) (31.95) Net asset value, end of period $ 1,185.43 $ 1,140.24 $ 1,087.85 $ 1,117.32 $ 1,113.29 $ 1,121.13 Total return 5.29% 7.78% 0.16% 3.17% 1.94% 1.13% Net assets, end of period (in thousands) $6,542,989 $6,554,926 $5,889,450 $6,199,225 $5,790,753 $5,455,282 Ratios/supplemental data Ratio of expenses to average net assets 0.31% 0.34% 0.42% 0.40% 0.41% 0.43% Ratio of net investment income to average net assets 2.3% 2.6% 2.7% 2.4% 2.4% 2.6% Portfolio turnover rate 29.5% 17.6% 15.2% 24.6% 20.3% 18.9% *The average shares outstanding method has been applied for this per share information. **Percentage amounts for the period, except total return, have been annualized. See accompanying Notes to Financial Statements (unaudited). 27

BOARD OF TRUSTEES *Executive Committee Member Helen R. Kanovsky* Chair Retired Vincent Alvarez President, New York City Central Labor Council Kenneth W. Cooper International Secretary-Treasurer, International Brotherhood of Electrical Workers Timothy J. Driscoll President, International Union of Bricklayers and Allied Craftworkers Sean McGarvey President, North America’s Building Trades Unions Terence O’Sullivan, General President, Laborers’ International Union of North America Kenneth Rigmaiden* General President, International Union of Painters & Allied Trades for the United States and Canada Anthony Shelton International President, Bakery, Confectionery, Tobacco Workers and Grain Millers’ International Union Liz Shuler* Secretary-Treasurer, AFL-CIO Richard L. Trumka* President, AFL-CIO Kevin Filter Managing Principal, GFW Equities LLC & Mad Duck Capital LLC Bridget Gainer Cook County Commissioner and Vice President of Global Affairs, Aon The Honorable Jack F. Quinn, Jr.* Senior Advisor for Public & Community Relations, Barclay Damon Jamie S. Rubin North American CEO, Meridiam Infrastructure Deidre L. Schmidt President & CEO, CommonBond Communities Tony Stanley* Director, TransCon Builders, Inc. Harry W. Thompson Consultant, Harry Thompson & Associates William C. Thompson, Jr. Senior Managing Director/Chief Administrative Officer, Siebert, Cisneros, Shank & Co.

Investors should consider the HIT’s investment objectives, risks and expenses carefully before investing. Investors may view the HIT’s current prospectus, which contains more complete information, on its website at www.aflcio-hit.com and may obtain a copy from the HIT by calling the Marketing and Investor Relations Department collect at 202-331-8055. Investors should read the current prospectus carefully before investing. The calculations of the HIT yield herein represent widely accepted portfolio characteristics information based on coupon rate, current price and, for yield to worst, certain prepayment assumptions, and are not current yield or other performance data as defined by the SEC in Rule 482. This document contains forecasts, estimates, opinions, and/or other information that is subjective. Statements concerning economic, financial, or market trends are based on current conditions, which will fluctuate. There is no guarantee that such statements will be applicable under all market conditions, especially during periods of downturn. Actual outcomes and results may differ significantly from the views expressed. It should not be considered as investment advice or a recommendation of any kind.

AFL-CIO HOUSING INVESTMENT TRUST NATIONAL OFFICE | 1227 25th Street, NW, Suite 500 | Washington, D.C. 20037 | (202) 331-8055 www.aflcio-hit.com
Item 2. Code of Ethics.
Not applicable for semi-annual reports.
Item 3. Audit Committee Financial Expert.
Not applicable for semi-annual reports.
Item 4. Principal Accountant Fees and Services.
Not applicable for semi-annual reports.
Item 5. Audit Committee of Listed Registrants.
Not applicable to open-end investment companies.
Item 6. Investments.
| (a) | Included herein under Item 1. |
Item 7. Disclosure of Proxy Voting Policies and Procedures for Closed-End Management Investment Companies.
Not applicable to open-end investment companies.
Item 8. Portfolio Managers of Closed-End Management Investment Companies.
Not applicable to open-end investment companies.
Item 9. Purchases of Equity Securities by Closed-End Management Investment Company and Affiliated Purchasers.
Not applicable to open-end investment companies.
Item 10. Submission of Matters to a Vote of Security Holders.
No material changes have been made to the procedures by which participants may recommend nominees to the Board of Trustees of the Registrant, where those changes were implemented after the Registrant last provided disclosure in response to the requirements of Item 407(c)(2)(iv) of Regulation S-K (per Item 22(b)(15) of Schedule 14A) or this Item.
Item 11. Controls and Procedures.
| (a) | The Registrant’s Chief Executive Officer (the principal executive officer) and Chief Financial Officer (the principal financial officer) have concluded that the Registrant’s disclosure controls and procedures (as defined in Rule 30a-3(c) under the Act (17 CFR 270.30a-3(c))) are effective to ensure that material information relating to the Registrant is made known to them by appropriate persons, based on their evaluation of such controls and procedures as of a date within 90 days of the filing of this report. |
| (b) | There were no changes in the Registrant’s internal control over financial reporting (as defined in Rule 30a-3(d) under the Act (17 CFR 270.30a-3(d)) that occurred during the period covered by this report that have materially affected, or are reasonably likely to materially affect, the Registrant’s internal control over financial reporting. |
Item 12. Disclosure of Securities Lending Activities for Closed-End Management Investment Companies.
Not applicable to open-end investment companies.
Item 13. Exhibits.
| (a) | (1) | Not applicable for semi-annual reports. |
| (4) | There was no change in the Registrant’s independent public accountant for the period covered by this report. |
SIGNATURES
Pursuant to the requirements of the Securities Exchange Act of 1934 and the Investment Company Act of 1940, the AFL-CIO Housing Investment Trust has duly caused this report to be signed on its behalf by the undersigned, thereunto duly authorized.
AFL-CIO HOUSING INVESTMENT TRUST
By:
/s/ Chang Suh
Chang Suh
Chief Executive Officer
Date: August 28, 2020
Pursuant to the requirements of the Securities Exchange Act of 1934 and the Investment Company Act of 1940, this report has been signed below by the following persons on behalf of the AFL-CIO Housing Investment Trust and in the capacities and on the dates indicated.
/s/ Chang Suh
Chang Suh
Chief Executive Officer
(Principal Executive Officer)
AFL-CIO Housing Investment Trust
Date: August 28, 2020
/s/ Erica Khatchadourian
Erica Khatchadourian,
Chief Financial Officer
(Principal Financial Officer)
AFL-CIO Housing Investment Trust
Date: August 28, 2020