UNITED STATES
SECURITIES AND EXCHANGE COMMISSION
Washington, D.C. 20549
FORM N-CSR
CERTIFIED SHAREHOLDER REPORT OF REGISTERED MANAGEMENT
INVESTMENT COMPANIES
Investment Company Act File Number: 811-3493
American Federation of Labor and Congress of Industrial Organizations Housing Investment Trust
(Exact name of registrant as specified in charter)
1227 25th Street, N.W., Suite 500
Washington, D.C. 20037
(Address of principal executive offices) (Zip code)
Corey F. Rose, Esq.
Dechert LLP
1900 K Street, NW
Washington, DC 20006-1110
(Name and address of agent for service)
(202) 331-8055
(Registrant’s telephone number, including area code)
Date of fiscal year end: December 31
Date of reporting period: January 1, 2024 - June 30, 2024
| Item 1. | Reports to Stockholders. |
| (a) | A copy of the 2024 Semi Annual Report (the “Report”) of the AFL-CIO Housing Investment Trust (the “Trust” or “Registrant”) transmitted to Trust participants pursuant to Rule 30e-1 under the Investment Company Act of 1940, as amended (17 CFR 270.30e-1) (the “Act”), is included herewith. |

SEMI-ANNUAL REPORT
AFL CIO HOUSING INVESTMENT TRUST
AFL CIO HOUSING INVESTMENT TRUST
JUNE 30, 2024
This semi-annual report contains important information about the AFL-CIO Housing Investment Trust (the “HIT”) for the period of January 1, 2024 to June 30, 2024. You can find additional information about the HIT at aflcio-hit.com/shareholder-reports/. You can also request this information by contacting us at 1-202-331-8055 or IR@aflcio-hit.com.
semi-annual shareholder report
WHAT WERE THE HIT’S COSTS FOR THE PAST SIX MONTHS?
BASED ON A HYPOTHETICAL $10,000 INVESTMENT
The below table explains the costs that Participants would have paid within the reporting period.
| | COSTS OF A $10,000 INVESTMENT | COSTS PAID AS A PERCENTAGE OF A $10,000 INVESTMENT1 |
| AFL-CIO Housing Investment Trust | $16.00 | 0.32% |
| 1 | | Expenses are equal to the HIT’s annualized six-month expense ratio of 0.32%, as of June 30, 2024 |
HOW DID THE HIT PERFORM DURING THE REPORTING PERIOD AND
WHAT AFFECTED ITS PERFORMANCE?
The HIT outperformed the Bloomberg US Aggregate Bond Index* (Bloomberg Aggregate or Benchmark) with a gross return of 0.47% and a net return of 0.31% for the first half of 2024, compared to -0.71% for the Benchmark. Interest rates rose materially throughout the first half of the year, causing investment grade fixed income strategies to broadly produce negative returns; however, the HIT was able to produce a positive total return primarily due to the strength of the multifamily sector.
Entering 2024, the market had priced in six interest rate cuts, starting as early as March, but sticky inflation and a resilient labor market in the first quarter caused a drastic shift in market expectations. As the second quarter concluded, the Federal Reserve had still not cut interest rates, remaining on pause to assess the lagged impacts of its restrictive monetary policy. Consequently, the 10-year Treasury rate closed June at its second-highest quarter-end level in over 15 years.
 | HIT’s overweight to agency-insured multifamily mortgage backed securities (MBS) as spreads tightened to Treasuries | |  | HIT’s structural underweight to corporate bonds, the second-best performing asset class in the Benchmark on an excess return basis |
| HIT’s underweight to agency-insured, fixed-rate single family MBS and Treasuries, the worst and second-worst performing asset classes in the Benchmark on an excess return basis, respectively | | | HIT’s overweight to the second highest credit quality sector, the worst performing asset classes in the Benchmark on an excess return basis |
| HIT’s overweight to spread product, as spreads across most investment grade fixed income assets tightened versus Treasuries due to the attractiveness of all-in-yields and lack of new issuance | | | |
continued
 | aflcio-hit.com |
| SEMI-ANNUAL REPORT continued | JUNE 30, 2024 |
FUND PERFORMANCE The following graph compares the initial and subsequent account values at the end of each of the most recently completed 10 fiscal years of the HIT. It assumes a $50,000 initial investment at the beginning of the first fiscal year in the Benchmark. |  |
AVERAGE ANNUAL TOTAL RETURNS
| | 1 YEAR | 5 YEAR | 10 YEAR |
| HIT Gross | 3.82% | -0.20% | 1.52% |
| HIT Net | 3.48% | -0.52% | 1.14% |
| Bloomberg Aggregate* | 2.63% | -0.23% | 1.35% |
| * | Bloomberg Index Services Limited. BLOOMBERG® is a trademark and service mark of Bloomberg Finance L.P. and its affiliates (collectively “Bloomberg”). Bloomberg or Bloomberg’s licensors own all proprietary rights in the Bloomberg Indices. Bloomberg does not approve or endorse this material or guarantee the accuracy or completeness of any information herein, nor does Bloomberg make any warranty, express or implied, as to the results to be obtained therefrom, and, to the maximum extent allowed by law, Bloomberg shall not have any liability or responsibility for injury or damages arising in connection therewith. |
Past performance is not a good predictor of future performance. Visit aflcio-hit.com for the most recent performance information.
KEY FUND STATISTICS
| HIT’s net assets | $6.555 Billion |
| Ratio of net investment income to average net assets | 3.59% |
| Portfolio turnover rate | 21.41% |
| Total number of portfolio holdings | 933 |
| Effective Duration | 5.97% |
| Current Yield | 4.05% |
| Yield to Worst2 | 5.65% |
| Advisory Fee Paid | N/A |
| 2 | Yield-to-Worst is a measure of the lowest possible yield that can be received on a bond that fully operates within the terms of its contract without defaulting. It does not represent the performance yield. It is calculated by using the lower of either the yield to maturity or the yield to call on every possible call date. |
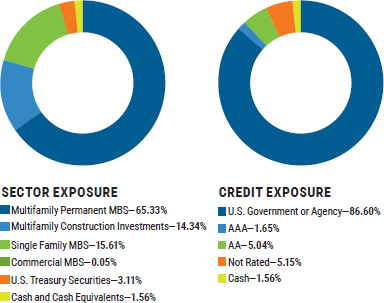
| 65.33 |
|---|
| 14.34 |
|---|
| 15.61 |
|---|
| 0.05 |
|---|
| 3.11 |
|---|
| 1.56 |
|---|
| 86.60 |
|---|
| 1.65 |
|---|
| 5.04 |
|---|
| 5.15 |
|---|
| 1.56 |
|---|
AVAILABILITY OF ADDITIONAL INFORMATION You can find additional information on the HIT’s website, including its: Prospectus, Financial information, Portfolio holdings, and Proxy voting information. You can also request this information by contacting HIT Investor Relations at 1-202-331-8055 or IR@aflcio-hit.com or scanning the QR code. | |  |
| * | Bloomberg Index Services Limited. BLOOMBERG® is a trademark and service mark of Bloomberg Finance L.P. and its affiliates (collectively “Bloomberg”). Bloomberg or Bloomberg’s licensors own all proprietary rights in the Bloomberg Indices. Bloomberg does not approve or endorse this material or guarantee the accuracy or completeness of any information herein, nor does Bloomberg make any warranty, express or implied, as to the results to be obtained therefrom, and, to the maximum extent allowed by law, Bloomberg shall not have any liability or responsibility for injury or damages arising in connection therewith. |
| 1227 25th Street, NW | Suite 500 | Washington, DC 20037 | 202.331.8055 | aflcio-hit.com |
Item 2. Code of Ethics.
Not applicable for semi-annual reports.
Item 3. Audit Committee Financial Expert.
Not applicable for semi-annual reports.
Item 4. Principal Accountant Fees and Services.
Not applicable for semi-annual reports.
Item 5. Audit Committee of Listed Registrants.
Not applicable to open-end investment companies.
Item 6. Schedule of Investments.
| (a) | Not applicable. The complete schedule of investments is included in Item 7 of this Form N-CSR. |
Item 7. Financial Statements and Financial Highlights for Open-End Management Investment Companies.
| (a) | Report pursuant to Regulation S-X. |
| (b) | Report pursuant to Regulation S-X. |

SEMI-ANNUAL FINANCIAL STATEMENTS AND OTHER INFORMATION
June 30, 2024
Table of Contents

Item 7. Financial Statements and Financial Highlights
STATEMENT OF ASSETS AND LIABILITIES
June 30, 2024 (dollars in thousands, except per share data; unaudited)
Assets
| Investments, at value (cost $7,416,354) | | $ | 6,604,014 | |
| Cash | | | 513 | |
| Accrued interest receivable | | | 26,180 | |
| Receivables for investments sold | | | 196 | |
| Cash collateral held with broker | | | 7,093 | |
| Right of use asset | | | 3,610 | |
| Other assets | | | 2,958 | |
| Total assets | | | 6,644,564 | |
| | | | | |
| Liabilities | | | |
| Payables for investments purchased | | | 3,383 | |
| Redemptions payable | | | 72,111 | |
| Income distribution and capital gains payable, net of dividends reinvested of $18,608 | | | 1,635 | |
| Refundable deposits | | | 857 | |
| Variation margin due to broker | | | 1,881 | |
| Accrued salaries and fringe benefits | | | 4,524 | |
| Lease Liability | | | 4,133 | |
| Other liabilities and accrued expenses | | | 829 | |
| Total liabilities | | | 89,353 | |
| | | | | |
| Other commitments and contingencies (Note 5 of financial statements) - | | | — | |
| | | | | |
| Net assets applicable to participants’ equity — | | | | |
| Certificates of participation—authorized unlimited; | | | | |
| Outstanding 6,835,499 units | | $ | 6,555,211 | |
| | | | | |
| Net asset value per unit of participation (in dollars) | | $ | 959.00 | |
| | | | | |
| Participants’ equity | | | | |
| Participants’ equity consisted of the following: | | | | |
| Amount invested and reinvested by current participants | | $ | 7,547,841 | |
| Distributable earnings (accumulated losses) | | | (992,630 | ) |
| Total participants’ equity | | $ | 6,555,211 | |
 | 1 |
SCHEDULE OF PORTFOLIO INVESTMENTS
June 30, 2024 (dollars in thousands; unaudited)
FHA Permanent Securities (1.8% of net assets)
| | | Interest Rate | | | Maturity Date | | Face Amount | | | Amortized Cost | | | Value | |
| Multifamily | | | 2.50 | % | | Apr-2063 | | $ | 5,610 | | | $ | 5,618 | | | $ | 4,410 | |
| | | | 3.40 | % | | Jun-2038 | | | 1,885 | | | | 1,886 | | | | 1,875 | |
| | | | 3.65 | % | | Dec-2037 | | | 6,924 | | | | 7,002 | | | | 6,891 | |
| | | | 3.72 | % | | Feb-2062 | | | 4,360 | | | | 4,369 | | | | 3,839 | |
| | | | 3.90 | % | | Mar-2062 | | | 3,041 | | | | 3,045 | | | | 2,706 | |
| | | | 4.00 | % | | Dec-2053 | | | 58,600 | | | | 58,577 | | | | 55,686 | |
| | | | 4.10 | % | | Dec-2060 | | | 21,182 | | | | 21,200 | | | | 18,981 | |
| | | | 4.70 | % | | May-2053 | | | 4,436 | | | | 4,599 | | | | 3,461 | |
| | | | 5.17 | % | | Feb-2050 | | | 7,207 | | | | 7,627 | | | | 7,105 | |
| | | | 5.80 | % | | Jan-2053 | | | 1,887 | | | | 1,894 | | | | 1,883 | |
| | | | 5.87 | % | | May-2044 | | | 1,527 | | | | 1,527 | | | | 1,525 | |
| | | | 5.89 | % | | Apr-2038 | | | 3,556 | | | | 3,559 | | | | 3,552 | |
| | | | 6.40 | % | | Aug-2046 | | | 3,378 | | | | 3,379 | | | | 3,376 | |
| | | | 6.60 | % | | Jan-2050 | | | 3,083 | | | | 3,099 | | | | 3,069 | |
| Total FHA Permanent Securities | | | | | $ | 126,676 | | | $ | 127,381 | | | $ | 118,359 | |
Ginnie Mae Securities (25.3% of net assets)
| | | Interest Rate | | | Maturity Date | | Face Amount | | | Amortized Cost | | | Value | |
| Single Family | | | 4.00 | % | | Feb-2040 - Jun-2040 | | $ | 849 | | | $ | 854 | | | $ | 808 | |
| | | | 4.50 | % | | Aug-2040 | | | 449 | | | | 455 | | | | 437 | |
| | | | 5.50 | % | | Jan-2033 - Jun-2037 | | | 706 | | | | 706 | | | | 714 | |
| | | | 6.00 | % | | Jan-2032 - Aug-2037 | | | 463 | | | | 463 | | | | 471 | |
| | | | 6.50 | % | | Jul-2028 | | | 26 | | | | 26 | | | | 26 | |
| | | | 7.00 | % | | Apr-2026 - Jan-2030 | | | 202 | | | | 202 | | | | 204 | |
| | | | 7.50 | % | | Aug-2025 - Aug-2030 | | | 78 | | | | 78 | | | | 79 | |
| | | | 8.00 | % | | Sep-2026 - Nov-2030 | | | 92 | | | | 93 | | | | 93 | |
| | | | 8.50 | % | | Aug-2027 | | | 12 | | | | 12 | | | | 12 | |
| | | | | | | | | | 2,877 | | | | 2,889 | | | | 2,844 | |
| Multifamily | | | 1.90 | % | | Feb-2061 | | | 22,712 | | | | 20,623 | | | | 12,967 | |
| | | | 1.95 | % | | Mar-2064 | | | 70,907 | | | | 70,888 | | | | 55,525 | |
| | | | 2.00 | % | | Oct-2062 | | | 52,304 | | | | 53,968 | | | | 40,193 | |
| | | | 2.00 | % | | Apr-2063 | | | 50,757 | | | | 51,565 | | | | 39,725 | |
| | | | 2.00 | % | | Apr-2063 | | | 47,992 | | | | 48,942 | | | | 37,148 | |
| | | | 2.00 | % | | Jul-2063 | | | 43,854 | | | | 44,225 | | | | 34,410 | |
| | | | 2.00 | % | | Oct-2063 | | | 41,634 | | | | 41,249 | | | | 31,934 | |
| | | | 2.00 | % | | Apr-2062 - Mar-2064 | | | 296,085 | | | | 299,253 | | | | 225,216 | |
| | | | 2.08 | % | | Nov-2056 | | | 50,359 | | | | 52,144 | | | | 41,358 | |
| | | | 2.15 | % | | May-2056 | | | 388 | | | | 387 | | | | 378 | |
| | | | 2.20 | % | | Jun-2056 | | | 792 | | | | 790 | | | | 755 | |
| | | | 2.25 | % | | Dec-2048 | | | 2,621 | | | | 2,604 | | | | 2,427 | |
| | | | 2.30 | % | | Mar-2056 - Oct-2056 | | | 2,933 | | | | 2,908 | | | | 2,758 | |
| | | | 2.31 | % | | Nov-2051 | | | 7,076 | | | | 7,076 | | | | 6,232 | |
| | | | 2.32 | % | | Sep-2060 | | | 26,190 | | | | 27,487 | | | | 22,244 | |
| | | | 2.35 | % | | Nov-2056 - Feb-2061 | | | 27,234 | | | | 28,010 | | | | 22,494 | |
| | | | 2.37 | % | | Jan-2053 | | | 20,824 | | | | 20,947 | | | | 18,513 | |
| | | | 2.40 | % | | Aug-2047 - Dec-2057 | | | 18,089 | | | | 18,474 | | | | 14,845 | |
| | | | 2.45 | % | | Apr-2062 | | | 14,291 | | | | 14,507 | | | | 11,902 | |
| | | | 2.50 | % | | Dec-2052 - Jan-2061 | | | 51,812 | | | | 52,555 | | | | 43,399 | |
| | | | 2.58 | % | | May-2063 | | | 28,078 | | | | 28,928 | | | | 22,808 | |
| | | | 2.60 | % | | Dec-2055 - Jun-2059 | | | 8,189 | | | | 8,209 | | | | 7,426 | |
| | | | 2.65 | % | | Oct-2062 | | | 6,277 | | | | 6,421 | | | | 5,245 | |
| | | | 2.67 | % | | Mar-2062 | | | 34,350 | | | | 35,102 | | | | 29,109 | |
| | | | 2.70 | % | | May-2048 - Jul-2058 | | | 4,648 | | | | 4,647 | | | | 4,417 | |
| | | | 2.72 | % | | Feb-2044 | | | 33 | | | | 34 | | | | 33 | |
| | | | 2.74 | % | | Apr-2057 | | | 23,083 | | | | 24,904 | | | | 20,177 | |
| | | | 2.75 | % | | Apr-2063 | | | 4,995 | | | | 5,190 | | | | 4,139 | |
| | | | 2.78 | % | | Aug-2058 | | | 10,299 | | | | 11,124 | | | | 9,023 | |
| | | | 2.79 | % | | Apr-2049 | | | 3,567 | | | | 3,593 | | | | 3,291 | |
| 2 |
Schedule of Portfolio Investments
June 30, 2024 (dollars in thousands; unaudited)
Ginnie Mae Securities continued
| | | Interest Rate | | | Maturity Date | | Face Amount | | | Amortized Cost | | | | Value | |
| | | | 2.80 | % | | Feb-2053 | | | 60,000 | | | | 57,386 | | | | 45,430 | |
| | | | 2.80 | % | | Dec-2059 | | | 4,124 | | | | 4,073 | | | | 3,965 | |
| | | | 2.82 | % | | Apr-2050 | | | 644 | | | | 654 | | | | 614 | |
| | | | 2.94 | % | | Nov-2059 | | | 46,001 | | | | 50,779 | | | | 39,652 | |
| | | | 2.98 | % | | Jun-2063 | | | 14,535 | | | | 15,027 | | | | 12,196 | |
| | | | 3.00 | % | | May-2062 | | | 58,456 | | | | 62,859 | | | | 49,657 | |
| | | | 3.03 | % | | Jan-2056 | | | 29,124 | | | | 30,835 | | | | 26,146 | |
| | | | 3.05 | % | | May-2054 | | | 11,545 | | | | 11,587 | | | | 10,019 | |
| | | | 3.17 | % | | Aug-2059 | | | 33,383 | | | | 36,657 | | | | 29,509 | |
| | | | 3.25 | % | | Sep-2054 - Apr 2059 | | | 46,930 | | | | 45,720 | | | | 44,412 | |
| | | | 3.27 | % | | Apr-2046 | | | 23,144 | | | | 24,222 | | | | 20,621 | |
| | | | 3.30 | % | | Sep-2060 | | | 7,173 | | | | 7,336 | | | | 6,508 | |
| | | | 3.33 | % | | May-2055 | | | 6,672 | | | | 6,366 | | | | 5,934 | |
| | | | 3.34 | % | | Sep-2059 | | | 16,359 | | | | 16,643 | | | | 14,989 | |
| | | | 3.35 | % | | Mar-2044 | | | 7,851 | | | | 7,600 | | | | 7,605 | |
| | | | 3.36 | % | | May-2061 | | | 50,176 | | | | 55,353 | | | | 44,668 | |
| | | | 3.38 | % | | Jan-2060 | | | 57,275 | | | | 57,280 | | | | 52,563 | |
| | | | 3.39 | % | | Feb-2059 | | | 13,718 | | | | 13,959 | | | | 12,710 | |
| | | | 3.41 | % | | Sep-2061 | | | 40,678 | | | | 42,142 | | | | 36,865 | |
| | | | 3.43 | % | | Nov-2061 | | | 51,414 | | | | 52,909 | | | | 45,771 | |
| | | | 3.50 | % | | Sep-2052 - Jan-2054 | | | 5,324 | | | | 5,383 | | | | 5,148 | |
| | | | 3.53 | % | | Apr-2042 | | | 14,737 | | | | 15,090 | | | | 14,011 | |
| | | | 3.60 | % | | Apr-2061 | | | 32,974 | | | | 33,962 | | | | 29,994 | |
| | | | 3.60 | % | | Jun-2057-Jan 2064 | | | 17,991 | | | | 18,568 | | | | 16,853 | |
| | | | 3.62 | % | | Dec-2057 | | | 27,448 | | | | 27,879 | | | | 26,015 | |
| | | | 3.63 | % | | Dec-2045 | | | 7,908 | | | | 7,664 | | | | 7,662 | |
| | | | 3.65 | % | | Oct-2058 | | | 9,898 | | | | 10,032 | | | | 9,387 | |
| | | | 3.67 | % | | Nov-2035 | | | 11,821 | | | | 12,056 | | | | 11,503 | |
| | | | 3.74 | % | | Aug-2059 | | | 15,072 | | | | 15,335 | | | | 14,217 | |
| | | | 3.75 | % | | Nov-2060 - Jan-2064 | | | 16,685 | | | | 17,190 | | | | 15,167 | |
| | | | 3.78 | % | | Aug-2060 | | | 38,274 | | | | 38,531 | | | | 35,268 | |
| | | | 3.92 | % | | Aug-2039 | | | 37,120 | | | | 38,604 | | | | 36,130 | |
| | | | 4.00 | % | | Nov-2057 | | | 24,001 | | | | 24,919 | | | | 22,190 | |
| | | | 4.10 | % | | May-2051 | | | 3,648 | | | | 3,906 | | | | 3,560 | |
| | | | 4.35 | % | | Dec-2060 | | | 2,224 | | | | 2,262 | | | | 2,135 | |
| | | | 4.37 | % | | Feb-2034 | | | 21,692 | | | | 23,169 | | | | 20,746 | |
| | | | 4.45 | % | | Jun-2055 | | | 2,403 | | | | 2,324 | | | | 2,397 | |
| | | | 4.53 | % | | Jan-2061 | | | 14,464 | | | | 14,873 | | | | 13,930 | |
| | | | 4.63% | 1 | Sep-2037 | | | 1,500 | | | | 1,472 | | | | 1,501 | |
| | | | 4.90% | 1 | Mar-2044 | | | 1,000 | | | | 992 | | | | 1,000 | |
| | | | 5.25 | % | | Apr-2037 | | | 14,900 | | | | 14,896 | | | | 14,869 | |
| | | | 5.62 | % | | Oct-2058 | | | 12,870 | | | | 13,352 | | | | 13,194 | |
| | | | 5.64 | % | | Nov-2058 | | | 2,257 | | | | 2,342 | | | | 2,317 | |
| | | | 5.66 | % | | Oct-2058 - Dec-2058 | | | 22,295 | | | | 23,146 | | | | 22,916 | |
| | | | 5.71 | % | | Oct-2058 | | | 6,500 | | | | 6,734 | | | | 6,683 | |
| | | | 5.78 | % | | Dec-2058 | | | 20,381 | | | | 21,116 | | | | 20,976 | |
| | | | 5.82 | % | | Nov-2058 | | | 5,533 | | | | 5,733 | | | | 5,711 | |
| | | | | | | | | | 1,942,495 | | | | 1,987,671 | | | | 1,655,405 | |
| Total Ginnie Mae Securities | | | | | | | | $ | 1,945,372 | | | $ | 1,990,560 | | | $ | 1,658,249 | |
Ginnie Mae Construction Securities (3.6% of net assets)
| | | Interest Rates2 | | | | | Unfunded | | | | | | | | | | |
| | | Permanent | | | Construction | | | Maturity Date | | Commitments3 | | | Face Amount | | | Amortized Cost | | | Value | |
| Multifamily | | | 2.25 | % | | | 4.10 | % | | Dec-2064 | | $ | 30,253 | | | $ | 35,674 | | | $ | 37,672 | | | $ | 20,019 | |
| | | | 2.59 | % | | | 3.59 | % | | Aug-2064 | | | 15,096 | | | | 27,217 | | | | 28,120 | | | | 18,578 | |
| | | | 3.05 | % | | | 3.05 | % | | Dec-2063 | (Level 3) | | 22,448 | | | | 82,296 | | | | 83,326 | | | | 75,260 | |
| | | | 3.24 | % | | | 3.24 | % | | Jan-2064 | | | 916 | | | | 25,515 | | | | 26,038 | | | | 21,460 | |
| | | | 3.69 | % | | | 4.75 | % | | Nov-2063 | | | 1,291 | | | | 11,213 | | | | 11,374 | | | | 9,757 | |
| | | | 4.08 | % | | | 4.08 | % | | Feb-2064 | | | 100 | | | | 15,327 | | | | 15,663 | | | | 13,954 | |
| | | | 4.14 | % | | | 4.14 | % | | Sep-2063 | | | — | | | | 11,197 | | | | 11,395 | | | | 10,288 | |
| | | | 5.17 | % | | | 8.75 | % | | Jul-2064 | | | 280 | | | | 10,470 | | | | 10,613 | | | | 10,633 | |
| | | | 5.34 | % | | | 9.75 | % | | Aug-2065 | | | 20,932 | | | | 25 | | | | 793 | | | | 575 | |
| | | | 5.88 | % | | | 10.75 | % | | Feb-2066 | | | 19,152 | | | | — | | | | 778 | | | | 1,040 | |
| | | | 5.90 | % | | | 5.90 | % | | Aug-2065 | | | 4,085 | | | | 25 | | | | 148 | | | | 171 | |
| | | | 5.92 | % | | | 5.92 | % | | May-2065- Jan-2066 | | | 4,495 | | | | 17,984 | | | | 17,234 | | | | 19,170 | |
| | | | 6.10 | % | | | 7.65 | % | | Aug-2065 | | | 2,009 | | | | 162 | | | | 254 | | | | 317 | |
| | | | 6.15 | % | | | 6.15 | % | | Apr-2065- Aug-2065 | | | 3,527 | | | | 30,846 | | | | 31,612 | | | | 33,258 | |
| Total Ginnie Mae Construction Securities | | $ | 124,584 | | | $ | 267,951 | | | $ | 275,020 | | | $ | 234,480 | |
| 3 |
Schedule of Portfolio Investments
June 30, 2024 (dollars in thousands; unaudited)
Fannie Mae Securities (46.7% of net assets)
| | | Interest Rate4 | | | Maturity Date | | Unfunded Commitments3 | | | Face Amount | | | Amortized Cost | | | Value | |
| Single Family | | | 2.50 | % | | May-2050 - Jan-2052 | | $ | — | | | $ | 107,320 | | | $ | 111,150 | | | $ | 88,433 | |
| | | | 2.50 | % | | Jan-2052 | | | — | | | | 42,211 | | | | 42,357 | | | | 34,905 | |
| | | | 3.00 | % | | Apr-2031 - Mar-2052 | | | — | | | | 122,906 | | | | 126,984 | | | | 106,275 | |
| | | | 3.00 | % | | Oct-2051 | | | — | | | | 40,411 | | | | 42,244 | | | | 34,605 | |
| | | | 3.50 | % | | Jan-2042 - Feb-2052 | | | — | | | | 88,470 | | | | 90,925 | | | | 79,454 | |
| | | | 3.50 | % | | Jan-2052 | | | — | | | | 35,379 | | | | 36,224 | | | | 31,322 | |
| | | | 4.00 | % | | Sep-2024 - Jul-2052 | | | — | | | | 75,380 | | | | 75,579 | | | | 69,681 | |
| | | | 4.50 | % | | Oct-2024 - Oct-2052 | | | — | | | | 117,804 | | | | 117,176 | | | | 112,054 | |
| | | | 5.00 | % | | May-2034 - May-2053 | | | — | | | | 127,323 | | | | 128,003 | | | | 124,001 | |
| | | | 5.50 | % | | Sep-2032 - May-2054 | | | — | | | | 131,149 | | | | 130,718 | | | | 130,097 | |
| | | | 5.70 | % 1M SOFR+36 | | Mar-2037 | | | — | | | | 85 | | | | 85 | | | | 84 | |
| | | | 5.74 | % 12M SOFR+221 | | Jul-2033 | | | — | | | | 94 | | | | 94 | | | | 95 | |
| | | | 5.77 | % 1M SOFR+43 | | Jun-2037 | | | — | | | | 415 | | | | 415 | | | | 409 | |
| | | | 5.82 | % 12M SOFR+224 | | Feb-2045 | | | — | | | | 1,539 | | | | 1,560 | | | | 1,572 | |
| | | | 5.85 | % 1M SOFR+51 | | Apr-2037 | | | — | | | | 196 | | | | 196 | | | | 193 | |
| | | | 5.86 | % 6M SOFR+204 | | Aug-2033 | | | — | | | | 102 | | | | 101 | | | | 103 | |
| | | | 5.87 | % 12M SOFR+234 | | Nov-2034 | | | — | | | | 122 | | | | 123 | | | | 124 | |
| | | | 5.91 | % 1M SOFR+57 | | Oct-2042 | | | — | | | | 1,233 | | | | 1,236 | | | | 1,213 | |
| | | | 5.95 | % 1M SOFR+61 | | Jun-2042 | | | — | | | | 2,688 | | | | 2,689 | | | | 2,654 | |
| | | | 5.99 | % 12M SOFR+241 | | Oct-2042 | | | — | | | | 1,133 | | | | 1,150 | | | | 1,162 | |
| | | | 6.00 | % 1M SOFR+66 | | Mar-2042 | | | — | | | | 1,426 | | | | 1,427 | | | | 1,412 | |
| | | | 6.00 | % | | Nov-2028 - Apr-2054 | | | — | | | | 132,039 | | | | 132,686 | | | | 133,022 | |
| | | | 6.05 | % 1M SOFR+71 | | Oct-2043 | | | — | | | | 2,875 | | | | 2,885 | | | | 2,850 | |
| | | | 6.20 | % 1Y UST+220 | | Aug-2033 | | | — | | | | 271 | | | | 271 | | | | 274 | |
| | | | 6.22 | % 1Y UST+222 | | Aug-2033 | | | — | | | | 112 | | | | 112 | | | | 113 | |
| | | | 6.27 | % 1Y UST+222 | | Jul-2033 | | | — | | | | 225 | | | | 225 | | | | 228 | |
| | | | 6.50 | % | | Sep-2028 - Nov-2053 | | | — | | | | 18,993 | | | | 18,875 | | | | 19,450 | |
| | | | 6.75 | % | | Apr-2034 | | | — | | | | 318 | | | | 321 | | | | 322 | |
| | | | 7.00 | % | | Sep-2027 - May-2032 | | | — | | | | 348 | | | | 348 | | | | 361 | |
| | | | 7.12 | % 1Y UST+223 | | May-2033 | | | — | | | | 68 | | | | 68 | | | | 68 | |
| | | | 7.17 | % 6M SOFR+198 | | Nov-2033 | | | — | | | | 480 | | | | 480 | | | | 485 | |
| | | | 7.50 | % | | Mar-2030 - Jun-2030 | | | — | | | | 2 | | | | 2 | | | | 3 | |
| | | | 8.00 | % | | Aug-2030 - May-2030 | | | — | | | | 27 | | | | 28 | | | | 28 | |
| | | | | | | | | | — | | | | 1,053,144 | | | | 1,066,737 | | | | 977,052 | |
| Multifamily | | | 1.06 | % | | Dec-2027 | | | — | | | | 20,722 | | | | 20,725 | | | | 18,215 | |
| | | | 1.17 | % | | Aug-2030 - Nov-2030 | | | — | | | | 34,190 | | | | 34,192 | | | | 27,625 | |
| | | | 1.22 | % | | Aug-2028 - Jul-2030 | | | — | | | | 35,610 | | | | 35,668 | | | | 29,692 | |
| | | | 1.25 | % | | Jul-2030 | | | — | | | | 37,950 | | | | 38,021 | | | | 30,982 | |
| | | | 1.26 | % | | Jan-2031 | | | — | | | | 24,771 | | | | 24,767 | | | | 20,251 | |
| | | | 1.27 | % | | Jul-2030 | | | — | | | | 14,235 | | | | 14,292 | | | | 11,667 | |
| | | | 1.31 | % | | Aug-2030 | | | — | | | | 4,290 | | | | 4,324 | | | | 3,538 | |
| | | | 1.32 | % | | Aug-2030 | | | — | | | | 21,000 | | | | 21,158 | | | | 17,324 | |
| | | | 1.38 | % | | Jul-2030 | | | — | | | | 10,500 | | | | 10,580 | | | | 8,663 | |
| | | | 1.41 | % | | Jul-2030 | | | — | | | | 3,131 | | | | 3,150 | | | | 2,622 | |
| | | | 1.46 | % | | Jul-2030 | | | — | | | | 7,154 | | | | 7,209 | | | | 6,014 | |
| | | | 1.47 | % | | Jul-2030 - Dec-2030 | | | — | | | | 15,425 | | | | 15,503 | | | | 12,521 | |
| | | | 1.50 | % | | Aug-2030 | | | — | | | | 1,109 | | | | 1,125 | | | | 931 | |
| | | | 1.52 | % | | Jul-2032 | | | — | | | | 14,158 | | | | 14,236 | | | | 11,271 | |
| | | | 1.53 | % | | Jul-2032 | | | — | | | | 10,500 | | | | 10,602 | | | | 8,409 | |
| | | | 1.55 | % | | Jul-2032 | | | — | | | | 20,129 | | | | 20,325 | | | | 16,179 | |
| | | | 1.57 | % | | Aug-2037 | | | — | | | | 45,615 | | | | 45,771 | | | | 32,626 | |
| | | | 1.57 | % | | Jan-2031 | | | — | | | | 21,759 | | | | 21,802 | | | | 17,983 | |
| | | | 1.58 | % | | Oct-2031 | | | — | | | | 57,950 | | | | 58,120 | | | | 46,233 | |
| | | | 1.65 | % | | Jul-2030 | | | — | | | | 1,201 | | | | 1,218 | | | | 1,019 | |
| | | | 1.74 | % | | Mar-2033 | | | — | | | | 6,160 | | | | 6,217 | | | | 4,830 | |
| | | | 1.76 | % | | Aug-2031 - Dec-2036 | | | — | | | | 43,137 | | | | 43,220 | | | | 35,422 | |
| | | | 1.82 | % | | Jul-2035 | | | — | | | | 4,470 | | | | 4,497 | | | | 3,446 | |
| | | | 1.88 | % | | Nov-2031 | | | — | | | | 25,400 | | | | 25,423 | | | | 20,725 | |
| | | | 2.00 | % | | Apr-2031 | | | — | | | | 18,000 | | | | 18,382 | | | | 15,130 | |
| | | | 2.09 | % | | May-2032 - Jul-2050 | | | — | | | | 21,792 | | | | 21,990 | | | | 16,156 | |
| | | | 2.16 | % | | Sep-2050 | | | — | | | | 14,200 | | | | 14,342 | | | | 8,130 | |
| | | | 2.33 | % | | Nov-2029 - Feb-2030 | | | — | | | | 17,653 | | | | 17,676 | | | | 15,557 | |
| | | | 2.41 | % | | Apr-2051 | | | — | | | | 3,611 | | | | 3,644 | | | | 2,561 | |
| | | | 2.43 | % | | Nov-2031 | | | — | | | | 18,655 | | | | 18,660 | | | | 15,931 | |
| | | | 2.46 | % | | Aug-2026 - Jan-2038 | | | — | | | | 35,055 | | | | 35,118 | | | | 32,047 | |
| | | | 2.47 | % | | Dec-2051 | | | — | | | | 13,001 | | | | 13,167 | | | | 9,306 | |
| | | | 2.49 | % | | Dec-2026 - Nov-2031 | | | — | | | | 26,509 | | | | 26,539 | | | | 23,879 | |
| | | | 2.53 | % | | Jan-2030 | | | — | | | | 20,550 | | | | 20,621 | | | | 18,159 | |
| | | | 2.55 | % | | Sep-2026 - Mar-2030 | | | — | | | | 25,030 | | | | 25,064 | | | | 23,006 | |
| | | | 2.56 | % | | Jul-2038 - Dec-2051 | | | — | | | | 12,209 | | | | 12,236 | | | | 8,867 | |
| 4 |
Schedule of Portfolio Investments
June 30, 2024 (dollars in thousands; unaudited)
Fannie Mae Securities continued
| | | Interest Rate4 | | | Maturity Date | | Unfunded Commitments3 | | | Face Amount | | | Amortized Cost | | | Value | |
| | | | 2.57 | % | | Mar-2042 | | | — | | | | 25,155 | | | | 25,165 | | | | 18,025 | |
| | | | 2.61 | % | | Nov-2026 | | | — | | | | 9,699 | | | | 9,712 | | | | 9,146 | |
| | | | 2.67 | % | | Aug-2029 | | | — | | | | 37,700 | | | | 37,845 | | | | 34,298 | |
| | | | 2.70 | % | | Nov-2025 | | | — | | | | 13,794 | | | | 13,794 | | | | 13,318 | |
| | | | 2.76 | % | | Oct-2031 | | | — | | | | 10,189 | | | | 10,272 | | | | 9,014 | |
| | | | 2.85 | % | | Aug-2031 | | | — | | | | 8,760 | | | | 8,787 | | | | 7,724 | |
| | | | 2.91 | % | | Jun-2031 | | | — | | | | 25,000 | | | | 25,067 | | | | 22,294 | |
| | | | 2.92 | % | | Jun-2027 | | | — | | | | 63,305 | | | | 63,317 | | | | 59,940 | |
| | | | 2.92 | % | | Apr-2028 | | | — | | | | 15,045 | | | | 15,061 | | | | 14,083 | |
| | | | 2.93 | % | | Apr-2038 | | | — | | | | 35,472 | | | | 35,489 | | | | 28,977 | |
| | | | 2.94 | % | | Jun-2027 - Jul-2039 | | | — | | | | 28,535 | | | | 28,553 | | | | 27,006 | |
| | | | 2.96 | % | | Sep-2034 | | | — | | | | 20,000 | | | | 20,496 | | | | 16,876 | |
| | | | 2.97 | % | | Sep-2034 | | | — | | | | 12,615 | | | | 12,746 | | | | 10,883 | |
| | | | 2.99 | % | | Jun-2025 | | | — | | | | 2,460 | | | | 2,460 | | | | 2,401 | |
| | | | 3.00 | % | | May-2027 | | | — | | | | 6,130 | | | | 6,132 | | | | 5,802 | |
| | | | 3.01 | % | | Apr-2052 | | | — | | | | 7,229 | | | | 7,233 | | | | 5,523 | |
| | | | 3.02 | % | | Jun-2027 | | | — | | | | 3,459 | | | | 3,461 | | | | 3,286 | |
| | | | 3.03 | % | | Sep-2027 | | | — | | | | 20,316 | | | | 20,338 | | | | 19,148 | |
| | | | 3.04 | % | | Apr-2030 | | | — | | | | 24,152 | | | | 24,178 | | | | 22,190 | |
| | | | 3.05 | % | | Apr-2030 | | | — | | | | 24,704 | | | | 24,713 | | | | 22,705 | |
| | | | 3.12 | % | | Apr-2030 | | | — | | | | 12,166 | | | | 12,167 | | | | 11,160 | |
| | | | 3.13 | % | | May-2026 | | | — | | | | 3,069 | | | | 3,075 | | | | 2,979 | |
| | | | 3.14 | % | | Apr-2029 | | | — | | | | 7,349 | | | | 7,354 | | | | 6,861 | |
| | | | 3.17 | % | | Jun-2029 | | | — | | | | 22,345 | | | | 22,390 | | | | 20,805 | |
| | | | 3.18 | % | | May-2035 | | | — | | | | 8,276 | | | | 8,340 | | | | 7,553 | |
| | | | 3.21 | % | | May-2030 | | | — | | | | 6,160 | | | | 6,190 | | | | 5,678 | |
| | | | 3.24 | % | | May-2052 | | | — | | | | 6,278 | | | | 6,395 | | | | 4,941 | |
| | | | 3.30 | % | | May-2029 | | | — | | | | 3,491 | | | | 3,553 | | | | 3,316 | |
| | | | 3.31 | % | | Oct-2027 | | | — | | | | 14,513 | | | | 14,534 | | | | 13,840 | |
| | | | 3.36 | % | | Oct-2029 | | | — | | | | 10,061 | | | | 10,063 | | | | 9,462 | |
| | | | 3.40 | % | | Oct-2026 | | | — | | | | 2,619 | | | | 2,620 | | | | 2,529 | |
| | | | 3.42 | % | | Apr-2035 | | | — | | | | 4,841 | | | | 4,881 | | | | 4,321 | |
| | | | 3.63 | % | | Jul-2035 | | | — | | | | 20,666 | | | | 20,682 | | | | 18,654 | |
| | | | 3.68 | % | | Jul-2028 | | | — | | | | 11,679 | | | | 11,860 | | | | 11,125 | |
| | | | 3.70 | % | | Oct-2033 | | | — | | | | 19,865 | | | | 19,914 | | | | 18,343 | |
| | | | 3.91 | % | | Aug-2032 | | | — | | | | 26,250 | | | | 26,485 | | | | 24,765 | |
| | | | 4.05 | % | | Jun-2030 | | | — | | | | 10,632 | | | | 10,537 | | | | 10,252 | |
| | | | 4.31 | % | | Jun-2033 | | | — | | | | 8,587 | | | | 8,609 | | | | 8,309 | |
| | | | 4.32 | % | | Mar-2028 | | | — | | | | 41,708 | | | | 41,791 | | | | 41,102 | |
| | | | 4.37 | % | | Jun-2033 | | | — | | | | 21,805 | | | | 21,828 | | | | 21,189 | |
| | | | 4.40 | % | | Jan-2034 | | | — | | | | 3,815 | | | | 3,702 | | | | 3,710 | |
| | | | 4.48 | % | | Jul-2030 | | | — | | | | 20,915 | | | | 20,915 | | | | 20,627 | |
| | | | 4.52 | % | | Sep-2033 | | | — | | | | 11,361 | | | | 11,266 | | | | 11,157 | |
| | | | 4.55 | % | | Jul-2030 | | | — | | | | 10,699 | | | | 10,718 | | | | 10,591 | |
| | | | 4.56 | % | | Feb-2028 | | | — | | | | 29,835 | | | | 29,877 | | | | 29,522 | |
| | | | 4.62 | % | | Feb-2034 | | | — | | | | 7,430 | | | | 7,364 | | | | 7,350 | |
| | | | 4.69 | % | | Jun-2035 | | | — | | | | 476 | | | | 482 | | | | 463 | |
| | | | 4.74 | % | | Sep-2033 | | | — | | | | 13,405 | | | | 13,436 | | | | 13,384 | |
| | | | 4.76 | % | | Sep-2030 | | | — | | | | 7,757 | | | | 7,759 | | | | 7,766 | |
| | | | 4.80 | % | | Oct-2052 | | | — | | | | 12,204 | | | | 12,240 | | | | 11,410 | |
| | | | 4.82 | % | | Jul-2030 - Feb 2034 | | | — | | | | 16,035 | | | | 16,116 | | | | 16,105 | |
| | | | 4.85 | % | | Jan-2034 | | | — | | | | 2,801 | | | | 2,810 | | | | 2,820 | |
| | | | 4.88 | % | | Jul-2030 | | | — | | | | 11,665 | | | | 11,828 | | | | 11,749 | |
| | | | 4.96 | % | | Aug-2033 | | | — | | | | 3,465 | | | | 3,465 | | | | 3,517 | |
| | | | 5.00 | % | | Jun-2029 | | | — | | | | 68,500 | | | | 69,188 | | | | 69,193 | |
| | | | 5.00 | % | | Sep-2033 | | | — | | | | 15,366 | | | | 15,398 | | | | 15,639 | |
| | | | 5.02 | % | | Dec-2033 | | | — | | | | 5,222 | | | | 5,191 | | | | 5,324 | |
| | | | 5.05 | % | | Oct-2030 | | | — | | | | 14,596 | | | | 14,659 | | | | 14,853 | |
| | | | 5.06 | % | | Dec-2032 - Feb 2034 | | | — | | | | 50,795 | | | | 52,197 | | | | 51,883 | |
| | | | 5.13 | % | | Jan-2029 | | | — | | | | 36,000 | | | | 36,242 | | | | 36,480 | |
| | | | 5.13 | % | | Sep-2028 | | | — | | | | 14,584 | | | | 14,722 | | | | 14,773 | |
| | | | 5.16 | % | | Oct-2030 | | | — | | | | 8,020 | | | | 8,087 | | | | 8,203 | |
| | | | 5.24 | % | | Nov-2028 | | | — | | | | 9,817 | | | | 10,003 | | | | 9,991 | |
| | | | 5.30 | % | | Aug-2029 - Sep-2033 | | | — | | | | 6,717 | | | | 6,773 | | | | 6,892 | |
| | | | 5.31 | % | | Nov-2028 | | | — | | | | 34,346 | | | | 34,990 | | | | 35,062 | |
| | | | 5.32 | % | | May-2024 | | | — | | | | 3,688 | | | | 3,770 | | | | 3,843 | |
| | | | 5.35 | % | | Dec-2032 | | | — | | | | 11,892 | | | | 12,464 | | | | 12,367 | |
| | | | 5.36 | % | | Nov-2028 | | | — | | | | 6,503 | | | | 6,650 | | | | 6,647 | |
| | | | 5.39 | % | | May-2034 | | | — | | | | 7,910 | | | | 8,139 | | | | 8,292 | |
| | | | 5.46 | % | | May-2029 | | | — | | | | 4,716 | | | | 4,781 | | | | 4,857 | |
| | | | 5.47 | % | | Nov-2033 | | | — | | | | 6,140 | | | | 6,227 | | | | 6,469 | |
| | | | 5.50 | % | | Jan-2029 | | | — | | | | 10,500 | | | | 10,815 | | | | 10,821 | |
| | | | 5.52 | % | | Oct-2033 | | | — | | | | 3,860 | | | | 3,949 | | | | 4,077 | |
| | | | 5.54 | % 1M SOFR+20 | | Nov-2031 | | | — | | | | 40,943 | | | | 40,947 | | | | 40,086 | |
| 5 |
Schedule of Portfolio Investments
June 30, 2024 (dollars in thousands; unaudited)
Fannie Mae Securities continued
| | | Interest Rate4 | | | Maturity Date | | Unfunded Commitments3 | | | Face Amount | | | Amortized Cost | | | Value | |
| | | | 5.55 | % 1M SOFR+21 | | Mar-2031 | | | — | | | | 23,855 | | | | 23,855 | | | | 23,385 | |
| | | | 5.55 | % | | Dec-2028 | | | — | | | | 20,041 | | | | 20,510 | | | | 20,657 | |
| | | | 5.63 | % 1M SOFR+29 | | Feb-2029 | | | — | | | | 20,000 | | | | 20,003 | | | | 19,629 | |
| | | | 5.69 | % | | Jun-2041 | | | — | | | | 4,019 | | | | 4,089 | | | | 4,022 | |
| | | | 5.74 | % 1M SOFR+40 | | Feb-2028 | | | — | | | | 29,768 | | | | 29,768 | | | | 29,353 | |
| | | | 5.75 | % | | Jun-2041 | | | — | | | | 1,952 | | | | 1,992 | | | | 1,971 | |
| | | | 5.76 | % 1M SOFR+42 | | Mar-2028 | | | — | | | | 37,472 | | | | 37,472 | | | | 36,967 | |
| | | | 5.79 | % 1M SOFR+45 | | Jan-2028 | | | — | | | | 22,425 | | | | 22,425 | | | | 22,151 | |
| | | | 5.80 | % 1M SOFR+46 | | Dec-2027 | | | — | | | | 17,541 | | | | 17,541 | | | | 17,336 | |
| | | | 5.81 | % 1M SOFR+47 | | Jun-2029 | | | — | | | | 70,001 | | | | 70,015 | | | | 69,877 | |
| | | | 5.83 | % 1M SOFR+49 | | May-2032 | | | — | | | | 28,526 | | | | 28,529 | | | | 28,523 | |
| | | | 5.86 | % 1M SOFR+52 | | Jun-2032 | | | — | | | | 30,975 | | | | 30,975 | | | | 30,968 | |
| | | | 5.87 | % | | Dec-2035 | | | — | | | | 6,609 | | | | 7,156 | | | | 7,165 | |
| | | | 5.96 | % | | Jan-2029 | | | — | | | | 170 | | | | 170 | | | | 169 | |
| | | | 5.99 | % | | Dec-2028 | | | — | | | | 6,377 | | | | 6,637 | | | | 6,680 | |
| | | | 6.03 | % 1M SOFR+69 | | Jun-2029 | | | — | | | | 41,302 | | | | 41,305 | | | | 41,327 | |
| | | | 6.03 | % 1M SOFR+69 | | May-2029 | | | — | | | | 17,340 | | | | 17,343 | | | | 17,351 | |
| | | | 6.12 | % 1M SOFR+78 | | Oct-2033 | | | — | | | | 12,400 | | | | 12,404 | | | | 12,402 | |
| | | | 6.16 | % 1M SOFR+82 | | Jan-2028 | | | — | | | | 3,750 | | | | 3,751 | | | | 3,745 | |
| | | | 6.19 | % 1M SOFR+85 | | Nov-2032 | | | — | | | | 15,800 | | | | 15,804 | | | | 15,777 | |
| | | | | | | | | | — | | | | 2,285,211 | | | | 2,296,585 | | | | 2,102,118 | |
| Forward Commitments | | | 2.58 | % | | Jan-2041 | | | 11,700 | | | | — | | | | — | | | | (2,800 | ) |
| | | | 2.59 | % | | Aug-2039 | | | 24,000 | | | | — | | | | — | | | | (5,528 | ) |
| | | | 2.72 | % | | Jan-2041 | | | 27,794 | | | | — | | | | 278 | | | | (6,440 | ) |
| | | | 4.47 | % | | Jul-2041 | | | 10,058 | | | | — | | | | — | | | | (766 | ) |
| | | | 5.21 | % | | Jul-2044 | | | 12,174 | | | | — | | | | — | | | | (322 | ) |
| | | | 5.40 | % | | Jun-2043 | | | 23,950 | | | | — | | | | — | | | | 515 | |
| | | | | | | | | | 109,676 | | | | — | | | | 278 | | | | (15,341 | ) |
| Total Fannie Mae Securities | | | | | $ | 109,676 | | | $ | 3,338,355 | | | $ | 3,363,600 | | | $ | 3,063,829 | |
Freddie Mac Securities (8.2% of net assets)
| | | Interest Rate4 | | | Maturity Date | | Unfunded Commitments3 | | | Face Amount | | | Amortized Cost | | | Value | |
| Single Family | | | 2.50 | % | | Jan-2043 - Aug-2046 | | $ | — | | | $ | 5,060 | | | $ | 5,109 | | | $ | 4,306 | |
| | | | 3.00 | % | | Aug-2042 - Sep-2046 | | | — | | | | 21,066 | | | | 21,381 | | | | 18,743 | |
| | | | 3.50 | % | | Jan-2026 - Oct-2046 | | | — | | | | 38,147 | | | | 38,844 | | | | 34,832 | |
| | | | 4.00 | % | | Nov-2024 - Aug-2047 | | | — | | | | 36,643 | | | | 37,833 | | | | 34,316 | |
| | | | 4.50 | % | | Jan-2038 - Dec-2044 | | | — | | | | 9,814 | | | | 10,139 | | | | 9,545 | |
| | | | 5.00 | % | | Jun-2026 - Aug-2040 | | | — | | | | 1,433 | | | | 1,427 | | | | 1,434 | |
| | | | 5.50 | % | | Apr-2033 - Jul-2038 | | | — | | | | 1,299 | | | | 1,295 | | | | 1,319 | |
| | | | 5.75 | % 1M SOFR+41 | | Feb-2036 | | | — | | | | 171 | | | | 171 | | | | 169 | |
| | | | 5.78 | % 1M SOFR+44 | | May-2037 | | | — | | | | 64 | | | | 64 | | | | 63 | |
| | | | 5.80 | % 1M SOFR+46 | | Apr-2036 - APR-2043 | | | — | | | | 1,826 | | | | 1,827 | | | | 1,788 | |
| | | | 5.85 | % 1M SOFR+51 | | Aug-2043 | | | — | | | | 1,679 | | | | 1,679 | | | | 1,648 | |
| | | | 5.93 | % 1M SOFR+59 | | Oct-2040 | | | — | | | | 1,266 | | | | 1,266 | | | | 1,240 | |
| | | | 5.95 | % 1M SOFR+61 | | Oct-2040 - Jun-2044 | | | — | | | | 4,505 | | | | 4,508 | | | | 4,445 | |
| | | | 6.00 | % 1M SOFR+66 | | Nov-2040 | | | — | | | | 1,154 | | | | 1,160 | | | | 1,139 | |
| | | | 6.00 | % | | Dec-2033 - Oct-2037 | | | — | | | | 1,971 | | | | 1,979 | | | | 2,025 | |
| | | | 6.02 | % 12M SOFR+250 | | Jul-2035 | | | — | | | | 88 | | | | 88 | | | | 90 | |
| | | | 6.12 | % 1M SOFR+78 | | Aug-2037 | | | — | | | | 1,369 | | | | 1,378 | | | | 1,367 | |
| | | | 6.34 | % 1Y UST+223 | | Oct-2033 | | | — | | | | 103 | | | | 103 | | | | 104 | |
| | | | 6.50 | % | | Apr-2028 - Nov-2037 | | | — | | | | 255 | | | | 256 | | | | 267 | |
| | | | 7.00 | % | | Apr-2028 - Mar-2030 | | | — | | | | 13 | | | | 13 | | | | 14 | |
| | | | 7.22 | % 1Y UST+223 | | Jun-2033 | | | — | | | | 24 | | | | 24 | | | | 24 | |
| | | | 7.50 | % | | Aug-2029 - Apr-2031 | | | — | | | | 12 | | | | 12 | | | | 12 | |
| | | | | | | | | | — | | | | 127,962 | | | | 130,556 | | | | 118,890 | |
| Multifamily | | | 2.04 | % | | May-2050 | | | — | | | | 19,505 | | | | 19,923 | | | | 13,656 | |
| | | | 2.38 | % | | Feb-2034 | | | — | | | | 42,779 | | | | 42,937 | | | | 35,738 | |
| | | | 2.40 | % | | Jun-2031 | | | — | | | | 7,444 | | | | 7,497 | | | | 6,488 | |
| | | | 2.42 | % | | Jun-2031 | | | — | | | | 11,768 | | | | 11,861 | | | | 10,269 | |
| | | | 3.28 | % | | Dec-2029 | | | — | | | | 15,408 | | | | 15,491 | | | | 14,365 | |
| | | | 3.34 | % | | Dec-2029 | | | — | | | | 9,158 | | | | 9,219 | | | | 8,558 | |
| | | | 3.35 | % | | Oct-2033 | | | — | | | | 33,450 | | | | 33,357 | | | | 30,401 | |
| | | | 3.50 | % | | Jan-2026 | | | — | | | | 15,354 | | | | 15,362 | | | | 14,961 | |
| | | | 3.60 | % | | Apr-2030 | | | — | | | | 23,892 | | | | 24,202 | | | | 22,518 | |
| | | | 3.68 | % | | Oct-2025 | | | — | | | | 10,000 | | | | 10,010 | | | | 9,766 | |
| | | | 4.25 | % | | Jan-2028 | | | — | | | | 93,650 | | | | 92,993 | | | | 92,126 | |
| | | | 4.36 | % | | Dec-2029 | | | — | | | | 9,198 | | | | 9,155 | | | | 9,027 | |
| 6 |
Schedule of Portfolio Investments
June 30, 2024 (dollars in thousands; unaudited)
Freddie Mac Securities continued
| | | Interest Rate4 | | | Maturity Date | | Unfunded Commitments3 | | | Face Amount | | | Amortized Cost | | | Value | |
| | | | 4.83 | % | | Jan-2039 | | | — | | | | 9,890 | | | | 9,976 | | | | 9,793 | |
| | | | 4.90 | % | | Dec-2032 | | | — | | | | 10,207 | | | | 10,188 | | | | 10,069 | |
| | | | 5.52 | % 1M SOFR+20 | | Aug-2031 | | | — | | | | 17,575 | | | | 17,575 | | | | 17,389 | |
| | | | 5.56 | % 1M SOFR+23 | | Jul-2027 | | | — | | | | 3,859 | | | | 3,859 | | | | 3,845 | |
| | | | 5.56 | % 1M SOFR+24 | | Jan-2031 - Jun-2031 | | | — | | | | 40,150 | | | | 40,154 | | | | 39,750 | |
| | | | 5.57 | % 1M SOFR+24 | | Nov-2027 | | | — | | | | 10,838 | | | | 10,838 | | | | 10,763 | |
| | | | 5.57 | % 1M SOFR+25 | | Dec-2030 | | | — | | | | 10,240 | | | | 10,240 | | | | 10,153 | |
| | | | 5.62 | % 1M SOFR+30 | | Dec-2030 | | | — | | | | 12,243 | | | | 12,243 | | | | 12,176 | |
| | | | 5.68 | % 1M SOFR+36 | | Oct-2030 | | | — | | | | 4,316 | | | | 4,316 | | | | 4,285 | |
| | | | 5.70 | % 1M SOFR+37 | | Nov-2030 | | | — | | | | 8,849 | | | | 8,849 | | | | 8,813 | |
| | | | 5.77 | % 1M SOFR+44 | | Oct-2030 | | | — | | | | 2,446 | | | | 2,446 | | | | 2,434 | |
| | | | 6.04 | % 1M SOFR+72 | | Jul-2033 | | | — | | | | 24,999 | | | | 25,098 | | | | 25,024 | |
| | | | | | | | | | — | | | | 447,218 | | | | 447,789 | | | | 422,367 | |
| Forward Commitments | | | 3.86 | % | | May-2040 | | | 27,450 | | | | — | | | | — | | | | (1,233 | ) |
| Total Freddie Mac Securities | | | | | $ | 27,450 | | | $ | 575,180 | | | $ | 578,345 | | | $ | 540,024 | |
State Housing Finance Agency Securities (7.1% of net assets)
| | | | | Interest Rates2 | | | | | | | | | | | | |
| | | Issuer | | Permanent | | | Construction | | | Maturity Date | | Face Amount | | | Amortized Cost | | | Value | |
| Multifamily | | Illinois Housing Development Auth | | | — | | | | 0.40 | % | | Dec-2024 | | $ | 470 | | | $ | 470 | | | $ | 464 | |
| | | Illinois Housing Development Auth | | | 2.06 | % | | | — | | | Jan-2042 | | | 26,895 | | | | 26,898 | | | | 19,203 | |
| | | Illinois Housing Development Auth | | | 2.07 | % | | | — | | | Jul-2041 | | | 84,895 | | | | 84,894 | | | | 60,189 | |
| | | Illinois Housing Development Auth | | | 2.65 | % | | | — | | | Jul-2062 | | | 21,300 | | | | 21,329 | | | | 13,732 | |
| | | NYC Housing Development Corp | | | 2.95 | % | | | — | | | Nov-2041 - Nov-2045 | | | 11,275 | | | | 11,275 | | | | 9,482 | |
| | | NYC Housing Development Corp | | | 3.05 | % | | | — | | | Nov-2046 | | | 13,000 | | | | 13,000 | | | | 8,778 | |
| | | NYC Housing Development Corp | | | 3.10 | % | | | — | | | Oct-2046 | | | 19,919 | | | | 19,919 | | | | 16,703 | |
| | | NYC Housing Development Corp | | | 3.25 | % | | | — | | | Nov-2049 | | | 10,240 | | | | 10,240 | | | | 8,235 | |
| | | Mass Housing5 | | | 3.30 | % | | | — | | | Dec-2059 | | | 8,340 | | | | 8,345 | | | | 6,379 | |
| | | NYC Housing Development Corp | | | 3.35 | % | | | — | | | Nov-2054 | | | 20,000 | | | | 20,000 | | | | 15,667 | |
| | | NYC Housing Development Corp | | | 3.45 | % | | | — | | | May-2059 | | | 20,000 | | | | 20,000 | | | | 15,636 | |
| | | Illinois Housing Development Auth | | | — | | | | 3.54 | % | | Nov-2026 | | | 5,615 | | | | 5,615 | | | | 5,633 | |
| | | NYC Housing Development Corp | | | 3.75 | % | | | — | | | May-2035 | | | 3,200 | | | | 3,200 | | | | 3,150 | |
| | | Mass Housing5 | | | 3.85 | % | | | — | | | Dec-2058 | | | 9,330 | | | | 9,327 | | | | 7,010 | |
| | | NYC Housing Development Corp | | | 3.95 | % | | | — | | | Nov-2043 | | | 12,800 | | | | 12,800 | | | | 12,261 | |
| | | NYC Housing Development Corp | | | 4.00 | % | | | — | | | Dec-2028 - Nov-2048 | | | 9,315 | | | | 9,315 | | | | 8,882 | |
| | | NYC Housing Development Corp | | | 4.13 | % | | | — | | | Nov-2040 - Nov-2053 | | | 13,305 | | | | 13,305 | | | | 12,744 | |
| | | NYC Housing Development Corp | | | 4.30 | % | | | — | | | Nov-2045 | | | 3,000 | | | | 3,000 | | | | 2,941 | |
| | | Chicago Housing Authority | | | 4.36 | % | | | — | | | Jan-2038 | | | 25,000 | | | | 25,000 | | | | 22,831 | |
| | | MassHousing | | | 4.50 | % | | | — | | | Jun-2056 | | | 45,000 | | | | 45,000 | | | | 43,754 | |
| | | MassHousing | | | 4.50 | % | | | — | | | Dec-2065 | | | 30,060 | | | | 30,103 | | | | 29,905 | |
| | | NYC Housing Development Corp | | | 4.65 | % | | | — | | | Nov-2049 | | | 2,000 | | | | 2,000 | | | | 2,007 | |
| | | NYC Housing Development Corp | | | 4.75 | % | | | — | | | Nov-2054 | | | 6,000 | | | | 6,000 | | | | 6,044 | |
| | | Mass Housing | | | 4.84 | % | | | — | | | Dec-2067 | | | 35,415 | | | | 35,415 | | | | 35,770 | |
| | | Mass Housing5 | | | 4.90 | % | | | — | | | Jun-2066 | | | 26,645 | | | | 26,682 | | | | 27,315 | |
| | | Illinois Housing Development Auth | | | 5.05 | % | | | — | | | Jul-2066 | | | 13,320 | | | | 13,320 | | | | 13,588 | |
| | | Mass Housing5 | | | 5.11 | % | | | — | | | Jun-2066 | | | 53,425 | | | | 53,466 | | | | 55,586 | |
| Total State Housing Finance Agency Securities | | | | $ | 529,764 | | | $ | 529,918 | | | $ | 463,889 | |
Commercial Mortgage-Backed Securities (0.1% of net assets)
| Issuer | | | Interest Rate | | | | Maturity Date | | | | Face Amount | | | | Amortized Cost | | | | Value | |
| Citigroup | | | 3.62 | % | | | Jul-2047 | | | $ | 3,312 | | | $ | 3,373 | | | $ | 3,308 | |
| Total Commercial Mortgage Backed Securities | | | | | | $ | 3,312 | | | $ | 3,373 | | | $ | 3,308 | |
| 7 |
Schedule of Portfolio Investments
June 30, 2024 (dollars in thousands; unaudited)
Other Mutifamily Investments (3.0% of net assets)
| | | Interest Rates2,4 | | | | | | Maturity | | Unfunded | | | Face | | | Amortized | | | | |
| Issuer | | Permanent | | | Construction | | | | | | | Date | | Commitments3 | | | Amount | | | Cost | | | Value | |
| Direct Loans | | | | | | | | | | | | | | | | | | | | |
| Peregrine Apartments (Level 3) | | | — | | | | 3.60 | % | | | | | | Dec-2024 | | $ | — | | | $ | 21,624 | | | $ | 21,632 | | | $ | 21,351 | |
| Ladder 260 - Tax Exempt (Level 3) | | | — | | | | 4.04 | % | | | | | | Nov-2025 | | | — | | | | 8,161 | | | | 8,136 | | | | 7,920 | |
| 99 Ocean (Level 3) | | | — | | | | 4.05 | % | | | | | | Oct-2024 | | | 1,103 | | | | 50,897 | | | | 50,786 | | | | 50,454 | |
| Olson Court (Level 3) | | | — | | | | 5.82 | % | | | | | | May-2027 | | | 21,833 | | | | 1,010 | | | | 876 | | | | 988 | |
| The Crest Apartments (Level 3) | | | — | | | | 6.75 | % | | | | | | Dec-2024 | | | — | | | | 9,219 | | | | 9,218 | | | | 9,040 | |
| 400 Lake Shore Drive (Level 3) | | | — | | | | 7.26 | % | | | 80% Daily SOFR+300 | | | Dec-20586 | | | 39,276 | | | | 10 | | | | (190 | ) | | | 490 | |
| Soul (Level 3) | | | — | | | | 7.33 | % | | | 1M SOFR+225 | | | May-2025 | | | — | | | | 24,750 | | | | 24,677 | | | | 24,631 | |
| San Cristina (Level 3) | | | — | | | | 7.68 | % | | | 1M SOFR+260 | | | Sep-2024 | | | 521 | | | | 16,951 | | | | 16,922 | | | | 16,864 | |
| Soul (Level 3) | | | — | | | | 7.93 | % | | | 1M SOFR+285 | | | May-2025 | | | 4,203 | | | | 8,298 | | | | 8,220 | | | | 8,282 | |
| Hudson Exchange (Level 3) | | | — | | | | 8.13 | % | | | 1M SOFR+275 | | | Jun-2027 | | | 39,830 | | | | 10,170 | | | | 10,089 | | | | 10,830 | |
| 311 W 42nd Street (Level 3) | | | — | | | | 8.45 | % | | | 1M Term SOFR+311 | | | Nov-2024 | | | 13,964 | | | | 36,036 | | | | 35,973 | | | | 35,938 | |
| Granada (Level 3) | | | — | | | | 11.43 | % | | | 1M SOFR+635 | | | Jul-2024 | | | — | | | | 3,000 | | | | 3,000 | | | | 2,972 | |
| | | | | | | | | | | | | | | | | | 120,730 | | | | 190,126 | | | | 189,339 | | | | 189,760 | |
| Forward Commitments | | | | | | | | | | | | | | | | | | | | |
| Olson Court (Level 3) | | | — | | | | 6.52 | % | | | | | | May-2027 | | | 2,157 | | | | — | | | | (13 | ) | | | (8 | ) |
| 400 Lake Shore Drive (Level 3) | | | — | | | | 7.26 | % | | | 80% Daily SOFR+300 | | | Dec-20536 | | | 15,714 | | | | — | | | | (116 | ) | | | 192 | |
| Union Tower (Level 3) | | | — | | | | 7.34 | % | | | 1M SOFR+200 | | | Jun-2027 | | | 15,068 | | | | — | | | | — | | | | (87 | ) |
| Landmark Towers (Level 3) | | | — | | | | 7.69 | % | | | | | | Jun-2027 | | | 18,660 | | | | — | | | | (3 | ) | | | 37 | |
| | | | | | | | | | | | | | | | | | 51,599 | | | | — | | | | (132 | ) | | | 134 | |
| Privately Insured Construction/Permanent Mortgages7 | | | | | | | | | | | | | | | | | | | | |
| Illinois Housing Development Auth | | | 6.20 | % | | | — | | | | | | | Dec-2047 | | | — | | | | 2,782 | | | | 2,789 | | | | 2,762 | |
| Illinois Housing Development Auth | | | 6.40 | % | | | — | | | | | | | Nov-2048 | | | — | | | | 850 | | | | 858 | | | | 844 | |
| | | | | | | | | | | | | | | | | | — | | | | 3,632 | | | | 3,647 | | | | 3,606 | |
| Total Other Multifamily Investments | | | | | | $ | 172,329 | | | $ | 193,758 | | | $ | 192,854 | | | $ | 193,500 | |
United States Treasury Securities (3.3% of net assets)
| | Interest Rate | | | Maturity Date | | Face Amount | | | Amortized Cost | | | Value | |
| | 1.75 | % | | Aug-2041 | | $ | 20,000 | | | $ | 19,511 | | | $ | 13,205 | |
| | 2.00 | % | | Nov-2041 | | | 7,000 | | | | 6,681 | | | | 4,806 | |
| | 2.38 | % | | Feb-2042 | | | 15,000 | | | | 15,276 | | | | 10,916 | |
| | 3.00 | % | | Aug-2052 | | | 20,000 | | | | 18,187 | | | | 15,050 | |
| | 3.63 | % | | Feb-2053 | | | 10,000 | | | | 9,699 | | | | 8,509 | |
| | 3.88 | % | | Feb-2043 | | | 105,000 | | | | 105,188 | | | | 94,903 | |
| | 4.00 | % | | Nov-2042 | | | 15,000 | | | | 14,770 | | | | 13,825 | |
| | 4.13 | % | | Aug-2053 | | | 40,000 | | | | 37,048 | | | | 37,254 | |
| | 4.75 | % | | Nov-2043- Nov 2053 | | | 20,000 | | | | 20,062 | | | | 20,472 | |
| Total United States Treasury Securities | | $ | 252,000 | | | $ | 246,422 | | | $ | 218,940 | |
| | | | | | | | | | | | | | | | | |
| Total Fixed-Income Investments | | $ | 7,232,368 | | | $ | 7,307,473 | | | $ | 6,494,578 | |
Equity Investment in Wholly-Owned Subsidiary (less than 0.01% of net assets)
| Issuer | | Face Amount (Cost) | | | Dividends or Interest | | | Value | |
| HIT Advisers8 (Level 3) | | $ | 1 | | | $ | — | | | $ | 556 | |
| Total Equity Investment | | $ | 1 | | | $ | — | | | $ | 556 | |
Short-Term Investments (1.7% of net assets)
| Issuer | | Interest Rate | | Maturity Date | | Face Amount | | | Amortized Cost | | | Value | |
| Blackrock Federal Funds | | 5.21% 9 | | Apr-2024 | | $ | 108,880 | | | $ | 108,880 | | | $ | 108,880 | |
| Total Short-Term Investments | | | | | | $ | 108,880 | | | $ | 108,880 | | | $ | 108,880 | |
| | | | | | | | | | | | | | | | | |
| Total Investments | | | | | | $ | 7,341,249 | | | $ | 7,416,354 | | | $ | 6,604,014 | |
Futures Contracts (Notional Amount 3.1% of net assets)
| | | | | | | | | | | | | | Unrealized | |
| Description | | Number of Contracts | | | Expiration Date | | Notional Amount | | | Market Value | | | Appreciation (Depreciation) | |
| Futures Long | | | | | | | | | | | | | | | | | | |
| CBOT Ultra Long U.S. Treasury | | | 415 | | | Sep-24 | | $ | 51,704 | | | $ | 52,018 | | | $ | 314 | |
| CBOT U.S. Treasury | | | 1300 | | | Sep-24 | | | 151,749 | | | | 153,806 | | | | 2,057 | |
| Total Futures Contracts | | | | | | | | | | | | | | | | $ | 2,371 | |
| | 8 |
Schedule of Portfolio Investments
June 30, 2024 (dollars in thousands; unaudited) continued
Footnotes
| 1. | Federally tax-exempt bonds collateralized by Ginnie Mae securities. |
| 2. | Construction interest rates are the rates charged to the borrower during the construction phase of the project. The permanent interest rates are charged to the borrower during the amortization period of the loan, unless the U.S. Department of Housing and Urban Development requires that such rates be charged earlier. |
| 3. | The HIT may make commitments, including forward commitments, in securities or loans that fund over time on a draw basis or fund at a single point in time. Generally, GNMA construction securities fund over a 12-to-24 month period. Funding periods for State Housing Agency construction securities and Direct Loans vary by project, but generally fund over a one-to-48 month period. Forward commitments generally settle within 12 months of the original commitment date. At period end, unfunded commitments totaled $434.0 million for which unrealized losses of $25.2 million are included in the related Value column of the Schedule of Portfolio Investments for such commitments. |
| 4. | For floating and variable rate securities the rate indicated is for the period end. With respect to these securities, the schedule also includes the reference rate and spread in basis points. |
| 5. | Securities exempt from registration under the Securities Act of 1933 and were privately placed directly by a state housing agency (a not-for-profit public agency) with the HIT. The securities are backed by mortgages and are general obligations of the state housing agency, and therefore secured by the full faith and credit of said agency. These securities may be resold in transactions exempt from registration, normally to qualified institutional buyers. These securities are considered liquid, under procedures established by and under the general supervision of the HIT's Board of Trustees. |
| 6. | Date reflects the stated maturity date of the bond. However, the bond is subject to a mandatory tender for purchase in December 2027, which may be extended to December 2028 under certain conditions. |
| 7. | Loans insured by Ambac Assurance Corporation, are additionally backed by a repurchase option from the mortgagee for the benefit of the HIT. The repurchase price is defined as the unpaid principal balance of the loan plus all accrued unpaid interest due through the remittance date. The repurchase option can be exercised by the HIT in the event of a payment failure by Ambac Assurance Corporation. |
| 8. | The HIT has a participation interest in HIT Advisers, a Delaware limited liability company. HIT Advisers is a New York based adviser currently exempt from investment adviser registration in New York. The investment in HIT Advisers is valued by the HIT's valuation committee in accordance with the fair value procedures adopted by the HIT's Board of Trustees, and approximates carrying value of HIT Advisors and its subsidiary on a consolidated basis. The participation interest is not registered under the federal securities laws. |
| 9. | Rate indicated is the annualized 1-day yield as of June 28, 2024. |
Key to abbreviations
| SOFR | Secured Overnight Financing Rate |
| | 9 |
STATEMENT OF OPERATIONS
For the Six Months Ended June 30, 2024 (dollars in thousands; unaudited)
| Investment income | | $ | 127,188 | |
| | | | | |
| Expenses | | | | |
| Non-officer salaries and fringe benefits | | | 4,021 | |
| Officer salaries and fringe benefits | | | 2,653 | |
| Investment management | | | 803 | |
| Marketing and sales promotion (12b-1) | | | 672 | |
| Legal fees | | | 256 | |
| Auditing, tax and accounting fees | | | 229 | |
| Consulting fees | | | 183 | |
| Insurance | | | 182 | |
| Trustee expenses | | | 58 | |
| Rental expenses | | | 295 | |
| General expenses | | | 932 | |
| Total expenses | | | 10,284 | |
| | | | | |
| Net investment income | | | 116,904 | |
| | | | | |
| Net realized and unrealized gains (losses) on investments | | | | |
| Net realized gains (losses) on investments | | | (73,273 | ) |
| Net realized gains (losses) on futures | | | (5,455 | ) |
| Total net realized gains (losses) | | | (78,728 | ) |
| | | | | |
| Net change in unrealized appreciation (depreciation) on investments | | | (17,057 | ) |
| Net change in unrealized appreciation (depreciation) on futures | | | (96 | ) |
| Total net change in unrealized gains (losses) | | | (17,153 | ) |
| Net realized and unrealized gains (losses) on investments | | | (95,881 | ) |
| | | | | |
| Net increase (decrease) in net assets resulting from operations | | $ | 21,023 | |
| See accompanying Notes to Financial Statements (unaudited). | | | | |
| | 10 |
STATEMENTS OF CHANGES IN NET ASSETS
(dollars in thousands)
| Increase (decrease) in net assets from operations | | Six Months Ended
June 30, 2024
(unaudited) | | | Year Ended
December 31, 2023 | |
| Net investment income | | $ | 116,904 | | | $ | 211,275 | |
| Net realized gains (losses) | | | (78,728 | ) | | | (35,634 | ) |
| Net change in unrealized appreciation (depreciation) | | | (17,153 | ) | | | 144,589 | |
| Net increase (decrease) in net assets resulting from operations | | | 21,023 | | | | 320,230 | |
| | | | | | | | | |
| Distributions to participants or reinvested | | | (118,879 | ) | | | (215,874 | ) |
| | | | | | | | |
| Increase (decrease) in net assets from unit transactions | | | | | | | | |
| Proceeds from the sale of units of participation | | | 156,075 | | | | 311,874 | |
| Dividend reinvestment of units of participation | | | 109,496 | | | | 199,710 | |
| Payments for redemption of units of participation | | | (171,335 | ) | | | (82,172 | ) |
| Net increase (decrease) from unit transactions | | | 94,236 | | | | 429,412 | |
| | | | | | | | | |
| Total increase (decrease) in net assets | | | (3,620 | ) | | | 533,768 | |
| | | | | | | | | |
| Net assets | | | | | | | | |
| Beginning of period | | $ | 6,558,831 | | | $ | 6,025,063 | |
| End of period | | $ | 6,555,211 | | | $ | 6,558,831 | |
| | | | | | | | | |
| Unit information | | | | | | | | |
| Units sold | | | 163,316 | | | | 326,967 | |
| Distributions reinvested | | | 114,505 | | | | 209,393 | |
| Units redeemed | | | (178,382 | ) | | | (86,124 | ) |
| Increase in units outstanding | | | 99,439 | | | | 450,236 | |
See accompanying Notes to Financial Statements (unaudited).
| | 11 |
NOTES TO FINANCIAL STATEMENTS
Unaudited
Note 1. Summary of Significant Accounting Policies
The American Federation of Labor and Congress of Industrial Organizations (AFL-CIO) Housing Investment Trust (HIT) is a common law trust created under the laws of the District of Columbia and is registered under the Investment Company Act of 1940, as amended (Investment Company Act), as a no-load, open-end investment company. The HIT has obtained certain exemptions from the requirements of the Investment Company Act that are described in the HIT’s Prospectus and Statement of Additional Information. Participation in the HIT is limited to eligible pension plans, state public funds and labor organizations, including health and welfare, general, voluntary employees’ benefit associations and other funds that have beneficiaries who are represented by labor organizations. The following is a summary of significant accounting policies followed by the HIT in the preparation of its financial statements. The policies are in conformity with generally accepted accounting principles (GAAP) in the United States. The HIT follows the investment company accounting and reporting guidance of the Financial Accounting Standards Board (FASB) Accounting Standards Codification Topic 946 Financial Services—Investment Companies.
Investment Valuation
Net asset value per share (NAV) is determined as of the close of regular trading (normally 4:00 p.m.) of the New York Stock Exchange on the last business day of each calendar month. The HIT’s Board of Trustees is responsible for the valuation process. The HIT’s Board of Trustees has designated the officers of the HIT that comprise the HIT’s Valuation Committee as the “valuation designee” to perform fair valuations of the HIT’s investments pursuant to Rule 2a-5 under the Investment Company Act. The Valuation Committee, in accordance with the policies and procedures approved by the HIT’s Board of Trustees, is also responsible for evaluating the effectiveness of the HIT’s pricing policies, determining the reliability of third-party pricing information and reporting to the Board of Trustees on valuation matters, including fair value determinations. Following is a description of the valuation methods and inputs applied to the HIT’s major categories of assets. The majority of the HIT’s assets are valued using evaluated prices provided by independent third-party pricing services that are approved by the Board of Trustees. Portfolio securities for which market quotations are readily available are valued through exchange determined market pricing. For U.S. Treasury securities, independent pricing services generally base evaluated prices on actual transactions as well as dealer-supplied market information. For State Housing Finance Agency securities, independent pricing services generally base evaluated prices using models that utilize trading spreads, new issue scales, verified bid information and credit ratings. For commercial mortgage-backed securities, independent pricing services generally base evaluated prices on cash flow models that take into consideration benchmark yields and utilize available trade information, dealer quotes and market color.
For U.S. agency and government-sponsored enterprise securities, including single family and multifamily mortgage-backed securities, construction mortgage securities and loans and collateralized mortgage obligations, independent pricing services generally base evaluated prices on an active TBA (to-be-announced) market for mortgage pools, discounted cash flow models, or option-adjusted spread models. Independent pricing services examine reference data and use observable inputs such as issue name, issue size, ratings, maturity, call type and spread/benchmark yields, as well as dealer-supplied market information. The discounted cash flow or option-adjusted spread models utilize inputs from matrix pricing, which consider observable market-based discount and prepayment rates, attributes of the collateral, and yield or price of bonds of comparable quality, coupon, maturity and type.
Investments in registered open-end investment management companies are valued based upon the NAV of such investments.
When the HIT finances the construction and permanent securities or participation interests, value is determined based upon the total amount, funded and/or unfunded, of the commitment.
Portfolio investments for which market quotations or independent third-party provider evaluated prices are deemed unreliable or not available are valued at their fair value determined in good faith by the HIT’s Valuation Committee, as valuation designee, pursuant to procedures approved by the HIT’s Board of Trustees. In determining fair market value, the Valuation Committee will employ a valuation method that it believes reflects fair value for that asset, which may include the use of an independent valuation consultant or the utilization of a discounted cash flow model based on broker and/ or other market inputs. The frequency with which these fair value procedures may be used cannot be predicted. However, on June 30, 2024, the Valuation Committee fair valued less than 0.01% of the HIT’s net assets utilizing internally derived unobservable inputs.
| | 12 |
Notes to Financial Statements
(unaudited)-continued
Futures contracts are valued at the settlement price established each day by the board of trade or exchange on which they are traded.
Short-term investments acquired with a stated maturity of 60 days or less are generally valued at amortized cost, which approximates fair market value.
The HIT holds a 100% ownership interest, either directly or indirectly in HIT Advisers LLC (HIT Advisers). HIT Advisers is valued at its fair value determined in good faith under consistently applied procedures approved by the HIT’s Board of Trustees, which approximates its respective carrying value.
GAAP establishes a disclosure hierarchy that categorizes the inputs to valuation techniques used to value assets and liabilities at measurement date. The HIT classifies its assets and liabilities into three levels based on the method used to value the assets or liabilities. Level 1 values are based on quoted prices in active markets for identical securities. Level 2 values are based on significant observable market inputs, such as quoted prices for similar securities, interest rates, prepayment speeds, credit risk and quoted prices in inactive markets. Level 3 values are based on significant unobservable inputs that reflect the HIT’s determination of assumptions that market participants might reasonably use in valuing the securities.
The following table presents the HIT’s valuation levels as of June 30, 2024:
| | | | Investment Securities | |
| (dollars in thousands) | | | Level 1 | | | | Level 2 | | | | Level 3 | | | | Total | |
| Investments in Securities: | | | | | | | | | | | | | | | | |
| FHA Permanent Securities | | $ | — | | | $ | 118,359 | | | $ | — | | | $ | 118,359 | |
| Ginnie Mae Securities | | | — | | | | 1,658,249 | | | | — | | | | 1,658,249 | |
| Ginnie Mae Construction Securities | | | — | | | | 159,220 | | | | 75,260 | | | | 234,480 | |
| Fannie Mae Securities | | | — | | | | 3,079,170 | | | | — | | | | 3,079,170 | |
| Freddie Mac Securities | | | — | | | | 541,257 | | | | — | | | | 541,257 | |
| State Housing Finance Agency Securities | | | — | | | | 463,889 | | | | — | | | | 463,889 | |
| Commercial Mortgage-Backed Securities | | | — | | | | 3,308 | | | | — | | | | 3,308 | |
| Other Multifamily Investments | | | | | | | | | | | | | | | | |
| Direct Loans | | | — | | | | — | | | | 189,760 | | | | 189,760 | |
| Privately Insured Construction/Permanent Mortgages | | | — | | | | 3,606 | | | | — | | | | 3,606 | |
| Total Other Multifamily Investments | | | — | | | | 3,606 | | | | 189,760 | | | | 193,366 | |
| United States Treasury Securities | | | — | | | | 218,940 | | | | — | | | | 218,940 | |
| Equity Investments | | | — | | | | — | | | | 556 | | | | 556 | |
| Short-Term Investments | | | 108,880 | | | | — | | | | — | | | | 108,880 | |
| Other Financial Instruments1 | | | — | | | | (16,574 | ) | | | 134 | | | | (16,440 | ) |
| Total Investments in Securities | | $ | 108,880 | | | $ | 6,229,424 | | | $ | 265,710 | | | $ | 6,604,014 | |
| Derivatives Investments: | | | | | | | | | | | | | | | | |
| Assets | | | | | | | | | | | | | | | | |
| Futures Contracts2 | | | 2,371 | | | | — | | | | — | | | | 2,371 | |
| Total Derivatives Investments | | $ | 2.371 | | | $ | — | | | $ | — | | | $ | 2.371 | |
| 1. | If held in the portfolio at report date, other financial instruments include forward commitments, TBA and when-issued securities. |
| 2. | Amounts shown represent unrealized appreciation (depreciation) at period end as presented in the Schedule of Investments. Only initial margin and variation margin on exchange-traded and centrally cleared derivatives, if any, are reported in the Statement of Assets and Liabilities. |
| | 13 |
Notes to Financial Statements
(unaudited)-continued
The following table reconciles the valuation of the HIT’s Level 3 investment securities and related transactions for the period ended June 30, 2024:
| | | Investments in Securities |
| (dollars in thousands) | | Other Multifamily Investments | | | Ginnie Mae Construction Securities | | | Equity
Investment | | | Other Financial Instruments | | | Total | |
| Beginning Balance, 12/31/2023 | | $ | 263,321 | | | $ | 45,828 | | | $ | 334 | | | $ | (171 | ) | | $ | 309,312 | |
| Paydowns/Settlements | | | (111,322 | ) | | | — | | | | — | | | | — | | | | (111,322 | ) |
| Total Unrealized Gain (Loss)* | | | 2,405 | | | | (770 | ) | | | 222 | | | | 305 | | | | 2,162 | |
| Cost of Purchases | | | 35,356 | | | | 30,202 | | | | — | | | | — | | | | 65,558 | |
| Ending Balance, 6/30/2024 | | $ | 189,760 | | | $ | 75,260 | | | $ | 556 | | | $ | 134 | | | $ | 265,710 | |
* Net change in unrealized gain (loss) attributable to Level 3 securities held at June 30, 2024 totaled $2,162,000 and is included on the accompanying Statement of Operations.
For the six months ended June 30, 2024, there were no transfers in levels.
Level 3 securities primarily consist of Direct Loans and one Ginnie Mae Construction Security which were valued using evaluated prices provided by an independent, third-party pricing service as of June 30, 2024, employing a discounted cash flow model. Weighted average lives for the loans ranged from 0.16 to 3.64 years. Unobservable inputs include spreads to relevant U.S. Treasuries ranging from 60 to 555 basis points. For the Ginnie Mae Construction Security, weighted average life was 2.84 years. A change in unobservable inputs may impact the value of the loans or securities.
Use of Estimates
The preparation of financial statements in conformity with GAAP requires management to make estimates and assumptions that affect the reported amounts of assets and liabilities at the date of the financial statements and the reported amounts of revenues and expenses during the period. Actual results could differ from those estimates.
Federal Income Taxes
The HIT’s policy is to comply with the requirements of the Internal Revenue Code of 1986, as amended (Internal Revenue Code), that are applicable to regulated investment companies, and to distribute all of its taxable income to its participants. Therefore, no federal income tax provision is required.
Tax positions taken or expected to be taken in the course of preparing the HIT’s tax returns are evaluated to determine whether the tax positions are “more-likely-than-not” of being sustained by the applicable tax authority. Tax positions not deemed to meet the more-likely-than-not threshold would be recorded as a tax benefit or expense in the current year. Management has analyzed for all open years the HIT’s tax positions taken on federal income tax returns and has concluded that no provision for income tax is required in the HIT’s financial statements.
The HIT files U.S. federal, state and local tax returns as required. The HIT’s tax returns are subject to examination by the relevant tax authorities until the expiration of the applicable statutes of limitations, which is generally three years after the filing of the tax return but could be longer in certain circumstances.
Distributions to Participants
At the end of each calendar month, a pro-rata distribution is made to participants of the net investment income earned during the month. This pro- rata distribution is based on the participant’s number of units held as of the immediately preceding month-end and excludes realized gains (losses) which are distributed at year-end. Participants redeeming their investments are paid their pro-rata share of undistributed net income accrued through the month-end of the month in which they redeem. The HIT offers a reinvestment plan that permits current participants to automatically reinvest their distributions of income and capital gains, if any, into the HIT’s units of participation. Total reinvestment was approximately 92% of distributed income for the six months ended June 30, 2024.
| | 14 |
Notes to Financial Statements
(unaudited)-continued
Investment Transactions and Income
For financial reporting purposes, security transactions are accounted for as of the trade date. Gains and losses on securities sold are determined on the basis of amortized cost. Realized gains (losses) on paydowns of mortgage- and asset-backed securities are classified as interest income.
Interest income is accrued as earned. Premiums, purchase discounts, and loan origination discounts, including related direct costs, are amortized as adjustments to the related loan’s yield over the contractual life of the loan using the effective interest method. In connection with the prepayment of a loan or security, any remaining unamortized amounts are recognized into income as a gain or loss and, depending upon the terms of the loan, there may be additional income that is earned based upon the prepayment and recognized in the period of the prepayment.
12b-1 Plan of Distribution
The HIT’s Board of Trustees has approved a Plan of Distribution under Rule 12b-1 under the Investment Company Act to pay for marketing and sales promotion expenses incurred in connection with the offer and sale of units and related distribution activities (12b-1 expenses). For the six months ended June 30, 2024, the HIT was authorized to pay 12b-1 expenses in an annual amount up to $600,000 or 0.05% of its average net assets on an annualized basis per fiscal year, whichever was greater. During the six months ended June 30, 2024, the HIT incurred approximately $672,000, or 0.02% of its average monthly net assets on an annualized basis, in 12b-1 expenses.
Note 2. Investment Risk
Interest Rate Risk
As with any fixed income investment, the market value of the HIT’s investments will generally fall at times when market interest rates rise. Rising interest rates may also reduce prepayment rates, causing the average life of the HIT’s investments to increase. This could in turn further reduce the value of the HIT’s portfolio.
Prepayment and Extension Risk
The HIT invests in certain fixed income securities whose value is derived from an underlying pool of mortgage loans that are subject to prepayment and extension risk.
Prepayment risk is the risk that a security will pay more quickly than its assumed payment rate, shortening its expected average life. In such an event, the HIT may be required to reinvest the proceeds of such prepayments in other investments bearing lower interest rates. The majority of the HIT’s securities backed by loans for multifamily projects include restrictions on prepayments for specified periods to mitigate this risk or include prepayment penalties to compensate the HIT. Prepayment penalties, when received, are included in realized gains.
Extension risk is the risk that a security will pay more slowly than its assumed payment rate, extending its expected average life. When this occurs, the HIT’s ability to reinvest principal repayments in higher returning investments may be limited.
These two risks may increase the sensitivity of the HIT’s portfolio to fluctuations in interest rates and negatively affect the value of the HIT’s portfolio.
| | 15 |
Notes to Financial Statements
(unaudited)-continued
Credit Risk
A majority of HIT’s investments have a form of credit enhancement to protect against losses in the event of a default. However, in the event of a default of an underlying mortgage loan where the investment does not have credit enhancement or that an entity providing credit enhancement for an investment fails to meet its obligations under the credit enhancement, the HIT would be subject to the risks that apply to real estate investments generally with respect to that investment. Certain real estate risks include construction failure, loan non-repayment, foreclosure, and environmental and litigation risk.
Futures Contracts
A futures contract is a standardized, exchange-traded agreement to buy or sell a specific quantity of an underlying asset at a specified price on a specified day or days in the future. The HIT may use U.S. Treasury futures contracts to manage the interest rate risk of the HIT portfolio. Upon entering into a futures contract, the HIT is required to deposit either cash or securities (Initial Margin) with a clearing broker. Non-cash collateral pledged by the HIT, if any, is disclosed in the Schedule of Investments, and cash collateral, if any, is held in a segregated account with the broker, which is reflected as Cash collateral held with broker in the Statement of Assets and Liabilities. Positions taken in the futures market are not normally held to maturity but are instead liquidated through offsetting transactions which may result in a profit or a loss. While the HIT will usually liquidate futures contracts in this manner, the HIT may instead make or take delivery of the underlying asset whenever it appears economically advantageous for the HIT to do so.
The HIT may invest up to 5% of its net assets, measured using notional value, in U.S. Treasury futures contracts for duration management purposes. Investments in U.S. Treasury futures contracts may add leverage because the HIT would be subject to investment exposure on the notional amount of the futures contracts. Investments in derivatives can increase the volatility of the HIT’s NAV and may expose it to significant additional costs. The use of derivatives is a highly specialized activity that involves investment techniques and risks different from those associated with investments in more traditional securities and instruments. There is no guarantee that the use of derivatives will achieve their intended result.
Any open futures contracts at period end are presented in the Schedule of Investments, which reflects unrealized cumulative appreciation (depreciation). The notional amount at value reflects each contract’s exposure to the underlying instrument at period end. The period end variation margin is reflected as Variation margin due from broker in the Statement of Assets and Liabilities, and the net cumulative appreciation (depreciation) is included in Net realized and change in unrealized gains (losses) on futures in the Statement of Operations. The average month-end notional amount of long futures contracts held was $143.6 million for the six months ended June 30, 2024. There were no short futures contacts held at period end.
Market Risk
The value of securities held by the HIT may fluctuate, sometimes rapidly or unpredictably, due to general market conditions, such as real or perceived adverse economic, political or regulatory conditions, inflation, changes in interest rates, adverse investor sentiment and other global market developments and disruptions, including those arising out of geopolitical events (such as war), health emergencies (such as pandemics), natural disasters, terrorism, supply chain disruptions, sanctions and government or quasi-government actions. It Is difficult to predict when events affecting the U.S or global financial markets may occur.
| | 16 |
Notes to Financial Statements
(unaudited)-continued
Note 3. Transactions with Related Entities
HIT Advisers
HIT Advisers, a Delaware limited liability company, was formed by the HIT to operate as an investment adviser and be registered, as appropriate under applicable federal or state law. HIT Advisers is owned by HIT directly (99.9%), and indirectly through HIT Advisers Managing Member (0.1%), which is also wholly owned by the HIT. This ownership structure is intended to insulate the HIT from any potential liabilities associated with the conduct of HIT Advisers’ business. The HIT receives no services from HIT Advisers and carries it as a portfolio investment that meets the definition of a controlled affiliate.
In accordance with a contract, in addition to its membership interest, the HIT provides HIT Advisers advances to assist with its operations and cash flow management as needed. Advances are expected to be repaid as cash becomes available. HIT maintains an allowance for doubtful receivable due to aging balances. Also, in accordance with the contract, the HIT may provide the time of certain personnel and allocates operational expenses to HIT Advisers on a cost-reimbursement basis. As of June 30, 2024, HIT Advisers had no assets under management.
A rollforward of advances to HIT Advisers by the HIT is included in the table below:
| Advances to HIT Advisers by HIT | | (dollars in thousands) |
| Ending Balance, 12/31/2023 | | $ | 571 | |
| Advances in 2024 | | | 16 | |
| Ending Balance, 06/30/2024 | | $ | 587 | |
Building America
Building America CDE, Inc. (Building America), a wholly owned subsidiary of HIT Advisers, is a Community Development Entity, certified by the Community Development Financial Institutions Fund (CDFI Fund) of the U.S. Department of the Treasury.
In accordance with a contract, the HIT provides the time of certain personnel to Building America and allocates operational expenses on a cost- reimbursement basis. Also, in accordance with the contract, the HIT provides Building America advances to assist with its operations and cash flow management as needed. Advances are repaid as cash becomes available.
A rollforward of advances to Building America by the HIT is included in the table below:
| Advances to BACDE by HIT | | (dollars in thousands) |
| Ending Balance, 12/31/2023 | | $ | 147 | |
| Advances in 2024 | | | 928 | |
| Repayment by BACDE in 2024 | | | (893 | ) |
| Ending Balance, 06/30/2024 | | $ | 182 | |
| | 17 |
Notes to Financial Statements
(unaudited)-continued
Summarized financial information on a consolidated basis for HIT Advisers and Building America included in the table below:
| | | (dollars in thousands) |
| As of June 30, 2024 | | | | |
| Assets | | $ | 2,397 | |
| Liabilities | | $ | 1,841 | |
| Equity | | $ | 556 | |
| For the period ended June 30, 2024 | | | | |
| Income | | $ | 1,101 | |
| Expenses | | | (687 | ) |
| Tax Expenses | | | (118 | ) |
| Net Income (Loss) | | $ | 296 | |
Note 4. Leases
The HIT leases certain real estate properties for office space which are classified as operating leases. The HIT also leases equipment which is classified as a financing lease. The leases are included in right-of-use (ROU) assets on the HIT’s statement of assets and liabilities. ROU assets represent the HIT’s right to use an underlying asset for the lease term and lease obligations represent the HIT’s obligation to make lease payments arising from the lease. ROU assets and obligations are recognized at the commencement date based on the present value of lease payments over the lease term. As most of the HIT’s leases do not provide an implicit rate, the HIT uses its incremental borrowing rate based on the information available at the commencement date of the lease in determining the present value of lease payments. The HIT determines if an arrangement is a lease at inception. The HIT’s lease terms may include options to extend or terminate the lease when it is reasonably certain that the HIT will exercise that option. Lease expense and amortization expense are recognized on a straight-line basis over the lease term.
| (dollars in thousands) | | Operating Lease | | Financing Lease | | Total |
| ROU Asset, 1/1/2024 | | $ | 3,825 | | | $ | 31 | | | $ | 3,856 | |
| Addition | | | — | | | | 7 | | | | 7 | |
| Reduction/Amortization of ROU Asset | | | (247 | ) | | | (6 | ) | | | (253 | ) |
| Right-of-Use Asset, 06/30/2024 | | $ | 3,578 | | | $ | 32 | | | $ | 3,610 | |
| | | | | | | | | | | | | |
| Lease Liability, 1/1/2024 | | | 4,355 | | | | 32 | | | | 4,387 | |
| Addition | | | — | | | | 7 | | | | 7 | |
| | | | | | | | | | | | | |
| Lease Payments | | | (292 | ) | | | (6 | ) | | | (298 | ) |
| Imputed Interest | | | 36 | | | | 1 | | | | 37 | |
| Reduction of Lease Liability | | | (256 | ) | | | (5 | ) | | | (261 | ) |
| Lease Liability, 06/30/2024 | | $ | 4,099 | | | $ | 34 | | | $ | 4,133 | |
| | | | | | | | | | | | | |
| Lease Expense | | | (283 | ) | | | (7 | ) | | | (290 | ) |
| Weighted Average Discount Rate | | | 1.94 | % | | | 5.26 | % | | | | |
| Weighted Average Remaining Term (Years) | | | 6.9 | | | | 3.2 | | | | | |
Note 5. Commitments
The HIT may make commitments, including forward commitments, in securities or loans that fund over time on a draw basis or fund at a single point in time. The HIT agrees to an interest rate and purchase price for these securities or loans when the commitment to purchase is originated.
| | 18 |
Notes to Financial Statements
(unaudited)-continued
Certain assets of the HIT are invested in liquid investments until they are required to fund these purchase commitments. As of June 30, 2024, the HIT had outstanding unfunded purchase commitments of approximately $434.0 million. The HIT maintains a sufficient level of liquid securities of no less than the total of the outstanding unfunded purchase commitments. As of June 30, 2024, the value of liquid securities, less short-term investments, maintained in a custodial trading account was approximately $6.3 billion.
Note 6. Investment Transactions
Purchases and sales of investments, excluding short-term securities and U.S. Treasury securities, for the six months ended June 30, 2024, were $761.2 million and $382.5 million, respectively.
Note 7. Income Taxes
No provision for federal income taxes is required since the HIT intends to continue to qualify as a regulated investment company under Subchapter M of the Internal Revenue Code and distribute to shareholders all of its taxable income and gains. Federal income tax regulations differ from GAAP; therefore, distributions determined in accordance with tax regulations may differ in amount or character from net investment income and realized gains for financial reporting purposes. Financial reporting records were adjusted for permanent book/tax differences of $2.0 million as of June 30, 2024, to reflect tax character. The amount and character of tax-basis distributions and composition of the net assets are finalized at fiscal year-end; accordingly, tax-basis balances have not been determined as of June 30, 2024.
At June 30, 2024, the cost of investments for federal income tax purposes was $7,416,354,000. Net unrealized loss aggregated to $812,340,000 at period-end, of which $14,707,000 was related to appreciate investments and $827,047,000 was related to depreciated investments.
Note 8. Retirement and Deferred Compensation Plans
The HIT participates in the AFL-CIO Staff Retirement Plan (Plan), which is a multiemployer defined benefit pension plan, under the terms of a collective bargaining agreement. The Plan covers substantially all employees, including non-bargaining unit employees. The risks of participating in a multiemployer plan are different from a single-employer plan in the following aspects:
| a. | Assets contributed to a multiemployer plan by one employer may be used to provide benefits to employees of other participating employers. |
| b. | If a participating employer stops contributing to the plan, the unfunded obligations of the plan may be borne by the remaining participating employers based on their level of contributions to the plan. |
| c. | If the HIT chooses to stop participating in its multiemployer plan, the HIT may be required to pay the plan an amount based on the HIT’s share of the underfunded status of the plan, referred to as a withdrawal liability. |
| | 19 |
Notes to Financial Statements
(unaudited)-continued
The HIT’s participation in the Plan for the year ended June 30, 2024, is outlined in the table below. The “EIN/Pension Plan Number” line provides the Employer Identification Number (EIN) and the three-digit plan number. The most recent Pension Protection Act (PPA) zone status available as of June 30, 2024, is for the 2022 Plan year ended at June 30, 2023. The zone status is based on information that the HIT received from the Plan and is certified by the Plan’s actuary. Among other factors, plans in the red zone are generally less than 65% funded, plans in the yellow zone are less than 80% funded, and plans in the green zone are at least 80% funded. The “FIP/RP Status Pending/Implemented” line indicates whether a financial improvement plan (FIP) or a rehabilitation plan (RP) is either pending or has been implemented. The HIT was listed in the Plan’s Form 5500 as providing more than 5% of the total contributions for the following plan year:
Pension Fund: AFL-CIO Staff Retirement Plan
| EIN/Pension Plan Number | | 53-0228172 / 001 | |
| 2022 Plan Year PPA Zone Status | | Green | |
| FIP/RP Status Pending/ Implemented | | No | |
| 2024 Contributions | | | $1,179,747 | |
| 2024 Contribution Rate | | | 24 | % |
| Surcharge Imposed | | | No | |
| Expiration Date of Collective Bargaining Agreement | | | 04/01/2024 | |
1. Included in salaries and fringe benefits expense line items on the Statement of Operations.
The HIT was listed in the Plan’s Form 5500 as providing more than 5% of the total contributions for the following plan year:
| | Year Contributions to Plan Exceeded 5 Percent of |
| Pension Fund | Total Contributions |
| AFL-CIO Staff Retirement Plan | 2022 1 |
1. The 2022 plan year ended at June 30, 2023.
At the date the HIT financial statements were issued, the Plan’s Form 5500 was not available for the plan year ended June 30, 2024.
The HIT also sponsors a deferred compensation plan, referred to as a 401(k) plan, covering all employees. This plan permits employees to defer the lesser of 100% of their total compensation or the applicable Internal Revenue Service limit. During 2024, the HIT will match dollar for dollar the first $6,400 of each employee’s contributions. The HIT’s 401(k) contribution for the six months ended June 30, 2024, was approximately $220,400.
Note 9. Contract Obligations
In the ordinary course of business, the HIT enters into contracts that contain a variety of indemnifications. The HIT’s maximum exposure under these arrangements is unknown. However, the HIT has not had any prior claims or losses pursuant to these contracts and expects the risk of loss to be low.
Note 10. Master Securities Forward Transaction Agreements
The HIT may enter into “Master Securities Forward Transaction Agreements (“MSFTA”) with certain counterparties that govern margining on certain forward settling mortgage-backed securities transactions. The MSFTAs contain provisions for, among other things, eligible collateral, rights of setoff, events of default, termination, and the transfer and maintenance of collateral. Under the MSFTAs and related agreements, collateral posted by counterparties would be held in segregated accounts under the control of the HIT at the HIT’s custodian while collateral posted by the HIT would be held for the benefit of the counterparties under the terms of account control agreements in segregated accounts at the HIT’s custodian. As of June 30, 2024, neither the HIT nor its counterparties were required to post collateral in connection with MSFTAs.
Note 11. Subsequent Events
The HIT evaluated subsequent events through the date the financial statements were available for issue and determined there were no additional material events that would require adjustment to or disclosure in the HIT’s financial statements.
| | 20 |
FINANCIAL HIGHLIGHTS
Select Per Share Data and Ratios
| | | Six Months Ended | | | | | | | | | | | | | | | | |
| | | June 30, 2024** | | | | | | | | | | | | | | | | |
| Per share data | | (unaudited) | | | 2023 | | | 2022 | | | 2021 | | | 2020 | | | 2019 | |
| Net asset value, beginning of period | | $ | 973.69 | | | $ | 958.52 | | | $ | 1,137.06 | | | $ | 1,176.64 | | | $ | 1,140.24 | | | $ | 1,087.85 | |
| Income from investment operations: | | | | | | | | | | | | | | | | | | | | | | | | |
| Net investment income * | | | 17.23 | | | | 32.45 | | | | 23.21 | | | | 20.20 | | | | 25.13 | | | | 29.65 | |
| Net realized and unrealized gains (losses) on | | | | | | | | | | | | | | | | | | | | | | | | |
| investments | | | (14.41 | ) | | | 15.84 | | | | (176.26 | ) | | | (32.43 | ) | | | 45.18 | | | | 54.26 | |
| Total income (loss) from investment operations | | | 2.82 | | | | 48.29 | | | | (153.05 | ) | | | (12.23 | ) | | | 70.31 | | | | 83.91 | |
| Less distributions from: | | | | | | | | | | | | | | | | | | | | | | | | |
| Net investment income | | | (17.52 | ) | | | (33.12 | ) | | | (25.49 | ) | | | (24.29 | ) | | | (28.41 | ) | | | (31.52 | ) |
| Net realized gains on investments | | | — | | | | — | | | | — | | | | (3.06 | ) | | | (5.50 | ) | | | — | |
| Total distributions | | | (17.52 | ) | | | (33.12 | ) | | | (25.49 | ) | | | (27.35 | ) | | | (33.91 | ) | | | (31.52 | ) |
| | | | | | | | | | | | | | | | | | | | | | | | | |
| Net asset value, end of period | | $ | 959.00 | | | $ | 973.69 | | | $ | 958.52 | | | $ | 1,137.06 | | | $ | 1,176.64 | | | $ | 1,140.24 | |
| | | | | | | | | | | | | | | | | | | | | | | | | |
| Total return | | | 0.31 | % | | | 5.17 | % | | | -13.55 | % | | | -1.04 | % | | | 6.20 | % | | | 7.78 | % |
| | | | | | | | | | | | | | | | | | | | | | | | | |
| Net assets, end of period (in thousands) | | $ | 6,555,211 | | | $ | 6,558,831 | | | $ | 6,025,063 | | | $ | 7,106,556 | | | $ | 6,749,288 | | | $ | 6,554,926 | |
| | | | | | | | | | | | | | | | | | | | | | | | | |
| Ratios/supplemental data | | | | | | | | | | | | | | | | | | | | | | | | |
| Ratio of expenses to average net assets | | | 0.32 | % | | | 0.33 | % | | | 0.32 | % | | | 0.31 | % | | | 0.32 | % | | | 0.34 | % |
| | | | | | | | | | | | | | | | | | | | | | | | |
| Ratio of net investment income to average net assets | | | 3.59 | % | | | 3.39 | % | | | 2.30 | % | | | 1.70 | % | | | 2.13 | % | | | 2.60 | % |
| Portfolio turnover rate | | | 21.4 | % | | | 14.5 | % | | | 25.3 | % | | | 30.4 | % | | | 30.3 | % | | | 17.6 | % |
*The average shares outstanding method has been applied for this per share information.
**Percentage amounts for the period, except total return, have been annualized.
See accompanying Notes to Financial Statements (unaudited).
| | 21 |
Item 8. Changes in and Disagreements with Accountants for Open-End Management Investment Companies. (Unaudited)
N/A
| | 22 |
Item 9. Proxy Disclosures for Open-End Management Investment Companies. (Unaudited
N/A
| | 23 |
Item 10. Renumeration Paid to Directors, Officers, and Others of Open-End Management Investment Companies. (Unaudited)
Note: This information is disclosed as part of Item 7: Financial Statements and Financial Highlights.
| | 24 |
Item 11. Statement Regarding Basis of Approval of Investment Advisory Contract
N/A
| | 25 |
Item 12. Disclosure of Proxy Voting Policies and Procedures for Closed-End Management Investment Companies.
Not applicable to open-end investment companies.
Item 13. Portfolio Managers of Closed-End Management Investment Companies.
Not applicable to open-end investment companies.
Item 14. Purchases of Equity Securities by Closed-End Management Investment Company and Affiliated Purchases.
Not applicable to open-end investment companies.
Item 15. Submission of Matters to a Vote of Security Holders.
There has been no change to the procedures by which participants may recommend nominees to the Board of Trustees of the Trust, where those changes were implemented after the Registrant last provided disclosure in response to the requirements of Item 407(c)(2)(iv) of Regulation S-K (per Item 22(b)(15) of Schedule 14A)), or this Item.
Item 16. Controls and Procedures.
| (a) | The Trust’s Chief Executive Officer (the principal executive officer) and Chief Financial Officer (the principal financial officer) have evaluated the Trust’s disclosure controls and procedures (as defined in Rule 30a-3(c) under the Act (17 CFR 270.30a-3(c)) within 90 days of this filing and have concluded that the registrant’s disclosure controls and procedures were effective, as of that date, in ensuring that information required to be disclosed by the registrant in this Form N-CSR was recorded, processed, summarized, and reported timely. |
| (b) | The Trust’s Chief Executive Officer (the principal executive officer) and Chief Financial Officer (the principal financial officer) are aware of no change in the Trust’s internal control over financial reporting (as defined in Rule 30a-3(d) under the Act (17 CFR 270.30a-3(d)) that occurred during the period covered by this report that has materially affected, or is reasonably likely to materially affect, the registrant’s internal control over financial reporting. |
Item 17. Disclosure of Securities Lending Activities for Closed-End Management Investment Companies.
Not applicable to open-end investment companies.
Item 18. Recovery of Erroneously Awarded Compensation.
Not applicable.
Item 19. Exhibits.
| (a) | (1) | Not applicable for semi-annual reports. |
SIGNATURES
Pursuant to the requirements of the Securities Exchange Act of 1934 and the Investment Company Act of 1940, the AFL-CIO Housing Investment Trust has duly caused this report to be signed on its behalf by the undersigned, thereunto duly authorized.
AFL-CIO HOUSING INVESTMENT TRUST
By:
| /s/ Chang Suh | |
| Chang Suh | |
| Chief Executive Officer | |
Date: August 29, 2024
Pursuant to the requirements of the Securities Exchange Act of 1934 and the Investment Company Act of 1940, this report has been signed below by the following persons on behalf of the AFL-CIO Housing Investment Trust and in the capacities and on the dates indicated.
| /s/ Chang Suh | |
| Chang Suh | |
| Chief Executive Officer | |
| AFL-CIO Housing Investment Trust |
| (Principal Executive Officer) |
Date: August 29, 2024
| /s/ Harpreet S. Peleg | |
| Harpreet S. Peleg, | |
| Chief Financial Officer | |
| AFL-CIO Housing Investment Trust |
| (Principal Financial Officer) |
Date: August 28, 2024