UNITED STATES
SECURITIES AND EXCHANGE COMMISSION
Washington, D.C. 20549
FORM N-CSR
CERTIFIED SHAREHOLDER REPORT OF REGISTERED
MANAGEMENT INVESTMENT COMPANIES
Investment Company Act file number 811-02737
Fidelity Summer Street Trust
(Exact name of registrant as specified in charter)
245 Summer St., Boston, MA 02210
(Address of principal executive offices) (Zip code)
Margaret Carey, Secretary
245 Summer St.
Boston, Massachusetts 02210
(Name and address of agent for service)
Registrant's telephone number, including area code:
617-563-7000
| |
Date of fiscal year end: | January 31 |
|
|
Date of reporting period: | July 31, 2024 |
Item 1.
Reports to Stockholders
| |
| | SEMI-ANNUAL SHAREHOLDER REPORT | AS OF JULY 31, 2024 | |
| | Fidelity® Series Sustainable U.S. Market Fund Fidelity® Series Sustainable U.S. Market Fund : FSUMX |
| | | |
This semi-annual shareholder report contains information about Fidelity® Series Sustainable U.S. Market Fund for the period February 1, 2024 to July 31, 2024. You can find additional information about the Fund at fundresearch.fidelity.com/prospectus/sec. You can also request this information by contacting us at 1-800-544-8544.
What were your Fund costs for the last six months?(based on hypothetical $10,000 investment)
| | Costs of a $10,000 investment | Costs paid as a percentage of a $10,000 investment | |
| Fidelity® Series Sustainable U.S. Market Fund | $ 0 A | 0.00%B | |
A Amount represents less than $.50
B Amount represents less than 0.005%
Key Fund Statistics (as of July 31, 2024)
KEY FACTS | | |
| Fund Size | $21,662,749 | |
| Number of Holdings | 776 | |
| Portfolio Turnover | 22% | |
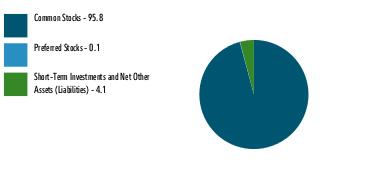
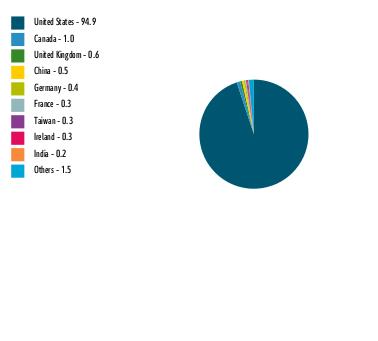
What did the Fund invest in?
(as of July 31, 2024)
MARKET SECTORS (% of Fund's net assets) | | |
| Information Technology | 27.4 | |
| Financials | 12.9 | |
| Health Care | 12.1 | |
| Industrials | 10.4 | |
| Consumer Discretionary | 9.0 | |
| Communication Services | 6.9 | |
| Consumer Staples | 5.5 | |
| Energy | 5.2 | |
| Materials | 2.9 | |
| Utilities | 1.9 | |
| Real Estate | 1.7 | |
| |
| Common Stocks | 95.8 |
| Preferred Stocks | 0.1 |
| Short-Term Investments and Net Other Assets (Liabilities) | 4.1 |
ASSET ALLOCATION (% of Fund's net assets) |
|
|
| United States | 94.9 |
| Canada | 1.0 |
| United Kingdom | 0.6 |
| China | 0.5 |
| Germany | 0.4 |
| France | 0.3 |
| Taiwan | 0.3 |
| Ireland | 0.3 |
| India | 0.2 |
| Others | 1.5 |
GEOGRAPHIC DIVERSIFICATION (% of Fund's net assets) |
|
| |
|
TOP HOLDINGS (% of Fund's net assets) | | |
| NVIDIA Corp | 5.6 | |
| Apple Inc | 4.8 | |
| Microsoft Corp | 4.8 | |
| Amazon.com Inc | 3.0 | |
| Alphabet Inc Class A | 1.9 | |
| Alphabet Inc Class C | 1.6 | |
| UnitedHealth Group Inc | 1.6 | |
| JPMorgan Chase & Co | 1.5 | |
| General Electric Co | 1.3 | |
| Eli Lilly & Co | 1.3 | |
| | 27.4 | |
| |
| Fidelity, the Fidelity Investments Logo and all other Fidelity trademarks or service marks used herein are trademarks or service marks of FMR LLC. Any third-party marks that are used herein are trademarks or service marks of their respective owners. © 2024 FMR LLC. All rights reserved. |
| | For additional information about the Fund; including its prospectus, financial information, holdings and proxy information, scan the QR code or visit fundresearch.fidelity.com/prospectus/sec 1.9914479.100 7319-TSRS-0924 |
Item 2.
Code of Ethics
Not applicable.
Item 3.
Audit Committee Financial Expert
Not applicable.
Item 4.
Principal Accountant Fees and Services
Not applicable.
Item 5.
Audit Committee of Listed Registrants
Not applicable.
Item 6.
Investments
(a)
Not applicable.
(b)
Not applicable
Item 7.
Financial Statements and Financial Highlights for Open-End Management Investment Companies
Fidelity® Series Sustainable U.S. Market Fund
Semi-Annual Report
July 31, 2024
Contents
To view a fund's proxy voting guidelines and proxy voting record for the 12-month period ended June 30, visit http://www.fidelity.com/proxyvotingresults or visit the Securities and Exchange Commission's (SEC) web site at http://www.sec.gov.
You may also call 1-800-544-8544 to request a free copy of the proxy voting guidelines.
Standard & Poor's, S&P and S&P 500 are registered service marks of The McGraw-Hill Companies, Inc. and have been licensed for use by Fidelity Distributors Corporation.
Other third-party marks appearing herein are the property of their respective owners.
All other marks appearing herein are registered or unregistered trademarks or service marks of FMR LLC or an affiliated company. © 2024 FMR LLC. All rights reserved.
This report and the financial statements contained herein are submitted for the general information of the shareholders of the Fund. This report is not authorized for distribution to prospective investors in the Fund unless preceded or accompanied by an effective prospectus.
A fund files its complete schedule of portfolio holdings with the SEC for the first and third quarters of each fiscal year on Form N-PORT. Forms N-PORT are available on the SEC's web site at http://www.sec.gov. A fund's Forms N-PORT may be reviewed and copied at the SEC's Public Reference Room in Washington, DC. Information regarding the operation of the SEC's Public Reference Room may be obtained by calling 1-800-SEC-0330.
For a complete list of a fund's portfolio holdings, view the most recent holdings listing, semiannual report, or annual report on Fidelity's web site at http://www.fidelity.com, http://www.institutional.fidelity.com, or http://www.401k.com, as applicable.
NOT FDIC INSURED •MAY LOSE VALUE •NO BANK GUARANTEE
Neither the Fund nor Fidelity Distributors Corporation is a bank.
Item 7: Financial Statements and Financial Highlights for Open-End Management Investment Companies (Semi-Annual Report)
Fidelity® Series Sustainable U.S. Market Fund
Schedule of Investments July 31, 2024 (Unaudited)
Showing Percentage of Net Assets
| Common Stocks - 95.8% |
| | | Shares | Value ($) |
| COMMUNICATION SERVICES - 6.9% | | | |
| Diversified Telecommunication Services - 0.4% | | | |
| AT&T, Inc. | | 930 | 17,903 |
| Cellnex Telecom SA (a) | | 28 | 977 |
| Cogent Communications Group, Inc. | | 56 | 3,953 |
| Frontier Communications Parent, Inc. (b) | | 64 | 1,875 |
| Iridium Communications, Inc. | | 77 | 2,210 |
| Verizon Communications, Inc. | | 1,656 | 67,101 |
| | | | 94,019 |
| Entertainment - 1.4% | | | |
| Electronic Arts, Inc. | | 200 | 30,188 |
| IMAX Corp. (b) | | 237 | 5,001 |
| Netflix, Inc. (b) | | 185 | 116,245 |
| Sphere Entertainment Co. (b) | | 38 | 1,690 |
| The Walt Disney Co. | | 1,298 | 121,610 |
| TKO Group Holdings, Inc. | | 57 | 6,233 |
| Universal Music Group NV | | 591 | 14,080 |
| Vivid Seats, Inc. Class A (b) | | 692 | 3,377 |
| | | | 298,424 |
| Interactive Media & Services - 4.2% | | | |
| Alphabet, Inc.: | | | |
| Class A | | 2,383 | 408,780 |
| Class C | | 1,980 | 342,837 |
| IAC, Inc. (b) | | 273 | 14,417 |
| Match Group, Inc. (b) | | 306 | 11,671 |
| Pinterest, Inc. Class A (b) | | 263 | 8,403 |
| QuinStreet, Inc. (b) | | 402 | 7,517 |
| Snap, Inc. Class A (b) | | 6,212 | 82,744 |
| TripAdvisor, Inc. (b) | | 235 | 4,143 |
| Ziff Davis, Inc. (b) | | 244 | 11,683 |
| Zoominfo Technologies, Inc. (b) | | 821 | 9,327 |
| | | | 901,522 |
| Media - 0.9% | | | |
| Comcast Corp. Class A | | 3,421 | 141,185 |
| Interpublic Group of Companies, Inc. | | 662 | 21,297 |
| News Corp.: | | | |
| Class A | | 240 | 6,619 |
| Class B | | 282 | 8,034 |
| Paramount Global Class B | | 1,118 | 12,768 |
| TechTarget, Inc. (b) | | 67 | 2,144 |
| Thryv Holdings, Inc. (b) | | 103 | 2,006 |
| | | | 194,053 |
| Wireless Telecommunication Services - 0.0% | | | |
| Gogo, Inc. (b) | | 520 | 4,722 |
TOTAL COMMUNICATION SERVICES | | | 1,492,740 |
| CONSUMER DISCRETIONARY - 9.1% | | | |
| Automobile Components - 0.1% | | | |
| Aptiv PLC (b) | | 177 | 12,282 |
| Gentherm, Inc. (b) | | 61 | 3,366 |
| LCI Industries | | 57 | 6,651 |
| | | | 22,299 |
| Automobiles - 0.7% | | | |
| Harley-Davidson, Inc. | | 127 | 4,763 |
| Lucid Group, Inc. Class A (b) | | 712 | 2,506 |
| Mahindra & Mahindra Ltd. sponsored GDR | | 147 | 5,145 |
| Rivian Automotive, Inc. (b) | | 785 | 12,882 |
| Tesla, Inc. (b) | | 569 | 132,048 |
| Thor Industries, Inc. | | 33 | 3,503 |
| | | | 160,847 |
| Broadline Retail - 3.0% | | | |
| Amazon.com, Inc. (b) | | 3,338 | 624,139 |
| Coupang, Inc. Class A (b) | | 97 | 2,013 |
| Dillard's, Inc. Class A | | 7 | 2,790 |
| JD.com, Inc. sponsored ADR | | 431 | 11,374 |
| Kohl's Corp. | | 163 | 3,531 |
| Macy's, Inc. | | 315 | 5,443 |
| Ollie's Bargain Outlet Holdings, Inc. (b) | | 48 | 4,687 |
| | | | 653,977 |
| Distributors - 0.2% | | | |
| LKQ Corp. | | 847 | 35,151 |
| Diversified Consumer Services - 0.3% | | | |
| ADT, Inc. | | 260 | 2,023 |
| Adtalem Global Education, Inc. (b) | | 39 | 3,058 |
| Bright Horizons Family Solutions, Inc. (b) | | 24 | 2,886 |
| European Wax Center, Inc. (b) | | 441 | 4,141 |
| Grand Canyon Education, Inc. (b) | | 46 | 7,174 |
| H&R Block, Inc. | | 494 | 28,622 |
| Laureate Education, Inc. | | 392 | 6,076 |
| New Oriental Education & Technology Group, Inc. sponsored ADR (b) | | 102 | 6,408 |
| OneSpaWorld Holdings Ltd. | | 362 | 5,825 |
| Service Corp. International | | 45 | 3,596 |
| | | | 69,809 |
| Hotels, Restaurants & Leisure - 1.2% | | | |
| Airbnb, Inc. Class A (b) | | 64 | 8,932 |
| Aramark | | 182 | 6,237 |
| Booking Holdings, Inc. | | 18 | 66,870 |
| Brinker International, Inc. (b) | | 41 | 2,739 |
| Chipotle Mexican Grill, Inc. (b) | | 615 | 33,407 |
| Draftkings Holdings, Inc. (b) | | 56 | 2,069 |
| Hilton Grand Vacations, Inc. (b) | | 34 | 1,469 |
| Hilton Worldwide Holdings, Inc. | | 54 | 11,592 |
| Light & Wonder, Inc. Class A (b) | | 37 | 3,966 |
| Marriott International, Inc. Class A | | 23 | 5,228 |
| McDonald's Corp. | | 171 | 45,383 |
| Planet Fitness, Inc. (b) | | 10 | 737 |
| Royal Caribbean Cruises Ltd. | | 76 | 11,911 |
| Starbucks Corp. | | 580 | 45,211 |
| Vail Resorts, Inc. | | 10 | 1,820 |
| Wingstop, Inc. | | 7 | 2,617 |
| | | | 250,188 |
| Household Durables - 0.5% | | | |
| Cavco Industries, Inc. (b) | | 12 | 4,975 |
| D.R. Horton, Inc. | | 144 | 25,910 |
| Garmin Ltd. | | 35 | 5,994 |
| Green Brick Partners, Inc. (b) | | 142 | 10,387 |
| Installed Building Products, Inc. | | 25 | 6,759 |
| Leggett & Platt, Inc. | | 155 | 2,041 |
| LGI Homes, Inc. (b) | | 22 | 2,532 |
| Mohawk Industries, Inc. (b) | | 18 | 2,899 |
| PulteGroup, Inc. | | 37 | 4,884 |
| Skyline Champion Corp. (b) | | 66 | 5,380 |
| Sony Group Corp. sponsored ADR | | 96 | 8,505 |
| TopBuild Corp. (b) | | 27 | 12,921 |
| Whirlpool Corp. | | 59 | 6,016 |
| | | | 99,203 |
| Leisure Products - 0.1% | | | |
| Acushnet Holdings Corp. | | 33 | 2,395 |
| BRP, Inc. | | 30 | 2,174 |
| Brunswick Corp. | | 64 | 5,213 |
| Clarus Corp. | | 484 | 2,923 |
| Hasbro, Inc. | | 87 | 5,608 |
| YETI Holdings, Inc. (b) | | 24 | 992 |
| | | | 19,305 |
| Specialty Retail - 2.3% | | | |
| Abercrombie & Fitch Co. Class A (b) | | 161 | 23,744 |
| Academy Sports & Outdoors, Inc. | | 284 | 15,356 |
| Advance Auto Parts, Inc. | | 75 | 4,750 |
| American Eagle Outfitters, Inc. | | 739 | 16,295 |
| Aritzia, Inc. (b) | | 89 | 2,921 |
| AutoNation, Inc. (b) | | 9 | 1,716 |
| Best Buy Co., Inc. | | 393 | 34,002 |
| Boot Barn Holdings, Inc. (b) | | 45 | 6,007 |
| Carvana Co. Class A (b) | | 139 | 18,519 |
| Dick's Sporting Goods, Inc. | | 70 | 15,145 |
| Five Below, Inc. (b) | | 82 | 5,965 |
| Foot Locker, Inc. | | 63 | 1,831 |
| GameStop Corp. Class A (b) | | 42 | 952 |
| Gap, Inc. | | 289 | 6,786 |
| Lowe's Companies, Inc. | | 590 | 144,851 |
| Murphy U.S.A., Inc. | | 57 | 28,780 |
| Ross Stores, Inc. | | 99 | 14,180 |
| The Home Depot, Inc. | | 291 | 107,135 |
| Tractor Supply Co. | | 55 | 14,483 |
| Ulta Beauty, Inc. (b) | | 27 | 9,852 |
| Warby Parker, Inc. (b) | | 321 | 5,287 |
| Williams-Sonoma, Inc. | | 166 | 25,677 |
| | | | 504,234 |
| Textiles, Apparel & Luxury Goods - 0.7% | | | |
| adidas AG | | 17 | 4,256 |
| Amer Sports, Inc. | | 229 | 2,659 |
| Columbia Sportswear Co. | | 25 | 2,043 |
| Compagnie Financiere Richemont SA Series A | | 50 | 7,627 |
| Crocs, Inc. (b) | | 135 | 18,140 |
| Hermes International SCA | | 3 | 6,568 |
| Kontoor Brands, Inc. | | 65 | 4,560 |
| lululemon athletica, Inc. (b) | | 207 | 53,543 |
| LVMH Moet Hennessy Louis Vuitton SE | | 13 | 9,170 |
| NIKE, Inc. Class B | | 267 | 19,988 |
| Prada SpA | | 600 | 4,331 |
| PVH Corp. | | 156 | 15,910 |
| Ralph Lauren Corp. Class A | | 8 | 1,405 |
| Tapestry, Inc. | | 280 | 11,225 |
| VF Corp. | | 11 | 187 |
| | | | 161,612 |
TOTAL CONSUMER DISCRETIONARY | | | 1,976,625 |
| CONSUMER STAPLES - 5.6% | | | |
| Beverages - 1.3% | | | |
| Brown-Forman Corp. Class A | | 110 | 5,015 |
| Celsius Holdings, Inc. (b) | | 175 | 8,195 |
| Coca-Cola Consolidated, Inc. | | 3 | 3,438 |
| Coca-Cola Europacific Partners PLC | | 362 | 26,705 |
| Constellation Brands, Inc. Class A (sub. vtg.) | | 4 | 981 |
| Diageo PLC | | 75 | 2,334 |
| Molson Coors Beverage Co. Class B | | 400 | 21,140 |
| Pernod Ricard SA | | 17 | 2,281 |
| Primo Water Corp. | | 231 | 5,066 |
| The Coca-Cola Co. | | 3,031 | 202,289 |
| The Vita Coco Co., Inc. (b) | | 167 | 4,315 |
| | | | 281,759 |
| Consumer Staples Distribution & Retail - 1.4% | | | |
| Alimentation Couche-Tard, Inc. (multi-vtg.) | | 151 | 9,308 |
| BJ's Wholesale Club Holdings, Inc. (b) | | 262 | 23,046 |
| Casey's General Stores, Inc. | | 31 | 12,023 |
| Costco Wholesale Corp. | | 68 | 55,896 |
| Dollar Tree, Inc. (b) | | 109 | 11,373 |
| Kroger Co. | | 626 | 34,117 |
| Performance Food Group Co. (b) | | 127 | 8,763 |
| Sprouts Farmers Market LLC (b) | | 114 | 11,387 |
| Sysco Corp. | | 51 | 3,909 |
| Target Corp. | | 344 | 51,741 |
| Walgreens Boots Alliance, Inc. | | 217 | 2,576 |
| Walmart, Inc. | | 1,182 | 81,132 |
| | | | 305,271 |
| Food Products - 1.4% | | | |
| Archer Daniels Midland Co. | | 243 | 15,068 |
| Bunge Global SA | | 154 | 16,205 |
| Campbell Soup Co. | | 333 | 15,604 |
| Conagra Brands, Inc. | | 40 | 1,213 |
| Darling Ingredients, Inc. (b) | | 75 | 2,980 |
| Flowers Foods, Inc. | | 88 | 1,982 |
| Freshpet, Inc. (b) | | 38 | 4,625 |
| General Mills, Inc. | | 1,129 | 75,801 |
| Hormel Foods Corp. | | 577 | 18,527 |
| Kellanova | | 1,038 | 60,360 |
| McCormick & Co., Inc. (non-vtg.) | | 226 | 17,404 |
| Mondelez International, Inc. | | 169 | 11,551 |
| Nomad Foods Ltd. | | 57 | 1,089 |
| Post Holdings, Inc. (b) | | 20 | 2,187 |
| The J.M. Smucker Co. | | 11 | 1,297 |
| The Kraft Heinz Co. | | 1,328 | 46,759 |
| The Simply Good Foods Co. (b) | | 197 | 6,682 |
| TreeHouse Foods, Inc. (b) | | 153 | 6,163 |
| | | | 305,497 |
| Household Products - 1.0% | | | |
| Church & Dwight Co., Inc. | | 293 | 28,717 |
| Kimberly-Clark Corp. | | 306 | 41,325 |
| Procter & Gamble Co. | | 755 | 121,374 |
| Spectrum Brands Holdings, Inc. | | 45 | 3,807 |
| The Clorox Co. | | 219 | 28,893 |
| | | | 224,116 |
| Personal Care Products - 0.5% | | | |
| Coty, Inc. Class A (b) | | 154 | 1,532 |
| elf Beauty, Inc. (b) | | 21 | 3,624 |
| Estee Lauder Companies, Inc. Class A | | 75 | 7,471 |
| Haleon PLC | | 2,314 | 10,379 |
| Haleon PLC ADR | | 1,596 | 14,603 |
| Kenvue, Inc. | | 3,089 | 57,116 |
| | | | 94,725 |
TOTAL CONSUMER STAPLES | | | 1,211,368 |
| ENERGY - 5.1% | | | |
| Energy Equipment & Services - 1.0% | | | |
| Baker Hughes Co. Class A | | 1,552 | 60,093 |
| Cactus, Inc. | | 280 | 17,674 |
| Championx Corp. | | 342 | 11,717 |
| Liberty Energy, Inc. Class A | | 675 | 16,301 |
| National Energy Services Reunited Corp. (b) | | 249 | 2,423 |
| NOV, Inc. | | 406 | 8,453 |
| Oceaneering International, Inc. (b) | | 215 | 6,454 |
| Schlumberger Ltd. | | 1,131 | 54,616 |
| TechnipFMC PLC | | 911 | 26,875 |
| Valaris Ltd. (b) | | 65 | 5,108 |
| Weatherford International PLC | | 59 | 6,954 |
| | | | 216,668 |
| Oil, Gas & Consumable Fuels - 4.1% | | | |
| Antero Midstream GP LP | | 678 | 9,736 |
| Antero Resources Corp. (b) | | 619 | 17,963 |
| Cameco Corp. | | 153 | 6,960 |
| Cameco Corp. | | 262 | 11,925 |
| Cheniere Energy, Inc. | | 248 | 45,295 |
| Chesapeake Energy Corp. | | 47 | 3,588 |
| Chord Energy Corp. | | 79 | 13,561 |
| Civitas Resources, Inc. | | 156 | 10,883 |
| ConocoPhillips Co. | | 27 | 3,002 |
| Coterra Energy, Inc. | | 140 | 3,612 |
| Devon Energy Corp. | | 143 | 6,725 |
| Diamondback Energy, Inc. | | 122 | 24,682 |
| DT Midstream, Inc. | | 140 | 10,550 |
| EOG Resources, Inc. | | 178 | 22,570 |
| EQT Corp. | | 42 | 1,449 |
| Equinor ASA sponsored ADR | | 1,634 | 43,399 |
| Galp Energia SGPS SA | | 988 | 20,803 |
| Golar LNG Ltd. | | 126 | 4,397 |
| Hess Corp. | | 76 | 11,660 |
| HF Sinclair Corp. | | 50 | 2,574 |
| Imperial Oil Ltd. | | 845 | 60,536 |
| Kosmos Energy Ltd. (b) | | 2,874 | 15,893 |
| Marathon Oil Corp. | | 385 | 10,799 |
| Matador Resources Co. | | 48 | 2,951 |
| MEG Energy Corp. | | 327 | 6,776 |
| New Fortress Energy, Inc. Class A | | 128 | 2,527 |
| Occidental Petroleum Corp. | | 943 | 57,353 |
| ONEOK, Inc. | | 713 | 59,414 |
| Ovintiv, Inc. | | 390 | 18,112 |
| Parex Resources, Inc. | | 539 | 8,085 |
| Parkland Corp. | | 78 | 2,188 |
| Permian Resource Corp. Class A | | 512 | 7,854 |
| Phillips 66 Co. | | 314 | 45,681 |
| Range Resources Corp. | | 159 | 4,966 |
| Reliance Industries Ltd. GDR (a) | | 287 | 20,693 |
| Shell PLC ADR | | 2,102 | 153,908 |
| Sitio Royalties Corp. | | 335 | 8,157 |
| Southwestern Energy Co. (b) | | 247 | 1,593 |
| Targa Resources Corp. | | 364 | 49,242 |
| The Williams Companies, Inc. | | 567 | 24,347 |
| Valero Energy Corp. | | 183 | 29,595 |
| Viper Energy, Inc. | | 166 | 7,083 |
| | | | 873,087 |
TOTAL ENERGY | | | 1,089,755 |
| FINANCIALS - 12.9% | | | |
| Banks - 5.4% | | | |
| Bank of America Corp. | | 6,209 | 250,285 |
| Bank OZK | | 121 | 5,674 |
| Byline Bancorp, Inc. | | 105 | 2,945 |
| Cadence Bank | | 67 | 2,202 |
| Citigroup, Inc. | | 1,203 | 78,051 |
| Comerica, Inc. | | 131 | 7,180 |
| ConnectOne Bancorp, Inc. | | 149 | 3,609 |
| Cullen/Frost Bankers, Inc. | | 26 | 3,044 |
| East West Bancorp, Inc. | | 119 | 10,459 |
| Eastern Bankshares, Inc. | | 359 | 5,974 |
| Fifth Third Bancorp | | 271 | 11,474 |
| First Bancorp, Puerto Rico | | 583 | 12,505 |
| First Hawaiian, Inc. | | 227 | 5,684 |
| First Horizon National Corp. | | 183 | 3,062 |
| First Interstate Bancsystem, Inc. | | 372 | 11,744 |
| FNB Corp., Pennsylvania | | 212 | 3,252 |
| Fulton Financial Corp. | | 146 | 2,828 |
| Glacier Bancorp, Inc. | | 133 | 5,946 |
| HDFC Bank Ltd. sponsored ADR | | 167 | 10,022 |
| Huntington Bancshares, Inc. | | 2,096 | 31,335 |
| Independent Bank Corp. | | 219 | 7,597 |
| International Bancshares Corp. | | 46 | 3,102 |
| JPMorgan Chase & Co. | | 1,439 | 306,219 |
| KeyCorp | | 540 | 8,710 |
| M&T Bank Corp. | | 200 | 34,434 |
| Metropolitan Bank Holding Corp. (b) | | 55 | 2,900 |
| Nu Holdings Ltd. Class A (b) | | 977 | 11,851 |
| Pathward Financial, Inc. | | 88 | 5,944 |
| Pinnacle Financial Partners, Inc. | | 95 | 9,150 |
| PNC Financial Services Group, Inc. | | 756 | 136,912 |
| Regions Financial Corp. | | 1,403 | 31,385 |
| Synovus Financial Corp. | | 335 | 15,661 |
| Trico Bancshares | | 109 | 5,072 |
| Truist Financial Corp. | | 544 | 24,311 |
| U.S. Bancorp | | 1,426 | 63,999 |
| United Community Bank, Inc. | | 157 | 4,859 |
| Univest Corp. of Pennsylvania | | 62 | 1,714 |
| Webster Financial Corp. | | 198 | 9,825 |
| Western Alliance Bancorp. | | 183 | 14,724 |
| Wintrust Financial Corp. | | 21 | 2,272 |
| Zions Bancorporation NA | | 59 | 3,049 |
| | | | 1,170,965 |
| Capital Markets - 2.6% | | | |
| 3i Group PLC | | 111 | 4,466 |
| Bank of New York Mellon Corp. | | 948 | 61,686 |
| BlackRock, Inc. | | 53 | 46,455 |
| Coinbase Global, Inc. (b) | | 121 | 27,148 |
| FactSet Research Systems, Inc. | | 34 | 14,045 |
| Goldman Sachs Group, Inc. | | 103 | 52,430 |
| Houlihan Lokey | | 22 | 3,306 |
| Invesco Ltd. | | 131 | 2,261 |
| Janus Henderson Group PLC | | 242 | 9,010 |
| KKR & Co., Inc. | | 381 | 47,034 |
| Lazard, Inc. Class A | | 16 | 787 |
| Moody's Corp. | | 84 | 38,344 |
| Morgan Stanley | | 716 | 73,898 |
| NASDAQ, Inc. | | 251 | 16,988 |
| Northern Trust Corp. | | 630 | 55,850 |
| Piper Sandler Cos. | | 24 | 6,559 |
| Robinhood Markets, Inc. (b) | | 123 | 2,530 |
| S&P Global, Inc. | | 198 | 95,977 |
| StepStone Group, Inc. Class A | | 74 | 3,719 |
| TMX Group Ltd. | | 111 | 3,373 |
| XP, Inc. Class A | | 112 | 1,916 |
| | | | 567,782 |
| Consumer Finance - 0.7% | | | |
| American Express Co. | | 282 | 71,357 |
| Capital One Financial Corp. | | 107 | 16,200 |
| Discover Financial Services | | 184 | 26,494 |
| FirstCash Holdings, Inc. | | 98 | 10,937 |
| OneMain Holdings, Inc. | | 38 | 1,986 |
| SLM Corp. | | 283 | 6,421 |
| Synchrony Financial | | 472 | 23,973 |
| | | | 157,368 |
| Financial Services - 1.7% | | | |
| Affirm Holdings, Inc. Class A, (b) | | 50 | 1,415 |
| Apollo Global Management, Inc. | | 114 | 14,285 |
| AvidXchange Holdings, Inc. (b) | | 233 | 2,083 |
| Corebridge Financial, Inc. | | 83 | 2,453 |
| Edenred SA | | 47 | 1,959 |
| Essent Group Ltd. | | 140 | 8,798 |
| Fidelity National Information Services, Inc. | | 389 | 29,887 |
| Flywire Corp. (b) | | 252 | 4,614 |
| MasterCard, Inc. Class A | | 274 | 127,057 |
| MGIC Investment Corp. | | 196 | 4,869 |
| PayPal Holdings, Inc. (b) | | 270 | 17,761 |
| Rocket Companies, Inc. (b) | | 149 | 2,412 |
| Visa, Inc. Class A | | 505 | 134,163 |
| Walker & Dunlop, Inc. | | 23 | 2,459 |
| WEX, Inc. (b) | | 7 | 1,284 |
| | | | 355,499 |
| Insurance - 2.5% | | | |
| AFLAC, Inc. | | 31 | 2,957 |
| American International Group, Inc. | | 52 | 4,120 |
| Assurant, Inc. | | 80 | 13,990 |
| Assured Guaranty Ltd. | | 27 | 2,224 |
| Axis Capital Holdings Ltd. | | 47 | 3,560 |
| CNA Financial Corp. | | 140 | 6,882 |
| Fidelity National Financial, Inc. | | 40 | 2,216 |
| First American Financial Corp. | | 106 | 6,421 |
| Genworth Financial, Inc. Class A (b) | | 595 | 4,028 |
| Globe Life, Inc. | | 27 | 2,504 |
| Hartford Financial Services Group, Inc. | | 376 | 41,706 |
| Kinsale Capital Group, Inc. | | 5 | 2,285 |
| Lincoln National Corp. | | 59 | 1,965 |
| Loews Corp. | | 89 | 7,116 |
| Marsh & McLennan Companies, Inc. | | 147 | 32,718 |
| MetLife, Inc. | | 515 | 39,578 |
| Primerica, Inc. | | 39 | 9,819 |
| Principal Financial Group, Inc. | | 144 | 11,737 |
| Progressive Corp. | | 270 | 57,812 |
| Prudential Financial, Inc. | | 838 | 105,018 |
| Reinsurance Group of America, Inc. | | 40 | 9,017 |
| RenaissanceRe Holdings Ltd. | | 16 | 3,711 |
| Selective Insurance Group, Inc. | | 75 | 6,774 |
| The Travelers Companies, Inc. | | 496 | 107,354 |
| Unum Group | | 117 | 6,731 |
| White Mountains Insurance Group Ltd. | | 5 | 8,930 |
| Willis Towers Watson PLC | | 159 | 44,883 |
| | | | 546,056 |
TOTAL FINANCIALS | | | 2,797,670 |
| HEALTH CARE - 12.1% | | | |
| Biotechnology - 2.0% | | | |
| AbbVie, Inc. | | 219 | 40,585 |
| Alnylam Pharmaceuticals, Inc. (b) | | 13 | 3,087 |
| ALX Oncology Holdings, Inc. (b) | | 328 | 1,574 |
| Amgen, Inc. | | 141 | 46,878 |
| AnaptysBio, Inc. (b) | | 84 | 2,927 |
| Arcellx, Inc. (b) | | 142 | 8,777 |
| Arrowhead Pharmaceuticals, Inc. (b) | | 40 | 1,142 |
| Astria Therapeutics, Inc. (b) | | 223 | 2,605 |
| Avidity Biosciences, Inc. (b) | | 57 | 2,598 |
| Biogen, Inc. (b) | | 56 | 11,939 |
| Blueprint Medicines Corp. (b) | | 70 | 7,581 |
| Cargo Therapeutics, Inc. | | 203 | 3,457 |
| Celldex Therapeutics, Inc. (b) | | 171 | 6,517 |
| Cogent Biosciences, Inc. (b) | | 321 | 3,027 |
| Crinetics Pharmaceuticals, Inc. (b) | | 142 | 7,543 |
| Cytokinetics, Inc. (b) | | 121 | 7,140 |
| Gilead Sciences, Inc. | | 1,038 | 78,950 |
| Immunovant, Inc. (b) | | 133 | 3,866 |
| Insmed, Inc. (b) | | 111 | 8,075 |
| Keros Therapeutics, Inc. (b) | | 114 | 5,718 |
| Merus BV (b) | | 153 | 8,115 |
| Mirati Therapeutics, Inc. rights (b)(c) | | 26 | 0 |
| Moderna, Inc. (b) | | 126 | 15,022 |
| Moonlake Immunotherapeutics Class A (b) | | 127 | 5,290 |
| Nuvalent, Inc. Class A (b) | | 26 | 2,078 |
| Regeneron Pharmaceuticals, Inc. (b) | | 65 | 70,147 |
| Repligen Corp. (b) | | 96 | 16,066 |
| Revolution Medicines, Inc. (b) | | 73 | 3,332 |
| Roivant Sciences Ltd. (b) | | 164 | 1,779 |
| Spyre Therapeutics, Inc. (b) | | 93 | 2,558 |
| Tango Therapeutics, Inc. (b) | | 234 | 2,305 |
| Tyra Biosciences, Inc. (b) | | 230 | 5,097 |
| Vaxcyte, Inc. (b) | | 215 | 16,961 |
| Vericel Corp. (b) | | 84 | 4,244 |
| Vertex Pharmaceuticals, Inc. (b) | | 45 | 22,307 |
| Viridian Therapeutics, Inc. (b) | | 156 | 2,629 |
| Xenon Pharmaceuticals, Inc. (b) | | 226 | 9,747 |
| Zentalis Pharmaceuticals, Inc. (b) | | 119 | 463 |
| | | | 442,126 |
| Health Care Equipment & Supplies - 1.6% | | | |
| Boston Scientific Corp. (b) | | 936 | 69,152 |
| DexCom, Inc. (b) | | 201 | 13,632 |
| Edwards Lifesciences Corp. (b) | | 518 | 32,660 |
| GE Healthcare Technologies, Inc. | | 170 | 14,387 |
| Glaukos Corp. (b) | | 122 | 14,295 |
| Hologic, Inc. (b) | | 143 | 11,670 |
| IDEXX Laboratories, Inc. (b) | | 82 | 39,042 |
| Inspire Medical Systems, Inc. (b) | | 11 | 1,552 |
| Integer Holdings Corp. (b) | | 50 | 5,938 |
| Intuitive Surgical, Inc. (b) | | 60 | 26,677 |
| iRhythm Technologies, Inc. (b) | | 23 | 1,984 |
| Lantheus Holdings, Inc. (b) | | 34 | 3,564 |
| Merit Medical Systems, Inc. (b) | | 57 | 4,862 |
| Penumbra, Inc. (b) | | 6 | 1,003 |
| PROCEPT BioRobotics Corp. (b) | | 65 | 4,116 |
| Solventum Corp. | | 45 | 2,650 |
| STERIS PLC | | 91 | 21,727 |
| Stryker Corp. | | 33 | 10,806 |
| Teleflex, Inc. | | 50 | 11,046 |
| The Cooper Companies, Inc. | | 236 | 22,026 |
| TransMedics Group, Inc. (b) | | 110 | 15,649 |
| Zimmer Biomet Holdings, Inc. | | 72 | 8,017 |
| | | | 336,455 |
| Health Care Providers & Services - 4.2% | | | |
| Acadia Healthcare Co., Inc. (b) | | 76 | 4,929 |
| agilon health, Inc. (b) | | 164 | 1,130 |
| Cardinal Health, Inc. | | 325 | 32,770 |
| Cencora, Inc. | | 158 | 37,585 |
| Centene Corp. (b) | | 762 | 58,613 |
| Cigna Group | | 416 | 145,047 |
| CVS Health Corp. | | 436 | 26,304 |
| Elevance Health, Inc. | | 142 | 75,548 |
| Encompass Health Corp. | | 25 | 2,324 |
| Guardant Health, Inc. (b) | | 98 | 3,443 |
| HCA Holdings, Inc. | | 53 | 19,242 |
| HealthEquity, Inc. (b) | | 68 | 5,337 |
| Hims & Hers Health, Inc. (b) | | 245 | 5,204 |
| Humana, Inc. | | 22 | 7,955 |
| Labcorp Holdings, Inc. | | 46 | 9,910 |
| LifeStance Health Group, Inc. (b) | | 476 | 2,623 |
| McKesson Corp. | | 141 | 87,000 |
| Molina Healthcare, Inc. (b) | | 24 | 8,190 |
| Privia Health Group, Inc. (b) | | 66 | 1,369 |
| Quest Diagnostics, Inc. | | 109 | 15,511 |
| R1 RCM, Inc. (b) | | 118 | 1,520 |
| Surgery Partners, Inc. (b) | | 140 | 4,250 |
| Tenet Healthcare Corp. (b) | | 70 | 10,479 |
| The Ensign Group, Inc. | | 59 | 8,304 |
| UnitedHealth Group, Inc. | | 577 | 332,444 |
| | | | 907,031 |
| Health Care Technology - 0.0% | | | |
| Veeva Systems, Inc. Class A (b) | | 54 | 10,364 |
| Life Sciences Tools & Services - 1.2% | | | |
| Agilent Technologies, Inc. | | 147 | 20,786 |
| Avantor, Inc. (b) | | 474 | 12,680 |
| Azenta, Inc. (b) | | 21 | 1,308 |
| Bruker Corp. | | 20 | 1,370 |
| Danaher Corp. | | 430 | 119,144 |
| Fortrea Holdings, Inc. (b) | | 38 | 1,048 |
| IQVIA Holdings, Inc. (b) | | 125 | 30,779 |
| Medpace Holdings, Inc. (b) | | 4 | 1,530 |
| Mettler-Toledo International, Inc. (b) | | 6 | 9,126 |
| Thermo Fisher Scientific, Inc. | | 48 | 29,440 |
| Waters Corp. (b) | | 55 | 18,495 |
| West Pharmaceutical Services, Inc. | | 26 | 7,960 |
| | | | 253,666 |
| Pharmaceuticals - 3.1% | | | |
| Arvinas Holding Co. LLC (b) | | 168 | 4,622 |
| AstraZeneca PLC sponsored ADR | | 487 | 38,546 |
| Bristol-Myers Squibb Co. | | 1,821 | 86,607 |
| Elanco Animal Health, Inc. (b) | | 203 | 2,647 |
| Eli Lilly & Co. | | 320 | 257,366 |
| Enliven Therapeutics, Inc. (b) | | 267 | 7,043 |
| GSK PLC sponsored ADR | | 362 | 14,035 |
| Intra-Cellular Therapies, Inc. (b) | | 23 | 1,811 |
| Longboard Pharmaceuticals, Inc. (b) | | 89 | 2,958 |
| Merck & Co., Inc. | | 461 | 52,153 |
| Novo Nordisk A/S: | | | |
| Series B | | 36 | 4,770 |
| Series B sponsored ADR | | 143 | 18,966 |
| Perrigo Co. PLC | | 80 | 2,262 |
| Pfizer, Inc. | | 1,566 | 47,826 |
| Roche Holding AG (participation certificate) | | 30 | 9,713 |
| Sanofi SA sponsored ADR | | 453 | 23,470 |
| Teva Pharmaceutical Industries Ltd. sponsored ADR (b) | | 264 | 4,602 |
| UCB SA | | 182 | 30,461 |
| Zoetis, Inc. Class A | | 378 | 68,055 |
| | | | 677,913 |
TOTAL HEALTH CARE | | | 2,627,555 |
| INDUSTRIALS - 10.4% | | | |
| Aerospace & Defense - 2.8% | | | |
| AerSale Corp. (b) | | 88 | 593 |
| Airbus Group NV | | 264 | 39,950 |
| Axon Enterprise, Inc. (b) | | 82 | 24,601 |
| BWX Technologies, Inc. | | 148 | 14,725 |
| Curtiss-Wright Corp. | | 62 | 18,271 |
| General Electric Co. | | 1,567 | 266,703 |
| HEICO Corp. | | 33 | 7,964 |
| HEICO Corp. Class A | | 47 | 8,935 |
| Hexcel Corp. | | 84 | 5,562 |
| Howmet Aerospace, Inc. | | 185 | 17,705 |
| Kratos Defense & Security Solutions, Inc. (b) | | 434 | 9,782 |
| Lockheed Martin Corp. | | 65 | 35,225 |
| Northrop Grumman Corp. | | 218 | 105,582 |
| Spirit AeroSystems Holdings, Inc. Class A (b) | | 599 | 21,714 |
| Textron, Inc. | | 99 | 9,197 |
| V2X, Inc. (b) | | 146 | 7,611 |
| Woodward, Inc. | | 51 | 7,955 |
| | | | 602,075 |
| Air Freight & Logistics - 0.7% | | | |
| C.H. Robinson Worldwide, Inc. | | 354 | 31,524 |
| DHL Group | | 213 | 9,501 |
| Expeditors International of Washington, Inc. | | 341 | 42,564 |
| FedEx Corp. | | 183 | 55,312 |
| GXO Logistics, Inc. (b) | | 73 | 4,087 |
| | | | 142,988 |
| Building Products - 0.9% | | | |
| AAON, Inc. | | 78 | 6,905 |
| Advanced Drain Systems, Inc. | | 23 | 4,072 |
| AZZ, Inc. | | 37 | 2,959 |
| Builders FirstSource, Inc. (b) | | 8 | 1,339 |
| Carrier Global Corp. | | 369 | 25,133 |
| Fortune Brands Innovations, Inc. | | 226 | 18,263 |
| Johnson Controls International PLC | | 521 | 37,272 |
| Lennox International, Inc. | | 41 | 23,924 |
| Simpson Manufacturing Co. Ltd. | | 20 | 3,842 |
| The AZEK Co., Inc. Class A, (b) | | 97 | 4,354 |
| Trane Technologies PLC | | 198 | 66,187 |
| | | | 194,250 |
| Commercial Services & Supplies - 0.2% | | | |
| ACV Auctions, Inc. Class A (b) | | 561 | 9,582 |
| Veralto Corp. | | 268 | 28,558 |
| Vestis Corp. | | 229 | 2,970 |
| VSE Corp. | | 29 | 2,581 |
| | | | 43,691 |
| Construction & Engineering - 0.4% | | | |
| Comfort Systems U.S.A., Inc. | | 33 | 10,970 |
| Dycom Industries, Inc. (b) | | 39 | 7,157 |
| EMCOR Group, Inc. | | 49 | 18,397 |
| Granite Construction, Inc. | | 77 | 5,271 |
| IES Holdings, Inc. (b) | | 113 | 17,399 |
| Larsen & Toubro Ltd. GDR | | 115 | 5,244 |
| MasTec, Inc. (b) | | 28 | 3,081 |
| Quanta Services, Inc. | | 41 | 10,881 |
| Sterling Construction Co., Inc. (b) | | 91 | 10,589 |
| Willscot Holdings Corp. (b) | | 50 | 2,050 |
| | | | 91,039 |
| Electrical Equipment - 1.0% | | | |
| Acuity Brands, Inc. | | 52 | 13,070 |
| Atkore, Inc. | | 50 | 6,750 |
| Eaton Corp. PLC | | 109 | 33,222 |
| Fluence Energy, Inc. (b) | | 135 | 2,211 |
| GE Vernova LLC | | 456 | 81,277 |
| Generac Holdings, Inc. (b) | | 15 | 2,335 |
| Hubbell, Inc. | | 15 | 5,935 |
| Nextracker, Inc. Class A (b) | | 141 | 6,929 |
| nVent Electric PLC | | 63 | 4,576 |
| Regal Rexnord Corp. | | 152 | 24,423 |
| Thermon Group Holdings, Inc. (b) | | 192 | 6,300 |
| Vertiv Holdings Co. | | 408 | 32,110 |
| | | | 219,138 |
| Ground Transportation - 0.8% | | | |
| ArcBest Corp. | | 77 | 9,706 |
| Avis Budget Group, Inc. | | 9 | 909 |
| J.B. Hunt Transport Services, Inc. | | 97 | 16,796 |
| Landstar System, Inc. | | 51 | 9,703 |
| Ryder System, Inc. | | 67 | 9,391 |
| Saia, Inc. (b) | | 13 | 5,432 |
| Schneider National, Inc. Class B | | 264 | 7,104 |
| U-Haul Holding Co. (b) | | 52 | 3,473 |
| U-Haul Holding Co. (non-vtg.) | | 58 | 3,696 |
| Uber Technologies, Inc. (b) | | 1,078 | 69,499 |
| Union Pacific Corp. | | 175 | 43,178 |
| | | | 178,887 |
| Industrial Conglomerates - 0.4% | | | |
| Honeywell International, Inc. | | 285 | 58,354 |
| Siemens AG | | 179 | 32,774 |
| | | | 91,128 |
| Machinery - 1.9% | | | |
| Astec Industries, Inc. | | 108 | 3,790 |
| Atmus Filtration Technologies, Inc. | | 3 | 93 |
| Caterpillar, Inc. | | 123 | 42,583 |
| Chart Industries, Inc. (b) | | 63 | 10,148 |
| CNH Industrial NV | | 1,514 | 16,124 |
| Crane Co. | | 62 | 9,946 |
| Cummins, Inc. | | 187 | 54,567 |
| Deere & Co. | | 191 | 71,048 |
| Dover Corp. | | 43 | 7,923 |
| Federal Signal Corp. | | 93 | 9,297 |
| Fortive Corp. | | 39 | 2,802 |
| Hillenbrand, Inc. | | 69 | 3,052 |
| IDEX Corp. | | 32 | 6,671 |
| Ingersoll Rand, Inc. | | 149 | 14,960 |
| ITT, Inc. | | 19 | 2,688 |
| Kadant, Inc. | | 10 | 3,515 |
| Mitsubishi Heavy Industries Ltd. | | 900 | 10,787 |
| Oshkosh Corp. | | 46 | 4,998 |
| Pentair PLC | | 779 | 68,451 |
| SPX Technologies, Inc. (b) | | 82 | 12,098 |
| Terex Corp. | | 223 | 14,107 |
| Westinghouse Air Brake Tech Co. | | 12 | 1,934 |
| Xylem, Inc. | | 241 | 32,174 |
| | | | 403,756 |
| Passenger Airlines - 0.0% | | | |
| Delta Air Lines, Inc. | | 80 | 3,442 |
| Professional Services - 0.9% | | | |
| Automatic Data Processing, Inc. | | 343 | 90,079 |
| Broadridge Financial Solutions, Inc. | | 271 | 57,994 |
| CACI International, Inc. (b) | | 3 | 1,384 |
| Concentrix Corp. | | 36 | 2,538 |
| Dayforce, Inc. (b) | | 149 | 8,833 |
| ExlService Holdings, Inc. (b) | | 121 | 4,266 |
| First Advantage Corp. | | 142 | 2,445 |
| FTI Consulting, Inc. (b) | | 12 | 2,616 |
| ICF International, Inc. | | 24 | 3,530 |
| KBR, Inc. | | 49 | 3,263 |
| Maximus, Inc. | | 47 | 4,366 |
| Paychex, Inc. | | 60 | 7,681 |
| WNS Holdings Ltd. | | 68 | 4,051 |
| | | | 193,046 |
| Trading Companies & Distributors - 0.4% | | | |
| Air Lease Corp. Class A | | 51 | 2,531 |
| Applied Industrial Technologies, Inc. | | 24 | 5,237 |
| Core & Main, Inc. (b) | | 98 | 5,240 |
| Ferguson PLC | | 168 | 37,405 |
| GMS, Inc. (b) | | 50 | 4,812 |
| SiteOne Landscape Supply, Inc. (b) | | 13 | 1,907 |
| United Rentals, Inc. | | 17 | 12,871 |
| W.W. Grainger, Inc. | | 21 | 20,513 |
| WESCO International, Inc. | | 18 | 3,149 |
| | | | 93,665 |
TOTAL INDUSTRIALS | | | 2,257,105 |
| INFORMATION TECHNOLOGY - 27.3% | | | |
| Communications Equipment - 0.7% | | | |
| Arista Networks, Inc. (b) | | 65 | 22,526 |
| Ciena Corp. (b) | | 160 | 8,438 |
| Cisco Systems, Inc. | | 2,164 | 104,846 |
| Juniper Networks, Inc. | | 326 | 12,287 |
| Lumentum Holdings, Inc. (b) | | 118 | 6,110 |
| | | | 154,207 |
| Electronic Equipment, Instruments & Components - 0.5% | | | |
| Advanced Energy Industries, Inc. | | 117 | 13,615 |
| Belden, Inc. | | 69 | 6,396 |
| Celestica, Inc. (b) | | 70 | 3,671 |
| Corning, Inc. | | 70 | 2,801 |
| Crane NXT Co. | | 18 | 1,132 |
| Fabrinet (b) | | 49 | 10,807 |
| Insight Enterprises, Inc. (b) | | 68 | 15,266 |
| Keysight Technologies, Inc. (b) | | 194 | 27,077 |
| Sanmina Corp. (b) | | 8 | 603 |
| TD SYNNEX Corp. | | 40 | 4,767 |
| Trimble, Inc. (b) | | 209 | 11,399 |
| Vontier Corp. | | 58 | 2,275 |
| | | | 99,809 |
| IT Services - 1.9% | | | |
| Accenture PLC Class A | | 184 | 60,834 |
| Akamai Technologies, Inc. (b) | | 283 | 27,813 |
| Amdocs Ltd. | | 299 | 26,154 |
| ASGN, Inc. (b) | | 86 | 8,142 |
| Capgemini SA | | 78 | 15,485 |
| Cloudflare, Inc. (b) | | 94 | 7,285 |
| Cognizant Technology Solutions Corp. Class A | | 57 | 4,314 |
| DXC Technology Co. (b) | | 82 | 1,668 |
| Gartner, Inc. (b) | | 29 | 14,535 |
| GoDaddy, Inc. (b) | | 137 | 19,927 |
| IBM Corp. | | 457 | 87,808 |
| Kyndryl Holdings, Inc. (b) | | 105 | 2,821 |
| MongoDB, Inc. Class A (b) | | 83 | 20,946 |
| Okta, Inc. (b) | | 243 | 22,827 |
| Perficient, Inc. (b) | | 21 | 1,584 |
| Shopify, Inc. Class A (b) | | 272 | 16,659 |
| Snowflake, Inc. (b) | | 188 | 24,511 |
| Twilio, Inc. Class A (b) | | 514 | 30,393 |
| VeriSign, Inc. (b) | | 57 | 10,660 |
| Wix.com Ltd. (b) | | 69 | 10,759 |
| | | | 415,125 |
| Semiconductors & Semiconductor Equipment - 10.5% | | | |
| Advanced Micro Devices, Inc. (b) | | 472 | 68,195 |
| Allegro MicroSystems LLC (b) | | 385 | 9,255 |
| Analog Devices, Inc. | | 183 | 42,343 |
| Applied Materials, Inc. | | 395 | 83,819 |
| ASML Holding NV (depository receipt) | | 7 | 6,557 |
| Broadcom, Inc. | | 822 | 132,079 |
| Cirrus Logic, Inc. (b) | | 124 | 16,180 |
| Diodes, Inc. (b) | | 215 | 16,813 |
| Enphase Energy, Inc. (b) | | 101 | 11,626 |
| First Solar, Inc. (b) | | 86 | 18,575 |
| GlobalFoundries, Inc. (b) | | 647 | 33,003 |
| Ichor Holdings Ltd. (b) | | 121 | 4,114 |
| Intel Corp. | | 1,952 | 60,004 |
| Lam Research Corp. | | 65 | 59,881 |
| Lattice Semiconductor Corp. (b) | | 75 | 3,975 |
| Micron Technology, Inc. | | 491 | 53,922 |
| MKS Instruments, Inc. | | 52 | 6,547 |
| Monolithic Power Systems, Inc. | | 23 | 19,851 |
| Nova Ltd. (b) | | 22 | 4,542 |
| NVIDIA Corp. | | 10,124 | 1,184,691 |
| NXP Semiconductors NV | | 361 | 95,001 |
| ON Semiconductor Corp. (b) | | 374 | 29,266 |
| Onto Innovation, Inc. (b) | | 60 | 11,478 |
| Qorvo, Inc. (b) | | 82 | 9,824 |
| Qualcomm, Inc. | | 273 | 49,399 |
| Silicon Motion Tech Corp. sponsored ADR | | 68 | 4,722 |
| Skyworks Solutions, Inc. | | 81 | 9,203 |
| SMART Global Holdings, Inc. (b) | | 343 | 8,026 |
| Taiwan Semiconductor Manufacturing Co. Ltd. sponsored ADR | | 379 | 62,838 |
| Teradyne, Inc. | | 79 | 10,362 |
| Texas Instruments, Inc. | | 661 | 134,718 |
| Universal Display Corp. | | 24 | 5,343 |
| Wolfspeed, Inc. (b) | | 88 | 1,659 |
| | | | 2,267,811 |
| Software - 8.4% | | | |
| Adobe, Inc. (b) | | 179 | 98,745 |
| ANSYS, Inc. (b) | | 38 | 11,918 |
| AppFolio, Inc. Class A, (b) | | 9 | 1,993 |
| AppLovin Corp. Class A, (b) | | 6 | 463 |
| Atlassian Corp. PLC Class A, (b) | | 63 | 11,124 |
| Autodesk, Inc. (b) | | 259 | 64,108 |
| Bill Holdings, Inc. (b) | | 20 | 999 |
| Cadence Design Systems, Inc. (b) | | 87 | 23,286 |
| CCC Intelligent Solutions Holdings, Inc. Class A (b) | | 183 | 1,878 |
| Dolby Laboratories, Inc. Class A | | 34 | 2,678 |
| DoubleVerify Holdings, Inc. (b) | | 169 | 3,569 |
| Elastic NV (b) | | 81 | 8,883 |
| Fair Isaac Corp. (b) | | 6 | 9,600 |
| Five9, Inc. (b) | | 58 | 2,584 |
| Gen Digital, Inc. | | 1,100 | 28,589 |
| Guidewire Software, Inc. (b) | | 51 | 7,654 |
| HubSpot, Inc. (b) | | 40 | 19,881 |
| Informatica, Inc. (b) | | 63 | 1,508 |
| Intapp, Inc. (b) | | 99 | 3,547 |
| Intuit, Inc. | | 159 | 102,929 |
| Life360, Inc. | | 70 | 2,349 |
| Lumine Group, Inc. (b) | | 229 | 6,129 |
| Microsoft Corp. | | 2,412 | 1,009,060 |
| Open Text Corp. | | 70 | 2,207 |
| Oracle Corp. | | 570 | 79,487 |
| Palo Alto Networks, Inc. (b) | | 64 | 20,783 |
| Procore Technologies, Inc. (b) | | 27 | 1,918 |
| Progress Software Corp. | | 73 | 4,263 |
| PROS Holdings, Inc. (b) | | 162 | 3,904 |
| PTC, Inc. (b) | | 130 | 23,121 |
| Salesforce, Inc. | | 305 | 78,934 |
| SAP SE sponsored ADR | | 166 | 35,126 |
| SentinelOne, Inc. (b) | | 89 | 2,038 |
| ServiceNow, Inc. (b) | | 69 | 56,193 |
| SPS Commerce, Inc. (b) | | 45 | 9,694 |
| Synopsys, Inc. (b) | | 57 | 31,824 |
| Tenable Holdings, Inc. (b) | | 226 | 10,378 |
| Varonis Systems, Inc. (b) | | 64 | 3,528 |
| Vertex, Inc. Class A (b) | | 97 | 3,846 |
| Workday, Inc. Class A (b) | | 125 | 28,390 |
| Workiva, Inc. (b) | | 38 | 2,803 |
| | | | 1,821,911 |
| Technology Hardware, Storage & Peripherals - 5.3% | | | |
| Apple, Inc. | | 4,690 | 1,041,555 |
| Dell Technologies, Inc. | | 171 | 19,439 |
| Hewlett Packard Enterprise Co. | | 1,236 | 24,609 |
| HP, Inc. | | 497 | 17,937 |
| NetApp, Inc. | | 79 | 10,031 |
| Samsung Electronics Co. Ltd. | | 144 | 8,820 |
| Western Digital Corp. (b) | | 269 | 18,036 |
| | | | 1,140,427 |
TOTAL INFORMATION TECHNOLOGY | | | 5,899,290 |
| MATERIALS - 2.8% | | | |
| Chemicals - 1.4% | | | |
| Axalta Coating Systems Ltd. (b) | | 59 | 2,103 |
| CF Industries Holdings, Inc. | | 112 | 8,556 |
| Corteva, Inc. | | 149 | 8,359 |
| Dow, Inc. | | 438 | 23,858 |
| DuPont de Nemours, Inc. | | 237 | 19,837 |
| Ecolab, Inc. | | 285 | 65,747 |
| Element Solutions, Inc. | | 384 | 10,349 |
| FMC Corp. | | 94 | 5,486 |
| International Flavors & Fragrances, Inc. | | 192 | 19,100 |
| Linde PLC | | 118 | 53,513 |
| LyondellBasell Industries NV Class A | | 277 | 27,550 |
| Minerals Technologies, Inc. | | 94 | 7,368 |
| NewMarket Corp. | | 5 | 2,804 |
| Nutrien Ltd. | | 279 | 14,285 |
| PPG Industries, Inc. | | 182 | 23,110 |
| Quaker Chemical Corp. | | 15 | 2,724 |
| The Mosaic Co. | | 223 | 6,639 |
| Tronox Holdings PLC | | 135 | 2,182 |
| | | | 303,570 |
| Construction Materials - 0.4% | | | |
| CRH PLC | | 909 | 77,901 |
| Containers & Packaging - 0.2% | | | |
| Aptargroup, Inc. | | 17 | 2,499 |
| Ball Corp. | | 156 | 9,957 |
| Crown Holdings, Inc. | | 116 | 10,289 |
| Graphic Packaging Holding Co. | | 183 | 5,508 |
| International Paper Co. | | 209 | 9,714 |
| | | | 37,967 |
| Metals & Mining - 0.8% | | | |
| ATI, Inc. (b) | | 171 | 11,578 |
| Carpenter Technology Corp. | | 101 | 14,733 |
| Commercial Metals Co. | | 222 | 13,342 |
| Constellium NV (b) | | 315 | 5,610 |
| First Quantum Minerals Ltd. | | 2,527 | 30,932 |
| Ivanhoe Mines Ltd. (b) | | 1,529 | 19,989 |
| Lundin Mining Corp. | | 1,067 | 10,773 |
| Newmont Corp. | | 515 | 25,271 |
| Nucor Corp. | | 118 | 19,227 |
| Reliance, Inc. | | 11 | 3,350 |
| Royal Gold, Inc. | | 35 | 4,834 |
| Southern Copper Corp. | | 117 | 12,473 |
| Steel Dynamics, Inc. | | 98 | 13,056 |
| | | | 185,168 |
| Paper & Forest Products - 0.0% | | | |
| Louisiana-Pacific Corp. | | 62 | 6,086 |
| Sylvamo Corp. | | 29 | 2,138 |
| | | | 8,224 |
TOTAL MATERIALS | | | 612,830 |
| REAL ESTATE - 1.7% | | | |
| Equity Real Estate Investment Trusts (REITs) - 1.4% | | | |
| American Tower Corp. | | 226 | 49,810 |
| Crown Castle, Inc. | | 800 | 88,064 |
| Digital Realty Trust, Inc. | | 192 | 28,702 |
| Equinix, Inc. | | 61 | 48,205 |
| Iron Mountain, Inc. | | 192 | 19,692 |
| Omega Healthcare Investors, Inc. | | 51 | 1,856 |
| Outfront Media, Inc. | | 185 | 3,001 |
| Park Hotels & Resorts, Inc. | | 134 | 2,018 |
| Prologis, Inc. | | 96 | 12,101 |
| SBA Communications Corp. Class A | | 51 | 11,197 |
| Welltower, Inc. | | 280 | 31,150 |
| Weyerhaeuser Co. | | 340 | 10,798 |
| | | | 306,594 |
| Real Estate Management & Development - 0.3% | | | |
| CBRE Group, Inc. (b) | | 371 | 41,815 |
| Colliers International Group, Inc. | | 25 | 3,369 |
| Cushman & Wakefield PLC (b) | | 492 | 6,450 |
| Jones Lang LaSalle, Inc. (b) | | 63 | 15,807 |
| | | | 67,441 |
TOTAL REAL ESTATE | | | 374,035 |
| UTILITIES - 1.9% | | | |
| Electric Utilities - 1.2% | | | |
| Avangrid, Inc. | | 28 | 999 |
| Constellation Energy Corp. | | 60 | 11,388 |
| Edison International | | 569 | 45,526 |
| Eversource Energy | | 564 | 36,609 |
| Exelon Corp. | | 683 | 25,408 |
| NextEra Energy, Inc. | | 1,027 | 78,453 |
| PG&E Corp. | | 2,648 | 48,326 |
| | | | 246,709 |
| Gas Utilities - 0.1% | | | |
| Brookfield Infrastructure Corp. A Shares | | 238 | 9,258 |
| New Jersey Resources Corp. | | 50 | 2,338 |
| Southwest Gas Holdings, Inc. | | 128 | 9,492 |
| UGI Corp. | | 272 | 6,740 |
| | | | 27,828 |
| Independent Power and Renewable Electricity Producers - 0.0% | | | |
| Clearway Energy, Inc. Class C | | 149 | 3,975 |
| Multi-Utilities - 0.5% | | | |
| Consolidated Edison, Inc. | | 124 | 12,092 |
| National Grid PLC | | 1,019 | 12,929 |
| Public Service Enterprise Group, Inc. | | 1,081 | 86,231 |
| Sempra | | 63 | 5,044 |
| | | | 116,296 |
| Water Utilities - 0.1% | | | |
| American Water Works Co., Inc. | | 47 | 6,691 |
| Essential Utilities, Inc. | | 306 | 12,439 |
| | | | 19,130 |
TOTAL UTILITIES | | | 413,938 |
| TOTAL COMMON STOCKS (Cost $17,221,303) | | | 20,752,911 |
| | | | |
| Nonconvertible Preferred Stocks - 0.1% |
| | | Shares | Value ($) |
| INFORMATION TECHNOLOGY - 0.1% | | | |
| Technology Hardware, Storage & Peripherals - 0.1% | | | |
Samsung Electronics Co. Ltd. (Cost $28,803) | | 635 | 30,086 |
| | | | |
| Money Market Funds - 3.7% |
| | | Shares | Value ($) |
Fidelity Cash Central Fund 5.39% (d) (Cost $803,381) | | 803,220 | 803,381 |
| | | | |
| TOTAL INVESTMENT IN SECURITIES - 99.6% (Cost $18,053,487) | 21,586,378 |
NET OTHER ASSETS (LIABILITIES) - 0.4% | 76,371 |
| NET ASSETS - 100.0% | 21,662,749 |
| | |
| Futures Contracts |
| | Number of contracts | Expiration Date | Notional Amount ($) | Value ($) | Unrealized Appreciation/ (Depreciation) ($) |
| Purchased | | | | | |
| | | | | | |
| Equity Index Contracts | | | | | |
| CME E-mini S&P 500 Index Contracts (United States) | 2 | Sep 2024 | 555,800 | 3,983 | 3,983 |
| | | | | | |
| The notional amount of futures purchased as a percentage of Net Assets is 2.6% |
Legend
| (a) | Security exempt from registration under Rule 144A of the Securities Act of 1933. These securities may be resold in transactions exempt from registration, normally to qualified institutional buyers. At the end of the period, the value of these securities amounted to $21,670 or 0.1% of net assets. |
| (d) | Affiliated fund that is generally available only to investment companies and other accounts managed by Fidelity Investments. The rate quoted is the annualized seven-day yield of the fund at period end. A complete unaudited listing of the fund's holdings as of its most recent quarter end is available upon request. In addition, each Fidelity Central Fund's financial statements are available on the SEC's website or upon request. |
Affiliated Central Funds
Fiscal year to date information regarding the Fund's investments in Fidelity Central Funds, including the ownership percentage, is presented below.
| Affiliate | Value, beginning of period ($) | Purchases ($) | Sales Proceeds ($) | Dividend Income ($) | Realized Gain (loss) ($) | Change in Unrealized appreciation (depreciation) ($) | Value, end of period ($) | % ownership, end of period |
| Fidelity Cash Central Fund 5.39% | 717,580 | 7,576,141 | 7,490,332 | 21,569 | (8) | - | 803,381 | 0.0% |
| Total | 717,580 | 7,576,141 | 7,490,332 | 21,569 | (8) | - | 803,381 | |
| | | | | | | | | |
Amounts in the dividend income column in the above table include any capital gain distributions from underlying funds, which are presented in the corresponding line item in the Statement of Operations, if applicable.
Amounts included in the purchases and sales proceeds columns may include in-kind transactions, if applicable.
Investment Valuation
The following is a summary of the inputs used, as of July 31, 2024, involving the Fund's assets and liabilities carried at fair value. The inputs or methodology used for valuing securities may not be an indication of the risk associated with investing in those securities. For more information on valuation inputs, and their aggregation into the levels used below, please refer to the Investment Valuation section in the accompanying Notes to Financial Statements.
| Valuation Inputs at Reporting Date: |
| Description | Total ($) | Level 1 ($) | Level 2 ($) | Level 3 ($) |
Investments in Securities: | | | | |
|
| Equities: | | | | |
Communication Services | 1,492,740 | 1,477,683 | 15,057 | - |
Consumer Discretionary | 1,976,625 | 1,959,828 | 16,797 | - |
Consumer Staples | 1,211,368 | 1,198,655 | 12,713 | - |
Energy | 1,089,755 | 1,089,755 | - | - |
Financials | 2,797,670 | 2,793,204 | 4,466 | - |
Health Care | 2,627,555 | 2,613,072 | 14,483 | - |
Industrials | 2,257,105 | 2,164,093 | 93,012 | - |
Information Technology | 5,929,376 | 5,913,891 | 15,485 | - |
Materials | 612,830 | 612,830 | - | - |
Real Estate | 374,035 | 374,035 | - | - |
Utilities | 413,938 | 401,009 | 12,929 | - |
|
| Money Market Funds | 803,381 | 803,381 | - | - |
| Total Investments in Securities: | 21,586,378 | 21,401,436 | 184,942 | - |
Derivative Instruments: Assets | | | | |
Futures Contracts | 3,983 | 3,983 | - | - |
| Total Assets | 3,983 | 3,983 | - | - |
| Total Derivative Instruments: | 3,983 | 3,983 | - | - |
Value of Derivative Instruments
The following table is a summary of the Fund's value of derivative instruments by primary risk exposure as of July 31, 2024. For additional information on derivative instruments, please refer to the Derivative Instruments section in the accompanying Notes to Financial Statements.
Primary Risk Exposure / Derivative Type | Value |
| Asset ($) | Liability ($) |
| Equity Risk | | |
Futures Contracts (a) | 3,983 | 0 |
| Total Equity Risk | 3,983 | 0 |
| Total Value of Derivatives | 3,983 | 0 |
(a)Reflects gross cumulative appreciation (depreciation) on futures contracts as presented in the Schedule of Investments. In the Statement of Assets and Liabilities, the period end daily variation margin is included in receivable or payable for daily variation margin on futures contracts, and the net cumulative appreciation (depreciation) is included in Total accumulated earnings (loss).
Financial Statements (Unaudited)
| Statement of Assets and Liabilities |
| As of July 31, 2024 (Unaudited) |
| Assets | | | | |
| Investment in securities, at value - See accompanying schedule: | | | | |
Unaffiliated issuers (cost $17,250,106) | $ | 20,782,997 | | |
Fidelity Central Funds (cost $803,381) | | 803,381 | | |
| | | | | |
| | | | | |
| Total Investment in Securities (cost $18,053,487) | | | $ | 21,586,378 |
| Segregated cash with brokers for derivative instruments | | | | 26,200 |
| Cash | | | | 42,807 |
| Receivable for fund shares sold | | | | 36,813 |
| Dividends receivable | | | | 11,201 |
| Distributions receivable from Fidelity Central Funds | | | | 4,789 |
| Receivable for daily variation margin on futures contracts | | | | 8,550 |
| Receivable from investment adviser for expense reductions | | | | 3,025 |
Total assets | | | | 21,719,763 |
| Liabilities | | | | |
| Payable to custodian bank | $ | 1 | | |
| Payable for fund shares redeemed | | 50,430 | | |
| Custody fee payable | | 5,073 | | |
| Other payables and accrued expenses | | 1,510 | | |
| Total liabilities | | | | 57,014 |
| Net Assets | | | $ | 21,662,749 |
| Net Assets consist of: | | | | |
| Paid in capital | | | $ | 17,850,727 |
| Total accumulated earnings (loss) | | | | 3,812,022 |
| Net Assets | | | $ | 21,662,749 |
Net Asset Value, offering price and redemption price per share ($21,662,749 ÷ 1,601,303 shares) | | | $ | 13.53 |
| Statement of Operations |
Six months ended July 31, 2024 (Unaudited) |
| Investment Income | | | | |
| Dividends | | | $ | 115,200 |
| Income from Fidelity Central Funds | | | | 21,569 |
| Total income | | | | 136,769 |
| Expenses | | | | |
| Custodian fees and expenses | $ | 8,097 | | |
| Independent trustees' fees and expenses | | 30 | | |
| Miscellaneous | | 6 | | |
| Total expenses before reductions | | 8,133 | | |
| Expense reductions | | (7,844) | | |
| Total expenses after reductions | | | | 289 |
| Net Investment income (loss) | | | | 136,480 |
| Realized and Unrealized Gain (Loss) | | | | |
| Net realized gain (loss) on: | | | | |
| Investment Securities: | | | | |
| Unaffiliated issuers | | 93,195 | | |
| Fidelity Central Funds | | (8) | | |
| Foreign currency transactions | | (8) | | |
| Futures contracts | | 63,475 | | |
| Total net realized gain (loss) | | | | 156,654 |
| Change in net unrealized appreciation (depreciation) on: | | | | |
| Investment Securities: | | | | |
| Unaffiliated issuers | | 2,037,293 | | |
| Assets and liabilities in foreign currencies | | 5 | | |
| Futures contracts | | (3,769) | | |
| Total change in net unrealized appreciation (depreciation) | | | | 2,033,529 |
| Net gain (loss) | | | | 2,190,183 |
| Net increase (decrease) in net assets resulting from operations | | | $ | 2,326,663 |
| Statement of Changes in Net Assets |
| |
| | Six months ended July 31, 2024 (Unaudited) | | For the period May 11, 2023 (commencement of operations) through January 31, 2024 |
| Increase (Decrease) in Net Assets | | | | |
| Operations | | | | |
| Net investment income (loss) | $ | 136,480 | $ | 121,823 |
| Net realized gain (loss) | | 156,654 | | 16,532 |
| Change in net unrealized appreciation (depreciation) | | 2,033,529 | | 1,503,347 |
| Net increase (decrease) in net assets resulting from operations | | 2,326,663 | | 1,641,702 |
| Distributions to shareholders | | (40,584) | | (115,759) |
| | | | | |
| Share transactions | | | | |
| Proceeds from sales of shares | | 8,473,508 | | 11,690,685 |
| Reinvestment of distributions | | 40,583 | | 115,759 |
| Cost of shares redeemed | | (862,138) | | (1,607,670) |
| | | | | |
Net increase (decrease) in net assets resulting from share transactions | | 7,651,953 | | 10,198,774 |
| Total increase (decrease) in net assets | | 9,938,032 | | 11,724,717 |
| | | | | |
| Net Assets | | | | |
| Beginning of period | | 11,724,717 | | - |
| End of period | $ | 21,662,749 | $ | 11,724,717 |
| | | | | |
| Other Information | | | | |
| Shares | | | | |
| Sold | | 665,543 | | 1,134,619 |
| Issued in reinvestment of distributions | | 3,257 | | 10,363 |
| Redeemed | | (66,563) | | (145,916) |
| Net increase (decrease) | | 602,237 | | 999,066 |
| | | | | |
Financial Highlights
Fidelity® Series Sustainable U.S. Market Fund |
| |
| | Six months ended (Unaudited) July 31, 2024 | | Years ended January 31, 2024 A |
Selected Per-Share Data | | | | |
| Net asset value, beginning of period | $ | 11.74 | $ | 10.00 |
| Income from Investment Operations | | | | |
Net investment income (loss) B,C | | .10 | | .14 |
| Net realized and unrealized gain (loss) | | 1.72 | | 1.72 |
| Total from investment operations | | 1.82 | | 1.86 |
| Distributions from net investment income | | (.01) | | (.12) |
| Distributions from net realized gain | | (.02) | | (.01) |
| Total distributions | | (.03) | | (.12) D |
| Net asset value, end of period | $ | 13.53 | $ | 11.74 |
Total Return E,F | | | | 18.66% |
Ratios to Average Net Assets C,G,H | | | | |
| Expenses before reductions | | .09% I,J | | .10% J |
| Expenses net of fee waivers, if any | | | | -% J,K |
| Expenses net of all reductions | | -% I,J,K | | -% J,K |
| Net investment income (loss) | | 1.58% I,J | | 1.75% J |
| Supplemental Data | | | | |
| Net assets, end of period (000 omitted) | $ | 21,663 | $ | 11,725 |
Portfolio turnover rate L | | | | 28% J |
AFor the period May 11, 2023 (commencement of operations) through January 31, 2024.
BCalculated based on average shares outstanding during the period.
CNet investment income (loss) is affected by the timing of the declaration of dividends by any underlying mutual funds or exchange-traded funds (ETFs). Net investment income (loss) of any mutual funds or ETFs is not included in the Fund's net investment income (loss) ratio.
DTotal distributions per share do not sum due to rounding.
ETotal returns for periods of less than one year are not annualized.
FTotal returns would have been lower if certain expenses had not been reduced during the applicable periods shown.
GFees and expenses of any underlying mutual funds or exchange-traded funds (ETFs) are not included in the Fund's expense ratio. The Fund indirectly bears its proportionate share of these expenses. For additional expense information related to investments in Fidelity Central Funds, please refer to the "Investments in Fidelity Central Funds" note found in the Notes to Financial Statements section of the most recent Annual or Semi-Annual report.
HExpense ratios reflect operating expenses of the class. Expenses before reductions do not reflect amounts reimbursed, waived, or reduced through arrangements with the investment adviser, brokerage services, or other offset arrangements, if applicable, and do not represent the amount paid by the class during periods when reimbursements, waivers or reductions occur.
IProxy expenses are not annualized.
JAnnualized.
KAmount represents less than .005%.
LAmount does not include the portfolio activity of any underlying mutual funds or exchange-traded funds (ETFs).
Notes to Financial Statements
(Unaudited)For the period ended July 31, 2024
1. Organization.
Fidelity Series Sustainable U.S. Market Fund (the Fund) is a fund of Fidelity Summer Street Trust (the Trust) and is authorized to issue an unlimited number of shares. Shares are offered only to certain other Fidelity funds, Fidelity managed 529 plans, and Fidelity managed collective investment trusts. The Trust is registered under the Investment Company Act of 1940, as amended (the 1940 Act), as an open-end management investment company organized as a Massachusetts business trust.
2. Investments in Fidelity Central Funds.
Funds may invest in Fidelity Central Funds, which are open-end investment companies generally available only to other investment companies and accounts managed by the investment adviser and its affiliates. The Schedule of Investments lists any Fidelity Central Funds held as an investment as of period end, but does not include the underlying holdings of each Fidelity Central Fund. An investing fund indirectly bears its proportionate share of the expenses of the underlying Fidelity Central Funds.
Based on its investment objective, each Fidelity Central Fund may invest or participate in various investment vehicles or strategies that are similar to those of the investing fund. These strategies are consistent with the investment objectives of the investing fund and may involve certain economic risks which may cause a decline in value of each of the Fidelity Central Funds and thus a decline in the value of the investing fund.
| Fidelity Central Fund | Investment Manager | Investment Objective | Investment Practices | Expense RatioA |
| Fidelity Money Market Central Funds | Fidelity Management & Research Company LLC (FMR) | Each fund seeks to obtain a high level of current income consistent with the preservation of capital and liquidity. | Short-term Investments | Less than .005% |
A Expenses expressed as a percentage of average net assets and are as of each underlying Central Fund's most recent annual or semi-annual shareholder report.
A complete unaudited list of holdings for each Fidelity Central Fund is available upon request or at the Securities and Exchange Commission website at www.sec.gov. In addition, the financial statements of the Fidelity Central Funds which contain the significant accounting policies (including investment valuation policies) of those funds, and are not covered by the Report of Independent Registered Public Accounting Firm, are available on the Securities and Exchange Commission website or upon request.
3. Significant Accounting Policies.
The Fund is an investment company and applies the accounting and reporting guidance of the Financial Accounting Standards Board (FASB) Accounting Standards Codification Topic 946 Financial Services - Investment Companies. The financial statements have been prepared in conformity with accounting principles generally accepted in the United States of America (GAAP), which require management to make certain estimates and assumptions at the date of the financial statements. Actual results could differ from those estimates. Subsequent events, if any, through the date that the financial statements were issued have been evaluated in the preparation of the financial statements. The Fund's Schedule of Investments lists any underlying mutual funds or exchange-traded funds (ETFs) but does not include the underlying holdings of these funds. The following summarizes the significant accounting policies of the Fund:
Investment Valuation. Investments are valued as of 4:00 p.m. Eastern time on the last calendar day of the period. The Board of Trustees (the Board) has designated the Fund's investment adviser as the valuation designee responsible for the fair valuation function and performing fair value determinations as needed. The investment adviser has established a Fair Value Committee (the Committee) to carry out the day-to-day fair valuation responsibilities and has adopted policies and procedures to govern the fair valuation process and the activities of the Committee. In accordance with these fair valuation policies and procedures, which have been approved by the Board, the Fund attempts to obtain prices from one or more third party pricing services or brokers to value its investments. When current market prices, quotations or currency exchange rates are not readily available or reliable, investments will be fair valued in good faith by the Committee, in accordance with the policies and procedures. Factors used in determining fair value vary by investment type and may include market or investment specific events, transaction data, estimated cash flows, and market observations of comparable investments. The frequency that the fair valuation procedures are used cannot be predicted and they may be utilized to a significant extent. The Committee manages the Fund's fair valuation practices and maintains the fair valuation policies and procedures. The Fund's investment adviser reports to the Board information regarding the fair valuation process and related material matters.
The Fund categorizes the inputs to valuation techniques used to value its investments into a disclosure hierarchy consisting of three levels as shown below:
Level 1 - unadjusted quoted prices in active markets for identical investments
Level 2 - other significant observable inputs (including quoted prices for similar investments, interest rates, prepayment speeds, etc.)
Level 3 - unobservable inputs (including the Fund's own assumptions based on the best information available)
Valuation techniques used to value the Fund's investments by major category are as follows:
Equity securities, including restricted securities, for which market quotations are readily available, are valued at the last reported sale price or official closing price as reported by a third party pricing service on the primary market or exchange on which they are traded and are categorized as Level 1 in the hierarchy. In the event there were no sales during the day or closing prices are not available, securities are valued at the last quoted bid price or may be valued using the last available price and are generally categorized as Level 2 in the hierarchy. For foreign equity securities, when market or security specific events arise, comparisons to the valuation of American Depositary Receipts (ADRs), futures contracts, Exchange-Traded Funds (ETFs) and certain indexes as well as quoted prices for similar securities may be used and would be categorized as Level 2 in the hierarchy. For equity securities, including restricted securities, where observable inputs are limited, assumptions about market activity and risk are used and these securities may be categorized as Level 3 in the hierarchy.
Futures contracts are valued at the settlement price established each day by the board of trade or exchange on which they are traded and are categorized as Level 1 in the hierarchy. Investments in open-end mutual funds, including the Fidelity Central Funds, are valued at their closing net asset value (NAV) each business day and are categorized as Level 1 in the hierarchy.
Changes in valuation techniques may result in transfers in or out of an assigned level within the disclosure hierarchy. The aggregate value of investments by input level as of July 31, 2024 is included at the end of the Fund's Schedule of Investments.
Foreign Currency. Certain Funds may use foreign currency contracts to facilitate transactions in foreign-denominated securities. Gains and losses from these transactions may arise from changes in the value of the foreign currency or if the counterparties do not perform under the contracts' terms.
Foreign-denominated assets, including investment securities, and liabilities are translated into U.S. dollars at the exchange rates at period end. Purchases and sales of investment securities, income and dividends received, and expenses denominated in foreign currencies are translated into U.S. dollars at the exchange rate in effect on the transaction date.
The effects of exchange rate fluctuations on investments are included with the net realized and unrealized gain (loss) on investment securities. Other foreign currency transactions resulting in realized and unrealized gain (loss) are disclosed separately.
Investment Transactions and Income. For financial reporting purposes, the Fund's investment holdings and NAV include trades executed through the end of the last business day of the period. The NAV per share for processing shareholder transactions is calculated as of the close of business of the New York Stock Exchange (NYSE), normally 4:00 p.m. Eastern time and includes trades executed through the end of the prior business day. Gains and losses on securities sold are determined on the basis of identified cost. Commissions paid to certain brokers with whom the investment adviser, or its affiliates, places trades on behalf of a fund include an amount in addition to trade execution, which may be rebated back to a fund. Any such rebates are included in net realized gain (loss) on investments in the Statement of Operations. Dividend income is recorded on the ex-dividend date, except for certain dividends from foreign securities where the ex-dividend date may have passed, which are recorded as soon as the Fund is informed of the ex-dividend date. Non-cash dividends included in dividend income, if any, are recorded at the fair market value of the securities received. Income and capital gain distributions from Fidelity Central Funds, if any, are recorded on the ex-dividend date. Certain distributions received by the Fund represent a return of capital or capital gain. The Fund determines the components of these distributions subsequent to the ex-dividend date, based upon receipt of tax filings or other correspondence relating to the underlying investment. These distributions are recorded as a reduction of cost of investments and/or as a realized gain. Investment income is recorded net of foreign taxes withheld where recovery of such taxes is uncertain.
Expenses. Expenses directly attributable to a fund are charged to that fund. Expenses attributable to more than one fund are allocated among the respective funds on the basis of relative net assets or other appropriate methods. Expenses included in the accompanying financial statements reflect the expenses of that fund and do not include any expenses associated with any underlying mutual funds or exchange-traded funds. Although not included in a fund's expenses, a fund indirectly bears its proportionate share of these expenses through the net asset value of each underlying mutual fund or exchange-traded fund. Expense estimates are accrued in the period to which they relate and adjustments are made when actual amounts are known.
Income Tax Information and Distributions to Shareholders. Each year, the Fund intends to qualify as a regulated investment company under Subchapter M of the Internal Revenue Code, including distributing substantially all of its taxable income and realized gains. As a result, no provision for U.S. Federal income taxes is required. The Fund files a U.S. federal tax return, in addition to state and local tax returns as required. The Fund's federal income tax returns are subject to examination by the Internal Revenue Service (IRS) for a period of three fiscal years after they are filed. State and local tax returns may be subject to examination for an additional fiscal year depending on the jurisdiction. Foreign taxes are provided for based on the Fund's understanding of the tax rules and rates that exist in the foreign markets in which it invests.
Distributions are declared and recorded on the ex-dividend date. Income and capital gain distributions are determined in accordance with income tax regulations, which may differ from GAAP.
Capital accounts within the financial statements are adjusted for permanent book-tax differences. These adjustments have no impact on net assets or the results of operations. Capital accounts are not adjusted for temporary book-tax differences which will reverse in a subsequent period.
Book-tax differences are primarily due to futures contracts, passive foreign investment companies (PFIC)and losses deferred due to wash sales.
As of period end, the cost and unrealized appreciation (depreciation) in securities, and derivatives if applicable, for federal income tax purposes were as follows:
Gross unrealized appreciation | $3,939,136 |
Gross unrealized depreciation | (407,992) |
Net unrealized appreciation (depreciation) | $3,531,144 |
Tax cost | $18,059,217 |
Restricted Securities (including Private Placements). Funds may invest in securities that are subject to legal or contractual restrictions on resale. These securities generally may be resold in transactions exempt from registration or to the public if the securities are registered. Disposal of these securities may involve time-consuming negotiations and expense, and prompt sale at an acceptable price may be difficult. Information regarding restricted securities held at period end is included at the end of the Schedule of Investments, if applicable.
4. Derivative Instruments.
Risk Exposures and the Use of Derivative Instruments. The Fund's investment objectives allow for various types of derivative instruments, including futures contracts. Derivatives are investments whose value is primarily derived from underlying assets, indices or reference rates and may be transacted on an exchange or over-the-counter (OTC). Derivatives may involve a future commitment to buy or sell a specified asset based on specified terms, to exchange future cash flows at periodic intervals based on a notional principal amount, or for one party to make one or more payments upon the occurrence of specified events in exchange for periodic payments from the other party.
Derivatives were used to increase returns and to manage exposure to certain risks as defined below. The success of any strategy involving derivatives depends on analysis of numerous economic factors, and if the strategies for investment do not work as intended, the objectives may not be achieved.
Derivatives were used to increase or decrease exposure to the following risk(s):
| | |
| Equity Risk | Equity risk relates to the fluctuations in the value of financial instruments as a result of changes in market prices (other than those arising from interest rate risk or foreign exchange risk), whether caused by factors specific to an individual investment, its issuer, or all factors affecting all instruments traded in a market or market segment. |
Funds are also exposed to additional risks from investing in derivatives, such as liquidity risk and counterparty credit risk. Liquidity risk is the risk that a fund will be unable to close out the derivative in the open market in a timely manner. Counterparty credit risk is the risk that the counterparty will not be able to fulfill its obligation to a fund. Counterparty credit risk related to exchange-traded contracts may be mitigated by the protection provided by the exchange on which they trade.
Investing in derivatives may involve greater risks than investing in the underlying assets directly and, to varying degrees, may involve risk of loss in excess of any initial investment and collateral received and amounts recognized in the Statement of Assets and Liabilities. In addition, there may be the risk that the change in value of the derivative contract does not correspond to the change in value of the underlying instrument.
Futures Contracts. A futures contract is an agreement between two parties to buy or sell a specified underlying instrument for a fixed price at a specified future date. Futures contracts were used to manage exposure to the stock market.
Upon entering into a futures contract, a fund is required to deposit either cash or securities (initial margin) with a clearing broker in an amount equal to a certain percentage of the face value of the contract. Futures contracts are marked-to-market daily and subsequent daily payments are made or received by a fund depending on the daily fluctuations in the value of the futures contracts and are recorded as unrealized appreciation or (depreciation). This receivable and/or payable, if any, is included in daily variation margin on futures contracts in the Statement of Assets and Liabilities. Realized gain or (loss) is recorded upon the expiration or closing of a futures contract. The net realized gain (loss) and change in net unrealized appreciation (depreciation) on futures contracts during the period is presented in the Statement of Operations.
Any open futures contracts at period end are presented in the Schedule of Investments under the caption "Futures Contracts". The notional amount at value reflects each contract's exposure to the underlying instrument or index at period end, and is representative of volume of activity during the period unless an average notional amount is presented. Any securities deposited to meet initial margin requirements are identified in the Schedule of Investments. Any cash deposited to meet initial margin requirements is presented as segregated cash with brokers for derivative instruments in the Statement of Assets and Liabilities.
5. Purchases and Sales of Investments.
Purchases and sales of securities, other than short-term securities, and in-kind transactions, as applicable, are noted in the table below.
| | Purchases ($) | Sales ($) |
Fidelity Series Sustainable U.S. Market Fund | 9,409,585 | 1,783,249 |
6. Fees and Other Transactions with Affiliates.
Management Fee. Fidelity Management & Research Company LLC (the investment adviser) and its affiliates provide the Fund with investment management related services for which the Fund does not pay a management fee. Under the management contract, the investment adviser or an affiliate pays all ordinary operating expenses of the Fund, except custody fees, fees and expenses of the independent Trustees, and certain miscellaneous expenses such as proxy and shareholder meeting expenses.
Brokerage Commissions. A portion of portfolio transactions were placed with brokerage firms which are affiliates of the investment adviser. Brokerage commissions are included in net realized gain (loss) and change in net unrealized appreciation (depreciation) in the Statement of Operations. The commissions paid to these affiliated firms were as follows:
| | Amount ($) |
| Fidelity Series Sustainable U.S. Market Fund | 102 |
Interfund Trades. Funds may purchase from or sell securities to other Fidelity Funds under procedures adopted by the Board. The procedures have been designed to ensure these interfund trades are executed in accordance with Rule 17a-7 of the 1940 Act. Any interfund trades are included within the respective purchases and sales amounts shown in the Purchases and Sales of Investments note. Interfund trades during the period are noted in the table below.
| | Purchases ($) | Sales ($) | Realized Gain (Loss)($) |
| Fidelity Series Sustainable U.S. Market Fund | 30,666 | 7,166 | (683) |
Sub Advisory Arrangements. Effective March 1, 2024, the Fund's sub-advisory agreements with FMR Investment Management (UK) Limited, Fidelity Management & Research (Hong Kong) Limited, and Fidelity Management & Research (Japan) Limited were amended to provide that the investment adviser pays each sub-adviser monthly fees equal to 110% of the sub-adviser's costs for providing sub-advisory services.
7. Committed Line of Credit.
Certain Funds participate with other funds managed by the investment adviser or an affiliate in a $4.25 billion credit facility (the "line of credit") to be utilized for temporary or emergency purposes to fund shareholder redemptions or for other short-term liquidity purposes. The commitment fees on the pro-rata portion of the line of credit are borne by the investment adviser. During the period, there were no borrowings on this line of credit.
8. Expense Reductions.
The investment adviser contractually agreed to reimburse the Fund to the extent annual operating expenses exceeded .003% of average net assets. This reimbursement will remain in place through May 31, 2027. Some expenses, for example the compensation of the independent Trustees, and certain other expenses such as interest expense, are excluded from this reimbursement. During the period this reimbursement reduced the Fund's expenses by $7,844.
9. Other.
A fund's organizational documents provide former and current trustees and officers with a limited indemnification against liabilities arising in connection with the performance of their duties to the fund. In the normal course of business, a fund may also enter into contracts that provide general indemnifications. A fund's maximum exposure under these arrangements is unknown as this would be dependent on future claims that may be made against a fund. The risk of material loss from such claims is considered remote.
At the end of the period, mutual funds and accounts managed by the investment adviser or its affiliates were the owners of record of all of the outstanding shares of the Fund.
10. Risk and Uncertainties.
Many factors affect a fund's performance. Developments that disrupt global economies and financial markets, such as pandemics, epidemics, outbreaks of infectious diseases, war, terrorism, and environmental disasters, may significantly affect a fund's investment performance. The effects of these developments to a fund will be impacted by the types of securities in which a fund invests, the financial condition, industry, economic sector, and geographic location of an issuer, and a fund's level of investment in the securities of that issuer. Significant concentrations in security types, issuers, industries, sectors, and geographic locations may magnify the factors that affect a fund's performance.
Item 8: Changes in and Disagreements with Accountants for Open-End Management Investment Companies
Note: This is not applicable for any fund included in this document.
Item 9: Proxy Disclosures for Open-End Management Investment Companies
| A special meeting of shareholders was held on July 16, 2024. The results of votes taken among shareholders on the proposal before them are reported below. Each vote reported represents one dollar of net asset value held on the record date for the meeting. |
| Proposal 1 |
| To elect a Board of Trustees. |
| | # of Votes | % of Votes |
| Bettina Doulton |
| Affirmative | 14,516,835,136.19 | 94.56 |
| Withheld | 834,887,998.33 | 5.44 |
| TOTAL | 15,351,723,134.52 | 100.00 |
| Robert A. Lawrence |
| Affirmative | 14,430,495,798.10 | 94.00 |
| Withheld | 921,227,336.42 | 6.00 |
| TOTAL | 15,351,723,134.52 | 100.00 |
| Vijay C. Advani |
| Affirmative | 14,465,231,640.25 | 94.23 |
| Withheld | 886,491,494.27 | 5.77 |
| TOTAL | 15,351,723,134.52 | 100.00 |
| Thomas P. Bostick |
| Affirmative | 14,471,831,170.84 | 94.27 |
| Withheld | 879,891,963.68 | 5.73 |
| TOTAL | 15,351,723,134.52 | 100.00 |
| Donald F. Donahue |
| Affirmative | 14,432,670,599.88 | 94.01 |
| Withheld | 919,052,534.64 | 5.99 |
| TOTAL | 15,351,723,134.52 | 100.00 |
| Vicki L. Fuller |
| Affirmative | 14,531,407,981.65 | 94.66 |
| Withheld | 820,315,152.87 | 5.34 |
| TOTAL | 15,351,723,134.52 | 100.00 |
| Patricia L. Kampling |
| Affirmative | 14,549,142,839.16 | 94.77 |
| Withheld | 802,580,295.36 | 5.23 |
| TOTAL | 15,351,723,134.52 | 100.00 |
| Thomas A. Kennedy |
| Affirmative | 14,469,818,769.40 | 94.26 |
| Withheld | 881,904,365.12 | 5.74 |
| TOTAL | 15,351,723,134.52 | 100.00 |
| Oscar Munoz |
| Affirmative | 14,434,061,467.08 | 94.02 |
| Withheld | 917,661,667.44 | 5.98 |
| TOTAL | 15,351,723,134.52 | 100.00 |
| Karen B. Peetz |
| Affirmative | 14,521,904,618.46 | 94.59 |
| Withheld | 829,818,516.06 | 5.41 |
| TOTAL | 15,351,723,134.52 | 100.00 |
| David M. Thomas |
| Affirmative | 14,417,745,861.73 | 93.92 |
| Withheld | 933,977,272.79 | 6.08 |
| TOTAL | 15,351,723,134.52 | 100.00 |
| Susan Tomasky |
| Affirmative | 14,467,973,468.18 | 94.24 |
| Withheld | 883,749,666.34 | 5.76 |
| TOTAL | 15,351,723,134.52 | 100.00 |
| Michael E. Wiley |
| Affirmative | 14,424,002,796.91 | 93.96 |
| Withheld | 927,720,337.61 | 6.04 |
| TOTAL | 15,351,723,134.52 | 100.00 |
| | | |
| Proposal 1 reflects trust-wide proposal and voting results. |
Item 10: Remuneration Paid to Directors, Officers, and others of Open-End Management Investment Companies
Note: This information is disclosed as part of the financial statements for each Fund as part of Item 7: Financial Statements and Financial Highlights for Open-End Management Investment companies.
Item 11: Statement Regarding Basis for Approval of Investment Advisory Contract
Board Approval of Investment Advisory Contracts and Management Fees
Fidelity Series Sustainable U.S. Market Fund
Each year, the Board of Trustees, including the Independent Trustees (together, the Board), considers the renewal of the fund's management contract with Fidelity Management & Research Company LLC (FMR) and the sub-advisory agreements (together, the Advisory Contracts) for the fund. FMR and the sub-advisers are referred to herein as the Investment Advisers. The Board, assisted by the advice of fund counsel and Independent Trustees' counsel, requests and considers a broad range of information relevant to the renewal of the Advisory Contracts throughout the year.
The Board meets regularly and, at each of its meetings, covers an extensive agenda of topics and materials and considers factors that are relevant to its annual consideration of the renewal of the fund's Advisory Contracts, including the services and support provided to the fund and its shareholders. The Board, acting directly and through its Committees (each of which is composed of and chaired by Independent Trustees), requests and receives information concerning the annual consideration of the renewal of the fund's Advisory Contracts. The Board also meets as needed to review matters specifically related to the Board's annual consideration of the renewal of the Advisory Contracts. Members of the Board may also meet with trustees of other Fidelity funds through joint ad hoc committees to discuss certain matters relevant to all of the Fidelity funds.
At its May 2024 meeting, the Board unanimously determined to renew the fund's Advisory Contracts. The Board considered all factors it believed relevant and reached a determination, with the assistance of fund counsel and Independent Trustees' counsel and through the exercise of its business judgment, that the renewal of the Advisory Contracts was in the best interests of the fund and its shareholders and the fact that no fee is payable under the management contract was fair and reasonable in light of all of the surrounding circumstances.
Nature, Extent, and Quality of Services Provided. The Board considered staffing as it relates to the fund, including the backgrounds and experience of investment personnel of the Investment Advisers, and also considered the Investment Advisers' implementation of the fund's investment program. The Independent Trustees also had discussions with senior management of Fidelity's investment operations and investment groups. The Board considered the structure of the investment personnel compensation program and whether this structure provides appropriate incentives to act in the best interests of the fund.
Resources Dedicated to Investment Management and Support Services. The Board and the Fund Oversight and Research Committees reviewed the general qualifications and capabilities of Fidelity's investment staff, including its size, education, experience, and resources, as well as Fidelity's approach to recruiting, training, managing, and compensating investment personnel. The Board noted the resources devoted to expansion of Fidelity's global investment organization, and that Fidelity's analysts have extensive resources, tools, and capabilities that allow them to conduct sophisticated quantitative and fundamental analysis, as well as credit analysis of issuers, counterparties, and guarantors. Further, the Board considered that Fidelity's investment professionals have sufficient access to global information and data so as to provide competitive investment results over time, and that those professionals also have access to sophisticated tools that permit them to assess portfolio construction and risk and performance attribution characteristics continuously, as well as to transmit new information and research conclusions rapidly around the world. Additionally, in its deliberations, the Board considered Fidelity's trading, risk management, compliance, and technology and operations capabilities and resources, which are integral parts of the investment management process.
Administrative Services. The Board considered (i) the nature, extent, quality, and cost of advisory and administrative services performed by the Investment Advisers and their affiliates under the Advisory Contracts and under separate agreements covering transfer agency and pricing and bookkeeping services for the fund; (ii) the nature and extent of Fidelity's supervision of third party service providers, principally custodians, subcustodians, and pricing vendors; and (iii) the resources devoted by Fidelity to, and the record of compliance with, the fund's compliance policies and procedures. The Board also reviewed the allocation of fund brokerage, including allocations to brokers affiliated with the Investment Advisers, the use of brokerage commissions to pay fund expenses, and the use of "soft" commission dollars to pay for research services. The Board also considered the fund's securities lending activities and any payments made to Fidelity relating to securities lending under a separate agreement.
Investment Performance. The Board reviewed the fund's absolute investment performance, as well as the fund's relative investment performance, and noted that the fund is not publicly offered as a stand-alone investment product. In this regard, the Board noted that the fund is designed to offer an investment option for other investment companies, 529 plans, and collective investment trusts managed by Fidelity and ultimately to enhance the performance of those investment companies, 529 plans, and collective investment trusts.
Based on its review, the Board concluded that the nature, extent, and quality of services provided to the fund under the Advisory Contracts should continue to benefit the shareholders of the fund.
Competitiveness of Management Fee and Total Expense Ratio. The Board considered that the fund does not pay FMR a management fee for investment advisory services, but that FMR receives fees for providing services to funds that invest in the fund. The Board noted that FMR or an affiliate undertakes to pay all operating expenses of the fund, except transfer agent fees, 12b-1 fees, Independent Trustee fees and expenses, custodian fees and expenses, proxy and shareholder meeting expenses, interest, taxes, and extraordinary expenses (such as litigation expenses). The Board further noted that the fund pays its non-operating expenses, including brokerage commissions and fees and expenses associated with the fund's securities lending program, if applicable.
The Board further considered that FMR has contractually agreed to reimburse the fund to the extent that total operating expenses, with certain exceptions, as a percentage of its average net assets, exceed 0.003% through May 31, 2027.
Based on its review, the Board considered that the fund does not pay a management fee and concluded that the total expense ratio of the fund was reasonable in light of the services that the fund and its shareholders receive and the other factors considered.
Costs of the Services and Profitability. The Board considered the level of Fidelity's profits in respect of all the Fidelity funds.
A public accounting firm has been engaged annually by the Board as part of the Board's assessment of Fidelity's profitability analysis. The engagement includes the review and assessment of the methodologies used by Fidelity in determining the revenues and expenses attributable to Fidelity's fund business, and completion of agreed-upon procedures in respect of the mathematical accuracy of certain fund profitability information and its conformity to established allocation methodologies. After considering the reports issued under the engagement and information provided by Fidelity, the Board concluded that while other allocation methods may also be reasonable, Fidelity's profitability methodologies are reasonable in all material respects.
The Board also reviewed Fidelity's non-fund businesses and potential indirect benefits such businesses may have received as a result of their association with Fidelity's fund business (i.e., fall-out benefits) as well as cases where Fidelity's affiliates may benefit from the funds' business. The Board considered areas where potential indirect benefits to the Fidelity funds from their relationships with Fidelity may exist. The Board's consideration of these matters was informed by the findings of a joint ad hoc committee created by it and the boards of other Fidelity funds to evaluate potential fall-out benefits.
The Board concluded that the costs of the services provided by and the profits realized by Fidelity in connection with the operation of the fund were not relevant to the renewal of the Advisory Contracts because the fund pays no advisory fees and FMR bears all expenses of the fund with certain exceptions.
Economies of Scale. The Board concluded that because the fund pays no advisory fees and FMR bears all expenses of the fund with certain exceptions, the realization of economies of scale was not a material factor in the Board's decision to renew the fund's Advisory Contracts.
Additional Information Requested by the Board. In order to develop fully the factual basis for consideration of the Fidelity funds' advisory contracts, the Board requested and received additional information on certain topics, including but not limited to: (i) fund flow and performance trends, in particular the underperformance of certain funds and strategies, and Fidelity's long-term strategies for certain funds; (ii) the operation of performance fees and the rationale for implementing performance fees on certain categories of funds but not others; (iii) Fidelity's pricing philosophy compared to competitors; (iv) fund profitability methodology and data; (v) evaluation of competitive fund data and peer group classifications and fee and expense comparisons; (vi) the management fee and expense structures for different funds and classes and information about the differences between various fee and expense structures; (vii) the variable management fee implemented for certain funds effective March 1, 2024; and (viii) information regarding other accounts managed by Fidelity and the funds' sub-advisory arrangements.
Conclusion. Based on its evaluation of all of the conclusions noted above, and after considering all factors it believed relevant, the Board, including the Independent Trustees, concluded that the advisory and sub-advisory fee arrangements are fair and reasonable in light of all of the surrounding circumstances and that the fund's Advisory Contracts should be renewed through May 31, 2025.
1.9908960.101
SUQ-SANN-0924
Item 8.
Changes in and Disagreements with Accountants for Open-End Management Investment Companies
See Item 7.
Item 9.
Proxy Disclosures for Open-End Management Investment Companies
See Item 7.
Item 10.
Remuneration Paid to Directors, Officers, and Others of Open-End Management Investment Companies
See Item 7.
Item 11.
Statement Regarding Basis for Approval of Investment Advisory Contract
See Item 7.
Item 12.
Disclosure of Proxy Voting Policies and Procedures for Closed-End Management Investment Companies
Not applicable.
Item 13.
Portfolio Managers of Closed-End Management Investment Companies
Not applicable.
Item 14.
Purchases of Equity Securities by Closed-End Management Investment Company and Affiliated Purchasers
Not applicable.
Item 15.
Submission of Matters to a Vote of Security Holders
There were no material changes to the procedures by which shareholders may recommend nominees to the Fidelity Summer Street Trust’s Board of Trustees.
Item 16.
Controls and Procedures
(a)(i) The President and Treasurer and the Chief Financial Officer have concluded that the Fidelity Summer Street Trust’s (the “Trust”) disclosure controls and procedures (as defined in Rule 30a-3(c) under the Investment Company Act) provide reasonable assurances that material information relating to the Trust is made known to them by the appropriate persons, based on their evaluation of these controls and procedures as of a date within 90 days of the filing date of this report.
(a)(ii) There was no change in the Trust’s internal control over financial reporting (as defined in Rule 30a-3(d) under the Investment Company Act) that occurred during the period covered by this report that has materially affected, or is reasonably likely to materially affect, the Trust’s internal control over financial reporting.
Item 17.
Disclosure of Securities Lending Activities for Closed-End Management Investment Companies
Not applicable.
Item 18.
Recovery of Erroneously Awarded Compensation
(a)
Not applicable.
(b)
Not applicable.
Item 19.
Exhibits
SIGNATURES
Pursuant to the requirements of the Securities Exchange Act of 1934 and the Investment Company Act of 1940, the registrant has duly caused this report to be signed on its behalf by the undersigned, thereunto duly authorized.
Fidelity Summer Street Trust
|
By: | /s/Stacie M. Smith |
| Stacie M. Smith |
| President and Treasurer (Principal Executive Officer) |
|
|
Date: | September 20, 2024 |
Pursuant to the requirements of the Securities Exchange Act of 1934 and the Investment Company Act of 1940, this report has been signed below by the following persons on behalf of the registrant and in the capacities and on the dates indicated.
|
By: | /s/Stacie M. Smith |
| Stacie M. Smith |
| President and Treasurer (Principal Executive Officer) |
|
|
Date: | September 20, 2024 |
|
By: | /s/John J. Burke III |
| John J. Burke III |
| Chief Financial Officer (Principal Financial Officer) |
|
|
Date: | September 20, 2024 |