UNITED STATES
SECURITIES AND EXCHANGE COMMISSION
Washington, D.C. 20549
FORM N-CSR
CERTIFIED SHAREHOLDER REPORT OF REGISTERED
MANAGEMENT INVESTMENT COMPANIES
Investment Company Act file number 811-02737
Fidelity Summer Street Trust
(Exact name of registrant as specified in charter)
245 Summer St., Boston, MA 02210
(Address of principal executive offices) (Zip code)
Nicole Macarchuk, Secretary
245 Summer St.
Boston, Massachusetts 02210
(Name and address of agent for service)
Registrant's telephone number, including area code:
617-563-7000
| |
Date of fiscal year end: | May 31 |
|
|
Date of reporting period: | November 30, 2024 |
Item 1.
Reports to Stockholders
| |
| | SEMI-ANNUAL SHAREHOLDER REPORT | AS OF NOVEMBER 30, 2024 | |
| | Fidelity® Sustainable U.S. Equity Fund Fidelity Advisor® Sustainable U.S. Equity Fund Class I : FSEQX |
| | | |
This semi-annual shareholder report contains information about Fidelity® Sustainable U.S. Equity Fund for the period June 1, 2024 to November 30, 2024. You can find additional information about the Fund at fundresearch.fidelity.com/prospectus/sec. You can also request this information by contacting us at 1-877-208-0098 or by sending an e-mail to fidfunddocuments@fidelity.com.
What were your Fund costs for the last six months?(based on hypothetical $10,000 investment)
| | Costs of a $10,000 investment | Costs paid as a percentage of a $10,000 investment | |
| Class I | $ 48 | 0.90% | |
Key Fund Statistics(as of November 30, 2024)
KEY FACTS | | |
| Fund Size | $29,599,091 | |
| Number of Holdings | 68 | |
| Portfolio Turnover | 35% | |
What did the Fund invest in?
(as of November 30, 2024)
MARKET SECTORS (% of Fund's net assets) | | |
| Information Technology | 29.1 | |
| Financials | 12.5 | |
| Health Care | 10.7 | |
| Consumer Discretionary | 10.7 | |
| Industrials | 9.5 | |
| Communication Services | 7.6 | |
| Consumer Staples | 4.7 | |
| Energy | 4.6 | |
| Materials | 4.2 | |
| Utilities | 2.4 | |
| Real Estate | 2.1 | |
| |
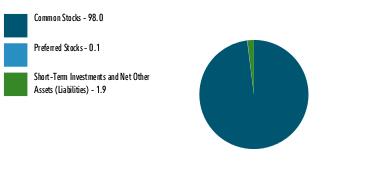
| Common Stocks | 98.0 |
| Preferred Stocks | 0.1 |
| Short-Term Investments and Net Other Assets (Liabilities) | 1.9 |
ASSET ALLOCATION (% of Fund's net assets) |
|
|
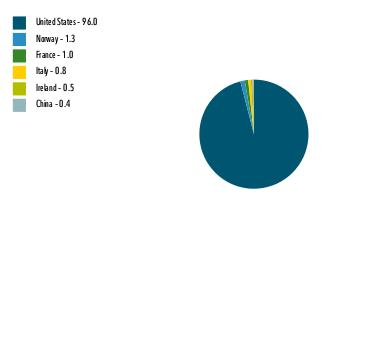
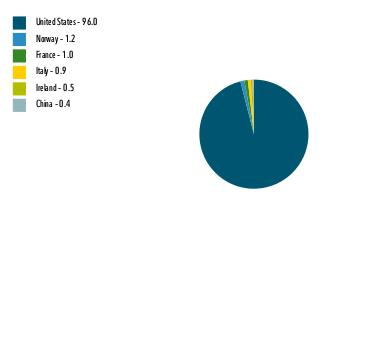
| United States | 96.0 |
| Norway | 1.3 |
| France | 1.0 |
| Italy | 0.8 |
| Ireland | 0.5 |
| China | 0.4 |
GEOGRAPHIC DIVERSIFICATION (% of Fund's net assets) |
|
| |
|
TOP HOLDINGS(% of Fund's net assets) | | |
| Apple Inc | 7.5 | |
| NVIDIA Corp | 6.4 | |
| Microsoft Corp | 6.0 | |
| Alphabet Inc Class A | 4.1 | |
| Amazon.com Inc | 3.5 | |
| Procter & Gamble Co/The | 3.0 | |
| Moody's Corp | 2.7 | |
| Salesforce Inc | 2.6 | |
| American Express Co | 2.5 | |
| Cigna Group/The | 2.2 | |
| | 40.5 | |
| Fidelity, the Fidelity Investments Logo and all other Fidelity trademarks or service marks used herein are trademarks or service marks of FMR LLC. Any third-party marks that are used herein are trademarks or service marks of their respective owners. © 2025 FMR LLC. All rights reserved. |
| | For additional information about the Fund; including its prospectus, financial information, holdings and proxy information, scan the QR code or visit fundresearch.fidelity.com/prospectus/sec 1.9915138.100 6395-TSRS-0125 |
| |
| | SEMI-ANNUAL SHAREHOLDER REPORT | AS OF NOVEMBER 30, 2024 | |
| | Fidelity® Water Sustainability Fund Fidelity® Water Sustainability Fund : FLOWX |
| | | |
This semi-annual shareholder report contains information about Fidelity® Water Sustainability Fund for the period June 1, 2024 to November 30, 2024. You can find additional information about the Fund at fundresearch.fidelity.com/prospectus/sec. You can also request this information by contacting us at 1-800-544-8544 or by sending an e-mail to fidfunddocuments@fidelity.com.
What were your Fund costs for the last six months?(based on hypothetical $10,000 investment)
| | Costs of a $10,000 investment | Costs paid as a percentage of a $10,000 investment | |
| Fidelity® Water Sustainability Fund | $ 47 | 0.91% | |
Key Fund Statistics(as of November 30, 2024)
KEY FACTS | | |
| Fund Size | $111,212,814 | |
| Number of Holdings | 37 | |
| Portfolio Turnover | 53% | |
What did the Fund invest in?
(as of November 30, 2024)
MARKET SECTORS (% of Fund's net assets) | | |
| Industrials | 57.7 | |
| Utilities | 34.2 | |
| Information Technology | 2.7 | |
| Materials | 2.4 | |
| Energy | 0.8 | |
| |
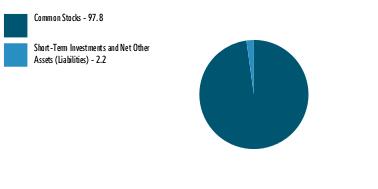
| Common Stocks | 97.8 |
| Short-Term Investments and Net Other Assets (Liabilities) | 2.2 |
ASSET ALLOCATION (% of Fund's net assets) |
|
|
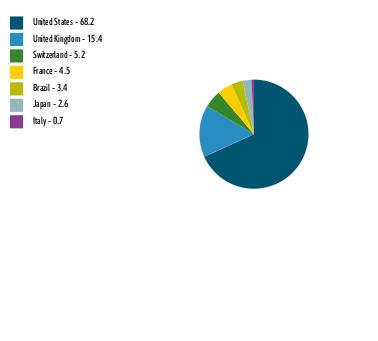
| United States | 68.2 |
| United Kingdom | 15.4 |
| Switzerland | 5.2 |
| France | 4.5 |
| Brazil | 3.4 |
| Japan | 2.6 |
| Italy | 0.7 |
GEOGRAPHIC DIVERSIFICATION (% of Fund's net assets) |
|
| |
|
TOP HOLDINGS(% of Fund's net assets) | | |
| Pentair PLC | 8.7 | |
| United Utilities Group PLC | 7.6 | |
| Severn Trent PLC | 6.8 | |
| Essential Utilities Inc | 6.1 | |
| Core & Main Inc Class A | 5.2 | |
| Chart Industries Inc | 5.0 | |
| American Water Works Co Inc | 4.8 | |
| Ingersoll Rand Inc | 4.6 | |
| Advanced Drainage Systems Inc | 4.6 | |
| Veolia Environnement SA | 4.5 | |
| | 57.9 | |
| Fidelity, the Fidelity Investments Logo and all other Fidelity trademarks or service marks used herein are trademarks or service marks of FMR LLC. Any third-party marks that are used herein are trademarks or service marks of their respective owners. © 2025 FMR LLC. All rights reserved. |
| | For additional information about the Fund; including its prospectus, financial information, holdings and proxy information, scan the QR code or visit fundresearch.fidelity.com/prospectus/sec 1.9915125.100 6042-TSRS-0125 |
| |
| | SEMI-ANNUAL SHAREHOLDER REPORT | AS OF NOVEMBER 30, 2024 | |
| | Fidelity® Climate Action Fund Fidelity Advisor® Climate Action Fund Class I : FCAUX |
| | | |
This semi-annual shareholder report contains information about Fidelity® Climate Action Fund for the period June 1, 2024 to November 30, 2024. You can find additional information about the Fund at fundresearch.fidelity.com/prospectus/sec. You can also request this information by contacting us at 1-877-208-0098 or by sending an e-mail to fidfunddocuments@fidelity.com.
What were your Fund costs for the last six months?(based on hypothetical $10,000 investment)
| | Costs of a $10,000 investment | Costs paid as a percentage of a $10,000 investment | |
| Class I | $ 55 | 1.05% | |
Key Fund Statistics(as of November 30, 2024)
KEY FACTS | | |
| Fund Size | $39,156,711 | |
| Number of Holdings | 98 | |
| Portfolio Turnover | 43% | |
What did the Fund invest in?
(as of November 30, 2024)
MARKET SECTORS (% of Fund's net assets) | | |
| Information Technology | 34.0 | |
| Industrials | 18.5 | |
| Financials | 13.0 | |
| Consumer Discretionary | 12.6 | |
| Health Care | 9.9 | |
| Communication Services | 4.3 | |
| Consumer Staples | 2.9 | |
| Materials | 2.8 | |
| Energy | 0.9 | |
| Utilities | 0.3 | |
| |
| Common Stocks | 99.2 |
| Preferred Securities | 0.0 |
| Preferred Stocks | 0.0 |
| Short-Term Investments and Net Other Assets (Liabilities) | 0.8 |
ASSET ALLOCATION (% of Fund's net assets) |
|
|
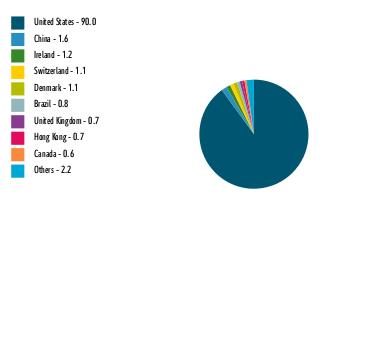
| United States | 90.0 |
| China | 1.6 |
| Ireland | 1.2 |
| Switzerland | 1.1 |
| Denmark | 1.1 |
| Brazil | 0.8 |
| United Kingdom | 0.7 |
| Hong Kong | 0.7 |
| Canada | 0.6 |
| Others | 2.2 |
GEOGRAPHIC DIVERSIFICATION (% of Fund's net assets) |
|
| |
|
TOP HOLDINGS(% of Fund's net assets) | | |
| NVIDIA Corp | 6.1 | |
| Apple Inc | 5.6 | |
| Microsoft Corp | 5.1 | |
| Alphabet Inc Class A | 4.3 | |
| Moody's Corp | 2.5 | |
| Tesla Inc | 2.3 | |
| Lowe's Cos Inc | 2.1 | |
| Morgan Stanley | 2.0 | |
| Eaton Corp PLC | 1.9 | |
| Deere & Co | 1.8 | |
| | 33.7 | |
| Fidelity, the Fidelity Investments Logo and all other Fidelity trademarks or service marks used herein are trademarks or service marks of FMR LLC. Any third-party marks that are used herein are trademarks or service marks of their respective owners. © 2025 FMR LLC. All rights reserved. |
| | For additional information about the Fund; including its prospectus, financial information, holdings and proxy information, scan the QR code or visit fundresearch.fidelity.com/prospectus/sec 1.9915132.100 6389-TSRS-0125 |
| |
| | SEMI-ANNUAL SHAREHOLDER REPORT | AS OF NOVEMBER 30, 2024 | |
| | Fidelity® Climate Action Fund Fidelity® Climate Action Fund : FCAEX |
| | | |
This semi-annual shareholder report contains information about Fidelity® Climate Action Fund for the period June 1, 2024 to November 30, 2024. You can find additional information about the Fund at fundresearch.fidelity.com/prospectus/sec. You can also request this information by contacting us at 1-800-544-8544 or by sending an e-mail to fidfunddocuments@fidelity.com.
What were your Fund costs for the last six months?(based on hypothetical $10,000 investment)
| | Costs of a $10,000 investment | Costs paid as a percentage of a $10,000 investment | |
| Fidelity® Climate Action Fund | $ 55 | 1.05% | |
Key Fund Statistics(as of November 30, 2024)
KEY FACTS | | |
| Fund Size | $39,156,711 | |
| Number of Holdings | 98 | |
| Portfolio Turnover | 43% | |
What did the Fund invest in?
(as of November 30, 2024)
MARKET SECTORS (% of Fund's net assets) | | |
| Information Technology | 34.0 | |
| Industrials | 18.5 | |
| Financials | 13.0 | |
| Consumer Discretionary | 12.6 | |
| Health Care | 9.9 | |
| Communication Services | 4.3 | |
| Consumer Staples | 2.9 | |
| Materials | 2.8 | |
| Energy | 0.9 | |
| Utilities | 0.3 | |
| |
| Common Stocks | 99.2 |
| Preferred Securities | 0.0 |
| Preferred Stocks | 0.0 |
| Short-Term Investments and Net Other Assets (Liabilities) | 0.8 |
ASSET ALLOCATION (% of Fund's net assets) |
|
|
| United States | 90.0 |
| China | 1.6 |
| Ireland | 1.2 |
| Switzerland | 1.1 |
| Denmark | 1.1 |
| Brazil | 0.8 |
| United Kingdom | 0.7 |
| Hong Kong | 0.7 |
| Canada | 0.6 |
| Others | 2.2 |
GEOGRAPHIC DIVERSIFICATION (% of Fund's net assets) |
|
| |
|
TOP HOLDINGS(% of Fund's net assets) | | |
| NVIDIA Corp | 6.1 | |
| Apple Inc | 5.6 | |
| Microsoft Corp | 5.1 | |
| Alphabet Inc Class A | 4.3 | |
| Moody's Corp | 2.5 | |
| Tesla Inc | 2.3 | |
| Lowe's Cos Inc | 2.1 | |
| Morgan Stanley | 2.0 | |
| Eaton Corp PLC | 1.9 | |
| Deere & Co | 1.8 | |
| | 33.7 | |
| Fidelity, the Fidelity Investments Logo and all other Fidelity trademarks or service marks used herein are trademarks or service marks of FMR LLC. Any third-party marks that are used herein are trademarks or service marks of their respective owners. © 2025 FMR LLC. All rights reserved. |
| | For additional information about the Fund; including its prospectus, financial information, holdings and proxy information, scan the QR code or visit fundresearch.fidelity.com/prospectus/sec 1.9915128.100 6385-TSRS-0125 |
| |
| | SEMI-ANNUAL SHAREHOLDER REPORT | AS OF NOVEMBER 30, 2024 | |
| | Fidelity® Climate Action Fund Fidelity Advisor® Climate Action Fund Class C : FCALX |
| | | |
This semi-annual shareholder report contains information about Fidelity® Climate Action Fund for the period June 1, 2024 to November 30, 2024. You can find additional information about the Fund at fundresearch.fidelity.com/prospectus/sec. You can also request this information by contacting us at 1-877-208-0098 or by sending an e-mail to fidfunddocuments@fidelity.com.
What were your Fund costs for the last six months?(based on hypothetical $10,000 investment)
| | Costs of a $10,000 investment | Costs paid as a percentage of a $10,000 investment | |
| Class C | $ 108 | 2.05% | |
Key Fund Statistics(as of November 30, 2024)
KEY FACTS | | |
| Fund Size | $39,156,711 | |
| Number of Holdings | 98 | |
| Portfolio Turnover | 43% | |
What did the Fund invest in?
(as of November 30, 2024)
MARKET SECTORS (% of Fund's net assets) | | |
| Information Technology | 34.0 | |
| Industrials | 18.5 | |
| Financials | 13.0 | |
| Consumer Discretionary | 12.6 | |
| Health Care | 9.9 | |
| Communication Services | 4.3 | |
| Consumer Staples | 2.9 | |
| Materials | 2.8 | |
| Energy | 0.9 | |
| Utilities | 0.3 | |
| |
| Common Stocks | 99.2 |
| Preferred Securities | 0.0 |
| Preferred Stocks | 0.0 |
| Short-Term Investments and Net Other Assets (Liabilities) | 0.8 |
ASSET ALLOCATION (% of Fund's net assets) |
|
|
| United States | 90.0 |
| China | 1.6 |
| Ireland | 1.2 |
| Switzerland | 1.1 |
| Denmark | 1.1 |
| Brazil | 0.8 |
| United Kingdom | 0.7 |
| Hong Kong | 0.7 |
| Canada | 0.6 |
| Others | 2.2 |
GEOGRAPHIC DIVERSIFICATION (% of Fund's net assets) |
|
| |
|
TOP HOLDINGS(% of Fund's net assets) | | |
| NVIDIA Corp | 6.1 | |
| Apple Inc | 5.6 | |
| Microsoft Corp | 5.1 | |
| Alphabet Inc Class A | 4.3 | |
| Moody's Corp | 2.5 | |
| Tesla Inc | 2.3 | |
| Lowe's Cos Inc | 2.1 | |
| Morgan Stanley | 2.0 | |
| Eaton Corp PLC | 1.9 | |
| Deere & Co | 1.8 | |
| | 33.7 | |
| Fidelity, the Fidelity Investments Logo and all other Fidelity trademarks or service marks used herein are trademarks or service marks of FMR LLC. Any third-party marks that are used herein are trademarks or service marks of their respective owners. © 2025 FMR LLC. All rights reserved. |
| | For additional information about the Fund; including its prospectus, financial information, holdings and proxy information, scan the QR code or visit fundresearch.fidelity.com/prospectus/sec 1.9915130.100 6387-TSRS-0125 |
| |
| | SEMI-ANNUAL SHAREHOLDER REPORT | AS OF NOVEMBER 30, 2024 | |
| | Fidelity® Sustainable U.S. Equity Fund Fidelity® Sustainable U.S. Equity Fund : FSEBX |
| | | |
This semi-annual shareholder report contains information about Fidelity® Sustainable U.S. Equity Fund for the period June 1, 2024 to November 30, 2024. You can find additional information about the Fund at fundresearch.fidelity.com/prospectus/sec. You can also request this information by contacting us at 1-800-544-8544 or by sending an e-mail to fidfunddocuments@fidelity.com.
What were your Fund costs for the last six months?(based on hypothetical $10,000 investment)
| | Costs of a $10,000 investment | Costs paid as a percentage of a $10,000 investment | |
| Fidelity® Sustainable U.S. Equity Fund | $ 48 | 0.90% | |
Key Fund Statistics(as of November 30, 2024)
KEY FACTS | | |
| Fund Size | $29,599,091 | |
| Number of Holdings | 68 | |
| Portfolio Turnover | 35% | |
What did the Fund invest in?
(as of November 30, 2024)
MARKET SECTORS (% of Fund's net assets) | | |
| Information Technology | 29.1 | |
| Financials | 12.5 | |
| Health Care | 10.7 | |
| Consumer Discretionary | 10.7 | |
| Industrials | 9.5 | |
| Communication Services | 7.6 | |
| Consumer Staples | 4.7 | |
| Energy | 4.6 | |
| Materials | 4.2 | |
| Utilities | 2.4 | |
| Real Estate | 2.1 | |
| |
| Common Stocks | 98.0 |
| Preferred Stocks | 0.1 |
| Short-Term Investments and Net Other Assets (Liabilities) | 1.9 |
ASSET ALLOCATION (% of Fund's net assets) |
|
|
| United States | 96.0 |
| Norway | 1.3 |
| France | 1.0 |
| Italy | 0.8 |
| Ireland | 0.5 |
| China | 0.4 |
GEOGRAPHIC DIVERSIFICATION (% of Fund's net assets) |
|
| |
|
TOP HOLDINGS(% of Fund's net assets) | | |
| Apple Inc | 7.5 | |
| NVIDIA Corp | 6.4 | |
| Microsoft Corp | 6.0 | |
| Alphabet Inc Class A | 4.1 | |
| Amazon.com Inc | 3.5 | |
| Procter & Gamble Co/The | 3.0 | |
| Moody's Corp | 2.7 | |
| Salesforce Inc | 2.6 | |
| American Express Co | 2.5 | |
| Cigna Group/The | 2.2 | |
| | 40.5 | |
| Fidelity, the Fidelity Investments Logo and all other Fidelity trademarks or service marks used herein are trademarks or service marks of FMR LLC. Any third-party marks that are used herein are trademarks or service marks of their respective owners. © 2025 FMR LLC. All rights reserved. |
| | For additional information about the Fund; including its prospectus, financial information, holdings and proxy information, scan the QR code or visit fundresearch.fidelity.com/prospectus/sec 1.9915134.100 6391-TSRS-0125 |
| |
| | SEMI-ANNUAL SHAREHOLDER REPORT | AS OF NOVEMBER 30, 2024 | |
| | Fidelity® Sustainable U.S. Equity Fund Fidelity Advisor® Sustainable U.S. Equity Fund Class A : FSEKX |
| | | |
This semi-annual shareholder report contains information about Fidelity® Sustainable U.S. Equity Fund for the period June 1, 2024 to November 30, 2024. You can find additional information about the Fund at fundresearch.fidelity.com/prospectus/sec. You can also request this information by contacting us at 1-877-208-0098 or by sending an e-mail to fidfunddocuments@fidelity.com.
What were your Fund costs for the last six months?(based on hypothetical $10,000 investment)
| | Costs of a $10,000 investment | Costs paid as a percentage of a $10,000 investment | |
| Class A | $ 61 | 1.15% | |
Key Fund Statistics(as of November 30, 2024)
KEY FACTS | | |
| Fund Size | $29,599,091 | |
| Number of Holdings | 68 | |
| Portfolio Turnover | 35% | |
What did the Fund invest in?
(as of November 30, 2024)
MARKET SECTORS (% of Fund's net assets) | | |
| Information Technology | 29.1 | |
| Financials | 12.5 | |
| Health Care | 10.7 | |
| Consumer Discretionary | 10.7 | |
| Industrials | 9.5 | |
| Communication Services | 7.6 | |
| Consumer Staples | 4.7 | |
| Energy | 4.6 | |
| Materials | 4.2 | |
| Utilities | 2.4 | |
| Real Estate | 2.1 | |
| |
| Common Stocks | 98.0 |
| Preferred Stocks | 0.1 |
| Short-Term Investments and Net Other Assets (Liabilities) | 1.9 |
ASSET ALLOCATION (% of Fund's net assets) |
|
|
| United States | 96.0 |
| Norway | 1.3 |
| France | 1.0 |
| Italy | 0.8 |
| Ireland | 0.5 |
| China | 0.4 |
GEOGRAPHIC DIVERSIFICATION (% of Fund's net assets) |
|
| |
|
TOP HOLDINGS(% of Fund's net assets) | | |
| Apple Inc | 7.5 | |
| NVIDIA Corp | 6.4 | |
| Microsoft Corp | 6.0 | |
| Alphabet Inc Class A | 4.1 | |
| Amazon.com Inc | 3.5 | |
| Procter & Gamble Co/The | 3.0 | |
| Moody's Corp | 2.7 | |
| Salesforce Inc | 2.6 | |
| American Express Co | 2.5 | |
| Cigna Group/The | 2.2 | |
| | 40.5 | |
| Fidelity, the Fidelity Investments Logo and all other Fidelity trademarks or service marks used herein are trademarks or service marks of FMR LLC. Any third-party marks that are used herein are trademarks or service marks of their respective owners. © 2025 FMR LLC. All rights reserved. |
| | For additional information about the Fund; including its prospectus, financial information, holdings and proxy information, scan the QR code or visit fundresearch.fidelity.com/prospectus/sec 1.9915135.100 6392-TSRS-0125 |
| |
| | SEMI-ANNUAL SHAREHOLDER REPORT | AS OF NOVEMBER 30, 2024 | |
| | Fidelity® Climate Action Fund Fidelity Advisor® Climate Action Fund Class A : FCAJX |
| | | |
This semi-annual shareholder report contains information about Fidelity® Climate Action Fund for the period June 1, 2024 to November 30, 2024. You can find additional information about the Fund at fundresearch.fidelity.com/prospectus/sec. You can also request this information by contacting us at 1-877-208-0098 or by sending an e-mail to fidfunddocuments@fidelity.com.
What were your Fund costs for the last six months?(based on hypothetical $10,000 investment)
| | Costs of a $10,000 investment | Costs paid as a percentage of a $10,000 investment | |
| Class A | $ 68 | 1.30% | |
Key Fund Statistics(as of November 30, 2024)
KEY FACTS | | |
| Fund Size | $39,156,711 | |
| Number of Holdings | 98 | |
| Portfolio Turnover | 43% | |
What did the Fund invest in?
(as of November 30, 2024)
MARKET SECTORS (% of Fund's net assets) | | |
| Information Technology | 34.0 | |
| Industrials | 18.5 | |
| Financials | 13.0 | |
| Consumer Discretionary | 12.6 | |
| Health Care | 9.9 | |
| Communication Services | 4.3 | |
| Consumer Staples | 2.9 | |
| Materials | 2.8 | |
| Energy | 0.9 | |
| Utilities | 0.3 | |
| |
| Common Stocks | 99.2 |
| Preferred Securities | 0.0 |
| Preferred Stocks | 0.0 |
| Short-Term Investments and Net Other Assets (Liabilities) | 0.8 |
ASSET ALLOCATION (% of Fund's net assets) |
|
|
| United States | 90.0 |
| China | 1.6 |
| Ireland | 1.2 |
| Switzerland | 1.1 |
| Denmark | 1.1 |
| Brazil | 0.8 |
| United Kingdom | 0.7 |
| Hong Kong | 0.7 |
| Canada | 0.6 |
| Others | 2.2 |
GEOGRAPHIC DIVERSIFICATION (% of Fund's net assets) |
|
| |
|
TOP HOLDINGS(% of Fund's net assets) | | |
| NVIDIA Corp | 6.1 | |
| Apple Inc | 5.6 | |
| Microsoft Corp | 5.1 | |
| Alphabet Inc Class A | 4.3 | |
| Moody's Corp | 2.5 | |
| Tesla Inc | 2.3 | |
| Lowe's Cos Inc | 2.1 | |
| Morgan Stanley | 2.0 | |
| Eaton Corp PLC | 1.9 | |
| Deere & Co | 1.8 | |
| | 33.7 | |
| Fidelity, the Fidelity Investments Logo and all other Fidelity trademarks or service marks used herein are trademarks or service marks of FMR LLC. Any third-party marks that are used herein are trademarks or service marks of their respective owners. © 2025 FMR LLC. All rights reserved. |
| | For additional information about the Fund; including its prospectus, financial information, holdings and proxy information, scan the QR code or visit fundresearch.fidelity.com/prospectus/sec 1.9915129.100 6386-TSRS-0125 |
| |
| | SEMI-ANNUAL SHAREHOLDER REPORT | AS OF NOVEMBER 30, 2024 | |
| | Fidelity® Sustainable U.S. Equity Fund Fidelity Advisor® Sustainable U.S. Equity Fund Class Z : FSEWX |
| | | |
This semi-annual shareholder report contains information about Fidelity® Sustainable U.S. Equity Fund for the period June 1, 2024 to November 30, 2024. You can find additional information about the Fund at fundresearch.fidelity.com/prospectus/sec. You can also request this information by contacting us at 1-877-208-0098 or by sending an e-mail to fidfunddocuments@fidelity.com.
What were your Fund costs for the last six months?(based on hypothetical $10,000 investment)
| | Costs of a $10,000 investment | Costs paid as a percentage of a $10,000 investment | |
| Class Z | $ 40 | 0.75% | |
Key Fund Statistics(as of November 30, 2024)
KEY FACTS | | |
| Fund Size | $29,599,091 | |
| Number of Holdings | 68 | |
| Portfolio Turnover | 35% | |
What did the Fund invest in?
(as of November 30, 2024)
MARKET SECTORS (% of Fund's net assets) | | |
| Information Technology | 29.1 | |
| Financials | 12.5 | |
| Health Care | 10.7 | |
| Consumer Discretionary | 10.7 | |
| Industrials | 9.5 | |
| Communication Services | 7.6 | |
| Consumer Staples | 4.7 | |
| Energy | 4.6 | |
| Materials | 4.2 | |
| Utilities | 2.4 | |
| Real Estate | 2.1 | |
| |
| Common Stocks | 98.0 |
| Preferred Stocks | 0.1 |
| Short-Term Investments and Net Other Assets (Liabilities) | 1.9 |
ASSET ALLOCATION (% of Fund's net assets) |
|
|
| United States | 96.0 |
| Norway | 1.3 |
| France | 1.0 |
| Italy | 0.8 |
| Ireland | 0.5 |
| China | 0.4 |
GEOGRAPHIC DIVERSIFICATION (% of Fund's net assets) |
|
| |
|
TOP HOLDINGS(% of Fund's net assets) | | |
| Apple Inc | 7.5 | |
| NVIDIA Corp | 6.4 | |
| Microsoft Corp | 6.0 | |
| Alphabet Inc Class A | 4.1 | |
| Amazon.com Inc | 3.5 | |
| Procter & Gamble Co/The | 3.0 | |
| Moody's Corp | 2.7 | |
| Salesforce Inc | 2.6 | |
| American Express Co | 2.5 | |
| Cigna Group/The | 2.2 | |
| | 40.5 | |
| Fidelity, the Fidelity Investments Logo and all other Fidelity trademarks or service marks used herein are trademarks or service marks of FMR LLC. Any third-party marks that are used herein are trademarks or service marks of their respective owners. © 2025 FMR LLC. All rights reserved. |
| | For additional information about the Fund; including its prospectus, financial information, holdings and proxy information, scan the QR code or visit fundresearch.fidelity.com/prospectus/sec 1.9915139.100 6396-TSRS-0125 |
| |
| | SEMI-ANNUAL SHAREHOLDER REPORT | AS OF NOVEMBER 30, 2024 | |
| | Fidelity® Sustainable U.S. Equity Fund Fidelity Advisor® Sustainable U.S. Equity Fund Class C : FSEOX |
| | | |
This semi-annual shareholder report contains information about Fidelity® Sustainable U.S. Equity Fund for the period June 1, 2024 to November 30, 2024. You can find additional information about the Fund at fundresearch.fidelity.com/prospectus/sec. You can also request this information by contacting us at 1-877-208-0098 or by sending an e-mail to fidfunddocuments@fidelity.com.
What were your Fund costs for the last six months?(based on hypothetical $10,000 investment)
| | Costs of a $10,000 investment | Costs paid as a percentage of a $10,000 investment | |
| Class C | $ 101 | 1.90% | |
Key Fund Statistics(as of November 30, 2024)
KEY FACTS | | |
| Fund Size | $29,599,091 | |
| Number of Holdings | 68 | |
| Portfolio Turnover | 35% | |
What did the Fund invest in?
(as of November 30, 2024)
MARKET SECTORS (% of Fund's net assets) | | |
| Information Technology | 29.1 | |
| Financials | 12.5 | |
| Health Care | 10.7 | |
| Consumer Discretionary | 10.7 | |
| Industrials | 9.5 | |
| Communication Services | 7.6 | |
| Consumer Staples | 4.7 | |
| Energy | 4.6 | |
| Materials | 4.2 | |
| Utilities | 2.4 | |
| Real Estate | 2.1 | |
| |
| Common Stocks | 98.0 |
| Preferred Stocks | 0.1 |
| Short-Term Investments and Net Other Assets (Liabilities) | 1.9 |
ASSET ALLOCATION (% of Fund's net assets) |
|
|
| United States | 96.0 |
| Norway | 1.3 |
| France | 1.0 |
| Italy | 0.8 |
| Ireland | 0.5 |
| China | 0.4 |
GEOGRAPHIC DIVERSIFICATION (% of Fund's net assets) |
|
| |
|
TOP HOLDINGS(% of Fund's net assets) | | |
| Apple Inc | 7.5 | |
| NVIDIA Corp | 6.4 | |
| Microsoft Corp | 6.0 | |
| Alphabet Inc Class A | 4.1 | |
| Amazon.com Inc | 3.5 | |
| Procter & Gamble Co/The | 3.0 | |
| Moody's Corp | 2.7 | |
| Salesforce Inc | 2.6 | |
| American Express Co | 2.5 | |
| Cigna Group/The | 2.2 | |
| | 40.5 | |
| Fidelity, the Fidelity Investments Logo and all other Fidelity trademarks or service marks used herein are trademarks or service marks of FMR LLC. Any third-party marks that are used herein are trademarks or service marks of their respective owners. © 2025 FMR LLC. All rights reserved. |
| | For additional information about the Fund; including its prospectus, financial information, holdings and proxy information, scan the QR code or visit fundresearch.fidelity.com/prospectus/sec 1.9915136.100 6393-TSRS-0125 |
| |
| | SEMI-ANNUAL SHAREHOLDER REPORT | AS OF NOVEMBER 30, 2024 | |
| | Fidelity® Climate Action Fund Fidelity Advisor® Climate Action Fund Class M : FCAOX |
| | | |
This semi-annual shareholder report contains information about Fidelity® Climate Action Fund for the period June 1, 2024 to November 30, 2024. You can find additional information about the Fund at fundresearch.fidelity.com/prospectus/sec. You can also request this information by contacting us at 1-877-208-0098 or by sending an e-mail to fidfunddocuments@fidelity.com.
What were your Fund costs for the last six months?(based on hypothetical $10,000 investment)
| | Costs of a $10,000 investment | Costs paid as a percentage of a $10,000 investment | |
| Class M | $ 82 | 1.55% | |
Key Fund Statistics(as of November 30, 2024)
KEY FACTS | | |
| Fund Size | $39,156,711 | |
| Number of Holdings | 98 | |
| Portfolio Turnover | 43% | |
What did the Fund invest in?
(as of November 30, 2024)
MARKET SECTORS (% of Fund's net assets) | | |
| Information Technology | 34.0 | |
| Industrials | 18.5 | |
| Financials | 13.0 | |
| Consumer Discretionary | 12.6 | |
| Health Care | 9.9 | |
| Communication Services | 4.3 | |
| Consumer Staples | 2.9 | |
| Materials | 2.8 | |
| Energy | 0.9 | |
| Utilities | 0.3 | |
| |
| Common Stocks | 99.2 |
| Preferred Securities | 0.0 |
| Preferred Stocks | 0.0 |
| Short-Term Investments and Net Other Assets (Liabilities) | 0.8 |
ASSET ALLOCATION (% of Fund's net assets) |
|
|
| United States | 90.0 |
| China | 1.6 |
| Ireland | 1.2 |
| Switzerland | 1.1 |
| Denmark | 1.1 |
| Brazil | 0.8 |
| United Kingdom | 0.7 |
| Hong Kong | 0.7 |
| Canada | 0.6 |
| Others | 2.2 |
GEOGRAPHIC DIVERSIFICATION (% of Fund's net assets) |
|
| |
|
TOP HOLDINGS(% of Fund's net assets) | | |
| NVIDIA Corp | 6.1 | |
| Apple Inc | 5.6 | |
| Microsoft Corp | 5.1 | |
| Alphabet Inc Class A | 4.3 | |
| Moody's Corp | 2.5 | |
| Tesla Inc | 2.3 | |
| Lowe's Cos Inc | 2.1 | |
| Morgan Stanley | 2.0 | |
| Eaton Corp PLC | 1.9 | |
| Deere & Co | 1.8 | |
| | 33.7 | |
| Fidelity, the Fidelity Investments Logo and all other Fidelity trademarks or service marks used herein are trademarks or service marks of FMR LLC. Any third-party marks that are used herein are trademarks or service marks of their respective owners. © 2025 FMR LLC. All rights reserved. |
| | For additional information about the Fund; including its prospectus, financial information, holdings and proxy information, scan the QR code or visit fundresearch.fidelity.com/prospectus/sec 1.9915131.100 6388-TSRS-0125 |
| |
| | SEMI-ANNUAL SHAREHOLDER REPORT | AS OF NOVEMBER 30, 2024 | |
| | Fidelity® Agricultural Productivity Fund Fidelity® Agricultural Productivity Fund : FARMX |
| | | |
This semi-annual shareholder report contains information about Fidelity® Agricultural Productivity Fund for the period June 1, 2024 to November 30, 2024. You can find additional information about the Fund at fundresearch.fidelity.com/prospectus/sec. You can also request this information by contacting us at 1-800-544-8544 or by sending an e-mail to fidfunddocuments@fidelity.com.
What were your Fund costs for the last six months?(based on hypothetical $10,000 investment)
| | Costs of a $10,000 investment | Costs paid as a percentage of a $10,000 investment | |
| Fidelity® Agricultural Productivity Fund | $ 49 | 0.95% | |
Key Fund Statistics(as of November 30, 2024)
KEY FACTS | | |
| Fund Size | $44,426,470 | |
| Number of Holdings | 29 | |
| Portfolio Turnover | 8% | |
What did the Fund invest in?
(as of November 30, 2024)
MARKET SECTORS (% of Fund's net assets) | | |
| Consumer Staples | 36.7 | |
| Industrials | 31.3 | |
| Materials | 29.8 | |
| Health Care | 0.3 | |
| |
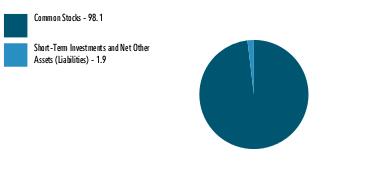
| Common Stocks | 98.1 |
| Short-Term Investments and Net Other Assets (Liabilities) | 1.9 |
ASSET ALLOCATION (% of Fund's net assets) |
|
|
| United States | 78.6 |
| Canada | 7.1 |
| United Kingdom | 3.8 |
| Faroe Islands | 2.8 |
| Saudi Arabia | 1.8 |
| Japan | 1.3 |
| Indonesia | 1.1 |
| Ireland | 1.0 |
| Brazil | 0.9 |
| Others | 1.6 |
GEOGRAPHIC DIVERSIFICATION (% of Fund's net assets) |
|
| |
|
TOP HOLDINGS(% of Fund's net assets) | | |
| Deere & Co | 24.8 | |
| Corteva Inc | 11.0 | |
| Nutrien Ltd | 7.1 | |
| Archer-Daniels-Midland Co | 6.0 | |
| CF Industries Holdings Inc | 4.9 | |
| Ingredion Inc | 4.9 | |
| Lamb Weston Holdings Inc | 4.9 | |
| Bunge Global SA | 4.4 | |
| Cranswick PLC | 3.8 | |
| Toro Co/The | 3.7 | |
| | 75.5 | |
| Fidelity, the Fidelity Investments Logo and all other Fidelity trademarks or service marks used herein are trademarks or service marks of FMR LLC. Any third-party marks that are used herein are trademarks or service marks of their respective owners. © 2025 FMR LLC. All rights reserved. |
| | For additional information about the Fund; including its prospectus, financial information, holdings and proxy information, scan the QR code or visit fundresearch.fidelity.com/prospectus/sec 1.9915124.100 6041-TSRS-0125 |
| |
| | SEMI-ANNUAL SHAREHOLDER REPORT | AS OF NOVEMBER 30, 2024 | |
| | Fidelity® Climate Action Fund Fidelity Advisor® Climate Action Fund Class Z : FCLZX |
| | | |
This semi-annual shareholder report contains information about Fidelity® Climate Action Fund for the period June 1, 2024 to November 30, 2024. You can find additional information about the Fund at fundresearch.fidelity.com/prospectus/sec. You can also request this information by contacting us at 1-877-208-0098 or by sending an e-mail to fidfunddocuments@fidelity.com.
What were your Fund costs for the last six months?(based on hypothetical $10,000 investment)
| | Costs of a $10,000 investment | Costs paid as a percentage of a $10,000 investment | |
| Class Z | $ 47 | 0.90% | |
Key Fund Statistics(as of November 30, 2024)
KEY FACTS | | |
| Fund Size | $39,156,711 | |
| Number of Holdings | 98 | |
| Portfolio Turnover | 43% | |
What did the Fund invest in?
(as of November 30, 2024)
MARKET SECTORS (% of Fund's net assets) | | |
| Information Technology | 34.0 | |
| Industrials | 18.5 | |
| Financials | 13.0 | |
| Consumer Discretionary | 12.6 | |
| Health Care | 9.9 | |
| Communication Services | 4.3 | |
| Consumer Staples | 2.9 | |
| Materials | 2.8 | |
| Energy | 0.9 | |
| Utilities | 0.3 | |
| |
| Common Stocks | 99.2 |
| Preferred Securities | 0.0 |
| Preferred Stocks | 0.0 |
| Short-Term Investments and Net Other Assets (Liabilities) | 0.8 |
ASSET ALLOCATION (% of Fund's net assets) |
|
|
| United States | 90.0 |
| China | 1.6 |
| Ireland | 1.2 |
| Switzerland | 1.1 |
| Denmark | 1.1 |
| Brazil | 0.8 |
| United Kingdom | 0.7 |
| Hong Kong | 0.7 |
| Canada | 0.6 |
| Others | 2.2 |
GEOGRAPHIC DIVERSIFICATION (% of Fund's net assets) |
|
| |
|
TOP HOLDINGS(% of Fund's net assets) | | |
| NVIDIA Corp | 6.1 | |
| Apple Inc | 5.6 | |
| Microsoft Corp | 5.1 | |
| Alphabet Inc Class A | 4.3 | |
| Moody's Corp | 2.5 | |
| Tesla Inc | 2.3 | |
| Lowe's Cos Inc | 2.1 | |
| Morgan Stanley | 2.0 | |
| Eaton Corp PLC | 1.9 | |
| Deere & Co | 1.8 | |
| | 33.7 | |
| Fidelity, the Fidelity Investments Logo and all other Fidelity trademarks or service marks used herein are trademarks or service marks of FMR LLC. Any third-party marks that are used herein are trademarks or service marks of their respective owners. © 2025 FMR LLC. All rights reserved. |
| | For additional information about the Fund; including its prospectus, financial information, holdings and proxy information, scan the QR code or visit fundresearch.fidelity.com/prospectus/sec 1.9915133.100 6390-TSRS-0125 |
| |
| | SEMI-ANNUAL SHAREHOLDER REPORT | AS OF NOVEMBER 30, 2024 | |
| | Fidelity® Sustainable U.S. Equity Fund Fidelity Advisor® Sustainable U.S. Equity Fund Class M : FSEPX |
| | | |
This semi-annual shareholder report contains information about Fidelity® Sustainable U.S. Equity Fund for the period June 1, 2024 to November 30, 2024. You can find additional information about the Fund at fundresearch.fidelity.com/prospectus/sec. You can also request this information by contacting us at 1-877-208-0098 or by sending an e-mail to fidfunddocuments@fidelity.com.
What were your Fund costs for the last six months?(based on hypothetical $10,000 investment)
| | Costs of a $10,000 investment | Costs paid as a percentage of a $10,000 investment | |
| Class M | $ 74 | 1.40% | |
Key Fund Statistics(as of November 30, 2024)
KEY FACTS | | |
| Fund Size | $29,599,091 | |
| Number of Holdings | 68 | |
| Portfolio Turnover | 35% | |
What did the Fund invest in?
(as of November 30, 2024)
MARKET SECTORS (% of Fund's net assets) | | |
| Information Technology | 29.1 | |
| Financials | 12.5 | |
| Health Care | 10.7 | |
| Consumer Discretionary | 10.7 | |
| Industrials | 9.5 | |
| Communication Services | 7.6 | |
| Consumer Staples | 4.7 | |
| Energy | 4.6 | |
| Materials | 4.2 | |
| Utilities | 2.4 | |
| Real Estate | 2.1 | |
| |
| Common Stocks | 98.0 |
| Preferred Stocks | 0.1 |
| Short-Term Investments and Net Other Assets (Liabilities) | 1.9 |
ASSET ALLOCATION (% of Fund's net assets) |
|
|
| United States | 96.0 |
| Norway | 1.3 |
| France | 1.0 |
| Italy | 0.8 |
| Ireland | 0.5 |
| China | 0.4 |
GEOGRAPHIC DIVERSIFICATION (% of Fund's net assets) |
|
| |
|
TOP HOLDINGS(% of Fund's net assets) | | |
| Apple Inc | 7.5 | |
| NVIDIA Corp | 6.4 | |
| Microsoft Corp | 6.0 | |
| Alphabet Inc Class A | 4.1 | |
| Amazon.com Inc | 3.5 | |
| Procter & Gamble Co/The | 3.0 | |
| Moody's Corp | 2.7 | |
| Salesforce Inc | 2.6 | |
| American Express Co | 2.5 | |
| Cigna Group/The | 2.2 | |
| | 40.5 | |
| Fidelity, the Fidelity Investments Logo and all other Fidelity trademarks or service marks used herein are trademarks or service marks of FMR LLC. Any third-party marks that are used herein are trademarks or service marks of their respective owners. © 2025 FMR LLC. All rights reserved. |
| | For additional information about the Fund; including its prospectus, financial information, holdings and proxy information, scan the QR code or visit fundresearch.fidelity.com/prospectus/sec 1.9915137.100 6394-TSRS-0125 |
| |
| | SEMI-ANNUAL SHAREHOLDER REPORT | AS OF NOVEMBER 30, 2024 | |
| | Fidelity® SAI Sustainable U.S. Equity Fund Fidelity® SAI Sustainable U.S. Equity Fund : FIDEX |
| | | |
This semi-annual shareholder report contains information about Fidelity® SAI Sustainable U.S. Equity Fund for the period June 1, 2024 to November 30, 2024. You can find additional information about the Fund at fundresearch.fidelity.com/prospectus/sec. You can also request this information by contacting us at 1-800-544-3455 or by sending an e-mail to fidfunddocuments@fidelity.com.
What were your Fund costs for the last six months?(based on hypothetical $10,000 investment)
| | Costs of a $10,000 investment | Costs paid as a percentage of a $10,000 investment | |
| Fidelity® SAI Sustainable U.S. Equity Fund | $ 29 | 0.55% | |
Key Fund Statistics(as of November 30, 2024)
KEY FACTS | | |
| Fund Size | $284,783,971 | |
| Number of Holdings | 68 | |
| Portfolio Turnover | 49% | |
What did the Fund invest in?
(as of November 30, 2024)
MARKET SECTORS (% of Fund's net assets) | | |
| Information Technology | 28.8 | |
| Financials | 12.5 | |
| Consumer Discretionary | 10.7 | |
| Health Care | 10.6 | |
| Industrials | 9.7 | |
| Communication Services | 7.6 | |
| Consumer Staples | 4.7 | |
| Energy | 4.5 | |
| Materials | 4.2 | |
| Utilities | 2.4 | |
| Real Estate | 2.0 | |
| |
| Common Stocks | 97.7 |
| Short-Term Investments and Net Other Assets (Liabilities) | 2.3 |
ASSET ALLOCATION (% of Fund's net assets) |
|
|
| United States | 96.0 |
| Norway | 1.2 |
| France | 1.0 |
| Italy | 0.9 |
| Ireland | 0.5 |
| China | 0.4 |
GEOGRAPHIC DIVERSIFICATION (% of Fund's net assets) |
|
| |
|
TOP HOLDINGS(% of Fund's net assets) | | |
| Apple Inc | 7.5 | |
| NVIDIA Corp | 6.4 | |
| Microsoft Corp | 6.0 | |
| Alphabet Inc Class A | 4.0 | |
| Amazon.com Inc | 3.5 | |
| Procter & Gamble Co/The | 3.0 | |
| Moody's Corp | 2.7 | |
| Salesforce Inc | 2.6 | |
| American Express Co | 2.5 | |
| Cigna Group/The | 2.3 | |
| | 40.5 | |
| Fidelity, the Fidelity Investments Logo and all other Fidelity trademarks or service marks used herein are trademarks or service marks of FMR LLC. Any third-party marks that are used herein are trademarks or service marks of their respective owners. © 2025 FMR LLC. All rights reserved. |
| | For additional information about the Fund; including its prospectus, financial information, holdings and proxy information, scan the QR code or visit fundresearch.fidelity.com/prospectus/sec 1.9915142.100 6552-TSRS-0125 |
| |
| | SEMI-ANNUAL SHAREHOLDER REPORT | AS OF NOVEMBER 30, 2024 | |
| | Fidelity® SAI Sustainable Sector Fund Fidelity® SAI Sustainable Sector Fund : FIDJX |
| | | |
This semi-annual shareholder report contains information about Fidelity® SAI Sustainable Sector Fund for the period June 1, 2024 to November 30, 2024. You can find additional information about the Fund at fundresearch.fidelity.com/prospectus/sec. You can also request this information by contacting us at 1-800-544-3455 or by sending an e-mail to fidfunddocuments@fidelity.com.
What were your Fund costs for the last six months?(based on hypothetical $10,000 investment)
| | Costs of a $10,000 investment | Costs paid as a percentage of a $10,000 investment | |
| Fidelity® SAI Sustainable Sector Fund | $ 23 | 0.44% | |
Key Fund Statistics(as of November 30, 2024)
KEY FACTS | | |
| Fund Size | $298,303,223 | |
| Number of Holdings | 230 | |
| Portfolio Turnover | 110% | |
What did the Fund invest in?
(as of November 30, 2024)
MARKET SECTORS (% of Fund's net assets) | | |
| Information Technology | 31.5 | |
| Financials | 14.1 | |
| Health Care | 11.1 | |
| Consumer Discretionary | 10.9 | |
| Industrials | 8.6 | |
| Communication Services | 7.3 | |
| Consumer Staples | 5.9 | |
| Materials | 3.0 | |
| Utilities | 2.3 | |
| Real Estate | 2.1 | |
| Energy | 1.4 | |
| |
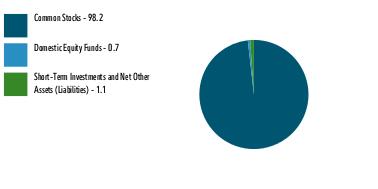
| Common Stocks | 98.2 |
| Domestic Equity Funds | 0.7 |
| Short-Term Investments and Net Other Assets (Liabilities) | 1.1 |
ASSET ALLOCATION (% of Fund's net assets) |
|
|
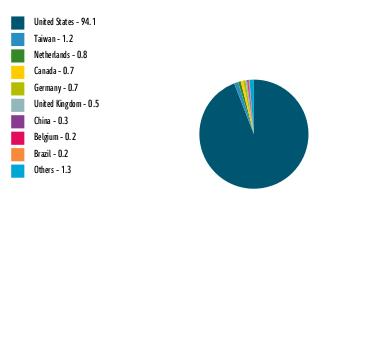
| United States | 94.1 |
| Taiwan | 1.2 |
| Netherlands | 0.8 |
| Canada | 0.7 |
| Germany | 0.7 |
| United Kingdom | 0.5 |
| China | 0.3 |
| Belgium | 0.2 |
| Brazil | 0.2 |
| Others | 1.3 |
GEOGRAPHIC DIVERSIFICATION (% of Fund's net assets) |
|
| |
|
TOP HOLDINGS(% of Fund's net assets) | | |
| Microsoft Corp | 8.4 | |
| NVIDIA Corp | 7.4 | |
| Apple Inc | 5.4 | |
| Amazon.com Inc | 4.3 | |
| Alphabet Inc Class A | 3.8 | |
| UnitedHealth Group Inc | 1.6 | |
| Tesla Inc | 1.5 | |
| Boston Scientific Corp | 1.4 | |
| Salesforce Inc | 1.2 | |
| Walmart Inc | 1.2 | |
| | 36.2 | |
| Fidelity, the Fidelity Investments Logo and all other Fidelity trademarks or service marks used herein are trademarks or service marks of FMR LLC. Any third-party marks that are used herein are trademarks or service marks of their respective owners. © 2025 FMR LLC. All rights reserved. |
| | For additional information about the Fund; including its prospectus, financial information, holdings and proxy information, scan the QR code or visit fundresearch.fidelity.com/prospectus/sec 1.9915141.100 6551-TSRS-0125 |
Item 2.
Code of Ethics
Not applicable.
Item 3.
Audit Committee Financial Expert
Not applicable.
Item 4.
Principal Accountant Fees and Services
Not applicable.
Item 5.
Audit Committee of Listed Registrants
Not applicable.
Item 6.
Investments
(a)
Not applicable.
(b)
Not applicable
Item 7.
Financial Statements and Financial Highlights for Open-End Management Investment Companies
Fidelity® Climate Action Fund
Semi-Annual Report
November 30, 2024
Includes Fidelity and Fidelity Advisor share classes
Contents
To view a fund's proxy voting guidelines and proxy voting record for the 12-month period ended June 30, visit http://www.fidelity.com/proxyvotingresults or visit the Securities and Exchange Commission's (SEC) web site at http://www.sec.gov.
You may also call 1-800-544-8544 if you're an individual investing directly with Fidelity, call 1-800-835-5092 if you're a plan sponsor or participant with Fidelity as your recordkeeper or call 1-877-208-0098 on institutional accounts or if you're an advisor or invest through one to request a free copy of the proxy voting guidelines.
Standard & Poor's, S&P and S&P 500 are registered service marks of The McGraw-Hill Companies, Inc. and have been licensed for use by Fidelity Distributors Corporation.
Other third-party marks appearing herein are the property of their respective owners.
All other marks appearing herein are registered or unregistered trademarks or service marks of FMR LLC or an affiliated company. © 2025 FMR LLC. All rights reserved.
This report and the financial statements contained herein are submitted for the general information of the shareholders of the Fund. This report is not authorized for distribution to prospective investors in the Fund unless preceded or accompanied by an effective prospectus.
A fund files its complete schedule of portfolio holdings with the SEC for the first and third quarters of each fiscal year on Form N-PORT. Forms N-PORT are available on the SEC's web site at http://www.sec.gov. A fund's Forms N-PORT may be reviewed and copied at the SEC's Public Reference Room in Washington, DC. Information regarding the operation of the SEC's Public Reference Room may be obtained by calling 1-800-SEC-0330.
For a complete list of a fund's portfolio holdings, view the most recent holdings listing, semiannual report, or annual report on Fidelity's web site at http://www.fidelity.com, http://www.institutional.fidelity.com, or http://www.401k.com, as applicable.
NOT FDIC INSURED •MAY LOSE VALUE •NO BANK GUARANTEE
Neither the Fund nor Fidelity Distributors Corporation is a bank.
Item 7: Financial Statements and Financial Highlights for Open-End Management Investment Companies (Semi-Annual Report)
Fidelity® Climate Action Fund
Schedule of Investments November 30, 2024 (Unaudited)
Showing Percentage of Net Assets
| Common Stocks - 99.1% |
| | | Shares | Value ($) |
| COMMUNICATION SERVICES - 4.3% | | | |
| Interactive Media & Services - 4.3% | | | |
| Alphabet, Inc. Class A | | 9,999 | 1,689,331 |
| CONSUMER DISCRETIONARY - 12.6% | | | |
| Automobiles - 2.9% | | | |
| BYD Co. Ltd. (A Shares) | | 7,000 | 267,874 |
| Tesla, Inc. (a) | | 2,592 | 894,655 |
| | | | 1,162,529 |
| Broadline Retail - 2.4% | | | |
| Amazon.com, Inc. (a) | | 3,022 | 628,244 |
| MercadoLibre, Inc. (a) | | 156 | 309,687 |
| | | | 937,931 |
| Hotels, Restaurants & Leisure - 0.8% | | | |
| Starbucks Corp. | | 2,970 | 304,306 |
| Household Durables - 2.0% | | | |
| Mohawk Industries, Inc. (a) | | 2,329 | 323,335 |
| TopBuild Corp. (a) | | 1,152 | 450,017 |
| | | | 773,352 |
| Specialty Retail - 3.0% | | | |
| Lowe's Companies, Inc. | | 3,016 | 821,649 |
| Williams-Sonoma, Inc. | | 2,062 | 354,705 |
| | | | 1,176,354 |
| Textiles, Apparel & Luxury Goods - 1.5% | | | |
| Hermes International SCA | | 76 | 165,846 |
| On Holding AG (a) | | 3,445 | 200,947 |
| VF Corp. | | 10,783 | 218,140 |
| | | | 584,933 |
TOTAL CONSUMER DISCRETIONARY | | | 4,939,405 |
| CONSUMER STAPLES - 2.9% | | | |
| Personal Care Products - 2.9% | | | |
| Haleon PLC | | 120,745 | 575,968 |
| Kenvue, Inc. | | 22,780 | 548,542 |
| | | | 1,124,510 |
| ENERGY - 0.8% | | | |
| Oil, Gas & Consumable Fuels - 0.8% | | | |
| Cameco Corp. | | 3,658 | 217,468 |
| Centrus Energy Corp. Class A (a) | | 1,138 | 103,558 |
| | | | 321,026 |
| FINANCIALS - 13.0% | | | |
| Capital Markets - 6.2% | | | |
| Intercontinental Exchange, Inc. | | 4,160 | 669,594 |
| Moody's Corp. | | 1,932 | 965,961 |
| Morgan Stanley | | 6,074 | 799,399 |
| | | | 2,434,954 |
| Consumer Finance - 3.0% | | | |
| American Express Co. | | 1,721 | 524,354 |
| Capital One Financial Corp. | | 3,403 | 653,410 |
| | | | 1,177,764 |
| Financial Services - 2.7% | | | |
| Fidelity National Information Services, Inc. | | 1,927 | 164,373 |
| PayPal Holdings, Inc. (a) | | 2,996 | 259,963 |
| Visa, Inc. Class A | | 2,021 | 636,777 |
| | | | 1,061,113 |
| Insurance - 1.1% | | | |
| Marsh & McLennan Companies, Inc. | | 1,797 | 419,114 |
TOTAL FINANCIALS | | | 5,092,945 |
| HEALTH CARE - 9.9% | | | |
| Biotechnology - 2.3% | | | |
| BioNTech SE ADR (a) | | 1,619 | 191,673 |
| Gilead Sciences, Inc. | | 6,343 | 587,235 |
| Repligen Corp. (a) | | 764 | 115,013 |
| | | | 893,921 |
| Health Care Equipment & Supplies - 1.3% | | | |
| Intuitive Surgical, Inc. (a) | | 945 | 512,190 |
| Health Care Providers & Services - 0.6% | | | |
| Elevance Health, Inc. | | 632 | 257,199 |
| Life Sciences Tools & Services - 3.8% | | | |
| Agilent Technologies, Inc. | | 2,222 | 306,569 |
| Bruker Corp. | | 5,821 | 337,327 |
| Danaher Corp. | | 1,268 | 303,927 |
| Mettler-Toledo International, Inc. (a) | | 161 | 201,443 |
| Thermo Fisher Scientific, Inc. | | 608 | 322,015 |
| | | | 1,471,281 |
| Pharmaceuticals - 1.9% | | | |
| GSK PLC | | 23,064 | 391,818 |
| Novo Nordisk A/S Series B | | 3,352 | 359,233 |
| | | | 751,051 |
TOTAL HEALTH CARE | | | 3,885,642 |
| INDUSTRIALS - 18.6% | | | |
| Building Products - 2.6% | | | |
| Tecnoglass, Inc. | | 1,452 | 117,685 |
| The AZEK Co., Inc. Class A, (a) | | 4,898 | 260,182 |
| Trane Technologies PLC | | 1,495 | 622,249 |
| | | | 1,000,116 |
| Commercial Services & Supplies - 1.4% | | | |
| Tetra Tech, Inc. | | 6,575 | 272,928 |
| Veralto Corp. | | 2,681 | 290,057 |
| | | | 562,985 |
| Construction & Engineering - 1.7% | | | |
| Fluor Corp. (a) | | 6,266 | 351,711 |
| Quanta Services, Inc. | | 905 | 311,791 |
| | | | 663,502 |
| Electrical Equipment - 5.7% | | | |
| Acuity Brands, Inc. | | 1,333 | 427,480 |
| Eaton Corp. PLC | | 1,880 | 705,790 |
| Net Power, Inc. Class A (a) | | 6,156 | 78,858 |
| Nextracker, Inc. Class A (a) | | 5,393 | 205,797 |
| NuScale Power Corp. Class A (a) | | 4,041 | 119,816 |
| Prysmian SpA | | 3,038 | 200,394 |
| Sensata Technologies PLC | | 4,110 | 132,095 |
| Sungrow Power Supply Co. Ltd. (A Shares) | | 25,860 | 292,102 |
| Vestas Wind Systems A/S (a) | | 4,346 | 68,047 |
| | | | 2,230,379 |
| Industrial Conglomerates - 0.8% | | | |
| 3M Co. | | 2,298 | 306,852 |
| Machinery - 3.4% | | | |
| Deere & Co. | | 1,505 | 701,180 |
| Ingersoll Rand, Inc. | | 3,688 | 384,179 |
| Techtronic Industries Co. Ltd. | | 18,722 | 263,744 |
| | | | 1,349,103 |
| Professional Services - 3.0% | | | |
| KBR, Inc. | | 5,156 | 313,639 |
| RELX PLC (London Stock Exchange) | | 6,218 | 293,142 |
| UL Solutions, Inc. Class A | | 4,847 | 260,429 |
| Verisk Analytics, Inc. | | 1,009 | 296,858 |
| | | | 1,164,068 |
TOTAL INDUSTRIALS | | | 7,277,005 |
| INFORMATION TECHNOLOGY - 33.9% | | | |
| Communications Equipment - 1.5% | | | |
| Ciena Corp. (a) | | 3,032 | 211,391 |
| Lumentum Holdings, Inc. (a) | | 2,395 | 208,293 |
| Motorola Solutions, Inc. | | 346 | 172,896 |
| | | | 592,580 |
| Electronic Equipment, Instruments & Components - 4.1% | | | |
| Amphenol Corp. Class A | | 6,761 | 491,187 |
| Coherent Corp. (a) | | 3,491 | 349,659 |
| Flex Ltd. (a) | | 7,643 | 297,848 |
| Keysight Technologies, Inc. (a) | | 1,390 | 237,468 |
| Zebra Technologies Corp. Class A (a) | | 555 | 225,885 |
| | | | 1,602,047 |
| IT Services - 2.6% | | | |
| Accenture PLC Class A | | 1,281 | 464,196 |
| IBM Corp. | | 2,396 | 544,874 |
| | | | 1,009,070 |
| Semiconductors & Semiconductor Equipment - 9.9% | | | |
| AEHR Test Systems (a) | | 8,710 | 103,562 |
| Allegro MicroSystems LLC (a) | | 8,393 | 182,380 |
| Applied Materials, Inc. | | 2,214 | 386,808 |
| Enphase Energy, Inc. (a) | | 1,999 | 142,629 |
| First Solar, Inc. (a) | | 2,381 | 474,462 |
| Flat Glass Group Co. Ltd. (A Shares) | | 24,100 | 85,287 |
| NVIDIA Corp. | | 17,385 | 2,403,475 |
| Universal Display Corp. | | 713 | 117,303 |
| | | | 3,895,906 |
| Software - 10.2% | | | |
| CyberArk Software Ltd. (a) | | 1,258 | 406,976 |
| DocuSign, Inc. (a) | | 5,061 | 403,311 |
| Microsoft Corp. | | 4,663 | 1,974,594 |
| Samsara, Inc. Class A (a) | | 5,167 | 276,383 |
| ServiceNow, Inc. (a) | | 497 | 521,572 |
| VRAIN Solution, Inc. | | 1,985 | 24,080 |
| Zoom Communications, Inc. Class A (a) | | 4,714 | 389,801 |
| | | | 3,996,717 |
| Technology Hardware, Storage & Peripherals - 5.6% | | | |
| Apple, Inc. | | 9,234 | 2,191,505 |
TOTAL INFORMATION TECHNOLOGY | | | 13,287,825 |
| MATERIALS - 2.8% | | | |
| Chemicals - 1.9% | | | |
| DSM-Firmenich AG | | 2,151 | 236,274 |
| Linde PLC | | 867 | 399,678 |
| PureCycle Technologies, Inc. (a) | | 6,547 | 87,042 |
| | | | 722,994 |
| Metals & Mining - 0.9% | | | |
| Freeport-McMoRan, Inc. | | 4,544 | 200,845 |
| Lynas Rare Earths Ltd. (a) | | 26,310 | 118,691 |
| MP Materials Corp. (a) | | 1,901 | 40,054 |
| | | | 359,590 |
TOTAL MATERIALS | | | 1,082,584 |
| UTILITIES - 0.3% | | | |
| Electric Utilities - 0.3% | | | |
| Oklo, Inc. Class A (a) | | 4,930 | 116,052 |
| TOTAL COMMON STOCKS (Cost $28,690,150) | | | 38,816,325 |
| | | | |
| Convertible Preferred Stocks - 0.0% |
| | | Shares | Value ($) |
| INFORMATION TECHNOLOGY - 0.0% | | | |
| Electronic Equipment, Instruments & Components - 0.0% | | | |
CelLink Corp. Series D (a)(b)(c) (Cost $8,330) | | 400 | 2,240 |
| TOTAL CONVERTIBLE PREFERRED STOCKS (Cost $8,330) | | | 2,240 |
| | | | |
| Preferred Securities - 0.1% |
| | | Principal Amount (d) | Value ($) |
| MATERIALS - 0.1% | | | |
| Metals & Mining - 0.1% | | | |
Illuminated Holdings, Inc. 15% (b)(c)(e) (Cost $12,000) | | 12,000 | 13,327 |
| TOTAL PREFERRED SECURITIES (Cost $12,000) | | | 13,327 |
| | | | |
| Money Market Funds - 1.0% |
| | | Shares | Value ($) |
Fidelity Cash Central Fund 4.64% (f) (Cost $402,736) | | 402,655 | 402,736 |
| | | | |
| TOTAL INVESTMENT IN SECURITIES - 100.2% (Cost $29,113,216) | 39,234,628 |
NET OTHER ASSETS (LIABILITIES) - (0.2)% | (77,917) |
| NET ASSETS - 100.0% | 39,156,711 |
| | |
Legend
| (b) | Restricted securities (including private placements) - Investment in securities not registered under the Securities Act of 1933 (excluding 144A issues). At the end of the period, the value of restricted securities (excluding 144A issues) amounted to $15,567 or 0.0% of net assets. |
| (d) | Amount is stated in United States dollars unless otherwise noted. |
| (e) | Security is perpetual in nature with no stated maturity date. |
| (f) | Affiliated fund that is generally available only to investment companies and other accounts managed by Fidelity Investments. The rate quoted is the annualized seven-day yield of the fund at period end. A complete unaudited listing of the fund's holdings as of its most recent quarter end is available upon request. In addition, each Fidelity Central Fund's financial statements are available on the SEC's website or upon request. |
| Additional information on each restricted holding is as follows: |
| Security | Acquisition Date | Acquisition Cost ($) |
| CelLink Corp. Series D | 1/20/22 | 8,330 |
| | | |
| Illuminated Holdings, Inc. 15% | 9/27/23 | 12,000 |
| | | |
Affiliated Central Funds
Fiscal year to date information regarding the Fund's investments in Fidelity Central Funds, including the ownership percentage, is presented below.
| Affiliate | Value, beginning of period ($) | Purchases ($) | Sales Proceeds ($) | Dividend Income ($) | Realized Gain (loss) ($) | Change in Unrealized appreciation (depreciation) ($) | Value, end of period ($) | % ownership, end of period |
| Fidelity Cash Central Fund 4.64% | 350,107 | 3,355,921 | 3,303,310 | 10,068 | 18 | - | 402,736 | 0.0% |
| Total | 350,107 | 3,355,921 | 3,303,310 | 10,068 | 18 | - | 402,736 | |
| | | | | | | | | |
Amounts in the dividend income column in the above table include any capital gain distributions from underlying funds, which are presented in the corresponding line item in the Statement of Operations, if applicable.
Amounts included in the purchases and sales proceeds columns may include in-kind transactions, if applicable.
Investment Valuation
The following is a summary of the inputs used, as of November 30, 2024, involving the Fund's assets and liabilities carried at fair value. The inputs or methodology used for valuing securities may not be an indication of the risk associated with investing in those securities. For more information on valuation inputs, and their aggregation into the levels used below, please refer to the Investment Valuation section in the accompanying Notes to Financial Statements.
| Valuation Inputs at Reporting Date: |
| Description | Total ($) | Level 1 ($) | Level 2 ($) | Level 3 ($) |
Investments in Securities: | | | | |
|
| Equities: | | | | |
Communication Services | 1,689,331 | 1,689,331 | - | - |
Consumer Discretionary | 4,939,405 | 4,671,531 | 267,874 | - |
Consumer Staples | 1,124,510 | 548,542 | 575,968 | - |
Energy | 321,026 | 321,026 | - | - |
Financials | 5,092,945 | 5,092,945 | - | - |
Health Care | 3,885,642 | 3,134,591 | 751,051 | - |
Industrials | 7,277,005 | 6,623,714 | 653,291 | - |
Information Technology | 13,290,065 | 13,202,538 | 85,287 | 2,240 |
Materials | 1,082,584 | 727,619 | 354,965 | - |
Utilities | 116,052 | 116,052 | - | - |
|
| Preferred Securities | 13,327 | - | - | 13,327 |
|
| Money Market Funds | 402,736 | 402,736 | - | - |
| Total Investments in Securities: | 39,234,628 | 36,530,625 | 2,688,436 | 15,567 |
Financial Statements (Unaudited)
| Statement of Assets and Liabilities |
| As of November 30, 2024 (Unaudited) |
| Assets | | | | |
| Investment in securities, at value - See accompanying schedule: | | | | |
Unaffiliated issuers (cost $28,710,480) | $ | 38,831,892 | | |
Fidelity Central Funds (cost $402,736) | | 402,736 | | |
| | | | | |
| | | | | |
| Total Investment in Securities (cost $29,113,216) | | | $ | 39,234,628 |
| Foreign currency held at value (cost $3) | | | | 3 |
| Receivable for investments sold | | | | 13,450 |
| Receivable for fund shares sold | | | | 18,610 |
| Dividends receivable | | | | 34,421 |
| Distributions receivable from Fidelity Central Funds | | | | 1,325 |
| Prepaid expenses | | | | 34 |
| Other receivables | | | | 591 |
Total assets | | | | 39,303,062 |
| Liabilities | | | | |
| Payable to custodian bank | $ | 13,450 | | |
| Payable for investments purchased | | 67,386 | | |
| Payable for fund shares redeemed | | 3,902 | | |
| Accrued management fee | | 27,869 | | |
| Distribution and service plan fees payable | | 817 | | |
| Audit fee payable | | 29,229 | | |
| Other payables and accrued expenses | | 3,698 | | |
| Total liabilities | | | | 146,351 |
| Net Assets | | | $ | 39,156,711 |
| Net Assets consist of: | | | | |
| Paid in capital | | | $ | 32,731,466 |
| Total accumulated earnings (loss) | | | | 6,425,245 |
| Net Assets | | | $ | 39,156,711 |
| | | | | |
| Net Asset Value and Maximum Offering Price | | | | |
| Class A : | | | | |
Net Asset Value and redemption price per share ($1,109,327 ÷ 88,076 shares)(a) | | | $ | 12.60 |
| Maximum offering price per share (100/94.25 of $12.60) | | | $ | 13.37 |
| Class M : | | | | |
Net Asset Value and redemption price per share ($640,163 ÷ 51,269 shares)(a) | | | $ | 12.49 |
| Maximum offering price per share (100/96.50 of $12.49) | | | $ | 12.94 |
| Class C : | | | | |
Net Asset Value and offering price per share ($354,994 ÷ 28,927 shares)(a) | | | $ | 12.27 |
| Fidelity Climate Action Fund : | | | | |
Net Asset Value, offering price and redemption price per share ($35,323,620 ÷ 2,785,677 shares) | | | $ | 12.68 |
| Class I : | | | | |
Net Asset Value, offering price and redemption price per share ($310,083 ÷ 24,452 shares) | | | $ | 12.68 |
| Class Z : | | | | |
Net Asset Value, offering price and redemption price per share ($1,418,524 ÷ 111,299 shares) | | | $ | 12.75 |
(a)Redemption price per share is equal to net asset value less any applicable contingent deferred sales charge. |
| Statement of Operations |
Six months ended November 30, 2024 (Unaudited) |
| Investment Income | | | | |
| Dividends | | | $ | 138,085 |
| Income from Fidelity Central Funds | | | | 10,068 |
| Total income | | | | 148,153 |
| Expenses | | | | |
| Management fee | | | | |
| Basic fee | $ | 143,463 | | |
| Performance adjustment | | (11,385) | | |
| Distribution and service plan fees | | 4,468 | | |
| Custodian fees and expenses | | 4,537 | | |
| Independent trustees' fees and expenses | | 72 | | |
| Registration fees | | 26,795 | | |
| Audit fees | | 29,962 | | |
| Legal | | 1,727 | | |
| Miscellaneous | | 91 | | |
| Total expenses before reductions | | 199,730 | | |
| Expense reductions | | (13,157) | | |
| Total expenses after reductions | | | | 186,573 |
| Net Investment income (loss) | | | | (38,420) |
| Realized and Unrealized Gain (Loss) | | | | |
| Net realized gain (loss) on: | | | | |
| Investment Securities: | | | | |
| Unaffiliated issuers | | 1,286,614 | | |
| Fidelity Central Funds | | 18 | | |
| Foreign currency transactions | | 284 | | |
| Total net realized gain (loss) | | | | 1,286,916 |
| Change in net unrealized appreciation (depreciation) on: | | | | |
| Investment Securities: | | | | |
| Unaffiliated issuers | | 2,166,258 | | |
| Assets and liabilities in foreign currencies | | (319) | | |
| Total change in net unrealized appreciation (depreciation) | | | | 2,165,939 |
| Net gain (loss) | | | | 3,452,855 |
| Net increase (decrease) in net assets resulting from operations | | | $ | 3,414,435 |
| Statement of Changes in Net Assets |
| |
| | Six months ended November 30, 2024 (Unaudited) | | Year ended May 31, 2024 |
| Increase (Decrease) in Net Assets | | | | |
| Operations | | | | |
| Net investment income (loss) | $ | (38,420) | $ | 2,779 |
| Net realized gain (loss) | | 1,286,916 | | (448,807) |
| Change in net unrealized appreciation (depreciation) | | 2,165,939 | | 7,339,918 |
| Net increase (decrease) in net assets resulting from operations | | 3,414,435 | | 6,893,890 |
| Distributions to shareholders | | - | | (36,997) |
| | | | | |
| Share transactions - net increase (decrease) | | 4,503,220 | | 1,496,009 |
| Total increase (decrease) in net assets | | 7,917,655 | | 8,352,902 |
| | | | | |
| Net Assets | | | | |
| Beginning of period | | 31,239,056 | | 22,886,154 |
| End of period | $ | 39,156,711 | $ | 31,239,056 |
| | | | | |
| | | | | |
Financial Highlights
Fidelity Advisor® Climate Action Fund Class A |
| |
| | Six months ended (Unaudited) November 30, 2024 | | Years ended May 31, 2024 | | 2023 | | 2022 A |
Selected Per-Share Data | | | | | | | | |
| Net asset value, beginning of period | $ | 11.45 | $ | 8.85 | $ | 8.88 | $ | 10.00 |
| Income from Investment Operations | | | | | | | | |
Net investment income (loss) B,C | | (.03) | | (.02) | | - D | | (.02) |
| Net realized and unrealized gain (loss) | | 1.18 | | 2.62 | | (.03) E | | (1.10) |
| Total from investment operations | | 1.15 | | 2.60 | | (.03) | | (1.12) |
| Net asset value, end of period | $ | 12.60 | $ | 11.45 | $ | 8.85 | $ | 8.88 |
Total Return F,G,H | | | | 29.38% | | (.34)% | | (11.20)% |
Ratios to Average Net Assets C,I,J | | | | | | | | |
| Expenses before reductions | | 1.40% K | | 1.74% | | 1.95% | | 2.95% K |
| Expenses net of fee waivers, if any | | | | 1.30% | | 1.30% | | 1.29% K |
| Expenses net of all reductions | | 1.30% K | | 1.30% | | 1.30% | | 1.29% K |
| Net investment income (loss) | | (.45)% K | | (.22)% | | (.05)% | | (.19)% K |
| Supplemental Data | | | | | | | | |
| Net assets, end of period (000 omitted) | $ | 1,109 | $ | 833 | $ | 449 | $ | 405 |
Portfolio turnover rate L | | | | 85% | | 51% | | 57% K |
AFor the period June 15, 2021 (commencement of operations) through May 31, 2022.
BCalculated based on average shares outstanding during the period.
CNet investment income (loss) is affected by the timing of the declaration of dividends by any underlying mutual funds or exchange-traded funds (ETFs). Net investment income (loss) of any mutual funds or ETFs is not included in the Fund's net investment income (loss) ratio.
DAmount represents less than $.005 per share.
EThe amount shown for a share outstanding does not correspond with the aggregate net gain (loss) on investments for the period due to the timing of sales and repurchases of shares in relation to fluctuating market values of the investments of the Fund.
FTotal returns for periods of less than one year are not annualized.
GTotal returns would have been lower if certain expenses had not been reduced during the applicable periods shown.
HTotal returns do not include the effect of the sales charges.
IFees and expenses of any underlying mutual funds or exchange-traded funds (ETFs) are not included in the Fund's expense ratio. The Fund indirectly bears its proportionate share of these expenses. For additional expense information related to investments in Fidelity Central Funds, please refer to the "Investments in Fidelity Central Funds" note found in the Notes to Financial Statements section of the most recent Annual or Semi-Annual report.
JExpense ratios reflect operating expenses of the class. Expenses before reductions do not reflect amounts reimbursed, waived, or reduced through arrangements with the investment adviser, brokerage services, or other offset arrangements, if applicable, and do not represent the amount paid by the class during periods when reimbursements, waivers or reductions occur.
KAnnualized.
LAmount does not include the portfolio activity of any underlying mutual funds or exchange-traded funds (ETFs), derivatives or securities that mature within one year from acquisition.
Fidelity Advisor® Climate Action Fund Class M |
| |
| | Six months ended (Unaudited) November 30, 2024 | | Years ended May 31, 2024 | | 2023 | | 2022 A |
Selected Per-Share Data | | | | | | | | |
| Net asset value, beginning of period | $ | 11.37 | $ | 8.81 | $ | 8.86 | $ | 10.00 |
| Income from Investment Operations | | | | | | | | |
Net investment income (loss) B,C | | (.04) | | (.05) | | (.03) | | (.04) |
| Net realized and unrealized gain (loss) | | 1.16 | | 2.61 | | (.02) D | | (1.10) |
| Total from investment operations | | 1.12 | | 2.56 | | (.05) | | (1.14) |
| Net asset value, end of period | $ | 12.49 | $ | 11.37 | $ | 8.81 | $ | 8.86 |
Total Return E,F,G | | | | 29.06% | | (.56)% | | (11.40)% |
Ratios to Average Net Assets C,H,I | | | | | | | | |
| Expenses before reductions | | 1.64% J | | 1.94% | | 2.04% | | 3.33% J |
| Expenses net of fee waivers, if any | | | | 1.55% | | 1.55% | | 1.55% J |
| Expenses net of all reductions | | 1.55% J | | 1.55% | | 1.55% | | 1.55% J |
| Net investment income (loss) | | (.70)% J | | (.47)% | | (.30)% | | (.45)% J |
| Supplemental Data | | | | | | | | |
| Net assets, end of period (000 omitted) | $ | 640 | $ | 563 | $ | 431 | $ | 132 |
Portfolio turnover rate K | | | | 85% | | 51% | | 57% J |
AFor the period June 15, 2021 (commencement of operations) through May 31, 2022.
BCalculated based on average shares outstanding during the period.
CNet investment income (loss) is affected by the timing of the declaration of dividends by any underlying mutual funds or exchange-traded funds (ETFs). Net investment income (loss) of any mutual funds or ETFs is not included in the Fund's net investment income (loss) ratio.
DThe amount shown for a share outstanding does not correspond with the aggregate net gain (loss) on investments for the period due to the timing of sales and repurchases of shares in relation to fluctuating market values of the investments of the Fund.
ETotal returns for periods of less than one year are not annualized.
FTotal returns would have been lower if certain expenses had not been reduced during the applicable periods shown.
GTotal returns do not include the effect of the sales charges.
HFees and expenses of any underlying mutual funds or exchange-traded funds (ETFs) are not included in the Fund's expense ratio. The Fund indirectly bears its proportionate share of these expenses. For additional expense information related to investments in Fidelity Central Funds, please refer to the "Investments in Fidelity Central Funds" note found in the Notes to Financial Statements section of the most recent Annual or Semi-Annual report.
IExpense ratios reflect operating expenses of the class. Expenses before reductions do not reflect amounts reimbursed, waived, or reduced through arrangements with the investment adviser, brokerage services, or other offset arrangements, if applicable, and do not represent the amount paid by the class during periods when reimbursements, waivers or reductions occur.
JAnnualized.
KAmount does not include the portfolio activity of any underlying mutual funds or exchange-traded funds (ETFs), derivatives or securities that mature within one year from acquisition.
Fidelity Advisor® Climate Action Fund Class C |
| |
| | Six months ended (Unaudited) November 30, 2024 | | Years ended May 31, 2024 | | 2023 | | 2022 A |
Selected Per-Share Data | | | | | | | | |
| Net asset value, beginning of period | $ | 11.20 | $ | 8.72 | $ | 8.82 | $ | 10.00 |
| Income from Investment Operations | | | | | | | | |
Net investment income (loss) B,C | | (.07) | | (.09) | | (.07) | | (.09) |
| Net realized and unrealized gain (loss) | | 1.14 | | 2.57 | | (.03) D | | (1.09) |
| Total from investment operations | | 1.07 | | 2.48 | | (.10) | | (1.18) |
| Net asset value, end of period | $ | 12.27 | $ | 11.20 | $ | 8.72 | $ | 8.82 |
Total Return E,F,G | | | | 28.44% | | (1.13)% | | (11.80)% |
Ratios to Average Net Assets C,H,I | | | | | | | | |
| Expenses before reductions | | 2.16% J | | 2.50% | | 2.63% | | 3.55% J |
| Expenses net of fee waivers, if any | | | | 2.05% | | 2.05% | | 2.04% J |
| Expenses net of all reductions | | 2.05% J | | 2.05% | | 2.05% | | 2.04% J |
| Net investment income (loss) | | (1.20)% J | | (.97)% | | (.80)% | | (.94)% J |
| Supplemental Data | | | | | | | | |
| Net assets, end of period (000 omitted) | $ | 355 | $ | 289 | $ | 199 | $ | 265 |
Portfolio turnover rate K | | | | 85% | | 51% | | 57% J |
AFor the period June 15, 2021 (commencement of operations) through May 31, 2022.
BCalculated based on average shares outstanding during the period.
CNet investment income (loss) is affected by the timing of the declaration of dividends by any underlying mutual funds or exchange-traded funds (ETFs). Net investment income (loss) of any mutual funds or ETFs is not included in the Fund's net investment income (loss) ratio.
DThe amount shown for a share outstanding does not correspond with the aggregate net gain (loss) on investments for the period due to the timing of sales and repurchases of shares in relation to fluctuating market values of the investments of the Fund.
ETotal returns for periods of less than one year are not annualized.
FTotal returns would have been lower if certain expenses had not been reduced during the applicable periods shown.
GTotal returns do not include the effect of the contingent deferred sales charge.
HFees and expenses of any underlying mutual funds or exchange-traded funds (ETFs) are not included in the Fund's expense ratio. The Fund indirectly bears its proportionate share of these expenses. For additional expense information related to investments in Fidelity Central Funds, please refer to the "Investments in Fidelity Central Funds" note found in the Notes to Financial Statements section of the most recent Annual or Semi-Annual report.
IExpense ratios reflect operating expenses of the class. Expenses before reductions do not reflect amounts reimbursed, waived, or reduced through arrangements with the investment adviser, brokerage services, or other offset arrangements, if applicable, and do not represent the amount paid by the class during periods when reimbursements, waivers or reductions occur.
JAnnualized.
KAmount does not include the portfolio activity of any underlying mutual funds or exchange-traded funds (ETFs), derivatives or securities that mature within one year from acquisition.
Fidelity® Climate Action Fund |
| |
| | Six months ended (Unaudited) November 30, 2024 | | Years ended May 31, 2024 | | 2023 | | 2022 A |
Selected Per-Share Data | | | | | | | | |
| Net asset value, beginning of period | $ | 11.52 | $ | 8.89 | $ | 8.90 | $ | 10.00 |
| Income from Investment Operations | | | | | | | | |
Net investment income (loss) B,C | | (.01) | | - D | | .02 | | .01 |
| Net realized and unrealized gain (loss) | | 1.17 | | 2.65 | | (.03) E | | (1.11) |
| Total from investment operations | | 1.16 | | 2.65 | | (.01) | | (1.10) |
| Distributions from net investment income | | - | | (.02) | | - D | | - |
| Total distributions | | - | | (.02) | | - D | | - |
| Net asset value, end of period | $ | 12.68 | $ | 11.52 | $ | 8.89 | $ | 8.90 |
Total Return F,G | | | | 29.79% | | (.08)% | | (11.00)% |
Ratios to Average Net Assets C,H,I | | | | | | | | |
| Expenses before reductions | | 1.12% J | | 1.48% | | 1.68% | | 2.66% J |
| Expenses net of fee waivers, if any | | | | 1.05% | | 1.05% | | 1.05% J |
| Expenses net of all reductions | | 1.05% J | | 1.05% | | 1.05% | | 1.05% J |
| Net investment income (loss) | | (.20)% J | | .03% | | .20% | | .06% J |
| Supplemental Data | | | | | | | | |
| Net assets, end of period (000 omitted) | $ | 35,324 | $ | 27,766 | $ | 21,237 | $ | 19,057 |
Portfolio turnover rate K | | | | 85% | | 51% | | 57% J |
AFor the period June 15, 2021 (commencement of operations) through May 31, 2022.
BCalculated based on average shares outstanding during the period.
CNet investment income (loss) is affected by the timing of the declaration of dividends by any underlying mutual funds or exchange-traded funds (ETFs). Net investment income (loss) of any mutual funds or ETFs is not included in the Fund's net investment income (loss) ratio.
DAmount represents less than $.005 per share.
EThe amount shown for a share outstanding does not correspond with the aggregate net gain (loss) on investments for the period due to the timing of sales and repurchases of shares in relation to fluctuating market values of the investments of the Fund.
FTotal returns for periods of less than one year are not annualized.
GTotal returns would have been lower if certain expenses had not been reduced during the applicable periods shown.
HFees and expenses of any underlying mutual funds or exchange-traded funds (ETFs) are not included in the Fund's expense ratio. The Fund indirectly bears its proportionate share of these expenses. For additional expense information related to investments in Fidelity Central Funds, please refer to the "Investments in Fidelity Central Funds" note found in the Notes to Financial Statements section of the most recent Annual or Semi-Annual report.
IExpense ratios reflect operating expenses of the class. Expenses before reductions do not reflect amounts reimbursed, waived, or reduced through arrangements with the investment adviser, brokerage services, or other offset arrangements, if applicable, and do not represent the amount paid by the class during periods when reimbursements, waivers or reductions occur.
JAnnualized.
KAmount does not include the portfolio activity of any underlying mutual funds or exchange-traded funds (ETFs), derivatives or securities that mature within one year from acquisition.
Fidelity Advisor® Climate Action Fund Class I |
| |
| | Six months ended (Unaudited) November 30, 2024 | | Years ended May 31, 2024 | | 2023 | | 2022 A |
Selected Per-Share Data | | | | | | | | |
| Net asset value, beginning of period | $ | 11.52 | $ | 8.89 | $ | 8.90 | $ | 10.00 |
| Income from Investment Operations | | | | | | | | |
Net investment income (loss) B,C | | (.01) | | - D | | .02 | | .01 |
| Net realized and unrealized gain (loss) | | 1.17 | | 2.65 | | (.03) E | | (1.11) |
| Total from investment operations | | 1.16 | | 2.65 | | (.01) | | (1.10) |
| Distributions from net investment income | | - | | (.02) | | - D | | - |
| Total distributions | | - | | (.02) | | - D | | - |
| Net asset value, end of period | $ | 12.68 | $ | 11.52 | $ | 8.89 | $ | 8.90 |
Total Return F,G | | | | 29.79% | | (.08)% | | (11.00)% |
Ratios to Average Net Assets C,H,I | | | | | | | | |
| Expenses before reductions | | 1.24% J | | 1.35% | | 1.55% | | 2.93% J |
| Expenses net of fee waivers, if any | | | | 1.05% | | 1.04% | | 1.04% J |
| Expenses net of all reductions | | 1.05% J | | 1.05% | | 1.04% | | 1.04% J |
| Net investment income (loss) | | (.20)% J | | .03% | | .20% | | .06% J |
| Supplemental Data | | | | | | | | |
| Net assets, end of period (000 omitted) | $ | 310 | $ | 903 | $ | 300 | $ | 192 |
Portfolio turnover rate K | | | | 85% | | 51% | | 57% J |
AFor the period June 15, 2021 (commencement of operations) through May 31, 2022.
BCalculated based on average shares outstanding during the period.
CNet investment income (loss) is affected by the timing of the declaration of dividends by any underlying mutual funds or exchange-traded funds (ETFs). Net investment income (loss) of any mutual funds or ETFs is not included in the Fund's net investment income (loss) ratio.
DAmount represents less than $.005 per share.
EThe amount shown for a share outstanding does not correspond with the aggregate net gain (loss) on investments for the period due to the timing of sales and repurchases of shares in relation to fluctuating market values of the investments of the Fund.
FTotal returns for periods of less than one year are not annualized.
GTotal returns would have been lower if certain expenses had not been reduced during the applicable periods shown.
HFees and expenses of any underlying mutual funds or exchange-traded funds (ETFs) are not included in the Fund's expense ratio. The Fund indirectly bears its proportionate share of these expenses. For additional expense information related to investments in Fidelity Central Funds, please refer to the "Investments in Fidelity Central Funds" note found in the Notes to Financial Statements section of the most recent Annual or Semi-Annual report.
IExpense ratios reflect operating expenses of the class. Expenses before reductions do not reflect amounts reimbursed, waived, or reduced through arrangements with the investment adviser, brokerage services, or other offset arrangements, if applicable, and do not represent the amount paid by the class during periods when reimbursements, waivers or reductions occur.
JAnnualized.
KAmount does not include the portfolio activity of any underlying mutual funds or exchange-traded funds (ETFs), derivatives or securities that mature within one year from acquisition.
Fidelity Advisor® Climate Action Fund Class Z |
| |
| | Six months ended (Unaudited) November 30, 2024 | | Years ended May 31, 2024 | | 2023 | | 2022 A |
Selected Per-Share Data | | | | | | | | |
| Net asset value, beginning of period | $ | 11.57 | $ | 8.92 | $ | 8.91 | $ | 10.00 |
| Income from Investment Operations | | | | | | | | |
Net investment income (loss) B,C | | - D | | .02 | | .03 | | .02 |
| Net realized and unrealized gain (loss) | | 1.18 | | 2.65 | | (.02) E | | (1.11) |
| Total from investment operations | | 1.18 | | 2.67 | | .01 | | (1.09) |
| Distributions from net investment income | | - | | (.02) | | - D | | - |
| Total distributions | | - | | (.02) | | - D | | - |
| Net asset value, end of period | $ | 12.75 | $ | 11.57 | $ | 8.92 | $ | 8.91 |
Total Return F,G | | | | 29.91% | | .15% | | (10.90)% |
Ratios to Average Net Assets C,H,I | | | | | | | | |
| Expenses before reductions | | .99% J | | 1.32% | | 1.40% | | 3.00% J |
| Expenses net of fee waivers, if any | | | | .90% | | .90% | | .90% J |
| Expenses net of all reductions | | .90% J | | .90% | | .89% | | .90% J |
| Net investment income (loss) | | (.05)% J | | .18% | | .35% | | .20% J |
| Supplemental Data | | | | | | | | |
| Net assets, end of period (000 omitted) | $ | 1,419 | $ | 884 | $ | 270 | $ | 109 |
Portfolio turnover rate K | | | | 85% | | 51% | | 57% J |
AFor the period June 15, 2021 (commencement of operations) through May 31, 2022.
BCalculated based on average shares outstanding during the period.
CNet investment income (loss) is affected by the timing of the declaration of dividends by any underlying mutual funds or exchange-traded funds (ETFs). Net investment income (loss) of any mutual funds or ETFs is not included in the Fund's net investment income (loss) ratio.
DAmount represents less than $.005 per share.
EThe amount shown for a share outstanding does not correspond with the aggregate net gain (loss) on investments for the period due to the timing of sales and repurchases of shares in relation to fluctuating market values of the investments of the Fund.
FTotal returns for periods of less than one year are not annualized.
GTotal returns would have been lower if certain expenses had not been reduced during the applicable periods shown.
HFees and expenses of any underlying mutual funds or exchange-traded funds (ETFs) are not included in the Fund's expense ratio. The Fund indirectly bears its proportionate share of these expenses. For additional expense information related to investments in Fidelity Central Funds, please refer to the "Investments in Fidelity Central Funds" note found in the Notes to Financial Statements section of the most recent Annual or Semi-Annual report.
IExpense ratios reflect operating expenses of the class. Expenses before reductions do not reflect amounts reimbursed, waived, or reduced through arrangements with the investment adviser, brokerage services, or other offset arrangements, if applicable, and do not represent the amount paid by the class during periods when reimbursements, waivers or reductions occur.
JAnnualized.
KAmount does not include the portfolio activity of any underlying mutual funds or exchange-traded funds (ETFs), derivatives or securities that mature within one year from acquisition.
Notes to Financial Statements
(Unaudited)For the period ended November 30, 2024
1. Organization.
Fidelity Climate Action Fund (the Fund) is a fund of Fidelity Summer Street Trust (the Trust) and is authorized to issue an unlimited number of shares. The Trust is registered under the Investment Company Act of 1940, as amended (the 1940 Act), as an open-end management investment company organized as a Massachusetts business trust. The Fund offers Class A, Class M, Class C, Climate Action, Class I and Class Z shares, each of which has equal rights as to assets and voting privileges. Class A, Class M, Class C, Class I and Class Z are Fidelity Advisor classes. Each class has exclusive voting rights with respect to matters that affect that class. Class C shares will automatically convert to Class A shares after a holding period of eight years from the initial date of purchase, with certain exceptions. Because the Fund focuses its investments in equity securities of climate aware companies, it will be more susceptible to events or factors affecting these companies. The Fund is particularly exposed to such developments as changes in global and regional climates, environmental protection regulatory actions, changes in government standards and subsidy levels, changes in taxation and other domestic and international political, regulatory, and economic developments.
2. Investments in Fidelity Central Funds.
Funds may invest in Fidelity Central Funds, which are open-end investment companies generally available only to other investment companies and accounts managed by the investment adviser and its affiliates. The Schedule of Investments lists any Fidelity Central Funds held as an investment as of period end, but does not include the underlying holdings of each Fidelity Central Fund. An investing fund indirectly bears its proportionate share of the expenses of the underlying Fidelity Central Funds.
Based on its investment objective, each Fidelity Central Fund may invest or participate in various investment vehicles or strategies that are similar to those of the investing fund. These strategies are consistent with the investment objectives of the investing fund and may involve certain economic risks which may cause a decline in value of each of the Fidelity Central Funds and thus a decline in the value of the investing fund.
| Fidelity Central Fund | Investment Manager | Investment Objective | Investment Practices | Expense RatioA |
| Fidelity Money Market Central Funds | Fidelity Management & Research Company LLC (FMR) | Each fund seeks to obtain a high level of current income consistent with the preservation of capital and liquidity. | Short-term Investments | Less than .005% |
A Expenses expressed as a percentage of average net assets and are as of each underlying Central Fund's most recent annual or semi-annual shareholder report.
A complete unaudited list of holdings for each Fidelity Central Fund is available upon request or at the Securities and Exchange Commission website at www.sec.gov. In addition, the financial statements of the Fidelity Central Funds which contain the significant accounting policies (including investment valuation policies) of those funds, and are not covered by the Report of Independent Registered Public Accounting Firm, are available on the Securities and Exchange Commission website or upon request.
3. Significant Accounting Policies.
The Fund is an investment company and applies the accounting and reporting guidance of the Financial Accounting Standards Board (FASB) Accounting Standards Codification Topic 946 Financial Services - Investment Companies. The financial statements have been prepared in conformity with accounting principles generally accepted in the United States of America (GAAP), which require management to make certain estimates and assumptions at the date of the financial statements. Actual results could differ from those estimates. Subsequent events, if any, through the date that the financial statements were issued have been evaluated in the preparation of the financial statements. The Fund's Schedule of Investments lists any underlying mutual funds or exchange-traded funds (ETFs) but does not include the underlying holdings of these funds. The following summarizes the significant accounting policies of the Fund:
Investment Valuation. Investments are valued as of 4:00 p.m. Eastern time on the last calendar day of the period. The Board of Trustees (the Board) has designated the Fund's investment adviser as the valuation designee responsible for the fair valuation function and performing fair value determinations as needed. The investment adviser has established a Fair Value Committee (the Committee) to carry out the day-to-day fair valuation responsibilities and has adopted policies and procedures to govern the fair valuation process and the activities of the Committee. In accordance with these fair valuation policies and procedures, which have been approved by the Board, the Fund attempts to obtain prices from one or more third party pricing services or brokers to value its investments. When current market prices, quotations or currency exchange rates are not readily available or reliable, investments will be fair valued in good faith by the Committee, in accordance with the policies and procedures. Factors used in determining fair value vary by investment type and may include market or investment specific events, transaction data, estimated cash flows, and market observations of comparable investments. The frequency that the fair valuation procedures are used cannot be predicted and they may be utilized to a significant extent. The Committee manages the Fund's fair valuation practices and maintains the fair valuation policies and procedures. The Fund's investment adviser reports to the Board information regarding the fair valuation process and related material matters.
The Fund categorizes the inputs to valuation techniques used to value its investments into a disclosure hierarchy consisting of three levels as shown below:
Level 1 - unadjusted quoted prices in active markets for identical investments
Level 2 - other significant observable inputs (including quoted prices for similar investments, interest rates, prepayment speeds, etc.)
Level 3 - unobservable inputs (including the Fund's own assumptions based on the best information available)
Valuation techniques used to value the Fund's investments by major category are as follows:
Equity securities, including restricted securities, for which market quotations are readily available, are valued at the last reported sale price or official closing price as reported by a third party pricing service on the primary market or exchange on which they are traded and are categorized as Level 1 in the hierarchy. In the event there were no sales during the day or closing prices are not available, securities are valued at the last quoted bid price or may be valued using the last available price and are generally categorized as Level 2 in the hierarchy. For foreign equity securities, when market or security specific events arise, comparisons to the valuation of American Depositary Receipts (ADRs), futures contracts, (ETFs) and certain indexes as well as quoted prices for similar securities may be used and would be categorized as Level 2 in the hierarchy. For equity securities, including restricted securities, where observable inputs are limited, assumptions about market activity and risk are used and these securities may be categorized as Level 3 in the hierarchy.
Debt securities, including restricted securities, are valued based on evaluated prices received from third party pricing services or from brokers who make markets in such securities. Preferred securities are valued by pricing services who utilize matrix pricing which considers yield or price of bonds of comparable quality, coupon, maturity and type or by broker-supplied prices. When independent prices are unavailable or unreliable, debt securities may be valued utilizing pricing methodologies which consider similar factors that would be used by third party pricing services. Debt securities are generally categorized as Level 2 in the hierarchy but may be Level 3 depending on the circumstances.
Investments in open-end mutual funds, including the Fidelity Central Funds, are valued at their closing net asset value (NAV) each business day and are categorized as Level 1 in the hierarchy.
Changes in valuation techniques may result in transfers in or out of an assigned level within the disclosure hierarchy. The aggregate value of investments by input level as of November 30, 2024 is included at the end of the Fund's Schedule of Investments.
Foreign Currency. Certain Funds may use foreign currency contracts to facilitate transactions in foreign-denominated securities. Gains and losses from these transactions may arise from changes in the value of the foreign currency or if the counterparties do not perform under the contracts' terms.
Foreign-denominated assets, including investment securities, and liabilities are translated into U.S. dollars at the exchange rates at period end. Purchases and sales of investment securities, income and dividends received, and expenses denominated in foreign currencies are translated into U.S. dollars at the exchange rate in effect on the transaction date.
The effects of exchange rate fluctuations on investments are included with the net realized and unrealized gain (loss) on investment securities. Other foreign currency transactions resulting in realized and unrealized gain (loss) are disclosed separately.
Investment Transactions and Income. For financial reporting purposes, the Fund's investment holdings and NAV include trades executed through the end of the last business day of the period. The NAV per share for processing shareholder transactions is calculated as of the close of business of the New York Stock Exchange (NYSE), normally 4:00 p.m. Eastern time and includes trades executed through the end of the prior business day. Gains and losses on securities sold are determined on the basis of identified cost. Commissions paid to certain brokers with whom the investment adviser, or its affiliates, places trades on behalf of a fund include an amount in addition to trade execution, which may be rebated back to a fund. Any such rebates are included in net realized gain (loss) on investments in the Statement of Operations. Dividend income is recorded on the ex-dividend date, except for certain dividends from foreign securities where the ex-dividend date may have passed, which are recorded as soon as the Fund is informed of the ex-dividend date. Non-cash dividends included in dividend income, if any, are recorded at the fair market value of the securities received. Income and capital gain distributions from Fidelity Central Funds, if any, are recorded on the ex-dividend date. Investment income is recorded net of foreign taxes withheld where recovery of such taxes is uncertain. Funds may file withholding tax reclaims in certain jurisdictions to recover a portion of amounts previously withheld. Any withholding tax reclaims income is included in the Statement of Operations in dividends. Any receivables for withholding tax reclaims are included in the Statement of Assets and Liabilities in dividends receivable.
Class Allocations and Expenses. Investment income, realized and unrealized capital gains and losses, common expenses of a fund, and certain fund-level expense reductions, if any, are allocated daily on a pro-rata basis to each class based on the relative net assets of each class to the total net assets of a fund. Each class differs with respect to transfer agent and distribution and service plan fees incurred, as applicable. Certain expense reductions may also differ by class, if applicable. For the reporting period, the allocated portion of income and expenses to each class as a percent of its average net assets may vary due to the timing of recording these transactions in relation to fluctuating net assets of the classes. Expenses directly attributable to a fund are charged to that fund. Expenses attributable to more than one fund are allocated among the respective funds on the basis of relative net assets or other appropriate methods. Expenses included in the accompanying financial statements reflect the expenses of that fund and do not include any expenses associated with any underlying mutual funds or exchange-traded funds (ETFs). Although not included in a fund's expenses, a fund indirectly bears its proportionate share of these expenses through the net asset value of each underlying mutual fund or exchange-traded fund (ETF). Expense estimates are accrued in the period to which they relate and adjustments are made when actual amounts are known.
Income Tax Information and Distributions to Shareholders. Each year, the Fund intends to qualify as a regulated investment company under Subchapter M of the Internal Revenue Code, including distributing substantially all of its taxable income and realized gains. As a result, no provision for U.S. Federal income taxes is required. The Fund files a U.S. federal tax return, in addition to state and local tax returns as required. The Fund's federal income tax returns are subject to examination by the Internal Revenue Service (IRS) for a period of three fiscal years after they are filed. State and local tax returns may be subject to examination for an additional fiscal year depending on the jurisdiction. Foreign taxes are provided for based on the Fund's understanding of the tax rules and rates that exist in the foreign markets in which it invests.
Distributions are declared and recorded on the ex-dividend date. Income and capital gain distributions are declared separately for each class. Income and capital gain distributions are determined in accordance with income tax regulations, which may differ from GAAP.
Capital accounts within the financial statements are adjusted for permanent book-tax differences. These adjustments have no impact on net assets or the results of operations. Capital accounts are not adjusted for temporary book-tax differences which will reverse in a subsequent period.
Book-tax differences are primarily due to foreign currency transactions, passive foreign investment companies (PFIC), capital loss carryforwards and losses deferred due to wash sales and excise tax regulations.
As of period end, the cost and unrealized appreciation (depreciation) in securities, and derivatives if applicable, for federal income tax purposes were as follows:
| Gross unrealized appreciation | $10,695,224 |
| Gross unrealized depreciation | (603,947) |
| Net unrealized appreciation (depreciation) | $10,091,277 |
| Tax cost | $29,143,351 |
Capital loss carryforwards are only available to offset future capital gains of the Fund to the extent provided by regulations and may be limited. The capital loss carryforward information presented below, including any applicable limitation, is estimated as of prior fiscal period end and is subject to adjustment.
Short-term | $(3,565,155) |
Long-term | (1,333,201) |
| Total capital loss carryforward | $(4,898,356) |
Restricted Securities (including Private Placements). Funds may invest in securities that are subject to legal or contractual restrictions on resale. These securities generally may be resold in transactions exempt from registration or to the public if the securities are registered. Disposal of these securities may involve time-consuming negotiations and expense, and prompt sale at an acceptable price may be difficult. Information regarding restricted securities held at period end is included at the end of the Schedule of Investments, if applicable.
New Accounting Pronouncement. In November 2023, the FASB issued Accounting Standards Update (ASU) 2023-07 Segment Reporting (Topic 280): Improvements to Reportable Segment Disclosures. Effective for fiscal years beginning after December 15, 2023 and interim periods within fiscal years beginning after December 15, 2024, the amendments enhance required disclosures of segment information for public entities on an annual and interim basis. The ASU allows for early adoption with updates applied retrospectively. Management is currently evaluating the impact of the ASU but does not expect this guidance to materially impact the financial statements.
4. Purchases and Sales of Investments.
Purchases and sales of securities, other than short-term securities and in-kind transactions, as applicable, are noted in the table below.
| | Purchases ($) | Sales ($) |
| Fidelity Climate Action Fund | 12,017,534 | 7,492,794 |
5.Fees and Other Transactions with Affiliates.
Management Fee. Fidelity Management & Research Company LLC (the investment adviser) and its affiliates provide the Fund with investment management related services for which the Fund pays a monthly management fee.
The Fund's management contract incorporates a basic fee rate that may vary by class (subject to a performance adjustment). The investment adviser or an affiliate pays certain expenses of managing and operating the Fund out of each class's management fee. Each class of the Fund pays a management fee to the investment adviser. The management fee is calculated and paid to the investment adviser every month. The management fee is determined by calculating a basic fee and then applying a performance adjustment. When determining a class's basic fee, a mandate rate is calculated based on the monthly average net assets of a group of funds advised by FMR within a designated asset class. A discount rate is subtracted from the mandate rate once the Fund's monthly average net assets reach a certain level. The mandate rate and discount rate may vary by class. The annual basic fee rate for a class of shares of the Fund is the lesser of (1) the class's mandate rate reduced by the class's discount rate (if applicable) or (2) the amount set forth in the following table.
| | Maximum Management Fee Rate % |
| Class A | .87 |
| Class M | .84 |
| Class C | .87 |
| Fidelity Climate Action Fund | .87 |
| Class I | .79 |
| Class Z | .71 |
One-twelfth of the basic fee rate for a class is applied to the average net assets of the class for the month, giving a dollar amount which is the basic fee for the class for that month. A different management fee rate may be applicable to each class of the Fund. The difference between classes is the result of separate arrangements for class-level services and/or waivers of certain expenses. It is not the result of any difference in advisory or custodial fees or other expenses related to the management of the Fund's assets, which do not vary by class. For the reporting period, the total annualized management fee rates were as follows:
| | Total Management Fee Rate % |
| Class A | .86 |
| Class M | .84 |
| Class C | .87 |
| Fidelity Climate Action Fund | .82 |
| Class I | .79 |
| Class Z | .71 |
The performance adjustment rate is calculated monthly by comparing over the performance period the Fund's performance to that of the performance adjustment index listed below.
| | Performance Adjustment Index |
| Fidelity Climate Action Fund | MSCI World Index |
For the purposes of calculating the performance adjustment for the Fund, the Fund's investment performance is based on the performance of Fidelity Climate Action Fund. To the extent that other classes of the Fund have higher expenses, this could result in those classes bearing a larger positive performance adjustment and smaller negative performance adjustment than would be the case if each class's own performance were considered. The performance period is the most recent 36 month period. The maximum annualized performance adjustment rate is ±.10% of the Fund's average net assets over the performance period. The performance adjustment rate is divided by twelve and multiplied by the Fund's average net assets over the performance period, and the resulting dollar amount is proportionately added to or subtracted from a class's basic fee. For the reporting period, the total annualized performance adjustment was (.07)%.
Distribution and Service Plan Fees. In accordance with Rule 12b-1 of the 1940 Act, the Fund has adopted separate Distribution and Service Plans for each class of shares. Certain classes pay Fidelity Distributors Company LLC (FDC), an affiliate of the investment adviser, separate Distribution and Service Fees, each of which is based on an annual percentage of each class' average net assets. In addition, FDC may pay financial intermediaries for selling shares of the Fund and providing shareholder support services. For the period, the Distribution and Service Fee rates, total fees and amounts retained by FDC were as follows:
| | Distribution Fee | Service Fee | Total Fees ($) | Retained by FDC ($) |
| Class A | - % | .25% | 1,284 | 49 |
| Class M | .25% | .25% | 1,504 | 78 |
| Class C | .75% | .25% | 1,680 | 673 |
| | | | 4,468 | 800 |
Sales Load. FDC may receive a front-end sales charge of up to 5.75% for selling Class A shares and 3.50% for selling Class M shares, some of which is paid to financial intermediaries for selling shares of the Fund. Depending on the holding period, FDC may receive contingent deferred sales charges levied on Class A, Class M and Class C redemptions. The deferred sales charges are 1.00% for Class C shares, 1.00% for certain purchases of Class A shares and .25% for certain purchases of Class M shares.
For the period, sales charge amounts retained by FDC were as follows:
| | Retained by FDC ($) |
| Class A | 679 |
| Class M | 7 |
| | 686 |
Brokerage Commissions. A portion of portfolio transactions were placed with brokerage firms which are affiliates of the investment adviser. Brokerage commissions are included in net realized gain (loss) and change in net unrealized appreciation (depreciation) in the Statement of Operations. The commissions paid to these affiliated firms were as follows:
| | Amount ($) |
| Fidelity Climate Action Fund | 208 |
Interfund Trades. Funds may purchase from or sell securities to other Fidelity Funds under procedures adopted by the Board. The procedures have been designed to ensure these interfund trades are executed in accordance with Rule 17a-7 of the 1940 Act. Any interfund trades are included within the respective purchases and sales amounts shown in the Purchases and Sales of Investments note. Interfund trades during the period are noted in the table below.
| | Purchases ($) | Sales ($) | Realized Gain (Loss)($) |
| Fidelity Climate Action Fund | 682,319 | 173,429 | 36,875 |
6. Committed Line of Credit.
Certain Funds participate with other funds managed by the investment adviser or an affiliate in a $4.25 billion credit facility (the "line of credit") to be utilized for temporary or emergency purposes to fund shareholder redemptions or for other short-term liquidity purposes. The participating funds have agreed to pay commitment fees on their pro-rata portion of the line of credit, which are reflected in Miscellaneous expenses on the Statement of Operations, and are listed below. During the period, there were no borrowings on this line of credit.
| | Amount ($) |
| Fidelity Climate Action Fund | 21 |
7. Expense Reductions.
The investment adviser contractually agreed to reimburse expenses of each class to the extent annual operating expenses exceeded certain levels of class-level average net assets as noted in the table below. This reimbursement will remain in place through September 30, 2025. Some expenses, for example the compensation of the independent Trustees, are excluded from this reimbursement.
The following classes were in reimbursement during the period:
| | Expense Limitations | Reimbursement ($) |
| Class A | 1.30% | 526 |
| Class M | 1.55% | 279 |
| Class C | 2.05% | 186 |
| Fidelity Climate Action Fund | 1.05% | 10,608 |
| Class I | 1.05% | 425 |
| Class Z | .90% | 554 |
| | | 12,578 |
In addition, during the period, custodian credits reduced the Fund's expenses by $579.
8. Distributions to Shareholders.
Distributions to shareholders of each class were as follows:
| | Six months ended November 30, 2024 | Year ended May 31, 2024 |
| Fidelity Climate Action Fund | | |
| Distributions to shareholders | | |
| Fidelity Climate Action Fund | - | 35,749 |
| Class I | - | 681 |
| Class Z | - | 567 |
Total | $ - | $36,997 |
9. Share Transactions.
Share transactions for each class were as follows and may contain in-kind transactions, automatic conversions between classes or exchanges between affiliated funds:
| | Shares | Shares | Dollars | Dollars |
| | Six months ended November 30, 2024 | Year ended May 31, 2024 | Six months ended November 30, 2024 | Year ended May 31, 2024 |
| Fidelity Climate Action Fund | | | | |
| Class A | | | | |
| Shares sold | 22,307 | 30,059 | $264,321 | $295,197 |
| Shares redeemed | (7,004) | (8,043) | (86,374) | (79,550) |
| Net increase (decrease) | 15,303 | 22,016 | $177,947 | $215,647 |
| Class M | | | | |
| Shares sold | 8,538 | 621 | $103,151 | $6,047 |
| Shares redeemed | (6,827) | - | (84,827) | - |
| Net increase (decrease) | 1,711 | 621 | $18,324 | $6,047 |
| Class C | | | | |
| Shares sold | 4,600 | 8,696 | $52,789 | $90,587 |
| Shares redeemed | (1,450) | (5,729) | (17,661) | (52,855) |
| Net increase (decrease) | 3,150 | 2,967 | $35,128 | $37,732 |
| Fidelity Climate Action Fund | | | | |
| Shares sold | 650,551 | 858,823 | $7,818,228 | $8,444,961 |
| Reinvestment of distributions | - | 3,426 | - | 32,644 |
| Shares redeemed | (275,908) | (839,099) | (3,332,794) | (8,128,604) |
| Net increase (decrease) | 374,643 | 23,150 | $4,485,434 | $349,001 |
| Class I | | | | |
| Shares sold | 7,697 | 44,674 | $91,676 | $423,410 |
| Reinvestment of distributions | - | 72 | - | 681 |
| Shares redeemed | (61,672) | (40) | (715,073) | (348) |
| Net increase (decrease) | (53,975) | 44,706 | $(623,397) | $423,743 |
| Class Z | | | | |
| Shares sold | 59,970 | 46,926 | $698,411 | $470,527 |
| Reinvestment of distributions | - | 53 | - | 507 |
| Shares redeemed | (25,129) | (768) | (288,627) | (7,195) |
| Net increase (decrease) | 34,841 | 46,211 | $409,784 | $463,839 |
10. Other.
A fund's organizational documents provide former and current trustees and officers with a limited indemnification against liabilities arising in connection with the performance of their duties to the fund. In the normal course of business, a fund may also enter into contracts that provide general indemnifications. A fund's maximum exposure under these arrangements is unknown as this would be dependent on future claims that may be made against a fund. The risk of material loss from such claims is considered remote.
11. Risk and Uncertainties.
Many factors affect a fund's performance. Developments that disrupt global economies and financial markets, such as pandemics, epidemics, outbreaks of infectious diseases, war, terrorism, and environmental disasters, may significantly affect a fund's investment performance. The effects of these developments to a fund will be impacted by the types of securities in which a fund invests, the financial condition, industry, economic sector, and geographic location of an issuer, and a fund's level of investment in the securities of that issuer. Significant concentrations in security types, issuers, industries, sectors, and geographic locations may magnify the factors that affect a fund's performance.
Item 8: Changes in and Disagreements with Accountants for Open-End Management Investment Companies
(Unaudited)
Note: This is not applicable for any fund included in this document.
Item 9: Proxy Disclosures for Open-End Management Investment Companies
(Unaudited)
| A special meeting of shareholders was held on July 16, 2024. The results of votes taken among shareholders on the proposal before them are reported below. Each vote reported represents one dollar of net asset value held on the record date for the meeting. |
| Proposal 1 |
| To elect a Board of Trustees. |
| | # of Votes | % of Votes |
| Bettina Doulton |
| Affirmative | 14,516,835,136.19 | 94.56 |
| Withheld | 834,887,998.33 | 5.44 |
| TOTAL | 15,351,723,134.52 | 100.00 |
| Robert A. Lawrence |
| Affirmative | 14,430,495,798.10 | 94.00 |
| Withheld | 921,227,336.42 | 6.00 |
| TOTAL | 15,351,723,134.52 | 100.00 |
| Vijay C. Advani |
| Affirmative | 14,465,231,640.25 | 94.23 |
| Withheld | 886,491,494.27 | 5.77 |
| TOTAL | 15,351,723,134.52 | 100.00 |
| Thomas P. Bostick |
| Affirmative | 14,471,831,170.84 | 94.27 |
| Withheld | 879,891,963.68 | 5.73 |
| TOTAL | 15,351,723,134.52 | 100.00 |
| Donald F. Donahue |
| Affirmative | 14,432,670,599.88 | 94.01 |
| Withheld | 919,052,534.64 | 5.99 |
| TOTAL | 15,351,723,134.52 | 100.00 |
| Vicki L. Fuller |
| Affirmative | 14,531,407,981.65 | 94.66 |
| Withheld | 820,315,152.87 | 5.34 |
| TOTAL | 15,351,723,134.52 | 100.00 |
| Patricia L. Kampling |
| Affirmative | 14,549,142,839.16 | 94.77 |
| Withheld | 802,580,295.36 | 5.23 |
| TOTAL | 15,351,723,134.52 | 100.00 |
| Thomas A. Kennedy |
| Affirmative | 14,469,818,769.40 | 94.26 |
| Withheld | 881,904,365.12 | 5.74 |
| TOTAL | 15,351,723,134.52 | 100.00 |
| Oscar Munoz |
| Affirmative | 14,434,061,467.08 | 94.02 |
| Withheld | 917,661,667.44 | 5.98 |
| TOTAL | 15,351,723,134.52 | 100.00 |
| Karen B. Peetz |
| Affirmative | 14,521,904,618.46 | 94.59 |
| Withheld | 829,818,516.06 | 5.41 |
| TOTAL | 15,351,723,134.52 | 100.00 |
| David M. Thomas |
| Affirmative | 14,417,745,861.73 | 93.92 |
| Withheld | 933,977,272.79 | 6.08 |
| TOTAL | 15,351,723,134.52 | 100.00 |
| Susan Tomasky |
| Affirmative | 14,467,973,468.18 | 94.24 |
| Withheld | 883,749,666.34 | 5.76 |
| TOTAL | 15,351,723,134.52 | 100.00 |
| Michael E. Wiley |
| Affirmative | 14,424,002,796.91 | 93.96 |
| Withheld | 927,720,337.61 | 6.04 |
| TOTAL | 15,351,723,134.52 | 100.00 |
| | | |
| Proposal 1 reflects trust-wide proposal and voting results. |
Item 10: Remuneration Paid to Directors, Officers, and others of Open-End Management Investment Companies
(Unaudited)
Note: This information is disclosed as part of the financial statements for each Fund as part of Item 7: Financial Statements and Financial Highlights for Open-End Management Investment companies.
Item 11: Statement Regarding Basis for Approval of Investment Advisory Contract
(Unaudited)
Note: This is not applicable for any fund included in this document.
1.9901891.103
CLA-SANN-0125
Fidelity® Sustainable U.S. Equity Fund
Semi-Annual Report
November 30, 2024
Includes Fidelity and Fidelity Advisor share classes
Contents
To view a fund's proxy voting guidelines and proxy voting record for the 12-month period ended June 30, visit http://www.fidelity.com/proxyvotingresults or visit the Securities and Exchange Commission's (SEC) web site at http://www.sec.gov.
You may also call 1-800-544-8544 if you're an individual investing directly with Fidelity, call 1-800-835-5092 if you're a plan sponsor or participant with Fidelity as your recordkeeper or call 1-877-208-0098 on institutional accounts or if you're an advisor or invest through one to request a free copy of the proxy voting guidelines.
Standard & Poor's, S&P and S&P 500 are registered service marks of The McGraw-Hill Companies, Inc. and have been licensed for use by Fidelity Distributors Corporation.
Other third-party marks appearing herein are the property of their respective owners.
All other marks appearing herein are registered or unregistered trademarks or service marks of FMR LLC or an affiliated company. © 2025 FMR LLC. All rights reserved.
This report and the financial statements contained herein are submitted for the general information of the shareholders of the Fund. This report is not authorized for distribution to prospective investors in the Fund unless preceded or accompanied by an effective prospectus.
A fund files its complete schedule of portfolio holdings with the SEC for the first and third quarters of each fiscal year on Form N-PORT. Forms N-PORT are available on the SEC's web site at http://www.sec.gov. A fund's Forms N-PORT may be reviewed and copied at the SEC's Public Reference Room in Washington, DC. Information regarding the operation of the SEC's Public Reference Room may be obtained by calling 1-800-SEC-0330.
For a complete list of a fund's portfolio holdings, view the most recent holdings listing, semiannual report, or annual report on Fidelity's web site at http://www.fidelity.com, http://www.institutional.fidelity.com, or http://www.401k.com, as applicable.
NOT FDIC INSURED •MAY LOSE VALUE •NO BANK GUARANTEE
Neither the Fund nor Fidelity Distributors Corporation is a bank.
Item 7: Financial Statements and Financial Highlights for Open-End Management Investment Companies (Semi-Annual Report)
Fidelity® Sustainable U.S. Equity Fund
Schedule of Investments November 30, 2024 (Unaudited)
Showing Percentage of Net Assets
| Common Stocks - 97.9% |
| | | Shares | Value ($) |
| COMMUNICATION SERVICES - 7.5% | | | |
| Entertainment - 2.5% | | | |
| Netflix, Inc. (a) | | 399 | 353,837 |
| The Walt Disney Co. | | 3,399 | 399,281 |
| | | | 753,118 |
| Interactive Media & Services - 4.0% | | | |
| Alphabet, Inc. Class A | | 6,952 | 1,174,540 |
| Media - 1.0% | | | |
| Comcast Corp. Class A | | 7,184 | 310,277 |
TOTAL COMMUNICATION SERVICES | | | 2,237,935 |
| CONSUMER DISCRETIONARY - 10.7% | | | |
| Automobiles - 1.6% | | | |
| Tesla, Inc. (a) | | 1,344 | 463,895 |
| Broadline Retail - 3.5% | | | |
| Amazon.com, Inc. (a) | | 5,018 | 1,043,192 |
| Hotels, Restaurants & Leisure - 2.1% | | | |
| Hilton Worldwide Holdings, Inc. | | 1,547 | 392,072 |
| Starbucks Corp. | | 2,115 | 216,703 |
| | | | 608,775 |
| Household Durables - 1.5% | | | |
| PulteGroup, Inc. | | 1,135 | 153,531 |
| Taylor Morrison Home Corp. (a) | | 4,159 | 307,225 |
| | | | 460,756 |
| Specialty Retail - 2.0% | | | |
| Lowe's Companies, Inc. | | 2,141 | 583,273 |
TOTAL CONSUMER DISCRETIONARY | | | 3,159,891 |
| CONSUMER STAPLES - 4.7% | | | |
| Food Products - 1.0% | | | |
| Danone SA | | 4,322 | 295,320 |
| Household Products - 3.0% | | | |
| Procter & Gamble Co. | | 4,944 | 886,261 |
| Personal Care Products - 0.7% | | | |
| Estee Lauder Companies, Inc. Class A | | 2,908 | 209,725 |
TOTAL CONSUMER STAPLES | | | 1,391,306 |
| ENERGY - 4.5% | | | |
| Energy Equipment & Services - 2.1% | | | |
| Baker Hughes Co. Class A | | 13,829 | 607,785 |
| Oil, Gas & Consumable Fuels - 2.4% | | | |
| Cheniere Energy, Inc. | | 1,584 | 354,832 |
| Equinor ASA | | 14,918 | 361,575 |
| | | | 716,407 |
TOTAL ENERGY | | | 1,324,192 |
| FINANCIALS - 12.5% | | | |
| Banks - 1.6% | | | |
| Bank of America Corp. | | 4,605 | 218,784 |
| Citigroup, Inc. | | 3,623 | 256,762 |
| | | | 475,546 |
| Capital Markets - 5.3% | | | |
| BlackRock, Inc. | | 573 | 586,064 |
| Moody's Corp. | | 1,587 | 793,468 |
| Northern Trust Corp. | | 1,588 | 176,522 |
| | | | 1,556,054 |
| Consumer Finance - 2.4% | | | |
| American Express Co. | | 2,383 | 726,052 |
| Financial Services - 2.7% | | | |
| Essent Group Ltd. | | 2,297 | 132,721 |
| MasterCard, Inc. Class A | | 1,247 | 664,576 |
| | | | 797,297 |
| Insurance - 0.5% | | | |
| Hartford Financial Services Group, Inc. | | 1,276 | 157,344 |
TOTAL FINANCIALS | | | 3,712,293 |
| HEALTH CARE - 10.6% | | | |
| Biotechnology - 2.0% | | | |
| Exact Sciences Corp. (a) | | 2,132 | 132,355 |
| Gilead Sciences, Inc. | | 4,900 | 453,642 |
| | | | 585,997 |
| Health Care Providers & Services - 4.6% | | | |
| BrightSpring Health Services, Inc. | | 24,279 | 468,585 |
| Centene Corp. (a) | | 3,896 | 233,760 |
| Cigna Group | | 1,971 | 665,804 |
| | | | 1,368,149 |
| Life Sciences Tools & Services - 1.9% | | | |
| Danaher Corp. | | 1,533 | 367,445 |
| ICON PLC (a) | | 894 | 187,964 |
| | | | 555,409 |
| Pharmaceuticals - 2.1% | | | |
| Merck & Co., Inc. | | 4,261 | 433,088 |
| Zoetis, Inc. Class A | | 1,121 | 196,455 |
| | | | 629,543 |
TOTAL HEALTH CARE | | | 3,139,098 |
| INDUSTRIALS - 9.5% | | | |
| Building Products - 1.2% | | | |
| Johnson Controls International PLC | | 4,293 | 360,011 |
| Commercial Services & Supplies - 0.8% | | | |
| Veralto Corp. | | 2,052 | 222,006 |
| Electrical Equipment - 3.4% | | | |
| Acuity Brands, Inc. | | 1,045 | 335,121 |
| Generac Holdings, Inc. (a) | | 1,019 | 191,776 |
| Prysmian SpA | | 3,596 | 237,201 |
| Regal Rexnord Corp. | | 1,485 | 256,474 |
| | | | 1,020,572 |
| Machinery - 2.2% | | | |
| Deere & Co. | | 740 | 344,766 |
| Ingersoll Rand, Inc. | | 1,703 | 177,402 |
| Timken Co. | | 1,680 | 130,116 |
| | | | 652,284 |
| Professional Services - 1.9% | | | |
| KBR, Inc. | | 6,944 | 422,404 |
| ManpowerGroup, Inc. | | 2,298 | 147,922 |
| | | | 570,326 |
TOTAL INDUSTRIALS | | | 2,825,199 |
| INFORMATION TECHNOLOGY - 29.2% | | | |
| Electronic Equipment, Instruments & Components - 0.6% | | | |
| CDW Corp. | | 951 | 167,309 |
| IT Services - 0.5% | | | |
| Accenture PLC Class A | | 425 | 154,007 |
| Semiconductors & Semiconductor Equipment - 9.8% | | | |
| Advanced Micro Devices, Inc. (a) | | 952 | 130,591 |
| First Solar, Inc. (a) | | 1,575 | 313,850 |
| NVIDIA Corp. | | 13,503 | 1,866,790 |
| NXP Semiconductors NV | | 565 | 129,594 |
| ON Semiconductor Corp. (a) | | 6,450 | 458,724 |
| | | | 2,899,549 |
| Software - 10.0% | | | |
| Gen Digital, Inc. | | 6,666 | 205,646 |
| Intuit, Inc. | | 353 | 226,531 |
| Microsoft Corp. | | 4,162 | 1,762,441 |
| Salesforce, Inc. | | 2,322 | 766,237 |
| | | | 2,960,855 |
| Technology Hardware, Storage & Peripherals - 8.3% | | | |
| Apple, Inc. | | 9,368 | 2,223,304 |
| Dell Technologies, Inc. Class C | | 1,785 | 227,748 |
| | | | 2,451,052 |
TOTAL INFORMATION TECHNOLOGY | | | 8,632,772 |
| MATERIALS - 4.2% | | | |
| Chemicals - 2.0% | | | |
| Linde PLC | | 1,259 | 580,386 |
| Containers & Packaging - 2.2% | | | |
| Avery Dennison Corp. | | 1,750 | 360,413 |
| Crown Holdings, Inc. | | 3,190 | 293,767 |
| | | | 654,180 |
TOTAL MATERIALS | | | 1,234,566 |
| REAL ESTATE - 2.1% | | | |
| Equity Real Estate Investment Trusts (REITs) - 2.1% | | | |
| Prologis, Inc. | | 3,302 | 385,608 |
| Public Storage Operating Co. | | 676 | 235,282 |
| | | | 620,890 |
| UTILITIES - 2.4% | | | |
| Electric Utilities - 1.3% | | | |
| NextEra Energy, Inc. | | 4,725 | 371,716 |
| Independent Power and Renewable Electricity Producers - 1.1% | | | |
| Clearway Energy, Inc. Class C | | 11,177 | 329,610 |
TOTAL UTILITIES | | | 701,326 |
| TOTAL COMMON STOCKS (Cost $21,843,843) | | | 28,979,468 |
| | | | |
| Convertible Preferred Stocks - 0.2% |
| | | Shares | Value ($) |
| HEALTH CARE - 0.2% | | | |
| Health Care Providers & Services - 0.2% | | | |
Somatus, Inc. Series E (a)(b)(c) (Cost $32,287) | | 37 | 40,932 |
| | | | |
| Money Market Funds - 1.8% |
| | | Shares | Value ($) |
Fidelity Cash Central Fund 4.64% (d) (Cost $536,786) | | 536,679 | 536,786 |
| | | | |
| TOTAL INVESTMENT IN SECURITIES - 99.9% (Cost $22,412,916) | 29,557,186 |
NET OTHER ASSETS (LIABILITIES) - 0.1% | 41,905 |
| NET ASSETS - 100.0% | 29,599,091 |
| | |
Legend
| (b) | Restricted securities (including private placements) - Investment in securities not registered under the Securities Act of 1933 (excluding 144A issues). At the end of the period, the value of restricted securities (excluding 144A issues) amounted to $40,932 or 0.1% of net assets. |
| (d) | Affiliated fund that is generally available only to investment companies and other accounts managed by Fidelity Investments. The rate quoted is the annualized seven-day yield of the fund at period end. A complete unaudited listing of the fund's holdings as of its most recent quarter end is available upon request. In addition, each Fidelity Central Fund's financial statements are available on the SEC's website or upon request. |
| Additional information on each restricted holding is as follows: |
| Security | Acquisition Date | Acquisition Cost ($) |
| Somatus, Inc. Series E | 1/31/22 | 32,287 |
| | | |
Affiliated Central Funds
Fiscal year to date information regarding the Fund's investments in Fidelity Central Funds, including the ownership percentage, is presented below.
| Affiliate | Value, beginning of period ($) | Purchases ($) | Sales Proceeds ($) | Dividend Income ($) | Realized Gain (loss) ($) | Change in Unrealized appreciation (depreciation) ($) | Value, end of period ($) | % ownership, end of period |
| Fidelity Cash Central Fund 4.64% | 271,902 | 3,872,875 | 3,607,994 | 12,974 | 3 | - | 536,786 | 0.0% |
| Total | 271,902 | 3,872,875 | 3,607,994 | 12,974 | 3 | - | 536,786 | |
| | | | | | | | | |
Amounts in the dividend income column in the above table include any capital gain distributions from underlying funds, which are presented in the corresponding line item in the Statement of Operations, if applicable.
Amounts included in the purchases and sales proceeds columns may include in-kind transactions, if applicable.
Investment Valuation
The following is a summary of the inputs used, as of November 30, 2024, involving the Fund's assets and liabilities carried at fair value. The inputs or methodology used for valuing securities may not be an indication of the risk associated with investing in those securities. For more information on valuation inputs, and their aggregation into the levels used below, please refer to the Investment Valuation section in the accompanying Notes to Financial Statements.
| Valuation Inputs at Reporting Date: |
| Description | Total ($) | Level 1 ($) | Level 2 ($) | Level 3 ($) |
Investments in Securities: | | | | |
|
| Equities: | | | | |
Communication Services | 2,237,935 | 2,237,935 | - | - |
Consumer Discretionary | 3,159,891 | 3,159,891 | - | - |
Consumer Staples | 1,391,306 | 1,391,306 | - | - |
Energy | 1,324,192 | 962,617 | 361,575 | - |
Financials | 3,712,293 | 3,712,293 | - | - |
Health Care | 3,180,030 | 3,139,098 | - | 40,932 |
Industrials | 2,825,199 | 2,825,199 | - | - |
Information Technology | 8,632,772 | 8,632,772 | - | - |
Materials | 1,234,566 | 1,234,566 | - | - |
Real Estate | 620,890 | 620,890 | - | - |
Utilities | 701,326 | 701,326 | - | - |
|
| Money Market Funds | 536,786 | 536,786 | - | - |
| Total Investments in Securities: | 29,557,186 | 29,154,679 | 361,575 | 40,932 |
Financial Statements (Unaudited)
| Statement of Assets and Liabilities |
| As of November 30, 2024 (Unaudited) |
| Assets | | | | |
| Investment in securities, at value - See accompanying schedule: | | | | |
Unaffiliated issuers (cost $21,876,130) | $ | 29,020,400 | | |
Fidelity Central Funds (cost $536,786) | | 536,786 | | |
| | | | | |
| | | | | |
| Total Investment in Securities (cost $22,412,916) | | | $ | 29,557,186 |
| Cash | | | | 23,219 |
| Foreign currency held at value (cost $7,724) | | | | 7,724 |
| Receivable for fund shares sold | | | | 41,642 |
| Dividends receivable | | | | 16,350 |
| Distributions receivable from Fidelity Central Funds | | | | 1,957 |
| Prepaid expenses | | | | 29 |
| Other receivables | | | | 171 |
Total assets | | | | 29,648,278 |
| Liabilities | | | | |
| Payable for fund shares redeemed | $ | 138 | | |
| Accrued management fee | | 16,883 | | |
| Distribution and service plan fees payable | | 919 | | |
| Audit fee payable | | 29,229 | | |
| Other payables and accrued expenses | | 2,018 | | |
| Total liabilities | | | | 49,187 |
| Net Assets | | | $ | 29,599,091 |
| Net Assets consist of: | | | | |
| Paid in capital | | | $ | 22,642,885 |
| Total accumulated earnings (loss) | | | | 6,956,206 |
| Net Assets | | | $ | 29,599,091 |
| | | | | |
| Net Asset Value and Maximum Offering Price | | | | |
| Class A : | | | | |
Net Asset Value and redemption price per share ($1,376,194 ÷ 100,993 shares)(a) | | | $ | 13.63 |
| Maximum offering price per share (100/94.25 of $13.63) | | | $ | 14.46 |
| Class M : | | | | |
Net Asset Value and redemption price per share ($407,657 ÷ 30,019 shares)(a) | | | $ | 13.58 |
| Maximum offering price per share (100/96.50 of $13.58) | | | $ | 14.07 |
| Class C : | | | | |
Net Asset Value and offering price per share ($538,113 ÷ 40,144 shares)(a) | | | $ | 13.40 |
| Fidelity Sustainable U.S. Equity Fund : | | | | |
Net Asset Value, offering price and redemption price per share ($26,512,018 ÷ 1,940,864 shares) | | | $ | 13.66 |
| Class I : | | | | |
Net Asset Value, offering price and redemption price per share ($371,157 ÷ 27,174 shares) | | | $ | 13.66 |
| Class Z : | | | | |
Net Asset Value, offering price and redemption price per share ($393,952 ÷ 28,700 shares) | | | $ | 13.73 |
(a)Redemption price per share is equal to net asset value less any applicable contingent deferred sales charge. |
| Statement of Operations |
Six months ended November 30, 2024 (Unaudited) |
| Investment Income | | | | |
| Dividends | | | $ | 168,253 |
| Income from Fidelity Central Funds | | | | 12,974 |
| Total income | | | | 181,227 |
| Expenses | | | | |
| Management fee | | | | |
| Basic fee | $ | 94,333 | | |
| Performance adjustment | | (3,632) | | |
| Distribution and service plan fees | | 5,274 | | |
| Custodian fees and expenses | | 1,509 | | |
| Independent trustees' fees and expenses | | 61 | | |
| Registration fees | | 26,650 | | |
| Audit fees | | 27,910 | | |
| Legal | | 653 | | |
| Miscellaneous | | 51 | | |
| Total expenses before reductions | | 152,809 | | |
| Expense reductions | | (21,860) | | |
| Total expenses after reductions | | | | 130,949 |
| Net Investment income (loss) | | | | 50,278 |
| Realized and Unrealized Gain (Loss) | | | | |
| Net realized gain (loss) on: | | | | |
| Investment Securities: | | | | |
| Unaffiliated issuers | | 740,402 | | |
| Fidelity Central Funds | | 3 | | |
| Foreign currency transactions | | 95 | | |
| Total net realized gain (loss) | | | | 740,500 |
| Change in net unrealized appreciation (depreciation) on: | | | | |
| Investment Securities: | | | | |
| Unaffiliated issuers | | 2,312,388 | | |
| Assets and liabilities in foreign currencies | | (67) | | |
| Total change in net unrealized appreciation (depreciation) | | | | 2,312,321 |
| Net gain (loss) | | | | 3,052,821 |
| Net increase (decrease) in net assets resulting from operations | | | $ | 3,103,099 |
| Statement of Changes in Net Assets |
| |
| | Six months ended November 30, 2024 (Unaudited) | | Year ended May 31, 2024 |
| Increase (Decrease) in Net Assets | | | | |
| Operations | | | | |
| Net investment income (loss) | $ | 50,278 | $ | 97,646 |
| Net realized gain (loss) | | 740,500 | | 572,958 |
| Change in net unrealized appreciation (depreciation) | | 2,312,321 | | 4,666,789 |
| Net increase (decrease) in net assets resulting from operations | | 3,103,099 | | 5,337,393 |
| Distributions to shareholders | | (33,191) | | (90,017) |
| | | | | |
| Share transactions - net increase (decrease) | | (325,500) | | 3,790,425 |
| Total increase (decrease) in net assets | | 2,744,408 | | 9,037,801 |
| | | | | |
| Net Assets | | | | |
| Beginning of period | | 26,854,683 | | 17,816,882 |
| End of period | $ | 29,599,091 | $ | 26,854,683 |
| | | | | |
| | | | | |
Financial Highlights
Fidelity Advisor® Sustainable U.S. Equity Fund Class A |
| |
| | Six months ended (Unaudited) November 30, 2024 | | Years ended May 31, 2024 | | 2023 | | 2022 A |
Selected Per-Share Data | | | | | | | | |
| Net asset value, beginning of period | $ | 12.22 | $ | 9.70 | $ | 9.38 | $ | 10.00 |
| Income from Investment Operations | | | | | | | | |
Net investment income (loss) B,C | | .01 | | .02 | | .05 D | | - E |
| Net realized and unrealized gain (loss) | | 1.40 | | 2.53 | | .31 | | (.58) |
| Total from investment operations | | 1.41 | | 2.55 | | .36 | | (.58) |
| Distributions from net investment income | | - E | | (.03) | | (.04) | | - |
| Distributions from net realized gain | | - | | - | | - | | (.04) |
| Total distributions | | - E | | (.03) | | (.04) | | (.04) |
| Net asset value, end of period | $ | 13.63 | $ | 12.22 | $ | 9.70 | $ | 9.38 |
Total Return F,G,H | | | | 26.27% | | 3.90% | | (5.87)% |
Ratios to Average Net Assets C,I,J | | | | | | | | |
| Expenses before reductions | | 1.34% K | | 1.65% | | 1.97% | | 3.52% K |
| Expenses net of fee waivers, if any | | | | 1.15% | | 1.15% | | 1.14% K |
| Expenses net of all reductions | | 1.15% K | | 1.15% | | 1.15% | | 1.14% K |
| Net investment income (loss) | | .14% K | | .22% | | .56% D | | -% K,L |
| Supplemental Data | | | | | | | | |
| Net assets, end of period (000 omitted) | $ | 1,376 | $ | 1,163 | $ | 642 | $ | 633 |
Portfolio turnover rate M | | | | 45% | | 37% | | 55% K |
AFor the period June 15, 2021 (commencement of operations) through May 31, 2022.
BCalculated based on average shares outstanding during the period.
CNet investment income (loss) is affected by the timing of the declaration of dividends by any underlying mutual funds or exchange-traded funds (ETFs). Net investment income (loss) of any mutual funds or ETFs is not included in the Fund's net investment income (loss) ratio.
DNet investment income per share reflects one or more large, non-recurring dividend(s) which amounted to $.02 per share. Excluding such non-recurring dividend(s), the ratio of net investment income (loss) to average net assets would have been .29%.
EAmount represents less than $.005 per share.
FTotal returns for periods of less than one year are not annualized.
GTotal returns would have been lower if certain expenses had not been reduced during the applicable periods shown.
HTotal returns do not include the effect of the sales charges.
IFees and expenses of any underlying mutual funds or exchange-traded funds (ETFs) are not included in the Fund's expense ratio. The Fund indirectly bears its proportionate share of these expenses. For additional expense information related to investments in Fidelity Central Funds, please refer to the "Investments in Fidelity Central Funds" note found in the Notes to Financial Statements section of the most recent Annual or Semi-Annual report.
JExpense ratios reflect operating expenses of the class. Expenses before reductions do not reflect amounts reimbursed, waived, or reduced through arrangements with the investment adviser, brokerage services, or other offset arrangements, if applicable, and do not represent the amount paid by the class during periods when reimbursements, waivers or reductions occur.
KAnnualized.
LAmount represents less than .005%.
MAmount does not include the portfolio activity of any underlying mutual funds or exchange-traded funds (ETFs), derivatives or securities that mature within one year from acquisition.
Fidelity Advisor® Sustainable U.S. Equity Fund Class M |
| |
| | Six months ended (Unaudited) November 30, 2024 | | Years ended May 31, 2024 | | 2023 | | 2022 A |
Selected Per-Share Data | | | | | | | | |
| Net asset value, beginning of period | $ | 12.19 | $ | 9.68 | $ | 9.37 | $ | 10.00 |
| Income from Investment Operations | | | | | | | | |
Net investment income (loss) B,C | | (.01) | | - D | | .03 E | | (.02) |
| Net realized and unrealized gain (loss) | | 1.40 | | 2.51 | | .31 | | (.59) |
| Total from investment operations | | 1.39 | | 2.51 | | .34 | | (.61) |
| Distributions from net investment income | | - | | - D | | (.03) | | - |
| Distributions from net realized gain | | - | | - | | - | | (.02) |
| Total distributions | | - | | - D | | (.03) | | (.02) |
| Net asset value, end of period | $ | 13.58 | $ | 12.19 | $ | 9.68 | $ | 9.37 |
Total Return F,G,H | | | | 25.95% | | 3.66% | | (6.10)% |
Ratios to Average Net Assets C,I,J | | | | | | | | |
| Expenses before reductions | | 1.60% K | | 1.89% | | 2.19% | | 4.05% K |
| Expenses net of fee waivers, if any | | | | 1.40% | | 1.40% | | 1.39% K |
| Expenses net of all reductions | | 1.40% K | | 1.40% | | 1.40% | | 1.39% K |
| Net investment income (loss) | | (.11)% K | | (.03)% | | .31% E | | (.26)% K |
| Supplemental Data | | | | | | | | |
| Net assets, end of period (000 omitted) | $ | 408 | $ | 424 | $ | 351 | $ | 258 |
Portfolio turnover rate L | | | | 45% | | 37% | | 55% K |
AFor the period June 15, 2021 (commencement of operations) through May 31, 2022.
BCalculated based on average shares outstanding during the period.
CNet investment income (loss) is affected by the timing of the declaration of dividends by any underlying mutual funds or exchange-traded funds (ETFs). Net investment income (loss) of any mutual funds or ETFs is not included in the Fund's net investment income (loss) ratio.
DAmount represents less than $.005 per share.
ENet investment income per share reflects one or more large, non-recurring dividend(s) which amounted to $.02 per share. Excluding such non-recurring dividend(s), the ratio of net investment income (loss) to average net assets would have been .04%.
FTotal returns for periods of less than one year are not annualized.
GTotal returns would have been lower if certain expenses had not been reduced during the applicable periods shown.
HTotal returns do not include the effect of the sales charges.
IFees and expenses of any underlying mutual funds or exchange-traded funds (ETFs) are not included in the Fund's expense ratio. The Fund indirectly bears its proportionate share of these expenses. For additional expense information related to investments in Fidelity Central Funds, please refer to the "Investments in Fidelity Central Funds" note found in the Notes to Financial Statements section of the most recent Annual or Semi-Annual report.
JExpense ratios reflect operating expenses of the class. Expenses before reductions do not reflect amounts reimbursed, waived, or reduced through arrangements with the investment adviser, brokerage services, or other offset arrangements, if applicable, and do not represent the amount paid by the class during periods when reimbursements, waivers or reductions occur.
KAnnualized.
LAmount does not include the portfolio activity of any underlying mutual funds or exchange-traded funds (ETFs), derivatives or securities that mature within one year from acquisition.
Fidelity Advisor® Sustainable U.S. Equity Fund Class C |
| |
| | Six months ended (Unaudited) November 30, 2024 | | Years ended May 31, 2024 | | 2023 | | 2022 A |
Selected Per-Share Data | | | | | | | | |
| Net asset value, beginning of period | $ | 12.06 | $ | 9.62 | $ | 9.34 | $ | 10.00 |
| Income from Investment Operations | | | | | | | | |
Net investment income (loss) B,C | | (.04) | | (.06) | | (.02) D | | (.07) |
| Net realized and unrealized gain (loss) | | 1.38 | | 2.50 | | .31 | | (.58) |
| Total from investment operations | | 1.34 | | 2.44 | | .29 | | (.65) |
| Distributions from net investment income | | - | | - | | (.01) | | - |
| Distributions from net realized gain | | - | | - | | - | | (.01) |
| Total distributions | | - | | - | | (.01) | | (.01) |
| Net asset value, end of period | $ | 13.40 | $ | 12.06 | $ | 9.62 | $ | 9.34 |
Total Return E,F,G | | | | 25.36% | | 3.07% | | (6.53)% |
Ratios to Average Net Assets C,H,I | | | | | | | | |
| Expenses before reductions | | 2.09% J | | 2.38% | | 2.71% | | 4.65% J |
| Expenses net of fee waivers, if any | | | | 1.90% | | 1.90% | | 1.89% J |
| Expenses net of all reductions | | 1.90% J | | 1.90% | | 1.90% | | 1.89% J |
| Net investment income (loss) | | (.61)% J | | (.53)% | | (.20)% D | | (.75)% J |
| Supplemental Data | | | | | | | | |
| Net assets, end of period (000 omitted) | $ | 538 | $ | 506 | $ | 305 | $ | 273 |
Portfolio turnover rate K | | | | 45% | | 37% | | 55% J |
AFor the period June 15, 2021 (commencement of operations) through May 31, 2022.
BCalculated based on average shares outstanding during the period.
CNet investment income (loss) is affected by the timing of the declaration of dividends by any underlying mutual funds or exchange-traded funds (ETFs). Net investment income (loss) of any mutual funds or ETFs is not included in the Fund's net investment income (loss) ratio.
DNet investment income per share reflects one or more large, non-recurring dividend(s) which amounted to $.02 per share. Excluding such non-recurring dividend(s), the ratio of net investment income (loss) to average net assets would have been (.46)%.
ETotal returns for periods of less than one year are not annualized.
FTotal returns would have been lower if certain expenses had not been reduced during the applicable periods shown.
GTotal returns do not include the effect of the contingent deferred sales charge.
HFees and expenses of any underlying mutual funds or exchange-traded funds (ETFs) are not included in the Fund's expense ratio. The Fund indirectly bears its proportionate share of these expenses. For additional expense information related to investments in Fidelity Central Funds, please refer to the "Investments in Fidelity Central Funds" note found in the Notes to Financial Statements section of the most recent Annual or Semi-Annual report.
IExpense ratios reflect operating expenses of the class. Expenses before reductions do not reflect amounts reimbursed, waived, or reduced through arrangements with the investment adviser, brokerage services, or other offset arrangements, if applicable, and do not represent the amount paid by the class during periods when reimbursements, waivers or reductions occur.
JAnnualized.
KAmount does not include the portfolio activity of any underlying mutual funds or exchange-traded funds (ETFs), derivatives or securities that mature within one year from acquisition.
Fidelity® Sustainable U.S. Equity Fund |
| |
| | Six months ended (Unaudited) November 30, 2024 | | Years ended May 31, 2024 | | 2023 | | 2022 A |
Selected Per-Share Data | | | | | | | | |
| Net asset value, beginning of period | $ | 12.25 | $ | 9.72 | $ | 9.40 | $ | 10.00 |
| Income from Investment Operations | | | | | | | | |
Net investment income (loss) B,C | | .03 | | .05 | | .07 D | | .02 |
| Net realized and unrealized gain (loss) | | 1.40 | | 2.53 | | .31 | | (.57) |
| Total from investment operations | | 1.43 | | 2.58 | | .38 | | (.55) |
| Distributions from net investment income | | (.02) | | (.05) | | (.06) | | (.01) |
| Distributions from net realized gain | | - | | - | | - | | (.04) |
| Total distributions | | (.02) | | (.05) | | (.06) | | (.05) |
| Net asset value, end of period | $ | 13.66 | $ | 12.25 | $ | 9.72 | $ | 9.40 |
Total Return E,F | | | | 26.58% | | 4.14% | | (5.58)% |
Ratios to Average Net Assets C,G,H | | | | | | | | |
| Expenses before reductions | | 1.05% I | | 1.38% | | 1.70% | | 3.21% I |
| Expenses net of fee waivers, if any | | | | .90% | | .90% | | .89% I |
| Expenses net of all reductions | | .90% I | | .90% | | .90% | | .89% I |
| Net investment income (loss) | | .39% I | | .47% | | .80% D | | .24% I |
| Supplemental Data | | | | | | | | |
| Net assets, end of period (000 omitted) | $ | 26,512 | $ | 24,205 | $ | 16,265 | $ | 14,669 |
Portfolio turnover rate J | | | | 45% | | 37% | | 55% I |
AFor the period June 15, 2021 (commencement of operations) through May 31, 2022.
BCalculated based on average shares outstanding during the period.
CNet investment income (loss) is affected by the timing of the declaration of dividends by any underlying mutual funds or exchange-traded funds (ETFs). Net investment income (loss) of any mutual funds or ETFs is not included in the Fund's net investment income (loss) ratio.
DNet investment income per share reflects one or more large, non-recurring dividend(s) which amounted to $.02 per share. Excluding such non-recurring dividend(s), the ratio of net investment income (loss) to average net assets would have been .54%.
ETotal returns for periods of less than one year are not annualized.
FTotal returns would have been lower if certain expenses had not been reduced during the applicable periods shown.
GFees and expenses of any underlying mutual funds or exchange-traded funds (ETFs) are not included in the Fund's expense ratio. The Fund indirectly bears its proportionate share of these expenses. For additional expense information related to investments in Fidelity Central Funds, please refer to the "Investments in Fidelity Central Funds" note found in the Notes to Financial Statements section of the most recent Annual or Semi-Annual report.
HExpense ratios reflect operating expenses of the class. Expenses before reductions do not reflect amounts reimbursed, waived, or reduced through arrangements with the investment adviser, brokerage services, or other offset arrangements, if applicable, and do not represent the amount paid by the class during periods when reimbursements, waivers or reductions occur.
IAnnualized.
JAmount does not include the portfolio activity of any underlying mutual funds or exchange-traded funds (ETFs), derivatives or securities that mature within one year from acquisition.
Fidelity Advisor® Sustainable U.S. Equity Fund Class I |
| |
| | Six months ended (Unaudited) November 30, 2024 | | Years ended May 31, 2024 | | 2023 | | 2022 A |
Selected Per-Share Data | | | | | | | | |
| Net asset value, beginning of period | $ | 12.25 | $ | 9.72 | $ | 9.40 | $ | 10.00 |
| Income from Investment Operations | | | | | | | | |
Net investment income (loss) B,C | | .03 | | .05 | | .07 D | | .02 |
| Net realized and unrealized gain (loss) | | 1.40 | | 2.53 | | .31 | | (.57) |
| Total from investment operations | | 1.43 | | 2.58 | | .38 | | (.55) |
| Distributions from net investment income | | (.02) | | (.05) | | (.06) | | (.01) |
| Distributions from net realized gain | | - | | - | | - | | (.04) |
| Total distributions | | (.02) | | (.05) | | (.06) | | (.05) |
| Net asset value, end of period | $ | 13.66 | $ | 12.25 | $ | 9.72 | $ | 9.40 |
Total Return E,F | | | | 26.58% | | 4.14% | | (5.58)% |
Ratios to Average Net Assets C,G,H | | | | | | | | |
| Expenses before reductions | | 1.02% I | | 1.27% | | 1.58% | | 3.76% I |
| Expenses net of fee waivers, if any | | | | .90% | | .90% | | .90% I |
| Expenses net of all reductions | | .89% I | | .90% | | .90% | | .90% I |
| Net investment income (loss) | | .40% I | | .47% | | .80% D | | .24% I |
| Supplemental Data | | | | | | | | |
| Net assets, end of period (000 omitted) | $ | 371 | $ | 193 | $ | 124 | $ | 116 |
Portfolio turnover rate J | | | | 45% | | 37% | | 55% I |
AFor the period June 15, 2021 (commencement of operations) through May 31, 2022.
BCalculated based on average shares outstanding during the period.
CNet investment income (loss) is affected by the timing of the declaration of dividends by any underlying mutual funds or exchange-traded funds (ETFs). Net investment income (loss) of any mutual funds or ETFs is not included in the Fund's net investment income (loss) ratio.
DNet investment income per share reflects one or more large, non-recurring dividend(s) which amounted to $.02 per share. Excluding such non-recurring dividend(s), the ratio of net investment income (loss) to average net assets would have been .54%.
ETotal returns for periods of less than one year are not annualized.
FTotal returns would have been lower if certain expenses had not been reduced during the applicable periods shown.
GFees and expenses of any underlying mutual funds or exchange-traded funds (ETFs) are not included in the Fund's expense ratio. The Fund indirectly bears its proportionate share of these expenses. For additional expense information related to investments in Fidelity Central Funds, please refer to the "Investments in Fidelity Central Funds" note found in the Notes to Financial Statements section of the most recent Annual or Semi-Annual report.
HExpense ratios reflect operating expenses of the class. Expenses before reductions do not reflect amounts reimbursed, waived, or reduced through arrangements with the investment adviser, brokerage services, or other offset arrangements, if applicable, and do not represent the amount paid by the class during periods when reimbursements, waivers or reductions occur.
IAnnualized.
JAmount does not include the portfolio activity of any underlying mutual funds or exchange-traded funds (ETFs), derivatives or securities that mature within one year from acquisition.
Fidelity Advisor® Sustainable U.S. Equity Fund Class Z |
| |
| | Six months ended (Unaudited) November 30, 2024 | | Years ended May 31, 2024 | | 2023 | | 2022 A |
Selected Per-Share Data | | | | | | | | |
| Net asset value, beginning of period | $ | 12.30 | $ | 9.74 | $ | 9.41 | $ | 10.00 |
| Income from Investment Operations | | | | | | | | |
Net investment income (loss) B,C | | .03 | | .07 | | .09 D | | .04 |
| Net realized and unrealized gain (loss) | | 1.42 | | 2.54 | | .30 | | (.58) |
| Total from investment operations | | 1.45 | | 2.61 | | .39 | | (.54) |
| Distributions from net investment income | | (.02) | | (.05) | | (.06) | | (.01) |
| Distributions from net realized gain | | - | | - | | - | | (.04) |
| Total distributions | | (.02) | | (.05) | | (.06) | | (.05) |
| Net asset value, end of period | $ | 13.73 | $ | 12.30 | $ | 9.74 | $ | 9.41 |
Total Return E,F | | | | 26.83% | | 4.24% | | (5.48)% |
Ratios to Average Net Assets C,G,H | | | | | | | | |
| Expenses before reductions | | .94% I | | 1.21% | | 1.51% | | 3.72% I |
| Expenses net of fee waivers, if any | | | | .75% | | .75% | | .75% I |
| Expenses net of all reductions | | .75% I | | .75% | | .75% | | .75% I |
| Net investment income (loss) | | .54% I | | .62% | | .96% D | | .39% I |
| Supplemental Data | | | | | | | | |
| Net assets, end of period (000 omitted) | $ | 394 | $ | 364 | $ | 130 | $ | 113 |
Portfolio turnover rate J | | | | 45% | | 37% | | 55% I |
AFor the period June 15, 2021 (commencement of operations) through May 31, 2022.
BCalculated based on average shares outstanding during the period.
CNet investment income (loss) is affected by the timing of the declaration of dividends by any underlying mutual funds or exchange-traded funds (ETFs). Net investment income (loss) of any mutual funds or ETFs is not included in the Fund's net investment income (loss) ratio.
DNet investment income per share reflects one or more large, non-recurring dividend(s) which amounted to $.02 per share. Excluding such non-recurring dividend(s), the ratio of net investment income (loss) to average net assets would have been .69%.
ETotal returns for periods of less than one year are not annualized.
FTotal returns would have been lower if certain expenses had not been reduced during the applicable periods shown.
GFees and expenses of any underlying mutual funds or exchange-traded funds (ETFs) are not included in the Fund's expense ratio. The Fund indirectly bears its proportionate share of these expenses. For additional expense information related to investments in Fidelity Central Funds, please refer to the "Investments in Fidelity Central Funds" note found in the Notes to Financial Statements section of the most recent Annual or Semi-Annual report.
HExpense ratios reflect operating expenses of the class. Expenses before reductions do not reflect amounts reimbursed, waived, or reduced through arrangements with the investment adviser, brokerage services, or other offset arrangements, if applicable, and do not represent the amount paid by the class during periods when reimbursements, waivers or reductions occur.
IAnnualized.
JAmount does not include the portfolio activity of any underlying mutual funds or exchange-traded funds (ETFs), derivatives or securities that mature within one year from acquisition.
Notes to Financial Statements
(Unaudited)For the period ended November 30, 2024
1. Organization.
Fidelity Sustainable U.S. Equity Fund (the Fund) is a fund of Fidelity Summer Street Trust (the Trust) and is authorized to issue an unlimited number of shares. The Trust is registered under the Investment Company Act of 1940, as amended (the 1940 Act), as an open-end management investment company organized as a Massachusetts business trust. The Fund offers Class A, Class M, Class C, Fidelity Sustainable U.S. Equity Fund, Class I and Class Z shares, each of which has equal rights as to assets and voting privileges. Class A, Class M, Class C, Class I and Class Z are Fidelity Advisor classes. Each class has exclusive voting rights with respect to matters that affect that class. Class C shares will automatically convert to Class A shares after a holding period of eight years from the initial date of purchase, with certain exceptions.
2. Investments in Fidelity Central Funds.
Funds may invest in Fidelity Central Funds, which are open-end investment companies generally available only to other investment companies and accounts managed by the investment adviser and its affiliates. The Schedule of Investments lists any Fidelity Central Funds held as an investment as of period end, but does not include the underlying holdings of each Fidelity Central Fund. An investing fund indirectly bears its proportionate share of the expenses of the underlying Fidelity Central Funds.
Based on its investment objective, each Fidelity Central Fund may invest or participate in various investment vehicles or strategies that are similar to those of the investing fund. These strategies are consistent with the investment objectives of the investing fund and may involve certain economic risks which may cause a decline in value of each of the Fidelity Central Funds and thus a decline in the value of the investing fund.
| Fidelity Central Fund | Investment Manager | Investment Objective | Investment Practices | Expense RatioA |
| Fidelity Money Market Central Funds | Fidelity Management & Research Company LLC (FMR) | Each fund seeks to obtain a high level of current income consistent with the preservation of capital and liquidity. | Short-term Investments | Less than .005% |
A Expenses expressed as a percentage of average net assets and are as of each underlying Central Fund's most recent annual or semi-annual shareholder report.
A complete unaudited list of holdings for each Fidelity Central Fund is available upon request or at the Securities and Exchange Commission website at www.sec.gov. In addition, the financial statements of the Fidelity Central Funds which contain the significant accounting policies (including investment valuation policies) of those funds, and are not covered by the Report of Independent Registered Public Accounting Firm, are available on the Securities and Exchange Commission website or upon request.
3. Significant Accounting Policies.
The Fund is an investment company and applies the accounting and reporting guidance of the Financial Accounting Standards Board (FASB) Accounting Standards Codification Topic 946 Financial Services - Investment Companies. The financial statements have been prepared in conformity with accounting principles generally accepted in the United States of America (GAAP), which require management to make certain estimates and assumptions at the date of the financial statements. Actual results could differ from those estimates. Subsequent events, if any, through the date that the financial statements were issued have been evaluated in the preparation of the financial statements. The Fund's Schedule of Investments lists any underlying mutual funds or exchange-traded funds (ETFs) but does not include the underlying holdings of these funds. The following summarizes the significant accounting policies of the Fund:
Investment Valuation. Investments are valued as of 4:00 p.m. Eastern time on the last calendar day of the period. The Board of Trustees (the Board) has designated the Fund's investment adviser as the valuation designee responsible for the fair valuation function and performing fair value determinations as needed. The investment adviser has established a Fair Value Committee (the Committee) to carry out the day-to-day fair valuation responsibilities and has adopted policies and procedures to govern the fair valuation process and the activities of the Committee. In accordance with these fair valuation policies and procedures, which have been approved by the Board, the Fund attempts to obtain prices from one or more third party pricing services or brokers to value its investments. When current market prices, quotations or currency exchange rates are not readily available or reliable, investments will be fair valued in good faith by the Committee, in accordance with the policies and procedures. Factors used in determining fair value vary by investment type and may include market or investment specific events, transaction data, estimated cash flows, and market observations of comparable investments. The frequency that the fair valuation procedures are used cannot be predicted and they may be utilized to a significant extent. The Committee manages the Fund's fair valuation practices and maintains the fair valuation policies and procedures. The Fund's investment adviser reports to the Board information regarding the fair valuation process and related material matters.
The Fund categorizes the inputs to valuation techniques used to value its investments into a disclosure hierarchy consisting of three levels as shown below:
Level 1 - unadjusted quoted prices in active markets for identical investments
Level 2 - other significant observable inputs (including quoted prices for similar investments, interest rates, prepayment speeds, etc.)
Level 3 - unobservable inputs (including the Fund's own assumptions based on the best information available)
Valuation techniques used to value the Fund's investments by major category are as follows:
Equity securities, including restricted securities, for which market quotations are readily available, are valued at the last reported sale price or official closing price as reported by a third party pricing service on the primary market or exchange on which they are traded and are categorized as Level 1 in the hierarchy. In the event there were no sales during the day or closing prices are not available, securities are valued at the last quoted bid price or may be valued using the last available price and are generally categorized as Level 2 in the hierarchy. For foreign equity securities, when market or security specific events arise, comparisons to the valuation of American Depositary Receipts (ADRs), futures contracts, Exchange-Traded Funds (ETFs) and certain indexes as well as quoted prices for similar securities may be used and would be categorized as Level 2 in the hierarchy. For equity securities, including restricted securities, where observable inputs are limited, assumptions about market activity and risk are used and these securities may be categorized as Level 3 in the hierarchy.
Investments in open-end mutual funds, including the Fidelity Central Funds, are valued at their closing net asset value (NAV) each business day and are categorized as Level 1 in the hierarchy.
Changes in valuation techniques may result in transfers in or out of an assigned level within the disclosure hierarchy. The aggregate value of investments by input level as of November 30, 2024 is included at the end of the Fund's Schedule of Investments.
Foreign Currency. Certain Funds may use foreign currency contracts to facilitate transactions in foreign-denominated securities. Gains and losses from these transactions may arise from changes in the value of the foreign currency or if the counterparties do not perform under the contracts' terms.
Foreign-denominated assets, including investment securities, and liabilities are translated into U.S. dollars at the exchange rates at period end. Purchases and sales of investment securities, income and dividends received, and expenses denominated in foreign currencies are translated into U.S. dollars at the exchange rate in effect on the transaction date.
The effects of exchange rate fluctuations on investments are included with the net realized and unrealized gain (loss) on investment securities. Other foreign currency transactions resulting in realized and unrealized gain (loss) are disclosed separately.
Investment Transactions and Income. For financial reporting purposes, the Fund's investment holdings and NAV include trades executed through the end of the last business day of the period. The NAV per share for processing shareholder transactions is calculated as of the close of business of the New York Stock Exchange (NYSE), normally 4:00 p.m. Eastern time and includes trades executed through the end of the prior business day. Gains and losses on securities sold are determined on the basis of identified cost. Commissions paid to certain brokers with whom the investment adviser, or its affiliates, places trades on behalf of a fund include an amount in addition to trade execution, which may be rebated back to a fund. Any such rebates are included in net realized gain (loss) on investments in the Statement of Operations. Dividend income is recorded on the ex-dividend date, except for certain dividends from foreign securities where the ex-dividend date may have passed, which are recorded as soon as the Fund is informed of the ex-dividend date. Non-cash dividends included in dividend income, if any, are recorded at the fair market value of the securities received. Income and capital gain distributions from Fidelity Central Funds, if any, are recorded on the ex-dividend date. Certain distributions received by the Fund represent a return of capital or capital gain. The Fund determines the components of these distributions subsequent to the ex-dividend date, based upon receipt of tax filings or other correspondence relating to the underlying investment. These distributions are recorded as a reduction of cost of investments and/or as a realized gain. Investment income is recorded net of foreign taxes withheld where recovery of such taxes is uncertain. Funds may file withholding tax reclaims in certain jurisdictions to recover a portion of amounts previously withheld. Any withholding tax reclaims income is included in the Statement of Operations in dividends. Any receivables for withholding tax reclaims are included in the Statement of Assets and Liabilities in dividends receivable.
Class Allocations and Expenses. Investment income, realized and unrealized capital gains and losses, common expenses of a fund, and certain fund-level expense reductions, if any, are allocated daily on a pro-rata basis to each class based on the relative net assets of each class to the total net assets of a fund. Each class differs with respect to transfer agent and distribution and service plan fees incurred, as applicable. Certain expense reductions may also differ by class, if applicable. For the reporting period, the allocated portion of income and expenses to each class as a percent of its average net assets may vary due to the timing of recording these transactions in relation to fluctuating net assets of the classes. Expenses directly attributable to a fund are charged to that fund. Expenses attributable to more than one fund are allocated among the respective funds on the basis of relative net assets or other appropriate methods. Expenses included in the accompanying financial statements reflect the expenses of that fund and do not include any expenses associated with any underlying mutual funds or exchange-traded funds (ETFs). Although not included in a fund's expenses, a fund indirectly bears its proportionate share of these expenses through the net asset value of each underlying mutual fund or exchange-traded fund (ETF). Expense estimates are accrued in the period to which they relate and adjustments are made when actual amounts are known.
Income Tax Information and Distributions to Shareholders. Each year, the Fund intends to qualify as a regulated investment company under Subchapter M of the Internal Revenue Code, including distributing substantially all of its taxable income and realized gains. As a result, no provision for U.S. Federal income taxes is required. The Fund files a U.S. federal tax return, in addition to state and local tax returns as required. The Fund's federal income tax returns are subject to examination by the Internal Revenue Service (IRS) for a period of three fiscal years after they are filed. State and local tax returns may be subject to examination for an additional fiscal year depending on the jurisdiction. Foreign taxes are provided for based on the Fund's understanding of the tax rules and rates that exist in the foreign markets in which it invests.
Distributions are declared and recorded on the ex-dividend date. Income and capital gain distributions are declared separately for each class. Income and capital gain distributions are determined in accordance with income tax regulations, which may differ from GAAP.
Capital accounts within the financial statements are adjusted for permanent book-tax differences. These adjustments have no impact on net assets or the results of operations. Capital accounts are not adjusted for temporary book-tax differences which will reverse in a subsequent period.
Book-tax differences are primarily due to foreign currency transactions, capital loss carryforwards and losses deferred due to wash sales.
As of period end, the cost and unrealized appreciation (depreciation) in securities, and derivatives if applicable, for federal income tax purposes were as follows:
| Gross unrealized appreciation | $7,726,327 |
| Gross unrealized depreciation | (672,582) |
| Net unrealized appreciation (depreciation) | $7,053,745 |
| Tax cost | $22,503,441 |
Capital loss carryforwards are only available to offset future capital gains of the Fund to the extent provided by regulations and may be limited. The capital loss carryforward information presented below, including any applicable limitation, is estimated as of fiscal period end and is subject to adjustment.
Short-term | $(723,468) |
Long-term | (348,372) |
| Total capital loss carryforward | $(1,071,840) |
Due to large subscriptions in a prior period, approximately $1,071,840 of the Fund's realized capital losses are subject to limitation. Due to this limitation, the Fund will only be permitted to use approximately $303,809 of those capital losses per year to offset capital gains. Additionally, the Fund is subject to an annual limit on its use of some of its unrealized capital losses to offset capital gains in future periods. If those losses are realized and the limitation prevents the Fund from using any of those losses in a future period, those capital losses will be available to offset capital gains in subsequent periods.
Restricted Securities (including Private Placements). Funds may invest in securities that are subject to legal or contractual restrictions on resale. These securities generally may be resold in transactions exempt from registration or to the public if the securities are registered. Disposal of these securities may involve time-consuming negotiations and expense, and prompt sale at an acceptable price may be difficult. Information regarding restricted securities held at period end is included at the end of the Schedule of Investments, if applicable.
New Accounting Pronouncement. In November 2023, the FASB issued Accounting Standards Update (ASU) 2023-07 Segment Reporting (Topic 280): Improvements to Reportable Segment Disclosures. Effective for fiscal years beginning after December 15, 2023 and interim periods within fiscal years beginning after December 15, 2024, the amendments enhance required disclosures of segment information for public entities on an annual and interim basis. The ASU allows for early adoption with updates applied retrospectively. Management is currently evaluating the impact of the ASU but does not expect this guidance to materially impact the financial statements.
4. Purchases and Sales of Investments.
Purchases and sales of securities, other than short-term securities and in-kind transactions, as applicable, are noted in the table below.
| | Purchases ($) | Sales ($) |
| Fidelity Sustainable U.S. Equity Fund | 4,826,458 | 5,442,589 |
5. Fees and Other Transactions with Affiliates.
Management Fee. Fidelity Management & Research Company LLC (the investment adviser) and its affiliates provide the Fund with investment management related services for which the Fund pays a monthly management fee.
The Fund's management contract incorporates a basic fee rate that may vary by class (subject to a performance adjustment). The investment adviser or an affiliate pays certain expenses of managing and operating the Fund out of each class's management fee. Each class of the Fund pays a management fee to the investment adviser. The management fee is calculated and paid to the investment adviser every month. The management fee is determined by calculating a basic fee and then applying a performance adjustment. When determining a class's basic fee, a mandate rate is calculated based on the monthly average net assets of a group of funds advised by FMR within a designated asset class. A discount rate is subtracted from the mandate rate once the Fund's monthly average net assets reach a certain level. The mandate rate and discount rate may vary by class. The annual basic fee rate for a class of shares of the Fund is the lesser of (1) the class's mandate rate reduced by the class's discount rate (if applicable) or (2) the amount set forth in the following table.
| | Maximum Management Fee Rate % |
| Class A | .72 |
| Class M | .72 |
| Class C | .72 |
| Fidelity Sustainable U.S. Equity Fund | .72 |
| Class I | .65 |
| Class Z | .56 |
One-twelfth of the basic fee rate for a class is applied to the average net assets of the class for the month, giving a dollar amount which is the basic fee for the class for that month. A different management fee rate may be applicable to each class of the Fund. The difference between classes is the result of separate arrangements for class-level services and/or waivers of certain expenses. It is not the result of any difference in advisory or custodial fees or other expenses related to the management of the Fund's assets, which do not vary by class. For the reporting period, the total annualized management fee rates were as follows:
| | Total Management Fee Rate % |
| Class A | .72 |
| Class M | .72 |
| Class C | .72 |
| Fidelity Sustainable U.S. Equity Fund | .67 |
| Class I | .65 |
| Class Z | .56 |
The performance adjustment rate is calculated monthly by comparing over the performance period the Fund's performance to that of the performance adjustment index listed below.
| | Performance Adjustment Index |
| Fidelity Sustainable U.S. Equity Fund | Russell 3000 Index |
For the purposes of calculating the performance adjustment for the Fund, the Fund's investment performance is based on the performance of Fidelity Sustainable U.S. Equity Fund. To the extent that other classes of the Fund have higher expenses, this could result in those classes bearing a larger positive performance adjustment and smaller negative performance adjustment than would be the case if each class's own performance were considered. The performance period is the most recent 36 month period. The maximum annualized performance adjustment rate is ±.10% of the Fund's average net assets over the performance period. The performance adjustment rate is divided by twelve and multiplied by the Fund's average net assets over the performance period, and the resulting dollar amount is proportionately added to or subtracted from a class's basic fee. For the reporting period, the total annualized performance adjustment was (.03) %.
Distribution and Service Plan Fees. In accordance with Rule 12b-1 of the 1940 Act, the Fund has adopted separate Distribution and Service Plans for each class of shares. Certain classes pay Fidelity Distributors Company LLC (FDC), an affiliate of the investment adviser, separate Distribution and Service Fees, each of which is based on an annual percentage of each class' average net assets. In addition, FDC may pay financial intermediaries for selling shares of the Fund and providing shareholder support services. For the period, the Distribution and Service Fee rates, total fees and amounts retained by FDC were as follows:
| | Distribution Fee | Service Fee | Total Fees ($) | Retained by FDC ($) |
| Class A | - % | .25% | 1,564 | 100 |
| Class M | .25% | .25% | 1,038 | 261 |
| Class C | .75% | .25% | 2,672 | 850 |
| | | | 5,274 | 1,211 |
Sales Load. FDC may receive a front-end sales charge of up to 5.75% for selling Class A shares and 3.50% for selling Class M shares, some of which is paid to financial intermediaries for selling shares of the Fund. Depending on the holding period, FDC may receive contingent deferred sales charges levied on Class A, Class M and Class C redemptions. The deferred sales charges are 1.00% for Class C shares, 1.00% for certain purchases of Class A shares and .25% for certain purchases of Class M shares.
For the period, sales charge amounts retained by FDC were as follows:
| | Retained by FDC ($) |
| Class A | 614 |
| Class M | 18 |
Class CA | 4 |
| | 636 |
A When Class C shares are initially sold, FDC pays commissions from its own resources to financial intermediaries through which the sales are made.
Brokerage Commissions. A portion of portfolio transactions were placed with brokerage firms which are affiliates of the investment adviser. Brokerage commissions are included in net realized gain (loss) and change in net unrealized appreciation (depreciation) in the Statement of Operations. The commissions paid to these affiliated firms were as follows:
| | Amount ($) |
| Fidelity Sustainable U.S. Equity Fund | 91 |
Interfund Trades. Funds may purchase from or sell securities to other Fidelity Funds under procedures adopted by the Board. The procedures have been designed to ensure these interfund trades are executed in accordance with Rule 17a-7 of the 1940 Act. Any interfund trades are included within the respective purchases and sales amounts shown in the Purchases and Sales of Investments note. Interfund trades during the period are noted in the table below.
| | Purchases ($) | Sales ($) | Realized Gain (Loss)($) |
| Fidelity Sustainable U.S. Equity Fund | 21,859 | 510,023 | 84,549 |
6. Committed Line of Credit.
Certain Funds participate with other funds managed by the investment adviser or an affiliate in a $4.25 billion credit facility (the "line of credit") to be utilized for temporary or emergency purposes to fund shareholder redemptions or for other short-term liquidity purposes. The participating funds have agreed to pay commitment fees on their pro-rata portion of the line of credit, which are reflected in Miscellaneous expenses on the Statement of Operations, and are listed below. During the period, there were no borrowings on this line of credit.
| | Amount ($) |
| Fidelity Sustainable U.S. Equity Fund | 18 |
7. Expense Reductions.
The investment adviser contractually agreed to reimburse expenses of each class to the extent annual operating expenses exceeded certain levels of class-level average net assets as noted in the table below. This reimbursement will remain in place through September 30, 2025. Some expenses, for example the compensation of the independent Trustees, are excluded from this reimbursement.
The following classes were in reimbursement during the period:
| | Expense Limitations | Reimbursement ($) |
| Class A | 1.15% | 1,195 |
| Class M | 1.40% | 412 |
| Class C | 1.90% | 518 |
| Fidelity Sustainable U.S. Equity Fund | .90% | 18,832 |
| Class I | .90% | 131 |
| Class Z | .75% | 351 |
| | | 21,439 |
Through arrangements with the Fund's custodian, credits realized as a result of certain uninvested cash balances were used to reduce the Fund's expenses. During the period, custodian credits reduced the Fund's expenses by $421.
8. Distributions to Shareholders.
Distributions to shareholders of each class were as follows:
| | Six months ended November 30, 2024 | Year ended May 31, 2024 |
| Fidelity Sustainable U.S. Equity Fund | | |
| Distributions to shareholders | | |
| Class A | $388 | $2,031 |
| Class M | - | 69 |
| Fidelity Sustainable U.S. Equity Fund | 31,997 | 86,166 |
| Class I | 269 | 775 |
| Class Z | 537 | 976 |
Total | $33,191 | $90,017 |
9. Share Transactions.
Share transactions for each class were as follows and may contain in-kind transactions, automatic conversions between classes or exchanges between affiliated funds:
| | Shares | Shares | Dollars | Dollars |
| | Six months ended November 30, 2024 | Year ended May 31, 2024 | Six months ended November 30, 2024 | Year ended May 31, 2024 |
| Fidelity Sustainable U.S. Equity Fund | | | | |
| Class A | | | | |
| Shares sold | 17,101 | 39,427 | $221,268 | $424,084 |
| Reinvestment of distributions | 30 | 189 | 388 | 2,031 |
| Shares redeemed | (11,324) | (10,614) | (146,987) | (116,524) |
| Net increase (decrease) | 5,807 | 29,002 | $74,669 | $309,591 |
| Class M | | | | |
| Shares sold | 499 | 7,112 | $6,334 | $76,164 |
| Reinvestment of distributions | - | 6 | - | 69 |
| Shares redeemed | (5,222) | (8,633) | (67,191) | (90,889) |
| Net increase (decrease) | (4,723) | (1,515) | $(60,857) | $(14,656) |
| Class C | | | | |
| Shares sold | 3,906 | 17,564 | $48,873 | $182,141 |
| Shares redeemed | (5,748) | (7,311) | (73,972) | (82,022) |
| Net increase (decrease) | (1,842) | 10,253 | $(25,099) | $100,119 |
| Fidelity Sustainable U.S. Equity Fund | | | | |
| Shares sold | 250,288 | 854,158 | $3,202,894 | $9,116,739 |
| Reinvestment of distributions | 2,198 | 6,965 | 28,019 | 74,785 |
| Shares redeemed | (288,071) | (558,573) | (3,686,212) | (5,995,611) |
| Net increase (decrease) | (35,585) | 302,550 | $(455,299) | $3,195,913 |
| Class I | | | | |
| Shares sold | 11,624 | 11,978 | $154,720 | $125,769 |
| Reinvestment of distributions | 21 | 55 | 269 | 590 |
| Shares redeemed | (227) | (8,991) | (2,981) | (101,667) |
| Net increase (decrease) | 11,418 | 3,042 | $152,008 | $24,692 |
| Class Z | | | | |
| Shares sold | 603 | 16,588 | $7,662 | $179,201 |
| Reinvestment of distributions | 20 | 64 | 257 | 685 |
| Shares redeemed | (1,513) | (443) | (18,841) | (5,120) |
| Net increase (decrease) | (890) | 16,209 | $(10,922) | $174,766 |
10. Other.
A fund's organizational documents provide former and current trustees and officers with a limited indemnification against liabilities arising in connection with the performance of their duties to the fund. In the normal course of business, a fund may also enter into contracts that provide general indemnifications. A fund's maximum exposure under these arrangements is unknown as this would be dependent on future claims that may be made against a fund. The risk of material loss from such claims is considered remote.
11. Risk and Uncertainties.
Many factors affect a fund's performance. Developments that disrupt global economies and financial markets, such as pandemics, epidemics, outbreaks of infectious diseases, war, terrorism, and environmental disasters, may significantly affect a fund's investment performance. The effects of these developments to a fund will be impacted by the types of securities in which a fund invests, the financial condition, industry, economic sector, and geographic location of an issuer, and a fund's level of investment in the securities of that issuer. Significant concentrations in security types, issuers, industries, sectors, and geographic locations may magnify the factors that affect a fund's performance.
Item 8: Changes in and Disagreements with Accountants for Open-End Management Investment Companies
(Unaudited)
Note: This is not applicable for any fund included in this document.
Item 9: Proxy Disclosures for Open-End Management Investment Companies
(Unaudited)
| A special meeting of shareholders was held on July 16, 2024. The results of votes taken among shareholders on the proposal before them are reported below. Each vote reported represents one dollar of net asset value held on the record date for the meeting. |
| Proposal 1 |
| To elect a Board of Trustees. |
| | # of Votes | % of Votes |
| Bettina Doulton |
| Affirmative | 14,516,835,136.19 | 94.56 |
| Withheld | 834,887,998.33 | 5.44 |
| TOTAL | 15,351,723,134.52 | 100.00 |
| Robert A. Lawrence |
| Affirmative | 14,430,495,798.10 | 94.00 |
| Withheld | 921,227,336.42 | 6.00 |
| TOTAL | 15,351,723,134.52 | 100.00 |
| Vijay C. Advani |
| Affirmative | 14,465,231,640.25 | 94.23 |
| Withheld | 886,491,494.27 | 5.77 |
| TOTAL | 15,351,723,134.52 | 100.00 |
| Thomas P. Bostick |
| Affirmative | 14,471,831,170.84 | 94.27 |
| Withheld | 879,891,963.68 | 5.73 |
| TOTAL | 15,351,723,134.52 | 100.00 |
| Donald F. Donahue |
| Affirmative | 14,432,670,599.88 | 94.01 |
| Withheld | 919,052,534.64 | 5.99 |
| TOTAL | 15,351,723,134.52 | 100.00 |
| Vicki L. Fuller |
| Affirmative | 14,531,407,981.65 | 94.66 |
| Withheld | 820,315,152.87 | 5.34 |
| TOTAL | 15,351,723,134.52 | 100.00 |
| Patricia L. Kampling |
| Affirmative | 14,549,142,839.16 | 94.77 |
| Withheld | 802,580,295.36 | 5.23 |
| TOTAL | 15,351,723,134.52 | 100.00 |
| Thomas A. Kennedy |
| Affirmative | 14,469,818,769.40 | 94.26 |
| Withheld | 881,904,365.12 | 5.74 |
| TOTAL | 15,351,723,134.52 | 100.00 |
| Oscar Munoz |
| Affirmative | 14,434,061,467.08 | 94.02 |
| Withheld | 917,661,667.44 | 5.98 |
| TOTAL | 15,351,723,134.52 | 100.00 |
| Karen B. Peetz |
| Affirmative | 14,521,904,618.46 | 94.59 |
| Withheld | 829,818,516.06 | 5.41 |
| TOTAL | 15,351,723,134.52 | 100.00 |
| David M. Thomas |
| Affirmative | 14,417,745,861.73 | 93.92 |
| Withheld | 933,977,272.79 | 6.08 |
| TOTAL | 15,351,723,134.52 | 100.00 |
| Susan Tomasky |
| Affirmative | 14,467,973,468.18 | 94.24 |
| Withheld | 883,749,666.34 | 5.76 |
| TOTAL | 15,351,723,134.52 | 100.00 |
| Michael E. Wiley |
| Affirmative | 14,424,002,796.91 | 93.96 |
| Withheld | 927,720,337.61 | 6.04 |
| TOTAL | 15,351,723,134.52 | 100.00 |
| | | |
| Proposal 1 reflects trust-wide proposal and voting results. |
Item 10: Remuneration Paid to Directors, Officers, and others of Open-End Management Investment Companies
(Unaudited)
Note: This information is disclosed as part of the financial statements for each Fund as part of Item 7: Financial Statements and Financial Highlights for Open-End Management Investment companies.
Item 11: Statement Regarding Basis for Approval of Investment Advisory Contract
(Unaudited)
Note: This is not applicable for any fund included in this document.
1.9901905.103
SUS-SANN-0125
Fidelity® SAI Sustainable Sector Fund
Semi-Annual Report
November 30, 2024
Offered exclusively to certain clients of the Adviser, or its affiliates, including Strategic Advisers LLC (Strategic Advisers) - not available for sale to the general public. Fidelity® SAI is a product name of Fidelity® funds dedicated to certain programs affiliated with Strategic Advisers.
Contents
To view a fund's proxy voting guidelines and proxy voting record for the 12-month period ended June 30, visit http://www.fidelity.com/proxyvotingresults or visit the Securities and Exchange Commission's (SEC) web site at http://www.sec.gov.
You may also call 1-800-544-3455 to request a free copy of the proxy voting guidelines.
Standard & Poor's, S&P and S&P 500 are registered service marks of The McGraw-Hill Companies, Inc. and have been licensed for use by Fidelity Distributors Corporation.
Other third-party marks appearing herein are the property of their respective owners.
All other marks appearing herein are registered or unregistered trademarks or service marks of FMR LLC or an affiliated company. © 2025 FMR LLC. All rights reserved.
This report and the financial statements contained herein are submitted for the general information of the shareholders of the Fund. This report is not authorized for distribution to prospective investors in the Fund unless preceded or accompanied by an effective prospectus.
A fund files its complete schedule of portfolio holdings with the SEC for the first and third quarters of each fiscal year on Form N-PORT. Forms N-PORT are available on the SEC's web site at http://www.sec.gov. A fund's Forms N-PORT may be reviewed and copied at the SEC's Public Reference Room in Washington, DC. Information regarding the operation of the SEC's Public Reference Room may be obtained by calling 1-800-SEC-0330.
For a complete list of a fund's portfolio holdings, view the most recent holdings listing, semiannual report, or annual report on Fidelity's web site at http://www.fidelity.com, http://www.institutional.fidelity.com, or http://www.401k.com, as applicable.
NOT FDIC INSURED •MAY LOSE VALUE •NO BANK GUARANTEE
Neither the Fund nor Fidelity Distributors Corporation is a bank.
Item 7: Financial Statements and Financial Highlights for Open-End Management Investment Companies (Semi-Annual Report)
Fidelity® SAI Sustainable Sector Fund
Schedule of Investments November 30, 2024 (Unaudited)
Showing Percentage of Net Assets
| Common Stocks - 98.2% |
| | | Shares | Value ($) |
| COMMUNICATION SERVICES - 7.2% | | | |
| Diversified Telecommunication Services - 0.7% | | | |
| Cellnex Telecom SA (a) | | 10,834 | 389,031 |
| Deutsche Telekom AG | | 50,761 | 1,624,270 |
| | | | 2,013,301 |
| Entertainment - 2.5% | | | |
| IMAX Corp. (b) | | 19,343 | 509,108 |
| Live Nation Entertainment, Inc. (b) | | 7,682 | 1,062,037 |
| Netflix, Inc. (b) | | 3,466 | 3,073,683 |
| Sea Ltd. ADR Class A (b) | | 4,673 | 531,787 |
| The Walt Disney Co. | | 18,529 | 2,176,602 |
| | | | 7,353,217 |
| Interactive Media & Services - 4.0% | | | |
| Alphabet, Inc. Class A | | 66,431 | 11,223,517 |
| Pinterest, Inc. Class A (b) | | 29,614 | 897,896 |
| | | | 12,121,413 |
TOTAL COMMUNICATION SERVICES | | | 21,487,931 |
| CONSUMER DISCRETIONARY - 10.9% | | | |
| Automobile Components - 0.1% | | | |
| Aptiv PLC (b) | | 6,554 | 363,944 |
| Automobiles - 1.5% | | | |
| Tesla, Inc. (b) | | 13,129 | 4,531,606 |
| Broadline Retail - 4.3% | | | |
| Amazon.com, Inc. (b) | | 61,013 | 12,683,993 |
| Etsy, Inc. (b) | | 4,396 | 241,165 |
| | | | 12,925,158 |
| Distributors - 0.2% | | | |
| LKQ Corp. | | 10,598 | 416,395 |
| Hotels, Restaurants & Leisure - 2.3% | | | |
| Booking Holdings, Inc. | | 231 | 1,201,657 |
| Caesars Entertainment, Inc. (b) | | 6,414 | 246,875 |
| Domino's Pizza, Inc. | | 1,462 | 696,190 |
| Flutter Entertainment PLC (b) | | 4,188 | 1,151,601 |
| Marriott International, Inc. Class A | | 4,198 | 1,213,600 |
| Restaurant Brands International, Inc. | | 14,539 | 1,012,761 |
| Starbucks Corp. | | 7,061 | 723,470 |
| Yum! Brands, Inc. | | 4,559 | 633,427 |
| | | | 6,879,581 |
| Household Durables - 0.1% | | | |
| D.R. Horton, Inc. | | 958 | 161,691 |
| Leisure Products - 0.1% | | | |
| Brunswick Corp. | | 2,492 | 200,631 |
| Specialty Retail - 1.8% | | | |
| Foot Locker, Inc. (b) | | 7,848 | 197,377 |
| Lowe's Companies, Inc. | | 9,737 | 2,652,651 |
| The Home Depot, Inc. | | 2,368 | 1,016,180 |
| TJX Companies, Inc. | | 12,053 | 1,514,942 |
| | | | 5,381,150 |
| Textiles, Apparel & Luxury Goods - 0.5% | | | |
| NIKE, Inc. Class B | | 8,745 | 688,844 |
| PVH Corp. | | 3,500 | 379,295 |
| Tapestry, Inc. | | 8,683 | 540,777 |
| | | | 1,608,916 |
TOTAL CONSUMER DISCRETIONARY | | | 32,469,072 |
| CONSUMER STAPLES - 5.9% | | | |
| Beverages - 1.0% | | | |
| PepsiCo, Inc. | | 5,343 | 873,313 |
| The Coca-Cola Co. | | 33,339 | 2,136,363 |
| | | | 3,009,676 |
| Consumer Staples Distribution & Retail - 2.4% | | | |
| Alimentation Couche-Tard, Inc. (multi-vtg.) | | 11,254 | 660,184 |
| Costco Wholesale Corp. | | 2,976 | 2,892,315 |
| Target Corp. | | 611 | 80,841 |
| Walmart, Inc. | | 37,088 | 3,430,640 |
| | | | 7,063,980 |
| Food Products - 0.8% | | | |
| Bunge Global SA | | 8,525 | 765,034 |
| Mondelez International, Inc. | | 17,116 | 1,111,684 |
| The Simply Good Foods Co. (b) | | 17,761 | 706,710 |
| | | | 2,583,428 |
| Household Products - 1.4% | | | |
| Colgate-Palmolive Co. | | 10,434 | 1,008,237 |
| Procter & Gamble Co. | | 17,121 | 3,069,110 |
| | | | 4,077,347 |
| Personal Care Products - 0.3% | | | |
| BellRing Brands, Inc. (b) | | 9,432 | 740,035 |
| Estee Lauder Companies, Inc. Class A | | 3,294 | 237,563 |
| | | | 977,598 |
TOTAL CONSUMER STAPLES | | | 17,712,029 |
| ENERGY - 1.4% | | | |
| Oil, Gas & Consumable Fuels - 1.4% | | | |
| Expand Energy Corp. | | 7,325 | 724,882 |
| MEG Energy Corp. | | 10,447 | 188,263 |
| Shell PLC ADR | | 21,715 | 1,405,829 |
| Targa Resources Corp. | | 4,211 | 860,307 |
| Valero Energy Corp. | | 7,844 | 1,090,944 |
| | | | 4,270,225 |
| FINANCIALS - 14.1% | | | |
| Banks - 5.1% | | | |
| AIB Group PLC | | 37,893 | 206,224 |
| Bank of America Corp. | | 51,261 | 2,435,410 |
| Citigroup, Inc. | | 23,143 | 1,640,144 |
| Eurobank Ergasias Services and Holdings SA ADR | | 308,993 | 320,735 |
| HDFC Bank Ltd. sponsored ADR | | 3,939 | 262,968 |
| JPMorgan Chase & Co. | | 9,498 | 2,371,841 |
| KeyCorp | | 27,710 | 539,791 |
| M&T Bank Corp. | | 2,968 | 652,930 |
| Pathward Financial, Inc. | | 3,400 | 285,192 |
| Piraeus Financial Holdings SA | | 47,218 | 173,625 |
| PNC Financial Services Group, Inc. | | 4,086 | 877,346 |
| U.S. Bancorp | | 36,902 | 1,966,508 |
| UMB Financial Corp. | | 2,003 | 251,356 |
| Wells Fargo & Co. | | 42,304 | 3,222,296 |
| | | | 15,206,366 |
| Capital Markets - 3.3% | | | |
| Bank of New York Mellon Corp. | | 13,476 | 1,103,280 |
| BlackRock, Inc. | | 385 | 393,778 |
| Carlyle Group LP | | 6,497 | 345,835 |
| Cboe Global Markets, Inc. | | 4,739 | 1,022,913 |
| Digitalbridge Group, Inc. Class A | | 11,387 | 149,170 |
| Intercontinental Exchange, Inc. | | 7,722 | 1,242,933 |
| London Stock Exchange Group PLC | | 2,660 | 381,228 |
| LPL Financial | | 2,698 | 877,255 |
| MarketAxess Holdings, Inc. | | 3,932 | 1,017,169 |
| Morgan Stanley | | 13,034 | 1,715,405 |
| Northern Trust Corp. | | 3,501 | 389,171 |
| State Street Corp. | | 7,353 | 724,344 |
| Tradeweb Markets, Inc. Class A | | 4,204 | 569,642 |
| | | | 9,932,123 |
| Consumer Finance - 0.5% | | | |
| Discover Financial Services | | 6,101 | 1,113,005 |
| OneMain Holdings, Inc. | | 4,960 | 284,456 |
| | | | 1,397,461 |
| Financial Services - 2.4% | | | |
| Affirm Holdings, Inc. Class A, (b) | | 4,055 | 283,891 |
| Apollo Global Management, Inc. | | 8,672 | 1,517,860 |
| MasterCard, Inc. Class A | | 3,276 | 1,745,911 |
| PayPal Holdings, Inc. (b) | | 4,767 | 413,633 |
| Visa, Inc. Class A | | 8,355 | 2,632,493 |
| Voya Financial, Inc. | | 6,362 | 528,046 |
| | | | 7,121,834 |
| Insurance - 2.8% | | | |
| Arthur J. Gallagher & Co. | | 2,973 | 928,290 |
| Chubb Ltd. | | 5,090 | 1,469,636 |
| Everest Re Group Ltd. | | 1,041 | 403,450 |
| Hartford Financial Services Group, Inc. | | 6,299 | 776,730 |
| Marsh & McLennan Companies, Inc. | | 7,322 | 1,707,710 |
| Progressive Corp. | | 3,418 | 919,032 |
| Prudential PLC | | 6,585 | 53,969 |
| The Travelers Companies, Inc. | | 3,604 | 958,808 |
| Unum Group | | 5,662 | 435,408 |
| Willis Towers Watson PLC | | 2,178 | 701,316 |
| | | | 8,354,349 |
TOTAL FINANCIALS | | | 42,012,133 |
| HEALTH CARE - 11.2% | | | |
| Biotechnology - 2.2% | | | |
| AbbVie, Inc. | | 2,784 | 509,277 |
| Alnylam Pharmaceuticals, Inc. (b) | | 2,518 | 637,230 |
| Argenx SE ADR (b) | | 1,337 | 824,327 |
| BioNTech SE ADR (b) | | 2,989 | 353,868 |
| Blueprint Medicines Corp. (b) | | 2,444 | 235,553 |
| Crinetics Pharmaceuticals, Inc. (b) | | 4,298 | 245,846 |
| Cytokinetics, Inc. (b) | | 6,375 | 330,608 |
| Exact Sciences Corp. (b) | | 11,242 | 697,903 |
| Gilead Sciences, Inc. | | 6,682 | 618,620 |
| Merus BV (b) | | 3,421 | 153,398 |
| Moonlake Immunotherapeutics Class A (b) | | 3,486 | 189,743 |
| Regeneron Pharmaceuticals, Inc. (b) | | 1,357 | 1,018,049 |
| Vaxcyte, Inc. (b) | | 5,396 | 509,059 |
| Xenon Pharmaceuticals, Inc. (b) | | 7,977 | 340,060 |
| | | | 6,663,541 |
| Health Care Equipment & Supplies - 3.1% | | | |
| Boston Scientific Corp. (b) | | 43,904 | 3,980,337 |
| Glaukos Corp. (b) | | 4,914 | 705,896 |
| ICU Medical, Inc. (b) | | 2,032 | 333,167 |
| Inspire Medical Systems, Inc. (b) | | 2,183 | 420,795 |
| Insulet Corp. (b) | | 4,587 | 1,223,720 |
| Intuitive Surgical, Inc. (b) | | 1,821 | 986,982 |
| Stryker Corp. | | 4,142 | 1,624,285 |
| | | | 9,275,182 |
| Health Care Providers & Services - 2.8% | | | |
| Cigna Group | | 2,675 | 903,615 |
| CVS Health Corp. | | 6,498 | 388,905 |
| LifeStance Health Group, Inc. (b) | | 49,654 | 373,398 |
| McKesson Corp. | | 2,184 | 1,372,644 |
| Molina Healthcare, Inc. (b) | | 1,727 | 514,473 |
| UnitedHealth Group, Inc. | | 7,849 | 4,789,460 |
| | | | 8,342,495 |
| Health Care Technology - 0.3% | | | |
| Phreesia, Inc. (b) | | 11,042 | 232,213 |
| Veeva Systems, Inc. Class A (b) | | 2,420 | 551,397 |
| | | | 783,610 |
| Life Sciences Tools & Services - 1.2% | | | |
| Bruker Corp. | | 5,960 | 345,382 |
| Danaher Corp. | | 9,112 | 2,184,055 |
| Thermo Fisher Scientific, Inc. | | 1,945 | 1,030,130 |
| | | | 3,559,567 |
| Pharmaceuticals - 1.6% | | | |
| Eli Lilly & Co. | | 3,172 | 2,522,850 |
| Merck & Co., Inc. | | 12,055 | 1,225,270 |
| Royalty Pharma PLC Class A | | 7,447 | 198,537 |
| Septerna, Inc. | | 7,672 | 194,025 |
| UCB SA | | 3,654 | 715,704 |
| | | | 4,856,386 |
TOTAL HEALTH CARE | | | 33,480,781 |
| INDUSTRIALS - 8.6% | | | |
| Aerospace & Defense - 2.5% | | | |
| GE Aerospace | | 13,662 | 2,488,670 |
| Howmet Aerospace, Inc. | | 13,265 | 1,570,311 |
| Lockheed Martin Corp. | | 3,188 | 1,687,759 |
| Northrop Grumman Corp. | | 1,805 | 883,818 |
| RTX Corp. | | 6,621 | 806,636 |
| | | | 7,437,194 |
| Air Freight & Logistics - 0.2% | | | |
| FedEx Corp. | | 2,026 | 613,209 |
| Building Products - 0.8% | | | |
| Fortune Brands Innovations, Inc. | | 1,584 | 124,027 |
| Trane Technologies PLC | | 5,632 | 2,344,151 |
| | | | 2,468,178 |
| Construction & Engineering - 0.3% | | | |
| Quanta Services, Inc. | | 2,291 | 789,295 |
| Electrical Equipment - 1.5% | | | |
| AMETEK, Inc. | | 8,778 | 1,706,268 |
| Eaton Corp. PLC | | 3,832 | 1,438,609 |
| GE Vernova LLC | | 3,684 | 1,230,898 |
| | | | 4,375,775 |
| Ground Transportation - 0.9% | | | |
| CSX Corp. | | 18,377 | 671,679 |
| Old Dominion Freight Lines, Inc. | | 4,500 | 1,013,130 |
| Uber Technologies, Inc. (b) | | 6,836 | 491,919 |
| Union Pacific Corp. | | 2,797 | 684,314 |
| | | | 2,861,042 |
| Machinery - 2.2% | | | |
| Caterpillar, Inc. | | 2,918 | 1,185,029 |
| Deere & Co. | | 1,003 | 467,298 |
| Fortive Corp. | | 11,167 | 885,878 |
| Ingersoll Rand, Inc. | | 15,897 | 1,655,990 |
| Parker Hannifin Corp. | | 3,277 | 2,303,403 |
| | | | 6,497,598 |
| Passenger Airlines - 0.0% | | | |
| Delta Air Lines, Inc. | | 1,396 | 89,093 |
| Professional Services - 0.2% | | | |
| Dun & Bradstreet Holdings, Inc. | | 41,948 | 532,740 |
TOTAL INDUSTRIALS | | | 25,664,124 |
| INFORMATION TECHNOLOGY - 31.5% | | | |
| Electronic Equipment, Instruments & Components - 0.2% | | | |
| Hon Hai Precision Industry Co. Ltd. (Foxconn) GDR (Reg. S) | | 55,736 | 673,291 |
| IT Services - 0.5% | | | |
| Capgemini SA | | 3,832 | 615,995 |
| Twilio, Inc. Class A (b) | | 7,376 | 771,087 |
| | | | 1,387,082 |
| Semiconductors & Semiconductor Equipment - 11.6% | | | |
| Advanced Micro Devices, Inc. (b) | | 4,426 | 607,137 |
| ASML Holding NV (Netherlands) | | 1,977 | 1,350,902 |
| Astera Labs, Inc. | | 4,866 | 502,415 |
| Broadcom, Inc. | | 5,484 | 888,847 |
| Lattice Semiconductor Corp. (b) | | 6,159 | 349,523 |
| Marvell Technology, Inc. | | 12,889 | 1,194,681 |
| Micron Technology, Inc. | | 24,509 | 2,400,657 |
| NVIDIA Corp. | | 159,071 | 21,991,566 |
| NXP Semiconductors NV | | 4,382 | 1,005,099 |
| ON Semiconductor Corp. (b) | | 9,158 | 651,317 |
| Renesas Electronics Corp. | | 44,953 | 589,608 |
| SolarEdge Technologies, Inc. (b) | | 10,663 | 168,475 |
| Taiwan Semiconductor Manufacturing Co. Ltd. sponsored ADR | | 16,433 | 3,034,518 |
| | | | 34,734,745 |
| Software - 13.5% | | | |
| Adobe, Inc. (b) | | 5,952 | 3,070,815 |
| Autodesk, Inc. (b) | | 5,187 | 1,514,085 |
| Elastic NV (b) | | 6,828 | 747,393 |
| HubSpot, Inc. (b) | | 2,197 | 1,584,147 |
| Intuit, Inc. | | 1,893 | 1,214,795 |
| Microsoft Corp. | | 59,226 | 25,079,836 |
| Salesforce, Inc. | | 10,781 | 3,557,622 |
| Synopsys, Inc. (b) | | 3,545 | 1,979,847 |
| Tenable Holdings, Inc. (b) | | 13,217 | 554,850 |
| Workday, Inc. Class A (b) | | 3,385 | 846,216 |
| | | | 40,149,606 |
| Technology Hardware, Storage & Peripherals - 5.7% | | | |
| Apple, Inc. | | 67,184 | 15,944,779 |
| Dell Technologies, Inc. Class C | | 8,128 | 1,037,052 |
| | | | 16,981,831 |
TOTAL INFORMATION TECHNOLOGY | | | 93,926,555 |
| MATERIALS - 3.0% | | | |
| Chemicals - 2.0% | | | |
| Air Products & Chemicals, Inc. | | 2,518 | 841,843 |
| Axalta Coating Systems Ltd. (b) | | 8,267 | 334,483 |
| Balchem Corp. | | 1,619 | 292,262 |
| Corteva, Inc. | | 14,067 | 875,530 |
| Dow, Inc. | | 12,960 | 572,962 |
| Ecolab, Inc. | | 3,055 | 759,992 |
| Element Solutions, Inc. | | 12,197 | 349,810 |
| Linde PLC | | 3,696 | 1,703,819 |
| Sherwin-Williams Co. | | 747 | 296,858 |
| | | | 6,027,559 |
| Containers & Packaging - 0.3% | | | |
| Aptargroup, Inc. | | 1,768 | 305,793 |
| International Paper Co. | | 6,289 | 369,982 |
| | | | 675,775 |
| Metals & Mining - 0.7% | | | |
| ATI, Inc. (b) | | 5,481 | 329,792 |
| First Quantum Minerals Ltd. (b) | | 36,362 | 497,622 |
| Nucor Corp. | | 4,395 | 679,863 |
| Wheaton Precious Metals Corp. | | 10,160 | 633,273 |
| | | | 2,140,550 |
TOTAL MATERIALS | | | 8,843,884 |
| REAL ESTATE - 2.1% | | | |
| Equity Real Estate Investment Trusts (REITs) - 1.9% | | | |
| American Tower Corp. | | 3,960 | 827,640 |
| COPT Defense Properties (SBI) | | 1,438 | 47,382 |
| Crown Castle, Inc. | | 2,758 | 293,038 |
| CubeSmart | | 6,103 | 302,465 |
| Digital Realty Trust, Inc. | | 2,170 | 424,647 |
| Equinix, Inc. | | 675 | 662,499 |
| Essex Property Trust, Inc. | | 406 | 126,047 |
| Mid-America Apartment Communities, Inc. | | 842 | 138,223 |
| NNN (REIT), Inc. | | 710 | 31,226 |
| Omega Healthcare Investors, Inc. | | 7,385 | 299,905 |
| Prologis, Inc. | | 4,371 | 510,445 |
| Public Storage Operating Co. | | 744 | 258,949 |
| Simon Property Group, Inc. | | 1,691 | 310,468 |
| Sun Communities, Inc. | | 1,322 | 167,008 |
| The Macerich Co. | | 6,787 | 143,952 |
| Ventas, Inc. | | 5,022 | 321,760 |
| Welltower, Inc. | | 6,249 | 863,487 |
| | | | 5,729,141 |
| Real Estate Management & Development - 0.2% | | | |
| CBRE Group, Inc. (b) | | 4,232 | 592,438 |
TOTAL REAL ESTATE | | | 6,321,579 |
| UTILITIES - 2.3% | | | |
| Electric Utilities - 1.3% | | | |
| Duke Energy Corp. | | 1,456 | 170,425 |
| Edison International | | 6,045 | 530,449 |
| Eversource Energy | | 4,403 | 283,949 |
| FirstEnergy Corp. | | 3,612 | 153,691 |
| NextEra Energy, Inc. | | 12,183 | 958,437 |
| NRG Energy, Inc. | | 5,511 | 559,973 |
| PG&E Corp. | | 51,878 | 1,122,121 |
| | | | 3,779,045 |
| Independent Power and Renewable Electricity Producers - 0.4% | | | |
| The AES Corp. | | 21,607 | 281,755 |
| Vistra Corp. | | 4,838 | 773,306 |
| | | | 1,055,061 |
| Multi-Utilities - 0.6% | | | |
| Ameren Corp. | | 1,564 | 147,626 |
| NiSource, Inc. | | 8,068 | 307,310 |
| Public Service Enterprise Group, Inc. | | 5,992 | 565,046 |
| Sempra | | 9,712 | 909,723 |
| | | | 1,929,705 |
TOTAL UTILITIES | | | 6,763,811 |
| TOTAL COMMON STOCKS (Cost $249,912,674) | | | 292,952,124 |
| | | | |
| Money Market Funds - 1.3% |
| | | Shares | Value ($) |
Fidelity Cash Central Fund 4.64% (c) (Cost $3,929,575) | | 3,928,789 | 3,929,575 |
| | | | |
| Equity Funds - 0.7% |
| | | Shares | Value ($) |
| Domestic Equity Funds - 0.7% | | | |
iShares ESG Aware MSCI U.S.A. ETF (Cost $2,070,502) | | 15,680 | 2,081,050 |
| | | | |
| TOTAL INVESTMENT IN SECURITIES - 100.2% (Cost $255,912,751) | 298,962,749 |
NET OTHER ASSETS (LIABILITIES) - (0.2)% | (659,526) |
| NET ASSETS - 100.0% | 298,303,223 |
| | |
Security Type Abbreviations
Legend
| (a) | Security exempt from registration under Rule 144A of the Securities Act of 1933. These securities may be resold in transactions exempt from registration, normally to qualified institutional buyers. At the end of the period, the value of these securities amounted to $389,031 or 0.1% of net assets. |
| (c) | Affiliated fund that is generally available only to investment companies and other accounts managed by Fidelity Investments. The rate quoted is the annualized seven-day yield of the fund at period end. A complete unaudited listing of the fund's holdings as of its most recent quarter end is available upon request. In addition, each Fidelity Central Fund's financial statements are available on the SEC's website or upon request. |
Affiliated Central Funds
Fiscal year to date information regarding the Fund's investments in Fidelity Central Funds, including the ownership percentage, is presented below.
| Affiliate | Value, beginning of period ($) | Purchases ($) | Sales Proceeds ($) | Dividend Income ($) | Realized Gain (loss) ($) | Change in Unrealized appreciation (depreciation) ($) | Value, end of period ($) | % ownership, end of period |
| Fidelity Cash Central Fund 4.64% | 1,762,155 | 17,308,574 | 15,141,154 | 50,956 | - | - | 3,929,575 | 0.0% |
| Total | 1,762,155 | 17,308,574 | 15,141,154 | 50,956 | - | - | 3,929,575 | |
| | | | | | | | | |
Amounts in the dividend income column in the above table include any capital gain distributions from underlying funds, which are presented in the corresponding line item in the Statement of Operations, if applicable.
Amounts included in the purchases and sales proceeds columns may include in-kind transactions, if applicable.
Investment Valuation
The following is a summary of the inputs used, as of November 30, 2024, involving the Fund's assets and liabilities carried at fair value. The inputs or methodology used for valuing securities may not be an indication of the risk associated with investing in those securities. For more information on valuation inputs, and their aggregation into the levels used below, please refer to the Investment Valuation section in the accompanying Notes to Financial Statements.
| Valuation Inputs at Reporting Date: |
| Description | Total ($) | Level 1 ($) | Level 2 ($) | Level 3 ($) |
Investments in Securities: | | | | |
|
| Equities: | | | | |
Communication Services | 21,487,931 | 21,487,931 | - | - |
Consumer Discretionary | 32,469,072 | 32,469,072 | - | - |
Consumer Staples | 17,712,029 | 17,712,029 | - | - |
Energy | 4,270,225 | 4,270,225 | - | - |
Financials | 42,012,133 | 41,403,311 | 608,822 | - |
Health Care | 33,480,781 | 33,480,781 | - | - |
Industrials | 25,664,124 | 25,664,124 | - | - |
Information Technology | 93,926,555 | 91,370,050 | 2,556,505 | - |
Materials | 8,843,884 | 8,843,884 | - | - |
Real Estate | 6,321,579 | 6,321,579 | - | - |
Utilities | 6,763,811 | 6,763,811 | - | - |
|
| Money Market Funds | 3,929,575 | 3,929,575 | - | - |
|
| Equity Funds | 2,081,050 | 2,081,050 | - | - |
| Total Investments in Securities: | 298,962,749 | 295,797,422 | 3,165,327 | - |
Financial Statements (Unaudited)
| Statement of Assets and Liabilities |
| As of November 30, 2024 (Unaudited) |
| Assets | | | | |
| Investment in securities, at value - See accompanying schedule: | | | | |
Unaffiliated issuers (cost $251,983,176) | $ | 295,033,174 | | |
Fidelity Central Funds (cost $3,929,575) | | 3,929,575 | | |
| | | | | |
| | | | | |
| Total Investment in Securities (cost $255,912,751) | | | $ | 298,962,749 |
| Foreign currency held at value (cost $88) | | | | 88 |
| Receivable for investments sold | | | | 792,764 |
| Receivable for fund shares sold | | | | 849,783 |
| Dividends receivable | | | | 187,340 |
| Distributions receivable from Fidelity Central Funds | | | | 10,889 |
| Prepaid expenses | | | | 152 |
| Other receivables | | | | 2,247 |
Total assets | | | | 300,806,012 |
| Liabilities | | | | |
| Payable for investments purchased | $ | 2,271,263 | | |
| Payable for fund shares redeemed | | 111,247 | | |
| Accrued management fee | | 94,385 | | |
| Other payables and accrued expenses | | 25,894 | | |
| Total liabilities | | | | 2,502,789 |
| Net Assets | | | $ | 298,303,223 |
| Net Assets consist of: | | | | |
| Paid in capital | | | $ | 254,301,498 |
| Total accumulated earnings (loss) | | | | 44,001,725 |
| Net Assets | | | $ | 298,303,223 |
Net Asset Value, offering price and redemption price per share ($298,303,223 ÷ 20,840,105 shares) | | | $ | 14.31 |
| Statement of Operations |
Six months ended November 30, 2024 (Unaudited) |
| Investment Income | | | | |
| Dividends | | | $ | 1,074,982 |
| Income from Fidelity Central Funds | | | | 50,956 |
| Total income | | | | 1,125,938 |
| Expenses | | | | |
| Management fee | $ | 405,066 | | |
| Custodian fees and expenses | | 4,775 | | |
| Independent trustees' fees and expenses | | 353 | | |
| Registration fees | | 8,335 | | |
| Audit fees | | 21,365 | | |
| Legal | | 3,979 | | |
| Miscellaneous | | 245 | | |
| Total expenses before reductions | | 444,118 | | |
| Expense reductions | | (1,311) | | |
| Total expenses after reductions | | | | 442,807 |
| Net Investment income (loss) | | | | 683,131 |
| Realized and Unrealized Gain (Loss) | | | | |
| Net realized gain (loss) on: | | | | |
| Investment Securities: | | | | |
| Unaffiliated issuers | | 521,964 | | |
| Foreign currency transactions | | (530) | | |
| Total net realized gain (loss) | | | | 521,434 |
| Change in net unrealized appreciation (depreciation) on: | | | | |
| Investment Securities: | | | | |
| Unaffiliated issuers | | 28,115,926 | | |
| Assets and liabilities in foreign currencies | | (735) | | |
| Total change in net unrealized appreciation (depreciation) | | | | 28,115,191 |
| Net gain (loss) | | | | 28,636,625 |
| Net increase (decrease) in net assets resulting from operations | | | $ | 29,319,756 |
| Statement of Changes in Net Assets |
| |
| | Six months ended November 30, 2024 (Unaudited) | | Year ended May 31, 2024 |
| Increase (Decrease) in Net Assets | | | | |
| Operations | | | | |
| Net investment income (loss) | $ | 683,131 | $ | 408,731 |
| Net realized gain (loss) | | 521,434 | | 595,088 |
| Change in net unrealized appreciation (depreciation) | | 28,115,191 | | 14,029,156 |
| Net increase (decrease) in net assets resulting from operations | | 29,319,756 | | 15,032,975 |
| Distributions to shareholders | | (954,777) | | (178,475) |
| | | | | |
| Share transactions | | | | |
| Proceeds from sales of shares | | 170,724,785 | | 112,118,070 |
| Reinvestment of distributions | | 837,041 | | 161,519 |
| Cost of shares redeemed | | (33,009,302) | | (8,403,793) |
| | | | | |
Net increase (decrease) in net assets resulting from share transactions | | 138,552,524 | | 103,875,796 |
| Total increase (decrease) in net assets | | 166,917,503 | | 118,730,296 |
| | | | | |
| Net Assets | | | | |
| Beginning of period | | 131,385,720 | | 12,655,424 |
| End of period | $ | 298,303,223 | $ | 131,385,720 |
| | | | | |
| Other Information | | | | |
| Shares | | | | |
| Sold | | 12,882,551 | | 9,766,272 |
| Issued in reinvestment of distributions | | 62,326 | | 14,674 |
| Redeemed | | (2,452,646) | | (725,871) |
| Net increase (decrease) | | 10,492,231 | | 9,055,075 |
| | | | | |
Financial Highlights
Fidelity® SAI Sustainable Sector Fund |
| |
| | Six months ended (Unaudited) November 30, 2024 | | Years ended May 31, 2024 | | 2023 | | 2022 A |
Selected Per-Share Data | | | | | | | | |
| Net asset value, beginning of period | $ | 12.70 | $ | 9.79 | $ | 9.35 | $ | 10.00 |
| Income from Investment Operations | | | | | | | | |
Net investment income (loss) B,C | | .04 | | .09 | | .09 | | .01 |
| Net realized and unrealized gain (loss) | | 1.65 | | 2.88 | | .39 | | (.66) |
| Total from investment operations | | 1.69 | | 2.97 | | .48 | | (.65) |
| Distributions from net investment income | | (.03) | | (.06) | | (.04) | | - |
| Distributions from net realized gain | | (.06) | | - | | - | | - |
| Total distributions | | (.08) D | | (.06) | | (.04) | | - |
| Net asset value, end of period | $ | 14.31 | $ | 12.70 | $ | 9.79 | $ | 9.35 |
Total Return E,F | | | | 30.43% | | 5.16% | | (6.50)% |
Ratios to Average Net Assets C,G,H | | | | | | | | |
| Expenses before reductions | | .44% I | | .58% | | 1.93% | | 3.86% I,J |
| Expenses net of fee waivers, if any | | | | .49% | | .49% | | .50% I,J |
| Expenses net of all reductions | | .43% I | | .49% | | .49% | | .50% I,J |
| Net investment income (loss) | | .67% I | | .75% | | .98% | | .81% I,J |
| Supplemental Data | | | | | | | | |
| Net assets, end of period (000 omitted) | $ | 298,303 | $ | 131,386 | $ | 12,655 | $ | 1,875 |
Portfolio turnover rate K | | | | 162% | | 112% | | 3% L |
AFor the period April 14, 2022 (commencement of operations) through May 31, 2022.
BCalculated based on average shares outstanding during the period.
CNet investment income (loss) is affected by the timing of the declaration of dividends by any underlying mutual funds or exchange-traded funds (ETFs). Net investment income (loss) of any mutual funds or ETFs is not included in the Fund's net investment income (loss) ratio.
DTotal distributions per share do not sum due to rounding.
ETotal returns for periods of less than one year are not annualized.
FTotal returns would have been lower if certain expenses had not been reduced during the applicable periods shown.
GFees and expenses of any underlying mutual funds or exchange-traded funds (ETFs) are not included in the Fund's expense ratio. The Fund indirectly bears its proportionate share of these expenses. For additional expense information related to investments in Fidelity Central Funds, please refer to the "Investments in Fidelity Central Funds" note found in the Notes to Financial Statements section of the most recent Annual or Semi-Annual report.
HExpense ratios reflect operating expenses of the class. Expenses before reductions do not reflect amounts reimbursed, waived, or reduced through arrangements with the investment adviser, brokerage services, or other offset arrangements, if applicable, and do not represent the amount paid by the class during periods when reimbursements, waivers or reductions occur.
IAnnualized.
JAudit fees are not annualized.
KAmount does not include the portfolio activity of any underlying mutual funds or exchange-traded funds (ETFs), derivatives or securities that mature within one year from acquisition.
LAmount not annualized.
Notes to Financial Statements
(Unaudited)For the period ended November 30, 2024
1. Organization.
Fidelity SAI Sustainable Sector Fund (the Fund) is a fund of Fidelity Summer Street Trust (the Trust) and is authorized to issue an unlimited number of shares. Shares are offered exclusively to certain clients of Fidelity Management & Research Company LLC (FMR) or its affiliates. The Trust is registered under the Investment Company Act of 1940, as amended (the 1940 Act), as an open-end management investment company organized as a Massachusetts business trust.
2. Investments in Fidelity Central Funds.
Funds may invest in Fidelity Central Funds, which are open-end investment companies generally available only to other investment companies and accounts managed by the investment adviser and its affiliates. The Schedule of Investments lists any Fidelity Central Funds held as an investment as of period end, but does not include the underlying holdings of each Fidelity Central Fund. An investing fund indirectly bears its proportionate share of the expenses of the underlying Fidelity Central Funds.
Based on its investment objective, each Fidelity Central Fund may invest or participate in various investment vehicles or strategies that are similar to those of the investing fund. These strategies are consistent with the investment objectives of the investing fund and may involve certain economic risks which may cause a decline in value of each of the Fidelity Central Funds and thus a decline in the value of the investing fund.
| Fidelity Central Fund | Investment Manager | Investment Objective | Investment Practices | Expense RatioA |
| Fidelity Money Market Central Funds | Fidelity Management & Research Company LLC (FMR) | Each fund seeks to obtain a high level of current income consistent with the preservation of capital and liquidity. | Short-term Investments | Less than .005% |
A Expenses expressed as a percentage of average net assets and are as of each underlying Central Fund's most recent annual or semi-annual shareholder report.
A complete unaudited list of holdings for each Fidelity Central Fund is available upon request or at the Securities and Exchange Commission website at www.sec.gov. In addition, the financial statements of the Fidelity Central Funds which contain the significant accounting policies (including investment valuation policies) of those funds, and are not covered by the Report of Independent Registered Public Accounting Firm, are available on the Securities and Exchange Commission website or upon request.
3. Significant Accounting Policies.
The Fund is an investment company and applies the accounting and reporting guidance of the Financial Accounting Standards Board (FASB) Accounting Standards Codification Topic 946 Financial Services - Investment Companies. The financial statements have been prepared in conformity with accounting principles generally accepted in the United States of America (GAAP), which require management to make certain estimates and assumptions at the date of the financial statements. Actual results could differ from those estimates. Subsequent events, if any, through the date that the financial statements were issued have been evaluated in the preparation of the financial statements. The Fund's Schedule of Investments lists any underlying mutual funds or exchange-traded funds (ETFs) but does not include the underlying holdings of these funds. The following summarizes the significant accounting policies of the Fund:
Investment Valuation. Investments are valued as of 4:00 p.m. Eastern time on the last calendar day of the period. The Board of Trustees (the Board) has designated the Fund's investment adviser as the valuation designee responsible for the fair valuation function and performing fair value determinations as needed. The investment adviser has established a Fair Value Committee (the Committee) to carry out the day-to-day fair valuation responsibilities and has adopted policies and procedures to govern the fair valuation process and the activities of the Committee. In accordance with these fair valuation policies and procedures, which have been approved by the Board, the Fund attempts to obtain prices from one or more third party pricing services or brokers to value its investments. When current market prices, quotations or currency exchange rates are not readily available or reliable, investments will be fair valued in good faith by the Committee, in accordance with the policies and procedures. Factors used in determining fair value vary by investment type and may include market or investment specific events, transaction data, estimated cash flows, and market observations of comparable investments. The frequency that the fair valuation procedures are used cannot be predicted and they may be utilized to a significant extent. The Committee manages the Fund's fair valuation practices and maintains the fair valuation policies and procedures. The Fund's investment adviser reports to the Board information regarding the fair valuation process and related material matters.
The Fund categorizes the inputs to valuation techniques used to value its investments into a disclosure hierarchy consisting of three levels as shown below:
Level 1 - unadjusted quoted prices in active markets for identical investments
Level 2 - other significant observable inputs (including quoted prices for similar investments, interest rates, prepayment speeds, etc.)
Level 3 - unobservable inputs (including the Fund's own assumptions based on the best information available)
Valuation techniques used to value the Fund's investments by major category are as follows:
Equity securities, including restricted securities, for which market quotations are readily available, are valued at the last reported sale price or official closing price as reported by a third party pricing service on the primary market or exchange on which they are traded and are categorized as Level 1 in the hierarchy. In the event there were no sales during the day or closing prices are not available, securities are valued at the last quoted bid price or may be valued using the last available price and are generally categorized as Level 2 in the hierarchy. For foreign equity securities, when market or security specific events arise, comparisons to the valuation of American Depositary Receipts (ADRs), futures contracts, Exchange-Traded Funds (ETFs) and certain indexes as well as quoted prices for similar securities may be used and would be categorized as Level 2 in the hierarchy. For equity securities, including restricted securities, where observable inputs are limited, assumptions about market activity and risk are used and these securities may be categorized as Level 3 in the hierarchy.
Exchange-Traded Funds (ETFs) are valued at their last sale price or official closing price as reported by a third party pricing service on the primary market or exchange on which they are traded and are categorized as Level 1 in the hierarchy. In the event there were no sales during the day but the exchange reports a closing bid level, ETFs are valued at the closing bid and would be categorized as Level 1 in the hierarchy. In the event there was no closing bid, ETFs may be valued by another method that the Board believes reflects fair value in accordance with the Board's fair value pricing policies and may be categorized as Level 2 in the hierarchy.
Investments in open-end mutual funds, including the Fidelity Central Funds, are valued at their closing net asset value (NAV) each business day and are categorized as Level 1 in the hierarchy.
Changes in valuation techniques may result in transfers in or out of an assigned level within the disclosure hierarchy. The aggregate value of investments by input level as of November 30, 2024 is included at the end of the Fund's Schedule of Investments.
Foreign Currency. Certain Funds may use foreign currency contracts to facilitate transactions in foreign-denominated securities. Gains and losses from these transactions may arise from changes in the value of the foreign currency or if the counterparties do not perform under the contracts' terms.
Foreign-denominated assets, including investment securities, and liabilities are translated into U.S. dollars at the exchange rates at period end. Purchases and sales of investment securities, income and dividends received, and expenses denominated in foreign currencies are translated into U.S. dollars at the exchange rate in effect on the transaction date.
The effects of exchange rate fluctuations on investments are included with the net realized and unrealized gain (loss) on investment securities. Other foreign currency transactions resulting in realized and unrealized gain (loss) are disclosed separately.
Investment Transactions and Income. For financial reporting purposes, the Fund's investment holdings and NAV include trades executed through the end of the last business day of the period. The NAV per share for processing shareholder transactions is calculated as of the close of business of the New York Stock Exchange (NYSE), normally 4:00 p.m. Eastern time and includes trades executed through the end of the prior business day. Gains and losses on securities sold are determined on the basis of identified cost. Commissions paid to certain brokers with whom the investment adviser, or its affiliates, places trades on behalf of a fund include an amount in addition to trade execution, which may be rebated back to a fund. Any such rebates are included in net realized gain (loss) on investments in the Statement of Operations. Dividend income is recorded on the ex-dividend date, except for certain dividends from foreign securities where the ex-dividend date may have passed, which are recorded as soon as the Fund is informed of the ex-dividend date. Non-cash dividends included in dividend income, if any, are recorded at the fair market value of the securities received. Income and capital gain distributions from Fidelity Central Funds, if any, are recorded on the ex-dividend date. Certain distributions received by the Fund represent a return of capital or capital gain. The Fund determines the components of these distributions subsequent to the ex-dividend date, based upon receipt of tax filings or other correspondence relating to the underlying investment. These distributions are recorded as a reduction of cost of investments and/or as a realized gain. Investment income is recorded net of foreign taxes withheld where recovery of such taxes is uncertain. Funds may file withholding tax reclaims in certain jurisdictions to recover a portion of amounts previously withheld. Any withholding tax reclaims income is included in the Statement of Operations in dividends. Any receivables for withholding tax reclaims are included in the Statement of Assets and Liabilities in dividends receivable.
Expenses. Expenses directly attributable to a fund are charged to that fund. Expenses attributable to more than one fund are allocated among the respective funds on the basis of relative net assets or other appropriate methods. Expenses included in the accompanying financial statements reflect the expenses of that fund and do not include any expenses associated with any underlying mutual funds or exchange-traded funds. Although not included in a fund's expenses, a fund indirectly bears its proportionate share of these expenses through the net asset value of each underlying mutual fund or exchange-traded fund. Expense estimates are accrued in the period to which they relate and adjustments are made when actual amounts are known.
Income Tax Information and Distributions to Shareholders. Each year, the Fund intends to qualify as a regulated investment company under Subchapter M of the Internal Revenue Code, including distributing substantially all of its taxable income and realized gains. As a result, no provision for U.S. Federal income taxes is required. The Fund files a U.S. federal tax return, in addition to state and local tax returns as required. The Fund's federal income tax returns are subject to examination by the Internal Revenue Service (IRS) for a period of three fiscal years after they are filed. State and local tax returns may be subject to examination for an additional fiscal year depending on the jurisdiction. Foreign taxes are provided for based on the Fund's understanding of the tax rules and rates that exist in the foreign markets in which it invests.
Distributions are declared and recorded on the ex-dividend date. Income and capital gain distributions are determined in accordance with income tax regulations, which may differ from GAAP.
Capital accounts within the financial statements are adjusted for permanent book-tax differences. These adjustments have no impact on net assets or the results of operations. Capital accounts are not adjusted for temporary book-tax differences which will reverse in a subsequent period.
Book-tax differences are primarily due to foreign currency transactions, passive foreign investment companies (PFIC), capital loss carryforwards and losses deferred due to wash sales.
As of period end, the cost and unrealized appreciation (depreciation) in securities, and derivatives if applicable, for federal income tax purposes were as follows:
| Gross unrealized appreciation | $47,361,212 |
| Gross unrealized depreciation | (4,866,024) |
| Net unrealized appreciation (depreciation) | $42,495,188 |
| Tax cost | $256,467,561 |
Restricted Securities (including Private Placements). Funds may invest in securities that are subject to legal or contractual restrictions on resale. These securities generally may be resold in transactions exempt from registration or to the public if the securities are registered. Disposal of these securities may involve time-consuming negotiations and expense, and prompt sale at an acceptable price may be difficult. Information regarding restricted securities held at period end is included at the end of the Schedule of Investments, if applicable.
New Accounting Pronouncement. In November 2023, the FASB issued Accounting Standards Update (ASU) 2023-07 Segment Reporting (Topic 280): Improvements to Reportable Segment Disclosures. Effective for fiscal years beginning after December 15, 2023 and interim periods within fiscal years beginning after December 15, 2024, the amendments enhance required disclosures of segment information for public entities on an annual and interim basis. The ASU allows for early adoption with updates applied retrospectively. Management is currently evaluating the impact of the ASU but does not expect this guidance to materially impact the financial statements.
4. Purchases and Sales of Investments.
Purchases and sales of securities, other than short-term securities and in-kind transactions, as applicable, are noted in the table below.
| | Purchases ($) | Sales ($) |
| Fidelity SAI Sustainable Sector Fund | 247,178,550 | 110,725,243 |
5. Fees and Other Transactions with Affiliates.
Management Fee. Fidelity Management & Research Company LLC (the investment adviser) and its affiliates provide the Fund with investment management related services for which the Fund pays a monthly management fee that is based on an annual rate of .398% of the Fund's average net assets.
Brokerage Commissions. A portion of portfolio transactions were placed with brokerage firms which are affiliates of the investment adviser. Brokerage commissions are included in net realized gain (loss) and change in net unrealized appreciation (depreciation) in the Statement of Operations. The commissions paid to these affiliated firms were as follows:
| | Amount ($) |
| Fidelity SAI Sustainable Sector Fund | 1,102 |
Interfund Trades. Funds may purchase from or sell securities to other Fidelity Funds under procedures adopted by the Board. The procedures have been designed to ensure these interfund trades are executed in accordance with Rule 17a-7 of the 1940 Act. Any interfund trades are included within the respective purchases and sales amounts shown in the Purchases and Sales of Investments note. Interfund trades during the period are noted in the table below.
| | Purchases ($) | Sales ($) | Realized Gain (Loss)($) |
| Fidelity SAI Sustainable Sector Fund | 2,958,362 | 3,733,534 | 85,034 |
6. Committed Line of Credit.
Certain Funds participate with other funds managed by the investment adviser or an affiliate in a $4.25 billion credit facility (the "line of credit") to be utilized for temporary or emergency purposes to fund shareholder redemptions or for other short-term liquidity purposes. The participating funds have agreed to pay commitment fees on their pro-rata portion of the line of credit, which are reflected in Miscellaneous expenses on the Statement of Operations, and are listed below. During the period, there were no borrowings on this line of credit.
| | | Amount ($) |
| Fidelity SAI Sustainable Sector Fund | | 100 |
7. Expense Reductions.
Through arrangements with the Fund's custodian, credits realized as a result of certain uninvested cash balances were used to reduce the Fund's expenses by $1,311.
8. Other.
A fund's organizational documents provide former and current trustees and officers with a limited indemnification against liabilities arising in connection with the performance of their duties to the fund. In the normal course of business, a fund may also enter into contracts that provide general indemnifications. A fund's maximum exposure under these arrangements is unknown as this would be dependent on future claims that may be made against a fund. The risk of material loss from such claims is considered remote.
9. Risk and Uncertainties.
Many factors affect a fund's performance. Developments that disrupt global economies and financial markets, such as pandemics, epidemics, outbreaks of infectious diseases, war, terrorism, and environmental disasters, may significantly affect a fund's investment performance. The effects of these developments to a fund will be impacted by the types of securities in which a fund invests, the financial condition, industry, economic sector, and geographic location of an issuer, and a fund's level of investment in the securities of that issuer. Significant concentrations in security types, issuers, industries, sectors, and geographic locations may magnify the factors that affect a fund's performance.
Item 8: Changes in and Disagreements with Accountants for Open-End Management Investment Companies
(Unaudited)
Note: This is not applicable for any fund included in this document.
Item 9: Proxy Disclosures for Open-End Management Investment Companies
(Unaudited)
| A special meeting of shareholders was held on July 16, 2024. The results of votes taken among shareholders on the proposal before them are reported below. Each vote reported represents one dollar of net asset value held on the record date for the meeting. |
| Proposal 1 |
| To elect a Board of Trustees. |
| | # of Votes | % of Votes |
| Bettina Doulton |
| Affirmative | 14,516,835,136.19 | 94.56 |
| Withheld | 834,887,998.33 | 5.44 |
| TOTAL | 15,351,723,134.52 | 100.00 |
| Robert A. Lawrence |
| Affirmative | 14,430,495,798.10 | 94.00 |
| Withheld | 921,227,336.42 | 6.00 |
| TOTAL | 15,351,723,134.52 | 100.00 |
| Vijay C. Advani |
| Affirmative | 14,465,231,640.25 | 94.23 |
| Withheld | 886,491,494.27 | 5.77 |
| TOTAL | 15,351,723,134.52 | 100.00 |
| Thomas P. Bostick |
| Affirmative | 14,471,831,170.84 | 94.27 |
| Withheld | 879,891,963.68 | 5.73 |
| TOTAL | 15,351,723,134.52 | 100.00 |
| Donald F. Donahue |
| Affirmative | 14,432,670,599.88 | 94.01 |
| Withheld | 919,052,534.64 | 5.99 |
| TOTAL | 15,351,723,134.52 | 100.00 |
| Vicki L. Fuller |
| Affirmative | 14,531,407,981.65 | 94.66 |
| Withheld | 820,315,152.87 | 5.34 |
| TOTAL | 15,351,723,134.52 | 100.00 |
| Patricia L. Kampling |
| Affirmative | 14,549,142,839.16 | 94.77 |
| Withheld | 802,580,295.36 | 5.23 |
| TOTAL | 15,351,723,134.52 | 100.00 |
| Thomas A. Kennedy |
| Affirmative | 14,469,818,769.40 | 94.26 |
| Withheld | 881,904,365.12 | 5.74 |
| TOTAL | 15,351,723,134.52 | 100.00 |
| Oscar Munoz |
| Affirmative | 14,434,061,467.08 | 94.02 |
| Withheld | 917,661,667.44 | 5.98 |
| TOTAL | 15,351,723,134.52 | 100.00 |
| Karen B. Peetz |
| Affirmative | 14,521,904,618.46 | 94.59 |
| Withheld | 829,818,516.06 | 5.41 |
| TOTAL | 15,351,723,134.52 | 100.00 |
| David M. Thomas |
| Affirmative | 14,417,745,861.73 | 93.92 |
| Withheld | 933,977,272.79 | 6.08 |
| TOTAL | 15,351,723,134.52 | 100.00 |
| Susan Tomasky |
| Affirmative | 14,467,973,468.18 | 94.24 |
| Withheld | 883,749,666.34 | 5.76 |
| TOTAL | 15,351,723,134.52 | 100.00 |
| Michael E. Wiley |
| Affirmative | 14,424,002,796.91 | 93.96 |
| Withheld | 927,720,337.61 | 6.04 |
| TOTAL | 15,351,723,134.52 | 100.00 |
| | | |
| Proposal 1 reflects trust-wide proposal and voting results. |
Item 10: Remuneration Paid to Directors, Officers, and others of Open-End Management Investment Companies
(Unaudited)
Note: This information is disclosed as part of the financial statements for each Fund as part of Item 7: Financial Statements and Financial Highlights for Open-End Management Investment companies.
Item 11: Statement Regarding Basis for Approval of Investment Advisory Contract
(Unaudited)
Note: This is not applicable for any fund included in this document.
1.9905646.102
SES-SANN-0125
Fidelity® SAI Sustainable U.S. Equity Fund
Semi-Annual Report
November 30, 2024
Offered exclusively to certain clients of the Adviser, or its affiliates, including Strategic Advisers LLC (Strategic Advisers) - not available for sale to the general public. Fidelity® SAI is a product name of Fidelity® funds dedicated to certain programs affiliated with Strategic Advisers.
Contents
To view a fund's proxy voting guidelines and proxy voting record for the 12-month period ended June 30, visit http://www.fidelity.com/proxyvotingresults or visit the Securities and Exchange Commission's (SEC) web site at http://www.sec.gov.
You may also call 1-800-544-3455 to request a free copy of the proxy voting guidelines.
Standard & Poor's, S&P and S&P 500 are registered service marks of The McGraw-Hill Companies, Inc. and have been licensed for use by Fidelity Distributors Corporation.
Other third-party marks appearing herein are the property of their respective owners.
All other marks appearing herein are registered or unregistered trademarks or service marks of FMR LLC or an affiliated company. © 2025 FMR LLC. All rights reserved.
This report and the financial statements contained herein are submitted for the general information of the shareholders of the Fund. This report is not authorized for distribution to prospective investors in the Fund unless preceded or accompanied by an effective prospectus.
A fund files its complete schedule of portfolio holdings with the SEC for the first and third quarters of each fiscal year on Form N-PORT. Forms N-PORT are available on the SEC's web site at http://www.sec.gov. A fund's Forms N-PORT may be reviewed and copied at the SEC's Public Reference Room in Washington, DC. Information regarding the operation of the SEC's Public Reference Room may be obtained by calling 1-800-SEC-0330.
For a complete list of a fund's portfolio holdings, view the most recent holdings listing, semiannual report, or annual report on Fidelity's web site at http://www.fidelity.com, http://www.institutional.fidelity.com, or http://www.401k.com, as applicable.
NOT FDIC INSURED •MAY LOSE VALUE •NO BANK GUARANTEE
Neither the Fund nor Fidelity Distributors Corporation is a bank.
Item 7: Financial Statements and Financial Highlights for Open-End Management Investment Companies (Semi-Annual Report)
Fidelity® SAI Sustainable U.S. Equity Fund
Schedule of Investments November 30, 2024 (Unaudited)
Showing Percentage of Net Assets
| Common Stocks - 97.7% |
| | | Shares | Value ($) |
| COMMUNICATION SERVICES - 7.6% | | | |
| Entertainment - 2.5% | | | |
| Netflix, Inc. (a) | | 3,848 | 3,412,445 |
| The Walt Disney Co. | | 32,779 | 3,850,549 |
| | | | 7,262,994 |
| Interactive Media & Services - 4.0% | | | |
| Alphabet, Inc. Class A | | 67,044 | 11,327,084 |
| Media - 1.1% | | | |
| Comcast Corp. Class A | | 69,282 | 2,992,290 |
TOTAL COMMUNICATION SERVICES | | | 21,582,368 |
| CONSUMER DISCRETIONARY - 10.7% | | | |
| Automobiles - 1.6% | | | |
| Tesla, Inc. (a) | | 12,961 | 4,473,619 |
| Broadline Retail - 3.5% | | | |
| Amazon.com, Inc. (a) | | 48,393 | 10,060,421 |
| Hotels, Restaurants & Leisure - 2.1% | | | |
| Hilton Worldwide Holdings, Inc. | | 14,919 | 3,781,071 |
| Starbucks Corp. | | 20,397 | 2,089,877 |
| | | | 5,870,948 |
| Household Durables - 1.5% | | | |
| PulteGroup, Inc. | | 10,946 | 1,480,665 |
| Taylor Morrison Home Corp. (a) | | 40,109 | 2,962,852 |
| | | | 4,443,517 |
| Specialty Retail - 2.0% | | | |
| Lowe's Companies, Inc. | | 20,648 | 5,625,135 |
| Textiles, Apparel & Luxury Goods - 0.0% | | | |
| Brunello Cucinelli SpA | | 1,396 | 138,302 |
TOTAL CONSUMER DISCRETIONARY | | | 30,611,942 |
| CONSUMER STAPLES - 4.7% | | | |
| Food Products - 1.0% | | | |
| Danone SA | | 41,681 | 2,848,040 |
| Household Products - 3.0% | | | |
| Procter & Gamble Co. | | 47,679 | 8,546,938 |
| Personal Care Products - 0.7% | | | |
| Estee Lauder Companies, Inc. Class A | | 28,044 | 2,022,533 |
TOTAL CONSUMER STAPLES | | | 13,417,511 |
| ENERGY - 4.5% | | | |
| Energy Equipment & Services - 2.1% | | | |
| Baker Hughes Co. Class A | | 133,365 | 5,861,392 |
| Oil, Gas & Consumable Fuels - 2.4% | | | |
| Cheniere Energy, Inc. | | 15,276 | 3,421,977 |
| Equinor ASA | | 143,867 | 3,486,977 |
| | | | 6,908,954 |
TOTAL ENERGY | | | 12,770,346 |
| FINANCIALS - 12.5% | | | |
| Banks - 1.6% | | | |
| Bank of America Corp. | | 44,410 | 2,109,919 |
| Citigroup, Inc. | | 34,940 | 2,476,198 |
| | | | 4,586,117 |
| Capital Markets - 5.2% | | | |
| BlackRock, Inc. | | 5,526 | 5,651,993 |
| Moody's Corp. | | 15,305 | 7,652,194 |
| Northern Trust Corp. | | 13,667 | 1,519,224 |
| | | | 14,823,411 |
| Consumer Finance - 2.5% | | | |
| American Express Co. | | 22,981 | 7,001,851 |
| Financial Services - 2.7% | | | |
| Essent Group Ltd. | | 22,152 | 1,279,943 |
| MasterCard, Inc. Class A | | 12,026 | 6,409,136 |
| | | | 7,689,079 |
| Insurance - 0.5% | | | |
| Hartford Financial Services Group, Inc. | | 12,306 | 1,517,453 |
TOTAL FINANCIALS | | | 35,617,911 |
| HEALTH CARE - 10.6% | | | |
| Biotechnology - 2.0% | | | |
| Exact Sciences Corp. (a) | | 20,561 | 1,276,427 |
| Gilead Sciences, Inc. | | 47,255 | 4,374,868 |
| | | | 5,651,295 |
| Health Care Providers & Services - 4.6% | | | |
| BrightSpring Health Services, Inc. (a) | | 234,144 | 4,518,979 |
| Centene Corp. (a) | | 37,573 | 2,254,380 |
| Cigna Group | | 19,008 | 6,420,902 |
| | | | 13,194,261 |
| Life Sciences Tools & Services - 1.9% | | | |
| Danaher Corp. | | 14,784 | 3,543,577 |
| ICON PLC (a) | | 8,622 | 1,812,776 |
| | | | 5,356,353 |
| Pharmaceuticals - 2.1% | | | |
| Merck & Co., Inc. | | 41,093 | 4,176,693 |
| Zoetis, Inc. Class A | | 10,811 | 1,894,628 |
| | | | 6,071,321 |
TOTAL HEALTH CARE | | | 30,273,230 |
| INDUSTRIALS - 9.6% | | | |
| Building Products - 1.2% | | | |
| Johnson Controls International PLC | | 41,401 | 3,471,888 |
| Commercial Services & Supplies - 0.8% | | | |
| Veralto Corp. | | 19,789 | 2,140,972 |
| Electrical Equipment - 3.5% | | | |
| Acuity Brands, Inc. | | 10,078 | 3,231,914 |
| Generac Holdings, Inc. (a) | | 9,827 | 1,849,441 |
| Prysmian SpA | | 34,679 | 2,287,508 |
| Regal Rexnord Corp. | | 14,321 | 2,473,380 |
| | | | 9,842,243 |
| Machinery - 2.2% | | | |
| Deere & Co. | | 7,136 | 3,324,662 |
| Ingersoll Rand, Inc. | | 16,423 | 1,710,784 |
| Timken Co. | | 16,202 | 1,254,845 |
| | | | 6,290,291 |
| Professional Services - 1.9% | | | |
| KBR, Inc. | | 66,967 | 4,073,603 |
| ManpowerGroup, Inc. | | 22,162 | 1,426,568 |
| | | | 5,500,171 |
TOTAL INDUSTRIALS | | | 27,245,565 |
| INFORMATION TECHNOLOGY - 28.8% | | | |
| Electronic Equipment, Instruments & Components - 0.6% | | | |
| CDW Corp. | | 9,171 | 1,613,454 |
| IT Services - 0.5% | | | |
| Accenture PLC Class A | | 4,099 | 1,485,355 |
| Semiconductors & Semiconductor Equipment - 9.4% | | | |
| Advanced Micro Devices, Inc. (a) | | 9,181 | 1,259,404 |
| First Solar, Inc. (a) | | 15,189 | 3,026,712 |
| NVIDIA Corp. | | 130,221 | 18,003,053 |
| NXP Semiconductors NV | | 5,449 | 1,249,837 |
| ON Semiconductor Corp. (a) | | 45,436 | 3,231,408 |
| | | | 26,770,414 |
| Software - 10.0% | | | |
| Gen Digital, Inc. | | 64,286 | 1,983,223 |
| Intuit, Inc. | | 3,404 | 2,184,449 |
| Microsoft Corp. | | 40,138 | 16,996,837 |
| Salesforce, Inc. | | 22,393 | 7,389,466 |
| | | | 28,553,975 |
| Technology Hardware, Storage & Peripherals - 8.3% | | | |
| Apple, Inc. | | 90,344 | 21,441,339 |
| Dell Technologies, Inc. Class C | | 17,214 | 2,196,334 |
| | | | 23,637,673 |
TOTAL INFORMATION TECHNOLOGY | | | 82,060,871 |
| MATERIALS - 4.2% | | | |
| Chemicals - 2.0% | | | |
| Linde PLC | | 12,142 | 5,597,341 |
| Containers & Packaging - 2.2% | | | |
| Avery Dennison Corp. | | 16,877 | 3,475,818 |
| Crown Holdings, Inc. | | 30,764 | 2,833,057 |
| | | | 6,308,875 |
TOTAL MATERIALS | | | 11,906,216 |
| REAL ESTATE - 2.1% | | | |
| Equity Real Estate Investment Trusts (REITs) - 2.1% | | | |
| Prologis, Inc. | | 31,844 | 3,718,742 |
| Public Storage Operating Co. | | 6,519 | 2,268,938 |
| | | | 5,987,680 |
| UTILITIES - 2.4% | | | |
| Electric Utilities - 1.3% | | | |
| NextEra Energy, Inc. | | 45,567 | 3,584,756 |
| Independent Power and Renewable Electricity Producers - 1.1% | | | |
| Clearway Energy, Inc. Class C | | 107,790 | 3,178,727 |
TOTAL UTILITIES | | | 6,763,483 |
| TOTAL COMMON STOCKS (Cost $240,010,923) | | | 278,237,123 |
| | | | |
| Money Market Funds - 2.1% |
| | | Shares | Value ($) |
Fidelity Cash Central Fund 4.64% (b) (Cost $5,904,911) | | 5,903,731 | 5,904,911 |
| | | | |
| TOTAL INVESTMENT IN SECURITIES - 99.8% (Cost $245,915,834) | 284,142,034 |
NET OTHER ASSETS (LIABILITIES) - 0.2% | 641,937 |
| NET ASSETS - 100.0% | 284,783,971 |
| | |
Legend
| (b) | Affiliated fund that is generally available only to investment companies and other accounts managed by Fidelity Investments. The rate quoted is the annualized seven-day yield of the fund at period end. A complete unaudited listing of the fund's holdings as of its most recent quarter end is available upon request. In addition, each Fidelity Central Fund's financial statements are available on the SEC's website or upon request. |
Affiliated Central Funds
Fiscal year to date information regarding the Fund's investments in Fidelity Central Funds, including the ownership percentage, is presented below.
| Affiliate | Value, beginning of period ($) | Purchases ($) | Sales Proceeds ($) | Dividend Income ($) | Realized Gain (loss) ($) | Change in Unrealized appreciation (depreciation) ($) | Value, end of period ($) | % ownership, end of period |
| Fidelity Cash Central Fund 4.64% | 1,594,563 | 55,776,558 | 51,699,868 | 91,841 | 144 | - | 5,904,911 | 0.0% |
| Total | 1,594,563 | 55,776,558 | 51,699,868 | 91,841 | 144 | - | 5,904,911 | |
| | | | | | | | | |
Amounts in the dividend income column in the above table include any capital gain distributions from underlying funds, which are presented in the corresponding line item in the Statement of Operations, if applicable.
Amounts included in the purchases and sales proceeds columns may include in-kind transactions, if applicable.
Purchases and sales proceeds exclude the value of securities received and delivered through reorganization transactions, if applicable.
Investment Valuation
The following is a summary of the inputs used, as of November 30, 2024, involving the Fund's assets and liabilities carried at fair value. The inputs or methodology used for valuing securities may not be an indication of the risk associated with investing in those securities. For more information on valuation inputs, and their aggregation into the levels used below, please refer to the Investment Valuation section in the accompanying Notes to Financial Statements.
| Valuation Inputs at Reporting Date: |
| Description | Total ($) | Level 1 ($) | Level 2 ($) | Level 3 ($) |
Investments in Securities: | | | | |
|
| Equities: | | | | |
Communication Services | 21,582,368 | 21,582,368 | - | - |
Consumer Discretionary | 30,611,942 | 30,611,942 | - | - |
Consumer Staples | 13,417,511 | 13,417,511 | - | - |
Energy | 12,770,346 | 9,283,369 | 3,486,977 | - |
Financials | 35,617,911 | 35,617,911 | - | - |
Health Care | 30,273,230 | 30,273,230 | - | - |
Industrials | 27,245,565 | 27,245,565 | - | - |
Information Technology | 82,060,871 | 82,060,871 | - | - |
Materials | 11,906,216 | 11,906,216 | - | - |
Real Estate | 5,987,680 | 5,987,680 | - | - |
Utilities | 6,763,483 | 6,763,483 | - | - |
|
| Money Market Funds | 5,904,911 | 5,904,911 | - | - |
| Total Investments in Securities: | 284,142,034 | 280,655,057 | 3,486,977 | - |
Financial Statements (Unaudited)
| Statement of Assets and Liabilities |
| As of November 30, 2024 (Unaudited) |
| Assets | | | | |
| Investment in securities, at value - See accompanying schedule: | | | | |
Unaffiliated issuers (cost $240,010,923) | $ | 278,237,123 | | |
Fidelity Central Funds (cost $5,904,911) | | 5,904,911 | | |
| | | | | |
| | | | | |
| Total Investment in Securities (cost $245,915,834) | | | $ | 284,142,034 |
| Cash | | | | 5,848 |
| Foreign currency held at value (cost $74,619) | | | | 74,619 |
| Receivable for fund shares sold | | | | 764,805 |
| Dividends receivable | | | | 121,110 |
| Distributions receivable from Fidelity Central Funds | | | | 22,210 |
| Prepaid expenses | | | | 127 |
| Other receivables | | | | 2,306 |
Total assets | | | | 285,133,059 |
| Liabilities | | | | |
| Payable for investments purchased | $ | 112,061 | | |
| Payable for fund shares redeemed | | 96,658 | | |
| Accrued management fee | | 111,908 | | |
| Audit fee payable | | 28,305 | | |
| Other payables and accrued expenses | | 156 | | |
| Total liabilities | | | | 349,088 |
| Net Assets | | | $ | 284,783,971 |
| Net Assets consist of: | | | | |
| Paid in capital | | | $ | 244,447,504 |
| Total accumulated earnings (loss) | | | | 40,336,467 |
| Net Assets | | | $ | 284,783,971 |
Net Asset Value, offering price and redemption price per share ($284,783,971 ÷ 21,177,263 shares) | | | $ | 13.45 |
| Statement of Operations |
Six months ended November 30, 2024 (Unaudited) |
| Investment Income | | | | |
| Dividends | | | $ | 949,130 |
| Income from Fidelity Central Funds | | | | 91,841 |
| Total income | | | | 1,040,971 |
| Expenses | | | | |
| Management fee | $ | 403,988 | | |
| Custodian fees and expenses | | 6,291 | | |
| Independent trustees' fees and expenses | | 300 | | |
| Registration fees | | 6,649 | | |
| Audit fees | | 32,413 | | |
| Legal | | 3,223 | | |
| Miscellaneous | | 174 | | |
| Total expenses before reductions | | 453,038 | | |
| Expense reductions | | (7,962) | | |
| Total expenses after reductions | | | | 445,076 |
| Net Investment income (loss) | | | | 595,895 |
| Realized and Unrealized Gain (Loss) | | | | |
| Net realized gain (loss) on: | | | | |
| Investment Securities: | | | | |
| Unaffiliated issuers | | 1,692,798 | | |
| Fidelity Central Funds | | 144 | | |
| Foreign currency transactions | | 897 | | |
| Total net realized gain (loss) | | | | 1,693,839 |
| Change in net unrealized appreciation (depreciation) on: | | | | |
| Investment Securities: | | | | |
| Unaffiliated issuers | | 19,158,066 | | |
| Assets and liabilities in foreign currencies | | (464) | | |
| Total change in net unrealized appreciation (depreciation) | | | | 19,157,602 |
| Net gain (loss) | | | | 20,851,441 |
| Net increase (decrease) in net assets resulting from operations | | | $ | 21,447,336 |
| Statement of Changes in Net Assets |
| |
| | Six months ended November 30, 2024 (Unaudited) | | Year ended May 31, 2024 |
| Increase (Decrease) in Net Assets | | | | |
| Operations | | | | |
| Net investment income (loss) | $ | 595,895 | $ | 363,918 |
| Net realized gain (loss) | | 1,693,839 | | 785,880 |
| Change in net unrealized appreciation (depreciation) | | 19,157,602 | | 10,850,362 |
| Net increase (decrease) in net assets resulting from operations | | 21,447,336 | | 12,000,160 |
| Distributions to shareholders | | (1,072,203) | | (142,989) |
| | | | | |
| Share transactions | | | | |
| Proceeds from sales of shares | | 111,912,934 | | 97,504,484 |
| Net asset value of shares issued in exchange for the net assets of the Acquired Fund(s) (see Reorganization Information note) | | 65,007,639 | | - |
| Reinvestment of distributions | | 910,304 | | 125,081 |
| Cost of shares redeemed | | (23,865,989) | | (7,087,145) |
| | | | | |
Net increase (decrease) in net assets resulting from share transactions | | 153,964,888 | | 90,542,420 |
| Total increase (decrease) in net assets | | 174,340,021 | | 102,399,591 |
| | | | | |
| Net Assets | | | | |
| Beginning of period | | 110,443,950 | | 8,044,359 |
| End of period | $ | 284,783,971 | $ | 110,443,950 |
| | | | | |
| Other Information | | | | |
| Shares | | | | |
| Sold | | 8,883,848 | | 8,903,387 |
| Issued in exchange for the shares of the Acquired Fund(s) (see Reorganization Information note) | | 4,970,001 | | - |
| Issued in reinvestment of distributions | | 72,650 | | 11,742 |
| Redeemed | | (1,871,417) | | (630,303) |
| Net increase (decrease) | | 12,055,082 | | 8,284,826 |
| | | | | |
Financial Highlights
Fidelity® SAI Sustainable U.S. Equity Fund |
| |
| | Six months ended (Unaudited) November 30, 2024 | | Years ended May 31, 2024 | | 2023 | | 2022 A |
Selected Per-Share Data | | | | | | | | |
| Net asset value, beginning of period | $ | 12.11 | $ | 9.61 | $ | 9.25 | $ | 10.00 |
| Income from Investment Operations | | | | | | | | |
Net investment income (loss) B,C | | .05 | | .09 | | .10 D | | .01 |
| Net realized and unrealized gain (loss) | | 1.40 | | 2.46 | | .32 | | (.76) |
| Total from investment operations | | 1.45 | | 2.55 | | .42 | | (.75) |
| Distributions from net investment income | | (.02) | | (.05) | | (.06) | | - |
| Distributions from net realized gain | | (.08) | | - | | - | | - |
| Total distributions | | (.11) E | | (.05) | | (.06) | | - |
| Net asset value, end of period | $ | 13.45 | $ | 12.11 | $ | 9.61 | $ | 9.25 |
Total Return F,G | | | | 26.61% | | 4.53% | | (7.50)% |
Ratios to Average Net Assets C,H,I | | | | | | | | |
| Expenses before reductions | | .56% J | | .73% | | 3.03% | | 7.28% J,K |
| Expenses net of fee waivers, if any | | | | .59% | | .59% | | .60% J,K |
| Expenses net of all reductions | | .55% J | | .59% | | .59% | | .60% J,K |
| Net investment income (loss) | | .73% J | | .82% | | 1.07% D | | .73% J,K |
| Supplemental Data | | | | | | | | |
| Net assets, end of period (000 omitted) | $ | 284,784 | $ | 110,444 | $ | 8,044 | $ | 928 |
Portfolio turnover rate L | | | | 49% | | 35% | | 2% N |
AFor the period April 14, 2022 (commencement of operations) through May 31, 2022.
BCalculated based on average shares outstanding during the period.
CNet investment income (loss) is affected by the timing of the declaration of dividends by any underlying mutual funds or exchange-traded funds (ETFs). Net investment income (loss) of any mutual funds or ETFs is not included in the Fund's net investment income (loss) ratio.
DNet investment income per share reflects one or more large, non-recurring dividend(s) which amounted to $.02 per share. Excluding such non-recurring dividend(s), the ratio of net investment income (loss) to average net assets would have been .89%.
ETotal distributions per share do not sum due to rounding.
FTotal returns for periods of less than one year are not annualized.
GTotal returns would have been lower if certain expenses had not been reduced during the applicable periods shown.
HFees and expenses of any underlying mutual funds or exchange-traded funds (ETFs) are not included in the Fund's expense ratio. The Fund indirectly bears its proportionate share of these expenses.
IExpense ratios reflect operating expenses of the class. Expenses before reductions do not reflect amounts reimbursed, waived, or reduced through arrangements with the investment adviser, brokerage services, or other offset arrangements, if applicable, and do not represent the amount paid by the class during periods when reimbursements, waivers or reductions occur.
JAnnualized.
KAudit fees are not annualized.
LAmount does not include the portfolio activity of any underlying mutual funds or exchange-traded funds (ETFs).
MThe portfolio turnover rate does not include the assets acquired in the reorganization.
NAmount not annualized.
Notes to Financial Statements
(Unaudited)For the period ended November 30, 2024
1. Organization.
Fidelity SAI Sustainable U.S. Equity Fund (the Fund) is a fund of Fidelity Summer Street Trust (the Trust) and is authorized to issue an unlimited number of shares. Shares are offered exclusively to certain clients of Fidelity Management & Research Company LLC (FMR) or its affiliates. The Trust is registered under the Investment Company Act of 1940, as amended (the 1940 Act), as an open-end management investment company organized as a Massachusetts business trust.
2. Investments in Fidelity Central Funds.
Funds may invest in Fidelity Central Funds, which are open-end investment companies generally available only to other investment companies and accounts managed by the investment adviser and its affiliates. The Schedule of Investments lists any Fidelity Central Funds held as an investment as of period end, but does not include the underlying holdings of each Fidelity Central Fund. An investing fund indirectly bears its proportionate share of the expenses of the underlying Fidelity Central Funds.
Based on its investment objective, each Fidelity Central Fund may invest or participate in various investment vehicles or strategies that are similar to those of the investing fund. These strategies are consistent with the investment objectives of the investing fund and may involve certain economic risks which may cause a decline in value of each of the Fidelity Central Funds and thus a decline in the value of the investing fund.
| Fidelity Central Fund | Investment Manager | Investment Objective | Investment Practices | Expense RatioA |
| Fidelity Money Market Central Funds | Fidelity Management & Research Company LLC (FMR) | Each fund seeks to obtain a high level of current income consistent with the preservation of capital and liquidity. | Short-term Investments | Less than .005% |
A Expenses expressed as a percentage of average net assets and are as of each underlying Central Fund's most recent annual or semi-annual shareholder report.
A complete unaudited list of holdings for each Fidelity Central Fund is available upon request or at the Securities and Exchange Commission website at www.sec.gov. In addition, the financial statements of the Fidelity Central Funds which contain the significant accounting policies (including investment valuation policies) of those funds, and are not covered by the Report of Independent Registered Public Accounting Firm, are available on the Securities and Exchange Commission website or upon request.
3. Significant Accounting Policies.
The Fund is an investment company and applies the accounting and reporting guidance of the Financial Accounting Standards Board (FASB) Accounting Standards Codification Topic 946 Financial Services - Investment Companies. The financial statements have been prepared in conformity with accounting principles generally accepted in the United States of America (GAAP), which require management to make certain estimates and assumptions at the date of the financial statements. Actual results could differ from those estimates. Subsequent events, if any, through the date that the financial statements were issued have been evaluated in the preparation of the financial statements. The Fund's Schedule of Investments lists any underlying mutual funds or exchange-traded funds (ETFs) but does not include the underlying holdings of these funds. The following summarizes the significant accounting policies of the Fund:
Investment Valuation. Investments are valued as of 4:00 p.m. Eastern time on the last calendar day of the period. The Board of Trustees (the Board) has designated the Fund's investment adviser as the valuation designee responsible for the fair valuation function and performing fair value determinations as needed. The investment adviser has established a Fair Value Committee (the Committee) to carry out the day-to-day fair valuation responsibilities and has adopted policies and procedures to govern the fair valuation process and the activities of the Committee. In accordance with these fair valuation policies and procedures, which have been approved by the Board, the Fund attempts to obtain prices from one or more third party pricing services or brokers to value its investments. When current market prices, quotations or currency exchange rates are not readily available or reliable, investments will be fair valued in good faith by the Committee, in accordance with the policies and procedures. Factors used in determining fair value vary by investment type and may include market or investment specific events, transaction data, estimated cash flows, and market observations of comparable investments. The frequency that the fair valuation procedures are used cannot be predicted and they may be utilized to a significant extent. The Committee manages the Fund's fair valuation practices and maintains the fair valuation policies and procedures. The Fund's investment adviser reports to the Board information regarding the fair valuation process and related material matters.
The Fund categorizes the inputs to valuation techniques used to value its investments into a disclosure hierarchy consisting of three levels as shown below:
Level 1 - unadjusted quoted prices in active markets for identical investments
Level 2 - other significant observable inputs (including quoted prices for similar investments, interest rates, prepayment speeds, etc.)
Level 3 - unobservable inputs (including the Fund's own assumptions based on the best information available)
Valuation techniques used to value the Fund's investments by major category are as follows:
Equity securities, including restricted securities, for which market quotations are readily available, are valued at the last reported sale price or official closing price as reported by a third party pricing service on the primary market or exchange on which they are traded and are categorized as Level 1 in the hierarchy. In the event there were no sales during the day or closing prices are not available, securities are valued at the last quoted bid price or may be valued using the last available price and are generally categorized as Level 2 in the hierarchy. For foreign equity securities, when market or security specific events arise, comparisons to the valuation of American Depositary Receipts (ADRs), futures contracts, Exchange-Traded Funds (ETFs) and certain indexes as well as quoted prices for similar securities may be used and would be categorized as Level 2 in the hierarchy. For equity securities, including restricted securities, where observable inputs are limited, assumptions about market activity and risk are used and these securities may be categorized as Level 3 in the hierarchy.
Investments in open-end mutual funds, including the Fidelity Central Funds, are valued at their closing net asset value (NAV) each business day and are categorized as Level 1 in the hierarchy.
Changes in valuation techniques may result in transfers in or out of an assigned level within the disclosure hierarchy. The aggregate value of investments by input level as of November 30, 2024 is included at the end of the Fund's Schedule of Investments.
Foreign Currency. Certain Funds may use foreign currency contracts to facilitate transactions in foreign-denominated securities. Gains and losses from these transactions may arise from changes in the value of the foreign currency or if the counterparties do not perform under the contracts' terms.
Foreign-denominated assets, including investment securities, and liabilities are translated into U.S. dollars at the exchange rates at period end. Purchases and sales of investment securities, income and dividends received, and expenses denominated in foreign currencies are translated into U.S. dollars at the exchange rate in effect on the transaction date.
The effects of exchange rate fluctuations on investments are included with the net realized and unrealized gain (loss) on investment securities. Other foreign currency transactions resulting in realized and unrealized gain (loss) are disclosed separately.
Investment Transactions and Income. For financial reporting purposes, the Fund's investment holdings and NAV include trades executed through the end of the last business day of the period. The NAV per share for processing shareholder transactions is calculated as of the close of business of the New York Stock Exchange (NYSE), normally 4:00 p.m. Eastern time and includes trades executed through the end of the prior business day. Gains and losses on securities sold are determined on the basis of identified cost. Commissions paid to certain brokers with whom the investment adviser, or its affiliates, places trades on behalf of a fund include an amount in addition to trade execution, which may be rebated back to a fund. Any such rebates are included in net realized gain (loss) on investments in the Statement of Operations. Dividend income is recorded on the ex-dividend date, except for certain dividends from foreign securities where the ex-dividend date may have passed, which are recorded as soon as the Fund is informed of the ex-dividend date. Non-cash dividends included in dividend income, if any, are recorded at the fair market value of the securities received. Income and capital gain distributions from Fidelity Central Funds, if any, are recorded on the ex-dividend date. Certain distributions received by the Fund represent a return of capital or capital gain. The Fund determines the components of these distributions subsequent to the ex-dividend date, based upon receipt of tax filings or other correspondence relating to the underlying investment. These distributions are recorded as a reduction of cost of investments and/or as a realized gain. Investment income is recorded net of foreign taxes withheld where recovery of such taxes is uncertain. Funds may file withholding tax reclaims in certain jurisdictions to recover a portion of amounts previously withheld. Any withholding tax reclaims income is included in the Statement of Operations in dividends. Any receivables for withholding tax reclaims are included in the Statement of Assets and Liabilities in dividends receivable.
Expenses. Expenses directly attributable to a fund are charged to that fund. Expenses attributable to more than one fund are allocated among the respective funds on the basis of relative net assets or other appropriate methods. Expenses included in the accompanying financial statements reflect the expenses of that fund and do not include any expenses associated with any underlying mutual funds or exchange-traded funds. Although not included in a fund's expenses, a fund indirectly bears its proportionate share of these expenses through the net asset value of each underlying mutual fund or exchange-traded fund. Expense estimates are accrued in the period to which they relate and adjustments are made when actual amounts are known.
Income Tax Information and Distributions to Shareholders. Each year, the Fund intends to qualify as a regulated investment company under Subchapter M of the Internal Revenue Code, including distributing substantially all of its taxable income and realized gains. As a result, no provision for U.S. Federal income taxes is required. The Fund files a U.S. federal tax return, in addition to state and local tax returns as required. The Fund's federal income tax returns are subject to examination by the Internal Revenue Service (IRS) for a period of three fiscal years after they are filed. State and local tax returns may be subject to examination for an additional fiscal year depending on the jurisdiction. Foreign taxes are provided for based on the Fund's understanding of the tax rules and rates that exist in the foreign markets in which it invests.
Distributions are declared and recorded on the ex-dividend date. Income and capital gain distributions are determined in accordance with income tax regulations, which may differ from GAAP.
Capital accounts within the financial statements are adjusted for permanent book-tax differences. These adjustments have no impact on net assets or the results of operations. Capital accounts are not adjusted for temporary book-tax differences which will reverse in a subsequent period.
Book-tax differences are primarily due to foreign currency transactions, capital loss carryforwards and losses deferred due to wash sales.
As of period end, the cost and unrealized appreciation (depreciation) in securities, and derivatives if applicable, for federal income tax purposes were as follows:
| Gross unrealized appreciation | $43,138,541 |
| Gross unrealized depreciation | (5,577,546) |
| Net unrealized appreciation (depreciation) | $37,560,995 |
| Tax cost | $246,581,039 |
New Accounting Pronouncement. In November 2023, the FASB issued Accounting Standards Update (ASU) 2023-07 Segment Reporting (Topic 280): Improvements to Reportable Segment Disclosures. Effective for fiscal years beginning after December 15, 2023 and interim periods within fiscal years beginning after December 15, 2024, the amendments enhance required disclosures of segment information for public entities on an annual and interim basis. The ASU allows for early adoption with updates applied retrospectively. Management is currently evaluating the impact of the ASU but does not expect this guidance to materially impact the financial statements.
4. Purchases and Sales of Investments.
Purchases and sales of securities, other than short-term securities, securities acquired in the reorganization and in-kind transactions, as applicable, are noted in the table below.
| | Purchases ($) | Sales ($) |
| Fidelity SAI Sustainable U.S. Equity Fund | 122,990,265 | 38,267,694 |
5. Fees and Other Transactions with Affiliates.
Management Fee. Fidelity Management & Research Company LLC (the investment adviser) and its affiliates provide the Fund with investment management related services for which the Fund pays a monthly management fee that is based on an annual rate of .498% of the Fund's average net assets.
Interfund Trades. Funds may purchase from or sell securities to other Fidelity Funds under procedures adopted by the Board. The procedures have been designed to ensure these interfund trades are executed in accordance with Rule 17a-7 of the 1940 Act. Any interfund trades are included within the respective purchases and sales amounts shown in the Purchases and Sales of Investments note. Interfund trades during the period are noted in the table below.
| | Purchases ($) | Sales ($) | Realized Gain (Loss)($) |
| Fidelity SAI Sustainable U.S. Equity Fund | 10,491,146 | 2,589,454 | 89,845 |
6. Committed Line of Credit.
Certain Funds participate with other funds managed by the investment adviser or an affiliate in a $4.25 billion credit facility (the "line of credit") to be utilized for temporary or emergency purposes to fund shareholder redemptions or for other short-term liquidity purposes. The participating funds have agreed to pay commitment fees on their pro-rata portion of the line of credit, which are reflected in Miscellaneous expenses on the Statement of Operations, and are listed below. During the period, there were no borrowings on this line of credit.
| | Amount ($) |
| Fidelity SAI Sustainable U.S. Equity Fund | 82 |
7. Expense Reductions.
Through arrangements with the Fund's custodian, credits realized as a result of certain uninvested cash balances were used to reduce the Fund's expenses by $153.
In addition, during the period the investment adviser or an affiliate reimbursed and/or waived a portion of operating expenses in the amount of $7,809.
8. Other.
A fund's organizational documents provide former and current trustees and officers with a limited indemnification against liabilities arising in connection with the performance of their duties to the fund. In the normal course of business, a fund may also enter into contracts that provide general indemnifications. A fund's maximum exposure under these arrangements is unknown as this would be dependent on future claims that may be made against a fund. The risk of material loss from such claims is considered remote.
9. Risk and Uncertainties.
Many factors affect a fund's performance. Developments that disrupt global economies and financial markets, such as pandemics, epidemics, outbreaks of infectious diseases, war, terrorism, and environmental disasters, may significantly affect a fund's investment performance. The effects of these developments to a fund will be impacted by the types of securities in which a fund invests, the financial condition, industry, economic sector, and geographic location of an issuer, and a fund's level of investment in the securities of that issuer. Significant concentrations in security types, issuers, industries, sectors, and geographic locations may magnify the factors that affect a fund's performance.
10. Reorganization Information.
On November 15, 2024, the Fund acquired all of the assets and assumed all of the liabilities of Fidelity SAI Sustainable Future Fund ("Acquired Fund") pursuant to an Agreement and Plan of Reorganization (Agreements) approved by the Board of Trustees ("The Board"). The securities held by the Acquired Fund were the primary assets acquired by the Fund. The acquisition was accomplished by an exchange of shares of the Fund for shares then outstanding of the Acquired Fund at its respective net asset value on the acquisition date. The reorganization provides shareholders of the Acquired Fund access to a larger portfolio with a similar investment objective and lower projected expenses. For financial reporting purposes, the assets and liabilities of the Acquired Fund and shares issued by the Fund were recorded at fair value; however, the cost basis of the investments received from the Acquired Fund were carried forward and will be utilized for purposes of the Fund's ongoing reporting of realized and unrealized gains and losses to more closely align subsequent reporting of realized gains with amounts distributable to shareholders for tax purposes. The reorganization qualified as a tax-free reorganization for federal income tax purposes with no gain or loss recognized to the funds or their shareholders.
| Acquired Fund | Investments $ | Unrealized appreciation (depreciation) $ | Net Assets $ | Shares Exchanged | Shares Exchanged Ratio |
Fidelity SAI Sustainable Future Fund | 65,017,133 | 7,736,152 | 65,007,639 | 4,970,001 | .9624541284 |
| Acquiring Fund | Net Assets $ | Total net assets after the acquisition $ |
| Fidelity SAI Sustainable U.S. Equity Fund | 206,893,573 | 271,901,212 |
Pro forma results of operations of the combined entity for the entire period ended November 30, 2024, as though the acquisition had occurred as of the beginning of the year (rather than on the actual acquisition date), are as follows:
| Net investment income (loss) | $889,677 |
| Total net realized gain (loss) | 8,910,883 |
| Total change in net unrealized appreciation (depreciation) | 16,508,805 |
| Net increase (decrease) in net assets resulting from operations | $26,309,365 |
Because the combined investment portfolios have been managed as a single portfolio since the acquisition was completed, it is not practicable to separate the amounts of revenue and earnings of the acquired fund that have been included in the Fund's accompanying Statement of Operations since November 15, 2024.
Item 8: Changes in and Disagreements with Accountants for Open-End Management Investment Companies
(Unaudited)
Note: This is not applicable for any fund included in this document.
Item 9: Proxy Disclosures for Open-End Management Investment Companies
(Unaudited)
| A special meeting of shareholders was held on July 16, 2024. The results of votes taken among shareholders on the proposal before them are reported below. Each vote reported represents one dollar of net asset value held on the record date for the meeting. |
| Proposal 1 |
| To elect a Board of Trustees. |
| | # of Votes | % of Votes |
| Bettina Doulton |
| Affirmative | 14,516,835,136.19 | 94.56 |
| Withheld | 834,887,998.33 | 5.44 |
| TOTAL | 15,351,723,134.52 | 100.00 |
| Robert A. Lawrence |
| Affirmative | 14,430,495,798.10 | 94.00 |
| Withheld | 921,227,336.42 | 6.00 |
| TOTAL | 15,351,723,134.52 | 100.00 |
| Vijay C. Advani |
| Affirmative | 14,465,231,640.25 | 94.23 |
| Withheld | 886,491,494.27 | 5.77 |
| TOTAL | 15,351,723,134.52 | 100.00 |
| Thomas P. Bostick |
| Affirmative | 14,471,831,170.84 | 94.27 |
| Withheld | 879,891,963.68 | 5.73 |
| TOTAL | 15,351,723,134.52 | 100.00 |
| Donald F. Donahue |
| Affirmative | 14,432,670,599.88 | 94.01 |
| Withheld | 919,052,534.64 | 5.99 |
| TOTAL | 15,351,723,134.52 | 100.00 |
| Vicki L. Fuller |
| Affirmative | 14,531,407,981.65 | 94.66 |
| Withheld | 820,315,152.87 | 5.34 |
| TOTAL | 15,351,723,134.52 | 100.00 |
| Patricia L. Kampling |
| Affirmative | 14,549,142,839.16 | 94.77 |
| Withheld | 802,580,295.36 | 5.23 |
| TOTAL | 15,351,723,134.52 | 100.00 |
| Thomas A. Kennedy |
| Affirmative | 14,469,818,769.40 | 94.26 |
| Withheld | 881,904,365.12 | 5.74 |
| TOTAL | 15,351,723,134.52 | 100.00 |
| Oscar Munoz |
| Affirmative | 14,434,061,467.08 | 94.02 |
| Withheld | 917,661,667.44 | 5.98 |
| TOTAL | 15,351,723,134.52 | 100.00 |
| Karen B. Peetz |
| Affirmative | 14,521,904,618.46 | 94.59 |
| Withheld | 829,818,516.06 | 5.41 |
| TOTAL | 15,351,723,134.52 | 100.00 |
| David M. Thomas |
| Affirmative | 14,417,745,861.73 | 93.92 |
| Withheld | 933,977,272.79 | 6.08 |
| TOTAL | 15,351,723,134.52 | 100.00 |
| Susan Tomasky |
| Affirmative | 14,467,973,468.18 | 94.24 |
| Withheld | 883,749,666.34 | 5.76 |
| TOTAL | 15,351,723,134.52 | 100.00 |
| Michael E. Wiley |
| Affirmative | 14,424,002,796.91 | 93.96 |
| Withheld | 927,720,337.61 | 6.04 |
| TOTAL | 15,351,723,134.52 | 100.00 |
| | | |
| Proposal 1 reflects trust-wide proposal and voting results. |
Item 10: Remuneration Paid to Directors, Officers, and others of Open-End Management Investment Companies
(Unaudited)
Note: This information is disclosed as part of the financial statements for each Fund as part of Item 7: Financial Statements and Financial Highlights for Open-End Management Investment companies.
Item 11: Statement Regarding Basis for Approval of Investment Advisory Contract
(Unaudited)
Note: This is not applicable for any fund included in this document.
1.9904863.102
EFS-SANN-0125
Fidelity® Agricultural Productivity Fund
Fidelity® Water Sustainability Fund
Semi-Annual Report
November 30, 2024
Contents
To view a fund's proxy voting guidelines and proxy voting record for the 12-month period ended June 30, visit http://www.fidelity.com/proxyvotingresults or visit the Securities and Exchange Commission's (SEC) web site at http://www.sec.gov.
You may also call 1-800-544-8544 to request a free copy of the proxy voting guidelines.
Standard & Poor's, S&P and S&P 500 are registered service marks of The McGraw-Hill Companies, Inc. and have been licensed for use by Fidelity Distributors Corporation.
Other third-party marks appearing herein are the property of their respective owners.
All other marks appearing herein are registered or unregistered trademarks or service marks of FMR LLC or an affiliated company. © 2025 FMR LLC. All rights reserved.
This report and the financial statements contained herein are submitted for the general information of the shareholders of the Funds. This report is not authorized for distribution to prospective investors in the Funds unless preceded or accompanied by an effective prospectus.
A fund files its complete schedule of portfolio holdings with the SEC for the first and third quarters of each fiscal year on Form N-PORT. Forms N-PORT are available on the SEC's web site at http://www.sec.gov. A fund's Forms N-PORT may be reviewed and copied at the SEC's Public Reference Room in Washington, DC. Information regarding the operation of the SEC's Public Reference Room may be obtained by calling 1-800-SEC-0330.
For a complete list of a fund's portfolio holdings, view the most recent holdings listing, semiannual report, or annual report on Fidelity's web site at http://www.fidelity.com, http://www.institutional.fidelity.com, or http://www.401k.com, as applicable.
NOT FDIC INSURED •MAY LOSE VALUE •NO BANK GUARANTEE
Neither the Funds nor Fidelity Distributors Corporation is a bank.
Item 7: Financial Statements and Financial Highlights for Open-End Management Investment Companies (Semi-Annual Report)
Fidelity® Agricultural Productivity Fund
Schedule of Investments November 30, 2024 (Unaudited)
Showing Percentage of Net Assets
| Common Stocks - 98.1% |
| | | Shares | Value ($) |
| CONSUMER STAPLES - 36.6% | | | |
| Food Products - 36.6% | | | |
| Adecoagro SA (a) | | 36,729 | 400,346 |
| Archer Daniels Midland Co. | | 48,757 | 2,662,132 |
| Bakkafrost | | 20,809 | 1,229,774 |
| Bunge Global SA | | 21,590 | 1,937,487 |
| Cranswick PLC | | 26,550 | 1,675,664 |
| Darling Ingredients, Inc. (a)(b) | | 27,505 | 1,114,778 |
| First Resources Ltd. | | 424,997 | 473,008 |
| Ingredion, Inc. | | 14,638 | 2,156,763 |
| Lamb Weston Holdings, Inc. | | 27,912 | 2,155,923 |
| Origin Enterprises PLC | | 131,275 | 425,192 |
| Pilgrim's Pride Corp. (b) | | 23,709 | 1,223,621 |
| Sakata Seed Corp. | | 26,133 | 597,366 |
| Tyson Foods, Inc. Class A | | 2,916 | 188,082 |
| WH Group Ltd. (c) | | 55,118 | 43,712 |
| | | | 16,283,848 |
| HEALTH CARE - 0.3% | | | |
| Biotechnology - 0.3% | | | |
| Cibus, Inc. (a)(b) | | 23,885 | 116,081 |
| INDUSTRIALS - 31.3% | | | |
| Machinery - 31.3% | | | |
| AGCO Corp. | | 5,993 | 606,552 |
| CNH Industrial NV Class A | | 50,543 | 634,820 |
| Deere & Co. | | 23,654 | 11,020,398 |
| Toro Co. | | 18,741 | 1,631,966 |
| | | | 13,893,736 |
| MATERIALS - 29.9% | | | |
| Chemicals - 29.9% | | | |
| CF Industries Holdings, Inc. | | 24,362 | 2,184,297 |
| Corteva, Inc. | | 78,460 | 4,883,350 |
| FMC Corp. | | 17,804 | 1,052,038 |
| Nufarm Ltd. | | 145,801 | 363,299 |
| Nutrien Ltd. | | 67,404 | 3,156,320 |
| OCI NV | | 26,884 | 314,495 |
| Sabic Agriculture-Nutrients Co. | | 27,858 | 821,599 |
| The Mosaic Co. | | 19,658 | 520,151 |
| | | | 13,295,549 |
| TOTAL COMMON STOCKS (Cost $35,307,378) | | | 43,589,214 |
| | | | |
| Money Market Funds - 3.4% |
| | | Shares | Value ($) |
| Fidelity Cash Central Fund 4.64% (d) | | 781,503 | 781,659 |
| Fidelity Securities Lending Cash Central Fund 4.64% (d)(e) | | 715,052 | 715,123 |
| TOTAL MONEY MARKET FUNDS (Cost $1,496,782) | | | 1,496,782 |
| | | | |
| TOTAL INVESTMENT IN SECURITIES - 101.5% (Cost $36,804,160) | 45,085,996 |
NET OTHER ASSETS (LIABILITIES) - (1.5)% | (659,526) |
| NET ASSETS - 100.0% | 44,426,470 |
| | |
Legend
| (a) | Security or a portion of the security is on loan at period end. |
| (c) | Security exempt from registration under Rule 144A of the Securities Act of 1933. These securities may be resold in transactions exempt from registration, normally to qualified institutional buyers. At the end of the period, the value of these securities amounted to $43,712 or 0.1% of net assets. |
| (d) | Affiliated fund that is generally available only to investment companies and other accounts managed by Fidelity Investments. The rate quoted is the annualized seven-day yield of the fund at period end. A complete unaudited listing of the fund's holdings as of its most recent quarter end is available upon request. In addition, each Fidelity Central Fund's financial statements are available on the SEC's website or upon request. |
| (e) | Investment made with cash collateral received from securities on loan. |
Affiliated Central Funds
Fiscal year to date information regarding the Fund's investments in Fidelity Central Funds, including the ownership percentage, is presented below.
| Affiliate | Value, beginning of period ($) | Purchases ($) | Sales Proceeds ($) | Dividend Income ($) | Realized Gain (loss) ($) | Change in Unrealized appreciation (depreciation) ($) | Value, end of period ($) | % ownership, end of period |
| Fidelity Cash Central Fund 4.64% | - | 4,173,625 | 3,391,975 | 2,533 | 9 | - | 781,659 | 0.0% |
| Fidelity Securities Lending Cash Central Fund 4.64% | 90,019 | 6,803,847 | 6,178,743 | 2,551 | - | - | 715,123 | 0.0% |
| Total | 90,019 | 10,977,472 | 9,570,718 | 5,084 | 9 | - | 1,496,782 | |
| | | | | | | | | |
Amounts in the dividend income column in the above table include any capital gain distributions from underlying funds, which are presented in the corresponding line item in the Statement of Operations, if applicable.
Amounts in the dividend income column for Fidelity Securities Lending Cash Central Fund represents the income earned on investing cash collateral, less rebates paid to borrowers and any lending agent fees associated with the loan, plus any premium payments received for lending certain types of securities.
Amounts included in the purchases and sales proceeds columns may include in-kind transactions, if applicable.
Investment Valuation
The following is a summary of the inputs used, as of November 30, 2024, involving the Fund's assets and liabilities carried at fair value. The inputs or methodology used for valuing securities may not be an indication of the risk associated with investing in those securities. For more information on valuation inputs, and their aggregation into the levels used below, please refer to the Investment Valuation section in the accompanying Notes to Financial Statements.
| Valuation Inputs at Reporting Date: |
| Description | Total ($) | Level 1 ($) | Level 2 ($) | Level 3 ($) |
Investments in Securities: | | | | |
|
| Equities: | | | | |
Consumer Staples | 16,283,848 | 15,810,840 | 473,008 | - |
Health Care | 116,081 | 116,081 | - | - |
Industrials | 13,893,736 | 13,893,736 | - | - |
Materials | 13,295,549 | 12,932,250 | 363,299 | - |
|
| Money Market Funds | 1,496,782 | 1,496,782 | - | - |
| Total Investments in Securities: | 45,085,996 | 44,249,689 | 836,307 | - |
Fidelity® Agricultural Productivity Fund
Financial Statements (Unaudited)
| Statement of Assets and Liabilities |
| As of November 30, 2024 (Unaudited) |
| Assets | | | | |
| Investment in securities, at value (including securities loaned of $708,593) - See accompanying schedule: | | | | |
Unaffiliated issuers (cost $35,307,378) | $ | 43,589,214 | | |
Fidelity Central Funds (cost $1,496,782) | | 1,496,782 | | |
| | | | | |
| | | | | |
| Total Investment in Securities (cost $36,804,160) | | | $ | 45,085,996 |
| Foreign currency held at value (cost $30,260) | | | | 30,333 |
| Receivable for investments sold | | | | 373,263 |
| Receivable for fund shares sold | | | | 10,744 |
| Dividends receivable | | | | 56,033 |
| Distributions receivable from Fidelity Central Funds | | | | 845 |
| Prepaid expenses | | | | 50 |
| Receivable from investment adviser for expense reductions | | | | 548 |
| Other receivables | | | | 333 |
Total assets | | | | 45,558,145 |
| Liabilities | | | | |
| Payable for investments purchased | $ | 328,882 | | |
| Payable for fund shares redeemed | | 24,093 | | |
| Accrued management fee | | 29,711 | | |
| Other payables and accrued expenses | | 33,866 | | |
| Collateral on securities loaned | | 715,123 | | |
| Total liabilities | | | | 1,131,675 |
| Net Assets | | | $ | 44,426,470 |
| Net Assets consist of: | | | | |
| Paid in capital | | | $ | 56,836,943 |
| Total accumulated earnings (loss) | | | | (12,410,473) |
| Net Assets | | | $ | 44,426,470 |
Net Asset Value, offering price and redemption price per share ($44,426,470 ÷ 2,341,501 shares) | | | $ | 18.97 |
| Statement of Operations |
Six months ended November 30, 2024 (Unaudited) |
| Investment Income | | | | |
| Dividends | | | $ | 465,220 |
| Special dividends | | | | 406,891 |
| Income from Fidelity Central Funds (including $2,551 from security lending) | | | | 5,084 |
| Total income | | | | 877,195 |
| Expenses | | | | |
| Management fee | $ | 188,410 | | |
| Custodian fees and expenses | | 9,726 | | |
| Independent trustees' fees and expenses | | 108 | | |
| Registration fees | | 4,814 | | |
| Audit fees | | 28,203 | | |
| Legal | | 1,643 | | |
| Miscellaneous | | 118 | | |
| Total expenses before reductions | | 233,022 | | |
| Expense reductions | | (15,530) | | |
| Total expenses after reductions | | | | 217,492 |
| Net Investment income (loss) | | | | 659,703 |
| Realized and Unrealized Gain (Loss) | | | | |
| Net realized gain (loss) on: | | | | |
| Investment Securities: | | | | |
| Unaffiliated issuers | | 310,263 | | |
| Fidelity Central Funds | | 9 | | |
| Foreign currency transactions | | (9,096) | | |
| Total net realized gain (loss) | | | | 301,176 |
| Change in net unrealized appreciation (depreciation) on: | | | | |
| Investment Securities: | | | | |
| Unaffiliated issuers | | 1,636,988 | | |
| Assets and liabilities in foreign currencies | | (17) | | |
| Total change in net unrealized appreciation (depreciation) | | | | 1,636,971 |
| Net gain (loss) | | | | 1,938,147 |
| Net increase (decrease) in net assets resulting from operations | | | $ | 2,597,850 |
| Statement of Changes in Net Assets |
| |
| | Six months ended November 30, 2024 (Unaudited) | | Year ended May 31, 2024 |
| Increase (Decrease) in Net Assets | | | | |
| Operations | | | | |
| Net investment income (loss) | $ | 659,703 | $ | 683,063 |
| Net realized gain (loss) | | 301,176 | | (2,036,555) |
| Change in net unrealized appreciation (depreciation) | | 1,636,971 | | 2,118,657 |
| Net increase (decrease) in net assets resulting from operations | | 2,597,850 | | 765,165 |
| Distributions to shareholders | | (160,694) | | (958,262) |
| | | | | |
| Share transactions | | | | |
| Proceeds from sales of shares | | 3,998,831 | | 16,307,124 |
| Reinvestment of distributions | | 143,168 | | 874,369 |
| Cost of shares redeemed | | (14,117,286) | | (47,925,972) |
| | | | | |
Net increase (decrease) in net assets resulting from share transactions | | (9,975,287) | | (30,744,479) |
| Total increase (decrease) in net assets | | (7,538,131) | | (30,937,576) |
| | | | | |
| Net Assets | | | | |
| Beginning of period | | 51,964,601 | | 82,902,177 |
| End of period | $ | 44,426,470 | $ | 51,964,601 |
| | | | | |
| Other Information | | | | |
| Shares | | | | |
| Sold | | 226,499 | | 881,384 |
| Issued in reinvestment of distributions | | 8,295 | | 46,941 |
| Redeemed | | (803,643) | | (2,622,261) |
| Net increase (decrease) | | (568,849) | | (1,693,936) |
| | | | | |
Financial Highlights
Fidelity® Agricultural Productivity Fund |
| |
| | Six months ended (Unaudited) November 30, 2024 | | Years ended May 31, 2024 | | 2023 | | 2022 | | 2021 | | 2020 A |
Selected Per-Share Data | | | | | | | | | | | | |
| Net asset value, beginning of period | $ | 17.86 | $ | 18.01 | $ | 21.61 | $ | 18.89 | $ | 10.91 | $ | 10.00 |
| Income from Investment Operations | | | | | | | | | | | | |
Net investment income (loss) B,C | | .25 D | | .19 | | .32 | | .16 E | | .13 F | | .03 |
| Net realized and unrealized gain (loss) | | .92 | | (.10) G | | (3.67) | | 2.69 | | 7.92 | | .88 |
| Total from investment operations | | 1.17 | | .09 | | (3.35) | | 2.85 | | 8.05 | | .91 |
| Distributions from net investment income | | (.06) | | (.24) | | (.25) | | (.09) | | (.07) | | - |
| Distributions from net realized gain | | - | | - | | - | | (.04) | | - H | | - |
| Total distributions | | (.06) | | (.24) | | (.25) | | (.13) | | (.07) | | - |
| Net asset value, end of period | $ | 18.97 | $ | 17.86 | $ | 18.01 | $ | 21.61 | $ | 18.89 | $ | 10.91 |
Total Return I,J | | | | .48% | | (15.66)% | | 15.24% | | 74.02% | | 9.10% |
Ratios to Average Net Assets C,K,L | | | | | | | | | | | | |
| Expenses before reductions | | 1.02% M | | 1.07% | | 1.08% | | 1.15% | | 1.59% | | 7.25% M,N,O |
| Expenses net of fee waivers, if any | | | | .95% | | .95% | | .99% | | 1.00% | | .97% M,N,O |
| Expenses net of all reductions | | .95% M | | .95% | | .95% | | .99% | | .98% | | .97% M,N,O |
| Net investment income (loss) | | 2.88% D,M | | 1.01% | | 1.57% | | .81% E | | .80% F | | 2.42% M,N |
| Supplemental Data | | | | | | | | | | | | |
| Net assets, end of period (000 omitted) | $ | 44,426 | $ | 51,965 | $ | 82,902 | $ | 166,545 | $ | 62,894 | $ | 3,390 |
Portfolio turnover rate P | | | | 12% | | 44% | | 50% | | 19% | | 4% M,Q |
AFor the period April 16, 2020 (commencement of operations) through May 31, 2020.
BCalculated based on average shares outstanding during the period.
CNet investment income (loss) is affected by the timing of the declaration of dividends by any underlying mutual funds or exchange-traded funds (ETFs). Net investment income (loss) of any mutual funds or ETFs is not included in the Fund's net investment income (loss) ratio.
DNet investment income per share reflects one or more large, non-recurring dividend(s) which amounted to $.16 per share. Such dividends are not annualized in the ratio of net investment income (loss) to average net assets. Excluding such non-recurring dividend(s) the ratio of net investment income (loss) to average net assets would have been 1.11%.
ENet investment income per share reflects one or more large, non-recurring dividend(s) which amounted to $.05 per share. Excluding such non-recurring dividend(s), the ratio of net investment income (loss) to average net assets would have been .55%.
FNet investment income per share reflects one or more large, non-recurring dividend(s) which amounted to $.04 per share. Excluding such non-recurring dividend(s), the ratio of net investment income (loss) to average net assets would have been .57%.
GThe amount shown for a share outstanding does not correspond with the aggregate net gain (loss) on investments for the period due to the timing of sales and repurchases of shares in relation to fluctuating market values of the investments of the Fund.
HAmount represents less than $.005 per share.
ITotal returns for periods of less than one year are not annualized.
JTotal returns would have been lower if certain expenses had not been reduced during the applicable periods shown.
KFees and expenses of any underlying mutual funds or exchange-traded funds (ETFs) are not included in the Fund's expense ratio. The Fund indirectly bears its proportionate share of these expenses. For additional expense information related to investments in Fidelity Central Funds, please refer to the "Investments in Fidelity Central Funds" note found in the Notes to Financial Statements section of the most recent Annual or Semi-Annual report.
LExpense ratios reflect operating expenses of the class. Expenses before reductions do not reflect amounts reimbursed, waived, or reduced through arrangements with the investment adviser, brokerage services, or other offset arrangements, if applicable, and do not represent the amount paid by the class during periods when reimbursements, waivers or reductions occur.
MAnnualized.
NAudit fees are not annualized.
OThe size and fluctuation of net assets and expense amounts may cause ratios to differ from contractual rates.
PAmount does not include the portfolio activity of any underlying mutual funds or exchange-traded funds (ETFs), derivatives or securities that mature within one year from acquisition.
QAmount not annualized.
Fidelity® Water Sustainability Fund
Schedule of Investments November 30, 2024 (Unaudited)
Showing Percentage of Net Assets
| Common Stocks - 97.8% |
| | | Shares | Value ($) |
| ENERGY - 0.8% | | | |
| Energy Equipment & Services - 0.8% | | | |
| TETRA Technologies, Inc. (a) | | 235,376 | 906,198 |
| INDUSTRIALS - 57.7% | | | |
| Building Products - 8.2% | | | |
| Advanced Drain Systems, Inc. | | 37,577 | 5,083,792 |
| Geberit AG (Reg.) | | 6,671 | 4,016,458 |
| | | | 9,100,250 |
| Commercial Services & Supplies - 3.0% | | | |
| Montrose Environmental Group, Inc. (a) | | 11,404 | 214,623 |
| Tetra Tech, Inc. | | 17,335 | 719,576 |
| Veralto Corp. | | 22,827 | 2,469,653 |
| | | | 3,403,852 |
| Machinery - 38.9% | | | |
| Chart Industries, Inc. (a) | | 28,874 | 5,579,901 |
| Crane Co. | | 6,817 | 1,241,239 |
| Dover Corp. | | 6,258 | 1,288,522 |
| Energy Recovery, Inc. (a) | | 86,491 | 1,345,800 |
| Georg Fischer AG (Reg.) | | 23,262 | 1,803,501 |
| Ingersoll Rand, Inc. | | 48,827 | 5,086,309 |
| Interpump Group SpA | | 17,200 | 800,839 |
| ITT, Inc. | | 7,291 | 1,138,271 |
| Kurita Water Industries Ltd. | | 59,318 | 2,259,884 |
| Mueller Water Products, Inc. | | 167,183 | 4,186,262 |
| Organo Corp. | | 11,799 | 671,908 |
| Parker Hannifin Corp. | | 1,733 | 1,218,126 |
| Pentair PLC | | 89,067 | 9,707,412 |
| Watts Water Technologies, Inc. Class A | | 12,951 | 2,794,696 |
| Xylem, Inc. | | 32,965 | 4,178,314 |
| | | | 43,300,984 |
| Professional Services - 2.4% | | | |
| KBR, Inc. | | 36,507 | 2,220,721 |
| Parsons Corp. (a) | | 4,761 | 456,628 |
| | | | 2,677,349 |
| Trading Companies & Distributors - 5.2% | | | |
| Core & Main, Inc. Class A (a) | | 118,317 | 5,744,290 |
TOTAL INDUSTRIALS | | | 64,226,725 |
| INFORMATION TECHNOLOGY - 2.7% | | | |
| Electronic Equipment, Instruments & Components - 1.4% | | | |
| Badger Meter, Inc. | | 7,369 | 1,597,747 |
| Software - 1.3% | | | |
| Roper Technologies, Inc. | | 2,450 | 1,387,778 |
TOTAL INFORMATION TECHNOLOGY | | | 2,985,525 |
| MATERIALS - 2.4% | | | |
| Chemicals - 2.4% | | | |
| Ecolab, Inc. | | 10,560 | 2,627,011 |
| UTILITIES - 34.2% | | | |
| Multi-Utilities - 4.4% | | | |
| Veolia Environnement SA | | 169,985 | 4,955,176 |
| Water Utilities - 29.8% | | | |
| American Water Works Co., Inc. | | 38,912 | 5,328,609 |
| Companhia de Saneamento Basico do Estado de Sao Paulo (SABESP) | | 137,905 | 2,102,451 |
| Companhia de Saneamento Basico do Estado de Sao Paulo (SABESP) sponsored ADR | | 113,416 | 1,730,728 |
| Essential Utilities, Inc. | | 169,329 | 6,778,240 |
| Pennon Group PLC | | 148,543 | 1,139,752 |
| Severn Trent PLC | | 220,002 | 7,550,023 |
| United Utilities Group PLC | | 595,104 | 8,477,303 |
| | | | 33,107,106 |
TOTAL UTILITIES | | | 38,062,282 |
| TOTAL COMMON STOCKS (Cost $87,693,130) | | | 108,807,741 |
| | | | |
| Money Market Funds - 1.8% |
| | | Shares | Value ($) |
Fidelity Cash Central Fund 4.64% (b) (Cost $1,989,909) | | 1,989,512 | 1,989,909 |
| | | | |
| TOTAL INVESTMENT IN SECURITIES - 99.6% (Cost $89,683,039) | 110,797,650 |
NET OTHER ASSETS (LIABILITIES) - 0.4% | 415,164 |
| NET ASSETS - 100.0% | 111,212,814 |
| | |
Legend
| (b) | Affiliated fund that is generally available only to investment companies and other accounts managed by Fidelity Investments. The rate quoted is the annualized seven-day yield of the fund at period end. A complete unaudited listing of the fund's holdings as of its most recent quarter end is available upon request. In addition, each Fidelity Central Fund's financial statements are available on the SEC's website or upon request. |
Affiliated Central Funds
Fiscal year to date information regarding the Fund's investments in Fidelity Central Funds, including the ownership percentage, is presented below.
| Affiliate | Value, beginning of period ($) | Purchases ($) | Sales Proceeds ($) | Dividend Income ($) | Realized Gain (loss) ($) | Change in Unrealized appreciation (depreciation) ($) | Value, end of period ($) | % ownership, end of period |
| Fidelity Cash Central Fund 4.64% | 822,232 | 21,548,483 | 20,380,806 | 35,703 | - | - | 1,989,909 | 0.0% |
| Total | 822,232 | 21,548,483 | 20,380,806 | 35,703 | - | - | 1,989,909 | |
| | | | | | | | | |
Amounts in the dividend income column in the above table include any capital gain distributions from underlying funds, which are presented in the corresponding line item in the Statement of Operations, if applicable.
Amounts included in the purchases and sales proceeds columns may include in-kind transactions, if applicable.
Investment Valuation
The following is a summary of the inputs used, as of November 30, 2024, involving the Fund's assets and liabilities carried at fair value. The inputs or methodology used for valuing securities may not be an indication of the risk associated with investing in those securities. For more information on valuation inputs, and their aggregation into the levels used below, please refer to the Investment Valuation section in the accompanying Notes to Financial Statements.
| Valuation Inputs at Reporting Date: |
| Description | Total ($) | Level 1 ($) | Level 2 ($) | Level 3 ($) |
Investments in Securities: | | | | |
|
| Equities: | | | | |
Energy | 906,198 | 906,198 | - | - |
Industrials | 64,226,725 | 64,226,725 | - | - |
Information Technology | 2,985,525 | 2,985,525 | - | - |
Materials | 2,627,011 | 2,627,011 | - | - |
Utilities | 38,062,282 | 33,107,106 | 4,955,176 | - |
|
| Money Market Funds | 1,989,909 | 1,989,909 | - | - |
| Total Investments in Securities: | 110,797,650 | 105,842,474 | 4,955,176 | - |
Fidelity® Water Sustainability Fund
Financial Statements (Unaudited)
| Statement of Assets and Liabilities |
| As of November 30, 2024 (Unaudited) |
| Assets | | | | |
| Investment in securities, at value - See accompanying schedule: | | | | |
Unaffiliated issuers (cost $87,693,130) | $ | 108,807,741 | | |
Fidelity Central Funds (cost $1,989,909) | | 1,989,909 | | |
| | | | | |
| | | | | |
| Total Investment in Securities (cost $89,683,039) | | | $ | 110,797,650 |
| Foreign currency held at value (cost $15,980) | | | | 16,140 |
| Receivable for fund shares sold | | | | 95,088 |
| Dividends receivable | | | | 386,478 |
| Reclaims receivable | | | | 61,876 |
| Distributions receivable from Fidelity Central Funds | | | | 7,025 |
| Prepaid expenses | | | | 105 |
| Other receivables | | | | 1,456 |
Total assets | | | | 111,365,818 |
| Liabilities | | | | |
| Payable for investments purchased | $ | 18,616 | | |
| Payable for fund shares redeemed | | 22,709 | | |
| Accrued management fee | | 74,413 | | |
| Audit fee payable | | 28,712 | | |
| Other payables and accrued expenses | | 8,554 | | |
| Total liabilities | | | | 153,004 |
| Net Assets | | | $ | 111,212,814 |
| Net Assets consist of: | | | | |
| Paid in capital | | | $ | 88,421,148 |
| Total accumulated earnings (loss) | | | | 22,791,666 |
| Net Assets | | | $ | 111,212,814 |
Net Asset Value, offering price and redemption price per share ($111,212,814 ÷ 5,960,287 shares) | | | $ | 18.66 |
| Statement of Operations |
Six months ended November 30, 2024 (Unaudited) |
| Investment Income | | | | |
| Dividends | | | $ | 907,611 |
| Income from Fidelity Central Funds | | | | 35,703 |
| Total income | | | | 943,314 |
| Expenses | | | | |
| Management fee | $ | 427,589 | | |
| Custodian fees and expenses | | 3,634 | | |
| Independent trustees' fees and expenses | | 225 | | |
| Registration fees | | 7,337 | | |
| Audit fees | | 31,722 | | |
| Legal | | 2,651 | | |
| Miscellaneous | | 192 | | |
| Total expenses before reductions | | 473,350 | | |
| Expense reductions | | (138) | | |
| Total expenses after reductions | | | | 473,212 |
| Net Investment income (loss) | | | | 470,102 |
| Realized and Unrealized Gain (Loss) | | | | |
| Net realized gain (loss) on: | | | | |
| Investment Securities: | | | | |
| Unaffiliated issuers | | 5,122,198 | | |
| Foreign currency transactions | | 9,044 | | |
| Total net realized gain (loss) | | | | 5,131,242 |
| Change in net unrealized appreciation (depreciation) on: | | | | |
| Investment Securities: | | | | |
| Unaffiliated issuers | | 1,381,299 | | |
| Assets and liabilities in foreign currencies | | 2,947 | | |
| Total change in net unrealized appreciation (depreciation) | | | | 1,384,246 |
| Net gain (loss) | | | | 6,515,488 |
| Net increase (decrease) in net assets resulting from operations | | | $ | 6,985,590 |
| Statement of Changes in Net Assets |
| |
| | Six months ended November 30, 2024 (Unaudited) | | Year ended May 31, 2024 |
| Increase (Decrease) in Net Assets | | | | |
| Operations | | | | |
| Net investment income (loss) | $ | 470,102 | $ | 555,985 |
| Net realized gain (loss) | | 5,131,242 | | 3,970,335 |
| Change in net unrealized appreciation (depreciation) | | 1,384,246 | | 16,568,684 |
| Net increase (decrease) in net assets resulting from operations | | 6,985,590 | | 21,095,004 |
| Distributions to shareholders | | (340,989) | | (396,236) |
| | | | | |
| Share transactions | | | | |
| Proceeds from sales of shares | | 15,007,572 | | 24,604,418 |
| Reinvestment of distributions | | 302,924 | | 355,014 |
| Cost of shares redeemed | | (12,320,036) | | (28,465,333) |
| | | | | |
Net increase (decrease) in net assets resulting from share transactions | | 2,990,460 | | (3,505,901) |
| Total increase (decrease) in net assets | | 9,635,061 | | 17,192,867 |
| | | | | |
| Net Assets | | | | |
| Beginning of period | | 101,577,753 | | 84,384,886 |
| End of period | $ | 111,212,814 | $ | 101,577,753 |
| | | | | |
| Other Information | | | | |
| Shares | | | | |
| Sold | | 841,780 | | 1,559,854 |
| Issued in reinvestment of distributions | | 16,980 | | 22,941 |
| Redeemed | | (695,130) | | (1,843,034) |
| Net increase (decrease) | | 163,630 | | (260,239) |
| | | | | |
Financial Highlights
Fidelity® Water Sustainability Fund |
| |
| | Six months ended (Unaudited) November 30, 2024 | | Years ended May 31, 2024 | | 2023 | | 2022 | | 2021 | | 2020 A |
Selected Per-Share Data | | | | | | | | | | | | |
| Net asset value, beginning of period | $ | 17.52 | $ | 13.93 | $ | 13.54 | $ | 14.84 | $ | 10.75 | $ | 10.00 |
| Income from Investment Operations | | | | | | | | | | | | |
Net investment income (loss) B,C | | .08 | | .09 | | .06 | | (.04) | | .01 | | .02 |
| Net realized and unrealized gain (loss) | | 1.12 | | 3.57 | | .34 | | (1.02) | | 4.28 | | .73 |
| Total from investment operations | | 1.20 | | 3.66 | | .40 | | (1.06) | | 4.29 | | .75 |
| Distributions from net investment income | | (.06) | | (.07) | | (.01) | | - D | | (.02) | | - |
| Distributions from net realized gain | | - | | - | | - | | (.24) | | (.18) | | - |
| Total distributions | | (.06) | | (.07) | | (.01) | | (.24) | | (.20) | | - |
| Net asset value, end of period | $ | 18.66 | $ | 17.52 | $ | 13.93 | $ | 13.54 | $ | 14.84 | $ | 10.75 |
Total Return E,F | | | | 26.32% | | 2.96% | | (7.44)% | | 40.20% | | 7.50% |
Ratios to Average Net Assets C,G,H | | | | | | | | | | | | |
| Expenses before reductions | | .91% I | | 1.02% | | 1.09% | | 1.11% | | 1.44% | | 4.15% I,J,K |
| Expenses net of fee waivers, if any | | | | .95% | | .95% | | 1.00% | | 1.00% | | .97% I,J,K |
| Expenses net of all reductions | | .91% I | | .95% | | .95% | | 1.00% | | .98% | | .97% I,J,K |
| Net investment income (loss) | | .90% I | | .61% | | .41% | | (.29)% | | .11% | | 1.39% I,J,K |
| Supplemental Data | | | | | | | | | | | | |
| Net assets, end of period (000 omitted) | $ | 111,213 | $ | 101,578 | $ | 84,385 | $ | 94,233 | $ | 55,774 | $ | 4,363 |
Portfolio turnover rate L | | | | 52% | | 54% | | 55% | | 95% | | 13% M |
AFor the period April 16, 2020 (commencement of operations) through May 31, 2020.
BCalculated based on average shares outstanding during the period.
CNet investment income (loss) is affected by the timing of the declaration of dividends by any underlying mutual funds or exchange-traded funds (ETFs). Net investment income (loss) of any mutual funds or ETFs is not included in the Fund's net investment income (loss) ratio.
DAmount represents less than $.005 per share.
ETotal returns for periods of less than one year are not annualized.
FTotal returns would have been lower if certain expenses had not been reduced during the applicable periods shown.
GFees and expenses of any underlying mutual funds or exchange-traded funds (ETFs) are not included in the Fund's expense ratio. The Fund indirectly bears its proportionate share of these expenses.
HExpense ratios reflect operating expenses of the class. Expenses before reductions do not reflect amounts reimbursed, waived, or reduced through arrangements with the investment adviser, brokerage services, or other offset arrangements, if applicable, and do not represent the amount paid by the class during periods when reimbursements, waivers or reductions occur.
IAnnualized.
JThe size and fluctuation of net assets and expense amounts may cause ratios to differ from contractual rates.
KAudit fees are not annualized.
LAmount does not include the portfolio activity of any underlying mutual funds or exchange-traded funds (ETFs).
MAmount not annualized.
Notes to Financial Statements
(Unaudited)For the period ended November 30, 2024
1. Organization.
Fidelity Agricultural Productivity Fund and Fidelity Water Sustainability Fund (the Funds) are non-diversified funds of Fidelity Summer Street Trust (the Trust). Each Fund is authorized to issue an unlimited number of shares. Share transactions on the Statement of Changes in Net Assets may contain exchanges between affiliated funds. The Trust is registered under the Investment Company Act of 1940, as amended (the 1940 Act), as an open-end management investment company organized as a Massachusetts business trust.
2. Investments in Fidelity Central Funds.
Funds may invest in Fidelity Central Funds, which are open-end investment companies generally available only to other investment companies and accounts managed by the investment adviser and its affiliates. The Schedule of Investments lists any Fidelity Central Funds held as an investment as of period end, but does not include the underlying holdings of each Fidelity Central Fund. An investing fund indirectly bears its proportionate share of the expenses of the underlying Fidelity Central Funds.
Based on its investment objective, each Fidelity Central Fund may invest or participate in various investment vehicles or strategies that are similar to those of the investing fund. These strategies are consistent with the investment objectives of the investing fund and may involve certain economic risks which may cause a decline in value of each of the Fidelity Central Funds and thus a decline in the value of the investing fund.
| Fidelity Central Fund | Investment Manager | Investment Objective | Investment Practices | Expense RatioA |
| Fidelity Money Market Central Funds | Fidelity Management & Research Company LLC (FMR) | Each fund seeks to obtain a high level of current income consistent with the preservation of capital and liquidity. | Short-term Investments | Less than .005% |
A Expenses expressed as a percentage of average net assets and are as of each underlying Central Fund's most recent annual or semi-annual shareholder report.
A complete unaudited list of holdings for each Fidelity Central Fund is available upon request or at the Securities and Exchange Commission website at www.sec.gov. In addition, the financial statements of the Fidelity Central Funds which contain the significant accounting policies (including investment valuation policies) of those funds, and are not covered by the Report of Independent Registered Public Accounting Firm, are available on the Securities and Exchange Commission website or upon request.
3. Significant Accounting Policies.
Each Fund is an investment company and applies the accounting and reporting guidance of the Financial Accounting Standards Board (FASB) Accounting Standards Codification Topic 946 Financial Services - Investment Companies. The financial statements have been prepared in conformity with accounting principles generally accepted in the United States of America (GAAP), which require management to make certain estimates and assumptions at the date of the financial statements. Actual results could differ from those estimates. Subsequent events, if any, through the date that the financial statements were issued have been evaluated in the preparation of the financial statements. Each Fund's Schedule of Investments lists any underlying mutual funds or exchange-traded funds (ETFs) but does not include the underlying holdings of these funds. The following summarizes the significant accounting policies of each Fund:
Investment Valuation. Investments are valued as of 4:00 p.m. Eastern time on the last calendar day of the period. The Board of Trustees (the Board) has designated each Fund's investment adviser as the valuation designee responsible for the fair valuation function and performing fair value determinations as needed. The investment adviser has established a Fair Value Committee (the Committee) to carry out the day-to-day fair valuation responsibilities and has adopted policies and procedures to govern the fair valuation process and the activities of the Committee. In accordance with these fair valuation policies and procedures, which have been approved by the Board, each Fund attempts to obtain prices from one or more third party pricing services or brokers to value its investments. When current market prices, quotations or currency exchange rates are not readily available or reliable, investments will be fair valued in good faith by the Committee, in accordance with the policies and procedures. Factors used in determining fair value vary by investment type and may include market or investment specific events, transaction data, estimated cash flows, and market observations of comparable investments. The frequency that the fair valuation procedures are used cannot be predicted and they may be utilized to a significant extent. The Committee manages each Fund's fair valuation practices and maintains the fair valuation policies and procedures. Each Fund's investment adviser reports to the Board information regarding the fair valuation process and related material matters.
Each Fund categorizes the inputs to valuation techniques used to value its investments into a disclosure hierarchy consisting of three levels as shown below:
Level 1 - unadjusted quoted prices in active markets for identical investments
Level 2 - other significant observable inputs (including quoted prices for similar investments, interest rates, prepayment speeds, etc.)
Level 3 - unobservable inputs (including the Fund's own assumptions based on the best information available)
Valuation techniques used to value each Fund's investments by major category are as follows:
Equity securities, including restricted securities, for which market quotations are readily available, are valued at the last reported sale price or official closing price as reported by a third party pricing service on the primary market or exchange on which they are traded and are categorized as Level 1 in the hierarchy. In the event there were no sales during the day or closing prices are not available, securities are valued at the last quoted bid price or may be valued using the last available price and are generally categorized as Level 2 in the hierarchy. For foreign equity securities, when market or security specific events arise, comparisons to the valuation of American Depositary Receipts (ADRs), futures contracts, Exchange-Traded Funds (ETFs) and certain indexes as well as quoted prices for similar securities may be used and would be categorized as Level 2 in the hierarchy. For equity securities, including restricted securities, where observable inputs are limited, assumptions about market activity and risk are used and these securities may be categorized as Level 3 in the hierarchy.
Investments in open-end mutual funds, including the Fidelity Central Funds, are valued at their closing net asset value (NAV) each business day and are categorized as Level 1 in the hierarchy.
Changes in valuation techniques may result in transfers in or out of an assigned level within the disclosure hierarchy. The aggregate value of investments by input level as of November 30, 2024 is included at the end of each Fund's Schedule of Investments.
Foreign Currency. Certain Funds may use foreign currency contracts to facilitate transactions in foreign-denominated securities. Gains and losses from these transactions may arise from changes in the value of the foreign currency or if the counterparties do not perform under the contracts' terms.
Foreign-denominated assets, including investment securities, and liabilities are translated into U.S. dollars at the exchange rates at period end. Purchases and sales of investment securities, income and dividends received, and expenses denominated in foreign currencies are translated into U.S. dollars at the exchange rate in effect on the transaction date.
The effects of exchange rate fluctuations on investments are included with the net realized and unrealized gain (loss) on investment securities. Other foreign currency transactions resulting in realized and unrealized gain (loss) are disclosed separately.
Investment Transactions and Income. For financial reporting purposes, the Funds' investment holdings and NAV include trades executed through the end of the last business day of the period. The NAV per share for processing shareholder transactions is calculated as of the close of business of the New York Stock Exchange (NYSE), normally 4:00 p.m. Eastern time and includes trades executed through the end of the prior business day. Gains and losses on securities sold are determined on the basis of identified cost. Commissions paid to certain brokers with whom the investment adviser, or its affiliates, places trades on behalf of a fund include an amount in addition to trade execution, which may be rebated back to a fund. Any such rebates are included in net realized gain (loss) on investments in the Statement of Operations. Dividend income is recorded on the ex-dividend date, except for certain dividends from foreign securities where the ex-dividend date may have passed, which are recorded as soon as the Funds are informed of the ex-dividend date. Non-cash dividends included in dividend income, if any, are recorded at the fair market value of the securities received. Income and capital gain distributions from Fidelity Central Funds, if any, are recorded on the ex-dividend date. Large, non-recurring dividends recognized by the Funds are presented separately on the Statement of Operations as "Special Dividends" and the impact of these dividends is presented in the Financial Highlights. Investment income is recorded net of foreign taxes withheld where recovery of such taxes is uncertain. Funds may file withholding tax reclaims in certain jurisdictions to recover a portion of amounts previously withheld. Any withholding tax reclaims income is included in the Statement of Operations in dividends. Any receivables for withholding tax reclaims are included in the Statement of Assets and Liabilities in dividends receivable.
Expenses. Expenses directly attributable to a fund are charged to that fund. Expenses attributable to more than one fund are allocated among the respective funds on the basis of relative net assets or other appropriate methods. Expenses included in the accompanying financial statements reflect the expenses of that fund and do not include any expenses associated with any underlying mutual funds or exchange-traded funds. Although not included in a fund's expenses, a fund indirectly bears its proportionate share of these expenses through the net asset value of each underlying mutual fund or exchange-traded fund. Expense estimates are accrued in the period to which they relate and adjustments are made when actual amounts are known.
Income Tax Information and Distributions to Shareholders. Each year, each Fund intends to qualify as a regulated investment company under Subchapter M of the Internal Revenue Code, including distributing substantially all of its taxable income and realized gains. As a result, no provision for U.S. Federal income taxes is required. Each Fund files a U.S. federal tax return, in addition to state and local tax returns as required. Each Fund's federal income tax returns are subject to examination by the Internal Revenue Service (IRS) for a period of three fiscal years after they are filed. State and local tax returns may be subject to examination for an additional fiscal year depending on the jurisdiction. Foreign taxes are provided for based on each Fund's understanding of the tax rules and rates that exist in the foreign markets in which it invests.
Distributions are declared and recorded on the ex-dividend date. Income and capital gain distributions are determined in accordance with income tax regulations, which may differ from GAAP.
Capital accounts within the financial statements are adjusted for permanent book-tax differences. These adjustments have no impact on net assets or the results of operations. Capital accounts are not adjusted for temporary book-tax differences which will reverse in a subsequent period.
Book-tax differences are primarily due to foreign currency transactions, capital loss carryforwards and losses deferred due to wash sales.
As of period end, the cost and unrealized appreciation (depreciation) in securities, and derivatives if applicable, for federal income tax purposes were as follows for each Fund:
| | Tax cost ($) | Gross unrealized appreciation ($) | Gross unrealized depreciation ($) | Net unrealized appreciation (depreciation)($) |
| Fidelity Agricultural Productivity Fund | 36,916,169 | 11,634,021 | (3,464,194) | 8,169,827 |
| Fidelity Water Sustainability Fund | 89,733,389 | 23,799,778 | (2,735,517) | 21,064,261 |
Capital loss carryforwards are only available to offset future capital gains of the Funds to the extent provided by regulations and may be limited. The capital loss carryforward information presented below, including any applicable limitation, is estimated as of prior fiscal period end and is subject to adjustment.
| | Short-term ($) | Long-term ($) | Total capital loss carryforward ($) |
| Fidelity Agricultural Productivity Fund | (19,152,898) | (2,419,618) | (21,572,516) |
| Fidelity Water Sustainability Fund | (3,863,801) | - | (3,863,801) |
| | | | |
Restricted Securities (including Private Placements). Funds may invest in securities that are subject to legal or contractual restrictions on resale. These securities generally may be resold in transactions exempt from registration or to the public if the securities are registered. Disposal of these securities may involve time-consuming negotiations and expense, and prompt sale at an acceptable price may be difficult. Information regarding restricted securities held at period end is included at the end of the Schedule of Investments, if applicable.
New Accounting Pronouncement. In November 2023, the FASB issued Accounting Standards Update (ASU) 2023-07 Segment Reporting (Topic 280): Improvements to Reportable Segment Disclosures. Effective for fiscal years beginning after December 15, 2023 and interim periods within fiscal years beginning after December 15, 2024, the amendments enhance required disclosures of segment information for public entities on an annual and interim basis. The ASU allows for early adoption with updates applied retrospectively. Management is currently evaluating the impact of the ASU but does not expect this guidance to materially impact the financial statements.
4. Purchases and Sales of Investments.
Purchases and sales of securities, other than short-term securities and in-kind transactions, as applicable, are noted in the table below.
| | Purchases ($) | Sales ($) |
| Fidelity Agricultural Productivity Fund | 1,832,256 | 11,804,026 |
| Fidelity Water Sustainability Fund | 28,981,820 | 27,207,045 |
5. Fees and Other Transactions with Affiliates.
Management Fee. Fidelity Management & Research Company LLC (the investment adviser) and its affiliates provide the Funds with investment management related services for which each Fund pays a monthly management fee.
Any reference to "class" in this note shall mean each "Fund" as each Fund currently offers only one class of shares. Each Fund's management contract incorporates a management fee rate that may vary by class. The investment adviser or an affiliate pays certain expenses of managing and operating each Fund out of each class's management fee. Each class of each Fund pays a management fee to the investment adviser. The management fee is calculated and paid to the investment adviser every month. When determining a class's management fee, a mandate rate is calculated based on the monthly average net assets of a group of funds advised by FMR within a designated asset class. A discount rate is subtracted from the mandate rate once each Fund's monthly average net assets reach a certain level. The mandate rate and discount rate may vary by class. The annual management fee rate for a class of shares of each Fund is the lesser of (1) the class's mandate rate reduced by the class's discount rate (if applicable) or (2) the amount set forth in the following table.
| | Maximum Management Fee Rate % |
| Fidelity Agricultural Productivity Fund | .88 |
| Fidelity Water Sustainability Fund | .88 |
One-twelfth of the management fee rate for a class is applied to the average net assets of the class for the month, giving a dollar amount which is the management fee for the class for that month. A different management fee rate may be applicable to each class of each Fund. The difference between classes is the result of separate arrangements for class-level services and/or waivers of certain expenses. It is not the result of any difference in advisory or custodial fees or other expenses related to the management of each Fund's assets, which do not vary by class. For the reporting period, the total annualized management fee rates were as follows:
| | Total Management Fee Rate % |
| Fidelity Agricultural Productivity Fund | .82 |
| Fidelity Water Sustainability Fund | .82 |
Interfund Trades. Funds may purchase from or sell securities to other Fidelity Funds under procedures adopted by the Board. The procedures have been designed to ensure these interfund trades are executed in accordance with Rule 17a-7 of the 1940 Act. Any interfund trades are included within the respective purchases and sales amounts shown in the Purchases and Sales of Investments note. Interfund trades during the period are noted in the table below.
| | Purchases ($) | Sales ($) | Realized Gain (Loss)($) |
| Fidelity Agricultural Productivity Fund | 132,116 | 12,818 | 1,883 |
| Fidelity Water Sustainability Fund | 1,091,571 | - | - |
Brokerage Commissions. A portion of portfolio transactions were placed with brokerage firms which are affiliates of the investment adviser. Brokerage commissions are included in net realized gain (loss) and change in net unrealized appreciation (depreciation) in the Statement of Operations. The commissions paid to these affiliated firms were as follows:
| | Amount ($) |
| Fidelity Agricultural Productivity Fund | 69 |
| Fidelity Water Sustainability Fund | 602 |
6. Committed Line of Credit.
Certain Funds participate with other funds managed by the investment adviser or an affiliate in a $4.25 billion credit facility (the "line of credit") to be utilized for temporary or emergency purposes to fund shareholder redemptions or for other short-term liquidity purposes. The participating funds have agreed to pay commitment fees on their pro-rata portion of the line of credit, which are reflected in Miscellaneous expenses on the Statement of Operations, and are listed below. During the period, there were no borrowings on this line of credit.
| | Amount ($) |
| Fidelity Agricultural Productivity Fund | 33 |
| Fidelity Water Sustainability Fund | 68 |
7. Security Lending.
Funds lend portfolio securities from time to time in order to earn additional income. Lending agents are used, including National Financial Services (NFS), an affiliate of the investment adviser. Pursuant to a securities lending agreement, NFS will receive a fee, which is capped at 9.9% of a fund's daily lending revenue, for its services as lending agent. A fund may lend securities to certain qualified borrowers, including NFS. On the settlement date of the loan, a fund receives collateral (in the form of U.S. Treasury obligations, letters of credit and/or cash) against the loaned securities and maintains collateral in an amount not less than 100% of the market value of the loaned securities during the period of the loan. The market value of the loaned securities is determined at the close of business of a fund and any additional required collateral is delivered to a fund on the next business day. A fund or borrower may terminate the loan at any time, and if the borrower defaults on its obligation to return the securities loaned because of insolvency or other reasons, a fund may apply collateral received from the borrower against the obligation. A fund may experience delays and costs in recovering the securities loaned. Any cash collateral received is invested in the Fidelity Securities Lending Cash Central Fund. Any loaned securities are identified as such in the Schedule of Investments, and the value of loaned securities and cash collateral at period end, as applicable, are presented in the Statement of Assets and Liabilities. Security lending income represents the income earned on investing cash collateral, less rebates paid to borrowers and any lending agent fees associated with the loan, plus any premium payments received for lending certain types of securities. Security lending income is presented in the Statement of Operations as a component of income from Fidelity Central Funds. Affiliated security lending activity, if any, was as follows:
| | Total Security Lending Fees Paid to NFS ($) | Security Lending Income From Securities Loaned to NFS ($) | Value of Securities Loaned to NFS at Period End ($) |
| Fidelity Agricultural Productivity Fund | 272 | - | - |
8. Expense Reductions.
The investment adviser contractually agreed to reimburse expenses of each Fund to the extent annual operating expenses exceeded certain levels of average net assets as noted in the table below. This reimbursement will remain in place through September 30, 2025. Some expenses, for example the compensation of the independent Trustees, and certain miscellaneous expenses such as proxy and shareholder meeting expenses, are excluded from this reimbursement.
Fidelity Agricultural Productivity Fund was in reimbursement during the period:
| | Expense Limitations | Reimbursement ($) |
| Fidelity Agricultural Productivity Fund | .95% | 15,530 |
Through arrangements with each applicable Fund's custodian, credits realized as a result of certain uninvested cash balances were used to reduce each applicable Fund's expenses. All of the applicable expense reductions are noted in the table below.
| | Brokerage service rebates ($) | Custodian credits ($) | Transfer Agent credits ($) |
| Fidelity Water Sustainability Fund | - | 138 | - |
9. Other.
A fund's organizational documents provide former and current trustees and officers with a limited indemnification against liabilities arising in connection with the performance of their duties to the fund. In the normal course of business, a fund may also enter into contracts that provide general indemnifications. A fund's maximum exposure under these arrangements is unknown as this would be dependent on future claims that may be made against a fund. The risk of material loss from such claims is considered remote.
10. Risk and Uncertainties.
Many factors affect a fund's performance. Developments that disrupt global economies and financial markets, such as pandemics, epidemics, outbreaks of infectious diseases, war, terrorism, and environmental disasters, may significantly affect a fund's investment performance. The effects of these developments to a fund will be impacted by the types of securities in which a fund invests, the financial condition, industry, economic sector, and geographic location of an issuer, and a fund's level of investment in the securities of that issuer. Significant concentrations in security types, issuers, industries, sectors, and geographic locations may magnify the factors that affect a fund's performance.
Item 8: Changes in and Disagreements with Accountants for Open-End Management Investment Companies
(Unaudited)
Note: This is not applicable for any fund included in this document.
Item 9: Proxy Disclosures for Open-End Management Investment Companies
(Unaudited)
| A special meeting of shareholders was held on July 16, 2024. The results of votes taken among shareholders on the proposal before them are reported below. Each vote reported represents one dollar of net asset value held on the record date for the meeting. |
| Proposal 1 |
| To elect a Board of Trustees. |
| | # of Votes | % of Votes |
| Bettina Doulton |
| Affirmative | 14,516,835,136.19 | 94.56 |
| Withheld | 834,887,998.33 | 5.44 |
| TOTAL | 15,351,723,134.52 | 100.00 |
| Robert A. Lawrence |
| Affirmative | 14,430,495,798.10 | 94.00 |
| Withheld | 921,227,336.42 | 6.00 |
| TOTAL | 15,351,723,134.52 | 100.00 |
| Vijay C. Advani |
| Affirmative | 14,465,231,640.25 | 94.23 |
| Withheld | 886,491,494.27 | 5.77 |
| TOTAL | 15,351,723,134.52 | 100.00 |
| Thomas P. Bostick |
| Affirmative | 14,471,831,170.84 | 94.27 |
| Withheld | 879,891,963.68 | 5.73 |
| TOTAL | 15,351,723,134.52 | 100.00 |
| Donald F. Donahue |
| Affirmative | 14,432,670,599.88 | 94.01 |
| Withheld | 919,052,534.64 | 5.99 |
| TOTAL | 15,351,723,134.52 | 100.00 |
| Vicki L. Fuller |
| Affirmative | 14,531,407,981.65 | 94.66 |
| Withheld | 820,315,152.87 | 5.34 |
| TOTAL | 15,351,723,134.52 | 100.00 |
| Patricia L. Kampling |
| Affirmative | 14,549,142,839.16 | 94.77 |
| Withheld | 802,580,295.36 | 5.23 |
| TOTAL | 15,351,723,134.52 | 100.00 |
| Thomas A. Kennedy |
| Affirmative | 14,469,818,769.40 | 94.26 |
| Withheld | 881,904,365.12 | 5.74 |
| TOTAL | 15,351,723,134.52 | 100.00 |
| Oscar Munoz |
| Affirmative | 14,434,061,467.08 | 94.02 |
| Withheld | 917,661,667.44 | 5.98 |
| TOTAL | 15,351,723,134.52 | 100.00 |
| Karen B. Peetz |
| Affirmative | 14,521,904,618.46 | 94.59 |
| Withheld | 829,818,516.06 | 5.41 |
| TOTAL | 15,351,723,134.52 | 100.00 |
| David M. Thomas |
| Affirmative | 14,417,745,861.73 | 93.92 |
| Withheld | 933,977,272.79 | 6.08 |
| TOTAL | 15,351,723,134.52 | 100.00 |
| Susan Tomasky |
| Affirmative | 14,467,973,468.18 | 94.24 |
| Withheld | 883,749,666.34 | 5.76 |
| TOTAL | 15,351,723,134.52 | 100.00 |
| Michael E. Wiley |
| Affirmative | 14,424,002,796.91 | 93.96 |
| Withheld | 927,720,337.61 | 6.04 |
| TOTAL | 15,351,723,134.52 | 100.00 |
| | | |
| Proposal 1 reflects trust-wide proposal and voting results. |
Item 10: Remuneration Paid to Directors, Officers, and others of Open-End Management Investment Companies
(Unaudited)
Note: This information is disclosed as part of the financial statements for each Fund as part of Item 7: Financial Statements and Financial Highlights for Open-End Management Investment companies.
Item 11: Statement Regarding Basis for Approval of Investment Advisory Contract
(Unaudited)
Note: This is not applicable for any fund included in this document.
1.9897394.104
DAS-DSW-SANN-0125
Item 8.
Changes in and Disagreements with Accountants for Open-End Management Investment Companies
See Item 7.
Item 9.
Proxy Disclosures for Open-End Management Investment Companies
See Item 7.
Item 10.
Remuneration Paid to Directors, Officers, and Others of Open-End Management Investment Companies
See Item 7.
Item 11.
Statement Regarding Basis for Approval of Investment Advisory Contract
See Item 7.
Item 12.
Disclosure of Proxy Voting Policies and Procedures for Closed-End Management Investment Companies
Not applicable.
Item 13.
Portfolio Managers of Closed-End Management Investment Companies
Not applicable.
Item 14.
Purchases of Equity Securities by Closed-End Management Investment Company and Affiliated Purchasers
Not applicable.
Item 15.
Submission of Matters to a Vote of Security Holders
There were no material changes to the procedures by which shareholders may recommend nominees to the Fidelity Summer Street Trust’s Board of Trustees.
Item 16.
Controls and Procedures
(a)(i) The President and Treasurer and the Chief Financial Officer have concluded that the Fidelity Summer Street Trust’s (the “Trust”) disclosure controls and procedures (as defined in Rule 30a-3(c) under the Investment Company Act) provide reasonable assurances that material information relating to the Trust is made known to them by the appropriate persons, based on their evaluation of these controls and procedures as of a date within 90 days of the filing date of this report.
(a)(ii) There was no change in the Trust’s internal control over financial reporting (as defined in Rule 30a-3(d) under the Investment Company Act) that occurred during the period covered by this report that has materially affected, or is reasonably likely to materially affect, the Trust’s internal control over financial reporting.
Item 17.
Disclosure of Securities Lending Activities for Closed-End Management Investment Companies
Not applicable.
Item 18.
Recovery of Erroneously Awarded Compensation
(a)
Not applicable.
(b)
Not applicable.
Item 19.
Exhibits
SIGNATURES
Pursuant to the requirements of the Securities Exchange Act of 1934 and the Investment Company Act of 1940, the registrant has duly caused this report to be signed on its behalf by the undersigned, thereunto duly authorized.
Fidelity Summer Street Trust
|
By: | /s/Stacie M. Smith |
| Stacie M. Smith |
| President and Treasurer (Principal Executive Officer) |
|
|
Date: | January 22, 2025 |
Pursuant to the requirements of the Securities Exchange Act of 1934 and the Investment Company Act of 1940, this report has been signed below by the following persons on behalf of the registrant and in the capacities and on the dates indicated.
|
By: | /s/Stacie M. Smith |
| Stacie M. Smith |
| President and Treasurer (Principal Executive Officer) |
|
|
Date: | January 22, 2025 |
|
By: | /s/Stephanie Caron |
| Stephanie Caron |
| Chief Financial Officer (Principal Financial Officer) |
|
|
Date: | January 22, 2025 |