UNITED STATES
SECURITIES AND EXCHANGE COMMISSION
Washington, D.C. 20549
FORM N-CSR
CERTIFIED SHAREHOLDER REPORT OF REGISTERED
MANAGEMENT INVESTMENT COMPANIES
Investment Company Act file number 811-02737
Fidelity Summer Street Trust
(Exact name of registrant as specified in charter)
245 Summer St., Boston, MA 02210
(Address of principal executive offices) (Zip code)
Nicole Macarchuk, Secretary
245 Summer St.
Boston, Massachusetts 02210
(Name and address of agent for service)
Registrant's telephone number, including area code:
617-563-7000
| |
Date of fiscal year end: | April 30 |
|
|
Date of reporting period: | October 31, 2024 |
Item 1.
Reports to Stockholders
| |
| | SEMI-ANNUAL SHAREHOLDER REPORT | AS OF OCTOBER 31, 2024 | |
| | Fidelity® Women's Leadership Fund Fidelity® Women's Leadership Fund : FWOMX |
| | | |
This semi-annual shareholder report contains information about Fidelity® Women's Leadership Fund for the period May 1, 2024 to October 31, 2024. You can find additional information about the Fund at fundresearch.fidelity.com/prospectus/sec. You can also request this information by contacting us at 1-800-544-8544 or by sending an e-mail to fidfunddocuments@fidelity.com.
What were your Fund costs for the last six months?(based on hypothetical $10,000 investment)
| | Costs of a $10,000 investment | Costs paid as a percentage of a $10,000 investment | |
| Fidelity® Women's Leadership Fund | $ 34 | 0.66% | |
Key Fund Statistics(as of October 31, 2024)
KEY FACTS | | |
| Fund Size | $148,487,329 | |
| Number of Holdings | 113 | |
| Portfolio Turnover | 26% | |
What did the Fund invest in?
(as of October 31, 2024)
MARKET SECTORS (% of Fund's net assets) | | |
| Information Technology | 30.0 | |
| Financials | 13.2 | |
| Health Care | 13.0 | |
| Industrials | 11.5 | |
| Consumer Discretionary | 11.3 | |
| Communication Services | 6.1 | |
| Materials | 3.8 | |
| Consumer Staples | 3.2 | |
| Energy | 2.9 | |
| Real Estate | 1.9 | |
| Utilities | 1.0 | |
| |
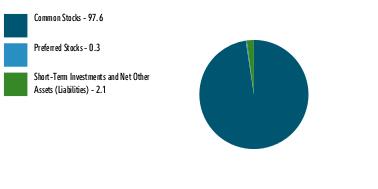
| Common Stocks | 97.6 |
| Preferred Stocks | 0.3 |
| Short-Term Investments and Net Other Assets (Liabilities) | 2.1 |
ASSET ALLOCATION (% of Fund's net assets) |
|
|
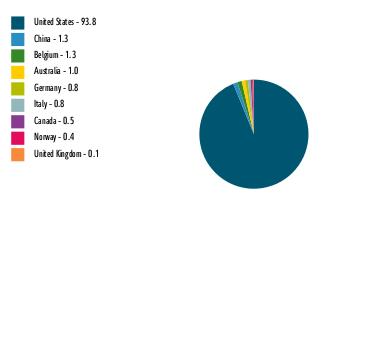
| United States | 93.8 |
| China | 1.3 |
| Belgium | 1.3 |
| Australia | 1.0 |
| Germany | 0.8 |
| Italy | 0.8 |
| Canada | 0.5 |
| Norway | 0.4 |
| United Kingdom | 0.1 |
GEOGRAPHIC DIVERSIFICATION (% of Fund's net assets) |
|
| |
|
TOP HOLDINGS(% of Fund's net assets) | | |
| Apple Inc | 4.4 | |
| NVIDIA Corp | 3.7 | |
| Microsoft Corp | 3.6 | |
| Amazon.com Inc | 2.6 | |
| Accenture Capital Inc Class A | 2.1 | |
| Walt Disney Co/The | 2.0 | |
| Salesforce Inc | 1.8 | |
| Hologic Inc | 1.7 | |
| JPMorgan Chase & Co | 1.7 | |
| Progressive Corp/The | 1.6 | |
| | 25.2 | |
| Fidelity, the Fidelity Investments Logo and all other Fidelity trademarks or service marks used herein are trademarks or service marks of FMR LLC. Any third-party marks that are used herein are trademarks or service marks of their respective owners. © 2024 FMR LLC. All rights reserved. |
| | For additional information about the Fund; including its prospectus, financial information, holdings and proxy information, scan the QR code or visit fundresearch.fidelity.com/prospectus/sec 1.9915099.100 3396-TSRS-1224 |
| |
| | SEMI-ANNUAL SHAREHOLDER REPORT | AS OF OCTOBER 31, 2024 | |
| | Fidelity® High Income Fund Fidelity Advisor® High Income Fund Class Z : FGUMX |
| | | |
This semi-annual shareholder report contains information about Fidelity® High Income Fund for the period May 1, 2024 to October 31, 2024. You can find additional information about the Fund at fundresearch.fidelity.com/prospectus/sec. You can also request this information by contacting us at 1-877-208-0098 or by sending an e-mail to fidfunddocuments@fidelity.com.
What were your Fund costs for the last six months?(based on hypothetical $10,000 investment)
| | Costs of a $10,000 investment | Costs paid as a percentage of a $10,000 investment | |
| Class Z | $ 31 | 0.60% | |
Key Fund Statistics(as of October 31, 2024)
KEY FACTS | | |
| Fund Size | $2,767,692,910 | |
| Number of Holdings | 926 | |
| Portfolio Turnover | 59% | |
What did the Fund invest in?
(as of October 31, 2024)
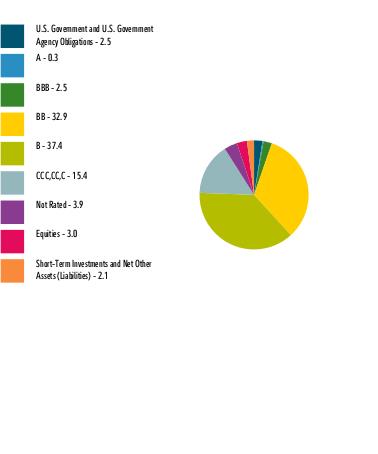
| U.S. Government and U.S. Government Agency Obligations | 2.5 |
| A | 0.3 |
| BBB | 2.5 |
| BB | 32.9 |
| B | 37.4 |
| CCC,CC,C | 15.4 |
| Not Rated | 3.9 |
| Equities | 3.0 |
| Short-Term Investments and Net Other Assets (Liabilities) | 2.1 |
QUALITY DIVERSIFICATION (% of Fund's net assets) |
|
| |
| We have used ratings from Moody's Investors Service, Inc. Where Moody's® ratings are not available, we have used S&P® ratings. All ratings are as of the date indicated and do not reflect subsequent changes. |
| Corporate Bonds | 86.1 |
| Bank Loan Obligations | 4.3 |
| U.S. Treasury Obligations | 2.5 |
| Common Stocks | 1.9 |
| Preferred Securities | 1.7 |
| Alternative Funds | 1.1 |
| Asset-Backed Securities | 0.2 |
| CMOs and Other Mortgage Related Securities | 0.1 |
| Short-Term Investments and Net Other Assets (Liabilities) | 2.1 |
ASSET ALLOCATION (% of Fund's net assets) |
|
|
| United States | 81.7 |
| Canada | 3.7 |
| United Kingdom | 2.4 |
| France | 1.3 |
| Germany | 0.9 |
| Ireland | 0.9 |
| Luxembourg | 0.9 |
| Netherlands | 0.7 |
| Tanzania | 0.6 |
| Others | 6.9 |
GEOGRAPHIC DIVERSIFICATION (% of Fund's net assets) |
|
| |
|
TOP HOLDINGS(% of Fund's net assets) | | |
| US Treasury Notes | 2.5 | |
| CHS/Community Health Systems Inc | 1.3 | |
| CCO Holdings LLC / CCO Holdings Capital Corp | 1.3 | |
| Fidelity Private Credit Company LLC | 1.1 | |
| TransDigm Inc | 1.1 | |
| MPT Operating Partnership LP / MPT Finance Corp | 1.0 | |
| Tenet Healthcare Corp | 0.9 | |
| Carnival Corp | 0.9 | |
| Vistra Operations Co LLC | 0.8 | |
| NRG Energy Inc | 0.8 | |
| | 11.7 | |
| Fidelity, the Fidelity Investments Logo and all other Fidelity trademarks or service marks used herein are trademarks or service marks of FMR LLC. Any third-party marks that are used herein are trademarks or service marks of their respective owners. © 2024 FMR LLC. All rights reserved. |
| | For additional information about the Fund; including its prospectus, financial information, holdings and proxy information, scan the QR code or visit fundresearch.fidelity.com/prospectus/sec 1.9915059.100 3316-TSRS-1224 |
| |
| | SEMI-ANNUAL SHAREHOLDER REPORT | AS OF OCTOBER 31, 2024 | |
| | Fidelity® Short Duration High Income Fund Fidelity Advisor® Short Duration High Income Fund Class I : FSFHX |
| | | |
This semi-annual shareholder report contains information about Fidelity® Short Duration High Income Fund for the period May 1, 2024 to October 31, 2024. You can find additional information about the Fund at fundresearch.fidelity.com/prospectus/sec. You can also request this information by contacting us at 1-877-208-0098 or by sending an e-mail to fidfunddocuments@fidelity.com.
What were your Fund costs for the last six months?(based on hypothetical $10,000 investment)
| | Costs of a $10,000 investment | Costs paid as a percentage of a $10,000 investment | |
| Class I | $ 39 | 0.75% | |
Key Fund Statistics(as of October 31, 2024)
KEY FACTS | | |
| Fund Size | $249,300,191 | |
| Number of Holdings | 487 | |
| Portfolio Turnover | 47% | |
What did the Fund invest in?
(as of October 31, 2024)
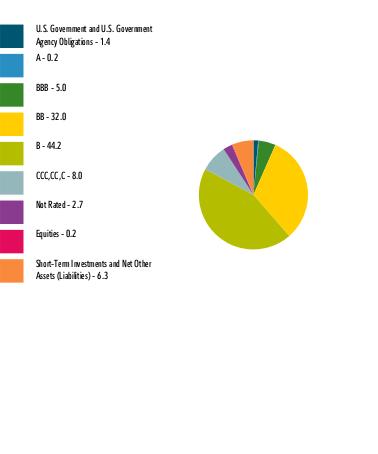
| U.S. Government and U.S. Government Agency Obligations | 1.4 |
| A | 0.2 |
| BBB | 5.0 |
| BB | 32.0 |
| B | 44.2 |
| CCC,CC,C | 8.0 |
| Not Rated | 2.7 |
| Equities | 0.2 |
| Short-Term Investments and Net Other Assets (Liabilities) | 6.3 |
QUALITY DIVERSIFICATION (% of Fund's net assets) |
|
| |
| We have used ratings from Moody's Investors Service, Inc. Where Moody's® ratings are not available, we have used S&P® ratings. All ratings are as of the date indicated and do not reflect subsequent changes. |
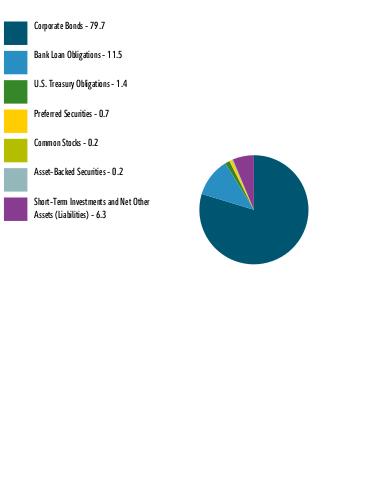
| Corporate Bonds | 79.7 |
| Bank Loan Obligations | 11.5 |
| U.S. Treasury Obligations | 1.4 |
| Preferred Securities | 0.7 |
| Common Stocks | 0.2 |
| Asset-Backed Securities | 0.2 |
| Short-Term Investments and Net Other Assets (Liabilities) | 6.3 |
ASSET ALLOCATION (% of Fund's net assets) |
|
|
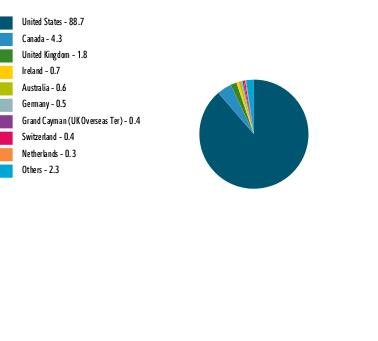
| United States | 88.7 |
| Canada | 4.3 |
| United Kingdom | 1.8 |
| Ireland | 0.7 |
| Australia | 0.6 |
| Germany | 0.5 |
| Grand Cayman (UK Overseas Ter) | 0.4 |
| Switzerland | 0.4 |
| Netherlands | 0.3 |
| Others | 2.3 |
GEOGRAPHIC DIVERSIFICATION (% of Fund's net assets) |
|
| |
|
TOP HOLDINGS(% of Fund's net assets) | | |
| TransDigm Inc | 2.2 | |
| US Treasury Notes | 1.4 | |
| Univision Communications Inc | 1.2 | |
| DISH Network Corp | 1.2 | |
| Carnival Corp | 1.2 | |
| Royal Caribbean Cruises Ltd | 1.1 | |
| CCO Holdings LLC / CCO Holdings Capital Corp | 1.0 | |
| Venture Global LNG Inc | 1.0 | |
| OneMain Finance Corp | 0.9 | |
| Tenet Healthcare Corp | 0.9 | |
| | 12.1 | |
| Fidelity, the Fidelity Investments Logo and all other Fidelity trademarks or service marks used herein are trademarks or service marks of FMR LLC. Any third-party marks that are used herein are trademarks or service marks of their respective owners. © 2024 FMR LLC. All rights reserved. |
| | For additional information about the Fund; including its prospectus, financial information, holdings and proxy information, scan the QR code or visit fundresearch.fidelity.com/prospectus/sec 1.9915081.100 2584-TSRS-1224 |
| |
| | SEMI-ANNUAL SHAREHOLDER REPORT | AS OF OCTOBER 31, 2024 | |
| | Fidelity® Focused High Income Fund Fidelity® Focused High Income Fund : FHIFX |
| | | |
This semi-annual shareholder report contains information about Fidelity® Focused High Income Fund for the period May 1, 2024 to October 31, 2024. You can find additional information about the Fund at fundresearch.fidelity.com/prospectus/sec. You can also request this information by contacting us at 1-800-544-8544 or by sending an e-mail to fidfunddocuments@fidelity.com.
What were your Fund costs for the last six months?(based on hypothetical $10,000 investment)
| | Costs of a $10,000 investment | Costs paid as a percentage of a $10,000 investment | |
| Fidelity® Focused High Income Fund | $ 39 | 0.75% | |
Key Fund Statistics(as of October 31, 2024)
KEY FACTS | | |
| Fund Size | $198,767,721 | |
| Number of Holdings | 394 | |
| Portfolio Turnover | 28% | |
What did the Fund invest in?
(as of October 31, 2024)
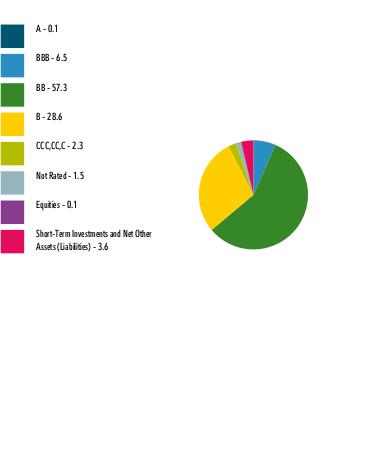
| A | 0.1 |
| BBB | 6.5 |
| BB | 57.3 |
| B | 28.6 |
| CCC,CC,C | 2.3 |
| Not Rated | 1.5 |
| Equities | 0.1 |
| Short-Term Investments and Net Other Assets (Liabilities) | 3.6 |
QUALITY DIVERSIFICATION (% of Fund's net assets) |
|
| |
| We have used ratings from Moody's Investors Service, Inc. Where Moody's® ratings are not available, we have used S&P® ratings. All ratings are as of the date indicated and do not reflect subsequent changes. |
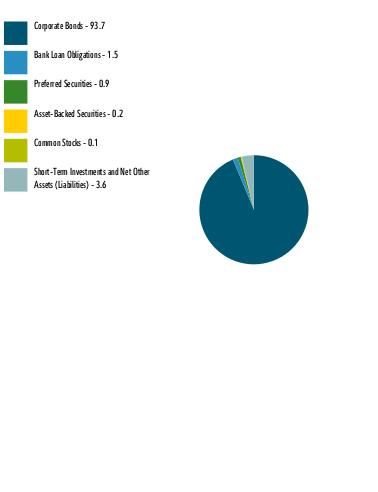
| Corporate Bonds | 93.7 |
| Bank Loan Obligations | 1.5 |
| Preferred Securities | 0.9 |
| Asset-Backed Securities | 0.2 |
| Common Stocks | 0.1 |
| Short-Term Investments and Net Other Assets (Liabilities) | 3.6 |
ASSET ALLOCATION (% of Fund's net assets) |
|
|
| United States | 87.3 |
| Canada | 4.1 |
| United Kingdom | 1.9 |
| Australia | 1.5 |
| Ireland | 0.7 |
| Hong Kong | 0.7 |
| Panama | 0.5 |
| Guatemala | 0.4 |
| France | 0.4 |
| Others | 2.5 |
GEOGRAPHIC DIVERSIFICATION (% of Fund's net assets) |
|
| |
|
TOP HOLDINGS(% of Fund's net assets) | | |
| CCO Holdings LLC / CCO Holdings Capital Corp | 2.0 | |
| Hilton Domestic Operating Co Inc | 1.9 | |
| Hess Midstream Operations LP | 1.7 | |
| Royal Caribbean Cruises Ltd | 1.4 | |
| OneMain Finance Corp | 1.4 | |
| Iron Mountain Inc | 1.3 | |
| Albertsons Cos Inc / Safeway Inc / New Albertsons LP / Albertsons LLC | 1.3 | |
| Vistra Operations Co LLC | 1.3 | |
| Yum! Brands Inc | 1.2 | |
| Sirius XM Radio Inc | 1.1 | |
| | 14.6 | |
| Fidelity, the Fidelity Investments Logo and all other Fidelity trademarks or service marks used herein are trademarks or service marks of FMR LLC. Any third-party marks that are used herein are trademarks or service marks of their respective owners. © 2024 FMR LLC. All rights reserved. |
| | For additional information about the Fund; including its prospectus, financial information, holdings and proxy information, scan the QR code or visit fundresearch.fidelity.com/prospectus/sec 1.9915068.100 1366-TSRS-1224 |
| |
| | SEMI-ANNUAL SHAREHOLDER REPORT | AS OF OCTOBER 31, 2024 | |
| | Fidelity® SAI High Income Fund Fidelity® SAI High Income Fund : FSHGX |
| | | |
This semi-annual shareholder report contains information about Fidelity® SAI High Income Fund for the period May 1, 2024 to October 31, 2024. You can find additional information about the Fund at fundresearch.fidelity.com/prospectus/sec. You can also request this information by contacting us at 1-800-544-3455 or by sending an e-mail to fidfunddocuments@fidelity.com.
What were your Fund costs for the last six months?(based on hypothetical $10,000 investment)
| | Costs of a $10,000 investment | Costs paid as a percentage of a $10,000 investment | |
| Fidelity® SAI High Income Fund | $ 29 | 0.55% | |
Key Fund Statistics(as of October 31, 2024)
KEY FACTS | | |
| Fund Size | $1,614,908,129 | |
| Number of Holdings | 820 | |
| Portfolio Turnover | 62% | |
What did the Fund invest in?
(as of October 31, 2024)
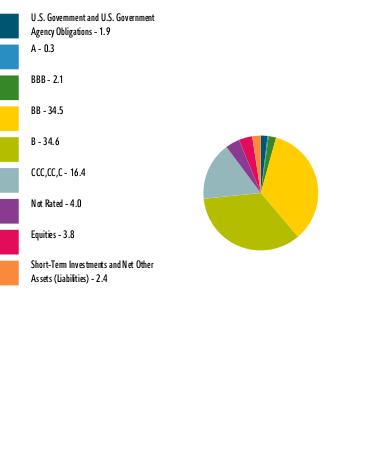
| U.S. Government and U.S. Government Agency Obligations | 1.9 |
| A | 0.3 |
| BBB | 2.1 |
| BB | 34.5 |
| B | 34.6 |
| CCC,CC,C | 16.4 |
| Not Rated | 4.0 |
| Equities | 3.8 |
| Short-Term Investments and Net Other Assets (Liabilities) | 2.4 |
QUALITY DIVERSIFICATION (% of Fund's net assets) |
|
| |
| We have used ratings from Moody's Investors Service, Inc. Where Moody's® ratings are not available, we have used S&P® ratings. All ratings are as of the date indicated and do not reflect subsequent changes. |
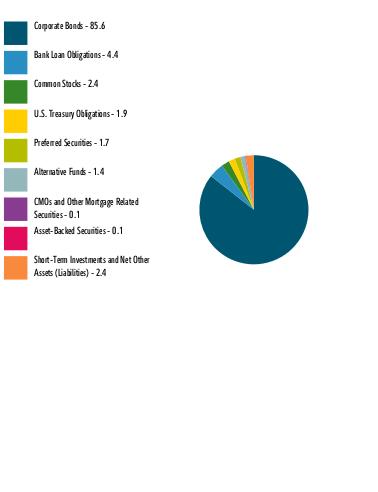
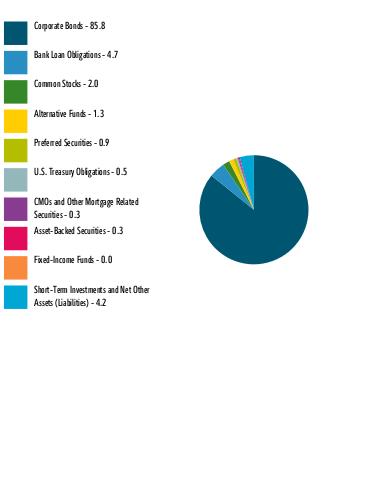
| Corporate Bonds | 85.6 |
| Bank Loan Obligations | 4.4 |
| Common Stocks | 2.4 |
| U.S. Treasury Obligations | 1.9 |
| Preferred Securities | 1.7 |
| Alternative Funds | 1.4 |
| CMOs and Other Mortgage Related Securities | 0.1 |
| Asset-Backed Securities | 0.1 |
| Short-Term Investments and Net Other Assets (Liabilities) | 2.4 |
ASSET ALLOCATION (% of Fund's net assets) |
|
|
| United States | 81.2 |
| Canada | 4.1 |
| United Kingdom | 2.7 |
| France | 1.4 |
| Germany | 0.9 |
| Luxembourg | 0.9 |
| Ireland | 0.9 |
| Tanzania | 0.6 |
| Switzerland | 0.6 |
| Others | 6.7 |
GEOGRAPHIC DIVERSIFICATION (% of Fund's net assets) |
|
| |
|
TOP HOLDINGS(% of Fund's net assets) | | |
| US Treasury Notes | 1.9 | |
| CHS/Community Health Systems Inc | 1.5 | |
| Fidelity Private Credit Company LLC | 1.4 | |
| CCO Holdings LLC / CCO Holdings Capital Corp | 1.2 | |
| Mesquite Energy Inc | 1.1 | |
| MPT Operating Partnership LP / MPT Finance Corp | 1.0 | |
| Tenet Healthcare Corp | 0.9 | |
| TransDigm Inc | 0.9 | |
| PG&E Corp | 0.9 | |
| Cloud Software Group Inc | 0.8 | |
| | 11.6 | |
| Fidelity, the Fidelity Investments Logo and all other Fidelity trademarks or service marks used herein are trademarks or service marks of FMR LLC. Any third-party marks that are used herein are trademarks or service marks of their respective owners. © 2024 FMR LLC. All rights reserved. |
| | For additional information about the Fund; including its prospectus, financial information, holdings and proxy information, scan the QR code or visit fundresearch.fidelity.com/prospectus/sec 1.9915107.100 6345-TSRS-1224 |
| |
| | SEMI-ANNUAL SHAREHOLDER REPORT | AS OF OCTOBER 31, 2024 | |
| | Fidelity® Women's Leadership Fund Fidelity Advisor® Women's Leadership Fund Class M : FWOEX |
| | | |
This semi-annual shareholder report contains information about Fidelity® Women's Leadership Fund for the period May 1, 2024 to October 31, 2024. You can find additional information about the Fund at fundresearch.fidelity.com/prospectus/sec. You can also request this information by contacting us at 1-877-208-0098 or by sending an e-mail to fidfunddocuments@fidelity.com.
What were your Fund costs for the last six months?(based on hypothetical $10,000 investment)
| | Costs of a $10,000 investment | Costs paid as a percentage of a $10,000 investment | |
| Class M | $ 63 | 1.21% | |
Key Fund Statistics(as of October 31, 2024)
KEY FACTS | | |
| Fund Size | $148,487,329 | |
| Number of Holdings | 113 | |
| Portfolio Turnover | 26% | |
What did the Fund invest in?
(as of October 31, 2024)
MARKET SECTORS (% of Fund's net assets) | | |
| Information Technology | 30.0 | |
| Financials | 13.2 | |
| Health Care | 13.0 | |
| Industrials | 11.5 | |
| Consumer Discretionary | 11.3 | |
| Communication Services | 6.1 | |
| Materials | 3.8 | |
| Consumer Staples | 3.2 | |
| Energy | 2.9 | |
| Real Estate | 1.9 | |
| Utilities | 1.0 | |
| |
| Common Stocks | 97.6 |
| Preferred Stocks | 0.3 |
| Short-Term Investments and Net Other Assets (Liabilities) | 2.1 |
ASSET ALLOCATION (% of Fund's net assets) |
|
|
| United States | 93.8 |
| China | 1.3 |
| Belgium | 1.3 |
| Australia | 1.0 |
| Germany | 0.8 |
| Italy | 0.8 |
| Canada | 0.5 |
| Norway | 0.4 |
| United Kingdom | 0.1 |
GEOGRAPHIC DIVERSIFICATION (% of Fund's net assets) |
|
| |
|
TOP HOLDINGS(% of Fund's net assets) | | |
| Apple Inc | 4.4 | |
| NVIDIA Corp | 3.7 | |
| Microsoft Corp | 3.6 | |
| Amazon.com Inc | 2.6 | |
| Accenture Capital Inc Class A | 2.1 | |
| Walt Disney Co/The | 2.0 | |
| Salesforce Inc | 1.8 | |
| Hologic Inc | 1.7 | |
| JPMorgan Chase & Co | 1.7 | |
| Progressive Corp/The | 1.6 | |
| | 25.2 | |
| Fidelity, the Fidelity Investments Logo and all other Fidelity trademarks or service marks used herein are trademarks or service marks of FMR LLC. Any third-party marks that are used herein are trademarks or service marks of their respective owners. © 2024 FMR LLC. All rights reserved. |
| | For additional information about the Fund; including its prospectus, financial information, holdings and proxy information, scan the QR code or visit fundresearch.fidelity.com/prospectus/sec 1.9915102.100 3399-TSRS-1224 |
| |
| | SEMI-ANNUAL SHAREHOLDER REPORT | AS OF OCTOBER 31, 2024 | |
| | Fidelity® High Income Fund Fidelity Advisor® High Income Fund Class M : FGRMX |
| | | |
This semi-annual shareholder report contains information about Fidelity® High Income Fund for the period May 1, 2024 to October 31, 2024. You can find additional information about the Fund at fundresearch.fidelity.com/prospectus/sec. You can also request this information by contacting us at 1-877-208-0098 or by sending an e-mail to fidfunddocuments@fidelity.com.
What were your Fund costs for the last six months?(based on hypothetical $10,000 investment)
| | Costs of a $10,000 investment | Costs paid as a percentage of a $10,000 investment | |
| Class M | $ 50 | 0.95% | |
Key Fund Statistics(as of October 31, 2024)
KEY FACTS | | |
| Fund Size | $2,767,692,910 | |
| Number of Holdings | 926 | |
| Portfolio Turnover | 59% | |
What did the Fund invest in?
(as of October 31, 2024)
| U.S. Government and U.S. Government Agency Obligations | 2.5 |
| A | 0.3 |
| BBB | 2.5 |
| BB | 32.9 |
| B | 37.4 |
| CCC,CC,C | 15.4 |
| Not Rated | 3.9 |
| Equities | 3.0 |
| Short-Term Investments and Net Other Assets (Liabilities) | 2.1 |
QUALITY DIVERSIFICATION (% of Fund's net assets) |
|
| |
| We have used ratings from Moody's Investors Service, Inc. Where Moody's® ratings are not available, we have used S&P® ratings. All ratings are as of the date indicated and do not reflect subsequent changes. |
| Corporate Bonds | 86.1 |
| Bank Loan Obligations | 4.3 |
| U.S. Treasury Obligations | 2.5 |
| Common Stocks | 1.9 |
| Preferred Securities | 1.7 |
| Alternative Funds | 1.1 |
| Asset-Backed Securities | 0.2 |
| CMOs and Other Mortgage Related Securities | 0.1 |
| Short-Term Investments and Net Other Assets (Liabilities) | 2.1 |
ASSET ALLOCATION (% of Fund's net assets) |
|
|
| United States | 81.7 |
| Canada | 3.7 |
| United Kingdom | 2.4 |
| France | 1.3 |
| Germany | 0.9 |
| Ireland | 0.9 |
| Luxembourg | 0.9 |
| Netherlands | 0.7 |
| Tanzania | 0.6 |
| Others | 6.9 |
GEOGRAPHIC DIVERSIFICATION (% of Fund's net assets) |
|
| |
|
TOP HOLDINGS(% of Fund's net assets) | | |
| US Treasury Notes | 2.5 | |
| CHS/Community Health Systems Inc | 1.3 | |
| CCO Holdings LLC / CCO Holdings Capital Corp | 1.3 | |
| Fidelity Private Credit Company LLC | 1.1 | |
| TransDigm Inc | 1.1 | |
| MPT Operating Partnership LP / MPT Finance Corp | 1.0 | |
| Tenet Healthcare Corp | 0.9 | |
| Carnival Corp | 0.9 | |
| Vistra Operations Co LLC | 0.8 | |
| NRG Energy Inc | 0.8 | |
| | 11.7 | |
| Fidelity, the Fidelity Investments Logo and all other Fidelity trademarks or service marks used herein are trademarks or service marks of FMR LLC. Any third-party marks that are used herein are trademarks or service marks of their respective owners. © 2024 FMR LLC. All rights reserved. |
| | For additional information about the Fund; including its prospectus, financial information, holdings and proxy information, scan the QR code or visit fundresearch.fidelity.com/prospectus/sec 1.9915056.100 3312-TSRS-1224 |
| |
| | SEMI-ANNUAL SHAREHOLDER REPORT | AS OF OCTOBER 31, 2024 | |
| | Fidelity® Short Duration High Income Fund Fidelity Advisor® Short Duration High Income Fund Class M : FSEHX |
| | | |
This semi-annual shareholder report contains information about Fidelity® Short Duration High Income Fund for the period May 1, 2024 to October 31, 2024. You can find additional information about the Fund at fundresearch.fidelity.com/prospectus/sec. You can also request this information by contacting us at 1-877-208-0098 or by sending an e-mail to fidfunddocuments@fidelity.com.
What were your Fund costs for the last six months?(based on hypothetical $10,000 investment)
| | Costs of a $10,000 investment | Costs paid as a percentage of a $10,000 investment | |
| Class M | $ 52 | 1.00% | |
Key Fund Statistics(as of October 31, 2024)
KEY FACTS | | |
| Fund Size | $249,300,191 | |
| Number of Holdings | 487 | |
| Portfolio Turnover | 47% | |
What did the Fund invest in?
(as of October 31, 2024)
| U.S. Government and U.S. Government Agency Obligations | 1.4 |
| A | 0.2 |
| BBB | 5.0 |
| BB | 32.0 |
| B | 44.2 |
| CCC,CC,C | 8.0 |
| Not Rated | 2.7 |
| Equities | 0.2 |
| Short-Term Investments and Net Other Assets (Liabilities) | 6.3 |
QUALITY DIVERSIFICATION (% of Fund's net assets) |
|
| |
| We have used ratings from Moody's Investors Service, Inc. Where Moody's® ratings are not available, we have used S&P® ratings. All ratings are as of the date indicated and do not reflect subsequent changes. |
| Corporate Bonds | 79.7 |
| Bank Loan Obligations | 11.5 |
| U.S. Treasury Obligations | 1.4 |
| Preferred Securities | 0.7 |
| Common Stocks | 0.2 |
| Asset-Backed Securities | 0.2 |
| Short-Term Investments and Net Other Assets (Liabilities) | 6.3 |
ASSET ALLOCATION (% of Fund's net assets) |
|
|
| United States | 88.7 |
| Canada | 4.3 |
| United Kingdom | 1.8 |
| Ireland | 0.7 |
| Australia | 0.6 |
| Germany | 0.5 |
| Grand Cayman (UK Overseas Ter) | 0.4 |
| Switzerland | 0.4 |
| Netherlands | 0.3 |
| Others | 2.3 |
GEOGRAPHIC DIVERSIFICATION (% of Fund's net assets) |
|
| |
|
TOP HOLDINGS(% of Fund's net assets) | | |
| TransDigm Inc | 2.2 | |
| US Treasury Notes | 1.4 | |
| Univision Communications Inc | 1.2 | |
| DISH Network Corp | 1.2 | |
| Carnival Corp | 1.2 | |
| Royal Caribbean Cruises Ltd | 1.1 | |
| CCO Holdings LLC / CCO Holdings Capital Corp | 1.0 | |
| Venture Global LNG Inc | 1.0 | |
| OneMain Finance Corp | 0.9 | |
| Tenet Healthcare Corp | 0.9 | |
| | 12.1 | |
| Fidelity, the Fidelity Investments Logo and all other Fidelity trademarks or service marks used herein are trademarks or service marks of FMR LLC. Any third-party marks that are used herein are trademarks or service marks of their respective owners. © 2024 FMR LLC. All rights reserved. |
| | For additional information about the Fund; including its prospectus, financial information, holdings and proxy information, scan the QR code or visit fundresearch.fidelity.com/prospectus/sec 1.9915080.100 2583-TSRS-1224 |
| |
| | SEMI-ANNUAL SHAREHOLDER REPORT | AS OF OCTOBER 31, 2024 | |
| | Fidelity® High Income Fund Fidelity Advisor® High Income Fund Class I : FGTMX |
| | | |
This semi-annual shareholder report contains information about Fidelity® High Income Fund for the period May 1, 2024 to October 31, 2024. You can find additional information about the Fund at fundresearch.fidelity.com/prospectus/sec. You can also request this information by contacting us at 1-877-208-0098 or by sending an e-mail to fidfunddocuments@fidelity.com.
What were your Fund costs for the last six months?(based on hypothetical $10,000 investment)
| | Costs of a $10,000 investment | Costs paid as a percentage of a $10,000 investment | |
| Class I | $ 37 | 0.70% | |
Key Fund Statistics(as of October 31, 2024)
KEY FACTS | | |
| Fund Size | $2,767,692,910 | |
| Number of Holdings | 926 | |
| Portfolio Turnover | 59% | |
What did the Fund invest in?
(as of October 31, 2024)
| U.S. Government and U.S. Government Agency Obligations | 2.5 |
| A | 0.3 |
| BBB | 2.5 |
| BB | 32.9 |
| B | 37.4 |
| CCC,CC,C | 15.4 |
| Not Rated | 3.9 |
| Equities | 3.0 |
| Short-Term Investments and Net Other Assets (Liabilities) | 2.1 |
QUALITY DIVERSIFICATION (% of Fund's net assets) |
|
| |
| We have used ratings from Moody's Investors Service, Inc. Where Moody's® ratings are not available, we have used S&P® ratings. All ratings are as of the date indicated and do not reflect subsequent changes. |
| Corporate Bonds | 86.1 |
| Bank Loan Obligations | 4.3 |
| U.S. Treasury Obligations | 2.5 |
| Common Stocks | 1.9 |
| Preferred Securities | 1.7 |
| Alternative Funds | 1.1 |
| Asset-Backed Securities | 0.2 |
| CMOs and Other Mortgage Related Securities | 0.1 |
| Short-Term Investments and Net Other Assets (Liabilities) | 2.1 |
ASSET ALLOCATION (% of Fund's net assets) |
|
|
| United States | 81.7 |
| Canada | 3.7 |
| United Kingdom | 2.4 |
| France | 1.3 |
| Germany | 0.9 |
| Ireland | 0.9 |
| Luxembourg | 0.9 |
| Netherlands | 0.7 |
| Tanzania | 0.6 |
| Others | 6.9 |
GEOGRAPHIC DIVERSIFICATION (% of Fund's net assets) |
|
| |
|
TOP HOLDINGS(% of Fund's net assets) | | |
| US Treasury Notes | 2.5 | |
| CHS/Community Health Systems Inc | 1.3 | |
| CCO Holdings LLC / CCO Holdings Capital Corp | 1.3 | |
| Fidelity Private Credit Company LLC | 1.1 | |
| TransDigm Inc | 1.1 | |
| MPT Operating Partnership LP / MPT Finance Corp | 1.0 | |
| Tenet Healthcare Corp | 0.9 | |
| Carnival Corp | 0.9 | |
| Vistra Operations Co LLC | 0.8 | |
| NRG Energy Inc | 0.8 | |
| | 11.7 | |
| Fidelity, the Fidelity Investments Logo and all other Fidelity trademarks or service marks used herein are trademarks or service marks of FMR LLC. Any third-party marks that are used herein are trademarks or service marks of their respective owners. © 2024 FMR LLC. All rights reserved. |
| | For additional information about the Fund; including its prospectus, financial information, holdings and proxy information, scan the QR code or visit fundresearch.fidelity.com/prospectus/sec 1.9915058.100 3314-TSRS-1224 |
| |
| | SEMI-ANNUAL SHAREHOLDER REPORT | AS OF OCTOBER 31, 2024 | |
| | Fidelity® High Income Fund Fidelity® High Income Fund : SPHIX |
| | | |
This semi-annual shareholder report contains information about Fidelity® High Income Fund for the period May 1, 2024 to October 31, 2024. You can find additional information about the Fund at fundresearch.fidelity.com/prospectus/sec. You can also request this information by contacting us at 1-800-544-8544 or by sending an e-mail to fidfunddocuments@fidelity.com.
What were your Fund costs for the last six months?(based on hypothetical $10,000 investment)
| | Costs of a $10,000 investment | Costs paid as a percentage of a $10,000 investment | |
| Fidelity® High Income Fund | $ 35 | 0.66% | |
Key Fund Statistics(as of October 31, 2024)
KEY FACTS | | |
| Fund Size | $2,767,692,910 | |
| Number of Holdings | 926 | |
| Portfolio Turnover | 59% | |
What did the Fund invest in?
(as of October 31, 2024)
| U.S. Government and U.S. Government Agency Obligations | 2.5 |
| A | 0.3 |
| BBB | 2.5 |
| BB | 32.9 |
| B | 37.4 |
| CCC,CC,C | 15.4 |
| Not Rated | 3.9 |
| Equities | 3.0 |
| Short-Term Investments and Net Other Assets (Liabilities) | 2.1 |
QUALITY DIVERSIFICATION (% of Fund's net assets) |
|
| |
| We have used ratings from Moody's Investors Service, Inc. Where Moody's® ratings are not available, we have used S&P® ratings. All ratings are as of the date indicated and do not reflect subsequent changes. |
| Corporate Bonds | 86.1 |
| Bank Loan Obligations | 4.3 |
| U.S. Treasury Obligations | 2.5 |
| Common Stocks | 1.9 |
| Preferred Securities | 1.7 |
| Alternative Funds | 1.1 |
| Asset-Backed Securities | 0.2 |
| CMOs and Other Mortgage Related Securities | 0.1 |
| Short-Term Investments and Net Other Assets (Liabilities) | 2.1 |
ASSET ALLOCATION (% of Fund's net assets) |
|
|
| United States | 81.7 |
| Canada | 3.7 |
| United Kingdom | 2.4 |
| France | 1.3 |
| Germany | 0.9 |
| Ireland | 0.9 |
| Luxembourg | 0.9 |
| Netherlands | 0.7 |
| Tanzania | 0.6 |
| Others | 6.9 |
GEOGRAPHIC DIVERSIFICATION (% of Fund's net assets) |
|
| |
|
TOP HOLDINGS(% of Fund's net assets) | | |
| US Treasury Notes | 2.5 | |
| CHS/Community Health Systems Inc | 1.3 | |
| CCO Holdings LLC / CCO Holdings Capital Corp | 1.3 | |
| Fidelity Private Credit Company LLC | 1.1 | |
| TransDigm Inc | 1.1 | |
| MPT Operating Partnership LP / MPT Finance Corp | 1.0 | |
| Tenet Healthcare Corp | 0.9 | |
| Carnival Corp | 0.9 | |
| Vistra Operations Co LLC | 0.8 | |
| NRG Energy Inc | 0.8 | |
| | 11.7 | |
| Fidelity, the Fidelity Investments Logo and all other Fidelity trademarks or service marks used herein are trademarks or service marks of FMR LLC. Any third-party marks that are used herein are trademarks or service marks of their respective owners. © 2024 FMR LLC. All rights reserved. |
| | For additional information about the Fund; including its prospectus, financial information, holdings and proxy information, scan the QR code or visit fundresearch.fidelity.com/prospectus/sec 1.9915060.100 455-TSRS-1224 |
| |
| | SEMI-ANNUAL SHAREHOLDER REPORT | AS OF OCTOBER 31, 2024 | |
| | Fidelity® High Income Fund Fidelity Advisor® High Income Fund Class C : FGSMX |
| | | |
This semi-annual shareholder report contains information about Fidelity® High Income Fund for the period May 1, 2024 to October 31, 2024. You can find additional information about the Fund at fundresearch.fidelity.com/prospectus/sec. You can also request this information by contacting us at 1-877-208-0098 or by sending an e-mail to fidfunddocuments@fidelity.com.
What were your Fund costs for the last six months?(based on hypothetical $10,000 investment)
| | Costs of a $10,000 investment | Costs paid as a percentage of a $10,000 investment | |
| Class C | $ 88 | 1.69% | |
Key Fund Statistics(as of October 31, 2024)
KEY FACTS | | |
| Fund Size | $2,767,692,910 | |
| Number of Holdings | 926 | |
| Portfolio Turnover | 59% | |
What did the Fund invest in?
(as of October 31, 2024)
| U.S. Government and U.S. Government Agency Obligations | 2.5 |
| A | 0.3 |
| BBB | 2.5 |
| BB | 32.9 |
| B | 37.4 |
| CCC,CC,C | 15.4 |
| Not Rated | 3.9 |
| Equities | 3.0 |
| Short-Term Investments and Net Other Assets (Liabilities) | 2.1 |
QUALITY DIVERSIFICATION (% of Fund's net assets) |
|
| |
| We have used ratings from Moody's Investors Service, Inc. Where Moody's® ratings are not available, we have used S&P® ratings. All ratings are as of the date indicated and do not reflect subsequent changes. |
| Corporate Bonds | 86.1 |
| Bank Loan Obligations | 4.3 |
| U.S. Treasury Obligations | 2.5 |
| Common Stocks | 1.9 |
| Preferred Securities | 1.7 |
| Alternative Funds | 1.1 |
| Asset-Backed Securities | 0.2 |
| CMOs and Other Mortgage Related Securities | 0.1 |
| Short-Term Investments and Net Other Assets (Liabilities) | 2.1 |
ASSET ALLOCATION (% of Fund's net assets) |
|
|
| United States | 81.7 |
| Canada | 3.7 |
| United Kingdom | 2.4 |
| France | 1.3 |
| Germany | 0.9 |
| Ireland | 0.9 |
| Luxembourg | 0.9 |
| Netherlands | 0.7 |
| Tanzania | 0.6 |
| Others | 6.9 |
GEOGRAPHIC DIVERSIFICATION (% of Fund's net assets) |
|
| |
|
TOP HOLDINGS(% of Fund's net assets) | | |
| US Treasury Notes | 2.5 | |
| CHS/Community Health Systems Inc | 1.3 | |
| CCO Holdings LLC / CCO Holdings Capital Corp | 1.3 | |
| Fidelity Private Credit Company LLC | 1.1 | |
| TransDigm Inc | 1.1 | |
| MPT Operating Partnership LP / MPT Finance Corp | 1.0 | |
| Tenet Healthcare Corp | 0.9 | |
| Carnival Corp | 0.9 | |
| Vistra Operations Co LLC | 0.8 | |
| NRG Energy Inc | 0.8 | |
| | 11.7 | |
| Fidelity, the Fidelity Investments Logo and all other Fidelity trademarks or service marks used herein are trademarks or service marks of FMR LLC. Any third-party marks that are used herein are trademarks or service marks of their respective owners. © 2024 FMR LLC. All rights reserved. |
| | For additional information about the Fund; including its prospectus, financial information, holdings and proxy information, scan the QR code or visit fundresearch.fidelity.com/prospectus/sec 1.9915057.100 3313-TSRS-1224 |
| |
| | SEMI-ANNUAL SHAREHOLDER REPORT | AS OF OCTOBER 31, 2024 | |
| | Fidelity® U.S. Low Volatility Equity Fund Fidelity® U.S. Low Volatility Equity Fund : FULVX |
| | | |
This semi-annual shareholder report contains information about Fidelity® U.S. Low Volatility Equity Fund for the period May 1, 2024 to October 31, 2024. You can find additional information about the Fund at fundresearch.fidelity.com/prospectus/sec. You can also request this information by contacting us at 1-800-544-8544 or by sending an e-mail to fidfunddocuments@fidelity.com.
What were your Fund costs for the last six months?(based on hypothetical $10,000 investment)
| | Costs of a $10,000 investment | Costs paid as a percentage of a $10,000 investment | |
| Fidelity® U.S. Low Volatility Equity Fund | $ 37 | 0.70% | |
Key Fund Statistics(as of October 31, 2024)
KEY FACTS | | |
| Fund Size | $42,811,441 | |
| Number of Holdings | 138 | |
| Portfolio Turnover | 58% | |
What did the Fund invest in?
(as of October 31, 2024)
MARKET SECTORS (% of Fund's net assets) | | |
| Health Care | 19.3 | |
| Information Technology | 18.2 | |
| Financials | 15.1 | |
| Consumer Staples | 12.9 | |
| Industrials | 9.0 | |
| Communication Services | 8.7 | |
| Utilities | 5.1 | |
| Consumer Discretionary | 4.1 | |
| Materials | 3.0 | |
| Energy | 2.5 | |
| Real Estate | 1.0 | |
| |
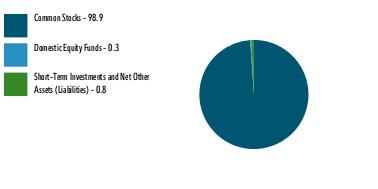
| Common Stocks | 98.9 |
| Domestic Equity Funds | 0.3 |
| Short-Term Investments and Net Other Assets (Liabilities) | 0.8 |
ASSET ALLOCATION (% of Fund's net assets) |
|
|
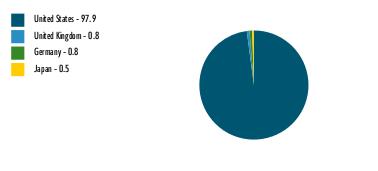
| United States | 97.9 |
| United Kingdom | 0.8 |
| Germany | 0.8 |
| Japan | 0.5 |
GEOGRAPHIC DIVERSIFICATION (% of Fund's net assets) |
|
| |
|
TOP HOLDINGS(% of Fund's net assets) | | |
| Walmart Inc | 1.2 | |
| CACI International Inc | 1.2 | |
| Cboe Global Markets Inc | 1.2 | |
| Exelixis Inc | 1.2 | |
| Marsh & McLennan Cos Inc | 1.1 | |
| The Travelers Companies, Inc. | 1.1 | |
| Philip Morris International Inc | 1.1 | |
| T-Mobile US Inc | 1.1 | |
| Linde PLC | 1.1 | |
| Southern Co/The | 1.1 | |
| | 11.4 | |
| Fidelity, the Fidelity Investments Logo and all other Fidelity trademarks or service marks used herein are trademarks or service marks of FMR LLC. Any third-party marks that are used herein are trademarks or service marks of their respective owners. © 2024 FMR LLC. All rights reserved. |
| | For additional information about the Fund; including its prospectus, financial information, holdings and proxy information, scan the QR code or visit fundresearch.fidelity.com/prospectus/sec 1.9915106.100 5029-TSRS-1224 |
| |
| | SEMI-ANNUAL SHAREHOLDER REPORT | AS OF OCTOBER 31, 2024 | |
| | Fidelity® Healthy Future Fund Fidelity Advisor® Healthy Future Fund Class A : FAPJX |
| | | |
This semi-annual shareholder report contains information about Fidelity® Healthy Future Fund for the period May 1, 2024 to October 31, 2024. You can find additional information about the Fund at fundresearch.fidelity.com/prospectus/sec. You can also request this information by contacting us at 1-877-208-0098 or by sending an e-mail to fidfunddocuments@fidelity.com.
What were your Fund costs for the last six months?(based on hypothetical $10,000 investment)
| | Costs of a $10,000 investment | Costs paid as a percentage of a $10,000 investment | |
| Class A | $ 69 | 1.31% | |
Key Fund Statistics(as of October 31, 2024)
KEY FACTS | | |
| Fund Size | $12,720,521 | |
| Number of Holdings | 69 | |
| Portfolio Turnover | 48% | |
What did the Fund invest in?
(as of October 31, 2024)
MARKET SECTORS (% of Fund's net assets) | | |
| Health Care | 33.0 | |
| Consumer Staples | 20.4 | |
| Consumer Discretionary | 14.5 | |
| Financials | 12.3 | |
| Information Technology | 9.8 | |
| Industrials | 4.8 | |
| Real Estate | 1.4 | |
| Communication Services | 0.9 | |
| Utilities | 0.9 | |
| |
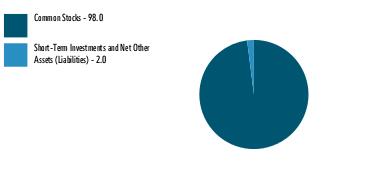
| Common Stocks | 98.0 |
| Short-Term Investments and Net Other Assets (Liabilities) | 2.0 |
ASSET ALLOCATION (% of Fund's net assets) |
|
|
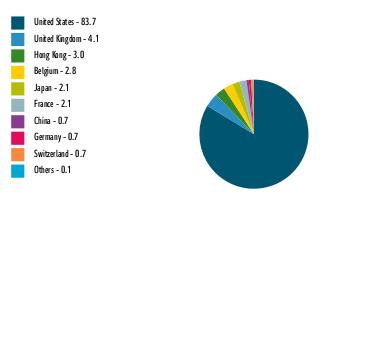
| United States | 83.7 |
| United Kingdom | 4.1 |
| Hong Kong | 3.0 |
| Belgium | 2.8 |
| Japan | 2.1 |
| France | 2.1 |
| China | 0.7 |
| Germany | 0.7 |
| Switzerland | 0.7 |
| Others | 0.1 |
GEOGRAPHIC DIVERSIFICATION (% of Fund's net assets) |
|
| |
|
TOP HOLDINGS(% of Fund's net assets) | | |
| NVIDIA Corp | 8.4 | |
| Procter & Gamble Co/The | 5.5 | |
| Tesla Inc | 4.6 | |
| Thermo Fisher Scientific Inc | 3.8 | |
| Vertex Pharmaceuticals Inc | 3.6 | |
| UnitedHealth Group Inc | 3.5 | |
| Unilever PLC | 3.5 | |
| Danaher Corp | 3.4 | |
| Apollo Global Management Inc | 3.0 | |
| AIA Group Ltd | 3.0 | |
| | 42.3 | |
| Fidelity, the Fidelity Investments Logo and all other Fidelity trademarks or service marks used herein are trademarks or service marks of FMR LLC. Any third-party marks that are used herein are trademarks or service marks of their respective owners. © 2024 FMR LLC. All rights reserved. |
| | For additional information about the Fund; including its prospectus, financial information, holdings and proxy information, scan the QR code or visit fundresearch.fidelity.com/prospectus/sec 1.9915109.100 6554-TSRS-1224 |
| |
| | SEMI-ANNUAL SHAREHOLDER REPORT | AS OF OCTOBER 31, 2024 | |
| | Fidelity® Healthy Future Fund Fidelity Advisor® Healthy Future Fund Class I : FAPMX |
| | | |
This semi-annual shareholder report contains information about Fidelity® Healthy Future Fund for the period May 1, 2024 to October 31, 2024. You can find additional information about the Fund at fundresearch.fidelity.com/prospectus/sec. You can also request this information by contacting us at 1-877-208-0098 or by sending an e-mail to fidfunddocuments@fidelity.com.
What were your Fund costs for the last six months?(based on hypothetical $10,000 investment)
| | Costs of a $10,000 investment | Costs paid as a percentage of a $10,000 investment | |
| Class I | $ 56 | 1.06% | |
Key Fund Statistics(as of October 31, 2024)
KEY FACTS | | |
| Fund Size | $12,720,521 | |
| Number of Holdings | 69 | |
| Portfolio Turnover | 48% | |
What did the Fund invest in?
(as of October 31, 2024)
MARKET SECTORS (% of Fund's net assets) | | |
| Health Care | 33.0 | |
| Consumer Staples | 20.4 | |
| Consumer Discretionary | 14.5 | |
| Financials | 12.3 | |
| Information Technology | 9.8 | |
| Industrials | 4.8 | |
| Real Estate | 1.4 | |
| Communication Services | 0.9 | |
| Utilities | 0.9 | |
| |
| Common Stocks | 98.0 |
| Short-Term Investments and Net Other Assets (Liabilities) | 2.0 |
ASSET ALLOCATION (% of Fund's net assets) |
|
|
| United States | 83.7 |
| United Kingdom | 4.1 |
| Hong Kong | 3.0 |
| Belgium | 2.8 |
| Japan | 2.1 |
| France | 2.1 |
| China | 0.7 |
| Germany | 0.7 |
| Switzerland | 0.7 |
| Others | 0.1 |
GEOGRAPHIC DIVERSIFICATION (% of Fund's net assets) |
|
| |
|
TOP HOLDINGS(% of Fund's net assets) | | |
| NVIDIA Corp | 8.4 | |
| Procter & Gamble Co/The | 5.5 | |
| Tesla Inc | 4.6 | |
| Thermo Fisher Scientific Inc | 3.8 | |
| Vertex Pharmaceuticals Inc | 3.6 | |
| UnitedHealth Group Inc | 3.5 | |
| Unilever PLC | 3.5 | |
| Danaher Corp | 3.4 | |
| Apollo Global Management Inc | 3.0 | |
| AIA Group Ltd | 3.0 | |
| | 42.3 | |
| Fidelity, the Fidelity Investments Logo and all other Fidelity trademarks or service marks used herein are trademarks or service marks of FMR LLC. Any third-party marks that are used herein are trademarks or service marks of their respective owners. © 2024 FMR LLC. All rights reserved. |
| | For additional information about the Fund; including its prospectus, financial information, holdings and proxy information, scan the QR code or visit fundresearch.fidelity.com/prospectus/sec 1.9915112.100 6557-TSRS-1224 |
| |
| | SEMI-ANNUAL SHAREHOLDER REPORT | AS OF OCTOBER 31, 2024 | |
| | Fidelity® Women's Leadership Fund Fidelity Advisor® Women's Leadership Fund Class Z : FWOZX |
| | | |
This semi-annual shareholder report contains information about Fidelity® Women's Leadership Fund for the period May 1, 2024 to October 31, 2024. You can find additional information about the Fund at fundresearch.fidelity.com/prospectus/sec. You can also request this information by contacting us at 1-877-208-0098 or by sending an e-mail to fidfunddocuments@fidelity.com.
What were your Fund costs for the last six months?(based on hypothetical $10,000 investment)
| | Costs of a $10,000 investment | Costs paid as a percentage of a $10,000 investment | |
| Class Z | $ 29 | 0.55% | |
Key Fund Statistics(as of October 31, 2024)
KEY FACTS | | |
| Fund Size | $148,487,329 | |
| Number of Holdings | 113 | |
| Portfolio Turnover | 26% | |
What did the Fund invest in?
(as of October 31, 2024)
MARKET SECTORS (% of Fund's net assets) | | |
| Information Technology | 30.0 | |
| Financials | 13.2 | |
| Health Care | 13.0 | |
| Industrials | 11.5 | |
| Consumer Discretionary | 11.3 | |
| Communication Services | 6.1 | |
| Materials | 3.8 | |
| Consumer Staples | 3.2 | |
| Energy | 2.9 | |
| Real Estate | 1.9 | |
| Utilities | 1.0 | |
| |
| Common Stocks | 97.6 |
| Preferred Stocks | 0.3 |
| Short-Term Investments and Net Other Assets (Liabilities) | 2.1 |
ASSET ALLOCATION (% of Fund's net assets) |
|
|
| United States | 93.8 |
| China | 1.3 |
| Belgium | 1.3 |
| Australia | 1.0 |
| Germany | 0.8 |
| Italy | 0.8 |
| Canada | 0.5 |
| Norway | 0.4 |
| United Kingdom | 0.1 |
GEOGRAPHIC DIVERSIFICATION (% of Fund's net assets) |
|
| |
|
TOP HOLDINGS(% of Fund's net assets) | | |
| Apple Inc | 4.4 | |
| NVIDIA Corp | 3.7 | |
| Microsoft Corp | 3.6 | |
| Amazon.com Inc | 2.6 | |
| Accenture Capital Inc Class A | 2.1 | |
| Walt Disney Co/The | 2.0 | |
| Salesforce Inc | 1.8 | |
| Hologic Inc | 1.7 | |
| JPMorgan Chase & Co | 1.7 | |
| Progressive Corp/The | 1.6 | |
| | 25.2 | |
| Fidelity, the Fidelity Investments Logo and all other Fidelity trademarks or service marks used herein are trademarks or service marks of FMR LLC. Any third-party marks that are used herein are trademarks or service marks of their respective owners. © 2024 FMR LLC. All rights reserved. |
| | For additional information about the Fund; including its prospectus, financial information, holdings and proxy information, scan the QR code or visit fundresearch.fidelity.com/prospectus/sec 1.9915104.100 3401-TSRS-1224 |
| |
| | SEMI-ANNUAL SHAREHOLDER REPORT | AS OF OCTOBER 31, 2024 | |
| | Fidelity® Short Duration High Income Fund Fidelity Advisor® Short Duration High Income Fund Class Z : FIJWX |
| | | |
This semi-annual shareholder report contains information about Fidelity® Short Duration High Income Fund for the period May 1, 2024 to October 31, 2024. You can find additional information about the Fund at fundresearch.fidelity.com/prospectus/sec. You can also request this information by contacting us at 1-877-208-0098 or by sending an e-mail to fidfunddocuments@fidelity.com.
What were your Fund costs for the last six months?(based on hypothetical $10,000 investment)
| | Costs of a $10,000 investment | Costs paid as a percentage of a $10,000 investment | |
| Class Z | $ 34 | 0.66% | |
Key Fund Statistics(as of October 31, 2024)
KEY FACTS | | |
| Fund Size | $249,300,191 | |
| Number of Holdings | 487 | |
| Portfolio Turnover | 47% | |
What did the Fund invest in?
(as of October 31, 2024)
| U.S. Government and U.S. Government Agency Obligations | 1.4 |
| A | 0.2 |
| BBB | 5.0 |
| BB | 32.0 |
| B | 44.2 |
| CCC,CC,C | 8.0 |
| Not Rated | 2.7 |
| Equities | 0.2 |
| Short-Term Investments and Net Other Assets (Liabilities) | 6.3 |
QUALITY DIVERSIFICATION (% of Fund's net assets) |
|
| |
| We have used ratings from Moody's Investors Service, Inc. Where Moody's® ratings are not available, we have used S&P® ratings. All ratings are as of the date indicated and do not reflect subsequent changes. |
| Corporate Bonds | 79.7 |
| Bank Loan Obligations | 11.5 |
| U.S. Treasury Obligations | 1.4 |
| Preferred Securities | 0.7 |
| Common Stocks | 0.2 |
| Asset-Backed Securities | 0.2 |
| Short-Term Investments and Net Other Assets (Liabilities) | 6.3 |
ASSET ALLOCATION (% of Fund's net assets) |
|
|
| United States | 88.7 |
| Canada | 4.3 |
| United Kingdom | 1.8 |
| Ireland | 0.7 |
| Australia | 0.6 |
| Germany | 0.5 |
| Grand Cayman (UK Overseas Ter) | 0.4 |
| Switzerland | 0.4 |
| Netherlands | 0.3 |
| Others | 2.3 |
GEOGRAPHIC DIVERSIFICATION (% of Fund's net assets) |
|
| |
|
TOP HOLDINGS(% of Fund's net assets) | | |
| TransDigm Inc | 2.2 | |
| US Treasury Notes | 1.4 | |
| Univision Communications Inc | 1.2 | |
| DISH Network Corp | 1.2 | |
| Carnival Corp | 1.2 | |
| Royal Caribbean Cruises Ltd | 1.1 | |
| CCO Holdings LLC / CCO Holdings Capital Corp | 1.0 | |
| Venture Global LNG Inc | 1.0 | |
| OneMain Finance Corp | 0.9 | |
| Tenet Healthcare Corp | 0.9 | |
| | 12.1 | |
| Fidelity, the Fidelity Investments Logo and all other Fidelity trademarks or service marks used herein are trademarks or service marks of FMR LLC. Any third-party marks that are used herein are trademarks or service marks of their respective owners. © 2024 FMR LLC. All rights reserved. |
| | For additional information about the Fund; including its prospectus, financial information, holdings and proxy information, scan the QR code or visit fundresearch.fidelity.com/prospectus/sec 1.9915082.100 3289-TSRS-1224 |
| |
| | SEMI-ANNUAL SHAREHOLDER REPORT | AS OF OCTOBER 31, 2024 | |
| | Fidelity® Healthy Future Fund Fidelity Advisor® Healthy Future Fund Class C : FAPKX |
| | | |
This semi-annual shareholder report contains information about Fidelity® Healthy Future Fund for the period May 1, 2024 to October 31, 2024. You can find additional information about the Fund at fundresearch.fidelity.com/prospectus/sec. You can also request this information by contacting us at 1-877-208-0098 or by sending an e-mail to fidfunddocuments@fidelity.com.
What were your Fund costs for the last six months?(based on hypothetical $10,000 investment)
| | Costs of a $10,000 investment | Costs paid as a percentage of a $10,000 investment | |
| Class C | $ 109 | 2.06% | |
Key Fund Statistics(as of October 31, 2024)
KEY FACTS | | |
| Fund Size | $12,720,521 | |
| Number of Holdings | 69 | |
| Portfolio Turnover | 48% | |
What did the Fund invest in?
(as of October 31, 2024)
MARKET SECTORS (% of Fund's net assets) | | |
| Health Care | 33.0 | |
| Consumer Staples | 20.4 | |
| Consumer Discretionary | 14.5 | |
| Financials | 12.3 | |
| Information Technology | 9.8 | |
| Industrials | 4.8 | |
| Real Estate | 1.4 | |
| Communication Services | 0.9 | |
| Utilities | 0.9 | |
| |
| Common Stocks | 98.0 |
| Short-Term Investments and Net Other Assets (Liabilities) | 2.0 |
ASSET ALLOCATION (% of Fund's net assets) |
|
|
| United States | 83.7 |
| United Kingdom | 4.1 |
| Hong Kong | 3.0 |
| Belgium | 2.8 |
| Japan | 2.1 |
| France | 2.1 |
| China | 0.7 |
| Germany | 0.7 |
| Switzerland | 0.7 |
| Others | 0.1 |
GEOGRAPHIC DIVERSIFICATION (% of Fund's net assets) |
|
| |
|
TOP HOLDINGS(% of Fund's net assets) | | |
| NVIDIA Corp | 8.4 | |
| Procter & Gamble Co/The | 5.5 | |
| Tesla Inc | 4.6 | |
| Thermo Fisher Scientific Inc | 3.8 | |
| Vertex Pharmaceuticals Inc | 3.6 | |
| UnitedHealth Group Inc | 3.5 | |
| Unilever PLC | 3.5 | |
| Danaher Corp | 3.4 | |
| Apollo Global Management Inc | 3.0 | |
| AIA Group Ltd | 3.0 | |
| | 42.3 | |
| Fidelity, the Fidelity Investments Logo and all other Fidelity trademarks or service marks used herein are trademarks or service marks of FMR LLC. Any third-party marks that are used herein are trademarks or service marks of their respective owners. © 2024 FMR LLC. All rights reserved. |
| | For additional information about the Fund; including its prospectus, financial information, holdings and proxy information, scan the QR code or visit fundresearch.fidelity.com/prospectus/sec 1.9915110.100 6555-TSRS-1224 |
| |
| | SEMI-ANNUAL SHAREHOLDER REPORT | AS OF OCTOBER 31, 2024 | |
| | Fidelity® Short Duration High Income Fund Fidelity Advisor® Short Duration High Income Fund Class A : FSBHX |
| | | |
This semi-annual shareholder report contains information about Fidelity® Short Duration High Income Fund for the period May 1, 2024 to October 31, 2024. You can find additional information about the Fund at fundresearch.fidelity.com/prospectus/sec. You can also request this information by contacting us at 1-877-208-0098 or by sending an e-mail to fidfunddocuments@fidelity.com.
What were your Fund costs for the last six months?(based on hypothetical $10,000 investment)
| | Costs of a $10,000 investment | Costs paid as a percentage of a $10,000 investment | |
| Class A | $ 52 | 1.00% | |
Key Fund Statistics(as of October 31, 2024)
KEY FACTS | | |
| Fund Size | $249,300,191 | |
| Number of Holdings | 487 | |
| Portfolio Turnover | 47% | |
What did the Fund invest in?
(as of October 31, 2024)
| U.S. Government and U.S. Government Agency Obligations | 1.4 |
| A | 0.2 |
| BBB | 5.0 |
| BB | 32.0 |
| B | 44.2 |
| CCC,CC,C | 8.0 |
| Not Rated | 2.7 |
| Equities | 0.2 |
| Short-Term Investments and Net Other Assets (Liabilities) | 6.3 |
QUALITY DIVERSIFICATION (% of Fund's net assets) |
|
| |
| We have used ratings from Moody's Investors Service, Inc. Where Moody's® ratings are not available, we have used S&P® ratings. All ratings are as of the date indicated and do not reflect subsequent changes. |
| Corporate Bonds | 79.7 |
| Bank Loan Obligations | 11.5 |
| U.S. Treasury Obligations | 1.4 |
| Preferred Securities | 0.7 |
| Common Stocks | 0.2 |
| Asset-Backed Securities | 0.2 |
| Short-Term Investments and Net Other Assets (Liabilities) | 6.3 |
ASSET ALLOCATION (% of Fund's net assets) |
|
|
| United States | 88.7 |
| Canada | 4.3 |
| United Kingdom | 1.8 |
| Ireland | 0.7 |
| Australia | 0.6 |
| Germany | 0.5 |
| Grand Cayman (UK Overseas Ter) | 0.4 |
| Switzerland | 0.4 |
| Netherlands | 0.3 |
| Others | 2.3 |
GEOGRAPHIC DIVERSIFICATION (% of Fund's net assets) |
|
| |
|
TOP HOLDINGS(% of Fund's net assets) | | |
| TransDigm Inc | 2.2 | |
| US Treasury Notes | 1.4 | |
| Univision Communications Inc | 1.2 | |
| DISH Network Corp | 1.2 | |
| Carnival Corp | 1.2 | |
| Royal Caribbean Cruises Ltd | 1.1 | |
| CCO Holdings LLC / CCO Holdings Capital Corp | 1.0 | |
| Venture Global LNG Inc | 1.0 | |
| OneMain Finance Corp | 0.9 | |
| Tenet Healthcare Corp | 0.9 | |
| | 12.1 | |
| Fidelity, the Fidelity Investments Logo and all other Fidelity trademarks or service marks used herein are trademarks or service marks of FMR LLC. Any third-party marks that are used herein are trademarks or service marks of their respective owners. © 2024 FMR LLC. All rights reserved. |
| | For additional information about the Fund; including its prospectus, financial information, holdings and proxy information, scan the QR code or visit fundresearch.fidelity.com/prospectus/sec 1.9915078.100 2581-TSRS-1224 |
| |
| | SEMI-ANNUAL SHAREHOLDER REPORT | AS OF OCTOBER 31, 2024 | |
| | Fidelity® High Income Fund Fidelity Advisor® High Income Fund Class A : FGQMX |
| | | |
This semi-annual shareholder report contains information about Fidelity® High Income Fund for the period May 1, 2024 to October 31, 2024. You can find additional information about the Fund at fundresearch.fidelity.com/prospectus/sec. You can also request this information by contacting us at 1-877-208-0098 or by sending an e-mail to fidfunddocuments@fidelity.com.
What were your Fund costs for the last six months?(based on hypothetical $10,000 investment)
| | Costs of a $10,000 investment | Costs paid as a percentage of a $10,000 investment | |
| Class A | $ 50 | 0.95% | |
Key Fund Statistics(as of October 31, 2024)
KEY FACTS | | |
| Fund Size | $2,767,692,910 | |
| Number of Holdings | 926 | |
| Portfolio Turnover | 59% | |
What did the Fund invest in?
(as of October 31, 2024)
| U.S. Government and U.S. Government Agency Obligations | 2.5 |
| A | 0.3 |
| BBB | 2.5 |
| BB | 32.9 |
| B | 37.4 |
| CCC,CC,C | 15.4 |
| Not Rated | 3.9 |
| Equities | 3.0 |
| Short-Term Investments and Net Other Assets (Liabilities) | 2.1 |
QUALITY DIVERSIFICATION (% of Fund's net assets) |
|
| |
| We have used ratings from Moody's Investors Service, Inc. Where Moody's® ratings are not available, we have used S&P® ratings. All ratings are as of the date indicated and do not reflect subsequent changes. |
| Corporate Bonds | 86.1 |
| Bank Loan Obligations | 4.3 |
| U.S. Treasury Obligations | 2.5 |
| Common Stocks | 1.9 |
| Preferred Securities | 1.7 |
| Alternative Funds | 1.1 |
| Asset-Backed Securities | 0.2 |
| CMOs and Other Mortgage Related Securities | 0.1 |
| Short-Term Investments and Net Other Assets (Liabilities) | 2.1 |
ASSET ALLOCATION (% of Fund's net assets) |
|
|
| United States | 81.7 |
| Canada | 3.7 |
| United Kingdom | 2.4 |
| France | 1.3 |
| Germany | 0.9 |
| Ireland | 0.9 |
| Luxembourg | 0.9 |
| Netherlands | 0.7 |
| Tanzania | 0.6 |
| Others | 6.9 |
GEOGRAPHIC DIVERSIFICATION (% of Fund's net assets) |
|
| |
|
TOP HOLDINGS(% of Fund's net assets) | | |
| US Treasury Notes | 2.5 | |
| CHS/Community Health Systems Inc | 1.3 | |
| CCO Holdings LLC / CCO Holdings Capital Corp | 1.3 | |
| Fidelity Private Credit Company LLC | 1.1 | |
| TransDigm Inc | 1.1 | |
| MPT Operating Partnership LP / MPT Finance Corp | 1.0 | |
| Tenet Healthcare Corp | 0.9 | |
| Carnival Corp | 0.9 | |
| Vistra Operations Co LLC | 0.8 | |
| NRG Energy Inc | 0.8 | |
| | 11.7 | |
| Fidelity, the Fidelity Investments Logo and all other Fidelity trademarks or service marks used herein are trademarks or service marks of FMR LLC. Any third-party marks that are used herein are trademarks or service marks of their respective owners. © 2024 FMR LLC. All rights reserved. |
| | For additional information about the Fund; including its prospectus, financial information, holdings and proxy information, scan the QR code or visit fundresearch.fidelity.com/prospectus/sec 1.9915055.100 3311-TSRS-1224 |
| |
| | SEMI-ANNUAL SHAREHOLDER REPORT | AS OF OCTOBER 31, 2024 | |
| | Fidelity® Women's Leadership Fund Fidelity Advisor® Women's Leadership Fund Class I : FWMNX |
| | | |
This semi-annual shareholder report contains information about Fidelity® Women's Leadership Fund for the period May 1, 2024 to October 31, 2024. You can find additional information about the Fund at fundresearch.fidelity.com/prospectus/sec. You can also request this information by contacting us at 1-877-208-0098 or by sending an e-mail to fidfunddocuments@fidelity.com.
What were your Fund costs for the last six months?(based on hypothetical $10,000 investment)
| | Costs of a $10,000 investment | Costs paid as a percentage of a $10,000 investment | |
| Class I | $ 35 | 0.67% | |
Key Fund Statistics(as of October 31, 2024)
KEY FACTS | | |
| Fund Size | $148,487,329 | |
| Number of Holdings | 113 | |
| Portfolio Turnover | 26% | |
What did the Fund invest in?
(as of October 31, 2024)
MARKET SECTORS (% of Fund's net assets) | | |
| Information Technology | 30.0 | |
| Financials | 13.2 | |
| Health Care | 13.0 | |
| Industrials | 11.5 | |
| Consumer Discretionary | 11.3 | |
| Communication Services | 6.1 | |
| Materials | 3.8 | |
| Consumer Staples | 3.2 | |
| Energy | 2.9 | |
| Real Estate | 1.9 | |
| Utilities | 1.0 | |
| |
| Common Stocks | 97.6 |
| Preferred Stocks | 0.3 |
| Short-Term Investments and Net Other Assets (Liabilities) | 2.1 |
ASSET ALLOCATION (% of Fund's net assets) |
|
|
| United States | 93.8 |
| China | 1.3 |
| Belgium | 1.3 |
| Australia | 1.0 |
| Germany | 0.8 |
| Italy | 0.8 |
| Canada | 0.5 |
| Norway | 0.4 |
| United Kingdom | 0.1 |
GEOGRAPHIC DIVERSIFICATION (% of Fund's net assets) |
|
| |
|
TOP HOLDINGS(% of Fund's net assets) | | |
| Apple Inc | 4.4 | |
| NVIDIA Corp | 3.7 | |
| Microsoft Corp | 3.6 | |
| Amazon.com Inc | 2.6 | |
| Accenture Capital Inc Class A | 2.1 | |
| Walt Disney Co/The | 2.0 | |
| Salesforce Inc | 1.8 | |
| Hologic Inc | 1.7 | |
| JPMorgan Chase & Co | 1.7 | |
| Progressive Corp/The | 1.6 | |
| | 25.2 | |
| Fidelity, the Fidelity Investments Logo and all other Fidelity trademarks or service marks used herein are trademarks or service marks of FMR LLC. Any third-party marks that are used herein are trademarks or service marks of their respective owners. © 2024 FMR LLC. All rights reserved. |
| | For additional information about the Fund; including its prospectus, financial information, holdings and proxy information, scan the QR code or visit fundresearch.fidelity.com/prospectus/sec 1.9915103.100 3400-TSRS-1224 |
| |
| | SEMI-ANNUAL SHAREHOLDER REPORT | AS OF OCTOBER 31, 2024 | |
| | Fidelity® Women's Leadership Fund Fidelity Advisor® Women's Leadership Fund Class C : FWOCX |
| | | |
This semi-annual shareholder report contains information about Fidelity® Women's Leadership Fund for the period May 1, 2024 to October 31, 2024. You can find additional information about the Fund at fundresearch.fidelity.com/prospectus/sec. You can also request this information by contacting us at 1-877-208-0098 or by sending an e-mail to fidfunddocuments@fidelity.com.
What were your Fund costs for the last six months?(based on hypothetical $10,000 investment)
| | Costs of a $10,000 investment | Costs paid as a percentage of a $10,000 investment | |
| Class C | $ 89 | 1.71% | |
Key Fund Statistics(as of October 31, 2024)
KEY FACTS | | |
| Fund Size | $148,487,329 | |
| Number of Holdings | 113 | |
| Portfolio Turnover | 26% | |
What did the Fund invest in?
(as of October 31, 2024)
MARKET SECTORS (% of Fund's net assets) | | |
| Information Technology | 30.0 | |
| Financials | 13.2 | |
| Health Care | 13.0 | |
| Industrials | 11.5 | |
| Consumer Discretionary | 11.3 | |
| Communication Services | 6.1 | |
| Materials | 3.8 | |
| Consumer Staples | 3.2 | |
| Energy | 2.9 | |
| Real Estate | 1.9 | |
| Utilities | 1.0 | |
| |
| Common Stocks | 97.6 |
| Preferred Stocks | 0.3 |
| Short-Term Investments and Net Other Assets (Liabilities) | 2.1 |
ASSET ALLOCATION (% of Fund's net assets) |
|
|
| United States | 93.8 |
| China | 1.3 |
| Belgium | 1.3 |
| Australia | 1.0 |
| Germany | 0.8 |
| Italy | 0.8 |
| Canada | 0.5 |
| Norway | 0.4 |
| United Kingdom | 0.1 |
GEOGRAPHIC DIVERSIFICATION (% of Fund's net assets) |
|
| |
|
TOP HOLDINGS(% of Fund's net assets) | | |
| Apple Inc | 4.4 | |
| NVIDIA Corp | 3.7 | |
| Microsoft Corp | 3.6 | |
| Amazon.com Inc | 2.6 | |
| Accenture Capital Inc Class A | 2.1 | |
| Walt Disney Co/The | 2.0 | |
| Salesforce Inc | 1.8 | |
| Hologic Inc | 1.7 | |
| JPMorgan Chase & Co | 1.7 | |
| Progressive Corp/The | 1.6 | |
| | 25.2 | |
| Fidelity, the Fidelity Investments Logo and all other Fidelity trademarks or service marks used herein are trademarks or service marks of FMR LLC. Any third-party marks that are used herein are trademarks or service marks of their respective owners. © 2024 FMR LLC. All rights reserved. |
| | For additional information about the Fund; including its prospectus, financial information, holdings and proxy information, scan the QR code or visit fundresearch.fidelity.com/prospectus/sec 1.9915101.100 3398-TSRS-1224 |
| |
| | SEMI-ANNUAL SHAREHOLDER REPORT | AS OF OCTOBER 31, 2024 | |
| | Fidelity® Short Duration High Income Fund Fidelity® Short Duration High Income Fund : FSAHX |
| | | |
This semi-annual shareholder report contains information about Fidelity® Short Duration High Income Fund for the period May 1, 2024 to October 31, 2024. You can find additional information about the Fund at fundresearch.fidelity.com/prospectus/sec. You can also request this information by contacting us at 1-800-544-8544 or by sending an e-mail to fidfunddocuments@fidelity.com.
What were your Fund costs for the last six months?(based on hypothetical $10,000 investment)
| | Costs of a $10,000 investment | Costs paid as a percentage of a $10,000 investment | |
| Fidelity® Short Duration High Income Fund | $ 39 | 0.75% | |
Key Fund Statistics(as of October 31, 2024)
KEY FACTS | | |
| Fund Size | $249,300,191 | |
| Number of Holdings | 487 | |
| Portfolio Turnover | 47% | |
What did the Fund invest in?
(as of October 31, 2024)
| U.S. Government and U.S. Government Agency Obligations | 1.4 |
| A | 0.2 |
| BBB | 5.0 |
| BB | 32.0 |
| B | 44.2 |
| CCC,CC,C | 8.0 |
| Not Rated | 2.7 |
| Equities | 0.2 |
| Short-Term Investments and Net Other Assets (Liabilities) | 6.3 |
QUALITY DIVERSIFICATION (% of Fund's net assets) |
|
| |
| We have used ratings from Moody's Investors Service, Inc. Where Moody's® ratings are not available, we have used S&P® ratings. All ratings are as of the date indicated and do not reflect subsequent changes. |
| Corporate Bonds | 79.7 |
| Bank Loan Obligations | 11.5 |
| U.S. Treasury Obligations | 1.4 |
| Preferred Securities | 0.7 |
| Common Stocks | 0.2 |
| Asset-Backed Securities | 0.2 |
| Short-Term Investments and Net Other Assets (Liabilities) | 6.3 |
ASSET ALLOCATION (% of Fund's net assets) |
|
|
| United States | 88.7 |
| Canada | 4.3 |
| United Kingdom | 1.8 |
| Ireland | 0.7 |
| Australia | 0.6 |
| Germany | 0.5 |
| Grand Cayman (UK Overseas Ter) | 0.4 |
| Switzerland | 0.4 |
| Netherlands | 0.3 |
| Others | 2.3 |
GEOGRAPHIC DIVERSIFICATION (% of Fund's net assets) |
|
| |
|
TOP HOLDINGS(% of Fund's net assets) | | |
| TransDigm Inc | 2.2 | |
| US Treasury Notes | 1.4 | |
| Univision Communications Inc | 1.2 | |
| DISH Network Corp | 1.2 | |
| Carnival Corp | 1.2 | |
| Royal Caribbean Cruises Ltd | 1.1 | |
| CCO Holdings LLC / CCO Holdings Capital Corp | 1.0 | |
| Venture Global LNG Inc | 1.0 | |
| OneMain Finance Corp | 0.9 | |
| Tenet Healthcare Corp | 0.9 | |
| | 12.1 | |
| Fidelity, the Fidelity Investments Logo and all other Fidelity trademarks or service marks used herein are trademarks or service marks of FMR LLC. Any third-party marks that are used herein are trademarks or service marks of their respective owners. © 2024 FMR LLC. All rights reserved. |
| | For additional information about the Fund; including its prospectus, financial information, holdings and proxy information, scan the QR code or visit fundresearch.fidelity.com/prospectus/sec 1.9915077.100 2580-TSRS-1224 |
| |
| | SEMI-ANNUAL SHAREHOLDER REPORT | AS OF OCTOBER 31, 2024 | |
| | Fidelity® Healthy Future Fund Fidelity® Healthy Future Fund : FAPHX |
| | | |
This semi-annual shareholder report contains information about Fidelity® Healthy Future Fund for the period May 1, 2024 to October 31, 2024. You can find additional information about the Fund at fundresearch.fidelity.com/prospectus/sec. You can also request this information by contacting us at 1-800-544-8544 or by sending an e-mail to fidfunddocuments@fidelity.com.
What were your Fund costs for the last six months?(based on hypothetical $10,000 investment)
| | Costs of a $10,000 investment | Costs paid as a percentage of a $10,000 investment | |
| Fidelity® Healthy Future Fund | $ 56 | 1.06% | |
Key Fund Statistics(as of October 31, 2024)
KEY FACTS | | |
| Fund Size | $12,720,521 | |
| Number of Holdings | 69 | |
| Portfolio Turnover | 48% | |
What did the Fund invest in?
(as of October 31, 2024)
MARKET SECTORS (% of Fund's net assets) | | |
| Health Care | 33.0 | |
| Consumer Staples | 20.4 | |
| Consumer Discretionary | 14.5 | |
| Financials | 12.3 | |
| Information Technology | 9.8 | |
| Industrials | 4.8 | |
| Real Estate | 1.4 | |
| Communication Services | 0.9 | |
| Utilities | 0.9 | |
| |
| Common Stocks | 98.0 |
| Short-Term Investments and Net Other Assets (Liabilities) | 2.0 |
ASSET ALLOCATION (% of Fund's net assets) |
|
|
| United States | 83.7 |
| United Kingdom | 4.1 |
| Hong Kong | 3.0 |
| Belgium | 2.8 |
| Japan | 2.1 |
| France | 2.1 |
| China | 0.7 |
| Germany | 0.7 |
| Switzerland | 0.7 |
| Others | 0.1 |
GEOGRAPHIC DIVERSIFICATION (% of Fund's net assets) |
|
| |
|
TOP HOLDINGS(% of Fund's net assets) | | |
| NVIDIA Corp | 8.4 | |
| Procter & Gamble Co/The | 5.5 | |
| Tesla Inc | 4.6 | |
| Thermo Fisher Scientific Inc | 3.8 | |
| Vertex Pharmaceuticals Inc | 3.6 | |
| UnitedHealth Group Inc | 3.5 | |
| Unilever PLC | 3.5 | |
| Danaher Corp | 3.4 | |
| Apollo Global Management Inc | 3.0 | |
| AIA Group Ltd | 3.0 | |
| | 42.3 | |
| Fidelity, the Fidelity Investments Logo and all other Fidelity trademarks or service marks used herein are trademarks or service marks of FMR LLC. Any third-party marks that are used herein are trademarks or service marks of their respective owners. © 2024 FMR LLC. All rights reserved. |
| | For additional information about the Fund; including its prospectus, financial information, holdings and proxy information, scan the QR code or visit fundresearch.fidelity.com/prospectus/sec 1.9915108.100 6553-TSRS-1224 |
| |
| | SEMI-ANNUAL SHAREHOLDER REPORT | AS OF OCTOBER 31, 2024 | |
| | Fidelity® Capital & Income Fund Fidelity® Capital & Income Fund : FAGIX |
| | | |
This semi-annual shareholder report contains information about Fidelity® Capital & Income Fund for the period May 1, 2024 to October 31, 2024. You can find additional information about the Fund at fundresearch.fidelity.com/prospectus/sec. You can also request this information by contacting us at 1-800-544-8544 or by sending an e-mail to fidfunddocuments@fidelity.com.
What were your Fund costs for the last six months?(based on hypothetical $10,000 investment)
| | Costs of a $10,000 investment | Costs paid as a percentage of a $10,000 investment | |
| Fidelity® Capital & Income Fund | $ 33 | 0.63% | |
Key Fund Statistics(as of October 31, 2024)
KEY FACTS | | |
| Fund Size | $13,387,526,690 | |
| Number of Holdings | 745 | |
| Portfolio Turnover | 18% | |
What did the Fund invest in?
(as of October 31, 2024)
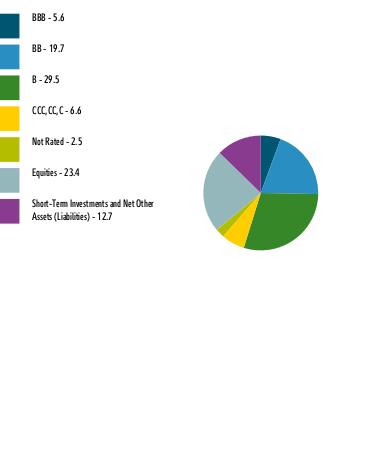
| BBB | 5.6 |
| BB | 19.7 |
| B | 29.5 |
| CCC,CC,C | 6.6 |
| Not Rated | 2.5 |
| Equities | 23.4 |
| Short-Term Investments and Net Other Assets (Liabilities) | 12.7 |
QUALITY DIVERSIFICATION (% of Fund's net assets) |
|
| |
| We have used ratings from Moody's Investors Service, Inc. Where Moody's® ratings are not available, we have used S&P® ratings. All ratings are as of the date indicated and do not reflect subsequent changes. |
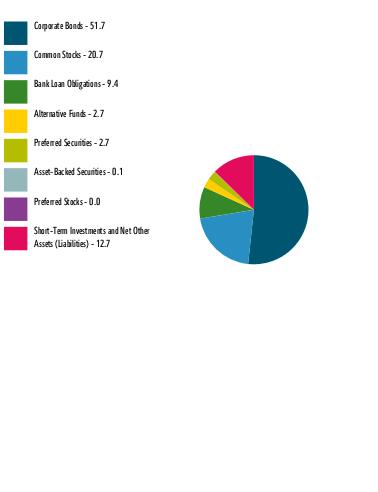
| Corporate Bonds | 51.7 |
| Common Stocks | 20.7 |
| Bank Loan Obligations | 9.4 |
| Alternative Funds | 2.7 |
| Preferred Securities | 2.7 |
| Asset-Backed Securities | 0.1 |
| Preferred Stocks | 0.0 |
| Short-Term Investments and Net Other Assets (Liabilities) | 12.7 |
ASSET ALLOCATION (% of Fund's net assets) |
|
|
| United States | 90.9 |
| Canada | 2.2 |
| United Kingdom | 1.7 |
| France | 1.3 |
| Netherlands | 0.5 |
| China | 0.5 |
| Australia | 0.4 |
| Luxembourg | 0.4 |
| Taiwan | 0.3 |
| Others | 1.8 |
GEOGRAPHIC DIVERSIFICATION (% of Fund's net assets) |
|
| |
|
TOP HOLDINGS(% of Fund's net assets) | | |
| Fidelity Private Credit Company LLC | 2.7 | |
| TransDigm Inc | 2.3 | |
| Ally Financial Inc | 1.4 | |
| NVIDIA Corp | 1.4 | |
| Energy Transfer LP | 1.2 | |
| Tenet Healthcare Corp | 1.1 | |
| Altice France SA | 1.1 | |
| DISH Network Corp | 1.1 | |
| Meta Platforms Inc Class A | 1.1 | |
| LBM Acquisition LLC | 1.1 | |
| | 14.5 | |
| Fidelity, the Fidelity Investments Logo and all other Fidelity trademarks or service marks used herein are trademarks or service marks of FMR LLC. Any third-party marks that are used herein are trademarks or service marks of their respective owners. © 2024 FMR LLC. All rights reserved. |
| | For additional information about the Fund; including its prospectus, financial information, holdings and proxy information, scan the QR code or visit fundresearch.fidelity.com/prospectus/sec 1.9915046.100 38-TSRS-1224 |
| |
| | SEMI-ANNUAL SHAREHOLDER REPORT | AS OF OCTOBER 31, 2024 | |
| | Fidelity® Healthy Future Fund Fidelity Advisor® Healthy Future Fund Class M : FAPLX |
| | | |
This semi-annual shareholder report contains information about Fidelity® Healthy Future Fund for the period May 1, 2024 to October 31, 2024. You can find additional information about the Fund at fundresearch.fidelity.com/prospectus/sec. You can also request this information by contacting us at 1-877-208-0098 or by sending an e-mail to fidfunddocuments@fidelity.com.
What were your Fund costs for the last six months?(based on hypothetical $10,000 investment)
| | Costs of a $10,000 investment | Costs paid as a percentage of a $10,000 investment | |
| Class M | $ 82 | 1.55% | |
Key Fund Statistics(as of October 31, 2024)
KEY FACTS | | |
| Fund Size | $12,720,521 | |
| Number of Holdings | 69 | |
| Portfolio Turnover | 48% | |
What did the Fund invest in?
(as of October 31, 2024)
MARKET SECTORS (% of Fund's net assets) | | |
| Health Care | 33.0 | |
| Consumer Staples | 20.4 | |
| Consumer Discretionary | 14.5 | |
| Financials | 12.3 | |
| Information Technology | 9.8 | |
| Industrials | 4.8 | |
| Real Estate | 1.4 | |
| Communication Services | 0.9 | |
| Utilities | 0.9 | |
| |
| Common Stocks | 98.0 |
| Short-Term Investments and Net Other Assets (Liabilities) | 2.0 |
ASSET ALLOCATION (% of Fund's net assets) |
|
|
| United States | 83.7 |
| United Kingdom | 4.1 |
| Hong Kong | 3.0 |
| Belgium | 2.8 |
| Japan | 2.1 |
| France | 2.1 |
| China | 0.7 |
| Germany | 0.7 |
| Switzerland | 0.7 |
| Others | 0.1 |
GEOGRAPHIC DIVERSIFICATION (% of Fund's net assets) |
|
| |
|
TOP HOLDINGS(% of Fund's net assets) | | |
| NVIDIA Corp | 8.4 | |
| Procter & Gamble Co/The | 5.5 | |
| Tesla Inc | 4.6 | |
| Thermo Fisher Scientific Inc | 3.8 | |
| Vertex Pharmaceuticals Inc | 3.6 | |
| UnitedHealth Group Inc | 3.5 | |
| Unilever PLC | 3.5 | |
| Danaher Corp | 3.4 | |
| Apollo Global Management Inc | 3.0 | |
| AIA Group Ltd | 3.0 | |
| | 42.3 | |
| Fidelity, the Fidelity Investments Logo and all other Fidelity trademarks or service marks used herein are trademarks or service marks of FMR LLC. Any third-party marks that are used herein are trademarks or service marks of their respective owners. © 2024 FMR LLC. All rights reserved. |
| | For additional information about the Fund; including its prospectus, financial information, holdings and proxy information, scan the QR code or visit fundresearch.fidelity.com/prospectus/sec 1.9915111.100 6556-TSRS-1224 |
| |
| | SEMI-ANNUAL SHAREHOLDER REPORT | AS OF OCTOBER 31, 2024 | |
| | Fidelity® Short Duration High Income Fund Fidelity Advisor® Short Duration High Income Fund Class C : FSDHX |
| | | |
This semi-annual shareholder report contains information about Fidelity® Short Duration High Income Fund for the period May 1, 2024 to October 31, 2024. You can find additional information about the Fund at fundresearch.fidelity.com/prospectus/sec. You can also request this information by contacting us at 1-877-208-0098 or by sending an e-mail to fidfunddocuments@fidelity.com.
What were your Fund costs for the last six months?(based on hypothetical $10,000 investment)
| | Costs of a $10,000 investment | Costs paid as a percentage of a $10,000 investment | |
| Class C | $ 90 | 1.75% | |
Key Fund Statistics(as of October 31, 2024)
KEY FACTS | | |
| Fund Size | $249,300,191 | |
| Number of Holdings | 487 | |
| Portfolio Turnover | 47% | |
What did the Fund invest in?
(as of October 31, 2024)
| U.S. Government and U.S. Government Agency Obligations | 1.4 |
| A | 0.2 |
| BBB | 5.0 |
| BB | 32.0 |
| B | 44.2 |
| CCC,CC,C | 8.0 |
| Not Rated | 2.7 |
| Equities | 0.2 |
| Short-Term Investments and Net Other Assets (Liabilities) | 6.3 |
QUALITY DIVERSIFICATION (% of Fund's net assets) |
|
| |
| We have used ratings from Moody's Investors Service, Inc. Where Moody's® ratings are not available, we have used S&P® ratings. All ratings are as of the date indicated and do not reflect subsequent changes. |
| Corporate Bonds | 79.7 |
| Bank Loan Obligations | 11.5 |
| U.S. Treasury Obligations | 1.4 |
| Preferred Securities | 0.7 |
| Common Stocks | 0.2 |
| Asset-Backed Securities | 0.2 |
| Short-Term Investments and Net Other Assets (Liabilities) | 6.3 |
ASSET ALLOCATION (% of Fund's net assets) |
|
|
| United States | 88.7 |
| Canada | 4.3 |
| United Kingdom | 1.8 |
| Ireland | 0.7 |
| Australia | 0.6 |
| Germany | 0.5 |
| Grand Cayman (UK Overseas Ter) | 0.4 |
| Switzerland | 0.4 |
| Netherlands | 0.3 |
| Others | 2.3 |
GEOGRAPHIC DIVERSIFICATION (% of Fund's net assets) |
|
| |
|
TOP HOLDINGS(% of Fund's net assets) | | |
| TransDigm Inc | 2.2 | |
| US Treasury Notes | 1.4 | |
| Univision Communications Inc | 1.2 | |
| DISH Network Corp | 1.2 | |
| Carnival Corp | 1.2 | |
| Royal Caribbean Cruises Ltd | 1.1 | |
| CCO Holdings LLC / CCO Holdings Capital Corp | 1.0 | |
| Venture Global LNG Inc | 1.0 | |
| OneMain Finance Corp | 0.9 | |
| Tenet Healthcare Corp | 0.9 | |
| | 12.1 | |
| Fidelity, the Fidelity Investments Logo and all other Fidelity trademarks or service marks used herein are trademarks or service marks of FMR LLC. Any third-party marks that are used herein are trademarks or service marks of their respective owners. © 2024 FMR LLC. All rights reserved. |
| | For additional information about the Fund; including its prospectus, financial information, holdings and proxy information, scan the QR code or visit fundresearch.fidelity.com/prospectus/sec 1.9915079.100 2582-TSRS-1224 |
| |
| | SEMI-ANNUAL SHAREHOLDER REPORT | AS OF OCTOBER 31, 2024 | |
| | Fidelity® Women's Leadership Fund Fidelity Advisor® Women's Leadership Fund Class A : FWOAX |
| | | |
This semi-annual shareholder report contains information about Fidelity® Women's Leadership Fund for the period May 1, 2024 to October 31, 2024. You can find additional information about the Fund at fundresearch.fidelity.com/prospectus/sec. You can also request this information by contacting us at 1-877-208-0098 or by sending an e-mail to fidfunddocuments@fidelity.com.
What were your Fund costs for the last six months?(based on hypothetical $10,000 investment)
| | Costs of a $10,000 investment | Costs paid as a percentage of a $10,000 investment | |
| Class A | $ 50 | 0.96% | |
Key Fund Statistics(as of October 31, 2024)
KEY FACTS | | |
| Fund Size | $148,487,329 | |
| Number of Holdings | 113 | |
| Portfolio Turnover | 26% | |
What did the Fund invest in?
(as of October 31, 2024)
MARKET SECTORS (% of Fund's net assets) | | |
| Information Technology | 30.0 | |
| Financials | 13.2 | |
| Health Care | 13.0 | |
| Industrials | 11.5 | |
| Consumer Discretionary | 11.3 | |
| Communication Services | 6.1 | |
| Materials | 3.8 | |
| Consumer Staples | 3.2 | |
| Energy | 2.9 | |
| Real Estate | 1.9 | |
| Utilities | 1.0 | |
| |
| Common Stocks | 97.6 |
| Preferred Stocks | 0.3 |
| Short-Term Investments and Net Other Assets (Liabilities) | 2.1 |
ASSET ALLOCATION (% of Fund's net assets) |
|
|
| United States | 93.8 |
| China | 1.3 |
| Belgium | 1.3 |
| Australia | 1.0 |
| Germany | 0.8 |
| Italy | 0.8 |
| Canada | 0.5 |
| Norway | 0.4 |
| United Kingdom | 0.1 |
GEOGRAPHIC DIVERSIFICATION (% of Fund's net assets) |
|
| |
|
TOP HOLDINGS(% of Fund's net assets) | | |
| Apple Inc | 4.4 | |
| NVIDIA Corp | 3.7 | |
| Microsoft Corp | 3.6 | |
| Amazon.com Inc | 2.6 | |
| Accenture Capital Inc Class A | 2.1 | |
| Walt Disney Co/The | 2.0 | |
| Salesforce Inc | 1.8 | |
| Hologic Inc | 1.7 | |
| JPMorgan Chase & Co | 1.7 | |
| Progressive Corp/The | 1.6 | |
| | 25.2 | |
| Fidelity, the Fidelity Investments Logo and all other Fidelity trademarks or service marks used herein are trademarks or service marks of FMR LLC. Any third-party marks that are used herein are trademarks or service marks of their respective owners. © 2024 FMR LLC. All rights reserved. |
| | For additional information about the Fund; including its prospectus, financial information, holdings and proxy information, scan the QR code or visit fundresearch.fidelity.com/prospectus/sec 1.9915100.100 3397-TSRS-1224 |
| |
| | SEMI-ANNUAL SHAREHOLDER REPORT | AS OF OCTOBER 31, 2024 | |
| | Fidelity® Healthy Future Fund Fidelity Advisor® Healthy Future Fund Class Z : FAPNX |
| | | |
This semi-annual shareholder report contains information about Fidelity® Healthy Future Fund for the period May 1, 2024 to October 31, 2024. You can find additional information about the Fund at fundresearch.fidelity.com/prospectus/sec. You can also request this information by contacting us at 1-877-208-0098 or by sending an e-mail to fidfunddocuments@fidelity.com.
What were your Fund costs for the last six months?(based on hypothetical $10,000 investment)
| | Costs of a $10,000 investment | Costs paid as a percentage of a $10,000 investment | |
| Class Z | $ 48 | 0.91% | |
Key Fund Statistics(as of October 31, 2024)
KEY FACTS | | |
| Fund Size | $12,720,521 | |
| Number of Holdings | 69 | |
| Portfolio Turnover | 48% | |
What did the Fund invest in?
(as of October 31, 2024)
MARKET SECTORS (% of Fund's net assets) | | |
| Health Care | 33.0 | |
| Consumer Staples | 20.4 | |
| Consumer Discretionary | 14.5 | |
| Financials | 12.3 | |
| Information Technology | 9.8 | |
| Industrials | 4.8 | |
| Real Estate | 1.4 | |
| Communication Services | 0.9 | |
| Utilities | 0.9 | |
| |
| Common Stocks | 98.0 |
| Short-Term Investments and Net Other Assets (Liabilities) | 2.0 |
ASSET ALLOCATION (% of Fund's net assets) |
|
|
| United States | 83.7 |
| United Kingdom | 4.1 |
| Hong Kong | 3.0 |
| Belgium | 2.8 |
| Japan | 2.1 |
| France | 2.1 |
| China | 0.7 |
| Germany | 0.7 |
| Switzerland | 0.7 |
| Others | 0.1 |
GEOGRAPHIC DIVERSIFICATION (% of Fund's net assets) |
|
| |
|
TOP HOLDINGS(% of Fund's net assets) | | |
| NVIDIA Corp | 8.4 | |
| Procter & Gamble Co/The | 5.5 | |
| Tesla Inc | 4.6 | |
| Thermo Fisher Scientific Inc | 3.8 | |
| Vertex Pharmaceuticals Inc | 3.6 | |
| UnitedHealth Group Inc | 3.5 | |
| Unilever PLC | 3.5 | |
| Danaher Corp | 3.4 | |
| Apollo Global Management Inc | 3.0 | |
| AIA Group Ltd | 3.0 | |
| | 42.3 | |
| Fidelity, the Fidelity Investments Logo and all other Fidelity trademarks or service marks used herein are trademarks or service marks of FMR LLC. Any third-party marks that are used herein are trademarks or service marks of their respective owners. © 2024 FMR LLC. All rights reserved. |
| | For additional information about the Fund; including its prospectus, financial information, holdings and proxy information, scan the QR code or visit fundresearch.fidelity.com/prospectus/sec 1.9915113.100 6558-TSRS-1224 |
| |
| | SEMI-ANNUAL SHAREHOLDER REPORT | AS OF OCTOBER 31, 2024 | |
| | Fidelity® Series High Income Fund Fidelity® Series High Income Fund : FSHNX |
| | | |
This semi-annual shareholder report contains information about Fidelity® Series High Income Fund for the period May 1, 2024 to October 31, 2024. You can find additional information about the Fund at fundresearch.fidelity.com/prospectus/sec. You can also request this information by contacting us at 1-800-544-8544.
What were your Fund costs for the last six months?(based on hypothetical $10,000 investment)
| | Costs of a $10,000 investment | Costs paid as a percentage of a $10,000 investment | |
| Fidelity® Series High Income Fund | $ 0 A | 0.00%B | |
A Amount represents less than $.50
B Amount represents less than 0.005%
Key Fund Statistics(as of October 31, 2024)
KEY FACTS | | |
| Fund Size | $1,458,074,536 | |
| Number of Holdings | 821 | |
| Portfolio Turnover | 30% | |
What did the Fund invest in?
(as of October 31, 2024)
| U.S. Government and U.S. Government Agency Obligations | 0.5 |
| A | 0.3 |
| BBB | 4.2 |
| BB | 31.4 |
| B | 36.6 |
| CCC,CC,C | 16.3 |
| Not Rated | 3.2 |
| Equities | 3.3 |
| Short-Term Investments and Net Other Assets (Liabilities) | 4.2 |
QUALITY DIVERSIFICATION (% of Fund's net assets) |
|
| |
| We have used ratings from Moody's Investors Service, Inc. Where Moody's® ratings are not available, we have used S&P® ratings. All ratings are as of the date indicated and do not reflect subsequent changes. |
| Corporate Bonds | 85.8 |
| Bank Loan Obligations | 4.7 |
| Common Stocks | 2.0 |
| Alternative Funds | 1.3 |
| Preferred Securities | 0.9 |
| U.S. Treasury Obligations | 0.5 |
| CMOs and Other Mortgage Related Securities | 0.3 |
| Asset-Backed Securities | 0.3 |
| Fixed-Income Funds | 0.0 |
| Short-Term Investments and Net Other Assets (Liabilities) | 4.2 |
ASSET ALLOCATION (% of Fund's net assets) |
|
|
| United States | 85.4 |
| Canada | 3.5 |
| United Kingdom | 2.0 |
| France | 0.9 |
| Luxembourg | 0.8 |
| Ireland | 0.7 |
| Italy | 0.6 |
| Germany | 0.6 |
| Switzerland | 0.6 |
| Others | 4.9 |
GEOGRAPHIC DIVERSIFICATION (% of Fund's net assets) |
|
| |
|
TOP HOLDINGS(% of Fund's net assets) | | |
| CHS/Community Health Systems Inc | 1.6 | |
| Fidelity Private Credit Company LLC | 1.3 | |
| TransDigm Inc | 1.3 | |
| CCO Holdings LLC / CCO Holdings Capital Corp | 1.2 | |
| DISH Network Corp | 1.0 | |
| Tenet Healthcare Corp | 1.0 | |
| Mesquite Energy Inc | 1.0 | |
| Alliant Holdings Intermediate LLC / Alliant Holdings Co-Issuer | 0.8 | |
| MPT Operating Partnership LP / MPT Finance Corp | 0.8 | |
| Altice France SA | 0.8 | |
| | 10.8 | |
| Fidelity, the Fidelity Investments Logo and all other Fidelity trademarks or service marks used herein are trademarks or service marks of FMR LLC. Any third-party marks that are used herein are trademarks or service marks of their respective owners. © 2024 FMR LLC. All rights reserved. |
| | For additional information about the Fund; including its prospectus, financial information, holdings and proxy information, scan the QR code or visit fundresearch.fidelity.com/prospectus/sec 1.9915069.100 2269-TSRS-1224 |
Item 2.
Code of Ethics
Not applicable.
Item 3.
Audit Committee Financial Expert
Not applicable.
Item 4.
Principal Accountant Fees and Services
Not applicable.
Item 5.
Audit Committee of Listed Registrants
Not applicable.
Item 6.
Investments
(a)
Not applicable.
(b)
Not applicable
Item 7.
Financial Statements and Financial Highlights for Open-End Management Investment Companies
Fidelity® High Income Fund
Semi-Annual Report
October 31, 2024
Includes Fidelity and Fidelity Advisor share classes
Contents
To view a fund's proxy voting guidelines and proxy voting record for the 12-month period ended June 30, visit http://www.fidelity.com/proxyvotingresults or visit the Securities and Exchange Commission's (SEC) web site at http://www.sec.gov.
You may also call 1-800-544-8544 if you're an individual investing directly with Fidelity, call 1-800-835-5092 if you're a plan sponsor or participant with Fidelity as your recordkeeper or call 1-877-208-0098 on institutional accounts or if you're an advisor or invest through one to request a free copy of the proxy voting guidelines.
Standard & Poor's, S&P and S&P 500 are registered service marks of The McGraw-Hill Companies, Inc. and have been licensed for use by Fidelity Distributors Corporation.
Other third-party marks appearing herein are the property of their respective owners.
All other marks appearing herein are registered or unregistered trademarks or service marks of FMR LLC or an affiliated company. © 2024 FMR LLC. All rights reserved.
This report and the financial statements contained herein are submitted for the general information of the shareholders of the Fund. This report is not authorized for distribution to prospective investors in the Fund unless preceded or accompanied by an effective prospectus.
A fund files its complete schedule of portfolio holdings with the SEC for the first and third quarters of each fiscal year on Form N-PORT. Forms N-PORT are available on the SEC's web site at http://www.sec.gov. A fund's Forms N-PORT may be reviewed and copied at the SEC's Public Reference Room in Washington, DC. Information regarding the operation of the SEC's Public Reference Room may be obtained by calling 1-800-SEC-0330.
For a complete list of a fund's portfolio holdings, view the most recent holdings listing, semiannual report, or annual report on Fidelity's web site at http://www.fidelity.com, http://www.institutional.fidelity.com, or http://www.401k.com, as applicable.
NOT FDIC INSURED •MAY LOSE VALUE •NO BANK GUARANTEE
Neither the Fund nor Fidelity Distributors Corporation is a bank.
Item 7: Financial Statements and Financial Highlights for Open-End Management Investment Companies (Semi-Annual Report)
Fidelity® High Income Fund
Schedule of Investments October 31, 2024 (Unaudited)
Showing Percentage of Net Assets
| Corporate Bonds - 86.1% |
| | | Principal Amount (a) (000s) | Value ($) (000s) |
| Convertible Bonds - 1.7% | | | |
| Automotive & Auto Parts - 0.2% | | | |
| Rivian Automotive, Inc. 3.625% 10/15/30 | | 5,959 | 4,609 |
| Broadcasting - 0.6% | | | |
| DISH Network Corp. 3.375% 8/15/26 | | 21,427 | 17,990 |
| Diversified Financial Services - 0.0% | | | |
| New Cotai LLC 5% 2/24/27 (b) | | 162 | 320 |
| Energy - 0.2% | | | |
| NextEra Energy Partners LP: | | | |
| 0% 11/15/25 (c) | | 914 | 852 |
| 2.5% 6/15/26 (c) | | 2,910 | 2,725 |
| Sunnova Energy International, Inc.: | | | |
| 0.25% 12/1/26 | | 4,100 | 2,662 |
| 2.625% 2/15/28 | | 487 | 252 |
| | | | 6,491 |
| Homebuilders/Real Estate - 0.3% | | | |
| Anywhere Real Estate Group LLC/Realogy Co-Issuer Corp. 0.25% 6/15/26 | | 2,241 | 1,942 |
| Redfin Corp. 0.5% 4/1/27 | | 7,717 | 5,556 |
| | | | 7,498 |
| Technology - 0.3% | | | |
| MKS Instruments, Inc. 1.25% 6/1/30 (c) | | 2,657 | 2,555 |
| Wolfspeed, Inc. 1.875% 12/1/29 | | 10,807 | 5,382 |
| | | | 7,937 |
| Utilities - 0.1% | | | |
| PG&E Corp. 4.25% 12/1/27 (c) | | 2,633 | 2,871 |
TOTAL CONVERTIBLE BONDS | | | 47,716 |
| Nonconvertible Bonds - 84.4% | | | |
| Aerospace - 2.4% | | | |
| ATI, Inc.: | | | |
| 4.875% 10/1/29 | | 35 | 33 |
| 5.125% 10/1/31 | | 25 | 24 |
| 5.875% 12/1/27 | | 3,200 | 3,174 |
| Bombardier, Inc.: | | | |
| 6% 2/15/28 (c) | | 45 | 45 |
| 7% 6/1/32 (c) | | 790 | 809 |
| 7.25% 7/1/31 (c) | | 3,940 | 4,071 |
| 7.875% 4/15/27 (c) | | 4,788 | 4,797 |
| 8.75% 11/15/30 (c) | | 1,285 | 1,392 |
| BWX Technologies, Inc. 4.125% 6/30/28 (c) | | 7,903 | 7,542 |
| Kaiser Aluminum Corp.: | | | |
| 4.5% 6/1/31 (c) | | 360 | 321 |
| 4.625% 3/1/28 (c) | | 1,205 | 1,148 |
| Moog, Inc. 4.25% 12/15/27 (c) | | 430 | 410 |
| Spirit Aerosystems, Inc. 9.75% 11/15/30 (c) | | 1,915 | 2,126 |
| TransDigm, Inc.: | | | |
| 4.625% 1/15/29 | | 5,930 | 5,631 |
| 4.875% 5/1/29 (d) | | 200 | 191 |
| 5.5% 11/15/27 | | 12,392 | 12,268 |
| 6% 1/15/33 (c) | | 1,525 | 1,512 |
| 6.375% 3/1/29 (c) | | 3,605 | 3,659 |
| 6.75% 8/15/28 (c) | | 4,210 | 4,305 |
| 6.875% 12/15/30 (c) | | 150 | 154 |
| 7.125% 12/1/31 (c) | | 1,560 | 1,614 |
| VistaJet Malta Finance PLC / XO Management Holding, Inc.: | | | |
| 6.375% 2/1/30 (c) | | 8,022 | 6,867 |
| 7.875% 5/1/27 (c) | | 3,095 | 3,013 |
| 9.5% 6/1/28 (c) | | 1,993 | 1,958 |
| | | | 67,064 |
| Air Transportation - 1.0% | | | |
| Air Canada 3.875% 8/15/26 (c) | | 595 | 576 |
| American Airlines, Inc.: | | | |
| 7.25% 2/15/28 (c)(d) | | 325 | 330 |
| 8.5% 5/15/29 (c) | | 1,920 | 2,018 |
| American Airlines, Inc. / AAdvantage Loyalty IP Ltd. 5.5% 4/20/26 (c) | | 4,603 | 4,589 |
| JetBlue Airways Corp./JetBlue Loyalty LP 9.875% 9/20/31 (c) | | 2,995 | 3,112 |
| Mileage Plus Holdings LLC 6.5% 6/20/27 (c) | | 789 | 797 |
| Rand Parent LLC 8.5% 2/15/30 (c)(d) | | 13,172 | 13,143 |
| Spirit Loyalty Cayman Ltd. / Spirit IP Cayman Ltd.: | | | |
| 8% 9/20/25 (c) | | 1,060 | 659 |
| 8% 9/20/25 (c) | | 3,350 | 2,082 |
| United Airlines, Inc. 4.375% 4/15/26 (c) | | 80 | 79 |
| | | | 27,385 |
| Automotive & Auto Parts - 1.9% | | | |
| Aston Martin Capital Holdings Ltd. 10% 3/31/29 (c) | | 3,380 | 3,284 |
| Belron UK Finance PLC 5.75% 10/15/29 (c) | | 4,515 | 4,525 |
| Champions Financing, Inc. 8.75% 2/15/29 (c) | | 4,580 | 4,624 |
| Hudson Automotive Group 8% 5/15/32 (c)(d) | | 1,660 | 1,735 |
| Macquarie AirFinance Holdings: | | | |
| 6.4% 3/26/29 (c) | | 3,490 | 3,596 |
| 6.5% 3/26/31 (c) | | 3,810 | 3,958 |
| 8.125% 3/30/29 (c) | | 3,368 | 3,563 |
| 8.375% 5/1/28 (c) | | 2,920 | 3,069 |
| McLaren Finance PLC 7.5% 8/1/26 (c) | | 5,067 | 4,915 |
| Rivian Holdco & Rivian LLC & Rivian Automotive LLC CME Term SOFR 6 Month Index + 6.050% 10.502% 10/15/26 (c)(e)(f) | | 4,021 | 4,026 |
| Wand NewCo 3, Inc. 7.625% 1/30/32 (c) | | 3,445 | 3,561 |
| ZF North America Capital, Inc.: | | | |
| 4.75% 4/29/25 (c) | | 3,615 | 3,587 |
| 6.75% 4/23/30 (c) | | 2,125 | 2,095 |
| 6.875% 4/14/28 (c)(d) | | 1,440 | 1,452 |
| 6.875% 4/23/32 (c) | | 2,250 | 2,201 |
| 7.125% 4/14/30 (c) | | 1,440 | 1,448 |
| | | | 51,639 |
| Banks & Thrifts - 1.2% | | | |
| Ally Financial, Inc.: | | | |
| 5.75% 11/20/25 | | 1,498 | 1,504 |
| 6.7% 2/14/33 (d) | | 6,655 | 6,683 |
| 8% 11/1/31 | | 155 | 173 |
| 8% 11/1/31 | | 108 | 120 |
| Jane Street Group LLC/JSG Finance, Inc.: | | | |
| 4.5% 11/15/29 (c) | | 2,430 | 2,299 |
| 6.125% 11/1/32 (c) | | 3,235 | 3,237 |
| 7.125% 4/30/31 (c) | | 3,935 | 4,079 |
| PHH Escrow Issuer LLC 9.875% 11/1/29 (c)(g) | | 295 | 289 |
| UniCredit SpA: | | | |
| 5.459% 6/30/35 (c)(e) | | 4,171 | 4,023 |
| 5.861% 6/19/32 (c)(e) | | 1,178 | 1,174 |
| VFH Parent LLC / Valor Co-Issuer, Inc. 7.5% 6/15/31 (c) | | 3,115 | 3,199 |
| Western Alliance Bancorp. 3% 6/15/31 (e) | | 6,260 | 5,783 |
| | | | 32,563 |
| Broadcasting - 1.3% | | | |
| Clear Channel Outdoor Holdings, Inc.: | | | |
| 5.125% 8/15/27 (c) | | 1,938 | 1,879 |
| 7.5% 6/1/29 (c) | | 3,479 | 2,973 |
| 7.75% 4/15/28 (c) | | 35 | 31 |
| 7.875% 4/1/30 (c) | | 4,715 | 4,807 |
| 9% 9/15/28 (c) | | 4,325 | 4,543 |
| Scripps Escrow, Inc. 5.875% 7/15/27 (c) | | 50 | 44 |
| Sirius XM Radio, Inc.: | | | |
| 4.125% 7/1/30 (c) | | 5,380 | 4,813 |
| 5.5% 7/1/29 (c)(d) | | 3,005 | 2,915 |
| Univision Communications, Inc.: | | | |
| 4.5% 5/1/29 (c) | | 5,715 | 5,074 |
| 6.625% 6/1/27 (c) | | 3,495 | 3,468 |
| 7.375% 6/30/30 (c) | | 990 | 950 |
| 8% 8/15/28 (c) | | 2,185 | 2,220 |
| 8.5% 7/31/31 (c) | | 3,745 | 3,681 |
| | | | 37,398 |
| Building Materials - 1.5% | | | |
| Advanced Drain Systems, Inc.: | | | |
| 5% 9/30/27 (c) | | 1,601 | 1,572 |
| 6.375% 6/15/30 (c)(d) | | 1,420 | 1,431 |
| AmeriTex Holdco Intermediate LLC 10.25% 10/15/28 (c) | | 635 | 668 |
| Beacon Roofing Supply, Inc. 6.5% 8/1/30 (c) | | 2,616 | 2,659 |
| Builders FirstSource, Inc.: | | | |
| 4.25% 2/1/32 (c) | | 5,595 | 5,005 |
| 6.375% 3/1/34 (c) | | 1,630 | 1,643 |
| Eco Material Technologies, Inc. 7.875% 1/31/27 (c) | | 7,209 | 7,255 |
| EMRLD Borrower LP / Emerald Co.: | | | |
| 6.625% 12/15/30 (c) | | 8,605 | 8,751 |
| 6.75% 7/15/31 (c) | | 2,415 | 2,469 |
| MasterBrand, Inc. 7% 7/15/32 (c) | | 1,441 | 1,476 |
| MITER Brands Acquisition Holdco, Inc. / MIWD Borrower LLC 6.75% 4/1/32 (c) | | 1,410 | 1,434 |
| Oscar Acquisition Co. LLC / Oscar Finance, Inc. 9.5% 4/15/30 (c) | | 3,255 | 3,180 |
| Smyrna Ready Mix Concrete LLC 8.875% 11/15/31 (c) | | 960 | 1,008 |
| Star Holding LLC 8.75% 8/1/31 (c) | | 1,020 | 970 |
| Summit Materials LLC/Summit Materials Finance Corp. 7.25% 1/15/31 (c)(d) | | 2,030 | 2,101 |
| | | | 41,622 |
| Cable/Satellite TV - 2.5% | | | |
| CCO Holdings LLC/CCO Holdings Capital Corp.: | | | |
| 4.25% 2/1/31 (c) | | 7,434 | 6,451 |
| 4.25% 1/15/34 (c)(d) | | 4,935 | 3,943 |
| 4.5% 8/15/30 (c) | | 4,225 | 3,774 |
| 4.5% 5/1/32 | | 12,236 | 10,410 |
| 4.5% 6/1/33 (c) | | 11,280 | 9,380 |
| 4.75% 3/1/30 (c) | | 80 | 73 |
| 5.125% 5/1/27 (c) | | 225 | 220 |
| CSC Holdings LLC: | | | |
| 3.375% 2/15/31 (c) | | 10,324 | 7,406 |
| 4.125% 12/1/30 (c) | | 2,939 | 2,169 |
| 4.5% 11/15/31 (c) | | 1,495 | 1,096 |
| 4.625% 12/1/30 (c) | | 11,350 | 5,708 |
| 5% 11/15/31 (c) | | 65 | 32 |
| 5.375% 2/1/28 (c) | | 4,235 | 3,625 |
| 5.75% 1/15/30 (c) | | 100 | 53 |
| 7.5% 4/1/28 (c) | | 230 | 151 |
| DISH DBS Corp. 5.875% 11/15/24 | | 5,705 | 5,662 |
| Telenet Finance Luxembourg Notes SARL 5.5% 3/1/28 (c) | | 2,400 | 2,336 |
| VTR Finance BV 6.375% 7/15/28 (c) | | 2,066 | 1,974 |
| Ziggo Bond Co. BV 6% 1/15/27 (c) | | 320 | 319 |
| Ziggo BV 4.875% 1/15/30 (c) | | 5,055 | 4,687 |
| | | | 69,469 |
| Capital Goods - 0.7% | | | |
| Mueller Water Products, Inc. 4% 6/15/29 (c) | | 2,420 | 2,253 |
| Patrick Industries, Inc. 6.375% 11/1/32 (c) | | 1,690 | 1,671 |
| Regal Rexnord Corp.: | | | |
| 6.05% 4/15/28 | | 530 | 543 |
| 6.3% 2/15/30 | | 1,505 | 1,558 |
| Resideo Funding, Inc. 6.5% 7/15/32 (c)(d) | | 1,797 | 1,809 |
| TK Elevator Holdco GmbH 7.625% 7/15/28 (c) | | 3,305 | 3,320 |
| TK Elevator U.S. Newco, Inc. 5.25% 7/15/27 (c) | | 9,784 | 9,624 |
| | | | 20,778 |
| Chemicals - 4.2% | | | |
| Axalta Coating Systems Dutch Holding B BV 7.25% 2/15/31 (c) | | 1,225 | 1,280 |
| Consolidated Energy Finance SA: | | | |
| 5.625% 10/15/28 (c) | | 910 | 742 |
| 12% 2/15/31 (c) | | 4,950 | 4,828 |
| CVR Partners LP/CVR Nitrogen Finance Corp. 6.125% 6/15/28 (c) | | 1,865 | 1,789 |
| Herens HoldCo Sarl 4.75% 5/15/28 (c) | | 2,480 | 2,167 |
| INEOS Quattro Finance 2 PLC 9.625% 3/15/29 (c) | | 1,185 | 1,254 |
| Kobe U.S. Midco 2, Inc. 9.25% 11/1/26 pay-in-kind (c)(e) | | 6,091 | 5,145 |
| LSB Industries, Inc. 6.25% 10/15/28 (c) | | 2,235 | 2,162 |
| Methanex Corp.: | | | |
| 5.125% 10/15/27 | | 11,101 | 10,803 |
| 5.65% 12/1/44 | | 6,514 | 5,763 |
| NOVA Chemicals Corp.: | | | |
| 4.25% 5/15/29 (c) | | 4,845 | 4,414 |
| 5% 5/1/25 (c) | | 2,270 | 2,260 |
| 5.25% 6/1/27 (c) | | 2,523 | 2,476 |
| 8.5% 11/15/28 (c) | | 1,430 | 1,516 |
| 9% 2/15/30 (c) | | 1,670 | 1,779 |
| Nufarm Australia Ltd. 5% 1/27/30 (c) | | 4,212 | 3,903 |
| Olin Corp. 5% 2/1/30 | | 8,780 | 8,380 |
| Olympus Water U.S. Holding Corp.: | | | |
| 4.25% 10/1/28 (c) | | 2,186 | 2,057 |
| 6.25% 10/1/29 (c) | | 4,740 | 4,521 |
| 7.25% 6/15/31 (c) | | 1,315 | 1,349 |
| 9.75% 11/15/28 (c) | | 6,453 | 6,846 |
| SCIH Salt Holdings, Inc.: | | | |
| 4.875% 5/1/28 (c) | | 368 | 352 |
| 6.625% 5/1/29 (c) | | 3,735 | 3,626 |
| SCIL IV LLC / SCIL U.S.A. Holdings LLC 5.375% 11/1/26 (c) | | 3,935 | 3,887 |
| The Chemours Co. LLC: | | | |
| 4.625% 11/15/29 (c)(d) | | 548 | 476 |
| 5.375% 5/15/27 | | 9,748 | 9,386 |
| 5.75% 11/15/28 (c) | | 6,620 | 6,111 |
| Tronox, Inc. 4.625% 3/15/29 (c)(d) | | 7,546 | 6,846 |
| W.R. Grace Holding LLC: | | | |
| 4.875% 6/15/27 (c) | | 70 | 69 |
| 5.625% 8/15/29 (c) | | 9,740 | 8,997 |
| | | | 115,184 |
| Consumer Products - 1.2% | | | |
| Foundation Building Materials, Inc. 6% 3/1/29 (c) | | 1,610 | 1,422 |
| Kohl's Corp. 4.25% 7/17/25 | | 635 | 627 |
| Kronos Acquisition Holdings, Inc.: | | | |
| 8.25% 6/30/31 (c) | | 1,578 | 1,563 |
| 10.75% 6/30/32 (c) | | 1,615 | 1,505 |
| Newell Brands, Inc.: | | | |
| 6.375% 9/15/27 (d) | | 1,015 | 1,026 |
| 6.375% 5/15/30 (g) | | 2,760 | 2,773 |
| 6.625% 9/15/29 (d) | | 1,470 | 1,490 |
| 6.625% 5/15/32 (g) | | 2,350 | 2,357 |
| 6.875% 4/1/36 (d)(h) | | 690 | 687 |
| 7% 4/1/46 (h) | | 1,100 | 1,021 |
| Tempur Sealy International, Inc.: | | | |
| 3.875% 10/15/31 (c) | | 75 | 65 |
| 4% 4/15/29 (c) | | 60 | 55 |
| The Gates Corp. 6.875% 7/1/29 (c) | | 2,675 | 2,748 |
| TKC Holdings, Inc.: | | | |
| 6.875% 5/15/28 (c) | | 4,325 | 4,258 |
| 10.5% 5/15/29 (c) | | 5,338 | 5,392 |
| Wayfair LLC 7.25% 10/31/29 (c)(d) | | 2,700 | 2,732 |
| Windsor Holdings III, LLC 8.5% 6/15/30 (c) | | 2,310 | 2,431 |
| | | | 32,152 |
| Containers - 0.8% | | | |
| ARD Finance SA: | | | |
| 5% 6/30/27 pay-in-kind (Reg. S) (e) | EUR | 100 | 21 |
| 6.5% 6/30/27 pay-in-kind (c)(e) | | 2,165 | 457 |
| Ardagh Packaging Finance PLC/Ardagh MP Holdings U.S.A., Inc. 4.125% 8/15/26 (c) | | 1,205 | 1,048 |
| Graham Packaging Co., Inc. 7.125% 8/15/28 (c) | | 1,720 | 1,673 |
| Graphic Packaging International, Inc.: | | | |
| 3.75% 2/1/30 (c) | | 1,600 | 1,463 |
| 6.375% 7/15/32 (c) | | 2,615 | 2,638 |
| LABL, Inc.: | | | |
| 5.875% 11/1/28 (c)(d) | | 800 | 743 |
| 9.5% 11/1/28 (c) | | 535 | 548 |
| Mauser Packaging Solutions Holding Co. 7.875% 4/15/27 (c) | | 4,120 | 4,233 |
| Sealed Air Corp.: | | | |
| 5% 4/15/29 (c) | | 3,810 | 3,680 |
| 6.5% 7/15/32 (c) | | 1,515 | 1,538 |
| Sealed Air Corp./Sealed Air Corp. U.S. 7.25% 2/15/31 (c) | | 2,555 | 2,653 |
| Trivium Packaging Finance BV: | | | |
| 5.5% 8/15/26 (c) | | 737 | 730 |
| 8.5% 8/15/27 (c) | | 2,141 | 2,135 |
| | | | 23,560 |
| Diversified Financial Services - 4.8% | | | |
| Aercap Global Aviation Trust 6.5% 6/15/45 (c)(e) | | 2,540 | 2,537 |
| Azorra Finance Ltd. 7.75% 4/15/30 (c) | | 3,040 | 3,003 |
| Boost Newco Borrower LLC 7.5% 1/15/31 (c) | | 6,605 | 6,963 |
| Capstone Borrower, Inc. 8% 6/15/30 (c) | | 1,073 | 1,121 |
| Cargo Aircraft Management, Inc. 4.75% 2/1/28 (c) | | 4,860 | 4,641 |
| Coinbase Global, Inc. 3.625% 10/1/31 (c)(d) | | 3,763 | 3,138 |
| Cruise Yacht Upper Holdco Ltd. 11.875% 7/5/28 | | 1,200 | 1,230 |
| Encore Capital Group, Inc.: | | | |
| 8.5% 5/15/30 (c) | | 5,199 | 5,481 |
| 9.25% 4/1/29 (c) | | 2,309 | 2,459 |
| Fortress Transportation & Infrastructure Investors LLC: | | | |
| 5.875% 4/15/33 (c) | | 305 | 297 |
| 7% 5/1/31 (c) | | 100 | 103 |
| 7% 6/15/32 (c) | | 1,050 | 1,077 |
| 7.875% 12/1/30 (c) | | 3,205 | 3,376 |
| GGAM Finance Ltd.: | | | |
| 5.875% 3/15/30 (c) | | 2,920 | 2,873 |
| 6.875% 4/15/29 (c) | | 705 | 718 |
| 7.75% 5/15/26 (c) | | 2,485 | 2,529 |
| 8% 2/15/27 (c) | | 5,110 | 5,279 |
| 8% 6/15/28 (c) | | 7,470 | 7,875 |
| Global Aircraft Leasing Co. Ltd. 8.75% 9/1/27 (c) | | 2,997 | 3,096 |
| Gn Bondco LLC 9.5% 10/15/31 (c)(d) | | 1,880 | 1,996 |
| Hightower Holding LLC: | | | |
| 6.75% 4/15/29 (c) | | 1,437 | 1,415 |
| 9.125% 1/31/30 (c) | | 5,245 | 5,530 |
| Icahn Enterprises LP/Icahn Enterprises Finance Corp.: | | | |
| 4.375% 2/1/29 | | 4,535 | 3,783 |
| 5.25% 5/15/27 | | 9,016 | 8,399 |
| 6.25% 5/15/26 | | 5,966 | 5,864 |
| 9% 6/15/30 | | 1,020 | 985 |
| Jefferies Finance LLC/JFIN Co-Issuer Corp. 5% 8/15/28 (c) | | 980 | 904 |
| Jefferies Finance LLC/JFIN Co.-Issuer Corp. 6.625% 10/15/31 (c) | | 1,680 | 1,673 |
| Ladder Capital Finance Holdings LLLP/Ladder Capital Finance Corp.: | | | |
| 4.75% 6/15/29 (c)(d) | | 3,635 | 3,463 |
| 5.25% 10/1/25 (c) | | 300 | 299 |
| 7% 7/15/31 (c) | | 2,640 | 2,738 |
| Navient Corp.: | | | |
| 4.875% 3/15/28 (d) | | 639 | 609 |
| 5% 3/15/27 (d) | | 639 | 628 |
| 5.625% 8/1/33 | | 934 | 806 |
| OneMain Finance Corp.: | | | |
| 3.5% 1/15/27 | | 630 | 601 |
| 3.875% 9/15/28 | | 7,855 | 7,240 |
| 6.625% 5/15/29 | | 620 | 620 |
| 7.125% 3/15/26 | | 8,580 | 8,790 |
| 7.125% 11/15/31 | | 265 | 268 |
| 9% 1/15/29 | | 5 | 5 |
| Optics Bidco SpA 7.2% 7/18/36 (c) | | 1,309 | 1,347 |
| PRA Group, Inc. 8.875% 1/31/30 (c)(d) | | 1,812 | 1,880 |
| Shift4 Payments LLC / Shift4 Payments Finance Sub, Inc. 6.75% 8/15/32 (c) | | 1,805 | 1,852 |
| SLM Corp. 4.2% 10/29/25 | | 1,555 | 1,526 |
| StoneX Group, Inc. 7.875% 3/1/31 (c)(d) | | 1,050 | 1,105 |
| Williams Scotsman, Inc. 6.625% 6/15/29 (c) | | 3,983 | 4,043 |
| Windstream Services LLC / Wind: | | | |
| 7.75% 8/15/28 (c) | | 3,720 | 3,741 |
| 8.25% 10/1/31 (c) | | 2,745 | 2,779 |
| | | | 132,685 |
| Diversified Media - 0.4% | | | |
| Advantage Sales & Marketing, Inc. 6.5% 11/15/28 (c) | | 6,368 | 5,960 |
| Outfront Media Capital LLC / Corp. 7.375% 2/15/31 (c)(d) | | 3,835 | 4,050 |
| | | | 10,010 |
| Energy - 11.4% | | | |
| Aethon United BR LP / Aethon United Finance Corp. 7.5% 10/1/29 (c)(d) | | 4,135 | 4,164 |
| Alpha Generation LLC 6.75% 10/15/32 (c) | | 3,245 | 3,291 |
| Antero Midstream Partners LP/Antero Midstream Finance Corp. 5.75% 3/1/27 (c) | | 1,515 | 1,512 |
| Archrock Partners LP / Archrock Partners Finance Corp. 6.625% 9/1/32 (c) | | 2,629 | 2,641 |
| Atlantica Sustainable Infrastructure PLC 4.125% 6/15/28 (c) | | 200 | 191 |
| Baytex Energy Corp. 7.375% 3/15/32 (c) | | 2,725 | 2,645 |
| Blue Racer Midstream LLC/Blue Racer Finance Corp. 7% 7/15/29 (c) | | 440 | 451 |
| California Buyer Ltd./Atlantica Sustainable Infrastructure PLC 6.375% 2/15/32 (c)(g) | | 5,170 | 5,134 |
| California Resources Corp.: | | | |
| 7.125% 2/1/26 (c)(d) | | 745 | 747 |
| 8.25% 6/15/29 (c) | | 7,170 | 7,241 |
| Calumet Specialty Products Partners LP/Calumet Finance Corp. 9.75% 7/15/28 (c) | | 1,363 | 1,400 |
| Canacol Energy Ltd. 5.75% 11/24/28 (c) | | 6,313 | 3,275 |
| Cheniere Energy Partners LP 5.75% 8/15/34 (c) | | 3,095 | 3,128 |
| Citgo Petroleum Corp.: | | | |
| 6.375% 6/15/26 (c) | | 6,168 | 6,169 |
| 7% 6/15/25 (c) | | 130 | 130 |
| 8.375% 1/15/29 (c) | | 1,700 | 1,768 |
| CNX Midstream Partners LP 4.75% 4/15/30 (c) | | 3,504 | 3,262 |
| CNX Resources Corp.: | | | |
| 6% 1/15/29 (c) | | 25 | 25 |
| 7.25% 3/1/32 (c) | | 3,785 | 3,900 |
| 7.375% 1/15/31 (c)(d) | | 1,580 | 1,624 |
| Comstock Resources, Inc.: | | | |
| 5.875% 1/15/30 (c) | | 5,080 | 4,641 |
| 6.75% 3/1/29 (c) | | 75 | 72 |
| 6.75% 3/1/29 (c)(d) | | 4,620 | 4,424 |
| CPI CG, Inc. 10% 7/15/29 (c) | | 1,410 | 1,477 |
| CQP Holdco LP / BIP-V Chinook Holdco LLC: | | | |
| 5.5% 6/15/31 (c) | | 250 | 238 |
| 7.5% 12/15/33 (c) | | 5,096 | 5,392 |
| Crescent Energy Finance LLC 7.625% 4/1/32 (c)(d) | | 1,390 | 1,372 |
| CrownRock LP/CrownRock Finance, Inc. 5% 5/1/29 (c) | | 3,855 | 3,898 |
| CVR Energy, Inc.: | | | |
| 5.75% 2/15/28 (c) | | 4,778 | 4,357 |
| 8.5% 1/15/29 (c) | | 5,880 | 5,702 |
| Delek Logistics Partners LP/Delek Logistics Finance Corp.: | | | |
| 7.125% 6/1/28 (c) | | 7,496 | 7,426 |
| 8.625% 3/15/29 (c) | | 3,940 | 4,043 |
| DT Midstream, Inc.: | | | |
| 4.125% 6/15/29 (c) | | 1,325 | 1,244 |
| 4.375% 6/15/31 (c) | | 815 | 750 |
| Energean Israel Finance Ltd.: | | | |
| 4.875% 3/30/26 (Reg. S) (c) | | 345 | 334 |
| 5.375% 3/30/28 (Reg. S) (c) | | 1,234 | 1,111 |
| Energean PLC 6.5% 4/30/27 (c) | | 3,633 | 3,610 |
| EnfraGen Energia Sur SA 5.375% 12/30/30 (c) | | 3,175 | 2,734 |
| EnLink Midstream LLC 6.5% 9/1/30 (c)(d) | | 4,750 | 5,003 |
| Expand Energy Corp.: | | | |
| 4.75% 2/1/32 | | 3,645 | 3,426 |
| 5.375% 2/1/29 | | 50 | 49 |
| Global Partners LP/GLP Finance Corp.: | | | |
| 6.875% 1/15/29 | | 1,840 | 1,837 |
| 7% 8/1/27 | | 6,506 | 6,526 |
| 8.25% 1/15/32 (c) | | 560 | 571 |
| Gran Tierra Energy, Inc. 9.5% 10/15/29 (c) | | 4,259 | 3,918 |
| Harbour Energy PLC 5.5% 10/15/26 (c) | | 880 | 875 |
| Harvest Midstream I LP: | | | |
| 7.5% 9/1/28 (c) | | 5,555 | 5,619 |
| 7.5% 5/15/32 (c) | | 1,565 | 1,602 |
| Hess Midstream Operations LP: | | | |
| 4.25% 2/15/30 (c) | | 1,805 | 1,685 |
| 5.125% 6/15/28 (c) | | 5,690 | 5,568 |
| 5.5% 10/15/30 (c)(d) | | 1,400 | 1,368 |
| 5.625% 2/15/26 (c) | | 6,275 | 6,260 |
| 6.5% 6/1/29 (c) | | 265 | 269 |
| Howard Midstream Energy Partners LLC: | | | |
| 7.375% 7/15/32 (c) | | 1,960 | 2,000 |
| 8.875% 7/15/28 (c) | | 4,687 | 4,945 |
| Kinetik Holdings LP: | | | |
| 5.875% 6/15/30 (c)(d) | | 3,635 | 3,607 |
| 6.625% 12/15/28 (c) | | 3,825 | 3,907 |
| Kosmos Energy Ltd.: | | | |
| 7.5% 3/1/28 (c) | | 1,223 | 1,166 |
| 7.75% 5/1/27 (c) | | 655 | 642 |
| 8.75% 10/1/31 (c) | | 1,405 | 1,372 |
| Matador Resources Co.: | | | |
| 6.25% 4/15/33 (c)(d) | | 1,530 | 1,497 |
| 6.5% 4/15/32 (c) | | 3,265 | 3,234 |
| MEG Energy Corp. 5.875% 2/1/29 (c) | | 110 | 108 |
| Mesquite Energy, Inc. 7.25% (b)(c)(i) | | 28,768 | 0 |
| Moss Creek Resources Holdings, Inc. 8.25% 9/1/31 (c)(d) | | 4,250 | 4,164 |
| Murphy Oil Corp. 6% 10/1/32 | | 1,380 | 1,329 |
| Nabors Industries, Inc.: | | | |
| 8.875% 8/15/31 (c) | | 1,590 | 1,503 |
| 9.125% 1/31/30 (c) | | 640 | 661 |
| New Fortress Energy, Inc.: | | | |
| 6.5% 9/30/26 (c) | | 12,816 | 11,872 |
| 6.75% 9/15/25 (c) | | 7,400 | 7,386 |
| Northern Oil & Gas, Inc.: | | | |
| 8.125% 3/1/28 (c) | | 4,310 | 4,352 |
| 8.75% 6/15/31 (c) | | 1,395 | 1,443 |
| PBF Holding Co. LLC/PBF Finance Corp. 7.875% 9/15/30 (c) | | 7,769 | 7,756 |
| Permian Resources Operating LLC: | | | |
| 5.875% 7/1/29 (c) | | 4,805 | 4,733 |
| 6.25% 2/1/33 (c) | | 1,215 | 1,206 |
| 7% 1/15/32 (c) | | 640 | 653 |
| Petroleos Mexicanos 6.5% 3/13/27 | | 3,595 | 3,519 |
| Prairie Acquiror LP 9% 8/1/29 (c) | | 840 | 852 |
| Rockies Express Pipeline LLC: | | | |
| 4.8% 5/15/30 (c) | | 1,900 | 1,757 |
| 4.95% 7/15/29 (c) | | 4,294 | 4,034 |
| 6.875% 4/15/40 (c) | | 1,598 | 1,515 |
| Seadrill Finance Ltd. 8.375% 8/1/30 (c) | | 1,260 | 1,287 |
| Sitio Royalties OP / Sitio Finance Corp. 7.875% 11/1/28 (c) | | 1,585 | 1,645 |
| SM Energy Co.: | | | |
| 6.75% 8/1/29 (c) | | 605 | 601 |
| 7% 8/1/32 (c)(d) | | 605 | 600 |
| Sunnova Energy Corp.: | | | |
| 5.875% 9/1/26 (c) | | 6,310 | 5,640 |
| 11.75% 10/1/28 (c) | | 320 | 260 |
| Sunoco Logistics Partners, LP: | | | |
| 7% 5/1/29 (c) | | 1,215 | 1,253 |
| 7.25% 5/1/32 (c)(d) | | 1,775 | 1,848 |
| Sunoco LP/Sunoco Finance Corp.: | | | |
| 4.5% 5/15/29 (d) | | 4,794 | 4,558 |
| 5.875% 3/15/28 | | 4,990 | 4,979 |
| 6% 4/15/27 | | 175 | 175 |
| Tallgrass Energy Partners LP / Tallgrass Energy Finance Corp.: | | | |
| 5.5% 1/15/28 (c) | | 7,115 | 6,833 |
| 6% 3/1/27 (c) | | 3,862 | 3,833 |
| 6% 12/31/30 (c) | | 1,675 | 1,572 |
| 6% 9/1/31 (c) | | 8,425 | 7,815 |
| Talos Production, Inc.: | | | |
| 9% 2/1/29 (c)(d) | | 1,145 | 1,179 |
| 9.375% 2/1/31 (c) | | 1,135 | 1,169 |
| TransMontaigne Partners LP 6.125% 2/15/26 | | 2,735 | 2,690 |
| Transocean Aquila Ltd. 8% 9/30/28 (c) | | 812 | 834 |
| Transocean Poseidon Ltd. 6.875% 2/1/27 (c) | | 1,359 | 1,358 |
| Transocean, Inc.: | | | |
| 8% 2/1/27 (c) | | 6,391 | 6,373 |
| 8.25% 5/15/29 (c) | | 2,315 | 2,328 |
| 8.5% 5/15/31 (c) | | 2,960 | 2,983 |
| 8.75% 2/15/30 (c) | | 1,883 | 1,951 |
| Tullow Oil PLC: | | | |
| 7% 3/1/25 (c) | | 2,810 | 2,682 |
| 10.25% 5/15/26 (c) | | 2,884 | 2,650 |
| U.S.A. Compression Partners LP/U.S.A. Compression Finance Corp. 7.125% 3/15/29 (c) | | 2,785 | 2,837 |
| Valaris Ltd. 8.375% 4/30/30 (c) | | 4,285 | 4,348 |
| Viper Energy, Inc. 7.375% 11/1/31 (c) | | 960 | 998 |
| Viridien 8.75% 4/1/27 (c) | | 6,249 | 6,041 |
| | | | 314,632 |
| Environmental - 0.8% | | | |
| Clean Harbors, Inc. 6.375% 2/1/31 (c) | | 1,325 | 1,335 |
| Darling Ingredients, Inc. 6% 6/15/30 (c) | | 2,155 | 2,140 |
| GFL Environmental, Inc.: | | | |
| 3.75% 8/1/25 (c) | | 2,765 | 2,738 |
| 5.125% 12/15/26 (c) | | 2,265 | 2,243 |
| 6.75% 1/15/31 (c) | | 505 | 520 |
| Madison IAQ LLC 5.875% 6/30/29 (c) | | 3,085 | 2,926 |
| Reworld Holding Corp. 4.875% 12/1/29 (c) | | 5,260 | 4,913 |
| Wrangler Holdco Corp. 6.625% 4/1/32 (c) | | 4,800 | 4,899 |
| | | | 21,714 |
| Food & Drug Retail - 1.1% | | | |
| Albertsons Companies LLC/Safeway, Inc./New Albertson's, Inc./Albertson's LLC: | | | |
| 3.5% 3/15/29 (c) | | 6,588 | 6,087 |
| 4.625% 1/15/27 (c) | | 95 | 93 |
| 4.875% 2/15/30 (c) | | 3,900 | 3,799 |
| Emergent BioSolutions, Inc. 3.875% 8/15/28 (c) | | 9,444 | 7,587 |
| Murphy Oil U.S.A., Inc. 3.75% 2/15/31 (c) | | 1,715 | 1,524 |
| Parkland Corp.: | | | |
| 4.5% 10/1/29 (c) | | 1,673 | 1,554 |
| 4.625% 5/1/30 (c) | | 8,235 | 7,569 |
| 6.625% 8/15/32 (c) | | 810 | 808 |
| Walgreens Boots Alliance, Inc. 8.125% 8/15/29 (d) | | 1,760 | 1,755 |
| | | | 30,776 |
| Food/Beverage/Tobacco - 2.4% | | | |
| BellRing Brands, Inc. 7% 3/15/30 (c)(d) | | 1,125 | 1,171 |
| C&S Group Enterprises LLC 5% 12/15/28 (c) | | 5,355 | 4,432 |
| Chobani Holdco II LLC 9.5% 10/1/29 pay-in-kind (c)(e) | | 2,105 | 2,172 |
| Fiesta Purchaser, Inc.: | | | |
| 7.875% 3/1/31 (c) | | 2,490 | 2,611 |
| 9.625% 9/15/32 (c) | | 1,510 | 1,578 |
| KeHE Distributor / Nextwave 9% 2/15/29 (c) | | 5,725 | 5,928 |
| Lamb Weston Holdings, Inc.: | | | |
| 4.125% 1/31/30 (c) | | 7,925 | 7,358 |
| 4.375% 1/31/32 (c) | | 1,370 | 1,255 |
| Performance Food Group, Inc.: | | | |
| 4.25% 8/1/29 (c) | | 40 | 37 |
| 5.5% 10/15/27 (c) | | 642 | 637 |
| 6.125% 9/15/32 (c) | | 4,300 | 4,318 |
| Post Holdings, Inc.: | | | |
| 4.625% 4/15/30 (c)(d) | | 3,700 | 3,458 |
| 5.5% 12/15/29 (c) | | 3,587 | 3,498 |
| 6.25% 2/15/32 (c)(d) | | 3,335 | 3,372 |
| 6.25% 10/15/34 (c) | | 1,550 | 1,533 |
| 6.375% 3/1/33 (c) | | 2,600 | 2,572 |
| Sigma Holdco BV 7.875% 5/15/26 (c) | | 5,013 | 4,965 |
| Triton Water Holdings, Inc. 6.25% 4/1/29 (c) | | 5,530 | 5,463 |
| U.S. Foods, Inc.: | | | |
| 4.625% 6/1/30 (c)(d) | | 2,080 | 1,974 |
| 4.75% 2/15/29 (c) | | 2,600 | 2,505 |
| 5.75% 4/15/33 (c) | | 2,435 | 2,398 |
| 6.875% 9/15/28 (c) | | 1,750 | 1,799 |
| 7.25% 1/15/32 (c) | | 50 | 52 |
| United Natural Foods, Inc. 6.75% 10/15/28 (c) | | 860 | 830 |
| | | | 65,916 |
| Gaming - 1.5% | | | |
| Caesars Entertainment, Inc.: | | | |
| 4.625% 10/15/29 (c) | | 90 | 84 |
| 6% 10/15/32 (c) | | 4,415 | 4,307 |
| 6.5% 2/15/32 (c)(d) | | 5,010 | 5,081 |
| 7% 2/15/30 (c) | | 1,300 | 1,333 |
| 8.125% 7/1/27 (c) | | 2,111 | 2,152 |
| Fertitta Entertainment LLC / Fertitta Entertainment Finance Co., Inc.: | | | |
| 4.625% 1/15/29 (c)(d) | | 90 | 84 |
| 6.75% 1/15/30 (c) | | 8,815 | 8,017 |
| GLP Capital LP/GLP Financing II, Inc.: | | | |
| 5.25% 6/1/25 | | 1,405 | 1,401 |
| 5.375% 4/15/26 | | 30 | 30 |
| Jacobs Entertainment, Inc. 6.75% 2/15/29 (c) | | 1,195 | 1,176 |
| MGM Resorts International 6.5% 4/15/32 (d) | | 2,720 | 2,720 |
| Mohegan Tribal Gaming Authority 8% 2/1/26 (c) | | 4,530 | 4,500 |
| Station Casinos LLC: | | | |
| 4.5% 2/15/28 (c) | | 2,880 | 2,749 |
| 4.625% 12/1/31 (c) | | 115 | 104 |
| 6.625% 3/15/32 (c)(d) | | 2,850 | 2,864 |
| VICI Properties LP / VICI Note Co. 4.125% 8/15/30 (c) | | 2,410 | 2,233 |
| Wynn Resorts Finance LLC / Wynn Resorts Capital Corp. 7.125% 2/15/31 (c)(d) | | 1,515 | 1,594 |
| | | | 40,429 |
| Healthcare - 7.5% | | | |
| 1375209 BC Ltd. 9% 1/30/28 (c) | | 4,700 | 4,691 |
| 180 Medical, Inc. 3.875% 10/15/29 (c) | | 2,575 | 2,395 |
| AdaptHealth LLC 5.125% 3/1/30 (c)(d) | | 5,790 | 5,304 |
| Akumin, Inc. 8% 8/1/28 (c) | | 1,630 | 1,324 |
| AMN Healthcare 4% 4/15/29 (c)(d) | | 1,674 | 1,543 |
| Avantor Funding, Inc.: | | | |
| 3.875% 11/1/29 (c) | | 3,380 | 3,117 |
| 4.625% 7/15/28 (c) | | 2,215 | 2,142 |
| Bausch Health Americas, Inc. 9.25% 4/1/26 (c) | | 1,758 | 1,701 |
| Bausch Health Companies, Inc.: | | | |
| 4.875% 6/1/28 (c) | | 4,005 | 3,095 |
| 5.25% 1/30/30 (c) | | 2,620 | 1,441 |
| 5.5% 11/1/25 (c) | | 11,923 | 11,701 |
| 9% 12/15/25 (c) | | 1,698 | 1,665 |
| 11% 9/30/28 (c) | | 2,430 | 2,236 |
| Catalent Pharma Solutions 3.5% 4/1/30 (c) | | 2,900 | 2,807 |
| Charles River Laboratories International, Inc.: | | | |
| 3.75% 3/15/29 (c) | | 2,995 | 2,746 |
| 4% 3/15/31 (c) | | 2,530 | 2,261 |
| CHS/Community Health Systems, Inc.: | | | |
| 4.75% 2/15/31 (c) | | 10,440 | 8,707 |
| 5.25% 5/15/30 (c) | | 19,820 | 17,298 |
| 6% 1/15/29 (c) | | 1,730 | 1,629 |
| 6.125% 4/1/30 (c) | | 5,786 | 4,530 |
| 6.875% 4/15/29 (c) | | 2,952 | 2,493 |
| CTR Partnership LP/CareTrust Capital Corp. 3.875% 6/30/28 (c) | | 5,375 | 5,092 |
| DaVita, Inc.: | | | |
| 3.75% 2/15/31 (c)(d) | | 1,870 | 1,626 |
| 4.625% 6/1/30 (c) | | 9,340 | 8,599 |
| 6.875% 9/1/32 (c) | | 4,370 | 4,393 |
| Embecta Corp. 5% 2/15/30 (c) | | 610 | 552 |
| Encompass Health Corp. 5.75% 9/15/25 | | 9 | 9 |
| Grifols SA 4.75% 10/15/28 (c) | | 1,552 | 1,430 |
| HAH Group Holding Co. LLC 9.75% 10/1/31 (c) | | 5,381 | 5,483 |
| IQVIA, Inc. 6.5% 5/15/30 (c)(d) | | 2,670 | 2,743 |
| Jazz Securities DAC 4.375% 1/15/29 (c) | | 4,460 | 4,220 |
| LifePoint Health, Inc.: | | | |
| 5.375% 1/15/29 (c) | | 1,488 | 1,362 |
| 9.875% 8/15/30 (c)(d) | | 1,785 | 1,953 |
| 10% 6/1/32 (c) | | 1,206 | 1,287 |
| Medline Borrower LP 3.875% 4/1/29 (c) | | 610 | 571 |
| Medline Borrower LP / Medline Co. 6.25% 4/1/29 (c) | | 12,335 | 12,550 |
| Modivcare, Inc. 5% 10/1/29 (c) | | 970 | 660 |
| Molina Healthcare, Inc.: | | | |
| 3.875% 11/15/30 (c) | | 3,120 | 2,825 |
| 3.875% 5/15/32 (c)(d) | | 1,565 | 1,387 |
| Omega Healthcare Investors, Inc. 3.25% 4/15/33 | | 6,131 | 5,156 |
| Organon & Co. / Organon Foreign Debt Co-Issuer BV: | | | |
| 4.125% 4/30/28 (c) | | 7,125 | 6,751 |
| 5.125% 4/30/31 (c) | | 2,928 | 2,670 |
| 6.75% 5/15/34 (c) | | 504 | 505 |
| 7.875% 5/15/34 (c) | | 785 | 810 |
| Pediatrix Medical Group, Inc. 5.375% 2/15/30 (c) | | 4,035 | 3,857 |
| Prime Healthcare Services 9.375% 9/1/29 (c)(d) | | 1,340 | 1,362 |
| Radiology Partners, Inc. 7.775% 1/31/29 pay-in-kind (c)(e) | | 6,557 | 6,459 |
| Sotera Health Holdings LLC 7.375% 6/1/31 (c) | | 2,118 | 2,169 |
| Surgery Center Holdings, Inc. 7.25% 4/15/32 (c) | | 4,985 | 5,119 |
| Teleflex, Inc. 4.25% 6/1/28 (c) | | 1,540 | 1,476 |
| Tenet Healthcare Corp.: | | | |
| 4.25% 6/1/29 | | 6,525 | 6,173 |
| 4.375% 1/15/30 | | 4,125 | 3,867 |
| 6.125% 10/1/28 | | 5,930 | 5,924 |
| 6.125% 6/15/30 | | 6,675 | 6,706 |
| 6.25% 2/1/27 | | 1,214 | 1,215 |
| 6.75% 5/15/31 (d) | | 945 | 966 |
| 6.875% 11/15/31 | | 10 | 11 |
| Teva Pharmaceutical Finance Netherlands III BV: | | | |
| 3.15% 10/1/26 | | 3,265 | 3,112 |
| 7.875% 9/15/29 | | 930 | 1,003 |
| U.S. Acute Care Solutions 9.75% 5/15/29 (c) | | 1,703 | 1,737 |
| | | | 208,616 |
| Homebuilders/Real Estate - 3.6% | | | |
| Anywhere Real Estate Group LLC 7% 4/15/30 (c)(d) | | 2,120 | 1,858 |
| Anywhere Real Estate Group LLC/Realogy Co-Issuer Corp. 5.75% 1/15/29 (c) | | 1,621 | 1,335 |
| Anywhere Real Estate Group LLC/Realogy Co.-Issuer Corp. 5.25% 4/15/30 (c) | | 736 | 561 |
| Ashton Woods U.S.A. LLC/Ashton Woods Finance Co.: | | | |
| 4.625% 8/1/29 (c) | | 2,555 | 2,388 |
| 6.625% 1/15/28 (c) | | 5 | 5 |
| ATP Tower Holdings LLC/Andean Tower Partners 4.05% 4/27/26 (c) | | 4,659 | 4,495 |
| Beazer Homes U.S.A., Inc. 7.5% 3/15/31 (c) | | 2,160 | 2,221 |
| Greystar Real Estate Partners 7.75% 9/1/30 (c) | | 1,240 | 1,299 |
| HAT Holdings I LLC/HAT Holdings II LLC: | | | |
| 3.375% 6/15/26 (c) | | 2,790 | 2,694 |
| 8% 6/15/27 (c) | | 530 | 555 |
| Howard Hughes Corp.: | | | |
| 4.125% 2/1/29 (c) | | 2,350 | 2,164 |
| 4.375% 2/1/31 (c) | | 1,350 | 1,210 |
| Jones DesLauriers Insurance Management, Inc. 10.5% 12/15/30 (c) | | 605 | 652 |
| Kennedy-Wilson, Inc.: | | | |
| 4.75% 3/1/29 | | 55 | 50 |
| 4.75% 2/1/30 (d) | | 3,915 | 3,502 |
| 5% 3/1/31 | | 55 | 49 |
| Landsea Homes Corp. 8.875% 4/1/29 (c) | | 1,215 | 1,240 |
| LGI Homes, Inc.: | | | |
| 4% 7/15/29 (c)(d) | | 1,585 | 1,419 |
| 8.75% 12/15/28 (c) | | 1,070 | 1,127 |
| MPT Operating Partnership LP/MPT Finance Corp.: | | | |
| 3.5% 3/15/31 | | 10,375 | 7,347 |
| 4.625% 8/1/29 (d) | | 5,920 | 4,604 |
| 5% 10/15/27 (d) | | 10,263 | 9,058 |
| 5.25% 8/1/26 (d) | | 5,594 | 5,291 |
| Panther Escrow Issuer LLC 7.125% 6/1/31 (c) | | 4,005 | 4,101 |
| Railworks Holdings LP 8.25% 11/15/28 (c) | | 5,744 | 5,879 |
| Rithm Capital Corp.: | | | |
| 6.25% 10/15/25 (c) | | 468 | 467 |
| 8% 4/1/29 (c) | | 1,300 | 1,297 |
| Safehold Operating Partnership LP: | | | |
| 2.8% 6/15/31 | | 5,785 | 4,970 |
| 2.85% 1/15/32 | | 3,605 | 3,057 |
| Starwood Property Trust, Inc.: | | | |
| 3.625% 7/15/26 (c) | | 595 | 570 |
| 3.75% 12/31/24 (c) | | 1,886 | 1,878 |
| 4.75% 3/15/25 | | 680 | 678 |
| 6% 4/15/30 (c) | | 2,495 | 2,446 |
| 7.25% 4/1/29 (c)(d) | | 1,625 | 1,663 |
| Taylor Morrison Communities, Inc./Monarch Communities, Inc.: | | | |
| 5.125% 8/1/30 (c) | | 1,005 | 972 |
| 5.75% 1/15/28 (c) | | 80 | 80 |
| 5.875% 6/15/27 (c) | | 55 | 55 |
| TopBuild Corp. 4.125% 2/15/32 (c) | | 2,115 | 1,886 |
| Uniti Group LP/Uniti Group Finance, Inc./CSL Capital LLC: | | | |
| 6.5% 2/15/29 (c) | | 6,755 | 5,815 |
| 10.5% 2/15/28 (c) | | 150 | 160 |
| 10.5% 2/15/28 (c) | | 7,423 | 7,907 |
| VICI Properties LP / VICI Note Co. 3.75% 2/15/27 (c)(d) | | 205 | 198 |
| | | | 99,203 |
| Hotels - 0.9% | | | |
| Carnival Holdings (Bermuda) Ltd. 10.375% 5/1/28 (c) | | 125 | 134 |
| Hilton Domestic Operating Co., Inc.: | | | |
| 3.625% 2/15/32 (c) | | 9,712 | 8,525 |
| 3.75% 5/1/29 (c) | | 35 | 33 |
| 4% 5/1/31 (c) | | 3,495 | 3,184 |
| 5.875% 4/1/29 (c) | | 2,280 | 2,314 |
| 5.875% 3/15/33 (c)(d) | | 1,445 | 1,448 |
| 6.125% 4/1/32 (c)(d) | | 2,325 | 2,348 |
| Hilton Grand Vacations Borrower Escrow LLC 6.625% 1/15/32 (c) | | 3,990 | 3,991 |
| Lindblad Expeditions Holdings 9% 5/15/28 (c) | | 185 | 193 |
| Lindblad Expeditions LLC 6.75% 2/15/27 (c) | | 720 | 723 |
| Park Intermediate Holdings LLC / PK Domestic Property LLC / PK Finance Co.-Issuer 7% 2/1/30 (c) | | 1,860 | 1,905 |
| | | | 24,798 |
| Insurance - 1.4% | | | |
| Acrisure LLC / Acrisure Finance, Inc.: | | | |
| 4.25% 2/15/29 (c)(d) | | 1,100 | 1,034 |
| 7.5% 11/6/30 (c) | | 1,320 | 1,342 |
| 8.25% 2/1/29 (c) | | 1,340 | 1,362 |
| 8.5% 6/15/29 (c) | | 1,320 | 1,356 |
| Alliant Holdings Intermediate LLC/Alliant Holdings Co.-Issuer: | | | |
| 4.25% 10/15/27 (c) | | 8,485 | 8,047 |
| 5.875% 11/1/29 (c) | | 190 | 179 |
| 6.5% 10/1/31 (c) | | 600 | 594 |
| 6.75% 10/15/27 (c) | | 1,580 | 1,574 |
| 6.75% 4/15/28 (c) | | 1,370 | 1,376 |
| 7.375% 10/1/32 (c) | | 2,115 | 2,097 |
| AmWINS Group, Inc.: | | | |
| 4.875% 6/30/29 (c) | | 3,210 | 3,021 |
| 6.375% 2/15/29 (c) | | 2,710 | 2,723 |
| APH Somerset Investor 2 LLC / APH2 Somerset Investor 2 LLC / APH3 Somerset Investor 2 LLC 7.875% 11/1/29 (c) | | 4,535 | 4,530 |
| AssuredPartners, Inc.: | | | |
| 5.625% 1/15/29 (c) | | 3,325 | 3,146 |
| 7.5% 2/15/32 (c) | | 3,390 | 3,414 |
| HUB International Ltd. 7.25% 6/15/30 (c) | | 3,345 | 3,457 |
| | | | 39,252 |
| Leisure - 2.3% | | | |
| Amer Sports Co. 6.75% 2/16/31 (c)(d) | | 5,815 | 5,907 |
| Carnival Corp.: | | | |
| 5.75% 3/1/27 (c) | | 135 | 135 |
| 6% 5/1/29 (c) | | 5,195 | 5,203 |
| 6.65% 1/15/28 | | 750 | 764 |
| 7.625% 3/1/26 (c) | | 10,535 | 10,609 |
| 10.5% 6/1/30 (c) | | 4,745 | 5,119 |
| ClubCorp Holdings, Inc. 8.5% 9/15/25 (c) | | 1,645 | 1,612 |
| MajorDrive Holdings IV LLC 6.375% 6/1/29 (c) | | 3,927 | 3,765 |
| Merlin Entertainments Group 7.375% 2/15/31 (c) | | 1,265 | 1,240 |
| NCL Corp. Ltd.: | | | |
| 3.625% 12/15/24 (c) | | 1,198 | 1,194 |
| 5.875% 3/15/26 (c) | | 2,195 | 2,193 |
| Royal Caribbean Cruises Ltd.: | | | |
| 4.25% 7/1/26 (c) | | 130 | 128 |
| 5.375% 7/15/27 (c) | | 60 | 60 |
| 5.5% 8/31/26 (c) | | 135 | 135 |
| 5.625% 9/30/31 (c) | | 9,760 | 9,705 |
| 6% 2/1/33 (c) | | 5,245 | 5,277 |
| 6.25% 3/15/32 (c) | | 4,680 | 4,771 |
| Viking Cruises Ltd. 9.125% 7/15/31 (c) | | 930 | 1,004 |
| Viking Ocean Cruises Ship VII Ltd. 5.625% 2/15/29 (c) | | 1,605 | 1,583 |
| Voc Escrow Ltd. 5% 2/15/28 (c) | | 2,130 | 2,071 |
| | | | 62,475 |
| Metals/Mining - 2.3% | | | |
| Alcoa Nederland Holding BV 7.125% 3/15/31 (c) | | 9,862 | 10,283 |
| Alpha Natural Resources, Inc. 9.75% (b)(i) | | 210 | 0 |
| Cleveland-Cliffs, Inc.: | | | |
| 6.875% 11/1/29 (c) | | 1,530 | 1,536 |
| 7% 3/15/32 (c)(d) | | 3,150 | 3,154 |
| 7.375% 5/1/33 (c) | | 1,530 | 1,541 |
| Eldorado Gold Corp. 6.25% 9/1/29 (c) | | 1,860 | 1,834 |
| ERO Copper Corp. 6.5% 2/15/30 (c) | | 8,273 | 8,128 |
| First Quantum Minerals Ltd.: | | | |
| 6.875% 10/15/27 (c) | | 5,495 | 5,431 |
| 8.625% 6/1/31 (c) | | 285 | 287 |
| 9.375% 3/1/29 (c) | | 7,740 | 8,229 |
| FMG Resources August 2006 Pty Ltd.: | | | |
| 4.375% 4/1/31 (c) | | 1,415 | 1,288 |
| 5.875% 4/15/30 (c) | | 130 | 129 |
| HudBay Minerals, Inc.: | | | |
| 4.5% 4/1/26 (c) | | 1,120 | 1,106 |
| 6.125% 4/1/29 (c) | | 105 | 106 |
| Mineral Resources Ltd.: | | | |
| 8% 11/1/27 (c) | | 3,910 | 4,009 |
| 8.5% 5/1/30 (c) | | 3,375 | 3,471 |
| 9.25% 10/1/28 (c) | | 2,425 | 2,553 |
| Novelis Corp. 3.875% 8/15/31 (c) | | 1,475 | 1,295 |
| Samarco Mineracao SA 9% 6/30/31 pay-in-kind (c)(e) | | 3,858 | 3,649 |
| Vibrantz Technologies, Inc. 9% 2/15/30 (c) | | 5,155 | 4,829 |
| Volcan Compania Minera SAA 8.75% 1/24/30 (c) | | 1,980 | 1,809 |
| | | | 64,667 |
| Paper - 1.1% | | | |
| Ahlstrom Holding 3 OY 4.875% 2/4/28 (c) | | 5,610 | 5,308 |
| Ardagh Metal Packaging Finance U.S.A. LLC/Ardagh Metal Packaging Finance PLC: | | | |
| 4% 9/1/29 (c) | | 5,755 | 5,048 |
| 6% 6/15/27 (c) | | 4,690 | 4,677 |
| Clydesdale Acquisition Holdings, Inc.: | | | |
| 6.625% 4/15/29 (c) | | 1,515 | 1,522 |
| 6.875% 1/15/30 (c)(d) | | 2,995 | 3,039 |
| 8.75% 4/15/30 (c) | | 5,305 | 5,387 |
| Mativ Holdings, Inc. 8% 10/1/29 (c) | | 1,520 | 1,547 |
| Mercer International, Inc. 5.125% 2/1/29 (d) | | 908 | 784 |
| Rayonier AM Products, Inc. 7.625% 1/15/26 (c) | | 2,282 | 2,283 |
| | | | 29,595 |
| Publishing/Printing - 0.1% | | | |
| Cimpress PLC 7.375% 9/15/32 (c) | | 2,335 | 2,299 |
| Railroad - 0.2% | | | |
| Genesee & Wyoming, Inc. 6.25% 4/15/32 (c) | | 6,650 | 6,708 |
| Restaurants - 0.9% | | | |
| 1011778 BC Unlimited Liability Co./New Red Finance, Inc.: | | | |
| 3.875% 1/15/28 (c) | | 2,310 | 2,202 |
| 4% 10/15/30 (c) | | 7,126 | 6,436 |
| 5.625% 9/15/29 (c) | | 3,985 | 3,975 |
| 6.125% 6/15/29 (c) | | 2,960 | 3,012 |
| Yum! Brands, Inc.: | | | |
| 3.625% 3/15/31 | | 705 | 638 |
| 4.625% 1/31/32 | | 9,050 | 8,485 |
| 4.75% 1/15/30 (c) | | 200 | 194 |
| 5.375% 4/1/32 (d) | | 1,100 | 1,071 |
| | | | 26,013 |
| Services - 5.5% | | | |
| ADT Corp. 4.125% 8/1/29 (c)(d) | | 3,320 | 3,104 |
| Allied Universal Holdco LLC 7.875% 2/15/31 (c) | | 4,155 | 4,228 |
| Allied Universal Holdco LLC / Allied Universal Finance Corp.: | | | |
| 6% 6/1/29 (c) | | 4,960 | 4,538 |
| 9.75% 7/15/27 (c) | | 7,370 | 7,388 |
| Artera Services LLC 8.5% 2/15/31 (c) | | 15,504 | 15,365 |
| ASGN, Inc. 4.625% 5/15/28 (c) | | 2,660 | 2,540 |
| Atlas Luxco 4 SARL / Allied Universal Holdco LLC / Allied Universal Finance Corp. 4.625% 6/1/28 (c) | | 38 | 36 |
| Avis Budget Car Rental LLC/Avis Budget Finance, Inc.: | | | |
| 5.375% 3/1/29 (c) | | 40 | 37 |
| 5.75% 7/15/27 (c) | | 320 | 314 |
| 8.25% 1/15/30 (c)(d) | | 590 | 603 |
| Brand Industrial Services, Inc. 10.375% 8/1/30 (c) | | 10,830 | 11,481 |
| CoreCivic, Inc.: | | | |
| 4.75% 10/15/27 | | 6,734 | 6,416 |
| 8.25% 4/15/29 (d) | | 6,685 | 7,020 |
| CoreLogic, Inc. 4.5% 5/1/28 (c) | | 2,960 | 2,779 |
| Garda World Security Corp.: | | | |
| 8.25% 8/1/32 (c) | | 1,620 | 1,612 |
| 8.375% 11/15/32 (c) | | 1,740 | 1,740 |
| Gartner, Inc. 4.5% 7/1/28 (c) | | 3,760 | 3,669 |
| Hertz Corp.: | | | |
| 5.5% (b)(c)(i) | | 65 | 4 |
| 6% (b)(c)(i) | | 85 | 14 |
| 6.25% (b)(i) | | 60 | 3 |
| 7.125% (b)(c)(i) | | 85 | 16 |
| Life Time, Inc.: | | | |
| 5.75% 1/15/26 (c) | | 3,378 | 3,376 |
| 6% 11/15/31 (c)(g) | | 7,560 | 7,528 |
| 8% 4/15/26 (c) | | 6,085 | 6,115 |
| Neptune BidCo U.S., Inc. 9.29% 4/15/29 (c) | | 1,062 | 988 |
| Service Corp. International: | | | |
| 4% 5/15/31 (d) | | 2,300 | 2,074 |
| 5.125% 6/1/29 | | 1,478 | 1,450 |
| 5.75% 10/15/32 | | 1,355 | 1,331 |
| Sotheby's 7.375% 10/15/27 (c) | | 3,894 | 3,790 |
| Staples, Inc.: | | | |
| 10.75% 9/1/29 (c) | | 4,915 | 4,753 |
| 12.75% 1/15/30 (c) | | 4,067 | 3,232 |
| StoneMor, Inc. 8.5% 5/15/29 (c) | | 1,515 | 1,350 |
| The GEO Group, Inc.: | | | |
| 8.625% 4/15/29 | | 4,285 | 4,482 |
| 10.25% 4/15/31 | | 3,686 | 3,951 |
| TriNet Group, Inc.: | | | |
| 3.5% 3/1/29 (c) | | 7,560 | 6,874 |
| 7.125% 8/15/31 (c) | | 1,445 | 1,480 |
| Uber Technologies, Inc.: | | | |
| 4.3% 1/15/30 | | 1,331 | 1,294 |
| 8% 11/1/26 (c) | | 9,595 | 9,595 |
| United Rentals North America, Inc. 6.125% 3/15/34 (c) | | 5,535 | 5,581 |
| WASH Multifamily Acquisition, Inc. 5.75% 4/15/26 (c) | | 9,222 | 9,199 |
| | | | 151,350 |
| Steel - 0.4% | | | |
| ATI, Inc. 7.25% 8/15/30 | | 1,350 | 1,399 |
| Commercial Metals Co.: | | | |
| 3.875% 2/15/31 | | 1,685 | 1,513 |
| 4.125% 1/15/30 | | 2,700 | 2,506 |
| TMK Capital SA 4.3% (Reg. S) (b)(i) | | 200 | 30 |
| Vallourec SA 7.5% 4/15/32 (c) | | 5,456 | 5,715 |
| | | | 11,163 |
| Super Retail - 1.8% | | | |
| Bath & Body Works, Inc.: | | | |
| 6.625% 10/1/30 (c)(d) | | 110 | 110 |
| 6.694% 1/15/27 (d) | | 1,315 | 1,346 |
| Carvana Co.: | | | |
| 4.875% 9/1/29 (c) | | 2,253 | 1,887 |
| 5.5% 4/15/27 (c) | | 2,422 | 2,228 |
| 5.625% 10/1/25 (c) | | 4,209 | 4,157 |
| 5.875% 10/1/28 (c) | | 1,267 | 1,139 |
| 10.25% 5/1/30 (c) | | 357 | 361 |
| 12% 12/1/28 pay-in-kind (c)(e) | | 2,388 | 2,526 |
| 13% 6/1/30 pay-in-kind (c)(e) | | 2,262 | 2,466 |
| 14% 6/1/31 pay-in-kind (c)(e) | | 4,477 | 5,337 |
| EG Global Finance PLC 12% 11/30/28 (c) | | 13,474 | 14,982 |
| LBM Acquisition LLC 6.25% 1/15/29 (c) | | 4,145 | 3,823 |
| Levi Strauss & Co. 3.5% 3/1/31 (c)(d) | | 620 | 548 |
| Michaels Companies, Inc. 5.25% 5/1/28 (c) | | 1,174 | 845 |
| Nordstrom, Inc.: | | | |
| 4.25% 8/1/31 | | 1,175 | 1,034 |
| 4.375% 4/1/30 (d) | | 870 | 789 |
| Sally Holdings LLC 6.75% 3/1/32 (d) | | 2,810 | 2,845 |
| Wolverine World Wide, Inc. 4% 8/15/29 (c) | | 3,140 | 2,685 |
| | | | 49,108 |
| Technology - 6.6% | | | |
| Acuris Finance U.S. 5% 5/1/28 (c) | | 8,951 | 8,078 |
| Ahead DB Holdings LLC 6.625% 5/1/28 (c) | | 3,435 | 3,335 |
| Amentum Holdings, Inc. 7.25% 8/1/32 (c) | | 3,155 | 3,268 |
| Block, Inc.: | | | |
| 3.5% 6/1/31 (d) | | 7,680 | 6,808 |
| 6.5% 5/15/32 (c) | | 7,105 | 7,231 |
| Cloud Software Group, Inc.: | | | |
| 6.5% 3/31/29 (c) | | 1,472 | 1,438 |
| 8.25% 6/30/32 (c) | | 5,905 | 6,069 |
| 9% 9/30/29 (c) | | 12,607 | 12,606 |
| Cogent Communications Group, Inc. 7% 6/15/27 (c) | | 4,640 | 4,666 |
| Coherent Corp. 5% 12/15/29 (c)(d) | | 5,525 | 5,300 |
| CommScope, Inc. 4.75% 9/1/29 (c) | | 5,730 | 4,899 |
| Elastic NV 4.125% 7/15/29 (c) | | 935 | 865 |
| Entegris, Inc.: | | | |
| 3.625% 5/1/29 (c) | | 2,050 | 1,876 |
| 4.75% 4/15/29 (c) | | 2,000 | 1,938 |
| 5.95% 6/15/30 (c) | | 8,335 | 8,326 |
| Gen Digital, Inc. 5% 4/15/25 (c) | | 2,715 | 2,708 |
| Go Daddy Operating Co. LLC / GD Finance Co., Inc.: | | | |
| 3.5% 3/1/29 (c)(d) | | 4,760 | 4,393 |
| 5.25% 12/1/27 (c) | | 945 | 934 |
| Helios Software Holdings, Inc. / ION Corporate Solutions Finance Sarl 8.75% 5/1/29 (c) | | 2,125 | 2,157 |
| HTA Group Ltd. 7.5% 6/4/29 (c) | | 12,055 | 12,249 |
| Iliad Holding SAS: | | | |
| 7% 10/15/28 (c) | | 285 | 289 |
| 8.5% 4/15/31 (c) | | 4,625 | 4,942 |
| Insight Enterprises, Inc. 6.625% 5/15/32 (c) | | 2,180 | 2,229 |
| ION Trading Technologies Ltd.: | | | |
| 5.75% 5/15/28 (c) | | 4,115 | 3,730 |
| 9.5% 5/30/29 (c) | | 265 | 269 |
| Lightning Power LLC 7.25% 8/15/32 (c) | | 2,445 | 2,544 |
| Match Group Holdings II LLC: | | | |
| 3.625% 10/1/31 (c)(d) | | 820 | 718 |
| 4.125% 8/1/30 (c) | | 1,815 | 1,650 |
| McAfee Corp. 7.375% 2/15/30 (c) | | 2,290 | 2,208 |
| NCR Atleos Corp. 9.5% 4/1/29 (c) | | 2,437 | 2,682 |
| NCR Voyix Corp. 5.125% 4/15/29 (c) | | 14 | 13 |
| ON Semiconductor Corp. 3.875% 9/1/28 (c) | | 3,675 | 3,446 |
| Open Text Corp. 3.875% 12/1/29 (c) | | 4,020 | 3,667 |
| Open Text Holdings, Inc.: | | | |
| 4.125% 2/15/30 (c) | | 4,820 | 4,425 |
| 4.125% 12/1/31 (c)(d) | | 4,170 | 3,745 |
| Rackspace Finance LLC 3.5% 5/15/28 (c) | | 6,438 | 3,793 |
| Roblox Corp. 3.875% 5/1/30 (c) | | 4,230 | 3,828 |
| Seagate HDD Cayman: | | | |
| 5.75% 12/1/34 | | 3,695 | 3,641 |
| 8.25% 12/15/29 | | 1,355 | 1,458 |
| 8.5% 7/15/31 | | 1,625 | 1,752 |
| Sensata Technologies BV 4% 4/15/29 (c) | | 3,505 | 3,278 |
| Sensata Technologies, Inc.: | | | |
| 3.75% 2/15/31 (c)(d) | | 1,370 | 1,223 |
| 6.625% 7/15/32 (c)(d) | | 2,945 | 2,984 |
| TTM Technologies, Inc. 4% 3/1/29 (c) | | 7,050 | 6,591 |
| UKG, Inc. 6.875% 2/1/31 (c) | | 3,350 | 3,432 |
| Veritas U.S., Inc./Veritas Bermuda Ltd. 7.5% 9/1/25 (c) | | 1,900 | 1,808 |
| Virtusa Corp. 7.125% 12/15/28 (c) | | 804 | 780 |
| Western Digital Corp.: | | | |
| 2.85% 2/1/29 | | 5,455 | 4,820 |
| 3.1% 2/1/32 (d) | | 2,295 | 1,920 |
| 4.75% 2/15/26 | | 300 | 296 |
| Wolfspeed, Inc. 4.2917% 6/23/30 pay-in-kind (b)(c)(e)(j) | | 4,855 | 4,661 |
| | | | 181,966 |
| Telecommunications - 4.9% | | | |
| Altice Financing SA 5.75% 8/15/29 (c) | | 13,325 | 10,928 |
| Altice France Holding SA 6% 2/15/28 (c) | | 3,268 | 868 |
| Altice France SA: | | | |
| 5.125% 1/15/29 (c) | | 11,664 | 8,736 |
| 5.125% 7/15/29 (c) | | 9,500 | 7,106 |
| 5.5% 1/15/28 (c) | | 4,070 | 3,158 |
| 5.5% 10/15/29 (c) | | 50 | 37 |
| AXIAN Telecom 7.375% 2/16/27 (c) | | 2,640 | 2,652 |
| C&W Senior Finance Ltd. 6.875% 9/15/27 (c) | | 7,600 | 7,525 |
| Cablevision Lightpath LLC: | | | |
| 3.875% 9/15/27 (c) | | 524 | 498 |
| 5.625% 9/15/28 (c) | | 1,015 | 942 |
| Consolidated Communications, Inc. 5% 10/1/28 (c) | | 2,530 | 2,340 |
| Frontier Communications Holdings LLC: | | | |
| 5% 5/1/28 (c) | | 5,565 | 5,471 |
| 5.875% 11/1/29 | | 3,564 | 3,482 |
| 8.75% 5/15/30 (c) | | 3,210 | 3,398 |
| IHS Holding Ltd.: | | | |
| 5.625% 11/29/26 (c) | | 2,672 | 2,617 |
| 6.25% 11/29/28 (c) | | 615 | 576 |
| IHS Netherlands Holdco BV 8% 9/18/27 (c) | | 2,850 | 2,847 |
| Intelsat Jackson Holdings SA 6.5% 3/15/30 (c) | | 4,520 | 4,247 |
| LCPR Senior Secured Financing DAC: | | | |
| 5.125% 7/15/29 (c) | | 3,809 | 3,207 |
| 6.75% 10/15/27 (c) | | 4,880 | 4,585 |
| Level 3 Financing, Inc.: | | | |
| 3.625% 1/15/29 (c) | | 1,055 | 791 |
| 3.875% 10/15/30 (c) | | 4,604 | 3,499 |
| 4% 4/15/31 (c) | | 384 | 290 |
| 4.25% 7/1/28 (c) | | 300 | 249 |
| 4.5% 4/1/30 (c) | | 2,255 | 1,804 |
| 4.625% 9/15/27 (c) | | 300 | 272 |
| 10.5% 5/15/30 (c) | | 7,137 | 7,806 |
| 11% 11/15/29 (c) | | 3,125 | 3,527 |
| Liquid Telecommunications Financing PLC 5.5% 9/4/26 (c) | | 5,831 | 4,140 |
| Millicom International Cellular SA: | | | |
| 4.5% 4/27/31 (c) | | 1,349 | 1,211 |
| 5.125% 1/15/28 (c) | | 2,750 | 2,658 |
| 7.375% 4/2/32 (c) | | 1,620 | 1,655 |
| Sable International Finance Ltd. 7.125% 10/15/32 (c) | | 4,540 | 4,555 |
| SBA Communications Corp.: | | | |
| 3.125% 2/1/29 | | 70 | 64 |
| 3.875% 2/15/27 (d) | | 200 | 194 |
| Sitios Latinoamerica S.A.B. de CV 5.375% 4/4/32 (c) | | 2,855 | 2,728 |
| Uniti Group LP/Uniti Fiber Holdings, Inc./CSL Capital LLC 6% 1/15/30 (c) | | 9,090 | 7,615 |
| ViaSat, Inc. 5.625% 9/15/25 (c) | | 5,933 | 5,856 |
| Virgin Media Secured Finance PLC 4.5% 8/15/30 (c) | | 5,830 | 5,106 |
| VMED O2 UK Financing I PLC: | | | |
| 4.25% 1/31/31 (c) | | 1,079 | 931 |
| 7.75% 4/15/32 (c) | | 1,360 | 1,362 |
| Zayo Group Holdings, Inc. 4% 3/1/27 (c)(d) | | 4,765 | 4,241 |
| | | | 135,774 |
| Textiles/Apparel - 0.1% | | | |
| Crocs, Inc. 4.125% 8/15/31 (c)(d) | | 1,525 | 1,336 |
| Kontoor Brands, Inc. 4.125% 11/15/29 (c)(d) | | 1,460 | 1,361 |
| | | | 2,697 |
| Transportation Ex Air/Rail - 0.7% | | | |
| Golar LNG Ltd.: | | | |
| 7% 10/20/25 (c) | | 4,760 | 4,799 |
| 7.75% 9/19/29 (Reg. S) (c) | | 4,000 | 3,979 |
| Seaspan Corp. 5.5% 8/1/29 (c) | | 2,955 | 2,811 |
| XPO, Inc.: | | | |
| 6.25% 6/1/28 (c) | | 800 | 812 |
| 7.125% 6/1/31 (c)(d) | | 1,330 | 1,377 |
| 7.125% 2/1/32 (c)(d) | | 4,620 | 4,799 |
| Yinson Boronia Production BV 8.947% 7/31/42 (c) | | 1,320 | 1,398 |
| | | | 19,975 |
| Utilities - 3.0% | | | |
| Calpine Corp.: | | | |
| 4.625% 2/1/29 (c) | | 1,820 | 1,726 |
| 5% 2/1/31 (c) | | 1,000 | 944 |
| 5.125% 3/15/28 (c) | | 2,127 | 2,079 |
| Clearway Energy Operating LLC: | | | |
| 3.75% 2/15/31 (c) | | 6,515 | 5,816 |
| 3.75% 1/15/32 (c)(d) | | 670 | 594 |
| 4.75% 3/15/28 (c) | | 1,030 | 999 |
| DPL, Inc.: | | | |
| 4.125% 7/1/25 | | 3,760 | 3,727 |
| 4.35% 4/15/29 | | 460 | 432 |
| NextEra Energy Partners LP: | | | |
| 4.5% 9/15/27 (c) | | 1,528 | 1,467 |
| 7.25% 1/15/29 (c)(d) | | 265 | 273 |
| NRG Energy, Inc.: | | | |
| 3.375% 2/15/29 (c) | | 5,740 | 5,234 |
| 3.625% 2/15/31 (c) | | 1,990 | 1,762 |
| 3.875% 2/15/32 (c)(d) | | 5 | 4 |
| 5.25% 6/15/29 (c) | | 5,350 | 5,228 |
| 5.75% 7/15/29 | | 3,330 | 3,280 |
| 6% 2/1/33 (c) | | 3,020 | 3,003 |
| 6.25% 11/1/34 (c) | | 3,238 | 3,235 |
| PG&E Corp.: | | | |
| 5% 7/1/28 (d) | | 2,190 | 2,136 |
| 5.25% 7/1/30 | | 13,273 | 12,935 |
| 7.375% 3/15/55 (e) | | 2,412 | 2,491 |
| Pike Corp.: | | | |
| 5.5% 9/1/28 (c) | | 1,937 | 1,898 |
| 8.625% 1/31/31 (c) | | 2,070 | 2,199 |
| Vistra Operations Co. LLC: | | | |
| 5% 7/31/27 (c) | | 8,046 | 7,940 |
| 5.5% 9/1/26 (c) | | 2,040 | 2,034 |
| 5.625% 2/15/27 (c) | | 6,435 | 6,418 |
| 6.875% 4/15/32 (c) | | 3,030 | 3,133 |
| 7.75% 10/15/31 (c) | | 2,240 | 2,366 |
| | | | 83,353 |
TOTAL NONCONVERTIBLE BONDS | | | 2,333,988 |
| TOTAL CORPORATE BONDS (Cost $2,430,947) | | | 2,381,704 |
| | | | |
| U.S. Treasury Obligations - 2.5% |
| | | Principal Amount (a) (000s) | Value ($) (000s) |
| U.S. Treasury Notes: | | | |
| 3.75% 5/31/30 | | 10,630 | 10,400 |
| 4% 2/15/34 | | 59,268 | 57,995 |
| TOTAL U.S. TREASURY OBLIGATIONS (Cost $68,822) | | | 68,395 |
| | | | |
| Asset-Backed Securities - 0.2% |
| | | Principal Amount (a) (000s) | Value ($) (000s) |
| Agl Clo 5 Ltd. Series 2024-5A Class ERR, CME Term SOFR 3 Month Index + 6.350% 10.9674% 7/20/34 (c)(e)(f) | | 154 | 154 |
| Ares Loan Funding Vii Ltd. Series 2024-ALF7 Class E, CME Term SOFR 3 Month Index + 6.250% 10.7901% 10/22/37 (c)(e)(f) | | 150 | 152 |
| Bbam U.S. Clo Iv Ltd. Series 2024-4A Class D, CME Term SOFR 3 Month Index + 6.250% 11.5729% 7/15/39 (c)(e)(f) | | 250 | 252 |
| Birch Grove Clo 5 LLC Series 2024-5A Class ER, CME Term SOFR 3 Month Index + 6.750% 11.5989% 10/20/37 (c)(e)(f) | | 184 | 187 |
| Carlyle U.S. Clo 2024-2 Ltd. Series 2024-2A Class E, CME Term SOFR 3 Month Index + 6.850% 11.4759% 4/25/37 (c)(e)(f) | | 250 | 254 |
| Carlyle U.S. Clo 2024-6 Ltd. Series 2024-6A Class E, CME Term SOFR 3 Month Index + 5.750% 0% 10/25/37 (c)(e)(f)(g) | | 223 | 223 |
| Carval Clo Xi-C Ltd. Series 2024-3A Class E, CME Term SOFR 3 Month Index + 6.350% 10.9214% 10/20/37 (c)(e)(f) | | 317 | 319 |
| Croton Pk Clo Ltd. CME Term SOFR 3 Month Index + 5.550% 10.1997% 10/15/36 (c)(e)(f) | | 285 | 288 |
| Eaton Vance CLO, Ltd. Series 2024-1A Class D2, CME Term SOFR 3 Month Index + 4.500% 9.1559% 10/15/37 (c)(e)(f) | | 200 | 202 |
| Golub Capital Partners Clo 76 B Lt Series 2024-76A Class E, CME Term SOFR 3 Month Index + 5.750% 10.4919% 10/25/37 (c)(e)(f) | | 175 | 176 |
| Invesco U.S. Clo 2023-2 Ltd. Series 2023-2A Class F, CME Term SOFR 3 Month Index + 7.580% 12.1974% 4/21/36 (c)(e)(f) | | 423 | 418 |
| Magnetite Xxix Ltd. Series 2024-29A Class ER, CME Term SOFR 3 Month Index + 6.000% 11.2417% 7/15/37 (c)(e)(f) | | 150 | 152 |
| Midocean Credit Clo Xii Ltd. Series 2024-12A Class ER, CME Term SOFR 3 Month Index + 6.650% 11.2824% 4/18/36 (c)(e)(f) | | 424 | 428 |
| Midocean Credit Clo Xv Ltd. Series 2024-15A Class E, CME Term SOFR 3 Month Index + 6.250% 10.8674% 7/21/37 (c)(e)(f) | | 250 | 251 |
| Midocean Credit Clo Xvi Series 2024-16A Class E, CME Term SOFR 3 Month Index + 6.250% 6.25% 10/20/37 (c)(e)(f)(g) | | 222 | 222 |
| Neuberger Berman Loan Advisers Series 2024-2A Class E, CME Term SOFR 3 Month Index + 7.500% 12.1174% 4/20/38 (c)(e)(f) | | 791 | 801 |
| Ocp Clo 2017-14 Ltd. Series 2024-14A Class ER, CME Term SOFR 3 Month Index + 6.550% 11.2908% 7/20/37 (c)(e)(f) | | 200 | 203 |
| OCP CLO Ltd.: | | | |
| Series 2021-21A Class E, CME Term SOFR 3 Month Index + 6.540% 11.159% 7/20/34 (c)(e)(f) | | 425 | 426 |
| Series 2024-11A Class ER2, CME Term SOFR 3 Month Index + 6.820% 11.4372% 4/26/36 (c)(e)(f) | | 560 | 562 |
| Orchard Park Clo Ltd. Series 2024-1A Class E, CME Term SOFR 3 Month Index + 5.600% 10.2529% 10/20/37 (c)(e)(f) | | 285 | 289 |
| Palmer Square Ln Funding 2024-2 Lt Series 2024-2A Class D, CME Term SOFR 3 Month Index + 4.700% 6.2% 1/15/33 (c)(e)(f)(g) | | 285 | 285 |
| Rr 31 Ltd. Series 2024-31A Class D, CME Term SOFR 3 Month Index + 6.000% 10.5928% 10/15/39 (c)(e)(f) | | 150 | 150 |
| TOTAL ASSET-BACKED SECURITIES (Cost $6,342) | | | 6,394 |
| | | | |
| Commercial Mortgage Securities - 0.1% |
| | | Principal Amount (a) (000s) | Value ($) (000s) |
| BX Commercial Mortgage Trust floater Series 2021-SOAR Class G, CME Term SOFR 1 Month Index + 2.910% 7.7185% 6/15/38 (c)(e)(f) | | 1,878 | 1,853 |
| Hilton U.S.A. Trust Series 2016-HHV Class F, 4.1935% 11/5/38 (c)(e) | | 1,700 | 1,605 |
| TOTAL COMMERCIAL MORTGAGE SECURITIES (Cost $3,318) | | | 3,458 |
| | | | |
| Common Stocks - 1.9% |
| | | Shares | Value ($) (000s) |
| Automotive & Auto Parts - 0.0% | | | |
| Aptiv PLC (k) | | 20,100 | 1,142 |
| UC Holdings, Inc. (b)(k) | | 3,510 | 1 |
TOTAL AUTOMOTIVE & AUTO PARTS | | | 1,143 |
| Energy - 0.9% | | | |
| California Resources Corp. | | 170 | 9 |
| Cheniere Energy, Inc. | | 13,400 | 2,564 |
| EP Energy Corp. (b)(k) | | 7,975 | 10 |
| Forbes Energy Services Ltd. (b)(k) | | 47,062 | 0 |
| Mesquite Energy, Inc. (b)(k) | | 213,506 | 18,031 |
| Mesquite Energy, Inc. (b)(k) | | 3,543 | 287 |
| Noble Corp. PLC: | | | |
| warrants 2/4/28 (k) | | 600 | 9 |
| warrants 2/4/28 (k) | | 600 | 6 |
| PureWest Energy (b)(k) | | 105 | 0 |
| South Bow Corp. | | 126,400 | 3,156 |
| Superior Energy Services, Inc. Class A (b) | | 609 | 37 |
| Tidewater, Inc. warrants 11/14/42 (k) | | 1,897 | 125 |
TOTAL ENERGY | | | 24,234 |
| Entertainment/Film - 0.0% | | | |
| New Cotai LLC/New Cotai Capital Corp. (b)(k)(l) | | 125,816 | 78 |
| Food & Drug Retail - 0.0% | | | |
| Northeast Grocery, Inc. (b)(k)(l) | | 12,754 | 64 |
| Southeastern Grocers, Inc. rights (b)(k) | | 1,243,047 | 803 |
TOTAL FOOD & DRUG RETAIL | | | 867 |
| Healthcare - 0.2% | | | |
| Cano Health, Inc. (b) | | 271,705 | 3,320 |
| Cano Health, Inc. warrants (b)(k) | | 14,480 | 57 |
| Centene Corp. (k) | | 19,300 | 1,202 |
TOTAL HEALTHCARE | | | 4,579 |
| Hotels - 0.0% | | | |
| Travelport Finance Luxembourg SARL (b) | | 7 | 17 |
| Leisure - 0.0% | | | |
| Topgolf Callaway Brands Corp. (k) | | 135,500 | 1,316 |
| Services - 0.1% | | | |
| CoreCivic, Inc. (k) | | 100,800 | 1,392 |
| The GEO Group, Inc. (k) | | 90,800 | 1,378 |
TOTAL SERVICES | | | 2,770 |
| Steel - 0.0% | | | |
| Vallourec SA (k) | | 82,400 | 1,349 |
| Technology - 0.2% | | | |
| Coherent Corp. (k) | | 22,600 | 2,089 |
| ON Semiconductor Corp. (k) | | 31,600 | 2,227 |
TOTAL TECHNOLOGY | | | 4,316 |
| Telecommunications - 0.5% | | | |
| GTT Communications, Inc. (b)(k) | | 113,281 | 6,123 |
| Helios Towers PLC (k) | | 4,721,184 | 6,477 |
| Intelsat Emergence SA (b) | | 2,308 | 79 |
TOTAL TELECOMMUNICATIONS | | | 12,679 |
| TOTAL COMMON STOCKS (Cost $40,069) | | | 53,348 |
| | | | |
| Bank Loan Obligations - 4.3% |
| | | Principal Amount (a) (000s) | Value ($) (000s) |
| Aerospace - 0.1% | | | |
| Azorra Soar Tlb Finance Ltd. Tranche B 1LN, term loan CME Term SOFR 1 Month Index + 3.500% 8.1324% 10/18/29 (e)(f)(m) | | 1,520 | 1,518 |
| Air Transportation - 0.0% | | | |
| Echo Global Logistics, Inc.: | | | |
| 1LN, term loan CME Term SOFR 3 Month Index + 4.750% 9.5352% 11/23/28 (b)(e)(f)(m) | | 189 | 189 |
| 2LN, term loan: | | | |
CME Term SOFR 3 Month Index + 7.000% 11.7852% 11/23/29 (b)(e)(f)(m) | | 30 | 30 |
CME Term SOFR 3 Month Index + 8.000% 12.7852% 11/23/29 (b)(e)(f)(m) | | 257 | 257 |
TOTAL AIR TRANSPORTATION | | | 476 |
| Banks & Thrifts - 0.0% | | | |
| Cpi Holdco B LLC Tranche B 1LN, term loan CME Term SOFR 1 Month Index + 2.250% 0% 5/19/31 (e)(f)(m)(n) | | 295 | 293 |
| Broadcasting - 0.3% | | | |
| Diamond Sports Group LLC: | | | |
| 1LN, term loan CME Term SOFR 1 Month Index + 8.000% 14.9441% 5/25/26 (e)(f)(m) | | 5,064 | 4,359 |
| Tranche DIP term loan 10% 8/2/27 (m) | | 2,353 | 2,476 |
| Sinclair Television Group, Inc. Tranche B 1LN, term loan CME Term SOFR 3 Month Index + 2.500% 7.2996% 9/30/26 (e)(f)(m) | | 1,716 | 1,654 |
TOTAL BROADCASTING | | | 8,489 |
| Chemicals - 0.3% | | | |
| Consolidated Energy Finance SA Tranche B 1LN, term loan CME Term SOFR 1 Month Index + 4.500% 9.5572% 11/15/30 (e)(f)(m) | | 75 | 70 |
| Discovery Purchaser Corp. 1LN, term loan CME Term SOFR 3 Month Index + 4.370% 8.9647% 10/4/29 (e)(f)(m) | | 1,076 | 1,074 |
| Hexion Holdings Corp. 1LN, term loan CME Term SOFR 3 Month Index + 4.500% 9.7711% 3/15/29 (e)(f)(m) | | 4,315 | 4,311 |
| Hexion, Inc. 2LN, term loan CME Term SOFR 1 Month Index + 7.430% 12.2227% 3/15/30 (e)(f)(m) | | 600 | 542 |
| M2S Group Intermediate Holding Tranche B 1LN, term loan CME Term SOFR 1 Month Index + 4.750% 9.8518% 8/22/31 (e)(f)(m) | | 3,597 | 3,476 |
TOTAL CHEMICALS | | | 9,473 |
| Consumer Products - 0.2% | | | |
| Mattress Firm, Inc. Tranche B 1LN, term loan CME Term SOFR 3 Month Index + 4.250% 8.9235% 9/24/28 (e)(f)(m) | | 1,476 | 1,475 |
| Olaplex, Inc. Tranche B 1LN, term loan CME Term SOFR 1 Month Index + 3.750% 0% 2/23/29 (e)(f)(m)(n) | | 610 | 589 |
| TGP Holdings III LLC Tranche B 1LN, term loan CME Term SOFR 1 Month Index + 3.250% 8.6811% 6/29/28 (e)(f)(m) | | 1,508 | 1,425 |
| TKC Holdings, Inc. 1LN, term loan 13.5% 2/14/27 (e)(m) | | 1,735 | 1,484 |
TOTAL CONSUMER PRODUCTS | | | 4,973 |
| Diversified Financial Services - 0.0% | | | |
| Softbank SVF II Cayman LP 1LN, term loan 3 month U.S. LIBOR + 5.000% 6% 12/31/25 (b)(e)(f)(m) | | 241 | 241 |
| Energy - 0.5% | | | |
| EG America LLC Tranche BC 1LN, term loan CME Term SOFR 1 Month Index + 5.500% 10.4445% 2/7/28 (e)(f)(m) | | 6,567 | 6,569 |
| Enstall Group BV Tranche B 1LN, term loan CME Term SOFR 3 Month Index + 4.750% 9.8653% 8/27/28 (e)(f)(m) | | 3,299 | 3,101 |
| Mesquite Energy, Inc.: | | | |
| 1LN, term loan 3 month U.S. LIBOR + 8.000% 0% (b)(e)(f)(i)(m) | | 4,024 | 0 |
| term loan 0% (b)(e)(i)(m) | | 1,718 | 0 |
| Natgasoline LLC Tranche B, term loan CME Term SOFR 6 Month Index + 3.500% 9.016% 11/14/25 (e)(f)(m) | | 1,510 | 1,480 |
| Win Waste Innovations Holdings Tranche B 1LN, term loan CME Term SOFR 1 Month Index + 2.750% 7.5496% 3/25/28 (e)(f)(m) | | 2,914 | 2,769 |
TOTAL ENERGY | | | 13,919 |
| Food & Drug Retail - 0.1% | | | |
| Upfield U.S.A. Corp. Tranche B7 1LN, term loan CME Term SOFR 1 Month Index + 4.250% 9.76% 1/3/28 (e)(f)(j)(m) | | 1,520 | 1,516 |
| Healthcare - 0.2% | | | |
| Cano Health, Inc. 1LN, term loan CME Term SOFR 1 Month Index + 8.000% 12.6037% 6/28/29 (e)(f)(m) | | 1,629 | 1,617 |
| HAH Group Holding Co. LLC 1LN, term loan CME Term SOFR 1 Month Index + 5.000% 9.6852% 9/24/31 (e)(f)(m) | | 1,150 | 1,124 |
| Modivcare, Inc. Tranche B 1LN, term loan CME Term SOFR 3 Month Index + 4.750% 9.3434% 7/1/31 (e)(f)(m) | | 2,459 | 2,364 |
TOTAL HEALTHCARE | | | 5,105 |
| Insurance - 0.0% | | | |
| Acrisure LLC Tranche B6 1LN, term loan CME Term SOFR 3 Month Index + 3.250% 8.0092% 11/6/30 (e)(f)(m) | | 5 | 5 |
| Truist Insurance Holdings LLC 2L, term loan CME Term SOFR 3 Month Index + 4.750% 9.3537% 5/6/32 (e)(f)(m) | | 80 | 81 |
TOTAL INSURANCE | | | 86 |
| Leisure - 0.7% | | | |
| Bulldog Purchaser, Inc. Tranche B 2LN, term loan CME Term SOFR 3 Month Index + 6.750% 11.3537% 6/14/32 (e)(f)(m) | | 535 | 532 |
| City Football Group Ltd. Tranche B 1LN, term loan CME Term SOFR 1 Month Index + 3.500% 7.8322% 7/21/30 (e)(f)(m) | | 6,340 | 6,261 |
| ClubCorp Holdings, Inc. Tranche B 1LN, term loan CME Term SOFR 3 Month Index + 5.000% 9.8653% 9/18/26 (e)(f)(m) | | 4,437 | 4,440 |
| Crown Finance U.S., Inc. Tranche B 1LN, term loan CME Term SOFR 1 Month Index + 5.000% 0% 10/31/31 (e)(f)(m)(n) | | 605 | 601 |
| United PF Holdings LLC: | | | |
| 1LN, term loan CME Term SOFR 3 Month Index + 4.000% 8.847% 12/30/26 (e)(f)(m) | | 8,318 | 7,990 |
| Tranche B 1LN, term loan CME Term SOFR 3 Month Index + 8.500% 13.347% 12/30/26 (e)(f)(m) | | 805 | 781 |
TOTAL LEISURE | | | 20,605 |
| Metals/Mining - 0.1% | | | |
| American Rock Salt Co. LLC: | | | |
| 1LN, term loan: | | | |
CME Term SOFR 3 Month Index + 4.000% 9.3188% 6/4/28 (e)(f)(m) | | 972 | 810 |
CME Term SOFR 3 Month Index + 6.500% 2% 6/12/28 (e)(f)(j)(m) | | 305 | 305 |
| Tranche B 1LN, term loan CME Term SOFR 3 Month Index + 6.500% 11.8736% 6/12/28 (e)(f)(m) | | 285 | 285 |
TOTAL METALS/MINING | | | 1,400 |
| Publishing/Printing - 0.0% | | | |
| Clear Channel International BV Tranche B 1LN, term loan 7.5% 4/1/27 (m) | | 120 | 118 |
| Restaurants - 0.0% | | | |
| Restaurant Technologies, Inc. Tranche B 1LN, term loan CME Term SOFR 3 Month Index + 4.250% 8.8537% 4/1/29 (e)(f)(m) | | 835 | 811 |
| Services - 1.0% | | | |
| Artera Services LLC Tranche B 1LN, term loan CME Term SOFR 3 Month Index + 4.500% 9.1037% 2/10/31 (e)(f)(m) | | 1,115 | 1,101 |
| Ascend Learning LLC 2LN, term loan CME Term SOFR 1 Month Index + 5.750% 10.5352% 12/10/29 (e)(f)(m) | | 1,590 | 1,561 |
| Brand Industrial Services, Inc. Tranche B 1LN, term loan CME Term SOFR 3 Month Index + 4.500% 9.7477% 8/1/30 (e)(f)(m) | | 2,384 | 2,351 |
| CACI International, Inc. Tranche B 1LN, term loan CME Term SOFR 1 Month Index + 1.750% 0% 10/17/31 (e)(f)(m)(n) | | 70 | 70 |
| CoreLogic, Inc. Tranche B 1LN, term loan CME Term SOFR 1 Month Index + 3.500% 8.2996% 6/2/28 (e)(f)(m) | | 6,272 | 6,229 |
| Finastra U.S.A., Inc. term loan CME Term SOFR 1 Month Index + 7.250% 12.1813% 9/13/29 (b)(e)(f)(m) | | 4,916 | 4,916 |
| Life Time, Inc. Tranche B 1LN, term loan CME Term SOFR 1 Month Index + 2.500% 0% 10/22/31 (e)(f)(m)(n) | | 520 | 519 |
| Spin Holdco, Inc. Tranche B 1LN, term loan CME Term SOFR 3 Month Index + 4.000% 9.256% 3/4/28 (e)(f)(m) | | 10,493 | 9,082 |
| Staples, Inc. Tranche B 1LN, term loan CME Term SOFR 3 Month Index + 5.750% 10.6886% 9/10/29 (e)(f)(m) | | 600 | 554 |
TOTAL SERVICES | | | 26,383 |
| Super Retail - 0.3% | | | |
| Great Outdoors Group LLC Tranche B 1LN, term loan CME Term SOFR 1 Month Index + 3.750% 8.5496% 3/5/28 (e)(f)(m) | | 154 | 154 |
| LBM Acquisition LLC Tranche B 1LN, term loan CME Term SOFR 1 Month Index + 3.750% 8.6684% 6/6/31 (e)(f)(m) | | 8,727 | 8,594 |
TOTAL SUPER RETAIL | | | 8,748 |
| Technology - 0.5% | | | |
| DH Corp./Societe term loan CME Term SOFR 3 Month Index + 7.250% 12.1813% 9/13/29 (b)(e)(f)(m) | | 115 | 115 |
| Leia Finco U.S. LLC: | | | |
| 1LN, term loan CME Term SOFR 1 Month Index + 3.250% 7.8867% 10/9/31 (e)(f)(m) | | 2,018 | 1,998 |
| 2LN, term loan CME Term SOFR 1 Month Index + 5.250% 9.8867% 10/12/32 (e)(f)(m) | | 1,315 | 1,276 |
| Polaris Newco LLC: | | | |
| 2LN, term loan CME Term SOFR 1 Month Index + 2.000% 14.1572% 6/4/29 (e)(f)(m) | | 1,815 | 1,776 |
| Tranche B 1LN, term loan CME Term SOFR 3 Month Index + 4.000% 8.847% 6/2/28 (e)(f)(m) | | 1,142 | 1,133 |
| Rackspace Finance LLC Tranche B 1LN, term loan CME Term SOFR 1 Month Index + 6.250% 11.1829% 5/15/28 (e)(f)(m) | | 1,049 | 1,067 |
| Weber-Stephen Products LLC Tranche B 1LN, term loan: | | | |
| CME Term SOFR 1 Month Index + 3.250% 8.0496% 10/30/27 (e)(f)(m) | | 2,045 | 1,932 |
| CME Term SOFR 1 Month Index + 4.250% 9.0352% 10/30/27 (e)(f)(m) | | 1,005 | 950 |
| Zelis Payments Buyer, Inc. Tranche B 1LN, term loan CME Term SOFR 1 Month Index + 3.250% 0% 10/27/31 (e)(f)(m)(n) | | 4,235 | 4,214 |
TOTAL TECHNOLOGY | | | 14,461 |
| TOTAL BANK LOAN OBLIGATIONS (Cost $121,041) | | | 118,615 |
| | | | |
| Preferred Securities - 1.7% |
| | | Principal Amount (a) (000s) | Value ($) (000s) |
| Banks & Thrifts - 0.9% | | | |
| Ally Financial, Inc.: | | | |
| 4.7% (e)(o) | | 4,365 | 3,585 |
| 4.7% (e)(o) | | 4,475 | 4,070 |
| Bank of America Corp.: | | | |
| 4.375% (e)(o) | | 100 | 96 |
| 5.875% (d)(e)(o) | | 5,575 | 5,668 |
| Citigroup, Inc. 7.125% (e)(o) | | 2,655 | 2,809 |
| Goldman Sachs Group, Inc. 6.125% (e)(o) | | 2,755 | 2,749 |
| JPMorgan Chase & Co. 4.6% (e)(o) | | 3,885 | 3,911 |
| M&T Bank Corp.: | | | |
| 3.5% (d)(e)(o) | | 615 | 563 |
| 5.125% (e)(o) | | 1,215 | 1,228 |
| Tinkoff Bank JSC 6% (b)(c)(e)(i)(o) | | 100 | 5 |
TOTAL BANKS & THRIFTS | | | 24,684 |
| Diversified Financial Services - 0.2% | | | |
| Aircastle Ltd. 5.25% (c)(e)(o) | | 5,175 | 5,122 |
| Energy - 0.3% | | | |
| Energy Transfer LP 6.625% (e)(o) | | 2,254 | 2,238 |
| Plains All American Pipeline LP CME Term SOFR 3 Month Index + 4.110% 9.4897% (e)(f)(o) | | 7,273 | 7,375 |
TOTAL ENERGY | | | 9,613 |
| Homebuilders/Real Estate - 0.1% | | | |
| Alliant Holdings LP 10% (b)(e)(o) | | 1,463 | 1,460 |
| Services - 0.2% | | | |
| Air Lease Corp.: | | | |
| 4.125% (e)(o) | | 5,559 | 5,249 |
| 6% (e)(o) | | 275 | 273 |
TOTAL SERVICES | | | 5,522 |
| TOTAL PREFERRED SECURITIES (Cost $40,380) | | | 46,401 |
| | | | |
| Other - 1.1% |
| | | Shares | Value ($) (000s) |
| Other - 1.1% | | | |
Fidelity Private Credit Co. LLC (l)(p) (Cost $29,058) | | 2,921,548 | 29,449 |
| | | | |
| Money Market Funds - 5.7% |
| | | Shares | Value ($) (000s) |
| Fidelity Cash Central Fund 4.87% (q) | | 51,025,634 | 51,036 |
| Fidelity Securities Lending Cash Central Fund 4.87% (q)(r) | | 107,695,770 | 107,707 |
| TOTAL MONEY MARKET FUNDS (Cost $158,743) | | | 158,743 |
| | | | |
| TOTAL INVESTMENT IN SECURITIES - 103.6% (Cost $2,898,720) | 2,866,507 |
NET OTHER ASSETS (LIABILITIES) - (3.6)% | (98,814) |
| NET ASSETS - 100.0% | 2,767,693 |
| | |
| Futures Contracts |
| | Number of contracts | Expiration Date | Notional Amount ($) (000s) | Value ($) (000s) | Unrealized Appreciation/ (Depreciation) ($) (000s) |
| Purchased | | | | | |
| | | | | | |
| Treasury Contracts | | | | | |
| CBOT 5-Year U.S. Treasury Note Contracts (United States) | 111 | Dec 2024 | 11,903 | (292) | (292) |
| | | | | | |
| The notional amount of futures purchased as a percentage of Net Assets is 0.4% |
Currency Abbreviations
| EUR | - | European Monetary Unit |
Any values shown as $0 in the Schedule of Investments may reflect amounts less than $500.
Legend
| (a) | Amount is stated in United States dollars unless otherwise noted. |
| (c) | Security exempt from registration under Rule 144A of the Securities Act of 1933. These securities may be resold in transactions exempt from registration, normally to qualified institutional buyers. At the end of the period, the value of these securities amounted to $2,010,122,000 or 72.6% of net assets. |
| (d) | Security or a portion of the security is on loan at period end. |
| (e) | Coupon rates for floating and adjustable rate securities reflect the rates in effect at period end. |
| (f) | Coupon is indexed to a floating interest rate which may be multiplied by a specified factor and/or subject to caps or floors. |
| (g) | Security or a portion of the security purchased on a delayed delivery or when-issued basis. |
| (h) | Security initially issued at one coupon which converts to a higher coupon at a specified date. The rate shown is the rate at period end. |
| (i) | Non-income producing - Security is in default. |
| (j) | Position or a portion of the position represents an unfunded loan commitment. At period end, the total principal amount and market value of unfunded commitments totaled $3,542,000 and $3,412,000, respectively. |
| (l) | Restricted securities (including private placements) - Investment in securities not registered under the Securities Act of 1933 (excluding 144A issues). At the end of the period, the value of restricted securities (excluding 144A issues) amounted to $29,591,000 or 1.1% of net assets. |
| (m) | Remaining maturities of bank loan obligations may be less than the stated maturities shown as a result of contractual or optional prepayments by the borrower. Such prepayments cannot be predicted with certainty. |
| (n) | A coupon rate of 0% signifies an unsettled loan. The coupon rate will be determined upon settlement of the loan after period end. |
| (o) | Security is perpetual in nature with no stated maturity date. |
| (q) | Affiliated fund that is generally available only to investment companies and other accounts managed by Fidelity Investments. The rate quoted is the annualized seven-day yield of the fund at period end. A complete unaudited listing of the fund's holdings as of its most recent quarter end is available upon request. In addition, each Fidelity Central Fund's financial statements are available on the SEC's website or upon request. |
| (r) | Investment made with cash collateral received from securities on loan. |
| Additional information on each restricted holding is as follows: |
| Security | Acquisition Date | Acquisition Cost ($) (000s) |
| Fidelity Private Credit Co. LLC | 6/06/22 | 29,058 |
| | | |
| New Cotai LLC/New Cotai Capital Corp. | 9/11/20 | 623 |
| | | |
| Northeast Grocery, Inc. | 11/08/21 | 5 |
| | | |
Affiliated Central Funds
Fiscal year to date information regarding the Fund's investments in Fidelity Central Funds, including the ownership percentage, is presented below.
| Affiliate (Amounts in thousands) | Value, beginning of period ($) | Purchases ($) | Sales Proceeds ($) | Dividend Income ($) | Realized Gain (loss) ($) | Change in Unrealized appreciation (depreciation) ($) | Value, end of period ($) | % ownership, end of period |
| Fidelity Cash Central Fund 4.87% | 11,046 | 395,173 | 377,113 | 547 | 2 | - | 51,036 | 0.1% |
| Fidelity Securities Lending Cash Central Fund 4.87% | 117,112 | 291,059 | 300,464 | 302 | - | - | 107,707 | 0.4% |
| Total | 128,158 | 686,232 | 677,577 | 849 | 2 | - | 158,743 | |
| | | | | | | | | |
Amounts in the dividend income column in the above table include any capital gain distributions from underlying funds, which are presented in the corresponding line item in the Statement of Operations, if applicable.
Amounts in the dividend income column for Fidelity Securities Lending Cash Central Fund represents the income earned on investing cash collateral, less rebates paid to borrowers and any lending agent fees associated with the loan, plus any premium payments received for lending certain types of securities.
Amounts included in the purchases and sales proceeds columns may include in-kind transactions, if applicable.
Affiliated Underlying Funds
Fiscal year to date information regarding the Fund's investments in affiliated Underlying Funds is presented below. Exchanges between classes of the same affiliated Underlying Funds may occur. If an Underlying Funds changes its name, the name presented below is the name in effect at period end.
| Affiliate (Amounts in thousands) | Value, beginning of period ($) | Purchases ($) | Sales Proceeds ($) | Dividend Income ($) | Realized Gain (loss) ($) | Change in Unrealized appreciation (depreciation) ($) | Value, end of period ($) |
| Fidelity Private Credit Co. LLC | 47,299 | - | 17,133 | 3,118 | (62) | (655) | 29,449 |
| | 47,299 | - | 17,133 | 3,118 | (62) | (655) | 29,449 |
Amounts in the dividend income column in the above table include any capital gain distributions from underlying funds, which are presented in the corresponding line item in the Statement of Operations, if applicable.
Amounts included in the purchases and sales proceeds columns may include in-kind transactions, if applicable.
Investment Valuation
The following is a summary of the inputs used, as of October 31, 2024, involving the Fund's assets and liabilities carried at fair value. The inputs or methodology used for valuing securities may not be an indication of the risk associated with investing in those securities. For more information on valuation inputs, and their aggregation into the levels used below, please refer to the Investment Valuation section in the accompanying Notes to Financial Statements.
| Valuation Inputs at Reporting Date: |
Description (Amounts in thousands) | Total ($) | Level 1 ($) | Level 2 ($) | Level 3 ($) |
Investments in Securities: | | | | |
|
| Equities: | | | | |
Communication Services | 6,556 | 6,477 | - | 79 |
Consumer Discretionary | 2,554 | 2,458 | - | 96 |
Consumer Staples | 867 | - | - | 867 |
Energy | 25,583 | 7,087 | 131 | 18,365 |
Health Care | 4,579 | 1,202 | - | 3,377 |
Industrials | 2,770 | 2,770 | - | - |
Information Technology | 10,439 | 4,316 | - | 6,123 |
Utilities | - | - | - | - |
|
| Corporate Bonds | 2,381,704 | - | 2,376,656 | 5,048 |
|
| U.S. Government and Government Agency Obligations | 68,395 | - | 68,395 | - |
|
| Asset-Backed Securities | 6,394 | - | 6,394 | - |
|
| Commercial Mortgage Securities | 3,458 | - | 3,458 | - |
|
| Bank Loan Obligations | 118,615 | - | 112,867 | 5,748 |
|
| Preferred Securities | 46,401 | - | 44,936 | 1,465 |
|
| Other | 29,449 | - | 29,449 | - |
|
| Money Market Funds | 158,743 | 158,743 | - | - |
| Total Investments in Securities: | 2,866,507 | 183,053 | 2,642,286 | 41,168 |
| | | | | |
|
| Net Unrealized Appreciation on Unfunded Commitments | 2,861 | (134) | - | 2,995 |
| Total | 2,861 | (134) | - | 2,995 |
Derivative Instruments: Liabilities | | | | |
Futures Contracts | (292) | (292) | - | - |
| Total Liabilities | (292) | (292) | - | - |
| Total Derivative Instruments: | (292) | (292) | - | - |
The following is a reconciliation of Investments in Securities for which Level 3 inputs were used in determining value:
| (Amounts in thousands) | |
| Investments in Securities: | |
| Beginning Balance | $ | 34,574 | |
| Net Realized Gain (Loss) on Investment Securities | | 870 | |
| Net Unrealized Gain (Loss) on Investment Securities | | (709) | |
| Cost of Purchases | | 15,635 | |
| Proceeds of Sales | | (9,251) | |
| Amortization/Accretion | | 49 | |
| Transfers into Level 3 | | - | |
| Transfers out of Level 3 | | - | |
| Ending Balance | $ | 41,168 | |
| The change in unrealized gain (loss) for the period attributable to Level 3 securities held at October 31, 2024 | $ | (1,014) | |
| The information used in the above reconciliation represents fiscal year to date activity for any Investments in Securities identified as using Level 3 inputs at either the beginning or the end of the current fiscal period. Cost of purchases and proceeds of sales may include securities received and/or delivered through in-kind transactions, corporate actions or exchanges. Transfers into Level 3 were attributable to a lack of observable market data resulting from decreases in market activity, decreases in liquidity, security restructurings or corporate actions. Transfers out of Level 3 were attributable to observable market data becoming available for those securities. Transfers in or out of Level 3 represent the beginning value of any Security or Instrument where a change in the pricing level occurred from the beginning to the end of the period. Realized and unrealized gains (losses) disclosed in the reconciliation are included in Net Gain (Loss) on the Fund's Statement of Operations. | |
Value of Derivative Instruments
The following table is a summary of the Fund's value of derivative instruments by primary risk exposure as of October 31, 2024. For additional information on derivative instruments, please refer to the Derivative Instruments section in the accompanying Notes to Financial Statements.
Primary Risk Exposure / Derivative Type | Value |
| (Amounts in thousands) | Asset ($) | Liability ($) |
| Interest Rate Risk | | |
Futures Contracts (a) | 0 | (292) |
| Total Interest Rate Risk | 0 | (292) |
| Total Value of Derivatives | 0 | (292) |
(a)Reflects gross cumulative appreciation (depreciation) on futures contracts as presented in the Schedule of Investments. In the Statement of Assets and Liabilities, the period end daily variation margin is included in receivable or payable for daily variation margin on futures contracts, and the net cumulative appreciation (depreciation) is included in Total accumulated earnings (loss).
Financial Statements (Unaudited)
| Statement of Assets and Liabilities |
| As of October 31, 2024 (Unaudited) Amounts in thousands (except per-share amounts) |
| Assets | | | | |
| Investment in securities, at value (including securities loaned of $103,843) - See accompanying schedule: | | | | |
Unaffiliated issuers (cost $2,710,919) | $ | 2,678,315 | | |
Fidelity Central Funds (cost $158,743) | | 158,743 | | |
Other affiliated issuers (cost $29,058) | | 29,449 | | |
| | | | | |
| | | | | |
| Total Investment in Securities (cost $2,898,720) | | | $ | 2,866,507 |
| Segregated cash with brokers for derivative instruments | | | | 155 |
| Cash | | | | 3,482 |
| Receivable for investments sold | | | | |
Regular delivery | | | | 17,998 |
Delayed delivery | | | | 1,212 |
| Unrealized appreciation on unfunded commitments | | | | 2,995 |
| Receivable for fund shares sold | | | | 4,056 |
| Dividends receivable | | | | 1 |
| Interest receivable | | | | 40,211 |
| Distributions receivable from Fidelity Central Funds | | | | 291 |
| Prepaid expenses | | | | 3 |
| Receivable from investment adviser for expense reductions | | | | 44 |
| Other receivables | | | | 1 |
Total assets | | | | 2,936,956 |
| Liabilities | | | | |
| Payable for investments purchased | | | | |
Regular delivery | $ | 34,931 | | |
Delayed delivery | | 20,369 | | |
| Unrealized depreciation on unfunded commitments | | 134 | | |
| Payable for fund shares redeemed | | 1,745 | | |
| Distributions payable | | 2,658 | | |
| Accrued management fee | | 1,511 | | |
| Distribution and service plan fees payable | | 46 | | |
| Payable for daily variation margin on futures contracts | | 16 | | |
| Other payables and accrued expenses | | 146 | | |
| Collateral on securities loaned | | 107,707 | | |
| Total liabilities | | | | 169,263 |
| Commitments and contingent liabilities (see Significant Accounting Policies and Litigation notes) | | | | |
| Net Assets | | | $ | 2,767,693 |
| Net Assets consist of: | | | | |
| Paid in capital | | | $ | 3,527,109 |
| Total accumulated earnings (loss) | | | | (759,416) |
| Net Assets | | | $ | 2,767,693 |
| | | | | |
| Net Asset Value and Maximum Offering Price | | | | |
| Class A : | | | | |
Net Asset Value and redemption price per share ($134,995 ÷ 17,061 shares)(a) | | | $ | 7.91 |
| Maximum offering price per share (100/96.00 of $7.91) | | | $ | 8.24 |
| Class M : | | | | |
Net Asset Value and redemption price per share ($33,325 ÷ 4,212 shares)(a) | | | $ | 7.91 |
| Maximum offering price per share (100/96.00 of $7.91) | | | $ | 8.24 |
| Class C : | | | | |
Net Asset Value and offering price per share ($12,438 ÷ 1,571 shares)(a) | | | $ | 7.92 |
| Fidelity High Income Fund : | | | | |
Net Asset Value, offering price and redemption price per share ($2,458,656 ÷ 310,565 shares) | | | $ | 7.92 |
| Class I : | | | | |
Net Asset Value, offering price and redemption price per share ($57,648 ÷ 7,283 shares) | | | $ | 7.92 |
| Class Z : | | | | |
Net Asset Value, offering price and redemption price per share ($70,631 ÷ 8,928 shares) | | | $ | 7.91 |
(a)Redemption price per share is equal to net asset value less any applicable contingent deferred sales charge. |
| Statement of Operations |
Six months ended October 31, 2024 (Unaudited) Amounts in thousands |
| Investment Income | | | | |
| Dividends: | | | | |
| Affiliated issuers | | | $ | 2,002 |
| Interest | | | | 88,128 |
| Income from Fidelity Central Funds (including $302 from security lending) | | | | 3,967 |
| Total income | | | | 94,097 |
| Expenses | | | | |
| Management fee | $ | 8,893 | | |
| Distribution and service plan fees | | 249 | | |
| Custodian fees and expenses | | 13 | | |
| Independent trustees' fees and expenses | | 5 | | |
| Registration fees | | 52 | | |
| Audit fees | | 67 | | |
| Legal | | 47 | | |
| Interest | | 5 | | |
| Miscellaneous | | 45 | | |
| Total expenses before reductions | | 9,376 | | |
| Expense reductions | | (202) | | |
| Total expenses after reductions | | | | 9,174 |
| Net Investment income (loss) | | | | 84,923 |
| Realized and Unrealized Gain (Loss) | | | | |
| Net realized gain (loss) on: | | | | |
| Investment Securities: | | | | |
| Unaffiliated issuers | | (33,886) | | |
| Fidelity Central Funds | | 2 | | |
| Other affiliated issuers | | (62) | | |
| Foreign currency transactions | | 2 | | |
| Futures contracts | | 1,048 | | |
| Total net realized gain (loss) | | | | (32,896) |
| Change in net unrealized appreciation (depreciation) on: | | | | |
| Investment Securities: | | | | |
| Unaffiliated issuers | | 128,934 | | |
| Affiliated issuers | | (655) | | |
| Unfunded commitments | | 2,861 | | |
| Futures contracts | | (292) | | |
| Total change in net unrealized appreciation (depreciation) | | | | 130,848 |
| Net gain (loss) | | | | 97,952 |
| Net increase (decrease) in net assets resulting from operations | | | $ | 182,875 |
| Statement of Changes in Net Assets |
| |
| Amount in thousands | | Six months ended October 31, 2024 (Unaudited) | | Year ended April 30, 2024 |
| Increase (Decrease) in Net Assets | | | | |
| Operations | | | | |
| Net investment income (loss) | $ | 84,923 | $ | 170,092 |
| Net realized gain (loss) | | (32,896) | | (136,100) |
| Change in net unrealized appreciation (depreciation) | | 130,848 | | 180,171 |
| Net increase (decrease) in net assets resulting from operations | | 182,875 | | 214,163 |
| Distributions to shareholders | | (77,910) | | (154,653) |
| | | | | |
| Share transactions - net increase (decrease) | | 21,853 | | (315,100) |
| Total increase (decrease) in net assets | | 126,818 | | (255,590) |
| | | | | |
| Net Assets | | | | |
| Beginning of period | | 2,640,875 | | 2,896,465 |
| End of period | $ | 2,767,693 | $ | 2,640,875 |
| | | | | |
| | | | | |
Financial Highlights
Fidelity Advisor® High Income Fund Class A |
| |
| | Six months ended (Unaudited) October 31, 2024 | | Years ended April 30, 2024 | | 2023 | | 2022 | | 2021 | | 2020 |
Selected Per-Share Data | | | | | | | | | | | | |
| Net asset value, beginning of period | $ | 7.61 | $ | 7.43 | $ | 7.91 | $ | 8.71 | $ | 7.93 | $ | 8.83 |
| Income from Investment Operations | | | | | | | | | | | | |
Net investment income (loss) A,B | | .237 | | .449 | | .387 | | .345 | | .368 | | .438 |
| Net realized and unrealized gain (loss) | | .280 | | .139 | | (.501) | | (.760) | | .772 | | (.908) |
| Total from investment operations | | .517 | | .588 | | (.114) | | (.415) | | 1.140 | | (.470) |
| Distributions from net investment income | | (.217) | | (.408) | | (.366) | | (.385) | | (.360) | | (.430) |
| Total distributions | | (.217) | | (.408) | | (.366) | | (.385) | | (.360) | | (.430) |
| Net asset value, end of period | $ | 7.91 | $ | 7.61 | $ | 7.43 | $ | 7.91 | $ | 8.71 | $ | 7.93 |
Total Return C,D,E | | | | 8.15% | | (1.33)% | | (5.02)% | | 14.56% | | (5.63)% |
Ratios to Average Net Assets B,F,G | | | | | | | | | | | | |
| Expenses before reductions | | .96% H | | .99% | | 1.02% | | .99% | | .98% | | .98% |
| Expenses net of fee waivers, if any | | | | .98% | | 1.02% | | .99% | | .98% | | .98% |
| Expenses net of all reductions | | .95% H | | .98% | | 1.02% | | .99% | | .98% | | .98% |
| Net investment income (loss) | | 6.04% H | | 6.03% | | 5.19% | | 4.02% | | 4.32% | | 5.04% |
| Supplemental Data | | | | | | | | | | | | |
| Net assets, end of period (in millions) | $ | 135 | $ | 118 | $ | 119 | $ | 132 | $ | 148 | $ | 144 |
Portfolio turnover rate I | | | | 43% | | 35% | | 54% | | 62% | | 44% K |
ACalculated based on average shares outstanding during the period.
BNet investment income (loss) is affected by the timing of the declaration of dividends by any underlying mutual funds or exchange-traded funds (ETFs). Net investment income (loss) of any mutual funds or ETFs is not included in the Fund's net investment income (loss) ratio.
CTotal returns for periods of less than one year are not annualized.
DTotal returns would have been lower if certain expenses had not been reduced during the applicable periods shown.
ETotal returns do not include the effect of the sales charges.
FFees and expenses of any underlying mutual funds or exchange-traded funds (ETFs) are not included in the Fund's expense ratio. The Fund indirectly bears its proportionate share of these expenses. For additional expense information related to investments in Fidelity Central Funds, please refer to the "Investments in Fidelity Central Funds" note found in the Notes to Financial Statements section of the most recent Annual or Semi-Annual report. For additional expense information related to investments in Fidelity Private Credit Company LLC, please refer to the Investment in Fidelity Private Credit Company LLC note found in the Notes to Financial Statements section of the most recent Annual or Semi-Annual report.
GExpense ratios reflect operating expenses of the class. Expenses before reductions do not reflect amounts reimbursed, waived, or reduced through arrangements with the investment adviser, brokerage services, or other offset arrangements, if applicable, and do not represent the amount paid by the class during periods when reimbursements, waivers or reductions occur.
HAnnualized.
IAmount does not include the portfolio activity of any underlying mutual funds or exchange-traded funds (ETFs).
JThe portfolio turnover rate does not include the assets acquired in the reorganization.
KPortfolio turnover rate excludes securities received or delivered in-kind.
Fidelity Advisor® High Income Fund Class M |
| |
| | Six months ended (Unaudited) October 31, 2024 | | Years ended April 30, 2024 | | 2023 | | 2022 | | 2021 | | 2020 |
Selected Per-Share Data | | | | | | | | | | | | |
| Net asset value, beginning of period | $ | 7.61 | $ | 7.43 | $ | 7.91 | $ | 8.71 | $ | 7.93 | $ | 8.83 |
| Income from Investment Operations | | | | | | | | | | | | |
Net investment income (loss) A,B | | .237 | | .449 | | .386 | | .345 | | .367 | | .438 |
| Net realized and unrealized gain (loss) | | .280 | | .139 | | (.500) | | (.761) | | .772 | | (.909) |
| Total from investment operations | | .517 | | .588 | | (.114) | | (.416) | | 1.139 | | (.471) |
| Distributions from net investment income | | (.217) | | (.408) | | (.366) | | (.384) | | (.359) | | (.429) |
| Total distributions | | (.217) | | (.408) | | (.366) | | (.384) | | (.359) | | (.429) |
| Net asset value, end of period | $ | 7.91 | $ | 7.61 | $ | 7.43 | $ | 7.91 | $ | 8.71 | $ | 7.93 |
Total Return C,D,E | | | | 8.15% | | (1.34)% | | (5.03)% | | 14.55% | | (5.64)% |
Ratios to Average Net Assets B,F,G | | | | | | | | | | | | |
| Expenses before reductions | | .96% H | | 1.00% | | 1.03% | | 1.00% | | .99% | | .99% |
| Expenses net of fee waivers, if any | | | | .98% | | 1.02% | | 1.00% | | .99% | | .99% |
| Expenses net of all reductions | | .95% H | | .98% | | 1.02% | | 1.00% | | .99% | | .99% |
| Net investment income (loss) | | 6.04% H | | 6.03% | | 5.18% | | 4.01% | | 4.31% | | 5.02% |
| Supplemental Data | | | | | | | | | | | | |
| Net assets, end of period (in millions) | $ | 33 | $ | 31 | $ | 29 | $ | 30 | $ | 36 | $ | 40 |
Portfolio turnover rate I | | | | 43% | | 35% | | 54% | | 62% | | 44% K |
ACalculated based on average shares outstanding during the period.
BNet investment income (loss) is affected by the timing of the declaration of dividends by any underlying mutual funds or exchange-traded funds (ETFs). Net investment income (loss) of any mutual funds or ETFs is not included in the Fund's net investment income (loss) ratio.
CTotal returns for periods of less than one year are not annualized.
DTotal returns would have been lower if certain expenses had not been reduced during the applicable periods shown.
ETotal returns do not include the effect of the sales charges.
FFees and expenses of any underlying mutual funds or exchange-traded funds (ETFs) are not included in the Fund's expense ratio. The Fund indirectly bears its proportionate share of these expenses. For additional expense information related to investments in Fidelity Central Funds, please refer to the "Investments in Fidelity Central Funds" note found in the Notes to Financial Statements section of the most recent Annual or Semi-Annual report. For additional expense information related to investments in Fidelity Private Credit Company LLC, please refer to the Investment in Fidelity Private Credit Company LLC note found in the Notes to Financial Statements section of the most recent Annual or Semi-Annual report.
GExpense ratios reflect operating expenses of the class. Expenses before reductions do not reflect amounts reimbursed, waived, or reduced through arrangements with the investment adviser, brokerage services, or other offset arrangements, if applicable, and do not represent the amount paid by the class during periods when reimbursements, waivers or reductions occur.
HAnnualized.
IAmount does not include the portfolio activity of any underlying mutual funds or exchange-traded funds (ETFs).
JThe portfolio turnover rate does not include the assets acquired in the reorganization.
KPortfolio turnover rate excludes securities received or delivered in-kind.
Fidelity Advisor® High Income Fund Class C |
| |
| | Six months ended (Unaudited) October 31, 2024 | | Years ended April 30, 2024 | | 2023 | | 2022 | | 2021 | | 2020 |
Selected Per-Share Data | | | | | | | | | | | | |
| Net asset value, beginning of period | $ | 7.61 | $ | 7.43 | $ | 7.91 | $ | 8.71 | $ | 7.93 | $ | 8.83 |
| Income from Investment Operations | | | | | | | | | | | | |
Net investment income (loss) A,B | | .208 | | .392 | | .330 | | .281 | | .302 | | .372 |
| Net realized and unrealized gain (loss) | | .290 | | .138 | | (.501) | | (.763) | | .772 | | (.909) |
| Total from investment operations | | .498 | | .530 | | (.171) | | (.482) | | 1.074 | | (.537) |
| Distributions from net investment income | | (.188) | | (.350) | | (.309) | | (.318) | | (.294) | | (.363) |
| Total distributions | | (.188) | | (.350) | | (.309) | | (.318) | | (.294) | | (.363) |
| Net asset value, end of period | $ | 7.92 | $ | 7.61 | $ | 7.43 | $ | 7.91 | $ | 8.71 | $ | 7.93 |
Total Return C,D,E | | | | 7.32% | | (2.09)% | | (5.75)% | | 13.68% | | (6.35)% |
Ratios to Average Net Assets B,F,G | | | | | | | | | | | | |
| Expenses before reductions | | 1.71% H | | 1.76% | | 1.79% | | 1.76% | | 1.75% | | 1.75% |
| Expenses net of fee waivers, if any | | | | 1.75% | | 1.79% | | 1.76% | | 1.75% | | 1.75% |
| Expenses net of all reductions | | 1.69% H | | 1.75% | | 1.79% | | 1.76% | | 1.75% | | 1.75% |
| Net investment income (loss) | | 5.29% H | | 5.26% | | 4.42% | | 3.25% | | 3.55% | | 4.27% |
| Supplemental Data | | | | | | | | | | | | |
| Net assets, end of period (in millions) | $ | 12 | $ | 10 | $ | 12 | $ | 17 | $ | 30 | $ | 36 |
Portfolio turnover rate I | | | | 43% | | 35% | | 54% | | 62% | | 44% K |
ACalculated based on average shares outstanding during the period.
BNet investment income (loss) is affected by the timing of the declaration of dividends by any underlying mutual funds or exchange-traded funds (ETFs). Net investment income (loss) of any mutual funds or ETFs is not included in the Fund's net investment income (loss) ratio.
CTotal returns for periods of less than one year are not annualized.
DTotal returns would have been lower if certain expenses had not been reduced during the applicable periods shown.
ETotal returns do not include the effect of the contingent deferred sales charge.
FFees and expenses of any underlying mutual funds or exchange-traded funds (ETFs) are not included in the Fund's expense ratio. The Fund indirectly bears its proportionate share of these expenses. For additional expense information related to investments in Fidelity Central Funds, please refer to the "Investments in Fidelity Central Funds" note found in the Notes to Financial Statements section of the most recent Annual or Semi-Annual report. For additional expense information related to investments in Fidelity Private Credit Company LLC, please refer to the Investment in Fidelity Private Credit Company LLC note found in the Notes to Financial Statements section of the most recent Annual or Semi-Annual report.
GExpense ratios reflect operating expenses of the class. Expenses before reductions do not reflect amounts reimbursed, waived, or reduced through arrangements with the investment adviser, brokerage services, or other offset arrangements, if applicable, and do not represent the amount paid by the class during periods when reimbursements, waivers or reductions occur.
HAnnualized.
IAmount does not include the portfolio activity of any underlying mutual funds or exchange-traded funds (ETFs).
JThe portfolio turnover rate does not include the assets acquired in the reorganization.
KPortfolio turnover rate excludes securities received or delivered in-kind.
Fidelity® High Income Fund |
| |
| | Six months ended (Unaudited) October 31, 2024 | | Years ended April 30, 2024 | | 2023 | | 2022 | | 2021 | | 2020 |
Selected Per-Share Data | | | | | | | | | | | | |
| Net asset value, beginning of period | $ | 7.61 | $ | 7.43 | $ | 7.91 | $ | 8.71 | $ | 7.93 | $ | 8.83 |
| Income from Investment Operations | | | | | | | | | | | | |
Net investment income (loss) A,B | | .249 | | .471 | | .408 | | .371 | | .392 | | .464 |
| Net realized and unrealized gain (loss) | | .289 | | .138 | | (.500) | | (.761) | | .772 | | (.909) |
| Total from investment operations | | .538 | | .609 | | (.092) | | (.390) | | 1.164 | | (.445) |
| Distributions from net investment income | | (.228) | | (.429) | | (.388) | | (.410) | | (.384) | | (.455) |
| Total distributions | | (.228) | | (.429) | | (.388) | | (.410) | | (.384) | | (.455) |
| Net asset value, end of period | $ | 7.92 | $ | 7.61 | $ | 7.43 | $ | 7.91 | $ | 8.71 | $ | 7.93 |
Total Return C,D | | | | 8.46% | | (1.04)% | | (4.75)% | | 14.89% | | (5.35)% |
Ratios to Average Net Assets B,E,F | | | | | | | | | | | | |
| Expenses before reductions | | .68% G | | .70% | | .73% | | .70% | | .69% | | .69% |
| Expenses net of fee waivers, if any | | | | .69% | | .73% | | .70% | | .69% | | .69% |
| Expenses net of all reductions | | .66% G | | .69% | | .73% | | .70% | | .69% | | .69% |
| Net investment income (loss) | | 6.33% G | | 6.32% | | 5.48% | | 4.31% | | 4.61% | | 5.33% |
| Supplemental Data | | | | | | | | | | | | |
| Net assets, end of period (in millions) | $ | 2,459 | $ | 2,367 | $ | 2,567 | $ | 3,181 | $ | 4,139 | $ | 3,871 |
Portfolio turnover rate H | | | | 43% | | 35% | | 54% | | 62% | | 44% J |
ACalculated based on average shares outstanding during the period.
BNet investment income (loss) is affected by the timing of the declaration of dividends by any underlying mutual funds or exchange-traded funds (ETFs). Net investment income (loss) of any mutual funds or ETFs is not included in the Fund's net investment income (loss) ratio.
CTotal returns for periods of less than one year are not annualized.
DTotal returns would have been lower if certain expenses had not been reduced during the applicable periods shown.
EFees and expenses of any underlying mutual funds or exchange-traded funds (ETFs) are not included in the Fund's expense ratio. The Fund indirectly bears its proportionate share of these expenses. For additional expense information related to investments in Fidelity Central Funds, please refer to the "Investments in Fidelity Central Funds" note found in the Notes to Financial Statements section of the most recent Annual or Semi-Annual report. For additional expense information related to investments in Fidelity Private Credit Company LLC, please refer to the Investment in Fidelity Private Credit Company LLC note found in the Notes to Financial Statements section of the most recent Annual or Semi-Annual report.
FExpense ratios reflect operating expenses of the class. Expenses before reductions do not reflect amounts reimbursed, waived, or reduced through arrangements with the investment adviser, brokerage services, or other offset arrangements, if applicable, and do not represent the amount paid by the class during periods when reimbursements, waivers or reductions occur.
GAnnualized.
HAmount does not include the portfolio activity of any underlying mutual funds or exchange-traded funds (ETFs).
IThe portfolio turnover rate does not include the assets acquired in the reorganization.
JPortfolio turnover rate excludes securities received or delivered in-kind.
Fidelity Advisor® High Income Fund Class I |
| |
| | Six months ended (Unaudited) October 31, 2024 | | Years ended April 30, 2024 | | 2023 | | 2022 | | 2021 | | 2020 |
Selected Per-Share Data | | | | | | | | | | | | |
| Net asset value, beginning of period | $ | 7.61 | $ | 7.43 | $ | 7.91 | $ | 8.71 | $ | 7.93 | $ | 8.83 |
| Income from Investment Operations | | | | | | | | | | | | |
Net investment income (loss) A,B | | .247 | | .465 | | .401 | | .390 | | .390 | | .458 |
| Net realized and unrealized gain (loss) | | .290 | | .137 | | (.499) | | (.774) | | .771 | | (.907) |
| Total from investment operations | | .537 | | .602 | | (.098) | | (.384) | | 1.161 | | (.449) |
| Distributions from net investment income | | (.227) | | (.422) | | (.382) | | (.416) | | (.381) | | (.451) |
| Total distributions | | (.227) | | (.422) | | (.382) | | (.416) | | (.381) | | (.451) |
| Net asset value, end of period | $ | 7.92 | $ | 7.61 | $ | 7.43 | $ | 7.91 | $ | 8.71 | $ | 7.93 |
Total Return C,D | | | | 8.35% | | (1.12)% | | (4.68)% | | 14.85% | | (5.40)% |
Ratios to Average Net Assets B,E,F | | | | | | | | | | | | |
| Expenses before reductions | | .72% G | | .81% | | .85% | | .72% | | .73% | | .74% |
| Expenses net of fee waivers, if any | | | | .79% | | .80% | | .71% | | .73% | | .74% |
| Expenses net of all reductions | | .70% G | | .79% | | .80% | | .71% | | .73% | | .74% |
| Net investment income (loss) | | 6.29% G | | 6.22% | | 5.41% | | 4.29% | | 4.57% | | 5.28% |
| Supplemental Data | | | | | | | | | | | | |
| Net assets, end of period (in millions) | $ | 58 | $ | 58 | $ | 111 | $ | 85 | $ | 4,010 | $ | 558 |
Portfolio turnover rate H | | | | 43% | | 35% | | 54% | | 62% | | 44% J |
ACalculated based on average shares outstanding during the period.
BNet investment income (loss) is affected by the timing of the declaration of dividends by any underlying mutual funds or exchange-traded funds (ETFs). Net investment income (loss) of any mutual funds or ETFs is not included in the Fund's net investment income (loss) ratio.
CTotal returns for periods of less than one year are not annualized.
DTotal returns would have been lower if certain expenses had not been reduced during the applicable periods shown.
EFees and expenses of any underlying mutual funds or exchange-traded funds (ETFs) are not included in the Fund's expense ratio. The Fund indirectly bears its proportionate share of these expenses. For additional expense information related to investments in Fidelity Central Funds, please refer to the "Investments in Fidelity Central Funds" note found in the Notes to Financial Statements section of the most recent Annual or Semi-Annual report. For additional expense information related to investments in Fidelity Private Credit Company LLC, please refer to the Investment in Fidelity Private Credit Company LLC note found in the Notes to Financial Statements section of the most recent Annual or Semi-Annual report.
FExpense ratios reflect operating expenses of the class. Expenses before reductions do not reflect amounts reimbursed, waived, or reduced through arrangements with the investment adviser, brokerage services, or other offset arrangements, if applicable, and do not represent the amount paid by the class during periods when reimbursements, waivers or reductions occur.
GAnnualized.
HAmount does not include the portfolio activity of any underlying mutual funds or exchange-traded funds (ETFs).
IThe portfolio turnover rate does not include the assets acquired in the reorganization.
JPortfolio turnover rate excludes securities received or delivered in-kind.
Fidelity Advisor® High Income Fund Class Z |
| |
| | Six months ended (Unaudited) October 31, 2024 | | Years ended April 30, 2024 | | 2023 | | 2022 | | 2021 | | 2020 |
Selected Per-Share Data | | | | | | | | | | | | |
| Net asset value, beginning of period | $ | 7.61 | $ | 7.43 | $ | 7.91 | $ | 8.71 | $ | 7.93 | $ | 8.83 |
| Income from Investment Operations | | | | | | | | | | | | |
Net investment income (loss) A,B | | .250 | | .476 | | .415 | | .378 | | .399 | | .464 |
| Net realized and unrealized gain (loss) | | .281 | | .138 | | (.502) | | (.763) | | .770 | | (.904) |
| Total from investment operations | | .531 | | .614 | | (.087) | | (.385) | | 1.169 | | (.440) |
| Distributions from net investment income | | (.231) | | (.434) | | (.393) | | (.415) | | (.389) | | (.460) |
| Total distributions | | (.231) | | (.434) | | (.393) | | (.415) | | (.389) | | (.460) |
| Net asset value, end of period | $ | 7.91 | $ | 7.61 | $ | 7.43 | $ | 7.91 | $ | 8.71 | $ | 7.93 |
Total Return C,D | | | | 8.53% | | (.98)% | | (4.68)% | | 14.96% | | (5.30)% |
Ratios to Average Net Assets B,E,F | | | | | | | | | | | | |
| Expenses before reductions | | .61% G | | .65% | | .66% | | .64% | | .63% | | .63% |
| Expenses net of fee waivers, if any | | | | .64% | | .66% | | .63% | | .63% | | .63% |
| Expenses net of all reductions | | .60% G | | .64% | | .66% | | .63% | | .62% | | .63% |
| Net investment income (loss) | | 6.39% G | | 6.37% | | 5.54% | | 4.37% | | 4.67% | | 5.39% |
| Supplemental Data | | | | | | | | | | | | |
| Net assets, end of period (in millions) | $ | 71 | $ | 57 | $ | 58 | $ | 133 | $ | 250 | $ | 61 |
Portfolio turnover rate H | | | | 43% | | 35% | | 54% | | 62% | | 44% J |
ACalculated based on average shares outstanding during the period.
BNet investment income (loss) is affected by the timing of the declaration of dividends by any underlying mutual funds or exchange-traded funds (ETFs). Net investment income (loss) of any mutual funds or ETFs is not included in the Fund's net investment income (loss) ratio.
CTotal returns for periods of less than one year are not annualized.
DTotal returns would have been lower if certain expenses had not been reduced during the applicable periods shown.
EFees and expenses of any underlying mutual funds or exchange-traded funds (ETFs) are not included in the Fund's expense ratio. The Fund indirectly bears its proportionate share of these expenses. For additional expense information related to investments in Fidelity Central Funds, please refer to the "Investments in Fidelity Central Funds" note found in the Notes to Financial Statements section of the most recent Annual or Semi-Annual report. For additional expense information related to investments in Fidelity Private Credit Company LLC, please refer to the Investment in Fidelity Private Credit Company LLC note found in the Notes to Financial Statements section of the most recent Annual or Semi-Annual report.
FExpense ratios reflect operating expenses of the class. Expenses before reductions do not reflect amounts reimbursed, waived, or reduced through arrangements with the investment adviser, brokerage services, or other offset arrangements, if applicable, and do not represent the amount paid by the class during periods when reimbursements, waivers or reductions occur.
GAnnualized.
HAmount does not include the portfolio activity of any underlying mutual funds or exchange-traded funds (ETFs).
IThe portfolio turnover rate does not include the assets acquired in the reorganization.
JPortfolio turnover rate excludes securities received or delivered in-kind.
Notes to Financial Statements
(Unaudited)For the period ended October 31, 2024
(Amounts in thousands except percentages)
1. Organization.
Fidelity High Income Fund (the Fund) is a fund of Fidelity Summer Street Trust (the Trust) and is authorized to issue an unlimited number of shares. The Trust is registered under the Investment Company Act of 1940, as amended (the 1940 Act), as an open-end management investment company organized as a Massachusetts business trust. The Fund offers Class A, Class M, Class C, Fidelity High Income Fund, Class I and Class Z shares, each of which has equal rights as to assets and voting privileges. Class A, Class M, Class C, Class I and Class Z are Fidelity Advisor classes. Each class has exclusive voting rights with respect to matters that affect that class. Class C shares will automatically convert to Class A shares after a holding period of eight years from the initial date of purchase, with certain exceptions.
2. Investments in Fidelity Central Funds.
Funds may invest in Fidelity Central Funds, which are open-end investment companies generally available only to other investment companies and accounts managed by the investment adviser and its affiliates. The Schedule of Investments lists any Fidelity Central Funds held as an investment as of period end, but does not include the underlying holdings of each Fidelity Central Fund. An investing fund indirectly bears its proportionate share of the expenses of the underlying Fidelity Central Funds.
Based on its investment objective, each Fidelity Central Fund may invest or participate in various investment vehicles or strategies that are similar to those of the investing fund. These strategies are consistent with the investment objectives of the investing fund and may involve certain economic risks which may cause a decline in value of each of the Fidelity Central Funds and thus a decline in the value of the investing fund.
| Fidelity Central Fund | Investment Manager | Investment Objective | Investment Practices | Expense RatioA |
| Fidelity Money Market Central Funds | Fidelity Management & Research Company LLC (FMR) | Each fund seeks to obtain a high level of current income consistent with the preservation of capital and liquidity. | Short-term Investments | Less than .005% |
A Expenses expressed as a percentage of average net assets and are as of each underlying Central Fund's most recent annual or semi-annual shareholder report.
A complete unaudited list of holdings for each Fidelity Central Fund is available upon request or at the Securities and Exchange Commission website at www.sec.gov. In addition, the financial statements of the Fidelity Central Funds which contain the significant accounting policies (including investment valuation policies) of those funds, and are not covered by the Report of Independent Registered Public Accounting Firm, are available on the Securities and Exchange Commission website or upon request.
3. Investment in Fidelity Private Credit Company LLC.
The Fund invests in Fidelity Private Credit Company LLC, which is a limited liability company. Fidelity Private Credit Company LLC's units are not registered under the Securities Act of 1933 and are subject to substantial restrictions on transfer. The Fund has no redemption rights under Fidelity Private Credit Company LLC's limited liability company agreement. There will be no trading market for the units.
Based on its investment objective, Fidelity Private Credit Company LLC may invest or participate in various investments or strategies that are similar to those in which the Fund may invest or participate. These strategies are consistent with the investment objectives of the Fund and may involve certain economic risks which may cause a decline in value of Fidelity Private Credit Company LLC and thus a decline in the value of the Fund. Fidelity Private Credit Company LLC intends to invest primarily in directly originated loans to private companies but also with liquid credit investments, like broadly syndicated loans, and other select private credit investments.
The Schedule of Investments lists Fidelity Private Credit Company LLC as an investment as of period end, but does not include the underlying holdings of Fidelity Private Credit Company LLC. Fidelity Private Credit Company LLC represented less than 5% of the Fund's net assets at period end. The Fund indirectly bears its proportionate share of the expenses of Fidelity Private Credit Company LLC. The annualized expense ratio for Fidelity Private Credit Company LLC for the nine month period ended September 30, 2024 was 11.38%.
4. Significant Accounting Policies.
The Fund is an investment company and applies the accounting and reporting guidance of the Financial Accounting Standards Board (FASB) Accounting Standards Codification Topic 946 Financial Services - Investment Companies. The financial statements have been prepared in conformity with accounting principles generally accepted in the United States of America (GAAP), which require management to make certain estimates and assumptions at the date of the financial statements. Actual results could differ from those estimates. Subsequent events, if any, through the date that the financial statements were issued have been evaluated in the preparation of the financial statements. The Fund's Schedule of Investments lists any underlying mutual funds or exchange-traded funds (ETFs) but does not include the underlying holdings of these funds. The following summarizes the significant accounting policies of the Fund:
Investment Valuation. Investments are valued as of 4:00 p.m. Eastern time on the last calendar day of the period. The Board of Trustees (the Board) has designated the Fund's investment adviser as the valuation designee responsible for the fair valuation function and performing fair value determinations as needed. The investment adviser has established a Fair Value Committee (the Committee) to carry out the day-to-day fair valuation responsibilities and has adopted policies and procedures to govern the fair valuation process and the activities of the Committee. In accordance with these fair valuation policies and procedures, which have been approved by the Board, the Fund attempts to obtain prices from one or more third party pricing services or brokers to value its investments. When current market prices, quotations or currency exchange rates are not readily available or reliable, investments will be fair valued in good faith by the Committee, in accordance with the policies and procedures. Factors used in determining fair value vary by investment type and may include market or investment specific events, transaction data, estimated cash flows, and market observations of comparable investments. The frequency that the fair valuation procedures are used cannot be predicted and they may be utilized to a significant extent. The Committee manages the Fund's fair valuation practices and maintains the fair valuation policies and procedures. The Fund's investment adviser reports to the Board information regarding the fair valuation process and related material matters.
The Fund categorizes the inputs to valuation techniques used to value its investments into a disclosure hierarchy consisting of three levels as shown below:
Level 1 - unadjusted quoted prices in active markets for identical investments
Level 2 - other significant observable inputs (including quoted prices for similar investments, interest rates, prepayment speeds, etc.)
Level 3 - unobservable inputs (including the Fund's own assumptions based on the best information available)
Valuation techniques used to value the Fund's investments by major category are as follows:
Debt securities, including restricted securities, are valued based on evaluated prices received from third party pricing services or from brokers who make markets in such securities. Corporate bonds, bank loan obligations, preferred securities and U.S. government and government agency obligations are valued by pricing services who utilize matrix pricing which considers yield or price of bonds of comparable quality, coupon, maturity and type or by broker-supplied prices. Asset backed securities and commercial mortgage securities are valued by pricing services who utilize matrix pricing which considers prepayment speed assumptions, attributes of the collateral, yield or price of bonds of comparable quality, coupon, maturity and type or by broker-supplied prices. When independent prices are unavailable or unreliable, debt securities may be valued utilizing pricing methodologies which consider similar factors that would be used by third party pricing services. Debt securities are generally categorized as Level 2 in the hierarchy but may be Level 3 depending on the circumstances. The Fund invests a significant portion of its assets in below investment grade securities. The value of these securities can be more volatile due to changes in the credit quality of the issuer and is sensitive to changes in economic, market and regulatory conditions.
Equity securities, including restricted securities, for which market quotations are readily available, are valued at the last reported sale price or official closing price as reported by a third party pricing service on the primary market or exchange on which they are traded and are categorized as Level 1 in the hierarchy. In the event there were no sales during the day or closing prices are not available, securities are valued at the last quoted bid price or may be valued using the last available price and are generally categorized as Level 2 in the hierarchy. For foreign equity securities, when market or security specific events arise, comparisons to the valuation of American Depositary Receipts (ADRs), futures contracts, Exchange-Traded Funds (ETFs) and certain indexes as well as quoted prices for similar securities may be used and would be categorized as Level 2 in the hierarchy. For equity securities, including restricted securities, where observable inputs are limited, assumptions about market activity and risk are used and these securities may be categorized as Level 3 in the hierarchy. Securities, including private placements or other restricted securities, for which observable inputs are not available are valued using alternate valuation approaches, including the market approach, the income approach and cost approach, and are categorized as Level 3 in the hierarchy. The market approach considers factors including the price of recent investments in the same or a similar security or financial metrics of comparable securities. The income approach considers factors including expected future cash flows, security specific risks and corresponding discount rates. The cost approach considers factors including the value of the security's underlying assets and liabilities.
Futures contracts are valued at the settlement price established each day by the board of trade or exchange on which they are traded and are categorized as Level 1 in the hierarchy. Investments in open-end mutual funds, including the Fidelity Central Funds, are valued at their closing net asset value (NAV) each business day and are categorized as Level 1 in the hierarchy.
Fidelity Private Credit Company LLC is valued at its net asset value (NAV) each month end and is categorized as Level 2 in the hierarchy.
The following provides information on Level 3 securities held by the Fund that were valued at period end based on unobservable inputs. These amounts exclude valuations provided by a broker and valuations using NAV as a practical expedient.
| Asset Type | Fair Value | Valuation Technique(s) | Unobservable Input | Amount or Range/Weighted Average | Impact to Valuation from an Increase in InputA |
| Equities | $28,907 | Market comparable | Enterprise value/Revenue multiple (EV/R) | 0.3 | Increase |
| | | | Enterprise value/EBITDA multiple (EV/EBITDA) | 3.5 - 12.3 / 6.6 | Increase |
| | | Market approach | Transaction price | $0.00 | Increase |
| | | Discounted cash flow | Discount rate | 10.8% | Decrease |
| | | | Yield | 12.2% | Decrease |
| | | Recovery value | Recovery value | $0.22 - $0.65 / $0.65 | Increase |
| | | Black scholes | Discount rate | 4.0% - 4.1% / 4.0% | Increase |
| | | | Term | 2.3 - 4.7 / 4.6 | Increase |
| | | | Volatility | 50.0% - 58.0% / 57.8% | Increase |
| Corporate Bonds | $5,048 | Market approach | Transaction price | $96.00 | Increase |
| | | Recovery value | Recovery value | $0.00 | Increase |
| | | Indicative market price | Evaluated bid | $5.50 - $18.50 / $15.27 | Increase |
| | | Black scholes | Discount rate | 4.1% | Increase |
| | | | Term | 2.3 | Increase |
| | | | Volatility | 50.0% | Increase |
| Preferred Securities | $1,465 | Indicative market price | Evaluated bid | $5.00 | Increase |
| | | Market approach | Transaction price | $98.50 | Increase |
| Bank Loan Obligations | $5,748 | Discounted cash flow | Yield | 6.0% - 11.1% / 10.7% | Decrease |
| | | Recovery value | Recovery value | $0.00 | Increase |
A Represents the directional change in the fair value of the Level 3 investments that could have resulted from an increase in the corresponding input as of period end. A decrease to the unobservable input would have had the opposite effect. Significant changes in these inputs may have resulted in a significantly higher or lower fair value measurement at period end.
Changes in valuation techniques may result in transfers in or out of an assigned level within the disclosure hierarchy. The aggregate value of investments by input level as of October 31, 2024, as well as a roll forward of Level 3 investments, is included at the end of the Fund's Schedule of Investments.
Foreign Currency. Certain Funds may use foreign currency contracts to facilitate transactions in foreign-denominated securities. Gains and losses from these transactions may arise from changes in the value of the foreign currency or if the counterparties do not perform under the contracts' terms.
Foreign-denominated assets, including investment securities, and liabilities are translated into U.S. dollars at the exchange rates at period end. Purchases and sales of investment securities, income and dividends received, and expenses denominated in foreign currencies are translated into U.S. dollars at the exchange rate in effect on the transaction date.
The effects of exchange rate fluctuations on investments are included with the net realized and unrealized gain (loss) on investment securities. Other foreign currency transactions resulting in realized and unrealized gain (loss) are disclosed separately.
Investment Transactions and Income. For financial reporting purposes, the Fund's investment holdings and NAV include trades executed through the end of the last business day of the period. The NAV per share for processing shareholder transactions is calculated as of the close of business of the New York Stock Exchange (NYSE), normally 4:00 p.m. Eastern time and includes trades executed through the end of the prior business day. Gains and losses on securities sold are determined on the basis of identified cost and include proceeds received from litigation. Commissions paid to certain brokers with whom the investment adviser, or its affiliates, places trades on behalf of a fund include an amount in addition to trade execution, which may be rebated back to a fund. Any such rebates are included in net realized gain (loss) on investments in the Statement of Operations. Dividend income is recorded on the ex-dividend date, except for certain dividends from foreign securities where the ex-dividend date may have passed, which are recorded as soon as the Fund is informed of the ex-dividend date. Non-cash dividends included in dividend income, if any, are recorded at the fair market value of the securities received. Income and capital gain distributions from Fidelity Central Funds, if any, are recorded on the ex-dividend date. Interest income is accrued as earned and includes coupon interest and amortization of premium and accretion of discount on debt securities as applicable. Paid in Kind (PIK) income is recorded at the fair market value of the securities received. Investment income is recorded net of foreign taxes withheld where recovery of such taxes is uncertain. Debt obligations may be placed on non-accrual status and related interest income may be reduced by ceasing current accruals and writing off interest receivables when the collection of all or a portion of interest has become doubtful based on consistently applied procedures. A debt obligation is removed from non-accrual status when the issuer resumes interest payments or when collectability of interest is reasonably assured. Funds may file withholding tax reclaims in certain jurisdictions to recover a portion of amounts previously withheld. Any withholding tax reclaims income is included in the Statement of Operations in interest. Any receivables for withholding tax reclaims are included in the Statement of Assets and Liabilities in interest receivable.
Class Allocations and Expenses. Investment income, realized and unrealized capital gains and losses, common expenses of a fund, and certain fund-level expense reductions, if any, are allocated daily on a pro-rata basis to each class based on the relative net assets of each class to the total net assets of a fund. Each class differs with respect to transfer agent and distribution and service plan fees incurred, as applicable. Certain expense reductions may also differ by class, if applicable. For the reporting period, the allocated portion of income and expenses to each class as a percent of its average net assets may vary due to the timing of recording these transactions in relation to fluctuating net assets of the classes. Expenses directly attributable to a fund are charged to that fund. Expenses attributable to more than one fund are allocated among the respective funds on the basis of relative net assets or other appropriate methods. Expenses included in the accompanying financial statements reflect the expenses of that fund and do not include any expenses associated with any underlying mutual funds or exchange-traded funds (ETFs). Although not included in a fund's expenses, a fund indirectly bears its proportionate share of these expenses through the net asset value of each underlying mutual fund or exchange-traded fund (ETF). Expense estimates are accrued in the period to which they relate and adjustments are made when actual amounts are known.
Income Tax Information and Distributions to Shareholders. Each year, the Fund intends to qualify as a regulated investment company under Subchapter M of the Internal Revenue Code, including distributing substantially all of its taxable income and realized gains. As a result, no provision for U.S. Federal income taxes is required. The Fund files a U.S. federal tax return, in addition to state and local tax returns as required. The Fund's federal income tax returns are subject to examination by the Internal Revenue Service (IRS) for a period of three fiscal years after they are filed. State and local tax returns may be subject to examination for an additional fiscal year depending on the jurisdiction. Foreign taxes are provided for based on the Fund's understanding of the tax rules and rates that exist in the foreign markets in which it invests.
Distributions are declared and recorded daily and paid monthly from net investment income. Distributions from realized gains, if any, are declared and recorded on the ex-dividend date. Income and capital gain distributions are declared separately for each class. Income and capital gain distributions are determined in accordance with income tax regulations, which may differ from GAAP.
Capital accounts within the financial statements are adjusted for permanent book-tax differences. These adjustments have no impact on net assets or the results of operations. Capital accounts are not adjusted for temporary book-tax differences which will reverse in a subsequent period.
Book-tax differences are primarily due to short-term gain distributions from the underlying funds, foreign currency transactions, passive foreign investment companies (PFIC), prior period premium and discount on debt securities, market discount, partnerships, capital loss carryforwards and losses deferred due to wash sales.
As of period end, the cost and unrealized appreciation (depreciation) in securities, and derivatives if applicable, for federal income tax purposes were as follows:
| Gross unrealized appreciation | $106,447 |
| Gross unrealized depreciation | (114,187) |
| Net unrealized appreciation (depreciation) | $(7,740) |
| Tax cost | $2,873,955 |
Capital loss carryforwards are only available to offset future capital gains of the Fund to the extent provided by regulations and may be limited. The capital loss carryforward information presented below, including any applicable limitation, is estimated as of prior fiscal period end and is subject to adjustment.
| Short-term | $(131,937) |
| Long-term | (599,387) |
| Total capital loss carryforward | $(731,324) |
Delayed Delivery Transactions and When-Issued Securities. During the period, certain Funds transacted in securities on a delayed delivery or when-issued basis. Payment and delivery may take place after the customary settlement period for that security. The price of the underlying securities and the date when the securities will be delivered and paid for are fixed at the time the transaction is negotiated. Securities purchased on a delayed delivery or when-issued basis are identified as such in the Schedule of Investments. Compensation for interest forgone in the purchase of a delayed delivery or when-issued debt security may be received. With respect to purchase commitments, each applicable Fund identifies securities as segregated in its records with a value at least equal to the amount of the commitment. Payables and receivables associated with the purchases and sales of delayed delivery securities having the same coupon, settlement date and broker are offset. Delayed delivery or when-issued securities that have been purchased from and sold to different brokers are reflected as both payables and receivables in the Statement of Assets and Liabilities under the caption "Delayed delivery", as applicable. Losses may arise due to changes in the value of the underlying securities or if the counterparty does not perform under the contract's terms, or if the issuer does not issue the securities due to political, economic, or other factors.
Restricted Securities (including Private Placements). Funds may invest in securities that are subject to legal or contractual restrictions on resale. These securities generally may be resold in transactions exempt from registration or to the public if the securities are registered. Disposal of these securities may involve time-consuming negotiations and expense, and prompt sale at an acceptable price may be difficult. Information regarding restricted securities held at period end is included at the end of the Schedule of Investments, if applicable.
Loans and Other Direct Debt Instruments. Direct debt instruments are interests in amounts owed to lenders by corporate or other borrowers. These instruments may be in the form of loans, trade claims or other receivables and may include standby financing commitments such as revolving credit facilities that obligate a fund to supply additional cash to the borrower on demand. Loans may be acquired through assignment, participation, or may be made directly to a borrower. Such instruments are presented in the Bank Loan Obligations section in the Schedule of Investments. Certain funds may also invest in unfunded loan commitments, which are contractual obligations for future funding. Information regarding unfunded commitments is included at the end of the Schedule of Investments, if applicable.
Commitments. A commitment is an agreement to acquire an investment at a future date (subject to conditions) in connection with a potential public or non-public offering. The amount of commitments outstanding at period end are presented in the table below. These commitments are not included in the net assets of the Fund at period end.
| | Investment to be Acquired | Commitment Amount ($) |
| Fidelity High Income Fund | Fidelity Private Credit Company LLC | 12,276 |
Commitments. A commitment is an agreement to acquire an investment at a future date (subject to conditions) in connection with a potential public or non-public offering. Commitments outstanding at period end are presented in the table below. Unrealized appreciation (depreciation) on any commitments outstanding at period end is separately presented in the Statement of Assets and Liabilities as Unrealized appreciation (depreciation) on unfunded commitments, and any change in unrealized appreciation (depreciation) on unfunded commitments during the period is separately presented in the Statement of Operations, as applicable based on contractual conditions of each commitment.
| | Investment to be Acquired | Commitment Amount ($) | Unrealized Appreciation (Depreciation)($) |
| Fidelity High Income Fund | EchoStar Corp | 1,263 | (134) |
| Fidelity High Income Fund | EchoStar Corp. 10.75% 9/27/29 | 34,569 | 2,995 |
New Accounting Pronouncement. In November 2023, the FASB issued Accounting Standards Update (ASU) 2023-07 Segment Reporting (Topic 280): Improvements to Reportable Segment Disclosures. Effective for fiscal years beginning after December 15, 2023 and interim periods within fiscal years beginning after December 15, 2024, the amendments enhance required disclosures of segment information for public entities on an annual and interim basis. The ASU allows for early adoption with updates applied retrospectively. Management is currently evaluating the impact of the ASU but does not expect this guidance to materially impact the financial statements.
5. Derivative Instruments.
Risk Exposures and the Use of Derivative Instruments. The Fund's investment objectives allow for various types of derivative instruments, including futures contracts. Derivatives are investments whose value is primarily derived from underlying assets, indices or reference rates and may be transacted on an exchange or over-the-counter (OTC). Derivatives may involve a future commitment to buy or sell a specified asset based on specified terms, to exchange future cash flows at periodic intervals based on a notional principal amount, or for one party to make one or more payments upon the occurrence of specified events in exchange for periodic payments from the other party.
Derivatives were used to increase returns and to manage exposure to certain risks as defined below. The success of any strategy involving derivatives depends on analysis of numerous economic factors, and if the strategies for investment do not work as intended, the objectives may not be achieved.
Derivatives were used to increase or decrease exposure to the following risk(s):
| | |
| Interest Rate Risk | Interest rate risk relates to the fluctuations in the value of interest-bearing securities due to changes in the prevailing levels of market interest rates. |
Funds are also exposed to additional risks from investing in derivatives, such as liquidity risk and counterparty credit risk. Liquidity risk is the risk that a fund will be unable to close out the derivative in the open market in a timely manner. Counterparty credit risk is the risk that the counterparty will not be able to fulfill its obligation to a fund. Counterparty credit risk related to exchange-traded contracts may be mitigated by the protection provided by the exchange on which they trade.
Investing in derivatives may involve greater risks than investing in the underlying assets directly and, to varying degrees, may involve risk of loss in excess of any initial investment and collateral received and amounts recognized in the Statement of Assets and Liabilities. In addition, there may be the risk that the change in value of the derivative contract does not correspond to the change in value of the underlying instrument.
Futures Contracts. A futures contract is an agreement between two parties to buy or sell a specified underlying instrument for a fixed price at a specified future date. Futures contracts were used to manage exposure to the bond market and fluctuations in interest rates.
Upon entering into a futures contract, a fund is required to deposit either cash or securities (initial margin) with a clearing broker in an amount equal to a certain percentage of the face value of the contract. Futures contracts are marked-to-market daily and subsequent daily payments are made or received by a fund depending on the daily fluctuations in the value of the futures contracts and are recorded as unrealized appreciation or (depreciation). This receivable and/or payable, if any, is included in daily variation margin on futures contracts in the Statement of Assets and Liabilities. Realized gain or (loss) is recorded upon the expiration or closing of a futures contract. The net realized gain (loss) and change in net unrealized appreciation (depreciation) on futures contracts during the period is presented in the Statement of Operations.
Any open futures contracts at period end are presented in the Schedule of Investments under the caption "Futures Contracts". The notional amount at value reflects each contract's exposure to the underlying instrument or index at period end, and is representative of volume of activity during the period unless an average notional amount is presented. Any securities deposited to meet initial margin requirements are identified in the Schedule of Investments. Any cash deposited to meet initial margin requirements is presented as segregated cash with brokers for derivative instruments in the Statement of Assets and Liabilities.
6. Purchases and Sales of Investments.
Purchases and sales of securities, other than short-term securities, U.S. government securities, securities acquired in the reorganization and in-kind transactions, as applicable, are noted in the table below.
| | Purchases ($) | Sales ($) |
| Fidelity High Income Fund | 634,455 | 741,142 |
7. Fees and Other Transactions with Affiliates.
Management Fee. Fidelity Management & Research Company LLC (the investment adviser) and its affiliates provide the Fund with investment management related services for which the Fund pays a monthly management fee.
The Fund's management contract incorporates a management fee rate that may vary by class. The investment adviser or an affiliate pays certain expenses of managing and operating the Fund out of each class's management fee. Each class of the Fund pays a management fee to the investment adviser. The management fee is calculated and paid to the investment adviser every month. When determining a class's management fee, a mandate rate is calculated based on the monthly average net assets of a group of funds advised by FMR within a designated asset class. A discount rate is subtracted from the mandate rate once the Fund's monthly average net assets reach a certain level. The mandate rate and discount rate may vary by class. The annual management fee rate for a class of shares of the Fund is the lesser of (1) the class's mandate rate reduced by the class's discount rate (if applicable) or (2) the amount set forth in the following table.
| | Maximum Management Fee Rate % |
| Class A | .71 |
| Class M | .72 |
| Class C | .74 |
| Fidelity High Income Fund | .67 |
| Class I | .76 |
| Class Z | .61 |
One-twelfth of the management fee rate for a class is applied to the average net assets of the class for the month, giving a dollar amount which is the management fee for the class for that month. A different management fee rate may be applicable to each class of the Fund. The difference between classes is the result of separate arrangements for class-level services and/or waivers of certain expenses. It is not the result of any difference in advisory or custodial fees or other expenses related to the management of the Fund's assets, which do not vary by class. For the reporting period, the total annualized management fee rates were as follows:
| | Total Management Fee Rate % |
| Class A | .70 |
| Class M | .70 |
| Class C | .70 |
| Fidelity High Income Fund | .66 |
| Class I | .70 |
| Class Z | .60 |
Distribution and Service Plan Fees. In accordance with Rule 12b-1 of the 1940 Act, the Fund has adopted separate Distribution and Service Plans for each class of shares. Certain classes pay Fidelity Distributors Company LLC (FDC), an affiliate of the investment adviser, separate Distribution and Service Fees, each of which is based on an annual percentage of each class' average net assets. In addition, FDC may pay financial intermediaries for selling shares of the Fund and providing shareholder support services. For the period, the Distribution and Service Fee rates, total fees and amounts retained by FDC were as follows:
| | Distribution Fee | Service Fee | Total Fees ($) | Retained by FDC ($) |
| Class A | - % | .25% | 155 | 2 |
| Class M | - % | .25% | 39 | - |
| Class C | .75% | .25% | 55 | 7 |
| | | | 249 | 9 |
Sales Load. FDC may receive a front-end sales charge of up to 4.00% for selling Class A shares and Class M shares, some of which is paid to financial intermediaries for selling shares of the Fund. Depending on the holding period, FDC may receive contingent deferred sales charges levied on Class A, Class M and Class C redemptions. The deferred sales charges are 1.00% for Class C shares, 1.00% for certain purchases of Class A shares and .25% for certain purchases of Class M shares.
For the period, sales charge amounts retained by FDC were as follows:
| | Retained by FDC ($) |
| Class A | 3 |
| Class M | -A |
Class CB | -A |
| | 3 |
A In the amount of less than five-hundred dollars.
B When Class C shares are initially sold, FDC pays commissions from its own resources to financial intermediaries through which the sales are made.
Brokerage Commissions. A portion of portfolio transactions were placed with brokerage firms which are affiliates of the investment adviser. Brokerage commissions are included in net realized gain (loss) and change in net unrealized appreciation (depreciation) in the Statement of Operations. The commissions paid to these affiliated firms were as follows:
| | Amount ($) |
Fidelity High Income Fund | -A |
A In the amount of less than five-hundred dollars.
Interfund Lending Program. Pursuant to an Exemptive Order issued by the Securities and Exchange Commission (the SEC), the Fund, along with other registered investment companies having management contracts with Fidelity Management & Research Company LLC (FMR), or other affiliated entities of FMR, may participate in an interfund lending program. This program provides an alternative credit facility allowing the Fund to borrow from, or lend money to, other participating affiliated funds at rates that are beneficial to both the borrowing and lending fund. Borrowings under the program are generally for temporary or emergency purposes, including meeting fund shareholder redemptions. The interfund loan rate is determined, as specified in the Exemptive Order, by averaging, (1) the higher of the overnight time deposit rate and the current overnight repurchase agreement rate, and (2) a benchmark rate representing the lowest bank loan rate available to the funds. At period end, there were no interfund loans outstanding. Activity in this program during the period for which loans were outstanding was as follows:
| | Borrower or Lender | Average Loan Balance ($) | Weighted Average Interest Rate | Interest Expense ($) |
| Fidelity High Income Fund | Borrower | 3,621 | 5.57% | 5 |
Interfund Trades. Funds may purchase from or sell securities to other Fidelity Funds under procedures adopted by the Board. The procedures have been designed to ensure these interfund trades are executed in accordance with Rule 17a-7 of the 1940 Act. Any interfund trades are included within the respective purchases and sales amounts shown in the Purchases and Sales of Investments note. Interfund trades during the period are noted in the table below.
| | Purchases ($) | Sales ($) | Realized Gain (Loss)($) |
| Fidelity High Income Fund | 7 | 2,377 | 1,144 |
8. Committed Line of Credit.
Certain Funds participate with other funds managed by the investment adviser or an affiliate in a $4.25 billion credit facility (the "line of credit") to be utilized for temporary or emergency purposes to fund shareholder redemptions or for other short-term liquidity purposes. The participating funds have agreed to pay commitment fees on their pro-rata portion of the line of credit, which are reflected in Miscellaneous expenses on the Statement of Operations, and are listed below. During the period, there were no borrowings on this line of credit.
| | Amount ($) |
| Fidelity High Income Fund | 2 |
9. Security Lending.
Funds lend portfolio securities from time to time in order to earn additional income. Lending agents are used, including National Financial Services (NFS), an affiliate of the investment adviser. Pursuant to a securities lending agreement, NFS will receive a fee, which is capped at 9.9% of a fund's daily lending revenue, for its services as lending agent. A fund may lend securities to certain qualified borrowers, including NFS. On the settlement date of the loan, a fund receives collateral (in the form of U.S. Treasury obligations, letters of credit and/or cash) against the loaned securities and maintains collateral in an amount not less than 100% of the market value of the loaned securities during the period of the loan. The market value of the loaned securities is determined at the close of business of a fund and any additional required collateral is delivered to a fund on the next business day. A fund or borrower may terminate the loan at any time, and if the borrower defaults on its obligation to return the securities loaned because of insolvency or other reasons, a fund may apply collateral received from the borrower against the obligation. A fund may experience delays and costs in recovering the securities loaned. Any cash collateral received is invested in the Fidelity Securities Lending Cash Central Fund. Any loaned securities are identified as such in the Schedule of Investments, and the value of loaned securities and cash collateral at period end, as applicable, are presented in the Statement of Assets and Liabilities. Security lending income represents the income earned on investing cash collateral, less rebates paid to borrowers and any lending agent fees associated with the loan, plus any premium payments received for lending certain types of securities. Security lending income is presented in the Statement of Operations as a component of income from Fidelity Central Funds. Affiliated security lending activity, if any, was as follows:
| | Total Security Lending Fees Paid to NFS ($) | Security Lending Income From Securities Loaned to NFS ($) | Value of Securities Loaned to NFS at Period End ($) |
| Fidelity High Income Fund | 32 | -A | - |
A In the amount of less than five-hundred dollars.
10. Expense Reductions.
The investment adviser has contractually agreed to waive the Fund's management fee with respect to the portion of the Fund's assets invested in Fidelity Private Credit Company LLC until August 31, 2025. During the period, this waiver reduced the Fund's management fee by $161.
Through arrangements with the Fund's custodian, credits realized as a result of certain uninvested cash balances were used to reduce the Fund's expenses. During the period, custodian credits reduced the Fund's expenses by $16.
In addition, during the period the investment adviser or an affiliate reimbursed and/or waived a portion of fund-level operating expenses in the amount of $25.
11. Distributions to Shareholders.
Distributions to shareholders of each class were as follows:
| | Six months ended October 31, 2024 | Year ended April 30, 2024 |
| Fidelity High Income Fund | | |
| Distributions to shareholders | | |
| Class A | $3,435 | $6,406 |
| Class M | 878 | 1,588 |
| Class C | 264 | 511 |
| Fidelity High Income Fund | 69,971 | 138,880 |
| Class I | 1,619 | 3,849 |
| Class Z | 1,743 | 3,419 |
Total | $77,910 | $154,653 |
12. Share Transactions.
Share transactions for each class were as follows and may contain in-kind transactions, automatic conversions between classes or exchanges between affiliated funds:
| | Shares | Shares | Dollars | Dollars |
| | Six months ended October 31, 2024 | Year ended April 30, 2024 | Six months ended October 31, 2024 | Year ended April 30, 2024 |
| Fidelity High Income Fund | | | | |
| Class A | | | | |
| Shares sold | 1,667 | 1,472 | $13,120 | $11,040 |
| Issued in exchange for the shares of the Acquired Fund(s) | 999 | - | 7,914 | - |
| Reinvestment of distributions | 403 | 781 | 3,151 | 5,837 |
| Shares redeemed | (1,569) | (2,774) | (12,272) | (20,682) |
| Net increase (decrease) | 1,500 | (521) | $11,913 | $(3,805) |
| Class M | | | | |
| Shares sold | 187 | 483 | $1,444 | $3,664 |
| Issued in exchange for the shares of the Acquired Fund(s) | 324 | - | 2,567 | - |
| Reinvestment of distributions | 99 | 187 | 772 | 1,397 |
| Shares redeemed | (420) | (546) | (3,284) | (4,097) |
| Net increase (decrease) | 190 | 124 | $1,499 | $964 |
| Class C | | | | |
| Shares sold | 293 | 216 | $2,288 | $1,615 |
| Issued in exchange for the shares of the Acquired Fund(s) | 140 | - | 1,111 | - |
| Reinvestment of distributions | 32 | 65 | 254 | 488 |
| Shares redeemed | (218) | (613) | (1,700) | (4,572) |
| Net increase (decrease) | 247 | (332) | $1,953 | $(2,469) |
| Fidelity High Income Fund | | | | |
| Shares sold | 15,910 | 32,505 | $124,635 | $243,092 |
| Issued in exchange for the shares of the Acquired Fund(s) | 7,109 | - | 56,301 | - |
| Reinvestment of distributions | 7,000 | 14,572 | 54,747 | 108,893 |
| Shares redeemed | (30,585) | (81,405) | (237,738) | (606,074) |
| Net increase (decrease) | (566) | (34,328) | $(2,055) | $(254,089) |
| Class I | | | | |
| Shares sold | 829 | 4,511 | $6,443 | $33,389 |
| Issued in exchange for the shares of the Acquired Fund(s) | 329 | - | 2,608 | - |
| Reinvestment of distributions | 198 | 483 | 1,550 | 3,617 |
| Shares redeemed | (1,699) | (12,288) | (13,167) | (90,920) |
| Net increase (decrease) | (343) | (7,294) | $(2,566) | $(53,914) |
| Class Z | | | | |
| Shares sold | 2,480 | 4,381 | $19,533 | $33,183 |
| Reinvestment of distributions | 203 | 420 | 1,584 | 3,141 |
| Shares redeemed | (1,283) | (5,083) | (10,008) | (38,111) |
| Net increase (decrease) | 1,400 | (282) | $11,109 | $(1,787) |
13. Other.
A fund's organizational documents provide former and current trustees and officers with a limited indemnification against liabilities arising in connection with the performance of their duties to the fund. In the normal course of business, a fund may also enter into contracts that provide general indemnifications. A fund's maximum exposure under these arrangements is unknown as this would be dependent on future claims that may be made against a fund. The risk of material loss from such claims is considered remote.
14. Litigation.
The Fund and other entities managed by FMR or its affiliates are involved with proceedings arising out of disputes in the United States Bankruptcy Court for the Southern District of Texas ("Bankruptcy Court"), relating to the In re Sanchez Energy Corporation chapter 11 bankruptcy case (Case No. 19-34508). A Bankruptcy Court-appointed representative of unsecured creditors asserted that eight million shares of Mesquite Energy, Inc. (formerly known as Sanchez Energy Corporation) (the "Company"), held in escrow pursuant to the terms of the Company's confirmed chapter 11 plan, should be awarded to the unsecured creditors instead of the Company's current equity holders, including the Fund, which were providers of debtor-in-possession financing to the Company during its chapter 11 case and holders of secured notes issued by the Company in 2018. The unsecured creditors also asserted that certain additional equity issued by the Company in 2020 in connection with two post-bankruptcy financings, also held by the Fund, is invalid. During August 2023, the Bankruptcy Court issued an opinion awarding a portion of the eight million shares to the unsecured creditors, diluting the value of the Fund's holdings in Mesquite. The Fund will appeal this decision. At this time, Management cannot determine any additional loss or dilution that may be realized. The Fund is also incurring legal costs in defending the disputes and has recovered a portion of these legal costs through an insurance claim.
15. Risk and Uncertainties.
Many factors affect a fund's performance. Developments that disrupt global economies and financial markets, such as pandemics, epidemics, outbreaks of infectious diseases, war, terrorism, and environmental disasters, may significantly affect a fund's investment performance. The effects of these developments to a fund will be impacted by the types of securities in which a fund invests, the financial condition, industry, economic sector, and geographic location of an issuer, and a fund's level of investment in the securities of that issuer. Significant concentrations in security types, issuers, industries, sectors, and geographic locations may magnify the factors that affect a fund's performance.
16. Reorganization Information.
On September 13, 2024, the Fund acquired all of the assets and assumed all of the liabilities of Fidelity Global High Income Fund ("Acquired Fund") pursuant to an Agreement and Plan of Reorganization (Agreements) approved by the Board of Trustees ("The Board"). The securities held by the Acquired Fund were the primary assets acquired by the Fund. The acquisition was accomplished by an exchange of each class of the Fund for corresponding shares then outstanding of the Acquired Fund at its respective net asset value on the acquisition date. The reorganization provides shareholders of the Acquired Fund access to a larger portfolio with a similar investment objective and lower projected expenses. For financial reporting purposes, the assets and liabilities of the Acquired Fund and shares issued by the Fund were recorded at fair value; however, the cost basis of the investments received from the Acquired Fund were carried forward and will be utilized for purposes of the Fund's ongoing reporting of realized and unrealized gains and losses to more closely align subsequent reporting of realized gains with amounts distributable to shareholders for tax purposes. The reorganization qualified as a tax-free reorganization for federal income tax purposes with no gain or loss recognized to the funds or their shareholders.
| Acquired Fund and Share Class | Investments $ | Unrealized appreciation (depreciation) $ | Net Assets $ | Shares Exchanged | Shares Exchanged Ratio |
| Fidelity Global High Income Fund | 72,413 | (1,545) | | | |
Class A | | | 7,914 | 999 | 1.1121843434 |
Class M | | | 2,567 | 324 | 1.1120833333 |
Class C | | | 1,111 | 140 | 1.1123232323 |
Global High Income | | | 56,301 | 7,109 | 1.1123106061 |
Class I | | | 2,608 | 329 | 1.1123358586 |
| Acquiring Fund | Net Assets $ | Total net assets after the acquisition $ |
| Fidelity High Income Fund | 2,673,809 | 2,744,310 |
Pro forma results of operations of the combined entity for the entire period ended October 31, 2024, as though the acquisition had occurred as of the beginning of the year (rather than on the actual acquisition date), are as follows:
| Net investment income (loss) | $86,435 |
| Total net realized gain (loss) | (33,612) |
| Total change in net unrealized appreciation (depreciation) | 134,100 |
| Net increase (decrease) in net assets resulting from operations | 186,923 |
Because the combined investment portfolios have been managed as a single portfolio since the acquisition was completed, it is not practicable to separate the amounts of revenue and earnings of the acquired fund that have been included in the Fund's accompanying Statement of Operations since September 13, 2024.
Item 8: Changes in and Disagreements with Accountants for Open-End Management Investment Companies
(Unaudited)
Note: This is not applicable for any fund included in this document.
Item 9: Proxy Disclosures for Open-End Management Investment Companies
(Unaudited)
| A special meeting of shareholders was held on July 16, 2024. The results of votes taken among shareholders on the proposal before them are reported below. Each vote reported represents one dollar of net asset value held on the record date for the meeting. |
| Proposal 1 |
| To elect a Board of Trustees. |
| | # of Votes | % of Votes |
| Bettina Doulton |
| Affirmative | 14,516,835,136.19 | 94.56 |
| Withheld | 834,887,998.33 | 5.44 |
| TOTAL | 15,351,723,134.52 | 100.00 |
| Robert A. Lawrence |
| Affirmative | 14,430,495,798.10 | 94.00 |
| Withheld | 921,227,336.42 | 6.00 |
| TOTAL | 15,351,723,134.52 | 100.00 |
| Vijay C. Advani |
| Affirmative | 14,465,231,640.25 | 94.23 |
| Withheld | 886,491,494.27 | 5.77 |
| TOTAL | 15,351,723,134.52 | 100.00 |
| Thomas P. Bostick |
| Affirmative | 14,471,831,170.84 | 94.27 |
| Withheld | 879,891,963.68 | 5.73 |
| TOTAL | 15,351,723,134.52 | 100.00 |
| Donald F. Donahue |
| Affirmative | 14,432,670,599.88 | 94.01 |
| Withheld | 919,052,534.64 | 5.99 |
| TOTAL | 15,351,723,134.52 | 100.00 |
| Vicki L. Fuller |
| Affirmative | 14,531,407,981.65 | 94.66 |
| Withheld | 820,315,152.87 | 5.34 |
| TOTAL | 15,351,723,134.52 | 100.00 |
| Patricia L. Kampling |
| Affirmative | 14,549,142,839.16 | 94.77 |
| Withheld | 802,580,295.36 | 5.23 |
| TOTAL | 15,351,723,134.52 | 100.00 |
| Thomas A. Kennedy |
| Affirmative | 14,469,818,769.40 | 94.26 |
| Withheld | 881,904,365.12 | 5.74 |
| TOTAL | 15,351,723,134.52 | 100.00 |
| Oscar Munoz |
| Affirmative | 14,434,061,467.08 | 94.02 |
| Withheld | 917,661,667.44 | 5.98 |
| TOTAL | 15,351,723,134.52 | 100.00 |
| Karen B. Peetz |
| Affirmative | 14,521,904,618.46 | 94.59 |
| Withheld | 829,818,516.06 | 5.41 |
| TOTAL | 15,351,723,134.52 | 100.00 |
| David M. Thomas |
| Affirmative | 14,417,745,861.73 | 93.92 |
| Withheld | 933,977,272.79 | 6.08 |
| TOTAL | 15,351,723,134.52 | 100.00 |
| Susan Tomasky |
| Affirmative | 14,467,973,468.18 | 94.24 |
| Withheld | 883,749,666.34 | 5.76 |
| TOTAL | 15,351,723,134.52 | 100.00 |
| Michael E. Wiley |
| Affirmative | 14,424,002,796.91 | 93.96 |
| Withheld | 927,720,337.61 | 6.04 |
| TOTAL | 15,351,723,134.52 | 100.00 |
| | | |
| Proposal 1 reflects trust-wide proposal and voting results. |
Item 10: Remuneration Paid to Directors, Officers, and others of Open-End Management Investment Companies
(Unaudited)
Note: This information is disclosed as part of the financial statements for each Fund as part of Item 7: Financial Statements and Financial Highlights for Open-End Management Investment companies.
Item 11: Statement Regarding Basis for Approval of Investment Advisory Contract
(Unaudited)
Board Approval of Investment Advisory Contracts and Management Fees
Fidelity High Income Fund
Each year, the Board of Trustees, including the Independent Trustees (together, the Board), considers the renewal of the fund's management contract with Fidelity Management & Research Company LLC (FMR) and certain affiliates and the sub-advisory agreements (together, the Advisory Contracts) for the fund. FMR and the sub-advisers are referred to herein as the Investment Advisers. The Board, assisted by the advice of fund counsel and Independent Trustees' counsel, requests and considers a broad range of information relevant to the renewal of the Advisory Contracts throughout the year.
The Board meets regularly and, at each of its meetings, covers an extensive agenda of topics and materials and considers factors that are relevant to its annual consideration of the renewal of the fund's Advisory Contracts, including the services and support provided to the fund and its shareholders. The Board, acting directly and through its Committees (each of which is composed of and chaired by Independent Trustees), requests and receives information concerning the annual consideration of the renewal of the fund's Advisory Contracts. The Board also meets as needed to review matters specifically related to the Board's annual consideration of the renewal of the Advisory Contracts. Members of the Board may also meet with trustees of other Fidelity funds through joint ad hoc committees to discuss certain matters relevant to all of the Fidelity funds.
At its May 2024 meeting, the Board unanimously determined to renew the fund's Advisory Contracts. In reaching its determination, the Board considered all factors it believed relevant, including (i) the nature, extent, and quality of the services provided to the fund and its shareholders (including the investment performance of the fund); (ii) the competitiveness relative to peer funds of the fund's management fee and the total expense ratio of a representative class (the retail class, which was selected because it was the largest class without 12b-1 fees); (iii) the total costs of the services provided by and the profits realized by FMR and its affiliates (Fidelity) from its relationships with the fund; and (iv) the extent to which, if any, economies of scale exist and are realized as the fund grows, and whether any economies of scale are appropriately shared with fund shareholders. The Board also considered the broad range of investment choices available to shareholders from FMR's competitors and that the fund's shareholders have chosen to invest in the fund, which is part of the Fidelity family of funds. The Board's decision to renew the Advisory Contracts was not based on any single factor.
The Board reached a determination, with the assistance of fund counsel and Independent Trustees' counsel and through the exercise of its business judgment, that the renewal of the Advisory Contracts was in the best interests of the fund and its shareholders and that the compensation payable under the Advisory Contracts was fair and reasonable in light of all of the surrounding circumstances.
Nature, Extent, and Quality of Services Provided. The Board considered staffing as it relates to the fund, including the backgrounds and experience of investment personnel of the Investment Advisers, and also considered the Investment Advisers' implementation of the fund's investment program. The Independent Trustees also had discussions with senior management of Fidelity's investment operations and investment groups. The Board considered the structure of the investment personnel compensation program and whether this structure provides appropriate incentives to act in the best interests of the fund. Additionally, the Board considered the portfolio managers' investments, if any, in the funds that they manage.
Resources Dedicated to Investment Management and Support Services. The Board and the Fund Oversight and Research Committees reviewed the general qualifications and capabilities of Fidelity's investment staff, including its size, education, experience, and resources, as well as Fidelity's approach to recruiting, training, managing, and compensating investment personnel. The Board noted the resources devoted to expansion of Fidelity's global investment organization, and that Fidelity's analysts have extensive resources, tools, and capabilities that allow them to conduct sophisticated quantitative and fundamental analysis, as well as credit analysis of issuers, counterparties, and guarantors. Further, the Board considered that Fidelity's investment professionals have sufficient access to global information and data so as to provide competitive investment results over time, and that those professionals also have access to sophisticated tools that permit them to assess portfolio construction and risk and performance attribution characteristics continuously, as well as to transmit new information and research conclusions rapidly around the world. Additionally, in its deliberations, the Board considered Fidelity's trading, risk management, compliance, and technology and operations capabilities and resources, which are integral parts of the investment management process.
Shareholder and Administrative Services. The Board considered (i) the nature, extent, quality, and cost of advisory, administrative, shareholder, transfer agency, and pricing and bookkeeping services performed by the Investment Advisers and their affiliates under the Advisory Contracts; (ii) the nature and extent of Fidelity's supervision of third party service providers, principally custodians, subcustodians, and pricing vendors; and (iii) the resources devoted by Fidelity to, and the record of compliance with, the fund's compliance policies and procedures. The Board also reviewed the allocation of fund brokerage, including allocations to brokers affiliated with the Investment Advisers, the use of brokerage commissions to pay fund expenses, and the use of "soft" commission dollars to pay for research services. The Board also considered the fund's securities lending activities and any payments made to Fidelity relating to securities lending under a separate agreement.
The Board noted that the growth of fund assets over time across the complex allows Fidelity to reinvest in the development of services designed to enhance the value and convenience of the Fidelity funds as investment vehicles. These services include 24-hour access to account information and market information over the Internet and through telephone representatives, investor education materials, and asset allocation tools. The Board also considered that it reviews customer service metrics such as telephone response times, continuity of services on the website and metrics addressing services at Fidelity Investor Centers.
Investment in a Large Fund Family. The Board considered the benefits to shareholders of investing in a fund that is part of a large family of funds offering a variety of investment disciplines and providing a large variety of fund investor services. The Board noted that Fidelity had taken, or had made recommendations that resulted in the Fidelity funds taking, a number of actions over the previous year that benefited particular funds and/or the Fidelity funds in general.
Investment Performance. The Board took into account discussions that occur with representatives of the Investment Advisers, and reports that it receives, at Board meetings throughout the year, relating to fund investment performance. In this regard the Board noted that as part of regularly scheduled fund reviews and other reports to the Board on fund performance, the Board considered annualized return information for the fund for different time periods, measured against an appropriate securities market index (benchmark index) and an appropriate peer group of funds with similar objectives (peer group). The Board also considered information about performance attribution. In its ongoing evaluation of fund investment performance, the Board gives particular attention to information indicating changes in performance of the funds over different time periods and discussed with the Investment Advisers the reasons for any overperformance or underperformance. The fund underperformed its benchmark and peers for the one- and three-year periods ended February 29, 2024, and as a result, the Board continues to engage in discussions with FMR about the steps it is taking to address the fund's performance.
In addition to reviewing absolute and relative fund performance, the Independent Trustees periodically consider the appropriateness of fund performance metrics in evaluating the results achieved. The Independent Trustees generally give greater weight to fund performance over longer time periods than over shorter time periods. Depending on the circumstances, the Independent Trustees may be satisfied with a fund's performance notwithstanding that it lags its benchmark index or peer group for certain periods.
Based on its review, the Board concluded that the nature, extent, and quality of services provided to the fund under the Advisory Contracts should continue to benefit the shareholders of the fund.
Competitiveness of Management Fee and Total Expense Ratio. The Board was provided with information regarding industry trends in management fees and expenses. The Board considered that, effective March 1, 2024, an amended Advisory Contract with FMR went into effect with class-level management fees based on tiered schedules and subject to a maximum class-level rate (the management fee). The Board also considered that in exchange for the variable management fee, each class of the fund receives investment advisory, management, administrative, transfer agent, and pricing and bookkeeping services. In its review of the management fee and total expense ratio of the retail class, the Board considered a pro forma management fee rate for the retail class as if it had been in effect for the 12-month period ended September 30, 2023, as well as other third-party fund expenses, as applicable, such as custodial, legal, and audit fees and any fund-paid 12b-1 fees. The Board noted that Fidelity may agree to waive fees or reimburse expenses from time to time, and the extent to which, if any, it has done so for the fund.
Comparisons of Management Fees and Total Expense Ratios. Among other things, the Board reviewed data for selected groups of competitive funds and classes (referred to as "mapped groups") that were compiled by Fidelity based on combining similar investment objective categories (as classified by Morningstar) that have comparable investment mandates. The data reviewed by the Board included (i) gross management fee comparisons (before taking into account expense reimbursements or caps) relative to the total universe of funds within the mapped group; (ii) gross management fee comparisons relative to a subset of non-Fidelity funds in the mapped group that are similar in size and management fee structure to the fund (referred to as the "asset size peer group"); (iii) total expense comparisons of the retail class of the fund relative to funds and classes in the mapped group that have a similar sales load structure to the retail class of the fund (referred to as the "similar sales load structure group"); and (iv) total expense comparisons of the retail class of the fund relative to funds and classes in the similar sales load structure group that are similar in size and management fee structure to the fund (referred to as the "total expense asset size peer group"). The total expense asset size peer group comparison excludes performance adjustments and fund-paid 12b-1 fees to eliminate variability in fee structures.
The information provided to the Board indicated that the fund's management fee rate ranked above the competitive median of the mapped group for the 12-month period ended September 30, 2023 and above the competitive median of the asset size peer group for the 12-month period ended September 30, 2023. Further, the information provided to the Board indicated that the total expense ratio of the retail class of the fund ranked below the competitive median of the similar sales load structure group for the 12-month period ended September 30, 2023 and below the competitive median of the total expense asset size peer group for the 12-month period ended September 30, 2023. The Board considered that the fund has a variable unified management fee that covers expenses for services beyond portfolio management.
The Board noted that a different variable management fee rate is applicable to each class of the fund. The Board considered that the difference in management fee rates between classes is the result of separate arrangements for class-level services and/or waivers of certain expenses and not the result of any difference in advisory or custodial fees or other expenses related to the management of the fund's assets, which do not vary by class.
Fees Charged to Other Fidelity Clients. The Board also considered Fidelity fee structures and other information with respect to clients of Fidelity, such as other funds advised or subadvised by Fidelity, pension plan clients, and other institutional clients with similar mandates. The Board noted that a joint ad hoc committee created by it and the boards of other Fidelity funds periodically reviews and compares Fidelity's institutional investment advisory business with its business of providing services to the Fidelity funds and also noted the most recent findings of the committee. The Board noted that the committee's review included a consideration of the differences in services provided, fees charged, and costs incurred, as well as competition in the markets serving the different categories of clients.
Based on its review, the Board concluded that the fund's management fee is fair and reasonable in light of the services that the fund receives and the other factors considered. Further based on its review of total expense ratios and fees charged to other Fidelity clients, the Board concluded that the total expense ratio of each class of the fund was reasonable in light of the services that the fund and its shareholders receive and the other factors considered.
Costs of the Services and Profitability. The Board considered the revenues earned and the expenses incurred by Fidelity in conducting the business of developing, marketing, distributing, managing, administering and servicing the fund and servicing the fund's shareholders. The Board also considered the level of Fidelity's profits in respect of all the Fidelity funds.
On an annual basis, Fidelity presents to the Board information about the profitability of its relationships with the fund. Fidelity calculates profitability information for each fund, as well as aggregate profitability information for groups of Fidelity funds and all Fidelity funds, using a series of detailed revenue and cost allocation methodologies which originate with the books and records of Fidelity on which Fidelity's audited financial statements are based. The Audit Committee of the Board reviews any significant changes from the prior year's methodologies.
A public accounting firm has been engaged annually by the Board as part of the Board's assessment of Fidelity's profitability analysis. The engagement includes the review and assessment of the methodologies used by Fidelity in determining the revenues and expenses attributable to Fidelity's fund business, and completion of agreed-upon procedures in respect of the mathematical accuracy of certain fund profitability information and its conformity to established allocation methodologies. After considering the reports issued under the engagement and information provided by Fidelity, the Board concluded that while other allocation methods may also be reasonable, Fidelity's profitability methodologies are reasonable in all material respects.
The Board also reviewed Fidelity's non-fund businesses and potential indirect benefits such businesses may have received as a result of their association with Fidelity's fund business (i.e., fall-out benefits) as well as cases where Fidelity's affiliates may benefit from the funds' business. The Board considered areas where potential indirect benefits to the Fidelity funds from their relationships with Fidelity may exist. The Board's consideration of these matters was informed by the findings of a joint ad hoc committee created by it and the boards of other Fidelity funds to evaluate potential fall-out benefits.
The Board considered the costs of the services provided by and the profits realized by Fidelity in connection with the operation of the fund and was satisfied that the profitability was not excessive.
Economies of Scale. The Board considered whether there have been economies of scale in respect of the management of the Fidelity funds, whether the Fidelity funds (including the fund) have appropriately benefited from any such economies of scale, and whether there is potential for realization of any further economies of scale. The Board considered the extent to which the fund will benefit from economies of scale as assets grow through increased services to the fund, through waivers or reimbursements, or through fee or expense ratio reductions. The Board also noted that a committee created by it and the boards of other Fidelity funds periodically analyzes whether Fidelity attains economies of scale in respect of the management and servicing of the Fidelity funds, whether the Fidelity funds have appropriately benefited from such economies of scale, and whether there is potential for realization of any further economies of scale.
The Board recognized that the fund's management contract incorporates a variable management fee structure, which provides breakpoints as a way to share, in part, any potential economies of scale that may exist at the asset class level and through a discount that considers both fund size and total assets of the four applicable asset classes. The Board considered that the variable management fee is designed to deliver the benefits of economies of scale to fund shareholders even if assets of any particular fund are unchanged or have declined, because some portion of Fidelity's costs are attributable to services provided to all funds subject to the variable management fee, and all such funds benefit if those costs can be allocated among more assets. The Board concluded that, given the variable management fee structure, fund shareholders will benefit from lower management fees due to the application of the breakpoints and discount factor, regardless of whether Fidelity achieves any such economies of scale.
The Board concluded, taking into account the analysis of the committee, that economies of scale, if any, are being appropriately shared between fund shareholders and Fidelity.
Additional Information Requested by the Board. In order to develop fully the factual basis for consideration of the Fidelity funds' advisory contracts, the Board requested and received additional information on certain topics, including but not limited to: (i) fund flow and performance trends, in particular the underperformance of certain funds and strategies, and Fidelity's long-term strategies for certain funds; (ii) the operation of performance fees and the rationale for implementing performance fees on certain categories of funds but not others; (iii) Fidelity's pricing philosophy compared to competitors; (iv) fund profitability methodology and data; (v) evaluation of competitive fund data and peer group classifications and fee and expense comparisons; (vi) the management fee and expense structures for different funds and classes and information about the differences between various fee and expense structures; (vii) the variable management fee implemented for certain funds effective March 1, 2024; and (viii) information regarding other accounts managed by Fidelity and the funds' sub-advisory arrangements.
Conclusion. Based on its evaluation of all of the conclusions noted above, and after considering all factors it believed relevant, the Board, including the Independent Trustees, concluded that the advisory and sub-advisory fee arrangements are fair and reasonable in light of all of the surrounding circumstances and that the fund's Advisory Contracts should be renewed through May 31, 2025.
1.538299.127
SPH-SANN-1224
Fidelity® Women's Leadership Fund
Semi-Annual Report
October 31, 2024
Includes Fidelity and Fidelity Advisor share classes
Contents
To view a fund's proxy voting guidelines and proxy voting record for the 12-month period ended June 30, visit http://www.fidelity.com/proxyvotingresults or visit the Securities and Exchange Commission's (SEC) web site at http://www.sec.gov.
You may also call 1-800-544-8544 if you're an individual investing directly with Fidelity, call 1-800-835-5092 if you're a plan sponsor or participant with Fidelity as your recordkeeper or call 1-877-208-0098 on institutional accounts or if you're an advisor or invest through one to request a free copy of the proxy voting guidelines.
Standard & Poor's, S&P and S&P 500 are registered service marks of The McGraw-Hill Companies, Inc. and have been licensed for use by Fidelity Distributors Corporation.
Other third-party marks appearing herein are the property of their respective owners.
All other marks appearing herein are registered or unregistered trademarks or service marks of FMR LLC or an affiliated company. © 2024 FMR LLC. All rights reserved.
This report and the financial statements contained herein are submitted for the general information of the shareholders of the Fund. This report is not authorized for distribution to prospective investors in the Fund unless preceded or accompanied by an effective prospectus.
A fund files its complete schedule of portfolio holdings with the SEC for the first and third quarters of each fiscal year on Form N-PORT. Forms N-PORT are available on the SEC's web site at http://www.sec.gov. A fund's Forms N-PORT may be reviewed and copied at the SEC's Public Reference Room in Washington, DC. Information regarding the operation of the SEC's Public Reference Room may be obtained by calling 1-800-SEC-0330.
For a complete list of a fund's portfolio holdings, view the most recent holdings listing, semiannual report, or annual report on Fidelity's web site at http://www.fidelity.com, http://www.institutional.fidelity.com, or http://www.401k.com, as applicable.
NOT FDIC INSURED •MAY LOSE VALUE •NO BANK GUARANTEE
Neither the Fund nor Fidelity Distributors Corporation is a bank.
Item 7: Financial Statements and Financial Highlights for Open-End Management Investment Companies (Semi-Annual Report)
Fidelity® Women's Leadership Fund
Schedule of Investments October 31, 2024 (Unaudited)
Showing Percentage of Net Assets
| Common Stocks - 97.6% |
| | | Shares | Value ($) |
| COMMUNICATION SERVICES - 6.1% | | | |
| Entertainment - 2.7% | | | |
| Netflix, Inc. (a) | | 1,294 | 978,303 |
| The Walt Disney Co. | | 30,880 | 2,970,656 |
| | | | 3,948,959 |
| Interactive Media & Services - 3.4% | | | |
| Alphabet, Inc.: | | | |
| Class A | | 13,606 | 2,328,123 |
| Class C | | 11,043 | 1,907,016 |
| Pinterest, Inc. Class A (a) | | 26,489 | 842,085 |
| | | | 5,077,224 |
TOTAL COMMUNICATION SERVICES | | | 9,026,183 |
| CONSUMER DISCRETIONARY - 11.3% | | | |
| Broadline Retail - 3.2% | | | |
| Amazon.com, Inc. (a) | | 21,109 | 3,934,718 |
| Etsy, Inc. (a) | | 16,691 | 858,585 |
| | | | 4,793,303 |
| Hotels, Restaurants & Leisure - 1.8% | | | |
| Hilton Worldwide Holdings, Inc. | | 5,084 | 1,193,977 |
| Starbucks Corp. | | 8,587 | 838,950 |
| Vail Resorts, Inc. | | 3,674 | 608,745 |
| | | | 2,641,672 |
| Household Durables - 0.9% | | | |
| Taylor Morrison Home Corp. (a) | | 19,772 | 1,354,382 |
| Specialty Retail - 4.5% | | | |
| Aritzia, Inc. (a) | | 24,804 | 798,623 |
| Best Buy Co., Inc. | | 8,978 | 811,881 |
| Gap, Inc. | | 17,859 | 370,931 |
| Lowe's Companies, Inc. | | 3,067 | 803,033 |
| Ulta Beauty, Inc. (a) | | 3,839 | 1,416,514 |
| Warby Parker, Inc. (a) | | 42,100 | 712,753 |
| Williams-Sonoma, Inc. | | 13,665 | 1,832,886 |
| | | | 6,746,621 |
| Textiles, Apparel & Luxury Goods - 0.9% | | | |
| NIKE, Inc. Class B | | 6,246 | 481,754 |
| Tapestry, Inc. | | 16,738 | 794,218 |
| | | | 1,275,972 |
TOTAL CONSUMER DISCRETIONARY | | | 16,811,950 |
| CONSUMER STAPLES - 3.2% | | | |
| Consumer Staples Distribution & Retail - 0.7% | | | |
| Maplebear, Inc. (NASDAQ) (a) | | 22,629 | 997,939 |
| Food Products - 0.9% | | | |
| Bunge Global SA | | 7,158 | 601,415 |
| The Hershey Co. | | 4,062 | 721,330 |
| | | | 1,322,745 |
| Household Products - 0.8% | | | |
| The Clorox Co. | | 7,794 | 1,235,739 |
| Personal Care Products - 0.8% | | | |
| elf Beauty, Inc. (a) | | 3,965 | 417,316 |
| Estee Lauder Companies, Inc. Class A | | 11,829 | 815,491 |
| | | | 1,232,807 |
TOTAL CONSUMER STAPLES | | | 4,789,230 |
| ENERGY - 2.8% | | | |
| Energy Equipment & Services - 1.0% | | | |
| Baker Hughes Co. Class A | | 39,345 | 1,498,258 |
| Oil, Gas & Consumable Fuels - 1.8% | | | |
| Antero Resources Corp. (a) | | 28,844 | 746,483 |
| EQT Corp. | | 19,051 | 696,124 |
| Equinor ASA | | 23,836 | 566,396 |
| Occidental Petroleum Corp. | | 14,120 | 707,553 |
| | | | 2,716,556 |
TOTAL ENERGY | | | 4,214,814 |
| FINANCIALS - 13.2% | | | |
| Banks - 5.0% | | | |
| Bank of America Corp. | | 40,694 | 1,701,823 |
| Citigroup, Inc. | | 23,069 | 1,480,338 |
| Huntington Bancshares, Inc. | | 61,822 | 963,805 |
| JPMorgan Chase & Co. | | 10,416 | 2,311,519 |
| Starling Bank Ltd. Series D (a)(b)(c) | | 34,700 | 141,838 |
| U.S. Bancorp | | 16,404 | 792,477 |
| | | | 7,391,800 |
| Capital Markets - 2.0% | | | |
| Macquarie Group Ltd. | | 9,992 | 1,512,253 |
| NASDAQ, Inc. | | 18,951 | 1,400,858 |
| | | | 2,913,111 |
| Financial Services - 2.7% | | | |
| Fidelity National Information Services, Inc. | | 14,313 | 1,284,305 |
| MasterCard, Inc. Class A | | 3,241 | 1,619,171 |
| WEX, Inc. (a) | | 6,741 | 1,163,497 |
| | | | 4,066,973 |
| Insurance - 3.5% | | | |
| Hartford Financial Services Group, Inc. | | 13,348 | 1,474,153 |
| Marsh & McLennan Companies, Inc. | | 5,962 | 1,301,147 |
| Progressive Corp. | | 9,995 | 2,427,086 |
| | | | 5,202,386 |
TOTAL FINANCIALS | | | 19,574,270 |
| HEALTH CARE - 12.8% | | | |
| Biotechnology - 2.2% | | | |
| Alnylam Pharmaceuticals, Inc. (a) | | 4,681 | 1,247,908 |
| Exact Sciences Corp. (a) | | 12,234 | 843,290 |
| Vertex Pharmaceuticals, Inc. (a) | | 1,805 | 859,144 |
| Zai Lab Ltd. ADR (a) | | 8,171 | 246,928 |
| | | | 3,197,270 |
| Health Care Equipment & Supplies - 3.6% | | | |
| Hologic, Inc. (a) | | 30,357 | 2,454,971 |
| Insulet Corp. (a) | | 6,340 | 1,467,900 |
| Outset Medical, Inc. (a) | | 5,606 | 3,195 |
| The Cooper Companies, Inc. (a) | | 14,048 | 1,470,545 |
| | | | 5,396,611 |
| Health Care Providers & Services - 3.0% | | | |
| Centene Corp. (a) | | 20,409 | 1,270,664 |
| Cigna Group | | 6,868 | 2,162,115 |
| Elevance Health, Inc. | | 2,335 | 947,450 |
| | | | 4,380,229 |
| Life Sciences Tools & Services - 0.4% | | | |
| ICON PLC (a) | | 2,572 | 571,267 |
| Pharmaceuticals - 3.6% | | | |
| GSK PLC sponsored ADR | | 19,283 | 708,843 |
| Merck & Co., Inc. | | 6,681 | 683,600 |
| Merck KGaA | | 7,192 | 1,189,111 |
| UCB SA | | 9,975 | 1,918,334 |
| Zoetis, Inc. Class A | | 5,070 | 906,415 |
| | | | 5,406,303 |
TOTAL HEALTH CARE | | | 18,951,680 |
| INDUSTRIALS - 11.5% | | | |
| Air Freight & Logistics - 0.8% | | | |
| United Parcel Service, Inc. Class B | | 8,533 | 1,143,934 |
| Commercial Services & Supplies - 0.5% | | | |
| Millerknoll, Inc. | | 8,471 | 189,412 |
| Veralto Corp. | | 5,132 | 524,439 |
| | | | 713,851 |
| Electrical Equipment - 4.3% | | | |
| Eaton Corp. PLC | | 4,444 | 1,473,542 |
| GE Vernova LLC | | 5,202 | 1,569,235 |
| nVent Electric PLC | | 11,078 | 826,086 |
| Prysmian SpA | | 16,628 | 1,172,406 |
| Regal Rexnord Corp. | | 5,949 | 990,746 |
| Sunrun, Inc. (a) | | 28,290 | 408,791 |
| | | | 6,440,806 |
| Ground Transportation - 0.3% | | | |
| ArcBest Corp. | | 4,503 | 469,123 |
| Machinery - 3.0% | | | |
| Deere & Co. | | 3,274 | 1,324,955 |
| Federal Signal Corp. | | 11,403 | 930,143 |
| Otis Worldwide Corp. | | 10,119 | 993,686 |
| Parker Hannifin Corp. | | 1,932 | 1,225,023 |
| | | | 4,473,807 |
| Professional Services - 2.6% | | | |
| Leidos Holdings, Inc. | | 8,774 | 1,607,046 |
| ManpowerGroup, Inc. | | 9,334 | 586,642 |
| Science Applications International Corp. | | 7,629 | 1,100,788 |
| UL Solutions, Inc. Class A | | 10,873 | 564,961 |
| | | | 3,859,437 |
TOTAL INDUSTRIALS | | | 17,100,958 |
| INFORMATION TECHNOLOGY - 30.0% | | | |
| Communications Equipment - 1.5% | | | |
| Arista Networks, Inc. (a) | | 5,571 | 2,152,857 |
| Electronic Equipment, Instruments & Components - 1.7% | | | |
| CDW Corp. | | 8,448 | 1,590,167 |
| Insight Enterprises, Inc. (a) | | 5,668 | 991,447 |
| | | | 2,581,614 |
| IT Services - 2.1% | | | |
| Accenture PLC Class A | | 8,939 | 3,082,346 |
| Semiconductors & Semiconductor Equipment - 9.5% | | | |
| Advanced Micro Devices, Inc. (a) | | 11,275 | 1,624,389 |
| First Solar, Inc. (a) | | 6,326 | 1,230,280 |
| Marvell Technology, Inc. | | 22,821 | 1,828,190 |
| Micron Technology, Inc. | | 13,037 | 1,299,137 |
| NVIDIA Corp. | | 40,749 | 5,409,837 |
| NXP Semiconductors NV | | 7,389 | 1,732,721 |
| SolarEdge Technologies, Inc. (a) | | 15,293 | 260,899 |
| Universal Display Corp. | | 4,362 | 786,556 |
| | | | 14,172,009 |
| Software - 10.2% | | | |
| Adobe, Inc. (a) | | 4,050 | 1,936,224 |
| Gen Digital, Inc. | | 53,215 | 1,549,089 |
| HubSpot, Inc. (a) | | 3,473 | 1,926,786 |
| Intuit, Inc. | | 2,162 | 1,319,469 |
| Microsoft Corp. | | 13,112 | 5,328,061 |
| Pagerduty, Inc. (a) | | 23,600 | 426,216 |
| Salesforce, Inc. | | 9,177 | 2,673,902 |
| | | | 15,159,747 |
| Technology Hardware, Storage & Peripherals - 5.0% | | | |
| Apple, Inc. | | 28,769 | 6,499,202 |
| Dell Technologies, Inc. Class C | | 7,170 | 886,427 |
| | | | 7,385,629 |
TOTAL INFORMATION TECHNOLOGY | | | 44,534,202 |
| MATERIALS - 3.8% | | | |
| Chemicals - 1.8% | | | |
| Cabot Corp. | | 10,363 | 1,117,442 |
| Celanese Corp. | | 6,185 | 779,124 |
| Eastman Chemical Co. | | 8,049 | 845,869 |
| | | | 2,742,435 |
| Construction Materials - 0.7% | | | |
| Summit Materials, Inc. Class A (a) | | 21,977 | 1,041,930 |
| Containers & Packaging - 0.6% | | | |
| Ball Corp. | | 14,758 | 874,412 |
| Metals & Mining - 0.7% | | | |
| ATI, Inc. (a) | | 11,955 | 630,148 |
| Radius Recycling, Inc. Class A | | 21,665 | 350,756 |
| | | | 980,904 |
TOTAL MATERIALS | | | 5,639,681 |
| REAL ESTATE - 1.9% | | | |
| Equity Real Estate Investment Trusts (REITs) - 1.9% | | | |
| Public Storage Operating Co. | | 3,161 | 1,040,159 |
| Ventas, Inc. | | 27,568 | 1,805,428 |
| | | | 2,845,587 |
| UTILITIES - 1.0% | | | |
| Electric Utilities - 1.0% | | | |
| NextEra Energy, Inc. | | 18,010 | 1,427,293 |
| TOTAL COMMON STOCKS (Cost $107,689,584) | | | 144,915,848 |
| | | | |
| Convertible Preferred Stocks - 0.3% |
| | | Shares | Value ($) |
| HEALTH CARE - 0.3% | | | |
| Health Care Providers & Services - 0.3% | | | |
Somatus, Inc. Series E (a)(b)(c) (Cost $350,799) | | 402 | 479,666 |
| | | | |
| Money Market Funds - 2.1% |
| | | Shares | Value ($) |
Fidelity Cash Central Fund 4.87% (d) (Cost $3,148,749) | | 3,148,119 | 3,148,749 |
| | | | |
| TOTAL INVESTMENT IN SECURITIES - 100.0% (Cost $111,189,132) | 148,544,263 |
NET OTHER ASSETS (LIABILITIES) - 0.0% | (56,934) |
| NET ASSETS - 100.0% | 148,487,329 |
| | |
Legend
| (b) | Restricted securities (including private placements) - Investment in securities not registered under the Securities Act of 1933 (excluding 144A issues). At the end of the period, the value of restricted securities (excluding 144A issues) amounted to $621,504 or 0.4% of net assets. |
| (d) | Affiliated fund that is generally available only to investment companies and other accounts managed by Fidelity Investments. The rate quoted is the annualized seven-day yield of the fund at period end. A complete unaudited listing of the fund's holdings as of its most recent quarter end is available upon request. In addition, each Fidelity Central Fund's financial statements are available on the SEC's website or upon request. |
| Additional information on each restricted holding is as follows: |
| Security | Acquisition Date | Acquisition Cost ($) |
| Somatus, Inc. Series E | 1/31/22 | 350,799 |
| | | |
| Starling Bank Ltd. Series D | 6/18/21 - 4/05/22 | 68,001 |
| | | |
Affiliated Central Funds
Fiscal year to date information regarding the Fund's investments in Fidelity Central Funds, including the ownership percentage, is presented below.
| Affiliate | Value, beginning of period ($) | Purchases ($) | Sales Proceeds ($) | Dividend Income ($) | Realized Gain (loss) ($) | Change in Unrealized appreciation (depreciation) ($) | Value, end of period ($) | % ownership, end of period |
| Fidelity Cash Central Fund 4.87% | 1,195,228 | 16,778,793 | 14,825,273 | 44,523 | 1 | - | 3,148,749 | 0.0% |
| Total | 1,195,228 | 16,778,793 | 14,825,273 | 44,523 | 1 | - | 3,148,749 | |
| | | | | | | | | |
Amounts in the dividend income column in the above table include any capital gain distributions from underlying funds, which are presented in the corresponding line item in the Statement of Operations, if applicable.
Amounts included in the purchases and sales proceeds columns may include in-kind transactions, if applicable.
Investment Valuation
The following is a summary of the inputs used, as of October 31, 2024, involving the Fund's assets and liabilities carried at fair value. The inputs or methodology used for valuing securities may not be an indication of the risk associated with investing in those securities. For more information on valuation inputs, and their aggregation into the levels used below, please refer to the Investment Valuation section in the accompanying Notes to Financial Statements.
| Valuation Inputs at Reporting Date: |
| Description | Total ($) | Level 1 ($) | Level 2 ($) | Level 3 ($) |
Investments in Securities: | | | | |
|
| Equities: | | | | |
Communication Services | 9,026,183 | 9,026,183 | - | - |
Consumer Discretionary | 16,811,950 | 16,811,950 | - | - |
Consumer Staples | 4,789,230 | 4,789,230 | - | - |
Energy | 4,214,814 | 3,648,418 | 566,396 | - |
Financials | 19,574,270 | 17,920,179 | 1,512,253 | 141,838 |
Health Care | 19,431,346 | 18,951,680 | - | 479,666 |
Industrials | 17,100,958 | 17,100,958 | - | - |
Information Technology | 44,534,202 | 44,534,202 | - | - |
Materials | 5,639,681 | 5,639,681 | - | - |
Real Estate | 2,845,587 | 2,845,587 | - | - |
Utilities | 1,427,293 | 1,427,293 | - | - |
|
| Money Market Funds | 3,148,749 | 3,148,749 | - | - |
| Total Investments in Securities: | 148,544,263 | 145,844,110 | 2,078,649 | 621,504 |
Financial Statements (Unaudited)
| Statement of Assets and Liabilities |
| As of October 31, 2024 (Unaudited) |
| Assets | | | | |
| Investment in securities, at value - See accompanying schedule: | | | | |
Unaffiliated issuers (cost $108,040,383) | $ | 145,395,514 | | |
Fidelity Central Funds (cost $3,148,749) | | 3,148,749 | | |
| | | | | |
| | | | | |
| Total Investment in Securities (cost $111,189,132) | | | $ | 148,544,263 |
| Cash | | | | 10,157 |
| Foreign currency held at value (cost $22) | | | | 22 |
| Receivable for fund shares sold | | | | 52,101 |
| Dividends receivable | | | | 77,112 |
| Distributions receivable from Fidelity Central Funds | | | | 14,077 |
| Prepaid expenses | | | | 184 |
Total assets | | | | 148,697,916 |
| Liabilities | | | | |
| Payable for fund shares redeemed | $ | 95,819 | | |
| Accrued management fee | | 74,700 | | |
| Distribution and service plan fees payable | | 4,024 | | |
| Audit fee payable | | 30,182 | | |
| Other payables and accrued expenses | | 5,862 | | |
| Total liabilities | | | | 210,587 |
| Net Assets | | | $ | 148,487,329 |
| Net Assets consist of: | | | | |
| Paid in capital | | | $ | 108,589,864 |
| Total accumulated earnings (loss) | | | | 39,897,465 |
| Net Assets | | | $ | 148,487,329 |
| | | | | |
| Net Asset Value and Maximum Offering Price | | | | |
| Class A : | | | | |
Net Asset Value and redemption price per share ($8,952,125 ÷ 529,326 shares)(a) | | | $ | 16.91 |
| Maximum offering price per share (100/94.25 of $16.91) | | | $ | 17.94 |
| Class M : | | | | |
Net Asset Value and redemption price per share ($1,312,376 ÷ 78,029 shares)(a) | | | $ | 16.82 |
| Maximum offering price per share (100/96.50 of $16.82) | | | $ | 17.43 |
| Class C : | | | | |
Net Asset Value and offering price per share ($1,786,209 ÷ 108,135 shares)(a) | | | $ | 16.52 |
| Fidelity Women's Leadership Fund : | | | | |
Net Asset Value, offering price and redemption price per share ($111,912,320 ÷ 6,583,395 shares) | | | $ | 17.00 |
| Class I : | | | | |
Net Asset Value, offering price and redemption price per share ($14,632,324 ÷ 861,597 shares) | | | $ | 16.98 |
| Class Z : | | | | |
Net Asset Value, offering price and redemption price per share ($9,891,975 ÷ 580,015 shares) | | | $ | 17.05 |
(a)Redemption price per share is equal to net asset value less any applicable contingent deferred sales charge. |
| Statement of Operations |
Six months ended October 31, 2024 (Unaudited) |
| Investment Income | | | | |
| Dividends | | | $ | 841,950 |
| Income from Fidelity Central Funds | | | | 44,523 |
| Total income | | | | 886,473 |
| Expenses | | | | |
| Management fee | | | | |
| Basic fee | $ | 512,436 | | |
| Performance adjustment | | (70,534) | | |
| Distribution and service plan fees | | 23,281 | | |
| Custodian fees and expenses | | 2,485 | | |
| Independent trustees' fees and expenses | | 313 | | |
| Registration fees | | 27,329 | | |
| Audit fees | | 28,327 | | |
| Legal | | 736 | | |
| Miscellaneous | | 6,474 | | |
| Total expenses | | | | 530,847 |
| Net Investment income (loss) | | | | 355,626 |
| Realized and Unrealized Gain (Loss) | | | | |
| Net realized gain (loss) on: | | | | |
| Investment Securities: | | | | |
| Unaffiliated issuers | | 2,596,439 | | |
| Fidelity Central Funds | | 1 | | |
| Foreign currency transactions | | 526 | | |
| Total net realized gain (loss) | | | | 2,596,966 |
| Change in net unrealized appreciation (depreciation) on: | | | | |
| Investment Securities: | | | | |
| Unaffiliated issuers | | 7,807,807 | | |
| Assets and liabilities in foreign currencies | | 708 | | |
| Total change in net unrealized appreciation (depreciation) | | | | 7,808,515 |
| Net gain (loss) | | | | 10,405,481 |
| Net increase (decrease) in net assets resulting from operations | | | $ | 10,761,107 |
| Statement of Changes in Net Assets |
| |
| | Six months ended October 31, 2024 (Unaudited) | | Year ended April 30, 2024 |
| Increase (Decrease) in Net Assets | | | | |
| Operations | | | | |
| Net investment income (loss) | $ | 355,626 | $ | 929,366 |
| Net realized gain (loss) | | 2,596,966 | | 5,094,499 |
| Change in net unrealized appreciation (depreciation) | | 7,808,515 | | 19,668,828 |
| Net increase (decrease) in net assets resulting from operations | | 10,761,107 | | 25,692,693 |
| Distributions to shareholders | | (113,053) | | (910,957) |
| | | | | |
| Share transactions - net increase (decrease) | | (10,418,111) | | (24,021,691) |
| Total increase (decrease) in net assets | | 229,943 | | 760,045 |
| | | | | |
| Net Assets | | | | |
| Beginning of period | | 148,257,386 | | 147,497,341 |
| End of period | $ | 148,487,329 | $ | 148,257,386 |
| | | | | |
| | | | | |
Financial Highlights
Fidelity Advisor® Women's Leadership Fund Class A |
| |
| | Six months ended (Unaudited) October 31, 2024 | | Years ended April 30, 2024 | | 2023 | | 2022 | | 2021 | | 2020 A |
Selected Per-Share Data | | | | | | | | | | | | |
| Net asset value, beginning of period | $ | 15.81 | $ | 13.39 | $ | 13.18 | $ | 15.28 | $ | 9.80 | $ | 10.00 |
| Income from Investment Operations | | | | | | | | | | | | |
Net investment income (loss) B,C | | .02 | | .06 | | .07 | | - D | | - D | | .04 |
| Net realized and unrealized gain (loss) | | 1.08 | | 2.42 | | .20 | | (1.70) | | 5.49 | | (.22) |
| Total from investment operations | | 1.10 | | 2.48 | | .27 | | (1.70) | | 5.49 | | (.18) |
| Distributions from net investment income | | - | | (.06) | | (.06) | | - D | | (.01) | | (.02) |
| Distributions from net realized gain | | - | | - | | - | | (.40) | | - | | - |
| Total distributions | | - | | (.06) | | (.06) | | (.40) | | (.01) | | (.02) |
| Net asset value, end of period | $ | 16.91 | $ | 15.81 | $ | 13.39 | $ | 13.18 | $ | 15.28 | $ | 9.80 |
Total Return E,F,G | | | | 18.56% | | 2.10% | | (11.46)% | | 56.03% | | (1.84)% |
Ratios to Average Net Assets C,H,I | | | | | | | | | | | | |
| Expenses before reductions | | .96% J,K | | 1.03% | | 1.09% | | 1.10% | | 1.28% | | 2.50% |
| Expenses net of fee waivers, if any | | | | 1.02% | | 1.09% | | 1.10% | | 1.25% | | 1.25% |
| Expenses net of all reductions | | .96% J,K | | 1.02% | | 1.09% | | 1.10% | | 1.24% | | 1.25% |
| Net investment income (loss) | | .19% J,K | | .38% | | .57% | | (.01)% | | (.03)% | | .37% |
| Supplemental Data | | | | | | | | | | | | |
| Net assets, end of period (000 omitted) | $ | 8,952 | $ | 7,926 | $ | 6,104 | $ | 5,171 | $ | 2,865 | $ | 769 |
Portfolio turnover rate L | | | | 33% | | 22% | | 48% | | 35% | | 52% |
AFor the period May 1, 2019 (commencement of operations) through April 30, 2020.
BCalculated based on average shares outstanding during the period.
CNet investment income (loss) is affected by the timing of the declaration of dividends by any underlying mutual funds or exchange-traded funds (ETFs). Net investment income (loss) of any mutual funds or ETFs is not included in the Fund's net investment income (loss) ratio.
DAmount represents less than $.005 per share.
ETotal returns for periods of less than one year are not annualized.
FTotal returns would have been lower if certain expenses had not been reduced during the applicable periods shown.
GTotal returns do not include the effect of the sales charges.
HFees and expenses of any underlying mutual funds or exchange-traded funds (ETFs) are not included in the Fund's expense ratio. The Fund indirectly bears its proportionate share of these expenses. For additional expense information related to investments in Fidelity Central Funds, please refer to the "Investments in Fidelity Central Funds" note found in the Notes to Financial Statements section of the most recent Annual or Semi-Annual report.
IExpense ratios reflect operating expenses of the class. Expenses before reductions do not reflect amounts reimbursed, waived, or reduced through arrangements with the investment adviser, brokerage services, or other offset arrangements, if applicable, and do not represent the amount paid by the class during periods when reimbursements, waivers or reductions occur.
JProxy expenses are not annualized.
KAnnualized.
LAmount does not include the portfolio activity of any underlying mutual funds or exchange-traded funds (ETFs).
Fidelity Advisor® Women's Leadership Fund Class M |
| |
| | Six months ended (Unaudited) October 31, 2024 | | Years ended April 30, 2024 | | 2023 | | 2022 | | 2021 | | 2020 A |
Selected Per-Share Data | | | | | | | | | | | | |
| Net asset value, beginning of period | $ | 15.74 | $ | 13.34 | $ | 13.14 | $ | 15.22 | $ | 9.78 | $ | 10.00 |
| Income from Investment Operations | | | | | | | | | | | | |
Net investment income (loss) B,C | | (.01) | | .02 | | .04 | | (.04) | | (.04) | | .01 |
| Net realized and unrealized gain (loss) | | 1.09 | | 2.41 | | .20 | | (1.69) | | 5.48 | | (.22) |
| Total from investment operations | | 1.08 | | 2.43 | | .24 | | (1.73) | | 5.44 | | (.21) |
| Distributions from net investment income | | - | | (.03) | | (.04) | | - | | - D | | (.01) |
| Distributions from net realized gain | | - | | - | | - | | (.35) | | - | | - |
| Total distributions | | - | | (.03) | | (.04) | | (.35) | | - D | | (.01) |
| Net asset value, end of period | $ | 16.82 | $ | 15.74 | $ | 13.34 | $ | 13.14 | $ | 15.22 | $ | 9.78 |
Total Return E,F,G | | | | 18.22% | | 1.83% | | (11.66)% | | 55.65% | | (2.12)% |
Ratios to Average Net Assets C,H,I | | | | | | | | | | | | |
| Expenses before reductions | | 1.21% J,K | | 1.29% | | 1.37% | | 1.35% | | 1.52% | | 2.86% |
| Expenses net of fee waivers, if any | | | | 1.29% | | 1.37% | | 1.35% | | 1.50% | | 1.50% |
| Expenses net of all reductions | | 1.21% J,K | | 1.29% | | 1.37% | | 1.35% | | 1.49% | | 1.50% |
| Net investment income (loss) | | (.06)% J,K | | .12% | | .28% | | (.27)% | | (.28)% | | .12% |
| Supplemental Data | | | | | | | | | | | | |
| Net assets, end of period (000 omitted) | $ | 1,312 | $ | 1,333 | $ | 1,122 | $ | 1,054 | $ | 974 | $ | 443 |
Portfolio turnover rate L | | | | 33% | | 22% | | 48% | | 35% | | 52% |
AFor the period May 1, 2019 (commencement of operations) through April 30, 2020.
BCalculated based on average shares outstanding during the period.
CNet investment income (loss) is affected by the timing of the declaration of dividends by any underlying mutual funds or exchange-traded funds (ETFs). Net investment income (loss) of any mutual funds or ETFs is not included in the Fund's net investment income (loss) ratio.
DAmount represents less than $.005 per share.
ETotal returns for periods of less than one year are not annualized.
FTotal returns would have been lower if certain expenses had not been reduced during the applicable periods shown.
GTotal returns do not include the effect of the sales charges.
HFees and expenses of any underlying mutual funds or exchange-traded funds (ETFs) are not included in the Fund's expense ratio. The Fund indirectly bears its proportionate share of these expenses. For additional expense information related to investments in Fidelity Central Funds, please refer to the "Investments in Fidelity Central Funds" note found in the Notes to Financial Statements section of the most recent Annual or Semi-Annual report.
IExpense ratios reflect operating expenses of the class. Expenses before reductions do not reflect amounts reimbursed, waived, or reduced through arrangements with the investment adviser, brokerage services, or other offset arrangements, if applicable, and do not represent the amount paid by the class during periods when reimbursements, waivers or reductions occur.
JAnnualized.
KProxy expenses are not annualized.
LAmount does not include the portfolio activity of any underlying mutual funds or exchange-traded funds (ETFs).
Fidelity Advisor® Women's Leadership Fund Class C |
| |
| | Six months ended (Unaudited) October 31, 2024 | | Years ended April 30, 2024 | | 2023 | | 2022 | | 2021 | | 2020 A |
Selected Per-Share Data | | | | | | | | | | | | |
| Net asset value, beginning of period | $ | 15.50 | $ | 13.18 | $ | 13.00 | $ | 15.09 | $ | 9.74 | $ | 10.00 |
| Income from Investment Operations | | | | | | | | | | | | |
Net investment income (loss) B,C | | (.05) | | (.05) | | (.03) | | (.11) | | (.10) | | (.04) |
| Net realized and unrealized gain (loss) | | 1.07 | | 2.37 | | .21 | | (1.68) | | 5.45 | | (.22) |
| Total from investment operations | | 1.02 | | 2.32 | | .18 | | (1.79) | | 5.35 | | (.26) |
| Distributions from net realized gain | | - | | - | | - | | (.30) | | - | | - |
| Total distributions | | - | | - | | - | | (.30) | | - | | - |
| Net asset value, end of period | $ | 16.52 | $ | 15.50 | $ | 13.18 | $ | 13.00 | $ | 15.09 | $ | 9.74 |
Total Return D,E,F | | | | 17.60% | | 1.38% | | (12.12)% | | 54.93% | | (2.60)% |
Ratios to Average Net Assets C,G,H | | | | | | | | | | | | |
| Expenses before reductions | | 1.71% I,J | | 1.79% | | 1.86% | | 1.84% | | 1.99% | | 3.36% |
| Expenses net of fee waivers, if any | | | | 1.78% | | 1.86% | | 1.84% | | 1.99% | | 2.00% |
| Expenses net of all reductions | | 1.71% I,J | | 1.78% | | 1.86% | | 1.84% | | 1.98% | | 2.00% |
| Net investment income (loss) | | (.56)% I,J | | (.37)% | | (.20)% | | (.75)% | | (.77)% | | (.38)% |
| Supplemental Data | | | | | | | | | | | | |
| Net assets, end of period (000 omitted) | $ | 1,786 | $ | 1,745 | $ | 1,603 | $ | 1,540 | $ | 937 | $ | 468 |
Portfolio turnover rate K | | | | 33% | | 22% | | 48% | | 35% | | 52% |
AFor the period May 1, 2019 (commencement of operations) through April 30, 2020.
BCalculated based on average shares outstanding during the period.
CNet investment income (loss) is affected by the timing of the declaration of dividends by any underlying mutual funds or exchange-traded funds (ETFs). Net investment income (loss) of any mutual funds or ETFs is not included in the Fund's net investment income (loss) ratio.
DTotal returns for periods of less than one year are not annualized.
ETotal returns would have been lower if certain expenses had not been reduced during the applicable periods shown.
FTotal returns do not include the effect of the contingent deferred sales charge.
GFees and expenses of any underlying mutual funds or exchange-traded funds (ETFs) are not included in the Fund's expense ratio. The Fund indirectly bears its proportionate share of these expenses. For additional expense information related to investments in Fidelity Central Funds, please refer to the "Investments in Fidelity Central Funds" note found in the Notes to Financial Statements section of the most recent Annual or Semi-Annual report.
HExpense ratios reflect operating expenses of the class. Expenses before reductions do not reflect amounts reimbursed, waived, or reduced through arrangements with the investment adviser, brokerage services, or other offset arrangements, if applicable, and do not represent the amount paid by the class during periods when reimbursements, waivers or reductions occur.
IAnnualized.
JProxy expenses are not annualized.
KAmount does not include the portfolio activity of any underlying mutual funds or exchange-traded funds (ETFs).
Fidelity® Women's Leadership Fund |
| |
| | Six months ended (Unaudited) October 31, 2024 | | Years ended April 30, 2024 | | 2023 | | 2022 | | 2021 | | 2020 A |
Selected Per-Share Data | | | | | | | | | | | | |
| Net asset value, beginning of period | $ | 15.88 | $ | 13.45 | $ | 13.22 | $ | 15.31 | $ | 9.81 | $ | 10.00 |
| Income from Investment Operations | | | | | | | | | | | | |
Net investment income (loss) B,C | | .04 | | .09 | | .10 | | .03 | | .03 | | .06 |
| Net realized and unrealized gain (loss) | | 1.09 | | 2.43 | | .21 | | (1.70) | | 5.50 | | (.22) |
| Total from investment operations | | 1.13 | | 2.52 | | .31 | | (1.67) | | 5.53 | | (.16) |
| Distributions from net investment income | | (.01) | | (.09) | | (.08) | | (.02) | | (.03) | | (.03) |
| Distributions from net realized gain | | - | | - | | - | | (.40) | | - | | - |
| Total distributions | | (.01) | | (.09) | | (.08) | | (.42) | | (.03) | | (.03) |
| Net asset value, end of period | $ | 17.00 | $ | 15.88 | $ | 13.45 | $ | 13.22 | $ | 15.31 | $ | 9.81 |
Total Return D,E | | | | 18.76% | | 2.37% | | (11.25)% | | 56.44% | | (1.63)% |
Ratios to Average Net Assets C,F,G | | | | | | | | | | | | |
| Expenses before reductions | | .66% H,I | | .79% | | .89% | | .92% | | 1.10% | | 2.19% |
| Expenses net of fee waivers, if any | | | | .78% | | .89% | | .90% | | 1.00% | | 1.00% |
| Expenses net of all reductions | | .66% H,I | | .78% | | .89% | | .90% | | .99% | | 1.00% |
| Net investment income (loss) | | .49% H,I | | .63% | | .76% | | .18% | | .22% | | .62% |
| Supplemental Data | | | | | | | | | | | | |
| Net assets, end of period (000 omitted) | $ | 111,912 | $ | 105,832 | $ | 115,107 | $ | 101,533 | $ | 98,888 | $ | 22,272 |
Portfolio turnover rate J | | | | 33% | | 22% | | 48% | | 35% | | 52% |
AFor the period May 1, 2019 (commencement of operations) through April 30, 2020.
BCalculated based on average shares outstanding during the period.
CNet investment income (loss) is affected by the timing of the declaration of dividends by any underlying mutual funds or exchange-traded funds (ETFs). Net investment income (loss) of any mutual funds or ETFs is not included in the Fund's net investment income (loss) ratio.
DTotal returns for periods of less than one year are not annualized.
ETotal returns would have been lower if certain expenses had not been reduced during the applicable periods shown.
FFees and expenses of any underlying mutual funds or exchange-traded funds (ETFs) are not included in the Fund's expense ratio. The Fund indirectly bears its proportionate share of these expenses. For additional expense information related to investments in Fidelity Central Funds, please refer to the "Investments in Fidelity Central Funds" note found in the Notes to Financial Statements section of the most recent Annual or Semi-Annual report.
GExpense ratios reflect operating expenses of the class. Expenses before reductions do not reflect amounts reimbursed, waived, or reduced through arrangements with the investment adviser, brokerage services, or other offset arrangements, if applicable, and do not represent the amount paid by the class during periods when reimbursements, waivers or reductions occur.
HAnnualized.
IProxy expenses are not annualized.
JAmount does not include the portfolio activity of any underlying mutual funds or exchange-traded funds (ETFs).
Fidelity Advisor® Women's Leadership Fund Class I |
| |
| | Six months ended (Unaudited) October 31, 2024 | | Years ended April 30, 2024 | | 2023 | | 2022 | | 2021 | | 2020 A |
Selected Per-Share Data | | | | | | | | | | | | |
| Net asset value, beginning of period | $ | 15.87 | $ | 13.44 | $ | 13.21 | $ | 15.31 | $ | 9.81 | $ | 10.00 |
| Income from Investment Operations | | | | | | | | | | | | |
Net investment income (loss) B,C | | .04 | | .10 | | .11 | | .04 | | .03 | | .06 |
| Net realized and unrealized gain (loss) | | 1.08 | | 2.43 | | .21 | | (1.70) | | 5.51 | | (.22) |
| Total from investment operations | | 1.12 | | 2.53 | | .32 | | (1.66) | | 5.54 | | (.16) |
| Distributions from net investment income | | (.01) | | (.10) | | (.09) | | (.04) | | (.04) | | (.03) |
| Distributions from net realized gain | | - | | - | | - | | (.40) | | - | | - |
| Total distributions | | (.01) | | (.10) | | (.09) | | (.44) | | (.04) | | (.03) |
| Net asset value, end of period | $ | 16.98 | $ | 15.87 | $ | 13.44 | $ | 13.21 | $ | 15.31 | $ | 9.81 |
Total Return D,E | | | | 18.88% | | 2.46% | | (11.20)% | | 56.52% | | (1.63)% |
Ratios to Average Net Assets C,F,G | | | | | | | | | | | | |
| Expenses before reductions | | .67% H,I | | .74% | | .80% | | .81% | | .98% | | 2.22% |
| Expenses net of fee waivers, if any | | | | .73% | | .79% | | .81% | | .98% | | 1.00% |
| Expenses net of all reductions | | .67% H,I | | .73% | | .79% | | .81% | | .97% | | 1.00% |
| Net investment income (loss) | | .48% H,I | | .68% | | .86% | | .28% | | .24% | | .62% |
| Supplemental Data | | | | | | | | | | | | |
| Net assets, end of period (000 omitted) | $ | 14,632 | $ | 16,279 | $ | 13,381 | $ | 11,273 | $ | 3,874 | $ | 702 |
Portfolio turnover rate J | | | | 33% | | 22% | | 48% | | 35% | | 52% |
AFor the period May 1, 2019 (commencement of operations) through April 30, 2020.
BCalculated based on average shares outstanding during the period.
CNet investment income (loss) is affected by the timing of the declaration of dividends by any underlying mutual funds or exchange-traded funds (ETFs). Net investment income (loss) of any mutual funds or ETFs is not included in the Fund's net investment income (loss) ratio.
DTotal returns for periods of less than one year are not annualized.
ETotal returns would have been lower if certain expenses had not been reduced during the applicable periods shown.
FFees and expenses of any underlying mutual funds or exchange-traded funds (ETFs) are not included in the Fund's expense ratio. The Fund indirectly bears its proportionate share of these expenses. For additional expense information related to investments in Fidelity Central Funds, please refer to the "Investments in Fidelity Central Funds" note found in the Notes to Financial Statements section of the most recent Annual or Semi-Annual report.
GExpense ratios reflect operating expenses of the class. Expenses before reductions do not reflect amounts reimbursed, waived, or reduced through arrangements with the investment adviser, brokerage services, or other offset arrangements, if applicable, and do not represent the amount paid by the class during periods when reimbursements, waivers or reductions occur.
HProxy expenses are not annualized.
IAnnualized.
JAmount does not include the portfolio activity of any underlying mutual funds or exchange-traded funds (ETFs).
Fidelity Advisor® Women's Leadership Fund Class Z |
| |
| | Six months ended (Unaudited) October 31, 2024 | | Years ended April 30, 2024 | | 2023 | | 2022 | | 2021 | | 2020 A |
Selected Per-Share Data | | | | | | | | | | | | |
| Net asset value, beginning of period | $ | 15.93 | $ | 13.49 | $ | 13.25 | $ | 15.35 | $ | 9.83 | $ | 10.00 |
| Income from Investment Operations | | | | | | | | | | | | |
Net investment income (loss) B,C | | .05 | | .12 | | .13 | | .06 | | .05 | | .08 |
| Net realized and unrealized gain (loss) | | 1.09 | | 2.44 | | .21 | | (1.71) | | 5.51 | | (.22) |
| Total from investment operations | | 1.14 | | 2.56 | | .34 | | (1.65) | | 5.56 | | (.14) |
| Distributions from net investment income | | (.02) | | (.12) | | (.10) | | (.05) | | (.04) | | (.03) |
| Distributions from net realized gain | | - | | - | | - | | (.40) | | - | | - |
| Total distributions | | (.02) | | (.12) | | (.10) | | (.45) | | (.04) | | (.03) |
| Net asset value, end of period | $ | 17.05 | $ | 15.93 | $ | 13.49 | $ | 13.25 | $ | 15.35 | $ | 9.83 |
Total Return D,E | | | | 19.02% | | 2.59% | | (11.13)% | | 56.63% | | (1.43)% |
Ratios to Average Net Assets C,F,G | | | | | | | | | | | | |
| Expenses before reductions | | .55% H,I | | .62% | | .68% | | .69% | | .87% | | 1.88% |
| Expenses net of fee waivers, if any | | | | .61% | | .67% | | .69% | | .85% | | .85% |
| Expenses net of all reductions | | .55% H,I | | .61% | | .67% | | .69% | | .84% | | .85% |
| Net investment income (loss) | | .60% H,I | | .80% | | .98% | | .40% | | .37% | | .76% |
| Supplemental Data | | | | | | | | | | | | |
| Net assets, end of period (000 omitted) | $ | 9,892 | $ | 15,144 | $ | 10,181 | $ | 8,216 | $ | 9,043 | $ | 2,376 |
Portfolio turnover rate J | | | | 33% | | 22% | | 48% | | 35% | | 52% |
AFor the period May 1, 2019 (commencement of operations) through April 30, 2020.
BCalculated based on average shares outstanding during the period.
CNet investment income (loss) is affected by the timing of the declaration of dividends by any underlying mutual funds or exchange-traded funds (ETFs). Net investment income (loss) of any mutual funds or ETFs is not included in the Fund's net investment income (loss) ratio.
DTotal returns for periods of less than one year are not annualized.
ETotal returns would have been lower if certain expenses had not been reduced during the applicable periods shown.
FFees and expenses of any underlying mutual funds or exchange-traded funds (ETFs) are not included in the Fund's expense ratio. The Fund indirectly bears its proportionate share of these expenses. For additional expense information related to investments in Fidelity Central Funds, please refer to the "Investments in Fidelity Central Funds" note found in the Notes to Financial Statements section of the most recent Annual or Semi-Annual report.
GExpense ratios reflect operating expenses of the class. Expenses before reductions do not reflect amounts reimbursed, waived, or reduced through arrangements with the investment adviser, brokerage services, or other offset arrangements, if applicable, and do not represent the amount paid by the class during periods when reimbursements, waivers or reductions occur.
HProxy expenses are not annualized.
IAnnualized.
JAmount does not include the portfolio activity of any underlying mutual funds or exchange-traded funds (ETFs).
Notes to Financial Statements
(Unaudited)For the period ended October 31, 2024
1. Organization.
Fidelity Women's Leadership Fund (the Fund) is a fund of Fidelity Summer Street Trust (the Trust) and is authorized to issue an unlimited number of shares. The Trust is registered under the Investment Company Act of 1940, as amended (the 1940 Act), as an open-end management investment company organized as a Massachusetts business trust. The Fund offers Class A, Class M, Class C, Fidelity Women's Leadership Fund, Class I and Class Z shares, each of which has equal rights as to assets and voting privileges. Class A, Class M, Class C, Class I and Class Z are Fidelity Advisor classes. Each class has exclusive voting rights with respect to matters that affect that class. Class C shares will automatically convert to Class A shares after a holding period of eight years from the initial date of purchase, with certain exceptions.
2. Investments in Fidelity Central Funds.
Funds may invest in Fidelity Central Funds, which are open-end investment companies generally available only to other investment companies and accounts managed by the investment adviser and its affiliates. The Schedule of Investments lists any Fidelity Central Funds held as an investment as of period end, but does not include the underlying holdings of each Fidelity Central Fund. An investing fund indirectly bears its proportionate share of the expenses of the underlying Fidelity Central Funds.
Based on its investment objective, each Fidelity Central Fund may invest or participate in various investment vehicles or strategies that are similar to those of the investing fund. These strategies are consistent with the investment objectives of the investing fund and may involve certain economic risks which may cause a decline in value of each of the Fidelity Central Funds and thus a decline in the value of the investing fund.
| Fidelity Central Fund | Investment Manager | Investment Objective | Investment Practices | Expense RatioA |
| Fidelity Money Market Central Funds | Fidelity Management & Research Company LLC (FMR) | Each fund seeks to obtain a high level of current income consistent with the preservation of capital and liquidity. | Short-term Investments | Less than .005% |
A Expenses expressed as a percentage of average net assets and are as of each underlying Central Fund's most recent annual or semi-annual shareholder report.
A complete unaudited list of holdings for each Fidelity Central Fund is available upon request or at the Securities and Exchange Commission website at www.sec.gov. In addition, the financial statements of the Fidelity Central Funds which contain the significant accounting policies (including investment valuation policies) of those funds, and are not covered by the Report of Independent Registered Public Accounting Firm, are available on the Securities and Exchange Commission website or upon request.
3. Significant Accounting Policies.
The Fund is an investment company and applies the accounting and reporting guidance of the Financial Accounting Standards Board (FASB) Accounting Standards Codification Topic 946 Financial Services - Investment Companies. The financial statements have been prepared in conformity with accounting principles generally accepted in the United States of America (GAAP), which require management to make certain estimates and assumptions at the date of the financial statements. Actual results could differ from those estimates. Subsequent events, if any, through the date that the financial statements were issued have been evaluated in the preparation of the financial statements. The Fund's Schedule of Investments lists any underlying mutual funds or exchange-traded funds (ETFs) but does not include the underlying holdings of these funds. The following summarizes the significant accounting policies of the Fund:
Investment Valuation. Investments are valued as of 4:00 p.m. Eastern time on the last calendar day of the period. The Board of Trustees (the Board) has designated the Fund's investment adviser as the valuation designee responsible for the fair valuation function and performing fair value determinations as needed. The investment adviser has established a Fair Value Committee (the Committee) to carry out the day-to-day fair valuation responsibilities and has adopted policies and procedures to govern the fair valuation process and the activities of the Committee. In accordance with these fair valuation policies and procedures, which have been approved by the Board, the Fund attempts to obtain prices from one or more third party pricing services or brokers to value its investments. When current market prices, quotations or currency exchange rates are not readily available or reliable, investments will be fair valued in good faith by the Committee, in accordance with the policies and procedures. Factors used in determining fair value vary by investment type and may include market or investment specific events, transaction data, estimated cash flows, and market observations of comparable investments. The frequency that the fair valuation procedures are used cannot be predicted and they may be utilized to a significant extent. The Committee manages the Fund's fair valuation practices and maintains the fair valuation policies and procedures. The Fund's investment adviser reports to the Board information regarding the fair valuation process and related material matters.
The Fund categorizes the inputs to valuation techniques used to value its investments into a disclosure hierarchy consisting of three levels as shown below:
Level 1 - unadjusted quoted prices in active markets for identical investments
Level 2 - other significant observable inputs (including quoted prices for similar investments, interest rates, prepayment speeds, etc.)
Level 3 - unobservable inputs (including the Fund's own assumptions based on the best information available)
Valuation techniques used to value the Fund's investments by major category are as follows:
Equity securities, including restricted securities, for which market quotations are readily available, are valued at the last reported sale price or official closing price as reported by a third party pricing service on the primary market or exchange on which they are traded and are categorized as Level 1 in the hierarchy. In the event there were no sales during the day or closing prices are not available, securities are valued at the last quoted bid price or may be valued using the last available price and are generally categorized as Level 2 in the hierarchy. For foreign equity securities, when market or security specific events arise, comparisons to the valuation of American Depositary Receipts (ADRs), futures contracts, Exchange-Traded Funds (ETFs) and certain indexes as well as quoted prices for similar securities may be used and would be categorized as Level 2 in the hierarchy. For equity securities, including restricted securities, where observable inputs are limited, assumptions about market activity and risk are used and these securities may be categorized as Level 3 in the hierarchy.
Investments in open-end mutual funds, including the Fidelity Central Funds, are valued at their closing net asset value (NAV) each business day and are categorized as Level 1 in the hierarchy.
Changes in valuation techniques may result in transfers in or out of an assigned level within the disclosure hierarchy. The aggregate value of investments by input level as of October 31, 2024 is included at the end of the Fund's Schedule of Investments.
Foreign Currency. Certain Funds may use foreign currency contracts to facilitate transactions in foreign-denominated securities. Gains and losses from these transactions may arise from changes in the value of the foreign currency or if the counterparties do not perform under the contracts' terms.
Foreign-denominated assets, including investment securities, and liabilities are translated into U.S. dollars at the exchange rates at period end. Purchases and sales of investment securities, income and dividends received, and expenses denominated in foreign currencies are translated into U.S. dollars at the exchange rate in effect on the transaction date.
The effects of exchange rate fluctuations on investments are included with the net realized and unrealized gain (loss) on investment securities. Other foreign currency transactions resulting in realized and unrealized gain (loss) are disclosed separately.
Investment Transactions and Income. For financial reporting purposes, the Fund's investment holdings and NAV include trades executed through the end of the last business day of the period. The NAV per share for processing shareholder transactions is calculated as of the close of business of the New York Stock Exchange (NYSE), normally 4:00 p.m. Eastern time and includes trades executed through the end of the prior business day. Gains and losses on securities sold are determined on the basis of identified cost. Commissions paid to certain brokers with whom the investment adviser, or its affiliates, places trades on behalf of a fund include an amount in addition to trade execution, which may be rebated back to a fund. Any such rebates are included in net realized gain (loss) on investments in the Statement of Operations. Dividend income is recorded on the ex-dividend date, except for certain dividends from foreign securities where the ex-dividend date may have passed, which are recorded as soon as the Fund is informed of the ex-dividend date. Non-cash dividends included in dividend income, if any, are recorded at the fair market value of the securities received. Income and capital gain distributions from Fidelity Central Funds, if any, are recorded on the ex-dividend date. Certain distributions received by the Fund represent a return of capital or capital gain. The Fund determines the components of these distributions subsequent to the ex-dividend date, based upon receipt of tax filings or other correspondence relating to the underlying investment. These distributions are recorded as a reduction of cost of investments and/or as a realized gain. Investment income is recorded net of foreign taxes withheld where recovery of such taxes is uncertain. Funds may file withholding tax reclaims in certain jurisdictions to recover a portion of amounts previously withheld. Any withholding tax reclaims income is included in the Statement of Operations in dividends. Any receivables for withholding tax reclaims are included in the Statement of Assets and Liabilities in dividends receivable.
Class Allocations and Expenses. Investment income, realized and unrealized capital gains and losses, common expenses of a fund, and certain fund-level expense reductions, if any, are allocated daily on a pro-rata basis to each class based on the relative net assets of each class to the total net assets of a fund. Each class differs with respect to transfer agent and distribution and service plan fees incurred, as applicable. Certain expense reductions may also differ by class, if applicable. For the reporting period, the allocated portion of income and expenses to each class as a percent of its average net assets may vary due to the timing of recording these transactions in relation to fluctuating net assets of the classes. Expenses directly attributable to a fund are charged to that fund. Expenses attributable to more than one fund are allocated among the respective funds on the basis of relative net assets or other appropriate methods. Expenses included in the accompanying financial statements reflect the expenses of that fund and do not include any expenses associated with any underlying mutual funds or exchange-traded funds (ETFs). Although not included in a fund's expenses, a fund indirectly bears its proportionate share of these expenses through the net asset value of each underlying mutual fund or exchange-traded fund (ETF). Expense estimates are accrued in the period to which they relate and adjustments are made when actual amounts are known.
Income Tax Information and Distributions to Shareholders. Each year, the Fund intends to qualify as a regulated investment company under Subchapter M of the Internal Revenue Code, including distributing substantially all of its taxable income and realized gains. As a result, no provision for U.S. Federal income taxes is required. The Fund files a U.S. federal tax return, in addition to state and local tax returns as required. The Fund's federal income tax returns are subject to examination by the Internal Revenue Service (IRS) for a period of three fiscal years after they are filed. State and local tax returns may be subject to examination for an additional fiscal year depending on the jurisdiction. Foreign taxes are provided for based on the Fund's understanding of the tax rules and rates that exist in the foreign markets in which it invests.
Distributions are declared and recorded on the ex-dividend date. Income and capital gain distributions are declared separately for each class. Income and capital gain distributions are determined in accordance with income tax regulations, which may differ from GAAP.
Capital accounts within the financial statements are adjusted for permanent book-tax differences. These adjustments have no impact on net assets or the results of operations. Capital accounts are not adjusted for temporary book-tax differences which will reverse in a subsequent period.
Book-tax differences are primarily due to foreign currency transactions, certain foreign taxes, capital loss carryforwards and losses deferred due to wash sales.
As of period end, the cost and unrealized appreciation (depreciation) in securities, and derivatives if applicable, for federal income tax purposes were as follows:
| Gross unrealized appreciation | $44,548,580 |
| Gross unrealized depreciation | (7,331,509) |
| Net unrealized appreciation (depreciation) | $37,217,071 |
| Tax cost | $111,327,192 |
Capital loss carryforwards are only available to offset future capital gains of the Fund to the extent provided by regulations and may be limited. The capital loss carryforward information presented below, including any applicable limitation, is estimated as of prior fiscal period end and is subject to adjustment.
Short-term | $(335,872) |
Long-term | - |
| Total capital loss carryforward | $(335,872) |
Restricted Securities (including Private Placements). Funds may invest in securities that are subject to legal or contractual restrictions on resale. These securities generally may be resold in transactions exempt from registration or to the public if the securities are registered. Disposal of these securities may involve time-consuming negotiations and expense, and prompt sale at an acceptable price may be difficult. Information regarding restricted securities held at period end is included at the end of the Schedule of Investments, if applicable.
New Accounting Pronouncement. In November 2023, the FASB issued Accounting Standards Update (ASU) 2023-07 Segment Reporting (Topic 280): Improvements to Reportable Segment Disclosures. Effective for fiscal years beginning after December 15, 2023 and interim periods within fiscal years beginning after December 15, 2024, the amendments enhance required disclosures of segment information for public entities on an annual and interim basis. The ASU allows for early adoption with updates applied retrospectively. Management is currently evaluating the impact of the ASU but does not expect this guidance to materially impact the financial statements.
4. Purchases and Sales of Investments.
Purchases and sales of securities, other than short-term securities and in-kind transactions, as applicable, are noted in the table below.
| | Purchases ($) | Sales ($) |
| Fidelity Women's Leadership Fund | 19,995,904 | 31,637,169 |
5. Fees and Other Transactions with Affiliates.
Management Fee. Fidelity Management & Research Company LLC (the investment adviser) and its affiliates provide the Fund with investment management related services for which the Fund pays a monthly management fee.
The Fund's management contract incorporates a basic fee rate that may vary by class (subject to a performance adjustment). The investment adviser or an affiliate pays certain expenses of managing and operating the Fund out of each class's management fee. Each class of the Fund pays a management fee to the investment adviser. The management fee is calculated and paid to the investment adviser every month. The management fee is determined by calculating a basic fee and then applying a performance adjustment. When determining a class's basic fee, a mandate rate is calculated based on the monthly average net assets of a group of funds advised by FMR within a designated asset class. A discount rate is subtracted from the mandate rate once the Fund's monthly average net assets reach a certain level. The mandate rate and discount rate may vary by class. The annual basic fee rate for a class of shares of the Fund is the lesser of (1) the class's mandate rate reduced by the class's discount rate (if applicable) or (2) the amount set forth in the following table.
| | Maximum Management Fee Rate % |
| Class A | .72 |
| Class M | .72 |
| Class C | .72 |
| Fidelity Women's Leadership Fund | .72 |
| Class I | .68 |
| Class Z | .56 |
One-twelfth of the basic fee rate for a class is applied to the average net assets of the class for the month, giving a dollar amount which is the basic fee for the class for that month. A different management fee rate may be applicable to each class of the Fund. The difference between classes is the result of separate arrangements for class-level services and/or waivers of certain expenses. It is not the result of any difference in advisory or custodial fees or other expenses related to the management of the Fund's assets, which do not vary by class. For the reporting period, the total annualized management fee rates were as follows:
| | Total Management Fee Rate % |
| Class A | .72 |
| Class M | .72 |
| Class C | .72 |
| Fidelity Women's Leadership Fund | .67 |
| Class I | .68 |
| Class Z | .56 |
The performance adjustment rate is calculated monthly by comparing over the performance period the Fund's performance to that of the performance adjustment index listed below.
| | Performance Adjustment Index |
| Fidelity Women's Leadership Fund | Russell 3000 Index |
For the purposes of calculating the performance adjustment for the Fund, the Fund's investment performance is based on the performance of Fidelity Women's Leadership Fund. To the extent that other classes of the Fund have higher expenses, this could result in those classes bearing a larger positive performance adjustment and smaller negative performance adjustment than would be the case if each class's own performance were considered. The performance period is the most recent 36 month period. The maximum annualized performance adjustment rate is ±.10% of the Fund's average net assets over the performance period. The performance adjustment rate is divided by twelve and multiplied by the Fund's average net assets over the performance period, and the resulting dollar amount is proportionately added to or subtracted from a class's basic fee. For the reporting period, the total annualized performance adjustment was (.09) %.
Distribution and Service Plan Fees. In accordance with Rule 12b-1 of the 1940 Act, the Fund has adopted separate Distribution and Service Plans for each class of shares. Certain classes pay Fidelity Distributors Company LLC (FDC), an affiliate of the investment adviser, separate Distribution and Service Fees, each of which is based on an annual percentage of each class' average net assets. In addition, FDC may pay financial intermediaries for selling shares of the Fund and providing shareholder support services. For the period, the Distribution and Service Fee rates, total fees and amounts retained by FDC were as follows:
| | Distribution Fee | Service Fee | Total Fees ($) | Retained by FDC ($) |
| Class A | - % | .25% | 10,851 | 97 |
| Class M | .25% | .25% | 3,438 | - |
| Class C | .75% | .25% | 8,992 | 799 |
| | | | 23,281 | 896 |
Sales Load. FDC may receive a front-end sales charge of up to 5.75% for selling Class A shares and 3.50% for selling Class M shares, some of which is paid to financial intermediaries for selling shares of the Fund. Depending on the holding period, FDC may receive contingent deferred sales charges levied on Class A, Class M and Class C redemptions. The deferred sales charges are 1.00% for Class C shares, 1.00% for certain purchases of Class A shares and .25% for certain purchases of Class M shares.
For the period, sales charge amounts retained by FDC were as follows:
| | Retained by FDC ($) |
| Class A | 4,853 |
| Class M | 116 |
Class CA | 11 |
| | 4,980 |
A When Class C shares are initially sold, FDC pays commissions from its own resources to financial intermediaries through which the sales are made.
Brokerage Commissions. A portion of portfolio transactions were placed with brokerage firms which are affiliates of the investment adviser. Brokerage commissions are included in net realized gain (loss) and change in net unrealized appreciation (depreciation) in the Statement of Operations. The commissions paid to these affiliated firms were as follows:
| | Amount ($) |
| Fidelity Women's Leadership Fund | 329 |
Interfund Trades. Funds may purchase from or sell securities to other Fidelity Funds under procedures adopted by the Board. The procedures have been designed to ensure these interfund trades are executed in accordance with Rule 17a-7 of the 1940 Act. Any interfund trades are included within the respective purchases and sales amounts shown in the Purchases and Sales of Investments note. Interfund trades during the period are noted in the table below.
| | Purchases ($) | Sales ($) | Realized Gain (Loss)($) |
| Fidelity Women's Leadership Fund | 1,392,253 | 1,386,475 | (173,390) |
6. Committed Line of Credit.
Certain Funds participate with other funds managed by the investment adviser or an affiliate in a $4.25 billion credit facility (the "line of credit") to be utilized for temporary or emergency purposes to fund shareholder redemptions or for other short-term liquidity purposes. The participating funds have agreed to pay commitment fees on their pro-rata portion of the line of credit, which are reflected in Miscellaneous expenses on the Statement of Operations, and are listed below. During the period, there were no borrowings on this line of credit.
| | Amount ($) |
| Fidelity Women's Leadership Fund | 106 |
7. Distributions to Shareholders.
Distributions to shareholders of each class were as follows:
| | Six months ended October 31, 2024 | Year ended April 30, 2024 |
| Fidelity Women's Leadership Fund | | |
| Distributions to shareholders | | |
| Class A | $ - | $29,747 |
| Class M | - | 2,422 |
| Fidelity Women's Leadership Fund | 79,296 | 668,906 |
| Class I | 14,490 | 102,091 |
| Class Z | 19,267 | 107,791 |
Total | $113,053 | $910,957 |
8. Share Transactions.
Share transactions for each class were as follows and may contain in-kind transactions, automatic conversions between classes or exchanges between affiliated funds:
| | Shares | Shares | Dollars | Dollars |
| | Six months ended October 31, 2024 | Year ended April 30, 2024 | Six months ended October 31, 2024 | Year ended April 30, 2024 |
| Fidelity Women's Leadership Fund | | | | |
| Class A | | | | |
| Shares sold | 62,364 | 89,980 | $1,041,586 | $1,319,806 |
| Reinvestment of distributions | - | 1,938 | - | 28,972 |
| Shares redeemed | (34,365) | (46,268) | (576,007) | (685,142) |
| Net increase (decrease) | 27,999 | 45,650 | $465,579 | $663,636 |
| Class M | | | | |
| Shares sold | 2,024 | 3,512 | $33,587 | $51,358 |
| Reinvestment of distributions | - | 161 | - | 2,422 |
| Shares redeemed | (8,652) | (3,117) | (145,823) | (44,710) |
| Net increase (decrease) | (6,628) | 556 | $(112,236) | $9,070 |
| Class C | | | | |
| Shares sold | 3,850 | 14,405 | $63,462 | $207,118 |
| Shares redeemed | (8,316) | (23,441) | (133,036) | (334,953) |
| Net increase (decrease) | (4,466) | (9,036) | $(69,574) | $(127,835) |
| Fidelity Women's Leadership Fund | | | | |
| Shares sold | 370,553 | 963,535 | $6,216,277 | $14,042,715 |
| Reinvestment of distributions | 4,417 | 41,573 | 72,832 | 618,490 |
| Shares redeemed | (456,797) | (2,901,042) | (7,656,315) | (42,354,418) |
| Net increase (decrease) | (81,827) | (1,895,934) | $(1,367,206) | $(27,693,213) |
| Class I | | | | |
| Shares sold | 87,031 | 365,609 | $1,449,339 | $5,078,142 |
| Reinvestment of distributions | 876 | 6,769 | 14,432 | 100,595 |
| Shares redeemed | (252,323) | (342,100) | (4,248,787) | (4,790,855) |
| Net increase (decrease) | (164,416) | 30,278 | $(2,785,016) | $387,882 |
| Class Z | | | | |
| Shares sold | 94,791 | 425,187 | $1,591,243 | $6,183,243 |
| Reinvestment of distributions | 872 | 5,982 | 14,419 | 89,229 |
| Shares redeemed | (466,322) | (235,141) | (8,155,320) | (3,533,703) |
| Net increase (decrease) | (370,659) | 196,028 | $(6,549,658) | $2,738,769 |
9. Other.
A fund's organizational documents provide former and current trustees and officers with a limited indemnification against liabilities arising in connection with the performance of their duties to the fund. In the normal course of business, a fund may also enter into contracts that provide general indemnifications. A fund's maximum exposure under these arrangements is unknown as this would be dependent on future claims that may be made against a fund. The risk of material loss from such claims is considered remote.
10. Risk and Uncertainties.
Many factors affect a fund's performance. Developments that disrupt global economies and financial markets, such as pandemics, epidemics, outbreaks of infectious diseases, war, terrorism, and environmental disasters, may significantly affect a fund's investment performance. The effects of these developments to a fund will be impacted by the types of securities in which a fund invests, the financial condition, industry, economic sector, and geographic location of an issuer, and a fund's level of investment in the securities of that issuer. Significant concentrations in security types, issuers, industries, sectors, and geographic locations may magnify the factors that affect a fund's performance.
Item 8: Changes in and Disagreements with Accountants for Open-End Management Investment Companies
(Unaudited)
Note: This is not applicable for any fund included in this document.
Item 9: Proxy Disclosures for Open-End Management Investment Companies
(Unaudited)
| A special meeting of shareholders was held on July 16, 2024. The results of votes taken among shareholders on the proposal before them are reported below. Each vote reported represents one dollar of net asset value held on the record date for the meeting. |
| Proposal 1 |
| To elect a Board of Trustees. |
| | # of Votes | % of Votes |
| Bettina Doulton |
| Affirmative | 14,516,835,136.19 | 94.56 |
| Withheld | 834,887,998.33 | 5.44 |
| TOTAL | 15,351,723,134.52 | 100.00 |
| Robert A. Lawrence |
| Affirmative | 14,430,495,798.10 | 94.00 |
| Withheld | 921,227,336.42 | 6.00 |
| TOTAL | 15,351,723,134.52 | 100.00 |
| Vijay C. Advani |
| Affirmative | 14,465,231,640.25 | 94.23 |
| Withheld | 886,491,494.27 | 5.77 |
| TOTAL | 15,351,723,134.52 | 100.00 |
| Thomas P. Bostick |
| Affirmative | 14,471,831,170.84 | 94.27 |
| Withheld | 879,891,963.68 | 5.73 |
| TOTAL | 15,351,723,134.52 | 100.00 |
| Donald F. Donahue |
| Affirmative | 14,432,670,599.88 | 94.01 |
| Withheld | 919,052,534.64 | 5.99 |
| TOTAL | 15,351,723,134.52 | 100.00 |
| Vicki L. Fuller |
| Affirmative | 14,531,407,981.65 | 94.66 |
| Withheld | 820,315,152.87 | 5.34 |
| TOTAL | 15,351,723,134.52 | 100.00 |
| Patricia L. Kampling |
| Affirmative | 14,549,142,839.16 | 94.77 |
| Withheld | 802,580,295.36 | 5.23 |
| TOTAL | 15,351,723,134.52 | 100.00 |
| Thomas A. Kennedy |
| Affirmative | 14,469,818,769.40 | 94.26 |
| Withheld | 881,904,365.12 | 5.74 |
| TOTAL | 15,351,723,134.52 | 100.00 |
| Oscar Munoz |
| Affirmative | 14,434,061,467.08 | 94.02 |
| Withheld | 917,661,667.44 | 5.98 |
| TOTAL | 15,351,723,134.52 | 100.00 |
| Karen B. Peetz |
| Affirmative | 14,521,904,618.46 | 94.59 |
| Withheld | 829,818,516.06 | 5.41 |
| TOTAL | 15,351,723,134.52 | 100.00 |
| David M. Thomas |
| Affirmative | 14,417,745,861.73 | 93.92 |
| Withheld | 933,977,272.79 | 6.08 |
| TOTAL | 15,351,723,134.52 | 100.00 |
| Susan Tomasky |
| Affirmative | 14,467,973,468.18 | 94.24 |
| Withheld | 883,749,666.34 | 5.76 |
| TOTAL | 15,351,723,134.52 | 100.00 |
| Michael E. Wiley |
| Affirmative | 14,424,002,796.91 | 93.96 |
| Withheld | 927,720,337.61 | 6.04 |
| TOTAL | 15,351,723,134.52 | 100.00 |
| | | |
| Proposal 1 reflects trust-wide proposal and voting results. |
Item 10: Remuneration Paid to Directors, Officers, and others of Open-End Management Investment Companies
(Unaudited)
Note: This information is disclosed as part of the financial statements for each Fund as part of Item 7: Financial Statements and Financial Highlights for Open-End Management Investment companies.
Item 11: Statement Regarding Basis for Approval of Investment Advisory Contract
(Unaudited)
Board Approval of Investment Advisory Contracts and Management Fees
Fidelity Women's Leadership Fund
Each year, the Board of Trustees, including the Independent Trustees (together, the Board), considers the renewal of the fund's management contract with Fidelity Management & Research Company LLC (FMR) and certain affiliates and the sub-advisory agreements (together, the Advisory Contracts) for the fund. FMR and the sub-advisers are referred to herein as the Investment Advisers. The Board, assisted by the advice of fund counsel and Independent Trustees' counsel, requests and considers a broad range of information relevant to the renewal of the Advisory Contracts throughout the year.
The Board meets regularly and, at each of its meetings, covers an extensive agenda of topics and materials and considers factors that are relevant to its annual consideration of the renewal of the fund's Advisory Contracts, including the services and support provided to the fund and its shareholders. The Board, acting directly and through its Committees (each of which is composed of and chaired by Independent Trustees), requests and receives information concerning the annual consideration of the renewal of the fund's Advisory Contracts. The Board also meets as needed to review matters specifically related to the Board's annual consideration of the renewal of the Advisory Contracts. Members of the Board may also meet with trustees of other Fidelity funds through joint ad hoc committees to discuss certain matters relevant to all of the Fidelity funds.
At its May 2024 meeting, the Board unanimously determined to renew the fund's Advisory Contracts. In reaching its determination, the Board considered all factors it believed relevant, including (i) the nature, extent, and quality of the services provided to the fund and its shareholders (including the investment performance of the fund); (ii) the competitiveness relative to peer funds of the fund's management fee and the total expense ratio of a representative class (the retail class, which was selected because it was the largest class without 12b-1 fees); (iii) the total costs of the services provided by and the profits realized by FMR and its affiliates (Fidelity) from its relationships with the fund; and (iv) the extent to which, if any, economies of scale exist and are realized as the fund grows, and whether any economies of scale are appropriately shared with fund shareholders. The Board also considered the broad range of investment choices available to shareholders from FMR's competitors and that the fund's shareholders have chosen to invest in the fund, which is part of the Fidelity family of funds. The Board's decision to renew the Advisory Contracts was not based on any single factor.
The Board reached a determination, with the assistance of fund counsel and Independent Trustees' counsel and through the exercise of its business judgment, that the renewal of the Advisory Contracts was in the best interests of the fund and its shareholders and that the compensation payable under the Advisory Contracts was fair and reasonable in light of all of the surrounding circumstances.
Nature, Extent, and Quality of Services Provided. The Board considered staffing as it relates to the fund, including the backgrounds and experience of investment personnel of the Investment Advisers, and also considered the Investment Advisers' implementation of the fund's investment program. The Independent Trustees also had discussions with senior management of Fidelity's investment operations and investment groups. The Board considered the structure of the investment personnel compensation program and whether this structure provides appropriate incentives to act in the best interests of the fund. Additionally, the Board considered the portfolio managers' investments, if any, in the funds that they manage.
Resources Dedicated to Investment Management and Support Services. The Board and the Fund Oversight and Research Committees reviewed the general qualifications and capabilities of Fidelity's investment staff, including its size, education, experience, and resources, as well as Fidelity's approach to recruiting, training, managing, and compensating investment personnel. The Board noted the resources devoted to expansion of Fidelity's global investment organization, and that Fidelity's analysts have extensive resources, tools, and capabilities that allow them to conduct sophisticated quantitative and fundamental analysis, as well as credit analysis of issuers, counterparties, and guarantors. Further, the Board considered that Fidelity's investment professionals have sufficient access to global information and data so as to provide competitive investment results over time, and that those professionals also have access to sophisticated tools that permit them to assess portfolio construction and risk and performance attribution characteristics continuously, as well as to transmit new information and research conclusions rapidly around the world. Additionally, in its deliberations, the Board considered Fidelity's trading, risk management, compliance, and technology and operations capabilities and resources, which are integral parts of the investment management process.
Shareholder and Administrative Services. The Board considered (i) the nature, extent, quality, and cost of advisory, administrative, shareholder, transfer agency, and pricing and bookkeeping services performed by the Investment Advisers and their affiliates under the Advisory Contracts; (ii) the nature and extent of Fidelity's supervision of third party service providers, principally custodians, subcustodians, and pricing vendors; and (iii) the resources devoted by Fidelity to, and the record of compliance with, the fund's compliance policies and procedures. The Board also reviewed the allocation of fund brokerage, including allocations to brokers affiliated with the Investment Advisers, the use of brokerage commissions to pay fund expenses, and the use of "soft" commission dollars to pay for research services. The Board also considered the fund's securities lending activities and any payments made to Fidelity relating to securities lending under a separate agreement.
The Board noted that the growth of fund assets over time across the complex allows Fidelity to reinvest in the development of services designed to enhance the value and convenience of the Fidelity funds as investment vehicles. These services include 24-hour access to account information and market information over the Internet and through telephone representatives, investor education materials and asset allocation tools. The Board also considered that it reviews customer service metrics such as telephone response times, continuity of services on the website and metrics addressing services at Fidelity Investor Centers.
Investment in a Large Fund Family. The Board considered the benefits to shareholders of investing in a fund that is part of a large family of funds offering a variety of investment disciplines and providing a large variety of fund investor services. The Board noted that Fidelity had taken, or had made recommendations that resulted in the Fidelity funds taking, a number of actions over the previous year that benefited particular funds and/or the Fidelity funds in general.
Investment Performance. The Board took into account discussions that occur with representatives of the Investment Advisers, and reports that it receives, at Board meetings throughout the year, relating to fund investment performance. In this regard the Board noted that as part of regularly scheduled fund reviews and other reports to the Board on fund performance, the Board considered annualized return information for the fund for different time periods, measured against an appropriate securities market index (benchmark index). The Board also considered information about performance attribution. In its ongoing evaluation of fund investment performance, the Board gives particular attention to information indicating changes in performance of the funds over different time periods and discussed with the Investment Advisers the reasons for any overperformance or underperformance.
In addition to reviewing absolute and relative fund performance, the Independent Trustees periodically consider the appropriateness of fund performance metrics in evaluating the results achieved. The Independent Trustees generally give greater weight to fund performance over longer time periods than over shorter time periods. Depending on the circumstances, the Independent Trustees may be satisfied with a fund's performance notwithstanding that it lags its benchmark index for certain periods.
Based on its review, the Board concluded that the nature, extent, and quality of services provided to the fund under the Advisory Contracts should continue to benefit the shareholders of the fund.
Competitiveness of Management Fee and Total Expense Ratio. The Board was provided with information regarding industry trends in management fees and expenses. The Board considered that, effective March 1, 2024, an amended Advisory Contract with FMR went into effect with class-level management fees based on tiered schedules and subject to a maximum class-level rate (the management fee). The Board also considered that in exchange for the variable management fee, each class of the fund receives investment advisory, management, administrative, transfer agent, and pricing and bookkeeping services. In its review of the management fee and total expense ratio of the retail class, the Board considered a pro forma management fee rate for the retail class as if it had been in effect for the 12-month period ended September 30, 2023, as well as other third-party fund expenses, as applicable, such as custodial, legal, and audit fees and any fund-paid 12b-1 fees. The Board noted that Fidelity may agree to waive fees or reimburse expenses from time to time, and the extent to which, if any, it has done so for the fund. The Board also considered information about the impact of the fund's performance adjustment.
Comparisons of Management Fees and Total Expense Ratios. Among other things, the Board reviewed data for selected groups of competitive funds and classes (referred to as "mapped groups") that were compiled by Fidelity based on combining similar investment objective categories (as classified by Morningstar) that have comparable investment mandates. The data reviewed by the Board included (i) gross management fee comparisons (before taking into account expense reimbursements or caps and without taking into account the fund's performance adjustment) relative to the total universe of funds within the mapped group; (ii) gross management fee comparisons relative to a subset of non-Fidelity funds in the mapped group that are similar in size and management fee structure to the fund (referred to as the "asset size peer group"); (iii) total expense comparisons of the retail class of the fund relative to funds and classes in the mapped group that have a similar sales load structure to the retail class of the fund (referred to as the "similar sales load structure group"); and (iv) total expense comparisons of the retail class of the fund relative to funds and classes in the similar sales load structure group that are similar in size and management fee structure to the fund (referred to as the "total expense asset size peer group"). The total expense asset size peer group comparison excludes performance adjustments and fund-paid 12b-1 fees to eliminate variability in fee structures.
The information provided to the Board indicated that the fund's management fee rate ranked above the competitive median of the mapped group for the 12-month period ended September 30, 2023 and below the competitive median of the asset size peer group for the 12-month period ended September 30, 2023. Further, the information provided to the Board indicated that the total expense ratio of the retail class of the fund ranked below the competitive median of the similar sales load structure group for the 12-month period ended September 30, 2023 and below the competitive median of the total expense asset size peer group for the 12-month period ended September 30, 2023. The Board considered that the fund has a variable unified management fee that covers expenses for services beyond portfolio management.
The Board noted that a different variable management fee rate is applicable to each class of the fund. The Board considered that the difference in management fee rates between classes is the result of separate arrangements for class-level services and/or waivers of certain expenses and not the result of any difference in advisory or custodial fees or other expenses related to the management of the fund's assets, which do not vary by class.
The Board also considered that the fund's management fee is subject to upward or downward adjustment depending upon whether, and to what extent, the fund's investment performance for the performance period (a rolling 36-month period) exceeds, or is exceeded by, a securities index, thus leading to a performance adjustment for the same period. The Board noted that the performance adjustment provides FMR with a strong economic incentive to seek to achieve superior long-term performance for the fund's shareholders and helps to more closely align the interests of FMR and the shareholders of the fund.
In connection with its consideration of the fund's performance adjustment, the Board noted that the performance of the retail class is used for purposes of determining the performance adjustment. The Board noted that to the extent the performance adjustment was based on the performance of a share class with higher total annual operating expenses, the fund would be subject to a smaller positive and larger negative performance adjustment. The Board considered the appropriateness of the use of the retail class as the basis for the performance adjustment. The Board noted that the retail class is typically the largest class (reflecting the actual investment experience for the plurality of shareholders), employs a standard expense structure, and does not include fund-paid 12b-1 fees, which Fidelity believes makes it a more appropriate measurement of Fidelity's investment skill.
Other Contractual Arrangements. The Board considered that FMR has contractually agreed to reimburse Class A, Class M, Class C, Class I, Class Z, and the retail class of the fund to the extent that total operating expenses (excluding interest, certain taxes, fees and expenses associated with a wholly owned subsidiary, if any, as well as non-operating expenses such as brokerage commissions and fees and expenses associated with the fund's securities lending program, if applicable) as a percentage of their respective average net assets, exceed 1.15%, 1.40%, 1.90%, 0.90%, 0.75%, and 0.90% through August 31, 2025.
Fees Charged to Other Fidelity Clients. The Board also considered Fidelity fee structures and other information with respect to clients of Fidelity, such as other funds advised or subadvised by Fidelity, pension plan clients, and other institutional clients with similar mandates. The Board noted that a joint ad hoc committee created by it and the boards of other Fidelity funds periodically reviews and compares Fidelity's institutional investment advisory business with its business of providing services to the Fidelity funds and also noted the most recent findings of the committee. The Board noted that the committee's review included a consideration of the differences in services provided, fees charged, and costs incurred, as well as competition in the markets serving the different categories of clients.
Based on its review, the Board concluded that the fund's management fee, including the use of the retail class as the basis for the performance adjustment, is fair and reasonable in light of the services that the fund receives and the other factors considered. Further, based on its review of total expense ratios and fees charged to other Fidelity clients, the Board concluded that the total expense ratio of each class of the fund was reasonable in light of the services that the fund and its shareholders receive and the other factors considered.
Costs of the Services and Profitability. The Board considered the revenues earned and the expenses incurred by Fidelity in conducting the business of developing, marketing, distributing, managing, administering and servicing the fund and servicing the fund's shareholders. The Board also considered the level of Fidelity's profits in respect of all the Fidelity funds.
On an annual basis, Fidelity presents to the Board information about the profitability of its relationships with the fund. Fidelity calculates profitability information for each fund, as well as aggregate profitability information for groups of Fidelity funds and all Fidelity funds, using a series of detailed revenue and cost allocation methodologies which originate with the books and records of Fidelity on which Fidelity's audited financial statements are based. The Audit Committee of the Board reviews any significant changes from the prior year's methodologies.
A public accounting firm has been engaged annually by the Board as part of the Board's assessment of Fidelity's profitability analysis. The engagement includes the review and assessment of the methodologies used by Fidelity in determining the revenues and expenses attributable to Fidelity's fund business, and completion of agreed-upon procedures in respect of the mathematical accuracy of certain fund profitability information and its conformity to established allocation methodologies. After considering the reports issued under the engagement and information provided by Fidelity, the Board concluded that while other allocation methods may also be reasonable, Fidelity's profitability methodologies are reasonable in all material respects.
The Board also reviewed Fidelity's non-fund businesses and potential indirect benefits such businesses may have received as a result of their association with Fidelity's fund business (i.e., fall-out benefits) as well as cases where Fidelity's affiliates may benefit from the funds' business. The Board considered areas where potential indirect benefits to the Fidelity funds from their relationships with Fidelity may exist. The Board's consideration of these matters was informed by the findings of a joint ad hoc committee created by it and the boards of other Fidelity funds to evaluate potential fall-out benefits.
The Board considered the costs of the services provided by and the profits realized by Fidelity in connection with the operation of the fund and was satisfied that the profitability was not excessive.
Economies of Scale. The Board considered whether there have been economies of scale in respect of the management of the Fidelity funds, whether the Fidelity funds (including the fund) have appropriately benefited from any such economies of scale, and whether there is potential for realization of any further economies of scale. The Board considered the extent to which the fund will benefit from economies of scale as assets grow through increased services to the fund, through waivers or reimbursements, or through fee or expense ratio reductions. The Board also noted that a committee created by it and the boards of other Fidelity funds periodically analyzes whether Fidelity attains economies of scale in respect of the management and servicing of the Fidelity funds, whether the Fidelity funds have appropriately benefited from such economies of scale, and whether there is potential for realization of any further economies of scale.
The Board recognized that the fund's management contract incorporates a variable management fee structure, which provides breakpoints as a way to share, in part, any potential economies of scale that may exist at the asset class level and through a discount that considers both fund size and total assets of the four applicable asset classes. The Board considered that the variable management fee is designed to deliver the benefits of economies of scale to fund shareholders even if assets of any particular fund are unchanged or have declined, because some portion of Fidelity's costs are attributable to services provided to all funds subject to the variable management fee, and all such funds benefit if those costs can be allocated among more assets. The Board concluded that, given the variable management fee structure, fund shareholders will benefit from lower management fees due to the application of the breakpoints and discount factor, regardless of whether Fidelity achieves any such economies of scale.
The Board concluded, taking into account the analysis of the committee, that economies of scale, if any, are being appropriately shared between fund shareholders and Fidelity.
Additional Information Requested by the Board. In order to develop fully the factual basis for consideration of the Fidelity funds' advisory contracts, the Board requested and received additional information on certain topics, including but not limited to: (i) fund flow and performance trends, in particular the underperformance of certain funds and strategies, and Fidelity's long-term strategies for certain funds; (ii) the operation of performance fees and the rationale for implementing performance fees on certain categories of funds but not others; (iii) Fidelity's pricing philosophy compared to competitors; (iv) fund profitability methodology and data; (v) evaluation of competitive fund data and peer group classifications and fee and expense comparisons; (vi) the management fee and expense structures for different funds and classes and information about the differences between various fee and expense structures; (vii) the variable management fee implemented for certain funds effective March 1, 2024; and (viii) information regarding other accounts managed by Fidelity and the funds' sub-advisory arrangements.
Conclusion. Based on its evaluation of all of the conclusions noted above, and after considering all factors it believed relevant, the Board, including the Independent Trustees, concluded that the advisory and sub-advisory fee arrangements are fair and reasonable in light of all of the surrounding circumstances and that the fund's Advisory Contracts should be renewed through May 31, 2025.
1.9893106.105
WLF-SANN-1224
Fidelity® Healthy Future Fund
Semi-Annual Report
October 31, 2024
Includes Fidelity and Fidelity Advisor share classes
Contents
To view a fund's proxy voting guidelines and proxy voting record for the 12-month period ended June 30, visit http://www.fidelity.com/proxyvotingresults or visit the Securities and Exchange Commission's (SEC) web site at http://www.sec.gov.
You may also call 1-800-544-8544 if you're an individual investing directly with Fidelity, call 1-800-835-5092 if you're a plan sponsor or participant with Fidelity as your recordkeeper or call 1-877-208-0098 on institutional accounts or if you're an advisor or invest through one to request a free copy of the proxy voting guidelines.
Standard & Poor's, S&P and S&P 500 are registered service marks of The McGraw-Hill Companies, Inc. and have been licensed for use by Fidelity Distributors Corporation.
Other third-party marks appearing herein are the property of their respective owners.
All other marks appearing herein are registered or unregistered trademarks or service marks of FMR LLC or an affiliated company. © 2024 FMR LLC. All rights reserved.
This report and the financial statements contained herein are submitted for the general information of the shareholders of the Fund. This report is not authorized for distribution to prospective investors in the Fund unless preceded or accompanied by an effective prospectus.
A fund files its complete schedule of portfolio holdings with the SEC for the first and third quarters of each fiscal year on Form N-PORT. Forms N-PORT are available on the SEC's web site at http://www.sec.gov. A fund's Forms N-PORT may be reviewed and copied at the SEC's Public Reference Room in Washington, DC. Information regarding the operation of the SEC's Public Reference Room may be obtained by calling 1-800-SEC-0330.
For a complete list of a fund's portfolio holdings, view the most recent holdings listing, semiannual report, or annual report on Fidelity's web site at http://www.fidelity.com, http://www.institutional.fidelity.com, or http://www.401k.com, as applicable.
NOT FDIC INSURED •MAY LOSE VALUE •NO BANK GUARANTEE
Neither the Fund nor Fidelity Distributors Corporation is a bank.
Item 7: Financial Statements and Financial Highlights for Open-End Management Investment Companies (Semi-Annual Report)
Fidelity® Healthy Future Fund
Schedule of Investments October 31, 2024 (Unaudited)
Showing Percentage of Net Assets
| Common Stocks - 98.0% |
| | | Shares | Value ($) |
| COMMUNICATION SERVICES - 0.9% | | | |
| Entertainment - 0.9% | | | |
| The Walt Disney Co. | | 1,177 | 113,227 |
| CONSUMER DISCRETIONARY - 14.6% | | | |
| Automobiles - 5.5% | | | |
| BYD Co. Ltd. (H Shares) | | 2,641 | 95,389 |
| Rivian Automotive, Inc. Class A (a) | | 2,214 | 22,361 |
| Tesla, Inc. (a) | | 2,339 | 584,399 |
| | | | 702,149 |
| Hotels, Restaurants & Leisure - 3.0% | | | |
| Airbnb, Inc. Class A (a) | | 258 | 34,776 |
| Cava Group, Inc. (a) | | 730 | 97,499 |
| Chipotle Mexican Grill, Inc. (a) | | 2,138 | 119,236 |
| Hilton Worldwide Holdings, Inc. | | 488 | 114,607 |
| Sweetgreen, Inc. Class A (a) | | 550 | 19,855 |
| | | | 385,973 |
| Specialty Retail - 2.0% | | | |
| Chewy, Inc. Class A (a) | | 1,747 | 47,117 |
| TJX Companies, Inc. | | 746 | 84,320 |
| Ulta Beauty, Inc. (a) | | 319 | 117,705 |
| | | | 249,142 |
| Textiles, Apparel & Luxury Goods - 4.1% | | | |
| adidas AG | | 387 | 92,683 |
| Crocs, Inc. (a) | | 331 | 35,688 |
| Deckers Outdoor Corp. (a) | | 1,254 | 201,756 |
| NIKE, Inc. Class B | | 1,265 | 97,569 |
| On Holding AG (a) | | 1,901 | 90,145 |
| | | | 517,841 |
TOTAL CONSUMER DISCRETIONARY | | | 1,855,105 |
| CONSUMER STAPLES - 20.3% | | | |
| Beverages - 0.4% | | | |
| The Vita Coco Co., Inc. (a) | | 1,511 | 44,741 |
| Consumer Staples Distribution & Retail - 1.3% | | | |
| Costco Wholesale Corp. | | 76 | 66,438 |
| Sprouts Farmers Market LLC (a) | | 814 | 104,542 |
| | | | 170,980 |
| Food Products - 4.4% | | | |
| Danone SA | | 2,965 | 211,815 |
| Freshpet, Inc. (a) | | 586 | 77,668 |
| Nestle SA (Reg. S) | | 2,901 | 274,123 |
| | | | 563,606 |
| Household Products - 8.1% | | | |
| Colgate-Palmolive Co. | | 3,568 | 334,357 |
| Procter & Gamble Co. | | 4,218 | 696,729 |
| | | | 1,031,086 |
| Personal Care Products - 6.1% | | | |
| elf Beauty, Inc. (a) | | 412 | 43,363 |
| Estee Lauder Companies, Inc. Class A | | 1,009 | 69,560 |
| Kenvue, Inc. | | 4,096 | 93,921 |
| L'Oreal SA | | 147 | 55,150 |
| Unilever PLC | | 7,189 | 438,544 |
| Warpaint London PLC | | 9,820 | 68,630 |
| | | | 769,168 |
TOTAL CONSUMER STAPLES | | | 2,579,581 |
| FINANCIALS - 12.3% | | | |
| Capital Markets - 1.2% | | | |
| BlackRock, Inc. | | 156 | 153,041 |
| Financial Services - 3.0% | | | |
| Apollo Global Management, Inc. | | 2,646 | 379,066 |
| Insurance - 8.1% | | | |
| AIA Group Ltd. | | 47,941 | 378,366 |
| Chubb Ltd. | | 881 | 248,830 |
| Hartford Financial Services Group, Inc. | | 1,201 | 132,638 |
| Marsh & McLennan Companies, Inc. | | 698 | 152,332 |
| Reinsurance Group of America, Inc. | | 569 | 120,105 |
| | | | 1,032,271 |
TOTAL FINANCIALS | | | 1,564,378 |
| HEALTH CARE - 33.0% | | | |
| Biotechnology - 8.2% | | | |
| Alnylam Pharmaceuticals, Inc. (a) | | 368 | 98,105 |
| Exact Sciences Corp. (a) | | 1,000 | 68,930 |
| Gilead Sciences, Inc. | | 1,905 | 169,202 |
| Regeneron Pharmaceuticals, Inc. (a) | | 298 | 249,784 |
| Vertex Pharmaceuticals, Inc. (a) | | 963 | 458,369 |
| | | | 1,044,390 |
| Health Care Equipment & Supplies - 6.2% | | | |
| Abbott Laboratories | | 1,958 | 221,978 |
| Boston Scientific Corp. (a) | | 2,492 | 209,378 |
| DexCom, Inc. (a) | | 563 | 39,680 |
| Insulet Corp. (a) | | 267 | 61,819 |
| Penumbra, Inc. (a) | | 241 | 55,158 |
| Terumo Corp. | | 3,738 | 71,191 |
| The Cooper Companies, Inc. (a) | | 972 | 101,749 |
| TransMedics Group, Inc. (a) | | 400 | 32,788 |
| | | | 793,741 |
| Health Care Providers & Services - 5.5% | | | |
| CVS Health Corp. | | 3,139 | 177,228 |
| LifeStance Health Group, Inc. (a) | | 11,927 | 80,030 |
| UnitedHealth Group, Inc. | | 780 | 440,310 |
| | | | 697,568 |
| Life Sciences Tools & Services - 7.2% | | | |
| Danaher Corp. | | 1,747 | 429,168 |
| Thermo Fisher Scientific, Inc. | | 889 | 485,678 |
| | | | 914,846 |
| Pharmaceuticals - 5.9% | | | |
| Eli Lilly & Co. | | 275 | 228,179 |
| Merck & Co., Inc. | | 1,064 | 108,868 |
| UCB SA | | 1,875 | 360,589 |
| Zoetis, Inc. Class A | | 305 | 54,528 |
| | | | 752,164 |
TOTAL HEALTH CARE | | | 4,202,709 |
| INDUSTRIALS - 4.8% | | | |
| Electrical Equipment - 0.7% | | | |
| Generac Holdings, Inc. (a) | | 518 | 85,755 |
| Ground Transportation - 2.5% | | | |
| Uber Technologies, Inc. (a) | | 4,488 | 323,360 |
| Industrial Conglomerates - 1.6% | | | |
| Hitachi Ltd. | | 8,050 | 202,255 |
TOTAL INDUSTRIALS | | | 611,370 |
| INFORMATION TECHNOLOGY - 9.8% | | | |
| Semiconductors & Semiconductor Equipment - 8.4% | | | |
| NVIDIA Corp. | | 8,061 | 1,070,180 |
| Technology Hardware, Storage & Peripherals - 1.4% | | | |
| Apple, Inc. | | 725 | 163,785 |
| Samsung Electronics Co. Ltd. GDR (Reg. S) | | 18 | 19,062 |
| | | | 182,847 |
TOTAL INFORMATION TECHNOLOGY | | | 1,253,027 |
| REAL ESTATE - 1.4% | | | |
| Equity Real Estate Investment Trusts (REITs) - 1.4% | | | |
| Welltower, Inc. | | 1,303 | 175,749 |
| UTILITIES - 0.9% | | | |
| Electric Utilities - 0.9% | | | |
| NextEra Energy, Inc. | | 1,388 | 109,999 |
| TOTAL COMMON STOCKS (Cost $10,220,339) | | | 12,465,145 |
| | | | |
| Money Market Funds - 0.8% |
| | | Shares | Value ($) |
Fidelity Cash Central Fund 4.87% (b) (Cost $106,867) | | 106,845 | 106,867 |
| | | | |
| TOTAL INVESTMENT IN SECURITIES - 98.8% (Cost $10,327,206) | 12,572,012 |
NET OTHER ASSETS (LIABILITIES) - 1.2% | 148,509 |
| NET ASSETS - 100.0% | 12,720,521 |
| | |
Legend
| (b) | Affiliated fund that is generally available only to investment companies and other accounts managed by Fidelity Investments. The rate quoted is the annualized seven-day yield of the fund at period end. A complete unaudited listing of the fund's holdings as of its most recent quarter end is available upon request. In addition, each Fidelity Central Fund's financial statements are available on the SEC's website or upon request. |
Affiliated Central Funds
Fiscal year to date information regarding the Fund's investments in Fidelity Central Funds, including the ownership percentage, is presented below.
| Affiliate | Value, beginning of period ($) | Purchases ($) | Sales Proceeds ($) | Dividend Income ($) | Realized Gain (loss) ($) | Change in Unrealized appreciation (depreciation) ($) | Value, end of period ($) | % ownership, end of period |
| Fidelity Cash Central Fund 4.87% | - | 3,415,836 | 3,308,955 | 5,889 | (14) | - | 106,867 | 0.0% |
| Total | - | 3,415,836 | 3,308,955 | 5,889 | (14) | - | 106,867 | |
| | | | | | | | | |
Amounts in the dividend income column in the above table include any capital gain distributions from underlying funds, which are presented in the corresponding line item in the Statement of Operations, if applicable.
Amounts included in the purchases and sales proceeds columns may include in-kind transactions, if applicable.
Investment Valuation
The following is a summary of the inputs used, as of October 31, 2024, involving the Fund's assets and liabilities carried at fair value. The inputs or methodology used for valuing securities may not be an indication of the risk associated with investing in those securities. For more information on valuation inputs, and their aggregation into the levels used below, please refer to the Investment Valuation section in the accompanying Notes to Financial Statements.
| Valuation Inputs at Reporting Date: |
| Description | Total ($) | Level 1 ($) | Level 2 ($) | Level 3 ($) |
Investments in Securities: | | | | |
|
| Equities: | | | | |
Communication Services | 113,227 | 113,227 | - | - |
Consumer Discretionary | 1,855,105 | 1,667,033 | 188,072 | - |
Consumer Staples | 2,579,581 | 1,599,949 | 979,632 | - |
Financials | 1,564,378 | 1,186,012 | 378,366 | - |
Health Care | 4,202,709 | 4,131,518 | 71,191 | - |
Industrials | 611,370 | 409,115 | 202,255 | - |
Information Technology | 1,253,027 | 1,253,027 | - | - |
Real Estate | 175,749 | 175,749 | - | - |
Utilities | 109,999 | 109,999 | - | - |
|
| Money Market Funds | 106,867 | 106,867 | - | - |
| Total Investments in Securities: | 12,572,012 | 10,752,496 | 1,819,516 | - |
Financial Statements (Unaudited)
| Statement of Assets and Liabilities |
| As of October 31, 2024 (Unaudited) |
| Assets | | | | |
| Investment in securities, at value - See accompanying schedule: | | | | |
Unaffiliated issuers (cost $10,220,339) | $ | 12,465,145 | | |
Fidelity Central Funds (cost $106,867) | | 106,867 | | |
| | | | | |
| | | | | |
| Total Investment in Securities (cost $10,327,206) | | | $ | 12,572,012 |
| Cash | | | | 4,906 |
| Foreign currency held at value (cost $32,200) | | | | 32,389 |
| Receivable for investments sold | | | | 194,656 |
| Receivable for fund shares sold | | | | 34,259 |
| Dividends receivable | | | | 13,409 |
| Reclaims receivable | | | | 7,163 |
| Distributions receivable from Fidelity Central Funds | | | | 984 |
| Prepaid expenses | | | | 14 |
| Receivable from investment adviser for expense reductions | | | | 1,329 |
Total assets | | | | 12,861,121 |
| Liabilities | | | | |
| Payable for investments purchased | $ | 26,151 | | |
| Payable for fund shares redeemed | | 78,703 | | |
| Accrued management fee | | 9,091 | | |
| Distribution and service plan fees payable | | 2,108 | | |
| Audit fee payable | | 23,099 | | |
| Other payables and accrued expenses | | 1,448 | | |
| Total liabilities | | | | 140,600 |
| Net Assets | | | $ | 12,720,521 |
| Net Assets consist of: | | | | |
| Paid in capital | | | $ | 10,689,858 |
| Total accumulated earnings (loss) | | | | 2,030,663 |
| Net Assets | | | $ | 12,720,521 |
| | | | | |
| Net Asset Value and Maximum Offering Price | | | | |
| Class A : | | | | |
Net Asset Value and redemption price per share ($984,462 ÷ 75,144 shares)(a) | | | $ | 13.10 |
| Maximum offering price per share (100/94.25 of $13.10) | | | $ | 13.90 |
| Class M : | | | | |
Net Asset Value and redemption price per share ($3,243,890 ÷ 249,097 shares)(a) | | | $ | 13.02 |
| Maximum offering price per share (100/96.50 of $13.02) | | | $ | 13.49 |
| Class C : | | | | |
Net Asset Value and offering price per share ($591,123 ÷ 45,954 shares)(a) | | | $ | 12.86 |
| Fidelity Healthy Future Fund : | | | | |
Net Asset Value, offering price and redemption price per share ($7,541,875 ÷ 573,191 shares) | | | $ | 13.16 |
| Class I : | | | | |
Net Asset Value, offering price and redemption price per share ($177,423 ÷ 13,481 shares) | | | $ | 13.16 |
| Class Z : | | | | |
Net Asset Value, offering price and redemption price per share ($181,748 ÷ 13,773 shares) | | | $ | 13.20 |
(a)Redemption price per share is equal to net asset value less any applicable contingent deferred sales charge. |
| Statement of Operations |
Six months ended October 31, 2024 (Unaudited) |
| Investment Income | | | | |
| Dividends | | | $ | 58,628 |
| Interest | | | | 21 |
| Income from Fidelity Central Funds | | | | 5,889 |
| Total income | | | | 64,538 |
| Expenses | | | | |
| Management fee | $ | 49,460 | | |
| Distribution and service plan fees | | 10,881 | | |
| Custodian fees and expenses | | 1,392 | | |
| Independent trustees' fees and expenses | | 22 | | |
| Registration fees | | 29,258 | | |
| Audit fees | | 22,013 | | |
| Legal | | 3 | | |
| Miscellaneous | | 765 | | |
| Total expenses before reductions | | 113,794 | | |
| Expense reductions | | (40,643) | | |
| Total expenses after reductions | | | | 73,151 |
| Net Investment income (loss) | | | | (8,613) |
| Realized and Unrealized Gain (Loss) | | | | |
| Net realized gain (loss) on: | | | | |
| Investment Securities: | | | | |
| Unaffiliated issuers | | (7,495) | | |
| Fidelity Central Funds | | (14) | | |
| Foreign currency transactions | | 1,313 | | |
| Total net realized gain (loss) | | | | (6,196) |
| Change in net unrealized appreciation (depreciation) on: | | | | |
| Investment Securities: | | | | |
| Unaffiliated issuers | | 1,009,059 | | |
| Assets and liabilities in foreign currencies | | 283 | | |
| Total change in net unrealized appreciation (depreciation) | | | | 1,009,342 |
| Net gain (loss) | | | | 1,003,146 |
| Net increase (decrease) in net assets resulting from operations | | | $ | 994,533 |
| Statement of Changes in Net Assets |
| |
| | Six months ended October 31, 2024 (Unaudited) | | Year ended April 30, 2024 |
| Increase (Decrease) in Net Assets | | | | |
| Operations | | | | |
| Net investment income (loss) | $ | (8,613) | $ | 6,724 |
| Net realized gain (loss) | | (6,196) | | (98,055) |
| Change in net unrealized appreciation (depreciation) | | 1,009,342 | | 913,735 |
| Net increase (decrease) in net assets resulting from operations | | 994,533 | | 822,404 |
| Distributions to shareholders | | (7,430) | | (3,025) |
| | | | | |
| Share transactions - net increase (decrease) | | 2,463,059 | | 4,382,036 |
| Total increase (decrease) in net assets | | 3,450,162 | | 5,201,415 |
| | | | | |
| Net Assets | | | | |
| Beginning of period | | 9,270,359 | | 4,068,944 |
| End of period | $ | 12,720,521 | $ | 9,270,359 |
| | | | | |
| | | | | |
Financial Highlights
Fidelity Advisor® Healthy Future Fund Class A |
| |
| | Six months ended (Unaudited) October 31, 2024 | | Years ended April 30, 2024 | | 2023 A |
Selected Per-Share Data | | | | | | |
| Net asset value, beginning of period | $ | 11.92 | $ | 10.57 | $ | 10.00 |
| Income from Investment Operations | | | | | | |
Net investment income (loss) B,C | | (.01) | | (.01) | | (.01) |
| Net realized and unrealized gain (loss) | | 1.19 | | 1.36 | | .58 |
| Total from investment operations | | 1.18 | | 1.35 | | .57 |
| Net asset value, end of period | $ | 13.10 | $ | 11.92 | $ | 10.57 |
Total Return D,E,F | | | | 12.77% | | 5.70% |
Ratios to Average Net Assets C,G,H | | | | | | |
| Expenses before reductions | | 2.03% I,J | | 3.08% | | 9.78% J,K |
| Expenses net of fee waivers, if any | | | | 1.29% | | 1.29% J |
| Expenses net of all reductions | | 1.30% I,J | | 1.29% | | 1.29% J |
| Net investment income (loss) | | (.21)% I,J | | (.05)% | | (.09)% J |
| Supplemental Data | | | | | | |
| Net assets, end of period (000 omitted) | $ | 984 | $ | 854 | $ | 205 |
Portfolio turnover rate L | | | | 37% | | 68% J |
AFor the period May 24, 2022 (commencement of operations) through April 30, 2023
BCalculated based on average shares outstanding during the period.
CNet investment income (loss) is affected by the timing of the declaration of dividends by any underlying mutual funds or exchange-traded funds (ETFs). Net investment income (loss) of any mutual funds or ETFs is not included in the Fund's net investment income (loss) ratio.
DTotal returns for periods of less than one year are not annualized.
ETotal returns would have been lower if certain expenses had not been reduced during the applicable periods shown.
FTotal returns do not include the effect of the sales charges.
GFees and expenses of any underlying mutual funds or exchange-traded funds (ETFs) are not included in the Fund's expense ratio. The Fund indirectly bears its proportionate share of these expenses. For additional expense information related to investments in Fidelity Central Funds, please refer to the "Investments in Fidelity Central Funds" note found in the Notes to Financial Statements section of the most recent Annual or Semi-Annual report.
HExpense ratios reflect operating expenses of the class. Expenses before reductions do not reflect amounts reimbursed, waived, or reduced through arrangements with the investment adviser, brokerage services, or other offset arrangements, if applicable, and do not represent the amount paid by the class during periods when reimbursements, waivers or reductions occur.
IProxy expenses are not annualized.
JAnnualized.
KAudit fees are not annualized.
LAmount does not include the portfolio activity of any underlying mutual funds or exchange-traded funds (ETFs).
Fidelity Advisor® Healthy Future Fund Class M |
| |
| | Six months ended (Unaudited) October 31, 2024 | | Years ended April 30, 2024 | | 2023 A |
Selected Per-Share Data | | | | | | |
| Net asset value, beginning of period | $ | 11.86 | $ | 10.54 | $ | 10.00 |
| Income from Investment Operations | | | | | | |
Net investment income (loss) B,C | | (.03) | | (.03) | | (.03) |
| Net realized and unrealized gain (loss) | | 1.19 | | 1.35 | | .57 |
| Total from investment operations | | 1.16 | | 1.32 | | .54 |
| Net asset value, end of period | $ | 13.02 | $ | 11.86 | $ | 10.54 |
Total Return D,E,F | | | | 12.52% | | 5.40% |
Ratios to Average Net Assets C,G,H | | | | | | |
| Expenses before reductions | | 2.24% I,J | | 3.46% | | 10.17% I,K |
| Expenses net of fee waivers, if any | | | | 1.54% | | 1.54% I |
| Expenses net of all reductions | | 1.55% I,J | | 1.53% | | 1.54% I |
| Net investment income (loss) | | (.46)% I,J | | (.29)% | | (.34)% I |
| Supplemental Data | | | | | | |
| Net assets, end of period (000 omitted) | $ | 3,244 | $ | 1,565 | $ | 136 |
Portfolio turnover rate L | | | | 37% | | 68% I |
AFor the period May 24, 2022 (commencement of operations) through April 30, 2023
BCalculated based on average shares outstanding during the period.
CNet investment income (loss) is affected by the timing of the declaration of dividends by any underlying mutual funds or exchange-traded funds (ETFs). Net investment income (loss) of any mutual funds or ETFs is not included in the Fund's net investment income (loss) ratio.
DTotal returns for periods of less than one year are not annualized.
ETotal returns would have been lower if certain expenses had not been reduced during the applicable periods shown.
FTotal returns do not include the effect of the sales charges.
GFees and expenses of any underlying mutual funds or exchange-traded funds (ETFs) are not included in the Fund's expense ratio. The Fund indirectly bears its proportionate share of these expenses. For additional expense information related to investments in Fidelity Central Funds, please refer to the "Investments in Fidelity Central Funds" note found in the Notes to Financial Statements section of the most recent Annual or Semi-Annual report.
HExpense ratios reflect operating expenses of the class. Expenses before reductions do not reflect amounts reimbursed, waived, or reduced through arrangements with the investment adviser, brokerage services, or other offset arrangements, if applicable, and do not represent the amount paid by the class during periods when reimbursements, waivers or reductions occur.
IAnnualized.
JProxy expenses are not annualized.
KAudit fees are not annualized.
LAmount does not include the portfolio activity of any underlying mutual funds or exchange-traded funds (ETFs).
Fidelity Advisor® Healthy Future Fund Class C |
| |
| | Six months ended (Unaudited) October 31, 2024 | | Years ended April 30, 2024 | | 2023 A |
Selected Per-Share Data | | | | | | |
| Net asset value, beginning of period | $ | 11.75 | $ | 10.49 | $ | 10.00 |
| Income from Investment Operations | | | | | | |
Net investment income (loss) B,C | | (.06) | | (.09) | | (.08) |
| Net realized and unrealized gain (loss) | | 1.17 | | 1.35 | | .57 |
| Total from investment operations | | 1.11 | | 1.26 | | .49 |
| Net asset value, end of period | $ | 12.86 | $ | 11.75 | $ | 10.49 |
Total Return D,E,F | | | | 12.01% | | 4.90% |
Ratios to Average Net Assets C,G,H | | | | | | |
| Expenses before reductions | | 2.76% I,J | | 3.94% | | 10.48% I,K |
| Expenses net of fee waivers, if any | | | | 2.04% | | 2.04% I |
| Expenses net of all reductions | | 2.05% I,J | | 2.03% | | 2.04% I |
| Net investment income (loss) | | (.96)% I,J | | (.80)% | | (.84)% I |
| Supplemental Data | | | | | | |
| Net assets, end of period (000 omitted) | $ | 591 | $ | 262 | $ | 130 |
Portfolio turnover rate L | | | | 37% | | 68% I |
AFor the period May 24, 2022 (commencement of operations) through April 30, 2023
BCalculated based on average shares outstanding during the period.
CNet investment income (loss) is affected by the timing of the declaration of dividends by any underlying mutual funds or exchange-traded funds (ETFs). Net investment income (loss) of any mutual funds or ETFs is not included in the Fund's net investment income (loss) ratio.
DTotal returns for periods of less than one year are not annualized.
ETotal returns would have been lower if certain expenses had not been reduced during the applicable periods shown.
FTotal returns do not include the effect of the contingent deferred sales charge.
GFees and expenses of any underlying mutual funds or exchange-traded funds (ETFs) are not included in the Fund's expense ratio. The Fund indirectly bears its proportionate share of these expenses. For additional expense information related to investments in Fidelity Central Funds, please refer to the "Investments in Fidelity Central Funds" note found in the Notes to Financial Statements section of the most recent Annual or Semi-Annual report.
HExpense ratios reflect operating expenses of the class. Expenses before reductions do not reflect amounts reimbursed, waived, or reduced through arrangements with the investment adviser, brokerage services, or other offset arrangements, if applicable, and do not represent the amount paid by the class during periods when reimbursements, waivers or reductions occur.
IAnnualized.
JProxy expenses are not annualized.
KAudit fees are not annualized.
LAmount does not include the portfolio activity of any underlying mutual funds or exchange-traded funds (ETFs).
Fidelity® Healthy Future Fund |
| |
| | Six months ended (Unaudited) October 31, 2024 | | Years ended April 30, 2024 | | 2023 A |
Selected Per-Share Data | | | | | | |
| Net asset value, beginning of period | $ | 11.97 | $ | 10.59 | $ | 10.00 |
| Income from Investment Operations | | | | | | |
Net investment income (loss) B,C | | - D | | .02 | | .02 |
| Net realized and unrealized gain (loss) | | 1.20 | | 1.37 | | .57 |
| Total from investment operations | | 1.20 | | 1.39 | | .59 |
| Distributions from net investment income | | (.01) | | (.01) | | - |
| Total distributions | | (.01) | | (.01) | | - |
| Net asset value, end of period | $ | 13.16 | $ | 11.97 | $ | 10.59 |
Total Return E,F | | | | 13.12% | | 5.90% |
Ratios to Average Net Assets C,G,H | | | | | | |
| Expenses before reductions | | 1.73% I,J | | 2.79% | | 9.38% I,K |
| Expenses net of fee waivers, if any | | | | 1.04% | | 1.04% I |
| Expenses net of all reductions | | 1.05% I,J | | 1.04% | | 1.04% I |
| Net investment income (loss) | | .04% I,J | | .20% | | .16% I |
| Supplemental Data | | | | | | |
| Net assets, end of period (000 omitted) | $ | 7,542 | $ | 6,309 | $ | 3,376 |
Portfolio turnover rate L | | | | 37% | | 68% I |
AFor the period May 24, 2022 (commencement of operations) through April 30, 2023
BCalculated based on average shares outstanding during the period.
CNet investment income (loss) is affected by the timing of the declaration of dividends by any underlying mutual funds or exchange-traded funds (ETFs). Net investment income (loss) of any mutual funds or ETFs is not included in the Fund's net investment income (loss) ratio.
DAmount represents less than $.005 per share.
ETotal returns for periods of less than one year are not annualized.
FTotal returns would have been lower if certain expenses had not been reduced during the applicable periods shown.
GFees and expenses of any underlying mutual funds or exchange-traded funds (ETFs) are not included in the Fund's expense ratio. The Fund indirectly bears its proportionate share of these expenses. For additional expense information related to investments in Fidelity Central Funds, please refer to the "Investments in Fidelity Central Funds" note found in the Notes to Financial Statements section of the most recent Annual or Semi-Annual report.
HExpense ratios reflect operating expenses of the class. Expenses before reductions do not reflect amounts reimbursed, waived, or reduced through arrangements with the investment adviser, brokerage services, or other offset arrangements, if applicable, and do not represent the amount paid by the class during periods when reimbursements, waivers or reductions occur.
IAnnualized.
JProxy expenses are not annualized.
KAudit fees are not annualized.
LAmount does not include the portfolio activity of any underlying mutual funds or exchange-traded funds (ETFs).
Fidelity Advisor® Healthy Future Fund Class I |
| |
| | Six months ended (Unaudited) October 31, 2024 | | Years ended April 30, 2024 | | 2023 A |
Selected Per-Share Data | | | | | | |
| Net asset value, beginning of period | $ | 11.97 | $ | 10.59 | $ | 10.00 |
| Income from Investment Operations | | | | | | |
Net investment income (loss) B,C | | - D | | .02 | | .02 |
| Net realized and unrealized gain (loss) | | 1.20 | | 1.37 | | .57 |
| Total from investment operations | | 1.20 | | 1.39 | | .59 |
| Distributions from net investment income | | (.01) | | (.01) | | - |
| Total distributions | | (.01) | | (.01) | | - |
| Net asset value, end of period | $ | 13.16 | $ | 11.97 | $ | 10.59 |
Total Return E,F | | | | 13.12% | | 5.90% |
Ratios to Average Net Assets C,G,H | | | | | | |
| Expenses before reductions | | 1.73% I,J | | 2.82% | | 9.48% I,K |
| Expenses net of fee waivers, if any | | | | 1.04% | | 1.05% I |
| Expenses net of all reductions | | 1.05% I,J | | 1.04% | | 1.04% I |
| Net investment income (loss) | | .04% I,J | | .20% | | .16% I |
| Supplemental Data | | | | | | |
| Net assets, end of period (000 omitted) | $ | 177 | $ | 159 | $ | 115 |
Portfolio turnover rate L | | | | 37% | | 68% I |
AFor the period May 24, 2022 (commencement of operations) through April 30, 2023
BCalculated based on average shares outstanding during the period.
CNet investment income (loss) is affected by the timing of the declaration of dividends by any underlying mutual funds or exchange-traded funds (ETFs). Net investment income (loss) of any mutual funds or ETFs is not included in the Fund's net investment income (loss) ratio.
DAmount represents less than $.005 per share.
ETotal returns for periods of less than one year are not annualized.
FTotal returns would have been lower if certain expenses had not been reduced during the applicable periods shown.
GFees and expenses of any underlying mutual funds or exchange-traded funds (ETFs) are not included in the Fund's expense ratio. The Fund indirectly bears its proportionate share of these expenses. For additional expense information related to investments in Fidelity Central Funds, please refer to the "Investments in Fidelity Central Funds" note found in the Notes to Financial Statements section of the most recent Annual or Semi-Annual report.
HExpense ratios reflect operating expenses of the class. Expenses before reductions do not reflect amounts reimbursed, waived, or reduced through arrangements with the investment adviser, brokerage services, or other offset arrangements, if applicable, and do not represent the amount paid by the class during periods when reimbursements, waivers or reductions occur.
IAnnualized.
JProxy expenses are not annualized.
KAudit fees are not annualized.
LAmount does not include the portfolio activity of any underlying mutual funds or exchange-traded funds (ETFs).
Fidelity Advisor® Healthy Future Fund Class Z |
| |
| | Six months ended (Unaudited) October 31, 2024 | | Years ended April 30, 2024 | | 2023 A |
Selected Per-Share Data | | | | | | |
| Net asset value, beginning of period | $ | 12.00 | $ | 10.61 | $ | 10.00 |
| Income from Investment Operations | | | | | | |
Net investment income (loss) B,C | | .01 | | .04 | | .03 |
| Net realized and unrealized gain (loss) | | 1.21 | | 1.36 | | .58 |
| Total from investment operations | | 1.22 | | 1.40 | | .61 |
| Distributions from net investment income | | (.02) | | (.01) | | - |
| Total distributions | | (.02) | | (.01) | | - |
| Net asset value, end of period | $ | 13.20 | $ | 12.00 | $ | 10.61 |
Total Return D,E | | | | 13.19% | | 6.10% |
Ratios to Average Net Assets C,F,G | | | | | | |
| Expenses before reductions | | 1.71% H,I | | 2.60% | | 9.34% H,J |
| Expenses net of fee waivers, if any | | | | .89% | | .90% H |
| Expenses net of all reductions | | .90% H,I | | .89% | | .89% H |
| Net investment income (loss) | | .19% H,I | | .35% | | .31% H |
| Supplemental Data | | | | | | |
| Net assets, end of period (000 omitted) | $ | 182 | $ | 122 | $ | 107 |
Portfolio turnover rate K | | | | 37% | | 68% H |
AFor the period May 24, 2022 (commencement of operations) through April 30, 2023
BCalculated based on average shares outstanding during the period.
CNet investment income (loss) is affected by the timing of the declaration of dividends by any underlying mutual funds or exchange-traded funds (ETFs). Net investment income (loss) of any mutual funds or ETFs is not included in the Fund's net investment income (loss) ratio.
DTotal returns for periods of less than one year are not annualized.
ETotal returns would have been lower if certain expenses had not been reduced during the applicable periods shown.
FFees and expenses of any underlying mutual funds or exchange-traded funds (ETFs) are not included in the Fund's expense ratio. The Fund indirectly bears its proportionate share of these expenses. For additional expense information related to investments in Fidelity Central Funds, please refer to the "Investments in Fidelity Central Funds" note found in the Notes to Financial Statements section of the most recent Annual or Semi-Annual report.
GExpense ratios reflect operating expenses of the class. Expenses before reductions do not reflect amounts reimbursed, waived, or reduced through arrangements with the investment adviser, brokerage services, or other offset arrangements, if applicable, and do not represent the amount paid by the class during periods when reimbursements, waivers or reductions occur.
HAnnualized.
IProxy expenses are not annualized.
JAudit fees are not annualized.
KAmount does not include the portfolio activity of any underlying mutual funds or exchange-traded funds (ETFs).
Notes to Financial Statements
(Unaudited)For the period ended October 31, 2024
1. Organization.
Fidelity Healthy Future Fund (the Fund) is a non-diversified fund of Fidelity Summer Street Trust (the Trust) and is authorized to issue an unlimited number of shares. The Trust is registered under the Investment Company Act of 1940, as amended (the 1940 Act), as an open-end management investment company organized as a Massachusetts business trust. The Fund offers Class A, Class M, Class C, Fidelity Healthy Future Fund, Class I and Class Z shares, each of which has equal rights as to assets and voting privileges. Class A, Class M, Class C, Class I and Class Z are Fidelity Advisor classes. Each class has exclusive voting rights with respect to matters that affect that class. Class C shares will automatically convert to Class A shares after a holding period of eight years from the initial date of purchase, with certain exceptions.
2. Investments in Fidelity Central Funds.
Funds may invest in Fidelity Central Funds, which are open-end investment companies generally available only to other investment companies and accounts managed by the investment adviser and its affiliates. The Schedule of Investments lists any Fidelity Central Funds held as an investment as of period end, but does not include the underlying holdings of each Fidelity Central Fund. An investing fund indirectly bears its proportionate share of the expenses of the underlying Fidelity Central Funds.
Based on its investment objective, each Fidelity Central Fund may invest or participate in various investment vehicles or strategies that are similar to those of the investing fund. These strategies are consistent with the investment objectives of the investing fund and may involve certain economic risks which may cause a decline in value of each of the Fidelity Central Funds and thus a decline in the value of the investing fund.
| Fidelity Central Fund | Investment Manager | Investment Objective | Investment Practices | Expense RatioA |
| Fidelity Money Market Central Funds | Fidelity Management & Research Company LLC (FMR) | Each fund seeks to obtain a high level of current income consistent with the preservation of capital and liquidity. | Short-term Investments | Less than .005% |
A Expenses expressed as a percentage of average net assets and are as of each underlying Central Fund's most recent annual or semi-annual shareholder report.
A complete unaudited list of holdings for each Fidelity Central Fund is available upon request or at the Securities and Exchange Commission website at www.sec.gov. In addition, the financial statements of the Fidelity Central Funds which contain the significant accounting policies (including investment valuation policies) of those funds, and are not covered by the Report of Independent Registered Public Accounting Firm, are available on the Securities and Exchange Commission website or upon request.
3. Significant Accounting Policies.
The Fund is an investment company and applies the accounting and reporting guidance of the Financial Accounting Standards Board (FASB) Accounting Standards Codification Topic 946 Financial Services - Investment Companies. The financial statements have been prepared in conformity with accounting principles generally accepted in the United States of America (GAAP), which require management to make certain estimates and assumptions at the date of the financial statements. Actual results could differ from those estimates. Subsequent events, if any, through the date that the financial statements were issued have been evaluated in the preparation of the financial statements. The Fund's Schedule of Investments lists any underlying mutual funds or exchange-traded funds (ETFs) but does not include the underlying holdings of these funds. The following summarizes the significant accounting policies of the Fund:
Investment Valuation. Investments are valued as of 4:00 p.m. Eastern time on the last calendar day of the period. The Board of Trustees (the Board) has designated the Fund's investment adviser as the valuation designee responsible for the fair valuation function and performing fair value determinations as needed. The investment adviser has established a Fair Value Committee (the Committee) to carry out the day-to-day fair valuation responsibilities and has adopted policies and procedures to govern the fair valuation process and the activities of the Committee. In accordance with these fair valuation policies and procedures, which have been approved by the Board, the Fund attempts to obtain prices from one or more third party pricing services or brokers to value its investments. When current market prices, quotations or currency exchange rates are not readily available or reliable, investments will be fair valued in good faith by the Committee, in accordance with the policies and procedures. Factors used in determining fair value vary by investment type and may include market or investment specific events, transaction data, estimated cash flows, and market observations of comparable investments. The frequency that the fair valuation procedures are used cannot be predicted and they may be utilized to a significant extent. The Committee manages the Fund's fair valuation practices and maintains the fair valuation policies and procedures. The Fund's investment adviser reports to the Board information regarding the fair valuation process and related material matters.
The Fund categorizes the inputs to valuation techniques used to value its investments into a disclosure hierarchy consisting of three levels as shown below:
Level 1 - unadjusted quoted prices in active markets for identical investments
Level 2 - other significant observable inputs (including quoted prices for similar investments, interest rates, prepayment speeds, etc.)
Level 3 - unobservable inputs (including the Fund's own assumptions based on the best information available)
Valuation techniques used to value the Fund's investments by major category are as follows:
Equity securities, including restricted securities, for which market quotations are readily available, are valued at the last reported sale price or official closing price as reported by a third party pricing service on the primary market or exchange on which they are traded and are categorized as Level 1 in the hierarchy. In the event there were no sales during the day or closing prices are not available, securities are valued at the last quoted bid price or may be valued using the last available price and are generally categorized as Level 2 in the hierarchy. For foreign equity securities, when market or security specific events arise, comparisons to the valuation of American Depositary Receipts (ADRs), futures contracts, Exchange-Traded Funds (ETFs) and certain indexes as well as quoted prices for similar securities may be used and would be categorized as Level 2 in the hierarchy. For equity securities, including restricted securities, where observable inputs are limited, assumptions about market activity and risk are used and these securities may be categorized as Level 3 in the hierarchy.
Investments in open-end mutual funds, including the Fidelity Central Funds, are valued at their closing net asset value (NAV) each business day and are categorized as Level 1 in the hierarchy.
Changes in valuation techniques may result in transfers in or out of an assigned level within the disclosure hierarchy. The aggregate value of investments by input level as of October 31, 2024 is included at the end of the Fund's Schedule of Investments.
Foreign Currency. Certain Funds may use foreign currency contracts to facilitate transactions in foreign-denominated securities. Gains and losses from these transactions may arise from changes in the value of the foreign currency or if the counterparties do not perform under the contracts' terms.
Foreign-denominated assets, including investment securities, and liabilities are translated into U.S. dollars at the exchange rates at period end. Purchases and sales of investment securities, income and dividends received, and expenses denominated in foreign currencies are translated into U.S. dollars at the exchange rate in effect on the transaction date.
The effects of exchange rate fluctuations on investments are included with the net realized and unrealized gain (loss) on investment securities. Other foreign currency transactions resulting in realized and unrealized gain (loss) are disclosed separately.
Investment Transactions and Income. For financial reporting purposes, the Fund's investment holdings and NAV include trades executed through the end of the last business day of the period. The NAV per share for processing shareholder transactions is calculated as of the close of business of the New York Stock Exchange (NYSE), normally 4:00 p.m. Eastern time and includes trades executed through the end of the prior business day. Gains and losses on securities sold are determined on the basis of identified cost. Commissions paid to certain brokers with whom the investment adviser, or its affiliates, places trades on behalf of a fund include an amount in addition to trade execution, which may be rebated back to a fund. Any such rebates are included in net realized gain (loss) on investments in the Statement of Operations. Dividend income is recorded on the ex-dividend date, except for certain dividends from foreign securities where the ex-dividend date may have passed, which are recorded as soon as the Fund is informed of the ex-dividend date. Non-cash dividends included in dividend income, if any, are recorded at the fair market value of the securities received. Income and capital gain distributions from Fidelity Central Funds, if any, are recorded on the ex-dividend date. Certain distributions received by the Fund represent a return of capital or capital gain. The Fund determines the components of these distributions subsequent to the ex-dividend date, based upon receipt of tax filings or other correspondence relating to the underlying investment. These distributions are recorded as a reduction of cost of investments and/or as a realized gain. Interest income is accrued as earned and includes coupon interest and amortization of premium and accretion of discount on debt securities as applicable. Investment income is recorded net of foreign taxes withheld where recovery of such taxes is uncertain. Funds may file withholding tax reclaims in certain jurisdictions to recover a portion of amounts previously withheld. Any withholding tax reclaims income is included in the Statement of Operations in dividends. Any receivables for withholding tax reclaims are included in the Statement of Assets and Liabilities in reclaims receivable.
Class Allocations and Expenses. Investment income, realized and unrealized capital gains and losses, common expenses of a fund, and certain fund-level expense reductions, if any, are allocated daily on a pro-rata basis to each class based on the relative net assets of each class to the total net assets of a fund. Each class differs with respect to transfer agent and distribution and service plan fees incurred, as applicable. Certain expense reductions may also differ by class, if applicable. For the reporting period, the allocated portion of income and expenses to each class as a percent of its average net assets may vary due to the timing of recording these transactions in relation to fluctuating net assets of the classes. Expenses directly attributable to a fund are charged to that fund. Expenses attributable to more than one fund are allocated among the respective funds on the basis of relative net assets or other appropriate methods. Expenses included in the accompanying financial statements reflect the expenses of that fund and do not include any expenses associated with any underlying mutual funds or exchange-traded funds (ETFs). Although not included in a fund's expenses, a fund indirectly bears its proportionate share of these expenses through the net asset value of each underlying mutual fund or exchange-traded fund (ETF). Expense estimates are accrued in the period to which they relate and adjustments are made when actual amounts are known.
Income Tax Information and Distributions to Shareholders. Each year, the Fund intends to qualify as a regulated investment company under Subchapter M of the Internal Revenue Code, including distributing substantially all of its taxable income and realized gains. As a result, no provision for U.S. Federal income taxes is required. The Fund files a U.S. federal tax return, in addition to state and local tax returns as required. The Fund's federal income tax returns are subject to examination by the Internal Revenue Service (IRS) for a period of three fiscal years after they are filed. State and local tax returns may be subject to examination for an additional fiscal year depending on the jurisdiction. Foreign taxes are provided for based on the Fund's understanding of the tax rules and rates that exist in the foreign markets in which it invests.
Distributions are declared and recorded on the ex-dividend date. Income and capital gain distributions are declared separately for each class. Income and capital gain distributions are determined in accordance with income tax regulations, which may differ from GAAP.
Capital accounts within the financial statements are adjusted for permanent book-tax differences. These adjustments have no impact on net assets or the results of operations. Capital accounts are not adjusted for temporary book-tax differences which will reverse in a subsequent period.
Book-tax differences are primarily due to foreign currency transactions, capital loss carryforwards and losses deferred due to wash sales.
As of period end, the cost and unrealized appreciation (depreciation) in securities, and derivatives if applicable, for federal income tax purposes were as follows:
| Gross unrealized appreciation | $2,617,749 |
| Gross unrealized depreciation | (408,065) |
| Net unrealized appreciation (depreciation) | $2,209,684 |
| Tax cost | $10,362,328 |
Capital loss carryforwards are only available to offset future capital gains of the Fund to the extent provided by regulations and may be limited. The capital loss carryforward information presented below, including any applicable limitation, is estimated as of prior fiscal period end and is subject to adjustment.
Short-term | $(158,215) |
Long-term | - |
| Total capital loss carryforward | $(158,215) |
New Accounting Pronouncement. In November 2023, the FASB issued Accounting Standards Update (ASU) 2023-07 Segment Reporting (Topic 280): Improvements to Reportable Segment Disclosures. Effective for fiscal years beginning after December 15, 2023 and interim periods within fiscal years beginning after December 15, 2024, the amendments enhance required disclosures of segment information for public entities on an annual and interim basis. The ASU allows for early adoption with updates applied retrospectively. Management is currently evaluating the impact of the ASU but does not expect this guidance to materially impact the financial statements.
4. Purchases and Sales of Investments.
Purchases and sales of securities, other than short-term securities and in-kind transactions, as applicable, are noted in the table below.
| | Purchases ($) | Sales ($) |
| Fidelity Healthy Future Fund | 4,954,257 | 2,749,998 |
5. Fees and Other Transactions with Affiliates.
Management Fee. Fidelity Management & Research Company LLC (the investment adviser) and its affiliates provide the Fund with investment management related services for which the Fund pays a monthly management fee.
The Fund's management contract incorporates a management fee rate that may vary by class. The investment adviser or an affiliate pays certain expenses of managing and operating the Fund out of each class's management fee. Each class of the Fund pays a management fee to the investment adviser. The management fee is calculated and paid to the investment adviser every month. When determining a class's management fee, a mandate rate is calculated based on the monthly average net assets of a group of funds advised by FMR within a designated asset class. A discount rate is subtracted from the mandate rate once the Fund's monthly average net assets reach a certain level. The mandate rate and discount rate may vary by class. The annual management fee rate for a class of shares of the Fund is the lesser of (1) the class's mandate rate reduced by the class's discount rate (if applicable) or (2) the amount set forth in the following table.
| | Maximum Management Fee Rate % |
| Class A | .87 |
| Class M | .87 |
| Class C | .87 |
| Fidelity Healthy Future Fund | .87 |
| Class I | .85 |
| Class Z | .71 |
One-twelfth of the management fee rate for a class is applied to the average net assets of the class for the month, giving a dollar amount which is the management fee for the class for that month. A different management fee rate may be applicable to each class of the Fund. The difference between classes is the result of separate arrangements for class-level services and/or waivers of certain expenses. It is not the result of any difference in advisory or custodial fees or other expenses related to the management of the Fund's assets, which do not vary by class. For the reporting period, the total annualized management fee rates were as follows:
| | Total Management Fee Rate % |
| Class A | .87 |
| Class M | .87 |
| Class C | .87 |
| Fidelity Healthy Future Fund | .82 |
| Class I | .85 |
| Class Z | .71 |
Distribution and Service Plan Fees. In accordance with Rule 12b-1 of the 1940 Act, the Fund has adopted separate Distribution and Service Plans for each class of shares. Certain classes pay Fidelity Distributors Company LLC (FDC), an affiliate of the investment adviser, separate Distribution and Service Fees, each of which is based on an annual percentage of each class' average net assets. In addition, FDC may pay financial intermediaries for selling shares of the Fund and providing shareholder support services. For the period, the Distribution and Service Fee rates, total fees and amounts retained by FDC were as follows:
| | Distribution Fee | Service Fee | Total Fees ($) | Retained by FDC ($) |
| Class A | - % | .25% | 1,233 | 222 |
| Class M | .25% | .25% | 6,860 | 223 |
| Class C | .75% | .25% | 2,788 | 789 |
| | | | 10,881 | 1,234 |
Sales Load. FDC may receive a front-end sales charge of up to 5.75% for selling Class A shares and 3.50% for selling Class M shares, some of which is paid to financial intermediaries for selling shares of the Fund. Depending on the holding period, FDC may receive contingent deferred sales charges levied on Class A, Class M and Class C redemptions. The deferred sales charges are 1.00% for Class C shares, 1.00% for certain purchases of Class A shares and .25% for certain purchases of Class M shares.
For the period, sales charge amounts retained by FDC were as follows:
| | Retained by FDC ($) |
| Class A | 492 |
| Class M | 449 |
Class CA | 5 |
| | 946 |
A When Class C shares are initially sold, FDC pays commissions from its own resources to financial intermediaries through which the sales are made.
Brokerage Commissions. A portion of portfolio transactions were placed with brokerage firms which are affiliates of the investment adviser. Brokerage commissions are included in net realized gain (loss) and change in net unrealized appreciation (depreciation) in the Statement of Operations. The commissions paid to these affiliated firms were as follows:
| | Amount ($) |
| Fidelity Healthy Future Fund | 28 |
Interfund Trades. Funds may purchase from or sell securities to other Fidelity Funds under procedures adopted by the Board. The procedures have been designed to ensure these interfund trades are executed in accordance with Rule 17a-7 of the 1940 Act. Any interfund trades are included within the respective purchases and sales amounts shown in the Purchases and Sales of Investments note. Interfund trades during the period are noted in the table below.
| | Purchases ($) | Sales ($) | Realized Gain (Loss)($) |
| Fidelity Healthy Future Fund | 807,805 | 188,308 | (30,267) |
6. Committed Line of Credit.
Certain Funds participate with other funds managed by the investment adviser or an affiliate in a $4.25 billion credit facility (the "line of credit") to be utilized for temporary or emergency purposes to fund shareholder redemptions or for other short-term liquidity purposes. The participating funds have agreed to pay commitment fees on their pro-rata portion of the line of credit, which are reflected in Miscellaneous expenses on the Statement of Operations, and are listed below. During the period, there were no borrowings on this line of credit.
| | Amount ($) |
| Fidelity Healthy Future Fund | 8 |
7. Expense Reductions.
The investment adviser contractually agreed to reimburse expenses of each class to the extent annual operating expenses exceeded certain levels of class-level average net assets as noted in the table below. This reimbursement will remain in place through August 31, 2025. Some expenses, for example the compensation of the independent Trustees, are excluded from this reimbursement.
The following classes were in reimbursement during the period:
| | Expense Limitations | Reimbursement ($) |
| Class A | 1.30% | 3,546 |
| Class M | 1.55% | 9,410 |
| Class C | 2.05% | 1,952 |
| Fidelity Healthy Future Fund | 1.05% | 24,263 |
| Class I | 1.05% | 513 |
| Class Z | .90% | 742 |
| | | 40,426 |
Through arrangements with the Fund's custodian, credits realized as a result of certain uninvested cash balances were used to reduce the Fund's expenses. During the period, custodian credits reduced the Fund's expenses by $217.
8. Distributions to Shareholders.
Distributions to shareholders of each class were as follows:
| | Six months ended October 31, 2024 | Year ended April 30, 2024 |
| Fidelity Healthy Future Fund | | |
| Distributions to shareholders | | |
| Fidelity Healthy Future Fund | 7,004 | 2,853 |
| Class I | 95 | 91 |
| Class Z | 331 | 81 |
Total | $7,430 | $3,025 |
9. Share Transactions.
Share transactions for each class were as follows and may contain in-kind transactions, automatic conversions between classes or exchanges between affiliated funds:
| | Shares | Shares | Dollars | Dollars |
| | Six months ended October 31, 2024 | Year ended April 30, 2024 | Six months ended October 31, 2024 | Year ended April 30, 2024 |
| Fidelity Healthy Future Fund | | | | |
| Class A | | | | |
| Shares sold | 10,419 | 60,658 | $134,653 | $668,918 |
| Shares redeemed | (6,909) | (8,451) | (91,020) | (96,085) |
| Net increase (decrease) | 3,510 | 52,207 | $43,633 | $572,833 |
| Class M | | | | |
| Shares sold | 121,941 | 128,604 | $1,534,464 | $1,431,236 |
| Shares redeemed | (4,824) | (9,527) | (62,041) | (104,174) |
| Net increase (decrease) | 117,117 | 119,077 | $1,472,423 | $1,327,062 |
| Class C | | | | |
| Shares sold | 26,858 | 10,734 | $330,808 | $123,647 |
| Shares redeemed | (3,176) | (807) | (41,026) | (8,515) |
| Net increase (decrease) | 23,682 | 9,927 | $289,782 | $115,132 |
| Fidelity Healthy Future Fund | | | | |
| Shares sold | 152,884 | 403,281 | $2,003,285 | $4,519,404 |
| Reinvestment of distributions | 482 | 215 | 6,247 | 2,296 |
| Shares redeemed | (107,386) | (195,003) | (1,400,845) | (2,184,086) |
| Net increase (decrease) | 45,980 | 208,493 | $608,687 | $2,337,614 |
| Class I | | | | |
| Shares sold | 2,908 | 4,013 | $39,191 | $47,126 |
| Reinvestment of distributions | 7 | 9 | 95 | 91 |
| Shares redeemed | (2,761) | (1,579) | (35,284) | (18,393) |
| Net increase (decrease) | 154 | 2,443 | $4,002 | $28,824 |
| Class Z | | | | |
| Shares sold | 7,701 | 47 | $96,922 | $490 |
| Reinvestment of distributions | 17 | 8 | 224 | 81 |
| Shares redeemed | (4,074) | - | (52,614) | - |
| Net increase (decrease) | 3,644 | 55 | $44,532 | $571 |
10. Other.
A fund's organizational documents provide former and current trustees and officers with a limited indemnification against liabilities arising in connection with the performance of their duties to the fund. In the normal course of business, a fund may also enter into contracts that provide general indemnifications. A fund's maximum exposure under these arrangements is unknown as this would be dependent on future claims that may be made against a fund. The risk of material loss from such claims is considered remote.
11. Risk and Uncertainties.
Many factors affect a fund's performance. Developments that disrupt global economies and financial markets, such as pandemics, epidemics, outbreaks of infectious diseases, war, terrorism, and environmental disasters, may significantly affect a fund's investment performance. The effects of these developments to a fund will be impacted by the types of securities in which a fund invests, the financial condition, industry, economic sector, and geographic location of an issuer, and a fund's level of investment in the securities of that issuer. Significant concentrations in security types, issuers, industries, sectors, and geographic locations may magnify the factors that affect a fund's performance.
Item 8: Changes in and Disagreements with Accountants for Open-End Management Investment Companies
(Unaudited)
Note: This is not applicable for any fund included in this document.
Item 9: Proxy Disclosures for Open-End Management Investment Companies
(Unaudited)
| A special meeting of shareholders was held on July 16, 2024. The results of votes taken among shareholders on the proposal before them are reported below. Each vote reported represents one dollar of net asset value held on the record date for the meeting. |
| Proposal 1 |
| To elect a Board of Trustees. |
| | # of Votes | % of Votes |
| Bettina Doulton |
| Affirmative | 14,516,835,136.19 | 94.56 |
| Withheld | 834,887,998.33 | 5.44 |
| TOTAL | 15,351,723,134.52 | 100.00 |
| Robert A. Lawrence |
| Affirmative | 14,430,495,798.10 | 94.00 |
| Withheld | 921,227,336.42 | 6.00 |
| TOTAL | 15,351,723,134.52 | 100.00 |
| Vijay C. Advani |
| Affirmative | 14,465,231,640.25 | 94.23 |
| Withheld | 886,491,494.27 | 5.77 |
| TOTAL | 15,351,723,134.52 | 100.00 |
| Thomas P. Bostick |
| Affirmative | 14,471,831,170.84 | 94.27 |
| Withheld | 879,891,963.68 | 5.73 |
| TOTAL | 15,351,723,134.52 | 100.00 |
| Donald F. Donahue |
| Affirmative | 14,432,670,599.88 | 94.01 |
| Withheld | 919,052,534.64 | 5.99 |
| TOTAL | 15,351,723,134.52 | 100.00 |
| Vicki L. Fuller |
| Affirmative | 14,531,407,981.65 | 94.66 |
| Withheld | 820,315,152.87 | 5.34 |
| TOTAL | 15,351,723,134.52 | 100.00 |
| Patricia L. Kampling |
| Affirmative | 14,549,142,839.16 | 94.77 |
| Withheld | 802,580,295.36 | 5.23 |
| TOTAL | 15,351,723,134.52 | 100.00 |
| Thomas A. Kennedy |
| Affirmative | 14,469,818,769.40 | 94.26 |
| Withheld | 881,904,365.12 | 5.74 |
| TOTAL | 15,351,723,134.52 | 100.00 |
| Oscar Munoz |
| Affirmative | 14,434,061,467.08 | 94.02 |
| Withheld | 917,661,667.44 | 5.98 |
| TOTAL | 15,351,723,134.52 | 100.00 |
| Karen B. Peetz |
| Affirmative | 14,521,904,618.46 | 94.59 |
| Withheld | 829,818,516.06 | 5.41 |
| TOTAL | 15,351,723,134.52 | 100.00 |
| David M. Thomas |
| Affirmative | 14,417,745,861.73 | 93.92 |
| Withheld | 933,977,272.79 | 6.08 |
| TOTAL | 15,351,723,134.52 | 100.00 |
| Susan Tomasky |
| Affirmative | 14,467,973,468.18 | 94.24 |
| Withheld | 883,749,666.34 | 5.76 |
| TOTAL | 15,351,723,134.52 | 100.00 |
| Michael E. Wiley |
| Affirmative | 14,424,002,796.91 | 93.96 |
| Withheld | 927,720,337.61 | 6.04 |
| TOTAL | 15,351,723,134.52 | 100.00 |
| | | |
| Proposal 1 reflects trust-wide proposal and voting results. |
Item 10: Remuneration Paid to Directors, Officers, and others of Open-End Management Investment Companies
(Unaudited)
Note: This information is disclosed as part of the financial statements for each Fund as part of Item 7: Financial Statements and Financial Highlights for Open-End Management Investment companies.
Item 11: Statement Regarding Basis for Approval of Investment Advisory Contract
(Unaudited)
Board Approval of Investment Advisory Contracts and Management Fees
Fidelity Healthy Future Fund
Each year, the Board of Trustees, including the Independent Trustees (together, the Board), considers the renewal of the fund's management contract with Fidelity Management & Research Company LLC (FMR) and certain affiliates and the sub-advisory agreements (together, the Advisory Contracts) for the fund. FMR and the sub-advisers are referred to herein as the Investment Advisers. The Board, assisted by the advice of fund counsel and Independent Trustees' counsel, requests and considers a broad range of information relevant to the renewal of the Advisory Contracts throughout the year.
The Board meets regularly and, at each of its meetings, covers an extensive agenda of topics and materials and considers factors that are relevant to its annual consideration of the renewal of the fund's Advisory Contracts, including the services and support provided to the fund and its shareholders. The Board, acting directly and through its Committees (each of which is composed of and chaired by Independent Trustees), requests and receives information concerning the annual consideration of the renewal of the fund's Advisory Contracts. The Board also meets as needed to review matters specifically related to the Board's annual consideration of the renewal of the Advisory Contracts. Members of the Board may also meet with trustees of other Fidelity funds through joint ad hoc committees to discuss certain matters relevant to all of the Fidelity funds.
At its May 2024 meeting, the Board unanimously determined to renew the fund's Advisory Contracts. In reaching its determination, the Board considered all factors it believed relevant, including (i) the nature, extent, and quality of the services provided to the fund and its shareholders (including the investment performance of the fund); (ii) the competitiveness relative to peer funds of the fund's management fee and the total expense ratio of a representative class (the retail class, which was selected because it was the largest class without 12b-1 fees); (iii) the total costs of the services provided by and the profits realized by FMR and its affiliates (Fidelity) from its relationships with the fund; and (iv) the extent to which, if any, economies of scale exist and are realized as the fund grows, and whether any economies of scale are appropriately shared with fund shareholders. The Board also considered the broad range of investment choices available to shareholders from FMR's competitors and that the fund's shareholders have chosen to invest in the fund, which is part of the Fidelity family of funds. The Board's decision to renew the Advisory Contracts was not based on any single factor.
The Board reached a determination, with the assistance of fund counsel and Independent Trustees' counsel and through the exercise of its business judgment, that the renewal of the Advisory Contracts was in the best interests of the fund and its shareholders and that the compensation payable under the Advisory Contracts was fair and reasonable in light of all of the surrounding circumstances.
Nature, Extent, and Quality of Services Provided. The Board considered staffing as it relates to the fund, including the backgrounds and experience of investment personnel of the Investment Advisers, and also considered the Investment Advisers' implementation of the fund's investment program. The Independent Trustees also had discussions with senior management of Fidelity's investment operations and investment groups. The Board considered the structure of the investment personnel compensation program and whether this structure provides appropriate incentives to act in the best interests of the fund. Additionally, the Board considered the portfolio managers' investments, if any, in the funds that they manage.
Resources Dedicated to Investment Management and Support Services. The Board and the Fund Oversight and Research Committees reviewed the general qualifications and capabilities of Fidelity's investment staff, including its size, education, experience, and resources, as well as Fidelity's approach to recruiting, training, managing, and compensating investment personnel. The Board noted the resources devoted to expansion of Fidelity's global investment organization, and that Fidelity's analysts have extensive resources, tools, and capabilities that allow them to conduct sophisticated quantitative and fundamental analysis, as well as credit analysis of issuers, counterparties, and guarantors. Further, the Board considered that Fidelity's investment professionals have sufficient access to global information and data so as to provide competitive investment results over time, and that those professionals also have access to sophisticated tools that permit them to assess portfolio construction and risk and performance attribution characteristics continuously, as well as to transmit new information and research conclusions rapidly around the world. Additionally, in its deliberations, the Board considered Fidelity's trading, risk management, compliance, and technology and operations capabilities and resources, which are integral parts of the investment management process.
Shareholder and Administrative Services. The Board considered (i) the nature, extent, quality, and cost of advisory, administrative, shareholder, transfer agency, and pricing and bookkeeping services performed by the Investment Advisers and their affiliates under the Advisory Contracts; (ii) the nature and extent of Fidelity's supervision of third party service providers, principally custodians, subcustodians, and pricing vendors; and (iii) the resources devoted by Fidelity to, and the record of compliance with, the fund's compliance policies and procedures. The Board also reviewed the allocation of fund brokerage, including allocations to brokers affiliated with the Investment Advisers, the use of brokerage commissions to pay fund expenses, and the use of "soft" commission dollars to pay for research services. The Board also considered the fund's securities lending activities and any payments made to Fidelity relating to securities lending under a separate agreement.
The Board noted that the growth of fund assets over time across the complex allows Fidelity to reinvest in the development of services designed to enhance the value and convenience of the Fidelity funds as investment vehicles. These services include 24-hour access to account information and market information over the Internet and through telephone representatives, investor education materials, and asset allocation tools. The Board also considered that it reviews customer service metrics such as telephone response times, continuity of services on the website and metrics addressing services at Fidelity Investor Centers.
Investment in a Large Fund Family. The Board considered the benefits to shareholders of investing in a fund that is part of a large family of funds offering a variety of investment disciplines and providing a large variety of fund investor services. The Board noted that Fidelity had taken, or had made recommendations that resulted in the Fidelity funds taking, a number of actions over the previous year that benefited particular funds and/or the Fidelity funds in general.
Investment Performance. The Board took into account discussions that occur with representatives of the Investment Advisers, and reports that it receives, at Board meetings throughout the year, relating to fund investment performance. In this regard the Board noted that as part of regularly scheduled fund reviews and other reports to the Board on fund performance, the Board considered annualized return information for the fund for different time periods, measured against an appropriate securities market index (benchmark index). The Board also considered information about performance attribution. In its ongoing evaluation of fund investment performance, the Board gives particular attention to information indicating changes in performance of the funds over different time periods and discussed with the Investment Advisers the reasons for any overperformance or underperformance.
In addition to reviewing absolute and relative fund performance, the Independent Trustees periodically consider the appropriateness of fund performance metrics in evaluating the results achieved. The Independent Trustees generally give greater weight to fund performance over longer time periods than over shorter time periods. Depending on the circumstances, the Independent Trustees may be satisfied with a fund's performance notwithstanding that it lags its benchmark index for certain periods.
Based on its review, the Board concluded that the nature, extent, and quality of services provided to the fund under the Advisory Contracts should continue to benefit the shareholders of the fund.
Competitiveness of Management Fee and Total Expense Ratio. The Board was provided with information regarding industry trends in management fees and expenses. The Board considered that, effective March 1, 2024, an amended Advisory Contract with FMR went into effect with class-level management fees based on tiered schedules and subject to a maximum class-level rate (the management fee). The Board also considered that in exchange for the variable management fee, each class of the fund receives investment advisory, management, administrative, transfer agent, and pricing and bookkeeping services. In its review of the management fee and total expense ratio of the retail class, the Board considered a pro forma management fee rate for the retail class as if it had been in effect for the 12-month period ended September 30, 2023, as well as other third-party fund expenses, as applicable, such as custodial, legal, and audit fees and any fund-paid 12b-1 fees. The Board noted that Fidelity may agree to waive fees or reimburse expenses from time to time, and the extent to which, if any, it has done so for the fund.
Comparisons of Management Fees and Total Expense Ratios. Among other things, the Board reviewed data for selected groups of competitive funds and classes (referred to as "mapped groups") that were compiled by Fidelity based on combining similar investment objective categories (as classified by Morningstar) that have comparable investment mandates. The data reviewed by the Board included (i) gross management fee comparisons (before taking into account expense reimbursements or caps) relative to the total universe of funds within the mapped group; (ii) gross management fee comparisons relative to a subset of non-Fidelity funds in the mapped group that are similar in size and management fee structure to the fund (referred to as the "asset size peer group"); (iii) total expense comparisons of the retail class of the fund relative to funds and classes in the mapped group that have a similar sales load structure to the retail class of the fund (referred to as the "similar sales load structure group"); and (iv) total expense comparisons of the retail class of the fund relative to funds and classes in the similar sales load structure group that are similar in size and management fee structure to the fund (referred to as the "total expense asset size peer group"). The total expense asset size peer group comparison excludes performance adjustments and fund-paid 12b-1 fees to eliminate variability in fee structures.
The information provided to the Board indicated that the fund's management fee rate ranked above the competitive median of the mapped group for the period ended September 30, 2023 and below the competitive median of the asset size peer group for the period ended September 30, 2023. Further, the information provided to the Board indicated that the total expense ratio of the retail class of the fund ranked above the competitive median of the similar sales load structure group for the period ended September 30, 2023 and below the competitive median of the total expense asset size peer group for the period ended September 30, 2023. The Board considered that the fund has a variable unified management fee that covers expenses for services beyond portfolio management. The Board considered the fund's small size and noted that Fidelity anticipates that the total expense ratio will decrease as assets grow.
The Board noted that a different variable management fee rate is applicable to each class of the fund. The Board considered that the difference in management fee rates between classes is the result of separate arrangements for class-level services and/or waivers of certain expenses and not the result of any difference in advisory or custodial fees or other expenses related to the management of the fund's assets, which do not vary by class.
Other Contractual Arrangements. The Board further considered that FMR has contractually agreed to reimburse Class A, Class M, Class C, Class I, Class Z, and the retail class of the fund to the extent that total operating expenses, with certain exceptions, as a percentage of their respective average net assets, exceed 1.30%, 1.55%, 2.05%, 1.05%, 0.90%, and 1.05% through August 31, 2025.
Fees Charged to Other Fidelity Clients. The Board also considered Fidelity fee structures and other information with respect to clients of Fidelity, such as other funds advised or subadvised by Fidelity, pension plan clients, and other institutional clients with similar mandates. The Board noted that a joint ad hoc committee created by it and the boards of other Fidelity funds periodically reviews and compares Fidelity's institutional investment advisory business with its business of providing services to the Fidelity funds and also noted the most recent findings of the committee. The Board noted that the committee's review included a consideration of the differences in services provided, fees charged, and costs incurred, as well as competition in the markets serving the different categories of clients.
Based on its review, the Board concluded that the fund's management fee is fair and reasonable in light of the services that the fund receives and the other factors considered. Further based on its review of total expense ratios and fees charged to other Fidelity clients, the Board concluded that the total expense ratio of each class of the fund was reasonable in light of the services that the fund and its shareholders receive and the other factors considered.
Costs of the Services and Profitability. The Board considered the revenues earned and the expenses incurred by Fidelity in conducting the business of developing, marketing, distributing, managing, administering and servicing the fund and servicing the fund's shareholders. The Board also considered the level of Fidelity's profits in respect of all the Fidelity funds.
On an annual basis, Fidelity presents to the Board information about the profitability of its relationships with the fund. Fidelity calculates profitability information for each fund, as well as aggregate profitability information for groups of Fidelity funds and all Fidelity funds, using a series of detailed revenue and cost allocation methodologies which originate with the books and records of Fidelity on which Fidelity's audited financial statements are based. The Audit Committee of the Board reviews any significant changes from the prior year's methodologies.
A public accounting firm has been engaged annually by the Board as part of the Board's assessment of Fidelity's profitability analysis. The engagement includes the review and assessment of the methodologies used by Fidelity in determining the revenues and expenses attributable to Fidelity's fund business, and completion of agreed-upon procedures in respect of the mathematical accuracy of certain fund profitability information and its conformity to established allocation methodologies. After considering the reports issued under the engagement and information provided by Fidelity, the Board concluded that while other allocation methods may also be reasonable, Fidelity's profitability methodologies are reasonable in all material respects.
The Board also reviewed Fidelity's non-fund businesses and potential indirect benefits such businesses may have received as a result of their association with Fidelity's fund business (i.e., fall-out benefits) as well as cases where Fidelity's affiliates may benefit from the funds' business. The Board considered areas where potential indirect benefits to the Fidelity funds from their relationships with Fidelity may exist. The Board's consideration of these matters was informed by the findings of a joint ad hoc committee created by it and the boards of other Fidelity funds to evaluate potential fall-out benefits.
The Board considered the costs of the services provided by and the profits realized by Fidelity in connection with the operation of the fund and was satisfied that the profitability was not excessive.
Economies of Scale. The Board considered whether there have been economies of scale in respect of the management of the Fidelity funds, whether the Fidelity funds (including the fund) have appropriately benefited from any such economies of scale, and whether there is potential for realization of any further economies of scale. The Board considered the extent to which the fund will benefit from economies of scale as assets grow through increased services to the fund, through waivers or reimbursements, or through fee or expense ratio reductions. The Board also noted that a committee created by it and the boards of other Fidelity funds periodically analyzes whether Fidelity attains economies of scale in respect of the management and servicing of the Fidelity funds, whether the Fidelity funds have appropriately benefited from such economies of scale, and whether there is potential for realization of any further economies of scale.
The Board recognized that the fund's management contract incorporates a variable management fee structure, which provides breakpoints as a way to share, in part, any potential economies of scale that may exist at the asset class level and through a discount that considers both fund size and total assets of the four applicable asset classes. The Board considered that the variable management fee is designed to deliver the benefits of economies of scale to fund shareholders even if assets of any particular fund are unchanged or have declined, because some portion of Fidelity's costs are attributable to services provided to all funds subject to the variable management fee, and all such funds benefit if those costs can be allocated among more assets. The Board concluded that, given the variable management fee structure, fund shareholders will benefit from lower management fees due to the application of the breakpoints and discount factor, regardless of whether Fidelity achieves any such economies of scale.
The Board concluded, taking into account the analysis of the committee, that economies of scale, if any, are being appropriately shared between fund shareholders and Fidelity.
Additional Information Requested by the Board. In order to develop fully the factual basis for consideration of the Fidelity funds' advisory contracts, the Board requested and received additional information on certain topics, including but not limited to: (i) fund flow and performance trends, in particular the underperformance of certain funds and strategies, and Fidelity's long-term strategies for certain funds; (ii) the operation of performance fees and the rationale for implementing performance fees on certain categories of funds but not others; (iii) Fidelity's pricing philosophy compared to competitors; (iv) fund profitability methodology and data; (v) evaluation of competitive fund data and peer group classifications and fee and expense comparisons; (vi) the management fee and expense structures for different funds and classes and information about the differences between various fee and expense structures; (vii) the variable management fee implemented for certain funds effective March 1, 2024; and (viii) information regarding other accounts managed by Fidelity and the funds' sub-advisory arrangements.
Conclusion. Based on its evaluation of all of the conclusions noted above, and after considering all factors it believed relevant, the Board, including the Independent Trustees, concluded that the advisory and sub-advisory fee arrangements are fair and reasonable in light of all of the surrounding circumstances and that the fund's Advisory Contracts should be renewed through May 31, 2025.
1.9904958.102
HWF-SANN-1224
Fidelity® Short Duration High Income Fund
Semi-Annual Report
October 31, 2024
Includes Fidelity and Fidelity Advisor share classes
Contents
To view a fund's proxy voting guidelines and proxy voting record for the 12-month period ended June 30, visit http://www.fidelity.com/proxyvotingresults or visit the Securities and Exchange Commission's (SEC) web site at http://www.sec.gov.
You may also call 1-800-544-8544 if you're an individual investing directly with Fidelity, call 1-800-835-5092 if you're a plan sponsor or participant with Fidelity as your recordkeeper or call 1-877-208-0098 on institutional accounts or if you're an advisor or invest through one to request a free copy of the proxy voting guidelines.
Standard & Poor's, S&P and S&P 500 are registered service marks of The McGraw-Hill Companies, Inc. and have been licensed for use by Fidelity Distributors Corporation.
Other third-party marks appearing herein are the property of their respective owners.
All other marks appearing herein are registered or unregistered trademarks or service marks of FMR LLC or an affiliated company. © 2024 FMR LLC. All rights reserved.
This report and the financial statements contained herein are submitted for the general information of the shareholders of the Fund. This report is not authorized for distribution to prospective investors in the Fund unless preceded or accompanied by an effective prospectus.
A fund files its complete schedule of portfolio holdings with the SEC for the first and third quarters of each fiscal year on Form N-PORT. Forms N-PORT are available on the SEC's web site at http://www.sec.gov. A fund's Forms N-PORT may be reviewed and copied at the SEC's Public Reference Room in Washington, DC. Information regarding the operation of the SEC's Public Reference Room may be obtained by calling 1-800-SEC-0330.
For a complete list of a fund's portfolio holdings, view the most recent holdings listing, semiannual report, or annual report on Fidelity's web site at http://www.fidelity.com, http://www.institutional.fidelity.com, or http://www.401k.com, as applicable.
NOT FDIC INSURED •MAY LOSE VALUE •NO BANK GUARANTEE
Neither the Fund nor Fidelity Distributors Corporation is a bank.
Item 7: Financial Statements and Financial Highlights for Open-End Management Investment Companies (Semi-Annual Report)
Fidelity® Short Duration High Income Fund
Schedule of Investments October 31, 2024 (Unaudited)
Showing Percentage of Net Assets
| Corporate Bonds - 79.7% |
| | | Principal Amount (a) | Value ($) |
| Convertible Bonds - 1.4% | | | |
| Automotive & Auto Parts - 0.1% | | | |
| Rivian Automotive, Inc. 3.625% 10/15/30 | | 527,000 | 407,582 |
| Broadcasting - 0.7% | | | |
| DISH Network Corp. 3.375% 8/15/26 | | 2,000,000 | 1,679,226 |
| Diversified Financial Services - 0.0% | | | |
| Coinbase Global, Inc. 0.25% 4/1/30 (b) | | 10,000 | 9,055 |
| Energy - 0.1% | | | |
| Sunnova Energy International, Inc. 0.25% 12/1/26 | | 263,000 | 170,753 |
| Homebuilders/Real Estate - 0.2% | | | |
| Anywhere Real Estate Group LLC/Realogy Co-Issuer Corp. 0.25% 6/15/26 | | 510,000 | 441,915 |
| Meritage Homes Corp. 1.75% 5/15/28 (b) | | 10,000 | 10,615 |
| | | | 452,530 |
| Leisure - 0.0% | | | |
| Peloton Interactive, Inc. 5.5% 12/1/29 (b) | | 30,000 | 62,115 |
| Technology - 0.3% | | | |
| BlackLine, Inc. 1% 6/1/29 (b) | | 40,000 | 41,620 |
| Global Payments, Inc. 1.5% 3/1/31 (b) | | 348,000 | 331,818 |
| Wolfspeed, Inc. 1.875% 12/1/29 | | 648,000 | 322,704 |
| | | | 696,142 |
TOTAL CONVERTIBLE BONDS | | | 3,477,403 |
| Nonconvertible Bonds - 78.3% | | | |
| Aerospace - 3.0% | | | |
| Bombardier, Inc.: | | | |
| 6% 2/15/28 (b) | | 125,000 | 124,860 |
| 7.875% 4/15/27 (b) | | 494,000 | 494,974 |
| Howmet Aerospace, Inc. 5.9% 2/1/27 | | 455,000 | 466,125 |
| Rolls-Royce PLC 5.75% 10/15/27 (b) | | 475,000 | 484,601 |
| Spirit Aerosystems, Inc. 9.75% 11/15/30 (b) | | 210,000 | 233,115 |
| TransDigm, Inc.: | | | |
| 5.5% 11/15/27 | | 1,235,000 | 1,222,650 |
| 6.375% 3/1/29 (b) | | 1,160,000 | 1,177,446 |
| 6.75% 8/15/28 (b) | | 2,935,000 | 3,001,038 |
| VistaJet Malta Finance PLC / XO Management Holding, Inc. 7.875% 5/1/27 (b) | | 385,000 | 374,785 |
| | | | 7,579,594 |
| Air Transportation - 2.1% | | | |
| American Airlines, Inc. 7.25% 2/15/28 (b)(c) | | 380,000 | 386,250 |
| American Airlines, Inc. / AAdvantage Loyalty IP Ltd. 5.5% 4/20/26 (b) | | 1,400,000 | 1,395,793 |
| JetBlue Airways Corp./JetBlue Loyalty LP 9.875% 9/20/31 (b) | | 190,000 | 197,442 |
| Rand Parent LLC 8.5% 2/15/30 (b)(c) | | 1,570,000 | 1,566,546 |
| Spirit Loyalty Cayman Ltd. / Spirit IP Cayman Ltd.: | | | |
| 8% 9/20/25 (b) | | 325,000 | 202,032 |
| 8% 9/20/25 (b) | | 95,000 | 59,056 |
| United Airlines, Inc. 4.375% 4/15/26 (b) | | 1,325,000 | 1,302,111 |
| | | | 5,109,230 |
| Automotive & Auto Parts - 1.2% | | | |
| Arko Corp. 5.125% 11/15/29 (b) | | 60,000 | 55,271 |
| Aston Martin Capital Holdings Ltd. 10% 3/31/29 (b) | | 200,000 | 194,290 |
| Belron UK Finance PLC 5.75% 10/15/29 (b) | | 370,000 | 370,810 |
| Clarios Global LP / Clarios U.S. Finance Co. 6.75% 5/15/28 (b) | | 180,000 | 184,253 |
| Hudson Automotive Group 8% 5/15/32 (b) | | 140,000 | 146,358 |
| Macquarie AirFinance Holdings: | | | |
| 8.125% 3/30/29 (b) | | 485,000 | 513,051 |
| 8.375% 5/1/28 (b) | | 600,000 | 630,664 |
| McLaren Finance PLC 7.5% 8/1/26 (b) | | 310,000 | 300,700 |
| Phinia, Inc. 6.75% 4/15/29 (b) | | 180,000 | 183,745 |
| Real Hero Merger Sub 2 6.25% 2/1/29 (b) | | 30,000 | 26,201 |
| Wand NewCo 3, Inc. 7.625% 1/30/32 (b) | | 295,000 | 304,915 |
| | | | 2,910,258 |
| Banks & Thrifts - 0.4% | | | |
| Jane Street Group LLC/JSG Finance, Inc. 6.125% 11/1/32 (b) | | 345,000 | 345,223 |
| VFH Parent LLC / Valor Co-Issuer, Inc. 7.5% 6/15/31 (b) | | 270,000 | 277,242 |
| Western Alliance Bancorp. 3% 6/15/31 (d) | | 520,000 | 480,381 |
| | | | 1,102,846 |
| Broadcasting - 2.2% | | | |
| Clear Channel Outdoor Holdings, Inc.: | | | |
| 7.5% 6/1/29 (b) | | 140,000 | 119,645 |
| 7.875% 4/1/30 (b) | | 235,000 | 239,604 |
| 9% 9/15/28 (b) | | 1,025,000 | 1,076,583 |
| DISH Network Corp. 11.75% 11/15/27 (b) | | 1,130,000 | 1,189,460 |
| iHeartCommunications, Inc. 4.75% 1/15/28 (b) | | 525,000 | 322,077 |
| Sirius XM Radio, Inc. 3.125% 9/1/26 (b) | | 1,995,000 | 1,913,695 |
| Univision Communications, Inc.: | | | |
| 4.5% 5/1/29 (b) | | 280,000 | 248,575 |
| 8% 8/15/28 (b) | | 370,000 | 376,011 |
| | | | 5,485,650 |
| Building Materials - 0.7% | | | |
| Advanced Drain Systems, Inc. 5% 9/30/27 (b) | | 245,000 | 240,561 |
| AmeriTex Holdco Intermediate LLC 10.25% 10/15/28 (b) | | 355,000 | 373,527 |
| Beacon Roofing Supply, Inc. 6.5% 8/1/30 (b) | | 195,000 | 198,212 |
| Eco Material Technologies, Inc. 7.875% 1/31/27 (b) | | 405,000 | 407,609 |
| Global Infrastructure Solutions, Inc. 5.625% 6/1/29 (b) | | 185,000 | 180,387 |
| Star Holding LLC 8.75% 8/1/31 (b) | | 235,000 | 223,487 |
| Summit Materials LLC/Summit Materials Finance Corp. 7.25% 1/15/31 (b) | | 180,000 | 186,300 |
| | | | 1,810,083 |
| Cable/Satellite TV - 1.0% | | | |
| CCO Holdings LLC/CCO Holdings Capital Corp. 5.125% 5/1/27 (b) | | 2,425,000 | 2,374,469 |
| Telenet Finance Luxembourg Notes SARL 5.5% 3/1/28 (b) | | 200,000 | 194,684 |
| | | | 2,569,153 |
| Capital Goods - 1.3% | | | |
| ESAB Corp. 6.25% 4/15/29 (b) | | 1,190,000 | 1,210,954 |
| Patrick Industries, Inc. 6.375% 11/1/32 (b) | | 375,000 | 370,860 |
| Resideo Funding, Inc. 6.5% 7/15/32 (b)(c) | | 360,000 | 362,314 |
| TK Elevator U.S. Newco, Inc. 5.25% 7/15/27 (b) | | 1,300,000 | 1,278,715 |
| | | | 3,222,843 |
| Chemicals - 3.5% | | | |
| Avient Corp. 6.25% 11/1/31 (b) | | 240,000 | 240,702 |
| Axalta Coating Systems Dutch Holding B BV 7.25% 2/15/31 (b) | | 590,000 | 616,577 |
| Compass Minerals International, Inc. 6.75% 12/1/27 (b) | | 205,000 | 202,067 |
| Kobe U.S. Midco 2, Inc. 9.25% 11/1/26 pay-in-kind (b)(d) | | 254,700 | 215,165 |
| LSB Industries, Inc. 6.25% 10/15/28 (b) | | 240,000 | 232,182 |
| Methanex Corp. 5.125% 10/15/27 | | 900,000 | 875,879 |
| NOVA Chemicals Corp.: | | | |
| 5% 5/1/25 (b) | | 1,005,000 | 1,000,701 |
| 5.25% 6/1/27 (b) | | 400,000 | 392,597 |
| 9% 2/15/30 (b) | | 110,000 | 117,158 |
| Olympus Water U.S. Holding Corp. 7.25% 6/15/31 (b) | | 460,000 | 471,965 |
| SCIH Salt Holdings, Inc.: | | | |
| 4.875% 5/1/28 (b) | | 1,995,000 | 1,910,285 |
| 6.625% 5/1/29 (b) | | 300,000 | 291,249 |
| SPCM SA 3.125% 3/15/27 (b) | | 395,000 | 375,761 |
| The Chemours Co. LLC 5.375% 5/15/27 | | 1,075,000 | 1,035,035 |
| Tronox, Inc. 4.625% 3/15/29 (b)(c) | | 530,000 | 480,862 |
| W.R. Grace Holding LLC 7.375% 3/1/31 (b) | | 180,000 | 186,037 |
| | | | 8,644,222 |
| Consumer Products - 2.3% | | | |
| Coty, Inc. 5% 4/15/26 (b) | | 1,100,000 | 1,094,273 |
| Kohl's Corp. 4.25% 7/17/25 | | 70,000 | 69,098 |
| Kronos Acquisition Holdings, Inc.: | | | |
| 8.25% 6/30/31 (b) | | 230,000 | 227,773 |
| 10.75% 6/30/32 (b) | | 205,000 | 191,004 |
| Mattel, Inc. 5.875% 12/15/27 (b) | | 460,000 | 464,666 |
| Newell Brands, Inc.: | | | |
| 5.7% 4/1/26 | | 675,000 | 676,507 |
| 6.375% 5/15/30 (e) | | 280,000 | 281,280 |
| 6.625% 5/15/32 (e) | | 215,000 | 215,621 |
| Tempur Sealy International, Inc. 4% 4/15/29 (b) | | 865,000 | 797,036 |
| The Gates Corp. 6.875% 7/1/29 (b) | | 340,000 | 349,326 |
| TKC Holdings, Inc.: | | | |
| 6.875% 5/15/28 (b) | | 390,000 | 383,957 |
| 10.5% 5/15/29 (b) | | 825,000 | 833,366 |
| Wayfair LLC 7.25% 10/31/29 (b)(c) | | 240,000 | 242,859 |
| | | | 5,826,766 |
| Containers - 1.9% | | | |
| Ardagh Packaging Finance PLC/Ardagh MP Holdings U.S.A., Inc. 4.125% 8/15/26 (b) | | 835,000 | 726,450 |
| Graphic Packaging International, Inc. 6.375% 7/15/32 (b) | | 460,000 | 464,106 |
| Mauser Packaging Solutions Holding Co. 7.875% 4/15/27 (b) | | 525,000 | 539,438 |
| Owens-Brockway Glass Container, Inc. 7.25% 5/15/31 (b)(c) | | 610,000 | 599,950 |
| Sealed Air Corp. 5% 4/15/29 (b) | | 1,500,000 | 1,448,954 |
| Sealed Air Corp./Sealed Air Corp. U.S. 6.125% 2/1/28 (b)(c) | | 515,000 | 520,473 |
| Trivium Packaging Finance BV 8.5% 8/15/27 (b) | | 450,000 | 448,656 |
| | | | 4,748,027 |
| Diversified Financial Services - 4.2% | | | |
| Azorra Finance Ltd. 7.75% 4/15/30 (b) | | 175,000 | 172,844 |
| Capstone Borrower, Inc. 8% 6/15/30 (b) | | 125,000 | 130,643 |
| Cargo Aircraft Management, Inc. 4.75% 2/1/28 (b) | | 225,000 | 214,875 |
| Encore Capital Group, Inc. 9.25% 4/1/29 (b) | | 200,000 | 212,950 |
| Focus Financial Partners LLC 6.75% 9/15/31 (b) | | 360,000 | 357,640 |
| Fortress Transportation & Infrastructure Investors LLC: | | | |
| 7% 6/15/32 (b) | | 230,000 | 235,981 |
| 7.875% 12/1/30 (b) | | 385,000 | 405,590 |
| Freedom Mortgage Corp. 6.625% 1/15/27 (b) | | 250,000 | 247,052 |
| GGAM Finance Ltd.: | | | |
| 6.875% 4/15/29 (b) | | 295,000 | 300,625 |
| 7.75% 5/15/26 (b) | | 1,240,000 | 1,261,783 |
| Global Aircraft Leasing Co. Ltd. 8.75% 9/1/27 (b) | | 235,000 | 242,749 |
| Gn Bondco LLC 9.5% 10/15/31 (b)(c) | | 410,000 | 435,367 |
| Hightower Holding LLC 6.75% 4/15/29 (b) | | 150,000 | 147,674 |
| Icahn Enterprises LP/Icahn Enterprises Finance Corp.: | | | |
| 5.25% 5/15/27 | | 1,310,000 | 1,220,411 |
| 6.25% 5/15/26 | | 750,000 | 737,164 |
| Jefferies Finance LLC/JFIN Co.-Issuer Corp. 6.625% 10/15/31 (b) | | 375,000 | 373,435 |
| Jefferson Capital Holding 9.5% 2/15/29 (b) | | 185,000 | 196,776 |
| Nationstar Mortgage Holdings, Inc. 6.5% 8/1/29 (b) | | 350,000 | 349,986 |
| Navient Corp. 6.75% 6/15/26 | | 250,000 | 254,776 |
| OneMain Finance Corp. 3.5% 1/15/27 | | 2,450,000 | 2,338,228 |
| PRA Group, Inc. 8.875% 1/31/30 (b)(c) | | 115,000 | 119,313 |
| Shift4 Payments LLC / Shift4 Payments Finance Sub, Inc. 6.75% 8/15/32 (b) | | 285,000 | 292,410 |
| Windstream Services LLC / Wind 8.25% 10/1/31 (b) | | 245,000 | 248,063 |
| | | | 10,496,335 |
| Diversified Media - 0.2% | | | |
| Advantage Sales & Marketing, Inc. 6.5% 11/15/28 (b) | | 425,000 | 397,800 |
| Energy - 12.6% | | | |
| Aethon United BR LP / Aethon United Finance Corp. 7.5% 10/1/29 (b) | | 305,000 | 307,115 |
| Alpha Generation LLC 6.75% 10/15/32 (b) | | 290,000 | 294,074 |
| Archrock Partners LP / Archrock Partners Finance Corp. 6.625% 9/1/32 (b) | | 235,000 | 236,062 |
| Ascent Resources - Utica LLC/ARU Finance Corp. 6.625% 10/15/32 (b) | | 100,000 | 99,052 |
| Baytex Energy Corp. 7.375% 3/15/32 (b) | | 305,000 | 296,101 |
| Berry Petroleum Co. LLC 7% 2/15/26 (b) | | 100,000 | 97,479 |
| Buckeye Partners LP: | | | |
| 4.125% 3/1/25 (b)(c) | | 352,000 | 349,478 |
| 4.125% 12/1/27 | | 1,400,000 | 1,338,405 |
| California Buyer Ltd./Atlantica Sustainable Infrastructure PLC 6.375% 2/15/32 (b)(e) | | 405,000 | 402,201 |
| California Resources Corp.: | | | |
| 7.125% 2/1/26 (b)(c) | | 97,000 | 97,316 |
| 8.25% 6/15/29 (b) | | 795,000 | 802,895 |
| Calumet Specialty Products Partners LP/Calumet Finance Corp. 11% 4/15/25 (b) | | 3,000 | 3,016 |
| Canacol Energy Ltd. 5.75% 11/24/28 (b) | | 450,000 | 233,438 |
| Cheniere Energy, Inc. 4.625% 10/15/28 | | 625,000 | 612,504 |
| Chord Energy Corp. 6.375% 6/1/26 (b) | | 100,000 | 100,214 |
| Citgo Petroleum Corp. 6.375% 6/15/26 (b) | | 525,000 | 525,049 |
| Comstock Resources, Inc. 6.75% 3/1/29 (b)(c) | | 490,000 | 469,257 |
| Continental Resources, Inc. 2.268% 11/15/26 (b) | | 100,000 | 94,327 |
| CPI CG, Inc. 10% 7/15/29 (b) | | 125,000 | 130,938 |
| CVR Energy, Inc. 8.5% 1/15/29 (b) | | 585,000 | 567,280 |
| DCP Midstream Operating LP 5.375% 7/15/25 | | 335,000 | 335,308 |
| Delek Logistics Partners LP/Delek Logistics Finance Corp.: | | | |
| 7.125% 6/1/28 (b) | | 80,000 | 79,252 |
| 8.625% 3/15/29 (b) | | 740,000 | 759,270 |
| Energy Transfer LP: | | | |
| 6% 2/1/29 (b) | | 560,000 | 568,705 |
| 7.375% 2/1/31 (b) | | 525,000 | 552,469 |
| EnLink Midstream Partners LP 4.85% 7/15/26 | | 525,000 | 522,721 |
| EQM Midstream Partners LP: | | | |
| 6% 7/1/25 (b) | | 147,000 | 147,169 |
| 7.5% 6/1/27 (b) | | 850,000 | 869,086 |
| EQT Corp. 3.125% 5/15/26 (b) | | 175,000 | 169,364 |
| Expand Energy Corp.: | | | |
| 5.5% 2/1/26 (b) | | 180,000 | 179,683 |
| 5.7% 1/23/25 (f) | | 428,000 | 427,305 |
| Genesis Energy LP/Genesis Energy Finance Corp.: | | | |
| 7.875% 5/15/32 | | 115,000 | 115,081 |
| 8% 1/15/27 | | 1,145,000 | 1,165,339 |
| Harvest Midstream I LP 7.5% 5/15/32 (b) | | 430,000 | 440,266 |
| Hess Midstream Operations LP 5.625% 2/15/26 (b) | | 900,000 | 897,836 |
| HF Sinclair Corp. 6.375% 4/15/27 (c) | | 105,000 | 106,319 |
| Howard Midstream Energy Partners LLC 7.375% 7/15/32 (b) | | 230,000 | 234,653 |
| Kinetik Holdings LP 6.625% 12/15/28 (b) | | 465,000 | 474,927 |
| Kodiak Gas Services LLC 7.25% 2/15/29 (b) | | 345,000 | 354,632 |
| Kosmos Energy Ltd. 8.75% 10/1/31 (b) | | 200,000 | 195,250 |
| Kraken Oil & Gas Partners LLC 7.625% 8/15/29 (b) | | 185,000 | 182,776 |
| Magnolia Oil & Gas Operating LLC/Magnolia Oil & Gas Finance Corp. 6% 8/1/26 (b) | | 475,000 | 474,093 |
| Matador Resources Co.: | | | |
| 6.25% 4/15/33 (b)(c) | | 125,000 | 122,329 |
| 6.5% 4/15/32 (b)(c) | | 400,000 | 396,146 |
| Mesquite Energy, Inc. 7.25% (b)(g)(h) | | 135,000 | 0 |
| Moss Creek Resources Holdings, Inc. 8.25% 9/1/31 (b) | | 120,000 | 117,576 |
| Murphy Oil Corp. 6% 10/1/32 | | 245,000 | 235,917 |
| Nabors Industries, Inc. 8.875% 8/15/31 (b) | | 295,000 | 278,900 |
| New Fortress Energy, Inc.: | | | |
| 6.5% 9/30/26 (b) | | 555,000 | 514,109 |
| 6.75% 9/15/25 (b) | | 969,000 | 967,146 |
| NGL Energy Operating LLC/NGL Energy Finance Corp. 8.125% 2/15/29 (b)(c) | | 345,000 | 347,228 |
| Northern Oil & Gas, Inc. 8.75% 6/15/31 (b) | | 285,000 | 294,862 |
| NuStar Logistics LP 6% 6/1/26 (c) | | 150,000 | 150,118 |
| PBF Holding Co. LLC/PBF Finance Corp. 7.875% 9/15/30 (b) | | 580,000 | 579,009 |
| Prairie Acquiror LP 9% 8/1/29 (b) | | 185,000 | 187,560 |
| Precision Drilling Corp. 7.125% 1/15/26 (b) | | 376,000 | 375,458 |
| Range Resources Corp. 4.875% 5/15/25 | | 450,000 | 448,509 |
| Sitio Royalties OP / Sitio Finance Corp. 7.875% 11/1/28 (b)(c) | | 1,002,000 | 1,040,164 |
| SM Energy Co. 6.625% 1/15/27 | | 431,000 | 430,916 |
| Summit Midstream Holdings LLC 8.625% 10/31/29 (b) | | 185,000 | 191,135 |
| Sunnova Energy Corp. 5.875% 9/1/26 (b) | | 810,000 | 723,986 |
| Sunoco LP/Sunoco Finance Corp. 6% 4/15/27 | | 1,010,000 | 1,011,058 |
| Tallgrass Energy Partners LP / Tallgrass Energy Finance Corp. 6% 3/1/27 (b) | | 750,000 | 744,305 |
| Talos Production, Inc. 9% 2/1/29 (b)(c) | | 100,000 | 102,993 |
| Transocean Aquila Ltd. 8% 9/30/28 (b) | | 490,154 | 503,115 |
| Transocean, Inc. 8.75% 2/15/30 (b) | | 552,500 | 572,478 |
| Tullow Oil PLC 10.25% 5/15/26 (b) | | 485,000 | 445,594 |
| U.S.A. Compression Partners LP/U.S.A. Compression Finance Corp. 7.125% 3/15/29 (b) | | 280,000 | 285,178 |
| Venture Global Calcasieu Pass LLC 6.25% 1/15/30 (b) | | 265,000 | 270,872 |
| Venture Global LNG, Inc. 7% 1/15/30 (b)(c) | | 2,340,000 | 2,354,444 |
| Western Midstream Operating LP 4.65% 7/1/26 | | 1,300,000 | 1,288,803 |
| | | | 31,287,613 |
| Entertainment/Film - 0.6% | | | |
| Live Nation Entertainment, Inc. 4.75% 10/15/27 (b)(c) | | 1,450,000 | 1,411,094 |
| Environmental - 1.3% | | | |
| Clean Harbors, Inc. 6.375% 2/1/31 (b) | | 210,000 | 211,579 |
| GFL Environmental, Inc.: | | | |
| 4% 8/1/28 (b) | | 1,200,000 | 1,134,910 |
| 6.75% 1/15/31 (b) | | 180,000 | 185,331 |
| Madison IAQ LLC 4.125% 6/30/28 (b)(c) | | 700,000 | 664,374 |
| Wrangler Holdco Corp. 6.625% 4/1/32 (b) | | 915,000 | 933,916 |
| | | | 3,130,110 |
| Food & Drug Retail - 1.1% | | | |
| Albertsons Companies LLC/Safeway, Inc./New Albertson's, Inc./Albertson's LLC: | | | |
| 3.25% 3/15/26 (b) | | 1,100,000 | 1,062,756 |
| 6.5% 2/15/28 (b)(c) | | 985,000 | 1,007,962 |
| Parkland Corp. 6.625% 8/15/32 (b) | | 590,000 | 588,765 |
| Walgreens Boots Alliance, Inc. 8.125% 8/15/29 (c) | | 160,000 | 159,574 |
| | | | 2,819,057 |
| Food/Beverage/Tobacco - 1.4% | | | |
| C&S Group Enterprises LLC 5% 12/15/28 (b) | | 380,000 | 314,536 |
| Chobani Holdco II LLC 9.5% 10/1/29 pay-in-kind (b)(d) | | 200,000 | 206,329 |
| Chobani LLC/Finance Corp., Inc. 7.625% 7/1/29 (b) | | 265,000 | 276,268 |
| Fiesta Purchaser, Inc.: | | | |
| 7.875% 3/1/31 (b) | | 210,000 | 220,229 |
| 9.625% 9/15/32 (b) | | 135,000 | 141,109 |
| KeHE Distributor / Nextwave 9% 2/15/29 (b) | | 345,000 | 357,234 |
| Performance Food Group, Inc.: | | | |
| 5.5% 10/15/27 (b) | | 400,000 | 396,610 |
| 6.125% 9/15/32 (b) | | 360,000 | 361,506 |
| Post Holdings, Inc.: | | | |
| 5.625% 1/15/28 (b) | | 125,000 | 126,021 |
| 6.25% 10/15/34 (b) | | 220,000 | 217,569 |
| 6.375% 3/1/33 (b) | | 235,000 | 232,494 |
| Sigma Holdco BV 7.875% 5/15/26 (b) | | 120,000 | 118,844 |
| Turning Point Brands, Inc. 5.625% 2/15/26 (b) | | 100,000 | 99,611 |
| U.S. Foods, Inc. 5.75% 4/15/33 (b) | | 215,000 | 211,728 |
| United Natural Foods, Inc. 6.75% 10/15/28 (b) | | 95,000 | 91,675 |
| Viking Baked Goods Acquisition Corp. 8.625% 11/1/31 (b)(e) | | 50,000 | 49,841 |
| | | | 3,421,604 |
| Gaming - 3.3% | | | |
| Affinity Interactive 6.875% 12/15/27 (b) | | 1,030,000 | 843,473 |
| Boyd Gaming Corp. 4.75% 12/1/27 (c) | | 475,000 | 466,065 |
| Caesars Entertainment, Inc.: | | | |
| 6% 10/15/32 (b) | | 370,000 | 360,908 |
| 8.125% 7/1/27 (b) | | 302,000 | 307,925 |
| Churchill Downs, Inc.: | | | |
| 4.75% 1/15/28 (b) | | 300,000 | 291,052 |
| 6.75% 5/1/31 (b) | | 495,000 | 503,944 |
| Fertitta Entertainment LLC / Fertitta Entertainment Finance Co., Inc. 6.75% 1/15/30 (b) | | 400,000 | 363,792 |
| International Game Technology PLC 4.125% 4/15/26 (b) | | 825,000 | 813,139 |
| Las Vegas Sands Corp. 3.5% 8/18/26 | | 400,000 | 389,157 |
| Light & Wonder International, Inc. 7% 5/15/28 (b) | | 1,000,000 | 1,004,245 |
| Melco Resorts Finance Ltd. 5.25% 4/26/26 (b) | | 200,000 | 196,124 |
| Ontario Gaming GTA LP / OTG Co. issuer, Inc. 8% 8/1/30 (b) | | 275,000 | 282,651 |
| Raptor Acquisition Corp. / Raptor Co-Issuer LLC 4.875% 11/1/26 (b) | | 95,000 | 94,207 |
| Station Casinos LLC 6.625% 3/15/32 (b)(c) | | 350,000 | 351,719 |
| Studio City Finance Ltd. 5% 1/15/29 (b) | | 225,000 | 202,791 |
| VICI Properties LP / VICI Note Co.: | | | |
| 3.5% 2/15/25 (b) | | 715,000 | 709,370 |
| 4.625% 6/15/25 (b) | | 300,000 | 298,377 |
| Wynn Las Vegas LLC/Wynn Las Vegas Capital Corp. 5.25% 5/15/27 (b) | | 325,000 | 322,570 |
| Wynn Resorts Finance LLC / Wynn Resorts Capital Corp. 6.25% 3/15/33 (b)(c) | | 480,000 | 477,751 |
| | | | 8,279,260 |
| Healthcare - 5.1% | | | |
| 1375209 BC Ltd. 9% 1/30/28 (b) | | 562,000 | 560,968 |
| Bausch Health Companies, Inc.: | | | |
| 5.5% 11/1/25 (b) | | 1,335,000 | 1,310,142 |
| 11% 9/30/28 (b) | | 850,000 | 782,136 |
| 14% 10/15/30 (b) | | 197,000 | 175,168 |
| Centene Corp. 3% 10/15/30 (c) | | 210,000 | 181,892 |
| CHS/Community Health Systems, Inc. 5.625% 3/15/27 (b) | | 1,950,000 | 1,901,761 |
| HAH Group Holding Co. LLC 9.75% 10/1/31 (b) | | 440,000 | 448,327 |
| HCA Holdings, Inc. 5.875% 2/15/26 | | 650,000 | 654,499 |
| IQVIA, Inc. 5% 5/15/27 (b) | | 1,675,000 | 1,653,505 |
| LifePoint Health, Inc. 11% 10/15/30 (b) | | 290,000 | 323,264 |
| Medline Borrower LP / Medline Co. 6.25% 4/1/29 (b) | | 940,000 | 956,397 |
| Molina Healthcare, Inc. 3.875% 5/15/32 (b)(c) | | 235,000 | 208,329 |
| Organon & Co. / Organon Foreign Debt Co-Issuer BV 4.125% 4/30/28 (b) | | 550,000 | 521,131 |
| Sotera Health Holdings LLC 7.375% 6/1/31 (b) | | 225,000 | 230,414 |
| Surgery Center Holdings, Inc. 7.25% 4/15/32 (b) | | 345,000 | 354,247 |
| Tenet Healthcare Corp. 5.125% 11/1/27 | | 2,300,000 | 2,280,566 |
| U.S. Acute Care Solutions 9.75% 5/15/29 (b) | | 100,000 | 101,998 |
| | | | 12,644,744 |
| Homebuilders/Real Estate - 2.7% | | | |
| Arcosa, Inc. 6.875% 8/15/32 (b) | | 120,000 | 123,164 |
| Beazer Homes U.S.A., Inc. 7.5% 3/15/31 (b)(c) | | 185,000 | 190,185 |
| Brookfield Property REIT, Inc./BPR Nimbus LLC/BPR Cumulus LLC/GGSI Sellco LLC 5.75% 5/15/26 (b) | | 919,000 | 909,815 |
| Greystar Real Estate Partners 7.75% 9/1/30 (b) | | 230,000 | 240,991 |
| HAT Holdings I LLC/HAT Holdings II LLC 8% 6/15/27 (b) | | 285,000 | 298,539 |
| Jones DesLauriers Insurance Management, Inc. 10.5% 12/15/30 (b) | | 70,000 | 75,406 |
| Landsea Homes Corp. 8.875% 4/1/29 (b) | | 230,000 | 234,658 |
| LGI Homes, Inc. 8.75% 12/15/28 (b) | | 195,000 | 205,431 |
| MPT Operating Partnership LP/MPT Finance Corp. 5.25% 8/1/26 (c) | | 1,285,000 | 1,215,442 |
| Railworks Holdings LP 8.25% 11/15/28 (b) | | 230,000 | 235,417 |
| Rithm Capital Corp. 8% 4/1/29 (b) | | 140,000 | 139,698 |
| Ryan Specialty Group LLC 5.875% 8/1/32 (b) | | 155,000 | 154,482 |
| Safehold Operating Partnership LP 2.85% 1/15/32 | | 710,000 | 602,120 |
| Starwood Property Trust, Inc. 4.75% 3/15/25 | | 1,500,000 | 1,495,893 |
| Uniti Group LP/Uniti Group Finance, Inc./CSL Capital LLC 6.5% 2/15/29 (b) | | 820,000 | 705,946 |
| | | | 6,827,187 |
| Hotels - 0.3% | | | |
| Hilton Domestic Operating Co., Inc. 5.875% 3/15/33 (b)(c) | | 360,000 | 360,753 |
| Hilton Grand Vacations Borrower Escrow LLC 6.625% 1/15/32 (b) | | 230,000 | 230,057 |
| Park Intermediate Holdings LLC / PK Domestic Property LLC / PK Finance Co.-Issuer 7% 2/1/30 (b) | | 160,000 | 163,902 |
| | | | 754,712 |
| Insurance - 0.5% | | | |
| Acrisure LLC / Acrisure Finance, Inc. 8.25% 2/1/29 (b) | | 230,000 | 233,744 |
| Alliant Holdings Intermediate LLC/Alliant Holdings Co.-Issuer: | | | |
| 6.75% 10/15/27 (b) | | 30,000 | 29,888 |
| 6.75% 4/15/28 (b) | | 615,000 | 617,897 |
| 7% 1/15/31 (b) | | 200,000 | 201,347 |
| APH Somerset Investor 2 LLC / APH2 Somerset Investor 2 LLC / APH3 Somerset Investor 2 LLC 7.875% 11/1/29 (b) | | 250,000 | 249,750 |
| | | | 1,332,626 |
| Leisure - 3.4% | | | |
| Amer Sports Co. 6.75% 2/16/31 (b)(c) | | 235,000 | 238,735 |
| Carnival Corp.: | | | |
| 7.625% 3/1/26 (b) | | 2,430,000 | 2,446,993 |
| 10.5% 6/1/30 (b) | | 245,000 | 264,335 |
| NCL Corp. Ltd.: | | | |
| 5.875% 3/15/26 (b) | | 400,000 | 399,562 |
| 5.875% 2/15/27 (b) | | 525,000 | 524,456 |
| 6.25% 3/1/30 (b) | | 600,000 | 593,461 |
| Royal Caribbean Cruises Ltd.: | | | |
| 5.375% 7/15/27 (b) | | 120,000 | 119,780 |
| 5.5% 8/31/26 (b) | | 1,435,000 | 1,436,616 |
| 5.5% 4/1/28 (b) | | 600,000 | 599,959 |
| 6.25% 3/15/32 (b) | | 230,000 | 234,490 |
| Six Flags Entertainment Corp. 5.5% 4/15/27 (b) | | 550,000 | 546,723 |
| Viking Cruises Ltd. 9.125% 7/15/31 (b) | | 1,000,000 | 1,079,977 |
| | | | 8,485,087 |
| Metals/Mining - 1.8% | | | |
| Alcoa Nederland Holding BV 7.125% 3/15/31 (b) | | 90,000 | 93,839 |
| Arsenal AIC Parent LLC 8% 10/1/30 (b) | | 110,000 | 115,623 |
| Cleveland-Cliffs, Inc.: | | | |
| 6.75% 4/15/30 (b) | | 195,000 | 194,800 |
| 6.875% 11/1/29 (b) | | 125,000 | 125,485 |
| 7% 3/15/32 (b)(c) | | 350,000 | 350,396 |
| 7.375% 5/1/33 (b) | | 125,000 | 125,925 |
| ERO Copper Corp. 6.5% 2/15/30 (b) | | 340,000 | 334,050 |
| HudBay Minerals, Inc. 4.5% 4/1/26 (b) | | 880,000 | 869,013 |
| Mineral Resources Ltd. 9.25% 10/1/28 (b) | | 1,355,000 | 1,426,512 |
| Novelis Corp. 3.25% 11/15/26 (b) | | 950,000 | 914,013 |
| | | | 4,549,656 |
| Paper - 0.4% | | | |
| Ardagh Metal Packaging Finance U.S.A. LLC/Ardagh Metal Packaging Finance PLC 6% 6/15/27 (b) | | 690,000 | 688,047 |
| Glatfelter Corp. 7.25% 11/15/31 (b) | | 175,000 | 173,513 |
| Mercer International, Inc. 12.875% 10/1/28 (b) | | 25,000 | 26,471 |
| | | | 888,031 |
| Publishing/Printing - 0.1% | | | |
| Cimpress PLC 7.375% 9/15/32 (b) | | 285,000 | 280,581 |
| Railroad - 0.1% | | | |
| Genesee & Wyoming, Inc. 6.25% 4/15/32 (b) | | 355,000 | 358,102 |
| Restaurants - 0.6% | | | |
| 1011778 BC Unlimited Liability Co./New Red Finance, Inc.: | | | |
| 3.875% 1/15/28 (b) | | 675,000 | 643,372 |
| 5.625% 9/15/29 (b) | | 480,000 | 478,787 |
| 6.125% 6/15/29 (b) | | 345,000 | 351,023 |
| Garden SpinCo Corp. 8.625% 7/20/30 (b)(c) | | 55,000 | 59,527 |
| | | | 1,532,709 |
| Services - 6.2% | | | |
| AECOM 5.125% 3/15/27 | | 930,000 | 925,023 |
| Allied Universal Holdco LLC 7.875% 2/15/31 (b) | | 340,000 | 346,009 |
| Aramark Services, Inc. 5% 4/1/25 (b) | | 1,025,000 | 1,022,756 |
| Artera Services LLC 8.5% 2/15/31 (b) | | 1,415,000 | 1,402,335 |
| Avis Budget Car Rental LLC/Avis Budget Finance, Inc. 8.25% 1/15/30 (b)(c) | | 195,000 | 199,216 |
| Brand Industrial Services, Inc. 10.375% 8/1/30 (b) | | 765,000 | 811,012 |
| Camelot Finance SA 4.5% 11/1/26 (b) | | 950,000 | 933,224 |
| CoreCivic, Inc.: | | | |
| 4.75% 10/15/27 | | 35,000 | 33,348 |
| 8.25% 4/15/29 | | 235,000 | 246,785 |
| CoreLogic, Inc. 4.5% 5/1/28 (b) | | 590,000 | 554,021 |
| Garda World Security Corp. 8.25% 8/1/32 (b) | | 235,000 | 233,782 |
| Hertz Corp. 4.625% 12/1/26 (b) | | 195,000 | 147,310 |
| Iron Mountain, Inc. 4.875% 9/15/27 (b) | | 475,000 | 466,848 |
| Life Time, Inc.: | | | |
| 5.75% 1/15/26 (b) | | 425,000 | 424,766 |
| 6% 11/15/31 (b)(e) | | 500,000 | 497,877 |
| Neptune BidCo U.S., Inc. 9.29% 4/15/29 (b) | | 360,000 | 334,800 |
| Prime Securities Services Borrower LLC/Prime Finance, Inc. 5.75% 4/15/26 (b)(c) | | 875,000 | 875,210 |
| Sabre GLBL, Inc. 8.625% 6/1/27 (b) | | 758,000 | 731,667 |
| Service Corp. International 5.75% 10/15/32 | | 240,000 | 235,759 |
| Sotheby's 7.375% 10/15/27 (b) | | 215,000 | 209,242 |
| Staples, Inc.: | | | |
| 10.75% 9/1/29 (b) | | 485,000 | 468,987 |
| 12.75% 1/15/30 (b) | | 340,000 | 270,206 |
| The GEO Group, Inc.: | | | |
| 8.625% 4/15/29 | | 230,000 | 240,581 |
| 10.25% 4/15/31 | | 470,000 | 503,750 |
| TriNet Group, Inc. 7.125% 8/15/31 (b)(c) | | 510,000 | 522,302 |
| Uber Technologies, Inc. 7.5% 9/15/27 (b) | | 503,000 | 512,358 |
| United Rentals North America, Inc.: | | | |
| 3.875% 11/15/27 (c) | | 550,000 | 529,452 |
| 6.125% 3/15/34 (b)(c) | | 585,000 | 589,882 |
| WASH Multifamily Acquisition, Inc. 5.75% 4/15/26 (b) | | 1,265,000 | 1,261,877 |
| | �� | | 15,530,385 |
| Super Retail - 1.4% | | | |
| At Home Group, Inc. 4.875% 7/15/28 (b) | | 60,000 | 25,174 |
| Carvana Co.: | | | |
| 4.875% 9/1/29 (b) | | 80,000 | 67,019 |
| 5.875% 10/1/28 (b) | | 115,000 | 103,363 |
| EG Global Finance PLC 12% 11/30/28 (b) | | 1,610,000 | 1,790,154 |
| Group 1 Automotive, Inc. 6.375% 1/15/30 (b) | | 225,000 | 226,009 |
| Hanesbrands, Inc. 4.875% 5/15/26 (b)(c) | | 900,000 | 889,096 |
| Sally Holdings LLC 6.75% 3/1/32 (c) | | 235,000 | 237,928 |
| Specialty Building Products Holdings LLC 7.75% 10/15/29 (b) | | 100,000 | 101,988 |
| Upbound Group, Inc. 6.375% 2/15/29 (b) | | 30,000 | 28,546 |
| | | | 3,469,277 |
| Technology - 5.7% | | | |
| Acuris Finance U.S.: | | | |
| 5% 5/1/28 (b) | | 1,250,000 | 1,128,116 |
| 9% 8/1/29 (b) | | 250,000 | 245,050 |
| Amentum Holdings, Inc. 7.25% 8/1/32 (b) | | 275,000 | 284,836 |
| Block, Inc. 6.5% 5/15/32 (b) | | 460,000 | 468,172 |
| Central Parent LLC/CDK GLO II/CDK Finance Co. 8% 6/15/29 (b) | | 1,005,000 | 1,027,024 |
| CommScope, Inc. 6% 3/1/26 (b) | | 775,000 | 756,561 |
| Elastic NV 4.125% 7/15/29 (b) | | 225,000 | 208,210 |
| Entegris, Inc. 4.75% 4/15/29 (b) | | 1,320,000 | 1,278,760 |
| GrafTech Global Enterprises, Inc. 9.875% 12/15/28 (b) | | 175,000 | 146,774 |
| HTA Group Ltd. 7.5% 6/4/29 (b) | | 800,000 | 812,880 |
| Insight Enterprises, Inc. 6.625% 5/15/32 (b) | | 185,000 | 189,128 |
| Lightning Power LLC 7.25% 8/15/32 (b) | | 220,000 | 228,875 |
| Open Text Corp. 3.875% 2/15/28 (b) | | 1,700,000 | 1,599,000 |
| Qorvo, Inc. 4.375% 10/15/29 | | 1,350,000 | 1,272,837 |
| Seagate HDD Cayman 8.25% 12/15/29 | | 165,000 | 177,508 |
| Sensata Technologies, Inc. 6.625% 7/15/32 (b) | | 250,000 | 253,284 |
| SS&C Technologies, Inc. 5.5% 9/30/27 (b) | | 2,000,000 | 1,992,051 |
| UKG, Inc. 6.875% 2/1/31 (b) | | 285,000 | 291,986 |
| Veritas U.S., Inc./Veritas Bermuda Ltd. 7.5% 9/1/25 (b) | | 625,000 | 594,822 |
| Virtusa Corp. 7.125% 12/15/28 (b) | | 50,000 | 48,485 |
| VM Consolidated, Inc. 5.5% 4/15/29 (b) | | 875,000 | 846,254 |
| Wolfspeed, Inc. 4.2917% 6/23/30 pay-in-kind (b)(d)(h)(i) | | 440,000 | 422,400 |
| | | | 14,273,013 |
| Telecommunications - 3.4% | | | |
| Altice Financing SA 5% 1/15/28 (b) | | 670,000 | 566,583 |
| Altice France SA 5.125% 7/15/29 (b) | | 250,000 | 186,988 |
| C&W Senior Finance Ltd. 6.875% 9/15/27 (b) | | 15,000 | 14,851 |
| Cogent Communications Group, Inc. 7% 6/15/27 (b) | | 675,000 | 682,162 |
| Consolidated Communications, Inc. 5% 10/1/28 (b) | | 385,000 | 356,094 |
| Frontier Communications Holdings LLC 5% 5/1/28 (b) | | 1,025,000 | 1,007,631 |
| Hughes Satellite Systems Corp. 5.25% 8/1/26 | | 525,000 | 479,570 |
| Level 3 Financing, Inc.: | | | |
| 3.875% 10/15/30 (b) | | 365,000 | 277,396 |
| 10.5% 5/15/30 (b) | | 260,000 | 284,375 |
| 11% 11/15/29 (b) | | 168,736 | 190,404 |
| Liquid Telecommunications Financing PLC 5.5% 9/4/26 (b) | | 395,000 | 280,450 |
| SBA Communications Corp. 3.875% 2/15/27 (c) | | 1,550,000 | 1,500,156 |
| T-Mobile U.S.A., Inc.: | | | |
| 2.25% 2/15/26 | | 1,210,000 | 1,171,776 |
| 2.625% 4/15/26 | | 320,000 | 309,781 |
| ViaSat, Inc. 5.625% 9/15/25 (b) | | 790,000 | 779,703 |
| Zayo Group Holdings, Inc. 4% 3/1/27 (b)(c) | | 450,000 | 400,504 |
| | | | 8,488,424 |
| Transportation Ex Air/Rail - 0.6% | | | |
| Golar LNG Ltd. 7.75% 9/19/29 (Reg. S) (b) | | 200,000 | 198,932 |
| Great Lakes Dredge & Dock Corp. 5.25% 6/1/29 (b) | | 70,000 | 65,776 |
| Seaspan Corp. 5.5% 8/1/29 (b) | | 645,000 | 613,532 |
| XPO, Inc. 6.25% 6/1/28 (b) | | 470,000 | 477,103 |
| | | | 1,355,343 |
| Utilities - 1.7% | | | |
| Calpine Corp. 5.125% 3/15/28 (b) | | 750,000 | 733,001 |
| NextEra Energy Partners LP 7.25% 1/15/29 (b)(c) | | 465,000 | 478,302 |
| PG&E Corp.: | | | |
| 5% 7/1/28 (c) | | 460,000 | 448,660 |
| 7.375% 3/15/55 (d) | | 217,000 | 224,143 |
| Pike Corp. 8.625% 1/31/31 (b) | | 275,000 | 292,181 |
| Solaris Midstream Holdings LLC 7.625% 4/1/26 (b) | | 120,000 | 120,639 |
| Vistra Operations Co. LLC: | | | |
| 5% 7/31/27 (b) | | 825,000 | 814,147 |
| 5.625% 2/15/27 (b) | | 805,000 | 802,923 |
| 7.75% 10/15/31 (b) | | 255,000 | 269,375 |
| | | | 4,183,371 |
TOTAL NONCONVERTIBLE BONDS | | | 195,204,793 |
| TOTAL CORPORATE BONDS (Cost $193,843,327) | | | 198,682,196 |
| | | | |
| U.S. Treasury Obligations - 1.4% |
| | | Principal Amount (a) | Value ($) |
U.S. Treasury Notes 1.5% 2/15/30 (Cost $3,635,252) | | 4,100,000 | 3,581,733 |
| | | | |
| Asset-Backed Securities - 0.2% |
| | | Principal Amount (a) | Value ($) |
| Carlyle U.S. Clo 2024-6 Ltd. Series 2024-6A Class E, CME Term SOFR 3 Month Index + 5.750% 0% 10/25/37 (b)(d)(e)(j) | | 150,000 | 150,031 |
| Palmer Square Ln Funding 2024-2 Lt Series 2024-2A Class D, CME Term SOFR 3 Month Index + 4.700% 6.2% 1/15/33 (b)(d)(e)(j) | | 250,000 | 250,000 |
| TOTAL ASSET-BACKED SECURITIES (Cost $400,000) | | | 400,031 |
| | | | |
| Common Stocks - 0.2% |
| | | Shares | Value ($) |
| Diversified Financial Services - 0.0% | | | |
| Limetree Bay Cayman Ltd. (h)(k) | | 80 | 5,282 |
| Energy - 0.1% | | | |
| California Resources Corp. | | 2 | 104 |
| Forbes Energy Services Ltd. (h)(k) | | 6,468 | 1 |
| Mesquite Energy, Inc. (h)(k) | | 1,922 | 162,342 |
TOTAL ENERGY | | | 162,447 |
| Healthcare - 0.1% | | | |
| Cano Health, Inc. (h) | | 29,327 | 358,376 |
| Cano Health, Inc. warrants (h)(k) | | 901 | 3,568 |
TOTAL HEALTHCARE | | | 361,944 |
| TOTAL COMMON STOCKS (Cost $798,947) | | | 529,673 |
| | | | |
| Bank Loan Obligations - 11.5% |
| | | Principal Amount (a) | Value ($) |
| Automotive & Auto Parts - 0.2% | | | |
| CWGS Group LLC Tranche B 1LN, term loan CME Term SOFR 1 Month Index + 2.500% 7.3303% 6/3/28 (d)(j)(l) | | 436,318 | 425,140 |
| Power Stop LLC 1LN, term loan CME Term SOFR 3 Month Index + 4.750% 9.9072% 1/26/29 (d)(j)(l) | | 119,380 | 114,531 |
TOTAL AUTOMOTIVE & AUTO PARTS | | | 539,671 |
| Broadcasting - 1.1% | | | |
| Diamond Sports Group LLC: | | | |
| 1LN, term loan CME Term SOFR 1 Month Index + 8.000% 14.9441% 5/25/26 (d)(j)(l) | | 420,000 | 361,498 |
| Tranche DIP term loan 10% 8/2/27 (l) | | 41,611 | 43,796 |
| Univision Communications, Inc. Tranche B 1LN, term loan CME Term SOFR 1 Month Index + 3.250% 8.0496% 1/31/29 (d)(j)(l) | | 2,312,269 | 2,273,723 |
TOTAL BROADCASTING | | | 2,679,017 |
| Building Materials - 0.3% | | | |
| Hunter Douglas, Inc. Tranche B 1LN, term loan CME Term SOFR 3 Month Index + 3.500% 8.5713% 2/25/29 (d)(j)(l) | | 255,000 | 253,776 |
| Oscar AcquisitionCo LLC 1LN, term loan CME Term SOFR 3 Month Index + 4.500% 8.8537% 4/29/29 (d)(j)(l) | | 490,000 | 485,526 |
TOTAL BUILDING MATERIALS | | | 739,302 |
| Chemicals - 1.3% | | | |
| Advancion Holdings LLC Tranche B 1LN, term loan CME Term SOFR 1 Month Index + 4.000% 8.7852% 11/24/27 (d)(j)(l) | | 363,656 | 362,838 |
| ARC Falcon I, Inc. Tranche B 1LN, term loan CME Term SOFR 1 Month Index + 3.750% 8.2852% 9/30/28 (d)(j)(l) | | 393,174 | 393,622 |
| Consolidated Energy Finance SA Tranche B 1LN, term loan CME Term SOFR 1 Month Index + 4.500% 9.5572% 11/15/30 (d)(j)(l) | | 398,000 | 374,403 |
| Discovery Purchaser Corp. 1LN, term loan CME Term SOFR 3 Month Index + 4.370% 8.9647% 10/4/29 (d)(j)(l) | | 363,839 | 363,158 |
| Hexion Holdings Corp. 1LN, term loan CME Term SOFR 3 Month Index + 4.500% 9.7711% 3/15/29 (d)(j)(l) | | 393,200 | 392,850 |
| Olympus Water U.S. Holding Corp. Tranche B 1LN, term loan CME Term SOFR 3 Month Index + 3.500% 8.1037% 6/23/31 (d)(j)(l) | | 656,091 | 656,747 |
| SCIH Salt Holdings, Inc. Tranche B 1LN, term loan CME Term SOFR 3 Month Index + 3.500% 8.0854% 3/16/27 (d)(j)(l) | | 31,676 | 31,736 |
| W.R. Grace Holding LLC Tranche B 1LN, term loan CME Term SOFR 3 Month Index + 3.750% 7.8537% 9/22/28 (d)(j)(l) | | 553,755 | 554,447 |
TOTAL CHEMICALS | | | 3,129,801 |
| Consumer Products - 0.1% | | | |
| Conair Holdings LLC Tranche B 1LN, term loan CME Term SOFR 1 Month Index + 3.750% 8.5496% 5/17/28 (d)(j)(l) | | 24,250 | 22,136 |
| TKC Holdings, Inc. 1LN, term loan 13.5% 2/14/27 (d)(l) | | 259,109 | 221,539 |
| TripAdvisor, Inc. Tranche B 1LN, term loan CME Term SOFR 1 Month Index + 2.750% 7.4352% 7/8/31 (d)(j)(l) | | 15,000 | 14,994 |
TOTAL CONSUMER PRODUCTS | | | 258,669 |
| Diversified Financial Services - 0.5% | | | |
| Dragon Buyer, Inc. 1LN, term loan CME Term SOFR 1 Month Index + 3.250% 7.8537% 9/30/31 (d)(j)(l) | | 25,000 | 24,836 |
| Hightower Holding LLC Tranche B 1LN, term loan CME Term SOFR 1 Month Index + 3.500% 8.7477% 4/21/28 (d)(j)(l) | | 828,090 | 828,711 |
| Nexus Buyer LLC Tranche B 1LN, term loan CME Term SOFR 1 Month Index + 4.000% 8.6852% 7/18/31 (d)(j)(l) | | 345,000 | 343,492 |
TOTAL DIVERSIFIED FINANCIAL SERVICES | | | 1,197,039 |
| Energy - 0.0% | | | |
| Forbes Energy Services LLC Tranche B, term loan 0% (d)(g)(h)(l) | | 60,604 | 0 |
| Mesquite Energy, Inc.: | | | |
| 1LN, term loan 3 month U.S. LIBOR + 8.000% 0% (d)(g)(h)(j)(l) | | 35,876 | 0 |
| term loan 0% (d)(g)(h)(l) | | 15,000 | 0 |
TOTAL ENERGY | | | 0 |
| Environmental - 0.3% | | | |
| LRS Holdings LLC Tranche B 1LN, term loan CME Term SOFR 1 Month Index + 4.250% 9.0496% 8/31/28 (d)(j)(l) | | 680,750 | 645,011 |
| Food/Beverage/Tobacco - 0.1% | | | |
| Del Monte Foods Corp. Ii, Inc. 1LN, term loan CME Term SOFR 1 Month Index + 8.000% 13.1657% 8/2/28 (d)(j)(l) | | 192,701 | 184,452 |
| Triton Water Holdings, Inc. Tranche B 1LN, term loan CME Term SOFR 3 Month Index + 3.250% 8.1153% 3/31/28 (d)(j)(l) | | 53,213 | 53,232 |
TOTAL FOOD/BEVERAGE/TOBACCO | | | 237,684 |
| Gaming - 0.1% | | | |
| Fertitta Entertainment LLC NV Tranche B 1LN, term loan CME Term SOFR 1 Month Index + 3.750% 8.1852% 1/29/29 (d)(j)(l) | | 315,976 | 315,989 |
| Healthcare - 1.1% | | | |
| Cano Health, Inc. 1LN, term loan CME Term SOFR 1 Month Index + 8.000% 12.6037% 6/28/29 (d)(j)(l) | | 175,823 | 174,504 |
| Confluent Health LLC Tranche B 1LN, term loan CME Term SOFR 1 Month Index + 4.000% 8.7996% 11/30/28 (d)(h)(j)(l) | | 14,636 | 14,270 |
| Jazz Financing Lux SARL Tranche B 1LN, term loan CME Term SOFR 1 Month Index + 2.250% 6.9352% 5/5/28 (d)(j)(l) | | 47,890 | 47,886 |
| MED ParentCo LP Tranche B 1LN, term loan CME Term SOFR 1 Month Index + 3.500% 8.2376% 4/15/31 (d)(j)(l) | | 438,402 | 438,709 |
| Medline Borrower LP Tranche B 1LN, term loan CME Term SOFR 1 Month Index + 2.750% 7.4352% 10/23/28 (d)(j)(l) | | 1,236,443 | 1,237,271 |
| Packaging Coordinators Midco, Inc. 1LN, term loan CME Term SOFR 1 Month Index + 3.250% 7.8354% 11/30/27 (d)(j)(l) | | 809,623 | 810,076 |
| Phoenix Newco, Inc. Tranche B 1LN, term loan CME Term SOFR 1 Month Index + 3.000% 7.6852% 11/15/28 (d)(j)(l) | | 56,238 | 56,187 |
| U.S. Anesthesia Partners, Inc. Tranche B 1LN, term loan CME Term SOFR 1 Month Index + 4.250% 9.2086% 10/1/28 (d)(j)(l) | | 29,100 | 28,642 |
TOTAL HEALTHCARE | | | 2,807,545 |
| Hotels - 0.0% | | | |
| Hilton Grand Vacations Borrower LLC Tranche B 1LN, term loan CME Term SOFR 1 Month Index + 3.000% 7.1852% 8/2/28 (d)(j)(l) | | 33,115 | 32,991 |
| Insurance - 0.4% | | | |
| Alliant Holdings Intermediate LLC Tranche B6 1LN, term loan CME Term SOFR 1 Month Index + 3.000% 7.7592% 9/19/31 (d)(j)(l) | | 380,697 | 378,794 |
| Asurion LLC 1LN, term loan CME Term SOFR 1 Month Index + 4.000% 8.7852% 8/19/28 (d)(j)(l) | | 363,769 | 360,263 |
| USI, Inc. Tranche B 1LN, term loan CME Term SOFR 3 Month Index + 2.750% 7.3537% 11/23/29 (d)(j)(l) | | 363,816 | 363,634 |
TOTAL INSURANCE | | | 1,102,691 |
| Leisure - 0.6% | | | |
| City Football Group Ltd. Tranche B 1LN, term loan CME Term SOFR 1 Month Index + 3.500% 7.8322% 7/21/30 (d)(j)(l) | | 522,925 | 516,388 |
| Hayward Industries, Inc. Tranche B 1LN, term loan CME Term SOFR 1 Month Index + 2.500% 7.2996% 5/28/28 (d)(j)(l) | | 387,000 | 386,930 |
| MajorDrive Holdings IV LLC 1LN, term loan CME Term SOFR 3 Month Index + 4.000% 8.8653% 6/1/28 (d)(j)(l) | | 24,188 | 24,239 |
| United PF Holdings LLC 1LN, term loan CME Term SOFR 3 Month Index + 4.000% 8.847% 12/30/26 (d)(j)(l) | | 513,655 | 493,433 |
TOTAL LEISURE | | | 1,420,990 |
| Metals/Mining - 0.3% | | | |
| American Rock Salt Co. LLC: | | | |
| 1LN, term loan: | | | |
CME Term SOFR 3 Month Index + 4.000% 9.3188% 6/4/28 (d)(j)(l) | | 557,125 | 464,118 |
CME Term SOFR 3 Month Index + 6.500% 2% 6/12/28 (d)(i)(j)(l) | | 174,862 | 174,643 |
| Tranche B 1LN, term loan CME Term SOFR 3 Month Index + 6.500% 11.8736% 6/12/28 (d)(j)(l) | | 163,464 | 163,260 |
TOTAL METALS/MINING | | | 802,021 |
| Paper - 0.4% | | | |
| Clydesdale Acquisition Holdings, Inc. 1LN, term loan CME Term SOFR 1 Month Index + 3.670% 7.8602% 4/13/29 (d)(j)(l) | | 963,925 | 961,274 |
| Services - 1.8% | | | |
| ABG Intermediate Holdings 2 LLC Tranche B1 1LN, term loan CME Term SOFR 1 Month Index + 2.750% 7.4465% 12/21/28 (d)(j)(l) | | 557,416 | 558,392 |
| Allied Universal Holdco LLC Tranche B 1LN, term loan CME Term SOFR 1 Month Index + 3.750% 8.5352% 5/14/28 (d)(j)(l) | | 1,445,841 | 1,442,342 |
| Ascend Learning LLC: | | | |
| 2LN, term loan CME Term SOFR 1 Month Index + 5.750% 10.5352% 12/10/29 (d)(j)(l) | | 20,000 | 19,633 |
| Tranche B 1LN, term loan CME Term SOFR 1 Month Index + 3.500% 8.2852% 12/10/28 (d)(j)(l) | | 875,094 | 874,411 |
| Brand Industrial Services, Inc. Tranche B 1LN, term loan CME Term SOFR 3 Month Index + 4.500% 9.7477% 8/1/30 (d)(j)(l) | | 262,357 | 258,668 |
| CHG Healthcare Services, Inc. 1LN, term loan CME Term SOFR 1 Month Index + 3.500% 8.2996% 9/30/28 (d)(j)(l) | | 14,550 | 14,575 |
| CoreLogic, Inc. Tranche B 1LN, term loan CME Term SOFR 1 Month Index + 3.500% 8.2996% 6/2/28 (d)(j)(l) | | 48,500 | 48,171 |
| Ensemble RCM LLC Tranche B 1LN, term loan CME Term SOFR 3 Month Index + 3.000% 7.5854% 8/1/29 (d)(j)(l) | | 29,925 | 29,951 |
| Neptune BidCo U.S., Inc. Tranche B 1LN, term loan CME Term SOFR 3 Month Index + 5.000% 9.7583% 4/11/29 (d)(j)(l) | | 405,310 | 373,899 |
| Spin Holdco, Inc. Tranche B 1LN, term loan CME Term SOFR 3 Month Index + 4.000% 9.256% 3/4/28 (d)(j)(l) | | 885,830 | 766,739 |
TOTAL SERVICES | | | 4,386,781 |
| Super Retail - 0.8% | | | |
| Empire Today LLC Tranche B 1LN, term loan CME Term SOFR 3 Month Index + 5.000% 9.847% 4/1/28 (d)(j)(l) | | 484,962 | 290,977 |
| Great Outdoors Group LLC Tranche B 1LN, term loan CME Term SOFR 1 Month Index + 3.750% 8.5496% 3/5/28 (d)(j)(l) | | 1,144,533 | 1,146,250 |
| LBM Acquisition LLC Tranche B 1LN, term loan CME Term SOFR 1 Month Index + 3.750% 8.6684% 6/6/31 (d)(j)(l) | | 502,675 | 495,009 |
TOTAL SUPER RETAIL | | | 1,932,236 |
| Technology - 1.4% | | | |
| Acuris Finance U.S., Inc. 1LN, term loan CME Term SOFR 1 Month Index + 3.750% 8.418% 2/16/28 (d)(j)(l) | | 6,306 | 6,291 |
| Applied Systems, Inc. Tranche 2LN, term loan CME Term SOFR 3 Month Index + 5.250% 9.8537% 2/23/32 (d)(j)(l) | | 5,000 | 5,136 |
| Athenahealth Group, Inc. Tranche B 1LN, term loan CME Term SOFR 1 Month Index + 3.250% 7.9352% 2/15/29 (d)(j)(l) | | 844,707 | 841,362 |
| Cloud Software Group, Inc. Tranche B 1LN, term loan CME Term SOFR 3 Month Index + 4.000% 8.6037% 3/29/29 (d)(j)(l) | | 1,815,450 | 1,814,633 |
| DG Investment Intermediate Holdings, Inc.: | | | |
| 2LN, term loan CME Term SOFR 1 Month Index + 6.750% 11.5496% 3/31/29 (d)(j)(l) | | 80,000 | 76,480 |
| Tranche B 1LN, term loan CME Term SOFR 1 Month Index + 3.750% 8.5496% 3/31/28 (d)(j)(l) | | 14,513 | 14,491 |
| Leia Finco U.S. LLC 1LN, term loan CME Term SOFR 1 Month Index + 3.250% 7.8867% 10/9/31 (d)(j)(l) | | 460,000 | 455,529 |
| Maverick Bidco, Inc. Tranche B 1LN, term loan CME Term SOFR 3 Month Index + 3.750% 8.4854% 5/18/28 (d)(j)(l) | | 291,019 | 289,927 |
TOTAL TECHNOLOGY | | | 3,503,849 |
| Telecommunications - 0.3% | | | |
| Cablevision Lightpath LLC Tranche B 1LN, term loan CME Term SOFR 1 Month Index + 3.250% 8.1684% 11/30/27 (d)(j)(l) | | 475,197 | 473,515 |
| Consolidated Communications, Inc. Tranche B 1LN, term loan CME Term SOFR 1 Month Index + 3.500% 8.2996% 10/2/27 (d)(j)(l) | | 250,000 | 245,720 |
TOTAL TELECOMMUNICATIONS | | | 719,235 |
| Textiles/Apparel - 0.2% | | | |
| Tory Burch LLC Tranche B 1LN, term loan CME Term SOFR 1 Month Index + 3.500% 8.0496% 4/16/28 (d)(j)(l) | | 598,632 | 598,548 |
| Utilities - 0.2% | | | |
| WEC U.S. Holdings Ltd. Tranche B 1LN, term loan CME Term SOFR 1 Month Index + 2.750% 7.5954% 1/20/31 (d)(j)(l) | | 600,770 | 601,064 |
| TOTAL BANK LOAN OBLIGATIONS (Cost $28,617,937) | | | 28,611,408 |
| | | | |
| Preferred Securities - 0.7% |
| | | Principal Amount (a) | Value ($) |
| Banks & Thrifts - 0.5% | | | |
| Ally Financial, Inc.: | | | |
| 4.7% (d)(m) | | 220,000 | 200,107 |
| 4.7% (d)(m) | | 230,000 | 188,899 |
| Citigroup, Inc. 7.125% (d)(m) | | 420,000 | 444,320 |
| Goldman Sachs Group, Inc. 6.125% (d)(m) | | 120,000 | 119,751 |
| Wells Fargo & Co. 7.625% (c)(d)(m) | | 290,000 | 314,545 |
TOTAL BANKS & THRIFTS | | | 1,267,622 |
| Diversified Financial Services - 0.2% | | | |
| Charles Schwab Corp. 5.375% (d)(m) | | 515,000 | 516,825 |
| TOTAL PREFERRED SECURITIES (Cost $1,560,924) | | | 1,784,447 |
| | | | |
| Money Market Funds - 12.2% |
| | | Shares | Value ($) |
| Fidelity Cash Central Fund 4.87% (n) | | 14,778,492 | 14,781,447 |
| Fidelity Securities Lending Cash Central Fund 4.87% (n)(o) | | 15,646,113 | 15,647,677 |
| TOTAL MONEY MARKET FUNDS (Cost $30,429,124) | | | 30,429,124 |
| | | | |
| TOTAL INVESTMENT IN SECURITIES - 105.9% (Cost $259,285,511) | 264,018,612 |
NET OTHER ASSETS (LIABILITIES) - (5.9)% | (14,718,421) |
| NET ASSETS - 100.0% | 249,300,191 |
| | |
Legend
| (a) | Amount is stated in United States dollars unless otherwise noted. |
| (b) | Security exempt from registration under Rule 144A of the Securities Act of 1933. These securities may be resold in transactions exempt from registration, normally to qualified institutional buyers. At the end of the period, the value of these securities amounted to $162,016,324 or 65.0% of net assets. |
| (c) | Security or a portion of the security is on loan at period end. |
| (d) | Coupon rates for floating and adjustable rate securities reflect the rates in effect at period end. |
| (e) | Security or a portion of the security purchased on a delayed delivery or when-issued basis. |
| (f) | Security initially issued at one coupon which converts to a higher coupon at a specified date. The rate shown is the rate at period end. |
| (g) | Non-income producing - Security is in default. |
| (i) | Position or a portion of the position represents an unfunded loan commitment. At period end, the total principal amount and market value of unfunded commitments totaled $468,195 and $456,243, respectively. |
| (j) | Coupon is indexed to a floating interest rate which may be multiplied by a specified factor and/or subject to caps or floors. |
| (l) | Remaining maturities of bank loan obligations may be less than the stated maturities shown as a result of contractual or optional prepayments by the borrower. Such prepayments cannot be predicted with certainty. |
| (m) | Security is perpetual in nature with no stated maturity date. |
| (n) | Affiliated fund that is generally available only to investment companies and other accounts managed by Fidelity Investments. The rate quoted is the annualized seven-day yield of the fund at period end. A complete unaudited listing of the fund's holdings as of its most recent quarter end is available upon request. In addition, each Fidelity Central Fund's financial statements are available on the SEC's website or upon request. |
| (o) | Investment made with cash collateral received from securities on loan. |
Affiliated Central Funds
Fiscal year to date information regarding the Fund's investments in Fidelity Central Funds, including the ownership percentage, is presented below.
| Affiliate | Value, beginning of period ($) | Purchases ($) | Sales Proceeds ($) | Dividend Income ($) | Realized Gain (loss) ($) | Change in Unrealized appreciation (depreciation) ($) | Value, end of period ($) | % ownership, end of period |
| Fidelity Cash Central Fund 4.87% | 9,395,617 | 70,913,770 | 65,528,053 | 372,675 | 113 | - | 14,781,447 | 0.0% |
| Fidelity Securities Lending Cash Central Fund 4.87% | - | 62,474,528 | 46,826,851 | 28,423 | - | - | 15,647,677 | 0.1% |
| Total | 9,395,617 | 133,388,298 | 112,354,904 | 401,098 | 113 | - | 30,429,124 | |
| | | | | | | | | |
Amounts in the dividend income column in the above table include any capital gain distributions from underlying funds, which are presented in the corresponding line item in the Statement of Operations, if applicable.
Amounts in the dividend income column for Fidelity Securities Lending Cash Central Fund represents the income earned on investing cash collateral, less rebates paid to borrowers and any lending agent fees associated with the loan, plus any premium payments received for lending certain types of securities.
Amounts included in the purchases and sales proceeds columns may include in-kind transactions, if applicable.
Investment Valuation
The following is a summary of the inputs used, as of October 31, 2024, involving the Fund's assets and liabilities carried at fair value. The inputs or methodology used for valuing securities may not be an indication of the risk associated with investing in those securities. For more information on valuation inputs, and their aggregation into the levels used below, please refer to the Investment Valuation section in the accompanying Notes to Financial Statements.
| Valuation Inputs at Reporting Date: |
| Description | Total ($) | Level 1 ($) | Level 2 ($) | Level 3 ($) |
Investments in Securities: | | | | |
|
| Equities: | | | | |
Energy | 162,447 | 104 | - | 162,343 |
Financials | 5,282 | - | - | 5,282 |
Health Care | 361,944 | - | - | 361,944 |
|
| Corporate Bonds | 198,682,196 | - | 198,259,796 | 422,400 |
|
| U.S. Government and Government Agency Obligations | 3,581,733 | - | 3,581,733 | - |
|
| Asset-Backed Securities | 400,031 | - | 400,031 | - |
|
| Bank Loan Obligations | 28,611,408 | - | 28,597,138 | 14,270 |
|
| Preferred Securities | 1,784,447 | - | 1,784,447 | - |
|
| Money Market Funds | 30,429,124 | 30,429,124 | - | - |
| Total Investments in Securities: | 264,018,612 | 30,429,228 | 232,623,145 | 966,239 |
| | | | | |
|
| Net Unrealized Appreciation on Unfunded Commitments | 288,981 | - | - | 288,981 |
| Total | 288,981 | - | - | 288,981 |
Financial Statements (Unaudited)
| Statement of Assets and Liabilities |
| As of October 31, 2024 (Unaudited) |
| Assets | | | | |
| Investment in securities, at value (including securities loaned of $15,077,371) - See accompanying schedule: | | | | |
Unaffiliated issuers (cost $228,856,387) | $ | 233,589,488 | | |
Fidelity Central Funds (cost $30,429,124) | | 30,429,124 | | |
| | | | | |
| | | | | |
| Total Investment in Securities (cost $259,285,511) | | | $ | 264,018,612 |
| Cash | | | | 411,236 |
| Receivable for investments sold | | | | 524,110 |
| Unrealized appreciation on unfunded commitments | | | | 288,981 |
| Receivable for fund shares sold | | | | 531,387 |
| Interest receivable | | | | 3,286,259 |
| Distributions receivable from Fidelity Central Funds | | | | 66,304 |
| Prepaid expenses | | | | 275 |
| Receivable from investment adviser for expense reductions | | | | 13,482 |
| Other receivables | | | | 867 |
Total assets | | | | 269,141,513 |
| Liabilities | | | | |
| Payable for investments purchased | | | | |
Regular delivery | $ | 1,867,630 | | |
Delayed delivery | | 1,850,000 | | |
| Payable for fund shares redeemed | | 134,061 | | |
| Distributions payable | | 148,067 | | |
| Accrued management fee | | 137,039 | | |
| Distribution and service plan fees payable | | 10,535 | | |
| Other payables and accrued expenses | | 46,312 | | |
| Collateral on securities loaned | | 15,647,678 | | |
| Total liabilities | | | | 19,841,322 |
| Commitments and contingent liabilities (see Significant Accounting Policies and Litigation notes) | | | | |
| Net Assets | | | $ | 249,300,191 |
| Net Assets consist of: | | | | |
| Paid in capital | | | $ | 256,333,316 |
| Total accumulated earnings (loss) | | | | (7,033,125) |
| Net Assets | | | $ | 249,300,191 |
| | | | | |
| Net Asset Value and Maximum Offering Price | | | | |
| Class A : | | | | |
Net Asset Value and redemption price per share ($30,547,226 ÷ 3,385,341 shares)(a) | | | $ | 9.02 |
| Maximum offering price per share (100/96.00 of $9.02) | | | $ | 9.40 |
| Class M : | | | | |
Net Asset Value and redemption price per share ($2,825,633 ÷ 313,191 shares)(a) | | | $ | 9.02 |
| Maximum offering price per share (100/96.00 of $9.02) | | | $ | 9.40 |
| Class C : | | | | |
Net Asset Value and offering price per share ($4,412,015 ÷ 488,909 shares)(a) | | | $ | 9.02 |
| Short Duration High Income : | | | | |
Net Asset Value, offering price and redemption price per share ($196,903,898 ÷ 21,821,689 shares) | | | $ | 9.02 |
| Class I : | | | | |
Net Asset Value, offering price and redemption price per share ($7,488,347 ÷ 829,823 shares) | | | $ | 9.02 |
| Class Z : | | | | |
Net Asset Value, offering price and redemption price per share ($7,123,072 ÷ 790,051 shares) | | | $ | 9.02 |
(a)Redemption price per share is equal to net asset value less any applicable contingent deferred sales charge. |
| Statement of Operations |
Six months ended October 31, 2024 (Unaudited) |
| Investment Income | | | | |
| Dividends | | | $ | 50,467 |
| Interest | | | | 8,754,730 |
| Income from Fidelity Central Funds (including $28,423 from security lending) | | | | 401,098 |
| Total income | | | | 9,206,295 |
| Expenses | | | | |
| Management fee | $ | 777,340 | | |
| Distribution and service plan fees | | 57,956 | | |
| Custodian fees and expenses | | 5,732 | | |
| Independent trustees' fees and expenses | | 473 | | |
| Registration fees | | 88,837 | | |
| Audit fees | | 37,044 | | |
| Legal | | 491 | | |
| Miscellaneous | | 3,300 | | |
| Total expenses before reductions | | 971,173 | | |
| Expense reductions | | (27,130) | | |
| Total expenses after reductions | | | | 944,043 |
| Net Investment income (loss) | | | | 8,262,252 |
| Realized and Unrealized Gain (Loss) | | | | |
| Net realized gain (loss) on: | | | | |
| Investment Securities: | | | | |
| Unaffiliated issuers | | (146,298) | | |
| Fidelity Central Funds | | 113 | | |
| Total net realized gain (loss) | | | | (146,185) |
| Change in net unrealized appreciation (depreciation) on: | | | | |
| Investment Securities: | | | | |
| Unaffiliated issuers | | 3,749,698 | | |
| Unfunded commitments | | 288,981 | | |
| Total change in net unrealized appreciation (depreciation) | | | | 4,038,679 |
| Net gain (loss) | | | | 3,892,494 |
| Net increase (decrease) in net assets resulting from operations | | | $ | 12,154,746 |
| Statement of Changes in Net Assets |
| |
| | Six months ended October 31, 2024 (Unaudited) | | Year ended April 30, 2024 |
| Increase (Decrease) in Net Assets | | | | |
| Operations | | | | |
| Net investment income (loss) | $ | 8,262,252 | $ | 26,932,407 |
| Net realized gain (loss) | | (146,185) | | (10,127,353) |
| Change in net unrealized appreciation (depreciation) | | 4,038,679 | | 4,892,935 |
| Net increase (decrease) in net assets resulting from operations | | 12,154,746 | | 21,697,989 |
| Distributions to shareholders | | (6,712,527) | | (22,490,058) |
| | | | | |
| Share transactions - net increase (decrease) | | 15,331,683 | | (273,189,716) |
| Total increase (decrease) in net assets | | 20,773,902 | | (273,981,785) |
| | | | | |
| Net Assets | | | | |
| Beginning of period | | 228,526,289 | | 502,508,074 |
| End of period | $ | 249,300,191 | $ | 228,526,289 |
| | | | | |
| | | | | |
Financial Highlights
Fidelity Advisor® Short Duration High Income Fund Class A |
| |
| | Six months ended (Unaudited) October 31, 2024 | | Years ended April 30, 2024 | | 2023 | | 2022 | | 2021 | | 2020 |
Selected Per-Share Data | | | | | | | | | | | | |
| Net asset value, beginning of period | $ | 8.82 | $ | 8.66 | $ | 8.98 | $ | 9.52 | $ | 8.87 | $ | 9.44 |
| Income from Investment Operations | | | | | | | | | | | | |
Net investment income (loss) A,B | | .303 | | .604 | | .502 | | .307 | | .300 | | .348 |
| Net realized and unrealized gain (loss) | | .141 | | .078 C | | (.429) | | (.546) | | .651 | | (.571) |
| Total from investment operations | | .444 | | .682 | | .073 | | (.239) | | .951 | | (.223) |
| Distributions from net investment income | | (.244) | | (.522) | | (.393) | | (.301) | | (.301) | | (.347) |
| Total distributions | | (.244) | | (.522) | | (.393) | | (.301) | | (.301) | | (.347) |
| Net asset value, end of period | $ | 9.02 | $ | 8.82 | $ | 8.66 | $ | 8.98 | $ | 9.52 | $ | 8.87 |
Total Return D,E,F | | | | 8.12% | | .93% | | (2.60)% | | 10.83% | | (2.47)% |
Ratios to Average Net Assets B,G,H | | | | | | | | | | | | |
| Expenses before reductions | | 1.06% I | | 1.04% | | 1.10% | | 1.13% | | 1.15% | | 1.15% |
| Expenses net of fee waivers, if any | | | | 1.01% | | 1.00% | | 1.01% | | 1.05% | | 1.05% |
| Expenses net of all reductions | | 1.00% I | | 1.01% | | 1.00% | | 1.01% | | 1.05% | | 1.05% |
| Net investment income (loss) | | 6.72% I | | 6.94% | | 5.81% | | 3.27% | | 3.21% | | 3.74% |
| Supplemental Data | | | | | | | | | | | | |
| Net assets, end of period (000 omitted) | $ | 30,547 | $ | 26,215 | $ | 21,379 | $ | 22,554 | $ | 17,126 | $ | 12,603 |
Portfolio turnover rate J | | | | 30% | | 14% | | 42% | | 74% | | 77% |
ACalculated based on average shares outstanding during the period.
BNet investment income (loss) is affected by the timing of the declaration of dividends by any underlying mutual funds or exchange-traded funds (ETFs). Net investment income (loss) of any mutual funds or ETFs is not included in the Fund's net investment income (loss) ratio.
CThe amount shown for a share outstanding does not correspond with the aggregate net gain (loss) on investments for the period due to the timing of sales and repurchases of shares in relation to fluctuating market values of the investments of the Fund.
DTotal returns for periods of less than one year are not annualized.
ETotal returns would have been lower if certain expenses had not been reduced during the applicable periods shown.
FTotal returns do not include the effect of the sales charges.
GFees and expenses of any underlying mutual funds or exchange-traded funds (ETFs) are not included in the Fund's expense ratio. The Fund indirectly bears its proportionate share of these expenses. For additional expense information related to investments in Fidelity Central Funds, please refer to the "Investments in Fidelity Central Funds" note found in the Notes to Financial Statements section of the most recent Annual or Semi-Annual report.
HExpense ratios reflect operating expenses of the class. Expenses before reductions do not reflect amounts reimbursed, waived, or reduced through arrangements with the investment adviser, brokerage services, or other offset arrangements, if applicable, and do not represent the amount paid by the class during periods when reimbursements, waivers or reductions occur.
IAnnualized.
JAmount does not include the portfolio activity of any underlying mutual funds or exchange-traded funds (ETFs).
Fidelity Advisor® Short Duration High Income Fund Class M |
| |
| | Six months ended (Unaudited) October 31, 2024 | | Years ended April 30, 2024 | | 2023 | | 2022 | | 2021 | | 2020 |
Selected Per-Share Data | | | | | | | | | | | | |
| Net asset value, beginning of period | $ | 8.81 | $ | 8.66 | $ | 8.98 | $ | 9.52 | $ | 8.86 | $ | 9.44 |
| Income from Investment Operations | | | | | | | | | | | | |
Net investment income (loss) A,B | | .302 | | .604 | | .502 | | .307 | | .300 | | .348 |
| Net realized and unrealized gain (loss) | | .152 | | .068 C | | (.429) | | (.546) | | .661 | | (.581) |
| Total from investment operations | | .454 | | .672 | | .073 | | (.239) | | .961 | | (.233) |
| Distributions from net investment income | | (.244) | | (.522) | | (.393) | | (.301) | | (.301) | | (.347) |
| Total distributions | | (.244) | | (.522) | | (.393) | | (.301) | | (.301) | | (.347) |
| Net asset value, end of period | $ | 9.02 | $ | 8.81 | $ | 8.66 | $ | 8.98 | $ | 9.52 | $ | 8.86 |
Total Return D,E,F | | | | 8.00% | | .93% | | (2.60)% | | 10.96% | | (2.58)% |
Ratios to Average Net Assets B,G,H | | | | | | | | | | | | |
| Expenses before reductions | | 1.08% I | | 1.06% | | 1.12% | | 1.13% | | 1.17% | | 1.16% |
| Expenses net of fee waivers, if any | | | | 1.01% | | 1.00% | | 1.01% | | 1.05% | | 1.05% |
| Expenses net of all reductions | | 1.00% I | | 1.01% | | 1.00% | | 1.01% | | 1.05% | | 1.05% |
| Net investment income (loss) | | 6.72% I | | 6.94% | | 5.81% | | 3.27% | | 3.21% | | 3.74% |
| Supplemental Data | | | | | | | | | | | | |
| Net assets, end of period (000 omitted) | $ | 2,826 | $ | 2,065 | $ | 2,318 | $ | 2,812 | $ | 2,289 | $ | 2,106 |
Portfolio turnover rate J | | | | 30% | | 14% | | 42% | | 74% | | 77% |
ACalculated based on average shares outstanding during the period.
BNet investment income (loss) is affected by the timing of the declaration of dividends by any underlying mutual funds or exchange-traded funds (ETFs). Net investment income (loss) of any mutual funds or ETFs is not included in the Fund's net investment income (loss) ratio.
CThe amount shown for a share outstanding does not correspond with the aggregate net gain (loss) on investments for the period due to the timing of sales and repurchases of shares in relation to fluctuating market values of the investments of the Fund.
DTotal returns for periods of less than one year are not annualized.
ETotal returns would have been lower if certain expenses had not been reduced during the applicable periods shown.
FTotal returns do not include the effect of the sales charges.
GFees and expenses of any underlying mutual funds or exchange-traded funds (ETFs) are not included in the Fund's expense ratio. The Fund indirectly bears its proportionate share of these expenses. For additional expense information related to investments in Fidelity Central Funds, please refer to the "Investments in Fidelity Central Funds" note found in the Notes to Financial Statements section of the most recent Annual or Semi-Annual report.
HExpense ratios reflect operating expenses of the class. Expenses before reductions do not reflect amounts reimbursed, waived, or reduced through arrangements with the investment adviser, brokerage services, or other offset arrangements, if applicable, and do not represent the amount paid by the class during periods when reimbursements, waivers or reductions occur.
IAnnualized.
JAmount does not include the portfolio activity of any underlying mutual funds or exchange-traded funds (ETFs).
Fidelity Advisor® Short Duration High Income Fund Class C |
| |
| | Six months ended (Unaudited) October 31, 2024 | | Years ended April 30, 2024 | | 2023 | | 2022 | | 2021 | | 2020 |
Selected Per-Share Data | | | | | | | | | | | | |
| Net asset value, beginning of period | $ | 8.82 | $ | 8.66 | $ | 8.98 | $ | 9.52 | $ | 8.87 | $ | 9.44 |
| Income from Investment Operations | | | | | | | | | | | | |
Net investment income (loss) A,B | | .269 | | .539 | | .439 | | .237 | | .230 | | .278 |
| Net realized and unrealized gain (loss) | | .141 | | .078 C | | (.430) | | (.546) | | .651 | | (.571) |
| Total from investment operations | | .410 | | .617 | | .009 | | (.309) | | .881 | | (.293) |
| Distributions from net investment income | | (.210) | | (.457) | | (.329) | | (.231) | | (.231) | | (.277) |
| Total distributions | | (.210) | | (.457) | | (.329) | | (.231) | | (.231) | | (.277) |
| Net asset value, end of period | $ | 9.02 | $ | 8.82 | $ | 8.66 | $ | 8.98 | $ | 9.52 | $ | 8.87 |
Total Return D,E,F | | | | 7.31% | | .18% | | (3.33)% | | 10.01% | | (3.20)% |
Ratios to Average Net Assets B,G,H | | | | | | | | | | | | |
| Expenses before reductions | | 1.84% I | | 1.83% | | 1.90% | | 1.91% | | 1.94% | | 1.93% |
| Expenses net of fee waivers, if any | | | | 1.76% | | 1.75% | | 1.76% | | 1.80% | | 1.80% |
| Expenses net of all reductions | | 1.75% I | | 1.76% | | 1.75% | | 1.76% | | 1.80% | | 1.80% |
| Net investment income (loss) | | 5.97% I | | 6.19% | | 5.06% | | 2.52% | | 2.46% | | 2.99% |
| Supplemental Data | | | | | | | | | | | | |
| Net assets, end of period (000 omitted) | $ | 4,412 | $ | 3,453 | $ | 2,795 | $ | 3,884 | $ | 4,018 | $ | 4,017 |
Portfolio turnover rate J | | | | 30% | | 14% | | 42% | | 74% | | 77% |
ACalculated based on average shares outstanding during the period.
BNet investment income (loss) is affected by the timing of the declaration of dividends by any underlying mutual funds or exchange-traded funds (ETFs). Net investment income (loss) of any mutual funds or ETFs is not included in the Fund's net investment income (loss) ratio.
CThe amount shown for a share outstanding does not correspond with the aggregate net gain (loss) on investments for the period due to the timing of sales and repurchases of shares in relation to fluctuating market values of the investments of the Fund.
DTotal returns for periods of less than one year are not annualized.
ETotal returns would have been lower if certain expenses had not been reduced during the applicable periods shown.
FTotal returns do not include the effect of the contingent deferred sales charge.
GFees and expenses of any underlying mutual funds or exchange-traded funds (ETFs) are not included in the Fund's expense ratio. The Fund indirectly bears its proportionate share of these expenses. For additional expense information related to investments in Fidelity Central Funds, please refer to the "Investments in Fidelity Central Funds" note found in the Notes to Financial Statements section of the most recent Annual or Semi-Annual report.
HExpense ratios reflect operating expenses of the class. Expenses before reductions do not reflect amounts reimbursed, waived, or reduced through arrangements with the investment adviser, brokerage services, or other offset arrangements, if applicable, and do not represent the amount paid by the class during periods when reimbursements, waivers or reductions occur.
IAnnualized.
JAmount does not include the portfolio activity of any underlying mutual funds or exchange-traded funds (ETFs).
Fidelity® Short Duration High Income Fund |
| |
| | Six months ended (Unaudited) October 31, 2024 | | Years ended April 30, 2024 | | 2023 | | 2022 | | 2021 | | 2020 |
Selected Per-Share Data | | | | | | | | | | | | |
| Net asset value, beginning of period | $ | 8.82 | $ | 8.66 | $ | 8.98 | $ | 9.52 | $ | 8.87 | $ | 9.44 |
| Income from Investment Operations | | | | | | | | | | | | |
Net investment income (loss) A,B | | .314 | | .624 | | .523 | | .331 | | .323 | | .372 |
| Net realized and unrealized gain (loss) | | .142 | | .083 C | | (.428) | | (.546) | | .651 | | (.572) |
| Total from investment operations | | .456 | | .707 | | .095 | | (.215) | | .974 | | (.200) |
| Distributions from net investment income | | (.256) | | (.547) | | (.415) | | (.325) | | (.324) | | (.370) |
| Total distributions | | (.256) | | (.547) | | (.415) | | (.325) | | (.324) | | (.370) |
| Net asset value, end of period | $ | 9.02 | $ | 8.82 | $ | 8.66 | $ | 8.98 | $ | 9.52 | $ | 8.87 |
Total Return D,E | | | | 8.42% | | 1.18% | | (2.35)% | | 11.11% | | (2.23)% |
Ratios to Average Net Assets A,F,G | | | | | | | | | | | | |
| Expenses before reductions | | .76% H | | .73% | | .76% | | .83% | | .87% | | .86% |
| Expenses net of fee waivers, if any | | | | .73% | | .75% | | .75% | | .80% | | .80% |
| Expenses net of all reductions | | .75% H | | .73% | | .75% | | .75% | | .80% | | .80% |
| Net investment income (loss) | | 6.97% H | | 7.22% | | 6.06% | | 3.52% | | 3.46% | | 3.99% |
| Supplemental Data | | | | | | | | | | | | |
| Net assets, end of period (000 omitted) | $ | 196,904 | $ | 180,997 | $ | 460,873 | $ | 87,949 | $ | 83,066 | $ | 63,703 |
Portfolio turnover rate I | | | | 30% | | 14% | | 42% | | 74% | | 77% |
ANet investment income (loss) is affected by the timing of the declaration of dividends by any underlying mutual funds or exchange-traded funds (ETFs). Net investment income (loss) of any mutual funds or ETFs is not included in the Fund's net investment income (loss) ratio.
BCalculated based on average shares outstanding during the period.
CThe amount shown for a share outstanding does not correspond with the aggregate net gain (loss) on investments for the period due to the timing of sales and repurchases of shares in relation to fluctuating market values of the investments of the Fund.
DTotal returns for periods of less than one year are not annualized.
ETotal returns would have been lower if certain expenses had not been reduced during the applicable periods shown.
FFees and expenses of any underlying mutual funds or exchange-traded funds (ETFs) are not included in the Fund's expense ratio. The Fund indirectly bears its proportionate share of these expenses. For additional expense information related to investments in Fidelity Central Funds, please refer to the "Investments in Fidelity Central Funds" note found in the Notes to Financial Statements section of the most recent Annual or Semi-Annual report.
GExpense ratios reflect operating expenses of the class. Expenses before reductions do not reflect amounts reimbursed, waived, or reduced through arrangements with the investment adviser, brokerage services, or other offset arrangements, if applicable, and do not represent the amount paid by the class during periods when reimbursements, waivers or reductions occur.
HAnnualized.
IAmount does not include the portfolio activity of any underlying mutual funds or exchange-traded funds (ETFs).
Fidelity Advisor® Short Duration High Income Fund Class I |
| |
| | Six months ended (Unaudited) October 31, 2024 | | Years ended April 30, 2024 | | 2023 | | 2022 | | 2021 | | 2020 |
Selected Per-Share Data | | | | | | | | | | | | |
| Net asset value, beginning of period | $ | 8.82 | $ | 8.66 | $ | 8.98 | $ | 9.52 | $ | 8.87 | $ | 9.44 |
| Income from Investment Operations | | | | | | | | | | | | |
Net investment income (loss) A,B | | .314 | | .625 | | .524 | | .331 | | .323 | | .372 |
| Net realized and unrealized gain (loss) | | .142 | | .079 C | | (.429) | | (.546) | | .651 | | (.572) |
| Total from investment operations | | .456 | | .704 | | .095 | | (.215) | | .974 | | (.200) |
| Distributions from net investment income | | (.256) | | (.544) | | (.415) | | (.325) | | (.324) | | (.370) |
| Total distributions | | (.256) | | (.544) | | (.415) | | (.325) | | (.324) | | (.370) |
| Net asset value, end of period | $ | 9.02 | $ | 8.82 | $ | 8.66 | $ | 8.98 | $ | 9.52 | $ | 8.87 |
Total Return D,E | | | | 8.39% | | 1.18% | | (2.35)% | | 11.11% | | (2.23)% |
Ratios to Average Net Assets B,F,G | | | | | | | | | | | | |
| Expenses before reductions | | .78% H | | .76% | | .84% | | .88% | | .92% | | .89% |
| Expenses net of fee waivers, if any | | | | .76% | | .75% | | .76% | | .80% | | .80% |
| Expenses net of all reductions | | .75% H | | .76% | | .75% | | .76% | | .80% | | .80% |
| Net investment income (loss) | | 6.97% H | | 7.19% | | 6.06% | | 3.52% | | 3.46% | | 3.99% |
| Supplemental Data | | | | | | | | | | | | |
| Net assets, end of period (000 omitted) | $ | 7,488 | $ | 6,093 | $ | 4,855 | $ | 5,055 | $ | 5,023 | $ | 3,950 |
Portfolio turnover rate I | | | | 30% | | 14% | | 42% | | 74% | | 77% |
ACalculated based on average shares outstanding during the period.
BNet investment income (loss) is affected by the timing of the declaration of dividends by any underlying mutual funds or exchange-traded funds (ETFs). Net investment income (loss) of any mutual funds or ETFs is not included in the Fund's net investment income (loss) ratio.
CThe amount shown for a share outstanding does not correspond with the aggregate net gain (loss) on investments for the period due to the timing of sales and repurchases of shares in relation to fluctuating market values of the investments of the Fund.
DTotal returns for periods of less than one year are not annualized.
ETotal returns would have been lower if certain expenses had not been reduced during the applicable periods shown.
FFees and expenses of any underlying mutual funds or exchange-traded funds (ETFs) are not included in the Fund's expense ratio. The Fund indirectly bears its proportionate share of these expenses. For additional expense information related to investments in Fidelity Central Funds, please refer to the "Investments in Fidelity Central Funds" note found in the Notes to Financial Statements section of the most recent Annual or Semi-Annual report.
GExpense ratios reflect operating expenses of the class. Expenses before reductions do not reflect amounts reimbursed, waived, or reduced through arrangements with the investment adviser, brokerage services, or other offset arrangements, if applicable, and do not represent the amount paid by the class during periods when reimbursements, waivers or reductions occur.
HAnnualized.
IAmount does not include the portfolio activity of any underlying mutual funds or exchange-traded funds (ETFs).
Fidelity Advisor® Short Duration High Income Fund Class Z |
| |
| | Six months ended (Unaudited) October 31, 2024 | | Years ended April 30, 2024 | | 2023 | | 2022 | | 2021 | | 2020 |
Selected Per-Share Data | | | | | | | | | | | | |
| Net asset value, beginning of period | $ | 8.82 | $ | 8.66 | $ | 8.98 | $ | 9.52 | $ | 8.87 | $ | 9.45 |
| Income from Investment Operations | | | | | | | | | | | | |
Net investment income (loss) A,B | | .320 | | .632 | | .531 | | .339 | | .331 | | .378 |
| Net realized and unrealized gain (loss) | | .140 | | .080 C | | (.428) | | (.546) | | .652 | | (.579) |
| Total from investment operations | | .460 | | .712 | | .103 | | (.207) | | .983 | | (.201) |
| Distributions from net investment income | | (.260) | | (.552) | | (.423) | | (.333) | | (.333) | | (.379) |
| Total distributions | | (.260) | | (.552) | | (.423) | | (.333) | | (.333) | | (.379) |
| Net asset value, end of period | $ | 9.02 | $ | 8.82 | $ | 8.66 | $ | 8.98 | $ | 9.52 | $ | 8.87 |
Total Return D,E | | | | 8.48% | | 1.27% | | (2.27)% | | 11.21% | | (2.24)% |
Ratios to Average Net Assets B,F,G | | | | | | | | | | | | |
| Expenses before reductions | | .71% H | | .70% | | .75% | | .78% | | .80% | | .80% |
| Expenses net of fee waivers, if any | | | | .67% | | .66% | | .66% | | .71% | | .71% |
| Expenses net of all reductions | | .66% H | | .67% | | .66% | | .66% | | .71% | | .71% |
| Net investment income (loss) | | 7.06% H | | 7.28% | | 6.15% | | 3.61% | | 3.55% | | 4.08% |
| Supplemental Data | | | | | | | | | | | | |
| Net assets, end of period (000 omitted) | $ | 7,123 | $ | 9,702 | $ | 10,289 | $ | 5,246 | $ | 3,815 | $ | 2,031 |
Portfolio turnover rate I | | | | 30% | | 14% | | 42% | | 74% | | 77% |
ACalculated based on average shares outstanding during the period.
BNet investment income (loss) is affected by the timing of the declaration of dividends by any underlying mutual funds or exchange-traded funds (ETFs). Net investment income (loss) of any mutual funds or ETFs is not included in the Fund's net investment income (loss) ratio.
CThe amount shown for a share outstanding does not correspond with the aggregate net gain (loss) on investments for the period due to the timing of sales and repurchases of shares in relation to fluctuating market values of the investments of the Fund.
DTotal returns for periods of less than one year are not annualized.
ETotal returns would have been lower if certain expenses had not been reduced during the applicable periods shown.
FFees and expenses of any underlying mutual funds or exchange-traded funds (ETFs) are not included in the Fund's expense ratio. The Fund indirectly bears its proportionate share of these expenses. For additional expense information related to investments in Fidelity Central Funds, please refer to the "Investments in Fidelity Central Funds" note found in the Notes to Financial Statements section of the most recent Annual or Semi-Annual report.
GExpense ratios reflect operating expenses of the class. Expenses before reductions do not reflect amounts reimbursed, waived, or reduced through arrangements with the investment adviser, brokerage services, or other offset arrangements, if applicable, and do not represent the amount paid by the class during periods when reimbursements, waivers or reductions occur.
HAnnualized.
IAmount does not include the portfolio activity of any underlying mutual funds or exchange-traded funds (ETFs).
Notes to Financial Statements
(Unaudited)For the period ended October 31, 2024
1. Organization.
Fidelity Short Duration High Income Fund (the Fund) is a fund of Fidelity Summer Street Trust (the Trust) and is authorized to issue an unlimited number of shares. The Trust is registered under the Investment Company Act of 1940, as amended (the 1940 Act), as an open-end management investment company organized as a Massachusetts business trust. The Fund offers Class A, Class M, Class C, Short Duration High Income, Class I and Class Z shares, each of which has equal rights as to assets and voting privileges. Class A, Class M, Class C, Class I and Class Z are Fidelity Advisor classes. Each class has exclusive voting rights with respect to matters that affect that class. Class C shares will automatically convert to Class A shares after a holding period of eight years from the initial date of purchase, with certain exceptions.
2. Investments in Fidelity Central Funds.
Funds may invest in Fidelity Central Funds, which are open-end investment companies generally available only to other investment companies and accounts managed by the investment adviser and its affiliates. The Schedule of Investments lists any Fidelity Central Funds held as an investment as of period end, but does not include the underlying holdings of each Fidelity Central Fund. An investing fund indirectly bears its proportionate share of the expenses of the underlying Fidelity Central Funds.
Based on its investment objective, each Fidelity Central Fund may invest or participate in various investment vehicles or strategies that are similar to those of the investing fund. These strategies are consistent with the investment objectives of the investing fund and may involve certain economic risks which may cause a decline in value of each of the Fidelity Central Funds and thus a decline in the value of the investing fund.
| Fidelity Central Fund | Investment Manager | Investment Objective | Investment Practices | Expense RatioA |
| Fidelity Money Market Central Funds | Fidelity Management & Research Company LLC (FMR) | Each fund seeks to obtain a high level of current income consistent with the preservation of capital and liquidity. | Short-term Investments | Less than .005% |
A Expenses expressed as a percentage of average net assets and are as of each underlying Central Fund's most recent annual or semi-annual shareholder report.
A complete unaudited list of holdings for each Fidelity Central Fund is available upon request or at the Securities and Exchange Commission website at www.sec.gov. In addition, the financial statements of the Fidelity Central Funds which contain the significant accounting policies (including investment valuation policies) of those funds, and are not covered by the Report of Independent Registered Public Accounting Firm, are available on the Securities and Exchange Commission website or upon request.
3. Significant Accounting Policies.
The Fund is an investment company and applies the accounting and reporting guidance of the Financial Accounting Standards Board (FASB) Accounting Standards Codification Topic 946 Financial Services - Investment Companies. The financial statements have been prepared in conformity with accounting principles generally accepted in the United States of America (GAAP), which require management to make certain estimates and assumptions at the date of the financial statements. Actual results could differ from those estimates. Subsequent events, if any, through the date that the financial statements were issued have been evaluated in the preparation of the financial statements. The Fund's Schedule of Investments lists any underlying mutual funds or exchange-traded funds (ETFs) but does not include the underlying holdings of these funds. The following summarizes the significant accounting policies of the Fund:
Investment Valuation. Investments are valued as of 4:00 p.m. Eastern time on the last calendar day of the period. The Board of Trustees (the Board) has designated the Fund's investment adviser as the valuation designee responsible for the fair valuation function and performing fair value determinations as needed. The investment adviser has established a Fair Value Committee (the Committee) to carry out the day-to-day fair valuation responsibilities and has adopted policies and procedures to govern the fair valuation process and the activities of the Committee. In accordance with these fair valuation policies and procedures, which have been approved by the Board, the Fund attempts to obtain prices from one or more third party pricing services or brokers to value its investments. When current market prices, quotations or currency exchange rates are not readily available or reliable, investments will be fair valued in good faith by the Committee, in accordance with the policies and procedures. Factors used in determining fair value vary by investment type and may include market or investment specific events, transaction data, estimated cash flows, and market observations of comparable investments. The frequency that the fair valuation procedures are used cannot be predicted and they may be utilized to a significant extent. The Committee manages the Fund's fair valuation practices and maintains the fair valuation policies and procedures. The Fund's investment adviser reports to the Board information regarding the fair valuation process and related material matters.
The Fund categorizes the inputs to valuation techniques used to value its investments into a disclosure hierarchy consisting of three levels as shown below:
Level 1 - unadjusted quoted prices in active markets for identical investments
Level 2 - other significant observable inputs (including quoted prices for similar investments, interest rates, prepayment speeds, etc.)
Level 3 - unobservable inputs (including the Fund's own assumptions based on the best information available)
Valuation techniques used to value the Fund's investments by major category are as follows:
Debt securities, including restricted securities, are valued based on evaluated prices received from third party pricing services or from brokers who make markets in such securities. Corporate bonds, bank loan obligations, preferred securities and U.S. government and government agency obligations are valued by pricing services who utilize matrix pricing which considers yield or price of bonds of comparable quality, coupon, maturity and type or by broker-supplied prices. Asset backed securities are valued by pricing services who utilize matrix pricing which considers prepayment speed assumptions, attributes of the collateral, yield or price of bonds of comparable quality, coupon, maturity and type or by broker-supplied prices. When independent prices are unavailable or unreliable, debt securities may be valued utilizing pricing methodologies which consider similar factors that would be used by third party pricing services. Debt securities are generally categorized as Level 2 in the hierarchy but may be Level 3 depending on the circumstances. The Fund invests a significant portion of its assets in below investment grade securities. The value of these securities can be more volatile due to changes in the credit quality of the issuer and is sensitive to changes in economic, market and regulatory conditions.
Equity securities, including restricted securities, for which market quotations are readily available, are valued at the last reported sale price or official closing price as reported by a third party pricing service on the primary market or exchange on which they are traded and are categorized as Level 1 in the hierarchy. In the event there were no sales during the day or closing prices are not available, securities are valued at the last quoted bid price or may be valued using the last available price and are generally categorized as Level 2 in the hierarchy. For foreign equity securities, when market or security specific events arise, comparisons to the valuation of American Depositary Receipts (ADRs), futures contracts, ETFs and certain indexes as well as quoted prices for similar securities may be used and would be categorized as Level 2 in the hierarchy. For equity securities, including restricted securities, where observable inputs are limited, assumptions about market activity and risk are used and these securities may be categorized as Level 3 in the hierarchy.
Investments in open-end mutual funds, including the Fidelity Central Funds, are valued at their closing net asset value (NAV) each business day and are categorized as Level 1 in the hierarchy.
Changes in valuation techniques may result in transfers in or out of an assigned level within the disclosure hierarchy. The aggregate value of investments by input level as of October 31, 2024 is included at the end of the Fund's Schedule of Investments.
Investment Transactions and Income. For financial reporting purposes, the Fund's investment holdings and NAV include trades executed through the end of the last business day of the period. The NAV per share for processing shareholder transactions is calculated as of the close of business of the New York Stock Exchange (NYSE), normally 4:00 p.m. Eastern time and includes trades executed through the end of the prior business day. Gains and losses on securities sold are determined on the basis of identified cost. Commissions paid to certain brokers with whom the investment adviser, or its affiliates, places trades on behalf of a fund include an amount in addition to trade execution, which may be rebated back to a fund. Any such rebates are included in net realized gain (loss) on investments in the Statement of Operations. Dividend income is recorded on the ex-dividend date. Income and capital gain distributions from Fidelity Central Funds, if any, are recorded on the ex-dividend date. Interest income is accrued as earned and includes coupon interest and amortization of premium and accretion of discount on debt securities as applicable. Paid in Kind (PIK) income is recorded at the fair market value of the securities received. Debt obligations may be placed on non-accrual status and related interest income may be reduced by ceasing current accruals and writing off interest receivables when the collection of all or a portion of interest has become doubtful based on consistently applied procedures. A debt obligation is removed from non-accrual status when the issuer resumes interest payments or when collectability of interest is reasonably assured.
Class Allocations and Expenses. Investment income, realized and unrealized capital gains and losses, common expenses of a fund, and certain fund-level expense reductions, if any, are allocated daily on a pro-rata basis to each class based on the relative net assets of each class to the total net assets of a fund. Each class differs with respect to transfer agent and distribution and service plan fees incurred, as applicable. Certain expense reductions may also differ by class, if applicable. For the reporting period, the allocated portion of income and expenses to each class as a percent of its average net assets may vary due to the timing of recording these transactions in relation to fluctuating net assets of the classes. Expenses directly attributable to a fund are charged to that fund. Expenses attributable to more than one fund are allocated among the respective funds on the basis of relative net assets or other appropriate methods. Expenses included in the accompanying financial statements reflect the expenses of that fund and do not include any expenses associated with any underlying mutual funds or exchange-traded funds (ETFs). Although not included in a fund's expenses, a fund indirectly bears its proportionate share of these expenses through the net asset value of each underlying mutual fund or exchange-traded fund (ETF). Expense estimates are accrued in the period to which they relate and adjustments are made when actual amounts are known.
Income Tax Information and Distributions to Shareholders. Each year, the Fund intends to qualify as a regulated investment company under Subchapter M of the Internal Revenue Code, including distributing substantially all of its taxable income and realized gains. As a result, no provision for U.S. Federal income taxes is required. The Fund files a U.S. federal tax return, in addition to state and local tax returns as required. The Fund's federal income tax returns are subject to examination by the Internal Revenue Service (IRS) for a period of three fiscal years after they are filed. State and local tax returns may be subject to examination for an additional fiscal year depending on the jurisdiction.
Distributions are declared and recorded daily and paid monthly from net investment income. Distributions from realized gains, if any, are declared and recorded on the ex-dividend date. Income and capital gain distributions are declared separately for each class. Income and capital gain distributions are determined in accordance with income tax regulations, which may differ from GAAP.
Capital accounts within the financial statements are adjusted for permanent book-tax differences. These adjustments have no impact on net assets or the results of operations. Capital accounts are not adjusted for temporary book-tax differences which will reverse in a subsequent period.
Book-tax differences are primarily due to market discount, partnerships, capital loss carryforwards and losses deferred due to wash sales.
As of period end, the cost and unrealized appreciation (depreciation) in securities, and derivatives if applicable, for federal income tax purposes were as follows:
| Gross unrealized appreciation | $11,217,927 |
| Gross unrealized depreciation | (1,915,089) |
| Net unrealized appreciation (depreciation) | $9,302,838 |
| Tax cost | $254,715,774 |
Capital loss carryforwards are only available to offset future capital gains of the Fund to the extent provided by regulations and may be limited. The capital loss carryforward information presented below, including any applicable limitation, is estimated as of prior fiscal period end and is subject to adjustment.
| Short-term | $(7,768,023) |
| Long-term | (10,974,238) |
| Total capital loss carryforward | $(18,742,261) |
Delayed Delivery Transactions and When-Issued Securities. During the period, certain Funds transacted in securities on a delayed delivery or when-issued basis. Payment and delivery may take place after the customary settlement period for that security. The price of the underlying securities and the date when the securities will be delivered and paid for are fixed at the time the transaction is negotiated. Securities purchased on a delayed delivery or when-issued basis are identified as such in the Schedule of Investments. Compensation for interest forgone in the purchase of a delayed delivery or when-issued debt security may be received. With respect to purchase commitments, each applicable Fund identifies securities as segregated in its records with a value at least equal to the amount of the commitment. Payables and receivables associated with the purchases and sales of delayed delivery securities having the same coupon, settlement date and broker are offset. Delayed delivery or when-issued securities that have been purchased from and sold to different brokers are reflected as both payables and receivables in the Statement of Assets and Liabilities under the caption "Delayed delivery", as applicable. Losses may arise due to changes in the value of the underlying securities or if the counterparty does not perform under the contract's terms, or if the issuer does not issue the securities due to political, economic, or other factors.
Restricted Securities (including Private Placements). Funds may invest in securities that are subject to legal or contractual restrictions on resale. These securities generally may be resold in transactions exempt from registration or to the public if the securities are registered. Disposal of these securities may involve time-consuming negotiations and expense, and prompt sale at an acceptable price may be difficult. Information regarding restricted securities held at period end is included at the end of the Schedule of Investments, if applicable.
Loans and Other Direct Debt Instruments. Direct debt instruments are interests in amounts owed to lenders by corporate or other borrowers. These instruments may be in the form of loans, trade claims or other receivables and may include standby financing commitments such as revolving credit facilities that obligate a fund to supply additional cash to the borrower on demand. Loans may be acquired through assignment, participation, or may be made directly to a borrower. Such instruments are presented in the Bank Loan Obligations section in the Schedule of Investments. Certain funds may also invest in unfunded loan commitments, which are contractual obligations for future funding. Information regarding unfunded commitments is included at the end of the Schedule of Investments, if applicable.
Commitments. A commitment is an agreement to acquire an investment at a future date (subject to conditions) in connection with a potential public or non-public offering. Commitments outstanding at period end are presented in the table below. Unrealized appreciation (depreciation) on any commitments outstanding at period end is separately presented in the Statement of Assets and Liabilities as Unrealized appreciation (depreciation) on unfunded commitments, and any change in unrealized appreciation (depreciation) on unfunded commitments during the period is separately presented in the Statement of Operations, as applicable based on contractual conditions of each commitment.
| | Investment to be Acquired | Commitment Amount ($) | Unrealized Appreciation (Depreciation)($) |
| Fidelity Short Duration High Income Fund | EchoStar Corp. 10.75% 9/27/29 | 3,334,875 | 288,981 |
New Accounting Pronouncement. In November 2023, the FASB issued Accounting Standards Update (ASU) 2023-07 Segment Reporting (Topic 280): Improvements to Reportable Segment Disclosures. Effective for fiscal years beginning after December 15, 2023 and interim periods within fiscal years beginning after December 15, 2024, the amendments enhance required disclosures of segment information for public entities on an annual and interim basis. The ASU allows for early adoption with updates applied retrospectively. Management is currently evaluating the impact of the ASU but does not expect this guidance to materially impact the financial statements.
4. Purchases and Sales of Investments.
Purchases and sales of securities, other than short-term securities, U.S. government securities and in-kind transactions, as applicable, are noted in the table below.
| | Purchases ($) | Sales ($) |
| Fidelity Short Duration High Income Fund | 55,913,002 | 48,184,121 |
5. Fees and Other Transactions with Affiliates.
Management Fee. Fidelity Management & Research Company LLC (the investment adviser) and its affiliates provide the Fund with investment management related services for which the Fund pays a monthly management fee.
The Fund's management contract incorporates a management fee rate that may vary by class. The investment adviser or an affiliate pays certain expenses of managing and operating the Fund out of each class's management fee. Each class of the Fund pays a management fee to the investment adviser. The management fee is calculated and paid to the investment adviser every month. When determining a class's management fee, a mandate rate is calculated based on the monthly average net assets of a group of funds advised by FMR within a designated asset class. A discount rate is subtracted from the mandate rate once the Fund's monthly average net assets reach a certain level. The mandate rate and discount rate may vary by class. The annual management fee rate for a class of shares of the Fund is the lesser of (1) the class's mandate rate reduced by the class's discount rate (if applicable) or (2) the amount set forth in the following table.
| | Maximum Management Fee Rate % |
| Class A | .70% |
| Class M | .72% |
| Class C | .74% |
| Short Duration High Income | .65% |
| Class I | .67% |
| Class Z | .61% |
One-twelfth of the management fee rate for a class is applied to the average net assets of the class for the month, giving a dollar amount which is the management fee for the class for that month. A different management fee rate may be applicable to each class of the Fund. The difference between classes is the result of separate arrangements for class-level services and/or waivers of certain expenses. It is not the result of any difference in advisory or custodial fees or other expenses related to the management of the Fund's assets, which do not vary by class. For the reporting period, the total annualized management fee rates were as follows:
| | Total Management Fee Rate % |
| Class A | .69 |
| Class M | .71 |
| Class C | .73 |
| Short Duration High Income | .64 |
| Class I | .66 |
| Class Z | .60 |
Distribution and Service Plan Fees. In accordance with Rule 12b-1 of the 1940 Act, the Fund has adopted separate Distribution and Service Plans for each class of shares. Certain classes pay Fidelity Distributors Company LLC (FDC), an affiliate of the investment adviser, separate Distribution and Service Fees, each of which is based on an annual percentage of each class' average net assets. In addition, FDC may pay financial intermediaries for selling shares of the Fund and providing shareholder support services. For the period, the Distribution and Service Fee rates, total fees and amounts retained by FDC were as follows:
| | Distribution Fee | Service Fee | Total Fees ($) | Retained by FDC ($) |
| Class A | - % | .25% | 34,942 | 2,150 |
| Class M | - % | .25% | 3,162 | - |
| Class C | .75% | .25% | 19,852 | 6,977 |
| | | | 57,956 | 9,127 |
Sales Load. FDC may receive a front-end sales charge of up to 4.00% for selling Class A shares and Class M shares, some of which is paid to financial intermediaries for selling shares of the Fund. Depending on the holding period, FDC may receive contingent deferred sales charges levied on Class A, Class M and Class C redemptions. The deferred sales charges are 1.00% for Class C shares, 1.00% for certain purchases of Class A shares and .25% for certain purchases of Class M shares.
For the period, sales charge amounts retained by FDC were as follows:
| | Retained by FDC ($) |
| Class A | 3,108 |
| Class M | 93 |
Class C A | 199 |
| | 3,400 |
A When Class C shares are initially sold, FDC pays commissions from its own resources to financial intermediaries through which the sales are made.
Interfund Trades. Funds may purchase from or sell securities to other Fidelity Funds under procedures adopted by the Board. The procedures have been designed to ensure these interfund trades are executed in accordance with Rule 17a-7 of the 1940 Act. Any interfund trades are included within the respective purchases and sales amounts shown in the Purchases and Sales of Investments note. During the period, there were no interfund trades.
6. Committed Line of Credit.
Certain Funds participate with other funds managed by the investment adviser or an affiliate in a $4.25 billion credit facility (the "line of credit") to be utilized for temporary or emergency purposes to fund shareholder redemptions or for other short-term liquidity purposes. The participating funds have agreed to pay commitment fees on their pro-rata portion of the line of credit, which are reflected in Miscellaneous expenses on the Statement of Operations, and are listed below. During the period, there were no borrowings on this line of credit.
| | Amount ($) |
| Fidelity Short Duration High Income Fund | 160 |
7. Security Lending.
Funds lend portfolio securities from time to time in order to earn additional income. Lending agents are used, including National Financial Services (NFS), an affiliate of the investment adviser. Pursuant to a securities lending agreement, NFS will receive a fee, which is capped at 9.9% of a fund's daily lending revenue, for its services as lending agent. A fund may lend securities to certain qualified borrowers, including NFS. On the settlement date of the loan, a fund receives collateral (in the form of U.S. Treasury obligations, letters of credit and/or cash) against the loaned securities and maintains collateral in an amount not less than 100% of the market value of the loaned securities during the period of the loan. The market value of the loaned securities is determined at the close of business of a fund and any additional required collateral is delivered to a fund on the next business day. A fund or borrower may terminate the loan at any time, and if the borrower defaults on its obligation to return the securities loaned because of insolvency or other reasons, a fund may apply collateral received from the borrower against the obligation. A fund may experience delays and costs in recovering the securities loaned. Any cash collateral received is invested in the Fidelity Securities Lending Cash Central Fund. Any loaned securities are identified as such in the Schedule of Investments, and the value of loaned securities and cash collateral at period end, as applicable, are presented in the Statement of Assets and Liabilities. Security lending income represents the income earned on investing cash collateral, less rebates paid to borrowers and any lending agent fees associated with the loan, plus any premium payments received for lending certain types of securities. Security lending income is presented in the Statement of Operations as a component of income from Fidelity Central Funds. Affiliated security lending activity, if any, was as follows:
| | Total Security Lending Fees Paid to NFS ($) | Security Lending Income From Securities Loaned to NFS ($) | Value of Securities Loaned to NFS at Period End ($) |
| Fidelity Short Duration High Income Fund | 2,957 | - | - |
8. Expense Reductions.
The investment adviser contractually agreed to reimburse expenses of each class to the extent annual operating expenses exceeded certain levels of class-level average net assets as noted in the table below. This reimbursement will remain in place through August 31, 2025. Some expenses, for example the compensation of the independent Trustees, and certain miscellaneous expenses such as proxy and shareholder meeting expenses, are excluded from this reimbursement.
The following classes were in reimbursement during the period:
| | Expense Limitations | Reimbursement ($) |
| Class A | 1.00% | 7,558 |
| Class M | 1.00% | 970 |
| Class C | 1.75% | 1,778 |
| Short Duration High Income | .75% | 5,343 |
| Class I | .75% | 876 |
| Class Z | .66% | 2,202 |
| | | 18,727 |
Through arrangements with the Fund's custodian, credits realized as a result of certain uninvested cash balances were used to reduce the Fund's expenses. During the period, custodian credits reduced the Fund's expenses by $8,403.
9. Distributions to Shareholders.
Distributions to shareholders of each class were as follows:
| | Six months ended October 31, 2024 | Year ended April 30, 2024 |
| Fidelity Short Duration High Income Fund | | |
| Distributions to shareholders | | |
| Class A | $763,075 | $1,453,378 |
| Class M | 69,007 | 126,712 |
| Class C | 93,390 | 166,155 |
| Short Duration High Income | 5,335,729 | 19,772,748 |
| Class I | 187,458 | 358,052 |
| Class Z | 263,868 | 613,013 |
Total | $6,712,527 | $22,490,058 |
10. Share Transactions.
Share transactions for each class were as follows and may contain in-kind transactions, automatic conversions between classes or exchanges between affiliated funds:
| | Shares | Shares | Dollars | Dollars |
| | Six months ended October 31, 2024 | Year ended April 30, 2024 | Six months ended October 31, 2024 | Year ended April 30, 2024 |
| Fidelity Short Duration High Income Fund | | | | |
| Class A | | | | |
| Shares sold | 567,317 | 915,629 | $5,086,620 | $7,927,624 |
| Reinvestment of distributions | 83,823 | 163,493 | 750,828 | 1,426,701 |
| Shares redeemed | (239,641) | (573,870) | (2,150,468) | (5,000,968) |
| Net increase (decrease) | 411,499 | 505,252 | $3,686,980 | $4,353,357 |
| Class M | | | | |
| Shares sold | 79,850 | 61,221 | $711,855 | $536,752 |
| Reinvestment of distributions | 7,527 | 14,180 | 67,440 | 123,623 |
| Shares redeemed | (8,524) | (108,706) | (76,157) | (948,746) |
| Net increase (decrease) | 78,853 | (33,305) | $703,138 | $(288,371) |
| Class C | | | | |
| Shares sold | 157,086 | 210,769 | $1,405,226 | $1,836,741 |
| Reinvestment of distributions | 10,037 | 18,510 | 89,924 | 161,586 |
| Shares redeemed | (69,859) | (160,324) | (625,195) | (1,396,285) |
| Net increase (decrease) | 97,264 | 68,955 | $869,955 | $602,042 |
| Short Duration High Income | | | | |
| Shares sold | 5,014,309 | 15,629,596 | $44,903,155 | $135,606,728 |
| Reinvestment of distributions | 501,382 | 2,012,341 | 4,490,353 | 17,448,514 |
| Shares redeemed | (4,226,301) | (50,323,387) | (37,779,731) | (431,331,667) |
| Net increase (decrease) | 1,289,390 | (32,681,450) | $11,613,777 | $(278,276,425) |
| Class I | | | | |
| Shares sold | 301,753 | 415,530 | $2,698,510 | $3,601,620 |
| Reinvestment of distributions | 19,228 | 38,900 | 172,191 | 339,483 |
| Shares redeemed | (182,287) | (323,830) | (1,623,151) | (2,814,401) |
| Net increase (decrease) | 138,694 | 130,600 | $1,247,550 | $1,126,702 |
| Class Z | | | | |
| Shares sold | 474,027 | 781,037 | $4,258,716 | $6,806,516 |
| Reinvestment of distributions | 27,275 | 66,980 | 244,477 | 583,737 |
| Shares redeemed | (811,417) | (935,376) | (7,292,910) | (8,097,274) |
| Net increase (decrease) | (310,115) | (87,359) | $(2,789,717) | $(707,021) |
11. Other.
A fund's organizational documents provide former and current trustees and officers with a limited indemnification against liabilities arising in connection with the performance of their duties to the fund. In the normal course of business, a fund may also enter into contracts that provide general indemnifications. A fund's maximum exposure under these arrangements is unknown as this would be dependent on future claims that may be made against a fund. The risk of material loss from such claims is considered remote.
12. Risk and Uncertainties.
Many factors affect a fund's performance. Developments that disrupt global economies and financial markets, such as pandemics, epidemics, outbreaks of infectious diseases, war, terrorism, and environmental disasters, may significantly affect a fund's investment performance. The effects of these developments to a fund will be impacted by the types of securities in which a fund invests, the financial condition, industry, economic sector, and geographic location of an issuer, and a fund's level of investment in the securities of that issuer. Significant concentrations in security types, issuers, industries, sectors, and geographic locations may magnify the factors that affect a fund's performance.
Item 8: Changes in and Disagreements with Accountants for Open-End Management Investment Companies
(Unaudited)
Note: This is not applicable for any fund included in this document.
Item 9: Proxy Disclosures for Open-End Management Investment Companies
(Unaudited)
| A special meeting of shareholders was held on July 16, 2024. The results of votes taken among shareholders on the proposal before them are reported below. Each vote reported represents one dollar of net asset value held on the record date for the meeting. |
| Proposal 1 |
| To elect a Board of Trustees. |
| | # of Votes | % of Votes |
| Bettina Doulton |
| Affirmative | 14,516,835,136.19 | 94.56 |
| Withheld | 834,887,998.33 | 5.44 |
| TOTAL | 15,351,723,134.52 | 100.00 |
| Robert A. Lawrence |
| Affirmative | 14,430,495,798.10 | 94.00 |
| Withheld | 921,227,336.42 | 6.00 |
| TOTAL | 15,351,723,134.52 | 100.00 |
| Vijay C. Advani |
| Affirmative | 14,465,231,640.25 | 94.23 |
| Withheld | 886,491,494.27 | 5.77 |
| TOTAL | 15,351,723,134.52 | 100.00 |
| Thomas P. Bostick |
| Affirmative | 14,471,831,170.84 | 94.27 |
| Withheld | 879,891,963.68 | 5.73 |
| TOTAL | 15,351,723,134.52 | 100.00 |
| Donald F. Donahue |
| Affirmative | 14,432,670,599.88 | 94.01 |
| Withheld | 919,052,534.64 | 5.99 |
| TOTAL | 15,351,723,134.52 | 100.00 |
| Vicki L. Fuller |
| Affirmative | 14,531,407,981.65 | 94.66 |
| Withheld | 820,315,152.87 | 5.34 |
| TOTAL | 15,351,723,134.52 | 100.00 |
| Patricia L. Kampling |
| Affirmative | 14,549,142,839.16 | 94.77 |
| Withheld | 802,580,295.36 | 5.23 |
| TOTAL | 15,351,723,134.52 | 100.00 |
| Thomas A. Kennedy |
| Affirmative | 14,469,818,769.40 | 94.26 |
| Withheld | 881,904,365.12 | 5.74 |
| TOTAL | 15,351,723,134.52 | 100.00 |
| Oscar Munoz |
| Affirmative | 14,434,061,467.08 | 94.02 |
| Withheld | 917,661,667.44 | 5.98 |
| TOTAL | 15,351,723,134.52 | 100.00 |
| Karen B. Peetz |
| Affirmative | 14,521,904,618.46 | 94.59 |
| Withheld | 829,818,516.06 | 5.41 |
| TOTAL | 15,351,723,134.52 | 100.00 |
| David M. Thomas |
| Affirmative | 14,417,745,861.73 | 93.92 |
| Withheld | 933,977,272.79 | 6.08 |
| TOTAL | 15,351,723,134.52 | 100.00 |
| Susan Tomasky |
| Affirmative | 14,467,973,468.18 | 94.24 |
| Withheld | 883,749,666.34 | 5.76 |
| TOTAL | 15,351,723,134.52 | 100.00 |
| Michael E. Wiley |
| Affirmative | 14,424,002,796.91 | 93.96 |
| Withheld | 927,720,337.61 | 6.04 |
| TOTAL | 15,351,723,134.52 | 100.00 |
| | | |
| Proposal 1 reflects trust-wide proposal and voting results. |
Item 10: Remuneration Paid to Directors, Officers, and others of Open-End Management Investment Companies
(Unaudited)
Note: This information is disclosed as part of the financial statements for each Fund as part of Item 7: Financial Statements and Financial Highlights for Open-End Management Investment companies.
Item 11: Statement Regarding Basis for Approval of Investment Advisory Contract
(Unaudited)
Board Approval of Investment Advisory Contracts and Management Fees
Fidelity Short Duration High Income Fund
Each year, the Board of Trustees, including the Independent Trustees (together, the Board), considers the renewal of the fund's management contract with Fidelity Management & Research Company LLC (FMR) and certain affiliates and the sub-advisory agreements (together, the Advisory Contracts) for the fund. FMR and the sub-advisers are referred to herein as the Investment Advisers. The Board, assisted by the advice of fund counsel and Independent Trustees' counsel, requests and considers a broad range of information relevant to the renewal of the Advisory Contracts throughout the year.
The Board meets regularly and, at each of its meetings, covers an extensive agenda of topics and materials and considers factors that are relevant to its annual consideration of the renewal of the fund's Advisory Contracts, including the services and support provided to the fund and its shareholders. The Board, acting directly and through its Committees (each of which is composed of and chaired by Independent Trustees), requests and receives information concerning the annual consideration of the renewal of the fund's Advisory Contracts. The Board also meets as needed to review matters specifically related to the Board's annual consideration of the renewal of the Advisory Contracts. Members of the Board may also meet with trustees of other Fidelity funds through joint ad hoc committees to discuss certain matters relevant to all of the Fidelity funds.
At its May 2024 meeting, the Board unanimously determined to renew the fund's Advisory Contracts. In reaching its determination, the Board considered all factors it believed relevant, including (i) the nature, extent, and quality of the services provided to the fund and its shareholders (including the investment performance of the fund); (ii) the competitiveness relative to peer funds of the fund's management fee and the total expense ratio of a representative class (the retail class, which was selected because it was the largest class without 12b-1 fees); (iii) the total costs of the services provided by and the profits realized by FMR and its affiliates (Fidelity) from its relationships with the fund; and (iv) the extent to which, if any, economies of scale exist and are realized as the fund grows, and whether any economies of scale are appropriately shared with fund shareholders. The Board also considered the broad range of investment choices available to shareholders from FMR's competitors and that the fund's shareholders have chosen to invest in the fund, which is part of the Fidelity family of funds. The Board's decision to renew the Advisory Contracts was not based on any single factor.
The Board reached a determination, with the assistance of fund counsel and Independent Trustees' counsel and through the exercise of its business judgment, that the renewal of the Advisory Contracts was in the best interests of the fund and its shareholders and that the compensation payable under the Advisory Contracts was fair and reasonable in light of all of the surrounding circumstances.
Nature, Extent, and Quality of Services Provided. The Board considered staffing as it relates to the fund, including the backgrounds and experience of investment personnel of the Investment Advisers, and also considered the Investment Advisers' implementation of the fund's investment program. The Independent Trustees also had discussions with senior management of Fidelity's investment operations and investment groups. The Board considered the structure of the investment personnel compensation program and whether this structure provides appropriate incentives to act in the best interests of the fund. Additionally, the Board considered the portfolio managers' investments, if any, in the funds that they manage.
Resources Dedicated to Investment Management and Support Services. The Board and the Fund Oversight and Research Committees reviewed the general qualifications and capabilities of Fidelity's investment staff, including its size, education, experience, and resources, as well as Fidelity's approach to recruiting, training, managing, and compensating investment personnel. The Board noted the resources devoted to expansion of Fidelity's global investment organization, and that Fidelity's analysts have extensive resources, tools, and capabilities that allow them to conduct sophisticated quantitative and fundamental analysis, as well as credit analysis of issuers, counterparties, and guarantors. Further, the Board considered that Fidelity's investment professionals have sufficient access to global information and data so as to provide competitive investment results over time, and that those professionals also have access to sophisticated tools that permit them to assess portfolio construction and risk and performance attribution characteristics continuously, as well as to transmit new information and research conclusions rapidly around the world. Additionally, in its deliberations, the Board considered Fidelity's trading, risk management, compliance, and technology and operations capabilities and resources, which are integral parts of the investment management process.
Shareholder and Administrative Services. The Board considered (i) the nature, extent, quality, and cost of advisory, administrative, shareholder, transfer agency, and pricing and bookkeeping services performed by the Investment Advisers and their affiliates under the Advisory Contracts; (ii) the nature and extent of Fidelity's supervision of third party service providers, principally custodians, subcustodians, and pricing vendors; and (iii) the resources devoted by Fidelity to, and the record of compliance with, the fund's compliance policies and procedures. The Board also reviewed the allocation of fund brokerage, including allocations to brokers affiliated with the Investment Advisers, the use of brokerage commissions to pay fund expenses, and the use of "soft" commission dollars to pay for research services. The Board also considered the fund's securities lending activities and any payments made to Fidelity relating to securities lending under a separate agreement.
The Board noted that the growth of fund assets over time across the complex allows Fidelity to reinvest in the development of services designed to enhance the value and convenience of the Fidelity funds as investment vehicles. These services include 24-hour access to account information and market information over the Internet and through telephone representatives, investor education materials, and asset allocation tools. The Board also considered that it reviews customer service metrics such as telephone response times, continuity of services on the website and metrics addressing services at Fidelity Investor Centers.
Investment in a Large Fund Family. The Board considered the benefits to shareholders of investing in a fund that is part of a large family of funds offering a variety of investment disciplines and providing a large variety of fund investor services. The Board noted that Fidelity had taken, or had made recommendations that resulted in the Fidelity funds taking, a number of actions over the previous year that benefited particular funds and/or the Fidelity funds in general.
Investment Performance. The Board took into account discussions that occur with representatives of the Investment Advisers, and reports that it receives, at Board meetings throughout the year, relating to fund investment performance. In this regard the Board noted that as part of regularly scheduled fund reviews and other reports to the Board on fund performance, the Board considered annualized return information for the fund for different time periods, measured against an appropriate securities market index (benchmark index). The Board also considered information about performance attribution. In its ongoing evaluation of fund investment performance, the Board gives particular attention to information indicating changes in performance of the funds over different time periods and discussed with the Investment Advisers the reasons for any overperformance or underperformance.
In addition to reviewing absolute and relative fund performance, the Independent Trustees periodically consider the appropriateness of fund performance metrics in evaluating the results achieved. The Independent Trustees generally give greater weight to fund performance over longer time periods than over shorter time periods. Depending on the circumstances, the Independent Trustees may be satisfied with a fund's performance notwithstanding that it lags its benchmark index for certain periods.
Based on its review, the Board concluded that the nature, extent, and quality of services provided to the fund under the Advisory Contracts should continue to benefit the shareholders of the fund.
Competitiveness of Management Fee and Total Expense Ratio. The Board was provided with information regarding industry trends in management fees and expenses. The Board considered that, effective March 1, 2024, an amended Advisory Contract with FMR went into effect with class-level management fees based on tiered schedules and subject to a maximum class-level rate (the management fee). The Board also considered that in exchange for the variable management fee, each class of the fund receives investment advisory, management, administrative, transfer agent, and pricing and bookkeeping services. In its review of the management fee and total expense ratio of the retail class, the Board considered a pro forma management fee rate for the retail class as if it had been in effect for the 12-month period ended September 30, 2023, as well as other third-party fund expenses, as applicable, such as custodial, legal, and audit fees and any fund-paid 12b-1 fees. The Board noted that Fidelity may agree to waive fees or reimburse expenses from time to time, and the extent to which, if any, it has done so for the fund.
Comparisons of Management Fees and Total Expense Ratios. Among other things, the Board reviewed data for selected groups of competitive funds and classes (referred to as "mapped groups") that were compiled by Fidelity based on combining similar investment objective categories (as classified by Morningstar) that have comparable investment mandates. The data reviewed by the Board included (i) gross management fee comparisons (before taking into account expense reimbursements or caps) relative to the total universe of funds within the mapped group; (ii) gross management fee comparisons relative to a subset of non-Fidelity funds in the mapped group that are similar in size and management fee structure to the fund (referred to as the "asset size peer group"); (iii) total expense comparisons of the retail class of the fund relative to funds and classes in the mapped group that have a similar sales load structure to the retail class of the fund (referred to as the "similar sales load structure group"); and (iv) total expense comparisons of the retail class of the fund relative to funds and classes in the similar sales load structure group that are similar in size and management fee structure to the fund (referred to as the "total expense asset size peer group"). The total expense asset size peer group comparison excludes performance adjustments and fund-paid 12b-1 fees to eliminate variability in fee structures.
The information provided to the Board indicated that the fund's management fee rate ranked above the competitive median of the mapped group for the 12-month period ended September 30, 2023 and above the competitive median of the asset size peer group for the 12-month period ended September 30, 2023. Further, the information provided to the Board indicated that the total expense ratio of the retail class of the fund ranked below the competitive median of the similar sales load structure group for the 12-month period ended September 30, 2023 and below the competitive median of the total expense asset size peer group for the 12-month period ended September 30, 2023. The Board considered that the fund has a variable unified management fee that covers expenses for services beyond portfolio management.
The Board noted that a different variable management fee rate is applicable to each class of the fund. The Board considered that the difference in management fee rates between classes is the result of separate arrangements for class-level services and/or waivers of certain expenses and not the result of any difference in advisory or custodial fees or other expenses related to the management of the fund's assets, which do not vary by class.
Other Contractual Arrangements. The Board further considered that FMR has contractually agreed to reimburse Class A, Class M, Class C, Class I, Class Z and the retail class of the fund to the extent that total operating expenses, with certain exceptions, as a percentage of their respective average net assets, exceed 1.00%, 1.00%, 1.75%, 0.75%, 0.66% and 0.75% through August 31, 2025.
Fees Charged to Other Fidelity Clients. The Board also considered Fidelity fee structures and other information with respect to clients of Fidelity, such as other funds advised or subadvised by Fidelity, pension plan clients, and other institutional clients with similar mandates. The Board noted that a joint ad hoc committee created by it and the boards of other Fidelity funds periodically reviews and compares Fidelity's institutional investment advisory business with its business of providing services to the Fidelity funds and also noted the most recent findings of the committee. The Board noted that the committee's review included a consideration of the differences in services provided, fees charged, and costs incurred, as well as competition in the markets serving the different categories of clients.
Based on its review, the Board concluded that the fund's management fee is fair and reasonable in light of the services that the fund receives and the other factors considered. Further, based on its review of total expense ratios and fees charged to other Fidelity clients, the Board concluded that the total expense ratio of each class of the fund was reasonable in light of the services that the fund and its shareholders receive and the other factors considered.
Costs of the Services and Profitability. The Board considered the revenues earned and the expenses incurred by Fidelity in conducting the business of developing, marketing, distributing, managing, administering and servicing the fund and servicing the fund's shareholders. The Board also considered the level of Fidelity's profits in respect of all the Fidelity funds.
On an annual basis, Fidelity presents to the Board information about the profitability of its relationships with the fund. Fidelity calculates profitability information for each fund, as well as aggregate profitability information for groups of Fidelity funds and all Fidelity funds, using a series of detailed revenue and cost allocation methodologies which originate with the books and records of Fidelity on which Fidelity's audited financial statements are based. The Audit Committee of the Board reviews any significant changes from the prior year's methodologies.
A public accounting firm has been engaged annually by the Board as part of the Board's assessment of Fidelity's profitability analysis. The engagement includes the review and assessment of the methodologies used by Fidelity in determining the revenues and expenses attributable to Fidelity's fund business, and completion of agreed-upon procedures in respect of the mathematical accuracy of certain fund profitability information and its conformity to established allocation methodologies. After considering the reports issued under the engagement and information provided by Fidelity, the Board concluded that while other allocation methods may also be reasonable, Fidelity's profitability methodologies are reasonable in all material respects.
The Board also reviewed Fidelity's non-fund businesses and potential indirect benefits such businesses may have received as a result of their association with Fidelity's fund business (i.e., fall-out benefits) as well as cases where Fidelity's affiliates may benefit from the funds' business. The Board considered areas where potential indirect benefits to the Fidelity funds from their relationships with Fidelity may exist. The Board's consideration of these matters was informed by the findings of a joint ad hoc committee created by it and the boards of other Fidelity funds to evaluate potential fall-out benefits.
The Board considered the costs of the services provided by and the profits realized by Fidelity in connection with the operation of the fund and was satisfied that the profitability was not excessive.
Economies of Scale. The Board considered whether there have been economies of scale in respect of the management of the Fidelity funds, whether the Fidelity funds (including the fund) have appropriately benefited from any such economies of scale, and whether there is potential for realization of any further economies of scale. The Board considered the extent to which the fund will benefit from economies of scale as assets grow through increased services to the fund, through waivers or reimbursements, or through fee or expense ratio reductions. The Board also noted that a committee created by it and the boards of other Fidelity funds periodically analyzes whether Fidelity attains economies of scale in respect of the management and servicing of the Fidelity funds, whether the Fidelity funds have appropriately benefited from such economies of scale, and whether there is potential for realization of any further economies of scale.
The Board recognized that the fund's management contract incorporates a variable management fee structure, which provides breakpoints as a way to share, in part, any potential economies of scale that may exist at the asset class level and through a discount that considers both fund size and total assets of the four applicable asset classes. The Board considered that the variable management fee is designed to deliver the benefits of economies of scale to fund shareholders even if assets of any particular fund are unchanged or have declined, because some portion of Fidelity's costs are attributable to services provided to all funds subject to the variable management fee, and all such funds benefit if those costs can be allocated among more assets. The Board concluded that, given the variable management fee structure, fund shareholders will benefit from lower management fees due to the application of the breakpoints and discount factor, regardless of whether Fidelity achieves any such economies of scale.
The Board concluded, taking into account the analysis of the committee, that economies of scale, if any, are being appropriately shared between fund shareholders and Fidelity.
Additional Information Requested by the Board. In order to develop fully the factual basis for consideration of the Fidelity funds' advisory contracts, the Board requested and received additional information on certain topics, including but not limited to: (i) fund flow and performance trends, in particular the underperformance of certain funds and strategies, and Fidelity's long-term strategies for certain funds; (ii) the operation of performance fees and the rationale for implementing performance fees on certain categories of funds but not others; (iii) Fidelity's pricing philosophy compared to competitors; (iv) fund profitability methodology and data; (v) evaluation of competitive fund data and peer group classifications and fee and expense comparisons; (vi) the management fee and expense structures for different funds and classes and information about the differences between various fee and expense structures; (vii) the variable management fee implemented for certain funds effective March 1, 2024; and (viii) information regarding other accounts managed by Fidelity and the funds' sub-advisory arrangements.
Conclusion. Based on its evaluation of all of the conclusions noted above, and after considering all factors it believed relevant, the Board, including the Independent Trustees, concluded that the advisory and sub-advisory fee arrangements are fair and reasonable in light of all of the surrounding circumstances and that the fund's Advisory Contracts should be renewed through May 31, 2025.
1.969437.110
SDH-SANN-1224
Fidelity® Focused High Income Fund
Semi-Annual Report
October 31, 2024
Contents
To view a fund's proxy voting guidelines and proxy voting record for the 12-month period ended June 30, visit http://www.fidelity.com/proxyvotingresults or visit the Securities and Exchange Commission's (SEC) web site at http://www.sec.gov.
You may also call 1-800-544-8544 to request a free copy of the proxy voting guidelines.
Standard & Poor's, S&P and S&P 500 are registered service marks of The McGraw-Hill Companies, Inc. and have been licensed for use by Fidelity Distributors Corporation.
Other third-party marks appearing herein are the property of their respective owners.
All other marks appearing herein are registered or unregistered trademarks or service marks of FMR LLC or an affiliated company. © 2024 FMR LLC. All rights reserved.
This report and the financial statements contained herein are submitted for the general information of the shareholders of the Fund. This report is not authorized for distribution to prospective investors in the Fund unless preceded or accompanied by an effective prospectus.
A fund files its complete schedule of portfolio holdings with the SEC for the first and third quarters of each fiscal year on Form N-PORT. Forms N-PORT are available on the SEC's web site at http://www.sec.gov. A fund's Forms N-PORT may be reviewed and copied at the SEC's Public Reference Room in Washington, DC. Information regarding the operation of the SEC's Public Reference Room may be obtained by calling 1-800-SEC-0330.
For a complete list of a fund's portfolio holdings, view the most recent holdings listing, semiannual report, or annual report on Fidelity's web site at http://www.fidelity.com, http://www.institutional.fidelity.com, or http://www.401k.com, as applicable.
NOT FDIC INSURED •MAY LOSE VALUE •NO BANK GUARANTEE
Neither the Fund nor Fidelity Distributors Corporation is a bank.
Item 7: Financial Statements and Financial Highlights for Open-End Management Investment Companies (Semi-Annual Report)
Fidelity® Focused High Income Fund
Schedule of Investments October 31, 2024 (Unaudited)
Showing Percentage of Net Assets
| Corporate Bonds - 93.6% |
| | | Principal Amount (a) | Value ($) |
| Convertible Bonds - 1.0% | | | |
| Automotive & Auto Parts - 0.2% | | | |
| Rivian Automotive, Inc. 3.625% 10/15/30 | | 421,000 | 325,601 |
| Broadcasting - 0.3% | | | |
| DISH Network Corp. 3.375% 8/15/26 | | 680,000 | 570,937 |
| Energy - 0.0% | | | |
| Sunnova Energy International, Inc. 0.25% 12/1/26 | | 112,000 | 72,716 |
| Homebuilders/Real Estate - 0.2% | | | |
| Anywhere Real Estate Group LLC/Realogy Co-Issuer Corp. 0.25% 6/15/26 | | 443,000 | 383,860 |
| Meritage Homes Corp. 1.75% 5/15/28 (b) | | 10,000 | 10,615 |
| | | | 394,475 |
| Leisure - 0.0% | | | |
| Peloton Interactive, Inc. 5.5% 12/1/29 (b) | | 30,000 | 62,115 |
| Technology - 0.3% | | | |
| BlackLine, Inc. 1% 6/1/29 (b) | | 30,000 | 31,215 |
| Global Payments, Inc. 1.5% 3/1/31 (b) | | 313,000 | 298,446 |
| Wolfspeed, Inc. 1.875% 12/1/29 | | 370,000 | 184,260 |
| | | | 513,921 |
TOTAL CONVERTIBLE BONDS | | | 1,939,765 |
| Nonconvertible Bonds - 92.6% | | | |
| Aerospace - 3.6% | | | |
| BWX Technologies, Inc. 4.125% 6/30/28 (b) | | 795,000 | 758,685 |
| Howmet Aerospace, Inc.: | | | |
| 5.95% 2/1/37 | | 400,000 | 422,339 |
| 6.75% 1/15/28 (c) | | 665,000 | 702,821 |
| Kaiser Aluminum Corp. 4.625% 3/1/28 (b)(c) | | 800,000 | 762,197 |
| Moog, Inc. 4.25% 12/15/27 (b)(c) | | 1,025,000 | 977,167 |
| Rolls-Royce PLC 5.75% 10/15/27 (b) | | 1,115,000 | 1,137,538 |
| Science Applications International Corp. 4.875% 4/1/28 (b)(c) | | 150,000 | 146,829 |
| TransDigm, Inc. 6.75% 8/15/28 (b) | | 2,190,000 | 2,239,275 |
| | | | 7,146,851 |
| Air Transportation - 1.4% | | | |
| American Airlines, Inc.: | | | |
| 7.25% 2/15/28 (b)(c) | | 175,000 | 177,878 |
| 8.5% 5/15/29 (b) | | 345,000 | 362,572 |
| American Airlines, Inc. / AAdvantage Loyalty IP Ltd. 5.5% 4/20/26 (b) | | 210,000 | 209,369 |
| Rand Parent LLC 8.5% 2/15/30 (b)(c) | | 430,000 | 429,054 |
| Spirit Loyalty Cayman Ltd. / Spirit IP Cayman Ltd.: | | | |
| 8% 9/20/25 (b) | | 76,000 | 47,244 |
| 8% 9/20/25 (b) | | 149,000 | 92,624 |
| United Airlines, Inc. 4.375% 4/15/26 (b) | | 1,440,000 | 1,415,124 |
| | | | 2,733,865 |
| Automotive & Auto Parts - 1.5% | | | |
| Allison Transmission, Inc. 3.75% 1/30/31 (b) | | 1,115,000 | 989,526 |
| Belron UK Finance PLC 5.75% 10/15/29 (b) | | 300,000 | 300,657 |
| Dana, Inc. 4.5% 2/15/32 | | 380,000 | 325,044 |
| Hudson Automotive Group 8% 5/15/32 (b) | | 125,000 | 130,677 |
| Macquarie AirFinance Holdings: | | | |
| 6.4% 3/26/29 (b) | | 65,000 | 66,982 |
| 8.125% 3/30/29 (b) | | 190,000 | 200,989 |
| Phinia, Inc. 6.75% 4/15/29 (b) | | 155,000 | 158,225 |
| Thor Industries, Inc. 4% 10/15/29 (b)(c) | | 500,000 | 456,340 |
| Wand NewCo 3, Inc. 7.625% 1/30/32 (b) | | 270,000 | 279,074 |
| | | | 2,907,514 |
| Banks & Thrifts - 0.6% | | | |
| Jane Street Group LLC/JSG Finance, Inc.: | | | |
| 4.5% 11/15/29 (b) | | 210,000 | 198,694 |
| 6.125% 11/1/32 (b) | | 275,000 | 275,178 |
| UniCredit SpA: | | | |
| 5.861% 6/19/32 (b)(d) | | 93,000 | 92,666 |
| 7.296% 4/2/34 (b)(d) | | 237,000 | 248,013 |
| VFH Parent LLC / Valor Co-Issuer, Inc. 7.5% 6/15/31 (b) | | 235,000 | 241,303 |
| Western Alliance Bancorp. 3% 6/15/31 (d) | | 120,000 | 110,857 |
| | | | 1,166,711 |
| Broadcasting - 2.1% | | | |
| Nexstar Media, Inc. 5.625% 7/15/27 (b) | | 990,000 | 972,879 |
| Scripps Escrow II, Inc. 3.875% 1/15/29 (b) | | 410,000 | 318,148 |
| Sirius XM Radio, Inc.: | | | |
| 5% 8/1/27 (b) | | 1,700,000 | 1,665,938 |
| 5.5% 7/1/29 (b)(c) | | 625,000 | 606,309 |
| TEGNA, Inc. 5% 9/15/29 (c) | | 210,000 | 196,046 |
| Univision Communications, Inc. 8% 8/15/28 (b) | | 325,000 | 330,280 |
| | | | 4,089,600 |
| Building Materials - 2.2% | | | |
| Advanced Drain Systems, Inc. 5% 9/30/27 (b)(c) | | 1,320,000 | 1,296,083 |
| Beacon Roofing Supply, Inc. 6.5% 8/1/30 (b) | | 230,000 | 233,789 |
| Builders FirstSource, Inc. 4.25% 2/1/32 (b) | | 890,000 | 796,183 |
| Eco Material Technologies, Inc. 7.875% 1/31/27 (b) | | 120,000 | 120,773 |
| Smyrna Ready Mix Concrete LLC 8.875% 11/15/31 (b) | | 375,000 | 393,896 |
| Standard Industries, Inc./New Jersey 4.375% 7/15/30 (b) | | 1,300,000 | 1,194,645 |
| Star Holding LLC 8.75% 8/1/31 (b) | | 200,000 | 190,202 |
| Summit Materials LLC/Summit Materials Finance Corp. 7.25% 1/15/31 (b)(c) | | 160,000 | 165,600 |
| | | | 4,391,171 |
| Cable/Satellite TV - 2.2% | | | |
| CCO Holdings LLC/CCO Holdings Capital Corp.: | | | |
| 4.5% 8/15/30 (b) | | 85,000 | 75,917 |
| 5% 2/1/28 (b) | | 1,780,000 | 1,722,789 |
| 5.125% 5/1/27 (b) | | 2,110,000 | 2,066,033 |
| CSC Holdings LLC: | | | |
| 4.125% 12/1/30 (b) | | 160,000 | 118,101 |
| 5.375% 2/1/28 (b) | | 200,000 | 171,170 |
| Ziggo Bond Co. BV 6% 1/15/27 (b) | | 300,000 | 299,318 |
| | | | 4,453,328 |
| Capital Goods - 0.5% | | | |
| ESAB Corp. 6.25% 4/15/29 (b) | | 370,000 | 376,515 |
| Patrick Industries, Inc. 6.375% 11/1/32 (b) | | 300,000 | 296,688 |
| Resideo Funding, Inc. 6.5% 7/15/32 (b)(c) | | 315,000 | 317,025 |
| | | | 990,228 |
| Chemicals - 3.8% | | | |
| Avient Corp. 6.25% 11/1/31 (b) | | 200,000 | 200,585 |
| Axalta Coating Systems/Dutch Holding BV 4.75% 6/15/27 (b) | | 935,000 | 916,315 |
| Kobe U.S. Midco 2, Inc. 9.25% 11/1/26 pay-in-kind (b)(d) | | 241,500 | 204,014 |
| LSB Industries, Inc. 6.25% 10/15/28 (b) | | 210,000 | 203,159 |
| Methanex Corp.: | | | |
| 5.25% 12/15/29 | | 160,000 | 154,417 |
| 5.65% 12/1/44 | | 991,000 | 876,714 |
| NOVA Chemicals Corp. 5.25% 6/1/27 (b) | | 1,710,000 | 1,678,354 |
| Nufarm Australia Ltd. 5% 1/27/30 (b) | | 865,000 | 801,565 |
| Olympus Water U.S. Holding Corp. 9.75% 11/15/28 (b) | | 245,000 | 259,923 |
| SPCM SA 3.125% 3/15/27 (b) | | 385,000 | 366,248 |
| The Chemours Co. LLC: | | | |
| 4.625% 11/15/29 (b)(c) | | 185,000 | 160,619 |
| 5.75% 11/15/28 (b)(c) | | 505,000 | 466,151 |
| Tronox, Inc. 4.625% 3/15/29 (b) | | 570,000 | 517,154 |
| W.R. Grace Holding LLC: | | | |
| 4.875% 6/15/27 (b) | | 685,000 | 672,147 |
| 7.375% 3/1/31 (b) | | 85,000 | 87,851 |
| | | | 7,565,216 |
| Consumer Products - 1.4% | | | |
| Kohl's Corp. 4.25% 7/17/25 | | 25,000 | 24,678 |
| Kronos Acquisition Holdings, Inc. 8.25% 6/30/31 (b) | | 200,000 | 198,063 |
| Mattel, Inc. 6.2% 10/1/40 | | 245,000 | 244,610 |
| Newell Brands, Inc.: | | | |
| 6.625% 9/15/29 (c) | | 875,000 | 887,193 |
| 6.875% 4/1/36 (e) | | 490,000 | 487,618 |
| Prestige Brands, Inc. 3.75% 4/1/31 (b) | | 600,000 | 534,832 |
| Tempur Sealy International, Inc. 3.875% 10/15/31 (b) | | 395,000 | 343,596 |
| | | | 2,720,590 |
| Containers - 2.2% | | | |
| Ball Corp. 3.125% 9/15/31 | | 640,000 | 553,103 |
| Graphic Packaging International, Inc.: | | | |
| 3.75% 2/1/30 (b) | | 700,000 | 640,147 |
| 6.375% 7/15/32 (b) | | 400,000 | 403,570 |
| Mauser Packaging Solutions Holding Co. 7.875% 4/15/27 (b) | | 430,000 | 441,825 |
| OI European Group BV 4.75% 2/15/30 (b) | | 390,000 | 356,064 |
| Sealed Air Corp.: | | | |
| 5% 4/15/29 (b) | | 950,000 | 917,671 |
| 6.875% 7/15/33 (b) | | 445,000 | 471,400 |
| Sealed Air Corp./Sealed Air Corp. U.S. 7.25% 2/15/31 (b) | | 400,000 | 415,292 |
| Trivium Packaging Finance BV 5.5% 8/15/26 (b) | | 215,000 | 213,095 |
| | | | 4,412,167 |
| Diversified Financial Services - 5.9% | | | |
| Azorra Finance Ltd. 7.75% 4/15/30 (b) | | 140,000 | 138,276 |
| Capstone Borrower, Inc. 8% 6/15/30 (b) | | 110,000 | 114,966 |
| Encore Capital Group, Inc. 9.25% 4/1/29 (b) | | 200,000 | 212,950 |
| Fortress Transportation & Infrastructure Investors LLC: | | | |
| 5.875% 4/15/33 (b) | | 300,000 | 292,487 |
| 7% 6/15/32 (b) | | 395,000 | 405,271 |
| 7.875% 12/1/30 (b) | | 310,000 | 326,579 |
| GGAM Finance Ltd.: | | | |
| 5.875% 3/15/30 (b) | | 100,000 | 98,406 |
| 6.875% 4/15/29 (b) | | 260,000 | 264,957 |
| 7.75% 5/15/26 (b) | | 540,000 | 549,486 |
| 8% 2/15/27 (b) | | 305,000 | 315,099 |
| Gn Bondco LLC 9.5% 10/15/31 (b)(c) | | 425,000 | 451,295 |
| Hightower Holding LLC 6.75% 4/15/29 (b) | | 605,000 | 595,620 |
| Icahn Enterprises LP/Icahn Enterprises Finance Corp. 5.25% 5/15/27 (c) | | 2,005,000 | 1,867,881 |
| Jefferies Finance LLC/JFIN Co.-Issuer Corp. 6.625% 10/15/31 (b) | | 300,000 | 298,748 |
| Ladder Capital Finance Holdings LLLP/Ladder Capital Finance Corp. 4.25% 2/1/27 (b)(c) | | 845,000 | 818,163 |
| LPL Holdings, Inc. 4% 3/15/29 (b) | | 1,520,000 | 1,429,420 |
| Nationstar Mortgage Holdings, Inc. 6.5% 8/1/29 (b) | | 305,000 | 304,988 |
| Navient Corp. 6.75% 6/15/26 (c) | | 540,000 | 550,316 |
| OneMain Finance Corp.: | | | |
| 3.5% 1/15/27 | | 1,145,000 | 1,092,764 |
| 6.625% 5/15/29 | | 200,000 | 200,000 |
| 7.125% 3/15/26 | | 500,000 | 512,243 |
| 7.125% 11/15/31 | | 100,000 | 101,117 |
| 7.5% 5/15/31 | | 805,000 | 823,228 |
| | | | 11,764,260 |
| Diversified Media - 0.4% | | | |
| Lamar Media Corp. 3.625% 1/15/31 | | 915,000 | 816,638 |
| Energy - 12.4% | | | |
| Aethon United BR LP / Aethon United Finance Corp. 7.5% 10/1/29 (b) | | 250,000 | 251,733 |
| Alpha Generation LLC 6.75% 10/15/32 (b) | | 235,000 | 238,301 |
| Apache Corp.: | | | |
| 4.25% 1/15/30 | | 215,000 | 202,448 |
| 5.1% 9/1/40 | | 600,000 | 518,015 |
| Archrock Partners LP / Archrock Partners Finance Corp. 6.625% 9/1/32 (b) | | 305,000 | 306,379 |
| Ascent Resources - Utica LLC/ARU Finance Corp. 6.625% 10/15/32 (b) | | 80,000 | 79,242 |
| Baytex Energy Corp. 7.375% 3/15/32 (b) | | 270,000 | 262,122 |
| California Buyer Ltd./Atlantica Sustainable Infrastructure PLC 6.375% 2/15/32 (b)(f) | | 320,000 | 317,789 |
| California Resources Corp. 8.25% 6/15/29 (b) | | 605,000 | 611,008 |
| Cheniere Energy, Inc. 4.625% 10/15/28 | | 640,000 | 627,204 |
| CNX Midstream Partners LP 4.75% 4/15/30 (b) | | 160,000 | 148,931 |
| CPI CG, Inc. 10% 7/15/29 (b) | | 110,000 | 115,225 |
| CVR Energy, Inc.: | | | |
| 5.75% 2/15/28 (b) | | 150,000 | 136,785 |
| 8.5% 1/15/29 (b) | | 220,000 | 213,336 |
| DCP Midstream Operating LP: | | | |
| 5.6% 4/1/44 | | 85,000 | 81,151 |
| 8.125% 8/16/30 | | 25,000 | 28,663 |
| Delek Logistics Partners LP/Delek Logistics Finance Corp. 8.625% 3/15/29 (b) | | 415,000 | 425,807 |
| EnLink Midstream LLC 5.625% 1/15/28 (b) | | 195,000 | 197,374 |
| EnLink Midstream Partners LP 5.05% 4/1/45 | | 255,000 | 221,727 |
| EQM Midstream Partners LP: | | | |
| 5.5% 7/15/28 | | 800,000 | 794,027 |
| 6.5% 7/1/27 (b) | | 785,000 | 802,957 |
| 7.5% 6/1/27 (b) | | 555,000 | 567,462 |
| EQT Corp. 3.9% 10/1/27 | | 1,450,000 | 1,411,052 |
| Genesis Energy LP/Genesis Energy Finance Corp. 7.875% 5/15/32 | | 100,000 | 100,070 |
| Global Partners LP/GLP Finance Corp. 8.25% 1/15/32 (b) | | 130,000 | 132,661 |
| Harvest Midstream I LP 7.5% 5/15/32 (b) | | 380,000 | 389,073 |
| Hess Midstream Operations LP: | | | |
| 5.125% 6/15/28 (b) | | 1,070,000 | 1,047,060 |
| 5.625% 2/15/26 (b) | | 2,310,000 | 2,304,445 |
| Hilcorp Energy I LP/Hilcorp Finance Co. 6.25% 11/1/28 (b) | | 330,000 | 321,975 |
| Howard Midstream Energy Partners LLC 7.375% 7/15/32 (b) | | 200,000 | 204,046 |
| Kinetik Holdings LP: | | | |
| 5.875% 6/15/30 (b) | | 270,000 | 267,921 |
| 6.625% 12/15/28 (b) | | 405,000 | 413,646 |
| Kodiak Gas Services LLC 7.25% 2/15/29 (b)(c) | | 315,000 | 323,794 |
| Matador Resources Co. 6.5% 4/15/32 (b) | | 345,000 | 341,676 |
| Murphy Oil Corp. 6% 10/1/32 | | 200,000 | 192,585 |
| New Fortress Energy, Inc. 6.5% 9/30/26 (b) | | 230,000 | 213,054 |
| Occidental Petroleum Corp. 3.5% 8/15/29 | | 810,000 | 741,651 |
| PBF Holding Co. LLC/PBF Finance Corp. 7.875% 9/15/30 (b) | | 810,000 | 808,616 |
| Permian Resources Operating LLC: | | | |
| 5.875% 7/1/29 (b) | | 200,000 | 197,000 |
| 6.25% 2/1/33 (b) | | 200,000 | 198,559 |
| 7% 1/15/32 (b) | | 630,000 | 642,659 |
| Seadrill Finance Ltd. 8.375% 8/1/30 (b) | | 605,000 | 617,818 |
| Sitio Royalties OP / Sitio Finance Corp. 7.875% 11/1/28 (b) | | 387,000 | 401,740 |
| Sunnova Energy Corp. 11.75% 10/1/28 (b) | | 105,000 | 85,370 |
| Sunoco LP/Sunoco Finance Corp.: | | | |
| 4.5% 5/15/29 (c) | | 1,140,000 | 1,083,906 |
| 6% 4/15/27 | | 25,000 | 25,026 |
| Superior Plus LP / Superior General Partner, Inc. 4.5% 3/15/29 (b) | | 320,000 | 295,257 |
| Tallgrass Energy Partners LP / Tallgrass Energy Finance Corp.: | | | |
| 5.5% 1/15/28 (b) | | 225,000 | 216,085 |
| 6% 12/31/30 (b) | | 1,190,000 | 1,116,833 |
| Talos Production, Inc. 9% 2/1/29 (b) | | 90,000 | 92,694 |
| Transocean, Inc. 8.25% 5/15/29 (b) | | 400,000 | 402,164 |
| Valaris Ltd. 8.375% 4/30/30 (b) | | 335,000 | 339,891 |
| Venture Global Calcasieu Pass LLC: | | | |
| 3.875% 8/15/29 (b) | | 480,000 | 442,582 |
| 3.875% 11/1/33 (b)(c) | | 380,000 | 330,149 |
| 4.125% 8/15/31 (b) | | 460,000 | 419,261 |
| Venture Global LNG, Inc.: | | | |
| 7% 1/15/30 (b)(c) | | 1,010,000 | 1,016,234 |
| 8.125% 6/1/28 (b) | | 320,000 | 332,091 |
| | | | 24,616,330 |
| Environmental - 1.6% | | | |
| Darling Ingredients, Inc.: | | | |
| 5.25% 4/15/27 (b) | | 970,000 | 960,608 |
| 6% 6/15/30 (b) | | 170,000 | 168,831 |
| GFL Environmental, Inc. 6.75% 1/15/31 (b) | | 155,000 | 159,591 |
| Madison IAQ LLC 4.125% 6/30/28 (b) | | 975,000 | 925,378 |
| Wrangler Holdco Corp. 6.625% 4/1/32 (b) | | 910,000 | 928,812 |
| | | | 3,143,220 |
| Food & Drug Retail - 1.8% | | | |
| Albertsons Companies LLC/Safeway, Inc./New Albertson's, Inc./Albertson's LLC 3.5% 3/15/29 (b) | | 2,810,000 | 2,596,208 |
| Emergent BioSolutions, Inc. 3.875% 8/15/28 (b) | | 375,000 | 301,265 |
| Murphy Oil U.S.A., Inc. 3.75% 2/15/31 (b) | | 190,000 | 168,836 |
| Parkland Corp. 6.625% 8/15/32 (b) | | 510,000 | 508,933 |
| | | | 3,575,242 |
| Food/Beverage/Tobacco - 2.5% | | | |
| BellRing Brands, Inc. 7% 3/15/30 (b)(c) | | 350,000 | 364,243 |
| C&S Group Enterprises LLC 5% 12/15/28 (b) | | 405,000 | 335,229 |
| Chobani Holdco II LLC 9.5% 10/1/29 pay-in-kind (b)(d) | | 200,000 | 206,329 |
| Chobani LLC/Finance Corp., Inc. 7.625% 7/1/29 (b) | | 245,000 | 255,417 |
| Fiesta Purchaser, Inc. 7.875% 3/1/31 (b) | | 195,000 | 204,498 |
| KeHE Distributor / Nextwave 9% 2/15/29 (b) | | 315,000 | 326,170 |
| Lamb Weston Holdings, Inc. 4.375% 1/31/32 (b) | | 755,000 | 691,667 |
| Performance Food Group, Inc. 6.125% 9/15/32 (b) | | 300,000 | 301,255 |
| Pilgrim's Pride Corp. 4.25% 4/15/31 | | 405,000 | 376,392 |
| Post Holdings, Inc.: | | | |
| 5.5% 12/15/29 (b) | | 590,000 | 575,442 |
| 5.625% 1/15/28 (b) | | 405,000 | 408,307 |
| 6.25% 10/15/34 (b) | | 180,000 | 178,011 |
| 6.375% 3/1/33 (b) | | 205,000 | 202,814 |
| U.S. Foods, Inc.: | | | |
| 4.625% 6/1/30 (b)(c) | | 180,000 | 170,786 |
| 5.75% 4/15/33 (b) | | 175,000 | 172,337 |
| 7.25% 1/15/32 (b)(c) | | 210,000 | 218,193 |
| | | | 4,987,090 |
| Gaming - 2.2% | | | |
| Caesars Entertainment, Inc.: | | | |
| 6% 10/15/32 (b) | | 405,000 | 395,048 |
| 6.5% 2/15/32 (b) | | 605,000 | 613,540 |
| Churchill Downs, Inc. 5.75% 4/1/30 (b)(c) | | 455,000 | 447,928 |
| Melco Resorts Finance Ltd. 4.875% 6/6/25 (b) | | 1,225,000 | 1,211,184 |
| Ontario Gaming GTA LP / OTG Co. issuer, Inc. 8% 8/1/30 (b) | | 115,000 | 118,200 |
| Station Casinos LLC 6.625% 3/15/32 (b)(c) | | 310,000 | 311,522 |
| Wynn Las Vegas LLC/Wynn Las Vegas Capital Corp. 5.25% 5/15/27 (b) | | 870,000 | 863,495 |
| Wynn Resorts Finance LLC / Wynn Resorts Capital Corp. 5.125% 10/1/29 (b) | | 380,000 | 368,912 |
| | | | 4,329,829 |
| Healthcare - 5.1% | | | |
| 180 Medical, Inc. 3.875% 10/15/29 (b) | | 625,000 | 581,292 |
| Avantor Funding, Inc. 4.625% 7/15/28 (b) | | 1,195,000 | 1,155,471 |
| Centene Corp. 2.45% 7/15/28 | | 75,000 | 67,509 |
| Charles River Laboratories International, Inc.: | | | |
| 3.75% 3/15/29 (b)(c) | | 795,000 | 728,787 |
| 4.25% 5/1/28 (b) | | 90,000 | 85,562 |
| DaVita, Inc. 4.625% 6/1/30 (b) | | 365,000 | 336,026 |
| Grifols SA 4.75% 10/15/28 (b) | | 100,000 | 92,148 |
| HAH Group Holding Co. LLC 9.75% 10/1/31 (b) | | 360,000 | 366,813 |
| HealthEquity, Inc. 4.5% 10/1/29 (b) | | 160,000 | 152,482 |
| Hologic, Inc. 4.625% 2/1/28 (b) | | 850,000 | 833,922 |
| IQVIA, Inc. 5% 5/15/27 (b) | | 820,000 | 809,477 |
| Jazz Securities DAC 4.375% 1/15/29 (b) | | 350,000 | 331,203 |
| Medline Borrower LP / Medline Co. 6.25% 4/1/29 (b) | | 615,000 | 625,728 |
| Molina Healthcare, Inc. 3.875% 5/15/32 (b) | | 510,000 | 452,118 |
| Organon & Co. / Organon Foreign Debt Co-Issuer BV 4.125% 4/30/28 (b) | | 840,000 | 795,910 |
| Surgery Center Holdings, Inc. 7.25% 4/15/32 (b) | | 300,000 | 308,041 |
| Teleflex, Inc. 4.25% 6/1/28 (b) | | 235,000 | 225,293 |
| Tenet Healthcare Corp.: | | | |
| 4.625% 6/15/28 | | 1,810,000 | 1,749,670 |
| 6.125% 6/15/30 | | 465,000 | 467,189 |
| | | | 10,164,641 |
| Homebuilders/Real Estate - 3.7% | | | |
| Century Communities, Inc. 3.875% 8/15/29 (b) | | 460,000 | 418,418 |
| Greystar Real Estate Partners 7.75% 9/1/30 (b) | | 95,000 | 99,540 |
| HAT Holdings I LLC/HAT Holdings II LLC: | | | |
| 3.375% 6/15/26 (b) | | 495,000 | 477,925 |
| 8% 6/15/27 (b) | | 250,000 | 261,877 |
| Howard Hughes Corp. 4.375% 2/1/31 (b) | | 825,000 | 739,320 |
| Kennedy-Wilson, Inc. 4.75% 2/1/30 | | 770,000 | 688,752 |
| LGI Homes, Inc. 8.75% 12/15/28 (b) | | 160,000 | 168,559 |
| MPT Operating Partnership LP/MPT Finance Corp.: | | | |
| 3.5% 3/15/31 | | 1,665,000 | 1,179,068 |
| 5.25% 8/1/26 (c) | | 415,000 | 392,536 |
| Panther Escrow Issuer LLC 7.125% 6/1/31 (b) | | 340,000 | 348,119 |
| Ryan Specialty Group LLC: | | | |
| 4.375% 2/1/30 (b)(c) | | 540,000 | 511,895 |
| 5.875% 8/1/32 (b) | | 130,000 | 129,566 |
| Safehold Operating Partnership LP 2.85% 1/15/32 | | 280,000 | 237,456 |
| Service Properties Trust: | | | |
| 3.95% 1/15/28 | | 75,000 | 64,364 |
| 5.5% 12/15/27 | | 415,000 | 392,983 |
| Taylor Morrison Communities, Inc./Monarch Communities, Inc. 5.75% 1/15/28 (b) | | 450,000 | 450,063 |
| TopBuild Corp. 4.125% 2/15/32 (b)(c) | | 810,000 | 722,115 |
| | | | 7,282,556 |
| Hotels - 2.5% | | | |
| Hilton Domestic Operating Co., Inc.: | | | |
| 3.625% 2/15/32 (b) | | 1,165,000 | 1,022,576 |
| 4% 5/1/31 (b) | | 2,780,000 | 2,532,338 |
| Hilton Grand Vacations Borrower Escrow LLC 6.625% 1/15/32 (b) | | 420,000 | 420,103 |
| Hilton Worldwide Finance LLC/Hilton Worldwide Finance Corp. 4.875% 4/1/27 (c) | | 445,000 | 441,653 |
| Park Intermediate Holdings LLC / PK Domestic Property LLC / PK Finance Co.-Issuer 7% 2/1/30 (b)(c) | | 140,000 | 143,414 |
| Wyndham Hotels & Resorts, Inc. 4.375% 8/15/28 (b) | | 525,000 | 499,680 |
| | | | 5,059,764 |
| Insurance - 0.6% | | | |
| Alliant Holdings Intermediate LLC/Alliant Holdings Co.-Issuer 4.25% 10/15/27 (b) | | 1,075,000 | 1,019,545 |
| APH Somerset Investor 2 LLC / APH2 Somerset Investor 2 LLC / APH3 Somerset Investor 2 LLC 7.875% 11/1/29 (b) | | 200,000 | 199,800 |
| | | | 1,219,345 |
| Leisure - 2.4% | | | |
| Amer Sports Co. 6.75% 2/16/31 (b)(c) | | 210,000 | 213,337 |
| Carnival Corp.: | | | |
| 7% 8/15/29 (b) | | 425,000 | 444,476 |
| 7.625% 3/1/26 (b) | | 675,000 | 679,720 |
| NCL Corp. Ltd.: | | | |
| 5.875% 2/15/27 (b) | | 350,000 | 349,637 |
| 8.375% 2/1/28 (b) | | 230,000 | 240,930 |
| Royal Caribbean Cruises Ltd.: | | | |
| 5.5% 4/1/28 (b) | | 1,200,000 | 1,199,917 |
| 5.625% 9/30/31 (b) | | 400,000 | 397,740 |
| 6% 2/1/33 (b) | | 1,010,000 | 1,016,202 |
| 6.25% 3/15/32 (b) | | 205,000 | 209,002 |
| | | | 4,750,961 |
| Metals/Mining - 2.2% | | | |
| Alcoa Nederland Holding BV 7.125% 3/15/31 (b) | | 80,000 | 83,412 |
| Arsenal AIC Parent LLC 8% 10/1/30 (b) | | 130,000 | 136,645 |
| Cleveland-Cliffs, Inc. 7% 3/15/32 (b) | | 595,000 | 595,673 |
| ERO Copper Corp. 6.5% 2/15/30 (b) | | 740,000 | 727,050 |
| FMG Resources August 2006 Pty Ltd. 4.5% 9/15/27 (b) | | 1,140,000 | 1,109,790 |
| HudBay Minerals, Inc. 4.5% 4/1/26 (b) | | 240,000 | 237,003 |
| Mineral Resources Ltd. 8% 11/1/27 (b) | | 1,130,000 | 1,158,696 |
| Novelis Corp. 3.875% 8/15/31 (b) | | 385,000 | 338,115 |
| | | | 4,386,384 |
| Paper - 0.4% | | | |
| Ardagh Metal Packaging Finance U.S.A. LLC/Ardagh Metal Packaging Finance PLC: | | | |
| 3.25% 9/1/28 (b) | | 570,000 | 513,602 |
| 6% 6/15/27 (b) | | 160,000 | 159,547 |
| Glatfelter Corp. 7.25% 11/15/31 (b) | | 140,000 | 138,810 |
| Mercer International, Inc. 12.875% 10/1/28 (b) | | 20,000 | 21,177 |
| | | | 833,136 |
| Publishing/Printing - 0.1% | | | |
| Cimpress PLC 7.375% 9/15/32 (b) | | 235,000 | 231,356 |
| Railroad - 0.2% | | | |
| Genesee & Wyoming, Inc. 6.25% 4/15/32 (b) | | 305,000 | 307,665 |
| Restaurants - 1.8% | | | |
| 1011778 BC Unlimited Liability Co./New Red Finance, Inc. 6.125% 6/15/29 (b) | | 1,010,000 | 1,027,633 |
| Garden SpinCo Corp. 8.625% 7/20/30 (b)(c) | | 115,000 | 124,465 |
| Yum! Brands, Inc.: | | | |
| 3.625% 3/15/31 (c) | | 2,615,000 | 2,368,043 |
| 5.35% 11/1/43 | | 110,000 | 107,035 |
| | | | 3,627,176 |
| Services - 7.4% | | | |
| ADT Corp.: | | | |
| 4.125% 8/1/29 (b) | | 385,000 | 359,991 |
| 4.875% 7/15/32 (b) | | 565,000 | 526,538 |
| AECOM 5.125% 3/15/27 | | 1,485,000 | 1,477,053 |
| Allied Universal Holdco LLC 7.875% 2/15/31 (b) | | 310,000 | 315,479 |
| Artera Services LLC 8.5% 2/15/31 (b) | | 1,025,000 | 1,015,826 |
| ASGN, Inc. 4.625% 5/15/28 (b) | | 965,000 | 921,495 |
| Booz Allen Hamilton, Inc. 4% 7/1/29 (b) | | 155,000 | 148,024 |
| Brand Industrial Services, Inc. 10.375% 8/1/30 (b) | | 320,000 | 339,247 |
| CoreCivic, Inc. 8.25% 4/15/29 | | 205,000 | 215,281 |
| Fair Isaac Corp. 4% 6/15/28 (b) | | 450,000 | 427,344 |
| Gartner, Inc.: | | | |
| 3.625% 6/15/29 (b) | | 220,000 | 205,340 |
| 4.5% 7/1/28 (b) | | 660,000 | 643,986 |
| Iron Mountain, Inc. 4.875% 9/15/29 (b) | | 2,715,000 | 2,614,685 |
| Life Time, Inc. 6% 11/15/31 (b)(f) | | 400,000 | 398,302 |
| Prime Securities Services Borrower LLC/Prime Finance, Inc. 3.375% 8/31/27 (b) | | 2,225,000 | 2,093,943 |
| Service Corp. International 5.125% 6/1/29 | | 1,425,000 | 1,398,133 |
| Sotheby's 7.375% 10/15/27 (b) | | 185,000 | 180,046 |
| The GEO Group, Inc. 8.625% 4/15/29 | | 240,000 | 251,041 |
| TriNet Group, Inc. 3.5% 3/1/29 (b) | | 710,000 | 645,609 |
| United Rentals North America, Inc. 6.125% 3/15/34 (b) | | 515,000 | 519,298 |
| | | | 14,696,661 |
| Steel - 0.0% | | | |
| Roller Bearing Co. of America, Inc. 4.375% 10/15/29 (b) | | 110,000 | 103,354 |
| Super Retail - 3.3% | | | |
| Asbury Automotive Group, Inc.: | | | |
| 4.625% 11/15/29 (b) | | 245,000 | 229,399 |
| 5% 2/15/32 (b) | | 260,000 | 239,514 |
| Bath & Body Works, Inc. 6.625% 10/1/30 (b)(c) | | 1,620,000 | 1,622,096 |
| EG Global Finance PLC 12% 11/30/28 (b) | | 615,000 | 683,817 |
| Gap, Inc. 3.875% 10/1/31 (b) | | 385,000 | 330,841 |
| Group 1 Automotive, Inc. 6.375% 1/15/30 (b) | | 195,000 | 195,874 |
| Hanesbrands, Inc. 4.875% 5/15/26 (b) | | 1,115,000 | 1,101,491 |
| Levi Strauss & Co. 3.5% 3/1/31 (b)(c) | | 630,000 | 556,482 |
| Nordstrom, Inc. 4.375% 4/1/30 | | 930,000 | 842,989 |
| Sally Holdings LLC 6.75% 3/1/32 (c) | | 205,000 | 207,555 |
| The William Carter Co. 5.625% 3/15/27 (b) | | 465,000 | 462,271 |
| | | | 6,472,329 |
| Technology - 6.8% | | | |
| Acuris Finance U.S.: | | | |
| 5% 5/1/28 (b) | | 375,000 | 338,435 |
| 9% 8/1/29 (b) | | 215,000 | 210,743 |
| Amentum Holdings, Inc. 7.25% 8/1/32 (b) | | 240,000 | 248,584 |
| Block, Inc.: | | | |
| 2.75% 6/1/26 | | 380,000 | 365,873 |
| 6.5% 5/15/32 (b) | | 405,000 | 412,195 |
| Broadcom, Inc. 2.45% 2/15/31 (b) | | 420,000 | 362,698 |
| Central Parent LLC/CDK GLO II/CDK Finance Co. 8% 6/15/29 (b)(c) | | 415,000 | 424,094 |
| Central Parent, Inc./Central Merger Sub, Inc. 7.25% 6/15/29 (b) | | 345,000 | 346,304 |
| Coherent Corp. 5% 12/15/29 (b)(c) | | 1,600,000 | 1,534,883 |
| Crowdstrike Holdings, Inc. 3% 2/15/29 | | 525,000 | 477,401 |
| Elastic NV 4.125% 7/15/29 (b) | | 235,000 | 217,464 |
| Entegris, Inc. 4.375% 4/15/28 (b) | | 730,000 | 697,928 |
| HTA Group Ltd. 7.5% 6/4/29 (b) | | 705,000 | 716,351 |
| Insight Enterprises, Inc. 6.625% 5/15/32 (b) | | 165,000 | 168,682 |
| Lightning Power LLC 7.25% 8/15/32 (b) | | 190,000 | 197,665 |
| Match Group Holdings II LLC: | | | |
| 3.625% 10/1/31 (b)(c) | | 575,000 | 503,768 |
| 4.125% 8/1/30 (b) | | 265,000 | 240,964 |
| ON Semiconductor Corp. 3.875% 9/1/28 (b) | | 545,000 | 511,046 |
| Open Text Corp.: | | | |
| 3.875% 2/15/28 (b) | | 1,410,000 | 1,326,229 |
| 3.875% 12/1/29 (b) | | 390,000 | 355,800 |
| Open Text Holdings, Inc. 4.125% 2/15/30 (b) | | 130,000 | 119,346 |
| Qorvo, Inc. 4.375% 10/15/29 (c) | | 505,000 | 476,135 |
| Seagate HDD Cayman 8.25% 12/15/29 | | 1,425,000 | 1,533,028 |
| Sensata Technologies, Inc. 3.75% 2/15/31 (b) | | 1,165,000 | 1,039,769 |
| VM Consolidated, Inc. 5.5% 4/15/29 (b) | | 345,000 | 333,666 |
| Wolfspeed, Inc. 4.2917% 6/23/30 pay-in-kind (b)(d)(g)(h) | | 350,000 | 336,000 |
| | | | 13,495,051 |
| Telecommunications - 2.9% | | | |
| Altice Financing SA 5% 1/15/28 (b) | | 10,000 | 8,456 |
| Altice France SA 5.125% 7/15/29 (b) | | 600,000 | 448,772 |
| C&W Senior Finance Ltd. 6.875% 9/15/27 (b) | | 909,000 | 899,986 |
| Cogent Communications Group, Inc. 7% 6/15/27 (b) | | 660,000 | 667,003 |
| LCPR Senior Secured Financing DAC 5.125% 7/15/29 (b) | | 870,000 | 732,470 |
| Level 3 Financing, Inc.: | | | |
| 4.875% 6/15/29 (b) | | 300,000 | 256,500 |
| 11% 11/15/29 (b) | | 133,344 | 150,467 |
| Millicom International Cellular SA 5.125% 1/15/28 (b) | | 900,000 | 869,625 |
| SBA Communications Corp. 3.875% 2/15/27 | | 750,000 | 725,882 |
| ViaSat, Inc. 5.625% 9/15/25 (b) | | 310,000 | 305,959 |
| Virgin Media Finance PLC 5% 7/15/30 (b) | | 105,000 | 90,265 |
| Virgin Media Secured Finance PLC 5.5% 5/15/29 (b) | | 740,000 | 699,826 |
| | | | 5,855,211 |
| Textiles/Apparel - 0.3% | | | |
| Crocs, Inc. 4.125% 8/15/31 (b)(c) | | 405,000 | 354,769 |
| Foot Locker, Inc. 4% 10/1/29 (b)(c) | | 200,000 | 171,853 |
| Kontoor Brands, Inc. 4.125% 11/15/29 (b) | | 130,000 | 121,165 |
| | | | 647,787 |
| Transportation Ex Air/Rail - 0.3% | | | |
| Seaspan Corp. 5.5% 8/1/29 (b) | | 200,000 | 190,242 |
| XPO, Inc.: | | | |
| 6.25% 6/1/28 (b) | | 325,000 | 329,911 |
| 7.125% 2/1/32 (b) | | 105,000 | 109,078 |
| | | | 629,231 |
| Utilities - 4.3% | | | |
| Clearway Energy Operating LLC: | | | |
| 3.75% 2/15/31 (b) | | 1,615,000 | 1,441,700 |
| 4.75% 3/15/28 (b) | | 195,000 | 189,150 |
| FirstEnergy Corp. 2.25% 9/1/30 (c) | | 825,000 | 710,452 |
| NextEra Energy Partners LP 7.25% 1/15/29 (b)(c) | | 405,000 | 416,586 |
| NRG Energy, Inc.: | | | |
| 5.25% 6/15/29 (b)(c) | | 625,000 | 610,751 |
| 6% 2/1/33 (b) | | 200,000 | 198,893 |
| 6.25% 11/1/34 (b) | | 200,000 | 199,789 |
| PG&E Corp. 5% 7/1/28 (c) | | 1,245,000 | 1,214,308 |
| TerraForm Power Operating LLC 4.75% 1/15/30 (b) | | 130,000 | 121,295 |
| Vertiv Group Corp. 4.125% 11/15/28 (b) | | 945,000 | 899,315 |
| Vistra Operations Co. LLC: | | | |
| 5% 7/31/27 (b) | | 2,395,000 | 2,363,493 |
| 7.75% 10/15/31 (b) | | 200,000 | 211,275 |
| | | | 8,577,007 |
TOTAL NONCONVERTIBLE BONDS | | | 184,149,465 |
| TOTAL CORPORATE BONDS (Cost $190,104,018) | | | 186,089,230 |
| | | | |
| Asset-Backed Securities - 0.2% |
| | | Principal Amount (a) | Value ($) |
| Carlyle U.S. Clo 2024-6 Ltd. Series 2024-6A Class E, CME Term SOFR 3 Month Index + 5.750% 0% 10/25/37 (b)(d)(f)(i) | | 150,000 | 150,031 |
| Palmer Square Ln Funding 2024-2 Lt Series 2024-2A Class D, CME Term SOFR 3 Month Index + 4.700% 6.2% 1/15/33 (b)(d)(f)(i) | | 250,000 | 250,000 |
| TOTAL ASSET-BACKED SECURITIES (Cost $400,000) | | | 400,031 |
| | | | |
| Common Stocks - 0.1% |
| | | Shares | Value ($) |
| Healthcare - 0.1% | | | |
| Cano Health, Inc. (h) | | 20,400 | 249,288 |
| Cano Health, Inc. warrants (h)(j) | | 627 | 2,483 |
| | | | |
| TOTAL COMMON STOCKS (Cost $402,107) | | | 251,771 |
| | | | |
| Bank Loan Obligations - 1.5% |
| | | Principal Amount (a) | Value ($) |
| Broadcasting - 0.1% | | | |
| Diamond Sports Group LLC Tranche DIP term loan 10% 8/2/27 (k) | | 109,824 | 115,590 |
| Consumer Products - 0.0% | | | |
| TripAdvisor, Inc. Tranche B 1LN, term loan CME Term SOFR 1 Month Index + 2.750% 7.4352% 7/8/31 (d)(i)(k) | | 15,000 | 14,994 |
| Diversified Financial Services - 0.2% | | | |
| Dragon Buyer, Inc. 1LN, term loan CME Term SOFR 1 Month Index + 3.250% 7.8537% 9/30/31 (d)(i)(k) | | 20,000 | 19,869 |
| Nexus Buyer LLC Tranche B 1LN, term loan CME Term SOFR 1 Month Index + 4.000% 8.6852% 7/18/31 (d)(i)(k) | | 300,000 | 298,689 |
TOTAL DIVERSIFIED FINANCIAL SERVICES | | | 318,558 |
| Healthcare - 0.1% | | | |
| Cano Health, Inc. 1LN, term loan CME Term SOFR 1 Month Index + 8.000% 12.6037% 6/28/29 (d)(i)(k) | | 122,305 | 121,388 |
| Insurance - 0.1% | | | |
| Alliant Holdings Intermediate LLC Tranche B6 1LN, term loan CME Term SOFR 1 Month Index + 3.000% 7.7592% 9/19/31 (d)(i)(k) | | 282,853 | 281,438 |
| Metals/Mining - 0.3% | | | |
| American Rock Salt Co. LLC: | | | |
| 1LN, term loan: | | | |
CME Term SOFR 3 Month Index + 4.000% 9.3188% 6/4/28 (d)(i)(k) | | 487,484 | 406,103 |
CME Term SOFR 3 Month Index + 6.500% 2% 6/12/28 (d)(g)(i)(k) | | 153,004 | 152,813 |
| Tranche B 1LN, term loan CME Term SOFR 3 Month Index + 6.500% 11.8736% 6/12/28 (d)(i)(k) | | 143,031 | 142,852 |
TOTAL METALS/MINING | | | 701,768 |
| Services - 0.4% | | | |
| ABG Intermediate Holdings 2 LLC Tranche B1 1LN, term loan CME Term SOFR 1 Month Index + 2.750% 7.4465% 12/21/28 (d)(i)(k) | | 131,974 | 132,205 |
| Ascend Learning LLC: | | | |
| 2LN, term loan CME Term SOFR 1 Month Index + 5.750% 10.5352% 12/10/29 (d)(i)(k) | | 50,000 | 49,084 |
| Tranche B 1LN, term loan CME Term SOFR 1 Month Index + 3.500% 8.2852% 12/10/28 (d)(i)(k) | | 191,112 | 190,963 |
| Ensemble RCM LLC Tranche B 1LN, term loan CME Term SOFR 3 Month Index + 3.000% 7.5854% 8/1/29 (d)(i)(k) | | 24,937 | 24,959 |
| Spin Holdco, Inc. Tranche B 1LN, term loan CME Term SOFR 3 Month Index + 4.000% 9.256% 3/4/28 (d)(i)(k) | | 369,044 | 319,430 |
TOTAL SERVICES | | | 716,641 |
| Technology - 0.2% | | | |
| Leia Finco U.S. LLC 1LN, term loan CME Term SOFR 1 Month Index + 3.250% 7.8867% 10/9/31 (d)(i)(k) | | 405,000 | 401,063 |
| Utilities - 0.1% | | | |
| WEC U.S. Holdings Ltd. Tranche B 1LN, term loan CME Term SOFR 1 Month Index + 2.750% 7.5954% 1/20/31 (d)(i)(k) | | 256,108 | 256,234 |
| TOTAL BANK LOAN OBLIGATIONS (Cost $2,915,366) | | | 2,927,674 |
| | | | |
| Preferred Securities - 0.9% |
| | | Principal Amount (a) | Value ($) |
| Banks & Thrifts - 0.6% | | | |
| Ally Financial, Inc.: | | | |
| 4.7% (d)(l) | | 385,000 | 350,188 |
| 4.7% (d)(l) | | 100,000 | 82,130 |
| Citigroup, Inc. 7.125% (d)(l) | | 375,000 | 396,715 |
| Wells Fargo & Co. 7.625% (c)(d)(l) | | 320,000 | 347,085 |
TOTAL BANKS & THRIFTS | | | 1,176,118 |
| Diversified Financial Services - 0.3% | | | |
| Charles Schwab Corp.: | | | |
| 4% (d)(l) | | 465,000 | 408,131 |
| 5.375% (d)(l) | | 225,000 | 225,797 |
TOTAL DIVERSIFIED FINANCIAL SERVICES | | | 633,928 |
| TOTAL PREFERRED SECURITIES (Cost $1,567,921) | | | 1,810,046 |
| | | | |
| Money Market Funds - 8.4% |
| | | Shares | Value ($) |
| Fidelity Cash Central Fund 4.87% (m) | | 6,494,507 | 6,495,806 |
| Fidelity Securities Lending Cash Central Fund 4.87% (m)(n) | | 10,062,446 | 10,063,452 |
| TOTAL MONEY MARKET FUNDS (Cost $16,559,258) | | | 16,559,258 |
| | | | |
| TOTAL INVESTMENT IN SECURITIES - 104.7% (Cost $211,948,670) | 208,038,010 |
NET OTHER ASSETS (LIABILITIES) - (4.7)% | (9,270,289) |
| NET ASSETS - 100.0% | 198,767,721 |
| | |
Legend
| (a) | Amount is stated in United States dollars unless otherwise noted. |
| (b) | Security exempt from registration under Rule 144A of the Securities Act of 1933. These securities may be resold in transactions exempt from registration, normally to qualified institutional buyers. At the end of the period, the value of these securities amounted to $149,546,954 or 75.2% of net assets. |
| (c) | Security or a portion of the security is on loan at period end. |
| (d) | Coupon rates for floating and adjustable rate securities reflect the rates in effect at period end. |
| (e) | Security initially issued at one coupon which converts to a higher coupon at a specified date. The rate shown is the rate at period end. |
| (f) | Security or a portion of the security purchased on a delayed delivery or when-issued basis. |
| (g) | Position or a portion of the position represents an unfunded loan commitment. At period end, the total principal amount and market value of unfunded commitments totaled $386,337 and $376,813, respectively. |
| (i) | Coupon is indexed to a floating interest rate which may be multiplied by a specified factor and/or subject to caps or floors. |
| (k) | Remaining maturities of bank loan obligations may be less than the stated maturities shown as a result of contractual or optional prepayments by the borrower. Such prepayments cannot be predicted with certainty. |
| (l) | Security is perpetual in nature with no stated maturity date. |
| (m) | Affiliated fund that is generally available only to investment companies and other accounts managed by Fidelity Investments. The rate quoted is the annualized seven-day yield of the fund at period end. A complete unaudited listing of the fund's holdings as of its most recent quarter end is available upon request. In addition, each Fidelity Central Fund's financial statements are available on the SEC's website or upon request. |
| (n) | Investment made with cash collateral received from securities on loan. |
Affiliated Central Funds
Fiscal year to date information regarding the Fund's investments in Fidelity Central Funds, including the ownership percentage, is presented below.
| Affiliate | Value, beginning of period ($) | Purchases ($) | Sales Proceeds ($) | Dividend Income ($) | Realized Gain (loss) ($) | Change in Unrealized appreciation (depreciation) ($) | Value, end of period ($) | % ownership, end of period |
| Fidelity Cash Central Fund 4.87% | 6,941,727 | 27,826,575 | 28,272,414 | 205,344 | (82) | - | 6,495,806 | 0.0% |
| Fidelity Securities Lending Cash Central Fund 4.87% | - | 51,665,206 | 41,601,754 | 17,607 | - | - | 10,063,452 | 0.0% |
| Total | 6,941,727 | 79,491,781 | 69,874,168 | 222,951 | (82) | - | 16,559,258 | |
| | | | | | | | | |
Amounts in the dividend income column in the above table include any capital gain distributions from underlying funds, which are presented in the corresponding line item in the Statement of Operations, if applicable.
Amounts in the dividend income column for Fidelity Securities Lending Cash Central Fund represents the income earned on investing cash collateral, less rebates paid to borrowers and any lending agent fees associated with the loan, plus any premium payments received for lending certain types of securities.
Amounts included in the purchases and sales proceeds columns may include in-kind transactions, if applicable.
Investment Valuation
The following is a summary of the inputs used, as of October 31, 2024, involving the Fund's assets and liabilities carried at fair value. The inputs or methodology used for valuing securities may not be an indication of the risk associated with investing in those securities. For more information on valuation inputs, and their aggregation into the levels used below, please refer to the Investment Valuation section in the accompanying Notes to Financial Statements.
| Valuation Inputs at Reporting Date: |
| Description | Total ($) | Level 1 ($) | Level 2 ($) | Level 3 ($) |
Investments in Securities: | | | | |
|
| Equities: | | | | |
Health Care | 251,771 | - | - | 251,771 |
|
| Corporate Bonds | 186,089,230 | - | 185,753,230 | 336,000 |
|
| Asset-Backed Securities | 400,031 | - | 400,031 | - |
|
| Bank Loan Obligations | 2,927,674 | - | 2,927,674 | - |
|
| Preferred Securities | 1,810,046 | - | 1,810,046 | - |
|
| Money Market Funds | 16,559,258 | 16,559,258 | - | - |
| Total Investments in Securities: | 208,038,010 | 16,559,258 | 190,890,981 | 587,771 |
Financial Statements (Unaudited)
| Statement of Assets and Liabilities |
| As of October 31, 2024 (Unaudited) |
| Assets | | | | |
| Investment in securities, at value (including securities loaned of $9,711,484) - See accompanying schedule: | | | | |
Unaffiliated issuers (cost $195,389,412) | $ | 191,478,752 | | |
Fidelity Central Funds (cost $16,559,258) | | 16,559,258 | | |
| | | | | |
| | | | | |
| Total Investment in Securities (cost $211,948,670) | | | $ | 208,038,010 |
| Cash | | | | 842,841 |
| Unrealized appreciation on unfunded commitments | | | | 98,254 |
| Receivable for fund shares sold | | | | 10,575 |
| Interest receivable | | | | 2,627,783 |
| Distributions receivable from Fidelity Central Funds | | | | 28,334 |
| Prepaid expenses | | | | 240 |
Total assets | | | | 211,646,037 |
| Liabilities | | | | |
| Payable for investments purchased | | | | |
Regular delivery | $ | 1,264,849 | | |
Delayed delivery | | 1,120,000 | | |
| Payable for fund shares redeemed | | 136,507 | | |
| Distributions payable | | 126,900 | | |
| Accrued management fee | | 119,074 | | |
| Other payables and accrued expenses | | 47,533 | | |
| Collateral on securities loaned | | 10,063,453 | | |
| Total liabilities | | | | 12,878,316 |
| Commitments and contingent liabilities (see Significant Accounting Policies note) | | | | |
| Net Assets | | | $ | 198,767,721 |
| Net Assets consist of: | | | | |
| Paid in capital | | | $ | 228,712,646 |
| Total accumulated earnings (loss) | | | | (29,944,925) |
| Net Assets | | | $ | 198,767,721 |
Net Asset Value, offering price and redemption price per share ($198,767,721 ÷ 24,392,210 shares) | | | $ | 8.15 |
| Statement of Operations |
Six months ended October 31, 2024 (Unaudited) |
| Investment Income | | | | |
| Dividends | | | $ | 55,738 |
| Interest | | | | 5,377,989 |
| Income from Fidelity Central Funds (including $17,607 from security lending) | | | | 222,951 |
| Total income | | | | 5,656,678 |
| Expenses | | | | |
| Management fee | $ | 705,926 | | |
| Custodian fees and expenses | | 2,083 | | |
| Independent trustees' fees and expenses | | 410 | | |
| Registration fees | | 19,514 | | |
| Audit fees | | 41,811 | | |
| Legal | | 60 | | |
| Miscellaneous | | 5,011 | | |
| Total expenses before reductions | | 774,815 | | |
| Expense reductions | | (9,166) | | |
| Total expenses after reductions | | | | 765,649 |
| Net Investment income (loss) | | | | 4,891,029 |
| Realized and Unrealized Gain (Loss) | | | | |
| Net realized gain (loss) on: | | | | |
| Investment Securities: | | | | |
| Unaffiliated issuers | | (1,629,768) | | |
| Fidelity Central Funds | | (82) | | |
| Total net realized gain (loss) | | | | (1,629,850) |
| Change in net unrealized appreciation (depreciation) on: | | | | |
| Investment Securities: | | | | |
| Unaffiliated issuers | | 7,714,060 | | |
| Unfunded commitments | | 98,254 | | |
| Total change in net unrealized appreciation (depreciation) | | | | 7,812,314 |
| Net gain (loss) | | | | 6,182,464 |
| Net increase (decrease) in net assets resulting from operations | | | $ | 11,073,493 |
| Statement of Changes in Net Assets |
| |
| | Six months ended October 31, 2024 (Unaudited) | | Year ended April 30, 2024 |
| Increase (Decrease) in Net Assets | | | | |
| Operations | | | | |
| Net investment income (loss) | $ | 4,891,029 | $ | 10,076,226 |
| Net realized gain (loss) | | (1,629,850) | | (4,781,263) |
| Change in net unrealized appreciation (depreciation) | | 7,812,314 | | 7,004,956 |
| Net increase (decrease) in net assets resulting from operations | | 11,073,493 | | 12,299,919 |
| Distributions to shareholders | | (4,621,345) | | (9,611,700) |
| | | | | |
| Share transactions | | | | |
| Proceeds from sales of shares | | 11,795,190 | | 19,201,153 |
| Reinvestment of distributions | | 3,859,133 | | 8,015,292 |
| Cost of shares redeemed | | (24,727,241) | | (49,896,043) |
| | | | | |
Net increase (decrease) in net assets resulting from share transactions | | (9,072,918) | | (22,679,598) |
| Total increase (decrease) in net assets | | (2,620,770) | | (19,991,379) |
| | | | | |
| Net Assets | | | | |
| Beginning of period | | 201,388,491 | | 221,379,870 |
| End of period | $ | 198,767,721 | $ | 201,388,491 |
| | | | | |
| Other Information | | | | |
| Shares | | | | |
| Sold | | 1,458,624 | | 2,466,412 |
| Issued in reinvestment of distributions | | 476,542 | | 1,028,051 |
| Redeemed | | (3,055,698) | | (6,414,200) |
| Net increase (decrease) | | (1,120,532) | | (2,919,737) |
| | | | | |
Financial Highlights
Fidelity® Focused High Income Fund |
| |
| | Six months ended (Unaudited) October 31, 2024 | | Years ended April 30, 2024 | | 2023 | | 2022 | | 2021 | | 2020 |
Selected Per-Share Data | | | | | | | | | | | | |
| Net asset value, beginning of period | $ | 7.89 | $ | 7.79 | $ | 7.99 | $ | 8.86 | $ | 8.28 | $ | 8.65 |
| Income from Investment Operations | | | | | | | | | | | | |
Net investment income (loss) A,B | | .197 | | .376 | | .357 | | .317 | | .340 | | .374 |
| Net realized and unrealized gain (loss) | | .249 | | .083 | | (.216) | | (.863) | | .574 | | (.378) |
| Total from investment operations | | .446 | | .459 | | .141 | | (.546) | | .914 | | (.004) |
| Distributions from net investment income | | (.186) | | (.359) | | (.341) | | (.324) | | (.334) | | (.366) |
| Total distributions | | (.186) | | (.359) | | (.341) | | (.324) | | (.334) | | (.366) |
| Net asset value, end of period | $ | 8.15 | $ | 7.89 | $ | 7.79 | $ | 7.99 | $ | 8.86 | $ | 8.28 |
Total Return C,D | | | | 6.04% | | 1.91% | | (6.41)% | | 11.16% | | (.16)% |
Ratios to Average Net Assets B,E,F | | | | | | | | | | | | |
| Expenses before reductions | | .76% G | | .79% | | .79% | | .75% | | .75% | | .78% |
| Expenses net of fee waivers, if any | | | | .75% | | .75% | | .75% | | .75% | | .78% |
| Expenses net of all reductions | | .75% G | | .75% | | .75% | | .75% | | .75% | | .78% |
| Net investment income (loss) | | 4.82% G | | 4.83% | | 4.62% | | 3.62% | | 3.88% | | 4.31% |
| Supplemental Data | | | | | | | | | | | | |
| Net assets, end of period (000 omitted) | $ | 198,768 | $ | 201,388 | $ | 221,380 | $ | 277,933 | $ | 384,632 | $ | 347,510 |
Portfolio turnover rate H | | | | 26% | | 9% | | 20% | | 73% | | 43% |
ACalculated based on average shares outstanding during the period.
BNet investment income (loss) is affected by the timing of the declaration of dividends by any underlying mutual funds or exchange-traded funds (ETFs). Net investment income (loss) of any mutual funds or ETFs is not included in the Fund's net investment income (loss) ratio.
CTotal returns for periods of less than one year are not annualized.
DTotal returns would have been lower if certain expenses had not been reduced during the applicable periods shown.
EFees and expenses of any underlying mutual funds or exchange-traded funds (ETFs) are not included in the Fund's expense ratio. The Fund indirectly bears its proportionate share of these expenses. For additional expense information related to investments in Fidelity Central Funds, please refer to the "Investments in Fidelity Central Funds" note found in the Notes to Financial Statements section of the most recent Annual or Semi-Annual report.
FExpense ratios reflect operating expenses of the class. Expenses before reductions do not reflect amounts reimbursed, waived, or reduced through arrangements with the investment adviser, brokerage services, or other offset arrangements, if applicable, and do not represent the amount paid by the class during periods when reimbursements, waivers or reductions occur.
GAnnualized.
HAmount does not include the portfolio activity of any underlying mutual funds or exchange-traded funds (ETFs).
Notes to Financial Statements
(Unaudited)For the period ended October 31, 2024
1. Organization.
Fidelity Focused High Income Fund (the Fund) is a fund of Fidelity Summer Street Trust (the Trust) and is authorized to issue an unlimited number of shares. Share transactions on the Statement of Changes in Net Assets may contain exchanges between affiliated funds. The Trust is registered under the Investment Company Act of 1940, as amended (the 1940 Act), as an open-end management investment company organized as a Massachusetts business trust.
2. Investments in Fidelity Central Funds.
Funds may invest in Fidelity Central Funds, which are open-end investment companies generally available only to other investment companies and accounts managed by the investment adviser and its affiliates. The Schedule of Investments lists any Fidelity Central Funds held as an investment as of period end, but does not include the underlying holdings of each Fidelity Central Fund. An investing fund indirectly bears its proportionate share of the expenses of the underlying Fidelity Central Funds.
Based on its investment objective, each Fidelity Central Fund may invest or participate in various investment vehicles or strategies that are similar to those of the investing fund. These strategies are consistent with the investment objectives of the investing fund and may involve certain economic risks which may cause a decline in value of each of the Fidelity Central Funds and thus a decline in the value of the investing fund.
| Fidelity Central Fund | Investment Manager | Investment Objective | Investment Practices | Expense RatioA |
| Fidelity Money Market Central Funds | Fidelity Management & Research Company LLC (FMR) | Each fund seeks to obtain a high level of current income consistent with the preservation of capital and liquidity. | Short-term Investments | Less than .005% |
A Expenses expressed as a percentage of average net assets and are as of each underlying Central Fund's most recent annual or semi-annual shareholder report.
A complete unaudited list of holdings for each Fidelity Central Fund is available upon request or at the Securities and Exchange Commission website at www.sec.gov. In addition, the financial statements of the Fidelity Central Funds which contain the significant accounting policies (including investment valuation policies) of those funds, and are not covered by the Report of Independent Registered Public Accounting Firm, are available on the Securities and Exchange Commission website or upon request.
3. Significant Accounting Policies.
The Fund is an investment company and applies the accounting and reporting guidance of the Financial Accounting Standards Board (FASB) Accounting Standards Codification Topic 946 Financial Services - Investment Companies. The financial statements have been prepared in conformity with accounting principles generally accepted in the United States of America (GAAP), which require management to make certain estimates and assumptions at the date of the financial statements. Actual results could differ from those estimates. Subsequent events, if any, through the date that the financial statements were issued have been evaluated in the preparation of the financial statements. The Fund's Schedule of Investments lists any underlying mutual funds or exchange-traded funds (ETFs) but does not include the underlying holdings of these funds. The following summarizes the significant accounting policies of the Fund:
Investment Valuation. Investments are valued as of 4:00 p.m. Eastern time on the last calendar day of the period. The Board of Trustees (the Board) has designated the Fund's investment adviser as the valuation designee responsible for the fair valuation function and performing fair value determinations as needed. The investment adviser has established a Fair Value Committee (the Committee) to carry out the day-to-day fair valuation responsibilities and has adopted policies and procedures to govern the fair valuation process and the activities of the Committee. In accordance with these fair valuation policies and procedures, which have been approved by the Board, the Fund attempts to obtain prices from one or more third party pricing services or brokers to value its investments. When current market prices, quotations or currency exchange rates are not readily available or reliable, investments will be fair valued in good faith by the Committee, in accordance with the policies and procedures. Factors used in determining fair value vary by investment type and may include market or investment specific events, transaction data, estimated cash flows, and market observations of comparable investments. The frequency that the fair valuation procedures are used cannot be predicted and they may be utilized to a significant extent. The Committee manages the Fund's fair valuation practices and maintains the fair valuation policies and procedures. The Fund's investment adviser reports to the Board information regarding the fair valuation process and related material matters.
The Fund categorizes the inputs to valuation techniques used to value its investments into a disclosure hierarchy consisting of three levels as shown below:
Level 1 - unadjusted quoted prices in active markets for identical investments
Level 2 - other significant observable inputs (including quoted prices for similar investments, interest rates, prepayment speeds, etc.)
Level 3 - unobservable inputs (including the Fund's own assumptions based on the best information available)
Valuation techniques used to value the Fund's investments by major category are as follows:
Debt securities, including restricted securities, are valued based on evaluated prices received from third party pricing services or from brokers who make markets in such securities. Corporate bonds, bank loan obligations and preferred securities are valued by pricing services who utilize matrix pricing which considers yield or price of bonds of comparable quality, coupon, maturity and type or by broker-supplied prices. Asset backed securities are valued by pricing services who utilize matrix pricing which considers prepayment speed assumptions, attributes of the collateral, yield or price of bonds of comparable quality, coupon, maturity and type or by broker-supplied prices. When independent prices are unavailable or unreliable, debt securities may be valued utilizing pricing methodologies which consider similar factors that would be used by third party pricing services. Debt securities are generally categorized as Level 2 in the hierarchy but may be Level 3 depending on the circumstances. The Fund invests a significant portion of its assets in below investment grade securities. The value of these securities can be more volatile due to changes in the credit quality of the issuer and is sensitive to changes in economic, market and regulatory conditions.
Equity securities, including restricted securities, for which market quotations are readily available, are valued at the last reported sale price or official closing price as reported by a third party pricing service on the primary market or exchange on which they are traded and are categorized as Level 1 in the hierarchy. In the event there were no sales during the day or closing prices are not available, securities are valued at the last quoted bid price or may be valued using the last available price and are generally categorized as Level 2 in the hierarchy. For equity securities, including restricted securities, where observable inputs are limited, assumptions about market activity and risk are used and these securities may be categorized as Level 3 in the hierarchy.
Investments in open-end mutual funds, including the Fidelity Central Funds, are valued at their closing net asset value (NAV) each business day and are categorized as Level 1 in the hierarchy.
Changes in valuation techniques may result in transfers in or out of an assigned level within the disclosure hierarchy. The aggregate value of investments by input level as of October 31, 2024 is included at the end of the Fund's Schedule of Investments.
Investment Transactions and Income. For financial reporting purposes, the Fund's investment holdings and NAV include trades executed through the end of the last business day of the period. The NAV per share for processing shareholder transactions is calculated as of the close of business of the New York Stock Exchange (NYSE), normally 4:00 p.m. Eastern time and includes trades executed through the end of the prior business day. Gains and losses on securities sold are determined on the basis of identified cost. Commissions paid to certain brokers with whom the investment adviser, or its affiliates, places trades on behalf of a fund include an amount in addition to trade execution, which may be rebated back to a fund. Any such rebates are included in net realized gain (loss) on investments in the Statement of Operations. Dividend income is recorded on the ex-dividend date, except for certain dividends from foreign securities where the ex-dividend date may have passed, which are recorded as soon as the Fund is informed of the ex-dividend date. Non-cash dividends included in dividend income, if any, are recorded at the fair market value of the securities received. Income and capital gain distributions from Fidelity Central Funds, if any, are recorded on the ex-dividend date. Interest income is accrued as earned and includes coupon interest and amortization of premium and accretion of discount on debt securities as applicable. Paid in Kind (PIK) income is recorded at the fair market value of the securities received. Debt obligations may be placed on non-accrual status and related interest income may be reduced by ceasing current accruals and writing off interest receivables when the collection of all or a portion of interest has become doubtful based on consistently applied procedures. A debt obligation is removed from non-accrual status when the issuer resumes interest payments or when collectability of interest is reasonably assured.
Expenses. Expenses directly attributable to a fund are charged to that fund. Expenses attributable to more than one fund are allocated among the respective funds on the basis of relative net assets or other appropriate methods. Expenses included in the accompanying financial statements reflect the expenses of that fund and do not include any expenses associated with any underlying mutual funds or exchange-traded funds. Although not included in a fund's expenses, a fund indirectly bears its proportionate share of these expenses through the net asset value of each underlying mutual fund or exchange-traded fund. Expense estimates are accrued in the period to which they relate and adjustments are made when actual amounts are known.
Income Tax Information and Distributions to Shareholders. Each year, the Fund intends to qualify as a regulated investment company under Subchapter M of the Internal Revenue Code, including distributing substantially all of its taxable income and realized gains. As a result, no provision for U.S. Federal income taxes is required. The Fund files a U.S. federal tax return, in addition to state and local tax returns as required. The Fund's federal income tax returns are subject to examination by the Internal Revenue Service (IRS) for a period of three fiscal years after they are filed. State and local tax returns may be subject to examination for an additional fiscal year depending on the jurisdiction.
Distributions are declared and recorded daily and paid monthly from net investment income. Distributions from realized gains, if any, are declared and recorded on the ex-dividend date. Income and capital gain distributions are determined in accordance with income tax regulations, which may differ from GAAP.
Capital accounts within the financial statements are adjusted for permanent book-tax differences. These adjustments have no impact on net assets or the results of operations. Capital accounts are not adjusted for temporary book-tax differences which will reverse in a subsequent period.
Book-tax differences are primarily due to market discount, partnerships, prior period premium and discount on debt securities and capital loss carryforwards and losses deferred due to wash sales.
As of period end, the cost and unrealized appreciation (depreciation) in securities, and derivatives if applicable, for federal income tax purposes were as follows:
| Gross unrealized appreciation | $3,933,091 |
| Gross unrealized depreciation | (6,619,837) |
| Net unrealized appreciation (depreciation) | $(2,686,746) |
| Tax cost | $210,724,756 |
Capital loss carryforwards are only available to offset future capital gains of the Fund to the extent provided by regulations and may be limited. The capital loss carryforward information presented below, including any applicable limitation, is estimated as of prior fiscal period end and is subject to adjustment.
Short-term | $(10,668,361) |
Long-term | (15,630,123) |
| Total capital loss carryforward | $(26,298,484) |
Delayed Delivery Transactions and When-Issued Securities. During the period, certain Funds transacted in securities on a delayed delivery or when-issued basis. Payment and delivery may take place after the customary settlement period for that security. The price of the underlying securities and the date when the securities will be delivered and paid for are fixed at the time the transaction is negotiated. Securities purchased on a delayed delivery or when-issued basis are identified as such in the Schedule of Investments. Compensation for interest forgone in the purchase of a delayed delivery or when-issued debt security may be received. With respect to purchase commitments, each applicable Fund identifies securities as segregated in its records with a value at least equal to the amount of the commitment. Payables and receivables associated with the purchases and sales of delayed delivery securities having the same coupon, settlement date and broker are offset. Delayed delivery or when-issued securities that have been purchased from and sold to different brokers are reflected as both payables and receivables in the Statement of Assets and Liabilities under the caption "Delayed delivery", as applicable. Losses may arise due to changes in the value of the underlying securities or if the counterparty does not perform under the contract's terms, or if the issuer does not issue the securities due to political, economic, or other factors.
Restricted Securities (including Private Placements). Funds may invest in securities that are subject to legal or contractual restrictions on resale. These securities generally may be resold in transactions exempt from registration or to the public if the securities are registered. Disposal of these securities may involve time-consuming negotiations and expense, and prompt sale at an acceptable price may be difficult. Information regarding restricted securities held at period end is included at the end of the Schedule of Investments, if applicable.
Loans and Other Direct Debt Instruments. Direct debt instruments are interests in amounts owed to lenders by corporate or other borrowers. These instruments may be in the form of loans, trade claims or other receivables and may include standby financing commitments such as revolving credit facilities that obligate a fund to supply additional cash to the borrower on demand. Loans may be acquired through assignment, participation, or may be made directly to a borrower. Such instruments are presented in the Bank Loan Obligations section in the Schedule of Investments. Certain funds may also invest in unfunded loan commitments, which are contractual obligations for future funding. Information regarding unfunded commitments is included at the end of the Schedule of Investments, if applicable.
Commitments. A commitment is an agreement to acquire an investment at a future date (subject to conditions) in connection with a potential public or non-public offering. Commitments outstanding at period end are presented in the table below. Unrealized appreciation (depreciation) on any commitments outstanding at period end is separately presented in the Statement of Assets and Liabilities as Unrealized appreciation (depreciation) on unfunded commitments, and any change in unrealized appreciation (depreciation) on unfunded commitments during the period is separately presented in the Statement of Operations, as applicable based on contractual conditions of each commitment.
| | Investment to be Acquired | Commitment Amount ($) | Unrealized Appreciation (Depreciation) ($) |
| Fidelity Focused High Income Fund | EchoStar Corp. 10.75% 9/27/29 | 1,133,858 | 98,254 |
New Accounting Pronouncement. In November 2023, the FASB issued Accounting Standards Update (ASU) 2023-07 Segment Reporting (Topic 280): Improvements to Reportable Segment Disclosures. Effective for fiscal years beginning after December 15, 2023 and interim periods within fiscal years beginning after December 15, 2024, the amendments enhance required disclosures of segment information for public entities on an annual and interim basis. The ASU allows for early adoption with updates applied retrospectively. Management is currently evaluating the impact of the ASU but does not expect this guidance to materially impact the financial statements.
4. Purchases and Sales of Investments.
Purchases and sales of securities, other than short-term securities and in-kind transactions, as applicable, are noted in the table below.
| | Purchases ($) | Sales ($) |
| Fidelity Focused High Income Fund | 25,760,800 | 32,740,851 |
5. Fees and Other Transactions with Affiliates.
Management Fee. Fidelity Management & Research Company LLC (the investment adviser) and its affiliates provide the Fund with investment management related services for which the Fund pays a monthly management fee.
Any reference to "class" in this note shall mean "the Fund" as the Fund currently offers only one class of shares. The Fund's management contract incorporates a management fee rate that may vary by class. The investment adviser or an affiliate pays certain expenses of managing and operating the Fund out of each class's management fee. Each class of the Fund pays a management fee to the investment adviser. The management fee is calculated and paid to the investment adviser every month. When determining a class's management fee, a mandate rate is calculated based on the monthly average net assets of a group of funds advised by FMR within a designated asset class. A discount rate is subtracted from the mandate rate once the Fund's monthly average net assets reach a certain level. The mandate rate and discount rate may vary by class. The annual management fee rate for a class of shares of the Fund is the lesser of (1) the class's mandate rate reduced by the class's discount rate (if applicable) or (2) the amount set forth in the following table.
| | Maximum Management Fee Rate % |
| Fidelity Focused High Income Fund | .71 |
One-twelfth of the management fee rate for a class is applied to the average net assets of the class for the month, giving a dollar amount which is the management fee for the class for that month. A different management fee rate may be applicable to each class of the Fund. The difference between classes is the result of separate arrangements for class-level services and/or waivers of certain expenses. It is not the result of any difference in advisory or custodial fees or other expenses related to the management of the Fund's assets, which do not vary by class. For the reporting period, the total annualized management fee rates were as follows:
| | Total Management Fee Rate % |
| Fidelity Focused High Income Fund | .70 |
Interfund Trades. Funds may purchase from or sell securities to other Fidelity Funds under procedures adopted by the Board. The procedures have been designed to ensure these interfund trades are executed in accordance with Rule 17a-7 of the 1940 Act. Any interfund trades are included within the respective purchases and sales amounts shown in the Purchases and Sales of Investments note. During the period, there were no interfund trades.
6. Committed Line of Credit.
Certain Funds participate with other funds managed by the investment adviser or an affiliate in a $4.25 billion credit facility (the "line of credit") to be utilized for temporary or emergency purposes to fund shareholder redemptions or for other short-term liquidity purposes. The participating funds have agreed to pay commitment fees on their pro-rata portion of the line of credit, which are reflected in Miscellaneous expenses on the Statement of Operations, and are listed below. During the period, there were no borrowings on this line of credit.
| | Amount ($) |
| Fidelity Focused High Income Fund | 138 |
7. Security Lending.
Funds lend portfolio securities from time to time in order to earn additional income. Lending agents are used, including National Financial Services (NFS), an affiliate of the investment adviser. Pursuant to a securities lending agreement, NFS will receive a fee, which is capped at 9.9% of a fund's daily lending revenue, for its services as lending agent. A fund may lend securities to certain qualified borrowers, including NFS. On the settlement date of the loan, a fund receives collateral (in the form of U.S. Treasury obligations, letters of credit and/or cash) against the loaned securities and maintains collateral in an amount not less than 100% of the market value of the loaned securities during the period of the loan. The market value of the loaned securities is determined at the close of business of a fund and any additional required collateral is delivered to a fund on the next business day. A fund or borrower may terminate the loan at any time, and if the borrower defaults on its obligation to return the securities loaned because of insolvency or other reasons, a fund may apply collateral received from the borrower against the obligation. A fund may experience delays and costs in recovering the securities loaned. Any cash collateral received is invested in the Fidelity Securities Lending Cash Central Fund. Any loaned securities are identified as such in the Schedule of Investments, and the value of loaned securities and cash collateral at period end, as applicable, are presented in the Statement of Assets and Liabilities. Security lending income represents the income earned on investing cash collateral, less rebates paid to borrowers and any lending agent fees associated with the loan, plus any premium payments received for lending certain types of securities. Security lending income is presented in the Statement of Operations as a component of income from Fidelity Central Funds. Affiliated security lending activity, if any, was as follows:
| | Total Security Lending Fees Paid to NFS ($) | Security Lending Income From Securities Loaned to NFS ($) | Value of Securities Loaned to NFS at Period End ($) |
| Fidelity Focused High Income Fund | 1,849 | - | - |
8. Expense Reductions.
The investment adviser contractually agreed to reimburse the Fund to the extent annual operating expenses exceeded .75% of average net assets. This reimbursement will remain in place through August 31, 2025. Some expenses, for example the compensation of the independent Trustees, and certain miscellaneous expenses such as proxy and shareholder meeting expenses, are excluded from this reimbursement. During the period this reimbursement reduced the Fund's expenses by $8,867.
Through arrangements with the Fund's custodian, credits realized as a result of certain uninvested cash balances were used to reduce the Fund's expenses by $299.
9. Other.
A fund's organizational documents provide former and current trustees and officers with a limited indemnification against liabilities arising in connection with the performance of their duties to the fund. In the normal course of business, a fund may also enter into contracts that provide general indemnifications. A fund's maximum exposure under these arrangements is unknown as this would be dependent on future claims that may be made against a fund. The risk of material loss from such claims is considered remote.
10. Risk and Uncertainties.
Many factors affect a fund's performance. Developments that disrupt global economies and financial markets, such as pandemics, epidemics, outbreaks of infectious diseases, war, terrorism, and environmental disasters, may significantly affect a fund's investment performance. The effects of these developments to a fund will be impacted by the types of securities in which a fund invests, the financial condition, industry, economic sector, and geographic location of an issuer, and a fund's level of investment in the securities of that issuer. Significant concentrations in security types, issuers, industries, sectors, and geographic locations may magnify the factors that affect a fund's performance.
Item 8: Changes in and Disagreements with Accountants for Open-End Management Investment Companies
(Unaudited)
Note: This is not applicable for any fund included in this document.
Item 9: Proxy Disclosures for Open-End Management Investment Companies
(Unaudited)
| A special meeting of shareholders was held on July 16, 2024. The results of votes taken among shareholders on the proposal before them are reported below. Each vote reported represents one dollar of net asset value held on the record date for the meeting. |
| Proposal 1 |
| To elect a Board of Trustees. |
| | # of Votes | % of Votes |
| Bettina Doulton |
| Affirmative | 14,516,835,136.19 | 94.56 |
| Withheld | 834,887,998.33 | 5.44 |
| TOTAL | 15,351,723,134.52 | 100.00 |
| Robert A. Lawrence |
| Affirmative | 14,430,495,798.10 | 94.00 |
| Withheld | 921,227,336.42 | 6.00 |
| TOTAL | 15,351,723,134.52 | 100.00 |
| Vijay C. Advani |
| Affirmative | 14,465,231,640.25 | 94.23 |
| Withheld | 886,491,494.27 | 5.77 |
| TOTAL | 15,351,723,134.52 | 100.00 |
| Thomas P. Bostick |
| Affirmative | 14,471,831,170.84 | 94.27 |
| Withheld | 879,891,963.68 | 5.73 |
| TOTAL | 15,351,723,134.52 | 100.00 |
| Donald F. Donahue |
| Affirmative | 14,432,670,599.88 | 94.01 |
| Withheld | 919,052,534.64 | 5.99 |
| TOTAL | 15,351,723,134.52 | 100.00 |
| Vicki L. Fuller |
| Affirmative | 14,531,407,981.65 | 94.66 |
| Withheld | 820,315,152.87 | 5.34 |
| TOTAL | 15,351,723,134.52 | 100.00 |
| Patricia L. Kampling |
| Affirmative | 14,549,142,839.16 | 94.77 |
| Withheld | 802,580,295.36 | 5.23 |
| TOTAL | 15,351,723,134.52 | 100.00 |
| Thomas A. Kennedy |
| Affirmative | 14,469,818,769.40 | 94.26 |
| Withheld | 881,904,365.12 | 5.74 |
| TOTAL | 15,351,723,134.52 | 100.00 |
| Oscar Munoz |
| Affirmative | 14,434,061,467.08 | 94.02 |
| Withheld | 917,661,667.44 | 5.98 |
| TOTAL | 15,351,723,134.52 | 100.00 |
| Karen B. Peetz |
| Affirmative | 14,521,904,618.46 | 94.59 |
| Withheld | 829,818,516.06 | 5.41 |
| TOTAL | 15,351,723,134.52 | 100.00 |
| David M. Thomas |
| Affirmative | 14,417,745,861.73 | 93.92 |
| Withheld | 933,977,272.79 | 6.08 |
| TOTAL | 15,351,723,134.52 | 100.00 |
| Susan Tomasky |
| Affirmative | 14,467,973,468.18 | 94.24 |
| Withheld | 883,749,666.34 | 5.76 |
| TOTAL | 15,351,723,134.52 | 100.00 |
| Michael E. Wiley |
| Affirmative | 14,424,002,796.91 | 93.96 |
| Withheld | 927,720,337.61 | 6.04 |
| TOTAL | 15,351,723,134.52 | 100.00 |
| | | |
| Proposal 1 reflects trust-wide proposal and voting results. |
Item 10: Remuneration Paid to Directors, Officers, and others of Open-End Management Investment Companies
(Unaudited)
Note: This information is disclosed as part of the financial statements for each Fund as part of Item 7: Financial Statements and Financial Highlights for Open-End Management Investment companies.
Item 11: Statement Regarding Basis for Approval of Investment Advisory Contract
(Unaudited)
Board Approval of Investment Advisory Contracts and Management Fees
Fidelity Focused High Income Fund
Each year, the Board of Trustees, including the Independent Trustees (together, the Board), considers the renewal of the fund's management contract with Fidelity Management & Research Company LLC (FMR) and certain affiliates and the sub-advisory agreements (together, the Advisory Contracts) for the fund. FMR and the sub-advisers are referred to herein as the Investment Advisers. The Board, assisted by the advice of fund counsel and Independent Trustees' counsel, requests and considers a broad range of information relevant to the renewal of the Advisory Contracts throughout the year.
The Board meets regularly and, at each of its meetings, covers an extensive agenda of topics and materials and considers factors that are relevant to its annual consideration of the renewal of the fund's Advisory Contracts, including the services and support provided to the fund and its shareholders. The Board, acting directly and through its Committees (each of which is composed of and chaired by Independent Trustees), requests and receives information concerning the annual consideration of the renewal of the fund's Advisory Contracts. The Board also meets as needed to review matters specifically related to the Board's annual consideration of the renewal of the Advisory Contracts. Members of the Board may also meet with trustees of other Fidelity funds through joint ad hoc committees to discuss certain matters relevant to all of the Fidelity funds.
At its May 2024 meeting, the Board unanimously determined to renew the fund's Advisory Contracts. In reaching its determination, the Board considered all factors it believed relevant, including (i) the nature, extent, and quality of the services provided to the fund and its shareholders (including the investment performance of the fund); (ii) the competitiveness relative to peer funds of the fund's management fee and total expense ratio; (iii) the total costs of the services provided by and the profits realized by FMR and its affiliates (Fidelity) from its relationships with the fund; and (iv) the extent to which, if any, economies of scale exist and are realized as the fund grows, and whether any economies of scale are appropriately shared with fund shareholders. The Board also considered the broad range of investment choices available to shareholders from FMR's competitors and that the fund's shareholders have chosen to invest in the fund, which is part of the Fidelity family of funds. The Board's decision to renew the Advisory Contracts was not based on any single factor.
The Board reached a determination, with the assistance of fund counsel and Independent Trustees' counsel and through the exercise of its business judgment, that the renewal of the Advisory Contracts was in the best interests of the fund and its shareholders and that the compensation payable under the Advisory Contracts was fair and reasonable in light of all of the surrounding circumstances.
Nature, Extent, and Quality of Services Provided. The Board considered staffing as it relates to the fund, including the backgrounds and experience of investment personnel of the Investment Advisers, and also considered the Investment Advisers' implementation of the fund's investment program. The Independent Trustees also had discussions with senior management of Fidelity's investment operations and investment groups. The Board considered the structure of the investment personnel compensation program and whether this structure provides appropriate incentives to act in the best interests of the fund. Additionally, the Board considered the portfolio managers' investments, if any, in the funds that they manage.
Resources Dedicated to Investment Management and Support Services. The Board and the Fund Oversight and Research Committees reviewed the general qualifications and capabilities of Fidelity's investment staff, including its size, education, experience, and resources, as well as Fidelity's approach to recruiting, training, managing, and compensating investment personnel. The Board noted the resources devoted to expansion of Fidelity's global investment organization, and that Fidelity's analysts have extensive resources, tools and capabilities that allow them to conduct sophisticated quantitative and fundamental analysis, as well as credit analysis of issuers, counterparties, and guarantors. Further, the Board considered that Fidelity's investment professionals have sufficient access to global information and data so as to provide competitive investment results over time, and that those professionals also have access to sophisticated tools that permit them to assess portfolio construction and risk and performance attribution characteristics continuously, as well as to transmit new information and research conclusions rapidly around the world. Additionally, in its deliberations, the Board considered Fidelity's trading, risk management, compliance, and technology and operations capabilities and resources, which are integral parts of the investment management process.
Shareholder and Administrative Services. The Board considered (i) the nature, extent, quality, and cost of advisory, administrative, shareholder, transfer agency, and pricing and bookkeeping services performed by the Investment Advisers and their affiliates under the Advisory Contracts; (ii) the nature and extent of Fidelity's supervision of third party service providers, principally custodians, subcustodians, and pricing vendors; and (iii) the resources devoted by Fidelity to, and the record of compliance with, the fund's compliance policies and procedures. The Board also reviewed the allocation of fund brokerage, including allocations to brokers affiliated with the Investment Advisers, the use of brokerage commissions to pay fund expenses, and the use of "soft" commission dollars to pay for research services. The Board also considered the fund's securities lending activities and any payments made to Fidelity relating to securities lending under a separate agreement.
The Board noted that the growth of fund assets over time across the complex allows Fidelity to reinvest in the development of services designed to enhance the value and convenience of the Fidelity funds as investment vehicles. These services include 24-hour access to account information and market information over the Internet and through telephone representatives, investor education materials and asset allocation tools. The Board also considered that it reviews customer service metrics such as telephone response times, continuity of services on the website and metrics addressing services at Fidelity Investor Centers.
Investment in a Large Fund Family. The Board considered the benefits to shareholders of investing in a fund that is part of a large family of funds offering a variety of investment disciplines and providing a large variety of fund investor services. The Board noted that Fidelity had taken, or had made recommendations that resulted in the Fidelity funds taking, a number of actions over the previous year that benefited particular funds and/or the Fidelity funds in general.
Investment Performance. The Board took into account discussions that occur with representatives of the Investment Advisers, and reports that it receives, at Board meetings throughout the year, relating to fund investment performance. In this regard the Board noted that as part of regularly scheduled fund reviews and other reports to the Board on fund performance, the Board considered annualized return information for the fund for different time periods, measured against an appropriate securities market index (benchmark index) and an appropriate peer group of funds with similar objectives (peer group). The Board also considered information about performance attribution. In its ongoing evaluation of fund investment performance, the Board gives particular attention to information indicating changes in performance of the funds over different time periods and discussed with the Investment Advisers the reasons for any overperformance or underperformance. The fund underperformed its benchmark and peers for the one- and three-year periods ended February 29, 2024, and as a result, the Board continues to engage in discussions with FMR about the steps it is taking to address the fund's performance.
In addition to reviewing absolute and relative fund performance, the Independent Trustees periodically consider the appropriateness of fund performance metrics in evaluating the results achieved. The Independent Trustees generally give greater weight to fund performance over longer time periods than over shorter time periods. Depending on the circumstances, the Independent Trustees may be satisfied with a fund's performance notwithstanding that it lags its benchmark index or peer group for certain periods.
Based on its review, the Board concluded that the nature, extent, and quality of services provided to the fund under the Advisory Contracts should continue to benefit the shareholders of the fund.
Competitiveness of Management Fee and Total Expense Ratio. The Board was provided with information regarding industry trends in management fees and expenses. The Board considered that, effective March 1, 2024, an amended Advisory Contract with FMR went into effect with a fee based on tiered schedules and subject to a maximum class-level rate (the management fee). The Board also considered that in exchange for the management fee, the fund will receive investment advisory, management, administrative, transfer agent, and pricing and bookkeeping services. In its review of the fund's management fee and total expense ratio, the Board considered the fund's pro forma management fee rate as if it had been in effect for the 12-month period ended September 30, 2023, as well as other third-party fund expenses, such as custodial, legal, and audit fees. The Board noted that Fidelity may agree to waive fees or reimburse expenses from time to time, and the extent to which, if any, it has done so for the fund.
Comparisons of Management Fees and Total Expense Ratios. Among other things, the Board reviewed data for selected groups of competitive funds and classes (referred to as "mapped groups") that were compiled by Fidelity based on combining similar investment objective categories (as classified by Morningstar) that have comparable investment mandates. The data reviewed by the Board included (i) gross management fee comparisons (before taking into account expense reimbursements or caps) relative to the total universe of funds within the mapped group; (ii) gross management fee comparisons relative to a subset of non-Fidelity funds in the mapped group that are similar in size and management fee structure to the fund (referred to as the "asset size peer group"); (iii) total expense comparisons of the fund relative to funds and classes in the mapped group that have a similar sales load structure to the fund (referred to as the "similar sales load structure group"); and (iv) total expense comparisons of the fund relative to funds and classes in the similar sales load structure group that are similar in size and management fee structure to the fund (referred to as the "total expense asset size peer group"). The total expense asset size peer group comparison excludes performance adjustments and fund-paid 12b-1 fees to eliminate variability in fee structures.
The information provided to the Board indicated that the fund's management fee rate ranked above the competitive median of the mapped group for the 12-month period ended September 30, 2023 and above the competitive median of the asset size peer group for the 12-month period ended September 30, 2023. Further, the information provided to the Board indicated that the total expense ratio of the fund ranked below the competitive median of the similar sales load structure group for the 12-month period ended September 30, 2023 and below the competitive median of the total expense asset size peer group for the 12-month period ended September 30, 2023. The Board considered that the fund has a variable unified management fee that covers expenses for services beyond portfolio management.
Other Contractual Arrangements. The Board further considered that FMR has contractually agreed to reimburse the fund to the extent that total operating expenses, with certain exceptions, as a percentage of its average net assets, exceed 0.75% through August 31, 2025.
Fees Charged to Other Fidelity Clients. The Board also considered Fidelity fee structures and other information with respect to clients of Fidelity, such as other funds advised or subadvised by Fidelity, pension plan clients, and other institutional clients with similar mandates. The Board noted that a joint ad hoc committee created by it and the boards of other Fidelity funds periodically reviews and compares Fidelity's institutional investment advisory business with its business of providing services to the Fidelity funds and also noted the most recent findings of the committee. The Board noted that the committee's review included a consideration of the differences in services provided, fees charged, and costs incurred, as well as competition in the markets serving the different categories of clients.
Based on its review, the Board concluded that the fund's management fee is fair and reasonable in light of the services that the fund receives and the other factors considered. Further, based on its review of total expense ratios and fees charged to other Fidelity clients, the Board concluded that the fund's total expense ratio was reasonable in light of the services that the fund and its shareholders receive and the other factors considered.
Costs of the Services and Profitability. The Board considered the revenues earned and the expenses incurred by Fidelity in conducting the business of developing, marketing, distributing, managing, administering, and servicing the fund and servicing the fund's shareholders. The Board also considered the level of Fidelity's profits in respect of all the Fidelity funds.
On an annual basis, Fidelity presents to the Board information about the profitability of its relationships with the fund. Fidelity calculates profitability information for each fund, as well as aggregate profitability information for groups of Fidelity funds and all Fidelity funds, using a series of detailed revenue and cost allocation methodologies which originate with the books and records of Fidelity on which Fidelity's audited financial statements are based. The Audit Committee of the Board reviews any significant changes from the prior year's methodologies.
A public accounting firm has been engaged annually by the Board as part of the Board's assessment of Fidelity's profitability analysis. The engagement includes the review and assessment of the methodologies used by Fidelity in determining the revenues and expenses attributable to Fidelity's fund business, and completion of agreed-upon procedures in respect of the mathematical accuracy of certain fund profitability information and its conformity to established allocation methodologies. After considering the reports issued under the engagement and information provided by Fidelity, the Board concluded that while other allocation methods may also be reasonable, Fidelity's profitability methodologies are reasonable in all material respects.
The Board also reviewed Fidelity's non-fund businesses and potential indirect benefits such businesses may have received as a result of their association with Fidelity's fund business (i.e., fall-out benefits) as well as cases where Fidelity's affiliates may benefit from the funds' business. The Board considered areas where potential indirect benefits to the Fidelity funds from their relationships with Fidelity may exist. The Board's consideration of these matters was informed by the findings of a joint ad hoc committee created by it and the boards of other Fidelity funds to evaluate potential fall-out benefits.
The Board considered the costs of the services provided by and the profits realized by Fidelity in connection with the operation of the fund and was satisfied that the profitability was not excessive.
excessive.
Economies of Scale. The Board considered whether there have been economies of scale in respect of the management of the Fidelity funds, whether the Fidelity funds (including the fund) have appropriately benefited from any such economies of scale, and whether there is potential for realization of any further economies of scale. The Board considered the extent to which the fund will benefit from economies of scale as assets grow through increased services to the fund, through waivers or reimbursements, or through fee or expense ratio reductions. The Board also noted that a committee created by it and the boards of other Fidelity funds periodically analyzes whether Fidelity attains economies of scale in respect of the management and servicing of the Fidelity funds, whether the Fidelity funds have appropriately benefited from such economies of scale, and whether there is potential for realization of any further economies of scale.
The Board recognized that the fund's management contract incorporates a variable management fee structure, which provides breakpoints as a way to share, in part, any potential economies of scale that may exist at the asset class level and through a discount that considers both fund size and total assets of the four applicable asset classes. The Board considered that the variable management fee is designed to deliver the benefits of economies of scale to fund shareholders even if assets of any particular fund are unchanged or have declined, because some portion of Fidelity's costs are attributable to services provided to all funds subject to the variable management fee, and all such funds benefit if those costs can be allocated among more assets. The Board concluded that, given the variable management fee structure, fund shareholders will benefit from lower management fees due to the application of the breakpoints and discount factor, regardless of whether Fidelity achieves any such economies of scale.
The Board concluded, taking into account the analysis of the committee, that economies of scale, if any, are being appropriately shared between fund shareholders and Fidelity.
Additional Information Requested by the Board. In order to develop fully the factual basis for consideration of the Fidelity funds' advisory contracts, the Board requested and received additional information on certain topics, including but not limited to: (i) fund flow and performance trends, in particular the underperformance of certain funds and strategies, and Fidelity's long-term strategies for certain funds; (ii) the operation of performance fees and the rationale for implementing performance fees on certain categories of funds but not others; (iii) Fidelity's pricing philosophy compared to competitors; (iv) fund profitability methodology and data; (v) evaluation of competitive fund data and peer group classifications and fee and expense comparisons; (vi) the management fee and expense structures for different funds and classes and information about the differences between various fee and expense structures; (vii) the variable management fee implemented for certain funds effective March 1, 2024; and (viii) information regarding other accounts managed by Fidelity and the funds' sub-advisory arrangements.
Conclusion. Based on its evaluation of all of the conclusions noted above, and after considering all factors it believed relevant, the Board, including the Independent Trustees, concluded that the advisory and sub-advisory fee arrangements are fair and reasonable in light of all of the surrounding circumstances and that the fund's Advisory Contracts should be renewed through May 31, 2025.
1.801609.121
FFH-SANN-1224
Fidelity® U.S. Low Volatility Equity Fund
Semi-Annual Report
October 31, 2024
Contents
To view a fund's proxy voting guidelines and proxy voting record for the 12-month period ended June 30, visit http://www.fidelity.com/proxyvotingresults or visit the Securities and Exchange Commission's (SEC) web site at http://www.sec.gov.
You may also call 1-800-544-8544 to request a free copy of the proxy voting guidelines.
Standard & Poor's, S&P and S&P 500 are registered service marks of The McGraw-Hill Companies, Inc. and have been licensed for use by Fidelity Distributors Corporation.
Other third-party marks appearing herein are the property of their respective owners.
All other marks appearing herein are registered or unregistered trademarks or service marks of FMR LLC or an affiliated company. © 2024 FMR LLC. All rights reserved.
This report and the financial statements contained herein are submitted for the general information of the shareholders of the Fund. This report is not authorized for distribution to prospective investors in the Fund unless preceded or accompanied by an effective prospectus.
A fund files its complete schedule of portfolio holdings with the SEC for the first and third quarters of each fiscal year on Form N-PORT. Forms N-PORT are available on the SEC's web site at http://www.sec.gov. A fund's Forms N-PORT may be reviewed and copied at the SEC's Public Reference Room in Washington, DC. Information regarding the operation of the SEC's Public Reference Room may be obtained by calling 1-800-SEC-0330.
For a complete list of a fund's portfolio holdings, view the most recent holdings listing, semiannual report, or annual report on Fidelity's web site at http://www.fidelity.com, http://www.institutional.fidelity.com, or http://www.401k.com, as applicable.
NOT FDIC INSURED •MAY LOSE VALUE •NO BANK GUARANTEE
Neither the Fund nor Fidelity Distributors Corporation is a bank.
Item 7: Financial Statements and Financial Highlights for Open-End Management Investment Companies (Semi-Annual Report)
Fidelity® U.S. Low Volatility Equity Fund
Schedule of Investments October 31, 2024 (Unaudited)
Showing Percentage of Net Assets
| Common Stocks - 98.9% |
| | | Shares | Value ($) |
| COMMUNICATION SERVICES - 8.7% | | | |
| Diversified Telecommunication Services - 1.6% | | | |
| AT&T, Inc. | | 15,263 | 344,028 |
| Verizon Communications, Inc. | | 7,550 | 318,082 |
| | | | 662,110 |
| Entertainment - 3.5% | | | |
| IMAX Corp. (a)(b) | | 18,397 | 447,047 |
| Liberty Media Corp. Liberty Formula One Class C (a) | | 2,660 | 212,374 |
| Netflix, Inc. (a) | | 450 | 340,214 |
| Spotify Technology SA (a) | | 700 | 269,570 |
| The Walt Disney Co. | | 2,427 | 233,477 |
| | | | 1,502,682 |
| Interactive Media & Services - 1.5% | | | |
| Alphabet, Inc. Class A | | 1,900 | 325,109 |
| Pinterest, Inc. Class A (a) | | 10,379 | 329,948 |
| | | | 655,057 |
| Media - 1.0% | | | |
| Comcast Corp. Class A | | 2,845 | 124,241 |
| The New York Times Co. Class A | | 5,526 | 308,572 |
| | | | 432,813 |
| Wireless Telecommunication Services - 1.1% | | | |
| T-Mobile U.S., Inc. | | 2,037 | 454,577 |
TOTAL COMMUNICATION SERVICES | | | 3,707,239 |
| CONSUMER DISCRETIONARY - 4.1% | | | |
| Hotels, Restaurants & Leisure - 1.5% | | | |
| McDonald's Corp. | | 1,156 | 337,679 |
| Yum! Brands, Inc. | | 2,230 | 292,487 |
| | | | 630,166 |
| Specialty Retail - 2.6% | | | |
| Murphy U.S.A., Inc. | | 721 | 352,172 |
| O'Reilly Automotive, Inc. (a) | | 299 | 344,789 |
| TJX Companies, Inc. | | 3,689 | 416,968 |
| | | | 1,113,929 |
TOTAL CONSUMER DISCRETIONARY | | | 1,744,095 |
| CONSUMER STAPLES - 12.9% | | | |
| Beverages - 3.1% | | | |
| Coca-Cola Consolidated, Inc. | | 248 | 278,816 |
| Constellation Brands, Inc. Class A (sub. vtg.) | | 536 | 124,534 |
| Keurig Dr. Pepper, Inc. | | 8,348 | 275,067 |
| Monster Beverage Corp. (a) | | 6,449 | 339,733 |
| The Coca-Cola Co. | | 4,947 | 323,089 |
| | | | 1,341,239 |
| Consumer Staples Distribution & Retail - 2.8% | | | |
| BJ's Wholesale Club Holdings, Inc. (a) | | 3,902 | 330,616 |
| Costco Wholesale Corp. | | 396 | 346,175 |
| Walmart, Inc. | | 6,417 | 525,873 |
| | | | 1,202,664 |
| Food Products - 3.5% | | | |
| Bunge Global SA | | 2,788 | 234,248 |
| Freshpet, Inc. (a) | | 700 | 92,778 |
| Post Holdings, Inc. (a) | | 2,800 | 305,788 |
| The J.M. Smucker Co. | | 2,406 | 273,105 |
| The Simply Good Foods Co. (a) | | 8,622 | 290,217 |
| Tyson Foods, Inc. Class A | | 5,077 | 297,461 |
| | | | 1,493,597 |
| Household Products - 2.4% | | | |
| Colgate-Palmolive Co. | | 3,791 | 355,255 |
| Procter & Gamble Co. | | 2,208 | 364,717 |
| The Clorox Co. | | 1,900 | 301,245 |
| | | | 1,021,217 |
| Tobacco - 1.1% | | | |
| Philip Morris International, Inc. | | 3,444 | 457,019 |
TOTAL CONSUMER STAPLES | | | 5,515,736 |
| ENERGY - 2.5% | | | |
| Oil, Gas & Consumable Fuels - 2.5% | | | |
| Cheniere Energy, Inc. | | 1,867 | 357,306 |
| Diamondback Energy, Inc. | | 858 | 151,669 |
| Exxon Mobil Corp. | | 3,330 | 388,877 |
| Phillips 66 Co. | | 1,338 | 162,995 |
| | | | 1,060,847 |
| FINANCIALS - 15.1% | | | |
| Capital Markets - 2.5% | | | |
| Cboe Global Markets, Inc. | | 2,322 | 495,910 |
| Intercontinental Exchange, Inc. | | 1,697 | 264,511 |
| S&P Global, Inc. | | 620 | 297,823 |
| | | | 1,058,244 |
| Financial Services - 2.8% | | | |
| Fiserv, Inc. (a) | | 1,867 | 369,479 |
| MasterCard, Inc. Class A | | 862 | 430,647 |
| Visa, Inc. Class A | | 1,396 | 404,631 |
| | | | 1,204,757 |
| Insurance - 9.8% | | | |
| American Financial Group, Inc. | | 2,048 | 264,049 |
| Arch Capital Group Ltd. | | 3,389 | 334,020 |
| Arthur J. Gallagher & Co. | | 1,483 | 417,020 |
| Brown & Brown, Inc. | | 4,223 | 441,895 |
| Chubb Ltd. | | 1,468 | 414,622 |
| Everest Re Group Ltd. | | 376 | 133,709 |
| Hanover Insurance Group, Inc. | | 2,261 | 335,374 |
| Hartford Financial Services Group, Inc. | | 3,560 | 393,166 |
| Marsh & McLennan Companies, Inc. | | 2,142 | 467,470 |
| Reinsurance Group of America, Inc. | | 1,692 | 357,147 |
| Selective Insurance Group, Inc. | | 2,036 | 184,910 |
| The Travelers Companies, Inc. | | 1,893 | 465,564 |
| | | | 4,208,946 |
TOTAL FINANCIALS | | | 6,471,947 |
| HEALTH CARE - 19.3% | | | |
| Biotechnology - 7.1% | | | |
| AbbVie, Inc. | | 1,901 | 387,557 |
| Alnylam Pharmaceuticals, Inc. (a) | | 1,140 | 303,913 |
| Exelixis, Inc. (a) | | 14,738 | 489,302 |
| Gilead Sciences, Inc. | | 4,428 | 393,295 |
| Incyte Corp. (a) | | 5,294 | 392,391 |
| Regeneron Pharmaceuticals, Inc. (a) | | 347 | 290,855 |
| United Therapeutics Corp. (a) | | 887 | 331,711 |
| Vaxcyte, Inc. (a) | | 1,500 | 159,525 |
| Vertex Pharmaceuticals, Inc. (a) | | 580 | 276,068 |
| | | | 3,024,617 |
| Health Care Equipment & Supplies - 2.1% | | | |
| Boston Scientific Corp. (a) | | 5,072 | 426,149 |
| Hologic, Inc. (a) | | 2,353 | 190,287 |
| Stryker Corp. | | 808 | 287,874 |
| | | | 904,310 |
| Health Care Providers & Services - 6.0% | | | |
| Cencora, Inc. | | 1,696 | 386,824 |
| Chemed Corp. | | 515 | 278,224 |
| Cigna Group | | 1,168 | 367,698 |
| Elevance Health, Inc. | | 589 | 238,993 |
| Encompass Health Corp. | | 3,500 | 348,110 |
| McKesson Corp. | | 643 | 321,879 |
| Molina Healthcare, Inc. (a) | | 788 | 253,121 |
| UnitedHealth Group, Inc. | | 702 | 396,279 |
| | | | 2,591,128 |
| Life Sciences Tools & Services - 1.2% | | | |
| Danaher Corp. | | 894 | 219,620 |
| Thermo Fisher Scientific, Inc. | | 545 | 297,744 |
| | | | 517,364 |
| Pharmaceuticals - 2.9% | | | |
| AstraZeneca PLC (United Kingdom) | | 2,427 | 345,347 |
| Eli Lilly & Co. | | 528 | 438,103 |
| Merck & Co., Inc. | | 3,175 | 324,866 |
| Royalty Pharma PLC Class A | | 5,000 | 135,000 |
| | | | 1,243,316 |
TOTAL HEALTH CARE | | | 8,280,735 |
| INDUSTRIALS - 9.0% | | | |
| Aerospace & Defense - 2.9% | | | |
| GE Aerospace | | 1,101 | 189,130 |
| General Dynamics Corp. | | 1,078 | 314,356 |
| Lockheed Martin Corp. | | 670 | 365,854 |
| Northrop Grumman Corp. | | 729 | 371,076 |
| | | | 1,240,416 |
| Air Freight & Logistics - 0.7% | | | |
| C.H. Robinson Worldwide, Inc. | | 2,973 | 306,338 |
| Commercial Services & Supplies - 0.9% | | | |
| Waste Connections, Inc. (United States) | | 2,267 | 400,692 |
| Construction & Engineering - 0.3% | | | |
| EMCOR Group, Inc. | | 251 | 111,964 |
| Ground Transportation - 1.5% | | | |
| CSX Corp. | | 3,938 | 132,474 |
| Landstar System, Inc. | | 1,849 | 324,999 |
| Union Pacific Corp. | | 869 | 201,669 |
| | | | 659,142 |
| Marine Transportation - 0.5% | | | |
| Kirby Corp. (a) | | 1,673 | 191,993 |
| Professional Services - 2.2% | | | |
| CACI International, Inc. (a) | | 950 | 524,932 |
| Leidos Holdings, Inc. | | 2,284 | 418,337 |
| | | | 943,269 |
TOTAL INDUSTRIALS | | | 3,853,814 |
| INFORMATION TECHNOLOGY - 18.2% | | | |
| Communications Equipment - 1.8% | | | |
| Cisco Systems, Inc. | | 6,245 | 342,039 |
| Motorola Solutions, Inc. | | 975 | 438,116 |
| | | | 780,155 |
| Electronic Equipment, Instruments & Components - 2.0% | | | |
| Amphenol Corp. Class A | | 4,790 | 321,026 |
| CDW Corp. | | 1,221 | 229,829 |
| Insight Enterprises, Inc. (a) | | 1,634 | 285,819 |
| | | | 836,674 |
| IT Services - 2.9% | | | |
| Amdocs Ltd. | | 3,499 | 307,020 |
| GoDaddy, Inc. Class A (a) | | 2,026 | 337,937 |
| IBM Corp. | | 1,567 | 323,930 |
| VeriSign, Inc. (a) | | 1,586 | 280,468 |
| | | | 1,249,355 |
| Semiconductors & Semiconductor Equipment - 0.7% | | | |
| Analog Devices, Inc. | | 1,291 | 288,035 |
| Software - 9.6% | | | |
| Adobe, Inc. (a) | | 630 | 301,190 |
| Blackbaud, Inc. (a) | | 1,600 | 120,816 |
| CCC Intelligent Solutions Holdings, Inc. Class A (a)(b) | | 18,836 | 196,083 |
| Dynatrace, Inc. (a) | | 6,400 | 344,320 |
| Manhattan Associates, Inc. (a) | | 1,488 | 391,880 |
| Microsoft Corp. | | 865 | 351,493 |
| PTC, Inc. (a) | | 2,258 | 418,475 |
| Roper Technologies, Inc. | | 766 | 411,901 |
| Salesforce, Inc. | | 797 | 232,222 |
| SAP SE sponsored ADR | | 1,426 | 333,171 |
| ServiceNow, Inc. (a) | | 375 | 349,871 |
| Workday, Inc. Class A (a) | | 1,334 | 311,956 |
| Zoom Video Communications, Inc. Class A (a) | | 4,800 | 358,752 |
| | | | 4,122,130 |
| Technology Hardware, Storage & Peripherals - 1.2% | | | |
| Apple, Inc. | | 1,342 | 303,171 |
| FUJIFILM Holdings Corp. ADR (b) | | 17,074 | 203,522 |
| | | | 506,693 |
TOTAL INFORMATION TECHNOLOGY | | | 7,783,042 |
| MATERIALS - 3.0% | | | |
| Chemicals - 1.8% | | | |
| Ecolab, Inc. | | 1,282 | 315,026 |
| Linde PLC | | 988 | 450,676 |
| | | | 765,702 |
| Containers & Packaging - 1.2% | | | |
| Aptargroup, Inc. | | 2,178 | 365,708 |
| Avery Dennison Corp. | | 742 | 153,616 |
| | | | 519,324 |
TOTAL MATERIALS | | | 1,285,026 |
| REAL ESTATE - 1.0% | | | |
| Equity Real Estate Investment Trusts (REITs) - 1.0% | | | |
| American Tower Corp. | | 1,300 | 277,602 |
| Welltower, Inc. | | 1,200 | 161,856 |
| | | | 439,458 |
| UTILITIES - 5.1% | | | |
| Electric Utilities - 3.2% | | | |
| Allete, Inc. | | 2,300 | 146,993 |
| American Electric Power Co., Inc. | | 3,100 | 306,125 |
| IDACORP, Inc. | | 1,300 | 134,524 |
| PPL Corp. | | 9,730 | 316,809 |
| Southern Co. | | 4,933 | 449,051 |
| | | | 1,353,502 |
| Gas Utilities - 0.3% | | | |
| National Fuel Gas Co. | | 2,300 | 139,219 |
| Multi-Utilities - 1.6% | | | |
| Public Service Enterprise Group, Inc. | | 4,107 | 367,207 |
| Sempra | | 3,900 | 325,143 |
| | | | 692,350 |
TOTAL UTILITIES | | | 2,185,071 |
| TOTAL COMMON STOCKS (Cost $34,841,407) | | | 42,327,010 |
| | | | |
| Money Market Funds - 1.7% |
| | | Shares | Value ($) |
| Fidelity Cash Central Fund 4.87% (c) | | 263,783 | 263,836 |
| Fidelity Securities Lending Cash Central Fund 4.87% (c)(d) | | 465,606 | 465,653 |
| TOTAL MONEY MARKET FUNDS (Cost $729,489) | | | 729,489 |
| | | | |
| Equity Funds - 0.3% |
| | | Shares | Value ($) |
| Domestic Equity Funds - 0.3% | | | |
iShares MSCI USA Minimum Volatility ETF (Cost $146,126) | | 1,700 | 152,983 |
| | | | |
| TOTAL INVESTMENT IN SECURITIES - 100.9% (Cost $35,717,022) | 43,209,482 |
NET OTHER ASSETS (LIABILITIES) - (0.9)% | (398,041) |
| NET ASSETS - 100.0% | 42,811,441 |
| | |
Security Type Abbreviations
Legend
| (b) | Security or a portion of the security is on loan at period end. |
| (c) | Affiliated fund that is generally available only to investment companies and other accounts managed by Fidelity Investments. The rate quoted is the annualized seven-day yield of the fund at period end. A complete unaudited listing of the fund's holdings as of its most recent quarter end is available upon request. In addition, each Fidelity Central Fund's financial statements are available on the SEC's website or upon request. |
| (d) | Investment made with cash collateral received from securities on loan. |
Affiliated Central Funds
Fiscal year to date information regarding the Fund's investments in Fidelity Central Funds, including the ownership percentage, is presented below.
| Affiliate | Value, beginning of period ($) | Purchases ($) | Sales Proceeds ($) | Dividend Income ($) | Realized Gain (loss) ($) | Change in Unrealized appreciation (depreciation) ($) | Value, end of period ($) | % ownership, end of period |
| Fidelity Cash Central Fund 4.87% | - | 3,168,982 | 2,905,147 | 4,369 | 1 | - | 263,836 | 0.0% |
| Fidelity Securities Lending Cash Central Fund 4.87% | 213,750 | 3,118,253 | 2,866,350 | 4,666 | - | - | 465,653 | 0.0% |
| Total | 213,750 | 6,287,235 | 5,771,497 | 9,035 | 1 | - | 729,489 | |
| | | | | | | | | |
Amounts in the dividend income column in the above table include any capital gain distributions from underlying funds, which are presented in the corresponding line item in the Statement of Operations, if applicable.
Amounts in the dividend income column for Fidelity Securities Lending Cash Central Fund represents the income earned on investing cash collateral, less rebates paid to borrowers and any lending agent fees associated with the loan, plus any premium payments received for lending certain types of securities.
Amounts included in the purchases and sales proceeds columns may include in-kind transactions, if applicable.
Investment Valuation
The following is a summary of the inputs used, as of October 31, 2024, involving the Fund's assets and liabilities carried at fair value. The inputs or methodology used for valuing securities may not be an indication of the risk associated with investing in those securities. For more information on valuation inputs, and their aggregation into the levels used below, please refer to the Investment Valuation section in the accompanying Notes to Financial Statements.
| Valuation Inputs at Reporting Date: |
| Description | Total ($) | Level 1 ($) | Level 2 ($) | Level 3 ($) |
Investments in Securities: | | | | |
|
| Equities: | | | | |
Communication Services | 3,707,239 | 3,707,239 | - | - |
Consumer Discretionary | 1,744,095 | 1,744,095 | - | - |
Consumer Staples | 5,515,736 | 5,515,736 | - | - |
Energy | 1,060,847 | 1,060,847 | - | - |
Financials | 6,471,947 | 6,471,947 | - | - |
Health Care | 8,280,735 | 7,935,388 | 345,347 | - |
Industrials | 3,853,814 | 3,853,814 | - | - |
Information Technology | 7,783,042 | 7,783,042 | - | - |
Materials | 1,285,026 | 1,285,026 | - | - |
Real Estate | 439,458 | 439,458 | - | - |
Utilities | 2,185,071 | 2,185,071 | - | - |
|
| Money Market Funds | 729,489 | 729,489 | - | - |
|
| Equity Funds | 152,983 | 152,983 | - | - |
| Total Investments in Securities: | 43,209,482 | 42,864,135 | 345,347 | - |
Financial Statements (Unaudited)
| Statement of Assets and Liabilities |
| As of October 31, 2024 (Unaudited) |
| Assets | | | | |
| Investment in securities, at value (including securities loaned of $500,372) - See accompanying schedule: | | | | |
Unaffiliated issuers (cost $34,987,533) | $ | 42,479,993 | | |
Fidelity Central Funds (cost $729,489) | | 729,489 | | |
| | | | | |
| | | | | |
| Total Investment in Securities (cost $35,717,022) | | | $ | 43,209,482 |
| Cash | | | | 19,964 |
| Receivable for fund shares sold | | | | 5,939 |
| Dividends receivable | | | | 24,408 |
| Reclaims receivable | | | | 75,913 |
| Distributions receivable from Fidelity Central Funds | | | | 1,849 |
| Prepaid expenses | | | | 37 |
| Receivable from investment adviser for expense reductions | | | | 12,479 |
| Other receivables | | | | 1,093 |
Total assets | | | | 43,351,164 |
| Liabilities | | | | |
| Payable to custodian bank | $ | 2 | | |
| Payable for fund shares redeemed | | 27,811 | | |
| Accrued management fee | | 20,827 | | |
| Other payables and accrued expenses | | 25,430 | | |
| Collateral on securities loaned | | 465,653 | | |
| Total liabilities | | | | 539,723 |
| Net Assets | | | $ | 42,811,441 |
| Net Assets consist of: | | | | |
| Paid in capital | | | $ | 34,431,309 |
| Total accumulated earnings (loss) | | | | 8,380,132 |
| Net Assets | | | $ | 42,811,441 |
Net Asset Value, offering price and redemption price per share ($42,811,441 ÷ 3,494,603 shares) | | | $ | 12.25 |
| Statement of Operations |
Six months ended October 31, 2024 (Unaudited) |
| Investment Income | | | | |
| Dividends | | | $ | 244,561 |
| Income from Fidelity Central Funds (including $4,666 from security lending) | | | | 9,035 |
| Total income | | | | 253,596 |
| Expenses | | | | |
| Management fee | $ | 105,110 | | |
| Custodian fees and expenses | | 1,437 | | |
| Independent trustees' fees and expenses | | 70 | | |
| Registration fees | | 20,925 | | |
| Audit fees | | 38,716 | | |
| Legal | | 315 | | |
| Miscellaneous | | 900 | | |
| Total expenses before reductions | | 167,473 | | |
| Expense reductions | | (38,694) | | |
| Total expenses after reductions | | | | 128,779 |
| Net Investment income (loss) | | | | 124,817 |
| Realized and Unrealized Gain (Loss) | | | | |
| Net realized gain (loss) on: | | | | |
| Investment Securities: | | | | |
| Unaffiliated issuers | | 794,492 | | |
| Fidelity Central Funds | | 1 | | |
| Foreign currency transactions | | 51 | | |
| Total net realized gain (loss) | | | | 794,544 |
| Change in net unrealized appreciation (depreciation) on: | | | | |
| Investment Securities: | | | | |
| Unaffiliated issuers | | 2,408,758 | | |
| Assets and liabilities in foreign currencies | | 4,884 | | |
| Total change in net unrealized appreciation (depreciation) | | | | 2,413,642 |
| Net gain (loss) | | | | 3,208,186 |
| Net increase (decrease) in net assets resulting from operations | | | $ | 3,333,003 |
| Statement of Changes in Net Assets |
| |
| | Six months ended October 31, 2024 (Unaudited) | | Year ended April 30, 2024 |
| Increase (Decrease) in Net Assets | | | | |
| Operations | | | | |
| Net investment income (loss) | $ | 124,817 | $ | 1,690,843 |
| Net realized gain (loss) | | 794,544 | | 31,280,451 |
| Change in net unrealized appreciation (depreciation) | | 2,413,642 | | (19,650,469) |
| Net increase (decrease) in net assets resulting from operations | | 3,333,003 | | 13,320,825 |
| Distributions to shareholders | | - | | (2,899,631) |
| | | | | |
| Share transactions | | | | |
| Proceeds from sales of shares | | 12,566,525 | | 14,238,685 |
| Reinvestment of distributions | | - | | 2,864,385 |
| Cost of shares redeemed | | (4,051,198) | | (203,454,396) |
| | | | | |
Net increase (decrease) in net assets resulting from share transactions | | 8,515,327 | | (186,351,326) |
| Total increase (decrease) in net assets | | 11,848,330 | | (175,930,132) |
| | | | | |
| Net Assets | | | | |
| Beginning of period | | 30,963,111 | | 206,893,243 |
| End of period | $ | 42,811,441 | $ | 30,963,111 |
| | | | | |
| Other Information | | | | |
| Shares | | | | |
| Sold | | 1,072,131 | | 1,355,755 |
| Issued in reinvestment of distributions | | - | | 275,401 |
| Redeemed | | (342,823) | | (18,859,577) |
| Net increase (decrease) | | 729,308 | | (17,228,421) |
| | | | | |
Financial Highlights
Fidelity® U.S. Low Volatility Equity Fund |
| |
| | Six months ended (Unaudited) October 31, 2024 | | Years ended April 30, 2024 | | 2023 | | 2022 | | 2021 | | 2020 A |
Selected Per-Share Data | | | | | | | | | | | | |
| Net asset value, beginning of period | $ | 11.20 | $ | 10.35 | $ | 10.90 | $ | 11.49 | $ | 9.23 | $ | 10.00 |
| Income from Investment Operations | | | | | | | | | | | | |
Net investment income (loss) B,C | | .04 | | .12 | | .13 | | .08 | | .08 | | .05 |
| Net realized and unrealized gain (loss) | | 1.01 | | .91 | | (.17) | | (.03) | | 2.25 | | (.79) |
| Total from investment operations | | 1.05 | | 1.03 | | (.04) | | .05 | | 2.33 | | (.74) |
| Distributions from net investment income | | - | | (.12) | | (.13) | | (.08) | | (.07) | | (.03) |
| Distributions from net realized gain | | - | | (.06) | | (.38) | | (.56) | | - | | - |
| Total distributions | | - | | (.18) | | (.51) | | (.64) | | (.07) | | (.03) |
| Net asset value, end of period | $ | 12.25 | $ | 11.20 | $ | 10.35 | $ | 10.90 | $ | 11.49 | $ | 9.23 |
Total Return D,E | | | | 10.05% | | (.22)% | | .12% | | 25.27% | | (7.44)% |
Ratios to Average Net Assets C,F,G | | | | | | | | | | | | |
| Expenses before reductions | | .91% H | | .68% | | .66% | | .73% | | .77% | | 2.28% H |
| Expenses net of fee waivers, if any | | | | .67% | | .66% | | .72% | | .77% | | .95% H |
| Expenses net of all reductions | | .70% H | | .67% | | .66% | | .72% | | .77% | | .95% H |
| Net investment income (loss) | | .68% H | | 1.11% | | 1.28% | | .71% | | .79% | | 1.46% H |
| Supplemental Data | | | | | | | | | | | | |
| Net assets, end of period (000 omitted) | $ | 42,811 | $ | 30,963 | $ | 206,893 | $ | 356,831 | $ | 361,699 | $ | 294,690 |
Portfolio turnover rate I | | | | 47% J | | 69% | | 46% | | 39% | | 101% J,K |
AFor the period November 5, 2019 (commencement of operations) through April 30, 2020.
BCalculated based on average shares outstanding during the period.
CNet investment income (loss) is affected by the timing of the declaration of dividends by any underlying mutual funds or exchange-traded funds (ETFs). Net investment income (loss) of any mutual funds or ETFs is not included in the Fund's net investment income (loss) ratio.
DTotal returns for periods of less than one year are not annualized.
ETotal returns would have been lower if certain expenses had not been reduced during the applicable periods shown.
FFees and expenses of any underlying mutual funds or exchange-traded funds (ETFs) are not included in the Fund's expense ratio. The Fund indirectly bears its proportionate share of these expenses. For additional expense information related to investments in Fidelity Central Funds, please refer to the "Investments in Fidelity Central Funds" note found in the Notes to Financial Statements section of the most recent Annual or Semi-Annual report.
GExpense ratios reflect operating expenses of the class. Expenses before reductions do not reflect amounts reimbursed, waived, or reduced through arrangements with the investment adviser, brokerage services, or other offset arrangements, if applicable, and do not represent the amount paid by the class during periods when reimbursements, waivers or reductions occur.
HAnnualized.
IAmount does not include the portfolio activity of any underlying mutual funds or exchange-traded funds (ETFs).
JPortfolio turnover rate excludes securities received or delivered in-kind.
KAmount not annualized.
Notes to Financial Statements
(Unaudited)For the period ended October 31, 2024
1. Organization.
Fidelity U.S. Low Volatility Equity Fund (the Fund) is a fund of Fidelity Summer Street Trust (the Trust) and is authorized to issue an unlimited number of shares. Share transactions on the Statement of Changes in Net Assets may contain exchanges between affiliated funds. The Trust is registered under the Investment Company Act of 1940, as amended (the 1940 Act), as an open-end management investment company organized as a Massachusetts business trust.
2. Investments in Fidelity Central Funds.
Funds may invest in Fidelity Central Funds, which are open-end investment companies generally available only to other investment companies and accounts managed by the investment adviser and its affiliates. The Schedule of Investments lists any Fidelity Central Funds held as an investment as of period end, but does not include the underlying holdings of each Fidelity Central Fund. An investing fund indirectly bears its proportionate share of the expenses of the underlying Fidelity Central Funds.
Based on its investment objective, each Fidelity Central Fund may invest or participate in various investment vehicles or strategies that are similar to those of the investing fund. These strategies are consistent with the investment objectives of the investing fund and may involve certain economic risks which may cause a decline in value of each of the Fidelity Central Funds and thus a decline in the value of the investing fund.
| Fidelity Central Fund | Investment Manager | Investment Objective | Investment Practices | Expense RatioA |
| Fidelity Money Market Central Funds | Fidelity Management & Research Company LLC (FMR) | Each fund seeks to obtain a high level of current income consistent with the preservation of capital and liquidity. | Short-term Investments | Less than .005% |
A Expenses expressed as a percentage of average net assets and are as of each underlying Central Fund's most recent annual or semi-annual shareholder report.
A complete unaudited list of holdings for each Fidelity Central Fund is available upon request or at the Securities and Exchange Commission website at www.sec.gov. In addition, the financial statements of the Fidelity Central Funds which contain the significant accounting policies (including investment valuation policies) of those funds, and are not covered by the Report of Independent Registered Public Accounting Firm, are available on the Securities and Exchange Commission website or upon request.
3. Significant Accounting Policies.
The Fund is an investment company and applies the accounting and reporting guidance of the Financial Accounting Standards Board (FASB) Accounting Standards Codification Topic 946 Financial Services - Investment Companies. The financial statements have been prepared in conformity with accounting principles generally accepted in the United States of America (GAAP), which require management to make certain estimates and assumptions at the date of the financial statements. Actual results could differ from those estimates. Subsequent events, if any, through the date that the financial statements were issued have been evaluated in the preparation of the financial statements. The Fund's Schedule of Investments lists any underlying mutual funds or exchange-traded funds (ETFs) but does not include the underlying holdings of these funds. The following summarizes the significant accounting policies of the Fund:
Investment Valuation. Investments are valued as of 4:00 p.m. Eastern time on the last calendar day of the period. The Board of Trustees (the Board) has designated the Fund's investment adviser as the valuation designee responsible for the fair valuation function and performing fair value determinations as needed. The investment adviser has established a Fair Value Committee (the Committee) to carry out the day-to-day fair valuation responsibilities and has adopted policies and procedures to govern the fair valuation process and the activities of the Committee. In accordance with these fair valuation policies and procedures, which have been approved by the Board, the Fund attempts to obtain prices from one or more third party pricing services or brokers to value its investments. When current market prices, quotations or currency exchange rates are not readily available or reliable, investments will be fair valued in good faith by the Committee, in accordance with the policies and procedures. Factors used in determining fair value vary by investment type and may include market or investment specific events, transaction data, estimated cash flows, and market observations of comparable investments. The frequency that the fair valuation procedures are used cannot be predicted and they may be utilized to a significant extent. The Committee manages the Fund's fair valuation practices and maintains the fair valuation policies and procedures. The Fund's investment adviser reports to the Board information regarding the fair valuation process and related material matters.
The Fund categorizes the inputs to valuation techniques used to value its investments into a disclosure hierarchy consisting of three levels as shown below:
Level 1 - unadjusted quoted prices in active markets for identical investments
Level 2 - other significant observable inputs (including quoted prices for similar investments, interest rates, prepayment speeds, etc.)
Level 3 - unobservable inputs (including the Fund's own assumptions based on the best information available)
Valuation techniques used to value the Fund's investments by major category are as follows:
Equity securities, including restricted securities, for which market quotations are readily available, are valued at the last reported sale price or official closing price as reported by a third party pricing service on the primary market or exchange on which they are traded and are categorized as Level 1 in the hierarchy. In the event there were no sales during the day or closing prices are not available, securities are valued at the last quoted bid price or may be valued using the last available price and are generally categorized as Level 2 in the hierarchy. For foreign equity securities, when market or security specific events arise, comparisons to the valuation of American Depositary Receipts (ADRs), futures contracts, Exchange-Traded Funds (ETFs) and certain indexes as well as quoted prices for similar securities may be used and would be categorized as Level 2 in the hierarchy. For equity securities, including restricted securities, where observable inputs are limited, assumptions about market activity and risk are used and these securities may be categorized as Level 3 in the hierarchy.
ETFs are valued at their last sale price or official closing price as reported by a third party pricing service on the primary market or exchange on which they are traded and are categorized as Level 1 in the hierarchy. In the event there were no sales during the day but the exchange reports a closing bid level, ETFs are valued at the closing bid and would be categorized as Level 1 in the hierarchy. In the event there was no closing bid, ETFs may be valued by another method that the Board believes reflects fair value in accordance with the Board's fair value pricing policies and may be categorized as Level 2 in the hierarchy.
Investments in open-end mutual funds, including the Fidelity Central Funds, are valued at their closing net asset value (NAV) each business day and are categorized as Level 1 in the hierarchy.
Changes in valuation techniques may result in transfers in or out of an assigned level within the disclosure hierarchy. The aggregate value of investments by input level as of October 31, 2024 is included at the end of the Fund's Schedule of Investments.
Foreign Currency. Certain Funds may use foreign currency contracts to facilitate transactions in foreign-denominated securities. Gains and losses from these transactions may arise from changes in the value of the foreign currency or if the counterparties do not perform under the contracts' terms.
Foreign-denominated assets, including investment securities, and liabilities are translated into U.S. dollars at the exchange rates at period end. Purchases and sales of investment securities, income and dividends received, and expenses denominated in foreign currencies are translated into U.S. dollars at the exchange rate in effect on the transaction date.
The effects of exchange rate fluctuations on investments are included with the net realized and unrealized gain (loss) on investment securities. Other foreign currency transactions resulting in realized and unrealized gain (loss) are disclosed separately.
Investment Transactions and Income. For financial reporting purposes, the Fund's investment holdings and NAV include trades executed through the end of the last business day of the period. The NAV per share for processing shareholder transactions is calculated as of the close of business of the New York Stock Exchange (NYSE), normally 4:00 p.m. Eastern time and includes trades executed through the end of the prior business day. Gains and losses on securities sold are determined on the basis of identified cost and include proceeds received from litigation. Commissions paid to certain brokers with whom the investment adviser, or its affiliates, places trades on behalf of a fund include an amount in addition to trade execution, which may be rebated back to a fund. Any such rebates are included in net realized gain (loss) on investments in the Statement of Operations. Dividend income is recorded on the ex-dividend date, except for certain dividends from foreign securities where the ex-dividend date may have passed, which are recorded as soon as the Fund is informed of the ex-dividend date. Non-cash dividends included in dividend income, if any, are recorded at the fair market value of the securities received. Income and capital gain distributions from Fidelity Central Funds, if any, are recorded on the ex-dividend date. Investment income is recorded net of foreign taxes withheld where recovery of such taxes is uncertain. Funds may file withholding tax reclaims in certain jurisdictions to recover a portion of amounts previously withheld. Any withholding tax reclaims income is included in the Statement of Operations in dividends. Any receivables for withholding tax reclaims are included in the Statement of Assets and Liabilities in reclaims receivable.
Expenses. Expenses directly attributable to a fund are charged to that fund. Expenses attributable to more than one fund are allocated among the respective funds on the basis of relative net assets or other appropriate methods. Expenses included in the accompanying financial statements reflect the expenses of that fund and do not include any expenses associated with any underlying mutual funds or exchange-traded funds. Although not included in a fund's expenses, a fund indirectly bears its proportionate share of these expenses through the net asset value of each underlying mutual fund or exchange-traded fund. Expense estimates are accrued in the period to which they relate and adjustments are made when actual amounts are known.
Income Tax Information and Distributions to Shareholders. Each year, the Fund intends to qualify as a regulated investment company under Subchapter M of the Internal Revenue Code, including distributing substantially all of its taxable income and realized gains. As a result, no provision for U.S. Federal income taxes is required. The Fund files a U.S. federal tax return, in addition to state and local tax returns as required. The Fund's federal income tax returns are subject to examination by the Internal Revenue Service (IRS) for a period of three fiscal years after they are filed. State and local tax returns may be subject to examination for an additional fiscal year depending on the jurisdiction. Foreign taxes are provided for based on the Fund's understanding of the tax rules and rates that exist in the foreign markets in which it invests.
Distributions are declared and recorded on the ex-dividend date. Income and capital gain distributions are determined in accordance with income tax regulations, which may differ from GAAP.
Capital accounts within the financial statements are adjusted for permanent book-tax differences. These adjustments have no impact on net assets or the results of operations. Capital accounts are not adjusted for temporary book-tax differences which will reverse in a subsequent period.
Book-tax differences are primarily due to foreign currency transactions, redemptions in-kind and losses deferred due to wash sales.
As of period end, the cost and unrealized appreciation (depreciation) in securities, and derivatives if applicable, for federal income tax purposes were as follows:
| Gross unrealized appreciation | $8,265,245 |
| Gross unrealized depreciation | (812,496) |
| Net unrealized appreciation (depreciation) | $7,452,749 |
| Tax cost | $35,756,733 |
New Accounting Pronouncement. In November 2023, the FASB issued Accounting Standards Update (ASU) 2023-07 Segment Reporting (Topic 280): Improvements to Reportable Segment Disclosures. Effective for fiscal years beginning after December 15, 2023 and interim periods within fiscal years beginning after December 15, 2024, the amendments enhance required disclosures of segment information for public entities on an annual and interim basis. The ASU allows for early adoption with updates applied retrospectively. Management is currently evaluating the impact of the ASU but does not expect this guidance to materially impact the financial statements.
4. Purchases and Sales of Investments.
Purchases and sales of securities, other than short-term securities and in-kind transactions, as applicable, are noted in the table below.
| | Purchases ($) | Sales ($) |
| Fidelity U.S. Low Volatility Equity Fund | 18,837,360 | 10,350,689 |
5. Fees and Other Transactions with Affiliates.
Management Fee. Fidelity Management & Research Company LLC (the investment adviser) and its affiliates provide the Fund with investment management related services for which the Fund pays a monthly management fee.
Any reference to "class" in this note shall mean "the Fund" as the Fund currently offers only one class of shares. The Fund's management contract incorporates a management fee rate that may vary by class. The investment adviser or an affiliate pays certain expenses of managing and operating the Fund out of each class's management fee. Each class of the Fund pays a management fee to the investment adviser. The management fee is calculated and paid to the investment adviser every month. When determining a class's management fee, a mandate rate is calculated based on the monthly average net assets of a group of funds advised by FMR within a designated asset class. A discount rate is subtracted from the mandate rate once the Fund's monthly average net assets reach a certain level. The mandate rate and discount rate may vary by class. The annual management fee rate for a class of shares of the Fund is the lesser of (1) the class's mandate rate reduced by the class's discount rate (if applicable) or (2) the amount set forth in the following table.
| | Maximum Management Fee Rate % |
| Fidelity U.S. Low Volatility Equity Fund | .59 |
One-twelfth of the management fee rate for a class is applied to the average net assets of the class for the month, giving a dollar amount which is the management fee for the class for that month. A different management fee rate may be applicable to each class of the Fund. The difference between classes is the result of separate arrangements for class-level services and/or waivers of certain expenses. It is not the result of any difference in advisory or custodial fees or other expenses related to the management of the Fund's assets, which do not vary by class. For the reporting period, the total annualized management fee rates were as follows:
| | Total Management Fee Rate % |
| Fidelity U.S. Low Volatility Equity Fund | .57 |
Brokerage Commissions. A portion of portfolio transactions were placed with brokerage firms which are affiliates of the investment adviser. Brokerage commissions are included in net realized gain (loss) and change in net unrealized appreciation (depreciation) in the Statement of Operations. The commissions paid to these affiliated firms were as follows:
| | Amount ($) |
| Fidelity U.S. Low Volatility Equity Fund | 76 |
Interfund Trades. Funds may purchase from or sell securities to other Fidelity Funds under procedures adopted by the Board. The procedures have been designed to ensure these interfund trades are executed in accordance with Rule 17a-7 of the 1940 Act. Any interfund trades are included within the respective purchases and sales amounts shown in the Purchases and Sales of Investments note. Interfund trades during the period are noted in the table below.
| | Purchases ($) | Sales ($) | Realized Gain (Loss) ($) |
| Fidelity U.S. Low Volatility Equity Fund | - | 360,722 | 2,573 |
Prior Fiscal Year Affiliated Redemptions In-Kind. Shares that were redeemed in-kind for investments, including accrued interest and cash, if any, are shown in the table below; along with realized gain or loss on investments delivered through in-kind redemptions. The amount of the in-kind redemptions is included in share transactions in the accompanying Statement of Changes in Net Assets. There was no gain or loss for federal income tax purposes.
| | Shares | Total net realized gain or loss ($) | Total Proceeds ($) |
| Fidelity U.S. Low Volatility Equity Fund | 12,998,678 | 24,654,864 | 141,738,370 |
6. Committed Line of Credit.
Certain Funds participate with other funds managed by the investment adviser or an affiliate in a $4.25 billion credit facility (the "line of credit") to be utilized for temporary or emergency purposes to fund shareholder redemptions or for other short-term liquidity purposes. The participating funds have agreed to pay commitment fees on their pro-rata portion of the line of credit, which are reflected in Miscellaneous expenses on the Statement of Operations, and are listed below. During the period, there were no borrowings on this line of credit.
| | Amount ($) |
| Fidelity U.S. Low Volatility Equity Fund | 23 |
7. Security Lending.
Funds lend portfolio securities from time to time in order to earn additional income. Lending agents are used, including National Financial Services (NFS), an affiliate of the investment adviser. Pursuant to a securities lending agreement, NFS will receive a fee, which is capped at 9.9% of a fund's daily lending revenue, for its services as lending agent. A fund may lend securities to certain qualified borrowers, including NFS. On the settlement date of the loan, a fund receives collateral (in the form of U.S. Treasury obligations, letters of credit and/or cash) against the loaned securities and maintains collateral in an amount not less than 100% of the market value of the loaned securities during the period of the loan. The market value of the loaned securities is determined at the close of business of a fund and any additional required collateral is delivered to a fund on the next business day. A fund or borrower may terminate the loan at any time, and if the borrower defaults on its obligation to return the securities loaned because of insolvency or other reasons, a fund may apply collateral received from the borrower against the obligation. A fund may experience delays and costs in recovering the securities loaned. Any cash collateral received is invested in the Fidelity Securities Lending Cash Central Fund. Any loaned securities are identified as such in the Schedule of Investments, and the value of loaned securities and cash collateral at period end, as applicable, are presented in the Statement of Assets and Liabilities. Security lending income represents the income earned on investing cash collateral, less rebates paid to borrowers and any lending agent fees associated with the loan, plus any premium payments received for lending certain types of securities. Security lending income is presented in the Statement of Operations as a component of income from Fidelity Central Funds. Affiliated security lending activity, if any, was as follows:
| | Total Security Lending Fees Paid to NFS ($) | Security Lending Income From Securities Loaned to NFS ($) | Value of Securities Loaned to NFS at Period End ($) |
| Fidelity U.S. Low Volatility Equity Fund | 495 | 1 | 10,410 |
8. Expense Reductions.
The investment adviser contractually agreed to reimburse the Fund to the extent annual operating expenses exceeded .70% of average net assets. This reimbursement will remain in place through August 31, 2025. Some expenses, for example the compensation of the independent Trustees, and certain miscellaneous expenses such as proxy and shareholder meeting expenses, are excluded from this reimbursement. During the period this reimbursement reduced the Fund's expenses by $38,694.
9. Other.
A fund's organizational documents provide former and current trustees and officers with a limited indemnification against liabilities arising in connection with the performance of their duties to the fund. In the normal course of business, a fund may also enter into contracts that provide general indemnifications. A fund's maximum exposure under these arrangements is unknown as this would be dependent on future claims that may be made against a fund. The risk of material loss from such claims is considered remote.
10. Risk and Uncertainties.
Many factors affect a fund's performance. Developments that disrupt global economies and financial markets, such as pandemics, epidemics, outbreaks of infectious diseases, war, terrorism, and environmental disasters, may significantly affect a fund's investment performance. The effects of these developments to a fund will be impacted by the types of securities in which a fund invests, the financial condition, industry, economic sector, and geographic location of an issuer, and a fund's level of investment in the securities of that issuer. Significant concentrations in security types, issuers, industries, sectors, and geographic locations may magnify the factors that affect a fund's performance.
Item 8: Changes in and Disagreements with Accountants for Open-End Management Investment Companies
(Unaudited)
Note: This is not applicable for any fund included in this document.
Item 9: Proxy Disclosures for Open-End Management Investment Companies
(Unaudited)
| A special meeting of shareholders was held on July 16, 2024. The results of votes taken among shareholders on the proposal before them are reported below. Each vote reported represents one dollar of net asset value held on the record date for the meeting. |
| Proposal 1 |
| To elect a Board of Trustees. |
| | # of Votes | % of Votes |
| Bettina Doulton |
| Affirmative | 14,516,835,136.19 | 94.56 |
| Withheld | 834,887,998.33 | 5.44 |
| TOTAL | 15,351,723,134.52 | 100.00 |
| Robert A. Lawrence |
| Affirmative | 14,430,495,798.10 | 94.00 |
| Withheld | 921,227,336.42 | 6.00 |
| TOTAL | 15,351,723,134.52 | 100.00 |
| Vijay C. Advani |
| Affirmative | 14,465,231,640.25 | 94.23 |
| Withheld | 886,491,494.27 | 5.77 |
| TOTAL | 15,351,723,134.52 | 100.00 |
| Thomas P. Bostick |
| Affirmative | 14,471,831,170.84 | 94.27 |
| Withheld | 879,891,963.68 | 5.73 |
| TOTAL | 15,351,723,134.52 | 100.00 |
| Donald F. Donahue |
| Affirmative | 14,432,670,599.88 | 94.01 |
| Withheld | 919,052,534.64 | 5.99 |
| TOTAL | 15,351,723,134.52 | 100.00 |
| Vicki L. Fuller |
| Affirmative | 14,531,407,981.65 | 94.66 |
| Withheld | 820,315,152.87 | 5.34 |
| TOTAL | 15,351,723,134.52 | 100.00 |
| Patricia L. Kampling |
| Affirmative | 14,549,142,839.16 | 94.77 |
| Withheld | 802,580,295.36 | 5.23 |
| TOTAL | 15,351,723,134.52 | 100.00 |
| Thomas A. Kennedy |
| Affirmative | 14,469,818,769.40 | 94.26 |
| Withheld | 881,904,365.12 | 5.74 |
| TOTAL | 15,351,723,134.52 | 100.00 |
| Oscar Munoz |
| Affirmative | 14,434,061,467.08 | 94.02 |
| Withheld | 917,661,667.44 | 5.98 |
| TOTAL | 15,351,723,134.52 | 100.00 |
| Karen B. Peetz |
| Affirmative | 14,521,904,618.46 | 94.59 |
| Withheld | 829,818,516.06 | 5.41 |
| TOTAL | 15,351,723,134.52 | 100.00 |
| David M. Thomas |
| Affirmative | 14,417,745,861.73 | 93.92 |
| Withheld | 933,977,272.79 | 6.08 |
| TOTAL | 15,351,723,134.52 | 100.00 |
| Susan Tomasky |
| Affirmative | 14,467,973,468.18 | 94.24 |
| Withheld | 883,749,666.34 | 5.76 |
| TOTAL | 15,351,723,134.52 | 100.00 |
| Michael E. Wiley |
| Affirmative | 14,424,002,796.91 | 93.96 |
| Withheld | 927,720,337.61 | 6.04 |
| TOTAL | 15,351,723,134.52 | 100.00 |
| | | |
| Proposal 1 reflects trust-wide proposal and voting results. |
Item 10: Remuneration Paid to Directors, Officers, and others of Open-End Management Investment Companies
(Unaudited)
Note: This information is disclosed as part of the financial statements for each Fund as part of Item 7: Financial Statements and Financial Highlights for Open-End Management Investment companies.
Item 11: Statement Regarding Basis for Approval of Investment Advisory Contract
(Unaudited)
Board Approval of Investment Advisory Contracts and Management Fees
Fidelity U.S. Low Volatility Equity Fund
Each year, the Board of Trustees, including the Independent Trustees (together, the Board), considers the renewal of the fund's management contract with Fidelity Management & Research Company LLC (FMR) and certain affiliates and the sub-advisory agreements (together, the Advisory Contracts) for the fund. FMR and the sub-advisers are referred to herein as the Investment Advisers. The Board, assisted by the advice of fund counsel and Independent Trustees' counsel, requests and considers a broad range of information relevant to the renewal of the Advisory Contracts throughout the year.
The Board meets regularly and, at each of its meetings, covers an extensive agenda of topics and materials and considers factors that are relevant to its annual consideration of the renewal of the fund's Advisory Contracts, including the services and support provided to the fund and its shareholders. The Board, acting directly and through its Committees (each of which is composed of and chaired by Independent Trustees), requests and receives information concerning the annual consideration of the renewal of the fund's Advisory Contracts. The Board also meets as needed to review matters specifically related to the Board's annual consideration of the renewal of the Advisory Contracts. Members of the Board may also meet with trustees of other Fidelity funds through joint ad hoc committees to discuss certain matters relevant to all of the Fidelity funds.
At its May 2024 meeting, the Board unanimously determined to renew the fund's Advisory Contracts. In reaching its determination, the Board considered all factors it believed relevant, including (i) the nature, extent, and quality of the services provided to the fund and its shareholders (including the investment performance of the fund); (ii) the competitiveness relative to peer funds of the fund's management fee and total expense ratio; (iii) the total costs of the services provided by and the profits realized by FMR and its affiliates (Fidelity) from its relationships with the fund; and (iv) the extent to which, if any, economies of scale exist and are realized as the fund grows, and whether any economies of scale are appropriately shared with fund shareholders. The Board also considered the broad range of investment choices available to shareholders from FMR's competitors and that the fund's shareholders have chosen to invest in the fund, which is part of the Fidelity family of funds. The Board's decision to renew the Advisory Contracts was not based on any single factor.
The Board reached a determination, with the assistance of fund counsel and Independent Trustees' counsel and through the exercise of its business judgment, that the renewal of the Advisory Contracts was in the best interests of the fund and its shareholders and that the compensation payable under the Advisory Contracts was fair and reasonable in light of all of the surrounding circumstances.
Nature, Extent, and Quality of Services Provided. The Board considered staffing as it relates to the fund, including the backgrounds and experience of investment personnel of the Investment Advisers, and also considered the Investment Advisers' implementation of the fund's investment program. The Independent Trustees also had discussions with senior management of Fidelity's investment operations and investment groups. The Board considered the structure of the investment personnel compensation program and whether this structure provides appropriate incentives to act in the best interests of the fund. Additionally, the Board considered the portfolio managers' investments, if any, in the funds that they manage.
Resources Dedicated to Investment Management and Support Services. The Board and the Fund Oversight and Research Committees reviewed the general qualifications and capabilities of Fidelity's investment staff, including its size, education, experience, and resources, as well as Fidelity's approach to recruiting, training, managing, and compensating investment personnel. The Board noted the resources devoted to expansion of Fidelity's global investment organization, and that Fidelity's analysts have extensive resources, tools, and capabilities that allow them to conduct sophisticated quantitative and fundamental analysis, as well as credit analysis of issuers, counterparties, and guarantors. Further, the Board considered that Fidelity's investment professionals have sufficient access to global information and data so as to provide competitive investment results over time, and that those professionals also have access to sophisticated tools that permit them to assess portfolio construction and risk and performance attribution characteristics continuously, as well as to transmit new information and research conclusions rapidly around the world. Additionally, in its deliberations, the Board considered Fidelity's trading, risk management, compliance, and technology and operations capabilities and resources, which are integral parts of the investment management process.
Shareholder and Administrative Services. The Board considered (i) the nature, extent, quality, and cost of advisory, administrative, shareholder, transfer agency, and pricing and bookkeeping services performed by the Investment Advisers and their affiliates under the Advisory Contracts; (ii) the nature and extent of Fidelity's supervision of third party service providers, principally custodians, subcustodians, and pricing vendors; and (iii) the resources devoted by Fidelity to, and the record of compliance with, the fund's compliance policies and procedures. The Board also reviewed the allocation of fund brokerage, including allocations to brokers affiliated with the Investment Advisers, the use of brokerage commissions to pay fund expenses, and the use of "soft" commission dollars to pay for research services. The Board also considered the fund's securities lending activities and any payments made to Fidelity relating to securities lending under a separate agreement.
The Board noted that the growth of fund assets over time across the complex allows Fidelity to reinvest in the development of services designed to enhance the value and convenience of the Fidelity funds as investment vehicles. These services include 24-hour access to account information and market information over the Internet and through telephone representatives, investor education materials, and asset allocation tools. The Board also considered that it reviews customer service metrics such as telephone response times, continuity of services on the website and metrics addressing services at Fidelity Investor Centers.
Investment in a Large Fund Family. The Board considered the benefits to shareholders of investing in a fund that is part of a large family of funds offering a variety of investment disciplines and providing a large variety of fund investor services. The Board noted that Fidelity had taken, or had made recommendations that resulted in the Fidelity funds taking, a number of actions over the previous year that benefited particular funds and/or the Fidelity funds in general.
Investment Performance. The Board took into account discussions that occur with representatives of the Investment Advisers, and reports that it receives, at Board meetings throughout the year, relating to fund investment performance. In this regard the Board noted that as part of regularly scheduled fund reviews and other reports to the Board on fund performance, the Board considered annualized return information for the fund for different time periods, measured against an appropriate securities market index (benchmark index). The Board also considered information about performance attribution. In its ongoing evaluation of fund investment performance, the Board gives particular attention to information indicating changes in performance of the funds over different time periods and discussed with the Investment Advisers the reasons for any overperformance or underperformance.
In addition to reviewing absolute and relative fund performance, the Independent Trustees periodically consider the appropriateness of fund performance metrics in evaluating the results achieved. The Independent Trustees generally give greater weight to fund performance over longer time periods than over shorter time periods. Depending on the circumstances, the Independent Trustees may be satisfied with a fund's performance notwithstanding that it lags its benchmark index for certain periods.
Based on its review, the Board concluded that the nature, extent, and quality of services provided to the fund under the Advisory Contracts should continue to benefit the shareholders of the fund.
Competitiveness of Management Fee and Total Expense Ratio. The Board was provided with information regarding industry trends in management fees and expenses. The Board considered that, effective March 1, 2024, an amended Advisory Contract with FMR went into effect with a fee based on tiered schedules and subject to a maximum class-level rate (the management fee). The Board also considered that in exchange for the management fee, the fund will receive investment advisory, management, administrative, transfer agent, and pricing and bookkeeping services. In its review of the fund's management fee and total expense ratio, the Board considered the fund's pro forma management fee rate as if it had been in effect for the 12-month period ended September 30, 2023, as well as other third-party fund expenses, such as custodial, legal, and audit fees. The Board noted that Fidelity may agree to waive fees or reimburse expenses from time to time, and the extent to which, if any, it has done so for the fund.
Comparisons of Management Fees and Total Expense Ratios. Among other things, the Board reviewed data for selected groups of competitive funds and classes (referred to as "mapped groups") that were compiled by Fidelity based on combining similar investment objective categories (as classified by Morningstar) that have comparable investment mandates. The data reviewed by the Board included (i) gross management fee comparisons (before taking into account expense reimbursements or caps) relative to the total universe of funds within the mapped group; (ii) gross management fee comparisons relative to a subset of non-Fidelity funds in the mapped group that are similar in size and management fee structure to the fund (referred to as the "asset size peer group"); (iii) total expense comparisons of the fund relative to funds and classes in the mapped group that have a similar sales load structure to the fund (referred to as the "similar sales load structure group"); and (iv) total expense comparisons of the fund relative to funds and classes in the similar sales load structure group that are similar in size and management fee structure to the fund (referred to as the "total expense asset size peer group"). The total expense asset size peer group comparison excludes performance adjustments and fund-paid 12b-1 fees to eliminate variability in fee structures.
The information provided to the Board indicated that the fund's management fee rate ranked below the competitive median of the mapped group for the 12-month period ended September 30, 2023 and below the competitive median of the asset size peer group for the 12-month period ended September 30, 2023. Further, the information provided to the Board indicated that the total expense ratio of the fund ranked below the competitive median of the similar sales load structure group for the 12-month period ended September 30, 2023 and below the competitive median of the total expense asset size peer group for the 12-month period ended September 30, 2023.
Other Contractual Arrangements. The Board further considered that FMR has contractually agreed to reimburse the fund to the extent that total operating expenses, with certain exceptions, as a percentage of its average net assets, exceed 0.70% through August 31, 2025.
Fees Charged to Other Fidelity Clients. The Board also considered Fidelity fee structures and other information with respect to clients of Fidelity, such as other funds advised or subadvised by Fidelity, pension plan clients, and other institutional clients with similar mandates. The Board noted that a joint ad hoc committee created by it and the boards of other Fidelity funds periodically reviews and compares Fidelity's institutional investment advisory business with its business of providing services to the Fidelity funds and also noted the most recent findings of the committee. The Board noted that the committee's review included a consideration of the differences in services provided, fees charged, and costs incurred, as well as competition in the markets serving the different categories of clients.
Based on its review, the Board concluded that the fund's management fee is fair and reasonable in light of the services that the fund receives and the other factors considered. Further, based on its review of total expense ratios and fees charged to other Fidelity clients, the Board concluded that the fund's total expense ratio was reasonable in light of the services that the fund and its shareholders receive and the other factors considered.
Costs of the Services and Profitability. The Board considered the revenues earned and the expenses incurred by Fidelity in conducting the business of developing, marketing, distributing, managing, administering and servicing the Fidelity funds and servicing the Fidelity funds' shareholders. The Board also considered the level of Fidelity's profits in respect of all the Fidelity funds.
On an annual basis, Fidelity presents to the Board information about the profitability of its relationships with the Fidelity funds. Fidelity calculates profitability information for each Fidelity fund, as well as aggregate profitability information for groups of Fidelity funds and all Fidelity funds, using a series of detailed revenue and cost allocation methodologies which originate with the books and records of Fidelity on which Fidelity's audited financial statements are based. The Audit Committee of the Board reviews any significant changes from the prior year's methodologies.
A public accounting firm has been engaged annually by the Board as part of the Board's assessment of Fidelity's profitability analysis. The engagement includes the review and assessment of the methodologies used by Fidelity in determining the revenues and expenses attributable to Fidelity's fund business, and completion of agreed-upon procedures in respect of the mathematical accuracy of certain fund profitability information and its conformity to established allocation methodologies. After considering the reports issued under the engagement and information provided by Fidelity, the Board concluded that while other allocation methods may also be reasonable, Fidelity's profitability methodologies are reasonable in all material respects.
The Board also reviewed Fidelity's non-fund businesses and potential indirect benefits such businesses may have received as a result of their association with Fidelity's fund business (i.e., fall-out benefits) as well as cases where Fidelity's affiliates may benefit from the funds' business. The Board considered areas where potential indirect benefits to the Fidelity funds from their relationships with Fidelity may exist. The Board's consideration of these matters was informed by the findings of a joint ad hoc committee created by it and the boards of other Fidelity funds to evaluate potential fall-out benefits.
The Board considered the costs of the services provided by and the profits realized by Fidelity in connection with the operation of the Fidelity funds and was satisfied that the profitability was not excessive.
Economies of Scale. The Board considered whether there have been economies of scale in respect of the management of the Fidelity funds, whether the Fidelity funds (including the fund) have appropriately benefited from any such economies of scale, and whether there is potential for realization of any further economies of scale. The Board considered the extent to which the fund will benefit from economies of scale as assets grow through increased services to the fund, through waivers or reimbursements, or through fee or expense ratio reductions. The Board also noted that a committee created by it and the boards of other Fidelity funds periodically analyzes whether Fidelity attains economies of scale in respect of the management and servicing of the Fidelity funds, whether the Fidelity funds have appropriately benefited from such economies of scale, and whether there is potential for realization of any further economies of scale.
The Board recognized that the fund's management contract incorporates a variable management fee structure, which provides breakpoints as a way to share, in part, any potential economies of scale that may exist at the asset class level and through a discount that considers both fund size and total assets of the four applicable asset classes. The Board considered that the variable management fee is designed to deliver the benefits of economies of scale to fund shareholders even if assets of any particular fund are unchanged or have declined, because some portion of Fidelity's costs are attributable to services provided to all funds subject to the variable management fee, and all such funds benefit if those costs can be allocated among more assets. The Board concluded that, given the variable management fee structure, fund shareholders will benefit from lower management fees due to the application of the breakpoints and discount factor, regardless of whether Fidelity achieves any such economies of scale.
The Board concluded, taking into account the analysis of the committee, that economies of scale, if any, are being appropriately shared between fund shareholders and Fidelity.
Additional Information Requested by the Board. In order to develop fully the factual basis for consideration of the Fidelity funds' advisory contracts, the Board requested and received additional information on certain topics, including but not limited to: (i) fund flow and performance trends, in particular the underperformance of certain funds and strategies, and Fidelity's long-term strategies for certain funds; (ii) the operation of performance fees and the rationale for implementing performance fees on certain categories of funds but not others; (iii) Fidelity's pricing philosophy compared to competitors; (iv) fund profitability methodology and data; (v) evaluation of competitive fund data and peer group classifications and fee and expense comparisons; (vi) the management fee and expense structures for different funds and classes and information about the differences between various fee and expense structures; (vii) the variable management fee implemented for certain funds effective March 1, 2024; and (viii) information regarding other accounts managed by Fidelity and the funds' sub-advisory arrangements.
Conclusion. Based on its evaluation of all of the conclusions noted above, and after considering all factors it believed relevant, the Board, including the Independent Trustees, concluded that the advisory and sub-advisory fee arrangements are fair and reasonable in light of all of the surrounding circumstances and that the fund's Advisory Contracts should be renewed through May 31, 2025.
1.9896229.104
USL-SANN-1224
Fidelity® Capital & Income Fund
Semi-Annual Report
October 31, 2024
Contents
To view a fund's proxy voting guidelines and proxy voting record for the 12-month period ended June 30, visit http://www.fidelity.com/proxyvotingresults or visit the Securities and Exchange Commission's (SEC) web site at http://www.sec.gov.
You may also call 1-800-544-8544 to request a free copy of the proxy voting guidelines.
Standard & Poor's, S&P and S&P 500 are registered service marks of The McGraw-Hill Companies, Inc. and have been licensed for use by Fidelity Distributors Corporation.
Other third-party marks appearing herein are the property of their respective owners.
All other marks appearing herein are registered or unregistered trademarks or service marks of FMR LLC or an affiliated company. © 2024 FMR LLC. All rights reserved.
This report and the financial statements contained herein are submitted for the general information of the shareholders of the Fund. This report is not authorized for distribution to prospective investors in the Fund unless preceded or accompanied by an effective prospectus.
A fund files its complete schedule of portfolio holdings with the SEC for the first and third quarters of each fiscal year on Form N-PORT. Forms N-PORT are available on the SEC's web site at http://www.sec.gov. A fund's Forms N-PORT may be reviewed and copied at the SEC's Public Reference Room in Washington, DC. Information regarding the operation of the SEC's Public Reference Room may be obtained by calling 1-800-SEC-0330.
For a complete list of a fund's portfolio holdings, view the most recent holdings listing, semiannual report, or annual report on Fidelity's web site at http://www.fidelity.com, http://www.institutional.fidelity.com, or http://www.401k.com, as applicable.
NOT FDIC INSURED •MAY LOSE VALUE •NO BANK GUARANTEE
Neither the Fund nor Fidelity Distributors Corporation is a bank.
Item 7: Financial Statements and Financial Highlights for Open-End Management Investment Companies (Semi-Annual Report)
Fidelity® Capital & Income Fund
Schedule of Investments October 31, 2024 (Unaudited)
Showing Percentage of Net Assets
| Corporate Bonds - 51.6% |
| | | Principal Amount (a) (000s) | Value ($) (000s) |
| Convertible Bonds - 1.1% | | | |
| Broadcasting - 0.6% | | | |
| DISH Network Corp.: | | | |
| 0% 12/15/25 | | 37,425 | 33,226 |
| 3.375% 8/15/26 | | 53,665 | 45,058 |
| | | | 78,284 |
| Diversified Financial Services - 0.1% | | | |
| Coinbase Global, Inc. 0.25% 4/1/30 (b) | | 8,566 | 7,757 |
| New Cotai LLC 5% 2/24/27 (c) | | 4,346 | 8,553 |
| | | | 16,310 |
| Technology - 0.4% | | | |
| Wolfspeed, Inc. 1.875% 12/1/29 | | 118,424 | 58,975 |
TOTAL CONVERTIBLE BONDS | | | 153,569 |
| Nonconvertible Bonds - 50.5% | | | |
| Aerospace - 2.9% | | | |
| ATI, Inc.: | | | |
| 4.875% 10/1/29 | | 6,080 | 5,759 |
| 5.125% 10/1/31 | | 5,395 | 5,093 |
| Bombardier, Inc.: | | | |
| 6% 2/15/28 (b) | | 6,075 | 6,068 |
| 7.125% 6/15/26 (b) | | 3,102 | 3,135 |
| 7.25% 7/1/31 (b) | | 6,080 | 6,282 |
| 7.875% 4/15/27 (b) | | 13,020 | 13,046 |
| 8.75% 11/15/30 (b) | | 9,040 | 9,795 |
| Kaiser Aluminum Corp. 4.625% 3/1/28 (b) | | 11,215 | 10,685 |
| Moog, Inc. 4.25% 12/15/27 (b) | | 3,455 | 3,294 |
| Rolls-Royce PLC 5.75% 10/15/27 (b) | | 10,870 | 11,090 |
| TransDigm, Inc.: | | | |
| 4.625% 1/15/29 | | 38,080 | 36,162 |
| 4.875% 5/1/29 | | 25,000 | 23,878 |
| 5.5% 11/15/27 | | 124,228 | 122,986 |
| 6.375% 3/1/29 (b) | | 15,065 | 15,292 |
| 6.625% 3/1/32 (b) | | 6,065 | 6,168 |
| 6.75% 8/15/28 (b) | | 27,225 | 27,838 |
| 6.875% 12/15/30 (b) | | 47,905 | 49,106 |
| 7.125% 12/1/31 (b) | | 12,085 | 12,505 |
| Triumph Group, Inc. 9% 3/15/28 (b) | | 7,141 | 7,440 |
| VistaJet Malta Finance PLC / XO Management Holding, Inc. 9.5% 6/1/28 (b) | | 8,905 | 8,748 |
| | | | 384,370 |
| Air Transportation - 1.2% | | | |
| Air Canada 3.875% 8/15/26 (b) | | 9,105 | 8,808 |
| Allegiant Travel Co. 7.25% 8/15/27 (b) | | 8,870 | 8,737 |
| American Airlines, Inc.: | | | |
| 7.25% 2/15/28 (b) | | 19,595 | 19,917 |
| 8.5% 5/15/29 (b) | | 20,045 | 21,066 |
| American Airlines, Inc. / AAdvantage Loyalty IP Ltd. 5.75% 4/20/29 (b) | | 29,825 | 29,534 |
| Rand Parent LLC 8.5% 2/15/30 (b) | | 14,880 | 14,847 |
| Spirit Loyalty Cayman Ltd. / Spirit IP Cayman Ltd.: | | | |
| 8% 9/20/25 (b) | | 7,779 | 4,836 |
| 8% 9/20/25 (b) | | 2,960 | 1,840 |
| United Airlines, Inc.: | | | |
| 4.375% 4/15/26 (b) | | 30,025 | 29,506 |
| 4.625% 4/15/29 (b) | | 18,025 | 17,252 |
| | | | 156,343 |
| Automotive & Auto Parts - 0.8% | | | |
| Adient Global Holdings Ltd. 7% 4/15/28 (b) | | 5,935 | 6,034 |
| Allison Transmission, Inc. 5.875% 6/1/29 (b) | | 7,960 | 7,933 |
| Clarios Global LP / Clarios U.S. Finance Co. 6.75% 5/15/28 (b) | | 11,885 | 12,166 |
| Dana, Inc.: | | | |
| 4.25% 9/1/30 | | 8,870 | 7,756 |
| 4.5% 2/15/32 | | 9,135 | 7,814 |
| LCM Investments Holdings 8.25% 8/1/31 (b) | | 7,185 | 7,504 |
| Macquarie AirFinance Holdings: | | | |
| 6.4% 3/26/29 (b) | | 4,205 | 4,333 |
| 6.5% 3/26/31 (b) | | 6,430 | 6,680 |
| 8.125% 3/30/29 (b) | | 8,990 | 9,510 |
| McLaren Finance PLC 7.5% 8/1/26 (b) | | 8,290 | 8,041 |
| Nesco Holdings II, Inc. 5.5% 4/15/29 (b) | | 14,525 | 13,517 |
| Wand NewCo 3, Inc. 7.625% 1/30/32 (b) | | 12,115 | 12,522 |
| | | | 103,810 |
| Banks & Thrifts - 1.4% | | | |
| Ally Financial, Inc.: | | | |
| 8% 11/1/31 | | 144,500 | 160,779 |
| 8% 11/1/31 | | 20,638 | 22,999 |
| Jane Street Group LLC/JSG Finance, Inc. 4.5% 11/15/29 (b) | | 8,740 | 8,269 |
| | | | 192,047 |
| Broadcasting - 1.2% | | | |
| DISH Network Corp. 11.75% 11/15/27 (b) | | 59,780 | 62,926 |
| Scripps Escrow II, Inc. 3.875% 1/15/29 (b) | | 2,820 | 2,188 |
| Sirius XM Radio, Inc.: | | | |
| 3.875% 9/1/31 (b) | | 12,130 | 10,424 |
| 4% 7/15/28 (b) | | 10,140 | 9,473 |
| 5% 8/1/27 (b) | | 8,280 | 8,114 |
| Univision Communications, Inc.: | | | |
| 4.5% 5/1/29 (b) | | 12,060 | 10,706 |
| 7.375% 6/30/30 (b) | | 39,140 | 37,576 |
| 8.5% 7/31/31 (b) | | 21,160 | 20,799 |
| | | | 162,206 |
| Building Materials - 0.6% | | | |
| Advanced Drain Systems, Inc.: | | | |
| 5% 9/30/27 (b) | | 2,325 | 2,283 |
| 6.375% 6/15/30 (b) | | 6,050 | 6,099 |
| Brundage-Bone Concrete Pumping Holdings, Inc. 6% 2/1/26 (b) | | 6,555 | 6,523 |
| James Hardie International Finance Ltd. 5% 1/15/28 (b) | | 4,136 | 4,000 |
| MITER Brands Acquisition Holdco, Inc. / MIWD Borrower LLC 6.75% 4/1/32 (b) | | 9,120 | 9,277 |
| MIWD Holdco II LLC / MIWD Finance Corp. 5.5% 2/1/30 (b) | | 4,125 | 3,941 |
| Smyrna Ready Mix Concrete LLC 8.875% 11/15/31 (b) | | 24,115 | 25,330 |
| Summit Materials LLC/Summit Materials Finance Corp.: | | | |
| 5.25% 1/15/29 (b) | | 10,525 | 10,434 |
| 7.25% 1/15/31 (b) | | 9,155 | 9,475 |
| | | | 77,362 |
| Cable/Satellite TV - 0.2% | | | |
| VZ Secured Financing BV 5% 1/15/32 (b) | | 24,310 | 21,823 |
| Ziggo BV 4.875% 1/15/30 (b) | | 7,990 | 7,409 |
| | | | 29,232 |
| Capital Goods - 0.2% | | | |
| ATS Corp. 4.125% 12/15/28 (b) | | 7,895 | 7,401 |
| Chart Industries, Inc. 7.5% 1/1/30 (b) | | 15,680 | 16,308 |
| | | | 23,709 |
| Chemicals - 1.2% | | | |
| Compass Minerals International, Inc. 6.75% 12/1/27 (b) | | 24,600 | 24,248 |
| Consolidated Energy Finance SA 12% 2/15/31 (b) | | 9,700 | 9,460 |
| Ingevity Corp. 3.875% 11/1/28 (b) | | 11,105 | 10,219 |
| LSB Industries, Inc. 6.25% 10/15/28 (b) | | 21,105 | 20,418 |
| NOVA Chemicals Corp. 8.5% 11/15/28 (b) | | 8,160 | 8,652 |
| Olympus Water U.S. Holding Corp.: | | | |
| 4.25% 10/1/28 (b) | | 15,305 | 14,405 |
| 7.125% 10/1/27 (b) | | 7,080 | 7,189 |
| 9.75% 11/15/28 (b) | | 30,040 | 31,870 |
| SCIH Salt Holdings, Inc. 4.875% 5/1/28 (b) | | 7,820 | 7,488 |
| SCIL IV LLC / SCIL U.S.A. Holdings LLC 5.375% 11/1/26 (b) | | 14,015 | 13,844 |
| Tronox, Inc. 4.625% 3/15/29 (b) | | 13,295 | 12,062 |
| W.R. Grace Holding LLC 7.375% 3/1/31 (b) | | 5,940 | 6,139 |
| | | | 165,994 |
| Consumer Products - 1.1% | | | |
| Angi Group LLC 3.875% 8/15/28 (b) | | 5,530 | 5,003 |
| Foundation Building Materials, Inc. 6% 3/1/29 (b) | | 5,845 | 5,164 |
| HFC Prestige Products, Inc./HFC Prestige International U.S. LLC 4.75% 1/15/29 (b) | | 8,760 | 8,451 |
| Kronos Acquisition Holdings, Inc. 8.25% 6/30/31 (b) | | 12,120 | 12,003 |
| PetSmart, Inc. / PetSmart Finance Corp.: | | | |
| 4.75% 2/15/28 (b) | | 16,195 | 15,396 |
| 7.75% 2/15/29 (b) | | 17,680 | 17,160 |
| Spectrum Brands Holdings, Inc. 3.875% 3/15/31 (b) | | 1,993 | 1,745 |
| Tempur Sealy International, Inc.: | | | |
| 3.875% 10/15/31 (b) | | 15,965 | 13,887 |
| 4% 4/15/29 (b) | | 15,925 | 14,674 |
| The Scotts Miracle-Gro Co. 4% 4/1/31 | | 11,945 | 10,694 |
| TKC Holdings, Inc. 6.875% 5/15/28 (b) | | 20,025 | 19,715 |
| Wayfair LLC 7.25% 10/31/29 (b) | | 13,000 | 13,155 |
| Windsor Holdings III, LLC 8.5% 6/15/30 (b) | | 5,960 | 6,272 |
| | | | 143,319 |
| Containers - 0.5% | | | |
| Crown Cork & Seal, Inc.: | | | |
| 7.375% 12/15/26 | | 4,845 | 5,031 |
| 7.5% 12/15/96 | | 12,871 | 13,515 |
| Graham Packaging Co., Inc. 7.125% 8/15/28 (b) | | 6,000 | 5,837 |
| Graphic Packaging International, Inc. 3.75% 2/1/30 (b) | | 7,880 | 7,206 |
| Intelligent Packaging Ltd. Finco, Inc. 6% 9/15/28 (b) | | 4,230 | 4,170 |
| Mauser Packaging Solutions Holding Co. 7.875% 4/15/27 (b) | | 11,865 | 12,191 |
| Sealed Air Corp./Sealed Air Corp. U.S. 6.125% 2/1/28 (b) | | 5,935 | 5,998 |
| Trident TPI Holdings, Inc. 12.75% 12/31/28 (b) | | 5,870 | 6,441 |
| | | | 60,389 |
| Diversified Financial Services - 1.9% | | | |
| Broadstreet Partners, Inc. 5.875% 4/15/29 (b) | | 15,505 | 14,766 |
| Coinbase Global, Inc.: | | | |
| 3.375% 10/1/28 (b) | | 29,675 | 26,377 |
| 3.625% 10/1/31 (b) | | 18,050 | 15,053 |
| Compass Group Diversified Holdings LLC: | | | |
| 5% 1/15/32 (b) | | 6,090 | 5,592 |
| 5.25% 4/15/29 (b) | | 17,730 | 17,047 |
| Fortress Transportation & Infrastructure Investors LLC 7.875% 12/1/30 (b) | | 9,065 | 9,550 |
| Hightower Holding LLC 6.75% 4/15/29 (b) | | 5,945 | 5,853 |
| Icahn Enterprises LP/Icahn Enterprises Finance Corp.: | | | |
| 4.375% 2/1/29 | | 11,165 | 9,314 |
| 5.25% 5/15/27 | | 38,210 | 35,597 |
| 6.25% 5/15/26 | | 24,085 | 23,673 |
| MSCI, Inc. 4% 11/15/29 (b) | | 3,245 | 3,075 |
| OneMain Finance Corp.: | | | |
| 4% 9/15/30 | | 5,610 | 4,938 |
| 5.375% 11/15/29 | | 9,400 | 9,009 |
| 6.625% 1/15/28 | | 7,305 | 7,420 |
| 7.125% 3/15/26 | | 50,145 | 51,373 |
| 7.875% 3/15/30 | | 6,055 | 6,304 |
| Williams Scotsman, Inc. 7.375% 10/1/31 (b) | | 5,990 | 6,206 |
| | | | 251,147 |
| Energy - 7.4% | | | |
| Antero Midstream Partners LP/Antero Midstream Finance Corp.: | | | |
| 5.375% 6/15/29 (b) | | 9,060 | 8,824 |
| 5.75% 1/15/28 (b) | | 17,645 | 17,549 |
| Atlantica Sustainable Infrastructure PLC 4.125% 6/15/28 (b) | | 7,820 | 7,457 |
| Borr IHC Ltd. / Borr Finance Ltd.: | | | |
| 10% 11/15/28 (b) | | 8,685 | 8,848 |
| 10.375% 11/15/30 (b) | | 2,932 | 2,998 |
| California Resources Corp. 8.25% 6/15/29 (b) | | 6,045 | 6,105 |
| Citgo Petroleum Corp.: | | | |
| 6.375% 6/15/26 (b) | | 8,760 | 8,761 |
| 7% 6/15/25 (b) | | 22,045 | 22,052 |
| 8.375% 1/15/29 (b) | | 26,350 | 27,410 |
| Civitas Resources, Inc. 8.625% 11/1/30 (b) | | 12,020 | 12,628 |
| CNX Midstream Partners LP 4.75% 4/15/30 (b) | | 6,435 | 5,990 |
| CNX Resources Corp.: | | | |
| 6% 1/15/29 (b) | | 5,345 | 5,300 |
| 7.375% 1/15/31 (b) | | 5,930 | 6,096 |
| Comstock Resources, Inc.: | | | |
| 5.875% 1/15/30 (b) | | 32,085 | 29,315 |
| 6.75% 3/1/29 (b) | | 20,060 | 19,211 |
| CPI CG, Inc. 10% 7/15/29 (b) | | 6,060 | 6,348 |
| CQP Holdco LP / BIP-V Chinook Holdco LLC: | | | |
| 5.5% 6/15/31 (b) | | 27,225 | 25,907 |
| 7.5% 12/15/33 (b) | | 16,090 | 17,024 |
| CrownRock LP/CrownRock Finance, Inc. 5% 5/1/29 (b) | | 5,055 | 5,112 |
| CVR Energy, Inc.: | | | |
| 5.75% 2/15/28 (b) | | 22,655 | 20,659 |
| 8.5% 1/15/29 (b) | | 42,375 | 41,091 |
| Delek Logistics Partners LP/Delek Logistics Finance Corp. 7.125% 6/1/28 (b) | | 17,655 | 17,490 |
| Diamond Foreign Asset Co. / Diamond Finance, LLC 8.5% 10/1/30 (b) | | 5,990 | 6,185 |
| DT Midstream, Inc.: | | | |
| 4.125% 6/15/29 (b) | | 9,070 | 8,517 |
| 4.375% 6/15/31 (b) | | 9,070 | 8,344 |
| Energy Transfer LP: | | | |
| 5.5% 6/1/27 | | 16,735 | 16,992 |
| 5.625% 5/1/27 (b) | | 18,015 | 18,020 |
| 5.75% 4/1/25 | | 4,790 | 4,783 |
| 6% 2/1/29 (b) | | 25,785 | 26,186 |
| 7.375% 2/1/31 (b) | | 5,000 | 5,262 |
| EnLink Midstream LLC 6.5% 9/1/30 (b) | | 17,745 | 18,689 |
| Expand Energy Corp.: | | | |
| 5.375% 3/15/30 | | 12,145 | 11,943 |
| 5.7% 1/23/25 (d) | | 244 | 244 |
| 5.875% 2/1/29 (b) | | 5,840 | 5,833 |
| 6.75% 4/15/29 (b) | | 8,995 | 9,093 |
| 7% (c)(e) | | 6,915 | 0 |
| 8% (c)(e) | | 2,132 | 0 |
| 8% (c)(e) | | 3,385 | 0 |
| Global Partners LP/GLP Finance Corp. 8.25% 1/15/32 (b) | | 7,505 | 7,659 |
| Gran Tierra Energy, Inc. 9.5% 10/15/29 (b) | | 7,555 | 6,951 |
| Hess Midstream Operations LP: | | | |
| 4.25% 2/15/30 (b) | | 9,875 | 9,221 |
| 5.125% 6/15/28 (b) | | 11,235 | 10,994 |
| 5.5% 10/15/30 (b) | | 6,060 | 5,921 |
| 5.625% 2/15/26 (b) | | 15,535 | 15,498 |
| HF Sinclair Corp.: | | | |
| 5% 2/1/28 | | 7,615 | 7,539 |
| 6.375% 4/15/27 | | 6,050 | 6,126 |
| Hilcorp Energy I LP/Hilcorp Finance Co. 6.25% 11/1/28 (b) | | 12,280 | 11,981 |
| Howard Midstream Energy Partners LLC 8.875% 7/15/28 (b) | | 14,895 | 15,715 |
| Kinetik Holdings LP 5.875% 6/15/30 (b) | | 9,060 | 8,990 |
| Mesquite Energy, Inc. 7.25% (b)(c)(e) | | 21,977 | 0 |
| Moss Creek Resources Holdings, Inc. 8.25% 9/1/31 (b) | | 6,030 | 5,908 |
| Nabors Industries Ltd. 7.5% 1/15/28 (b) | | 9,715 | 9,242 |
| Nabors Industries, Inc. 9.125% 1/31/30 (b) | | 12,085 | 12,480 |
| Noble Finance II LLC 8% 4/15/30 (b) | | 5,935 | 6,016 |
| Northern Oil & Gas, Inc.: | | | |
| 8.125% 3/1/28 (b) | | 6,005 | 6,063 |
| 8.75% 6/15/31 (b) | | 11,950 | 12,364 |
| NuStar Logistics LP 6% 6/1/26 | | 12,025 | 12,034 |
| Occidental Petroleum Corp. 7.2% 3/15/29 | | 3,964 | 4,263 |
| PBF Holding Co. LLC/PBF Finance Corp.: | | | |
| 6% 2/15/28 | | 27,530 | 26,720 |
| 7.875% 9/15/30 (b) | | 18,055 | 18,024 |
| Permian Resources Operating LLC 5.875% 7/1/29 (b) | | 8,645 | 8,515 |
| Seadrill Finance Ltd. 8.375% 8/1/30 (b) | | 11,920 | 12,173 |
| Sitio Royalties OP / Sitio Finance Corp. 7.875% 11/1/28 (b) | | 15,045 | 15,618 |
| SM Energy Co.: | | | |
| 6.625% 1/15/27 | | 21,320 | 21,316 |
| 6.75% 9/15/26 | | 4,550 | 4,560 |
| Southern Natural Gas Co. LLC: | | | |
| 7.35% 2/15/31 | | 23,497 | 26,059 |
| 8% 3/1/32 | | 12,475 | 14,384 |
| Suburban Propane Partners LP/Suburban Energy Finance Corp. 5% 6/1/31 (b) | | 12,070 | 11,070 |
| Sunnova Energy Corp.: | | | |
| 5.875% 9/1/26 (b) | | 3,020 | 2,699 |
| 11.75% 10/1/28 (b) | | 18,140 | 14,749 |
| Sunoco LP/Sunoco Finance Corp.: | | | |
| 4.5% 5/15/29 | | 10,170 | 9,670 |
| 4.5% 4/30/30 | | 12,185 | 11,435 |
| 7% 9/15/28 (b) | | 5,990 | 6,156 |
| Tallgrass Energy Partners LP / Tallgrass Energy Finance Corp.: | | | |
| 5.5% 1/15/28 (b) | | 595 | 571 |
| 6% 3/1/27 (b) | | 5,935 | 5,890 |
| 6% 9/1/31 (b) | | 11,485 | 10,654 |
| Talos Production, Inc.: | | | |
| 9% 2/1/29 (b) | | 5,340 | 5,500 |
| 9.375% 2/1/31 (b) | | 6,055 | 6,234 |
| Targa Resources Partners LP/Targa Resources Partners Finance Corp. 4.875% 2/1/31 | | 10,360 | 10,053 |
| Teine Energy Ltd. 6.875% 4/15/29 (b) | | 8,990 | 8,842 |
| Transocean Titan Finance Ltd. 8.375% 2/1/28 (b) | | 12,289 | 12,644 |
| Transocean, Inc.: | | | |
| 8% 2/1/27 (b) | | 7,668 | 7,646 |
| 8.25% 5/15/29 (b) | | 4,565 | 4,590 |
| 8.5% 5/15/31 (b) | | 4,565 | 4,600 |
| 8.75% 2/15/30 (b) | | 20,090 | 20,816 |
| Unit Corp. 0% 12/1/29 (c) | | 2,202 | 0 |
| Valaris Ltd. 8.375% 4/30/30 (b) | | 5,985 | 6,072 |
| Venture Global Calcasieu Pass LLC: | | | |
| 3.875% 8/15/29 (b) | | 7,585 | 6,994 |
| 4.125% 8/15/31 (b) | | 7,585 | 6,913 |
| 6.25% 1/15/30 (b) | | 23,810 | 24,338 |
| Viridien 8.75% 4/1/27 (b) | | 11,985 | 11,586 |
| | | | 994,322 |
| Environmental - 0.8% | | | |
| Clean Harbors, Inc. 6.375% 2/1/31 (b) | | 4,960 | 4,997 |
| Darling Ingredients, Inc. 6% 6/15/30 (b) | | 13,885 | 13,790 |
| GFL Environmental, Inc.: | | | |
| 4% 8/1/28 (b) | | 9,105 | 8,611 |
| 4.75% 6/15/29 (b) | | 12,095 | 11,580 |
| 6.75% 1/15/31 (b) | | 8,975 | 9,241 |
| Madison IAQ LLC: | | | |
| 4.125% 6/30/28 (b) | | 11,390 | 10,810 |
| 5.875% 6/30/29 (b) | | 9,085 | 8,617 |
| Reworld Holding Corp.: | | | |
| 4.875% 12/1/29 (b) | | 26,475 | 24,727 |
| 5% 9/1/30 | | 13,761 | 12,646 |
| | | | 105,019 |
| Food & Drug Retail - 1.1% | | | |
| Albertsons Companies LLC/Safeway, Inc./New Albertson's, Inc./Albertson's LLC: | | | |
| 3.5% 3/15/29 (b) | | 36,160 | 33,409 |
| 4.625% 1/15/27 (b) | | 25,300 | 24,822 |
| 4.875% 2/15/30 (b) | | 44,700 | 43,538 |
| Murphy Oil U.S.A., Inc.: | | | |
| 3.75% 2/15/31 (b) | | 5,300 | 4,710 |
| 4.75% 9/15/29 | | 6,860 | 6,556 |
| 5.625% 5/1/27 | | 6,030 | 6,045 |
| Parkland Corp.: | | | |
| 4.5% 10/1/29 (b) | | 8,995 | 8,356 |
| 4.625% 5/1/30 (b) | | 12,175 | 11,190 |
| 6.625% 8/15/32 (b) | | 6,030 | 6,017 |
| | | | 144,643 |
| Food/Beverage/Tobacco - 1.7% | | | |
| BellRing Brands, Inc. 7% 3/15/30 (b) | | 14,740 | 15,340 |
| C&S Group Enterprises LLC 5% 12/15/28 (b) | | 8,615 | 7,131 |
| Chobani LLC/Finance Corp., Inc. 4.625% 11/15/28 (b) | | 6,285 | 6,035 |
| Fiesta Purchaser, Inc.: | | | |
| 7.875% 3/1/31 (b) | | 11,455 | 12,013 |
| 9.625% 9/15/32 (b) | | 7,330 | 7,662 |
| KeHE Distributor / Nextwave 9% 2/15/29 (b) | | 33,960 | 35,164 |
| Lamb Weston Holdings, Inc.: | | | |
| 4.125% 1/31/30 (b) | | 12,150 | 11,281 |
| 4.375% 1/31/32 (b) | | 6,075 | 5,565 |
| Performance Food Group, Inc.: | | | |
| 4.25% 8/1/29 (b) | | 8,495 | 7,951 |
| 5.5% 10/15/27 (b) | | 8,855 | 8,780 |
| Post Holdings, Inc.: | | | |
| 4.5% 9/15/31 (b) | | 47,500 | 43,243 |
| 4.625% 4/15/30 (b) | | 15,630 | 14,608 |
| 5.5% 12/15/29 (b) | | 21,040 | 20,521 |
| Simmons Foods, Inc. 4.625% 3/1/29 (b) | | 8,340 | 7,726 |
| Triton Water Holdings, Inc. 6.25% 4/1/29 (b) | | 6,360 | 6,282 |
| U.S. Foods, Inc.: | | | |
| 4.625% 6/1/30 (b) | | 7,520 | 7,135 |
| 7.25% 1/15/32 (b) | | 5,990 | 6,224 |
| | | | 222,661 |
| Gaming - 1.5% | | | |
| Boyd Gaming Corp. 4.75% 6/15/31 (b) | | 15,120 | 14,111 |
| Churchill Downs, Inc.: | | | |
| 5.75% 4/1/30 (b) | | 14,970 | 14,737 |
| 6.75% 5/1/31 (b) | | 11,880 | 12,095 |
| Fertitta Entertainment LLC / Fertitta Entertainment Finance Co., Inc.: | | | |
| 4.625% 1/15/29 (b) | | 25,865 | 24,147 |
| 6.75% 1/15/30 (b) | | 34,295 | 31,191 |
| Jacobs Entertainment, Inc. 6.75% 2/15/29 (b) | | 8,585 | 8,450 |
| Light & Wonder International, Inc. 7.5% 9/1/31 (b) | | 5,990 | 6,188 |
| MGM Resorts International 4.75% 10/15/28 | | 11,125 | 10,754 |
| Ontario Gaming GTA LP / OTG Co. issuer, Inc. 8% 8/1/30 (b) | | 12,285 | 12,627 |
| Premier Entertainment Sub LLC: | | | |
| 5.625% 9/1/29 (b) | | 13,730 | 9,714 |
| 5.875% 9/1/31 (b) | | 2,100 | 1,355 |
| Station Casinos LLC 4.625% 12/1/31 (b) | | 9,135 | 8,301 |
| Studio City Finance Ltd. 5% 1/15/29 (b) | | 5,700 | 5,137 |
| VICI Properties LP / VICI Note Co.: | | | |
| 3.875% 2/15/29 (b) | | 11,195 | 10,534 |
| 4.25% 12/1/26 (b) | | 21,450 | 21,041 |
| 4.625% 12/1/29 (b) | | 12,240 | 11,757 |
| | | | 202,139 |
| Healthcare - 3.8% | | | |
| 180 Medical, Inc. 3.875% 10/15/29 (b) | | 6,495 | 6,041 |
| Avantor Funding, Inc. 3.875% 11/1/29 (b) | | 6,075 | 5,603 |
| Bausch + Lomb Corp. 8.375% 10/1/28 (b) | | 11,980 | 12,569 |
| Bausch Health Companies, Inc.: | | | |
| 4.875% 6/1/28 (b) | | 17,445 | 13,480 |
| 5.75% 8/15/27 (b) | | 18,030 | 14,881 |
| 6.125% 2/1/27 (b) | | 31,505 | 28,438 |
| 11% 9/30/28 (b) | | 5,140 | 4,730 |
| Charles River Laboratories International, Inc.: | | | |
| 3.75% 3/15/29 (b) | | 10,515 | 9,639 |
| 4% 3/15/31 (b) | | 12,085 | 10,801 |
| 4.25% 5/1/28 (b) | | 3,400 | 3,232 |
| CHS/Community Health Systems, Inc.: | | | |
| 4.75% 2/15/31 (b) | | 21,790 | 18,172 |
| 5.25% 5/15/30 (b) | | 18,245 | 15,923 |
| 6% 1/15/29 (b) | | 8,490 | 7,995 |
| 6.125% 4/1/30 (b) | | 21,795 | 17,065 |
| 10.875% 1/15/32 (b) | | 19,370 | 20,759 |
| DaVita, Inc.: | | | |
| 3.75% 2/15/31 (b) | | 4,180 | 3,635 |
| 4.625% 6/1/30 (b) | | 31,515 | 29,013 |
| Grifols SA 4.75% 10/15/28 (b) | | 6,075 | 5,598 |
| HAH Group Holding Co. LLC 9.75% 10/1/31 (b) | | 9,035 | 9,206 |
| HealthEquity, Inc. 4.5% 10/1/29 (b) | | 6,410 | 6,109 |
| IQVIA, Inc. 5% 5/15/27 (b) | | 12,070 | 11,915 |
| Jazz Securities DAC 4.375% 1/15/29 (b) | | 12,305 | 11,644 |
| Molina Healthcare, Inc.: | | | |
| 3.875% 11/15/30 (b) | | 10,465 | 9,476 |
| 3.875% 5/15/32 (b) | | 12,160 | 10,780 |
| 4.375% 6/15/28 (b) | | 7,525 | 7,220 |
| Organon & Co. / Organon Foreign Debt Co-Issuer BV: | | | |
| 4.125% 4/30/28 (b) | | 21,010 | 19,907 |
| 5.125% 4/30/31 (b) | | 18,260 | 16,653 |
| Owens & Minor, Inc. 4.5% 3/31/29 (b) | | 8,310 | 7,478 |
| Tenet Healthcare Corp.: | | | |
| 4.25% 6/1/29 | | 17,640 | 16,688 |
| 4.375% 1/15/30 | | 43,755 | 41,022 |
| 5.125% 11/1/27 | | 18,070 | 17,917 |
| 6.125% 6/15/30 | | 30,025 | 30,166 |
| 6.25% 2/1/27 | | 35,815 | 35,843 |
| 6.75% 5/15/31 | | 6,005 | 6,139 |
| Teva Pharmaceutical Finance Netherlands III BV: | | | |
| 4.75% 5/9/27 | | 6,085 | 5,918 |
| 5.125% 5/9/29 | | 6,085 | 5,909 |
| 7.875% 9/15/29 | | 5,935 | 6,404 |
| | | | 503,968 |
| Homebuilders/Real Estate - 1.7% | | | |
| Arcosa, Inc. 4.375% 4/15/29 (b) | | 8,410 | 7,936 |
| Ashton Woods U.S.A. LLC/Ashton Woods Finance Co. 4.625% 4/1/30 (b) | | 8,940 | 8,233 |
| Brookfield Residential Properties, Inc./Brookfield Residential U.S. Corp. 4.875% 2/15/30 (b) | | 7,775 | 7,231 |
| Century Communities, Inc. 3.875% 8/15/29 (b) | | 9,110 | 8,286 |
| Greystar Real Estate Partners 7.75% 9/1/30 (b) | | 5,305 | 5,558 |
| Jones DesLauriers Insurance Management, Inc. 10.5% 12/15/30 (b) | | 3,840 | 4,137 |
| LGI Homes, Inc. 8.75% 12/15/28 (b) | | 6,060 | 6,384 |
| MPT Operating Partnership LP/MPT Finance Corp.: | | | |
| 3.5% 3/15/31 | | 11,190 | 7,924 |
| 4.625% 8/1/29 | | 18,080 | 14,061 |
| 5% 10/15/27 | | 38,043 | 33,574 |
| Panther Escrow Issuer LLC 7.125% 6/1/31 (b) | | 21,230 | 21,737 |
| Shea Homes Ltd. Partnership/Corp. 4.75% 4/1/29 | | 8,020 | 7,606 |
| Taylor Morrison Communities, Inc./Monarch Communities, Inc.: | | | |
| 5.125% 8/1/30 (b) | | 10,725 | 10,373 |
| 5.875% 6/15/27 (b) | | 9,260 | 9,298 |
| TopBuild Corp. 3.625% 3/15/29 (b) | | 5,910 | 5,418 |
| TRI Pointe Homes, Inc. 5.7% 6/15/28 | | 14,380 | 14,289 |
| Uniti Group LP/Uniti Group Finance, Inc./CSL Capital LLC: | | | |
| 4.75% 4/15/28 (b) | | 31,410 | 28,873 |
| 6.5% 2/15/29 (b) | | 14,000 | 12,053 |
| 10.5% 2/15/28 (b) | | 4,785 | 5,097 |
| Weekley Homes LLC/Weekley Finance Corp. 4.875% 9/15/28 (b) | | 5,045 | 4,821 |
| | | | 222,889 |
| Hotels - 0.5% | | | |
| Carnival Holdings (Bermuda) Ltd. 10.375% 5/1/28 (b) | | 17,635 | 18,931 |
| Hilton Domestic Operating Co., Inc.: | | | |
| 3.75% 5/1/29 (b) | | 5,595 | 5,206 |
| 4% 5/1/31 (b) | | 8,395 | 7,647 |
| 4.875% 1/15/30 | | 6,900 | 6,686 |
| 5.875% 4/1/29 (b) | | 8,555 | 8,682 |
| 6.125% 4/1/32 (b) | | 11,955 | 12,074 |
| Hilton Worldwide Finance LLC/Hilton Worldwide Finance Corp. 4.875% 4/1/27 | | 8,435 | 8,372 |
| | | | 67,598 |
| Insurance - 2.1% | | | |
| Acrisure LLC / Acrisure Finance, Inc.: | | | |
| 6% 8/1/29 (b) | | 9,105 | 8,616 |
| 7.5% 11/6/30 (b) | | 6,065 | 6,167 |
| 8.25% 2/1/29 (b) | | 28,450 | 28,913 |
| Alliant Holdings Intermediate LLC/Alliant Holdings Co.-Issuer: | | | |
| 4.25% 10/15/27 (b) | | 11,125 | 10,551 |
| 5.875% 11/1/29 (b) | | 9,115 | 8,609 |
| 6.75% 10/15/27 (b) | | 49,965 | 49,778 |
| 6.75% 4/15/28 (b) | | 35,177 | 35,343 |
| 7% 1/15/31 (b) | | 10,385 | 10,455 |
| AmWINS Group, Inc. 4.875% 6/30/29 (b) | | 8,805 | 8,287 |
| AssuredPartners, Inc.: | | | |
| 5.625% 1/15/29 (b) | | 8,355 | 7,906 |
| 7.5% 2/15/32 (b) | | 6,065 | 6,108 |
| HUB International Ltd.: | | | |
| 5.625% 12/1/29 (b) | | 36,135 | 34,992 |
| 7.25% 6/15/30 (b) | | 38,895 | 40,195 |
| 7.375% 1/31/32 (b) | | 15,140 | 15,444 |
| MGIC Investment Corp. 5.25% 8/15/28 | | 7,710 | 7,595 |
| USI, Inc. 7.5% 1/15/32 (b) | | 8,005 | 8,167 |
| | | | 287,126 |
| Leisure - 1.2% | | | |
| Boyne U.S.A., Inc. 4.75% 5/15/29 (b) | | 6,360 | 6,065 |
| Carnival Corp.: | | | |
| 4% 8/1/28 (b) | | 56,090 | 53,467 |
| 7% 8/15/29 (b) | | 6,075 | 6,353 |
| 7.625% 3/1/26 (b) | | 19,665 | 19,803 |
| Merlin Entertainments PLC 5.75% 6/15/26 (b) | | 7,725 | 7,617 |
| NCL Corp. Ltd. 5.875% 2/15/27 (b) | | 12,100 | 12,087 |
| Royal Caribbean Cruises Ltd.: | | | |
| 5.375% 7/15/27 (b) | | 9,125 | 9,108 |
| 6.25% 3/15/32 (b) | | 12,110 | 12,346 |
| SeaWorld Parks & Entertainment, Inc. 5.25% 8/15/29 (b) | | 12,145 | 11,664 |
| Viking Ocean Cruises Ship VII Ltd. 5.625% 2/15/29 (b) | | 4,965 | 4,896 |
| Voc Escrow Ltd. 5% 2/15/28 (b) | | 19,690 | 19,141 |
| | | | 162,547 |
| Metals/Mining - 1.4% | | | |
| Alcoa Nederland Holding BV: | | | |
| 4.125% 3/31/29 (b) | | 15,485 | 14,562 |
| 6.125% 5/15/28 (b) | | 3,565 | 3,571 |
| 7.125% 3/15/31 (b) | | 4,970 | 5,182 |
| Arsenal AIC Parent LLC 8% 10/1/30 (b) | | 7,040 | 7,400 |
| Cleveland-Cliffs, Inc.: | | | |
| 4.625% 3/1/29 (b) | | 23,720 | 22,223 |
| 4.875% 3/1/31 (b) | | 11,440 | 10,556 |
| 6.75% 4/15/30 (b) | | 3,000 | 2,997 |
| Eldorado Gold Corp. 6.25% 9/1/29 (b) | | 13,719 | 13,529 |
| ERO Copper Corp. 6.5% 2/15/30 (b) | | 9,085 | 8,926 |
| First Quantum Minerals Ltd.: | | | |
| 8.625% 6/1/31 (b) | | 21,965 | 22,130 |
| 9.375% 3/1/29 (b) | | 14,250 | 15,150 |
| FMG Resources August 2006 Pty Ltd.: | | | |
| 4.375% 4/1/31 (b) | | 8,990 | 8,184 |
| 4.5% 9/15/27 (b) | | 9,015 | 8,776 |
| HudBay Minerals, Inc. 4.5% 4/1/26 (b) | | 7,020 | 6,932 |
| Mineral Resources Ltd.: | | | |
| 8% 11/1/27 (b) | | 6,040 | 6,193 |
| 8.125% 5/1/27 (b) | | 18,015 | 18,143 |
| 8.5% 5/1/30 (b) | | 4,475 | 4,603 |
| 9.25% 10/1/28 (b) | | 10,605 | 11,165 |
| Murray Energy Corp.: | | | |
| 11.25% (b)(c)(e) | | 8,915 | 0 |
| 12% pay-in-kind (b)(c)(e)(f) | | 10,343 | 0 |
| | | | 190,222 |
| Paper - 0.7% | | | |
| Ardagh Metal Packaging Finance U.S.A. LLC/Ardagh Metal Packaging Finance PLC: | | | |
| 3.25% 9/1/28 (b) | | 5,915 | 5,330 |
| 4% 9/1/29 (b) | | 11,830 | 10,377 |
| 6% 6/15/27 (b) | | 6,045 | 6,028 |
| Cascades, Inc.: | | | |
| 5.125% 1/15/26 (b) | | 5,600 | 5,570 |
| 5.375% 1/15/28 (b) | | 5,600 | 5,509 |
| Clydesdale Acquisition Holdings, Inc.: | | | |
| 6.625% 4/15/29 (b) | | 7,185 | 7,219 |
| 8.75% 4/15/30 (b) | | 44,650 | 45,342 |
| Mercer International, Inc. 5.125% 2/1/29 | | 15,060 | 12,998 |
| | | | 98,373 |
| Restaurants - 0.6% | | | |
| 1011778 BC Unlimited Liability Co./New Red Finance, Inc.: | | | |
| 3.875% 1/15/28 (b) | | 12,115 | 11,547 |
| 4% 10/15/30 (b) | | 39,005 | 35,227 |
| 4.375% 1/15/28 (b) | | 10,600 | 10,195 |
| Bloomin Brands, Inc. / OSI Restaurant Partners LLC 5.125% 4/15/29 (b) | | 5,565 | 5,160 |
| Garden SpinCo Corp. 8.625% 7/20/30 (b) | | 5,205 | 5,633 |
| Papa John's International, Inc. 3.875% 9/15/29 (b) | | 5,560 | 5,071 |
| Yum! Brands, Inc. 4.625% 1/31/32 | | 11,975 | 11,227 |
| | | | 84,060 |
| Services - 3.5% | | | |
| Adtalem Global Education, Inc. 5.5% 3/1/28 (b) | | 9,010 | 8,820 |
| AECOM 5.125% 3/15/27 | | 11,885 | 11,821 |
| Artera Services LLC 8.5% 2/15/31 (b) | | 25,315 | 25,088 |
| Atlas Luxco 4 SARL / Allied Universal Holdco LLC / Allied Universal Finance Corp. 4.625% 6/1/28 (b) | | 7,690 | 7,200 |
| Brand Industrial Services, Inc. 10.375% 8/1/30 (b) | | 44,695 | 47,383 |
| Camelot Finance SA 4.5% 11/1/26 (b) | | 10,590 | 10,403 |
| CoreCivic, Inc. 8.25% 4/15/29 | | 34,400 | 36,125 |
| Fair Isaac Corp. 4% 6/15/28 (b) | | 2,910 | 2,763 |
| H&E Equipment Services, Inc. 3.875% 12/15/28 (b) | | 16,800 | 15,512 |
| Hertz Corp.: | | | |
| 4.625% 12/1/26 (b) | | 6,240 | 4,714 |
| 5% 12/1/29 (b) | | 7,615 | 4,862 |
| 5.5% (b)(c)(e) | | 10,890 | 599 |
| 6% (b)(c)(e) | | 10,285 | 1,748 |
| 6.25% (c)(e) | | 11,875 | 683 |
| 7.125% (b)(c)(e) | | 10,285 | 1,903 |
| 12.625% 7/15/29 (b) | | 2,915 | 3,091 |
| Iron Mountain, Inc.: | | | |
| 4.5% 2/15/31 (b) | | 22,025 | 20,451 |
| 4.875% 9/15/29 (b) | | 24,110 | 23,219 |
| Neptune BidCo U.S., Inc. 9.29% 4/15/29 (b) | | 47,450 | 44,129 |
| OpenLane, Inc. 5.125% 6/1/25 (b) | | 10,355 | 10,294 |
| Service Corp. International 4% 5/15/31 | | 12,070 | 10,885 |
| The Brink's Co. 4.625% 10/15/27 (b) | | 12,180 | 11,857 |
| The GEO Group, Inc.: | | | |
| 8.625% 4/15/29 | | 21,310 | 22,290 |
| 10.25% 4/15/31 | | 15,225 | 16,318 |
| TriNet Group, Inc. 3.5% 3/1/29 (b) | | 8,865 | 8,061 |
| Uber Technologies, Inc.: | | | |
| 4.5% 8/15/29 (b) | | 27,335 | 26,532 |
| 6.25% 1/15/28 (b) | | 9,175 | 9,265 |
| 7.5% 9/15/27 (b) | | 19,197 | 19,554 |
| 8% 11/1/26 (b) | | 51,060 | 51,060 |
| WASH Multifamily Acquisition, Inc. 5.75% 4/15/26 (b) | | 9,760 | 9,736 |
| | | | 466,366 |
| Steel - 0.2% | | | |
| Algoma Steel SCA 0% 12/31/24 (c) | | 1,982 | 0 |
| ATI, Inc. 7.25% 8/15/30 | | 5,985 | 6,202 |
| Commercial Metals Co. 3.875% 2/15/31 | | 6,135 | 5,508 |
| Roller Bearing Co. of America, Inc. 4.375% 10/15/29 (b) | | 4,375 | 4,111 |
| Vallourec SA 7.5% 4/15/32 (b) | | 12,405 | 12,993 |
| | | | 28,814 |
| Super Retail - 1.4% | | | |
| Asbury Automotive Group, Inc.: | | | |
| 4.5% 3/1/28 | | 3,534 | 3,411 |
| 4.625% 11/15/29 (b) | | 10,005 | 9,368 |
| 4.75% 3/1/30 | | 3,523 | 3,315 |
| 5% 2/15/32 (b) | | 10,800 | 9,949 |
| Bath & Body Works, Inc.: | | | |
| 6.625% 10/1/30 (b) | | 23,165 | 23,195 |
| 6.75% 7/1/36 | | 12,766 | 12,835 |
| 7.5% 6/15/29 | | 8,335 | 8,582 |
| EG Global Finance PLC 12% 11/30/28 (b) | | 93,735 | 104,224 |
| LBM Acquisition LLC 6.25% 1/15/29 (b) | | 17,805 | 16,421 |
| | | | 191,300 |
| Technology - 3.3% | | | |
| Acuris Finance U.S. 5% 5/1/28 (b) | | 9,045 | 8,163 |
| Block, Inc. 3.5% 6/1/31 | | 12,070 | 10,699 |
| CA Magnum Holdings 5.375% 10/31/26 (b) | | 4,870 | 4,779 |
| Clarivate Science Holdings Corp.: | | | |
| 3.875% 7/1/28 (b) | | 10,695 | 10,094 |
| 4.875% 7/1/29 (b) | | 10,115 | 9,559 |
| Cloud Software Group, Inc. 6.5% 3/31/29 (b) | | 101,715 | 99,331 |
| Coherent Corp. 5% 12/15/29 (b) | | 9,495 | 9,109 |
| Crowdstrike Holdings, Inc. 3% 2/15/29 | | 8,870 | 8,066 |
| Elastic NV 4.125% 7/15/29 (b) | | 24,245 | 22,436 |
| Gen Digital, Inc. 5% 4/15/25 (b) | | 10,050 | 10,022 |
| Go Daddy Operating Co. LLC / GD Finance Co., Inc.: | | | |
| 3.5% 3/1/29 (b) | | 11,810 | 10,899 |
| 5.25% 12/1/27 (b) | | 9,345 | 9,236 |
| ION Trading Technologies Ltd.: | | | |
| 5.75% 5/15/28 (b) | | 12,040 | 10,915 |
| 9.5% 5/30/29 (b) | | 9,105 | 9,250 |
| Iron Mountain Information Management Services, Inc. 5% 7/15/32 (b) | | 9,100 | 8,577 |
| Lightning Power LLC 7.25% 8/15/32 (b) | | 11,955 | 12,437 |
| NCR Atleos Corp. 9.5% 4/1/29 (b) | | 8,995 | 9,900 |
| NCR Voyix Corp.: | | | |
| 5% 10/1/28 (b) | | 5,530 | 5,320 |
| 5.125% 4/15/29 (b) | | 2,583 | 2,469 |
| ON Semiconductor Corp. 3.875% 9/1/28 (b) | | 11,065 | 10,376 |
| Open Text Corp. 6.9% 12/1/27 (b) | | 10,610 | 11,031 |
| Open Text Holdings, Inc.: | | | |
| 4.125% 2/15/30 (b) | | 5,690 | 5,224 |
| 4.125% 12/1/31 (b) | | 5,485 | 4,926 |
| PTC, Inc.: | | | |
| 3.625% 2/15/25 (b) | | 6,650 | 6,611 |
| 4% 2/15/28 (b) | | 6,575 | 6,290 |
| Roblox Corp. 3.875% 5/1/30 (b) | | 9,120 | 8,254 |
| Seagate HDD Cayman: | | | |
| 8.25% 12/15/29 | | 19,590 | 21,075 |
| 8.5% 7/15/31 | | 12,720 | 13,714 |
| Sensata Technologies BV 4% 4/15/29 (b) | | 11,970 | 11,193 |
| Synaptics, Inc. 4% 6/15/29 (b) | | 7,015 | 6,435 |
| TTM Technologies, Inc. 4% 3/1/29 (b) | | 8,870 | 8,293 |
| Twilio, Inc.: | | | |
| 3.625% 3/15/29 | | 9,995 | 9,204 |
| 3.875% 3/15/31 | | 10,460 | 9,438 |
| UKG, Inc. 6.875% 2/1/31 (b) | | 9,090 | 9,313 |
| Unisys Corp. 6.875% 11/1/27 (b) | | 6,095 | 5,958 |
| Wolfspeed, Inc. 4.2917% 6/23/30 pay-in-kind (b)(c)(f)(g) | | 23,590 | 22,646 |
| | | | 441,242 |
| Telecommunications - 2.1% | | | |
| Altice Financing SA: | | | |
| 5% 1/15/28 (b) | | 14,560 | 12,313 |
| 5.75% 8/15/29 (b) | | 25,600 | 20,995 |
| Altice France SA: | | | |
| 5.125% 1/15/29 (b) | | 2,945 | 2,206 |
| 5.125% 7/15/29 (b) | | 76,070 | 56,897 |
| 5.5% 1/15/28 (b) | | 4,740 | 3,678 |
| 5.5% 10/15/29 (b) | | 109,185 | 81,751 |
| C&W Senior Finance Ltd. 6.875% 9/15/27 (b) | | 22,290 | 22,069 |
| Frontier Communications Holdings LLC: | | | |
| 5% 5/1/28 (b) | | 19,575 | 19,243 |
| 5.875% 10/15/27 (b) | | 10,375 | 10,353 |
| Millicom International Cellular SA 4.5% 4/27/31 (b) | | 1,725 | 1,548 |
| Qwest Corp. 7.25% 9/15/25 | | 1,480 | 1,475 |
| SBA Communications Corp.: | | | |
| 3.125% 2/1/29 | | 13,305 | 12,108 |
| 3.875% 2/15/27 | | 17,015 | 16,468 |
| Uniti Group LP/Uniti Fiber Holdings, Inc./CSL Capital LLC 6% 1/15/30 (b) | | 7,365 | 6,170 |
| VMED O2 UK Financing I PLC 4.75% 7/15/31 (b) | | 21,200 | 18,360 |
| | | | 285,634 |
| Textiles/Apparel - 0.1% | | | |
| Crocs, Inc.: | | | |
| 4.125% 8/15/31 (b) | | 6,075 | 5,322 |
| 4.25% 3/15/29 (b) | | 8,675 | 7,957 |
| Kontoor Brands, Inc. 4.125% 11/15/29 (b) | | 5,320 | 4,958 |
| | | | 18,237 |
| Transportation Ex Air/Rail - 0.2% | | | |
| Seaspan Corp. 5.5% 8/1/29 (b) | | 9,095 | 8,651 |
| XPO, Inc.: | | | |
| 6.25% 6/1/28 (b) | | 5,950 | 6,040 |
| 7.125% 2/1/32 (b) | | 9,085 | 9,438 |
| | | | 24,129 |
| Utilities - 2.0% | | | |
| Clearway Energy Operating LLC: | | | |
| 3.75% 2/15/31 (b) | | 13,295 | 11,868 |
| 3.75% 1/15/32 (b) | | 6,075 | 5,383 |
| 4.75% 3/15/28 (b) | | 6,920 | 6,712 |
| NextEra Energy Partners LP 7.25% 1/15/29 (b) | | 6,060 | 6,233 |
| NRG Energy, Inc.: | | | |
| 3.375% 2/15/29 (b) | | 5,145 | 4,691 |
| 3.625% 2/15/31 (b) | | 10,215 | 9,044 |
| 3.875% 2/15/32 (b) | | 1,254 | 1,114 |
| 5.75% 1/15/28 | | 9,000 | 9,005 |
| 6% 2/1/33 (b) | | 4,240 | 4,217 |
| 6.25% 11/1/34 (b) | | 5,090 | 5,085 |
| Pacific Gas & Electric Co.: | | | |
| 3.45% 7/1/25 | | 2,868 | 2,838 |
| 3.75% 7/1/28 | | 2,868 | 2,754 |
| 3.95% 12/1/47 | | 10,826 | 8,142 |
| 4% 12/1/46 | | 13,774 | 10,501 |
| 4.3% 3/15/45 | | 5,995 | 4,851 |
| PG&E Corp.: | | | |
| 5% 7/1/28 | | 22,000 | 21,458 |
| 5.25% 7/1/30 | | 8,330 | 8,118 |
| Pike Corp.: | | | |
| 5.5% 9/1/28 (b) | | 37,175 | 36,426 |
| 8.625% 1/31/31 (b) | | 15,130 | 16,075 |
| Vistra Operations Co. LLC: | | | |
| 4.375% 5/1/29 (b) | | 23,230 | 22,113 |
| 5% 7/31/27 (b) | | 22,585 | 22,288 |
| 5.5% 9/1/26 (b) | | 3,485 | 3,474 |
| 5.625% 2/15/27 (b) | | 28,195 | 28,122 |
| 7.75% 10/15/31 (b) | | 11,985 | 12,661 |
| | | | 263,173 |
TOTAL NONCONVERTIBLE BONDS | | | 6,754,390 |
| TOTAL CORPORATE BONDS (Cost $7,041,936) | | | 6,907,959 |
| | | | |
| Asset-Backed Securities - 0.2% |
| | | Principal Amount (a) (000s) | Value ($) (000s) |
| Agl Clo 5 Ltd. Series 2024-5A Class ERR, CME Term SOFR 3 Month Index + 6.350% 10.9674% 7/20/34 (b)(f)(h) | | 746 | 747 |
| Ares Loan Funding Vii Ltd. Series 2024-ALF7 Class E, CME Term SOFR 3 Month Index + 6.250% 10.7901% 10/22/37 (b)(f)(h) | | 1,152 | 1,171 |
| Birch Grove Clo 5 LLC Series 2024-5A Class ER, CME Term SOFR 3 Month Index + 6.750% 11.5989% 10/20/37 (b)(f)(h) | | 903 | 916 |
| Carlyle U.S. Clo 2024-6 Ltd. Series 2024-6A Class E, CME Term SOFR 3 Month Index + 5.750% 0% 10/25/37 (b)(f)(h)(i) | | 1,082 | 1,082 |
| Carval Clo Xi-C Ltd. Series 2024-3A Class E, CME Term SOFR 3 Month Index + 6.350% 10.9214% 10/20/37 (b)(f)(h) | | 412 | 415 |
| Croton Pk Clo Ltd. CME Term SOFR 3 Month Index + 5.550% 10.1997% 10/15/36 (b)(f)(h) | | 5,156 | 5,211 |
| Golub Capital Partners Clo 76 B Lt Series 2024-76A Class E, CME Term SOFR 3 Month Index + 5.750% 10.4919% 10/25/37 (b)(f)(h) | | 1,000 | 1,006 |
| Magnetite Xxix Ltd. Series 2024-29A Class ER, CME Term SOFR 3 Month Index + 6.000% 11.2417% 7/15/37 (b)(f)(h) | | 914 | 926 |
| Midocean Credit Clo Xvi Series 2024-16A Class E, CME Term SOFR 3 Month Index + 6.250% 6.25% 10/20/37 (b)(f)(h)(i) | | 1,070 | 1,070 |
| Ocp Clo 2017-14 Ltd. Series 2024-14A Class ER, CME Term SOFR 3 Month Index + 6.550% 11.2908% 7/20/37 (b)(f)(h) | | 1,291 | 1,308 |
| Orchard Park Clo Ltd. Series 2024-1A Class E, CME Term SOFR 3 Month Index + 5.600% 10.2529% 10/20/37 (b)(f)(h) | | 2,024 | 2,049 |
| Palmer Square Ln Funding 2024-2 Lt Series 2024-2A Class D, CME Term SOFR 3 Month Index + 4.700% 6.2% 1/15/33 (b)(f)(h)(i) | | 2,485 | 2,485 |
| Rr 31 Ltd. Series 2024-31A Class D, CME Term SOFR 3 Month Index + 6.000% 10.5928% 10/15/39 (b)(f)(h) | | 1,250 | 1,252 |
| TOTAL ASSET-BACKED SECURITIES (Cost $19,485) | | | 19,638 |
| | | | |
| Common Stocks - 20.7% |
| | | Shares | Value ($) (000s) |
| Aerospace - 0.1% | | | |
| TransDigm Group, Inc. | | 13,200 | 17,190 |
| Air Transportation - 0.1% | | | |
| Delta Air Lines, Inc. | | 146,750 | 8,397 |
| Automotive & Auto Parts - 0.5% | | | |
| Allison Transmission Holdings, Inc. | | 151,500 | 16,189 |
| BYD Co. Ltd. (H Shares) | | 1,412,500 | 51,018 |
| UC Holdings, Inc. (c)(j) | | 677,217 | 237 |
TOTAL AUTOMOTIVE & AUTO PARTS | | | 67,444 |
| Banks & Thrifts - 0.2% | | | |
| Blue Owl Capital, Inc. Class A | | 1,137,300 | 25,430 |
| Broadcasting - 0.0% | | | |
| iHeartMedia, Inc. (j) | | 104 | 0 |
| Building Materials - 1.3% | | | |
| Builders FirstSource, Inc. (j) | | 90,400 | 15,495 |
| Carlisle Companies, Inc. | | 94,400 | 39,859 |
| Eagle Materials, Inc. | | 142,000 | 40,535 |
| EMCOR Group, Inc. | | 94,800 | 42,287 |
| Fortune Brands Innovations, Inc. | | 319,300 | 26,607 |
| Martin Marietta Materials, Inc. | | 23,300 | 13,802 |
TOTAL BUILDING MATERIALS | | | 178,585 |
| Capital Goods - 0.5% | | | |
| Deere & Co. | | 14,600 | 5,908 |
| Parker Hannifin Corp. | | 58,900 | 37,347 |
| Trane Technologies PLC | | 75,800 | 28,058 |
TOTAL CAPITAL GOODS | | | 71,313 |
| Chemicals - 0.2% | | | |
| The Chemours Co. LLC | | 857,210 | 15,567 |
| Westlake Corp. | | 34,577 | 4,562 |
TOTAL CHEMICALS | | | 20,129 |
| Consumer Products - 0.1% | | | |
| elf Beauty, Inc. (j) | | 104,900 | 11,041 |
| Containers - 0.2% | | | |
| Graphic Packaging Holding Co. | | 746,300 | 21,090 |
| Diversified Financial Services - 1.6% | | | |
| Apollo Global Management, Inc. | | 610,300 | 87,432 |
| Ares Management Corp. Class A, | | 145,100 | 24,330 |
| Carnelian Point Holdings LP warrants (c)(j) | | 931 | 3 |
| Coinbase Global, Inc. Class A (j) | | 95,100 | 17,047 |
| MasterCard, Inc. Class A | | 92,500 | 46,212 |
| Moody's Corp. | | 33,900 | 15,392 |
| OneMain Holdings, Inc. | | 569,200 | 28,272 |
| PJT Partners, Inc. Class A | | 5,092 | 708 |
TOTAL DIVERSIFIED FINANCIAL SERVICES | | | 219,396 |
| Energy - 1.0% | | | |
| California Resources Corp. | | 17,780 | 924 |
| Canvas Energy, Inc. Series B warrants 10/1/25 (c)(j) | | 392 | 0 |
| Cheniere Energy, Inc. | | 146,800 | 28,095 |
| Energy Transfer LP | | 1,252,700 | 20,644 |
| EP Energy Corp. (c)(j) | | 841,775 | 1,077 |
| Forbes Energy Services Ltd. (c)(j) | | 193,218 | 0 |
| Mesquite Energy, Inc. (c)(j) | | 317,026 | 26,773 |
| Permian Resource Corp. Class A | | 1,353,800 | 18,452 |
| PureWest Energy (c)(j) | | 17,812 | 4 |
| South Bow Corp. | | 927,800 | 23,169 |
| Superior Energy Services, Inc. Class A (c) | | 110,370 | 6,730 |
| Unit Corp. | | 37,978 | 1,181 |
TOTAL ENERGY | | | 127,049 |
| Entertainment/Film - 0.0% | | | |
| New Cotai LLC/New Cotai Capital Corp. (c)(j)(k) | | 3,366,626 | 2,087 |
| Food & Drug Retail - 0.0% | | | |
| Southeastern Grocers, Inc. rights (c)(j) | | 793,345 | 513 |
| Food/Beverage/Tobacco - 0.3% | | | |
| Celsius Holdings, Inc. (j)(l) | | 238,100 | 7,162 |
| U.S. Foods Holding Corp. (j) | | 632,300 | 38,981 |
TOTAL FOOD/BEVERAGE/TOBACCO | | | 46,143 |
| Gaming - 0.3% | | | |
| Boyd Gaming Corp. | | 453,873 | 31,449 |
| Studio City International Holdings Ltd.: | | | |
| ADR (b)(j) | | 631,958 | 3,977 |
| (NYSE) ADR (j) | | 695,700 | 4,378 |
TOTAL GAMING | | | 39,804 |
| Healthcare - 0.2% | | | |
| Cano Health, Inc. warrants (c)(j) | | 10,791 | 43 |
| DaVita, Inc. (j) | | 86,600 | 12,108 |
| Encompass Health Corp. | | 34 | 3 |
| Enhabit Home Health & Hospice (j) | | 17 | 0 |
| Tenet Healthcare Corp. (j) | | 105,498 | 16,354 |
TOTAL HEALTHCARE | | | 28,508 |
| Homebuilders/Real Estate - 1.5% | | | |
| Arthur J. Gallagher & Co. | | 211,900 | 59,586 |
| Comfort Systems U.S.A., Inc. | | 185,100 | 72,382 |
| TopBuild Corp. (j) | | 131,500 | 46,469 |
| Willscot Holdings Corp. (j) | | 610,100 | 20,219 |
TOTAL HOMEBUILDERS/REAL ESTATE | | | 198,656 |
| Leisure - 0.0% | | | |
| Viking Holdings Ltd. | | 34,900 | 1,370 |
| Metals/Mining - 0.0% | | | |
| Elah Holdings, Inc. (j) | | 906 | 32 |
| Restaurants - 0.1% | | | |
| Domino's Pizza, Inc. | | 30,300 | 12,536 |
| Services - 0.6% | | | |
| Airbnb, Inc. Class A (j) | | 202,100 | 27,241 |
| Penhall Acquisition Co. (c) | | 34,884 | 0 |
| Visa, Inc. Class A | | 178,500 | 51,738 |
TOTAL SERVICES | | | 78,979 |
| Steel - 0.0% | | | |
| Algoma Steel SCA (c)(j) | | 198,162 | 0 |
| Super Retail - 1.0% | | | |
| Amazon.com, Inc. (j) | | 256,900 | 47,886 |
| Arena Brands Holding Corp. Class B (c)(j)(k) | | 659,302 | 11,116 |
| Booking Holdings, Inc. | | 4,600 | 21,511 |
| Dick's Sporting Goods, Inc. | | 140,400 | 27,483 |
| Williams-Sonoma, Inc. | | 152,606 | 20,469 |
TOTAL SUPER RETAIL | | | 128,465 |
| Technology - 8.8% | | | |
| Adobe, Inc. (j) | | 80,400 | 38,438 |
| Alphabet, Inc. Class A | | 229,200 | 39,218 |
| Arista Networks, Inc. (j) | | 96,000 | 37,098 |
| ASML Holding NV (depository receipt) | | 21,300 | 14,325 |
| Autodesk, Inc. (j) | | 75,700 | 21,484 |
| Block, Inc. Class A (j) | | 377,300 | 27,286 |
| Dell Technologies, Inc. Class C | | 148,200 | 18,322 |
| Eaton Corp. PLC | | 162,300 | 53,815 |
| Fiserv, Inc. (j) | | 164,300 | 32,515 |
| Gen Digital, Inc. | | 606,400 | 17,652 |
| Intuit, Inc. | | 30,300 | 18,492 |
| KLA Corp. | | 42,500 | 28,315 |
| Lam Research Corp. | | 579,000 | 43,049 |
| Marvell Technology, Inc. | | 273,600 | 21,918 |
| Meta Platforms, Inc. Class A | | 241,300 | 136,957 |
| Micron Technology, Inc. | | 170,800 | 17,020 |
| Microsoft Corp. | | 185,200 | 75,256 |
| MKS Instruments, Inc. | | 155,900 | 15,486 |
| Monday.com Ltd. (j) | | 142,300 | 41,818 |
| Nextracker, Inc. Class A (j) | | 876,300 | 34,894 |
| nVent Electric PLC | | 315,900 | 23,557 |
| NVIDIA Corp. | | 1,349,000 | 179,093 |
| NXP Semiconductors NV | | 43,500 | 10,201 |
| ON Semiconductor Corp. (j) | | 700,403 | 49,371 |
| Oracle Corp. | | 169,900 | 28,516 |
| Pinterest, Inc. Class A (j) | | 966,900 | 30,738 |
| Salesforce, Inc. | | 111,700 | 32,546 |
| Taiwan Semiconductor Manufacturing Co. Ltd. sponsored ADR | | 229,000 | 43,634 |
| Vertiv Holdings Co. | | 414,400 | 45,290 |
TOTAL TECHNOLOGY | | | 1,176,304 |
| Telecommunications - 0.3% | | | |
| EchoStar Corp. Class A (j) | | 769,300 | 19,279 |
| GTT Communications, Inc. (c)(j) | | 85,487 | 4,621 |
| Palo Alto Networks, Inc. (j) | | 54,800 | 19,746 |
TOTAL TELECOMMUNICATIONS | | | 43,646 |
| Textiles/Apparel - 0.3% | | | |
| Crocs, Inc. (j) | | 297,900 | 32,120 |
| LVMH Moet Hennessy Louis Vuitton SE | | 11,800 | 7,856 |
TOTAL TEXTILES/APPAREL | | | 39,976 |
| Transportation Ex Air/Rail - 0.0% | | | |
| Tricer Holdco SCA: | | | |
| Class A1 (c)(j)(k) | | 598,287 | 0 |
| Class A2 (c)(j)(k) | | 598,287 | 0 |
| Class A3 (c)(j)(k) | | 598,287 | 0 |
| Class A4 (c)(j)(k) | | 598,287 | 0 |
| Class A5 (c)(j)(k) | | 598,287 | 0 |
| Class A6 (c)(j)(k) | | 598,287 | 0 |
| Class A7 (c)(j)(k) | | 598,287 | 0 |
| Class A8 (c)(j)(k) | | 598,287 | 0 |
| Class A9 (c)(j)(k) | | 598,287 | 0 |
TOTAL TRANSPORTATION EX AIR/RAIL | | | 0 |
| Utilities - 1.5% | | | |
| Constellation Energy Corp. | | 254,300 | 66,871 |
| Core & Main, Inc. Class A (j) | | 352,800 | 15,622 |
| PG&E Corp. | | 2,097,796 | 42,417 |
| Portland General Electric Co. | | 14,817 | 702 |
| Vistra Corp. | | 636,300 | 79,512 |
TOTAL UTILITIES | | | 205,124 |
| TOTAL COMMON STOCKS (Cost $2,006,621) | | | 2,769,207 |
| | | | |
| Nonconvertible Preferred Stocks - 0.0% |
| | | Shares | Value ($) (000s) |
| Transportation Ex Air/Rail - 0.0% | | | |
Tricer Holdco SCA (c)(j)(k) (Cost $10,250) | | 287,159,690 | 3 |
| | | | |
| Bank Loan Obligations - 9.4% |
| | | Principal Amount (a) (000s) | Value ($) (000s) |
| Aerospace - 0.1% | | | |
| TransDigm, Inc. Tranche L 1LN, term loan CME Term SOFR 1 Month Index + 2.500% 7.3196% 1/20/32 (f)(h)(m) | | 10,250 | 10,253 |
| Air Transportation - 0.0% | | | |
| SkyMiles IP Ltd. Tranche B 1LN, term loan CME Term SOFR 3 Month Index + 3.750% 8.3674% 10/20/27 (f)(h)(m) | | 1,284 | 1,307 |
| United Airlines, Inc. Tranche 1LN, term loan CME Term SOFR 3 Month Index + 2.750% 7.3848% 2/24/31 (f)(h)(m) | | 2,716 | 2,718 |
TOTAL AIR TRANSPORTATION | | | 4,025 |
| Automotive & Auto Parts - 0.1% | | | |
| Belron Finance 2019 LLC Tranche B 1LN, term loan CME Term SOFR 1 Month Index + 2.750% 7.5359% 10/1/31 (f)(h)(m) | | 4,685 | 4,701 |
| Clarios Global LP Tranche B 1LN, term loan CME Term SOFR 1 Month Index + 2.500% 7.1852% 5/6/30 (f)(h)(m) | | 2,638 | 2,639 |
| Wand NewCo 3, Inc. Tranche B 1LN, term loan CME Term SOFR 1 Month Index + 3.250% 7.9052% 1/30/31 (f)(h)(m) | | 2,224 | 2,224 |
TOTAL AUTOMOTIVE & AUTO PARTS | | | 9,564 |
| Banks & Thrifts - 0.1% | | | |
| Citadel Securities LP Tranche B 1LN, term loan CME Term SOFR 1 Month Index + 2.250% 7.0954% 7/29/30 (f)(h)(m) | | 9,504 | 9,502 |
| Broadcasting - 0.1% | | | |
| Diamond Sports Group LLC 1LN, term loan CME Term SOFR 1 Month Index + 8.000% 14.9441% 5/25/26 (f)(h)(m) | | 3,007 | 2,588 |
| Univision Communications, Inc.: | | | |
| 1LN, term loan CME Term SOFR 3 Month Index + 4.250% 8.8537% 6/24/29 (f)(h)(m) | | 738 | 731 |
| Tranche B 1LN, term loan CME Term SOFR 1 Month Index + 3.250% 8.0496% 1/31/29 (f)(h)(m) | | 7,313 | 7,191 |
TOTAL BROADCASTING | | | 10,510 |
| Building Materials - 0.2% | | | |
| Hunter Douglas, Inc. Tranche B 1LN, term loan CME Term SOFR 3 Month Index + 3.500% 8.5713% 2/25/29 (f)(h)(m) | | 22,243 | 22,136 |
| MIWD Holdco II LLC Tranche B2, term loan CME Term SOFR 1 Month Index + 3.500% 7.6852% 3/28/31 (f)(h)(m) | | 783 | 785 |
TOTAL BUILDING MATERIALS | | | 22,921 |
| Chemicals - 0.5% | | | |
| Consolidated Energy Finance SA Tranche B 1LN, term loan CME Term SOFR 1 Month Index + 4.500% 9.5572% 11/15/30 (f)(h)(m) | | 12,064 | 11,349 |
| Discovery Purchaser Corp. 1LN, term loan CME Term SOFR 3 Month Index + 4.370% 8.9647% 10/4/29 (f)(h)(m) | | 44,651 | 44,568 |
| Olympus Water U.S. Holding Corp. Tranche B 1LN, term loan CME Term SOFR 3 Month Index + 3.500% 8.1037% 6/23/31 (f)(h)(m) | | 3,342 | 3,345 |
| W.R. Grace Holding LLC Tranche B 1LN, term loan CME Term SOFR 3 Month Index + 3.750% 7.8537% 9/22/28 (f)(h)(m) | | 14,606 | 14,624 |
TOTAL CHEMICALS | | | 73,886 |
| Consumer Products - 0.3% | | | |
| Kronos Acquisition Holdings, Inc. Tranche B 1LN, term loan CME Term SOFR 1 Month Index + 4.000% 8.584% 6/27/31 (f)(h)(m) | | 19,693 | 18,474 |
| TKC Holdings, Inc. 1LN, term loan CME Term SOFR 1 Month Index + 5.000% 9.7592% 5/15/28 (f)(h)(m) | | 26,709 | 26,587 |
TOTAL CONSUMER PRODUCTS | | | 45,061 |
| Containers - 0.0% | | | |
| Kloeckner Pentaplast of America, Inc. Tranche B 1LN, term loan CME Term SOFR 6 Month Index + 4.750% 9.7229% 2/9/26 (f)(h)(m) | | 1,452 | 1,350 |
| Diversified Financial Services - 0.2% | | | |
| Focus Financial Partners LLC: | | | |
| Tranche B8 1LN, term loan CME Term SOFR 1 Month Index + 3.250% 7.9352% 9/17/31 (f)(h)(m) | | 21,749 | 21,759 |
| Tranche DD 1LN, term loan CME Term SOFR 1 Month Index + 3.250% 0% 9/10/31 (f)(g)(h)(m) | | 2,336 | 2,337 |
TOTAL DIVERSIFIED FINANCIAL SERVICES | | | 24,096 |
| Energy - 0.4% | | | |
| EG America LLC Tranche BC 1LN, term loan CME Term SOFR 1 Month Index + 5.500% 10.4445% 2/7/28 (f)(h)(m) | | 46,885 | 46,897 |
| Epic Crude Services LP Tranche B 1LN, term loan CME Term SOFR 1 Month Index + 3.000% 7.6559% 10/9/31 (f)(h)(m) | | 1,820 | 1,818 |
| Forbes Energy Services LLC Tranche B, term loan 0% (c)(e)(f)(m) | | 1,810 | 0 |
| Mesquite Energy, Inc.: | | | |
| 1LN, term loan 3 month U.S. LIBOR + 8.000% 0% (c)(e)(f)(h)(m) | | 5,861 | 0 |
| term loan 0% (c)(e)(f)(m) | | 2,528 | 0 |
TOTAL ENERGY | | | 48,715 |
| Environmental - 0.0% | | | |
| Madison IAQ LLC Tranche B 1LN, term loan CME Term SOFR 1 Month Index + 3.250% 7.8892% 6/21/28 (f)(h)(m) | | 2,932 | 2,928 |
| Reworld Holding Corp.: | | | |
| Tranche B 1LN, term loan CME Term SOFR 1 Month Index + 2.500% 7.1929% 11/30/28 (f)(h)(m) | | 2,159 | 2,160 |
| Tranche C 1LN, term loan CME Term SOFR 6 Month Index + 2.500% 7.5877% 11/30/28 (f)(h)(m) | | 166 | 166 |
TOTAL ENVIRONMENTAL | | | 5,254 |
| Food/Beverage/Tobacco - 0.0% | | | |
| Fiesta Purchaser, Inc. Tranche B 1LN, term loan CME Term SOFR 1 Month Index + 4.000% 8.6852% 2/12/31 (f)(h)(m) | | 2,145 | 2,149 |
| Naked Juice LLC 1LN, term loan CME Term SOFR 3 Month Index + 3.250% 7.9537% 1/24/29 (f)(h)(m) | | 2,234 | 1,668 |
TOTAL FOOD/BEVERAGE/TOBACCO | | | 3,817 |
| Gaming - 0.3% | | | |
| Fertitta Entertainment LLC NV Tranche B 1LN, term loan CME Term SOFR 1 Month Index + 3.750% 8.1852% 1/29/29 (f)(h)(m) | | 29,297 | 29,298 |
| Ontario Gaming GTA LP Tranche B 1LN, term loan CME Term SOFR 3 Month Index + 4.250% 8.8932% 8/1/30 (f)(h)(m) | | 5,960 | 5,957 |
TOTAL GAMING | | | 35,255 |
| Healthcare - 0.3% | | | |
| Gainwell Acquisition Corp. Tranche B 1LN, term loan CME Term SOFR 3 Month Index + 4.000% 8.7037% 10/1/27 (f)(h)(m) | | 17,228 | 16,522 |
| Medline Borrower LP Tranche B 1LN, term loan CME Term SOFR 1 Month Index + 2.750% 7.4352% 10/23/28 (f)(h)(m) | | 22,804 | 22,819 |
| Phoenix Newco, Inc. Tranche B 1LN, term loan CME Term SOFR 1 Month Index + 3.000% 7.6852% 11/15/28 (f)(h)(m) | | 6,744 | 6,738 |
TOTAL HEALTHCARE | | | 46,079 |
| Insurance - 0.8% | | | |
| Acrisure LLC: | | | |
| Tranche B1 1LN, term loan CME Term SOFR 3 Month Index + 3.000% 7.7592% 2/16/27 (f)(h)(m) | | 16,408 | 16,364 |
| Tranche B6 1LN, term loan CME Term SOFR 3 Month Index + 3.250% 8.0092% 11/6/30 (f)(h)(m) | | 11,760 | 11,731 |
| Alliant Holdings Intermediate LLC Tranche B6 1LN, term loan CME Term SOFR 1 Month Index + 3.000% 7.7592% 9/19/31 (f)(h)(m) | | 34,502 | 34,329 |
| HUB International Ltd. Tranche B 1LN, term loan CME Term SOFR 3 Month Index + 2.750% 7.3674% 6/20/30 (f)(h)(m) | | 9,184 | 9,200 |
| Truist Insurance Holdings LLC: | | | |
| 2L, term loan CME Term SOFR 3 Month Index + 4.750% 9.3537% 5/6/32 (f)(h)(m) | | 25,720 | 26,035 |
| Tranche B 1LN, term loan CME Term SOFR 3 Month Index + 3.250% 7.8537% 5/6/31 (f)(h)(m) | | 4,905 | 4,908 |
TOTAL INSURANCE | | | 102,567 |
| Leisure - 0.4% | | | |
| Carnival Corp. Tranche B 1LN, term loan: | | | |
| CME Term SOFR 1 Month Index + 2.750% 7.4352% 8/9/27 (f)(h)(m) | | 18,998 | 19,034 |
| CME Term SOFR 1 Month Index + 2.750% 7.4352% 10/18/28 (f)(h)(m) | | 28,776 | 28,812 |
| United PF Holdings LLC 1LN, term loan CME Term SOFR 3 Month Index + 4.000% 8.847% 12/30/26 (f)(h)(m) | | 9,035 | 8,679 |
TOTAL LEISURE | | | 56,525 |
| Metals/Mining - 0.0% | | | |
| Arsenal AIC Parent LLC Tranche B 1LN, term loan CME Term SOFR 1 Month Index + 3.250% 7.9352% 8/19/30 (f)(h)(m) | | 1,624 | 1,625 |
| Paper - 0.5% | | | |
| Clydesdale Acquisition Holdings, Inc. 1LN, term loan CME Term SOFR 1 Month Index + 3.670% 7.8602% 4/13/29 (f)(h)(m) | | 62,363 | 62,192 |
| Services - 1.0% | | | |
| ABG Intermediate Holdings 2 LLC Tranche B1 1LN, term loan CME Term SOFR 1 Month Index + 2.750% 7.4465% 12/21/28 (f)(h)(m) | | 17,622 | 17,653 |
| Artera Services LLC Tranche B 1LN, term loan CME Term SOFR 3 Month Index + 4.500% 9.1037% 2/10/31 (f)(h)(m) | | 6,313 | 6,236 |
| Ascend Learning LLC: | | | |
| 2LN, term loan CME Term SOFR 1 Month Index + 5.750% 10.5352% 12/10/29 (f)(h)(m) | | 15,190 | 14,912 |
| Tranche B 1LN, term loan CME Term SOFR 1 Month Index + 3.500% 8.2852% 12/10/28 (f)(h)(m) | | 17,680 | 17,666 |
| Bifm California Buyer, Inc. Tranche 1LN, term loan CME Term SOFR 1 Month Index + 4.250% 8.9352% 5/31/28 (f)(h)(m) | | 1,448 | 1,452 |
| Brand Industrial Services, Inc. Tranche B 1LN, term loan CME Term SOFR 3 Month Index + 4.500% 9.7477% 8/1/30 (f)(h)(m) | | 31,218 | 30,779 |
| Neptune BidCo U.S., Inc. Tranche B 1LN, term loan CME Term SOFR 3 Month Index + 5.000% 9.7583% 4/11/29 (f)(h)(m) | | 15,445 | 14,248 |
| Sabert Corp. Tranche B 1LN, term loan CME Term SOFR 1 Month Index + 3.000% 7.8591% 12/10/26 (f)(h)(m) | | 4,968 | 4,977 |
| Spin Holdco, Inc. Tranche B 1LN, term loan CME Term SOFR 3 Month Index + 4.000% 9.256% 3/4/28 (f)(h)(m) | | 17,648 | 15,275 |
| STS Operating, Inc. 1LN, term loan CME Term SOFR 1 Month Index + 4.000% 8.7852% 3/25/31 (f)(h)(m) | | 6,114 | 6,096 |
| The GEO Group, Inc. Tranche B 1LN, term loan CME Term SOFR 1 Month Index + 5.250% 9.9352% 4/14/29 (f)(h)(m) | | 3,924 | 3,991 |
TOTAL SERVICES | | | 133,285 |
| Super Retail - 0.9% | | | |
| Great Outdoors Group LLC Tranche B 1LN, term loan CME Term SOFR 1 Month Index + 3.750% 8.5496% 3/5/28 (f)(h)(m) | | 3,007 | 3,011 |
| LBM Acquisition LLC Tranche B 1LN, term loan CME Term SOFR 1 Month Index + 3.750% 8.6684% 6/6/31 (f)(h)(m) | | 116,959 | 115,175 |
TOTAL SUPER RETAIL | | | 118,186 |
| Technology - 3.1% | | | |
| Acuris Finance U.S., Inc. 1LN, term loan CME Term SOFR 1 Month Index + 3.750% 8.418% 2/16/28 (f)(h)(m) | | 702 | 700 |
| Amentum Holdings, Inc. 1LN, term loan CME Term SOFR 1 Month Index + 2.250% 6.9352% 9/29/31 (f)(h)(m) | | 5,895 | 5,891 |
| Applied Systems, Inc.: | | | |
| Tranche 2LN, term loan CME Term SOFR 3 Month Index + 5.250% 9.8537% 2/23/32 (f)(h)(m) | | 225 | 231 |
| Tranche B 1LN, term loan CME Term SOFR 3 Month Index + 3.500% 7.6037% 2/24/31 (f)(h)(m) | | 11,805 | 11,827 |
| Athenahealth Group, Inc. Tranche B 1LN, term loan CME Term SOFR 1 Month Index + 3.250% 7.9352% 2/15/29 (f)(h)(m) | | 28,966 | 28,852 |
| ConnectWise LLC Tranche B 1LN, term loan CME Term SOFR 3 Month Index + 3.500% 8.3653% 9/30/28 (f)(h)(m) | | 18,030 | 18,003 |
| Cotiviti, Inc. Tranche B 1LN, term loan CME Term SOFR 1 Month Index + 3.250% 8.0941% 5/1/31 (f)(h)(m) | | 41,238 | 41,238 |
| DG Investment Intermediate Holdings, Inc. Tranche B 1LN, term loan CME Term SOFR 1 Month Index + 3.750% 8.5496% 3/31/28 (f)(h)(m) | | 1,964 | 1,961 |
| First Advantage Holdings LLC Tranche B 1LN, term loan CME Term SOFR 1 Month Index + 2.750% 7.9352% 1/31/27 (f)(h)(m) | | 3,110 | 3,099 |
| Lightning Power LLC Tranche B 1LN, term loan CME Term SOFR 1 Month Index + 3.250% 8.3455% 8/18/31 (f)(h)(m) | | 2,960 | 2,965 |
| McAfee Corp. Tranche B 1LN, term loan CME Term SOFR 1 Month Index + 3.250% 8.0995% 3/1/29 (f)(h)(m) | | 30,936 | 30,846 |
| MH Sub I LLC Tranche B 1LN, term loan CME Term SOFR 1 Month Index + 4.250% 8.9352% 5/3/28 (f)(h)(m) | | 17,602 | 17,485 |
| Modena Buyer LLC 1LN, term loan CME Term SOFR 3 Month Index + 4.500% 9.1037% 7/1/31 (f)(h)(m) | | 29,405 | 28,119 |
| Polaris Newco LLC Tranche B 1LN, term loan CME Term SOFR 3 Month Index + 4.000% 8.847% 6/2/28 (f)(h)(m) | | 6,572 | 6,522 |
| Project Alpha Intermediate Holding, Inc. Tranche B 1LN, term loan CME Term SOFR 3 Month Index + 3.750% 8.3354% 10/28/30 (f)(h)(m) | | 11,955 | 11,994 |
| Proofpoint, Inc. Tranche B 1LN, term loan CME Term SOFR 1 Month Index + 3.000% 7.6852% 8/31/28 (f)(h)(m) | | 77,998 | 78,014 |
| RealPage, Inc. Tranche B 1LN, term loan CME Term SOFR 1 Month Index + 3.000% 7.7996% 4/22/28 (f)(h)(m) | | 5,849 | 5,760 |
| UKG, Inc. Tranche B 1LN, term loan CME Term SOFR 3 Month Index + 3.500% 7.6172% 2/10/31 (f)(h)(m) | | 83,847 | 83,915 |
| VS Buyer LLC Tranche B 1LN, term loan CME Term SOFR 1 Month Index + 3.250% 8.0359% 4/14/31 (f)(h)(m) | | 35,087 | 35,087 |
TOTAL TECHNOLOGY | | | 412,509 |
| Telecommunications - 0.1% | | | |
| Aventiv Technologies LLC 1LN, term loan: | | | |
| CME Term SOFR 3 Month Index + 5.090% 9.9553% 7/31/25 (f)(h)(m) | | 7,077 | 6,169 |
| CME Term SOFR 3 Month Index + 7.500% 12.3653% 7/31/25 (f)(h)(m) | | 183 | 183 |
| Connect U.S. Finco LLC Tranche B 1LN, term loan CME Term SOFR 1 Month Index + 4.500% 9.1852% 9/13/29 (f)(h)(m) | | 8,667 | 7,857 |
| GTT Communications, Inc. 1LN, term loan CME Term SOFR 1 Month Index + 9.000% 13.9454% 6/30/28 (f)(h)(m) | | 4,158 | 3,095 |
| Gtt Remainco LLC 1LN, term loan CME Term SOFR 1 Month Index + 7.000% 11.7852% 12/30/27 (f)(h)(m) | | 4,812 | 4,517 |
TOTAL TELECOMMUNICATIONS | | | 21,821 |
| Utilities - 0.0% | | | |
| Talen Energy Supply LLC: | | | |
| Tranche TLB-EXIT 1LN, term loan CME Term SOFR 1 Month Index + 4.500% 8.5955% 5/17/30 (f)(h)(m) | | 553 | 554 |
| Tranche TLC-EXIT 1LN, term loan CME Term SOFR 1 Month Index + 4.500% 8.5955% 5/17/30 (f)(h)(m) | | 364 | 365 |
TOTAL UTILITIES | | | 919 |
| TOTAL BANK LOAN OBLIGATIONS (Cost $1,268,918) | | | 1,259,917 |
| | | | |
| Preferred Securities - 2.7% |
| | | Principal Amount (a) (000s) | Value ($) (000s) |
| Banks & Thrifts - 1.8% | | | |
| Ally Financial, Inc. 4.7% (f)(n) | | 7,055 | 5,794 |
| Bank of America Corp. 5.875% (f)(n) | | 102,630 | 104,344 |
| Citigroup, Inc. 4.7% (f)(n) | | 15,285 | 15,369 |
| JPMorgan Chase & Co.: | | | |
| 4% (f)(n) | | 26,340 | 26,019 |
| 4.6% (f)(n) | | 31,365 | 31,575 |
| Wells Fargo & Co. 5.875% (f)(n) | | 50,420 | 51,411 |
TOTAL BANKS & THRIFTS | | | 234,512 |
| Diversified Financial Services - 0.0% | | | |
| OEC Finance Ltd. 7.5% pay-in-kind (b)(n) | | 40 | 1 |
| Energy - 0.6% | | | |
| Energy Transfer LP: | | | |
| 6.5% (f)(n) | | 10,860 | 11,152 |
| 6.625% (f)(n) | | 35,195 | 34,946 |
| 7.125% (f)(n) | | 26,105 | 27,395 |
| Summit Midstream Corp. 3 month U.S. LIBOR + 7.430% 12.6383% (e)(f)(h)(n) | | 2,912 | 4,353 |
TOTAL ENERGY | | | 77,846 |
| Homebuilders/Real Estate - 0.3% | | | |
| Alliant Holdings LP 10% (c)(f)(n) | | 46,268 | 46,158 |
| TOTAL PREFERRED SECURITIES (Cost $352,766) | | | 358,517 |
| | | | |
| Other - 2.7% |
| | | Shares | Value ($) (000s) |
| Other - 2.7% | | | |
Fidelity Private Credit Co. LLC (k)(o) (Cost $362,317) | | 36,401,533 | 366,917 |
| | | | |
| Money Market Funds - 12.2% |
| | | Shares | Value ($) (000s) |
| Fidelity Cash Central Fund 4.87% (p) | | 1,630,207,760 | 1,630,534 |
| Fidelity Securities Lending Cash Central Fund 4.87% (p)(q) | | 5,603,290 | 5,604 |
| TOTAL MONEY MARKET FUNDS (Cost $1,636,091) | | | 1,636,138 |
| | | | |
| TOTAL INVESTMENT IN SECURITIES - 99.5% (Cost $12,698,384) | 13,318,296 |
NET OTHER ASSETS (LIABILITIES) - 0.5% | 69,231 |
| NET ASSETS - 100.0% | 13,387,527 |
| | |
Any values shown as $0 in the Schedule of Investments may reflect amounts less than $500.
Legend
| (a) | Amount is stated in United States dollars unless otherwise noted. |
| (b) | Security exempt from registration under Rule 144A of the Securities Act of 1933. These securities may be resold in transactions exempt from registration, normally to qualified institutional buyers. At the end of the period, the value of these securities amounted to $5,393,320,000 or 40.3% of net assets. |
| (d) | Security initially issued at one coupon which converts to a higher coupon at a specified date. The rate shown is the rate at period end. |
| (e) | Non-income producing - Security is in default. |
| (f) | Coupon rates for floating and adjustable rate securities reflect the rates in effect at period end. |
| (g) | Position or a portion of the position represents an unfunded loan commitment. At period end, the total principal amount and market value of unfunded commitments totaled $17,472,000 and $16,844,000, respectively. |
| (h) | Coupon is indexed to a floating interest rate which may be multiplied by a specified factor and/or subject to caps or floors. |
| (i) | Security or a portion of the security purchased on a delayed delivery or when-issued basis. |
| (k) | Restricted securities (including private placements) - Investment in securities not registered under the Securities Act of 1933 (excluding 144A issues). At the end of the period, the value of restricted securities (excluding 144A issues) amounted to $380,123,000 or 2.8% of net assets. |
| (l) | Security or a portion of the security is on loan at period end. |
| (m) | Remaining maturities of bank loan obligations may be less than the stated maturities shown as a result of contractual or optional prepayments by the borrower. Such prepayments cannot be predicted with certainty. |
| (n) | Security is perpetual in nature with no stated maturity date. |
| (p) | Affiliated fund that is generally available only to investment companies and other accounts managed by Fidelity Investments. The rate quoted is the annualized seven-day yield of the fund at period end. A complete unaudited listing of the fund's holdings as of its most recent quarter end is available upon request. In addition, each Fidelity Central Fund's financial statements are available on the SEC's website or upon request. |
| (q) | Investment made with cash collateral received from securities on loan. |
| Additional information on each restricted holding is as follows: |
| Security | Acquisition Date | Acquisition Cost ($) (000s) |
| Arena Brands Holding Corp. Class B | 6/18/97 - 1/12/99 | 21,592 |
| | | |
| Fidelity Private Credit Co. LLC | 4/15/22 - 10/28/24 | 362,317 |
| | | |
| New Cotai LLC/New Cotai Capital Corp. | 9/11/20 | 16,677 |
| | | |
| Tricer Holdco SCA | 10/16/09 - 12/30/17 | 10,248 |
| | | |
| Tricer Holdco SCA Class A1 | 10/16/09 - 10/29/09 | 1,653 |
| | | |
| Tricer Holdco SCA Class A2 | 10/16/09 - 10/29/09 | 1,653 |
| | | |
| Tricer Holdco SCA Class A3 | 10/16/09 - 10/29/09 | 1,653 |
| | | |
| Tricer Holdco SCA Class A4 | 10/16/09 - 10/29/09 | 1,653 |
| | | |
| Tricer Holdco SCA Class A5 | 10/16/09 - 10/29/09 | 1,653 |
| | | |
| Tricer Holdco SCA Class A6 | 10/16/09 - 10/29/09 | 1,653 |
| | | |
| Tricer Holdco SCA Class A7 | 10/16/09 - 10/29/09 | 1,653 |
| | | |
| Tricer Holdco SCA Class A8 | 10/16/09 - 10/29/09 | 1,653 |
| | | |
| Tricer Holdco SCA Class A9 | 10/16/09 - 10/29/09 | 1,655 |
| | | |
Affiliated Central Funds
Fiscal year to date information regarding the Fund's investments in Fidelity Central Funds, including the ownership percentage, is presented below.
| Affiliate (Amounts in thousands) | Value, beginning of period ($) | Purchases ($) | Sales Proceeds ($) | Dividend Income ($) | Realized Gain (loss) ($) | Change in Unrealized appreciation (depreciation) ($) | Value, end of period ($) | % ownership, end of period |
| Fidelity Cash Central Fund 4.87% | 662,430 | 1,676,445 | 708,343 | 30,873 | 2 | - | 1,630,534 | 3.2% |
| Fidelity Securities Lending Cash Central Fund 4.87% | 1,079 | 90,452 | 85,927 | 2 | - | - | 5,604 | 0.0% |
| Total | 663,509 | 1,766,897 | 794,270 | 30,875 | 2 | - | 1,636,138 | |
| | | | | | | | | |
Amounts in the dividend income column in the above table include any capital gain distributions from underlying funds, which are presented in the corresponding line item in the Statement of Operations, if applicable.
Amounts in the dividend income column for Fidelity Securities Lending Cash Central Fund represents the income earned on investing cash collateral, less rebates paid to borrowers and any lending agent fees associated with the loan, plus any premium payments received for lending certain types of securities.
Amounts included in the purchases and sales proceeds columns may include in-kind transactions, if applicable.
Affiliated Underlying Funds
Fiscal year to date information regarding the Fund's investments in affiliated Underlying Funds is presented below. Exchanges between classes of the same affiliated Underlying Funds may occur. If an Underlying Funds changes its name, the name presented below is the name in effect at period end.
| Affiliate (Amounts in thousands) | Value, beginning of period ($) | Purchases ($) | Sales Proceeds ($) | Dividend Income ($) | Realized Gain (loss) ($) | Change in Unrealized appreciation (depreciation) ($) | Value, end of period ($) |
| Fidelity Private Credit Co. LLC | 354,826 | 15,137 | - | 25,180 | - | (3,046) | 366,917 |
| | 354,826 | 15,137 | - | 25,180 | - | (3,046) | 366,917 |
Amounts in the dividend income column in the above table include any capital gain distributions from underlying funds, which are presented in the corresponding line item in the Statement of Operations, if applicable.
Amounts included in the purchases and sales proceeds columns may include in-kind transactions, if applicable.
Investment Valuation
The following is a summary of the inputs used, as of October 31, 2024, involving the Fund's assets and liabilities carried at fair value. The inputs or methodology used for valuing securities may not be an indication of the risk associated with investing in those securities. For more information on valuation inputs, and their aggregation into the levels used below, please refer to the Investment Valuation section in the accompanying Notes to Financial Statements.
| Valuation Inputs at Reporting Date: |
Description (Amounts in thousands) | Total ($) | Level 1 ($) | Level 2 ($) | Level 3 ($) |
Investments in Securities: | | | | |
|
| Equities: | | | | |
Communication Services | 226,192 | 226,192 | - | - |
Consumer Discretionary | 349,203 | 276,889 | 58,874 | 13,440 |
Consumer Staples | 57,697 | 57,184 | - | 513 |
Energy | 127,045 | 92,465 | - | 34,580 |
Financials | 415,951 | 415,948 | - | 3 |
Health Care | 28,508 | 28,465 | - | 43 |
Industrials | 503,119 | 503,116 | - | 3 |
Information Technology | 776,401 | 771,780 | - | 4,621 |
Materials | 95,588 | 95,588 | - | - |
Utilities | 189,506 | 189,502 | - | 4 |
|
| Corporate Bonds | 6,907,959 | - | 6,871,827 | 36,132 |
|
| Asset-Backed Securities | 19,638 | - | 19,638 | - |
|
| Bank Loan Obligations | 1,259,917 | - | 1,259,917 | - |
|
| Preferred Securities | 358,517 | - | 312,359 | 46,158 |
|
| Other | 366,917 | - | 366,917 | - |
|
| Money Market Funds | 1,636,138 | 1,636,138 | - | - |
| Total Investments in Securities: | 13,318,296 | 4,293,267 | 8,889,532 | 135,497 |
| | | | | |
|
| Net Unrealized Appreciation on Unfunded Commitments | 11,505 | (1,409) | - | 12,914 |
| Total | 11,505 | (1,409) | - | 12,914 |
The following is a reconciliation of Investments in Securities for which Level 3 inputs were used in determining value:
| (Amounts in thousands) | |
| Investments in Securities: | |
| Beginning Balance | $ | 70,291 | |
| Net Realized Gain (Loss) on Investment Securities | | 693 | |
| Net Unrealized Gain (Loss) on Investment Securities | | 1,859 | |
| Cost of Purchases | | 72,888 | |
| Proceeds of Sales | | (10,244) | |
| Amortization/Accretion | | 38 | |
| Transfers into Level 3 | | - | |
| Transfers out of Level 3 | | (28) | |
| Ending Balance | $ | 135,497 | |
| The change in unrealized gain (loss) for the period attributable to Level 3 securities held at October 31, 2024 | $ | 398 | |
| The information used in the above reconciliation represents fiscal year to date activity for any Investments in Securities identified as using Level 3 inputs at either the beginning or the end of the current fiscal period. Cost of purchases and proceeds of sales may include securities received and/or delivered through in-kind transactions, corporate actions or exchanges. Transfers into Level 3 were attributable to a lack of observable market data resulting from decreases in market activity, decreases in liquidity, security restructurings or corporate actions. Transfers out of Level 3 were attributable to observable market data becoming available for those securities. Transfers in or out of Level 3 represent the beginning value of any Security or Instrument where a change in the pricing level occurred from the beginning to the end of the period. Realized and unrealized gains (losses) disclosed in the reconciliation are included in Net Gain (Loss) on the Fund's Statement of Operations. | |
Financial Statements (Unaudited)
| Statement of Assets and Liabilities |
| As of October 31, 2024 (Unaudited) Amounts in thousands (except per-share amount) |
| Assets | | | | |
| Investment in securities, at value (including securities loaned of $5,351) - See accompanying schedule: | | | | |
Unaffiliated issuers (cost $10,699,976) | $ | 11,315,241 | | |
Fidelity Central Funds (cost $1,636,091) | | 1,636,138 | | |
Other affiliated issuers (cost $362,317) | | 366,917 | | |
| | | | | |
| | | | | |
| Total Investment in Securities (cost $12,698,384) | | | $ | 13,318,296 |
| Cash | | | | 851 |
| Receivable for investments sold | | | | 455 |
| Unrealized appreciation on unfunded commitments | | | | 12,914 |
| Receivable for fund shares sold | | | | 16,472 |
| Dividends receivable | | | | 443 |
| Interest receivable | | | | 122,977 |
| Distributions receivable from Fidelity Central Funds | | | | 6,506 |
| Prepaid expenses | | | | 15 |
| Other receivables | | | | 533 |
Total assets | | | | 13,479,462 |
| Liabilities | | | | |
| Payable for investments purchased | | | | |
Regular delivery | $ | 54,559 | | |
Delayed delivery | | 4,637 | | |
| Unrealized depreciation on unfunded commitments | | 1,409 | | |
| Payable for fund shares redeemed | | 11,378 | | |
| Distributions payable | | 6,509 | | |
| Accrued management fee | | 6,981 | | |
| Other payables and accrued expenses | | 858 | | |
| Collateral on securities loaned | | 5,604 | | |
| Total liabilities | | | | 91,935 |
| Commitments and contingent liabilities (see Significant Accounting Policies note) | | | | |
| Net Assets | | | $ | 13,387,527 |
| Net Assets consist of: | | | | |
| Paid in capital | | | $ | 12,813,742 |
| Total accumulated earnings (loss) | | | | 573,785 |
| Net Assets | | | $ | 13,387,527 |
Net Asset Value, offering price and redemption price per share ($13,387,527 ÷ 1,317,645 shares) | | | $ | 10.16 |
| Statement of Operations |
Six months ended October 31, 2024 (Unaudited) Amounts in thousands |
| Investment Income | | | | |
| Dividends: | | | | |
| Unaffiliated issuers | | | $ | 35,510 |
| Affiliated issuers | | | | 25,180 |
| Interest | | | | 306,964 |
| Income from Fidelity Central Funds (including $2 from security lending) | | | | 30,875 |
| Total income | | | | 398,529 |
| Expenses | | | | |
| Management fee | $ | 42,108 | | |
| Custodian fees and expenses | | 17 | | |
| Independent trustees' fees and expenses | | 26 | | |
| Registration fees | | 128 | | |
| Audit fees | | 66 | | |
| Legal | | 72 | | |
| Miscellaneous | | 343 | | |
| Total expenses before reductions | | 42,760 | | |
| Expense reductions | | (1,308) | | |
| Total expenses after reductions | | | | 41,452 |
| Net Investment income (loss) | | | | 357,077 |
| Realized and Unrealized Gain (Loss) | | | | |
| Net realized gain (loss) on: | | | | |
| Investment Securities: | | | | |
| Unaffiliated issuers | | (9,914) | | |
| Fidelity Central Funds | | 2 | | |
| Foreign currency transactions | | 31 | | |
| Total net realized gain (loss) | | | | (9,881) |
| Change in net unrealized appreciation (depreciation) on: | | | | |
| Investment Securities: | | | | |
| Unaffiliated issuers | | 489,484 | | |
| Affiliated issuers | | (3,046) | | |
| Unfunded commitments | | 11,505 | | |
| Assets and liabilities in foreign currencies | | (4) | | |
| Total change in net unrealized appreciation (depreciation) | | | | 497,939 |
| Net gain (loss) | | | | 488,058 |
| Net increase (decrease) in net assets resulting from operations | | | $ | 845,135 |
| Statement of Changes in Net Assets |
| |
| Amount in thousands | | Six months ended October 31, 2024 (Unaudited) | | Year ended April 30, 2024 |
| Increase (Decrease) in Net Assets | | | | |
| Operations | | | | |
| Net investment income (loss) | $ | 357,077 | $ | 669,300 |
| Net realized gain (loss) | | (9,881) | | (96,078) |
| Change in net unrealized appreciation (depreciation) | | 497,939 | | 679,285 |
| Net increase (decrease) in net assets resulting from operations | | 845,135 | | 1,252,507 |
| Distributions to shareholders | | (313,513) | | (651,200) |
| | | | | |
| Share transactions | | | | |
| Proceeds from sales of shares | | 1,139,078 | | 2,290,716 |
| Reinvestment of distributions | | 273,984 | | 567,039 |
| Cost of shares redeemed | | (1,208,202) | | (2,265,878) |
| | | | | |
Net increase (decrease) in net assets resulting from share transactions | | 204,860 | | 591,877 |
| Total increase (decrease) in net assets | | 736,482 | | 1,193,184 |
| | | | | |
| Net Assets | | | | |
| Beginning of period | | 12,651,045 | | 11,457,861 |
| End of period | $ | 13,387,527 | $ | 12,651,045 |
| | | | | |
| Other Information | | | | |
| Shares | | | | |
| Sold | | 113,950 | | 241,969 |
| Issued in reinvestment of distributions | | 27,305 | | 59,793 |
| Redeemed | | (120,795) | | (239,445) |
| Net increase (decrease) | | 20,460 | | 62,317 |
| | | | | |
Financial Highlights
Fidelity® Capital & Income Fund |
| |
| | Six months ended (Unaudited) October 31, 2024 | | Years ended April 30, 2024 | | 2023 | | 2022 | | 2021 | | 2020 |
Selected Per-Share Data | | | | | | | | | | | | |
| Net asset value, beginning of period | $ | 9.75 | $ | 9.28 | $ | 10.17 | $ | 11.24 | $ | 8.92 | $ | 10.08 |
| Income from Investment Operations | | | | | | | | | | | | |
Net investment income (loss) A,B | | .274 | | .529 | | .480 | | .387 | | .386 | | .426 |
| Net realized and unrealized gain (loss) | | .376 | | .456 | | (.308) | | (.714) | | 2.442 | | (1.085) |
| Total from investment operations | | .650 | | .985 | | .172 | | (.327) | | 2.828 | | (.659) |
| Distributions from net investment income | | (.240) | | (.515) | | (.473) | | (.390) | | (.390) | | (.425) |
| Distributions from net realized gain | | - | | - | | (.589) | | (.353) | | (.118) | | (.076) |
| Total distributions | | (.240) | | (.515) | | (1.062) | | (.743) | | (.508) | | (.501) |
| Net asset value, end of period | $ | 10.16 | $ | 9.75 | $ | 9.28 | $ | 10.17 | $ | 11.24 | $ | 8.92 |
Total Return C,D | | | | 10.91% | | 2.09% | | (3.27)% | | 32.35% | | (6.89)% |
Ratios to Average Net Assets B,E,F | | | | | | | | | | | | |
| Expenses before reductions | | .65% G | | .67% | | .68% | | .67% | | .68% | | .67% |
| Expenses net of fee waivers, if any | | | | .65% | | .68% | | .67% | | .68% | | .67% |
| Expenses net of all reductions | | .63% G | | .65% | | .68% | | .67% | | .68% | | .67% |
| Net investment income (loss) | | 5.43% G | | 5.60% | | 5.16% | | 3.49% | | 3.75% | | 4.32% |
| Supplemental Data | | | | | | | | | | | | |
| Net assets, end of period (in millions) | $ | 13,388 | $ | 12,651 | $ | 11,458 | $ | 13,077 | $ | 14,674 | $ | 10,228 |
Portfolio turnover rate H | | | | 36% | | 20% | | 28% | | 37% | | 46% |
ACalculated based on average shares outstanding during the period.
BNet investment income (loss) is affected by the timing of the declaration of dividends by any underlying mutual funds or exchange-traded funds (ETFs). Net investment income (loss) of any mutual funds or ETFs is not included in the Fund's net investment income (loss) ratio.
CTotal returns for periods of less than one year are not annualized.
DTotal returns would have been lower if certain expenses had not been reduced during the applicable periods shown.
EFees and expenses of any underlying mutual funds or exchange-traded funds (ETFs) are not included in the Fund's expense ratio. The Fund indirectly bears its proportionate share of these expenses. For additional expense information related to investments in Fidelity Central Funds, please refer to the "Investments in Fidelity Central Funds" note found in the Notes to Financial Statements section of the most recent Annual or Semi-Annual report. For additional expense information related to investments in Fidelity Private Credit Company LLC, please refer to the Investment in Fidelity Private Credit Company LLC note found in the Notes to Financial Statements section of the most recent Annual or Semi-Annual report.
FExpense ratios reflect operating expenses of the class. Expenses before reductions do not reflect amounts reimbursed, waived, or reduced through arrangements with the investment adviser, brokerage services, or other offset arrangements, if applicable, and do not represent the amount paid by the class during periods when reimbursements, waivers or reductions occur.
GAnnualized.
HAmount does not include the portfolio activity of any underlying mutual funds or exchange-traded funds (ETFs).
Notes to Financial Statements
(Unaudited)For the period ended October 31, 2024
(Amounts in thousands except percentages)
1. Organization.
Fidelity Capital & Income Fund (the Fund) is a fund of Fidelity Summer Street Trust (the Trust) and is authorized to issue an unlimited number of shares. Share transactions on the Statement of Changes in Net Assets may contain exchanges between affiliated funds. The Trust is registered under the Investment Company Act of 1940, as amended (the 1940 Act), as an open-end management investment company organized as a Massachusetts business trust.
2. Investments in Fidelity Central Funds.
Funds may invest in Fidelity Central Funds, which are open-end investment companies generally available only to other investment companies and accounts managed by the investment adviser and its affiliates. The Schedule of Investments lists any Fidelity Central Funds held as an investment as of period end, but does not include the underlying holdings of each Fidelity Central Fund. An investing fund indirectly bears its proportionate share of the expenses of the underlying Fidelity Central Funds.
Based on its investment objective, each Fidelity Central Fund may invest or participate in various investment vehicles or strategies that are similar to those of the investing fund. These strategies are consistent with the investment objectives of the investing fund and may involve certain economic risks which may cause a decline in value of each of the Fidelity Central Funds and thus a decline in the value of the investing fund.
| Fidelity Central Fund | Investment Manager | Investment Objective | Investment Practices | Expense RatioA |
| Fidelity Money Market Central Funds | Fidelity Management & Research Company LLC (FMR) | Each fund seeks to obtain a high level of current income consistent with the preservation of capital and liquidity. | Short-term Investments | Less than .005% |
A Expenses expressed as a percentage of average net assets and are as of each underlying Central Fund's most recent annual or semi-annual shareholder report.
A complete unaudited list of holdings for each Fidelity Central Fund is available upon request or at the Securities and Exchange Commission website at www.sec.gov. In addition, the financial statements of the Fidelity Central Funds which contain the significant accounting policies (including investment valuation policies) of those funds, and are not covered by the Report of Independent Registered Public Accounting Firm, are available on the Securities and Exchange Commission website or upon request.
3. Investment in Fidelity Private Credit Company LLC.
The Fund invests in Fidelity Private Credit Company LLC, which is a limited liability company. Fidelity Private Credit Company LLC's units are not registered under the Securities Act of 1933 and are subject to substantial restrictions on transfer. The Fund has no redemption rights under Fidelity Private Credit Company LLC's limited liability company agreement. There will be no trading market for the units.
Based on its investment objective, Fidelity Private Credit Company LLC may invest or participate in various investments or strategies that are similar to those in which the Fund may invest or participate. These strategies are consistent with the investment objectives of the Fund and may involve certain economic risks which may cause a decline in value of Fidelity Private Credit Company LLC and thus a decline in the value of the Fund. Fidelity Private Credit Company LLC intends to invest primarily in directly originated loans to private companies but also with liquid credit investments, like broadly syndicated loans, and other select private credit investments.
The Schedule of Investments lists Fidelity Private Credit Company LLC as an investment as of period end, but does not include the underlying holdings of Fidelity Private Credit Company LLC. Fidelity Private Credit Company LLC represented less than 5% of the Fund's net assets at period end. The Fund indirectly bears its proportionate share of the expenses of Fidelity Private Credit Company LLC. The annualized expense ratio for Fidelity Private Credit Company LLC for the nine month period ended September 30, 2024 was 11.38%.
4. Significant Accounting Policies.
The Fund is an investment company and applies the accounting and reporting guidance of the Financial Accounting Standards Board (FASB) Accounting Standards Codification Topic 946 Financial Services - Investment Companies. The financial statements have been prepared in conformity with accounting principles generally accepted in the United States of America (GAAP), which require management to make certain estimates and assumptions at the date of the financial statements. Actual results could differ from those estimates. Subsequent events, if any, through the date that the financial statements were issued have been evaluated in the preparation of the financial statements. The Fund's Schedule of Investments lists any underlying mutual funds or exchange-traded funds (ETFs) but does not include the underlying holdings of these funds. The following summarizes the significant accounting policies of the Fund:
Investment Valuation. Investments are valued as of 4:00 p.m. Eastern time on the last calendar day of the period. The Board of Trustees (the Board) has designated the Fund's investment adviser as the valuation designee responsible for the fair valuation function and performing fair value determinations as needed. The investment adviser has established a Fair Value Committee (the Committee) to carry out the day-to-day fair valuation responsibilities and has adopted policies and procedures to govern the fair valuation process and the activities of the Committee. In accordance with these fair valuation policies and procedures, which have been approved by the Board, the Fund attempts to obtain prices from one or more third party pricing services or brokers to value its investments. When current market prices, quotations or currency exchange rates are not readily available or reliable, investments will be fair valued in good faith by the Committee, in accordance with the policies and procedures. Factors used in determining fair value vary by investment type and may include market or investment specific events, transaction data, estimated cash flows, and market observations of comparable investments. The frequency that the fair valuation procedures are used cannot be predicted and they may be utilized to a significant extent. The Committee manages the Fund's fair valuation practices and maintains the fair valuation policies and procedures. The Fund's investment adviser reports to the Board information regarding the fair valuation process and related material matters.
The Fund categorizes the inputs to valuation techniques used to value its investments into a disclosure hierarchy consisting of three levels as shown below:
Level 1 - unadjusted quoted prices in active markets for identical investments
Level 2 - other significant observable inputs (including quoted prices for similar investments, interest rates, prepayment speeds, etc.)
Level 3 - unobservable inputs (including the Fund's own assumptions based on the best information available)
Valuation techniques used to value the Fund's investments by major category are as follows:
Debt securities, including restricted securities, are valued based on evaluated prices received from third party pricing services or from brokers who make markets in such securities. Corporate bonds, bank loan obligations and preferred securities are valued by pricing services who utilize matrix pricing which considers yield or price of bonds of comparable quality, coupon, maturity and type or by broker-supplied prices. Asset backed securities are valued by pricing services who utilize matrix pricing which considers prepayment speed assumptions, attributes of the collateral, yield or price of bonds of comparable quality, coupon, maturity and type or by broker-supplied prices. When independent prices are unavailable or unreliable, debt securities may be valued utilizing pricing methodologies which consider similar factors that would be used by third party pricing services. Debt securities are generally categorized as Level 2 in the hierarchy but may be Level 3 depending on the circumstances. The Fund invests a significant portion of its assets in below investment grade securities. The value of these securities can be more volatile due to changes in the credit quality of the issuer and is sensitive to changes in economic, market and regulatory conditions.
Equity securities, including restricted securities, for which market quotations are readily available, are valued at the last reported sale price or official closing price as reported by a third party pricing service on the primary market or exchange on which they are traded and are categorized as Level 1 in the hierarchy. In the event there were no sales during the day or closing prices are not available, securities are valued at the last quoted bid price or may be valued using the last available price and are generally categorized as Level 2 in the hierarchy. For foreign equity securities, when market or security specific events arise, comparisons to the valuation of American Depositary Receipts (ADRs), futures contracts, Exchange-Traded Funds (ETFs) and certain indexes as well as quoted prices for similar securities may be used and would be categorized as Level 2 in the hierarchy. For equity securities, including restricted securities, where observable inputs are limited, assumptions about market activity and risk are used and these securities may be categorized as Level 3 in the hierarchy.
Investments in open-end mutual funds, including the Fidelity Central Funds, are valued at their closing net asset value (NAV) each business day and are categorized as Level 1 in the hierarchy.
Fidelity Private Credit Company LLC is valued at its net asset value (NAV) each month end and is categorized as Level 2 in the hierarchy.
The following provides information on Level 3 securities held by the Fund that were valued at period end based on unobservable inputs. These amounts exclude valuations provided by a broker and valuations using NAV as a practical expedient.
| Asset Type | Fair Value | Valuation Technique(s) | Unobservable Input | Amount or Range/Weighted Average | Impact to Valuation from an Increase in InputA |
| Equities | $53,207 | Market comparable | Enterprise value/Revenue multiple (EV/R) | 0.3 | Increase |
| | | | Enterprise value/EBITDA multiple (EV/EBITDA) | 3.5 - 7.3 / 5.1 | Increase |
| | | Market approach | Transaction price | $0.00 - $2.92 / $2.90 | Increase |
| | | Discounted cash flow | Discount rate | 10.8% | Decrease |
| | | | Yield | 12.2% | Decrease |
| | | Recovery value | Recovery value | $0.00 - $0.65 / $0.64 | Increase |
| | | Black scholes | Discount rate | 4.0% - 4.1% / 4.1% | Increase |
| | | | Term | 2.3 - 4.7 / 2.4 | Increase |
| | | | Volatility | 50.0% - 58.0% / 50.2% | Increase |
| Corporate Bonds | $36,132 | Market approach | Transaction price | $96.00 | Increase |
| | | Recovery value | Recovery value | $0.00 | Increase |
| | | Indicative market price | Evaluated bid | $5.50 - $18.50 / $14.63 | Increase |
| | | Black scholes | Discount rate | 4.1% | Increase |
| | | | Term | 2.3 | Increase |
| | | | Volatility | 50.0% | Increase |
| Preferred Securities | $46,158 | Market approach | Transaction price | $98.50 | Increase |
| Bank Loan Obligations | $- | Recovery value | Recovery value | $0.00 | Increase |
A Represents the directional change in the fair value of the Level 3 investments that could have resulted from an increase in the corresponding input as of period end. A decrease to the unobservable input would have had the opposite effect. Significant changes in these inputs may have resulted in a significantly higher or lower fair value measurement at period end.
Changes in valuation techniques may result in transfers in or out of an assigned level within the disclosure hierarchy. The aggregate value of investments by input level as of October 31, 2024, as well as a roll forward of Level 3 investments, is included at the end of the Fund's Schedule of Investments.
Foreign Currency. Certain Funds may use foreign currency contracts to facilitate transactions in foreign-denominated securities. Gains and losses from these transactions may arise from changes in the value of the foreign currency or if the counterparties do not perform under the contracts' terms.
Foreign-denominated assets, including investment securities, and liabilities are translated into U.S. dollars at the exchange rates at period end. Purchases and sales of investment securities, income and dividends received, and expenses denominated in foreign currencies are translated into U.S. dollars at the exchange rate in effect on the transaction date.
The effects of exchange rate fluctuations on investments are included with the net realized and unrealized gain (loss) on investment securities. Other foreign currency transactions resulting in realized and unrealized gain (loss) are disclosed separately.
Investment Transactions and Income. For financial reporting purposes, the Fund's investment holdings and NAV include trades executed through the end of the last business day of the period. The NAV per share for processing shareholder transactions is calculated as of the close of business of the New York Stock Exchange (NYSE), normally 4:00 p.m. Eastern time and includes trades executed through the end of the prior business day. Gains and losses on securities sold are determined on the basis of identified cost and include proceeds received from litigation. Commissions paid to certain brokers with whom the investment adviser, or its affiliates, places trades on behalf of a fund include an amount in addition to trade execution, which may be rebated back to a fund. Any such rebates are included in net realized gain (loss) on investments in the Statement of Operations. Dividend income is recorded on the ex-dividend date, except for certain dividends from foreign securities where the ex-dividend date may have passed, which are recorded as soon as the Fund is informed of the ex-dividend date. Non-cash dividends included in dividend income, if any, are recorded at the fair market value of the securities received. Income and capital gain distributions from Fidelity Central Funds, if any, are recorded on the ex-dividend date. Certain distributions received by the Fund represent a return of capital or capital gain. The Fund determines the components of these distributions subsequent to the ex-dividend date, based upon receipt of tax filings or other correspondence relating to the underlying investment. These distributions are recorded as a reduction of cost of investments and/or as a realized gain. Interest income is accrued as earned and includes coupon interest and amortization of premium and accretion of discount on debt securities as applicable. Paid in Kind (PIK) income is recorded at the fair market value of the securities received. Investment income is recorded net of foreign taxes withheld where recovery of such taxes is uncertain. Debt obligations may be placed on non-accrual status and related interest income may be reduced by ceasing current accruals and writing off interest receivables when the collection of all or a portion of interest has become doubtful based on consistently applied procedures. A debt obligation is removed from non-accrual status when the issuer resumes interest payments or when collectability of interest is reasonably assured. Funds may file withholding tax reclaims in certain jurisdictions to recover a portion of amounts previously withheld. Any withholding tax reclaims income is included in the Statement of Operations in dividends. Any receivables for withholding tax reclaims are included in the Statement of Assets and Liabilities in dividends receivable.
Expenses. Expenses directly attributable to a fund are charged to that fund. Expenses attributable to more than one fund are allocated among the respective funds on the basis of relative net assets or other appropriate methods. Expenses included in the accompanying financial statements reflect the expenses of that fund and do not include any expenses associated with any underlying mutual funds or exchange-traded funds. Although not included in a fund's expenses, a fund indirectly bears its proportionate share of these expenses through the net asset value of each underlying mutual fund or exchange-traded fund. Expense estimates are accrued in the period to which they relate and adjustments are made when actual amounts are known.
Deferred Trustee Compensation. Under a Deferred Compensation Plan (the Plan) for certain Funds, certain independent Trustees have elected to defer receipt of a portion of their annual compensation. Deferred amounts are invested in affiliated mutual funds, are marked-to-market and remain in a fund until distributed in accordance with the Plan. The investment of deferred amounts and the offsetting payable to the Trustees presented below are included in the accompanying Statement of Assets and Liabilities in other receivables and other payables and accrued expenses, as applicable.
| Fidelity Capital & Income Fund | $531 |
Income Tax Information and Distributions to Shareholders. Each year, the Fund intends to qualify as a regulated investment company under Subchapter M of the Internal Revenue Code, including distributing substantially all of its taxable income and realized gains. As a result, no provision for U.S. Federal income taxes is required. The Fund files a U.S. federal tax return, in addition to state and local tax returns as required. The Fund's federal income tax returns are subject to examination by the Internal Revenue Service (IRS) for a period of three fiscal years after they are filed. State and local tax returns may be subject to examination for an additional fiscal year depending on the jurisdiction. Foreign taxes are provided for based on the Fund's understanding of the tax rules and rates that exist in the foreign markets in which it invests.
Distributions are declared and recorded daily and paid monthly from net investment income. Distributions from realized gains, if any, are declared and recorded on the ex-dividend date. Income and capital gain distributions are determined in accordance with income tax regulations, which may differ from GAAP.
Capital accounts within the financial statements are adjusted for permanent book-tax differences. These adjustments have no impact on net assets or the results of operations. Capital accounts are not adjusted for temporary book-tax differences which will reverse in a subsequent period.
Book-tax differences are primarily due to the short-term gain distributions from the underlying mutual funds or exchange-traded funds (ETFs), foreign currency transactions, partnerships, market discount, capital loss carryforwards and losses deferred due to wash sales and excise tax regulations.
As of period end, the cost and unrealized appreciation (depreciation) in securities, and derivatives if applicable, for federal income tax purposes were as follows:
| Gross unrealized appreciation | $1,174,729 |
| Gross unrealized depreciation | (499,136) |
| Net unrealized appreciation (depreciation) | $675,593 |
| Tax cost | $12,642,703 |
Capital loss carryforwards are only available to offset future capital gains of the Fund to the extent provided by regulations and may be limited. The capital loss carryforward information presented below, including any applicable limitation, is estimated as of prior fiscal period end and is subject to adjustment.
Short-term | $- |
Long-term | (147,585) |
| Total capital loss carryforward | $(147,585) |
Delayed Delivery Transactions and When-Issued Securities. During the period, certain Funds transacted in securities on a delayed delivery or when-issued basis. Payment and delivery may take place after the customary settlement period for that security. The price of the underlying securities and the date when the securities will be delivered and paid for are fixed at the time the transaction is negotiated. Securities purchased on a delayed delivery or when-issued basis are identified as such in the Schedule of Investments. Compensation for interest forgone in the purchase of a delayed delivery or when-issued debt security may be received. With respect to purchase commitments, each applicable Fund identifies securities as segregated in its records with a value at least equal to the amount of the commitment. Payables and receivables associated with the purchases and sales of delayed delivery securities having the same coupon, settlement date and broker are offset. Delayed delivery or when-issued securities that have been purchased from and sold to different brokers are reflected as both payables and receivables in the Statement of Assets and Liabilities under the caption "Delayed delivery", as applicable. Losses may arise due to changes in the value of the underlying securities or if the counterparty does not perform under the contract's terms, or if the issuer does not issue the securities due to political, economic, or other factors.
Restricted Securities (including Private Placements). Funds may invest in securities that are subject to legal or contractual restrictions on resale. These securities generally may be resold in transactions exempt from registration or to the public if the securities are registered. Disposal of these securities may involve time-consuming negotiations and expense, and prompt sale at an acceptable price may be difficult. Information regarding restricted securities held at period end is included at the end of the Schedule of Investments, if applicable.
Loans and Other Direct Debt Instruments. Direct debt instruments are interests in amounts owed to lenders by corporate or other borrowers. These instruments may be in the form of loans, trade claims or other receivables and may include standby financing commitments such as revolving credit facilities that obligate a fund to supply additional cash to the borrower on demand. Loans may be acquired through assignment, participation, or may be made directly to a borrower. Such instruments are presented in the Bank Loan Obligations section in the Schedule of Investments. Certain funds may also invest in unfunded loan commitments, which are contractual obligations for future funding. Information regarding unfunded commitments is included at the end of the Schedule of Investments, if applicable.
Commitments. A commitment is an agreement to acquire an investment at a future date (subject to conditions) in connection with a potential public or non-public offering. The amount of commitments outstanding at period end are presented in the table below. These commitments are not included in the net assets of the Fund at period end.
| | Investment to be Acquired | Commitment Amount ($) |
| Fidelity Capital & Income Fund | Fidelity Private Credit Company LLC | 54,768 |
Commitments. A commitment is an agreement to acquire an investment at a future date (subject to conditions) in connection with a potential public or non-public offering. Commitments outstanding at period end are presented in the table below. Unrealized appreciation (depreciation) on any commitments outstanding at period end is separately presented in the Statement of Assets and Liabilities as Unrealized appreciation (depreciation) on unfunded commitments, and any change in unrealized appreciation (depreciation) on unfunded commitments during the period is separately presented in the Statement of Operations, as applicable based on contractual conditions of each commitment.
| | Investment to be Acquired | Commitment Amount ($) | Unrealized Appreciation (Depreciation)($) |
| Fidelity Capital & Income Fund | EchoStar Corp. 10.75% 9/27/29 | 149,034 | 12,914 |
| Fidelity Capital & Income Fund | EchoStar Corp. | 13,257 | (1,409) |
New Accounting Pronouncement. In November 2023, the FASB issued Accounting Standards Update (ASU) 2023-07 Segment Reporting (Topic 280): Improvements to Reportable Segment Disclosures. Effective for fiscal years beginning after December 15, 2023 and interim periods within fiscal years beginning after December 15, 2024, the amendments enhance required disclosures of segment information for public entities on an annual and interim basis. The ASU allows for early adoption with updates applied retrospectively. Management is currently evaluating the impact of the ASU but does not expect this guidance to materially impact the financial statements.
5. Purchases and Sales of Investments.
Purchases and sales of securities, other than short-term securities and in-kind transactions, as applicable, are noted in the table below.
| | Purchases ($) | Sales ($) |
| Fidelity Capital & Income Fund | 945,736 | 1,700,923 |
6. Fees and Other Transactions with Affiliates.
Management Fee. Fidelity Management & Research Company LLC (the investment adviser) and its affiliates provide the Fund with investment management related services for which the Fund pays a monthly management fee.
Any reference to "class" in this note shall mean "the Fund" as the Fund currently offers only one class of shares. The Fund's management contract incorporates a management fee rate that may vary by class. The investment adviser or an affiliate pays certain expenses of managing and operating the Fund out of each class's management fee. Each class of the Fund pays a management fee to the investment adviser. The management fee is calculated and paid to the investment adviser every month. When determining a class's management fee, a mandate rate is calculated based on the monthly average net assets of a group of funds advised by FMR within a designated asset class. A discount rate is subtracted from the mandate rate once the Fund's monthly average net assets reach a certain level. The mandate rate and discount rate may vary by class. The annual management fee rate for a class of shares of the Fund is the lesser of (1) the class's mandate rate reduced by the class's discount rate (if applicable) or (2) the amount set forth in the following table.
| | Maximum Management Fee Rate % |
| Fidelity Capital & Income Fund | .65 |
One-twelfth of the management fee rate for a class is applied to the average net assets of the class for the month, giving a dollar amount which is the management fee for the class for that month. A different management fee rate may be applicable to each class of the Fund. The difference between classes is the result of separate arrangements for class-level services and/or waivers of certain expenses. It is not the result of any difference in advisory or custodial fees or other expenses related to the management of the Fund's assets, which do not vary by class. For the reporting period, the total annualized management fee rates were as follows:
| | Total Management Fee Rate % |
| Fidelity Capital & Income Fund | .64 |
Brokerage Commissions. A portion of portfolio transactions were placed with brokerage firms which are affiliates of the investment adviser. Brokerage commissions are included in net realized gain (loss) and change in net unrealized appreciation (depreciation) in the Statement of Operations. The commissions paid to these affiliated firms were as follows:
| | Amount ($) |
| Fidelity Capital & Income Fund | 3 |
Interfund Trades. Funds may purchase from or sell securities to other Fidelity Funds under procedures adopted by the Board. The procedures have been designed to ensure these interfund trades are executed in accordance with Rule 17a-7 of the 1940 Act. Any interfund trades are included within the respective purchases and sales amounts shown in the Purchases and Sales of Investments note. Interfund trades during the period are noted in the table below.
| | Purchases ($) | Sales ($) | Realized Gain (Loss)($) |
| Fidelity Capital & Income Fund | 36,415 | 33,968 | 5,700 |
7. Committed Line of Credit.
Certain Funds participate with other funds managed by the investment adviser or an affiliate in a $4.25 billion credit facility (the "line of credit") to be utilized for temporary or emergency purposes to fund shareholder redemptions or for other short-term liquidity purposes. The participating funds have agreed to pay commitment fees on their pro-rata portion of the line of credit, which are reflected in Miscellaneous expenses on the Statement of Operations, and are listed below. During the period, there were no borrowings on this line of credit.
| | Amount ($) |
| Fidelity Capital & Income Fund | 9 |
8. Security Lending.
Funds lend portfolio securities from time to time in order to earn additional income. Lending agents are used, including National Financial Services (NFS), an affiliate of the investment adviser. Pursuant to a securities lending agreement, NFS will receive a fee, which is capped at 9.9% of a fund's daily lending revenue, for its services as lending agent. A fund may lend securities to certain qualified borrowers, including NFS. On the settlement date of the loan, a fund receives collateral (in the form of U.S. Treasury obligations, letters of credit and/or cash) against the loaned securities and maintains collateral in an amount not less than 100% of the market value of the loaned securities during the period of the loan. The market value of the loaned securities is determined at the close of business of a fund and any additional required collateral is delivered to a fund on the next business day. A fund or borrower may terminate the loan at any time, and if the borrower defaults on its obligation to return the securities loaned because of insolvency or other reasons, a fund may apply collateral received from the borrower against the obligation. A fund may experience delays and costs in recovering the securities loaned. Any cash collateral received is invested in the Fidelity Securities Lending Cash Central Fund. Any loaned securities are identified as such in the Schedule of Investments, and the value of loaned securities and cash collateral at period end, as applicable, are presented in the Statement of Assets and Liabilities. Security lending income represents the income earned on investing cash collateral, less rebates paid to borrowers and any lending agent fees associated with the loan, plus any premium payments received for lending certain types of securities. Security lending income is presented in the Statement of Operations as a component of income from Fidelity Central Funds. Affiliated security lending activity, if any, was as follows:
| | Total Security Lending Fees Paid to NFS ($) | Security Lending Income From Securities Loaned to NFS ($) | Value of Securities Loaned to NFS at Period End ($) |
| Fidelity Capital & Income Fund | -A | - | - |
A Amount is less than five-hundred dollars.
9. Expense Reductions.
The investment adviser has contractually agreed to waive the Fund's management fee with respect to the portion of the Fund's assets invested in Fidelity Private Credit Company LLC until August 31, 2025. During the period, this waiver reduced the Fund's management fee by $1,303.
Through arrangements with the Fund's custodian, credits realized as a result of certain uninvested cash balances were used to reduce the Fund's expenses by $5.
10. Other.
A fund's organizational documents provide former and current trustees and officers with a limited indemnification against liabilities arising in connection with the performance of their duties to the fund. In the normal course of business, a fund may also enter into contracts that provide general indemnifications. A fund's maximum exposure under these arrangements is unknown as this would be dependent on future claims that may be made against a fund. The risk of material loss from such claims is considered remote.
11. Risk and Uncertainties.
Many factors affect a fund's performance. Developments that disrupt global economies and financial markets, such as pandemics, epidemics, outbreaks of infectious diseases, war, terrorism, and environmental disasters, may significantly affect a fund's investment performance. The effects of these developments to a fund will be impacted by the types of securities in which a fund invests, the financial condition, industry, economic sector, and geographic location of an issuer, and a fund's level of investment in the securities of that issuer. Significant concentrations in security types, issuers, industries, sectors, and geographic locations may magnify the factors that affect a fund's performance.
Item 8: Changes in and Disagreements with Accountants for Open-End Management Investment Companies
(Unaudited)
Note: This is not applicable for any fund included in this document.
Item 9: Proxy Disclosures for Open-End Management Investment Companies
(Unaudited)
| A special meeting of shareholders was held on July 16, 2024. The results of votes taken among shareholders on the proposal before them are reported below. Each vote reported represents one dollar of net asset value held on the record date for the meeting. |
| Proposal 1 |
| To elect a Board of Trustees. |
| | # of Votes | % of Votes |
| Bettina Doulton |
| Affirmative | 14,516,835,136.19 | 94.56 |
| Withheld | 834,887,998.33 | 5.44 |
| TOTAL | 15,351,723,134.52 | 100.00 |
| Robert A. Lawrence |
| Affirmative | 14,430,495,798.10 | 94.00 |
| Withheld | 921,227,336.42 | 6.00 |
| TOTAL | 15,351,723,134.52 | 100.00 |
| Vijay C. Advani |
| Affirmative | 14,465,231,640.25 | 94.23 |
| Withheld | 886,491,494.27 | 5.77 |
| TOTAL | 15,351,723,134.52 | 100.00 |
| Thomas P. Bostick |
| Affirmative | 14,471,831,170.84 | 94.27 |
| Withheld | 879,891,963.68 | 5.73 |
| TOTAL | 15,351,723,134.52 | 100.00 |
| Donald F. Donahue |
| Affirmative | 14,432,670,599.88 | 94.01 |
| Withheld | 919,052,534.64 | 5.99 |
| TOTAL | 15,351,723,134.52 | 100.00 |
| Vicki L. Fuller |
| Affirmative | 14,531,407,981.65 | 94.66 |
| Withheld | 820,315,152.87 | 5.34 |
| TOTAL | 15,351,723,134.52 | 100.00 |
| Patricia L. Kampling |
| Affirmative | 14,549,142,839.16 | 94.77 |
| Withheld | 802,580,295.36 | 5.23 |
| TOTAL | 15,351,723,134.52 | 100.00 |
| Thomas A. Kennedy |
| Affirmative | 14,469,818,769.40 | 94.26 |
| Withheld | 881,904,365.12 | 5.74 |
| TOTAL | 15,351,723,134.52 | 100.00 |
| Oscar Munoz |
| Affirmative | 14,434,061,467.08 | 94.02 |
| Withheld | 917,661,667.44 | 5.98 |
| TOTAL | 15,351,723,134.52 | 100.00 |
| Karen B. Peetz |
| Affirmative | 14,521,904,618.46 | 94.59 |
| Withheld | 829,818,516.06 | 5.41 |
| TOTAL | 15,351,723,134.52 | 100.00 |
| David M. Thomas |
| Affirmative | 14,417,745,861.73 | 93.92 |
| Withheld | 933,977,272.79 | 6.08 |
| TOTAL | 15,351,723,134.52 | 100.00 |
| Susan Tomasky |
| Affirmative | 14,467,973,468.18 | 94.24 |
| Withheld | 883,749,666.34 | 5.76 |
| TOTAL | 15,351,723,134.52 | 100.00 |
| Michael E. Wiley |
| Affirmative | 14,424,002,796.91 | 93.96 |
| Withheld | 927,720,337.61 | 6.04 |
| TOTAL | 15,351,723,134.52 | 100.00 |
| | | |
| Proposal 1 reflects trust-wide proposal and voting results. |
Item 10: Remuneration Paid to Directors, Officers, and others of Open-End Management Investment Companies
(Unaudited)
Note: This information is disclosed as part of the financial statements for each Fund as part of Item 7: Financial Statements and Financial Highlights for Open-End Management Investment companies.
Item 11: Statement Regarding Basis for Approval of Investment Advisory Contract
(Unaudited)
Board Approval of Investment Advisory Contracts and Management Fees
Fidelity Capital & Income Fund
Each year, the Board of Trustees, including the Independent Trustees (together, the Board), considers the renewal of the fund's management contract with Fidelity Management & Research Company LLC (FMR) and certain affiliates and the sub-advisory agreements (together, the Advisory Contracts) for the fund. FMR and the sub-advisers are referred to herein as the Investment Advisers. The Board, assisted by the advice of fund counsel and Independent Trustees' counsel, requests and considers a broad range of information relevant to the renewal of the Advisory Contracts throughout the year.
The Board meets regularly and, at each of its meetings, covers an extensive agenda of topics and materials and considers factors that are relevant to its annual consideration of the renewal of the fund's Advisory Contracts, including the services and support provided to the fund and its shareholders. The Board, acting directly and through its Committees (each of which is composed of and chaired by Independent Trustees), requests and receives information concerning the annual consideration of the renewal of the fund's Advisory Contracts. The Board also meets as needed to review matters specifically related to the Board's annual consideration of the renewal of the Advisory Contracts. Members of the Board may also meet with trustees of other Fidelity funds through joint ad hoc committees to discuss certain matters relevant to all of the Fidelity funds.
At its May 2024 meeting, the Board unanimously determined to renew the fund's Advisory Contracts. In reaching its determination, the Board considered all factors it believed relevant, including (i) the nature, extent, and quality of the services provided to the fund and its shareholders (including the investment performance of the fund); (ii) the competitiveness relative to peer funds of the fund's management fee and total expense ratio; (iii) the total costs of the services provided by and the profits realized by FMR and its affiliates (Fidelity) from its relationships with the fund; and (iv) the extent to which, if any, economies of scale exist and are realized as the fund grows, and whether any economies of scale are appropriately shared with fund shareholders. The Board also considered the broad range of investment choices available to shareholders from FMR's competitors and that the fund's shareholders have chosen to invest in the fund, which is part of the Fidelity family of funds. The Board's decision to renew the Advisory Contracts was not based on any single factor.
The Board reached a determination, with the assistance of fund counsel and Independent Trustees' counsel and through the exercise of its business judgment, that the renewal of the Advisory Contracts was in the best interests of the fund and its shareholders and that the compensation payable under the Advisory Contracts was fair and reasonable in light of all of the surrounding circumstances.
Nature, Extent, and Quality of Services Provided. The Board considered staffing as it relates to the fund, including the backgrounds and experience of investment personnel of the Investment Advisers, and also considered the Investment Advisers' implementation of the fund's investment program. The Independent Trustees also had discussions with senior management of Fidelity's investment operations and investment groups. The Board considered the structure of the investment personnel compensation program and whether this structure provides appropriate incentives to act in the best interests of the fund. Additionally, the Board considered the portfolio managers' investments, if any, in the funds that they manage.
Resources Dedicated to Investment Management and Support Services. The Board and the Fund Oversight and Research Committees reviewed the general qualifications and capabilities of Fidelity's investment staff, including its size, education, experience, and resources, as well as Fidelity's approach to recruiting, training, managing, and compensating investment personnel. The Board noted the resources devoted to expansion of Fidelity's global investment organization, and that Fidelity's analysts have extensive resources, tools, and capabilities that allow them to conduct sophisticated quantitative and fundamental analysis, as well as credit analysis of issuers, counterparties, and guarantors. Further, the Board considered that Fidelity's investment professionals have sufficient access to global information and data so as to provide competitive investment results over time, and that those professionals also have access to sophisticated tools that permit them to assess portfolio construction and risk and performance attribution characteristics continuously, as well as to transmit new information and research conclusions rapidly around the world. Additionally, in its deliberations, the Board considered Fidelity's trading, risk management, compliance, and technology and operations capabilities and resources, which are integral parts of the investment management process.
Shareholder and Administrative Services. The Board considered (i) the nature, extent, quality, and cost of advisory, administrative, shareholder, transfer agency, and pricing and bookkeeping services performed by the Investment Advisers and their affiliates under the Advisory Contracts; (ii) the nature and extent of Fidelity's supervision of third party service providers, principally custodians, subcustodians, and pricing vendors; and (iii) the resources devoted by Fidelity to, and the record of compliance with, the fund's compliance policies and procedures. The Board also reviewed the allocation of fund brokerage, including allocations to brokers affiliated with the Investment Advisers, the use of brokerage commissions to pay fund expenses, and the use of "soft" commission dollars to pay for research services. The Board also considered the fund's securities lending activities and any payments made to Fidelity relating to securities lending under a separate agreement.
The Board noted that the growth of fund assets over time across the complex allows Fidelity to reinvest in the development of services designed to enhance the value and convenience of the Fidelity funds as investment vehicles. These services include 24-hour access to account information and market information over the Internet and through telephone representatives, investor education materials, and asset allocation tools. The Board also considered that it reviews customer service metrics such as telephone response times, continuity of services on the website and metrics addressing services at Fidelity Investor Centers.
Investment in a Large Fund Family. The Board considered the benefits to shareholders of investing in a fund that is part of a large family of funds offering a variety of investment disciplines and providing a large variety of fund investor services. The Board noted that Fidelity had taken, or had made recommendations that resulted in the Fidelity funds taking, a number of actions over the previous year that benefited particular funds and/or the Fidelity funds in general.
Investment Performance. The Board took into account discussions that occur with representatives of the Investment Advisers, and reports that it receives, at Board meetings throughout the year, relating to fund investment performance. In this regard the Board noted that as part of regularly scheduled fund reviews and other reports to the Board on fund performance, the Board considered annualized return information for the fund for different time periods, measured against an appropriate securities market index (benchmark index) and an appropriate peer group of funds with similar objectives (peer group). The Board also considered information about performance attribution. In its ongoing evaluation of fund investment performance, the Board gives particular attention to information indicating changes in performance of the funds over different time periods and discussed with the Investment Advisers the reasons for any overperformance or underperformance.
In addition to reviewing absolute and relative fund performance, the Independent Trustees periodically consider the appropriateness of fund performance metrics in evaluating the results achieved. The Independent Trustees generally give greater weight to fund performance over longer time periods than over shorter time periods. Depending on the circumstances, the Independent Trustees may be satisfied with a fund's performance notwithstanding that it lags its benchmark index or peer group for certain periods.
Based on its review, the Board concluded that the nature, extent, and quality of services provided to the fund under the Advisory Contracts should continue to benefit the shareholders of the fund.
Competitiveness of Management Fee and Total Expense Ratio. The Board was provided with information regarding industry trends in management fees and expenses. The Board considered that, effective March 1, 2024, an amended Advisory Contract with FMR went into effect with a fee based on tiered schedules and subject to a maximum class-level rate (the management fee). The Board also considered that in exchange for the management fee, the fund will receive investment advisory, management, administrative, transfer agent, and pricing and bookkeeping services. In its review of the fund's management fee and total expense ratio, the Board considered the fund's pro forma management fee rate as if it had been in effect for the 12-month period ended September 30, 2023, as well as other third-party fund expenses, such as custodial, legal, and audit fees. The Board noted that Fidelity may agree to waive fees or reimburse expenses from time to time, and the extent to which, if any, it has done so for the fund.
Comparisons of Management Fees and Total Expense Ratios. Among other things, the Board reviewed data for selected groups of competitive funds and classes (referred to as "mapped groups") that were compiled by Fidelity based on combining similar investment objective categories (as classified by Morningstar) that have comparable investment mandates. The data reviewed by the Board included (i) gross management fee comparisons (before taking into account expense reimbursements or caps) relative to the total universe of funds within the mapped group; (ii) gross management fee comparisons relative to a subset of non-Fidelity funds in the mapped group that are similar in size and management fee structure to the fund (referred to as the "asset size peer group"); (iii) total expense comparisons of the fund relative to funds and classes in the mapped group that have a similar sales load structure to the fund (referred to as the "similar sales load structure group"); and (iv) total expense comparisons of the fund relative to funds and classes in the similar sales load structure group that are similar in size and management fee structure to the fund (referred to as the "total expense asset size peer group"). The total expense asset size peer group comparison excludes performance adjustments and fund-paid 12b-1 fees to eliminate variability in fee structures.
The information provided to the Board indicated that the fund's management fee rate ranked above the competitive median of the mapped group for the 12-month period ended September 30, 2023 and above the competitive median of the asset size peer group for the 12-month period ended September 30, 2023. Further, the information provided to the Board indicated that the total expense ratio of the fund ranked below the competitive median of the similar sales load structure group for the 12-month period ended September 30, 2023 and below the competitive median of the total expense asset size peer group for the 12-month period ended September 30, 2023. The Board considered that the fund has a variable unified management fee that covers expenses for services beyond portfolio management.
Fees Charged to Other Fidelity Clients. The Board also considered Fidelity fee structures and other information with respect to clients of Fidelity, such as other funds advised or subadvised by Fidelity, pension plan clients, and other institutional clients with similar mandates. The Board noted that a joint ad hoc committee created by it and the boards of other Fidelity funds periodically reviews and compares Fidelity's institutional investment advisory business with its business of providing services to the Fidelity funds and also noted the most recent findings of the committee. The Board noted that the committee's review included a consideration of the differences in services provided, fees charged, and costs incurred, as well as competition in the markets serving the different categories of clients.
Based on its review, the Board concluded that the fund's management fee is fair and reasonable in light of the services that the fund receives and the other factors considered. Further based on its review of total expense ratios and fees charged to other Fidelity clients, the Board concluded that the fund's total expense ratio was reasonable in light of the services that the fund and its shareholders receive and the other factors considered.
Costs of the Services and Profitability. The Board considered the revenues earned and the expenses incurred by Fidelity in conducting the business of developing, marketing, distributing, managing, administering and servicing the fund and servicing the fund's shareholders. The Board also considered the level of Fidelity's profits in respect of all the Fidelity funds.
On an annual basis, Fidelity presents to the Board information about the profitability of its relationships with the fund. Fidelity calculates profitability information for each fund, as well as aggregate profitability information for groups of Fidelity funds and all Fidelity funds, using a series of detailed revenue and cost allocation methodologies which originate with the books and records of Fidelity on which Fidelity's audited financial statements are based. The Audit Committee of the Board reviews any significant changes from the prior year's methodologies.
A public accounting firm has been engaged annually by the Board as part of the Board's assessment of Fidelity's profitability analysis. The engagement includes the review and assessment of the methodologies used by Fidelity in determining the revenues and expenses attributable to Fidelity's fund business, and completion of agreed-upon procedures in respect of the mathematical accuracy of certain fund profitability information and its conformity to established allocation methodologies. After considering the reports issued under the engagement and information provided by Fidelity, the Board concluded that while other allocation methods may also be reasonable, Fidelity's profitability methodologies are reasonable in all material respects.
The Board also reviewed Fidelity's non-fund businesses and potential indirect benefits such businesses may have received as a result of their association with Fidelity's fund business (i.e., fall-out benefits) as well as cases where Fidelity's affiliates may benefit from the funds' business. The Board considered areas where potential indirect benefits to the Fidelity funds from their relationships with Fidelity may exist. The Board's consideration of these matters was informed by the findings of a joint ad hoc committee created by it and the boards of other Fidelity funds to evaluate potential fall-out benefits.
The Board considered the costs of the services provided by and the profits realized by Fidelity in connection with the operation of the fund and was satisfied that the profitability was not excessive.
Economies of Scale. The Board considered whether there have been economies of scale in respect of the management of the Fidelity funds, whether the Fidelity funds (including the fund) have appropriately benefited from any such economies of scale, and whether there is potential for realization of any further economies of scale. The Board considered the extent to which the fund will benefit from economies of scale as assets grow through increased services to the fund, through waivers or reimbursements, or through fee or expense ratio reductions. The Board also noted that a committee created by it and the boards of other Fidelity funds periodically analyzes whether Fidelity attains economies of scale in respect of the management and servicing of the Fidelity funds, whether the Fidelity funds have appropriately benefited from such economies of scale, and whether there is potential for realization of any further economies of scale.
The Board recognized that the fund's management contract incorporates a variable management fee structure, which provides breakpoints as a way to share, in part, any potential economies of scale that may exist at the asset class level and through a discount that considers both fund size and total assets of the four applicable asset classes. The Board considered that the variable management fee is designed to deliver the benefits of economies of scale to fund shareholders even if assets of any particular fund are unchanged or have declined, because some portion of Fidelity's costs are attributable to services provided to all funds subject to the variable management fee, and all such funds benefit if those costs can be allocated among more assets. The Board concluded that, given the variable management fee structure, fund shareholders will benefit from lower management fees due to the application of the breakpoints and discount factor, regardless of whether Fidelity achieves any such economies of scale.
The Board concluded, taking into account the analysis of the committee, that economies of scale, if any, are being appropriately shared between fund shareholders and Fidelity.
Additional Information Requested by the Board. In order to develop fully the factual basis for consideration of the Fidelity funds' advisory contracts, the Board requested and received additional information on certain topics, including but not limited to: (i) fund flow and performance trends, in particular the underperformance of certain funds and strategies, and Fidelity's long-term strategies for certain funds; (ii) the operation of performance fees and the rationale for implementing performance fees on certain categories of funds but not others; (iii) Fidelity's pricing philosophy compared to competitors; (iv) fund profitability methodology and data; (v) evaluation of competitive fund data and peer group classifications and fee and expense comparisons; (vi) the management fee and expense structures for different funds and classes and information about the differences between various fee and expense structures; (vii) the variable management fee implemented for certain funds effective March 1, 2024; and (viii) information regarding other accounts managed by Fidelity and the funds' sub-advisory arrangements.
Conclusion. Based on its evaluation of all of the conclusions noted above, and after considering all factors it believed relevant, the Board, including the Independent Trustees, concluded that the advisory and sub-advisory fee arrangements are fair and reasonable in light of all of the surrounding circumstances and that the fund's Advisory Contracts should be renewed through May 31, 2025.
1.538653.127
CAI-SANN-1224
Fidelity® Series High Income Fund
Semi-Annual Report
October 31, 2024
Contents
To view a fund's proxy voting guidelines and proxy voting record for the 12-month period ended June 30, visit http://www.fidelity.com/proxyvotingresults or visit the Securities and Exchange Commission's (SEC) web site at http://www.sec.gov.
You may also call 1-800-544-8544 to request a free copy of the proxy voting guidelines.
Standard & Poor's, S&P and S&P 500 are registered service marks of The McGraw-Hill Companies, Inc. and have been licensed for use by Fidelity Distributors Corporation.
Other third-party marks appearing herein are the property of their respective owners.
All other marks appearing herein are registered or unregistered trademarks or service marks of FMR LLC or an affiliated company. © 2024 FMR LLC. All rights reserved.
This report and the financial statements contained herein are submitted for the general information of the shareholders of the Fund. This report is not authorized for distribution to prospective investors in the Fund unless preceded or accompanied by an effective prospectus.
A fund files its complete schedule of portfolio holdings with the SEC for the first and third quarters of each fiscal year on Form N-PORT. Forms N-PORT are available on the SEC's web site at http://www.sec.gov. A fund's Forms N-PORT may be reviewed and copied at the SEC's Public Reference Room in Washington, DC. Information regarding the operation of the SEC's Public Reference Room may be obtained by calling 1-800-SEC-0330.
For a complete list of a fund's portfolio holdings, view the most recent holdings listing, semiannual report, or annual report on Fidelity's web site at http://www.fidelity.com, http://www.institutional.fidelity.com, or http://www.401k.com, as applicable.
NOT FDIC INSURED •MAY LOSE VALUE •NO BANK GUARANTEE
Neither the Fund nor Fidelity Distributors Corporation is a bank.
Item 7: Financial Statements and Financial Highlights for Open-End Management Investment Companies (Semi-Annual Report)
Fidelity® Series High Income Fund
Schedule of Investments October 31, 2024 (Unaudited)
Showing Percentage of Net Assets
| Corporate Bonds - 85.8% |
| | | Principal Amount (a) | Value ($) |
| Convertible Bonds - 1.8% | | | |
| Automotive & Auto Parts - 0.2% | | | |
| Rivian Automotive, Inc. 3.625% 10/15/30 | | 3,078,000 | 2,380,525 |
| Broadcasting - 0.8% | | | |
| DISH Network Corp. 3.375% 8/15/26 | | 13,185,000 | 11,070,295 |
| Diversified Financial Services - 0.0% | | | |
| Coinbase Global, Inc. 0.25% 4/1/30 (b) | | 40,000 | 36,220 |
| Energy - 0.1% | | | |
| Sunnova Energy International, Inc. 0.25% 12/1/26 | | 2,574,000 | 1,671,168 |
| Homebuilders/Real Estate - 0.3% | | | |
| Anywhere Real Estate Group LLC/Realogy Co-Issuer Corp. 0.25% 6/15/26 | | 2,957,000 | 2,562,241 |
| Meritage Homes Corp. 1.75% 5/15/28 (b) | | 20,000 | 21,230 |
| Redfin Corp. 0.5% 4/1/27 | | 3,576,000 | 2,574,720 |
| | | | 5,158,191 |
| Leisure - 0.0% | | | |
| Peloton Interactive, Inc. 5.5% 12/1/29 (b) | | 190,000 | 393,395 |
| Technology - 0.3% | | | |
| BlackLine, Inc. 1% 6/1/29 (b) | | 220,000 | 228,910 |
| Global Payments, Inc. 1.5% 3/1/31 (b) | | 2,034,000 | 1,939,419 |
| Wolfspeed, Inc. 1.875% 12/1/29 | | 5,485,000 | 2,731,530 |
| | | | 4,899,859 |
| Utilities - 0.1% | | | |
| PG&E Corp. 4.25% 12/1/27 (b) | | 990,000 | 1,079,595 |
TOTAL CONVERTIBLE BONDS | | | 26,689,248 |
| Nonconvertible Bonds - 84.0% | | | |
| Aerospace - 2.8% | | | |
| ATI, Inc.: | | | |
| 4.875% 10/1/29 | | 1,215,000 | 1,150,856 |
| 5.875% 12/1/27 | | 1,230,000 | 1,219,926 |
| Bombardier, Inc.: | | | |
| 7% 6/1/32 (b) | | 3,405,000 | 3,486,040 |
| 7.25% 7/1/31 (b) | | 1,950,000 | 2,014,658 |
| 7.875% 4/15/27 (b) | | 1,814,000 | 1,817,576 |
| BWX Technologies, Inc. 4.125% 6/30/28 (b) | | 3,247,000 | 3,098,678 |
| Howmet Aerospace, Inc.: | | | |
| 5.9% 2/1/27 | | 545,000 | 558,326 |
| 5.95% 2/1/37 | | 435,000 | 459,293 |
| Kaiser Aluminum Corp.: | | | |
| 4.5% 6/1/31 (b)(c) | | 830,000 | 740,948 |
| 4.625% 3/1/28 (b) | | 2,375,000 | 2,262,773 |
| Moog, Inc. 4.25% 12/15/27 (b) | | 165,000 | 157,300 |
| Spirit Aerosystems, Inc. 9.75% 11/15/30 (b) | | 965,000 | 1,071,220 |
| TransDigm, Inc.: | | | |
| 4.625% 1/15/29 | | 2,335,000 | 2,217,378 |
| 5.5% 11/15/27 | | 3,780,000 | 3,742,200 |
| 6% 1/15/33 (b) | | 4,265,000 | 4,227,743 |
| 6.375% 3/1/29 (b) | | 6,800,000 | 6,902,269 |
| 6.75% 8/15/28 (b) | | 1,630,000 | 1,666,675 |
| VistaJet Malta Finance PLC / XO Management Holding, Inc.: | | | |
| 6.375% 2/1/30 (b) | | 3,129,000 | 2,678,408 |
| 7.875% 5/1/27 (b) | | 435,000 | 423,458 |
| 9.5% 6/1/28 (b) | | 440,000 | 432,248 |
| | | | 40,327,973 |
| Air Transportation - 0.7% | | | |
| Air Canada 3.875% 8/15/26 (b) | | 805,000 | 778,744 |
| American Airlines, Inc.: | | | |
| 7.25% 2/15/28 (b)(c) | | 540,000 | 548,882 |
| 8.5% 5/15/29 (b) | | 2,080,000 | 2,185,939 |
| JetBlue Airways Corp./JetBlue Loyalty LP 9.875% 9/20/31 (b) | | 1,125,000 | 1,169,065 |
| Mileage Plus Holdings LLC 6.5% 6/20/27 (b) | | 299,750 | 302,709 |
| Rand Parent LLC 8.5% 2/15/30 (b)(c) | | 4,015,000 | 4,006,167 |
| Spirit Loyalty Cayman Ltd. / Spirit IP Cayman Ltd.: | | | |
| 8% 9/20/25 (b) | | 560,000 | 348,117 |
| 8% 9/20/25 (b) | | 1,865,000 | 1,159,353 |
| | | | 10,498,976 |
| Automotive & Auto Parts - 1.8% | | | |
| Adient Global Holdings Ltd. 7% 4/15/28 (b) | | 330,000 | 335,483 |
| Arko Corp. 5.125% 11/15/29 (b) | | 375,000 | 345,442 |
| Aston Martin Capital Holdings Ltd. 10% 3/31/29 (b) | | 1,090,000 | 1,058,882 |
| Belron UK Finance PLC 5.75% 10/15/29 (b) | | 2,155,000 | 2,159,719 |
| Dana, Inc.: | | | |
| 4.25% 9/1/30 | | 440,000 | 384,740 |
| 5.375% 11/15/27 | | 295,000 | 288,539 |
| Ford Motor Co.: | | | |
| 3.25% 2/12/32 (c) | | 1,085,000 | 907,753 |
| 4.75% 1/15/43 | | 545,000 | 441,809 |
| 5.291% 12/8/46 (c) | | 215,000 | 188,024 |
| 6.1% 8/19/32 | | 4,525,000 | 4,544,122 |
| 7.4% 11/1/46 | | 435,000 | 464,606 |
| Ford Motor Credit Co. LLC: | | | |
| U.S. Secured Overnight Fin. Rate (SOFR) Index + 2.950% 7.9445% 3/6/26 (d)(e) | | 1,540,000 | 1,572,201 |
| 3.375% 11/13/25 | | 545,000 | 534,570 |
| 4% 11/13/30 | | 550,000 | 496,675 |
| 4.389% 1/8/26 | | 1,090,000 | 1,076,621 |
| 5.125% 6/16/25 | | 545,000 | 543,610 |
| Hudson Automotive Group 8% 5/15/32 (b) | | 835,000 | 872,919 |
| LCM Investments Holdings 8.25% 8/1/31 (b)(c) | | 755,000 | 788,517 |
| Macquarie AirFinance Holdings: | | | |
| 6.4% 3/26/29 (b) | | 450,000 | 463,723 |
| 8.125% 3/30/29 (b) | | 1,115,000 | 1,179,488 |
| 8.375% 5/1/28 (b) | | 1,180,000 | 1,240,306 |
| McLaren Finance PLC 7.5% 8/1/26 (b) | | 1,820,000 | 1,765,400 |
| Phinia, Inc. 6.75% 4/15/29 (b) | | 1,045,000 | 1,066,743 |
| Rivian Holdco & Rivian LLC & Rivian Automotive LLC CME Term SOFR 6 Month Index + 6.050% 10.502% 10/15/26 (b)(d)(e) | | 335,000 | 335,398 |
| Wand NewCo 3, Inc. 7.625% 1/30/32 (b) | | 1,645,000 | 1,700,286 |
| ZF North America Capital, Inc.: | | | |
| 6.875% 4/14/28 (b) | | 595,000 | 600,143 |
| 7.125% 4/14/30 (b) | | 595,000 | 598,409 |
| | | | 25,954,128 |
| Banks & Thrifts - 0.9% | | | |
| Ally Financial, Inc.: | | | |
| 5.75% 11/20/25 | | 110,000 | 110,432 |
| 6.7% 2/14/33 (c) | | 2,170,000 | 2,179,160 |
| Jane Street Group LLC/JSG Finance, Inc.: | | | |
| 4.5% 11/15/29 (b) | | 970,000 | 917,779 |
| 6.125% 11/1/32 (b) | | 2,000,000 | 2,001,295 |
| Rocket Mortgage LLC / Rocket Mortgage Co.-Issuer, Inc. 4% 10/15/33 (b)(c) | | 435,000 | 375,169 |
| UniCredit SpA: | | | |
| 5.861% 6/19/32 (b)(d) | | 2,542,000 | 2,532,871 |
| 7.296% 4/2/34 (b)(d) | | 1,403,000 | 1,468,193 |
| VFH Parent LLC / Valor Co-Issuer, Inc. 7.5% 6/15/31 (b) | | 1,620,000 | 1,663,453 |
| Western Alliance Bancorp. 3% 6/15/31 (d) | | 1,910,000 | 1,764,477 |
| | | | 13,012,829 |
| Broadcasting - 1.8% | | | |
| Clear Channel Outdoor Holdings, Inc.: | | | |
| 5.125% 8/15/27 (b) | | 2,900,000 | 2,811,438 |
| 7.5% 6/1/29 (b) | | 1,685,000 | 1,440,013 |
| 9% 9/15/28 (b) | | 3,050,000 | 3,203,491 |
| DISH Network Corp. 11.75% 11/15/27 (b) | | 2,760,000 | 2,905,230 |
| Sinclair Television Group, Inc. 5.5% 3/1/30 (b) | | 1,110,000 | 763,769 |
| Sirius XM Radio, Inc.: | | | |
| 4% 7/15/28 (b) | | 2,505,000 | 2,340,344 |
| 4.125% 7/1/30 (b) | | 2,200,000 | 1,968,257 |
| 5.5% 7/1/29 (b) | | 660,000 | 640,263 |
| TEGNA, Inc.: | | | |
| 4.625% 3/15/28 | | 1,895,000 | 1,779,441 |
| 5% 9/15/29 (c) | | 725,000 | 676,827 |
| Univision Communications, Inc.: | | | |
| 4.5% 5/1/29 (b) | | 2,170,000 | 1,926,455 |
| 6.625% 6/1/27 (b) | | 3,080,000 | 3,055,851 |
| 8% 8/15/28 (b) | | 1,975,000 | 2,007,088 |
| 8.5% 7/31/31 (b) | | 1,130,000 | 1,110,722 |
| | | | 26,629,189 |
| Building Materials - 1.2% | | | |
| Advanced Drain Systems, Inc.: | | | |
| 5% 9/30/27 (b) | | 824,000 | 809,070 |
| 6.375% 6/15/30 (b) | | 490,000 | 493,928 |
| AmeriTex Holdco Intermediate LLC 10.25% 10/15/28 (b) | | 815,000 | 857,534 |
| Beacon Roofing Supply, Inc. 6.5% 8/1/30 (b) | | 1,325,000 | 1,346,825 |
| Builders FirstSource, Inc. 4.25% 2/1/32 (b) | | 2,210,000 | 1,977,039 |
| Eco Material Technologies, Inc. 7.875% 1/31/27 (b) | | 2,370,000 | 2,385,270 |
| EMRLD Borrower LP / Emerald Co. 6.625% 12/15/30 (b) | | 4,830,000 | 4,912,221 |
| Smyrna Ready Mix Concrete LLC 8.875% 11/15/31 (b) | | 2,240,000 | 2,352,875 |
| Star Holding LLC 8.75% 8/1/31 (b) | | 1,400,000 | 1,331,414 |
| Summit Materials LLC/Summit Materials Finance Corp. 7.25% 1/15/31 (b) | | 950,000 | 983,250 |
| | | | 17,449,426 |
| Cable/Satellite TV - 2.3% | | | |
| CCO Holdings LLC/CCO Holdings Capital Corp.: | | | |
| 4.25% 1/15/34 (b) | | 2,145,000 | 1,713,660 |
| 4.5% 8/15/30 (b) | | 675,000 | 602,869 |
| 4.5% 5/1/32 | | 5,635,000 | 4,794,187 |
| 4.75% 3/1/30 (b) | | 4,755,000 | 4,325,478 |
| 4.75% 2/1/32 (b)(c) | | 3,090,000 | 2,671,462 |
| 5% 2/1/28 (b) | | 1,495,000 | 1,446,949 |
| 5.375% 6/1/29 (b) | | 1,705,000 | 1,627,509 |
| CSC Holdings LLC: | | | |
| 3.375% 2/15/31 (b) | | 2,195,000 | 1,574,641 |
| 4.125% 12/1/30 (b) | | 2,050,000 | 1,513,170 |
| 4.5% 11/15/31 (b) | | 555,000 | 406,848 |
| 4.625% 12/1/30 (b) | | 4,920,000 | 2,474,180 |
| 5.375% 2/1/28 (b) | | 3,840,000 | 3,286,465 |
| 7.5% 4/1/28 (b) | | 1,530,000 | 1,004,827 |
| DIRECTV Financing LLC / DIRECTV Financing Co-Obligor, Inc. 5.875% 8/15/27 (b) | | 535,000 | 515,112 |
| Radiate Holdco LLC/Radiate Financial Service Ltd. 4.5% 9/15/26 (b) | | 1,630,000 | 1,416,310 |
| Telenet Finance Luxembourg Notes SARL 5.5% 3/1/28 (b) | | 1,000,000 | 973,420 |
| Virgin Media Vendor Financing Notes IV DAC 5% 7/15/28 (b) | | 1,505,000 | 1,442,523 |
| Ziggo BV 4.875% 1/15/30 (b) | | 1,455,000 | 1,349,127 |
| | | | 33,138,737 |
| Capital Goods - 1.3% | | | |
| ESAB Corp. 6.25% 4/15/29 (b) | | 2,470,000 | 2,513,493 |
| Mueller Water Products, Inc. 4% 6/15/29 (b) | | 1,905,000 | 1,773,600 |
| Patrick Industries, Inc. 6.375% 11/1/32 (b) | | 2,195,000 | 2,170,768 |
| Regal Rexnord Corp.: | | | |
| 6.05% 2/15/26 | | 1,640,000 | 1,657,178 |
| 6.05% 4/15/28 | | 1,090,000 | 1,116,086 |
| 6.3% 2/15/30 | | 1,090,000 | 1,128,740 |
| Resideo Funding, Inc. 6.5% 7/15/32 (b) | | 1,455,000 | 1,464,354 |
| TK Elevator Holdco GmbH 7.625% 7/15/28 (b) | | 1,645,000 | 1,652,422 |
| TK Elevator U.S. Newco, Inc. 5.25% 7/15/27 (b) | | 4,865,000 | 4,785,345 |
| | | | 18,261,986 |
| Chemicals - 4.2% | | | |
| Avient Corp. 6.25% 11/1/31 (b) | | 1,420,000 | 1,424,154 |
| Axalta Coating Systems Dutch Holding B BV 7.25% 2/15/31 (b) | | 2,445,000 | 2,555,135 |
| Consolidated Energy Finance SA 12% 2/15/31 (b) | | 2,085,000 | 2,033,497 |
| CVR Partners LP/CVR Nitrogen Finance Corp. 6.125% 6/15/28 (b) | | 1,807,000 | 1,733,755 |
| Element Solutions, Inc. 3.875% 9/1/28 (b) | | 1,044,000 | 1,005,697 |
| INEOS Quattro Finance 2 PLC 9.625% 3/15/29 (b) | | 2,460,000 | 2,602,776 |
| Kobe U.S. Midco 2, Inc. 9.25% 11/1/26 pay-in-kind (b)(d) | | 4,053,262 | 3,424,115 |
| LSB Industries, Inc. 6.25% 10/15/28 (b) | | 880,000 | 851,334 |
| Methanex Corp.: | | | |
| 5.125% 10/15/27 | | 3,800,000 | 3,698,155 |
| 5.65% 12/1/44 | | 2,732,000 | 2,416,935 |
| NOVA Chemicals Corp.: | | | |
| 4.25% 5/15/29 (b) | | 1,900,000 | 1,730,929 |
| 5.25% 6/1/27 (b) | | 1,935,000 | 1,899,190 |
| 9% 2/15/30 (b) | | 660,000 | 702,947 |
| Nufarm Australia Ltd. 5% 1/27/30 (b) | | 2,575,000 | 2,386,163 |
| Olin Corp.: | | | |
| 5% 2/1/30 (c) | | 1,110,000 | 1,059,411 |
| 5.125% 9/15/27 | | 2,795,000 | 2,756,614 |
| Olympus Water U.S. Holding Corp.: | | | |
| 4.25% 10/1/28 (b) | | 2,030,000 | 1,910,645 |
| 6.25% 10/1/29 (b) | | 2,255,000 | 2,150,692 |
| 7.25% 6/15/31 (b) | | 1,930,000 | 1,980,199 |
| 9.75% 11/15/28 (b) | | 2,225,000 | 2,360,523 |
| SCIH Salt Holdings, Inc.: | | | |
| 4.875% 5/1/28 (b) | | 3,750,000 | 3,590,761 |
| 6.625% 5/1/29 (b) | | 1,815,000 | 1,762,059 |
| SCIL IV LLC / SCIL U.S.A. Holdings LLC 5.375% 11/1/26 (b) | | 1,550,000 | 1,531,045 |
| The Chemours Co. LLC: | | | |
| 4.625% 11/15/29 (b)(c) | | 790,000 | 685,885 |
| 5.375% 5/15/27 | | 2,604,000 | 2,507,193 |
| 5.75% 11/15/28 (b) | | 2,625,000 | 2,423,060 |
| Tronox, Inc. 4.625% 3/15/29 (b)(c) | | 3,860,000 | 3,502,129 |
| W.R. Grace Holding LLC: | | | |
| 5.625% 8/15/29 (b) | | 4,500,000 | 4,156,505 |
| 7.375% 3/1/31 (b) | | 440,000 | 454,757 |
| | | | 61,296,260 |
| Consumer Products - 1.5% | | | |
| HFC Prestige Products, Inc./HFC Prestige International U.S. LLC 6.625% 7/15/30 (b) | | 1,850,000 | 1,886,264 |
| Kohl's Corp. 4.25% 7/17/25 | | 150,000 | 148,067 |
| Kronos Acquisition Holdings, Inc.: | | | |
| 8.25% 6/30/31 (b) | | 1,370,000 | 1,356,734 |
| 10.75% 6/30/32 (b) | | 1,240,000 | 1,155,340 |
| Mattel, Inc.: | | | |
| 3.375% 4/1/26 (b) | | 1,750,000 | 1,708,816 |
| 5.45% 11/1/41 | | 435,000 | 398,367 |
| Newell Brands, Inc.: | | | |
| 5.7% 4/1/26 | | 545,000 | 546,217 |
| 6.375% 9/15/27 (c) | | 3,340,000 | 3,375,528 |
| 6.375% 5/15/30 (f) | | 730,000 | 733,336 |
| 6.625% 9/15/29 (c) | | 605,000 | 613,430 |
| 6.625% 5/15/32 (f) | | 730,000 | 732,108 |
| 7% 4/1/46 (g) | | 435,000 | 403,689 |
| The Gates Corp. 6.875% 7/1/29 (b) | | 2,040,000 | 2,095,957 |
| The Scotts Miracle-Gro Co.: | | | |
| 4% 4/1/31 | | 215,000 | 192,476 |
| 4.375% 2/1/32 | | 330,000 | 298,584 |
| TKC Holdings, Inc.: | | | |
| 6.875% 5/15/28 (b) | | 2,260,000 | 2,224,979 |
| 10.5% 5/15/29 (b) | | 3,010,000 | 3,040,521 |
| Wayfair LLC 7.25% 10/31/29 (b)(c) | | 1,405,000 | 1,421,737 |
| | | | 22,332,150 |
| Containers - 1.4% | | | |
| ARD Finance SA 6.5% 6/30/27 pay-in-kind (b)(d) | | 895,000 | 189,069 |
| Ardagh Packaging Finance PLC/Ardagh MP Holdings U.S.A., Inc. 4.125% 8/15/26 (b) | | 2,155,000 | 1,874,850 |
| Ball Corp.: | | | |
| 2.875% 8/15/30 (c) | | 545,000 | 473,867 |
| 6% 6/15/29 | | 710,000 | 721,018 |
| Graham Packaging Co., Inc. 7.125% 8/15/28 (b) | | 545,000 | 530,162 |
| Graphic Packaging International, Inc.: | | | |
| 3.75% 2/1/30 (b) | | 610,000 | 557,842 |
| 6.375% 7/15/32 (b) | | 2,720,000 | 2,744,279 |
| LABL, Inc.: | | | |
| 5.875% 11/1/28 (b) | | 330,000 | 306,384 |
| 9.5% 11/1/28 (b) | | 220,000 | 225,431 |
| 10.5% 7/15/27 (b) | | 625,000 | 618,754 |
| Mauser Packaging Solutions Holding Co.: | | | |
| 7.875% 4/15/27 (b) | | 1,630,000 | 1,674,825 |
| 9.25% 4/15/27 (b) | | 1,335,000 | 1,365,259 |
| Owens-Brockway Glass Container, Inc.: | | | |
| 7.25% 5/15/31 (b)(c) | | 450,000 | 442,586 |
| 7.375% 6/1/32 (b)(c) | | 1,360,000 | 1,330,630 |
| Sealed Air Corp. 5% 4/15/29 (b) | | 3,300,000 | 3,187,699 |
| Sealed Air Corp./Sealed Air Corp. U.S.: | | | |
| 6.125% 2/1/28 (b) | | 655,000 | 661,961 |
| 7.25% 2/15/31 (b) | | 2,415,000 | 2,507,323 |
| Trivium Packaging Finance BV: | | | |
| 5.5% 8/15/26 (b) | | 494,000 | 489,622 |
| 8.5% 8/15/27 (b) | | 810,000 | 807,580 |
| | | | 20,709,141 |
| Diversified Financial Services - 4.6% | | | |
| Aercap Global Aviation Trust 6.5% 6/15/45 (b)(d) | | 1,090,000 | 1,088,871 |
| Azorra Finance Ltd. 7.75% 4/15/30 (b) | | 1,020,000 | 1,007,436 |
| Boost Newco Borrower LLC 7.5% 1/15/31 (b) | | 1,525,000 | 1,607,685 |
| Capstone Borrower, Inc. 8% 6/15/30 (b) | | 745,000 | 778,632 |
| Coinbase Global, Inc. 3.375% 10/1/28 (b)(c) | | 900,000 | 799,962 |
| Encore Capital Group, Inc. 9.25% 4/1/29 (b) | | 1,005,000 | 1,070,076 |
| Focus Financial Partners LLC 6.75% 9/15/31 (b)(c) | | 2,140,000 | 2,125,973 |
| Fortress Transportation & Infrastructure Investors LLC: | | | |
| 5.875% 4/15/33 (b) | | 860,000 | 838,463 |
| 7% 6/15/32 (b) | | 680,000 | 697,682 |
| 7.875% 12/1/30 (b) | | 1,860,000 | 1,959,475 |
| GGAM Finance Ltd.: | | | |
| 6.875% 4/15/29 (b) | | 1,715,000 | 1,747,700 |
| 7.75% 5/15/26 (b) | | 1,115,000 | 1,134,587 |
| 8% 2/15/27 (b) | | 2,705,000 | 2,794,563 |
| 8% 6/15/28 (b) | | 1,675,000 | 1,765,907 |
| Global Aircraft Leasing Co. Ltd. 8.75% 9/1/27 (b) | | 1,405,000 | 1,451,327 |
| Gn Bondco LLC 9.5% 10/15/31 (b)(c) | | 2,490,000 | 2,644,059 |
| Hightower Holding LLC: | | | |
| 6.75% 4/15/29 (b) | | 1,835,000 | 1,806,549 |
| 9.125% 1/31/30 (b) | | 2,630,000 | 2,772,859 |
| Icahn Enterprises LP/Icahn Enterprises Finance Corp.: | | | |
| 4.375% 2/1/29 | | 4,560,000 | 3,803,935 |
| 5.25% 5/15/27 | | 3,780,000 | 3,521,491 |
| Intercontinental Exchange, Inc. 3.625% 9/1/28 | | 3,485,000 | 3,352,392 |
| Jefferies Finance LLC/JFIN Co-Issuer Corp. 5% 8/15/28 (b) | | 390,000 | 359,751 |
| Jefferies Finance LLC/JFIN Co.-Issuer Corp. 6.625% 10/15/31 (b) | | 2,185,000 | 2,175,879 |
| Jefferson Capital Holding 9.5% 2/15/29 (b) | | 1,050,000 | 1,116,839 |
| Ladder Capital Finance Holdings LLLP/Ladder Capital Finance Corp. 4.75% 6/15/29 (b) | | 1,415,000 | 1,348,106 |
| LPL Holdings, Inc. 4.375% 5/15/31 (b)(c) | | 545,000 | 503,870 |
| Nationstar Mortgage Holdings, Inc. 6.5% 8/1/29 (b) | | 2,095,000 | 2,094,916 |
| OneMain Finance Corp.: | | | |
| 3.5% 1/15/27 | | 3,265,000 | 3,116,046 |
| 3.875% 9/15/28 | | 4,040,000 | 3,723,679 |
| 7.125% 3/15/26 | | 3,970,000 | 4,067,213 |
| Optics Bidco SpA: | | | |
| 6% 9/30/34 (b) | | 2,848,000 | 2,776,208 |
| 7.2% 7/18/36 (b) | | 1,085,000 | 1,116,158 |
| 7.721% 6/4/38 (b) | | 269,000 | 285,350 |
| PRA Group, Inc. 8.875% 1/31/30 (b)(c) | | 685,000 | 710,692 |
| Shift4 Payments LLC / Shift4 Payments Finance Sub, Inc. 6.75% 8/15/32 (b) | | 1,685,000 | 1,728,808 |
| Windstream Services LLC / Wind: | | | |
| 7.75% 8/15/28 (b) | | 2,220,000 | 2,232,285 |
| 8.25% 10/1/31 (b) | | 1,425,000 | 1,442,815 |
| | | | 67,568,239 |
| Diversified Media - 0.3% | | | |
| Advantage Sales & Marketing, Inc. 6.5% 11/15/28 (b) | | 2,875,000 | 2,691,001 |
| CMG Media Corp. 8.875% 6/18/29 | | 3,100,000 | 2,263,000 |
| | | | 4,954,001 |
| Energy - 11.3% | | | |
| Aethon United BR LP / Aethon United Finance Corp. 7.5% 10/1/29 (b) | | 1,780,000 | 1,792,341 |
| Alpha Generation LLC 6.75% 10/15/32 (b) | | 1,690,000 | 1,713,741 |
| Antero Midstream Partners LP/Antero Midstream Finance Corp. 5.75% 3/1/27 (b) | | 545,000 | 543,981 |
| Apache Corp.: | | | |
| 4.25% 1/15/30 | | 775,000 | 729,754 |
| 5.1% 9/1/40 | | 980,000 | 846,092 |
| Archrock Partners LP / Archrock Partners Finance Corp. 6.625% 9/1/32 (b) | | 1,685,000 | 1,692,618 |
| Ascent Resources - Utica LLC/ARU Finance Corp. 6.625% 10/15/32 (b) | | 590,000 | 584,408 |
| Atlantica Sustainable Infrastructure PLC 4.125% 6/15/28 (b) | | 2,540,000 | 2,422,133 |
| Baytex Energy Corp. 7.375% 3/15/32 (b) | | 1,780,000 | 1,728,064 |
| California Buyer Ltd./Atlantica Sustainable Infrastructure PLC 6.375% 2/15/32 (b)(f) | | 2,365,000 | 2,348,656 |
| California Resources Corp.: | | | |
| 7.125% 2/1/26 (b)(c) | | 295,000 | 295,962 |
| 8.25% 6/15/29 (b) | | 4,500,000 | 4,544,690 |
| Calumet Specialty Products Partners LP/Calumet Finance Corp. 9.75% 7/15/28 (b) | | 960,000 | 986,294 |
| Canacol Energy Ltd. 5.75% 11/24/28 (b) | | 2,695,000 | 1,398,031 |
| Citgo Petroleum Corp.: | | | |
| 6.375% 6/15/26 (b) | | 2,380,000 | 2,380,221 |
| 8.375% 1/15/29 (b) | | 1,230,000 | 1,279,467 |
| CNX Resources Corp. 7.375% 1/15/31 (b) | | 625,000 | 642,461 |
| Comstock Resources, Inc.: | | | |
| 5.875% 1/15/30 (b) | | 1,410,000 | 1,288,266 |
| 6.75% 3/1/29 (b) | | 3,005,000 | 2,877,792 |
| CPI CG, Inc. 10% 7/15/29 (b) | | 735,000 | 769,914 |
| CQP Holdco LP / BIP-V Chinook Holdco LLC 7.5% 12/15/33 (b) | | 1,560,000 | 1,650,510 |
| CrownRock LP/CrownRock Finance, Inc. 5% 5/1/29 (b) | | 1,855,000 | 1,875,765 |
| CVR Energy, Inc.: | | | |
| 5.75% 2/15/28 (b) | | 2,890,000 | 2,635,398 |
| 8.5% 1/15/29 (b) | | 3,535,000 | 3,427,922 |
| Delek Logistics Partners LP/Delek Logistics Finance Corp.: | | | |
| 7.125% 6/1/28 (b) | | 3,165,000 | 3,135,390 |
| 8.625% 3/15/29 (b) | | 2,440,000 | 2,503,540 |
| DT Midstream, Inc.: | | | |
| 4.125% 6/15/29 (b) | | 1,140,000 | 1,070,526 |
| 4.375% 6/15/31 (b) | | 545,000 | 501,355 |
| Energy Transfer LP: | | | |
| 5.75% 4/1/25 (c) | | 2,285,000 | 2,281,857 |
| 7.375% 2/1/31 (b) | | 1,090,000 | 1,147,031 |
| EnLink Midstream LLC: | | | |
| 5.625% 1/15/28 (b)(c) | | 5,415,000 | 5,480,928 |
| 6.5% 9/1/30 (b) | | 1,020,000 | 1,074,234 |
| EnLink Midstream Partners LP: | | | |
| 4.15% 6/1/25 | | 545,000 | 541,770 |
| 4.85% 7/15/26 | | 985,000 | 980,724 |
| EQM Midstream Partners LP: | | | |
| 6% 7/1/25 (b) | | 140,000 | 140,161 |
| 6.5% 7/1/27 (b) | | 437,000 | 446,996 |
| Expand Energy Corp. 4.75% 2/1/32 | | 1,640,000 | 1,541,482 |
| Ferrellgas LP/Ferrellgas Finance Corp. 5.375% 4/1/26 (b) | | 295,000 | 292,935 |
| Genesis Energy LP/Genesis Energy Finance Corp. 7.875% 5/15/32 (c) | | 670,000 | 670,469 |
| Global Partners LP/GLP Finance Corp.: | | | |
| 6.875% 1/15/29 | | 2,210,000 | 2,205,960 |
| 7% 8/1/27 | | 2,927,000 | 2,936,100 |
| Harvest Midstream I LP: | | | |
| 7.5% 9/1/28 (b) | | 1,110,000 | 1,122,871 |
| 7.5% 5/15/32 (b) | | 2,535,000 | 2,595,523 |
| Hess Midstream Operations LP: | | | |
| 4.25% 2/15/30 (b) | | 1,115,000 | 1,041,130 |
| 5.125% 6/15/28 (b) | | 3,025,000 | 2,960,147 |
| 5.5% 10/15/30 (b) | | 545,000 | 532,507 |
| 5.625% 2/15/26 (b) | | 2,610,000 | 2,603,724 |
| HF Sinclair Corp. 5% 2/1/28 | | 2,280,000 | 2,257,320 |
| Howard Midstream Energy Partners LLC: | | | |
| 7.375% 7/15/32 (b) | | 1,380,000 | 1,407,916 |
| 8.875% 7/15/28 (b) | | 1,170,000 | 1,234,425 |
| Kinetik Holdings LP: | | | |
| 5.875% 6/15/30 (b) | | 1,535,000 | 1,523,183 |
| 6.625% 12/15/28 (b) | | 4,320,000 | 4,412,228 |
| Kodiak Gas Services LLC 7.25% 2/15/29 (b) | | 1,950,000 | 2,004,440 |
| Kosmos Energy Ltd. 8.75% 10/1/31 (b) | | 1,060,000 | 1,034,825 |
| Kraken Oil & Gas Partners LLC 7.625% 8/15/29 (b) | | 1,120,000 | 1,106,533 |
| Matador Resources Co.: | | | |
| 6.25% 4/15/33 (b)(c) | | 720,000 | 704,613 |
| 6.5% 4/15/32 (b) | | 2,310,000 | 2,287,745 |
| Mesquite Energy, Inc. 7.25% (b)(h)(i) | | 10,580,000 | 1 |
| Moss Creek Resources Holdings, Inc. 8.25% 9/1/31 (b) | | 1,405,000 | 1,376,614 |
| Murphy Oil Corp. 6% 10/1/32 | | 1,435,000 | 1,381,799 |
| Nabors Industries, Inc. 8.875% 8/15/31 (b) | | 1,780,000 | 1,682,854 |
| New Fortress Energy, Inc. 6.5% 9/30/26 (b) | | 4,310,000 | 3,992,451 |
| NGL Energy Operating LLC/NGL Energy Finance Corp. 8.125% 2/15/29 (b)(c) | | 1,950,000 | 1,962,591 |
| Northern Oil & Gas, Inc.: | | | |
| 8.125% 3/1/28 (b) | | 1,730,000 | 1,746,790 |
| 8.75% 6/15/31 (b) | | 555,000 | 574,205 |
| Occidental Petroleum Corp. 4.5% 7/15/44 | | 1,335,000 | 1,029,353 |
| PBF Holding Co. LLC/PBF Finance Corp. 7.875% 9/15/30 (b)(c) | | 4,690,000 | 4,681,987 |
| Permian Resources Operating LLC: | | | |
| 5.875% 7/1/29 (b) | | 1,573,000 | 1,549,405 |
| 7% 1/15/32 (b) | | 2,785,000 | 2,840,959 |
| Prairie Acquiror LP 9% 8/1/29 (b) | | 1,080,000 | 1,094,944 |
| Rockies Express Pipeline LLC: | | | |
| 4.8% 5/15/30 (b) | | 145,000 | 134,098 |
| 4.95% 7/15/29 (b) | | 1,480,000 | 1,390,278 |
| 6.875% 4/15/40 (b) | | 655,000 | 621,026 |
| Seadrill Finance Ltd. 8.375% 8/1/30 (b) | | 925,000 | 944,598 |
| Sitio Royalties OP / Sitio Finance Corp. 7.875% 11/1/28 (b) | | 2,285,000 | 2,372,032 |
| Suburban Propane Partners LP/Suburban Energy Finance Corp. 5.875% 3/1/27 | | 210,000 | 209,713 |
| Summit Midstream Holdings LLC 8.625% 10/31/29 (b) | | 1,120,000 | 1,157,144 |
| Sunnova Energy Corp.: | | | |
| 5.875% 9/1/26 (b) | | 880,000 | 786,552 |
| 11.75% 10/1/28 (b) | | 1,210,000 | 983,792 |
| Sunoco LP/Sunoco Finance Corp.: | | | |
| 4.5% 5/15/29 (c) | | 4,570,000 | 4,345,131 |
| 5.875% 3/15/28 | | 875,000 | 872,988 |
| Superior Plus LP / Superior General Partner, Inc. 4.5% 3/15/29 (b) | | 1,155,000 | 1,065,692 |
| Tallgrass Energy Partners LP / Tallgrass Energy Finance Corp.: | | | |
| 5.5% 1/15/28 (b) | | 3,125,000 | 3,001,174 |
| 6% 9/1/31 (b) | | 3,695,000 | 3,427,510 |
| Talos Production, Inc. 9% 2/1/29 (b) | | 560,000 | 576,761 |
| Targa Resources Partners LP/Targa Resources Partners Finance Corp. 4.875% 2/1/31 | | 1,085,000 | 1,052,803 |
| Teine Energy Ltd. 6.875% 4/15/29 (b) | | 295,000 | 290,144 |
| Transocean Poseidon Ltd. 6.875% 2/1/27 (b) | | 606,000 | 605,710 |
| Transocean, Inc.: | | | |
| 8% 2/1/27 (b) | | 4,113,000 | 4,101,113 |
| 8.25% 5/15/29 (b) | | 2,750,000 | 2,764,875 |
| 8.75% 2/15/30 (b) | | 1,202,750 | 1,246,240 |
| Tullow Oil PLC 10.25% 5/15/26 (b) | | 2,840,000 | 2,609,250 |
| U.S.A. Compression Partners LP/U.S.A. Compression Finance Corp. 7.125% 3/15/29 (b) | | 1,630,000 | 1,660,144 |
| Valaris Ltd. 8.375% 4/30/30 (b) | | 2,135,000 | 2,166,171 |
| Venture Global Calcasieu Pass LLC: | | | |
| 3.875% 8/15/29 (b) | | 2,155,000 | 1,987,008 |
| 4.125% 8/15/31 (b) | | 1,680,000 | 1,531,213 |
| 6.25% 1/15/30 (b) | | 1,445,000 | 1,477,017 |
| Viridien 8.75% 4/1/27 (b) | | 1,310,000 | 1,266,335 |
| | | | 164,795,534 |
| Environmental - 1.3% | | | |
| Clean Harbors, Inc. 6.375% 2/1/31 (b) | | 515,000 | 518,872 |
| Darling Ingredients, Inc. 6% 6/15/30 (b) | | 910,000 | 903,743 |
| GFL Environmental, Inc.: | | | |
| 3.75% 8/1/25 (b) | | 1,090,000 | 1,079,229 |
| 5.125% 12/15/26 (b) | | 1,090,000 | 1,079,174 |
| 6.75% 1/15/31 (b) | | 930,000 | 957,544 |
| Madison IAQ LLC: | | | |
| 4.125% 6/30/28 (b)(c) | | 2,375,000 | 2,254,127 |
| 5.875% 6/30/29 (b) | | 1,515,000 | 1,436,936 |
| Reworld Holding Corp. 4.875% 12/1/29 (b) | | 1,650,000 | 1,541,084 |
| Stericycle, Inc. 3.875% 1/15/29 (b) | | 3,330,000 | 3,271,881 |
| Wrangler Holdco Corp. 6.625% 4/1/32 (b)(c) | | 5,510,000 | 5,623,908 |
| | | | 18,666,498 |
| Food & Drug Retail - 0.9% | | | |
| Albertsons Companies LLC/Safeway, Inc./New Albertson's, Inc./Albertson's LLC: | | | |
| 3.25% 3/15/26 (b) | | 295,000 | 285,012 |
| 3.5% 3/15/29 (b) | | 2,690,000 | 2,485,338 |
| 4.875% 2/15/30 (b) | | 1,855,000 | 1,806,784 |
| Emergent BioSolutions, Inc. 3.875% 8/15/28 (b) | | 4,325,000 | 3,474,586 |
| Murphy Oil U.S.A., Inc. 3.75% 2/15/31 (b) | | 785,000 | 697,559 |
| Parkland Corp. 4.625% 5/1/30 (b) | | 3,475,000 | 3,193,985 |
| Walgreens Boots Alliance, Inc. 8.125% 8/15/29 (c) | | 940,000 | 937,498 |
| | | | 12,880,762 |
| Food/Beverage/Tobacco - 2.7% | | | |
| BellRing Brands, Inc. 7% 3/15/30 (b) | | 435,000 | 452,702 |
| C&S Group Enterprises LLC 5% 12/15/28 (b) | | 2,380,000 | 1,969,987 |
| Chobani Holdco II LLC 9.5% 10/1/29 pay-in-kind (b)(d) | | 1,110,000 | 1,145,128 |
| Chobani LLC/Finance Corp., Inc.: | | | |
| 4.625% 11/15/28 (b)(c) | | 435,000 | 417,678 |
| 7.625% 7/1/29 (b) | | 1,490,000 | 1,553,354 |
| Fiesta Purchaser, Inc.: | | | |
| 7.875% 3/1/31 (b) | | 1,195,000 | 1,253,206 |
| 9.625% 9/15/32 (b) | | 805,000 | 841,428 |
| KeHE Distributor / Nextwave 9% 2/15/29 (b) | | 1,935,000 | 2,003,617 |
| Lamb Weston Holdings, Inc. 4.125% 1/31/30 (b) | | 3,660,000 | 3,398,149 |
| Performance Food Group, Inc.: | | | |
| 4.25% 8/1/29 (b) | | 2,690,000 | 2,517,768 |
| 5.5% 10/15/27 (b) | | 1,505,000 | 1,492,245 |
| 6.125% 9/15/32 (b) | | 285,000 | 286,192 |
| Pilgrim's Pride Corp.: | | | |
| 3.5% 3/1/32 | | 545,000 | 476,726 |
| 4.25% 4/15/31 | | 640,000 | 594,792 |
| Post Holdings, Inc.: | | | |
| 4.625% 4/15/30 (b) | | 1,290,000 | 1,205,617 |
| 5.5% 12/15/29 (b) | | 3,980,000 | 3,881,796 |
| 6.25% 10/15/34 (b) | | 1,295,000 | 1,280,693 |
| 6.375% 3/1/33 (b)(c) | | 2,105,000 | 2,082,553 |
| Sigma Holdco BV 7.875% 5/15/26 (b) | | 705,000 | 698,209 |
| TreeHouse Foods, Inc. 4% 9/1/28 | | 860,000 | 783,688 |
| Triton Water Holdings, Inc. 6.25% 4/1/29 (b) | | 5,285,000 | 5,220,556 |
| U.S. Foods, Inc.: | | | |
| 4.625% 6/1/30 (b)(c) | | 820,000 | 778,025 |
| 4.75% 2/15/29 (b) | | 2,180,000 | 2,100,070 |
| 5.75% 4/15/33 (b) | | 1,265,000 | 1,245,748 |
| 7.25% 1/15/32 (b)(c) | | 1,225,000 | 1,272,793 |
| United Natural Foods, Inc. 6.75% 10/15/28 (b) | | 215,000 | 207,475 |
| Viking Baked Goods Acquisition Corp. 8.625% 11/1/31 (b)(f) | | 290,000 | 289,077 |
| | | | 39,449,272 |
| Gaming - 2.0% | | | |
| Caesars Entertainment, Inc.: | | | |
| 6% 10/15/32 (b) | | 1,175,000 | 1,146,128 |
| 6.5% 2/15/32 (b) | | 3,735,000 | 3,787,720 |
| 7% 2/15/30 (b) | | 1,305,000 | 1,337,693 |
| 8.125% 7/1/27 (b) | | 849,000 | 865,657 |
| Churchill Downs, Inc. 5.75% 4/1/30 (b) | | 3,965,000 | 3,903,371 |
| Fertitta Entertainment LLC / Fertitta Entertainment Finance Co., Inc.: | | | |
| 4.625% 1/15/29 (b)(c) | | 2,730,000 | 2,548,643 |
| 6.75% 1/15/30 (b) | | 4,015,000 | 3,651,566 |
| Jacobs Entertainment, Inc. 6.75% 2/15/29 (b) | | 975,000 | 959,649 |
| Ontario Gaming GTA LP / OTG Co. issuer, Inc. 8% 8/1/30 (b) | | 660,000 | 678,363 |
| Station Casinos LLC: | | | |
| 4.5% 2/15/28 (b) | | 1,665,000 | 1,589,109 |
| 6.625% 3/15/32 (b)(c) | | 2,735,000 | 2,748,429 |
| VICI Properties LP / VICI Note Co. 4.125% 8/15/30 (b) | | 1,085,000 | 1,005,335 |
| Wynn Resorts Finance LLC / Wynn Resorts Capital Corp. 7.125% 2/15/31 (b)(c) | | 5,135,000 | 5,401,943 |
| | | | 29,623,606 |
| Healthcare - 7.0% | | | |
| 1375209 BC Ltd. 9% 1/30/28 (b) | | 1,456,000 | 1,453,326 |
| 180 Medical, Inc. 3.875% 10/15/29 (b) | | 1,055,000 | 981,221 |
| Amgen, Inc. 5.6% 3/2/43 (c) | | 1,195,000 | 1,195,946 |
| AMN Healthcare 4% 4/15/29 (b)(c) | | 680,000 | 626,687 |
| Avantor Funding, Inc.: | | | |
| 3.875% 11/1/29 (b) | | 1,345,000 | 1,240,508 |
| 4.625% 7/15/28 (b) | | 885,000 | 855,725 |
| Bausch Health Companies, Inc.: | | | |
| 4.875% 6/1/28 (b) | | 2,075,000 | 1,603,373 |
| 5.25% 1/30/30 (b) | | 1,335,000 | 734,376 |
| 5.5% 11/1/25 (b) | | 4,535,000 | 4,450,558 |
| 11% 9/30/28 (b) | | 1,510,000 | 1,389,442 |
| Catalent Pharma Solutions 3.5% 4/1/30 (b) | | 1,320,000 | 1,277,609 |
| Centene Corp. 2.5% 3/1/31 | | 1,470,000 | 1,229,390 |
| Charles River Laboratories International, Inc.: | | | |
| 3.75% 3/15/29 (b) | | 1,150,000 | 1,054,220 |
| 4% 3/15/31 (b) | | 975,000 | 871,428 |
| 4.25% 5/1/28 (b) | | 472,000 | 448,723 |
| CHS/Community Health Systems, Inc.: | | | |
| 4.75% 2/15/31 (b) | | 4,055,000 | 3,381,746 |
| 5.25% 5/15/30 (b) | | 7,690,000 | 6,711,313 |
| 5.625% 3/15/27 (b) | | 4,905,000 | 4,783,660 |
| 6% 1/15/29 (b) | | 2,290,000 | 2,156,576 |
| 6.125% 4/1/30 (b) | | 2,340,000 | 1,832,167 |
| 6.875% 4/15/29 (b) | | 1,490,000 | 1,258,386 |
| 10.875% 1/15/32 (b) | | 2,065,000 | 2,213,090 |
| CTR Partnership LP/CareTrust Capital Corp. 3.875% 6/30/28 (b) | | 2,070,000 | 1,960,855 |
| DaVita, Inc.: | | | |
| 3.75% 2/15/31 (b) | | 855,000 | 743,565 |
| 4.625% 6/1/30 (b) | | 4,560,000 | 4,198,021 |
| 6.875% 9/1/32 (b) | | 700,000 | 703,648 |
| Embecta Corp. 5% 2/15/30 (b) | | 490,000 | 443,532 |
| Grifols SA 4.75% 10/15/28 (b) | | 660,000 | 608,180 |
| HAH Group Holding Co. LLC 9.75% 10/1/31 (b) | | 2,580,000 | 2,628,827 |
| HealthEquity, Inc. 4.5% 10/1/29 (b)(c) | | 1,865,000 | 1,777,368 |
| Hologic, Inc. 3.25% 2/15/29 (b) | | 840,000 | 771,435 |
| Humana, Inc. 5.875% 3/1/33 | | 1,085,000 | 1,106,788 |
| IQVIA, Inc. 6.5% 5/15/30 (b) | | 1,110,000 | 1,140,224 |
| Jazz Securities DAC 4.375% 1/15/29 (b) | | 1,850,000 | 1,750,642 |
| LifePoint Health, Inc. 5.375% 1/15/29 (b) | | 1,570,000 | 1,436,546 |
| Medline Borrower LP 3.875% 4/1/29 (b) | | 6,955,000 | 6,506,195 |
| Medline Borrower LP / Medline Co. 6.25% 4/1/29 (b) | | 2,740,000 | 2,787,797 |
| Modivcare, Inc. 5% 10/1/29 (b) | | 215,000 | 146,385 |
| Molina Healthcare, Inc. 3.875% 11/15/30 (b) | | 1,465,000 | 1,326,541 |
| Option Care Health, Inc. 4.375% 10/31/29 (b) | | 255,000 | 234,724 |
| Organon & Co. / Organon Foreign Debt Co-Issuer BV: | | | |
| 4.125% 4/30/28 (b) | | 3,935,000 | 3,728,459 |
| 5.125% 4/30/31 (b) | | 1,050,000 | 957,607 |
| Pediatrix Medical Group, Inc. 5.375% 2/15/30 (b) | | 2,895,000 | 2,766,966 |
| Radiology Partners, Inc. 7.775% 1/31/29 pay-in-kind (b)(d) | | 1,395,645 | 1,374,710 |
| Sotera Health Holdings LLC 7.375% 6/1/31 (b) | | 1,335,000 | 1,367,120 |
| Surgery Center Holdings, Inc. 7.25% 4/15/32 (b) | | 1,995,000 | 2,048,474 |
| Teleflex, Inc. 4.25% 6/1/28 (b) | | 930,000 | 891,584 |
| Tenet Healthcare Corp.: | | | |
| 4.25% 6/1/29 | | 2,790,000 | 2,639,406 |
| 4.375% 1/15/30 | | 1,990,000 | 1,865,702 |
| 6.125% 10/1/28 | | 3,035,000 | 3,032,112 |
| 6.125% 6/15/30 | | 2,820,000 | 2,833,274 |
| 6.25% 2/1/27 | | 2,741,000 | 2,743,106 |
| 6.75% 5/15/31 (c) | | 390,000 | 398,696 |
| Teva Pharmaceutical Finance Netherlands III BV: | | | |
| 3.15% 10/1/26 | | 1,310,000 | 1,248,812 |
| 7.875% 9/15/29 | | 330,000 | 356,061 |
| 8.125% 9/15/31 | | 330,000 | 369,081 |
| U.S. Acute Care Solutions 9.75% 5/15/29 (b) | | 585,000 | 596,686 |
| | | | 101,238,599 |
| Homebuilders/Real Estate - 2.7% | | | |
| Anywhere Real Estate Group LLC 7% 4/15/30 (b)(c) | | 874,400 | 766,231 |
| Anywhere Real Estate Group LLC/Realogy Co-Issuer Corp. 5.75% 1/15/29 (b) | | 32,000 | 26,360 |
| Anywhere Real Estate Group LLC/Realogy Co.-Issuer Corp. 5.25% 4/15/30 (b) | | 25,000 | 19,066 |
| Arcosa, Inc. 6.875% 8/15/32 (b) | | 845,000 | 867,279 |
| Ashton Woods U.S.A. LLC/Ashton Woods Finance Co. 4.625% 8/1/29 (b) | | 985,000 | 920,646 |
| Beazer Homes U.S.A., Inc. 7.5% 3/15/31 (b)(c) | | 1,085,000 | 1,115,409 |
| Greystar Real Estate Partners 7.75% 9/1/30 (b) | | 555,000 | 581,521 |
| HAT Holdings I LLC/HAT Holdings II LLC 8% 6/15/27 (b) | | 1,520,000 | 1,592,209 |
| Howard Hughes Corp.: | | | |
| 4.125% 2/1/29 (b) | | 945,000 | 870,257 |
| 4.375% 2/1/31 (b) | | 775,000 | 694,513 |
| Jones DesLauriers Insurance Management, Inc. 10.5% 12/15/30 (b) | | 415,000 | 447,052 |
| Kennedy-Wilson, Inc. 4.75% 2/1/30 | | 1,605,000 | 1,435,645 |
| Landsea Homes Corp. 8.875% 4/1/29 (b) | | 1,330,000 | 1,356,938 |
| LGI Homes, Inc. 8.75% 12/15/28 (b) | | 960,000 | 1,011,352 |
| MPT Operating Partnership LP/MPT Finance Corp.: | | | |
| 3.5% 3/15/31 | | 5,035,000 | 3,565,531 |
| 4.625% 8/1/29 (c) | | 2,850,000 | 2,216,478 |
| 5% 10/15/27 (c) | | 5,705,000 | 5,034,888 |
| 5.25% 8/1/26 (c) | | 1,085,000 | 1,026,268 |
| Panther Escrow Issuer LLC 7.125% 6/1/31 (b) | | 2,255,000 | 2,308,850 |
| Railworks Holdings LP 8.25% 11/15/28 (b) | | 1,990,000 | 2,036,868 |
| Rithm Capital Corp. 8% 4/1/29 (b) | | 830,000 | 828,210 |
| Ryan Specialty Group LLC 5.875% 8/1/32 (b) | | 930,000 | 926,894 |
| Safehold Operating Partnership LP 2.85% 1/15/32 | | 1,635,000 | 1,386,573 |
| Taylor Morrison Communities, Inc./Monarch Communities, Inc. 5.125% 8/1/30 (b) | | 395,000 | 382,023 |
| TopBuild Corp. 4.125% 2/15/32 (b) | | 1,185,000 | 1,056,428 |
| TRI Pointe Homes, Inc. 5.7% 6/15/28 | | 220,000 | 218,603 |
| Uniti Group LP/Uniti Group Finance, Inc./CSL Capital LLC: | | | |
| 6.5% 2/15/29 (b) | | 4,996,000 | 4,301,106 |
| 10.5% 2/15/28 (b) | | 2,175,000 | 2,316,743 |
| | | | 39,309,941 |
| Hotels - 0.9% | | | |
| Hilton Domestic Operating Co., Inc.: | | | |
| 3.625% 2/15/32 (b) | | 4,715,000 | 4,138,580 |
| 3.75% 5/1/29 (b) | | 495,000 | 460,560 |
| 4% 5/1/31 (b) | | 2,420,000 | 2,204,409 |
| 5.875% 4/1/29 (b) | | 685,000 | 695,135 |
| 5.875% 3/15/33 (b)(c) | | 995,000 | 997,082 |
| Hilton Grand Vacations Borrower Escrow LLC 6.625% 1/15/32 (b) | | 2,585,000 | 2,585,636 |
| Park Intermediate Holdings LLC / PK Domestic Property LLC / PK Finance Co.-Issuer 7% 2/1/30 (b) | | 935,000 | 957,803 |
| Wyndham Hotels & Resorts, Inc. 4.375% 8/15/28 (b) | | 1,785,000 | 1,698,911 |
| | | | 13,738,116 |
| Insurance - 1.8% | | | |
| Acrisure LLC / Acrisure Finance, Inc.: | | | |
| 4.25% 2/15/29 (b) | | 435,000 | 409,054 |
| 8.25% 2/1/29 (b) | | 1,485,000 | 1,509,173 |
| 8.5% 6/15/29 (b) | | 950,000 | 976,190 |
| Alliant Holdings Intermediate LLC/Alliant Holdings Co.-Issuer: | | | |
| 4.25% 10/15/27 (b) | | 3,740,000 | 3,547,068 |
| 5.875% 11/1/29 (b) | | 1,365,000 | 1,289,266 |
| 6.75% 10/15/27 (b) | | 6,945,000 | 6,918,956 |
| 6.75% 4/15/28 (b) | | 540,000 | 542,543 |
| AmWINS Group, Inc. 4.875% 6/30/29 (b) | | 1,660,000 | 1,562,391 |
| APH Somerset Investor 2 LLC / APH2 Somerset Investor 2 LLC / APH3 Somerset Investor 2 LLC 7.875% 11/1/29 (b) | | 1,455,000 | 1,453,545 |
| AssuredPartners, Inc.: | | | |
| 5.625% 1/15/29 (b) | | 1,355,000 | 1,282,131 |
| 7.5% 2/15/32 (b) | | 2,145,000 | 2,160,133 |
| HUB International Ltd. 7.25% 6/15/30 (b) | | 3,595,000 | 3,715,156 |
| USI, Inc. 7.5% 1/15/32 (b) | | 840,000 | 857,038 |
| | | | 26,222,644 |
| Leisure - 2.4% | | | |
| Amer Sports Co. 6.75% 2/16/31 (b)(c) | | 1,375,000 | 1,396,852 |
| Carnival Corp.: | | | |
| 5.75% 3/1/27 (b) | | 3,414,000 | 3,424,225 |
| 6% 5/1/29 (b) | | 2,235,000 | 2,238,656 |
| 6.65% 1/15/28 | | 300,000 | 305,720 |
| 7% 8/15/29 (b) | | 2,465,000 | 2,577,958 |
| 10.5% 6/1/30 (b) | | 1,985,000 | 2,141,654 |
| ClubCorp Holdings, Inc. 8.5% 9/15/25 (b) | | 315,000 | 308,700 |
| MajorDrive Holdings IV LLC 6.375% 6/1/29 (b) | | 1,705,000 | 1,634,816 |
| NCL Corp. Ltd.: | | | |
| 5.875% 3/15/26 (b) | | 890,000 | 889,026 |
| 7.75% 2/15/29 (b) | | 3,300,000 | 3,496,624 |
| NCL Finance Ltd. 6.125% 3/15/28 (b) | | 3,490,000 | 3,511,366 |
| Royal Caribbean Cruises Ltd.: | | | |
| 5.375% 7/15/27 (b) | | 1,535,000 | 1,532,185 |
| 5.5% 4/1/28 (b) | | 2,745,000 | 2,744,811 |
| 5.625% 9/30/31 (b) | | 1,145,000 | 1,138,532 |
| 6% 2/1/33 (b) | | 2,795,000 | 2,812,162 |
| 6.25% 3/15/32 (b) | | 1,730,000 | 1,763,771 |
| Viking Cruises Ltd. 9.125% 7/15/31 (b) | | 1,195,000 | 1,290,573 |
| Viking Ocean Cruises Ship VII Ltd. 5.625% 2/15/29 (b) | | 630,000 | 621,287 |
| Voc Escrow Ltd. 5% 2/15/28 (b) | | 865,000 | 840,878 |
| | | | 34,669,796 |
| Metals/Mining - 1.8% | | | |
| Alcoa Nederland Holding BV 7.125% 3/15/31 (b) | | 530,000 | 552,608 |
| Arsenal AIC Parent LLC 8% 10/1/30 (b) | | 740,000 | 777,827 |
| Cleveland-Cliffs, Inc.: | | | |
| 4.875% 3/1/31 (b) | | 215,000 | 198,394 |
| 6.875% 11/1/29 (b) | | 730,000 | 732,831 |
| 7% 3/15/32 (b)(c) | | 2,745,000 | 2,748,103 |
| 7.375% 5/1/33 (b) | | 730,000 | 735,402 |
| Eldorado Gold Corp. 6.25% 9/1/29 (b) | | 1,005,000 | 991,051 |
| ERO Copper Corp. 6.5% 2/15/30 (b) | | 5,665,000 | 5,565,863 |
| First Quantum Minerals Ltd.: | | | |
| 6.875% 10/15/27 (b) | | 2,360,000 | 2,332,600 |
| 8.625% 6/1/31 (b) | | 1,180,000 | 1,188,850 |
| 9.375% 3/1/29 (b) | | 3,380,000 | 3,593,457 |
| FMG Resources August 2006 Pty Ltd.: | | | |
| 4.375% 4/1/31 (b) | | 545,000 | 496,144 |
| 4.5% 9/15/27 (b) | | 630,000 | 613,305 |
| Mineral Resources Ltd.: | | | |
| 8.5% 5/1/30 (b) | | 1,400,000 | 1,439,916 |
| 9.25% 10/1/28 (b) | | 1,105,000 | 1,163,318 |
| Novelis Corp.: | | | |
| 3.25% 11/15/26 (b) | | 330,000 | 317,499 |
| 3.875% 8/15/31 (b) | | 545,000 | 478,630 |
| Vibrantz Technologies, Inc. 9% 2/15/30 (b) | | 2,130,000 | 1,995,469 |
| | | | 25,921,267 |
| Paper - 0.9% | | | |
| Ahlstrom Holding 3 OY 4.875% 2/4/28 (b) | | 2,205,000 | 2,086,173 |
| Ardagh Metal Packaging Finance U.S.A. LLC/Ardagh Metal Packaging Finance PLC: | | | |
| 4% 9/1/29 (b) | | 1,145,000 | 1,004,367 |
| 6% 6/15/27 (b) | | 1,985,000 | 1,979,380 |
| Clydesdale Acquisition Holdings, Inc.: | | | |
| 6.625% 4/15/29 (b) | | 3,325,000 | 3,340,657 |
| 8.75% 4/15/30 (b) | | 3,310,000 | 3,361,305 |
| Glatfelter Corp. 7.25% 11/15/31 (b)(c) | | 1,020,000 | 1,011,330 |
| Mercer International, Inc.: | | | |
| 5.125% 2/1/29 (c) | | 710,000 | 612,766 |
| 12.875% 10/1/28 (b) | | 140,000 | 148,236 |
| | | | 13,544,214 |
| Publishing/Printing - 0.2% | | | |
| Cimpress PLC 7.375% 9/15/32 (b) | | 1,695,000 | 1,668,718 |
| News Corp. 5.125% 2/15/32 (b) | | 1,685,000 | 1,614,720 |
| | | | 3,283,438 |
| Railroad - 0.2% | | | |
| First Student Bidco, Inc./First Transit Parent, Inc. 4% 7/31/29 (b)(c) | | 1,045,000 | 961,988 |
| Genesee & Wyoming, Inc. 6.25% 4/15/32 (b) | | 2,040,000 | 2,057,824 |
| | | | 3,019,812 |
| Restaurants - 0.9% | | | |
| 1011778 BC Unlimited Liability Co./New Red Finance, Inc.: | | | |
| 3.875% 1/15/28 (b) | | 930,000 | 886,424 |
| 4% 10/15/30 (b) | | 5,530,000 | 4,994,418 |
| 6.125% 6/15/29 (b) | | 2,755,000 | 2,803,097 |
| Garden SpinCo Corp. 8.625% 7/20/30 (b)(c) | | 550,000 | 595,266 |
| Yum! Brands, Inc.: | | | |
| 3.625% 3/15/31 | | 545,000 | 493,531 |
| 4.625% 1/31/32 | | 3,225,000 | 3,023,514 |
| 5.375% 4/1/32 | | 435,000 | 423,391 |
| | | | 13,219,641 |
| Services - 6.0% | | | |
| AECOM 5.125% 3/15/27 | | 730,000 | 726,094 |
| Allied Universal Holdco LLC 7.875% 2/15/31 (b) | | 3,120,000 | 3,175,140 |
| Allied Universal Holdco LLC / Allied Universal Finance Corp.: | | | |
| 6% 6/1/29 (b) | | 2,040,000 | 1,866,603 |
| 9.75% 7/15/27 (b) | | 1,455,000 | 1,458,505 |
| Aramark Services, Inc. 5% 2/1/28 (b) | | 1,560,000 | 1,531,833 |
| Artera Services LLC 8.5% 2/15/31 (b) | | 8,240,000 | 8,166,250 |
| ASGN, Inc. 4.625% 5/15/28 (b) | | 1,025,000 | 978,790 |
| Atlas Luxco 4 SARL / Allied Universal Holdco LLC / Allied Universal Finance Corp. 4.625% 6/1/28 (b) | | 2,190,000 | 2,050,520 |
| Avis Budget Car Rental LLC/Avis Budget Finance, Inc. 8.25% 1/15/30 (b)(c) | | 1,140,000 | 1,164,648 |
| Booz Allen Hamilton, Inc. 3.875% 9/1/28 (b) | | 3,975,000 | 3,810,367 |
| Brand Industrial Services, Inc. 10.375% 8/1/30 (b) | | 5,400,000 | 5,724,794 |
| CoreCivic, Inc.: | | | |
| 4.75% 10/15/27 | | 3,661,000 | 3,488,148 |
| 8.25% 4/15/29 | | 1,365,000 | 1,433,455 |
| CoreLogic, Inc. 4.5% 5/1/28 (b) | | 1,535,000 | 1,441,394 |
| Garda World Security Corp. 8.25% 8/1/32 (b) | | 1,395,000 | 1,387,771 |
| Gartner, Inc.: | | | |
| 3.625% 6/15/29 (b) | | 345,000 | 322,011 |
| 3.75% 10/1/30 (b) | | 555,000 | 510,424 |
| 4.5% 7/1/28 (b) | | 2,505,000 | 2,444,220 |
| Hertz Corp. 4.625% 12/1/26 (b) | | 1,165,000 | 880,084 |
| Iron Mountain, Inc. 4.5% 2/15/31 (b) | | 545,000 | 506,051 |
| Korn Ferry 4.625% 12/15/27 (b) | | 400,000 | 390,009 |
| Life Time, Inc.: | | | |
| 6% 11/15/31 (b)(f) | | 2,920,000 | 2,907,601 |
| 8% 4/15/26 (b) | | 1,655,000 | 1,663,124 |
| Neptune BidCo U.S., Inc. 9.29% 4/15/29 (b) | | 2,925,000 | 2,720,250 |
| Prime Securities Services Borrower LLC/Prime Finance, Inc. 5.75% 4/15/26 (b) | | 1,090,000 | 1,090,262 |
| Service Corp. International: | | | |
| 4% 5/15/31 | | 945,000 | 852,254 |
| 5.125% 6/1/29 | | 597,000 | 585,744 |
| 5.75% 10/15/32 | | 2,850,000 | 2,799,637 |
| Sotheby's 7.375% 10/15/27 (b) | | 1,270,000 | 1,235,990 |
| Staples, Inc.: | | | |
| 10.75% 9/1/29 (b) | | 3,495,000 | 3,379,606 |
| 12.75% 1/15/30 (b) | | 2,045,000 | 1,625,212 |
| The GEO Group, Inc.: | | | |
| 8.625% 4/15/29 | | 1,375,000 | 1,438,258 |
| 10.25% 4/15/31 | | 2,710,000 | 2,904,600 |
| TriNet Group, Inc. 3.5% 3/1/29 (b) | | 3,950,000 | 3,591,771 |
| Uber Technologies, Inc.: | | | |
| 4.5% 8/15/29 (b) | | 6,630,000 | 6,435,343 |
| 8% 11/1/26 (b) | | 3,275,000 | 3,275,000 |
| United Rentals North America, Inc.: | | | |
| 6% 12/15/29 (b) | | 545,000 | 553,577 |
| 6.125% 3/15/34 (b)(c) | | 3,415,000 | 3,443,498 |
| WASH Multifamily Acquisition, Inc. 5.75% 4/15/26 (b) | | 2,762,000 | 2,755,182 |
| | | | 86,714,020 |
| Steel - 0.2% | | | |
| Commercial Metals Co.: | | | |
| 3.875% 2/15/31 | | 655,000 | 588,014 |
| 4.125% 1/15/30 | | 1,140,000 | 1,057,897 |
| Roller Bearing Co. of America, Inc. 4.375% 10/15/29 (b) | | 1,475,000 | 1,385,888 |
| | | | 3,031,799 |
| Super Retail - 1.8% | | | |
| Bath & Body Works, Inc. 6.694% 1/15/27 | | 625,000 | 639,769 |
| Carvana Co.: | | | |
| 4.875% 9/1/29 (b) | | 1,855,000 | 1,554,002 |
| 5.5% 4/15/27 (b) | | 1,025,000 | 943,000 |
| 5.875% 10/1/28 (b) | | 507,000 | 455,696 |
| 10.25% 5/1/30 (b) | | 150,000 | 151,583 |
| 12% 12/1/28 pay-in-kind (b)(d) | | 642,818 | 679,884 |
| 13% 6/1/30 pay-in-kind (b)(d) | | 974,652 | 1,062,614 |
| 14% 6/1/31 pay-in-kind (b)(d) | | 1,162,144 | 1,385,541 |
| EG Global Finance PLC 12% 11/30/28 (b) | | 5,560,000 | 6,182,147 |
| Group 1 Automotive, Inc. 6.375% 1/15/30 (b) | | 1,330,000 | 1,335,963 |
| Hanesbrands, Inc. 4.875% 5/15/26 (b) | | 295,000 | 291,426 |
| LBM Acquisition LLC 6.25% 1/15/29 (b) | | 2,315,000 | 2,135,008 |
| Levi Strauss & Co. 3.5% 3/1/31 (b)(c) | | 700,000 | 618,313 |
| Michaels Companies, Inc. 5.25% 5/1/28 (b) | | 1,060,000 | 762,763 |
| Nordstrom, Inc.: | | | |
| 4.25% 8/1/31 | | 1,630,000 | 1,434,121 |
| 4.375% 4/1/30 | | 1,090,000 | 988,019 |
| Sally Holdings LLC 6.75% 3/1/32 (c) | | 1,405,000 | 1,422,508 |
| Specialty Building Products Holdings LLC 7.75% 10/15/29 (b) | | 585,000 | 596,628 |
| Wolverine World Wide, Inc. 4% 8/15/29 (b) | | 3,250,000 | 2,779,048 |
| | | | 25,418,033 |
| Technology - 6.6% | | | |
| Acuris Finance U.S.: | | | |
| 5% 5/1/28 (b) | | 4,390,000 | 3,961,944 |
| 9% 8/1/29 (b) | | 1,545,000 | 1,514,409 |
| Amentum Holdings, Inc. 7.25% 8/1/32 (b)(c) | | 1,655,000 | 1,714,194 |
| Athenahealth Group, Inc. 6.5% 2/15/30 (b) | | 760,000 | 718,783 |
| Block, Inc.: | | | |
| 3.5% 6/1/31 | | 3,117,000 | 2,763,074 |
| 6.5% 5/15/32 (b) | | 2,720,000 | 2,768,321 |
| Broadcom, Inc. 2.6% 2/15/33 (b) | | 1,570,000 | 1,302,966 |
| Central Parent LLC/CDK GLO II/CDK Finance Co. 8% 6/15/29 (b) | | 2,415,000 | 2,467,922 |
| Clarivate Science Holdings Corp.: | | | |
| 3.875% 7/1/28 (b) | | 710,000 | 670,075 |
| 4.875% 7/1/29 (b) | | 720,000 | 680,444 |
| Cloud Software Group, Inc.: | | | |
| 6.5% 3/31/29 (b) | | 3,725,000 | 3,637,700 |
| 8.25% 6/30/32 (b) | | 1,360,000 | 1,397,873 |
| 9% 9/30/29 (b) | | 5,045,000 | 5,044,542 |
| Cogent Communications Group, Inc. 7% 6/15/27 (b) | | 1,670,000 | 1,679,334 |
| Coherent Corp. 5% 12/15/29 (b)(c) | | 2,885,000 | 2,767,585 |
| CommScope, Inc.: | | | |
| 4.75% 9/1/29 (b) | | 1,415,000 | 1,209,825 |
| 6% 3/1/26 (b) | | 1,260,000 | 1,230,022 |
| Elastic NV 4.125% 7/15/29 (b) | | 1,715,000 | 1,587,022 |
| Entegris, Inc.: | | | |
| 3.625% 5/1/29 (b) | | 990,000 | 905,885 |
| 4.75% 4/15/29 (b) | | 3,475,000 | 3,366,433 |
| 5.95% 6/15/30 (b) | | 3,270,000 | 3,266,432 |
| Gen Digital, Inc.: | | | |
| 5% 4/15/25 (b) | | 1,090,000 | 1,087,008 |
| 7.125% 9/30/30 (b)(c) | | 545,000 | 564,027 |
| Go Daddy Operating Co. LLC / GD Finance Co., Inc.: | | | |
| 3.5% 3/1/29 (b) | | 2,070,000 | 1,910,385 |
| 5.25% 12/1/27 (b) | | 625,000 | 617,700 |
| GrafTech Global Enterprises, Inc. 9.875% 12/15/28 (b) | | 1,090,000 | 914,194 |
| HTA Group Ltd. 7.5% 6/4/29 (b) | | 4,790,000 | 4,867,119 |
| Insight Enterprises, Inc. 6.625% 5/15/32 (b) | | 1,115,000 | 1,139,882 |
| ION Trading Technologies Ltd. 5.75% 5/15/28 (b) | | 2,305,000 | 2,089,624 |
| Lightning Power LLC 7.25% 8/15/32 (b) | | 1,310,000 | 1,362,847 |
| Match Group Holdings II LLC: | | | |
| 3.625% 10/1/31 (b)(c) | | 325,000 | 284,738 |
| 4.125% 8/1/30 (b) | | 695,000 | 631,962 |
| McAfee Corp. 7.375% 2/15/30 (b) | | 1,505,000 | 1,450,960 |
| ON Semiconductor Corp. 3.875% 9/1/28 (b) | | 1,875,000 | 1,758,187 |
| Open Text Corp.: | | | |
| 3.875% 2/15/28 (b) | | 1,310,000 | 1,232,170 |
| 3.875% 12/1/29 (b) | | 1,655,000 | 1,509,868 |
| Open Text Holdings, Inc.: | | | |
| 4.125% 2/15/30 (b) | | 1,840,000 | 1,689,202 |
| 4.125% 12/1/31 (b) | | 875,000 | 785,841 |
| Rackspace Finance LLC 3.5% 5/15/28 (b) | | 2,262,850 | 1,333,213 |
| Roblox Corp. 3.875% 5/1/30 (b) | | 3,450,000 | 3,122,413 |
| Seagate HDD Cayman: | | | |
| 5.75% 12/1/34 | | 1,210,000 | 1,192,290 |
| 8.25% 12/15/29 | | 555,000 | 597,074 |
| 8.5% 7/15/31 | | 670,000 | 722,346 |
| Sensata Technologies BV 4% 4/15/29 (b) | | 3,430,000 | 3,207,394 |
| Sensata Technologies, Inc.: | | | |
| 3.75% 2/15/31 (b) | | 545,000 | 486,416 |
| 6.625% 7/15/32 (b) | | 1,515,000 | 1,534,900 |
| SS&C Technologies, Inc.: | | | |
| 5.5% 9/30/27 (b) | | 440,000 | 438,251 |
| 6.5% 6/1/32 (b) | | 2,710,000 | 2,758,590 |
| TTM Technologies, Inc. 4% 3/1/29 (b) | | 4,905,000 | 4,585,736 |
| UKG, Inc. 6.875% 2/1/31 (b) | | 1,605,000 | 1,644,341 |
| Veritas U.S., Inc./Veritas Bermuda Ltd. 7.5% 9/1/25 (b) | | 1,760,000 | 1,675,019 |
| VM Consolidated, Inc. 5.5% 4/15/29 (b) | | 2,020,000 | 1,953,637 |
| Wolfspeed, Inc. 4.2917% 6/23/30 pay-in-kind (b)(d)(i)(j) | | 2,560,000 | 2,457,600 |
| | | | 96,259,719 |
| Telecommunications - 4.6% | | | |
| Altice Financing SA: | | | |
| 5% 1/15/28 (b) | | 1,570,000 | 1,327,664 |
| 5.75% 8/15/29 (b) | | 6,145,000 | 5,039,672 |
| Altice France Holding SA 6% 2/15/28 (b) | | 1,775,000 | 471,629 |
| Altice France SA: | | | |
| 5.125% 1/15/29 (b) | | 2,620,000 | 1,962,236 |
| 5.125% 7/15/29 (b) | | 6,260,000 | 4,682,187 |
| 5.5% 1/15/28 (b) | | 4,455,000 | 3,457,085 |
| 5.5% 10/15/29 (b) | | 1,620,000 | 1,212,957 |
| C&W Senior Finance Ltd. 6.875% 9/15/27 (b) | | 4,077,000 | 4,036,571 |
| Cablevision Lightpath LLC: | | | |
| 3.875% 9/15/27 (b) | | 765,000 | 726,627 |
| 5.625% 9/15/28 (b) | | 605,000 | 561,655 |
| Consolidated Communications, Inc. 5% 10/1/28 (b) | | 1,740,000 | 1,609,359 |
| Frontier Communications Holdings LLC: | | | |
| 5% 5/1/28 (b) | | 430,000 | 422,714 |
| 5.875% 10/15/27 (b) | | 1,685,000 | 1,681,390 |
| 5.875% 11/1/29 | | 2,485,000 | 2,427,999 |
| 8.75% 5/15/30 (b) | | 1,675,000 | 1,773,197 |
| IHS Netherlands Holdco BV 8% 9/18/27 (b) | | 680,000 | 679,363 |
| Intelsat Jackson Holdings SA 6.5% 3/15/30 (b) | | 3,100,000 | 2,912,703 |
| LCPR Senior Secured Financing DAC 5.125% 7/15/29 (b) | | 5,995,000 | 5,047,309 |
| Level 3 Financing, Inc.: | | | |
| 3.875% 10/15/30 (b) | | 2,880,000 | 2,188,770 |
| 4% 4/15/31 (b) | | 1,535,000 | 1,158,925 |
| 4.5% 4/1/30 (b) | | 2,100,000 | 1,679,877 |
| 10.5% 5/15/30 (b) | | 2,909,000 | 3,181,719 |
| 11% 11/15/29 (b) | | 1,014,402 | 1,144,663 |
| Liquid Telecommunications Financing PLC 5.5% 9/4/26 (b) | | 2,350,000 | 1,668,500 |
| Millicom International Cellular SA 4.5% 4/27/31 (b) | | 475,000 | 426,313 |
| Sable International Finance Ltd. 7.125% 10/15/32 (b) | | 2,155,000 | 2,162,090 |
| SBA Communications Corp. 3.125% 2/1/29 (c) | | 550,000 | 500,523 |
| Telecom Italia Capital SA: | | | |
| 6% 9/30/34 | | 184,000 | 178,962 |
| 7.2% 7/18/36 | | 364,000 | 368,842 |
| 7.721% 6/4/38 | | 131,000 | 136,348 |
| Uniti Group LP/Uniti Fiber Holdings, Inc./CSL Capital LLC 6% 1/15/30 (b) | | 3,690,000 | 3,091,347 |
| ViaSat, Inc. 5.625% 9/15/25 (b) | | 2,135,000 | 2,107,172 |
| Virgin Media Secured Finance PLC 4.5% 8/15/30 (b) | | 2,980,000 | 2,609,857 |
| VMED O2 UK Financing I PLC 4.25% 1/31/31 (b) | | 3,745,000 | 3,230,701 |
| Zayo Group Holdings, Inc. 4% 3/1/27 (b) | | 905,000 | 805,458 |
| | | | 66,672,384 |
| Textiles/Apparel - 0.1% | | | |
| Crocs, Inc. 4.125% 8/15/31 (b)(c) | | 720,000 | 630,700 |
| Foot Locker, Inc. 4% 10/1/29 (b)(c) | | 715,000 | 614,373 |
| Kontoor Brands, Inc. 4.125% 11/15/29 (b) | | 580,000 | 540,583 |
| | | | 1,785,656 |
| Transportation Ex Air/Rail - 0.5% | | | |
| Golar LNG Ltd. 7.75% 9/19/29 (Reg. S) (b) | | 1,400,000 | 1,392,524 |
| Great Lakes Dredge & Dock Corp. 5.25% 6/1/29 (b) | | 1,020,000 | 958,451 |
| Seaspan Corp. 5.5% 8/1/29 (b) | | 3,000,000 | 2,853,636 |
| XPO, Inc.: | | | |
| 6.25% 6/1/28 (b) | | 335,000 | 340,063 |
| 7.125% 6/1/31 (b) | | 550,000 | 569,267 |
| 7.125% 2/1/32 (b) | | 1,650,000 | 1,714,078 |
| | | | 7,828,019 |
| Utilities - 2.4% | | | |
| Clearway Energy Operating LLC: | | | |
| 3.75% 2/15/31 (b) | | 2,580,000 | 2,303,149 |
| 3.75% 1/15/32 (b)(c) | | 280,000 | 248,121 |
| DPL, Inc. 4.35% 4/15/29 | | 185,000 | 173,729 |
| NextEra Energy Partners LP 7.25% 1/15/29 (b)(c) | | 2,495,000 | 2,566,374 |
| NRG Energy, Inc.: | | | |
| 3.375% 2/15/29 (b) | | 2,360,000 | 2,151,940 |
| 3.625% 2/15/31 (b) | | 790,000 | 699,424 |
| 5.25% 6/15/29 (b) | | 2,565,000 | 2,506,521 |
| 5.75% 7/15/29 | | 1,390,000 | 1,369,150 |
| 6.25% 11/1/34 (b) | | 1,460,000 | 1,458,463 |
| PG&E Corp.: | | | |
| 5% 7/1/28 (c) | | 4,420,000 | 4,311,039 |
| 5.25% 7/1/30 | | 5,970,000 | 5,818,035 |
| Pike Corp.: | | | |
| 5.5% 9/1/28 (b) | | 1,847,000 | 1,809,765 |
| 8.625% 1/31/31 (b) | | 1,425,000 | 1,514,028 |
| Vistra Operations Co. LLC: | | | |
| 5% 7/31/27 (b) | | 2,849,000 | 2,811,520 |
| 5.5% 9/1/26 (b) | | 1,130,000 | 1,126,590 |
| 5.625% 2/15/27 (b) | | 1,965,000 | 1,959,930 |
| 7.75% 10/15/31 (b) | | 2,445,000 | 2,582,833 |
| | | | 35,410,611 |
TOTAL NONCONVERTIBLE BONDS | | | 1,224,836,416 |
| TOTAL CORPORATE BONDS (Cost $1,276,279,377) | | | 1,251,525,664 |
| | | | |
| U.S. Treasury Obligations - 0.5% |
| | | Principal Amount (a) | Value ($) |
U.S. Treasury Notes 4.125% 11/15/32 (Cost $6,938,649) | | 6,995,000 | 6,941,991 |
| | | | |
| Asset-Backed Securities - 0.3% |
| | | Principal Amount (a) | Value ($) |
| Agl Clo 5 Ltd. Series 2024-5A Class ERR, CME Term SOFR 3 Month Index + 6.350% 10.9674% 7/20/34 (b)(d)(e) | | 100,000 | 100,096 |
| Ares Loan Funding Vii Ltd. Series 2024-ALF7 Class E, CME Term SOFR 3 Month Index + 6.250% 10.7901% 10/22/37 (b)(d)(e) | | 125,000 | 127,015 |
| Bbam U.S. Clo Iv Ltd. Series 2024-4A Class D, CME Term SOFR 3 Month Index + 6.250% 11.5729% 7/15/39 (b)(d)(e) | | 250,000 | 251,690 |
| Birch Grove Clo 4 Ltd. Series 2024-4A Class ER, CME Term SOFR 3 Month Index + 6.500% 11.1559% 7/15/37 (b)(d)(e) | | 316,000 | 317,651 |
| Birch Grove Clo 5 LLC Series 2024-5A Class ER, CME Term SOFR 3 Month Index + 6.750% 11.5989% 10/20/37 (b)(d)(e) | | 100,000 | 101,387 |
| Carval Clo Xi-C Ltd. Series 2024-3A Class E, CME Term SOFR 3 Month Index + 6.350% 10.9214% 10/20/37 (b)(d)(e) | | 150,000 | 150,964 |
| Croton Pk Clo Ltd. CME Term SOFR 3 Month Index + 5.550% 10.1997% 10/15/36 (b)(d)(e) | | 558,000 | 564,000 |
| Goldentree Loan Management U.S. CLO 21, Ltd. Series 2024-21A Class E, CME Term SOFR 3 Month Index + 5.700% 10.3174% 7/20/37 (b)(d)(e) | | 397,000 | 399,049 |
| Golub Capital Partners Clo 76 B Lt Series 2024-76A Class E, CME Term SOFR 3 Month Index + 5.750% 10.4919% 10/25/37 (b)(d)(e) | | 213,000 | 214,189 |
| Magnetite Xxix Ltd. Series 2024-29A Class ER, CME Term SOFR 3 Month Index + 6.000% 11.2417% 7/15/37 (b)(d)(e) | | 100,000 | 101,282 |
| Midocean Credit Clo Xvi Series 2024-16A Class E, CME Term SOFR 3 Month Index + 6.250% 6.25% 10/20/37 (b)(d)(e)(f) | | 125,000 | 125,025 |
| Orchard Park Clo Ltd. Series 2024-1A Class E, CME Term SOFR 3 Month Index + 5.600% 10.2529% 10/20/37 (b)(d)(e) | | 220,000 | 222,745 |
| Palmer Square Clo 2024-2 Ltd. Series 2024-2A Class E, CME Term SOFR 3 Month Index + 5.700% 10.9939% 7/20/37 (b)(d)(e) | | 1,000,000 | 1,014,914 |
| Palmer Square Ln Funding 2024-2 Lt Series 2024-2A Class D, CME Term SOFR 3 Month Index + 4.700% 6.2% 1/15/33 (b)(d)(e)(f) | | 269,000 | 269,000 |
| Rr 31 Ltd. Series 2024-31A Class D, CME Term SOFR 3 Month Index + 6.000% 10.5928% 10/15/39 (b)(d)(e) | | 208,000 | 208,362 |
| TOTAL ASSET-BACKED SECURITIES (Cost $4,131,449) | | | 4,167,369 |
| | | | |
| Commercial Mortgage Securities - 0.3% |
| | | Principal Amount (a) | Value ($) |
| BX Commercial Mortgage Trust floater Series 2021-SOAR Class G, CME Term SOFR 1 Month Index + 2.910% 7.7185% 6/15/38 (b)(d)(e) | | 838,161 | 826,996 |
| ELP Commercial Mortgage Trust floater Series 2021-ELP Class F, CME Term SOFR 1 Month Index + 2.780% 7.5855% 11/15/38 (b)(d)(e) | | 1,196,607 | 1,188,381 |
| Extended Stay America Trust floater Series 2021-ESH Class F, CME Term SOFR 1 Month Index + 3.810% 8.6185% 7/15/38 (b)(d)(e) | | 477,316 | 479,103 |
| Hilton U.S.A. Trust Series 2016-HHV Class F, 4.1935% 11/5/38 (b)(d) | | 772,000 | 728,917 |
| MHP Commercial Mortgage Trust floater Series 2021-STOR Class F, CME Term SOFR 1 Month Index + 2.310% 7.1185% 7/15/38 (b)(d)(e) | | 1,791,000 | 1,771,971 |
| TOTAL COMMERCIAL MORTGAGE SECURITIES (Cost $4,830,832) | | | 4,995,368 |
| | | | |
| Common Stocks - 2.0% |
| | | Shares | Value ($) |
| Automotive & Auto Parts - 0.1% | | | |
| Aptiv PLC (k) | | 12,300 | 699,009 |
| Capital Goods - 0.0% | | | |
| Chart Industries, Inc. (k) | | 3,500 | 422,520 |
| Energy - 0.9% | | | |
| California Resources Corp. | | 8,171 | 424,647 |
| Mesquite Energy, Inc. (i)(k) | | 149,356 | 12,613,138 |
TOTAL ENERGY | | | 13,037,785 |
| Food & Drug Retail - 0.1% | | | |
| Albertsons Companies, Inc. | | 35,300 | 638,930 |
| Southeastern Grocers, Inc. rights (i)(k) | | 963,443 | 622,721 |
TOTAL FOOD & DRUG RETAIL | | | 1,261,651 |
| Healthcare - 0.1% | | | |
| Cano Health, Inc. (i) | | 106,584 | 1,302,456 |
| Cano Health, Inc. warrants (i)(k) | | 4,738 | 18,762 |
| Centene Corp. (k) | | 12,700 | 790,702 |
TOTAL HEALTHCARE | | | 2,111,920 |
| Metals/Mining - 0.0% | | | |
| Elah Holdings, Inc. (k) | | 333 | 11,655 |
| Services - 0.1% | | | |
| CoreCivic, Inc. (k) | | 40,300 | 556,543 |
| The GEO Group, Inc. (k) | | 35,900 | 544,962 |
TOTAL SERVICES | | | 1,101,505 |
| Technology - 0.2% | | | |
| Coherent Corp. (k) | | 15,300 | 1,414,332 |
| MKS Instruments, Inc. | | 5,900 | 586,047 |
| ON Semiconductor Corp. (k) | | 17,500 | 1,233,575 |
TOTAL TECHNOLOGY | | | 3,233,954 |
| Telecommunications - 0.5% | | | |
| GTT Communications, Inc. (i)(k) | | 40,978 | 2,214,861 |
| Helios Towers PLC (k) | | 2,493,500 | 3,421,019 |
| SBA Communications Corp. Class A | | 5,600 | 1,285,032 |
TOTAL TELECOMMUNICATIONS | | | 6,920,912 |
| TOTAL COMMON STOCKS (Cost $17,811,405) | | | 28,800,911 |
| | | | |
| Bank Loan Obligations - 4.7% |
| | | Principal Amount (a) | Value ($) |
| Automotive & Auto Parts - 0.0% | | | |
| Power Stop LLC 1LN, term loan CME Term SOFR 3 Month Index + 4.750% 9.9072% 1/26/29 (d)(e)(l) | | 726,227 | 696,727 |
| Broadcasting - 0.2% | | | |
| Diamond Sports Group LLC: | | | |
| 1LN, term loan CME Term SOFR 1 Month Index + 8.000% 14.9441% 5/25/26 (d)(e)(l) | | 2,466,768 | 2,123,172 |
| Tranche DIP term loan 10% 8/2/27 (l) | | 922,441 | 970,870 |
TOTAL BROADCASTING | | | 3,094,042 |
| Chemicals - 0.6% | | | |
| Consolidated Energy Finance SA Tranche B 1LN, term loan CME Term SOFR 1 Month Index + 4.500% 9.5572% 11/15/30 (d)(e)(l) | | 2,830,775 | 2,662,938 |
| Discovery Purchaser Corp. 1LN, term loan CME Term SOFR 3 Month Index + 4.370% 8.9647% 10/4/29 (d)(e)(l) | | 1,886,615 | 1,883,087 |
| Hexion Holdings Corp. 1LN, term loan CME Term SOFR 3 Month Index + 4.500% 9.7711% 3/15/29 (d)(e)(l) | | 3,572,589 | 3,569,409 |
| Olympus Water U.S. Holding Corp. Tranche B 1LN, term loan CME Term SOFR 3 Month Index + 3.500% 8.1037% 6/23/31 (d)(e)(l) | | 1,306,874 | 1,308,181 |
TOTAL CHEMICALS | | | 9,423,615 |
| Consumer Products - 0.1% | | | |
| Mattress Firm, Inc. Tranche B 1LN, term loan CME Term SOFR 3 Month Index + 4.250% 8.9235% 9/24/28 (d)(e)(l) | | 1,678,064 | 1,677,023 |
| TripAdvisor, Inc. Tranche B 1LN, term loan CME Term SOFR 1 Month Index + 2.750% 7.4352% 7/8/31 (d)(e)(l) | | 85,000 | 84,964 |
TOTAL CONSUMER PRODUCTS | | | 1,761,987 |
| Diversified Financial Services - 0.2% | | | |
| Dragon Buyer, Inc. 1LN, term loan CME Term SOFR 1 Month Index + 3.250% 7.8537% 9/30/31 (d)(e)(l) | | 155,000 | 153,983 |
| Nexus Buyer LLC Tranche B 1LN, term loan CME Term SOFR 1 Month Index + 4.000% 8.6852% 7/18/31 (d)(e)(l) | | 2,070,000 | 2,060,954 |
TOTAL DIVERSIFIED FINANCIAL SERVICES | | | 2,214,937 |
| Diversified Media - 0.1% | | | |
| CMG Media Corp. Tranche B 1LN, term loan CME Term SOFR 3 Month Index + 3.500% 8.2037% 12/17/26 (d)(e)(l) | | 1,278,359 | 1,165,224 |
| Energy - 0.2% | | | |
| EG America LLC Tranche BC 1LN, term loan CME Term SOFR 1 Month Index + 5.500% 10.4445% 2/7/28 (d)(e)(l) | | 2,334,543 | 2,335,126 |
| Mesquite Energy, Inc.: | | | |
| 1LN, term loan 3 month U.S. LIBOR + 8.000% 0% (d)(e)(h)(i)(l) | | 2,735,146 | 0 |
| term loan 0% (d)(h)(i)(l) | | 1,217,000 | 0 |
TOTAL ENERGY | | | 2,335,126 |
| Healthcare - 0.1% | | | |
| Cano Health, Inc. 1LN, term loan CME Term SOFR 1 Month Index + 8.000% 12.6037% 6/28/29 (d)(e)(l) | | 638,996 | 634,203 |
| WCG Intermediate Corp. Tranche B 1LN, term loan CME Term SOFR 1 Month Index + 3.500% 8.1852% 1/8/27 (d)(e)(l) | | 126,051 | 126,058 |
TOTAL HEALTHCARE | | | 760,261 |
| Insurance - 0.0% | | | |
| Alliant Holdings Intermediate LLC Tranche B6 1LN, term loan CME Term SOFR 1 Month Index + 3.000% 7.7592% 9/19/31 (d)(e)(l) | | 159,620 | 158,822 |
| Leisure - 0.6% | | | |
| City Football Group Ltd. Tranche B 1LN, term loan CME Term SOFR 1 Month Index + 3.500% 7.8322% 7/21/30 (d)(e)(l) | | 3,232,501 | 3,192,095 |
| ClubCorp Holdings, Inc. Tranche B 1LN, term loan CME Term SOFR 3 Month Index + 5.000% 9.8653% 9/18/26 (d)(e)(l) | | 2,130,290 | 2,132,058 |
| United PF Holdings LLC 1LN, term loan CME Term SOFR 3 Month Index + 4.000% 8.847% 12/30/26 (d)(e)(l) | | 3,086,920 | 2,965,388 |
TOTAL LEISURE | | | 8,289,541 |
| Metals/Mining - 0.3% | | | |
| American Rock Salt Co. LLC: | | | |
| 1LN, term loan: | | | |
CME Term SOFR 3 Month Index + 4.000% 9.3188% 6/4/28 (d)(e)(l) | | 3,273,183 | 2,726,758 |
CME Term SOFR 3 Month Index + 6.500% 2% 6/12/28 (d)(e)(j)(l) | | 1,027,337 | 1,026,053 |
| Tranche B 1LN, term loan CME Term SOFR 3 Month Index + 6.500% 11.8736% 6/12/28 (d)(e)(l) | | 960,375 | 959,174 |
TOTAL METALS/MINING | | | 4,711,985 |
| Paper - 0.0% | | | |
| Clydesdale Acquisition Holdings, Inc. 1LN, term loan CME Term SOFR 1 Month Index + 3.670% 7.8602% 4/13/29 (d)(e)(l) | | 345,893 | 344,942 |
| Services - 1.0% | | | |
| ABG Intermediate Holdings 2 LLC Tranche B1 1LN, term loan CME Term SOFR 1 Month Index + 2.750% 7.4465% 12/21/28 (d)(e)(l) | | 634,350 | 635,460 |
| Ascend Learning LLC: | | | |
| 2LN, term loan CME Term SOFR 1 Month Index + 5.750% 10.5352% 12/10/29 (d)(e)(l) | | 225,000 | 220,876 |
| Tranche B 1LN, term loan CME Term SOFR 1 Month Index + 3.500% 8.2852% 12/10/28 (d)(e)(l) | | 2,207,575 | 2,205,853 |
| Brand Industrial Services, Inc. Tranche B 1LN, term loan CME Term SOFR 3 Month Index + 4.500% 9.7477% 8/1/30 (d)(e)(l) | | 628,666 | 619,827 |
| CoreLogic, Inc. Tranche B 1LN, term loan CME Term SOFR 1 Month Index + 3.500% 8.2996% 6/2/28 (d)(e)(l) | | 2,475,342 | 2,458,534 |
| Ensemble RCM LLC Tranche B 1LN, term loan CME Term SOFR 3 Month Index + 3.000% 7.5854% 8/1/29 (d)(e)(l) | | 179,549 | 179,707 |
| Finastra U.S.A., Inc. term loan CME Term SOFR 1 Month Index + 7.250% 12.1813% 9/13/29 (d)(e)(i)(l) | | 3,252,319 | 3,252,319 |
| Spin Holdco, Inc. Tranche B 1LN, term loan CME Term SOFR 3 Month Index + 4.000% 9.256% 3/4/28 (d)(e)(l) | | 5,687,782 | 4,923,116 |
TOTAL SERVICES | | | 14,495,692 |
| Super Retail - 0.5% | | | |
| Great Outdoors Group LLC Tranche B 1LN, term loan CME Term SOFR 1 Month Index + 3.750% 8.5496% 3/5/28 (d)(e)(l) | | 2,729,648 | 2,733,743 |
| LBM Acquisition LLC Tranche B 1LN, term loan CME Term SOFR 1 Month Index + 3.750% 8.6684% 6/6/31 (d)(e)(l) | | 3,913,456 | 3,853,776 |
TOTAL SUPER RETAIL | | | 6,587,519 |
| Technology - 0.5% | | | |
| Applied Systems, Inc. Tranche 2LN, term loan CME Term SOFR 3 Month Index + 5.250% 9.8537% 2/23/32 (d)(e)(l) | | 25,000 | 25,681 |
| Athenahealth Group, Inc. Tranche B 1LN, term loan CME Term SOFR 1 Month Index + 3.250% 7.9352% 2/15/29 (d)(e)(l) | | 1,567,440 | 1,561,233 |
| DH Corp./Societe term loan CME Term SOFR 3 Month Index + 7.250% 12.1813% 9/13/29 (d)(e)(i)(l) | | 75,956 | 75,956 |
| Ellucian, Inc. Tranche B 1LN, term loan CME Term SOFR 1 Month Index + 3.500% 8.2852% 10/7/29 (d)(e)(l) | | 613,089 | 615,278 |
| Leia Finco U.S. LLC 1LN, term loan CME Term SOFR 1 Month Index + 3.250% 7.8867% 10/9/31 (d)(e)(l) | | 2,770,000 | 2,743,076 |
| Rackspace Finance LLC Tranche B 1LN, term loan CME Term SOFR 1 Month Index + 6.250% 11.1829% 5/15/28 (d)(e)(l) | | 523,067 | 532,111 |
| UKG, Inc. Tranche B 1LN, term loan CME Term SOFR 3 Month Index + 3.500% 7.6172% 2/10/31 (d)(e)(l) | | 2,456,824 | 2,458,839 |
TOTAL TECHNOLOGY | | | 8,012,174 |
| Telecommunications - 0.3% | | | |
| GTT Communications, Inc. 1LN, term loan CME Term SOFR 1 Month Index + 9.000% 13.9454% 6/30/28 (d)(e)(l) | | 1,993,314 | 1,483,365 |
| Gtt Remainco LLC 1LN, term loan CME Term SOFR 1 Month Index + 7.000% 11.7852% 12/30/27 (d)(e)(l) | | 2,306,624 | 2,165,343 |
TOTAL TELECOMMUNICATIONS | | | 3,648,708 |
| Textiles/Apparel - 0.0% | | | |
| Tory Burch LLC Tranche B 1LN, term loan CME Term SOFR 1 Month Index + 3.500% 8.0496% 4/16/28 (d)(e)(l) | | 725,625 | 725,523 |
| TOTAL BANK LOAN OBLIGATIONS (Cost $70,572,629) | | | 68,426,825 |
| | | | |
| Preferred Securities - 0.8% |
| | | Principal Amount (a) | Value ($) |
| Banks & Thrifts - 0.7% | | | |
| Ally Financial, Inc.: | | | |
| 4.7% (d)(m) | | 1,820,000 | 1,655,432 |
| 4.7% (d)(m) | | 1,785,000 | 1,466,024 |
| Bank of America Corp. 5.875% (c)(d)(m) | | 2,195,000 | 2,231,662 |
| Citigroup, Inc. 7.125% (d)(m) | | 2,535,000 | 2,681,791 |
| Goldman Sachs Group, Inc. 6.125% (d)(m) | | 720,000 | 718,507 |
| JPMorgan Chase & Co. 4.6% (d)(m) | | 1,580,000 | 1,590,597 |
| Wells Fargo & Co. 7.625% (c)(d)(m) | | 615,000 | 667,053 |
TOTAL BANKS & THRIFTS | | | 11,011,066 |
| Diversified Financial Services - 0.1% | | | |
| Aircastle Ltd. 5.25% (b)(d)(m) | | 225,000 | 222,691 |
| Charles Schwab Corp. 4% (d)(m) | | 1,405,000 | 1,233,170 |
TOTAL DIVERSIFIED FINANCIAL SERVICES | | | 1,455,861 |
| TOTAL PREFERRED SECURITIES (Cost $10,764,027) | | | 12,466,927 |
| | | | |
| Fixed-Income Funds - 0.1% |
| | | Shares | Value ($) |
iShares Broad USD High Yield Corporate Bond ETF (Cost $1,417,590) | | 39,100 | 1,451,783 |
| | | | |
| Other - 1.3% |
| | | Shares | Value ($) |
| Other - 1.3% | | | |
Fidelity Private Credit Co. LLC (n)(o) (Cost $18,864,246) | | 1,893,451 | 19,085,978 |
| | | | |
| Money Market Funds - 7.2% |
| | | Shares | Value ($) |
| Fidelity Cash Central Fund 4.87% (p) | | 48,876,406 | 48,886,182 |
| Fidelity Securities Lending Cash Central Fund 4.87% (p)(q) | | 55,613,401 | 55,618,963 |
| TOTAL MONEY MARKET FUNDS (Cost $104,505,144) | | | 104,505,145 |
| | | | |
| TOTAL INVESTMENT IN SECURITIES - 103.0% (Cost $1,516,115,348) | 1,502,367,961 |
NET OTHER ASSETS (LIABILITIES) - (3.0)% | (44,293,425) |
| NET ASSETS - 100.0% | 1,458,074,536 |
| | |
Security Type Abbreviations
Legend
| (a) | Amount is stated in United States dollars unless otherwise noted. |
| (b) | Security exempt from registration under Rule 144A of the Securities Act of 1933. These securities may be resold in transactions exempt from registration, normally to qualified institutional buyers. At the end of the period, the value of these securities amounted to $1,050,644,855 or 72.1% of net assets. |
| (c) | Security or a portion of the security is on loan at period end. |
| (d) | Coupon rates for floating and adjustable rate securities reflect the rates in effect at period end. |
| (e) | Coupon is indexed to a floating interest rate which may be multiplied by a specified factor and/or subject to caps or floors. |
| (f) | Security or a portion of the security purchased on a delayed delivery or when-issued basis. |
| (g) | Security initially issued at one coupon which converts to a higher coupon at a specified date. The rate shown is the rate at period end. |
| (h) | Non-income producing - Security is in default. |
| (j) | Position or a portion of the position represents an unfunded loan commitment. At period end, the total principal amount and market value of unfunded commitments totaled $2,734,004 and $2,664,453, respectively. |
| (l) | Remaining maturities of bank loan obligations may be less than the stated maturities shown as a result of contractual or optional prepayments by the borrower. Such prepayments cannot be predicted with certainty. |
| (m) | Security is perpetual in nature with no stated maturity date. |
| (o) | Restricted securities (including private placements) - Investment in securities not registered under the Securities Act of 1933 (excluding 144A issues). At the end of the period, the value of restricted securities (excluding 144A issues) amounted to $19,085,978 or 1.3% of net assets. |
| (p) | Affiliated fund that is generally available only to investment companies and other accounts managed by Fidelity Investments. The rate quoted is the annualized seven-day yield of the fund at period end. A complete unaudited listing of the fund's holdings as of its most recent quarter end is available upon request. In addition, each Fidelity Central Fund's financial statements are available on the SEC's website or upon request. |
| (q) | Investment made with cash collateral received from securities on loan. |
| Additional information on each restricted holding is as follows: |
| Security | Acquisition Date | Acquisition Cost ($) |
| Fidelity Private Credit Co. LLC | 4/15/22 - 10/28/24 | 18,864,246 |
| | | |
Affiliated Central Funds
Fiscal year to date information regarding the Fund's investments in Fidelity Central Funds, including the ownership percentage, is presented below.
| Affiliate | Value, beginning of period ($) | Purchases ($) | Sales Proceeds ($) | Dividend Income ($) | Realized Gain (loss) ($) | Change in Unrealized appreciation (depreciation) ($) | Value, end of period ($) | % ownership, end of period |
| Fidelity Cash Central Fund 4.87% | 54,802,390 | 227,063,100 | 232,979,941 | 1,304,742 | 632 | 1 | 48,886,182 | 0.1% |
| Fidelity Securities Lending Cash Central Fund 4.87% | 8,172,350 | 253,045,792 | 205,599,179 | 114,578 | - | - | 55,618,963 | 0.2% |
| Total | 62,974,740 | 480,108,892 | 438,579,120 | 1,419,320 | 632 | 1 | 104,505,145 | |
| | | | | | | | | |
Amounts in the dividend income column in the above table include any capital gain distributions from underlying funds, which are presented in the corresponding line item in the Statement of Operations, if applicable.
Amounts in the dividend income column for Fidelity Securities Lending Cash Central Fund represents the income earned on investing cash collateral, less rebates paid to borrowers and any lending agent fees associated with the loan, plus any premium payments received for lending certain types of securities.
Amounts included in the purchases and sales proceeds columns may include in-kind transactions, if applicable.
Affiliated Underlying Funds
Fiscal year to date information regarding the Fund's investments in affiliated Underlying Funds is presented below. Exchanges between classes of the same affiliated Underlying Funds may occur. If an Underlying Funds changes its name, the name presented below is the name in effect at period end.
| Affiliate | Value, beginning of period ($) | Purchases ($) | Sales Proceeds ($) | Dividend Income ($) | Realized Gain (loss) ($) | Change in Unrealized appreciation (depreciation) ($) | Value, end of period ($) |
| Fidelity Private Credit Co. LLC | 17,286,920 | 1,932,558 | - | 1,262,554 | - | (133,500) | 19,085,978 |
| | 17,286,920 | 1,932,558 | - | 1,262,554 | - | (133,500) | 19,085,978 |
Amounts in the dividend income column in the above table include any capital gain distributions from underlying funds, which are presented in the corresponding line item in the Statement of Operations, if applicable.
Amounts included in the purchases and sales proceeds columns may include in-kind transactions, if applicable.
Investment Valuation
The following is a summary of the inputs used, as of October 31, 2024, involving the Fund's assets and liabilities carried at fair value. The inputs or methodology used for valuing securities may not be an indication of the risk associated with investing in those securities. For more information on valuation inputs, and their aggregation into the levels used below, please refer to the Investment Valuation section in the accompanying Notes to Financial Statements.
| Valuation Inputs at Reporting Date: |
| Description | Total ($) | Level 1 ($) | Level 2 ($) | Level 3 ($) |
Investments in Securities: | | | | |
|
| Equities: | | | | |
Communication Services | 3,421,019 | 3,421,019 | - | - |
Consumer Discretionary | 699,009 | 699,009 | - | - |
Consumer Staples | 1,261,651 | 638,930 | - | 622,721 |
Energy | 13,037,785 | 424,647 | - | 12,613,138 |
Health Care | 2,111,920 | 790,702 | - | 1,321,218 |
Industrials | 1,524,025 | 1,524,025 | - | - |
Information Technology | 5,448,815 | 3,233,954 | - | 2,214,861 |
Materials | 11,655 | 11,655 | - | - |
Real Estate | 1,285,032 | 1,285,032 | - | - |
|
| Corporate Bonds | 1,251,525,664 | - | 1,249,068,063 | 2,457,601 |
|
| U.S. Government and Government Agency Obligations | 6,941,991 | - | 6,941,991 | - |
|
| Asset-Backed Securities | 4,167,369 | - | 4,167,369 | - |
|
| Commercial Mortgage Securities | 4,995,368 | - | 4,995,368 | - |
|
| Bank Loan Obligations | 68,426,825 | - | 65,098,550 | 3,328,275 |
|
| Preferred Securities | 12,466,927 | - | 12,466,927 | - |
|
| Fixed-Income Funds | 1,451,783 | 1,451,783 | - | - |
|
| Other | 19,085,978 | - | 19,085,978 | - |
|
| Money Market Funds | 104,505,145 | 104,505,145 | - | - |
| Total Investments in Securities: | 1,502,367,961 | 117,985,901 | 1,361,824,246 | 22,557,814 |
| | | | | |
|
| Net Unrealized Appreciation on Unfunded Commitments | 1,448,119 | (456,989) | - | 1,905,108 |
| Total | 1,448,119 | (456,989) | - | 1,905,108 |
The following is a reconciliation of Investments in Securities for which Level 3 inputs were used in determining value:
| |
| Investments in Securities: | |
| Beginning Balance | $ | 22,328,055 | |
| Net Realized Gain (Loss) on Investment Securities | | 1,053,285 | |
| Net Unrealized Gain (Loss) on Investment Securities | | (233,868) | |
| Cost of Purchases | | 5,394,751 | |
| Proceeds of Sales | | (5,998,692) | |
| Amortization/Accretion | | 24,535 | |
| Transfers into Level 3 | | - | |
| Transfers out of Level 3 | | (10,252) | |
| Ending Balance | $ | 22,557,814 | |
| The change in unrealized gain (loss) for the period attributable to Level 3 securities held at October 31, 2024 | $ | 75,097 | |
| The information used in the above reconciliation represents fiscal year to date activity for any Investments in Securities identified as using Level 3 inputs at either the beginning or the end of the current fiscal period. Cost of purchases and proceeds of sales may include securities received and/or delivered through in-kind transactions, corporate actions or exchanges. Transfers into Level 3 were attributable to a lack of observable market data resulting from decreases in market activity, decreases in liquidity, security restructurings or corporate actions. Transfers out of Level 3 were attributable to observable market data becoming available for those securities. Transfers in or out of Level 3 represent the beginning value of any Security or Instrument where a change in the pricing level occurred from the beginning to the end of the period. Realized and unrealized gains (losses) disclosed in the reconciliation are included in Net Gain (Loss) on the Fund's Statement of Operations. | |
Financial Statements (Unaudited)
| Statement of Assets and Liabilities |
| As of October 31, 2024 (Unaudited) |
| Assets | | | | |
| Investment in securities, at value (including securities loaned of $53,754,146) - See accompanying schedule: | | | | |
Unaffiliated issuers (cost $1,392,745,958) | $ | 1,378,776,838 | | |
Fidelity Central Funds (cost $104,505,144) | | 104,505,145 | | |
Other affiliated issuers (cost $18,864,246) | | 19,085,978 | | |
| | | | | |
| | | | | |
| Total Investment in Securities (cost $1,516,115,348) | | | $ | 1,502,367,961 |
| Cash | | | | 2,153,271 |
| Receivable for investments sold | | | | 3,994,714 |
| Unrealized appreciation on unfunded commitments | | | | 1,905,108 |
| Receivable for fund shares sold | | | | 131,359 |
| Dividends receivable | | | | 4,236 |
| Interest receivable | | | | 20,636,786 |
| Distributions receivable from Fidelity Central Funds | | | | 242,838 |
| Receivable from investment adviser for expense reductions | | | | 27,592 |
| Other receivables | | | | 91 |
Total assets | | | | 1,531,463,956 |
| Liabilities | | | | |
| Payable for investments purchased | | | | |
Regular delivery | $ | 7,541,703 | | |
Delayed delivery | | 7,429,000 | | |
| Unrealized depreciation on unfunded commitments | | 456,989 | | |
| Payable for fund shares redeemed | | 2,337,281 | | |
| Distributions payable | | 962 | | |
| Other payables and accrued expenses | | 4,522 | | |
| Collateral on securities loaned | | 55,618,963 | | |
| Total liabilities | | | | 73,389,420 |
| Commitments and contingent liabilities (see Significant Accounting Policies and Litigation notes) | | | | |
| Net Assets | | | $ | 1,458,074,536 |
| Net Assets consist of: | | | | |
| Paid in capital | | | $ | 1,875,834,195 |
| Total accumulated earnings (loss) | | | | (417,759,659) |
| Net Assets | | | $ | 1,458,074,536 |
Net Asset Value, offering price and redemption price per share ($1,458,074,536 ÷ 168,374,206 shares) | | | $ | 8.66 |
| Statement of Operations |
Six months ended October 31, 2024 (Unaudited) |
| Investment Income | | | | |
| Dividends: | | | | |
| Unaffiliated issuers | | | $ | 740,246 |
| Affiliated issuers | | | | 1,262,554 |
| Interest | | | | 45,158,546 |
| Income from Fidelity Central Funds (including $114,578 from security lending) | | | | 1,419,320 |
| Payment from investment adviser | | | | 65,933 |
| Total income | | | | 48,646,599 |
| Expenses | | | | |
| Custodian fees and expenses | $ | 6,554 | | |
| Independent trustees' fees and expenses | | 2,802 | | |
| Legal | | 31,640 | | |
| Miscellaneous | | 71 | | |
| Total expenses before reductions | | 41,067 | | |
| Expense reductions | | (26,094) | | |
| Total expenses after reductions | | | | 14,973 |
| Net Investment income (loss) | | | | 48,631,626 |
| Realized and Unrealized Gain (Loss) | | | | |
| Net realized gain (loss) on: | | | | |
| Investment Securities: | | | | |
| Unaffiliated issuers | | (10,411,899) | | |
| Fidelity Central Funds | | 632 | | |
| Total net realized gain (loss) | | | | (10,411,267) |
| Change in net unrealized appreciation (depreciation) on: | | | | |
| Investment Securities: | | | | |
| Unaffiliated issuers | | 58,282,044 | | |
| Fidelity Central Funds | | 1 | | |
| Other affiliated issuers | | (133,500) | | |
| Unfunded commitments | | 1,448,119 | | |
| Total change in net unrealized appreciation (depreciation) | | | | 59,596,664 |
| Net gain (loss) | | | | 49,185,397 |
| Net increase (decrease) in net assets resulting from operations | | | $ | 97,817,023 |
| Statement of Changes in Net Assets |
| |
| | Six months ended October 31, 2024 (Unaudited) | | Year ended April 30, 2024 |
| Increase (Decrease) in Net Assets | | | | |
| Operations | | | | |
| Net investment income (loss) | $ | 48,631,626 | $ | 85,959,811 |
| Net realized gain (loss) | | (10,411,267) | | (23,247,623) |
| Change in net unrealized appreciation (depreciation) | | 59,596,664 | | 34,030,795 |
| Net increase (decrease) in net assets resulting from operations | | 97,817,023 | | 96,742,983 |
| Distributions to shareholders | | (44,465,275) | | (81,389,502) |
| | | | | |
| Share transactions | | | | |
| Proceeds from sales of shares | | 113,474,910 | | 228,600,645 |
| Reinvestment of distributions | | 44,449,311 | | 81,389,526 |
| Cost of shares redeemed | | (102,400,008) | | (176,213,871) |
| | | | | |
Net increase (decrease) in net assets resulting from share transactions | | 55,524,213 | | 133,776,300 |
| Total increase (decrease) in net assets | | 108,875,961 | | 149,129,781 |
| | | | | |
| Net Assets | | | | |
| Beginning of period | | 1,349,198,575 | | 1,200,068,794 |
| End of period | $ | 1,458,074,536 | $ | 1,349,198,575 |
| | | | | |
| Other Information | | | | |
| Shares | | | | |
| Sold | | 13,107,854 | | 27,698,132 |
| Issued in reinvestment of distributions | | 5,193,520 | | 9,876,597 |
| Redeemed | | (11,832,531) | | (21,371,348) |
| Net increase (decrease) | | 6,468,843 | | 16,203,381 |
| | | | | |
Financial Highlights
Fidelity® Series High Income Fund |
| |
| | Six months ended (Unaudited) October 31, 2024 | | Years ended April 30, 2024 | | 2023 | | 2022 | | 2021 | | 2020 |
Selected Per-Share Data | | | | | | | | | | | | |
| Net asset value, beginning of period | $ | 8.33 | $ | 8.24 | $ | 8.74 | $ | 9.44 | $ | 8.54 | $ | 9.50 |
| Income from Investment Operations | | | | | | | | | | | | |
Net investment income (loss) A,B | | .295 | | .562 | | .536 | | .510 | | .513 | | .577 |
| Net realized and unrealized gain (loss) | | .305 | | .060 | | (.516) | | (.699) | | .890 | | (.935) |
| Total from investment operations | | .600 | | .622 | | .020 | | (.189) | | 1.403 | | (.358) |
| Distributions from net investment income | | (.270) | | (.532) | | (.520) | | (.511) | | (.503) | | (.598) |
| Distributions from net realized gain | | - | | - | | - | | - | | - | | (.004) |
| Total distributions | | (.270) | | (.532) | | (.520) | | (.511) | | (.503) | | (.602) |
| Net asset value, end of period | $ | 8.66 | $ | 8.33 | $ | 8.24 | $ | 8.74 | $ | 9.44 | $ | 8.54 |
Total Return C,D | | | | 7.82% | | .41% | | (2.24)% | | 16.72% | | (4.11)% |
Ratios to Average Net Assets B,E,F | | | | | | | | | | | | |
| Expenses before reductions | | .01% G | | -% H | | .04% | | .02% | | -% H | | -% H |
| Expenses net of fee waivers, if any | | | | -% H | | -% H | | -% H | | -% H | | -% H |
| Expenses net of all reductions | | -% G,H | | -% H | | -% H | | -% H | | -% H | | -% H |
| Net investment income (loss) | | 6.87% G | | 6.83% | | 6.49% | | 5.42% | | 5.58% | | 6.20% |
| Supplemental Data | | | | | | | | | | | | |
| Net assets, end of period (000 omitted) | $ | 1,458,075 | $ | 1,349,199 | $ | 1,200,069 | $ | 1,474,882 | $ | 1,702,161 | $ | 1,491,532 |
Portfolio turnover rate I | | | | 28% | | 34% | | 49% | | 68% | | 41% J |
ACalculated based on average shares outstanding during the period.
BNet investment income (loss) is affected by the timing of the declaration of dividends by any underlying mutual funds or exchange-traded funds (ETFs). Net investment income (loss) of any mutual funds or ETFs is not included in the Fund's net investment income (loss) ratio.
CTotal returns for periods of less than one year are not annualized.
DTotal returns would have been lower if certain expenses had not been reduced during the applicable periods shown.
EFees and expenses of any underlying mutual funds or exchange-traded funds (ETFs) are not included in the Fund's expense ratio. The Fund indirectly bears its proportionate share of these expenses. For additional expense information related to investments in Fidelity Central Funds, please refer to the "Investments in Fidelity Central Funds" note found in the Notes to Financial Statements section of the most recent Annual or Semi-Annual report. For additional expense information related to investments in Fidelity Private Credit Company LLC, please refer to the Investment in Fidelity Private Credit Company LLC note found in the Notes to Financial Statements section of the most recent Annual or Semi-Annual report.
FExpense ratios reflect operating expenses of the class. Expenses before reductions do not reflect amounts reimbursed, waived, or reduced through arrangements with the investment adviser, brokerage services, or other offset arrangements, if applicable, and do not represent the amount paid by the class during periods when reimbursements, waivers or reductions occur.
GAnnualized.
HAmount represents less than .005%.
IAmount does not include the portfolio activity of any underlying mutual funds or exchange-traded funds (ETFs).
JPortfolio turnover rate excludes securities received or delivered in-kind.
Notes to Financial Statements
(Unaudited)For the period ended October 31, 2024
1. Organization.
Fidelity Series High Income Fund (the Fund) is a fund of Fidelity Summer Street Trust (the Trust) and is authorized to issue an unlimited number of shares. Shares are offered only to certain other Fidelity funds, Fidelity managed 529 plans, and Fidelity managed collective investment trusts. The Trust is registered under the Investment Company Act of 1940, as amended (the 1940 Act), as an open-end management investment company organized as a Massachusetts business trust.
2. Investments in Fidelity Central Funds.
Funds may invest in Fidelity Central Funds, which are open-end investment companies generally available only to other investment companies and accounts managed by the investment adviser and its affiliates. The Schedule of Investments lists any Fidelity Central Funds held as an investment as of period end, but does not include the underlying holdings of each Fidelity Central Fund. An investing fund indirectly bears its proportionate share of the expenses of the underlying Fidelity Central Funds.
Based on its investment objective, each Fidelity Central Fund may invest or participate in various investment vehicles or strategies that are similar to those of the investing fund. These strategies are consistent with the investment objectives of the investing fund and may involve certain economic risks which may cause a decline in value of each of the Fidelity Central Funds and thus a decline in the value of the investing fund.
| Fidelity Central Fund | Investment Manager | Investment Objective | Investment Practices | Expense RatioA |
| Fidelity Money Market Central Funds | Fidelity Management & Research Company LLC (FMR) | Each fund seeks to obtain a high level of current income consistent with the preservation of capital and liquidity. | Short-term Investments | Less than .005% |
A Expenses expressed as a percentage of average net assets and are as of each underlying Central Fund's most recent annual or semi-annual shareholder report.
A complete unaudited list of holdings for each Fidelity Central Fund is available upon request or at the Securities and Exchange Commission website at www.sec.gov. In addition, the financial statements of the Fidelity Central Funds which contain the significant accounting policies (including investment valuation policies) of those funds, and are not covered by the Report of Independent Registered Public Accounting Firm, are available on the Securities and Exchange Commission website or upon request.
3. Investment in Fidelity Private Credit Company LLC.
The Fund invests in Fidelity Private Credit Company LLC, which is a limited liability company. Fidelity Private Credit Company LLC's units are not registered under the Securities Act of 1933 and are subject to substantial restrictions on transfer. The Fund has no redemption rights under Fidelity Private Credit Company LLC's limited liability company agreement. There will be no trading market for the units.
Based on its investment objective, Fidelity Private Credit Company LLC may invest or participate in various investments or strategies that are similar to those in which the Fund may invest or participate. These strategies are consistent with the investment objectives of the Fund and may involve certain economic risks which may cause a decline in value of Fidelity Private Credit Company LLC and thus a decline in the value of the Fund. Fidelity Private Credit Company LLC intends to invest primarily in directly originated loans to private companies but also with liquid credit investments, like broadly syndicated loans, and other select private credit investments.
The Schedule of Investments lists Fidelity Private Credit Company LLC as an investment as of period end, but does not include the underlying holdings of Fidelity Private Credit Company LLC. Fidelity Private Credit Company LLC represented less than 5% of the Fund's net assets at period end. The Fund indirectly bears its proportionate share of the expenses of Fidelity Private Credit Company LLC. The annualized expense ratio for Fidelity Private Credit Company LLC for the nine month period ended September 30, 2024 was 11.38%.
4. Significant Accounting Policies.
The Fund is an investment company and applies the accounting and reporting guidance of the Financial Accounting Standards Board (FASB) Accounting Standards Codification Topic 946 Financial Services - Investment Companies. The financial statements have been prepared in conformity with accounting principles generally accepted in the United States of America (GAAP), which require management to make certain estimates and assumptions at the date of the financial statements. Actual results could differ from those estimates. Subsequent events, if any, through the date that the financial statements were issued have been evaluated in the preparation of the financial statements. The Fund's Schedule of Investments lists any underlying mutual funds or exchange-traded funds (ETFs) but does not include the underlying holdings of these funds. The following summarizes the significant accounting policies of the Fund:
Investment Valuation. Investments are valued as of 4:00 p.m. Eastern time on the last calendar day of the period. The Board of Trustees (the Board) has designated the Fund's investment adviser as the valuation designee responsible for the fair valuation function and performing fair value determinations as needed. The investment adviser has established a Fair Value Committee (the Committee) to carry out the day-to-day fair valuation responsibilities and has adopted policies and procedures to govern the fair valuation process and the activities of the Committee. In accordance with these fair valuation policies and procedures, which have been approved by the Board, the Fund attempts to obtain prices from one or more third party pricing services or brokers to value its investments. When current market prices, quotations or currency exchange rates are not readily available or reliable, investments will be fair valued in good faith by the Committee, in accordance with the policies and procedures. Factors used in determining fair value vary by investment type and may include market or investment specific events, transaction data, estimated cash flows, and market observations of comparable investments. The frequency that the fair valuation procedures are used cannot be predicted and they may be utilized to a significant extent. The Committee manages the Fund's fair valuation practices and maintains the fair valuation policies and procedures. The Fund's investment adviser reports to the Board information regarding the fair valuation process and related material matters.
The Fund categorizes the inputs to valuation techniques used to value its investments into a disclosure hierarchy consisting of three levels as shown below:
Level 1 - unadjusted quoted prices in active markets for identical investments
Level 2 - other significant observable inputs (including quoted prices for similar investments, interest rates, prepayment speeds, etc.)
Level 3 - unobservable inputs (including the Fund's own assumptions based on the best information available)
Valuation techniques used to value the Fund's investments by major category are as follows:
Debt securities, including restricted securities, are valued based on evaluated prices received from third party pricing services or from brokers who make markets in such securities. Corporate bonds, bank loan obligations, preferred securities and U.S. government and government agency obligations are valued by pricing services who utilize matrix pricing which considers yield or price of bonds of comparable quality, coupon, maturity and type or by broker-supplied prices. Asset backed securities and commercial mortgage securities are valued by pricing services who utilize matrix pricing which considers prepayment speed assumptions, attributes of the collateral, yield or price of bonds of comparable quality, coupon, maturity and type or by broker-supplied prices. When independent prices are unavailable or unreliable, debt securities may be valued utilizing pricing methodologies which consider similar factors that would be used by third party pricing services. Debt securities are generally categorized as Level 2 in the hierarchy but may be Level 3 depending on the circumstances. The Fund invests a significant portion of its assets in below investment grade securities. The value of these securities can be more volatile due to changes in the credit quality of the issuer and is sensitive to changes in economic, market and regulatory conditions.
Equity securities, including restricted securities, for which market quotations are readily available, are valued at the last reported sale price or official closing price as reported by a third party pricing service on the primary market or exchange on which they are traded and are categorized as Level 1 in the hierarchy. In the event there were no sales during the day or closing prices are not available, securities are valued at the last quoted bid price or may be valued using the last available price and are generally categorized as Level 2 in the hierarchy. For foreign equity securities, when market or security specific events arise, comparisons to the valuation of American Depositary Receipts (ADRs), futures contracts, ETFs) and certain indexes as well as quoted prices for similar securities may be used and would be categorized as Level 2 in the hierarchy. For equity securities, including restricted securities, where observable inputs are limited, assumptions about market activity and risk are used and these securities may be categorized as Level 3 in the hierarchy. Securities, including private placements or other restricted securities, for which observable inputs are not available are valued using alternate valuation approaches, including the market approach, the income approach and cost approach, and are categorized as Level 3 in the hierarchy. The market approach considers factors including the price of recent investments in the same or a similar security or financial metrics of comparable securities. The income approach considers factors including expected future cash flows, security specific risks and corresponding discount rates. The cost approach considers factors including the value of the security's underlying assets and liabilities.
Exchange-Traded Funds (ETFs) are valued at their last sale price or official closing price as reported by a third party pricing service on the primary market or exchange on which they are traded and are categorized as Level 1 in the hierarchy. In the event there were no sales during the day but the exchange reports a closing bid level, ETFs are valued at the closing bid and would be categorized as Level 1 in the hierarchy. In the event there was no closing bid, ETFs may be valued by another method that the Board believes reflects fair value in accordance with the Board's fair value pricing policies and may be categorized as Level 2 in the hierarchy.
Investments in open-end mutual funds, including the Fidelity Central Funds, are valued at their closing net asset value (NAV) each business day and are categorized as Level 1 in the hierarchy.
Fidelity Private Credit Company LLC is valued at its net asset value (NAV) each month end and is categorized as Level 2 in the hierarchy.
The following provides information on Level 3 securities held by the Fund that were valued at period end based on unobservable inputs. These amounts exclude valuations provided by a broker and valuations using NAV as a practical expedient.
| Asset Type | Fair Value | Valuation Technique(s) | Unobservable Input | Amount or Range/Weighted Average | Impact to Valuation from an Increase in InputA |
| Equities | $16,771,938 | Market comparable | Enterprise value/EBITDA multiple (EV/EBITDA) | 5.4 - 7.3 / 6.6 | Increase |
| | | Discounted cash flow | Discount rate | 10.8% | Decrease |
| | | Recovery value | Recovery value | $0.65 | Increase |
| | | Black scholes | Discount rate | 4.0% | Increase |
| | | | Term | 4.7 | Increase |
| | | | Volatility | 58.0% | Increase |
| Corporate Bonds | $2,457,601 | Market approach | Transaction price | $96.00 | Increase |
| | | Recovery value | Recovery value | $0.00 | Increase |
| Bank Loan Obligations | $3,328,275 | Discounted cash flow | Yield | 11.1% | Decrease |
| | | Recovery value | Recovery value | $0.00 | Increase |
A Represents the directional change in the fair value of the Level 3 investments that could have resulted from an increase in the corresponding input as of period end. A decrease to the unobservable input would have had the opposite effect. Significant changes in these inputs may have resulted in a significantly higher or lower fair value measurement at period end.
Changes in valuation techniques may result in transfers in or out of an assigned level within the disclosure hierarchy. The aggregate value of investments by input level as of October 31, 2024, as well as a roll forward of Level 3 investments, is included at the end of the Fund's Schedule of Investments.
Investment Transactions and Income. For financial reporting purposes, the Fund's investment holdings and NAV include trades executed through the end of the last business day of the period. The NAV per share for processing shareholder transactions is calculated as of the close of business of the New York Stock Exchange (NYSE), normally 4:00 p.m. Eastern time and includes trades executed through the end of the prior business day. Gains and losses on securities sold are determined on the basis of identified cost and include proceeds received from litigation. Commissions paid to certain brokers with whom the investment adviser, or its affiliates, places trades on behalf of a fund include an amount in addition to trade execution, which may be rebated back to a fund. Any such rebates are included in net realized gain (loss) on investments in the Statement of Operations. Dividend income is recorded on the ex-dividend date, except for certain dividends from foreign securities where the ex-dividend date may have passed, which are recorded as soon as the Fund is informed of the ex-dividend date. Non-cash dividends included in dividend income, if any, are recorded at the fair market value of the securities received. Income and capital gain distributions from Fidelity Central Funds, if any, are recorded on the ex-dividend date. Interest income is accrued as earned and includes coupon interest and amortization of premium and accretion of discount on debt securities as applicable. Paid in Kind (PIK) income is recorded at the fair market value of the securities received. Debt obligations may be placed on non-accrual status and related interest income may be reduced by ceasing current accruals and writing off interest receivables when the collection of all or a portion of interest has become doubtful based on consistently applied procedures. A debt obligation is removed from non-accrual status when the issuer resumes interest payments or when collectability of interest is reasonably assured. The investment adviser has contractually agreed to reimburse the Fund with respect to the portion of the Fund's assets invested in Fidelity Private Credit Company LLC until April 30, 2024 as presented in the Statement of Operations in payment from investment adviser.
Expenses. Expenses directly attributable to a fund are charged to that fund. Expenses attributable to more than one fund are allocated among the respective funds on the basis of relative net assets or other appropriate methods. Expenses included in the accompanying financial statements reflect the expenses of that fund and do not include any expenses associated with any underlying mutual funds or exchange-traded funds. Although not included in a fund's expenses, a fund indirectly bears its proportionate share of these expenses through the net asset value of each underlying mutual fund or exchange-traded fund. Expense estimates are accrued in the period to which they relate and adjustments are made when actual amounts are known.
Income Tax Information and Distributions to Shareholders. Each year, the Fund intends to qualify as a regulated investment company under Subchapter M of the Internal Revenue Code, including distributing substantially all of its taxable income and realized gains. As a result, no provision for U.S. Federal income taxes is required. The Fund files a U.S. federal tax return, in addition to state and local tax returns as required. The Fund's federal income tax returns are subject to examination by the Internal Revenue Service (IRS) for a period of three fiscal years after they are filed. State and local tax returns may be subject to examination for an additional fiscal year depending on the jurisdiction.
Distributions are declared and recorded daily and paid monthly from net investment income. Distributions from realized gains, if any, are declared and recorded on the ex-dividend date. Income and capital gain distributions are determined in accordance with income tax regulations, which may differ from GAAP.
Capital accounts within the financial statements are adjusted for permanent book-tax differences. These adjustments have no impact on net assets or the results of operations. Capital accounts are not adjusted for temporary book-tax differences which will reverse in a subsequent period.
Book-tax differences are primarily due to short-term gain distributions from the underlying mutual funds, foreign currency transactions, passive foreign investment companies (PFIC), prior period premium and discount on debt securities, market discount, partnerships, capital loss carryforwards and losses deferred due to wash sales.
As of period end, the cost and unrealized appreciation (depreciation) in securities, and derivatives if applicable, for federal income tax purposes were as follows:
| Gross unrealized appreciation | $54,540,290 |
| Gross unrealized depreciation | (54,975,057) |
| Net unrealized appreciation (depreciation) | $(434,767) |
| Tax cost | $1,502,802,728 |
Capital loss carryforwards are only available to offset future capital gains of the Fund to the extent provided by regulations and may be limited. The capital loss carryforward information presented below, including any applicable limitation, is estimated as of prior fiscal period end and is subject to adjustment.
Short-term | $(49,453,366) |
Long-term | (362,726,789) |
| Total capital loss carryforward | $(412,180,155) |
Delayed Delivery Transactions and When-Issued Securities. During the period, certain Funds transacted in securities on a delayed delivery or when-issued basis. Payment and delivery may take place after the customary settlement period for that security. The price of the underlying securities and the date when the securities will be delivered and paid for are fixed at the time the transaction is negotiated. Securities purchased on a delayed delivery or when-issued basis are identified as such in the Schedule of Investments. Compensation for interest forgone in the purchase of a delayed delivery or when-issued debt security may be received. With respect to purchase commitments, each applicable Fund identifies securities as segregated in its records with a value at least equal to the amount of the commitment. Payables and receivables associated with the purchases and sales of delayed delivery securities having the same coupon, settlement date and broker are offset. Delayed delivery or when-issued securities that have been purchased from and sold to different brokers are reflected as both payables and receivables in the Statement of Assets and Liabilities under the caption "Delayed delivery", as applicable. Losses may arise due to changes in the value of the underlying securities or if the counterparty does not perform under the contract's terms, or if the issuer does not issue the securities due to political, economic, or other factors.
Restricted Securities (including Private Placements). Funds may invest in securities that are subject to legal or contractual restrictions on resale. These securities generally may be resold in transactions exempt from registration or to the public if the securities are registered. Disposal of these securities may involve time-consuming negotiations and expense, and prompt sale at an acceptable price may be difficult. Information regarding restricted securities held at period end is included at the end of the Schedule of Investments, if applicable.
Loans and Other Direct Debt Instruments. Direct debt instruments are interests in amounts owed to lenders by corporate or other borrowers. These instruments may be in the form of loans, trade claims or other receivables and may include standby financing commitments such as revolving credit facilities that obligate a fund to supply additional cash to the borrower on demand. Loans may be acquired through assignment, participation, or may be made directly to a borrower. Such instruments are presented in the Bank Loan Obligations section in the Schedule of Investments. Certain funds may also invest in unfunded loan commitments, which are contractual obligations for future funding. Information regarding unfunded commitments is included at the end of the Schedule of Investments, if applicable.
Commitments. A commitment is an agreement to acquire an investment at a future date (subject to conditions) in connection with a potential public or non-public offering. The amount of commitments outstanding at period end are presented in the table below. These commitments are not included in the net assets of the Fund at period end.
| | Investment to be Acquired | Commitment Amount ($) |
| Fidelity Series High Income Fund | Fidelity Private Credit Company LLC | 2,416,009 |
Commitments. A commitment is an agreement to acquire an investment at a future date (subject to conditions) in connection with a potential public or non-public offering. Commitments outstanding at period end are presented in the table below. Unrealized appreciation (depreciation) on any commitments outstanding at period end is separately presented in the Statement of Assets and Liabilities as Unrealized appreciation (depreciation) on unfunded commitments, and any change in unrealized appreciation (depreciation) on unfunded commitments during the period is separately presented in the Statement of Operations, as applicable based on contractual conditions of each commitment.| | Investment to be Acquired | Commitment Amount ($) | Unrealized Appreciation (Depreciation)($) |
| Fidelity Series High Income Fund | EchoStar Corp | 4,299,990 | (456,989) |
| Fidelity Series High Income Fund | EchoStar Corp. 10.75% 9/27/29 | 21,985,164 | 1,905,108 |
New Accounting Pronouncement. In November 2023, the FASB issued Accounting Standards Update (ASU) 2023-07 Segment Reporting (Topic 280): Improvements to Reportable Segment Disclosures. Effective for fiscal years beginning after December 15, 2023 and interim periods within fiscal years beginning after December 15, 2024, the amendments enhance required disclosures of segment information for public entities on an annual and interim basis. The ASU allows for early adoption with updates applied retrospectively. Management is currently evaluating the impact of the ASU but does not expect this guidance to materially impact the financial statements.
5. Purchases and Sales of Investments.
Purchases and sales of securities, other than short-term securities and U.S government securities, as applicable, are noted in the table below.
| | Purchases ($) | Sales ($) |
| Fidelity Series High Income Fund | 262,708,326 | 204,100,088 |
6. Fees and Other Transactions with Affiliates.
Management Fee. Fidelity Management & Research Company LLC (the investment adviser) and its affiliates provide the Fund with investment management related services for which the Fund does not pay a management fee. Under the management contract, the investment adviser or an affiliate pays all ordinary operating expenses of the Fund, except custody fees, fees and expenses of the independent Trustees, and certain miscellaneous expenses such as proxy and shareholder meeting expenses.
Brokerage Commissions. A portion of portfolio transactions were placed with brokerage firms which are affiliates of the investment adviser. Brokerage commissions are included in net realized gain (loss) and change in net unrealized appreciation (depreciation) in the Statement of Operations. The commissions paid to these affiliated firms were as follows:
| | Amount ($) |
| Fidelity Series High Income Fund | 466 |
Interfund Trades. Funds may purchase from or sell securities to other Fidelity Funds under procedures adopted by the Board. The procedures have been designed to ensure these interfund trades are executed in accordance with Rule 17a-7 of the 1940 Act. Any interfund trades are included within the respective purchases and sales amounts shown in the Purchases and Sales of Investments note. Interfund trades during the period are noted in the table below.
| | Purchases ($) | Sales ($) | Realized Gain (Loss)($) |
| Fidelity Series High Income Fund | - | 86,544 | 54,902 |
7. Committed Line of Credit.
Certain Funds participate with other funds managed by the investment adviser or an affiliate in a $4.25 billion credit facility (the "line of credit") to be utilized for temporary or emergency purposes to fund shareholder redemptions or for other short-term liquidity purposes. The commitment fees on the pro-rata portion of the line of credit are borne by the investment adviser. During the period, there were no borrowings on this line of credit.
8. Security Lending.
Funds lend portfolio securities from time to time in order to earn additional income. Lending agents are used, including National Financial Services (NFS), an affiliate of the investment adviser. Pursuant to a securities lending agreement, NFS will receive a fee, which is capped at 9.9% of a fund's daily lending revenue, for its services as lending agent. A fund may lend securities to certain qualified borrowers, including NFS. On the settlement date of the loan, a fund receives collateral (in the form of U.S. Treasury obligations, letters of credit and/or cash) against the loaned securities and maintains collateral in an amount not less than 100% of the market value of the loaned securities during the period of the loan. The market value of the loaned securities is determined at the close of business of a fund and any additional required collateral is delivered to a fund on the next business day. A fund or borrower may terminate the loan at any time, and if the borrower defaults on its obligation to return the securities loaned because of insolvency or other reasons, a fund may apply collateral received from the borrower against the obligation. A fund may experience delays and costs in recovering the securities loaned. Any cash collateral received is invested in the Fidelity Securities Lending Cash Central Fund. Any loaned securities are identified as such in the Schedule of Investments, and the value of loaned securities and cash collateral at period end, as applicable, are presented in the Statement of Assets and Liabilities. Security lending income represents the income earned on investing cash collateral, less rebates paid to borrowers and any lending agent fees associated with the loan, plus any premium payments received for lending certain types of securities. Security lending income is presented in the Statement of Operations as a component of income from Fidelity Central Funds. Affiliated security lending activity, if any, was as follows:
| | Total Security Lending Fees Paid to NFS ($) | Security Lending Income From Securities Loaned to NFS ($) | Value of Securities Loaned to NFS at Period End ($) |
| Fidelity Series High Income Fund | 12,009 | - | - |
9. Expense Reductions.
The investment adviser contractually agreed to reimburse the Fund to the extent annual operating expenses exceeded .003% of average net assets. This reimbursement will remain in place through August 31, 2027. Some expenses, for example the compensation of the independent Trustees, and certain other expenses such as interest expense, are excluded from this reimbursement. During the period this reimbursement reduced the Fund's expenses by $17,017.
Through arrangements with the Fund's custodian, credits realized as a result of certain uninvested cash balances were used to reduce the Fund's expenses by $9,077.
10. Other.
A fund's organizational documents provide former and current trustees and officers with a limited indemnification against liabilities arising in connection with the performance of their duties to the fund. In the normal course of business, a fund may also enter into contracts that provide general indemnifications. A fund's maximum exposure under these arrangements is unknown as this would be dependent on future claims that may be made against a fund. The risk of material loss from such claims is considered remote.
At the end of the period, mutual funds and accounts managed by the investment adviser or its affiliates were the owners of record of all of the outstanding shares of the Fund.
11. Litigation.
The Fund and other entities managed by FMR or its affiliates are involved with proceedings arising out of disputes in the United States Bankruptcy Court for the Southern District of Texas ("Bankruptcy Court"), relating to the In re Sanchez Energy Corporation chapter 11 bankruptcy case (Case No. 19-34508). A Bankruptcy Court-appointed representative of unsecured creditors asserted that eight million shares of Mesquite Energy, Inc. (formerly known as Sanchez Energy Corporation) (the "Company"), held in escrow pursuant to the terms of the Company's confirmed chapter 11 plan, should be awarded to the unsecured creditors instead of the Company's current equity holders, including the Fund, which were providers of debtor-in-possession financing to the Company during its chapter 11 case and holders of secured notes issued by the Company in 2018. The unsecured creditors also asserted that certain additional equity issued by the Company in 2020 in connection with two post-bankruptcy financings, also held by the Fund, is invalid. During August 2023, the Bankruptcy Court issued an opinion awarding a portion of the eight million shares to the unsecured creditors, diluting the value of the Fund's holdings in Mesquite. The Fund will appeal this decision. At this time, Management cannot determine any additional loss or dilution that may be realized. The Fund is also incurring legal costs in defending the disputes and has recovered a portion of these legal costs through an insurance claim.
12. Risk and Uncertainties.
Many factors affect a fund's performance. Developments that disrupt global economies and financial markets, such as pandemics, epidemics, outbreaks of infectious diseases, war, terrorism, and environmental disasters, may significantly affect a fund's investment performance. The effects of these developments to a fund will be impacted by the types of securities in which a fund invests, the financial condition, industry, economic sector, and geographic location of an issuer, and a fund's level of investment in the securities of that issuer. Significant concentrations in security types, issuers, industries, sectors, and geographic locations may magnify the factors that affect a fund's performance.
Item 8: Changes in and Disagreements with Accountants for Open-End Management Investment Companies
(Unaudited)
Note: This is not applicable for any fund included in this document.
Item 9: Proxy Disclosures for Open-End Management Investment Companies
(Unaudited)
| A special meeting of shareholders was held on July 16, 2024. The results of votes taken among shareholders on the proposal before them are reported below. Each vote reported represents one dollar of net asset value held on the record date for the meeting. |
| Proposal 1 |
| To elect a Board of Trustees. |
| | # of Votes | % of Votes |
| Bettina Doulton |
| Affirmative | 14,516,835,136.19 | 94.56 |
| Withheld | 834,887,998.33 | 5.44 |
| TOTAL | 15,351,723,134.52 | 100.00 |
| Robert A. Lawrence |
| Affirmative | 14,430,495,798.10 | 94.00 |
| Withheld | 921,227,336.42 | 6.00 |
| TOTAL | 15,351,723,134.52 | 100.00 |
| Vijay C. Advani |
| Affirmative | 14,465,231,640.25 | 94.23 |
| Withheld | 886,491,494.27 | 5.77 |
| TOTAL | 15,351,723,134.52 | 100.00 |
| Thomas P. Bostick |
| Affirmative | 14,471,831,170.84 | 94.27 |
| Withheld | 879,891,963.68 | 5.73 |
| TOTAL | 15,351,723,134.52 | 100.00 |
| Donald F. Donahue |
| Affirmative | 14,432,670,599.88 | 94.01 |
| Withheld | 919,052,534.64 | 5.99 |
| TOTAL | 15,351,723,134.52 | 100.00 |
| Vicki L. Fuller |
| Affirmative | 14,531,407,981.65 | 94.66 |
| Withheld | 820,315,152.87 | 5.34 |
| TOTAL | 15,351,723,134.52 | 100.00 |
| Patricia L. Kampling |
| Affirmative | 14,549,142,839.16 | 94.77 |
| Withheld | 802,580,295.36 | 5.23 |
| TOTAL | 15,351,723,134.52 | 100.00 |
| Thomas A. Kennedy |
| Affirmative | 14,469,818,769.40 | 94.26 |
| Withheld | 881,904,365.12 | 5.74 |
| TOTAL | 15,351,723,134.52 | 100.00 |
| Oscar Munoz |
| Affirmative | 14,434,061,467.08 | 94.02 |
| Withheld | 917,661,667.44 | 5.98 |
| TOTAL | 15,351,723,134.52 | 100.00 |
| Karen B. Peetz |
| Affirmative | 14,521,904,618.46 | 94.59 |
| Withheld | 829,818,516.06 | 5.41 |
| TOTAL | 15,351,723,134.52 | 100.00 |
| David M. Thomas |
| Affirmative | 14,417,745,861.73 | 93.92 |
| Withheld | 933,977,272.79 | 6.08 |
| TOTAL | 15,351,723,134.52 | 100.00 |
| Susan Tomasky |
| Affirmative | 14,467,973,468.18 | 94.24 |
| Withheld | 883,749,666.34 | 5.76 |
| TOTAL | 15,351,723,134.52 | 100.00 |
| Michael E. Wiley |
| Affirmative | 14,424,002,796.91 | 93.96 |
| Withheld | 927,720,337.61 | 6.04 |
| TOTAL | 15,351,723,134.52 | 100.00 |
| | | |
| Proposal 1 reflects trust-wide proposal and voting results. |
Item 10: Remuneration Paid to Directors, Officers, and others of Open-End Management Investment Companies
(Unaudited)
Note: This information is disclosed as part of the financial statements for each Fund as part of Item 7: Financial Statements and Financial Highlights for Open-End Management Investment companies.
Item 11: Statement Regarding Basis for Approval of Investment Advisory Contract
(Unaudited)
Board Approval of Investment Advisory Contracts and Management Fees
Fidelity Series High Income Fund
Each year, the Board of Trustees, including the Independent Trustees (together, the Board), considers the renewal of the fund's management contract with Fidelity Management & Research Company LLC (FMR) and the sub-advisory agreements (together, the Advisory Contracts) for the fund. FMR and the sub-advisers are referred to herein as the Investment Advisers. The Board, assisted by the advice of fund counsel and Independent Trustees' counsel, requests and considers a broad range of information relevant to the renewal of the Advisory Contracts throughout the year.
The Board meets regularly and, at each of its meetings, covers an extensive agenda of topics and materials and considers factors that are relevant to its annual consideration of the renewal of the fund's Advisory Contracts, including the services and support provided to the fund and its shareholders. The Board, acting directly and through its Committees (each of which is composed of and chaired by Independent Trustees), requests and receives information concerning the annual consideration of the renewal of the fund's Advisory Contracts. The Board also meets as needed to review matters specifically related to the Board's annual consideration of the renewal of the Advisory Contracts. Members of the Board may also meet with trustees of other Fidelity funds through joint ad hoc committees to discuss certain matters relevant to all of the Fidelity funds.
At its May 2024 meeting, the Board unanimously determined to renew the fund's Advisory Contracts. The Board considered all factors it believed relevant and reached a determination, with the assistance of fund counsel and Independent Trustees' counsel and through the exercise of its business judgment, that the renewal of the Advisory Contracts was in the best interests of the fund and its shareholders and the fact that no fee is payable under the management contract was fair and reasonable in light of all of the surrounding circumstances.
Nature, Extent, and Quality of Services Provided. The Board considered staffing as it relates to the fund, including the backgrounds and experience of investment personnel of the Investment Advisers, and also considered the Investment Advisers' implementation of the fund's investment program. The Independent Trustees also had discussions with senior management of Fidelity's investment operations and investment groups. The Board considered the structure of the investment personnel compensation program and whether this structure provides appropriate incentives to act in the best interests of the fund.
Resources Dedicated to Investment Management and Support Services. The Board and the Fund Oversight and Research Committees reviewed the general qualifications and capabilities of Fidelity's investment staff, including its size, education, experience, and resources, as well as Fidelity's approach to recruiting, training, managing, and compensating investment personnel. The Board noted the resources devoted to expansion of Fidelity's global investment organization, and that Fidelity's analysts have extensive resources, tools, and capabilities that allow them to conduct sophisticated quantitative and fundamental analysis, as well as credit analysis of issuers, counterparties, and guarantors. Further, the Board considered that Fidelity's investment professionals have sufficient access to global information and data so as to provide competitive investment results over time, and that those professionals also have access to sophisticated tools that permit them to assess portfolio construction and risk and performance attribution characteristics continuously, as well as to transmit new information and research conclusions rapidly around the world. Additionally, in its deliberations, the Board considered Fidelity's trading, risk management, compliance, and technology and operations capabilities and resources, which are integral parts of the investment management process.
Administrative Services. The Board considered (i) the nature, extent, quality, and cost of advisory and administrative services performed by the Investment Advisers and their affiliates under the Advisory Contracts and under separate agreements covering transfer agency and pricing and bookkeeping serviesfor the fund; (ii) the nature and extent of Fidelity's supervision of third party service providers, principally custodians, subcustodians, and pricing vendors; and (iii) the resources devoted by Fidelity to, and the record of compliance with, the fund's compliance policies and procedures. The Board also reviewed the allocation of fund brokerage, including allocations to brokers affiliated with the Investment Advisers, the use of brokerage commissions to pay fund expenses, and the use of "soft" commission dollars to pay for research services. The Board also considered the fund's securities lending activities and any payments made to Fidelity relating to securities lending under a separate agreement.
Investment Performance. The Board reviewed the fund's absolute investment performance, as well as the fund's relative investment performance and noted that the fund is not publicly offered as a stand-alone investment product. In this regard, the Board noted that the fund is designed to offer an investment option for other investment companies, 529 plans, and collective investment trusts managed by Fidelity and ultimately to enhance the performance of those investment companies, 529 plans, and collective investment trusts.
Based on its review, the Board concluded that the nature, extent, and quality of services provided to the fund under the Advisory Contracts should continue to benefit the shareholders of the fund.
Competitiveness of Management Fee and Total Expense Ratio. The Board considered that the fund does not pay FMR a management fee for investment advisory services, but that FMR receives fees for providing services to funds that invest in the fund. The Board noted that FMR or an affiliate undertakes to pay all operating expenses of the fund, except transfer agent fees, 12b-1 fees, Independent Trustee fees and expenses, custodian fees and expenses, proxy and shareholder meeting expenses, interest, taxes, and extraordinary expenses (such as litigation expenses). The Board further noted that the fund pays its non-operating expenses, including brokerage commissions and fees and expenses associated with the fund's securities lending program, if applicable.
Other Contractual Arrangements. The Board further considered that FMR has contractually agreed to reimburse the fund to the extent that total operating expenses, with certain exceptions, as a percentage of its average net assets, exceed 0.003% through August 31, 2027.
Based on its review, the Board considered that the fund does not pay a management fee and concluded that the total expense ratio of the fund was reasonable in light of the services that the fund and its shareholders receive and the other factors considered.
Costs of the Services and Profitability. The Board considered the level of Fidelity's profits in respect of all the Fidelity funds.
A public accounting firm has been engaged annually by the Board as part of the Board's assessment of Fidelity's profitability analysis. The engagement includes the review and assessment of the methodologies used by Fidelity in determining the revenues and expenses attributable to Fidelity's fund business, and completion of agreed-upon procedures in respect of the mathematical accuracy of certain fund profitability information and its conformity to established allocation methodologies. After considering the reports issued under the engagement and information provided by Fidelity, the Board concluded that while other allocation methods may also be reasonable, Fidelity's profitability methodologies are reasonable in all material respects.
The Board also reviewed Fidelity's non-fund businesses and potential indirect benefits such businesses may have received as a result of their association with Fidelity's fund business (i.e., fall-out benefits) as well as cases where Fidelity's affiliates may benefit from the funds' business. The Board considered areas where potential indirect benefits to the Fidelity funds from their relationships with Fidelity may exist. The Board's consideration of these matters was informed by the findings of a joint ad hoc committee created by it and the boards of other Fidelity funds to evaluate potential fall-out benefits.
The Board concluded that the costs of the services provided by and the profits realized by Fidelity in connection with the operation of the fund were not relevant to the renewal of the Advisory Contracts because the fund pays no advisory fees and FMR bears all expenses of the fund with certain exceptions.
Economies of Scale. The Board concluded that because the fund pays no advisory fees and FMR bears all expenses of the fund with certain exceptions, the realization of economies of scale was not a material factor in the Board's decision to renew the fund's Advisory Contracts.
Additional Information Requested by the Board. In order to develop fully the factual basis for consideration of the Fidelity funds' advisory contracts, the Board requested and received additional information on certain topics, including but not limited to: (i) fund flow and performance trends, in particular the underperformance of certain funds and strategies, and Fidelity's long-term strategies for certain funds; (ii) the operation of performance fees and the rationale for implementing performance fees on certain categories of funds but not others; (iii) Fidelity's pricing philosophy compared to competitors; (iv) fund profitability methodology and data; (v) evaluation of competitive fund data and peer group classifications and fee and expense comparisons; (vi) the management fee and expense structures for different funds and classes and information about the differences between various fee and expense structures; (vii) the variable management fee implemented for certain funds effective March 1, 2024; and (viii) information regarding other accounts managed by Fidelity and the funds' sub-advisory arrangements.
Conclusion. Based on its evaluation of all of the conclusions noted above, and after considering all factors it believed relevant, the Board, including the Independent Trustees, concluded that the advisory and sub-advisory fee arrangements are fair and reasonable in light of all of the surrounding circumstances and that the fund's Advisory Contracts should be renewed through May 31, 2025.
1.924273.113
FSH-SANN-1224
Fidelity® SAI High Income Fund
Semi-Annual Report
October 31, 2024
Offered exclusively to certain clients of the Adviser, or its affiliates, including Strategic Advisers LLC (Strategic Advisers) - not available for sale to the general public. Fidelity® SAI is a product name of Fidelity® funds dedicated to certain programs affiliated with Strategic Advisers.
Contents
To view a fund's proxy voting guidelines and proxy voting record for the 12-month period ended June 30, visit http://www.fidelity.com/proxyvotingresults or visit the Securities and Exchange Commission's (SEC) web site at http://www.sec.gov.
You may also call 1-800-544-3455 to request a free copy of the proxy voting guidelines.
Standard & Poor's, S&P and S&P 500 are registered service marks of The McGraw-Hill Companies, Inc. and have been licensed for use by Fidelity Distributors Corporation.
Other third-party marks appearing herein are the property of their respective owners.
All other marks appearing herein are registered or unregistered trademarks or service marks of FMR LLC or an affiliated company. © 2024 FMR LLC. All rights reserved.
This report and the financial statements contained herein are submitted for the general information of the shareholders of the Fund. This report is not authorized for distribution to prospective investors in the Fund unless preceded or accompanied by an effective prospectus.
A fund files its complete schedule of portfolio holdings with the SEC for the first and third quarters of each fiscal year on Form N-PORT. Forms N-PORT are available on the SEC's web site at http://www.sec.gov. A fund's Forms N-PORT may be reviewed and copied at the SEC's Public Reference Room in Washington, DC. Information regarding the operation of the SEC's Public Reference Room may be obtained by calling 1-800-SEC-0330.
For a complete list of a fund's portfolio holdings, view the most recent holdings listing, semiannual report, or annual report on Fidelity's web site at http://www.fidelity.com, http://www.institutional.fidelity.com, or http://www.401k.com, as applicable.
NOT FDIC INSURED •MAY LOSE VALUE •NO BANK GUARANTEE
Neither the Fund nor Fidelity Distributors Corporation is a bank.
Item 7: Financial Statements and Financial Highlights for Open-End Management Investment Companies (Semi-Annual Report)
Fidelity® SAI High Income Fund
Schedule of Investments October 31, 2024 (Unaudited)
Showing Percentage of Net Assets
| Corporate Bonds - 85.6% |
| | | Principal Amount (a) | Value ($) |
| Convertible Bonds - 1.7% | | | |
| Automotive & Auto Parts - 0.2% | | | |
| Rivian Automotive, Inc. 3.625% 10/15/30 | | 3,418,000 | 2,643,481 |
| Broadcasting - 0.6% | | | |
| DISH Network Corp. 3.375% 8/15/26 | | 12,477,000 | 10,475,849 |
| Energy - 0.2% | | | |
| NextEra Energy Partners LP: | | | |
| 0% 11/15/25 (b) | | 523,000 | 487,436 |
| 2.5% 6/15/26 (b) | | 1,722,000 | 1,612,725 |
| Sunnova Energy International, Inc.: | | | |
| 0.25% 12/1/26 | | 2,137,000 | 1,387,446 |
| 2.625% 2/15/28 | | 294,000 | 152,315 |
| | | | 3,639,922 |
| Homebuilders/Real Estate - 0.3% | | | |
| Anywhere Real Estate Group LLC/Realogy Co-Issuer Corp. 0.25% 6/15/26 | | 1,318,000 | 1,142,047 |
| Redfin Corp. 0.5% 4/1/27 | | 4,807,000 | 3,461,040 |
| | | | 4,603,087 |
| Technology - 0.3% | | | |
| MKS Instruments, Inc. 1.25% 6/1/30 (b) | | 1,558,000 | 1,498,017 |
| Wolfspeed, Inc. 1.875% 12/1/29 | | 6,326,000 | 3,150,348 |
| | | | 4,648,365 |
| Utilities - 0.1% | | | |
| PG&E Corp. 4.25% 12/1/27 (b) | | 1,502,000 | 1,637,931 |
TOTAL CONVERTIBLE BONDS | | | 27,648,635 |
| Nonconvertible Bonds - 83.9% | | | |
| Aerospace - 2.2% | | | |
| Bombardier, Inc.: | | | |
| 7% 6/1/32 (b) | | 1,250,000 | 1,279,750 |
| 7.25% 7/1/31 (b) | | 2,255,000 | 2,329,771 |
| 7.875% 4/15/27 (b) | | 2,450,000 | 2,454,830 |
| 8.75% 11/15/30 (b) | | 1,250,000 | 1,354,395 |
| BWX Technologies, Inc. 4.125% 6/30/28 (b) | | 4,425,000 | 4,222,867 |
| Kaiser Aluminum Corp.: | | | |
| 4.5% 6/1/31 (b)(c) | | 280,000 | 249,958 |
| 4.625% 3/1/28 (b) | | 820,000 | 781,252 |
| Moog, Inc. 4.25% 12/15/27 (b) | | 220,000 | 209,733 |
| Spirit Aerosystems, Inc. 9.75% 11/15/30 (b) | | 1,145,000 | 1,271,034 |
| TransDigm, Inc.: | | | |
| 4.625% 1/15/29 | | 4,090,000 | 3,883,973 |
| 6% 1/15/33 (b) | | 920,000 | 911,963 |
| 6.375% 3/1/29 (b) | | 2,690,000 | 2,730,456 |
| 6.75% 8/15/28 (b) | | 2,050,000 | 2,096,125 |
| 6.875% 12/15/30 (b) | | 3,840,000 | 3,936,303 |
| 7.125% 12/1/31 (b) | | 885,000 | 915,774 |
| VistaJet Malta Finance PLC / XO Management Holding, Inc.: | | | |
| 6.375% 2/1/30 (b) | | 4,879,000 | 4,176,400 |
| 7.875% 5/1/27 (b) | | 1,779,000 | 1,731,797 |
| 9.5% 6/1/28 (b) | | 1,145,000 | 1,124,827 |
| | | | 35,661,208 |
| Air Transportation - 1.0% | | | |
| Air Canada 3.875% 8/15/26 (b) | | 1,075,000 | 1,039,938 |
| American Airlines, Inc.: | | | |
| 7.25% 2/15/28 (b)(c) | | 215,000 | 218,536 |
| 8.5% 5/15/29 (b) | | 1,465,000 | 1,539,615 |
| American Airlines, Inc. / AAdvantage Loyalty IP Ltd. 5.5% 4/20/26 (b) | | 2,262,500 | 2,255,701 |
| JetBlue Airways Corp./JetBlue Loyalty LP 9.875% 9/20/31 (b) | | 1,805,000 | 1,875,700 |
| Mileage Plus Holdings LLC 6.5% 6/20/27 (b) | | 401,500 | 405,463 |
| Rand Parent LLC 8.5% 2/15/30 (b)(c) | | 7,653,000 | 7,636,163 |
| Spirit Loyalty Cayman Ltd. / Spirit IP Cayman Ltd.: | | | |
| 8% 9/20/25 (b) | | 615,000 | 382,307 |
| 8% 9/20/25 (b) | | 1,985,000 | 1,233,949 |
| | | | 16,587,372 |
| Automotive & Auto Parts - 1.9% | | | |
| Aston Martin Capital Holdings Ltd. 10% 3/31/29 (b) | | 1,960,000 | 1,904,044 |
| Belron UK Finance PLC 5.75% 10/15/29 (b) | | 2,580,000 | 2,585,650 |
| Champions Financing, Inc. 8.75% 2/15/29 (b) | | 2,930,000 | 2,957,938 |
| Hudson Automotive Group 8% 5/15/32 (b) | | 965,000 | 1,008,823 |
| Macquarie AirFinance Holdings: | | | |
| 6.4% 3/26/29 (b) | | 2,090,000 | 2,153,735 |
| 6.5% 3/26/31 (b) | | 1,840,000 | 1,911,466 |
| 8.125% 3/30/29 (b) | | 2,535,000 | 2,681,617 |
| 8.375% 5/1/28 (b) | | 1,420,000 | 1,492,572 |
| McLaren Finance PLC 7.5% 8/1/26 (b) | | 2,780,000 | 2,696,600 |
| Rivian Holdco & Rivian LLC & Rivian Automotive LLC CME Term SOFR 6 Month Index + 6.050% 10.502% 10/15/26 (b)(d)(e) | | 2,365,000 | 2,367,807 |
| Wand NewCo 3, Inc. 7.625% 1/30/32 (b) | | 2,070,000 | 2,139,570 |
| ZF North America Capital, Inc.: | | | |
| 4.75% 4/29/25 (b) | | 1,930,000 | 1,915,213 |
| 6.75% 4/23/30 (b) | | 2,175,000 | 2,143,998 |
| 6.875% 4/14/28 (b) | | 810,000 | 817,001 |
| 6.875% 4/23/32 (b) | | 1,320,000 | 1,291,080 |
| 7.125% 4/14/30 (b) | | 810,000 | 814,641 |
| | | | 30,881,755 |
| Banks & Thrifts - 1.1% | | | |
| Ally Financial, Inc. 6.7% 2/14/33 (c) | | 3,380,000 | 3,394,268 |
| Jane Street Group LLC/JSG Finance, Inc.: | | | |
| 4.5% 11/15/29 (b) | | 2,015,000 | 1,906,520 |
| 6.125% 11/1/32 (b) | | 1,560,000 | 1,561,010 |
| 7.125% 4/30/31 (b) | | 2,265,000 | 2,347,752 |
| PHH Escrow Issuer LLC 9.875% 11/1/29 (b)(f) | | 170,000 | 166,600 |
| UniCredit SpA: | | | |
| 5.459% 6/30/35 (b)(d) | | 2,591,000 | 2,499,074 |
| 5.861% 6/19/32 (b)(d) | | 745,000 | 742,325 |
| VFH Parent LLC / Valor Co-Issuer, Inc. 7.5% 6/15/31 (b) | | 1,840,000 | 1,889,354 |
| Western Alliance Bancorp. 3% 6/15/31 (d) | | 3,700,000 | 3,418,097 |
| | | | 17,925,000 |
| Broadcasting - 1.3% | | | |
| Clear Channel Outdoor Holdings, Inc.: | | | |
| 5.125% 8/15/27 (b)(c) | | 1,440,000 | 1,396,024 |
| 7.5% 6/1/29 (b) | | 1,925,000 | 1,645,119 |
| 7.875% 4/1/30 (b) | | 2,665,000 | 2,717,215 |
| 9% 9/15/28 (b) | | 2,690,000 | 2,825,374 |
| Sirius XM Radio, Inc.: | | | |
| 4.125% 7/1/30 (b) | | 4,645,000 | 4,155,706 |
| 5.5% 7/1/29 (b)(c) | | 775,000 | 751,824 |
| Univision Communications, Inc.: | | | |
| 4.5% 5/1/29 (b) | | 130,000 | 115,410 |
| 6.625% 6/1/27 (b) | | 2,495,000 | 2,475,438 |
| 7.375% 6/30/30 (b) | | 2,750,000 | 2,640,135 |
| 8% 8/15/28 (b) | | 1,215,000 | 1,234,740 |
| 8.5% 7/31/31 (b) | | 1,635,000 | 1,607,106 |
| | | | 21,564,091 |
| Building Materials - 1.5% | | | |
| Advanced Drain Systems, Inc.: | | | |
| 5% 9/30/27 (b) | | 350,000 | 343,658 |
| 6.375% 6/15/30 (b)(c) | | 1,330,000 | 1,340,663 |
| AmeriTex Holdco Intermediate LLC 10.25% 10/15/28 (b) | | 395,000 | 415,615 |
| Beacon Roofing Supply, Inc. 6.5% 8/1/30 (b) | | 1,565,000 | 1,590,779 |
| Builders FirstSource, Inc.: | | | |
| 4.25% 2/1/32 (b) | | 3,750,000 | 3,354,705 |
| 6.375% 3/1/34 (b) | | 945,000 | 952,615 |
| Eco Material Technologies, Inc. 7.875% 1/31/27 (b) | | 4,215,000 | 4,242,157 |
| EMRLD Borrower LP / Emerald Co.: | | | |
| 6.625% 12/15/30 (b) | | 5,285,000 | 5,374,967 |
| 6.75% 7/15/31 (b) | | 1,065,000 | 1,088,741 |
| MasterBrand, Inc. 7% 7/15/32 (b) | | 835,000 | 855,319 |
| MITER Brands Acquisition Holdco, Inc. / MIWD Borrower LLC 6.75% 4/1/32 (b) | | 798,000 | 811,765 |
| Oscar Acquisition Co. LLC / Oscar Finance, Inc. 9.5% 4/15/30 (b) | | 2,040,000 | 1,993,029 |
| Smyrna Ready Mix Concrete LLC 8.875% 11/15/31 (b) | | 575,000 | 603,975 |
| Star Holding LLC 8.75% 8/1/31 (b) | | 610,000 | 580,116 |
| Summit Materials LLC/Summit Materials Finance Corp. 7.25% 1/15/31 (b)(c) | | 1,235,000 | 1,278,225 |
| | | | 24,826,329 |
| Cable/Satellite TV - 2.3% | | | |
| CCO Holdings LLC/CCO Holdings Capital Corp.: | | | |
| 4.25% 2/1/31 (b) | | 5,510,000 | 4,781,506 |
| 4.25% 1/15/34 (b)(c) | | 2,840,000 | 2,268,902 |
| 4.5% 8/15/30 (b) | | 2,435,000 | 2,174,793 |
| 4.5% 5/1/32 (c) | | 5,889,000 | 5,010,287 |
| 4.5% 6/1/33 (b) | | 5,460,000 | 4,540,504 |
| 4.75% 2/1/32 (b)(c) | | 390,000 | 337,175 |
| CSC Holdings LLC: | | | |
| 3.375% 2/15/31 (b) | | 2,515,000 | 1,804,201 |
| 4.125% 12/1/30 (b) | | 3,145,000 | 2,321,424 |
| 4.5% 11/15/31 (b) | | 745,000 | 546,130 |
| 4.625% 12/1/30 (b) | | 6,555,000 | 3,296,393 |
| 5.375% 2/1/28 (b) | | 2,550,000 | 2,182,418 |
| DISH DBS Corp. 5.875% 11/15/24 | | 3,375,000 | 3,349,739 |
| Telenet Finance Luxembourg Notes SARL 5.5% 3/1/28 (b) | | 1,400,000 | 1,362,788 |
| VTR Finance BV 6.375% 7/15/28 (b) | | 1,230,000 | 1,175,031 |
| Ziggo Bond Co. BV 6% 1/15/27 (b) | | 185,000 | 184,580 |
| Ziggo BV 4.875% 1/15/30 (b) | | 1,730,000 | 1,604,116 |
| | | | 36,939,987 |
| Capital Goods - 0.7% | | | |
| Mueller Water Products, Inc. 4% 6/15/29 (b) | | 1,440,000 | 1,340,674 |
| Patrick Industries, Inc. 6.375% 11/1/32 (b) | | 970,000 | 959,292 |
| Regal Rexnord Corp. 6.3% 2/15/30 | | 595,000 | 616,147 |
| Resideo Funding, Inc. 6.5% 7/15/32 (b) | | 1,100,000 | 1,107,072 |
| TK Elevator Holdco GmbH 7.625% 7/15/28 (b) | | 2,560,000 | 2,571,551 |
| TK Elevator U.S. Newco, Inc. 5.25% 7/15/27 (b) | | 4,880,000 | 4,800,100 |
| | | | 11,394,836 |
| Chemicals - 4.4% | | | |
| Axalta Coating Systems Dutch Holding B BV 7.25% 2/15/31 (b) | | 730,000 | 762,883 |
| Consolidated Energy Finance SA: | | | |
| 5.625% 10/15/28 (b) | | 525,000 | 427,838 |
| 12% 2/15/31 (b) | | 2,945,000 | 2,872,253 |
| CVR Partners LP/CVR Nitrogen Finance Corp. 6.125% 6/15/28 (b) | | 3,015,000 | 2,892,790 |
| Herens HoldCo Sarl 4.75% 5/15/28 (b) | | 875,000 | 764,665 |
| INEOS Quattro Finance 2 PLC 9.625% 3/15/29 (b) | | 705,000 | 745,918 |
| Kobe U.S. Midco 2, Inc. 9.25% 11/1/26 pay-in-kind (b)(d) | | 3,479,312 | 2,939,253 |
| LSB Industries, Inc. 6.25% 10/15/28 (b) | | 1,210,000 | 1,170,585 |
| Methanex Corp.: | | | |
| 5.125% 10/15/27 | | 4,425,000 | 4,306,405 |
| 5.25% 12/15/29 | | 1,430,000 | 1,380,104 |
| 5.65% 12/1/44 | | 3,660,000 | 3,237,914 |
| NOVA Chemicals Corp.: | | | |
| 4.25% 5/15/29 (b) | | 4,555,000 | 4,149,675 |
| 5.25% 6/1/27 (b) | | 3,354,000 | 3,291,929 |
| 8.5% 11/15/28 (b) | | 825,000 | 874,713 |
| 9% 2/15/30 (b) | | 955,000 | 1,017,143 |
| Nufarm Australia Ltd. 5% 1/27/30 (b) | | 2,428,000 | 2,249,943 |
| Olin Corp. 5% 2/1/30 (c) | | 5,195,000 | 4,958,235 |
| Olympus Water U.S. Holding Corp.: | | | |
| 4.25% 10/1/28 (b) | | 1,641,000 | 1,544,517 |
| 6.25% 10/1/29 (b) | | 2,940,000 | 2,804,007 |
| 7.25% 6/15/31 (b) | | 775,000 | 795,158 |
| 9.75% 11/15/28 (b) | | 4,500,000 | 4,774,091 |
| SCIH Salt Holdings, Inc.: | | | |
| 4.875% 5/1/28 (b) | | 690,000 | 660,700 |
| 6.625% 5/1/29 (b) | | 2,144,000 | 2,081,463 |
| SCIL IV LLC / SCIL U.S.A. Holdings LLC 5.375% 11/1/26 (b) | | 3,235,000 | 3,195,439 |
| The Chemours Co. LLC: | | | |
| 4.625% 11/15/29 (b)(c) | | 3,145,000 | 2,730,517 |
| 5.375% 5/15/27 | | 1,830,000 | 1,761,967 |
| 5.75% 11/15/28 (b) | | 3,530,000 | 3,258,438 |
| Tronox, Inc. 4.625% 3/15/29 (b)(c) | | 4,550,000 | 4,128,157 |
| W.R. Grace Holding LLC 5.625% 8/15/29 (b) | | 5,025,000 | 4,641,430 |
| | | | 70,418,130 |
| Consumer Products - 1.2% | | | |
| Foundation Building Materials, Inc. 6% 3/1/29 (b) | | 938,000 | 828,755 |
| Kohl's Corp. 4.25% 7/17/25 | | 365,000 | 360,296 |
| Kronos Acquisition Holdings, Inc.: | | | |
| 8.25% 6/30/31 (b) | | 930,000 | 920,994 |
| 10.75% 6/30/32 (b) | | 950,000 | 885,140 |
| Newell Brands, Inc.: | | | |
| 6.375% 9/15/27 (c) | | 540,000 | 545,744 |
| 6.375% 5/15/30 (f) | | 1,610,000 | 1,617,358 |
| 6.625% 9/15/29 (c) | | 820,000 | 831,426 |
| 6.625% 5/15/32 (f) | | 1,370,000 | 1,373,956 |
| 6.875% 4/1/36 (c)(g) | | 410,000 | 408,007 |
| 7% 4/1/46 (g) | | 585,000 | 542,892 |
| The Gates Corp. 6.875% 7/1/29 (b) | | 1,525,000 | 1,566,831 |
| TKC Holdings, Inc.: | | | |
| 6.875% 5/15/28 (b) | | 2,575,000 | 2,535,098 |
| 10.5% 5/15/29 (b) | | 3,208,000 | 3,240,529 |
| Wayfair LLC 7.25% 10/31/29 (b)(c) | | 1,545,000 | 1,563,404 |
| Windsor Holdings III, LLC 8.5% 6/15/30 (b) | | 1,605,000 | 1,689,122 |
| | | | 18,909,552 |
| Containers - 0.9% | | | |
| ARD Finance SA 6.5% 6/30/27 pay-in-kind (b)(d) | | 1,187,000 | 250,754 |
| Ardagh Packaging Finance PLC/Ardagh MP Holdings U.S.A., Inc. 4.125% 8/15/26 (b) | | 700,000 | 609,000 |
| Ball Corp. 6% 6/15/29 | | 507,000 | 514,868 |
| Graham Packaging Co., Inc. 7.125% 8/15/28 (b) | | 940,000 | 914,408 |
| Graphic Packaging International, Inc.: | | | |
| 3.75% 2/1/30 (b) | | 960,000 | 877,915 |
| 6.375% 7/15/32 (b) | | 1,550,000 | 1,563,835 |
| LABL, Inc.: | | | |
| 5.875% 11/1/28 (b)(c) | | 450,000 | 417,797 |
| 9.5% 11/1/28 (b) | | 300,000 | 307,406 |
| Mauser Packaging Solutions Holding Co. 7.875% 4/15/27 (b) | | 2,190,000 | 2,250,225 |
| Sealed Air Corp.: | | | |
| 5% 4/15/29 (b) | | 2,580,000 | 2,492,201 |
| 6.5% 7/15/32 (b) | | 895,000 | 908,437 |
| Sealed Air Corp./Sealed Air Corp. U.S. 7.25% 2/15/31 (b)(c) | | 1,425,000 | 1,479,476 |
| Trivium Packaging Finance BV: | | | |
| 5.5% 8/15/26 (b) | | 180,000 | 178,405 |
| 8.5% 8/15/27 (b) | | 1,295,000 | 1,291,131 |
| | | | 14,055,858 |
| Diversified Financial Services - 4.9% | | | |
| Aercap Global Aviation Trust 6.5% 6/15/45 (b)(d) | | 1,500,000 | 1,498,447 |
| Azorra Finance Ltd. 7.75% 4/15/30 (b) | | 1,755,000 | 1,733,383 |
| Boost Newco Borrower LLC 7.5% 1/15/31 (b) | | 3,255,000 | 3,431,485 |
| Capstone Borrower, Inc. 8% 6/15/30 (b) | | 633,000 | 661,576 |
| Cargo Aircraft Management, Inc. 4.75% 2/1/28 (b)(c) | | 2,180,000 | 2,081,900 |
| Coinbase Global, Inc. 3.625% 10/1/31 (b)(c) | | 2,320,000 | 1,934,742 |
| Cruise Yacht Upper Holdco Ltd. 11.875% 7/5/28 | | 600,000 | 614,872 |
| Encore Capital Group, Inc.: | | | |
| 8.5% 5/15/30 (b) | | 3,400,000 | 3,584,280 |
| 9.25% 4/1/29 (b) | | 1,345,000 | 1,432,091 |
| Fortress Transportation & Infrastructure Investors LLC: | | | |
| 5.875% 4/15/33 (b) | | 175,000 | 170,617 |
| 7% 6/15/32 (b) | | 735,000 | 754,112 |
| 7.875% 12/1/30 (b) | | 1,910,000 | 2,012,149 |
| GGAM Finance Ltd.: | | | |
| 5.875% 3/15/30 (b) | | 1,725,000 | 1,697,507 |
| 6.875% 4/15/29 (b) | | 375,000 | 382,150 |
| 7.75% 5/15/26 (b) | | 1,385,000 | 1,409,330 |
| 8% 2/15/27 (b) | | 3,565,000 | 3,683,037 |
| 8% 6/15/28 (b) | | 4,200,000 | 4,427,947 |
| Global Aircraft Leasing Co. Ltd. 8.75% 9/1/27 (b) | | 1,805,000 | 1,864,516 |
| Gn Bondco LLC 9.5% 10/15/31 (b)(c) | | 1,205,000 | 1,279,555 |
| Hightower Holding LLC: | | | |
| 6.75% 4/15/29 (b) | | 835,000 | 822,054 |
| 9.125% 1/31/30 (b) | | 3,160,000 | 3,331,648 |
| Icahn Enterprises LP/Icahn Enterprises Finance Corp.: | | | |
| 4.375% 2/1/29 | | 3,245,000 | 2,706,967 |
| 5.25% 5/15/27 | | 6,556,000 | 6,107,645 |
| 6.25% 5/15/26 | | 2,155,000 | 2,118,117 |
| 9% 6/15/30 | | 485,000 | 468,390 |
| Jefferies Finance LLC/JFIN Co-Issuer Corp. 5% 8/15/28 (b) | | 520,000 | 479,668 |
| Jefferies Finance LLC/JFIN Co.-Issuer Corp. 6.625% 10/15/31 (b) | | 960,000 | 955,993 |
| Ladder Capital Finance Holdings LLLP/Ladder Capital Finance Corp.: | | | |
| 4.75% 6/15/29 (b) | | 2,550,000 | 2,429,449 |
| 5.25% 10/1/25 (b) | | 175,000 | 174,399 |
| 7% 7/15/31 (b) | | 1,565,000 | 1,623,144 |
| Navient Corp.: | | | |
| 4.875% 3/15/28 (c) | | 375,000 | 357,313 |
| 5% 3/15/27 (c) | | 375,000 | 368,659 |
| 5.625% 8/1/33 | | 550,000 | 474,608 |
| OneMain Finance Corp.: | | | |
| 3.5% 1/15/27 | | 2,675,000 | 2,552,963 |
| 3.875% 9/15/28 | | 5,843,000 | 5,385,508 |
| 6.625% 5/15/29 | | 360,000 | 360,000 |
| 7.125% 3/15/26 | | 1,980,000 | 2,028,484 |
| 7.125% 11/15/31 | | 160,000 | 161,788 |
| 9% 1/15/29 | | 5,000 | 5,297 |
| Optics Bidco SpA 7.2% 7/18/36 (b) | | 692,000 | 711,872 |
| PRA Group, Inc. 8.875% 1/31/30 (b)(c) | | 1,070,000 | 1,110,132 |
| Shift4 Payments LLC / Shift4 Payments Finance Sub, Inc. 6.75% 8/15/32 (b) | | 1,088,000 | 1,116,287 |
| SLM Corp. 4.2% 10/29/25 | | 945,000 | 927,617 |
| StoneX Group, Inc. 7.875% 3/1/31 (b) | | 610,000 | 641,715 |
| Williams Scotsman, Inc. 6.625% 6/15/29 (b) | | 2,355,000 | 2,390,735 |
| Windstream Services LLC / Wind: | | | |
| 7.75% 8/15/28 (b) | | 2,215,000 | 2,227,258 |
| 8.25% 10/1/31 (b) | | 1,570,000 | 1,589,628 |
| | | | 78,281,034 |
| Diversified Media - 0.4% | | | |
| Advantage Sales & Marketing, Inc. 6.5% 11/15/28 (b) | | 3,885,000 | 3,636,362 |
| Outfront Media Capital LLC / Corp. 7.375% 2/15/31 (b)(c) | | 2,295,000 | 2,423,509 |
| | | | 6,059,871 |
| Energy - 11.9% | | | |
| Aethon United BR LP / Aethon United Finance Corp. 7.5% 10/1/29 (b) | | 1,440,000 | 1,449,984 |
| Alpha Generation LLC 6.75% 10/15/32 (b) | | 917,000 | 929,882 |
| Antero Midstream Partners LP/Antero Midstream Finance Corp. 5.75% 3/1/27 (b) | | 730,000 | 728,636 |
| Archrock Partners LP / Archrock Partners Finance Corp. 6.625% 9/1/32 (b) | | 1,585,000 | 1,592,166 |
| Baytex Energy Corp. 7.375% 3/15/32 (b) | | 1,585,000 | 1,538,754 |
| Blue Racer Midstream LLC/Blue Racer Finance Corp.: | | | |
| 7% 7/15/29 (b) | | 540,000 | 553,965 |
| 7.25% 7/15/32 (b) | | 155,000 | 160,116 |
| California Buyer Ltd./Atlantica Sustainable Infrastructure PLC 6.375% 2/15/32 (b)(f) | | 3,010,000 | 2,989,198 |
| California Resources Corp.: | | | |
| 7.125% 2/1/26 (b)(c) | | 394,000 | 395,284 |
| 8.25% 6/15/29 (b) | | 4,220,000 | 4,261,909 |
| Calumet Specialty Products Partners LP/Calumet Finance Corp. 9.75% 7/15/28 (b) | | 800,000 | 821,912 |
| Canacol Energy Ltd. 5.75% 11/24/28 (b) | | 3,709,000 | 1,924,044 |
| Cheniere Energy Partners LP 5.75% 8/15/34 (b)(c) | | 1,840,000 | 1,859,712 |
| Citgo Petroleum Corp.: | | | |
| 6.375% 6/15/26 (b) | | 3,110,000 | 3,110,289 |
| 8.375% 1/15/29 (b) | | 1,000,000 | 1,040,217 |
| CNX Midstream Partners LP 4.75% 4/15/30 (b) | | 3,015,000 | 2,806,420 |
| CNX Resources Corp.: | | | |
| 7.25% 3/1/32 (b) | | 2,185,000 | 2,251,398 |
| 7.375% 1/15/31 (b)(c) | | 855,000 | 878,887 |
| Comstock Resources, Inc.: | | | |
| 5.875% 1/15/30 (b) | | 3,580,000 | 3,270,916 |
| 6.75% 3/1/29 (b) | | 2,490,000 | 2,384,593 |
| CPI CG, Inc. 10% 7/15/29 (b) | | 835,000 | 874,664 |
| CQP Holdco LP / BIP-V Chinook Holdco LLC 7.5% 12/15/33 (b) | | 3,192,000 | 3,377,197 |
| Crescent Energy Finance LLC 7.625% 4/1/32 (b) | | 808,000 | 797,784 |
| CrownRock LP/CrownRock Finance, Inc. 5% 5/1/29 (b) | | 3,265,000 | 3,301,548 |
| CVR Energy, Inc.: | | | |
| 5.75% 2/15/28 (b) | | 3,675,000 | 3,351,242 |
| 8.5% 1/15/29 (b) | | 2,885,000 | 2,797,611 |
| Delek Logistics Partners LP/Delek Logistics Finance Corp.: | | | |
| 7.125% 6/1/28 (b) | | 4,740,000 | 4,695,655 |
| 8.625% 3/15/29 (b) | | 2,305,000 | 2,365,025 |
| DT Midstream, Inc.: | | | |
| 4.125% 6/15/29 (b) | | 575,000 | 539,958 |
| 4.375% 6/15/31 (b) | | 195,000 | 179,384 |
| Energean Israel Finance Ltd.: | | | |
| 4.875% 3/30/26 (Reg. S) (b) | | 175,000 | 169,619 |
| 5.375% 3/30/28 (Reg. S) (b) | | 730,000 | 657,036 |
| Energean PLC 6.5% 4/30/27 (b) | | 2,175,000 | 2,161,298 |
| Energy Transfer LP: | | | |
| 6% 2/1/29 (b) | | 995,000 | 1,010,467 |
| 7.375% 2/1/31 (b) | | 1,355,000 | 1,425,896 |
| EnfraGen Energia Sur SA 5.375% 12/30/30 (b) | | 1,848,000 | 1,591,128 |
| EnLink Midstream LLC 6.5% 9/1/30 (b)(c) | | 4,155,000 | 4,375,926 |
| EQM Midstream Partners LP: | | | |
| 4.75% 1/15/31 (b) | | 600,000 | 570,370 |
| 6.5% 7/1/27 (b) | | 610,000 | 623,954 |
| Expand Energy Corp. 4.75% 2/1/32 | | 3,505,000 | 3,294,448 |
| Global Partners LP/GLP Finance Corp.: | | | |
| 6.875% 1/15/29 (c) | | 3,538,000 | 3,531,533 |
| 7% 8/1/27 | | 2,975,000 | 2,984,249 |
| 8.25% 1/15/32 (b) | | 450,000 | 459,210 |
| Gran Tierra Energy, Inc. 9.5% 10/15/29 (b) | | 2,520,000 | 2,318,400 |
| Harbour Energy PLC 5.5% 10/15/26 (b) | | 540,000 | 536,646 |
| Harvest Midstream I LP: | | | |
| 7.5% 9/1/28 (b) | | 3,565,000 | 3,606,338 |
| 7.5% 5/15/32 (b) | | 925,000 | 947,084 |
| Hess Midstream Operations LP: | | | |
| 4.25% 2/15/30 (b) | | 1,030,000 | 961,761 |
| 5.125% 6/15/28 (b) | | 1,650,000 | 1,614,626 |
| 5.5% 10/15/30 (b)(c) | | 580,000 | 566,705 |
| 5.625% 2/15/26 (b) | | 3,510,000 | 3,501,560 |
| 6.5% 6/1/29 (b) | | 685,000 | 696,367 |
| Howard Midstream Energy Partners LLC: | | | |
| 7.375% 7/15/32 (b) | | 1,100,000 | 1,122,252 |
| 8.875% 7/15/28 (b)(c) | | 2,800,000 | 2,954,179 |
| Kinetik Holdings LP: | | | |
| 5.875% 6/15/30 (b) | | 2,270,000 | 2,252,525 |
| 6.625% 12/15/28 (b) | | 2,335,000 | 2,384,850 |
| Kosmos Energy Ltd.: | | | |
| 7.5% 3/1/28 (b) | | 709,000 | 675,989 |
| 7.75% 5/1/27 (b) | | 380,000 | 372,519 |
| 8.75% 10/1/31 (b) | | 850,000 | 829,813 |
| Matador Resources Co.: | | | |
| 6.25% 4/15/33 (b)(c) | | 875,000 | 856,300 |
| 6.5% 4/15/32 (b) | | 1,900,000 | 1,881,695 |
| Moss Creek Resources Holdings, Inc. 8.25% 9/1/31 (b)(c) | | 2,470,000 | 2,420,097 |
| Murphy Oil Corp. 6% 10/1/32 | | 565,000 | 544,053 |
| Nabors Industries, Inc.: | | | |
| 8.875% 8/15/31 (b) | | 955,000 | 902,880 |
| 9.125% 1/31/30 (b) | | 380,000 | 392,427 |
| New Fortress Energy, Inc.: | | | |
| 6.5% 9/30/26 (b) | | 7,851,000 | 7,272,559 |
| 6.75% 9/15/25 (b) | | 4,343,000 | 4,334,692 |
| Northern Oil & Gas, Inc.: | | | |
| 8.125% 3/1/28 (b) | | 2,370,000 | 2,393,001 |
| 8.75% 6/15/31 (b) | | 760,000 | 786,298 |
| PBF Holding Co. LLC/PBF Finance Corp. 7.875% 9/15/30 (b) | | 4,382,000 | 4,374,513 |
| Permian Resources Operating LLC: | | | |
| 5.875% 7/1/29 (b) | | 1,733,000 | 1,707,005 |
| 6.25% 2/1/33 (b) | | 730,000 | 724,740 |
| 7% 1/15/32 (b) | | 530,000 | 540,649 |
| Petroleos Mexicanos 6.5% 3/13/27 | | 2,117,000 | 2,072,310 |
| Prairie Acquiror LP 9% 8/1/29 (b) | | 495,000 | 501,849 |
| Rockies Express Pipeline LLC: | | | |
| 4.8% 5/15/30 (b)(c) | | 2,185,000 | 2,020,721 |
| 4.95% 7/15/29 (b) | | 3,370,000 | 3,165,700 |
| 6.875% 4/15/40 (b) | | 330,000 | 312,883 |
| Seadrill Finance Ltd. 8.375% 8/1/30 (b) | | 740,000 | 755,678 |
| Sitio Royalties OP / Sitio Finance Corp. 7.875% 11/1/28 (b) | | 1,000,000 | 1,038,088 |
| SM Energy Co.: | | | |
| 6.75% 8/1/29 (b) | | 360,000 | 357,781 |
| 7% 8/1/32 (b)(c) | | 360,000 | 357,081 |
| Sunnova Energy Corp.: | | | |
| 5.875% 9/1/26 (b) | | 3,625,000 | 3,240,059 |
| 11.75% 10/1/28 (b) | | 500,000 | 406,526 |
| Sunoco Logistics Partners, LP: | | | |
| 7% 5/1/29 (b) | | 710,000 | 732,421 |
| 7.25% 5/1/32 (b)(c) | | 1,085,000 | 1,129,513 |
| Sunoco LP/Sunoco Finance Corp.: | | | |
| 4.5% 5/15/29 | | 2,585,000 | 2,457,804 |
| 5.875% 3/15/28 | | 2,780,000 | 2,773,608 |
| Tallgrass Energy Partners LP / Tallgrass Energy Finance Corp.: | | | |
| 5.5% 1/15/28 (b) | | 2,805,000 | 2,693,854 |
| 6% 12/31/30 (b) | | 5,570,000 | 5,227,528 |
| 6% 9/1/31 (b) | | 4,265,000 | 3,956,247 |
| Talos Production, Inc.: | | | |
| 9% 2/1/29 (b) | | 530,000 | 545,863 |
| 9.375% 2/1/31 (b) | | 950,000 | 978,116 |
| TransMontaigne Partners LP 6.125% 2/15/26 | | 1,580,000 | 1,554,162 |
| Transocean Aquila Ltd. 8% 9/30/28 (b) | | 462,923 | 475,165 |
| Transocean Poseidon Ltd. 6.875% 2/1/27 (b) | | 822,000 | 821,607 |
| Transocean, Inc.: | | | |
| 8% 2/1/27 (b) | | 4,096,000 | 4,084,163 |
| 8.25% 5/15/29 (b) | | 1,315,000 | 1,322,113 |
| 8.5% 5/15/31 (b) | | 1,695,000 | 1,708,012 |
| 8.75% 2/15/30 (b) | | 1,062,500 | 1,100,919 |
| Tullow Oil PLC: | | | |
| 7% 3/1/25 (b) | | 1,660,000 | 1,584,437 |
| 10.25% 5/15/26 (b) | | 1,701,000 | 1,562,794 |
| U.S.A. Compression Partners LP/U.S.A. Compression Finance Corp. 7.125% 3/15/29 (b) | | 1,570,000 | 1,599,034 |
| Valaris Ltd. 8.375% 4/30/30 (b) | | 3,400,000 | 3,449,640 |
| Viper Energy, Inc. 7.375% 11/1/31 (b) | | 570,000 | 592,274 |
| Viridien 8.75% 4/1/27 (b) | | 3,650,000 | 3,528,339 |
| | | | 192,662,296 |
| Environmental - 0.8% | | | |
| Clean Harbors, Inc. 6.375% 2/1/31 (b) | | 950,000 | 957,142 |
| Darling Ingredients, Inc. 6% 6/15/30 (b) | | 1,345,000 | 1,335,752 |
| GFL Environmental, Inc.: | | | |
| 3.75% 8/1/25 (b) | | 1,460,000 | 1,445,573 |
| 5.125% 12/15/26 (b) | | 1,460,000 | 1,445,499 |
| 6.75% 1/15/31 (b) | | 305,000 | 314,033 |
| Madison IAQ LLC 5.875% 6/30/29 (b) | | 2,180,000 | 2,067,670 |
| Reworld Holding Corp. 4.875% 12/1/29 (b) | | 2,860,000 | 2,671,211 |
| Wrangler Holdco Corp. 6.625% 4/1/32 (b) | | 2,840,000 | 2,898,711 |
| | | | 13,135,591 |
| Food & Drug Retail - 1.2% | | | |
| Albertsons Companies LLC/Safeway, Inc./New Albertson's, Inc./Albertson's LLC: | | | |
| 3.5% 3/15/29 (b) | | 3,410,000 | 3,150,559 |
| 4.875% 2/15/30 (b) | | 4,380,000 | 4,266,152 |
| Emergent BioSolutions, Inc. 3.875% 8/15/28 (b) | | 5,715,000 | 4,591,274 |
| Murphy Oil U.S.A., Inc. 3.75% 2/15/31 (b) | | 1,315,000 | 1,168,523 |
| Parkland Corp.: | | | |
| 4.5% 10/1/29 (b) | | 980,000 | 910,406 |
| 4.625% 5/1/30 (b) | | 4,735,000 | 4,352,091 |
| 6.625% 8/15/32 (b) | | 490,000 | 488,975 |
| Walgreens Boots Alliance, Inc. 8.125% 8/15/29 (c) | | 1,060,000 | 1,057,178 |
| | | | 19,985,158 |
| Food/Beverage/Tobacco - 2.4% | | | |
| BellRing Brands, Inc. 7% 3/15/30 (b) | | 585,000 | 608,806 |
| C&S Group Enterprises LLC 5% 12/15/28 (b) | | 3,320,000 | 2,748,049 |
| Chobani Holdco II LLC 9.5% 10/1/29 pay-in-kind (b)(d) | | 1,225,000 | 1,263,767 |
| Fiesta Purchaser, Inc.: | | | |
| 7.875% 3/1/31 (b) | | 1,455,000 | 1,525,870 |
| 9.625% 9/15/32 (b) | | 915,000 | 956,406 |
| KeHE Distributor / Nextwave 9% 2/15/29 (b) | | 3,380,000 | 3,499,858 |
| Lamb Weston Holdings, Inc.: | | | |
| 4.125% 1/31/30 (b)(c) | | 4,645,000 | 4,312,679 |
| 4.375% 1/31/32 (b) | | 735,000 | 673,345 |
| Performance Food Group, Inc.: | | | |
| 5.5% 10/15/27 (b) | | 335,000 | 332,161 |
| 6.125% 9/15/32 (b) | | 2,600,000 | 2,610,878 |
| Post Holdings, Inc.: | | | |
| 4.625% 4/15/30 (b) | | 2,035,000 | 1,901,884 |
| 5.5% 12/15/29 (b) | | 2,055,000 | 2,004,294 |
| 6.25% 2/15/32 (b)(c) | | 1,905,000 | 1,926,161 |
| 6.25% 10/15/34 (b) | | 885,000 | 875,223 |
| 6.375% 3/1/33 (b) | | 1,565,000 | 1,548,312 |
| Sigma Holdco BV 7.875% 5/15/26 (b) | | 2,924,000 | 2,895,835 |
| Triton Water Holdings, Inc. 6.25% 4/1/29 (b) | | 3,598,000 | 3,554,127 |
| U.S. Foods, Inc.: | | | |
| 4.625% 6/1/30 (b)(c) | | 1,725,000 | 1,636,699 |
| 4.75% 2/15/29 (b) | | 1,695,000 | 1,632,852 |
| 5.75% 4/15/33 (b) | | 1,390,000 | 1,368,845 |
| 6.875% 9/15/28 (b) | | 1,000,000 | 1,027,910 |
| United Natural Foods, Inc. 6.75% 10/15/28 (b) | | 480,000 | 463,200 |
| | | | 39,367,161 |
| Gaming - 1.3% | | | |
| Caesars Entertainment, Inc.: | | | |
| 6% 10/15/32 (b) | | 2,530,000 | 2,467,832 |
| 6.5% 2/15/32 (b) | | 2,840,000 | 2,880,087 |
| 8.125% 7/1/27 (b) | | 1,119,000 | 1,140,954 |
| Fertitta Entertainment LLC / Fertitta Entertainment Finance Co., Inc. 6.75% 1/15/30 (b) | | 5,302,000 | 4,822,068 |
| GLP Capital LP/GLP Financing II, Inc. 5.25% 6/1/25 | | 795,000 | 792,592 |
| Jacobs Entertainment, Inc. 6.75% 2/15/29 (b) | | 780,000 | 767,719 |
| MGM Resorts International 6.5% 4/15/32 (c) | | 1,585,000 | 1,585,152 |
| Mohegan Tribal Gaming Authority 8% 2/1/26 (b) | | 2,640,000 | 2,622,240 |
| Station Casinos LLC: | | | |
| 4.5% 2/15/28 (b) | | 390,000 | 372,224 |
| 6.625% 3/15/32 (b)(c) | | 1,580,000 | 1,587,758 |
| VICI Properties LP / VICI Note Co. 4.125% 8/15/30 (b) | | 1,285,000 | 1,190,650 |
| Wynn Resorts Finance LLC / Wynn Resorts Capital Corp. 7.125% 2/15/31 (b) | | 735,000 | 773,209 |
| | | | 21,002,485 |
| Healthcare - 7.7% | | | |
| 1375209 BC Ltd. 9% 1/30/28 (b) | | 3,058,000 | 3,052,385 |
| 180 Medical, Inc. 3.875% 10/15/29 (b) | | 1,435,000 | 1,334,647 |
| AdaptHealth LLC 5.125% 3/1/30 (b)(c) | | 3,841,000 | 3,518,765 |
| Akumin, Inc. 8% 8/1/28 (b) | | 950,000 | 771,875 |
| AMN Healthcare 4% 4/15/29 (b)(c) | | 925,000 | 852,478 |
| Avantor Funding, Inc.: | | | |
| 3.875% 11/1/29 (b) | | 1,830,000 | 1,687,829 |
| 4.625% 7/15/28 (b) | | 280,000 | 270,738 |
| Bausch Health Americas, Inc. 9.25% 4/1/26 (b) | | 1,005,000 | 972,699 |
| Bausch Health Companies, Inc.: | | | |
| 4.875% 6/1/28 (b) | | 2,360,000 | 1,823,596 |
| 5.25% 1/30/30 (b) | | 1,541,000 | 847,696 |
| 5.5% 11/1/25 (b) | | 6,832,000 | 6,704,788 |
| 9% 12/15/25 (b) | | 970,000 | 951,124 |
| 11% 9/30/28 (b) | | 1,465,000 | 1,348,034 |
| Catalent Pharma Solutions 3.5% 4/1/30 (b) | | 1,295,000 | 1,253,412 |
| Charles River Laboratories International, Inc.: | | | |
| 3.75% 3/15/29 (b) | | 1,300,000 | 1,191,727 |
| 4% 3/15/31 (b) | | 1,310,000 | 1,170,841 |
| CHS/Community Health Systems, Inc.: | | | |
| 4.75% 2/15/31 (b) | | 5,555,000 | 4,632,700 |
| 5.25% 5/15/30 (b) | | 13,300,000 | 11,607,342 |
| 6% 1/15/29 (b) | | 600,000 | 565,042 |
| 6.125% 4/1/30 (b) | | 3,534,000 | 2,767,041 |
| 6.875% 4/15/29 (b) | | 3,619,000 | 3,056,442 |
| CTR Partnership LP/CareTrust Capital Corp. 3.875% 6/30/28 (b)(c) | | 3,610,000 | 3,419,656 |
| DaVita, Inc.: | | | |
| 4.625% 6/1/30 (b) | | 5,865,000 | 5,399,429 |
| 6.875% 9/1/32 (b) | | 2,635,000 | 2,648,731 |
| Embecta Corp. 5% 2/15/30 (b) | | 354,000 | 320,429 |
| Grifols SA 4.75% 10/15/28 (b) | | 810,000 | 746,403 |
| HAH Group Holding Co. LLC 9.75% 10/1/31 (b) | | 3,165,000 | 3,224,898 |
| IQVIA, Inc.: | | | |
| 5% 10/15/26 (b) | | 295,000 | 291,840 |
| 6.5% 5/15/30 (b) | | 1,525,000 | 1,566,524 |
| Jazz Securities DAC 4.375% 1/15/29 (b) | | 2,600,000 | 2,460,362 |
| LifePoint Health, Inc.: | | | |
| 5.375% 1/15/29 (b) | | 890,000 | 814,348 |
| 9.875% 8/15/30 (b)(c) | | 1,080,000 | 1,181,391 |
| 10% 6/1/32 (b) | | 715,000 | 762,877 |
| Medline Borrower LP 3.875% 4/1/29 (b) | | 325,000 | 304,028 |
| Medline Borrower LP / Medline Co. 6.25% 4/1/29 (b) | | 7,110,000 | 7,234,027 |
| Modivcare, Inc. 5% 10/1/29 (b) | | 626,000 | 426,219 |
| Molina Healthcare, Inc.: | | | |
| 3.875% 11/15/30 (b) | | 1,385,000 | 1,254,102 |
| 3.875% 5/15/32 (b)(c) | | 785,000 | 695,908 |
| Omega Healthcare Investors, Inc. 3.25% 4/15/33 | | 3,934,000 | 3,308,544 |
| Organon & Co. / Organon Foreign Debt Co-Issuer BV: | | | |
| 4.125% 4/30/28 (b) | | 3,344,000 | 3,168,479 |
| 5.125% 4/30/31 (b)(c) | | 2,370,000 | 2,161,456 |
| 6.75% 5/15/34 (b) | | 380,000 | 380,721 |
| 7.875% 5/15/34 (b) | | 760,000 | 784,505 |
| Pediatrix Medical Group, Inc. 5.375% 2/15/30 (b) | | 2,468,000 | 2,358,850 |
| Prime Healthcare Services 9.375% 9/1/29 (b)(c) | | 810,000 | 823,167 |
| Radiology Partners, Inc. 7.775% 1/31/29 pay-in-kind (b)(d) | | 3,986,548 | 3,926,750 |
| Sotera Health Holdings LLC 7.375% 6/1/31 (b) | | 1,215,000 | 1,244,233 |
| Surgery Center Holdings, Inc. 7.25% 4/15/32 (b) | | 2,965,000 | 3,044,474 |
| Teleflex, Inc. 4.25% 6/1/28 (b) | | 1,275,000 | 1,222,333 |
| Tenet Healthcare Corp.: | | | |
| 4.25% 6/1/29 (c) | | 3,575,000 | 3,382,034 |
| 4.375% 1/15/30 | | 3,385,000 | 3,173,569 |
| 6.125% 10/1/28 | | 3,245,000 | 3,241,912 |
| 6.125% 6/15/30 | | 4,165,000 | 4,184,605 |
| 6.25% 2/1/27 | | 610,000 | 610,469 |
| 6.75% 5/15/31 (c) | | 480,000 | 490,703 |
| Teva Pharmaceutical Finance Netherlands III BV: | | | |
| 3.15% 10/1/26 | | 1,775,000 | 1,692,092 |
| 7.875% 9/15/29 | | 250,000 | 269,743 |
| U.S. Acute Care Solutions 9.75% 5/15/29 (b) | | 1,000,000 | 1,019,976 |
| | | | 123,620,988 |
| Homebuilders/Real Estate - 3.7% | | | |
| Anywhere Real Estate Group LLC 7% 4/15/30 (b)(c) | | 1,194,400 | 1,046,644 |
| Anywhere Real Estate Group LLC/Realogy Co-Issuer Corp. 5.75% 1/15/29 (b) | | 975,000 | 803,145 |
| Anywhere Real Estate Group LLC/Realogy Co.-Issuer Corp. 5.25% 4/15/30 (b) | | 429,000 | 327,172 |
| Ashton Woods U.S.A. LLC/Ashton Woods Finance Co. 4.625% 8/1/29 (b) | | 2,060,000 | 1,925,412 |
| ATP Tower Holdings LLC/Andean Tower Partners 4.05% 4/27/26 (b) | | 2,714,000 | 2,618,632 |
| Beazer Homes U.S.A., Inc. 7.5% 3/15/31 (b) | | 1,255,000 | 1,290,174 |
| Greystar Real Estate Partners 7.75% 9/1/30 (b) | | 750,000 | 785,839 |
| HAT Holdings I LLC/HAT Holdings II LLC: | | | |
| 3.375% 6/15/26 (b) | | 1,730,000 | 1,670,323 |
| 8% 6/15/27 (b) | | 695,000 | 728,017 |
| Howard Hughes Corp.: | | | |
| 4.125% 2/1/29 (b) | | 1,830,000 | 1,685,260 |
| 4.375% 2/1/31 (b) | | 765,000 | 685,552 |
| Jones DesLauriers Insurance Management, Inc. 10.5% 12/15/30 (b) | | 365,000 | 393,191 |
| Kennedy-Wilson, Inc. 4.75% 2/1/30 (c) | | 2,080,000 | 1,860,524 |
| Landsea Homes Corp. 8.875% 4/1/29 (b) | | 780,000 | 795,798 |
| LGI Homes, Inc.: | | | |
| 4% 7/15/29 (b) | | 965,000 | 863,894 |
| 8.75% 12/15/28 (b) | | 640,000 | 674,235 |
| MPT Operating Partnership LP/MPT Finance Corp.: | | | |
| 3.5% 3/15/31 | | 8,090,000 | 5,728,927 |
| 4.625% 8/1/29 (c) | | 2,525,000 | 1,963,722 |
| 5% 10/15/27 (c) | | 5,000,000 | 4,412,698 |
| 5.25% 8/1/26 (c) | | 3,410,000 | 3,225,415 |
| Panther Escrow Issuer LLC 7.125% 6/1/31 (b) | | 2,295,000 | 2,349,806 |
| Railworks Holdings LP 8.25% 11/15/28 (b) | | 3,585,000 | 3,669,433 |
| Rithm Capital Corp.: | | | |
| 6.25% 10/15/25 (b) | | 368,000 | 367,107 |
| 8% 4/1/29 (b) | | 760,000 | 758,361 |
| Safehold Operating Partnership LP: | | | |
| 2.8% 6/15/31 | | 3,516,000 | 3,020,730 |
| 2.85% 1/15/32 | | 2,255,000 | 1,912,368 |
| Starwood Property Trust, Inc.: | | | |
| 3.625% 7/15/26 (b) | | 358,000 | 343,139 |
| 3.75% 12/31/24 (b) | | 1,150,000 | 1,145,060 |
| 4.75% 3/15/25 | | 365,000 | 364,001 |
| 6% 4/15/30 (b) | | 1,430,000 | 1,401,717 |
| 7.25% 4/1/29 (b)(c) | | 940,000 | 961,894 |
| Taylor Morrison Communities, Inc./Monarch Communities, Inc. 5.125% 8/1/30 (b) | | 535,000 | 517,423 |
| TopBuild Corp. 4.125% 2/15/32 (b) | | 1,320,000 | 1,176,780 |
| Uniti Group LP/Uniti Group Finance, Inc./CSL Capital LLC: | | | |
| 6.5% 2/15/29 (b) | | 5,405,000 | 4,653,218 |
| 10.5% 2/15/28 (b) | | 3,485,000 | 3,712,115 |
| 10.5% 2/15/28 (b) | | 89,000 | 94,800 |
| | | | 59,932,526 |
| Hotels - 0.8% | | | |
| Hilton Domestic Operating Co., Inc.: | | | |
| 3.625% 2/15/32 (b) | | 3,750,000 | 3,291,554 |
| 4% 5/1/31 (b) | | 2,055,000 | 1,871,926 |
| 5.875% 4/1/29 (b) | | 1,325,000 | 1,344,604 |
| 5.875% 3/15/33 (b)(c) | | 875,000 | 876,831 |
| 6.125% 4/1/32 (b)(c) | | 1,325,000 | 1,338,233 |
| Hilton Grand Vacations Borrower Escrow LLC 6.625% 1/15/32 (b) | | 3,305,000 | 3,305,813 |
| Lindblad Expeditions LLC 6.75% 2/15/27 (b) | | 395,000 | 396,868 |
| Park Intermediate Holdings LLC / PK Domestic Property LLC / PK Finance Co.-Issuer 7% 2/1/30 (b) | | 1,085,000 | 1,111,461 |
| | | | 13,537,290 |
| Insurance - 1.2% | | | |
| Acrisure LLC / Acrisure Finance, Inc.: | | | |
| 4.25% 2/15/29 (b)(c) | | 585,000 | 550,107 |
| 7.5% 11/6/30 (b) | | 780,000 | 793,133 |
| 8.25% 2/1/29 (b) | | 830,000 | 843,511 |
| 8.5% 6/15/29 (b) | | 780,000 | 801,503 |
| Alliant Holdings Intermediate LLC/Alliant Holdings Co.-Issuer: | | | |
| 6.5% 10/1/31 (b) | | 355,000 | 351,522 |
| 6.75% 10/15/27 (b) | | 740,000 | 737,225 |
| 6.75% 4/15/28 (b) | | 735,000 | 738,462 |
| 7.375% 10/1/32 (b) | | 1,250,000 | 1,239,151 |
| AmWINS Group, Inc.: | | | |
| 4.875% 6/30/29 (b) | | 1,910,000 | 1,797,691 |
| 6.375% 2/15/29 (b)(c) | | 1,590,000 | 1,597,847 |
| APH Somerset Investor 2 LLC / APH2 Somerset Investor 2 LLC / APH3 Somerset Investor 2 LLC 7.875% 11/1/29 (b) | | 2,640,000 | 2,637,360 |
| AssuredPartners, Inc.: | | | |
| 5.625% 1/15/29 (b) | | 2,915,000 | 2,758,237 |
| 7.5% 2/15/32 (b) | | 1,900,000 | 1,913,405 |
| HUB International Ltd. 7.25% 6/15/30 (b) | | 1,965,000 | 2,030,676 |
| | | | 18,789,830 |
| Leisure - 1.9% | | | |
| Amer Sports Co. 6.75% 2/16/31 (b)(c) | | 3,595,000 | 3,652,132 |
| Carnival Corp.: | | | |
| 6% 5/1/29 (b) | | 3,000,000 | 3,004,907 |
| 6.65% 1/15/28 | | 670,000 | 682,774 |
| 10.5% 6/1/30 (b) | | 3,840,000 | 4,143,049 |
| ClubCorp Holdings, Inc. 8.5% 9/15/25 (b) | | 930,000 | 911,400 |
| MajorDrive Holdings IV LLC 6.375% 6/1/29 (b) | | 2,435,000 | 2,334,766 |
| Merlin Entertainments Group 7.375% 2/15/31 (b) | | 750,000 | 735,390 |
| NCL Corp. Ltd.: | | | |
| 3.625% 12/15/24 (b) | | 1,364,000 | 1,359,908 |
| 5.875% 3/15/26 (b) | | 1,435,000 | 1,433,430 |
| Royal Caribbean Cruises Ltd.: | | | |
| 5.625% 9/30/31 (b) | | 2,460,000 | 2,446,104 |
| 6% 2/1/33 (b) | | 3,160,000 | 3,179,403 |
| 6.25% 3/15/32 (b) | | 3,225,000 | 3,287,955 |
| Viking Cruises Ltd. 9.125% 7/15/31 (b) | | 535,000 | 577,788 |
| Viking Ocean Cruises Ship VII Ltd. 5.625% 2/15/29 (b) | | 1,545,000 | 1,523,632 |
| Voc Escrow Ltd. 5% 2/15/28 (b) | | 1,420,000 | 1,380,400 |
| | | | 30,653,038 |
| Metals/Mining - 2.5% | | | |
| Alcoa Nederland Holding BV 7.125% 3/15/31 (b) | | 6,344,000 | 6,614,610 |
| Cleveland-Cliffs, Inc.: | | | |
| 6.875% 11/1/29 (b) | | 875,000 | 878,393 |
| 7% 3/15/32 (b)(c) | | 1,800,000 | 1,802,035 |
| 7.375% 5/1/33 (b) | | 875,000 | 881,475 |
| Eldorado Gold Corp. 6.25% 9/1/29 (b) | | 1,340,000 | 1,321,401 |
| ERO Copper Corp. 6.5% 2/15/30 (b) | | 4,860,000 | 4,774,950 |
| First Quantum Minerals Ltd.: | | | |
| 6.875% 10/15/27 (b) | | 2,820,000 | 2,787,260 |
| 8.625% 6/1/31 (b) | | 1,625,000 | 1,637,188 |
| 9.375% 3/1/29 (b) | | 3,705,000 | 3,938,982 |
| FMG Resources August 2006 Pty Ltd. 4.375% 4/1/31 (b) | | 730,000 | 664,560 |
| HudBay Minerals, Inc. 4.5% 4/1/26 (b) | | 1,840,000 | 1,817,026 |
| Mineral Resources Ltd.: | | | |
| 8% 11/1/27 (b) | | 1,980,000 | 2,030,282 |
| 8.5% 5/1/30 (b) | | 2,110,000 | 2,170,160 |
| 9.25% 10/1/28 (b) | | 1,360,000 | 1,431,776 |
| Novelis Corp. 3.875% 8/15/31 (b) | | 740,000 | 649,883 |
| Samarco Mineracao SA 9% 6/30/31 pay-in-kind (b)(d) | | 2,269,950 | 2,146,987 |
| Vibrantz Technologies, Inc. 9% 2/15/30 (b) | | 3,065,000 | 2,871,415 |
| Volcan Compania Minera SAA 8.75% 1/24/30 (b) | | 1,158,000 | 1,057,833 |
| | | | 39,476,216 |
| Paper - 1.1% | | | |
| Ahlstrom Holding 3 OY 4.875% 2/4/28 (b) | | 2,810,000 | 2,658,569 |
| Ardagh Metal Packaging Finance U.S.A. LLC/Ardagh Metal Packaging Finance PLC: | | | |
| 4% 9/1/29 (b) | | 3,000,000 | 2,631,531 |
| 6% 6/15/27 (b) | | 2,930,000 | 2,921,705 |
| Clydesdale Acquisition Holdings, Inc.: | | | |
| 6.625% 4/15/29 (b) | | 1,405,000 | 1,411,616 |
| 6.875% 1/15/30 (b)(c) | | 1,805,000 | 1,831,290 |
| 8.75% 4/15/30 (b) | | 2,422,000 | 2,459,541 |
| Mativ Holdings, Inc. 8% 10/1/29 (b) | | 870,000 | 885,273 |
| Mercer International, Inc. 5.125% 2/1/29 (c) | | 950,000 | 819,898 |
| Rayonier AM Products, Inc. 7.625% 1/15/26 (b) | | 1,315,000 | 1,315,443 |
| | | | 16,934,866 |
| Publishing/Printing - 0.1% | | | |
| Cimpress PLC 7.375% 9/15/32 (b) | | 1,375,000 | 1,353,679 |
| Railroad - 0.2% | | | |
| Genesee & Wyoming, Inc. 6.25% 4/15/32 (b) | | 3,825,000 | 3,858,420 |
| Restaurants - 0.9% | | | |
| 1011778 BC Unlimited Liability Co./New Red Finance, Inc.: | | | |
| 3.875% 1/15/28 (b) | | 1,265,000 | 1,205,727 |
| 4% 10/15/30 (b) | | 3,170,000 | 2,862,985 |
| 5.625% 9/15/29 (b) | | 3,210,000 | 3,201,890 |
| 6.125% 6/15/29 (b) | | 2,350,000 | 2,391,026 |
| Yum! Brands, Inc.: | | | |
| 3.625% 3/15/31 | | 380,000 | 344,113 |
| 4.625% 1/31/32 | | 3,255,000 | 3,051,640 |
| 5.375% 4/1/32 | | 585,000 | 569,388 |
| | | | 13,626,769 |
| Services - 4.4% | | | |
| ADT Corp. 4.125% 8/1/29 (b) | | 1,715,000 | 1,603,596 |
| Allied Universal Holdco LLC 7.875% 2/15/31 (b) | | 2,945,000 | 2,997,047 |
| Allied Universal Holdco LLC / Allied Universal Finance Corp.: | | | |
| 6% 6/1/29 (b) | | 2,635,000 | 2,411,028 |
| 9.75% 7/15/27 (b) | | 4,932,000 | 4,943,881 |
| Aramark Services, Inc. 5% 2/1/28 (b) | | 760,000 | 746,278 |
| Artera Services LLC 8.5% 2/15/31 (b) | | 8,961,000 | 8,880,797 |
| ASGN, Inc. 4.625% 5/15/28 (b) | | 1,395,000 | 1,332,109 |
| Avis Budget Car Rental LLC/Avis Budget Finance, Inc.: | | | |
| 5.75% 7/15/27 (b) | | 185,000 | 181,598 |
| 8.25% 1/15/30 (b)(c) | | 355,000 | 362,675 |
| Brand Industrial Services, Inc. 10.375% 8/1/30 (b) | | 6,275,000 | 6,652,422 |
| CoreCivic, Inc.: | | | |
| 4.75% 10/15/27 | | 3,160,000 | 3,010,803 |
| 8.25% 4/15/29 | | 3,855,000 | 4,048,328 |
| CoreLogic, Inc. 4.5% 5/1/28 (b) | | 1,395,000 | 1,309,931 |
| Garda World Security Corp.: | | | |
| 8.25% 8/1/32 (b) | | 883,000 | 878,424 |
| 8.375% 11/15/32 (b) | | 1,010,000 | 1,009,917 |
| Gartner, Inc. 4.5% 7/1/28 (b) | | 630,000 | 614,714 |
| Life Time, Inc. 6% 11/15/31 (b)(f) | | 4,405,000 | 4,386,296 |
| Neptune BidCo U.S., Inc. 9.29% 4/15/29 (b) | | 638,000 | 593,340 |
| Service Corp. International: | | | |
| 4% 5/15/31 | | 1,285,000 | 1,158,885 |
| 5.125% 6/1/29 | | 810,000 | 794,728 |
| 5.75% 10/15/32 | | 635,000 | 623,779 |
| Sotheby's 7.375% 10/15/27 (b) | | 2,380,000 | 2,316,266 |
| Staples, Inc.: | | | |
| 10.75% 9/1/29 (b) | | 2,894,000 | 2,798,449 |
| 12.75% 1/15/30 (b) | | 2,376,712 | 1,888,832 |
| StoneMor, Inc. 8.5% 5/15/29 (b) | | 895,000 | 797,395 |
| The GEO Group, Inc.: | | | |
| 8.625% 4/15/29 | | 2,475,000 | 2,588,865 |
| 10.25% 4/15/31 | | 2,115,000 | 2,266,874 |
| TriNet Group, Inc.: | | | |
| 3.5% 3/1/29 (b) | | 4,635,000 | 4,214,647 |
| 7.125% 8/15/31 (b) | | 875,000 | 896,106 |
| United Rentals North America, Inc. 6.125% 3/15/34 (b)(c) | | 3,160,000 | 3,186,370 |
| WASH Multifamily Acquisition, Inc. 5.75% 4/15/26 (b) | | 2,175,000 | 2,169,631 |
| | | | 71,664,011 |
| Steel - 0.4% | | | |
| ATI, Inc. 7.25% 8/15/30 | | 820,000 | 849,759 |
| Commercial Metals Co.: | | | |
| 3.875% 2/15/31 | | 880,000 | 790,004 |
| 4.125% 1/15/30 | | 2,025,000 | 1,879,159 |
| Vallourec SA 7.5% 4/15/32 (b) | | 3,201,000 | 3,352,692 |
| | | | 6,871,614 |
| Super Retail - 1.7% | | | |
| Bath & Body Works, Inc. 6.694% 1/15/27 (c) | | 1,123,000 | 1,149,538 |
| Carvana Co.: | | | |
| 4.875% 9/1/29 (b) | | 1,322,000 | 1,107,488 |
| 5.5% 4/15/27 (b) | | 1,312,000 | 1,207,040 |
| 5.625% 10/1/25 (b) | | 2,159,000 | 2,132,170 |
| 5.875% 10/1/28 (b) | | 764,000 | 686,689 |
| 12% 12/1/28 pay-in-kind (b)(d) | | 1,812,189 | 1,916,683 |
| 13% 6/1/30 pay-in-kind (b)(d) | | 1,175,450 | 1,281,534 |
| 14% 6/1/31 pay-in-kind (b)(d) | | 3,118,811 | 3,718,334 |
| EG Global Finance PLC 12% 11/30/28 (b) | | 5,170,000 | 5,748,507 |
| LBM Acquisition LLC 6.25% 1/15/29 (b) | | 3,695,000 | 3,407,712 |
| Levi Strauss & Co. 3.5% 3/1/31 (b)(c) | | 310,000 | 273,824 |
| Michaels Companies, Inc. 5.25% 5/1/28 (b) | | 655,000 | 471,330 |
| Nordstrom, Inc.: | | | |
| 4.25% 8/1/31 | | 685,000 | 602,683 |
| 4.375% 4/1/30 | | 435,000 | 394,301 |
| Sally Holdings LLC 6.75% 3/1/32 (c) | | 1,590,000 | 1,609,813 |
| Wolverine World Wide, Inc. 4% 8/15/29 (b) | | 2,074,000 | 1,773,460 |
| | | | 27,481,106 |
| Technology - 6.6% | | | |
| Acuris Finance U.S.: | | | |
| 5% 5/1/28 (b) | | 4,250,000 | 3,835,595 |
| 9% 8/1/29 (b) | | 787,000 | 771,417 |
| Ahead DB Holdings LLC 6.625% 5/1/28 (b) | | 1,310,000 | 1,271,814 |
| Amentum Holdings, Inc. 7.25% 8/1/32 (b)(c) | | 1,870,000 | 1,936,884 |
| Block, Inc.: | | | |
| 3.5% 6/1/31 | | 4,995,000 | 4,427,833 |
| 6.5% 5/15/32 (b) | | 4,765,000 | 4,849,650 |
| Cloud Software Group, Inc.: | | | |
| 6.5% 3/31/29 (b) | | 959,000 | 936,525 |
| 8.25% 6/30/32 (b) | | 3,525,000 | 3,623,163 |
| 9% 9/30/29 (b) | | 7,578,000 | 7,577,312 |
| Cogent Communications Group, Inc. 7% 6/15/27 (b) | | 2,400,000 | 2,413,414 |
| Coherent Corp. 5% 12/15/29 (b)(c) | | 3,310,000 | 3,175,288 |
| CommScope, Inc.: | | | |
| 4.75% 9/1/29 (b) | | 3,625,000 | 3,099,375 |
| 6% 3/1/26 (b) | | 445,000 | 434,412 |
| Elastic NV 4.125% 7/15/29 (b) | | 878,000 | 812,481 |
| Entegris, Inc.: | | | |
| 3.625% 5/1/29 (b)(c) | | 1,200,000 | 1,098,042 |
| 4.75% 4/15/29 (b) | | 500,000 | 484,379 |
| 5.95% 6/15/30 (b) | | 4,125,000 | 4,120,500 |
| Gen Digital, Inc. 5% 4/15/25 (b) | | 1,480,000 | 1,475,937 |
| Go Daddy Operating Co. LLC / GD Finance Co., Inc.: | | | |
| 3.5% 3/1/29 (b) | | 4,760,000 | 4,392,963 |
| 5.25% 12/1/27 (b) | | 855,000 | 845,014 |
| Helios Software Holdings, Inc. / ION Corporate Solutions Finance Sarl 8.75% 5/1/29 (b) | | 1,256,000 | 1,275,119 |
| HTA Group Ltd. 7.5% 6/4/29 (b) | | 6,710,000 | 6,818,031 |
| Iliad Holding SAS: | | | |
| 7% 10/15/28 (b) | | 170,000 | 172,276 |
| 8.5% 4/15/31 (b) | | 2,690,000 | 2,874,429 |
| Insight Enterprises, Inc. 6.625% 5/15/32 (b) | | 1,280,000 | 1,308,564 |
| ION Trading Technologies Ltd. 5.75% 5/15/28 (b) | | 2,825,000 | 2,561,035 |
| Lightning Power LLC 7.25% 8/15/32 (b) | | 1,475,000 | 1,534,503 |
| Match Group Holdings II LLC: | | | |
| 3.625% 10/1/31 (b)(c) | | 440,000 | 385,492 |
| 4.125% 8/1/30 (b) | | 930,000 | 845,646 |
| McAfee Corp. 7.375% 2/15/30 (b) | | 1,380,000 | 1,330,448 |
| NCR Atleos Corp. 9.5% 4/1/29 (b) | | 1,465,000 | 1,612,387 |
| ON Semiconductor Corp. 3.875% 9/1/28 (b) | | 305,000 | 285,998 |
| Open Text Corp.: | | | |
| 3.875% 2/15/28 (b) | | 1,590,000 | 1,495,535 |
| 3.875% 12/1/29 (b) | | 905,000 | 825,638 |
| Open Text Holdings, Inc.: | | | |
| 4.125% 2/15/30 (b) | | 3,045,000 | 2,795,445 |
| 4.125% 12/1/31 (b)(c) | | 3,020,000 | 2,712,275 |
| Rackspace Finance LLC 3.5% 5/15/28 (b) | | 2,033,225 | 1,197,924 |
| Roblox Corp. 3.875% 5/1/30 (b) | | 3,215,000 | 2,909,727 |
| Seagate HDD Cayman: | | | |
| 5.75% 12/1/34 | | 1,955,000 | 1,926,386 |
| 8.25% 12/15/29 | | 715,000 | 769,203 |
| 8.5% 7/15/31 | | 875,000 | 943,363 |
| Sensata Technologies BV 4% 4/15/29 (b) | | 2,060,000 | 1,926,307 |
| Sensata Technologies, Inc.: | | | |
| 3.75% 2/15/31 (b) | | 735,000 | 655,992 |
| 6.625% 7/15/32 (b) | | 1,735,000 | 1,757,790 |
| TTM Technologies, Inc. 4% 3/1/29 (b) | | 4,105,000 | 3,837,808 |
| UKG, Inc. 6.875% 2/1/31 (b) | | 1,955,000 | 2,002,920 |
| Veritas U.S., Inc./Veritas Bermuda Ltd. 7.5% 9/1/25 (b) | | 1,197,000 | 1,139,203 |
| Virtusa Corp. 7.125% 12/15/28 (b) | | 525,000 | 509,092 |
| Western Digital Corp.: | | | |
| 2.85% 2/1/29 | | 3,130,000 | 2,765,588 |
| 3.1% 2/1/32 (c) | | 1,300,000 | 1,087,501 |
| 4.75% 2/15/26 | | 180,000 | 177,884 |
| Wolfspeed, Inc. 4.2917% 6/23/30 pay-in-kind (b)(d)(h)(i) | | 2,825,000 | 2,712,000 |
| | | | 106,733,507 |
| Telecommunications - 5.4% | | | |
| Altice Financing SA 5.75% 8/15/29 (b) | | 9,632,000 | 7,899,450 |
| Altice France Holding SA 6% 2/15/28 (b) | | 1,972,000 | 523,974 |
| Altice France SA: | | | |
| 5.125% 1/15/29 (b) | | 4,950,000 | 3,707,279 |
| 5.125% 7/15/29 (b) | | 8,147,000 | 6,093,575 |
| 5.5% 1/15/28 (b) | | 1,790,000 | 1,389,042 |
| 5.5% 10/15/29 (b) | | 30,000 | 22,462 |
| AXIAN Telecom 7.375% 2/16/27 (b) | | 982,000 | 986,603 |
| C&W Senior Finance Ltd. 6.875% 9/15/27 (b) | | 4,268,000 | 4,225,677 |
| Cablevision Lightpath LLC: | | | |
| 3.875% 9/15/27 (b) | | 1,330,000 | 1,263,285 |
| 5.625% 9/15/28 (b) | | 2,530,000 | 2,348,741 |
| Consolidated Communications, Inc. 5% 10/1/28 (b) | | 2,005,000 | 1,854,463 |
| Frontier Communications Holdings LLC: | | | |
| 5% 5/1/28 (b) | | 1,495,000 | 1,469,667 |
| 5.875% 10/15/27 (b) | | 1,190,000 | 1,187,450 |
| 5.875% 11/1/29 | | 2,365,000 | 2,310,752 |
| 8.75% 5/15/30 (b) | | 2,415,000 | 2,556,579 |
| IHS Holding Ltd.: | | | |
| 5.625% 11/29/26 (b) | | 1,586,000 | 1,553,550 |
| 6.25% 11/29/28 (b) | | 360,000 | 337,428 |
| IHS Netherlands Holdco BV 8% 9/18/27 (b) | | 1,664,000 | 1,662,440 |
| Intelsat Jackson Holdings SA 6.5% 3/15/30 (b) | | 2,690,000 | 2,527,474 |
| LCPR Senior Secured Financing DAC: | | | |
| 5.125% 7/15/29 (b) | | 1,985,000 | 1,671,211 |
| 6.75% 10/15/27 (b) | | 2,995,000 | 2,813,996 |
| Level 3 Financing, Inc.: | | | |
| 3.625% 1/15/29 (b) | | 625,000 | 468,642 |
| 3.875% 10/15/30 (b) | | 5,092,000 | 3,869,866 |
| 4% 4/15/31 (b) | | 175,000 | 132,125 |
| 4.25% 7/1/28 (b) | | 175,000 | 145,469 |
| 4.5% 4/1/30 (b) | | 1,950,000 | 1,559,886 |
| 4.625% 9/15/27 (b) | | 175,000 | 158,813 |
| 10.5% 5/15/30 (b) | | 3,258,000 | 3,563,438 |
| 11% 11/15/29 (b) | | 1,581,023 | 1,784,045 |
| Liquid Telecommunications Financing PLC 5.5% 9/4/26 (b) | | 3,390,000 | 2,406,900 |
| Millicom International Cellular SA: | | | |
| 4.5% 4/27/31 (b) | | 610,000 | 547,475 |
| 5.125% 1/15/28 (b) | | 1,453,500 | 1,404,444 |
| 7.375% 4/2/32 (b) | | 940,000 | 960,210 |
| Sable International Finance Ltd. 7.125% 10/15/32 (b) | | 2,600,000 | 2,608,554 |
| Sitios Latinoamerica S.A.B. de CV 5.375% 4/4/32 (b) | | 1,660,000 | 1,585,881 |
| Uniti Group LP/Uniti Fiber Holdings, Inc./CSL Capital LLC 6% 1/15/30 (b) | | 4,647,000 | 3,893,087 |
| ViaSat, Inc. 5.625% 9/15/25 (b) | | 3,484,000 | 3,438,590 |
| Virgin Media Secured Finance PLC 4.5% 8/15/30 (b) | | 4,685,000 | 4,103,081 |
| VMED O2 UK Financing I PLC 4.25% 1/31/31 (b) | | 4,045,000 | 3,489,502 |
| Zayo Group Holdings, Inc. 4% 3/1/27 (b)(c) | | 2,840,000 | 2,527,625 |
| | | | 87,052,731 |
| Textiles/Apparel - 0.1% | | | |
| Crocs, Inc. 4.125% 8/15/31 (b)(c) | | 864,000 | 756,840 |
| Kontoor Brands, Inc. 4.125% 11/15/29 (b) | | 1,230,000 | 1,146,410 |
| | | | 1,903,250 |
| Transportation Ex Air/Rail - 0.8% | | | |
| Golar LNG Ltd.: | | | |
| 7% 10/20/25 (b) | | 3,344,000 | 3,371,053 |
| 7.75% 9/19/29 (Reg. S) (b) | | 2,400,000 | 2,387,184 |
| Seaspan Corp. 5.5% 8/1/29 (b) | | 1,693,000 | 1,610,402 |
| XPO, Inc.: | | | |
| 6.25% 6/1/28 (b) | | 460,000 | 466,952 |
| 7.125% 6/1/31 (b)(c) | | 760,000 | 786,624 |
| 7.125% 2/1/32 (b)(c) | | 2,815,000 | 2,924,321 |
| Yinson Boronia Production BV 8.947% 7/31/42 (b) | | 905,000 | 958,295 |
| | | | 12,504,831 |
| Utilities - 3.0% | | | |
| Calpine Corp.: | | | |
| 4.625% 2/1/29 (b) | | 1,100,000 | 1,043,068 |
| 5.125% 3/15/28 (b) | | 1,285,000 | 1,255,875 |
| Clearway Energy Operating LLC: | | | |
| 3.75% 2/15/31 (b) | | 3,795,000 | 3,387,771 |
| 3.75% 1/15/32 (b)(c) | | 385,000 | 341,166 |
| 4.75% 3/15/28 (b) | | 825,000 | 800,249 |
| DPL, Inc.: | | | |
| 4.125% 7/1/25 | | 2,005,000 | 1,987,625 |
| 4.35% 4/15/29 | | 245,000 | 230,073 |
| NextEra Energy Partners LP: | | | |
| 4.5% 9/15/27 (b)(c) | | 905,000 | 868,804 |
| 7.25% 1/15/29 (b)(c) | | 490,000 | 504,017 |
| NRG Energy, Inc.: | | | |
| 3.375% 2/15/29 (b) | | 2,565,000 | 2,338,867 |
| 3.625% 2/15/31 (b) | | 930,000 | 823,373 |
| 5.25% 6/15/29 (b) | | 2,640,000 | 2,579,811 |
| 5.75% 7/15/29 | | 1,525,000 | 1,502,125 |
| 6% 2/1/33 (b) | | 1,760,000 | 1,750,259 |
| 6.25% 11/1/34 (b) | | 2,700,000 | 2,697,157 |
| PG&E Corp.: | | | |
| 5.25% 7/1/30 (c) | | 11,165,000 | 10,880,797 |
| 7.375% 3/15/55 (d) | | 1,460,000 | 1,508,060 |
| Pike Corp.: | | | |
| 5.5% 9/1/28 (b) | | 757,000 | 741,739 |
| 8.625% 1/31/31 (b) | | 3,042,000 | 3,232,052 |
| Vistra Operations Co. LLC: | | | |
| 5% 7/31/27 (b) | | 1,945,000 | 1,919,413 |
| 5.5% 9/1/26 (b) | | 935,000 | 932,179 |
| 5.625% 2/15/27 (b) | | 2,700,000 | 2,693,033 |
| 6.875% 4/15/32 (b) | | 1,895,000 | 1,959,533 |
| 7.75% 10/15/31 (b)(c) | | 2,065,000 | 2,181,411 |
| | | | 48,158,457 |
TOTAL NONCONVERTIBLE BONDS | | | 1,353,810,843 |
| TOTAL CORPORATE BONDS (Cost $1,389,182,505) | | | 1,381,459,478 |
| | | | |
| U.S. Treasury Obligations - 1.9% |
| | | Principal Amount (a) | Value ($) |
| U.S. Treasury Notes: | | | |
| 3.75% 5/31/30 | | 800,000 | 782,688 |
| 4% 2/15/34 | | 31,246,000 | 30,572,244 |
| TOTAL U.S. TREASURY OBLIGATIONS (Cost $31,665,313) | | | 31,354,932 |
| | | | |
| Asset-Backed Securities - 0.1% |
| | | Principal Amount (a) | Value ($) |
| Agl Clo 5 Ltd. Series 2024-5A Class ERR, CME Term SOFR 3 Month Index + 6.350% 10.9674% 7/20/34 (b)(d)(e) | | 100,000 | 100,096 |
| Ares Loan Funding Vii Ltd. Series 2024-ALF7 Class E, CME Term SOFR 3 Month Index + 6.250% 10.7901% 10/22/37 (b)(d)(e) | | 141,000 | 143,273 |
| Birch Grove Clo 5 LLC Series 2024-5A Class ER, CME Term SOFR 3 Month Index + 6.750% 11.5989% 10/20/37 (b)(d)(e) | | 108,000 | 109,497 |
| Carlyle U.S. Clo 2024-6 Ltd. Series 2024-6A Class E, CME Term SOFR 3 Month Index + 5.750% 0% 10/25/37 (b)(d)(e)(f) | | 150,000 | 150,031 |
| Carval Clo Xi-C Ltd. Series 2024-3A Class E, CME Term SOFR 3 Month Index + 6.350% 10.9214% 10/20/37 (b)(d)(e) | | 150,000 | 150,964 |
| Croton Pk Clo Ltd. CME Term SOFR 3 Month Index + 5.550% 10.1997% 10/15/36 (b)(d)(e) | | 285,000 | 288,065 |
| Golub Capital Partners Clo 76 B Lt Series 2024-76A Class E, CME Term SOFR 3 Month Index + 5.750% 10.4919% 10/25/37 (b)(d)(e) | | 175,000 | 175,977 |
| Magnetite Xxix Ltd. Series 2024-29A Class ER, CME Term SOFR 3 Month Index + 6.000% 11.2417% 7/15/37 (b)(d)(e) | | 112,000 | 113,436 |
| Midocean Credit Clo Xvi Series 2024-16A Class E, CME Term SOFR 3 Month Index + 6.250% 6.25% 10/20/37 (b)(d)(e)(f) | | 127,000 | 127,026 |
| Orchard Park Clo Ltd. Series 2024-1A Class E, CME Term SOFR 3 Month Index + 5.600% 10.2529% 10/20/37 (b)(d)(e) | | 248,000 | 251,094 |
| Palmer Square Ln Funding 2024-2 Lt Series 2024-2A Class D, CME Term SOFR 3 Month Index + 4.700% 6.2% 1/15/33 (b)(d)(e)(f) | | 285,000 | 285,000 |
| Rr 31 Ltd. Series 2024-31A Class D, CME Term SOFR 3 Month Index + 6.000% 10.5928% 10/15/39 (b)(d)(e) | | 150,000 | 150,261 |
| TOTAL ASSET-BACKED SECURITIES (Cost $2,031,449) | | | 2,044,720 |
| | | | |
| Commercial Mortgage Securities - 0.1% |
| | | Principal Amount (a) | Value ($) |
| BX Commercial Mortgage Trust floater Series 2021-SOAR Class G, CME Term SOFR 1 Month Index + 2.910% 7.7185% 6/15/38 (b)(d)(e) | | 1,132,745 | 1,117,655 |
| Hilton U.S.A. Trust Series 2016-HHV Class F, 4.1935% 11/5/38 (b)(d) | | 1,066,000 | 1,006,510 |
| TOTAL COMMERCIAL MORTGAGE SECURITIES (Cost $2,037,534) | | | 2,124,165 |
| | | | |
| Common Stocks - 2.4% |
| | | Shares | Value ($) |
| Automotive & Auto Parts - 0.0% | | | |
| Aptiv PLC (j) | | 11,500 | 653,545 |
| Energy - 1.3% | | | |
| Cheniere Energy, Inc. | | 7,700 | 1,473,626 |
| Mesquite Energy, Inc. (i)(j) | | 204,784 | 17,294,009 |
| South Bow Corp. | | 72,400 | 1,807,985 |
TOTAL ENERGY | | | 20,575,620 |
| Food & Drug Retail - 0.0% | | | |
| Southeastern Grocers, Inc. rights (i)(j) | | 1,184,833 | 765,817 |
| Healthcare - 0.2% | | | |
| Cano Health, Inc. (i) | | 153,538 | 1,876,234 |
| Cano Health, Inc. warrants (i)(j) | | 8,312 | 32,916 |
| Centene Corp. (j) | | 11,000 | 684,860 |
TOTAL HEALTHCARE | | | 2,594,010 |
| Leisure - 0.0% | | | |
| Topgolf Callaway Brands Corp. (j) | | 77,600 | 753,496 |
| Services - 0.1% | | | |
| CoreCivic, Inc. (j) | | 58,700 | 810,647 |
| The GEO Group, Inc. (j) | | 52,900 | 803,022 |
TOTAL SERVICES | | | 1,613,669 |
| Steel - 0.1% | | | |
| Vallourec SA (j) | | 49,600 | 811,984 |
| Technology - 0.2% | | | |
| Coherent Corp. (j) | | 12,900 | 1,192,476 |
| ON Semiconductor Corp. (j) | | 18,100 | 1,275,869 |
TOTAL TECHNOLOGY | | | 2,468,345 |
| Telecommunications - 0.5% | | | |
| GTT Communications, Inc. (i)(j) | | 89,354 | 4,829,584 |
| Helios Towers PLC (j) | | 2,752,362 | 3,776,171 |
TOTAL TELECOMMUNICATIONS | | | 8,605,755 |
| TOTAL COMMON STOCKS (Cost $27,391,941) | | | 38,842,241 |
| | | | |
| Bank Loan Obligations - 4.4% |
| | | Principal Amount (a) | Value ($) |
| Aerospace - 0.1% | | | |
| Azorra Soar Tlb Finance Ltd. Tranche B 1LN, term loan CME Term SOFR 1 Month Index + 3.500% 8.1324% 10/18/29 (d)(e)(k) | | 875,000 | 873,906 |
| Banks & Thrifts - 0.0% | | | |
| Cpi Holdco B LLC Tranche B 1LN, term loan CME Term SOFR 1 Month Index + 2.250% 0% 5/19/31 (d)(e)(k)(l) | | 170,000 | 168,832 |
| Broadcasting - 0.3% | | | |
| Diamond Sports Group LLC: | | | |
| 1LN, term loan CME Term SOFR 1 Month Index + 8.000% 14.9441% 5/25/26 (d)(e)(k) | | 2,924,114 | 2,516,814 |
| Tranche DIP term loan 10% 8/2/27 (k) | | 1,367,922 | 1,439,738 |
| Sinclair Television Group, Inc. Tranche B 1LN, term loan CME Term SOFR 3 Month Index + 2.500% 7.2996% 9/30/26 (d)(e)(k) | | 1,000,000 | 963,750 |
TOTAL BROADCASTING | | | 4,920,302 |
| Chemicals - 0.4% | | | |
| Discovery Purchaser Corp. 1LN, term loan CME Term SOFR 3 Month Index + 4.370% 8.9647% 10/4/29 (d)(e)(k) | | 1,473,544 | 1,470,788 |
| Hexion Holdings Corp. 1LN, term loan CME Term SOFR 3 Month Index + 4.500% 9.7711% 3/15/29 (d)(e)(k) | | 3,543,259 | 3,540,106 |
| Hexion, Inc. 2LN, term loan CME Term SOFR 1 Month Index + 7.430% 12.2227% 3/15/30 (d)(e)(k) | | 360,000 | 325,440 |
| M2S Group Intermediate Holding Tranche B 1LN, term loan CME Term SOFR 1 Month Index + 4.750% 9.8518% 8/22/31 (d)(e)(k) | | 1,805,000 | 1,744,081 |
TOTAL CHEMICALS | | | 7,080,415 |
| Consumer Products - 0.2% | | | |
| Mattress Firm, Inc. Tranche B 1LN, term loan CME Term SOFR 3 Month Index + 4.250% 8.9235% 9/24/28 (d)(e)(k) | | 887,625 | 887,075 |
| Olaplex, Inc. Tranche B 1LN, term loan CME Term SOFR 1 Month Index + 3.750% 0% 2/23/29 (d)(e)(k)(l) | | 350,000 | 337,946 |
| TGP Holdings III LLC Tranche B 1LN, term loan CME Term SOFR 1 Month Index + 3.250% 8.6811% 6/29/28 (d)(e)(k) | | 875,000 | 827,129 |
| TKC Holdings, Inc. 1LN, term loan 13.5% 2/14/27 (d)(k) | | 1,021,411 | 873,306 |
TOTAL CONSUMER PRODUCTS | | | 2,925,456 |
| Energy - 0.6% | | | |
| EG America LLC Tranche BC 1LN, term loan CME Term SOFR 1 Month Index + 5.500% 10.4445% 2/7/28 (d)(e)(k) | | 6,113,581 | 6,115,109 |
| Enstall Group BV Tranche B 1LN, term loan CME Term SOFR 3 Month Index + 4.750% 9.8653% 8/27/28 (d)(e)(k) | | 1,974,552 | 1,856,079 |
| Mesquite Energy, Inc.: | | | |
| 1LN, term loan 3 month U.S. LIBOR + 8.000% 0% (d)(e)(i)(k)(m) | | 3,800,000 | 0 |
| term loan 0% (d)(i)(k)(m) | | 1,620,000 | 0 |
| Natgasoline LLC Tranche B, term loan CME Term SOFR 6 Month Index + 3.500% 9.016% 11/14/25 (d)(e)(k) | | 880,000 | 862,400 |
| Win Waste Innovations Holdings Tranche B 1LN, term loan CME Term SOFR 1 Month Index + 2.750% 7.5496% 3/25/28 (d)(e)(k) | | 1,752,680 | 1,665,450 |
TOTAL ENERGY | | | 10,499,038 |
| Food & Drug Retail - 0.1% | | | |
| Upfield U.S.A. Corp. Tranche B7 1LN, term loan CME Term SOFR 1 Month Index + 4.250% 9.76% 1/3/28 (d)(e)(h)(k) | | 875,000 | 872,813 |
| Healthcare - 0.2% | | | |
| Cano Health, Inc. 1LN, term loan CME Term SOFR 1 Month Index + 8.000% 12.6037% 6/28/29 (d)(e)(k) | | 920,489 | 913,586 |
| HAH Group Holding Co. LLC 1LN, term loan CME Term SOFR 1 Month Index + 5.000% 9.6852% 9/24/31 (d)(e)(k) | | 665,000 | 650,244 |
| Modivcare, Inc. Tranche B 1LN, term loan CME Term SOFR 3 Month Index + 4.750% 9.3434% 7/1/31 (d)(e)(k) | | 1,456,350 | 1,399,916 |
TOTAL HEALTHCARE | | | 2,963,746 |
| Leisure - 0.8% | | | |
| Bulldog Purchaser, Inc. Tranche B 2LN, term loan CME Term SOFR 3 Month Index + 6.750% 11.3537% 6/14/32 (d)(e)(k) | | 315,000 | 313,110 |
| City Football Group Ltd. Tranche B 1LN, term loan CME Term SOFR 1 Month Index + 3.500% 7.8322% 7/21/30 (d)(e)(k) | | 4,113,823 | 4,062,400 |
| ClubCorp Holdings, Inc. Tranche B 1LN, term loan CME Term SOFR 3 Month Index + 5.000% 9.8653% 9/18/26 (d)(e)(k) | | 3,163,695 | 3,166,321 |
| Crown Finance U.S., Inc. Tranche B 1LN, term loan CME Term SOFR 1 Month Index + 5.000% 0% 10/31/31 (d)(e)(k)(l) | | 350,000 | 347,813 |
| United PF Holdings LLC: | | | |
| 1LN, term loan CME Term SOFR 3 Month Index + 4.000% 8.847% 12/30/26 (d)(e)(k) | | 4,954,222 | 4,759,174 |
| Tranche B 1LN, term loan CME Term SOFR 3 Month Index + 8.500% 13.347% 12/30/26 (d)(e)(k) | | 460,000 | 446,200 |
TOTAL LEISURE | | | 13,095,018 |
| Metals/Mining - 0.1% | | | |
| American Rock Salt Co. LLC: | | | |
| 1LN, term loan: | | | |
CME Term SOFR 3 Month Index + 4.000% 9.3188% 6/4/28 (d)(e)(k) | | 565,615 | 471,192 |
CME Term SOFR 3 Month Index + 6.500% 2% 6/12/28 (d)(e)(h)(k) | | 177,527 | 177,305 |
| Tranche B 1LN, term loan CME Term SOFR 3 Month Index + 6.500% 11.8736% 6/12/28 (d)(e)(k) | | 165,955 | 165,748 |
TOTAL METALS/MINING | | | 814,245 |
| Restaurants - 0.0% | | | |
| Restaurant Technologies, Inc. Tranche B 1LN, term loan CME Term SOFR 3 Month Index + 4.250% 8.8537% 4/1/29 (d)(e)(k) | | 480,000 | 466,051 |
| Services - 0.9% | | | |
| Artera Services LLC Tranche B 1LN, term loan CME Term SOFR 3 Month Index + 4.500% 9.1037% 2/10/31 (d)(e)(k) | | 347,000 | 342,735 |
| Ascend Learning LLC 2LN, term loan CME Term SOFR 1 Month Index + 5.750% 10.5352% 12/10/29 (d)(e)(k) | | 1,000,000 | 981,670 |
| Brand Industrial Services, Inc. Tranche B 1LN, term loan CME Term SOFR 3 Month Index + 4.500% 9.7477% 8/1/30 (d)(e)(k) | | 1,394,549 | 1,374,942 |
| CACI International, Inc. Tranche B 1LN, term loan CME Term SOFR 1 Month Index + 1.750% 0% 10/17/31 (d)(e)(k)(l) | | 40,000 | 40,000 |
| CoreLogic, Inc. Tranche B 1LN, term loan CME Term SOFR 1 Month Index + 3.500% 8.2996% 6/2/28 (d)(e)(k) | | 3,364,304 | 3,341,460 |
| Finastra U.S.A., Inc. term loan CME Term SOFR 1 Month Index + 7.250% 12.1813% 9/13/29 (d)(e)(i)(k) | | 2,897,432 | 2,897,432 |
| Life Time, Inc. Tranche B 1LN, term loan CME Term SOFR 1 Month Index + 2.500% 0% 10/22/31 (d)(e)(k)(l) | | 305,000 | 304,619 |
| Spin Holdco, Inc. Tranche B 1LN, term loan CME Term SOFR 3 Month Index + 4.000% 9.256% 3/4/28 (d)(e)(k) | | 6,047,969 | 5,234,880 |
| Staples, Inc. Tranche B 1LN, term loan CME Term SOFR 3 Month Index + 5.750% 10.6886% 9/10/29 (d)(e)(k) | | 675,000 | 623,410 |
TOTAL SERVICES | | | 15,141,148 |
| Super Retail - 0.2% | | | |
| Great Outdoors Group LLC Tranche B 1LN, term loan CME Term SOFR 1 Month Index + 3.750% 8.5496% 3/5/28 (d)(e)(k) | | 463,488 | 464,183 |
| LBM Acquisition LLC Tranche B 1LN, term loan CME Term SOFR 1 Month Index + 3.750% 8.6684% 6/6/31 (d)(e)(k) | | 3,538,820 | 3,484,853 |
TOTAL SUPER RETAIL | | | 3,949,036 |
| Technology - 0.5% | | | |
| DH Corp./Societe term loan CME Term SOFR 3 Month Index + 7.250% 12.1813% 9/13/29 (d)(e)(i)(k) | | 67,668 | 67,668 |
| Leia Finco U.S. LLC: | | | |
| 1LN, term loan CME Term SOFR 1 Month Index + 3.250% 7.8867% 10/9/31 (d)(e)(k) | | 1,195,000 | 1,183,385 |
| 2LN, term loan CME Term SOFR 1 Month Index + 5.250% 9.8867% 10/12/32 (d)(e)(k) | | 780,000 | 757,091 |
| Polaris Newco LLC: | | | |
| 2LN, term loan CME Term SOFR 1 Month Index + 2.000% 14.1572% 6/4/29 (d)(e)(k) | | 1,091,000 | 1,067,358 |
| Tranche B 1LN, term loan CME Term SOFR 3 Month Index + 4.000% 8.847% 6/2/28 (d)(e)(k) | | 359,075 | 356,346 |
| Rackspace Finance LLC Tranche B 1LN, term loan CME Term SOFR 1 Month Index + 6.250% 11.1829% 5/15/28 (d)(e)(k) | | 330,177 | 335,886 |
| Weber-Stephen Products LLC Tranche B 1LN, term loan: | | | |
| CME Term SOFR 1 Month Index + 3.250% 8.0496% 10/30/27 (d)(e)(k) | | 1,193,000 | 1,126,789 |
| CME Term SOFR 1 Month Index + 4.250% 9.0352% 10/30/27 (d)(e)(k) | | 585,000 | 552,825 |
| Zelis Payments Buyer, Inc. Tranche B 1LN, term loan CME Term SOFR 1 Month Index + 3.250% 0% 10/27/31 (d)(e)(k)(l) | | 2,465,000 | 2,452,675 |
TOTAL TECHNOLOGY | | | 7,900,023 |
| TOTAL BANK LOAN OBLIGATIONS (Cost $70,804,665) | | | 71,670,029 |
| | | | |
| Preferred Securities - 1.7% |
| | | Principal Amount (a) | Value ($) |
| Banks & Thrifts - 0.9% | | | |
| Ally Financial, Inc.: | | | |
| 4.7% (d)(n) | | 2,270,000 | 2,064,742 |
| 4.7% (d)(n) | | 2,935,000 | 2,410,521 |
| Bank of America Corp. 5.875% (c)(d)(n) | | 2,985,000 | 3,034,858 |
| Citigroup, Inc. 7.125% (d)(n) | | 1,560,000 | 1,650,333 |
| Goldman Sachs Group, Inc. 6.125% (d)(n) | | 323,000 | 322,330 |
| JPMorgan Chase & Co. 4.6% (d)(n) | | 2,155,000 | 2,169,453 |
| M&T Bank Corp.: | | | |
| 3.5% (c)(d)(n) | | 365,000 | 334,233 |
| 5.125% (d)(n) | | 710,000 | 717,394 |
| Wells Fargo & Co. 6.85% (d)(n) | | 1,580,000 | 1,642,975 |
TOTAL BANKS & THRIFTS | | | 14,346,839 |
| Diversified Financial Services - 0.2% | | | |
| Aircastle Ltd. 5.25% (b)(d)(n) | | 3,160,000 | 3,127,565 |
| Energy - 0.3% | | | |
| Energy Transfer LP 6.625% (d)(n) | | 1,225,000 | 1,216,334 |
| Plains All American Pipeline LP CME Term SOFR 3 Month Index + 4.110% 9.4897% (c)(d)(e)(n) | | 4,375,000 | 4,436,073 |
TOTAL ENERGY | | | 5,652,407 |
| Homebuilders/Real Estate - 0.1% | | | |
| Alliant Holdings LP 10% (d)(i)(n) | | 837,000 | 835,004 |
| Services - 0.2% | | | |
| Air Lease Corp.: | | | |
| 4.125% (d)(n) | | 3,435,000 | 3,243,699 |
| 6% (d)(n) | | 160,000 | 158,595 |
TOTAL SERVICES | | | 3,402,294 |
| TOTAL PREFERRED SECURITIES (Cost $23,767,854) | | | 27,364,109 |
| | | | |
| Other - 1.4% |
| | | Shares | Value ($) |
| Other - 1.4% | | | |
Fidelity Private Credit Co. LLC (o)(p) (Cost $22,192,842) | | 2,227,530 | 22,453,506 |
| | | | |
| Money Market Funds - 6.7% |
| | | Shares | Value ($) |
| Fidelity Cash Central Fund 4.87% (q) | | 33,050,898 | 33,057,508 |
| Fidelity Securities Lending Cash Central Fund 4.87% (q)(r) | | 74,220,105 | 74,227,528 |
| TOTAL MONEY MARKET FUNDS (Cost $107,285,036) | | | 107,285,036 |
| | | | |
| TOTAL INVESTMENT IN SECURITIES - 104.3% (Cost $1,676,359,139) | 1,684,598,216 |
NET OTHER ASSETS (LIABILITIES) - (4.3)% | (69,690,087) |
| NET ASSETS - 100.0% | 1,614,908,129 |
| | |
Legend
| (a) | Amount is stated in United States dollars unless otherwise noted. |
| (b) | Security exempt from registration under Rule 144A of the Securities Act of 1933. These securities may be resold in transactions exempt from registration, normally to qualified institutional buyers. At the end of the period, the value of these securities amounted to $1,176,951,824 or 72.9% of net assets. |
| (c) | Security or a portion of the security is on loan at period end. |
| (d) | Coupon rates for floating and adjustable rate securities reflect the rates in effect at period end. |
| (e) | Coupon is indexed to a floating interest rate which may be multiplied by a specified factor and/or subject to caps or floors. |
| (f) | Security or a portion of the security purchased on a delayed delivery or when-issued basis. |
| (g) | Security initially issued at one coupon which converts to a higher coupon at a specified date. The rate shown is the rate at period end. |
| (h) | Position or a portion of the position represents an unfunded loan commitment. At period end, the total principal amount and market value of unfunded commitments totaled $2,047,527 and $1,972,505, respectively. |
| (k) | Remaining maturities of bank loan obligations may be less than the stated maturities shown as a result of contractual or optional prepayments by the borrower. Such prepayments cannot be predicted with certainty. |
| (l) | A coupon rate of 0% signifies an unsettled loan. The coupon rate will be determined upon settlement of the loan after period end. |
| (m) | Non-income producing - Security is in default. |
| (n) | Security is perpetual in nature with no stated maturity date. |
| (p) | Restricted securities (including private placements) - Investment in securities not registered under the Securities Act of 1933 (excluding 144A issues). At the end of the period, the value of restricted securities (excluding 144A issues) amounted to $22,453,506 or 1.4% of net assets. |
| (q) | Affiliated fund that is generally available only to investment companies and other accounts managed by Fidelity Investments. The rate quoted is the annualized seven-day yield of the fund at period end. A complete unaudited listing of the fund's holdings as of its most recent quarter end is available upon request. In addition, each Fidelity Central Fund's financial statements are available on the SEC's website or upon request. |
| (r) | Investment made with cash collateral received from securities on loan. |
| Additional information on each restricted holding is as follows: |
| Security | Acquisition Date | Acquisition Cost ($) |
| Fidelity Private Credit Co. LLC | 4/15/22 - 10/28/24 | 22,192,842 |
| | | |
Affiliated Central Funds
Fiscal year to date information regarding the Fund's investments in Fidelity Central Funds, including the ownership percentage, is presented below.
| Affiliate | Value, beginning of period ($) | Purchases ($) | Sales Proceeds ($) | Dividend Income ($) | Realized Gain (loss) ($) | Change in Unrealized appreciation (depreciation) ($) | Value, end of period ($) | % ownership, end of period |
| Fidelity Cash Central Fund 4.87% | 11,724,968 | 242,920,106 | 221,588,328 | 317,379 | 762 | - | 33,057,508 | 0.1% |
| Fidelity Securities Lending Cash Central Fund 4.87% | 66,847,611 | 209,408,076 | 202,028,159 | 179,023 | - | - | 74,227,528 | 0.3% |
| Total | 78,572,579 | 452,328,182 | 423,616,487 | 496,402 | 762 | - | 107,285,036 | |
| | | | | | | | | |
Amounts in the dividend income column in the above table include any capital gain distributions from underlying funds, which are presented in the corresponding line item in the Statement of Operations, if applicable.
Amounts in the dividend income column for Fidelity Securities Lending Cash Central Fund represents the income earned on investing cash collateral, less rebates paid to borrowers and any lending agent fees associated with the loan, plus any premium payments received for lending certain types of securities.
Amounts included in the purchases and sales proceeds columns may include in-kind transactions, if applicable.
Affiliated Underlying Funds
Fiscal year to date information regarding the Fund's investments in affiliated Underlying Funds is presented below. Exchanges between classes of the same affiliated Underlying Funds may occur. If an Underlying Funds changes its name, the name presented below is the name in effect at period end.
| Affiliate | Value, beginning of period ($) | Purchases ($) | Sales Proceeds ($) | Dividend Income ($) | Realized Gain (loss) ($) | Change in Unrealized appreciation (depreciation) ($) | Value, end of period ($) |
| Fidelity Private Credit Co. LLC | 20,336,289 | 2,274,258 | - | 1,485,258 | - | (157,041) | 22,453,506 |
| | 20,336,289 | 2,274,258 | - | 1,485,258 | - | (157,041) | 22,453,506 |
Amounts in the dividend income column in the above table include any capital gain distributions from underlying funds, which are presented in the corresponding line item in the Statement of Operations, if applicable.
Amounts included in the purchases and sales proceeds columns may include in-kind transactions, if applicable.
Investment Valuation
The following is a summary of the inputs used, as of October 31, 2024, involving the Fund's assets and liabilities carried at fair value. The inputs or methodology used for valuing securities may not be an indication of the risk associated with investing in those securities. For more information on valuation inputs, and their aggregation into the levels used below, please refer to the Investment Valuation section in the accompanying Notes to Financial Statements.
| Valuation Inputs at Reporting Date: |
| Description | Total ($) | Level 1 ($) | Level 2 ($) | Level 3 ($) |
Investments in Securities: | | | | |
|
| Equities: | | | | |
Communication Services | 3,776,171 | 3,776,171 | - | - |
Consumer Discretionary | 1,407,041 | 1,407,041 | - | - |
Consumer Staples | 765,817 | - | - | 765,817 |
Energy | 21,387,604 | 4,093,595 | - | 17,294,009 |
Health Care | 2,594,010 | 684,860 | - | 1,909,150 |
Industrials | 1,613,669 | 1,613,669 | - | - |
Information Technology | 7,297,929 | 2,468,345 | - | 4,829,584 |
|
| Corporate Bonds | 1,381,459,478 | - | 1,378,747,478 | 2,712,000 |
|
| U.S. Government and Government Agency Obligations | 31,354,932 | - | 31,354,932 | - |
|
| Asset-Backed Securities | 2,044,720 | - | 2,044,720 | - |
|
| Commercial Mortgage Securities | 2,124,165 | - | 2,124,165 | - |
|
| Bank Loan Obligations | 71,670,029 | - | 68,704,929 | 2,965,100 |
|
| Preferred Securities | 27,364,109 | - | 26,529,105 | 835,004 |
|
| Other | 22,453,506 | - | 22,453,506 | - |
|
| Money Market Funds | 107,285,036 | 107,285,036 | - | - |
| Total Investments in Securities: | 1,684,598,216 | 121,328,717 | 1,531,958,835 | 31,310,664 |
| | | | | |
|
| Net Unrealized Appreciation on Unfunded Commitments | 1,667,512 | (76,830) | - | 1,744,342 |
| Total | 1,667,512 | (76,830) | - | 1,744,342 |
The following is a reconciliation of Investments in Securities for which Level 3 inputs were used in determining value:
| |
| Investments in Securities: | |
| Energy | | | |
| Beginning Balance | $ | 16,763,618 | |
| Net Realized Gain (Loss) on Investment Securities | | - | |
| Net Unrealized Gain (Loss) on Investment Securities | | 530,391 | |
| Cost of Purchases | | - | |
| Proceeds of Sales | | - | |
| Amortization/Accretion | | - | |
| Transfers into Level 3 | | - | |
| Transfers out of Level 3 | | - | |
| Ending Balance | $ | 17,294,009 | |
| The change in unrealized gain (loss) for the period attributable to Level 3 securities held at October 31, 2024 | $ | 530,391 | |
| Other Investments in Securities | | | |
| Beginning Balance | $ | 13,354,901 | |
| Net Realized Gain (Loss) on Investment Securities | | 1,452,299 | |
| Net Unrealized Gain (Loss) on Investment Securities | | (677,298) | |
| Cost of Purchases | | 7,965,335 | |
| Proceeds of Sales | | (8,110,882) | |
| Amortization/Accretion | | 32,300 | |
| Transfers into Level 3 | | - | |
| Transfers out of Level 3 | | - | |
| Ending Balance | $ | 14,016,655 | |
| The change in unrealized gain (loss) for the period attributable to Level 3 securities held at October 31, 2024 | $ | (251,145) | |
| The information used in the above reconciliation represents fiscal year to date activity for any Investments in Securities identified as using Level 3 inputs at either the beginning or the end of the current fiscal period. Cost of purchases and proceeds of sales may include securities received and/or delivered through in-kind transactions, corporate actions or exchanges. Transfers into Level 3 were attributable to a lack of observable market data resulting from decreases in market activity, decreases in liquidity, security restructurings or corporate actions. Transfers out of Level 3 were attributable to observable market data becoming available for those securities. Transfers in or out of Level 3 represent the beginning value of any Security or Instrument where a change in the pricing level occurred from the beginning to the end of the period. Realized and unrealized gains (losses) disclosed in the reconciliation are included in Net Gain (Loss) on the Fund's Statement of Operations. | |
Financial Statements (Unaudited)
| Statement of Assets and Liabilities |
| As of October 31, 2024 (Unaudited) |
| Assets | | | | |
| Investment in securities, at value (including securities loaned of $71,553,454) - See accompanying schedule: | | | | |
Unaffiliated issuers (cost $1,546,881,261) | $ | 1,554,859,674 | | |
Fidelity Central Funds (cost $107,285,036) | | 107,285,036 | | |
Other affiliated issuers (cost $22,192,842) | | 22,453,506 | | |
| | | | | |
| | | | | |
| Total Investment in Securities (cost $1,676,359,139) | | | $ | 1,684,598,216 |
| Cash | | | | 972,840 |
| Receivable for investments sold | | | | |
Regular delivery | | | | 10,960,218 |
Delayed delivery | | | | 701,313 |
| Unrealized appreciation on unfunded commitments | | | | 1,744,342 |
| Receivable for fund shares sold | | | | 1,868,011 |
| Interest receivable | | | | 23,290,401 |
| Distributions receivable from Fidelity Central Funds | | | | 175,672 |
| Prepaid expenses | | | | 1,865 |
Total assets | | | | 1,724,312,878 |
| Liabilities | | | | |
| Payable for investments purchased | | | | |
Regular delivery | $ | 20,580,460 | | |
Delayed delivery | | 11,996,246 | | |
| Unrealized depreciation on unfunded commitments | | 76,830 | | |
| Payable for fund shares redeemed | | 1,574,154 | | |
| Distributions payable | | 21,441 | | |
| Accrued management fee | | 701,533 | | |
| Other payables and accrued expenses | | 226,557 | | |
| Collateral on securities loaned | | 74,227,528 | | |
| Total liabilities | | | | 109,404,749 |
| Commitments and contingent liabilities (see Significant Accounting Policies and Litigation notes) | | | | |
| Net Assets | | | $ | 1,614,908,129 |
| Net Assets consist of: | | | | |
| Paid in capital | | | $ | 1,911,500,852 |
| Total accumulated earnings (loss) | | | | (296,592,723) |
| Net Assets | | | $ | 1,614,908,129 |
Net Asset Value, offering price and redemption price per share ($1,614,908,129 ÷ 175,292,906 shares) | | | $ | 9.21 |
| Statement of Operations |
Six months ended October 31, 2024 (Unaudited) |
| Investment Income | | | | |
| Dividends: | | | | |
| Unaffiliated issuers | | | $ | 1,164,219 |
| Affiliated issuers | | | | 1,485,258 |
| Interest | | | | 52,900,057 |
| Income from Fidelity Central Funds (including $179,023 from security lending) | | | | 496,402 |
| Total income | | | | 56,045,936 |
| Expenses | | | | |
| Management fee | $ | 4,206,045 | | |
| Custodian fees and expenses | | 9,128 | | |
| Independent trustees' fees and expenses | | 3,193 | | |
| Registration fees | | 23,197 | | |
| Audit fees | | 51,143 | | |
| Legal | | 43,821 | | |
| Miscellaneous | | 199,646 | | |
| Total expenses before reductions | | 4,536,173 | | |
| Expense reductions | | (69,650) | | |
| Total expenses after reductions | | | | 4,466,523 |
| Net Investment income (loss) | | | | 51,579,413 |
| Realized and Unrealized Gain (Loss) | | | | |
| Net realized gain (loss) on: | | | | |
| Investment Securities: | | | | |
| Unaffiliated issuers | | (14,410,414) | | |
| Fidelity Central Funds | | 762 | | |
| Foreign currency transactions | | 1,139 | | |
| Futures contracts | | 571,843 | | |
| Total net realized gain (loss) | | | | (13,836,670) |
| Change in net unrealized appreciation (depreciation) on: | | | | |
| Investment Securities: | | | | |
| Unaffiliated issuers | | 72,510,690 | | |
| Affiliated issuers | | (157,041) | | |
| Unfunded commitments | | 1,667,512 | | |
| Total change in net unrealized appreciation (depreciation) | | | | 74,021,161 |
| Net gain (loss) | | | | 60,184,491 |
| Net increase (decrease) in net assets resulting from operations | | | $ | 111,763,904 |
| Statement of Changes in Net Assets |
| |
| | Six months ended October 31, 2024 (Unaudited) | | Year ended April 30, 2024 |
| Increase (Decrease) in Net Assets | | | | |
| Operations | | | | |
| Net investment income (loss) | $ | 51,579,413 | $ | 103,577,241 |
| Net realized gain (loss) | | (13,836,670) | | (88,763,631) |
| Change in net unrealized appreciation (depreciation) | | 74,021,161 | | 109,870,317 |
| Net increase (decrease) in net assets resulting from operations | | 111,763,904 | | 124,683,927 |
| Distributions to shareholders | | (46,899,388) | | (93,914,132) |
| | | | | |
| Share transactions | | | | |
| Proceeds from sales of shares | | 248,114,572 | | 436,578,762 |
| Reinvestment of distributions | | 46,677,554 | | 93,610,032 |
| Cost of shares redeemed | | (309,646,310) | | (636,365,834) |
| | | | | |
Net increase (decrease) in net assets resulting from share transactions | | (14,854,184) | | (106,177,040) |
| Total increase (decrease) in net assets | | 50,010,332 | | (75,407,245) |
| | | | | |
| Net Assets | | | | |
| Beginning of period | | 1,564,897,797 | | 1,640,305,042 |
| End of period | $ | 1,614,908,129 | $ | 1,564,897,797 |
| | | | | |
| Other Information | | | | |
| Shares | | | | |
| Sold | | 27,309,580 | | 50,252,095 |
| Issued in reinvestment of distributions | | 5,133,275 | | 10,770,620 |
| Redeemed | | (34,137,568) | | (73,289,474) |
| Net increase (decrease) | | (1,694,713) | | (12,266,759) |
| | | | | |
Financial Highlights
Fidelity® SAI High Income Fund |
| |
| | Six months ended (Unaudited) October 31, 2024 | | Years ended April 30, 2024 | | 2023 | | 2022 A |
Selected Per-Share Data | | | | | | | | |
| Net asset value, beginning of period | $ | 8.84 | $ | 8.67 | $ | 9.15 | $ | 10.00 |
| Income from Investment Operations | | | | | | | | |
Net investment income (loss) B,C | | .296 | | .557 | | .491 | | .388 |
| Net realized and unrealized gain (loss) | | .343 | | .118 | | (.510) | | (.879) |
| Total from investment operations | | .639 | | .675 | | (.019) | | (.491) |
| Distributions from net investment income | | (.269) | | (.505) | | (.461) | | (.345) |
| Distributions from net realized gain | | - | | - | | - | | (.014) |
| Total distributions | | (.269) | | (.505) | | (.461) | | (.359) |
| Net asset value, end of period | $ | 9.21 | $ | 8.84 | $ | 8.67 | $ | 9.15 |
Total Return D,E | | | | 8.05% | | (.07)% | | (5.10)% |
Ratios to Average Net Assets C,F,G | | | | | | | | |
| Expenses before reductions | | .56% H,I | | .56% | | .60% | | .60% H |
| Expenses net of fee waivers, if any | | | | .55% | | .60% | | .60% H |
| Expenses net of all reductions | | .55% H,I | | .55% | | .60% | | .60% H |
| Net investment income (loss) | | 6.48% H,I | | 6.43% | | 5.65% | | 4.06% H |
| Supplemental Data | | | | | | | | |
| Net assets, end of period (000 omitted) | $ | 1,614,908 | $ | 1,564,898 | $ | 1,640,305 | $ | 2,481,365 |
Portfolio turnover rate J | | | | 48% | | 32% | | 59% H,K |
AFor the period May 13, 2021 (commencement of operations) through April 30, 2022.
BCalculated based on average shares outstanding during the period.
CNet investment income (loss) is affected by the timing of the declaration of dividends by any underlying mutual funds or exchange-traded funds (ETFs). Net investment income (loss) of any mutual funds or ETFs is not included in the Fund's net investment income (loss) ratio.
DTotal returns for periods of less than one year are not annualized.
ETotal returns would have been lower if certain expenses had not been reduced during the applicable periods shown.
FFees and expenses of any underlying mutual funds or exchange-traded funds (ETFs) are not included in the Fund's expense ratio. The Fund indirectly bears its proportionate share of these expenses. For additional expense information related to investments in Fidelity Central Funds, please refer to the "Investments in Fidelity Central Funds" note found in the Notes to Financial Statements section of the most recent Annual or Semi-Annual report. For additional expense information related to investments in Fidelity Private Credit Company LLC, please refer to the Investment in Fidelity Private Credit Company LLC note found in the Notes to Financial Statements section of the most recent Annual or Semi-Annual report.
GExpense ratios reflect operating expenses of the class. Expenses before reductions do not reflect amounts reimbursed, waived, or reduced through arrangements with the investment adviser, brokerage services, or other offset arrangements, if applicable, and do not represent the amount paid by the class during periods when reimbursements, waivers or reductions occur.
HAnnualized.
IProxy expenses are not annualized.
JAmount does not include the portfolio activity of any underlying mutual funds or exchange-traded funds (ETFs).
KPortfolio turnover rate excludes securities received or delivered in-kind.
Notes to Financial Statements
(Unaudited)For the period ended October 31, 2024
1. Organization.
Fidelity SAI High Income Fund (the Fund) is a fund of Fidelity Summer Street Trust (the Trust) and is authorized to issue an unlimited number of shares. Shares are offered exclusively to certain clients of Fidelity Management & Research Company LLC (FMR) or its affiliates. The Trust is registered under the Investment Company Act of 1940, as amended (the 1940 Act), as an open-end management investment company organized as a Massachusetts business trust.
2. Investments in Fidelity Central Funds.
Funds may invest in Fidelity Central Funds, which are open-end investment companies generally available only to other investment companies and accounts managed by the investment adviser and its affiliates. The Schedule of Investments lists any Fidelity Central Funds held as an investment as of period end, but does not include the underlying holdings of each Fidelity Central Fund. An investing fund indirectly bears its proportionate share of the expenses of the underlying Fidelity Central Funds.
Based on its investment objective, each Fidelity Central Fund may invest or participate in various investment vehicles or strategies that are similar to those of the investing fund. These strategies are consistent with the investment objectives of the investing fund and may involve certain economic risks which may cause a decline in value of each of the Fidelity Central Funds and thus a decline in the value of the investing fund.
| Fidelity Central Fund | Investment Manager | Investment Objective | Investment Practices | Expense RatioA |
| Fidelity Money Market Central Funds | Fidelity Management & Research Company LLC (FMR) | Each fund seeks to obtain a high level of current income consistent with the preservation of capital and liquidity. | Short-term Investments | Less than .005% |
A Expenses expressed as a percentage of average net assets and are as of each underlying Central Fund's most recent annual or semi-annual shareholder report.
A complete unaudited list of holdings for each Fidelity Central Fund is available upon request or at the Securities and Exchange Commission website at www.sec.gov. In addition, the financial statements of the Fidelity Central Funds which contain the significant accounting policies (including investment valuation policies) of those funds, and are not covered by the Report of Independent Registered Public Accounting Firm, are available on the Securities and Exchange Commission website or upon request.
3.Investment in Fidelity Private Credit Company LLC.
The Fund invests in Fidelity Private Credit Company LLC, which is a limited liability company. Fidelity Private Credit Company LLC's units are not registered under the Securities Act of 1933 and are subject to substantial restrictions on transfer. The Fund has no redemption rights under Fidelity Private Credit Company LLC's limited liability company agreement. There will be no trading market for the units.
Based on its investment objective, Fidelity Private Credit Company LLC may invest or participate in various investments or strategies that are similar to those in which the Fund may invest or participate. These strategies are consistent with the investment objectives of the Fund and may involve certain economic risks which may cause a decline in value of Fidelity Private Credit Company LLC and thus a decline in the value of the Fund. Fidelity Private Credit Company LLC intends to invest primarily in directly originated loans to private companies but also with liquid credit investments, like broadly syndicated loans, and other select private credit investments.
The Schedule of Investments lists Fidelity Private Credit Company LLC as an investment as of period end, but does not include the underlying holdings of Fidelity Private Credit Company LLC. Fidelity Private Credit Company LLC represented less than 5% of the Fund's net assets at period end. The Fund indirectly bears its proportionate share of the expenses of Fidelity Private Credit Company LLC. The annualized expense ratio for Fidelity Private Credit Company LLC for the nine month period ended September 30, 2024 was 11.38%.
4. Significant Accounting Policies.
The Fund is an investment company and applies the accounting and reporting guidance of the Financial Accounting Standards Board (FASB) Accounting Standards Codification Topic 946 Financial Services - Investment Companies. The financial statements have been prepared in conformity with accounting principles generally accepted in the United States of America (GAAP), which require management to make certain estimates and assumptions at the date of the financial statements. Actual results could differ from those estimates. Subsequent events, if any, through the date that the financial statements were issued have been evaluated in the preparation of the financial statements. The Fund's Schedule of Investments lists any underlying mutual funds or exchange-traded funds (ETFs) but does not include the underlying holdings of these funds. The following summarizes the significant accounting policies of the Fund:
Investment Valuation. Investments are valued as of 4:00 p.m. Eastern time on the last calendar day of the period. The Board of Trustees (the Board) has designated the Fund's investment adviser as the valuation designee responsible for the fair valuation function and performing fair value determinations as needed. The investment adviser has established a Fair Value Committee (the Committee) to carry out the day-to-day fair valuation responsibilities and has adopted policies and procedures to govern the fair valuation process and the activities of the Committee. In accordance with these fair valuation policies and procedures, which have been approved by the Board, the Fund attempts to obtain prices from one or more third party pricing services or brokers to value its investments. When current market prices, quotations or currency exchange rates are not readily available or reliable, investments will be fair valued in good faith by the Committee, in accordance with the policies and procedures. Factors used in determining fair value vary by investment type and may include market or investment specific events, transaction data, estimated cash flows, and market observations of comparable investments. The frequency that the fair valuation procedures are used cannot be predicted and they may be utilized to a significant extent. The Committee manages the Fund's fair valuation practices and maintains the fair valuation policies and procedures. The Fund's investment adviser reports to the Board information regarding the fair valuation process and related material matters.
The Fund categorizes the inputs to valuation techniques used to value its investments into a disclosure hierarchy consisting of three levels as shown below:
Level 1 - unadjusted quoted prices in active markets for identical investments
Level 2 - other significant observable inputs (including quoted prices for similar investments, interest rates, prepayment speeds, etc.)
Level 3 - unobservable inputs (including the Fund's own assumptions based on the best information available)
Valuation techniques used to value the Fund's investments by major category are as follows:
Debt securities, including restricted securities, are valued based on evaluated prices received from third party pricing services or from brokers who make markets in such securities. Corporate bonds, bank loan obligations, preferred securities and U.S. government and government agency obligations are valued by pricing services who utilize matrix pricing which considers yield or price of bonds of comparable quality, coupon, maturity and type or by broker-supplied prices. Asset backed securities and commercial mortgage securities are valued by pricing services who utilize matrix pricing which considers prepayment speed assumptions, attributes of the collateral, yield or price of bonds of comparable quality, coupon, maturity and type or by broker-supplied prices. Independent prices obtained from a single source or broker are evaluated by management and may be categorized as Level 3 in the hierarchy. When independent prices are unavailable or unreliable, debt securities may be valued utilizing pricing methodologies which consider similar factors that would be used by third party pricing services. Debt securities are generally categorized as Level 2 in the hierarchy but may be Level 3 depending on the circumstances. The Fund invests a significant portion of its assets in below investment grade securities. The value of these securities can be more volatile due to changes in the credit quality of the issuer and is sensitive to changes in economic, market and regulatory conditions.
Equity securities, including restricted securities, for which market quotations are readily available, are valued at the last reported sale price or official closing price as reported by a third party pricing service on the primary market or exchange on which they are traded and are categorized as Level 1 in the hierarchy. In the event there were no sales during the day or closing prices are not available, securities are valued at the last quoted bid price or may be valued using the last available price and are generally categorized as Level 2 in the hierarchy. For foreign equity securities, when market or security specific events arise, comparisons to the valuation of American Depositary Receipts (ADRs), futures contracts, Exchange-Traded Funds (ETFs) and certain indexes as well as quoted prices for similar securities may be used and would be categorized as Level 2 in the hierarchy. For equity securities, including restricted securities, where observable inputs are limited, assumptions about market activity and risk are used and these securities may be categorized as Level 3 in the hierarchy. Securities, including private placements or other restricted securities, for which observable inputs are not available are valued using alternate valuation approaches, including the market approach, the income approach and cost approach, and are categorized as Level 3 in the hierarchy. The market approach considers factors including the price of recent investments in the same or a similar security or financial metrics of comparable securities. The income approach considers factors including expected future cash flows, security specific risks and corresponding discount rates. The cost approach considers factors including the value of the security's underlying assets and liabilities.
Investments in open-end mutual funds, including the Fidelity Central Funds, are valued at their closing net asset value (NAV) each business day and are categorized as Level 1 in the hierarchy.
Fidelity Private Credit Company LLC is valued at its net asset value (NAV) each month end and is categorized as Level 2 in the hierarchy.
The following provides information on Level 3 securities held by the Fund that were valued at period end based on unobservable inputs. These amounts exclude valuations provided by a broker and valuations using NAV as a practical expedient.
| Asset Type | Fair Value | Valuation Technique(s) | Unobservable Input | Amount or Range/Weighted Average | Impact to Valuation from an Increase in InputA |
| Equities | $24,798,560 | Market comparable | Enterprise value/EBITDA multiple (EV/EBITDA) | 5.4 - 7.3 / 6.7 | Increase |
| | | Discounted cash flow | Discount rate | 10.8% | Decrease |
| | | Recovery value | Recovery value | $0.65 | Increase |
| | | Black scholes | Discount rate | 4.0% | Increase |
| | | | Term | 4.7 | Increase |
| | | | Volatility | 58.0% | Increase |
| Corporate Bonds | $2,712,000 | Market approach | Transaction price | $96.00 | Increase |
| Preferred Securities | $835,004 | Market approach | Transaction price | $98.50 | Increase |
| Bank Loan Obligations | $2,965,100 | Discounted cash flow | Yield | 11.1% | Decrease |
| | | Recovery value | Recovery value | $0.00 | Increase |
A Represents the directional change in the fair value of the Level 3 investments that could have resulted from an increase in the corresponding input as of period end. A decrease to the unobservable input would have had the opposite effect. Significant changes in these inputs may have resulted in a significantly higher or lower fair value measurement at period end.
Changes in valuation techniques may result in transfers in or out of an assigned level within the disclosure hierarchy. The aggregate value of investments by input level as of October 31, 2024, as well as a roll forward of Level 3 investments, is included at the end of the Fund's Schedule of Investments.
Foreign Currency. Certain Funds may use foreign currency contracts to facilitate transactions in foreign-denominated securities. Gains and losses from these transactions may arise from changes in the value of the foreign currency or if the counterparties do not perform under the contracts' terms.
Foreign-denominated assets, including investment securities, and liabilities are translated into U.S. dollars at the exchange rates at period end. Purchases and sales of investment securities, income and dividends received, and expenses denominated in foreign currencies are translated into U.S. dollars at the exchange rate in effect on the transaction date.
The effects of exchange rate fluctuations on investments are included with the net realized and unrealized gain (loss) on investment securities. Other foreign currency transactions resulting in realized and unrealized gain (loss) are disclosed separately.
Investment Transactions and Income. For financial reporting purposes, the Fund's investment holdings and NAV include trades executed through the end of the last business day of the period. The NAV per share for processing shareholder transactions is calculated as of the close of business of the New York Stock Exchange (NYSE), normally 4:00 p.m. Eastern time and includes trades executed through the end of the prior business day. Gains and losses on securities sold are determined on the basis of identified cost. Commissions paid to certain brokers with whom the investment adviser, or its affiliates, places trades on behalf of a fund include an amount in addition to trade execution, which may be rebated back to a fund. Any such rebates are included in net realized gain (loss) on investments in the Statement of Operations. Dividend income is recorded on the ex-dividend date, except for certain dividends from foreign securities where the ex-dividend date may have passed, which are recorded as soon as the Fund is informed of the ex-dividend date. Non-cash dividends included in dividend income, if any, are recorded at the fair market value of the securities received. Income and capital gain distributions from Fidelity Central Funds, if any, are recorded on the ex-dividend date. Interest income is accrued as earned and includes coupon interest and amortization of premium and accretion of discount on debt securities as applicable. Paid in Kind (PIK) income is recorded at the fair market value of the securities received. Investment income is recorded net of foreign taxes withheld where recovery of such taxes is uncertain. Debt obligations may be placed on non-accrual status and related interest income may be reduced by ceasing current accruals and writing off interest receivables when the collection of all or a portion of interest has become doubtful based on consistently applied procedures. A debt obligation is removed from non-accrual status when the issuer resumes interest payments or when collectability of interest is reasonably assured.
Expenses. Expenses directly attributable to a fund are charged to that fund. Expenses attributable to more than one fund are allocated among the respective funds on the basis of relative net assets or other appropriate methods. Expenses included in the accompanying financial statements reflect the expenses of that fund and do not include any expenses associated with any underlying mutual funds or exchange-traded funds. Although not included in a fund's expenses, a fund indirectly bears its proportionate share of these expenses through the net asset value of each underlying mutual fund or exchange-traded fund. Expense estimates are accrued in the period to which they relate and adjustments are made when actual amounts are known.
Income Tax Information and Distributions to Shareholders. Each year, the Fund intends to qualify as a regulated investment company under Subchapter M of the Internal Revenue Code, including distributing substantially all of its taxable income and realized gains. As a result, no provision for U.S. Federal income taxes is required. The Fund files a U.S. federal tax return, in addition to state and local tax returns as required. The Fund's federal income tax returns are subject to examination by the Internal Revenue Service (IRS) for a period of three fiscal years after they are filed. State and local tax returns may be subject to examination for an additional fiscal year depending on the jurisdiction. Foreign taxes are provided for based on the Fund's understanding of the tax rules and rates that exist in the foreign markets in which it invests.
Distributions are declared and recorded daily and paid monthly from net investment income. Distributions from realized gains, if any, are declared and recorded on the ex-dividend date. Income and capital gain distributions are determined in accordance with income tax regulations, which may differ from GAAP.
Capital accounts within the financial statements are adjusted for permanent book-tax differences. These adjustments have no impact on net assets or the results of operations. Capital accounts are not adjusted for temporary book-tax differences which will reverse in a subsequent period.
Book-tax differences are primarily due to the short-term gain distributions from the underlying mutual funds or exchange-traded funds (ETFs), short-term gain distributions from the underlying funds, swaps, foreign currency transactions, passive foreign investment companies (PFIC), prior period premium and discount on debt securities, market discount, capital loss carryforwards, partnerships and losses deferred due to wash sales.
As of period end, the cost and unrealized appreciation (depreciation) in securities, and derivatives if applicable, for federal income tax purposes were as follows:
| Gross unrealized appreciation | $66,212,455 |
| Gross unrealized depreciation | (42,682,254) |
| Net unrealized appreciation (depreciation) | $23,530,201 |
| Tax cost | $1,661,068,015 |
Capital loss carryforwards are only available to offset future capital gains of the Fund to the extent provided by regulations and may be limited. The capital loss carryforward information presented below, including any applicable limitation, is estimated as of prior fiscal period end and is subject to adjustment.
Short-term | $(157,920,898) |
Long-term | (155,126,316) |
| Total capital loss carryforward | $(313,047,214) |
Delayed Delivery Transactions and When-Issued Securities. During the period, certain Funds transacted in securities on a delayed delivery or when-issued basis. Payment and delivery may take place after the customary settlement period for that security. The price of the underlying securities and the date when the securities will be delivered and paid for are fixed at the time the transaction is negotiated. Securities purchased on a delayed delivery or when-issued basis are identified as such in the Schedule of Investments. Compensation for interest forgone in the purchase of a delayed delivery or when-issued debt security may be received. With respect to purchase commitments, each applicable Fund identifies securities as segregated in its records with a value at least equal to the amount of the commitment. Payables and receivables associated with the purchases and sales of delayed delivery securities having the same coupon, settlement date and broker are offset. Delayed delivery or when-issued securities that have been purchased from and sold to different brokers are reflected as both payables and receivables in the Statement of Assets and Liabilities under the caption "Delayed delivery", as applicable. Losses may arise due to changes in the value of the underlying securities or if the counterparty does not perform under the contract's terms, or if the issuer does not issue the securities due to political, economic, or other factors.
Restricted Securities (including Private Placements). Funds may invest in securities that are subject to legal or contractual restrictions on resale. These securities generally may be resold in transactions exempt from registration or to the public if the securities are registered. Disposal of these securities may involve time-consuming negotiations and expense, and prompt sale at an acceptable price may be difficult. Information regarding restricted securities held at period end is included at the end of the Schedule of Investments, if applicable.
Loans and Other Direct Debt Instruments. Direct debt instruments are interests in amounts owed to lenders by corporate or other borrowers. These instruments may be in the form of loans, trade claims or other receivables and may include standby financing commitments such as revolving credit facilities that obligate a fund to supply additional cash to the borrower on demand. Loans may be acquired through assignment, participation, or may be made directly to a borrower. Such instruments are presented in the Bank Loan Obligations section in the Schedule of Investments. Certain funds may also invest in unfunded loan commitments, which are contractual obligations for future funding. Information regarding unfunded commitments is included at the end of the Schedule of Investments, if applicable.
Commitments. A commitment is an agreement to acquire an investment at a future date (subject to conditions) in connection with a potential public or non-public offering. The amount of commitments outstanding at period end are presented in the table below. These commitments are not included in the net assets of the Fund at period end.
| | Investment to be Acquired | Commitment Amount ($) |
| Fidelity SAI High Income Fund | Fidelity Private Credit Company LLC | 2,843,000 |
Commitments. A commitment is an agreement to acquire an investment at a future date (subject to conditions) in connection with a potential public or non-public offering. Commitments outstanding at period end are presented in the table below. Unrealized appreciation (depreciation) on any commitments outstanding at period end is separately presented in the Statement of Assets and Liabilities as Unrealized appreciation (depreciation) on unfunded commitments, and any change in unrealized appreciation (depreciation) on unfunded commitments during the period is separately presented in the Statement of Operations, as applicable based on contractual conditions of each commitment.
| | Investment to be Acquired | Commitment Amount ($) | Unrealized Appreciation (Depreciation)($) |
| Fidelity SAI High Income Fund | EchoStar Corp. | 722,927 | (76,830) |
| Fidelity SAI High Income Fund | EchoStar Corp. 10.75% 9/27/29 | 20,129,912 | 1,744,342 |
New Accounting Pronouncement. In November 2023, the FASB issued Accounting Standards Update (ASU) 2023-07 Segment Reporting (Topic 280): Improvements to Reportable Segment Disclosures. Effective for fiscal years beginning after December 15, 2023 and interim periods within fiscal years beginning after December 15, 2024, the amendments enhance required disclosures of segment information for public entities on an annual and interim basis. The ASU allows for early adoption with updates applied retrospectively. Management is currently evaluating the impact of the ASU but does not expect this guidance to materially impact the financial statements.
5. Derivative Instruments.
Risk Exposures and the Use of Derivative Instruments. The Fund's investment objectives allow for various types of derivative instruments, including futures contracts. Derivatives are investments whose value is primarily derived from underlying assets, indices or reference rates and may be transacted on an exchange or over-the-counter (OTC). Derivatives may involve a future commitment to buy or sell a specified asset based on specified terms, to exchange future cash flows at periodic intervals based on a notional principal amount, or for one party to make one or more payments upon the occurrence of specified events in exchange for periodic payments from the other party.
Derivatives were used to increase returns and to manage exposure to certain risks as defined below. The success of any strategy involving derivatives depends on analysis of numerous economic factors, and if the strategies for investment do not work as intended, the objectives may not be achieved.
Derivatives were used to increase or decrease exposure to the following risk(s):
| | |
| Interest Rate Risk | Interest rate risk relates to the fluctuations in the value of interest-bearing securities due to changes in the prevailing levels of market interest rates. |
Funds are also exposed to additional risks from investing in derivatives, such as liquidity risk and counterparty credit risk. Liquidity risk is the risk that a fund will be unable to close out the derivative in the open market in a timely manner. Counterparty credit risk is the risk that the counterparty will not be able to fulfill its obligation to a fund. Counterparty credit risk related to exchange-traded contracts may be mitigated by the protection provided by the exchange on which they trade.
Investing in derivatives may involve greater risks than investing in the underlying assets directly and, to varying degrees, may involve risk of loss in excess of any initial investment and collateral received and amounts recognized in the Statement of Assets and Liabilities. In addition, there may be the risk that the change in value of the derivative contract does not correspond to the change in value of the underlying instrument.
Futures Contracts. A futures contract is an agreement between two parties to buy or sell a specified underlying instrument for a fixed price at a specified future date. Futures contracts were used to manage exposure to the bond market and fluctuations in interest rates.
Upon entering into a futures contract, a fund is required to deposit either cash or securities (initial margin) with a clearing broker in an amount equal to a certain percentage of the face value of the contract. Futures contracts are marked-to-market daily and subsequent daily payments are made or received by a fund depending on the daily fluctuations in the value of the futures contracts and are recorded as unrealized appreciation or (depreciation). This receivable and/or payable, if any, is included in daily variation margin on futures contracts in the Statement of Assets and Liabilities. Realized gain or (loss) is recorded upon the expiration or closing of a futures contract. The net realized gain (loss) and change in net unrealized appreciation (depreciation) on futures contracts during the period is presented in the Statement of Operations.
Any open futures contracts at period end are presented in the Schedule of Investments under the caption "Futures Contracts". The notional amount at value reflects each contract's exposure to the underlying instrument or index at period end, and is representative of volume of activity during the period unless an average notional amount is presented. Any securities deposited to meet initial margin requirements are identified in the Schedule of Investments. Any cash deposited to meet initial margin requirements is presented as segregated cash with brokers for derivative instruments in the Statement of Assets and Liabilities.
6. Purchases and Sales of Investments.
Purchases and sales of securities, other than short-term securities, U.S. government securities, and in-kind transactions, as applicable, are noted in the table below.
| | Purchases ($) | Sales ($) |
| Fidelity SAI High Income Fund | 380,010,205 | 432,916,320 |
7.Fees and Other Transactions with Affiliates.
Management Fee. Fidelity Management & Research Company LLC (the investment adviser) and its affiliates provide the Fund with investment management related services for which the Fund pays a monthly management fee that is based on an annual rate of .532% of the Fund's average net assets.
Brokerage Commissions. A portion of portfolio transactions were placed with brokerage firms which are affiliates of the investment adviser. Brokerage commissions are included in net realized gain (loss) and change in net unrealized appreciation (depreciation) in the Statement of Operations. The commissions paid to these affiliated firms were as follows:
| | Amount ($) |
| Fidelity SAI High Income Fund | 264 |
Interfund Trades. Funds may purchase from or sell securities to other Fidelity Funds under procedures adopted by the Board. The procedures have been designed to ensure these interfund trades are executed in accordance with Rule 17a-7 of the 1940 Act. Any interfund trades are included within the respective purchases and sales amounts shown in the Purchases and Sales of Investments note. Interfund trades during the period are noted in the table below.
| | Purchases ($) | Sales ($) | Realized Gain (Loss)($) |
| Fidelity SAI High Income Fund | 7,031 | 1,446,220 | 705,750 |
8. Committed Line of Credit.
Certain Funds participate with other funds managed by the investment adviser or an affiliate in a $4.25 billion credit facility (the "line of credit") to be utilized for temporary or emergency purposes to fund shareholder redemptions or for other short-term liquidity purposes. The participating funds have agreed to pay commitment fees on their pro-rata portion of the line of credit, which are reflected in Miscellaneous expenses on the Statement of Operations, and are listed below. During the period, there were no borrowings on this line of credit.
| | Amount ($) |
| Fidelity SAI High Income Fund | 1,081 |
9. Security Lending.
Funds lend portfolio securities from time to time in order to earn additional income. Lending agents are used, including National Financial Services (NFS), an affiliate of the investment adviser. Pursuant to a securities lending agreement, NFS will receive a fee, which is capped at 9.9% of a fund's daily lending revenue, for its services as lending agent. A fund may lend securities to certain qualified borrowers, including NFS. On the settlement date of the loan, a fund receives collateral (in the form of U.S. Treasury obligations, letters of credit and/or cash) against the loaned securities and maintains collateral in an amount not less than 100% of the market value of the loaned securities during the period of the loan. The market value of the loaned securities is determined at the close of business of a fund and any additional required collateral is delivered to a fund on the next business day. A fund or borrower may terminate the loan at any time, and if the borrower defaults on its obligation to return the securities loaned because of insolvency or other reasons, a fund may apply collateral received from the borrower against the obligation. A fund may experience delays and costs in recovering the securities loaned. Any cash collateral received is invested in the Fidelity Securities Lending Cash Central Fund. Any loaned securities are identified as such in the Schedule of Investments, and the value of loaned securities and cash collateral at period end, as applicable, are presented in the Statement of Assets and Liabilities. Security lending income represents the income earned on investing cash collateral, less rebates paid to borrowers and any lending agent fees associated with the loan, plus any premium payments received for lending certain types of securities. Security lending income is presented in the Statement of Operations as a component of income from Fidelity Central Funds. Affiliated security lending activity, if any, was as follows:
| | Total Security Lending Fees Paid to NFS ($) | Security Lending Income From Securities Loaned to NFS ($) | Value of Securities Loaned to NFS at Period End ($) |
| Fidelity SAI High Income Fund | 18,780 | 14 | - |
10. Expense Reductions.
The investment adviser has contractually agreed to waive the Fund's management fee with respect to the portion of the Fund's assets invested in Fidelity Private Credit Company LLC until August 31, 2025. During the period, this waiver reduced the Fund's management fee by $56,717.
Through arrangements with the Fund's custodian, credits realized as a result of certain uninvested cash balances were used to reduce the Fund's expenses by $12,933.
11. Other.
A fund's organizational documents provide former and current trustees and officers with a limited indemnification against liabilities arising in connection with the performance of their duties to the fund. In the normal course of business, a fund may also enter into contracts that provide general indemnifications. A fund's maximum exposure under these arrangements is unknown as this would be dependent on future claims that may be made against a fund. The risk of material loss from such claims is considered remote.
At the end of the period, the following mutual funds managed by the investment adviser or its affiliates were the owners of record of 10% or more of the total outstanding shares.
| | Strategic Advisers Fidelity Core Income Fund |
| Fidelity SAI High Income Fund | 11% |
12. Litigation.
The Fund and other entities managed by FMR or its affiliates are involved with proceedings arising out of disputes in the United States Bankruptcy Court for the Southern District of Texas ("Bankruptcy Court"), relating to the In re Sanchez Energy Corporation chapter 11 bankruptcy case (Case No. 19-34508). A Bankruptcy Court-appointed representative of unsecured creditors asserted that eight million shares of Mesquite Energy, Inc. (formerly known as Sanchez Energy Corporation) (the "Company"), held in escrow pursuant to the terms of the Company's confirmed chapter 11 plan, should be awarded to the unsecured creditors instead of the Company's current equity holders, including the Fund, which were providers of debtor-in-possession financing to the Company during its chapter 11 case and holders of secured notes issued by the Company in 2018. The unsecured creditors also asserted that certain additional equity issued by the Company in 2020 in connection with two post-bankruptcy financings, also held by the Fund, is invalid. During August 2023, the Bankruptcy Court issued an opinion awarding a portion of the eight million shares to the unsecured creditors, diluting the value of the Fund's holdings in Mesquite. The Fund will appeal this decision. At this time, Management cannot determine any additional loss or dilution that may be realized. The Fund is also incurring legal costs in defending the disputes and has recovered a portion of these legal costs through an insurance claim.
13. Risk and Uncertainties.
Many factors affect a fund's performance. Developments that disrupt global economies and financial markets, such as pandemics, epidemics, outbreaks of infectious diseases, war, terrorism, and environmental disasters, may significantly affect a fund's investment performance. The effects of these developments to a fund will be impacted by the types of securities in which a fund invests, the financial condition, industry, economic sector, and geographic location of an issuer, and a fund's level of investment in the securities of that issuer. Significant concentrations in security types, issuers, industries, sectors, and geographic locations may magnify the factors that affect a fund's performance.
Item 8: Changes in and Disagreements with Accountants for Open-End Management Investment Companies
(Unaudited)
Note: This is not applicable for any fund included in this document.
Item 9: Proxy Disclosures for Open-End Management Investment Companies
(Unaudited)
| A special meeting of shareholders was held on July 16, 2024. The results of votes taken among shareholders on the proposal before them are reported below. Each vote reported represents one dollar of net asset value held on the record date for the meeting. |
| Proposal 1 |
| To elect a Board of Trustees. |
| | # of Votes | % of Votes |
| Bettina Doulton |
| Affirmative | 14,516,835,136.19 | 94.56 |
| Withheld | 834,887,998.33 | 5.44 |
| TOTAL | 15,351,723,134.52 | 100.00 |
| Robert A. Lawrence |
| Affirmative | 14,430,495,798.10 | 94.00 |
| Withheld | 921,227,336.42 | 6.00 |
| TOTAL | 15,351,723,134.52 | 100.00 |
| Vijay C. Advani |
| Affirmative | 14,465,231,640.25 | 94.23 |
| Withheld | 886,491,494.27 | 5.77 |
| TOTAL | 15,351,723,134.52 | 100.00 |
| Thomas P. Bostick |
| Affirmative | 14,471,831,170.84 | 94.27 |
| Withheld | 879,891,963.68 | 5.73 |
| TOTAL | 15,351,723,134.52 | 100.00 |
| Donald F. Donahue |
| Affirmative | 14,432,670,599.88 | 94.01 |
| Withheld | 919,052,534.64 | 5.99 |
| TOTAL | 15,351,723,134.52 | 100.00 |
| Vicki L. Fuller |
| Affirmative | 14,531,407,981.65 | 94.66 |
| Withheld | 820,315,152.87 | 5.34 |
| TOTAL | 15,351,723,134.52 | 100.00 |
| Patricia L. Kampling |
| Affirmative | 14,549,142,839.16 | 94.77 |
| Withheld | 802,580,295.36 | 5.23 |
| TOTAL | 15,351,723,134.52 | 100.00 |
| Thomas A. Kennedy |
| Affirmative | 14,469,818,769.40 | 94.26 |
| Withheld | 881,904,365.12 | 5.74 |
| TOTAL | 15,351,723,134.52 | 100.00 |
| Oscar Munoz |
| Affirmative | 14,434,061,467.08 | 94.02 |
| Withheld | 917,661,667.44 | 5.98 |
| TOTAL | 15,351,723,134.52 | 100.00 |
| Karen B. Peetz |
| Affirmative | 14,521,904,618.46 | 94.59 |
| Withheld | 829,818,516.06 | 5.41 |
| TOTAL | 15,351,723,134.52 | 100.00 |
| David M. Thomas |
| Affirmative | 14,417,745,861.73 | 93.92 |
| Withheld | 933,977,272.79 | 6.08 |
| TOTAL | 15,351,723,134.52 | 100.00 |
| Susan Tomasky |
| Affirmative | 14,467,973,468.18 | 94.24 |
| Withheld | 883,749,666.34 | 5.76 |
| TOTAL | 15,351,723,134.52 | 100.00 |
| Michael E. Wiley |
| Affirmative | 14,424,002,796.91 | 93.96 |
| Withheld | 927,720,337.61 | 6.04 |
| TOTAL | 15,351,723,134.52 | 100.00 |
| | | |
| Proposal 1 reflects trust-wide proposal and voting results. |
Item 10: Remuneration Paid to Directors, Officers, and others of Open-End Management Investment Companies
(Unaudited)
Note: This information is disclosed as part of the financial statements for each Fund as part of Item 7: Financial Statements and Financial Highlights for Open-End Management Investment companies.
Item 11: Statement Regarding Basis for Approval of Investment Advisory Contract
(Unaudited)
Board Approval of Investment Advisory Contracts and Management Fees
Fidelity SAI High Income Fund
Each year, the Board of Trustees, including the Independent Trustees (together, the Board), considers the renewal of the fund's management contract with Fidelity Management & Research Company LLC (FMR) and the sub-advisory agreements (together, the Advisory Contracts) for the fund. FMR and the sub-advisers are referred to herein as the Investment Advisers. The Board, assisted by the advice of fund counsel and Independent Trustees' counsel, requests and considers a broad range of information relevant to the renewal of the Advisory Contracts throughout the year.
The Board meets regularly and, at each of its meetings, covers an extensive agenda of topics and materials and considers factors that are relevant to its annual consideration of the renewal of the fund's Advisory Contracts, including the services and support provided to the fund and its shareholders. The Board, acting directly and through its Committees (each of which is composed of and chaired by Independent Trustees), requests and receives information concerning the annual consideration of the renewal of the fund's Advisory Contracts. The Board also meets as needed to review matters specifically related to the Board's annual consideration of the renewal of the Advisory Contracts. Members of the Board may also meet with trustees of other Fidelity funds through joint ad hoc committees to discuss certain matters relevant to all of the Fidelity funds.
At its May 2024 meeting, the Board unanimously determined to renew the fund's Advisory Contracts. In reaching its determination, the Board considered all factors it believed relevant, including (i) the nature, extent, and quality of the services provided to the fund and its shareholders (including the investment performance of the fund); (ii) the competitiveness relative to peer funds of the fund's management fee and total expense ratio; (iii) the total costs of the services provided by and the profits realized by FMR and its affiliates (Fidelity) from its relationships with the fund; and (iv) the extent to which, if any, economies of scale exist and are realized as the fund grows, and whether any economies of scale are appropriately shared with fund shareholders. The Board also considered the broad range of investment choices available to shareholders from FMR's competitors and that the fund's shareholders have chosen to invest in the fund, which is part of the Fidelity family of funds. The Board's decision to renew the Advisory Contracts was not based on any single factor.
The Board reached a determination, with the assistance of fund counsel and Independent Trustees' counsel and through the exercise of its business judgment, that the renewal of the Advisory Contracts was in the best interests of the fund and its shareholders and that the compensation payable under the Advisory Contracts was fair and reasonable in light of all of the surrounding circumstances.
Nature, Extent, and Quality of Services Provided. The Board considered staffing as it relates to the fund, including the backgrounds and experience of investment personnel of the Investment Advisers, and also considered the Investment Advisers' implementation of the fund's investment program. The Independent Trustees also had discussions with senior management of Fidelity's investment operations and investment groups. The Board considered the structure of the investment personnel compensation program and whether this structure provides appropriate incentives to act in the best interests of the fund. Additionally, the Board considered the portfolio managers' investments, if any, in the funds that they manage.
Resources Dedicated to Investment Management and Support Services. The Board and the Fund Oversight and Research Committees reviewed the general qualifications and capabilities of Fidelity's investment staff, including its size, education, experience, and resources, as well as Fidelity's approach to recruiting, training, managing, and compensating investment personnel. The Board noted the resources devoted to expansion of Fidelity's global investment organization, and that Fidelity's analysts have extensive resources, tools, and capabilities that allow them to conduct sophisticated quantitative and fundamental analysis, as well as credit analysis of issuers, counterparties, and guarantors. Further, the Board considered that Fidelity's investment professionals have sufficient access to global information and data so as to provide competitive investment results over time, and that those professionals also have access to sophisticated tools that permit them to assess portfolio construction and risk and performance attribution characteristics continuously, as well as to transmit new information and research conclusions rapidly around the world. Additionally, in its deliberations, the Board considered Fidelity's trading, risk management, compliance, and technology and operations capabilities and resources, which are integral parts of the investment management process.
Shareholder and Administrative Services. The Board considered (i) the nature, extent, quality, and cost of advisory, administrative, and shareholder services performed by the Investment Advisers and their affiliates under the Advisory Contracts and under separate agreements covering transfer agency and pricing and bookkeeping services for the fund; (ii) the nature and extent of Fidelity's supervision of third party service providers, principally custodians, subcustodians, and pricing vendors; and (iii) the resources devoted by Fidelity to, and the record of compliance with, the fund's compliance policies and procedures. The Board also reviewed the allocation of fund brokerage, including allocations to brokers affiliated with the Investment Advisers, the use of brokerage commissions to pay fund expenses, and the use of "soft" commission dollars to pay for research services. The Board also considered the fund's securities lending activities and any payments made to Fidelity relating to securities lending under a separate agreement.
The Board noted that the growth of fund assets over time across the complex allows Fidelity to reinvest in the development of services designed to enhance the value and convenience of the Fidelity funds as investment vehicles. These services include 24-hour access to account information and market information over the Internet and through telephone representatives, investor education materials, and asset allocation tools. The Board also considered that it reviews customer service metrics such as telephone response times, continuity of services on the website and metrics addressing services at Fidelity Investor Centers.
Investment in a Large Fund Family. The Board considered the benefits to shareholders of investing in a fund that is part of a large family of funds offering a variety of investment disciplines and providing a large variety of fund investor services. The Board noted that Fidelity had taken, or had made recommendations that resulted in the Fidelity funds taking, a number of actions over the previous year that benefited particular funds and/or the Fidelity funds in general.
Investment Performance. The Board took into account discussions that occur with representatives of the Investment Advisers, and reports that it receives, at Board meetings throughout the year, relating to fund investment performance. In this regard the Board noted that as part of regularly scheduled fund reviews and other reports to the Board on fund performance, the Board considered annualized return information for the fund for different time periods, measured against an appropriate securities market index (benchmark index) and an appropriate peer group of funds with similar objectives (peer group). The Board also considered information about performance attribution. In its ongoing evaluation of fund investment performance, the Board gives particular attention to information indicating changes in performance of the funds over different time periods and discussed with the Investment Advisers the reasons for any overperformance or underperformance.
In addition to reviewing absolute and relative fund performance, the Independent Trustees periodically consider the appropriateness of fund performance metrics in evaluating the results achieved. The Independent Trustees generally give greater weight to fund performance over longer time periods than over shorter time periods. Depending on the circumstances, the Independent Trustees may be satisfied with a fund's performance notwithstanding that it lags its benchmark index or peer group for certain periods.
Based on its review, the Board concluded that the nature, extent, and quality of services provided to the fund under the Advisory Contracts should continue to benefit the shareholders of the fund.
Competitiveness of Management Fee and Total Expense Ratio. The Board was provided with information regarding industry trends in management fees and expenses. The Board considered that, effective March 1, 2024, an amended Advisory Contract with FMR went into effect with a flat management fee that replaced the prior management fee structure. In its review of the fund's management fee and total expense ratio, the Board considered the fund's pro forma management fee rate as if it had been in effect for the 12-month period ended September 30, 2023, as well as other fund expenses. The Board noted that Fidelity may agree to waive fees or reimburse expenses from time to time, and the extent to which, if any, it has done so for the fund.
Comparisons of Management Fees and Total Expense Ratios. Among other things, the Board reviewed data for selected groups of competitive funds and classes (referred to as "mapped groups") that were compiled by Fidelity based on combining similar investment objective categories (as classified by Lipper) that have comparable investment mandates. The data reviewed by the Board included (i) gross management fee comparisons (before taking into account expense reimbursements or caps) relative to the total universe of funds within the mapped group; (ii) gross management fee comparisons relative to a subset of non-Fidelity funds in the mapped group that are similar in size and management fee structure to the fund (referred to as the "asset size peer group"); (iii) total expense comparisons of the fund relative to funds and classes in the mapped group that have a similar sales load structure to the fund (referred to as the "similar sales load structure group"); and (iv) total expense comparisons of the fund relative to funds and classes in the similar sales load structure group that are similar in size and management fee structure to the fund (referred to as the "total expense asset size peer group"). The total expense asset size peer group comparison excludes performance adjustments and fund-paid 12b-1 fees to eliminate variability in fee structures.
The information provided to the Board indicated that the fund's management fee rate ranked below the competitive median of the mapped group for the 12-month period ended September 30, 2023 and below the competitive median of the asset size peer group for the 12-month period ended September 30, 2023. Further, the information provided to the Board indicated that the total expense ratio of the fund ranked below the competitive median of the similar sales load structure group for the 12-month period ended September 30, 2023 and below the competitive median of the total expense asset size peer group for the 12-month period ended September 30, 2023.
Fees Charged to Other Fidelity Clients. The Board also considered Fidelity fee structures and other information with respect to clients of Fidelity, such as other funds advised or subadvised by Fidelity, pension plan clients, and other institutional clients with similar mandates. The Board noted that a joint ad hoc committee created by it and the boards of other Fidelity funds periodically reviews and compares Fidelity's institutional investment advisory business with its business of providing services to the Fidelity funds and also noted the most recent findings of the committee. The Board noted that the committee's review included a consideration of the differences in services provided, fees charged, and costs incurred, as well as competition in the markets serving the different categories of clients.
Based on its review, the Board concluded that the fund's management fee is fair and reasonable in light of the services that the fund receives and the other factors considered. Further, based on its review of total expense ratios and fees charged to other Fidelity clients, the Board concluded that the fund's total expense ratio was reasonable in light of the services that the fund and its shareholders receive and the other factors considered.
Costs of the Services and Profitability. The Board considered the revenues earned and the expenses incurred by Fidelity in conducting the business of developing, marketing, distributing, managing, administering and servicing the fund and servicing the fund's shareholders. The Board also considered the level of Fidelity's profits in respect of all the Fidelity funds.
On an annual basis, Fidelity presents to the Board information about the profitability of its relationships with the fund. Fidelity calculates profitability information for each fund, as well as aggregate profitability information for groups of Fidelity funds and all Fidelity funds, using a series of detailed revenue and cost allocation methodologies which originate with the books and records of Fidelity on which Fidelity's audited financial statements are based. The Audit Committee of the Board reviews any significant changes from the prior year's methodologies.
A public accounting firm has been engaged annually by the Board as part of the Board's assessment of Fidelity's profitability analysis. The engagement includes the review and assessment of the methodologies used by Fidelity in determining the revenues and expenses attributable to Fidelity's fund business, and completion of agreed-upon procedures in respect of the mathematical accuracy of certain fund profitability information and its conformity to established allocation methodologies. After considering the reports issued under the engagement and information provided by Fidelity, the Board concluded that while other allocation methods may also be reasonable, Fidelity's profitability methodologies are reasonable in all material respects.
The Board also reviewed Fidelity's non-fund businesses and potential indirect benefits such businesses may have received as a result of their association with Fidelity's fund business (i.e., fall-out benefits) as well as cases where Fidelity's affiliates may benefit from the funds' business. The Board considered areas where potential indirect benefits to the Fidelity funds from their relationships with Fidelity may exist. The Board's consideration of these matters was informed by the findings of a joint ad hoc committee created by it and the boards of other Fidelity funds to evaluate potential fall-out benefits.
The Board considered the costs of the services provided by and the profits realized by Fidelity in connection with the operation of the fund and was satisfied that the profitability was not excessive.
Economies of Scale. The Board considered whether there have been economies of scale in respect of the management of the Fidelity funds, whether the Fidelity funds (including the fund) have appropriately benefited from any such economies of scale, and whether there is potential for realization of any further economies of scale. The Board considered the extent to which the fund will benefit from economies of scale as assets grow through increased services to the fund, through waivers or reimbursements, or through fee or expense ratio reductions. The Board also noted that a committee created by it and the boards of other Fidelity funds periodically analyzes whether Fidelity attains economies of scale in respect of the management and servicing of the Fidelity funds, whether the Fidelity funds have appropriately benefited from such economies of scale, and whether there is potential for realization of any further economies of scale.
The Board concluded, taking into account the analysis of the committee, that economies of scale, if any, are being appropriately shared between fund shareholders and Fidelity.
Additional Information Requested by the Board. In order to develop fully the factual basis for consideration of the Fidelity funds' advisory contracts, the Board requested and received additional information on certain topics, including but not limited to: (i) fund flow and performance trends, in particular the underperformance of certain funds and strategies, and Fidelity's long-term strategies for certain funds; (ii) the operation of performance fees and the rationale for implementing performance fees on certain categories of funds but not others; (iii) Fidelity's pricing philosophy compared to competitors; (iv) fund profitability methodology and data; (v) evaluation of competitive fund data and peer group classifications and fee and expense comparisons; (vi) the management fee and expense structures for different funds and classes and information about the differences between various fee and expense structures; (vii) the variable management fee implemented for certain funds effective March 1, 2024; and (viii) information regarding other accounts managed by Fidelity and the funds' sub-advisory arrangements.
Conclusion. Based on its evaluation of all of the conclusions noted above, and after considering all factors it believed relevant, the Board, including the Independent Trustees, concluded that the advisory and sub-advisory fee arrangements are fair and reasonable in light of all of the surrounding circumstances and that the fund's Advisory Contracts should be renewed through May 31, 2025.
1.9901442.103
SAH-SANN-1224
Item 8.
Changes in and Disagreements with Accountants for Open-End Management Investment Companies
See Item 7.
Item 9.
Proxy Disclosures for Open-End Management Investment Companies
See Item 7.
Item 10.
Remuneration Paid to Directors, Officers, and Others of Open-End Management Investment Companies
See Item 7.
Item 11.
Statement Regarding Basis for Approval of Investment Advisory Contract
See Item 7.
Item 12.
Disclosure of Proxy Voting Policies and Procedures for Closed-End Management Investment Companies
Not applicable.
Item 13.
Portfolio Managers of Closed-End Management Investment Companies
Not applicable.
Item 14.
Purchases of Equity Securities by Closed-End Management Investment Company and Affiliated Purchasers
Not applicable.
Item 15.
Submission of Matters to a Vote of Security Holders
There were no material changes to the procedures by which shareholders may recommend nominees to the Fidelity Summer Street Trust’s Board of Trustees.
Item 16.
Controls and Procedures
(a)(i) The President and Treasurer and the Chief Financial Officer have concluded that the Fidelity Summer Street Trust’s (the “Trust”) disclosure controls and procedures (as defined in Rule 30a-3(c) under the Investment Company Act) provide reasonable assurances that material information relating to the Trust is made known to them by the appropriate persons, based on their evaluation of these controls and procedures as of a date within 90 days of the filing date of this report.
(a)(ii) There was no change in the Trust’s internal control over financial reporting (as defined in Rule 30a-3(d) under the Investment Company Act) that occurred during the period covered by this report that has materially affected, or is reasonably likely to materially affect, the Trust’s internal control over financial reporting.
Item 17.
Disclosure of Securities Lending Activities for Closed-End Management Investment Companies
Not applicable.
Item 18.
Recovery of Erroneously Awarded Compensation
(a)
Not applicable.
(b)
Not applicable.
Item 19.
Exhibits
SIGNATURES
Pursuant to the requirements of the Securities Exchange Act of 1934 and the Investment Company Act of 1940, the registrant has duly caused this report to be signed on its behalf by the undersigned, thereunto duly authorized.
Fidelity Summer Street Trust
|
By: | /s/Stacie M. Smith |
| Stacie M. Smith |
| President and Treasurer (Principal Executive Officer) |
|
|
Date: | December 20, 2024 |
Pursuant to the requirements of the Securities Exchange Act of 1934 and the Investment Company Act of 1940, this report has been signed below by the following persons on behalf of the registrant and in the capacities and on the dates indicated.
|
By: | /s/Stacie M. Smith |
| Stacie M. Smith |
| President and Treasurer (Principal Executive Officer) |
|
|
Date: | December 20, 2024 |
|
By: | /s/Stephanie Caron |
| Stephanie Caron |
| Chief Financial Officer (Principal Financial Officer) |
|
|
Date: | December 20, 2024 |