UNITED STATES
SECURITIES AND EXCHANGE COMMISSION
Washington, D.C. 20549
FORM N-CSR
CERTIFIED SHAREHOLDER REPORT OF
REGISTERED MANAGEMENT INVESTMENT COMPANIES
Investment Company Act file number 811-02794
MFS SERIES TRUST III
(Exact name of registrant as specified in charter)
111 Huntington Avenue, Boston, Massachusetts 02199
(Address of principal executive offices) (Zip code)
Susan S. Newton
Massachusetts Financial Services Company
111 Huntington Avenue
Boston, Massachusetts 02199
(Name and address of agents for service)
Registrant’s telephone number, including area code: (617) 954-5000
Date of fiscal year end: January 31
Date of reporting period: January 31, 2013*
| * | MFS High Yield Pooled Portfolio, a series of the Registrant, did not commence investment operations during the reporting period. |
| ITEM 1. | REPORTS TO STOCKHOLDERS. |
MFS High Yield Pooled Portfolio, a series of the Registrant, did not have any shareholders as of period end. For further information please see the introductory footnote.
ANNUAL REPORT
January 31, 2013

MFS® HIGH INCOME FUND

MFH-ANN
MFS® HIGH INCOME FUND
CONTENTS
The report is prepared for the general information of shareholders. It is authorized for distribution to prospective investors only when preceded or accompanied by a current prospectus.
NOT FDIC INSURED Ÿ MAY LOSE VALUE Ÿ NO BANK GUARANTEE

LETTER FROM THE CHAIRMAN AND CEO
Dear Shareholders:
Global financial markets began 2013 with greater optimism. U.S. and Asian economic trends have turned more positive. Europe continues to struggle through its economic
slump. However, even there, sentiment has improved. The U.S. Congress averted its year-end fiscal cliff, but a degree of uncertainty remains regarding upcoming negotiations over spending cuts and the debt ceiling. The U.S. Federal Reserve Board is continuing its accommodative monetary easing, while the U.S. housing and job markets have made steady gains. Corporate profits have been resilient, and investors have demonstrated increased tolerance for risk.
Overseas, the eurozone remains in a broad contraction, with economic output receding in France as well as Italy and Spain. However, large-scale early repayments of European Central
Bank loans by banks and Germany’s strong rebound in manufacturing activity are encouraging signs. In Asia, both China and Japan appear to be in the early stages of a turnaround. China’s economic activity has picked up from last year’s relative slowdown, and Japan’s sharp devaluation of the yen, an important anti-deflationary measure, seems to be having its desired impact: Japanese stocks have soared, corporate profits are rising and confidence is returning among consumers, businesses and investors.
As always, managing risk in the face of uncertainty remains a top priority for investors. At MFS®, our uniquely collaborative investment process employs global research and active risk management. Our global team of investment professionals shares ideas and evaluates opportunities across continents, investment disciplines and asset classes — all with a goal of building better insights, and ultimately better results, for our clients.
We remain mindful of the many economic challenges investors face today, and believe it is more important than ever to maintain a long-term view and employ time-tested principles, such as asset allocation and diversification. We also remain confident that our unique approach can serve investors well as they work with their financial advisors to identify and pursue the most suitable opportunities.
Respectfully,

Robert J. Manning
Chairman and Chief Executive Officer
MFS Investment Management®
March 18, 2013
The opinions expressed in this letter are subject to change, may not be relied upon for investment advice, and no forecasts can be guaranteed.
1
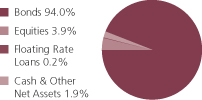
PORTFOLIO COMPOSITION
Portfolio structure (i)
| | | | |
| Top five industries (i) | | | | |
| Energy-Independent | | | 8.2% | |
| Broadcasting | | | 5.7% | |
| Medical & Health Technology & Services | | | 4.9% | |
| Utilities-Electric Power | | | 4.4% | |
| Telecommunications-Wireless | | | 4.2% | |
| | | | |
| Composition including fixed income credit quality (a)(i) | |
| A | | | 0.3% | |
| BBB | | | 5.9% | |
| BB | | | 32.2% | |
| B | | | 41.8% | |
| CCC | | | 13.9% | |
| C (o) | | | 0.0% | |
| D | | | 0.1% | |
| Not Rated (o) | | | 0.0% | |
| Non-Fixed Income | | | 3.9% | |
| Cash & Other | | | 1.9% | |
| |
| Portfolio facts (i) | | | | |
| Average Duration (d) | | | 3.7 | |
| Average Effective Maturity (m) | | | 7.0 yrs. | |
| (a) | For all securities other than those specifically described below, ratings are assigned to underlying securities utilizing ratings from Moody’s, Fitch, and Standard & Poor’s rating agencies and applying the following hierarchy: If all three agencies provide a rating, the middle rating (after dropping the highest and lowest ratings) is assigned; if two of the three agencies rate a security, the lower of the two is assigned. Ratings are shown in the S&P and Fitch scale (e.g., AAA). Securities rated BBB or higher are considered investment grade. All ratings are subject to change. Not Rated includes fixed income securities, including fixed income futures contracts, which have not been rated by any rating agency. Non-Fixed Income includes equity securities (including convertible bonds and equity derivatives) and commodities. Cash & Other includes cash, other assets less liabilities, offsets to derivative positions, and short-term securities. The fund may not hold all of these instruments. The fund is not rated by these agencies. |
| (d) | Duration is a measure of how much a bond’s price is likely to fluctuate with general changes in interest rates, e.g., if rates rise 1.00%, a bond with a 5-year duration is likely to lose about 5.00% of its value due to the interest rate move. |
| (i) | For purposes of this presentation, the components include the market value of securities, and reflect the impact of the equivalent exposure of derivative positions, if any. These amounts may be negative from time to time. The bond component will include any accrued interest amounts. Equivalent exposure is a calculated amount that translates the derivative position into a reasonable approximation of the amount of the underlying asset that the portfolio would have to hold at a given point in time to have the same price sensitivity that results from the portfolio’s ownership of the derivative contract. When dealing with derivatives, equivalent exposure is a more representative measure of the potential impact of a position on portfolio performance than market value. Where the fund holds convertible bonds, these are treated as part of the equity portion of the portfolio. |
2
Portfolio Composition – continued
| (m) | In determining an instrument’s effective maturity for purposes of calculating the fund’s dollar-weighted average effective maturity, MFS uses the instrument’s stated maturity or, if applicable, an earlier date on which MFS believes it is probable that a maturity-shortening device (such as a put, pre-refunding or prepayment) will cause the instrument to be repaid. Such an earlier date can be substantially shorter than the instrument’s stated maturity. |
Percentages are based on net assets as of 1/31/13.
The portfolio is actively managed and current holdings may be different.
3
MANAGEMENT REVIEW
Summary of Results
For the twelve months ended January 31, 2013, Class A shares of the MFS High Income Fund (“fund”) provided a total return of 12.05%, at net asset value. This compares with a return of 13.87% for the fund’s benchmark, the Barclays U.S. High-Yield Corporate Bond 2% Issuer Capped Index.
Market Environment
The beginning of the period was characterized by a risk-on sentiment as a result of additional liquidity measures by the Federal Reserve Bank (“Fed”) and the European Central Bank (“ECB”) as well as a commensurate improvement in macroeconomic conditions. During this time, global equity valuations rose, credit spreads contracted, and high-quality sovereign yields increased modestly.
During the middle of the period, however, conditions worsened, driven by broadly weaker global macroeconomic indicators, as well as renewed concerns over the eurozone’s capacity and determination to address its ongoing crisis. Despite this deterioration, broad market sentiment remained relatively resilient as equity markets generally maintained gains and credit spreads did not indicate deterioration.
However, this renewed weakness in the fundamentals precipitated a further round of monetary easing by both the Fed (through a third round of quantitative easing) and the ECB (through a new bond purchase facility) in the second half of the period, which soon instilled additional confidence in risk markets. Nonetheless, towards the end of the period, weaker equity earnings reports and declining forward guidance caused market sentiment to soften. In addition, as we moved toward year end, the fiscal cliff negotiations between the Republicans in the U.S. Congress and President Obama were a particular source of market attention, where uncertainty surrounding the fiscal negotiations continued right up to the end-of-year deadline.
Detractors from Performance
The portion of the fund’s return derived from yield, which was less than that of the Barclays U.S. High-Yield Corporate Bond 2% Issuer Capped Index, was a primary factor that detracted from relative results.
The fund’s lesser exposure to “BB” and “B” rated (r) securities was another negative factor for relative results as these credit quality sectors outperformed higher-quality issues. The fund’s lesser exposure to the telecommunications sector also detracted from performance as this market segment outperformed the benchmark over the reporting period.
Among individual securities, the fund’s holdings of energy companies OGX Petroleo e Gas Participacoes (h) and ATP Oil & Gas (h), and chemical company Momentive Performance Materials (h), were among the fund’s top relative detractors for the reporting period.
Contributors to Performance
The fund’s greater exposure to bonds in the financial sector benefited relative performance as this sector outperformed the benchmark for the period. In addition, a greater exposure to “BBB” rated securities contributed to performance as spreads narrowed.
4
Management Review – continued
Top individual contributors during the reporting period included the fund’s debt holdings of insurance company American International Group and financial firms Abbey National Capital and Royal Bank of Scotland.
Respectfully,
| | |
| William Adams | | David Cole |
| Portfolio Manager | | Portfolio Manager |
| (h) | Security was not held in the portfolio at period end. |
| (r) | Bonds rated “BBB”, “Baa”, or higher are considered investment grade; bonds rated “BB”, “Ba”, or below are considered non-investment grade. The source for bond quality ratings is Moody’s Investors Service, Standard & Poor’s and Fitch, Inc. and are applied using the following hierarchy: If all three agencies provide a rating, the middle rating (after dropping the highest and lowest ratings) is assigned; if two of the three agencies rate a security, the lower of the two is assigned. Ratings are shown in the S&P and Fitch scale (e.g., AAA). For securities which are not rated by any of the three agencies, the security is considered Not Rated. |
The views expressed in this report are those of the portfolio managers only through the end of the period of the report as stated on the cover and do not necessarily reflect the views of MFS or any other person in the MFS organization. These views are subject to change at any time based on market or other conditions, and MFS disclaims any responsibility to update such views. These views may not be relied upon as investment advice or an indication of trading intent on behalf of any MFS portfolio. References to specific securities are not recommendations of such securities, and may not be representative of any MFS portfolio’s current or future investments.
5
PERFORMANCE SUMMARY THROUGH 1/31/13
The following chart illustrates a representative class of the fund’s historical performance in comparison to its benchmark(s). Performance results include the deduction of the maximum applicable sales charge and reflect the percentage change in net asset value, including reinvestment of dividends and capital gains distributions. The performance of other share classes will be greater than or less than that of the class depicted below. Benchmarks are unmanaged and may not be invested in directly. Benchmark returns do not reflect sales charges, commissions or expenses. (See Notes to Performance Summary.)
Performance data shown represents past performance and is no guarantee of future results. Investment return and principal value fluctuate so your shares, when sold, may be worth more or less than the original cost; current performance may be lower or higher than quoted. The performance shown does not reflect the deduction of taxes, if any, that a shareholder would pay on fund distributions or the redemption of fund shares.
Growth of a Hypothetical $10,000 Investment

6
Performance Summary – continued
Total Returns through 1/31/13
Average annual without sales charge
| | | | | | | | | | | | | | |
| | | Share class | | Class inception date | | 1-yr | | 5-yr | | 10-yr | | Life (t) | | |
| | | A | | 2/17/78 | | 12.05% | | 8.18% | | 8.27% | | N/A | | |
| | | B | | 9/27/93 | | 11.22% | | 7.33% | | 7.46% | | N/A | | |
| | | C | | 1/03/94 | | 11.21% | | 7.33% | | 7.45% | | N/A | | |
| | | I | | 1/02/97 | | 12.02% | | 8.40% | | 8.53% | | N/A | | |
| | | R1 | | 4/01/05 | | 11.22% | | 7.33% | | N/A | | 6.12% | | |
| | | R2 | | 10/31/03 | | 11.77% | | 7.92% | | N/A | | 6.87% | | |
| | | R3 | | 4/01/05 | | 12.05% | | 8.19% | | N/A | | 6.94% | | |
| | | R4 | | 4/01/05 | | 12.33% | | 8.46% | | N/A | | 7.23% | | |
| | | R5 | | 6/01/12 | | N/A | | N/A | | N/A | | 10.74% | | |
| | | 529A | | 7/31/02 | | 12.33% | | 8.07% | | 8.04% | | N/A | | |
| | | 529B | | 7/31/02 | | 11.17% | | 7.30% | | 7.30% | | N/A | | |
| | | 529C | | 7/31/02 | | 11.17% | | 7.23% | | 7.27% | | N/A | | |
Comparative benchmark
| | | | | | | | | | | | | | |
| | | Barclays U.S. High-Yield Corporate
Bond 2% Issuer Capped Index (f) | | 13.87% | | 11.08% | | 10.39% | | N/A | | |
| Average annual with sales charge | | | | | | |
| | | A
With Initial Sales Charge (4.75%) | | 6.73% | | 7.13% | | 7.75% | | N/A | | |
| | | B
With CDSC (Declining over six years
from 4% to 0%) (x) | | 7.22% | | 7.03% | | 7.46% | | N/A | | |
| | | C
With CDSC (1% for 12 months) (x) | | 10.21% | | 7.33% | | 7.45% | | N/A | | |
| | | 529A
With Initial Sales Charge (4.75%) | | 6.99% | | 7.03% | | 7.52% | | N/A | | |
| | | 529B
With CDSC (Declining over six years
from 4% to 0%) (x) | | 7.17% | | 6.99% | | 7.30% | | N/A | | |
| | | 529C
With CDSC (1% for 12 months) (x) | | 10.17% | | 7.23% | | 7.27% | | N/A | | |
Class I, R1, R2, R3, R4 and R5 shares do not have a sales charge.
CDSC – Contingent Deferred Sales Charge.
| (f) | Source: FactSet Research Systems Inc. |
7
Performance Summary – continued
| (t) | For the period from the class inception date through the stated period end (for those share classes with less than 10 years of performance history). No comparative benchmark performance information is provided for “life” periods. (See Notes to Performance Summary.) |
| (x) | Assuming redemption at the end of the applicable period. |
Benchmark Definition
Barclays U.S. High-Yield Corporate Bond 2% Issuer Capped Index – a component of the Barclays U.S. High-Yield Corporate Bond Index, which measures performance of non-investment grade, fixed rate debt. The index limits the maximum exposure to any one issuer to 2%.
It is not possible to invest directly in an index.
Notes to Performance Summary
Class 529 shares are only available in conjunction with qualified tuition programs, such as the MFS 529 Savings Plan. There also is an additional fee, which is detailed in the program description, on qualified tuition programs. If this fee was reflected, the performance for Class 529 shares would have been lower. This annual fee is waived for Oregon residents and for those accounts with assets of $25,000 or more.
Average annual total return represents the average annual change in value for each share class for the periods presented. Life returns are presented where the share class has less than 10 years of performance history and represent the average annual total return from the class inception date to the stated period end date. As the fund’s share classes may have different inception dates, the life returns may represent different time periods and may not be comparable. As a result, no comparative benchmark performance information is provided for life periods.
Performance results reflect any applicable expense subsidies and waivers in effect during the periods shown. Without such subsidies and waivers the fund’s performance results would be less favorable. Please see the prospectus and financial statements for complete details.
Performance results do not include adjustments made for financial reporting purposes in accordance with U.S. generally accepted accounting principles and may differ from amounts reported in the financial highlights.
From time to time the fund may receive proceeds from litigation settlements, without which performance would be lower.
8
EXPENSE TABLE
Fund expenses borne by the shareholders during the period,
August 1, 2012 through January 31, 2013
As a shareholder of the fund, you incur two types of costs: (1) transaction costs, including sales charges (loads) on certain purchase or redemption payments, and (2) ongoing costs, including management fees; distribution and service (12b-1) fees; and other fund expenses. This example is intended to help you understand your ongoing costs (in dollars) of investing in the fund and to compare these costs with the ongoing costs of investing in other mutual funds.
The example is based on an investment of $1,000 invested at the beginning of the period and held for the entire period August 1, 2012 through January 31, 2013.
The expenses include the payment of a portion of the transfer-agent-related expenses of MFS funds that invest in the fund. For further information, please see the Notes to the Financial Statements.
Actual Expenses
The first line for each share class in the following table provides information about actual account values and actual expenses. You may use the information in this line, together with the amount you invested, to estimate the expenses that you paid over the period. Simply divide your account value by $1,000 (for example, an $8,600 account value divided by $1,000 = 8.6), then multiply the result by the number in the first line under the heading entitled “Expenses Paid During Period” to estimate the expenses you paid on your account during this period.
Hypothetical Example for Comparison Purposes
The second line for each share class in the following table provides information about hypothetical account values and hypothetical expenses based on the fund’s actual expense ratio and an assumed rate of return of 5% per year before expenses, which is not the fund’s actual return. The hypothetical account values and expenses may not be used to estimate the actual ending account balance or expenses you paid for the period. You may use this information to compare the ongoing costs of investing in the fund and other funds. To do so, compare this 5% hypothetical example with the 5% hypothetical examples that appear in the shareholder reports of the other funds.
Please note that the expenses shown in the table are meant to highlight your ongoing costs only and do not reflect any transactional costs, such as sales charges (loads). Therefore, the second line for each share class in the table is useful in comparing ongoing costs only, and will not help you determine the relative total costs of owning different funds. In addition, if these transactional costs were included, your costs would have been higher.
9
Expense Table – continued
| | | | | | | | | | | | | | | | | | |
Share
Class | | | | Annualized Expense Ratio | | | Beginning
Account Value
8/01/12 | | | Ending Account Value
1/31/13 | | | Expenses Paid During
Period (p) 8/01/12-1/31/13 | |
| A | | Actual | | | 0.93% | | | | $1,000.00 | | | | $1,064.86 | | | | $4.83 | |
| | Hypothetical (h) | | | 0.93% | | | | $1,000.00 | | | | $1,020.46 | | | | $4.72 | |
| B | | Actual | | | 1.68% | | | | $1,000.00 | | | | $1,057.92 | | | | $8.69 | |
| | Hypothetical (h) | | | 1.68% | | | | $1,000.00 | | | | $1,016.69 | | | | $8.52 | |
| C | | Actual | | | 1.68% | | | | $1,000.00 | | | | $1,057.84 | | | | $8.69 | |
| | Hypothetical (h) | | | 1.68% | | | | $1,000.00 | | | | $1,016.69 | | | | $8.52 | |
| I | | Actual | | | 0.68% | | | | $1,000.00 | | | | $1,063.27 | | | | $3.53 | |
| | Hypothetical (h) | | | 0.68% | | | | $1,000.00 | | | | $1,021.72 | | | | $3.46 | |
| R1 | | Actual | | | 1.68% | | | | $1,000.00 | | | | $1,057.93 | | | | $8.69 | |
| | Hypothetical (h) | | | 1.68% | | | | $1,000.00 | | | | $1,016.69 | | | | $8.52 | |
| R2 | | Actual | | | 1.18% | | | | $1,000.00 | | | | $1,060.54 | | | | $6.11 | |
| | Hypothetical (h) | | | 1.18% | | | | $1,000.00 | | | | $1,019.20 | | | | $5.99 | |
| R3 | | Actual | | | 0.93% | | | | $1,000.00 | | | | $1,064.86 | | | | $4.83 | |
| | Hypothetical (h) | | | 0.93% | | | | $1,000.00 | | | | $1,020.46 | | | | $4.72 | |
| R4 | | Actual | | | 0.68% | | | | $1,000.00 | | | | $1,063.18 | | | | $3.53 | |
| | Hypothetical (h) | | | 0.68% | | | | $1,000.00 | | | | $1,021.72 | | | | $3.46 | |
| R5 | | Actual | | | 0.63% | | | | $1,000.00 | | | | $1,066.46 | | | | $3.27 | |
| | Hypothetical (h) | | | 0.63% | | | | $1,000.00 | | | | $1,021.97 | | | | $3.20 | |
| 529A | | Actual | | | 0.98% | | | | $1,000.00 | | | | $1,064.64 | | | | $5.09 | |
| | Hypothetical (h) | | | 0.98% | | | | $1,000.00 | | | | $1,020.21 | | | | $4.98 | |
| 529B | | Actual | | | 1.73% | | | | $1,000.00 | | | | $1,060.70 | | | | $8.96 | |
| | Hypothetical (h) | | | 1.73% | | | | $1,000.00 | | | | $1,016.44 | | | | $8.77 | |
| 529C | | Actual | | | 1.73% | | | | $1,000.00 | | | | $1,057.69 | | | | $8.95 | |
| | Hypothetical (h) | | | 1.73% | | | | $1,000.00 | | | | $1,016.44 | | | | $8.77 | |
| (h) | 5% class return per year before expenses. |
| (p) | Expenses paid are equal to each class’s annualized expense ratio, as shown above, multiplied by the average account value over the period, multiplied by the number of days in the period, divided by the number of days in the year. Expenses paid do not include any applicable sales charges (loads). If these transaction costs had been included, your costs would have been higher. |
10
PORTFOLIO OF INVESTMENTS
1/31/13
The Portfolio of Investments is a complete list of all securities owned by your fund. It is categorized by broad-based asset classes.
| | | | | | | | |
| Bonds - 92.2% | | | | | | | | |
| Issuer | | Shares/Par | | | Value ($) | |
| Aerospace - 2.1% | | | | | | | | |
| Bombardier, Inc., 4.25%, 2016 (z) | | $ | 715,000 | | | $ | 736,450 | |
| Bombardier, Inc., 7.5%, 2018 (n) | | | 4,875,000 | | | | 5,484,375 | |
| Bombardier, Inc., 7.75%, 2020 (n) | | | 2,770,000 | | | | 3,137,025 | |
| CPI International, Inc., 8%, 2018 | | | 3,135,000 | | | | 3,135,000 | |
| Heckler & Koch GmbH, 9.5%, 2018 (z) | | EUR | 1,753,000 | | | | 2,106,498 | |
| Huntington Ingalls Industries, Inc., 7.125%, 2021 | | $ | 5,390,000 | | | | 5,929,000 | |
| Kratos Defense & Security Solutions, Inc., 10%, 2017 | | | 4,230,000 | | | | 4,642,425 | |
| | | | | | | | |
| | | | | | | $ | 25,170,773 | |
| Apparel Manufacturers - 1.0% | | | | | | | | |
| Hanesbrands, Inc., 6.375%, 2020 | | $ | 2,990,000 | | | $ | 3,236,675 | |
| Jones Group, Inc., 6.875%, 2019 | | | 2,720,000 | | | | 2,839,000 | |
| PVH Corp., 7.375%, 2020 | | | 3,895,000 | | | | 4,406,219 | |
| PVH Corp., 4.5%, 2022 | | | 2,120,000 | | | | 2,109,400 | |
| | | | | | | | |
| | | | | | | $ | 12,591,294 | |
| Asset-Backed & Securitized - 0.4% | | | | | | | | |
| Citigroup Commercial Mortgage Trust, FRN, 5.702%, 2049 | | $ | 2,948,120 | | | $ | 568,984 | |
| CWCapital Cobalt Ltd., CDO, “E2”, 6%, 2045 (z) | | | 1,268,985 | | | | 12,690 | |
| CWCapital Cobalt Ltd., CDO, “F”, FRN, 1.6%, 2050 (z) | | | 644,319 | | | | 1,611 | |
| CWCapital Cobalt Ltd., CDO, “G”, FRN, 1.801%, 2050 (z) | | | 2,009,514 | | | | 5,024 | |
| Falcon Franchise Loan LLC, FRN, 6.542%, 2025 (i)(z) | | | 2,114,515 | | | | 332,402 | |
| First Union National Bank Commercial Mortgage Trust, 6.75%, 2032 | | | 1,461,820 | | | | 731,422 | |
| G-Force LLC, CDO, “A2”, 4.83%, 2036 (z) | | | 1,746,526 | | | | 1,755,259 | |
| JPMorgan Chase Commercial Mortgage Securities Corp., “C”, FRN, 6.002%, 2051 | | | 2,285,000 | | | | 666,306 | |
| LB Commercial Conduit Mortgage Trust, FRN, 1.218%, 2030 (i) | | | 4,203,445 | | | | 77,209 | |
| Morgan Stanley Capital I, Inc., FRN, 1.384%, 2039 (i)(z) | | | 6,918,013 | | | | 134,901 | |
| | | | | | | | |
| | | | | | | $ | 4,285,808 | |
| Automotive - 3.5% | | | | | | | | |
| Accuride Corp., 9.5%, 2018 | | $ | 3,695,000 | | | $ | 3,648,813 | |
| Allison Transmission, Inc., 7.125%, 2019 (n) | | | 6,085,000 | | | | 6,602,225 | |
| Continental Rubber of America Corp., 4.5%, 2019 (n) | | | 815,000 | | | | 835,375 | |
| Ford Motor Credit Co. LLC, 8%, 2014 | | | 1,965,000 | | | | 2,131,261 | |
| Ford Motor Credit Co. LLC, 12%, 2015 | | | 5,848,000 | | | | 7,134,560 | |
| Ford Motor Credit Co. LLC, 8.125%, 2020 | | | 1,320,000 | | | | 1,662,334 | |
| General Motors Financial Co., Inc., 4.75%, 2017 (n) | | | 1,815,000 | | | | 1,896,829 | |
11
Portfolio of Investments – continued
| | | | | | | | |
| Issuer | | Shares/Par | | | Value ($) | |
| Bonds - continued | | | | | | | | |
| Automotive - continued | | | | | | | | |
| General Motors Financial Co., Inc., 6.75%, 2018 | | $ | 2,670,000 | | | $ | 3,090,525 | |
| Goodyear Tire & Rubber Co., 8.25%, 2020 | | | 770,000 | | | | 845,075 | |
| Goodyear Tire & Rubber Co., 7%, 2022 | | | 1,340,000 | | | | 1,437,150 | |
| Jaguar Land Rover PLC, 7.75%, 2018 (n) | | | 1,385,000 | | | | 1,520,038 | |
| Jaguar Land Rover PLC, 8.125%, 2021 (n) | | | 6,910,000 | | | | 7,756,475 | |
| Jaguar Land Rover PLC, 5.625%, 2023 (z) | | | 1,055,000 | | | | 1,076,100 | |
| Lear Corp., 8.125%, 2020 | | | 1,737,000 | | | | 1,941,098 | |
| Lear Corp., 4.75%, 2023 (z) | | | 885,000 | | | | 880,575 | |
| | | | | | | | |
| | | | | | | $ | 42,458,433 | |
| Broadcasting - 5.4% | | | | | | | | |
| Allbritton Communications Co., 8%, 2018 | | $ | 1,575,000 | | | $ | 1,704,938 | |
| AMC Networks, Inc., 7.75%, 2021 | | | 3,211,000 | | | | 3,668,568 | |
| Clear Channel Communications, Inc., 9%, 2021 | | | 3,497,000 | | | | 3,252,210 | |
| Clear Channel Worldwide Holdings, Inc., 6.5%, 2022 (n) | | | 830,000 | | | | 875,650 | |
| Clear Channel Worldwide Holdings, Inc., 6.5%, 2022 (n) | | | 2,225,000 | | | | 2,369,625 | |
| Clear Channel Worldwide Holdings, Inc., “A”, 7.625%, 2020 | | | 170,000 | | | | 175,950 | |
| Clear Channel Worldwide Holdings, Inc., “B”, 7.625%, 2020 | | | 2,425,000 | | | | 2,534,125 | |
| Hughes Network Systems LLC, 7.625%, 2021 | | | 1,920,000 | | | | 2,198,400 | |
| IAC/InterActiveCorp, 4.75%, 2022 (n) | | | 490,000 | | | | 486,325 | |
| Inmarsat Finance PLC, 7.375%, 2017 (n) | | | 2,735,000 | | | | 2,940,125 | |
| Intelsat Bermuda Ltd., 11.25%, 2017 | | | 5,420,000 | | | | 5,745,200 | |
| Intelsat Bermuda Ltd., 11.5%, 2017 (p) | | | 6,915,000 | | | | 7,329,900 | |
| Intelsat Jackson Holdings Ltd., 6.625%, 2022 (n) | | | 2,700,000 | | | | 2,743,875 | |
| LBI Media, Inc., 13.5% to 2015, 11.5% to 2020 (p)(z) | | | 921,000 | | | | 377,610 | |
| Liberty Media Corp., 8.5%, 2029 | | | 4,285,000 | | | | 4,777,775 | |
| Liberty Media Corp., 8.25%, 2030 | | | 40,000 | | | | 44,200 | |
| Local TV Finance LLC, 9.25%, 2015 (p)(z) | | | 2,931,123 | | | | 2,953,106 | |
| Netflix, Inc., 5.375%, 2021 (z) | | | 1,765,000 | | | | 1,756,175 | |
| Nexstar Broadcasting Group, Inc., 8.875%, 2017 | | | 1,340,000 | | | | 1,477,350 | |
| Nexstar Broadcasting Group, Inc., 6.875%, 2020 (n) | | | 490,000 | | | | 510,825 | |
| Sinclair Broadcast Group, Inc., 9.25%, 2017 (n) | | | 1,540,000 | | �� | | 1,682,450 | |
| Sinclair Broadcast Group, Inc., 8.375%, 2018 | | | 430,000 | | | | 478,375 | |
| SIRIUS XM Radio, Inc., 8.75%, 2015 (n) | | | 2,805,000 | | | | 3,176,662 | |
| SIRIUS XM Radio, Inc., 7.625%, 2018 (n) | | | 2,705,000 | | | | 3,002,550 | |
| SIRIUS XM Radio, Inc., 5.25%, 2022 (n) | | | 1,515,000 | | | | 1,541,512 | |
| Univision Communications, Inc., 6.875%, 2019 (n) | | | 3,455,000 | | | | 3,627,750 | |
| Univision Communications, Inc., 7.875%, 2020 (n) | | | 2,280,000 | | | | 2,468,100 | |
| Univision Communications, Inc., 8.5%, 2021 (n) | | | 2,090,000 | | | | 2,225,850 | |
| | | | | | | | |
| | | | | | | $ | 66,125,181 | |
| Brokerage & Asset Managers - 0.4% | | | | | | | | |
| E*TRADE Financial Corp., 6.375%, 2019 | | $ | 5,275,000 | | | $ | 5,472,813 | |
12
Portfolio of Investments – continued
| | | | | | | | |
| Issuer | | Shares/Par | | | Value ($) | |
| Bonds - continued | | | | | | | | |
| Building - 2.6% | | | | | | | | |
| Boise Cascade LLC/Finance Corp., 6.375%, 2020 (n) | | $ | 1,510,000 | | | $ | 1,577,950 | |
| Building Materials Holding Corp., 6.875%, 2018 (n) | | | 2,125,000 | | | | 2,295,000 | |
| Building Materials Holding Corp., 7%, 2020 (n) | | | 1,150,000 | | | | 1,253,500 | |
| Building Materials Holding Corp., 6.75%, 2021 (n) | | | 2,235,000 | | | | 2,464,088 | |
| CEMEX Espana S.A., 9.25%, 2020 | | | 2,785,000 | | | | 2,993,875 | |
| Gibraltar Industries, Inc., 6.25%, 2021 (z) | | | 500,000 | | | | 519,375 | |
| HD Supply, Inc., 13.5%, 2015 | | | 2,225,000 | | | | 2,294,531 | |
| HD Supply, Inc., 8.125%, 2019 (n) | | | 1,545,000 | | | | 1,749,712 | |
| HD Supply, Inc., 11.5%, 2020 (n) | | | 1,295,000 | | | | 1,492,487 | |
| HD Supply, Inc., 10.5%, 2021 (z) | | | 260,000 | | | | 265,850 | |
| Masonite International Corp., 8.25%, 2021 (n) | | | 3,060,000 | | | | 3,366,000 | |
| Nortek, Inc., 8.5%, 2021 | | | 4,375,000 | | | | 4,954,687 | |
| Roofing Supply Group LLC/Roofing Supply Finance, Inc., 10%, 2020 (n) | | | 1,035,000 | | | | 1,169,550 | |
| USG Corp., 6.3%, 2016 | | | 3,295,000 | | | | 3,467,987 | |
| USG Corp., 7.875%, 2020 (n) | | | 1,570,000 | | | | 1,789,800 | |
| | | | | | | | |
| | | | | | | $ | 31,654,392 | |
| Business Services - 1.8% | | | | | | | | |
| Ceridian Corp., 12.25%, 2015 (p) | | $ | 1,250,000 | | | $ | 1,268,750 | |
| Ceridian Corp., 8.875%, 2019 (n) | | | 725,000 | | | | 808,375 | |
| Fidelity National Information Services, Inc., 7.625%, 2017 | | | 1,345,000 | | | | 1,452,600 | |
| Fidelity National Information Services, Inc., 5%, 2022 | | | 2,295,000 | | | | 2,484,338 | |
| iGATE Corp., 9%, 2016 | | | 4,863,000 | | | | 5,343,221 | |
| Iron Mountain, Inc., 8.375%, 2021 | | | 3,635,000 | | | | 4,007,588 | |
| Legend Acquisition Sub, Inc., 10.75%, 2020 (n) | | | 2,185,000 | | | | 1,922,800 | |
| Lender Processing Services, Inc., 5.75%, 2023 | | | 1,835,000 | | | | 1,945,100 | |
| Neustar, Inc., 4.5%, 2023 (z) | | | 1,400,000 | | | | 1,400,000 | |
| SunGard Data Systems, Inc., 7.375%, 2018 | | | 1,255,000 | | | | 1,333,437 | |
| | | | | | | | |
| | | | | | | $ | 21,966,209 | |
| Cable TV - 3.5% | | | | | | | | |
| Bresnan Broadband Holdings LLC, 8%, 2018 (n) | | $ | 675,000 | | | $ | 729,000 | |
| CCO Holdings LLC, 7.875%, 2018 | | | 2,885,000 | | | | 3,083,344 | |
| CCO Holdings LLC, 8.125%, 2020 | | | 6,665,000 | | | | 7,481,463 | |
| CCO Holdings LLC, 7.375%, 2020 | | | 1,305,000 | | | | 1,451,813 | |
| CCO Holdings LLC, 5.125%, 2023 | | | 1,195,000 | | | | 1,177,075 | |
| Cequel Communications Holdings, 6.375%, 2020 (n) | | | 2,310,000 | | | | 2,419,725 | |
| DISH DBS Corp., 6.75%, 2021 | | | 3,410,000 | | | | 3,819,200 | |
| DISH DBS Corp., 5%, 2023 (n) | | | 1,240,000 | | | | 1,224,500 | |
| EchoStar Corp., 7.125%, 2016 | | | 2,585,000 | | | | 2,882,275 | |
| Telenet Finance Luxembourg, 6.375%, 2020 (n) | | EUR | 1,290,000 | | | | 1,874,171 | |
| Unitymedia Hessen, 5.5%, 2023 (n) | | $ | 365,000 | | | | 372,300 | |
13
Portfolio of Investments – continued
| | | | | | | | |
| Issuer | | Shares/Par | | | Value ($) | |
| Bonds - continued | | | | | | | | |
| Cable TV - continued | | | | | | | | |
| UPC Holding B.V., 9.875%, 2018 (n) | | $ | 2,170,000 | | | $ | 2,452,100 | |
| UPCB Finance III Ltd., 6.625%, 2020 (n) | | | 5,403,000 | | | | 5,767,702 | |
| Virgin Media Finance PLC, 8.375%, 2019 | | | 865,000 | | | | 978,531 | |
| Virgin Media Finance PLC, 4.875%, 2022 | | | 425,000 | | | | 423,937 | |
| Virgin Media Finance PLC, 5.25%, 2022 | | | 3,190,000 | | | | 3,333,550 | |
| Ziggo Bond Co. B.V., 8%, 2018 (n) | | EUR | 2,225,000 | | | | 3,268,836 | |
| | | | | | | | |
| | | | | | | $ | 42,739,522 | |
| Chemicals - 2.2% | | | | | | | | |
| Celanese U.S. Holdings LLC, 6.625%, 2018 | | $ | 2,955,000 | | | $ | 3,235,725 | |
| Flash Dutch 2 B.V./U.S. Coatings Acquisition, 7.375%, 2021 (z) | | | 520,000 | | | | 535,600 | |
| Hexion U.S. Finance Corp./Hexion Nova Scotia Finance, 8.875%, 2018 | | | 3,550,000 | | | | 3,585,500 | |
| Hexion U.S. Finance Corp./Hexion Nova Scotia Finance, 9%, 2020 | | | 2,145,000 | | | | 1,994,850 | |
| Huntsman International LLC, 8.625%, 2021 | | | 3,780,000 | | | | 4,328,100 | |
| INEOS Finance PLC, 8.375%, 2019 (n) | | | 3,075,000 | | | | 3,367,125 | |
| INEOS Group Holdings PLC, 8.5%, 2016 (n) | | | 2,765,000 | | | | 2,785,737 | |
| LyondellBasell Industries N.V., 5%, 2019 | | | 1,450,000 | | | | 1,598,625 | |
| LyondellBasell Industries N.V., 6%, 2021 | | | 3,230,000 | | | | 3,795,250 | |
| Polypore International, Inc., 7.5%, 2017 | | | 1,560,000 | | | | 1,696,500 | |
| | | | | | | | |
| | | | | | | $ | 26,923,012 | |
| Computer Software - 1.1% | | | | | | | | |
| Infor U.S., Inc., 11.5%, 2018 | | $ | 2,545,000 | | | $ | 2,996,737 | |
| Nuance Communications, Inc., 5.375%, 2020 (n) | | | 2,635,000 | | | | 2,714,050 | |
| Seagate HDD Cayman, 6.875%, 2020 | | | 1,411,000 | | | | 1,530,935 | |
| Syniverse Holdings, Inc., 9.125%, 2019 | | | 4,215,000 | | | | 4,583,812 | |
| TransUnion Holding Co., Inc., 9.625%, 2018 | | | 1,325,000 | | | | 1,414,437 | |
| TransUnion LLC/TransUnion Financing Corp., 11.375%, 2018 | | | 635,000 | | | | 734,219 | |
| | | | | | | | |
| | | | | | | $ | 13,974,190 | |
| Computer Software - Systems - 1.0% | | | | | | | | |
| Audatex North America, Inc., 6.75%, 2018 (n) | | $ | 2,705,000 | | | $ | 2,901,113 | |
| CDW LLC/CDW Finance Corp., 12.535%, 2017 | | | 2,145,000 | | | | 2,295,150 | |
| CDW LLC/CDW Finance Corp., 8.5%, 2019 | | | 3,795,000 | | | | 4,202,963 | |
| DuPont Fabros Technology, Inc., REIT, 8.5%, 2017 | | | 2,930,000 | | | | 3,179,050 | |
| | | | | | | | |
| | | | | | | $ | 12,578,276 | |
| Conglomerates - 1.2% | | | | | | | | |
| Amsted Industries, Inc., 8.125%, 2018 (n) | | $ | 5,470,000 | | | $ | 5,839,225 | |
| BC Mountain LLC, 7%, 2021 (z) | | | 375,000 | | | | 384,375 | |
| Dynacast International LLC, 9.25%, 2019 | | | 2,295,000 | | | | 2,449,913 | |
| Griffon Corp., 7.125%, 2018 | | | 4,075,000 | | | | 4,411,187 | |
14
Portfolio of Investments – continued
| | | | | | | | |
| Issuer | | Shares/Par | | | Value ($) | |
| Bonds - continued | | | | | | | | |
| Conglomerates - continued | | | | | | | | |
| Silver II Borrower, 7.75%, 2020 (n) | | $ | 1,555,000 | | | $ | 1,628,862 | |
| | | | | | | | |
| | | | | | | $ | 14,713,562 | |
| Consumer Products - 1.0% | | | | | | | | |
| Easton-Bell Sports, Inc., 9.75%, 2016 | | $ | 2,295,000 | | | $ | 2,475,754 | |
| Elizabeth Arden, Inc., 7.375%, 2021 | | | 3,216,000 | | | | 3,577,800 | |
| Jarden Corp., 7.5%, 2020 | | | 3,195,000 | | | | 3,482,550 | |
| Libbey Glass, Inc., 6.875%, 2020 | | | 1,035,000 | | | | 1,113,919 | |
| Prestige Brands, Inc., 8.125%, 2020 | | | 300,000 | | | | 336,000 | |
| Spectrum Brands Escrow Corp., 6.375%, 2020 (n) | | | 1,020,000 | | | | 1,085,025 | |
| Spectrum Brands Escrow Corp., 6.625%, 2022 (n) | | | 260,000 | | | | 280,800 | |
| | | | | | | | |
| | | | | | | $ | 12,351,848 | |
| Consumer Services - 0.8% | | | | | | | | |
| QVC, Inc., 7.375%, 2020 (n) | | $ | 1,995,000 | | | $ | 2,202,199 | |
| Service Corp. International, 6.75%, 2015 | | | 930,000 | | | | 1,020,675 | |
| Service Corp. International, 7%, 2017 | | | 5,080,000 | | | | 5,835,650 | |
| Service Corp. International, 7%, 2019 | | | 115,000 | | | | 126,356 | |
| | | | | | | | |
| | | | | | | $ | 9,184,880 | |
| Containers - 2.5% | | | | | | | | |
| Ardagh Packaging Finance PLC , 7%, 2020 (z) | | $ | 1,210,000 | | | $ | 1,219,075 | |
| Ardagh Packaging Finance PLC, 7.375%, 2017 (n) | | | 2,530,000 | | | | 2,779,838 | |
| Ardagh Packaging Finance PLC, 9.125%, 2020 (n) | | | 400,000 | | | | 439,000 | |
| Ardagh Packaging Finance PLC, 9.125%, 2020 (n) | | | 4,110,000 | | | | 4,490,175 | |
| Ball Corp., 5%, 2022 | | | 1,624,000 | | | | 1,721,440 | |
| Berry Plastics Group, Inc., 9.5%, 2018 | | | 1,190,000 | | | | 1,329,825 | |
| Crown Americas LLC, 4.5%, 2023 (z) | | | 2,030,000 | | | | 1,999,550 | |
| Greif, Inc., 6.75%, 2017 | | | 3,415,000 | | | | 3,807,725 | |
| Greif, Inc., 7.75%, 2019 | | | 795,000 | | | | 922,200 | |
| Reynolds Group, 7.125%, 2019 | | | 2,925,000 | | | | 3,122,437 | |
| Reynolds Group, 9.875%, 2019 | | | 1,030,000 | | | | 1,125,275 | |
| Reynolds Group, 5.75%, 2020 | | | 1,760,000 | | | | 1,799,600 | |
| Reynolds Group, 8.25%, 2021 | | | 6,090,000 | | | | 6,379,275 | |
| | | | | | | | |
| | | | | | | $ | 31,135,415 | |
| Defense Electronics - 0.5% | | | | | | | | |
| Ducommun, Inc., 9.75%, 2018 | | $ | 3,256,000 | | | $ | 3,573,460 | |
| MOOG, Inc., 7.25%, 2018 | | | 2,560,000 | | | | 2,675,200 | |
| | | | | | | | |
| | | | | | | $ | 6,248,660 | |
| Electrical Equipment - 0.2% | | | | | | | | |
| Avaya, Inc., 9.75%, 2015 | | $ | 2,175,000 | | | $ | 2,071,688 | |
| Avaya, Inc., 7%, 2019 (n) | | | 805,000 | | | | 768,775 | |
| | | | | | | | |
| | | | | | | $ | 2,840,463 | |
15
Portfolio of Investments – continued
| | | | | | | | |
| Issuer | | Shares/Par | | | Value ($) | |
| Bonds - continued | | | | | | | | |
| Electronics - 0.9% | | | | | | | | |
| Freescale Semiconductor, Inc., 9.25%, 2018 (n) | | $ | 4,260,000 | | | $ | 4,686,000 | |
| Nokia Corp., 5.375%, 2019 | | | 1,075,000 | | | | 1,029,312 | |
| Nokia Corp., 6.625%, 2039 | | | 770,000 | | | | 719,950 | |
| NXP B.V., 9.75%, 2018 (n) | | | 100,000 | | | | 115,000 | |
| NXP B.V., 5.75%, 2021 (z) | | | 870,000 | | | | 870,000 | |
| Sensata Technologies B.V., 6.5%, 2019 (n) | | | 3,770,000 | | | | 4,043,325 | |
| | | | | | | | |
| | | | | | | $ | 11,463,587 | |
| Energy - Independent - 8.0% | | | | | | | | |
| BreitBurn Energy Partners LP, 8.625%, 2020 | | $ | 1,395,000 | | | $ | 1,531,013 | |
| BreitBurn Energy Partners LP, 7.875%, 2022 (n) | | | 3,450,000 | | | | 3,648,375 | |
| Carrizo Oil & Gas, Inc., 8.625%, 2018 | | | 995,000 | | | | 1,072,113 | |
| Chaparral Energy, Inc., 7.625%, 2022 | | | 2,445,000 | | | | 2,640,600 | |
| Chesapeake Energy Corp., 6.875%, 2020 | | | 3,685,000 | | | | 4,053,500 | |
| Concho Resources, Inc., 8.625%, 2017 | | | 1,700,000 | | | | 1,836,000 | |
| Concho Resources, Inc., 6.5%, 2022 | | | 4,690,000 | | | | 5,112,100 | |
| Continental Resources, Inc., 8.25%, 2019 | | | 3,180,000 | | | | 3,573,525 | |
| Denbury Resources, Inc., 8.25%, 2020 | | | 4,860,000 | | | | 5,418,900 | |
| Denbury Resources, Inc., 4.625%, 2023 | | | 1,245,000 | | | | 1,220,100 | |
| Energy XXI Gulf Coast, Inc., 9.25%, 2017 | | | 4,980,000 | | | | 5,670,975 | |
| EP Energy LLC, 9.375%, 2020 | | | 9,115,000 | | | | 10,208,800 | |
| EPL Oil & Gas, Inc., 8.25%, 2018 (n) | | | 1,860,000 | | | | 1,957,650 | |
| EXCO Resources, Inc., 7.5%, 2018 | | | 1,175,000 | | | | 1,113,313 | |
| Harvest Operations Corp., 6.875%, 2017 | | | 4,585,000 | | | | 5,095,081 | |
| Hilcorp Energy I/Hilcorp Finance Co., 8%, 2020 (n) | | | 1,870,000 | | | | 2,071,025 | |
| Laredo Petroleum, Inc., 9.5%, 2019 | | | 1,955,000 | | | | 2,209,150 | |
| LINN Energy LLC, 6.5%, 2019 | | | 1,245,000 | | | | 1,268,344 | |
| LINN Energy LLC, 8.625%, 2020 | | | 2,075,000 | | | | 2,287,688 | |
| LINN Energy LLC, 7.75%, 2021 | | | 2,621,000 | | | | 2,804,470 | |
| MEG Energy Corp., 6.5%, 2021 (n) | | | 1,030,000 | | | | 1,081,500 | |
| Newfield Exploration Co., 6.875%, 2020 | | | 3,155,000 | | | | 3,411,344 | |
| Plains Exploration & Production Co., 8.625%, 2019 | | | 2,885,000 | | | | 3,288,900 | |
| Plains Exploration & Production Co., 6.5%, 2020 | | | 1,200,000 | | | | 1,327,500 | |
| Plains Exploration & Production Co., 6.75%, 2022 | | | 2,940,000 | | | | 3,311,175 | |
| QEP Resources, Inc., 6.875%, 2021 | | | 4,980,000 | | | | 5,764,350 | |
| Range Resources Corp., 8%, 2019 | | | 2,910,000 | | | | 3,230,100 | |
| Range Resources Corp., 5%, 2022 | | | 1,040,000 | | | | 1,092,000 | |
| Samson Investment Co., 9.75%, 2020 (n) | | | 2,510,000 | | | | 2,670,012 | |
| SandRidge Energy, Inc., 8%, 2018 (n) | | | 2,850,000 | | | | 2,992,500 | |
| SM Energy Co., 6.5%, 2021 | | | 2,765,000 | | | | 2,944,725 | |
| Whiting Petroleum Corp., 6.5%, 2018 | | | 2,035,000 | | | | 2,182,537 | |
| | | | | | | | |
| | | | | | | $ | 98,089,365 | |
16
Portfolio of Investments – continued
| | | | | | | | |
| Issuer | | Shares/Par | | | Value ($) | |
| Bonds - continued | | | | | | | | |
| Energy - Integrated - 0.1% | | | | | | | | |
| Pacific Rubiales Energy Corp., 7.25%, 2021 (n) | | $ | 934,000 | | | $ | 1,089,044 | |
| | |
| Engineering - Construction - 0.2% | | | | | | | | |
| BakerCorp International, Inc., 8.25%, 2019 | | $ | 2,760,000 | | | $ | 2,794,500 | |
| | |
| Entertainment - 1.2% | | | | | | | | |
| AMC Entertainment, Inc., 8.75%, 2019 | | $ | 1,860,000 | | | $ | 2,055,300 | |
| AMC Entertainment, Inc., 9.75%, 2020 | | | 2,124,000 | | | | 2,474,460 | |
| Cedar Fair LP, 9.125%, 2018 | | | 1,875,000 | | | | 2,100,000 | |
| Cinemark USA, Inc., 8.625%, 2019 | | | 3,230,000 | | | | 3,577,225 | |
| Cinemark USA, Inc., 5.125%, 2022 (n) | | | 635,000 | | | | 642,938 | |
| NAI Entertainment Holdings LLC, 8.25%, 2017 (n) | | | 1,161,000 | | | | 1,271,295 | |
| Six Flags Entertainment Corp., 5.25%, 2021 (n) | | | 2,455,000 | | | | 2,442,725 | |
| | | | | | | | |
| | | | | | | $ | 14,563,943 | |
| Financial Institutions - 4.6% | | | | | | | | |
| Aviation Capital Group, 4.625%, 2018 (z) | | $ | 985,000 | | | $ | 997,889 | |
| CIT Group, Inc., 5.25%, 2014 (n) | | | 3,940,000 | | | | 4,107,450 | |
| CIT Group, Inc., 5.25%, 2018 | | | 3,330,000 | | | | 3,563,100 | |
| CIT Group, Inc., 6.625%, 2018 (n) | | | 5,369,000 | | | | 6,013,280 | |
| CIT Group, Inc., 5.5%, 2019 (n) | | | 3,347,000 | | | | 3,581,290 | |
| Credit Acceptance Corp., 9.125%, 2017 | | | 2,555,000 | | | | 2,791,338 | |
| Icahn Enterprises LP, 8%, 2018 | | | 4,406,000 | | | | 4,719,928 | |
| International Lease Finance Corp., 4.875%, 2015 | | | 1,300,000 | | | | 1,356,875 | |
| International Lease Finance Corp., 8.625%, 2015 | | | 1,345,000 | | | | 1,528,256 | |
| International Lease Finance Corp., 7.125%, 2018 (n) | | | 3,601,000 | | | | 4,213,170 | |
| Nationstar Mortgage LLC/Capital Corp., 10.875%, 2015 | | | 4,265,000 | | | | 4,542,225 | |
| Nationstar Mortgage LLC/Capital Corp., 9.625%, 2019 (n) | | | 1,130,000 | | | | 1,288,200 | |
| Nationstar Mortgage LLC/Capital Corp., 7.875%, 2020 (n) | | | 990,000 | | | | 1,079,100 | |
| PHH Corp., 9.25%, 2016 | | | 2,190,000 | | | | 2,567,775 | |
| PHH Corp., 7.375%, 2019 | | | 1,890,000 | | | | 2,121,525 | |
| SLM Corp., 8.45%, 2018 | | | 2,865,000 | | | | 3,413,241 | |
| SLM Corp., 8%, 2020 | | | 5,450,000 | | | | 6,308,375 | |
| SLM Corp., 7.25%, 2022 | | | 1,410,000 | | | | 1,575,675 | |
| | | | | | | | |
| | | | | | | $ | 55,768,692 | |
| Food & Beverages - 0.9% | | | | | | | | |
| ARAMARK Corp., 8.5%, 2015 | | $ | 2,151,000 | | | $ | 2,164,465 | |
| B&G Foods, Inc., 7.625%, 2018 | | | 3,015,000 | | | | 3,252,431 | |
| Constellation Brands, Inc., 7.25%, 2016 | | | 1,410,000 | | | | 1,614,450 | |
| Pinnacle Foods Finance LLC, 8.25%, 2017 | | | 780,000 | | | | 829,725 | |
| TreeHouse Foods, Inc., 7.75%, 2018 | | | 2,455,000 | | | | 2,657,537 | |
| | | | | | | | |
| | | | | | | $ | 10,518,608 | |
17
Portfolio of Investments – continued
| | | | | | | | |
| Issuer | | Shares/Par | | | Value ($) | |
| Bonds - continued | | | | | | | | |
| Forest & Paper Products - 1.2% | | | | | | | | |
| Boise, Inc., 8%, 2020 | | $ | 2,770,000 | | | $ | 3,067,775 | |
| Clearwater Paper Corp., 4.5%, 2023 (z) | | | 500,000 | | | | 496,250 | |
| Georgia-Pacific Corp., 8%, 2024 | | | 263,000 | | | | 366,761 | |
| Graphic Packaging Holding Co., 7.875%, 2018 | | | 1,840,000 | | | | 2,019,400 | |
| Millar Western Forest Products Ltd., 8.5%, 2021 | | | 595,000 | | | | 575,662 | |
| Sappi Papier Holding GmbH, 7.75%, 2017 (n) | | | 1,525,000 | | | | 1,715,625 | |
| Smurfit Kappa Group PLC, 4.875%, 2018 (n) | | | 1,825,000 | | | | 1,879,750 | |
| Smurfit Kappa Group PLC, 7.75%, 2019 (n) | | EUR | 1,920,000 | | | | 2,854,639 | |
| Tembec Industries, Inc., 11.25%, 2018 | | $ | 1,615,000 | | | | 1,780,537 | |
| | | | | | | | |
| | | | | | | $ | 14,756,399 | |
| Gaming & Lodging - 3.3% | | | | | | | | |
| Boyd Gaming Corp., 9%, 2020 (n) | | $ | 1,265,000 | | | $ | 1,283,975 | |
| Caesars Entertainment Operating Co., Inc., 8.5%, 2020 | | | 3,495,000 | | | | 3,512,475 | |
| Choice Hotels International, Inc., 5.75%, 2022 | | | 520,000 | | | | 577,200 | |
| CityCenter Holdings LLC, 10.75%, 2017 (p) | | | 1,240,000 | | | | 1,368,650 | |
| FelCor Lodging LP, 5.625%, 2023 (n) | | | 485,000 | | | | 489,244 | |
| Fontainebleau Las Vegas Holdings LLC, 10.25%, 2015 (a)(d)(n) | | | 3,300,000 | | | | 2,063 | |
| GWR Operating Partnership LLP, 10.875%, 2017 | | | 1,305,000 | | | | 1,484,438 | |
| Host Hotels & Resorts, Inc., REIT, 5.25%, 2022 | | | 1,725,000 | | | | 1,880,250 | |
| Isle of Capri Casinos, Inc., 8.875%, 2020 | | | 3,480,000 | | | | 3,801,900 | |
| MGM Mirage, 6.625%, 2015 | | | 1,760,000 | | | | 1,900,800 | |
| MGM Resorts International, 11.375%, 2018 | | | 3,485,000 | | | | 4,338,825 | |
| MGM Resorts International, 6.625%, 2021 | | | 1,265,000 | | | | 1,302,950 | |
| Penn National Gaming, Inc., 8.75%, 2019 | | | 4,595,000 | | | | 5,238,300 | |
| Pinnacle Entertainment, Inc., 8.75%, 2020 | | | 1,435,000 | | | | 1,556,975 | |
| Seven Seas Cruises S. DE R.L., 9.125%, 2019 | | | 3,660,000 | | | | 3,879,600 | |
| Viking Cruises Ltd., 8.5%, 2022 (n) | | | 1,985,000 | | | | 2,188,462 | |
| Wyndham Worldwide Corp., 7.375%, 2020 | | | 1,670,000 | | | | 2,038,886 | |
| Wynn Las Vegas LLC, 7.75%, 2020 | | | 2,830,000 | | | | 3,190,825 | |
| | | | | | | | |
| | | | | | | $ | 40,035,818 | |
| Industrial - 0.9% | | | | | | | | |
| Dematic S.A., 7.75%, 2020 (z) | | $ | 2,195,000 | | | $ | 2,244,388 | |
| Hyva Global B.V., 8.625%, 2016 (n) | | | 1,989,000 | | | | 1,929,330 | |
| Mueller Water Products, Inc., 8.75%, 2020 | | | 1,952,000 | | | | 2,220,400 | |
| Rexel S.A., 6.125%, 2019 (n) | | | 2,040,000 | | | | 2,182,800 | |
| SPL Logistics Escrow LLC, 8.875%, 2020 (n) | | | 2,325,000 | | | | 2,487,750 | |
| Unifrax I LLC, 7.5%, 2019 (z) | | | 510,000 | | | | 510,000 | |
| | | | | | | | |
| | | | | | | $ | 11,574,668 | |
18
Portfolio of Investments – continued
| | | | | | | | |
| Issuer | | Shares/Par | | | Value ($) | |
| Bonds - continued | | | | | | | | |
| Insurance - 1.1% | | | | | | | | |
| American International Group, Inc., 8.25%, 2018 | | $ | 2,765,000 | | | $ | 3,589,006 | |
| American International Group, Inc., 8.175% to 2038, FRN to 2068 | | | 5,895,000 | | | | 7,663,500 | |
| MetLife, Inc., 9.25% to 2038, FRN to 2068 (n) | | | 1,300,000 | | | | 1,787,500 | |
| | | | | | | | |
| | | | | | | $ | 13,040,006 | |
| Insurance - Property & Casualty - 0.8% | | | | | | | | |
| Liberty Mutual Group, Inc., 10.75% to 2038, FRN to 2088 (n) | | $ | 3,430,000 | | | $ | 5,213,600 | |
| XL Group PLC, 6.5% to 2017, FRN to 2049 | | | 5,275,000 | | | | 5,070,594 | |
| | | | | | | | |
| | | | | | | $ | 10,284,194 | |
| International Market Quasi-Sovereign - 0.1% | | | | | | | | |
| Electricite de France, FRN, 5.25%, 2049 (n) | | $ | 331,000 | | | $ | 323,125 | |
| Exportfinans ASA, 5.5%, 2016 | | | 1,090,000 | | | | 1,137,890 | |
| | | | | | | | |
| | | | | | | $ | 1,461,015 | |
| Machinery & Tools - 2.0% | | | | | | | | |
| Case New Holland, Inc., 7.875%, 2017 | | $ | 5,625,000 | | | $ | 6,651,563 | |
| CNH America LLC, 7.25%, 2016 | | | 2,140,000 | | | | 2,391,450 | |
| CNH Capital LLC, 3.875%, 2015 (n) | | | 650,000 | | | | 667,875 | |
| CNH Capital LLC, 6.25%, 2016 | | | 785,000 | | | | 865,463 | |
| H&E Equipment Services LLC, 7%, 2022 (n) | | | 3,655,000 | | | | 3,993,087 | |
| NESCO LLC/NESCO Holdings Corp., 11.75%, 2017 (n) | | | 3,465,000 | | | | 3,776,850 | |
| RSC Equipment Rental, Inc., 8.25%, 2021 | | | 2,910,000 | | | | 3,310,125 | |
| United Rentals North America, Inc., 5.75%, 2018 | | | 1,420,000 | | | | 1,526,500 | |
| United Rentals North America, Inc., 7.625%, 2022 | | | 1,412,000 | | | | 1,574,380 | |
| | | | | | | | |
| | | | | | | $ | 24,757,293 | |
| Major Banks - 1.1% | | | | | | | | |
| Bank of America Corp., 5.65%, 2018 | | $ | 2,900,000 | | | $ | 3,348,601 | |
| Barclays Bank PLC, 7.625%, 2022 | | | 2,360,000 | | | | 2,327,550 | |
| Royal Bank of Scotland Group PLC, 6.99% to 2017, FRN to 2049 (n) | | | 1,370,000 | | | | 1,287,800 | |
| Royal Bank of Scotland Group PLC, 7.648% to 2031, FRN to 2049 | | | 5,670,000 | | | | 5,981,850 | |
| | | | | | | | |
| | | | | | | $ | 12,945,801 | |
| Medical & Health Technology & Services - 4.8% | | | | | | | | |
| AmSurg Corp., 5.625%, 2020 (n) | | $ | 1,635,000 | | | $ | 1,708,575 | |
| CDRT Holding Corp., 9.25%, 2017 (n)(p) | | | 750,000 | | | | 774,375 | |
| Davita, Inc., 6.375%, 2018 | | | 5,225,000 | | | | 5,590,750 | |
| Davita, Inc., 6.625%, 2020 | | | 4,515,000 | | | | 4,921,350 | |
| Fresenius Medical Care AG & Co. KGaA, 9%, 2015 (n) | | | 2,540,000 | | | | 2,895,600 | |
| Fresenius Medical Care Capital Trust III, 5.625%, 2019 (n) | | | 2,410,000 | | | | 2,608,825 | |
| Fresenius Medical Care Capital Trust III, 5.875%, 2022 (z) | | | 1,015,000 | | | | 1,108,888 | |
| HCA, Inc., 8.5%, 2019 | | | 8,245,000 | | | | 9,172,562 | |
| HCA, Inc., 7.5%, 2022 | | | 4,995,000 | | | | 5,769,225 | |
| HCA, Inc., 5.875%, 2022 | | | 2,180,000 | | | | 2,370,750 | |
19
Portfolio of Investments – continued
| | | | | | | | |
| Issuer | | Shares/Par | | | Value ($) | |
| Bonds - continued | | | | | | | | |
| Medical & Health Technology & Services - continued | | | | | | | | |
| HealthSouth Corp., 8.125%, 2020 | | $ | 4,915,000 | | | $ | 5,394,213 | |
| IASIS Healthcare LLC/IASIS Capital Corp., 8.375%, 2019 | | | 3,945,000 | | | | 4,004,175 | |
| Select Medical Corp., 7.625%, 2015 | | | 449,000 | | | | 449,561 | |
| Tenet Healthcare Corp., 9.25%, 2015 | | | 1,805,000 | | | | 2,044,162 | |
| Tenet Healthcare Corp., 8%, 2020 | | | 2,165,000 | | | | 2,354,437 | |
| Tenet Healthcare Corp., 4.5%, 2021 (z) | | | 1,250,000 | | | | 1,229,687 | |
| Universal Health Services, Inc, 7.625%, 2020 | | | 2,615,000 | | | | 2,804,587 | |
| Universal Health Services, Inc., 7%, 2018 | | | 2,130,000 | | | | 2,348,325 | |
| Universal Hospital Services, Inc., FRN, 3.902%, 2015 | | | 1,015,000 | | | | 1,011,194 | |
| Vanguard Health Systems, Inc., 0%, 2016 | | | 7,000 | | | | 5,355 | |
| | | | | | | | |
| | | | | | | $ | 58,566,596 | |
| Medical Equipment - 0.7% | | | | | | | | |
| Biomet, Inc., 6.5%, 2020 (n) | | $ | 2,760,000 | | | $ | 2,898,000 | |
| Hologic, Inc., 6.25%, 2020 (n) | | | 1,030,000 | | | | 1,107,250 | |
| Physio-Control International, Inc., 9.875%, 2019 (n) | | | 1,860,000 | | | | 2,083,200 | |
| Teleflex, Inc., 6.875%, 2019 | | | 2,645,000 | | | | 2,869,825 | |
| | | | | | | | |
| | | | | | | $ | 8,958,275 | |
| Metals & Mining - 1.8% | | | | | | | | |
| Arch Coal, Inc., 7.25%, 2020 | | $ | 2,715,000 | | | $ | 2,429,925 | |
| Cloud Peak Energy, Inc., 8.25%, 2017 | | | 5,780,000 | | | | 6,141,250 | |
| Cloud Peak Energy, Inc., 8.5%, 2019 | | | 380,000 | | | | 413,250 | |
| Consol Energy, Inc., 8%, 2017 | | | 1,985,000 | | | | 2,143,800 | |
| Consol Energy, Inc., 8.25%, 2020 | | | 2,055,000 | | | | 2,224,538 | |
| First Quantum Minerals Ltd., 7.25%, 2019 (n) | | | 1,783,000 | | | | 1,814,203 | |
| Fortescue Metals Group Ltd., 8.25%, 2019 (n) | | | 2,310,000 | | | | 2,477,475 | |
| Peabody Energy Corp., 6%, 2018 | | | 2,295,000 | | | | 2,404,012 | |
| Peabody Energy Corp., 6.25%, 2021 | | | 1,295,000 | | | | 1,353,275 | |
| | | | | | | | |
| | | | | | | $ | 21,401,728 | |
| Municipals - 0.2% | | | | | | | | |
| New Jersey Tobacco Settlement Financing Corp., “1-A”, 4.5%, 2023 | | $ | 2,330,000 | | | $ | 2,320,354 | |
| | |
| Natural Gas - Distribution - 0.4% | | | | | | | | |
| AmeriGas Finance LLC, 6.75%, 2020 | | $ | 2,385,000 | | | $ | 2,587,725 | |
| Ferrellgas LP/Ferrellgas Finance Corp., 6.5%, 2021 | | | 1,735,000 | | | | 1,752,350 | |
| | | | | | | | |
| | | | | | | $ | 4,340,075 | |
| Natural Gas - Pipeline - 3.1% | | | | | | | | |
| Access Midstream Partners Co., 4.875%, 2023 | | $ | 1,200,000 | | | $ | 1,194,000 | |
| Atlas Pipeline Partners LP, 8.75%, 2018 | | | 4,520,000 | | | | 4,845,440 | |
| Atlas Pipeline Partners LP, 5.875%, 2023 (z) | | | 1,865,000 | | | | 1,860,338 | |
20
Portfolio of Investments – continued
| | | | | | | | |
| Issuer | | Shares/Par | | | Value ($) | |
| Bonds - continued | | | | | | | | |
| Natural Gas - Pipeline - continued | | | | | | | | |
| Crosstex Energy, Inc., 8.875%, 2018 | | $ | 5,455,000 | | | $ | 5,857,306 | |
| El Paso Corp., 7%, 2017 | | | 3,790,000 | | | | 4,344,765 | |
| El Paso Corp., 7.75%, 2032 | | | 4,425,000 | | | | 5,202,827 | |
| Energy Transfer Equity LP, 7.5%, 2020 | | | 3,590,000 | | | | 4,137,475 | |
| Enterprise Products Partners LP, 8.375% to 2016, FRN to 2066 | | | 1,721,000 | | | | 1,966,243 | |
| Enterprise Products Partners LP, 7.034% to 2018, FRN to 2068 | | | 1,047,000 | | | | 1,198,815 | |
| Inergy Midstream LP, 6%, 2020 (n) | | | 2,815,000 | | | | 2,906,487 | |
| MarkWest Energy Partners LP, 5.5%, 2023 | | | 2,150,000 | | | | 2,268,250 | |
| Rockies Express Pipeline LLC, 5.625%, 2020 (n) | | | 949,000 | | | | 892,060 | |
| Sabine Pass Liquefaction, 5.625%, 2021 (z) | | | 805,000 | | | | 808,019 | |
| | | | | | | | |
| | | | | | | $ | 37,482,025 | |
| Network & Telecom - 1.8% | | | | | | | | |
| Centurylink, Inc., 7.65%, 2042 | | $ | 3,030,000 | | | $ | 3,118,179 | |
| Cincinnati Bell, Inc., 8.25%, 2017 | | | 850,000 | | | | 912,688 | |
| Citizens Communications Co., 9%, 2031 | | | 1,795,000 | | | | 1,947,575 | |
| Eileme 2 AB, 11.625%, 2020 (n) | | | 2,149,000 | | | | 2,530,448 | |
| Frontier Communications Corp., 8.125%, 2018 | | | 2,940,000 | | | | 3,403,050 | |
| Qwest Communications International, Inc., 7.125%, 2018 (n) | | | 3,990,000 | | | | 4,162,388 | |
| TW Telecom Holdings, Inc., 5.375%, 2022 | | | 1,280,000 | | | | 1,344,000 | |
| Windstream Corp., 8.125%, 2018 | | | 570,000 | | | | 625,575 | |
| Windstream Corp., 7.75%, 2020 | | | 2,615,000 | | | | 2,843,812 | |
| Windstream Corp., 7.75%, 2021 | | | 1,265,000 | | | | 1,382,012 | |
| | | | | | | | |
| | | | | | | $ | 22,269,727 | |
| Oil Services - 1.3% | | | | | | | | |
| Bristow Group, Inc., 6.25%, 2022 | | $ | 1,295,000 | | | $ | 1,398,600 | |
| Chesapeake Energy Corp., 6.625%, 2019 (n) | | | 1,035,000 | | | | 1,024,650 | |
| Dresser-Rand Group, Inc., 6.5%, 2021 | | | 1,300,000 | | | | 1,378,000 | |
| Edgen Murray Corp., 8.75%, 2020 (n) | | | 2,620,000 | | | | 2,678,950 | |
| Pioneer Energy Services Corp., 9.875%, 2018 | | | 2,210,000 | | | | 2,397,850 | |
| Shale-Inland Holdings LLC/Finance Co., 8.75%, 2019 (n) | | | 2,810,000 | | | | 2,950,500 | |
| Unit Corp., 6.625%, 2021 | | | 4,060,000 | | | | 4,212,250 | |
| | | | | | | | |
| | | | | | | $ | 16,040,800 | |
| Other Banks & Diversified Financials - 2.4% | | | | | | | | |
| Ally Financial, Inc., 5.5%, 2017 | | $ | 7,745,000 | | | $ | 8,326,479 | |
| Ally Financial, Inc., 6.25%, 2017 | | | 1,680,000 | | | | 1,869,156 | |
| GMAC, Inc., 8%, 2031 | | | 540,000 | | | | 682,425 | |
| Groupe BPCE S.A., 12.5% to 2019, FRN to 2049 (n) | | | 2,865,000 | | | | 3,504,554 | |
| LBG Capital No. 1 PLC, 7.875%, 2020 (n) | | | 5,525,000 | | | | 6,055,400 | |
| Santander UK PLC, 8.963% to 2030, FRN to 2049 | | | 6,666,000 | | | | 7,699,230 | |
| UBS AG, 7.625%, 2022 | | | 1,460,000 | | | | 1,604,162 | |
| | | | | | | | |
| | | | | | | $ | 29,741,406 | |
21
Portfolio of Investments – continued
| | | | | | | | |
| Issuer | | Shares/Par | | | Value ($) | |
| Bonds - continued | | | | | | | | |
| Pharmaceuticals - 0.7% | | | | | | | | |
| Capsugel FinanceCo. SCA, 9.875%, 2019 (n) | | EUR | 1,370,000 | | | $ | 2,078,758 | |
| Valeant Pharmaceuticals International, Inc., 7%, 2020 (n) | | $ | 3,750,000 | | | | 3,975,000 | |
| Valeant Pharmaceuticals International, Inc., 7.25%, 2022 (n) | | | 2,800,000 | | | | 3,010,000 | |
| | | | | | | | |
| | | | | | | $ | 9,063,758 | |
| Pollution Control - 0.3% | | | | | | | | |
| Heckmann Corp., 9.875%, 2018 | | $ | 2,300,000 | | | $ | 2,443,750 | |
| Heckmann Corp., 9.875%, 2018 (z) | | | 765,000 | | | | 807,075 | |
| | | | | | | | |
| | | | | | | $ | 3,250,825 | |
| Precious Metals & Minerals - 0.5% | | | | | | | | |
| Eldorado Gold Corp., 6.125%, 2020 (n) | | $ | 2,785,000 | | | $ | 2,927,731 | |
| IAMGOLD Corp., 6.75%, 2020 (n) | | | 3,587,000 | | | | 3,515,260 | |
| | | | | | | | |
| | | | | | | $ | 6,442,991 | |
| Printing & Publishing - 0.4% | | | | | | | | |
| American Media, Inc., 13.5%, 2018 (z) | | $ | 297,449 | | | $ | 260,268 | |
| Nielsen Finance LLC, 7.75%, 2018 | | | 2,760,000 | | | | 3,073,950 | |
| Nielsen Finance LLC, 4.5%, 2020 (n) | | | 1,520,000 | | | | 1,497,200 | |
| | | | | | | | |
| | | | | | | $ | 4,831,418 | |
| Railroad & Shipping - 0.1% | | | | | | | | |
| Kansas City Southern de Mexico S.A. de C.V., 6.125%, 2021 | | $ | 1,295,000 | | | $ | 1,456,875 | |
| | |
| Real Estate - 1.2% | | | | | | | | |
| CB Richard Ellis Group, Inc., 11.625%, 2017 | | $ | 1,680,000 | | | $ | 1,831,200 | |
| CNL Lifestyle Properties, Inc., REIT, 7.25%, 2019 | | | 1,300,000 | | | | 1,290,250 | |
| Entertainment Properties Trust, REIT, 7.75%, 2020 | | | 3,050,000 | | | | 3,558,697 | |
| Entertainment Properties Trust, REIT, 5.75%, 2022 | | | 815,000 | | | | 857,801 | |
| Kennedy Wilson, Inc., 8.75%, 2019 | | | 1,220,000 | | | | 1,293,200 | |
| MPT Operating Partnership LP, REIT, 6.875%, 2021 | | | 2,435,000 | | | | 2,672,412 | |
| MPT Operating Partnership LP, REIT, 6.375%, 2022 | | | 3,215,000 | | | | 3,448,087 | |
| | | | | | | | |
| | | | | | | $ | 14,951,647 | |
| Retailers - 2.3% | | | | | | | | |
| Academy Ltd., 9.25%, 2019 (n) | | $ | 1,565,000 | | | $ | 1,744,975 | |
| Burlington Coat Factory Warehouse Corp., 10%, 2019 | | | 3,540,000 | | | | 3,849,750 | |
| J. Crew Group, Inc., 8.125%, 2019 | | | 3,160,000 | | | | 3,389,100 | |
| Limited Brands, Inc., 6.9%, 2017 | | | 1,960,000 | | | | 2,258,900 | |
| Limited Brands, Inc., 7%, 2020 | | | 1,520,000 | | | | 1,748,000 | |
| Limited Brands, Inc., 6.95%, 2033 | | | 1,080,000 | | | | 1,112,400 | |
| Pantry, Inc., 8.375%, 2020 (n) | | | 1,285,000 | | | | 1,374,950 | |
| Rite Aid Corp., 9.25%, 2020 | | | 2,530,000 | | | | 2,814,625 | |
| Sally Beauty Holdings, Inc., 6.875%, 2019 | | | 1,285,000 | | | | 1,419,925 | |
22
Portfolio of Investments – continued
| | | | | | | | |
| Issuer | | Shares/Par | | | Value ($) | |
| Bonds - continued | | | | | | | | |
| Retailers - continued | | | | | | | | |
| Toys “R” Us Property Co. II LLC, 8.5%, 2017 | | $ | 1,466,000 | | | $ | 1,542,965 | |
| Toys “R” Us, Inc., 10.75%, 2017 | | | 4,665,000 | | | | 5,014,875 | |
| Yankee Acquisition Corp., 8.5%, 2015 | | | 21,000 | | | | 21,053 | |
| YCC Holdings LLC/Yankee Finance, Inc., 10.25%, 2016 (p) | | | 1,260,000 | | | | 1,297,813 | |
| | | | | | | | |
| | | | | | | $ | 27,589,331 | |
| Specialty Chemicals - 0.2% | | | | | | | | |
| Eagle Spinco, Inc., 4.625%, 2021 (z) | | $ | 625,000 | | | $ | 628,906 | |
| Georgia Gulf Corp., 4.875%, 2023 (z) | | | 255,000 | | | | 256,913 | |
| Koppers, Inc., 7.875%, 2019 | | | 1,835,000 | | | | 2,020,794 | |
| | | | | | | | |
| | | | | | | $ | 2,906,613 | |
| Specialty Stores - 0.4% | | | | | | | | |
| Gymboree Corp., 9.125%, 2018 | | $ | 1,305,000 | | | $ | 1,226,700 | |
| Michaels Stores, Inc., 11.375%, 2016 | | | 1,249,000 | | | | 1,303,656 | |
| Michaels Stores, Inc., 7.75%, 2018 | | | 1,980,000 | | | | 2,165,625 | |
| | | | | | | | |
| | | | | | | $ | 4,695,981 | |
| Telecommunications - Wireless - 4.1% | | | | | | | | |
| Clearwire Corp., 12%, 2015 (n) | | $ | 3,140,000 | | | $ | 3,402,975 | |
| Cricket Communications, Inc., 7.75%, 2016 | | | 2,040,000 | | | | 2,147,100 | |
| Cricket Communications, Inc., 7.75%, 2020 | | | 2,670,000 | | | | 2,770,125 | |
| Crown Castle International Corp., 7.125%, 2019 | | | 4,420,000 | | | | 4,911,725 | |
| Crown Castle International Corp., 5.25%, 2023 (n) | | | 1,655,000 | | | | 1,737,750 | |
| Digicel Group Ltd., 12%, 2014 (n) | | | 560,000 | | | | 603,400 | |
| Digicel Group Ltd., 8.25%, 2017 (n) | | | 3,050,000 | | | | 3,233,000 | |
| Digicel Group Ltd., 10.5%, 2018 (n) | | | 2,540,000 | | | | 2,832,100 | |
| MetroPCS Wireless, Inc., 7.875%, 2018 | | | 2,455,000 | | | | 2,657,537 | |
| Sprint Capital Corp., 6.875%, 2028 | | | 3,280,000 | | | | 3,312,800 | |
| Sprint Nextel Corp., 6%, 2016 | | | 4,115,000 | | | | 4,433,912 | |
| Sprint Nextel Corp., 8.375%, 2017 | | | 3,611,000 | | | | 4,175,219 | |
| Sprint Nextel Corp., 9%, 2018 (n) | | | 1,350,000 | | | | 1,670,625 | |
| Sprint Nextel Corp., 6%, 2022 | | | 3,600,000 | | | | 3,618,000 | |
| Wind Acquisition Finance S.A., 11.75%, 2017 (n) | | | 3,205,000 | | | | 3,445,375 | |
| Wind Acquisition Finance S.A., 7.25%, 2018 (n) | | | 4,710,000 | | | | 4,957,275 | |
| | | | | | | | |
| | | | | | | $ | 49,908,918 | |
| Telephone Services - 0.5% | | | | | | | | |
| Cogent Communications Group, Inc., 8.375%, 2018 (n) | | $ | 1,240,000 | | | $ | 1,373,300 | |
| Level 3 Financing, Inc., 9.375%, 2019 | | | 2,095,000 | | | | 2,367,350 | |
| Level 3 Financing, Inc., 7%, 2020 (n) | | | 770,000 | | | | 816,200 | |
| Level 3 Financing, Inc., 8.625%, 2020 | | | 1,315,000 | | | | 1,472,800 | |
| | | | | | | | |
| | | | | | | $ | 6,029,650 | |
23
Portfolio of Investments – continued
| | | | | | | | |
| Issuer | | Shares/Par | | | Value ($) | |
| Bonds - continued | | | | | | | | |
| Transportation - 0.2% | | | | | | | | |
| Navios South American Logistics, Inc., 9.25%, 2019 | | $ | 2,457,000 | | | $ | 2,457,000 | |
| | |
| Transportation - Services - 2.9% | | | | | | | | |
| ACL I Corp., 10.625%, 2016 (p) | | $ | 3,174,052 | | | $ | 3,051,168 | |
| Aguila American Resources Ltd., 7.875%, 2018 (n) | | | 2,765,000 | | | | 2,930,900 | |
| Avis Budget Car Rental LLC, 8.25%, 2019 | | | 1,980,000 | | | | 2,192,850 | |
| Avis Budget Car Rental LLC, 9.75%, 2020 | | | 1,130,000 | | | | 1,307,975 | |
| CEVA Group PLC, 8.375%, 2017 (n) | | | 5,780,000 | | | | 5,910,050 | |
| Commercial Barge Line Co., 12.5%, 2017 | | | 6,370,000 | | | | 6,991,075 | |
| HDTFS, Inc., 5.875%, 2020 (n) | | | 585,000 | | | | 621,563 | |
| Navios Maritime Acquisition Corp., 8.625%, 2017 | | | 3,385,000 | | | | 3,207,287 | |
| Navios Maritime Holdings, Inc., 8.875%, 2017 | | | 3,200,000 | | | | 3,160,000 | |
| Swift Services Holdings, Inc., 10%, 2018 | | | 5,170,000 | | | | 5,835,637 | |
| | | | | | | | |
| | | | | | | $ | 35,208,505 | |
| Utilities - Electric Power - 4.3% | | | | | | | | |
| AES Corp., 8%, 2017 | | $ | 4,225,000 | | | $ | 4,879,875 | |
| AES Corp., 7.375%, 2021 | | | 1,265,000 | | | | 1,410,475 | |
| Calpine Corp., 8%, 2016 (n) | | | 2,690,000 | | | | 2,837,950 | |
| Calpine Corp., 7.875%, 2020 (n) | | | 4,162,000 | | | | 4,588,605 | |
| Covanta Holding Corp., 7.25%, 2020 | | | 3,565,000 | | | | 3,927,222 | |
| Covanta Holding Corp., 6.375%, 2022 | | | 850,000 | | | | 927,658 | |
| EDP Finance B.V., 6%, 2018 (n) | | | 4,590,000 | | | | 4,853,925 | |
| Energy Future Holdings Corp., 10%, 2020 | | | 9,606,000 | | | | 11,022,885 | |
| Energy Future Holdings Corp., 10%, 2020 (z) | | | 3,565,000 | | | | 4,081,925 | |
| Energy Future Holdings Corp., 11.75%, 2022 (n) | | | 2,510,000 | | | | 2,858,263 | |
| GenOn Energy, Inc., 9.875%, 2020 | | | 4,555,000 | | | | 5,238,250 | |
| NRG Energy, Inc., 8.25%, 2020 | | | 3,950,000 | | | | 4,463,500 | |
| Texas Competitive Electric Holdings Co. LLC, 11.5%, 2020 (n) | | | 1,345,000 | | | | 1,062,550 | |
| | | | | | | | |
| | | | | | | $ | 52,153,083 | |
| Total Bonds (Identified Cost, $1,070,331,598) | | | | | | $ | 1,127,625,245 | |
| | |
| Floating Rate Loans (g)(r) - 0.2% | | | | | | | | |
| Financial Institutions - 0.1% | | | | | | | | |
| Springleaf Finance Corp., Term Loan, 5.5%, 2017 | | $ | 1,315,949 | | | $ | 1,318,251 | |
| | |
| Utilities - Electric Power - 0.1% | | | | | | | | |
| Dynegy Holdings, Inc., Term Loan B, 9.25%, 2016 | | $ | 426,339 | | | $ | 444,154 | |
| Dynegy Holdings, Inc., Term Loan B1, 9.25%, 2016 | | | 322,338 | | | | 334,425 | |
| | | | | | | | |
| | | | | | | $ | 778,579 | |
| Total Floating Rate Loans (Identified Cost, $2,048,643) | | | | | | $ | 2,096,830 | |
24
Portfolio of Investments – continued
| | | | | | | | |
| Common Stocks - 0.1% | | | | | | | | |
| Issuer | | Shares/Par | | | Value ($) | |
| Automotive - 0.0% | | | | | | | | |
| Accuride Corp. (a) | | | 65,068 | | | $ | 244,656 | |
| | |
| Broadcasting - 0.1% | | | | | | | | |
| New Young Broadcasting Holding Co., Inc. (a) | | | 213 | | | $ | 798,750 | |
| | |
| Chemicals - 0.0% | | | | | | | | |
| LyondellBasell Industries N.V., “A” | | | 198 | | | $ | 12,557 | |
| | |
| Printing & Publishing - 0.0% | | | | | | | | |
| American Media Operations, Inc. (a) | | | 76,223 | | | $ | 362,059 | |
| Total Common Stocks (Identified Cost, $2,582,143) | | | | | | $ | 1,418,022 | |
| | |
| Convertible Preferred Stocks - 0.2% | | | | | | | | |
| Automotive - 0.2% | | | | | | | | |
| General Motors Co., 4.75% (Identified Cost, $2,883,804) | | $ | 59,470 | | | $ | 2,576,240 | |
| | |
| Convertible Bonds - 0.3% | | | | | | | | |
| Network & Telecom - 0.3% | | | | | | | | |
Nortel Networks Corp., 2.125%, 2014
(Identified Cost, $4,289,100) (a)(d) | | $ | 4,345,000 | | | $ | 4,323,275 | |
| | |
| Preferred Stocks - 0.4% | | | | | | | | |
| Other Banks & Diversified Financials - 0.4% | | | | | | | | |
| Ally Financial, Inc., 7% (z) | | | 2,489 | | | $ | 2,429,186 | |
| GMAC Capital Trust I, 8.125% | | | 90,100 | | | | 2,402,967 | |
| Total Preferred Stocks (Identified Cost, $4,658,622) | | | | | | $ | 4,832,153 | |
| | | | | | | | | | | | | | | | |
| | | | |
| | | Strike Price | | | First Exercise | | | | | | | |
| Warrants - 0.1% | | | | | | | | | | | | | |
| Broadcasting - 0.1% | | | | | | | | | |
| New Young Broadcasting Holding Co., Inc. (1 share for 1 warrant) (Identified Cost, $513,055) (a) | | $ | 0.01 | | | | 7/14/10 | | | | 263 | | | $ | 986,250 | |
| | |
| Issuer/Expiration Date/Strike Price | | | Number
of
Contracts | | | | |
| Call Options Purchased - 0.1% | | | | | | | | | |
| Russell 2000 Index - March 2013 @ 925 (Premiums Paid, $949,774) | | | | 1,253 | | | $ | 1,105,146 | |
25
Portfolio of Investments – continued
| | | | | | | | |
| Money Market Funds - 5.1% | | | | | | | | |
| Issuer | | Shares/Par | | | Value ($) | |
MFS Institutional Money Market Portfolio, 0.14%,
at Cost and Net Asset Value (v) | | | 62,312,638 | | | $ | 62,312,638 | |
| Total Investments (Identified Cost, $1,150,569,377) | | | | | | $ | 1,207,275,799 | |
| | |
| Other Assets, Less Liabilities - 1.3% | | | | | | | 15,754,346 | |
| Net Assets - 100.0% | | | | | | $ | 1,223,030,145 | |
| (a) | Non-income producing security. |
| (d) | In default. Interest and/or scheduled principal payment(s) have been missed. |
| (g) | The rate shown represents a weighted average coupon rate on settled positions at period end, unless otherwise indicated. |
| (i) | Interest only security for which the fund receives interest on notional principal (Par amount). Par amount shown is the notional principal and does not reflect the cost of the security. |
| (n) | Securities exempt from registration under Rule 144A of the Securities Act of 1933. These securities may be sold in the ordinary course of business in transactions exempt from registration, normally to qualified institutional buyers. At period end, the aggregate value of these securities was $322,153,135 representing 26.3% of net assets. |
| (p) | Payment-in-kind security. |
| (r) | Remaining maturities of floating rate loans may be less than stated maturities shown as a result of contractual or optional prepayments by the borrower. Such prepayments cannot be predicted with certainty. These loans may be subject to restrictions on resale. Floating rate loans generally have rates of interest which are determined periodically by reference to a base lending rate plus a premium. |
| (v) | Underlying affiliated fund that is available only to investment companies managed by MFS. The rate quoted for the MFS Institutional Money Market Portfolio is the annualized seven-day yield of the fund at period end. |
| (z) | Restricted securities are not registered under the Securities Act of 1933 and are subject to legal restrictions on resale. These securities generally may be resold in transactions exempt from registration or to the public if the securities are subsequently registered. Disposal of these securities may involve time-consuming negotiations and prompt sale at an acceptable price may be difficult. The fund holds the following restricted securities: |
| | | | | | | | | | |
| Restricted Securities | | Acquisition Date | | Cost | | | Value | |
| Ally Financial, Inc., 7% (Preferred Stock) | | 4/13/11-11/27/12 | | | $2,370,188 | | | | $2,429,186 | |
| American Media, Inc., 13.5%, 2018 | | 12/28/10 | | | 301,291 | | | | 260,268 | |
| Ardagh Packaging Finance PLC , 7%, 2020 | | 1/16/13 | | | 1,210,000 | | | | 1,219,075 | |
| Atlas Pipeline Partners LP, 5.875%, 2023 | | 1/28/13 | | | 1,865,000 | | | | 1,860,338 | |
| Aviation Capital Group, 4.625%, 2018 | | 1/14/13 | | | 985,000 | | | | 997,889 | |
| BC Mountain LLC, 7%, 2021 | | 1/25/13 | | | 375,000 | | | | 384,375 | |
| Bombardier, Inc., 4.25%, 2016 | | 1/09/13 | | | 715,000 | | | | 736,450 | |
| CWCapital Cobalt Ltd., CDO, “E2”, 6%, 2045 | | 3/20/06-11/25/12 | | | 1,228,919 | | | | 12,690 | |
| CWCapital Cobalt Ltd., CDO, “F”, FRN, 1.6%, 2050 | | 4/12/06-1/26/13 | | | 644,319 | | | | 1,611 | |
| CWCapital Cobalt Ltd., CDO, “G”, FRN, 1.801%, 2050 | | 4/12/06-1/26/13 | | | 2,009,514 | | | | 5,024 | |
26
Portfolio of Investments – continued
| | | | | | | | | | |
| Restricted Securities - continued | | Acquisition Date | | Cost | | | Value | |
| Clearwater Paper Corp., 4.5%, 2023 | | 1/17/13 | | | $500,000 | | | | $496,250 | |
| Crown Americas LLC, 4.5%, 2023 | | 1/03/13 | | | 2,030,000 | | | | 1,999,550 | |
| Dematic S.A., 7.75%, 2020 | | 12/13/12 | | | 2,195,000 | | | | 2,244,388 | |
| Eagle Spinco, Inc., 4.625%, 2021 | | 1/17/13 | | | 625,000 | | | | 628,906 | |
| Energy Future Holdings Corp., 10%, 2020 | | 1/07/10-9/10/12 | | | 3,774,580 | | | | 4,081,925 | |
| Falcon Franchise Loan LLC, FRN, 6.542%, 2025 | | 1/29/03 | | | 169,898 | | | | 332,402 | |
| Flash Dutch 2 B.V./U.S. Coatings Acquisition, 7.375%, 2021 | | 1/16/13 | | | 520,000 | | | | 535,600 | |
| Fresenius Medical Care Capital Trust III, 5.875%, 2022 | | 1/24/13 | | | 1,121,496 | | | | 1,108,888 | |
| G-Force LLC, CDO, “A2”, 4.83%, 2036 | | 1/20/11-2/14/11 | | | 1,697,035 | | | | 1,755,259 | |
| Georgia Gulf Corp., 4.875%, 2023 | | 1/17/13 | | | 255,000 | | | | 256,913 | |
| Gibraltar Industries, Inc., 6.25%, 2021 | | 1/18/13 | | | 500,000 | | | | 519,375 | |
| HD Supply, Inc., 10.5%, 2021 | | 1/09/13 | | | 260,000 | | | | 265,850 | |
| Heckler & Koch GmbH, 9.5%, 2018 | | 5/06/11-1/02/13 | | | 2,350,479 | | | | 2,106,498 | |
| Heckmann Corp., 9.875%, 2018 | | 10/26/12 | | | 766,847 | | | | 807,075 | |
| Jaguar Land Rover PLC, 5.625%, 2023 | | 1/23/13 | | | 1,055,000 | | | | 1,076,100 | |
| LBI Media, Inc., 13.5% to 2015, 11.5% to 2020 | | 1/02/13 | | | 390,656 | | | | 377,610 | |
| Lear Corp., 4.75%, 2023 | | 1/14/13 | | | 885,000 | | | | 880,575 | |
| Local TV Finance LLC, 9.25%, 2015 | | 12/10/07-12/06/12 | | | 2,921,390 | | | | 2,953,106 | |
| Morgan Stanley Capital I, Inc., FRN, 1.384%, 2039 | | 7/20/04 | | | 180,416 | | | | 134,901 | |
| NXP B.V., 5.75%, 2021 | | 1/31/13 | | | 870,000 | | | | 870,000 | |
| Netflix, Inc., 5.375%, 2021 | | 1/29/13-1/30/13 | | | 1,767,356 | | | | 1,756,175 | |
| Neustar, Inc., 4.5%, 2023 | | 1/11/13-1/16/13 | | | 1,399,645 | | | | 1,400,000 | |
| Sabine Pass Liquefaction, 5.625%, 2021 | | 1/29/13 | | | 805,000 | | | | 808,019 | |
| Tenet Healthcare Corp., 4.5%, 2021 | | 1/22/13 | | | 1,250,000 | | | | 1,229,687 | |
| Unifrax I LLC, 7.5%, 2019 | | 1/31/13 | | | 510,000 | | | | 510,000 | |
| Total Restricted Securities | | | | $37,041,958 | |
| % of Net assets | | | | 3.0% | |
The following abbreviations are used in this report and are defined:
| CDO | | Collateralized Debt Obligation |
| FRN | | Floating Rate Note. Interest rate resets periodically and may not be the rate reported at period end. |
| PLC | | Public Limited Company |
| REIT | | Real Estate Investment Trust |
Abbreviations indicate amounts shown in currencies other than the U.S. dollar. All amounts are stated in U.S. dollars unless otherwise indicated. A list of abbreviations is shown below:
27
Portfolio of Investments – continued
Derivative Contracts at 1/31/13
Forward Foreign Currency Exchange Contracts at 1/31/13
| | | | | | | | | | | | | | | | | | | | | | | | |
| Type | | Currency | | Counterparty | | Contracts
to
Deliver/ Receive | | | Settlement
Date Range | | | In
Exchange
for | | | Contracts
at Value | | | Net Unrealized
Appreciation (Depreciation) | |
| Liability Derivatives | | | | | | | | | | | | | | | |
| SELL | | EUR | | Barclays Bank PLC | | | 272,000 | | | | 4/15/13 | | | | $363,280 | | | | $369,460 | | | | $(6,180 | ) |
| SELL | | EUR | | Deutsche Bank AG | | | 4,487,101 | | | | 4/15/13 | | | | 5,869,859 | | | | 6,094,874 | | | | (225,015 | ) |
| SELL | | EUR | | JPMorgan Chase Bank N.A. | | | 4,487,101 | | | | 4/15/13 | | | | 5,869,384 | | | | 6,094,874 | | | | (225,490 | ) |
| | | | | | | | | | | | | | | | | | | | | | | | |
| | | | | | | | | | | | | | | | | | | | | | | $(456,685 | ) |
| | | | | | | | | | | | | | | | | | | | | | | | |
See Notes to Financial Statements
28
Financial Statements
STATEMENT OF ASSETS AND LIABILITIES
At 1/31/13
This statement represents your fund’s balance sheet, which details the assets and liabilities comprising the total value of the fund.
| | | | |
| Assets | | | | |
Investments- | | | | |
Non-affiliated issuers, at value (identified cost, $1,088,256,739) | | | $1,144,963,161 | |
Underlying affiliated funds, at cost and value | | | 62,312,638 | |
Total investments, at value (identified cost, $1,150,569,377) | | | $1,207,275,799 | |
Receivables for | | | | |
Investments sold | | | 5,170,668 | |
Fund shares sold | | | 3,397,779 | |
Interest and dividends | | | 22,761,576 | |
Other assets | | | 8,494 | |
Total assets | | | $1,238,614,316 | |
| Liabilities | | | | |
Payable to custodian | | | $128,088 | |
Payables for | | | | |
Distributions | | | 669,394 | |
Forward foreign currency exchange contracts | | | 456,685 | |
Investments purchased | | | 11,842,199 | |
Fund shares reacquired | | | 1,832,370 | |
Payable to affiliates | | | | |
Investment adviser | | | 31,663 | |
Shareholder servicing costs | | | 363,250 | |
Distribution and service fees | | | 13,535 | |
Program manager fees | | | 12 | |
Payable for independent Trustees’ compensation | | | 62,428 | |
Accrued expenses and other liabilities | | | 184,547 | |
Total liabilities | | | $15,584,171 | |
Net assets | | | $1,223,030,145 | |
| Net assets consist of | | | | |
Paid-in capital | | | $1,382,030,074 | |
Unrealized appreciation (depreciation) on investments and translation of assets and liabilities in foreign currencies | | | 56,259,510 | |
Accumulated net realized gain (loss) on investments and foreign currency | | | (213,670,201 | ) |
Accumulated distributions in excess of net investment income | | | (1,589,238 | ) |
Net assets | | | $1,223,030,145 | |
Shares of beneficial interest outstanding | | | 338,960,521 | |
29
Statement of Assets and Liabilities – continued
| | | | | | | | | | | | |
| | | Net assets | | | Shares
outstanding | | | Net asset value
per share (a) | |
Class A | | | $504,600,427 | | | | 139,873,215 | | | | $3.61 | |
Class B | | | 31,655,755 | | | | 8,758,581 | | | | 3.61 | |
Class C | | | 81,710,021 | | | | 22,566,170 | | | | 3.62 | |
Class I | | | 70,506,150 | | | | 19,576,281 | | | | 3.60 | |
Class R1 | | | 1,137,051 | | | | 314,689 | | | | 3.61 | |
Class R2 | | | 4,103,090 | | | | 1,136,693 | | | | 3.61 | |
Class R3 | | | 8,182,819 | | | | 2,268,580 | | | | 3.61 | |
Class R4 | | | 301,942 | | | | 83,640 | | | | 3.61 | |
Class R5 | | | 516,398,712 | | | | 143,154,027 | | | | 3.61 | |
Class 529A | | | 2,748,381 | | | | 762,080 | | | | 3.61 | |
Class 529B | | | 374,732 | | | | 103,884 | | | | 3.61 | |
Class 529C | | | 1,311,065 | | | | 362,681 | | | | 3.61 | |
| (a) | Maximum offering price per share was equal to the net asset value per share for all share classes, except for Classes A and 529A, for which the maximum offering prices per share were $3.79 [100 / 95.25 x $3.61] and $3.79 [100 / 95.25 x $3.61], respectively. On sales of $50,000 or more, the maximum offering prices of Class A and Class 529A shares are reduced. A contingent deferred sales charge may be imposed on redemptions of Class A, Class B, Class C, Class 529B, and Class 529C shares. Redemption price per share was equal to the net asset value per share for Classes I, R1, R2, R3, R4, R5, and 529A. |
See Notes to Financial Statements
30
Financial Statements
STATEMENT OF OPERATIONS
Year ended 1/31/13
This statement describes how much your fund earned in investment income and accrued in expenses. It also describes any gains and/or losses generated by fund operations.
| | | | |
| Net investment income | | | | |
Income | | | | |
Interest | | | $80,134,491 | |
Dividends | | | 546,479 | |
Dividends from underlying affiliated funds | | | 81,723 | |
Total investment income | | | $80,762,693 | |
Expenses | | | | |
Management fee | | | $5,112,105 | |
Distribution and service fees | | | 2,318,195 | |
Program manager fees | | | 3,773 | |
Shareholder servicing costs | | | 1,487,751 | |
Administrative services fee | | | 165,508 | |
Independent Trustees’ compensation | | | 27,989 | |
Custodian fee | | | 149,652 | |
Shareholder communications | | | 74,487 | |
Audit and tax fees | | | 76,733 | |
Legal fees | | | 14,007 | |
Miscellaneous | | | 241,973 | |
Total expenses | | | $9,672,173 | |
Fees paid indirectly | | | (247 | ) |
Reduction of expenses by investment adviser and distributor | | | (5,597 | ) |
Net expenses | | | $9,666,329 | |
Net investment income | | | $71,096,364 | |
| Realized and unrealized gain (loss) on investments and foreign currency | |
Realized gain (loss) (identified cost basis) | | | | |
Investments | | | $3,835,660 | |
Foreign currency | | | (217,540 | ) |
Net realized gain (loss) on investments and foreign currency | | | $3,618,120 | |
Change in unrealized appreciation (depreciation) | | | | |
Investments | | | $52,990,054 | |
Translation of assets and liabilities in foreign currencies | | | (197,023 | ) |
Net unrealized gain (loss) on investments and foreign currency translation | | | $52,793,031 | |
Net realized and unrealized gain (loss) on investments and foreign currency | | | $56,411,151 | |
Change in net assets from operations | | | $127,507,515 | |
See Notes to Financial Statements
31
Financial Statements
STATEMENTS OF CHANGES IN NET ASSETS
These statements describe the increases and/or decreases in net assets resulting from operations, any distributions, and any shareholder transactions.
| | | | | | | | |
| | | Years ended 1/31 | |
| | | 2013 | | | 2012 | |
| Change in net assets | | | | | | |
| From operations | | | | | | | | |
Net investment income | | | $71,096,364 | | | | $68,375,836 | |
Net realized gain (loss) on investments and foreign currency | | | 3,618,120 | | | | (2,037,291 | ) |
Net unrealized gain (loss) on investments and foreign currency translation | | | 52,793,031 | | | | (20,065,177 | ) |
Change in net assets from operations | | | $127,507,515 | | | | $46,273,368 | |
| Distributions declared to shareholders | | | | | | | | |
From net investment income | | | $(73,590,229 | ) | | | $(70,548,283 | ) |
Change in net assets from fund share transactions | | | $139,293,851 | | | | $31,456,676 | |
Total change in net assets | | | $193,211,137 | | | | $7,181,761 | |
| Net assets | | | | | | | | |
At beginning of period | | | 1,029,819,008 | | | | 1,022,637,247 | |
At end of period (including accumulated distributions in excess of net investment income of $1,589,238 and $1,523,002, respectively) | | | $1,223,030,145 | | | | $1,029,819,008 | |
See Notes to Financial Statements
32
Financial Statements
FINANCIAL HIGHLIGHTS
The financial highlights table is intended to help you understand the fund’s financial performance for the past 5 years (or life of a particular share class, if shorter). Certain information reflects financial results for a single fund share. The total returns in the table represent the rate by which an investor would have earned (or lost) on an investment in the fund share class (assuming reinvestment of all distributions) held for the entire period.
| | | | | | | | | | | | | | | | | | | | |
| Class A | | Years ended 1/31 | |
| | | 2013 | | | 2012 | | | 2011 | | | 2010 | | | 2009 | |
Net asset value, beginning of period | | | $3.44 | | | | $3.52 | | | | $3.26 | | | | $2.49 | | | | $3.58 | |
| Income (loss) from investment operations | | | | | | | | | | | | | |
Net investment income (d) | | | $0.22 | | | | $0.23 | | | | $0.25 | | | | $0.25 | | | | $0.26 | |
Net realized and unrealized gain (loss)
on investments and foreign currency | | | 0.18 | | | | (0.07 | ) | | | 0.26 | | | | 0.77 | | | | (1.08 | ) |
Total from investment operations | | | $0.40 | | | | $0.16 | | | | $0.51 | | | | $1.02 | | | | $(0.82 | ) |
| Less distributions declared to shareholders | | | | | | | | | | | | | |
From net investment income | | | $(0.23 | ) | | | $(0.24 | ) | | | $(0.25 | ) | | | $(0.25 | ) | | | $(0.27 | ) |
From tax return of capital | | | — | | | | — | | | | — | | | | — | | | | (0.00 | )(w) |
Total distributions declared to
shareholders | | | $(0.23 | ) | | | $(0.24 | ) | | | $(0.25 | ) | | | $(0.25 | ) | | | $(0.27 | ) |
Net asset value, end of period (x) | | | $3.61 | | | | $3.44 | | | | $3.52 | | | | $3.26 | | | | $2.49 | |
Total return (%) (r)(s)(t)(x) | | | 12.05 | | | | 4.77 | | | | 16.22 | | | | 42.99 | | | | (24.05 | ) |
Ratios (%) (to average net assets)
and Supplemental data: | | | | | | | | | |
Expenses before expense reductions (f) | | | 0.93 | | | | 0.93 | | | | 0.93 | | | | 1.00 | | | | 1.05 | |
Expenses after expense reductions (f) | | | 0.93 | | | | 0.92 | | | | 0.93 | | | | 1.00 | | | | 1.05 | |
Net investment income | | | 6.39 | | | | 6.76 | | | | 7.53 | | | | 8.68 | | | | 8.22 | |
Portfolio turnover | | | 38 | | | | 60 | | | | 66 | | | | 58 | | | | 61 | |
Net assets at end of period (000 omitted) | | | $504,600 | | | | $462,232 | | | | $501,139 | | | | $531,990 | | | | $360,076 | |
See Notes to Financial Statements
33
Financial Highlights – continued
| | | | | | | | | | | | | | | | | | | | |
| Class B | | Years ended 1/31 | |
| | | 2013 | | | 2012 | | | 2011 | | | 2010 | | | 2009 | |
Net asset value, beginning of period | | | $3.44 | | | | $3.53 | | | | $3.26 | | | | $2.50 | | | | $3.59 | |
| Income (loss) from investment operations | | | | | | | | | | | | | |
Net investment income (d) | | | $0.20 | | | | $0.21 | | | | $0.23 | | | | $0.23 | | | | $0.24 | |
Net realized and unrealized gain (loss)
on investments and foreign currency | | | 0.18 | | | | (0.09 | ) | | | 0.26 | | | | 0.76 | | | | (1.08 | ) |
Total from investment operations | | | $0.38 | | | | $0.12 | | | | $0.49 | | | | $0.99 | | | | $(0.84 | ) |
| Less distributions declared to shareholders | | | | | | | | | | | | | |
From net investment income | | | $(0.21 | ) | | | $(0.21 | ) | | | $(0.22 | ) | | | $(0.23 | ) | | | $(0.25 | ) |
From tax return of capital | | | — | | | | — | | | | — | | | | — | | | | (0.00 | )(w) |
Total distributions declared to
shareholders | | | $(0.21 | ) | | | $(0.21 | ) | | | $(0.22 | ) | | | $(0.23 | ) | | | $(0.25 | ) |
Net asset value, end of period (x) | | | $3.61 | | | | $3.44 | | | | $3.53 | | | | $3.26 | | | | $2.50 | |
Total return (%) (r)(s)(t)(x) | | | 11.22 | | | | 3.70 | | | | 15.69 | | | | 41.40 | | | | (24.51 | ) |
Ratios (%) (to average net assets)
and Supplemental data: | | | | | | | | | |
Expenses before expense reductions (f) | | | 1.67 | | | | 1.67 | | | | 1.68 | | | | 1.75 | | | | 1.75 | |
Expenses after expense reductions (f) | | | 1.67 | | | | 1.67 | | | | 1.68 | | | | 1.75 | | | | 1.75 | |
Net investment income | | | 5.59 | | | | 5.99 | | | | 6.78 | | | | 8.11 | | | | 7.41 | |
Portfolio turnover | | | 38 | | | | 60 | | | | 66 | | | | 58 | | | | 61 | |
Net assets at end of period (000 omitted) | | | $31,656 | | | | $25,983 | | | | $37,772 | | | | $46,690 | | | | $52,384 | |
See Notes to Financial Statements
34
Financial Highlights – continued
| | | | | | | | | | | | | | | | | | | | |
| Class C | | Years ended 1/31 | |
| | | 2013 | | | 2012 | | | 2011 | | | 2010 | | | 2009 | |
Net asset value, beginning of period | | | $3.45 | | | | $3.53 | | | | $3.27 | | | | $2.50 | | | | $3.60 | |
| Income (loss) from investment operations | | | | | | | | | | | | | |
Net investment income (d) | | | $0.20 | | | | $0.21 | | | | $0.23 | | | | $0.23 | | | | $0.24 | |
Net realized and unrealized gain (loss)
on investments and foreign currency | | | 0.18 | | | | (0.08 | ) | | | 0.25 | | | | 0.77 | | | | (1.09 | ) |
Total from investment operations | | | $0.38 | | | | $0.13 | | | | $0.48 | | | | $1.00 | | | | $(0.85 | ) |
| Less distributions declared to shareholders | | | | | | | | | | | | | |
From net investment income | | | $(0.21 | ) | | | $(0.21 | ) | | | $(0.22 | ) | | | $(0.23 | ) | | | $(0.25 | ) |
From tax return of capital | | | — | | | | — | | | | — | | | | — | | | | (0.00 | )(w) |
Total distributions declared to
shareholders | | | $(0.21 | ) | | | $(0.21 | ) | | | $(0.22 | ) | | | $(0.23 | ) | | | $(0.25 | ) |
Net asset value, end of period (x) | | | $3.62 | | | | $3.45 | | | | $3.53 | | | | $3.27 | | | | $2.50 | |
Total return (%) (r)(s)(t)(x) | | | 11.21 | | | | 4.00 | | | | 15.34 | | | | 41.82 | | | | (24.72 | ) |
Ratios (%) (to average net assets)
and Supplemental data: | | | | | | | | | |
Expenses before expense reductions (f) | | | 1.67 | | | | 1.67 | | | | 1.68 | | | | 1.74 | | | | 1.75 | |
Expenses after expense reductions (f) | | | 1.67 | | | | 1.67 | | | | 1.68 | | | | 1.74 | | | | 1.75 | |
Net investment income | | | 5.61 | | | | 5.99 | | | | 6.74 | | | | 7.80 | | | | 7.44 | |
Portfolio turnover | | | 38 | | | | 60 | | | | 66 | | | | 58 | | | | 61 | |
Net assets at end of period (000 omitted) | | | $81,710 | | | | $75,309 | | | | $80,802 | | | | $73,475 | | | | $39,345 | |
See Notes to Financial Statements
35
Financial Highlights – continued
| | | | | | | | | | | | | | | | | | | | |
| Class I | | Years ended 1/31 | |
| | | 2013 | | | 2012 | | | 2011 | | | 2010 | | | 2009 | |
Net asset value, beginning of period | | | $3.44 | | | | $3.52 | | | | $3.25 | | | | $2.49 | | | | $3.58 | |
| Income (loss) from investment operations | | | | | | | | | | | | | |
Net investment income (d) | | | $0.24 | | | | $0.24 | | | | $0.26 | | | | $0.26 | | | | $0.27 | |
Net realized and unrealized gain (loss)
on investments and foreign currency | | | 0.16 | | | | (0.07 | ) | | | 0.27 | | | | 0.76 | | | | (1.08 | ) |
Total from investment operations | | | $0.40 | | | | $0.17 | | | | $0.53 | | | | $1.02 | | | | $(0.81 | ) |
| Less distributions declared to shareholders | | | | | | | | | | | | | |
From net investment income | | | $(0.24 | ) | | | $(0.25 | ) | | | $(0.26 | ) | | | $(0.26 | ) | | | $(0.28 | ) |
From tax return of capital | | | — | | | | — | | | | — | | | | — | | | | (0.00 | )(w) |
Total distributions declared to
shareholders | | | $(0.24 | ) | | | $(0.25 | ) | | | $(0.26 | ) | | | $(0.26 | ) | | | $(0.28 | ) |
Net asset value, end of period (x) | | | $3.60 | | | | $3.44 | | | | $3.52 | | | | $3.25 | | | | $2.49 | |
Total return (%) (r)(s)(x) | | | 12.02 | | | | 5.03 | | | | 16.86 | | | | 42.90 | | | | (23.82 | ) |
Ratios (%) (to average net assets)
and Supplemental data: | | | | | | | | | |
Expenses before expense reductions (f) | | | 0.67 | | | | 0.68 | | | | 0.68 | | | | 0.75 | | | | 0.76 | |
Expenses after expense reductions (f) | | | 0.67 | | | | 0.68 | | | | 0.68 | | | | 0.75 | | | | 0.76 | |
Net investment income | | | 6.86 | | | | 7.02 | | | | 7.75 | | | | 8.97 | | | | 8.55 | |
Portfolio turnover | | | 38 | | | | 60 | | | | 66 | | | | 58 | | | | 61 | |
Net assets at end of period (000 omitted) | | | $70,506 | | | | $448,607 | | | | $386,185 | | | | $283,704 | | | | $185,811 | |
See Notes to Financial Statements
36
Financial Highlights – continued
| | | | | | | | | | | | | | | | | | | | |
| Class R1 | | Years ended 1/31 | |
| | | 2013 | | | 2012 | | | 2011 | | | 2010 | | | 2009 | |
Net asset value, beginning of period | | | $3.44 | | | | $3.52 | | | | $3.26 | | | | $2.50 | | | | $3.59 | |
| Income (loss) from investment operations | | | | | | | | | |
Net investment income (d) | | | $0.20 | | | | $0.21 | | | | $0.23 | | | | $0.23 | | | | $0.24 | |
Net realized and unrealized gain (loss)
on investments and foreign currency | | | 0.18 | | | | (0.08 | ) | | | 0.25 | | | | 0.76 | | | | (1.09 | ) |
Total from investment operations | | | $0.38 | | | | $0.13 | | | | $0.48 | | | | $0.99 | | | | $(0.85 | ) |
| Less distributions declared to shareholders | | | | | | | | | | | | | |
From net investment income | | | $(0.21 | ) | | | $(0.21 | ) | | | $(0.22 | ) | | | $(0.23 | ) | | | $(0.24 | ) |
From tax return of capital | | | — | | | | — | | | | — | | | | — | | | | (0.00 | )(w) |
Total distributions declared to
shareholders | | | $(0.21 | ) | | | $(0.21 | ) | | | $(0.22 | ) | | | $(0.23 | ) | | | $(0.24 | ) |
Net asset value, end of period (x) | | | $3.61 | | | | $3.44 | | | | $3.52 | | | | $3.26 | | | | $2.50 | |
Total return (%) (r)(s)(x) | | | 11.22 | | | | 4.00 | | | | 15.36 | | | | 41.39 | | | | (24.52 | ) |
Ratios (%) (to average net assets)
and Supplemental data: | | | | | | | | | |
Expenses before expense reductions (f) | | | 1.68 | | | | 1.67 | | | | 1.68 | | | | 1.74 | | | | 1.76 | |
Expenses after expense reductions (f) | | | 1.68 | | | | 1.67 | | | | 1.68 | | | | 1.74 | | | | 1.76 | |
Net investment income | | | 5.65 | | | | 6.01 | | | | 6.78 | | | | 7.96 | | | | 7.53 | |
Portfolio turnover | | | 38 | | | | 60 | | | | 66 | | | | 58 | | | | 61 | |
Net assets at end of period (000 omitted) | | | $1,137 | | | | $1,201 | | | | $1,138 | | | | $1,200 | | | | $937 | |
See Notes to Financial Statements
37
Financial Highlights – continued
| | | | | | | | | | | | | | | | | | | | |
| Class R2 | | Years ended 1/31 | |
| | | 2013 | | | 2012 | | | 2011 | | | 2010 | | | 2009 | |
Net asset value, beginning of period | | | $3.44 | | | | $3.52 | | | | $3.26 | | | | $2.49 | | | | $3.58 | |
| Income (loss) from investment operations | | | | | | | | | | | | | |
Net investment income (d) | | | $0.22 | | | | $0.22 | | | | $0.24 | | | | $0.24 | | | | $0.25 | |
Net realized and unrealized gain (loss)
on investments and foreign currency | | | 0.17 | | | | (0.07 | ) | | | 0.26 | | | | 0.78 | | | | (1.08 | ) |
Total from investment operations | | | $0.39 | | | | $0.15 | | | | $0.50 | | | | $1.02 | | | | $(0.83 | ) |
| Less distributions declared to shareholders | | | | | | | | | | | | | |
From net investment income | | | $(0.22 | ) | | | $(0.23 | ) | | | $(0.24 | ) | | | $(0.25 | ) | | | $(0.26 | ) |
From tax return of capital | | | — | | | | — | | | | — | | | | — | | | | (0.00 | )(w) |
Total distributions declared to
shareholders | | | $(0.22 | ) | | | $(0.23 | ) | | | $(0.24 | ) | | | $(0.25 | ) | | | $(0.26 | ) |
Net asset value, end of period (x) | | | $3.61 | | | | $3.44 | | | | $3.52 | | | | $3.26 | | | | $2.49 | |
Total return (%) (r)(s)(x) | | | 11.77 | | | | 4.51 | | | | 15.93 | | | | 42.65 | | | | (24.21 | ) |
Ratios (%) (to average net assets)
and Supplemental data: | | | | | | | | | |
Expenses before expense reductions (f) | | | 1.18 | | | | 1.18 | | | | 1.18 | | | | 1.25 | | | | 1.25 | |
Expenses after expense reductions (f) | | | 1.18 | | | | 1.17 | | | | 1.18 | | | | 1.25 | | | | 1.25 | |
Net investment income | | | 6.18 | | | | 6.52 | | | | 7.27 | | | | 8.47 | | | | 7.99 | |
Portfolio turnover | | | 38 | | | | 60 | | | | 66 | | | | 58 | | | | 61 | |
Net assets at end of period (000 omitted) | | | $4,103 | | | | $5,639 | | | | $5,653 | | | | $5,251 | | | | $3,446 | |
See Notes to Financial Statements
38
Financial Highlights – continued
| | | | | | | | | | | | | | | | | | | | |
| Class R3 | | Years ended 1/31 | |
| | | 2013 | | | 2012 | | | 2011 | | | 2010 | | | 2009 | |
Net asset value, beginning of period | | | $3.44 | | | | $3.52 | | | | $3.25 | | | | $2.49 | | | | $3.58 | |
| Income (loss) from investment operations | | | | | | | | | | | | | |
Net investment income (d) | | | $0.22 | | | | $0.23 | | | | $0.25 | | | | $0.25 | | | | $0.26 | |
Net realized and unrealized gain (loss)
on investments and foreign currency | | | 0.18 | | | | (0.07 | ) | | | 0.27 | | | | 0.76 | | | | (1.08 | ) |
Total from investment operations | | | $0.40 | | | | $0.16 | | | | $0.52 | | | | $1.01 | | | | $(0.82 | ) |
| Less distributions declared to shareholders | | | | | | | | | | | | | |
From net investment income | | | $(0.23 | ) | | | $(0.24 | ) | | | $(0.25 | ) | | | $(0.25 | ) | | | $(0.27 | ) |
From tax return of capital | | | — | | | | — | | | | — | | | | — | | | | (0.00 | )(w) |
Total distributions declared to
shareholders | | | $(0.23 | ) | | | $(0.24 | ) | | | $(0.25 | ) | | | $(0.25 | ) | | | $(0.27 | ) |
Net asset value, end of period (x) | | | $3.61 | | | | $3.44 | | | | $3.52 | | | | $3.25 | | | | $2.49 | |
Total return (%) (r)(s)(x) | | | 12.05 | | | | 4.77 | | | | 16.58 | | | | 42.55 | | | | (24.02 | ) |
Ratios (%) (to average net assets)
and Supplemental data: | | | | | | | | | |
Expenses before expense reductions (f) | | | 0.93 | | | | 0.93 | | | | 0.93 | | | | 1.00 | | | | 1.01 | |
Expenses after expense reductions (f) | | | 0.93 | | | | 0.93 | | | | 0.93 | | | | 1.00 | | | | 1.01 | |
Net investment income | | | 6.39 | | | | 6.78 | | | | 7.54 | | | | 8.75 | | | | 8.35 | |
Portfolio turnover | | | 38 | | | | 60 | | | | 66 | | | | 58 | | | | 61 | |
Net assets at end of period (000 omitted) | | | $8,183 | | | | $7,376 | | | | $7,281 | | | | $7,929 | | | | $6,706 | |
See Notes to Financial Statements
39
Financial Highlights – continued
| | | | | | | | | | | | | | | | | | | | |
| Class R4 | | Years ended 1/31 | |
| | | 2013 | | | 2012 | | | 2011 | | | 2010 | | | 2009 | |
Net asset value, beginning of period | | | $3.44 | | | | $3.52 | | | | $3.26 | | | | $2.49 | | | | $3.58 | |
| Income (loss) from investment operations | | | | | | | | | | | | | |
Net investment income (d) | | | $0.23 | | | | $0.24 | | | | $0.26 | | | | $0.26 | | | | $0.27 | |
Net realized and unrealized gain (loss)
on investments and foreign currency | | | 0.18 | | | | (0.07 | ) | | | 0.26 | | | | 0.77 | | | | (1.08 | ) |
Total from investment operations | | | $0.41 | | | | $0.17 | | | | $0.52 | | | | $1.03 | | | | $(0.81 | ) |
| Less distributions declared to shareholders | | | | | | | | | | | | | |
From net investment income | | | $(0.24 | ) | | | $(0.25 | ) | | | $(0.26 | ) | | | $(0.26 | ) | | | $(0.28 | ) |
From tax return of capital | | | — | | | | — | | | | — | | | | — | | | | (0.00 | )(w) |
Total distributions declared to
shareholders | | | $(0.24 | ) | | | $(0.25 | ) | | | $(0.26 | ) | | | $(0.26 | ) | | | $(0.28 | ) |
Net asset value, end of period (x) | | | $3.61 | | | | $3.44 | | | | $3.52 | | | | $3.26 | | | | $2.49 | |
Total return (%) (r)(s)(x) | | | 12.33 | | | | 5.04 | | | | 16.50 | | | | 43.33 | | | | (23.82 | ) |
Ratios (%) (to average net assets)
and Supplemental data: | | | | | | | | | |
Expenses before expense reductions (f) | | | 0.68 | | | | 0.68 | | | | 0.68 | | | | 0.74 | | | | 0.76 | |
Expenses after expense reductions (f) | | | 0.68 | | | | 0.67 | | | | 0.68 | | | | 0.74 | | | | 0.76 | |
Net investment income | | | 6.65 | | | | 7.02 | | | | 7.72 | | | | 8.78 | | | | 8.56 | |
Portfolio turnover | | | 38 | | | | 60 | | | | 66 | | | | 58 | | | | 61 | |
Net assets at end of period (000 omitted) | | | $302 | | | | $331 | | | | $316 | | | | $148 | | | | $44 | |
| | | | |
| Class R5 | | Period ended
1/31/13 (i) | |
Net asset value, beginning of period | | | $3.41 | |
| Income (loss) from investment operations | |
Net investment income (d) | | | $0.15 | |
Net realized and unrealized gain (loss) on investments and foreign currency | | | 0.21 | |
Total from investment operations | | | $0.36 | |
| Less distributions declared to shareholders | |
From net investment income | | | $(0.16 | ) |
Net asset value, end of period (x) | | | $3.61 | |
Total return (%) (r)(s)(x) | | | 10.74 | (n) |
Ratios (%) (to average net assets)
and Supplemental data: | |
Expenses before expense reductions (f) | | | 0.63 | (a) |
Expenses after expense reductions (f) | | | 0.63 | (a) |
Net investment income | | | 6.37 | (a) |
Portfolio turnover | | | 38 | (n) |
Net assets at end of period (000 omitted) | | | $516,399 | |
See Notes to Financial Statements
40
Financial Highlights – continued
| | | | | | | | | | | | | | | | | | | | |
| Class 529A | | Years ended 1/31 | |
| | | 2013 | | | 2012 | | | 2011 | | | 2010 | | | 2009 | |
Net asset value, beginning of period | | | $3.43 | | | | $3.52 | | | | $3.25 | | | | $2.49 | | | | $3.58 | |
| Income (loss) from investment operations | | | | | | | | | | | | | |
Net investment income (d) | | | $0.22 | | | | $0.23 | | | | $0.25 | | | | $0.25 | | | | $0.25 | |
Net realized and unrealized gain (loss)
on investments and foreign currency | | | 0.19 | | | | (0.08 | ) | | | 0.26 | | | | 0.76 | | | | (1.08 | ) |
Total from investment operations | | | $0.41 | | | | $0.15 | | | | $0.51 | | | | $1.01 | | | | $(0.83 | ) |
| Less distributions declared to shareholders | | | | | | | | | | | | | |
From net investment income | | | $(0.23 | ) | | | $(0.24 | ) | | | $(0.24 | ) | | | $(0.25 | ) | | | $(0.26 | ) |
From tax return of capital | | | — | | | | — | | | | — | | | | — | | | | (0.00 | )(w) |
Total distributions declared to
shareholders | | | $(0.23 | ) | | | $(0.24 | ) | | | $(0.24 | ) | | | $(0.25 | ) | | | $(0.26 | ) |
Net asset value, end of period (x) | | | $3.61 | | | | $3.43 | | | | $3.52 | | | | $3.25 | | | | $2.49 | |
Total return (%) (r)(s)(t)(x) | | | 12.33 | | | | 4.40 | | | | 16.46 | | | | 42.40 | | | | (24.19 | ) |
Ratios (%) (to average net assets)
and Supplemental data: | | | | | | | | | |
Expenses before expense reductions (f) | | | 1.03 | | | | 1.03 | | | | 1.03 | | | | 1.10 | | | | 1.23 | |
Expenses after expense reductions (f) | | | 0.98 | | | | 1.00 | | | | 1.03 | | | | 1.10 | | | | 1.23 | |
Net investment income | | | 6.31 | | | | 6.71 | | | | 7.41 | | | | 8.62 | | | | 8.07 | |
Portfolio turnover | | | 38 | | | | 60 | | | | 66 | | | | 58 | | | | 61 | |
Net assets at end of period (000 omitted) | | | $2,748 | | | | $1,719 | | | | $1,215 | | | | $858 | | | | $579 | |
See Notes to Financial Statements
41
Financial Highlights – continued
| | | | | | | | | | | | | | | | | | | | |
| Class 529B | | Years ended 1/31 | |
| | | 2013 | | | 2012 | | | 2011 | | | 2010 | | | 2009 | |
Net asset value, beginning of period | | | $3.44 | | | | $3.52 | | | | $3.25 | | | | $2.49 | | | | $3.58 | |
| Income (loss) from investment operations | | | | | | | | | | | | | |
Net investment income (d) | | | $0.20 | | | | $0.20 | | | | $0.22 | | | | $0.23 | | | | $0.23 | |
Net realized and unrealized gain (loss)
on investments and foreign currency | | | 0.17 | | | | (0.07 | ) | | | 0.27 | | | | 0.76 | | | | (1.08 | ) |
Total from investment operations | | | $0.37 | | | | $0.13 | | | | $0.49 | | | | $0.99 | | | | $(0.85 | ) |
| Less distributions declared to shareholders | | | | | | | | | | | | | |
From net investment income | | | $(0.20 | ) | | | $(0.21 | ) | | | $(0.22 | ) | | | $(0.23 | ) | | | $(0.24 | ) |
From tax return of capital | | | — | | | | — | | | | — | | | | — | | | | (0.00 | )(w) |
Total distributions declared to
shareholders | | | $(0.20 | ) | | | $(0.21 | ) | | | $(0.22 | ) | | | $(0.23 | ) | | | $(0.24 | ) |
Net asset value, end of period (x) | | | $3.61 | | | | $3.44 | | | | $3.52 | | | | $3.25 | | | | $2.49 | |
Total return (%) (r)(s)(t)(x) | | | 11.17 | | | | 3.92 | | | | 15.60 | | | | 41.40 | | | | (24.70 | ) |
Ratios (%) (to average net assets)
and Supplemental data: | | | | | | | | | |
Expenses before expense reductions (f) | | | 1.78 | | | | 1.78 | | | | 1.78 | | | | 1.84 | | | | 1.88 | |
Expenses after expense reductions (f) | | | 1.73 | | | | 1.75 | | | | 1.78 | | | | 1.84 | | | | 1.88 | |
Net investment income | | | 5.60 | | | | 5.95 | | | | 6.65 | | | | 7.82 | | | | 7.43 | |
Portfolio turnover | | | 38 | | | | 60 | | | | 66 | | | | 58 | | | | 61 | |
Net assets at end of period (000 omitted) | | | $375 | | | | $362 | | | | $398 | | | | $315 | | �� | | $183 | |
See Notes to Financial Statements
42
Financial Highlights – continued
| | | | | | | | | | | | | | | | | | | | |
| Class 529C | | Years ended 1/31 | |
| | | 2013 | | | 2012 | | | 2011 | | | 2010 | | | 2009 | |
Net asset value, beginning of period | | | $3.44 | | | | $3.52 | | | | $3.26 | | | | $2.50 | | | | $3.59 | |
| Income (loss) from investment operations | | | | | | | | | | | | | |
Net investment income (d) | | | $0.20 | | | | $0.20 | | | | $0.22 | | | | $0.23 | | | | $0.23 | |
Net realized and unrealized gain (loss)
on investments and foreign currency | | | 0.17 | | | | (0.07 | ) | | | 0.26 | | | | 0.76 | | | | (1.08 | ) |
Total from investment operations | | | $0.37 | | | | $0.13 | | | | $0.48 | | | | $0.99 | | | | $(0.85 | ) |
| Less distributions declared to shareholders | | | | | | | | | | | | | |
From net investment income | | | $(0.20 | ) | | | $(0.21 | ) | | | $(0.22 | ) | | | $(0.23 | ) | | | $(0.24 | ) |
From tax return of capital | | | — | | | | — | | | | — | | | | — | | | | (0.00 | )(w) |
Total distributions declared to
shareholders | | | $(0.20 | ) | | | $(0.21 | ) | | | $(0.22 | ) | | | $(0.23 | ) | | | $(0.24 | ) |
Net asset value, end of period (x) | | | $3.61 | | | | $3.44 | | | | $3.52 | | | | $3.26 | | | | $2.50 | |
Total return (%) (r)(s)(t)(x) | | | 11.17 | | | | 3.92 | | | | 15.25 | | | | 41.26 | | | | (24.61 | ) |
Ratios (%) (to average net assets)
and Supplemental data: | | | | | | | | | |
Expenses before expense reductions (f) | | | 1.77 | | | | 1.77 | | | | 1.78 | | | | 1.84 | | | | 1.88 | |
Expenses after expense reductions (f) | | | 1.72 | | | | 1.74 | | | | 1.77 | | | | 1.84 | | | | 1.88 | |
Net investment income | | | 5.56 | | | | 5.94 | | | | 6.61 | | | | 7.71 | | | | 7.39 | |
Portfolio turnover | | | 38 | | | | 60 | | | | 66 | | | | 58 | | | | 61 | |
Net assets at end of period (000 omitted) | | | $1,311 | | | | $1,060 | | | | $739 | | | | $462 | | | | $221 | |
| (d) | Per share data is based on average shares outstanding. |
| (f) | Ratios do not reflect reductions from fees paid indirectly, if applicable. |
| (i) | For Class R5, the period is from inception, June 1, 2012, through the stated period end. |
| (r) | Certain expenses have been reduced without which performance would have been lower. |
| (s) | From time to time the fund may receive proceeds from litigation settlements, without which performance would be lower. |
| (t) | Total returns do not include any applicable sales charges. |
| (w) | Per share amount was less than $0.01. |
| (x) | The net asset values per share and total returns have been calculated on net assets which include adjustments made in accordance with U.S. generally accepted accounting principles required at period end for financial reporting purposes. |
See Notes to Financial Statements
43
NOTES TO FINANCIAL STATEMENTS
(1) Business and Organization
MFS High Income Fund (the fund) is a series of MFS Series Trust III (the trust). The trust is organized as a Massachusetts business trust and is registered under the Investment Company Act of 1940, as amended, as an open-end management investment company.
(2) Significant Accounting Policies
General – The preparation of financial statements in conformity with U.S. generally accepted accounting principles requires management to make estimates and assumptions that affect the reported amounts of assets and liabilities, and disclosure of contingent assets and liabilities at the date of the financial statements and the reported amounts of revenues and expenses during the reporting period. Actual results could differ from those estimates. In the preparation of these financial statements, management has evaluated subsequent events occurring after the date of the fund’s Statement of Assets and Liabilities through the date that the financial statements were issued. The fund invests in high-yield securities rated below investment grade. Investments in high-yield securities involve greater degrees of credit and market risk than investments in higher-rated securities and tend to be more sensitive to economic conditions. The fund invests in foreign securities. Investments in foreign securities are vulnerable to the effects of changes in the relative values of the local currency and the U.S. dollar and to the effects of changes in each country’s legal, political, and economic environment.
In this reporting period the fund adopted Financial Accounting Standards Board (FASB) Accounting Standards Update 2011-04, Fair Value Measurement (Topic 820) – Amendments to Achieve Common Fair Value Measurement and Disclosure Requirements in U.S. GAAP and IFRSs (“ASU 2011-04”). ASU 2011-04 seeks to improve the comparability of fair value measurements as presented and disclosed in financial statements prepared in accordance with U.S. GAAP and International Financial Reporting Standards (IFRS) by providing common requirements for fair value measurement and disclosure.
In December 2011, the FASB issued Accounting Standards Update 2011-11, Balance Sheet (Topic 210) – Disclosures about Offsetting Assets and Liabilities (“ASU 2011-11”). Effective for annual reporting periods beginning on or after January 1, 2013 and interim periods within those annual periods, ASU 2011-11 is intended to enhance disclosure requirements on the offsetting of financial assets and liabilities. Although still evaluating the potential impacts of ASU 2011-11 to the fund, management expects that the impact of the fund’s adoption will be limited to additional financial statement disclosures.
Investment Valuations – Debt instruments and floating rate loans (other than short-term instruments), including restricted debt instruments, are generally valued at an evaluated or composite bid as provided by a third-party pricing service. Equity securities, including restricted equity securities, are generally valued at the last sale or official closing price as provided by a third-party pricing service on the market or exchange on which they are primarily traded. Equity securities, for which there were no
44
Notes to Financial Statements – continued
sales reported that day, are generally valued at the last quoted daily bid quotation as provided by a third-party pricing service on the market or exchange on which such securities are primarily traded. Short-term instruments with a maturity at issuance of 60 days or less generally are valued at amortized cost, which approximates market value. Exchange-traded options are generally valued at the last sale or official closing price as provided by a third-party pricing service on the exchange on which such options are primarily traded. Exchange-traded options for which there were no sales reported that day are generally valued at the last daily bid quotation as provided by a third-party pricing service on the exchange on which such options are primarily traded. Options not traded on an exchange are generally valued at a broker/dealer bid quotation. Foreign currency options are generally valued at valuations provided by a third-party pricing service. Forward foreign currency exchange contracts are generally valued at the mean of bid and asked prices for the time period interpolated from rates provided by a third-party pricing service for proximate time periods. Open-end investment companies are generally valued at net asset value per share. Securities and other assets generally valued on the basis of information from a third-party pricing service may also be valued at a broker/dealer bid quotation. Values obtained from third-party pricing services can utilize both transaction data and market information such as yield, quality, coupon rate, maturity, type of issue, trading characteristics, and other market data. The values of foreign securities and other assets and liabilities expressed in foreign currencies are converted to U.S. dollars using the mean of bid and asked prices for rates provided by a third-party pricing service.
The Board of Trustees has delegated primary responsibility for determining or causing to be determined the value of the fund’s investments (including any fair valuation) to the adviser pursuant to valuation policies and procedures approved by the Board. If the adviser determines that reliable market quotations are not readily available, investments are valued at fair value as determined in good faith by the adviser in accordance with such procedures under the oversight of the Board of Trustees. Under the fund’s valuation policies and procedures, market quotations are not considered to be readily available for most types of debt instruments and floating rate loans and many types of derivatives. These investments are generally valued at fair value based on information from third-party pricing services. In addition, investments may be valued at fair value if the adviser determines that an investment’s value has been materially affected by events occurring after the close of the exchange or market on which the investment is principally traded (such as foreign exchange or market) and prior to the determination of the fund’s net asset value, or after the halting of trading of a specific security where trading does not resume prior to the close of the exchange or market on which the security is principally traded. The adviser generally relies on third-party pricing services or other information (such as the correlation with price movements of similar securities in the same or other markets; the type, cost and investment characteristics of the security; the business and financial condition of the issuer; and trading and other market data) to assist in determining whether to fair value and at what value to fair value an investment. The value of an investment for purposes of calculating the fund’s net asset value can differ depending on the source and method used to determine value. When fair valuation is used, the value of an investment used to determine the fund’s net asset value may differ from quoted or published prices for the same
45
Notes to Financial Statements – continued
investment. There can be no assurance that the fund could obtain the fair value assigned to an investment if it were to sell the investment at the same time at which the fund determines its net asset value per share.
Various inputs are used in determining the value of the fund’s assets or liabilities. These inputs are categorized into three broad levels. In certain cases, the inputs used to measure fair value may fall into different levels of the fair value hierarchy. In such cases, an investment’s level within the fair value hierarchy is based on the lowest level of input that is significant to the fair value measurement. The fund’s assessment of the significance of a particular input to the fair value measurement in its entirety requires judgment, and considers factors specific to the investment. Level 1 includes unadjusted quoted prices in active markets for identical assets or liabilities. Level 2 includes other significant observable market-based inputs (including quoted prices for similar securities, interest rates, prepayment speed, and credit risk). Level 3 includes unobservable inputs, which may include the adviser’s own assumptions in determining the fair value of investments. Other financial instruments are derivative instruments not reflected in total investments, such as forward foreign currency exchange contracts. The following is a summary of the levels used as of January 31, 2013 in valuing the fund’s assets or liabilities:
| | | | | | | | | | | | | | | | |
| Investments at Value | | Level 1 | | | Level 2 | | | Level 3 | | | Total | |
| Equity Securities | | | $6,341,566 | | | | $4,214,186 | | | | $362,059 | | | | $10,917,811 | |
| Non-U.S. Sovereign Debt | | | — | | | | 1,461,015 | | | | — | | | | 1,461,015 | |
| Municipal Bonds | | | — | | | | 2,320,354 | | | | — | | | | 2,320,354 | |
| U.S. Corporate Bonds | | | — | | | | 929,028,724 | | | | — | | | | 929,028,724 | |
| Commercial Mortgage-Backed Securities | | | — | | | | 2,511,224 | | | | — | | | | 2,511,224 | |
| Asset-Backed Securities (including CDOs) | | | — | | | | 1,774,584 | | | | — | | | | 1,774,584 | |
| Foreign Bonds | | | — | | | | 194,852,619 | | | | — | | | | 194,852,619 | |
| Floating Rate Loans | | | — | | | | 2,096,830 | | | | — | | | | 2,096,830 | |
| Mutual Funds | | | 62,312,638 | | | | — | | | | — | | | | 62,312,638 | |
| Total Investments | | | $68,654,204 | | | | $1,138,259,536 | | | | $362,059 | | | | $1,207,275,799 | |
| | |
| Other Financial Instruments | | | | | | | |
| Forward Foreign Currency Exchange Contracts | | | $— | | | | $(456,685 | ) | | | $— | | | | $(456,685 | ) |
For further information regarding security characteristics, see the Portfolio of Investments.
The following is a reconciliation of level 3 assets for which significant unobservable inputs were used to determine fair value. The fund’s policy is to recognize transfers between the levels as of the end of the period. The table presents the activity of level 3 securities held at the beginning and the end of the period.
| | | | |
| | | Equity Securities | |
| Balance as of 1/31/12 | | | $906,291 | |
Change in unrealized appreciation (depreciation) | | | (544,232 | ) |
| Balance as of 1/31/13 | | | $362,059 | |
46
Notes to Financial Statements – continued
The net change in unrealized appreciation (depreciation) from investments still held as level 3 at January 31, 2013 is $(544,232).
Foreign Currency Translation – Purchases and sales of foreign investments, income, and expenses are converted into U.S. dollars based upon currency exchange rates prevailing on the respective dates of such transactions or on the reporting date for foreign denominated receivables and payables. Gains and losses attributable to foreign currency exchange rates on sales of securities are recorded for financial statement purposes as net realized gains and losses on investments. Gains and losses attributable to foreign exchange rate movements on receivables, payables, income and expenses are recorded for financial statement purposes as foreign currency transaction gains and losses. That portion of both realized and unrealized gains and losses on investments that results from fluctuations in foreign currency exchange rates is not separately disclosed.
Derivatives – The fund uses derivatives for different purposes, primarily to increase or decrease exposure to a particular market or segment of the market, or security, to increase or decrease interest rate or currency exposure, or as alternatives to direct investments. Derivatives are used for hedging or non-hedging purposes. While hedging can reduce or eliminate losses, it can also reduce or eliminate gains. When the fund uses derivatives as an investment to increase market exposure, or for hedging purposes, gains and losses from derivative instruments may be substantially greater than the derivative’s original cost.
The derivative instruments used by the fund were purchased options and forward foreign currency exchange contracts. The fund’s period end derivatives, as presented in the Portfolio of Investments and the associated Derivative Contract tables, generally are indicative of the volume of its derivative activity during the period.
The following table presents, by major type of derivative contract, the fair value, on a gross basis, of the asset and liability components of derivatives held by the fund at January 31, 2013 as reported in the Statement of Assets and Liabilities:
| | | | | | | | | | |
| | | | | Fair Value (a) | |
| Risk | | Derivative Contracts | | Asset Derivatives | | | Liability Derivatives | |
| Foreign Exchange | | Forward Foreign Currency Exchange | | | $— | | | | $(456,685 | ) |
| Equity | | Purchased Equity Options | | | 1,105,146 | | | | — | |
| Total | | | | | $1,105,146 | | | | $(456,685 | ) |
| (a) | The value of purchased options outstanding is included in total investments, at value, within the fund’s Statement of Assets and Liabilities. |
47
Notes to Financial Statements – continued
The following table presents, by major type of derivative contract, the realized gain (loss) on derivatives held by the fund for the year ended January 31, 2013 as reported in the Statement of Operations:
| | | | | | | | |
| Risk | | Foreign
Currency | | | Investments
(Purchased
Options) | |
| Foreign Exchange | | | $(201,339 | ) | | | $— | |
| Equity | | | — | | | | 1,419,786 | |
| Total | | | $(201,339 | ) | | | $1,419,786 | |
The following table presents, by major type of derivative contract, the change in unrealized appreciation (depreciation) on derivatives held by the fund for the year ended January 31, 2013 as reported in the Statement of Operations:
| | | | | | | | |
| Risk | | Translation of Assets and Liabilities in Foreign
Currencies | | | Investments
(Purchased
Options) | |
| Foreign Exchange | | | $(210,502 | ) | | | $— | |
| Equity | | | — | | | | 155,372 | |
| Total | | | $(210,502 | ) | | | $155,372 | |
Derivative counterparty credit risk is managed through formal evaluation of the creditworthiness of all potential counterparties. On certain over-the-counter derivatives, the fund attempts to reduce its exposure to counterparty credit risk whenever possible by entering into an International Swaps and Derivatives Association (ISDA) Master Agreement on a bilateral basis with each of the counterparties with whom it undertakes a significant volume of transactions. The ISDA Master Agreement gives each party to the agreement the right to terminate all transactions traded under such agreement if there is a certain deterioration in the credit quality of the other party. The ISDA Master Agreement gives the fund the right, upon an event of default by the applicable counterparty or a termination of the agreement, to close out all transactions traded under such agreement and to net amounts owed under each transaction to one net amount payable by one party to the other. This right to close out and net payments across all transactions traded under the ISDA Master Agreement could result in a reduction of the fund’s credit risk to such counterparty equal to any amounts payable by the fund under the applicable transactions, if any. However, absent an event of default by the counterparty or a termination of the agreement, the ISDA Master Agreement does not result in an offset of reported amounts of assets and liabilities in the Statement of Assets and Liabilities across transactions between the fund and the applicable counterparty.
Collateral requirements differ by type of derivative. Collateral or margin requirements are set by the broker or exchange clearing house for exchange traded derivatives (i.e., futures contracts and exchange-traded options) while collateral terms are contract specific for over-the-counter traded derivatives (i.e., forward foreign currency exchange contracts, swap agreements and over-the-counter options). For derivatives traded under an ISDA Master Agreement, the collateral requirements are netted across all
48
Notes to Financial Statements – continued
transactions traded under such agreement and one amount is posted from one party to the other to collateralize such obligations. Cash collateral that has been pledged to cover obligations of the fund under derivative contracts, if any, will be reported separately in the Statement of Assets and Liabilities as restricted cash. Securities collateral pledged for the same purpose, if any, is noted in the Portfolio of Investments.
Purchased Options – The fund purchased call options for a premium. Purchased call options entitle the holder to buy a specified number of shares or units of a particular security, currency or index at a specified price at a specified date or within a specified period of time. Purchasing call options may hedge against an anticipated increase in the dollar cost of securities or currency to be acquired or increase the fund’s exposure to an underlying instrument.
The premium paid is initially recorded as an investment in the Statement of Assets and Liabilities. That investment is subsequently marked-to-market daily with the difference between the premium paid and the market value of the purchased option being recorded as unrealized appreciation or depreciation. Premiums paid for purchased call options which have expired are treated as realized losses on investments in the Statement of Operations. Upon the exercise or closing of a purchased call option, the premium paid is added to the cost of the security or financial instrument purchased.
Whether or not the option is exercised, the fund’s maximum risk of loss from purchasing an option is the amount of premium paid. All option contracts involve credit risk if the counterparty to the option contract fails to perform. For over-the-counter options, this risk is mitigated in cases where there is an ISDA Master Agreement between the fund and the counterparty providing for netting as described above and for posting of collateral by the counterparty to the fund to cover the fund’s exposure to the counterparty under such ISDA Master Agreement.
Forward Foreign Currency Exchange Contracts – The fund entered into forward foreign currency exchange contracts for the purchase or sale of a specific foreign currency at a fixed price on a future date. These contracts may be used to hedge the fund’s currency risk or for non-hedging purposes. For hedging purposes, the fund may enter into contracts to deliver or receive foreign currency that the fund will receive from or use in its normal investment activities. The fund may also use contracts to hedge against declines in the value of foreign currency denominated securities due to unfavorable exchange rate movements. For non-hedging purposes, the fund may enter into contracts with the intent of changing the relative exposure of the fund’s portfolio of securities to different currencies to take advantage of anticipated exchange rate changes.
Forward foreign currency exchange contracts are adjusted by the daily exchange rate of the underlying currency and any unrealized gains or losses are recorded as a receivable or payable for forward foreign currency exchange contracts until the contract settlement date. On contract settlement date, any gain or loss on the contract is recorded as realized gains or losses on foreign currency.
Risks may arise upon entering into these contracts from unanticipated movements in the value of the contract and from the potential inability of counterparties to meet the terms of their contracts. Generally, the fund’s maximum risk due to counterparty credit risk is the unrealized gain on the contract due to the use of Continuous Linked
49
Notes to Financial Statements – continued
Settlement, an industry accepted settlement system. This risk is mitigated in cases where there is an ISDA Master Agreement between the fund and the counterparty providing for netting as described above and for posting of collateral by the counterparty to the fund to cover the fund’s exposure to the counterparty under such ISDA Master Agreement.
Loans and Other Direct Debt Instruments – The fund invests in loans and loan participations or other receivables. These investments may include standby financing commitments, including revolving credit facilities, which obligate the fund to supply additional cash to the borrower on demand. Loan participations involve a risk of insolvency of the lending bank or other financial intermediary.
Indemnifications – Under the fund’s organizational documents, its officers and Trustees may be indemnified against certain liabilities and expenses arising out of the performance of their duties to the fund. Additionally, in the normal course of business, the fund enters into agreements with service providers that may contain indemnification clauses. The fund’s maximum exposure under these agreements is unknown as this would involve future claims that may be made against the fund that have not yet occurred.
Investment Transactions and Income – Investment transactions are recorded on the trade date. Interest income is recorded on the accrual basis. All premium and discount is amortized or accreted for financial statement purposes in accordance with U.S. generally accepted accounting principles. The fund earns certain fees in connection with its floating rate loan purchasing activities. These fees are in addition to interest payments earned and may include amendment fees, commitment fees, facility fees, consent fees, and prepayment fees. Commitment fees are recorded on an accrual basis as income in the accompanying financial statements. Dividends received in cash are recorded on the ex-dividend date. Certain dividends from foreign securities will be recorded when the fund is informed of the dividend if such information is obtained subsequent to the ex-dividend date. Dividend and interest payments received in additional securities are recorded on the ex-dividend or ex-interest date in an amount equal to the value of the security on such date. Debt obligations may be placed on non-accrual status or set to accrue at a rate of interest less than the contractual coupon when the collection of all or a portion of interest has become doubtful. Interest income for those debt obligations may be further reduced by the write-off of the related interest receivables when deemed uncollectible.
The fund may receive proceeds from litigation settlements. Any proceeds received from litigation involving portfolio holdings are reflected in the Statement of Operations in realized gain/loss if the security has been disposed of by the fund or in unrealized gain/loss if the security is still held by the fund. Any other proceeds from litigation not related to portfolio holdings are reflected as other income in the Statement of Operations.
Fees Paid Indirectly – The fund’s custody fee may be reduced according to an arrangement that measures the value of cash deposited with the custodian by the fund. This amount, for the year ended January 31, 2013, is shown as a reduction of total expenses in the Statement of Operations.
50
Notes to Financial Statements – continued
Tax Matters and Distributions – The fund intends to qualify as a regulated investment company, as defined under Subchapter M of the Internal Revenue Code, and to distribute all of its taxable income, including realized capital gains. As a result, no provision for federal income tax is required. The fund’s federal tax returns, when filed, will remain subject to examination by the Internal Revenue Service for a three year period.
Distributions to shareholders are recorded on the ex-dividend date. Income and capital gain distributions are determined in accordance with income tax regulations, which may differ from U.S. generally accepted accounting principles. Certain capital accounts in the financial statements are periodically adjusted for permanent differences in order to reflect their tax character. These adjustments have no impact on net assets or net asset value per share. Temporary differences which arise from recognizing certain items of income, expense, gain or loss in different periods for financial statement and tax purposes will reverse at some time in the future. Distributions in excess of net investment income or net realized gains are temporary overdistributions for financial statement purposes resulting from differences in the recognition or classification of income or distributions for financial statement and tax purposes.
Book/tax differences primarily relate to the expiration of capital loss carryforwards and amortization and accretion of debt securities.
The tax character of distributions declared to shareholders for the last two fiscal years is as follows:
| | | | | | | | |
| | | 1/31/13 | | | 1/31/12 | |
| Ordinary income (including any short-term capital gains) | | | $73,590,229 | | | | $70,548,283 | |
The federal tax cost and the tax basis components of distributable earnings were as follows:
| | | | |
| As of 1/31/13 | | | |
| Cost of investments | | | $1,155,103,714 | |
| Gross appreciation | | | 67,343,013 | |
| Gross depreciation | | | (15,170,928 | ) |
| Net unrealized appreciation (depreciation) | | | $52,172,085 | |
| Undistributed ordinary income | | | 4,716,752 | |
| Capital loss carryforwards | | | (208,010,349 | ) |
| Post-October capital loss deferral | | | (970,143 | ) |
| Other temporary differences | | | (6,908,274 | ) |
Under the Regulated Investment Company Modernization Act of 2010 (the “Act”), net capital losses recognized after January 31, 2011 may be carried forward indefinitely, and their character is retained as short-term and/or long-term losses. Previously, net capital losses were carried forward for eight years and treated as short-term losses. As a transition rule, the Act requires that post-enactment net capital losses be used before pre-enactment net capital losses.
51
Notes to Financial Statements – continued
As of January 31, 2013, the fund had capital loss carryforwards available to offset future realized gains.
| | | | |
| Pre-enactment losses expire as follows: | |
| 1/31/14 | | | $(20,014,075 | ) |
| 1/31/15 | | | (43,048,498 | ) |
| 1/31/16 | | | (1,964,268 | ) |
| 1/31/17 | | | (94,687,685 | ) |
| 1/31/18 | | | (46,635,154 | ) |
| Total | | | $(206,349,680 | ) |
| | | | |
Post-enactment losses are characterized
as follows: | |
| Long-Term | | | $(1,660,669 | ) |
The availability of a portion of the capital loss carryforwards, which were acquired on July 24, 2009 in connection with the MFS Floating Rate High Income Fund merger, may be limited in a given year.
Multiple Classes of Shares of Beneficial Interest – The fund offers multiple classes of shares, which differ in their respective distribution, service, and program manager fees. The fund’s income and common expenses are allocated to shareholders based on the value of settled shares outstanding of each class. The fund’s realized and unrealized gain (loss) are allocated to shareholders based on the daily net assets of each class. Dividends are declared separately for each class. Differences in per share dividend rates are generally due to differences in separate class expenses. Class B and Class 529B shares will convert to Class A and Class 529A shares, respectively, approximately eight years after purchase. The fund’s distributions declared to shareholders as reported in the Statements of Changes in Net Assets are presented by class as follows:
| | | | | | | | |
| | | From net investment
income | |
| | | Year
ended
1/31/13 (i) | | | Year
ended
1/31/12 | |
| Class A | | | $30,841,571 | | | | $33,162,764 | |
| Class B | | | 1,720,399 | | | | 1,878,765 | |
| Class C | | | 4,497,130 | | | | 4,767,259 | |
| Class I | | | 15,277,639 | | | | 29,588,175 | |
| Class R1 | | | 72,831 | | | | 70,857 | |
| Class R2 | | | 301,935 | | | | 374,119 | |
| Class R3 | | | 517,383 | | | | 509,502 | |
| Class R4 | | | 24,030 | | | | 23,276 | |
| Class R5 | | | 20,103,485 | | | | — | |
| Class 529A | | | 141,072 | | | | 95,046 | |
| Class 529B | | | 22,515 | | | | 22,722 | |
| Class 529C | | | 70,239 | | | | 55,798 | |
| Total | | | $73,590,229 | | | | $70,548,283 | |
| (i) | For Class R5, the period is from inception, June 1, 2012, through the stated period end. |
52
Notes to Financial Statements – continued
(3) Transactions with Affiliates
Investment Adviser – The fund has an investment advisory agreement with MFS to provide overall investment management and related administrative services and facilities to the fund.
The management fee is computed daily and paid monthly at the following annual rates:
| | | | |
| First $1.4 billion of average daily net assets | | | 0.46 | % |
| Average daily net assets in excess of $1.4 billion | | | 0.44 | % |
The management fee incurred for the year ended January 31, 2013 was equivalent to an annual effective rate of 0.46% of the fund’s average daily net assets.
Distributor – MFS Fund Distributors, Inc. (MFD), a wholly-owned subsidiary of MFS, as distributor, received $210,277 and $4,501 for the year ended January 31, 2013, as its portion of the initial sales charge on sales of Class A and Class 529A shares of the fund, respectively.
The Board of Trustees has adopted a distribution plan for certain class shares pursuant to Rule 12b-1 of the Investment Company Act of 1940.
The fund’s distribution plan provides that the fund will pay MFD for services provided by MFD and financial intermediaries in connection with the distribution and servicing of certain share classes. One component of the plan is a distribution fee paid to MFD and another component of the plan is a service fee paid to MFD. MFD may subsequently pay all, or a portion, of the distribution and/or service fees to financial intermediaries.
Distribution Plan Fee Table:
| | | | | | | | | | | | | | | | | | | | |
| | | Distribution
Fee Rate (d) | | | Service
Fee Rate (d) | | | Total
Distribution
Plan (d) | | | Annual
Effective
Rate (e) | | | Distribution
and Service
Fee | |
| Class A | | | — | | | | 0.25% | | | | 0.25% | | | | 0.25% | | | | $1,173,298 | |
| Class B | | | 0.75% | | | | 0.25% | | | | 1.00% | | | | 1.00% | | | | 296,207 | |
| Class C | | | 0.75% | | | | 0.25% | | | | 1.00% | | | | 1.00% | | | | 771,292 | |
| Class R1 | | | 0.75% | | | | 0.25% | | | | 1.00% | | | | 1.00% | | | | 12,481 | |
| Class R2 | | | 0.25% | | | | 0.25% | | | | 0.50% | | | | 0.50% | | | | 23,756 | |
| Class R3 | | | — | | | | 0.25% | | | | 0.25% | | | | 0.25% | | | | 19,686 | |
| Class 529A | | | — | | | | 0.25% | | | | 0.25% | | | | 0.25% | | | | 5,419 | |
| Class 529B | | | 0.75% | | | | 0.25% | | | | 1.00% | | | | 1.00% | | | | 3,891 | |
| Class 529C | | | 0.75% | | | | 0.25% | | | | 1.00% | | | | 1.00% | | | | 12,165 | |
| Total Distribution and Service Fees | | | | | | | | | | | | $2,318,195 | |
| (d) | In accordance with the distribution plan for certain classes, the fund pays distribution and/or service fees equal to these annual percentage rates of each class’s average daily net assets. The distribution and service fee rates disclosed by class represent the current rates in effect at the end of the reporting period. |
| (e) | The annual effective rates represent actual fees incurred under the distribution plan for the year ended January 31, 2013 based on each class’s average daily net assets. |
Certain Class A shares are subject to a contingent deferred sales charge (CDSC) in the event of a shareholder redemption within 18 months of purchase for shares purchased on or after August 1, 2012, and within 24 months of purchase for shares purchased prior to August 1, 2012. Class C and Class 529C shares are subject to a CDSC in the
53
Notes to Financial Statements – continued
event of a shareholder redemption within 12 months of purchase. Class B and Class 529B shares are subject to a CDSC in the event of a shareholder redemption within six years of purchase. All contingent deferred sales charges are paid to MFD and during the year ended January 31, 2013, were as follows:
| | | | |
| | | Amount | |
| Class A | | | $10,070 | |
| Class B | | | 35,309 | |
| Class C | | | 3,968 | |
| Class 529B | | | 237 | |
| Class 529C | | | — | |
The fund has entered into and may from time to time enter into contracts with program managers and other parties which administer the tuition programs through which an investment in the fund’s 529 share classes is made. The fund has entered into an agreement with MFD pursuant to which MFD receives an annual fee of up to 0.10% of the average daily net assets attributable to each 529 share class. MFD has agreed to waive a portion of this fee in an amount equal to 0.05% of the average daily net assets for each 529 share class. This waiver agreement will continue until modified by the fund’s Board of Trustees but such agreement will continue at least until May 31, 2013, after which MFD may eliminate this waiver without a vote of the fund’s Board of Trustees. For the year ended January 31, 2013, this waiver amounted to $1,887 and is reflected as a reduction of total expenses in the Statement of Operations. The program manager fee incurred for the year ended January 31, 2013 was equivalent to an annual effective rate of 0.05% of the average daily net assets attributable to each 529 share class. The services provided by MFD, or a third party with which MFD contracts, include recordkeeping and tax reporting and account services, as well as services designed to maintain the program’s compliance with the Internal Revenue Code and other regulatory requirements. Program manager fees and waivers for the year ended January 31, 2013, were as follows:
| | | | | | | | |
| | | Fee | | | Waiver | |
| Class 529A | | | $2,168 | | | | $1,084 | |
| Class 529B | | | 389 | | | | 195 | |
| Class 529C | | | 1,216 | | | | 608 | |
| Total Program Manager Fees and Waivers | | | $3,773 | | | | $1,887 | |
Shareholder Servicing Agent – MFS Service Center, Inc. (MFSC), a wholly-owned subsidiary of MFS, receives a fee from the fund for its services as shareholder servicing agent calculated as a percentage of the average daily net assets of the fund as determined periodically under the supervision of the fund’s Board of Trustees. For the year ended January 31, 2013, the fee was $360,474, which equated to 0.0324% annually of the fund’s average daily net assets. MFSC also receives payment from the fund for out-of-pocket expenses, sub-accounting and other shareholder servicing costs which may be paid to affiliated and unaffiliated service providers. Class R5 shares do not incur sub-accounting fees. For the year ended January 31, 2013, these out-of-pocket expenses, sub-accounting and other shareholder servicing costs amounted to $520,053.
54
Notes to Financial Statements – continued
Under a Special Servicing Agreement among MFS, each MFS fund which invests in other MFS funds (“MFS fund-of-funds”) and certain underlying funds in which a MFS fund-of-funds invests (“underlying funds”), each underlying fund may pay a portion of each MFS fund-of-fund’s transfer agent-related expenses, including sub-accounting fees payable to financial intermediaries, to the extent such payments do not exceed the benefits realized or expected to be realized by the underlying fund from the investment in the underlying fund by the MFS fund-of-fund. For the year ended January 31, 2013, these costs for the fund amounted to $607,224 and are reflected in the “Shareholder servicing costs” in the Statement of Operations.
Administrator – MFS provides certain financial, legal, shareholder communications, compliance, and other administrative services to the fund. Under an administrative services agreement, the fund partially reimburses MFS the costs incurred to provide these services. The fund is charged an annual fixed amount of $17,500 plus a fee based on average daily net assets. The administrative services fee incurred for the year ended January 31, 2013 was equivalent to an annual effective rate of 0.0149% of the fund’s average daily net assets.
Trustees’ and Officers’ Compensation – The fund pays compensation to independent Trustees in the form of a retainer, attendance fees, and additional compensation to Board and Committee chairpersons. The fund does not pay compensation directly to Trustees or officers of the fund who are also officers of the investment adviser, all of whom receive remuneration for their services to the fund from MFS. Certain officers and Trustees of the fund are officers or directors of MFS, MFD, and MFSC.
Prior to December 31, 2001, the fund had an unfunded defined benefit plan (“DB plan”) for independent Trustees. As of December 31, 2001, the Board took action to terminate the DB plan with respect to then-current and any future independent Trustees, such that the DB plan covers only certain of those former independent Trustees who retired on or before December 31, 2001. Effective January 1, 2002, accrued benefits under the DB plan for then-current independent Trustees who continued were credited to an unfunded retirement deferral plan (the “Retirement Deferral plan”), which was established for and exists solely with respect to these credited amounts, and is not available for other deferrals by these or other independent Trustees. Although the Retirement Deferral plan is unfunded, amounts deferred under the plan are periodically adjusted for investment experience as if they had been invested in shares of the fund. The DB plan resulted in a pension expense of $2,420 and the Retirement Deferral plan resulted in an expense of $5,341. Both amounts are included in independent Trustees’ compensation for the year ended January 31, 2013. The liability for deferred retirement benefits payable to certain independent Trustees under both plans amounted to $62,420 at January 31, 2013, and is included in “Payable for independent Trustees’ compensation” in the Statement of Assets and Liabilities.
Other – This fund and certain other funds managed by MFS (the funds) have entered into services agreements (the Agreements) which provide for payment of fees by the funds to Tarantino LLC and Griffin Compliance LLC in return for the provision of services of an Independent Chief Compliance Officer (ICCO) and Assistant ICCO, respectively, for the funds. The ICCO and Assistant ICCO are officers of the funds and
55
Notes to Financial Statements – continued
the sole members of Tarantino LLC and Griffin Compliance LLC, respectively. The funds can terminate the Agreements with Tarantino LLC and Griffin Compliance LLC at any time under the terms of the Agreements. For the year ended January 31, 2013, the aggregate fees paid by the fund to Tarantino LLC and Griffin Compliance LLC were $8,865 and are included in “Miscellaneous” expense in the Statement of Operations. MFS has agreed to reimburse the fund for a portion of the payments made by the fund in the amount of $3,710, which is shown as a reduction of total expenses in the Statement of Operations. Additionally, MFS has agreed to bear all expenses associated with office space, other administrative support, and supplies provided to the ICCO and Assistant ICCO.
The fund invests in the MFS Institutional Money Market Portfolio which is managed by MFS and seeks current income consistent with preservation of capital and liquidity. Income earned on this investment is included in “Dividends from underlying affiliated funds” in the Statement of Operations. This money market fund does not pay a management fee to MFS.
On May 31, 2012, MFS purchased 29,326 shares of Class R5 for an aggregate amount of $100,000.
(4) Portfolio Securities
Purchases and sales of investments, other than purchased option transactions, and short-term obligations, aggregated $515,737,253 and $390,623,790, respectively.
(5) Shares of Beneficial Interest
The fund’s Declaration of Trust permits the Trustees to issue an unlimited number of full and fractional shares of beneficial interest. Transactions in fund shares were as follows:
| | | | | | | | | | | | | | | | |
| | | Year ended
1/31/13 (i) | | | Year ended
1/31/12 | |
| | | Shares | | | Amount | | | Shares | | | Amount | |
| Shares sold | | | | | | | | | | | | | | | | |
Class A | | | 37,926,389 | | | | $133,588,887 | | | | 40,971,097 | | | | $141,283,531 | |
Class B | | | 3,678,551 | | | | 12,885,658 | | | | 1,788,219 | | | | 6,127,252 | |
Class C | | | 4,401,599 | | | | 15,527,434 | | | | 3,705,729 | | | | 12,749,334 | |
Class I | | | 23,095,779 | | | | 80,270,101 | | | | 27,474,124 | | | | 94,109,549 | |
Class R1 | | | 106,585 | | | | 374,003 | | | | 66,387 | | | | 229,409 | |
Class R2 | | | 219,964 | | | | 772,688 | | | | 395,496 | | | | 1,357,004 | |
Class R3 | | | 432,960 | | | | 1,519,275 | | | | 591,107 | | | | 2,048,397 | |
Class R4 | | | 18,438 | | | | 63,964 | | | | 11,539 | | | | 39,628 | |
Class R5 | | | 144,005,941 | | | | 493,707,322 | | | | — | | | | — | |
Class 529A | | | 310,590 | | | | 1,096,036 | | | | 177,689 | | | | 604,420 | |
Class 529B | | | 41,923 | | | | 146,659 | | | | 14,943 | | | | 51,139 | |
Class 529C | | | 133,976 | | | | 470,182 | | | | 126,286 | | | | 434,928 | |
| | | 214,372,695 | | | | $740,422,209 | | | | 75,322,616 | | | | $259,034,591 | |
56
Notes to Financial Statements – continued
| | | | | | | | | | | | | | | | |
| | | Year ended
1/31/13 (i) | | | Year ended
1/31/12 | |
| | | Shares | | | Amount | | | Shares | | | Amount | |
| Shares issued to shareholders in reinvestment of distributions | | | | | | | | | | | | | | | | |
Class A | | | 6,846,113 | | | | $24,077,229 | | | | 6,978,303 | | | | $23,957,043 | |
Class B | | | 372,944 | | | | 1,315,972 | | | | 344,328 | | | | 1,187,171 | |
Class C | | | 948,179 | | | | 3,350,101 | | | | 926,266 | | | | 3,193,709 | |
Class I | | | 3,842,281 | | | | 13,362,376 | | | | 8,207,085 | | | | 28,129,205 | |
Class R1 | | | 20,648 | | | | 72,686 | | | | 20,616 | | | | 70,820 | |
Class R2 | | | 83,820 | | | | 294,571 | | | | 106,634 | | | | 366,011 | |
Class R3 | | | 147,100 | | | | 517,296 | | | | 148,175 | | | | 508,179 | |
Class R4 | | | 6,828 | | | | 24,030 | | | | 6,783 | | | | 23,276 | |
Class R5 | | | 5,665,992 | | | | 20,103,484 | | | | — | | | | — | |
Class 529A | | | 39,944 | | | | 140,663 | | | | 27,681 | | | | 94,736 | |
Class 529B | | | 6,334 | | | | 22,255 | | | | 6,597 | | | | 22,646 | |
Class 529C | | | 19,846 | | | | 69,991 | | | | 16,205 | | | | 55,614 | |
| | | 18,000,029 | | | | $63,350,654 | | | | 16,788,673 | | | | $57,608,410 | |
| | | | |
| Shares reacquired | | | | | | | | | | | | | | | | |
Class A | | | (39,425,483 | ) | | | $(138,201,516 | ) | | | (55,890,653 | ) | | | $(191,980,670 | ) |
Class B | | | (2,838,499 | ) | | | (9,998,115 | ) | | | (5,301,302 | ) | | | (18,317,793 | ) |
Class C | | | (4,616,000 | ) | | | (16,236,799 | ) | | | (5,678,043 | ) | | | (19,553,421 | ) |
Class I | | | (137,959,990 | ) | | | (471,436,686 | ) | | | (14,925,778 | ) | | | (50,763,795 | ) |
Class R1 | | | (161,538 | ) | | | (571,113 | ) | | | (61,017 | ) | | | (208,509 | ) |
Class R2 | | | (807,065 | ) | | | (2,825,243 | ) | | | (467,863 | ) | | | (1,622,299 | ) |
Class R3 | | | (458,687 | ) | | | (1,617,198 | ) | | | (662,678 | ) | | | (2,275,166 | ) |
Class R4 | | | (37,898 | ) | | | (135,112 | ) | | | (11,819 | ) | | | (39,318 | ) |
Class R5 | | | (6,517,906 | ) | | | (22,618,362 | ) | | | — | | | | — | |
Class 529A | | | (88,834 | ) | | | (313,860 | ) | | | (50,566 | ) | | | (172,531 | ) |
Class 529B | | | (49,857 | ) | | | (175,879 | ) | | | (29,299 | ) | | | (100,666 | ) |
Class 529C | | | (98,901 | ) | | | (349,129 | ) | | | (44,246 | ) | | | (152,157 | ) |
| | | (193,060,658 | ) | | | $(664,479,012 | ) | | | (83,123,264 | ) | | | $(285,186,325 | ) |
| | | | |
| Net change | | | | | | | | | | | | | | | | |
Class A | | | 5,347,019 | | | | $19,464,600 | | | | (7,941,253 | ) | | | $(26,740,096 | ) |
Class B | | | 1,212,996 | | | | 4,203,515 | | | | (3,168,755 | ) | | | (11,003,370 | ) |
Class C | | | 733,778 | | | | 2,640,736 | | | | (1,046,048 | ) | | | (3,610,378 | ) |
Class I | | | (111,021,930 | ) | | | (377,804,209 | ) | | | 20,755,431 | | | | 71,474,959 | |
Class R1 | | | (34,305 | ) | | | (124,424 | ) | | | 25,986 | | | | 91,720 | |
Class R2 | | | (503,281 | ) | | | (1,757,984 | ) | | | 34,267 | | | | 100,716 | |
Class R3 | | | 121,373 | | | | 419,373 | | | | 76,604 | | | | 281,410 | |
Class R4 | | | (12,632 | ) | | | (47,118 | ) | | | 6,503 | | | | 23,586 | |
Class R5 | | | 143,154,027 | | | | 491,192,444 | | | | — | | | | — | |
Class 529A | | | 261,700 | | | | 922,839 | | | | 154,804 | | | | 526,625 | |
Class 529B | | | (1,600 | ) | | | (6,965 | ) | | | (7,759 | ) | | | (26,881 | ) |
Class 529C | | | 54,921 | | | | 191,044 | | | | 98,245 | | | | 338,385 | |
| | | 39,312,066 | | | | $139,293,851 | | | | 8,988,025 | | | | $31,456,676 | |
| (i) | For Class R5, the period is from inception, June 1, 2012, through the stated period end. |
57
Notes to Financial Statements – continued
The fund is one of several mutual funds in which the MFS funds-of-funds may invest. The MFS funds-of-funds do not invest in the underlying MFS funds for the purpose of exercising management or control. At the end of the period, the MFS Conservative Allocation Fund, the MFS Growth Allocation Fund, and the MFS Moderate Allocation Fund were the owners of record of approximately 9%, 14%, and 17%, respectively, of the value of outstanding voting shares of the fund. In addition, the Lifetime Retirement Income Fund, the MFS Lifetime 2010, the MFS Lifetime 2020 Fund, and the MFS Lifetime 2030 Fund were each the owners of record of less than 1% of the value of outstanding voting shares of the fund.
(6) Line of Credit
The fund and certain other funds managed by MFS participate in a $1.1 billion unsecured committed line of credit, subject to a $1 billion sublimit, provided by a syndication of banks under a credit agreement. Borrowings may be made for temporary financing needs. Interest is charged to each fund, based on its borrowings, generally at a rate equal to the higher of the Federal Reserve funds rate or one month LIBOR plus an agreed upon spread. A commitment fee, based on the average daily, unused portion of the committed line of credit, is allocated among the participating funds at the end of each calendar quarter. In addition, the fund and other funds managed by MFS have established unsecured uncommitted borrowing arrangements with certain banks for temporary financing needs. Interest is charged to each fund, based on its borrowings, at a rate equal to the Federal Reserve funds rate plus an agreed upon spread. For the year ended January 31, 2013, the fund’s commitment fee and interest expense were $6,938 and $0, respectively, and are included in “Miscellaneous” expense in the Statement of Operations.
(7) Transactions in Underlying Affiliated Funds-Affiliated Issuers
An affiliated issuer may be considered one in which the fund owns 5% or more of the outstanding voting securities, or a company which is under common control. For the purposes of this report, the fund assumes the following to be an affiliated issuer:
| | | | | | | | | | | | | | | | |
| Underlying Affiliated Fund | | Beginning
Shares/Par
Amount | | | Acquisitions
Shares/Par
Amount | | | Dispositions
Shares/Par
Amount | | | Ending
Shares/Par
Amount | |
MFS Institutional Money
Market Portfolio | | | 47,548,693 | | | | 290,567,599 | | | | (275,803,654 | ) | | | 62,312,638 | |
| | | | |
| Underlying Affiliated Fund | | Realized Gain (Loss) | | | Capital Gain Distributions | | | Dividend Income | | | Ending Value | |
MFS Institutional Money
Market Portfolio | | | $— | | | | $— | | | | $81,723 | | | | $62,312,638 | |
58
REPORT OF INDEPENDENT REGISTERED PUBLIC ACCOUNTING FIRM
To the Board of Trustees of MFS Series Trust III and the Shareholders of
MFS High Income Fund:
We have audited the accompanying statement of assets and liabilities, including the portfolio of investments, of MFS High Income Fund (one of the portfolios constituting the MFS Series Trust III) (the “Fund”) as of January 31, 2013, and the related statements of operations for the year then ended, the statement of changes in net assets for each of the two years in the period then ended, and the financial highlights for the period presented. These financial statements and financial highlights are the responsibility of the Fund’s management. Our responsibility is to express an opinion on these financial statements and financial highlights based on our audits.
We conducted our audits in accordance with the standards of the Public Company Accounting Oversight Board (United States). Those standards require that we plan and perform the audit to obtain reasonable assurance about whether the financial statements and financial highlights are free of material misstatement. The Fund is not required to have, nor were we engaged to perform, an audit of its internal control over financial reporting. Our audits included consideration of internal control over financial reporting as a basis for designing audit procedures that are appropriate in the circumstances, but not for the purpose of expressing an opinion on the effectiveness of the Fund’s internal control over financial reporting. Accordingly, we express no such opinion. An audit also includes examining, on a test basis, evidence supporting the amounts and disclosures in the financial statements, assessing the accounting principles used and significant estimates made by management, as well as evaluating the overall financial statement presentation. Our procedures included confirmation of securities owned as of January 31, 2013, by correspondence with the custodian and brokers; where replies were not received from brokers, we performed other auditing procedures. We believe that our audits provide a reasonable basis for our opinion.
In our opinion, the financial statements and financial highlights referred to above present fairly, in all material respects, the financial position of MFS High Income Fund of the MFS Series Trust III as of January 31, 2013, the results of its operations for the year then ended, the changes in its net assets for each of the two years in the period then ended, and the financial highlights for the period presented, in conformity with accounting principles generally accepted in the United States of America.
DELOITTE & TOUCHE LLP
Boston, Massachusetts
March 18, 2013
59
TRUSTEES AND OFFICERS — IDENTIFICATION AND BACKGROUND
The Trustees and officers of the Trust, as of March 1, 2013, are listed below, together with their principal occupations during the past five years. (Their titles may have varied during that period.) The address of each Trustee and officer is 111 Huntington Avenue, Boston, Massachusetts 02199-7618.
| | | | | | | | |
Name, Age | | Position(s) Held with Fund | | Trustee/Officer
Since (h) | | Principal
Occupations During the Past Five Years | | Other Directorships (j) |
| INTERESTED TRUSTEES |
Robert J. Manning (k)
(age 49) | | Trustee | | February 2004 | | Massachusetts Financial Services Company, Chairman, Chief Executive Officer and Director; President (until December 2009); Chief Investment Officer (until July 2010) | | N/A |
| INDEPENDENT TRUSTEES | | | | | | |
David H. Gunning
(age 70) | | Trustee and Chair of Trustees | | January 2004 | | Private investor | | Lincoln Electric Holdings, Inc. (welding equipment manufacturer), Director; Development Alternatives, Inc. (consulting), Director/Non-Executive Chairman; Portman Limited (mining), Director (until 2008) |
Robert E. Butler
(age 71) | | Trustee | | January 2006 | | Consultant – investment company industry regulatory and compliance matters | | N/A |
Maureen R. Goldfarb
(age 57) | | Trustee | | January 2009 | | Private investor | | N/A |
William R. Gutow
(age 71) | | Trustee | | December 1993 | | Private investor and real estate consultant; Capitol Entertainment Management Company (video franchise), Vice Chairman | | Texas Donuts (donut franchise), Vice Chairman (until 2010) |
60
Trustees and Officers – continued
| | | | | | | | |
Name, Age | | Position(s) Held with Fund | | Trustee/Officer
Since (h) | | Principal
Occupations During the Past Five Years | | Other Directorships (j) |
Michael Hegarty
(age 68) | | Trustee | | December 2004 | | Private investor; Rouse Properties Inc. (real estate), Director | | Brookfield Office Properties, Inc. (real estate), Director; Rouse Properties Inc. (real estate), Director; Capmark Financial Group Inc. (real esate), Director |
John P. Kavanaugh
(age 58) | | Trustee | | January 2009 | | Private investor | | N/A |
J. Dale Sherratt
(age 74) | | Trustee | | June 1989 | | Insight Resources, Inc. (acquisition planning specialists), President; Wellfleet Investments (investor in health care companies), Managing General Partner | | N/A |
Laurie J. Thomsen
(age 55) | | Trustee | | March 2005 | | Private investor; New Profit, Inc. (venture philanthropy), Executive Partner (until 2010) | | The Travelers Companies (insurance), Director |
Robert W. Uek
(age 71) | | Trustee | | January 2006 | | Consultant to investment company industry | | N/A |
| OFFICERS |
John M. Corcoran (k)
(age 47) | | President | | October 2008 | | Massachusetts Financial Services Company, Senior Vice President (since October 2008); State Street Bank and Trust (financial services provider), Senior Vice President, (until September 2008) | | N/A |
Christopher R. Bohane (k)
(age 39) | | Assistant Secretary and Assistant Clerk | | July 2005 | | Massachusetts Financial Services Company, Vice President and Senior Counsel | | N/A |
Kino Clark (k)
(age 44) | | Assistant Treasurer | | January 2012 | | Massachusetts Financial Services Company, Vice President | | N/A |
61
Trustees and Officers – continued
| | | | | | | | |
Name, Age | | Position(s) Held with Fund | | Trustee/Officer
Since (h) | | Principal
Occupations During the Past Five Years | | Other Directorships (j) |
Thomas H. Connors (k)
(age 53) | | Assistant
Secretary and Assistant Clerk | | September 2012 | | Massachusetts Financial Services Company, Vice President and Senior Counsel; Deutsche Investment Management Americas Inc. (financial service provider), Director and Senior Counsel (until 2012) | | N/A |
Ethan D. Corey (k)
(age 49) | | Assistant
Secretary and Assistant Clerk | | July 2005 | | Massachusetts Financial Services Company, Senior Vice President and Associate General Counsel | | N/A |
David L. DiLorenzo (k)
(age 44) | | Treasurer | | July 2005 | | Massachusetts Financial Services Company, Senior Vice President | | N/A |
Robyn L. Griffin
(age 37) | | Assistant
Independent Chief Compliance
Officer | | August 2008 | | Griffin Compliance LLC (provider of compliance services), Principal (since August 2008); State Street Corporation (financial services provider), Mutual Fund Administration Assistant Vice President (October 2006 – July 2008) | | N/A |
Brian E. Langenfeld (k)
(age 39) | | Assistant
Secretary and Assistant Clerk | | June 2006 | | Massachusetts Financial Services Company, Vice President and Senior Counsel | | N/A |
Susan S. Newton (k)
(age 62) | | Assistant
Secretary and Assistant Clerk | | May 2005 | | Massachusetts Financial Services Company, Senior Vice President and Associate General Counsel | | N/A |
Susan A. Pereira (k)
(age 42) | | Assistant
Secretary and Assistant Clerk | | July 2005 | | Massachusetts Financial Services Company, Vice President and Senior Counsel | | N/A |
62
Trustees and Officers – continued
| | | | | | | | |
Name, Age | | Position(s) Held with Fund | | Trustee/Officer
Since (h) | | Principal
Occupations During the Past Five Years | | Other Directorships (j) |
Kasey L. Phillips (k)
(age 42) | | Assistant Treasurer | | September 2012 | | Massachusetts Financial Services Company, Vice President; Wells Fargo Funds Management, LLC, Senior Vice President, Fund Treasurer (until 2012) | | N/A |
Mark N. Polebaum (k)
(age 60) | | Secretary and Clerk | | January 2006 | | Massachusetts Financial Services Company, Executive Vice President, General Counsel and Secretary | | N/A |
Frank L. Tarantino
(age 68) | | Independent
Chief Compliance Officer | | June 2004 | | Tarantino LLC (provider of compliance services), Principal | | N/A |
Richard S. Weitzel (k)
(age 42) | | Assistant Secretary and Assistant Clerk | | October 2007 | | Massachusetts Financial Services Company, Senior Vice President and Associate General Counsel | | N/A |
James O. Yost (k)
(age 52) | | Deputy Treasurer | | September 1990 | | Massachusetts Financial Services Company, Senior Vice President | | N/A |
| (h) | Date first appointed to serve as Trustee/officer of an MFS fund. Each Trustee has served continuously since appointment unless indicated otherwise. For the period from December 15, 2004 until February 22, 2005, Mr. Manning served as Advisory Trustee. For the period October 2008, until January 2012, Mr. Corcoran served as Treasurer of the Funds. Prior to January 2012, Messrs. DiLorenzo and Yost served as Assistant Treasurers of the Funds. |
| (j) | Directorships or trusteeships of companies required to report to the Securities and Exchange Commission (i.e., “public companies”). |
| (k) | “Interested person” of the Trust within the meaning of the Investment Company Act of 1940 (referred to as the 1940 Act), which is the principal federal law governing investment companies like the fund, as a result of position with MFS. The address of MFS is 111 Huntington Avenue, Boston, Massachusetts 02199-7618. |
Each Trustee has been elected by shareholders and each Trustee and officer holds office until his or her successor is chosen and qualified or until his or her earlier death, resignation, retirement or removal. The Trust does not hold annual meetings for the purpose of electing Trustees, and Trustees are not elected for fixed terms. Messrs. Butler, Kavanaugh, Uek and Ms. Thomsen are members of the Trust’s Audit Committee.
Each of the Fund’s Trustees and officers holds comparable positions with certain other funds of which MFS or a subsidiary is the investment adviser or distributor, and, in the case of the officers, with certain affiliates of MFS. As of January 1, 2013, the Trustees served as board members of 143 funds within the MFS Family of Funds.
63
Trustees and Officers – continued
The Statement of Additional Information for the Fund includes further information about the Trustees and is available without charge upon request by calling 1-800-225-2606.
| | |
| Investment Adviser | | Custodian |
Massachusetts Financial Services Company
111 Huntington Avenue
Boston, MA 02199-7618 | | JPMorgan Chase Bank One Chase Manhattan Plaza New York, NY 10081 |
| Distributor | | Independent Registered Public Accounting Firm |
MFS Fund Distributors, Inc.
111 Huntington Avenue
Boston, MA 02199-7618 | | Deloitte & Touche LLP 200 Berkeley Street
Boston, MA 02116 |
| Portfolio Managers | | |
William Adams David Cole | | |
64
BOARD REVIEW OF INVESTMENT ADVISORY AGREEMENT
A discussion regarding the Board’s most recent review and renewal of the fund’s Investment Advisory Agreement with MFS is available by clicking on the fund’s name under “Mutual Funds” in the “Products” section of the MFS Web site (mfs.com).
PROXY VOTING POLICIES AND INFORMATION
A general description of the MFS funds’ proxy voting policies and procedures is available without charge, upon request, by calling 1-800-225-2606, by visiting the Proxy Voting section of mfs.com or by visiting the SEC’s Web site at http://www.sec.gov.
Information regarding how the fund voted proxies relating to portfolio securities during the most recent twelve-month period ended June 30 is available without charge by visiting the Proxy Voting section of mfs.com or by visiting the SEC’s Web site at http://www.sec.gov.
QUARTERLY PORTFOLIO DISCLOSURE
The fund will file a complete schedule of portfolio holdings with the Securities and Exchange Commission (the Commission) for the first and third quarters of each fiscal year on Form N-Q. A shareholder can obtain the quarterly portfolio holdings report at mfs.com. The fund’s Form N-Q is also available on the EDGAR database on the Commission’s Internet Web site at http://www.sec.gov, and may be reviewed and copied at the:
Public Reference Room
Securities and Exchange Commission
100 F Street, NE, Room 1580
Washington, D.C. 20549
Information on the operation of the Public Reference Room may be obtained by calling the Commission at 1-800-SEC-0330. Copies of the fund’s Form N-Q also may be obtained, upon payment of a duplicating fee, by electronic request at the following e-mail address: publicinfo@sec.gov or by writing the Public Reference Section at the above address.
FURTHER INFORMATION
From time to time, MFS may post important information about the fund or the MFS funds on the MFS web site (mfs.com). This information is available by visiting the “News & Commentary” section of mfs.com or by clicking on the fund’s name under “Mutual Funds” in the “Products” section of mfs.com.
FEDERAL TAX INFORMATION (unaudited)
The fund will notify shareholders of amounts for use in preparing 2013 income tax forms in January 2014.
65
rev. 3/11
| | | | |
| | | |
FACTS | | WHAT DOES MFS DO WITH YOUR PERSONAL INFORMATION? | |  |
| | |
| Why? | | Financial companies choose how they share your personal information. Federal law gives consumers the right to limit some but not all sharing. Federal law also requires us to tell you how we collect, share, and protect your personal information. Please read this notice carefully to understand what we do. |
| | |
| What? | | The types of personal information we collect and share depend on the product or service you have with us. This information can include: •Social Security number and account balances •Account transactions and transaction history •Checking account information and wire transfer instructions When you are no longer our customer, we continue to share your information as described in this notice. |
| | |
| How? | | All financial companies need to share customers’ personal information to run their everyday business. In the section below, we list the reasons financial companies can share their customers’ personal information; the reasons MFS chooses to share; and whether you can limit this sharing. |
| | | | |
Reasons we can share your
personal information | | Does MFS
share? | | Can you limit
this sharing? |
For our everyday business purposes – such as to process your transactions, maintain your account(s), respond to court orders and legal investigations, or report to credit bureaus | | Yes | | No |
For our marketing purposes – to offer our products and services to you | | No | | We don’t share |
| For joint marketing with other financial companies | | No | | We don’t share |
For our affiliates’ everyday business purposes – information about your transactions and experiences | | No | | We don’t share |
For our affiliates’ everyday business purposes – information about your creditworthiness | | No | | We don’t share |
| For nonaffiliates to market to you | | No | | We don’t share |
| | |
| Questions? | | Call 800-225-2606 or go to mfs.com. |
66
| | |
| Who we are |
| Who is providing this notice? | | MFS Funds, MFS Investment Management, MFS Institutional Advisors, Inc., MFS Fund Distributors, Inc., MFS Heritage Trust Company, and MFS Service Center, Inc. |
| | |
| What we do |
| How does MFS protect my personal information? | | To protect your personal information from unauthorized access and use, we use security measures that comply with federal law. These measures include procedural, electronic, and physical safeguards for the protection of the personal information we collect about you. |
| How does MFS collect my personal information? | | We collect your personal information, for example, when you •open an account or provide account information •direct us to buy securities or direct us to sell your securities •make a wire transfer We also collect your personal information from others, such as credit bureaus, affiliates and other companies. |
| Why can’t I limit all sharing? | | Federal law gives you the right to limit only •sharing for affiliates’ everyday business purposes – information about your creditworthiness •affiliates from using your information to market to you •sharing for nonaffiliates to market to you State laws and individual companies may give you additional rights to limit sharing. |
| | |
| Definitions |
| Affiliates | | Companies related by common ownership or control. They can be financial and nonfinancial companies. •MFS does not share personal information with affiliates, except for everyday business purposes as described on page one of this notice. |
| Nonaffiliates | | Companies not related by common ownership or control. They can be financial and nonfinancial companies. •MFS does not share with nonaffiliates so they can market to you. |
| Joint Marketing | | A formal agreement between nonaffiliated financial companies that together market financial products or services to you. •MFS doesn’t jointly market. |
| | |
| Other important information |
| If you own an MFS product or receive an MFS service in the name of a third party such as a bank or broker-dealer, their privacy policy may apply to you instead of ours. |
67
Save paper with eDelivery.

| MFS® will send you prospectuses, |
reports, and proxies directly via e-mail so you will get information faster with less mailbox clutter.
To sign up:
1. Go to mfs.com.
2. Log in via MFS® Access.
3. Select eDelivery.
If you own your MFS fund shares through a financial institution or a retirement plan, MFS® TALK, MFS® Access, or eDelivery may not be available to you.
CONTACT
WEB SITE
mfs.com
MFS TALK
1-800-637-8255
24 hours a day
ACCOUNT SERVICE AND LITERATURE
Shareholders
1-800-225-2606
Financial advisors
1-800-343-2829
Retirement plan services
1-800-637-1255
MAILING ADDRESS
MFS Service Center, Inc.
P.O. Box 55824
Boston, MA 02205-5824
OVERNIGHT MAIL
MFS Service Center, Inc.
c/o Boston Financial Data Services
30 Dan Road
Canton, MA 02021-2809
ANNUAL REPORT
January 31, 2013

MFS® HIGH YIELD OPPORTUNITIES FUND

HYO-ANN
MFS® HIGH YIELD OPPORTUNITIES FUND
CONTENTS
The report is prepared for the general information of shareholders.
It is authorized for distribution to prospective investors only when preceded or accompanied by a current prospectus.
NOT FDIC INSURED Ÿ MAY LOSE VALUE Ÿ NO BANK GUARANTEE

LETTER FROM THE CHAIRMAN AND CEO
Dear Shareholders:
Global financial markets began 2013 with greater optimism. U.S. and Asian economic trends have turned more positive. Europe continues to struggle through its economic
slump. However, even there, sentiment has improved. The U.S. Congress averted its year-end fiscal cliff, but a degree of uncertainty remains regarding upcoming negotiations over spending cuts and the debt ceiling. The U.S. Federal Reserve Board is continuing its accommodative monetary easing, while the U.S. housing and job markets have made steady gains. Corporate profits have been resilient, and investors have demonstrated increased tolerance for risk.
Overseas, the eurozone remains in a broad contraction, with economic output receding in France as well as Italy and Spain. However, large-scale early repayments of European Central
Bank loans by banks and Germany’s strong rebound in manufacturing activity are encouraging signs. In Asia, both China and Japan appear to be in the early stages of a turnaround. China’s economic activity has picked up from last year’s relative slowdown, and Japan’s sharp devaluation of the yen, an important anti-deflationary measure, seems to be having its desired impact: Japanese stocks have soared, corporate profits are rising and confidence is returning among consumers, businesses and investors.
As always, managing risk in the face of uncertainty remains a top priority for investors. At MFS®, our uniquely collaborative investment process employs global research and active risk management. Our global team of investment professionals shares ideas and evaluates opportunities across continents, investment disciplines and asset classes — all with a goal of building better insights, and ultimately better results, for our clients.
We remain mindful of the many economic challenges investors face today, and believe it is more important than ever to maintain a long-term view and employ time-tested principles, such as asset allocation and diversification. We also remain confident that our unique approach can serve investors well as they work with their financial advisors to identify and pursue the most suitable opportunities.
Respectfully,

Robert J. Manning
Chairman and Chief Executive Officer
MFS Investment Management®
March 18, 2013
The opinions expressed in this letter are subject to change, may not be relied upon for investment advice, and no forecasts can be guaranteed.
1
PORTFOLIO COMPOSITION
Portfolio structure (i)

| | | | |
| Top five industries (i) | | | | |
| Energy-Independent | | | 7.3% | |
| Broadcasting | | | 5.7% | |
| Medical & Health Technology & Services | | | 4.2% | |
| Telecommunications-Wireless | | | 4.2% | |
| Utilities-Electric Power | | | 4.1% | |
| | | | |
Composition including fixed
income credit quality (a)(i) | |
| A | | | 0.3% | |
| BBB | | | 8.9% | |
| BB | | | 29.6% | |
| B | | | 41.7% | |
| CCC | | | 15.2% | |
| CC | | | 0.2% | |
| C | | | 0.1% | |
| Not Rated | | | 0.1% | |
| Non-Fixed Income | | | 3.7% | |
| Cash & Other | | | 0.2% | |
| |
| Portfolio facts (i) | | | | |
| Average Duration (d) | | | 4.0 | |
| Average Effective Maturity (m) | | | 7.1 yrs. | |
| (a) | For all securities other than those specifically described below, ratings are assigned to underlying securities utilizing ratings from Moody’s, Fitch, and Standard & Poor’s rating agencies and applying the following hierarchy: If all three agencies provide a rating, the middle rating (after dropping the highest and lowest ratings) is assigned; if two of the three agencies rate a security, the lower of the two is assigned. Ratings are shown in the S&P and Fitch scale (e.g., AAA). Securities rated BBB or higher are considered investment grade. All ratings are subject to change. Not Rated includes fixed income securities, including fixed income futures contracts, which have not been rated by any rating agency. Non-Fixed Income includes equity securities (including convertible bonds and equity derivatives) and commodities. Cash & Other includes cash, other assets less liabilities, offsets to derivative positions, and short-term securities. The fund may not hold all of these instruments. The fund is not rated by these agencies. |
| (d) | Duration is a measure of how much a bond’s price is likely to fluctuate with general changes in interest rates, e.g., if rates rise 1.00%, a bond with a 5-year duration is likely to lose about 5.00% of its value due to the interest rate move. |
| (i) | For purposes of this presentation, the components include the market value of securities, and reflect the impact of the equivalent exposure of derivative positions, if any. These amounts may be negative from time to time. The bond component will include any accrued interest amounts. Equivalent exposure is a calculated amount that translates the derivative position into a reasonable approximation of the amount of the underlying asset that the portfolio would have to hold at a given point in time to have the same price sensitivity that results from the portfolio’s ownership of the derivative contract. When dealing with derivatives, equivalent exposure is a more representative measure of the potential impact of a position on portfolio performance than market value. Where the fund holds convertible bonds, these are treated as part of the equity portion of the portfolio. |
2
Portfolio Composition – continued
| (m) | In determining an instrument’s effective maturity for purposes of calculating the fund’s dollar-weighted average effective maturity, MFS uses the instrument’s stated maturity or, if applicable, an earlier date on which MFS believes it is probable that a maturity-shortening device (such as a put, pre-refunding or prepayment) will cause the instrument to be repaid. Such an earlier date can be substantially shorter than the instrument’s stated maturity. |
Percentages are based on net assets as of 1/31/13.
The portfolio is actively managed and current holdings may be different.
3
MANAGEMENT REVIEW
Summary of Results
For the twelve months ended January 31, 2013, Class A shares of the MFS High Yield Opportunities Fund (“fund”) provided a total return of 12.73%, at net asset value. This compares with a return of 13.87% for the fund’s benchmark, the Barclays U.S. High-Yield Corporate Bond 2% Issuer Capped Index.
Market Environment
The beginning of the period was characterized by a risk-on sentiment as a result of additional liquidity measures by the Federal Reserve Bank (“Fed”) and the European Central Bank (“ECB”) as well as a commensurate improvement in macroeconomic conditions. During this time, global equity valuations rose, credit spreads contracted, and high-quality sovereign yield increased modestly.
During the middle of the period, however, conditions worsened, driven by broadly weaker global macroeconomic indicators, as well as renewed concerns over the Eurozone’s capacity and determination to address its ongoing crisis. Despite this deterioration, broad market sentiment remained relatively resilient as equity markets generally maintained gains and credit spreads did not indicate deterioration.
However, this renewed weakness in the fundamentals precipitated a further round of monetary easing by the Fed (through a third round of quantitative easing) and the ECB (through a new bond purchase facility) in the second half of the period, which soon instilled additional confidence in risk markets. Nonetheless, towards the end of the period, weaker equity earnings reports and declining forward guidance caused market sentiment to soften. In addition, as we moved toward year end, the fiscal cliff negotiations between the Republicans in the U.S. Congress and President Obama were a particular source of market attention, where uncertainty surrounding the fiscal negotiations continued right up to the end-of-year deadline.
Detractors from Performance
Relative to the Barclays U.S. High-Yield Corporate Bond 2% Issuer Capped Index, the fund’s lesser exposure to the telecom and industrial sectors detracted from performance as these market segments outperformed the benchmark over the reporting period.
The fund’s lesser exposure to “BB” and “B” rated (r) securities held back performance as these credit quality sectors outperformed higher-rated securities. Additionally, the portion of fund’s return derived from yield, which was less than that of the benchmark, detracted from relative performance.
Among individual securities, the fund’s debt holdings of broadcasting company LBI Media, commercial mortgage-backed security JPMorgan Chase, and oil company ATP Oil and Gas (h) were top relative detractors.
Contributors to Performance
The fund’s greater exposure to the financial sector benefited performance as this market segment outperformed the benchmark over the reporting period.
4
Management Review – continued
The fund’s greater exposure to “BBB” rated securities was another positive factor for relative results as credit spreads narrowed over the period.
Relative to the benchmark, the fund’s greater exposure to emerging markets debt, particularly Latin America, supported relative performance as this market segment turned in positive performance over the reporting period.
Top individual contributors over the reporting period included the fund’s debt holdings of insurance company American International Group, Abbey National Capital Trust (h), and diversified bank Royal Bank of Scotland Group.
Respectfully,
| | | | |
| William Adams | | David Cole | | Matthew Ryan |
| Portfolio Manager | | Portfolio Manager | | Portfolio Manager |
| (h) | Security was not held in the portfolio at period end. |
| (r) | Bonds rated “BBB”, “Baa”, or higher are considered investment grade; bonds rated “BB”, “Ba”, or below are considered non-investment grade. The source for bond quality ratings is Moody’s Investors Service, Standard & Poor’s and Fitch, Inc. and are applied using the following hierarchy: If all three agencies provide a rating, the middle rating (after dropping the highest and lowest ratings) is assigned; if two of the three agencies rate a security, the lower of the two is assigned. Ratings are shown in the S&P and Fitch scale (e.g., AAA). For securities which are not rated by any of the three agencies, the security is considered Not Rated. |
The views expressed in this report are those of the portfolio managers only through the end of the period of the report as stated on the cover and do not necessarily reflect the views of MFS or any other person in the MFS organization. These views are subject to change at any time based on market or other conditions, and MFS disclaims any responsibility to update such views. These views may not be relied upon as investment advice or an indication of trading intent on behalf of any MFS portfolio. References to specific securities are not recommendations of such securities, and may not be representative of any MFS portfolio’s current or future investments.
5
PERFORMANCE SUMMARY THROUGH 1/31/13
The following chart illustrates a representative class of the fund’s historical performance in comparison to its benchmark(s). Performance results include the deduction of the maximum applicable sales charge and reflect the percentage change in net asset value, including reinvestment of dividends and capital gains distributions. The performance of other share classes will be greater than or less than that of the class depicted below. Benchmarks are unmanaged and may not be invested in directly. Benchmark returns do not reflect sales charges, commissions or expenses. (See Notes to Performance Summary.)
Performance data shown represents past performance and is no guarantee of future results. Investment return and principal value fluctuate so your shares, when sold, may be worth more or less than the original cost; current performance may be lower or higher than quoted. The performance shown does not reflect the deduction of taxes, if any, that a shareholder would pay on fund distributions or the redemption of fund shares.
Growth of a Hypothetical $10,000 Investment
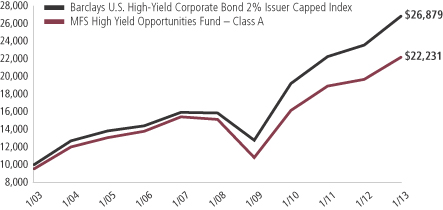
6
Performance Summary – continued
Total Returns through 1/31/13
Average annual without sales charge
| | | | | | | | | | | | | | |
| | | Share class | | Class inception date | | 1-yr | | 5-yr | | 10-yr | | Life (t) | | |
| | | A | | 7/01/98 | | 12.73% | | 7.96% | | 8.85% | | N/A | | |
| | | B | | 7/01/98 | | 11.71% | | 7.15% | | 8.09% | | N/A | | |
| | | C | | 7/01/98 | | 11.73% | | 7.18% | | 8.10% | | N/A | | |
| | | I | | 7/01/98 | | 13.00% | | 8.22% | | 9.15% | | N/A | | |
| | | R1 | | 6/02/08 | | 11.71% | | N/A | | N/A | | 7.01% | | |
| | | R2 | | 6/02/08 | | 12.26% | | N/A | | N/A | | 7.55% | | |
| | | R3 | | 6/02/08 | | 12.55% | | N/A | | N/A | | 7.84% | | |
| | | R4 | | 6/02/08 | | 13.85% | | N/A | | N/A | | 8.29% | | |
| | | R5
(formerly Class W) | | 6/02/08 | | 13.03% | | N/A | | N/A | | 8.00% | | |
| Comparative benchmark | | | | | | | | | | |
| | | Barclays U.S. High-Yield Corporate Bond
2% Issuer Capped Index (f) | | 13.87% | | 11.08% | | 10.39% | | N/A | | |
| Average annual with sales charge | | | | | | | | | | |
| | | A With Initial Sales Charge (4.75%) | | 7.37% | | 6.91% | | 8.32% | | N/A | | |
| | | B With CDSC (Declining over six years from 4% to 0%) (x) | | 7.71% | | 6.86% | | 8.09% | | N/A | | |
| | | C With CDSC (1% for 12 months) (x) | | 10.73% | | 7.18% | | 8.10% | | N/A | | |
Class I, R1, R2, R3, R4 and R5 shares do not have a sales charge.
CDSC – Contingent Deferred Sales Charge.
As further discussed in Note 5 in the Notes to Financial Statements, on May 10, 2012, sales of Class W shares (including exchanges) were suspended. On May 11, 2012, certain Class W shares were automatically converted to Class I shares. Shareholders of certain Class W shares became shareholders of Class I and received Class I shares with a total net asset value equal to their Class W shares at the time of the conversion. On May 30, 2012, remaining Class W shares, which represented MFS seed money, were redesignated as Class R5. Class R5 shares are generally available only to certain eligible retirement plans and to funds distributed by MFD. Class R5 shares do not pay a 12b-1 distribution fee or sub-accounting costs. On June 1, 2012, Class R5 shares were offered for sale to the public. For further information about the fund’s fee arrangements and changes to those fee arrangements, please see Note 3 in the Notes to Financial Statements.
| (f) | Source: FactSet Research Systems Inc. |
| (t) | For the period from the class inception date through the stated period end (for those share classes with less than 10 years of performance history). No comparative benchmark performance information is provided for “life” periods. (See Notes to Performance Summary.) |
| (x) | Assuming redemption at the end of the applicable period. |
7
Performance Summary – continued
Benchmark Definition
Barclays U.S. High-Yield Corporate Bond 2% Issuer Capped Index – a component of the Barclays U.S. High-Yield Corporate Bond Index, which measures performance of non-investment grade, fixed rate debt. The index limits the maximum exposure to any one issuer to 2%.
It is not possible to invest directly in an index.
Notes to Performance Summary
Average annual total return represents the average annual change in value for each share class for the periods presented. Life returns are presented where the share class has less than 10 years of performance history and represent the average annual total return from the class inception date to the stated period end date. As the fund’s share classes may have different inception dates, the life returns may represent different time periods and may not be comparable. As a result, no comparative benchmark performance information is provided for life periods.
Performance results reflect any applicable expense subsidies and waivers in effect during the periods shown. Without such subsidies and waivers the fund’s performance results would be less favorable. Please see the prospectus and financial statements for complete details.
Performance results do not include adjustments made for financial reporting purposes in accordance with U.S. generally accepted accounting principles and may differ from amounts reported in the financial highlights.
From time to time the fund may receive proceeds from litigation settlements, without which performance would be lower.
8
EXPENSE TABLE
Fund expenses borne by the shareholders during the period,
August 1, 2012 through January 31, 2013
As a shareholder of the fund, you incur two types of costs: (1) transaction costs, including sales charges (loads) on certain purchase or redemption payments, and (2) ongoing costs, including management fees; distribution and service (12b-1) fees; and other fund expenses. This example is intended to help you understand your ongoing costs (in dollars) of investing in the fund and to compare these costs with the ongoing costs of investing in other mutual funds.
The example is based on an investment of $1,000 invested at the beginning of the period and held for the entire period August 1, 2012 through January 31, 2013.
Actual Expenses
The first line for each share class in the following table provides information about actual account values and actual expenses. You may use the information in this line, together with the amount you invested, to estimate the expenses that you paid over the period. Simply divide your account value by $1,000 (for example, an $8,600 account value divided by $1,000 = 8.6), then multiply the result by the number in the first line under the heading entitled “Expenses Paid During Period” to estimate the expenses you paid on your account during this period.
Hypothetical Example for Comparison Purposes
The second line for each share class in the following table provides information about hypothetical account values and hypothetical expenses based on the fund’s actual expense ratio and an assumed rate of return of 5% per year before expenses, which is not the fund’s actual return. The hypothetical account values and expenses may not be used to estimate the actual ending account balance or expenses you paid for the period. You may use this information to compare the ongoing costs of investing in the fund and other funds. To do so, compare this 5% hypothetical example with the 5% hypothetical examples that appear in the shareholder reports of the other funds.
Please note that the expenses shown in the table are meant to highlight your ongoing costs only and do not reflect any transactional costs, such as sales charges (loads). Therefore, the second line for each share class in the table is useful in comparing ongoing costs only, and will not help you determine the relative total costs of owning different funds. In addition, if these transactional costs were included, your costs would have been higher.
9
Expense Table – continued
| | | | | | | | | | | | | | | | | | |
Share
Class | | | | Annualized
Expense Ratio | | | Beginning
Account Value
8/01/12 | | | Ending Account Value
1/31/13 | | | Expenses
Paid During
Period (p)
8/01/12-1/31/13 | |
| A | | Actual | | | 1.05% | | | | $1,000.00 | | | | $1,071.89 | | | | $5.47 | |
| | Hypothetical (h) | | | 1.05% | | | | $1,000.00 | | | | $1,019.86 | | | | $5.33 | |
| B | | Actual | | | 1.80% | | | | $1,000.00 | | | | $1,066.20 | | | | $9.35 | |
| | Hypothetical (h) | | | 1.80% | | | | $1,000.00 | | | | $1,016.09 | | | | $9.12 | |
| C | | Actual | | | 1.80% | | | | $1,000.00 | | | | $1,067.97 | | | | $9.36 | |
| | Hypothetical (h) | | | 1.80% | | | | $1,000.00 | | | | $1,016.09 | | | | $9.12 | |
| I | | Actual | | | 0.80% | | | | $1,000.00 | | | | $1,073.17 | | | | $4.17 | |
| | Hypothetical (h) | | | 0.80% | | | | $1,000.00 | | | | $1,021.11 | | | | $4.06 | |
| R1 | | Actual | | | 1.80% | | | | $1,000.00 | | | | $1,066.19 | | | | $9.35 | |
| | Hypothetical (h) | | | 1.80% | | | | $1,000.00 | | | | $1,016.09 | | | | $9.12 | |
| R2 | | Actual | | | 1.30% | | | | $1,000.00 | | | | $1,068.84 | | | | $6.76 | |
| | Hypothetical (h) | | | 1.30% | | | | $1,000.00 | | | | $1,018.60 | | | | $6.60 | |
| R3 | | Actual | | | 1.05% | | | | $1,000.00 | | | | $1,071.88 | | | | $5.47 | |
| | Hypothetical (h) | | | 1.05% | | | | $1,000.00 | | | | $1,019.86 | | | | $5.33 | |
| R4 | | Actual | | | 0.80% | | | | $1,000.00 | | | | $1,072.91 | | | | $4.17 | |
| | Hypothetical (h) | | | 0.80% | | | | $1,000.00 | | | | $1,021.11 | | | | $4.06 | |
R5
(formerly Class W) | | Actual | | | 0.73% | | | | $1,000.00 | | | | $1,072.00 | | | | $3.80 | |
| | Hypothetical (h) | | | 0.73% | | | | $1,000.00 | | | | $1,021.47 | | | | $3.71 | |
| (h) | 5% class return per year before expenses. |
| (p) | Expenses paid are equal to each class’s annualized expense ratio, as shown above, multiplied by the average account value over the period, multiplied by the number of days in the period, divided by the number of days in the year. Expenses paid do not include any applicable sales charges (loads). If these transaction costs had been included, your costs would have been higher. |
10
PORTFOLIO OF INVESTMENTS
1/31/13
The Portfolio of Investments is a complete list of all securities owned by your fund. It is categorized by broad-based asset classes.
| | | | | | | | |
| Bonds - 94.1% | | | | | | | | |
| Issuer | | Shares/Par | | | Value ($) | |
| Aerospace - 2.0% | | | | | | | | |
| Bombardier, Inc., 4.25%, 2016 (z) | | $ | 346,000 | | | $ | 356,324 | |
| Bombardier, Inc., 7.5%, 2018 (n) | | | 2,470,000 | | | | 2,778,750 | |
| Bombardier, Inc., 7.75%, 2020 (n) | | | 865,000 | | | | 979,613 | |
| CPI International, Inc., 8%, 2018 | | | 1,855,000 | | | | 1,855,000 | |
| Embraer Empresa Brasileria de Aeronaves, 5.15%, 2022 | | | 200,000 | | | | 220,000 | |
| Heckler & Koch GmbH, 9.5%, 2018 (z) | | EUR | 1,163,000 | | | | 1,397,522 | |
| Huntington Ingalls Industries, Inc., 7.125%, 2021 | | $ | 2,415,000 | | | | 2,656,500 | |
| Kratos Defense & Security Solutions, Inc., 10%, 2017 | | | 1,845,000 | | | | 2,024,888 | |
| | | | | | | | |
| | | | | | | $ | 12,268,597 | |
| Agricultural Products - 0.0% | | | | | | | | |
| Corporacion Azucarera del Peru S.A., 6.375%, 2022 (n) | | $ | 100,000 | | | $ | 107,500 | |
| | |
| Apparel Manufacturers - 1.0% | | | | | | | | |
| Hanesbrands, Inc., 6.375%, 2020 | | $ | 1,540,000 | | | $ | 1,667,050 | |
| Jones Group, Inc., 6.875%, 2019 | | | 1,555,000 | | | | 1,623,031 | |
| PVH Corp., 7.375%, 2020 | | | 1,755,000 | | | | 1,985,344 | |
| PVH Corp., 4.5%, 2022 | | | 1,045,000 | | | | 1,039,775 | |
| | | | | | | | |
| | | | | | | $ | 6,315,200 | |
| Asset-Backed & Securitized - 0.5% | | | | | | | | |
| Arbor Realty Mortgage Securities, CDO, FRN, 2.602%, 2038 (z) | | $ | 1,136,457 | | | $ | 340,937 | |
| Banc of America Commercial Mortgage, Inc., FRN, 6.255%, 2051 (z) | | | 3,830,049 | | | | 913,773 | |
| Citigroup Commercial Mortgage Trust, FRN, 5.702%, 2017 | | | 2,500,000 | | | | 482,498 | |
| Crest Ltd., CDO, 7%, 2040 (a)(p) | | | 1,202,393 | | | | 60,120 | |
| Falcon Franchise Loan LLC, FRN, 6.542%, 2025 (i)(z) | | | 268,249 | | | | 42,169 | |
| G-Force LLC, CDO, “A2”, 4.83%, 2036 (z) | | | 918,673 | | | | 923,266 | |
| JPMorgan Chase Commercial Mortgage Securities Corp., “C”, FRN, 6.002%, 2051 | | | 1,390,000 | | | | 405,324 | |
| LB Commercial Conduit Mortgage Trust, FRN, 1.218%, 2030 (i) | | | 616,956 | | | | 11,332 | |
| Morgan Stanley Capital I, Inc., FRN, 1.384%, 2039 (i)(z) | | | 1,451,031 | | | | 28,295 | |
| Preferred Term Securities XII Ltd., CDO, 0%, 2033 (a)(c)(z) | | | 1,775,000 | | | | 533 | |
| Preferred Term Securities XVI Ltd., CDO, 0%, 2035 (a)(c)(z) | | | 3,250,000 | | | | 325 | |
| Preferred Term Securities XVII Ltd., CDO, 0%, 2035 (a)(c)(z) | | | 1,813,000 | | | | 181 | |
| | | | | | | | |
| | | | | | | $ | 3,208,753 | |
| Automotive - 3.1% | | | | | | | | |
| Accuride Corp., 9.5%, 2018 | | $ | 1,855,000 | | | $ | 1,831,813 | |
| Allison Transmission, Inc., 7.125%, 2019 (n) | | | 2,390,000 | | | | 2,593,150 | |
11
Portfolio of Investments – continued
| | | | | | | | |
| Issuer | | Shares/Par | | | Value ($) | |
| Bonds - continued | | | | | | | | |
| Automotive - continued | | | | | | | | |
| Automotores Gildemeister S.A., 8.25%, 2021 (n) | | $ | 116,000 | | | $ | 128,760 | |
| Continental Rubber of America Corp., 4.5%, 2019 (n) | | | 445,000 | | | | 456,125 | |
| Ford Motor Credit Co. LLC, 12%, 2015 | | | 2,400,000 | | | | 2,928,000 | |
| Ford Motor Credit Co. LLC, 8.125%, 2020 | | | 685,000 | | | | 862,651 | |
| General Motors Financial Co., Inc., 4.75%, 2017 (n) | | | 575,000 | | | | 600,924 | |
| General Motors Financial Co., Inc., 6.75%, 2018 | | | 1,425,000 | | | | 1,649,438 | |
| Goodyear Tire & Rubber Co., 8.25%, 2020 | | | 415,000 | | | | 455,463 | |
| Goodyear Tire & Rubber Co., 7%, 2022 | | | 685,000 | | | | 734,663 | |
| Jaguar Land Rover PLC, 7.75%, 2018 (n) | | | 1,275,000 | | | | 1,399,313 | |
| Jaguar Land Rover PLC, 8.125%, 2021 (n) | | | 3,530,000 | | | | 3,962,425 | |
| Jaguar Land Rover PLC, 5.625%, 2023 (z) | | | 395,000 | | | | 402,900 | |
| Lear Corp., 8.125%, 2020 | | | 882,000 | | | | 985,635 | |
| Lear Corp., 4.75%, 2023 (z) | | | 430,000 | | | | 427,850 | |
| | | | | | | | |
| | | | | | | $ | 19,419,110 | |
| Broadcasting - 5.4% | | | | | | | | |
| Allbritton Communications Co., 8%, 2018 | | $ | 780,000 | | | $ | 844,350 | |
| AMC Networks, Inc., 7.75%, 2021 | | | 1,677,000 | | | | 1,915,973 | |
| Clear Channel Communications, Inc., 9%, 2021 | | | 2,904,000 | | | | 2,700,720 | |
| Clear Channel Worldwide Holdings, Inc., 6.5%, 2022 (n) | | | 435,000 | | | | 458,925 | |
| Clear Channel Worldwide Holdings, Inc., 6.5%, 2022 (n) | | | 1,100,000 | | | | 1,171,500 | |
| Clear Channel Worldwide Holdings, Inc., “A”, 7.625%, 2020 | | | 90,000 | | | | 93,150 | |
| Clear Channel Worldwide Holdings, Inc., “B”, 7.625%, 2020 | | | 880,000 | | | | 919,600 | |
| Hughes Network Systems LLC, 7.625%, 2021 | | | 1,045,000 | | | | 1,196,525 | |
| IAC/InterActiveCorp, 4.75%, 2022 (n) | | | 240,000 | | | | 238,200 | |
| Inmarsat Finance PLC, 7.375%, 2017 (n) | | | 1,395,000 | | | | 1,499,625 | |
| Intelsat Bermuda Ltd., 11.25%, 2017 | | | 2,515,000 | | | | 2,665,900 | |
| Intelsat Bermuda Ltd., 11.5%, 2017 (p) | | | 3,290,000 | | | | 3,487,400 | |
| Intelsat Jackson Holdings Ltd., 6.625%, 2022 (n) | | | 1,540,000 | | | | 1,565,025 | |
| LBI Media Holdings, Inc., 11%, 2013 | | | 2,110,000 | | | | 253,200 | |
| LBI Media, Inc., 13.5% to 2015, 11.5% to 2020 (p)(z) | | | 902,000 | | | | 369,820 | |
| Liberty Media Corp., 8.5%, 2029 | | | 1,770,000 | | | | 1,973,550 | |
| Liberty Media Corp., 8.25%, 2030 | | | 450,000 | | | | 497,250 | |
| Local TV Finance LLC, 9.25%, 2015 (p)(z) | | | 2,080,072 | | | | 2,095,673 | |
| Netflix, Inc., 5.375%, 2021 (z) | | | 905,000 | | | | 900,475 | |
| Nexstar Broadcasting Group, Inc., 8.875%, 2017 | | | 685,000 | | | | 755,213 | |
| Nexstar Broadcasting Group, Inc., 6.875%, 2020 (n) | | | 245,000 | | | | 255,413 | |
| Sinclair Broadcast Group, Inc., 9.25%, 2017 (n) | | | 975,000 | | | | 1,065,188 | |
| Sinclair Broadcast Group, Inc., 8.375%, 2018 | | | 255,000 | | | | 283,688 | |
| SIRIUS XM Radio, Inc., 8.75%, 2015 (n) | | | 1,380,000 | | | | 1,562,850 | |
| SIRIUS XM Radio, Inc., 7.625%, 2018 (n) | | | 1,200,000 | | | | 1,332,000 | |
| SIRIUS XM Radio, Inc., 5.25%, 2022 (n) | | | 275,000 | | | | 279,813 | |
| Univision Communications, Inc., 6.875%, 2019 (n) | | | 475,000 | | | | 498,750 | |
12
Portfolio of Investments – continued
| | | | | | | | |
| Issuer | | Shares/Par | | | Value ($) | |
| Bonds - continued | | | | | | | | |
| Broadcasting - continued | | | | | | | | |
| Univision Communications, Inc., 7.875%, 2020 (n) | | $ | 1,030,000 | | | $ | 1,114,975 | |
| Univision Communications, Inc., 8.5%, 2021 (n) | | | 1,760,000 | | | | 1,874,400 | |
| | | | | | | | |
| | | | | | | $ | 33,869,151 | |
| Brokerage & Asset Managers - 0.4% | | | | | | | | |
| E*TRADE Financial Corp., 6.375%, 2019 | | $ | 2,295,000 | | | $ | 2,381,063 | |
| | |
| Building - 2.8% | | | | | | | | |
| Boise Cascade LLC/Finance Corp., 6.375%, 2020 (n) | | $ | 770,000 | | | $ | 804,650 | |
| Building Materials Holding Corp., 6.875%, 2018 (n) | | | 1,020,000 | | | | 1,101,600 | |
| Building Materials Holding Corp., 7%, 2020 (n) | | | 640,000 | | | | 697,600 | |
| Building Materials Holding Corp., 6.75%, 2021 (n) | | | 740,000 | | | | 815,850 | |
| CEMEX Espana S.A., 9.25%, 2020 | | | 1,985,000 | | | | 2,133,875 | |
| CEMEX S.A.B. de C.V., 9%, 2018 (n) | | | 609,000 | | | | 657,720 | |
| Gibraltar Industries, Inc., 6.25%, 2021 (z) | | | 240,000 | | | | 249,300 | |
| HD Supply, Inc., 13.5%, 2015 | | | 1,150,000 | | | | 1,185,938 | |
| HD Supply, Inc., 8.125%, 2019 (n) | | | 835,000 | | | | 945,638 | |
| HD Supply, Inc., 11.5%, 2020 (n) | | | 665,000 | | | | 766,413 | |
| HD Supply, Inc., 10.5%, 2021 (z) | | | 120,000 | | | | 122,700 | |
| Masonite International Corp., 8.25%, 2021 (n) | | | 1,560,000 | | | | 1,716,000 | |
| Nortek, Inc., 8.5%, 2021 | | | 2,140,000 | | | | 2,423,550 | |
| Roofing Supply Group LLC/Roofing Supply Finance, Inc., 10%, 2020 (n) | | | 925,000 | | | | 1,045,250 | |
| USG Corp., 6.3%, 2016 | | | 1,840,000 | | | | 1,936,600 | |
| USG Corp., 7.875%, 2020 (n) | | | 835,000 | | | | 951,900 | |
| | | | | | | | |
| | | | | | | $ | 17,554,584 | |
| Business Services - 1.8% | | | | | | | | |
| Ceridian Corp., 12.25%, 2015 (p) | | $ | 655,000 | | | $ | 664,825 | |
| Ceridian Corp., 8.875%, 2019 (n) | | | 335,000 | | | | 373,525 | |
| Fidelity National Information Services, Inc., 7.625%, 2017 | | | 695,000 | | | | 750,600 | |
| Fidelity National Information Services, Inc., 5%, 2022 | | | 1,310,000 | | | | 1,418,075 | |
| iGate Corp., 9%, 2016 | | | 2,430,000 | | | | 2,669,963 | |
| Iron Mountain, Inc., 8.375%, 2021 | | | 1,830,000 | | | | 2,017,575 | |
| Legend Acquisition Sub, Inc., 10.75%, 2020 (n) | | | 1,135,000 | | | | 998,800 | |
| Lender Processing Services, Inc., 5.75%, 2023 | | | 945,000 | | | | 1,001,700 | |
| Neustar, Inc., 4.5%, 2023 (z) | | | 190,000 | | | | 190,000 | |
| SunGard Data Systems, Inc., 7.375%, 2018 | | | 1,040,000 | | | | 1,105,000 | |
| Tencent Holdings Ltd., 3.375%, 2018 (n) | | | 288,000 | | | | 295,213 | |
| | | | | | | | |
| | | | | | | $ | 11,485,276 | |
| Cable TV - 3.5% | | | | | | | | |
| Bresnan Broadband Holdings LLC, 8%, 2018 (n) | | $ | 405,000 | | | $ | 437,400 | |
| CCO Holdings LLC, 7.875%, 2018 | | | 2,115,000 | | | | 2,260,406 | |
13
Portfolio of Investments – continued
| | | | | | | | |
| Issuer | | Shares/Par | | | Value ($) | |
| Bonds - continued | | | | | | | | |
| Cable TV - continued | | | | | | | | |
| CCO Holdings LLC, 8.125%, 2020 | | $ | 2,040,000 | | | $ | 2,289,900 | |
| CCO Holdings LLC, 7.375%, 2020 | | | 260,000 | | | | 289,250 | |
| CCO Holdings LLC, 5.125%, 2023 | | | 590,000 | | | | 581,150 | |
| Cequel Communications Holdings, 6.375%, 2020 (n) | | | 480,000 | | | | 502,800 | |
| DISH DBS Corp., 6.75%, 2021 | | | 800,000 | | | | 896,000 | |
| DISH DBS Corp., 5%, 2023 (n) | | | 675,000 | | | | 666,563 | |
| EchoStar Corp., 7.125%, 2016 | | | 850,000 | | | | 947,750 | |
| Nara Cable Funding Ltd., 8.875%, 2018 (z) | | | 1,225,000 | | | | 1,249,500 | |
| ONO Finance ll PLC, 10.875%, 2019 (n) | | | 550,000 | | | | 555,500 | |
| Telenet Finance Luxembourg, 6.375%, 2020 (n) | | EUR | 1,000,000 | | | | 1,452,846 | |
| Unitymedia Hessen, 5.5%, 2023 (n) | | $ | 370,000 | | | | 377,400 | |
| UPC Holding B.V., 9.875%, 2018 (n) | | | 2,200,000 | | | | 2,486,000 | |
| UPCB Finance III Ltd., 6.625%, 2020 (n) | | | 1,937,000 | | | | 2,067,748 | |
| Virgin Media Finance PLC, 4.875%, 2022 | | | 210,000 | | | | 209,475 | |
| Virgin Media Finance PLC, 5.25%, 2022 | | | 1,675,000 | | | | 1,750,375 | |
| Ziggo Bond Co. B.V., 8%, 2018 (n) | | EUR | 1,885,000 | | | | 2,769,328 | |
| | | | | | | | |
| | | | | | | $ | 21,789,391 | |
| Chemicals - 2.2% | | | | | | | | |
| Celanese U.S. Holdings LLC, 6.625%, 2018 | | $ | 1,305,000 | | | $ | 1,428,975 | |
| Flash Dutch 2 B.V./U.S. Coatings Acquisition, 7.375%, 2021 (z) | | | 255,000 | | | | 262,650 | |
| Hexion U.S. Finance Corp./Hexion Nova Scotia Finance, 8.875%, 2018 | | | 1,325,000 | | | | 1,338,250 | |
| Hexion U.S. Finance Corp./Hexion Nova Scotia Finance, 9%, 2020 | | | 1,110,000 | | | | 1,032,300 | |
| Huntsman International LLC, 8.625%, 2021 | | | 2,180,000 | | | | 2,496,100 | |
| INEOS Finance PLC, 8.375%, 2019 (n) | | | 1,025,000 | | | | 1,122,375 | |
| INEOS Group Holdings PLC, 8.5%, 2016 (n) | | | 2,505,000 | | | | 2,523,788 | |
| LyondellBasell Industries N.V., 5%, 2019 | | | 745,000 | | | | 821,363 | |
| LyondellBasell Industries N.V., 6%, 2021 | | | 1,800,000 | | | | 2,115,000 | |
| Polypore International, Inc., 7.5%, 2017 | | | 890,000 | | | | 967,875 | |
| | | | | | | | |
| | | | | | | $ | 14,108,676 | |
| Computer Software - 1.2% | | | | | | | | |
| Infor U.S., Inc., 11.5%, 2018 | | $ | 1,465,000 | | | $ | 1,725,038 | |
| Nuance Communications, Inc., 5.375%, 2020 (n) | | | 1,365,000 | | | | 1,405,950 | |
| Seagate HDD Cayman, 6.875%, 2020 | | | 804,000 | | | | 872,340 | |
| Syniverse Holdings, Inc., 9.125%, 2019 | | | 2,205,000 | | | | 2,397,938 | |
| TransUnion Holding Co., Inc., 9.625%, 2018 | | | 705,000 | | | | 752,588 | |
| TransUnion LLC/TransUnion Financing Corp., 11.375%, 2018 | | | 320,000 | | | | 370,000 | |
| | | | | | | | |
| | | | | | | $ | 7,523,854 | |
| Computer Software - Systems - 0.8% | | | | | | | | |
| Audatex North America, Inc., 6.75%, 2018 (n) | | $ | 720,000 | | | $ | 772,200 | |
| CDW LLC/CDW Finance Corp., 12.535%, 2017 | | | 1,137,000 | | | | 1,216,590 | |
14
Portfolio of Investments – continued
| | | | | | | | |
| Issuer | | Shares/Par | | | Value ($) | |
| Bonds - continued | | | | | | | | |
| Computer Software - Systems - continued | | | | | | | | |
| CDW LLC/CDW Finance Corp., 8.5%, 2019 | | $ | 1,495,000 | | | $ | 1,655,713 | |
| DuPont Fabros Technology, Inc., REIT, 8.5%, 2017 | | | 1,130,000 | | | | 1,226,050 | |
| | | | | | | | |
| | | | | | | $ | 4,870,553 | |
| Conglomerates - 1.2% | | | | | | | | |
| Amsted Industries, Inc., 8.125%, 2018 (n) | | $ | 2,805,000 | | | $ | 2,994,338 | |
| BC Mountain LLC, 7%, 2021 (z) | | | 180,000 | | | | 184,500 | |
| Dynacast International LLC, 9.25%, 2019 | | | 1,230,000 | | | | 1,313,025 | |
| Griffon Corp., 7.125%, 2018 | | | 2,105,000 | | | | 2,278,663 | |
| Silver II Borrower, 7.75%, 2020 (n) | | | 620,000 | | | | 649,450 | |
| | | | | | | | |
| | | | | | | $ | 7,419,976 | |
| Construction - 0.0% | | | | | | | | |
| Empresas ICA, S.A.B. de C.V., 8.375%, 2017 (n) | | $ | 150,000 | | | $ | 156,750 | |
| | |
| Consumer Products - 0.9% | | | | | | | | |
| Easton-Bell Sports, Inc., 9.75%, 2016 | | $ | 1,055,000 | | | $ | 1,138,092 | |
| Elizabeth Arden, Inc., 7.375%, 2021 | | | 1,662,000 | | | | 1,848,975 | |
| Jarden Corp., 7.5%, 2020 | | | 1,330,000 | | | | 1,449,700 | |
| Libbey Glass, Inc., 6.875%, 2020 | | | 555,000 | | | | 597,319 | |
| Prestige Brands, Inc., 8.125%, 2020 | | | 160,000 | | | | 179,200 | |
| Spectrum Brands Escrow Corp., 6.375%, 2020 (n) | | | 520,000 | | | | 553,150 | |
| Spectrum Brands Escrow Corp., 6.625%, 2022 (n) | | | 125,000 | | | | 135,000 | |
| | | | | | | | |
| | | | | | | $ | 5,901,436 | |
| Consumer Services - 0.6% | | | | | | | | |
| QVC, Inc., 7.375%, 2020 (n) | | $ | 985,000 | | | $ | 1,087,301 | |
| Service Corp. International, 7%, 2017 | | | 1,620,000 | | | | 1,860,975 | |
| Service Corp. International, 7%, 2019 | | | 750,000 | | | | 824,063 | |
| | | | | | | | |
| | | | | | | $ | 3,772,339 | |
| Containers - 2.2% | | | | | | | | |
| Ardagh Packaging Finance PLC, 7.375%, 2017 (n) | | $ | 1,545,000 | | | $ | 1,697,569 | |
| Ardagh Packaging Finance PLC, 9.125%, 2020 (n) | | | 3,090,000 | | | | 3,375,825 | |
| Berry Plastics Group, Inc., 9.5%, 2018 | | | 605,000 | | | | 676,088 | |
| Crown Americas LLC, 4.5%, 2023 (z) | | | 1,050,000 | | | | 1,034,250 | |
| Greif, Inc., 6.75%, 2017 | | | 630,000 | | | | 702,450 | |
| Greif, Inc., 7.75%, 2019 | | | 300,000 | | | | 348,000 | |
| Reynolds Group, 7.125%, 2019 | | | 1,960,000 | | | | 2,092,300 | |
| Reynolds Group, 9.875%, 2019 | | | 560,000 | | | | 611,800 | |
| Reynolds Group, 5.75%, 2020 | | | 945,000 | | | | 966,263 | |
| Reynolds Group, 8.25%, 2021 | | | 1,910,000 | | | | 2,000,725 | |
| | | | | | | | |
| | | | | | | $ | 13,505,270 | |
15
Portfolio of Investments – continued
| | | | | | | | |
| Issuer | | Shares/Par | | | Value ($) | |
| Bonds - continued | | | | | | | | |
| Defense Electronics - 0.4% | | | | | | | | |
| Ducommun, Inc., 9.75%, 2018 | | $ | 1,337,000 | | | $ | 1,467,358 | |
| MOOG, Inc., 7.25%, 2018 | | | 710,000 | | | | 741,950 | |
| | | | | | | | |
| | | | | | | $ | 2,209,308 | |
| Electrical Equipment - 0.3% | | | | | | | | |
| Avaya, Inc., 9.75%, 2015 | | $ | 1,595,000 | | | $ | 1,519,238 | |
| Avaya, Inc., 7%, 2019 (n) | | | 390,000 | | | | 372,450 | |
| | | | | | | | |
| | | | | | | $ | 1,891,688 | |
| Electronics - 1.0% | | | | | | | | |
| Freescale Semiconductor, Inc., 9.25%, 2018 (n) | | $ | 2,225,000 | | | $ | 2,447,500 | |
| Nokia Corp., 5.375%, 2019 | | | 1,235,000 | | | | 1,182,513 | |
| Nokia Corp., 6.625%, 2039 | | | 400,000 | | | | 374,000 | |
| NXP B.V., 9.75%, 2018 (n) | | | 149,000 | | | | 171,350 | |
| NXP B.V., 5.75%, 2021 (z) | | | 415,000 | | | | 415,000 | |
| Sensata Technologies B.V., 6.5%, 2019 (n) | | | 1,770,000 | | | | 1,898,325 | |
| | | | | | | | |
| | | | | | | $ | 6,488,688 | |
| Emerging Market Quasi-Sovereign - 3.0% | | | | | | | | |
| Banco do Brasil S.A., 3.875%, 2017 | | $ | 1,362,000 | | | $ | 1,430,100 | |
| Banco do Brasil S.A., 5.875%, 2023 (n) | | | 226,000 | | | | 244,645 | |
| Banco do Estado Rio Grande do Sul S.A., 7.375%, 2022 (n) | | | 200,000 | | | | 220,000 | |
| Bank of Ceylon, 6.875%, 2017 (n) | | | 200,000 | | | | 213,000 | |
| Comision Federal de Electricidad, 5.75%, 2042 (n) | | | 1,195,000 | | | | 1,326,450 | |
| Development Bank of Kazakhstan, 4.125%, 2022 (n) | | | 237,000 | | | | 242,333 | |
| Dolphin Energy Ltd., 5.5%, 2021 (n) | | | 400,000 | | | | 461,000 | |
| Ecopetrol S.A., 7.625%, 2019 | | | 547,000 | | | | 697,425 | |
| Gaz Capital S.A., 9.25%, 2019 | | | 624,000 | | | | 813,540 | |
| Gaz Capital S.A., 5.999%, 2021 (n) | | | 1,547,000 | | | | 1,742,309 | |
| Gaz Capital S.A., 4.95%, 2022 (n) | | | 247,000 | | | | 258,733 | |
| Georgian Oil & Gas Corp., 6.875%, 2017 (n) | | | 200,000 | | | | 209,000 | |
| JSC Georgian Railway, 7.75%, 2022 (n) | | | 200,000 | | | | 234,000 | |
| Kazakhstan Temir Zholy Co., 6.95%, 2042 (n) | | | 200,000 | | | | 249,500 | |
| KazMunaiGaz Finance B.V., 9.125%, 2018 (n) | | | 420,000 | | | | 542,430 | |
| Majapahit Holding B.V., 7.25%, 2017 (n) | | | 723,000 | | | | 847,718 | |
| Majapahit Holding B.V., 7.75%, 2020 (n) | | | 654,000 | | | | 814,230 | |
| Pertamina PT, 4.875%, 2022 (n) | | | 255,000 | | | | 274,125 | |
| Pertamina PT, 6%, 2042 (n) | | | 297,000 | | | | 320,760 | |
| Petrobras International Finance Co., 5.375%, 2021 | | | 521,000 | | | | 570,817 | |
| Petrobras International Finance Co., 6.75%, 2041 | | | 245,000 | | | | 286,360 | |
| Petroleos de Venezuela S.A., 5.25%, 2017 | | | 2,698,000 | | | | 2,340,515 | |
| Petroleos Mexicanos, 4.875%, 2022 | | | 733,000 | | | | 807,216 | |
| Petroleos Mexicanos, 6.5%, 2041 | | | 133,000 | | | | 156,608 | |
| PT Perusahaan Listrik Negara, 5.5%, 2021 (n) | | | 270,000 | | | | 301,050 | |
16
Portfolio of Investments – continued
| | | | | | | | |
| Issuer | | Shares/Par | | | Value ($) | |
| Bonds - continued | | | | | | | | |
| Emerging Market Quasi-Sovereign - continued | | | | | | | | |
| PTTEP Canada International Finance Ltd., 6.35%, 2042 (n) | | $ | 200,000 | | | $ | 236,656 | |
| Rosneft, 3.149%, 2017 (z) | | | 208,000 | | | | 208,260 | |
| Rosneft, 4.199%, 2022 (n) | | | 344,000 | | | | 344,000 | |
| Sberbank of Russia, 6.125%, 2022 (n) | | | 739,000 | | | | 843,413 | |
| Turkiye Vakiflar Bankasi, 6%, 2022 (n) | | | 206,000 | | | | 214,374 | |
| Turkiye Vakiflar Bankasi T.A.O., 5.75%, 2017 (n) | | | 201,000 | | | | 217,884 | |
| Vnesheconombank, 6.025%, 2022 (n) | | | 200,000 | | | | 229,500 | |
| VTB Capital S.A., 6%, 2017 (n) | | | 717,000 | | | | 767,190 | |
| | | | | | | | |
| | | | | | | $ | 18,665,141 | |
| Emerging Market Sovereign - 2.2% | | | | | | | | |
| Dominican Republic, 7.5%, 2021 (n) | | $ | 790,000 | | | $ | 900,600 | |
| Government of Ukraine, 6.875%, 2015 (n) | | | 240,000 | | | | 241,800 | |
| Government of Ukraine, 6.25%, 2016 | | | 732,000 | | | | 732,000 | |
| Government of Ukraine, 9.25%, 2017 (n) | | | 200,000 | | | | 217,500 | |
| Republic of Argentina, 8.75%, 2017 | | | 1,394,000 | | | | 1,104,745 | |
| Republic of Argentina, 2.5% to 2019, 3.75% to 2029, 5.25% to 2038 | | | 1,594,000 | | | | 530,005 | |
| Republic of Guatemala, 5.75%, 2022 (n) | | | 201,000 | | | | 229,643 | |
| Republic of Latvia, 5.25%, 2017 (n) | | | 200,000 | | | | 221,600 | |
| Republic of Lithuania, 6.625%, 2022 (n) | | | 2,093,000 | | | | 2,605,785 | |
| Republic of Philippines, 5.5%, 2026 | | | 343,000 | | | | 420,604 | |
| Republic of Romania, 6.75%, 2022 (n) | | | 1,122,000 | | | | 1,350,866 | |
| Republic of Serbia, 7.25%, 2021 (n) | | | 200,000 | | | | 232,500 | |
| Republic of Venezuela, 7%, 2018 | | | 824,000 | | | | 789,804 | |
| Republic of Venezuela, 12.75%, 2022 | | | 1,472,000 | | | | 1,766,400 | |
| Republic of Venezuela, 9.25%, 2027 | | | 797,000 | | | | 810,948 | |
| Republic of Venezuela, 7%, 2038 | | | 2,047,000 | | | | 1,663,188 | |
| | | | | | | | |
| | | | | | | $ | 13,817,988 | |
| Energy - Independent - 7.1% | | | | | | | | |
| BreitBurn Energy Partners LP, 8.625%, 2020 | | $ | 665,000 | | | $ | 729,838 | |
| BreitBurn Energy Partners LP, 7.875%, 2022 (n) | | | 2,095,000 | | | | 2,215,463 | |
| Carrizo Oil & Gas, Inc., 8.625%, 2018 | | | 605,000 | | | | 651,888 | |
| Chaparral Energy, Inc., 7.625%, 2022 | | | 970,000 | | | | 1,047,600 | |
| Chesapeake Energy Corp., 6.875%, 2020 | | | 1,565,000 | | | | 1,721,500 | |
| Concho Resources, Inc., 8.625%, 2017 | | | 925,000 | | | | 999,000 | |
| Concho Resources, Inc., 6.5%, 2022 | | | 1,045,000 | | | | 1,139,050 | |
| Continental Resources, Inc., 8.25%, 2019 | | | 1,455,000 | | | | 1,635,056 | |
| Denbury Resources, Inc., 8.25%, 2020 | | | 2,260,000 | | | | 2,519,900 | |
| Denbury Resources, Inc., 4.625%, 2023 | | | 600,000 | | | | 588,000 | |
| Energy XXI Gulf Coast, Inc., 9.25%, 2017 | | | 2,615,000 | | | | 2,977,831 | |
| EP Energy LLC, 9.375%, 2020 | | | 3,645,000 | | | | 4,082,400 | |
| EPL Oil & Gas, Inc., 8.25%, 2018 (n) | | | 975,000 | | | | 1,026,188 | |
17
Portfolio of Investments – continued
| | | | | | | | |
| Issuer | | Shares/Par | | | Value ($) | |
| Bonds - continued | | | | | | | | |
| Energy - Independent - continued | | | | | | | | |
| EXCO Resources, Inc., 7.5%, 2018 | | $ | 640,000 | | | $ | 606,400 | |
| Harvest Operations Corp., 6.875%, 2017 | | | 2,160,000 | | | | 2,400,300 | |
| Hilcorp Energy I/Hilcorp Finance Co., 8%, 2020 (n) | | | 550,000 | | | | 609,125 | |
| Laredo Petroleum, Inc., 9.5%, 2019 | | | 1,080,000 | | | | 1,220,400 | |
| LINN Energy LLC, 6.5%, 2019 | | | 735,000 | | | | 748,781 | |
| LINN Energy LLC, 8.625%, 2020 | | | 690,000 | | | | 760,725 | |
| LINN Energy LLC, 7.75%, 2021 | | | 1,493,000 | | | | 1,597,510 | |
| MEG Energy Corp., 6.5%, 2021 (n) | | | 595,000 | | | | 624,750 | |
| Newfield Exploration Co., 6.875%, 2020 | | | 1,645,000 | | | | 1,778,656 | |
| Plains Exploration & Production Co., 8.625%, 2019 | | | 1,515,000 | | | | 1,727,100 | |
| Plains Exploration & Production Co., 6.5%, 2020 | | | 880,000 | | | | 973,500 | |
| Plains Exploration & Production Co., 6.75%, 2022 | | | 945,000 | | | | 1,064,306 | |
| QEP Resources, Inc., 6.875%, 2021 | | | 1,225,000 | | | | 1,417,938 | |
| Range Resources Corp., 8%, 2019 | | | 580,000 | | | | 643,800 | |
| Range Resources Corp., 5%, 2022 | | | 595,000 | | | | 624,750 | |
| Samson Investment Co., 9.75%, 2020 (n) | | | 1,290,000 | | | | 1,372,238 | |
| SandRidge Energy, Inc., 8%, 2018 (n) | | | 1,805,000 | | | | 1,895,250 | |
| SM Energy Co., 6.5%, 2021 | | | 1,720,000 | | | | 1,831,800 | |
| Whiting Petroleum Corp., 6.5%, 2018 | | | 1,175,000 | | | | 1,260,188 | |
| | | | | | | | |
| | | | | | | $ | 44,491,231 | |
| Energy - Integrated - 0.2% | | | | | | | | |
| Listrindo Capital B.V., 6.95%, 2019 (n) | | $ | 200,000 | | | $ | 223,043 | |
| Pacific Rubiales Energy Corp., 7.25%, 2021 (n) | | | 916,000 | | | | 1,068,056 | |
| | | | | | | | |
| | | | | | | $ | 1,291,099 | |
| Engineering - Construction - 0.2% | | | | | | | | |
| BakerCorp International, Inc., 8.25%, 2019 | | $ | 1,425,000 | | | $ | 1,442,813 | |
| | |
| Entertainment - 1.1% | | | | | | | | |
| AMC Entertainment, Inc., 8.75%, 2019 | | $ | 1,180,000 | | | $ | 1,303,900 | |
| AMC Entertainment, Inc., 9.75%, 2020 | | | 1,001,000 | | | | 1,166,165 | |
| Cedar Fair LP, 9.125%, 2018 | | | 970,000 | | | | 1,086,400 | |
| Cinemark USA, Inc., 8.625%, 2019 | | | 915,000 | | | | 1,013,363 | |
| Cinemark USA, Inc., 5.125%, 2022 (n) | | | 310,000 | | | | 313,875 | |
| NAI Entertainment Holdings LLC, 8.25%, 2017 (n) | | | 639,000 | | | | 699,705 | |
| Six Flags Entertainment Corp., 5.25%, 2021 (n) | | | 1,210,000 | | | | 1,203,950 | |
| | | | | | | | |
| | | | | | | $ | 6,787,358 | |
| Financial Institutions - 4.1% | | | | | | | | |
| Aviation Capital Group, 4.625%, 2018 (z) | | $ | 480,000 | | | $ | 486,281 | |
| CIT Group, Inc., 5.25%, 2018 | | | 1,810,000 | | | | 1,936,700 | |
| CIT Group, Inc., 6.625%, 2018 (n) | | | 2,895,000 | | | | 3,242,400 | |
| CIT Group, Inc., 5.5%, 2019 (n) | | | 1,793,000 | | | | 1,918,510 | |
18
Portfolio of Investments – continued
| | | | | | | | |
| Issuer | | Shares/Par | | | Value ($) | |
| Bonds - continued | | | | | | | | |
| Financial Institutions - continued | | | | | | | | |
| Credit Acceptance Corp., 9.125%, 2017 | | $ | 1,495,000 | | | $ | 1,633,288 | |
| Icahn Enterprises LP, 8%, 2018 | | | 2,123,000 | | | | 2,274,264 | |
| International Lease Finance Corp., 4.875%, 2015 | | | 710,000 | | | | 741,063 | |
| International Lease Finance Corp., 8.625%, 2015 | | | 690,000 | | | | 784,013 | |
| International Lease Finance Corp., 7.125%, 2018 (n) | | | 1,465,000 | | | | 1,714,050 | |
| Nationstar Mortgage LLC/Capital Corp., 10.875%, 2015 | | | 1,935,000 | | | | 2,060,775 | |
| Nationstar Mortgage LLC/Capital Corp., 9.625%, 2019 (n) | | | 200,000 | | | | 227,000 | |
| Nationstar Mortgage LLC/Capital Corp., 9.625%, 2019 (n) | | | 575,000 | | | | 655,500 | |
| Nationstar Mortgage LLC/Capital Corp., 7.875%, 2020 (n) | | | 530,000 | | | | 577,700 | |
| PHH Corp., 9.25%, 2016 | | | 1,500,000 | | | | 1,758,750 | |
| PHH Corp., 7.375%, 2019 | | | 425,000 | | | | 477,063 | |
| SLM Corp., 8.45%, 2018 | | | 1,440,000 | | | | 1,715,556 | |
| SLM Corp., 8%, 2020 | | | 2,245,000 | | | | 2,598,588 | |
| SLM Corp., 7.25%, 2022 | | | 690,000 | | | | 771,075 | |
| | | | | | | | |
| | | | | | | $ | 25,572,576 | |
| Food & Beverages - 0.7% | | | | | | | | |
| Ajecorp B.V., 6.5%, 2022 (n) | | $ | 150,000 | | | $ | 165,000 | |
| ARAMARK Corp., 8.5%, 2015 | | | 70,000 | | | | 70,438 | |
| B&G Foods, Inc., 7.625%, 2018 | | | 1,245,000 | | | | 1,343,044 | |
| Constellation Brands, Inc., 7.25%, 2016 | | | 675,000 | | | | 772,875 | |
| Corporacion Jose R Lindey S.A., 6.75%, 2021 (n) | | | 56,000 | | | | 64,820 | |
| Minerva Luxembourg S.A., 7.75%, 2023 (z) | | | 200,000 | | | | 205,000 | |
| Pinnacle Foods Finance LLC, 8.25%, 2017 | | | 430,000 | | | | 457,413 | |
| TreeHouse Foods, Inc., 7.75%, 2018 | | | 1,410,000 | | | | 1,526,325 | |
| | | | | | | | |
| | | | | | | $ | 4,604,915 | |
| Forest & Paper Products - 1.2% | | | | | | | | |
| Boise, Inc., 8%, 2020 | | $ | 1,250,000 | | | $ | 1,384,375 | �� |
| Clearwater Paper Corp., 4.5%, 2023 (z) | | | 240,000 | | | | 238,200 | |
| Georgia-Pacific Corp., 8%, 2024 | | | 111,000 | | | | 154,793 | |
| Graphic Packaging Holding Co., 7.875%, 2018 | | | 1,005,000 | | | | 1,102,988 | |
| Millar Western Forest Products Ltd., 8.5%, 2021 | | | 310,000 | | | | 299,925 | |
| Sappi Papier Holding GmbH, 7.75%, 2017 (n) | | | 850,000 | | | | 956,250 | |
| Smurfit Kappa Group PLC, 4.875%, 2018 (n) | | | 540,000 | | | | 556,200 | |
| Smurfit Kappa Group PLC, 7.75%, 2019 (n) | | | EUR 900,000 | | | | 1,338,112 | |
| Tembec Industries, Inc., 11.25%, 2018 | | $ | 835,000 | | | | 920,588 | |
| Votorantim Participacoes S.A., 6.75%, 2021 (n) | | | 362,000 | | | | 428,970 | |
| | | | | | | | |
| | | | | | | $ | 7,380,401 | |
| Gaming & Lodging - 3.5% | | | | | | | | |
| Boyd Gaming Corp., 9%, 2020 (n) | | $ | 655,000 | | | $ | 664,825 | |
| Caesars Entertainment Operating Co., Inc., 8.5%, 2020 | | | 1,825,000 | | | | 1,834,125 | |
| Choice Hotels International, Inc., 5.75%, 2022 | | | 270,000 | | | | 299,700 | |
19
Portfolio of Investments – continued
| | | | | | | | |
| Issuer | | Shares/Par | | | Value ($) | |
| Bonds - continued | | | | | | | | |
| Gaming & Lodging - continued | | | | | | | | |
| CityCenter Holdings LLC, 10.75%, 2017 (p) | | $ | 645,000 | | | $ | 711,919 | |
| FelCor Lodging LP, 5.625%, 2023 (n) | | | 235,000 | | | | 237,056 | |
| Fontainebleau Las Vegas Holdings LLC, 10.25%, 2015 (a)(d)(n) | | | 3,510,000 | | | | 2,194 | |
| Great Canadian Gaming Corp., 6.625%, 2022 (z) | | CAD | 1,375,000 | | | | 1,437,174 | |
| GWR Operating Partnership LLP, 10.875%, 2017 | | $ | 730,000 | | | | 830,375 | |
| Host Hotels & Resorts, Inc., 5.25%, 2022 | | | 890,000 | | | | 970,100 | |
| Isle of Capri Casinos, Inc., 8.875%, 2020 | | | 1,550,000 | | | | 1,693,375 | |
| MGM Mirage, 6.625%, 2015 | | | 555,000 | | | | 599,400 | |
| MGM Resorts International, 11.375%, 2018 | | | 2,010,000 | | | | 2,502,450 | |
| MGM Resorts International, 6.625%, 2021 | | | 620,000 | | | | 638,600 | |
| Penn National Gaming, Inc., 8.75%, 2019 | | | 2,120,000 | | | | 2,416,800 | |
| Pinnacle Entertainment, Inc., 8.75%, 2020 | | | 750,000 | | | | 813,750 | |
| Seven Seas Cruises S. DE R.L., 9.125%, 2019 | | | 2,180,000 | | | | 2,310,800 | |
| Viking Cruises Ltd., 8.5%, 2022 (n) | | | 995,000 | | | | 1,096,988 | |
| Wyndham Worldwide Corp., 7.375%, 2020 | | | 830,000 | | | | 1,013,339 | |
| Wynn Las Vegas LLC, 7.75%, 2020 | | | 1,465,000 | | | | 1,651,788 | |
| | | | | | | | |
| | | | | | | $ | 21,724,758 | |
| Industrial - 1.1% | | | | | | | | |
| Dematic S.A., 7.75%, 2020 (z) | | $ | 1,085,000 | | | $ | 1,109,413 | |
| Hyva Global B.V., 8.625%, 2016 (n) | | | 2,329,000 | | | | 2,259,130 | |
| Marfrig Holding Europe B.V., 9.875%, 2017 (z) | | | 200,000 | | | | 197,000 | |
| Mueller Water Products, Inc., 8.75%, 2020 | | | 1,001,000 | | | | 1,138,638 | |
| Rexel S.A., 6.125%, 2019 (n) | | | 1,260,000 | | | | 1,348,200 | |
| SPL Logistics Escrow LLC, 8.875%, 2020 (n) | | | 810,000 | | | | 866,700 | |
| Unifrax I LLC, 7.5%, 2019 (z) | | | 240,000 | | | | 240,000 | |
| | | | | | | | |
| | | | | | | $ | 7,159,081 | |
| Insurance - 0.8% | | | | | | | | |
| American International Group, Inc., 8.25%, 2018 | | $ | 825,000 | | | $ | 1,070,861 | |
| American International Group, Inc., 8.175% to 2038, FRN to 2058 | | | 3,060,000 | | | | 3,978,000 | |
| | | | | | | | |
| | | | | | | $ | 5,048,861 | |
| Insurance - Property & Casualty - 0.8% | | | | | | | | |
| Liberty Mutual Group, Inc., 10.75% to 2038, FRN to 2058 (n) | | $ | 1,770,000 | | | $ | 2,690,400 | |
| XL Group PLC, 6.5% to 2017, FRN to 2049 | | | 2,325,000 | | | | 2,234,906 | |
| | | | | | | | |
| | | | | | | $ | 4,925,306 | |
| International Market Quasi-Sovereign - 0.1% | | | | | | | | |
| Electricite de France, FRN, 5.25%, 2049 (n) | | $ | 142,000 | | | $ | 138,622 | |
| Exportfinans ASA, 5.5%, 2016 | | | 170,000 | | | | 177,469 | |
| Israel Electric Corp. Ltd., 6.7%, 2017 (n) | | | 319,000 | | | | 352,495 | |
| | | | | | | | |
| | | | | | | $ | 668,586 | |
20
Portfolio of Investments – continued
| | | | | | | | |
| Issuer | | Shares/Par | | | Value ($) | |
| Bonds - continued | | | | | | | | |
| International Market Sovereign - 0.3% | | | | | | | | |
| Republic of Iceland, 4.875%, 2016 (n) | | $ | 1,712,000 | | | $ | 1,830,128 | |
| Republic of Iceland, 5.875%, 2022 (n) | | | 297,000 | | | | 335,937 | |
| | | | | | | | |
| | | | | | | $ | 2,166,065 | |
| Machinery & Tools - 1.9% | | | | | | | | |
| Case New Holland, Inc., 7.875%, 2017 | | $ | 2,760,000 | | | $ | 3,263,700 | |
| CNH America LLC, 7.25%, 2016 | | | 670,000 | | | | 748,725 | |
| CNH Capital LLC, 3.875%, 2015 (n) | | | 315,000 | | | | 323,663 | |
| CNH Capital LLC, 6.25%, 2016 | | | 440,000 | | | | 485,100 | |
| H&E Equipment Services LLC, 7%, 2022 (n) | | | 1,870,000 | | | | 2,042,975 | |
| NESCO LLC/NESCO Holdings Corp., 11.75%, 2017 (n) | | | 1,790,000 | | | | 1,951,100 | |
| RSC Equipment Rental, Inc., 8.25%, 2021 | | | 1,775,000 | | | | 2,019,063 | |
| United Rentals North America, Inc., 5.75%, 2018 | | | 760,000 | | | | 817,000 | |
| United Rentals North America, Inc., 7.625%, 2022 | | | 256,000 | | | | 285,440 | |
| | | | | | | | |
| | | | | | | $ | 11,936,766 | |
| Major Banks - 1.1% | | | | | | | | |
| Bank of America Corp., 5.65%, 2018 | | $ | 930,000 | | | $ | 1,073,862 | |
| Barclays Bank PLC, 7.625%, 2022 | | | 1,220,000 | | | | 1,203,225 | |
| RBS Capital Trust II, 6.425% to 2034, FRN to 2049 | | | 1,375,000 | | | | 1,237,500 | |
| Royal Bank of Scotland Group PLC, 6.99% to 2017, FRN to 2049 (n) | | | 825,000 | | | | 775,500 | |
| Royal Bank of Scotland Group PLC, 7.648% to 2031, FRN to 2049 | | | 2,620,000 | | | | 2,764,100 | |
| | | | | | | | |
| | | | | | | $ | 7,054,187 | |
| Medical & Health Technology & Services - 4.1% | | | | | | | | |
| AmSurg Corp., 5.625%, 2020 (n) | | $ | 375,000 | | | $ | 391,875 | |
| CDRT Holding Corp., 9.25%, 2017 (n)(p) | | | 385,000 | | | | 397,513 | |
| Davita, Inc., 6.375%, 2018 | | | 2,025,000 | | | | 2,166,750 | |
| Davita, Inc., 6.625%, 2020 | | | 2,295,000 | | | | 2,501,550 | |
| Fresenius Medical Care AG & Co. KGaA, 9%, 2015 (n) | | | 765,000 | | | | 872,100 | |
| Fresenius Medical Care Capital Trust III, 5.625%, 2019 (n) | | | 530,000 | | | | 573,725 | |
| Fresenius Medical Care Capital Trust III, 5.875%, 2022 (z) | | | 525,000 | | | | 573,563 | |
| HCA, Inc., 8.5%, 2019 | | | 1,980,000 | | | | 2,202,750 | |
| HCA, Inc., 7.5%, 2022 | | | 2,515,000 | | | | 2,904,825 | |
| HCA, Inc., 5.875%, 2022 | | | 1,155,000 | | | | 1,256,063 | |
| HealthSouth Corp., 8.125%, 2020 | | | 2,425,000 | | | | 2,661,438 | |
| IASIS Healthcare LLC/IASIS Capital Corp., 8.375%, 2019 | | | 2,110,000 | | | | 2,141,650 | |
| Select Medical Corp., 7.625%, 2015 | | | 234,000 | | | | 234,293 | |
| Tenet Healthcare Corp., 9.25%, 2015 | | | 925,000 | | | | 1,047,563 | |
| Tenet Healthcare Corp., 8%, 2020 | | | 1,125,000 | | | | 1,223,438 | |
| Tenet Healthcare Corp., 4.5%, 2021 (z) | | | 600,000 | | | | 590,250 | |
| Universal Health Services, Inc, 7.625%, 2020 | | | 1,400,000 | | | | 1,501,500 | |
| Universal Health Services, Inc., 7%, 2018 | | | 415,000 | | | | 457,538 | |
| Universal Hospital Services, Inc., FRN, 3.902%, 2015 | | | 590,000 | | | | 587,788 | |
21
Portfolio of Investments – continued
| | | | | | | | |
| Issuer | | Shares/Par | | | Value ($) | |
| Bonds - continued | | | | | | | | |
| Medical & Health Technology & Services - continued | | | | | | | | |
| Vanguard Health Systems, Inc., 0%, 2016 | | $ | 7,000 | | | $ | 5,355 | |
| WP Rocket Merger Sub, Inc., 10.125%, 2019 (n) | | | 1,385,000 | | | | 1,385,000 | |
| | | | | | | | |
| | | | | | | $ | 25,676,527 | |
| Medical Equipment - 0.7% | | | | | | | | |
| Biomet, Inc., 6.5%, 2020 (n) | | $ | 1,490,000 | | | $ | 1,564,500 | |
| Hologic, Inc., 6.25%, 2020 (n) | | | 540,000 | | | | 580,500 | |
| Physio-Control International, Inc., 9.875%, 2019 (n) | | | 940,000 | | | | 1,052,800 | |
| Teleflex, Inc., 6.875%, 2019 | | | 920,000 | | | | 998,200 | |
| | | | | | | | |
| | | | | | | $ | 4,196,000 | |
| Metals & Mining - 1.8% | | | | | | | | |
| Arch Coal, Inc., 7.25%, 2020 | | $ | 1,280,000 | | | $ | 1,145,600 | |
| Cloud Peak Energy, Inc., 8.25%, 2017 | | | 2,240,000 | | | | 2,380,000 | |
| Cloud Peak Energy, Inc., 8.5%, 2019 | | | 745,000 | | | | 810,188 | |
| Consol Energy, Inc., 8%, 2017 | | | 1,295,000 | | | | 1,398,600 | |
| Consol Energy, Inc., 8.25%, 2020 | | | 1,030,000 | | | | 1,114,975 | |
| First Quantum Minerals Ltd., 7.25%, 2019 (n) | | | 967,000 | | | | 983,923 | |
| Fortescue Metals Group Ltd., 8.25%, 2019 (n) | | | 1,275,000 | | | | 1,367,438 | |
| Peabody Energy Corp., 6%, 2018 | | | 725,000 | | | | 759,438 | |
| Peabody Energy Corp., 6.25%, 2021 | | | 725,000 | | | | 757,625 | |
| Southern Copper Corp., 6.75%, 2040 | | | 326,000 | | | | 381,366 | |
| | | | | | | | |
| | | | | | | $ | 11,099,153 | |
| Municipals - 0.2% | | | | | | | | |
| New Jersey Tobacco Settlement Financing Corp., “1-A”, 4.5%, 2023 | | $ | 1,210,000 | | | $ | 1,204,991 | |
| | |
| Natural Gas - Distribution - 0.4% | | | | | | | | |
| AmeriGas Finance LLC, 6.75%, 2020 | | $ | 1,265,000 | | | $ | 1,372,525 | |
| Ferrellgas LP/Ferrellgas Finance Corp., 6.5%, 2021 | | | 905,000 | | | | 914,050 | |
| | | | | | | | |
| | | | | | | $ | 2,286,575 | |
| Natural Gas - Pipeline - 2.5% | | | | | | | | |
| Access Midstream Partners Co., 4.875%, 2023 | | $ | 590,000 | | | $ | 587,050 | |
| Atlas Pipeline Partners LP, 8.75%, 2018 | | | 1,680,000 | | | | 1,800,960 | |
| Atlas Pipeline Partners LP, 5.875%, 2023 (z) | | | 895,000 | | | | 892,763 | |
| Crosstex Energy, Inc., 8.875%, 2018 | | | 2,130,000 | | | | 2,287,088 | |
| El Paso Corp., 7%, 2017 | | | 945,000 | | | | 1,083,325 | |
| El Paso Corp., 7.75%, 2032 | | | 1,370,000 | | | | 1,610,819 | |
| Energy Transfer Equity LP, 7.5%, 2020 | | | 1,825,000 | | | | 2,103,313 | |
| Enterprise Products Partners LP, 8.375% to 2016, FRN to 2066 | | | 870,000 | | | | 993,975 | |
| Enterprise Products Partners LP, 7.034% to 2018, FRN to 2068 | | | 544,000 | | | | 622,880 | |
| Inergy Midstream LP, 6%, 2020 (n) | | | 1,420,000 | | | | 1,466,150 | |
| MarkWest Energy Partners LP, 5.5%, 2023 | | | 1,165,000 | | | | 1,229,075 | |
22
Portfolio of Investments – continued
| | | | | | | | |
| Issuer | | Shares/Par | | | Value ($) | |
| Bonds - continued | | | | | | | | |
| Natural Gas - Pipeline - continued | | | | | | | | |
| Rockies Express Pipeline LLC, 5.625%, 2020 (n) | | $ | 470,000 | | | $ | 441,800 | |
| Sabine Pass Liquefaction, 5.625%, 2021 (z) | | | 390,000 | | | | 391,463 | |
| | | | | | | | |
| | | | | | | $ | 15,510,661 | |
| Network & Telecom - 1.7% | | | | | | | | |
| Centurylink, Inc., 7.65%, 2042 | | $ | 1,585,000 | | | $ | 1,631,127 | |
| Cincinnati Bell, Inc., 8.25%, 2017 | | | 405,000 | | | | 434,869 | |
| Citizens Communications Co., 9%, 2031 | | | 870,000 | | | | 943,950 | |
| Eileme 2 AB, 11.625%, 2020 (n) | | | 1,026,000 | | | | 1,208,115 | |
| Frontier Communications Corp., 8.125%, 2018 | | | 1,535,000 | | | | 1,776,763 | |
| Qwest Communications International, Inc., 7.125%, 2018 (n) | | | 1,320,000 | | | | 1,377,031 | |
| TW Telecom Holdings, Inc., 5.375%, 2022 | | | 650,000 | | | | 682,500 | |
| Windstream Corp., 8.125%, 2018 | | | 305,000 | | | | 334,738 | |
| Windstream Corp., 7.75%, 2020 | | | 1,360,000 | | | | 1,479,000 | |
| Windstream Corp., 7.75%, 2021 | | | 655,000 | | | | 715,588 | |
| | | | | | | | |
| | | | | | | $ | 10,583,681 | |
| Oil Services - 1.5% | | | | | | | | |
| Afren PLC, 11.5%, 2016 (n) | | $ | 1,000,000 | | | $ | 1,165,000 | |
| Bristow Group, Inc., 6.25%, 2022 | | | 660,000 | | | | 712,800 | |
| Chesapeake Energy Corp., 6.625%, 2019 (n) | | | 575,000 | | | | 569,250 | |
| Dresser-Rand Group, Inc., 6.5%, 2021 | | | 620,000 | | | | 657,200 | |
| Edgen Murray Corp., 8.75%, 2020 (n) | | | 1,360,000 | | | | 1,390,600 | |
| Pioneer Energy Services Corp., 9.875%, 2018 | | | 1,155,000 | | | | 1,253,175 | |
| Qgog Constellation S.A., 6.25%, 2019 (n) | | | 202,000 | | | | 213,110 | |
| Shale-Inland Holdings LLC/Finance Co., 8.75%, 2019 (n) | | | 1,455,000 | | | | 1,527,750 | |
| Unit Corp., 6.625%, 2021 | | | 1,780,000 | | | | 1,846,750 | |
| | | | | | | | |
| | | | | | | $ | 9,335,635 | |
| Other Banks & Diversified Financials - 3.1% | | | | | | | | |
| Akbank T.A.S., 5%, 2022 (n) | | $ | 150,000 | | | $ | 156,644 | |
| Alfa Bank, 7.5%, 2019 (n) | | | 200,000 | | | | 217,000 | |
| Ally Financial, Inc., 5.5%, 2017 | | | 3,695,000 | | | | 3,972,413 | |
| Ally Financial, Inc., 6.25%, 2017 | | | 875,000 | | | | 973,519 | |
| Banco de Credito del Peru, FRN, 6.875%, 2026 (n) | | | 42,000 | | | | 48,300 | |
| Banco de Credito del Peru, FRN, 6.125% to 2022, FRN to 2027 (n) | | | 281,000 | | | | 311,208 | |
| Banco de Reservas de La Republica Dominicana, 7%, 2023 (z) | | | 606,000 | | | | 613,575 | |
| Bancolombia S.A., 5.95%, 2021 | | | 914,000 | | | | 1,055,670 | |
| Bangkok Bank (Hong Kong), 3.875%, 2022 (n) | | | 217,000 | | | | 222,085 | |
| BBVA Banco Continental S.A., 5%, 2022 (n) | | | 150,000 | | | | 161,250 | |
| BBVA Bancomer S.A. de C.V., 6.5%, 2021 (n) | | | 975,000 | | | | 1,116,375 | |
| BBVA Bancomer S.A. de C.V., 6.75%, 2022 (n) | | | 157,000 | | | | 182,905 | |
| GMAC, Inc., 8%, 2031 | | | 275,000 | | | | 347,531 | |
| Groupe BPCE S.A., 12.5% to 2019, FRN to 2049 (n) | | | 1,527,000 | | | | 1,867,872 | |
23
Portfolio of Investments – continued
| | | | | | | | |
| Issuer | | Shares/Par | | | Value ($) | |
| Bonds - continued | | | | | | | | |
| Other Banks & Diversified Financials - continued | | | | | | | | |
| Grupo Aval Ltd., 4.75%, 2022 (n) | | $ | 200,000 | | | $ | 203,500 | |
| Industrial Senior Trust, 5.5%, 2022 (n) | | | 101,000 | | | | 102,010 | |
| LBG Capital No. 1 PLC, 7.875%, 2020 (n) | | | 2,780,000 | | | | 3,046,880 | |
| Santander UK PLC, 8.963% to 2030, FRN to 2049 | | | 3,169,000 | | | | 3,660,195 | |
| Turkiye Is Bankasi A.S., 6%, 2022 (n) | | | 200,000 | | | | 210,000 | |
| UBS AG, 7.625%, 2022 | | | 850,000 | | | | 933,930 | |
| Yapi Ve Kredi Bankasi, 5.5%, 2022 (z) | | | 206,000 | | | | 204,970 | |
| | | | | | | | |
| | | | | | | $ | 19,607,832 | |
| Pharmaceuticals - 0.8% | | | | | | | | |
| Capsugel FinanceCo. SCA, 9.875%, 2019 (n) | | EUR | 1,344,000 | | | $ | 2,039,307 | |
| Valeant Pharmaceuticals International, Inc., 7%, 2020 (n) | | $ | 1,650,000 | | | | 1,749,000 | |
| Valeant Pharmaceuticals International, Inc., 7.25%, 2022 (n) | | | 1,025,000 | | | | 1,101,875 | |
| | | | | | | | |
| | | | | | | $ | 4,890,182 | |
| Pollution Control - 0.3% | | | | | | | | |
| Heckmann Corp., 9.875%, 2018 (z) | | $ | 395,000 | | | $ | 416,725 | |
| Heckmann Corp., 9.875%, 2018 | | | 1,330,000 | | | | 1,413,125 | |
| | | | | | | | |
| | | | | | | $ | 1,829,850 | |
| Precious Metals & Minerals - 0.4% | | | | | | | | |
| Eldorado Gold Corp., 6.125%, 2020 (n) | | $ | 985,000 | | | $ | 1,035,481 | |
| IAMGOLD Corp., 6.75%, 2020 (n) | | | 1,640,000 | | | | 1,607,200 | |
| | | | | | | | |
| | | | | | | $ | 2,642,681 | |
| Printing & Publishing - 0.4% | | | | | | | | |
| American Media, Inc., 13.5%, 2018 (z) | | $ | 274,005 | | | $ | 239,754 | |
| Nielsen Finance LLC, 7.75%, 2018 | | | 1,310,000 | | | | 1,459,013 | |
| Nielsen Finance LLC, 4.5%, 2020 (n) | | | 835,000 | | | | 822,475 | |
| | | | | | | | |
| | | | | | | $ | 2,521,242 | |
| Railroad & Shipping - 0.2% | | | | | | | | |
| Brunswick Rail Finance Ltd., 6.5%, 2017 (n) | | $ | 200,000 | | | $ | 213,750 | |
| Kansas City Southern de Mexico S.A. de C.V., 6.125%, 2021 | | | 735,000 | | | | 826,875 | |
| | | | | | | | |
| | | | | | | $ | 1,040,625 | |
| Real Estate - 1.0% | | | | | | | | |
| CB Richard Ellis Group, Inc., 11.625%, 2017 | | $ | 205,000 | | | $ | 223,450 | |
| CNL Lifestyle Properties, Inc., REIT, 7.25%, 2019 | | | 715,000 | | | | 709,638 | |
| Entertainment Properties Trust, REIT, 7.75%, 2020 | | | 765,000 | | | | 892,591 | |
| Entertainment Properties Trust, REIT, 5.75%, 2022 | | | 805,000 | | | | 847,276 | |
| Kennedy Wilson, Inc., 8.75%, 2019 | | | 600,000 | | | | 636,000 | |
| MPT Operating Partnership LP, REIT, 6.875%, 2021 | | | 1,025,000 | | | | 1,124,938 | |
| MPT Operating Partnership LP, REIT, 6.375%, 2022 | | | 1,570,000 | | | | 1,683,825 | |
| | | | | | | | |
| | | | | | | $ | 6,117,718 | |
24
Portfolio of Investments – continued
| | | | | | | | |
| Issuer | | Shares/Par | | | Value ($) | |
| Bonds - continued | | | | | | | | |
| Retailers - 2.1% | | | | | | | | |
| Academy Ltd., 9.25%, 2019 (n) | | $ | 835,000 | | | $ | 931,025 | |
| Burlington Coat Factory Warehouse Corp., 10%, 2019 | | | 1,520,000 | | | | 1,653,000 | |
| J. Crew Group, Inc., 8.125%, 2019 | | | 1,185,000 | | | | 1,270,913 | |
| Limited Brands, Inc., 6.9%, 2017 | | | 945,000 | | | | 1,089,113 | |
| Limited Brands, Inc., 7%, 2020 | | | 875,000 | | | | 1,006,250 | |
| Limited Brands, Inc., 6.95%, 2033 | | | 510,000 | | | | 525,300 | |
| Pantry, Inc., 8.375%, 2020 (n) | | | 685,000 | | | | 732,950 | |
| Rite Aid Corp., 9.25%, 2020 | | | 1,215,000 | | | | 1,351,688 | |
| Sally Beauty Holdings, Inc., 6.875%, 2019 | | | 710,000 | | | | 784,550 | |
| Toys “R” Us Property Co. II LLC, 8.5%, 2017 | | | 1,459,000 | | | | 1,535,598 | |
| Toys “R” Us, Inc., 10.75%, 2017 | | | 1,460,000 | | | | 1,569,500 | |
| Yankee Acquisition Corp., 8.5%, 2015 | | | 11,000 | | | | 11,028 | |
| YCC Holdings LLC/Yankee Finance, Inc., 10.25%, 2016 (p) | | | 695,000 | | | | 715,857 | |
| | | | | | | | |
| | | | | | | $ | 13,176,772 | |
| Specialty Chemicals - 0.2% | | | | | | | | |
| Eagle Spinco, Inc., 4.625%, 2021 (z) | | $ | 300,000 | | | $ | 301,875 | |
| Georgia Gulf Corp., 4.875%, 2023 (z) | | | 120,000 | | | | 120,900 | |
| Koppers, Inc., 7.875%, 2019 | | | 535,000 | | | | 589,169 | |
| SIBUR Securities Ltd., 3.914%, 2018 (z) | | | 200,000 | | | | 199,033 | |
| | | | | | | | |
| | | | | | | $ | 1,210,977 | |
| Specialty Stores - 0.3% | | | | | | | | |
| Gymboree Corp., 9.125%, 2018 | | $ | 685,000 | | | $ | 643,900 | |
| Michaels Stores, Inc., 11.375%, 2016 | | | 104,000 | | | | 108,551 | |
| Michaels Stores, Inc., 7.75%, 2018 | | | 965,000 | | | | 1,055,469 | |
| | | | | | | | |
| | | | | | | $ | 1,807,920 | |
| Telecommunications - Wireless - 4.1% | | | | | | | | |
| Altice Financing S.A., 7.875%, 2019 (z) | | $ | 1,512,000 | | | $ | 1,623,888 | |
| Clearwire Corp., 12%, 2015 (n) | | | 1,640,000 | | | | 1,777,350 | |
| Cricket Communications, Inc., 7.75%, 2016 | | | 1,000,000 | | | | 1,052,500 | |
| Cricket Communications, Inc., 7.75%, 2020 | | | 1,395,000 | | | | 1,447,313 | |
| Crown Castle International Corp., 7.125%, 2019 | | | 590,000 | | | | 655,638 | |
| Crown Castle International Corp., 5.25%, 2023 (n) | | | 985,000 | | | | 1,034,250 | |
| Digicel Group Ltd., 12%, 2014 (n) | | | 362,000 | | | | 390,055 | |
| Digicel Group Ltd., 8.25%, 2017 (n) | | | 1,564,000 | | | | 1,657,840 | |
| Digicel Group Ltd., 10.5%, 2018 (n) | | | 1,435,000 | | | | 1,600,025 | |
| Digicel Group Ltd., 8.25%, 2020 (n) | | | 200,000 | | | | 223,000 | |
| MetroPCS Wireless, Inc., 7.875%, 2018 | | | 1,280,000 | | | | 1,385,600 | |
| Sprint Capital Corp., 6.875%, 2028 | | | 1,715,000 | | | | 1,732,150 | |
| Sprint Nextel Corp., 6%, 2016 | | | 2,075,000 | | | | 2,235,813 | |
| Sprint Nextel Corp., 8.375%, 2017 | | | 1,279,000 | | | | 1,478,844 | |
| Sprint Nextel Corp., 9%, 2018 (n) | | | 1,075,000 | | | | 1,330,313 | |
25
Portfolio of Investments – continued
| | | | | | | | |
| Issuer | | Shares/Par | | | Value ($) | |
| Bonds - continued | | | | | | | | |
| Telecommunications - Wireless - continued | | | | | | | | |
| Sprint Nextel Corp., 6%, 2022 | | $ | 1,875,000 | | | $ | 1,884,375 | |
| Wind Acquisition Finance S.A., 11.75%, 2017 (n) | | | 1,960,000 | | | | 2,107,000 | |
| Wind Acquisition Finance S.A., 7.25%, 2018 (n) | | | 2,020,000 | | | | 2,126,050 | |
| | | | | | | | |
| | | | | | | $ | 25,742,004 | |
| Telephone Services - 0.5% | | | | | | | | |
| Cogent Communications Group, Inc., 8.375%, 2018 (n) | | $ | 715,000 | | | $ | 791,863 | |
| Level 3 Financing, Inc., 9.375%, 2019 | | | 1,150,000 | | | | 1,299,500 | |
| Level 3 Financing, Inc., 7%, 2020 (n) | | | 440,000 | | | | 466,400 | |
| Level 3 Financing, Inc., 8.625%, 2020 | | | 595,000 | | | | 666,400 | |
| | | | | | | | |
| | | | | | | $ | 3,224,163 | |
| Transportation - 0.2% | | | | | | | | |
| Navios South American Logistics, Inc., 9.25%, 2019 | | $ | 1,521,000 | | | $ | 1,521,000 | |
| | |
| Transportation - Services - 3.0% | | | | | | | | |
| ACL I Corp., 10.625%, 2016 (p) | | $ | 2,363,259 | | | $ | 2,271,765 | |
| Aguila American Resources Ltd., 7.875%, 2018 (n) | | | 2,410,000 | | | | 2,554,600 | |
| Avis Budget Car Rental LLC, 8.25%, 2019 | | | 1,010,000 | | | | 1,118,575 | |
| Avis Budget Car Rental LLC, 9.75%, 2020 | | | 625,000 | | | | 723,438 | |
| CEVA Group PLC, 8.375%, 2017 (n) | | | 2,590,000 | | | | 2,648,275 | |
| Commercial Barge Line Co., 12.5%, 2017 | | | 2,510,000 | | | | 2,754,725 | |
| Navios Maritime Acquisition Corp., 8.625%, 2017 | | | 2,105,000 | | | | 1,994,488 | |
| Navios Maritime Holdings, Inc., 8.875%, 2017 | | | 1,655,000 | | | | 1,634,313 | |
| Swift Services Holdings, Inc., 10%, 2018 | | | 2,745,000 | | | | 3,098,419 | |
| | | | | | | | |
| | | | | | | $ | 18,798,598 | |
| Utilities - Electric Power - 3.9% | | | | | | | | |
| AES Corp., 8%, 2017 | | $ | 1,995,000 | | | $ | 2,304,225 | |
| AES Corp., 7.375%, 2021 | | | 650,000 | | | | 724,750 | |
| Calpine Corp., 8%, 2016 (n) | | | 1,260,000 | | | | 1,329,300 | |
| Calpine Corp., 7.875%, 2020 (n) | | | 1,113,000 | | | | 1,227,083 | |
| Covanta Holding Corp., 7.25%, 2020 | | | 1,080,000 | | | | 1,189,733 | |
| Covanta Holding Corp., 6.375%, 2022 | | | 465,000 | | | | 507,483 | |
| EDP Finance B.V., 6%, 2018 (n) | | | 2,620,000 | | | | 2,770,650 | |
| Empresa de Energia de Bogota S.A., 6.125%, 2021 (n) | | | 200,000 | | | | 227,000 | |
| Energy Future Holdings Corp., 10%, 2020 | | | 3,547,000 | | | | 4,070,183 | |
| Energy Future Holdings Corp., 10%, 2020 (z) | | | 1,365,000 | | | | 1,562,925 | |
| Energy Future Holdings Corp., 11.75%, 2022 (n) | | | 1,275,000 | | | | 1,451,906 | |
| GenOn Energy, Inc., 9.875%, 2020 | | | 1,880,000 | | | | 2,162,000 | |
| NRG Energy, Inc., 8.25%, 2020 | | | 2,120,000 | | | | 2,395,600 | |
| Texas Competitive Electric Holdings Co. LLC, 11.5%, 2020 (n) | | | 1,760,000 | | | | 1,390,400 | |
26
Portfolio of Investments – continued
| | | | | | | | |
| Issuer | | Shares/Par | | | Value ($) | |
| Bonds - continued | | | | | | | | |
| Utilities - Electric Power - continued | | | | | | | | |
| Viridian Group FundCo II, Ltd., 11.125%, 2017 (z) | | $ | 1,110,000 | | | $ | 1,165,500 | |
| | | | | | | $ | 24,478,738 | |
| Total Bonds (Identified Cost, $567,490,716) | | | | | | $ | 589,487,820 | |
| | |
| Floating Rate Loans (g)(r) - 0.1% | | | | | | | | |
| Utilities - Electric Power - 0.1% | | | | | | | | |
| Dynegy Holdings, Inc., Term Loan B1, 9.25%, 2016 | | $ | 167,213 | | | $ | 173,484 | |
| Dynegy Holdings, Inc., Term Loan B, 9.25%, 2016 | | | 221,164 | | | | 230,406 | |
| Total Floating Rate Loans (Identified Cost, $382,522) | | | | | | $ | 403,890 | |
| | |
| Common Stocks - 0.2% | | | | | | | | |
| Automotive - 0.0% | | | | | | | | |
| Accuride Corp. (a) | | | 34,663 | | | $ | 130,333 | |
| | |
| Broadcasting - 0.1% | | | | | | | | |
| New Young Broadcasting Holding Co., Inc. (a) | | | 98 | | | $ | 367,500 | |
| | |
| Chemicals - 0.0% | | | | | | | | |
| LyondellBasell Industries N.V., “A” | | | 81 | | | $ | 5,137 | |
| | |
| Containers - 0.0% | | | | | | | | |
| Owens-Illinois, Inc. (a) | | | 12,400 | | | $ | 295,120 | |
| | |
| Energy - Independent - 0.0% | | | | | | | | |
| SandRidge Energy, Inc. (a) | | | 490 | | | $ | 3,469 | |
| | |
| Natural Gas - Distribution - 0.0% | | | | | | | | |
| Dynegy, Inc. (a) | | | 12,819 | | | $ | 256,380 | |
| | |
| Printing & Publishing - 0.1% | | | | | | | | |
| American Media Operations, Inc. (a) | | | 70,215 | | | $ | 333,521 | |
| Total Common Stocks (Identified Cost, $2,555,383) | | | | | | $ | 1,391,460 | |
| | |
| Convertible Preferred Stocks - 0.2% | | | | | | | | |
| Automotive - 0.2% | | | | | | | | |
| General Motors Co., 4.75% (Identified Cost, $1,490,746) | | | 30,680 | | | $ | 1,329,058 | |
| | |
| Preferred Stocks - 0.3% | | | | | | | | |
| Other Banks & Diversified Financials - 0.3% | | | | | | | | |
| Ally Financial, Inc., 7% (z) | | | 809 | | | $ | 789,559 | |
| GMAC Capital Trust I, 8.125% | | | 49,825 | | | | 1,328,833 | |
| Total Preferred Stocks (Identified Cost, $2,021,701) | | | | | | $ | 2,118,392 | |
27
Portfolio of Investments – continued
| | | | | | | | | | | | | | | | |
| Warrants - 0.1% | | | | | | | | | | | | | | | | |
| Issuer | | Strike Price | | | First Exercise | | | Shares/Par | | | Value ($) | |
| Broadcasting - 0.1% | | | | | | | | | | | | | | | | |
| New Young Broadcasting Holding Co., Inc. (1 share for 1 warrant) (Identified Cost $337,603) (a) | | $ | 0.01 | | | | 7/14/10 | | | | 174 | | | $ | 652,500 | |
| | | | | | | | | | | | |
| | | | |
| Convertible Bonds - 0.1% | | | | | | | | | | | | |
| Network & Telecom - 0.1% | | | | | | | | | | | | |
Nortel Networks Corp., 2.125%, 2014
(Identified Cost, $476,275) (a)(d) | | | | | | $ | 480,000 | | | $ | 477,600 | |
| | | | |
| Issuer/Expiration Date/Strike Price | | | | | | Number
of
Contracts | | | | |
| Call Options Purchased - 0.1% | | | | | | | | | | | | |
Russell 2000 Index - March 2013 @ 925
(Premiums Paid $490,426) | | | | | | | 647 | | | $ | 570,654 | |
| | | | |
| Issuer | | | | | | Shares/Par | | | | |
| Money Market Funds - 3.7% | | | | | | | | | | | | |
MFS Institutional Money Market Portfolio, 0.14%,
at Cost and Net Asset Value (v) | | | | | | | 23,476,201 | | | $ | 23,476,201 | |
| Total Investments (Identified Cost, $598,721,573) | | | | | | | | | | $ | 619,907,575 | |
| | | | |
| Other Assets, Less Liabilities - 1.1% | | | | | | | | | | | 6,617,591 | |
| Net Assets - 100.0% | | | | | | | | | | $ | 626,525,166 | |
| (a) | Non-income producing security. |
| (c) | The rate shown represents a current effective yield, not a coupon rate. |
| (d) | In default. Interest and/or scheduled principal payment(s) have been missed. |
| (g) | The rate shown represents a weighted average coupon rate on settled positions at period end, unless otherwise indicated. |
| (i) | Interest only security for which the fund receives interest on notional principal (Par amount). Par amount shown is the notional principal and does not reflect the cost of the security. |
| (n) | Securities exempt from registration under Rule 144A of the Securities Act of 1933. These securities may be sold in the ordinary course of business in transactions exempt from registration, normally to qualified institutional buyers. At period end, the aggregate value of these securities was $190,849,583, representing 30.5% of net assets. |
| (p) | Payment-in-kind security. |
| (r) | Remaining maturities of floating rate loans may be less than stated maturities shown as a result of contractual or optional prepayments by the borrower. Such prepayments cannot be predicted with certainty. These loans may be subject to restrictions on resale. Floating rate loans generally have rates of interest which are determined periodically by reference to a base lending rate plus a premium. |
| (v) | Underlying affiliated fund that is available only to investment companies managed by MFS. The rate quoted for the MFS Institutional Money Market Portfolio is the annualized seven-day yield of the fund at period end. |
28
Portfolio of Investments – continued
| (z) | Restricted securities are not registered under the Securities Act of 1933 and are subject to legal restrictions on resale. These securities generally may be resold in transactions exempt from registration or to the public if the securities are subsequently registered. Disposal of these securities may involve time-consuming negotiations and prompt sale at an acceptable price may be difficult. The fund holds the following restricted securities: |
| | | | | | | | | | |
| Restricted Securities | | Acquisition
Date | | Cost | | | Value | |
| Ally Financial, Inc., 7% (Preferred Stock) | | 4/13/11-4/14/11 | | | $758,438 | | | | $789,559 | |
| Altice Financing S.A., 7.875%, 2019 | | 12/07/12 | | | 1,512,000 | | | | 1,623,888 | |
| American Media, Inc., 13.5%, 2018 | | 12/28/10 | | | 277,544 | | | | 239,754 | |
| Arbor Realty Mortgage Securities, CDO, FRN, 2.602%, 2038 | | 12/20/05 | | | 1,136,457 | | | | 340,937 | |
| Atlas Pipeline Partners LP, 5.875%, 2023 | | 1/28/13 | | | 895,000 | | | | 892,763 | |
| Aviation Capital Group, 4.625%, 2018 | | 1/14/13 | | | 480,000 | | | | 486,281 | |
| BC Mountain LLC, 7%, 2021 | | 1/25/13 | | | 180,000 | | | | 184,500 | |
| Banc of America Commercial Mortgage, Inc., FRN, 6.255%, 2051 | | 6/19/08 | | | 2,868,810 | | | | 913,773 | |
| Banco de Reservas de La Republica Dominicana, 7%, 2023 | | 1/25/13 | | | 600,722 | | | | 613,575 | |
| Bombardier, Inc., 4.25%, 2016 | | 1/09/13 | | | 346,006 | | | | 356,324 | |
| Clearwater Paper Corp., 4.5%, 2023 | | 1/17/13 | | | 240,000 | | | | 238,200 | |
| Crown Americas LLC, 4.5%, 2023 | | 1/03/13 | | | 1,050,000 | | | | 1,034,250 | |
| Dematic S.A., 7.75%, 2020 | | 12/13/12 | | | 1,085,000 | | | | 1,109,413 | |
| Eagle Spinco, Inc., 4.625%, 2021 | | 1/17/13 | | | 300,000 | | | | 301,875 | |
| Energy Future Holdings Corp., 10%, 2020 | | 1/07/10-8/06/10 | | | 1,391,320 | | | | 1,562,925 | |
| Falcon Franchise Loan LLC, FRN, 6.542%, 2025 | | 1/29/03 | | | 21,553 | | | | 42,169 | |
| Flash Dutch 2 B.V./U.S. Coatings Acquisition, 7.375%, 2021 | | 1/16/13 | | | 255,000 | | | | 262,650 | |
| Fresenius Medical Care Capital Trust III, 5.875%, 2022 | | 1/24/13 | | | 580,084 | | | | 573,563 | |
| G-Force LLC, CDO, “A2”, 4.83%, 2036 | | 1/20/11-2/14/11 | | | 892,558 | | | | 923,266 | |
| Georgia Gulf Corp., 4.875%, 2023 | | 1/17/13 | | | 120,000 | | | | 120,900 | |
| Gibraltar Industries, Inc., 6.25%, 2021 | | 1/18/13 | | | 240,000 | | | | 249,300 | |
| Great Canadian Gaming Corp., 6.625%, 2022 | | 7/18/12 | | | 1,360,376 | | | | 1,437,174 | |
| HD Supply, Inc., 10.5%, 2021 | | 1/09/13 | | | 120,000 | | | | 122,700 | |
| Heckler & Koch GmbH, 9.5%, 2018 | | 5/06/11-5/10/11 | | | 1,651,931 | | | | 1,397,522 | |
| Heckmann Corp., 9.875%, 2018 | | 10/26/12 | | | 395,954 | | | | 416,725 | |
Jaguar Land Rover PLC, 5.625%, 2023 | | 1/23/13 | | | 395,000 | | | | 402,900 | |
| LBI Media, Inc., 13.5% to 2015, 11.5% to 2020 | | 1/02/13 | | | 380,790 | | | | 369,820 | |
| Lear Corp., 4.75%, 2023 | | 1/14/13 | | | 430,000 | | | | 427,850 | |
| Local TV Finance LLC, 9.25%, 2015 | | 11/13/07-
2/16/11 | | | 2,060,957 | | | | 2,095,673 | |
| Marfrig Holding Europe B.V., 9.875%, 2017 | | 1/16/13 | | | 200,000 | | | | 197,000 | |
| Minerva Luxembourg S.A., 7.75%, 2023 | | 1/17/13 | | | 196,603 | | | | 205,000 | |
| Morgan Stanley Capital I, Inc., FRN, 1.384%, 2039 | | 7/20/04 | | | 37,838 | | | | 28,295 | |
| NXP B.V., 5.75%, 2021 | | 1/31/13 | | | 415,000 | | | | 415,000 | |
| Nara Cable Funding Ltd., 8.875%, 2018 | | 1/26/12 | | | 1,191,564 | | | | 1,249,500 | |
29
Portfolio of Investments – continued
| | | | | | | | | | |
| Restricted Securities - continued | | Acquisition
Date | | Cost | | | Value | |
| Netflix, Inc., 5.375%, 2021 | | 1/29/13-1/30/13 | | | $906,244 | | | | $900,475 | |
| Neustar, Inc., 4.5%, 2023 | | 1/11/13-1/16/13 | | | 189,944 | | | | 190,000 | |
| Preferred Term Securities XII Ltd., CDO, 0%, 2033 | | 1/07/05 | | | 1,376,758 | | | | 533 | |
| Preferred Term Securities XVI Ltd., CDO, 0%, 2035 | | 12/08/04-1/25/05 | | | 2,573,173 | | | | 325 | |
| Preferred Term Securities XVII Ltd., CDO, 0%, 2035 | | 3/09/05 | | | 1,419,521 | | | | 181 | |
| Rosneft, 3.149%, 2017 | | 11/29/12 | | | 208,000 | | | | 208,260 | |
| SIBUR Securities Ltd., 3.914%, 2018 | | 1/24/13 | | | 200,000 | | | | 199,033 | |
| Sabine Pass Liquefaction, 5.625%, 2021 | | 1/29/13 | | | 390,000 | | | | 391,463 | |
| Tenet Healthcare Corp., 4.5%, 2021 | | 1/22/13 | | | 600,000 | | | | 590,250 | |
| Unifrax I LLC, 7.5%, 2019 | | 1/31/13 | | | 240,000 | | | | 240,000 | |
| Viridian Group FundCo II, Ltd., 11.125%, 2017 | | 3/1/12 | | | 1,078,669 | | | | 1,165,500 | |
| Yapi Ve Kredi Bankasi, 5.5%, 2022 | | 11/29/12 | | | 206,000 | | | | 204,970 | |
| Total Restricted Securities | | | | $25,716,014 | |
| % of Net assets | | | | 4.1% | |
The following abbreviations are used in this report and are defined:
| CDO | | Collateralized Debt Obligation |
| FRN | | Floating Rate Note. Interest rate resets periodically and may not be the rate reported at period end. |
| PLC | | Public Limited Company |
| REIT | | Real Estate Investment Trust |
Abbreviations indicate amounts shown in currencies other than the U.S. dollar. All amounts are stated in U.S. dollars unless otherwise indicated. A list of abbreviations is shown below:
Derivative Contracts at 1/31/13
Forward Foreign Currency Exchange Contracts at 1/31/13
| | | | | | | | | | | | | | | | | | | | | | | | |
| Type | | Currency | | Counterparty | | Contracts to
Deliver/
Receive | | | Settlement
Date Range | | | In
Exchange
for | | | Contracts
at Value | | | Net
Unrealized
Appreciation
(Depreciation) | |
| Asset Derivatives | | | | | | | | | | | | | |
| SELL | | CAD | | Merril Lynch International Bank | | | 1,375,000 | | | | 4/15/13 | | | | $1,390,179 | | | | $1,376,514 | | | | $13,665 | |
| | | | | | | | | | | | | | | | | | | | | | | | |
| | | |
| Liability Derivatives | | | | | | | | | | |
| SELL | | EUR | | Deutche Bank AG | | | 6,805,000 | | | | 4/15/13 | | | | $8,890,460 | | | | $9,243,299 | | | | $(352,839 | ) |
| | | | | | | | | | | | | | | | | | | | | | | | |
See Notes to Financial Statements
30
Financial Statements
STATEMENT OF ASSETS AND LIABILITIES
At 1/31/13
This statement represents your fund’s balance sheet, which details the assets and liabilities comprising the total value of the fund.
| | | | |
| Assets | | | | |
Investments- | | | | |
Non-affiliated issuers, at value (identified cost, $575,245,372) | | | $596,431,374 | |
Underlying affiliated funds, at cost and value | | | 23,476,201 | |
Total investments, at value (identified cost, $598,721,573) | | | $619,907,575 | |
Foreign currency, at value (identified cost, $33,560) | | | 21,154 | |
Receivables for | | | | |
Forward foreign currency exchange contracts | | | 13,665 | |
Investments sold | | | 3,142,763 | |
Fund shares sold | | | 1,493,515 | |
Interest and dividends | | | 12,053,898 | |
Receivable from investment adviser | | | 32,073 | |
Other assets | | | 4,484 | |
Total assets | | | $636,669,127 | |
| Liabilities | | | | |
Payable to custodian | | | $64,001 | |
Payables for | | | | |
Distributions | | | 678,509 | |
Forward foreign currency exchange contracts | | | 352,839 | |
Investments purchased | | | 6,333,709 | |
Fund shares reacquired | | | 2,272,672 | |
Payable to affiliates | | | | |
Shareholder servicing costs | | | 268,334 | |
Distribution and service fees | | | 13,091 | |
Payable for independent Trustees’ compensation | | | 5,047 | |
Accrued expenses and other liabilities | | | 155,759 | |
Total liabilities | | | $10,143,961 | |
Net assets | | | $626,525,166 | |
| Net assets consist of | | | | |
Paid-in capital | | | $707,825,664 | |
Unrealized appreciation (depreciation) on investments and translation of assets and liabilities in foreign currencies | | | 20,842,534 | |
Accumulated net realized gain (loss) on investments and foreign currency | | | (100,959,356 | ) |
Accumulated distributions in excess of net investment income | | | (1,183,676 | ) |
Net assets | | | $626,525,166 | |
Shares of beneficial interest outstanding | | | 94,376,939 | |
31
Statement of Assets and Liabilities – continued
| | | | | | | | | | | | |
| | | Net assets | | | Shares
outstanding | | | Net asset value
per share (a) | |
| Class A | | | $412,833,781 | | | | 62,190,475 | | | | $6.64 | |
| Class B | | | 33,337,614 | | | | 5,011,289 | | | | 6.65 | |
| Class C | | | 99,785,775 | | | | 15,051,224 | | | | 6.63 | |
| Class I | | | 70,977,160 | | | | 10,680,936 | | | | 6.65 | |
| Class R1 | | | 207,450 | | | | 31,194 | | | | 6.65 | |
| Class R2 | | | 253,295 | | | | 38,070 | | | | 6.65 | |
| Class R3 | | | 7,587,788 | | | | 1,142,940 | | | | 6.64 | |
| Class R4 | | | 1,430,692 | | | | 213,973 | | | | 6.69 | |
| Class R5 (formerly Class W) | | | 111,611 | | | | 16,838 | | | | 6.63 | |
| (a) | Maximum offering price per share was equal to the net asset value per share for all share classes, except for Class A, for which the maximum offering price per share was $6.97 [100 / 95.25 x $6.64]. On sales of $50,000 or more, the maximum offering price of Class A shares is reduced. A contingent deferred sales charge may be imposed on redemptions of Class A, Class B, and Class C shares. Redemption price per share was equal to the net asset value per share for Classes I, R1, R2, R3, R4, and R5. |
See Notes to Financial Statements
32
Financial Statements
STATEMENT OF OPERATIONS
Year ended 1/31/13
This statement describes how much your fund earned in investment income and accrued in expenses. It also describes any gains and/or losses generated by fund operations.
| | | | |
| Net investment income | | | | |
Income | | | | |
Interest | | | $46,942,671 | |
Dividends | | | 281,115 | |
Dividends from underlying affiliated funds | | | 28,682 | |
Foreign taxes withheld | | | (1,875 | ) |
Total investment income | | | $47,250,593 | |
Expenses | | | | |
Management fee | | | $4,047,991 | |
Distribution and service fees | | | 2,377,186 | |
Shareholder servicing costs | | | 816,602 | |
Administrative services fee | | | 97,681 | |
Independent Trustees’ compensation | | | 19,043 | |
Custodian fee | | | 103,319 | |
Shareholder communications | | | 154,277 | |
Audit and tax fees | | | 79,228 | |
Legal fees | | | 7,638 | |
Miscellaneous | | | 209,528 | |
Total expenses | | | $7,912,493 | |
Fees paid indirectly | | | (120 | ) |
Reduction of expenses by investment adviser | | | (549,065 | ) |
Net expenses | | | $7,363,308 | |
Net investment income | | | $39,887,285 | |
| Realized and unrealized gain (loss) on investments and foreign currency | |
Realized gain (loss) (identified cost basis) | | | | |
Investments | | | $(6,039,187 | ) |
Foreign currency | | | (171,372 | ) |
Net realized gain (loss) on investments and foreign currency | | | $(6,210,559 | ) |
Change in unrealized appreciation (depreciation) | | | | |
Investments | | | $39,808,044 | |
Translation of assets and liabilities in foreign currencies | | | (143,023 | ) |
Net unrealized gain (loss) on investments and foreign currency translation | | | $39,665,021 | |
Net realized and unrealized gain (loss) on investments and foreign currency | | | $33,454,462 | |
Change in net assets from operations | | | $73,341,747 | |
See Notes to Financial Statements
33
Financial Statements
STATEMENTS OF CHANGES IN NET ASSETS
These statements describe the increases and/or decreases in net assets resulting from operations, any distributions, and any shareholder transactions.
| | | | | | | | |
| | | Year ended 1/31 | |
| | | 2013 | | | 2012 | |
| Change in net assets | | | | | | |
| From operations | | | | | | | | |
Net investment income | | | $39,887,285 | | | | $42,218,759 | |
Net realized gain (loss) on investments and foreign currency | | | (6,210,559 | ) | | | (1,863,435 | ) |
Net unrealized gain (loss) on investments and foreign currency translation | | | 39,665,021 | | | | (16,437,958 | ) |
Change in net assets from operations | | | $73,341,747 | | | | $23,917,366 | |
| Distributions declared to shareholders | | | | | | | | |
From net investment income | | | $(41,248,929 | ) | | | $(43,098,356 | ) |
Change in net assets from fund share transactions | | | $(3,589,503 | ) | | | $(44,144,594 | ) |
Total change in net assets | | | $28,503,315 | | | | $(63,325,584 | ) |
| Net assets | | | | | | | | |
At beginning of period | | | 598,021,851 | | | | 661,347,435 | |
At end of period (including accumulated distributions in excess of net investment income of $1,183,676 and $1,497,528, respectively) | | | $626,525,166 | | | | $598,021,851 | |
See Notes to Financial Statements
34
Financial Statements
FINANCIAL HIGHLIGHTS
The financial highlights table is intended to help you understand the fund’s financial performance for the past 5 years (or life of a particular share class, if shorter). Certain information reflects financial results for a single fund share. The total returns in the table represent the rate by which an investor would have earned (or lost) on an investment in the fund share class (assuming reinvestment of all distributions) held for the entire period.
| | | | | | | | | | | | | | | | | | | | |
| Class A | | Years ended 1/31 | |
| | | 2013 | | | 2012 | | | 2011 | | | 2010 | | | 2009 | |
Net asset value, beginning of period | | | $6.30 | | | | $6.49 | | | | $5.98 | | | | $4.42 | | | | $6.90 | |
| Income (loss) from investment operations | | | | | |
Net investment income (d) | | | $0.42 | | | | $0.44 | | | | $0.47 | | | | $0.49 | | | | $0.57 | |
Net realized and unrealized gain (loss)
on investments and foreign currency | | | 0.35 | | | | (0.18 | ) | | | 0.51 | | | | 1.59 | | | | (2.46 | ) |
Total from investment operations | | | $0.77 | | | | $0.26 | | | | $0.98 | | | | $2.08 | | | | $(1.89 | ) |
| Less distributions declared to shareholders | |
From net investment income | | | $(0.43 | ) | | | $(0.45 | ) | | | $(0.47 | ) | | | $(0.51 | ) | | | $(0.59 | ) |
From net realized gain on investments | | | — | | | | — | | | | — | | | | — | | | | (0.00 | )(w) |
From tax return of capital | | | — | | | | — | | | | — | | | | (0.01 | ) | | | — | |
Total distributions declared to shareholders | | | $(0.43 | ) | | | $(0.45 | ) | | | $(0.47 | ) | | | $(0.52 | ) | | | $(0.59 | ) |
Net asset value, end of period (x) | | | $6.64 | | | | $6.30 | | | | $6.49 | | | | $5.98 | | | | $4.42 | |
Total return (%) (r)(s)(t)(x) | | | 12.73 | | | | 4.21 | | | | 17.06 | | | | 49.74 | | | | (28.79 | ) |
Ratios (%) (to average net assets)
and Supplemental data: | | | | | | | | | | | | | | | | | | | | |
Expenses before expense reductions (f) | | | 1.14 | | | | 1.13 | | | | 1.13 | | | | 1.16 | | | | 1.24 | |
Expenses after expense reductions (f) | | | 1.05 | | | | 1.05 | | | | 1.02 | | | | 0.93 | | | | 0.85 | |
Net investment income | | | 6.54 | | | | 6.96 | | | | 7.64 | | | | 9.36 | | | | 9.54 | |
Portfolio turnover | | | 48 | | | | 61 | | | | 68 | | | | 61 | | | | 72 | |
Net assets at end of period (000 omitted) | | | $412,834 | | | | $422,926 | | | | $474,643 | | | | $369,073 | | | | $276,917 | |
See Notes to Financial Statements
35
Financial Highlights – continued
| | | | | | | | | | | | | | | | | | | | |
| Class B | | Years ended 1/31 | |
| | | 2013 | | | 2012 | | | 2011 | | | 2010 | | | 2009 | |
Net asset value, beginning of period | | | $6.32 | | | | $6.51 | | | | $5.99 | | | | $4.43 | | | | $6.92 | |
| Income (loss) from investment operations | | | | | | | | | | | | | | | | | | | | |
Net investment income (d) | | | $0.37 | | | | $0.39 | | | | $0.43 | | | | $0.45 | | | | $0.53 | |
Net realized and unrealized gain (loss)
on investments and foreign currency | | | 0.35 | | | | (0.18 | ) | | | 0.52 | | | | 1.59 | | | | (2.47 | ) |
Total from investment operations | | | $0.72 | | | | $0.21 | | | | $0.95 | | | | $2.04 | | | | $(1.94 | ) |
| Less distributions declared to shareholders | | | | | | | | | | | | | | | | | | | | |
From net investment income | | | $(0.39 | ) | | | $(0.40 | ) | | | $(0.43 | ) | | | $(0.47 | ) | | | $(0.55 | ) |
From net realized gain on investments | | | — | | | | — | | | | — | | | | — | | | | (0.00 | )(w) |
From tax return of capital | | | — | | | | — | | | | — | | | | (0.01 | ) | | | — | |
Total distributions declared to shareholders | | | $(0.39 | ) | | | $(0.40 | ) | | | $(0.43 | ) | | | $(0.48 | ) | | | $(0.55 | ) |
Net asset value, end of period (x) | | | $6.65 | | | | $6.32 | | | | $6.51 | | | | $5.99 | | | | $4.43 | |
Total return (%) (r)(s)(t)(x) | | | 11.71 | | | | 3.44 | | | | 16.37 | | | | 48.59 | | | | (29.31 | ) |
Ratios (%) (to average net assets)
and Supplemental data: | | | | | | | | | | | | | | | | | | | | |
Expenses before expense reductions (f) | | | 1.89 | | | | 1.88 | | | | 1.88 | | | | 1.90 | | | | 1.89 | |
Expenses after expense reductions (f) | | | 1.80 | | | | 1.80 | | | | 1.77 | | | | 1.68 | | | | 1.50 | |
Net investment income | | | 5.77 | | | | 6.21 | | | | 6.92 | | | | 8.64 | | | | 8.82 | |
Portfolio turnover | | | 48 | | | | 61 | | | | 68 | | | | 61 | | | | 72 | |
Net assets at end of period (000 omitted) | | | $33,338 | | | | $35,751 | | | | $46,297 | | | | $51,506 | | | | $42,757 | |
See Notes to Financial Statements
36
Financial Highlights – continued
| | | | | | | | | | | | | | | | | | | | |
| Class C | | Years ended 1/31 | |
| | | 2013 | | | 2012 | | | 2011 | | | 2010 | | | 2009 | |
Net asset value, beginning of period | | | $6.30 | | | | $6.48 | | | | $5.97 | | | | $4.41 | | | | $6.89 | |
| Income (loss) from investment operations | | | | | | | | | | | | | | | | | | | | |
Net investment income (d) | | | $0.37 | | | | $0.40 | | | | $0.43 | | | | $0.45 | | | | $0.53 | |
Net realized and unrealized gain (loss)
on investments and foreign currency | | | 0.35 | | | | (0.18 | ) | | | 0.50 | | | | 1.59 | | | | (2.46 | ) |
Total from investment operations | | | $0.72 | | | | $0.22 | | | | $0.93 | | | | $2.04 | | | | $(1.93 | ) |
| Less distributions declared to shareholders | | | | | | | | | | | | | | | | | | | | |
From net investment income | | | $(0.39 | ) | | | $(0.40 | ) | | | $(0.42 | ) | | | $(0.47 | ) | | | $(0.55 | ) |
From net realized gain on investments | | | — | | | | — | | | | — | | | | — | | | | (0.00 | )(w) |
From tax return of capital | | | — | | | | — | | | | — | | | | (0.01 | ) | | | — | |
Total distributions declared to shareholders | | | $(0.39 | ) | | | $(0.40 | ) | | | $(0.42 | ) | | | $(0.48 | ) | | | $(0.55 | ) |
Net asset value, end of period (x) | | | $6.63 | | | | $6.30 | | | | $6.48 | | | | $5.97 | | | | $4.41 | |
Total return (%) (r)(s)(t)(x) | | | 11.73 | | | | 3.59 | | | | 16.22 | | | | 48.77 | | | | (29.32 | ) |
Ratios (%) (to average net assets)
and Supplemental data: | | | | | | | | | | | | | | | | | | | | |
Expenses before expense reductions (f) | | | 1.89 | | | | 1.89 | | | | 1.88 | | | | 1.90 | | | | 1.90 | |
Expenses after expense reductions (f) | | | 1.80 | | | | 1.80 | | | | 1.77 | | | | 1.68 | | | | 1.50 | |
Net investment income | | | 5.79 | | | | 6.25 | | | | 6.94 | | | | 8.52 | | | | 8.94 | |
Portfolio turnover | | | 48 | | | | 61 | | | | 68 | | | | 61 | | | | 72 | |
Net assets at end of period (000 omitted) | | | $99,786 | | | | $89,483 | | | | $96,519 | | | | $89,930 | | | | $55,001 | |
See Notes to Financial Statements
37
Financial Highlights – continued
| | | | | | | | | | | | | | | | | | | | |
| Class I | | Years ended 1/31 | |
| | | 2013 | | | 2012 | | | 2011 | | | 2010 | | | 2009 | |
Net asset value, beginning of period | | | $6.31 | | | | $6.50 | | | | $5.99 | | | | $4.43 | | | | $6.92 | |
| Income (loss) from investment operations | | | | | | | | | | | | | | | | | | | | |
Net investment income (d) | | | $0.44 | | | | $0.46 | | | | $0.48 | | | | $0.50 | | | | $0.60 | |
Net realized and unrealized gain (loss)
on investments and foreign currency | | | 0.35 | | | | (0.18 | ) | | | 0.52 | | | | 1.60 | | | | (2.48 | ) |
Total from investment operations | | | $0.79 | | | | $0.28 | | | | $1.00 | | | | $2.10 | | | | $(1.88 | ) |
| Less distributions declared to shareholders | | | | | | | | | | | | | | | | | | | | |
From net investment income | | | $(0.45 | ) | | | $(0.47 | ) | | | $(0.49 | ) | | | $(0.53 | ) | | | $(0.61 | ) |
From net realized gain on investments | | | — | | | | — | | | | — | | | | — | | | | (0.00 | )(w) |
From tax return of capital | | | — | | | | — | | | | — | | | | (0.01 | ) | | | — | |
Total distributions declared to shareholders | | | $(0.45 | ) | | | $(0.47 | ) | | | $(0.49 | ) | | | $(0.54 | ) | | | $(0.61 | ) |
Net asset value, end of period (x) | | | $6.65 | | | | $6.31 | | | | $6.50 | | | | $5.99 | | | | $4.43 | |
Total return (%) (r)(s)(x) | | | 13.00 | | | | 4.47 | | | | 17.33 | | | | 50.02 | | | | (28.57 | ) |
Ratios (%) (to average net assets)
and Supplemental data: | | | | | | | | | | | | | | | | | | | | |
Expenses before expense reductions (f) | | | 0.89 | | | | 0.88 | | | | 0.87 | | | | 0.90 | | | | 0.89 | |
Expenses after expense reductions (f) | | | 0.80 | | | | 0.80 | | | | 0.78 | | | | 0.68 | | | | 0.50 | |
Net investment income | | | 6.74 | | | | 7.21 | | | | 7.76 | | | | 9.45 | | | | 9.81 | |
Portfolio turnover | | | 48 | | | | 61 | | | | 68 | | | | 61 | | | | 72 | |
Net assets at end of period (000 omitted) | | | $70,977 | | | | $38,143 | | | | $38,266 | | | | $20,317 | | | | $11,581 | |
See Notes to Financial Statements
38
Financial Highlights – continued
| | | | | | | | | | | | | | | | | | | | |
| Class R1 | | Years ended 1/31 | |
| | | 2013 | | | 2012 | | | 2011 | | | 2010 | | | 2009 (i) | |
Net asset value, beginning of period | | | $6.32 | | | | $6.51 | | | | $5.99 | | | | $4.43 | | | | $6.94 | |
| Income (loss) from investment operations | | | | | | | | | | | | | | | | | | | | |
Net investment income (d) | | | $0.37 | | | | $0.39 | | | | $0.43 | | | | $0.45 | | | | $0.35 | |
Net realized and unrealized gain (loss)
on investments and foreign currency | | | 0.35 | | | | (0.18 | ) | | | 0.51 | | | | 1.59 | | | | (2.48 | ) |
Total from investment operations | | | $0.72 | | | | $0.21 | | | | $0.94 | | | | $2.04 | | | | $(2.13 | ) |
| Less distributions declared to shareholders | | | | | | | | | | | | | | | | | | | | |
From net investment income | | | $(0.39 | ) | | | $(0.40 | ) | | | $(0.42 | ) | | | $(0.47 | ) | | | $(0.38 | ) |
From tax return of capital | | | — | | | | — | | | | — | | | | (0.01 | ) | | | — | |
Total distributions declared to shareholders | | | $(0.39 | ) | | | $(0.40 | ) | | | $(0.42 | ) | | | $(0.48 | ) | | | $(0.38 | ) |
Net asset value, end of period (x) | | | $6.65 | | | | $6.32 | | | | $6.51 | | | | $5.99 | | | | $4.43 | |
Total return (%) (r)(s)(x) | | | 11.71 | | | | 3.44 | | | | 16.36 | | | | 48.59 | | | | (31.30 | )(n) |
Ratios (%) (to average net assets)
and Supplemental data: | | | | | | | | | | | | | | | | | | | | |
Expenses before expense reductions (f) | | | 1.89 | | | | 1.88 | | | | 1.88 | | | | 1.90 | | | | 1.92 | (a) |
Expenses after expense reductions (f) | | | 1.80 | | | | 1.80 | | | | 1.77 | | | | 1.68 | | | | 1.50 | (a) |
Net investment income | | | 5.70 | | | | 6.22 | | | | 6.90 | | | | 8.53 | | | | 9.60 | (a) |
Portfolio turnover | | | 48 | | | | 61 | | | | 68 | | | | 61 | | | | 72 | (n) |
Net assets at end of period (000 omitted) | | | $207 | | | | $132 | | | | $126 | | | | $107 | | | | $71 | |
See Notes to Financial Statements
39
Financial Highlights – continued
| | | | | | | | | | | | | | | | | | | | |
| Class R2 | | Years ended 1/31 | |
| | | 2013 | | | 2012 | | | 2011 | | | 2010 | | | 2009 (i) | |
Net asset value, beginning of period | | | $6.32 | | | | $6.51 | | | | $5.99 | | | | $4.43 | | | | $6.94 | |
| Income (loss) from investment operations | | | | | | | | | | | | | | | | | | | | |
Net investment income (d) | | | $0.40 | | | | $0.43 | | | | $0.46 | | | | $0.47 | | | | $0.37 | |
Net realized and unrealized gain (loss)
on investments and foreign currency | | | 0.35 | | | | (0.18 | ) | | | 0.52 | | | | 1.60 | | | | (2.48 | ) |
Total from investment operations | | | $0.75 | | | | $0.25 | | | | $0.98 | | | | $2.07 | | | | $(2.11 | ) |
| Less distributions declared to shareholders | | | | | | | | | | | | | | | | | | | | |
From net investment income | | | $(0.42 | ) | | | $(0.44 | ) | | | $(0.46 | ) | | | $(0.50 | ) | | | $(0.40 | ) |
From tax return of capital | | | — | | | | — | | | | — | | | | (0.01 | ) | | | — | |
Total distributions declared to shareholders | | | $(0.42 | ) | | | $(0.44 | ) | | | $(0.46 | ) | | | $(0.51 | ) | | | $(0.40 | ) |
Net asset value, end of period (x) | | | $6.65 | | | | $6.32 | | | | $6.51 | | | | $5.99 | | | | $4.43 | |
Total return (%) (r)(s)(x) | | | 12.26 | | | | 3.96 | | | | 16.94 | | | | 49.30 | | | | (31.05 | )(n) |
Ratios (%) (to average net assets)
and Supplemental data: | | | | | | | | | | | | | | | | | | | | |
Expenses before expense reductions (f) | | | 1.39 | | | | 1.38 | | | | 1.37 | | | | 1.40 | | | | 1.42 | (a) |
Expenses after expense reductions (f) | | | 1.30 | | | | 1.30 | | | | 1.27 | | | | 1.18 | | | | 1.00 | (a) |
Net investment income | | | 6.22 | | | | 6.72 | | | | 7.37 | | | | 9.03 | | | | 10.11 | (a) |
Portfolio turnover | | | 48 | | | | 61 | | | | 68 | | | | 61 | | | | 72 | (n) |
Net assets at end of period (000 omitted) | | | $253 | | | | $172 | | | | $162 | | | | $114 | | | | $69 | |
See Notes to Financial Statements
40
Financial Highlights – continued
| | | | | | | | | | | | | | | | | | | | |
| Class R3 | | Years ended 1/31 | |
| | | 2013 | | | 2012 | | | 2011 | | | 2010 | | | 2009 (i) | |
Net asset value, beginning of period | | | $6.31 | | | | $6.49 | | | | $5.98 | | | | $4.42 | | | | $6.92 | |
| Income (loss) from investment operations | | | | | | | | | | | | | | | | | | | | |
Net investment income (d) | | | $0.40 | | | | $0.44 | | | | $0.47 | | | | $0.49 | | | | $0.34 | |
Net realized and unrealized gain (loss)
on investments and foreign currency | | | 0.36 | | | | (0.17 | ) | | | 0.51 | | | | 1.59 | | | | (2.43 | ) |
Total from investment operations | | | $0.76 | | | | $0.27 | | | | $0.98 | | | | $2.08 | | | | $(2.09 | ) |
| Less distributions declared to shareholders | | | | | | | | | | | | | | | | | | | | |
From net investment income | | | $(0.43 | ) | | | $(0.45 | ) | | | $(0.47 | ) | | | $(0.51 | ) | | | $(0.41 | ) |
From tax return of capital | | | — | | | | — | | | | — | | | | (0.01 | ) | | | — | |
Total distributions declared to shareholders | | | $(0.43 | ) | | | $(0.45 | ) | | | $(0.47 | ) | | | $(0.52 | ) | | | $(0.41 | ) |
Net asset value, end of period (x) | | | $6.64 | | | | $6.31 | | | | $6.49 | | | | $5.98 | | | | $4.42 | |
Total return (%) (r)(s)(x) | | | 12.55 | | | | 4.37 | | | | 17.06 | | | | 49.75 | | | | (30.90 | )(n) |
Ratios (%) (to average net assets)
and Supplemental data: | | | | | | | | | | | | | | | | | | | | |
Expenses before expense reductions (f) | | | 1.12 | | | | 1.14 | | | | 1.13 | | | | 1.17 | | | | 1.17 | (a) |
Expenses after expense reductions (f) | | | 1.05 | | | | 1.05 | | | | 1.03 | | | | 0.92 | | | | 0.74 | (a) |
Net investment income | | | 6.06 | | | | 7.00 | | | | 7.60 | | | | 9.91 | | | | 10.25 | (a) |
Portfolio turnover | | | 48 | | | | 61 | | | | 68 | | | | 61 | | | | 72 | (n) |
Net assets at end of period (000 omitted) | | | $7,588 | | | | $771 | | | | $560 | | | | $352 | | | | $587 | |
See Notes to Financial Statements
41
Financial Highlights – continued
| | | | | | | | | | | | | | | | | | | | |
| Class R4 | | Years ended 1/31 | |
| | | 2013 | | | 2012 | | | 2011 | | | 2010 | | | 2009 (i) | |
Net asset value, beginning of period | | | $6.30 | | | | $6.49 | | | | $5.98 | | | | $4.42 | | | | $6.92 | |
| Income (loss) from investment operations | | | | | | | | | | | | | | | | | | | | |
Net investment income (d) | | | $0.45 | | | | $0.46 | | | | $0.47 | | | | $0.50 | | | | $0.39 | |
Net realized and unrealized gain (loss)
on investments and foreign currency | | | 0.39 | | | | (0.18 | ) | | | 0.53 | | | | 1.59 | | | | (2.47 | ) |
Total from investment operations | | | $0.84 | | | | $0.28 | | | | $1.00 | | | | $2.09 | | | | $(2.08 | ) |
| Less distributions declared to shareholders | | | | | | | | | | | | | | | | | | | | |
From net investment income | | | $(0.45 | ) | | | $(0.47 | ) | | | $(0.49 | ) | | | $(0.52 | ) | | | $(0.42 | ) |
From tax return of capital | | | — | | | | — | | | | — | | | | (0.01 | ) | | | — | |
Total distributions declared to shareholders | | | $(0.45 | ) | | | $(0.47 | ) | | | $(0.49 | ) | | | $(0.53 | ) | | | $(0.42 | ) |
Net asset value, end of period (x) | | | $6.69 | | | | $6.30 | | | | $6.49 | | | | $5.98 | | | | $4.42 | |
Total return (%) (r)(s)(x) | | | 13.85 | | | | 4.47 | | | | 17.35 | | | | 50.11 | | | | (30.77 | )(n) |
Ratios (%) (to average net assets)
and Supplemental data: | | | | | | | | | | | | | | | | | | | | |
Expenses before expense reductions (f) | | | 0.89 | | | | 0.89 | | | | 0.85 | | | | 0.90 | | | | 0.92 | (a) |
Expenses after expense reductions (f) | | | 0.80 | | | | 0.80 | | | | 0.79 | | | | 0.68 | | | | 0.50 | (a) |
Net investment income | | | 6.98 | | | | 7.25 | | | | 7.40 | | | | 9.49 | | | | 10.64 | (a) |
Portfolio turnover | | | 48 | | | | 61 | | | | 68 | | | | 61 | | | | 72 | (n) |
Net assets at end of period (000 omitted) | | | $1,431 | | | | $3,014 | | | | $3,040 | | | | $122 | | | | $69 | |
See Notes to Financial Statements
42
Financial Highlights – continued
| | | | | | | | | | | | | | | | | | | | |
| Class R5 (formerly Class W) (y) | | Years ended 1/31 | |
| | | 2013 | | | 2012 | | | 2011 | | | 2010 | | | 2009 (i) | |
Net asset value, beginning of period | | | $6.29 | | | | $6.49 | | | | $5.97 | | | | $4.42 | | | | $6.92 | |
| Income (loss) from investment operations | | | | | | | | | | | | | | | | | | | | |
Net investment income (d) | | | $0.44 | | | | $0.45 | | | | $0.47 | | | | $0.48 | | | | $0.38 | |
Net realized and unrealized gain (loss)
on investments and foreign currency | | | 0.35 | | | | (0.19 | ) | | | 0.53 | | | | 1.60 | | | | (2.47 | ) |
Total from investment operations | | | $0.79 | | | | $0.26 | | | | $1.00 | | | | $2.08 | | | | $(2.09 | ) |
| Less distributions declared to shareholders | | | | | | | | | | | | | | | | | | | | |
From net investment income | | | $(0.45 | ) | | | $(0.46 | ) | | | $(0.48 | ) | | | $(0.52 | ) | | | $(0.41 | ) |
From tax return of capital | | | — | | | | — | | | | — | | | | (0.01 | ) | | | — | |
Total distributions declared to shareholders | | | $(0.45 | ) | | | $(0.46 | ) | | | $(0.48 | ) | | | $(0.53 | ) | | | $(0.41 | ) |
Net asset value, end of period (x) | | | $6.63 | | | | $6.29 | | | | $6.49 | | | | $5.97 | | | | $4.42 | |
Total return (%) (r)(s)(x) | | | 13.03 | | | | 4.20 | | | | 17.43 | | | | 49.72 | | | | (30.82 | )(n) |
Ratios (%) (to average net assets)
and Supplemental data: | | | | | | | | | | | | | | | | | | | | |
Expenses before expense reductions (f) | | | 0.97 | | | | 0.99 | | | | 0.95 | | | | 0.98 | | | | 1.02 | (a) |
Expenses after expense reductions (f) | | | 0.90 | | | | 0.90 | | | | 0.88 | | | | 0.78 | | | | 0.59 | (a) |
Net investment income | | | 6.89 | | | | 7.14 | | | | 7.45 | | | | 9.02 | | | | 10.81 | (a) |
Portfolio turnover | | | 48 | | | | 61 | | | | 68 | | | | 61 | | | | 72 | (n) |
Net assets at end of period (000 omitted) | | | $112 | | | | $7,631 | | | | $1,734 | | | | $364 | | |
| $129
|
|
See Notes to Financial Statements
43
Financial Highlights – continued
| (d) | Per share data is based on average shares outstanding. |
| (f) | Ratios do not reflect reductions from fees paid indirectly, if applicable. |
| (i) | For the period from the class’ inception, June 2, 2008 (Classes R1, R2, R3, R4 and R5) through the stated period end. |
| (r) | Certain expenses have been reduced without which performance would have been lower. |
| (s) | From time to time the fund may receive proceeds from litigation settlements, without which performance would be lower. |
| (t) | Total returns do not include any applicable sales charges. |
| (w) | Per share amount was less than $0.01. |
| (x) | The net asset values per share and total returns have been calculated on net assets which include adjustments made in accordance with U.S. generally accepted accounting principles required at period end for financial reporting purposes. |
| (y) | As further discussed in Note 5 in the Notes to Financial Statements, on May 10, 2012, sales of Class W shares (including exchanges) were suspended. On May 11, 2012, certain Class W shares were automatically converted to Class I shares. Shareholders of certain Class W shares became shareholders of Class I and received Class I shares with a total net asset value equal to their Class W shares at the time of the conversion. On May 30, 2012, remaining Class W shares, which represented MFS seed money, were redesignated Class R5. Class R5 shares are generally available only to certain eligible retirement plans and to funds distributed by MFD. Class R5 shares do not pay a 12b-1 distribution fee or sub-accounting costs. On June 1, 2012, Class R5 shares were offered for sale to the public. For further information about the fund’s fee arrangements and changes to those fee arrangements, please see Note 3 in the Notes to Financial Statements. |
See Notes to Financial Statements
44
NOTES TO FINANCIAL STATEMENTS
(1) Business and Organization
MFS High Yield Opportunities Fund (the fund) is a series of MFS Series Trust III (the trust). The trust is organized as a Massachusetts business trust and is registered under the Investment Company Act of 1940, as amended, as an open-end management investment company.
(2) Significant Accounting Policies
General – The preparation of financial statements in conformity with U.S. generally accepted accounting principles requires management to make estimates and assumptions that affect the reported amounts of assets and liabilities, and disclosure of contingent assets and liabilities at the date of the financial statements and the reported amounts of revenues and expenses during the reporting period. Actual results could differ from those estimates. In the preparation of these financial statements, management has evaluated subsequent events occurring after the date of the fund’s Statement of Assets and Liabilities through the date that the financial statements were issued. The fund invests in high-yield securities rated below investment grade. Investments in high-yield securities involve greater degrees of credit and market risk than investments in higher-rated securities and tend to be more sensitive to economic conditions. The fund invests in foreign securities. Investments in foreign securities are vulnerable to the effects of changes in the relative values of the local currency and the U.S. dollar and to the effects of changes in each country’s legal, political, and economic environment.
In this reporting period the fund adopted Financial Accounting Standards Board (FASB) Accounting Standards Update 2011-04, Fair Value Measurement (Topic 820) – Amendments to Achieve Common Fair Value Measurement and Disclosure Requirements in U.S. GAAP and IFRSs (“ASU 2011-04”). ASU 2011-04 seeks to improve the comparability of fair value measurements as presented and disclosed in financial statements prepared in accordance with U.S. GAAP and International Financial Reporting Standards (IFRS) by providing common requirements for fair value measurement and disclosure.
In December 2011, the FASB issued Accounting Standards Update 2011-11, Balance Sheet (Topic 210) – Disclosures about Offsetting Assets and Liabilities (“ASU 2011-11”). Effective for annual reporting periods beginning on or after January 1, 2013 and interim periods within those annual periods, ASU 2011-11 is intended to enhance disclosure requirements on the offsetting of financial assets and liabilities. Although still evaluating the potential impacts of ASU 2011-11 to the fund, management expects that the impact of the fund’s adoption will be limited to additional financial statement disclosures.
Investment Valuations – Debt instruments and floating rate loans (other than short-term instruments), including restricted debt instruments, are generally valued at an evaluated or composite bid as provided by a third-party pricing service. Equity securities, including restricted equity securities, are generally valued at the last sale or official closing price as provided by a third-party pricing service on the market or exchange on which they are primarily traded. Equity securities, for which there were no
45
Notes to Financial Statements – continued
sales reported that day, are generally valued at the last quoted daily bid quotation as provided by a third-party pricing service on the market or exchange on which such securities are primarily traded. Short-term instruments with a maturity at issuance of 60 days or less generally are valued at amortized cost, which approximates market value. Forward foreign currency exchange contracts are generally valued at the mean of bid and asked prices for the time period interpolated from rates provided by a third-party pricing service for proximate time periods. Exchange-traded options are generally valued at the last sale or official closing price as provided by a third-party pricing service on the exchange on which such options are primarily traded. Exchange-traded options for which there were no sales reported that day are generally valued at the last daily bid quotation as provided by a third-party pricing service on the exchange on which such options are primarily traded. Options not traded on an exchange are generally valued at a broker/dealer bid quotation. Foreign currency options are generally valued at valuations provided by a third-party pricing service. Open-end investment companies are generally valued at net asset value per share. Securities and other assets generally valued on the basis of information from a third-party pricing service may also be valued at a broker/dealer bid quotation. Values obtained from third-party pricing services can utilize both transaction data and market information such as yield, quality, coupon rate, maturity, type of issue, trading characteristics, and other market data. The values of foreign securities and other assets and liabilities expressed in foreign currencies are converted to U.S. dollars using the mean of bid and asked prices for rates provided by a third-party pricing service.
The Board of Trustees has delegated primary responsibility for determining or causing to be determined the value of the fund’s investments (including any fair valuation) to the adviser pursuant to valuation policies and procedures approved by the Board. If the adviser determines that reliable market quotations are not readily available, investments are valued at fair value as determined in good faith by the adviser in accordance with such procedures under the oversight of the Board of Trustees. Under the fund’s valuation policies and procedures, market quotations are not considered to be readily available for most types of debt instruments and floating rate loans and many types of derivatives. These investments are generally valued at fair value based on information from third-party pricing services. In addition, investments may be valued at fair value if the adviser determines that an investment’s value has been materially affected by events occurring after the close of the exchange or market on which the investment is principally traded (such as foreign exchange or market) and prior to the determination of the fund’s net asset value, or after the halting of trading of a specific security where trading does not resume prior to the close of the exchange or market on which the security is principally traded. The adviser generally relies on third-party pricing services or other information (such as the correlation with price movements of similar securities in the same or other markets; the type, cost and investment characteristics of the security; the business and financial condition of the issuer; and trading and other market data) to assist in determining whether to fair value and at what value to fair value an investment. The value of an investment for purposes of calculating the fund’s net asset value can differ depending on the source and method used to determine value. When fair valuation is used, the value of an investment used to determine the fund’s net asset value may differ from quoted or published prices for the same
46
Notes to Financial Statements – continued
investment. There can be no assurance that the fund could obtain the fair value assigned to an investment if it were to sell the investment at the same time at which the fund determines its net asset value per share.
Various inputs are used in determining the value of the fund’s assets or liabilities. These inputs are categorized into three broad levels. In certain cases, the inputs used to measure fair value may fall into different levels of the fair value hierarchy. In such cases, an investment’s level within the fair value hierarchy is based on the lowest level of input that is significant to the fair value measurement. The fund’s assessment of the significance of a particular input to the fair value measurement in its entirety requires judgment, and considers factors specific to the investment. Level 1 includes unadjusted quoted prices in active markets for identical assets or liabilities. Level 2 includes other significant observable market-based inputs (including quoted prices for similar securities, interest rates, prepayment speed, and credit risk). Level 3 includes unobservable inputs, which may include the adviser’s own assumptions in determining the fair value of investments. Other financial instruments are derivative instruments not reflected in total investments, such as forward foreign currency exchange contracts. The following is a summary of the levels used as of January 31, 2013 in valuing the fund’s assets or liabilities:
| | | | | | | | | | | | | | | | |
| Investments at Value | | Level 1 | | | Level 2 | | | Level 3 | | | Total | |
| Equity Securities | | | $3,918,983 | | | | $1,809,559 | | | | $333,521 | | | | $6,062,063 | |
| Non-U.S. Sovereign Debt | | | — | | | | 35,317,776 | | | | — | | | | 35,317,776 | |
| Municipal Bonds | | | — | | | | 1,204,991 | | | | — | | | | 1,204,991 | |
| U.S. Corporate Bonds | | | — | | | | 428,397,169 | | | | — | | | | 428,397,169 | |
| Commercial Mortgage-Backed Securities | | | — | | | | 1,883,391 | | �� | | — | | | | 1,883,391 | |
| Asset-Backed Securities (including CDOs) | | | — | | | | 1,325,362 | | | | — | | | | 1,325,362 | |
| Foreign Bonds | | | — | | | | 121,836,732 | | | | — | | | | 121,836,732 | |
| Floating Rate Loans | | | — | | | | 403,890 | | | | — | | | | 403,890 | |
| Mutual Funds | | | 23,476,201 | | | | — | | | | — | | | | 23,476,201 | |
| Total Investments | | | $27,395,184 | | | | $592,178,870 | | | | $333,521 | | | | $619,907,575 | |
| | | | |
| Other Financial Instruments | | | | | | | | | | | | |
| Forward Foreign Currency Exchange Contracts | | | $— | | | | $(339,174 | ) | | | $— | | | | $(339,174 | ) |
For further information regarding security characteristics, see the Portfolio of Investments.
The following is a reconciliation of level 3 assets for which significant unobservable inputs were used to determine fair value. The fund’s policy is to recognize transfers between the levels as of the end of the period. The table presents the activity of level 3 securities held at the beginning and the end of the period.
| | | | |
| | | Equity Securities | |
| Balance as of 1/31/12 | | | $834,856 | |
Change in unrealized appreciation (depreciation) | | | (501,335 | ) |
| Balance as of 1/31/13 | | | $333,521 | |
47
Notes to Financial Statements – continued
The net change in unrealized appreciation (depreciation) from investments still held as level 3 at January 31, 2013 is $(501,335).
Foreign Currency Translation – Purchases and sales of foreign investments, income, and expenses are converted into U.S. dollars based upon currency exchange rates prevailing on the respective dates of such transactions or on the reporting date for foreign denominated receivables and payables. Gains and losses attributable to foreign currency exchange rates on sales of securities are recorded for financial statement purposes as net realized gains and losses on investments. Gains and losses attributable to foreign exchange rate movements on receivables, payables, income and expenses are recorded for financial statement purposes as foreign currency transaction gains and losses. That portion of both realized and unrealized gains and losses on investments that results from fluctuations in foreign currency exchange rates is not separately disclosed.
Derivatives – The fund uses derivatives for different purposes, primarily to increase or decrease exposure to a particular market or segment of the market, or security, to increase or decrease interest rate or currency exposure, or as alternatives to direct investments. Derivatives are used for hedging or non-hedging purposes. While hedging can reduce or eliminate losses, it can also reduce or eliminate gains. When the fund uses derivatives as an investment to increase market exposure, or for hedging purposes, gains and losses from derivative instruments may be substantially greater than the derivative’s original cost.
The derivative instruments used by the fund were purchased options and forward foreign currency exchange contracts. The fund’s period end derivatives, as presented in the Portfolio of Investments and the associated Derivative Contract tables, generally are indicative of the volume of its derivative activity during the period.
The following table presents, by major type of derivative contract, the fair value, on a gross basis, of the asset and liability components of derivatives held by the fund at January 31, 2013 as reported in the Statement of Assets and Liabilities:
| | | | | | | | | | |
| | | | | Fair Value (a) | |
| Risk | | Derivative Contracts | | Asset Derivatives | | | Liability Derivatives | |
| Foreign Exchange | | Forward Foreign Currency Exchange | | | $13,665 | | | $ | (352,839 | ) |
| Equity | | Purchased Equity Options | | | 570,654 | | | | — | |
| Total | | | | | $584,319 | | | $ | (352,839 | ) |
| (a) | The value of purchased options is included in total investments, at value within the fund’s Statement of Assets and Liabilities. |
48
Notes to Financial Statements – continued
The following table presents, by major type of derivative contract, the realized gain (loss) on derivatives held by the fund for the year ended January 31, 2013 as reported in the Statement of Operations:
| | | | | | | | |
| Risk | | Foreign
Currency | | | Investments
(Purchased
Options) | |
| Foreign Exchange | | | $(157,835 | ) | | | $— | |
| Equity | | | — | | | | 733,020 | |
| Total | | | $(157,835 | ) | | | $733,020 | |
The following table presents, by major type of derivative contract, the change in unrealized appreciation (depreciation) on derivatives held by the fund for the year ended January 31, 2013 as reported in the Statement of Operations:
| | | | | | | | |
| Risk | | Translation of Assets
and Liabilities in Foreign
Currencies | | | Investments
(Purchased
Options) | |
| Foreign Exchange | | | $(149,221 | ) | | | $— | |
| Equity | | | — | | | | 80,228 | |
| Total | | | $(149,221 | ) | | | $80,228 | |
Derivative counterparty credit risk is managed through formal evaluation of the creditworthiness of all potential counterparties. On certain over-the-counter derivatives, the fund attempts to reduce its exposure to counterparty credit risk whenever possible by entering into an International Swaps and Derivatives Association (ISDA) Master Agreement on a bilateral basis with each of the counterparties with whom it undertakes a significant volume of transactions. The ISDA Master Agreement gives each party to the agreement the right to terminate all transactions traded under such agreement if there is a certain deterioration in the credit quality of the other party. The ISDA Master Agreement gives the fund the right, upon an event of default by the applicable counterparty or a termination of the agreement, to close out all transactions traded under such agreement and to net amounts owed under each transaction to one net amount payable by one party to the other. This right to close out and net payments across all transactions traded under the ISDA Master Agreement could result in a reduction of the fund’s credit risk to such counterparty equal to any amounts payable by the fund under the applicable transactions, if any. However, absent an event of default by the counterparty or a termination of the agreement, the ISDA Master Agreement does not result in an offset of reported amounts of assets and liabilities in the Statement of Assets and Liabilities across transactions between the fund and the applicable counterparty.
Collateral requirements differ by type of derivative. Collateral or margin requirements are set by the broker or exchange clearing house for exchange traded derivatives (i.e., futures contracts and exchange-traded options) while collateral terms are contract specific for over-the-counter traded derivatives (i.e., forward foreign currency exchange contracts, swap agreements and over-the-counter options). For derivatives traded under an ISDA Master Agreement, the collateral requirements are netted across all
49
Notes to Financial Statements – continued
transactions traded under such agreement and one amount is posted from one party to the other to collateralize such obligations. Cash collateral that has been pledged to cover obligations of the fund under derivative contracts, if any, will be reported separately in the Statement of Assets and Liabilities as restricted cash. Securities collateral pledged for the same purpose, if any, is noted in the Portfolio of Investments.
Purchased Options – The fund purchased call and put options for a premium. Purchased call and put options entitle the holder to buy and sell a specified number of shares or units of a particular security, currency or index at a specified price at a specified date or within a specified period of time. Purchasing call options may be used to hedge against an anticipated increase in the dollar cost of securities or currency to be acquired or to increase the fund’s exposure to an underlying instrument. Purchasing put options may hedge against an anticipated decline in the value of portfolio securities or currency or decrease the fund’s exposure to an underlying instrument.
The premium paid is initially recorded as an investment in the Statement of Assets and Liabilities. That investment is subsequently marked-to-market daily with the difference between the premium paid and the market value of the purchased option being recorded as unrealized appreciation or depreciation. Premiums paid for purchased call and put options which have expired are treated as realized losses on investments in the Statement of Operations. Upon the exercise or closing of a purchased call option, the premium paid is added to the cost of the security or financial instrument. Upon the exercise or closing of a purchased put option, the premium paid is offset against the proceeds on the sale of the underlying security or financial instrument in order to determine the realized gain or loss on investments.
Whether or not the option is exercised, the fund’s maximum risk of loss from purchasing an option is the amount of premium paid. All option contracts involve credit risk if the counterparty to the option contract fails to perform. For over-the-counter options, this risk is mitigated in cases where there is an ISDA Master Agreement between the fund and the counterparty providing for netting as described above and for posting of collateral by the counterparty to the fund to cover the fund’s exposure to the counterparty under such ISDA Master Agreement.
Forward Foreign Currency Exchange Contracts – The fund entered into forward foreign currency exchange contracts for the purchase or sale of a specific foreign currency at a fixed price on a future date. These contracts may be used to hedge the fund’s currency risk or for non-hedging purposes. For hedging purposes, the fund may enter into contracts to deliver or receive foreign currency that the fund will receive from or use in its normal investment activities. The fund may also use contracts to hedge against declines in the value of foreign currency denominated securities due to unfavorable exchange rate movements. For non-hedging purposes, the fund may enter into contracts with the intent of changing the relative exposure of the fund’s portfolio of securities to different currencies to take advantage of anticipated exchange rate changes.
Forward foreign currency exchange contracts are adjusted by the daily exchange rate of the underlying currency and any unrealized gains or losses are recorded as a receivable or payable for forward foreign currency exchange contracts until the contract settlement date. On contract settlement date, any gain or loss on the contract is recorded as realized gains or losses on foreign currency.
50
Notes to Financial Statements – continued
Risks may arise upon entering into these contracts from unanticipated movements in the value of the contract and from the potential inability of counterparties to meet the terms of their contracts. Generally, the fund’s maximum risk due to counterparty credit risk is the unrealized gain on the contract due to the use of Continuous Linked Settlement, an industry accepted settlement system. This risk is mitigated in cases where there is an ISDA Master Agreement between the fund and the counterparty providing for netting as described above and for posting of collateral by the counterparty to the fund to cover the fund’s exposure to the counterparty under such ISDA Master Agreement.
Loans and Other Direct Debt Instruments – The fund invests in loans and loan participations or other receivables. These investments may include standby financing commitments, including revolving credit facilities, which obligate the fund to supply additional cash to the borrower on demand. Loan participations involve a risk of insolvency of the lending bank or other financial intermediary.
Indemnifications – Under the fund’s organizational documents, its officers and Trustees may be indemnified against certain liabilities and expenses arising out of the performance of their duties to the fund. Additionally, in the normal course of business, the fund enters into agreements with service providers that may contain indemnification clauses. The fund’s maximum exposure under these agreements is unknown as this would involve future claims that may be made against the fund that have not yet occurred.
Investment Transactions and Income – Investment transactions are recorded on the trade date. Interest income is recorded on the accrual basis. All premium and discount is amortized or accreted for financial statement purposes in accordance with U.S. generally accepted accounting principles. The fund earns certain fees in connection with its floating rate loan purchasing activities. These fees are in addition to interest payments earned and may include amendment fees, commitment fees, facility fees, consent fees, and prepayment fees. Commitment fees are recorded on an accrual basis as income in the accompanying financial statements. Dividends received in cash are recorded on the ex-dividend date. Certain dividends from foreign securities will be recorded when the fund is informed of the dividend if such information is obtained subsequent to the ex-dividend date. Dividend and interest payments received in additional securities are recorded on the ex-dividend or ex-interest date in an amount equal to the value of the security on such date. Debt obligations may be placed on non-accrual status or set to accrue at a rate of interest less than the contractual coupon when the collection of all or a portion of interest has become doubtful. Interest income for those debt obligations may be further reduced by the write-off of the related interest receivables when deemed uncollectible.
The fund may receive proceeds from litigation settlements. Any proceeds received from litigation involving portfolio holdings are reflected in the Statement of Operations in realized gain/loss if the security has been disposed of by the fund or in unrealized gain/loss if the security is still held by the fund. Any other proceeds from litigation not related to portfolio holdings are reflected as other income in the Statement of Operations.
51
Notes to Financial Statements – continued
Fees Paid Indirectly – The fund’s custody fee may be reduced according to an arrangement that measures the value of cash deposited with the custodian by the fund. This amount, for the year ended January 31, 2013, is shown as a reduction of total expenses in the Statement of Operations.
Tax Matters and Distributions – The fund intends to qualify as a regulated investment company, as defined under Subchapter M of the Internal Revenue Code, and to distribute all of its taxable income, including realized capital gains. As a result, no provision for federal income tax is required. The fund’s federal tax returns, when filed, will remain subject to examination by the Internal Revenue Service for a three year period. Foreign taxes have been accrued by the fund in the accompanying financial statements.
Distributions to shareholders are recorded on the ex-dividend date. Income and capital gain distributions are determined in accordance with income tax regulations, which may differ from U.S. generally accepted accounting principles. Certain capital accounts in the financial statements are periodically adjusted for permanent differences in order to reflect their tax character. These adjustments have no impact on net assets or net asset value per share. Temporary differences which arise from recognizing certain items of income, expense, gain or loss in different periods for financial statement and tax purposes will reverse at some time in the future. Distributions in excess of net investment income or net realized gains are temporary overdistributions for financial statement purposes resulting from differences in the recognition or classification of income or distributions for financial statement and tax purposes.
Book/tax differences primarily relate to amortization and accretion of debt securities.
The tax character of distributions declared to shareholders for the last two fiscal years is as follows:
| | | | | | | | |
| | | 1/31/13 | | | 1/31/12 | |
| Ordinary income (including any short-term capital gains) | | | $41,248,929 | | | | $43,098,356 | |
The federal tax cost and the tax basis components of distributable earnings were as follows:
| | | | |
| As of 1/31/13 | | | |
| Cost of investments | | | $602,600,779 | |
| Gross appreciation | | | 38,648,792 | |
| Gross depreciation | | | (21,341,996 | ) |
| Net unrealized appreciation (depreciation) | | | $17,306,796 | |
| Undistributed ordinary income | | | 1,922,038 | |
| Capital loss carryforwards | | | (96,100,066 | ) |
| Post-October capital loss deferral | | | (899,856 | ) |
| Other temporary differences | | | (3,529,410 | ) |
Under the Regulated Investment Company Modernization Act of 2010 (the “Act”), net capital losses recognized after January 31, 2011 may be carried forward indefinitely, and their character is retained as short-term and/or long-term losses. Previously, net
52
Notes to Financial Statements – continued
capital losses were carried forward for eight years and treated as short-term losses. As a transition rule, the Act requires that post-enactment net capital losses be used before pre-enactment net capital losses.
As of January 31, 2013, the fund had capital loss carryforwards available to offset future realized gains.
| | | | |
| Pre-enactment losses expire as follows: | |
| 1/31/17 | | | $(39,675,228 | ) |
| 1/31/18 | | | (45,531,096 | ) |
| Total | | | $(85,206,324 | ) |
|
Post-enactment losses are characterized as
follows: | |
| Long-Term | | | $(10,893,742 | ) |
Multiple Classes of Shares of Beneficial Interest – The fund offers multiple classes of shares, which differ in their respective distribution and service fees. The fund’s income and common expenses are allocated to shareholders based on the value of settled shares outstanding of each class. The fund’s realized and unrealized gain (loss) are allocated to shareholders based on the daily net assets of each class. Dividends are declared separately for each class. Differences in per share dividend rates are generally due to differences in separate class expenses. Class B shares will convert to Class A shares approximately eight years after purchase. The fund’s distributions declared to shareholders as reported in the Statements of Changes in Net Assets are presented by class as follows:
| | | | | | | | |
| | | From net investment
income | |
| | | Year
ended
1/31/13 | | | Year
ended
1/31/12 | |
| Class A | | | $28,978,403 | | | | $31,016,364 | |
| Class B | | | 2,078,840 | | | | 2,543,811 | |
| Class C | | | 5,704,050 | | | | 5,846,355 | |
| Class I | | | 4,082,792 | | | | 3,087,059 | |
| Class R1 | | | 9,356 | | | | 7,912 | |
| Class R2 | | | 12,967 | | | | 11,388 | |
| Class R3 | | | 96,121 | | | | 50,788 | |
| Class R4 | | | 121,208 | | | | 227,392 | |
| Class R5 (formerly Class W) | | | 165,192 | | | | 307,287 | |
| Total | | | $41,248,929 | | | | $43,098,356 | |
On May 30, 2012, Class W shares were redesignated Class R5. See Note 5 for additional information.
(3) Transactions with Affiliates
Investment Adviser – The fund has an investment advisory agreement with MFS to provide overall investment management and related administrative services and facilities to the fund.
53
Notes to Financial Statements – continued
The management fee is computed daily and paid monthly at an annual rate of 0.65% of the fund’s average daily net assets.
The investment adviser has agreed in writing to pay a portion of the fund’s total annual operating expenses, exclusive of interest, taxes, extraordinary expenses, brokerage and transaction costs, and investment-related expenses, such that total annual fund operating expenses do not exceed the following rates annually of each class’s average daily net assets.
| | | | | | | | | | | | | | | | |
| Classes |
| A | | B | | C | | I | | R1 | | R2 | | R3 | | R4 | | R5
(formerly
Class W) |
| 1.05% | | 1.80% | | 1.80% | | 0.80% | | 1.80% | | 1.30% | | 1.05% | | 0.80% | | 0.73% |
This written agreement will continue until modified by the fund’s Board of Trustees, but such agreement will continue at least until May 31, 2014. For the year ended January 31, 2013, this reduction amounted to $546,915 and is reflected as a reduction of total expenses in the Statement of Operations. Prior to June 1, 2012, the total annual operating expense limit was 0.90% for Class R5.
Distributor – MFS Fund Distributors, Inc. (MFD), a wholly-owned subsidiary of MFS, as distributor, received $203,992 for the year ended January 31, 2013, as its portion of the initial sales charge on sales of Class A shares of the fund.
The Board of Trustees has adopted a distribution plan for certain class shares pursuant to Rule 12b-1 of the Investment Company Act of 1940.
The fund’s distribution plan provides that the fund will pay MFD for services provided by MFD and financial intermediaries in connection with the distribution and servicing of certain share classes. One component of the plan is a distribution fee paid to MFD and another component of the plan is a service fee paid to MFD. MFD may subsequently pay all, or a portion, of the distribution and/or service fees to financial intermediaries.
Distribution Plan Fee Table:
| | | | | | | | | | | | | | | | | | | | |
| | | Distribution
Fee Rate (d) | | | Service
Fee Rate (d) | | | Total
Distribution
Plan (d) | | | Annual
Effective
Rate (e) | | | Distribution
and Service
Fee | |
| Class A | | | — | | | | 0.25% | | | | 0.25% | | | | 0.25% | | | | $1,071,446 | |
| Class B | | | 0.75% | | | | 0.25% | | | | 1.00% | | | | 1.00% | | | | 346,159 | |
| Class C | | | 0.75% | | | | 0.25% | | | | 1.00% | | | | 1.00% | | | | 951,104 | |
| Class R1 | | | 0.75% | | | | 0.25% | | | | 1.00% | | | | 1.00% | | | | 1,571 | |
| Class R2 | | | 0.25% | | | | 0.25% | | | | 0.50% | | | | 0.50% | | | | 1,004 | |
| Class R3 | | | — | | | | 0.25% | | | | 0.25% | | | | 0.25% | | | | 3,673 | |
Class R5
(formerly Class W) | | | — | | | | — | | | | — | | | | 0.10% | | | | 2,229 | |
| Total Distribution and Service Fees | | | | $2,377,186 | |
| (d) | In accordance with the distribution plan for certain classes, the fund pays distribution and/or service fees equal to these annual percentage rates of each class’s average daily net assets. The distribution and service fee rates disclosed by class represent the current rates in effect at the end of the reporting period. |
54
Notes to Financial Statements – continued
| (e) | The annual effective rates represent actual fees incurred under the distribution plan for the year ended January 31, 2013 based on each class’s average daily net assets. Effective May 30, 2012, Class W shares were redesignated Class R5 shares. Effective May 31, 2012, the 0.10% Class W distribution fee was eliminated. See Note 5 for additional information. |
Certain Class A shares are subject to a contingent deferred sales charge (CDSC) in the event of a shareholder redemption within 18 months of purchase for shares purchased on or after August 1, 2012, and within 24 months of purchase for shares purchased prior to August 1, 2012. Class C shares are subject to a CDSC in the event of a shareholder redemption within 12 months of purchase. Class B shares are subject to a CDSC in the event of a shareholder redemption within six years of purchase. All contingent deferred sales charges are paid to MFD and during the year ended January 31, 2013, were as follows:
| | | | |
| | | Amount | |
| Class A | | | $3,274 | |
| Class B | | | 54,919 | |
| Class C | | | 6,495 | |
Shareholder Servicing Agent – MFS Service Center, Inc. (MFSC), a wholly-owned subsidiary of MFS, receives a fee from the fund for its services as shareholder servicing agent calculated as a percentage of the average daily net assets of the fund as determined periodically under the supervision of the fund’s Board of Trustees. For the year ended January 31, 2013, the fee was $164,243, which equated to 0.0264% annually of the fund’s average daily net assets. MFSC also receives payment from the fund for out-of-pocket expenses, sub-accounting and other shareholder servicing costs which may be paid to affiliated and unaffiliated service providers. Class R5 shares do not incur sub-accounting fees. For the year ended January 31, 2013, these out-of-pocket expenses, sub-accounting and other shareholder servicing costs amounted to $652,359.
Administrator – MFS provides certain financial, legal, shareholder communications, compliance, and other administrative services to the fund. Under an administrative services agreement, the fund partially reimburses MFS the costs incurred to provide these services. The fund is charged an annual fixed amount of $17,500 plus a fee based on average daily net assets. The administrative services fee incurred for the year ended January 31, 2013 was equivalent to an annual effective rate of 0.0157% of the fund’s average daily net assets.
Trustees’ and Officers’ Compensation – The fund pays compensation to independent Trustees in the form of a retainer, attendance fees, and additional compensation to Board and Committee chairpersons. The fund does not pay compensation directly to Trustees or officers of the fund who are also officers of the investment adviser, all of whom receive remuneration for their services to the fund from MFS. Certain officers and Trustees of the fund are officers or directors of MFS, MFD, and MFSC.
Prior to December 31, 2001, the fund had an unfunded defined benefit plan (“DB plan”) for independent Trustees. As of December 31, 2001, the Board took action to terminate the DB plan with respect to then-current and any future independent Trustees, such that the DB plan covers only certain of those former independent
55
Notes to Financial Statements – continued
Trustees who retired on or before December 31, 2001. Effective January 1, 2002, accrued benefits under the DB plan for then-current independent Trustees who continued were credited to an unfunded retirement deferral plan (the “Retirement Deferral plan”), which was established for and exists solely with respect to these credited amounts, and is not available for other deferrals by these or other independent Trustees. Although the Retirement Deferral plan is unfunded, amounts deferred under the plan are periodically adjusted for investment experience as if they had been invested in shares of the fund. The Retirement Deferral plan resulted in an expense of $757 and is included in independent Trustees’ compensation for the year ended January 31, 2013. The liability for deferred retirement benefits payable to certain independent Trustees under the Retirement Deferral plan amounted to $4,985 at January 31, 2013, and is included in “Payable for independent Trustees’ compensation” in the Statement of Assets and Liabilities.
Other – This fund and certain other funds managed by MFS (the funds) have entered into services agreements (the Agreements) which provide for payment of fees by the funds to Tarantino LLC and Griffin Compliance LLC in return for the provision of services of an Independent Chief Compliance Officer (ICCO) and Assistant ICCO, respectively, for the funds. The ICCO and Assistant ICCO are officers of the funds and the sole members of Tarantino LLC and Griffin Compliance LLC, respectively. The funds can terminate the Agreements with Tarantino LLC and Griffin Compliance LLC at any time under the terms of the Agreements. For the year ended January 31, 2013, the aggregate fees paid by the fund to Tarantino LLC and Griffin Compliance LLC were $5,034 and are included in “Miscellaneous” expense in the Statement of Operations. MFS has agreed to reimburse the fund for a portion of the payments made by the fund in the amount of $2,150, which is shown as a reduction of total expenses in the Statement of Operations. Additionally, MFS has agreed to bear all expenses associated with office space, other administrative support, and supplies provided to the ICCO and Assistant ICCO.
The fund invests in the MFS Institutional Money Market Portfolio which is managed by MFS and seeks current income consistent with preservation of capital and liquidity. Income earned on this investment is included in “Dividends from underlying affiliated funds” in the Statement of Operations. This money market fund does not pay a management fee to MFS.
On April 2, 2012, MFS redeemed 4,669 shares of Class R4 for an aggregate amount of $29,788. On May 31, 2012, MFS purchased 16,077 shares of Class R5 for an aggregate amount of $100,000 and redeemed 20,509 shares of Class W for an aggregate amount of $127,564.
At January 31, 2013, MFS held 66%, 55%, and 100% of the outstanding shares of Class R1, Class R2, and Class R5, respectively.
(4) Portfolio Securities
Purchases and sales of investments, other than purchased option transactions, and short-term obligations, aggregated $280,681,226 and $284,127,951, respectively.
56
Notes to Financial Statements – continued
(5) Shares of Beneficial Interest
The fund’s Declaration of Trust permits the Trustees to issue an unlimited number of full and fractional shares of beneficial interest. Transactions in fund shares were as follows:
| | | | | | | | | | | | | | | | |
| | | Year ended
1/31/13 | | | Year ended
1/31/12 | |
| | | Shares | | | Amount | | | Shares | | | Amount | |
| Shares sold | | | | | | | | | | | | | | | | |
Class A | | | 25,363,634 | | | | $163,115,225 | | | | 32,457,852 | | | | $204,739,514 | |
Class B | | | 1,211,353 | | | | 7,775,847 | | | | 1,038,541 | | | | 6,593,040 | |
Class C | | | 2,577,620 | | | | 16,550,503 | | | | 2,142,002 | | | | 13,614,117 | |
Class I | | | 8,217,473 | | | | 52,839,400 | | | | 3,523,712 | | | | 22,600,738 | |
Class R1 | | | 8,920 | | | | 57,988 | | | | 861 | | | | 5,340 | |
Class R2 | | | 9,064 | | | | 58,993 | | | | 2,045 | | | | 13,064 | |
Class R3 | | | 1,048,142 | | | | 6,919,868 | | | | 54,428 | | | | 347,334 | |
Class R4 | | | 379,439 | | | | 2,439,280 | | | | 267,974 | | | | 1,703,621 | |
Class R5 (formerly Class W) | | | 150,933 | | | | 957,445 | | | | 1,135,394 | | | | 7,146,226 | |
| | | 38,966,578 | | | | $250,714,549 | | | | 40,622,809 | | | | $256,762,994 | |
| | | |
Shares issued to shareholders in
reinvestment of distributions | | | | | | | | | | | | | |
Class A | | | 3,519,491 | | | | $22,664,449 | | | | 3,692,804 | | | | $23,412,521 | |
Class B | | | 240,455 | | | | 1,553,807 | | | | 256,430 | | | | 1,628,174 | |
Class C | | | 568,268 | | | | 3,660,437 | | | | 515,877 | | | | 3,260,445 | |
Class I | | | 385,756 | | | | 2,502,159 | | | | 240,441 | | | | 1,526,519 | |
Class R1 | | | 1,445 | | | | 9,356 | | | | 1,247 | | | | 7,905 | |
Class R2 | | | 2,003 | | | | 12,964 | | | | 1,794 | | | | 11,379 | |
Class R3 | | | 14,700 | | | | 95,917 | | | | 8,059 | | | | 50,782 | |
Class R4 | | | 15,947 | | | | 102,847 | | | | 35,964 | | | | 227,392 | |
Class R5 (formerly Class W) | | | 16,237 | | | | 103,669 | | | | 41,541 | | | | 259,584 | |
| | | 4,764,302 | | | | $30,705,605 | | | | 4,794,157 | | | | $30,384,701 | |
| | | |
| Shares reacquired | | | | | | | | | | | | | |
Class A | | | (33,778,358 | ) | | | $(218,173,778 | ) | | | (42,201,664 | ) | | | $(266,377,043 | ) |
Class B | | | (2,098,305 | ) | | | (13,536,803 | ) | | | (2,752,997 | ) | | | (17,565,568 | ) |
Class C | | | (2,308,205 | ) | | | (14,861,932 | ) | | | (3,339,195 | ) | | | (21,098,134 | ) |
Class I | | | (3,963,999 | ) | | | (25,345,361 | ) | | | (3,608,680 | ) | | | (22,764,276 | ) |
Class R1 | | | — | | | | — | | | | (574 | ) | | | (3,691 | ) |
Class R2 | | | (228 | ) | | | (1,495 | ) | | | (1,503 | ) | | | (9,552 | ) |
Class R3 | | | (42,216 | ) | | | (276,275 | ) | | | (26,503 | ) | | | (165,086 | ) |
Class R4 | | | (659,505 | ) | | | (4,124,237 | ) | | | (294,393 | ) | | | (1,855,004 | ) |
Class R5 (formerly Class W) | | | (1,362,632 | ) | | | (8,689,776 | ) | | | (231,997 | ) | | | (1,453,935 | ) |
| | | (44,213,448 | ) | | | $(285,009,657 | ) | | | (52,457,506 | ) | | | $(331,292,289 | ) |
57
Notes to Financial Statements – continued
| | | | | | | | | | | | | | | | |
| | | Year ended
1/31/13 | | | Year ended
1/31/12 | |
| | | Shares | | | Amount | | | Shares | | | Amount | |
| Net change | | | | | | | | | | | | | | | | |
Class A | | | (4,895,233 | ) | | | $(32,394,104 | ) | | | (6,051,008 | ) | | | $(38,225,008 | ) |
Class B | | | (646,497 | ) | | | (4,207,149 | ) | | | (1,458,026 | ) | | | (9,344,354 | ) |
Class C | | | 837,683 | | | | 5,349,008 | | | | (681,316 | ) | | | (4,223,572 | ) |
Class I | | | 4,639,230 | | | | 29,996,198 | | | | 155,473 | | | | 1,362,981 | |
Class R1 | | | 10,365 | | | | 67,344 | | | | 1,534 | | | | 9,554 | |
Class R2 | | | 10,839 | | | | 70,462 | | | | 2,336 | | | | 14,891 | |
Class R3 | | | 1,020,626 | | | | 6,739,510 | | | | 35,984 | | | | 233,030 | |
Class R4 | | | (264,119 | ) | | | (1,582,110 | ) | | | 9,545 | | | | 76,009 | |
Class R5 (formerly Class W) | | | (1,195,462 | ) | | | (7,628,662 | ) | | | 944,938 | | | | 5,951,875 | |
| | | (482,568 | ) | | | $(3,589,503 | ) | | | (7,040,540 | ) | | | $(44,144,594 | ) |
On May 10, 2012, sales of Class W shares (including exchanges) were suspended. On May 11, 2012, certain Class W shares were automatically converted to Class I shares. Shareholders of certain Class W shares became shareholders of Class I and received Class I shares with a total net asset value equal to their Class W shares at the time of the conversion. On May 30, 2012, remaining Class W shares, which represented MFS seed money, were redesignated as Class R5. Class R5 shares are generally available only to certain eligible retirement plans and to funds distributed by MFD. Class R5 shares do not pay a 12b-1 distribution fee or sub-accounting costs. On June 1, 2012, Class R5 shares were offered for sale.
(6) Line of Credit
The fund and certain other funds managed by MFS participate in a $1.1 billion unsecured committed line of credit, subject to a $1 billion sublimit, provided by a syndication of banks under a credit agreement. Borrowings may be made for temporary financing needs. Interest is charged to each fund, based on its borrowings, generally at a rate equal to the higher of the Federal Reserve funds rate or one month LIBOR plus an agreed upon spread. A commitment fee, based on the average daily, unused portion of the committed line of credit, is allocated among the participating funds at the end of each calendar quarter. In addition, the fund and other funds managed by MFS have established unsecured uncommitted borrowing arrangements with certain banks for temporary financing needs. Interest is charged to each fund, based on its borrowings, at a rate equal to the Federal Reserve funds rate plus an agreed upon spread. For the year ended January 31, 2013, the fund’s commitment fee and interest expense were $4,019 and $0, respectively, and are included in “Miscellaneous” expense in the Statement of Operations.
58
Notes to Financial Statements – continued
(7) Transactions in Underlying Affiliated Funds-Affiliated Issuers
An affiliated issuer may be considered one in which the fund owns 5% or more of the outstanding voting securities, or a company which is under common control. For the purposes of this report, the fund assumes the following to be an affiliated issuer:
| | | | | | | | | | | | | | | | |
| Underlying Affiliated Fund | | Beginning
Shares/Par
Amount | | | Acquisitions
Shares/Par
Amount | | | Dispositions
Shares/Par
Amount | | | Ending
Shares/Par
Amount | |
MFS Institutional Money
Market Portfolio | | | 24,895,480 | | | | 228,856,304 | | | | (230,275,583 | ) | | | 23,476,201 | |
| | | | |
| Underlying Affiliated Fund | | Realized
Gain (Loss) | | | Capital Gain
Distributions | | | Dividend
Income | | | Ending
Value | |
MFS Institutional Money
Market Portfolio | | | $— | | | | $— | | | | $28,682 | | | | $23,476,201 | |
59
REPORT OF INDEPENDENT REGISTERED PUBLIC ACCOUNTING FIRM
To the Board of Trustees of MFS Series Trust III and the Shareholders of
MFS High Yield Opportunities Fund:
We have audited the accompanying statement of assets and liabilities, including the portfolio of investments, of MFS High Yield Opportunities Fund (the “Fund”) (one of the portfolios constituting the MFS Series Trust III) as of January 31, 2013, and the related statements of operations for the year then ended, the statement of changes in net assets for each of the two years in the period then ended, and the financial highlights for each of the five years in the period then ended. These financial statements and the financial highlights for the period are the responsibility of the Fund’s management. Our responsibility is to express an opinion on these financial statements and financial highlights based on our audits.
We conducted our audits in accordance with the standards of the Public Company Accounting Oversight Board (United States). Those standards require that we plan and perform the audit to obtain reasonable assurance about whether the financial statements and financial highlights are free of material misstatement. The Fund is not required to have, nor were we engaged to perform, an audit of its internal control over financial reporting. Our audits included consideration of internal control over financial reporting as a basis for designing audit procedures that are appropriate in the circumstances, but not for the purpose of expressing an opinion on the effectiveness of the Fund’s internal control over financial reporting. Accordingly, we express no such opinion. An audit also includes examining, on a test basis, evidence supporting the amounts and disclosures in the financial statements, assessing the accounting principles used and significant estimates made by management, as well as evaluating the overall financial statement presentation. Our procedures included confirmation of securities owned as of January 31, 2013, by correspondence with the custodian and brokers; where replies were not received from brokers, we performed other auditing procedures. We believe that our audits provide a reasonable basis for our opinion.
In our opinion, the financial statements and financial highlights referred to above present fairly, in all material respects, the financial position of MFS High Yield Opportunities Fund of the MFS Series Trust III as of January 31, 2013, the results of its operations for the year then ended, the changes in its net assets for each of the two years in the period then ended, and the financial highlights for the period ended, in conformity with accounting principles generally accepted in the United States of America.
DELOITTE & TOUCHE LLP
Boston, Massachusetts
March 18, 2013
60
TRUSTEES AND OFFICERS — IDENTIFICATION AND BACKGROUND
The Trustees and officers of the Trust, as of March 1, 2013, are listed below, together with their principal occupations during the past five years. (Their titles may have varied during that period.) The address of each Trustee and officer is 111 Huntington Avenue, Boston, Massachusetts 02199-7618.
| | | | | | | | |
Name, Age | | Position(s) Held with Fund | | Trustee/Officer
Since (h) | | Principal
Occupations During the Past Five Years | | Other Directorships (j) |
| INTERESTED TRUSTEES |
Robert J. Manning (k)
(age 49) | | Trustee | | February 2004 | | Massachusetts Financial Services Company, Chairman, Chief Executive Officer and Director; President (until December 2009); Chief Investment Officer (until July 2010) | | N/A |
| INDEPENDENT TRUSTEES | | | | | | |
David H. Gunning
(age 70) | | Trustee and Chair of Trustees | | January 2004 | | Private investor | | Lincoln Electric Holdings, Inc. (welding equipment manufacturer), Director; Development Alternatives, Inc. (consulting), Director/Non-Executive Chairman; Portman Limited (mining), Director (until 2008) |
Robert E. Butler
(age 71) | | Trustee | | January 2006 | | Consultant – investment company industry regulatory and compliance matters | | N/A |
Maureen R. Goldfarb
(age 57) | | Trustee | | January 2009 | | Private investor | | N/A |
William R. Gutow
(age 71) | | Trustee | | December 1993 | | Private investor and real estate consultant; Capitol Entertainment Management Company (video franchise), Vice Chairman | | Texas Donuts (donut franchise), Vice Chairman (until 2010) |
61
Trustees and Officers – continued
| | | | | | | | |
Name, Age | | Position(s) Held with Fund | | Trustee/Officer
Since (h) | | Principal
Occupations During the Past Five Years | | Other Directorships (j) |
Michael Hegarty
(age 68) | | Trustee | | December 2004 | | Private investor; Rouse Properties Inc. (real estate), Director | | Brookfield Office Properties, Inc. (real estate), Director; Rouse Properties Inc. (real estate), Director; Capmark Financial Group Inc. (real esate), Director |
John P. Kavanaugh
(age 58) | | Trustee | | January 2009 | | Private investor | | N/A |
J. Dale Sherratt
(age 74) | | Trustee | | June 1989 | | Insight Resources, Inc. (acquisition planning specialists), President; Wellfleet Investments (investor in health care companies), Managing General Partner | | N/A |
Laurie J. Thomsen
(age 55) | | Trustee | | March 2005 | | Private investor; New Profit, Inc. (venture philanthropy), Executive Partner (until 2010) | | The Travelers Companies (insurance), Director |
Robert W. Uek
(age 71) | | Trustee | | January 2006 | | Consultant to investment company industry | | N/A |
| OFFICERS |
John M. Corcoran (k)
(age 47) | | President | | October 2008 | | Massachusetts Financial Services Company, Senior Vice President (since October 2008); State Street Bank and Trust (financial services provider), Senior Vice President, (until September 2008) | | N/A |
Christopher R. Bohane (k)
(age 39) | | Assistant Secretary and Assistant Clerk | | July 2005 | | Massachusetts Financial Services Company, Vice President and Senior Counsel | | N/A |
Kino Clark (k)
(age 44) | | Assistant Treasurer | | January 2012 | | Massachusetts Financial Services Company, Vice President | | N/A |
62
Trustees and Officers – continued
| | | | | | | | |
Name, Age | | Position(s) Held with Fund | | Trustee/Officer
Since (h) | | Principal
Occupations During the Past Five Years | | Other Directorships (j) |
Thomas H. Connors (k)
(age 53) | | Assistant
Secretary and Assistant Clerk | | September 2012 | | Massachusetts Financial Services Company, Vice President and Senior Counsel; Deutsche Investment Management Americas Inc. (financial service provider), Director and Senior Counsel (until 2012) | | N/A |
Ethan D. Corey (k)
(age 49) | | Assistant
Secretary and Assistant Clerk | | July 2005 | | Massachusetts Financial Services Company, Senior Vice President and Associate General Counsel | | N/A |
David L. DiLorenzo (k)
(age 44) | | Treasurer | | July 2005 | | Massachusetts Financial Services Company, Senior Vice President | | N/A |
Robyn L. Griffin
(age 37) | | Assistant
Independent Chief Compliance
Officer | | August 2008 | | Griffin Compliance LLC (provider of compliance services), Principal (since August 2008); State Street Corporation (financial services provider), Mutual Fund Administration Assistant Vice President (October 2006 – July 2008) | | N/A |
Brian E. Langenfeld (k)
(age 39) | | Assistant
Secretary and Assistant Clerk | | June 2006 | | Massachusetts Financial Services Company, Vice President and Senior Counsel | | N/A |
Susan S. Newton (k)
(age 62) | | Assistant
Secretary and Assistant Clerk | | May 2005 | | Massachusetts Financial Services Company, Senior Vice President and Associate General Counsel | | N/A |
Susan A. Pereira (k)
(age 42) | | Assistant
Secretary and Assistant Clerk | | July 2005 | | Massachusetts Financial Services Company, Vice President and Senior Counsel | | N/A |
63
Trustees and Officers – continued
| | | | | | | | |
Name, Age | | Position(s) Held with Fund | | Trustee/Officer
Since (h) | | Principal
Occupations During the Past Five Years | | Other Directorships (j) |
Kasey L. Phillips (k)
(age 42) | | Assistant Treasurer | | September 2012 | | Massachusetts Financial Services Company, Vice President; Wells Fargo Funds Management, LLC, Senior Vice President, Fund Treasurer (until 2012) | | N/A |
Mark N. Polebaum (k)
(age 60) | | Secretary and Clerk | | January 2006 | | Massachusetts Financial Services Company, Executive Vice President, General Counsel and Secretary | | N/A |
Frank L. Tarantino
(age 68) | | Independent
Chief Compliance Officer | | June 2004 | | Tarantino LLC (provider of compliance services), Principal | | N/A |
Richard S. Weitzel (k)
(age 42) | | Assistant Secretary and Assistant Clerk | | October 2007 | | Massachusetts Financial Services Company, Senior Vice President and Associate General Counsel | | N/A |
James O. Yost (k)
(age 52) | | Deputy Treasurer | | September 1990 | | Massachusetts Financial Services Company, Senior Vice President | | N/A |
| (h) | Date first appointed to serve as Trustee/officer of an MFS fund. Each Trustee has served continuously since appointment unless indicated otherwise. For the period from December 15, 2004 until February 22, 2005, Mr. Manning served as Advisory Trustee. For the period October 2008, until January 2012, Mr. Corcoran served as Treasurer of the Funds. Prior to January 2012, Messrs. DiLorenzo and Yost served as Assistant Treasurers of the Funds. |
| (j) | Directorships or trusteeships of companies required to report to the Securities and Exchange Commission (i.e., “public companies”). |
| (k) | “Interested person” of the Trust within the meaning of the Investment Company Act of 1940 (referred to as the 1940 Act), which is the principal federal law governing investment companies like the fund, as a result of position with MFS. The address of MFS is 111 Huntington Avenue, Boston, Massachusetts 02199-7618. |
Each Trustee has been elected by shareholders and each Trustee and officer holds office until his or her successor is chosen and qualified or until his or her earlier death, resignation, retirement or removal. The Trust does not hold annual meetings for the purpose of electing Trustees, and Trustees are not elected for fixed terms. Messrs. Butler, Kavanaugh, Uek and Ms. Thomsen are members of the Trust’s Audit Committee.
Each of the Fund’s Trustees and officers holds comparable positions with certain other funds of which MFS or a subsidiary is the investment adviser or distributor, and, in the case of the officers, with certain affiliates of MFS. As of January 1, 2013, the Trustees served as board members of 143 funds within the MFS Family of Funds.
64
Trustees and Officers – continued
The Statement of Additional Information for the Fund includes further information about the Trustees and is available without charge upon request by calling 1-800-225-2606.
| | |
| Investment Adviser | | Custodian |
Massachusetts Financial Services Company
111 Huntington Avenue
Boston, MA 02199-7618 | | JPMorgan Chase Bank One Chase Manhattan Plaza New York, NY 10081 |
| Distributor | | Independent Registered Public Accounting Firm |
MFS Fund Distributors, Inc.
111 Huntington Avenue
Boston, MA 02199-7618 | | Deloitte & Touche LLP 200 Berkeley Street
Boston, MA 02116 |
| Portfolio Managers | | |
William Adams David Cole Matthew Ryan | | |
65
BOARD REVIEW OF INVESTMENT ADVISORY AGREEMENT
A discussion regarding the Board’s most recent review and renewal of the fund’s Investment Advisory Agreement with MFS is available by clicking on the fund’s name under “Mutual Funds” in the “Products” section of the MFS Web site (mfs.com).
PROXY VOTING POLICIES AND INFORMATION
A general description of the MFS funds’ proxy voting policies and procedures is available without charge, upon request, by calling 1-800-225-2606, by visiting the Proxy Voting section of mfs.com or by visiting the SEC’s Web site at http://www.sec.gov.
Information regarding how the fund voted proxies relating to portfolio securities during the most recent twelve-month period ended June 30 is available without charge by visiting the Proxy Voting section of mfs.com or by visiting the SEC’s Web site at http://www.sec.gov.
QUARTERLY PORTFOLIO DISCLOSURE
The fund will file a complete schedule of portfolio holdings with the Securities and Exchange Commission (the Commission) for the first and third quarters of each fiscal year on Form N-Q. A shareholder can obtain the quarterly portfolio holdings report at mfs.com. The fund’s Form N-Q is also available on the EDGAR database on the Commission’s Internet Web site at http://www.sec.gov, and may be reviewed and copied at the:
Public Reference Room
Securities and Exchange Commission
100 F Street, NE, Room 1580
Washington, D.C. 20549
Information on the operation of the Public Reference Room may be obtained by calling the Commission at 1-800-SEC-0330. Copies of the fund’s Form N-Q also may be obtained, upon payment of a duplicating fee, by electronic request at the following e-mail address: publicinfo@sec.gov or by writing the Public Reference Section at the above address.
FURTHER INFORMATION
From time to time, MFS may post important information about the fund or the MFS funds on the MFS web site (mfs.com). This information is available by visiting the “News & Commentary” section of mfs.com or by clicking on the fund’s name under “Mutual Funds” in the “Products” section of mfs.com.
FEDERAL TAX INFORMATION (unaudited)
The fund will notify shareholders of amounts for use in preparing 2013 income tax forms in January 2014.
66
rev. 3/11
| | | | |
| | | |
FACTS | | WHAT DOES MFS DO WITH YOUR PERSONAL INFORMATION? | |  |
| | |
| Why? | | Financial companies choose how they share your personal information. Federal law gives consumers the right to limit some but not all sharing. Federal law also requires us to tell you how we collect, share, and protect your personal information. Please read this notice carefully to understand what we do. |
| | |
| What? | | The types of personal information we collect and share depend on the product or service you have with us. This information can include: • Social Security number and account balances • Account transactions and transaction history • Checking account information and wire transfer instructions When you are no longer our customer, we continue to share your information as described in this notice. |
| | |
| How? | | All financial companies need to share customers’ personal information to run their everyday business. In the section below, we list the reasons financial companies can share their customers’ personal information; the reasons MFS chooses to share; and whether you can limit this sharing. |
| | | | |
Reasons we can share your
personal information | | Does MFS
share? | | Can you limit
this sharing? |
For our everyday business purposes – such as to process your transactions, maintain your account(s), respond to court orders and legal investigations, or report to credit bureaus | | Yes | | No |
For our marketing purposes – to offer our products and services to you | | No | | We don’t share |
| For joint marketing with other financial companies | | No | | We don’t share |
For our affiliates’ everyday business purposes – information about your transactions and experiences | | No | | We don’t share |
For our affiliates’ everyday business purposes – information about your creditworthiness | | No | | We don’t share |
| For nonaffiliates to market to you | | No | | We don’t share |
| | |
| Questions? | | Call 800-225-2606 or go to mfs.com. |
67
| | |
| Who we are |
| Who is providing this notice? | | MFS Funds, MFS Investment Management, MFS Institutional Advisors, Inc., MFS Fund Distributors, Inc., MFS Heritage Trust Company, and MFS Service Center, Inc. |
| | |
| What we do |
| How does MFS protect my personal information? | | To protect your personal information from unauthorized access and use, we use security measures that comply with federal law. These measures include procedural, electronic, and physical safeguards for the protection of the personal information we collect about you. |
| How does MFS collect my personal information? | | We collect your personal information, for example, when you •open an account or provide account information •direct us to buy securities or direct us to sell your securities •make a wire transfer We also collect your personal information from others, such as credit bureaus, affiliates and other companies. |
| Why can’t I limit all sharing? | | Federal law gives you the right to limit only •sharing for affiliates’ everyday business purposes – information about your creditworthiness •affiliates from using your information to market to you •sharing for nonaffiliates to market to you State laws and individual companies may give you additional rights to limit sharing. |
| | |
| Definitions |
| Affiliates | | Companies related by common ownership or control. They can be financial and nonfinancial companies. •MFS does not share personal information with affiliates, except for everyday business purposes as described on page one of this notice. |
| Nonaffiliates | | Companies not related by common ownership or control. They can be financial and nonfinancial companies. •MFS does not share with nonaffiliates so they can market to you. |
| Joint Marketing | | A formal agreement between nonaffiliated financial companies that together market financial products or services to you. •MFS doesn’t jointly market. |
| | |
| Other important information |
| If you own an MFS product or receive an MFS service in the name of a third party such as a bank or broker-dealer, their privacy policy may apply to you instead of ours. |
68
Save paper with eDelivery.

| MFS® will send you prospectuses, |
reports, and proxies directly via e-mail so you will get information faster with less mailbox clutter.
To sign up:
1. Go to mfs.com.
2. Log in via MFS® Access.
3. Select eDelivery.
If you own your MFS fund shares through a financial institution or a retirement plan, MFS® TALK, MFS® Access, or eDelivery may not be available to you.
CONTACT
WEB SITE
mfs.com
MFS TALK
1-800-637-8255
24 hours a day
ACCOUNT SERVICE AND LITERATURE
Shareholders
1-800-225-2606
Financial advisors
1-800-343-2829
Retirement plan services
1-800-637-1255
MAILING ADDRESS
MFS Service Center, Inc.
P.O. Box 55824
Boston, MA 02205-5824
OVERNIGHT MAIL
MFS Service Center, Inc.
c/o Boston Financial Data Services
30 Dan Road
Canton, MA 02021-2809
ANNUAL REPORT
January 31, 2013

MFS® MUNICIPAL HIGH INCOME FUND

MMH-ANN
MFS® MUNICIPAL HIGH INCOME FUND
CONTENTS
The report is prepared for the general information of shareholders.
It is authorized for distribution to prospective investors only when preceded or accompanied by a current prospectus.
NOT FDIC INSURED Ÿ MAY LOSE VALUE Ÿ NO BANK GUARANTEE

LETTER FROM THE CHAIRMAN AND CEO
Dear Shareholders:
Global financial markets began 2013 with greater optimism. U.S. and Asian economic trends have turned more positive. Europe continues to struggle through its economic
slump. However, even there, sentiment has improved. The U.S. Congress averted its year-end fiscal cliff, but a degree of uncertainty remains regarding upcoming negotiations over spending cuts and the debt ceiling. The U.S. Federal Reserve Board is continuing its accommodative monetary easing, while the U.S. housing and job markets have made steady gains. Corporate profits have been resilient, and investors have demonstrated increased tolerance for risk.
Overseas, the eurozone remains in a broad contraction, with economic output receding in France as well as Italy and Spain. However, large-scale early repayments of European Central
Bank loans by banks and Germany’s strong rebound in manufacturing activity are encouraging signs. In Asia, both China and Japan appear to be in the early stages of a turnaround. China’s economic activity has picked up from last year’s relative slowdown, and Japan’s sharp devaluation of the yen, an important anti-deflationary measure, seems to be having its desired impact: Japanese stocks have soared, corporate profits are rising and confidence is returning among consumers, businesses and investors.
As always, managing risk in the face of uncertainty remains a top priority for investors. At MFS®, our uniquely collaborative investment process employs global research and active risk management. Our global team of investment professionals shares ideas and evaluates opportunities across continents, investment disciplines and asset classes — all with a goal of building better insights, and ultimately better results, for our clients.
We remain mindful of the many economic challenges investors face today, and believe it is more important than ever to maintain a long-term view and employ time-tested principles, such as asset allocation and diversification. We also remain confident that our unique approach can serve investors well as they work with their financial advisors to identify and pursue the most suitable opportunities.
Respectfully,

Robert J. Manning
Chairman and Chief Executive Officer
MFS Investment Management®
March 18, 2013
The opinions expressed in this letter are subject to change, may not be relied upon for investment advice, and no forecasts can be guaranteed.
1
PORTFOLIO COMPOSITION
Portfolio structure (i)

| | | | |
| Top five industries (i) | | | | |
| Healthcare Revenue - Hospitals | | | 19.1% | |
| Healthcare Revenue - Long Term Care | | | 10.0% | |
| Universities - Colleges | | | 9.3% | |
| Tobacco | | | 7.4% | |
| Sales & Excise Tax Revenue | | | 4.4% | |
| | | | |
| Composition including fixed income credit quality (a)(i) | |
| AAA | | | 4.3% | |
| AA | | | 12.2% | |
| A | | | 18.6% | |
| BBB | | | 31.2% | |
| BB | | | 8.0% | |
| B | | | 9.3% | |
| CC (o) | | | 0.0% | |
| C | | | 0.4% | |
| D (o) | | | 0.0% | |
| Not Rated | | | 16.0% | |
| Cash & Other (o) | | | 0.0% | |
| |
| Portfolio facts (i) | | | | |
| Average Duration (d) | | | 9.7 | |
| Average Effective Maturity (m) | | | 21.5 yrs. | |
| (a) | For all securities other than those specifically described below, ratings are assigned to underlying securities utilizing ratings from Moody’s, Fitch, and Standard & Poor’s rating agencies and applying the following hierarchy: If all three agencies provide a rating, the middle rating (after dropping the highest and lowest ratings) is assigned; if two of the three agencies rate a security, the lower of the two is assigned. Ratings are shown in the S&P and Fitch scale (e.g., AAA). Securities rated BBB or higher are considered investment grade. All ratings are subject to change. Not Rated includes fixed income securities, including fixed income futures contracts, which have not been rated by any rating agency. Cash & Other includes cash, other assets less liabilities, offsets to derivative positions, and short-term securities. The fund may not hold all of these instruments. The fund is not rated by these agencies. |
| (d) | Duration is a measure of how much a bond’s price is likely to fluctuate with general changes in interest rates, e.g., if rates rise 1.00%, a bond with a 5-year duration is likely to lose about 5.00% of its value due to the interest rate move. |
| (i) | For purposes of this presentation, the components include the market value of securities, and reflect the impact of the equivalent exposure of derivative positions, if any. These amounts may be negative from time to time. The bond component will include any accrued interest amounts. Equivalent exposure is a calculated amount that translates the derivative position into a reasonable approximation of the amount of the underlying asset that the portfolio would have to hold at a given point in time to have the same price sensitivity that results from the portfolio’s ownership of the derivative contract. When dealing with derivatives, equivalent exposure is a more representative measure of the potential impact of a position on portfolio performance than market value. Where the fund holds convertible bonds, these are treated as part of the equity portion of the portfolio. |
2
Portfolio Composition – continued
| (m) | In determining an instrument’s effective maturity for purposes of calculating the fund’s dollar-weighted average effective maturity, MFS uses the instrument’s stated maturity or, if applicable, an earlier date on which MFS believes it is probable that a maturity-shortening device (such as a put, pre-refunding or prepayment) will cause the instrument to be repaid. Such an earlier date can be substantially shorter than the instrument’s stated maturity. |
Percentages are based on net assets as of 1/31/13.
The portfolio is actively managed and current holdings may be different.
3
MANAGEMENT REVIEW
Summary of Results
For the twelve months ended January 31, 2013, Class A shares of the MFS Municipal High Income Fund (“fund”) provided a total return of 10.72%, at net asset value. This compares with a return of 4.80% for the fund’s benchmark, the Barclays Municipal Bond Index.
Market Environment
The beginning of the period was characterized by a risk-on sentiment as a result of additional liquidity measures by the Federal Reserve Bank (“Fed”) and the European Central Bank (“ECB”) as well as a commensurate improvement in macroeconomic conditions. During this time, global equity valuations rose, credit spreads contracted, and high-quality sovereign yields increased modestly.
During the middle of the period, however, conditions worsened, driven by broadly weaker global macroeconomic indicators, as well as renewed concerns over the eurozone’s capacity and determination to address its ongoing crisis. Despite this deterioration, broad market sentiment remained relatively resilient as equity markets generally maintained gains and credit spreads did not indicate deterioration.
However, this renewed weakness in the fundamentals precipitated a further round of monetary easing by both the Fed (through a third round of quantitative easing) and the ECB (through a new bond purchase facility) in the second half of the period, which soon instilled additional confidence in risk markets. Nonetheless, towards the end of the period, weaker equity earnings reports and declining forward guidance caused market sentiment to soften. In addition, as we moved toward year end, the fiscal cliff negotiations between the Republicans in the U.S. Congress and President Obama were a particular source of market attention, where uncertainty surrounding the fiscal negotiations continued right up to the end-of-year deadline.
Over the twelve months ended January 31, 2013, Municipal bond yield spreads over treasuries tightened and all-in yields declined to multi-decade lows. A few municipalities continued to garner headlines with signs of fiscal stress. Nevertheless, lower-quality bonds strongly outperformed during the period, with “BBB” (r) rated municipal bonds generating total returns approximately twice that of the highest-quality municipal issuance. Investors seemed willing to recognize the unique circumstances of these municipalities, rather than viewing them as symptomatic of broader credit trends. In our view, the underlying fundamentals of municipal issuers remain somewhat mixed, necessitating careful selectivity, but we continue to think that the vast majority of municipal issuers have retained both their ability and willingness to honor their debt obligations.
Contributors to Performance
A key factor for the fund’s positive performance relative to the Barclays Municipal Bond Index was the fund’s greater exposure to bonds rated (r) “BBB” and “BB”, and lesser exposure to bonds rated “AA”, as lower-quality bonds outperformed higher-quality issues during the period.
Bond selection in the health care, tobacco, and education sectors were additional factors that benefited relative returns.
4
Management Review – continued
Detractors from Performance
There were no significant factors that detracted from relative performance during the period.
Respectfully,
| | |
| Gary Lasman | | Geoffrey Schechter |
| Portfolio Manager | | Portfolio Manager |
| (r) | Bonds rated “BBB”, “Baa”, or higher are considered investment grade; bonds rated “BB”, “Ba”, or below are considered non-investment grade. The source for bond quality ratings is Moody’s Investors Service, Standard & Poor’s and Fitch, Inc. and are applied using the following hierarchy: If all three agencies provide a rating, the middle rating (after dropping the highest and lowest ratings) is assigned; if two of the three agencies rate a security, the lower of the two is assigned. Ratings are shown in the S&P and Fitch scale (e.g., AAA). For securities which are not rated by any of the three agencies, the security is considered Not Rated. |
The views expressed in this report are those of the portfolio managers only through the end of the period of the report as stated on the cover and do not necessarily reflect the views of MFS or any other person in the MFS organization. These views are subject to change at any time based on market or other conditions, and MFS disclaims any responsibility to update such views. These views may not be relied upon as investment advice or an indication of trading intent on behalf of any MFS portfolio. References to specific securities are not recommendations of such securities, and may not be representative of any MFS portfolio’s current or future investments.
5
PERFORMANCE SUMMARY THROUGH 1/31/13
The following chart illustrates a representative class of the fund’s historical performance in comparison to its benchmark(s). Performance results include the deduction of the maximum applicable sales charge and reflect the percentage change in net asset value, including reinvestment of dividends and capital gains distributions. The performance of other share classes will be greater than or less than that of the class depicted below. Benchmarks are unmanaged and may not be invested in directly. Benchmark returns do not reflect sales charges, commissions or expenses. (See Notes to Performance Summary.)
Performance data shown represents past performance and is no guarantee of future results. Investment return and principal value fluctuate so your shares, when sold, may be worth more or less than the original cost; current performance may be lower or higher than quoted. The performance shown does not reflect the deduction of taxes, if any, that a shareholder would pay on fund distributions or the redemption of fund shares.
Growth of a Hypothetical $10,000 Investment
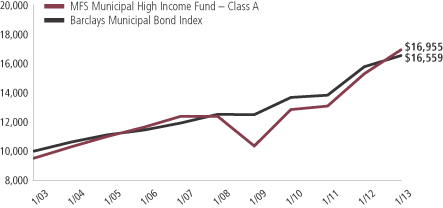
6
Performance Summary – continued
Total Returns through 1/31/13
Average annual without sales charge
| | | | | | | | | | | | | | |
| | | Share class | | Class inception date | | 1-yr | | 5-yr | | 10-yr | | Life (t) | | |
| | | A | | 2/24/84 | | 10.72% | | 6.45% | | 5.94% | | N/A | | |
| | | B | | 9/07/93 | | 9.82% | | 5.64% | | 5.13% | | N/A | | |
| | | C | | 9/25/98 | | 9.61% | | 5.42% | | 4.88% | | N/A | | |
| | | I | | 6/01/11 | | 10.71% | | N/A | | N/A | | 13.87% | | |
| Comparative benchmark | | | | | | | | | | |
| | | Barclays Municipal Bond Index (f) | | 4.80% | | 5.73% | | 5.17% | | N/A | | |
| Average annual with sales charge | | | | | | | | | | |
| | | A
With Initial Sales Charge (4.75%) | | 5.46% | | 5.42% | | 5.42% | | N/A | | |
| | | B
With CDSC (Declining over six years from 4% to 0%) (x) | | 5.82% | | 5.32% | | 5.13% | | N/A | | |
| | | C
With CDSC (1% for 12 months) (x) | | 8.61% | | 5.42% | | 4.88% | | N/A | | |
Class I shares do not have a sales charge.
CDSC – Contingent Deferred Sales Charge.
| (f) | Source: FactSet Research Systems Inc. |
| (t) | For the period from the class inception date through the stated period end (for those share classes with less than 10 years of performance history). No comparative benchmark performance information is provided for “life” periods. (See Notes to Performance Summary.) |
| (x) | Assuming redemption at the end of the applicable period. |
Benchmark Definition
Barclays Municipal Bond Index – a market capitalization-weighted index that measures the performance of the tax-exempt bond market.
It is not possible to invest directly in an index.
Notes to Performance Summary
Average annual total return represents the average annual change in value for each share class for the periods presented. Life returns are presented where the share class has less than 10 years of performance history and represent the average annual total return from the class inception date to the stated period end date. As the fund’s share classes may have different inception dates, the life returns may represent different time periods and may not be comparable. As a result, no comparative benchmark performance information is provided for life periods.
Performance results reflect any applicable expense subsidies and waivers in effect during the periods shown. Without such subsidies and waivers the fund’s performance results would be less favorable. Please see the prospectus and financial statements for complete details.
7
Performance Summary – continued
Performance results do not include adjustments made for financial reporting purposes in accordance with U.S. generally accepted accounting principles and may differ from amounts reported in the financial highlights.
A portion of income may be subject to state, federal, and/or alternative minimum tax. Capital gains, if any, are subject to a capital gains tax.
From time to time the fund may receive proceeds from litigation settlements, without which performance would be lower.
8
EXPENSE TABLE
Fund expenses borne by the shareholders during the period,
August 1, 2012 through January 31, 2013
As a shareholder of the fund, you incur two types of costs: (1) transaction costs, including sales charges (loads) on certain purchase or redemption payments, and (2) ongoing costs, including management fees; distribution and service (12b-1) fees; and other fund expenses. This example is intended to help you understand your ongoing costs (in dollars) of investing in the fund and to compare these costs with the ongoing costs of investing in other mutual funds.
The example is based on an investment of $1,000 invested at the beginning of the period and held for the entire period August 1, 2012 through January 31, 2013.
Actual Expenses
The first line for each share class in the following table provides information about actual account values and actual expenses. You may use the information in this line, together with the amount you invested, to estimate the expenses that you paid over the period. Simply divide your account value by $1,000 (for example, an $8,600 account value divided by $1,000 = 8.6), then multiply the result by the number in the first line under the heading entitled “Expenses Paid During Period” to estimate the expenses you paid on your account during this period.
Hypothetical Example for Comparison Purposes
The second line for each share class in the following table provides information about hypothetical account values and hypothetical expenses based on the fund’s actual expense ratio and an assumed rate of return of 5% per year before expenses, which is not the fund’s actual return. The hypothetical account values and expenses may not be used to estimate the actual ending account balance or expenses you paid for the period. You may use this information to compare the ongoing costs of investing in the fund and other funds. To do so, compare this 5% hypothetical example with the 5% hypothetical examples that appear in the shareholder reports of the other funds.
Please note that the expenses shown in the table are meant to highlight your ongoing costs only and do not reflect any transactional costs, such as sales charges (loads). Therefore, the second line for each share class in the table is useful in comparing ongoing costs only, and will not help you determine the relative total costs of owning different funds. In addition, if these transactional costs were included, your costs would have been higher.
9
Expense Table – continued
| | | | | | | | | | | | | | | | | | |
Share
Class | | | | Annualized
Expense
Ratio | | | Beginning
Account Value
8/01/12 | | | Ending
Account Value
1/31/13 | | | Expenses
Paid During
Period (p)
8/01/12-1/31/13 | |
| A | | Actual | | | 0.69% | | | | $1,000.00 | | | | $1,040.93 | | | | $3.54 | |
| | Hypothetical (h) | | | 0.69% | | | | $1,000.00 | | | | $1,021.67 | | | | $3.51 | |
| B | | Actual | | | 1.51% | | | | $1,000.00 | | | | $1,036.63 | | | | $7.73 | |
| | Hypothetical (h) | | | 1.51% | | | | $1,000.00 | | | | $1,017.55 | | | | $7.66 | |
| C | | Actual | | | 1.69% | | | | $1,000.00 | | | | $1,035.68 | | | | $8.65 | |
| | Hypothetical (h) | | | 1.69% | | | | $1,000.00 | | | | $1,016.64 | | | | $8.57 | |
| I | | Actual | | | 0.69% | | | | $1,000.00 | | | | $1,040.91 | | | | $3.54 | |
| | Hypothetical (h) | | | 0.69% | | | | $1,000.00 | | | | $1,021.67 | | | | $3.51 | |
| (h) | 5% class return per year before expenses. |
| (p) | Expenses paid are equal to each class’s annualized expense ratio, as shown above, multiplied by the average account value over the period, multiplied by the number of days in the period, divided by the number of days in the year. Expenses paid do not include any applicable sales charges (loads). If these transaction costs had been included, your costs would have been higher. |
Expenses Impacting Table
Expense ratios include 0.02% of investment related expenses from inverse floaters that are outside of the expense cap arrangement (See Note 3 of the Notes to Financial Statements).
10
PORTFOLIO OF INVESTMENTS
1/31/13
The Portfolio of Investments is a complete list of all securities owned by your fund. It is categorized by broad-based asset classes.
| | | | | | | | |
| Municipal Bonds - 98.6% | | | | | | | | |
| Issuer | | Shares/Par | | | Value ($) | |
| Airport Revenue - 1.7% | | | | | | | | |
| Burlington, VT, Airport Rev., “A”, 4%, 2028 | | $ | 1,565,000 | | | $ | 1,531,319 | |
| Chicago, IL, O’Hare International Airport Rev., Third Lien, “A”, 5.625%, 2035 | | | 5,645,000 | | | | 6,650,431 | |
| Cleveland, OH, Airport System Rev., “A”, AGM, 5%, 2030 | | | 1,360,000 | | | | 1,560,845 | |
| Cleveland, OH, Airport System Rev., “A”, AGM, 5%, 2031 | | | 905,000 | | | | 1,031,845 | |
| Dallas Fort Worth, TX, International Airport Rev., “D”, 5%, 2038 | | | 10,065,000 | | | | 11,018,156 | |
| Denver, CO, City & County Airport Systems Rev., “A”, 5%, 2027 | | | 1,845,000 | | | | 2,110,182 | |
| Denver, CO, City & County Airport Systems Rev., “A”, 5%, 2028 | | | 1,795,000 | | | | 2,035,315 | |
| Denver, CO, City & County Airport Systems Rev., “B”, 5%, 2032 | | | 3,595,000 | | | | 4,137,701 | |
| Houston, TX, Airport System Rev., “B”, 5%, 2026 | | | 1,335,000 | | | | 1,571,081 | |
| Houston, TX, Airport System Rev., Subordinate Lien, “A”, 5%, 2031 | | | 2,410,000 | | | | 2,701,610 | |
| Massachusetts Port Authority Rev., “A”, 5%, 2037 | | | 430,000 | | | | 485,345 | |
| Miami-Dade County, FL, Aviation Rev., “A”, 5%, 2031 | | | 1,990,000 | | | | 2,225,775 | |
| Port Authority of NY & NJ, Special Obligation Rev. (JFK International Air Terminal LLC), 6%, 2036 | | | 2,435,000 | | | | 2,861,028 | |
| Port Authority of NY & NJ, Special Obligation Rev. (JFK International Air Terminal LLC), 6%, 2042 | | | 2,780,000 | | | | 3,266,389 | |
| San Jose, CA, Airport Rev., “A-2”, 5.25%, 2034 | | | 6,545,000 | | | | 7,324,706 | |
| | | | | | | | |
| | | | | | | $ | 50,511,728 | |
| General Obligations - General Purpose - 3.3% | | | | | | | | |
| Allegheny County, PA, “C-70”, 5%, 2037 | | $ | 2,950,000 | | | $ | 3,309,753 | |
| Bellwood, IL, General Obligation, 5.875%, 2027 | | | 2,300,000 | | | | 2,282,934 | |
| Bellwood, IL, General Obligation, 6.15%, 2032 | | | 4,800,000 | | | | 4,745,376 | |
| Chicago, IL, Metropolitan Water Reclamation District-Greater Chicago, “C”, 5%, 2030 | | | 6,960,000 | | | | 8,250,941 | |
| Commonwealth of Puerto Rico, Public Improvement, “B”, 6.5%, 2037 | | | 2,325,000 | | | | 2,524,625 | |
| Deaf Smith County, TX, Hospital District, “A”, 6.5%, 2040 | | | 3,800,000 | | | | 4,477,350 | |
| Luzerne County, PA, AGM, 6.75%, 2023 | | | 1,225,000 | | | | 1,436,386 | |
| Puerto Rico Public Buildings Authority Rev., Guaranteed (Government Facilities), “F”, 5.25%, 2024 | | | 10,090,000 | | | | 10,557,066 | |
| State of California, 5.25%, 2028 | | | 3,545,000 | | | | 4,290,194 | |
| State of California, 5.25%, 2030 | | | 2,000,000 | | | | 2,381,160 | |
| State of California, 5.125%, 2033 | | | 7,845,000 | | | | 8,936,867 | |
| State of California, 5.25%, 2035 | | | 7,715,000 | | | | 9,081,867 | |
| State of California, 5%, 2041 | | | 2,580,000 | | | | 2,909,853 | |
| State of California (Veterans), 5.05%, 2036 | | | 1,105,000 | | | | 1,138,095 | |
11
Portfolio of Investments – continued
| | | | | | | | |
| Issuer | | Shares/Par | | | Value ($) | |
| Municipal Bonds - continued | | | | | | | | |
| General Obligations - General Purpose - continued | | | | | |
| State of Hawaii, “DZ”, 5%, 2031 | | $ | 1,800,000 | | | $ | 2,146,374 | |
| State of Illinois, 5%, 2025 | | | 940,000 | | | | 1,065,180 | |
| Washington Motor Vehicle Fuel Tax, “B”, NATL, 5%, 2032 (u) | | | 25,010,000 | | | | 28,441,622 | |
| | | | | | | | |
| | | | | | | $ | 97,975,643 | |
| General Obligations - Improvement - 0.2% | | | | | | | | |
| Guam Government, “A”, 7%, 2039 | | $ | 1,115,000 | | | $ | 1,264,354 | |
| Mississippi Development Bank Special Obligation (Greenville, MS Project), 5%, 2027 | | | 1,500,000 | | | | 1,509,960 | |
| New Orleans, LA, 5%, 2030 | | | 575,000 | | | | 645,121 | |
| New Orleans, LA, 5%, 2031 | | | 990,000 | | | | 1,106,375 | |
| | | | | | | | |
| | | | | | | $ | 4,525,810 | |
| General Obligations - Schools - 1.1% | | | | | | | | |
| Beverly Hills, CA, Unified School District (Election of 2008), Capital Appreciation, 0%, 2031 | | $ | 2,060,000 | | | $ | 1,034,553 | |
| Beverly Hills, CA, Unified School District (Election of 2008), Capital Appreciation, 0%, 2032 | | | 2,095,000 | | | | 1,004,029 | |
| Beverly Hills, CA, Unified School District (Election of 2008), Capital Appreciation, 0%, 2033 | | | 4,185,000 | | | | 1,912,043 | |
| Escondido, CA, Union High School District (Election of 2008), Capital Appreciation, “A”, ASSD GTY, 0%, 2030 | | | 4,785,000 | | | | 2,212,345 | |
| Escondido, CA, Union High School District (Election of 2008), Capital Appreciation, “A”, ASSD GTY, 0%, 2031 | | | 4,280,000 | | | | 1,876,438 | |
| Escondido, CA, Union High School District (Election of 2008), Capital Appreciation, “A”, ASSD GTY, 0%, 2032 | | | 3,010,000 | | | | 1,250,113 | |
| Escondido, CA, Union High School District (Election of 2008), Capital Appreciation, “A”, ASSD GTY, 0%, 2033 | | | 2,965,000 | | | | 1,163,051 | |
| Frisco, TX, Independent School District, School Building, “B”, 3%, 2042 | | | 2,395,000 | | | | 2,268,760 | |
| Hartnell, CA, Community College District (Election of 2002), Capital Appreciation, “D”, 0%, 2039 | | | 10,355,000 | | | | 1,909,566 | |
| Lake Tahoe, CA, Unified School District (Election of 2008), Capital Appreciation, AGM, 0%, 2045 | | | 4,240,000 | | | | 1,764,900 | |
| Los Angeles, CA, Unified School District, “D”, 5%, 2034 | | | 525,000 | | | | 594,920 | |
| Merced, CA, Union High School District, Capital Appreciation, “A”, ASSD GTY, 0%, 2030 | | | 645,000 | | | | 293,662 | |
| Newport Mesa, CA, Unified School District (Election of 2005), Capital Appreciation, 0%, 2041 | | | 12,965,000 | | | | 2,380,763 | |
| Oceanside, CA, Unified School District, Capital Appreciation, ASSD GTY, 0%, 2024 | | | 3,110,000 | | | | 1,968,661 | |
| Oceanside, CA, Unified School District, Capital Appreciation, ASSD GTY, 0%, 2027 | | | 2,070,000 | | | | 1,127,094 | |
12
Portfolio of Investments – continued
| | | | | | | | |
| Issuer | | Shares/Par | | | Value ($) | |
| Municipal Bonds - continued | | | | | | | | |
| General Obligations - Schools - continued | | | | | |
| Oceanside, CA, Unified School District, Capital Appreciation, ASSD GTY, 0%, 2029 | | $ | 4,025,000 | | | $ | 1,973,337 | |
| Oceanside, CA, Unified School District, Capital Appreciation, ASSD GTY, 0%, 2030 | | | 4,455,000 | | | | 2,070,372 | |
| Royse City, TX, Independent School District, School Building, Capital Appreciation, PSF, 0%, 2027 | | | 2,960,000 | | | | 1,535,441 | |
| Royse City, TX, Independent School District, School Building, Capital Appreciation, PSF, 0%, 2029 | | | 2,995,000 | | | | 1,391,327 | |
| West Contra Costa, CA, Unified School District (Election of 2005), Capital Appreciation, “C”, ASSD GTY, 0%, 2029 | | | 3,665,000 | | | | 1,698,251 | |
| Whittier, CA, Union High School District, Capital Appreciation, 0%, 2034 | | | 2,270,000 | | | | 661,750 | |
| | | | | | | | |
| | | | | | | $ | 32,091,376 | |
| Healthcare Revenue - Hospitals - 18.8% | | | | | | | | |
| Alexander City, AL, Special Care Facilities Financing Authority Medical Facilities Rev., “A” (Russell Hospital Corp.), 5.75%, 2036 | | $ | 1,900,000 | | | $ | 1,961,541 | |
| Allegheny County, PA, Hospital Development Authority Rev. (West Penn Allegheny Health), “A”, 5%, 2028 | | | 750,000 | | | | 636,840 | |
| Astoria, OR, Hospital Facilities Authority (Columbia Memorial Hospital), 5%, 2025 | | | 1,145,000 | | | | 1,268,992 | |
| Astoria, OR, Hospital Facilities Authority (Columbia Memorial Hospital), 5%, 2028 | | | 1,325,000 | | | | 1,445,151 | |
| Astoria, OR, Hospital Facilities Authority (Columbia Memorial Hospital), 5%, 2037 | | | 1,750,000 | | | | 1,848,805 | |
| Atchison, KS, Hospital Rev. (Atchison Hospital Assn.), “A”, 6.75%, 2030 | | | 2,600,000 | | | | 3,000,374 | |
| Athens County, OH, Hospital Facilities Rev. (O’Bleness Memorial Hospital), “A”, 7.125%, 2033 | | | 2,500,000 | | | | 2,523,775 | |
| Brazoria County, TX, Health Facilities Development Corp., Hospital Rev. (Brazosport Regional Health System), 5.25%, 2032 | | | 2,000,000 | | | | 2,090,500 | |
| Brazoria County, TX, Health Facilities Development Corp., Hospital Rev. (Brazosport Regional Health System), 5.5%, 2042 | | | 9,910,000 | | | | 10,468,032 | |
| Brunswick, GA, Hospital Authority Rev. (Glynn-Brunswick Memorial Hospital), 5.625%, 2034 | | | 1,375,000 | | | | 1,531,379 | |
| Butler County, OH, Hospital Facilities Rev. (UC Health), 5.5%, 2040 | | | 5,435,000 | | | | 6,014,588 | |
| Butler County, OH, Hospital Facilities Rev. (UC Health), 5.75%, 2040 | | | 2,210,000 | | | | 2,485,432 | |
California Health Facilities Financing Authority Rev.
(Children’s Hospital Los Angeles), “A”, 5%, 2029 | | | 3,500,000 | | | | 3,894,555 | |
13
Portfolio of Investments – continued
| | | | | | | | |
| Issuer | | Shares/Par | | | Value ($) | |
| Municipal Bonds - continued | | | | | | | | |
| Healthcare Revenue - Hospitals - continued | | | | | | | | |
| California Health Facilities Financing Authority Rev. (St. Joseph Health System), “A”, 5.75%, 2039 | | $ | 2,765,000 | | | $ | 3,144,607 | |
| California Statewide Communities Development Authority Rev. (Kaiser Permanente), “A”, 5%, 2042 | | | 1,065,000 | | | | 1,202,523 | |
| Chautauqua County, NY, Capital Resource Corp., Rev. (Women’s Christian Assn.), “A”, 8%, 2030 | | | 3,890,000 | | | | 4,224,073 | |
| Citrus County, FL, Hospital Board Rev. (Citrus Memorial Hospital), 6.25%, 2023 | | | 3,360,000 | | | | 3,373,373 | |
| Citrus County, FL, Hospital Board Rev. (Citrus Memorial Hospital), 6.375%, 2032 | | | 5,810,000 | | | | 5,824,874 | |
| Cullman County, AL, Health Care Authority (Cullman Regional Medical Center), “A”, 6.25%, 2023 | | | 1,400,000 | | | | 1,531,978 | |
| Cullman County, AL, Health Care Authority (Cullman Regional Medical Center), “A”, 6.75%, 2029 | | | 4,790,000 | | | | 5,208,886 | |
| Cullman County, AL, Health Care Authority (Cullman Regional Medical Center), “A”, 7%, 2036 | | | 1,000,000 | | | | 1,094,830 | |
| Dauphin County, PA, General Authority Health System Rev. (Pinnacle Health System), “A”, 5%, 2042 | | | 4,330,000 | | | | 4,681,466 | |
| DeKalb County, GA, Hospital Authority Rev. (DeKalb Medical Center, Inc.), 6.125%, 2040 | | | 7,170,000 | | | | 8,448,770 | |
| Duluth, MN, Economic Development Authority Health Care Facilities Rev. (St. Luke’s Hospital Authority Obligated Group), 5.75%, 2027 | | | 2,325,000 | | | | 2,522,695 | |
| Duluth, MN, Economic Development Authority Health Care Facilities Rev. (St. Luke’s Hospital Authority Obligated Group), 5.75%, 2032 | | | 5,025,000 | | | | 5,392,981 | |
| Duluth, MN, Economic Development Authority Health Care Facilities Rev. (St. Luke’s Hospital Authority Obligated Group), 6%, 2039 | | | 5,780,000 | | | | 6,270,491 | |
| Escambia County, FL, Health Facilities Authority (Baptist Hospital, Inc.), “A”, 6%, 2036 | | | 3,050,000 | | | | 3,535,438 | |
| Fruita, CO, Rev. (Family Health West Project), 7%, 2018 | | | 850,000 | | | | 980,101 | |
| Fruita, CO, Rev. (Family Health West Project), 8%, 2043 | | | 4,440,000 | | | | 5,154,130 | |
| Gallia County, OH, Hospital Facilities Rev. (Holzer Health Systems), “A”, 8%, 2042 | | | 16,000,000 | | | | 18,586,080 | |
| Glasgow, KY, Healthcare Rev. (TJ Samson Community Hospital), 6.375%, 2035 | | | 2,840,000 | | | | 3,301,472 | |
| Grundy County, MO, Industrial Development Authority, Health Facilities Rev. (Wright Memorial Hospital), 6.75%, 2034 | | | 1,590,000 | | | | 1,792,487 | |
| Harris County, TX, Cultural Education Facilities Finance Corp. Medical Facilities Rev. (Baylor College of Medicine), “A”, 5%, 2037 | | | 6,075,000 | | | | 6,866,694 | |
14
Portfolio of Investments – continued
| | | | | | | | |
| Issuer | | Shares/Par | | | Value ($) | |
| Municipal Bonds - continued | | | | | | | | |
| Healthcare Revenue - Hospitals - continued | | | | | | | | |
| Harris County, TX, Cultural Education Facilities Finance Corp. Medical Facilities Rev. (Baylor College of Medicine), “D”, 5.625%, 2032 | | $ | 4,535,000 | | | $ | 5,047,455 | |
| Harris County, TX, Health Facilities Development Corp., Hospital Rev. (Memorial Hermann Healthcare Systems), “B”, 7.25%, 2035 | | | 2,400,000 | | | | 2,999,232 | |
| Hillsborough County, FL, Industrial Development Authority Rev. (University Community Hospital), “A”, 5.625%, 2018 (c) | | | 4,700,000 | | | | 5,883,366 | |
| Illinois Finance Authority Rev. (Advocate Healthcare), 4%, 2047 | | | 3,415,000 | | | | 3,414,829 | |
| Illinois Finance Authority Rev. (Ascension Healthcare), “A”, 5%, 2042 | | | 3,480,000 | | | | 3,916,183 | |
| Illinois Finance Authority Rev. (Centegra Health System), 5%, 2038 | | | 2,810,000 | | | | 3,054,863 | |
| Illinois Finance Authority Rev. (Kewanee Hospital), 5.1%, 2031 | | | 1,885,000 | | | | 1,974,047 | |
| Illinois Finance Authority Rev. (KishHealth Systems Obligated Group), 5.75%, 2028 | | | 3,770,000 | | | | 4,249,016 | |
| Illinois Finance Authority Rev. (O.S.F. Healthcare Systems) “A”, 7%, 2029 | | | 3,025,000 | | | | 3,747,673 | |
| Illinois Finance Authority Rev. (O.S.F. Healthcare Systems) “A”, 7.125%, 2037 | | | 2,555,000 | | | | 3,140,683 | |
| Illinois Finance Authority Rev. (Provena Health), “A”, 6%, 2028 | | | 4,000,000 | | | | 4,549,360 | |
| Illinois Finance Authority Rev. (Provena Health), “A”, 7.75%, 2034 | | | 3,865,000 | | | | 4,885,747 | |
| Illinois Finance Authority Rev. (Resurrection Health), 6.125%, 2025 | | | 2,620,000 | | | | 2,982,294 | |
| Illinois Finance Authority Rev. (Silver Cross Hospital & Medical Centers), 6.875%, 2038 | | | 1,500,000 | | | | 1,799,910 | |
| Illinois Finance Authority Rev. (Silver Cross Hospital & Medical Centers), 7%, 2044 | | | 2,545,000 | | | | 3,055,832 | |
| Illinois Finance Authority Rev. (Silver Cross Hospital & Medical Centers), “A”, 5.5%, 2030 | | | 4,000,000 | | | | 4,356,920 | |
| Indiana Finance Authority Rev. (Community Foundation of Northwest Indiana Obligated Group), 5%, 2041 | | | 8,000,000 | | | | 8,628,720 | |
| Indiana Finance Authority, Hospital Rev. (Parkview Health System), 5%, 2029 | | | 1,415,000 | | | | 1,572,971 | |
| Indiana Health & Educational Facilities Finance Authority, Hospital Rev. (Clarian Health), “A”, 5%, 2039 | | | 2,000,000 | | | | 2,124,480 | |
| Indiana Health & Educational Facilities Finance Authority, Hospital Rev. (Clarian Health), “B”, 5%, 2033 | | | 2,510,000 | | | | 2,699,480 | |
| Iron River, MI, Hospital Finance Authority Rev. (Iron County Community Hospital, Inc.), 6.5%, 2040 | | | 2,250,000 | | | | 2,327,693 | |
Jefferson Parish, LA, Hospital Service District No. 1
(West Jefferson Medical Center), “A”, 6%, 2039 | | | 1,500,000 | | | | 1,662,945 | |
15
Portfolio of Investments – continued
| | | | | | | | |
| Issuer | | Shares/Par | | | Value ($) | |
| Municipal Bonds - continued | | | | | | | | |
| Healthcare Revenue - Hospitals - continued | | | | | | | | |
Jefferson Parish, LA, Hospital Service District No. 2
(East Jefferson General Hospital), 6.25%, 2031 | | $ | 3,200,000 | | | $ | 3,746,912 | |
Jefferson Parish, LA, Hospital Service District No. 2
(East Jefferson General Hospital), 6.375%, 2041 | | | 2,000,000 | | | | 2,350,200 | |
| Johnson City, TN, Health & Educational Facilities Board, Hospital Rev. (Mountain States Health Alliance), 6%, 2038 | | | 1,700,000 | | | | 2,021,453 | |
| Johnson City, TN, Health & Educational Facilities Board, Hospital Rev. (Mountain States Health Alliance), “A”, 5.5%, 2036 | | | 3,905,000 | | | | 4,187,253 | |
| Kentucky Economic Development Finance Authority, Hospital Facilities Rev. (Baptist Healthcare System), “A”, 5.625%, 2027 | | | 815,000 | | | | 937,552 | |
| Kentucky Economic Development Finance Authority, Hospital Facilities Rev. (Owensboro Medical Health System), “A”, 6%, 2030 | | | 710,000 | | | | 839,838 | |
| Kentucky Economic Development Finance Authority, Hospital Facilities Rev. (Owensboro Medical Health System), “A”, 6.375%, 2040 | | | 5,030,000 | | | | 6,053,957 | |
| Kentucky Economic Development Finance Authority, Hospital Facilities Rev. (Owensboro Medical Health System), “A”, 6.5%, 2045 | | | 1,955,000 | | | | 2,363,126 | |
| Knox County, IN, Economic Development Rev. (Good Samaritan Hospital), “A”, 5%, 2037 | | | 520,000 | | | | 571,646 | |
| Knox County, IN, Economic Development Rev. (Good Samaritan Hospital), “A”, 5%, 2042 | | | 1,030,000 | | | | 1,120,619 | |
| Knox County, TN, Health, Educational, Hospital & Housing Facilities Board Rev. (Covenant Health), Capital Appreciation, “A”, 0%, 2035 | | | 3,795,000 | | | | 1,303,924 | |
| Lake County, OH, Hospital Facilities Rev. (Lake Hospital), “C”, 6%, 2043 | | | 2,870,000 | | | | 3,183,605 | |
| Laramie County, WY, Hospital Rev. (Cheyenne Regional Medical Center Project), 5%, 2032 | | | 370,000 | | | | 415,033 | |
| Laramie County, WY, Hospital Rev. (Cheyenne Regional Medical Center Project), 5%, 2037 | | | 1,225,000 | | | | 1,342,600 | |
| Laramie County, WY, Hospital Rev. (Cheyenne Regional Medical Center Project), 5%, 2042 | | | 1,845,000 | | | | 1,996,179 | |
Lebanon County, PA, Health Facilities Authority Rev.
(Good Samaritan Hospital), 5.9%, 2028 | | | 1,890,000 | | | | 1,902,928 | |
Lebanon County, PA, Health Facilities Authority Rev.
(Good Samaritan Hospital), 6%, 2035 | | | 5,500,000 | | | | 5,530,910 | |
| Louisiana Public Facilities Authority Hospital Rev. (Lake Charles Memorial Hospital), 6.375%, 2034 | | | 7,975,000 | | | | 8,647,851 | |
| Louisville & Jefferson County, KY, Metropolitan Government Healthcare Systems Rev. (Norton Healthcare, Inc.), 5.25%, 2036 | | | 6,485,000 | | | | 6,919,106 | |
16
Portfolio of Investments – continued
| | | | | | | | |
| Issuer | | Shares/Par | | | Value ($) | |
| Municipal Bonds - continued | | | | | | | | |
| Healthcare Revenue - Hospitals - continued | | | | | | | | |
Lufkin, TX, Health Facilities Development Corp. Rev.
(Memorial Health System), 5.5%, 2032 | | $ | 1,000,000 | | | $ | 1,042,060 | |
Lufkin, TX, Health Facilities Development Corp. Rev.
(Memorial Health System), 5.5%, 2037 | | | 6,400,000 | | | | 6,616,640 | |
Lufkin, TX, Health Facilities Development Corp. Rev.
(Memorial Health System), 6.25%, 2037 | | | 4,340,000 | | | | 4,753,776 | |
Macomb County, MI, Hospital Finance Authority Rev.
(Mount Clemens General Hospital), 5.875%, 2013 (c) | | | 4,345,000 | | | | 4,536,180 | |
| Maine Health & Higher Educational Facilities Authority Rev. (Eastern Maine Medical Center Obligated Group), 5%, 2043 | | | 2,085,000 | | | | 2,242,584 | |
| Martin County, FL, Health Facilities Authority Rev. (Martin Memorial Medical Center), 5.5%, 2042 | | | 2,760,000 | | | | 3,070,224 | |
| Maryland Health & Higher Educational Facilities Authority Rev. (Doctors Community Hospital), 5.75%, 2038 | | | 2,575,000 | | | | 2,830,105 | |
| Maryland Health & Higher Educational Facilities Authority Rev. (Mercy Medical Center), “A”, 5.5%, 2042 | | | 2,000,000 | | | | 2,121,660 | |
| Massachusetts Development Finance Agency Rev. (Partners Healthcare), “L”, 5%, 2031 | | | 2,220,000 | | | | 2,565,499 | |
Massachusetts Development Finance Agency Rev.
(Partners Healthcare), “L”, 5%, 2036 | | | 1,330,000 | | | | 1,505,174 | |
| Massachusetts Health & Educational Facilities Authority Rev. (Jordan Hospital), “D”, 5.25%, 2018 | | | 4,185,000 | | | | 4,189,478 | |
| Mecosta County, MI, General Hospital Rev., 6%, 2018 | | | 870,000 | | | | 871,227 | |
| Miami Beach, FL, Health Facilities Authority Rev. (Mount Sinai Medical Center), 6.75%, 2021 | | | 1,235,000 | | | | 1,343,952 | |
| Miami Beach, FL, Health Facilities Authority Rev. (Mount Sinai Medical Center), 5%, 2029 | | | 1,750,000 | | | | 1,897,735 | |
| Miami Beach, FL, Health Facilities Authority Rev. (Mount Sinai Medical Center), 6.75%, 2014 (c) | | | 338,500 | | | | 376,859 | |
| Miami Beach, FL, Health Facilities Authority Rev. (Mount Sinai Medical Center), 6.75%, 2029 | | | 2,151,500 | | | | 2,329,020 | |
| Miami-Dade County, FL, Health Facilities Authority Hospital Rev. (Miami Childrens Hospital), 6%, 2046 | | | 7,250,000 | | | | 8,386,655 | |
| Michigan Finance Authority Rev. (Trinity Health Corp.), 5%, 2035 | | | 3,825,000 | | | | 4,375,685 | |
| Michigan Hospital Finance Authority Rev. (Henry Ford Health System), 5.625%, 2029 | | | 765,000 | | | | 874,686 | |
| Michigan Hospital Finance Authority Rev. (Henry Ford Health System), 5.75%, 2039 | | | 4,405,000 | | | | 4,998,177 | |
| Monroe County, MI, Hospital Finance Authority, Hospital Rev. (Mercy Memorial Hospital Corp.), 5.375%, 2026 | | | 3,200,000 | | | | 3,445,824 | |
| Monroe County, MI, Hospital Finance Authority, Hospital Rev. (Mercy Memorial Hospital Corp.), 5.5%, 2035 | | | 3,340,000 | | | | 3,579,044 | |
17
Portfolio of Investments – continued
| | | | | | | | |
| Issuer | | Shares/Par | | | Value ($) | |
| Municipal Bonds - continued | | | | | | | | |
| Healthcare Revenue - Hospitals - continued | | | | | | | | |
| Monroe County, PA, Hospital Authority Rev. (Pocono Medical Center), “A”, 5%, 2032 | | $ | 540,000 | | | $ | 586,003 | |
| Monroe County, PA, Hospital Authority Rev. (Pocono Medical Center), “A”, 5%, 2041 | | | 385,000 | | | | 411,808 | |
| Montgomery, AL, Medical Clinic Board Health Care Facility Rev. (Jackson Hospital & Clinic), 5.25%, 2031 | | | 2,745,000 | | | | 2,830,370 | |
| Nassau County, NY, Local Economic Assistance Corp. Rev. (Winthrop-University Hospital Association Project), 5%, 2032 | | | 960,000 | | | | 1,061,558 | |
| Nassau County, NY, Local Economic Assistance Corp. Rev. (Winthrop-University Hospital Association Project), 5%, 2037 | | | 1,800,000 | | | | 1,939,878 | |
| New Hampshire Business Finance Authority Rev. (Elliot Hospital Obligated Group), “A”, 6%, 2027 | | | 4,935,000 | | | | 5,763,636 | |
| New Hampshire Business Finance Authority Rev. (Huggins Hospital), 6.875%, 2039 | | | 845,000 | | | | 936,209 | |
| New Hampshire Health & Education Facilities Authority Rev. (Concord Hospital), “A”, 5%, 2043 | | | 1,150,000 | | | | 1,270,405 | |
| New Hampshire Health & Education Facilities Authority Rev. (Memorial Hospital at Conway), 5.25%, 2036 | | | 585,000 | | | | 592,061 | |
| New Jersey Health Care Facilities, Financing Authority Rev. (Palisades Medical Center), 6.625%, 2031 | | | 1,115,000 | | | | 1,120,809 | |
| New Jersey Health Care Facilities, Financing Authority Rev. (St. Joseph’s Healthcare System), 6.625%, 2038 | | | 8,000,000 | | | | 9,268,160 | |
| New Mexico Hospital Equipment Loan Council, Hospital Rev. (Rehoboth McKinley Christian Hospital), “A”, 5%, 2017 | | | 400,000 | | | | 400,316 | |
| New Mexico Hospital Equipment Loan Council, Hospital Rev. (Rehoboth McKinley Christian Hospital), “A”, 5.25%, 2026 | | | 1,580,000 | | | | 1,453,363 | |
| New York Dormitory Authority Rev., Non-State Supported Debt (Bronx-Lebanon Hospital Center), LOC, 6.5%, 2030 | | | 1,570,000 | | | | 1,881,457 | |
| New York Dormitory Authority Rev., Non-State Supported Debt (Bronx-Lebanon Hospital Center), LOC, 6.25%, 2035 | | | 975,000 | | | | 1,137,425 | |
| Norfolk, VA, Economic Development Authority Health Care Facilities Rev. (Sentara Healthcare), “B”, 5%, 2043 | | | 2,400,000 | | | | 2,709,600 | |
| Norman, OK, Regional Hospital Authority Rev., 5%, 2027 | | | 1,350,000 | | | | 1,416,785 | |
| Norman, OK, Regional Hospital Authority Rev., 5.375%, 2029 | | | 795,000 | | | | 830,759 | |
| Norman, OK, Regional Hospital Authority Rev., 5.375%, 2036 | | | 6,240,000 | | | | 6,457,651 | |
| Norman, OK, Regional Hospital Authority Rev., 5.125%, 2037 | | | 3,735,000 | | | | 3,859,973 | |
| North Carolina Medical Care Commission Health Care Facilities Rev. (Columbus Regional Healthcare System), “A”, 4%, 2042 | | | 1,000,000 | | | | 991,370 | |
| Northampton County, PA, General Purpose Authority Hospital Rev. (St. Luke’s Hospital), “A”, 5.5%, 2040 | | | 1,075,000 | | | | 1,149,304 | |
| Ohio Higher Educational Facility Commission (University Hospital Health System), “A”, 6.75%, 2015(c) | | | 5,390,000 | | | | 6,053,401 | |
18
Portfolio of Investments – continued
| | | | | | | | |
| Issuer | | Shares/Par | | | Value ($) | |
| Municipal Bonds - continued | | | | | | | | |
| Healthcare Revenue - Hospitals - continued | | | | | | | | |
| Ohio Hospital Rev. (University Hospitals Health System), “A”, 5%, 2041 | | $ | 6,000,000 | | | $ | 6,442,620 | |
| Orange County, FL, Health Facilities Authority Rev. (Orlando Health, Inc.), “A”, 5%, 2042 | | | 4,545,000 | | | | 4,959,504 | |
| Palomar Pomerado Health Care District, CA, COP, 6.75%, 2039 | | | 4,080,000 | | | | 4,666,786 | |
| Philadelphia, PA, Hospitals & Higher Education Facilities Authority Rev. (Temple University Health System), “A”, 5.625%, 2042 | | | 4,700,000 | | | | 5,127,982 | |
| Richmond, IN, Hospital Authority Rev. (Reid Hospital & Health Center Services), “A”, 6.625%, 2039 | | | 4,760,000 | | | | 5,492,326 | |
| Royal Oak, MI, Hospital Finance Authority Rev. (William Beaumont Hospital), 8.25%, 2039 | | | 6,945,000 | | | | 8,835,637 | |
| Salida, CO, Hospital District Rev., 5.25%, 2036 | | | 6,014,000 | | | | 6,145,827 | |
| San Buenaventura, CA, Rev. (Community Memorial Health System), 7.5%, 2041 | | | 6,000,000 | | | | 7,451,640 | |
| Scioto County, OH, Hospital Facilities Rev. (Southern Ohio Medical Center), 5.625%, 2031 | | | 1,370,000 | | | | 1,495,876 | |
| Scioto County, OH, Hospital Facilities Rev. (Southern Ohio Medical Center), 5.75%, 2038 | | | 4,100,000 | | | | 4,476,462 | |
| Shelby County, TN, Health, Educational & Housing Facilities Board Rev. (Methodist Le Bonheur Healthcare), 5%, 2042 | | | 2,030,000 | | | | 2,258,334 | |
Skagit County, WA, Public Hospital District No. 001 Rev.
(Skagit Valley Hospital), 6%, 2023 | | | 795,000 | | | | 817,141 | |
Skagit County, WA, Public Hospital District No. 001 Rev.
(Skagit Valley Hospital), 5.5%, 2030 | | | 2,750,000 | | | | 2,885,850 | |
Skagit County, WA, Public Hospital District No. 001 Rev.
(Skagit Valley Hospital), 5.75%, 2032 | | | 2,205,000 | | | | 2,355,624 | |
| South Carolina Jobs & Economic Development Authority, Hospital Rev. (Palmetto Health), 5.75%, 2039 | | | 940,000 | | | | 1,063,563 | |
| South Dakota Health & Educational Facilities Authority Rev. (Avera Health), “A”, 5%, 2042 | | | 2,285,000 | | | | 2,478,928 | |
| South Dakota Health & Educational Facilities Authority Rev. (Sanford), “E”, 5%, 2037 | | | 1,000,000 | | | | 1,098,570 | |
| South Dakota Health & Educational Facilities Authority Rev. (Sanford), “E”, 5%, 2042 | | | 3,280,000 | | | | 3,569,854 | |
| South Lake County, FL, Hospital District Rev. (South Lake Hospital), “A”, 6%, 2029 | | | 1,155,000 | | | | 1,329,463 | |
| South Lake County, FL, Hospital District Rev. (South Lake Hospital), “A”, 6.25%, 2039 | | | 1,715,000 | | | | 1,971,993 | |
| Southeastern Ohio Port Authority, Hospital Facilities Rev. (Memorial Health System), 5.75%, 2032 | | | 3,725,000 | | | | 4,029,593 | |
| Southeastern Ohio Port Authority, Hospital Facilities Rev. (Memorial Health System), 6%, 2042 | | | 3,830,000 | | | | 4,133,336 | |
19
Portfolio of Investments – continued
| | | | | | | | |
| Issuer | | Shares/Par | | | Value ($) | |
| Municipal Bonds - continued | | | | | | | | |
| Healthcare Revenue - Hospitals - continued | | | | | | | | |
| St. Louis County, MO, Industrial Development Authority, Health Facilities Rev. (Ranken Jordan Project), 5%, 2027 | | $ | 1,350,000 | | | $ | 1,365,174 | |
| St. Louis County, MO, Industrial Development Authority, Health Facilities Rev. (Ranken Jordan Project), 5%, 2035 | | | 1,300,000 | | | | 1,305,668 | |
| Sullivan County, TN, Health, Educational & Housing Facilities Board Hospital Rev. (Wellmont Health Systems Project), RADIAN, 5%, 2017 | | | 2,155,000 | | | | 2,193,682 | |
| Sullivan County, TN, Health, Educational & Housing Facilities Board Hospital Rev. (Wellmont Health Systems Project), “C”, 5.25%, 2036 | | | 6,330,000 | | | | 6,724,992 | |
| Sumner County, TN, Health, Educational & Housing Facilities Board Rev. (Sumner Regional Health Systems, Inc.), “A”, 5.5%, 2022 (a)(d) | | | 685,000 | | | | 1,719 | |
| Sumner County, TN, Health, Educational & Housing Facilities Board Rev. (Sumner Regional Health Systems, Inc.), “A”, 5.5%, 2046 (a)(d) | | | 7,415,000 | | | | 18,612 | |
| Tyler, TX, Health Facilities Development Corp. (East Texas Medical Center), “A”, 5.25%, 2032 | | | 3,515,000 | | | | 3,732,368 | |
| Tyler, TX, Health Facilities Development Corp. (East Texas Medical Center), “A”, 5.375%, 2037 | | | 2,885,000 | | | | 3,022,788 | |
| Upland, CA, COP (San Antonio Community Hospital), 6.375%, 2032 | | | 600,000 | | | | 716,838 | |
| Upper Illinois River Valley Development, Health Facilities Rev. (Morris Hospital), 6.625%, 2031 | | | 1,855,000 | | | | 1,867,354 | |
| Washington Health Care Facilities Authority Rev. (Central Washington Health Services), 6.75%, 2029 | | | 1,550,000 | | | | 1,839,695 | |
| Washington Health Care Facilities Authority Rev. (Central Washington Health Services), 7%, 2039 | | | 3,665,000 | | | | 4,264,961 | |
| Washington Health Care Facilities Authority Rev. (Highline Medical Center), FHA, 6.25%, 2036 | | | 5,670,000 | | | | 6,639,967 | |
| Washington Health Care Facilities Authority Rev. (Virginia Mason Medical Center), “A”, 6.25%, 2042 | | | 5,075,000 | | | | 5,607,672 | |
| Washington Health Care Facilities Authority Rev. (Virginia Mason Medical Center), “B”, ACA, 5.75%, 2037 | | | 1,000,000 | | | | 1,086,470 | |
| West Contra Costa, CA, Healthcare District, AMBAC, 5.5%, 2029 | | | 700,000 | | | | 717,563 | |
West Virginia Hospital Finance Authority, Hospital Rev.
(Thomas Health System), 6.5%, 2038 | | | 3,450,000 | | | | 3,600,110 | |
Wisconsin Health & Educational Facilities Authority Rev.
(Aurora Health Care, Inc.), 6.875%, 2030 | | | 2,250,000 | | | | 2,270,925 | |
Wisconsin Health & Educational Facilities Authority Rev.
(Aurora Health Care, Inc.), “A”, 5%, 2026 | | | 1,830,000 | | | | 2,076,373 | |
Wisconsin Health & Educational Facilities Authority Rev.
(Aurora Health Care, Inc.), “A”, 5%, 2028 | | | 550,000 | | | | 614,972 | |
20
Portfolio of Investments – continued
| | | | | | | | |
| Issuer | | Shares/Par | | | Value ($) | |
| Municipal Bonds - continued | | | | | | | | |
| Healthcare Revenue - Hospitals - continued | | | | | | | | |
| Wisconsin Health & Educational Facilities Authority Rev. (Howard Young Health Care, Inc.), 5%, 2027 | | $ | 5,215,000 | | | $ | 5,611,862 | |
| Wisconsin Health & Educational Facilities Authority Rev. (Howard Young Health Care, Inc.), 5%, 2030 | | | 2,375,000 | | | | 2,519,068 | |
| Wisconsin Health & Educational Facilities Authority Rev. (Marshfield Clinic), “B”, 5%, 2040 | | | 5,000,000 | | | | 5,415,100 | |
Wisconsin Health & Educational Facilities Authority Rev.
(Mercy Alliance), 5%, 2039 | | | 3,885,000 | | | | 4,219,265 | |
Wisconsin Health & Educational Facilities Authority Rev.
(Meritor Hospital), “A”, 5.5%, 2031 | | | 1,855,000 | | | | 2,076,172 | |
Wisconsin Health & Educational Facilities Authority Rev.
(Meritor Hospital), “A”, 6%, 2041 | | | 1,405,000 | | | | 1,613,235 | |
| Wisconsin Health & Educational Facilities Authority Rev. (Wheaton Franciscan Healthcare), 5.25%, 2031 | | | 6,570,000 | | | | 7,015,840 | |
| Wisconsin Health & Educational Facilities Authority Rev. (Wheaton Franciscan Services), 5.25%, 2034 | | | 4,155,000 | | | | 4,434,133 | |
| Wood County, OH, Hospital Facilities Rev. (Wood County Hospital Project), 5%, 2037 | | | 1,595,000 | | | | 1,683,586 | |
| Wood County, OH, Hospital Facilities Rev. (Wood County Hospital Project), 5%, 2042 | | | 1,595,000 | | | | 1,678,355 | |
| | | | | | | | |
| | | | | | | $ | 556,912,277 | |
| Healthcare Revenue - Long Term Care - 9.9% | | | | | | | | |
| ABAG Finance Authority for Non-Profit Corps., CA, Rev. (Episcopal Senior Communities), 6.125%, 2041 | | $ | 4,000,000 | | | $ | 4,688,800 | |
| Abilene, TX, Health Facilities Development Corp., Retirement Facilities Rev. (Sears Methodist Retirement Systems, Inc.), “A”, 6.5%, 2020 | | | 880,000 | | | | 709,157 | |
| Abilene, TX, Health Facilities Development Corp., Retirement Facilities Rev. (Sears Methodist Retirement Systems, Inc.), “A”, 7%, 2033 | | | 5,155,000 | | | | 4,165,652 | |
| Alachua County, FL, Health Facilities Authority, Continuing Care Rev. (Oak Hammock at the University of Florida, Inc.), “A”, 8%, 2032 | | | 1,250,000 | | | | 1,540,025 | |
| Alachua County, FL, Health Facilities Authority, Continuing Care Rev. (Oak Hammock at the University of Florida, Inc.), “A”, 8%, 2042 | | | 2,000,000 | | | | 2,441,620 | |
| Alachua County, FL, Health Facilities Authority, Continuing Care Rev. (Oak Hammock at the University of Florida, Inc.), “A”, 8%, 2046 | | | 1,000,000 | | | | 1,210,570 | |
| Arizona Health Facilities Authority Rev. (The Terraces Project), 7.75%, 2013 (c) | | | 2,250,000 | | | | 2,402,370 | |
21
Portfolio of Investments – continued
| | | | | | | | |
| Issuer | | Shares/Par | | | Value ($) | |
| Municipal Bonds - continued | | | | | | | | |
| Healthcare Revenue - Long Term Care - continued | | | | | |
Bell County, TX, Health Facility Development Corp.
(Advanced Living Technologies, Inc.), 8%, 2036 (a)(d) | | $ | 4,650,000 | | | $ | 3,022,500 | |
| Bucks County, PA, Industrial Development Authority Retirement Community Rev. (Ann’s Choice, Inc.), “A”, 6.125%, 2025 | | | 1,320,000 | | | | 1,334,348 | |
| Bucks County, PA, Industrial Development Authority Retirement Community Rev. (Ann’s Choice, Inc.), “A”, 6.25%, 2035 | | | 2,590,000 | | | | 2,612,688 | |
| Bucks County, PA, Industrial Development Authority Rev. (Lutheran Community Telford Center), 5.75%, 2027 | | | 620,000 | | | | 636,945 | |
| Bucks County, PA, Industrial Development Authority Rev. (Lutheran Community Telford Center), 5.75%, 2037 | | | 800,000 | | | | 809,416 | |
| California Statewide Communities Development Authority Rev. (American Baptist Homes of the West), 6.25%, 2039 | | | 2,985,000 | | | | 3,385,050 | |
| California Statewide Communities Development Authority Rev. (American Baptist Homes of the West), “A”, 5%, 2043 | | | 1,095,000 | | | | 1,177,388 | |
| California Statewide Communities Development Authority Rev. (Episcopal Communities & Services for Seniors Obligated Group), 5%, 2027 | | | 205,000 | | | | 232,122 | |
| California Statewide Communities Development Authority Rev. (Episcopal Communities & Services for Seniors Obligated Group), 5%, 2032 | | | 265,000 | | | | 295,578 | |
| California Statewide Communities Development Authority Rev. (Episcopal Communities & Services for Seniors Obligated Group), 5%, 2042 | | | 620,000 | | | | 681,752 | |
| California Statewide Communities Development Authority Rev. (Eskaton Properties, Inc.), 5.25%, 2034 | | | 2,850,000 | | | | 3,057,024 | |
| California Statewide Communities Development Authority Rev. (Southern California Presbyterian Homes), 7%, 2029 | | | 1,400,000 | | | | 1,653,456 | |
| California Statewide Communities Development Authority Rev. (Southern California Presbyterian Homes), 7.25%, 2041 | | | 560,000 | | | | 652,607 | |
| California Statewide Communities Development Authority Rev. (The Terraces at San Joaquin Gardens), “A”, 5.625%, 2032 | | | 1,000,000 | | | | 1,063,880 | |
| California Statewide Communities Development Authority Rev. (The Terraces at San Joaquin Gardens), “A”, 6%, 2042 | | | 1,000,000 | | | | 1,082,140 | |
| Carmel, IN, Rev. (Barrington of Carmel Project), “A”, 7.125%, 2042 | | | 3,000,000 | | | | 3,267,390 | |
| Carmel, IN, Rev. (Barrington of Carmel Project), “A”, 7.125%, 2047 | | | 3,000,000 | | | | 3,253,470 | |
| Chartiers Valley, PA, Industrial & Commercial Development Authority (Asbury Health Center Project), 5.75%, 2022 | | | 500,000 | | | | 516,900 | |
Chester County, PA, Industrial Development Authority Rev.
(RHA Nursing Home), 8.5%, 2032 | | | 875,000 | | | | 851,051 | |
| Colorado Health Facilities Authority Rev. (American Baptist Homes), “A”, 5.9%, 2037 | | | 2,730,000 | | | | 2,763,170 | |
22
Portfolio of Investments – continued
| | | | | | | | |
| Issuer | | Shares/Par | | | Value ($) | |
| Municipal Bonds - continued | | | | | | | | |
| Healthcare Revenue - Long Term Care - continued | | | | | |
| Colorado Health Facilities Authority Rev. (Christian Living Communities Project), “A”, 5.75%, 2037 | | $ | 2,650,000 | | | $ | 2,830,863 | |
| Colorado Health Facilities Authority Rev. (Christian Living Communities Project), 5.125%, 2030 | | | 550,000 | | | | 591,685 | |
| Colorado Health Facilities Authority Rev. (Christian Living Communities Project), 5.25%, 2037 | | | 785,000 | | | | 836,669 | |
| Colorado Health Facilities Authority Rev. (Christian Living Communities Project), 6.375%, 2041 | | | 1,620,000 | | | | 1,847,156 | |
| Colorado Health Facilities Authority Rev. (Covenant Retirement Communities, Inc.), “A”, 5%, 2033 | | | 4,345,000 | | | | 4,661,968 | |
| Colorado Health Facilities Authority Rev. (Evangelical Lutheran Good Samaritan Society Project), 5%, 2042 | | | 6,620,000 | | | | 7,222,089 | |
| Colorado Health Facilities Authority Rev. (Total Longterm Care, Inc.),“A”, 6%, 2030 | | | 700,000 | | | | 782,320 | |
| Colorado Health Facilities Authority Rev. (Total Longterm Care, Inc.),“A”, 6.25%, 2040 | | | 1,150,000 | | | | 1,279,157 | |
| Cumberland County, PA, Municipal Authority Rev. (Asbury Atlantic, Inc.), 6%, 2030 | | | 1,035,000 | | | | 1,135,229 | |
| Cumberland County, PA, Municipal Authority Rev. (Asbury Atlantic, Inc.), 6%, 2040 | | | 2,495,000 | | | | 2,721,097 | |
| Cumberland County, PA, Municipal Authority Rev. (Asbury Atlantic, Inc.), 5.25%, 2041 | | | 965,000 | | | | 988,392 | |
| Cumberland County, PA, Municipal Authority Rev. (Asbury Atlantic, Inc.), 6.125%, 2045 | | | 7,220,000 | | | | 7,918,391 | |
| Cumberland County, PA, Municipal Authority Rev. (Diakon Lutheran Social Ministries), 6.125%, 2029 | | | 905,000 | | | | 1,016,858 | |
| Cumberland County, PA, Municipal Authority Rev. (Diakon Lutheran Social Ministries), 6.35%, 2029 | | | 435,000 | | | | 444,918 | |
| Cumberland County, PA, Municipal Authority Rev. (Diakon Lutheran Social Ministries), 6.375%, 2039 | | | 7,060,000 | | | | 7,890,609 | |
| Cumberland County, PA, Municipal Authority Rev. (Diakon Lutheran Social Ministries), 6.5%, 2039 | | | 325,000 | | | | 331,819 | |
| Fulton County, GA, Residential Care Facilities, Elderly Authority Rev. (Canterbury Court), “A”, 6.125%, 2034 | | | 1,020,000 | | | | 1,041,032 | |
| Georgia Medical Center Hospital Authority Rev. (Spring Harbor Green Island Project), 5.25%, 2037 | | | 4,510,000 | | | | 4,509,775 | |
| Hawaii Department of Budget & Finance, Special Purpose Rev. (15 Craigside Project), “A”, 8.75%, 2029 | | | 415,000 | | | | 495,058 | |
| Hawaii Department of Budget & Finance, Special Purpose Rev. (15 Craigside Project), “A”, 9%, 2044 | | | 1,190,000 | | | | 1,425,073 | |
| Hawaii Department of Budget & Finance, Special Purpose Rev. (Kahala Nui Senior Living Community), 8%, 2013 (c) | | | 1,600,000 | | | | 1,727,424 | |
23
Portfolio of Investments – continued
| | | | | | | | |
| Issuer | | Shares/Par | | | Value ($) | |
| Municipal Bonds - continued | | | | | | | | |
| Healthcare Revenue - Long Term Care - continued | | | | | |
| Hawaii Department of Budget & Finance, Special Purpose Senior Living Rev. (Kahala Nui), 5.125%, 2032 | | $ | 1,215,000 | | | $ | 1,330,826 | |
| Hawaii Department of Budget & Finance, Special Purpose Senior Living Rev. (Kahala Nui), 5.25%, 2037 | | | 1,085,000 | | | | 1,171,898 | |
| Huntsville-Redstone Village, AL, Special Care Facilities Financing Authority (Redstone Village Project), 5.5%, 2028 | | | 1,540,000 | | | | 1,550,118 | |
| Huntsville-Redstone Village, AL, Special Care Facilities Financing Authority (Redstone Village Project), 5.5%, 2043 | | | 1,560,000 | | | | 1,532,950 | |
| Illinois Finance Authority Rev. (Christian Homes, Inc.), 6.125%, 2027 | | | 4,150,000 | | | | 4,679,457 | |
| Illinois Finance Authority Rev. (Evangelical Retirement Homes of Greater Chicago, Inc.), 7.25%, 2045 | | | 3,600,000 | | | | 3,991,788 | |
| Illinois Finance Authority Rev. (Franciscan Communities, Inc.), “A”, 5.5%, 2027 | | | 1,600,000 | | | | 1,645,216 | |
| Illinois Finance Authority Rev. (Franciscan Communities, Inc.), “A”, 5.5%, 2037 | | | 3,890,000 | | | | 3,962,237 | |
| Illinois Finance Authority Rev. (Friendship Village), “A”, 5.375%, 2025 | | | 4,630,000 | | | | 4,678,106 | |
| Illinois Finance Authority Rev. (Lutheran Home & Services), 5.625%, 2042 | | | 3,110,000 | | | | 3,250,292 | |
| Illinois Finance Authority Rev. (Montgomery Place), “A”, 5.75%, 2038 | | | 1,730,000 | | | | 1,747,784 | |
| Illinois Finance Authority Rev. (The Clare at Water Tower), “A-6”, 6%, 2028 (a)(d) | | | 1,057,000 | | | | 106 | |
| Illinois Finance Authority Rev., Capital Appreciation, (The Clare at Water Tower), “B”, 0%, 2050 (a) | | | 453,000 | | | | 45 | |
| Indiana Finance Authority Rev. (Marquette Project), 4.75%, 2032 | | | 4,790,000 | | | | 4,957,650 | |
| Indiana Finance Authority Rev. (Marquette Project), 5%, 2039 | | | 1,215,000 | | | | 1,270,854 | |
Iowa Finance Authority, Health Care Facilities Rev.
(Care Initiatives), “A”, 5.5%, 2021 | | | 1,530,000 | | | | 1,650,855 | |
Iowa Finance Authority, Health Care Facilities Rev.
(Care Initiatives), “A”, 5.5%, 2025 | | | 2,495,000 | | | | 2,680,354 | |
Iowa Finance Authority, Health Care Facilities Rev.
(Care Initiatives), “B”, 5.75%, 2018 | | | 1,635,000 | | | | 1,639,022 | |
| James City County, VA, Economic Development (WindsorMeade Project), “A”, 5.4%, 2027 (a) | | | 2,180,000 | | | | 1,596,523 | |
| James City County, VA, Economic Development (WindsorMeade Project), “A”, 5.5%, 2037 (a) | | | 2,710,000 | | | | 1,975,726 | |
Kalamazoo, MI, Economic Development Corp. Rev.
(Heritage Community), 5.375%, 2027 | | | 750,000 | | | | 737,108 | |
Kalamazoo, MI, Economic Development Corp. Rev.
(Heritage Community), 5.5%, 2036 | | | 2,550,000 | | | | 2,468,502 | |
24
Portfolio of Investments – continued
| | | | | | | | |
| Issuer | | Shares/Par | | | Value ($) | |
| Municipal Bonds - continued | | | | | | | | |
| Healthcare Revenue - Long Term Care - continued | | | | | |
| Kentucky Economic Development Finance Authority Health Care Rev. (Masonic Homes of Kentucky, Inc.), 5.375%, 2042 | | $ | 2,335,000 | | | $ | 2,374,765 | |
| Kentucky Economic Development Finance Authority Health Care Rev. (Masonic Homes of Kentucky, Inc.), 5.5%, 2045 | | | 1,325,000 | | | | 1,345,909 | |
| Kentucky Economic Development Finance Authority Rev. (Masonic Home Independent Living II), 7.25%, 2041 | | | 3,000,000 | | | | 3,477,150 | |
| Kentucky Economic Development Finance Authority Rev. (Masonic Home Independent Living II), 7.375%, 2046 | | | 1,050,000 | | | | 1,221,182 | |
| Kentwood, MI, Economic Development Corp. Rev. (Holland Home Obligated Group), 5.625%, 2041 | | | 3,250,000 | | | | 3,403,953 | |
| Lee County, FL, Industrial Development Authority Healthcare Facilities Rev. (Shell Point Alliance), “B”, 6.5%, 2031 | | | 1,600,000 | | | | 1,771,392 | |
| Lenexa, KS, Health Care Facilities Rev. (Lakeview Village, Inc.), 5.375%, 2027 | | | 1,185,000 | | | | 1,225,788 | |
| Lenexa, KS, Health Care Facilities Rev. (Lakeview Village, Inc.), 7.125%, 2029 | | | 1,555,000 | | | | 1,762,313 | |
| Lenexa, KS, Health Care Facilities Rev. (Lakeview Village, Inc.), 5.5%, 2039 | | | 2,325,000 | | | | 2,361,038 | |
| Maryland Health & Higher Educational Facilities Authority Rev. (Charlestown Community), 6.25%, 2041 | | | 2,360,000 | | | | 2,711,569 | |
| Massachusetts Development Finance Agency Rev. (Adventcare), “A”, 6.75%, 2037 | | | 4,640,000 | | | | 4,902,114 | |
| Massachusetts Development Finance Agency Rev. (Linden Ponds, Inc.), “A-1”, 6.25%, 2031 | | | 869,621 | | | | 712,707 | |
| Massachusetts Development Finance Agency Rev. (Linden Ponds, Inc.), “A-1”, 6.25%, 2039 | | | 218,601 | | | | 168,983 | |
| Massachusetts Development Finance Agency Rev. (Linden Ponds, Inc.), “A-2”, 5.5%, 2046 | | | 58,153 | | | | 39,083 | |
| Massachusetts Development Finance Agency Rev. (Linden Ponds, Inc.), Capital Appreciation, “B”, 0%, 2056 | | | 289,249 | | | | 4,090 | |
| Massachusetts Development Finance Agency Rev. (The Groves in Lincoln), “A”, 7.75%, 2039 | | | 680,000 | | | | 323,877 | |
| Massachusetts Development Finance Agency Rev. (The Groves in Lincoln), “A”, 7.875%, 2044 | | | 1,010,000 | | | | 480,982 | |
| Michigan Strategic Fund Ltd. Obligation Rev. (Evangelical Homes), 5.25%, 2032 | | | 1,310,000 | | | | 1,317,572 | |
| Michigan Strategic Fund Ltd. Obligation Rev. (Evangelical Homes), 5.5%, 2047 | | | 2,400,000 | | | | 2,413,704 | |
| Montgomery County, OH, Health Care & Multifamily Housing Rev. (St. Leonard), 6.375%, 2030 | | | 2,235,000 | | | | 2,520,834 | |
| Montgomery County, OH, Health Care & Multifamily Housing Rev. (St. Leonard), 6.625%, 2040 | | | 3,230,000 | | | | 3,649,932 | |
25
Portfolio of Investments – continued
| | | | | | | | |
| Issuer | | Shares/Par | | | Value ($) | |
| Municipal Bonds - continued | | | | | | | | |
| Healthcare Revenue - Long Term Care - continued | | | | | |
| Montgomery County, PA, Higher Education & Health Authority Rev. (AHF/Montgomery), 6.875%, 2036 | | $ | 3,700,000 | | | $ | 3,877,896 | |
| Montgomery County, PA, Industrial Development Authority Rev. (Whitemarsh Continuing Care), 6.125%, 2028 | | | 1,850,000 | | | | 1,885,428 | |
| Montgomery County, PA, Industrial Development Authority Rev. (Whitemarsh Continuing Care), 6.25%, 2035 | | | 1,490,000 | | | | 1,516,373 | |
| Nassau County, NY, Industrial Development Agency Continuing Care (Amsterdam at Harborside), 6.7%, 2043 | | | 2,610,000 | | | | 1,712,813 | |
| New Hampshire Health & Education Facilities Authority Rev. (Rivermead), “A”, 6.875%, 2041 | | | 2,625,000 | | | | 2,978,535 | |
| New Jersey Economic Development Authority Rev. (Lions Gate), “A”, 5.75%, 2025 | | | 475,000 | | | | 483,707 | |
| New Jersey Economic Development Authority Rev. (Lions Gate), “A”, 5.875%, 2037 | | | 2,830,000 | | | | 2,852,838 | |
| New Jersey Economic Development Authority Rev. (Seabrook Village, Inc.), 5.25%, 2036 | | | 2,735,000 | | | | 2,815,874 | |
Norfolk, VA, Redevelopment & Housing Authority Rev.
(Fort Norfolk Retirement Community), “A”, 6%, 2025 | | | 785,000 | | | | 790,299 | |
Norfolk, VA, Redevelopment & Housing Authority Rev.
(Fort Norfolk Retirement Community), “A”, 6.125%, 2035 | | | 3,530,000 | | | | 3,552,416 | |
| Oklahoma County, OK, Finance Authority Rev. (Epworth Villa Project), “A”, 5.125%, 2042 | | | 3,735,000 | | | | 3,763,237 | |
| Pell City, AL, Special Care Facilities, Financing Authority Rev. (Noland Health Services, Inc.), 5%, 2039 | | | 1,670,000 | | | | 1,777,682 | |
Sarasota County, FL, Health Facility Authority Rev.
(Sarasota Manatee), 5.75%, 2037 | | | 2,390,000 | | | | 2,150,450 | |
Sarasota County, FL, Health Facility Authority Rev.
(Sarasota Manatee), 5.75%, 2045 | | | 395,000 | | | | 348,876 | |
| Scott County, IA, Rev. (Christian Retirement Homes, Inc.), 5.25%, 2021 | | | 2,410,000 | | | | 2,517,944 | |
| Shelby County, TN, Health, Educational & Housing Facilities Board Rev. (Germantown Village), “A”, 7.25%, 2034 | | | 1,250,000 | | | | 1,319,775 | |
| South Carolina Jobs & Economic Development Authority Rev. (Woodlands at Furman), “A”, 6%, 2032 | | | 1,311,828 | | | | 913,885 | |
| South Carolina Jobs & Economic Development Authority Rev. (Woodlands at Furman), “A”, 6%, 2047 | | | 2,987,260 | | | | 1,946,140 | |
| South Carolina Jobs & Economic Development Authority Rev. (Woodlands at Furman), Capital Appreciation, “B”, 0%, 2047 | | | 562,212 | | | | 11,081 | |
| South Carolina Jobs & Economic Development Authority Rev. (Woodlands at Furman), Capital Appreciation, “B”, 0%, 2047 | | | 516,379 | | | | 10,178 | |
| St. John’s County, FL, Industrial Development Authority (Bayview Project), “A”, 5.2%, 2027 | | | 1,590,000 | | | | 1,442,496 | |
26
Portfolio of Investments – continued
| | | | | | | | |
| Issuer | | Shares/Par | | | Value ($) | |
| Municipal Bonds - continued | | | | | | | | |
| Healthcare Revenue - Long Term Care - continued | | | | | |
| St. John’s County, FL, Industrial Development Authority (Bayview Project), “A”, 5.25%, 2041 | | $ | 2,800,000 | | | $ | 2,356,928 | |
| St. John’s County, FL, Industrial Development Authority Rev. (Presbyterian Retirement), “A”, 6%, 2045 | | | 7,715,000 | | | | 8,779,901 | |
| St. Louis County, MO, Industrial Development Authority, Senior Living Facilities Rev. (Friendship Village Sunset Hills), 5%, 2032 | | | 1,120,000 | | | | 1,209,242 | |
| St. Louis County, MO, Industrial Development Authority, Senior Living Facilities Rev. (Friendship Village Sunset Hills), 5%, 2042 | | | 2,000,000 | | | | 2,110,460 | |
| Suffolk County, NY, Industrial Development Agency (Medford Hamlet Assisted Living), 6.375%, 2039 | | | 1,500,000 | | | | 1,478,385 | |
| Tarrant County, TX, Cultural Education Facilities Finance Corp. Retirement Facility (Air Force Village Foundation, Inc.), 5.75%, 2019 | | | 500,000 | | | | 556,800 | |
| Tarrant County, TX, Cultural Education Facilities Finance Corp. Retirement Facility (Air Force Village Foundation, Inc.), 6.125%, 2029 | | | 520,000 | | | | 583,684 | |
| Tarrant County, TX, Cultural Education Facilities Finance Corp. Retirement Facility (Air Force Village Foundation, Inc.), 5.125%, 2037 | | | 835,000 | | | | 848,226 | |
| Tarrant County, TX, Cultural Education Facilities Finance Corp. Retirement Facility (Air Force Village Foundation, Inc.), 6.375%, 2044 | | | 3,515,000 | | | | 3,887,414 | |
| Tarrant County, TX, Cultural Education Facilities Finance Corp. Retirement Facility (Stayton at Museum Way), 8.25%, 2044 | | | 6,750,000 | | | | 7,532,933 | |
| Tempe, AZ, Industrial Development Authority Rev. (Friendship Village), “A”, 6.25%, 2042 | | | 1,675,000 | | | | 1,832,752 | |
| Tempe, AZ, Industrial Development Authority Rev. (Friendship Village), “A”, 6.25%, 2046 | | | 1,275,000 | | | | 1,393,167 | |
| Terre Haute, IN, Rev. (Westminster Village), 6%, 2039 | | | 3,600,000 | | | | 3,644,100 | |
| Travis County, TX, Health Facilities Development Corp. Rev. (Westminster Manor Health), 7%, 2030 | | | 3,940,000 | | | | 4,731,349 | |
| Travis County, TX, Health Facilities Development Corp. Rev. (Westminster Manor Health), 7.125%, 2040 | | | 3,560,000 | | | | 4,249,430 | |
| Travis County, TX, Health Facilities Development Corp., Retirement Facilities Rev. (Querencia Barton Creek), 5.5%, 2025 | | | 1,440,000 | | | | 1,493,093 | |
| Tulsa County, OK, Industrial Authority, Senior Living Community Rev. (Montereau, Inc.), “A”, 7.25%, 2040 | | | 3,250,000 | | | | 3,670,290 | |
| Tulsa County, OK, Industrial Authority, Senior Living Community Rev. (Montereau, Inc.), “A”, 7.25%, 2045 | | | 3,500,000 | | | | 3,939,075 | |
Ulster County, NY, Industrial Development Agency
(Woodland Pond), “A”, 6%, 2037 | | | 3,925,000 | | | | 2,658,089 | |
| Upper Illinois River Valley Development Authority (Pleasant View Lutheran Home), 7.25%, 2040 | | | 1,080,000 | | | | 1,171,163 | |
27
Portfolio of Investments – continued
| | | | | | | | |
| Issuer | | Shares/Par | | | Value ($) | |
| Municipal Bonds - continued | | | | | | | | |
| Healthcare Revenue - Long Term Care - continued | | | | | |
| Upper Illinois River Valley Development Authority (Pleasant View Lutheran Home), 7.375%, 2045 | | $ | 1,250,000 | | | $ | 1,355,413 | |
| Wisconsin Health & Educational Facilities Authority Rev. (American Eagle Nursing Home), 7.15%, 2028 | | | 3,555,000 | | | | 3,834,316 | |
Wisconsin Health & Educational Facilities Authority Rev.
(St. John’s Community, Inc.), “A”, 7.25%, 2029 | | | 485,000 | | | | 565,937 | |
Wisconsin Health & Educational Facilities Authority Rev.
(St. John’s Community, Inc.), “A”, 7.625%, 2039 | | | 1,960,000 | | | | 2,279,990 | |
| | | | | | | | |
| | | | | | | $ | 292,741,065 | |
| Healthcare Revenue - Other - 0.1% | | | | | | | | |
| Koyukuk, AK, Tanana Chiefs Conference, Healthcare Facilities Project, 7.75%, 2041 | | $ | 3,315,000 | | | $ | 3,775,122 | |
| | |
| Human Services - 0.5% | | | | | | | | |
| Alaska Industrial Development & Export Authority, Community Provider Rev. (Boys & Girls Home of Alaska, Inc.), 5.875%, 2027 (a)(d) | | $ | 3,790,000 | | | $ | 1,705,500 | |
| Alaska Industrial Development & Export Authority, Community Provider Rev. (Boys & Girls Home of Alaska, Inc.), 6%, 2036 (a)(d) | | | 1,175,000 | | | | 528,750 | |
| Louisiana Local Government, Environmental Facilities & Community Development Authority Rev. (CDF Healthcare), “A”, 7%, 2036 | | | 1,535,000 | | | | 1,567,956 | |
| Louisiana Local Government, Environmental Facilities & Community Development Authority Rev. (CDF Healthcare), “C”, 7%, 2036 | | | 1,270,000 | | | | 1,291,565 | |
| Louisiana Local Government, Environmental Facilities & Community Development Authority Rev. (Westside Rehab Center Project), “A”, 6.85%, 2036 | | | 3,415,000 | | | | 3,528,993 | |
| Montgomery County, PA, Industrial Development Authority (Wordsworth Academy), 8%, 2024 | | | 2,850,000 | | | | 2,852,508 | |
| Orange County, FL, Health Facilities Authority Rev. (GF/Orlando Healthcare Facilities), 8.875%, 2021 | | | 1,785,000 | | | | 1,789,802 | |
| Orange County, FL, Health Facilities Authority Rev. (GF/Orlando Healthcare Facilities), 9%, 2031 | | | 1,945,000 | | | | 1,947,217 | |
| Osceola County, FL, Industrial Development Authority Rev. (Community Provider), 7.75%, 2017 | | | 198,000 | | | | 199,146 | |
| | | | | | | | |
| | | | | | | $ | 15,411,437 | |
28
Portfolio of Investments – continued
| | | | | | | | |
| Issuer | | Shares/Par | | | Value ($) | |
| Municipal Bonds - continued | | | | | | | | |
| Industrial Revenue - Airlines - 4.0% | | | | | | | | |
| Clayton County, GA, Development Authority Special Facilities Rev. (Delta Airlines, Inc.), “A”, 8.75%, 2029 | | $ | 4,070,000 | | | $ | 5,118,188 | |
| Clayton County, GA, Development Authority Special Facilities Rev. (Delta Airlines, Inc.), “B”, 9%, 2035 | | | 1,310,000 | | | | 1,466,440 | |
| Denver, CO, City & County Airport Rev. (United Airlines), 5.25%, 2032 | | | 13,545,000 | | | | 13,824,027 | |
| Denver, CO, City & County Airport Rev. (United Airlines), 5.75%, 2032 | | | 3,460,000 | | | | 3,617,430 | |
| Houston, TX, Airport Systems Rev., Special Facilities (Continental Airlines, Inc. Terminal E project), 6.75%, 2021 | | | 2,500,000 | | | | 2,512,050 | |
| Houston, TX, Airport Systems Rev., Special Facilities (Continental Airlines, Inc. Terminal E project), 7.375%, 2022 | | | 1,100,000 | | | | 1,105,830 | |
| Houston, TX, Airport Systems Rev., Special Facilities (Continental Airlines, Inc. Terminal E project), 6.75%, 2029 | | | 16,365,000 | | | | 16,411,313 | |
| Houston, TX, Airport Systems Rev., Special Facilities (Continental Airlines, Inc. Terminal E project), 7%, 2029 | | | 1,830,000 | | | | 1,835,490 | |
| Houston, TX, Airport Systems Rev., Special Facilities (Continental Airlines, Inc.), 6.625%, 2038 | | | 5,630,000 | | | | 6,307,233 | |
| Los Angeles, CA, Regional Airports Improvement Corp. Lease Rev. (American Airlines, Inc.), “C”, 7.5%, 2024 (d) | | | 11,735,000 | | | | 11,926,750 | |
| New Jersey Economic Development Authority, Special Facilities Rev. (Continental Airlines, Inc.), 4.875%, 2019 | | | 13,725,000 | | | | 14,094,889 | |
| New Jersey Economic Development Authority, Special Facilities Rev. (Continental Airlines, Inc.), 5.125%, 2023 | | | 5,870,000 | | | | 6,026,846 | |
| New Jersey Economic Development Authority, Special Facilities Rev. (Continental Airlines, Inc.), 5.25%, 2029 (b) | | | 5,770,000 | | | | 5,879,976 | |
| New York, NY, City Industrial Development Agency Special Facility Rev. (American Airlines, Inc. - JFK International Airport), 7.625%, 2025 (d)(q) | | | 13,310,000 | | | | 15,189,904 | |
| New York, NY, City Industrial Development Agency Special Facility Rev. (American Airlines, Inc. - JFK International Airport), 7.75%, 2031 (d)(q) | | | 8,045,000 | | | | 9,269,288 | |
| Port Seattle, WA, Industrial Development Corp., Special Facilities Rev. (Delta Airlines, Inc.), 5%, 2030 | | | 4,000,000 | | | | 4,057,040 | |
| | | | | | | | |
| | | | | | | $ | 118,642,694 | |
| Industrial Revenue - Chemicals - 1.2% | | | | | | | | |
| Brazos River, TX, Harbor Navigation District (Dow Chemical Co.), “A”, 5.95%, 2033 | | $ | 8,190,000 | | | $ | 9,383,611 | |
| Brazos River, TX, Harbor Navigation District (Dow Chemical Co.), “B-2”, 4.95%, 2033 | | | 1,625,000 | | | | 1,761,370 | |
| Giles County, VA, Industrial Development Authority Rev. (Celanese Corp.), 6.45%, 2026 | | | 1,000,000 | | | | 1,001,260 | |
29
Portfolio of Investments – continued
| | | | | | | | |
| Issuer | | Shares/Par | | | Value ($) | |
| Municipal Bonds - continued | | | | | | | | |
| Industrial Revenue - Chemicals - continued | | | | | | | | |
| Louisiana Environmental Facilities & Community Development Authority Rev. (Westlake Chemical), 6.75%, 2032 | | $ | 4,800,000 | | | $ | 5,459,712 | |
| Louisiana Environmental Facilities & Community Development Authority Rev. (Westlake Chemical), “A”, 6.5%, 2029 | | | 2,990,000 | | | | 3,578,611 | |
| Louisiana Environmental Facilities & Community Development Authority Rev. (Westlake Chemical), “A-2”, 6.5%, 2035 | | | 4,000,000 | | | | 4,780,160 | |
| Port of Bay, TX, City Authority (Hoechst Celanese Corp.), 6.5%, 2026 | | | 2,500,000 | | | | 2,503,150 | |
| Red River Authority, TX, Pollution Control Rev. (Celanese Project) “A”, 6.45%, 2030 | | | 430,000 | | | | 436,067 | |
| Red River Authority, TX, Pollution Control Rev. (Celanese Project) “B”, 6.7%, 2030 | | | 5,380,000 | | | | 5,455,320 | |
| York County, SC, Industrial Rev. (Hoechst Celanese), 5.7%, 2024 | | | 130,000 | | | | 130,126 | |
| | | | | | | | |
| | | | | | | $ | 34,489,387 | |
| Industrial Revenue - Environmental Services - 1.3% | | | | | | | | |
| Cobb County, GA, Development Authority, Solid Waste Disposal Rev. (Waste Management, Inc.), “A”, 5%, 2033 | | $ | 1,590,000 | | | $ | 1,685,575 | |
| Colorado Housing & Finance Authority, Solid Waste Rev. (Waste Management, Inc.), 5.7%, 2018 | | | 540,000 | | | | 646,466 | |
| Gulf Coast Waste Disposal Authority (Waste Management, Inc.), 5.2%, 2028 | | | 3,260,000 | | | | 3,513,432 | |
| Maine Finance Authority Solid Waste Disposal Rev. (Casella Waste Systems, Inc.), 6.25%, 2025 (b) | | | 3,985,000 | | | | 4,090,722 | |
| Massachusetts Development Finance Agency, Resource Recovery Rev. (Covanta Energy Project), “A”, 4.875%, 2027 | | | 3,585,000 | | | | 3,640,030 | |
| Massachusetts Development Finance Agency, Resource Recovery Rev. (Covanta Energy Project), “C”, 5.25%, 2042 | | | 11,780,000 | | | | 12,152,484 | |
| Niagara County, NY, Industrial Development Agency, Solid Waste Disposal Rev. (Covanta Energy Project), “A”, 5.25%, 2042 | | | 12,055,000 | | | | 12,436,179 | |
| | | | | | | | |
| | | | | | | $ | 38,164,888 | |
| Industrial Revenue - Other - 1.1% | | | | | | | | |
| Bayonne, NJ, Redevelopment Agency (Royal Caribbean Project), “A”, 5.375%, 2035 | | $ | 2,500,000 | | | $ | 2,515,325 | |
| California Statewide Communities, Development Authority Environmental Facilities (Microgy Holdings), 9%, 2038 (a)(d) | | | 100,980 | | | | 1,010 | |
| Gulf Coast, TX, Industrial Development Authority Rev. (CITGO Petroleum Corp.), 4.875%, 2025 | | | 4,640,000 | | | | 4,712,987 | |
| Gulf Coast, TX, Industrial Development Authority Rev. (Microgy Holdings LLC Project), 7%, 2036 (a)(d) | | | 746,831 | | | | 7,468 | |
| Houston, TX, Industrial Development Corp. (United Parcel Service, Inc.), 6%, 2023 | | | 245,000 | | | | 245,252 | |
30
Portfolio of Investments – continued
| | | | | | | | |
| Issuer | | Shares/Par | | | Value ($) | |
| Municipal Bonds - continued | | | | | | | | |
| Industrial Revenue - Other - continued | | | | | | | | |
| Liberty, NY, Development Corp. Rev. (Goldman Sachs Headquarters), 5.25%, 2035 | | $ | 3,430,000 | | | $ | 4,093,328 | |
| New Jersey Economic Development Authority Rev. (GMT Realty LLC), “B”, 6.875%, 2037 | | | 1,570,000 | | | | 1,590,598 | |
| New Jersey Economic Development Authority Rev. (GMT Realty LLC), “C”, 6.5%, 2015 | | | 810,000 | | | | 816,310 | |
| New York, NY, City Industrial Development Agency Rev., Liberty Bonds (IAC/InterActiveCorp), 5%, 2035 | | | 4,880,000 | | | | 5,069,637 | |
| Park Creek Metropolitan District, CO, Rev. (Custodial Receipts), “CR-1”, 7.875%, 2032 (b)(n) | | | 4,205,000 | | | | 4,257,058 | |
| Park Creek Metropolitan District, CO, Rev. (Custodial Receipts), “CR-2”, 7.875%, 2032 (b)(n) | | | 1,850,000 | | | | 1,872,903 | |
| Peninsula Ports Authority, VA, Coal Terminal Rev. (Dominion Terminal Associates), 6%, 2033 | | | 530,000 | | | | 536,593 | |
| Philadelphia, PA, Industrial Development Authority Rev. (Host Marriott LP), 7.75%, 2017 | | | 2,000,000 | | | | 2,005,020 | |
| St. Charles Parish, LA, Gulf Zone Opportunity Zone Rev. (Valero Energy Corp.), 4%, 2040 (b) | | | 5,655,000 | | | | 6,247,305 | |
| | | | | | | | |
| | | | | | | $ | 33,970,794 | |
| Industrial Revenue - Paper - 1.1% | | | | | | | | |
| Arkansas Development Finance Authority, Industrial Facilities Rev. (Potlatch Corp.), “A”, 7.75%, 2025 | | $ | 1,200,000 | | | $ | 1,225,656 | |
| Butler, AL, Industrial Development Board, Solid Waste Disposal Rev. (Georgia-Pacific Corp.), 5.75%, 2028 | | | 4,010,000 | | | | 4,159,212 | |
| Cass County, TX, Industrial Development Corp. (International Paper Co.), “A”, 4.625%, 2027 | | | 3,750,000 | | | | 3,841,425 | |
| De Soto Parish, LA, Environmental Improvement Rev. (International Paper Co.), 6.35%, 2025 | | | 1,650,000 | | | | 1,657,640 | |
| Escambia County, FL, Environmental Improvement Rev. (International Paper Co.), “A”, 4.75%, 2030 | | | 1,940,000 | | | | 1,941,377 | |
| Phenix City, AL, Industrial Development Board Environmental Improvement Rev. (MeadWestvaco Coated Board Project), “A”, 4.125%, 2035 | | | 1,785,000 | | | | 1,755,512 | |
| Rockdale County, GA, Development Authority Project Rev. (Visy Paper Project), “A”, 6.125%, 2034 | | | 4,835,000 | | | | 5,053,445 | |
| Sabine River, LA, Water Facilities Authority Rev. (International Paper Co.), 6.2%, 2025 | | | 2,250,000 | | | | 2,260,170 | |
| Selma, AL, Industrial Development Board Rev., Gulf Opportunity Zone (International Paper Co.), “A”, 6.25%, 2033 | | | 6,750,000 | | | | 7,685,888 | |
| Selma, AL, Industrial Development Board Rev., Gulf Opportunity Zone (International Paper Co.), “A”, 5.375%, 2035 | | | 1,635,000 | | | | 1,810,893 | |
31
Portfolio of Investments – continued
| | | | | | | | |
| Issuer | | Shares/Par | | | Value ($) | |
| Municipal Bonds - continued | | | | | | | | |
| Industrial Revenue - Paper - continued | | | | | | | | |
| West Point, VA, Industrial Development Authority, Solid Waste Disposal Rev. (Chesapeake Corp.), “A”, 6.375%, 2019 (a)(d) | | $ | 800,000 | | | $ | 80 | |
| West Point, VA, Industrial Development Authority, Solid Waste Disposal Rev. (Chesapeake Corp.), “B”, 6.25%, 2019 (a)(d) | | | 6,830,000 | | | | 683 | |
| | | | | | | | |
| | | | | | | $ | 31,391,981 | |
| Miscellaneous Revenue - Entertainment & Tourism - 1.8% | | | | | |
| Agua Caliente Band of Cahuilla Indians, CA, Rev., 6%, 2018 (n) | | $ | 1,750,000 | | | $ | 1,755,985 | |
| Brooklyn, NY, Arena Local Development Corp. (Barclays Center Project), 6%, 2030 | | | 2,265,000 | | | | 2,671,115 | |
| Brooklyn, NY, Arena Local Development Corp. (Barclays Center Project), 6.25%, 2040 | | | 3,580,000 | | | | 4,192,073 | |
| Fort Sill Apache Tribe, OK, Economic Development Authority, Gaming Enterprise., “A”, 8.5%, 2026 (n) | | | 2,710,000 | | | | 3,016,122 | |
| Harris County, Houston, TX, Sports Authority Rev., Capital Appreciation, “A”, 0%, 2034 | | | 4,580,000 | | | | 1,529,216 | |
| Harris County, Houston, TX, Sports Authority Rev., Capital Appreciation, “A”, 0%, 2038 | | | 40,280,000 | | | | 10,329,403 | |
| Harris County, Houston, TX, Sports Authority, Special Rev., “A”, NATL, 5%, 2025 | | | 6,780,000 | | | | 6,781,559 | |
| Louisiana Stadium & Exposition District Rev., “A”, 5%, 2029 | | | 1,670,000 | | | | 1,926,228 | |
| Louisiana Stadium & Exposition District Rev., “A”, 5%, 2030 | | | 2,625,000 | | | | 3,017,726 | |
| Louisiana Stadium & Exposition District Rev., “A”, 5%, 2031 | | | 580,000 | | | | 664,576 | |
| Louisiana Stadium & Exposition District Rev., “A”, 5%, 2036 | | | 1,700,000 | | | | 1,920,745 | |
| Seminole Tribe, FL, Special Obligation Rev., “A”, 5.75%, 2022 (n) | | | 4,150,000 | | | | 4,585,252 | |
| Seminole Tribe, FL, Special Obligation Rev., “A”, 5.25%, 2027 (n) | | | 1,840,000 | | | | 1,960,851 | |
| Seneca Nation of Indians, NY, Capital Improvements Authority, Special Obligation, 5%, 2023 (n) | | | 2,715,000 | | | | 2,810,731 | |
| Seneca Nation of Indians, NY, Capital Improvements Authority, Special Obligations, “A”, 5.25%, 2016 (n) | | | 300,000 | | | | 315,216 | |
| St. Louis, MO, Land Clearance Redevelopment Authority, Facilities Improvement Special Rev. (Kiel Opera House), “B”, 7%, 2035 | | | 4,450,000 | | | | 4,742,410 | |
| | | | | | | | |
| | | | | | | $ | 52,219,208 | |
| Miscellaneous Revenue - Other - 3.0% | | | | | | | | |
| Austin, TX, Convention Center (Convention Enterprises, Inc.), “A”, SYNCORA, 5.25%, 2017 | | $ | 845,000 | | | $ | 940,595 | |
| Austin, TX, Convention Center (Convention Enterprises, Inc.), “A”, SYNCORA, 5.25%, 2020 | | | 830,000 | | | | 916,362 | |
32
Portfolio of Investments – continued
| | | | | | | | |
| Issuer | | Shares/Par | | | Value ($) | |
| Municipal Bonds - continued | | | | | | | | |
| Miscellaneous Revenue - Other - continued | | | | | | | | |
| Austin, TX, Convention Center (Convention Enterprises, Inc.), “A”, SYNCORA, 5.25%, 2024 | | $ | 4,640,000 | | | $ | 5,055,883 | |
| Austin, TX, Convention Center (Convention Enterprises, Inc.), “A”, SYNCORA, 5%, 2034 | | | 2,015,000 | | | | 2,126,631 | |
| Baker, FL, Correctional Development Corp. (Baker County Detention Center), 7.5%, 2030 | | | 1,560,000 | | | | 1,543,760 | |
| Citizens Property Insurance Corp., FL, “A-1”, 5%, 2019 | | | 660,000 | | | | 774,028 | |
| Cleveland-Cuyahoga County, OH, Port Authority Rev., 7%, 2040 | | | 1,165,000 | | | | 1,302,843 | |
| Cleveland-Cuyahoga County, OH, Port Authority Rev. (Columbia National Group), 5%, 2020 | | | 1,035,000 | | | | 1,039,233 | |
| Cleveland-Cuyahoga County, OH, Port Authority Rev. (Fairmount), “B”, 5.125%, 2025 | | | 450,000 | | | | 456,674 | |
| District of Columbia Rev. (American Society Hematology), 5%, 2036 | | | 540,000 | | | | 590,377 | |
| District of Columbia Rev. (American Society Hematology), 5%, 2042 | | | 860,000 | | | | 929,634 | |
| Fulton County, GA, Development Authority Rev. (Georgia Tech Athletic Association), “A”, 5%, 2042 | | | 1,930,000 | | | | 2,137,012 | |
| Hardeman County, TN, Correctional Facilities Rev., 7.75%, 2017 | | | 3,425,000 | | | | 3,449,557 | |
| Massachusetts Port Authority Facilities Rev. (Conrac Project), “A”, 5.125%, 2041 | | | 340,000 | | | | 371,120 | |
| Miami-Dade County, FL, Special Obligation, “B”, 5%, 2035 | | | 2,255,000 | | | | 2,528,058 | |
| Miami-Dade County, FL, Special Obligation, “B”, 5%, 2037 | | | 6,310,000 | | | | 7,013,944 | |
| New Jersey Economic Development Authority Rev. (Kapkowski Road Landfill Project), 5.75%, 2021 | | | 200,000 | | | | 219,852 | |
| New Jersey Economic Development Authority Rev. (Kapkowski Road Landfill Project), 6.5%, 2028 | | | 1,500,000 | | | | 1,832,505 | |
| New Jersey Economic Development Authority Rev. (Kapkowski Road Landfill Project), 6.5%, 2031 | | | 5,250,000 | | | | 6,358,958 | |
| New Jersey Economic Development Authority Rev. (Kapkowski Road Landfill Project), “B”, 6.5%, 2018 | | | 2,820,000 | | | | 3,144,074 | |
| New Orleans, LA, Aviation Board Gulf Opportunity Zone CFC Rev. (Consolidated Rental Car), “A”, 6.25%, 2030 | | | 2,050,000 | | | | 2,327,406 | |
| New York City, NY, Trust for Cultural Resources Rev. (Whitney Museum of American Art), 5%, 2031 | | | 5,000,000 | | | | 5,587,100 | |
| New York Liberty Development Corp., Liberty Rev. (One Bryant Park LLC), 6.375%, 2049 | | | 4,760,000 | | | | 5,638,982 | |
| New York Liberty Development Corp., Liberty Rev. (World Trade Center Project), 5%, 2044 | | | 4,680,000 | | | | 5,217,592 | |
| Riversouth, OH, Authority Rev. (Lazarus Building), “A”, 5.75%, 2027 | | | 3,975,000 | | | | 4,068,572 | |
| Summit County, OH, Port Authority Building Rev. (Flats East Development Recovery Zone Facility Bonds), 6.875%, 2040 | | | 440,000 | | | | 492,039 | |
33
Portfolio of Investments – continued
| | | | | | | | |
| Issuer | | Shares/Par | | | Value ($) | |
| Municipal Bonds - continued | | | | | | | | |
| Miscellaneous Revenue - Other - continued | | | | | | | | |
| Summit County, OH, Port Authority Building Rev. (Seville Project), “A”, 5.1%, 2025 | | $ | 490,000 | | | $ | 491,872 | |
| Summit County, OH, Port Authority Building Rev. (Workforce Policy Board), “F”, 4.875%, 2025 | | | 2,480,000 | | | | 2,493,392 | |
| Texas Midwest Public Facility Corp. Rev. (Secure Treatment Facility Project), 9%, 2030 (a)(d) | | | 1,605,000 | | | | 481,500 | |
| Wisconsin Public Finance Authority, Airport Facilities Rev. (Transportation Infrastructure Properties LLC), “B”, 5.25%, 2028 | | | 2,175,000 | | | | 2,388,085 | |
| Wisconsin Public Finance Authority, Airport Facilities Rev. (Transportation Infrastructure Properties LLC), “B”, 5%, 2042 | | | 16,755,000 | | | | 17,416,990 | |
| | | | | | | | |
| | | | | | | $ | 89,334,630 | |
| Multi-Family Housing Revenue - 0.5% | | | | | | | | |
| Bay County, FL, Housing Finance Authority, Multi-Family Rev. (Andrews Place II Apartments), AGM, 5%, 2035 | | $ | 635,000 | | | $ | 641,947 | |
| East Rochester, NY, Housing Authority Rev. (Woodland Village Project), 5.5%, 2033 | | | 600,000 | | | | 610,500 | |
| Fairfax County, VA, Economic Development Authority, Senior Living (Lewinsville Retirement Village), “A”, 5.25%, 2032 | | | 1,215,000 | | | | 1,219,799 | |
| Indianapolis, IN, Multi-Family Rev. (Cambridge Station Apartments II), FNMA, 5.25%, 2039 (b) | | | 1,345,000 | | | | 1,364,812 | |
| Mississippi Home Corp. Rev. (Kirkwood Apartments Project), 6.8%, 2037 (d)(q) | | | 3,760,000 | | | | 2,444,564 | |
| MuniMae TE Bond Subsidiary LLC, 5.4%, 2049 (z) | | | 2,000,000 | | | | 1,440,080 | |
| MuniMae TE Bond Subsidiary LLC, 5.9%, 2049 (z) | | | 2,000,000 | | | | 1,181,000 | |
| MuniMae TE Bond Subsidiary LLC, FRN, 7.5%, 2049 (n) | | | 4,547,633 | | | | 4,547,633 | |
| North Charleston, SC, Housing Authority Rev. (Horizon Village), “A”, GNMA, 5.15%, 2048 | | | 1,380,000 | | | | 1,408,345 | |
| | | | | | | | |
| | | | | | | $ | 14,858,680 | |
| Parking - 0.1% | | | | | | | | |
| Boston, MA, Metropolitan Transit Parking Corp., Systemwide Parking Rev., 5.25%, 2036 | | $ | 2,335,000 | | | $ | 2,709,534 | |
| Port Revenue - 0.3% | | | | | | | | |
| Alameda Corridor Transportation Authority, California Rev., “A”, AGMC, 5%, 2028 | | $ | 890,000 | | | $ | 1,057,543 | |
| Maryland Economic Development Corp. Rev. (Port America Chesapeake Terminal Project), “B”, 5.375%, 2025 | | | 885,000 | | | | 1,016,573 | |
| Maryland Economic Development Corp. Rev. (Port America Chesapeake Terminal Project), “B”, 5.75%, 2035 | | | 1,740,000 | | | | 1,980,137 | |
| Port Authority NY & NJ (170th Series), 4%, 2034 | | | 3,665,000 | | | | 3,786,568 | |
| Port of Seattle, WA, Rev., “A”, 5%, 2033 | | | 1,500,000 | | | | 1,747,485 | |
| | | | | | | | |
| | | | | | | $ | 9,588,306 | |
34
Portfolio of Investments – continued
| | | | | | | | |
| Issuer | | Shares/Par | | | Value ($) | |
| Municipal Bonds - continued | | | | | | | | |
| Sales & Excise Tax Revenue - 4.4% | | | | | | | | |
| Chicago, IL, Transit Authority Sales Tax Receipts Rev., 5.25%, 2029 | | $ | 1,435,000 | | | $ | 1,687,230 | |
| Chicago, IL, Transit Authority Sales Tax Receipts Rev., 5.25%, 2030 | | | 2,875,000 | | | | 3,365,734 | |
| Chicago, IL, Transit Authority Sales Tax Receipts Rev., 5.25%, 2031 | | | 540,000 | | | | 631,260 | |
| Chicago, IL, Transit Authority Sales Tax Receipts Rev., 5.25%, 2040 | | | 5,585,000 | | | | 6,380,304 | |
| Colorado Regional Transportation District, Private Activity Rev. (Denver Transportation Partners), 6%, 2034 | | | 8,490,000 | | | | 9,852,136 | |
| Massachusetts Bay Transportation Authority, Sales Tax Rev., “A”, 5%, 2024 | | | 10,090,000 | | | | 12,937,600 | |
| Massachusetts Bay Transportation Authority, Sales Tax Rev., “A”, 5%, 2025 | | | 20,000,000 | | | | 25,599,600 | |
| Massachusetts School Building Authority, Dedicated Sales Tax Rev., “B”, 5%, 2032 (u) | | | 12,280,000 | | | | 14,580,781 | |
| Metropolitan Pier & Exposition Authority, Dedicated State Tax Rev. (McCormick Place), “B”, AGM, 5%, 2050 (u) | | | 20,000,000 | | | | 21,674,600 | |
| Miami-Dade County, FL, Transit Sales Surtax Rev., 5%, 2037 | | | 2,985,000 | | | | 3,418,332 | |
| Poplar Bluff, MO, Regional Transportation Development District, Sales Tax Rev., 4%, 2036 | | | 1,075,000 | | | | 1,053,887 | |
| Poplar Bluff, MO, Regional Transportation Development District, Sales Tax Rev., 4.75%, 2042 | | | 860,000 | | | | 873,450 | |
| Puerto Rico Sales Tax Financing Corp., Sales Tax Rev., “A”, 5.5%, 2037 | | | 1,175,000 | | | | 1,261,527 | |
| Puerto Rico Sales Tax Financing Corp., Sales Tax Rev., “A”, 5.375%, 2039 | | | 1,860,000 | | | | 1,965,797 | |
| Puerto Rico Sales Tax Financing Corp., Sales Tax Rev., “A”, 5.5%, 2042 | | | 1,635,000 | | | | 1,736,125 | |
| Puerto Rico Sales Tax Financing Corp., Sales Tax Rev., “A”, 6%, 2042 | | | 3,695,000 | | | | 4,056,149 | |
| Puerto Rico Sales Tax Financing Corp., Sales Tax Rev., “C”, 5.375%, 2038 | | | 645,000 | | | | 689,840 | |
| Puerto Rico Sales Tax Financing Corp., Sales Tax Rev., Capital Appreciation, “A”, 0% to 2016, 6.75% to 2032 | | | 4,390,000 | | | | 4,531,621 | |
| Puerto Rico Sales Tax Financing Corp., Sales Tax Rev., Capital Appreciation, “A”, 0%, 2033 | | | 2,655,000 | | | | 2,298,779 | |
| Puerto Rico Sales Tax Financing Corp., Sales Tax Rev., Capital Appreciation, “A”, 0%, 2047 | | | 14,305,000 | | | | 2,107,985 | |
| Puerto Rico Sales Tax Financing Corp., Sales Tax Rev., Capital Appreciation, “A”, AMBAC, 0%, 2054 | | | 22,295,000 | | | | 1,949,921 | |
| Utah Transit Authority Sales Tax Rev., Capital Appreciation, “A”, NATL, 0%, 2028 | | | 6,825,000 | | | | 3,473,379 | |
35
Portfolio of Investments – continued
| | | | | | | | |
| Issuer | | Shares/Par | | | Value ($) | |
| Municipal Bonds - continued | | | | | | | | |
| Sales & Excise Tax Revenue - continued | | | | | | | | |
| Wyandotte County/Kansas City, KS, Unified Government Special Obligation Rev., Capital Appreciation, “B”, 0%, 2021 | | $ | 5,750,000 | | | $ | 3,741,698 | |
| | | | | | | | |
| | | | | | | $ | 129,867,735 | |
| Single Family Housing - Local - 0.1% | | | | | | | | |
| Jefferson County, TX, Housing Finance Corp., Capital Appreciation, NATL, 0%, 2015 | | $ | 275,000 | | | $ | 208,403 | |
| Nortex, TX, Housing Finance Corp., Single Family Mortgage Rev., “B”, 5.5%, 2038 | | | 25,000 | | | | 23,874 | |
| Sedgwick & Shawnee Counties, KS, Single Family Housing Rev., “A”, GNMA, 5.9%, 2035 | | | 360,000 | | | | 381,326 | |
| Sedgwick & Shawnee Counties, KS, Single Family Housing Rev., “A”, GNMA, 6.25%, 2035 | | | 125,000 | | | | 132,356 | |
| Sedgwick & Shawnee Counties, KS, Single Family Housing Rev., “A-1”, GNMA, 5.75%, 2037 | | | 90,000 | | | | 96,122 | |
| Sedgwick & Shawnee Counties, KS, Single Family Housing Rev., “A-2”, GNMA, 5.75%, 2037 | | | 325,000 | | | | 343,450 | |
| Sedgwick & Shawnee Counties, KS, Single Family Housing Rev., “A-3”, GNMA, 6%, 2035 | | | 390,000 | | | | 419,312 | |
| Sedgwick & Shawnee Counties, KS, Single Family Housing Rev., “A-4”, GNMA, 5.625%, 2036 | | | 370,000 | | | | 390,117 | |
| Sedgwick & Shawnee Counties, KS, Single Family Housing Rev., “A-4”, GNMA, 5.85%, 2037 | | | 490,000 | | | | 503,460 | |
| Sedgwick & Shawnee Counties, KS, Single Family Housing Rev., “A-5”, GNMA, 5.9%, 2037 | | | 160,000 | | | | 166,918 | |
| | | | | | | | |
| | | | | | | $ | 2,665,338 | |
| Single Family Housing - State - 1.5% | | | | | | | | |
| California Housing Finance Agency Rev. (Home Mortgage), “E”, 4.75%, 2030 | | $ | 2,560,000 | | | $ | 2,565,965 | |
| California Housing Finance Agency Rev. (Home Mortgage), “G”, 4.95%, 2023 | | | 8,080,000 | | | | 8,264,628 | |
| California Housing Finance Agency Rev. (Home Mortgage), “L”, 5.45%, 2033 | | | 12,730,000 | | | | 13,035,393 | |
| California Housing Finance Agency Rev., “A”, 4.75%, 2021 | | | 2,000,000 | | | | 2,021,960 | |
| Colorado Housing & Finance Authority Rev., “B-2”, 6.1%, 2023 | | | 110,000 | | | | 112,164 | |
| Colorado Housing & Finance Authority Rev., “B-3”, 6.55%, 2033 | | | 175,000 | | | | 180,675 | |
| Colorado Housing & Finance Authority Rev., “C-2”, 5.9%, 2023 | | | 230,000 | | | | 241,771 | |
| Colorado Housing & Finance Authority Rev., “C-2”, FHA, 6.6%, 2032 | | | 185,000 | | | | 192,944 | |
| Mississippi Home Corp., Single Family Rev., “A”, GNMA, 6.1%, 2034 | | | 900,000 | | | | 923,679 | |
36
Portfolio of Investments – continued
| | | | | | | | |
| Issuer | | Shares/Par | | | Value ($) | |
| Municipal Bonds - continued | | | | | | | | |
| Single Family Housing - State - continued | | | | | | | | |
| Mississippi Home Corp., Single Family Rev., “A-2”, GNMA, 6.5%, 2032 | | $ | 740,000 | | | $ | 781,396 | |
| Missouri Housing Development Commission, Single Family Mortgage Rev. (Home Loan Program), “B”, GNMA, 6.05%, 2037 | | | 1,025,000 | | | | 1,105,791 | |
| New Hampshire Housing Finance Authority Rev., “B”, 6.5%, 2035 | | | 240,000 | | | | 244,404 | |
| North Carolina Housing Finance Agency Rev., “30-A”, 5.25%, 2039 (u) | | | 11,975,000 | | | | 12,279,884 | |
| Texas Affordable Housing Corp. (Single Family Mortgage), “B”, GNMA, 5.25%, 2039 | | | 1,845,000 | | | | 1,929,464 | |
| | | | | | | | |
| | | | | | | $ | 43,880,118 | |
| Solid Waste Revenue - 0.0% | | | | | | | | |
| Pennsylvania Economic Development Financing Authority, Sewer Sludge Disposal Rev. (Philadelphia Biosolids Facility), 6.25%, 2032 | | $ | 650,000 | | | $ | 745,479 | |
| | |
| State & Agency - Other - 0.1% | | | | | | | | |
| Commonwealth of Puerto Rico (Mepsi Campus), “A”, 6.5%, 2037 | | $ | 3,600,000 | | | $ | 3,738,276 | |
| Tift County, GA, Hospital Authority Rev. Anticipation Certificates, 5%, 2038 | | | 400,000 | | | | 445,968 | |
| | | | | | | | |
| | | | | | | $ | 4,184,244 | |
| State & Local Agencies - 1.1% | | | | | | | | |
| Acton-Agua Dulce, CA, Unified School District (Election of 2008), Capital Appreciation, AGM, 0%, 2039 | | $ | 7,550,000 | | | $ | 2,050,429 | |
| Alabama Incentives Financing Authority Special Obligation, “A”, 5%, 2037 | | | 1,600,000 | | | | 1,823,072 | |
| California Public Works Board Lease Rev. (Various Capital Projects), “G-1”, 5.75%, 2030 | | | 3,380,000 | | | | 3,986,000 | |
| Commonwealth of Pennsylvania, State Public School Building Authority Lease Rev. (School District of Philadelphia Project), 5%, 2028 | | | 1,740,000 | | | | 1,961,763 | |
| Commonwealth of Pennsylvania, State Public School Building Authority Lease Rev. (School District of Philadelphia Project), 5%, 2030 | | | 870,000 | | | | 972,155 | |
| Commonwealth of Pennsylvania, State Public School Building Authority Lease Rev. (School District of Philadelphia Project), 5%, 2031 | | | 655,000 | | | | 729,198 | |
| Commonwealth of Pennsylvania, State Public School Building Authority Lease Rev. (School District of Philadelphia Project), 5%, 2032 | | | 220,000 | | | | 244,013 | |
37
Portfolio of Investments – continued
| | | | | | | | |
| Issuer | | Shares/Par | | | Value ($) | |
| Municipal Bonds - continued | | | | | | | | |
| State & Local Agencies - continued | | | | | | | | |
| Delaware Valley, PA, Regional Finance Authority, AMBAC, 5.5%, 2018 | | $ | 1,380,000 | | | $ | 1,592,630 | |
| Delaware Valley, PA, Regional Finance Authority, “B”, FRN, AMBAC, 0.474%, 2018 | | | 50,000 | | | | 50,000 | |
| Delaware Valley, PA, Regional Finance Authority, RITES, FRN, AMBAC, 9.913%, 2018 (p) | | | 150,000 | | | | 196,224 | |
| Golden State, CA, Tobacco Securitization Corp., Tobacco Settlement Rev., Enhanced, “A”, AMBAC, 5%, 2020 | | | 250,000 | | | | 250,598 | |
| Golden State, CA, Tobacco Securitization Corp., Tobacco Settlement Rev., Enhanced, “A”, FGIC, 5%, 2035 | | | 2,030,000 | | | | 2,126,851 | |
| Golden State, CA, Tobacco Securitization Corp., Tobacco Settlement Rev., Enhanced, “A”, 5%, 2045 | | | 6,065,000 | | | | 6,323,794 | |
| Golden State, CA, Tobacco Securitization Corp., Tobacco Settlement Rev., Enhanced, “A-1”, AMBAC, 4.6%, 2023 | | | 1,185,000 | | | | 1,303,903 | |
| Guam Government Department of Education (John F. Kennedy High School), “A”, COP, 6.875%, 2040 | | | 3,055,000 | | | | 3,365,724 | |
| Harris County, TX, 5.8%, 2014 | | | 255,946 | | | | 261,424 | |
| Harris County, TX, 5.625%, 2020 | | | 1,430,814 | | | | 1,431,730 | |
| Mississippi Development Bank Special Obligation (Marshall County Industrial Development Authority Mississippi Highway Construction Project), 5%, 2028 | | | 1,350,000 | | | | 1,588,451 | |
| Philadelphia, PA, Municipal Authority Rev., 6.5%, 2034 | | | 1,060,000 | | | | 1,229,006 | |
| Puerto Rico Public Finance Corp., Commonwealth Appropriations, “B”, 6%, 2026 | | | 1,960,000 | | | | 2,081,696 | |
| | | | | | | | |
| | | | | | | $ | 33,568,661 | |
| Student Loan Revenue - 0.6% | | | | | | | | |
| Iowa Student Loan Liquidity Corp., “A-2”, 5.5%, 2025 | | $ | 1,785,000 | | | $ | 1,968,373 | |
| Iowa Student Loan Liquidity Corp., “A-2”, 5.6%, 2026 | | | 1,785,000 | | | | 1,974,406 | |
| Iowa Student Loan Liquidity Corp., “A-2”, 5.7%, 2027 | | | 215,000 | | | | 238,811 | |
| Iowa Student Loan Liquidity Corp., “A-2”, 5.75%, 2028 | | | 3,615,000 | | | | 4,005,420 | |
| Massachusetts Educational Financing Authority, Education Loan Rev., “H”, ASSD GTY, 6.35%, 2030 | | | 2,900,000 | | | | 3,185,795 | |
| Massachusetts Educational Financing Authority, Education Loan Rev., “I-A”, 5.5%, 2022 | | | 250,000 | | | | 289,220 | |
| Massachusetts Educational Financing Authority, Education Loan Rev., “J”, 4.7%, 2026 | | | 2,400,000 | | | | 2,465,160 | |
| Massachusetts Educational Financing Authority, Education Loan Rev., “J”, 4.9%, 2028 | | | 2,495,000 | | | | 2,579,805 | |
| | | | | | | | |
| | | | | | | $ | 16,706,990 | |
38
Portfolio of Investments – continued
| | | | | | | | |
| Issuer | | Shares/Par | | | Value ($) | |
| Municipal Bonds - continued | | | | | | | | |
| Tax - Other - 1.4% | | | | | | | | |
| Allentown, PA, Neighborhood Improvement Zone Development Authority Tax Rev., “A”, 5%, 2035 | | $ | 1,110,000 | | | $ | 1,208,390 | |
| Allentown, PA, Neighborhood Improvement Zone Development Authority Tax Rev., “A”, 5%, 2042 | | | 4,605,000 | | | | 4,946,461 | |
| D’ Iberville, MS, Tax Increment Ltd. Rev. (Gulf Coast Promenade Project), 5%, 2033 | | | 750,000 | | | | 802,830 | |
| Hudson Yards, NY, Infrastructure Corp. Rev., “A”, 5%, 2047 | | | 3,340,000 | | | | 3,544,709 | |
| Hudson Yards, NY, Infrastructure Corp. Rev., “A”, 5.75%, 2047 | | | 3,230,000 | | | | 3,844,281 | |
| JobsOhio Beverage System Ohio Statewide Liquor Profits Rev., “A”, 5%, 2038 | | | 6,230,000 | | | | 7,101,577 | |
| New Jersey Economic Development Authority Rev., 5%, 2025 | | | 1,770,000 | | | | 2,036,721 | |
| New Jersey Economic Development Authority Rev., 5%, 2026 | | | 885,000 | | | | 1,012,175 | |
| New Jersey Economic Development Authority Rev., 5%, 2028 | | | 355,000 | | | | 401,416 | |
| New Jersey Economic Development Authority Rev., 5%, 2029 | | | 355,000 | | | | 398,686 | |
| New York Dormitory Authority, State Personal Income Tax Rev., “C”, 5%, 2034 | | | 9,000,000 | | | | 10,427,490 | |
| Virgin Islands Public Finance Authority Rev. (Diageo Project), “A”, 6.75%, 2037 | | | 4,090,000 | | | | 4,762,028 | |
| | | | | | | | |
| | | | | | | $ | 40,486,764 | |
| Tax Assessment - 2.7% | | | | | | | | |
| Altoona, IA, Urban Renewal Tax Increment Rev., 6%, 2043 | | $ | 3,000,000 | | | $ | 3,216,510 | |
| Anne Arundel County, MD, Special Obligation (National Business Park-North Project), 6.1%, 2040 | | | 1,320,000 | | | | 1,435,711 | |
| Anne Arundel County, MD, Special Obligation (VLG South Waugh Chapel Project), 6.25%, 2040 | | | 4,700,000 | | | | 5,005,500 | |
| Arborwood Community Development District, FL, Capital Improvement Rev. (Centex Homes Project), “A-1”, 5.5%, 2036 (a)(d) | | | 635,000 | | | | 139,700 | |
| Arborwood Community Development District, FL, Capital Improvement Rev. (Centex Homes Project), “A-3”, 5.5%, 2036 | | | 320,000 | | | | 323,261 | |
| Arborwood Community Development District, FL, Capital Improvement Rev. (Master Infrastructure Projects), “A”, 5.35%, 2036 | | | 1,710,000 | | | | 1,330,329 | |
| Arborwood Community Development District, FL, Special Assessment (Master Infrastructure Projects), “B”, 5.1%, 2014 | | | 575,000 | | | | 507,737 | |
| Arvada, CO, Cimarron Metropolitan District, Rev., 6%, 2022 | | | 2,000,000 | | | | 2,014,500 | |
| Atlanta, GA, Tax Allocation (Eastside Project), “B”, 5.6%, 2030 | | | 2,450,000 | | | | 2,623,215 | |
| Atlanta, GA, Tax Allocation (Princeton Lakes Project), 5.5%, 2031 | | | 1,515,000 | | | | 1,597,961 | |
| Baltimore, MD, Special Obligation, (East Baltimore Research Park Project), “A”, 7%, 2038 | | | 2,600,000 | | | | 2,846,090 | |
39
Portfolio of Investments – continued
| | | | | | | | |
| Issuer | | Shares/Par | | | Value ($) | |
| Municipal Bonds - continued | | | | | | | | |
| Tax Assessment - continued | | | | | | | | |
| Capital Region Community Development District, FL, Capital Improvement Rev., “A”, 7%, 2039 | | $ | 2,605,000 | | | $ | 2,589,735 | |
| Century Gardens Village Community Development District, FL, Special Assessment, 5.1%, 2037 | | | 915,000 | | | | 892,555 | |
| Concord Station Community Development District, FL, Special Assessment, 5%, 2015 | | | 345,000 | | | | 344,469 | |
| Corona-Norco, CA, Unified School District, Public Financing Authority Special Tax Rev. (Riverside County), “A”, 5%, 2032 | | | 1,000,000 | | | | 1,105,490 | |
| Corona-Norco, CA, Unified School District, Public Financing Authority Special Tax Rev. (Riverside County), “A”, 5%, 2035 | | | 585,000 | | | | 638,709 | |
| Corona-Norco, CA, Unified School District, Public Financing Authority Special Tax Rev. (Riverside County), “B”, 5%, 2032 | | | 1,000,000 | | | | 1,047,670 | |
| Corona-Norco, CA, Unified School District, Public Financing Authority Special Tax Rev. (Riverside County), “B”, 5%, 2035 | | | 480,000 | | | | 494,698 | |
| Creekside Community Development District, FL, Special Assessment, 5.2%, 2038 (a)(d) | | | 2,600,000 | | | | 1,040,000 | |
| Dardenne, MO, Town Square Transportation Development District, “A”, 5%, 2026 | | | 2,570,000 | | | | 1,278,472 | |
| Du Page County, IL, Special Service Area No. 31 Special Tax (Monarch Landing Project), 5.625%, 2036 | | | 945,000 | | | | 946,143 | |
| Fishhawk Community Development District, FL, 7.04%, 2014 | | | 30,000 | | | | 30,333 | |
| Heritage Harbour North Community Development District, FL, Capital Improvement Rev., 6.375%, 2038 | | | 1,895,000 | | | | 1,897,198 | |
| Killarney Community Development District, FL, Special Assessment, “B”, 5.125%, 2009 (a)(d) | | | 640,000 | | | | 288,000 | |
| Lakeshore Villages Master Community Development District, LA, Special Assessment, “A”, 5.25%, 2017 (a)(d) | | | 2,862,000 | | | | 1,144,800 | |
| Lancaster County, SC, Assessment Rev. (Sun City Carolina Lakes), 5.45%, 2037 | | | 1,540,000 | | | | 1,543,065 | |
| Legends Bay Community Development District, FL, “A”, 5.5%, 2014 | | | 1,460,000 | | | | 1,317,022 | |
| Legends Bay Community Development District, FL, “A”, 5.875%, 2038 | | | 1,335,000 | | | | 1,026,829 | |
| Lincolnshire, IL, Special Service Area No. 1 (Sedgebrook Project), 6.25%, 2034 | | | 3,137,000 | | | | 3,183,804 | |
| Main Street Community Development District, FL, “A”, 6.8%, 2038 | | | 1,755,000 | | | | 1,723,410 | |
| Middle Village Community Development District, FL, Special Assessment, “A”, 5.8%, 2022 | | | 635,000 | | | | 514,001 | |
| Miromar Lakes, FL, Community Development District, Capital Improvement Rev., 4.875%, 2022 | | | 1,000,000 | | | | 999,560 | |
| Miromar Lakes, FL, Community Development District, Capital Improvement Rev., 5.375%, 2032 | | | 1,000,000 | | | | 1,011,300 | |
40
Portfolio of Investments – continued
| | | | | | | | |
| Issuer | | Shares/Par | | | Value ($) | |
| Municipal Bonds - continued | | | | | | | | |
| Tax Assessment - continued | | | | | | | | |
| Naturewalk Community Development District, FL, Capital Improvement Rev., “B”, 5.3%, 2016 (d)(q) | | $ | 2,300,000 | | | $ | 1,196,000 | |
| Ohio County, WV, Commission Tax Increment Rev. (Fort Henry Centre), “A”, 5.85%, 2034 | | | 865,000 | | | | 908,267 | |
| Old Palm Community Development District, FL, Special Assessment (Palm Beach Gardens), “B”, 5.375%, 2014 | | | 585,000 | | | | 580,964 | |
| Osage Beach, MO, Tax Increment Rev. (Prewitts), 4.8%, 2016 | | | 1,385,000 | | | | 1,357,286 | |
| Osage Beach, MO, Tax Increment Rev. (Prewitts), 5%, 2023 | | | 1,500,000 | | | | 1,436,085 | |
| OTC Community Development District, FL, Special Assessment, “A”, 5.3%, 2038 | | | 3,695,000 | | | | 3,718,352 | |
| Overland Park, KS, Special Assessment (Tallgrass Creek), 4.85%, 2016 | | | 666,000 | | | | 657,402 | |
| Overland Park, KS, Special Assessment (Tallgrass Creek), 5.125%, 2028 | | | 3,848,000 | | | | 3,456,197 | |
| Palm Glades Community Development District, FL, Special Assessment, “A”, 5.3%, 2036 | | | 1,005,000 | | | | 1,005,211 | |
| Palm River, FL, Community Development District, Special Assessment Rev., “A”, 5.375%, 2036 (a)(d) | | | 895,000 | | | | 358,000 | |
| Palm River, FL, Community Development District, Special Assessment Rev., “B”, 5.15%, 2013 (a)(d) | | | 1,000,000 | | | | 400,000 | |
| Panther Trace II, Community Development District, FL, Special Assessment, 5.125%, 2013 | | | 395,000 | | | | 372,615 | |
| Parkway Center Community Development District, FL, Special Assessment, “B”, 5.625%, 2014 | | | 2,075,000 | | | | 1,951,413 | |
| Paseo Community Development District, FL, Capital Improvement Rev., “B”, 4.875%, 2010 (a)(d) | | | 1,415,000 | | | | 14 | |
| Paseo Community Development District, FL, Capital Improvement Rev., Capital Appreciation, “A-2”, 0%, 2036 | | | 3,205,000 | | | | 1,195,177 | |
| Paseo Community Development District, FL, Special Assessment, “A-1”, 5.4%, 2036 | | | 255,000 | | | | 272,498 | |
| Prince George’s County, MD, Special Obligation (National Harbor Project), 5.2%, 2034 | | | 755,000 | | | | 773,724 | |
| San Francisco, CA, City & County Redevelopment Successor Agency, Community Facilities District No. 6 (Mission Bay South Public Improvements), “A”, 5%, 2031 | | | 995,000 | | | | 1,055,227 | |
| San Francisco, CA, City & County Redevelopment Successor Agency, Community Facilities District No. 6 (Mission Bay South Public Improvements), Capital Appreciation, “A”, 0%, 2043 | | | 8,725,000 | | | | 1,467,807 | |
| Six Mile Creek Community Development District, FL, Capital Improvement Rev., 5.875%, 2038 (a)(d) | | | 5,000,000 | | | | 1,325,000 | |
| Sterling Hill Community Development District, FL, Capital Improvement Rev., “B”, 5.5%, 2010 (d) | | | 545,000 | | | | 354,255 | |
| Stone Ridge, CO, Metropolitan District No. 2, 7.25%, 2031 | | | 2,396,000 | | | | 628,351 | |
41
Portfolio of Investments – continued
| | | | | | | | |
| Issuer | | Shares/Par | | | Value ($) | |
| Municipal Bonds - continued | | | | | | | | |
| Tax Assessment - continued | | | | | | | | |
| Stonebrier Community Development District, FL, Special Assessment, 5.5%, 2037 | | $ | 1,710,000 | | | $ | 1,711,847 | |
| Tuscany Reserve Community Development District, FL, Special Assessment, “B”, 5.25%, 2016 | | | 2,465,000 | | | | 2,413,901 | |
| Two Creeks Community Development District, FL, Capital Improvement Rev., 5.25%, 2037 | | | 2,000,000 | | | | 1,337,140 | |
| Villa Portofino East Community Development District, FL, Special Assessment, 5.2%, 2037 | | | 1,985,000 | | | | 1,828,403 | |
| Villa Vizcaya Community Development District, FL, “A”, 5.55%, 2039 (a)(d) | | | 790,000 | | | | 339,700 | |
| Washington County, PA, Redevelopment Authority (Victory Centre Project), “A”, 5.45%, 2035 | | | 780,000 | | | | 801,746 | |
| Watergrass Community Development District, FL, “A”, 5.375%, 2039 | | | 1,470,000 | | | | 857,275 | |
| Watergrass Community Development District, FL, Special Assessment, “B”, 6.96%, 2017 | | | 825,000 | | | | 804,086 | |
| | | | | | | | |
| | | | | | | $ | 80,661,720 | |
| Tobacco - 7.2% | | | | | | | | |
| Buckeye, OH, Tobacco Settlement Financing Authority, “A-2”, 5.125%, 2024 | | $ | 25,260,000 | | | $ | 23,343,019 | |
| Buckeye, OH, Tobacco Settlement Financing Authority, “A-2”, 5.875%, 2030 | | | 3,310,000 | | | | 3,013,292 | |
| Buckeye, OH, Tobacco Settlement Financing Authority, “A-2”, 5.75%, 2034 | | | 4,485,000 | | | | 3,990,663 | |
| Buckeye, OH, Tobacco Settlement Financing Authority, “A-2”, 5.875%, 2047 | | | 4,790,000 | | | | 4,314,018 | |
| Buckeye, OH, Tobacco Settlement Financing Authority, “A-2”, 6.5%, 2047 | | | 25,000,000 | | | | 24,133,500 | |
| Buckeye, OH, Tobacco Settlement Financing Authority, “A-3”, 6.25%, 2037 | | | 11,535,000 | | | | 10,941,294 | |
| California Statewide Financing Authority, Tobacco Settlement, 5.625%, 2029 | | | 3,480,000 | | | | 3,481,601 | |
| District of Columbia, Tobacco Settlement, 6.25%, 2024 | | | 2,340,000 | | | | 2,404,233 | |
| District of Columbia, Tobacco Settlement, 6.75%, 2040 | | | 885,000 | | | | 920,559 | |
| Golden State, CA, Tobacco Securitization Corp., Tobacco Settlement Rev., “A-1”, 4.5%, 2027 | | | 2,375,000 | | | | 2,238,176 | |
| Golden State, CA, Tobacco Securitization Corp., Tobacco Settlement Rev., “A-1”, 5.125%, 2047 | | | 5,000,000 | | | | 4,302,000 | |
| Golden State, CA, Tobacco Securitization Corp., Tobacco Settlement Rev., “A-1”, 5.75%, 2047 | | | 23,705,000 | | | | 22,385,817 | |
| Golden State, CA, Tobacco Securitization Corp., Tobacco Settlement Rev., “A-4”, 7.8%, 2013 (c) | | | 3,000,000 | | | | 3,073,980 | |
42
Portfolio of Investments – continued
| | | | | | | | |
| Issuer | | Shares/Par | | | Value ($) | |
| Municipal Bonds - continued | | | | | | | | |
| Tobacco - continued | | | | | | | | |
| Golden State, CA, Tobacco Securitization Corp., Tobacco Settlement Rev., Asset Backed, “A-1”, 5%, 2033 | | $ | 6,085,000 | | | $ | 5,707,913 | |
| Illinois Railsplitter Tobacco Settlement Authority, 6.25%, 2024 | | | 3,110,000 | | | | 3,488,954 | |
| Illinois Railsplitter Tobacco Settlement Authority, 6%, 2028 | | | 14,375,000 | | | | 17,470,369 | |
| Iowa Tobacco Settlement Authority, Tobacco Settlement Rev., Asset Backed, “B”, 5.6%, 2034 | | | 4,295,000 | | | | 4,268,199 | |
| Louisiana Tobacco Settlement Authority Rev., “2001-B”, 5.5%, 2030 | | | 2,855,000 | | | | 2,911,843 | |
| Louisiana Tobacco Settlement Authority Rev., “2001-B”, 5.875%, 2039 | | | 6,940,000 | | | | 7,100,939 | |
| Michigan Tobacco Settlement Finance Authority Rev., Asset Backed, “A”, 6%, 2048 | | | 5,000,000 | | | | 4,747,450 | |
| New Jersey Tobacco Settlement Financing Corp., 7%, 2013 (c) | | | 45,000 | | | | 45,991 | |
| New Jersey Tobacco Settlement Financing Corp., “1-A”, 4.5%, 2023 | | | 20,020,000 | | | | 19,937,117 | |
| New Jersey Tobacco Settlement Financing Corp., “1-A”, 5%, 2041 | | | 34,705,000 | | | | 31,173,419 | |
| Suffolk, NY, Tobacco Asset Securitization Corp., Tobacco Settlement, “B”, 5.25%, 2037 | | | 930,000 | | | | 996,476 | |
| Washington Tobacco Settlement Authority Rev., 6.5%, 2026 | | | 860,000 | | | | 893,368 | |
| Washington Tobacco Settlement Authority Rev., 6.625%, 2032 | | | 4,935,000 | | | | 5,049,097 | |
| | | | | | | | |
| | | | | | | $ | 212,333,287 | |
| Toll Roads - 2.2% | | | | | | | | |
| Chesapeake, VA, Toll Road Rev. (Transportation System), “A”, 5%, 2047 | | $ | 1,205,000 | | | $ | 1,289,193 | |
| Chesapeake, VA, Toll Road Rev. Convertible Capital Appreciation (Transportation System), “B”, 0%, 2032 | | | 1,610,000 | | | | 1,000,535 | |
| Chesapeake, VA, Toll Road Rev. Convertible Capital Appreciation (Transportation System), “B”, 0%, 2040 | | | 1,605,000 | | | | 981,185 | |
| E-470 Public Highway Authority Rev., CO, “C”, 5.375%, 2026 | | | 755,000 | | | | 833,112 | |
| E-470 Public Highway Authority Rev., CO, Capital Appreciation, “B”, NATL, 0%, 2027 | | | 12,305,000 | | | | 6,075,102 | |
| Illinois Toll Highway Authority Rev., “B”, 5.5%, 2033 | | | 4,355,000 | | | | 4,989,175 | |
| Mid-Bay Bridge Authority, FL, Springing Lien Rev., “A”, 7.25%, 2034 | | | 300,000 | | | | 385,698 | |
| Mid-Bay Bridge Authority, FL, Springing Lien Rev., “A”, 7.25%, 2040 | | | 8,365,000 | | | | 10,718,325 | |
| North Texas Tollway Authority Rev., 6%, 2043 | | | 1,280,000 | | | | 1,493,517 | |
| North Texas Tollway Authority Rev. (Special Projects System), “D”, 5%, 2031 | | | 5,980,000 | | | | 7,006,168 | |
| Triborough Bridge & Tunnel Authority Rev., NY, “A”, 5%, 2025 | | | 3,185,000 | | | | 3,862,418 | |
43
Portfolio of Investments – continued
| | | | | | | | |
| Issuer | | Shares/Par | | | Value ($) | |
| Municipal Bonds - continued | | | | | | | | |
| Toll Roads - continued | | | | | | | | |
| Virginia Small Business Financing Authority Rev. (95 Express Lanes LLC), 5%, 2034 | | $ | 2,165,000 | | | $ | 2,267,902 | |
| Virginia Small Business Financing Authority Rev. (95 Express Lanes LLC), 5%, 2040 | | | 3,460,000 | | | | 3,585,633 | |
| Virginia Small Business Financing Authority Rev. (Elizabeth River Crossings Opco LLC Project), 5.25%, 2032 | | | 3,640,000 | | | | 3,957,918 | |
| Virginia Small Business Financing Authority Rev. (Elizabeth River Crossings Opco LLC Project), 6%, 2037 | | | 6,065,000 | | | | 7,054,323 | |
| Virginia Small Business Financing Authority Rev. (Elizabeth River Crossings Opco LLC Project), 5.5%, 2042 | | | 9,705,000 | | | | 10,637,068 | |
| | | | | | | | |
| | | | | | | $ | 66,137,272 | |
| Transportation - Special Tax - 0.5% | | | | | | | | |
| Metropolitan Transportation Authority Rev., NY, “A”, 5%, 2041 | | $ | 2,250,000 | | | $ | 2,530,193 | |
| Metropolitan Transportation Authority Rev., NY, Capital Appreciation, “A”, 0%, 2030 | | | 3,000,000 | | | | 1,633,140 | |
| New Jersey Transportation Trust Fund Authority, “AA”, 4%, 2031 | | | 8,585,000 | | | | 9,100,787 | |
| | | | | | | | |
| | | | | | | $ | 13,264,120 | |
| Universities - Colleges - 9.1% | | | | | | | | |
| Allegheny County, PA, Higher Education Building Authority Rev. (Chatham University), “A”, 5%, 2030 | | $ | 915,000 | | | $ | 1,022,641 | |
| Allegheny County, PA, Higher Education Building Authority Rev. (Robert Morris University), “A”, 5.9%, 2028 | | | 1,305,000 | | | | 1,483,394 | |
| Allegheny County, PA, Higher Education Building Authority Rev. (Robert Morris University), “A”, 6%, 2038 | | | 2,025,000 | | | | 2,271,989 | |
| Brevard County, FL, Industrial Development Rev. (TUFF Florida Tech LLC Project), 6.75%, 2039 | | | 4,720,000 | | | | 5,298,955 | |
| California Educational Facilities Authority Rev. (California Lutheran University), 5.75%, 2038 | | | 2,320,000 | | | | 2,517,432 | |
| California Educational Facilities Authority Rev. (Chapman University), 5%, 2031 | | | 1,240,000 | | | | 1,389,606 | |
| California Educational Facilities Authority Rev. (University Financing Project), 5%, 2026 | | | 3,590,000 | | | | 3,601,560 | |
| California Educational Facilities Authority Rev. (University of La Verne), “A”, 5%, 2029 | | | 2,205,000 | | | | 2,292,053 | |
| California Municipal Finance Authority Rev. (Biola University), 5.8%, 2028 | | | 1,915,000 | | | | 2,121,016 | |
| California Municipal Finance Authority Rev. (University of La Verne), “A”, 6.25%, 2040 | | | 900,000 | | | | 1,047,231 | |
| California Statewide Communities Development Authority Rev. (California Baptist University), “A”, 5.4%, 2027 | | | 1,385,000 | | | | 1,492,074 | |
44
Portfolio of Investments – continued
| | | | | | | | |
| Issuer | | Shares/Par | | | Value ($) | |
| Municipal Bonds - continued | | | | | | | | |
| Universities - Colleges - continued | | | | | | | | |
| California Statewide Communities Development Authority Rev. (California Baptist University), “A”, 5.5%, 2038 | | $ | 4,580,000 | | | $ | 4,916,538 | |
| Claiborne County, TN, Industrial Development Board Rev. (Lincoln Memorial University Project), 6.125%, 2040 | | | 5,000,000 | | | | 5,610,350 | |
| Delaware County, PA, Authority College Rev. (Neumann University), 6%, 2025 | | | 510,000 | | | | 568,237 | |
| Delaware County, PA, Authority College Rev. (Neumann University), 6.125%, 2034 | | | 250,000 | | | | 276,105 | |
| Florida Higher Educational Facilities, Financial Authority Rev. (University of Tampa Project), “A”, 5%, 2032 | | | 340,000 | | | | 372,110 | |
| Florida Higher Educational Facilities, Financial Authority Rev. (University of Tampa Project), “A”, 5.25%, 2042 | | | 2,920,000 | | | | 3,223,271 | |
| Forest Grove, OR, Campus Improvement Rev. (Pacific University Project), 6.375%, 2039 | | | 2,500,000 | | | | 2,580,375 | |
| Forest Grove, OR, Student Housing Rev. (Oak Tree Foundation, Inc.), 5.5%, 2037 | | | 2,775,000 | | | | 2,848,038 | |
| Grand Valley, MI, State University Rev., 5.5%, 2027 | | | 1,015,000 | | | | 1,170,559 | |
| Grand Valley, MI, State University Rev., 5.625%, 2029 | | | 495,000 | | | | 570,562 | |
| Illinois Finance Authority Rev. (Illinois Institute of Technology), “A”, 5%, 2031 | | | 3,125,000 | | | | 3,134,750 | |
| Illinois Finance Authority Rev. (Illinois Institute of Technology), “A”, 5%, 2036 | | | 3,080,000 | | | | 3,080,678 | |
| Illinois Finance Authority Rev. (Roosevelt University Project), 6.25%, 2029 | | | 6,045,000 | | | | 6,896,922 | |
| Illinois Finance Authority Rev. (University of Chicago), “A”, 5%, 2051 | | | 1,525,000 | | | | 1,680,108 | |
| Indiana County, PA, Industrial Development Authority (Student Cooperative Association, Inc./Indiana University of Pennsylvania), 5%, 2033 | | | 960,000 | | | | 1,061,606 | |
| Indiana University Rev., “A”, 5%, 2029 | | | 775,000 | | | | 939,509 | |
| Indiana University Rev., “A”, 5%, 2030 | | | 345,000 | | | | 413,776 | |
| Indiana University Rev., “A”, 5%, 2031 | | | 430,000 | | | | 514,142 | |
| Indiana University Rev., “A”, 5%, 2032 | | | 430,000 | | | | 512,577 | |
| Indiana University Rev., “A”, 5%, 2037 | | | 1,290,000 | | | | 1,505,249 | |
| Lakeland, FL, Educational Facilities Rev. (Florida Southern College), “A”, 5%, 2032 | | | 935,000 | | | | 1,025,097 | |
| Lakeland, FL, Educational Facilities Rev. (Florida Southern College), “A”, 5%, 2037 | | | 1,365,000 | | | | 1,481,680 | |
| Lakeland, FL, Educational Facilities Rev. (Florida Southern College), “A”, 5%, 2042 | | | 740,000 | | | | 800,184 | |
| Marietta, GA, Development Facilities Authority Rev. (Life University), 7%, 2030 | | | 2,330,000 | | | | 2,524,974 | |
45
Portfolio of Investments – continued
| | | | | | | | |
| Issuer | | Shares/Par | | | Value ($) | |
| Municipal Bonds - continued | | | | | | | | |
| Universities - Colleges - continued | | | | | | | | |
| Marietta, GA, Development Facilities Authority Rev. (Life University), 7%, 2039 | | $ | 1,575,000 | | | $ | 1,699,157 | |
| Maryland Health & Higher Educational Facilities Authority Rev. (Maryland Institute College of Art), 5%, 2047 | | | 1,000,000 | | | | 1,086,040 | |
| Massachusetts Development Finance Agency Rev. (Curry College), “A”, ACA, 5%, 2036 | | | 1,135,000 | | | | 1,161,207 | |
| Massachusetts Development Finance Agency Rev. (Curry College), “A”, RADIAN, 5%, 2036 | | | 800,000 | | | | 818,472 | |
| Massachusetts Development Finance Agency Rev. (Merrimack College), “A”, 5%, 2032 | | | 1,450,000 | | | | 1,600,960 | |
| Massachusetts Development Finance Agency Rev. (Merrimack College), “A”, 5.25%, 2042 | | | 900,000 | | | | 999,351 | |
| Massachusetts Development Finance Agency Rev. (Simmons College), “H”, SYNCORA, 5.25%, 2033 | | | 430,000 | | | | 479,859 | |
| Massachusetts Health & Educational Facilities Authority Rev. (Harvard University), 5.5%, 2036 (u) | | | 25,000,000 | | | | 29,947,250 | |
| Massachusetts Health & Educational Facilities Authority Rev. (Simmons College), “I”, 8%, 2029 | | | 2,140,000 | | | | 2,466,778 | |
| Massachusetts Health & Educational Facilities Authority Rev. (Suffolk University), “A”, 6.25%, 2030 | | | 6,130,000 | | | | 7,212,619 | |
| Massachusetts Health & Educational Facilities Authority Rev. (Suffolk University), “A”, 5.75%, 2039 | | | 4,365,000 | | | | 4,969,683 | |
| Miami-Dade County, FL, Educational Facilities Authority Rev. (University of Miami), “A”, 4%, 2037 | | | 1,080,000 | | | | 1,104,419 | |
| Nashville & Davidson County, TN, Metropolitan Government Health & Educational Facilities Board (Belmont University), 5%, 2028 | | | 1,000,000 | | | | 1,131,340 | |
| Nashville & Davidson County, TN, Metropolitan Government Health & Educational Facilities Board (Vanderbilt University), “A”, 5%, 2039 (u) | | | 10,000,000 | | | | 11,340,100 | |
| Nashville & Davidson County, TN, Metropolitan Government Health & Educational Facilities Board (Vanderbilt University), “B”, 5%, 2039 (u) | | | 10,000,000 | | | | 11,340,100 | |
| New Hampshire Health & Education Facilities Authority Rev. (Dartmouth College), 5.25%, 2039 (u) | | | 20,000,000 | | | | 23,491,000 | |
| New Jersey Educational Facilities Authority Rev. (University of Medicine & Dentistry), “B”, 6%, 2017 | | | 2,335,000 | | | | 2,772,883 | |
| New Jersey Educational Facilities Authority Rev. (University of Medicine & Dentistry), “B”, 7.5%, 2032 | | | 4,280,000 | | | | 5,358,988 | |
| New York Dormitory Authority Rev., Non-State Supported Debt (Rochester Institute of Technology), 4%, 2030 | | | 1,320,000 | | | | 1,427,448 | |
| New York Dormitory Authority Rev., Non-State Supported Debt (Rochester Institute of Technology), 4%, 2031 | | | 1,320,000 | | | | 1,421,838 | |
46
Portfolio of Investments – continued
| | | | | | | | |
| Issuer | | Shares/Par | | | Value ($) | |
| Municipal Bonds - continued | | | | | | | | |
| Universities - Colleges - continued | | | | | | | | |
| New York Dormitory Authority Rev., Non-State Supported Debt (Rochester Institute of Technology), 4%, 2032 | | $ | 1,100,000 | | | $ | 1,180,212 | |
| New York Dormitory Authority Rev., Non-State Supported Debt (Rochester Institute of Technology), 4%, 2033 | | | 895,000 | | | | 956,487 | |
| Northeastern Pennsylvania Hospital & Education Authority Rev. (Wilkes University), “A”, 5.25%, 2042 | | | 2,400,000 | | | | 2,588,400 | |
| Onondaga, NY, Civic Development Corp. (Le Moyne College), 5%, 2042 | | | 1,300,000 | | | | 1,412,710 | |
| Oregon Facilities Authority Rev. (Concordia University Project), “A”, 6.125%, 2030 | | | 2,780,000 | | | | 3,067,063 | |
| Oregon Facilities Authority Rev. (Concordia University Project), “A”, 6.375%, 2040 | | | 4,100,000 | | | | 4,533,124 | |
| Oregon Health & Science University Rev., “A”, 5%, 2026 | | | 470,000 | | | | 553,693 | |
| Pennsylvania Higher Educational Facilities Authority Rev. (La Salle University), 5.5%, 2034 | | | 2,580,000 | | | | 2,612,431 | |
| Pennsylvania Higher Educational Facilities Authority Rev. (La Salle University), 5%, 2037 | | | 2,500,000 | | | | 2,796,150 | |
| Pennsylvania Higher Educational Facilities Authority Rev. (La Salle University), “A”, 5.25%, 2027 | | | 1,330,000 | | | | 1,455,672 | |
| Pennsylvania Higher Educational Facilities Authority Rev. (Saint Francis University Project), “JJ2”, 6.25%, 2041 | | | 1,545,000 | | | | 1,762,428 | |
| Pinellas County, FL, Educational Facilities Authority Rev. (Barry University), 5.25%, 2030 | | | 1,000,000 | | | | 1,090,050 | |
| Pinellas County, FL, Educational Facilities Authority Rev. (Barry University), 6%, 2041 | | | 5,330,000 | | | | 6,124,117 | |
| Private Colleges & Universities, GA, Authority Rev. (Mercer University), “C”, 5.25%, 2027 | | | 920,000 | | | | 1,071,404 | |
| Puerto Rico Industrial, Tourist, Educational, Medical, & Environmental Control Facilities Financing Authority, Higher Education Rev. (Ana G. Mendez University System Project), 5.125%, 2032 | | | 425,000 | | | | 428,838 | |
| Puerto Rico Industrial, Tourist, Educational, Medical, & Environmental Control Facilities Financing Authority, Higher Education Rev. (Ana G. Mendez University System Project), 5.375%, 2042 | | | 1,040,000 | | | | 1,044,774 | |
| Puerto Rico Industrial, Tourist, Medical, & Environmental Central Facilities (University of Sacred Heart), 4.375%, 2031 | | | 525,000 | | | | 516,747 | |
| Puerto Rico Industrial, Tourist, Medical, & Environmental Central Facilities (University of Sacred Heart), 5%, 2042 | | | 260,000 | | | | 261,765 | |
| Quad Cities, IL, Regional Economic Development Authority Rev. (Augustana College), 4%, 2021 | | | 600,000 | | | | 632,766 | |
| Quad Cities, IL, Regional Economic Development Authority Rev. (Augustana College), 5%, 2025 | | | 890,000 | | | | 984,705 | |
47
Portfolio of Investments – continued
| | | | | | | | |
| Issuer | | Shares/Par | | | Value ($) | |
| Municipal Bonds - continued | | | | | | | | |
| Universities - Colleges - continued | | | | | | | | |
| Quad Cities, IL, Regional Economic Development Authority Rev. (Augustana College), 5%, 2026 | | $ | 800,000 | | | $ | 880,344 | |
| Quad Cities, IL, Regional Economic Development Authority Rev. (Augustana College), 4.75%, 2029 | | | 845,000 | | | | 900,888 | |
| Quad Cities, IL, Regional Economic Development Authority Rev. (Augustana College), 4.75%, 2032 | | | 1,000,000 | | | | 1,053,800 | |
| San Leanna, TX, Educational Facilities Corp., Higher Education Rev. (St. Edwards University), 4.75%, 2032 | | | 2,150,000 | | | | 2,221,939 | |
| San Leanna, TX, Educational Facilities Corp., Higher Education Rev. (St. Edwards University), 5.125%, 2036 | | | 1,055,000 | | | | 1,097,801 | |
| Texas Tech University Rev., Refunding & Improvement, “A”, 5%, 2030 | | | 1,755,000 | | | | 2,073,813 | |
| Texas Tech University Rev., Refunding & Improvement, “A”, 5%, 2031 | | | 770,000 | | | | 907,299 | |
| Texas Tech University Rev., Refunding & Improvement, “A”, 5%, 2032 | | | 735,000 | | | | 863,610 | |
| Texas Tech University Rev., Refunding & Improvement, “A”, 5%, 2037 | | | 1,350,000 | | | | 1,570,577 | |
| Tulsa, OK, Industrial Authority Rev. (University of Tulsa), 6%, 2027 | | | 4,795,000 | | | | 5,603,245 | |
| University of California Rev., “G”, 4%, 2029 | | | 14,995,000 | | | | 16,558,979 | |
| University of Southern Indiana Rev. (Student Fee), “J”, ASSD GTY, 5.75%, 2028 | | | 1,445,000 | | | | 1,780,052 | |
| Waco Education Finance Corp. Rev. (Baylor University), 5%, 2043 | | | 4,060,000 | | | | 4,621,133 | |
| Washington Higher Education Facilities Authority Rev. (Whitworth University), 5%, 2032 | | | 750,000 | | | | 823,875 | |
| Washington Higher Education Facilities Authority Rev. (Whitworth University), 5.875%, 2034 | | | 2,435,000 | | | | 2,734,091 | |
| Washington Higher Education Facilities Authority Rev. (Whitworth University), 5.25%, 2037 | | | 1,100,000 | | | | 1,202,718 | |
| Washington Higher Education Facilities Authority Rev. (Whitworth University), 5.25%, 2046 | | | 1,000,000 | | | | 1,089,390 | |
| Wilkes-Barre, PA, Finance Authority Rev. (Wilkes University), 5%, 2037 | | | 3,000,000 | | | | 3,090,000 | |
| Wisconsin Health & Educational Facilities Authority Rev. (Beloit College), “A”, 6.125%, 2035 | | | 710,000 | | | | 807,795 | |
| Wisconsin Health & Educational Facilities Authority Rev. (Beloit College), “A”, 6.125%, 2039 | | | 1,435,000 | | | | 1,627,778 | |
| | | | | | | | |
| | | | | | | $ | 270,657,503 | |
48
Portfolio of Investments – continued
| | | | | | | | |
| Issuer | | Shares/Par | | | Value ($) | |
| Municipal Bonds - continued | | | | | | | | |
| Universities - Dormitories - 1.5% | | | | | | | | |
| Bowling Green, OH, Student Housing Rev. (State University Project), 6%, 2045 | | $ | 5,990,000 | | | $ | 6,655,190 | |
| California Statewide Communities Development Authority Rev. (Lancer Educational Student Housing Project), 5.625%, 2033 | | | 2,345,000 | | | | 2,521,625 | |
| California Statewide Communities Development Authority Rev. (Lancer Educational Student Housing Project), 7.5%, 2042 | | | 1,575,000 | | | | 1,806,226 | |
| California Statewide Communities Development Authority Rev. (Student Housing, SUCI East Campus), 6%, 2040 | | | 2,125,000 | | | | 2,339,051 | |
| California Statewide Communities Development Authority Rev. (University of California, Irvine East Campus Apartments), 5.375%, 2038 | | | 3,000,000 | | | | 3,308,070 | |
| Illinois Finance Authority Student Housing Rev. (Illinois State University), 6.75%, 2031 | | | 1,875,000 | | | | 2,214,938 | |
| Illinois Finance Authority Student Housing Rev. (Northern Illinois University Project), 6.625%, 2031 | | | 5,785,000 | | | | 6,928,579 | |
| Oregon Facilities Authority, Student Housing Rev. (Southern Oregon University), ASSD GTY, 4.7%, 2033 | | | 695,000 | | | | 753,206 | |
| Oregon Facilities Authority, Student Housing Rev. (Southern Oregon University), ASSD GTY, 5%, 2044 | | | 835,000 | | | | 926,140 | |
| Pennsylvania Higher Educational Facilities Authority Rev. (East Stroudsburg University), 5%, 2042 | | | 2,525,000 | | | | 2,645,771 | |
| Pennsylvania Higher Educational Facilities Authority Rev. (Edinboro University Foundation), 5.8%, 2030 | | | 740,000 | | | | 840,344 | |
| Pennsylvania Higher Educational Facilities Authority Rev. (Edinboro University Foundation), 6%, 2043 | | | 1,050,000 | | | | 1,186,994 | |
| Pennsylvania Higher Educational Facilities Authority Rev. (Shippensburg University Student Services), 5%, 2030 | | | 1,195,000 | | | | 1,329,342 | |
| Pennsylvania Higher Educational Facilities Authority Rev. (Shippensburg University Student Services), 6.25%, 2043 | | | 5,500,000 | | | | 6,423,835 | |
| Pennsylvania Higher Educational Facilities Authority Rev. (Shippensburg University Student Services), 5%, 2044 | | | 1,235,000 | | | | 1,339,234 | |
| Platteville, WI, Redevelopment Authority, Redevelopment Rev. (Platteville Real Estate), 5%, 2032 | | | 1,115,000 | | | | 1,180,127 | |
| Platteville, WI, Redevelopment Authority, Redevelopment Rev. (Platteville Real Estate), 5%, 2042 | | | 2,390,000 | | | | 2,458,545 | |
| | | | | | | | |
| | | | | | | $ | 44,857,217 | |
| Universities - Secondary Schools - 4.2% | | | | | | | | |
| Anoka County, MN, Charter School Lease Rev. (Spectrum Building Co.), “A”, 5%, 2027 | | $ | 290,000 | | | $ | 308,879 | |
| Anoka County, MN, Charter School Lease Rev. (Spectrum Building Co.), “A”, 5%, 2032 | | | 300,000 | | | | 313,626 | |
49
Portfolio of Investments – continued
| | | | | | | | |
| Issuer | | Shares/Par | | | Value ($) | |
| Municipal Bonds - continued | | | | | | | | |
| Universities - Secondary Schools - continued | | | | | | | | |
| Anoka County, MN, Charter School Lease Rev. (Spectrum Building Co.), “A”, 5%, 2043 | | $ | 1,000,000 | | | $ | 1,018,590 | |
| California Municipal Finance Authority Rev. (Partnerships to Uplift Communities Project), “A”, 5%, 2032 | | | 1,585,000 | | | | 1,602,895 | |
| California Statewide Communities Development Authority, School Facility Rev. (Aspire Public Schools), 6%, 2030 | | | 2,000,000 | | | | 2,113,620 | |
| California Statewide Communities Development Authority, School Facility Rev. (Aspire Public Schools), 6.375%, 2045 | | | 6,000,000 | | | | 6,401,280 | |
| California Statewide Communities Development Authority, School Facility Rev. (Aspire Public Schools), 6.125%, 2046 | | | 7,655,000 | | | | 8,066,303 | |
| Clifton, TX, Higher Education Finance Corp. Rev. (Idea Public Schools), 5.5%, 2031 | | | 870,000 | | | | 976,862 | |
| Clifton, TX, Higher Education Finance Corp. Rev. (Idea Public Schools), 5.75%, 2041 | | | 695,000 | | | | 790,750 | |
| Clifton, TX, Higher Education Finance Corp. Rev. (Idea Public Schools), 5%, 2042 | | | 2,385,000 | | | | 2,578,280 | |
| Clifton, TX, Higher Education Finance Corp. Rev. (Uplift Education), “A”, 6.125%, 2040 | | | 4,940,000 | | | | 5,617,817 | |
| Clifton, TX, Higher Education Finance Corp. Rev. (Uplift Education), “A”, 4.35%, 2042 | | | 1,270,000 | | | | 1,275,994 | |
| Clifton, TX, Higher Education Finance Corp. Rev. (Uplift Education), “A”, 6.25%, 2045 | | | 1,670,000 | | | | 1,907,006 | |
| Clifton, TX, Higher Education Finance Corp. Rev. (Uplift Education), “A”, 4.4%, 2047 | | | 1,115,000 | | | | 1,120,241 | |
| Colorado Educational & Cultural Facilities Authority Rev. (Littleton Preparatory Charter School Project), 5%, 2033 | | | 450,000 | | | | 460,139 | |
| Colorado Educational & Cultural Facilities Authority Rev. (Littleton Preparatory Charter School Project), 5%, 2042 | | | 540,000 | | | | 544,131 | |
| Colorado Educational & Cultural Facilities Authority Rev. (Montessori Charter School Project), 4%, 2027 | | | 370,000 | | | | 382,654 | |
| Colorado Educational & Cultural Facilities Authority Rev. (Montessori Charter School Project), 5%, 2037 | | | 490,000 | | | | 521,076 | |
| Delaware Economic Development Authority Rev. (Newark Charter School, Inc. Project), 5%, 2042 | | | 1,170,000 | | | | 1,254,568 | |
| Florida Development Finance Corp. Educational Facilities Rev. (Bay Area Charter Foundation LLC), “A”, 7.75%, 2042 | | | 3,480,000 | | | | 3,939,778 | |
| Florida Development Finance Corp. Educational Facilities Rev. (Renaissance Charter School), “A”, 6%, 2032 | | | 1,950,000 | | | | 1,958,132 | |
| Florida Development Finance Corp. Educational Facilities Rev. (Renaissance Charter School), “A”, 6.125%, 2043 | | | 4,070,000 | | | | 4,033,614 | |
| Florida Development Finance Corp. Educational Facilities Rev. (Renaissance Charter School),“A”, 6%, 2030 | | | 2,575,000 | | | | 2,826,681 | |
50
Portfolio of Investments – continued
| | | | | | | | |
| Issuer | | Shares/Par | | | Value ($) | |
| Municipal Bonds - continued | | | | | | | | |
| Universities - Secondary Schools - continued | | | | | | | | |
| Florida Development Finance Corp. Educational Facilities Rev. (Renaissance Charter School),“A”, 6%, 2040 | | $ | 5,490,000 | | | $ | 5,923,710 | |
| Florida Development Finance Corp. Educational Facilities Rev. (Renaissance Charter School),“A”, 7.625%, 2041 | | | 10,125,000 | | | | 11,795,018 | |
| Illinois Finance Authority Charter School Rev. (Uno Charter School Network, Inc.), “A”, 7.125%, 2041 | | | 2,000,000 | | | | 2,298,500 | |
| La Vernia, TX, Higher Education Finance Corp. Rev. (KIPP, Inc.), “A”, 6.25%, 2039 | | | 1,670,000 | | | | 1,927,598 | |
| La Vernia, TX, Higher Education Finance Corp. Rev. (Lifeschool of Dallas), “A”, 7.5%, 2041 | | | 4,385,000 | | | | 5,190,174 | |
| Lee County, FL, Industrial Development Authority Rev. (Lee Charter Foundation), “A”, 5.25%, 2027 | | | 2,070,000 | | | | 2,118,397 | |
| Lee County, FL, Industrial Development Authority Rev. (Lee Charter Foundation), “A”, 5.375%, 2037 | | | 3,155,000 | | | | 3,199,391 | |
| Maryland Health & Higher Educational Facilities Authority Rev. (Washington Christian Academy), 5.25%, 2018 (a)(d) | | | 985,000 | | | | 394,000 | |
| Maryland Health & Higher Educational Facilities Authority Rev. (Washington Christian Academy), 5.5%, 2038 (a)(d) | | | 460,000 | | | | 184,000 | |
| Maryland Industrial Development Financing Authority, Economic Development Authority Rev. (Our Lady of Good Council), “A”, 6%, 2035 | | | 450,000 | | | | 470,435 | |
| Newark, TX, Cultural Education Facilities, Finance Corp. Lease Rev. (A.W. Brown Fellowship Academy), “A”, 6%, 2032 | | | 620,000 | | | | 653,102 | |
| Newark, TX, Cultural Education Facilities, Finance Corp. Lease Rev. (A.W. Brown Fellowship Academy), “A”, 6%, 2042 | | | 2,000,000 | | | | 2,101,580 | |
| North Texas Education Finance Corp., Education Rev. (Uplift Education), “A”, 4.875%, 2032 | | | 705,000 | | | | 754,836 | |
| North Texas Education Finance Corp., Education Rev. (Uplift Education), “A”, 5.125%, 2042 | | | 2,355,000 | | | | 2,544,107 | |
| Philadelphia, PA, Authority for Industrial Development Rev. (Discovery Charter School Project), 6.25%, 2037 | | | 1,065,000 | | | | 1,181,575 | |
| Philadelphia, PA, Authority for Industrial Development Rev. (Discovery Charter School Project), 6.25%, 2042 | | | 1,950,000 | | | | 2,155,823 | |
| Philadelphia, PA, Authority for Industrial Development Rev. (Global Leadership Academy Project), 5.75%, 2030 | | | 520,000 | | | | 537,722 | |
| Philadelphia, PA, Authority for Industrial Development Rev. (MaST Charter School), 6%, 2035 | | | 470,000 | | | | 527,406 | |
| Phoenix, AZ, Industrial Development Authority Education Rev. (Choice Academies, Inc. Project), 5.625%, 2042 | | | 2,205,000 | | | | 2,251,526 | |
| San Juan, TX, Higher Education Finance Authority Education Rev. (Idea Public Schools), “A”, 6.7%, 2040 | | | 2,955,000 | | | | 3,509,506 | |
| Seminole County, FL, Industrial Development Authority Rev. (Choices in Learning, Inc.),“A”, 7.375%, 2041 | | | 2,500,000 | | | | 2,788,250 | |
51
Portfolio of Investments – continued
| | | | | | | | |
| Issuer | | Shares/Par | | | Value ($) | |
| Municipal Bonds - continued | | | | | | | | |
| Universities - Secondary Schools - continued | | | | | | | | |
| St. Paul, MN, Housing & Redevelopment Authority Charter School Lease Rev. (Nova Classical Academy), “A”, 6.375%, 2031 | | $ | 630,000 | | | $ | 683,821 | |
| St. Paul, MN, Housing & Redevelopment Authority Charter School Lease Rev. (Nova Classical Academy), “A”, 6.625%, 2042 | | | 1,260,000 | | | | 1,366,621 | |
| Utah County, UT, Charter School Finance Authority, Charter School Rev. (Early Light Academy Project), 8.25%, 2035 | | | 3,730,000 | | | | 4,335,304 | |
| Utah County, UT, Charter School Finance Authority, Charter School Rev. (Hawthorne Academy Project), 8.25%, 2035 | | | 4,015,000 | | | | 4,479,576 | |
| Utah County, UT, Charter School Rev. (Renaissance Academy), “A”, 5.625%, 2037 | | | 2,405,000 | | | | 2,408,175 | |
| Utah County, UT, Charter School Rev. (Ronald Wilson Reagan Academy), “A”, 6%, 2038 | | | 6,070,000 | | | | 6,249,915 | |
| Woodbury, MN, Charter School Lease Rev. (MSA Building Co.), “A”, 5%, 2027 | | | 210,000 | | | | 221,663 | |
| Woodbury, MN, Charter School Lease Rev. (MSA Building Co.), “A”, 5%, 2032 | | | 220,000 | | | | 228,494 | |
| Woodbury, MN, Charter School Lease Rev. (MSA Building Co.), “A”, 5%, 2043 | | | 880,000 | | | | 893,605 | |
| | | | | | | | |
| | | | | | | $ | 123,386,746 | |
| Utilities - Cogeneration - 0.6% | | | | | | | | |
| California Pollution Control Financing Authority, Water Furnishing Rev. (Poseidon Resources Desalination Project), 5%, 2045 | | $ | 13,690,000 | | | $ | 14,230,892 | |
| New Jersey Economic Development Authority Energy Facility Rev. (UMM Energy Partners LLC Project), “A”, 5%, 2037 | | | 870,000 | | | | 906,262 | |
| New Jersey Economic Development Authority Energy Facility Rev. (UMM Energy Partners LLC Project), “A”, 5.125%, 2043 | | | 865,000 | | | | 905,880 | |
| Pennsylvania Economic Development Financing Authority Rev., Resource Recovery Rev. (Colver), “G”, 5.125%, 2015 | | | 1,200,000 | | | | 1,239,180 | |
| St. Paul, MN, Port Authority Rev. (Energy Park Utility Co. Project), 5.45%, 2028 | | | 250,000 | | | | 262,268 | |
| St. Paul, MN, Port Authority Rev. (Energy Park Utility Co. Project), 5.7%, 2036 | | | 1,250,000 | | | | 1,310,550 | |
| | | | | | | | |
| | | | | | | $ | 18,855,032 | |
| Utilities - Investor Owned - 3.0% | | | | | | | | |
| Apache County, AZ, Industrial Development Authority, Pollution Control Rev. (Tucson Electric Power Co.),“A”, 4.5%, 2030 | | $ | 5,170,000 | | | $ | 5,376,903 | |
| Brazos River Authority, TX, Pollution Control Rev. (TXU Energy Co. LLC), 5%, 2041 | | | 3,015,000 | | | | 324,504 | |
52
Portfolio of Investments – continued
| | | | | | | | |
| Issuer | | Shares/Par | | | Value ($) | |
| Municipal Bonds - continued | | | | | | | | |
| Utilities - Investor Owned - continued | | | | | | | | |
| California Pollution Control Financing Authority, Water Facilities Rev. (American Water Capital Corp. Project), 5.25%, 2040 | | $ | 3,500,000 | | | $ | 3,768,975 | |
| Chula Vista, CA, Industrial Development Rev. (San Diego Gas & Electric Co.), “E”, 5.875%, 2034 | | | 1,940,000 | | | | 2,280,916 | |
| Chula Vista, CA, Industrial Development Rev. (San Diego Gas & Electric Co.), “F”, 4%, 2039 | | | 2,405,000 | | | | 2,427,102 | |
| Farmington, NM, Pollution Control Rev. (Public Service New Mexico), “D”, 5.9%, 2040 | | | 11,915,000 | | | | 13,338,962 | |
| Fort Bend County, TX, Industrial Development Corp. (NRG Energy, Inc.), “A”, 4.75%, 2038 | | | 3,700,000 | | | | 3,831,128 | |
| Hawaii Department of Budget & Finance Special Purpose Rev. (Hawaiian Electric Co. & Subsidiary), 6.5%, 2039 | | | 10,580,000 | | | | 12,320,833 | |
| Hawaii Department of Budget & Finance Special Purpose Rev. (Hawaiian Electric Co. & Subsidiary),“A”, FGIC, 4.8%, 2025 | | | 1,000,000 | | | | 1,025,030 | |
| Maricopa County, AZ, Pollution Control Rev. (El Paso Electric Co. Palo Verde Project), “A”, 4.5%, 2042 | | | 2,160,000 | | | | 2,230,783 | |
| Maricopa County, AZ, Pollution Control Rev. (El Paso Electric), “B”, 7.25%, 2040 | | | 1,790,000 | | | | 2,129,241 | |
| Maricopa County, AZ, Pollution Control Rev. (Southern California Edison Co.),“A”, 5%, 2035 | | | 4,700,000 | | | | 5,251,404 | |
| Massachusetts Development Finance Agency, Solid Waste Disposal Rev. (Dominion Energy Brayton), 5.75%, 2042 (b) | | | 685,000 | | | | 839,899 | |
| Matagorda County, TX, Pollution Control Rev. (Central Power & Light Co.), “A”, 6.3%, 2029 | | | 2,155,000 | | | | 2,516,717 | |
| Michigan Strategic Fund Ltd. Obligation Rev. (Detroit Edison Co.), 5.625%, 2020 | | | 1,050,000 | | | | 1,299,354 | |
| Ohio Air Quality Development Authority Rev. (FirstEnergy Corp.), “A”, 5.7%, 2020 | | | 4,335,000 | | | | 5,231,001 | |
| Owen County, KY, Waterworks System Rev. (American Water Co. Project), “A”, 6.25%, 2039 | | | 1,635,000 | | | | 1,827,946 | |
| Owen County, KY, Waterworks System Rev. (American Water Co. Project), “B”, 5.625%, 2039 | | | 1,830,000 | | | | 1,988,204 | |
| Pennsylvania Economic Development Financing Authority (Allegheny Energy Supply Co. LLC), 7%, 2039 | | | 7,390,000 | | | | 8,861,053 | |
| Pima County, AZ, Industrial Development Authority Rev. (Tucson Electric Power Co.), 5.75%, 2029 | | | 5,430,000 | | | | 5,751,890 | |
| Pima County, AZ, Industrial Development Authority Rev. (Tucson Electric Power Co.), “A”, 5.25%, 2040 | | | 4,755,000 | | | | 5,199,117 | |
| | | | | | | | |
| | | | | | | $ | 87,820,962 | |
| Utilities - Municipal Owned - 1.9% | | | | | | | | |
| Guam Power Authority Rev., “A”, AGM, 5%, 2025 | | $ | 1,060,000 | | | $ | 1,223,081 | |
| Guam Power Authority Rev., “A”, AGM, 5%, 2026 | | | 885,000 | | | | 1,017,184 | |
53
Portfolio of Investments – continued
| | | | | | | | |
| Issuer | | Shares/Par | | | Value ($) | |
| Municipal Bonds - continued | | | | | | | | |
| Utilities - Municipal Owned - continued | | | | | | | | |
| Guam Power Authority Rev., “A”, AGM, 5%, 2027 | | $ | 355,000 | | | $ | 405,801 | |
| Guam Power Authority Rev., “A”, 5%, 2034 | | | 1,060,000 | | | | 1,148,574 | |
| Los Angeles, CA, Department of Water & Power Rev. (Power System), “B”, 5%, 2038 | | | 4,605,000 | | | | 5,318,038 | |
| Mississippi Business Finance Corp., Gulf Opportunity Zone Rev., “A”, 5%, 2037 | | | 3,000,000 | | | | 3,262,380 | |
| Philadelphia, PA, Gas Works Rev., 5.25%, 2040 | | | 1,070,000 | | | | 1,150,079 | |
| Puerto Rico Electric Power Authority, Power Rev., “AAA”, 5.25%, 2028 | | | 5,240,000 | | | | 5,408,309 | |
| Puerto Rico Electric Power Authority, Power Rev., “AAA”, 5.25%, 2031 | | | 2,245,000 | | | | 2,293,200 | |
| Salt River, AZ, Project Agricultural Improvement & Power District Electric, “A”, 5%, 2032 | | | 2,615,000 | | | | 3,012,114 | |
| San Antonio, TX, Electric & Gas Rev., 5.25%, 2025 (u) | | | 25,000,000 | | | | 32,689,000 | |
| | | | | | | | |
| | | | | | | $ | 56,927,760 | |
| Utilities - Other - 2.8% | | | | | | | | |
| California M-S-R Energy Authority Gas Rev., “A”, 7%, 2034 | | $ | 1,135,000 | | | $ | 1,620,008 | |
| California M-S-R Energy Authority Gas Rev., “A”, 6.5%, 2039 | | | 5,110,000 | | | | 6,987,005 | |
| Georgia Main Street Natural Gas, Inc., Gas Project Rev., “A”, 5.5%, 2028 | | | 2,245,000 | | | | 2,775,291 | |
| Nebraska Central Plains Energy Project, Gas Project Rev., “3”, 5%, 2032 | | | 7,340,000 | | | | 8,197,165 | |
| Public Authority for Colorado Energy Natural Gas Purchase Rev., 6.25%, 2028 | | | 4,865,000 | | | | 6,242,476 | |
| Public Authority for Colorado Energy Natural Gas Purchase Rev., 6.5%, 2038 | | | 7,060,000 | | | | 9,587,621 | |
| SA Energy Acquisition Public Facility Corp. (Tex Gas Supply), 5.5%, 2027 | | | 4,000,000 | | | | 4,732,600 | |
| Salt Verde Financial Corp., AZ, Senior Gas Rev., 5%, 2032 | | | 6,670,000 | | | | 7,706,185 | |
| Salt Verde Financial Corp., AZ, Senior Gas Rev., 5%, 2037 | | | 9,565,000 | | | | 10,913,569 | |
| Tennessee Energy Acquisition Corp., Gas Rev., “A”, 5.25%, 2019 | | | 12,055,000 | | | | 13,933,892 | |
| Tennessee Energy Acquisition Corp., Gas Rev., “A”, 5.25%, 2022 | | | 2,105,000 | | | | 2,445,147 | |
| Tennessee Energy Acquisition Corp., Gas Rev., “A”, 5.25%, 2024 | | | 3,625,000 | | | | 4,205,544 | |
| Texas Gas Acquisition & Supply Corp. III, Gas Supply Rev., 5%, 2031 | | | 1,680,000 | | | | 1,831,435 | |
| Texas Gas Acquisition & Supply Corp. III, Gas Supply Rev., 5%, 2032 | | | 2,680,000 | | | | 2,898,768 | |
| | | | | | | | |
| | | | | | | $ | 84,076,706 | |
54
Portfolio of Investments – continued
| | | | | | | | |
| Issuer | | Shares/Par | | | Value ($) | |
| Municipal Bonds - continued | | | | | | | | |
| Water & Sewer Utility Revenue - 3.7% | | | | | | | | |
| Atlanta, GA, Water & Wastewater Rev., “A”, 6%, 2022 | | $ | 2,895,000 | | | $ | 3,686,493 | |
| Clairton, PA, Municipal Authority, “B”, 5%, 2037 | | | 1,735,000 | | | | 1,820,015 | |
| Commonwealth of Puerto Rico Aqueduct & Sewer Authority Rev., “A”, 5.75%, 2037 | | | 5,090,000 | | | | 5,288,205 | |
| Commonwealth of Puerto Rico Aqueduct & Sewer Authority Rev., “A”, 6%, 2044 | | | 1,215,000 | | | | 1,250,429 | |
| DeKalb County, GA, Water & Sewer Rev., “A”, 5.25%, 2028 | | | 5,505,000 | | | | 6,581,888 | |
| DeKalb County, GA, Water & Sewer Rev., “A”, 5.25%, 2029 | | | 1,010,000 | | | | 1,202,415 | |
| DeKalb County, GA, Water & Sewer Rev., “A”, 5.25%, 2030 | | | 4,680,000 | | | | 5,547,859 | |
| DeKalb County, GA, Water & Sewer Rev., “A”, 5.25%, 2031 | | | 175,000 | | | | 206,862 | |
| DeKalb County, GA, Water & Sewer Rev., “A”, 5.25%, 2041 | | | 4,655,000 | | | | 5,356,090 | |
| Detroit, MI, Water & Sewerage Department, Sewage Disposal System Rev., “A”, 5%, 2032 | | | 6,265,000 | | | | 6,716,331 | |
| East Bay, CA, Municipal Utility District, Water System Rev., “A”, 5%, 2028 | | | 5,000,000 | | | | 5,908,500 | |
| El Paso, TX, Water & Sewer Rev., 5%, 2028 | | | 545,000 | | | | 650,092 | |
| Houston, TX, Utility System Rev., “D”, 5%, 2036 | | | 4,045,000 | | | | 4,712,587 | |
| Iowa Finance Authority Rev., 5%, 2031 | | | 11,825,000 | | | | 13,984,245 | |
| Madera, CA, Irrigation Financing Authority Rev., 6.5%, 2040 | | | 5,970,000 | | | | 6,766,279 | |
| Massachusetts Water Resources Authority, “B”, 5%, 2041 | | | 2,875,000 | | | | 3,284,573 | |
| Metropolitan Water District of Salt Lake & Sandy (Water Rev. Project), “A”, 5%, 2037 | | | 1,260,000 | | | | 1,475,284 | |
| New York Environmental Facilities Corp., Clean Drinking Water Revolving Funds, 5%, 2024 | | | 1,685,000 | | | | 2,066,568 | |
| North Hudson, NJ, Sewerage Authority, Gross Rev. Lease Certificates, “A”, 5%, 2042 | | | 2,210,000 | | | | 2,469,786 | |
| Orange County, CA, Sanitation District, Wastewater Rev., “A”, 4%, 2033 (u) | | | 20,000,000 | | | | 21,845,600 | |
| St. Johns County, FL, Water & Sewer Rev., Capital Appreciation, “B”, 0%, 2030 | | | 850,000 | | | | 428,026 | |
| St. Johns County, FL, Water & Sewer Rev., Capital Appreciation, “B”, 0%, 2031 | | | 555,000 | | | | 264,319 | |
| St. Johns County, FL, Water & Sewer Rev., Capital Appreciation, “B”, 0%, 2032 | | | 705,000 | | | | 320,000 | |
| St. Johns County, FL, Water & Sewer Rev., Capital Appreciation, “B”, 0%, 2033 | | | 900,000 | | | | 388,260 | |
| St. Johns County, FL, Water & Sewer Rev., Capital Appreciation, “B”, 0%, 2034 | | | 960,000 | | | | 392,419 | |
| Tarrant, TX, Regional Water District Rev., 5%, 2037 | | | 5,000,000 | | | | 5,810,550 | |
| | | | | | | | |
| | | | | | | $ | 108,423,675 | |
| Total Municipal Bonds (Identified Cost, $2,690,308,862) | | | $ | 2,918,821,889 | |
55
Portfolio of Investments – continued
| | | | | | | | |
| Floating Rate Demand Notes - 0.2% | | | | | | | | |
| Issuer | | Shares/Par | | | Value ($) | |
| Sublette County, WY, Pollution Control Rev. (Exxon Mobil Corp.), 0.08%, due 2/01/13, at Identified Cost | | $ | 6,100,000 | | | $ | 6,100,000 | |
| | |
| Money Market Funds - 3.8% | | | | | | | | |
MFS Institutional Money Market Portfolio, 0.14%,
at Cost and Net Asset Value (v) | | | 111,057,169 | | | $ | 111,057,169 | |
| Total Investments (Identified Cost, $2,807,466,031) | | | | | | $ | 3,035,979,058 | |
| | |
| Other Assets, Less Liabilities - (2.6)% | | | | | | | (76,839,471 | ) |
| Net Assets - 100.0% | | | | | | $ | 2,959,139,587 | |
| (a) | Non-income producing security. |
| (b) | Mandatory tender date is earlier than stated maturity date. |
| (d) | In default. Interest and/or scheduled principal payment(s) have been missed. |
| (n) | Securities exempt from registration under Rule 144A of the Securities Act of 1933. These securities may be sold in the ordinary course of business in transactions exempt from registration, normally to qualified institutional buyers. At period end, the aggregate value of these securities was $25,121,751 representing 0.8% of net assets. |
| (p) | Primary inverse floater. |
| (q) | Interest received was less than stated coupon rate. |
| (u) | Underlying security deposited into special purpose trust (“the trust”) by investment banker upon creation of self-deposited inverse floaters. |
| (v) | Underlying affiliated fund that is available only to investment companies managed by MFS. The rate quoted for the MFS Institutional Money Market Portfolio is the annualized seven-day yield of the fund at period end. |
| (z) | Restricted securities are not registered under the Securities Act of 1933 and are subject to legal restrictions on resale. These securities generally may be resold in transactions exempt from registration or to the public if the securities are subsequently registered. Disposal of these securities may involve time-consuming negotiations and prompt sale at an acceptable price may be difficult. The fund holds the following restricted securities: |
| | | | | | | | | | |
| Restricted Securities | | Acquisition
Date | |
Cost | | | Value | |
| MuniMae TE Bond Subsidiary LLC, 5.4%, 2049 | | 10/14/04 | | | $2,000,000 | | | | $1,440,080 | |
| MuniMae TE Bond Subsidiary LLC, 5.9%, 2049 | | 11/02/05 | | | 2,000,000 | | | | 1,181,000 | |
| Total Restricted Securities | | | | $2,621,080 | |
| % of Net assets | | | | 0.1% | |
The following abbreviations are used in this report and are defined:
| COP | | Certificate of Participation |
| FRN | | Floating Rate Note. Interest rate resets periodically and may not be the rate reported at period end. |
56
Portfolio of Investments – continued
| | | | | | |
| Insurers | | Inverse Floaters |
| ACA | | ACA Financial Guaranty Corp. | | RITES | | Residual Interest Tax-Exempt Security |
| AGM | | Assured Guaranty Municipal | | | | |
| AMBAC | | AMBAC Indemnity Corp. | | | | |
| ASSD GTY | | Assured Guaranty Insurance Co. | | | | |
| FGIC | | Financial Guaranty Insurance Co. | | | | |
| FHA | | Federal Housing Administration | | | | |
| FNMA | | Federal National Mortgage Assn. | | | | |
| GNMA | | Government National Mortgage Assn. | | | | |
| NATL | | National Public Finance Guarantee Corp. | | | | |
| PSF | | Permanent School Fund | | | | |
| RADIAN | | Radian Asset Assurance, Inc. | | | | |
| SYNCORA | | Syncora Guarantee Inc. | | | | |
See Notes to Financial Statements
57
Financial Statements
STATEMENT OF ASSETS AND LIABILITIES
At 1/31/13
This statement represents your fund’s balance sheet, which details the assets and liabilities comprising the total value of the fund.
| | | | |
| Assets | | | | |
Investments- | | | | |
Non-affiliated issuers, at value (identified cost, $2,696,408,862) | | | $2,924,921,889 | |
Underlying affiliated funds, at cost and value | | | 111,057,169 | |
Total investments, at value (identified cost, $2,807,466,031) | | | $3,035,979,058 | |
Cash | | | 563 | |
Receivables for | | | | |
Investments sold | | | 8,760,455 | |
Fund shares sold | | | 12,630,174 | |
Interest and dividends | | | 36,366,539 | |
Receivable from investment adviser | | | 298,191 | |
Other assets | | | 20,409 | |
Total assets | | | $3,094,055,389 | |
| Liabilities | | | | |
Payables for | | | | |
Distributions | | | $2,423,116 | |
Investments purchased | | | 34,005,533 | |
Interest expense and fees | | | 681,719 | |
Fund shares reacquired | | | 6,567,419 | |
Payable to the holders of the floating rate certificates from trust assets | | | 89,841,011 | |
Payable to affiliates | | | | |
Shareholder servicing costs | | | 1,098,782 | |
Distribution and service fees | | | 21,241 | |
Payable for independent Trustees’ compensation | | | 17,330 | |
Accrued expenses and other liabilities | | | 259,651 | |
Total liabilities | | | $134,915,802 | |
Net assets | | | $2,959,139,587 | |
| Net assets consist of | | | | |
Paid-in capital | | | $2,832,880,850 | |
Unrealized appreciation (depreciation) on investments | | | 228,513,027 | |
Accumulated net realized gain (loss) on investments | | | (108,270,942 | ) |
Undistributed net investment income | | | 6,016,652 | |
Net assets | | | $2,959,139,587 | |
Shares of beneficial interest outstanding | | | 354,605,100 | |
| | | | | | | | | | | | |
| | | Net assets | | | Shares
outstanding | | | Net asset value
per share (a) | |
Class A | | | $2,161,677,209 | | | | 259,046,533 | | | | $8.34 | |
Class B | | | 52,885,921 | | | | 6,330,930 | | | | 8.35 | |
Class C | | | 299,381,298 | | | | 35,838,501 | | | | 8.35 | |
Class I | | | 445,195,159 | | | | 53,389,136 | | | | 8.34 | |
| (a) | Maximum offering price per share was equal to the net asset value per share for all share classes, except for Class A, for which the maximum offering price per share was $8.76 [100 / 95.25 x $8.34]. On sales of $50,000 or more, the maximum offering price of Class A shares is reduced. A contingent deferred sales charge may be imposed on redemptions of Class A, Class B, and Class C shares. Redemption price per share was equal to the net asset value per share for Class I. |
See Notes to Financial Statements
58
Financial Statements
STATEMENT OF OPERATIONS
Year ended 1/31/13
This statement describes how much your fund earned in investment income and accrued in expenses. It also describes any gains and/or losses generated by fund operations.
| | | | |
| Net investment income | | | | |
Income | | | | |
Interest | | | $145,932,216 | |
Dividends from underlying affiliated funds | | | 144,714 | |
Total investment income | | | $146,076,930 | |
Expenses | | | | |
Management fee | | | $14,534,926 | |
Distribution and service fees | | | 3,218,868 | |
Shareholder servicing costs | | | 2,331,045 | |
Administrative services fee | | | 378,325 | |
Independent Trustees’ compensation | | | 52,690 | |
Custodian fee | | | 213,306 | |
Shareholder communications | | | 141,198 | |
Audit and tax fees | | | 60,181 | |
Legal fees | | | 46,436 | |
Interest expense and fees | | | 775,967 | |
Miscellaneous | | | 362,555 | |
Total expenses | | | $22,115,497 | |
Fees paid indirectly | | | (130 | ) |
Reduction of expenses by investment adviser | | | (495,418 | ) |
Net expenses | | | $21,619,949 | |
Net investment income | | | $124,456,981 | |
| Realized and unrealized gain (loss) on investments | | | | |
Realized gain (loss) (identified cost basis) | | | | |
Investments | | | $1,641,971 | |
Futures contracts | | | (734,048 | ) |
Net realized gain (loss) on investments | | | $907,923 | |
Change in unrealized appreciation (depreciation) | | | | |
Investments | | | $138,863,180 | |
Futures contracts | | | 331,037 | |
Net unrealized gain (loss) on investments | | | $139,194,217 | |
Net realized and unrealized gain (loss) on investments | | | $140,102,140 | |
Change in net assets from operations | | | $264,559,121 | |
See Notes to Financial Statements
59
Financial Statements
STATEMENTS OF CHANGES IN NET ASSETS
These statements describe the increases and/or decreases in net assets resulting from operations, any distributions, and any shareholder transactions.
| | | | | | | | |
| | | Years ended 1/31 | |
| | | 2013 | | | 2012 | |
| Change in net assets | | | | | | |
| From operations | | | | | | | | |
Net investment income | | | $124,456,981 | | | | $103,595,988 | |
Net realized gain (loss) on investments | | | 907,923 | | | | (40,685,262 | ) |
Net unrealized gain (loss) on investments | | | 139,194,217 | | | | 244,517,505 | |
Change in net assets from operations | | | $264,559,121 | | | | $307,428,231 | |
| Distributions declared to shareholders | | | | | | | | |
From net investment income | | | $(119,759,769 | ) | | | $(102,325,739 | ) |
Change in net assets from fund share transactions | | | $525,888,072 | | | | $359,669,368 | |
Total change in net assets | | | $670,687,424 | | | | $564,771,860 | |
| Net assets | | | | | | | | |
At beginning of period | | | 2,288,452,163 | | | | 1,723,680,303 | |
At end of period (including undistributed net investment income of $6,016,652 and $5,049,841, respectively) | | | $2,959,139,587 | | | | $2,288,452,163 | |
See Notes to Financial Statements
60
Financial Statements
FINANCIAL HIGHLIGHTS
The financial highlights table is intended to help you understand the fund’s financial performance for the past 5 years (or life of a particular share class, if shorter). Certain information reflects financial results for a single fund share. The total returns in the table represent the rate by which an investor would have earned (or lost) on an investment in the fund share class (assuming reinvestment of all distributions) held for the entire period.
| | | | | | | | | | | | | | | | | | | | |
| Class A | | Years ended 1/31 | |
| | | 2013 | | | 2012 | | | 2011 | | | 2010 | | | 2009 | |
Net asset value, beginning of period | | | $7.89 | | | | $7.13 | | | | $7.39 | | | | $6.33 | | | | $8.06 | |
| Income (loss) from investment operations | | | | | | | | | |
Net investment income (d) | | | $0.39 | | | | $0.41 | | | | $0.43 | | | | $0.43 | | | | $0.44 | |
Net realized and unrealized gain (loss)
on investments | | | 0.44 | | | | 0.75 | | | | (0.27 | ) | | | 1.05 | | | | (1.73 | ) |
Total from investment operations | | | $0.83 | | | | $1.16 | | | | $0.16 | | | | $1.48 | | | | $(1.29 | ) |
| Less distributions declared to shareholders | | | | | | | | | |
From net investment income | | | $(0.38 | ) | | | $(0.40 | ) | | | $(0.42 | ) | | | $(0.42 | ) | | | $(0.44 | ) |
Net asset value, end of period (x) | | | $8.34 | | | | $7.89 | | | | $7.13 | | | | $7.39 | | | | $6.33 | |
Total return (%) (r)(s)(t)(x) | | | 10.72 | | | | 16.83 | | | | 2.03 | | | | 24.03 | | | | (16.50 | ) |
Ratios (%) (to average net assets)
and Supplemental data: | | | | | | | | | |
Expenses before expense reductions (f) | | | 0.72 | | | | 0.71 | | | | 0.72 | | | | 0.72 | | | | 0.80 | |
Expenses after expense reductions (f) | | | 0.70 | | | | 0.70 | | | | 0.70 | | | | 0.69 | | | | 0.70 | |
Net investment income | | | 4.83 | | | | 5.49 | | | | 5.68 | | | | 6.17 | | | | 5.97 | |
Portfolio turnover | | | 18 | | | | 21 | | | | 20 | | | | 17 | | | | 38 | |
Net assets at end of period (000 omitted) | | | $2,161,677 | | | | $1,858,416 | | | | $1,463,867 | | | | $1,452,126 | | | | $1,039,232 | |
| Supplemental Ratios (%): | | | | | | | | | | | | | | | | | |
Ratio of expenses to average net assets
after expense reductions and excluding
interest expense and fees (f)(l) | | | 0.67 | | | | 0.67 | | | | 0.67 | | | | 0.67 | | | | 0.64 | |
See Notes to Financial Statements
61
Financial Highlights – continued
| | | | | | | | | | | | | | | | | | | | |
| Class B | | Years ended 1/31 | |
| | | 2013 | | | 2012 | | | 2011 | | | 2010 | | | 2009 | |
Net asset value, beginning of period | | | $7.90 | | | | $7.13 | | | | $7.40 | | | | $6.33 | | | | $8.06 | |
| Income (loss) from investment operations | | | | | | | | | |
Net investment income (d) | | | $0.33 | | | | $0.35 | | | | $0.37 | | | | $0.38 | | | | $0.38 | |
Net realized and unrealized gain (loss)
on investments | | | 0.43 | | | | 0.76 | | | | (0.28 | ) | | | 1.06 | | | | (1.73 | ) |
Total from investment operations | | | $0.76 | | | | $1.11 | | | | $0.09 | | | | $1.44 | | | | $(1.35 | ) |
| Less distributions declared to shareholders | | | | | | | | | |
From net investment income | | | $(0.31 | ) | | | $(0.34 | ) | | | $(0.36 | ) | | | $(0.37 | ) | | | $(0.38 | ) |
Net asset value, end of period (x) | | | $8.35 | | | | $7.90 | | | | $7.13 | | | | $7.40 | | | | $6.33 | |
Total return (%) (r)(s)(t)(x) | | | 9.82 | | | | 16.06 | | | | 1.10 | | | | 23.25 | | | | (17.16 | ) |
Ratios (%) (to average net assets)
and Supplemental data: | | | | | | | | | |
Expenses before expense reductions (f) | | | 1.71 | | | | 1.71 | | | | 1.64 | | | | 1.50 | | | | 1.56 | |
Expenses after expense reductions (f) | | | 1.51 | | | | 1.49 | | | | 1.49 | | | | 1.47 | | | | 1.47 | |
Net investment income | | | 4.02 | | | | 4.74 | | | | 4.89 | | | | 5.45 | | | | 5.18 | |
Portfolio turnover | | | 18 | | | | 21 | | | | 20 | | | | 17 | | | | 38 | |
Net assets at end of period (000 omitted) | | | $52,886 | | | | $47,927 | | | | $50,750 | | | | $68,348 | | | | $75,791 | |
| Supplemental Ratios (%): | | | | | | | | | | | | | | | | | |
Ratio of expenses to average net assets
after expense reductions and excluding
interest expense and fees (f)(l) | | | 1.48 | | | | 1.46 | | | | 1.46 | | | | 1.45 | | | | 1.41 | |
See Notes to Financial Statements
62
Financial Highlights – continued
| | | | | | | | | | | | | | | | | | | | |
| Class C | | Years ended 1/31 | |
| | | 2013 | | | 2012 | | | 2011 | | | 2010 | | | 2009 | |
Net asset value, beginning of period | | | $7.90 | | | | $7.13 | | | | $7.40 | | | | $6.33 | | | | $8.06 | |
| Income (loss) from investment operations | | | | | | | | | |
Net investment income (d) | | | $0.31 | | | | $0.33 | | | | $0.35 | | | | $0.36 | | | | $0.36 | |
Net realized and unrealized gain (loss)
on investments | | | 0.44 | | | | 0.77 | | | | (0.27 | ) | | | 1.06 | | | | (1.72 | ) |
Total from investment operations | | | $0.75 | | | | $1.10 | | | | $0.08 | | | | $1.42 | | | | $(1.36 | ) |
| Less distributions declared to shareholders | | | | | | | | | |
From net investment income | | | $(0.30 | ) | | | $(0.33 | ) | | | $(0.35 | ) | | | $(0.35 | ) | | | $(0.37 | ) |
Net asset value, end of period (x) | | | $8.35 | | | | $7.90 | | | | $7.13 | | | | $7.40 | | | | $6.33 | |
Total return (%) (r)(s)(t)(x) | | | 9.61 | | | | 15.82 | | | | 0.88 | | | | 22.99 | | | | (17.36 | ) |
Ratios (%) (to average net assets)
and Supplemental data: | | | | | | | | | |
Expenses before expense reductions (f) | | | 1.71 | | | | 1.71 | | | | 1.72 | | | | 1.72 | | | | 1.80 | |
Expenses after expense reductions (f) | | | 1.70 | | | | 1.70 | | | | 1.70 | | | | 1.69 | | | | 1.70 | |
Net investment income | | | 3.82 | | | | 4.51 | | | | 4.68 | | | | 5.17 | | | | 4.96 | |
Portfolio turnover | | | 18 | | | | 21 | | | | 20 | | | | 17 | | | | 38 | |
Net assets at end of period (000 omitted) | | | $299,381 | | | | $236,487 | | | | $209,064 | | | | $213,166 | | | | $155,407 | |
| Supplemental Ratios (%): | | | | | | | | | | | | | | | | | |
Ratio of expenses to average net assets
after expense reductions and excluding
interest expense and fees (f)(l) | | | 1.67 | | | | 1.67 | | | | 1.67 | | | | 1.67 | | | | 1.64 | |
See Notes to Financial Statements
63
Financial Highlights – continued
| | | | | | | | |
| Class I | | Years ended 1/31 | |
| | | 2013 | | | 2012 (i) | |
Net asset value, beginning of period | | | $7.89 | | | | $7.28 | |
| Income (loss) from investment operations | |
Net investment income (d) | | | $0.39 | | | | $0.26 | |
Net realized and unrealized gain (loss) on investments | | | 0.44 | | | | 0.61 | |
Total from investment operations | | | $0.83 | | | | $0.87 | |
| Less distributions declared to shareholders | |
From net investment income | | | $(0.38 | ) | | | $(0.26 | ) |
Net asset value, end of period (x) | | | $8.34 | | | | $7.89 | |
Total return (%) (r)(s)(x) | | | 10.71 | | | | 12.22 | (n) |
Ratios (%) (to average net assets)
and Supplemental data: | |
Expenses before expense reductions (f) | | | 0.72 | | | | 0.72 | (a) |
Expenses after expense reductions (f) | | | 0.70 | | | | 0.69 | (a) |
Net investment income | | | 4.82 | | | | 5.03 | (a) |
Portfolio turnover | | | 18 | | | | 21 | (n) |
Net assets at end of period (000 omitted) | | | $445,195 | | | | $145,622 | |
| Supplemental Ratios (%): | | | | | |
Ratio of expenses to average net assets after expense reductions and excluding
interest expense and fees (f)(l) | | | 0.67 | | | | 0.67 | (a) |
| (d) | Per share data is based on average shares outstanding. |
| (f) | Ratios do not reflect reductions from fees paid indirectly, if applicable. |
| (i) | For Class I, the period is from inception, June 1, 2011, through the stated period end. |
| (l) | Interest expense and fees relate to payments made to the holders of the floating rate certificates from trust assets. |
| (r) | Certain expenses have been reduced without which performance would have been lower. |
| (s) | From time to time the fund may receive proceeds from litigation settlements, without which performance would be lower. |
| (t) | Total returns do not include any applicable sales charges. |
| (x) | The net asset values per share and total returns have been calculated on net assets which include adjustments made in accordance with U.S. generally accepted accounting principles required at period end for financial reporting purposes. |
See Notes to Financial Statements
64
NOTES TO FINANCIAL STATEMENTS
(1) Business and Organization
MFS Municipal High Income Fund (the fund) is a series of MFS Series Trust III which is organized as a Massachusetts business trust and is registered under the Investment Company Act of 1940, as amended, as an open-end management investment company.
(2) Significant Accounting Policies
General – The preparation of financial statements in conformity with U.S. generally accepted accounting principles requires management to make estimates and assumptions that affect the reported amounts of assets and liabilities, and disclosure of contingent assets and liabilities at the date of the financial statements and the reported amounts of revenues and expenses during the reporting period. Actual results could differ from those estimates. In the preparation of these financial statements, management has evaluated subsequent events occurring after the date of the fund’s Statement of Assets and Liabilities through the date that the financial statements were issued. The fund invests primarily in municipal instruments. The value of municipal instruments can be affected by changes in their actual or perceived credit quality. The credit quality of municipal instruments can be affected by, among other things, the financial condition of the issuer or guarantor, the issuer’s future borrowing plans and sources of revenue, the economic feasibility of the revenue bond project or general borrowing purpose, political or economic developments in the region where the instrument is issued and the liquidity of the security. Municipal instruments generally trade in the over-the-counter market. Municipal instruments backed by current and anticipated revenues from a specific project or specific assets can be negatively affected by the discontinuance of the taxation supporting the projects or assets or the inability to collect revenues for the project or from the assets. If the Internal Revenue Service determines an issuer of a municipal instrument has not complied with the applicable tax requirements, the security could decline in value, interest from the security could become taxable and the funds may be required to issue Forms 1099-DIV. The fund invests in high-yield securities rated below investment grade. Investments in high-yield securities involve greater degrees of credit and market risk than investments in higher-rated securities and tend to be more sensitive to economic conditions.
In this reporting period the fund adopted Financial Accounting Standards Board (FASB) Accounting Standards Update 2011-04, Fair Value Measurement (Topic 820) – Amendments to Achieve Common Fair Value Measurement and Disclosure Requirements in U.S. GAAP and IFRSs (“ASU 2011-04”). ASU 2011-04 seeks to improve the comparability of fair value measurements as presented and disclosed in financial statements prepared in accordance with U.S. GAAP and International Financial Reporting Standards (IFRS) by providing common requirements for fair value measurement and disclosure.
In December 2011, the FASB issued Accounting Standards Update 2011-11, Balance Sheet (Topic 210) – Disclosures about Offsetting Assets and Liabilities (“ASU 2011-11”). Effective for annual reporting periods beginning on or after January 1, 2013 and interim periods within those annual periods, ASU 2011-11 is intended to enhance disclosure requirements on the offsetting of financial assets and liabilities.
65
Notes to Financial Statements – continued
Although still evaluating the potential impacts of ASU 2011-11 to the fund, management expects that the impact of the fund’s adoption will be limited to additional financial statement disclosures.
Investment Valuations – Debt instruments and floating rate loans (other than short-term instruments), including restricted debt instruments, are generally valued at an evaluated or composite bid as provided by a third-party pricing service. Short-term instruments with a maturity at issuance of 60 days or less generally are valued at amortized cost, which approximates market value. Futures contracts are generally valued at last posted settlement price as provided by a third-party pricing service on the market on which they are primarily traded. Futures contracts for which there were no trades that day for a particular position are generally valued at the closing bid quotation as provided by a third-party pricing service on the market on which such futures contracts are primarily traded. Open-end investment companies are generally valued at net asset value per share. Securities and other assets generally valued on the basis of information from a third-party pricing service may also be valued at a broker/dealer bid quotation. Values obtained from third-party pricing services can utilize both transaction data and market information such as yield, quality, coupon rate, maturity, type of issue, trading characteristics, and other market data.
The Board of Trustees has delegated primary responsibility for determining or causing to be determined the value of the fund’s investments (including any fair valuation) to the adviser pursuant to valuation policies and procedures approved by the Board. If the adviser determines that reliable market quotations are not readily available, investments are valued at fair value as determined in good faith by the adviser in accordance with such procedures under the oversight of the Board of Trustees. Under the fund’s valuation policies and procedures, market quotations are not considered to be readily available for most types of debt instruments and floating rate loans and many types of derivatives. These investments are generally valued at fair value based on information from third-party pricing services. In addition, investments may be valued at fair value if the adviser determines that an investment’s value has been materially affected by events occurring after the close of the exchange or market on which the investment is principally traded (such as foreign exchange or market) and prior to the determination of the fund’s net asset value, or after the halting of trading of a specific security where trading does not resume prior to the close of the exchange or market on which the security is principally traded. The adviser generally relies on third-party pricing services or other information (such as the correlation with price movements of similar securities in the same or other markets; the type, cost and investment characteristics of the security; the business and financial condition of the issuer; and trading and other market data) to assist in determining whether to fair value and at what value to fair value an investment. The value of an investment for purposes of calculating the fund’s net asset value can differ depending on the source and method used to determine value. When fair valuation is used, the value of an investment used to determine the fund’s net asset value may differ from quoted or published prices for the same investment. There can be no assurance that the fund could obtain the fair value assigned to an investment if it were to sell the investment at the same time at which the fund determines its net asset value per share.
66
Notes to Financial Statements – continued
Various inputs are used in determining the value of the fund’s assets or liabilities. These inputs are categorized into three broad levels. In certain cases, the inputs used to measure fair value may fall into different levels of the fair value hierarchy. In such cases, an investment’s level within the fair value hierarchy is based on the lowest level of input that is significant to the fair value measurement. The fund’s assessment of the significance of a particular input to the fair value measurement in its entirety requires judgment, and considers factors specific to the investment. Level 1 includes unadjusted quoted prices in active markets for identical assets or liabilities. Level 2 includes other significant observable market-based inputs (including quoted prices for similar securities, interest rates, prepayment speed, and credit risk). Level 3 includes unobservable inputs, which may include the adviser’s own assumptions in determining the fair value of investments. The following is a summary of the levels used as of January 31, 2013 in valuing the fund’s assets or liabilities:
| | | | | | | | | | | | | | | | |
| Investments at Value | | Level 1 | | | Level 2 | | | Level 3 | | | Total | |
| Municipal Bonds | | | $— | | | | $2,918,821,889 | | | | $— | | | | $2,918,821,889 | |
| Short Term Securities | | | — | | | | 6,100,000 | | | | — | | | | 6,100,000 | |
| Mutual Funds | | | 111,057,169 | | | | — | | | | — | | | | 111,057,169 | |
| Total Investments | | | $111,057,169 | | | | $2,924,921,889 | | | | $— | | | | $3,035,979,058 | |
For further information regarding security characteristics, see the Portfolio of Investments.
Derivatives – The fund uses derivatives for different purposes, primarily to increase or decrease exposure to a particular market or segment of the market, or security, to increase or decrease interest rate exposure, or as alternatives to direct investments. Derivatives are used for hedging or non-hedging purposes. While hedging can reduce or eliminate losses, it can also reduce or eliminate gains. When the fund uses derivatives as an investment to increase market exposure, or for hedging purposes, gains and losses from derivative instruments may be substantially greater than the derivative’s original cost.
The derivative instruments used by the fund were futures contracts. At January 31, 2013, the fund did not have any outstanding derivative instruments.
The following table presents, by major type of derivative contract, the realized gain (loss) on derivatives held by the fund for the year ended January 31, 2013 as reported in the Statement of Operations:
| | | | |
| Risk | | Futures Contracts | |
| Interest Rate | | | $(734,048 | ) |
The following table presents, by major type of derivative contract, the change in unrealized appreciation (depreciation) on derivatives held by the fund for the year ended January 31, 2013 as reported in the Statement of Operations:
| | | | |
| Risk | | Futures Contracts | |
| Interest Rate | | | $331,037 | |
Derivative counterparty credit risk is managed through formal evaluation of the creditworthiness of all potential counterparties. On certain over-the-counter derivatives, the fund attempts to reduce its exposure to counterparty credit risk whenever possible
67
Notes to Financial Statements – continued
by entering into an International Swaps and Derivatives Association (ISDA) Master Agreement on a bilateral basis with each of the counterparties with whom it undertakes a significant volume of transactions. The ISDA Master Agreement gives each party to the agreement the right to terminate all transactions traded under such agreement if there is a certain deterioration in the credit quality of the other party. The ISDA Master Agreement gives the fund the right, upon an event of default by the applicable counterparty or a termination of the agreement, to close out all transactions traded under such agreement and to net amounts owed under each transaction to one net amount payable by one party to the other. This right to close out and net payments across all transactions traded under the ISDA Master Agreement could result in a reduction of the fund’s credit risk to such counterparty equal to any amounts payable by the fund under the applicable transactions, if any. However, absent an event of default by the counterparty or a termination of the agreement, the ISDA Master Agreement does not result in an offset of reported amounts of assets and liabilities in the Statement of Assets and Liabilities across transactions between the fund and the applicable counterparty.
Collateral requirements differ by type of derivative. Collateral or margin requirements are set by the broker or exchange clearing house for exchange traded derivatives (i.e., futures contracts and exchange-traded options) while collateral terms are contract specific for over-the-counter traded derivatives (i.e., forward foreign currency exchange contracts, swap agreements and over-the-counter options). For derivatives traded under an ISDA Master Agreement, the collateral requirements are netted across all transactions traded under such agreement and one amount is posted from one party to the other to collateralize such obligations. Cash collateral that has been pledged to cover obligations of the fund under derivative contracts, if any, will be reported separately in the Statement of Assets and Liabilities as restricted cash. Securities collateral pledged for the same purpose, if any, is noted in the Portfolio of Investments.
Futures Contracts – The fund entered into futures contracts which may be used to hedge against or obtain broad market exposure, interest rate exposure, or to manage duration. A futures contract represents a commitment for the future purchase or sale of an asset at a specified price on a specified date.
Upon entering into a futures contract, the fund is required to deposit with the broker, either in cash or securities, an initial margin in an amount equal to a certain percentage of the notional amount of the contract. Subsequent payments (variation margin) are made or received by the fund each day, depending on the daily fluctuations in the value of the contract, and are recorded for financial statement purposes as unrealized gain or loss by the fund until the contract is closed or expires at which point the gain or loss on futures contracts is realized.
The fund bears the risk of interest rates or securities prices moving unexpectedly, in which case, the fund may not achieve the anticipated benefits of the futures contracts and may realize a loss. While futures contracts may present less counterparty risk to the fund since the contracts are exchange traded and the exchange’s clearinghouse guarantees payments to the broker, there is still counterparty credit risk due to the insolvency of the broker. The fund’s maximum risk of loss due to counterparty credit risk is equal to the margin posted by the fund to the broker plus any gains or minus any losses on the outstanding futures contracts.
68
Notes to Financial Statements – continued
Inverse Floaters – The fund invests in municipal inverse floating rate securities which are structured by the issuer (known as primary market inverse floating rate securities) or by an investment banker utilizing municipal bonds which have already been issued (known as secondary market inverse floating rate securities) to have variable rates of interest which typically move in the opposite direction of short term interest rates. A secondary market inverse floating rate security is created when an investment banker transfers a fixed rate municipal bond to a special purpose trust, and causes the trust to (a) issue floating rate certificates to third parties, in an amount equal to a fraction of the par amount of the deposited bonds (these certificates usually pay tax-exempt interest at short-term interest rates that typically reset weekly; and the certificates holders typically, on seven days notice, have the option to tender their certificates to the investment banker or another party for redemption at par plus accrued interest), and (b) issue inverse floating rate certificates (sometimes referred to as “inverse floaters”). If the holders of the inverse floater transfer the municipal bonds to an investment banker for the purpose of depositing the municipal bonds into the special purpose trust, the inverse floating rate certificates that are issued by the trust are referred to as “self-deposited inverse floaters.” If the bonds held by the trust are purchased by the investment banker for deposit into the trust from someone other than the purchasers of the inverse floaters, the inverse floating rate certificates that are issued by the trust are referred to as “externally deposited inverse floaters.” Such self-deposited inverse floaters held by the fund are accounted for as secured borrowings, with the municipal bonds reflected in the investments of the fund and amounts owed to the holders of the floating rate certificates under the provisions of the trust, which amounts are paid solely from the assets of the trust, reflected as liabilities of the fund in the Statement of Assets and Liabilities under the caption, “Payable to the holders of the floating rate certificates from trust assets”. The carrying value of the fund’s payable to the holders of the floating rate certificates from trust assets as reported in the fund’s Statement of Assets and Liabilities approximates its fair value. The payable to the holders of the floating rate certificates from trust assets value as of the reporting date is considered Level 2 under the fair value hierarchy disclosure. At January 31, 2013, the fund’s payable to the holders of the floating rate certificates from trust assets was $89,841,011 and the interest rate on the floating rate certificates issued by these trust was 0.13%. For the year ended January, 31, 2013, the average payable to the holders of the floating rate certificates from trust assets was $80,878,648 at a weighted average interest rate of 0.23%. Interest expense and fees relate to interest payments made to the holders of certain floating rate certificates and associated fees, both of which are made from trust assets. Interest expense and fees are recorded as incurred. For the year ended January, 31, 2013 interest expense and fees in connection with self-deposited inverse floaters was $775,967. Primary and externally deposited inverse floaters held by the fund are not accounted for as secured borrowings.
Indemnifications – Under the fund’s organizational documents, its officers and Trustees may be indemnified against certain liabilities and expenses arising out of the performance of their duties to the fund. Additionally, in the normal course of business, the fund enters into agreements with service providers that may contain indemnification clauses. The fund’s maximum exposure under these agreements is
69
Notes to Financial Statements – continued
unknown as this would involve future claims that may be made against the fund that have not yet occurred.
Investment Transactions and Income – Investment transactions are recorded on the trade date. Interest income is recorded on the accrual basis. All premium and discount is amortized or accreted for financial statement purposes in accordance with U.S. generally accepted accounting principles. Interest payments received in additional securities are recorded on the ex-interest date in an amount equal to the value of the security on such date. Debt obligations may be placed on non-accrual status or set to accrue at a rate of interest less than the contractual coupon when the collection of all or a portion of interest has become doubtful. Interest income for those debt obligations may be further reduced by the write-off of the related interest receivables when deemed uncollectible.
The fund may receive proceeds from litigation settlements. Any proceeds received from litigation involving portfolio holdings are reflected in the Statement of Operations in realized gain/loss if the security has been disposed of by the fund or in unrealized gain/loss if the security is still held by the fund. Any other proceeds from litigation not related to portfolio holdings are reflected as other income in the Statement of Operations.
Legal fees and other related expenses incurred to preserve and protect the value of a security owned are added to the cost of the security; other legal fees are expensed. Capital infusions made directly to the security issuer, which are generally non-recurring, incurred to protect or enhance the value of high-yield debt securities, are reported as additions to the cost basis of the security. Costs that are incurred to negotiate the terms or conditions of capital infusions or that are expected to result in a plan of reorganization are reported as realized losses. Ongoing costs incurred to protect or enhance an investment, or costs incurred to pursue other claims or legal actions, are expensed.
Fees Paid Indirectly – The fund’s custody fee may be reduced according to an arrangement that measures the value of cash deposited with the custodian by the fund. This amount, for the year ended January 31, 2013, is shown as a reduction of total expenses in the Statement of Operations.
Tax Matters and Distributions – The fund intends to qualify as a regulated investment company, as defined under Subchapter M of the Internal Revenue Code, and to distribute all of its taxable and tax-exempt income, including realized capital gains. As a result, no provision for federal income tax is required. The fund’s federal tax returns, when filed, will remain subject to examination by the Internal Revenue Service for a three year period.
Distributions to shareholders are recorded on the ex-dividend date. Income and capital gain distributions are determined in accordance with income tax regulations, which may differ from U.S. generally accepted accounting principles. Certain capital accounts in the financial statements are periodically adjusted for permanent differences in order to reflect their tax character. These adjustments have no impact on net assets or net asset value per share. Temporary differences which arise from recognizing certain items of income, expense, gain or loss in different periods for financial statement and tax purposes will reverse at some time in the future. Distributions in excess of net
70
Notes to Financial Statements – continued
investment income or net realized gains are temporary overdistributions for financial statement purposes resulting from differences in the recognition or classification of income or distributions for financial statement and tax purposes.
Book/tax differences primarily relate to expiration of capital loss carryforwards, amortization and accretion of debt securities, and defaulted bonds.
The tax character of distributions declared to shareholders for the last two fiscal years is as follows:
| | | | | | | | |
| | | 1/31/13 | | | 1/31/12 | |
| Ordinary income (including any short-term capital gains) | | | $219,307 | | | | $841,790 | |
| Tax-exempt income | | | 119,540,462 | | | | 101,483,949 | |
| Total distributions | | | $119,759,769 | | | | $102,325,739 | |
The federal tax cost and the tax basis components of distributable earnings were as follows:
| | | | |
| As of 1/31/13 | | | |
| Cost of investments | | | $2,707,244,750 | |
| Gross appreciation | | | 283,124,542 | |
| Gross depreciation | | | (44,231,245 | ) |
| Net unrealized appreciation (depreciation) | | | $238,893,297 | |
| Undistributed ordinary income | | | 2,660,724 | |
| Undistributed tax-exempt income | | | 18,682,594 | |
| Capital loss carryforwards | | | (118,748,448 | ) |
| Other temporary differences | | | (15,229,430 | ) |
Under the Regulated Investment Company Modernization Act of 2010 (the “Act”), net capital losses recognized after January 31, 2011 may be carried forward indefinitely, and their character is retained as short-term and/or long-term losses. Previously, net capital losses were carried forward for eight years and treated as short-term losses. As a transition rule, the Act requires that post-enactment net capital losses be used before pre-enactment net capital losses.
As of January 31, 2013, the fund had capital loss carryforwards available to offset future realized gains.
| | | | |
| Pre-enactment losses expire as follows: | |
| 1/31/14 | | | $(10,798,317 | ) |
| 1/31/15 | | | (230,213 | ) |
| 1/31/17 | | | (18,935,036 | ) |
| 1/31/18 | | | (28,497,487 | ) |
| 1/31/19 | | | (16,085,714 | ) |
| Total | | | $(74,546,767 | ) |
|
Post-enactment losses are characterized
as follows: | |
| Long-Term | | | $(44,201,681 | ) |
71
Notes to Financial Statements – continued
Multiple Classes of Shares of Beneficial Interest – The fund offers multiple classes of shares, which differ in their respective distribution and service fees. The fund’s income and common expenses are allocated to shareholders based on the value of settled shares outstanding of each class. The fund’s realized and unrealized gain (loss) are allocated to shareholders based on the daily net assets of each class. Dividends are declared separately for each class. Differences in per share dividend rates are generally due to differences in separate class expenses. Class B shares will convert to Class A shares approximately eight years after purchase. The fund’s distributions declared to shareholders as reported in the Statements of Changes in Net Assets are presented by class as follows:
| | | | | | | | |
| | | From net investment
income | |
| | | Year
ended
1/31/13 | | | Year
ended
1/31/12 (i) | |
| Class A | | | $90,929,910 | | | | $88,784,509 | |
| Class B | | | 1,971,689 | | | | 2,183,969 | |
| Class C | | | 9,854,319 | | | | 9,404,287 | |
| Class I | | | 17,003,851 | | | | 1,952,974 | |
| Total | | | $119,759,769 | | | | $102,325,739 | |
| (i) | For Class I, the period is from inception, June 1, 2011 through the stated period end. |
(3) Transactions with Affiliates
Investment Adviser – The fund has an investment advisory agreement with MFS to provide overall investment management and related administrative services and facilities to the fund. The management fee is computed daily and paid monthly at an annual rate of 0.55% of the fund’s average daily net assets.
The investment adviser has agreed in writing to pay a portion of the fund’s operating expenses, exclusive of management fee, distribution and service fees, interest, taxes, extraordinary expenses, brokerage and transaction costs and investment-related expenses (including interest expenses and fees associated with investments in inverse floating rate instruments), such that fund operating expenses do not exceed 0.12% annually of the fund’s average daily net assets. This written agreement will continue until modified by the fund’s Board of Trustees, but such agreement will continue at least until May 31, 2013. For the year ended January 31, 2013, this reduction amounted to $389,726 and is reflected as a reduction of total expenses in the Statement of Operations.
Distributor – MFS Fund Distributors, Inc. (MFD), a wholly-owned subsidiary of MFS, as distributor, received $1,255,947 for the year ended January 31, 2013, as its portion of the initial sales charge on sales of Class A shares of the fund.
The Board of Trustees has adopted a distribution plan for certain class shares pursuant to Rule 12b-1 of the Investment Company Act of 1940.
The fund’s distribution plan provides that the fund will pay MFD for services provided by MFD and financial intermediaries in connection with the distribution and servicing of certain share classes. One component of the plan is a distribution fee paid to MFD and another component of the plan is a service fee paid to MFD. MFD may subsequently
pay all, or a portion, of the distribution and/or service fees to financial intermediaries.
72
Notes to Financial Statements – continued
Distribution Plan Fee Table:
| | | | | | | | | | | | | | | | | | | | |
| | | Distribution
Fee Rate (d) | | | Service
Fee Rate (d) | | | Total
Distribution
Plan (d) | | | Annual
Effective
Rate (e) | | | Distribution
and Service
Fee | |
| Class B | | | 0.75% | | | | 0.25% | | | | 1.00% | | | | 0.80% | | | | $514,411 | |
| Class C | | | 0.75% | | | | 0.25% | | | | 1.00% | | | | 1.00% | | | | 2,704,457 | |
| Total Distribution and Service Fees | | | | | | | | | | | | $3,218,868 | |
| (d) | In accordance with the distribution plan for certain classes, the fund pays distribution and/or service fees equal to these annual percentage rates of each class’s average daily net assets. The distribution and service fee rates disclosed by class represent the current rates in effect at the end of the reporting period. |
| (e) | The annual effective rates represent actual fees incurred under the distribution plan for the year ended January 31, 2013 based on each class’s average daily net assets. For one year from the date of sale of Class B shares, assets attributable to such Class B shares are subject to the 0.25% annual Class B service fee. On assets attributable to all other Class B shares, MFD has agreed in writing to waive the service fee. This agreement will continue until modified by the fund’s Board of Trustees, but such agreement will continue at least until May 31, 2013. For the year ended January 31, 2013 this waiver amounted to $97,018 and is reflected as a reduction of total expenses in the Statement of Operations. |
Certain Class A shares are subject to a contingent deferred sales charge (CDSC) in the event of a shareholder redemption within 18 months of purchase for shares purchased on or after August 1, 2012, and within 24 months of purchase for shares purchased prior to August 1, 2012. Class C shares are subject to a CDSC in the event of a shareholder redemption within 12 months of purchase. Class B shares are subject to a CDSC in the event of a shareholder redemption within six years of purchase. All contingent deferred sales charges are paid to MFD and during the year ended January 31, 2013, were as follows:
| | | | |
| | | Amount | |
| Class A | | | $38,081 | |
| Class B | | | 60,021 | |
| Class C | | | 24,492 | |
Shareholder Servicing Agent – MFS Service Center, Inc. (MFSC), a wholly-owned subsidiary of MFS, receives a fee from the fund for its services as shareholder servicing agent calculated as a percentage of the average daily net assets of the fund as determined periodically under the supervision of the fund’s Board of Trustees. For the year ended January 31, 2013, the fee was $382,143, which equated to 0.0145% annually of the fund’s average daily net assets. MFSC also receives payment from the fund for out-of-pocket expenses, sub-accounting and other shareholder servicing costs which may be paid to affiliated and unaffiliated service providers. For the year ended January 31, 2013, these out-of-pocket expenses, sub-accounting and other shareholder servicing costs amounted to $1,948,902.
Administrator – MFS provides certain financial, legal, shareholder communications, compliance, and other administrative services to the fund. Under an administrative services agreement, the fund partially reimburses MFS the costs incurred to provide these services. The fund is charged an annual fixed amount of $17,500 plus a fee
73
Notes to Financial Statements – continued
based on average daily net assets. The administrative services fee incurred for the year ended January 31, 2013 was equivalent to an annual effective rate of 0.0143% of the fund’s average daily net assets.
Trustees’ and Officers’ Compensation – The fund pays compensation to independent Trustees in the form of a retainer, attendance fees, and additional compensation to Board and Committee chairpersons. The fund does not pay compensation directly to Trustees or officers of the fund who are also officers of the investment adviser, all of whom receive remuneration for their services to the fund from MFS. Certain officers and Trustees of the fund are officers or directors of MFS, MFD, and MFSC.
Prior to December 31, 2001, the fund had an unfunded defined benefit plan (“DB plan”) for independent Trustees. As of December 31, 2001, the Board took action to terminate the DB plan with respect to then-current and any future independent Trustees, such that the DB plan covers only certain of those former independent Trustees who retired on or before December 31, 2001. Effective January 1, 2002, accrued benefits under the DB plan for then-current independent Trustees who continued were credited to an unfunded retirement deferral plan (the “Retirement Deferral plan”), which was established for and exists solely with respect to these credited amounts, and is not available for other deferrals by these or other independent Trustees. Although the Retirement Deferral plan is unfunded, amounts deferred under the plan are periodically adjusted for investment experience as if they had been invested in shares of the fund. The DB plan resulted in a pension expense of $1,478 and is included in independent Trustees’ compensation for the year ended January 31, 2013. The liability for deferred retirement benefits payable to certain independent Trustees under the DB plan amounted to $17,320 at January 31, 2013, and is included in “Payable for independent Trustees’ compensation” in the Statement of Assets and Liabilities.
Other – This fund and certain other funds managed by MFS (the funds) have entered into services agreements (the Agreements) which provide for payment of fees by the funds to Tarantino LLC and Griffin Compliance LLC in return for the provision of services of an Independent Chief Compliance Officer (ICCO) and Assistant ICCO, respectively, for the funds. The ICCO and Assistant ICCO are officers of the funds and the sole members of Tarantino LLC and Griffin Compliance LLC, respectively. The funds can terminate the Agreements with Tarantino LLC and Griffin Compliance LLC at any time under the terms of the Agreements. For the year ended January 31, 2013, the aggregate fees paid by the fund to Tarantino LLC and Griffin Compliance LLC were $20,735 and are included in “Miscellaneous” expense in the Statement of Operations. MFS has agreed to reimburse the fund for a portion of the payments made by the fund in the amount of $8,674, which is shown as a reduction of total expenses in the Statement of Operations. Additionally, MFS has agreed to bear all expenses associated with office space, other administrative support, and supplies provided to the ICCO and Assistant ICCO.
The fund invests in the MFS Institutional Money Market Portfolio which is managed by MFS and seeks current income consistent with preservation of capital and liquidity.
74
Notes to Financial Statements – continued
Income earned on this investment is included in “Dividends from underlying affiliated funds” in the Statement of Operations. This money market fund does not pay a management fee to MFS.
(4) Portfolio Securities
Purchases and sales of investments, other than short-term obligations, aggregated $993,728,723 and $448,278,440, respectively.
(5) Shares of Beneficial Interest
The fund’s Declaration of Trust permits the Trustees to issue an unlimited number of full and fractional shares of beneficial interest. Transactions in fund shares were as follows:
| | | | | | | | | | | | | | | | |
| | | Year ended
1/31/13 | | | Year ended
1/31/12 (i) | |
| | | Shares | | | Amount | | | Shares | | | Amount | |
| Shares sold | | | | | | | | | | | | | | | | |
Class A | | | 77,446,475 | | | | $631,600,689 | | | | 86,958,167 | | | | $645,383,462 | |
Class B | | | 1,560,561 | | | | 12,666,747 | | | | 1,131,622 | | | | 8,467,741 | |
Class C | | | 10,244,740 | | | | 83,574,613 | | | | 5,780,925 | | | | 43,279,060 | |
Class I | | | 44,084,898 | | | | 354,412,627 | | | | 19,559,655 | | | | 147,169,534 | |
| | | 133,336,674 | | | | $1,082,254,676 | | | | 113,430,369 | | | | $844,299,797 | |
| | | | |
| Shares issued to shareholders in reinvestment of distributions | | | | | | | | | | | | | | | | |
Class A | | | 8,787,195 | | | | $71,841,720 | | | | 7,813,716 | | | | $58,140,011 | |
Class B | | | 169,750 | | | | 1,390,465 | | | | 152,737 | | | | 1,133,050 | |
Class C | | | 765,766 | | | | 6,270,849 | | | | 668,419 | | | | 4,961,866 | |
Class I | | | 1,169,986 | | | | 9,586,672 | | | | 24,142 | | | | 183,028 | |
| | | 10,892,697 | | | | $89,089,706 | | | | 8,659,014 | | | | $64,417,955 | |
| | | | |
| Shares reacquired | | | | | | | | | | | | | | | | |
Class A | | | (62,613,958 | ) | | | $(506,922,106 | ) | | | (64,745,166 | ) | | | $(480,408,760 | ) |
Class B | | | (1,464,551 | ) | | | (11,942,059 | ) | | | (2,332,780 | ) | | | (17,185,010 | ) |
Class C | | | (5,100,089 | ) | | | (41,812,559 | ) | | | (5,825,846 | ) | | | (42,872,735 | ) |
Class I | | | (10,327,519 | ) | | | (84,779,586 | ) | | | (1,122,026 | ) | | | (8,581,879 | ) |
| | | (79,506,117 | ) | | | $(645,456,310 | ) | | | (74,025,818 | ) | | | $(549,048,384 | ) |
| | | | |
| Net change | | | | | | | | | | | | | | | | |
Class A | | | 23,619,712 | | | | $196,520,303 | | | | 30,026,717 | | | | $223,114,713 | |
Class B | | | 265,760 | | | | 2,115,153 | | | | (1,048,421 | ) | | | (7,584,219 | ) |
Class C | | | 5,910,417 | | | | 48,032,903 | | | | 623,498 | | | | 5,368,191 | |
Class I | | | 34,927,365 | | | | 279,219,713 | | | | 18,461,771 | | | | 138,770,683 | |
| | | 64,723,254 | | | | $525,888,072 | | | | 48,063,565 | | | | $359,669,368 | |
| (i) | For Class I, the period is from inception, June 1,2011 through the stated period end. |
(6) Line of Credit
The fund and certain other funds managed by MFS participate in a $1.1 billion unsecured committed line of credit, subject to a $1 billion sublimit, provided by a
75
Notes to Financial Statements – continued
syndication of banks under a credit agreement. Borrowings may be made for temporary financing needs. Interest is charged to each fund, based on its borrowings, generally at a rate equal to the higher of the Federal Reserve funds rate or one month LIBOR plus an agreed upon spread. A commitment fee, based on the average daily, unused portion of the committed line of credit, is allocated among the participating funds at the end of each calendar quarter. In addition, the fund and other funds managed by MFS have established unsecured uncommitted borrowing arrangements with certain banks for temporary financing needs. Interest is charged to each fund, based on its borrowings, at a rate equal to the Federal Reserve funds rate plus an agreed upon spread. For the year ended January 31, 2013, the fund’s commitment fee and interest expense were $16,420 and $0, respectively, and are included in “Miscellaneous” expense in the Statement of Operations.
(7) Transactions in Underlying Affiliated Funds-Affiliated Issuers
An affiliated issuer may be considered one in which the fund owns 5% or more of the outstanding voting securities, or a company which is under common control. For the purposes of this report, the fund assumes the following to be an affiliated issuer:
| | | | | | | | | | | | | | | | |
| Underlying Affiliated Fund | | Beginning
Shares/Par
Amount | | | Acquisitions
Shares/Par
Amount | | | Dispositions
Shares/Par
Amount | | | Ending
Shares/Par
Amount | |
MFS Institutional Money
Market Portfolio | | | 121,128,137 | | | | 614,834,753 | | | | (624,905,721 | ) | | | 111,057,169 | |
| | | | |
| Underlying Affiliated Fund | | Realized
Gain (Loss) | | | Capital Gain
Distributions | | | Dividend
Income | | | Ending
Value | |
MFS Institutional Money
Market Portfolio | | | $— | | | | $— | | | | $144,714 | | | | $111,057,169 | |
76
REPORT OF INDEPENDENT REGISTERED PUBLIC ACCOUNTING FIRM
To the Trustees and Shareholders of
MFS Municipal High Income Fund:
We have audited the accompanying statement of assets and liabilities of MFS Municipal High Income Fund (the Fund), including the portfolio of investments, as of January 31, 2013, and the related statement of operations for the year then ended, the statements of changes in net assets for each of the two years in the period then ended, and the financial highlights for each of the periods indicated therein. These financial statements and financial highlights are the responsibility of the Fund’s management. Our responsibility is to express an opinion on these financial statements and financial highlights based on our audits.
We conducted our audits in accordance with the standards of the Public Company Accounting Oversight Board (United States). Those standards require that we plan and perform the audit to obtain reasonable assurance about whether the financial statements and financial highlights are free of material misstatement. We were not engaged to perform an audit of the Fund’s internal control over financial reporting. Our audits included consideration of internal control over financial reporting as a basis for designing audit procedures that are appropriate in the circumstances, but not for the purpose of expressing an opinion on the effectiveness of the Fund’s internal control over financial reporting. Accordingly, we express no such opinion. An audit also includes examining, on a test basis, evidence supporting the amounts and disclosures in the financial statements and financial highlights, assessing the accounting principles used and significant estimates made by management, and evaluating the overall financial statement presentation. Our procedures included confirmation of securities owned as of January 31, 2013, by correspondence with the Fund’s custodian and brokers or by other appropriate auditing procedures where replies from brokers were not received. We believe that our audits provide a reasonable basis for our opinion.
In our opinion, the financial statements and financial highlights referred to above present fairly, in all material respects, the financial position of MFS Municipal High Income Fund at January 31, 2013, the results of its operations for the year then ended, the changes in its net assets for each of the two years in the period then ended, and its financial highlights for each of the periods indicated therein, in conformity with U.S. generally accepted accounting principles.

Boston, Massachusetts
March 18, 2013
77
TRUSTEES AND OFFICERS — IDENTIFICATION AND BACKGROUND
The Trustees and officers of the Trust, as of March 1, 2013, are listed below, together with their principal occupations during the past five years. (Their titles may have varied during that period.) The address of each Trustee and officer is 111 Huntington Avenue, Boston, Massachusetts 02199-7618.
| | | | | | | | |
Name, Age | | Position(s) Held with Fund | | Trustee/Officer
Since (h) | | Principal
Occupations During the Past Five Years | | Other Directorships (j) |
| INTERESTED TRUSTEES |
Robert J. Manning (k)
(age 49) | | Trustee | | February 2004 | | Massachusetts Financial Services Company, Chairman, Chief Executive Officer and Director; President (until December 2009); Chief Investment Officer (until July 2010) | | N/A |
| INDEPENDENT TRUSTEES | | | | | | |
David H. Gunning
(age 70) | | Trustee and Chair of Trustees | | January 2004 | | Private investor | | Lincoln Electric Holdings, Inc. (welding equipment manufacturer), Director; Development Alternatives, Inc. (consulting), Director/Non-Executive Chairman; Portman Limited (mining), Director (until 2008) |
Robert E. Butler
(age 71) | | Trustee | | January 2006 | | Consultant – investment company industry regulatory and compliance matters | | N/A |
Maureen R. Goldfarb
(age 57) | | Trustee | | January 2009 | | Private investor | | N/A |
William R. Gutow
(age 71) | | Trustee | | December 1993 | | Private investor and real estate consultant; Capitol Entertainment Management Company (video franchise), Vice Chairman | | Texas Donuts (donut franchise), Vice Chairman (until 2010) |
78
Trustees and Officers – continued
| | | | | | | | |
Name, Age | | Position(s) Held with Fund | | Trustee/Officer
Since (h) | | Principal
Occupations During the Past Five Years | | Other Directorships (j) |
Michael Hegarty
(age 68) | | Trustee | | December 2004 | | Private investor; Rouse Properties Inc. (real estate), Director | | Brookfield Office Properties, Inc. (real estate), Director; Rouse Properties Inc. (real estate), Director; Capmark Financial Group Inc. (real esate), Director |
John P. Kavanaugh
(age 58) | | Trustee | | January 2009 | | Private investor | | N/A |
J. Dale Sherratt
(age 74) | | Trustee | | June 1989 | | Insight Resources, Inc. (acquisition planning specialists), President; Wellfleet Investments (investor in health care companies), Managing General Partner | | N/A |
Laurie J. Thomsen
(age 55) | | Trustee | | March 2005 | | Private investor; New Profit, Inc. (venture philanthropy), Executive Partner (until 2010) | | The Travelers Companies (insurance), Director |
Robert W. Uek
(age 71) | | Trustee | | January 2006 | | Consultant to investment company industry | | N/A |
| OFFICERS |
John M. Corcoran (k)
(age 47) | | President | | October 2008 | | Massachusetts Financial Services Company, Senior Vice President (since October 2008); State Street Bank and Trust (financial services provider), Senior Vice President, (until September 2008) | | N/A |
Christopher R. Bohane (k)
(age 39) | | Assistant Secretary and Assistant Clerk | | July 2005 | | Massachusetts Financial Services Company, Vice President and Senior Counsel | | N/A |
Kino Clark (k)
(age 44) | | Assistant Treasurer | | January 2012 | | Massachusetts Financial Services Company, Vice President | | N/A |
79
Trustees and Officers – continued
| | | | | | | | |
Name, Age | | Position(s) Held with Fund | | Trustee/Officer
Since (h) | | Principal
Occupations During the Past Five Years | | Other Directorships (j) |
Thomas H. Connors (k)
(age 53) | | Assistant
Secretary and Assistant Clerk | | September 2012 | | Massachusetts Financial Services Company, Vice President and Senior Counsel; Deutsche Investment Management Americas Inc. (financial service provider), Director and Senior Counsel (until 2012) | | N/A |
Ethan D. Corey (k)
(age 49) | | Assistant
Secretary and Assistant Clerk | | July 2005 | | Massachusetts Financial Services Company, Senior Vice President and Associate General Counsel | | N/A |
David L. DiLorenzo (k)
(age 44) | | Treasurer | | July 2005 | | Massachusetts Financial Services Company, Senior Vice President | | N/A |
Robyn L. Griffin
(age 37) | | Assistant
Independent Chief Compliance
Officer | | August 2008 | | Griffin Compliance LLC (provider of compliance services), Principal (since August 2008); State Street Corporation (financial services provider), Mutual Fund Administration Assistant Vice President (October 2006 – July 2008) | | N/A |
Brian E. Langenfeld (k)
(age 39) | | Assistant
Secretary and Assistant Clerk | | June 2006 | | Massachusetts Financial Services Company, Vice President and Senior Counsel | | N/A |
Susan S. Newton (k)
(age 62) | | Assistant
Secretary and Assistant Clerk | | May 2005 | | Massachusetts Financial Services Company, Senior Vice President and Associate General Counsel | | N/A |
Susan A. Pereira (k)
(age 42) | | Assistant
Secretary and Assistant Clerk | | July 2005 | | Massachusetts Financial Services Company, Vice President and Senior Counsel | | N/A |
80
Trustees and Officers – continued
| | | | | | | | |
Name, Age | | Position(s) Held with Fund | | Trustee/Officer
Since (h) | | Principal
Occupations During the Past Five Years | | Other Directorships (j) |
Kasey L. Phillips (k)
(age 42) | | Assistant Treasurer | | September 2012 | | Massachusetts Financial Services Company, Vice President; Wells Fargo Funds Management, LLC, Senior Vice President, Fund Treasurer (until 2012) | | N/A |
Mark N. Polebaum (k)
(age 60) | | Secretary and Clerk | | January 2006 | | Massachusetts Financial Services Company, Executive Vice President, General Counsel and Secretary | | N/A |
Frank L. Tarantino
(age 68) | | Independent
Chief Compliance Officer | | June 2004 | | Tarantino LLC (provider of compliance services), Principal | | N/A |
Richard S. Weitzel (k)
(age 42) | | Assistant Secretary and Assistant Clerk | | October 2007 | | Massachusetts Financial Services Company, Senior Vice President and Associate General Counsel | | N/A |
James O. Yost (k)
(age 52) | | Deputy Treasurer | | September 1990 | | Massachusetts Financial Services Company, Senior Vice President | | N/A |
| (h) | Date first appointed to serve as Trustee/officer of an MFS fund. Each Trustee has served continuously since appointment unless indicated otherwise. For the period from December 15, 2004 until February 22, 2005, Mr. Manning served as Advisory Trustee. For the period October 2008, until January 2012, Mr. Corcoran served as Treasurer of the Funds. Prior to January 2012, Messrs. DiLorenzo and Yost served as Assistant Treasurers of the Funds. |
| (j) | Directorships or trusteeships of companies required to report to the Securities and Exchange Commission (i.e., “public companies”). |
| (k) | “Interested person” of the Trust within the meaning of the Investment Company Act of 1940 (referred to as the 1940 Act), which is the principal federal law governing investment companies like the fund, as a result of position with MFS. The address of MFS is 111 Huntington Avenue, Boston, Massachusetts 02199-7618. |
Each Trustee has been elected by shareholders and each Trustee and officer holds office until his or her successor is chosen and qualified or until his or her earlier death, resignation, retirement or removal. The Trust does not hold annual meetings for the purpose of electing Trustees, and Trustees are not elected for fixed terms. Messrs. Butler, Kavanaugh, Uek and Ms. Thomsen are members of the Trust’s Audit Committee.
Each of the Fund’s Trustees and officers holds comparable positions with certain other funds of which MFS or a subsidiary is the investment adviser or distributor, and, in the case of the officers, with certain affiliates of MFS. As of January 1, 2013, the Trustees served as board members of 143 funds within the MFS Family of Funds.
81
Trustees and Officers – continued
The Statement of Additional Information for the Fund includes further information about the Trustees and is available without charge upon request by calling 1-800-225-2606.
| | |
| Investment Adviser | | Custodian |
Massachusetts Financial Services Company
111 Huntington Avenue
Boston, MA 02199-7618 | | JPMorgan Chase Bank One Chase Manhattan Plaza New York, NY 10081 |
| Distributor | | Independent Registered Public Accounting Firm |
MFS Fund Distributors, Inc.
111 Huntington Avenue
Boston, MA 02199-7618 | | Ernst & Young LLP 200 Clarendon Street Boston, MA 02116 |
| Portfolio Managers | | |
| Gary Lasman | | |
| Geoffrey Schechter | | |
82
BOARD REVIEW OF INVESTMENT ADVISORY AGREEMENT
A discussion regarding the Board’s most recent review and renewal of the fund’s Investment Advisory Agreement with MFS is available by clicking on the fund’s name under “Mutual Funds” in the “Products” section of the MFS Web site (mfs.com).
PROXY VOTING POLICIES AND INFORMATION
A general description of the MFS funds’ proxy voting policies and procedures is available without charge, upon request, by calling 1-800-225-2606, by visiting the Proxy Voting section of mfs.com or by visiting the SEC’s Web site at http://www.sec.gov.
Information regarding how the fund voted proxies relating to portfolio securities during the most recent twelve-month period ended June 30 is available without charge by visiting the Proxy Voting section of mfs.com or by visiting the SEC’s Web site at http://www.sec.gov.
QUARTERLY PORTFOLIO DISCLOSURE
The fund will file a complete schedule of portfolio holdings with the Securities and Exchange Commission (the Commission) for the first and third quarters of each fiscal year on Form N-Q. A shareholder can obtain the quarterly portfolio holdings report at mfs.com. The fund’s Form N-Q is also available on the EDGAR database on the Commission’s Internet Web site at http://www.sec.gov, and may be reviewed and copied at the:
Public Reference Room
Securities and Exchange Commission
100 F Street, NE, Room 1580
Washington, D.C. 20549
Information on the operation of the Public Reference Room may be obtained by calling the Commission at 1-800-SEC-0330. Copies of the fund’s Form N-Q also may be obtained, upon payment of a duplicating fee, by electronic request at the following e-mail address: publicinfo@sec.gov or by writing the Public Reference Section at the above address.
FURTHER INFORMATION
From time to time, MFS may post important information about the fund or the MFS funds on the MFS web site (mfs.com). This information is available by visiting the “News & Commentary” section of mfs.com or by clicking on the fund’s name under “Mutual Funds” in the “Products” section of mfs.com.
FEDERAL TAX INFORMATION (unaudited)
The fund will notify shareholders of amounts for use in preparing 2013 income tax forms in January 2014. The following information is provided pursuant to provisions of the Internal Revenue Code.
Of the dividends paid from net investment income during the fiscal year, 99.82% is designated as exempt interest dividends for federal income tax purposes. If the fund has earned income on private activity bonds, a portion of the dividends paid may be considered a tax preference item for purposes of computing a shareholder’s alternative minimum tax.
83
rev. 3/11
| | | | |
| | | |
FACTS | | WHAT DOES MFS DO WITH YOUR PERSONAL INFORMATION? | |  |
| | |
| Why? | | Financial companies choose how they share your personal information. Federal law gives consumers the right to limit some but not all sharing. Federal law also requires us to tell you how we collect, share, and protect your personal information. Please read this notice carefully to understand what we do. |
| | |
| What? | | The types of personal information we collect and share depend on the product or service you have with us. This information can include: • Social Security number and account balances • Account transactions and transaction history • Checking account information and wire transfer instructions When you are no longer our customer, we continue to share your information as described in this notice. |
| | |
| How? | | All financial companies need to share customers’ personal information to run their everyday business. In the section below, we list the reasons financial companies can share their customers’ personal information; the reasons MFS chooses to share; and whether you can limit this sharing. |
| | | | |
Reasons we can share your
personal information | | Does MFS
share? | | Can you limit
this sharing? |
For our everyday business purposes – such as to process your transactions, maintain your account(s), respond to court orders and legal investigations, or report to credit bureaus | | Yes | | No |
For our marketing purposes – to offer our products and services to you | | No | | We don’t share |
| For joint marketing with other financial companies | | No | | We don’t share |
For our affiliates’ everyday business purposes – information about your transactions and experiences | | No | | We don’t share |
For our affiliates’ everyday business purposes – information about your creditworthiness | | No | | We don’t share |
| For nonaffiliates to market to you | | No | | We don’t share |
| | |
| Questions? | | Call 800-225-2606 or go to mfs.com. |
84
| | |
| Who we are |
| Who is providing this notice? | | MFS Funds, MFS Investment Management, MFS Institutional Advisors, Inc., MFS Fund Distributors, Inc., MFS Heritage Trust Company, and MFS Service Center, Inc. |
| | |
| What we do |
| How does MFS protect my personal information? | | To protect your personal information from unauthorized access and use, we use security measures that comply with federal law. These measures include procedural, electronic, and physical safeguards for the protection of the personal information we collect about you. |
| How does MFS collect my personal information? | | We collect your personal information, for example, when you • open an account or provide account information • direct us to buy securities or direct us to sell your securities • make a wire transfer We also collect your personal information from others, such as credit bureaus, affiliates and other companies. |
| Why can’t I limit all sharing? | | Federal law gives you the right to limit only • sharing for affiliates’ everyday business purposes – information about your creditworthiness • affiliates from using your information to market to you • sharing for nonaffiliates to market to you State laws and individual companies may give you additional rights to limit sharing. |
| | |
| Definitions |
| Affiliates | | Companies related by common ownership or control. They can be financial and nonfinancial companies. • MFS does not share personal information with affiliates, except for everyday business purposes as described on page one of this notice. |
| Nonaffiliates | | Companies not related by common ownership or control. They can be financial and nonfinancial companies. • MFS does not share with nonaffiliates so they can market to you. |
| Joint Marketing | | A formal agreement between nonaffiliated financial companies that together market financial products or services to you. • MFS doesn’t jointly market. |
| | |
| Other important information |
| If you own an MFS product or receive an MFS service in the name of a third party such as a bank or broker-dealer, their privacy policy may apply to you instead of ours. |
85
Save paper with eDelivery.

| MFS® will send you prospectuses, |
reports, and proxies directly via e-mail so you will get information faster with less mailbox clutter.
To sign up:
1. Go to mfs.com.
2. Log in via MFS® Access.
3. Select eDelivery.
If you own your MFS fund shares through a financial institution or a retirement plan, MFS® TALK, MFS® Access, or eDelivery may not be available to you.
CONTACT
WEB SITE
mfs.com
MFS TALK
1-800-637-8255
24 hours a day
ACCOUNT SERVICE AND LITERATURE
Shareholders
1-800-225-2606
Financial advisors
1-800-343-2829
Retirement plan services
1-800-637-1255
MAILING ADDRESS
MFS Service Center, Inc.
P.O. Box 55824
Boston, MA 02205-5824
OVERNIGHT MAIL
MFS Service Center, Inc.
c/o Boston Financial Data Services
30 Dan Road
Canton, MA 02021-2809
The Registrant has adopted a Code of Ethics pursuant to Section 406 of the Sarbanes-Oxley Act and as defined in Form N-CSR that applies to the Registrant’s principal executive officer and principal financial and accounting officer. During the period covered by this report, the Registrant has not amended any provision in its Code of Ethics (the “Code”) that relates to an element of the Code’s definitions enumerated in paragraph (b) of Item 2 of this Form N-CSR. During the period covered by this report, the Registrant did not grant a waiver, including an implicit waiver, from any provision of the Code.
A copy of the Code of Ethics is filed as an exhibit to this Form N-CSR.
| ITEM 3. | AUDIT COMMITTEE FINANCIAL EXPERT. |
Messrs. Robert E. Butler, John P. Kavanaugh and Robert W. Uek and Ms. Laurie J. Thomsen, members of the Audit Committee, have been determined by the Board of Trustees in their reasonable business judgment to meet the definition of “audit committee financial expert” as such term is defined in Form N-CSR. In addition, Messrs. Butler, Kavanaugh and Uek and Ms. Thomsen are “independent” members of the Audit Committee (as such term has been defined by the Securities and Exchange Commission in regulations implementing Section 407 of the Sarbanes-Oxley Act of 2002). The Securities and Exchange Commission has stated that the designation of a person as an audit committee financial expert pursuant to this Item 3 on the Form N-CSR does not impose on such a person any duties, obligations or liability that are greater than the duties, obligations or liability imposed on such person as a member of the Audit Committee and the Board of Trustees in the absence of such designation or identification.
| ITEM 4. | PRINCIPAL ACCOUNTANT FEES AND SERVICES. |
Items 4(a) through 4(d) and 4(g):
The Board of Trustees has appointed Deloitte & Touche LLP (“Deloitte”) to serve as independent accountants to certain series of the Registrant and Ernst & Young LLP (“E&Y”) to serve in the same capacity to certain other series of the Registrant (the series referred to collectively as the “Funds” and singularly as a “Fund”). The tables below set forth the audit fees billed to the Funds as well as fees for non-audit services provided to the Funds and/or to the Funds’ investment adviser, Massachusetts Financial Services Company (“MFS”), and to various entities either controlling, controlled by, or under common control with MFS that provide ongoing services to the Funds (“MFS Related Entities”).
For the fiscal years ended January 31, 2013 and 2012, audit fees billed to the Funds by Deloitte and E&Y were as follows:
| | | | | | | | |
| | | Audit Fees | |
| | | 2013 | | | 2012 | |
Fees billed by Deloitte: | | | | | | | | |
MFS High Income Fund | | | 66,261 | | | | 61,056 | |
MFS High Yield Opportunities Fund | | | 70,737 | | | | 65,934 | |
Total | | | 136,998 | | | | 126,990 | |
| |
| | | Audit Fees | |
| | | 2013 | | | 2012 | |
Fees billed by E&Y: | | | | | | | | |
MFS Municipal High Income Fund | | | 49,345 | | | | 45,942 | |
For the fiscal years ended January 31, 2013 and 2012, fees billed by Deloitte and E&Y for audit-related, tax and other services provided to the Funds and for audit-related, tax and other services provided to MFS and MFS Related Entities were as follows:
| | | | | | | | | | | | | | | | | | | | | | | | |
| | | Audit-Related Fees1 | | | Tax Fees2 | | | All Other Fees3 | |
| | | 2013 | | | 2012 | | | 2013 | | | 2012 | | | 2013 | | | 2012 | |
Fees billed by Deloitte: | | | | | | | | | | | | | | | | | | | | | | | | |
To MFS High Income Fund | | | 0 | | | | 0 | | | | 8,138 | | | | 7,978 | | | | 845 | | | | 1,331 | |
To MFS High Yield Opportunities Fund | | | 0 | | | | 0 | | | | 6,291 | | | | 6,168 | | | | 845 | | | | 1,331 | |
Total fees billed by Deloitte To above Funds | | | 0 | | | | 0 | | | | 14,429 | | | | 14,146 | | | | 1,690 | | | | 2,662 | |
| | | |
| | | Audit-Related Fees1 | | | Tax Fees2 | | | All Other Fees3 | |
| | | 2013 | | | 2012 | | | 2013 | | | 2012 | | | 2013 | | | 2012 | |
Fees billed by Deloitte: | | | | | | | | | | | | | | | | | | | | | | | | |
To MFS and MFS Related Entities of MFS High Income Fund * | | | 1,197,638 | | | | 1,193,300 | | | | 0 | | | | 0 | | | | 0 | | | | 0 | |
To MFS and MFS Related Entities of MFS High Yield Opportunities Fund* | | | 1,197,638 | | | | 1,193,300 | | | | 0 | | | | 0 | | | | 0 | | | | 0 | |
| | | | | | | | |
| | | 2013 | | | 20125 | |
Aggregate fees for non-audit services: | | | | | | | | |
To MFS High Income Fund, MFS and MFS Related Entities# | | | 1,348,191 | | | | 1,603,324 | |
To MFS High Yield Opportunities Fund, MFS and MFS Related Entities# | | | 1,346,344 | | | | 1,601,514 | |
| | | | | | | | | | | | | | | | | | | | | | | | |
| | | Audit-Related Fees1 | | | Tax Fees2 | | | All Other Fees4 | |
| | | 2013 | | | 2012 | | | 2013 | | | 2012 | | | 2013 | | | 2012 | |
Fees billed by E&Y: | | | | | | | | | | | | | | | | | | | | | | | | |
To MFS Municipal High Income Fund | | | 0 | | | | 0 | | | | 8,987 | | | | 8,811 | | | | 0 | | | | 0 | |
| | | |
| | | Audit-Related Fees1 | | | Tax Fees2 | | | All Other Fees4 | |
| | | 2013 | | | 2012 | | | 2013 | | | 2012 | | | 2013 | | | 2012 | |
Fees billed by E&Y: | | | | | | | | | | | | | | | | | | | | | | | | |
To MFS and MFS Related Entities of MFS Municipal High Income Fund* | | | 0 | | | | 0 | | | | 0 | | | | 0 | | | | 0 | | | | 0 | |
| | | | | | | | |
| | | 2013 | | | 20125 | |
Aggregate fees for non-audit services: | | | | | | | | |
To MFS Municipal High Income Fund, MFS and MFS Related Entities# | | | 53,987 | | | | 143,811 | |
| * | This amount reflects the fees billed to MFS and MFS Related Entities for non-audit services relating directly to the operations and financial reporting of the Funds (portions of which services also related to the operations and financial reporting of other funds within the MFS Funds complex). |
| # | This amount reflects the aggregate fees billed by Deloitte or E&Y, as the case may be, for non-audit services rendered to the Funds and for non-audit services rendered to MFS and the MFS Related Entities. |
| 1 | The fees included under “Audit-Related Fees” are fees related to assurance and related services that are reasonably related to the performance of the audit or review of financial statements, but not reported under “Audit Fees,” including accounting consultations, agreed-upon procedure reports, attestation reports, comfort letters and internal control reviews. |
| 2 | The fees included under “Tax Fees” are fees associated with tax compliance, tax advice and tax planning, including services relating to the filing or amendment of federal, state or local income tax returns, regulated investment company qualification reviews and tax distribution and analysis. |
| 3 | The fees included under “All Other Fees” are fees for products and services provided by Deloitte other than those reported under “Audit Fees,” “Audit-Related Fees” and “Tax Fees,” including fees for services related to the review of internal controls and Rule 38a-1 compliance program. |
| 4 | The fees under “All Other Fees” are fees for products and services provided by E&Y other than those reported under “Audit Fees,” “Audit-Related Fees” and “Tax Fees”. |
| 5 | Fees reported in 2012 have been restated in this filing from those reported in the Registrant’s filing for the reporting period ended January 31, 2012. |
Item 4(e)(1):
Set forth below are the policies and procedures established by the Audit Committee of the Board of Trustees relating to the pre-approval of audit and non-audit related services:
To the extent required by applicable law, pre-approval by the Audit Committee of the Board is needed for all audit and permissible non-audit services rendered to the Funds and all permissible non-audit services rendered to MFS or MFS Related Entities if the services relate directly to the operations and financial reporting of the Registrant. Pre-approval is currently on an engagement-by-engagement basis. In the event pre-approval of such services is necessary between regular meetings of the Audit Committee and it is not practical to wait to seek pre-approval at the next regular meeting of the Audit Committee, pre-approval of such services may be referred to the Chair of the Audit Committee for approval; provided that the Chair may not pre-approve any individual engagement for such services exceeding $50,000 or multiple engagements for such services in the aggregate exceeding $100,000 in each period between regular meetings of the Audit Committee. Any engagement pre-approved by the Chair between regular meetings of the Audit Committee shall be presented for ratification by the entire Audit Committee at its next regularly scheduled meeting.
Item 4(e)(2):
None, or 0%, of the services relating to the Audit-Related Fees, Tax Fees and All Other Fees paid by the Fund and MFS and MFS Related Entities relating directly to the operations and financial reporting of the Registrant disclosed above were approved by the audit committee pursuant to paragraphs (c)(7)(i)(C) of Rule 2-01 of Regulation S-X (which permits audit committee approval after the start of the engagement with respect to services other than audit, review or attest services, if certain conditions are satisfied).
Item 4(f): Not applicable.
Item 4(h): The Registrant’s Audit Committee has considered whether the provision by a Registrant’s independent registered public accounting firm of non-audit services to MFS and MFS Related Entities that were not pre-approved by the Committee (because such services did not relate directly to the operations and financial reporting of the Registrant) was compatible with maintaining the independence of the independent registered public accounting firm as the Registrant’s principal auditors.
| ITEM 5. | AUDIT COMMITTEE OF LISTED REGISTRANTS. |
Not applicable to the Registrant.
A schedule of investments of the Registrant is included as part of the report to shareholders of such series under Item 1 of this Form N-CSR.
| ITEM 7. | DISCLOSURE OF PROXY VOTING POLICIES AND PROCEDURES FOR CLOSED-END MANAGEMENT INVESTMENT COMPANIES. |
Not applicable to the Registrant.
| ITEM 8. | PORTFOLIO MANAGERS OF CLOSED-END MANAGEMENT INVESTMENT COMPANIES. |
Not applicable to the Registrant.
| ITEM 9. | PURCHASES OF EQUITY SECURITIES BY CLOSED-END MANAGEMENT INVESTMENT COMPANY AND AFFILIATED PURCHASERS. |
Not applicable to the Registrant.
| ITEM 10. | SUBMISSION OF MATTERS TO A VOTE OF SECURITY HOLDERS. |
There were no material changes to the procedures by which shareholders may send recommendations to the Board for nominees to the Registrant’s Board since the Registrant last provided disclosure as to such procedures in response to the requirements of Item 407 (c)(2)(iv) of Regulation S-K or this Item.
| ITEM 11. | CONTROLS AND PROCEDURES. |
| (a) | Based upon their evaluation of the effectiveness of the registrant’s disclosure controls and procedures (as defined in Rule 30a-3(c) under the Investment Company Act of 1940 (the “Act”)) as conducted within 90 days of the filing date of this report on Form N-CSR, the registrant’s principal financial officer and principal executive officer have concluded that those disclosure controls and procedures provide reasonable assurance that the material information required to be disclosed by the registrant on this report is recorded, processed, summarized and reported within the time periods specified in the Securities and Exchange Commission’s rules and forms. |
| (b) | There were no changes in the registrant’s internal controls over financial reporting (as defined in Rule 30a-3(d) under the Act) that occurred during the second fiscal quarter of the period covered by the report that have materially affected, or are reasonably likely to materially affect, the registrant’s internal control over financial reporting. |
| (a) | File the exhibits listed below as part of this form. Letter or number the exhibits in the sequence indicated. |
| | (1) | Any code of ethics, or amendment thereto, that is the subject of the disclosure required by Item 2, to the extent that the registrant intends to satisfy the Item 2 requirements through filing of an exhibit: Code of Ethics attached hereto. |
| | (2) | A separate certification for each principal executive officer and principal financial officer of the registrant as required by Rule 30a-2(a) under the Act (17 CFR 270.30a-2): Attached hereto. |
| (b) | If the report is filed under Section 13(a) or 15(d) of the Exchange Act, provide the certifications required by Rule 30a-2(b) under the Act (17 CFR 270.30a-2(b)), Rule 13a-14(b) or Rule 15d-14(b) under the Exchange Act (17 CFR 240.13a-14(b) or 240.15d-14(b)) and Section 1350 of Chapter 63 of Title 18 of the United States Code (18 U.S.C. 1350) as an exhibit. A certification furnished pursuant to this paragraph will not be deemed “filed” for the purposes of Section 18 of the Exchange Act (15 U.S.C. 78r), or otherwise subject to the liability of that section. Such certification will not be deemed to be incorporated by reference into any filing under the Securities Act of 1933 or the Exchange Act, except to the extent that the registrant specifically incorporates it by reference: Attached hereto. |
Notice
A copy of the Amended and Restated Declaration of Trust, as amended, of the Registrant is on file with the Secretary of State of The Commonwealth of Massachusetts and notice is hereby given that this instrument is executed on behalf of the Registrant by an officer of the Registrant as an officer and not individually and the obligations of or arising out of this instrument are not binding upon any of the Trustees or shareholders individually, but are binding only upon the assets and property of the respective constituent series of the Registrant.
SIGNATURES
Pursuant to the requirements of the Securities Exchange Act of 1934 and the Investment Company Act of 1940, the registrant has duly caused this report to be signed on its behalf by the undersigned, thereunto duly authorized.
(Registrant) MFS SERIES TRUST III
| | |
| By (Signature and Title)* | | JOHN M. CORCORAN |
| | John M. Corcoran, President |
Date: March 18, 2013
Pursuant to the requirements of the Securities Exchange Act of 1934 and the Investment Company Act of 1940, this report has been signed below by the following persons on behalf of the registrant and in the capacities and on the dates indicated.
| | |
| By (Signature and Title)* | | JOHN M. CORCORAN |
| | John M. Corcoran, President (Principal Executive Officer) |
Date: March 18, 2013
| | |
| By (Signature and Title)* | | DAVID L. DILORENZO |
| | David L. DiLorenzo, Treasurer (Principal Financial Officer and Accounting Officer) |
Date: March 18, 2013
| * | Print name and title of each signing officer under his or her signature. |