UNITED STATES
SECURITIES AND EXCHANGE COMMISSION
Washington, D.C. 20549
FORM N-CSR
CERTIFIED SHAREHOLDER REPORT OF
REGISTERED MANAGEMENT INVESTMENT COMPANIES
Investment Company Act file number 811-02794
MFS SERIES TRUST III
(Exact name of registrant as specified in charter)
111 Huntington Avenue, Boston, Massachusetts 02199
(Address of principal executive offices) (Zip code)
Kristin V. Collins
Massachusetts Financial Services Company
111 Huntington Avenue
Boston, Massachusetts 02199
(Name and address of agents for service)
Registrant’s telephone number, including area code: (617) 954-5000
Date of fiscal year end: January 31
Date of reporting period: January 31, 2016
| ITEM 1. | REPORTS TO STOCKHOLDERS. |
ANNUAL REPORT
January 31, 2016

MFS® GLOBAL HIGH YIELD FUND

HYO-ANN
MFS® GLOBAL HIGH YIELD FUND
CONTENTS
The report is prepared for the general information of shareholders.
It is authorized for distribution to prospective investors only when preceded or accompanied by a current prospectus.
NOT FDIC INSURED • MAY LOSE VALUE • NO BANK GUARANTEE

LETTER FROM THE CHAIRMAN
Dear Shareholders:
Market volatility remains elevated amid signs of slowing global growth and continued weakness in the price of oil and other commodities. Chinese markets remain skittish
following a series of policy missteps and currency depreciations, which have contributed to large capital outflows.
A lower-for-longer interest rate environment is likely for the foreseeable future given accommodative global central bank policies. The Bank of Japan has adopted a negative interest rate policy while the European Central Bank has signaled plans for additional monetary stimulus later this year. Meanwhile, expectations for further monetary policy tightening from the U.S. Federal Reserve have been reduced in the face of more challenging financial conditions.
The U.S. manufacturing sector is suffering the effects of a strong U.S. dollar and falling global demand. There is some reason for optimism, however, as U.S. labor markets continue to improve while auto and home sales remain upbeat.
As markets have become more focused on short-term trends in recent years, we believe it’s important for investors to lengthen their investment time horizon. At MFS®, we don’t trade on headlines or trends; we invest for the long term.
We believe that this approach, coupled with the professional guidance of a financial advisor, will help you reach your investment goals.
Respectfully,

Robert J. Manning
Chairman
MFS Investment Management
March 17, 2016
The opinions expressed in this letter are subject to change and may not be relied upon for investment advice. No forecasts can be guaranteed.
1
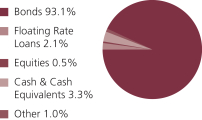
PORTFOLIO COMPOSITION
Portfolio structure (i)
| | | | |
| Top five industries (i) | | | | |
| Cable TV | | | 7.4% | |
| Telecommunications – Wireless | | | 6.0% | |
| Building | | | 4.9% | |
| Medical & Health Technology & Services | | | 4.6% | |
| Midstream | | | 3.5% | |
|
| Composition including fixed income credit quality (a)(i) | |
| BBB | | | 3.8% | |
| BB | | | 42.3% | |
| B | | | 40.5% | |
| CCC | | | 9.1% | |
| C | | | 0.2% | |
| D | | | 0.2% | |
| Not Rated | | | (0.9)% | |
| Non-Fixed Income | | | 0.5% | |
| Cash & Cash Equivalents | | | 3.3% | |
| Other | | | 1.0% | |
| | | | |
| Portfolio facts (i) | | | | |
| Average Duration (d) | | | 4.2 | |
| Average Effective Maturity (m) | | | 5.7 yrs. | |
|
| Issuer country weightings (i)(x) | |
| United States | | | 60.3% | |
| United Kingdom | | | 4.7% | |
| Canada | | | 3.8% | |
| Mexico | | | 3.1% | |
| Italy | | | 2.9% | |
| Germany | | | 2.8% | |
| Luxembourg | | | 2.6% | |
| Brazil | | | 2.5% | |
| Russia | | | 2.2% | |
| Other Countries | | | 15.1% | |
2
Portfolio Composition – continued
| (a) | For all securities other than those specifically described below, ratings are assigned to underlying securities utilizing ratings from Moody’s, Fitch, and Standard & Poor’s rating agencies and applying the following hierarchy: If all three agencies provide a rating, the middle rating (after dropping the highest and lowest ratings) is assigned; if two of the three agencies rate a security, the lower of the two is assigned. Ratings are shown in the S&P and Fitch scale (e.g., AAA). Securities rated BBB or higher are considered investment grade. All ratings are subject to change. Not Rated includes fixed income securities, including fixed income futures contracts, which have not been rated by any rating agency. Non-Fixed Income includes any equity securities (including convertible bonds and equity derivatives) and/or commodity-linked derivatives. The fund may not hold all of these instruments. The fund is not rated by these agencies. |
| (d) | Duration is a measure of how much a bond’s price is likely to fluctuate with general changes in interest rates, e.g., if rates rise 1.00%, a bond with a 5-year duration is likely to lose about 5.00% of its value due to the interest rate move. |
| (i) | For purposes of this presentation, the components include the value of securities, and reflect the impact of the equivalent exposure of derivative positions, if any. These amounts may be negative from time to time. Equivalent exposure is a calculated amount that translates the derivative position into a reasonable approximation of the amount of the underlying asset that the portfolio would have to hold at a given point in time to have the same price sensitivity that results from the portfolio’s ownership of the derivative contract. When dealing with derivatives, equivalent exposure is a more representative measure of the potential impact of a position on portfolio performance than value. The bond component will include any accrued interest amounts. |
| (m) | In determining an instrument’s effective maturity for purposes of calculating the fund’s dollar-weighted average effective maturity, MFS uses the instrument’s stated maturity or, if applicable, an earlier date on which MFS believes it is probable that a maturity-shortening device (such as a put, pre-refunding or prepayment) will cause the instrument to be repaid. Such an earlier date can be substantially shorter than the instrument’s stated maturity. |
| (x) | Represents the portfolio’s exposure to issuer countries as a percentage of a portfolio’s net assets. For purposes of this presentation, United States includes Cash & Cash Equivalents. |
Where the fund holds convertible bonds, these are treated as part of the equity portion of the portfolio.
The fund invests a portion of its assets in the MFS High Yield Pooled Portfolio. Percentages reflect exposure to the underlying holdings, including Cash & Cash Equivalents and Other, of the MFS High Yield Pooled Portfolio and not to the exposure from investing directly in the MFS High Yield Pooled Portfolio itself.
Cash & Cash Equivalents includes any cash, investments in money market funds, short-term securities, and other assets less liabilities. Please see the Statement of Assets and Liabilities for additional information related to the fund’s cash position and other assets and liabilities.
Other includes currency derivatives and/or any offsets to derivative positions.
Percentages are based on net assets as of 1/31/16.
The portfolio is actively managed and current holdings may be different.
3
MANAGEMENT REVIEW
Summary of Results
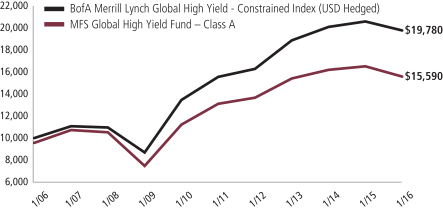
For the twelve months ended January 31, 2016, Class A shares of the MFS Global High Yield Fund (“fund”) provided a total return of –5.54%, at net asset value. This compares with a return of –3.86 % for the fund’s benchmark, the BofA Merrill Lynch Global High Yield – Constrained Index (USD Hedged).
Market Environment
Sluggish global growth weighed on both developed and emerging market (“EM”) economies during the reporting period. EM economies have been particularly lackluster. While the US Federal Reserve (“Fed”) began its anticipated monetary policy tightening cycle toward the end of the period, other large developed economies continued to embrace accommodative monetary policies, particularly the European Central Bank and the Bank of Japan. Focus remained on China after policy missteps by the Chinese government roiled global markets over the summer, beginning with the uncoordinated response to the stock market’s boom and bust and then the confusing decision to devalue the renminbi in August. China subsequently ramped up a wide range of monetary and fiscal measures to stimulate the economy, bolster sentiment and stabilize its currency.
During the second half of the reporting period, many US companies faced significant headwinds to earnings caused primarily by the sharp decline in the prices of oil and other commodities. Earnings contractions were concentrated primarily in the energy, materials and industrial sectors. The sharp rise in the US dollar also weighed on earnings during the period. Exports were crimped by the dollar’s strength and falling demand in emerging markets. Beyond the Fed’s interest rate hike in December, tighter financial conditions rippled through the economy. Consumer spending held up well during the second half of the period amid a modest increase in real wages and falling gasoline prices. Demand for autos reached near-record territory late in the period. In emerging markets, two key factors weighed on economies and asset prices: 1) weaker Chinese growth, which drove the decline in commodity prices and 2) prospects for higher US interest rates. Structural factors like floating exchange rates and fiscal buffers partially offset these cyclical headwinds.
Detractors from Performance
The portion of the fund’s return derived from yield, which was less than that of the benchmark, was a primary detractor from performance relative to the BofA Merrill Lynch Global High Yield – Constrained Index (USD Hedged).
The fund’s greater exposure to non-investment grade bonds, particularly “B” and “C” rated (r) securities, also held back performance as these credit quality sectors underperformed higher-rated securities. The fund’s longer duration (d) stance in the US and lesser duration stance in the Eurozone dampened relative returns.
A greater exposure to the Utility – other sector, within the North American region, further weakened relative performance during the period.
4
Management Review – continued
Contributors to Performance
The fund’s greater exposure to shifts in the middle portion (centered around maturities of 7 years) of the US yield curve (y) was a primary contributor to relative performance during the reporting period.
The fund’s yield curve positioning in the Eurozone and United Kingdom, particularly a lesser exposure to shifts in the long end (centered around maturities of 10 or more years) of the respective yield curves also benefited relative results. Strong bond selection further supported relative results.
Respectfully,
| | | | |
| William Adams | | David Cole | | Matthew Ryan |
| Portfolio Manager | | Portfolio Manager | | Portfolio Manager |
| (d) | Duration is a measure of how much a bond’s price is likely to fluctuate with general changes in interest rates, e.g., if rates rise 1.00%, a bond with a 5-year duration is likely to lose about 5.00% of its value. |
| (r) | Bonds rated “BBB”, “Baa”, or higher are considered investment grade; bonds rated “BB”, “Ba”, or below are considered non-investment grade. The source for bond quality ratings is Moody’s Investors Service, Standard & Poor’s and Fitch, Inc. and are applied using the following hierarchy: If all three agencies provide a rating, the middle rating (after dropping the highest and lowest ratings) is assigned; if two of the three agencies rate a security, the lower of the two is assigned. Ratings are shown in the S&P and Fitch scale (e.g., AAA). For securities which are not rated by any of the three agencies, the security is considered Not Rated. |
| (y) | A yield curve graphically depicts the yields of different maturity bonds of the same credit quality and type; a normal yield curve is upward sloping, with short-term rates lower than long-term rates. |
The views expressed in this report are those of the portfolio managers only through the end of the period of the report as stated on the cover and do not necessarily reflect the views of MFS or any other person in the MFS organization. These views are subject to change at any time based on market or other conditions, and MFS disclaims any responsibility to update such views. These views may not be relied upon as investment advice or an indication of trading intent on behalf of any MFS portfolio. References to specific securities are not recommendations of such securities, and may not be representative of any MFS portfolio’s current or future investments.
This discussion reflects the fund’s investment in securities held within the fund’s portfolio as well as those securities held within the MFS High Yield Pooled Portfolio.
5
PERFORMANCE SUMMARY THROUGH 1/31/16
The following chart illustrates a representative class of the fund’s historical performance in comparison to its benchmark(s). Performance results include the deduction of the maximum applicable sales charge and reflect the percentage change in net asset value, including reinvestment of dividends and capital gains distributions. The performance of other share classes will be greater than or less than that of the class depicted below. Benchmarks are unmanaged and may not be invested in directly. Benchmark returns do not reflect sales charges, commissions or expenses. (See Notes to Performance Summary.)
Performance data shown represents past performance and is no guarantee of future results. Investment return and principal value fluctuate so your shares, when sold, may be worth more or less than the original cost; current performance may be lower or higher than quoted. The performance shown does not reflect the deduction of taxes, if any, that a shareholder would pay on fund distributions or the redemption of fund shares.
Growth of a Hypothetical $10,000 Investment
6
Performance Summary – continued
Total Returns through 1/31/16
Average annual without sales charge
| | | | | | | | | | | | | | |
| | | Share Class | | Class Inception Date | | 1-yr | | 5-yr | | 10-yr | | Life (t) | | |
| | | A | | 7/01/98 | | (5.54)% | | 3.51% | | 5.00% | | N/A | | |
| | | B | | 7/01/98 | | (6.23)% | | 2.71% | | 4.24% | | N/A | | |
| | | C | | 7/01/98 | | (6.41)% | | 2.73% | | 4.26% | | N/A | | |
| | | I | | 7/01/98 | | (5.45)% | | 3.73% | | 5.26% | | N/A | | |
| | | R1 | | 6/02/08 | | (6.23)% | | 2.71% | | N/A | | 4.06% | | |
| | | R2 | | 6/02/08 | | (5.75)% | | 3.22% | | N/A | | 4.58% | | |
| | | R3 | | 6/02/08 | | (5.54)% | | 3.51% | | N/A | | 4.86% | | |
| | | R4 | | 6/02/08 | | (5.39)% | | 3.87% | | N/A | | 5.19% | | |
| | | R5 | | 6/02/08 | | (5.37)% | | 3.77% | | N/A | | 5.09% | | |
| Comparative benchmark | | | | | | | | | | |
| | | BofA Merrill Lynch Global High Yield – Constrained Index (USD Hedged) (f) | | (3.86)% | | 4.94% | | 7.06% | | N/A | | |
| Average annual with sales charge | | | | | | | | | | |
| | | A
With Initial Sales Charge (4.25%) | | (9.55)% | | 2.61% | | 4.54% | | N/A | | |
| | | B
With CDSC (Declining over six years from 4% to 0%) (v) | | (9.78)% | | 2.40% | | 4.24% | | N/A | | |
| | | C
With CDSC (1% for 12 months) (v) | | (7.30)% | | 2.73% | | 4.26% | | N/A | | |
On May 30, 2012, Class W shares were redesignated Class R5 shares. Total returns for Class R5 shares prior to May 30, 2012 reflect the performance history of Class W shares which had different fees and expenses than Class R5 shares.
CDSC – Contingent Deferred Sales Charge.
Class I, R1, R2, R3, R4, and R5 shares do not have a sales charge.
| (f) | Source: FactSet Research Systems Inc. |
| (t) | For the period from the class inception date through the stated period end (for those share classes with less than 10 years of performance history). No comparative benchmark performance information is provided for “life” periods. (See Notes to Performance Summary.) |
| (v) | Assuming redemption at the end of the applicable period. |
Benchmark Definition
BofA Merrill Lynch Global High Yield – Constrained Index (USD Hedged) – tracks the performance of below investment grade corporate debt of issuers domiciled in countries having an investment grade foreign currency long-term debt rating (based on an average of Moody’s and S&P). The Index is weighted by outstanding issuance, but constrained such that the percentage of any one issuer may not represent more than 2% of the Index.
It is not possible to invest directly in an index.
7
Performance Summary – continued
Notes to Performance Summary
Average annual total return represents the average annual change in value for each share class for the periods presented. Life returns are presented where the share class has less than 10 years of performance history and represent the average annual total return from the class inception date to the stated period end date. As the fund’s share classes may have different inception dates, the life returns may represent different time periods and may not be comparable. As a result, no comparative benchmark performance information is provided for life periods.
Performance results reflect any applicable expense subsidies and waivers in effect during the periods shown. Without such subsidies and waivers the fund’s performance results would be less favorable. Please see the prospectus and financial statements for complete details.
Performance results do not include adjustments made for financial reporting purposes in accordance with U.S. generally accepted accounting principles and may differ from amounts reported in the financial highlights.
From time to time the fund may receive proceeds from litigation settlements, without which performance would be lower.
8
EXPENSE TABLE
Fund expenses borne by the shareholders during the period, August 1, 2015 through January 31, 2016
As a shareholder of the fund, you incur two types of costs: (1) transaction costs, including sales charges (loads) on certain purchase or redemption payments, and (2) ongoing costs, including management fees; distribution and service (12b-1) fees; and other fund expenses. This example is intended to help you understand your ongoing costs (in dollars) of investing in the fund and to compare these costs with the ongoing costs of investing in other mutual funds.
In addition to the fees and expenses which the fund bears directly, the fund indirectly bears a pro rata share of the fees and expenses of the underlying MFS Pooled Portfolio in which the fund invests. MFS Pooled Portfolios are mutual funds advised by MFS that do not pay management fees to MFS but do incur investment and operating costs. If these transactional and indirect costs were included, your costs would have been higher.
The example is based on an investment of $1,000 invested at the beginning of the period and held for the entire period August 1, 2015 through January 31, 2016.
Actual Expenses
The first line for each share class in the following table provides information about actual account values and actual expenses. You may use the information in this line, together with the amount you invested, to estimate the expenses that you paid over the period. Simply divide your account value by $1,000 (for example, an $8,600 account value divided by $1,000 = 8.6), then multiply the result by the number in the first line under the heading entitled “Expenses Paid During Period” to estimate the expenses you paid on your account during this period.
Hypothetical Example for Comparison Purposes
The second line for each share class in the following table provides information about hypothetical account values and hypothetical expenses based on the fund’s actual expense ratio and an assumed rate of return of 5% per year before expenses, which is not the fund’s actual return. The hypothetical account values and expenses may not be used to estimate the actual ending account balance or expenses you paid for the period. You may use this information to compare the ongoing costs of investing in the fund and other funds. To do so, compare this 5% hypothetical example with the 5% hypothetical examples that appear in the shareholder reports of the other funds.
Please note that the expenses shown in the table are meant to highlight your ongoing costs only and do not reflect any transactional costs, such as sales charges (loads). Therefore, the second line for each share class in the table is useful in comparing ongoing costs only, and will not help you determine the relative total costs of owning different funds. In addition, if these transactional costs were included, your costs would have been higher.
9
Expense Table – continued
| | | | | | | | | | | | | | | | | | |
Share
Class | | | | Annualized Expense Ratio | | | Beginning Account Value 8/01/15 | | | Ending Account Value 1/31/16 | | | Expenses Paid During Period (p) 8/01/15-1/31/16 | |
| A | | Actual | | | 1.05% | | | | $1,000.00 | | | | $927.41 | | | | $5.10 | |
| | Hypothetical (h) | | | 1.05% | | | | $1,000.00 | | | | $1,019.91 | | | | $5.35 | |
| B | | Actual | | | 1.80% | | | | $1,000.00 | | | | $924.06 | | | | $8.73 | |
| | Hypothetical (h) | | | 1.80% | | | | $1,000.00 | | | | $1,016.13 | | | | $9.15 | |
| C | | Actual | | | 1.80% | | | | $1,000.00 | | | | $922.25 | | | | $8.72 | |
| | Hypothetical (h) | | | 1.80% | | | | $1,000.00 | | | | $1,016.13 | | | | $9.15 | |
| I | | Actual | | | 0.80% | | | | $1,000.00 | | | | $927.11 | | | | $3.89 | |
| | Hypothetical (h) | | | 0.80% | | | | $1,000.00 | | | | $1,021.17 | | | | $4.08 | |
| R1 | | Actual | | | 1.80% | | | | $1,000.00 | | | | $924.06 | | | | $8.73 | |
| | Hypothetical (h) | | | 1.80% | | | | $1,000.00 | | | | $1,016.13 | | | | $9.15 | |
| R2 | | Actual | | | 1.30% | | | | $1,000.00 | | | | $926.40 | | | | $6.31 | |
| | Hypothetical (h) | | | 1.30% | | | | $1,000.00 | | | | $1,018.65 | | | | $6.61 | |
| R3 | | Actual | | | 1.05% | | | | $1,000.00 | | | | $927.41 | | | | $5.10 | |
| | Hypothetical (h) | | | 1.05% | | | | $1,000.00 | | | | $1,019.91 | | | | $5.35 | |
| R4 | | Actual | | | 0.80% | | | | $1,000.00 | | | | $927.63 | | | | $3.89 | |
| | Hypothetical (h) | | | 0.80% | | | | $1,000.00 | | | | $1,021.17 | | | | $4.08 | |
| R5 | | Actual | | | 0.70% | | | | $1,000.00 | | | | $927.39 | | | | $3.40 | |
| | Hypothetical (h) | | | 0.70% | | | | $1,000.00 | | | | $1,021.68 | | | | $3.57 | |
| (h) | 5% class return per year before expenses. |
| (p) | “Expenses Paid During Period” are equal to each class’s annualized expense ratio, as shown above, multiplied by the average account value over the period, multiplied by 184/365 (to reflect the one-half year period). Expenses paid do not include any applicable sales charges (loads). If these transaction costs had been included, your costs would have been higher. In addition to the fees and expenses which the fund bears directly, the fund indirectly bears a pro rata share of the fees and expenses of the underlying funds in which the fund invests. If these indirect costs were included, your costs would have been higher. |
10
PORTFOLIO OF INVESTMENTS
1/31/16
The Portfolio of Investments is a complete list of all securities owned by your fund. It is categorized by broad-based asset classes.
| | | | | | | | |
| Bonds - 30.5% | | | | | | | | |
| Issuer | | Shares/Par | | | Value ($) | |
| | | | | | | | |
| Aerospace - 0.3% | | | | | | | | |
| TA Aerospace, 3.625%, 4/15/23 (n) | | EUR | 1,225,000 | | | $ | 1,240,923 | |
| | |
| Asset-Backed & Securitized - 0.1% | | | | | | | | |
| Citigroup Commercial Mortgage Trust, FRN, 5.898%, 12/10/49 | | $ | 2,500,000 | | | $ | 249,845 | |
| Crest Ltd., CDO, 7%, 1/28/40 (a)(p) | | | 1,480,674 | | | | 127,516 | |
| Falcon Franchise Loan LLC, FRN, 44.017%, 1/05/25 (i)(z) | | | 30,270 | | | | 7,315 | |
LB Commercial Conduit Mortgage Trust, FRN,
1.191%, 2/18/30 (i) | | | 143,852 | | | | 1,393 | |
| Morgan Stanley Capital I, Inc., FRN, 1.405%, 4/28/39 (i)(z) | | | 942,867 | | | | 4,563 | |
| | | | | | | | |
| | | | $ | 390,632 | |
| Automotive - 1.1% | | | | | | | | |
| Rhino Bondco S.p.A., 7.25%, 11/15/20 (n) | | EUR | 751,000 | | | $ | 864,602 | |
| Schaeffler Finance B.V., 4.25%, 5/15/18 | | EUR | 100,000 | | | | 109,901 | |
| Schaeffler Finance B.V., 3.25%, 5/15/25 (n) | | EUR | 905,000 | | | | 919,112 | |
| Schaeffler Finance B.V., 6.875%, 8/15/18 (n)(p) | | $ | 640,000 | | | | 657,600 | |
| Schaeffler Finance B.V., 4.75%, 5/15/21 (n) | | | 295,000 | | | | 295,000 | |
| Schaeffler Holding Finance B.V., 6.25%, 11/15/19 (n)(p) | | | 200,000 | | | | 208,500 | |
| Tupy Overseas S.A., 6.625%, 7/17/24 | | | 1,465,000 | | | | 1,188,481 | |
| ZF North America Capital, Inc., 4.5%, 4/29/22 (n) | | | 200,000 | | | | 192,750 | |
| | | | | | | | |
| | | | $ | 4,435,946 | |
| Building - 2.6% | | | | | | | | |
| CEMEX S.A.B. de C.V., 5.875%, 3/25/19 (n) | | $ | 345,000 | | | $ | 326,612 | |
| CEMEX S.A.B. de C.V., 6.5%, 12/10/19 (n) | | | 845,000 | | | | 797,469 | |
| CEMEX S.A.B. de C.V., 7.25%, 1/15/21 (n) | | | 235,000 | | | | 223,485 | |
| Cimpor Financial Operations B.V., 5.75%, 7/17/24 (n) | | | 918,000 | | | | 564,570 | |
| Cimpor Financial Operations B.V., 5.75%, 7/17/24 | | | 1,265,000 | | | | 777,975 | |
| Elementia S.A. de C.V., 5.5%, 1/15/25 (n) | | | 1,664,000 | | | | 1,539,366 | |
| Grupo Cementos de Chihuahua S.A.B. de C.V., 8.125%, 2/08/20 | | | 1,563,000 | | | | 1,594,260 | |
| Grupo Cementos de Chihuahua S.A.B. de C.V., 8.125%, 2/08/20 (n) | | | 795,000 | | | | 810,900 | |
| Paroc Group Oy, 6.25%, 5/15/20 | | EUR | 1,125,000 | | | | 1,145,658 | |
| Titan Global Finance PLC, 4.25%, 7/10/19 | | EUR | 1,125,000 | | | | 1,194,338 | |
| Union Andina de Cementos S.A.A., 5.875%, 10/30/21 (n) | | $ | 1,627,000 | | | | 1,565,174 | |
| | | | | | | | |
| | | | $ | 10,539,807 | |
| Business Services - 0.1% | | | | | | | | |
| Worldpay Finance PLC, 3.75%, 11/15/22 (n) | | EUR | 479,000 | | | $ | 522,792 | |
11
Portfolio of Investments – continued
| | | | | | | | |
| Issuer | | Shares/Par | | | Value ($) | |
| | | | | | | | |
| Bonds - continued | | | | | | | | |
| Cable TV - 2.8% | | | | | | | | |
| Altice Financing S.A., 7.875%, 12/15/19 (n) | | $ | 1,512,000 | | | $ | 1,576,260 | |
| Altice Financing S.A., 6.625%, 2/15/23 (n) | | | 400,000 | | | | 393,000 | |
| Altice Finco S.A., 8.125%, 1/15/24 (n) | | | 278,000 | | | | 266,880 | |
| Cogeco Communications, Inc., 4.875%, 5/01/20 (n) | | | 1,135,000 | | | | 1,139,256 | |
| LGE Holdco VI B.V., 7.125%, 5/15/24 | | EUR | 380,000 | | | | 442,569 | |
| LGE Holdco VI B.V., 7.125%, 5/15/24 (n) | | $ | 755,000 | | | | 879,315 | |
| Lynx I Corp., 5.375%, 4/15/21 (n) | | | 814,500 | | | | 832,826 | |
| Telenet Group Holding N.V., 6.25%, 8/15/22 (n) | | EUR | 780,000 | | | | 903,066 | |
| Unitymedia Hessen NRW GmbH, 6.25%, 1/15/29 | | EUR | 1,160,000 | | | | 1,360,425 | |
| Unitymedia KabelBW GmbH, 6.125%, 1/15/25 (n) | | $ | 200,000 | | | | 203,040 | |
| Videotron Ltd., 5.375%, 6/15/24 (n) | | | 1,890,000 | | | | 1,904,175 | |
| Virgin Media Secured Finance PLC, 5.25%, 1/15/26 (n) | | | 485,000 | | | | 480,150 | |
| VTR Finance B.V., 6.875%, 1/15/24 (n) | | | 1,320,000 | | | | 1,230,900 | |
| | | | | | | | |
| | | | $ | 11,611,862 | |
| Chemicals - 0.7% | | | | | | | | |
| Consolidated Energy Finance S.A., 6.75%, 10/15/19 | | $ | 200,000 | | | $ | 176,000 | |
| Consolidated Energy Finance S.A., 6.75%, 10/15/19 (n) | | | 1,554,000 | | | | 1,367,520 | |
| INEOS Group Holdings S.A., 5.75%, 2/15/19 | | EUR | 760,000 | | | | 802,725 | |
| SPCM S.A., 2.875%, 6/15/23 (n) | | EUR | 647,000 | | | | 658,323 | |
| | | | | | | | |
| | | | $ | 3,004,568 | |
| Conglomerates - 0.7% | | | | | | | | |
| Grupo Kuo S.A.B. de C.V., 6.25%, 12/04/22 | | $ | 1,505,000 | | | $ | 1,375,194 | |
| Kion Finance S.A., 6.75%, 2/15/20 | | EUR | 770,000 | | | | 863,965 | |
| Votorantim Cimentos S.A., 7.25%, 4/05/41 | | $ | 814,000 | | | | 557,590 | |
| | | | | | | | |
| | | | $ | 2,796,749 | |
| Construction - 0.1% | | | | | | | | |
| Empresas ICA S.A.B. de C.V., 8.375%, 7/24/17 (n) | | $ | 150,000 | | | $ | 25,125 | |
| Empresas ICA S.A.B. de C.V., 8.375%, 7/24/17 | | | 291,000 | | | | 48,743 | |
| Empresas ICA S.A.B. de C.V., 8.9%, 2/04/21 | | | 1,639,000 | | | | 303,215 | |
| Empresas ICA S.A.B. de C.V., 8.875%, 5/29/24 (a)(d)(n) | | | 915,000 | | | | 169,275 | |
| | | | | | | | |
| | | | $ | 546,358 | |
| Consumer Products - 0.3% | | | | | | | | |
| Jarden Corp., 3.75%, 10/01/21 | | EUR | 1,125,000 | | | $ | 1,270,276 | |
| | |
| Consumer Services - 0.5% | | | | | | | | |
| Grupo Posadas S.A.B. de C.V., 7.875%, 6/30/22 (n) | | $ | 2,249,000 | | | $ | 2,125,305 | |
| | |
| Containers - 0.3% | | | | | | | | |
| San Miguel Industrias PET S.A., 7.75%, 11/06/20 (n) | | $ | 1,211,000 | | | $ | 1,241,396 | |
12
Portfolio of Investments – continued
| | | | | | | | |
| Issuer | | Shares/Par | | | Value ($) | |
| | | | | | | | |
| Bonds - continued | | | | | | | | |
| Emerging Market Quasi-Sovereign - 1.6% | | | | | | | | |
| Banco de Reservas de la Republica Dominicana, 7%, 2/01/23 (n) | | $ | 606,000 | | | $ | 579,945 | |
| Banco do Brasil S.A., 6.25% to 4/15/24, FRN to 1/31/49 (n) | | | 935,000 | | | | 451,138 | |
| Banco do Brasil S.A., 9% to 6/18/2024, FRN to 6/29/49 | | | 910,000 | | | | 546,000 | |
| Gazprom OAO Via Gaz Capital S.A., 4.95%, 7/19/22 | | | 1,840,000 | | | | 1,725,736 | |
| Sberbank of Russia, 5.25%, 5/23/23 | | | 1,115,000 | | | | 990,120 | |
Trade & Development Bank of Mongolia LLC,
9.375%, 5/19/20 (n) | | | 600,000 | | | | 532,566 | |
| Turkiye Vakiflar Bankasi T.A.O., 6.875% to 2/03/20, FRN to 2/03/25 (n) | | | 1,820,000 | | | | 1,749,584 | |
| | | | | | | | |
| | | | $ | 6,575,089 | |
| Emerging Market Sovereign - 1.5% | | | | | | | | |
| Dominican Republic, 7.5%, 5/06/21 (n) | | $ | 790,000 | | | $ | 835,425 | |
| Dominican Republic, 6.6%, 1/28/24 (n) | | | 122,000 | | | | 122,915 | |
| Dominican Republic, 5.875%, 4/18/24 (n) | | | 111,000 | | | | 107,115 | |
| Dominican Republic, 5.5%, 1/27/25 (n) | | | 140,000 | | | | 131,600 | |
| Dominican Republic, 7.45%, 4/30/44 (n) | | | 107,000 | | | | 103,255 | |
| Government of Jamaica, 7.875%, 7/28/45 | | | 499,000 | | | | 479,040 | |
| Republic of Croatia, 5.5%, 4/04/23 (n) | | | 1,264,000 | | | | 1,318,352 | |
| Republic of Ecuador, 10.5%, 3/24/20 (n) | | | 1,446,000 | | | | 1,070,040 | |
| Republic of Kazakhstan, 5.125%, 7/21/25 (n) | | | 439,000 | | | | 436,893 | |
| Republic of Venezuela, 7%, 3/31/38 | | | 1,930,000 | | | | 622,425 | |
| Russian Federation, 5%, 4/29/20 | | | 800,000 | | | | 829,859 | |
| | | | | | | | |
| | | | $ | 6,056,919 | |
| Energy - Independent - 0.1% | | | | | | | | |
| Afren PLC, 15%, 4/25/16 (d)(p) | | $ | 1,173,632 | | | $ | 352,090 | |
| Afren PLC, 6.625%, 12/09/20 (a)(d)(n) | | | 528,000 | | | | 2,640 | |
| Afren PLC, 11.5% (a)(d)(n) | | | 1,000,000 | | | | 5,000 | |
| Northern Blizzard Resources, Inc., 7.25%, 2/01/22 (n) | | | 279,000 | | | | 199,485 | |
| | | | | | | | |
| | | | $ | 559,215 | |
| Energy - Integrated - 0.8% | | | | | | | | |
| Inkia Energy Ltd., 8.375%, 4/04/21 | | $ | 1,597,000 | | | $ | 1,525,135 | |
| LUKOIL International Finance B.V., 4.563%, 4/24/23 | | | 1,655,000 | | | | 1,499,844 | |
| Pacific Rubiales Energy Corp., 7.25%, 12/12/21 (n) | | | 2,406,000 | | | | 300,750 | |
| | | | | | | | |
| | | | $ | 3,325,729 | |
| Entertainment - 0.4% | | | | | | | | |
| CPUK Finance Ltd., 7%, 2/28/42 (n) | | GBP | 1,110,000 | | | $ | 1,601,407 | |
| | |
| Food & Beverages - 2.1% | | | | | | | | |
| Brakes Capital, 7.125%, 12/15/18 | | GBP | 1,150,000 | | | $ | 1,679,601 | |
| Central American Bottling Corp., 6.75%, 2/09/22 | | $ | 1,495,000 | | | | 1,515,556 | |
13
Portfolio of Investments – continued
| | | | | | | | |
| Issuer | | Shares/Par | | | Value ($) | |
| | | | | | | | |
| Bonds - continued | | | | | | | | |
| Food & Beverages - continued | | | | | | | | |
| Corporacion Lindley S.A., 6.75%, 11/23/21 (n) | | $ | 56,000 | | | $ | 61,180 | |
| Corporacion Lindley S.A., 6.75%, 11/23/21 | | | 389,000 | | | | 424,983 | |
| Corporacion Lindley S.A., 4.625%, 4/12/23 (n) | | | 802,000 | | | | 796,988 | |
| Darling Global Finance B.V., 4.75%, 5/30/22 (n) | | EUR | 710,000 | | | | 722,802 | |
| JBS Investments GmbH, 7.75%, 10/28/20 (n) | | $ | 979,000 | | | | 866,415 | |
| Minerva Luxembourg S.A., 7.75%, 1/31/23 | | | 1,560,000 | | | | 1,454,700 | |
| R&R Ice Cream PLC, 5.5%, 5/15/20 | | GBP | 750,000 | | | | 1,087,377 | |
| | | | | | | | |
| | | | $ | 8,609,602 | |
| Forest & Paper Products - 0.0% | | | | | | | | |
| Tembec Industries, Inc., 9%, 12/15/19 (n) | | $ | 130,000 | | | $ | 82,225 | |
| | |
| Gaming & Lodging - 0.2% | | | | | | | | |
| Great Canadian Gaming Corp., 6.625%, 7/25/22 (n) | | CAD | 1,375,000 | | | $ | 964,335 | |
| | |
| Industrial - 0.9% | | | | | | | | |
| Deutsche Raststatten Gruppe IV GmbH, 6.75%, 12/30/20 | | EUR | 385,000 | | | $ | 439,762 | |
| Galapagos Holding S.A., 7%, 6/15/22 | | EUR | 1,031,000 | | | | 922,545 | |
| Galapagos S.A., 5.375%, 6/15/21 | | EUR | 281,000 | | | | 285,230 | |
| Grupo Isolux Corsan Finance B.V., 6.625%, 4/15/21 | | EUR | 1,380,000 | | | | 448,486 | |
| Transfield Services Ltd., 8.375%, 5/15/20 (n) | | $ | 1,500,000 | | | | 1,518,750 | |
| | | | | | | | |
| | | | $ | 3,614,773 | |
| Machinery & Tools - 0.5% | | | | | | | | |
| Ashtead Capital, Inc., 5.625%, 10/01/24 (n) | | $ | 260,000 | | | $ | 250,250 | |
| Loxam SAS, 7%, 7/23/22 | | EUR | 1,500,000 | | | | 1,641,199 | |
| | | | | | | | |
| | | | $ | 1,891,449 | |
| Major Banks - 1.1% | | | | | | | | |
| Royal Bank of Scotland Group PLC, 6%, 12/19/23 | | $ | 1,850,000 | | | $ | 1,961,561 | |
| Royal Bank of Scotland Group PLC, 3.625% to 3/25/19, FRN to 3/25/24 | | EUR | 1,850,000 | | | | 2,041,225 | |
| Royal Bank of Scotland Group PLC, 7.5% to 8/10/20, FRN to 12/29/65 | | $ | 325,000 | | | | 330,688 | |
| | | | | | | | |
| | | | $ | 4,333,474 | |
| Medical & Health Technology & Services - 0.4% | | | | | | | | |
| Medi-Partenaires SAS, 7%, 5/15/20 | | EUR | 1,300,000 | | | $ | 1,485,042 | |
| | |
| Metals & Mining - 0.5% | | | | | | | | |
| Hudbay Minerals, Inc., 9.5%, 10/01/20 | | $ | 260,000 | | | $ | 159,900 | |
| Lundin Mining Corp., 7.5%, 11/01/20 (n) | | | 240,000 | | | | 204,000 | |
| Lundin Mining Corp., 7.875%, 11/01/22 (n) | | | 150,000 | | | | 121,125 | |
| Ovako AB, 6.5%, 6/01/19 | | EUR | 750,000 | | | | 512,672 | |
14
Portfolio of Investments – continued
| | | | | | | | |
| Issuer | | Shares/Par | | | Value ($) | |
| | | | | | | | |
| Bonds - continued | | | | | | | | |
| Metals & Mining - continued | | | | | | | | |
| Petra Diamonds U.S. Treasury PLC, 8.25%, 5/31/20 (n) | | $ | 955,000 | | | $ | 706,700 | |
| Southern Copper Corp., 5.875%, 4/23/45 | | | 212,000 | | | | 162,812 | |
| | | | | | | | |
| | | | $ | 1,867,209 | |
| Network & Telecom - 1.1% | | | | | | | | |
| Colombia Telecomunicaciones S.A., 8.5% to 3/30/20, FRN to 12/29/49 (n) | | $ | 996,000 | | | $ | 819,409 | |
| Columbus International, Inc., 7.375%, 3/30/21 (n) | | | 1,387,000 | | | | 1,390,468 | |
| Columbus International, Inc., 7.375%, 3/30/21 | | | 200,000 | | | | 200,500 | |
| Telecom Italia S.p.A., 5.303%, 5/30/24 (n) | | | 2,240,000 | | | | 2,184,000 | |
| | | | | | | | |
| | | | $ | 4,594,377 | |
| Oil Services - 0.2% | | | | | | | | |
| Odebrecht Offshore Drilling Finance Ltd., 6.75%, 10/01/22 (n) | | $ | 1,716,470 | | | $ | 369,041 | |
| QGOG Constellation S.A., 6.25%, 11/09/19 | | | 400,000 | | | | 152,000 | |
| QGOG Constellation S.A., 6.25%, 11/09/19 (n) | | | 1,298,000 | | | | 493,240 | |
| | | | | | | | |
| | | | $ | 1,014,281 | |
| Oils - 0.1% | | | | | | | | |
| CITGO Holding, Inc., 10.75%, 2/15/20 (n) | | $ | 210,000 | | | $ | 199,500 | |
| | |
| Other Banks & Diversified Financials - 3.0% | | | | | | | | |
| Banco Popolare Societa Cooperativa, 3.5%, 3/14/19 | | EUR | 1,480,000 | | | $ | 1,583,184 | |
| BBVA Bancomer S.A. de C.V., 6.5%, 3/10/21 (n) | | $ | 1,375,000 | | | | 1,477,878 | |
| BBVA Subordinated Capital S.A.U., 3.5% to 4/11/19, FRN to 4/11/24 | | EUR | 1,900,000 | | | | 2,110,470 | |
| CaixaBank S.A., 5% to 11/14/18, FRN to 11/14/23 | | EUR | 1,900,000 | | | | 2,103,336 | |
| Groupe BPCE S.A., 12.5% to 9/30/19, FRN to 8/29/49 (n) | | $ | 407,000 | | | | 516,210 | |
| ING Groep N.V., 6.5% to 4/16/25, FRN to 12/29/49 | | | 1,850,000 | | | | 1,792,188 | |
| Intesa Sanpaolo S.p.A., 2.855%, 4/23/25 | | EUR | 1,850,000 | | | | 1,953,217 | |
| Itau Unibanco Holding S.A., 5.125%, 5/13/23 | | $ | 1,115,000 | | | | 975,068 | |
| | | | | | | | |
| | | | $ | 12,511,551 | |
| Pollution Control - 0.1% | | | | | | | | |
| Paprec Holding S.A., 5.25%, 4/01/22 (n) | | EUR | 365,000 | | | $ | 375,255 | |
| | |
| Precious Metals & Minerals - 0.2% | | | | | | | | |
| Aurico Gold, Inc., 7.75%, 4/01/20 (n) | | $ | 1,155,000 | | | $ | 961,538 | |
| | |
| Restaurants - 0.4% | | | | | | | | |
| Stonegate Pub Co. Financing PLC, 5.75%, 4/15/19 | | GBP | 1,075,000 | | | $ | 1,533,682 | |
| | |
| Retailers - 0.4% | | | | | | | | |
| AA Bond Co. Ltd., 5.5%, 7/31/22 (n) | | GBP | 545,000 | | | $ | 722,661 | |
| AA Bond Co. Ltd., 5.5%, 7/31/22 | | GBP | 185,000 | | | | 245,307 | |
15
Portfolio of Investments – continued
| | | | | | | | |
| Issuer | | Shares/Par | | | Value ($) | |
| | | | | | | | |
| Bonds - continued | | | | | | | | |
| Retailers - continued | | | | | | | | |
| Kirk Beauty Zero GmbH, 6.25%, 7/15/22 (n) | | EUR | 600,000 | | | $ | 675,979 | |
| | | | | | | | |
| | | | $ | 1,643,947 | |
| Specialty Stores - 0.4% | | | | | | | | |
| Office Depot de Mexico S.A. de C.V., 6.875%, 9/20/20 (n) | | $ | 1,621,000 | | | $ | 1,598,711 | |
| | |
| Supermarkets - 0.1% | | | | | | | | |
| Casino Guichard Perrachon S.A., 4.87% to 1/31/19, FRN to 1/31/49 | | EUR | 400,000 | | | $ | 342,388 | |
| | |
| Telecommunications - Wireless - 2.6% | | | | | | | | |
| Altice S.A., 7.75%, 5/15/22 (n) | | $ | 1,130,000 | | | $ | 1,053,725 | |
| Comcel Trust, 6.875%, 2/06/24 (n) | | | 1,259,000 | | | | 1,007,200 | |
| Digicel Group Ltd., 8.25%, 9/30/20 (n) | | | 830,000 | | | | 671,366 | |
| Digicel Group Ltd., 6%, 4/15/21 (n) | | | 1,436,000 | | | | 1,251,115 | |
| Digicel Group Ltd., 6.75%, 3/01/23 | | | 341,000 | | | | 293,260 | |
| Millicom International Cellular S.A., 4.75%, 5/22/20 (n) | | | 768,000 | | | | 669,850 | |
| Millicom International Cellular S.A., 6.625%, 10/15/21 (n) | | | 1,314,000 | | | | 1,169,460 | |
| MTS International Funding Ltd., 5%, 5/30/23 (n) | | | 2,538,000 | | | | 2,347,752 | |
| VimpelCom Ltd., 5.95%, 2/13/23 (n) | | | 1,750,000 | | | | 1,627,500 | |
| Wind Acquisition Finance S.A., 4.75%, 7/15/20 (n) | | | 200,000 | | | | 196,500 | |
| Wind Acquisition Finance S.A., 7.375%, 4/23/21 (n) | | | 610,000 | | | | 579,878 | |
| | | | | | | | |
| | | | $ | 10,867,606 | |
| Telephone Services - 0.5% | | | | | | | | |
| B Communications Ltd., 7.375%, 2/15/21 (n) | | $ | 1,908,000 | | | $ | 2,068,463 | |
| | |
| Transportation - Services - 0.5% | | | | | | | | |
| Navios Logistics Finance (U.S.), Inc., 7.25%, 5/01/22 (n) | | $ | 990,000 | | | $ | 509,850 | |
| Stena AB, 7%, 2/01/24 (n) | | | 530,000 | | | | 402,800 | |
| Topaz Marine S.A., 8.625%, 11/01/18 (n) | | | 1,378,000 | | | | 1,143,740 | |
| Ultrapetrol Bahamas Ltd., 8.875%, 6/15/21 (a)(d) | | | 147,000 | | | | 24,990 | |
| | | | | | | | |
| | | | | | | $ | 2,081,380 | |
| Utilities - Electric Power - 1.2% | | | | | | | | |
| CE Energy AS, 7%, 2/01/21 | | EUR | 1,150,000 | | | $ | 1,214,650 | |
| Enel S.p.A., 8.75% to 9/24/23, FRN to 9/24/73 (n) | | $ | 955,000 | | | | 1,050,500 | |
| Greenko Dutch B.V., 8%, 8/01/19 (n) | | | 1,060,000 | | | | 1,110,061 | |
| TerraForm Global Operating LLC, 9.75%, 8/15/22 (n) | | | 1,730,000 | | | | 1,349,400 | |
| | | | | | | | |
| | | | | | | $ | 4,724,611 | |
| Total Bonds (Identified Cost, $150,560,058) | | | | | | $ | 125,210,372 | |
16
Portfolio of Investments – continued
| | | | | | | | |
| Underlying Affiliated Funds - 67.5% | | | | | | | | |
| Issuer | | Shares/Par | | | Value ($) | |
| | | | | | | | |
MFS High Yield Pooled Portfolio
(Identified Cost, $330,735,916) (v)(y) | | | 33,012,769 | | | $ | 277,637,383 | |
| | | | | | | | | | | | | | | | |
| | | | |
| | | Strike Price | | | First Exercise | | | | | | | |
| | | | | | | | | | | | | | | | |
| Warrants - 0.0% | | | | | | | | | | | | | | | | |
| Medical & Health Technology & Services - 0.0% | | | | | | | | | |
HealthSouth Corp.
(Identified Cost, $0) (a) | | $ | 41.40 | | | | 1/04/16 | | | | 394 | | | $ | 816 | |
| | | |
| Money Market Funds - 1.2% | | | | | | | | | | | | | |
MFS Institutional Money Market Portfolio, 0.28%,
at Cost and Net Asset Value (v) | | | | 4,900,492 | | | $ | 4,900,492 | |
| Total Investments (Identified Cost, $486,196,466) | | | | | | | $ | 407,749,063 | |
| | |
| Other Assets, Less Liabilities - 0.8% | | | | | | | | 3,107,956 | |
| Net Assets - 100.0% | | | | | | | | | | | | | | $ | 410,857,019 | |
| (a) | Non-income producing security. |
| (i) | Interest only security for which the fund receives interest on notional principal (Par amount). Par amount shown is the notional principal and does not reflect the cost of the security. |
| (n) | Securities exempt from registration under Rule 144A of the Securities Act of 1933. These securities may be sold in the ordinary course of business in transactions exempt from registration, normally to qualified institutional buyers. At period end, the aggregate value of these securities was $71,960,597, representing 17.5% of net assets. |
| (p) | Payment-in-kind security for which interest income may be received in additional securities and/or cash. During the period, the following amount of interest income was received in additional securities and/or cash: |
| | | | | | |
| Payment-in-kind Securities | | Cash | | Additional
Securities | |
| Afren PLC, 15%, 4/25/16 | | $14,607 | | | $— | |
| Schaeffler Finance B.V., 6.875%, 8/15/18 | | 44,000 | | | — | |
| Schaeffler Holding Finance B.V., 6.25%, 11/15/19 | | 13,090 | | | — | |
| Total | | $71,697 | | | $— | |
| (v) | Underlying affiliated fund that is available only to investment companies managed by MFS. The rate quoted for the MFS Institutional Money Market Portfolio is the annualized seven-day yield of the fund at period end. |
| (y) | The annual report for MFS High Yield Pooled Portfolio as of January 31, 2016 has been included as Appendix A. |
| (z) | Restricted securities are not registered under the Securities Act of 1933 and are subject to legal restrictions on resale. These securities generally may be resold in transactions exempt from registration or to the public if the securities are subsequently registered. Disposal of these |
17
Portfolio of Investments – continued
| | securities may involve time-consuming negotiations and prompt sale at an acceptable price may be difficult. The fund holds the following restricted securities: |
| | | | | | | | | | |
| Restricted Securities | | Acquisition
Date | |
Cost | | | Value | |
| Falcon Franchise Loan LLC, FRN, 44.017%, 1/05/25 | | 1/29/03 | | | $2,391 | | | | $7,315 | |
| Morgan Stanley Capital I, Inc., FRN, 1.405%, 4/28/39 | | 7/20/04 | | | 55,069 | | | | 4,563 | |
| Total Restricted Securities | | | | | | | | | $11,878 | |
| % of Net assets | | | | | | | | | 0% | |
The following abbreviations are used in this report and are defined:
| CDO | | Collateralized Debt Obligation |
| FRN | | Floating Rate Note. Interest rate resets periodically and the current rate may not be the rate reported at period end. |
| PLC | | Public Limited Company |
Abbreviations indicate amounts shown in currencies other than the U.S. dollar. All amounts are stated in U.S. dollars unless otherwise indicated. A list of abbreviations is shown below:
Derivative Contracts at 1/31/16
Forward Foreign Currency Exchange Contracts at 1/31/16
| | | | | | | | | | | | | | | | | | | | | | | | |
| Type | | Currency | | Counter- party | | Contracts
to
Deliver/
Receive | | | Settlement
Date Range | | | In
Exchange
For | | | Contracts
at Value | | | Net
Unrealized
Appreciation
(Depreciation) | |
| Asset Derivatives | | | | | | | | | | | | | |
| SELL | | EUR | | Goldman Sachs International | | | 32,405,067 | | | | 4/15/16 | | | | $35,196,310 | | | | $35,175,171 | | | | $21,139 | |
| SELL | | GBP | | BNP Paribas SA | | | 4,965,319 | | | | 4/15/16 | | | | 7,171,236 | | | | 7,076,277 | | | | 94,959 | |
| | | | | | | | | | | | | | | | | | | | | | | | |
| | | | | | | | | | | | | | | | | | | | | | | $116,098 | |
| | | | | | | | | | | | | | | | | | | | | | | | |
| | | | |
| Liability Derivatives | | | | | | | | | | | | | |
| SELL | | CAD | | Merrill Lynch International | | | 1,375,000 | | | | 4/15/16 | | | | $967,125 | | | | $981,556 | | | | $(14,431 | ) |
| | | | | | | | | | | | | | | | | | | | | | | | |
Futures Contracts at 1/31/16
| | | | | | | | | | | | | | | | | | |
| Description | | Currency | | | Contracts | | | Value | | Expiration
Date | | | Unrealized
Appreciation
(Depreciation) | |
| Liability Derivatives | | | | | | | | | | | | | | | | | | |
| Interest Rate Futures | | | | | | | | | | | | | | | |
| U.S. Treasury Note 10 yr (Short) | | | USD | | | | 12 | | | $1,554,938 | | | March - 2016 | | | | $(37,977 | ) |
| | | | | | | | | | | | | | | | | | |
At January 31, 2016, the fund had cash collateral of $16,200 to cover any commitments for certain derivative contracts. Cash collateral is comprised of “Deposits with brokers” in the Statement of Assets and Liabilities.
See Notes to Financial Statements
18
Financial Statements
STATEMENT OF ASSETS AND LIABILITIES
At 1/31/16
This statement represents your fund’s balance sheet, which details the assets and liabilities comprising the total value of the fund.
| | | | |
| Assets | | | | |
Investments | | | | |
Non-affiliated issuers, at value (identified cost, $150,560,058) | | | $125,211,188 | |
Underlying affiliated funds, at value (identified cost, $335,636,408) | | | 282,537,875 | |
Total investments, at value (identified cost, $486,196,466) | | | $407,749,063 | |
Foreign currency, at value (identified cost, $33,060) | | | 7,549 | |
Deposits with brokers | | | 16,200 | |
Receivables for | | | | |
Forward foreign currency exchange contracts | | | 116,098 | |
Investments sold | | | 1,715,807 | |
Fund shares sold | | | 441,086 | |
Interest and dividends | | | 2,558,108 | |
Other assets | | | 2,700 | |
Total assets | | | $412,606,611 | |
| Liabilities | | | | |
Payable to custodian | | | $17,348 | |
Payables for | | | | |
Daily variation margin on open futures contracts | | | 6,563 | |
Distributions | | | 294,073 | |
Forward foreign currency exchange contracts | | | 14,431 | |
Investments purchased | | | 17,461 | |
Fund shares reacquired | | | 1,088,926 | |
Payable to affiliates | | | | |
Investment adviser | | | 13,124 | |
Shareholder servicing costs | | | 132,187 | |
Distribution and service fees | | | 15,286 | |
Payable for independent Trustees’ compensation | | | 3,242 | |
Accrued expenses and other liabilities | | | 146,951 | |
Total liabilities | | | $1,749,592 | |
Net assets | | | $410,857,019 | |
| Net assets consist of | | | | |
Paid-in capital | | | $573,263,266 | |
Unrealized appreciation (depreciation) on investments and translation of assets and liabilities in foreign currencies | | | (78,420,613 | ) |
Accumulated net realized gain (loss) on investments and foreign currency | | | (84,618,526 | ) |
Undistributed net investment income | | | 632,892 | |
Net assets | | | $410,857,019 | |
Shares of beneficial interest outstanding | | | 73,126,773 | |
19
Statement of Assets and Liabilities – continued
| | | | | | | | | | | | |
| | | Net assets | | | Shares
outstanding | | | Net asset value
per share (a) | |
Class A | | | $226,692,024 | | | | 40,351,678 | | | | $5.62 | |
Class B | | | 16,518,186 | | | | 2,934,622 | | | | 5.63 | |
Class C | | | 65,212,839 | | | | 11,619,340 | | | | 5.61 | |
Class I | | | 84,619,750 | | | | 15,055,263 | | | | 5.62 | |
Class R1 | | | 163,023 | | | | 28,972 | | | | 5.63 | |
Class R2 | | | 175,303 | | | | 31,137 | | | | 5.63 | |
Class R3 | | | 7,152,739 | | | | 1,273,131 | | | | 5.62 | |
Class R4 | | | 6,494,626 | | | | 1,149,992 | | | | 5.65 | |
Class R5 | | | 3,828,529 | | | | 682,638 | | | | 5.61 | |
| (a) | Maximum offering price per share was equal to the net asset value per share for all share classes, except for Class A, for which the maximum offering price per share was $5.87 [100 / 95.75 x $5.62]. On sales of $50,000 or more, the maximum offering price of Class A shares is reduced. A contingent deferred sales charge may be imposed on redemptions of Class A, Class B, and Class C shares. Redemption price per share was equal to the net asset value per share for Classes I, R1, R2, R3, R4, and R5. |
See Notes to Financial Statements
20
Financial Statements
STATEMENT OF OPERATIONS
Year ended 1/31/16
This statement describes how much your fund earned in investment income and accrued in expenses. It also describes any gains and/or losses generated by fund operations.
| | | | |
| Net investment income | | | | |
Income | | | | |
Interest | | | $9,303,608 | |
Dividends | | | 5,650 | |
Dividends from underlying affiliated funds | | | 22,194,349 | |
Foreign taxes withheld | | | (4,037 | ) |
Total investment income | | | $31,499,570 | |
Expenses | | | | |
Management fee | | | $3,185,797 | |
Distribution and service fees | | | 1,644,999 | |
Shareholder servicing costs | | | 604,566 | |
Administrative services fee | | | 86,197 | |
Independent Trustees’ compensation | | | 15,796 | |
Custodian fee | | | 77,864 | |
Shareholder communications | | | 67,823 | |
Audit and tax fees | | | 80,823 | |
Legal fees | | | 27,414 | |
Miscellaneous | | | 152,333 | |
Total expenses | | | $5,943,612 | |
Fees paid indirectly | | | (12 | ) |
Reduction of expenses by investment adviser and distributor | | | (382,581 | ) |
Net expenses | | | $5,561,019 | |
Net investment income | | | $25,938,551 | |
| Realized and unrealized gain (loss) on investments and foreign currency | |
Realized gain (loss) (identified cost basis) | | | | |
Investments: | | | | |
Non-affiliated issuers | | | $(3,630,684 | ) |
Underlying affiliated funds | | | (3,093,135 | ) |
Capital gain distributions from underlying affiliated funds | | | 236,519 | |
Futures contracts | | | (32,431 | ) |
Foreign currency | | | 3,120,794 | |
Net realized gain (loss) on investments and foreign currency | | | $(3,398,937 | ) |
Change in unrealized appreciation (depreciation) | | | | |
Investments | | | $(45,823,834 | ) |
Futures contracts | | | 19,065 | |
Translation of assets and liabilities in foreign currencies | | | (1,521,673 | ) |
Net unrealized gain (loss) on investments and foreign currency translation | | | $(47,326,442 | ) |
Net realized and unrealized gain (loss) on investments and foreign currency | | | $(50,725,379 | ) |
Change in net assets from operations | | | $(24,786,828 | ) |
See Notes to Financial Statements
21
Financial Statements
STATEMENTS OF CHANGES IN NET ASSETS
These statements describe the increases and/or decreases in net assets resulting from operations, any distributions, and any shareholder transactions.
| | | | | | | | |
| | | Years ended 1/31 | |
| | | 2016 | | | 2015 | |
| Change in net assets | | | | | | |
| From operations | | | | | | | | |
Net investment income | | | $25,938,551 | | | | $30,432,552 | |
Net realized gain (loss) on investments and foreign currency | | | (3,398,937 | ) | | | 6,579,280 | |
Net unrealized gain (loss) on investments and foreign currency translation | | | (47,326,442 | ) | | | (25,535,222 | ) |
Change in net assets from operations | | | $(24,786,828 | ) | | | $11,476,610 | |
| Distributions declared to shareholders | | | | | | | | |
From net investment income | | | $(28,715,702 | ) | | | $(32,835,979 | ) |
Change in net assets from fund share transactions | | | $(65,742,404 | ) | | | $(31,892,927 | ) |
Total change in net assets | | | $(119,244,934 | ) | | | $(53,252,296 | ) |
| Net assets | | | | | | | | |
At beginning of period | | | 530,101,953 | | | | 583,354,249 | |
At end of period (including undistributed net investment income of $632,892 and $1,494,098, respectively) | | | $410,857,019 | | | | $530,101,953 | |
See Notes to Financial Statements
22
Financial Statements
FINANCIAL HIGHLIGHTS
The financial highlights table is intended to help you understand the fund’s financial performance for the past 5 years. Certain information reflects financial results for a single fund share. The total returns in the table represent the rate by which an investor would have earned (or lost) on an investment in the fund share class (assuming reinvestment of all distributions) held for the entire period.
| | | | | | | | | | | | | | | | | | | | |
| Class A | | Years ended 1/31 | |
| | | 2016 | | | 2015 | | | 2014 | | | 2013 | | | 2012 | |
Net asset value, beginning of period | | | $6.32 | | | | $6.57 | | | | $6.64 | | | | $6.30 | | | | $6.49 | |
| Income (loss) from investment operations | | | | | | | | | | | | | | | | | |
Net investment income (d) | | | $0.33 | | | | $0.36 | | | | $0.38 | | | | $0.42 | | | | $0.44 | |
Net realized and unrealized gain (loss) on
investments and foreign currency | | | (0.66 | ) | | | (0.23 | ) | | | (0.06 | ) | | | 0.35 | | | | (0.18 | ) |
Total from investment operations | | | $(0.33 | ) | | | $0.13 | | | | $0.32 | | | | $0.77 | | | | $0.26 | |
| Less distributions declared to shareholders | | | | | | | | | | | | | | | | | |
From net investment income | | | $(0.37 | ) | | | $(0.38 | ) | | | $(0.39 | ) | | | $(0.43 | ) | | | $(0.45 | ) |
Net asset value, end of period (x) | | | $5.62 | | | | $6.32 | | | | $6.57 | | | | $6.64 | | | | $6.30 | |
Total return (%) (r)(s)(t)(x) | | | (5.54 | ) | | | 1.97 | | | | 5.00 | | | | 12.73 | | | | 4.21 | |
Ratios (%) (to average net assets)
and Supplemental data: | | | | | | | | | | | | | | | | | |
Expenses before expense reductions (f)(h) | | | 1.13 | | | | 1.12 | | | | 1.11 | | | | 1.14 | | | | 1.13 | |
Expenses after expense reductions (f)(h) | | | 1.05 | | | | 1.05 | | | | 1.05 | | | | 1.05 | | | | 1.05 | |
Net investment income | | | 5.38 | | | | 5.42 | | | | 5.84 | | | | 6.54 | | | | 6.96 | |
Portfolio turnover | | | 16 | | | | 18 | | | | 38 | | | | 48 | | | | 61 | |
Net assets at end of period (000 omitted) | | | $226,692 | | | | $281,874 | | | | $366,654 | | | | $412,834 | | | | $422,926 | |
See Notes to Financial Statements
23
Financial Highlights – continued
| | | | | | | | | | | | | | | | | | | | |
| Class B | | Years ended 1/31 | |
| | | 2016 | | | 2015 | | | 2014 | | | 2013 | | | 2012 | |
Net asset value, beginning of period | | | $6.33 | | | | $6.59 | | | | $6.65 | | | | $6.32 | | | | $6.51 | |
| Income (loss) from investment operations | | | | | | | | | | | | | | | | | |
Net investment income (d) | | | $0.29 | | | | $0.31 | | | | $0.33 | | | | $0.37 | | | | $0.39 | |
Net realized and unrealized gain (loss) on
investments and foreign currency | | | (0.67 | ) | | | (0.24 | ) | | | (0.05 | ) | | | 0.35 | | | | (0.18 | ) |
Total from investment operations | | | $(0.38 | ) | | | $0.07 | | | | $0.28 | | | | $0.72 | | | | $0.21 | |
| Less distributions declared to shareholders | | | | | | | | | | | | | | | | | |
From net investment income | | | $(0.32 | ) | | | $(0.33 | ) | | | $(0.34 | ) | | | $(0.39 | ) | | | $(0.40 | ) |
Net asset value, end of period (x) | | | $5.63 | | | | $6.33 | | | | $6.59 | | | | $6.65 | | | | $6.32 | |
Total return (%) (r)(s)(t)(x) | | | (6.23 | ) | | | 1.06 | | | | 4.37 | | | | 11.71 | | | | 3.44 | |
Ratios (%) (to average net assets)
and Supplemental data: | | | | | | | | | | | | | | | | | |
Expenses before expense reductions (f)(h) | | | 1.88 | | | | 1.87 | | | | 1.86 | | | | 1.89 | | | | 1.88 | |
Expenses after expense reductions (f)(h) | | | 1.80 | | | | 1.80 | | | | 1.80 | | | | 1.80 | | | | 1.80 | |
Net investment income | | | 4.62 | | | | 4.65 | | | | 5.08 | | | | 5.77 | | | | 6.21 | |
Portfolio turnover | | | 16 | | | | 18 | | | | 38 | | | | 48 | | | | 61 | |
Net assets at end of period (000 omitted) | | | $16,518 | | | | $23,026 | | | | $27,959 | | | | $33,338 | | | | $35,751 | |
| |
| Class C | | Years ended 1/31 | |
| | | 2016 | | | 2015 | | | 2014 | | | 2013 | | | 2012 | |
Net asset value, beginning of period | | | $6.32 | | | | $6.56 | | | | $6.63 | | | | $6.30 | | | | $6.48 | |
| Income (loss) from investment operations | | | | | | | | | | | | | | | | | |
Net investment income (d) | | | $0.29 | | | | $0.31 | | | | $0.33 | | | | $0.37 | | | | $0.40 | |
Net realized and unrealized gain (loss) on
investments and foreign currency | | | (0.68 | ) | | | (0.22 | ) | | | (0.06 | ) | | | 0.35 | | | | (0.18 | ) |
Total from investment operations | | | $(0.39 | ) | | | $0.09 | | | | $0.27 | | | | $0.72 | | | | $0.22 | |
| Less distributions declared to shareholders | | | | | | | | | | | | | | | | | |
From net investment income | | | $(0.32 | ) | | | $(0.33 | ) | | | $(0.34 | ) | | | $(0.39 | ) | | | $(0.40 | ) |
Net asset value, end of period (x) | | | $5.61 | | | | $6.32 | | | | $6.56 | | | | $6.63 | | | | $6.30 | |
Total return (%) (r)(s)(t)(x) | | | (6.41 | ) | | | 1.36 | | | | 4.21 | | | | 11.73 | | | | 3.59 | |
Ratios (%) (to average net assets)
and Supplemental data: | | | | | | | | | | | | | | | | | |
Expenses before expense reductions (f)(h) | | | 1.88 | | | | 1.88 | | | | 1.86 | | | | 1.89 | | | | 1.89 | |
Expenses after expense reductions (f)(h) | | | 1.80 | | | | 1.80 | | | | 1.80 | | | | 1.80 | | | | 1.80 | |
Net investment income | | | 4.64 | | | | 4.66 | | | | 5.10 | | | | 5.79 | | | | 6.25 | |
Portfolio turnover | | | 16 | | | | 18 | | | | 38 | | | | 48 | | | | 61 | |
Net assets at end of period (000 omitted) | | | $65,213 | | | | $81,975 | | | | $93,058 | | | | $99,786 | | | | $89,483 | |
See Notes to Financial Statements
24
Financial Highlights – continued
| | | | | | | | | | | | | | | | | | | | |
| Class I | | Years ended 1/31 | |
| | | 2016 | | | 2015 | | | 2014 | | | 2013 | | | 2012 | |
Net asset value, beginning of period | | | $6.33 | | | | $6.58 | | | | $6.65 | | | | $6.31 | | | | $6.50 | |
| Income (loss) from investment operations | | | | | | | | | | | | | | | | | |
Net investment income (d) | | | $0.35 | | | | $0.37 | | | | $0.40 | | | | $0.44 | | | | $0.46 | |
Net realized and unrealized gain (loss) on
investments and foreign currency | | | (0.67 | ) | | | (0.22 | ) | | | (0.06 | ) | | | 0.35 | | | | (0.18 | ) |
Total from investment operations | | | $(0.32 | ) | | | $0.15 | | | | $0.34 | | | | $0.79 | | | | $0.28 | |
| Less distributions declared to shareholders | | | | | | | | | | | | | | | | | |
From net investment income | | | $(0.39 | ) | | | $(0.40 | ) | | | $(0.41 | ) | | | $(0.45 | ) | | | $(0.47 | ) |
Net asset value, end of period (x) | | | $5.62 | | | | $6.33 | | | | $6.58 | | | | $6.65 | | | | $6.31 | |
Total return (%) (r)(s)(x) | | | (5.45 | ) | | | 2.23 | | | | 5.26 | | | | 13.00 | | | | 4.47 | |
Ratios (%) (to average net assets)
and Supplemental data: | | | | | | | | | | | | | | | | | |
Expenses before expense reductions (f)(h) | | | 0.88 | | | | 0.87 | | | | 0.86 | | | | 0.89 | | | | 0.88 | |
Expenses after expense reductions (f)(h) | | | 0.80 | | | | 0.80 | | | | 0.80 | | | | 0.80 | | | | 0.80 | |
Net investment income | | | 5.61 | | | | 5.61 | | | | 6.05 | | | | 6.74 | | | | 7.21 | |
Portfolio turnover | | | 16 | | | | 18 | | | | 38 | | | | 48 | | | | 61 | |
Net assets at end of period (000 omitted) | | | $84,620 | | | | $130,780 | | | | $85,542 | | | | $70,977 | | | | $38,143 | |
| |
| Class R1 | | Years ended 1/31 | |
| | | 2016 | | | 2015 | | | 2014 | | | 2013 | | | 2012 | |
Net asset value, beginning of period | | | $6.33 | | | | $6.58 | | | | $6.65 | | | | $6.32 | | | | $6.51 | |
| Income (loss) from investment operations | | | | | | | | | | | | | | | | | |
Net investment income (d) | | | $0.29 | | | | $0.31 | | | | $0.33 | | | | $0.37 | | | | $0.39 | |
Net realized and unrealized gain (loss) on
investments and foreign currency | | | (0.67 | ) | | | (0.23 | ) | | | (0.06 | ) | | | 0.35 | | | | (0.18 | ) |
Total from investment operations | | | $(0.38 | ) | | | $0.08 | | | | $0.27 | | | | $0.72 | | | | $0.21 | |
| Less distributions declared to shareholders | | | | | | | | | | | | | | | | | |
From net investment income | | | $(0.32 | ) | | | $(0.33 | ) | | | $(0.34 | ) | | | $(0.39 | ) | | | $(0.40 | ) |
Net asset value, end of period (x) | | | $5.63 | | | | $6.33 | | | | $6.58 | | | | $6.65 | | | | $6.32 | |
Total return (%) (r)(s)(x) | | | (6.23 | ) | | | 1.21 | | | | 4.22 | | | | 11.71 | | | | 3.44 | |
Ratios (%) (to average net assets)
and Supplemental data: | | | | | | | | | | | | | | | | | |
Expenses before expense reductions (f)(h) | | | 1.88 | | | | 1.87 | | | | 1.86 | | | | 1.89 | | | | 1.88 | |
Expenses after expense reductions (f)(h) | | | 1.80 | | | | 1.80 | | | | 1.80 | | | | 1.80 | | | | 1.80 | |
Net investment income | | | 4.65 | | | | 4.65 | | | | 5.07 | | | | 5.70 | | | | 6.22 | |
Portfolio turnover | | | 16 | | | | 18 | | | | 38 | | | | 48 | | | | 61 | |
Net assets at end of period (000 omitted) | | | $163 | | | | $227 | | | | $236 | | | | $207 | | | | $132 | |
See Notes to Financial Statements
25
Financial Highlights – continued
| | | | | | | | | | | | | | | | | | | | |
| Class R2 | | Years ended 1/31 | |
| | | 2016 | | | 2015 | | | 2014 | | | 2013 | | | 2012 | |
Net asset value, beginning of period | | | $6.33 | | | | $6.59 | | | | $6.65 | | | | $6.32 | | | | $6.51 | |
| Income (loss) from investment operations | | | | | | | | | | | | | | | | | |
Net investment income (d) | | | $0.32 | | | | $0.34 | | | | $0.37 | | | | $0.40 | | | | $0.43 | |
Net realized and unrealized gain (loss) on
investments and foreign currency | | | (0.67 | ) | | | (0.23 | ) | | | (0.06 | ) | | | 0.35 | | | | (0.18 | ) |
Total from investment operations | | | $(0.35 | ) | | | $0.11 | | | | $0.31 | | | | $0.75 | | | | $0.25 | |
| Less distributions declared to shareholders | | | | | | | | | | | | | | | | | |
From net investment income | | | $(0.35 | ) | | | $(0.37 | ) | | | $(0.37 | ) | | | $(0.42 | ) | | | $(0.44 | ) |
Net asset value, end of period (x) | | | $5.63 | | | | $6.33 | | | | $6.59 | | | | $6.65 | | | | $6.32 | |
Total return (%) (r)(s)(x) | | | (5.75 | ) | | | 1.57 | | | | 4.90 | | | | 12.26 | | | | 3.96 | |
Ratios (%) (to average net assets)
and Supplemental data: | | | | | | | | | | | | | | | | | |
Expenses before expense reductions (f)(h) | | | 1.38 | | | | 1.37 | | | | 1.36 | | | | 1.39 | | | | 1.38 | |
Expenses after expense reductions (f)(h) | | | 1.30 | | | | 1.30 | | | | 1.30 | | | | 1.30 | | | | 1.30 | |
Net investment income | | | 5.16 | | | | 5.14 | | | | 5.57 | | | | 6.22 | | | | 6.72 | |
Portfolio turnover | | | 16 | | | | 18 | | | | 38 | | | | 48 | | | | 61 | |
Net assets at end of period (000 omitted) | | | $175 | | | | $248 | | | | $232 | | | | $253 | | | | $172 | |
| |
| Class R3 | | Years ended 1/31 | |
| | | 2016 | | | 2015 | | | 2014 | | | 2013 | | | 2012 | |
Net asset value, beginning of period | | | $6.32 | | | | $6.57 | | | | $6.64 | | | | $6.31 | | | | $6.49 | |
| Income (loss) from investment operations | | | | | | | | | | | | | | | | | |
Net investment income (d) | | | $0.33 | | | | $0.36 | | | | $0.38 | | | | $0.40 | | | | $0.44 | |
Net realized and unrealized gain (loss) on
investments and foreign currency | | | (0.66 | ) | | | (0.23 | ) | | | (0.06 | ) | | | 0.36 | | | | (0.17 | ) |
Total from investment operations | | | $(0.33 | ) | | | $0.13 | | | | $0.32 | | | | $0.76 | | | | $0.27 | |
| Less distributions declared to shareholders | | | | | | | | | | | | | | | | | |
From net investment income | | | $(0.37 | ) | | | $(0.38 | ) | | | $(0.39 | ) | | | $(0.43 | ) | | | $(0.45 | ) |
Net asset value, end of period (x) | | | $5.62 | | | | $6.32 | | | | $6.57 | | | | $6.64 | | | | $6.31 | |
Total return (%) (r)(s)(x) | | | (5.54 | ) | | | 1.97 | | | | 5.00 | | | | 12.55 | | | | 4.37 | |
Ratios (%) (to average net assets)
and Supplemental data: | | | | | | | | | | | | | | | | | |
Expenses before expense reductions (f)(h) | | | 1.13 | | | | 1.13 | | | | 1.11 | | | | 1.12 | | | | 1.14 | |
Expenses after expense reductions (f)(h) | | | 1.05 | | | | 1.05 | | | | 1.05 | | | | 1.05 | | | | 1.05 | |
Net investment income | | | 5.39 | | | | 5.41 | | | | 5.83 | | | | 6.06 | | | | 7.00 | |
Portfolio turnover | | | 16 | | | | 18 | | | | 38 | | | | 48 | | | | 61 | |
Net assets at end of period (000 omitted) | | | $7,153 | | | | $7,722 | | | | $7,751 | | | | $7,588 | | | | $771 | |
See Notes to Financial Statements
26
Financial Highlights – continued
| | | | | | | | | | | | | | | | | | | | |
| Class R4 | | Years ended 1/31 | |
| | | 2016 | | | 2015 | | | 2014 | | | 2013 | | | 2012 | |
Net asset value, beginning of period | | | $6.36 | | | | $6.62 | | | | $6.69 | | | | $6.30 | | | | $6.49 | |
| Income (loss) from investment operations | | | | | | | | | | | | | | | | | |
Net investment income (d) | | | $0.35 | | | | $0.37 | | | | $0.40 | | | | $0.45 | | | | $0.46 | |
Net realized and unrealized gain (loss) on
investments and foreign currency | | | (0.67 | ) | | | (0.23 | ) | | | (0.06 | ) | | | 0.39 | | | | (0.18 | ) |
Total from investment operations | | | $(0.32 | ) | | | $0.14 | | | | $0.34 | | | | $0.84 | | | | $0.28 | |
| Less distributions declared to shareholders | | | | | | | | | | | | | | | | | |
From net investment income | | | $(0.39 | ) | | | $(0.40 | ) | | | $(0.41 | ) | | | $(0.45 | ) | | | $(0.47 | ) |
Net asset value, end of period (x) | | | $5.65 | | | | $6.36 | | | | $6.62 | | | | $6.69 | | | | $6.30 | |
Total return (%) (r)(s)(x) | | | (5.39 | ) | | | 2.09 | | | | 5.27 | | | | 13.85 | | | | 4.47 | |
Ratios (%) (to average net assets)
and Supplemental data: | | | | | | | | | | | | | | | | | |
Expenses before expense reductions (f)(h) | | | 0.87 | | | | 0.87 | | | | 0.85 | | | | 0.89 | | | | 0.89 | |
Expenses after expense reductions (f)(h) | | | 0.80 | | | | 0.80 | | | | 0.80 | | | | 0.80 | | | | 0.80 | |
Net investment income | | | 5.58 | | | | 5.60 | | | | 6.05 | | | | 6.98 | | | | 7.25 | |
Portfolio turnover | | | 16 | | | | 18 | | | | 38 | | | | 48 | | | | 61 | |
Net assets at end of period (000 omitted) | | | $6,495 | | | | $3,690 | | | | $1,542 | | | | $1,431 | | | | $3,014 | |
| |
| Class R5 (y) | | Years ended 1/31 | |
| | | 2016 | | | 2015 | | | 2014 | | | 2013 | | | 2012 | |
Net asset value, beginning of period | | | $6.32 | | | | $6.57 | | | | $6.63 | | | | $6.29 | | | | $6.49 | |
| Income (loss) from investment operations | | | | | | | | | | | | | | | | | |
Net investment income (d) | | | $0.34 | | | | $0.38 | | | | $0.40 | | | | $0.44 | | | | $0.45 | |
Net realized and unrealized gain (loss) on
investments and foreign currency | | | (0.66 | ) | | | (0.22 | ) | | | (0.05 | ) | | | 0.35 | | | | (0.19 | ) |
Total from investment operations | | | $(0.32 | ) | | | $0.16 | | | | $0.35 | | | | $0.79 | | | | $0.26 | |
| Less distributions declared to shareholders | | | | | | | | | | | | | | | | | |
From net investment income | | | $(0.39 | ) | | | $(0.41 | ) | | | $(0.41 | ) | | | $(0.45 | ) | | | $(0.46 | ) |
Net asset value, end of period (x) | | | $5.61 | | | | $6.32 | | | | $6.57 | | | | $6.63 | | | | $6.29 | |
Total return (%) (r)(s)(x) | | | (5.37 | ) | | | 2.33 | | | | 5.51 | | | | 13.03 | | | | 4.20 | |
Ratios (%) (to average net assets)
and Supplemental data: | | | | | | | | | | | | | | | | | |
Expenses before expense reductions (f)(h) | | | 0.76 | | | | 0.77 | | | | 0.77 | | | | 0.97 | | | | 0.99 | |
Expenses after expense reductions (f)(h) | | | 0.70 | | | | 0.70 | | | | 0.72 | | | | 0.90 | | | | 0.90 | |
Net investment income | | | 5.64 | | | | 5.74 | | | | 6.14 | | | | 6.89 | | | | 7.14 | |
Portfolio turnover | | | 16 | | | | 18 | | | | 38 | | | | 48 | | | | 61 | |
Net assets at end of period (000 omitted) | | | $3,829 | | | | $561 | | | | $381 | | | | $112 | | | | $7,631 | |
See Notes to Financial Statements
27
Financial Highlights – continued
| (d) | Per share data is based on average shares outstanding. |
| (f) | Ratios do not reflect reductions from fees paid indirectly, if applicable. |
| (h) | In addition to the fees and expenses which the fund bears directly, the fund indirectly bears a pro rata share of the fees and expenses of the underlying affiliated funds in which the fund invests. Accordingly, the expense ratio for the fund reflects only those fees and expenses borne directly by the fund. Because the underlying affiliated funds have varied expense and fee levels and the fund may own different proportions of the underlying affiliated funds at different times, the amount of fees and expenses incurred indirectly by the fund will vary. |
| (r) | Certain expenses have been reduced without which performance would have been lower. |
| (s) | From time to time the fund may receive proceeds from litigation settlements, without which performance would be lower. |
| (t) | Total returns do not include any applicable sales charges. |
| (x) | The net asset values and total returns have been calculated on net assets which include adjustments made in accordance with U.S. generally accepted accounting principles required at period end for financial reporting purposes. |
| (y) | On May 10, 2012, sales of Class W shares (including exchanges) were suspended. On May 11, 2012, certain Class W shares were automatically converted to Class I shares. Shareholders of certain Class W shares became shareholders of Class I and received Class I shares with a total net asset value equal to their Class W shares at the time of the conversion. On May 30, 2012, remaining Class W shares, which represented MFS seed money, were redesignated Class R5. Class R5 shares are generally available only to certain eligible retirement plans and to funds distributed by MFD. Class R5 shares do not pay a 12b-1 distribution fee or sub-accounting costs. On June 1, 2012, Class R5 shares were offered for sale to the public. |
See Notes to Financial Statements
28
NOTES TO FINANCIAL STATEMENTS
(1) Business and Organization
MFS Global High Yield Fund (the fund) is a diversified series of MFS Series Trust III (the trust). The trust is organized as a Massachusetts business trust and is registered under the Investment Company Act of 1940, as amended, as an open-end management investment company.
The fund is an investment company and accordingly follows the investment company accounting and reporting guidance of the Financial Accounting Standards Board (FASB) Accounting Standards Codification Topic 946 Financial Services – Investment Companies.
(2) Significant Accounting Policies
General – The preparation of financial statements in conformity with U.S. generally accepted accounting principles requires management to make estimates and assumptions that affect the reported amounts of assets and liabilities, and disclosure of contingent assets and liabilities at the date of the financial statements and the reported amounts of increases and decreases in net assets from operations during the reporting period. Actual results could differ from those estimates. In the preparation of these financial statements, management has evaluated subsequent events occurring after the date of the fund’s Statement of Assets and Liabilities through the date that the financial statements were issued. As of January 31, 2016, 67.5% of the fund’s net assets were invested in the MFS High Yield Pooled Portfolio (“High Yield Pooled Portfolio”). MFS does not receive a management fee from the High Yield Pooled Portfolio. The High Yield Pooled Portfolio’s investment objective is to seek total return with an emphasis on high current income, but also considering capital appreciation. The accounting policies of the High Yield Pooled Portfolio are outlined in its shareholder reports. The accounting policies detailed in the Significant Accounting Policies note cover both the fund and the High Yield Pooled Portfolio. For purposes of this policy disclosure, “fund” refers to both the fund and the High Yield Pooled Portfolio in which the fund invests. The High Yield Pooled Portfolio’s shareholder reports are not covered by this report. The annual report for the High Yield Pooled Portfolio as of January 31, 2016 has been included as Appendix A, and should be read in conjunction with the fund’s financial statements. The fund and the High Yield Pooled Portfolio invest in high-yield securities rated below investment grade. Investments in below investment grade quality securities involve greater degrees of credit and market risk than investments in higher-rated securities and tend to be more sensitive to economic conditions. The fund and the High Yield Pooled Portfolio invest in foreign securities. Investments in foreign securities are vulnerable to the effects of changes in the relative values of the local currency and the U.S. dollar and to the effects of changes in each country’s legal, political, and economic environment.
In January 2016, FASB issued Accounting Standards Update 2016-01, Financial Instruments – Overall (Subtopic 825-10) – Recognition and Measurement of Financial Assets and Financial Liabilities (“ASU 2016-01”) which would first be effective for annual reporting periods beginning after December 15, 2017, and interim periods therein. ASU 2016-01, which changes the accounting for equity investments and for certain financial liabilities, also modifies the presentation and disclosure requirements
29
Notes to Financial Statements – continued
for financial instruments. Investment companies are specifically exempted from ASU 2016-01’s equity investment accounting provisions and will continue to follow the industry specific guidance for investment accounting under ASC 946. Although still evaluating the potential impacts of ASU 2016-01 to the fund, management expects that the impact of the fund’s adoption will be limited to additional financial statement disclosures.
Balance Sheet Offsetting – The fund’s accounting policy with respect to balance sheet offsetting is that, absent an event of default by the counterparty or a termination of the agreement, the International Swaps and Derivatives Association (ISDA) Master Agreement does not result in an offset of reported amounts of financial assets and financial liabilities in the Statement of Assets and Liabilities across transactions between the fund and the applicable counterparty. The fund’s right to setoff may be restricted or prohibited by the bankruptcy or insolvency laws of the particular jurisdiction to which a specific master netting agreement counterparty is subject. Balance sheet offsetting disclosures, to the extent applicable to the fund, have been included in the fund’s Significant Accounting Policies note under the captions for each of the fund’s in-scope financial instruments and transactions.
Investment Valuations – The investments of the fund and the High Yield Pooled Portfolio are valued as described below.
Debt instruments and floating rate loans, including restricted debt instruments, are generally valued at an evaluated or composite bid as provided by a third-party pricing service. Equity securities, including restricted equity securities, are generally valued at the last sale or official closing price on their primary market or exchange as provided by a third-party pricing service. Equity securities, for which there were no sales reported that day, are generally valued at the last quoted daily bid quotation on their primary market or exchange as provided by a third-party pricing service. Short-term instruments with a maturity at issuance of 60 days or less may be valued at amortized cost, which approximates market value. Futures contracts are generally valued at last posted settlement price on their primary exchange as provided by a third-party pricing service. Futures contracts for which there were no trades that day for a particular position are generally valued at the closing bid quotation on their primary exchange as provided by a third-party pricing service. Forward foreign currency exchange contracts are generally valued at the mean of bid and asked prices for the time period interpolated from rates provided by a third-party pricing service for proximate time periods. Open-end investment companies are generally valued at net asset value per share. Securities and other assets generally valued on the basis of information from a third-party pricing service may also be valued at a broker/dealer bid quotation. Values obtained from third-party pricing services can utilize both transaction data and market information such as yield, quality, coupon rate, maturity, type of issue, trading characteristics, and other market data. The values of foreign securities and other assets and liabilities expressed in foreign currencies are converted to U.S. dollars using the mean of bid and asked prices for rates provided by a third-party pricing service.
The Board of Trustees has delegated primary responsibility for determining or causing to be determined the value of the fund’s investments (including any fair valuation) to the adviser pursuant to valuation policies and procedures approved by the Board. If the adviser determines that reliable market quotations are not readily available, investments
30
Notes to Financial Statements – continued
are valued at fair value as determined in good faith by the adviser in accordance with such procedures under the oversight of the Board of Trustees. Under the fund’s valuation policies and procedures, market quotations are not considered to be readily available for most types of debt instruments and floating rate loans and many types of derivatives. These investments are generally valued at fair value based on information from third-party pricing services. In addition, investments may be valued at fair value if the adviser determines that an investment’s value has been materially affected by events occurring after the close of the exchange or market on which the investment is principally traded (such as foreign exchange or market) and prior to the determination of the fund’s net asset value, or after the halting of trading of a specific security where trading does not resume prior to the close of the exchange or market on which the security is principally traded. The adviser generally relies on third-party pricing services or other information (such as the correlation with price movements of similar securities in the same or other markets; the type, cost and investment characteristics of the security; the business and financial condition of the issuer; and trading and other market data) to assist in determining whether to fair value and at what value to fair value an investment. The value of an investment for purposes of calculating the fund’s net asset value can differ depending on the source and method used to determine value. When fair valuation is used, the value of an investment used to determine the fund’s net asset value may differ from quoted or published prices for the same investment. There can be no assurance that the fund could obtain the fair value assigned to an investment if it were to sell the investment at the same time at which the fund determines its net asset value per share.
Various inputs are used in determining the value of the fund’s assets or liabilities. These inputs are categorized into three broad levels. In certain cases, the inputs used to measure fair value may fall into different levels of the fair value hierarchy. In such cases, an investment’s level within the fair value hierarchy is based on the lowest level of input that is significant to the fair value measurement. The fund’s assessment of the significance of a particular input to the fair value measurement in its entirety requires judgment, and considers factors specific to the investment. Level 1 includes unadjusted quoted prices in active markets for identical assets or liabilities. Level 2 includes other significant observable market-based inputs (including quoted prices for similar securities, interest rates, prepayment speed, and credit risk). Level 3 includes unobservable inputs, which may include the adviser’s own assumptions in determining the fair value of investments. Other financial instruments are derivative instruments not
31
Notes to Financial Statements – continued
reflected in total investments, such as futures contracts and forward foreign currency exchange contracts. The following is a summary of the levels used as of January 31, 2016 in valuing the fund’s assets or liabilities:
| | | | | | | | | | | | | | | | |
| Investments at Value | | Level 1 | | | Level 2 | | | Level 3 | | | Total | |
| Equity Securities | | | $816 | | | | $— | | | | $— | | | | $816 | |
| Non-U.S. Sovereign Debt | | | — | | | | 12,632,008 | | | | — | | | | 12,632,008 | |
| U.S. Corporate Bonds | | | — | | | | 3,433,501 | | | | — | | | | 3,433,501 | |
| Commercial Mortgage-Backed Securities | | | — | | | | 263,116 | | | | — | | | | 263,116 | |
| Asset-Backed Securities (including CDOs) | | | — | | | | 127,516 | | | | — | | | | 127,516 | |
| Foreign Bonds | | | — | | | | 108,754,231 | | | | — | | | | 108,754,231 | |
| Mutual Funds | | | 282,537,875 | | | | — | | | | — | | | | 282,537,875 | |
| Total Investments | | | $282,538,691 | | | | $125,210,372 | | | | $— | | | | $407,749,063 | |
| | | | |
| Other Financial Instruments | | | | | | | | | | | | |
| Futures Contracts | | | $(37,977 | ) | | | $— | | | | $— | | | | $(37,977 | ) |
| Forward Foreign Currency Exchange Contracts | | | — | | | | 101,667 | | | | — | | | | 101,667 | |
For further information regarding security characteristics, see the Portfolio of Investments. Please refer to the High Yield Pooled Portfolio’s shareholder report for further information regarding the levels used in valuing its assets or liabilities.
Foreign Currency Translation – Purchases and sales of foreign investments, income, and expenses are converted into U.S. dollars based upon currency exchange rates prevailing on the respective dates of such transactions or on the reporting date for foreign denominated receivables and payables. Gains and losses attributable to foreign currency exchange rates on sales of securities are recorded for financial statement purposes as net realized gains and losses on investments. Gains and losses attributable to foreign exchange rate movements on receivables, payables, income and expenses are recorded for financial statement purposes as foreign currency transaction gains and losses. That portion of both realized and unrealized gains and losses on investments that results from fluctuations in foreign currency exchange rates is not separately disclosed.
Derivatives – The fund uses derivatives for different purposes, primarily to increase or decrease exposure to a particular market or segment of the market, or security, to increase or decrease interest rate or currency exposure, or as alternatives to direct investments. Derivatives are used for hedging or non-hedging purposes. While hedging can reduce or eliminate losses, it can also reduce or eliminate gains. When the fund uses derivatives as an investment to increase market exposure, or for hedging purposes, gains and losses from derivative instruments may be substantially greater than the derivative’s original cost.
The derivative instruments used by the fund were futures contracts and forward foreign currency exchange contracts. The fund’s period end derivatives, as presented in the Portfolio of Investments and the associated Derivative Contract tables generally are indicative of the volume of its derivative activity during the period.
32
Notes to Financial Statements – continued
The following table presents, by major type of derivative contract, the fair value, on a gross basis, of the asset and liability components of derivatives held by the fund at January 31, 2016 as reported in the Statement of Assets and Liabilities:
| | | | | | | | | | |
| | | | | Fair Value (a) | |
| Risk | | Derivative Contracts | | Asset Derivatives | | | Liability Derivatives | |
| Interest Rate | | Interest Rate Futures | | | $— | | | | $(37,977 | ) |
| Foreign Exchange | | Forward Foreign Currency Exchange | | | 116,098 | | | | (14,431 | ) |
| Total | | | | | $116,098 | | | | $(52,408) | |
| (a) | The value of futures contracts includes cumulative appreciation (depreciation) as reported in the fund’s Portfolio of Investments. Only the current day net variation margin for futures contracts is separately reported within the fund’s Statement of Assets and Liabilities. |
The following table presents, by major type of derivative contract, the realized gain (loss) on derivatives held by the fund for the year ended January 31, 2016 as reported in the Statement of Operations:
| | | | | | | | |
| Risk | | Futures
Contracts | | | Foreign
Currency | |
| Interest Rate | | | $(32,431 | ) | | | $— | |
| Foreign Exchange | | | — | | | | 3,165,384 | |
| Total | | | $(32,431 | ) | | | $3,165,384 | |
The following table presents, by major type of derivative contract, the change in unrealized appreciation (depreciation) on derivatives held by the fund for the year ended January 31, 2016 as reported in the Statement of Operations:
| | | | | | | | |
| Risk | | Futures
Contracts | | | Translation of Assets
and Liabilities in Foreign
Currencies | |
| Interest Rate | | | $19,065 | | | | $— | |
| Foreign Exchange | | | — | | | | (1,535,346 | ) |
| Total | | | $19,065 | | | | $(1,535,346 | ) |
Derivative counterparty credit risk is managed through formal evaluation of the creditworthiness of all potential counterparties. On certain, but not all, uncleared derivatives, the fund attempts to reduce its exposure to counterparty credit risk whenever possible by entering into an ISDA Master Agreement on a bilateral basis. The ISDA Master Agreement gives each party to the agreement the right to terminate all transactions traded under such agreement if there is a certain deterioration in the credit quality of the other party. Upon an event of default or a termination of the ISDA Master Agreement, the non-defaulting party has the right to close out all transactions traded under such agreement and to net amounts owed under each transaction to one net amount payable by one party to the other. This right to close out and net payments across all transactions traded under the ISDA Master Agreement could result in a reduction of the fund’s credit risk to such counterparty equal to any amounts payable by the fund under the applicable transactions, if any.
33
Notes to Financial Statements – continued
Collateral and margin requirements differ by type of derivative. Margin requirements are set by the clearing broker and the clearing house for cleared derivatives (e.g., futures contracts, cleared swaps, and exchange-traded options) while collateral terms are contract specific for uncleared derivatives (e.g., forward foreign currency exchange contracts, uncleared swap agreements, and uncleared options). For derivatives traded under an ISDA Master Agreement, which contains a collateral support annex, the collateral requirements are netted across all transactions traded under such agreement and one amount is posted from one party to the other to collateralize such obligations. Cash that has been segregated to cover the fund’s collateral or margin obligations under derivative contracts, if any, will be reported separately in the Statement of Assets and Liabilities as “Restricted cash” or “Deposits with brokers.” Securities pledged as collateral or margin for the same purpose, if any, are noted in the Portfolio of Investments.
Futures Contracts – The fund entered into futures contracts which may be used to hedge against or obtain broad market exposure, interest rate exposure, currency exposure, or to manage duration. A futures contract represents a commitment for the future purchase or sale of an asset at a specified price on a specified date.
Upon entering into a futures contract, the fund is required to deposit with the broker, either in cash or securities, an initial margin in an amount equal to a certain percentage of the notional amount of the contract. Subsequent payments (variation margin) are made or received by the fund each day, depending on the daily fluctuations in the value of the contract, and are recorded for financial statement purposes as unrealized gain or loss by the fund until the contract is closed or expires at which point the gain or loss on futures contracts is realized.
The fund bears the risk of interest rates, exchange rates or securities prices moving unexpectedly, in which case, the fund may not achieve the anticipated benefits of the futures contracts and may realize a loss. While futures contracts may present less counterparty risk to the fund since the contracts are exchange traded and the exchange’s clearinghouse guarantees payments to the broker, there is still counterparty credit risk due to the insolvency of the broker. The fund’s maximum risk of loss due to counterparty credit risk is equal to the margin posted by the fund to the broker plus any gains or minus any losses on the outstanding futures contracts.
Forward Foreign Currency Exchange Contracts – The fund entered into forward foreign currency exchange contracts for the purchase or sale of a specific foreign currency at a fixed price on a future date. These contracts may be used to hedge the fund’s currency risk or for non-hedging purposes. For hedging purposes, the fund may enter into contracts to deliver or receive foreign currency that the fund will receive from or use in its normal investment activities. The fund may also use contracts to hedge against declines in the value of foreign currency denominated securities due to unfavorable exchange rate movements. For non-hedging purposes, the fund may enter into contracts with the intent of changing the relative exposure of the fund’s portfolio of securities to different currencies to take advantage of anticipated exchange rate changes.
Forward foreign currency exchange contracts are adjusted by the daily exchange rate of the underlying currency and any unrealized gains or losses are recorded as a receivable
34
Notes to Financial Statements – continued
or payable for forward foreign currency exchange contracts until the contract settlement date. On contract settlement date, any gain or loss on the contract is recorded as realized gains or losses on foreign currency.
Risks may arise upon entering into these contracts from unanticipated movements in the value of the contract and from the potential inability of counterparties to meet the terms of their contracts. Generally, the fund’s maximum risk due to counterparty credit risk is the unrealized gain on the contract due to the use of Continuous Linked Settlement, an industry accepted settlement system. This risk is mitigated in cases where there is an ISDA Master Agreement between the fund and the counterparty providing for netting as described above and, where applicable, by the posting of collateral by the counterparty to the fund to cover the fund’s exposure to the counterparty under such ISDA Master Agreement.
Loans and Other Direct Debt Instruments – The fund invests in loans and loan participations or other receivables. These investments may include standby financing commitments, including revolving credit facilities, which contractually obligate the fund to supply additional cash to the borrower on demand. The fund generally provides this financial support in order to preserve its existing investment or to obtain a more senior secured interest in the assets of the borrower. Loan participations involve a risk of insolvency of the lending bank or other financial intermediary.
Indemnifications – Under the fund’s organizational documents, its officers and Trustees may be indemnified against certain liabilities and expenses arising out of the performance of their duties to the fund. Additionally, in the normal course of business, the fund enters into agreements with service providers that may contain indemnification clauses. The fund’s maximum exposure under these agreements is unknown as this would involve future claims that may be made against the fund that have not yet occurred.
Investment Transactions and Income – Investment transactions are recorded on the trade date. Interest income is recorded on the accrual basis. All premium and discount is amortized or accreted for financial statement purposes in accordance with U.S. generally accepted accounting principles. The fund earns certain fees in connection with its floating rate loan purchasing activities. These fees are in addition to interest payments earned and may include amendment fees, commitment fees, facility fees, consent fees, and prepayment fees. Commitment fees are recorded on an accrual basis as income in the accompanying financial statements. Distributions of income and capital gains from the High Yield Pooled Portfolio are recorded on the ex-dividend date.
Dividends received in cash are recorded on the ex-dividend date. Certain dividends from foreign securities will be recorded when the fund is informed of the dividend if such information is obtained subsequent to the ex-dividend date. Dividend and interest payments received in additional securities are recorded on the ex-dividend or ex-interest date in an amount equal to the value of the security on such date.
Debt obligations may be placed on non-accrual status or set to accrue at a rate of interest less than the contractual coupon when the collection of all or a portion of interest has become doubtful. Interest income for those debt obligations may be further reduced by the write-off of the related interest receivables when deemed uncollectible.
35
Notes to Financial Statements – continued
The fund and/or the High Yield Pooled Portfolio may receive proceeds from litigation settlements. Any proceeds received from litigation involving portfolio holdings are reflected in the Statement of Operations in realized gain/loss if the security has been disposed of by the fund or in unrealized gain/loss if the security is still held by the fund. Any other proceeds from litigation not related to portfolio holdings are reflected as other income in the Statement of Operations.
Fees Paid Indirectly – The fund’s custody fee may be reduced by a credit earned under an arrangement that measures the value of U.S. dollars deposited with the custodian by the fund. The amount of the credit, for the year ended January 31, 2016, is shown as a reduction of total expenses in the Statement of Operations.
Tax Matters and Distributions – The fund intends to qualify as a regulated investment company, as defined under Subchapter M of the Internal Revenue Code, and to distribute all of its taxable income, including realized capital gains. As a result, no provision for federal income tax is required. The fund’s federal tax returns, when filed, will remain subject to examination by the Internal Revenue Service for a three year period. Management has analyzed the fund’s tax positions taken on federal and state tax returns for all open tax years and does not believe that there are any uncertain tax positions that require recognition of a tax liability. Foreign taxes, if any, have been accrued by the fund in the accompanying financial statements in accordance with the applicable foreign tax law. Foreign income taxes may be withheld by certain countries in which the fund invests. Additionally, capital gains realized by the fund on securities issued in or by certain foreign countries may be subject to capital gains tax imposed by those countries.
Distributions to shareholders are recorded on the ex-dividend date. Income and capital gain distributions are determined in accordance with income tax regulations, which may differ from U.S. generally accepted accounting principles. Certain capital accounts in the financial statements are periodically adjusted for permanent differences in order to reflect their tax character. These adjustments have no impact on net assets or net asset value per share. Temporary differences which arise from recognizing certain items of income, expense, gain or loss in different periods for financial statement and tax purposes will reverse at some time in the future. Distributions in excess of net investment income or net realized gains are temporary overdistributions for financial statement purposes resulting from differences in the recognition or classification of income or distributions for financial statement and tax purposes.
Book/tax differences primarily relate to defaulted bonds and amortization and accretion of debt securities.
The tax character of distributions declared to shareholders for the last two fiscal years is as follows:
| | | | | | | | |
| | | 1/31/16 | | | 1/31/15 | |
| Ordinary income (including any short-term capital gains) | | | $28,715,702 | | | | $32,835,979 | |
36
Notes to Financial Statements – continued
The federal tax cost and the tax basis components of distributable earnings were as follows:
| | | | |
| As of 1/31/16 | | | |
| Cost of investments | | | $488,506,241 | |
| Gross appreciation | | | 884,421 | |
| Gross depreciation | | | (81,641,599 | ) |
| Net unrealized appreciation (depreciation) | | | $(80,757,178 | ) |
| Undistributed ordinary income | | | 3,238,512 | |
| Capital loss carryforwards | | | (82,346,728 | ) |
| Other temporary differences | | | (2,540,853 | ) |
Under the Regulated Investment Company Modernization Act of 2010 (the “Act”), net capital losses recognized for fund fiscal years beginning after January 31, 2011 may be carried forward indefinitely, and their character is retained as short-term and/or long-term losses (“post-enactment losses”). Previously, net capital losses were carried forward for eight years and treated as short-term losses (“pre-enactment losses”). As a transition rule, the Act requires that all post-enactment net capital losses be used before pre-enactment net capital losses.
As of January 31, 2016, the fund had capital loss carryforwards available to offset future realized gains as follows:
| | | | |
Pre-enactment losses which expire as
follows: | |
| 1/31/17 | | | $(30,697,499 | ) |
| 1/31/18 | | | (45,531,096 | ) |
| Total | | | $(76,228,595 | ) |
|
Post-enactment losses which are
characterized as follows: | |
| Short-Term | | | $(2,617,668 | ) |
| Long-Term | | | (3,500,465 | ) |
| Total | | | $(6,118,133 | ) |
Multiple Classes of Shares of Beneficial Interest – The fund offers multiple classes of shares, which differ in their respective distribution and service fees. The fund’s income and common expenses are allocated to shareholders based on the value of settled shares outstanding of each class. The fund’s realized and unrealized gain (loss) are allocated to shareholders based on the daily net assets of each class. Dividends are declared separately for each class. Differences in per share dividend rates are generally due to differences in separate class expenses. Class B shares will convert to Class A
37
Notes to Financial Statements – continued
shares approximately eight years after purchase. The fund’s distributions declared to shareholders as reported in the Statements of Changes in Net Assets are presented by class as follows:
| | | | | | | | |
| | | From net investment
income | |
| | | Year
ended
1/31/16 | | | Year
ended
1/31/15 | |
| Class A | | | $15,684,717 | | | | $18,935,328 | |
| Class B | | | 1,055,464 | | | | 1,322,566 | |
| Class C | | | 3,960,687 | | | | 4,607,529 | |
| Class I | | | 6,995,659 | | | | 7,308,699 | |
| Class R1 | | | 11,295 | | | | 11,906 | |
| Class R2 | | | 12,870 | | | | 13,621 | |
| Class R3 | | | 448,842 | | | | 459,449 | |
| Class R4 | | | 417,322 | | | | 146,555 | |
| Class R5 | | | 128,846 | | | | 30,326 | |
| Total | | | $28,715,702 | | | | $32,835,979 | |
(3) Transactions with Affiliates
Investment Adviser – The fund has an investment advisory agreement with MFS to provide overall investment management and related administrative services and facilities to the fund. The management fee is computed daily and paid monthly at an annual rate of 0.65% of the fund’s average daily net assets.
The investment adviser has agreed in writing to reduce its management fee to 0.60% of average daily net assets in excess of $1.5 billion to $2.5 billion and 0.55% of average daily net assets in excess of $2.5 billion. This written agreement will continue until modified by the fund’s Board of Trustees, but such agreement will continue at least until May 31, 2017. For the year ended January 31, 2016, the fund’s average daily net assets did not exceed $1.5 billion and therefore, the management fee was not reduced in accordance with this agreement.
MFS has agreed in writing to reduce its management fee by a specified amount if certain MFS mutual fund assets exceed thresholds agreed to by MFS and the fund’s Board of Trustees. For the year ended January 31, 2016, this management fee reduction amounted to $34,482, which is included in the reduction of total expenses in the Statement of Operations. The management fee incurred for the year ended January 31, 2016 was equivalent to an annual effective rate of 0.64% of the fund’s average daily net assets.
The investment adviser has agreed in writing to pay a portion of the fund’s total annual operating expenses, excluding interest, taxes, extraordinary expenses, brokerage and transaction costs, and investment-related expenses (including fees and expenses associated with investments in investment companies and other similar investment vehicles), such that total fund operating expenses do not exceed the following rates annually of each class’s average daily net assets:
| | | | | | | | | | | | | | | | | | | | | | | | | | | | | | | | |
| Classes | |
| A | | B | | | C | | | I | | | R1 | | | R2 | | | R3 | | | R4 | | | R5 | |
| 1.05% | | | 1.80% | | | | 1.80% | | | | 0.80% | | | | 1.80% | | | | 1.30% | | | | 1.05% | | | | 0.80% | | | | 0.73% | |
38
Notes to Financial Statements – continued
This written agreement will continue until modified by the fund’s Board of Trustees, but such agreement will continue at least until May 31, 2017. For the year ended January 31, 2016, this reduction amounted to $343,138, which is included in the reduction of total expenses in the Statement of Operations.
Distributor – MFS Fund Distributors, Inc. (MFD), a wholly-owned subsidiary of MFS, as distributor, received $17,795 for the year ended January 31, 2016, as its portion of the initial sales charge on sales of Class A shares of the fund. The Board of Trustees has adopted a distribution plan for certain share classes pursuant to Rule 12b-1 of the Investment Company Act of 1940.
The fund’s distribution plan provides that the fund will pay MFD for services provided by MFD and financial intermediaries in connection with the distribution and servicing of certain share classes. One component of the plan is a distribution fee paid to MFD and another component of the plan is a service fee paid to MFD. MFD may subsequently pay all, or a portion, of the distribution and/or service fees to financial intermediaries.
Distribution Plan Fee Table:
| | | | | | | | | | | | | | | | | | | | |
| | | Distribution
Fee Rate (d) | | | Service
Fee Rate (d) | | | Total
Distribution
Plan (d) | | | Annual
Effective
Rate (e) | | | Distribution
and Service
Fee | |
| Class A | | | — | | | | 0.25% | | | | 0.25% | | | | 0.25% | | | | $658,340 | |
| Class B | | | 0.75% | | | | 0.25% | | | | 1.00% | | | | 1.00% | | | | 203,693 | |
| Class C | | | 0.75% | | | | 0.25% | | | | 1.00% | | | | 1.00% | | | | 760,891 | |
| Class R1 | | | 0.75% | | | | 0.25% | | | | 1.00% | | | | 1.00% | | | | 2,210 | |
| Class R2 | | | 0.25% | | | | 0.25% | | | | 0.50% | | | | 0.50% | | | | 1,138 | |
| Class R3 | | | — | | | | 0.25% | | | | 0.25% | | | | 0.25% | | | | 18,727 | |
| Total Distribution and Service Fees | | | | $1,644,999 | |
| (d) | In accordance with the distribution plan for certain classes, the fund pays distribution and/or service fees equal to these annual percentage rates of each class’s average daily net assets. The distribution and service fee rates disclosed by class represent the current rates in effect at the end of the reporting period. Any rate changes, if applicable, are detailed below. |
| (e) | The annual effective rates represent actual fees incurred under the distribution plan for the year ended January 31, 2016 based on each class’s average daily net assets. MFD has voluntarily agreed to rebate a portion of each class’s 0.25% service fee attributable to accounts for which MFD retains the 0.25% service fee except for accounts attributable to MFS or its affiliates’ seed money. For the year ended January 31, 2016, this rebate amounted to $4,225, $157, and $579 for Class A, Class B, and Class C, respectively, and is included in the reduction of total expenses in the Statement of Operations. |
Certain Class A shares are subject to a contingent deferred sales charge (CDSC) in the event of a shareholder redemption within 18 months of purchase. Class C shares are subject to a CDSC in the event of a shareholder redemption within 12 months of purchase. Class B shares are subject to a CDSC in the event of a shareholder redemption within six years of purchase. All contingent deferred sales charges are paid to MFD and during the year ended January 31, 2016, were as follows:
| | | | |
| | | Amount | |
| Class A | | | $44 | |
| Class B | | | 42,468 | |
| Class C | | | 3,053 | |
39
Notes to Financial Statements – continued
Shareholder Servicing Agent – MFS Service Center, Inc. (MFSC), a wholly-owned subsidiary of MFS, receives a fee from the fund for its services as shareholder servicing agent calculated as a percentage of the average daily net assets of the fund as determined periodically under the supervision of the fund’s Board of Trustees. For the year ended January 31, 2016, the fee was $74,893, which equated to 0.0153% annually of the fund’s average daily net assets. MFSC also receives payment from the fund for out-of-pocket expenses, sub-accounting and other shareholder servicing costs which may be paid to affiliated and unaffiliated service providers. Class R5 shares do not incur sub-accounting fees. For the year ended January 31, 2016, these out-of-pocket expenses, sub-accounting and other shareholder servicing costs amounted to $529,673.
Administrator – MFS provides certain financial, legal, shareholder communications, compliance, and other administrative services to the fund. Under an administrative services agreement, the fund reimburses MFS the costs incurred to provide these services. The fund is charged an annual fixed amount of $17,500 plus a fee based on average daily net assets. The administrative services fee incurred for the year ended January 31, 2016 was equivalent to an annual effective rate of 0.0176% of the fund’s average daily net assets.
Trustees’ and Officers’ Compensation – The fund pays compensation to independent Trustees in the form of a retainer, attendance fees, and additional compensation to Board and Committee chairpersons. The fund does not pay compensation directly to Trustees or officers of the fund who are also officers of the investment adviser, all of whom receive remuneration for their services to the fund from MFS. Certain officers and Trustees of the fund are officers or directors of MFS, MFD, and MFSC.
Prior to December 31, 2001, the fund had an unfunded defined benefit plan (“DB plan”) for independent Trustees. As of December 31, 2001, the Board took action to terminate the DB plan with respect to then-current and any future independent Trustees, such that the DB plan covers only certain of those former independent Trustees who retired on or before December 31, 2001. Effective January 1, 2002, accrued benefits under the DB plan for then-current independent Trustees who continued were credited to an unfunded retirement deferral plan (the “Retirement Deferral plan”), which was established for and exists solely with respect to these credited amounts, and is not available for other deferrals by these or other independent Trustees. Although the Retirement Deferral plan is unfunded, amounts deferred under the plan are periodically adjusted for investment experience as if they had been invested in shares of the fund. The Retirement Deferral plan resulted in a net decrease in expense of $163 and is included in “Independent Trustees’ compensation” in the Statement of Operations for the year ended January 31, 2016. The liability for deferred retirement benefits payable to certain independent Trustees under the Retirement Deferral plan amounted to $3,224 at January 31, 2016, and is included in “Payable for independent Trustees’ compensation” in the Statement of Assets and Liabilities.
Other – This fund and certain other funds managed by MFS (the funds) have entered into a service agreement (the ISO Agreement) which provides for payment of fees
40
Notes to Financial Statements – continued
solely by the funds to Tarantino LLC in return for the provision of services of an Independent Senior Officer (ISO) for the funds. Frank L. Tarantino serves as the ISO and is an officer of the funds and the sole member of Tarantino LLC. The funds can terminate the ISO Agreement with Tarantino LLC at any time under the terms of the ISO Agreement. For the year ended January 31, 2016, the fee paid by the fund under this agreement was $1,535 and is included in “Miscellaneous” expense in the Statement of Operations. MFS has agreed to bear all expenses associated with office space, other administrative support, and supplies provided to the ISO.
The fund invests in the MFS Institutional Money Market Portfolio which is managed by MFS and seeks current income consistent with preservation of capital and liquidity. Income earned on this investment is included in “Dividends from underlying affiliated funds” in the Statement of Operations. This money market fund does not pay a management fee to MFS.
The fund invests in the High Yield Pooled Portfolio, which is a mutual fund advised by MFS that does not pay management fees to MFS but does incur investment and operating costs. The fund invests in the High Yield Pooled Portfolio to gain exposure to high income debt instruments, rather than investing in high income debt instruments directly (see Appendix A). Income earned on this investment is included in “Dividends from underlying affiliated funds” in the Statement of Operations. The High Yield Pooled Portfolio does not pay a management fee to MFS or distribution and/or service fee to MFD.
MFS redeemed the following shares of the fund for the amounts and dates noted below:
| | | | | | | | | | | | |
| Date | | Share Class | | | Shares | | | Amount | |
| 9/9/15 | | | Class R1 | | | | 15,318 | | | | $94,053 | |
| 9/9/15 | | | Class R2 | | | | 16,197 | | | | 99,450 | |
| 9/9/15 | | | Class R3 | | | | 410 | | | | 2,513 | |
| 9/9/15 | | | Class R4 | | | | 19,540 | | | | 120,366 | |
| 9/9/15 | | | Class R5 | | | | 11,528 | | | | 70,551 | |
MFS purchased the following shares of the fund for the amounts and dates noted below:
| | | | | | | | | | | | |
| Date | | Share Class | | | Shares | | | Amount | |
| 3/18/15 | | | Class I | | | | 22,344 | | | | $142,331 | |
(4) Portfolio Securities
For the year ended January 31, 2016, purchases and sales of investments, other than short-term obligations, aggregated $76,401,285 and $164,234,213, respectively.
41
Notes to Financial Statements – continued
(5) Shares of Beneficial Interest
The fund’s Declaration of Trust permits the Trustees to issue an unlimited number of full and fractional shares of beneficial interest. Transactions in fund shares were as follows:
| | | | | | | | | | | | | | | | |
| | | Year ended
1/31/16 | | | Year ended
1/31/15 | |
| | | Shares | | | Amount | | | Shares | | | Amount | |
| Shares sold | | | | | | | | | | | | | | | | |
Class A | | | 7,801,979 | | | | $48,563,641 | | | | 8,361,352 | | | | $55,260,871 | |
Class B | | | 182,420 | | | | 1,141,116 | | | | 362,573 | | | | 2,402,055 | |
Class C | | | 677,737 | | | | 4,205,076 | | | | 957,341 | | | | 6,326,440 | |
Class I | | | 6,265,451 | | | | 38,933,823 | | | | 13,572,232 | | | | 89,673,139 | |
Class R1 | | | 14,122 | | | | 90,103 | | | | 4,812 | | | | 31,179 | |
Class R2 | | | 9,429 | | | | 58,141 | | | | 3,572 | | | | 23,690 | |
Class R3 | | | 201,448 | | | | 1,215,474 | | | | 263,313 | | | | 1,714,745 | |
Class R4 | | | 751,734 | | | | 4,805,139 | | | | 425,167 | | | | 2,783,555 | |
Class R5 | | | 642,960 | | | | 3,883,846 | | | | 34,050 | | | | 225,513 | |
| | | 16,547,280 | | | | $102,896,359 | | | | 23,984,412 | | | | $158,441,187 | |
| | | |
Shares issued to shareholders in
reinvestment of distributions | | | | | | | | | | | | | |
Class A | | | 2,180,859 | | | | $13,328,859 | | | | 2,463,286 | | | | $16,194,212 | |
Class B | | | 158,916 | | | | 972,764 | | | | 178,991 | | | | 1,178,303 | |
Class C | | | 521,184 | | | | 3,177,221 | | | | 531,784 | | | | 3,488,243 | |
Class I | | | 1,030,655 | | | | 6,326,405 | | | | 1,013,305 | | | | 6,648,868 | |
Class R1 | | | 1,836 | | | | 11,292 | | | | 1,799 | | | | 11,824 | |
Class R2 | | | 2,074 | | | | 12,753 | | | | 2,069 | | | | 13,606 | |
Class R3 | | | 73,581 | | | | 448,824 | | | | 69,538 | | | | 456,615 | |
Class R4 | | | 68,240 | | | | 417,320 | | | | 22,347 | | | | 146,538 | |
Class R5 | | | 5,925 | | | | 36,051 | | | | 4,631 | | | | 30,325 | |
| | | 4,043,270 | | | | $24,731,489 | | | | 4,287,750 | | | | $28,168,534 | |
| | | | |
| Shares reacquired | | | | | | | | | | | | | | | | |
Class A | | | (14,217,672 | ) | | | $(87,858,351 | ) | | | (22,019,225 | ) | | | $(145,247,640 | ) |
Class B | | | (1,041,783 | ) | | | (6,428,785 | ) | | | (1,151,655 | ) | | | (7,601,986 | ) |
Class C | | | (2,560,378 | ) | | | (15,756,373 | ) | | | (2,683,212 | ) | | | (17,541,964 | ) |
Class I | | | (12,916,293 | ) | | | (79,832,796 | ) | | | (6,912,889 | ) | | | (45,446,037 | ) |
Class R1 | | | (22,824 | ) | | | (142,538 | ) | | | (6,665 | ) | | | (42,984 | ) |
Class R2 | | | (19,489 | ) | | | (119,633 | ) | | | (1,698 | ) | | | (11,252 | ) |
Class R3 | | | (223,252 | ) | | | (1,375,571 | ) | | | (290,596 | ) | | | (1,898,575 | ) |
Class R4 | | | (250,199 | ) | | | (1,531,223 | ) | | | (100,285 | ) | | | (660,955 | ) |
Class R5 | | | (55,111 | ) | | | (324,982 | ) | | | (7,765 | ) | | | (51,255 | ) |
| | | (31,307,001 | ) | | | $(193,370,252 | ) | | | (33,173,990 | ) | | | $(218,502,648 | ) |
42
Notes to Financial Statements – continued
| | | | | | | | | | | | | | | | |
| | | Year ended
1/31/16 | | | Year ended
1/31/15 | |
| | | Shares | | | Amount | | | Shares | | | Amount | |
| Net change | | | | | | | | | | | | | | | | |
Class A | | | (4,234,834 | ) | | | $(25,965,851 | ) | | | (11,194,587 | ) | | | $(73,792,557 | ) |
Class B | | | (700,447 | ) | | | (4,314,905 | ) | | | (610,091 | ) | | | (4,021,628 | ) |
Class C | | | (1,361,457 | ) | | | (8,374,076 | ) | | | (1,194,087 | ) | | | (7,727,281 | ) |
Class I | | | (5,620,187 | ) | | | (34,572,568 | ) | | | 7,672,648 | | | | 50,875,970 | |
Class R1 | | | (6,866 | ) | | | (41,143 | ) | | | (54 | ) | | | 19 | |
Class R2 | | | (7,986 | ) | | | (48,739 | ) | | | 3,943 | | | | 26,044 | |
Class R3 | | | 51,777 | | | | 288,727 | | | | 42,255 | | | | 272,785 | |
Class R4 | | | 569,775 | | | | 3,691,236 | | | | 347,229 | | | | 2,269,138 | |
Class R5 | | | 593,774 | | | | 3,594,915 | | | | 30,916 | | | | 204,583 | |
| | | (10,716,451 | ) | | | $(65,742,404 | ) | | | (4,901,828 | ) | | | $(31,892,927 | ) |
(6) Line of Credit
The fund and certain other funds managed by MFS participate in a $1.25 billion unsecured committed line of credit, subject to a $1 billion sublimit, provided by a syndication of banks under a credit agreement. Borrowings may be made for temporary financing needs. Interest is charged to each fund, based on its borrowings, generally at a rate equal to the higher of the Overnight Federal Reserve funds rate or daily one month LIBOR plus an agreed upon spread. A commitment fee, based on the average daily, unused portion of the committed line of credit, is allocated among the participating funds at the end of each calendar quarter. In addition, the fund and other funds managed by MFS have established unsecured uncommitted borrowing arrangements with certain banks for temporary financing needs. Interest is charged to each fund, based on its borrowings, at a rate equal to the Overnight Federal Reserve funds rate plus an agreed upon spread. For the year ended January 31, 2016, the fund’s commitment fee and interest expense were $1,687 and $0, respectively, and are included in “Miscellaneous” expense in the Statement of Operations.
(7) Transactions in Underlying Affiliated Funds-Affiliated Issuers
An affiliated issuer may be considered one in which the fund owns 5% or more of the outstanding voting securities, or a company which is under common control. For the purposes of this report, the fund assumes the following to be affiliated issuers:
| | | | | | | | | | | | | | | | |
| Underlying Affiliated Funds | | Beginning
Shares/Par
Amount | | | Acquisitions
Shares/Par
Amount | | | Dispositions
Shares/Par
Amount | | | Ending
Shares/Par
Amount | |
| MFS High Yield Pooled Portfolio | | | 41,397,796 | | | | 4,461,206 | | | | (12,846,233 | ) | | | 33,012,769 | |
MFS Institutional Money
Market Portfolio | | | 7,074,596 | | | | 97,218,668 | | | | (99,392,772 | ) | | | 4,900,492 | |
| | | | |
| Underlying Affiliated Funds | | Realized
Gain (Loss) | | | Capital Gain
Distributions | | | Dividend
Income | | | Ending
Value | |
| MFS High Yield Pooled Portfolio | | | $(3,093,135 | ) | | | $236,519 | | | | $22,187,544 | | | | $277,637,383 | |
MFS Institutional Money
Market Portfolio | | | — | | | | — | | | | 6,805 | | | | 4,900,492 | |
| Total | | | $(3,093,135 | ) | | | $236,519 | | | | $22,194,349 | | | | $282,537,875 | |
43
Notes to Financial Statements – continued
(8) Legal Proceedings
In May 2015, the Motors Liquidation Company Avoidance Action Trust (hereafter, “AAT”) served upon the fund a complaint in an adversary proceeding in the U.S. Bankruptcy Court for the Southern District of New York, captioned Motors Liquidation Company Avoidance Action Trust v. JPMorgan Chase Bank, N.A., et al. (No. 09-00504 (REG)). The complaint, which was originally filed in 2009 but not served on the fund until 2015, names as defendants over 500 entities (including the fund) that held an interest in a $1.5 billion General Motors (GM) term loan in 2009, when GM filed for bankruptcy. The AAT alleges that the fund and the other term loan lenders were improperly treated as secured lenders with respect to the term loan shortly before and immediately after GM’s bankruptcy, receiving full principal and interest payments under the loan. The AAT alleges that the fund and other term loan lenders should have been treated as unsecured (or partially unsecured) creditors because the main lien securing the collateral was allegedly not perfected at the time of GM’s bankruptcy due to an erroneous filing in October 2008 that terminated the financing statement perfecting the lien. The AAT seeks to claw back payments made to the fund and the other term loan lenders after, and during the 90 days before, GM’s June 2009 bankruptcy petition. During that time period, the fund received term loan payments of approximately $3,030,000. The fund cannot predict the outcome of this proceeding. Among other things, it is unclear whether the AAT’s claims will succeed; what the fund would be entitled to as an unsecured (or partially unsecured) creditor, given the existence of other collateral not impacted by the erroneous October 2008 filing; whether third parties responsible for the erroneous October 2008 filing would bear some or all of any liability; and the degree to which the fund may be entitled to indemnification from a third party for any amount required to be disgorged. The fund has and will continue to incur legal expenses associated with the defense of this action and in related claims against third parties.
44
REPORT OF INDEPENDENT REGISTERED PUBLIC ACCOUNTING FIRM
To the Board of Trustees of MFS Series Trust III and the Shareholders of MFS Global High Yield Fund:
We have audited the accompanying statement of assets and liabilities, including the portfolio of investments, of MFS Global High Yield Fund (one of the series of MFS Series Trust III) (the “Fund”) as of January 31, 2016, and the related statement of operations for the year then ended, the statements of changes in net assets for each of the two years in the period then ended, and the financial highlights for each of the five years in the period then ended. These financial statements and financial highlights are the responsibility of the Fund’s management. Our responsibility is to express an opinion on these financial statements and financial highlights based on our audits.
We conducted our audits in accordance with the standards of the Public Company Accounting Oversight Board (United States). Those standards require that we plan and perform the audit to obtain reasonable assurance about whether the financial statements and financial highlights are free of material misstatement. The Fund is not required to have, nor were we engaged to perform, an audit of its internal control over financial reporting. Our audits included consideration of internal control over financial reporting as a basis for designing audit procedures that are appropriate in the circumstances, but not for the purpose of expressing an opinion on the effectiveness of the Fund’s internal control over financial reporting. Accordingly, we express no such opinion. An audit also includes examining, on a test basis, evidence supporting the amounts and disclosures in the financial statements, assessing the accounting principles used and significant estimates made by management, as well as evaluating the overall financial statement presentation. Our procedures included confirmation of securities owned as of January 31, 2016, by correspondence with the custodian, brokers, and transfer agent; when replies were not received from brokers, we performed other auditing procedures. We believe that our audits provide a reasonable basis for our opinion.
In our opinion, such financial statements and financial highlights referred to above present fairly, in all material respects, the financial position of MFS Global High Yield Fund as of January 31, 2016, the results of its operations for the year then ended, the changes in its net assets for each of the two years in the period then ended, and the financial highlights for each of the five years in the period then ended, in conformity with accounting principles generally accepted in the United States of America.
DELOITTE & TOUCHE LLP
Boston, Massachusetts
March 17, 2016
45
TRUSTEES AND OFFICERS — IDENTIFICATION AND BACKGROUND
The Trustees and Officers of the Trust, as of March 1, 2016, are listed below, together with their principal occupations during the past five years. (Their titles may have varied during that period.) The address of each Trustee and Officer is 111 Huntington Avenue, Boston, Massachusetts 02199-7618.
| | | | | | | | |
Name, Age | | Position(s)
Held with Fund | | Trustee/Officer
Since (h) | | Principal
Occupations During the Past Five Years | | Other Directorships (j) |
| INTERESTED TRUSTEES |
Robert J. Manning (k)
(age 52) | | Trustee | | February 2004 | | Massachusetts Financial Services Company, Chairman, Co-Chief Executive Officer and Director | | N/A |
Robin A. Stelmach (k)
(age 54) | | Trustee and President | | January 2014 | | Massachusetts Financial Services Company, Executive Vice President and Chief Operating Officer | | N/A |
| INDEPENDENT TRUSTEES | | | | | | |
David H. Gunning
(age 73) | | Trustee and Chair of Trustees | | January 2004 | | Private investor | | Lincoln Electric Holdings, Inc., Director; Development Alternatives, Inc., Director/Non-Executive Chairman |
Steven E. Buller
(age 64) | | Trustee | | February 2014 | | Chairman, Financial Accounting Standards Advisory Council; Standing Advisory Group, Public Company Accounting Oversight Board, Member (until 2014); BlackRock, Inc. (investment management), Managing Director (until 2014), BlackRock Finco UK (investment management), Director (until 2014) | | N/A |
Robert E. Butler
(age 74) | | Trustee | | January 2006 | | Consultant – investment company industry regulatory and compliance matters | | N/A |
Maureen R. Goldfarb
(age 60) | | Trustee | | January 2009 | | Private investor | | N/A |
46
Trustees and Officers – continued
| | | | | | | | |
Name, Age | | Position(s)
Held with Fund | | Trustee/Officer
Since (h) | | Principal
Occupations During the Past Five Years | | Other Directorships (j) |
William R. Gutow
(age 74) | | Trustee | | December 1993 | | Private investor and real estate consultant; Capitol Entertainment Management Company (video franchise), Vice Chairman (until 2014) | | Texas Donuts, Vice Chairman (until 2010) |
Michael Hegarty
(age 71) | | Trustee | | December 2004 | | Private investor | | Rouse Properties Inc., Director; Capmark Financial Group Inc., Director (until 2015) |
John P. Kavanaugh
(age 61) | | Trustee | | January 2009 | | Private investor | | N/A |
Maryanne L. Roepke
(age 60) | | Trustee | | May 2014 | | American Century Investments (investment management), Senior Vice President and Chief Compliance Officer (until 2014) | | N/A |
Laurie J. Thomsen
(age 58) | | Trustee | | March 2005 | | Private investor | | The Travelers Companies, Director; Dycom Industries, Inc., Director |
Robert W. Uek
(age 74) | | Trustee | | January 2006 | | Consultant to investment company industry | | N/A |
| OFFICERS | | | | | | | | |
Christopher R. Bohane (k)
(age 42) | | Assistant Secretary and Assistant Clerk | | July 2005 | | Massachusetts Financial Services Company, Vice President and Assistant General Counsel | | N/A |
Kino Clark (k)
(age 47) | | Assistant Treasurer | | January 2012 | | Massachusetts Financial Services Company, Vice President | | N/A |
Kristin V. Collins (k)
(age 43) | | Assistant Secretary and Assistant Clerk | | September 2015 | | Massachusetts Financial Services Company, Vice President and Assistant General Counsel | | N/A |
47
Trustees and Officers – continued
| | | | | | | | |
Name, Age | | Position(s)
Held with Fund | | Trustee/Officer
Since (h) | | Principal
Occupations During the Past Five Years | | Other Directorships (j) |
Thomas H. Connors (k)
(age 56) | | Assistant Secretary and Assistant Clerk | | September 2012 | | Massachusetts Financial Services Company, Vice President and Senior Counsel; Deutsche Investment Management Americas Inc. (financial service provider), Director and Senior Counsel (until 2012) | | N/A |
Ethan D. Corey (k)
(age 52) | | Assistant Secretary and Assistant Clerk | | July 2005 | | Massachusetts Financial Services Company, Senior Vice President and Associate General Counsel | | N/A |
David L. DiLorenzo (k)
(age 47) | | Treasurer | | July 2005 | | Massachusetts Financial Services Company, Senior Vice President | | N/A |
Brian E. Langenfeld (k)
(age 42) | | Assistant Secretary and Assistant Clerk | | June 2006 | | Massachusetts Financial Services Company, Vice President and Senior Counsel | | N/A |
Kenneth Paek (k)
(age 41) | | Assistant Treasurer | | February 2015 | | Massachusetts Financial Services Company, Vice President; Cohen & Steers, Vice President/Head of Fund Administration (until 2014); Morgan Stanley, Executive Director/Head of European Fund Administration (until 2012) | | N/A |
Susan A. Pereira (k)
(age 45) | | Assistant Secretary and Assistant Clerk | | July 2005 | | Massachusetts Financial Services Company, Vice President and Senior Counsel | | N/A |
48
Trustees and Officers – continued
| | | | | | | | |
Name, Age | | Position(s)
Held with Fund | | Trustee/Officer
Since (h) | | Principal
Occupations During the Past Five Years | | Other Directorships (j) |
Kasey L. Phillips (k)
(age 45) | | Assistant Treasurer | | September 2012 | | Massachusetts Financial Services Company, Vice President; Wells Fargo Funds Management, LLC, Senior Vice President, Fund Treasurer (until 2012) | | N/A |
Mark N. Polebaum (k)
(age 63) | | Secretary and Clerk | | January 2006 | | Massachusetts Financial Services Company, Executive Vice President, General Counsel and Secretary | | N/A |
Matthew A. Stowe (k)
(age 41) | | Assistant Secretary and Assistant Clerk | | October 2014 | | Massachusetts Financial Services Company, Vice President and Assistant General Counsel | | N/A |
Frank L. Tarantino
(age 71) | | Independent Senior Officer | | June 2004 | | Tarantino LLC (provider of compliance services), Principal | | N/A |
Richard S. Weitzel (k)
(age 45) | | Assistant Secretary and Assistant Clerk | | October 2007 | | Massachusetts Financial Services Company, Senior Vice President and Associate General Counsel | | N/A |
Martin J. Wolin (k)
(age 48) | | Chief Compliance Officer | | July 2015 | | Massachusetts Financial Services Company, Senior Vice President and Chief Compliance Officer (since July 2015); Mercer (financial service provider), Chief Risk and Compliance Officer, North America and Latin America (until June 2015) | | N/A |
James O. Yost (k)
(age 55) | | Deputy Treasurer | | September 1990 | | Massachusetts Financial Services Company, Senior Vice President | | N/A |
| (h) | Date first appointed to serve as Trustee/officer of an MFS Fund. Each Trustee has served continuously since appointment unless indicated otherwise. For the period from December 15, 2004 until February 22, 2005, Mr. Manning served as Advisory Trustee. Prior to January 2012, Messrs. DiLorenzo and Yost served as Assistant Treasurers of the Funds. Ms. Stelmach was appointed as President of the Funds as of October 1, 2014. |
49
Trustees and Officers – continued
| (j) | Directorships or trusteeships of companies required to report to the Securities and Exchange Commission (i.e., “public companies”). |
| (k) | “Interested person” of the Trust within the meaning of the Investment Company Act of 1940 (referred to as the 1940 Act), which is the principal federal law governing investment companies like the fund, as a result of a position with MFS. The address of MFS is 111 Huntington Avenue, Boston, Massachusetts 02199-7618. |
Each Trustee (except Ms. Stelmach, Mr. Buller and Ms. Roepke) has been elected by shareholders and each Trustee and officer holds office until his or her successor is chosen and qualified or until his or her earlier death, resignation, retirement or removal. The Trust does not hold annual meetings for the purpose of electing Trustees, and Trustees are not elected for fixed terms. Messrs. Buller, Butler, Kavanaugh, Uek and Ms. Roepke are members of the Trust’s Audit Committee.
Each of the Fund’s Trustees and officers holds comparable positions with certain other funds of which MFS or a subsidiary is the investment adviser or distributor, and, in the case of the officers, with certain affiliates of MFS. As of March 1, 2016, the Trustees served as board members of 137 funds within the MFS Family of Funds.
The Statement of Additional Information for a Fund includes further information about the Trustees and is available without charge upon request by calling 1-800-225-2606.
| | |
| Investment Adviser | | Custodian |
Massachusetts Financial Services Company
111 Huntington Avenue
Boston, MA 02199-7618 | | JPMorgan Chase Bank, NA 4 Metrotech Center New York, NY 11245 |
| Distributor | | Independent Registered Public Accounting Firm |
MFS Fund Distributors, Inc.
111 Huntington Avenue
Boston, MA 02199-7618 | | Deloitte & Touche LLP 200 Berkeley Street Boston, MA 02116 |
| Portfolio Managers | | |
William Adams David Cole Matthew Ryan | | |
50
PROXY VOTING POLICIES AND INFORMATION
MFS votes proxies on behalf of the fund pursuant to proxy voting policies and procedures that are available without charge, upon request, by calling 1-800-225-2606, by visiting the Proxy Voting section of mfs.com or by visiting the SEC’s Web site at http://www.sec.gov.
Information regarding how the fund voted proxies relating to portfolio securities during the most recent twelve-month period ended June 30 is available without charge by visiting the Proxy Voting section of mfs.com or by visiting the SEC’s Web site at http://www.sec.gov.
QUARTERLY PORTFOLIO DISCLOSURE
The fund will file a complete schedule of portfolio holdings with the Securities and Exchange Commission (the Commission) for the first and third quarters of each fiscal year on Form N-Q. A shareholder can obtain the quarterly portfolio holdings report at mfs.com. The fund’s Form N-Q is also available on the EDGAR database on the Commission’s Internet Web site at http://www.sec.gov, and may be reviewed and copied at the:
Public Reference Room
Securities and Exchange Commission
100 F Street, NE, Room 1580
Washington, D.C. 20549
Information on the operation of the Public Reference Room may be obtained by calling the Commission at 1-800-SEC-0330. Copies of the fund’s Form N-Q also may be obtained, upon payment of a duplicating fee, by electronic request at the following e-mail address: publicinfo@sec.gov or by writing the Public Reference Section at the above address.
FURTHER INFORMATION
From time to time, MFS may post important information about the fund or the MFS funds on the MFS web site (mfs.com). This information is available by visiting the “Market Commentary” and “Announcements” sub sections in the “Market Outlooks” section of mfs.com or by clicking on the fund’s name under “Mutual Funds” in the “Products” section of mfs.com.
FEDERAL TAX INFORMATION (unaudited)
The fund will notify shareholders of amounts for use in preparing 2016 income tax forms in January 2017.
51
rev. 3/11
| | | | |
| | | |
FACTS | | WHAT DOES MFS DO WITH YOUR PERSONAL INFORMATION? | |  |
| | |
| Why? | | Financial companies choose how they share your personal information. Federal law gives consumers the right to limit some but not all sharing. Federal law also requires us to tell you how we collect, share, and protect your personal information. Please read this notice carefully to understand what we do. |
| | |
| What? | | The types of personal information we collect and share depend on the product or service you have with us. This information can include: • Social Security number and account balances • Account transactions and transaction history • Checking account information and wire transfer instructions When you are no longer our customer, we continue to share your information as described in this notice. |
| | |
| How? | | All financial companies need to share customers’ personal information to run their everyday business. In the section below, we list the reasons financial companies can share their customers’ personal information; the reasons MFS chooses to share; and whether you can limit this sharing. |
| | | | |
Reasons we can share your
personal information | | Does MFS
share? | | Can you limit
this sharing? |
For our everyday business purposes – such as to process your transactions, maintain your account(s), respond to court orders and legal investigations, or report to credit bureaus | | Yes | | No |
For our marketing purposes – to offer our products and services to you | | No | | We don’t share |
| For joint marketing with other financial companies | | No | | We don’t share |
For our affiliates’ everyday business purposes – information about your transactions and experiences | | No | | We don’t share |
For our affiliates’ everyday business purposes – information about your creditworthiness | | No | | We don’t share |
| For nonaffiliates to market to you | | No | | We don’t share |
| | |
| Questions? | | Call 800-225-2606 or go to mfs.com. |
52
| | |
| Who we are |
| Who is providing this notice? | | MFS Funds, MFS Investment Management, MFS Institutional Advisors, Inc., MFS Fund Distributors, Inc., MFS Heritage Trust Company, and MFS Service Center, Inc. |
| | |
| What we do |
| How does MFS protect my personal information? | | To protect your personal information from unauthorized access and use, we use security measures that comply with federal law. These measures include procedural, electronic, and physical safeguards for the protection of the personal information we collect about you. |
| How does MFS collect my personal information? | | We collect your personal information, for example, when you • open an account or provide account information • direct us to buy securities or direct us to sell your securities • make a wire transfer We also collect your personal information from others, such as credit bureaus, affiliates and other companies. |
| Why can’t I limit all sharing? | | Federal law gives you the right to limit only • sharing for affiliates’ everyday business purposes – information about your creditworthiness • affiliates from using your information to market to you • sharing for nonaffiliates to market to you State laws and individual companies may give you additional rights to limit sharing. |
| | |
| Definitions |
| Affiliates | | Companies related by common ownership or control. They can be financial and nonfinancial companies. • MFS does not share personal information with affiliates, except for everyday business purposes as described on page one of this notice. |
| Nonaffiliates | | Companies not related by common ownership or control. They can be financial and nonfinancial companies. • MFS does not share with nonaffiliates so they can market to you. |
| Joint Marketing | | A formal agreement between nonaffiliated financial companies that together market financial products or services to you. • MFS doesn’t jointly market. |
| | |
| Other important information |
| If you own an MFS product or receive an MFS service in the name of a third party such as a bank or broker-dealer, their privacy policy may apply to you instead of ours. |
53
Save paper with eDelivery.

| MFS® will send you prospectuses, |
reports, and proxies directly via e-mail so you will get information faster with less mailbox clutter.
To sign up:
1. Go to mfs.com.
2. Log in via MFS® Access.
3. Select eDelivery.
If you own your MFS fund shares through a financial institution or a retirement plan, MFS® TALK, MFS® Access, or eDelivery may not be available to you.
CONTACT
WEB SITE
mfs.com
MFS TALK
1-800-637-8255
24 hours a day
ACCOUNT SERVICE AND LITERATURE
Shareholders
1-800-225-2606
Financial advisors
1-800-343-2829
Retirement plan services
1-800-637-1255
MAILING ADDRESS
MFS Service Center, Inc.
P.O. Box 55824
Boston, MA 02205-5824
OVERNIGHT MAIL
MFS Service Center, Inc.
c/o Boston Financial Data Services
30 Dan Road
Canton, MA 02021-2809
APPENDIX A
ANNUAL REPORT
January 31, 2016
MFS® HIGH YIELD
POOLED PORTFOLIO
HYP-ANN
MFS® HIGH YIELD POOLED PORTFOLIO
CONTENTS
The report is prepared for the general information of shareholders.
It is authorized for distribution to prospective investors only when preceded or accompanied by a current prospectus.
NOT FDIC INSURED • MAY LOSE VALUE • NO BANK GUARANTEE

LETTER FROM THE CHAIRMAN
Dear Shareholders:
Market volatility remains elevated amid signs of slowing global growth and continued weakness in the price of oil and other commodities. Chinese markets remain skittish
following a series of policy missteps and currency depreciations, which have contributed to large capital outflows.
A lower-for-longer interest rate environment is likely for the foreseeable future given accommodative global central bank policies. The Bank of Japan has adopted a negative interest rate policy while the European Central Bank has signaled plans for additional monetary stimulus later this year. Meanwhile, expectations for further monetary policy tightening from the U.S. Federal Reserve have been reduced in the face of more challenging financial conditions.
The U.S. manufacturing sector is suffering the effects of a strong U.S. dollar and falling global demand. There is some reason for optimism, however, as U.S. labor markets continue to improve while auto and home sales remain upbeat.
As markets have become more focused on short-term trends in recent years, we believe it’s important for investors to lengthen their investment time horizon. At MFS®, we don’t trade on headlines or trends; we invest for the long term.
We believe that this approach, coupled with the professional guidance of a financial advisor, will help you reach your investment goals.
Respectfully,

Robert J. Manning
Chairman
MFS Investment Management
March 17, 2016
The opinions expressed in this letter are subject to change and may not be relied upon for investment advice. No forecasts can be guaranteed.
1
PORTFOLIO COMPOSITION
Portfolio structure (i)
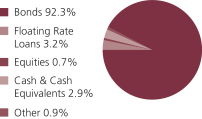
| | | | |
| Top five industries (i) | | | | |
| Cable TV | | | 6.7% | |
| Medical & Health Technology & Services | | | 6.2% | |
| Midstream | | | 5.1% | |
| Telecommunications-Wireless | | | 4.8% | |
| Containers | | | 4.4% | |
| | | | |
| Composition including fixed income credit quality (a)(i) | | | | |
| BBB | | | 2.8% | |
| BB | | | 38.2% | |
| B | | | 42.8% | |
| CCC | | | 12.5% | |
| D | | | 0.1% | |
| Not Rated | | | (0.9)% | |
| Non-Fixed Income | | | 0.7% | |
| Cash & Cash Equivalents | | | 2.9% | |
| Other | | | 0.9% | |
| |
| Portfolio facts (i) | | | | |
| Average Duration (d) | | | 4.2 | |
| Average Effective Maturity (m) | | | 5.7 yrs. | |
| (a) | For all securities other than those specifically described below, ratings are assigned to underlying securities utilizing ratings from Moody’s, Fitch, and Standard & Poor’s rating agencies and applying the following hierarchy: If all three agencies provide a rating, the middle rating (after dropping the highest and lowest ratings) is assigned; if two of the three agencies rate a security, the lower of the two is assigned. Ratings are shown in the S&P and Fitch scale (e.g., AAA). Securities rated BBB or higher are considered investment grade. All ratings are subject to change. Not Rated includes fixed income securities, including fixed income futures contracts, which have not been rated by any rating agency. Non-Fixed Income includes any equity securities (including convertible bonds and equity derivatives) and/or commodity-linked derivatives. The fund may not hold all of these instruments. The fund is not rated by these agencies. |
| (d) | Duration is a measure of how much a bond’s price is likely to fluctuate with general changes in interest rates, e.g., if rates rise 1.00%, a bond with a 5-year duration is likely to lose about 5.00% of its value due to the interest rate move. |
| (i) | For purposes of this presentation, the components include the value of securities, and reflect the impact of the equivalent exposure of derivative positions, if any. These amounts may be negative from time to time. Equivalent exposure is a calculated amount that translates the derivative position into a reasonable approximation of the amount of the underlying asset that the portfolio would have to hold at a given point in time to have the same price sensitivity that results from the portfolio’s ownership of the derivative contract. When dealing with derivatives, equivalent exposure is a more representative measure of the potential impact of a position on portfolio performance than value. The bond component will include any accrued interest amounts. |
2
Portfolio Composition – continued
| (m) | In determining an instrument’s effective maturity for purposes of calculating the fund’s dollar-weighted average effective maturity, MFS uses the instrument’s stated maturity or, if applicable, an earlier date on which MFS believes it is probable that a maturity-shortening device (such as a put, pre-refunding or prepayment) will cause the instrument to be repaid. Such an earlier date can be substantially shorter than the instrument’s stated maturity. |
Where the fund holds convertible bonds, these are treated as part of the equity portion of the portfolio.
Cash & Cash Equivalents includes any cash, investments in money market funds, short-term securities, and other assets less liabilities. Please see the Statement of Assets and Liabilities for additional information related to the fund’s cash position and other assets and liabilities.
Other includes currency derivatives and/or any offsets to derivative positions.
Percentages are based on net assets as of 1/31/16.
The portfolio is actively managed and current holdings may be different.
3
MANAGEMENT REVIEW
Summary of Results
For the twelve months ended January 31, 2016, shares of the MFS High Yield Pooled Portfolio (“fund”) provided a total return of –5.23%, at net asset value. This compares with a return of –6.58% for the fund’s benchmark, the Barclays U.S. High-Yield Corporate Bond 2% Issuer Capped Index.
Market Environment
Sluggish global growth weighed on both developed and emerging market (“EM”) economies during the reporting period. EM economies have been particularly lackluster. While the US Federal Reserve (“Fed”) began its anticipated monetary policy tightening cycle toward the end of the period, other large developed economies continued to embrace accommodative monetary policies, particularly the European Central Bank and the Bank of Japan. Focus remained on China after policy missteps by the Chinese government roiled global markets over the summer, beginning with the uncoordinated response to the stock market’s boom and bust and then the confusing decision to devalue the renminbi in August. China subsequently ramped up a wide range of monetary and fiscal measures to stimulate the economy, bolster sentiment and stabilize its currency.
During the second half of the reporting period, many US companies faced significant headwinds to earnings caused primarily by the sharp decline in the prices of oil and other commodities. Earnings contractions were concentrated primarily in the energy, materials and industrial sectors. The sharp rise in the US dollar also weighed on earnings during the period. Exports were crimped by the dollar’s strength and falling demand in emerging markets. Beyond the Fed’s interest rate hike in December, tighter financial conditions rippled through the economy. Consumer spending held up well during the second half of the period amid a modest increase in real wages and falling gasoline prices. Demand for autos reached near-record territory late in the period. In emerging markets, two key factors weighed on economies and asset prices: 1) weaker Chinese growth, which drove the decline in commodity prices and 2) prospects for higher US interest rates. Structural factors like floating exchange rates and fiscal buffers partially offset these cyclical headwinds.
Contributors to Performance
Credit quality in US Bonds, particularly in high-yield bonds (“CCC” rated (r)), was a primary contributor to performance relative to the Barclays U.S. High-Yield Corporate Bond 2% Issuer Capped Index.
Bond selection within the industrials sector also benefited relative results. In particular, the fund’s long credit position in issues from casinos owner and operator CCM Merger and pharmaceutical firm Endo Finance strengthened relative results.
Detractors from Performance
The portion of the fund’s return derived from yield, which was less than that of the Barclays U.S. High-Yield Corporate Bond 2% Issuer Capped Index, was a primary factor that detracted from relative results.
4
Management Review – continued
Credit quality in US bonds, particularly a greater exposure to “B” rated securities, was another area of relative weakness.
The fund’s greater exposure to the utility sector also held back relative performance as this market segment performed poorly over the reporting period.
Respectfully,
| | |
| William Adams | | David Cole |
| Portfolio Manager | | Portfolio Manager |
| (r) | Bonds rated “BBB”, “Baa”, or higher are considered investment grade; bonds rated “BB”, “Ba”, or below are considered non-investment grade. The source for bond quality ratings is Moody’s Investors Service, Standard & Poor’s and Fitch, Inc. and are applied using the following hierarchy: If all three agencies provide a rating, the middle rating (after dropping the highest and lowest ratings) is assigned; if two of the three agencies rate a security, the lower of the two is assigned. Ratings are shown in the S&P and Fitch scale (e.g., AAA). For securities which are not rated by any of the three agencies, the security is considered Not Rated. |
The views expressed in this report are those of the portfolio managers only through the end of the period of the report as stated on the cover and do not necessarily reflect the views of MFS or any other person in the MFS organization. These views are subject to change at any time based on market or other conditions, and MFS disclaims any responsibility to update such views. These views may not be relied upon as investment advice or an indication of trading intent on behalf of any MFS portfolio. References to specific securities are not recommendations of such securities, and may not be representative of any MFS portfolio’s current or future investments.
5
PERFORMANCE SUMMARY THROUGH 1/31/16
The following chart illustrates the fund’s historical performance in comparison to its benchmark(s). Performance results reflect the percentage change in net asset value, including reinvestment of dividends and capital gains distributions. Benchmarks are unmanaged and may not be invested in directly. Benchmark returns do not reflect sales charges, commissions or expenses. (See Notes to Performance Summary.)
Performance data shown represents past performance and is no guarantee of future results. Investment return and principal value fluctuate so your shares, when sold, may be worth more or less than the original cost; current performance may be lower or higher than quoted. The performance shown does not reflect the deduction of taxes, if any, that a shareholder would pay on fund distributions or the redemption of fund shares.
Growth of a Hypothetical $10,000 Investment (t)
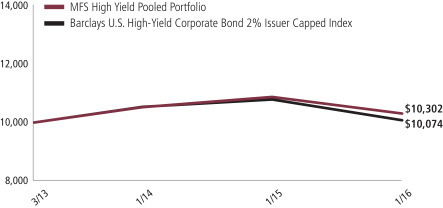
6
Performance Summary – continued
Total Returns through 1/31/16
Average annual without sales charge
| | | | | | | | | | |
| | | Fund inception date | | | | 1-yr | | Life (t) | | |
| | | 3/25/13 | | | | (5.23)% | | 1.04% | | |
| Comparative benchmark | | | | | | |
| | | Barclays U.S. High-Yield Corporate Bond 2% Issuer Capped Index (f) | | (6.58)% | | 0.26% | | |
| (f) | Source: FactSet Research Systems Inc. |
| (t) | For the period from the fund inception date through the stated period end. (See Notes to Performance Summary.) |
Benchmark Definition
Barclays U.S. High-Yield Corporate Bond 2% Issuer Capped Index – a component of the Barclays U.S. High-Yield Corporate Bond Index, which measures performance of non-investment grade, fixed rate debt. The index limits the maximum exposure to any one issuer to 2%.
It is not possible to invest directly in an index.
Notes to Performance Summary
Average annual total return represents the average annual change in value for the fund for the periods presented. Life returns are presented where the fund has less than 10 years of performance history and represent the average annual total return from the fund inception date to the stated period end date.
Performance results reflect any applicable expense subsidies and waivers in effect during the periods shown. Without such subsidies and waivers the fund’s performance results would be less favorable. Please see the prospectus and financial statements for complete details.
Performance results do not include adjustments made for financial reporting purposes in accordance with U.S. generally accepted accounting principles and may differ from amounts reported in the financial highlights.
From time to time the fund may receive proceeds from litigation settlements, without which performance would be lower.
7
EXPENSE TABLE
Fund expenses borne by the shareholders during the period, August 1, 2015 through January 31, 2016
As a shareholder of the fund, you incur ongoing costs, including fund expenses. This example is intended to help you understand your ongoing costs (in dollars) of investing in the fund and to compare these costs with the ongoing costs of investing in other mutual funds.
The example is based on an investment of $1,000 invested at the beginning of the period and held for the entire period August 1, 2015 through January 31, 2016.
Actual Expenses
The first line of the following table provides information about actual account values and actual expenses. You may use the information in this line, together with the amount you invested, to estimate the expenses that you paid over the period. Simply divide your account value by $1,000 (for example, an $8,600 account value divided by $1,000 = 8.6), then multiply the result by the number in the first line under the heading entitled “Expenses Paid During Period” to estimate the expenses you paid on your account during this period.
Hypothetical Example for Comparison Purposes
The second line of the following table provides information about hypothetical account values and hypothetical expenses based on the fund’s actual expense ratio and an assumed rate of return of 5% per year before expenses, which is not the fund’s actual return. The hypothetical account values and expenses may not be used to estimate the actual ending account balance or expenses you paid for the period. You may use this information to compare the ongoing costs of investing in the fund and other funds. To do so, compare this 5% hypothetical example with the 5% hypothetical examples that appear in the shareholder reports of the other funds.
Please note that the expenses shown in the table are meant to highlight your ongoing costs only and do not reflect any transactional costs, such as sales charges (loads). Therefore, the second line of the table is useful in comparing ongoing costs only, and will not help you determine the relative total costs of owning different funds. In addition, if these transactional costs were included, your costs would have been higher.
| | | | | | | | |
| | | Annualized
Expense
Ratio | | Beginning
Account Value
8/01/15 | | Ending
Account Value
1/31/16 | | Expenses
Paid During
Period (p)
8/01/15-1/31/16 |
| Actual | | 0.02% | | $1,000.00 | | $931.70 | | $0.10 |
| Hypothetical (h) | | 0.02% | | $1,000.00 | | $1,025.10 | | $0.10 |
| (h) | 5% fund return per year before expenses. |
| (p) | “Expenses Paid During Period” are equal to the fund’s annualized expense ratio, as shown above, multiplied by the average account value over the period, multiplied by 184/365 (to reflect the one-half year period). |
8
PORTFOLIO OF INVESTMENTS
1/31/16
The Portfolio of Investments is a complete list of all securities owned by your fund. It is categorized by broad-based asset classes.
| | | | | | | | |
| Bonds - 91.3% | | | | | | | | |
| Issuer | | Shares/Par | | | Value ($) | |
| Aerospace - 1.7% | | | | | | | | |
| Aerojet Rocketdyne Holdings, Inc., 7.125%, 3/15/21 | | $ | 7,220,000 | | | $ | 7,328,261 | |
| Bombardier, Inc., 6.125%, 1/15/23 (n) | | | 4,160,000 | | | | 2,849,600 | |
| Bombardier, Inc., 7.5%, 3/15/25 (n) | | | 2,655,000 | | | | 1,825,313 | |
| CPI International, Inc., 8.75%, 2/15/18 | | | 5,895,000 | | | | 5,747,625 | |
| TransDigm, Inc., 6%, 7/15/22 | | | 875,000 | | | | 857,500 | |
| TransDigm, Inc., 6.5%, 7/15/24 | | | 4,315,000 | | | | 4,217,913 | |
| | | | | | | | |
| | | | | | | $ | 22,826,212 | |
| Apparel Manufacturers - 0.4% | | | | | | | | |
| Hanesbrands, Inc., 6.375%, 12/15/20 | | $ | 2,250,000 | | | $ | 2,334,645 | |
| PVH Corp., 4.5%, 12/15/22 | | | 3,740,000 | | | | 3,627,800 | |
| | | | | | | | |
| | | | | | | $ | 5,962,445 | |
| Automotive - 2.5% | | | | | | | | |
| Accuride Corp., 9.5%, 8/01/18 | | $ | 6,190,000 | | | $ | 4,828,200 | |
| Goodyear Tire & Rubber Co., 6.5%, 3/01/21 | | | 6,790,000 | | | | 7,129,500 | |
| Goodyear Tire & Rubber Co., 7%, 5/15/22 | | | 1,110,000 | | | | 1,187,145 | |
| Lear Corp., 4.75%, 1/15/23 | | | 4,230,000 | | | | 4,272,300 | |
| Lear Corp., 5.25%, 1/15/25 | | | 3,145,000 | | | | 3,266,869 | |
| Schaeffler Finance B.V., 6.875%, 8/15/18 (n)(p) | | | 2,905,000 | | | | 2,984,888 | |
| Schaeffler Finance B.V., 4.75%, 5/15/21 (n) | | | 2,175,000 | | | | 2,175,000 | |
| Schaeffler Holding Finance B.V., 6.25%, 11/15/19 (n)(p) | | | 2,525,000 | | | | 2,632,313 | |
| ZF North America Capital, Inc., 4.5%, 4/29/22 (n) | | | 3,825,000 | | | | 3,686,344 | |
| ZF North America Capital, Inc., 4.75%, 4/29/25 (n) | | | 2,215,000 | | | | 2,076,563 | |
| | | | | | | | |
| | | | | | | $ | 34,239,122 | |
| Broadcasting - 2.7% | | | | | | | | |
| Activision Blizzard, Inc., 6.125%, 9/15/23 (n) | | $ | 4,465,000 | | | $ | 4,777,550 | |
| AMC Networks, Inc., 7.75%, 7/15/21 | | | 4,715,000 | | | | 4,997,900 | |
| Clear Channel Worldwide Holdings, Inc., “A”, 6.5%, 11/15/22 | | | 745,000 | | | | 663,050 | |
| Clear Channel Worldwide Holdings, Inc., “B”, 6.5%, 11/15/22 | | | 3,490,000 | | | | 3,232,613 | |
| iHeartMedia, Inc., 9%, 3/01/21 | | | 6,128,000 | | | | 3,983,200 | |
| Liberty Media Corp., 8.5%, 7/15/29 | | | 2,790,000 | | | | 2,783,025 | |
| Liberty Media Corp., 8.25%, 2/01/30 | | | 1,215,000 | | | | 1,202,850 | |
| Netflix, Inc., 5.375%, 2/01/21 | | | 3,335,000 | | | | 3,585,125 | |
| Netflix, Inc., 5.875%, 2/15/25 (n) | | | 2,335,000 | | | | 2,407,969 | |
| Nexstar Broadcasting, Inc., 6.875%, 11/15/20 | | | 5,005,000 | | | | 5,017,513 | |
| Tribune Media Co., 5.875%, 7/15/22 (n) | | | 3,355,000 | | | | 3,346,613 | |
| | | | | | | | |
| | | | | | | $ | 35,997,408 | |
9
Portfolio of Investments – continued
| | | | | | | | |
| Issuer | | Shares/Par | | | Value ($) | |
| Bonds - continued | | | | | | | | |
| Building - 3.1% | | | | | | | | |
| Allegion PLC, 5.875%, 9/15/23 | | $ | 1,145,000 | | | $ | 1,182,213 | |
| Allegion U.S. Holding Co., Inc., 5.75%, 10/01/21 | | | 7,640,000 | | | | 7,945,600 | |
| Beacon Roofing Supply, Inc., 6.375%, 10/01/23 (n) | | | 3,580,000 | | | | 3,691,875 | |
| Building Materials Corp. of America, 5.375%, 11/15/24 (n) | | | 2,895,000 | | | | 2,851,575 | |
| Building Materials Corp. of America, 6%, 10/15/25 (n) | | | 3,770,000 | | | | 3,845,400 | |
| Cimpor Financial Operations B.V., 5.75%, 7/17/24 | | | 1,071,000 | | | | 658,665 | |
| Gibraltar Industries, Inc., 6.25%, 2/01/21 | | | 4,675,000 | | | | 4,686,688 | |
| HD Supply, Inc., 7.5%, 7/15/20 | | | 5,785,000 | | | | 6,016,400 | |
| Headwaters, Inc., 7.25%, 1/15/19 | | | 3,040,000 | | | | 3,100,800 | |
| PriSo Acquisition Corp., 9%, 5/15/23 (n) | | | 3,455,000 | | | | 3,213,150 | |
| Summit Materials LLC/Summit Materials Finance Co., 6.125%, 7/15/23 | | | 4,275,000 | | | | 4,125,375 | |
| | | | | | | | |
| | | | | | | $ | 41,317,741 | |
| Business Services - 1.5% | | | | | | | | |
| Equinix, Inc., 4.875%, 4/01/20 | | $ | 3,450,000 | | | $ | 3,579,375 | |
| Equinix, Inc., 5.375%, 1/01/22 | | | 2,265,000 | | | | 2,355,600 | |
| Equinix, Inc., 5.375%, 4/01/23 | | | 2,605,000 | | | | 2,696,175 | |
| Iron Mountain, Inc., REIT, 6%, 10/01/20 (n) | | | 2,080,000 | | | | 2,215,200 | |
| Iron Mountain, Inc., REIT, 6%, 8/15/23 | | | 5,400,000 | | | | 5,616,000 | |
| NeuStar, Inc., 4.5%, 1/15/23 | | | 5,390,000 | | | | 4,419,800 | |
| | | | | | | | |
| | | | | | | $ | 20,882,150 | |
| Cable TV - 6.4% | | | | | | | | |
| Altice Financing S.A., 6.625%, 2/15/23 (n) | | $ | 6,955,000 | | | $ | 6,833,288 | |
| CCO Holdings LLC/CCO Holdings Capital Corp., 7.375%, 6/01/20 | | | 705,000 | | | | 733,200 | |
| CCO Holdings LLC/CCO Holdings Capital Corp., 6.5%, 4/30/21 | | | 7,010,000 | | | | 7,312,271 | |
| CCO Holdings LLC/CCO Holdings Capital Corp., 5.125%, 5/01/23 (n) | | | 4,385,000 | | | | 4,385,000 | |
| CCO Holdings LLC/CCO Holdings Capital Corp., 5.75%, 1/15/24 | | | 5,925,000 | | | | 6,095,344 | |
| CCO Holdings LLC/CCO Holdings Capital Corp., 5.375%, 5/01/25 (n) | | | 1,325,000 | | | | 1,311,750 | |
| Cequel Communications Holdings, 6.375%, 9/15/20 (n) | | | 5,575,000 | | | | 5,386,844 | |
| DISH DBS Corp., 6.75%, 6/01/21 | | | 3,960,000 | | | | 4,039,200 | |
| DISH DBS Corp., 5%, 3/15/23 | | | 2,750,000 | | | | 2,392,500 | |
| DISH DBS Corp., 5.875%, 11/15/24 | | | 1,190,000 | | | | 1,060,588 | |
| Intelsat Jackson Holdings S.A., 7.25%, 4/01/19 | | | 2,850,000 | | | | 2,586,375 | |
| Intelsat Jackson Holdings S.A., 6.625%, 12/15/22 | | | 5,565,000 | | | | 3,603,338 | |
| Intelsat Jackson Holdings S.A., 5.5%, 8/01/23 | | | 5,045,000 | | | | 4,023,388 | |
| Intelsat Luxembourg S.A., 8.125%, 6/01/23 | | | 5,835,000 | | | | 2,406,938 | |
| LGE Holdco VI B.V., 7.125%, 5/15/24 (n) | | | 1,895,000 | | | | 2,207,023 | |
| Lynx I Corp., 5.375%, 4/15/21 (n) | | | 1,251,000 | | | | 1,279,148 | |
| Lynx II Corp., 6.375%, 4/15/23 (n) | | | 2,530,000 | | | | 2,593,250 | |
| Neptune Finco Corp., 10.875%, 10/15/25 (n) | | | 3,165,000 | | | | 3,346,988 | |
10
Portfolio of Investments – continued
| | | | | | | | |
| Issuer | | Shares/Par | | | Value ($) | |
| Bonds - continued | | | | | | | | |
| Cable TV - continued | | | | | | | | |
| SIRIUS XM Radio, Inc., 4.25%, 5/15/20 (n) | | $ | 860,000 | | | $ | 872,900 | |
| SIRIUS XM Radio, Inc., 5.875%, 10/01/20 (n) | | | 395,000 | | | | 411,788 | |
| SIRIUS XM Radio, Inc., 4.625%, 5/15/23 (n) | | | 2,495,000 | | | | 2,445,100 | |
| SIRIUS XM Radio, Inc., 6%, 7/15/24 (n) | | | 2,740,000 | | | | 2,870,150 | |
| SIRIUS XM Radio, Inc., 5.375%, 4/15/25 (n) | | | 2,570,000 | | | | 2,582,850 | |
| Unitymedia Hessen, 5.5%, 1/15/23 (n) | | | 4,480,000 | | | | 4,684,198 | |
| Unitymedia KabelBW GmbH, 6.125%, 1/15/25 (n) | | | 2,960,000 | | | | 3,004,992 | |
| Virgin Media Finance PLC, 5.75%, 1/15/25 (n) | | | 1,230,000 | | | | 1,217,700 | |
| Virgin Media Secured Finance PLC, 5.25%, 1/15/26 (n) | | | 3,860,000 | | | | 3,821,400 | |
| Ziggo Bond Finance B.V., 5.875%, 1/15/25 (n) | | | 2,750,000 | | | | 2,523,125 | |
| | | | | | | | |
| | | | | | | $ | 86,030,636 | |
| Chemicals - 2.2% | | | | | | | | |
| Flash Dutch 2 B.V./U.S. Coatings Acquisition, 7.375%, 5/01/21 (n) | | $ | 4,210,000 | | | $ | 4,417,848 | |
| GCP Applied Technologies Co., 9.5%, 2/01/23 (n) | | | 2,195,000 | | | | 2,321,213 | |
| Hexion U.S. Finance Corp., 6.625%, 4/15/20 | | | 2,280,000 | | | | 1,767,000 | |
| Hexion U.S. Finance Corp./Hexion Nova Scotia Finance, 8.875%, 2/01/18 | | | 2,915,000 | | | | 1,982,200 | |
| INEOS Group Holdings S.A., 6.125%, 8/15/18 (n) | | | 3,590,000 | | | | 3,585,513 | |
| Momentive Performance Materials, Inc., 3.88%, 10/24/21 | | | 2,220,000 | | | | 1,492,950 | |
| The Chemours Co., 6.625%, 5/15/23 (n) | | | 3,790,000 | | | | 2,321,375 | |
| Tronox Finance LLC, 6.375%, 8/15/20 | | | 6,240,000 | | | | 3,853,200 | |
| Tronox Finance LLC, 7.5%, 3/15/22 (n) | | | 5,010,000 | | | | 3,018,525 | |
| W.R. Grace & Co., 5.125%, 10/01/21 (n) | | | 5,590,000 | | | | 5,617,950 | |
| | | | | | | | |
| | | | | | | $ | 30,377,774 | |
| Computer Software - 0.4% | | | | | | | | |
| Syniverse Holdings, Inc., 9.125%, 1/15/19 | | $ | 1,150,000 | | | $ | 437,000 | |
| VeriSign, Inc., 4.625%, 5/01/23 | | | 5,340,000 | | | | 5,233,200 | |
| | | | | | | | |
| | | | | | | $ | 5,670,200 | |
| Computer Software - Systems - 0.8% | | | | | | | | |
| CDW LLC/CDW Finance Corp., 6%, 8/15/22 | | $ | 1,710,000 | | | $ | 1,797,638 | |
| CDW LLC/CDW Finance Corp., 5.5%, 12/01/24 | | | 2,640,000 | | | | 2,747,237 | |
| Sabre GLBL, Inc., 5.375%, 4/15/23 (n) | | | 6,230,000 | | | | 6,261,150 | |
| | | | | | | | |
| | | | | | | $ | 10,806,025 | |
| Conglomerates - 2.6% | | | | | | | | |
| Accudyne Industries Borrower S.C.A., 7.75%, 12/15/20 (n) | | $ | 2,995,000 | | | $ | 2,051,575 | |
| Amsted Industries Co., 5%, 3/15/22 (n) | | | 6,730,000 | | | | 6,662,700 | |
| BC Mountain LLC, 7%, 2/01/21 (n) | | | 6,390,000 | | | | 4,632,750 | |
| EnerSys, 5%, 4/30/23 (n) | | | 7,470,000 | | | | 7,357,950 | |
| Enpro Industries, Inc., 5.875%, 9/15/22 | | | 5,560,000 | | | | 5,407,100 | |
| Entegris, Inc., 6%, 4/01/22 (n) | | | 4,685,000 | | | | 4,755,275 | |
11
Portfolio of Investments – continued
| | | | | | | | |
| Issuer | | Shares/Par | | | Value ($) | |
| Bonds - continued | | | | | | | | |
| Conglomerates - continued | | | | | | | | |
| Renaissance Acquisition, 6.875%, 8/15/21 (n) | | $ | 5,775,000 | | | $ | 4,244,625 | |
| | | | | | | | |
| | | | | | | $ | 35,111,975 | |
| Construction - 0.1% | | | | | | | | |
| Empresas ICA S.A.B. de C.V., 8.9%, 2/04/21 | | $ | 2,120,000 | | | $ | 392,200 | |
| Empresas ICA S.A.B. de C.V., 8.875%, 5/29/24 (a)(d)(n) | | | 1,723,000 | | | | 318,755 | |
| | | | | | | | |
| | | | | | | $ | 710,955 | |
| Consumer Products - 1.1% | | | | | | | | |
| Alphabet Holding Co., Inc., 7.75%, 11/01/17 | | $ | 655,000 | | | $ | 640,263 | |
| Elizabeth Arden, Inc., 7.375%, 3/15/21 | | | 2,245,000 | | | | 1,492,925 | |
| Prestige Brands, Inc., 8.125%, 2/01/20 | | | 2,165,000 | | | | 2,246,188 | |
| Prestige Brands, Inc., 5.375%, 12/15/21 (n) | | | 3,800,000 | | | | 3,705,000 | |
| Spectrum Brands, Inc., 6.375%, 11/15/20 | | | 3,940,000 | | | | 4,156,700 | |
| Spectrum Brands, Inc., 6.125%, 12/15/24 (n) | | | 1,065,000 | | | | 1,107,600 | |
| Spectrum Brands, Inc., 5.75%, 7/15/25 (n) | | | 2,185,000 | | | | 2,239,625 | |
| | | | | | | | |
| | | | | | | $ | 15,588,301 | |
| Consumer Services - 2.5% | | | | | | | | |
| ADT Corp., 6.25%, 10/15/21 | | $ | 8,050,000 | | | $ | 8,351,875 | |
| ADT Corp., 4.125%, 6/15/23 | | | 1,360,000 | | | | 1,251,200 | |
| CEB, Inc., 5.625%, 6/15/23 (n) | | | 4,055,000 | | | | 4,055,000 | |
| Garda World Security Corp., 7.25%, 11/15/21 (n) | | | 3,660,000 | | | | 2,854,800 | |
| Garda World Security Corp., 7.25%, 11/15/21 (n) | | | 2,330,000 | | | | 1,817,400 | |
| Interval Acquisition Corp., 5.625%, 4/15/23 (n) | | | 8,300,000 | | | | 8,258,500 | |
| Monitronics International, Inc., 9.125%, 4/01/20 | | | 4,800,000 | | | | 3,852,000 | |
| Service Corp. International, 5.375%, 5/15/24 | | | 3,235,000 | | | | 3,421,013 | |
| | | | | | | | |
| | | | | | | $ | 33,861,788 | |
| Containers - 4.1% | | | | | | | | |
| Ardagh Packaging Finance PLC, 7%, 11/15/20 (n) | | $ | 317,647 | | | $ | 300,971 | |
| Ardagh Packaging Finance PLC, 9.125%, 10/15/20 (n) | | | 5,380,000 | | | | 5,413,625 | |
| Ball Corp., 5%, 3/15/22 | | | 3,365,000 | | | | 3,482,775 | |
| Berry Plastics Group, Inc., 5.5%, 5/15/22 | | | 6,035,000 | | | | 6,019,913 | |
| Berry Plastics Group, Inc., 6%, 10/15/22 (n) | | | 1,545,000 | | | | 1,575,900 | |
| Crown American LLC, 4.5%, 1/15/23 | | | 6,918,000 | | | | 6,848,820 | |
| Multi-Color Corp., 6.125%, 12/01/22 (n) | | | 4,950,000 | | | | 4,912,875 | |
| Plastipak Holdings, Inc., 6.5%, 10/01/21 (n) | | | 4,302,000 | | | | 4,119,165 | |
| Reynolds Group, 9.875%, 8/15/19 | | | 598,000 | | | | 584,545 | |
| Reynolds Group, 5.75%, 10/15/20 | | | 2,550,000 | | | | 2,553,188 | |
| Reynolds Group, 8.25%, 2/15/21 | | | 7,985,000 | | | | 7,446,013 | |
| Sealed Air Corp., 4.875%, 12/01/22 (n) | | | 4,940,000 | | | | 4,973,938 | |
| Sealed Air Corp., 5.125%, 12/01/24 (n) | | | 2,215,000 | | | | 2,215,000 | |
| Signode Industrial Group, 6.375%, 5/01/22 (n) | | | 6,615,000 | | | | 5,490,450 | |
| | | | | | | | |
| | | | | | | $ | 55,937,178 | |
12
Portfolio of Investments – continued
| | | | | | | | |
| Issuer | | Shares/Par | | | Value ($) | |
| Bonds - continued | | | | | | | | |
| Electrical Equipment - 0.0% | | | | | | | | |
| Avaya, Inc., 10.5%, 3/01/21 (n) | | $ | 2,350,000 | | | $ | 587,500 | |
| | |
| Electronics - 1.7% | | | | | | | | |
| Advanced Micro Devices, Inc., 6.75%, 3/01/19 | | $ | 3,655,000 | | | $ | 2,494,538 | |
| Advanced Micro Devices, Inc., 7%, 7/01/24 | | | 2,250,000 | | | | 1,395,000 | |
| Micron Technology, Inc., 5.875%, 2/15/22 | | | 3,730,000 | | | | 3,319,700 | |
| Micron Technology, Inc., 5.5%, 2/01/25 | | | 3,515,000 | | | | 2,776,850 | |
| NXP B.V., 5.75%, 2/15/21 (n) | | | 1,645,000 | | | | 1,702,575 | |
| NXP B.V., 5.75%, 3/15/23 (n) | | | 5,390,000 | | | | 5,501,142 | |
| Sensata Technologies B.V., 5.625%, 11/01/24 (n) | | | 3,185,000 | | | | 3,248,700 | |
| Sensata Technologies B.V., 5%, 10/01/25 (n) | | | 2,270,000 | | | | 2,184,875 | |
| | | | | | | | |
| | | | | | | $ | 22,623,380 | |
| Energy - Independent - 3.4% | | | | | | | | |
| Baytex Energy Corp., 5.625%, 6/01/24 (n) | | $ | 2,275,000 | | | $ | 1,319,500 | |
| Bonanza Creek Energy, Inc., 6.75%, 4/15/21 | | | 4,265,000 | | | | 1,674,013 | |
| Bonanza Creek Energy, Inc., 5.75%, 2/01/23 | | | 1,305,000 | | | | 469,800 | |
| Chaparral Energy, Inc., 7.625%, 11/15/22 | | | 6,970,000 | | | | 1,324,300 | |
| Chesapeake Energy Corp., 5.75%, 3/15/23 | | | 6,545,000 | | | | 1,799,875 | |
| Concho Resources, Inc., 6.5%, 1/15/22 | | | 3,440,000 | | | | 3,216,400 | |
| Concho Resources, Inc., 5.5%, 4/01/23 | | | 6,430,000 | | | | 5,831,946 | |
| EP Energy LLC, 9.375%, 5/01/20 | | | 5,725,000 | | | | 2,433,125 | |
| EP Energy LLC, 7.75%, 9/01/22 | | | 5,050,000 | | | | 1,767,500 | |
| Halcon Resources Corp., 8.875%, 5/15/21 | | | 5,475,000 | | | | 793,875 | |
| Linn Energy LLC/Linn Energy Finance Corp., 8.625%, 4/15/20 | | | 2,670,000 | | | | 400,500 | |
| Linn Energy LLC/Linn Energy Finance Corp., 7.75%, 2/01/21 | | | 5,394,000 | | | | 647,280 | |
| Linn Energy LLC/Linn Energy Finance Corp., 6.5%, 9/15/21 | | | 2,320,000 | | | | 261,046 | |
| Northern Blizzard Resources, Inc., 7.25%, 2/01/22 (n) | | | 3,857,000 | | | | 2,757,755 | |
| Oasis Petroleum, Inc., 6.875%, 3/15/22 | | | 5,005,000 | | | | 2,902,900 | |
| QEP Resources, Inc., 5.25%, 5/01/23 | | | 8,165,000 | | | | 5,552,200 | |
| RSP Permian, Inc., 6.625%, 10/01/22 | | | 4,410,000 | | | | 3,924,900 | |
| Sanchez Energy Corp., 6.125%, 1/15/23 | | | 7,155,000 | | | | 2,862,000 | |
| SM Energy Co., 6.5%, 11/15/21 | | | 4,550,000 | | | | 2,649,010 | |
| SM Energy Co., 6.125%, 11/15/22 | | | 3,620,000 | | | | 2,081,500 | |
| WPX Energy, Inc., 6%, 1/15/22 | | | 2,925,000 | | | | 1,696,500 | |
| | | | | | | | |
| | | | | | | $ | 46,365,925 | |
| Entertainment - 1.8% | | | | | | | | |
| Carmike Cinemas, Inc., 6%, 6/15/23 (n) | | $ | 2,180,000 | | | $ | 2,259,025 | |
| Cedar Fair LP, 5.25%, 3/15/21 | | | 5,965,000 | | | | 6,114,125 | |
| Cedar Fair LP, 5.375%, 6/01/24 | | | 1,420,000 | | | | 1,427,100 | |
| Cinemark USA, Inc., 5.125%, 12/15/22 | | | 2,445,000 | | | | 2,457,225 | |
| Cinemark USA, Inc., 4.875%, 6/01/23 | | | 3,010,000 | | | | 2,957,325 | |
| NCL Corp. Ltd., 5.25%, 11/15/19 (n) | | | 4,105,000 | | | | 4,125,525 | |
13
Portfolio of Investments – continued
| | | | | | | | |
| Issuer | | Shares/Par | | | Value ($) | |
| Bonds - continued | | | | | | | | |
| Entertainment - continued | | | | | | | | |
| Six Flags Entertainment Corp., 5.25%, 1/15/21 (n) | | $ | 4,915,000 | | | $ | 5,004,945 | |
| | | | | | | | |
| | | | | | | $ | 24,345,270 | |
| Financial Institutions - 5.1% | | | | | | | | |
| Aircastle Ltd., 4.625%, 12/15/18 | | $ | 3,340,000 | | | $ | 3,369,225 | |
| Aircastle Ltd., 5.125%, 3/15/21 | | | 2,295,000 | | | | 2,266,313 | |
| Aircastle Ltd., 5.5%, 2/15/22 | | | 2,620,000 | | | | 2,606,900 | |
| CIT Group, Inc., 5.25%, 3/15/18 | | | 5,335,000 | | | | 5,511,695 | |
| CIT Group, Inc., 6.625%, 4/01/18 (n) | | | 4,776,000 | | | | 5,048,232 | |
| CIT Group, Inc., 5.5%, 2/15/19 (n) | | | 5,607,000 | | | | 5,789,228 | |
| CIT Group, Inc., 5%, 8/15/22 | | | 1,885,000 | | | | 1,906,253 | |
| Credit Acceptance Co., 7.375%, 3/15/23 (n) | | | 2,930,000 | | | | 2,834,775 | |
| Icahn Enterprises LP, 6%, 8/01/20 | | | 3,910,000 | | | | 3,670,122 | |
| Icahn Enterprises LP, 5.875%, 2/01/22 | | | 6,850,000 | | | | 6,122,188 | |
| Nationstar Mortgage LLC/Capital Corp., 6.5%, 8/01/18 | | | 4,045,000 | | | | 3,903,425 | |
| Nationstar Mortgage LLC/Capital Corp., 7.875%, 10/01/20 | | | 7,005,000 | | | | 6,672,263 | |
| Navient Corp., 8%, 3/25/20 | | | 7,300,000 | | | | 7,190,500 | |
| Navient Corp., 5.875%, 3/25/21 | | | 1,975,000 | | | | 1,708,375 | |
| Navient Corp., 7.25%, 1/25/22 | | | 5,685,000 | | | | 5,059,650 | |
| Navient Corp., 6.125%, 3/25/24 | | | 2,795,000 | | | | 2,295,394 | |
| PHH Corp., 6.375%, 8/15/21 | | | 3,470,000 | | | | 3,010,225 | |
| | | | | | | | |
| | | | | | | $ | 68,964,763 | |
| Food & Beverages - 0.9% | | | | | | | | |
| Darling Ingredients, Inc., 5.375%, 1/15/22 | | $ | 4,230,000 | | | $ | 4,145,400 | |
| Pinnacle Foods Finance LLC/Pinnacle Foods Finance Corp., 5.875%, 1/15/24 (n) | | | 1,240,000 | | | | 1,283,400 | |
| Sun Merger Sub, Inc., 5.875%, 8/01/21 (n) | | | 6,335,000 | | | | 6,430,025 | |
| | | | | | | | |
| | | | | | | $ | 11,858,825 | |
| Forest & Paper Products - 0.2% | | | | | | | | |
| Appvion, Inc., 9%, 6/01/20 (n) | | $ | 4,245,000 | | | $ | 1,379,625 | |
| Tembec Industries, Inc., 9%, 12/15/19 (n) | | | 2,760,000 | | | | 1,745,700 | |
| | | | | | | | |
| | | | | | | $ | 3,125,325 | |
| Gaming & Lodging - 3.5% | | | | | | | | |
| CCM Merger, Inc., 9.125%, 5/01/19 (n) | | $ | 4,878,000 | | | $ | 5,024,340 | |
| Eldorado Resorts, Inc., 7%, 8/01/23 (n) | | | 1,515,000 | | | | 1,492,275 | |
| GLP Capital LP/GLP Financing II, Inc., 5.375%, 11/01/23 | | | 4,770,000 | | | | 4,567,275 | |
| Greektown Holdings LLC, 8.875%, 3/15/19 (n) | | | 5,100,000 | | | | 5,023,500 | |
| Hilton Worldwide Finance LLC/Hilton Worldwide Finance Corp., 5.625%, 10/15/21 | | | 6,575,000 | | | | 6,772,250 | |
| Isle of Capri Casinos, Inc., 8.875%, 6/15/20 | | | 1,110,000 | | | | 1,171,050 | |
| Isle of Capri Casinos, Inc., 5.875%, 3/15/21 | | | 5,520,000 | | | | 5,644,200 | |
14
Portfolio of Investments – continued
| | | | | | | | |
| Issuer | | Shares/Par | | | Value ($) | |
| Bonds - continued | | | | | | | | |
| Gaming & Lodging - continued | | | | | | | | |
| MGM Resorts International, 6.625%, 12/15/21 | | $ | 4,865,000 | | | $ | 4,998,788 | |
| MGM Resorts International, 6%, 3/15/23 | | | 5,340,000 | | | | 5,323,313 | |
| Ryman Hospitality Properties, Inc., REIT, 5%, 4/15/21 | | | 6,105,000 | | | | 6,181,313 | |
| Ryman Hospitality Properties, Inc., REIT, 5%, 4/15/23 | | | 1,395,000 | | | | 1,389,769 | |
| | | | | | | | |
| | | | | | | $ | 47,588,073 | |
| Industrial - 1.3% | | | | | | | | |
| Anixter, Inc., 5.125%, 10/01/21 | | $ | 3,975,000 | | | $ | 3,875,625 | |
| Dematic S.A., 7.75%, 12/15/20 (n) | | | 7,305,000 | | | | 7,213,688 | |
| Howard Hughes Corp., 6.875%, 10/01/21 (n) | | | 5,885,000 | | | | 5,885,000 | |
| | | | | | | | |
| | | | | | | $ | 16,974,313 | |
| Insurance - Health - 0.3% | | | | | | | | |
| Centene Escrow Corp., 5.625%, 2/15/21 (n) | | $ | 2,105,000 | | | $ | 2,141,838 | |
| Centene Escrow Corp., 6.125%, 2/15/24 (n) | | | 2,105,000 | | | | 2,162,888 | |
| | | | | | | | |
| | | | | | | $ | 4,304,726 | |
| Machinery & Tools - 1.5% | | | | | | | | |
| Ashtead Capital, Inc., 5.625%, 10/01/24 (n) | | $ | 4,700,000 | | | $ | 4,523,750 | |
| CNH Industrial Capital LLC, 4.375%, 11/06/20 | | | 5,390,000 | | | | 5,120,500 | |
| H&E Equipment Services Co., 7%, 9/01/22 | | | 5,800,000 | | | | 5,307,000 | |
| Jurassic Holdings III, Inc., 6.875%, 2/15/21 (n) | | | 5,015,000 | | | | 3,009,000 | |
| Light Tower Rentals, Inc., 8.125%, 8/01/19 (n) | | | 3,930,000 | | | | 1,739,025 | |
| | | | | | | | |
| | | | | | | $ | 19,699,275 | |
| Major Banks - 2.0% | | | | | | | | |
| Bank of America Corp., FRN, 6.1%, 12/31/49 | | $ | 13,320,000 | | | $ | 13,542,444 | |
| JPMorgan Chase & Co., 6% to 8/01/23, FRN to 12/31/49 | | | 7,240,000 | | | | 7,226,425 | |
| Royal Bank of Scotland Group PLC, 7.5% to 8/10/20, FRN to 12/31/49 | | | 6,020,000 | | | | 6,125,350 | |
| | | | | | | | |
| | | | | | | $ | 26,894,219 | |
| Medical & Health Technology & Services - 5.9% | | | | | | | | |
| CHS/Community Health Systems, Inc., 6.875%, 2/01/22 | | $ | 9,445,000 | | | $ | 8,547,725 | |
| Davita Healthcare Partners, Inc., 5%, 5/01/25 | | | 5,210,000 | | | | 5,125,338 | |
| Davita, Inc., 5.125%, 7/15/24 | | | 3,100,000 | | | | 3,117,438 | |
| HCA, Inc., 4.25%, 10/15/19 | | | 5,320,000 | | | | 5,453,000 | |
| HCA, Inc., 7.5%, 2/15/22 | | | 7,040,000 | | | | 7,814,400 | |
| HCA, Inc., 5.875%, 3/15/22 | | | 5,160,000 | | | | 5,534,100 | |
| HCA, Inc., 5%, 3/15/24 | | | 2,340,000 | | | | 2,369,250 | |
| HCA, Inc., 5.375%, 2/01/25 | | | 3,500,000 | | | | 3,539,375 | |
| HCA, Inc., 5.875%, 2/15/26 | | | 3,270,000 | | | | 3,335,400 | |
| HealthSouth Corp., 5.125%, 3/15/23 | | | 5,730,000 | | | | 5,558,100 | |
| HealthSouth Corp., 5.75%, 11/01/24 (n) | | | 3,470,000 | | | | 3,425,202 | |
15
Portfolio of Investments – continued
| | | | | | | | |
| Issuer | | Shares/Par | | | Value ($) | |
| Bonds - continued | | | | | | | | |
| Medical & Health Technology & Services - continued | | | | | | | | |
| LifePoint Hospitals, Inc., 5.5%, 12/01/21 | | $ | 2,850,000 | | | $ | 2,892,750 | |
| TeamHealth, Inc., 7.25%, 12/15/23 (n) | | | 895,000 | | | | 935,275 | |
| Tenet Healthcare Corp., 8%, 8/01/20 | | | 9,080,000 | | | | 9,102,700 | |
| Tenet Healthcare Corp., 4.5%, 4/01/21 | | | 2,610,000 | | | | 2,557,800 | |
| Tenet Healthcare Corp., 8.125%, 4/01/22 | | | 3,015,000 | | | | 3,022,538 | |
| Tenet Healthcare Corp., 6.75%, 6/15/23 | | | 3,275,000 | | | | 3,029,375 | |
| Universal Health Services, Inc., 7.625%, 8/15/20 | | | 4,290,000 | | | | 3,775,200 | |
| | | | | | | | |
| | | | | | | $ | 79,134,966 | |
| Medical Equipment - 1.3% | | | | | | | | |
| Alere, Inc., 6.375%, 7/01/23 (n) | | $ | 4,410,000 | | | $ | 4,167,450 | |
| DJO Finco, Inc., 8.125%, 6/15/21 (n) | | | 4,115,000 | | | | 3,456,600 | |
| Hologic, Inc., 5.25%, 7/15/22 (n) | | | 5,190,000 | | | | 5,371,650 | |
| Teleflex, Inc., 5.25%, 6/15/24 | | | 4,750,000 | | | | 4,750,000 | |
| | | | | | | | |
| | | | | | | $ | 17,745,700 | |
| Metals & Mining - 2.7% | | | | | | | | |
| Century Aluminum Co., 7.5%, 6/01/21 (n) | | $ | 4,715,000 | | | $ | 3,076,538 | |
| Commercial Metals Co., 4.875%, 5/15/23 | | | 4,263,000 | | | | 3,543,619 | |
| Consol Energy, Inc., 5.875%, 4/15/22 | | | 4,225,000 | | | | 2,730,406 | |
| Consol Energy, Inc., 8%, 4/01/23 | | | 4,265,000 | | | | 2,857,550 | |
| First Quantum Minerals Ltd., 7.25%, 10/15/19 (n) | | | 6,352,000 | | | | 2,953,680 | |
| First Quantum Minerals Ltd., 7.25%, 5/15/22 (n) | | | 2,005,000 | | | | 902,250 | |
| GrafTech International Co., 6.375%, 11/15/20 | | | 5,185,000 | | | | 2,955,450 | |
| Hudbay Minerals, Inc., 9.5%, 10/01/20 | | | 5,195,000 | | | | 3,194,925 | |
| Lundin Mining Corp., 7.5%, 11/01/20 (n) | | | 2,750,000 | | | | 2,337,500 | |
| Lundin Mining Corp., 7.875%, 11/01/22 (n) | | | 1,735,000 | | | | 1,401,013 | |
| Steel Dynamics, Inc., 5.125%, 10/01/21 | | | 1,725,000 | | | | 1,608,563 | |
| Steel Dynamics, Inc., 5.25%, 4/15/23 | | | 970,000 | | | | 880,275 | |
| Steel Dynamics, Inc., 5.5%, 10/01/24 | | | 2,725,000 | | | | 2,459,313 | |
| Suncoke Energy Partners LP/Suncoke Energy Partners Finance Corp., 7.375%, 2/01/20 (n) | | | 3,605,000 | | | | 2,045,838 | |
| Suncoke Energy Partners LP/Suncoke Energy Partners Finance Corp., 7.375%, 2/01/20 (n) | | | 1,650,000 | | | | 936,375 | |
| Suncoke Energy, Inc., 7.625%, 8/01/19 | | | 472,000 | | | | 449,580 | |
| TMS International Corp., 7.625%, 10/15/21 (n) | | | 3,595,000 | | | | 2,777,138 | |
| | | | | | | | |
| | | | | | | $ | 37,110,013 | |
| Midstream - 5.1% | | | | | | | | |
| AmeriGas Finance LLC, 6.75%, 5/20/20 | | $ | 7,080,000 | | | $ | 7,009,200 | |
| Blue Racer Midstream LLC/Blue Racer Finance Corp., 6.125%, 11/15/22 (n) | | | 3,845,000 | | | | 2,874,138 | |
| Crestwood Midstream Partners LP, 6%, 12/15/20 | | | 2,690,000 | | | | 1,704,788 | |
| Crestwood Midstream Partners LP, 6.125%, 3/01/22 | | | 2,930,000 | | | | 1,765,325 | |
16
Portfolio of Investments – continued
| | | | | | | | |
| Issuer | | Shares/Par | | | Value ($) | |
| Bonds - continued | | | | | | | | |
| Midstream - continued | | | | | | | | |
| Energy Transfer Equity LP, 7.5%, 10/15/20 | | $ | 8,350,000 | | | $ | 7,348,000 | |
| Ferrellgas LP/Ferrellgas Finance Corp., 6.5%, 5/01/21 | | | 2,080,000 | | | | 1,640,600 | |
| Ferrellgas LP/Ferrellgas Finance Corp., 6.75%, 1/15/22 | | | 6,820,000 | | | | 5,370,750 | |
| Kinder Morgan (Delaware), Inc., 7.75%, 1/15/32 | | | 10,697,000 | | | | 10,042,857 | |
| MPLX LP, 5.5%, 2/15/23 (n) | | | 3,370,000 | | | | 2,800,537 | |
| MPLX LP, 4.5%, 7/15/23 (n) | | | 4,924,000 | | | | 3,855,837 | |
| Sabine Pass Liquefaction LLC, 5.625%, 2/01/21 | | | 5,880,000 | | | | 5,380,200 | |
| Sabine Pass Liquefaction LLC, 5.625%, 4/15/23 | | | 7,800,000 | | | | 6,844,500 | |
| Sabine Pass Liquefaction LLC, 5.75%, 5/15/24 | | | 1,705,000 | | | | 1,496,138 | |
| Sabine Pass Liquefaction LLC, 5.625%, 3/01/25 | | | 3,104,000 | | | | 2,669,440 | |
| Summit Midstream Holdings LLC/Summit Midstream Finance Corp., 7.5%, 7/01/21 | | | 2,135,000 | | | | 1,558,550 | |
| Summit Midstream Holdings LLC/Summit Midstream Finance Corp., 5.5%, 8/15/22 | | | 2,140,000 | | | | 1,348,200 | |
| Targa Resources Partners LP/Targa Resources Finance Corp., 5%, 1/15/18 | | | 1,680,000 | | | | 1,568,700 | |
| Targa Resources Partners LP/Targa Resources Finance Corp., 4.125%, 11/15/19 | | | 2,555,000 | | | | 2,146,200 | |
| Targa Resources Partners LP/Targa Resources Finance Corp., 5.25%, 5/01/23 | | | 1,305,000 | | | | 1,011,375 | |
| | | | | | | | |
| | | | | | | $ | 68,435,335 | |
| Network & Telecom - 1.7% | | | | | | | | |
| Centurylink, Inc., 6.45%, 6/15/21 | | $ | 4,305,000 | | | $ | 4,194,706 | |
| Centurylink, Inc., 7.65%, 3/15/42 | | | 4,835,000 | | | | 3,626,250 | |
| Frontier Communications Corp., 8.125%, 10/01/18 | | | 1,270,000 | | | | 1,296,988 | |
| Frontier Communications Corp., 6.25%, 9/15/21 | | | 1,590,000 | | | | 1,339,575 | |
| Frontier Communications Corp., 7.125%, 1/15/23 | | | 2,740,000 | | | | 2,281,050 | |
| Frontier Communications Corp., 11%, 9/15/25 (n) | | | 2,105,000 | | | | 2,028,694 | |
| Frontier Communications Corp., 9%, 8/15/31 | | | 2,815,000 | | | | 2,237,925 | |
| Telecom Italia Capital, 6%, 9/30/34 | | | 2,180,000 | | | | 1,951,100 | |
| Telecom Italia S.p.A., 5.303%, 5/30/24 (n) | | | 3,865,000 | | | | 3,768,375 | |
| | | | | | | | |
| | | | | | | $ | 22,724,663 | |
| Oil Services - 0.5% | | | | | | | | |
| Bristow Group, Inc., 6.25%, 10/15/22 | | $ | 5,768,000 | | | $ | 3,965,500 | |
| Pacific Drilling S.A., 5.375%, 6/01/20 (n) | | | 4,250,000 | | | | 1,020,000 | |
| Shale-Inland Holdings LLC/Finance Co., 8.75%, 11/15/19 (n) | | | 2,425,000 | | | | 1,515,625 | |
| | | | | | | | |
| | | | | | | $ | 6,501,125 | |
| Oils - 0.6% | | | | | | | | |
| CITGO Holding, Inc., 10.75%, 2/15/20 (n) | | $ | 2,615,000 | | | $ | 2,484,250 | |
| CITGO Petroleum Corp., 6.25%, 8/15/22 (n) | | | 5,445,000 | | | | 5,213,588 | |
| | | | | | | | |
| | | | | | | $ | 7,697,838 | |
17
Portfolio of Investments – continued
| | | | | | | | |
| Issuer | | Shares/Par | | | Value ($) | |
| Bonds - continued | | | | | | | | |
| Other Banks & Diversified Financials - 0.4% | | | | | | | | |
| Groupe BPCE S.A., 12.5% to 9/30/19, FRN to 12/31/49 (n) | | $ | 3,873,000 | | | $ | 4,912,242 | |
| | |
| Pharmaceuticals - 2.9% | | | | | | | | |
| Capsugel S.A., 7%, 5/15/19 (n)(p) | | $ | 1,955,000 | | | $ | 1,911,013 | |
| Endo Finance LLC/Endo Finco, Inc., 6%, 7/15/23 (n) | | | 3,235,000 | | | | 3,251,175 | |
| Endo Finance LLC/Endo Finco, Inc., 7.75%, 1/15/22 (n) | | | 5,835,000 | | | | 6,090,281 | |
| Endo Finance LLC/Endo Finco, Inc., 6%, 2/01/25 (n) | | | 1,280,000 | | | | 1,264,154 | |
| Mallinckrodt International Finance S.A., 5.75%, 8/01/22 (n) | | | 3,400,000 | | | | 3,247,000 | |
| Mallinckrodt International Finance S.A., 5.5%, 4/15/25 (n) | | | 1,370,000 | | | | 1,219,300 | |
| Valeant Pharmaceuticals International, Inc., 7%, 10/01/20 (n) | | | 7,040,000 | | | | 6,934,400 | |
| Valeant Pharmaceuticals International, Inc., 7.25%, 7/15/22 (n) | | | 4,075,000 | | | | 3,973,125 | |
| Valeant Pharmaceuticals International, Inc., 5.5%, 3/01/23 (n) | | | 2,720,000 | | | | 2,400,400 | |
| Vantage Point Imaging, 7.5%, 7/15/21 (n) | | | 3,230,000 | | | | 3,203,756 | |
| VRX Escrow Corp., 5.875%, 5/15/23 (n) | | | 6,560,000 | | | | 5,871,200 | |
| | | | | | | | |
| | | | | | | $ | 39,365,804 | |
| Precious Metals & Minerals - 0.6% | | | | | | | | |
| Aurico Gold, Inc., 7.75%, 4/01/20 (n) | | $ | 3,585,000 | | | $ | 2,984,513 | |
| Eldorado Gold Corp., 6.125%, 12/15/20 (n) | | | 5,515,000 | | | | 4,618,813 | |
| | | | | | | | |
| | | | | | | $ | 7,603,326 | |
| Printing & Publishing - 1.4% | | | | | | | | |
| American Media, Inc., 13.5%, 6/15/18 (z) | | $ | 338,724 | | | $ | 334,067 | |
| Nielsen Finance LLC, 5%, 4/15/22 (n) | | | 8,015,000 | | | | 8,085,131 | |
| Outdoor Americas Capital LLC/Outfront Media Capital Corp., 5.625%, 2/15/24 | | | 2,590,000 | | | | 2,648,275 | |
| TEGNA, Inc., 5.125%, 7/15/20 | | | 1,415,000 | | | | 1,464,525 | |
| TEGNA, Inc., 4.875%, 9/15/21 (n) | | | 1,900,000 | | | | 1,909,500 | |
| TEGNA, Inc., 6.375%, 10/15/23 | | | 3,900,000 | | | | 4,114,500 | |
| | | | | | | | |
| | | | | | | $ | 18,555,998 | |
| Real Estate - Healthcare - 0.6% | | | | | | | | |
| MPT Operating Partnership LP, REIT, 6.875%, 5/01/21 | | $ | 3,275,000 | | | $ | 3,389,625 | |
| MPT Operating Partnership LP, REIT, 6.375%, 2/15/22 | | | 4,390,000 | | | | 4,455,850 | |
| | | | | | | | |
| | | | | | | $ | 7,845,475 | |
| Real Estate - Other - 0.9% | | | | | | | | |
| DuPont Fabros Technology LP, REIT, 5.875%, 9/15/21 | | $ | 7,260,000 | | | $ | 7,477,800 | |
| Felcor Lodging LP, REIT, 5.625%, 3/01/23 | | | 5,115,000 | | | | 5,108,606 | |
| | | | | | | | |
| | | | | | | $ | 12,586,406 | |
| Retailers - 2.1% | | | | | | | | |
| Best Buy Co., Inc., 5.5%, 3/15/21 | | $ | 4,815,000 | | | $ | 4,863,150 | |
| Bon Ton Stores, Inc., 8%, 6/15/21 | | | 835,000 | | | | 321,475 | |
18
Portfolio of Investments – continued
| | | | | | | | |
| Issuer | | Shares/Par | | | Value ($) | |
| Bonds - continued | | | | | | | | |
| Retailers - continued | | | | | | | | |
| DriveTime Automotive Group, Inc./DT Acceptance Corp., 8%, 6/01/21 (n) | | $ | 3,763,000 | | | $ | 3,358,478 | |
| Family Tree Escrow LLC, 5.75%, 3/01/23 (n) | | | 6,865,000 | | | | 7,233,994 | |
| Neiman Marcus Group Ltd., 8%, 10/15/21 (n) | | | 5,870,000 | | | | 4,402,500 | |
| Rite Aid Corp., 9.25%, 3/15/20 | | | 1,400,000 | | | | 1,475,250 | |
| Rite Aid Corp., 6.75%, 6/15/21 | | | 1,380,000 | | | | 1,459,350 | |
| Rite Aid Corp., 6.125%, 4/01/23 (n) | | | 4,245,000 | | | | 4,478,475 | |
| Sally Beauty Holdings, Inc., 5.625%, 12/01/25 | | | 1,395,000 | | | | 1,440,338 | |
| | | | | | | | |
| | | | | | | $ | 29,033,010 | |
| Specialty Chemicals - 0.9% | | | | | | | | |
| Chemtura Corp., 5.75%, 7/15/21 | | $ | 6,615,000 | | | $ | 6,565,388 | |
| Univar USA, Inc., 6.75%, 7/15/23 (n) | | | 5,705,000 | | | | 5,048,925 | |
| | | | | | | | |
| | | | | | | $ | 11,614,313 | |
| Specialty Stores - 1.3% | | | | | | | | |
| Argos Merger Sub, Inc., 7.125%, 3/15/23 (n) | | $ | 5,385,000 | | | $ | 5,425,388 | |
| Group 1 Automotive, Inc., 5%, 6/01/22 | | | 7,030,000 | | | | 6,687,288 | |
| Michaels Stores, Inc., 5.875%, 12/15/20 (n) | | | 4,705,000 | | | | 4,846,150 | |
| | | | | | | | |
| | | | | | | $ | 16,958,826 | |
| Telecommunications - Wireless - 4.7% | | | | | | | | |
| Altice S.A., 7.75%, 5/15/22 (n) | | $ | 1,120,000 | | | $ | 1,044,400 | |
| Crown Castle International Corp., 5.25%, 1/15/23 | | | 4,465,000 | | | | 4,755,225 | |
| Digicel Group Ltd., 8.25%, 9/30/20 (n) | | | 2,600,000 | | | | 2,103,075 | |
| Digicel Group Ltd., 7.125%, 4/01/22 (n) | | | 2,231,000 | | | | 1,663,211 | |
| Digicel Group Ltd., 6.75%, 3/01/23 (n) | | | 6,053,000 | | | | 5,205,580 | |
| Sprint Capital Corp., 6.875%, 11/15/28 | | | 3,690,000 | | | | 2,430,788 | |
| Sprint Corp., 7.875%, 9/15/23 | | | 6,605,000 | | | | 4,706,063 | |
| Sprint Corp., 7.125%, 6/15/24 | | | 10,250,000 | | | | 6,918,750 | |
| Sprint Corp., 7%, 8/15/20 | | | 925,000 | | | | 679,875 | |
| Sprint Nextel Corp., 9%, 11/15/18 (n) | | | 1,745,000 | | | | 1,779,900 | |
| Sprint Nextel Corp., 6%, 11/15/22 | | | 4,585,000 | | | | 3,083,413 | |
| T-Mobile USA, Inc., 6.125%, 1/15/22 | | | 475,000 | | | | 483,313 | |
| T-Mobile USA, Inc., 6.5%, 1/15/24 | | | 3,035,000 | | | | 3,065,350 | |
| T-Mobile USA, Inc., 6.464%, 4/28/19 | | | 1,465,000 | | | | 1,510,781 | |
| T-Mobile USA, Inc., 6.25%, 4/01/21 | | | 9,000,000 | | | | 9,157,500 | |
| T-Mobile USA, Inc., 6.633%, 4/28/21 | | | 1,890,000 | | | | 1,953,788 | |
| T-Mobile USA, Inc., 6.5%, 1/15/26 | | | 3,600,000 | | | | 3,600,000 | |
| Wind Acquisition Finance S.A., 4.75%, 7/15/20 (n) | | | 2,505,000 | | | | 2,461,163 | |
| Wind Acquisition Finance S.A., 7.375%, 4/23/21 (n) | | | 7,745,000 | | | | 7,362,552 | |
| | | | | | | | |
| | | | | | | $ | 63,964,727 | |
19
Portfolio of Investments – continued
| | | | | | | | |
| Issuer | | Shares/Par | | | Value ($) | |
| Bonds - continued | | | | | | | | |
| Telephone Services - 0.6% | | | | | | | | |
| Level 3 Financing, Inc., 5.375%, 1/15/24 (n) | | $ | 1,900,000 | | | $ | 1,919,000 | |
| Level 3 Financing, Inc., 5.375%, 5/01/25 | | | 6,000,000 | | | | 6,037,500 | |
| | | | | | | | |
| | | | | | | $ | 7,956,500 | |
| Transportation - Services - 1.4% | | | | | | | | |
| Jack Cooper Holdings Corp., 10.25%, 6/01/20 (n) | | $ | 5,010,000 | | | $ | 3,957,900 | |
| Navios Maritime Acquisition Corp., 8.125%, 11/15/21 (n) | | | 3,487,000 | | | | 2,772,165 | |
| Navios Maritime Holding, Inc., 7.375%, 1/15/22 (n) | | | 4,175,000 | | | | 1,503,000 | |
| SPL Logistics Escrow LLC, 8.875%, 8/01/20 (n) | | | 3,600,000 | | | | 3,276,000 | |
| Stena AB, 7%, 2/01/24 (n) | | | 7,225,000 | | | | 5,491,000 | |
| Syncreon Group BV/Syncre, 8.625%, 11/01/21 (n) | | | 3,185,000 | | | | 2,468,375 | |
| Ultrapetrol Bahamas Ltd., 8.875%, 6/15/21 (a)(d) | | | 786,000 | | | | 133,620 | |
| | | | | | | | |
| | | | | | | $ | 19,602,060 | |
| Utilities - Electric Power - 1.9% | | | | | | | | |
| Calpine Corp., 5.5%, 2/01/24 | | $ | 4,885,000 | | | $ | 4,274,375 | |
| Covanta Holding Corp., 7.25%, 12/01/20 | | | 4,290,000 | | | | 4,340,944 | |
| Covanta Holding Corp., 6.375%, 10/01/22 | | | 2,185,000 | | | | 2,059,363 | |
| Covanta Holding Corp., 5.875%, 3/01/24 | | | 2,475,000 | | | | 2,159,438 | |
| NRG Energy, Inc., 8.25%, 9/01/20 | | | 5,025,000 | | | | 4,560,188 | |
| NRG Energy, Inc., 6.25%, 7/15/22 | | | 430,000 | | | | 354,750 | |
| NRG Energy, Inc., 6.625%, 3/15/23 | | | 4,945,000 | | | | 4,091,988 | |
| TerraForm Power Operating Co., 5.875%, 2/01/23 (n) | | | 4,267,000 | | | | 3,402,933 | |
| | | | | | | | |
| | | | | | | $ | 25,243,979 | |
| Total Bonds (Identified Cost, $1,393,093,900) | | | | | | $ | 1,233,243,810 | |
| | |
| Floating Rate Loans (g)(r) - 3.2% | | | | | | | | |
| Aerospace - 0.3% | | | | | | | | |
| TransDigm, Inc., Term Loan C, 3.75%, 2/28/20 | | $ | 3,669,832 | | | $ | 3,579,616 | |
| | |
| Building - 0.2% | | | | | | | | |
| ABC Supply Co., Inc., Term Loan B, 3.5%, 4/16/20 | | $ | 3,365,087 | | | $ | 3,326,389 | |
| | |
| Cable TV - 0.2% | | | | | | | | |
| Cequel Communications LLC, Term Loan B, 3.5%, 2/14/19 | | $ | 2,740,232 | | | $ | 2,683,958 | |
| | |
| Conglomerates - 0.2% | | | | | | | | |
| Entegris, Inc., Term Loan B, 3.5%, 4/30/21 | | $ | 2,775,185 | | | $ | 2,750,902 | |
| | |
| Consumer Services - 0.1% | | | | | | | | |
| Realogy Corp., Term Loan B, 3.75%, 3/05/20 | | $ | 2,139,458 | | | $ | 2,121,630 | |
| | |
| Containers - 0.2% | | | | | | | | |
| Berry Plastics, Term Loan E, 3.75%, 1/06/21 | | $ | 2,874,742 | | | $ | 2,837,609 | |
20
Portfolio of Investments – continued
| | | | | | | | |
| Issuer | | Shares/Par | | | Value ($) | |
| Floating Rate Loans (g)(r) - continued | | | | | | | | |
| Electronics - 0.3% | | | | | | | | |
| Avago Technologies Ltd., Term Loan B, 3.75%, 5/06/21 | | $ | 3,788,376 | | | $ | 3,767,854 | |
| | |
| Energy - Independent - 0.1% | | | | | | | | |
| MEG Energy Corp., Term Loan B, 3.75%, 3/31/20 | | $ | 1,400,533 | | | $ | 1,086,113 | |
| | |
| Entertainment - 0.1% | | | | | | | | |
| Cedar Fair LP, Term Loan B, 3.25%, 3/06/20 | | $ | 1,055,676 | | | $ | 1,057,655 | |
| | |
| Gaming & Lodging - 0.2% | | | | | | | | |
| Hilton Worldwide, Term Loan B, 3.5%, 10/25/20 | | $ | 2,836,642 | | | $ | 2,829,905 | |
| | |
| Medical & Health Technology & Services - 0.3% | | | | | | | | |
| Davita Healthcare, Term Loan B, 3.5%, 6/24/21 | | $ | 3,923,118 | | | $ | 3,908,407 | |
| | |
| Printing & Publishing - 0.2% | | | | | | | | |
| CBS Outdoor, Term Loan, 3%, 1/31/21 | | $ | 2,917,085 | | | $ | 2,876,975 | |
| | |
| Retailers - 0.1% | | | | | | | | |
| Rite Aid Corp., Term Loan, 4.87%, 6/21/21 | | $ | 937,940 | | | $ | 935,888 | |
| | |
| Transportation - Services - 0.4% | | | | | | | | |
| Commercial Barge Line Co., Term Loan B, 9.75%, 11/12/20 | | $ | 7,087,325 | | | $ | 6,201,409 | |
| | |
| Utilities - Electric Power - 0.3% | | | | | | | | |
| Calpine Construction Finance Co., Term Loan B, 3%, 5/03/20 | | $ | 3,948,525 | | | $ | 3,703,389 | |
| Total Floating Rate Loans (Identified Cost, $44,960,941) | | | $ | 43,667,699 | |
| | |
| Common Stocks - 0.7% | | | | | | | | |
| Automotive - 0.0% | | | | | | | | |
| Accuride Corp. (a) | | | 48,891 | | | $ | 41,117 | |
| | |
| Special Products & Services - 0.7% | | | | | | | | |
| iShares iBoxx $ High Yield Corporate Bond ETF | | | 120,500 | | | $ | 9,553,240 | |
| Total Common Stocks (Identified Cost, $10,968,981) | | | | | | $ | 9,594,357 | |
| | |
| Money Market Funds - 2.6% | | | | | | | | |
MFS Institutional Money Market Portfolio, 0.28%,
at Cost and Net Asset Value (v) | | | 34,778,255 | | | $ | 34,778,255 | |
| Total Investments (Identified Cost, $1,483,802,077) | | | | | | $ | 1,321,284,121 | |
| | |
| Other Assets, Less Liabilities - 2.2% | | | | | | | 29,382,137 | |
| Net Assets - 100.0% | | | | | | $ | 1,350,666,258 | |
21
Portfolio of Investments – continued
| (a) | Non-income producing security. |
| (g) | The rate shown represents a weighted average coupon rate on settled positions at period end, unless otherwise indicated. |
| (n) | Securities exempt from registration under Rule 144A of the Securities Act of 1933. These securities may be sold in the ordinary course of business in transactions exempt from registration, normally to qualified institutional buyers. At period end, the aggregate value of these securities was $500,809,451, representing 37.1% of net assets. |
| (p) | Payment-in-kind security for which interest income may be received in additional securities and/or cash. During the period, the following amount of interest income was received in additional securities and/or cash: |
| | | | | | |
| Payment-in-kind Securities | | Cash | | Additional
Securities | |
| Schaeffler Finance B.V., 6.875%, 8/15/18 | | $177,566 | | | $— | |
| Schaeffler Holding Finance B.V., 6.25%, 11/15/19 | | 165,265 | | | — | |
| Total | | $342,831 | | | $— | |
| (r) | Remaining maturities of floating rate loans may be less than stated maturities shown as a result of contractual or optional prepayments by the borrower. Such prepayments cannot be predicted with certainty. These loans may be subject to restrictions on resale. Floating rate loans generally have rates of interest which are determined periodically by reference to a base lending rate plus a premium. |
| (v) | Underlying affiliated fund that is available only to investment companies managed by MFS. The rate quoted for the MFS Institutional Money Market Portfolio is the annualized seven-day yield of the fund at period end. |
| (z) | Restricted securities are not registered under the Securities Act of 1933 and are subject to legal restrictions on resale. These securities generally may be resold in transactions exempt from registration or to the public if the securities are subsequently registered. Disposal of these securities may involve time-consuming negotiations and prompt sale at an acceptable price may be difficult. The fund holds the following restricted securities: |
| | | | | | | | | | |
| Restricted Securities | | Acquisition
Date | | Cost | | | Value | |
| American Media, Inc., 13.5%, 6/15/18 | | 12/22/10-12/28/10 | | | $341,025 | | | | $334,067 | |
| % of Net assets | | | | 0.0% | |
The following abbreviations are used in this report and are defined:
| FRN | | Floating Rate Note. Interest rate resets periodically and the current rate may not be the rate reported at period end. |
| PLC | | Public Limited Company |
| REIT | | Real Estate Investment Trust |
Abbreviations indicate amounts shown in currencies other than the U.S. dollar. All amounts are stated in U.S. dollars unless otherwise indicated. A list of abbreviations is shown below:
22
Portfolio of Investments – continued
Derivative Contracts at 1/31/16
Forward Foreign Currency Exchange Contracts at 1/31/16
| | | | | | | | | | | | | | | | | | | | | | | | |
| Type | | Currency | | Counter-
party | | Contracts
to
Deliver/
Receive | | | Settlement
Date Range | | | In
Exchange
For | | | Contracts
at Value | | | Net
Unrealized
Appreciation
(Depreciation) | |
| Asset Derivatives | | | | | | | | | | | | | | | | | | | | |
| SELL | | EUR | | Goldman Sachs International | | | 2,033,642 | | | | 4/15/16 | | | | $2,208,812 | | | | $2,207,485 | | | | $1,327 | |
| | | | | | | | | | | | | | | | | | | | | | | | |
Futures Contracts at 1/31/16
| | | | | | | | | | | | | | | | | | |
| Description | | Currency | | | Contracts | | | Value | | Expiration
Date | | | Unrealized
Appreciation
(Depreciation) | |
| Liability Derivatives | | | | | | | | | | | | | | | | | | |
| Interest Rate Futures | | | | | | | | | | | | | | | | | | |
| U.S. Treasury Note 10 yr (Short) | | | USD | | | | 91 | | | $11,791,609 | | | March - 2016 | | | | ($287,993 | ) |
| | | | | | | | | | | | | | | | | | |
At January 31, 2016, the fund had cash collateral of $122,850 to cover any commitments for certain derivative contracts. Cash collateral is comprised of “Deposits with brokers” in the Statement of Assets and Liabilities.
See Notes to Financial Statements
23
Financial Statements
STATEMENT OF ASSETS AND LIABILITIES
At 1/31/16
This statement represents your fund’s balance sheet, which details the assets and liabilities comprising the total value of the fund.
| | | | |
| Assets | | | | |
Investments | | | | |
Non-affiliated issuers, at value (identified cost, $1,449,023,822) | | | $1,286,505,866 | |
Underlying affiliated funds, at cost and value | | | 34,778,255 | |
Total investments, at value (identified cost, $1,483,802,077) | | | $1,321,284,121 | |
Cash | | | 268,705 | |
Deposits with brokers | | | 122,850 | |
Receivables for | | | | |
Forward foreign currency exchange contracts | | | 1,327 | |
Investments sold | | | 10,879,225 | |
Fund shares sold | | | 38,684 | |
Interest and dividends | | | 25,916,432 | |
Other assets | | | 7,769 | |
Total assets | | | $1,358,519,113 | |
| Liabilities | | | | |
Payables for | | | | |
Distributions | | | $410 | |
Daily variation margin on open futures contracts | | | 49,766 | |
Investments purchased | | | 5,773,663 | |
Fund shares reacquired | | | 1,901,689 | |
Payable to affiliates | | | | |
Administrator | | | 192 | |
Shareholder servicing costs | | | 11 | |
Accrued expenses and other liabilities | | | 127,124 | |
Total liabilities | | | $7,852,855 | |
Net assets | | | $1,350,666,258 | |
| Net assets consist of | | | | |
Paid-in capital | | | $1,536,334,937 | |
Unrealized appreciation (depreciation) on investments and translation of assets and liabilities in foreign currencies | | | (162,804,646 | ) |
Accumulated net realized gain (loss) on investments and foreign currency | | | (22,160,646 | ) |
Accumulated distributions in excess of net investment income | | | (703,387 | ) |
Net assets | | | $1,350,666,258 | |
Shares of beneficial interest outstanding | | | 160,582,837 | |
Net asset value per share (net assets of $1,350,666,258 / 160,582,837 shares of beneficial interest outstanding) | | | $8.41 | |
See Notes to Financial Statements
24
Financial Statements
STATEMENT OF OPERATIONS
Year ended 1/31/16
This statement describes how much your fund earned in investment income and accrued in expenses. It also describes any gains and/or losses generated by fund operations.
| | | | |
| Net investment income | | | | |
Income | | | | |
Interest | | | $86,296,899 | |
Dividends | | | 541,655 | |
Dividends from underlying affiliated funds | | | 63,242 | |
Total investment income | | | $86,901,796 | |
Expenses | | | | |
Shareholder servicing costs | | | 46 | |
Administrative services fee | | | 17,500 | |
Custodian fee | | | 155,206 | |
Shareholder communications | | | 7,593 | |
Audit and tax fees | | | 41,410 | |
Legal fees | | | 12,372 | |
Pricing service fees | | | 17,654 | |
Registration fees | | | 18,742 | |
Miscellaneous | | | 26,849 | |
Total expenses | | | $297,372 | |
Fees paid indirectly | | | (218 | ) |
Net expenses | | | $297,154 | |
Net investment income | | | $86,604,642 | |
| Realized and unrealized gain (loss) on investments and foreign currency | |
Realized gain (loss) (identified cost basis) | | | | |
Investments | | | $(13,793,810 | ) |
Written options | | | 53,759 | |
Futures contracts | | | (245,935 | ) |
Foreign currency | | | 252,608 | |
Net realized gain (loss) on investments and foreign currency | | | $(13,733,378 | ) |
Change in unrealized appreciation (depreciation) | | | | |
Investments | | | $(147,729,711 | ) |
Futures contracts | | | 144,576 | |
Translation of assets and liabilities in foreign currencies | | | (147,626 | ) |
Net unrealized gain (loss) on investments and foreign currency translation | | | $(147,732,761 | ) |
Net realized and unrealized gain (loss) on investments and foreign currency | | | $(161,466,139 | ) |
Change in net assets from operations | | | $(74,861,497 | ) |
See Notes to Financial Statements
25
Financial Statements
STATEMENTS OF CHANGES IN NET ASSETS
These statements describe the increases and/or decreases in net assets resulting from operations, any distributions, and any shareholder transactions.
| | | | | | | | |
| | | Years ended 1/31 | |
| | | 2016 | | | 2015 | |
| Change in net assets | | | | | | |
| From operations | | | | | | | | |
Net investment income | | | $86,604,642 | | | | $70,322,027 | |
Net realized gain (loss) on investments and foreign currency | | | (13,733,378 | ) | | | 11,928,307 | |
Net unrealized gain (loss) on investments and foreign currency translation | | | (147,732,761 | ) | | | (45,449,886 | ) |
Change in net assets from operations | | | $(74,861,497 | ) | | | $36,800,448 | |
| Distributions declared to shareholders | | | | | |
From net investment income | | | $(89,680,774 | ) | | | $(72,674,007 | ) |
From net realized gain on investments | | | (996,862 | ) | | | (9,130,455 | ) |
Total distributions declared to shareholders | | | $(90,677,636 | ) | | | $(81,804,462 | ) |
Change in net assets from fund share transactions | | | $178,673,761 | | | | $268,826,805 | |
Total change in net assets | | | $13,134,628 | | | | $223,822,791 | |
| Net assets | | | | | | | | |
At beginning of period | | | 1,337,531,630 | | | | 1,113,708,839 | |
At end of period (including accumulated distributions in excess of net investment income of $703,387 and $572,054, respectively) | | | $1,350,666,258 | | | | $1,337,531,630 | |
See Notes to Financial Statements
26
Financial Statements
FINANCIAL HIGHLIGHTS
The financial highlights table is intended to help you understand the fund’s financial performance for the past 5 years (or life of a particular share class, if shorter). Certain information reflects financial results for a single fund share. The total returns in the table represent the rate by which an investor would have earned (or lost) on an investment in the fund share class (assuming reinvestment of all distributions) held for the entire period.
| | | | | | | | | | | | |
| | | Years ended 1/31 | | | Period
ended
1/31/14 (c) | |
| | | 2016 | | | 2015 | | |
Net asset value, beginning of period | | | $9.47 | | | | $9.85 | | | | $10.00 | |
| Income (loss) from investment operations | | | | | | | | | | | | |
Net investment income (d) | | | $0.57 | | | | $0.61 | | | | $0.55 | |
Net realized and unrealized gain (loss) on investments
and foreign currency | | | (1.03 | ) | | | (0.29 | ) | | | (0.04 | ) |
Total from investment operations | | | $(0.46 | ) | | | $0.32 | | | | $0.51 | |
| Less distributions declared to shareholders | | | | | | | | | | | | |
From net investment income | | | $(0.59 | ) | | | $(0.63 | ) | | | $(0.59 | ) |
From net realized gain on investments | | | (0.01 | ) | | | (0.07 | ) | | | (0.07 | ) |
Total distributions declared to shareholders | | | $(0.60 | ) | | | $(0.70 | ) | | | $(0.66 | ) |
Net asset value, end of period (x) | | | $8.41 | | | | $9.47 | | | | $9.85 | |
Total return (%) (r)(s)(x) | | | (5.23 | ) | | | 3.28 | | | | 5.26 | (n) |
Ratios (%) (to average net assets)
and Supplemental data: | | | | | | | | | | | | |
Expenses before expense reductions (f) | | | 0.02 | | | | 0.03 | | | | 0.02 | (a) |
Expenses after expense reductions (f) | | | 0.02 | | | | 0.03 | | | | 0.02 | (a) |
Net investment income | | | 6.19 | | | | 6.18 | | | | 6.54 | (a) |
Portfolio turnover | | | 33 | | | | 43 | | | | 42 | (n) |
Net assets at end of period (000 omitted) | | | $1,350,666 | | | | $1,337,532 | | | | $1,113,709 | |
| (c) | For the period from the commencement of the fund’s investment operations, March 25, 2013, through the stated period end. |
| (d) | Per share data is based on average shares outstanding. |
| (f) | Ratios do not reflect reductions from fees paid indirectly, if applicable. |
| (r) | Certain expenses have been reduced without which performance would have been lower. |
| (s) | From time to time the fund may receive proceeds from litigation settlements, without which performance would be lower. |
| (x) | The net asset values and total returns have been calculated on net assets which include adjustments made in accordance with U.S. generally accepted accounting principles required at period end for financial reporting purposes. |
See Notes to Financial Statements
27
NOTES TO FINANCIAL STATEMENTS
(1) Business and Organization
MFS High Yield Pooled Portfolio (the fund) is a diversified series of MFS Series Trust III (the trust). The trust is organized as a Massachusetts business trust and is registered under the Investment Company Act of 1940, as amended, as an open-end management investment company. This fund is available only to certain U.S. registered investment companies managed by MFS. MFS does not receive a management fee from this fund.
The fund is an investment company and accordingly follows the investment company accounting and reporting guidance of the Financial Accounting Standards Board (FASB) Accounting Standards Codification Topic 946 Financial Services – Investment Companies.
(2) Significant Accounting Policies
General – The preparation of financial statements in conformity with U.S. generally accepted accounting principles requires management to make estimates and assumptions that affect the reported amounts of assets and liabilities, and disclosure of contingent assets and liabilities at the date of the financial statements and the reported amounts of increases and decreases in net assets from operations during the reporting period. Actual results could differ from those estimates. In the preparation of these financial statements, management has evaluated subsequent events occurring after the date of the fund’s Statement of Assets and Liabilities through the date that the financial statements were issued. The fund invests in high-yield securities rated below investment grade. Investments in high-yield securities involve greater degrees of credit and market risk than investments in higher-rated securities and tend to be more sensitive to economic conditions. The fund invests in foreign securities. Investments in foreign securities are vulnerable to the effects of changes in the relative values of the local currency and the U.S. dollar and to the effects of changes in each country’s legal, political, and economic environment.
In January 2016, FASB issued Accounting Standards Update 2016-01, Financial Instruments – Overall (Subtopic 825-10) – Recognition and Measurement of Financial Assets and Financial Liabilities (“ASU 2016-01”) which would first be effective for annual reporting periods beginning after December 15, 2017, and interim periods therein. ASU 2016-01, which changes the accounting for equity investments and for certain financial liabilities, also modifies the presentation and disclosure requirements for financial instruments. Investment companies are specifically exempted from ASU 2016-01’s equity investment accounting provisions and will continue to follow the industry specific guidance for investment accounting under ASC 946. Although still evaluating the potential impacts of ASU 2016-01 to the fund, management expects that the impact of the fund’s adoption will be limited to additional financial statement disclosures.
Balance Sheet Offsetting – The fund’s accounting policy with respect to balance sheet offsetting is that, absent an event of default by the counterparty or a termination of the agreement, the International Swaps and Derivatives Association (ISDA) Master Agreement does not result in an offset of reported amounts of financial assets and financial liabilities in the Statement of Assets and Liabilities across transactions between
28
Notes to Financial Statements – continued
the fund and the applicable counterparty. The fund’s right to setoff may be restricted or prohibited by the bankruptcy or insolvency laws of the particular jurisdiction to which a specific master netting agreement counterparty is subject. Balance sheet offsetting disclosures, to the extent applicable to the fund, have been included in the fund’s Significant Accounting Policies note under the captions for each of the fund’s in-scope financial instruments and transactions.
Investment Valuations – Debt instruments and floating rate loans, including restricted debt instruments, are generally valued at an evaluated or composite bid as provided by a third-party pricing service. Equity securities, including restricted equity securities, are generally valued at the last sale or official closing price on their primary market or exchange as provided by a third-party pricing service. Equity securities, for which there were no sales reported that day, are generally valued at the last quoted daily bid quotation on their primary market or exchange as provided by a third-party pricing service. Short-term instruments with a maturity at issuance of 60 days or less may be valued at amortized cost, which approximates market value. Exchange-traded options are generally valued at the last sale or official closing price on their primary exchange as provided by a third-party pricing service. Exchange-traded options for which there were no sales reported that day are generally valued at the last daily bid quotation on their primary exchange as provided by a third-party pricing service. Options not traded on an exchange are generally valued at a broker/dealer bid quotation. Foreign currency options are generally valued at valuations provided by a third-party pricing service. Futures contracts are generally valued at last posted settlement price on their primary exchange as provided by a third-party pricing service. Futures contracts for which there were no trades that day for a particular position are generally valued at the closing bid quotation on their primary exchange as provided by a third-party pricing service. Forward foreign currency exchange contracts are generally valued at the mean of bid and asked prices for the time period interpolated from rates provided by a third-party pricing service for proximate time periods. Open-end investment companies are generally valued at net asset value per share. Securities and other assets generally valued on the basis of information from a third-party pricing service may also be valued at a broker/dealer bid quotation. Values obtained from third-party pricing services can utilize both transaction data and market information such as yield, quality, coupon rate, maturity, type of issue, trading characteristics, and other market data. The values of foreign securities and other assets and liabilities expressed in foreign currencies are converted to U.S. dollars using the mean of bid and asked prices for rates provided by a third-party pricing service.
The Board of Trustees has delegated primary responsibility for determining or causing to be determined the value of the fund’s investments (including any fair valuation) to the adviser pursuant to valuation policies and procedures approved by the Board. If the adviser determines that reliable market quotations are not readily available, investments are valued at fair value as determined in good faith by the adviser in accordance with such procedures under the oversight of the Board of Trustees. Under the fund’s valuation policies and procedures, market quotations are not considered to be readily available for most types of debt instruments and floating rate loans and many types of derivatives. These investments are generally valued at fair value based on information from third-party pricing services. In addition, investments may be valued at fair value if
29
Notes to Financial Statements – continued
the adviser determines that an investment’s value has been materially affected by events occurring after the close of the exchange or market on which the investment is principally traded (such as foreign exchange or market) and prior to the determination of the fund’s net asset value, or after the halting of trading of a specific security where trading does not resume prior to the close of the exchange or market on which the security is principally traded. The adviser generally relies on third-party pricing services or other information (such as the correlation with price movements of similar securities in the same or other markets; the type, cost and investment characteristics of the security; the business and financial condition of the issuer; and trading and other market data) to assist in determining whether to fair value and at what value to fair value an investment. The value of an investment for purposes of calculating the fund’s net asset value can differ depending on the source and method used to determine value. When fair valuation is used, the value of an investment used to determine the fund’s net asset value may differ from quoted or published prices for the same investment. There can be no assurance that the fund could obtain the fair value assigned to an investment if it were to sell the investment at the same time at which the fund determines its net asset value per share.
Various inputs are used in determining the value of the fund’s assets or liabilities. These inputs are categorized into three broad levels. In certain cases, the inputs used to measure fair value may fall into different levels of the fair value hierarchy. In such cases, an investment’s level within the fair value hierarchy is based on the lowest level of input that is significant to the fair value measurement. The fund’s assessment of the significance of a particular input to the fair value measurement in its entirety requires judgment, and considers factors specific to the investment. Level 1 includes unadjusted quoted prices in active markets for identical assets or liabilities. Level 2 includes other significant observable market-based inputs (including quoted prices for similar securities, interest rates, prepayment speed, and credit risk). Level 3 includes unobservable inputs, which may include the adviser’s own assumptions in determining the fair value of investments. Other financial instruments are derivative instruments not reflected in total investments, such as futures contracts and forward foreign currency exchange contracts. The following is a summary of the levels used as of January 31, 2016 in valuing the fund’s assets or liabilities:
| | | | | | | | | | | | | | | | |
| Investments at Value | | Level 1 | | | Level 2 | | | Level 3 | | | Total | |
| Equity Securities | | | $9,594,357 | | | | $— | | | | $— | | | | $9,594,357 | |
| U.S. Corporate Bonds | | | — | | | | 1,046,463,596 | | | | — | | | | 1,046,463,596 | |
| Foreign Bonds | | | — | | | | 186,780,214 | | | | — | | | | 186,780,214 | |
| Floating Rate Loans | | | — | | | | 43,667,699 | | | | — | | | | 43,667,699 | |
| Mutual Funds | | | 34,778,255 | | | | — | | | | — | | | | 34,778,255 | |
| Total Investments | | | $44,372,612 | | | | $1,276,911,509 | | | | $— | | | | $1,321,284,121 | |
|
| Other Financial Instruments | |
| Futures Contracts | | | $(287,993 | ) | | | $— | | | | $— | | | | $(287,993 | ) |
| Forward Foreign Currency Exchange Contracts | | | — | | | | 1,327 | | | | — | | | | 1,327 | |
For further information regarding security characteristics, see the Portfolio of Investments.
30
Notes to Financial Statements – continued
Foreign Currency Translation – Purchases and sales of foreign investments, income, and expenses are converted into U.S. dollars based upon currency exchange rates prevailing on the respective dates of such transactions or on the reporting date for foreign denominated receivables and payables. Gains and losses attributable to foreign currency exchange rates on sales of securities are recorded for financial statement purposes as net realized gains and losses on investments. Gains and losses attributable to foreign exchange rate movements on receivables, payables, income and expenses are recorded for financial statement purposes as foreign currency transaction gains and losses. That portion of both realized and unrealized gains and losses on investments that results from fluctuations in foreign currency exchange rates is not separately disclosed.
Derivatives – The fund uses derivatives for different purposes, primarily to increase or decrease exposure to a particular market or segment of the market, or security, to increase or decrease interest rate or currency exposure, or as alternatives to direct investments. Derivatives are used for hedging or non-hedging purposes. While hedging can reduce or eliminate losses, it can also reduce or eliminate gains. When the fund uses derivatives as an investment to increase market exposure, or for hedging purposes, gains and losses from derivative instruments may be substantially greater than the derivative’s original cost.
The derivative instruments used by the fund were written options, futures contracts, and forward foreign currency exchange contracts. The fund’s period end derivatives, as presented in the Portfolio of Investments and the associated Derivative Contract tables, generally are indicative of the volume of its derivative activity during the period.
The following table presents, by major type of derivative contract, the fair value, on a gross basis, of the asset and liability components of derivatives held by the fund at January 31, 2016 as reported in the Statement of Assets and Liabilities:
| | | | | | | | |
| | | | | Fair Value (a) |
| Risk | | Derivative Contracts | | Asset Derivatives | | | Liability Derivatives |
| Interest Rate | | Interest Rate Futures | | | $— | | | $(287,993) |
| Foreign Exchange | | Forward Foreign Currency Exchange | | | 1,327 | | | — |
| Total | | | | | $1,327 | | | $(287,993) |
| (a) | The value of futures contracts includes cumulative appreciation (depreciation) as reported in the fund’s Portfolio of Investments. Only the current day net variation margin for futures contracts is separately reported within the fund’s Statement of Assets and Liabilities. |
The following table presents, by major type of derivative contract, the realized gain (loss) on derivatives held by the fund for the year ended January 31, 2016 as reported in the Statement of Operations:
| | | | | | | | | | | | |
| Risk | | Futures
Contracts | | | Written
Options | | | Foreign
Currency | |
| Interest Rate | | | $(245,935 | ) | | | $— | | | | $— | |
| Foreign Exchange | | | — | | | | — | | | | 257,916 | |
| Equity | | | — | | | | 53,759 | | | | — | |
| Total | | | $(245,935 | ) | | | $53,759 | | | | $257,916 | |
31
Notes to Financial Statements – continued
The following table presents, by major type of derivative contract, the change in unrealized appreciation (depreciation) on derivatives held by the fund for the year ended January 31, 2016 as reported in the Statement of Operations:
| | | | | | | | |
| Risk | | Futures
Contracts | | | Translation
of Assets
and
Liabilities in
Foreign
Currencies | |
| Interest Rate | | | $144,576 | | | | $— | |
| Foreign Exchange | | | — | | | | (151,958 | ) |
| Total | | | $144,576 | | | | $(151,958 | ) |
Derivative counterparty credit risk is managed through formal evaluation of the creditworthiness of all potential counterparties. On certain, but not all, uncleared derivatives, the fund attempts to reduce its exposure to counterparty credit risk whenever possible by entering into an ISDA Master Agreement on a bilateral basis. The ISDA Master Agreement gives each party to the agreement the right to terminate all transactions traded under such agreement if there is a certain deterioration in the credit quality of the other party. Upon an event of default or a termination of the ISDA Master Agreement, the non-defaulting party has the right to close out all transactions traded under such agreement and to net amounts owed under each transaction to one net amount payable by one party to the other. This right to close out and net payments across all transactions traded under the ISDA Master Agreement could result in a reduction of the fund’s credit risk to such counterparty equal to any amounts payable by the fund under the applicable transactions, if any.
Collateral and margin requirements differ by type of derivative. Margin requirements are set by the clearing broker and the clearing house for cleared derivatives (e.g., futures contracts, cleared swaps, and exchange-traded options) while collateral terms are contract specific for uncleared derivatives (e.g., forward foreign currency exchange contracts, uncleared swap agreements, and uncleared options). For derivatives traded under an ISDA Master Agreement, which contains a collateral support annex, the collateral requirements are netted across all transactions traded under such agreement and one amount is posted from one party to the other to collateralize such obligations. Cash that has been segregated to cover the fund’s collateral or margin obligations under derivative contracts, if any, will be reported separately in the Statement of Assets and Liabilities as “Restricted cash” or “Deposits with brokers.” Securities pledged as collateral or margin for the same purpose, if any, are noted in the Portfolio of Investments.
Written Options – In exchange for a premium, the fund wrote put options on securities for which it anticipated the price would increase. At the time the option was written, the fund believed the premium received exceeded the potential loss that could result from adverse price changes in the options’ underlying securities. In a written option, the fund as the option writer grants the buyer the right to purchase from, or sell to, the fund a specified number of shares or units of a particular security, currency or index at a specified price within a specified period of time.
32
Notes to Financial Statements – continued
The premium received is initially recorded as a liability in the Statement of Assets and Liabilities. The option is subsequently marked-to-market daily with the difference between the premium received and the market value of the written option being recorded as unrealized appreciation or depreciation. When a written option expires, the fund realizes a gain equal to the amount of the premium received. The difference between the premium received and the amount paid on effecting a closing transaction is considered a realized gain or loss. When a written put option is exercised, the premium reduces the cost basis of the security purchased by the fund.
At the initiation of the written option contract, for exchange traded options, the fund is required to deposit securities or cash as collateral with the custodian for the benefit of the broker or directly with the clearing broker, based on the type of option. For uncleared options, the fund may post collateral subject to the terms of an ISDA Master Agreement as generally described above if the market value of the options contract moves against it. The fund, as writer of an option, may have no control over whether the underlying securities may be sold (call) or purchased (put) and, as a result, bears the market risk of an unfavorable change in the price of the securities underlying the written option. Losses from writing options can exceed the premium received and can exceed the potential loss from an ordinary buy and sell transaction. Although the fund’s market risk may be significant, the maximum counterparty credit risk to the fund is equal to the market value of any collateral posted to the broker. For uncleared options, this risk is mitigated in cases where there is an ISDA Master Agreement between the fund and the counterparty providing for netting as described above.
The following table represents the written option activity in the fund during the year ended January 31, 2016:
| | | | | | | | |
| | | Number of
Contracts | | | Premiums
Received | |
| Outstanding, beginning of period | | | — | | | | $— | |
| Options written | | | 840 | | | | 53,759 | |
| Options expired | | | (840 | ) | | | (53,759 | ) |
| Outstanding, end of period | | | — | | | | $— | |
Futures Contracts – The fund entered into futures contracts which may be used to hedge against or obtain broad market exposure, interest rate exposure, currency exposure, or to manage duration. A futures contract represents a commitment for the future purchase or sale of an asset at a specified price on a specified date.
Upon entering into a futures contract, the fund is required to deposit with the broker, either in cash or securities, an initial margin in an amount equal to a certain percentage of the notional amount of the contract. Subsequent payments (variation margin) are made or received by the fund each day, depending on the daily fluctuations in the value of the contract, and are recorded for financial statement purposes as unrealized gain or loss by the fund until the contract is closed or expires at which point the gain or loss on futures contracts is realized.
The fund bears the risk of interest rates, exchange rates or securities prices moving unexpectedly, in which case, the fund may not achieve the anticipated benefits of the futures contracts and may realize a loss. While futures contracts may present less counterparty risk to the fund since the contracts are exchange traded and the
33
Notes to Financial Statements – continued
exchange’s clearinghouse guarantees payments to the broker, there is still counterparty credit risk due to the insolvency of the broker. The fund’s maximum risk of loss due to counterparty credit risk is equal to the margin posted by the fund to the broker plus any gains or minus any losses on the outstanding futures contracts.
Forward Foreign Currency Exchange Contracts – The fund entered into forward foreign currency exchange contracts for the purchase or sale of a specific foreign currency at a fixed price on a future date. These contracts may be used to hedge the fund’s currency risk or for non-hedging purposes. For hedging purposes, the fund may enter into contracts to deliver or receive foreign currency that the fund will receive from or use in its normal investment activities. The fund may also use contracts to hedge against declines in the value of foreign currency denominated securities due to unfavorable exchange rate movements. For non-hedging purposes, the fund may enter into contracts with the intent of changing the relative exposure of the fund’s portfolio of securities to different currencies to take advantage of anticipated exchange rate changes.
Forward foreign currency exchange contracts are adjusted by the daily exchange rate of the underlying currency and any unrealized gains or losses are recorded as a receivable or payable for forward foreign currency exchange contracts until the contract settlement date. On contract settlement date, any gain or loss on the contract is recorded as realized gains or losses on foreign currency.
Risks may arise upon entering into these contracts from unanticipated movements in the value of the contract and from the potential inability of counterparties to meet the terms of their contracts. Generally, the fund’s maximum risk due to counterparty credit risk is the unrealized gain on the contract due to the use of Continuous Linked Settlement, an industry accepted settlement system. This risk is mitigated in cases where there is an ISDA Master Agreement between the fund and the counterparty providing for netting as described above and, where applicable, by the posting of collateral by the counterparty to the fund to cover the fund’s exposure to the counterparty under such ISDA Master Agreement.
Loans and Other Direct Debt Instruments – The fund invests in loans and loan participations or other receivables. These investments may include standby financing commitments, including revolving credit facilities, which contractually obligate the fund to supply additional cash to the borrower on demand. The fund generally provides this financial support in order to preserve its existing investment or to obtain a more senior secured interest in the assets of the borrower. Loan participations involve a risk of insolvency of the lending bank or other financial intermediary.
Indemnifications – Under the fund’s organizational documents, its officers and Trustees may be indemnified against certain liabilities and expenses arising out of the performance of their duties to the fund. Additionally, in the normal course of business, the fund enters into agreements with service providers that may contain indemnification clauses. The fund’s maximum exposure under these agreements is unknown as this would involve future claims that may be made against the fund that have not yet occurred.
Investment Transactions and Income – Investment transactions are recorded on the trade date. Interest income is recorded on the accrual basis. All premium and discount
34
Notes to Financial Statements – continued
is amortized or accreted for financial statement purposes in accordance with U.S. generally accepted accounting principles. The fund earns certain fees in connection with its floating rate loan purchasing activities. These fees are in addition to interest payments earned and may include amendment fees, commitment fees, facility fees, consent fees, and prepayment fees. Commitment fees are recorded on an accrual basis as income in the accompanying financial statements. Dividends received in cash are recorded on the ex-dividend date. Certain dividends from foreign securities will be recorded when the fund is informed of the dividend if such information is obtained subsequent to the ex-dividend date. Dividend and interest payments received in additional securities are recorded on the ex-dividend or ex-interest date in an amount equal to the value of the security on such date. Debt obligations may be placed on non-accrual status or set to accrue at a rate of interest less than the contractual coupon when the collection of all or a portion of interest has become doubtful. Interest income for those debt obligations may be further reduced by the write-off of the related interest receivables when deemed uncollectible.
The fund may receive proceeds from litigation settlements. Any proceeds received from litigation involving portfolio holdings are reflected in the Statement of Operations in realized gain/loss if the security has been disposed of by the fund or in unrealized gain/loss if the security is still held by the fund. Any other proceeds from litigation not related to portfolio holdings are reflected as other income in the Statement of Operations.
Fees Paid Indirectly – The fund’s custody fee may be reduced by a credit earned under an arrangement that measures the value of U.S. dollars deposited with the custodian by the fund. The amount of the credit, for the year ended January 31, 2016, is shown as a reduction of total expenses in the Statement of Operations.
Tax Matters and Distributions – The fund intends to qualify as a regulated investment company, as defined under Subchapter M of the Internal Revenue Code, and to distribute all of its taxable income, including realized capital gains. As a result, no provision for federal income tax is required. The fund’s federal tax returns, when filed, will remain subject to examination by the Internal Revenue Service for a three year period. Management has analyzed the fund’s tax positions taken on federal and state tax returns for all open tax years and does not believe that there are any uncertain tax positions that require recognition of a tax liability. Foreign taxes, if any, have been accrued by the fund in the accompanying financial statements in accordance with the applicable foreign tax law. Foreign income taxes may be withheld by certain countries in which the fund invests. Additionally, capital gains realized by the fund on securities issued in or by certain foreign countries may be subject to capital gains tax imposed by those countries.
Distributions to shareholders are recorded on the ex-dividend date. Income and capital gain distributions are determined in accordance with income tax regulations, which may differ from U.S. generally accepted accounting principles. Certain capital accounts in the financial statements are periodically adjusted for permanent differences in order to reflect their tax character. These adjustments have no impact on net assets or net asset value per share. Temporary differences which arise from recognizing certain items of income, expense, gain or loss in different periods for financial statement and tax purposes will reverse at some time in the future. Distributions in excess of net
35
Notes to Financial Statements – continued
investment income or net realized gains are temporary overdistributions for financial statement purposes resulting from differences in the recognition or classification of income or distributions for financial statement and tax purposes.
Book/tax differences primarily relate to amortization and accretion of debt securities.
The tax character of distributions declared to shareholders for the last two fiscal years is as follows:
| | | | | | | | |
| | | 1/31/16 | | | 1/31/15 | |
| Ordinary income (including any short-term capital gains) | | | $90,677,636 | | | | $74,460,101 | |
| Long-term capital gains | | | — | | | | 7,344,361 | |
| Total distributions | | | $90,677,636 | | | | $81,804,462 | |
The federal tax cost and the tax basis components of distributable earnings were as follows:
| | | | |
| As of 1/31/16 | | | |
| Cost of investments | | | $1,490,637,891 | |
| Gross appreciation | | | 5,840,449 | |
| Gross depreciation | | | (175,194,219 | ) |
| Net unrealized appreciation (depreciation) | | | $(169,353,770 | ) |
| Undistributed ordinary income | | | 7,257,274 | |
| Capital loss carryforwards | | | (15,612,825 | ) |
| Other temporary differences | | | (7,959,358 | ) |
As of January 31, 2016, the fund had capital loss carryforwards available to offset future realized gains. Such losses are characterized as follows:
| | | | |
| Short-Term | | | $(9,428,846 | ) |
| Long-Term | | | (6,183,979 | ) |
| Total | | | $(15,612,825 | ) |
Under the Regulated Investment Company Modernization Act of 2010 (the “Act”), the above net capital losses may be carried forward indefinitely, and their character is retained as short-term and/or long-term losses. Previously, net capital losses were carried forward for eight years and treated as short-term losses.
(3) Transactions with Affiliates
Investment Adviser – The fund has an investment advisory agreement with MFS to provide overall investment management and related administrative services and facilities to the fund. MFS receives no compensation under this agreement; however MFS receives management fees from MFS funds that invest in the fund.
Shareholder Servicing Agent – MFS Service Center, Inc. (MFSC), a wholly-owned subsidiary of MFS, provides transfer agent and recordkeeping functions in connection with the issuance, transfer, and redemption of shares of the fund under a Shareholder Servicing Agent Agreement. MFSC is not paid a fee for providing these services. MFSC receives payment from the fund for out-of-pocket expenses paid by MFSC on behalf of the fund. For the year ended January 31, 2016, these costs amounted to $46. The fund may also pay shareholder servicing related costs to non-related parties.
36
Notes to Financial Statements – continued
Administrator – MFS provides certain financial, legal, shareholder communications, compliance, and other administrative services to the fund. Under an administrative services agreement, the fund reimburses MFS the costs incurred to provide these services. The fund is charged an annual fixed amount of $17,500. The administrative services fee incurred for the year ended January 31, 2016 was equivalent to an annual effective rate of 0.0013% of the fund’s average daily net assets.
Trustees’ and Officers’ Compensation – The fund may pay compensation to independent Trustees in the form of a retainer, attendance fees, and additional compensation to Board and Committee chairpersons. The fund does not pay compensation directly to Trustees or officers of the fund who are also officers of the investment adviser, all of whom receive remuneration for their services to the fund from MFS. Certain officers and Trustees of the fund are officers or directors of MFS, MFS Fund Distributors, Inc. (MFD), and MFSC. The independent Trustees do not currently receive compensation from the fund.
Other – This fund and certain other funds managed by MFS (the funds) have entered into a service agreement (the ISO Agreement) which provides for payment of fees solely by the funds to Tarantino LLC in return for the provision of services of an Independent Senior Officer (ISO) for the funds. Frank L. Tarantino serves as the ISO and is an officer of the funds and the sole member of Tarantino LLC. The funds can terminate the ISO Agreement with Tarantino LLC at any time under the terms of the ISO Agreement. For the year ended January 31, 2016, the fee paid by the fund under this agreement was $4,337 and is included in “Miscellaneous” expense in the Statement of Operations. MFS has agreed to bear all expenses associated with office space, other administrative support, and supplies provided to the ISO.
The fund invests in the MFS Institutional Money Market Portfolio which is managed by MFS and seeks current income consistent with preservation of capital and liquidity. Income earned on this investment is included in “Dividends from underlying affiliated funds” in the Statement of Operations. This money market fund does not pay a management fee to MFS.
(4) Portfolio Securities
For the year ended January 31, 2016, purchases and sales of investments, other than short-term obligations, aggregated $614,618,686 and $434,717,396, respectively.
37
Notes to Financial Statements – continued
(5) Shares of Beneficial Interest
The fund’s Declaration of Trust permits the Trustees to issue an unlimited number of full and fractional shares of beneficial interest. Transactions in fund shares were as follows:
| | | | | | | | | | | | | | | | |
| | | Year ended
1/31/16 | | | Year ended
1/31/15 | |
| | | Shares | | | Amount | | | Shares | | | Amount | |
| Shares sold | | | 33,576,052 | | | | $307,119,857 | | | | 35,605,372 | | | | $343,405,971 | |
Shares issued to shareholders in
reinvestment of distributions | | | 9,908,700 | | | | 90,676,904 | | | | 8,373,274 | | | | 81,804,462 | |
| Shares reacquired | | | (24,098,828 | ) | | | (219,123,000 | ) | | | (15,868,117 | ) | | | (156,383,628 | ) |
| Net change | | | 19,385,924 | | | | $178,673,761 | | | | 28,110,529 | | | | $268,826,805 | |
The fund is an MFS Pooled Portfolio, which is designed to be used by certain MFS funds to invest in a particular security type rather than invest in the security type directly. The fund is solely invested in by other MFS funds for the purpose of gaining exposure to high income debt instruments, rather than investing in high income debt instruments directly. The MFS funds do not invest in this fund for the purpose of exercising management or control. At the end of the period, the MFS Diversified Income Fund, the MFS Global High Yield Fund, the MFS Strategic Income Fund, and the MFS Strategic Income Portfolio were the owners of record of approximately 71%, 21%, 7%, and 1%, respectively, of the value of outstanding voting shares of the fund.
(6) Line of Credit
The fund and certain other funds managed by MFS participate in a $1.25 billion unsecured committed line of credit, subject to a $1 billion sublimit, provided by a syndication of banks under a credit agreement. Borrowings may be made for temporary financing needs. Interest is charged to each fund, based on its borrowings, generally at a rate equal to the higher of the Overnight Federal Reserve funds rate or daily one month LIBOR plus an agreed upon spread. A commitment fee, based on the average daily, unused portion of the committed line of credit, is allocated among the participating funds at the end of each calendar quarter. In addition, the fund and other funds managed by MFS have established unsecured uncommitted borrowing arrangements with certain banks for temporary financing needs. Interest is charged to each fund, based on its borrowings, at a rate equal to the Overnight Federal Reserve funds rate plus an agreed upon spread. For the year ended January 31, 2016, the fund’s commitment fee and interest expense were $4,702 and $0, respectively, and are included in “Miscellaneous” expense in the Statement of Operations.
38
Notes to Financial Statements – continued
(7) Transactions in Underlying Affiliated Funds-Affiliated Issuers
An affiliated issuer may be considered one in which the fund owns 5% or more of the outstanding voting securities, or a company which is under common control. For the purposes of this report, the fund assumes the following to be an affiliated issuer:
| | | | | | | | | | | | | | | | |
| Underlying Affiliated Fund | | Beginning
Shares/Par
Amount | | | Acquisitions
Shares/Par
Amount | | | Dispositions
Shares/Par
Amount | | | Ending
Shares/Par
Amount | |
MFS Institutional Money
Market Portfolio | | | 42,212,532 | | | | 427,452,249 | | | | (434,886,526 | ) | | | 34,778,255 | |
| | | | |
| Underlying Affiliated Fund | | Realized
Gain (Loss) | | | Capital Gain
Distributions | | | Dividend
Income | | | Ending
Value | |
MFS Institutional Money
Market Portfolio | | | $— | | | | $— | | | | $63,242 | | | | $34,778,255 | |
39
REPORT OF INDEPENDENT REGISTERED PUBLIC ACCOUNTING FIRM
To the Board of Trustees of MFS Series Trust III and the Shareholders of MFS High Yield Pooled Portfolio:
We have audited the accompanying statement of assets and liabilities, including the portfolio of investments, of MFS High Yield Pooled Portfolio (one of the series of MFS Series Trust III) (the “Fund”) as of January 31, 2016, and the related statement of operations for the year then ended, the statements of changes in net assets for each of the two years in the period then ended, and the financial highlights for each of the periods presented. These financial statements and financial highlights are the responsibility of the Fund’s management. Our responsibility is to express an opinion on these financial statements and financial highlights based on our audits.
We conducted our audits in accordance with the standards of the Public Company Accounting Oversight Board (United States). Those standards require that we plan and perform the audit to obtain reasonable assurance about whether the financial statements and financial highlights are free of material misstatement. The Fund is not required to have, nor were we engaged to perform, an audit of its internal control over financial reporting. Our audits included consideration of internal control over financial reporting as a basis for designing audit procedures that are appropriate in the circumstances, but not for the purpose of expressing an opinion on the effectiveness of the Fund’s internal control over financial reporting. Accordingly, we express no such opinion. An audit also includes examining, on a test basis, evidence supporting the amounts and disclosures in the financial statements, assessing the accounting principles used and significant estimates made by management, as well as evaluating the overall financial statement presentation. Our procedures included confirmation of securities owned as of January 31, 2016, by correspondence with the custodian, brokers, and agent banks; when replies were not received from brokers or agent banks, we performed other auditing procedures. We believe that our audits provide a reasonable basis for our opinion.
In our opinion, such financial statements and financial highlights referred to above present fairly, in all material respects, the financial position of MFS High Yield Pooled Portfolio as of January 31, 2016, the results of its operations for the year then ended, the changes in its net assets for each of the two years in the period then ended, and the financial highlights for each of the periods presented, in conformity with accounting principles generally accepted in the United States of America.
DELOITTE & TOUCHE LLP
Boston, Massachusetts
March 17, 2016
40
TRUSTEES AND OFFICERS — IDENTIFICATION AND BACKGROUND
The Trustees and Officers of the Trust, as of March 1, 2016, are listed below, together with their principal occupations during the past five years. (Their titles may have varied during that period.) The address of each Trustee and Officer is 111 Huntington Avenue, Boston, Massachusetts 02199-7618.
| | | | | | | | |
Name, Age | | Position(s)
Held with Fund | | Trustee/Officer
Since (h) | | Principal
Occupations During the Past Five Years | | Other Directorships (j) |
| INTERESTED TRUSTEES |
Robert J. Manning (k)
(age 52) | | Trustee | | February 2004 | | Massachusetts Financial Services Company, Chairman, Co-Chief Executive Officer and Director | | N/A |
Robin A. Stelmach (k)
(age 54) | | Trustee and President | | January 2014 | | Massachusetts Financial Services Company, Executive Vice President and Chief Operating Officer | | N/A |
| INDEPENDENT TRUSTEES | | | | | | |
David H. Gunning
(age 73) | | Trustee and Chair of Trustees | | January 2004 | | Private investor | | Lincoln Electric Holdings, Inc., Director; Development Alternatives, Inc., Director/Non-Executive Chairman |
Steven E. Buller
(age 64) | | Trustee | | February 2014 | | Chairman, Financial Accounting Standards Advisory Council; Standing Advisory Group, Public Company Accounting Oversight Board, Member (until 2014); BlackRock, Inc. (investment management), Managing Director (until 2014), BlackRock Finco UK (investment management), Director (until 2014) | | N/A |
Robert E. Butler
(age 74) | | Trustee | | January 2006 | | Consultant – investment company industry regulatory and compliance matters | | N/A |
Maureen R. Goldfarb
(age 60) | | Trustee | | January 2009 | | Private investor | | N/A |
41
Trustees and Officers – continued
| | | | | | | | |
Name, Age | | Position(s)
Held with Fund | | Trustee/Officer
Since (h) | | Principal
Occupations During the Past Five Years | | Other Directorships (j) |
William R. Gutow
(age 74) | | Trustee | | December 1993 | | Private investor and real estate consultant; Capitol Entertainment Management Company (video franchise), Vice Chairman (until 2014) | | Texas Donuts, Vice Chairman (until 2010) |
Michael Hegarty
(age 71) | | Trustee | | December 2004 | | Private investor | | Rouse Properties Inc., Director; Capmark Financial Group Inc., Director (until 2015) |
John P. Kavanaugh
(age 61) | | Trustee | | January 2009 | | Private investor | | N/A |
Maryanne L. Roepke
(age 60) | | Trustee | | May 2014 | | American Century Investments (investment management), Senior Vice President and Chief Compliance Officer (until 2014) | | N/A |
Laurie J. Thomsen
(age 58) | | Trustee | | March 2005 | | Private investor | | The Travelers Companies, Director; Dycom Industries, Inc., Director |
Robert W. Uek
(age 74) | | Trustee | | January 2006 | | Consultant to investment company industry | | N/A |
| OFFICERS | | | | | | | | |
Christopher R. Bohane (k)
(age 42) | | Assistant Secretary and Assistant Clerk | | July 2005 | | Massachusetts Financial Services Company, Vice President and Assistant General Counsel | | N/A |
Kino Clark (k)
(age 47) | | Assistant Treasurer | | January 2012 | | Massachusetts Financial Services Company, Vice President | | N/A |
Kristin V. Collins (k)
(age 43) | | Assistant Secretary and Assistant Clerk | | September 2015 | | Massachusetts Financial Services Company, Vice President and Assistant General Counsel | | N/A |
42
Trustees and Officers – continued
| | | | | | | | |
Name, Age | | Position(s)
Held with Fund | | Trustee/Officer
Since (h) | | Principal
Occupations During the Past Five Years | | Other Directorships (j) |
Thomas H. Connors (k)
(age 56) | | Assistant Secretary and Assistant Clerk | | September 2012 | | Massachusetts Financial Services Company, Vice President and Senior Counsel; Deutsche Investment Management Americas Inc. (financial service provider), Director and Senior Counsel (until 2012) | | N/A |
Ethan D. Corey (k)
(age 52) | | Assistant Secretary and Assistant Clerk | | July 2005 | | Massachusetts Financial Services Company, Senior Vice President and Associate General Counsel | | N/A |
David L. DiLorenzo (k)
(age 47) | | Treasurer | | July 2005 | | Massachusetts Financial Services Company, Senior Vice President | | N/A |
Brian E. Langenfeld (k)
(age 42) | | Assistant Secretary and Assistant Clerk | | June 2006 | | Massachusetts Financial Services Company, Vice President and Senior Counsel | | N/A |
Kenneth Paek (k)
(age 41) | | Assistant Treasurer | | February 2015 | | Massachusetts Financial Services Company, Vice President; Cohen & Steers, Vice President/Head of Fund Administration (until 2014); Morgan Stanley, Executive Director/Head of European Fund Administration (until 2012) | | N/A |
Susan A. Pereira (k)
(age 45) | | Assistant Secretary and Assistant Clerk | | July 2005 | | Massachusetts Financial Services Company, Vice President and Senior Counsel | | N/A |
43
Trustees and Officers – continued
| | | | | | | | |
Name, Age | | Position(s)
Held with Fund | | Trustee/Officer
Since (h) | | Principal
Occupations During the Past Five Years | | Other Directorships (j) |
Kasey L. Phillips (k)
(age 45) | | Assistant Treasurer | | September 2012 | | Massachusetts Financial Services Company, Vice President; Wells Fargo Funds Management, LLC, Senior Vice President, Fund Treasurer (until 2012) | | N/A |
Mark N. Polebaum (k)
(age 63) | | Secretary and Clerk | | January 2006 | | Massachusetts Financial Services Company, Executive Vice President, General Counsel and Secretary | | N/A |
Matthew A. Stowe (k)
(age 41) | | Assistant Secretary and Assistant Clerk | | October 2014 | | Massachusetts Financial Services Company, Vice President and Assistant General Counsel | | N/A |
Frank L. Tarantino
(age 71) | | Independent Senior Officer | | June 2004 | | Tarantino LLC (provider of compliance services), Principal | | N/A |
Richard S. Weitzel (k)
(age 45) | | Assistant Secretary and Assistant Clerk | | October 2007 | | Massachusetts Financial Services Company, Senior Vice President and Associate General Counsel | | N/A |
Martin J. Wolin (k)
(age 48) | | Chief Compliance Officer | | July 2015 | | Massachusetts Financial Services Company, Senior Vice President and Chief Compliance Officer (since July 2015); Mercer (financial service provider), Chief Risk and Compliance Officer, North America and Latin America (until June 2015) | | N/A |
James O. Yost (k)
(age 55) | | Deputy Treasurer | | September 1990 | | Massachusetts Financial Services Company, Senior Vice President | | N/A |
| (h) | Date first appointed to serve as Trustee/officer of an MFS Fund. Each Trustee has served continuously since appointment unless indicated otherwise. For the period from December 15, 2004 until February 22, 2005, Mr. Manning served as Advisory Trustee. Prior to January 2012, Messrs. DiLorenzo and Yost served as Assistant Treasurers of the Funds. Ms. Stelmach was appointed as President of the Funds as of October 1, 2014. |
44
Trustees and Officers – continued
| (j) | Directorships or trusteeships of companies required to report to the Securities and Exchange Commission (i.e., “public companies”). |
| (k) | “Interested person” of the Trust within the meaning of the Investment Company Act of 1940 (referred to as the 1940 Act), which is the principal federal law governing investment companies like the fund, as a result of a position with MFS. The address of MFS is 111 Huntington Avenue, Boston, Massachusetts 02199-7618. |
Each Trustee (except Ms. Stelmach, Mr. Buller and Ms. Roepke) has been elected by shareholders and each Trustee and officer holds office until his or her successor is chosen and qualified or until his or her earlier death, resignation, retirement or removal. The Trust does not hold annual meetings for the purpose of electing Trustees, and Trustees are not elected for fixed terms. Messrs. Buller, Butler, Kavanaugh, Uek and Ms. Roepke are members of the Trust’s Audit Committee.
Each of the Fund’s Trustees and officers holds comparable positions with certain other funds of which MFS or a subsidiary is the investment adviser or distributor, and, in the case of the officers, with certain affiliates of MFS. As of March 1, 2016, the Trustees served as board members of 137 funds within the MFS Family of Funds.
The Statement of Additional Information for a Fund includes further information about the Trustees and is available without charge upon request by calling 1-800-225-2606.
| | |
| Investment Adviser | | Custodian |
Massachusetts Financial Services Company
111 Huntington Avenue
Boston, MA 02199-7618 | | JPMorgan Chase Bank, NA 4 Metrotech Center New York, NY 11245 |
| Distributor | | Independent Registered Public Accounting Firm |
MFS Fund Distributors, Inc.
111 Huntington Avenue
Boston, MA 02199-7618 | | Deloitte & Touche LLP 200 Berkeley Street Boston, MA 02116 |
| Portfolio Managers | | |
William Adams David Cole | | |
45
PROXY VOTING POLICIES AND INFORMATION
MFS votes proxies on behalf of the fund pursuant to proxy voting policies and procedures that are available without charge, upon request, by calling 1-800-225-2606, by visiting the Proxy Voting section of mfs.com or by visiting the SEC’s Web site at http://www.sec.gov.
Information regarding how the fund voted proxies relating to portfolio securities during the most recent twelve-month period ended June 30 is available without charge by visiting the Proxy Voting section of mfs.com or by visiting the SEC’s Web site at http://www.sec.gov.
QUARTERLY PORTFOLIO DISCLOSURE
The fund will file a complete schedule of portfolio holdings with the Securities and Exchange Commission (the Commission) for the first and third quarters of each fiscal year on Form N-Q. The fund’s Form N-Q is available on the EDGAR database on the Commission’s Internet Web site at http://www.sec.gov, and may be reviewed and copied at the:
Public Reference Room
Securities and Exchange Commission
100 F Street, NE, Room 1580
Washington, D.C. 20549
Information on the operation of the Public Reference Room may be obtained by calling the Commission at 1-800-SEC-0330. Copies of the fund’s Form N-Q also may be obtained, upon payment of a duplicating fee, by electronic request at the following e-mail address: publicinfo@sec.gov or by writing the Public Reference Section at the above address.
FURTHER INFORMATION
From time to time, MFS may post important information about the fund or the MFS funds on the MFS web site (mfs.com). This information is available by visiting the “Market Commentary” and “Announcements” sub sections in the “Market Outlooks” section of mfs.com.
FEDERAL TAX INFORMATION (unaudited)
The fund will notify shareholders of amounts for use in preparing 2016 income tax forms in January 2017.
46
rev. 3/11
| | | | |
| | | |
FACTS | | WHAT DOES MFS DO WITH YOUR PERSONAL INFORMATION? | |  |
| | |
| Why? | | Financial companies choose how they share your personal information. Federal law gives consumers the right to limit some but not all sharing. Federal law also requires us to tell you how we collect, share, and protect your personal information. Please read this notice carefully to understand what we do. |
| | |
| What? | | The types of personal information we collect and share depend on the product or service you have with us. This information can include: • Social Security number and account balances • Account transactions and transaction history • Checking account information and wire transfer instructions When you are no longer our customer, we continue to share your information as described in this notice. |
| | |
| How? | | All financial companies need to share customers’ personal information to run their everyday business. In the section below, we list the reasons financial companies can share their customers’ personal information; the reasons MFS chooses to share; and whether you can limit this sharing. |
| | | | |
Reasons we can share your
personal information | | Does MFS
share? | | Can you limit
this sharing? |
For our everyday business purposes – such as to process your transactions, maintain your account(s), respond to court orders and legal investigations, or report to credit bureaus | | Yes | | No |
For our marketing purposes – to offer our products and services to you | | No | | We don’t share |
| For joint marketing with other financial companies | | No | | We don’t share |
For our affiliates’ everyday business purposes – information about your transactions and experiences | | No | | We don’t share |
For our affiliates’ everyday business purposes – information about your creditworthiness | | No | | We don’t share |
| For nonaffiliates to market to you | | No | | We don’t share |
| | |
| Questions? | | Call 800-225-2606 or go to mfs.com. |
47
| | |
| Who we are |
| Who is providing this notice? | | MFS Funds, MFS Investment Management, MFS Institutional Advisors, Inc., MFS Fund Distributors, Inc., MFS Heritage Trust Company, and MFS Service Center, Inc. |
| | |
| What we do |
| How does MFS protect my personal information? | | To protect your personal information from unauthorized access and use, we use security measures that comply with federal law. These measures include procedural, electronic, and physical safeguards for the protection of the personal information we collect about you. |
| How does MFS collect my personal information? | | We collect your personal information, for example, when you • open an account or provide account information • direct us to buy securities or direct us to sell your securities • make a wire transfer We also collect your personal information from others, such as credit bureaus, affiliates and other companies. |
| Why can’t I limit all sharing? | | Federal law gives you the right to limit only • sharing for affiliates’ everyday business purposes – information about your creditworthiness • affiliates from using your information to market to you • sharing for nonaffiliates to market to you State laws and individual companies may give you additional rights to limit sharing. |
| | |
| Definitions |
| Affiliates | | Companies related by common ownership or control. They can be financial and nonfinancial companies. • MFS does not share personal information with affiliates, except for everyday business purposes as described on page one of this notice. |
| Nonaffiliates | | Companies not related by common ownership or control. They can be financial and nonfinancial companies. • MFS does not share with nonaffiliates so they can market to you. |
| Joint Marketing | | A formal agreement between nonaffiliated financial companies that together market financial products or services to you. • MFS doesn’t jointly market. |
| | |
| Other important information |
| If you own an MFS product or receive an MFS service in the name of a third party such as a bank or broker-dealer, their privacy policy may apply to you instead of ours. |
48

Save paper with eDelivery.

| MFS® will send you prospectuses, |
reports, and proxies directly via e-mail so you will get information faster with less mailbox clutter.
To sign up:
1. Go to mfs.com.
2. Log in via MFS® Access.
3. Select eDelivery.
If you own your MFS fund shares through a financial institution or a retirement plan, MFS® TALK, MFS® Access, or eDelivery may not be available to you.
CONTACT
WEB SITE
mfs.com
MFS TALK
1-800-637-8255
24 hours a day
ACCOUNT SERVICE AND LITERATURE
Shareholders
1-800-225-2606
Financial advisors
1-800-343-2829
Retirement plan services
1-800-637-1255
MAILING ADDRESS
MFS Service Center, Inc.
P.O. Box 55824
Boston, MA 02205-5824
OVERNIGHT MAIL
MFS Service Center, Inc.
c/o Boston Financial Data Services
30 Dan Road
Canton, MA 02021-2809
ANNUAL REPORT
January 31, 2016

MFS® HIGH INCOME FUND

MFH-ANN
MFS® HIGH INCOME FUND
CONTENTS
The report is prepared for the general information of shareholders.
It is authorized for distribution to prospective investors only when preceded or accompanied by a current prospectus.
NOT FDIC INSURED • MAY LOSE VALUE • NO BANK GUARANTEE

LETTER FROM THE CHAIRMAN
Dear Shareholders:
Market volatility remains elevated amid signs of slowing global growth and continued weakness in the price of oil and other commodities. Chinese markets remain skittish
following a series of policy missteps and currency depreciations, which have contributed to large capital outflows.
A lower-for-longer interest rate environment is likely for the foreseeable future given accommodative global central bank policies. The Bank of Japan has adopted a negative interest rate policy while the European Central Bank has signaled plans for additional monetary stimulus later this year. Meanwhile, expectations for further monetary policy tightening from the U.S. Federal Reserve have been reduced in the face of more challenging financial conditions.
The U.S. manufacturing sector is suffering the effects of a strong U.S. dollar and falling global demand. There is some reason for optimism, however, as U.S. labor markets continue to improve while auto and home sales remain upbeat.
As markets have become more focused on short-term trends in recent years, we believe it’s important for investors to lengthen their investment time horizon. At MFS®, we don’t trade on headlines or trends; we invest for the long term.
We believe that this approach, coupled with the professional guidance of a financial advisor, will help you reach your investment goals.
Respectfully,

Robert J. Manning
Chairman
MFS Investment Management
March 17, 2016
The opinions expressed in this letter are subject to change and may not be relied upon for investment advice. No forecasts can be guaranteed.
1
PORTFOLIO COMPOSITION
Portfolio structure (i)
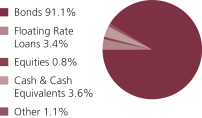
| | | | |
| Top five industries (i) | |
| Cable TV | | | 6.5% | |
| Medical & Health Technology & Services | | | 6.1% | |
| Midstream | | | 5.1% | |
| Telecommunications-Wireless | | | 4.7% | |
| Containers | | | 4.3% | |
| | | | |
Composition including fixed
income credit quality (a)(i) | |
| BBB | | | 2.8% | |
| BB | | | 38.2% | |
| B | | | 42.1% | |
| CCC | | | 12.4% | |
| C (o) | | | 0.0% | |
| D | | | 0.1% | |
| Not Rated | | | (1.1)% | |
| Non-Fixed Income | | | 0.8% | |
| Cash & Cash Equivalents | | | 3.6% | |
| Other | | | 1.1% | |
| |
| Portfolio facts (i) | | | | |
| Average Duration (d) | | | 4.1 | |
| Average Effective Maturity (m) | | | 5.7 yrs. | |
| (a) | For all securities other than those specifically described below, ratings are assigned to underlying securities utilizing ratings from Moody’s, Fitch, and Standard & Poor’s rating agencies and applying the following hierarchy: If all three agencies provide a rating, the middle rating (after dropping the highest and lowest ratings) is assigned; if two of the three agencies rate a security, the lower of the two is assigned. Ratings are shown in the S&P and Fitch scale (e.g., AAA). Securities rated BBB or higher are considered investment grade. All ratings are subject to change. Not Rated includes fixed income securities, including fixed income futures contracts, which have not been rated by any rating agency. Non-Fixed Income includes any equity securities (including convertible bonds and equity derivatives) and/or commodity-linked derivatives. The fund may not hold all of these instruments. The fund is not rated by these agencies. |
| (d) | Duration is a measure of how much a bond’s price is likely to fluctuate with general changes in interest rates, e.g., if rates rise 1.00%, a bond with a 5-year duration is likely to lose about 5.00% of its value due to the interest rate move. |
| (i) | For purposes of this presentation, the components include the value of securities, and reflect the impact of the equivalent exposure of derivative positions, if any. These amounts may be negative from time to time. Equivalent exposure is a calculated amount that translates the derivative position into a reasonable approximation of the amount of the underlying asset that the portfolio would have to hold at a given point in time to have the same price sensitivity that results from the portfolio’s ownership of the derivative contract. When dealing with derivatives, equivalent exposure is a more representative measure of the potential impact of a position on portfolio performance than value. The bond component will include any accrued interest amounts. |
2
Portfolio Composition – continued
| (m) | In determining an instrument’s effective maturity for purposes of calculating the fund’s dollar-weighted average effective maturity, MFS uses the instrument’s stated maturity or, if applicable, an earlier date on which MFS believes it is probable that a maturity-shortening device (such as a put, pre-refunding or prepayment) will cause the instrument to be repaid. Such an earlier date can be substantially shorter than the instrument’s stated maturity. |
Where the fund holds convertible bonds, these are treated as part of the equity portion of the portfolio.
Cash & Cash Equivalents includes any cash, investments in money market funds, short-term securities, and other assets less liabilities. Please see the Statement of Assets and Liabilities for additional information related to the fund’s cash position and other assets and liabilities.
Other includes currency derivatives and/or any offsets to derivative positions.
Percentages are based on net assets as of 1/31/16.
The portfolio is actively managed and current holdings may be different.
3
MANAGEMENT REVIEW
Summary of Results
For the twelve months ended January 31, 2016, Class A shares of the MFS High Income Fund (“fund”) provided a total return of –5.87%, at net asset value. This compares with a return of –6.58% for the fund’s benchmark, the Barclays U.S. High-Yield Corporate Bond 2% Issuer Capped Index.
Market Environment
Sluggish global growth weighed on both developed and emerging market (“EM”) economies during the reporting period. EM economies have been particularly lackluster. While the US Federal Reserve (“Fed”) began its anticipated monetary policy tightening cycle toward the end of the period, other large developed economies continued to embrace accommodative monetary policies, particularly the European Central Bank and the Bank of Japan. Focus remained on China after policy missteps by the Chinese government roiled global markets over the summer, beginning with the uncoordinated response to the stock market’s boom and bust and then the confusing decision to devalue the renminbi in August. China subsequently ramped up a wide range of monetary and fiscal measures to stimulate the economy, bolster sentiment and stabilize its currency.
During the second half of the reporting period, many US companies faced significant headwinds to earnings caused primarily by the sharp decline in the prices of oil and other commodities. Earnings contractions were concentrated primarily in the energy, materials and industrial sectors. The sharp rise in the US dollar also weighed on earnings during the period. Exports were crimped by the dollar’s strength and falling demand in emerging markets. Beyond the Fed’s interest rate hike in December, tighter financial conditions rippled through the economy. Consumer spending held up well during the second half of the period amid a modest increase in real wages and falling gasoline prices. Demand for autos reached near-record territory late in the period. In emerging markets, two key factors weighed on economies and asset prices: 1) weaker Chinese growth, which drove the decline in commodity prices and 2) prospects for higher US interest rates. Structural factors like floating exchange rates and fiscal buffers partially offset these cyclical headwinds.
Contributors to Performance
Strong bond selection and a lesser exposure to “CCC” rated (r) securities contributed to performance relative to the Barclays U.S. High-Yield Corporate Bond 2% Issuer Capped Index as this credit quality sector underperformed higher-credit quality issues.
The fund’s yield curve positioning in the United States, particularly a lesser exposure to shifts in the long end (centered around maturities of 10 or more years) of the respective yield curve also benefited relative results.
Among individual securities, the fund’s holding of financial services company Bank of America was among the top relative contributors for the reporting period.
Detractors from Performance
The portion of the fund’s return derived from yield, which was less than that of the fund’s benchmark, detracted from relative results.
4
Management Review – continued
The fund’s greater exposure to “B” rated securities was another area of relative weakness.
A greater exposure to the Utility – other sector also held back relative performance as this market segment underperformed over the reporting period.
Respectfully,
| | |
| William Adams | | David Cole |
| Portfolio Manager | | Portfolio Manager |
| (d) | Duration is a measure of how much a bond’s price is likely to fluctuate with general changes in interest rates, e.g., if rates rise 1.00%, a bond with a 5-year duration is likely to lose about 5.00% of its value. |
| (r) | Bonds rated “BBB”, “Baa”, or higher are considered investment grade; bonds rated “BB”, “Ba”, or below are considered non-investment grade. The source for bond quality ratings is Moody’s Investors Service, Standard & Poor’s and Fitch, Inc. and are applied using the following hierarchy: If all three agencies provide a rating, the middle rating (after dropping the highest and lowest ratings) is assigned; if two of the three agencies rate a security, the lower of the two is assigned. Ratings are shown in the S&P and Fitch scale (e.g., AAA). For securities which are not rated by any of the three agencies, the security is considered Not Rated. |
The views expressed in this report are those of the portfolio managers only through the end of the period of the report as stated on the cover and do not necessarily reflect the views of MFS or any other person in the MFS organization. These views are subject to change at any time based on market or other conditions, and MFS disclaims any responsibility to update such views. These views may not be relied upon as investment advice or an indication of trading intent on behalf of any MFS portfolio. References to specific securities are not recommendations of such securities, and may not be representative of any MFS portfolio’s current or future investments.
5
PERFORMANCE SUMMARY THROUGH 1/31/16
The following chart illustrates a representative class of the fund’s historical performance in comparison to its benchmark(s). Performance results include the deduction of the maximum applicable sales charge and reflect the percentage change in net asset value, including reinvestment of dividends and capital gains distributions. The performance of other share classes will be greater than or less than that of the class depicted below. Benchmarks are unmanaged and may not be invested in directly. Benchmark returns do not reflect sales charges, commissions or expenses. (See Notes to Performance Summary.)
Performance data shown represents past performance and is no guarantee of future results. Investment return and principal value fluctuate so your shares, when sold, may be worth more or less than the original cost; current performance may be lower or higher than quoted. The performance shown does not reflect the deduction of taxes, if any, that a shareholder would pay on fund distributions or the redemption of fund shares.
Growth of a Hypothetical $10,000 Investment
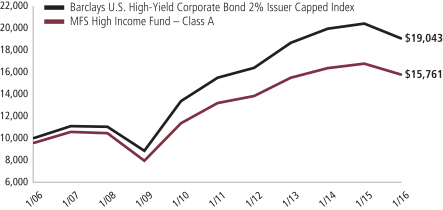
6
Performance Summary – continued
Total Returns through 1/31/16
Average annual without sales charge
| | | | | | | | | | | | | | |
| | | Share Class | | Class Inception Date | | 1-yr | | 5-yr | | 10-yr | | Life (t) | | |
| | | A | | 2/17/78 | | (5.87)% | | 3.66% | | 5.11% | | N/A | | |
| | | B | | 9/27/93 | | (6.57)% | | 2.83% | | 4.32% | | N/A | | |
| | | C | | 1/03/94 | | (6.55)% | | 2.89% | | 4.32% | | N/A | | |
| | | I | | 1/02/97 | | (5.66)% | | 3.85% | | 5.35% | | N/A | | |
| | | R1 | | 4/01/05 | | (6.58)% | | 2.89% | | 4.29% | | N/A | | |
| | | R2 | | 10/31/03 | | (6.11)% | | 3.40% | | 4.81% | | N/A | | |
| | | R3 | | 4/01/05 | | (5.87)% | | 3.66% | | 5.10% | | N/A | | |
| | | R4 | | 4/01/05 | | (5.63)% | | 3.92% | | 5.37% | | N/A | | |
| | | R5 | | 6/01/12 | | (5.55)% | | N/A | | N/A | | 3.64% | | |
| | | 529A | | 7/31/02 | | (6.20)% | | 3.55% | | 4.95% | | N/A | | |
| | | 529B | | 7/31/02 | | (6.63)% | | 2.83% | | 4.23% | | N/A | | |
| | | 529C | | 7/31/02 | | (6.62)% | | 2.83% | | 4.20% | | N/A | | |
| Comparative benchmark | | | | | | | | | | |
| | | Barclays U.S. High-Yield Corporate Bond
2% Issuer Capped Index (f) | | (6.58)% | | 4.24% | | 6.65% | | N/A | | |
| Average annual with sales charge | | | | | | | | | | |
| | | A
With Initial Sales Charge (4.25%) | | (9.87)% | | 2.76% | | 4.65% | | N/A | | |
| | | B
With CDSC (Declining over six years from 4% to 0%) (v) | | (10.14)% | | 2.51% | | 4.32% | | N/A | | |
| | | C
With CDSC (1% for 12 months) (v) | | (7.44)% | | 2.89% | | 4.32% | | N/A | | |
| | | 529A
With Initial Sales Charge (4.25%) | | (10.19)% | | 2.65% | | 4.50% | | N/A | | |
| | | 529B
With CDSC (Declining over six years from 4% to 0%) (v) | | (10.19)% | | 2.51% | | 4.23% | | N/A | | |
| | | 529C
With CDSC (1% for 12 months) (v) | | (7.51)% | | 2.83% | | 4.20% | | N/A | | |
CDSC – Contingent Deferred Sales Charge.
Class I, R1, R2, R3, R4, and R5 shares do not have a sales charge.
| (f) | Source: FactSet Research Systems Inc. |
7
Performance Summary – continued
| (t) | For the period from the class inception date through the stated period end (for those share classes with less than 10 years of performance history). No comparative benchmark performance information is provided for “life” periods. (See Notes to Performance Summary.) |
| (v) | Assuming redemption at the end of the applicable period. |
Benchmark Definition
Barclays U.S. High-Yield Corporate Bond 2% Issuer Capped Index – a component of the Barclays U.S. High-Yield Corporate Bond Index, which measures performance of non-investment grade, fixed rate debt. The index limits the maximum exposure to any one issuer to 2%.
It is not possible to invest directly in an index.
Notes to Performance Summary
Class 529 shares are only available in conjunction with qualified tuition programs, such as the MFS 529 Savings Plan. There also is an additional fee, which is detailed in the program description, on qualified tuition programs. If this fee was reflected, the performance for Class 529 shares would have been lower. This annual fee is waived for Oregon residents and for those accounts with assets of $25,000 or more.
Average annual total return represents the average annual change in value for each share class for the periods presented. Life returns are presented where the share class has less than 10 years of performance history and represent the average annual total return from the class inception date to the stated period end date. As the funds share classes may have different inception dates, the life returns may represent different time periods and may not be comparable. As a result, no comparative benchmark performance information is provided for life periods.
Performance results reflect any applicable expense subsidies and waivers in effect during the periods shown. Without such subsidies and waivers the fund’s performance results would be less favorable. Please see the prospectus and financial statements for complete details.
Performance results do not include adjustments made for financial reporting purposes in accordance with U.S. generally accepted accounting principles and may differ from amounts reported in the financial highlights.
From time to time the fund may receive proceeds from litigation settlements, without which performance would be lower.
8
EXPENSE TABLE
Fund expenses borne by the shareholders during the period, August 1, 2015 through January 31, 2016
As a shareholder of the fund, you incur two types of costs: (1) transaction costs, including sales charges (loads) on certain purchase or redemption payments, and (2) ongoing costs, including management fees; distribution and service (12b-1) fees; and other fund expenses. This example is intended to help you understand your ongoing costs (in dollars) of investing in the fund and to compare these costs with the ongoing costs of investing in other mutual funds.
The example is based on an investment of $1,000 invested at the beginning of the period and held for the entire period August 1, 2015 through January 31, 2016.
The expenses include the payment of a portion of the transfer-agent-related expenses of MFS funds that invest in the fund. For further information, please see the Notes to the Financial Statements.
Actual Expenses
The first line for each share class in the following table provides information about actual account values and actual expenses. You may use the information in this line, together with the amount you invested, to estimate the expenses that you paid over the period. Simply divide your account value by $1,000 (for example, an $8,600 account value divided by $1,000 = 8.6), then multiply the result by the number in the first line under the heading entitled “Expenses Paid During Period” to estimate the expenses you paid on your account during this period.
Hypothetical Example for Comparison Purposes
The second line for each share class in the following table provides information about hypothetical account values and hypothetical expenses based on the fund’s actual expense ratio and an assumed rate of return of 5% per year before expenses, which is not the fund’s actual return. The hypothetical account values and expenses may not be used to estimate the actual ending account balance or expenses you paid for the period. You may use this information to compare the ongoing costs of investing in the fund and other funds. To do so, compare this 5% hypothetical example with the 5% hypothetical examples that appear in the shareholder reports of the other funds.
Please note that the expenses shown in the table are meant to highlight your ongoing
costs only and do not reflect any transactional costs, such as sales charges (loads). Therefore, the second line for each share class in the table is useful in comparing ongoing costs only, and will not help you determine the relative total costs of owning different funds. In addition, if these transactional costs were included, your costs would have been higher.
9
Expense Table – continued
| | | | | | | | | | | | | | | | | | |
Share
Class | | | | Annualized
Expense
Ratio | | | Beginning
Account Value
8/01/15 | | | Ending
Account Value
1/31/16 | | | Expenses
Paid During
Period (p)
8/01/15-1/31/16 | |
| A | | Actual | | | 0.96% | | | | $1,000.00 | | | | $929.67 | | | | $4.67 | |
| | Hypothetical (h) | | | 0.96% | | | | $1,000.00 | | | | $1,020.37 | | | | $4.89 | |
| B | | Actual | | | 1.71% | | | | $1,000.00 | | | | $923.49 | | | | $8.29 | |
| | Hypothetical (h) | | | 1.71% | | | | $1,000.00 | | | | $1,016.59 | | | | $8.69 | |
| C | | Actual | | | 1.71% | | | | $1,000.00 | | | | $926.43 | | | | $8.30 | |
| | Hypothetical (h) | | | 1.71% | | | | $1,000.00 | | | | $1,016.59 | | | | $8.69 | |
| I | | Actual | | | 0.72% | | | | $1,000.00 | | | | $927.88 | | | | $3.50 | |
| | Hypothetical (h) | | | 0.72% | | | | $1,000.00 | | | | $1,021.58 | | | | $3.67 | |
| R1 | | Actual | | | 1.72% | | | | $1,000.00 | | | | $926.15 | | | | $8.35 | |
| | Hypothetical (h) | | | 1.72% | | | | $1,000.00 | | | | $1,016.53 | | | | $8.74 | |
| R2 | | Actual | | | 1.22% | | | | $1,000.00 | | | | $928.50 | | | | $5.93 | |
| | Hypothetical (h) | | | 1.22% | | | | $1,000.00 | | | | $1,019.06 | | | | $6.21 | |
| R3 | | Actual | | | 0.97% | | | | $1,000.00 | | | | $929.68 | | | | $4.72 | |
| | Hypothetical (h) | | | 0.97% | | | | $1,000.00 | | | | $1,020.32 | | | | $4.94 | |
| R4 | | Actual | | | 0.72% | | | | $1,000.00 | | | | $930.85 | | | | $3.50 | |
| | Hypothetical (h) | | | 0.72% | | | | $1,000.00 | | | | $1,021.58 | | | | $3.67 | |
| R5 | | Actual | | | 0.62% | | | | $1,000.00 | | | | $931.33 | | | | $3.02 | |
| | Hypothetical (h) | | | 0.62% | | | | $1,000.00 | | | | $1,022.08 | | | | $3.16 | |
| 529A | | Actual | | | 1.00% | | | | $1,000.00 | | | | $926.56 | | | | $4.86 | |
| | Hypothetical (h) | | | 1.00% | | | | $1,000.00 | | | | $1,020.16 | | | | $5.09 | |
| 529B | | Actual | | | 1.77% | | | | $1,000.00 | | | | $925.91 | | | | $8.59 | |
| | Hypothetical (h) | | | 1.77% | | | | $1,000.00 | | | | $1,016.28 | | | | $9.00 | |
| 529C | | Actual | | | 1.76% | | | | $1,000.00 | | | | $923.26 | | | | $8.53 | |
| | Hypothetical (h) | | | 1.76% | | | | $1,000.00 | | | | $1,016.33 | | | | $8.94 | |
| (h) | 5% class return per year before expenses. |
| (p) | “Expenses Paid During Period” are equal to each class’s annualized expense ratio, as shown above, multiplied by the average account value over the period, multiplied by 184/365 (to reflect the one-half year period). Expenses paid do not include any applicable sales charges (loads). If these transaction costs had been included, your costs would have been higher. |
Notes to Expense Table
Each class with a Rule 12b-1 service fee is subject to a rebate of a portion of such fee. Such rebates are included in the expense ratios above. For Class A and Class 529A shares, this rebate reduced the expense ratios above by 0.01% and 0.02%, respectively. See Note 3 in the Notes to Financial Statements for additional information.
10
PORTFOLIO OF INVESTMENTS
1/31/16
The Portfolio of Investments is a complete list of all securities owned by your fund. It is categorized by broad-based asset classes.
| | | | | | | | |
| Bonds - 90.4% | | | | | | | | |
| Issuer | | Shares/Par | | | Value ($) | |
| Aerospace - 1.6% | | | | | | | | |
| Aerojet Rocketdyne Holdings, Inc., 7.125%, 3/15/21 | | $ | 6,465,000 | | | $ | 6,561,943 | |
| Bombardier, Inc., 6.125%, 1/15/23 (n) | | | 3,760,000 | | | | 2,575,600 | |
| Bombardier, Inc., 7.5%, 3/15/25 (n) | | | 2,680,000 | | | | 1,842,500 | |
| CPI International, Inc., 8.75%, 2/15/18 | | | 5,857,000 | | | | 5,710,575 | |
| TransDigm, Inc., 6%, 7/15/22 | | | 1,095,000 | | | | 1,073,100 | |
| TransDigm, Inc., 6.5%, 7/15/24 | | | 3,365,000 | | | | 3,289,288 | |
| | | | | | | | |
| | | | $ | 21,053,006 | |
| Apparel Manufacturers - 0.5% | | | | | | | | |
| Hanesbrands, Inc., 6.375%, 12/15/20 | | $ | 2,990,000 | | | $ | 3,102,484 | |
| PVH Corp., 4.5%, 12/15/22 | | | 3,485,000 | | | | 3,380,450 | |
| | | | | | | | |
| | | | $ | 6,482,934 | |
| Asset-Backed & Securitized - 0.0% | | | | | | | | |
| Citigroup Commercial Mortgage Trust, FRN, 5.898%, 12/10/49 | | $ | 2,948,120 | | | $ | 294,629 | |
| CW Capital Cobalt Commercial Mortgage Trust, “F”, CDO, FRN, 0%, 4/26/50 (a)(p)(z) | | | 675,577 | | | | 7 | |
| CW Capital Cobalt Commercial Mortgage Trust, “G”, CDO, FRN, 0%, 4/26/50 (a)(p)(z) | | | 2,119,783 | | | | 21 | |
| Falcon Franchise Loan LLC, FRN, 44.017%, 1/05/25 (i)(z) | | | 238,609 | | | | 57,658 | |
| LB Commercial Conduit Mortgage Trust, FRN, 1.191%, 2/18/30 (i) | | | 980,093 | | | | 9,492 | |
| Morgan Stanley Capital I, Inc., FRN, 1.405%, 4/28/39 (i)(z) | | | 4,495,266 | | | | 21,757 | |
| | | | | | | | |
| | | | $ | 383,564 | |
| Automotive - 2.6% | | | | | | | | |
| Accuride Corp., 9.5%, 8/01/18 | | $ | 6,635,000 | | | $ | 5,175,300 | |
| Goodyear Tire & Rubber Co., 6.5%, 3/01/21 | | | 6,665,000 | | | | 6,998,250 | |
| Goodyear Tire & Rubber Co., 7%, 5/15/22 | | | 1,340,000 | | | | 1,433,130 | |
| Lear Corp., 4.75%, 1/15/23 | | | 4,000,000 | | | | 4,040,000 | |
| Lear Corp., 5.25%, 1/15/25 | | | 3,160,000 | | | | 3,282,450 | |
| Schaeffler Finance B.V., 6.875%, 8/15/18 (n)(p) | | | 3,050,000 | | | | 3,133,875 | |
| Schaeffler Finance B.V., 4.75%, 5/15/21 (n) | | | 2,295,000 | | | | 2,295,000 | |
| Schaeffler Holding Finance B.V., 6.25%, 11/15/19 (n)(p) | | | 2,345,000 | | | | 2,444,663 | |
| ZF North America Capital, Inc., 4.5%, 4/29/22 (n) | | | 3,945,000 | | | | 3,801,994 | |
| ZF North America Capital, Inc., 4.75%, 4/29/25 (n) | | | 1,690,000 | | | | 1,584,375 | |
| | | | | | | | |
| | | | $ | 34,189,037 | |
| Broadcasting - 2.7% | | | | | | | | |
| Activision Blizzard, Inc., 6.125%, 9/15/23 (n) | | $ | 4,525,000 | | | $ | 4,841,750 | |
| AMC Networks, Inc., 7.75%, 7/15/21 | | | 4,811,000 | | | | 5,099,660 | |
11
Portfolio of Investments – continued
| | | | | | | | |
| Issuer | | Shares/Par | | | Value ($) | |
| Bonds - continued | | | | | | | | |
| Broadcasting - continued | | | | | | | | |
| Clear Channel Worldwide Holdings, Inc., “A”, 6.5%, 11/15/22 | | $ | 830,000 | | | $ | 738,700 | |
| Clear Channel Worldwide Holdings, Inc., “B”, 6.5%, 11/15/22 | | | 3,250,000 | | | | 3,010,313 | |
| iHeartMedia, Inc., 9%, 3/01/21 | | | 5,717,000 | | | | 3,716,050 | |
| Liberty Media Corp., 8.5%, 7/15/29 | | | 4,285,000 | | | | 4,274,288 | |
| Liberty Media Corp., 8.25%, 2/01/30 | | | 40,000 | | | | 39,600 | |
| Netflix, Inc., 5.375%, 2/01/21 | | | 3,625,000 | | | | 3,896,875 | |
| Netflix, Inc., 5.875%, 2/15/25 (n) | | | 1,580,000 | | | | 1,629,375 | |
| Nexstar Broadcasting, Inc., 6.875%, 11/15/20 | | | 4,675,000 | | | | 4,686,688 | |
| Tribune Media Co., 5.875%, 7/15/22 (n) | | | 3,410,000 | | | | 3,401,475 | |
| | | | | | | | |
| | | | $ | 35,334,774 | |
| Building - 3.1% | | | | | | | | |
| Allegion PLC, 5.875%, 9/15/23 | | $ | 1,155,000 | | | $ | 1,192,538 | |
| Allegion U.S. Holding Co., Inc., 5.75%, 10/01/21 | | | 7,161,000 | | | | 7,447,440 | |
| Beacon Roofing Supply, Inc., 6.375%, 10/01/23 (n) | | | 3,590,000 | | | | 3,702,188 | |
| Building Materials Corp. of America, 5.375%, 11/15/24 (n) | | | 3,160,000 | | | | 3,112,600 | |
| Building Materials Corp. of America, 6%, 10/15/25 (n) | | | 2,805,000 | | | | 2,861,100 | |
| Cimpor Financial Operations B.V., 5.75%, 7/17/24 | | | 1,088,000 | | | | 669,120 | |
| Gibraltar Industries, Inc., 6.25%, 2/01/21 | | | 4,755,000 | | | | 4,766,888 | |
| HD Supply, Inc., 7.5%, 7/15/20 | | | 5,575,000 | | | | 5,798,000 | |
| Headwaters, Inc., 7.25%, 1/15/19 | | | 3,150,000 | | | | 3,213,000 | |
| PriSo Acquisition Corp., 9%, 5/15/23 (n) | | | 3,530,000 | | | | 3,282,900 | |
| Summit Materials LLC/Summit Materials Finance Co., 6.125%, 7/15/23 | | | 4,315,000 | | | | 4,163,975 | |
| | | | | | | | |
| | | | $ | 40,209,749 | |
| Business Services - 1.6% | | | | | | | | |
| Equinix, Inc., 4.875%, 4/01/20 | | $ | 3,670,000 | | | $ | 3,807,625 | |
| Equinix, Inc., 5.375%, 1/01/22 | | | 1,620,000 | | | | 1,684,800 | |
| Equinix, Inc., 5.375%, 4/01/23 | | | 2,935,000 | | | | 3,037,725 | |
| Iron Mountain, Inc., REIT, 6%, 10/01/20 (n) | | �� | 2,085,000 | | | | 2,220,525 | |
| Iron Mountain, Inc., REIT, 6%, 8/15/23 | | | 5,205,000 | | | | 5,413,200 | |
| NeuStar, Inc., 4.5%, 1/15/23 | | | 5,870,000 | | | | 4,813,400 | |
| | | | | | | | |
| | | | $ | 20,977,275 | |
| Cable TV - 6.3% | | | | | | | | |
| Altice Financing S.A., 6.625%, 2/15/23 (n) | | $ | 6,665,000 | | | $ | 6,548,363 | |
| CCO Holdings LLC/CCO Holdings Capital Corp., 7.375%, 6/01/20 | | | 1,305,000 | | | | 1,357,200 | |
| CCO Holdings LLC/CCO Holdings Capital Corp., 6.5%, 4/30/21 | | | 6,610,000 | | | | 6,895,023 | |
| CCO Holdings LLC/CCO Holdings Capital Corp., 5.125%, 5/01/23 (n) | | | 3,550,000 | | | | 3,550,000 | |
| CCO Holdings LLC/CCO Holdings Capital Corp., 5.75%, 1/15/24 | | | 5,645,000 | | | | 5,807,294 | |
| CCO Holdings LLC/CCO Holdings Capital Corp., 5.375%, 5/01/25 (n) | | | 1,395,000 | | | | 1,381,050 | |
12
Portfolio of Investments – continued
| | | | | | | | |
| Issuer | | Shares/Par | | | Value ($) | |
| Bonds - continued | | | | | | | | |
| Cable TV - continued | | | | | | | | |
| Cequel Communications Holdings, 6.375%, 9/15/20 (n) | | $ | 5,430,000 | | | $ | 5,246,738 | |
| DISH DBS Corp., 6.75%, 6/01/21 | | | 3,410,000 | | | | 3,478,200 | |
| DISH DBS Corp., 5%, 3/15/23 | | | 2,975,000 | | | | 2,588,250 | |
| DISH DBS Corp., 5.875%, 11/15/24 | | | 1,495,000 | | | | 1,332,419 | |
| Intelsat Jackson Holdings S.A., 7.25%, 4/01/19 | | | 2,880,000 | | | | 2,613,600 | |
| Intelsat Jackson Holdings S.A., 6.625%, 12/15/22 | | | 4,575,000 | | | | 2,962,313 | |
| Intelsat Jackson Holdings S.A., 5.5%, 8/01/23 | | | 5,075,000 | | | | 4,047,313 | |
| Intelsat Luxembourg S.A., 8.125%, 6/01/23 | | | 5,705,000 | | | | 2,353,313 | |
| LGE Holdco VI B.V., 7.125%, 5/15/24 (n) | | | 2,225,000 | | | | 2,591,359 | |
| Lynx I Corp., 5.375%, 4/15/21 (n) | | | 1,417,500 | | | | 1,449,394 | |
| Lynx II Corp., 6.375%, 4/15/23 (n) | | | 2,635,000 | | | | 2,700,875 | |
| Neptune Finco Corp., 10.875%, 10/15/25 (n) | | | 2,700,000 | | | | 2,855,250 | |
| SIRIUS XM Radio, Inc., 4.25%, 5/15/20 (n) | | | 1,020,000 | | | | 1,035,300 | |
| SIRIUS XM Radio, Inc., 5.875%, 10/01/20 (n) | | | 460,000 | | | | 479,550 | |
| SIRIUS XM Radio, Inc., 4.625%, 5/15/23 (n) | | | 2,750,000 | | | | 2,695,000 | |
| SIRIUS XM Radio, Inc., 6%, 7/15/24 (n) | | | 2,340,000 | | | | 2,451,150 | |
| SIRIUS XM Radio, Inc., 5.375%, 4/15/25 (n) | | | 2,285,000 | | | | 2,296,425 | |
| Unitymedia Hessen, 5.5%, 1/15/23 (n) | | | 4,235,000 | | | | 4,428,031 | |
| Unitymedia KabelBW GmbH, 6.125%, 1/15/25 (n) | | | 3,000,000 | | | | 3,045,600 | |
| Virgin Media Finance PLC, 5.75%, 1/15/25 (n) | | | 1,125,000 | | | | 1,113,750 | |
| Virgin Media Secured Finance PLC, 5.25%, 1/15/26 (n) | | | 3,185,000 | | | | 3,153,150 | |
| Ziggo Bond Finance B.V., 5.875%, 1/15/25 (n) | | | 2,000,000 | | | | 1,835,000 | |
| | | | | | | | |
| | | | $ | 82,290,910 | |
| Chemicals - 2.2% | | | | | | | | |
| Flash Dutch 2 B.V./U.S. Coatings Acquisition, 7.375%, 5/01/21 (n) | | $ | 3,930,000 | | | $ | 4,124,024 | |
| GCP Applied Technologies Co., 9.5%, 2/01/23 (n) | | | 2,125,000 | | | | 2,247,188 | |
| Hexion U.S. Finance Corp., 6.625%, 4/15/20 | | | 2,495,000 | | | | 1,933,625 | |
| Hexion U.S. Finance Corp./Hexion Nova Scotia Finance, 8.875%, 2/01/18 | | | 2,975,000 | | | | 2,023,000 | |
| INEOS Group Holdings S.A., 6.125%, 8/15/18 (n) | | | 3,665,000 | | | | 3,660,419 | |
| Momentive Performance Materials, Inc., 3.88%, 10/24/21 | | | 2,220,000 | | | | 1,492,950 | |
| The Chemours Co., 6.625%, 5/15/23 (n) | | | 2,860,000 | | | | 1,751,750 | |
| Tronox Finance LLC, 6.375%, 8/15/20 | | | 6,715,000 | | | | 4,146,513 | |
| Tronox Finance LLC, 7.5%, 3/15/22 (n) | | | 3,830,000 | | | | 2,307,575 | |
| W.R. Grace & Co., 5.125%, 10/01/21 (n) | | | 5,585,000 | | | | 5,612,925 | |
| | | | | | | | |
| | | | $ | 29,299,969 | |
| Computer Software - 0.4% | | | | | | | | |
| Syniverse Holdings, Inc., 9.125%, 1/15/19 | | $ | 1,453,000 | | | $ | 552,140 | |
| VeriSign, Inc., 4.625%, 5/01/23 | | | 5,390,000 | | | | 5,282,200 | |
| | | | | | | | |
| | | | $ | 5,834,340 | |
13
Portfolio of Investments – continued
| | | | | | | | |
| Issuer | | Shares/Par | | | Value ($) | |
| Bonds - continued | | | | | | | | |
| Computer Software - Systems - 0.8% | | | | | | | | |
| CDW LLC/CDW Finance Corp., 6%, 8/15/22 | | $ | 2,200,000 | | | $ | 2,312,750 | |
| CDW LLC/CDW Finance Corp., 5.5%, 12/01/24 | | | 2,115,000 | | | | 2,200,911 | |
| Sabre GLBL, Inc., 5.375%, 4/15/23 (n) | | | 5,925,000 | | | | 5,954,625 | |
| | | | | | | | |
| | | | $ | 10,468,286 | |
| Conglomerates - 2.6% | | | | | | | | |
| Accudyne Industries Borrower S.C.A., 7.75%, 12/15/20 (n) | | $ | 3,030,000 | | | $ | 2,075,550 | |
| Amsted Industries Co., 5%, 3/15/22 (n) | | | 6,495,000 | | | | 6,430,050 | |
| BC Mountain LLC, 7%, 2/01/21 (n) | | | 5,585,000 | | | | 4,049,125 | |
| EnerSys, 5%, 4/30/23 (n) | | | 6,750,000 | | | | 6,648,750 | |
| Enpro Industries, Inc., 5.875%, 9/15/22 | | | 5,660,000 | | | | 5,504,350 | |
| Entegris, Inc., 6%, 4/01/22 (n) | | | 5,005,000 | | | | 5,080,075 | |
| Renaissance Acquisition, 6.875%, 8/15/21 (n) | | | 5,585,000 | | | | 4,104,975 | |
| | | | | | | | |
| | | | $ | 33,892,875 | |
| Construction - 0.1% | | | | | | | | |
| Empresas ICA S.A.B. de C.V., 8.9%, 2/04/21 | | $ | 2,555,000 | | | $ | 472,675 | |
| Empresas ICA S.A.B. de C.V., 8.875%, 5/29/24 (a)(d)(n) | | | 1,546,000 | | | | 286,010 | |
| | | | | | | | |
| | | | $ | 758,685 | |
| Consumer Products - 1.2% | | | | | | | | |
| Alphabet Holding Co., Inc., 7.75%, 11/01/17 | | $ | 635,000 | | | $ | 620,713 | |
| Elizabeth Arden, Inc., 7.375%, 3/15/21 | | | 2,245,000 | | | | 1,492,925 | |
| Prestige Brands, Inc., 8.125%, 2/01/20 | | | 1,531,000 | | | | 1,588,413 | |
| Prestige Brands, Inc., 5.375%, 12/15/21 (n) | | | 4,125,000 | | | | 4,021,875 | |
| Spectrum Brands, Inc., 6.375%, 11/15/20 | | | 4,360,000 | | | | 4,599,800 | |
| Spectrum Brands, Inc., 6.125%, 12/15/24 (n) | | | 710,000 | | | | 738,400 | |
| Spectrum Brands, Inc., 5.75%, 7/15/25 (n) | | | 2,210,000 | | | | 2,265,250 | |
| | | | | | | | |
| | | | $ | 15,327,376 | |
| Consumer Services - 2.4% | | | | | | | | |
| ADT Corp., 6.25%, 10/15/21 | | $ | 6,995,000 | | | $ | 7,257,313 | |
| ADT Corp., 4.125%, 6/15/23 | | | 1,585,000 | | | | 1,458,200 | |
| CEB, Inc., 5.625%, 6/15/23 (n) | | | 4,125,000 | | | | 4,125,000 | |
| Garda World Security Corp., 7.25%, 11/15/21 (n) | | | 2,905,000 | | | | 2,265,900 | |
| Garda World Security Corp., 7.25%, 11/15/21 (n) | | | 2,325,000 | | | | 1,813,500 | |
| Interval Acquisition Corp., 5.625%, 4/15/23 (n) | | | 7,375,000 | | | | 7,338,125 | |
| Monitronics International, Inc., 9.125%, 4/01/20 | | | 4,750,000 | | | | 3,811,875 | |
| Service Corp. International, 5.375%, 5/15/24 | | | 3,295,000 | | | | 3,484,463 | |
| | | | | | | | |
| | | | $ | 31,554,376 | |
| Containers - 4.1% | | | | | | | | |
| Ardagh Packaging Finance PLC, 7%, 11/15/20 (n) | | $ | 748,235 | | | $ | 708,953 | |
| Ardagh Packaging Finance PLC, 9.125%, 10/15/20 (n) | | | 4,510,000 | | | | 4,538,188 | |
14
Portfolio of Investments – continued
| | | | | | | | |
| Issuer | | Shares/Par | | | Value ($) | |
| Bonds - continued | | | | | | | | |
| Containers - continued | | | | | | | | |
| Ball Corp., 5%, 3/15/22 | | $ | 3,515,000 | | | $ | 3,638,025 | |
| Berry Plastics Group, Inc., 5.5%, 5/15/22 | | | 5,470,000 | | | | 5,456,325 | |
| Berry Plastics Group, Inc., 6%, 10/15/22 (n) | | | 1,550,000 | | | | 1,581,000 | |
| Crown American LLC, 4.5%, 1/15/23 | | | 6,220,000 | | | | 6,157,800 | |
| Multi-Color Corp., 6.125%, 12/01/22 (n) | | | 5,020,000 | | | | 4,982,350 | |
| Plastipak Holdings, Inc., 6.5%, 10/01/21 (n) | | | 4,207,000 | | | | 4,028,203 | |
| Reynolds Group, 9.875%, 8/15/19 | | | 512,000 | | | | 500,480 | |
| Reynolds Group, 5.75%, 10/15/20 | | | 2,760,000 | | | | 2,763,450 | |
| Reynolds Group, 8.25%, 2/15/21 | | | 7,070,000 | | | | 6,592,775 | |
| Sealed Air Corp., 4.875%, 12/01/22 (n) | | | 5,815,000 | | | | 5,854,949 | |
| Sealed Air Corp., 5.125%, 12/01/24 (n) | | | 1,355,000 | | | | 1,355,000 | |
| Signode Industrial Group, 6.375%, 5/01/22 (n) | | | 6,230,000 | | | | 5,170,900 | |
| | | | | | | | |
| | | | $ | 53,328,398 | |
| Electrical Equipment - 0.0% | | | | | | | | |
| Avaya, Inc., 10.5%, 3/01/21 (n) | | $ | 2,175,000 | | | $ | 543,750 | |
| | |
| Electronics - 1.7% | | | | | | | | |
| Advanced Micro Devices, Inc., 6.75%, 3/01/19 | | $ | 3,600,000 | | | $ | 2,457,000 | |
| Advanced Micro Devices, Inc., 7%, 7/01/24 | | | 2,325,000 | | | | 1,441,500 | |
| Micron Technology, Inc., 5.875%, 2/15/22 | | | 3,305,000 | | | | 2,941,450 | |
| Micron Technology, Inc., 5.5%, 2/01/25 | | | 3,530,000 | | | | 2,788,700 | |
| NXP B.V., 5.75%, 2/15/21 (n) | | | 2,100,000 | | | | 2,173,500 | |
| NXP B.V., 5.75%, 3/15/23 (n) | | | 4,875,000 | | | | 4,975,523 | |
| Sensata Technologies B.V., 5.625%, 11/01/24 (n) | | | 3,145,000 | | | | 3,207,900 | |
| Sensata Technologies B.V., 5%, 10/01/25 (n) | | | 2,100,000 | | | | 2,021,250 | |
| | | | | | | | |
| | | | $ | 22,006,823 | |
| Energy - Independent - 3.4% | | | | | | | | |
| Baytex Energy Corp., 5.625%, 6/01/24 (n) | | $ | 2,210,000 | | | $ | 1,281,800 | |
| Bonanza Creek Energy, Inc., 6.75%, 4/15/21 | | | 4,375,000 | | | | 1,717,188 | |
| Bonanza Creek Energy, Inc., 5.75%, 2/01/23 | | | 1,320,000 | | | | 475,200 | |
| Chaparral Energy, Inc., 7.625%, 11/15/22 | | | 5,800,000 | | | | 1,102,000 | |
| Chesapeake Energy Corp., 5.75%, 3/15/23 | | | 6,550,000 | | | | 1,801,250 | |
| Concho Resources, Inc., 6.5%, 1/15/22 | | | 3,465,000 | | | | 3,239,775 | |
| Concho Resources, Inc., 5.5%, 4/01/23 | | | 5,495,000 | | | | 4,983,910 | |
| EP Energy LLC, 9.375%, 5/01/20 | | | 3,795,000 | | | | 1,612,875 | |
| EP Energy LLC, 7.75%, 9/01/22 | | | 6,260,000 | | | | 2,191,000 | |
| Halcon Resources Corp., 8.875%, 5/15/21 | | | 5,245,000 | | | | 760,525 | |
| Linn Energy LLC/Linn Energy Finance Corp., 8.625%, 4/15/20 | | | 2,655,000 | | | | 398,250 | |
| Linn Energy LLC/Linn Energy Finance Corp., 7.75%, 2/01/21 | | | 5,201,000 | | | | 624,120 | |
| Linn Energy LLC/Linn Energy Finance Corp., 6.5%, 9/15/21 | | | 2,765,000 | | | | 311,118 | |
| Northern Blizzard Resources, Inc., 7.25%, 2/01/22 (n) | | | 3,885,000 | | | | 2,777,775 | |
15
Portfolio of Investments – continued
| | | | | | | | |
| Issuer | | Shares/Par | | | Value ($) | |
| Bonds - continued | | | | | | | | |
| Energy - Independent - continued | | | | | | | | |
| Oasis Petroleum, Inc., 6.875%, 3/15/22 | | $ | 5,030,000 | | | $ | 2,917,400 | |
| QEP Resources, Inc., 5.25%, 5/01/23 | | | 8,230,000 | | | | 5,596,400 | |
| RSP Permian, Inc., 6.625%, 10/01/22 | | | 4,330,000 | | | | 3,853,700 | |
| Sanchez Energy Corp., 6.125%, 1/15/23 | | | 6,185,000 | | | | 2,474,000 | |
| SM Energy Co., 6.5%, 11/15/21 | | | 5,450,000 | | | | 3,172,990 | |
| SM Energy Co., 6.125%, 11/15/22 | | | 2,440,000 | | | | 1,403,000 | |
| WPX Energy, Inc., 6%, 1/15/22 | | | 2,840,000 | | | | 1,647,200 | |
| | | | | | | | |
| | | | $ | 44,341,476 | |
| Entertainment - 1.8% | | | | | | | | |
| Carmike Cinemas, Inc., 6%, 6/15/23 (n) | | $ | 2,220,000 | | | $ | 2,300,475 | |
| Cedar Fair LP, 5.25%, 3/15/21 | | | 5,270,000 | | | | 5,401,750 | |
| Cedar Fair LP, 5.375%, 6/01/24 | | | 1,790,000 | | | | 1,798,950 | |
| Cinemark USA, Inc., 5.125%, 12/15/22 | | | 2,805,000 | | | | 2,819,025 | |
| Cinemark USA, Inc., 4.875%, 6/01/23 | | | 2,495,000 | | | | 2,451,338 | |
| NCL Corp. Ltd., 5.25%, 11/15/19 (n) | | | 3,755,000 | | | | 3,773,775 | |
| Six Flags Entertainment Corp., 5.25%, 1/15/21 (n) | | | 4,755,000 | | | | 4,842,017 | |
| | | | | | | | |
| | | | $ | 23,387,330 | |
| Financial Institutions - 5.0% | | | | | | | | |
| Aircastle Ltd., 4.625%, 12/15/18 | | $ | 3,385,000 | | | $ | 3,414,619 | |
| Aircastle Ltd., 5.125%, 3/15/21 | | | 2,710,000 | | | | 2,676,125 | |
| Aircastle Ltd., 5.5%, 2/15/22 | | | 2,135,000 | | | | 2,124,325 | |
| CIT Group, Inc., 5.25%, 3/15/18 | | | 3,330,000 | | | | 3,440,290 | |
| CIT Group, Inc., 6.625%, 4/01/18 (n) | | | 5,369,000 | | | | 5,675,033 | |
| CIT Group, Inc., 5.5%, 2/15/19 (n) | | | 5,562,000 | | | | 5,742,765 | |
| CIT Group, Inc., 5%, 8/15/22 | | | 1,690,000 | | | | 1,709,055 | |
| Credit Acceptance Co., 7.375%, 3/15/23 (n) | | | 2,875,000 | | | | 2,781,563 | |
| Icahn Enterprises LP, 6%, 8/01/20 | | | 4,240,000 | | | | 3,979,876 | |
| Icahn Enterprises LP, 5.875%, 2/01/22 | | | 6,210,000 | | | | 5,550,188 | |
| Nationstar Mortgage LLC/Capital Corp., 6.5%, 8/01/18 | | | 3,450,000 | | | | 3,329,250 | |
| Nationstar Mortgage LLC/Capital Corp., 7.875%, 10/01/20 | | | 6,635,000 | | | | 6,319,838 | |
| Navient Corp., 8%, 3/25/20 | | | 6,735,000 | | | | 6,633,975 | |
| Navient Corp., 5.875%, 3/25/21 | | | 2,040,000 | | | | 1,764,600 | |
| Navient Corp., 7.25%, 1/25/22 | | | 5,845,000 | | | | 5,202,050 | |
| Navient Corp., 6.125%, 3/25/24 | | | 2,140,000 | | | | 1,757,475 | |
| PHH Corp., 6.375%, 8/15/21 | | | 3,525,000 | | | | 3,057,938 | |
| | | | | | | | |
| | | | $ | 65,158,965 | |
| Food & Beverages - 0.8% | | | | | | | | |
| Darling Ingredients, Inc., 5.375%, 1/15/22 | | $ | 4,325,000 | | | $ | 4,238,500 | |
| Pinnacle Foods Finance LLC/Pinnacle Foods Finance Corp., 5.875%, 1/15/24 (n) | | | 1,195,000 | | | | 1,236,825 | |
16
Portfolio of Investments – continued
| | | | | | | | |
| Issuer | | Shares/Par | | | Value ($) | |
| Bonds - continued | | | | | | | | |
| Food & Beverages - continued | | | | | | | | |
| Sun Merger Sub, Inc., 5.875%, 8/01/21 (n) | | $ | 5,605,000 | | | $ | 5,689,075 | |
| | | | | | | | |
| | | | $ | 11,164,400 | |
| Forest & Paper Products - 0.2% | | | | | | | | |
| Appvion, Inc., 9%, 6/01/20 (n) | | $ | 4,005,000 | | | $ | 1,301,625 | |
| Tembec Industries, Inc., 9%, 12/15/19 (n) | | | 2,725,000 | | | | 1,723,563 | |
| | | | | | | | |
| | | | $ | 3,025,188 | |
| Gaming & Lodging - 3.5% | | | | | | | | |
| CCM Merger, Inc., 9.125%, 5/01/19 (n) | | $ | 5,077,000 | | | $ | 5,229,310 | |
| Eldorado Resorts, Inc., 7%, 8/01/23 (n) | | | 1,525,000 | | | | 1,502,125 | |
| GLP Capital LP/GLP Financing II, Inc., 5.375%, 11/01/23 | | | 4,340,000 | | | | 4,155,550 | |
| Greektown Holdings LLC, 8.875%, 3/15/19 (n) | | | 4,640,000 | | | | 4,570,400 | |
| Hilton Worldwide Finance LLC/Hilton Worldwide Finance Corp., 5.625%, 10/15/21 | | | 6,095,000 | | | | 6,277,850 | |
| Isle of Capri Casinos, Inc., 8.875%, 6/15/20 | | | 1,385,000 | | | | 1,461,175 | |
| Isle of Capri Casinos, Inc., 5.875%, 3/15/21 | | | 5,285,000 | | | | 5,403,913 | |
| MGM Resorts International, 6.625%, 12/15/21 | | | 4,660,000 | | | | 4,788,150 | |
| MGM Resorts International, 6%, 3/15/23 | | | 4,885,000 | | | | 4,869,734 | |
| Ryman Hospitality Properties, Inc., REIT, 5%, 4/15/21 | | | 6,215,000 | | | | 6,292,688 | |
| Ryman Hospitality Properties, Inc., REIT, 5%, 4/15/23 | | | 1,470,000 | | | | 1,464,488 | |
| | | | | | | | |
| | | | $ | 46,015,383 | |
| Industrial - 1.3% | | | | | | | | |
| Anixter, Inc., 5.125%, 10/01/21 | | $ | 4,025,000 | | | $ | 3,924,375 | |
| Dematic S.A., 7.75%, 12/15/20 (n) | | | 7,015,000 | | | | 6,927,313 | |
| Howard Hughes Corp., 6.875%, 10/01/21 (n) | | | 5,615,000 | | | | 5,615,000 | |
| | | | | | | | |
| | | | $ | 16,466,688 | |
| Insurance - Health - 0.3% | | | | | | | | |
| Centene Escrow Corp., 5.625%, 2/15/21 (n) | | $ | 2,025,000 | | | $ | 2,060,438 | |
| Centene Escrow Corp., 6.125%, 2/15/24 (n) | | | 2,025,000 | | | | 2,080,688 | |
| | | | | | | | |
| | | | $ | 4,141,126 | |
| Machinery & Tools - 1.5% | | | | | | | | |
| Ashtead Capital, Inc., 5.625%, 10/01/24 (n) | | $ | 4,560,000 | | | $ | 4,389,000 | |
| CNH Industrial Capital LLC, 4.375%, 11/06/20 | | | 4,860,000 | | | | 4,617,000 | |
| H&E Equipment Services Co., 7%, 9/01/22 | | | 5,815,000 | | | | 5,320,725 | |
| Jurassic Holdings III, Inc., 6.875%, 2/15/21 (n) | | | 5,040,000 | | | | 3,024,000 | |
| Light Tower Rentals, Inc., 8.125%, 8/01/19 (n) | | | 4,015,000 | | | | 1,776,638 | |
| | | | | | | | |
| | | | $ | 19,127,363 | |
| Major Banks - 1.9% | | | | | | | | |
| Bank of America Corp., FRN, 6.1%, 12/29/49 | | $ | 12,450,000 | | | $ | 12,657,915 | |
| JPMorgan Chase & Co., 6% to 8/01/23, FRN to 12/29/49 | | | 6,865,000 | | | | 6,852,128 | |
17
Portfolio of Investments – continued
| | | | | | | | |
| Issuer | | Shares/Par | | | Value ($) | |
| Bonds - continued | | | | | | | | |
| Major Banks - continued | | | | | | | | |
| Royal Bank of Scotland Group PLC, 7.5% to 8/10/20, FRN to 12/29/49 | | $ | 5,085,000 | | | $ | 5,173,988 | |
| | | | | | | | |
| | | | $ | 24,684,031 | |
| Medical & Health Technology & Services - 5.7% | | | | | | | | |
| CHS/Community Health Systems, Inc., 6.875%, 2/01/22 | | $ | 8,520,000 | | | $ | 7,710,600 | |
| Davita Healthcare Partners, Inc., 5%, 5/01/25 | | | 5,385,000 | | | | 5,297,494 | |
| Davita, Inc., 5.125%, 7/15/24 | | | 2,205,000 | | | | 2,217,403 | |
| HCA, Inc., 4.25%, 10/15/19 | | | 5,110,000 | | | | 5,237,750 | |
| HCA, Inc., 7.5%, 2/15/22 | | | 6,995,000 | | | | 7,764,450 | |
| HCA, Inc., 5.875%, 3/15/22 | | | 4,855,000 | | | | 5,206,988 | |
| HCA, Inc., 5%, 3/15/24 | | | 2,930,000 | | | | 2,966,625 | |
| HCA, Inc., 5.375%, 2/01/25 | | | 3,110,000 | | | | 3,144,988 | |
| HCA, Inc., 5.875%, 2/15/26 | | | 2,275,000 | | | | 2,320,500 | |
| HealthSouth Corp., 5.125%, 3/15/23 | | | 5,075,000 | | | | 4,922,750 | |
| HealthSouth Corp., 5.75%, 11/01/24 (n) | | | 3,520,000 | | | | 3,474,557 | |
| LifePoint Hospitals, Inc., 5.5%, 12/01/21 | | | 2,900,000 | | | | 2,943,500 | |
| TeamHealth, Inc., 7.25%, 12/15/23 (n) | | | 900,000 | | | | 940,500 | |
| Tenet Healthcare Corp., 8%, 8/01/20 | | | 8,360,000 | | | | 8,380,900 | |
| Tenet Healthcare Corp., 4.5%, 4/01/21 | | | 3,365,000 | | | | 3,297,700 | |
| Tenet Healthcare Corp., 8.125%, 4/01/22 | | | 2,235,000 | | | | 2,240,588 | |
| Tenet Healthcare Corp., 6.75%, 6/15/23 | | | 3,330,000 | | | | 3,080,250 | |
| Universal Health Services, Inc., 7.625%, 8/15/20 | | | 3,770,000 | | | | 3,317,600 | |
| | | | | | | | |
| | | | $ | 74,465,143 | |
| Medical Equipment - 1.3% | | | | | | | | |
| Alere, Inc., 6.375%, 7/01/23 (n) | | $ | 4,437,000 | | | $ | 4,192,965 | |
| DJO Finco, Inc., 8.125%, 6/15/21 (n) | | | 4,185,000 | | | | 3,515,400 | |
| Hologic, Inc., 5.25%, 7/15/22 (n) | | | 5,230,000 | | | | 5,413,050 | |
| Teleflex, Inc., 5.25%, 6/15/24 | | | 4,155,000 | | | | 4,155,000 | |
| | | | | | | | |
| | | | $ | 17,276,415 | |
| Metals & Mining - 2.8% | | | | | | | | |
| Century Aluminum Co., 7.5%, 6/01/21 (n) | | $ | 4,270,000 | | | $ | 2,786,175 | |
| Commercial Metals Co., 4.875%, 5/15/23 | | | 4,343,000 | | | | 3,610,119 | |
| Consol Energy, Inc., 5.875%, 4/15/22 | | | 4,540,000 | | | | 2,933,975 | |
| Consol Energy, Inc., 8%, 4/01/23 | | | 3,560,000 | | | | 2,385,200 | |
| First Quantum Minerals Ltd., 7.25%, 10/15/19 (n) | | | 6,523,000 | | | | 3,033,195 | |
| First Quantum Minerals Ltd., 7.25%, 5/15/22 (n) | | | 1,583,000 | | | | 712,350 | |
| GrafTech International Co., 6.375%, 11/15/20 | | | 5,255,000 | | | | 2,995,350 | |
| Hudbay Minerals, Inc., 9.5%, 10/01/20 | | | 4,955,000 | | | | 3,047,325 | |
| Lundin Mining Corp., 7.5%, 11/01/20 (n) | | | 2,300,000 | | | | 1,955,000 | |
| Lundin Mining Corp., 7.875%, 11/01/22 (n) | | | 2,210,000 | | | | 1,784,575 | |
| Steel Dynamics, Inc., 5.125%, 10/01/21 | | | 1,670,000 | | | | 1,557,275 | |
18
Portfolio of Investments – continued
| | | | | | | | |
| Issuer | | Shares/Par | | | Value ($) | |
| Bonds - continued | | | | | | | | |
| Metals & Mining - continued | | | | | | | | |
| Steel Dynamics, Inc., 5.25%, 4/15/23 | | $ | 1,610,000 | | | $ | 1,461,075 | |
| Steel Dynamics, Inc., 5.5%, 10/01/24 | | | 2,170,000 | | | | 1,958,425 | |
| Suncoke Energy Partners LP/Suncoke Energy Partners Finance Corp., 7.375%, 2/01/20 (n) | | | 1,440,000 | | | | 817,200 | |
| Suncoke Energy Partners LP/Suncoke Energy Partners Finance Corp., 7.375%, 2/01/20 (n) | | | 3,555,000 | | | | 2,017,463 | |
| Suncoke Energy, Inc., 7.625%, 8/01/19 | | | 600,000 | | | | 571,500 | |
| TMS International Corp., 7.625%, 10/15/21 (n) | | | 3,655,000 | | | | 2,823,488 | |
| | | | | | | | |
| | | | $ | 36,449,690 | |
| Midstream - 5.0% | | | | | | | | |
| AmeriGas Finance LLC, 6.75%, 5/20/20 | | $ | 6,730,000 | | | $ | 6,662,700 | |
| Blue Racer Midstream LLC/Blue Racer Finance Corp., 6.125%, 11/15/22 (n) | | | 4,055,000 | | | | 3,031,113 | |
| Crestwood Midstream Partners LP, 6%, 12/15/20 | | | 3,215,000 | | | | 2,037,506 | |
| Crestwood Midstream Partners LP, 6.125%, 3/01/22 | | | 2,420,000 | | | | 1,458,050 | |
| Energy Transfer Equity LP, 7.5%, 10/15/20 | | | 8,205,000 | | | | 7,220,400 | |
| Ferrellgas LP/Ferrellgas Finance Corp., 6.5%, 5/01/21 | | | 2,035,000 | | | | 1,605,106 | |
| Ferrellgas LP/Ferrellgas Finance Corp., 6.75%, 1/15/22 | | | 6,540,000 | | | | 5,150,250 | |
| Kinder Morgan (Delaware), Inc., 7.75%, 1/15/32 | | | 9,840,000 | | | | 9,238,264 | |
| MPLX LP, 5.5%, 2/15/23 (n) | | | 3,605,000 | | | | 2,995,827 | |
| MPLX LP, 4.5%, 7/15/23 (n) | | | 4,669,000 | | | | 3,656,154 | |
| Sabine Pass Liquefaction LLC, 5.625%, 2/01/21 | | | 4,840,000 | | | | 4,428,600 | |
| Sabine Pass Liquefaction LLC, 5.625%, 4/15/23 | | | 7,070,000 | | | | 6,203,925 | |
| Sabine Pass Liquefaction LLC, 5.75%, 5/15/24 | | | 2,130,000 | | | | 1,869,075 | |
| Sabine Pass Liquefaction LLC, 5.625%, 3/01/25 | | | 3,370,000 | | | | 2,898,200 | |
| Summit Midstream Holdings LLC/Summit Midstream Finance Corp., 7.5%, 7/01/21 | | | 2,490,000 | | | | 1,817,700 | |
| Summit Midstream Holdings LLC/Summit Midstream Finance Corp., 5.5%, 8/15/22 | | | 1,365,000 | | | | 859,950 | |
| Targa Resources Partners LP/Targa Resources Finance Corp., 5%, 1/15/18 | | | 1,390,000 | | | | 1,297,913 | |
| Targa Resources Partners LP/Targa Resources Finance Corp., 4.125%, 11/15/19 | | | 2,670,000 | | | | 2,242,800 | |
| Targa Resources Partners LP/Targa Resources Finance Corp., 5.25%, 5/01/23 | | | 1,385,000 | | | | 1,073,375 | |
| | | | | | | | |
| | | | $ | 65,746,908 | |
| Network & Telecom - 1.6% | | | | | | | | |
| Centurylink, Inc., 6.45%, 6/15/21 | | $ | 4,215,000 | | | $ | 4,107,012 | |
| Centurylink, Inc., 7.65%, 3/15/42 | | | 4,390,000 | | | | 3,292,500 | |
| Frontier Communications Corp., 8.125%, 10/01/18 | | | 1,030,000 | | | | 1,051,888 | |
| Frontier Communications Corp., 6.25%, 9/15/21 | | | 1,995,000 | | | | 1,680,788 | |
19
Portfolio of Investments – continued
| | | | | | | | |
| Issuer | | Shares/Par | | | Value ($) | |
| Bonds - continued | | | | | | | | |
| Network & Telecom - continued | | | | | | | | |
| Frontier Communications Corp., 7.125%, 1/15/23 | | $ | 2,325,000 | | | $ | 1,935,563 | |
| Frontier Communications Corp., 11%, 9/15/25 (n) | | | 2,000,000 | | | | 1,927,500 | |
| Frontier Communications Corp., 9%, 8/15/31 | | | 2,535,000 | | | | 2,015,325 | |
| Telecom Italia Capital, 6%, 9/30/34 | | | 1,515,000 | | | | 1,355,925 | |
| Telecom Italia S.p.A., 5.303%, 5/30/24 (n) | | | 4,255,000 | | | | 4,148,625 | |
| | | | | | | | |
| | | | $ | 21,515,126 | |
| Oil Services - 0.5% | | | | | | | | |
| Bristow Group, Inc., 6.25%, 10/15/22 | | $ | 5,520,000 | | | $ | 3,795,000 | |
| Pacific Drilling S.A., 5.375%, 6/01/20 (n) | | | 4,320,000 | | | | 1,036,800 | |
| Shale-Inland Holdings LLC/Finance Co., 8.75%, 11/15/19 (n) | | | 2,655,000 | | | | 1,659,375 | |
| | | | | | | | |
| | | | $ | 6,491,175 | |
| Oils - 0.6% | | | | | | | | |
| CITGO Holding, Inc., 10.75%, 2/15/20 (n) | | $ | 2,330,000 | | | $ | 2,213,500 | |
| CITGO Petroleum Corp., 6.25%, 8/15/22 (n) | | | 5,470,000 | | | | 5,237,525 | |
| | | | | | | | |
| | | | $ | 7,451,025 | |
| Other Banks & Diversified Financials - 0.4% | | | | | | | | |
| Groupe BPCE S.A., 12.5% to 9/30/19, FRN to 8/29/49 (n) | | $ | 3,895,000 | | | $ | 4,940,145 | |
| | |
| Pharmaceuticals - 2.8% | | | | | | | | |
| Capsugel S.A., 7%, 5/15/19 (n)(p) | | $ | 1,910,000 | | | $ | 1,867,025 | |
| Endo Finance LLC/Endo Finco, Inc., 6%, 7/15/23 (n) | | | 2,265,000 | | | | 2,276,325 | |
| Endo Finance LLC/Endo Finco, Inc., 7.75%, 1/15/22 (n) | | | 5,945,000 | | | | 6,205,094 | |
| Endo Finance LLC/Endo Finco, Inc., 6%, 2/01/25 (n) | | | 1,170,000 | | | | 1,155,515 | |
| Mallinckrodt International Finance S.A., 5.75%, 8/01/22 (n) | | | 3,440,000 | | | | 3,285,200 | |
| Mallinckrodt International Finance S.A., 5.5%, 4/15/25 (n) | | | 1,410,000 | | | | 1,254,900 | |
| Valeant Pharmaceuticals International, Inc., 7%, 10/01/20 (n) | | | 7,435,000 | | | | 7,323,475 | |
| Valeant Pharmaceuticals International, Inc., 7.25%, 7/15/22 (n) | | | 3,850,000 | | | | 3,753,750 | |
| Valeant Pharmaceuticals International, Inc., 5.5%, 3/01/23 (n) | | | 2,070,000 | | | | 1,826,775 | |
| Vantage Point Imaging, 7.5%, 7/15/21 (n) | | | 2,850,000 | | | | 2,826,844 | |
| VRX Escrow Corp., 5.875%, 5/15/23 (n) | | | 5,800,000 | | | | 5,191,000 | |
| | | | | | | | |
| | | | $ | 36,965,903 | |
| Precious Metals & Minerals - 0.6% | | | | | | | | |
| Aurico Gold, Inc., 7.75%, 4/01/20 (n) | | $ | 3,865,000 | | | $ | 3,217,613 | |
| Eldorado Gold Corp., 6.125%, 12/15/20 (n) | | | 5,635,000 | | | | 4,719,313 | |
| | | | | | | | |
| | | | $ | 7,936,926 | |
| Printing & Publishing - 1.4% | | | | | | | | |
| American Media, Inc., 13.5%, 6/15/18 (z) | | $ | 297,449 | | | $ | 293,359 | |
| Nielsen Finance LLC, 5%, 4/15/22 (n) | | | 7,230,000 | | | | 7,293,263 | |
20
Portfolio of Investments – continued
| | | | | | | | |
| Issuer | | Shares/Par | | | Value ($) | |
| Bonds - continued | | | | | | | | |
| Printing & Publishing - continued | | | | | | | | |
| Outdoor Americas Capital LLC/Outfront Media Capital Corp., 5.625%, 2/15/24 | | $ | 2,685,000 | | | $ | 2,745,413 | |
| TEGNA, Inc., 5.125%, 7/15/20 | | | 1,645,000 | | | | 1,702,575 | |
| TEGNA, Inc., 4.875%, 9/15/21 (n) | | | 2,120,000 | | | | 2,130,600 | |
| TEGNA, Inc., 6.375%, 10/15/23 | | | 3,430,000 | | | | 3,618,650 | |
| | | | | | | | |
| | | | $ | 17,783,860 | |
| Real Estate - Healthcare - 0.6% | | | | | | | | |
| MPT Operating Partnership LP, REIT, 6.875%, 5/01/21 | | $ | 3,435,000 | | | $ | 3,555,225 | |
| MPT Operating Partnership LP, REIT, 6.375%, 2/15/22 | | | 3,810,000 | | | | 3,867,150 | |
| | | | | | | | |
| | | | $ | 7,422,375 | |
| Real Estate - Other - 0.9% | | | | | | | | |
| DuPont Fabros Technology LP, REIT, 5.875%, 9/15/21 | | $ | 6,825,000 | | | $ | 7,029,750 | |
| Felcor Lodging LP, REIT, 5.625%, 3/01/23 | | | 5,205,000 | | | | 5,198,494 | |
| | | | | | | | |
| | | | $ | 12,228,244 | |
| Retailers - 2.2% | | | | | | | | |
| Best Buy Co., Inc., 5.5%, 3/15/21 | | $ | 5,055,000 | | | $ | 5,105,550 | |
| Bon Ton Stores, Inc., 8%, 6/15/21 | | | 867,000 | | | | 333,795 | |
| DriveTime Automotive Group, Inc./DT Acceptance Corp., 8%, 6/01/21 (n) | | | 3,543,000 | | | | 3,162,128 | |
| Family Tree Escrow LLC, 5.75%, 3/01/23 (n) | | | 6,665,000 | | | | 7,023,244 | |
| Neiman Marcus Group Ltd., 8%, 10/15/21 (n) | | | 5,460,000 | | | | 4,095,000 | |
| Rite Aid Corp., 9.25%, 3/15/20 | | | 1,660,000 | | | | 1,749,225 | |
| Rite Aid Corp., 6.75%, 6/15/21 | | | 1,490,000 | | | | 1,575,675 | |
| Rite Aid Corp., 6.125%, 4/01/23 (n) | | | 3,675,000 | | | | 3,877,125 | |
| Sally Beauty Holdings, Inc., 5.625%, 12/01/25 | | | 1,400,000 | | | | 1,445,500 | |
| | | | | | | | |
| | | | $ | 28,367,242 | |
| Specialty Chemicals - 0.8% | | | | | | | | |
| Chemtura Corp., 5.75%, 7/15/21 | | $ | 6,565,000 | | | $ | 6,515,763 | |
| Univar USA, Inc., 6.75%, 7/15/23 (n) | | | 5,250,000 | | | | 4,646,250 | |
| | | | | | | | |
| | | | $ | 11,162,013 | |
| Specialty Stores - 1.2% | | | | | | | | |
| Argos Merger Sub, Inc., 7.125%, 3/15/23 (n) | | $ | 5,310,000 | | | $ | 5,349,825 | |
| Group 1 Automotive, Inc., 5%, 6/01/22 | | | 6,620,000 | | | | 6,297,275 | |
| Michaels Stores, Inc., 5.875%, 12/15/20 (n) | | | 4,530,000 | | | | 4,665,900 | |
| | | | | | | | |
| | | | $ | 16,313,000 | |
| Telecommunications - Wireless - 4.7% | | | | | | | | |
| Altice S.A., 7.75%, 5/15/22 (n) | | $ | 1,085,000 | | | $ | 1,011,763 | |
| Crown Castle International Corp., 5.25%, 1/15/23 | | | 4,270,000 | | | | 4,547,550 | |
| Digicel Group Ltd., 8.25%, 9/30/20 (n) | | | 2,860,000 | | | | 2,313,383 | |
21
Portfolio of Investments – continued
| | | | | | | | |
| Issuer | | Shares/Par | | | Value ($) | |
| Bonds - continued | | | | | | | | |
| Telecommunications - Wireless - continued | | | | | | | | |
| Digicel Group Ltd., 7.125%, 4/01/22 (n) | | $ | 2,189,000 | | | $ | 1,631,900 | |
| Digicel Group Ltd., 6.75%, 3/01/23 (n) | | | 5,257,000 | | | | 4,521,020 | |
| Sprint Capital Corp., 6.875%, 11/15/28 | | | 4,745,000 | | | | 3,125,769 | |
| Sprint Corp., 7.875%, 9/15/23 | | | 6,310,000 | | | | 4,495,875 | |
| Sprint Corp., 7.125%, 6/15/24 | | | 8,525,000 | | | | 5,754,375 | |
| Sprint Corp., 7%, 8/15/20 | | | 950,000 | | | | 698,250 | |
| Sprint Nextel Corp., 9%, 11/15/18 (n) | | | 2,120,000 | | | | 2,162,400 | |
| Sprint Nextel Corp., 6%, 11/15/22 | | | 3,950,000 | | | | 2,656,375 | |
| T-Mobile USA, Inc., 6.125%, 1/15/22 | | | 565,000 | | | | 574,888 | |
| T-Mobile USA, Inc., 6.5%, 1/15/24 | | | 2,280,000 | | | | 2,302,800 | |
| T-Mobile USA, Inc., 6.464%, 4/28/19 | | | 1,760,000 | | | | 1,815,000 | |
| T-Mobile USA, Inc., 6.25%, 4/01/21 | | | 7,105,000 | | | | 7,229,338 | |
| T-Mobile USA, Inc., 6.633%, 4/28/21 | | | 3,350,000 | | | | 3,463,063 | |
| T-Mobile USA, Inc., 6.5%, 1/15/26 | | | 3,610,000 | | | | 3,610,000 | |
| Wind Acquisition Finance S.A., 4.75%, 7/15/20 (n) | | | 2,995,000 | | | | 2,942,588 | |
| Wind Acquisition Finance S.A., 7.375%, 4/23/21 (n) | | | 6,555,000 | | | | 6,231,314 | |
| | | | | | | | |
| | | | $ | 61,087,651 | |
| Telephone Services - 0.5% | | | | | | | | |
| Level 3 Financing, Inc., 5.375%, 1/15/24 (n) | | $ | 1,890,000 | | | $ | 1,908,900 | |
| Level 3 Financing, Inc., 5.375%, 5/01/25 | | | 5,265,000 | | | | 5,297,906 | |
| | | | | | | | |
| | | | $ | 7,206,806 | |
| Transportation - Services - 1.4% | | | | | | | | |
| Jack Cooper Holdings Corp., 10.25%, 6/01/20 (n) | | $ | 4,585,000 | | | $ | 3,622,150 | |
| Navios Maritime Acquisition Corp., 8.125%, 11/15/21 (n) | | | 3,479,000 | | | | 2,765,805 | |
| Navios Maritime Holding, Inc., 7.375%, 1/15/22 (n) | | | 3,945,000 | | | | 1,420,200 | |
| SPL Logistics Escrow LLC, 8.875%, 8/01/20 (n) | | | 3,320,000 | | | | 3,021,200 | |
| Stena AB, 7%, 2/01/24 (n) | | | 6,510,000 | | | | 4,947,600 | |
| Syncreon Group BV/Syncre, 8.625%, 11/01/21 (n) | | | 3,300,000 | | | | 2,557,500 | |
| Ultrapetrol Bahamas Ltd., 8.875%, 6/15/21 (a)(d) | | | 953,000 | | | | 162,010 | |
| | | | | | | | |
| | | | $ | 18,496,465 | |
| Utilities - Electric Power - 1.8% | | | | | | | | |
| Calpine Corp., 5.5%, 2/01/24 | | $ | 4,015,000 | | | $ | 3,513,125 | |
| Covanta Holding Corp., 7.25%, 12/01/20 | | | 4,425,000 | | | | 4,477,547 | |
| Covanta Holding Corp., 6.375%, 10/01/22 | | | 1,975,000 | | | | 1,861,438 | |
| Covanta Holding Corp., 5.875%, 3/01/24 | | | 1,840,000 | | | | 1,605,400 | |
| NRG Energy, Inc., 8.25%, 9/01/20 | | | 4,950,000 | | | | 4,492,125 | |
| NRG Energy, Inc., 6.25%, 7/15/22 | | | 145,000 | | | | 119,625 | |
| NRG Energy, Inc., 6.625%, 3/15/23 | | | 4,715,000 | | | | 3,901,663 | |
| TerraForm Power Operating Co., 5.875%, 2/01/23 (n) | | | 4,297,000 | | | | 3,426,858 | |
| | | | | | | | |
| | | | $ | 23,397,781 | |
| Total Bonds (Identified Cost, $1,354,592,896) | | | $ | 1,184,151,970 | |
22
Portfolio of Investments – continued
| | | | | | | | |
| Floating Rate Loans (g)(r) - 3.4% | | | | | | | | |
| Issuer | | Shares/Par | | | Value ($) | |
| Aerospace - 0.2% | | | | | | | | |
| TransDigm, Inc., Term Loan C, 3.75%, 2/28/20 | | $ | 3,496,214 | | | $ | 3,410,266 | |
| | |
| Building - 0.3% | | | | | | | | |
| ABC Supply Co., Inc., Term Loan B, 3.5%, 4/16/20 | | $ | 3,705,464 | | | $ | 3,662,851 | |
| | |
| Cable TV - 0.2% | | | | | | | | |
| Cequel Communications LLC, Term Loan B, 3.81%, 2/14/19 | | $ | 2,236,616 | | | $ | 2,190,685 | |
| | |
| Conglomerates - 0.2% | | | | | | | | |
| Entegris, Inc., Term Loan B, 3.5%, 4/30/21 | | $ | 2,557,974 | | | $ | 2,535,592 | |
| | |
| Consumer Services - 0.2% | | | | | | | | |
| Realogy Corp., Term Loan B, 3.75%, 3/05/20 | | $ | 2,733,894 | | | $ | 2,711,112 | |
| | |
| Containers - 0.2% | | | | | | | | |
| Berry Plastics, Term Loan E, 3.75%, 1/06/21 | | $ | 2,402,817 | | | $ | 2,371,780 | |
| | |
| Electronics - 0.3% | | | | | | | | |
| Avago Technologies Ltd., Term Loan B, 3.75%, 5/06/21 | | $ | 4,126,798 | | | $ | 4,104,443 | |
| | |
| Energy - Independent - 0.1% | | | | | | | | |
| MEG Energy Corp., Term Loan B, 3.75%, 3/31/20 | | $ | 1,587,495 | | | $ | 1,231,102 | |
| | |
| Entertainment - 0.1% | | | | | | | | |
| Cedar Fair LP, Term Loan B, 3.25%, 3/06/20 | | $ | 1,478,784 | | | $ | 1,481,557 | |
| | |
| Gaming & Lodging - 0.2% | | | | | | | | |
| Hilton Worldwide, Term Loan B, 3.5%, 10/26/20 | | $ | 3,000,168 | | | $ | 2,993,043 | |
| | |
| Medical & Health Technology & Services - 0.3% | | | | | | | | |
| Davita Healthcare, Term Loan B, 3.5%, 6/24/21 | | $ | 3,688,222 | | | $ | 3,674,391 | |
| | |
| Printing & Publishing - 0.2% | | | | | | | | |
| CBS Outdoor, Term Loan, 3%, 1/31/21 | | $ | 2,529,595 | | | $ | 2,494,813 | |
| | |
| Retailers - 0.1% | | | | | | | | |
| Rite Aid Corp., Term Loan, 4.87%, 6/21/21 | | $ | 1,149,016 | | | $ | 1,146,503 | |
| | |
| Transportation - Services - 0.5% | | | | | | | | |
| Commercial Barge Line Co., Term Loan B, 9.75%, 11/12/20 | | $ | 7,221,869 | | | $ | 6,319,135 | |
23
Portfolio of Investments – continued
| | | | | | | | |
| Issuer | | Shares/Par | | | Value ($) | |
| Floating Rate Loans (g)(r) - continued | | | | | | | | |
| Utilities - Electric Power - 0.3% | | | | | | | | |
| Calpine Construction Finance Co., Term Loan B, 3%, 5/03/20 | | $ | 4,641,983 | | | $ | 4,353,795 | |
Total Floating Rate Loans
(Identified Cost, $46,140,287) | | | | | | $ | 44,681,068 | |
| | |
| Common Stocks - 0.7% | | | | | | | | |
| Automotive - 0.0% | | | | | | | | |
| Accuride Corp. (a) | | | 65,068 | | | $ | 54,722 | |
| | |
Special Products & Services - 0.7%
| | | | | | | | |
| iShares iBoxx $ High Yield Corporate Bond ETF | | | 122,010 | | | $ | 9,672,953 | |
| Total Common Stocks (Identified Cost, $11,674,789) | | | | | | $ | 9,727,675 | |
| | | | | | | | | | | | | | | | |
| | | | |
| | | Strike Price | | | First Exercise | | | | | | | |
| Warrants - 0.0% | | | | | | | | | | | | | | | | |
| Medical & Health Technology & Services - 0.0% | | | | | | | | | |
| HealthSouth Corp. (1 share for 1 warrant) (Identified Cost, $0) (a) | | $ | 41.40 | | | | 1/04/16 | | | | 3,594 | | | $ | 7,440 | |
| | | |
| Money Market Funds - 3.4% | | | | | | | | | | | | | |
MFS Institutional Money Market Portfolio, 0.28%,
at Cost and Net Asset Value (v) | | | | 43,971,779 | | | $ | 43,971,779 | |
| Total Investments (Identified Cost, $1,456,379,751) | | | $ | 1,282,539,932 | |
| |
| Other Assets, Less Liabilities - 2.1% | | | | 27,466,087 | |
| Net Assets - 100.0% | | | $ | 1,310,006,019 | |
| (a) | Non-income producing security. |
| (g) | The rate shown represents a weighted average coupon rate on settled positions at period end, unless otherwise indicated. |
| (i) | Interest only security for which the fund receives interest on notional principal (Par amount). Par amount shown is the notional principal and does not reflect the cost of the security. |
| (n) | Securities exempt from registration under Rule 144A of the Securities Act of 1933. These securities may be sold in the ordinary course of business in transactions exempt from registration, normally to qualified institutional buyers. At period end, the aggregate value of these securities was $481,872,892 representing 36.8% of net assets. |
| (p) | Payment-in-kind security for which interest income may be received in additional securities and/or cash. During the period, the following amount of interest income was received in additional securities and/or cash: |
| | | | | | | | |
| Payment-in-kind Securities | | Cash | | | Additional
Securities | |
| Schaeffler Finance B.V., 6.875%, 8/15/18 | | | $209,688 | | | | $— | |
| Schaeffler Holding Finance B.V., 6.25%, 11/15/19 | | | 153,483 | | | | — | |
| Total | | | $363,171 | | | | $— | |
24
Portfolio of Investments – continued
| (v) | Underlying affiliated fund that is available only to investment companies managed by MFS. The rate quoted for the MFS Institutional Money Market Portfolio is the annualized seven-day yield of the fund at period end. |
| (r) | Remaining maturities of floating rate loans may be less than stated maturities shown as a result of contractual or optional prepayments by the borrower. Such prepayments cannot be predicted with certainty. These loans may be subject to restrictions on resale. Floating rate loans generally have rates of interest which are determined periodically by reference to a base lending rate plus a premium. |
| (z) | Restricted securities are not registered under the Securities Act of 1933 and are subject to legal restrictions on resale. These securities generally may be resold in transactions exempt from registration or to the public if the securities are subsequently registered. Disposal of these securities may involve time-consuming negotiations and prompt sale at an acceptable price may be difficult. The fund holds the following restricted securities: |
| | | | | | | | | | |
| Restricted Securities | | Acquisition
Date | |
Cost | | | Value | |
| American Media, Inc., 13.5%, 6/15/18 | | 12/28/10 | | | $299,470 | | | | $293,359 | |
| CW Capital Cobalt Commercial Mortgage Trust, “F”, CDO, FRN, 0%, 4/26/50 | | 4/12/06-1/28/16 | | | 657,150 | | | | 7 | |
| CW Capital Cobalt Commercial Mortgage Trust, “G”, CDO, FRN, 0%, 4/26/50 | | 4/12/06-1/28/16 | | | 2,054,697 | | | | 21 | |
| Falcon Franchise Loan LLC, FRN, 44.017%, 1/05/25 | | 1/29/03 | | | 18,850 | | | | 57,658 | |
| Morgan Stanley Capital I, Inc., FRN, 1.405%, 4/28/39 | | 7/20/04 | | | 262,549 | | | | 21,757 | |
| Total Restricted Securities | | | | $372,802 | |
| % of Net assets | | | | 0% | |
The following abbreviations are used in this report and are defined:
| CDO | | Collateralized Debt Obligation |
| FRN | | Floating Rate Note. Interest rate resets periodically and the current rate may not be the rate reported at period end. |
| PLC | | Public Limited Company |
| REIT | | Real Estate Investment Trust |
Abbreviations indicate amounts shown in currencies other than the U.S. dollar. All amounts are stated in U.S. dollars unless otherwise indicated. A list of abbreviations is shown below:
Derivative Contracts at 1/31/16
Forward Foreign Currency Exchange Contracts at 1/31/16
| | | | | | | | | | | | | | | | | | | | | | | | |
| Type | | Currency | | Counter-
party | | Contracts
to
Deliver/
Receive | | | Settlement
Date Range | | | In
Exchange
For | | | Contracts
at Value | | | Net
Unrealized
Appreciation
(Depreciation) | |
| Asset Derivatives | | | | | | | | | | | | | |
| SELL | | EUR | | Goldman Sachs International | | | 2,488,013 | | | | 4/15/16 | | | | $2,702,143 | | | | $2,700,697 | | | | $1,446 | |
| | | | | | | | | | | | | | | | | | | | | | | | |
25
Portfolio of Investments – continued
Futures Contracts Outstanding at 1/31/2016
| | | | | | | | | | | | | | | | | | |
| Description | | Currency | | | Contracts | | | Value | | Expiration
Date | | | Unrealized
Appreciation
(Depreciation) | |
| Liability Derivatives | | | | | | | | | | | | | | | | | | |
| Interest Rate Futures | | | | | | | | | | | | | | | |
| U.S. Treasury Note 10 yr (Short) | | | USD | | | | 114 | | | $14,771,906 | | | March - 2016 | | | | $(360,783 | ) |
| | | | | | | | | | | | | | | | | | |
At January 31, 2016, the fund had cash collateral of $153,900 to cover any commitments for certain derivative contracts. Cash collateral is comprised of “Deposits with broker” in the Statement of Assets and Liabilities.
See Notes to Financial Statements
26
Financial Statements
STATEMENT OF ASSETS AND LIABILITIES
At 1/31/16
This statement represents your fund’s balance sheet, which details the assets and liabilities comprising the total value of the fund.
| | | | |
| Assets | | | | |
Investments | | | | |
Non-affiliated issuers, at value (identified cost, $1,412,407,972) | | | $1,238,568,153 | |
Underlying affiliated funds, at cost and value | | | 43,971,779 | |
Total investments, at value (identified cost, $1,456,379,751) | | | $1,282,539,932 | |
Cash | | | 231,422 | |
Deposits with broker | | | 153,900 | |
Receivables for | | | | |
Forward foreign currency exchange contracts | | | 1,446 | |
Investments sold | | | 11,471,683 | |
Fund shares sold | | | 986,253 | |
Interest | | | 24,837,859 | |
Other assets | | | 7,550 | |
Total assets | | | $1,320,230,045 | |
| Liabilities | | | | |
Payables for | | | | |
Distributions | | | $262,054 | |
Daily variation margin on open futures contracts | | | 62,344 | |
Investments purchased | | | 5,568,664 | |
Fund shares reacquired | | | 3,636,606 | |
Payable to affiliates | | | | |
Investment adviser | | | 66,789 | |
Shareholder servicing costs | | | 374,897 | |
Distribution and service fees | | | 17,356 | |
Program manager fees | | | 24 | |
Payable for independent Trustees’ compensation | | | 38,276 | |
Accrued expenses and other liabilities | | | 197,016 | |
Total liabilities | | | $10,224,026 | |
Net assets | | | $1,310,006,019 | |
| Net assets consist of | | | | |
Paid-in capital | | | $1,639,877,216 | |
Unrealized appreciation (depreciation) on investments and translation of assets and liabilities in foreign currencies | | | (174,199,184 | ) |
Accumulated net realized gain (loss) on investments and foreign currency | | | (155,188,197 | ) |
Accumulated distributions in excess of net investment income | | | (483,816 | ) |
Net assets | | | $1,310,006,019 | |
Shares of beneficial interest outstanding | | | 421,733,059 | |
27
Statement of Assets and Liabilities – continued
| | | | | | | | | | | | |
| | | Net assets | | | Shares
outstanding | | | Net asset value per share (a) | |
Class A | | | $398,206,396 | | | | 128,173,960 | | | | $3.11 | |
Class B | | | 20,419,910 | | | | 6,564,077 | | | | 3.11 | |
Class C | | | 57,442,249 | | | | 18,435,166 | | | | 3.12 | |
Class I | | | 49,917,161 | | | | 16,093,476 | | | | 3.10 | |
Class R1 | | | 1,006,967 | | | | 323,845 | | | | 3.11 | |
Class R2 | | | 2,618,410 | | | | 842,471 | | | | 3.11 | |
Class R3 | | | 6,359,270 | | | | 2,047,958 | | | | 3.11 | |
Class R4 | | | 299,858 | | | | 96,535 | | | | 3.11 | |
Class R5 | | | 769,245,795 | | | | 247,709,896 | | | | 3.11 | |
Class 529A | | | 2,924,648 | | | | 942,335 | | | | 3.10 | |
Class 529B | | | 308,218 | | | | 99,230 | | | | 3.11 | |
Class 529C | | | 1,257,137 | | | | 404,110 | | | | 3.11 | |
| (a) | Maximum offering price per share was equal to the net asset value per share for all share classes, except for Classes A and 529A, for which the maximum offering prices per share were $3.25 [100 / 95.75 x $3.11] and $3.24 [100 / 95.75 x $3.10], respectively. On sales of $100,000 or more, the maximum offering prices of Class A and Class 529A shares are reduced. A contingent deferred sales charge may be imposed on redemptions of Class A, Class B, Class C, Class 529B, and Class 529C shares. Redemption price per share was equal to the net asset value per share for Classes I, R1, R2, R3, R4, R5, and 529A. |
See Notes to Financial Statements
28
Financial Statements
STATEMENT OF OPERATIONS
Year ended 1/31/16
This statement describes how much your fund earned in investment income and accrued in expenses. It also describes any gains and/or losses generated by fund operations.
| | | | |
| Net investment income | | | | |
Income | | | | |
Interest | | | $87,004,905 | |
Dividends | | | 489,450 | |
Dividends from underlying affiliated funds | | | 64,811 | |
Total investment income | | | $87,559,166 | |
Expenses | | | | |
Management fee | | | $6,551,913 | |
Distribution and service fees | | | 2,083,233 | |
Shareholder servicing costs | | | 1,873,040 | |
Program manager fees | | | 5,059 | |
Administrative services fee | | | 232,163 | |
Independent Trustees’ compensation | | | 28,673 | |
Custodian fee | | | 187,097 | |
Shareholder communications | | | 94,654 | |
Audit and tax fees | | | 78,568 | |
Legal fees | | | 58,228 | |
Miscellaneous | | | 215,900 | |
Total expenses | | | $11,408,528 | |
Fees paid indirectly | | | (242 | ) |
Reduction of expenses by investment adviser and distributor | | | (139,567 | ) |
Net expenses | | | $11,268,719 | |
Net investment income | | | $76,290,447 | |
| Realized and unrealized gain (loss) on investments and foreign currency | |
Realized gain (loss) (identified cost basis) | | | | |
Investments | | | $(13,463,453 | ) |
Written options | | | 55,039 | |
Futures contracts | | | (308,094 | ) |
Foreign currency | | | 438,789 | |
Net realized gain (loss) on investments and foreign currency | | | $(13,277,719 | ) |
Change in unrealized appreciation (depreciation) | | | | |
Investments | | | $(143,946,953 | ) |
Futures contracts | | | 181,116 | |
Translation of assets and liabilities in foreign currencies | | | (266,463 | ) |
Net unrealized gain (loss) on investments and foreign currency translation | | | $(144,032,300 | ) |
Net realized and unrealized gain (loss) on investments and foreign currency | | | $(157,310,019 | ) |
Change in net assets from operations | | | $(81,019,572 | ) |
See Notes to Financial Statements
29
Financial Statements
STATEMENTS OF CHANGES IN NET ASSETS
These statements describe the increases and/or decreases in net assets resulting from operations, any distributions, and any shareholder transactions.
| | | | | | | | |
| | | Years ended 1/31 | |
| | | 2016 | | | 2015 | |
| Change in net assets | | | | | | |
| From operations | | | | | | | | |
Net investment income | | | $76,290,447 | | | | $75,929,994 | |
Net realized gain (loss) on investments and foreign currency | | | (13,277,719 | ) | | | 14,945,943 | |
Net unrealized gain (loss) on investments and foreign currency translation | | | (144,032,300 | ) | | | (56,528,916 | ) |
Change in net assets from operations | | | $(81,019,572 | ) | | | $34,347,021 | |
| Distributions declared to shareholders | | | | | | | | |
From net investment income | | | $(80,164,041 | ) | | | $(80,078,822 | ) |
Change in net assets from fund share transactions | | | $24,814,827 | | | | $142,655,611 | |
Total change in net assets | | | $(136,368,786 | ) | | | $96,923,810 | |
| Net assets | | | | | | | | |
At beginning of period | | | 1,446,374,805 | | | | 1,349,450,995 | |
At end of period (including accumulated distributions in excess of net investment income of $483,816 and $380,735, respectively) | | | $1,310,006,019 | | | | $1,446,374,805 | |
See Notes to Financial Statements
30
Financial Statements
FINANCIAL HIGHLIGHTS
The financial highlights table is intended to help you understand the fund’s financial performance for the past 5 years (or life of a particular share class, if shorter). Certain information reflects financial results for a single fund share. The total returns in the table represent the rate by which an investor would have earned (or lost) on an investment in the fund share class (assuming reinvestment of all distributions) held for the entire period.
| | | | | | | | | | | | | | | | | | | | |
| Class A | | Years ended 1/31 | |
| | | 2016 | | | 2015 | | | 2014 | | | 2013 | | | 2012 | |
Net asset value, beginning of period | | | $3.49 | | | | $3.60 | | | | $3.61 | | | | $3.44 | | | | $3.52 | |
| Income (loss) from investment operations | | | | | | | | | | | | | |
Net investment income (d) | | | $0.18 | | | | $0.19 | | | | $0.20 | | | | $0.22 | | | | $0.23 | |
Net realized and unrealized gain (loss) on
investments and foreign currency | | | (0.37 | ) | | | (0.10 | ) | | | (0.00 | )(w) | | | 0.18 | | | | (0.07 | ) |
Total from investment operations | | | $(0.19 | ) | | | $0.09 | | | | $0.20 | | | | $0.40 | | | | $0.16 | |
| Less distributions declared to shareholders | | | | | | | | | | | | | |
From net investment income | | | $(0.19 | ) | | | $(0.20 | ) | | | $(0.21 | ) | | | $(0.23 | ) | | | $(0.24 | ) |
Net asset value, end of period (x) | | | $3.11 | | | | $3.49 | | | | $3.60 | | | | $3.61 | | | | $3.44 | |
Total return (%) (r)(s)(t)(x) | | | (5.87 | ) | | | 2.45 | | | | 5.71 | | | | 12.05 | | | | 4.77 | |
Ratios (%) (to average net assets)
and Supplemental data: | | | | | | | | | | | | | | | | | |
Expenses before expense reductions (f) | | | 0.95 | | | | 0.95 | | | | 0.93 | | | | 0.93 | | | | 0.93 | |
Expenses after expense reductions (f) | | | 0.94 | | | | 0.93 | | | | 0.92 | | | | 0.93 | | | | 0.92 | |
Net investment income | | | 5.20 | | | | 5.25 | | | | 5.64 | | | | 6.39 | | | | 6.76 | |
Portfolio turnover | | | 36 | | | | 43 | | | | 46 | | | | 38 | | | | 60 | |
Net assets at end of period (000 omitted) | | | $398,206 | | | | $452,587 | | | | $457,198 | | | | $504,600 | | | | $462,232 | |
See Notes to Financial Statements
31
Financial Highlights – continued
| | | | | | | | | | | | | | | | | | | | |
| Class B | | Years ended 1/31 | |
| | | 2016 | | | 2015 | | | 2014 | | | 2013 | | | 2012 | |
Net asset value, beginning of period | | | $3.49 | | | | $3.60 | | | | $3.61 | | | | $3.44 | | | | $3.53 | |
| Income (loss) from investment operations | | | | | | | | | | | | | |
Net investment income (d) | | | $0.15 | | | | $0.16 | | | | $0.17 | | | | $0.20 | | | | $0.21 | |
Net realized and unrealized gain (loss) on
investments and foreign currency | | | (0.37 | ) | | | (0.10 | ) | | | (0.00 | )(w) | | | 0.18 | | | | (0.09 | ) |
Total from investment operations | | | $(0.22 | ) | | | $0.06 | | | | $0.17 | | | | $0.38 | | | | $0.12 | |
| Less distributions declared to shareholders | | | | | | | | | | | | | |
From net investment income | | | $(0.16 | ) | | | $(0.17 | ) | | | $(0.18 | ) | | | $(0.21 | ) | | | $(0.21 | ) |
Net asset value, end of period (x) | | | $3.11 | | | | $3.49 | | | | $3.60 | | | | $3.61 | | | | $3.44 | |
Total return (%) (r)(s)(t)(x) | | | (6.57 | ) | | | 1.68 | | | | 4.93 | | | | 11.22 | | | | 3.70 | |
Ratios (%) (to average net assets)
and Supplemental data: | | | | | | | | | | | | | | | | | |
Expenses before expense reductions (f) | | | 1.70 | | | | 1.70 | | | | 1.68 | | | | 1.67 | | | | 1.67 | |
Expenses after expense reductions (f) | | | 1.69 | | | | 1.69 | | | | 1.68 | | | | 1.67 | | | | 1.67 | |
Net investment income | | | 4.44 | | | | 4.49 | | | | 4.86 | | | | 5.59 | | | | 5.99 | |
Portfolio turnover | | | 36 | | | | 43 | | | | 46 | | | | 38 | | | | 60 | |
Net assets at end of period (000 omitted) | | | $20,420 | | | | $27,034 | | | | $31,175 | | | | $31,656 | | | | $25,983 | |
| |
| Class C | | Years ended 1/31 | |
| | | 2016 | | | 2015 | | | 2014 | | | 2013 | | | 2012 | |
Net asset value, beginning of period | | | $3.50 | | | | $3.61 | | | | $3.62 | | | | $3.45 | | | | $3.53 | |
| Income (loss) from investment operations | | | | | | | | | | | | | |
Net investment income (d) | | | $0.15 | | | | $0.16 | | | | $0.17 | | | | $0.20 | | | | $0.21 | |
Net realized and unrealized gain (loss) on
investments and foreign currency | | | (0.37 | ) | | | (0.10 | ) | | | (0.00 | )(w) | | | 0.18 | | | | (0.08 | ) |
Total from investment operations | | | $(0.22 | ) | | | $0.06 | | | | $0.17 | | | | $0.38 | | | | $0.13 | |
| Less distributions declared to shareholders | | | | | | | | | | | | | |
From net investment income | | | $(0.16 | ) | | | $(0.17 | ) | | | $(0.18 | ) | | | $(0.21 | ) | | | $(0.21 | ) |
Net asset value, end of period (x) | | | $3.12 | | | | $3.50 | | | | $3.61 | | | | $3.62 | | | | $3.45 | |
Total return (%) (r)(s)(t)(x) | | | (6.55 | ) | | | 1.69 | | | | 4.93 | | | | 11.21 | | | | 4.00 | |
Ratios (%) (to average net assets)
and Supplemental data: | | | | | | | | | | | | | | | | | |
Expenses before expense reductions (f) | | | 1.70 | | | | 1.69 | | | | 1.68 | | | | 1.67 | | | | 1.67 | |
Expenses after expense reductions (f) | | | 1.69 | | | | 1.69 | | | | 1.68 | | | | 1.67 | | | | 1.67 | |
Net investment income | | | 4.42 | | | | 4.48 | | | | 4.86 | | | | 5.61 | | | | 5.99 | |
Portfolio turnover | | | 36 | | | | 43 | | | | 46 | | | | 38 | | | | 60 | |
Net assets at end of period (000 omitted) | | | $57,442 | | | | $69,162 | | | | $76,490 | | | | $81,710 | | | | $75,309 | |
See Notes to Financial Statements
32
Financial Highlights – continued
| | | | | | | | | | | | | | | | | | | | |
| Class I | | Years ended 1/31 | |
| | | 2016 | | | 2015 | | | 2014 | | | 2013 | | | 2012 | |
Net asset value, beginning of period | | | $3.48 | | | | $3.59 | | | | $3.60 | | | | $3.44 | | | | $3.52 | |
| Income (loss) from investment operations | | | | | | | | | | | | | |
Net investment income (d) | | | $0.19 | | | | $0.19 | | | | $0.21 | | | | $0.24 | | | | $0.24 | |
Net realized and unrealized gain (loss) on
investments and foreign currency | | | (0.38 | ) | | | (0.09 | ) | | | (0.00 | )(w) | | | 0.16 | | | | (0.07 | ) |
Total from investment operations | | | $(0.19 | ) | | | $0.10 | | | | $0.21 | | | | $0.40 | | | | $0.17 | |
| Less distributions declared to shareholders | | | | | | | | | | | | | |
From net investment income | | | $(0.19 | ) | | | $(0.21 | ) | | | $(0.22 | ) | | | $(0.24 | ) | | | $(0.25 | ) |
Net asset value, end of period (x) | | | $3.10 | | | | $3.48 | | | | $3.59 | | | | $3.60 | | | | $3.44 | |
Total return (%) (r)(s)(x) | | | (5.66 | ) | | | 2.70 | | | | 5.98 | | | | 12.02 | | | | 5.03 | |
Ratios (%) (to average net assets)
and Supplemental data: | | | | | | | | | | | | | | | | | |
Expenses before expense reductions (f) | | | 0.70 | | | | 0.69 | | | | 0.68 | | | | 0.67 | | | | 0.68 | |
Expenses after expense reductions (f) | | | 0.69 | | | | 0.69 | | | | 0.68 | | | | 0.67 | | | | 0.68 | |
Net investment income | | | 5.43 | | | | 5.44 | | | | 5.88 | | | | 6.86 | | | | 7.02 | |
Portfolio turnover | | | 36 | | | | 43 | | | | 46 | | | | 38 | | | | 60 | |
Net assets at end of period (000 omitted) | | | $49,917 | | | | $95,887 | | | | $67,027 | | | | $70,506 | | | | $448,607 | |
| |
| Class R1 | | Years ended 1/31 | |
| | | 2016 | | | 2015 | | | 2014 | | | 2013 | | | 2012 | |
Net asset value, beginning of period | | | $3.49 | | | | $3.60 | | | | $3.61 | | | | $3.44 | | | | $3.52 | |
| Income (loss) from investment operations | | | | | | | | | | | | | |
Net investment income (d) | | | $0.15 | | | | $0.16 | | | | $0.17 | | | | $0.20 | | | | $0.21 | |
Net realized and unrealized gain (loss) on
investments and foreign currency | | | (0.37 | ) | | | (0.10 | ) | | | (0.00 | )(w) | | | 0.18 | | | | (0.08 | ) |
Total from investment operations | | | $(0.22 | ) | | | $0.06 | | | | $0.17 | | | | $0.38 | | | | $0.13 | |
| Less distributions declared to shareholders | | | | | | | | | | | | | |
From net investment income | | | $(0.16 | ) | | | $(0.17 | ) | | | $(0.18 | ) | | | $(0.21 | ) | | | $(0.21 | ) |
Net asset value, end of period (x) | | | $3.11 | | | | $3.49 | | | | $3.60 | | | | $3.61 | | | | $3.44 | |
Total return (%) (r)(s)(x) | | | (6.58 | ) | | | 1.68 | | | | 4.93 | | | | 11.22 | | | | 4.00 | |
Ratios (%) (to average net assets)
and Supplemental data: | | | | | | | | | | | | | | | | | |
Expenses before expense reductions (f) | | | 1.70 | | | | 1.70 | | | | 1.68 | | | | 1.68 | | | | 1.67 | |
Expenses after expense reductions (f) | | | 1.70 | | | | 1.69 | | | | 1.68 | | | | 1.68 | | | | 1.67 | |
Net investment income | | | 4.44 | | | | 4.47 | | | | 4.87 | | | | 5.65 | | | | 6.01 | |
Portfolio turnover | | | 36 | | | | 43 | | | | 46 | | | | 38 | | | | 60 | |
Net assets at end of period (000 omitted) | | | $1,007 | | | | $1,317 | | | | $1,199 | | | | $1,137 | | | | $1,201 | |
See Notes to Financial Statements
33
Financial Highlights – continued
| | | | | | | | | | | | | | | | | | | | |
| Class R2 | | Years ended 1/31 | |
| | | 2016 | | | 2015 | | | 2014 | | | 2013 | | | 2012 | |
Net asset value, beginning of period | | | $3.49 | | | | $3.60 | | | | $3.61 | | | | $3.44 | | | | $3.52 | |
| Income (loss) from investment operations | | | | | | | | | | | | | |
Net investment income (d) | | | $0.17 | | | | $0.18 | | | | $0.19 | | | | $0.22 | | | | $0.22 | |
Net realized and unrealized gain (loss) on
investments and foreign currency | | | (0.37 | ) | | | (0.10 | ) | | | (0.00 | )(w) | | | 0.17 | | | | (0.07 | ) |
Total from investment operations | | | $(0.20 | ) | | | $0.08 | | | | $0.19 | | | | $0.39 | | | | $0.15 | |
| Less distributions declared to shareholders | | | | | | | | | | | | | |
From net investment income | | | $(0.18 | ) | | | $(0.19 | ) | | | $(0.20 | ) | | | $(0.22 | ) | | | $(0.23 | ) |
Net asset value, end of period (x) | | | $3.11 | | | | $3.49 | | | | $3.60 | | | | $3.61 | | | | $3.44 | |
Total return (%) (r)(s)(x) | | | (6.11 | ) | | | 2.19 | | | | 5.45 | | | | 11.77 | | | | 4.51 | |
Ratios (%) (to average net assets)
and Supplemental data: | | | | | | | | | | | | | | | | | |
Expenses before expense reductions (f) | | | 1.20 | | | | 1.20 | | | | 1.18 | | | | 1.18 | | | | 1.18 | |
Expenses after expense reductions (f) | | | 1.20 | | | | 1.19 | | | | 1.18 | | | | 1.18 | | | | 1.17 | |
Net investment income | | | 4.94 | | | | 5.00 | | | | 5.38 | | | | 6.18 | | | | 6.52 | |
Portfolio turnover | | | 36 | | | | 43 | | | | 46 | | | | 38 | | | | 60 | |
Net assets at end of period (000 omitted) | | | $2,618 | | | | $3,036 | | | | $3,469 | | | | $4,103 | | | | $5,639 | |
| |
| Class R3 | | Years ended 1/31 | |
| | | 2016 | | | 2015 | | | 2014 | | | 2013 | | | 2012 | |
Net asset value, beginning of period | | | $3.49 | | | | $3.60 | | | | $3.61 | | | | $3.44 | | | | $3.52 | |
| Income (loss) from investment operations | | | | | | | | | | | | | |
Net investment income (d) | | | $0.18 | | | | $0.19 | | | | $0.20 | | | | $0.22 | | | | $0.23 | |
Net realized and unrealized gain (loss) on
investments and foreign currency | | | (0.37 | ) | | | (0.10 | ) | | | (0.00 | )(w) | | | 0.18 | | | | (0.07 | ) |
Total from investment operations | | | $(0.19 | ) | | | $0.09 | | | | $0.20 | | | | $0.40 | | | | $0.16 | |
| Less distributions declared to shareholders | | | | | | | | | | | | | |
From net investment income | | | $(0.19 | ) | | | $(0.20 | ) | | | $(0.21 | ) | | | $(0.23 | ) | | | $(0.24 | ) |
Net asset value, end of period (x) | | | $3.11 | | | | $3.49 | | | | $3.60 | | | | $3.61 | | | | $3.44 | |
Total return (%) (r)(s)(x) | | | (5.87 | ) | | | 2.45 | | | | 5.71 | | | | 12.05 | | | | 4.77 | |
Ratios (%) (to average net assets)
and Supplemental data: | | | | | | | | | | | | | | | | | |
Expenses before expense reductions (f) | | | 0.95 | | | | 0.95 | | | | 0.93 | | | | 0.93 | | | | 0.93 | |
Expenses after expense reductions (f) | | | 0.95 | | | | 0.94 | | | | 0.93 | | | | 0.93 | | | | 0.93 | |
Net investment income | | | 5.20 | | | | 5.26 | | | | 5.63 | | | | 6.39 | | | | 6.78 | |
Portfolio turnover | | | 36 | | | | 43 | | | | 46 | | | | 38 | | | | 60 | |
Net assets at end of period (000 omitted) | | | $6,359 | | | | $6,755 | | | | $8,046 | | | | $8,183 | | | | $7,376 | |
See Notes to Financial Statements
34
Financial Highlights – continued
| | | | | | | | | | | | | | | | | | | | |
| Class R4 | | Years ended 1/31 | |
| | | 2016 | | | 2015 | | | 2014 | | | 2013 | | | 2012 | |
Net asset value, beginning of period | | | $3.49 | | | | $3.60 | | | | $3.61 | | | | $3.44 | | | | $3.52 | |
| Income (loss) from investment operations | | | | | | | | | | | | | |
Net investment income (d) | | | $0.19 | | | | $0.20 | | | | $0.21 | | | | $0.23 | | | | $0.24 | |
Net realized and unrealized gain (loss) on
investments and foreign currency | | | (0.38 | ) | | | (0.10 | ) | | | (0.00 | )(w) | | | 0.18 | | | | (0.07 | ) |
Total from investment operations | | | $(0.19 | ) | | | $0.10 | | | | $0.21 | | | | $0.41 | | | | $0.17 | |
| Less distributions declared to shareholders | | | | | | | | | | | | | |
From net investment income | | | $(0.19 | ) | | | $(0.21 | ) | | | $(0.22 | ) | | | $(0.24 | ) | | | $(0.25 | ) |
Net asset value, end of period (x) | | | $3.11 | | | | $3.49 | | | | $3.60 | | | | $3.61 | | | | $3.44 | |
Total return (%) (r)(s)(x) | | | (5.63 | ) | | | 2.71 | | | | 5.98 | | | | 12.33 | | | | 5.04 | |
Ratios (%) (to average net assets)
and Supplemental data: | | | | | | | | | | | | | | | | | |
Expenses before expense reductions (f) | | | 0.70 | | | | 0.70 | | | | 0.68 | | | | 0.68 | | | | 0.68 | |
Expenses after expense reductions (f) | | | 0.70 | | | | 0.69 | | | | 0.68 | | | | 0.68 | | | | 0.67 | |
Net investment income | | | 5.44 | | | | 5.47 | | | | 5.86 | | | | 6.65 | | | | 7.02 | |
Portfolio turnover | | | 36 | | | | 43 | | | | 46 | | | | 38 | | | | 60 | |
Net assets at end of period (000 omitted) | | | $300 | | | | $571 | | | | $464 | | | | $302 | | | | $331 | |
| | | | | | | | | | | | | | | | |
| Class R5 | | Years ended 1/31 | | | Period ended 2013 (i) | |
| | | 2016 | | | 2015 | | | 2014 | | |
Net asset value, beginning of period | | | $3.49 | | | | $3.60 | | | | $3.61 | | | | $3.41 | |
| Income (loss) from investment operations | | | | | | | | | |
Net investment income (d) | | | $0.19 | | | | $0.20 | | | | $0.21 | | | | $0.15 | |
Net realized and unrealized gain (loss) on
investments and foreign currency | | | (0.37 | ) | | | (0.10 | ) | | | (0.00 | )(w) | | | 0.21 | |
Total from investment operations | | | $(0.18 | ) | | | $0.10 | | | | $0.21 | | | | $0.36 | |
| Less distributions declared to shareholders | | | | | | | | | |
From net investment income | | | $(0.20 | ) | | | $(0.21 | ) | | | $(0.22 | ) | | | $(0.16 | ) |
Net asset value, end of period (x) | | | $3.11 | | | | $3.49 | | | | $3.60 | | | | $3.61 | |
Total return (%) (r)(s)(x) | | | (5.55 | ) | | | 2.79 | | | | 6.06 | | | | 10.74 | (n) |
Ratios (%) (to average net assets)
and Supplemental data: | | | | | | | | | |
Expenses before expense reductions (f) | | | 0.61 | | | | 0.62 | | | | 0.61 | | | | 0.63 | (a) |
Expenses after expense reductions (f) | | | 0.61 | | | | 0.61 | | | | 0.61 | | | | 0.63 | (a) |
Net investment income | | | 5.54 | | | | 5.57 | | | | 5.93 | | | | 6.37 | (a) |
Portfolio turnover | | | 36 | | | | 43 | | | | 46 | | | | 38 | |
Net assets at end of period (000 omitted) | | | $769,246 | | | | $784,830 | | | | $699,123 | | | | $516,399 | |
See Notes to Financial Statements
35
Financial Highlights – continued
| | | | | | | | | | | | | | | | | | | | |
| Class 529A | | Years ended 1/31 | |
| | | 2016 | | | 2015 | | | 2014 | | | 2013 | | | 2012 | |
Net asset value, beginning of period | | | $3.49 | | | | $3.60 | | | | $3.61 | | | | $3.43 | | | | $3.52 | |
| Income (loss) from investment operations | | | | | | | | | | | | | |
Net investment income (d) | | | $0.18 | | | | $0.19 | | | | $0.20 | | | | $0.22 | | | | $0.23 | |
Net realized and unrealized gain (loss) on
investments and foreign currency | | | (0.39 | ) | | | (0.10 | ) | | | (0.00 | )(w) | | | 0.19 | | | | (0.08 | ) |
Total from investment operations | | | $(0.21 | ) | | | $0.09 | | | | $0.20 | | | | $0.41 | | | | $0.15 | |
| Less distributions declared to shareholders | | | | | | | | | | | | | |
From net investment income | | | $(0.18 | ) | | | $(0.20 | ) | | | $(0.21 | ) | | | $(0.23 | ) | | | $(0.24 | ) |
Net asset value, end of period (x) | | | $3.10 | | | | $3.49 | | | | $3.60 | | | | $3.61 | | | | $3.43 | |
Total return (%) (r)(s)(t)(x) | | | (6.20 | ) | | | 2.41 | | | | 5.69 | | | | 12.33 | | | | 4.40 | |
Ratios (%) (to average net assets)
and Supplemental data: | | | | | | | | | | | | | | | | | |
Expenses before expense reductions (f) | | | 1.05 | | | | 1.05 | | | | 1.03 | | | | 1.03 | | | | 1.03 | |
Expenses after expense reductions (f) | | | 0.98 | | | | 0.98 | | | | 0.96 | | | | 0.98 | | | | 1.00 | |
Net investment income | | | 5.16 | | | | 5.21 | | | | 5.60 | | | | 6.31 | | | | 6.71 | |
Portfolio turnover | | | 36 | | | | 43 | | | | 46 | | | | 38 | | | | 60 | |
Net assets at end of period (000 omitted) | | | $2,925 | | | | $3,270 | | | | $3,164 | | | | $2,748 | | | | $1,719 | |
| |
| Class 529B | | Years ended 1/31 | |
| | | 2016 | | | 2015 | | | 2014 | | | 2013 | | | 2012 | |
Net asset value, beginning of period | | | $3.49 | | | | $3.60 | | | | $3.61 | | | | $3.44 | | | | $3.52 | |
| Income (loss) from investment operations | | | | | | | | | | | | | |
Net investment income (d) | | | $0.15 | | | | $0.16 | | | | $0.17 | | | | $0.20 | | | | $0.20 | |
Net realized and unrealized gain (loss) on
investments and foreign currency | | | (0.37 | ) | | | (0.10 | ) | | | (0.00 | )(w) | | | 0.17 | | | | (0.07 | ) |
Total from investment operations | | | $(0.22 | ) | | | $0.06 | | | | $0.17 | | | | $0.37 | | | | $0.13 | |
| Less distributions declared to shareholders | | | | | | | | | | | | | |
From net investment income | | | $(0.16 | ) | | | $(0.17 | ) | | | $(0.18 | ) | | | $(0.20 | ) | | | $(0.21 | ) |
Net asset value, end of period (x) | | | $3.11 | | | | $3.49 | | | | $3.60 | | | | $3.61 | | | | $3.44 | |
Total return (%) (r)(s)(t)(x) | | | (6.63 | ) | | | 1.63 | | | | 4.87 | | | | 11.17 | | | | 3.92 | |
Ratios (%) (to average net assets)
and Supplemental data: | | | | | | | | | | | | | | | | | |
Expenses before expense reductions (f) | | | 1.80 | | | | 1.80 | | | | 1.78 | | | | 1.78 | | | | 1.78 | |
Expenses after expense reductions (f) | | | 1.75 | | | | 1.74 | | | | 1.73 | | | | 1.73 | | | | 1.75 | |
Net investment income | | | 4.40 | | | | 4.45 | | | | 4.83 | | | | 5.60 | | | | 5.95 | |
Portfolio turnover | | | 36 | | | | 43 | | | | 46 | | | | 38 | | | | 60 | |
Net assets at end of period (000 omitted) | | | $308 | | | | $334 | | | | $337 | | | | $375 | | | | $362 | |
See Notes to Financial Statements
36
Financial Highlights – continued
| | | | | | | | | | | | | | | | | | | | |
| Class 529C | | Years ended 1/31 | |
| | | 2016 | | | 2015 | | | 2014 | | | 2013 | | | 2012 | |
Net asset value, beginning of period | | | $3.49 | | | | $3.60 | | | | $3.61 | | | | $3.44 | | | | $3.52 | |
| Income (loss) from investment operations | | | | | | | | | | | | | |
Net investment income (d) | | | $0.15 | | | | $0.16 | | | | $0.17 | | | | $0.20 | | | | $0.20 | |
Net realized and unrealized gain (loss) on
investments and foreign currency | | | (0.37 | ) | | | (0.10 | ) | | | (0.00 | )(w) | | | 0.17 | | | | (0.07 | ) |
Total from investment operations | | | $(0.22 | ) | | | $0.06 | | | | $0.17 | | | | $0.37 | | | | $0.13 | |
| Less distributions declared to shareholders | | | | | | | | | | | | | |
From net investment income | | | $(0.16 | ) | | | $(0.17 | ) | | | $(0.18 | ) | | | $(0.20 | ) | | | $(0.21 | ) |
Net asset value, end of period (x) | | | $3.11 | | | | $3.49 | | | | $3.60 | | | | $3.61 | | | | $3.44 | |
Total return (%) (r)(s)(t)(x) | | | (6.62 | ) | | | 1.63 | | | | 4.88 | | | | 11.17 | | | | 3.92 | |
Ratios (%) (to average net assets)
and Supplemental data: | | | | | | | | | | | | | | | | | |
Expenses before expense reductions (f) | | | 1.80 | | | | 1.79 | | | | 1.78 | | | | 1.77 | | | | 1.77 | |
Expenses after expense reductions (f) | | | 1.75 | | | | 1.74 | | | | 1.73 | | | | 1.72 | | | | 1.74 | |
Net investment income | | | 4.38 | | | | 4.43 | | | | 4.81 | | | | 5.56 | | | | 5.94 | |
Portfolio turnover | | | 36 | | | | 43 | | | | 46 | | | | 38 | | | | 60 | |
Net assets at end of period (000 omitted) | | | $1,257 | | | | $1,593 | | | | $1,758 | | | | $1,311 | | | | $1,060 | |
| (d) | Per share data is based on average shares outstanding. |
| (f) | Ratios do not reflect reductions from fees paid indirectly, if applicable. |
| (i) | For Class R5, the period is from inception, June 1, 2012, through the stated period end. |
| (r) | Certain expenses have been reduced without which performance would have been lower. |
| (s) | From time to time the fund may receive proceeds from litigation settlements, without which performance would be lower. |
| (t) | Total returns do not include any applicable sales charges. |
| (w) | Per share amount was less than $0.01. |
| (x) | The net asset values and total returns have been calculated on net assets which include adjustments made in accordance with U.S. generally accepted accounting principles required at period end for financial reporting purposes. |
See Notes to Financial Statements
37
NOTES TO FINANCIAL STATEMENTS
(1) Business and Organization
MFS High Income Fund (the fund) is a diversified series of MFS Series Trust III (the trust). The trust is organized as a Massachusetts business trust and is registered under the Investment Company Act of 1940, as amended, as an open-end management investment company.
The fund is an investment company and accordingly follows the investment company accounting and reporting guidance of the Financial Accounting Standards Board (FASB) Accounting Standards Codification Topic 946 Financial Services – Investment Companies.
(2) Significant Accounting Policies
General – The preparation of financial statements in conformity with U.S. generally accepted accounting principles requires management to make estimates and assumptions that affect the reported amounts of assets and liabilities, and disclosure of contingent assets and liabilities at the date of the financial statements and the reported amounts of increases and decreases in net assets from operations during the reporting period. Actual results could differ from those estimates. In the preparation of these financial statements, management has evaluated subsequent events occurring after the date of the fund’s Statement of Assets and Liabilities through the date that the financial statements were issued. The fund invests in high-yield securities rated below investment grade. Investments in high-yield securities involve greater degrees of credit and market risk than investments in higher-rated securities and tend to be more sensitive to economic conditions. The fund invests in foreign securities. Investments in foreign securities are vulnerable to the effects of changes in the relative values of the local currency and the U.S. dollar and to the effects of changes in each country’s legal, political, and economic environment.
In January 2016, FASB issued Accounting Standards Update 2016-01, Financial Instruments – Overall (Subtopic 825-10) – Recognition and Measurement of Financial Assets and Financial Liabilities (“ASU 2016-01”) which would first be effective for annual reporting periods beginning after December 15, 2017, and interim periods therein. ASU 2016-01, which changes the accounting for equity investments and for certain financial liabilities, also modifies the presentation and disclosure requirements for financial instruments. Investment companies are specifically exempted from ASU 2016-01’s equity investment accounting provisions and will continue to follow the industry specific guidance for investment accounting under ASC 946. Although still evaluating the potential impacts of ASU 2016-01 to the fund, management expects that the impact of the fund’s adoption will be limited to additional financial statement disclosures.
Balance Sheet Offsetting – The fund’s accounting policy with respect to balance sheet offsetting is that, absent an event of default by the counterparty or a termination of the agreement, the International Swaps and Derivatives Association (ISDA) Master Agreement does not result in an offset of reported amounts of financial assets and financial liabilities in the Statement of Assets and Liabilities across transactions between the fund and the applicable counterparty. The fund’s right to setoff may be restricted or prohibited by the bankruptcy or insolvency laws of the particular jurisdiction to
38
Notes to Financial Statements – continued
which a specific master netting agreement counterparty is subject. Balance sheet offsetting disclosures, to the extent applicable to the fund, have been included in the fund’s Significant Accounting Policies note under the captions for each of the fund’s in-scope financial instruments and transactions.
Investment Valuations – Debt instruments and floating rate loans, including restricted debt instruments, are generally valued at an evaluated or composite bid as provided by a third-party pricing service. Equity securities, including restricted equity securities, are generally valued at the last sale or official closing price on their primary market or exchange as provided by a third-party pricing service. Equity securities, for which there were no sales reported that day, are generally valued at the last quoted daily bid quotation on their primary market or exchange as provided by a third-party pricing service. Short-term instruments with a maturity at issuance of 60 days or less may be valued at amortized cost, which approximates market value. Exchange-traded options are generally valued at the last sale or official closing price as provided by a third-party pricing service on the exchange on which such options are primarily traded. Exchange-traded options for which there were no sales reported that day are generally valued at the last daily bid quotation as provided by a third-party pricing service on the exchange on which such options are primarily traded. Options not traded on an exchange are generally valued at a broker/dealer bid quotation. Foreign currency options are generally valued at valuations provided by a third-party service. Futures contracts are generally valued at last posted settlement price on their primary exchange as provided by a third-party pricing service. Futures contracts for which there were no trades that day for a particular position are generally valued at the closing bid quotation on their primary exchange as provided by a third-party pricing service. Forward foreign currency exchange contracts are generally valued at the mean of bid and asked prices for the time period interpolated from rates provided by a third-party pricing service for proximate time periods. Open-end investment companies are generally valued at net asset value per share. Securities and other assets generally valued on the basis of information from a third-party pricing service may also be valued at a broker/dealer bid quotation. Values obtained from third-party pricing services can utilize both transaction data and market information such as yield, quality, coupon rate, maturity, type of issue, trading characteristics, and other market data. The values of foreign securities and other assets and liabilities expressed in foreign currencies are converted to U.S. dollars using the mean of bid and asked prices for rates provided by a third-party pricing service.
The Board of Trustees has delegated primary responsibility for determining or causing to be determined the value of the fund’s investments (including any fair valuation) to the adviser pursuant to valuation policies and procedures approved by the Board. If the adviser determines that reliable market quotations are not readily available, investments are valued at fair value as determined in good faith by the adviser in accordance with such procedures under the oversight of the Board of Trustees. Under the fund’s valuation policies and procedures, market quotations are not considered to be readily available for most types of debt instruments and floating rate loans and many types of derivatives. These investments are generally valued at fair value based on information from third-party pricing services. In addition, investments may be valued at fair value if the adviser determines that an investment’s value has been materially affected by events occurring after the close of the exchange or market on which the investment is
39
Notes to Financial Statements – continued
principally traded (such as foreign exchange or market) and prior to the determination of the fund’s net asset value, or after the halting of trading of a specific security where trading does not resume prior to the close of the exchange or market on which the security is principally traded. The adviser generally relies on third-party pricing services or other information (such as the correlation with price movements of similar securities in the same or other markets; the type, cost and investment characteristics of the security; the business and financial condition of the issuer; and trading and other market data) to assist in determining whether to fair value and at what value to fair value an investment. The value of an investment for purposes of calculating the fund’s net asset value can differ depending on the source and method used to determine value. When fair valuation is used, the value of an investment used to determine the fund’s net asset value may differ from quoted or published prices for the same investment. There can be no assurance that the fund could obtain the fair value assigned to an investment if it were to sell the investment at the same time at which the fund determines its net asset value per share.
Various inputs are used in determining the value of the fund’s assets or liabilities. These inputs are categorized into three broad levels. In certain cases, the inputs used to measure fair value may fall into different levels of the fair value hierarchy. In such cases, an investment’s level within the fair value hierarchy is based on the lowest level of input that is significant to the fair value measurement. The fund’s assessment of the significance of a particular input to the fair value measurement in its entirety requires judgment, and considers factors specific to the investment. Level 1 includes unadjusted quoted prices in active markets for identical assets or liabilities. Level 2 includes other significant observable market-based inputs (including quoted prices for similar securities, interest rates, prepayment speed, and credit risk). Level 3 includes unobservable inputs, which may include the adviser’s own assumptions in determining the fair value of investments. Other financial instruments are derivative instruments not reflected in total investments, such as futures contracts and forward foreign currency exchange contracts. The following is a summary of the levels used as of January 31, 2016 in valuing the fund’s assets or liabilities:
| | | | | | | | | | | | | | | | |
| Investments at Value | | Level 1 | | | Level 2 | | | Level 3 | | | Total | |
| Equity Securities | | | $9,735,115 | | | | $— | | | | $— | | | | $9,735,115 | |
| U.S. Corporate Bonds | | | — | | | | 1,006,292,894 | | | | — | | | | 1,006,292,894 | |
| Commercial Mortgage-Backed Securities | | | — | | | | 383,536 | | | | — | | | | 383,536 | |
| Asset-Backed Securities (including CDOs) | | | — | | | | 28 | | | | — | | | | 28 | |
| Foreign Bonds | | | — | | | | 177,475,512 | | | | — | | | | 177,475,512 | |
| Floating Rate Loans | | | — | | | | 44,681,068 | | | | — | | | | 44,681,068 | |
| Mutual Funds | | | 43,971,779 | | | | — | | | | — | | | | 43,971,779 | |
| Total Investments | | | $53,706,894 | | | | $1,228,833,038 | | | | $— | | | | $1,282,539,932 | |
| | | | |
| Other Financial Instruments | | | | | | | | | | | | |
| Futures Contracts | | | $(360,783 | ) | | | $— | | | | $— | | | | $(360,783 | ) |
| Forward Foreign Currency Exchange Contracts | | | — | | | | 1,446 | | | | — | | | | 1,446 | |
For further information regarding security characteristics, see the Portfolio of Investments.
40
Notes to Financial Statements – continued
Foreign Currency Translation – Purchases and sales of foreign investments, income, and expenses are converted into U.S. dollars based upon currency exchange rates prevailing on the respective dates of such transactions or on the reporting date for foreign denominated receivables and payables. Gains and losses attributable to foreign currency exchange rates on sales of securities are recorded for financial statement purposes as net realized gains and losses on investments. Gains and losses attributable to foreign exchange rate movements on receivables, payables, income and expenses are recorded for financial statement purposes as foreign currency transaction gains and losses. That portion of both realized and unrealized gains and losses on investments that results from fluctuations in foreign currency exchange rates is not separately disclosed.
Derivatives – The fund uses derivatives for different purposes, primarily to increase or decrease exposure to a particular market or segment of the market, or security, to increase or decrease interest rate or currency exposure, or as alternatives to direct investments. Derivatives are used for hedging or non-hedging purposes. While hedging can reduce or eliminate losses, it can also reduce or eliminate gains. When the fund uses derivatives as an investment to increase market exposure, or for hedging purposes, gains and losses from derivative instruments may be substantially greater than the derivative’s original cost.
The derivative instruments used by the fund were written options, futures contracts, and forward foreign currency exchange contracts. The fund’s period end derivatives, as presented in the Portfolio of Investments and the associated Derivative Contract tables, generally are indicative of the volume of its derivative activity during the period.
The following table presents, by major type of derivative contract, the fair value, on a gross basis, of the asset and liability components of derivatives held by the fund at January 31, 2016 as reported in the Statement of Assets and Liabilities:
| | | | | | | | | | |
| | | | | Fair Value (a) | |
| Risk | | Derivative Contracts | | Asset Derivatives | | | Liability Derivatives | |
| Interest Rate | | Interest Rate Futures | | | $— | | | | $(360,783) | |
| Foreign Exchange | | Forward Foreign Currency Exchange | | | 1,446 | | | | — | |
| Total | | | | | $1,446 | | | | $(360,783) | |
| (a) | The value of futures contracts includes cumulative depreciation as reported in the fund’s Portfolio of Investments. Only the current day net variation margin for futures contracts is separately reported within the fund’s Statement of Assets and Liabilities. |
The following table presents, by major type of derivative contract, the realized gain (loss) on derivatives held by the fund for the year ended January 31, 2016 as reported in the Statement of Operations:
| | | | | | | | | | | | |
| Risk | | Futures
Contracts | | | Written
Options | | | Foreign
Currency | |
| Interest Rate | | | $(308,094 | ) | | | $— | | | | $— | |
| Foreign Exchange | | | — | | | | — | | | | 445,226 | |
| Equity | | | — | | | | 55,039 | | | | — | |
| Total | | | $(308,094 | ) | | | $55,039 | | | | $445,226 | |
41
Notes to Financial Statements – continued
The following table presents, by major type of derivative contract, the change in unrealized appreciation (depreciation) on derivatives held by the fund for the year ended January 31, 2016 as reported in the Statement of Operations:
| | | | | | | | |
| Risk | | Futures
Contracts | | | Translation
of Assets
and
Liabilities in
Foreign
Currencies | |
| Interest Rate | | | $181,116 | | | | $— | |
| Foreign Exchange | | | — | | | | (271,748 | ) |
| Total | | | $181,116 | | | | $(271,748 | ) |
Derivative counterparty credit risk is managed through formal evaluation of the creditworthiness of all potential counterparties. On certain, but not all, uncleared derivatives, the fund attempts to reduce its exposure to counterparty credit risk whenever possible by entering into an ISDA Master Agreement on a bilateral basis. The ISDA Master Agreement gives each party to the agreement the right to terminate all transactions traded under such agreement if there is a certain deterioration in the credit quality of the other party. Upon an event of default or a termination of the ISDA Master Agreement, the non-defaulting party has the right to close out all transactions traded under such agreement and to net amounts owed under each transaction to one net amount payable by one party to the other. This right to close out and net payments across all transactions traded under the ISDA Master Agreement could result in a reduction of the fund’s credit risk to such counterparty equal to any amounts payable by the fund under the applicable transactions, if any.
Collateral and margin requirements differ by type of derivative. Margin requirements are set by the clearing broker and the clearing house for cleared derivatives (e.g., futures contracts, cleared swaps, and exchange-traded options) while collateral terms are contract specific for uncleared derivatives (e.g., forward foreign currency exchange contracts, uncleared swap agreements, and uncleared options). For derivatives traded under an ISDA Master Agreement, which contains a collateral support annex, the collateral requirements are netted across all transactions traded under such agreement and one amount is posted from one party to the other to collateralize such obligations. Cash that has been segregated to cover the fund’s collateral or margin obligations under derivative contracts, if any, will be reported separately in the Statement of Assets and Liabilities as “Restricted cash” or “Deposits with brokers.” Securities pledged as collateral or margin for the same purpose, if any, are noted in the Portfolio of Investments.
Written Options – In exchange for a premium, the fund wrote put options on securities for which it anticipated the price would increase. At the time the option was written, the fund believed the premium received exceeded the potential loss that could result from adverse price changes in the options’ underlying securities. In a written option, the fund as the option writer grants the buyer the right to purchase from, or sell to, the fund a specified number of shares or units of a particular security, currency or index at a specified price within a specified period of time.
42
Notes to Financial Statements – continued
The premium received is initially recorded as a liability in the Statement of Assets and Liabilities. The option is subsequently marked-to-market daily with the difference between the premium received and the market value of the written option being recorded as unrealized appreciation or depreciation. When a written option expires, the fund realizes a gain equal to the amount of the premium received. The difference between the premium received and the amount paid on effecting a closing transaction is considered a realized gain or loss. When a written put option is exercised, the premium reduces the cost basis of the security purchased by the fund.
At the initiation of the written option contract, for exchange traded options, the fund is required to deposit securities or cash as collateral with the custodian for the benefit of the broker or directly with the clearing broker, based on the type of option. For uncleared options, the fund may post collateral subject to the terms of an ISDA Master Agreement as generally described above if the market value of the options contract moves against it. The fund, as writer of an option, may have no control over whether the underlying securities may be sold (call) or purchased (put) and, as a result, bears the market risk of an unfavorable change in the price of the securities underlying the written option. Losses from writing options can exceed the premium received and can exceed the potential loss from an ordinary buy and sell transaction. Although the fund’s market risk may be significant, the maximum counterparty credit risk to the fund is equal to the market value of any collateral posted to the broker. For uncleared options, this risk is mitigated in cases where there is an ISDA Master Agreement between the fund and the counterparty providing for netting as described above.
The following table represents the written option activity in the fund during the year ended January 31, 2016:
| | | | | | | | |
| | | Number of
Contracts | | | Premiums
Received | |
| Outstanding, beginning of period | | | — | | | | $— | |
| Options written | | | 860 | | | | 55,039 | |
| Options expired | | | (860 | ) | | | (55,039 | ) |
| Outstanding, end of period | | | — | | | | $— | |
Futures Contracts – The fund entered into futures contracts which may be used to hedge against or obtain broad market exposure, interest rate exposure, currency exposure, or to manage duration. A futures contract represents a commitment for the future purchase or sale of an asset at a specified price on a specified date.
Upon entering into a futures contract, the fund is required to deposit with the broker, either in cash or securities, an initial margin in an amount equal to a certain percentage of the notional amount of the contract. Subsequent payments (variation margin) are made or received by the fund each day, depending on the daily fluctuations in the value of the contract, and are recorded for financial statement purposes as unrealized gain or loss by the fund until the contract is closed or expires at which point the gain or loss on futures contracts is realized.
The fund bears the risk of interest rates, exchange rates or securities prices moving unexpectedly, in which case, the fund may not achieve the anticipated benefits of the futures contracts and may realize a loss. While futures contracts may present less
43
Notes to Financial Statements – continued
counterparty risk to the fund since the contracts are exchange traded and the exchange’s clearinghouse guarantees payments to the broker, there is still counterparty credit risk due to the insolvency of the broker. The fund’s maximum risk of loss due to counterparty credit risk is equal to the margin posted by the fund to the broker plus any gains or minus any losses on the outstanding futures contracts.
Forward Foreign Currency Exchange Contracts – The fund entered into forward foreign currency exchange contracts for the purchase or sale of a specific foreign currency at a fixed price on a future date. These contracts may be used to hedge the fund’s currency risk or for non-hedging purposes. For hedging purposes, the fund may enter into contracts to deliver or receive foreign currency that the fund will receive from or use in its normal investment activities. The fund may also use contracts to hedge against declines in the value of foreign currency denominated securities due to unfavorable exchange rate movements. For non-hedging purposes, the fund may enter into contracts with the intent of changing the relative exposure of the fund’s portfolio of securities to different currencies to take advantage of anticipated exchange rate changes.
Forward foreign currency exchange contracts are adjusted by the daily exchange rate of the underlying currency and any unrealized gains or losses are recorded as a receivable or payable for forward foreign currency exchange contracts until the contract settlement date. On contract settlement date, any gain or loss on the contract is recorded as realized gains or losses on foreign currency.
Risks may arise upon entering into these contracts from unanticipated movements in the value of the contract and from the potential inability of counterparties to meet the terms of their contracts. Generally, the fund’s maximum risk due to counterparty credit risk is the unrealized gain on the contract due to the use of Continuous Linked Settlement, an industry accepted settlement system. This risk is mitigated in cases where there is an ISDA Master Agreement between the fund and the counterparty providing for netting as described above and, where applicable, by the posting of collateral by the counterparty to the fund to cover the fund’s exposure to the counterparty under such ISDA Master Agreement.
Loans and Other Direct Debt Instruments – The fund invests in loans and loan participations or other receivables. These investments may include standby financing commitments, including revolving credit facilities, which contractually obligate the fund to supply additional cash to the borrower on demand. The fund generally provides this financial support in order to preserve its existing investment or to obtain a more senior secured interest in the assets of the borrower. Loan participations involve a risk of insolvency of the lending bank or other financial intermediary.
Indemnifications – Under the fund’s organizational documents, its officers and Trustees may be indemnified against certain liabilities and expenses arising out of the performance of their duties to the fund. Additionally, in the normal course of business, the fund enters into agreements with service providers that may contain indemnification clauses. The fund’s maximum exposure under these agreements is unknown as this would involve future claims that may be made against the fund that have not yet occurred.
44
Notes to Financial Statements – continued
Investment Transactions and Income – Investment transactions are recorded on the trade date. Interest income is recorded on the accrual basis. All premium and discount is amortized or accreted for financial statement purposes in accordance with U.S. generally accepted accounting principles. The fund earns certain fees in connection with its floating rate loan purchasing activities. These fees are in addition to interest payments earned and may include amendment fees, commitment fees, facility fees, consent fees, and prepayment fees. Commitment fees are recorded on an accrual basis as income in the accompanying financial statements. Dividends received in cash are recorded on the ex-dividend date. Certain dividends from foreign securities will be recorded when the fund is informed of the dividend if such information is obtained subsequent to the ex-dividend date. Dividend and interest payments received in additional securities are recorded on the ex-dividend or ex-interest date in an amount equal to the value of the security on such date. Debt obligations may be placed on non-accrual status or set to accrue at a rate of interest less than the contractual coupon when the collection of all or a portion of interest has become doubtful. Interest income for those debt obligations may be further reduced by the write-off of the related interest receivables when deemed uncollectible.
The fund may receive proceeds from litigation settlements. Any proceeds received from litigation involving portfolio holdings are reflected in the Statement of Operations in realized gain/loss if the security has been disposed of by the fund or in unrealized gain/loss if the security is still held by the fund. Any other proceeds from litigation not related to portfolio holdings are reflected as other income in the Statement of Operations.
Fees Paid Indirectly – The fund’s custody fee may be reduced by a credit earned under an arrangement that measures the value of U.S. dollars deposited with the custodian by the fund. The amount of the credit, for the year ended January 31, 2016, is shown as a reduction of total expenses in the Statement of Operations.
Tax Matters and Distributions – The fund intends to qualify as a regulated investment company, as defined under Subchapter M of the Internal Revenue Code, and to distribute all of its taxable income, including realized capital gains. As a result, no provision for federal income tax is required. The fund’s federal tax returns, when filed, will remain subject to examination by the Internal Revenue Service for a three year period. Management has analyzed the fund’s tax positions taken on federal and state tax returns for all open tax years and does not believe that there are any uncertain tax positions that require recognition of a tax liability. Foreign taxes, if any, have been accrued by the fund in the accompanying financial statements in accordance with the applicable foreign tax law. Foreign income taxes may be withheld by certain countries in which the fund invests. Additionally, capital gains realized by the fund on securities issued in or by certain foreign countries may be subject to capital gains tax imposed by those countries.
Distributions to shareholders are recorded on the ex-dividend date. Income and capital gain distributions are determined in accordance with income tax regulations, which may differ from U.S. generally accepted accounting principles. Certain capital accounts in the financial statements are periodically adjusted for permanent differences in order to reflect their tax character. These adjustments have no impact on net assets or net asset value per share. Temporary differences which arise from recognizing certain items
45
Notes to Financial Statements – continued
of income, expense, gain or loss in different periods for financial statement and tax purposes will reverse at some time in the future. Distributions in excess of net investment income or net realized gains are temporary overdistributions for financial statement purposes resulting from differences in the recognition or classification of income or distributions for financial statement and tax purposes.
Book/tax differences primarily relate to amortization and accretion of debt securities.
The tax character of distributions declared to shareholders for the last two fiscal year is as follows:
| | | | | | | | |
| | | 1/31/16 | | | 1/31/15 | |
Ordinary income (including any short-term capital gains) | | | $80,164,041 | | | | $80,078,822 | |
The federal tax cost and the tax basis components of distributable earnings were as follows:
| | | | |
| As of 1/31/16 | | | |
| Cost of investments | | | $1,463,787,988 | |
| Gross appreciation | | | 6,176,901 | |
| Gross depreciation | | | (187,424,957 | ) |
| Net unrealized appreciation (depreciation) | | | $(181,248,056 | ) |
| Undistributed ordinary income | | | 6,296,552 | |
| Capital loss carryforwards | | | (148,140,743 | ) |
| Other temporary differences | | | (6,778,950 | ) |
Under the Regulated Investment Company Modernization Act of 2010 (the “Act”), net capital losses recognized for fund fiscal years beginning after January 31, 2011 may be carried forward indefinitely, and their character is retained as short-term and/or long-term losses (“post-enactment losses”). Previously, net capital losses were carried forward for eight years and treated as short-term losses (“pre-enactment losses”). As a transition rule, the Act requires that all post-enactment net capital losses be used before pre-enactment net capital losses.
As of January 31, 2016, the fund had capital loss carryforwards available to offset future realized gains as follows:
| | | | |
Pre-enactment losses which expire as
follows: | |
| 1/31/17 | | | $(82,988,636 | ) |
| 1/31/18 | | | (46,635,154 | ) |
| Total | | | $(129,623,790 | ) |
|
Post-enactment losses which are
characterized as follows: | |
| Short-Term | | | $(6,841,825 | ) |
| Long-Term | | | (11,675,128 | ) |
| Total | | | $(18,516,953 | ) |
46
Notes to Financial Statements – continued
The availability of $24,285,300 of the capital loss carryforwards, which were acquired on July 24, 2009 in connection with the MFS Floating Rate High Income Fund merger, may be limited in a given year.
Multiple Classes of Shares of Beneficial Interest – The fund offers multiple classes of shares, which differ in their respective distribution, service, and program manager fees. The fund’s income and common expenses are allocated to shareholders based on the value of settled shares outstanding of each class. The fund’s realized and unrealized gain (loss) are allocated to shareholders based on the daily net assets of each class. Dividends are declared separately for each class. Differences in per share dividend rates are generally due to differences in separate class expenses. Class B and Class 529B shares will convert to Class A and Class 529A shares, respectively, approximately eight years after purchase. The fund’s distributions declared to shareholders as reported in the Statements of Changes in Net Assets are presented by class as follows:
| | | | | | | | |
| | | From net investment
income | |
| | | Year
ended
1/31/16 | | | Year
ended
1/31/15 | |
| Class A | | | $24,166,073 | | | | $25,663,339 | |
| Class B | | | 1,152,591 | | | | 1,436,375 | |
| Class C | | | 3,125,471 | | | | 3,557,473 | |
| Class I | | | 4,572,774 | | | | 4,239,647 | |
| Class R1 | | | 53,732 | | | | 62,227 | |
| Class R2 | | | 146,288 | | | | 172,561 | |
| Class R3 | | | 372,178 | | | | 401,921 | |
| Class R4 | | | 30,800 | | | | 31,095 | |
| Class R5 | | | 46,283,882 | | | | 44,229,586 | |
| Class 529A | | | 173,599 | | | | 185,256 | |
| Class 529B | | | 15,392 | | | | 16,328 | |
| Class 529C | | | 71,261 | | | | 83,014 | |
| Total | | | $80,164,041 | | | | $80,078,822 | |
(3) Transactions with Affiliates
Investment Adviser – The fund has an investment advisory agreement with MFS to provide overall investment management and related administrative services and facilities to the fund. The management fee is computed daily and paid monthly at the following annual rates:
| | | | |
| First $1.4 billion of average daily net assets | | | 0.46 | % |
| Average daily net assets in excess of $1.4 billion | | | 0.44 | % |
The investment adviser has agreed in writing to reduce its management fee to 0.42% of average daily net assets in excess of $3 billion. This written agreement will continue until modified by the fund’s Board of Trustees, but such agreement will continue at least until May 31, 2017. For the year ended January 31, 2016, the fund’s average daily net assets did not exceed $3 billion and therefore, the management fee was not reduced in accordance with this agreement. MFS has also agreed in writing to reduce its management fee by a specified amount if certain MFS mutual fund assets exceed
47
Notes to Financial Statements – continued
thresholds agreed to by MFS and the fund’s Board of Trustees. For the year ended January 31, 2016, this management fee reduction amounted to $100,577, which is included in the reduction of total expenses in the Statement of Operations. The management fee incurred for the year ended January 31, 2016 was equivalent to an annual effective rate of 0.45% of the fund’s average daily net assets.
Distributor – MFS Fund Distributors, Inc. (MFD), a wholly-owned subsidiary of MFS, as distributor, received $78,055 and $546 for the year ended January 31, 2016, as its portion of the initial sales charge on sales of Class A and Class 529A shares of the fund, respectively.
The Board of Trustees has adopted a distribution plan for certain share classes pursuant to Rule 12b-1 of the Investment Company Act of 1940.
The fund’s distribution plan provides that the fund will pay MFD for services provided by MFD and financial intermediaries in connection with the distribution and servicing of certain share classes. One component of the plan is a distribution fee paid to MFD and another component of the plan is a service fee paid to MFD. MFD may subsequently pay all, or a portion, of the distribution and/or service fees to financial intermediaries.
Distribution Plan Fee Table:
| | | | | | | | | | | | | | | | | | | | |
| | | Distribution
Fee Rate (d) | | | Service
Fee Rate (d) | | | Total
Distribution
Plan (d) | | | Annual
Effective
Rate (e) | | | Distribution
and Service
Fee | |
| Class A | | | — | | | | 0.25% | | | | 0.25% | | | | 0.24% | | | | $1,106,268 | |
| Class B | | | 0.75% | | | | 0.25% | | | | 1.00% | | | | 1.00% | | | | 244,423 | |
| Class C | | | 0.75% | | | | 0.25% | | | | 1.00% | | | | 1.00% | | | | 663,495 | |
| Class R1 | | | 0.75% | | | | 0.25% | | | | 1.00% | | | | 1.00% | | | | 11,408 | |
| Class R2 | | | 0.25% | | | | 0.25% | | | | 0.50% | | | | 0.50% | | | | 14,024 | |
| Class R3 | | | — | | | | 0.25% | | | | 0.25% | | | | 0.25% | | | | 17,020 | |
| Class 529A | | | — | | | | 0.25% | | | | 0.25% | | | | 0.23% | | | | 7,996 | |
| Class 529B | | | 0.75% | | | | 0.25% | | | | 1.00% | | | | 1.00% | | | | 3,302 | |
| Class 529C | | | 0.75% | | | | 0.25% | | | | 1.00% | | | | 1.00% | | | | 15,297 | |
| Total Distribution and Service Fees | | | | $2,083,233 | |
| (d) | In accordance with the distribution plan for certain classes, the fund pays distribution and/or service fees equal to these annual percentage rates of each class’s average daily net assets. The distribution and service fee rates disclosed by class represent the current rates in effect at the end of the reporting period. Any rate changes, if applicable, are detailed below. |
| (e) | The annual effective rates represent actual fees incurred under the distribution plan for the year ended January 31, 2016 based on each class’s average daily net assets. MFD has voluntarily agreed to rebate a portion of each class’s 0.25% service fee attributable to accounts for which MFD retains the 0.25% service fee except for accounts attributable to MFS or its affiliates’ seed money. For the year ended January 31, 2016, this rebate amounted to $35,415, $260, $300, $485, and $1 for Class A, Class B, Class C, Class 529A, and Class 529C, respectively, and is included in the reduction of total expenses in the Statement of Operations. |
Certain Class A shares are subject to a contingent deferred sales charge (CDSC) in the event of a shareholder redemption within 18 months of purchase. Class C and Class 529C shares are subject to a CDSC in the event of a shareholder redemption within 12 months of purchase. Class B and Class 529B shares are subject to a CDSC in
48
Notes to Financial Statements – continued
the event of a shareholder redemption within six years of purchase. All contingent deferred sales charges are paid to MFD and during the year ended January 31, 2016, were as follows:
| | | | |
| | | Amount | |
| Class A | | | $7,530 | |
| Class B | | | 55,763 | |
| Class C | | | 5,795 | |
| Class 529B | | | 43 | |
| Class 529C | | | 59 | |
The fund has entered into and may from time to time enter into contracts with program managers and other parties which administer the tuition programs through which an investment in the fund’s 529 share classes is made. The fund has entered into an agreement with MFD pursuant to which MFD receives an annual fee of up to 0.10% of the average daily net assets attributable to each 529 share class. MFD has agreed to waive a portion of this fee in an amount equal to 0.05% of the average daily net assets for each 529 share class. This waiver agreement will expire on May 31, 2017, unless MFD elects to extend the waiver. For the year ended January 31, 2016, this waiver amounted to $2,529 and is included in the reduction of total expenses in the Statement of Operations. The program manager fee incurred for the year ended January 31, 2016 was equivalent to an annual effective rate of 0.05% of the average daily net assets attributable to each 529 share class. The services provided by MFD, or a third party with which MFD contracts, include recordkeeping and tax reporting and account services, as well as services designed to maintain the program’s compliance with the Internal Revenue Code and other regulatory requirements. Program manager fees and waivers for the year ended January 31, 2016, were as follows:
| | | | | | | | |
| | | Fee | | | Waiver | |
| Class 529A | | | $3,199 | | | | $1,599 | |
| Class 529B | | | 330 | | | | 165 | |
| Class 529C | | | 1,530 | | | | 765 | |
| Total Program Manager Fees and Waivers | | | $5,059 | | | | $2,529 | |
Shareholder Servicing Agent – MFS Service Center, Inc. (MFSC), a wholly-owned subsidiary of MFS, receives a fee from the fund for its services as shareholder servicing agent calculated as a percentage of the average daily net assets of the fund as determined periodically under the supervision of the fund’s Board of Trustees. For the year ended January 31, 2016, the fee was $221,074, which equated to 0.0155% annually of the fund’s average daily net assets. MFSC also receives payment from the fund for out-of-pocket expenses, sub-accounting and other shareholder servicing costs which may be paid to affiliated and unaffiliated service providers. Class R5 shares do not incur sub-accounting fees. For the year ended January 31, 2016, these out-of-pocket expenses, sub-accounting and other shareholder servicing costs amounted to $669,484.
Under a Special Servicing Agreement among MFS, certain MFS funds which invest in other MFS funds (“MFS fund-of-funds”) and certain underlying funds in which a MFS fund-of-funds invests (“underlying funds”), each underlying fund may pay a portion of each MFS fund-of-funds’ transfer agent-related expenses, including sub-accounting fees payable to financial intermediaries, to the extent such payments do not exceed the
49
Notes to Financial Statements – continued
benefits realized or expected to be realized by the underlying fund from the investment in the underlying fund by the MFS fund-of-funds. For the year ended January 31, 2016, these costs for the fund amounted to $982,482 and are included in “Shareholder servicing costs” in the Statement of Operations.
Administrator – MFS provides certain financial, legal, shareholder communications, compliance, and other administrative services to the fund. Under an administrative services agreement, the fund reimburses MFS the costs incurred to provide these services. The fund is charged an annual fixed amount of $17,500 plus a fee based on average daily net assets. The administrative services fee incurred for the year ended January 31, 2016 was equivalent to an annual effective rate of 0.0163% of the fund’s average daily net assets.
Trustees’ and Officers’ Compensation – The fund pays compensation to independent Trustees in the form of a retainer, attendance fees, and additional compensation to Board and Committee chairpersons. The fund does not pay compensation directly to Trustees or officers of the fund who are also officers of the investment adviser, all of whom receive remuneration for their services to the fund from MFS. Certain officers and Trustees of the fund are officers or directors of MFS, MFD, and MFSC.
Prior to December 31, 2001, the fund had an unfunded defined benefit plan (“DB plan”) for independent Trustees. As of December 31, 2001, the Board took action to terminate the DB plan with respect to then-current and any future independent Trustees, such that the DB plan covers only certain of those former independent Trustees who retired on or before December 31, 2001. Effective January 1, 2002, accrued benefits under the DB plan for then-current independent Trustees who continued were credited to an unfunded retirement deferral plan (the “Retirement Deferral plan”), which was established for and exists solely with respect to these credited amounts, and is not available for other deferrals by these or other independent Trustees. Although the Retirement Deferral plan is unfunded, amounts deferred under the plan are periodically adjusted for investment experience as if they had been invested in shares of the fund. The DB plan resulted in a pension expense of $3,637 and the Retirement Deferral plan resulted in a net decrease in expense of $1,167. Both amounts are included in “Independent Trustees’ compensation” in the Statement of Operations for the year ended January 31, 2016. The liability for deferred retirement benefits payable to certain independent Trustees under both plans amounted to $38,262 at January 31, 2016, and is included in “Payable for independent Trustees’ compensation” in the Statement of Assets and Liabilities.
Other – This fund and certain other funds managed by MFS (the funds) have entered into a service agreement (the ISO Agreement) which provides for payment of fees solely by the funds to Tarantino LLC in return for the provision of services of an Independent Senior Officer (ISO) for the funds. Frank L. Tarantino serves as the ISO and is an officer of the funds and the sole member of Tarantino LLC. The funds can terminate the ISO Agreement with Tarantino LLC at any time under the terms of the ISO Agreement. For the year ended January 31, 2016, the fee paid by the fund under this agreement was $4,444 and is included in “Miscellaneous” expense in the Statement of Operations. MFS has agreed to bear all expenses associated with office space, other administrative support, and supplies provided to the ISO.
50
Notes to Financial Statements – continued
The fund invests in the MFS Institutional Money Market Portfolio which is managed by MFS and seeks current income consistent with preservation of capital and liquidity. Income earned on this investment is included in “Dividends from underlying affiliated funds” in the Statement of Operations. This money market fund does not pay a management fee to MFS.
(4) Portfolio Securities
For the year ended January 31, 2016, purchases and sales of investments, other than purchased option transactions and short-term obligations, aggregated $520,035,337 and $479,635,502, respectively.
(5) Shares of Beneficial Interest
The fund’s Declaration of Trust permits the Trustees to issue an unlimited number of full and fractional shares of beneficial interest. Transactions in fund shares were as follows:
| | | | | | | | | | | | | | | | |
| | | Year ended
1/31/16 | | | Year ended
1/31/15 | |
| | | Shares | | | Amount | | | Shares | | | Amount | |
| Shares sold | | | | | | | | | | | | | | | | |
Class A | | | 30,364,004 | | | | $103,414,541 | | | | 29,604,469 | | | | $105,999,664 | |
Class B | | | 816,890 | | | | 2,780,574 | | | | 1,036,181 | | | | 3,737,113 | |
Class C | | | 3,133,817 | | | | 10,702,426 | | | | 3,233,066 | | | | 11,652,249 | |
Class I | | | 23,023,278 | | | | 78,615,770 | | | | 33,132,981 | | | | 117,478,895 | |
Class R1 | | | 84,022 | | | | 286,914 | | | | 119,524 | | | | 431,220 | |
Class R2 | | | 171,821 | | | | 575,098 | | | | 136,262 | | | | 490,440 | |
Class R3 | | | 193,429 | | | | 658,875 | | | | 274,689 | | | | 988,039 | |
Class R4 | | | 33,277 | | | | 115,223 | | | | 42,331 | | | | 153,729 | |
Class R5 | | | 15,089,767 | | | | 50,094,036 | | | | 24,849,471 | | | | 89,048,046 | |
Class 529A | | | 243,216 | | | | 811,992 | | | | 170,588 | | | | 612,258 | |
Class 529B | | | 8,041 | | | | 27,365 | | | | 9,672 | | | | 34,797 | |
Class 529C | | | 68,857 | | | | 240,846 | | | | 69,887 | | | | 251,517 | |
| | | 73,230,419 | | | | $248,323,660 | | | | 92,679,121 | | | | $330,877,967 | |
|
Shares issued to shareholders in
reinvestment of distributions | |
Class A | | | 6,471,379 | | | | $21,876,784 | | | | 6,293,561 | | | | $22,620,581 | |
Class B | | | 310,853 | | | | 1,053,240 | | | | 357,121 | | | | 1,286,189 | |
Class C | | | 808,335 | | | | 2,742,183 | | | | 827,628 | | | | 2,985,357 | |
Class I | | | 1,262,575 | | | | 4,290,921 | | | | 1,069,676 | | | | 3,837,979 | |
Class R1 | | | 15,816 | | | | 53,608 | | | | 17,279 | | | | 62,169 | |
Class R2 | | | 41,688 | | | | 141,111 | | | | 46,648 | | | | 167,866 | |
Class R3 | | | 110,264 | | | | 372,176 | | | | 111,776 | | | | 401,908 | |
Class R4 | | | 9,040 | | | | 30,799 | | | | 8,661 | | | | 31,095 | |
Class R5 | | | 13,656,269 | | | | 46,086,682 | | | | 12,314,456 | | | | 44,229,586 | |
Class 529A | | | 50,964 | | | | 172,202 | | | | 51,353 | | | | 184,486 | |
Class 529B | | | 4,556 | | | | 15,387 | | | | 4,532 | | | | 16,292 | |
Class 529C | | | 20,795 | | | | 70,496 | | | | 22,903 | | | | 82,479 | |
| | | 22,762,534 | | | | $76,905,589 | | | | 21,125,594 | | | | $75,905,987 | |
51
Notes to Financial Statements – continued
| | | | | | | | | | | | | | | | |
| | | Year ended
1/31/16 | | | Year ended
1/31/15 | |
| | | Shares | | | Amount | | | Shares | | | Amount | |
| Shares reacquired | |
Class A | | | (38,427,371 | ) | | | $(130,209,088 | ) | | | (33,233,097 | ) | | | $(118,695,288 | ) |
Class B | | | (2,302,852 | ) | | | (7,804,017 | ) | | | (2,306,375 | ) | | | (8,275,956 | ) |
Class C | | | (5,273,538 | ) | | | (17,771,984 | ) | | | (5,485,311 | ) | | | (19,748,105 | ) |
Class I | | | (35,746,162 | ) | | | (120,581,473 | ) | | | (25,315,559 | ) | | | (89,505,098 | ) |
Class R1 | | | (153,128 | ) | | | (529,105 | ) | | | (92,444 | ) | | | (332,626 | ) |
Class R2 | | | (241,018 | ) | | | (827,014 | ) | | | (276,708 | ) | | | (998,308 | ) |
Class R3 | | | (193,225 | ) | | | (644,305 | ) | | | (686,457 | ) | | | (2,476,665 | ) |
Class R4 | | | (109,423 | ) | | | (364,116 | ) | | | (16,262 | ) | | | (58,597 | ) |
Class R5 | | | (6,132,328 | ) | | | (20,200,136 | ) | | | (6,470,093 | ) | | | (22,969,466 | ) |
Class 529A | | | (289,986 | ) | | | (973,735 | ) | | | (163,857 | ) | | | (582,800 | ) |
Class 529B | | | (9,229 | ) | | | (31,138 | ) | | | (12,134 | ) | | | (43,725 | ) |
Class 529C | | | (141,619 | ) | | | (478,311 | ) | | | (124,646 | ) | | | (441,709 | ) |
| | | (89,019,879 | ) | | | $(300,414,422 | ) | | | (74,182,943 | ) | | | $(264,128,343 | ) |
|
| Net change | |
Class A | | | (1,591,988 | ) | | | $(4,917,763 | ) | | | 2,664,933 | | | | $9,924,957 | |
Class B | | | (1,175,109 | ) | | | (3,970,203 | ) | | | (913,073 | ) | | | (3,252,654 | ) |
Class C | | | (1,331,386 | ) | | | (4,327,375 | ) | | | (1,424,617 | ) | | | (5,110,499 | ) |
Class I | | | (11,460,309 | ) | | | (37,674,782 | ) | | | 8,887,098 | | | | 31,811,776 | |
Class R1 | | | (53,290 | ) | | | (188,583 | ) | | | 44,359 | | | | 160,763 | |
Class R2 | | | (27,509 | ) | | | (110,805 | ) | | | (93,798 | ) | | | (340,002 | ) |
Class R3 | | | 110,468 | | | | 386,746 | | | | (299,992 | ) | | | (1,086,718 | ) |
Class R4 | | | (67,106 | ) | | | (218,094 | ) | | | 34,730 | | | | 126,227 | |
Class R5 | | | 22,613,708 | | | | 75,980,582 | | | | 30,693,834 | | | | 110,308,166 | |
Class 529A | | | 4,194 | | | | 10,459 | | | | 58,084 | | | | 213,944 | |
Class 529B | | | 3,368 | | | | 11,614 | | | | 2,070 | | | | 7,364 | |
Class 529C | | | (51,967 | ) | | | (166,969 | ) | | | (31,856 | ) | | | (107,713 | ) |
| | | 6,973,074 | | | | $24,814,827 | | | | 39,621,772 | | | | $142,655,611 | |
The fund is one of several mutual funds in which certain of the MFS funds-of-funds may invest. The MFS funds-of-funds do not invest in the underlying MFS funds for the purpose of exercising management or control. At the end of the period, the MFS Moderate Allocation Fund, the MFS Growth Allocation Fund, the MFS Conservative Allocation Fund, the MFS Lifetime 2030 Fund, the MFS Lifetime 2020 Fund, and the MFS Lifetime Income Fund were the owners of record of approximately 23%, 19%, 11%, 2%, 1%, and 1%, respectively, of the value of outstanding voting shares of the fund. In addition, the MFS Lifetime 2015 Fund, the MFS Lifetime 2025 Fund, the MFS Lifetime 2035 Fund, and the MFS Lifetime 2040 Fund were each the owners of record of less than 1% of the value of outstanding voting shares of the fund.
(6) Line of Credit
The fund and certain other funds managed by MFS participate in a $1.25 billion unsecured committed line of credit, subject to a $1 billion sublimit, provided by a syndication of banks under a credit agreement. Borrowings may be made for temporary financing needs. Interest is charged to each fund, based on its borrowings, generally at a rate equal to the higher of the Overnight Federal Reserve funds rate or daily one month LIBOR plus an agreed upon spread. A commitment fee, based on the
52
Notes to Financial Statements – continued
average daily, unused portion of the committed line of credit, is allocated among the participating funds at the end of each calendar quarter. In addition, the fund and other funds managed by MFS have established unsecured uncommitted borrowing arrangements with certain banks for temporary financing needs. Interest is charged to each fund, based on its borrowings, at a rate equal to the Overnight Federal Reserve funds rate plus an agreed upon spread. For the year ended January 31, 2016, the fund’s commitment fee and interest expense were $4,862 and $0, respectively, and are included in “Miscellaneous” expense in the Statement of Operations.
(7) Transactions in Underlying Affiliated Funds-Affiliated Issuers
An affiliated issuer may be considered one in which the fund owns 5% or more of the outstanding voting securities, or a company which is under common control. For the purposes of this report, the fund assumes the following to be an affiliated issuer:
| | | | | | | | | | | | | | | | |
Underlying Affiliated
Fund | | Beginning
Shares/Par
Amount | | | Acquisitions
Shares/Par
Amount | | | Dispositions
Shares/Par
Amount | | | Ending Shares/Par
Amount | |
MFS Institutional Money
Market Portfolio | | | 32,644,694 | | | | 385,148,828 | | | | (373,821,743 | ) | | | 43,971,779 | |
| | | | |
Underlying Affiliated
Fund | | Realized
Gain (Loss) | | | Capital Gain
Distributions | | | Dividend
Income | | | Ending
Value | |
MFS Institutional Money
Market Portfolio | | | $— | | | | $— | | | | $64,811 | | | | $43,971,779 | |
(8) Legal Proceedings
In May 2015, the Motors Liquidation Company Avoidance Action Trust (hereafter, “AAT”) served upon the fund a complaint in an adversary proceeding in the U.S. Bankruptcy Court for the Southern District of New York, captioned Motors Liquidation Company Avoidance Action Trust v. JPMorgan Chase Bank, N.A., et al. (No. 09-00504 (REG)). The complaint, which was originally filed in 2009 but not served on the fund until 2015, names as defendants over 500 entities (including the fund) that held an interest in a $1.5 billion General Motors (GM) term loan in 2009, when GM filed for bankruptcy. The AAT alleges that the fund and the other term loan lenders were improperly treated as secured lenders with respect to the term loan shortly before and immediately after GM’s bankruptcy, receiving full principal and interest payments under the loan. The AAT alleges that the fund and other term loan lenders should have been treated as unsecured (or partially unsecured) creditors because the main lien securing the collateral was allegedly not perfected at the time of GM’s bankruptcy due to an erroneous filing in October 2008 that terminated the financing statement perfecting the lien. The AAT seeks to claw back payments made to the fund and the other term loan lenders after, and during the 90 days before, GM’s June 2009 bankruptcy petition. During that time period, the fund received term loan payments of approximately $6,084,000. The fund cannot predict the outcome of this proceeding. Among other things, it is unclear whether the AAT’s claims will succeed; what the fund would be entitled to as an unsecured (or partially unsecured) creditor, given the existence of other collateral not impacted by the erroneous October 2008 filing; whether third parties responsible for the erroneous October 2008 filing would bear some or all of any liability; and the degree to which the fund may be entitled to indemnification from a third party for any amount required to be disgorged. The fund has and will continue to incur legal expenses associated with the defense of this action and in related claims against third parties.
53
REPORT OF INDEPENDENT REGISTERED PUBLIC ACCOUNTING FIRM
To the Board of Trustees of MFS Series Trust III and the Shareholders of MFS High Income Fund:
We have audited the accompanying statement of assets and liabilities, including the portfolio of investments, of MFS High Income Fund (one of the series of MFS Series Trust III) (the “Fund”) as of January 31, 2016, and the related statement of operations for the year then ended, the statements of changes in net assets for each of the two years in the period then ended, and the financial highlights for each of the five years in the period then ended. These financial statements and financial highlights are the responsibility of the Fund’s management. Our responsibility is to express an opinion on these financial statements and financial highlights based on our audits.
We conducted our audits in accordance with the standards of the Public Company Accounting Oversight Board (United States). Those standards require that we plan and perform the audit to obtain reasonable assurance about whether the financial statements and financial highlights are free of material misstatement. The Fund is not required to have, nor were we engaged to perform, an audit of its internal control over financial reporting. Our audits included consideration of internal control over financial reporting as a basis for designing audit procedures that are appropriate in the circumstances, but not for the purpose of expressing an opinion on the effectiveness of the Fund’s internal control over financial reporting. Accordingly, we express no such opinion. An audit also includes examining, on a test basis, evidence supporting the amounts and disclosures in the financial statements, assessing the accounting principles used and significant estimates made by management, as well as evaluating the overall financial statement presentation. Our procedures included confirmation of securities owned as of January 31, 2016, by correspondence with the custodian, brokers, and agent banks; when replies were not received from brokers or agent banks, we performed other auditing procedures. We believe that our audits provide a reasonable basis for our opinion.
In our opinion, such financial statements and financial highlights referred to above present fairly, in all material respects, the financial position of MFS High Income Fund as of January 31, 2016, the results of its operations for the year then ended, the changes in its net assets for each of the two years in the period then ended, and the financial highlights for each of the five years in the period then ended, in conformity with accounting principles generally accepted in the United States of America.
DELOITTE & TOUCHE LLP
Boston, Massachusetts
March 17, 2016
54
TRUSTEES AND OFFICERS — IDENTIFICATION AND BACKGROUND
The Trustees and Officers of the Trust, as of March 1, 2016, are listed below, together with their principal occupations during the past five years. (Their titles may have varied during that period.) The address of each Trustee and Officer is 111 Huntington Avenue, Boston, Massachusetts 02199-7618.
| | | | | | | | |
Name, Age | | Position(s)
Held with Fund | | Trustee/Officer
Since (h) | | Principal
Occupations During the Past Five Years | | Other Directorships (j) |
| INTERESTED TRUSTEES |
Robert J. Manning (k)
(age 52) | | Trustee | | February 2004 | | Massachusetts Financial Services Company, Chairman, Co-Chief Executive Officer and Director | | N/A |
Robin A. Stelmach (k)
(age 54) | | Trustee and President | | January 2014 | | Massachusetts Financial Services Company, Executive Vice President and Chief Operating Officer | | N/A |
| INDEPENDENT TRUSTEES | | | | | | |
David H. Gunning
(age 73) | | Trustee and Chair of Trustees | | January 2004 | | Private investor | | Lincoln Electric Holdings, Inc., Director; Development Alternatives, Inc., Director/Non-Executive Chairman |
Steven E. Buller
(age 64) | | Trustee | | February 2014 | | Chairman, Financial Accounting Standards Advisory Council; Standing Advisory Group, Public Company Accounting Oversight Board, Member (until 2014); BlackRock, Inc. (investment management), Managing Director (until 2014), BlackRock Finco UK (investment management), Director (until 2014) | | N/A |
Robert E. Butler
(age 74) | | Trustee | | January 2006 | | Consultant – investment company industry regulatory and compliance matters | | N/A |
Maureen R. Goldfarb
(age 60) | | Trustee | | January 2009 | | Private investor | | N/A |
55
Trustees and Officers – continued
| | | | | | | | |
Name, Age | | Position(s)
Held with Fund | | Trustee/Officer
Since (h) | | Principal
Occupations During the Past Five Years | | Other Directorships (j) |
William R. Gutow
(age 74) | | Trustee | | December 1993 | | Private investor and real estate consultant; Capitol Entertainment Management Company (video franchise), Vice Chairman (until 2014) | | Texas Donuts, Vice Chairman (until 2010) |
Michael Hegarty
(age 71) | | Trustee | | December 2004 | | Private investor | | Rouse Properties Inc., Director; Capmark Financial Group Inc., Director (until 2015) |
John P. Kavanaugh
(age 61) | | Trustee | | January 2009 | | Private investor | | N/A |
Maryanne L. Roepke
(age 60) | | Trustee | | May 2014 | | American Century Investments (investment management), Senior Vice President and Chief Compliance Officer (until 2014) | | N/A |
Laurie J. Thomsen
(age 58) | | Trustee | | March 2005 | | Private investor | | The Travelers Companies, Director; Dycom Industries, Inc., Director |
Robert W. Uek
(age 74) | | Trustee | | January 2006 | | Consultant to investment company industry | | N/A |
| OFFICERS | | | | | | | | |
Christopher R. Bohane (k)
(age 42) | | Assistant Secretary and Assistant Clerk | | July 2005 | | Massachusetts Financial Services Company, Vice President and Assistant General Counsel | | N/A |
Kino Clark (k)
(age 47) | | Assistant Treasurer | | January 2012 | | Massachusetts Financial Services Company, Vice President | | N/A |
Kristin V. Collins (k)
(age 43) | | Assistant Secretary and Assistant Clerk | | September 2015 | | Massachusetts Financial Services Company, Vice President and Assistant General Counsel | | N/A |
56
Trustees and Officers – continued
| | | | | | | | |
Name, Age | | Position(s)
Held with Fund | | Trustee/Officer
Since (h) | | Principal
Occupations During the Past Five Years | | Other Directorships (j) |
Thomas H. Connors (k)
(age 56) | | Assistant Secretary and Assistant Clerk | | September 2012 | | Massachusetts Financial Services Company, Vice President and Senior Counsel; Deutsche Investment Management Americas Inc. (financial service provider), Director and Senior Counsel (until 2012) | | N/A |
Ethan D. Corey (k)
(age 52) | | Assistant Secretary and Assistant Clerk | | July 2005 | | Massachusetts Financial Services Company, Senior Vice President and Associate General Counsel | | N/A |
David L. DiLorenzo (k)
(age 47) | | Treasurer | | July 2005 | | Massachusetts Financial Services Company, Senior Vice President | | N/A |
Brian E. Langenfeld (k)
(age 42) | | Assistant Secretary and Assistant Clerk | | June 2006 | | Massachusetts Financial Services Company, Vice President and Senior Counsel | | N/A |
Kenneth Paek (k)
(age 41) | | Assistant Treasurer | | February 2015 | | Massachusetts Financial Services Company, Vice President; Cohen & Steers, Vice President/Head of Fund Administration (until 2014); Morgan Stanley, Executive Director/Head of European Fund Administration (until 2012) | | N/A |
Susan A. Pereira (k)
(age 45) | | Assistant Secretary and Assistant Clerk | | July 2005 | | Massachusetts Financial Services Company, Vice President and Senior Counsel | | N/A |
57
Trustees and Officers – continued
| | | | | | | | |
Name, Age | | Position(s)
Held with Fund | | Trustee/Officer
Since (h) | | Principal
Occupations During the Past Five Years | | Other Directorships (j) |
Kasey L. Phillips (k)
(age 45) | | Assistant Treasurer | | September 2012 | | Massachusetts Financial Services Company, Vice President; Wells Fargo Funds Management, LLC, Senior Vice President, Fund Treasurer (until 2012) | | N/A |
Mark N. Polebaum (k)
(age 63) | | Secretary and Clerk | | January 2006 | | Massachusetts Financial Services Company, Executive Vice President, General Counsel and Secretary | | N/A |
Matthew A. Stowe (k)
(age 41) | | Assistant Secretary and Assistant Clerk | | October 2014 | | Massachusetts Financial Services Company, Vice President and Assistant General Counsel | | N/A |
Frank L. Tarantino
(age 71) | | Independent Senior Officer | | June 2004 | | Tarantino LLC (provider of compliance services), Principal | | N/A |
Richard S. Weitzel (k)
(age 45) | | Assistant Secretary and Assistant Clerk | | October 2007 | | Massachusetts Financial Services Company, Senior Vice President and Associate General Counsel | | N/A |
Martin J. Wolin (k)
(age 48) | | Chief Compliance Officer | | July 2015 | | Massachusetts Financial Services Company, Senior Vice President and Chief Compliance Officer (since July 2015); Mercer (financial service provider), Chief Risk and Compliance Officer, North America and Latin America (until June 2015) | | N/A |
James O. Yost (k)
(age 55) | | Deputy Treasurer | | September 1990 | | Massachusetts Financial Services Company, Senior Vice President | | N/A |
| (h) | Date first appointed to serve as Trustee/officer of an MFS Fund. Each Trustee has served continuously since appointment unless indicated otherwise. For the period from December 15, 2004 until February 22, 2005, Mr. Manning served as Advisory Trustee. Prior to January 2012, Messrs. DiLorenzo and Yost served as Assistant Treasurers of the Funds. Ms. Stelmach was appointed as President of the Funds as of October 1, 2014. |
58
Trustees and Officers – continued
| (j) | Directorships or trusteeships of companies required to report to the Securities and Exchange Commission (i.e., “public companies”). |
| (k) | “Interested person” of the Trust within the meaning of the Investment Company Act of 1940 (referred to as the 1940 Act), which is the principal federal law governing investment companies like the fund, as a result of a position with MFS. The address of MFS is 111 Huntington Avenue, Boston, Massachusetts 02199-7618. |
Each Trustee (except Ms. Stelmach, Mr. Buller and Ms. Roepke) has been elected by shareholders and each Trustee and officer holds office until his or her successor is chosen and qualified or until his or her earlier death, resignation, retirement or removal. The Trust does not hold annual meetings for the purpose of electing Trustees, and Trustees are not elected for fixed terms. Messrs. Buller, Butler, Kavanaugh, Uek and Ms. Roepke are members of the Trust’s Audit Committee.
Each of the Fund’s Trustees and officers holds comparable positions with certain other funds of which MFS or a subsidiary is the investment adviser or distributor, and, in the case of the officers, with certain affiliates of MFS. As of March 1, 2016, the Trustees served as board members of 137 funds within the MFS Family of Funds.
The Statement of Additional Information for a Fund includes further information about the Trustees and is available without charge upon request by calling 1-800-225-2606.
| | |
| Investment Adviser | | Custodian |
Massachusetts Financial Services Company
111 Huntington Avenue
Boston, MA 02199-7618 | | JPMorgan Chase Bank, NA 4 Metrotech Center New York, NY 11245 |
| Distributor | | Independent Registered Public Accounting Firm |
MFS Fund Distributors, Inc.
111 Huntington Avenue
Boston, MA 02199-7618 | | Deloitte & Touche LLP 200 Berkeley Street Boston, MA 02116 |
| Portfolio Managers | | |
William Adams David Cole | | |
59
PROXY VOTING POLICIES AND INFORMATION
MFS votes proxies on behalf of the fund pursuant to proxy voting policies and procedures that are available without charge, upon request, by calling 1-800-225-2606, by visiting the Proxy Voting section of mfs.com or by visiting the SEC’s Web site at http://www.sec.gov.
Information regarding how the fund voted proxies relating to portfolio securities during the most recent twelve-month period ended June 30 is available without charge by visiting the Proxy Voting section of mfs.com or by visiting the SEC’s Web site at http://www.sec.gov.
QUARTERLY PORTFOLIO DISCLOSURE
The fund will file a complete schedule of portfolio holdings with the Securities and Exchange Commission (the Commission) for the first and third quarters of each fiscal year on Form N-Q. A shareholder can obtain the quarterly portfolio holdings report at mfs.com. The fund’s Form N-Q is also available on the EDGAR database on the Commission’s Internet Web site at http://www.sec.gov, and may be reviewed and copied at the:
Public Reference Room
Securities and Exchange Commission
100 F Street, NE, Room 1580
Washington, D.C. 20549
Information on the operation of the Public Reference Room may be obtained by calling the Commission at 1-800-SEC-0330. Copies of the fund’s Form N-Q also may be obtained, upon payment of a duplicating fee, by electronic request at the following e-mail address: publicinfo@sec.gov or by writing the Public Reference Section at the above address.
FURTHER INFORMATION
From time to time, MFS may post important information about the fund or the MFS funds on the MFS web site (mfs.com). This information is available by visiting the “Market Commentary” and “Announcements” sub sections in the “Market Outlooks” section of mfs.com or by clicking on the fund’s name under “Mutual Funds” in the “Products” section of mfs.com.
FEDERAL TAX INFORMATION (unaudited)
The fund will notify shareholders of amounts for use in preparing 2016 income tax forms in January 2017.
60
rev. 3/11
| | | | |
| | | |
FACTS | | WHAT DOES MFS DO WITH YOUR PERSONAL INFORMATION? | |  |
| | |
| Why? | | Financial companies choose how they share your personal information. Federal law gives consumers the right to limit some but not all sharing. Federal law also requires us to tell you how we collect, share, and protect your personal information. Please read this notice carefully to understand what we do. |
| | |
| What? | | The types of personal information we collect and share depend on the product or service you have with us. This information can include: • Social Security number and account balances • Account transactions and transaction history • Checking account information and wire transfer instructions When you are no longer our customer, we continue to share your information as described in this notice. |
| | |
| How? | | All financial companies need to share customers’ personal information to run their everyday business. In the section below, we list the reasons financial companies can share their customers’ personal information; the reasons MFS chooses to share; and whether you can limit this sharing. |
| | | | |
Reasons we can share your
personal information | | Does MFS
share? | | Can you limit
this sharing? |
For our everyday business purposes – such as to process your transactions, maintain your account(s), respond to court orders and legal investigations, or report to credit bureaus | | Yes | | No |
For our marketing purposes – to offer our products and services to you | | No | | We don’t share |
| For joint marketing with other financial companies | | No | | We don’t share |
For our affiliates’ everyday business purposes – information about your transactions and experiences | | No | | We don’t share |
For our affiliates’ everyday business purposes – information about your creditworthiness | | No | | We don’t share |
| For nonaffiliates to market to you | | No | | We don’t share |
| | |
| Questions? | | Call 800-225-2606 or go to mfs.com. |
61
| | |
| Who we are |
| Who is providing this notice? | | MFS Funds, MFS Investment Management, MFS Institutional Advisors, Inc., MFS Fund Distributors, Inc., MFS Heritage Trust Company, and MFS Service Center, Inc. |
| | |
| What we do |
| How does MFS protect my personal information? | | To protect your personal information from unauthorized access and use, we use security measures that comply with federal law. These measures include procedural, electronic, and physical safeguards for the protection of the personal information we collect about you. |
| How does MFS collect my personal information? | | We collect your personal information, for example, when you • open an account or provide account information • direct us to buy securities or direct us to sell your securities • make a wire transfer We also collect your personal information from others, such as credit bureaus, affiliates and other companies. |
| Why can’t I limit all sharing? | | Federal law gives you the right to limit only • sharing for affiliates’ everyday business purposes – information about your creditworthiness • affiliates from using your information to market to you • sharing for nonaffiliates to market to you State laws and individual companies may give you additional rights to limit sharing. |
| | |
| Definitions |
| Affiliates | | Companies related by common ownership or control. They can be financial and nonfinancial companies. • MFS does not share personal information with affiliates, except for everyday business purposes as described on page one of this notice. |
| Nonaffiliates | | Companies not related by common ownership or control. They can be financial and nonfinancial companies. • MFS does not share with nonaffiliates so they can market to you. |
| Joint Marketing | | A formal agreement between nonaffiliated financial companies that together market financial products or services to you. • MFS doesn’t jointly market. |
| | |
| Other important information |
| If you own an MFS product or receive an MFS service in the name of a third party such as a bank or broker-dealer, their privacy policy may apply to you instead of ours. |
62
Save paper with eDelivery.

| MFS® will send you prospectuses, |
reports, and proxies directly via e-mail so you will get information faster with less mailbox clutter.
To sign up:
1. Go to mfs.com.
2. Log in via MFS® Access.
3. Select eDelivery.
If you own your MFS fund shares through a financial institution or a retirement plan, MFS® TALK, MFS® Access, or eDelivery may not be available to you.
CONTACT
WEB SITE
mfs.com
MFS TALK
1-800-637-8255
24 hours a day
ACCOUNT SERVICE AND LITERATURE
Shareholders
1-800-225-2606
Financial advisors
1-800-343-2829
Retirement plan services
1-800-637-1255
MAILING ADDRESS
MFS Service Center, Inc.
P.O. Box 55824
Boston, MA 02205-5824
OVERNIGHT MAIL
MFS Service Center, Inc.
c/o Boston Financial Data Services
30 Dan Road
Canton, MA 02021-2809
ANNUAL REPORT
January 31, 2016
MFS® HIGH YIELD POOLED PORTFOLIO

HYP-ANN
MFS® HIGH YIELD POOLED PORTFOLIO
CONTENTS
The report is prepared for the general information of shareholders.
It is authorized for distribution to prospective investors only when preceded or accompanied by a current prospectus.
NOT FDIC INSURED • MAY LOSE VALUE • NO BANK GUARANTEE
LETTER FROM THE CHAIRMAN
Dear Shareholders:
Market volatility remains elevated amid signs of slowing global growth and continued weakness in the price of oil and other commodities. Chinese markets remain skittish
following a series of policy missteps and currency depreciations, which have contributed to large capital outflows.
A lower-for-longer interest rate environment is likely for the foreseeable future given accommodative global central bank policies. The Bank of Japan has adopted a negative interest rate policy while the European Central Bank has signaled plans for additional monetary stimulus later this year. Meanwhile, expectations for further monetary policy tightening from the U.S. Federal Reserve have been reduced in the face of more challenging financial conditions.
The U.S. manufacturing sector is suffering the effects of a strong U.S. dollar and falling global demand. There is some reason for optimism, however, as U.S. labor markets continue to improve while auto and home sales remain upbeat.
As markets have become more focused on short-term trends in recent years, we believe it’s important for investors to lengthen their investment time horizon. At MFS®, we don’t trade on headlines or trends; we invest for the long term.
We believe that this approach, coupled with the professional guidance of a financial advisor, will help you reach your investment goals.
Respectfully,
Robert J. Manning
Chairman
MFS Investment Management
March 17, 2016
The opinions expressed in this letter are subject to change and may not be relied upon for investment advice. No forecasts can be guaranteed.
1
PORTFOLIO COMPOSITION
Portfolio structure (i)
| | | | |
| Top five industries (i) | | | | |
| Cable TV | | | 6.7% | |
| Medical & Health Technology & Services | | | 6.2% | |
| Midstream | | | 5.1% | |
| Telecommunications-Wireless | | | 4.8% | |
| Containers | | | 4.4% | |
| | | | |
| Composition including fixed income credit quality (a)(i) | | | | |
| BBB | | | 2.8% | |
| BB | | | 38.2% | |
| B | | | 42.8% | |
| CCC | | | 12.5% | |
| D | | | 0.1% | |
| Not Rated | | | (0.9)% | |
| Non-Fixed Income | | | 0.7% | |
| Cash & Cash Equivalents | | | 2.9% | |
| Other | | | 0.9% | |
| |
| Portfolio facts (i) | | | | |
| Average Duration (d) | | | 4.2 | |
| Average Effective Maturity (m) | | | 5.7 yrs. | |
| (a) | For all securities other than those specifically described below, ratings are assigned to underlying securities utilizing ratings from Moody’s, Fitch, and Standard & Poor’s rating agencies and applying the following hierarchy: If all three agencies provide a rating, the middle rating (after dropping the highest and lowest ratings) is assigned; if two of the three agencies rate a security, the lower of the two is assigned. Ratings are shown in the S&P and Fitch scale (e.g., AAA). Securities rated BBB or higher are considered investment grade. All ratings are subject to change. Not Rated includes fixed income securities, including fixed income futures contracts, which have not been rated by any rating agency. Non-Fixed Income includes any equity securities (including convertible bonds and equity derivatives) and/or commodity-linked derivatives. The fund may not hold all of these instruments. The fund is not rated by these agencies. |
| (d) | Duration is a measure of how much a bond’s price is likely to fluctuate with general changes in interest rates, e.g., if rates rise 1.00%, a bond with a 5-year duration is likely to lose about 5.00% of its value due to the interest rate move. |
| (i) | For purposes of this presentation, the components include the value of securities, and reflect the impact of the equivalent exposure of derivative positions, if any. These amounts may be negative from time to time. Equivalent exposure is a calculated amount that translates the derivative position into a reasonable approximation of the amount of the underlying asset that the portfolio would have to hold at a given point in time to have the same price sensitivity that results from the portfolio’s ownership of the derivative contract. When dealing with derivatives, equivalent exposure is a more representative measure of the potential impact of a position on portfolio performance than value. The bond component will include any accrued interest amounts. |
2
Portfolio Composition – continued
| (m) | In determining an instrument’s effective maturity for purposes of calculating the fund’s dollar-weighted average effective maturity, MFS uses the instrument’s stated maturity or, if applicable, an earlier date on which MFS believes it is probable that a maturity-shortening device (such as a put, pre-refunding or prepayment) will cause the instrument to be repaid. Such an earlier date can be substantially shorter than the instrument’s stated maturity. |
Where the fund holds convertible bonds, these are treated as part of the equity portion of the portfolio.
Cash & Cash Equivalents includes any cash, investments in money market funds, short-term securities, and other assets less liabilities. Please see the Statement of Assets and Liabilities for additional information related to the fund’s cash position and other assets and liabilities.
Other includes currency derivatives and/or any offsets to derivative positions.
Percentages are based on net assets as of 1/31/16.
The portfolio is actively managed and current holdings may be different.
3
MANAGEMENT REVIEW
Summary of Results
For the twelve months ended January 31, 2016, shares of the MFS High Yield Pooled Portfolio (“fund”) provided a total return of –5.23%, at net asset value. This compares with a return of –6.58% for the fund’s benchmark, the Barclays U.S. High-Yield Corporate Bond 2% Issuer Capped Index.
Market Environment
Sluggish global growth weighed on both developed and emerging market (“EM”) economies during the reporting period. EM economies have been particularly lackluster. While the US Federal Reserve (“Fed”) began its anticipated monetary policy tightening cycle toward the end of the period, other large developed economies continued to embrace accommodative monetary policies, particularly the European Central Bank and the Bank of Japan. Focus remained on China after policy missteps by the Chinese government roiled global markets over the summer, beginning with the uncoordinated response to the stock market’s boom and bust and then the confusing decision to devalue the renminbi in August. China subsequently ramped up a wide range of monetary and fiscal measures to stimulate the economy, bolster sentiment and stabilize its currency.
During the second half of the reporting period, many US companies faced significant headwinds to earnings caused primarily by the sharp decline in the prices of oil and other commodities. Earnings contractions were concentrated primarily in the energy, materials and industrial sectors. The sharp rise in the US dollar also weighed on earnings during the period. Exports were crimped by the dollar’s strength and falling demand in emerging markets. Beyond the Fed’s interest rate hike in December, tighter financial conditions rippled through the economy. Consumer spending held up well during the second half of the period amid a modest increase in real wages and falling gasoline prices. Demand for autos reached near-record territory late in the period. In emerging markets, two key factors weighed on economies and asset prices: 1) weaker Chinese growth, which drove the decline in commodity prices and 2) prospects for higher US interest rates. Structural factors like floating exchange rates and fiscal buffers partially offset these cyclical headwinds.
Contributors to Performance
Credit quality in US Bonds, particularly in high-yield bonds (“CCC” rated (r)), was a primary contributor to performance relative to the Barclays U.S. High-Yield Corporate Bond 2% Issuer Capped Index.
Bond selection within the industrials sector also benefited relative results. In particular, the fund’s long credit position in issues from casinos owner and operator CCM Merger and pharmaceutical firm Endo Finance strengthened relative results.
Detractors from Performance
The portion of the fund’s return derived from yield, which was less than that of the Barclays U.S. High-Yield Corporate Bond 2% Issuer Capped Index, was a primary factor that detracted from relative results.
4
Management Review – continued
Credit quality in US bonds, particularly a greater exposure to “B” rated securities, was another area of relative weakness.
The fund’s greater exposure to the utility sector also held back relative performance as this market segment performed poorly over the reporting period.
Respectfully,
| | |
| William Adams | | David Cole |
| Portfolio Manager | | Portfolio Manager |
| (r) | Bonds rated “BBB”, “Baa”, or higher are considered investment grade; bonds rated “BB”, “Ba”, or below are considered non-investment grade. The source for bond quality ratings is Moody’s Investors Service, Standard & Poor’s and Fitch, Inc. and are applied using the following hierarchy: If all three agencies provide a rating, the middle rating (after dropping the highest and lowest ratings) is assigned; if two of the three agencies rate a security, the lower of the two is assigned. Ratings are shown in the S&P and Fitch scale (e.g., AAA). For securities which are not rated by any of the three agencies, the security is considered Not Rated. |
The views expressed in this report are those of the portfolio managers only through the end of the period of the report as stated on the cover and do not necessarily reflect the views of MFS or any other person in the MFS organization. These views are subject to change at any time based on market or other conditions, and MFS disclaims any responsibility to update such views. These views may not be relied upon as investment advice or an indication of trading intent on behalf of any MFS portfolio. References to specific securities are not recommendations of such securities, and may not be representative of any MFS portfolio’s current or future investments.
5
PERFORMANCE SUMMARY THROUGH 1/31/16
The following chart illustrates the fund’s historical performance in comparison to its benchmark(s). Performance results reflect the percentage change in net asset value, including reinvestment of dividends and capital gains distributions. Benchmarks are unmanaged and may not be invested in directly. Benchmark returns do not reflect sales charges, commissions or expenses. (See Notes to Performance Summary.)
Performance data shown represents past performance and is no guarantee of future results. Investment return and principal value fluctuate so your shares, when sold, may be worth more or less than the original cost; current performance may be lower or higher than quoted. The performance shown does not reflect the deduction of taxes, if any, that a shareholder would pay on fund distributions or the redemption of fund shares.
Growth of a Hypothetical $10,000 Investment (t)
6
Performance Summary – continued
Total Returns through 1/31/16
Average annual without sales charge
| | | | | | | | | | |
| | | Fund inception date | | | | 1-yr | | Life (t) | | |
| | | 3/25/13 | | | | (5.23)% | | 1.04% | | |
| Comparative benchmark | | | | | | |
| | | Barclays U.S. High-Yield Corporate Bond 2% Issuer Capped Index (f) | | (6.58)% | | 0.26% | | |
| (f) | Source: FactSet Research Systems Inc. |
| (t) | For the period from the fund inception date through the stated period end. (See Notes to Performance Summary.) |
Benchmark Definition
Barclays U.S. High-Yield Corporate Bond 2% Issuer Capped Index – a component of the Barclays U.S. High-Yield Corporate Bond Index, which measures performance of non-investment grade, fixed rate debt. The index limits the maximum exposure to any one issuer to 2%.
It is not possible to invest directly in an index.
Notes to Performance Summary
Average annual total return represents the average annual change in value for the fund for the periods presented. Life returns are presented where the fund has less than 10 years of performance history and represent the average annual total return from the fund inception date to the stated period end date.
Performance results reflect any applicable expense subsidies and waivers in effect during the periods shown. Without such subsidies and waivers the fund’s performance results would be less favorable. Please see the prospectus and financial statements for complete details.
Performance results do not include adjustments made for financial reporting purposes in accordance with U.S. generally accepted accounting principles and may differ from amounts reported in the financial highlights.
From time to time the fund may receive proceeds from litigation settlements, without which performance would be lower.
7
EXPENSE TABLE
Fund expenses borne by the shareholders during the period, August 1, 2015 through January 31, 2016
As a shareholder of the fund, you incur ongoing costs, including fund expenses. This example is intended to help you understand your ongoing costs (in dollars) of investing in the fund and to compare these costs with the ongoing costs of investing in other mutual funds.
The example is based on an investment of $1,000 invested at the beginning of the period and held for the entire period August 1, 2015 through January 31, 2016.
Actual Expenses
The first line of the following table provides information about actual account values and actual expenses. You may use the information in this line, together with the amount you invested, to estimate the expenses that you paid over the period. Simply divide your account value by $1,000 (for example, an $8,600 account value divided by $1,000 = 8.6), then multiply the result by the number in the first line under the heading entitled “Expenses Paid During Period” to estimate the expenses you paid on your account during this period.
Hypothetical Example for Comparison Purposes
The second line of the following table provides information about hypothetical account values and hypothetical expenses based on the fund’s actual expense ratio and an assumed rate of return of 5% per year before expenses, which is not the fund’s actual return. The hypothetical account values and expenses may not be used to estimate the actual ending account balance or expenses you paid for the period. You may use this information to compare the ongoing costs of investing in the fund and other funds. To do so, compare this 5% hypothetical example with the 5% hypothetical examples that appear in the shareholder reports of the other funds.
Please note that the expenses shown in the table are meant to highlight your ongoing costs only and do not reflect any transactional costs, such as sales charges (loads). Therefore, the second line of the table is useful in comparing ongoing costs only, and will not help you determine the relative total costs of owning different funds. In addition, if these transactional costs were included, your costs would have been higher.
| | | | | | | | |
| | | Annualized
Expense
Ratio | | Beginning
Account Value
8/01/15 | | Ending
Account Value
1/31/16 | | Expenses
Paid During
Period (p)
8/01/15-1/31/16 |
| Actual | | 0.02% | | $1,000.00 | | $931.70 | | $0.10 |
| Hypothetical (h) | | 0.02% | | $1,000.00 | | $1,025.10 | | $0.10 |
| (h) | 5% fund return per year before expenses. |
| (p) | “Expenses Paid During Period” are equal to the fund’s annualized expense ratio, as shown above, multiplied by the average account value over the period, multiplied by 184/365 (to reflect the one-half year period). |
8
PORTFOLIO OF INVESTMENTS
1/31/16
The Portfolio of Investments is a complete list of all securities owned by your fund. It is categorized by broad-based asset classes.
| | | | | | | | |
| Bonds - 91.3% | | | | | | | | |
| Issuer | | Shares/Par | | | Value ($) | |
| Aerospace - 1.7% | | | | | | | | |
| Aerojet Rocketdyne Holdings, Inc., 7.125%, 3/15/21 | | $ | 7,220,000 | | | $ | 7,328,261 | |
| Bombardier, Inc., 6.125%, 1/15/23 (n) | | | 4,160,000 | | | | 2,849,600 | |
| Bombardier, Inc., 7.5%, 3/15/25 (n) | | | 2,655,000 | | | | 1,825,313 | |
| CPI International, Inc., 8.75%, 2/15/18 | | | 5,895,000 | | | | 5,747,625 | |
| TransDigm, Inc., 6%, 7/15/22 | | | 875,000 | | | | 857,500 | |
| TransDigm, Inc., 6.5%, 7/15/24 | | | 4,315,000 | | | | 4,217,913 | |
| | | | | | | | |
| | | | | | | $ | 22,826,212 | |
| Apparel Manufacturers - 0.4% | | | | | | | | |
| Hanesbrands, Inc., 6.375%, 12/15/20 | | $ | 2,250,000 | | | $ | 2,334,645 | |
| PVH Corp., 4.5%, 12/15/22 | | | 3,740,000 | | | | 3,627,800 | |
| | | | | | | | |
| | | | | | | $ | 5,962,445 | |
| Automotive - 2.5% | | | | | | | | |
| Accuride Corp., 9.5%, 8/01/18 | | $ | 6,190,000 | | | $ | 4,828,200 | |
| Goodyear Tire & Rubber Co., 6.5%, 3/01/21 | | | 6,790,000 | | | | 7,129,500 | |
| Goodyear Tire & Rubber Co., 7%, 5/15/22 | | | 1,110,000 | | | | 1,187,145 | |
| Lear Corp., 4.75%, 1/15/23 | | | 4,230,000 | | | | 4,272,300 | |
| Lear Corp., 5.25%, 1/15/25 | | | 3,145,000 | | | | 3,266,869 | |
| Schaeffler Finance B.V., 6.875%, 8/15/18 (n)(p) | | | 2,905,000 | | | | 2,984,888 | |
| Schaeffler Finance B.V., 4.75%, 5/15/21 (n) | | | 2,175,000 | | | | 2,175,000 | |
| Schaeffler Holding Finance B.V., 6.25%, 11/15/19 (n)(p) | | | 2,525,000 | | | | 2,632,313 | |
| ZF North America Capital, Inc., 4.5%, 4/29/22 (n) | | | 3,825,000 | | | | 3,686,344 | |
| ZF North America Capital, Inc., 4.75%, 4/29/25 (n) | | | 2,215,000 | | | | 2,076,563 | |
| | | | | | | | |
| | | | | | | $ | 34,239,122 | |
| Broadcasting - 2.7% | | | | | | | | |
| Activision Blizzard, Inc., 6.125%, 9/15/23 (n) | | $ | 4,465,000 | | | $ | 4,777,550 | |
| AMC Networks, Inc., 7.75%, 7/15/21 | | | 4,715,000 | | | | 4,997,900 | |
| Clear Channel Worldwide Holdings, Inc., “A”, 6.5%, 11/15/22 | | | 745,000 | | | | 663,050 | |
| Clear Channel Worldwide Holdings, Inc., “B”, 6.5%, 11/15/22 | | | 3,490,000 | | | | 3,232,613 | |
| iHeartMedia, Inc., 9%, 3/01/21 | | | 6,128,000 | | | | 3,983,200 | |
| Liberty Media Corp., 8.5%, 7/15/29 | | | 2,790,000 | | | | 2,783,025 | |
| Liberty Media Corp., 8.25%, 2/01/30 | | | 1,215,000 | | | | 1,202,850 | |
| Netflix, Inc., 5.375%, 2/01/21 | | | 3,335,000 | | | | 3,585,125 | |
| Netflix, Inc., 5.875%, 2/15/25 (n) | | | 2,335,000 | | | | 2,407,969 | |
| Nexstar Broadcasting, Inc., 6.875%, 11/15/20 | | | 5,005,000 | | | | 5,017,513 | |
| Tribune Media Co., 5.875%, 7/15/22 (n) | | | 3,355,000 | | | | 3,346,613 | |
| | | | | | | | |
| | | | | | | $ | 35,997,408 | |
9
Portfolio of Investments – continued
| | | | | | | | |
| Issuer | | Shares/Par | | | Value ($) | |
| Bonds - continued | | | | | | | | |
| Building - 3.1% | | | | | | | | |
| Allegion PLC, 5.875%, 9/15/23 | | $ | 1,145,000 | | | $ | 1,182,213 | |
| Allegion U.S. Holding Co., Inc., 5.75%, 10/01/21 | | | 7,640,000 | | | | 7,945,600 | |
| Beacon Roofing Supply, Inc., 6.375%, 10/01/23 (n) | | | 3,580,000 | | | | 3,691,875 | |
| Building Materials Corp. of America, 5.375%, 11/15/24 (n) | | | 2,895,000 | | | | 2,851,575 | |
| Building Materials Corp. of America, 6%, 10/15/25 (n) | | | 3,770,000 | | | | 3,845,400 | |
| Cimpor Financial Operations B.V., 5.75%, 7/17/24 | | | 1,071,000 | | | | 658,665 | |
| Gibraltar Industries, Inc., 6.25%, 2/01/21 | | | 4,675,000 | | | | 4,686,688 | |
| HD Supply, Inc., 7.5%, 7/15/20 | | | 5,785,000 | | | | 6,016,400 | |
| Headwaters, Inc., 7.25%, 1/15/19 | | | 3,040,000 | | | | 3,100,800 | |
| PriSo Acquisition Corp., 9%, 5/15/23 (n) | | | 3,455,000 | | | | 3,213,150 | |
| Summit Materials LLC/Summit Materials Finance Co., 6.125%, 7/15/23 | | | 4,275,000 | | | | 4,125,375 | |
| | | | | | | | |
| | | | | | | $ | 41,317,741 | |
| Business Services - 1.5% | | | | | | | | |
| Equinix, Inc., 4.875%, 4/01/20 | | $ | 3,450,000 | | | $ | 3,579,375 | |
| Equinix, Inc., 5.375%, 1/01/22 | | | 2,265,000 | | | | 2,355,600 | |
| Equinix, Inc., 5.375%, 4/01/23 | | | 2,605,000 | | | | 2,696,175 | |
| Iron Mountain, Inc., REIT, 6%, 10/01/20 (n) | | | 2,080,000 | | | | 2,215,200 | |
| Iron Mountain, Inc., REIT, 6%, 8/15/23 | | | 5,400,000 | | | | 5,616,000 | |
| NeuStar, Inc., 4.5%, 1/15/23 | | | 5,390,000 | | | | 4,419,800 | |
| | | | | | | | |
| | | | | | | $ | 20,882,150 | |
| Cable TV - 6.4% | | | | | | | | |
| Altice Financing S.A., 6.625%, 2/15/23 (n) | | $ | 6,955,000 | | | $ | 6,833,288 | |
| CCO Holdings LLC/CCO Holdings Capital Corp., 7.375%, 6/01/20 | | | 705,000 | | | | 733,200 | |
| CCO Holdings LLC/CCO Holdings Capital Corp., 6.5%, 4/30/21 | | | 7,010,000 | | | | 7,312,271 | |
| CCO Holdings LLC/CCO Holdings Capital Corp., 5.125%, 5/01/23 (n) | | | 4,385,000 | | | | 4,385,000 | |
| CCO Holdings LLC/CCO Holdings Capital Corp., 5.75%, 1/15/24 | | | 5,925,000 | | | | 6,095,344 | |
| CCO Holdings LLC/CCO Holdings Capital Corp., 5.375%, 5/01/25 (n) | | | 1,325,000 | | | | 1,311,750 | |
| Cequel Communications Holdings, 6.375%, 9/15/20 (n) | | | 5,575,000 | | | | 5,386,844 | |
| DISH DBS Corp., 6.75%, 6/01/21 | | | 3,960,000 | | | | 4,039,200 | |
| DISH DBS Corp., 5%, 3/15/23 | | | 2,750,000 | | | | 2,392,500 | |
| DISH DBS Corp., 5.875%, 11/15/24 | | | 1,190,000 | | | | 1,060,588 | |
| Intelsat Jackson Holdings S.A., 7.25%, 4/01/19 | | | 2,850,000 | | | | 2,586,375 | |
| Intelsat Jackson Holdings S.A., 6.625%, 12/15/22 | | | 5,565,000 | | | | 3,603,338 | |
| Intelsat Jackson Holdings S.A., 5.5%, 8/01/23 | | | 5,045,000 | | | | 4,023,388 | |
| Intelsat Luxembourg S.A., 8.125%, 6/01/23 | | | 5,835,000 | | | | 2,406,938 | |
| LGE Holdco VI B.V., 7.125%, 5/15/24 (n) | | | 1,895,000 | | | | 2,207,023 | |
| Lynx I Corp., 5.375%, 4/15/21 (n) | | | 1,251,000 | | | | 1,279,148 | |
| Lynx II Corp., 6.375%, 4/15/23 (n) | | | 2,530,000 | | | | 2,593,250 | |
| Neptune Finco Corp., 10.875%, 10/15/25 (n) | | | 3,165,000 | | | | 3,346,988 | |
10
Portfolio of Investments – continued
| | | | | | | | |
| Issuer | | Shares/Par | | | Value ($) | |
| Bonds - continued | | | | | | | | |
| Cable TV - continued | | | | | | | | |
| SIRIUS XM Radio, Inc., 4.25%, 5/15/20 (n) | | $ | 860,000 | | | $ | 872,900 | |
| SIRIUS XM Radio, Inc., 5.875%, 10/01/20 (n) | | | 395,000 | | | | 411,788 | |
| SIRIUS XM Radio, Inc., 4.625%, 5/15/23 (n) | | | 2,495,000 | | | | 2,445,100 | |
| SIRIUS XM Radio, Inc., 6%, 7/15/24 (n) | | | 2,740,000 | | | | 2,870,150 | |
| SIRIUS XM Radio, Inc., 5.375%, 4/15/25 (n) | | | 2,570,000 | | | | 2,582,850 | |
| Unitymedia Hessen, 5.5%, 1/15/23 (n) | | | 4,480,000 | | | | 4,684,198 | |
| Unitymedia KabelBW GmbH, 6.125%, 1/15/25 (n) | | | 2,960,000 | | | | 3,004,992 | |
| Virgin Media Finance PLC, 5.75%, 1/15/25 (n) | | | 1,230,000 | | | | 1,217,700 | |
| Virgin Media Secured Finance PLC, 5.25%, 1/15/26 (n) | | | 3,860,000 | | | | 3,821,400 | |
| Ziggo Bond Finance B.V., 5.875%, 1/15/25 (n) | | | 2,750,000 | | | | 2,523,125 | |
| | | | | | | | |
| | | | | | | $ | 86,030,636 | |
| Chemicals - 2.2% | | | | | | | | |
| Flash Dutch 2 B.V./U.S. Coatings Acquisition, 7.375%, 5/01/21 (n) | | $ | 4,210,000 | | | $ | 4,417,848 | |
| GCP Applied Technologies Co., 9.5%, 2/01/23 (n) | | | 2,195,000 | | | | 2,321,213 | |
| Hexion U.S. Finance Corp., 6.625%, 4/15/20 | | | 2,280,000 | | | | 1,767,000 | |
| Hexion U.S. Finance Corp./Hexion Nova Scotia Finance, 8.875%, 2/01/18 | | | 2,915,000 | | | | 1,982,200 | |
| INEOS Group Holdings S.A., 6.125%, 8/15/18 (n) | | | 3,590,000 | | | | 3,585,513 | |
| Momentive Performance Materials, Inc., 3.88%, 10/24/21 | | | 2,220,000 | | | | 1,492,950 | |
| The Chemours Co., 6.625%, 5/15/23 (n) | | | 3,790,000 | | | | 2,321,375 | |
| Tronox Finance LLC, 6.375%, 8/15/20 | | | 6,240,000 | | | | 3,853,200 | |
| Tronox Finance LLC, 7.5%, 3/15/22 (n) | | | 5,010,000 | | | | 3,018,525 | |
| W.R. Grace & Co., 5.125%, 10/01/21 (n) | | | 5,590,000 | | | | 5,617,950 | |
| | | | | | | | |
| | | | | | | $ | 30,377,774 | |
| Computer Software - 0.4% | | | | | | | | |
| Syniverse Holdings, Inc., 9.125%, 1/15/19 | | $ | 1,150,000 | | | $ | 437,000 | |
| VeriSign, Inc., 4.625%, 5/01/23 | | | 5,340,000 | | | | 5,233,200 | |
| | | | | | | | |
| | | | | | | $ | 5,670,200 | |
| Computer Software - Systems - 0.8% | | | | | | | | |
| CDW LLC/CDW Finance Corp., 6%, 8/15/22 | | $ | 1,710,000 | | | $ | 1,797,638 | |
| CDW LLC/CDW Finance Corp., 5.5%, 12/01/24 | | | 2,640,000 | | | | 2,747,237 | |
| Sabre GLBL, Inc., 5.375%, 4/15/23 (n) | | | 6,230,000 | | | | 6,261,150 | |
| | | | | | | | |
| | | | | | | $ | 10,806,025 | |
| Conglomerates - 2.6% | | | | | | | | |
| Accudyne Industries Borrower S.C.A., 7.75%, 12/15/20 (n) | | $ | 2,995,000 | | | $ | 2,051,575 | |
| Amsted Industries Co., 5%, 3/15/22 (n) | | | 6,730,000 | | | | 6,662,700 | |
| BC Mountain LLC, 7%, 2/01/21 (n) | | | 6,390,000 | | | | 4,632,750 | |
| EnerSys, 5%, 4/30/23 (n) | | | 7,470,000 | | | | 7,357,950 | |
| Enpro Industries, Inc., 5.875%, 9/15/22 | | | 5,560,000 | | | | 5,407,100 | |
| Entegris, Inc., 6%, 4/01/22 (n) | | | 4,685,000 | | | | 4,755,275 | |
11
Portfolio of Investments – continued
| | | | | | | | |
| Issuer | | Shares/Par | | | Value ($) | |
| Bonds - continued | | | | | | | | |
| Conglomerates - continued | | | | | | | | |
| Renaissance Acquisition, 6.875%, 8/15/21 (n) | | $ | 5,775,000 | | | $ | 4,244,625 | |
| | | | | | | | |
| | | | | | | $ | 35,111,975 | |
| Construction - 0.1% | | | | | | | | |
| Empresas ICA S.A.B. de C.V., 8.9%, 2/04/21 | | $ | 2,120,000 | | | $ | 392,200 | |
| Empresas ICA S.A.B. de C.V., 8.875%, 5/29/24 (a)(d)(n) | | | 1,723,000 | | | | 318,755 | |
| | | | | | | | |
| | | | | | | $ | 710,955 | |
| Consumer Products - 1.1% | | | | | | | | |
| Alphabet Holding Co., Inc., 7.75%, 11/01/17 | | $ | 655,000 | | | $ | 640,263 | |
| Elizabeth Arden, Inc., 7.375%, 3/15/21 | | | 2,245,000 | | | | 1,492,925 | |
| Prestige Brands, Inc., 8.125%, 2/01/20 | | | 2,165,000 | | | | 2,246,188 | |
| Prestige Brands, Inc., 5.375%, 12/15/21 (n) | | | 3,800,000 | | | | 3,705,000 | |
| Spectrum Brands, Inc., 6.375%, 11/15/20 | | | 3,940,000 | | | | 4,156,700 | |
| Spectrum Brands, Inc., 6.125%, 12/15/24 (n) | | | 1,065,000 | | | | 1,107,600 | |
| Spectrum Brands, Inc., 5.75%, 7/15/25 (n) | | | 2,185,000 | | | | 2,239,625 | |
| | | | | | | | |
| | | | | | | $ | 15,588,301 | |
| Consumer Services - 2.5% | | | | | | | | |
| ADT Corp., 6.25%, 10/15/21 | | $ | 8,050,000 | | | $ | 8,351,875 | |
| ADT Corp., 4.125%, 6/15/23 | | | 1,360,000 | | | | 1,251,200 | |
| CEB, Inc., 5.625%, 6/15/23 (n) | | | 4,055,000 | | | | 4,055,000 | |
| Garda World Security Corp., 7.25%, 11/15/21 (n) | | | 3,660,000 | | | | 2,854,800 | |
| Garda World Security Corp., 7.25%, 11/15/21 (n) | | | 2,330,000 | | | | 1,817,400 | |
| Interval Acquisition Corp., 5.625%, 4/15/23 (n) | | | 8,300,000 | | | | 8,258,500 | |
| Monitronics International, Inc., 9.125%, 4/01/20 | | | 4,800,000 | | | | 3,852,000 | |
| Service Corp. International, 5.375%, 5/15/24 | | | 3,235,000 | | | | 3,421,013 | |
| | | | | | | | |
| | | | | | | $ | 33,861,788 | |
| Containers - 4.1% | | | | | | | | |
| Ardagh Packaging Finance PLC, 7%, 11/15/20 (n) | | $ | 317,647 | | | $ | 300,971 | |
| Ardagh Packaging Finance PLC, 9.125%, 10/15/20 (n) | | | 5,380,000 | | | | 5,413,625 | |
| Ball Corp., 5%, 3/15/22 | | | 3,365,000 | | | | 3,482,775 | |
| Berry Plastics Group, Inc., 5.5%, 5/15/22 | | | 6,035,000 | | | | 6,019,913 | |
| Berry Plastics Group, Inc., 6%, 10/15/22 (n) | | | 1,545,000 | | | | 1,575,900 | |
| Crown American LLC, 4.5%, 1/15/23 | | | 6,918,000 | | | | 6,848,820 | |
| Multi-Color Corp., 6.125%, 12/01/22 (n) | | | 4,950,000 | | | | 4,912,875 | |
| Plastipak Holdings, Inc., 6.5%, 10/01/21 (n) | | | 4,302,000 | | | | 4,119,165 | |
| Reynolds Group, 9.875%, 8/15/19 | | | 598,000 | | | | 584,545 | |
| Reynolds Group, 5.75%, 10/15/20 | | | 2,550,000 | | | | 2,553,188 | |
| Reynolds Group, 8.25%, 2/15/21 | | | 7,985,000 | | | | 7,446,013 | |
| Sealed Air Corp., 4.875%, 12/01/22 (n) | | | 4,940,000 | | | | 4,973,938 | |
| Sealed Air Corp., 5.125%, 12/01/24 (n) | | | 2,215,000 | | | | 2,215,000 | |
| Signode Industrial Group, 6.375%, 5/01/22 (n) | | | 6,615,000 | | | | 5,490,450 | |
| | | | | | | | |
| | | | | | | $ | 55,937,178 | |
12
Portfolio of Investments – continued
| | | | | | | | |
| Issuer | | Shares/Par | | | Value ($) | |
| Bonds - continued | | | | | | | | |
| Electrical Equipment - 0.0% | | | | | | | | |
| Avaya, Inc., 10.5%, 3/01/21 (n) | | $ | 2,350,000 | | | $ | 587,500 | |
| | |
| Electronics - 1.7% | | | | | | | | |
| Advanced Micro Devices, Inc., 6.75%, 3/01/19 | | $ | 3,655,000 | | | $ | 2,494,538 | |
| Advanced Micro Devices, Inc., 7%, 7/01/24 | | | 2,250,000 | | | | 1,395,000 | |
| Micron Technology, Inc., 5.875%, 2/15/22 | | | 3,730,000 | | | | 3,319,700 | |
| Micron Technology, Inc., 5.5%, 2/01/25 | | | 3,515,000 | | | | 2,776,850 | |
| NXP B.V., 5.75%, 2/15/21 (n) | | | 1,645,000 | | | | 1,702,575 | |
| NXP B.V., 5.75%, 3/15/23 (n) | | | 5,390,000 | | | | 5,501,142 | |
| Sensata Technologies B.V., 5.625%, 11/01/24 (n) | | | 3,185,000 | | | | 3,248,700 | |
| Sensata Technologies B.V., 5%, 10/01/25 (n) | | | 2,270,000 | | | | 2,184,875 | |
| | | | | | | | |
| | | | | | | $ | 22,623,380 | |
| Energy - Independent - 3.4% | | | | | | | | |
| Baytex Energy Corp., 5.625%, 6/01/24 (n) | | $ | 2,275,000 | | | $ | 1,319,500 | |
| Bonanza Creek Energy, Inc., 6.75%, 4/15/21 | | | 4,265,000 | | | | 1,674,013 | |
| Bonanza Creek Energy, Inc., 5.75%, 2/01/23 | | | 1,305,000 | | | | 469,800 | |
| Chaparral Energy, Inc., 7.625%, 11/15/22 | | | 6,970,000 | | | | 1,324,300 | |
| Chesapeake Energy Corp., 5.75%, 3/15/23 | | | 6,545,000 | | | | 1,799,875 | |
| Concho Resources, Inc., 6.5%, 1/15/22 | | | 3,440,000 | | | | 3,216,400 | |
| Concho Resources, Inc., 5.5%, 4/01/23 | | | 6,430,000 | | | | 5,831,946 | |
| EP Energy LLC, 9.375%, 5/01/20 | | | 5,725,000 | | | | 2,433,125 | |
| EP Energy LLC, 7.75%, 9/01/22 | | | 5,050,000 | | | | 1,767,500 | |
| Halcon Resources Corp., 8.875%, 5/15/21 | | | 5,475,000 | | | | 793,875 | |
| Linn Energy LLC/Linn Energy Finance Corp., 8.625%, 4/15/20 | | | 2,670,000 | | | | 400,500 | |
| Linn Energy LLC/Linn Energy Finance Corp., 7.75%, 2/01/21 | | | 5,394,000 | | | | 647,280 | |
| Linn Energy LLC/Linn Energy Finance Corp., 6.5%, 9/15/21 | | | 2,320,000 | | | | 261,046 | |
| Northern Blizzard Resources, Inc., 7.25%, 2/01/22 (n) | | | 3,857,000 | | | | 2,757,755 | |
| Oasis Petroleum, Inc., 6.875%, 3/15/22 | | | 5,005,000 | | | | 2,902,900 | |
| QEP Resources, Inc., 5.25%, 5/01/23 | | | 8,165,000 | | | | 5,552,200 | |
| RSP Permian, Inc., 6.625%, 10/01/22 | | | 4,410,000 | | | | 3,924,900 | |
| Sanchez Energy Corp., 6.125%, 1/15/23 | | | 7,155,000 | | | | 2,862,000 | |
| SM Energy Co., 6.5%, 11/15/21 | | | 4,550,000 | | | | 2,649,010 | |
| SM Energy Co., 6.125%, 11/15/22 | | | 3,620,000 | | | | 2,081,500 | |
| WPX Energy, Inc., 6%, 1/15/22 | | | 2,925,000 | | | | 1,696,500 | |
| | | | | | | | |
| | | | | | | $ | 46,365,925 | |
| Entertainment - 1.8% | | | | | | | | |
| Carmike Cinemas, Inc., 6%, 6/15/23 (n) | | $ | 2,180,000 | | | $ | 2,259,025 | |
| Cedar Fair LP, 5.25%, 3/15/21 | | | 5,965,000 | | | | 6,114,125 | |
| Cedar Fair LP, 5.375%, 6/01/24 | | | 1,420,000 | | | | 1,427,100 | |
| Cinemark USA, Inc., 5.125%, 12/15/22 | | | 2,445,000 | | | | 2,457,225 | |
| Cinemark USA, Inc., 4.875%, 6/01/23 | | | 3,010,000 | | | | 2,957,325 | |
| NCL Corp. Ltd., 5.25%, 11/15/19 (n) | | | 4,105,000 | | | | 4,125,525 | |
13
Portfolio of Investments – continued
| | | | | | | | |
| Issuer | | Shares/Par | | | Value ($) | |
| Bonds - continued | | | | | | | | |
| Entertainment - continued | | | | | | | | |
| Six Flags Entertainment Corp., 5.25%, 1/15/21 (n) | | $ | 4,915,000 | | | $ | 5,004,945 | |
| | | | | | | | |
| | | | | | | $ | 24,345,270 | |
| Financial Institutions - 5.1% | | | | | | | | |
| Aircastle Ltd., 4.625%, 12/15/18 | | $ | 3,340,000 | | | $ | 3,369,225 | |
| Aircastle Ltd., 5.125%, 3/15/21 | | | 2,295,000 | | | | 2,266,313 | |
| Aircastle Ltd., 5.5%, 2/15/22 | | | 2,620,000 | | | | 2,606,900 | |
| CIT Group, Inc., 5.25%, 3/15/18 | | | 5,335,000 | | | | 5,511,695 | |
| CIT Group, Inc., 6.625%, 4/01/18 (n) | | | 4,776,000 | | | | 5,048,232 | |
| CIT Group, Inc., 5.5%, 2/15/19 (n) | | | 5,607,000 | | | | 5,789,228 | |
| CIT Group, Inc., 5%, 8/15/22 | | | 1,885,000 | | | | 1,906,253 | |
| Credit Acceptance Co., 7.375%, 3/15/23 (n) | | | 2,930,000 | | | | 2,834,775 | |
| Icahn Enterprises LP, 6%, 8/01/20 | | | 3,910,000 | | | | 3,670,122 | |
| Icahn Enterprises LP, 5.875%, 2/01/22 | | | 6,850,000 | | | | 6,122,188 | |
| Nationstar Mortgage LLC/Capital Corp., 6.5%, 8/01/18 | | | 4,045,000 | | | | 3,903,425 | |
| Nationstar Mortgage LLC/Capital Corp., 7.875%, 10/01/20 | | | 7,005,000 | | | | 6,672,263 | |
| Navient Corp., 8%, 3/25/20 | | | 7,300,000 | | | | 7,190,500 | |
| Navient Corp., 5.875%, 3/25/21 | | | 1,975,000 | | | | 1,708,375 | |
| Navient Corp., 7.25%, 1/25/22 | | | 5,685,000 | | | | 5,059,650 | |
| Navient Corp., 6.125%, 3/25/24 | | | 2,795,000 | | | | 2,295,394 | |
| PHH Corp., 6.375%, 8/15/21 | | | 3,470,000 | | | | 3,010,225 | |
| | | | | | | | |
| | | | | | | $ | 68,964,763 | |
| Food & Beverages - 0.9% | | | | | | | | |
| Darling Ingredients, Inc., 5.375%, 1/15/22 | | $ | 4,230,000 | | | $ | 4,145,400 | |
| Pinnacle Foods Finance LLC/Pinnacle Foods Finance Corp., 5.875%, 1/15/24 (n) | | | 1,240,000 | | | | 1,283,400 | |
| Sun Merger Sub, Inc., 5.875%, 8/01/21 (n) | | | 6,335,000 | | | | 6,430,025 | |
| | | | | | | | |
| | | | | | | $ | 11,858,825 | |
| Forest & Paper Products - 0.2% | | | | | | | | |
| Appvion, Inc., 9%, 6/01/20 (n) | | $ | 4,245,000 | | | $ | 1,379,625 | |
| Tembec Industries, Inc., 9%, 12/15/19 (n) | | | 2,760,000 | | | | 1,745,700 | |
| | | | | | | | |
| | | | | | | $ | 3,125,325 | |
| Gaming & Lodging - 3.5% | | | | | | | | |
| CCM Merger, Inc., 9.125%, 5/01/19 (n) | | $ | 4,878,000 | | | $ | 5,024,340 | |
| Eldorado Resorts, Inc., 7%, 8/01/23 (n) | | | 1,515,000 | | | | 1,492,275 | |
| GLP Capital LP/GLP Financing II, Inc., 5.375%, 11/01/23 | | | 4,770,000 | | | | 4,567,275 | |
| Greektown Holdings LLC, 8.875%, 3/15/19 (n) | | | 5,100,000 | | | | 5,023,500 | |
| Hilton Worldwide Finance LLC/Hilton Worldwide Finance Corp., 5.625%, 10/15/21 | | | 6,575,000 | | | | 6,772,250 | |
| Isle of Capri Casinos, Inc., 8.875%, 6/15/20 | | | 1,110,000 | | | | 1,171,050 | |
| Isle of Capri Casinos, Inc., 5.875%, 3/15/21 | | | 5,520,000 | | | | 5,644,200 | |
14
Portfolio of Investments – continued
| | | | | | | | |
| Issuer | | Shares/Par | | | Value ($) | |
| Bonds - continued | | | | | | | | |
| Gaming & Lodging - continued | | | | | | | | |
| MGM Resorts International, 6.625%, 12/15/21 | | $ | 4,865,000 | | | $ | 4,998,788 | |
| MGM Resorts International, 6%, 3/15/23 | | | 5,340,000 | | | | 5,323,313 | |
| Ryman Hospitality Properties, Inc., REIT, 5%, 4/15/21 | | | 6,105,000 | | | | 6,181,313 | |
| Ryman Hospitality Properties, Inc., REIT, 5%, 4/15/23 | | | 1,395,000 | | | | 1,389,769 | |
| | | | | | | | |
| | | | | | | $ | 47,588,073 | |
| Industrial - 1.3% | | | | | | | | |
| Anixter, Inc., 5.125%, 10/01/21 | | $ | 3,975,000 | | | $ | 3,875,625 | |
| Dematic S.A., 7.75%, 12/15/20 (n) | | | 7,305,000 | | | | 7,213,688 | |
| Howard Hughes Corp., 6.875%, 10/01/21 (n) | | | 5,885,000 | | | | 5,885,000 | |
| | | | | | | | |
| | | | | | | $ | 16,974,313 | |
| Insurance - Health - 0.3% | | | | | | | | |
| Centene Escrow Corp., 5.625%, 2/15/21 (n) | | $ | 2,105,000 | | | $ | 2,141,838 | |
| Centene Escrow Corp., 6.125%, 2/15/24 (n) | | | 2,105,000 | | | | 2,162,888 | |
| | | | | | | | |
| | | | | | | $ | 4,304,726 | |
| Machinery & Tools - 1.5% | | | | | | | | |
| Ashtead Capital, Inc., 5.625%, 10/01/24 (n) | | $ | 4,700,000 | | | $ | 4,523,750 | |
| CNH Industrial Capital LLC, 4.375%, 11/06/20 | | | 5,390,000 | | | | 5,120,500 | |
| H&E Equipment Services Co., 7%, 9/01/22 | | | 5,800,000 | | | | 5,307,000 | |
| Jurassic Holdings III, Inc., 6.875%, 2/15/21 (n) | | | 5,015,000 | | | | 3,009,000 | |
| Light Tower Rentals, Inc., 8.125%, 8/01/19 (n) | | | 3,930,000 | | | | 1,739,025 | |
| | | | | | | | |
| | | | | | | $ | 19,699,275 | |
| Major Banks - 2.0% | | | | | | | | |
| Bank of America Corp., FRN, 6.1%, 12/31/49 | | $ | 13,320,000 | | | $ | 13,542,444 | |
| JPMorgan Chase & Co., 6% to 8/01/23, FRN to 12/31/49 | | | 7,240,000 | | | | 7,226,425 | |
| Royal Bank of Scotland Group PLC, 7.5% to 8/10/20, FRN to 12/31/49 | | | 6,020,000 | | | | 6,125,350 | |
| | | | | | | | |
| | | | | | | $ | 26,894,219 | |
| Medical & Health Technology & Services - 5.9% | | | | | | | | |
| CHS/Community Health Systems, Inc., 6.875%, 2/01/22 | | $ | 9,445,000 | | | $ | 8,547,725 | |
| Davita Healthcare Partners, Inc., 5%, 5/01/25 | | | 5,210,000 | | | | 5,125,338 | |
| Davita, Inc., 5.125%, 7/15/24 | | | 3,100,000 | | | | 3,117,438 | |
| HCA, Inc., 4.25%, 10/15/19 | | | 5,320,000 | | | | 5,453,000 | |
| HCA, Inc., 7.5%, 2/15/22 | | | 7,040,000 | | | | 7,814,400 | |
| HCA, Inc., 5.875%, 3/15/22 | | | 5,160,000 | | | | 5,534,100 | |
| HCA, Inc., 5%, 3/15/24 | | | 2,340,000 | | | | 2,369,250 | |
| HCA, Inc., 5.375%, 2/01/25 | | | 3,500,000 | | | | 3,539,375 | |
| HCA, Inc., 5.875%, 2/15/26 | | | 3,270,000 | | | | 3,335,400 | |
| HealthSouth Corp., 5.125%, 3/15/23 | | | 5,730,000 | | | | 5,558,100 | |
| HealthSouth Corp., 5.75%, 11/01/24 (n) | | | 3,470,000 | | | | 3,425,202 | |
15
Portfolio of Investments – continued
| | | | | | | | |
| Issuer | | Shares/Par | | | Value ($) | |
| Bonds - continued | | | | | | | | |
| Medical & Health Technology & Services - continued | | | | | | | | |
| LifePoint Hospitals, Inc., 5.5%, 12/01/21 | | $ | 2,850,000 | | | $ | 2,892,750 | |
| TeamHealth, Inc., 7.25%, 12/15/23 (n) | | | 895,000 | | | | 935,275 | |
| Tenet Healthcare Corp., 8%, 8/01/20 | | | 9,080,000 | | | | 9,102,700 | |
| Tenet Healthcare Corp., 4.5%, 4/01/21 | | | 2,610,000 | | | | 2,557,800 | |
| Tenet Healthcare Corp., 8.125%, 4/01/22 | | | 3,015,000 | | | | 3,022,538 | |
| Tenet Healthcare Corp., 6.75%, 6/15/23 | | | 3,275,000 | | | | 3,029,375 | |
| Universal Health Services, Inc., 7.625%, 8/15/20 | | | 4,290,000 | | | | 3,775,200 | |
| | | | | | | | |
| | | | | | | $ | 79,134,966 | |
| Medical Equipment - 1.3% | | | | | | | | |
| Alere, Inc., 6.375%, 7/01/23 (n) | | $ | 4,410,000 | | | $ | 4,167,450 | |
| DJO Finco, Inc., 8.125%, 6/15/21 (n) | | | 4,115,000 | | | | 3,456,600 | |
| Hologic, Inc., 5.25%, 7/15/22 (n) | | | 5,190,000 | | | | 5,371,650 | |
| Teleflex, Inc., 5.25%, 6/15/24 | | | 4,750,000 | | | | 4,750,000 | |
| | | | | | | | |
| | | | | | | $ | 17,745,700 | |
| Metals & Mining - 2.7% | | | | | | | | |
| Century Aluminum Co., 7.5%, 6/01/21 (n) | | $ | 4,715,000 | | | $ | 3,076,538 | |
| Commercial Metals Co., 4.875%, 5/15/23 | | | 4,263,000 | | | | 3,543,619 | |
| Consol Energy, Inc., 5.875%, 4/15/22 | | | 4,225,000 | | | | 2,730,406 | |
| Consol Energy, Inc., 8%, 4/01/23 | | | 4,265,000 | | | | 2,857,550 | |
| First Quantum Minerals Ltd., 7.25%, 10/15/19 (n) | | | 6,352,000 | | | | 2,953,680 | |
| First Quantum Minerals Ltd., 7.25%, 5/15/22 (n) | | | 2,005,000 | | | | 902,250 | |
| GrafTech International Co., 6.375%, 11/15/20 | | | 5,185,000 | | | | 2,955,450 | |
| Hudbay Minerals, Inc., 9.5%, 10/01/20 | | | 5,195,000 | | | | 3,194,925 | |
| Lundin Mining Corp., 7.5%, 11/01/20 (n) | | | 2,750,000 | | | | 2,337,500 | |
| Lundin Mining Corp., 7.875%, 11/01/22 (n) | | | 1,735,000 | | | | 1,401,013 | |
| Steel Dynamics, Inc., 5.125%, 10/01/21 | | | 1,725,000 | | | | 1,608,563 | |
| Steel Dynamics, Inc., 5.25%, 4/15/23 | | | 970,000 | | | | 880,275 | |
| Steel Dynamics, Inc., 5.5%, 10/01/24 | | | 2,725,000 | | | | 2,459,313 | |
| Suncoke Energy Partners LP/Suncoke Energy Partners Finance Corp., 7.375%, 2/01/20 (n) | | | 3,605,000 | | | | 2,045,838 | |
| Suncoke Energy Partners LP/Suncoke Energy Partners Finance Corp., 7.375%, 2/01/20 (n) | | | 1,650,000 | | | | 936,375 | |
| Suncoke Energy, Inc., 7.625%, 8/01/19 | | | 472,000 | | | | 449,580 | |
| TMS International Corp., 7.625%, 10/15/21 (n) | | | 3,595,000 | | | | 2,777,138 | |
| | | | | | | | |
| | | | | | | $ | 37,110,013 | |
| Midstream - 5.1% | | | | | | | | |
| AmeriGas Finance LLC, 6.75%, 5/20/20 | | $ | 7,080,000 | | | $ | 7,009,200 | |
| Blue Racer Midstream LLC/Blue Racer Finance Corp., 6.125%, 11/15/22 (n) | | | 3,845,000 | | | | 2,874,138 | |
| Crestwood Midstream Partners LP, 6%, 12/15/20 | | | 2,690,000 | | | | 1,704,788 | |
| Crestwood Midstream Partners LP, 6.125%, 3/01/22 | | | 2,930,000 | | | | 1,765,325 | |
16
Portfolio of Investments – continued
| | | | | | | | |
| Issuer | | Shares/Par | | | Value ($) | |
| Bonds - continued | | | | | | | | |
| Midstream - continued | | | | | | | | |
| Energy Transfer Equity LP, 7.5%, 10/15/20 | | $ | 8,350,000 | | | $ | 7,348,000 | |
| Ferrellgas LP/Ferrellgas Finance Corp., 6.5%, 5/01/21 | | | 2,080,000 | | | | 1,640,600 | |
| Ferrellgas LP/Ferrellgas Finance Corp., 6.75%, 1/15/22 | | | 6,820,000 | | | | 5,370,750 | |
| Kinder Morgan (Delaware), Inc., 7.75%, 1/15/32 | | | 10,697,000 | | | | 10,042,857 | |
| MPLX LP, 5.5%, 2/15/23 (n) | | | 3,370,000 | | | | 2,800,537 | |
| MPLX LP, 4.5%, 7/15/23 (n) | | | 4,924,000 | | | | 3,855,837 | |
| Sabine Pass Liquefaction LLC, 5.625%, 2/01/21 | | | 5,880,000 | | | | 5,380,200 | |
| Sabine Pass Liquefaction LLC, 5.625%, 4/15/23 | | | 7,800,000 | | | | 6,844,500 | |
| Sabine Pass Liquefaction LLC, 5.75%, 5/15/24 | | | 1,705,000 | | | | 1,496,138 | |
| Sabine Pass Liquefaction LLC, 5.625%, 3/01/25 | | | 3,104,000 | | | | 2,669,440 | |
| Summit Midstream Holdings LLC/Summit Midstream Finance Corp., 7.5%, 7/01/21 | | | 2,135,000 | | | | 1,558,550 | |
| Summit Midstream Holdings LLC/Summit Midstream Finance Corp., 5.5%, 8/15/22 | | | 2,140,000 | | | | 1,348,200 | |
| Targa Resources Partners LP/Targa Resources Finance Corp., 5%, 1/15/18 | | | 1,680,000 | | | | 1,568,700 | |
| Targa Resources Partners LP/Targa Resources Finance Corp., 4.125%, 11/15/19 | | | 2,555,000 | | | | 2,146,200 | |
| Targa Resources Partners LP/Targa Resources Finance Corp., 5.25%, 5/01/23 | | | 1,305,000 | | | | 1,011,375 | |
| | | | | | | | |
| | | | | | | $ | 68,435,335 | |
| Network & Telecom - 1.7% | | | | | | | | |
| Centurylink, Inc., 6.45%, 6/15/21 | | $ | 4,305,000 | | | $ | 4,194,706 | |
| Centurylink, Inc., 7.65%, 3/15/42 | | | 4,835,000 | | | | 3,626,250 | |
| Frontier Communications Corp., 8.125%, 10/01/18 | | | 1,270,000 | | | | 1,296,988 | |
| Frontier Communications Corp., 6.25%, 9/15/21 | | | 1,590,000 | | | | 1,339,575 | |
| Frontier Communications Corp., 7.125%, 1/15/23 | | | 2,740,000 | | | | 2,281,050 | |
| Frontier Communications Corp., 11%, 9/15/25 (n) | | | 2,105,000 | | | | 2,028,694 | |
| Frontier Communications Corp., 9%, 8/15/31 | | | 2,815,000 | | | | 2,237,925 | |
| Telecom Italia Capital, 6%, 9/30/34 | | | 2,180,000 | | | | 1,951,100 | |
| Telecom Italia S.p.A., 5.303%, 5/30/24 (n) | | | 3,865,000 | | | | 3,768,375 | |
| | | | | | | | |
| | | | | | | $ | 22,724,663 | |
| Oil Services - 0.5% | | | | | | | | |
| Bristow Group, Inc., 6.25%, 10/15/22 | | $ | 5,768,000 | | | $ | 3,965,500 | |
| Pacific Drilling S.A., 5.375%, 6/01/20 (n) | | | 4,250,000 | | | | 1,020,000 | |
| Shale-Inland Holdings LLC/Finance Co., 8.75%, 11/15/19 (n) | | | 2,425,000 | | | | 1,515,625 | |
| | | | | | | | |
| | | | | | | $ | 6,501,125 | |
| Oils - 0.6% | | | | | | | | |
| CITGO Holding, Inc., 10.75%, 2/15/20 (n) | | $ | 2,615,000 | | | $ | 2,484,250 | |
| CITGO Petroleum Corp., 6.25%, 8/15/22 (n) | | | 5,445,000 | | | | 5,213,588 | |
| | | | | | | | |
| | | | | | | $ | 7,697,838 | |
17
Portfolio of Investments – continued
| | | | | | | | |
| Issuer | | Shares/Par | | | Value ($) | |
| Bonds - continued | | | | | | | | |
| Other Banks & Diversified Financials - 0.4% | | | | | | | | |
| Groupe BPCE S.A., 12.5% to 9/30/19, FRN to 12/31/49 (n) | | $ | 3,873,000 | | | $ | 4,912,242 | |
| | |
| Pharmaceuticals - 2.9% | | | | | | | | |
| Capsugel S.A., 7%, 5/15/19 (n)(p) | | $ | 1,955,000 | | | $ | 1,911,013 | |
| Endo Finance LLC/Endo Finco, Inc., 6%, 7/15/23 (n) | | | 3,235,000 | | | | 3,251,175 | |
| Endo Finance LLC/Endo Finco, Inc., 7.75%, 1/15/22 (n) | | | 5,835,000 | | | | 6,090,281 | |
| Endo Finance LLC/Endo Finco, Inc., 6%, 2/01/25 (n) | | | 1,280,000 | | | | 1,264,154 | |
| Mallinckrodt International Finance S.A., 5.75%, 8/01/22 (n) | | | 3,400,000 | | | | 3,247,000 | |
| Mallinckrodt International Finance S.A., 5.5%, 4/15/25 (n) | | | 1,370,000 | | | | 1,219,300 | |
| Valeant Pharmaceuticals International, Inc., 7%, 10/01/20 (n) | | | 7,040,000 | | | | 6,934,400 | |
| Valeant Pharmaceuticals International, Inc., 7.25%, 7/15/22 (n) | | | 4,075,000 | | | | 3,973,125 | |
| Valeant Pharmaceuticals International, Inc., 5.5%, 3/01/23 (n) | | | 2,720,000 | | | | 2,400,400 | |
| Vantage Point Imaging, 7.5%, 7/15/21 (n) | | | 3,230,000 | | | | 3,203,756 | |
| VRX Escrow Corp., 5.875%, 5/15/23 (n) | | | 6,560,000 | | | | 5,871,200 | |
| | | | | | | | |
| | | | | | | $ | 39,365,804 | |
| Precious Metals & Minerals - 0.6% | | | | | | | | |
| Aurico Gold, Inc., 7.75%, 4/01/20 (n) | | $ | 3,585,000 | | | $ | 2,984,513 | |
| Eldorado Gold Corp., 6.125%, 12/15/20 (n) | | | 5,515,000 | | | | 4,618,813 | |
| | | | | | | | |
| | | | | | | $ | 7,603,326 | |
| Printing & Publishing - 1.4% | | | | | | | | |
| American Media, Inc., 13.5%, 6/15/18 (z) | | $ | 338,724 | | | $ | 334,067 | |
| Nielsen Finance LLC, 5%, 4/15/22 (n) | | | 8,015,000 | | | | 8,085,131 | |
| Outdoor Americas Capital LLC/Outfront Media Capital Corp., 5.625%, 2/15/24 | | | 2,590,000 | | | | 2,648,275 | |
| TEGNA, Inc., 5.125%, 7/15/20 | | | 1,415,000 | | | | 1,464,525 | |
| TEGNA, Inc., 4.875%, 9/15/21 (n) | | | 1,900,000 | | | | 1,909,500 | |
| TEGNA, Inc., 6.375%, 10/15/23 | | | 3,900,000 | | | | 4,114,500 | |
| | | | | | | | |
| | | | | | | $ | 18,555,998 | |
| Real Estate - Healthcare - 0.6% | | | | | | | | |
| MPT Operating Partnership LP, REIT, 6.875%, 5/01/21 | | $ | 3,275,000 | | | $ | 3,389,625 | |
| MPT Operating Partnership LP, REIT, 6.375%, 2/15/22 | | | 4,390,000 | | | | 4,455,850 | |
| | | | | | | | |
| | | | | | | $ | 7,845,475 | |
| Real Estate - Other - 0.9% | | | | | | | | |
| DuPont Fabros Technology LP, REIT, 5.875%, 9/15/21 | | $ | 7,260,000 | | | $ | 7,477,800 | |
| Felcor Lodging LP, REIT, 5.625%, 3/01/23 | | | 5,115,000 | | | | 5,108,606 | |
| | | | | | | | |
| | | | | | | $ | 12,586,406 | |
| Retailers - 2.1% | | | | | | | | |
| Best Buy Co., Inc., 5.5%, 3/15/21 | | $ | 4,815,000 | | | $ | 4,863,150 | |
| Bon Ton Stores, Inc., 8%, 6/15/21 | | | 835,000 | | | | 321,475 | |
18
Portfolio of Investments – continued
| | | | | | | | |
| Issuer | | Shares/Par | | | Value ($) | |
| Bonds - continued | | | | | | | | |
| Retailers - continued | | | | | | | | |
| DriveTime Automotive Group, Inc./DT Acceptance Corp., 8%, 6/01/21 (n) | | $ | 3,763,000 | | | $ | 3,358,478 | |
| Family Tree Escrow LLC, 5.75%, 3/01/23 (n) | | | 6,865,000 | | | | 7,233,994 | |
| Neiman Marcus Group Ltd., 8%, 10/15/21 (n) | | | 5,870,000 | | | | 4,402,500 | |
| Rite Aid Corp., 9.25%, 3/15/20 | | | 1,400,000 | | | | 1,475,250 | |
| Rite Aid Corp., 6.75%, 6/15/21 | | | 1,380,000 | | | | 1,459,350 | |
| Rite Aid Corp., 6.125%, 4/01/23 (n) | | | 4,245,000 | | | | 4,478,475 | |
| Sally Beauty Holdings, Inc., 5.625%, 12/01/25 | | | 1,395,000 | | | | 1,440,338 | |
| | | | | | | | |
| | | | | | | $ | 29,033,010 | |
| Specialty Chemicals - 0.9% | | | | | | | | |
| Chemtura Corp., 5.75%, 7/15/21 | | $ | 6,615,000 | | | $ | 6,565,388 | |
| Univar USA, Inc., 6.75%, 7/15/23 (n) | | | 5,705,000 | �� | | | 5,048,925 | |
| | | | | | | | |
| | | | | | | $ | 11,614,313 | |
| Specialty Stores - 1.3% | | | | | | | | |
| Argos Merger Sub, Inc., 7.125%, 3/15/23 (n) | | $ | 5,385,000 | | | $ | 5,425,388 | |
| Group 1 Automotive, Inc., 5%, 6/01/22 | | | 7,030,000 | | | | 6,687,288 | |
| Michaels Stores, Inc., 5.875%, 12/15/20 (n) | | | 4,705,000 | | | | 4,846,150 | |
| | | | | | | | |
| | | | | | | $ | 16,958,826 | |
| Telecommunications - Wireless - 4.7% | | | | | | | | |
| Altice S.A., 7.75%, 5/15/22 (n) | | $ | 1,120,000 | | | $ | 1,044,400 | |
| Crown Castle International Corp., 5.25%, 1/15/23 | | | 4,465,000 | | | | 4,755,225 | |
| Digicel Group Ltd., 8.25%, 9/30/20 (n) | | | 2,600,000 | | | | 2,103,075 | |
| Digicel Group Ltd., 7.125%, 4/01/22 (n) | | | 2,231,000 | | | | 1,663,211 | |
| Digicel Group Ltd., 6.75%, 3/01/23 (n) | | | 6,053,000 | | | | 5,205,580 | |
| Sprint Capital Corp., 6.875%, 11/15/28 | | | 3,690,000 | | | | 2,430,788 | |
| Sprint Corp., 7.875%, 9/15/23 | | | 6,605,000 | | | | 4,706,063 | |
| Sprint Corp., 7.125%, 6/15/24 | | | 10,250,000 | | | | 6,918,750 | |
| Sprint Corp., 7%, 8/15/20 | | | 925,000 | | | | 679,875 | |
| Sprint Nextel Corp., 9%, 11/15/18 (n) | | | 1,745,000 | | | | 1,779,900 | |
| Sprint Nextel Corp., 6%, 11/15/22 | | | 4,585,000 | | | | 3,083,413 | |
| T-Mobile USA, Inc., 6.125%, 1/15/22 | | | 475,000 | | | | 483,313 | |
| T-Mobile USA, Inc., 6.5%, 1/15/24 | | | 3,035,000 | | | | 3,065,350 | |
| T-Mobile USA, Inc., 6.464%, 4/28/19 | | | 1,465,000 | | | | 1,510,781 | |
| T-Mobile USA, Inc., 6.25%, 4/01/21 | | | 9,000,000 | | | | 9,157,500 | |
| T-Mobile USA, Inc., 6.633%, 4/28/21 | | | 1,890,000 | | | | 1,953,788 | |
| T-Mobile USA, Inc., 6.5%, 1/15/26 | | | 3,600,000 | | | | 3,600,000 | |
| Wind Acquisition Finance S.A., 4.75%, 7/15/20 (n) | | | 2,505,000 | | | | 2,461,163 | |
| Wind Acquisition Finance S.A., 7.375%, 4/23/21 (n) | | | 7,745,000 | | | | 7,362,552 | |
| | | | | | | | |
| | | | | | | $ | 63,964,727 | |
19
Portfolio of Investments – continued
| | | | | | | | |
| Issuer | | Shares/Par | | | Value ($) | |
| Bonds - continued | | | | | | | | |
| Telephone Services - 0.6% | | | | | | | | |
| Level 3 Financing, Inc., 5.375%, 1/15/24 (n) | | $ | 1,900,000 | | | $ | 1,919,000 | |
| Level 3 Financing, Inc., 5.375%, 5/01/25 | | | 6,000,000 | | | | 6,037,500 | |
| | | | | | | | |
| | | | | | | $ | 7,956,500 | |
| Transportation - Services - 1.4% | | | | | | | | |
| Jack Cooper Holdings Corp., 10.25%, 6/01/20 (n) | | $ | 5,010,000 | | | $ | 3,957,900 | |
| Navios Maritime Acquisition Corp., 8.125%, 11/15/21 (n) | | | 3,487,000 | | | | 2,772,165 | |
| Navios Maritime Holding, Inc., 7.375%, 1/15/22 (n) | | | 4,175,000 | | | | 1,503,000 | |
| SPL Logistics Escrow LLC, 8.875%, 8/01/20 (n) | | | 3,600,000 | | | | 3,276,000 | |
| Stena AB, 7%, 2/01/24 (n) | | | 7,225,000 | | | | 5,491,000 | |
| Syncreon Group BV/Syncre, 8.625%, 11/01/21 (n) | | | 3,185,000 | | | | 2,468,375 | |
| Ultrapetrol Bahamas Ltd., 8.875%, 6/15/21 (a)(d) | | | 786,000 | | | | 133,620 | |
| | | | | | | | |
| | | | | | | $ | 19,602,060 | |
| Utilities - Electric Power - 1.9% | | | | | | | | |
| Calpine Corp., 5.5%, 2/01/24 | | $ | 4,885,000 | | | $ | 4,274,375 | |
| Covanta Holding Corp., 7.25%, 12/01/20 | | | 4,290,000 | | | | 4,340,944 | |
| Covanta Holding Corp., 6.375%, 10/01/22 | | | 2,185,000 | | | | 2,059,363 | |
| Covanta Holding Corp., 5.875%, 3/01/24 | | | 2,475,000 | | | | 2,159,438 | |
| NRG Energy, Inc., 8.25%, 9/01/20 | | | 5,025,000 | | | | 4,560,188 | |
| NRG Energy, Inc., 6.25%, 7/15/22 | | | 430,000 | | | | 354,750 | |
| NRG Energy, Inc., 6.625%, 3/15/23 | | | 4,945,000 | | | | 4,091,988 | |
| TerraForm Power Operating Co., 5.875%, 2/01/23 (n) | | | 4,267,000 | | | | 3,402,933 | |
| | | | | | | | |
| | | | | | | $ | 25,243,979 | |
| Total Bonds (Identified Cost, $1,393,093,900) | | | | | | $ | 1,233,243,810 | |
| | |
| Floating Rate Loans (g)(r) - 3.2% | | | | | | | | |
| Aerospace - 0.3% | | | | | | | | |
| TransDigm, Inc., Term Loan C, 3.75%, 2/28/20 | | $ | 3,669,832 | | | $ | 3,579,616 | |
| | |
| Building - 0.2% | | | | | | | | |
| ABC Supply Co., Inc., Term Loan B, 3.5%, 4/16/20 | | $ | 3,365,087 | | | $ | 3,326,389 | |
| | |
| Cable TV - 0.2% | | | | | | | | |
| Cequel Communications LLC, Term Loan B, 3.5%, 2/14/19 | | $ | 2,740,232 | | | $ | 2,683,958 | |
| | |
| Conglomerates - 0.2% | | | | | | | | |
| Entegris, Inc., Term Loan B, 3.5%, 4/30/21 | | $ | 2,775,185 | | | $ | 2,750,902 | |
| | |
| Consumer Services - 0.1% | | | | | | | | |
| Realogy Corp., Term Loan B, 3.75%, 3/05/20 | | $ | 2,139,458 | | | $ | 2,121,630 | |
| | |
| Containers - 0.2% | | | | | | | | |
| Berry Plastics, Term Loan E, 3.75%, 1/06/21 | | $ | 2,874,742 | | | $ | 2,837,609 | |
20
Portfolio of Investments – continued
| | | | | | | | |
| Issuer | | Shares/Par | | | Value ($) | |
| Floating Rate Loans (g)(r) - continued | | | | | | | | |
| Electronics - 0.3% | | | | | | | | |
| Avago Technologies Ltd., Term Loan B, 3.75%, 5/06/21 | | $ | 3,788,376 | | | $ | 3,767,854 | |
| | |
| Energy - Independent - 0.1% | | | | | | | | |
| MEG Energy Corp., Term Loan B, 3.75%, 3/31/20 | | $ | 1,400,533 | | | $ | 1,086,113 | |
| | |
| Entertainment - 0.1% | | | | | | | | |
| Cedar Fair LP, Term Loan B, 3.25%, 3/06/20 | | $ | 1,055,676 | | | $ | 1,057,655 | |
| | |
| Gaming & Lodging - 0.2% | | | | | | | | |
| Hilton Worldwide, Term Loan B, 3.5%, 10/25/20 | | $ | 2,836,642 | | | $ | 2,829,905 | |
| | |
| Medical & Health Technology & Services - 0.3% | | | | | | | | |
| Davita Healthcare, Term Loan B, 3.5%, 6/24/21 | | $ | 3,923,118 | | | $ | 3,908,407 | |
| | |
| Printing & Publishing - 0.2% | | | | | | | | |
| CBS Outdoor, Term Loan, 3%, 1/31/21 | | $ | 2,917,085 | | | $ | 2,876,975 | |
| | |
| Retailers - 0.1% | | | | | | | | |
| Rite Aid Corp., Term Loan, 4.87%, 6/21/21 | | $ | 937,940 | | | $ | 935,888 | |
| | |
| Transportation - Services - 0.4% | | | | | | | | |
| Commercial Barge Line Co., Term Loan B, 9.75%, 11/12/20 | | $ | 7,087,325 | | | $ | 6,201,409 | |
| | |
| Utilities - Electric Power - 0.3% | | | | | | | | |
| Calpine Construction Finance Co., Term Loan B, 3%, 5/03/20 | | $ | 3,948,525 | | | $ | 3,703,389 | |
| Total Floating Rate Loans (Identified Cost, $44,960,941) | | | $ | 43,667,699 | |
| | |
| Common Stocks - 0.7% | | | | | | | | |
| Automotive - 0.0% | | | | | | | | |
| Accuride Corp. (a) | | | 48,891 | | | $ | 41,117 | |
| | |
| Special Products & Services - 0.7% | | | | | | | | |
| iShares iBoxx $ High Yield Corporate Bond ETF | | | 120,500 | | | $ | 9,553,240 | |
| Total Common Stocks (Identified Cost, $10,968,981) | | | | | | $ | 9,594,357 | |
| | |
| Money Market Funds - 2.6% | | | | | | | | |
MFS Institutional Money Market Portfolio, 0.28%,
at Cost and Net Asset Value (v) | | | 34,778,255 | | | $ | 34,778,255 | |
| Total Investments (Identified Cost, $1,483,802,077) | | | | | | $ | 1,321,284,121 | |
| | |
| Other Assets, Less Liabilities - 2.2% | | | | | | | 29,382,137 | |
| Net Assets - 100.0% | | | | | | $ | 1,350,666,258 | |
21
Portfolio of Investments – continued
| (a) | Non-income producing security. |
| (g) | The rate shown represents a weighted average coupon rate on settled positions at period end, unless otherwise indicated. |
| (n) | Securities exempt from registration under Rule 144A of the Securities Act of 1933. These securities may be sold in the ordinary course of business in transactions exempt from registration, normally to qualified institutional buyers. At period end, the aggregate value of these securities was $500,809,451, representing 37.1% of net assets. |
| (p) | Payment-in-kind security for which interest income may be received in additional securities and/or cash. During the period, the following amount of interest income was received in additional securities and/or cash: |
| | | | | | |
| Payment-in-kind Securities | | Cash | | Additional
Securities | |
| Schaeffler Finance B.V., 6.875%, 8/15/18 | | $177,566 | | | $— | |
| Schaeffler Holding Finance B.V., 6.25%, 11/15/19 | | 165,265 | | | — | |
| Total | | $342,831 | | | $— | |
| (r) | Remaining maturities of floating rate loans may be less than stated maturities shown as a result of contractual or optional prepayments by the borrower. Such prepayments cannot be predicted with certainty. These loans may be subject to restrictions on resale. Floating rate loans generally have rates of interest which are determined periodically by reference to a base lending rate plus a premium. |
| (v) | Underlying affiliated fund that is available only to investment companies managed by MFS. The rate quoted for the MFS Institutional Money Market Portfolio is the annualized seven-day yield of the fund at period end. |
| (z) | Restricted securities are not registered under the Securities Act of 1933 and are subject to legal restrictions on resale. These securities generally may be resold in transactions exempt from registration or to the public if the securities are subsequently registered. Disposal of these securities may involve time-consuming negotiations and prompt sale at an acceptable price may be difficult. The fund holds the following restricted securities: |
| | | | | | | | | | |
| Restricted Securities | | Acquisition
Date | | Cost | | | Value | |
| American Media, Inc., 13.5%, 6/15/18 | | 12/22/10-12/28/10 | | | $341,025 | | | | $334,067 | |
| % of Net assets | | | | 0.0% | |
The following abbreviations are used in this report and are defined:
| FRN | | Floating Rate Note. Interest rate resets periodically and the current rate may not be the rate reported at period end. |
| PLC | | Public Limited Company |
| REIT | | Real Estate Investment Trust |
Abbreviations indicate amounts shown in currencies other than the U.S. dollar. All amounts are stated in U.S. dollars unless otherwise indicated. A list of abbreviations is shown below:
22
Portfolio of Investments – continued
Derivative Contracts at 1/31/16
Forward Foreign Currency Exchange Contracts at 1/31/16
| | | | | | | | | | | | | | | | | | | | | | | | |
| Type | | Currency | | Counter-
party | | Contracts
to
Deliver/
Receive | | | Settlement
Date Range | | | In
Exchange
For | | | Contracts
at Value | | | Net
Unrealized
Appreciation
(Depreciation) | |
| Asset Derivatives | | | | | | | | | | | | | | | | | | | | |
| SELL | | EUR | | Goldman Sachs International | | | 2,033,642 | | | | 4/15/16 | | | | $2,208,812 | | | | $2,207,485 | | | | $1,327 | |
| | | | | | | | | | | | | | | | | | | | | | | | |
Futures Contracts at 1/31/16
| | | | | | | | | | | | | | | | | | |
| Description | | Currency | | | Contracts | | | Value | | Expiration
Date | | | Unrealized
Appreciation
(Depreciation) | |
| Liability Derivatives | | | | | | | | | | | | | | | | | | |
| Interest Rate Futures | | | | | | | | | | | | | | | | | | |
| U.S. Treasury Note 10 yr (Short) | | | USD | | | | 91 | | | $11,791,609 | | | March - 2016 | | | | ($287,993 | ) |
| | | | | | | | | | | | | | | | | | |
At January 31, 2016, the fund had cash collateral of $122,850 to cover any commitments for certain derivative contracts. Cash collateral is comprised of “Deposits with brokers” in the Statement of Assets and Liabilities.
See Notes to Financial Statements
23
Financial Statements
STATEMENT OF ASSETS AND LIABILITIES
At 1/31/16
This statement represents your fund’s balance sheet, which details the assets and liabilities comprising the total value of the fund.
| | | | |
| Assets | | | | |
Investments | | | | |
Non-affiliated issuers, at value (identified cost, $1,449,023,822) | | | $1,286,505,866 | |
Underlying affiliated funds, at cost and value | | | 34,778,255 | |
Total investments, at value (identified cost, $1,483,802,077) | | | $1,321,284,121 | |
Cash | | | 268,705 | |
Deposits with brokers | | | 122,850 | |
Receivables for | | | | |
Forward foreign currency exchange contracts | | | 1,327 | |
Investments sold | | | 10,879,225 | |
Fund shares sold | | | 38,684 | |
Interest and dividends | | | 25,916,432 | |
Other assets | | | 7,769 | |
Total assets | | | $1,358,519,113 | |
| Liabilities | | | | |
Payables for | | | | |
Distributions | | | $410 | |
Daily variation margin on open futures contracts | | | 49,766 | |
Investments purchased | | | 5,773,663 | |
Fund shares reacquired | | | 1,901,689 | |
Payable to affiliates | | | | |
Administrator | | | 192 | |
Shareholder servicing costs | | | 11 | |
Accrued expenses and other liabilities | | | 127,124 | |
Total liabilities | | | $7,852,855 | |
Net assets | | | $1,350,666,258 | |
| Net assets consist of | | | | |
Paid-in capital | | | $1,536,334,937 | |
Unrealized appreciation (depreciation) on investments and translation of assets and liabilities in foreign currencies | | | (162,804,646 | ) |
Accumulated net realized gain (loss) on investments and foreign currency | | | (22,160,646 | ) |
Accumulated distributions in excess of net investment income | | | (703,387 | ) |
Net assets | | | $1,350,666,258 | |
Shares of beneficial interest outstanding | | | 160,582,837 | |
Net asset value per share (net assets of $1,350,666,258 / 160,582,837 shares of beneficial interest outstanding) | | | $8.41 | |
See Notes to Financial Statements
24
Financial Statements
STATEMENT OF OPERATIONS
Year ended 1/31/16
This statement describes how much your fund earned in investment income and accrued in expenses. It also describes any gains and/or losses generated by fund operations.
| | | | |
| Net investment income | | | | |
Income | | | | |
Interest | | | $86,296,899 | |
Dividends | | | 541,655 | |
Dividends from underlying affiliated funds | | | 63,242 | |
Total investment income | | | $86,901,796 | |
Expenses | | | | |
Shareholder servicing costs | | | 46 | |
Administrative services fee | | | 17,500 | |
Custodian fee | | | 155,206 | |
Shareholder communications | | | 7,593 | |
Audit and tax fees | | | 41,410 | |
Legal fees | | | 12,372 | |
Pricing service fees | | | 17,654 | |
Registration fees | | | 18,742 | |
Miscellaneous | | | 26,849 | |
Total expenses | | | $297,372 | |
Fees paid indirectly | | | (218 | ) |
Net expenses | | | $297,154 | |
Net investment income | | | $86,604,642 | |
| Realized and unrealized gain (loss) on investments and foreign currency | |
Realized gain (loss) (identified cost basis) | | | | |
Investments | | | $(13,793,810 | ) |
Written options | | | 53,759 | |
Futures contracts | | | (245,935 | ) |
Foreign currency | | | 252,608 | |
Net realized gain (loss) on investments and foreign currency | | | $(13,733,378 | ) |
Change in unrealized appreciation (depreciation) | | | | |
Investments | | | $(147,729,711 | ) |
Futures contracts | | | 144,576 | |
Translation of assets and liabilities in foreign currencies | | | (147,626 | ) |
Net unrealized gain (loss) on investments and foreign currency translation | | | $(147,732,761 | ) |
Net realized and unrealized gain (loss) on investments and foreign currency | | | $(161,466,139 | ) |
Change in net assets from operations | | | $(74,861,497 | ) |
See Notes to Financial Statements
25
Financial Statements
STATEMENTS OF CHANGES IN NET ASSETS
These statements describe the increases and/or decreases in net assets resulting from operations, any distributions, and any shareholder transactions.
| | | | | | | | |
| | | Years ended 1/31 | |
| | | 2016 | | | 2015 | |
| Change in net assets | | | | | | |
| From operations | | | | | | | | |
Net investment income | | | $86,604,642 | | | | $70,322,027 | |
Net realized gain (loss) on investments and foreign currency | | | (13,733,378 | ) | | | 11,928,307 | |
Net unrealized gain (loss) on investments and foreign currency translation | | | (147,732,761 | ) | | | (45,449,886 | ) |
Change in net assets from operations | | | $(74,861,497 | ) | | | $36,800,448 | |
| Distributions declared to shareholders | | | | | |
From net investment income | | | $(89,680,774 | ) | | | $(72,674,007 | ) |
From net realized gain on investments | | | (996,862 | ) | | | (9,130,455 | ) |
Total distributions declared to shareholders | | | $(90,677,636 | ) | | | $(81,804,462 | ) |
Change in net assets from fund share transactions | | | $178,673,761 | | | | $268,826,805 | |
Total change in net assets | | | $13,134,628 | | | | $223,822,791 | |
| Net assets | | | | | | | | |
At beginning of period | | | 1,337,531,630 | | | | 1,113,708,839 | |
At end of period (including accumulated distributions in excess of net investment income of $703,387 and $572,054, respectively) | | | $1,350,666,258 | | | | $1,337,531,630 | |
See Notes to Financial Statements
26
Financial Statements
FINANCIAL HIGHLIGHTS
The financial highlights table is intended to help you understand the fund’s financial performance for the past 5 years (or life of a particular share class, if shorter). Certain information reflects financial results for a single fund share. The total returns in the table represent the rate by which an investor would have earned (or lost) on an investment in the fund share class (assuming reinvestment of all distributions) held for the entire period.
| | | | | | | | | | | | |
| | | Years ended 1/31 | | | Period
ended
1/31/14 (c) | |
| | | 2016 | | | 2015 | | |
Net asset value, beginning of period | | | $9.47 | | | | $9.85 | | | | $10.00 | |
| Income (loss) from investment operations | | | | | | | | | | | | |
Net investment income (d) | | | $0.57 | | | | $0.61 | | | | $0.55 | |
Net realized and unrealized gain (loss) on investments
and foreign currency | | | (1.03 | ) | | | (0.29 | ) | | | (0.04 | ) |
Total from investment operations | | | $(0.46 | ) | | | $0.32 | | | | $0.51 | |
| Less distributions declared to shareholders | | | | | | | | | | | | |
From net investment income | | | $(0.59 | ) | | | $(0.63 | ) | | | $(0.59 | ) |
From net realized gain on investments | | | (0.01 | ) | | | (0.07 | ) | | | (0.07 | ) |
Total distributions declared to shareholders | | | $(0.60 | ) | | | $(0.70 | ) | | | $(0.66 | ) |
Net asset value, end of period (x) | | | $8.41 | | | | $9.47 | | | | $9.85 | |
Total return (%) (r)(s)(x) | | | (5.23 | ) | | | 3.28 | | | | 5.26 | (n) |
Ratios (%) (to average net assets)
and Supplemental data: | | | | | | | | | | | | |
Expenses before expense reductions (f) | | | 0.02 | | | | 0.03 | | | | 0.02 | (a) |
Expenses after expense reductions (f) | | | 0.02 | | | | 0.03 | | | | 0.02 | (a) |
Net investment income | | | 6.19 | | | | 6.18 | | | | 6.54 | (a) |
Portfolio turnover | | | 33 | | | | 43 | | | | 42 | (n) |
Net assets at end of period (000 omitted) | | | $1,350,666 | | | | $1,337,532 | | | | $1,113,709 | |
| (c) | For the period from the commencement of the fund’s investment operations, March 25, 2013, through the stated period end. |
| (d) | Per share data is based on average shares outstanding. |
| (f) | Ratios do not reflect reductions from fees paid indirectly, if applicable. |
| (r) | Certain expenses have been reduced without which performance would have been lower. |
| (s) | From time to time the fund may receive proceeds from litigation settlements, without which performance would be lower. |
| (x) | The net asset values and total returns have been calculated on net assets which include adjustments made in accordance with U.S. generally accepted accounting principles required at period end for financial reporting purposes. |
See Notes to Financial Statements
27
NOTES TO FINANCIAL STATEMENTS
(1) Business and Organization
MFS High Yield Pooled Portfolio (the fund) is a diversified series of MFS Series Trust III (the trust). The trust is organized as a Massachusetts business trust and is registered under the Investment Company Act of 1940, as amended, as an open-end management investment company. This fund is available only to certain U.S. registered investment companies managed by MFS. MFS does not receive a management fee from this fund.
The fund is an investment company and accordingly follows the investment company accounting and reporting guidance of the Financial Accounting Standards Board (FASB) Accounting Standards Codification Topic 946 Financial Services – Investment Companies.
(2) Significant Accounting Policies
General – The preparation of financial statements in conformity with U.S. generally accepted accounting principles requires management to make estimates and assumptions that affect the reported amounts of assets and liabilities, and disclosure of contingent assets and liabilities at the date of the financial statements and the reported amounts of increases and decreases in net assets from operations during the reporting period. Actual results could differ from those estimates. In the preparation of these financial statements, management has evaluated subsequent events occurring after the date of the fund’s Statement of Assets and Liabilities through the date that the financial statements were issued. The fund invests in high-yield securities rated below investment grade. Investments in high-yield securities involve greater degrees of credit and market risk than investments in higher-rated securities and tend to be more sensitive to economic conditions. The fund invests in foreign securities. Investments in foreign securities are vulnerable to the effects of changes in the relative values of the local currency and the U.S. dollar and to the effects of changes in each country’s legal, political, and economic environment.
In January 2016, FASB issued Accounting Standards Update 2016-01, Financial Instruments – Overall (Subtopic 825-10) – Recognition and Measurement of Financial Assets and Financial Liabilities (“ASU 2016-01”) which would first be effective for annual reporting periods beginning after December 15, 2017, and interim periods therein. ASU 2016-01, which changes the accounting for equity investments and for certain financial liabilities, also modifies the presentation and disclosure requirements for financial instruments. Investment companies are specifically exempted from ASU 2016-01’s equity investment accounting provisions and will continue to follow the industry specific guidance for investment accounting under ASC 946. Although still evaluating the potential impacts of ASU 2016-01 to the fund, management expects that the impact of the fund’s adoption will be limited to additional financial statement disclosures.
Balance Sheet Offsetting – The fund’s accounting policy with respect to balance sheet offsetting is that, absent an event of default by the counterparty or a termination of the agreement, the International Swaps and Derivatives Association (ISDA) Master Agreement does not result in an offset of reported amounts of financial assets and financial liabilities in the Statement of Assets and Liabilities across transactions between
28
Notes to Financial Statements – continued
the fund and the applicable counterparty. The fund’s right to setoff may be restricted or prohibited by the bankruptcy or insolvency laws of the particular jurisdiction to which a specific master netting agreement counterparty is subject. Balance sheet offsetting disclosures, to the extent applicable to the fund, have been included in the fund’s Significant Accounting Policies note under the captions for each of the fund’s in-scope financial instruments and transactions.
Investment Valuations – Debt instruments and floating rate loans, including restricted debt instruments, are generally valued at an evaluated or composite bid as provided by a third-party pricing service. Equity securities, including restricted equity securities, are generally valued at the last sale or official closing price on their primary market or exchange as provided by a third-party pricing service. Equity securities, for which there were no sales reported that day, are generally valued at the last quoted daily bid quotation on their primary market or exchange as provided by a third-party pricing service. Short-term instruments with a maturity at issuance of 60 days or less may be valued at amortized cost, which approximates market value. Exchange-traded options are generally valued at the last sale or official closing price on their primary exchange as provided by a third-party pricing service. Exchange-traded options for which there were no sales reported that day are generally valued at the last daily bid quotation on their primary exchange as provided by a third-party pricing service. Options not traded on an exchange are generally valued at a broker/dealer bid quotation. Foreign currency options are generally valued at valuations provided by a third-party pricing service. Futures contracts are generally valued at last posted settlement price on their primary exchange as provided by a third-party pricing service. Futures contracts for which there were no trades that day for a particular position are generally valued at the closing bid quotation on their primary exchange as provided by a third-party pricing service. Forward foreign currency exchange contracts are generally valued at the mean of bid and asked prices for the time period interpolated from rates provided by a third-party pricing service for proximate time periods. Open-end investment companies are generally valued at net asset value per share. Securities and other assets generally valued on the basis of information from a third-party pricing service may also be valued at a broker/dealer bid quotation. Values obtained from third-party pricing services can utilize both transaction data and market information such as yield, quality, coupon rate, maturity, type of issue, trading characteristics, and other market data. The values of foreign securities and other assets and liabilities expressed in foreign currencies are converted to U.S. dollars using the mean of bid and asked prices for rates provided by a third-party pricing service.
The Board of Trustees has delegated primary responsibility for determining or causing to be determined the value of the fund’s investments (including any fair valuation) to the adviser pursuant to valuation policies and procedures approved by the Board. If the adviser determines that reliable market quotations are not readily available, investments are valued at fair value as determined in good faith by the adviser in accordance with such procedures under the oversight of the Board of Trustees. Under the fund’s valuation policies and procedures, market quotations are not considered to be readily available for most types of debt instruments and floating rate loans and many types of derivatives. These investments are generally valued at fair value based on information from third-party pricing services. In addition, investments may be valued at fair value if
29
Notes to Financial Statements – continued
the adviser determines that an investment’s value has been materially affected by events occurring after the close of the exchange or market on which the investment is principally traded (such as foreign exchange or market) and prior to the determination of the fund’s net asset value, or after the halting of trading of a specific security where trading does not resume prior to the close of the exchange or market on which the security is principally traded. The adviser generally relies on third-party pricing services or other information (such as the correlation with price movements of similar securities in the same or other markets; the type, cost and investment characteristics of the security; the business and financial condition of the issuer; and trading and other market data) to assist in determining whether to fair value and at what value to fair value an investment. The value of an investment for purposes of calculating the fund’s net asset value can differ depending on the source and method used to determine value. When fair valuation is used, the value of an investment used to determine the fund’s net asset value may differ from quoted or published prices for the same investment. There can be no assurance that the fund could obtain the fair value assigned to an investment if it were to sell the investment at the same time at which the fund determines its net asset value per share.
Various inputs are used in determining the value of the fund’s assets or liabilities. These inputs are categorized into three broad levels. In certain cases, the inputs used to measure fair value may fall into different levels of the fair value hierarchy. In such cases, an investment’s level within the fair value hierarchy is based on the lowest level of input that is significant to the fair value measurement. The fund’s assessment of the significance of a particular input to the fair value measurement in its entirety requires judgment, and considers factors specific to the investment. Level 1 includes unadjusted quoted prices in active markets for identical assets or liabilities. Level 2 includes other significant observable market-based inputs (including quoted prices for similar securities, interest rates, prepayment speed, and credit risk). Level 3 includes unobservable inputs, which may include the adviser’s own assumptions in determining the fair value of investments. Other financial instruments are derivative instruments not reflected in total investments, such as futures contracts and forward foreign currency exchange contracts. The following is a summary of the levels used as of January 31, 2016 in valuing the fund’s assets or liabilities:
| | | | | | | | | | | | | | | | |
| Investments at Value | | Level 1 | | | Level 2 | | | Level 3 | | | Total | |
| Equity Securities | | | $9,594,357 | | | | $— | | | | $— | | | | $9,594,357 | |
| U.S. Corporate Bonds | | | — | | | | 1,046,463,596 | | | | — | | | | 1,046,463,596 | |
| Foreign Bonds | | | — | | | | 186,780,214 | | | | — | | | | 186,780,214 | |
| Floating Rate Loans | | | — | | | | 43,667,699 | | | | — | | | | 43,667,699 | |
| Mutual Funds | | | 34,778,255 | | | | — | | | | — | | | | 34,778,255 | |
| Total Investments | | | $44,372,612 | | | | $1,276,911,509 | | | | $— | | | | $1,321,284,121 | |
|
| Other Financial Instruments | |
| Futures Contracts | | | $(287,993 | ) | | | $— | | | | $— | | | | $(287,993 | ) |
| Forward Foreign Currency Exchange Contracts | | | — | | | | 1,327 | | | | — | | | | 1,327 | |
For further information regarding security characteristics, see the Portfolio of Investments.
30
Notes to Financial Statements – continued
Foreign Currency Translation – Purchases and sales of foreign investments, income, and expenses are converted into U.S. dollars based upon currency exchange rates prevailing on the respective dates of such transactions or on the reporting date for foreign denominated receivables and payables. Gains and losses attributable to foreign currency exchange rates on sales of securities are recorded for financial statement purposes as net realized gains and losses on investments. Gains and losses attributable to foreign exchange rate movements on receivables, payables, income and expenses are recorded for financial statement purposes as foreign currency transaction gains and losses. That portion of both realized and unrealized gains and losses on investments that results from fluctuations in foreign currency exchange rates is not separately disclosed.
Derivatives – The fund uses derivatives for different purposes, primarily to increase or decrease exposure to a particular market or segment of the market, or security, to increase or decrease interest rate or currency exposure, or as alternatives to direct investments. Derivatives are used for hedging or non-hedging purposes. While hedging can reduce or eliminate losses, it can also reduce or eliminate gains. When the fund uses derivatives as an investment to increase market exposure, or for hedging purposes, gains and losses from derivative instruments may be substantially greater than the derivative’s original cost.
The derivative instruments used by the fund were written options, futures contracts, and forward foreign currency exchange contracts. The fund’s period end derivatives, as presented in the Portfolio of Investments and the associated Derivative Contract tables, generally are indicative of the volume of its derivative activity during the period.
The following table presents, by major type of derivative contract, the fair value, on a gross basis, of the asset and liability components of derivatives held by the fund at January 31, 2016 as reported in the Statement of Assets and Liabilities:
| | | | | | | | |
| | | | | Fair Value (a) |
| Risk | | Derivative Contracts | | Asset Derivatives | | | Liability Derivatives |
| Interest Rate | | Interest Rate Futures | | | $— | | | $(287,993) |
| Foreign Exchange | | Forward Foreign Currency Exchange | | | 1,327 | | | — |
| Total | | | | | $1,327 | | | $(287,993) |
| (a) | The value of futures contracts includes cumulative appreciation (depreciation) as reported in the fund’s Portfolio of Investments. Only the current day net variation margin for futures contracts is separately reported within the fund’s Statement of Assets and Liabilities. |
The following table presents, by major type of derivative contract, the realized gain (loss) on derivatives held by the fund for the year ended January 31, 2016 as reported in the Statement of Operations:
| | | | | | | | | | | | |
| Risk | | Futures
Contracts | | | Written
Options | | | Foreign
Currency | |
| Interest Rate | | | $(245,935 | ) | | | $— | | | | $— | |
| Foreign Exchange | | | — | | | | — | | | | 257,916 | |
| Equity | | | — | | | | 53,759 | | | | — | |
| Total | | | $(245,935 | ) | | | $53,759 | | | | $257,916 | |
31
Notes to Financial Statements – continued
The following table presents, by major type of derivative contract, the change in unrealized appreciation (depreciation) on derivatives held by the fund for the year ended January 31, 2016 as reported in the Statement of Operations:
| | | | | | | | |
| Risk | | Futures
Contracts | | | Translation
of Assets
and
Liabilities in
Foreign
Currencies | |
| Interest Rate | | | $144,576 | | | | $— | |
| Foreign Exchange | | | — | | | | (151,958 | ) |
| Total | | | $144,576 | | | | $(151,958 | ) |
Derivative counterparty credit risk is managed through formal evaluation of the creditworthiness of all potential counterparties. On certain, but not all, uncleared derivatives, the fund attempts to reduce its exposure to counterparty credit risk whenever possible by entering into an ISDA Master Agreement on a bilateral basis. The ISDA Master Agreement gives each party to the agreement the right to terminate all transactions traded under such agreement if there is a certain deterioration in the credit quality of the other party. Upon an event of default or a termination of the ISDA Master Agreement, the non-defaulting party has the right to close out all transactions traded under such agreement and to net amounts owed under each transaction to one net amount payable by one party to the other. This right to close out and net payments across all transactions traded under the ISDA Master Agreement could result in a reduction of the fund’s credit risk to such counterparty equal to any amounts payable by the fund under the applicable transactions, if any.
Collateral and margin requirements differ by type of derivative. Margin requirements are set by the clearing broker and the clearing house for cleared derivatives (e.g., futures contracts, cleared swaps, and exchange-traded options) while collateral terms are contract specific for uncleared derivatives (e.g., forward foreign currency exchange contracts, uncleared swap agreements, and uncleared options). For derivatives traded under an ISDA Master Agreement, which contains a collateral support annex, the collateral requirements are netted across all transactions traded under such agreement and one amount is posted from one party to the other to collateralize such obligations. Cash that has been segregated to cover the fund’s collateral or margin obligations under derivative contracts, if any, will be reported separately in the Statement of Assets and Liabilities as “Restricted cash” or “Deposits with brokers.” Securities pledged as collateral or margin for the same purpose, if any, are noted in the Portfolio of Investments.
Written Options – In exchange for a premium, the fund wrote put options on securities for which it anticipated the price would increase. At the time the option was written, the fund believed the premium received exceeded the potential loss that could result from adverse price changes in the options’ underlying securities. In a written option, the fund as the option writer grants the buyer the right to purchase from, or sell to, the fund a specified number of shares or units of a particular security, currency or index at a specified price within a specified period of time.
32
Notes to Financial Statements – continued
The premium received is initially recorded as a liability in the Statement of Assets and Liabilities. The option is subsequently marked-to-market daily with the difference between the premium received and the market value of the written option being recorded as unrealized appreciation or depreciation. When a written option expires, the fund realizes a gain equal to the amount of the premium received. The difference between the premium received and the amount paid on effecting a closing transaction is considered a realized gain or loss. When a written put option is exercised, the premium reduces the cost basis of the security purchased by the fund.
At the initiation of the written option contract, for exchange traded options, the fund is required to deposit securities or cash as collateral with the custodian for the benefit of the broker or directly with the clearing broker, based on the type of option. For uncleared options, the fund may post collateral subject to the terms of an ISDA Master Agreement as generally described above if the market value of the options contract moves against it. The fund, as writer of an option, may have no control over whether the underlying securities may be sold (call) or purchased (put) and, as a result, bears the market risk of an unfavorable change in the price of the securities underlying the written option. Losses from writing options can exceed the premium received and can exceed the potential loss from an ordinary buy and sell transaction. Although the fund’s market risk may be significant, the maximum counterparty credit risk to the fund is equal to the market value of any collateral posted to the broker. For uncleared options, this risk is mitigated in cases where there is an ISDA Master Agreement between the fund and the counterparty providing for netting as described above.
The following table represents the written option activity in the fund during the year ended January 31, 2016:
| | | | | | | | |
| | | Number of
Contracts | | | Premiums
Received | |
| Outstanding, beginning of period | | | — | | | | $— | |
| Options written | | | 840 | | | | 53,759 | |
| Options expired | | | (840 | ) | | | (53,759 | ) |
| Outstanding, end of period | | | — | | | | $— | |
Futures Contracts – The fund entered into futures contracts which may be used to hedge against or obtain broad market exposure, interest rate exposure, currency exposure, or to manage duration. A futures contract represents a commitment for the future purchase or sale of an asset at a specified price on a specified date.
Upon entering into a futures contract, the fund is required to deposit with the broker, either in cash or securities, an initial margin in an amount equal to a certain percentage of the notional amount of the contract. Subsequent payments (variation margin) are made or received by the fund each day, depending on the daily fluctuations in the value of the contract, and are recorded for financial statement purposes as unrealized gain or loss by the fund until the contract is closed or expires at which point the gain or loss on futures contracts is realized.
The fund bears the risk of interest rates, exchange rates or securities prices moving unexpectedly, in which case, the fund may not achieve the anticipated benefits of the futures contracts and may realize a loss. While futures contracts may present less counterparty risk to the fund since the contracts are exchange traded and the
33
Notes to Financial Statements – continued
exchange’s clearinghouse guarantees payments to the broker, there is still counterparty credit risk due to the insolvency of the broker. The fund’s maximum risk of loss due to counterparty credit risk is equal to the margin posted by the fund to the broker plus any gains or minus any losses on the outstanding futures contracts.
Forward Foreign Currency Exchange Contracts – The fund entered into forward foreign currency exchange contracts for the purchase or sale of a specific foreign currency at a fixed price on a future date. These contracts may be used to hedge the fund’s currency risk or for non-hedging purposes. For hedging purposes, the fund may enter into contracts to deliver or receive foreign currency that the fund will receive from or use in its normal investment activities. The fund may also use contracts to hedge against declines in the value of foreign currency denominated securities due to unfavorable exchange rate movements. For non-hedging purposes, the fund may enter into contracts with the intent of changing the relative exposure of the fund’s portfolio of securities to different currencies to take advantage of anticipated exchange rate changes.
Forward foreign currency exchange contracts are adjusted by the daily exchange rate of the underlying currency and any unrealized gains or losses are recorded as a receivable or payable for forward foreign currency exchange contracts until the contract settlement date. On contract settlement date, any gain or loss on the contract is recorded as realized gains or losses on foreign currency.
Risks may arise upon entering into these contracts from unanticipated movements in the value of the contract and from the potential inability of counterparties to meet the terms of their contracts. Generally, the fund’s maximum risk due to counterparty credit risk is the unrealized gain on the contract due to the use of Continuous Linked Settlement, an industry accepted settlement system. This risk is mitigated in cases where there is an ISDA Master Agreement between the fund and the counterparty providing for netting as described above and, where applicable, by the posting of collateral by the counterparty to the fund to cover the fund’s exposure to the counterparty under such ISDA Master Agreement.
Loans and Other Direct Debt Instruments – The fund invests in loans and loan participations or other receivables. These investments may include standby financing commitments, including revolving credit facilities, which contractually obligate the fund to supply additional cash to the borrower on demand. The fund generally provides this financial support in order to preserve its existing investment or to obtain a more senior secured interest in the assets of the borrower. Loan participations involve a risk of insolvency of the lending bank or other financial intermediary.
Indemnifications – Under the fund’s organizational documents, its officers and Trustees may be indemnified against certain liabilities and expenses arising out of the performance of their duties to the fund. Additionally, in the normal course of business, the fund enters into agreements with service providers that may contain indemnification clauses. The fund’s maximum exposure under these agreements is unknown as this would involve future claims that may be made against the fund that have not yet occurred.
Investment Transactions and Income – Investment transactions are recorded on the trade date. Interest income is recorded on the accrual basis. All premium and discount
34
Notes to Financial Statements – continued
is amortized or accreted for financial statement purposes in accordance with U.S. generally accepted accounting principles. The fund earns certain fees in connection with its floating rate loan purchasing activities. These fees are in addition to interest payments earned and may include amendment fees, commitment fees, facility fees, consent fees, and prepayment fees. Commitment fees are recorded on an accrual basis as income in the accompanying financial statements. Dividends received in cash are recorded on the ex-dividend date. Certain dividends from foreign securities will be recorded when the fund is informed of the dividend if such information is obtained subsequent to the ex-dividend date. Dividend and interest payments received in additional securities are recorded on the ex-dividend or ex-interest date in an amount equal to the value of the security on such date. Debt obligations may be placed on non-accrual status or set to accrue at a rate of interest less than the contractual coupon when the collection of all or a portion of interest has become doubtful. Interest income for those debt obligations may be further reduced by the write-off of the related interest receivables when deemed uncollectible.
The fund may receive proceeds from litigation settlements. Any proceeds received from litigation involving portfolio holdings are reflected in the Statement of Operations in realized gain/loss if the security has been disposed of by the fund or in unrealized gain/loss if the security is still held by the fund. Any other proceeds from litigation not related to portfolio holdings are reflected as other income in the Statement of Operations.
Fees Paid Indirectly – The fund’s custody fee may be reduced by a credit earned under an arrangement that measures the value of U.S. dollars deposited with the custodian by the fund. The amount of the credit, for the year ended January 31, 2016, is shown as a reduction of total expenses in the Statement of Operations.
Tax Matters and Distributions – The fund intends to qualify as a regulated investment company, as defined under Subchapter M of the Internal Revenue Code, and to distribute all of its taxable income, including realized capital gains. As a result, no provision for federal income tax is required. The fund’s federal tax returns, when filed, will remain subject to examination by the Internal Revenue Service for a three year period. Management has analyzed the fund’s tax positions taken on federal and state tax returns for all open tax years and does not believe that there are any uncertain tax positions that require recognition of a tax liability. Foreign taxes, if any, have been accrued by the fund in the accompanying financial statements in accordance with the applicable foreign tax law. Foreign income taxes may be withheld by certain countries in which the fund invests. Additionally, capital gains realized by the fund on securities issued in or by certain foreign countries may be subject to capital gains tax imposed by those countries.
Distributions to shareholders are recorded on the ex-dividend date. Income and capital gain distributions are determined in accordance with income tax regulations, which may differ from U.S. generally accepted accounting principles. Certain capital accounts in the financial statements are periodically adjusted for permanent differences in order to reflect their tax character. These adjustments have no impact on net assets or net asset value per share. Temporary differences which arise from recognizing certain items of income, expense, gain or loss in different periods for financial statement and tax purposes will reverse at some time in the future. Distributions in excess of net
35
Notes to Financial Statements – continued
investment income or net realized gains are temporary overdistributions for financial statement purposes resulting from differences in the recognition or classification of income or distributions for financial statement and tax purposes.
Book/tax differences primarily relate to amortization and accretion of debt securities.
The tax character of distributions declared to shareholders for the last two fiscal years is as follows:
| | | | | | | | |
| | | 1/31/16 | | | 1/31/15 | |
| Ordinary income (including any short-term capital gains) | | | $90,677,636 | | | | $74,460,101 | |
| Long-term capital gains | | | — | | | | 7,344,361 | |
| Total distributions | | | $90,677,636 | | | | $81,804,462 | |
The federal tax cost and the tax basis components of distributable earnings were as follows:
| | | | |
| As of 1/31/16 | | | |
| Cost of investments | | | $1,490,637,891 | |
| Gross appreciation | | | 5,840,449 | |
| Gross depreciation | | | (175,194,219 | ) |
| Net unrealized appreciation (depreciation) | | | $(169,353,770 | ) |
| Undistributed ordinary income | | | 7,257,274 | |
| Capital loss carryforwards | | | (15,612,825 | ) |
| Other temporary differences | | | (7,959,358 | ) |
As of January 31, 2016, the fund had capital loss carryforwards available to offset future realized gains. Such losses are characterized as follows:
| | | | |
| Short-Term | | | $(9,428,846 | ) |
| Long-Term | | | (6,183,979 | ) |
| Total | | | $(15,612,825 | ) |
Under the Regulated Investment Company Modernization Act of 2010 (the “Act”), the above net capital losses may be carried forward indefinitely, and their character is retained as short-term and/or long-term losses. Previously, net capital losses were carried forward for eight years and treated as short-term losses.
(3) Transactions with Affiliates
Investment Adviser – The fund has an investment advisory agreement with MFS to provide overall investment management and related administrative services and facilities to the fund. MFS receives no compensation under this agreement; however MFS receives management fees from MFS funds that invest in the fund.
Shareholder Servicing Agent – MFS Service Center, Inc. (MFSC), a wholly-owned subsidiary of MFS, provides transfer agent and recordkeeping functions in connection with the issuance, transfer, and redemption of shares of the fund under a Shareholder Servicing Agent Agreement. MFSC is not paid a fee for providing these services. MFSC receives payment from the fund for out-of-pocket expenses paid by MFSC on behalf of the fund. For the year ended January 31, 2016, these costs amounted to $46. The fund may also pay shareholder servicing related costs to non-related parties.
36
Notes to Financial Statements – continued
Administrator – MFS provides certain financial, legal, shareholder communications, compliance, and other administrative services to the fund. Under an administrative services agreement, the fund reimburses MFS the costs incurred to provide these services. The fund is charged an annual fixed amount of $17,500. The administrative services fee incurred for the year ended January 31, 2016 was equivalent to an annual effective rate of 0.0013% of the fund’s average daily net assets.
Trustees’ and Officers’ Compensation – The fund may pay compensation to independent Trustees in the form of a retainer, attendance fees, and additional compensation to Board and Committee chairpersons. The fund does not pay compensation directly to Trustees or officers of the fund who are also officers of the investment adviser, all of whom receive remuneration for their services to the fund from MFS. Certain officers and Trustees of the fund are officers or directors of MFS, MFS Fund Distributors, Inc. (MFD), and MFSC. The independent Trustees do not currently receive compensation from the fund.
Other – This fund and certain other funds managed by MFS (the funds) have entered into a service agreement (the ISO Agreement) which provides for payment of fees solely by the funds to Tarantino LLC in return for the provision of services of an Independent Senior Officer (ISO) for the funds. Frank L. Tarantino serves as the ISO and is an officer of the funds and the sole member of Tarantino LLC. The funds can terminate the ISO Agreement with Tarantino LLC at any time under the terms of the ISO Agreement. For the year ended January 31, 2016, the fee paid by the fund under this agreement was $4,337 and is included in “Miscellaneous” expense in the Statement of Operations. MFS has agreed to bear all expenses associated with office space, other administrative support, and supplies provided to the ISO.
The fund invests in the MFS Institutional Money Market Portfolio which is managed by MFS and seeks current income consistent with preservation of capital and liquidity. Income earned on this investment is included in “Dividends from underlying affiliated funds” in the Statement of Operations. This money market fund does not pay a management fee to MFS.
(4) Portfolio Securities
For the year ended January 31, 2016, purchases and sales of investments, other than short-term obligations, aggregated $614,618,686 and $434,717,396, respectively.
37
Notes to Financial Statements – continued
(5) Shares of Beneficial Interest
The fund’s Declaration of Trust permits the Trustees to issue an unlimited number of full and fractional shares of beneficial interest. Transactions in fund shares were as follows:
| | | | | | | | | | | | | | | | |
| | | Year ended
1/31/16 | | | Year ended
1/31/15 | |
| | | Shares | | | Amount | | | Shares | | | Amount | |
| Shares sold | | | 33,576,052 | | | | $307,119,857 | | | | 35,605,372 | | | | $343,405,971 | |
Shares issued to shareholders in
reinvestment of distributions | | | 9,908,700 | | | | 90,676,904 | | | | 8,373,274 | | | | 81,804,462 | |
| Shares reacquired | | | (24,098,828 | ) | | | (219,123,000 | ) | | | (15,868,117 | ) | | | (156,383,628 | ) |
| Net change | | | 19,385,924 | | | | $178,673,761 | | | | 28,110,529 | | | | $268,826,805 | |
The fund is an MFS Pooled Portfolio, which is designed to be used by certain MFS funds to invest in a particular security type rather than invest in the security type directly. The fund is solely invested in by other MFS funds for the purpose of gaining exposure to high income debt instruments, rather than investing in high income debt instruments directly. The MFS funds do not invest in this fund for the purpose of exercising management or control. At the end of the period, the MFS Diversified Income Fund, the MFS Global High Yield Fund, the MFS Strategic Income Fund, and the MFS Strategic Income Portfolio were the owners of record of approximately 71%, 21%, 7%, and 1%, respectively, of the value of outstanding voting shares of the fund.
(6) Line of Credit
The fund and certain other funds managed by MFS participate in a $1.25 billion unsecured committed line of credit, subject to a $1 billion sublimit, provided by a syndication of banks under a credit agreement. Borrowings may be made for temporary financing needs. Interest is charged to each fund, based on its borrowings, generally at a rate equal to the higher of the Overnight Federal Reserve funds rate or daily one month LIBOR plus an agreed upon spread. A commitment fee, based on the average daily, unused portion of the committed line of credit, is allocated among the participating funds at the end of each calendar quarter. In addition, the fund and other funds managed by MFS have established unsecured uncommitted borrowing arrangements with certain banks for temporary financing needs. Interest is charged to each fund, based on its borrowings, at a rate equal to the Overnight Federal Reserve funds rate plus an agreed upon spread. For the year ended January 31, 2016, the fund’s commitment fee and interest expense were $4,702 and $0, respectively, and are included in “Miscellaneous” expense in the Statement of Operations.
38
Notes to Financial Statements – continued
(7) Transactions in Underlying Affiliated Funds-Affiliated Issuers
An affiliated issuer may be considered one in which the fund owns 5% or more of the outstanding voting securities, or a company which is under common control. For the purposes of this report, the fund assumes the following to be an affiliated issuer:
| | | | | | | | | | | | | | | | |
| Underlying Affiliated Fund | | Beginning
Shares/Par
Amount | | | Acquisitions
Shares/Par
Amount | | | Dispositions
Shares/Par
Amount | | | Ending
Shares/Par
Amount | |
MFS Institutional Money
Market Portfolio | | | 42,212,532 | | | | 427,452,249 | | | | (434,886,526 | ) | | | 34,778,255 | |
| | | | |
| Underlying Affiliated Fund | | Realized
Gain (Loss) | | | Capital Gain
Distributions | | | Dividend
Income | | | Ending
Value | |
MFS Institutional Money
Market Portfolio | | | $— | | | | $— | | | | $63,242 | | | | $34,778,255 | |
39
REPORT OF INDEPENDENT REGISTERED PUBLIC ACCOUNTING FIRM
To the Board of Trustees of MFS Series Trust III and the Shareholders of MFS High Yield Pooled Portfolio:
We have audited the accompanying statement of assets and liabilities, including the portfolio of investments, of MFS High Yield Pooled Portfolio (one of the series of MFS Series Trust III) (the “Fund”) as of January 31, 2016, and the related statement of operations for the year then ended, the statements of changes in net assets for each of the two years in the period then ended, and the financial highlights for each of the periods presented. These financial statements and financial highlights are the responsibility of the Fund’s management. Our responsibility is to express an opinion on these financial statements and financial highlights based on our audits.
We conducted our audits in accordance with the standards of the Public Company Accounting Oversight Board (United States). Those standards require that we plan and perform the audit to obtain reasonable assurance about whether the financial statements and financial highlights are free of material misstatement. The Fund is not required to have, nor were we engaged to perform, an audit of its internal control over financial reporting. Our audits included consideration of internal control over financial reporting as a basis for designing audit procedures that are appropriate in the circumstances, but not for the purpose of expressing an opinion on the effectiveness of the Fund’s internal control over financial reporting. Accordingly, we express no such opinion. An audit also includes examining, on a test basis, evidence supporting the amounts and disclosures in the financial statements, assessing the accounting principles used and significant estimates made by management, as well as evaluating the overall financial statement presentation. Our procedures included confirmation of securities owned as of January 31, 2016, by correspondence with the custodian, brokers, and agent banks; when replies were not received from brokers or agent banks, we performed other auditing procedures. We believe that our audits provide a reasonable basis for our opinion.
In our opinion, such financial statements and financial highlights referred to above present fairly, in all material respects, the financial position of MFS High Yield Pooled Portfolio as of January 31, 2016, the results of its operations for the year then ended, the changes in its net assets for each of the two years in the period then ended, and the financial highlights for each of the periods presented, in conformity with accounting principles generally accepted in the United States of America.
DELOITTE & TOUCHE LLP
Boston, Massachusetts
March 17, 2016
40
TRUSTEES AND OFFICERS — IDENTIFICATION AND BACKGROUND
The Trustees and Officers of the Trust, as of March 1, 2016, are listed below, together with their principal occupations during the past five years. (Their titles may have varied during that period.) The address of each Trustee and Officer is 111 Huntington Avenue, Boston, Massachusetts 02199-7618.
| | | | | | | | |
Name, Age | | Position(s)
Held with Fund | | Trustee/Officer
Since (h) | | Principal
Occupations During the Past Five Years | | Other Directorships (j) |
| INTERESTED TRUSTEES |
Robert J. Manning (k)
(age 52) | | Trustee | | February 2004 | | Massachusetts Financial Services Company, Chairman, Co-Chief Executive Officer and Director | | N/A |
Robin A. Stelmach (k)
(age 54) | | Trustee and President | | January 2014 | | Massachusetts Financial Services Company, Executive Vice President and Chief Operating Officer | | N/A |
| INDEPENDENT TRUSTEES | | | | | | |
David H. Gunning
(age 73) | | Trustee and Chair of Trustees | | January 2004 | | Private investor | | Lincoln Electric Holdings, Inc., Director; Development Alternatives, Inc., Director/Non-Executive Chairman |
Steven E. Buller
(age 64) | | Trustee | | February 2014 | | Chairman, Financial Accounting Standards Advisory Council; Standing Advisory Group, Public Company Accounting Oversight Board, Member (until 2014); BlackRock, Inc. (investment management), Managing Director (until 2014), BlackRock Finco UK (investment management), Director (until 2014) | | N/A |
Robert E. Butler
(age 74) | | Trustee | | January 2006 | | Consultant – investment company industry regulatory and compliance matters | | N/A |
Maureen R. Goldfarb
(age 60) | | Trustee | | January 2009 | | Private investor | | N/A |
41
Trustees and Officers – continued
| | | | | | | | |
Name, Age | | Position(s)
Held with Fund | | Trustee/Officer
Since (h) | | Principal
Occupations During the Past Five Years | | Other Directorships (j) |
William R. Gutow
(age 74) | | Trustee | | December 1993 | | Private investor and real estate consultant; Capitol Entertainment Management Company (video franchise), Vice Chairman (until 2014) | | Texas Donuts, Vice Chairman (until 2010) |
Michael Hegarty
(age 71) | | Trustee | | December 2004 | | Private investor | | Rouse Properties Inc., Director; Capmark Financial Group Inc., Director (until 2015) |
John P. Kavanaugh
(age 61) | | Trustee | | January 2009 | | Private investor | | N/A |
Maryanne L. Roepke
(age 60) | | Trustee | | May 2014 | | American Century Investments (investment management), Senior Vice President and Chief Compliance Officer (until 2014) | | N/A |
Laurie J. Thomsen
(age 58) | | Trustee | | March 2005 | | Private investor | | The Travelers Companies, Director; Dycom Industries, Inc., Director |
Robert W. Uek
(age 74) | | Trustee | | January 2006 | | Consultant to investment company industry | | N/A |
| OFFICERS | | | | | | | | |
Christopher R. Bohane (k)
(age 42) | | Assistant Secretary and Assistant Clerk | | July 2005 | | Massachusetts Financial Services Company, Vice President and Assistant General Counsel | | N/A |
Kino Clark (k)
(age 47) | | Assistant Treasurer | | January 2012 | | Massachusetts Financial Services Company, Vice President | | N/A |
Kristin V. Collins (k)
(age 43) | | Assistant Secretary and Assistant Clerk | | September 2015 | | Massachusetts Financial Services Company, Vice President and Assistant General Counsel | | N/A |
42
Trustees and Officers – continued
| | | | | | | | |
Name, Age | | Position(s)
Held with Fund | | Trustee/Officer
Since (h) | | Principal
Occupations During the Past Five Years | | Other Directorships (j) |
Thomas H. Connors (k)
(age 56) | | Assistant Secretary and Assistant Clerk | | September 2012 | | Massachusetts Financial Services Company, Vice President and Senior Counsel; Deutsche Investment Management Americas Inc. (financial service provider), Director and Senior Counsel (until 2012) | | N/A |
Ethan D. Corey (k)
(age 52) | | Assistant Secretary and Assistant Clerk | | July 2005 | | Massachusetts Financial Services Company, Senior Vice President and Associate General Counsel | | N/A |
David L. DiLorenzo (k)
(age 47) | | Treasurer | | July 2005 | | Massachusetts Financial Services Company, Senior Vice President | | N/A |
Brian E. Langenfeld (k)
(age 42) | | Assistant Secretary and Assistant Clerk | | June 2006 | | Massachusetts Financial Services Company, Vice President and Senior Counsel | | N/A |
Kenneth Paek (k)
(age 41) | | Assistant Treasurer | | February 2015 | | Massachusetts Financial Services Company, Vice President; Cohen & Steers, Vice President/Head of Fund Administration (until 2014); Morgan Stanley, Executive Director/Head of European Fund Administration (until 2012) | | N/A |
Susan A. Pereira (k)
(age 45) | | Assistant Secretary and Assistant Clerk | | July 2005 | | Massachusetts Financial Services Company, Vice President and Senior Counsel | | N/A |
43
Trustees and Officers – continued
| | | | | | | | |
Name, Age | | Position(s)
Held with Fund | | Trustee/Officer
Since (h) | | Principal
Occupations During the Past Five Years | | Other Directorships (j) |
Kasey L. Phillips (k)
(age 45) | | Assistant Treasurer | | September 2012 | | Massachusetts Financial Services Company, Vice President; Wells Fargo Funds Management, LLC, Senior Vice President, Fund Treasurer (until 2012) | | N/A |
Mark N. Polebaum (k)
(age 63) | | Secretary and Clerk | | January 2006 | | Massachusetts Financial Services Company, Executive Vice President, General Counsel and Secretary | | N/A |
Matthew A. Stowe (k)
(age 41) | | Assistant Secretary and Assistant Clerk | | October 2014 | | Massachusetts Financial Services Company, Vice President and Assistant General Counsel | | N/A |
Frank L. Tarantino
(age 71) | | Independent Senior Officer | | June 2004 | | Tarantino LLC (provider of compliance services), Principal | | N/A |
Richard S. Weitzel (k)
(age 45) | | Assistant Secretary and Assistant Clerk | | October 2007 | | Massachusetts Financial Services Company, Senior Vice President and Associate General Counsel | | N/A |
Martin J. Wolin (k)
(age 48) | | Chief Compliance Officer | | July 2015 | | Massachusetts Financial Services Company, Senior Vice President and Chief Compliance Officer (since July 2015); Mercer (financial service provider), Chief Risk and Compliance Officer, North America and Latin America (until June 2015) | | N/A |
James O. Yost (k)
(age 55) | | Deputy Treasurer | | September 1990 | | Massachusetts Financial Services Company, Senior Vice President | | N/A |
| (h) | Date first appointed to serve as Trustee/officer of an MFS Fund. Each Trustee has served continuously since appointment unless indicated otherwise. For the period from December 15, 2004 until February 22, 2005, Mr. Manning served as Advisory Trustee. Prior to January 2012, Messrs. DiLorenzo and Yost served as Assistant Treasurers of the Funds. Ms. Stelmach was appointed as President of the Funds as of October 1, 2014. |
44
Trustees and Officers – continued
| (j) | Directorships or trusteeships of companies required to report to the Securities and Exchange Commission (i.e., “public companies”). |
| (k) | “Interested person” of the Trust within the meaning of the Investment Company Act of 1940 (referred to as the 1940 Act), which is the principal federal law governing investment companies like the fund, as a result of a position with MFS. The address of MFS is 111 Huntington Avenue, Boston, Massachusetts 02199-7618. |
Each Trustee (except Ms. Stelmach, Mr. Buller and Ms. Roepke) has been elected by shareholders and each Trustee and officer holds office until his or her successor is chosen and qualified or until his or her earlier death, resignation, retirement or removal. The Trust does not hold annual meetings for the purpose of electing Trustees, and Trustees are not elected for fixed terms. Messrs. Buller, Butler, Kavanaugh, Uek and Ms. Roepke are members of the Trust’s Audit Committee.
Each of the Fund’s Trustees and officers holds comparable positions with certain other funds of which MFS or a subsidiary is the investment adviser or distributor, and, in the case of the officers, with certain affiliates of MFS. As of March 1, 2016, the Trustees served as board members of 137 funds within the MFS Family of Funds.
The Statement of Additional Information for a Fund includes further information about the Trustees and is available without charge upon request by calling 1-800-225-2606.
| | |
| Investment Adviser | | Custodian |
Massachusetts Financial Services Company
111 Huntington Avenue
Boston, MA 02199-7618 | | JPMorgan Chase Bank, NA 4 Metrotech Center New York, NY 11245 |
| Distributor | | Independent Registered Public Accounting Firm |
MFS Fund Distributors, Inc.
111 Huntington Avenue
Boston, MA 02199-7618 | | Deloitte & Touche LLP 200 Berkeley Street Boston, MA 02116 |
| Portfolio Managers | | |
William Adams David Cole | | |
45
PROXY VOTING POLICIES AND INFORMATION
MFS votes proxies on behalf of the fund pursuant to proxy voting policies and procedures that are available without charge, upon request, by calling 1-800-225-2606, by visiting the Proxy Voting section of mfs.com or by visiting the SEC’s Web site at http://www.sec.gov.
Information regarding how the fund voted proxies relating to portfolio securities during the most recent twelve-month period ended June 30 is available without charge by visiting the Proxy Voting section of mfs.com or by visiting the SEC’s Web site at http://www.sec.gov.
QUARTERLY PORTFOLIO DISCLOSURE
The fund will file a complete schedule of portfolio holdings with the Securities and Exchange Commission (the Commission) for the first and third quarters of each fiscal year on Form N-Q. The fund’s Form N-Q is available on the EDGAR database on the Commission’s Internet Web site at http://www.sec.gov, and may be reviewed and copied at the:
Public Reference Room
Securities and Exchange Commission
100 F Street, NE, Room 1580
Washington, D.C. 20549
Information on the operation of the Public Reference Room may be obtained by calling the Commission at 1-800-SEC-0330. Copies of the fund’s Form N-Q also may be obtained, upon payment of a duplicating fee, by electronic request at the following e-mail address: publicinfo@sec.gov or by writing the Public Reference Section at the above address.
FURTHER INFORMATION
From time to time, MFS may post important information about the fund or the MFS funds on the MFS web site (mfs.com). This information is available by visiting the “Market Commentary” and “Announcements” sub sections in the “Market Outlooks” section of mfs.com.
FEDERAL TAX INFORMATION (unaudited)
The fund will notify shareholders of amounts for use in preparing 2016 income tax forms in January 2017.
46
rev. 3/11
| | | | |
| | | |
FACTS | | WHAT DOES MFS DO WITH YOUR PERSONAL INFORMATION? | | |
| | |
| Why? | | Financial companies choose how they share your personal information. Federal law gives consumers the right to limit some but not all sharing. Federal law also requires us to tell you how we collect, share, and protect your personal information. Please read this notice carefully to understand what we do. |
| | |
| What? | | The types of personal information we collect and share depend on the product or service you have with us. This information can include: • Social Security number and account balances • Account transactions and transaction history • Checking account information and wire transfer instructions When you are no longer our customer, we continue to share your information as described in this notice. |
| | |
| How? | | All financial companies need to share customers’ personal information to run their everyday business. In the section below, we list the reasons financial companies can share their customers’ personal information; the reasons MFS chooses to share; and whether you can limit this sharing. |
| | | | |
Reasons we can share your
personal information | | Does MFS
share? | | Can you limit
this sharing? |
For our everyday business purposes – such as to process your transactions, maintain your account(s), respond to court orders and legal investigations, or report to credit bureaus | | Yes | | No |
For our marketing purposes – to offer our products and services to you | | No | | We don’t share |
| For joint marketing with other financial companies | | No | | We don’t share |
For our affiliates’ everyday business purposes – information about your transactions and experiences | | No | | We don’t share |
For our affiliates’ everyday business purposes – information about your creditworthiness | | No | | We don’t share |
| For nonaffiliates to market to you | | No | | We don’t share |
| | |
| Questions? | | Call 800-225-2606 or go to mfs.com. |
47
| | |
| Who we are |
| Who is providing this notice? | | MFS Funds, MFS Investment Management, MFS Institutional Advisors, Inc., MFS Fund Distributors, Inc., MFS Heritage Trust Company, and MFS Service Center, Inc. |
| | |
| What we do |
| How does MFS protect my personal information? | | To protect your personal information from unauthorized access and use, we use security measures that comply with federal law. These measures include procedural, electronic, and physical safeguards for the protection of the personal information we collect about you. |
| How does MFS collect my personal information? | | We collect your personal information, for example, when you • open an account or provide account information • direct us to buy securities or direct us to sell your securities • make a wire transfer We also collect your personal information from others, such as credit bureaus, affiliates and other companies. |
| Why can’t I limit all sharing? | | Federal law gives you the right to limit only • sharing for affiliates’ everyday business purposes – information about your creditworthiness • affiliates from using your information to market to you • sharing for nonaffiliates to market to you State laws and individual companies may give you additional rights to limit sharing. |
| | |
| Definitions |
| Affiliates | | Companies related by common ownership or control. They can be financial and nonfinancial companies. • MFS does not share personal information with affiliates, except for everyday business purposes as described on page one of this notice. |
| Nonaffiliates | | Companies not related by common ownership or control. They can be financial and nonfinancial companies. • MFS does not share with nonaffiliates so they can market to you. |
| Joint Marketing | | A formal agreement between nonaffiliated financial companies that together market financial products or services to you. • MFS doesn’t jointly market. |
| | |
| Other important information |
| If you own an MFS product or receive an MFS service in the name of a third party such as a bank or broker-dealer, their privacy policy may apply to you instead of ours. |
48
Save paper with eDelivery.
| MFS® will send you prospectuses, |
reports, and proxies directly via e-mail so you will get information faster with less mailbox clutter.
To sign up:
1. Go to mfs.com.
2. Log in via MFS® Access.
3. Select eDelivery.
If you own your MFS fund shares through a financial institution or a retirement plan, MFS® TALK, MFS® Access, or eDelivery may not be available to you.
CONTACT
WEB SITE
mfs.com
MFS TALK
1-800-637-8255
24 hours a day
ACCOUNT SERVICE AND LITERATURE
Shareholders
1-800-225-2606
Financial advisors
1-800-343-2829
Retirement plan services
1-800-637-1255
MAILING ADDRESS
MFS Service Center, Inc.
P.O. Box 55824
Boston, MA 02205-5824
OVERNIGHT MAIL
MFS Service Center, Inc.
c/o Boston Financial Data Services
30 Dan Road
Canton, MA 02021-2809
ANNUAL REPORT
January 31, 2016

MFS® MUNICIPAL HIGH INCOME FUND

MMH-ANN
MFS® MUNICIPAL HIGH INCOME FUND
CONTENTS
The report is prepared for the general information of shareholders.
It is authorized for distribution to prospective investors only when preceded or accompanied by a current prospectus.
NOT FDIC INSURED • MAY LOSE VALUE • NO BANK GUARANTEE

LETTER FROM THE CHAIRMAN
Dear Shareholders:
Market volatility remains elevated amid signs of slowing global growth and continued weakness in the price of oil and other commodities. Chinese markets remain skittish
following a series of policy missteps and currency depreciations, which have contributed to large capital outflows.
A lower-for-longer interest rate environment is likely for the foreseeable future given accommodative global central bank policies. The Bank of Japan has adopted a negative interest rate policy while the European Central Bank has signaled plans for additional monetary stimulus later this year. Meanwhile, expectations for further monetary policy tightening from the U.S. Federal Reserve have been reduced in the face of more challenging financial conditions.
The U.S. manufacturing sector is suffering the effects of a strong U.S. dollar and falling global demand. There is some reason for optimism, however, as U.S. labor markets continue to improve while auto and home sales remain upbeat.
As markets have become more focused on short-term trends in recent years, we believe it’s important for investors to lengthen their investment time horizon. At MFS®, we don’t trade on headlines or trends; we invest for the long term.
We believe that this approach, coupled with the professional guidance of a financial advisor, will help you reach your investment goals.
Respectfully,

Robert J. Manning
Chairman
MFS Investment Management
March 17, 2016
The opinions expressed in this letter are subject to change and may not be relied upon for investment advice. No forecasts can be guaranteed.
1
PORTFOLIO COMPOSITION
Portfolio structure (i)
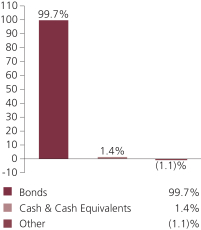
| | | | |
| Top ten industries (i) | | | | |
| Healthcare Revenue – Long Term Care | | | 13.6% | |
| Healthcare Revenue – Hospitals | | | 13.2% | |
| Tobacco | | | 8.7% | |
| Universities – Colleges | | | 7.6% | |
| Universities – Secondary Schools | | | 6.6% | |
| Miscellaneous Revenue – Other | | | 5.0% | |
| Industrial Revenue – Airlines | | | 4.6% | |
| General Obligations – General Purpose | | | 3.6% | |
| Tax Assessment | | | 3.4% | |
| Water & Sewer Utility Revenue | | | 2.8% | |
| | | | |
| Composition including fixed income credit quality (a)(i) | |
| AAA | | | 1.7% | |
| AA | | | 8.6% | |
| A | | | 19.5% | |
| BBB | | | 26.0% | |
| BB | | | 10.5% | |
| B | | | 11.6% | |
| C | | | 1.0% | |
| D | | | 0.5% | |
| Not Rated | | | 20.3% | |
| Cash & Cash Equivalents | | | 1.4% | |
| Other | | | (1.1)% | |
| |
| Portfolio facts (i) | | | | |
| Average Duration (d) | | | 7.8 | |
| Average Effective Maturity (m) | | | 18.9 yrs. | |
| (a) | For all securities other than those specifically described below, ratings are assigned to underlying securities utilizing ratings from Moody’s, Fitch, and Standard & Poor’s rating agencies and applying the following hierarchy: If all three agencies provide a rating, the middle rating (after dropping the highest and lowest ratings) is assigned; if two of the three agencies rate a security, the lower of the two is assigned. Ratings are shown in the S&P and Fitch scale (e.g., AAA). Securities rated BBB or higher are considered investment grade. All ratings are subject to change. Not Rated includes fixed income securities, including fixed income futures contracts, which have not been rated by any rating agency. The fund may not hold all of these instruments. The fund is not rated by these agencies. |
2
Portfolio Composition – continued
| (d) | Duration is a measure of how much a bond’s price is likely to fluctuate with general changes in interest rates, e.g., if rates rise 1.00%, a bond with a 5-year duration is likely to lose about 5.00% of its value due to the interest rate move. |
| (i) | For purposes of this presentation, the components include the value of securities, and reflect the impact of the equivalent exposure of derivative positions, if any. These amounts may be negative from time to time. Equivalent exposure is a calculated amount that translates the derivative position into a reasonable approximation of the amount of the underlying asset that the portfolio would have to hold at a given point in time to have the same price sensitivity that results from the portfolio’s ownership of the derivative contract. When dealing with derivatives, equivalent exposure is a more representative measure of the potential impact of a position on portfolio performance than value. The bond component will include any accrued interest amounts. |
| (m) | In determining an instrument’s effective maturity for purposes of calculating the fund’s dollar-weighted average effective maturity, MFS uses the instrument’s stated maturity or, if applicable, an earlier date on which MFS believes it is probable that a maturity-shortening device (such as a put, pre-refunding or prepayment) will cause the instrument to be repaid. Such an earlier date can be substantially shorter than the instrument’s stated maturity. |
From time to time Other may be negative due to offsets to derivative positions and/or offsets to the leverage created through the issuance of self-deposited inverse floaters.
Where the fund holds convertible bonds, these are treated as part of the equity portion of the portfolio.
Cash & Cash Equivalents includes any cash, investments in money market funds, short-term securities, and other assets less liabilities. Please see the Statement of Assets and Liabilities for additional information related to the fund’s cash position and other assets and liabilities.
Other includes currency derivatives and/or any offsets to derivative positions and/or the leverage created through the issuance of self-deposited inverse floaters.
Percentages are based on net assets as of 1/31/16.
The portfolio is actively managed and current holdings may be different.
3
MANAGEMENT REVIEW
Summary of Results
For the twelve months ended January 31, 2016, Class A shares of the MFS Municipal High Income Fund (“fund”) provided a total return of 3.86%, at net asset value. This compares with a return of 2.71% for the fund’s benchmark, the Barclays Municipal Bond Index.
Market Environment
Sluggish global growth weighed on both developed and emerging market (“EM”) economies during the reporting period. EM economies have been particularly lackluster. While the US Federal Reserve (“Fed”) began its anticipated monetary policy tightening cycle toward the end of the period, other large developed economies continued to embrace accommodative monetary policies, particularly the European Central Bank (“ECB”) and the Bank of Japan. Focus remained on China after policy missteps by the Chinese government roiled global markets over the summer, beginning with the uncoordinated response to the stock market’s boom and bust and then the confusing decision to devalue the renminbi in August. China subsequently ramped up a wide range of monetary and fiscal measures to stimulate the economy, bolster sentiment and stabilize its currency.
During the second half of the reporting period, many US companies faced significant headwinds to earnings caused primarily by the sharp decline in the prices of oil and other commodities. Earnings contractions were concentrated primarily in the energy, materials and industrial sectors. The sharp rise in the US dollar also weighed on earnings during the period. Exports were crimped by the dollar’s strength and falling demand in emerging markets. Beyond the Fed’s interest rate hike in December, tighter financial conditions rippled through the economy. Consumer spending held up well during the second half of the period amid a modest increase in real wages and falling gasoline prices. Demand for autos reached near-record territory late in the period. In emerging markets, two key factors weighed on economies and asset prices: 1) weaker Chinese growth, which drove the decline in commodity prices and 2) prospects for higher US interest rates. Structural factors like floating exchange rates and fiscal buffers partially offset these cyclical headwinds.
According to data from the Fed, the 10-Year US Treasury yield finished the fiscal year ended January 2016 at 1.94%; a 26 basis point increase over the prior fiscal year ended January 2015. However, US Treasuries experienced significant volatility during the reporting period, as yields remained below 2% early in 2015 amid declining oil prices, lower inflation and Quantitative Easing implementation by the ECB. Subsequently, 10-Year US Treasury yields rebounded to as high as 2.49% in June 2015 as oil prices rose, payroll growth remained steady and the market started to anticipate the first Fed step toward normalizing policy. In December, however, the Fed raised the Federal Funds rate for the first time since 2006 and, as a result, concerns about weaker global growth, especially out of China and other emerging markets, and further declines in oil prices, caused 10-Year US Treasury yields to subsequently decline.
Municipal bonds produced positive returns for the 12-months ended January 31, 2016, as measured by the Barclays Municipal Bond Index, and generally outperformed other
4
Management Review – continued
fixed income asset classes. Municipal bond performance benefited from limited new issuance and continued strong demand for municipal bonds from investors who appeared to have viewed the asset class as a safe haven and somewhat insulated from global macro events such as slower growth in China and the steep decline in commodity prices.
While Puerto Rico made headlines during the summer of 2015 by indicating that it could not service its outstanding debt, the municipal market generally shrugged off the news. However, markets appeared to have remained concerned about underfunded public employee pension systems, and other benefits promised to public employees, and the political difficulties in enacting reform. Nowhere had these challenges appeared more acute than in Illinois and Chicago, where burgeoning budget deficits attracted increased market and rating agency attention. This demonstrated that the market was differentiating between those issuers who had taken steps toward fiscal sustainability and those with ongoing budget and pension challenges.
Generally, fundamentals remained sound for the majority of municipal issuers. Tax-equivalent yields seemed attractive relative to overall credit quality, but should be weighed against the longer duration nature of municipal bonds in an environment of interest rate uncertainty.
Contributors to Performance
Relative to the Barclays Municipal Bond Index, strong security selection in the health care and tobacco sectors benefited relative returns.
The fund’s greater exposure to “BB” and “B” (r) rated securities also contributed to relative performance, as bonds within these credit quality segments outperformed the benchmark during the reporting period.
Additionally, a longer relative duration (d) stance, especially within “AA” and “B” rated securities also supported relative performance. Selection within bonds issued by the states of Ohio, New Jersey and Florida was another source of relative strength.
Detractors from Performance
The portfolio’s shorter relative duration (d) stance, especially within “AAA” rated securities detracted from relative performance.
Respectfully,
| | |
| Gary Lasman | | Geoffrey Schechter |
| Portfolio Manager | | Portfolio Manager |
| (d) | Duration is a measure of how much a bond’s price is likely to fluctuate with general changes in interest rates, e.g., if rates rise 1.00%, a bond with a 5-year duration is likely to lose about 5.00% of its value. |
| (r) | Bonds rated “BBB”, “Baa”, or higher are considered investment grade; bonds rated “BB”, “Ba”, or below are considered non-investment grade. The source for bond quality ratings is Moody’s Investors Service, Standard & Poor’s and Fitch, Inc. and are applied using the following hierarchy: If all three agencies provide a rating, the middle rating (after dropping the highest and lowest ratings) is assigned; if two of the three agencies rate a security, the lower of the two is assigned. Ratings are shown in the S&P and Fitch scale (e.g., AAA). For securities which are not rated by any of the three agencies, the security is considered Not Rated. |
5
Management Review – continued
The views expressed in this report are those of the portfolio managers only through the end of the period of the report as stated on the cover and do not necessarily reflect the views of MFS or any other person in the MFS organization. These views are subject to change at any time based on market or other conditions, and MFS disclaims any responsibility to update such views. These views may not be relied upon as investment advice or an indication of trading intent on behalf of any MFS portfolio. References to specific securities are not recommendations of such securities, and may not be representative of any MFS portfolio’s current or future investments.
6
PERFORMANCE SUMMARY THROUGH 1/31/16
The following chart illustrates a representative class of the fund’s historical performance in comparison to its benchmark(s). Performance results include the deduction of the maximum applicable sales charge and reflect the percentage change in net asset value, including reinvestment of dividends and capital gains distributions. The performance of other share classes will be greater than or less than that of the class depicted below. Benchmarks are unmanaged and may not be invested in directly. Benchmark returns do not reflect sales charges, commissions or expenses. (See Notes to Performance Summary.)
Performance data shown represents past performance and is no guarantee of future results. Investment return and principal value fluctuate so your shares, when sold, may be worth more or less than the original cost; current performance may be lower or higher than quoted. The performance shown does not reflect the deduction of taxes, if any, that a shareholder would pay on fund distributions or the redemption of fund shares.
Growth of a Hypothetical $10,000 Investment
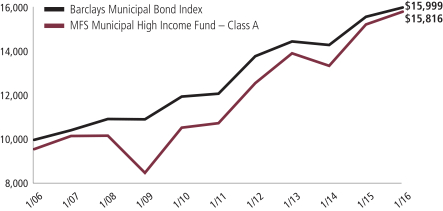
7
Performance Summary – continued
Total Returns through 1/31/16
Average annual without sales charge
| | | | | | | | | | | | | | |
| | | Share Class | | Class Inception Date | | 1-yr | | 5-yr | | 10-yr | | Life (t) | | |
| | | A | | 2/24/84 | | 3.86% | | 8.01% | | 5.15% | | N/A | | |
| | | B | | 9/07/93 | | 3.06% | | 7.19% | | 4.34% | | N/A | | |
| | | C | | 9/25/98 | | 2.83% | | 6.96% | | 4.10% | | N/A | | |
| | | I | | 6/01/11 | | 3.86% | | N/A | | N/A | | 7.65% | | |
| Comparative benchmark | | | | | | | | | | |
| | | Barclays Municipal Bond Index (f) | | 2.71% | | 5.75% | | 4.81% | | N/A | | |
| Average annual with sales charge | | | | | | | | | | |
| | | A
With Initial Sales Charge (4.25%) | | (0.56)% | | 7.07% | | 4.69% | | N/A | | |
| | | B
With CDSC (Declining over six years
from 4% to 0%) (v) | | (0.92)% | | 6.88% | | 4.34% | | N/A | | |
| | | C
With CDSC (1% for 12 months) (v) | | 1.83% | | 6.96% | | 4.10% | | N/A | | |
CDSC – Contingent Deferred Sales Charge.
Class I shares do not have a sales charge.
| (f) | Source: FactSet Research Systems Inc. |
| (t) | For the period from the class inception date through the stated period end (for those share classes with less than 10 years of performance history). No comparative benchmark performance information is provided for “life” periods. (See Notes to Performance Summary.) |
| (v) | Assuming redemption at the end of the applicable period. |
Benchmark Definition
Barclays Municipal Bond Index – a market capitalization-weighted index that measures the performance of the tax-exempt bond market.
It is not possible to invest directly in an index.
Notes to Performance Summary
Average annual total return represents the average annual change in value for each share class for the periods presented. Life returns are presented where the share class has less than 10 years of performance history and represent the average annual total return from the class inception date to the stated period end date. As the funds share classes may have different inception dates, the life returns may represent different time periods and may not be comparable. As a result, no comparative benchmark performance information is provided for life periods.
Performance results reflect any applicable expense subsidies and waivers in effect during the periods shown. Without such subsidies and waivers the fund’s performance results would be less favorable. Please see the prospectus and financial statements for complete details.
8
Performance Summary – continued
Performance results do not include adjustments made for financial reporting purposes in accordance with U.S. generally accepted accounting principles and may differ from amounts reported in the financial highlights.
A portion of income may be subject to state, federal, and/or alternative minimum tax. Capital gains, if any, are subject to a capital gains tax.
From time to time the fund may receive proceeds from litigation settlements, without which performance would be lower.
9
EXPENSE TABLE
Fund expenses borne by the shareholders during the period, August 1, 2015 through January 31, 2016
As a shareholder of the fund, you incur two types of costs: (1) transaction costs, including sales charges (loads) on certain purchase or redemption payments, and (2) ongoing costs, including management fees; distribution and service (12b-1) fees; and other fund expenses. This example is intended to help you understand your ongoing costs (in dollars) of investing in the fund and to compare these costs with the ongoing costs of investing in other mutual funds.
The example is based on an investment of $1,000 invested at the beginning of the period and held for the entire period August 1, 2015 through January 31, 2016.
Actual Expenses
The first line for each share class in the following table provides information about actual account values and actual expenses. You may use the information in this line, together with the amount you invested, to estimate the expenses that you paid over the period. Simply divide your account value by $1,000 (for example, an $8,600 account value divided by $1,000 = 8.6), then multiply the result by the number in the first line under the heading entitled “Expenses Paid During Period” to estimate the expenses you paid on your account during this period.
Hypothetical Example for Comparison Purposes
The second line for each share class in the following table provides information about hypothetical account values and hypothetical expenses based on the fund’s actual expense ratio and an assumed rate of return of 5% per year before expenses, which is not the fund’s actual return. The hypothetical account values and expenses may not be used to estimate the actual ending account balance or expenses you paid for the period. You may use this information to compare the ongoing costs of investing in the fund and other funds. To do so, compare this 5% hypothetical example with the 5% hypothetical examples that appear in the shareholder reports of the other funds.
Please note that the expenses shown in the table are meant to highlight your ongoing costs only and do not reflect any transactional costs, such as sales charges (loads). Therefore, the second line for each share class in the table is useful in comparing ongoing costs only, and will not help you determine the relative total costs of owning different funds. In addition, if these transactional costs were included, your costs would have been higher.
10
Expense Table – continued
| | | | | | | | | | | | | | | | | | |
Share
Class | | | | Annualized
Expense
Ratio | | | Beginning
Account Value
8/01/15 | | | Ending
Account Value
1/31/16 | | | Expenses
Paid During
Period (p)
8/01/15-1/31/16 | |
| A | | Actual | | | 0.66% | | | | $1,000.00 | | | | $1,044.20 | | | | $3.40 | |
| | Hypothetical (h) | | | 0.66% | | | | $1,000.00 | | | | $1,021.88 | | | | $3.36 | |
| B | | Actual | | | 1.44% | | | | $1,000.00 | | | | $1,041.38 | | | | $7.41 | |
| | Hypothetical (h) | | | 1.44% | | | | $1,000.00 | | | | $1,017.95 | | | | $7.32 | |
| C | | Actual | | | 1.66% | | | | $1,000.00 | | | | $1,040.22 | | | | $8.54 | |
| | Hypothetical (h) | | | 1.66% | | | | $1,000.00 | | | | $1,016.84 | | | | $8.44 | |
| I | | Actual | | | 0.66% | | | | $1,000.00 | | | | $1,045.48 | | | | $3.40 | |
| | Hypothetical (h) | | | 0.66% | | | | $1,000.00 | | | | $1,021.88 | | | | $3.36 | |
| (h) | 5% class return per year before expenses. |
| (p) | “Expenses Paid During Period” are equal to each class’s annualized expense ratio, as shown above, multiplied by the average account value over the period, multiplied by 184/365 (to reflect the one-half year period). Expenses paid do not include any applicable sales charges (loads). If these transaction costs had been included, your costs would have been higher. |
Notes to Expense Table
Expense ratios include 0.01% of investment related expenses from self-deposited inverse floaters (as described in Note 2 of the Notes to Financial Statements) that are outside of the expense limitation arrangement (See Note 3 of the Notes to Financial Statements).
11
PORTFOLIO OF INVESTMENTS
1/31/16
The Portfolio of Investments is a complete list of all securities owned by your fund. It is categorized by jurisdiction.
| | | | | | | | |
| Municipal Bonds - 98.5% | | | | | | | | |
| Issuer | | Shares/Par | | | Value ($) | |
| Alabama - 1.2% | | | | | | | | |
| Alexander City, AL, Special Care Facilities Financing Authority Medical Facilities Rev., “A” (Russell Hospital Corp.), 5.75%, 12/01/36 | | $ | 1,900,000 | | | $ | 1,918,924 | |
| Birmingham, AL, Special Care Facilities Financing Authority Rev. (Methodist Home for the Aging), 5.5%, 6/01/30 | | | 1,630,000 | | | | 1,655,575 | |
| Birmingham, AL, Special Care Facilities Financing Authority Rev. (Methodist Home for the Aging), 5.75%, 6/01/35 | | | 1,685,000 | | | | 1,719,745 | |
| Birmingham, AL, Special Care Facilities Financing Authority Rev. (Methodist Home for the Aging), 5.75%, 6/01/45 | | | 2,445,000 | | | | 2,479,988 | |
| Birmingham, AL, Special Care Facilities Financing Authority Rev. (Methodist Home for the Aging), 6%, 6/01/50 | | | 2,565,000 | | | | 2,632,331 | |
| Cullman County, AL, Health Care Authority (Cullman Regional Medical Center), “A���, 6.25%, 2/01/23 | | | 1,400,000 | | | | 1,510,040 | |
| Cullman County, AL, Health Care Authority (Cullman Regional Medical Center), “A”, 6.75%, 2/01/29 | | | 4,790,000 | | | | 5,201,940 | |
| Cullman County, AL, Health Care Authority (Cullman Regional Medical Center), “A”, 7%, 2/01/36 | | | 1,000,000 | | | | 1,089,490 | |
| Huntsville-Redstone Village, AL, Special Care Facilities Financing Authority (Redstone Village Project), 5.5%, 1/01/28 | | | 1,700,000 | | | | 1,712,682 | |
| Huntsville-Redstone Village, AL, Special Care Facilities Financing Authority (Redstone Village Project), 5.5%, 1/01/43 | | | 1,560,000 | | | | 1,566,037 | |
| Jefferson County, AL, Sewer Rev. Warrants, Capital Appreciation, Senior Lien, “B”, AGM, 0%, 10/01/25 | | | 65,000 | | | | 45,638 | |
| Jefferson County, AL, Sewer Rev. Warrants, Capital Appreciation, Senior Lien, “B”, AGM, 0%, 10/01/26 | | | 805,000 | | | | 534,657 | |
| Jefferson County, AL, Sewer Rev. Warrants, Capital Appreciation, Senior Lien, “B”, AGM, 0%, 10/01/29 | | | 1,130,000 | | | | 610,279 | |
| Jefferson County, AL, Sewer Rev. Warrants, Capital Appreciation, Senior Lien, “B”, AGM, 0%, 10/01/34 | | | 1,620,000 | | | | 609,655 | |
| Jefferson County, AL, Sewer Rev. Warrants, Capital Appreciation, Senior Lien, “B”, AGM, 0%, 10/01/35 | | | 3,080,000 | | | | 1,085,146 | |
| Jefferson County, AL, Sewer Rev. Warrants, Subordinate Lien, “D”, 5%, 10/01/16 | | | 860,000 | | | | 882,480 | |
| Jefferson County, AL, Sewer Rev. Warrants, Subordinate Lien, “D”, 5%, 10/01/17 | | | 1,165,000 | | | | 1,232,558 | |
| Jefferson County, AL, Sewer Rev. Warrants, Subordinate Lien, “D”, 5%, 10/01/18 | | | 1,210,000 | | | | 1,311,374 | |
| Jefferson County, AL, Sewer Rev. Warrants, Subordinate Lien, “D”, 5%, 10/01/21 | | | 1,360,000 | | | | 1,516,998 | |
12
Portfolio of Investments – continued
| | | | | | | | |
| Issuer | | Shares/Par | | | Value ($) | |
| Municipal Bonds - continued | | | | | | | | |
| Alabama - continued | | | | | | | | |
| Jefferson County, AL, Sewer Rev. Warrants, Subordinate Lien, “D”, 5%, 10/01/23 | | $ | 1,995,000 | | | $ | 2,241,981 | |
| Pell City, AL, Special Care Facilities, Financing Authority Rev. (Noland Health Services, Inc.), 5%, 12/01/39 | | | 1,670,000 | | | | 1,828,867 | |
| Selma, AL, Industrial Development Board Rev., Gulf Opportunity Zone (International Paper Co.), “A”, 6.25%, 11/01/33 | | | 6,750,000 | | | | 7,810,830 | |
| Selma, AL, Industrial Development Board Rev., Gulf Opportunity Zone (International Paper Co.), “A”, 5.375%, 12/01/35 | | | 1,635,000 | | | | 1,821,112 | |
| | | | | | | | |
| | | | | | | $ | 43,018,327 | |
| Alaska - 0.2% | | | | | | | | |
| Alaska Industrial Development & Export Authority Power Rev. (Snettisham Hydroelectric Project), 5%, 1/01/30 | | $ | 875,000 | | | $ | 981,785 | |
| Alaska Industrial Development & Export Authority Power Rev. (Snettisham Hydroelectric Project), 5%, 1/01/31 | | | 1,270,000 | | | | 1,420,660 | |
| Koyukuk, AK, Tanana Chiefs Conference, Healthcare Facilities Project, 7.75%, 10/01/41 | | | 3,315,000 | | | | 3,791,631 | |
| | | | | | | | |
| | | | | | | $ | 6,194,076 | |
| Arizona - 1.8% | | | | | | | | |
| Florence, AZ, Industrial Development Authority Education Rev. (Legacy Traditional School Project - Queen Creek & Casa Grande Campuses), 6%, 7/01/43 | | $ | 3,150,000 | | | $ | 3,420,396 | |
| Maricopa County, AZ, Pollution Control Rev. (El Paso Electric), “B”, 7.25%, 4/01/40 | | | 1,790,000 | | | | 2,100,655 | |
| Maricopa County, AZ, Pollution Control Rev. (Southern California Edison Co.), “A”, 5%, 6/01/35 | | | 4,700,000 | | | | 5,286,748 | |
| Phoenix, AZ, Industrial Development Authority Education Facility Rev. (Basis Schools Projects), “A”, 5%, 7/01/35 | | | 700,000 | | | | 738,717 | |
| Phoenix, AZ, Industrial Development Authority Education Facility Rev. (Basis Schools Projects), “A”, 5%, 7/01/35 | | | 2,035,000 | | | | 2,145,948 | |
| Phoenix, AZ, Industrial Development Authority Education Facility Rev. (Basis Schools Projects), “A”, 5%, 7/01/45 | | | 3,015,000 | | | | 3,113,259 | |
| Phoenix, AZ, Industrial Development Authority Education Facility Rev. (Basis Schools Projects), “A”, 5%, 7/01/46 | | | 1,735,000 | | | | 1,791,127 | |
| Phoenix, AZ, Industrial Development Authority Education Facility Rev. (Legacy Traditional Schools Project), 5%, 7/01/35 | | | 1,430,000 | | | | 1,456,855 | |
| Phoenix, AZ, Industrial Development Authority Education Facility Rev. (Legacy Traditional Schools Project), 5%, 7/01/45 | | | 1,570,000 | | | | 1,553,232 | |
| Phoenix, AZ, Industrial Development Authority Education Rev. (Choice Academies, Inc. Project), 5.625%, 9/01/42 | | | 2,205,000 | | | | 2,335,977 | |
| Phoenix, AZ, Industrial Development Authority Education Rev. (Eagle College Prep Project), 5%, 7/01/33 | | | 855,000 | | | | 882,437 | |
13
Portfolio of Investments – continued
| | | | | | | | |
| Issuer | | Shares/Par | | | Value ($) | |
| Municipal Bonds - continued | | | | | | | | |
| Arizona - continued | | | | | | | | |
| Phoenix, AZ, Industrial Development Authority Education Rev. (Eagle College Prep Project), 5%, 7/01/43 | | $ | 1,715,000 | | | $ | 1,743,177 | |
| Phoenix, AZ, Industrial Development Authority Education Rev. (Great Hearts Academies Project), “A”, 5%, 7/01/34 | | | 6,355,000 | | | | 6,703,063 | |
| Phoenix, AZ, Industrial Development Authority Education Rev. (Great Hearts Academies Project), “A”, 5%, 7/01/44 | | | 3,970,000 | | | | 4,104,940 | |
| Phoenix, AZ, Industrial Development Authority Education Rev. (Legacy Traditional Schools Project), 6.5%, 7/01/34 | | | 1,970,000 | | | | 2,220,032 | |
| Phoenix, AZ, Industrial Development Authority Education Rev. (Legacy Traditional Schools Project), 6.75%, 7/01/44 | | | 3,155,000 | | | | 3,566,444 | |
| Phoenix, AZ, Industrial Development Authority Rev. (Guam Facilities Foundation, Inc.), 5.125%, 2/01/34 | | | 4,545,000 | | | | 4,589,541 | |
| Phoenix, AZ, Industrial Development Authority Rev. (Guam Facilities Foundation, Inc.), 5.375%, 2/01/41 | | | 4,785,000 | | | | 4,847,061 | |
| Pima County, AZ, Industrial Development Authority Rev. (Tucson Electric Power Co.), “A”, 5.25%, 10/01/40 | | | 4,755,000 | | | | 5,278,193 | |
| Salt Verde Financial Corp., AZ, Senior Gas Rev., 5%, 12/01/32 | | | 2,940,000 | | | | 3,547,610 | |
| Tempe, AZ, Industrial Development Authority Rev. (Friendship Village), “A”, 6.25%, 12/01/42 | | | 1,675,000 | | | | 1,827,509 | |
| Tempe, AZ, Industrial Development Authority Rev. (Friendship Village), “A”, 6.25%, 12/01/46 | | | 1,275,000 | | | | 1,388,883 | |
| | | | | | | | |
| | | | | | | $ | 64,641,804 | |
| Arkansas - 0.4% | | | | | | | | |
| Arkansas Development Finance Authority Hospital Rev. (Washington Regional Medical Center), “A”, 5%, 2/01/35 | | $ | 365,000 | | | $ | 413,611 | |
| Arkansas Development Finance Authority Hospital Rev. (Washington Regional Medical Center), “C”, 5%, 2/01/33 | | | 540,000 | | | | 615,530 | |
| Arkansas Development Finance Authority, Tobacco Settlement Rev. (Cancer Research Center Project), Capital Appreciation, AMBAC, 0%, 7/01/46 | | | 6,455,000 | | | | 1,811,919 | |
| Pulaski County, AR, Public Facilities Board Healthcare Rev. (Baptist Health), 5%, 12/01/39 | | | 9,510,000 | | | | 10,818,481 | |
| Pulaski County, AR, Public Facilities Board Healthcare Rev. (Baptist Health), 5%, 12/01/42 | | | 1,360,000 | | | | 1,541,424 | |
| | | | | | | | |
| | | | | | | $ | 15,200,965 | |
| California - 8.9% | | | | | | | | |
| ABAG Finance Authority for Non-Profit Corps., CA, Rev. (Episcopal Senior Communities), 6.125%, 7/01/41 | | $ | 4,000,000 | | | $ | 4,580,200 | |
| Acton-Agua Dulce, CA, Unified School District (Election of 2008), Capital Appreciation, AGM, 0%, 5/01/39 | | | 7,550,000 | | | | 2,845,746 | |
| Agua Caliente Band of Cahuilla Indians, CA, Rev., 6%, 7/01/18 (n) | | | 1,105,000 | | | | 1,099,906 | |
14
Portfolio of Investments – continued
| | | | | | | | |
| Issuer | | Shares/Par | | | Value ($) | |
| Municipal Bonds - continued | | | | | | | | |
| California - continued | | | | | | | | |
| Beverly Hills, CA, Unified School District (Election of 2008), Capital Appreciation, 0%, 8/01/31 | | $ | 2,060,000 | | | $ | 1,330,348 | |
| Beverly Hills, CA, Unified School District (Election of 2008), Capital Appreciation, 0%, 8/01/32 | | | 2,095,000 | | | | 1,311,072 | |
| Beverly Hills, CA, Unified School District (Election of 2008), Capital Appreciation, 0%, 8/01/33 | | | 4,185,000 | | | | 2,528,159 | |
| California Educational Facilities Authority Rev., 5%, 2/01/26 (Prerefunded 2/01/17) | | | 900,000 | | | | 941,328 | |
| California Educational Facilities Authority Rev., 5%, 2/01/26 | | | 2,690,000 | | | | 2,771,588 | |
| California Educational Facilities Authority Rev. (California Lutheran University), 5.75%, 10/01/38 | | | 2,320,000 | | | | 2,561,976 | |
| California Educational Facilities Authority Rev. (Dominican University of California), 5%, 12/01/36 | | | 1,000,000 | | | | 1,026,500 | |
| California Health Facilities Financing Authority Rev. (St. Joseph Health System), “A”, 5.75%, 7/01/39 | | | 2,765,000 | | | | 3,175,520 | |
| California Housing Finance Agency Rev. (Home Mortgage), “E”, 4.75%, 2/01/30 | | | 2,560,000 | | | | 2,601,984 | |
| California Housing Finance Agency Rev. (Home Mortgage), “G”, 4.95%, 8/01/23 | | | 8,080,000 | | | | 8,291,130 | |
| California Housing Finance Agency Rev. (Home Mortgage), “I”, 4.8%, 8/01/36 | | | 740,000 | | | | 740,821 | |
| California Housing Finance Agency Rev. (Home Mortgage), “L”, 5.45%, 8/01/33 | | | 12,730,000 | | | | 13,505,894 | |
| California M-S-R Energy Authority Gas Rev., “A”, 7%, 11/01/34 | | | 1,135,000 | | | | 1,675,839 | |
| California M-S-R Energy Authority Gas Rev., “A”, 6.5%, 11/01/39 | | | 5,110,000 | | | | 7,358,042 | |
| California Municipal Finance Authority Rev. (Biola University), 5.8%, 10/01/28 | | | 1,915,000 | | | | 2,072,719 | |
| California Municipal Finance Authority Rev. (Northbay Healthcare Group), 5%, 11/01/35 | | | 475,000 | | | | 531,349 | |
| California Municipal Finance Authority Rev. (Partnerships to Uplift Communities Project), “A”, 5%, 8/01/32 | | | 1,585,000 | | | | 1,668,498 | |
| California Municipal Finance Authority Rev. (University of La Verne), “A”, 6.25%, 6/01/40 | | | 900,000 | | | | 1,031,373 | |
| California Municipal Finance Authority, Solid Waste Rev. (Republic Services, Inc. Project), 0.45%, 9/01/21 (Put Date 4/01/16) | | | 15,000,000 | | | | 15,000,000 | |
| California Pollution Control Financing Authority, Water Facilities Rev. (American Water Capital Corp. Project), 5.25%, 8/01/40 | | | 3,500,000 | | | | 3,754,765 | |
| California Pollution Control Financing Authority, Water Furnishing Rev. (Poseidon Resources Desalination Project), 5%, 11/21/45 | | | 4,080,000 | | | | 4,456,380 | |
| California Pollution Control Financing Authority, Water Furnishing Rev. (San Diego County Water Desalination Project Pipeline), 5%, 11/21/45 | | | 2,975,000 | | | | 3,049,256 | |
15
Portfolio of Investments – continued
| | | | | | | | |
| Issuer | | Shares/Par | | | Value ($) | |
| Municipal Bonds - continued | | | | | | | | |
| California - continued | | | | | | | | |
| California Public Works Board Lease Rev. (Various Capital Projects), “G-1”, 5.75%, 10/01/30 | | $ | 3,380,000 | | | $ | 3,949,091 | |
| California Public Works Board Lease Rev., Department of Corrections and Rehabilitation (Various Correctional Facilities), “A”, 5%, 9/01/33 | | | 10,830,000 | | | | 12,846,438 | |
| California School Finance Authority, School Facility Rev. (Alliance for College-Ready Public Schools Projects), “A”, 4%, 7/01/24 | | | 730,000 | | | | 754,791 | |
| California School Finance Authority, School Facility Rev. (Alliance for College-Ready Public Schools Projects), “A”, 4%, 7/01/25 | | | 760,000 | | | | 782,253 | |
| California School Finance Authority, School Facility Rev. (Alliance for College-Ready Public Schools Projects), “A”, 5%, 7/01/30 | | | 435,000 | | | | 466,385 | |
| California School Finance Authority, School Facility Rev. (Alliance for College-Ready Public Schools Projects), “A”, 5%, 7/01/45 | | | 1,150,000 | | | | 1,196,414 | |
| California School Finance Authority, School Facility Rev. (ICEF View Park Elementary and Middle Schools), “A”, 4.75%, 10/01/24 | | | 425,000 | | | | 451,342 | |
| California School Finance Authority, School Facility Rev. (ICEF View Park Elementary and Middle Schools), “A”, 5.625%, 10/01/34 | | | 575,000 | | | | 616,716 | |
| California School Finance Authority, School Facility Rev. (ICEF View Park Elementary and Middle Schools), “A”, 5.875%, 10/01/44 | | | 545,000 | | | | 586,720 | |
| California School Finance Authority, School Facility Rev. (ICEF View Park Elementary and Middle Schools), “A”, 6%, 10/01/49 | | | 620,000 | | | | 670,536 | |
| California School Finance Authority, School Facility Rev. (Kipp LA Projects), “A”, 4.125%, 7/01/24 | | | 450,000 | | | | 481,883 | |
| California School Finance Authority, School Facility Rev. (Kipp LA Projects), “A”, 5.125%, 7/01/44 | | | 430,000 | | | | 463,329 | |
| California Statewide Communities Development Authority Environmental Facilities Rev. (Microgy Holdings Project), 9%, 12/01/38 (a)(d) | | | 100,980 | | | | 757 | |
| California Statewide Communities Development Authority Rev. (899 Charleston Project), “A”, 5.25%, 11/01/44 | | | 760,000 | | | | 784,981 | |
| California Statewide Communities Development Authority Rev. (899 Charleston Project), “A”, 5.375%, 11/01/49 | | | 945,000 | | | | 973,378 | |
| California Statewide Communities Development Authority Rev. (American Baptist Homes of the West), 6.25%, 10/01/39 | | | 2,985,000 | | | | 3,314,305 | |
| California Statewide Communities Development Authority Rev. (California Baptist University), “A”, 5.125%, 11/01/23 | | | 540,000 | | | | 584,059 | |
| California Statewide Communities Development Authority Rev. (California Baptist University), “A”, 5.4%, 11/01/27 | | | 1,385,000 | | | | 1,441,286 | |
| California Statewide Communities Development Authority Rev. (California Baptist University), “A”, 6.125%, 11/01/33 | | | 1,600,000 | | | | 1,769,600 | |
16
Portfolio of Investments – continued
| | | | | | | | |
| Issuer | | Shares/Par | | | Value ($) | |
| Municipal Bonds - continued | | | | | | | | |
| California - continued | | | | | | | | |
| California Statewide Communities Development Authority Rev. (California Baptist University), “A”, 6.375%, 11/01/43 | | $ | 1,335,000 | | | $ | 1,482,931 | |
| California Statewide Communities Development Authority Rev. (Enloe Medical Center), CALHF, 5%, 8/15/38 | | | 2,500,000 | | | | 2,959,400 | |
| California Statewide Communities Development Authority Rev. (Enloe Medical Center), CALHF, 5%, 8/15/31 | | | 440,000 | | | | 535,858 | |
| California Statewide Communities Development Authority Rev. (Lancer Educational Student Housing Project), 5.625%, 6/01/33 | | | 2,910,000 | | | | 2,992,091 | |
| California Statewide Communities Development Authority Rev. (Lancer Educational Student Housing Project), 7.5%, 6/01/42 | | | 1,545,000 | | | | 1,700,659 | |
| California Statewide Communities Development Authority Rev. (Lancer Plaza Project), 5.125%, 11/01/23 | | | 615,000 | | | | 652,490 | |
| California Statewide Communities Development Authority Rev. (Lancer Plaza Project), 5.625%, 11/01/33 | | | 780,000 | | | | 812,994 | |
| California Statewide Communities Development Authority Rev. (Lancer Plaza Project), 5.875%, 11/01/43 | | | 1,315,000 | | | | 1,363,721 | |
| California Statewide Communities Development Authority Rev. (Loma Linda University Medical Center), “A”, 5.25%, 12/01/34 | | | 3,400,000 | | | | 3,785,934 | |
| California Statewide Communities Development Authority Rev. (Loma Linda University Medical Center), “A”, 5.25%, 12/01/44 | | | 6,155,000 | | | | 6,656,079 | |
| California Statewide Communities Development Authority Rev. (Los Angeles Jewish Home for The Aging - Fountainview at Gonda), “A”, CALHF, 5%, 8/01/34 | | | 1,000,000 | | | | 1,169,550 | |
| California Statewide Communities Development Authority Rev. (Los Angeles Jewish Home for The Aging - Fountainview at Gonda), “A”, CALHF, 5%, 8/01/44 | | | 2,400,000 | | | | 2,767,632 | |
| California Statewide Communities Development Authority Rev. (Los Angeles Jewish Home for The Aging - Fountainview at Gonda), “B”, CALHF, 3%, 8/01/21 | | | 1,540,000 | | | | 1,560,451 | |
| California Statewide Communities Development Authority Rev. (Los Angeles Jewish Home for The Aging - Fountainview at Gonda), “C”, CALHF, 2.5%, 8/01/20 | | | 1,040,000 | | | | 1,051,055 | |
| California Statewide Communities Development Authority Rev. (Los Angeles Jewish Home for The Aging - Fountainview at Gonda), “D”, 4.75%, 8/01/20 | | | 2,650,000 | | | | 2,670,008 | |
| California Statewide Communities Development Authority Rev. (Southern California Presbyterian Homes), 7%, 11/15/29 | | | 1,400,000 | | | | 1,642,172 | |
| California Statewide Communities Development Authority Rev. (Southern California Presbyterian Homes), 7.25%, 11/15/41 | | | 560,000 | | | | 653,262 | |
| California Statewide Communities Development Authority Rev. (Student Housing, SUCI East Campus), 6%, 5/15/40 | | | 2,125,000 | | | | 2,306,475 | |
| California Statewide Communities Development Authority Rev. (The Terraces at San Joaquin Gardens), “A”, 5.625%, 10/01/32 | | | 1,000,000 | | | | 1,074,130 | |
17
Portfolio of Investments – continued
| | | | | | | | |
| Issuer | | Shares/Par | | | Value ($) | |
| Municipal Bonds - continued | | | | | | | | |
| California - continued | | | | | | | | |
| California Statewide Communities Development Authority Rev. (The Terraces at San Joaquin Gardens), “A”, 6%, 10/01/42 | | $ | 1,000,000 | | | $ | 1,084,360 | |
| California Statewide Communities Development Authority Rev. (University of California, Irvine East Campus Apartments), 5.375%, 5/15/38 | | | 3,000,000 | | | | 3,413,160 | |
| California Statewide Communities Development Authority School Facility Rev. (Aspire Public Schools), 6%, 7/01/30 | | | 1,990,000 | | | | 2,180,344 | |
| California Statewide Communities Development Authority School Facility Rev. (Aspire Public Schools), 6.375%, 7/01/45 | | | 2,340,000 | | | | 2,403,320 | |
| California Statewide Communities Development Authority School Facility Rev. (Aspire Public Schools), 6.125%, 7/01/46 | | | 7,630,000 | | | | 8,318,913 | |
| California Statewide Financing Authority, Tobacco Settlement, 5.625%, 5/01/29 | | | 2,610,000 | | | | 2,653,848 | |
| Chula Vista, CA, Industrial Development Rev. (San Diego Gas & Electric Co.), “E”, 5.875%, 1/01/34 | | | 1,940,000 | | | | 2,243,901 | |
| District of Southern CA, Water Replenishment Financing Authority Assessment Rev., 5%, 8/01/36 | | | 1,305,000 | | | | 1,577,053 | |
| District of Southern CA, Water Replenishment Financing Authority Assessment Rev., 5%, 8/01/37 | | | 1,385,000 | | | | 1,667,235 | |
| District of Southern CA, Water Replenishment Financing Authority Assessment Rev., 5%, 8/01/41 | | | 3,000,000 | | | | 3,558,480 | |
| Escondido, CA, Union High School District (Election of 2008), Capital Appreciation, “A”, ASSD GTY, 0%, 8/01/30 | | | 4,785,000 | | | | 2,963,685 | |
| Escondido, CA, Union High School District (Election of 2008), Capital Appreciation, “A”, ASSD GTY, 0%, 8/01/31 | | | 4,280,000 | | | | 2,528,282 | |
| Escondido, CA, Union High School District (Election of 2008), Capital Appreciation, “A”, ASSD GTY, 0%, 8/01/32 | | | 3,010,000 | | | | 1,703,148 | |
| Golden State, CA, Tobacco Securitization Corp., Tobacco Settlement Rev., “A-1”, 5.75%, 6/01/47 | | | 13,270,000 | | | | 12,672,983 | |
| Golden State, CA, Tobacco Securitization Corp., Tobacco Settlement Rev., Enhanced, “A-1”, AMBAC, 4.6%, 6/01/23 | | | 1,185,000 | | | | 1,272,500 | |
| Hartnell , CA, Community College District (Monterey and San Benito Counties), Election of 2002 General Obligation, Capital Appreciation, “D”, 0%, 8/01/39 (Prerefunded 8/01/19) | | | 10,355,000 | | | | 2,310,201 | |
| Hollister, CA, (Community Development Project), BAM, 5%, 10/01/29 | | | 1,480,000 | | | | 1,761,733 | |
| Hollister, CA, (Community Development Project), BAM, 5%, 10/01/31 | | | 1,675,000 | | | | 1,976,701 | |
| Imperial, CA, Irrigation District Electric Rev., “C”, 5%, 11/01/37 | | | 2,000,000 | | | | 2,405,940 | |
| Imperial, CA, Irrigation District Electric Rev., “C”, 5%, 11/01/38 | | | 1,350,000 | | | | 1,618,448 | |
| Inland Valley, CA, Development Successor Agency Tax Allocation, “A”, 5%, 9/01/44 | | | 1,745,000 | | | | 1,954,051 | |
| Irvine, CA, Special Tax Bonds, Community Facilities District No. 2013-3, 5%, 9/01/39 | | | 1,000,000 | | | | 1,116,960 | |
18
Portfolio of Investments – continued
| | | | | | | | |
| Issuer | | Shares/Par | | | Value ($) | |
| Municipal Bonds - continued | | | | | | | | |
| California - continued | | | | | | | | |
| Irvine, CA, Special Tax Bonds, Community Facilities District No. 2013-3, 5%, 9/01/44 | | $ | 1,500,000 | | | $ | 1,668,360 | |
| Jurupa, CA, Public Financing Authority, Special Tax Rev., “A”, 5%, 9/01/42 | | | 1,535,000 | | | | 1,711,725 | |
| La Verne, CA, COP (Brethren Hillcrest Homes), 5%, 5/15/36 | | | 455,000 | | | | 492,865 | |
| Lake Tahoe, CA, Unified School District (Election of 2008), Capital Appreciation, AGM, 0%, 8/01/45 | | | 4,240,000 | | | | 2,563,292 | |
| Long Beach, CA, Marina Rev. (Alamitos Bay Marina Project), 5%, 5/15/35 | | | 450,000 | | | | 510,782 | |
| Los Angeles County, CA, Regional Financing Authority Rev. (Montecedro Inc. Project), “A”, CALHF, 5%, 11/15/34 | | | 330,000 | | | | 382,364 | |
| Los Angeles County, CA, Regional Financing Authority Rev. (Montecedro Inc. Project), “A”, CALHF, 5%, 11/15/44 | | | 555,000 | | | | 633,732 | |
| Los Angeles County, CA, Regional Financing Authority Rev. (Montecedro Inc. Project), “B-2”, CALHF, 3%, 11/15/20 | | | 290,000 | | | | 290,664 | |
| Los Angeles County, CA, Regional Financing Authority Rev. (Montecedro Inc. Project), “B-3”, CALHF, 2.5%, 11/15/20 | | | 460,000 | | | | 460,851 | |
| Los Angeles County, CA, Rio Hondo Community College District, “C”, Convertible Capital Appreciation, 0% to 8/01/2024, 6.85% to 8/01/42 | | | 10,000,000 | | | | 9,746,500 | |
| Los Angeles, CA, Community Facilities District No. 4 Special Tax Refunding (Playa Vista- Phase 1), 5%, 9/01/29 | | | 1,000,000 | | | | 1,167,170 | |
| Los Angeles, CA, Community Facilities District No. 4 Special Tax Refunding (Playa Vista- Phase 1), 5%, 9/01/30 | | | 1,000,000 | | | | 1,160,550 | |
| Los Angeles, CA, Community Facilities District No. 4 Special Tax Refunding (Playa Vista- Phase 1), 5%, 9/01/31 | | | 1,660,000 | | | | 1,919,209 | |
| Los Angeles, CA, Unified School District, “D”, 5%, 1/01/34 | | | 525,000 | | | | 592,452 | |
| Madera, CA, Irrigation Financing Authority Water Rev., 6.5%, 1/01/40 (Prerefunded 1/01/20) | | | 5,970,000 | | | | 7,247,759 | |
| Merced, CA, Union High School District, Capital Appreciation, “A”, ASSD GTY, 0%, 8/01/30 | | | 645,000 | | | | 373,610 | |
| Mount San Antonio, CA, Community College District Rev. (Election of 2008), Convertible Capital Appreciation, 0% to 8/01/2028, 6.25% to 8/01/43 | | | 7,025,000 | | | | 5,175,458 | |
| Newport Mesa, CA, Unified School District (Election of 2005), Capital Appreciation, 0%, 8/01/41 | | | 12,965,000 | | | | 2,842,706 | |
| Oceanside, CA, Unified School District, Capital Appreciation, ASSD GTY, 0%, 8/01/24 | | | 3,110,000 | | | | 2,518,634 | |
| Oceanside, CA, Unified School District, Capital Appreciation, ASSD GTY, 0%, 8/01/27 | | | 2,070,000 | | | | 1,488,123 | |
| Oceanside, CA, Unified School District, Capital Appreciation, ASSD GTY, 0%, 8/01/29 | | | 4,025,000 | | | | 2,649,577 | |
| Oceanside, CA, Unified School District, Capital Appreciation, ASSD GTY, 0%, 8/01/30 | | | 4,455,000 | | | | 2,827,054 | |
19
Portfolio of Investments – continued
| | | | | | | | |
| Issuer | | Shares/Par | | | Value ($) | |
| Municipal Bonds - continued | | | | | | | | |
| California - continued | | | | | | | | |
| Oxnard, CA, Financing Authority, Wastewater Rev., AGM, 5%, 6/01/30 | | $ | 1,360,000 | | | $ | 1,594,981 | |
| Palomar Pomerado Health Care District, CA, COP, 6.75%, 11/01/39 | | | 4,080,000 | | | | 4,521,334 | |
| Pittsburg, CA, Redevelopment Successor Agency, Tax Allocation (Los Medanos Community Development Project), AGM, 5%, 8/01/25 | | | 865,000 | | | | 1,057,774 | |
| Pittsburg, CA, Redevelopment Successor Agency, Tax Allocation (Los Medanos Community Development Project), AGM, 5%, 8/01/26 | | | 905,000 | | | | 1,097,729 | |
| Pittsburg, CA, Redevelopment Successor Agency, Tax Allocation (Los Medanos Community Development Project), AGM, 5%, 8/01/27 | | | 1,225,000 | | | | 1,474,471 | |
| Pittsburg, CA, Redevelopment Successor Agency, Tax Allocation (Los Medanos Community Development Project), AGM, 5%, 8/01/28 | | | 635,000 | | | | 757,834 | |
| San Buenaventura, CA, Rev. (Community Memorial Health System), 7.5%, 12/01/41 | | | 6,000,000 | | | | 7,378,140 | |
| San Francisco, CA, Bay Area Toll Authority, Bridge Rev., “B”, 1.5%, 4/01/47 (Put Date 4/02/18) | | | 3,095,000 | | | | 3,122,638 | |
| San Francisco, CA, Bay Area Toll Authority, Bridge Rev., “C”, 1.875%, 4/01/47 (Put Date 4/01/19) | | | 2,505,000 | | | | 2,552,294 | |
| San Francisco, CA, City & County Redevelopment Successor Agency, Community Facilities District No. 6 (Mission Bay South Public Improvements), Capital Appreciation, “A”, 0%, 8/01/43 | | | 8,725,000 | | | | 1,950,736 | |
| San Francisco, CA, City & County Redevelopment Successor Agency, Tax Allocation (Mission Bay South Public Improvements), “A”, 5%, 8/01/43 | | | 225,000 | | | | 250,342 | |
| San Jose, CA, Airport Rev., “A-2”, 5.25%, 3/01/34 | | | 6,545,000 | | | | 7,546,974 | |
| San Jose, CA, Airport Rev., “C”, 5%, 3/01/30 | | | 885,000 | | | | 1,060,434 | |
| State of California, 5%, 5/01/44 | | | 3,710,000 | | | | 4,287,016 | |
| Upland, CA, COP (San Antonio Community Hospital), 6.375%, 1/01/32 | | | 600,000 | | | | 703,092 | |
| West Contra Costa, CA, Healthcare District, AMBAC, 5.5%, 7/01/29 | | | 700,000 | | | | 701,848 | |
| West Contra Costa, CA, Unified School District (Election of 2005), Capital Appreciation, “C”, ASSD GTY, 0%, 8/01/29 | | | 3,665,000 | | | | 2,371,255 | |
| Whittier, CA, Health Facility Rev. (PIH Health), 5%, 6/01/44 | | | 4,300,000 | | | | 4,842,273 | |
| Whittier, CA, Union High School District, Capital Appreciation, 0%, 8/01/34 | | | 2,270,000 | | | | 819,266 | |
| | | | | | | | |
| | | | | | | $ | 319,780,663 | |
| Colorado - 3.3% | | | | | | | | |
| Arvada, CO, Cimarron Metropolitan District, Rev., 6%, 12/01/22 | | $ | 2,000,000 | | | $ | 2,011,640 | |
| Central Platte Valley, CO, General Obligation, 5%, 12/01/43 | | | 1,250,000 | | | | 1,313,575 | |
20
Portfolio of Investments – continued
| | | | | | | | |
| Issuer | | Shares/Par | | | Value ($) | |
| Municipal Bonds - continued | | | | | | | | |
| Colorado - continued | | | | | | | | |
| Colorado Educational & Cultural Facilities Authority Rev. (Liberty Common Project), 5%, 1/15/29 | | $ | 305,000 | | | $ | 347,182 | |
| Colorado Educational & Cultural Facilities Authority Rev. (Liberty Common Project), 5%, 1/15/39 | | | 560,000 | | | | 615,059 | |
| Colorado Educational & Cultural Facilities Authority Rev. (Liberty Common Project), 5%, 1/15/44 | | | 395,000 | | | | 430,408 | |
| Colorado Educational & Cultural Facilities Authority Rev. (Littleton Preparatory Charter School Project), 5%, 12/01/33 | | | 450,000 | | | | 463,896 | |
| Colorado Educational & Cultural Facilities Authority Rev. (Littleton Preparatory Charter School Project), 5%, 12/01/42 | | | 1,120,000 | | | | 1,133,507 | |
| Colorado Educational & Cultural Facilities Authority Rev. (Montessori Charter School Project), 5%, 7/15/37 | | | 490,000 | | | | 532,165 | |
| Colorado Educational & Cultural Facilities Authority Rev. (Peak to Peak Charter School Project), 5%, 8/15/30 | | | 350,000 | | | | 398,839 | |
| Colorado Educational & Cultural Facilities Authority Rev. (Peak to Peak Charter School Project), 5%, 8/15/34 | | | 350,000 | | | | 396,211 | |
| Colorado Educational & Cultural Facilities Authority Rev. (Science, Technology, Engineering and Math School Project), 5%, 11/01/44 | | | 885,000 | | | | 909,576 | |
| Colorado Educational & Cultural Facilities Authority Rev. (Science, Technology, Engineering and Math School Project), 5.125%, 11/01/49 | | | 765,000 | | | | 781,838 | |
| Colorado Educational & Cultural Facilities Authority Rev. (The Classical Academy Project), 5%, 12/01/31 | | | 1,715,000 | | | | 1,980,945 | |
| Colorado Educational & Cultural Facilities Authority Rev. (The Classical Academy Project), “A”, 5%, 12/01/38 | | | 895,000 | | | | 999,876 | |
| Colorado Educational & Cultural Facilities Authority Rev. (University Lab School Project), 5%, 12/15/35 | | | 2,000,000 | | | | 2,054,840 | |
| Colorado Educational & Cultural Facilities Authority Rev. (University Lab School Project), 5%, 12/15/45 | | | 2,675,000 | | | | 2,681,046 | |
| Colorado Health Facilities Authority Rev. (American Baptist Homes), 8%, 8/01/43 | | | 2,975,000 | | | | 3,573,124 | |
| Colorado Health Facilities Authority Rev. (American Baptist Homes), “A”, 5.9%, 8/01/37 | | | 1,310,000 | | | | 1,325,379 | |
| Colorado Health Facilities Authority Rev. (Christian Living Communities Project), 6.375%, 1/01/41 | | | 1,620,000 | | | | 1,761,232 | |
| Colorado Health Facilities Authority Rev. (Christian Living Communities Project), “A”, 5.75%, 1/01/37 | | | 2,650,000 | | | | 2,687,630 | |
| Colorado Health Facilities Authority Rev. (Covenant Retirement Communities, Inc. Project), “A”, 5%, 12/01/21 | | | 105,000 | | | | 120,207 | |
| Colorado Health Facilities Authority Rev. (Covenant Retirement Communities, Inc. Project), “A”, 5%, 12/01/33 | | | 4,295,000 | | | | 4,651,013 | |
| Colorado Health Facilities Authority Rev. (Covenant Retirement Communities, Inc. Project), “A”, 5%, 12/01/35 | | | 1,710,000 | | | | 1,884,095 | |
21
Portfolio of Investments – continued
| | | | | | | | |
| Issuer | | Shares/Par | | | Value ($) | |
| Municipal Bonds - continued | | | | | | | | |
| Colorado - continued | | | | | | | | |
| Colorado Health Facilities Authority Rev. (Evangelical Lutheran Good Samaritan Society), 5.625%, 6/01/43 | | $ | 825,000 | | | $ | 961,348 | |
| Colorado Health Facilities Authority Rev. (Total Longterm Care, Inc.), “A”, 6%, 11/15/30 | | | 700,000 | | | | 800,149 | |
| Colorado Health Facilities Authority Rev. (Total Longterm Care, Inc.), “A”, 6.25%, 11/15/40 | | | 1,150,000 | | | | 1,310,724 | |
| Colorado Health Facilities Hospital Authority Rev. (Adventist Health System/Sunbelt Obligated Group), “2014-E”, 5%, 11/15/34 | | | 6,530,000 | | | | 7,576,041 | |
| Colorado Housing & Finance Authority, Solid Waste Rev. (Waste Management, Inc.), 5.7%, 7/01/18 | | | 540,000 | | | | 600,032 | |
| Colorado Regional Transportation District, Private Activity Rev. (Denver Transportation Partners), 6%, 1/15/34 | | | 8,490,000 | | | | 9,598,964 | |
| Denver, CO, City & County Airport Rev. (United Airlines), 5.25%, 10/01/32 | | | 13,545,000 | | | | 14,071,630 | |
| Denver, CO, City & County Airport Rev. (United Airlines), 5.75%, 10/01/32 | | | 4,705,000 | | | | 4,932,534 | |
| Denver, CO, Health & Hospital Authority Rev., “A”, 5.25%, 12/01/45 | | | 795,000 | | | | 885,582 | |
| E-470 Public Highway Authority Rev., CO, Capital Appreciation, “B”, NATL, 0%, 9/01/27 | | | 12,305,000 | | | | 7,195,718 | |
| Fruita, CO, Rev. (Family Health West Project), 7%, 1/01/18 | | | 375,000 | | | | 404,336 | |
| Fruita, CO, Rev. (Family Health West Project), 8%, 1/01/43 | | | 4,440,000 | | | | 4,985,498 | |
| Park Creek Metropolitan District of Columbia Rev. (Senior Limited Property Tax Supported), “A”, 5%, 12/01/45 | | | 5,280,000 | | | | 5,934,192 | |
| Public Authority for Colorado Energy Natural Gas Purchase Rev., 6.25%, 11/15/28 | | | 6,860,000 | | | | 8,999,840 | |
| Public Authority for Colorado Energy Natural Gas Purchase Rev., 6.5%, 11/15/38 | | | 7,145,000 | | | | 10,137,612 | |
| Salida, CO, Hospital District Rev., 5.25%, 10/01/36 | | | 5,607,000 | | | | 5,633,073 | |
| Stone Ridge, CO, Metropolitan District No. 2, 7.25%, 12/01/31 (a)(d) | | | 2,396,000 | | | | 527,192 | |
| Tallyn’s Reach, CO, Metropolitan District No. 3, CO, 5%, 12/01/33 | | | 404,000 | | | | 430,373 | |
| Tallyn’s Reach, CO, Metropolitan District No. 3, CO, 5.125%, 11/01/38 | | | 824,000 | | | | 878,953 | |
| | | | | | | | |
| | | | | | | $ | 118,917,074 | |
| Connecticut - 0.8% | | | | | | | | |
| Connecticut Health & Educational Facilities Authority Rev. (Trinity Health Credit Group), 5%, 12/01/41 | | $ | 10,000,000 | | | $ | 11,573,400 | |
| Connecticut Housing Finance Authority Rev., (Housing Mortgage Finance Program), “C-1”, 3.5%, 11/15/45 | | | 3,375,000 | | | | 3,615,739 | |
| Connecticut Housing Finance Authority Rev., (Housing Mortgage Finance Program), “D-1”, 4%, 11/15/44 | | | 2,660,000 | | | | 2,824,627 | |
22
Portfolio of Investments – continued
| | | | | | | | |
| Issuer | | Shares/Par | | | Value ($) | |
| Municipal Bonds - continued | | | | | | | | |
| Connecticut - continued | | | | | | | | |
| Mohegan Tribal Finance Authority, CT, Economic Development Bonds, 7%, 2/01/45 (n) | | $ | 6,325,000 | | | $ | 6,301,598 | |
| Mohegan Tribe Indians, CT, Gaming Authority Rev., “C”, 4.75%, 2/01/20 (n) | | | 5,305,000 | | | | 5,324,363 | |
| | | | | | | | |
| | | | | | | $ | 29,639,727 | |
| Delaware - 0.1% | | | | | | | | |
| Delaware Economic Development Authority Rev. (Delaware Military Academy, Inc. Project), 4.625%, 9/01/34 | | $ | 915,000 | | | $ | 956,870 | |
| Delaware Economic Development Authority Rev. (Delaware Military Academy, Inc. Project), 5%, 9/01/44 | | | 1,030,000 | | | | 1,090,389 | |
| Delaware Economic Development Authority Rev. (Delaware Military Academy, Inc. Project), 5%, 9/01/49 | | | 1,210,000 | | | | 1,272,025 | |
| Delaware Economic Development Authority Rev. (Newark Charter School, Inc. Project), 5%, 9/01/42 | | | 1,170,000 | | | | 1,240,422 | |
| | | | | | | | |
| | | | | | | $ | 4,559,706 | |
| District of Columbia - 0.6% | | | | | | | | |
| District of Columbia Rev. (Kipp, D.C. Charter School), “A”, 6%, 7/01/33 | | $ | 420,000 | | | $ | 491,387 | |
| District of Columbia Rev. (Kipp, D.C. Charter School), “A”, 6%, 7/01/43 | | | 1,095,000 | | | | 1,271,766 | |
| District of Columbia Rev. (Methodist Home of the District of Columbia Issue), 4.5%, 1/01/25 | | | 1,275,000 | | | | 1,299,378 | |
| District of Columbia Rev. (Methodist Home of the District of Columbia Issue), “A”, 5.125%, 1/01/35 | | | 1,165,000 | | | | 1,179,761 | |
| District of Columbia Rev. (Methodist Home of the District of Columbia Issue), “A”, 5.25%, 1/01/39 | | | 765,000 | | | | 776,070 | |
| District of Columbia Student Dormitory Rev. (Provident Group - Howard Properties LLC), 5%, 10/01/30 | | | 1,475,000 | | | | 1,500,001 | |
| District of Columbia Student Dormitory Rev. (Provident Group - Howard Properties LLC), 5%, 10/01/35 | | | 5,000,000 | | | | 5,044,800 | |
| District of Columbia Student Dormitory Rev. (Provident Group - Howard Properties LLC), 5%, 10/01/45 | | | 8,820,000 | | | | 8,698,549 | |
| District of Columbia, Tobacco Settlement, 6.25%, 5/15/24 | | | 480,000 | | | | 480,130 | |
| District of Columbia, Tobacco Settlement, 6.75%, 5/15/40 | | | 885,000 | | | | 885,212 | |
| | | | | | | | |
| | | | | | | $ | 21,627,054 | |
| Florida - 7.7% | | | | | | | | |
| Alachua County, FL, Health Facilities Authority Rev. (East Ridge Retirement Village, Inc.), 6%, 11/15/34 | | $ | 1,180,000 | | | $ | 1,309,104 | |
| Alachua County, FL, Health Facilities Authority Rev. (East Ridge Retirement Village, Inc.), 6.25%, 11/15/44 | | | 2,955,000 | | | | 3,297,366 | |
23
Portfolio of Investments – continued
| | | | | | | | |
| Issuer | | Shares/Par | | | Value ($) | |
| Municipal Bonds - continued | | | | | | | | |
| Florida - continued | | | | | | | | |
| Alachua County, FL, Health Facilities Authority Rev. (East Ridge Retirement Village, Inc.), 6.375%, 11/15/49 | | $ | 1,970,000 | | | $ | 2,191,093 | |
| Alachua County, FL, Health Facilities Authority, Continuing Care Rev. (Oak Hammock at the University of Florida, Inc.), “A”, 8%, 10/01/32 | | | 1,250,000 | | | | 1,561,875 | |
| Alachua County, FL, Health Facilities Authority, Continuing Care Rev. (Oak Hammock at the University of Florida, Inc.), “A”, 8%, 10/01/42 | | | 2,000,000 | | | | 2,486,960 | |
| Alachua County, FL, Health Facilities Authority, Continuing Care Rev. (Oak Hammock at the University of Florida, Inc.), “A”, 8%, 10/01/46 | | | 1,000,000 | | | | 1,241,360 | |
| Arborwood Community Development District, FL, Capital Improvement Rev. (Centex Homes Project), “A-3”, 5.5%, 5/01/36 | | | 280,000 | | | | 279,992 | |
| Arborwood Community Development District, FL, Capital Improvement Rev. (Master Infrastructure Projects), “A-2”, 5.35%, 5/01/36 | | | 1,265,000 | | | | 1,265,405 | |
| Arborwood Community Development District, FL, Capital Improvement Rev., Convertible Capital Appreciation, “A-1”, 0% to 5/01/16, 6.9% to 5/01/36 | | | 300,000 | | | | 341,367 | |
| Arborwood Community Development District, FL, Capital Improvement Rev., Convertible Capital Appreciation, “A-2”, 0% to 5/01/16, 6.9% to 5/01/36 | | | 35,000 | | | | 39,826 | |
| Arborwood Community Development District, FL, Capital Improvement Rev., Convertible Capital Appreciation, “B”, 0% to 5/01/16, 6.9% to 5/01/25 | | | 325,000 | | | | 357,838 | |
| Baker, FL, Correctional Development Corp. (Baker County Detention Center), 7.5%, 2/01/30 | | | 1,560,000 | | | | 1,304,441 | |
| Bellalago, FL, Educational Facilities Benefit District (Osceola County) Capital Improvement Refunding Rev., 4.375%, 5/01/30 | | | 690,000 | | | | 739,156 | |
| Bellalago, FL, Educational Facilities Benefit District (Osceola County) Capital Improvement Refunding Rev., 4.5%, 5/01/33 | | | 320,000 | | | | 342,045 | |
| Bellalago, FL, Educational Facilities Benefit District (Osceola County) Capital Improvement Refunding Rev., 4.6%, 5/01/34 | | | 1,355,000 | | | | 1,458,983 | |
| Brevard County, FL, Industrial Development Rev. (TUFF Florida Tech LLC Project), 6.75%, 11/01/39 | | | 4,720,000 | | | | 5,159,479 | |
| Cape Coral, FL, Health Facilities Authority, Senior Housing Rev. (Gulf Care, Inc. Project), 5.875%, 7/01/40 | | | 3,590,000 | | | | 3,677,165 | |
| Capital Region Community Development District, FL, Capital Improvement Rev., “A”, 7%, 5/01/39 | | | 2,475,000 | | | | 2,512,892 | |
| Capital Trust Agency, FL, Charter School Rev. (River City Educational Services, Inc. Project) “A”, 5.375%, 2/01/35 | | | 1,465,000 | | | | 1,494,329 | |
| Capital Trust Agency, FL, Charter School Rev. (River City Educational Services, Inc. Project) “A”, 5.625%, 2/01/45 | | | 2,725,000 | | | | 2,766,311 | |
24
Portfolio of Investments – continued
| | | | | | | | |
| Issuer | | Shares/Par | | | Value ($) | |
| Municipal Bonds - continued | | | | | | | | |
| Florida - continued | | | | | | | | |
| Century Gardens Village Community Development District, FL, Special Assessment, 5.1%, 5/01/37 | | $ | 915,000 | | | $ | 916,940 | |
| Collier County, FL, Educational Facilities Authority Rev. (Ave Maria University, Inc. Project), “A”, 6.125%, 6/01/43 | | | 3,200,000 | | | | 3,559,744 | |
| Collier County, FL, Industrial Development Authority Continuing Care Community Rev. (The Arlington of Naples Project), “A”, 5.5%, 5/15/25 | | | 300,000 | | | | 306,786 | |
| Collier County, FL, Industrial Development Authority Continuing Care Community Rev. (The Arlington of Naples Project), “A”, 6.25%, 5/15/35 | | | 300,000 | | | | 306,558 | |
| Collier County, FL, Industrial Development Authority Continuing Care Community Rev. (The Arlington of Naples Project), “A”, 8.125%, 5/15/44 | | | 4,970,000 | | | | 5,912,908 | |
| Collier County, FL, Industrial Development Authority Continuing Care Community Rev. (The Arlington of Naples Project), “A”, 6.5%, 5/15/49 | | | 805,000 | | | | 822,396 | |
| Collier County, FL, Industrial Development Authority Continuing Care Community Rev. (The Arlington of Naples Project), “B”, 5.25%, 5/15/22 | | | 2,560,000 | | | | 2,565,939 | |
| Collier County, FL, Industrial Development Authority Continuing Care Community Rev. (The Arlington of Naples Project), “B-1”, 6.875%, 5/15/21 | | | 1,180,000 | | | | 1,181,817 | |
| Creekside Community Development District, FL, Special Assessment, 5.2%, 5/01/38 (a)(d) | | | 1,400,000 | | | | 560,014 | |
| Daytona Beach, FL, Halifax Hospital Medical Center Rev., 5%, 6/01/20 | | | 395,000 | | | | 447,843 | |
| Daytona Beach, FL, Halifax Hospital Medical Center Rev., 5%, 6/01/21 | | | 620,000 | | | | 716,385 | |
| Daytona Beach, FL, Halifax Hospital Medical Center Rev., 5%, 6/01/22 | | | 520,000 | | | | 610,012 | |
| Daytona Beach, FL, Halifax Hospital Medical Center Rev., 5%, 6/01/23 | | | 685,000 | | | | 811,896 | |
| Daytona Beach, FL, Halifax Hospital Medical Center Rev., 5%, 6/01/24 | | | 575,000 | | | | 684,325 | |
| Daytona Beach, FL, Halifax Hospital Medical Center Rev., 5%, 6/01/25 | | | 670,000 | | | | 799,538 | |
| Daytona Beach, FL, Halifax Hospital Medical Center Rev., 5%, 6/01/35 | | | 1,650,000 | | | | 1,840,064 | |
| Daytona Beach, FL, Halifax Hospital Medical Center Rev., 5%, 6/01/46 | | | 2,245,000 | | | | 2,462,428 | |
| Escambia County, FL, Health Facilities Authority (Baptist Hospital, Inc.), “A”, 5.75%, 8/15/29 | | | 1,000,000 | | | | 1,146,190 | |
| Escambia County, FL, Health Facilities Authority (Baptist Hospital, Inc.), “A”, 6%, 8/15/36 | | | 3,050,000 | | | | 3,490,329 | |
25
Portfolio of Investments – continued
| | | | | | | | |
| Issuer | | Shares/Par | | | Value ($) | |
| Municipal Bonds - continued | | | | | | | | |
| Florida - continued | | | | | | | | |
| Florida Board of Education, Lottery Rev., “A”, 5%, 7/01/20 | | $ | 8,410,000 | | | $ | 9,817,918 | |
| Florida Citizens Property Insurance Corp., “A-1”, 5%, 6/01/19 | | | 660,000 | | | | 742,295 | |
| Florida Development Finance Corp. Educational Facilities Rev. (Bay Area Charter Foundation LLC), “A”, 7.75%, 6/15/42 | | | 3,480,000 | | | | 3,820,240 | |
| Florida Development Finance Corp. Educational Facilities Rev. (Renaissance Charter School), “A”, 6%, 9/15/30 | | | 2,575,000 | | | | 2,713,715 | |
| Florida Development Finance Corp. Educational Facilities Rev. (Renaissance Charter School), “A”, 6%, 6/15/32 | | | 1,950,000 | | | | 2,011,211 | |
| Florida Development Finance Corp. Educational Facilities Rev. (Renaissance Charter School), “A”, 6%, 9/15/40 | | | 5,490,000 | | | | 5,727,772 | |
| Florida Development Finance Corp. Educational Facilities Rev. (Renaissance Charter School), “A”, 7.625%, 6/15/41 | | | 10,125,000 | | | | 11,968,864 | |
| Florida Development Finance Corp. Educational Facilities Rev. (Renaissance Charter School), “A”, 6.125%, 6/15/43 | | | 4,070,000 | | | | 4,176,390 | |
| Florida Development Finance Corp. Educational Facilities Rev. (Renaissance Charter School), “A”, 6.125%, 6/15/44 | | | 5,000,000 | | | | 5,126,200 | |
| Florida Housing Finance Corp, Homeowner Mortgage Rev. (Special Program), “A”, FHLMC, 3.5%, 7/01/46 | | | 1,605,000 | | | | 1,711,139 | |
| Florida Mid-Bay Bridge Authority Rev., “A”, 5%, 10/01/35 | | | 5,000,000 | | | | 5,623,750 | |
| Heritage Harbour North Community Development District, FL, Capital Improvement Rev., 6.375%, 5/01/38 | | | 1,780,000 | | | | 1,848,067 | |
| Hillsborough County, FL, Industrial Development Authority Rev. (University Community Hospital), “A”, 5.625%, 8/15/29 (Prerefunded 8/15/18) | | | 4,700,000 | | | | 5,273,259 | |
| Lakeland, FL, Hospital Rev. (Lakeland Regional Health Systems), 5%, 11/15/33 | | | 1,905,000 | | | | 2,153,469 | |
| Lakeland, FL, Hospital Rev. (Lakeland Regional Health Systems), 5%, 11/15/34 | | | 1,655,000 | | | | 1,868,164 | |
| Lakeland, FL, Hospital Rev. (Lakeland Regional Health Systems), 5%, 11/15/35 | | | 2,340,000 | | | | 2,629,996 | |
| Lakewood Ranch Stewardship District, FL, Special Assessment Rev. (Lakewood Centre North Project), 4.25%, 5/01/25 | | | 960,000 | | | | 988,032 | |
| Lakewood Ranch Stewardship District, FL, Special Assessment Rev. (Lakewood Centre North Project), 4.875%, 5/01/35 | | | 1,400,000 | | | | 1,435,140 | |
| Lakewood Ranch Stewardship District, FL, Special Assessment Rev. (Lakewood Centre North Project), 4.875%, 5/01/45 | | | 2,520,000 | | | | 2,564,554 | |
| Lee County, FL, Industrial Development Authority Healthcare Facilities Rev. (Shell Point Alliance), “B”, 6.5%, 11/15/31 | | | 1,600,000 | | | | 1,887,344 | |
| Legends Bay Community Development District, FL, “A”, 5.875%, 5/01/38 | | | 1,325,000 | | | | 1,325,663 | |
| Main Street Community Development District, FL, “A”, 6.8%, 5/01/38 | | | 1,630,000 | | | | 1,649,462 | |
| Marshall Creek, FL, Community Development District Rev. (St. John’s County), “A”, 5%, 5/01/32 | | | 1,560,000 | | | | 1,613,633 | |
26
Portfolio of Investments – continued
| | | | | | | | |
| Issuer | | Shares/Par | | | Value ($) | |
| Municipal Bonds - continued | | | | | | | | |
| Florida - continued | | | | | | | | |
| Miami-Dade County, FL, Health Facilities Authority Hospital Rev. (Miami Children’s Hospital), 6%, 8/01/46 | | $ | 7,250,000 | | | $ | 8,390,063 | |
| Miami-Dade County, FL, Industrial Development Authority Rev. (Pinecrest Academy Project), 5.25%, 9/15/44 | | | 2,895,000 | | | | 3,029,704 | |
| Miami-Dade County, FL, Industrial Development Authority Rev. (Pinecrest Academy Project), 5%, 9/15/24 | | | 345,000 | | | | 384,872 | |
| Miami-Dade County, FL, Rickenbacker Causeway Rev., 5%, 10/01/43 | | | 2,000,000 | | | | 2,233,720 | |
| Mid-Bay Bridge Authority Rev., FL, Springing Lien, “A”, 7.25%, 10/01/34 (Prerefunded 10/01/21) | | | 300,000 | | | | 396,327 | |
| Mid-Bay Bridge Authority Rev., FL, Springing Lien, “A”, 7.25%, 10/01/40 (Prerefunded 10/01/21) | | | 8,365,000 | | | | 11,050,918 | |
| Middle Village Community Development District, FL, Special Assessment, “A”, 5.8%, 5/01/22 | | | 450,000 | | | | 397,310 | |
| Midtown Miami, FL, Community Development District Special Assessment (Infrastructure Project), “B”, 5%, 5/01/29 | | | 1,215,000 | | | | 1,301,058 | |
| Midtown Miami, FL, Community Development District Special Assessment (Infrastructure Project), “B”, 5%, 5/01/37 | | | 740,000 | | | | 785,199 | |
| Midtown Miami, FL, Community Development District Special Assessment (Parking Garage Project), “A”, 5%, 5/01/37 | | | 1,055,000 | | | | 1,119,439 | |
| Miromar Lakes, FL, Community Development District, Capital Improvement Rev., 4.875%, 5/01/22 | | | 740,000 | | | | 796,684 | |
| Miromar Lakes, FL, Community Development District, Capital Improvement Rev., 5.375%, 5/01/32 | | | 990,000 | | | | 1,065,181 | |
| Naturewalk Community Development District, FL, Capital Improvement Rev., “B”, 5.3%, 5/01/16 (d)(q) | | | 1,575,000 | | | | 866,219 | |
| OTC Community Development District, FL, Special Assessment, “A”, 5.3%, 5/01/38 | | | 4,375,000 | | | | 4,397,838 | |
| Palm Beach County, FL, Health Facilities Authority Hospital Rev. (BRRH Corp. Obligated Group), 5%, 12/01/31 | | | 1,000,000 | | | | 1,144,210 | |
| Palm Beach County, FL, Health Facilities Rev. (Sinai Residences of Boca Raton Project), 7.5%, 6/01/49 | | | 2,030,000 | | | | 2,478,853 | |
| Palm Glades Community Development District, FL, Special Assessment, “A”, 5.3%, 5/01/36 | | | 815,000 | | | | 816,883 | |
| Palm River, FL, Community Development District, Special Assessment Rev., “A”, 5.375%, 5/01/36 (a)(d) | | | 895,000 | | | | 353,212 | |
| Palm River, FL, Community Development District, Special Assessment Rev., “B”, 5.15%, 5/01/13 (a)(d) | | | 1,000,000 | | | | 394,040 | |
| Parkway Center Community Development District, FL, Special Assessment, “B”, 7%, 5/01/23 | | | 1,345,000 | | | | 1,366,776 | |
| Pasco County, FL, Estancia At Wiregrass Community Development District, Capital Improvement, 5.25%, 11/01/35 | | | 500,000 | | | | 512,860 | |
| Pasco County, FL, Estancia At Wiregrass Community Development District, Capital Improvement, 7%, 11/01/45 | | | 1,995,000 | | | | 2,431,506 | |
27
Portfolio of Investments – continued
| | | | | | | | |
| Issuer | | Shares/Par | | | Value ($) | |
| Municipal Bonds - continued | | | | | | | | |
| Florida - continued | | | | | | | | |
| Pasco County, FL, Estancia At Wiregrass Community Development District, Capital Improvement, 5.375%, 11/01/46 | | $ | 435,000 | | | $ | 446,153 | |
| Paseo Community Development District, FL, Capital Improvement Rev., “B”, 4.875%, 5/01/10 (a)(d) | | | 1,415,000 | | | | 14 | |
| Paseo Community Development District, FL, Capital Improvement Rev., Capital Appreciation, “A-2”, 0%, 5/01/36 | | | 2,175,000 | | | | 1,030,102 | |
| Paseo Community Development District, FL, Special Assessment, “A-1”, 5.4%, 5/01/36 | | | 240,000 | | | | 242,033 | |
| Pinellas County, FL, Educational Facilities Authority Rev. (Barry University), 6%, 10/01/41 | | | 5,330,000 | | | | 6,059,784 | |
| Pompano Beach, FL (John Knox Village Project), 5%, 9/01/44 | | | 2,215,000 | | | | 2,391,314 | |
| Sarasota County, FL, Health Facility Authority Rev. (Sarasota Manatee), 5.75%, 7/01/37 | | | 3,240,000 | | | | 3,256,038 | |
| Sarasota County, FL, Health Facility Authority Rev. (Sarasota Manatee), 5.75%, 7/01/45 | | | 395,000 | | | | 396,090 | |
| Seminole County, FL, Industrial Development Authority Rev. (Choices in Learning, Inc.), “A”, 7.375%, 11/15/41 | | | 2,500,000 | | | | 2,844,150 | |
| Seminole Tribe, FL, Special Obligation Rev., “A”, 5.75%, 10/01/22 (n) | | | 4,150,000 | | | | 4,360,281 | |
| Seminole Tribe, FL, Special Obligation Rev., “A”, 5.5%, 10/01/24 (n) | | | 2,505,000 | | | | 2,621,758 | |
| Seminole Tribe, FL, Special Obligation Rev., “A”, 5.25%, 10/01/27 (n) | | | 1,840,000 | | | | 1,918,292 | |
| South Lake County, FL, Hospital District Rev. (South Lake Hospital), “A”, 6%, 4/01/29 | | | 1,155,000 | | | | 1,311,168 | |
| South Lake County, FL, Hospital District Rev. (South Lake Hospital), “A”, 6.25%, 4/01/39 | | | 1,715,000 | | | | 1,944,690 | |
| St. John’s County, FL, Industrial Development Authority Rev. (Bayview Project), “A”, 5.2%, 10/01/27 | | | 1,590,000 | | | | 1,505,507 | |
| St. John’s County, FL, Industrial Development Authority Rev. (Bayview Project), “A”, 5.25%, 10/01/41 | | | 2,800,000 | | | | 2,516,696 | |
| St. John’s County, FL, Industrial Development Authority Rev. (Presbyterian Retirement), “A”, 6%, 8/01/45 | | | 7,715,000 | | | | 8,666,337 | |
| Sterling Hill Community Development District, FL, Capital Improvement Rev., “B”, 5.5%, 11/01/10 (d) | | | 525,000 | | | | 367,421 | |
| Stonebrier Community Development District, FL, Special Assessment, 5.5%, 5/01/37 | | | 1,600,000 | | | | 1,600,992 | |
| Sumter County, FL, Industrial Development Authority Hospital Rev. (Central Florida Health Alliance Projects), “A”, 5%, 7/01/26 | | | 155,000 | | | | 181,237 | |
| Sumter County, FL, Industrial Development Authority Hospital Rev. (Central Florida Health Alliance Projects), “A”, 5%, 7/01/29 | | | 145,000 | | | | 166,412 | |
| Sumter County, FL, Industrial Development Authority Hospital Rev. (Central Florida Health Alliance Projects), “A”, 5.125%, 7/01/34 | | | 315,000 | | | | 356,659 | |
28
Portfolio of Investments – continued
| | | | | | | | |
| Issuer | | Shares/Par | | | Value ($) | |
| Municipal Bonds - continued | | | | | | | | |
| Florida - continued | | | | | | | | |
| Sumter County, FL, Industrial Development Authority Hospital Rev. (Central Florida Health Alliance Projects), “A”, 5.25%, 7/01/44 | | $ | 935,000 | | | $ | 1,054,222 | |
| Tallahassee, FL, Health Facilities Rev. (Tallahassee Memorial Healthcare, Inc.), “A”, 5%, 12/01/40 | | | 5,935,000 | | | | 6,608,682 | |
| Tallahassee, FL, Health Facilities Rev. (Tallahassee Memorial Healthcare, Inc.), “A”, 5%, 12/01/44 | | | 2,695,000 | | | | 2,982,853 | |
| Tallahassee, FL, Health Facilities Rev. (Tallahassee Memorial Healthcare, Inc.), “A”, 5%, 12/01/55 | | | 6,300,000 | | | | 6,871,788 | |
| Tampa, FL (University of Tampa Project), 5%, 4/01/40 | | | 965,000 | | | | 1,068,902 | |
| Trout Creek Community Development District, FL, Capital Improvement Rev., 5.5%, 5/01/35 | | | 2,280,000 | | | | 2,292,928 | |
| Trout Creek Community Development District, FL, Capital Improvement Rev., 5.625%, 5/01/45 | | | 4,180,000 | | | | 4,196,051 | |
| Tuscany Reserve Community Development District, FL, Special Assessment, “B”, 5.25%, 5/01/16 | | | 1,150,000 | | | | 1,154,577 | |
| Two Creeks Community Development District, FL, Capital Improvement Rev., 5.25%, 5/01/37 | | | 1,860,000 | | | | 1,860,502 | |
| University of South Florida Financing Corp, Refunding Certificates of Participation, “A”, 5%, 7/01/28 | | | 4,380,000 | | | | 5,187,103 | |
| University of South Florida Financing Corp, Refunding Certificates of Participation, “A”, 5%, 7/01/31 | | | 5,420,000 | | | | 6,328,067 | |
| Villa Portofino East Community Development District, FL, Special Assessment, 5.2%, 5/01/37 | | | 1,810,000 | | | | 1,836,118 | |
| Villa Vizcaya Community Development District, FL, “A”, 5.55%, 5/01/39 (a)(d) | | | 790,000 | | | | 434,571 | |
| Watergrass Community Development District, FL, Special Assessment, “B”, 6.96%, 11/01/17 | | | 165,000 | | | | 165,124 | |
| Wiregrass Community Development District, FL, Capital Improvement Rev., 5.625%, 5/01/45 | | | 1,000,000 | | | | 1,018,460 | |
| Wiregrass Community Development District, FL, Capital Improvement Rev., 5.375%, 5/01/35 | | | 500,000 | | | | 509,080 | |
| | | | | | | | |
| | | | | | | $ | 275,110,404 | |
| Georgia - 1.6% | | | | | | | | |
| Americus and Sumter County, GA, Hospital Authority Rev. (Magnolia Manor Obligated Group), “A”, 6.25%, 5/15/33 | | $ | 1,060,000 | | | $ | 1,175,561 | |
| Americus and Sumter County, GA, Hospital Authority Rev. (Magnolia Manor Obligated Group), “A”, 6.375%, 5/15/43 | | | 1,060,000 | | | | 1,170,208 | |
| Atlanta, GA, Tax Allocation (Eastside Project), “B”, 5.6%, 1/01/30 | | | 2,450,000 | | | | 2,459,163 | |
| Atlanta, GA, Tax Allocation (Princeton Lakes Project), 5.5%, 1/01/31 | | | 1,515,000 | | | | 1,516,591 | |
| Atlanta, GA, Water & Wastewater Rev., “A”, 6%, 11/01/22 (Prerefunded 11/01/19) | | | 2,895,000 | | | | 3,438,160 | |
29
Portfolio of Investments – continued
| | | | | | | | |
| Issuer | | Shares/Par | | | Value ($) | |
| Municipal Bonds - continued | | | | | | | | |
| Georgia - continued | | | | | | | | |
| Clayton County, GA, Development Authority Special Facilities Rev. (Delta Airlines, Inc.), “A”, 8.75%, 6/01/29 | | $ | 4,070,000 | | | $ | 5,054,004 | |
| Cobb County, GA, Development Authority Student Housing Rev. (Kennesaw State University Real Estate Foundations), “C”, 5%, 7/15/30 | | | 580,000 | | | | 652,268 | |
| Cobb County, GA, Development Authority Student Housing Rev. (Kennesaw State University Real Estate Foundations), “C”, 5%, 7/15/33 | | | 1,025,000 | | | | 1,139,185 | |
| Cobb County, GA, Development Authority Student Housing Rev. (Kennesaw State University Real Estate Foundations), “C”, 5%, 7/15/38 | | | 1,100,000 | | | | 1,204,984 | |
| DeKalb County, GA, Hospital Authority Rev. (DeKalb Medical Center, Inc.), 6.125%, 9/01/40 | | | 7,170,000 | | | | 7,879,400 | |
| DeKalb County, GA, Water & Sewer Rev., “A”, 5.25%, 10/01/31 | | | 175,000 | | | | 206,560 | |
| Georgia Housing & Finance Authority Rev., Single Family Mortgage, “A”, 3.5%, 6/01/45 | | | 2,205,000 | | | | 2,355,557 | |
| Georgia Housing & Finance Authority Rev., Single Family Mortgage, “A-1”, 4%, 6/01/44 | | | 1,520,000 | | | | 1,622,858 | |
| Georgia Main Street Natural Gas, Inc., Gas Project Rev., “A”, 5.5%, 9/15/28 | | | 2,245,000 | | | | 2,844,797 | |
| Georgia Medical Center Hospital Authority Rev. (Spring Harbor Green Island Project), 5.25%, 7/01/37 | | | 4,610,000 | | | | 4,747,378 | |
| Glynn-Brunswick, GA, Memorial Hospital Authority Rev., 5.625%, 8/01/34 (Prerefunded 8/01/18) | | | 1,235,000 | | | | 1,381,533 | |
| Glynn-Brunswick, GA, Memorial Hospital Authority Rev., Unrefunded Balance, 5.625%, 8/01/34 | | | 140,000 | | | | 152,989 | |
| Hall County and Gainesville, GA, Hospital Authority Rev. (Northeast Georgia Health System, Inc.), “A”, 5.5%, 8/15/54 | | | 3,465,000 | | | | 4,132,116 | |
| Marietta, GA, Development Facilities Authority Rev. (Life University), 7%, 6/15/30 | | | 2,330,000 | | | | 2,444,263 | |
| Marietta, GA, Development Facilities Authority Rev. (Life University), 7%, 6/15/39 | | | 4,360,000 | | | | 4,544,559 | |
| Private Colleges & Universities, GA, Authority Rev. (Mercer University), “C”, 5.25%, 10/01/27 | | | 920,000 | | | | 1,074,404 | |
| Rockdale County, GA, Development Authority Project Rev. (Visy Paper Project), “A”, 6.125%, 1/01/34 | | | 4,835,000 | | | | 4,960,565 | |
| | | | | | | | |
| | | | | | | $ | 56,157,103 | |
| Guam - 0.1% | | | | | | | | |
| Guam Government Department of Education (John F. Kennedy High School), “A”, COP, 6.875%, 12/01/40 | | $ | 3,055,000 | | | $ | 3,361,539 | |
| Guam Government, “A”, 7%, 11/15/39 (Prerefunded 11/15/19) | | | 1,115,000 | | | | 1,366,265 | |
| Guam International Airport Authority Rev., “C”, 5%, 10/01/16 | | | 255,000 | | | | 261,594 | |
| | | | | | | | |
| | | | | | | $ | 4,989,398 | |
30
Portfolio of Investments – continued
| | | | | | | | |
| Issuer | | Shares/Par | | | Value ($) | |
| Municipal Bonds - continued | | | | | | | | |
| Hawaii - 0.5% | | | | | | | | |
| Hawaii Department of Budget & Finance Special Purpose Rev. (Chaminade University), 5%, 1/01/30 | | $ | 2,015,000 | | | $ | 2,123,125 | |
| Hawaii Department of Budget & Finance Special Purpose Rev. (Chaminade University), 5%, 1/01/35 | | | 1,125,000 | | | | 1,161,743 | |
| Hawaii Department of Budget & Finance Special Purpose Rev. (Chaminade University), 5%, 1/01/45 | | | 1,140,000 | | | | 1,154,695 | |
| Hawaii Department of Budget & Finance, Special Purpose Rev. (15 Craigside Project), “A”, 8.75%, 11/15/29 | | | 970,000 | | | | 1,203,392 | |
| Hawaii Department of Budget & Finance, Special Purpose Rev. (15 Craigside Project), “A”, 9%, 11/15/44 | | | 1,190,000 | | | | 1,476,481 | |
| Hawaii Department of Budget & Finance, Special Purpose Rev. (Hawaiian Electric Co. & Subsidiary), 6.5%, 7/01/39 | | | 10,580,000 | | | | 11,987,457 | |
| | | | | | | | |
| | | | | | | $ | 19,106,893 | |
| Idaho - 0.1% | | | | | | | | |
| Idaho Health Facilities Authority Rev. (The Terraces of Boise Project), “B2”, 6%, 10/01/21 | | $ | 2,120,000 | | | $ | 2,122,926 | |
| Idaho Health Facilities Authority Rev. (The Terraces of Boise Project), “B3”, 5.25%, 10/01/20 | | | 1,750,000 | | | | 1,754,480 | |
| | | | | | | | |
| | | | | | | $ | 3,877,406 | |
| Illinois - 6.6% | | | | | | | | |
| Burbank, IL, Educational Facility Rev. (Intercultural Montessori Language School Project), “A”, 6%, 9/01/35 | | $ | 2,170,000 | | | $ | 2,249,899 | |
| Burbank, IL, Educational Facility Rev. (Intercultural Montessori Language School Project), “A”, 6.25%, 9/01/45 | | | 3,565,000 | | | | 3,702,752 | |
| Chicago, IL, AGM, 5%, 1/01/22 | | | 785,000 | | | | 792,834 | |
| Chicago, IL, AGM, 5%, 1/01/23 | | | 505,000 | | | | 510,040 | |
| Chicago, IL, AGM, 5%, 1/01/25 | | | 70,000 | | | | 70,699 | |
| Chicago, IL, AGM, 5%, 1/01/26 | | | 25,000 | | | | 25,177 | |
| Chicago, IL (Modern Schools Program), “A”, AMBAC, 5%, 12/01/24 | | | 4,580,000 | | | | 4,690,928 | |
| Chicago, IL (Modern Schools Program), “G”, AMBAC, 5%, 12/01/23 | | | 945,000 | | | | 968,285 | |
| Chicago, IL (Modern Schools Program), “H”, AMBAC, 5%, 12/01/21 | | | 1,675,000 | | | | 1,716,406 | |
| Chicago, IL, “A”, AGM, 5%, 1/01/17 | | | 70,000 | | | | 70,267 | |
| Chicago, IL, “A”, AGM, 5%, 1/01/17 (Prerefunded 2/20/16) | | | 2,450,000 | | | | 2,456,664 | |
| Chicago, IL, “A”, AGM, 5%, 1/01/22 | | | 50,000 | | | | 50,191 | |
| Chicago, IL, “A”, AGM, 5%, 1/01/22 (Prerefunded 2/20/16) | | | 5,970,000 | | | | 5,986,238 | |
| Chicago, IL, “A”, AGM, 5%, 1/01/22 (Prerefunded 2/20/16) | | | 655,000 | | | | 656,782 | |
| Chicago, IL, “A”, AGM, 5%, 1/01/23 | | | 20,000 | | | | 20,200 | |
| Chicago, IL, “A”, AGM, 5%, 1/01/23 (Prerefunded 2/20/16) | | | 3,830,000 | | | | 3,840,418 | |
| Chicago, IL, “A”, AGM, 5%, 1/01/24 | | | 25,000 | | | | 25,095 | |
31
Portfolio of Investments – continued
| | | | | | | | |
| Issuer | | Shares/Par | | | Value ($) | |
| Municipal Bonds - continued | | | | | | | | |
| Illinois - continued | | | | | | | | |
| Chicago, IL, “A”, AGM, 5%, 1/01/24 (Prerefunded 2/20/16) | | $ | 400,000 | | | $ | 401,088 | |
| Chicago, IL, “A”, AGM, 5%, 1/01/25 (Prerefunded 2/20/16) | | | 545,000 | | | | 546,482 | |
| Chicago, IL, “A”, AGM, 5%, 1/01/26 (Prerefunded 2/20/16) | | | 190,000 | | | | 190,517 | |
| Chicago, IL, “A”, AGM, 5%, 1/01/27 | | | 295,000 | | | | 300,537 | |
| Chicago, IL, “A”, AGM, 5%, 1/01/28 | | | 15,070,000 | | | | 16,142,532 | |
| Chicago, IL, “A”, AGM, 4.75%, 1/01/30 | | | 815,000 | | | | 815,685 | |
| Chicago, IL, “A”, AGM, 5%, 1/01/34 | | | 2,605,000 | | | | 2,607,761 | |
| Chicago, IL, “A”, AGM, 5%, 1/01/37 | | | 4,935,000 | | | | 5,004,633 | |
| Chicago, IL, “A”, AMBAC, 5%, 1/01/24 | | | 1,500,000 | | | | 1,533,945 | |
| Chicago, IL, “B”, AGM, 5%, 1/01/23 (Prerefunded 2/20/16) | | | 735,000 | | | | 736,999 | |
| Chicago, IL, “C”, NATL, 5%, 1/01/23 | | | 640,000 | | | | 661,901 | |
| Chicago, IL, “D”, AMBAC, 5%, 12/01/22 | | | 4,465,000 | | | | 4,575,018 | |
| Chicago, IL, Board of Education, AGM, 5%, 12/01/35 | | | 5,655,000 | | | | 5,694,359 | |
| Chicago, IL, Board of Education, “A”, NATL, 5%, 12/01/16 | | | 6,695,000 | | | | 6,774,671 | |
| Chicago, IL, Board of Education, “B”, AMBAC, 5%, 12/01/20 | | | 4,575,000 | | | | 4,593,803 | |
| Chicago, IL, Board of Education, Unlimited Tax General Obligation Refunding Dedicated Rev., “B”, AMBAC, 5%, 12/01/21 | | | 6,890,000 | | | | 6,909,912 | |
| Chicago, IL, Board of Education, Unlimited Tax General Obligation Refunding Dedicated Rev., “B”, AMBAC, 5%, 12/01/23 | | | 1,630,000 | | | | 1,632,527 | |
| Chicago, IL, O’Hare International Airport Rev., Customer Facility Charge, AGM, 5.25%, 1/01/32 | | | 675,000 | | | | 793,712 | |
| Chicago, IL, O’Hare International Airport Rev., Customer Facility Charge, AGM, 5.25%, 1/01/33 | | | 335,000 | | | | 392,456 | |
| Chicago, IL, O’Hare International Airport Rev., Customer Facility Charge, AGM, 5.5%, 1/01/43 | | | 1,350,000 | | | | 1,547,708 | |
| Chicago, IL, O’Hare International Airport Rev., Senior Lien, “B”, 5%, 1/01/30 | | | 4,970,000 | | | | 5,849,342 | |
| Chicago, IL, O’Hare International Airport Rev., Third Lien, “A”, 5.625%, 1/01/35 | | | 5,645,000 | | | | 6,559,321 | |
| Chicago, IL, Transit Authority Sales Tax Receipts Rev., 5.25%, 12/01/31 | | | 540,000 | | | | 601,857 | |
| Chicago, IL, Wastewater Transmission Rev., “C”, 5%, 1/01/35 | | | 435,000 | | | | 482,511 | |
| Chicago, IL, Wastewater Transmission Rev., “C”, 5%, 1/01/39 | | | 650,000 | | | | 707,512 | |
| Du Page County, IL, Special Service Area No. 31 Special Tax (Monarch Landing Project), 5.625%, 3/01/36 | | | 945,000 | | | | 945,728 | |
| Illinois Finance Authority Charter School Rev. (Uno Charter School Network, Inc.), “A”, 7.125%, 10/01/41 | | | 2,000,000 | | | | 2,201,360 | |
| Illinois Finance Authority Educational Facility Rev. (Rogers Park Montessori School Project), 6%, 2/01/34 | | | 700,000 | | | | 747,145 | |
| Illinois Finance Authority Educational Facility Rev. (Rogers Park Montessori School Project), 6.125%, 2/01/45 | | | 1,800,000 | | | | 1,905,480 | |
32
Portfolio of Investments – continued
| | | | | | | | |
| Issuer | | Shares/Par | | | Value ($) | |
| Municipal Bonds - continued | | | | | | | | |
| Illinois - continued | | | | | | | | |
| Illinois Finance Authority Rev. (Christian Homes), 6.125%, 5/15/27 (Prerefunded 5/15/20) | | $ | 1,470,000 | | | $ | 1,780,890 | |
| Illinois Finance Authority Rev. (Christian Homes), 6.125%, 5/15/27 | | | 2,680,000 | | | | 2,912,972 | |
| Illinois Finance Authority Rev. (Evangelical Retirement Homes of Greater Chicago, Inc.), 7.25%, 2/15/45 | | | 3,600,000 | | | | 3,863,232 | |
| Illinois Finance Authority Rev. (Franciscan Communities, Inc.), “A”, 5.5%, 5/15/27 | | | 1,600,000 | | | | 1,656,816 | |
| Illinois Finance Authority Rev. (Franciscan Communities, Inc.), “A”, 5.5%, 5/15/37 | | | 8,015,000 | | | | 8,244,469 | |
| Illinois Finance Authority Rev. (Franciscan Communities, Inc.), “A”, 4.75%, 5/15/33 | | | 2,745,000 | | | | 2,819,746 | |
| Illinois Finance Authority Rev. (Franciscan Communities, Inc.), “A”, 5.125%, 5/15/43 | | | 3,410,000 | | | | 3,508,992 | |
| Illinois Finance Authority Rev. (Friendship Village), “A”, 5.375%, 2/15/25 | | | 4,270,000 | | | | 4,271,110 | |
| Illinois Finance Authority Rev. (KishHealth Systems Obligated Group), 5.75%, 10/01/28 | | | 3,770,000 | | | | 4,257,536 | |
| Illinois Finance Authority Rev. (Lutheran Home & Services), 5.5%, 5/15/27 | | | 680,000 | | | | 735,828 | |
| Illinois Finance Authority Rev. (Lutheran Home & Services), 5.625%, 5/15/42 | | | 3,505,000 | | | | 3,720,277 | |
| Illinois Finance Authority Rev. (Montgomery Place), “A”, 5.75%, 5/15/38 | | | 1,730,000 | | | | 1,747,110 | |
| Illinois Finance Authority Rev. (OSF Healthcare), “A”, 7%, 11/15/29 (Prerefunded 5/15/19) | | | 3,025,000 | | | | 3,619,080 | |
| Illinois Finance Authority Rev. (OSF Healthcare), “A”, 7.125%, 11/15/37 (Prerefunded 5/15/19) | | | 2,555,000 | | | | 3,067,124 | |
| Illinois Finance Authority Rev. (Presence Health Obligated Group), 6.125%, 5/15/25 (Prerefunded 5/15/19) | | | 75,000 | | | | 87,552 | |
| Illinois Finance Authority Rev. (Presence Health Obligated Group), Unrefunded, 6.125%, 5/15/25 | | | 2,545,000 | | | | 2,858,442 | |
| Illinois Finance Authority Rev. (Provena Health), “A”, 6%, 5/01/28 | | | 4,125,000 | | | | 4,781,370 | |
| Illinois Finance Authority Rev. (Provena Health), “A”, 7.75%, 8/15/34 | | | 3,865,000 | | | | 4,677,887 | |
| Illinois Finance Authority Rev. (Rehabilitation Institute of Chicago), “A”, 6%, 7/01/43 | | | 1,305,000 | | | | 1,560,858 | |
| Illinois Finance Authority Rev. (Roosevelt University Project), 6.25%, 4/01/29 | | | 6,045,000 | | | | 6,700,822 | |
| Illinois Finance Authority Rev. (Silver Cross Hospital & Medical Centers), 6.875%, 8/15/38 (Prerefunded 8/15/19) | | | 1,500,000 | | | | 1,811,970 | |
| Illinois Finance Authority Rev. (Silver Cross Hospital & Medical Centers), 7%, 8/15/44 (Prerefunded 8/15/19) | | | 2,545,000 | | | | 3,085,380 | |
33
Portfolio of Investments – continued
| | | | | | | | |
| Issuer | | Shares/Par | | | Value ($) | |
| Municipal Bonds - continued | | | | | | | | |
| Illinois - continued | | | | | | | | |
| Illinois Finance Authority Rev. (Smith Village), “A”, 6.125%, 11/15/25 | | $ | 1,195,000 | | | $ | 1,204,799 | |
| Illinois Finance Authority Rev. (Smith Village), “A”, 6.25%, 11/15/35 | | | 2,195,000 | | | | 2,206,392 | |
| Illinois Finance Authority Rev. (The Clare at Water Tower), “A-6”, 6%, 5/15/28 (a)(d) | | | 1,057,000 | | | | 11 | |
| Illinois Finance Authority Rev. (The Clare at Water Tower), Capital Appreciation, “B”, 0%, 5/15/50 (a)(d) | | | 453,000 | | | | 5 | |
| Illinois Finance Authority Student Housing Rev. (Illinois State University), 6.75%, 4/01/31 | | | 1,875,000 | | | | 2,148,488 | |
| Illinois Finance Authority Student Housing Rev. (Northern Illinois University Project), 6.625%, 10/01/31 | | | 5,785,000 | | | | 6,665,651 | |
| Illinois Railsplitter Tobacco Settlement Authority, 5.5%, 6/01/23 | | | 560,000 | | | | 662,693 | |
| Illinois Railsplitter Tobacco Settlement Authority, 6.25%, 6/01/24 | | | 3,110,000 | | | | 3,171,143 | |
| Illinois Railsplitter Tobacco Settlement Authority, 6%, 6/01/28 | | | 14,375,000 | | | | 17,300,744 | |
| Illinois Toll Highway Authority Rev., “B”, 5.5%, 1/01/33 | | | 4,355,000 | | | | 4,750,782 | |
| Illinois Toll Highway Authority Rev., “C”, 5%, 1/01/37 | | | 7,500,000 | | | | 8,660,025 | |
| Lincolnshire, IL, Special Service Area No. 1 (Sedgebrook Project), 6.25%, 3/01/34 | | | 2,855,000 | | | | 2,882,237 | |
| Romeoville, IL, Rev. (Lewis University Project), “A”, 5%, 10/01/42 | | | 1,450,000 | | | | 1,608,514 | |
| State of Illinois, NATL, 5%, 1/01/19 | | | 1,575,000 | | | | 1,579,646 | |
| Upper Illinois River Valley Development Authority (Pleasant View Lutheran Home), 7.25%, 11/15/40 | | | 1,080,000 | | | | 1,159,996 | |
| Upper Illinois River Valley Development Authority (Pleasant View Lutheran Home), 7.375%, 11/15/45 | | | 1,250,000 | | | | 1,341,200 | |
| | | | | | | | |
| | | | | | | $ | 236,801,166 | |
| Indiana - 2.6% | | | | | | | | |
| Carmel, IN, Rev. (Barrington of Carmel Project), “A”, 7.125%, 11/15/42 | | $ | 3,000,000 | | | $ | 3,387,060 | |
| Indiana Economic Development Finance Authority Rev. (Republic Services, Inc. Project), 0.58%, 12/01/37 (Put Date 3/01/16) | | | 8,000,000 | | | | 8,000,000 | |
| Indiana Finance Authority Rev. (I-69 Section 5 Project), 5.25%, 9/01/34 | | | 3,205,000 | | | | 3,612,804 | |
| Indiana Finance Authority Rev. (I-69 Section 5 Project), 5.25%, 9/01/40 | | | 3,005,000 | | | | 3,310,098 | |
| Indiana Finance Authority Rev. (Marquette Project), 4.75%, 3/01/32 | | | 4,790,000 | | | | 5,003,347 | |
| Indiana Finance Authority Rev. (Marquette Project), 5%, 3/01/39 | | | 1,215,000 | | | | 1,286,770 | |
| Indiana Finance Authority Rev. (Marquette Project), “A”, 5%, 3/01/30 | | | 460,000 | | | | 511,414 | |
| Indiana Finance Authority Rev. (Marquette Project), “A”, 5%, 3/01/39 | | | 1,155,000 | | | | 1,245,899 | |
34
Portfolio of Investments – continued
| | | | | | | | |
| Issuer | | Shares/Par | | | Value ($) | |
| Municipal Bonds - continued | | | | | | | | |
| Indiana - continued | | | | | | | | |
| Indiana Finance Authority Rev. (Ohio River Bridges East End Crossing Project), “A”, 5%, 7/01/35 | | $ | 2,095,000 | | | $ | 2,300,226 | |
| Indiana Finance Authority Rev. (Ohio River Bridges East End Crossing Project), “A”, 5%, 7/01/40 | | | 5,350,000 | | | | 5,794,050 | |
| Indiana Finance Authority Rev. (Ohio River Bridges East End Crossing Project), “A”, 5%, 7/01/44 | | | 3,260,000 | | | | 3,526,179 | |
| Indiana Finance Authority Rev. (Ohio River Bridges East End Crossing Project), “A”, 5%, 7/01/48 | | | 4,020,000 | | | | 4,329,339 | |
| Indiana Finance Authority Rev. (Ohio River Bridges East End Crossing Project), “B”, 5%, 1/01/19 | | | 2,540,000 | | | | 2,633,599 | |
| Indiana Health & Educational Facilities Finance Authority Hospital Rev. (Clarian Health), “B”, 5%, 2/15/33 | | | 2,470,000 | | | | 2,476,274 | |
| Indiana Municipal Power Agency, Power Supply System Rev., “A”, 5%, 1/01/36 | | | 4,985,000 | | | | 5,881,353 | |
| Indiana Municipal Power Agency, Power Supply System Rev., “A”, 5%, 1/01/37 | | | 8,700,000 | | | | 10,221,717 | |
| Knox County, IN, Economic Development Rev. (Good Samaritan Hospital), “A”, 5%, 4/01/42 | | | 1,430,000 | | | | 1,518,703 | |
| Richmond, IN, Hospital Authority Rev. (Reid Hospital & Health Center Services), “A”, 6.625%, 1/01/39 (Prerefunded 1/01/19) | | | 4,760,000 | | | | 5,526,170 | |
| Terre Haute, IN, Rev. (Westminster Village), 6%, 8/01/39 | | | 3,600,000 | | | | 3,665,844 | |
| University of Southern Indiana Rev. (Student Fee), “J”, ASSD GTY, 5.75%, 10/01/28 | | | 1,445,000 | | | | 1,670,680 | |
| Valparaiso, IN, Exempt Facilities Rev. (Pratt Paper LLC Project), 6.75%, 1/01/34 | | | 4,370,000 | | | | 5,351,852 | |
| Valparaiso, IN, Exempt Facilities Rev. (Pratt Paper LLC Project), 7%, 1/01/44 | | | 10,875,000 | | | | 13,403,546 | |
| | | | | | | | |
| | | | | | | $ | 94,656,924 | |
| Iowa - 0.8% | | | | | | | | |
| Altoona, IA, Urban Renewal Tax Increment Rev., 6%, 6/01/43 | | $ | 3,000,000 | �� | | $ | 3,222,810 | |
| Iowa Finance Authority Health Facilities Rev. (UnityPoint Health), “C”, 5%, 2/15/30 | | | 800,000 | | | | 932,864 | |
| Iowa Finance Authority Health Facilities Rev. (UnityPoint Health), “C”, 5%, 2/15/31 | | | 1,480,000 | | | | 1,715,364 | |
| Iowa Finance Authority Health Facilities Rev. (UnityPoint Health), “C”, 5%, 2/15/32 | | | 715,000 | | | | 825,360 | |
| Iowa Finance Authority Midwestern Disaster Area Rev. (Iowa Fertilizer Co.), 5%, 12/01/19 | | | 1,455,000 | | | | 1,522,570 | |
| Iowa Finance Authority, Health Care Facilities Rev. (Care Initiatives), “A”, 5.5%, 7/01/21 | | | 1,530,000 | | | | 1,547,978 | |
| Iowa Finance Authority, Health Care Facilities Rev. (Care Initiatives), “A”, 5.5%, 7/01/25 | | | 2,495,000 | | | | 2,521,721 | |
35
Portfolio of Investments – continued
| | | | | | | | |
| Issuer | | Shares/Par | | | Value ($) | |
| Municipal Bonds - continued | | | | | | | | |
| Iowa - continued | | | | | | | | |
| Iowa Student Loan Liquidity Corp. Rev., “A-1”, 4.625%, 12/01/19 | | $ | 2,640,000 | | | $ | 2,762,602 | |
| Iowa Student Loan Liquidity Corp. Rev., “A-1”, 4.875%, 12/01/20 | | | 490,000 | | | | 512,697 | |
| Iowa Student Loan Liquidity Corp. Rev., “A-2”, 5.5%, 12/01/25 | | | 1,190,000 | | | | 1,283,879 | |
| Iowa Student Loan Liquidity Corp. Rev., “A-2”, 5.6%, 12/01/26 | | | 1,205,000 | | | | 1,300,412 | |
| Iowa Student Loan Liquidity Corp. Rev., “A-2”, 5.7%, 12/01/27 | | | 140,000 | | | | 150,255 | |
| Iowa Student Loan Liquidity Corp. Rev., “A-2”, 5.75%, 12/01/28 | | | 2,430,000 | | | | 2,607,050 | |
| Iowa Tobacco Settlement Authority, Tobacco Settlement Rev., Asset Backed, “B”, 5.6%, 6/01/34 | | | 4,295,000 | | | | 4,297,921 | |
| Scott County, IA, Rev. (Christian Retirement Homes, Inc.), 5.25%, 11/15/21 | | | 2,410,000 | | | | 2,451,524 | |
| | | | | | | | |
| | | | | | | $ | 27,655,007 | |
| Kansas - 0.7% | | | | | | | | |
| Atchison, KS, Hospital Rev. (Atchison Hospital Assn.), “A”, 6.75%, 9/01/30 | | $ | 2,600,000 | | | $ | 2,733,926 | |
| Coffeyville, KS, Electric Utility System Rev., “B”, NATL, 5%, 6/01/38 | | | 3,600,000 | | | | 3,872,232 | |
| Coffeyville, KS, Electric Utility System Rev., “B”, NATL, 5%, 6/01/42 | | | 1,500,000 | | | | 1,596,105 | |
| Lenexa, KS, Health Care Facilities Rev. (Lakeview Village, Inc.), 5.375%, 5/15/27 | | | 1,185,000 | | | | 1,205,809 | |
| Lenexa, KS, Health Care Facilities Rev. (Lakeview Village, Inc.), 7.125%, 5/15/29 | | | 1,555,000 | | | | 1,727,310 | |
| Lenexa, KS, Health Care Facilities Rev. (Lakeview Village, Inc.), 5.5%, 5/15/39 | | | 2,325,000 | | | | 2,356,388 | |
| Overland Park, KS, Special Assessment (Tallgrass Creek), 4.85%, 9/01/16 | | | 155,000 | | | | 156,321 | |
| Overland Park, KS, Special Assessment (Tallgrass Creek), 5.125%, 9/01/28 | | | 3,848,000 | | | | 3,883,863 | |
| Wichita, KS, Health Care Facilities Rev. (Presbyterian Manors, Inc.), “A”, 6.375%, 5/15/43 | | | 4,165,000 | | | | 4,560,300 | |
| Wichita, KS, Health Care Facilities Rev. (Presbyterian Manors, Inc.), “IV-A”, 5%, 5/15/29 | | | 500,000 | | | | 513,550 | |
| Wichita, KS, Health Care Facilities Rev. (Presbyterian Manors, Inc.), “IV-B2”, 3.375%, 11/15/20 | | | 635,000 | | | | 635,241 | |
| Wyandotte County/Kansas City, KS, Unified Government Special Obligation Rev., Capital Appreciation, “B”, 0%, 6/01/21 | | | 720,000 | | | | 540,108 | |
| Wyandotte County/Kansas City, KS, Unified Government Utility System Improvement Rev., “A”, 5%, 9/01/44 | | | 1,740,000 | | | | 1,967,957 | |
| | | | | | | | |
| | | | | | | $ | 25,749,110 | |
| Kentucky - 1.0% | | | | | | | | |
| Glasgow, KY, Healthcare Rev. (TJ Samson Community Hospital), 6.375%, 2/01/35 | | $ | 2,840,000 | | | $ | 3,284,091 | |
36
Portfolio of Investments – continued
| | | | | | | | |
| Issuer | | Shares/Par | | | Value ($) | |
| Municipal Bonds - continued | | | | | | | | |
| Kentucky - continued | | | | | | | | |
| Kentucky Economic Development Finance Authority Health Care Rev. (Masonic Homes of Kentucky, Inc.), 5.375%, 11/15/42 | | $ | 2,915,000 | | | $ | 2,967,412 | |
| Kentucky Economic Development Finance Authority Health Care Rev. (Masonic Homes of Kentucky, Inc.), 5.5%, 11/15/45 | | | 1,325,000 | | | | 1,356,535 | |
| Kentucky Economic Development Finance Authority Rev. (Masonic Home Independent Living II), 7.25%, 5/15/41 | | | 3,000,000 | | | | 3,520,170 | |
| Kentucky Economic Development Finance Authority Rev. (Masonic Home Independent Living II), 7.375%, 5/15/46 | | | 1,495,000 | | | | 1,762,366 | |
| Kentucky Economic Development Finance Authority, Hospital Facilities Rev. (Baptist Healthcare System), “A”, 5.625%, 8/15/27 | | | 815,000 | | | | 894,943 | |
| Kentucky Economic Development Finance Authority, Hospital Facilities Rev. (Owensboro Medical Health System), “A”, 6%, 6/01/30 | | | 710,000 | | | | 815,329 | |
| Kentucky Economic Development Finance Authority, Hospital Facilities Rev. (Owensboro Medical Health System), “A”, 6.375%, 6/01/40 | | | 6,255,000 | | | | 7,214,892 | |
| Kentucky Economic Development Finance Authority, Hospital Facilities Rev. (Owensboro Medical Health System), “A”, 6.5%, 3/01/45 | | | 1,955,000 | | | | 2,260,625 | |
| Louisville & Jefferson County, KY, Metropolitan Government Healthcare Systems Rev. (Norton Healthcare, Inc.), 5.25%, 10/01/36 | | | 5,180,000 | | | | 5,283,652 | |
| Owen County, KY, Waterworks System Rev. (American Water Co. Project), “A”, 6.25%, 6/01/39 | | | 1,635,000 | | | | 1,846,716 | |
| Owen County, KY, Waterworks System Rev. (American Water Co. Project), “B”, 5.625%, 9/01/39 | | | 1,830,000 | | | | 2,002,679 | |
| University of Kentucky, General Receipts, “A”, 5%, 4/01/36 | | | 1,460,000 | | | | 1,712,916 | |
| | | | | | | | |
| | | | | | | $ | 34,922,326 | |
| Louisiana - 2.2% | | | | | | | | |
| Jefferson Parish, LA, Hospital Service District No. 1 (West Jefferson Medical Center), “A”, 6%, 1/01/39 (Prerefunded 1/01/21) | | $ | 1,500,000 | | | $ | 1,838,295 | |
| Jefferson Parish, LA, Hospital Service District No. 2 (East Jefferson General Hospital), 6.25%, 7/01/31 | | | 3,200,000 | | | | 3,644,960 | |
| Jefferson Parish, LA, Hospital Service District No. 2 (East Jefferson General Hospital), 6.375%, 7/01/41 | | | 2,000,000 | | | | 2,287,940 | |
| Louisiana Citizens Property Insurance Corp. Rev., AGM, 5%, 6/01/21 | | | 1,705,000 | | | | 2,012,599 | |
| Louisiana Citizens Property Insurance Corp. Rev., AGM, 5%, 6/01/22 | | | 1,365,000 | | | | 1,642,778 | |
| Louisiana Local Government, Environmental Facilities & Community Development Authority Rev. (CDF Healthcare), “A”, 5.625%, 6/01/45 | | | 6,355,000 | | | | 6,471,106 | |
37
Portfolio of Investments – continued
| | | | | | | | |
| Issuer | | Shares/Par | | | Value ($) | |
| Municipal Bonds - continued | | | | | | | | |
| Louisiana - continued | | | | | | | | |
| Louisiana Local Government, Environmental Facilities & Community Development Authority Rev. (CDF Healthcare), “A”, 7%, 6/01/36 (Prerefunded 6/01/16) | | $ | 1,530,000 | | | $ | 1,577,216 | |
| Louisiana Local Government, Environmental Facilities & Community Development Authority Rev. (CDF Healthcare), “C”, 7%, 6/01/36 (Prerefunded 6/01/16) | | | 1,225,000 | | | | 1,250,590 | |
| Louisiana Local Government, Environmental Facilities & Community Development Authority Rev. (St. James Place of Baton Rouge Project), “A”, 6%, 11/15/35 | | | 1,145,000 | | | | 1,164,373 | |
| Louisiana Local Government, Environmental Facilities & Community Development Authority Rev. (St. James Place of Baton Rouge Project), “A”, 6.25%, 11/15/45 | | | 4,435,000 | | | | 4,518,999 | |
| Louisiana Local Government, Environmental Facilities & Community Development Authority Rev. (Westlake Chemical), 6.75%, 11/01/32 | | | 5,000,000 | | | | 5,407,500 | |
| Louisiana Local Government, Environmental Facilities & Community Development Authority Rev. (Westlake Chemical), “A”, 6.5%, 8/01/29 | | | 2,990,000 | | | | 3,537,200 | |
| Louisiana Local Government, Environmental Facilities & Community Development Authority Rev. (Westlake Chemical), “A-2”, 6.5%, 11/01/35 | | | 4,000,000 | | | | 4,742,600 | |
| Louisiana Local Government, Environmental Facilities & Community Development Authority Rev. (Westside Rehab Center Project), “A”, 6.85%, 10/01/36 | | | 6,995,000 | | | | 7,211,565 | |
| Louisiana Public Facilities Authority Hospital Rev. (Lake Charles Memorial Hospital), 6.375%, 12/01/34 | | | 6,470,000 | | | | 7,041,430 | |
| New Orleans LA, Aviation Board General Airport Rev. (North Terminal Project), “B”, 5%, 1/01/40 | | | 2,675,000 | | | | 2,969,330 | |
| New Orleans LA, Aviation Board General Airport Rev. (North Terminal Project), “B”, 5%, 1/01/45 | | | 1,150,000 | | | | 1,270,049 | |
| New Orleans, LA, Aviation Board Gulf Opportunity Zone CFC Rev. (Consolidated Rental Car), “A”, 6.25%, 1/01/30 | | | 2,050,000 | | | | 2,291,101 | |
| New Orleans, LA, Sewerage Service Rev., 5%, 6/01/40 | | | 655,000 | | | | 739,901 | |
| New Orleans, LA, Sewerage Service Rev., 5%, 12/01/40 | | | 875,000 | | | | 993,554 | |
| New Orleans, LA, Sewerage Service Rev., 5%, 6/01/45 | | | 2,405,000 | | | | 2,704,447 | |
| New Orleans, LA, Sewerage Service Rev., 5%, 12/01/45 | | | 1,095,000 | | | | 1,233,583 | |
| Shreveport, LA, Water and Sewer Rev., AGM, 5%, 12/01/30 | | | 3,000,000 | | | | 3,598,560 | |
| Shreveport, LA, Water and Sewer Rev., AGM, 5%, 12/01/34 | | | 930,000 | | | | 1,095,224 | |
| St. Charles Parish, LA, Gulf Zone Opportunity Zone Rev. (Valero Energy Corp.), 4%, 12/01/40 (Put Date 6/01/22) | | | 8,660,000 | | | | 9,338,338 | |
| | | | | | | | |
| | | | | | | $ | 80,583,238 | |
38
Portfolio of Investments – continued
| | | | | | | | |
| Issuer | | Shares/Par | | | Value ($) | |
| Municipal Bonds - continued | | | | | | | | |
| Maine - 0.4% | | | | | | | | |
| Maine Finance Authority Solid Waste Disposal Rev. (Casella Waste Systems, Inc.), 6.25%, 1/01/25 (Put Date 2/01/17) | | $ | 3,985,000 | | | $ | 4,089,327 | |
| State of Maine, “B”, 5%, 6/01/21 | | | 9,675,000 | | | | 11,647,442 | |
| | | | | | | | |
| | | | | | | $ | 15,736,769 | |
| Maryland - 0.6% | | | | | | | | |
| Anne Arundel County, MD, Special Obligation (National Business Park-North Project), 6.1%, 7/01/40 | | $ | 1,320,000 | | | $ | 1,399,438 | |
| Anne Arundel County, MD, Special Obligation (VLG South Waugh Chapel Project), 6.25%, 7/01/40 | | | 4,700,000 | | | | 4,983,128 | |
| Baltimore, MD, Special Obligation (East Baltimore Research Park Project), “A”, 7%, 9/01/38 | | | 2,600,000 | | | | 2,779,270 | |
| Maryland Economic Development Corp. Adjustable Mode Rev. Refunding (Constellation Energy Group, Inc. Project), “B”, 2.55%, 12/01/25 (Put Date 6/01/20) | | | 3,155,000 | | | | 3,190,620 | |
| Maryland Economic Development Corp. Rev. (Port America Chesapeake Terminal Project), “B”, 5.375%, 6/01/25 | | | 885,000 | | | | 978,606 | |
| Maryland Health & Higher Educational Facilities Authority Rev. (Charlestown Community), 6.25%, 1/01/41 | | | 2,360,000 | | | | 2,679,591 | |
| State of Maryland, “B”, 4%, 8/01/27 | | | 3,105,000 | | | | 3,531,472 | |
| Westminster, MD, Refunding Rev. (Carroll Lutheran Village, Inc.), 5.125%, 7/01/40 | | | 2,600,000 | | | | 2,749,656 | |
| | | | | | | | |
| | | | | | | $ | 22,291,781 | |
| Massachusetts - 3.0% | | | | | | | | |
| Massachusetts College Building Authority Rev., “A”, 5%, 5/01/31 | | $ | 2,535,000 | | | $ | 3,023,520 | |
| Massachusetts Development Finance Agency Rev. (Adventcare), “A”, 6.75%, 10/15/37 | | | 4,640,000 | | | | 4,792,285 | |
| Massachusetts Development Finance Agency Rev. (Emerson College), 5%, 1/01/21 | | | 685,000 | | | | 786,757 | |
| Massachusetts Development Finance Agency Rev. (Emerson College), 5%, 1/01/22 | | | 685,000 | | | | 799,642 | |
| Massachusetts Development Finance Agency Rev. (Emerson College), 5%, 1/01/23 | | | 510,000 | | | | 600,862 | |
| Massachusetts Development Finance Agency Rev. (Emerson College), 5%, 1/01/24 | | | 1,250,000 | | | | 1,484,175 | |
| Massachusetts Development Finance Agency Rev. (Emerson College), 5%, 1/01/29 | | | 1,450,000 | | | | 1,679,187 | |
| Massachusetts Development Finance Agency Rev. (Emerson College), 5%, 1/01/30 | | | 3,015,000 | | | | 3,463,542 | |
| Massachusetts Development Finance Agency Rev. (Emerson College), 5%, 1/01/31 | | | 835,000 | | | | 955,015 | |
| Massachusetts Development Finance Agency Rev. (Emerson College), 5%, 1/01/35 | | | 9,160,000 | | | | 10,242,162 | |
39
Portfolio of Investments – continued
| | | | | | | | |
| Issuer | | Shares/Par | | | Value ($) | |
| Municipal Bonds - continued | | | | | | | | |
| Massachusetts - continued | | | | | | | | |
| Massachusetts Development Finance Agency Rev. (Linden Ponds, Inc.), “A-1”, 6.25%, 11/15/31 | | $ | 869,621 | | | $ | 842,419 | |
| Massachusetts Development Finance Agency Rev. (Linden Ponds, Inc.), “A-1”, 6.25%, 11/15/39 | | | 218,601 | | | | 210,213 | |
| Massachusetts Development Finance Agency Rev. (Linden Ponds, Inc.), “A-1”, 6.25%, 11/15/46 | | | 525,000 | | | | 502,861 | |
| Massachusetts Development Finance Agency Rev. (Linden Ponds, Inc.), “A-2”, 5.5%, 11/15/46 | | | 58,153 | | | | 49,970 | |
| Massachusetts Development Finance Agency Rev. (Linden Ponds, Inc.), Capital Appreciation, “B”, 0%, 11/15/56 | | | 289,249 | | | | 1,675 | |
| Massachusetts Development Finance Agency Rev. (North Hill Communities), “A”, 6.25%, 11/15/33 | | | 1,350,000 | | | | 1,473,174 | |
| Massachusetts Development Finance Agency Rev. (North Hill Communities), “A”, 6.5%, 11/15/43 | | | 2,080,000 | | | | 2,277,766 | |
| Massachusetts Development Finance Agency Rev. (Sabis International Charter School Issue), 4%, 4/15/20 | | | 105,000 | | | | 112,910 | |
| Massachusetts Development Finance Agency Rev. (Sabis International Charter School Issue), 5%, 4/15/25 | | | 170,000 | | | | 196,586 | |
| Massachusetts Development Finance Agency Rev. (Simmons College), “H”, SYNCORA, 5.25%, 10/01/33 | | | 430,000 | | | | 523,422 | |
| Massachusetts Development Finance Agency Rev. (Simmons College), “K-1”, 5%, 10/01/24 | | | 1,400,000 | | | | 1,671,908 | |
| Massachusetts Development Finance Agency Rev. (Simmons College), “K-1”, 5%, 10/01/25 | | | 800,000 | | | | 961,152 | |
| Massachusetts Development Finance Agency Rev. (UMass Memorial Health Care Obligated Group), “I”, 5%, 7/01/36 | | | 1,685,000 | | | | 1,932,476 | |
| Massachusetts Development Finance Agency Rev. (UMass Memorial Health Care Obligated Group), “I”, 5%, 7/01/46 | | | 485,000 | | | | 549,379 | |
| Massachusetts Development Finance Agency Rev. (Western New England University), 5%, 9/01/28 | | | 960,000 | | | | 1,124,160 | |
| Massachusetts Development Finance Agency, Resource Recovery Rev. (Covanta Energy Project), “A”, 4.875%, 11/01/27 | | | 3,585,000 | | | | 3,620,169 | |
| Massachusetts Development Finance Agency, Resource Recovery Rev. (Covanta Energy Project), “C”, 5.25%, 11/01/42 | | | 11,780,000 | | | | 11,847,617 | |
| Massachusetts Development Finance Agency, Solid Waste Disposal Rev. (Dominion Energy Brayton), 5.75%, 12/01/42 (Prerefunded 5/01/19) | | | 685,000 | | | | 791,586 | |
| Massachusetts Educational Financing Authority, Education Loan Rev, “A”, 4.25%, 1/01/30 | | | 2,030,000 | | | | 2,129,876 | |
| Massachusetts Educational Financing Authority, Education Loan Rev, “A”, 4.25%, 1/01/31 | | | 1,375,000 | | | | 1,433,905 | |
| Massachusetts Educational Financing Authority, Education Loan Rev., “H”, ASSD GTY, 6.35%, 1/01/30 | | | 1,735,000 | | | | 1,824,613 | |
40
Portfolio of Investments – continued
| | | | | | | | |
| Issuer | | Shares/Par | | | Value ($) | |
| Municipal Bonds - continued | | | | | | | | |
| Massachusetts - continued | | | | | | | | |
| Massachusetts Educational Financing Authority, Education Loan Rev., “I-A”, 5.5%, 1/01/22 | | $ | 250,000 | | | $ | 284,570 | |
| Massachusetts Educational Financing Authority, Education Loan Rev., “J”, 4.7%, 7/01/26 | | | 1,730,000 | | | | 1,811,846 | |
| Massachusetts Educational Financing Authority, Education Loan Rev., “J”, 4.9%, 7/01/28 | | | 1,800,000 | | | | 1,890,900 | |
| Massachusetts Health & Educational Facilities Authority Rev. (Harvard University), 5.5%, 11/15/36 (u) | | | 25,000,000 | | | | 28,220,250 | |
| Massachusetts Health & Educational Facilities Authority Rev. (Suffolk University), “A”, 6.25%, 7/01/30 | | | 6,130,000 | | | | 7,056,672 | |
| Massachusetts Housing Finance Agency, Single Family Housing Rev., “169”, 4%, 12/01/29 | | | 1,585,000 | | | | 1,711,420 | |
| Massachusetts Housing Finance Agency, Single Family Housing Rev., “177”, 4%, 6/01/39 | | | 1,325,000 | | | | 1,425,382 | |
| Massachusetts Port Authority Special Facilities Rev. (Conrac Project), “A”, 5.125%, 7/01/41 | | | 340,000 | | | | 375,363 | |
| Massachusetts Port Authority Special Facilities Rev. (Delta Air Lines Project, Inc.), “A”, AMBAC, 5%, 1/01/27 | | | 2,760,000 | | | | 2,768,556 | |
| | | | | | | | |
| | | | | | | $ | 107,449,943 | |
| Michigan - 3.1% | | | | | | | | |
| Detroit, MI, Sewage Disposal System Rev., Senior Lien, “A”, 5.25%, 7/01/39 | | $ | 9,635,000 | | | $ | 10,714,120 | |
| Detroit, MI, Water & Sewerage Department, Senior Lien Sewage Disposal System Rev., “A”, 5%, 7/01/19 | | | 3,270,000 | | | | 3,671,327 | |
| Detroit, MI, Water & Sewerage Department, Senior Lien Sewage Disposal System Rev., “A”, 5%, 7/01/20 | | | 3,275,000 | | | | 3,766,676 | |
| Detroit, MI, Water & Sewerage Department, Senior Lien Sewage Disposal System Rev., “A”, AGM, 5%, 7/01/16 | | | 1,695,000 | | | | 1,726,035 | |
| Detroit, MI, Water & Sewerage Department, Senior Lien Sewage Disposal System Rev., “A”, AGM, 5%, 7/01/39 | | | 3,190,000 | | | | 3,505,332 | |
| Detroit, MI, Water Supply System Rev., Senior Lien, “A”, AGM, 5%, 7/01/23 | | | 1,020,000 | | | | 1,033,127 | |
| Detroit, MI, Water Supply System Rev., Senior Lien, “A”, 5%, 7/01/36 | | | 375,000 | | | | 409,129 | |
| Detroit, MI, Water Supply System Rev., Senior Lien, “A”, 5.25%, 7/01/41 | | | 2,055,000 | | | | 2,249,198 | |
| Detroit, MI, Water Supply System Rev., Senior Lien, “A”, AGM, 5%, 7/01/25 | | | 155,000 | | | | 156,752 | |
| Detroit, MI, Water Supply System Rev., Senior Lien, “C”, 5%, 7/01/41 | | | 535,000 | | | | 578,977 | |
| Grand Valley, MI, State University Rev., 5.5%, 12/01/27 (Prerefunded 12/01/16) | | | 1,015,000 | | | | 1,057,752 | |
41
Portfolio of Investments – continued
| | | | | | | | |
| Issuer | | Shares/Par | | | Value ($) | |
| Municipal Bonds - continued | | | | | | | | |
| Michigan - continued | | | | | | | | |
| Kalamazoo, MI, Economic Development Corp. Rev. (Heritage Community), 5.375%, 5/15/27 | | $ | 750,000 | | | $ | 760,230 | |
| Kalamazoo, MI, Economic Development Corp. Rev. (Heritage Community), 5.5%, 5/15/36 | | | 3,050,000 | | | | 3,084,282 | |
| Michigan Finance Authority (City of Detroit Financial Recovery Income Tax Rev.), “F”, 3.875%, 10/01/23 | | | 635,000 | | | | 682,269 | |
| Michigan Finance Authority (City of Detroit Financial Recovery Income Tax Rev.), “F”, 4%, 10/01/24 | | | 800,000 | | | | 861,296 | |
| Michigan Finance Authority Hospital Rev. (Beaumont Health Credit Group), 5%, 11/01/44 | | | 8,675,000 | | | | 9,740,811 | |
| Michigan Finance Authority Hospital Rev. (Beaumont Health Credit Group), “A”, 5%, 8/01/33 | | | 1,105,000 | | | | 1,271,612 | |
| Michigan Finance Authority Hospital Rev. (Sparrow Obligated Group), 5%, 11/15/45 | | | 7,000,000 | | | | 7,962,780 | |
| Michigan Finance Authority Local Government Loan Program Rev. (Detroit Water and Sewerage Department Sewage Disposal System Rev. Refunding Second Lien Local Project), “C”, 5%, 7/01/33 | | | 875,000 | | | | 1,000,694 | |
| Michigan Finance Authority Local Government Loan Program Rev. (Detroit Water and Sewerage Department Sewage Disposal System Rev. Refunding Second Lien Local Project), “C”, 5%, 7/01/34 | | | 885,000 | | | | 1,008,272 | |
| Michigan Finance Authority Local Government Loan Program Rev. (Detroit Water and Sewerage Department Sewage Disposal System Rev. Refunding Second Lien Local Project), “C”, 5%, 7/01/34 | | | 2,070,000 | | | | 2,358,330 | |
| Michigan Finance Authority Local Government Loan Program Rev. (Detroit Water and Sewerage Department Sewage Disposal System Rev. Refunding Second Lien Local Project), “C”, 5%, 7/01/35 | | | 1,355,000 | | | | 1,537,857 | |
| Michigan Finance Authority Rev. (Detroit Water and Sewerage Department), “C-1”, 5%, 7/01/44 | | | 2,375,000 | | | | 2,572,576 | |
| Michigan Finance Authority Rev. (Detroit Water and Sewerage Department), “C-2”, 5%, 7/01/44 | | | 1,365,000 | | | | 1,452,729 | |
| Michigan Finance Authority Rev. (Detroit Water and Sewerage Department), “C-6”, 5%, 7/01/33 | | | 2,280,000 | | | | 2,600,705 | |
| Michigan Hospital Finance Authority Rev. (Henry Ford Health System), 5.75%, 11/15/39 | | | 4,405,000 | | | | 5,029,849 | |
| Michigan Housing Development Authority, “A”, 4%, 6/01/46 | | | 7,000,000 | | | | 7,627,900 | |
| Michigan Strategic Fund (Waste Management, Inc.), 1.5%, 8/01/27 (Put Date 8/01/17) | | | 4,505,000 | | | | 4,514,461 | |
| Michigan Strategic Fund Ltd. Obligation Rev. (Detroit Edison Co.), 5.625%, 7/01/20 | | | 1,050,000 | | | | 1,233,162 | |
42
Portfolio of Investments – continued
| | | | | | | | |
| Issuer | | Shares/Par | | | Value ($) | |
| Municipal Bonds - continued | | | | | | | | |
| Michigan - continued | | | | | | | | |
| Royal Oak, MI, Hospital Finance Authority Rev. (William Beaumont Hospital), “V”, 8.25%, 9/01/39 (Prerefunded 9/01/18) | | $ | 6,945,000 | | | $ | 8,262,050 | |
| Wayne County, MI, Airport Authority Rev. (Detroit Metropolitan Wayne County Airport), “B”, 5%, 12/01/44 | | | 2,215,000 | | | | 2,462,061 | |
| Wayne County, MI, Airport Authority Rev. (Detroit Metropolitan Wayne County Airport), “B”, BAM, 5%, 12/01/39 | | | 750,000 | | | | 853,808 | |
| Wayne County, MI, Airport Authority Rev. (Detroit Metropolitan Wayne County Airport), “C”, 5%, 12/01/39 | | | 575,000 | | | | 626,813 | |
| Wayne County, MI, Airport Authority Rev. (Detroit Metropolitan Wayne County Airport), “C”, 5%, 12/01/44 | | | 1,240,000 | | | | 1,340,130 | |
| Wayne County, MI, Airport Authority Rev. (Detroit Metropolitan Wayne County Airport), “D”, AGM, 5%, 12/01/40 | | | 8,165,000 | | | | 9,374,481 | |
| Western Michigan University Rev., “A”, 5%, 11/15/40 | | | 1,250,000 | | | | 1,424,213 | |
| Western Michigan University Rev., “A”, 5%, 11/15/45 | | | 1,850,000 | | | | 2,091,980 | |
| | | | | | | | |
| | | | | | | $ | 110,603,776 | |
| Minnesota - 0.4% | | | | | | | | |
| Anoka County, MN, Charter School Lease Rev. (Spectrum Building Co.), “A”, 5%, 6/01/43 | | $ | 1,000,000 | | | $ | 1,023,930 | |
| Brooklyn Park, MN, Charter School Lease Rev. (Athlos Leadership Academic Project), “A”, 5.25%, 7/01/30 | | | 410,000 | | | | 416,995 | |
| Brooklyn Park, MN, Charter School Lease Rev. (Athlos Leadership Academic Project), “A”, 5.5%, 7/01/35 | | | 540,000 | | | | 550,309 | |
| Brooklyn Park, MN, Charter School Lease Rev. (Athlos Leadership Academic Project), “A”, 5.5%, 7/01/40 | | | 610,000 | | | | 611,751 | |
| Brooklyn Park, MN, Charter School Lease Rev. (Athlos Leadership Academic Project), “A”, 5.75%, 7/01/46 | | | 1,145,000 | | | | 1,160,206 | |
| Deephaven, MN, Charter School Lease Rev. (Eagle Ridge Academy Project), “A”, 5.25%, 7/01/40 | | | 500,000 | | | | 516,490 | |
| Deephaven, MN, Charter School Lease Rev. (Eagle Ridge Academy Project), “A”, 5.5%, 7/01/50 | | | 3,000,000 | | | | 3,100,110 | |
| Minnesota Housing Finance Agency, Residential Housing, “A”, 4%, 1/01/41 | | | 1,875,000 | | | | 2,030,194 | |
| St. Paul, MN, Housing & Redevelopment Authority Charter School Lease Rev. (Nova Classical Academy), “A”, 6.375%, 9/01/31 | | | 630,000 | | | | 717,942 | |
| St. Paul, MN, Housing & Redevelopment Authority Charter School Lease Rev. (Nova Classical Academy), “A”, 6.625%, 9/01/42 | | | 1,260,000 | | | | 1,427,668 | |
| St. Paul, MN, Port Authority Rev. (Energy Park Utility Co. Project), 5.45%, 8/01/28 | | | 250,000 | | | | 264,275 | |
| St. Paul, MN, Port Authority Rev. (Energy Park Utility Co. Project), 5.7%, 8/01/36 | | | 1,250,000 | | | | 1,318,725 | |
| | | | | | | | |
| | | | | | | $ | 13,138,595 | |
43
Portfolio of Investments – continued
| | | | | | | | |
| Issuer | | Shares/Par | | | Value ($) | |
| Municipal Bonds - continued | | | | | | | | |
| Mississippi - 0.4% | | | | | | | | |
| Jackson County, MS, Utility Authority Rev. (Water and Wastewater Treatment System), AGM, 5%, 9/01/40 | | $ | 2,345,000 | | | $ | 2,666,218 | |
| Mississippi Development Bank Special Obligation (Greenville, MS Project), 5%, 4/01/27 | | | 1,275,000 | | | | 1,322,889 | |
| Mississippi Home Corp. Rev. (Kirkwood Apartments Project), 6.8%, 11/01/37 (d)(q) | | | 3,660,000 | | | | 2,539,345 | |
| Mississippi Hospital Equipment & Facilities Authority Rev. (Baptist Memorial Healthcare), “A”, 5%, 9/01/22 | | | 1,845,000 | | | | 2,151,990 | |
| Mississippi Hospital Equipment & Facilities Authority Rev. (Baptist Memorial Healthcare), “A”, 5%, 9/01/23 | | | 4,810,000 | | | | 5,654,588 | |
| | | | | | | | |
| | | | | | | $ | 14,335,030 | |
| Missouri - 1.0% | | | | | | | | |
| Dardenne, MO, Town Square Transportation Development District, “A”, 5%, 5/01/26 (d)(q) | | $ | 2,495,000 | | | $ | 898,499 | |
| Grundy County, MO, Industrial Development Authority Health Facilities Rev. (Wright Memorial Hospital), 6.125%, 9/01/25 | | | 1,070,000 | | | | 1,152,807 | |
| Grundy County, MO, Industrial Development Authority Health Facilities Rev. (Wright Memorial Hospital), 6.75%, 9/01/34 | | | 1,590,000 | | | | 1,727,010 | |
| Missouri Health & Educational Facilities Authority Rev. (A.T. Still University Health Services), 5%, 10/01/39 | | | 465,000 | | | | 529,319 | |
| Missouri Health & Educational Facilities Authority Rev. (Bethesda Health Group, Inc.), 5%, 8/01/40 | | | 1,650,000 | | | | 1,766,028 | |
| Missouri Health & Educational Facilities Authority Rev. (Bethesda Health Group, Inc.), 5%, 8/01/45 | | | 2,300,000 | | | | 2,449,086 | |
| Missouri Health & Educational Facilities Authority Rev. (Lutheran Senior Service Projects), “A”, 5%, 2/01/35 | | | 3,190,000 | | | | 3,493,592 | |
| Missouri Health & Educational Facilities Authority Rev. (Lutheran Senior Service Projects), “A”, 5%, 2/01/44 | | | 795,000 | | | | 860,317 | |
| Missouri Health & Educational Facilities Authority Rev. (SSM Health Care), “A”, 5%, 6/01/31 | | | 1,735,000 | | | | 2,038,191 | |
| Missouri Health & Educational Facilities Authority, Senior Living Facilities Rev. (Lutheran Senior Services Project), “A”, 5%, 2/01/36 | | | 495,000 | | | | 551,034 | |
| Missouri Health & Educational Facilities Authority, Senior Living Facilities Rev. (Lutheran Senior Services Project), “A”, 5%, 2/01/46 | | | 1,155,000 | | | | 1,266,446 | |
| Missouri Housing Development Commission, Single Family Mortgage Rev. (First Place Homeownership Loan Program), “A”, GNMA, 3.75%, 5/01/38 | | | 1,405,000 | | | | 1,516,740 | |
| Missouri Housing Development Commission, Single Family Mortgage Rev. (Special Home Ownership Loan Program), “B”, GNMA, 4%, 11/01/40 | | | 1,350,000 | | | | 1,456,164 | |
44
Portfolio of Investments – continued
| | | | | | | | |
| Issuer | | Shares/Par | | | Value ($) | |
| Municipal Bonds - continued | | | | | | | | |
| Missouri - continued | | | | | | | | |
| Osage Beach, MO, Tax Increment Rev. (Prewitts), 4.8%, 5/01/16 | | $ | 375,000 | | | $ | 375,116 | |
| Osage Beach, MO, Tax Increment Rev. (Prewitts), 5%, 5/01/23 | | | 1,500,000 | | | | 1,494,750 | |
| St. Louis County, MO, Industrial Development Authority Health Facilities Rev. (Nazareth Living Center), “A”, 5%, 8/15/30 | | | 695,000 | | | | 727,755 | |
| St. Louis County, MO, Industrial Development Authority Health Facilities Rev. (Nazareth Living Center), “A”, 5%, 8/15/35 | | | 490,000 | | | | 505,376 | |
| St. Louis County, MO, Industrial Development Authority Health Facilities Rev. (Nazareth Living Center), “A”, 5.125%, 8/15/45 | | | 1,320,000 | | | | 1,348,446 | |
| St. Louis County, MO, Industrial Development Authority Health Facilities Rev. (Nazareth Living Center), “B-2”, 3.85%, 8/15/20 | | | 270,000 | | | | 270,572 | |
| St. Louis County, MO, Industrial Development Authority Senior Living Facilities Rev. (St. Andrews Resources for Seniors Obligated Group), “B”, 3.125%, 12/01/19 | | | 3,195,000 | | | | 3,203,115 | |
| St. Louis, MO, Industrial Development Authority Rev. (St. Andrew’s Resources for Seniors Obligated Group), “A”, 5.125%, 12/01/45 | | | 3,620,000 | | | | 3,694,065 | |
| St. Louis, MO, Land Clearance Redevelopment Authority, Facilities Improvement Special Rev. (Kiel Opera House), “B”, 7%, 9/01/35 | | | 4,320,000 | | | | 4,503,557 | |
| | | | | | | | |
| | | | | | | $ | 35,827,985 | |
| Nebraska - 0.1% | | | | | | | | |
| Nebraska Investment Finance Authority, Single Family Housing Rev., “A”, 3%, 3/01/44 | | $ | 1,080,000 | | | $ | 1,105,402 | |
| Nebraska Investment Finance Authority, Single Family Housing Rev., “A”, 4%, 9/01/44 | | | 2,230,000 | | | | 2,399,435 | |
| | | | | | | | |
| | | | | | | $ | 3,504,837 | |
| Nevada - 0.1% | | | | | | | | |
| Director of the State of Nevada, Department of Business and Industry, Charter School Lease Rev. (Somerset Academy), “A”, 5%, 12/15/35 | | $ | 1,715,000 | | | $ | 1,747,036 | |
| Director of the State of Nevada, Department of Business and Industry, Charter School Lease Rev. (Somerset Academy), “A”, 5.125%, 12/15/45 | | | 2,205,000 | | | | 2,221,868 | |
| | | | | | | | |
| | | | | | | $ | 3,968,904 | |
| New Hampshire - 0.9% | | | | | | | | |
| New Hampshire Business Finance Authority Rev. (Elliot Hospital Obligated Group), “A”, 6%, 10/01/27 | | $ | 4,935,000 | | | $ | 5,558,044 | |
| New Hampshire Business Finance Authority Rev. (Huggins Hospital), 6.875%, 10/01/39 | | | 805,000 | | | | 861,117 | |
| New Hampshire Business Finance Authority, Solid Waste Disposal Rev. (Casella Waste Systems, Inc. Project), 4%, 4/01/29 (Put Date 10/01/19) | | | 985,000 | | | | 997,214 | |
45
Portfolio of Investments – continued
| | | | | | | | |
| Issuer | | Shares/Par | | | Value ($) | |
| Municipal Bonds - continued | | | | | | | | |
| New Hampshire - continued | | | | | | | | |
| New Hampshire Health & Education Facilities Authority Rev. (Dartmouth College), 5.25%, 6/01/39 (u) | | $ | 20,000,000 | | | $ | 22,634,200 | |
| New Hampshire Health & Education Facilities Authority Rev. (Rivermead), “A”, 6.875%, 7/01/41 | | | 2,625,000 | | | | 2,975,490 | |
| | | | | | | | |
| | | | | | | $ | 33,026,065 | |
| New Jersey - 5.9% | | | | | | | | |
| Bayonne, NJ, Redevelopment Agency (Royal Caribbean Project), “A”, 5.375%, 11/01/35 | | $ | 2,500,000 | | | $ | 2,509,300 | |
| New Jersey Casino Reinvestment Development Authority, Luxury Tax Rev., AGM, 5%, 11/01/29 | | | 445,000 | | | | 495,886 | |
| New Jersey Casino Reinvestment Development Authority, Luxury Tax Rev., AGM, 5%, 11/01/30 | | | 690,000 | | | | 765,879 | |
| New Jersey Casino Reinvestment Development Authority, Luxury Tax Rev., AGM, 5%, 11/01/31 | | | 2,570,000 | | | | 2,833,965 | |
| New Jersey Casino Reinvestment Development Authority, Luxury Tax Rev., AGM, 5%, 11/01/32 | | | 1,305,000 | | | | 1,431,846 | |
| New Jersey Economic Development Authority Rev. (GMT Realty LLC), “B”, 6.875%, 1/01/37 | | | 1,505,000 | | | | 1,505,000 | |
| New Jersey Economic Development Authority Rev. (Kapkowski Road Landfill Project), 5.75%, 10/01/21 | | | 200,000 | | | | 216,980 | |
| New Jersey Economic Development Authority Rev. (Kapkowski Road Landfill Project), 6.5%, 4/01/28 | | | 1,500,000 | | | | 1,857,180 | |
| New Jersey Economic Development Authority Rev. (Kapkowski Road Landfill Project), 6.5%, 4/01/31 | | | 9,985,000 | | | | 11,999,574 | |
| New Jersey Economic Development Authority Rev. (Kapkowski Road Landfill Project), “B”, 6.5%, 4/01/18 | | | 1,780,000 | | | | 1,910,794 | |
| New Jersey Economic Development Authority Rev. (Lions Gate Project), 5%, 1/01/34 | | | 850,000 | | | | 878,603 | |
| New Jersey Economic Development Authority Rev. (Lions Gate Project), 5.25%, 1/01/44 | | | 1,695,000 | | | | 1,757,715 | |
| New Jersey Economic Development Authority Rev. (Provident Group - Rowan Properties LLC - Rowan University Student Housing Project), “A”, 5%, 1/01/21 | | | 105,000 | | | | 118,121 | |
| New Jersey Economic Development Authority Rev. (Provident Group - Rowan Properties LLC - Rowan University Student Housing Project), “A”, 5%, 1/01/22 | | | 615,000 | | | | 698,775 | |
| New Jersey Economic Development Authority Rev. (Provident Group - Rowan Properties LLC - Rowan University Student Housing Project), “A”, 5%, 1/01/23 | | | 705,000 | | | | 808,177 | |
| New Jersey Economic Development Authority Rev. (Provident Group - Rowan Properties LLC - Rowan University Student Housing Project), “A”, 5%, 1/01/30 | | | 985,000 | | | | 1,096,561 | |
46
Portfolio of Investments – continued
| | | | | | | | |
| Issuer | | Shares/Par | | | Value ($) | |
| Municipal Bonds - continued | | | | | | | | |
| New Jersey - continued | | | | | | | | |
| New Jersey Economic Development Authority Rev. (Provident Group - Rowan Properties LLC - Rowan University Student Housing Project), “A”, 5%, 1/01/35 | | $ | 1,510,000 | | | $ | 1,650,762 | |
| New Jersey Economic Development Authority Rev. (Provident Group - Rowan Properties LLC - Rowan University Student Housing Project), “A”, 5%, 1/01/48 | | | 410,000 | | | | 438,909 | |
| New Jersey Economic Development Authority Rev. (Seabrook Village, Inc.), 5.25%, 11/15/36 (Prerefunded 11/15/16) | | | 2,735,000 | | | | 2,838,082 | |
| New Jersey Economic Development Authority Rev. (The Goethals Bridge Replacement Project), 5.5%, 1/01/27 | | | 325,000 | | | | 376,197 | |
| New Jersey Economic Development Authority Rev. (The Goethals Bridge Replacement Project), 5%, 1/01/28 | | | 325,000 | | | | 363,233 | |
| New Jersey Economic Development Authority Rev. (The Goethals Bridge Replacement Project), AGM, 5%, 1/01/31 | | | 975,000 | | | | 1,095,042 | |
| New Jersey Economic Development Authority Rev. (The Goethals Bridge Replacement Project), AGM, 5.125%, 1/01/39 | | | 1,060,000 | | | | 1,175,158 | |
| New Jersey Economic Development Authority Rev. (The Goethals Bridge Replacement Project), AGM, 5.125%, 7/01/42 | | | 530,000 | | | | 583,345 | |
| New Jersey Economic Development Authority, Special Facilities Rev. (Continental Airlines, Inc.), 4.875%, 9/15/19 | | | 8,540,000 | | | | 9,009,444 | |
| New Jersey Economic Development Authority, Special Facilities Rev. (Continental Airlines, Inc.), 5.125%, 9/15/23 | | | 7,870,000 | | | | 8,729,876 | |
| New Jersey Economic Development Authority, Special Facilities Rev. (Continental Airlines, Inc.), 5.25%, 9/15/29 | | | 5,770,000 | | | | 6,335,345 | |
| New Jersey Economic Development Authority, Special Facilities Rev. (Continental Airlines, Inc.), “A”, 5.625%, 11/15/30 | | | 1,820,000 | | | | 2,063,061 | |
| New Jersey Economic Development Authority, Special Facilities Rev. (Continental Airlines, Inc.), “B”, 5.625%, 11/15/30 | | | 8,595,000 | | | | 9,741,573 | |
| New Jersey Educational Facilities Authority Rev. (University of Medicine & Dentistry), “B”, 7.5%, 12/01/32 (Prerefunded 6/01/19) | | | 4,280,000 | | | | 5,180,983 | |
| New Jersey Educational Facilities Authority Rev. (University of Medicine & Dentistry), “B”, ETM, 6%, 12/01/17 | | | 2,335,000 | | | | 2,498,940 | |
| New Jersey Health Care Facilities, Financing Authority Rev. (St. Joseph’s Healthcare System), 6.625%, 7/01/38 | | | 8,000,000 | | | | 8,837,360 | |
| New Jersey Health Care Facilities, Financing Authority Rev. (University Hospital), “A”, AGM, 5%, 7/01/46 | | | 10,225,000 | | | | 11,507,931 | |
| New Jersey Higher Education Assistance Authority Senior Student Loan Rev., “1A”, 3.5%, 12/01/29 | | | 3,415,000 | | | | 3,421,215 | |
| New Jersey Higher Education Assistance Authority Student Loan Rev., “A”, ASSD GTY, 6.125%, 6/01/30 | | | 2,545,000 | | | | 2,750,560 | |
| New Jersey Tobacco Settlement Financing Corp., “1-A”, 4.5%, 6/01/23 | | | 17,610,000 | | | | 17,853,194 | |
47
Portfolio of Investments – continued
| | | | | | | | |
| Issuer | | Shares/Par | | | Value ($) | |
| Municipal Bonds - continued | | | | | | | | |
| New Jersey - continued | | | | | | | | |
| New Jersey Tobacco Settlement Financing Corp., “1-A”, 4.75%, 6/01/34 | | $ | 31,335,000 | | | $ | 26,163,785 | |
| New Jersey Tobacco Settlement Financing Corp., “1-A”, 5%, 6/01/41 | | | 62,205,000 | | | | 51,954,238 | |
| New Jersey Tobacco Settlement Financing Corp., Capital Appreciation, “1-B”, 0%, 6/01/41 | | | 32,595,000 | | | | 8,294,776 | |
| New Jersey Tobacco Settlement Financing Corp., Capital Appreciation, “1-C”, 0%, 6/01/41 | | | 400,000 | | | | 97,852 | |
| | | | | | | | |
| | | | | | | $ | 213,845,217 | |
| New Mexico - 0.7% | | | | | | | | |
| Farmington, NM, Pollution Control Rev. (Public Service New Mexico), “D”, 5.9%, 6/01/40 | | $ | 11,915,000 | | | $ | 13,159,760 | |
| New Mexico Hospital Equipment Loan Council, Hospital Rev. (Rehoboth McKinley Christian Hospital), “A”, 5%, 8/15/17 | | | 100,000 | | | | 100,469 | |
| New Mexico Hospital Equipment Loan Council, Hospital Rev. (Rehoboth McKinley Christian Hospital), “A”, 5.25%, 8/15/26 | | | 1,580,000 | | | | 1,553,614 | |
| New Mexico Municipal Energy Acquisition Authority, Gas Supply Rev., “A”, 5%, 11/01/39 (Put Date 8/01/19) | | | 8,250,000 | | | | 9,284,633 | |
| | | | | | | | |
| | | | | | | $ | 24,098,476 | |
| New York - 6.2% | | | | | | | | |
| Brooklyn, NY, Arena Local Development Corp. (Barclays Center Project), 6%, 7/15/30 | | $ | 2,265,000 | | | $ | 2,598,114 | |
| Buffalo & Erie County, NY, Industrial Land Development Corp. Rev. (Catholic Health System, Inc.), 5%, 7/01/20 | | | 155,000 | | | | 176,770 | |
| Buffalo & Erie County, NY, Industrial Land Development Corp. Rev. (Catholic Health System, Inc.), 5%, 7/01/22 | | | 415,000 | | | | 489,961 | |
| Buffalo & Erie County, NY, Industrial Land Development Corp. Rev. (Catholic Health System, Inc.), 5%, 7/01/24 | | | 210,000 | | | | 251,941 | |
| Buffalo & Erie County, NY, Industrial Land Development Corp. Rev. (Catholic Health System, Inc.), 5%, 7/01/25 | | | 155,000 | | | | 186,412 | |
| Build NYC Resource Corp. Rev. (Albert Einstein School of Medicine, Inc.), 5.5%, 9/01/45 | | | 8,235,000 | | | | 8,876,259 | |
| Build NYC Resource Corp. Rev. (International Leadership Charter School Project), 5.75%, 7/01/33 | | | 3,860,000 | | | | 3,813,834 | |
| Build NYC Resource Corp. Rev. (International Leadership Charter School Project), 6%, 7/01/43 | | | 4,025,000 | | | | 3,940,032 | |
| Build NYC Resource Corp. Rev. (South Bronx Charter School for International Cultures and the Arts), “A”, 5%, 4/15/43 | | | 2,655,000 | | | | 2,711,206 | |
| Build NYC Resource Corp. Solid Waste Disposal Rev. (Pratt Paper, Inc. Project), 5%, 1/01/35 | | | 3,360,000 | | | | 3,627,994 | |
| Chautauqua County, NY, Capital Resource Corp. Rev. (Women’s Christian Assn.), “A”, 8%, 11/15/30 | | | 3,890,000 | | | | 3,985,149 | |
48
Portfolio of Investments – continued
| | | | | | | | |
| Issuer | | Shares/Par | | | Value ($) | |
| Municipal Bonds - continued | | | | | | | | |
| New York - continued | | | | | | | | |
| East Rochester, NY, Housing Authority Rev. (Woodland Village Project), 5.5%, 8/01/33 | | $ | 600,000 | | | $ | 608,172 | |
| Hudson Yards, NY, Infrastructure Corp. Rev., “A”, 5%, 2/15/47 | | | 3,340,000 | | | | 3,469,325 | |
| Hudson Yards, NY, Infrastructure Corp. Rev., “A”, 5.75%, 2/15/47 | | | 3,230,000 | | | | 3,760,560 | |
| Liberty, NY, Development Corp. Rev. (Goldman Sachs Headquarters), 5.25%, 10/01/35 | | | 22,535,000 | | | | 27,815,627 | |
| New Rochelle, NY, Corp. for Local Development Rev. (Iona College Project), “A”, 5%, 7/01/34 | | | 785,000 | | | | 890,936 | |
| New Rochelle, NY, Corp. for Local Development Rev. (Iona College Project), “A”, 5%, 7/01/40 | | | 2,130,000 | | | | 2,368,241 | |
| New Rochelle, NY, Corp. for Local Development Rev. (Iona College Project), “A”, 5%, 7/01/45 | | | 990,000 | | | | 1,092,396 | |
| New York Dormitory Authority Rev., Non-State Supported Debt (Bronx-Lebanon Hospital Center), LOC, 6.25%, 2/15/35 | | | 975,000 | | | | 1,101,107 | |
| New York Dormitory Authority Rev., Non-State Supported Debt (Bronx-Lebanon Hospital Center), LOC, 6.5%, 8/15/30 | | | 1,570,000 | | | | 1,792,155 | |
| New York Dormitory Authority Rev., Non-State Supported Debt (Orange Regional Medical Center), 5%, 12/01/40 | | | 1,000,000 | | | | 1,065,200 | |
| New York Energy Research & Development Authority Pollution Control Rev. (New York Electric & Gas Corp. Project), “C”, 2%, 6/01/29 (Put Date 5/01/20) | | | 3,015,000 | | | | 3,074,396 | |
| New York Liberty Development Corp., Liberty Rev. (3 World Trade Center Project), “1”, 5%, 11/15/44 | | | 12,985,000 | | | | 13,790,589 | |
| New York Liberty Development Corp., Liberty Rev. (3 World Trade Center Project), “2”, 5.375%, 11/15/40 | | | 5,850,000 | | | | 6,244,232 | |
| New York Liberty Development Corp., Liberty Rev. (3 World Trade Center Project), “3”, 7.25%, 11/15/44 | | | 3,970,000 | | | | 4,813,268 | |
| New York Liberty Development Corp., Liberty Rev. (One Bryant Park LLC), 6.375%, 7/15/49 | | | 4,760,000 | | | | 5,375,658 | |
| New York, NY, “J-9”, FRN, 0.41%, 8/01/27 | | | 3,355,000 | | | | 3,350,739 | |
| New York, NY, City Housing Development Corp., Multifamily Housing Rev. (8 Spruce Street), “F”, 4.5%, 2/15/48 | | | 10,911,318 | | | | 11,743,088 | |
| New York, NY, City Industrial Development Agency Rev. (Yankee Stadium Project), “A”, ASSD GTY, 7%, 3/01/49 | | | 10,000,000 | | | | 11,713,800 | |
| New York, NY, City Industrial Development Agency Special Facility Rev. (American Airlines, Inc. - JFK International Airport Project), 7.625%, 8/01/25 | | | 18,935,000 | | | | 19,731,595 | |
| New York, NY, City Industrial Development Agency Special Facility Rev. (American Airlines, Inc. - JFK International Airport Project), 7.75%, 8/01/31 | | | 8,045,000 | | | | 8,388,522 | |
| New York, NY, City Industrial Development Agency Special Facility Rev. (American Airlines, Inc. - JFK International Airport Project), “B”, 2%, 8/01/28 (Put Date 8/01/16) | | | 6,400,000 | | | | 6,413,312 | |
49
Portfolio of Investments – continued
| | | | | | | | |
| Issuer | | Shares/Par | | | Value ($) | |
| Municipal Bonds - continued | | | | | | | | |
| New York - continued | | | | | | | | |
| New York, NY, Municipal Water Finance Authority, Water & Sewer Systems Rev., “CC”, 5%, 6/15/47 | | $ | 1,330,000 | | | $ | 1,527,838 | |
| Niagara County, NY, Industrial Development Agency, Solid Waste Disposal Rev. (Covanta Energy Project), “A”, 5.25%, 11/01/42 | | | 12,055,000 | | | | 12,167,353 | |
| Onondaga, NY, Civic Development Corp. Rev. (St. Joseph’s Hospital Health Center), 5%, 7/01/25 | | | 505,000 | | | | 575,538 | |
| Onondaga, NY, Civic Development Corp. Rev. (St. Joseph’s Hospital Health Center), 5.125%, 7/01/31 | | | 510,000 | | | | 583,379 | |
| Onondaga, NY, Civic Development Corp. Rev. (St. Joseph’s Hospital Health Center), 5%, 7/01/42 | | | 3,110,000 | | | | 3,822,221 | |
| Orange County, NY, Funding Corp. Assisted Living Residence Rev. (The Hamlet at Wallkill Assisted Living Project), 6.5%, 1/01/46 | | | 3,000,000 | | | | 3,033,060 | |
| Port Authority of NY & NJ, Special Obligation Rev. (JFK International Air Terminal LLC), 6%, 12/01/36 | | | 2,435,000 | | | | 2,851,336 | |
| Port Authority of NY & NJ, Special Obligation Rev. (JFK International Air Terminal LLC), 6%, 12/01/42 | | | 2,780,000 | | | | 3,241,174 | |
| Seneca Nation of Indians, NY, Capital Improvements Authority, Special Obligation, 5%, 12/01/23 (n) | | | 6,470,000 | | | | 6,645,596 | |
| Seneca Nation of Indians, NY, Capital Improvements Authority, Special Obligation, “A”, 5.25%, 12/01/16 (n) | | | 90,000 | | | | 91,376 | |
| Suffolk County, NY, Industrial Development Agency (Medford Hamlet Assisted Living), 6.375%, 1/01/39 | | | 1,400,000 | | | | 1,416,898 | |
| Tobacco Settlement Asset Securitization Corporation, NY, “1”, 5%, 6/01/26 | | | 10,730,000 | | | | 10,817,557 | |
| Ulster County, NY, Capital Resource Corp Rev. (Health Alliance Senior Living- Woodland Pond at New Paltz), “B”, 7%, 9/15/44 | | | 2,010,000 | | | | 2,080,732 | |
| Ulster County, NY, Capital Resource Corp Rev. (Health Alliance Senior Living- Woodland Pond at New Paltz), Convertible Capital Appreciation, “A”, 0% to 9/15/2019, 7.5% to 9/15/44 | | | 905,000 | | | | 681,646 | |
| Ulster County, NY, Industrial Development Agency (Woodland Pond), “A”, 6%, 9/15/37 | | | 5,620,000 | | | | 5,630,566 | |
| | | | | | | | |
| | | | | | | $ | 224,426,860 | |
| North Carolina - 0.5% | | | | | | | | |
| North Carolina Housing Finance Agency Rev., “30-A”, 5.25%, 7/01/39 | | $ | 8,530,000 | | | $ | 8,632,275 | |
| North Carolina Medical Care Commission, Health Care Facilities Rev. (Pennybyrn at Maryfield), 5%, 10/01/25 | | | 1,030,000 | | | | 1,134,463 | |
| North Carolina Medical Care Commission, Health Care Facilities Rev. (Pennybyrn at Maryfield), 5%, 10/01/30 | | | 1,310,000 | | | | 1,393,277 | |
| North Carolina Medical Care Commission, Health Care Facilities Rev. (Pennybyrn at Maryfield), 5%, 10/01/35 | | | 750,000 | | | | 793,193 | |
| North Carolina Medical Care Commission, Retirement Facilities First Mortgage Rev. (Aldersgate), 5%, 7/01/45 | | | 1,325,000 | | | | 1,383,035 | |
50
Portfolio of Investments – continued
| | | | | | | | |
| Issuer | | Shares/Par | | | Value ($) | |
| Municipal Bonds - continued | | | | | | | | |
| North Carolina - continued | | | | | | | | |
| North Carolina Medical Care Commission, Retirement Facilities First Mortgage Rev. (United Church Homes and Services), “A”, 5%, 9/01/37 | | $ | 1,260,000 | | | $ | 1,284,003 | |
| University of North Carolina at Wilmington (Student Housing Projects), 5%, 6/01/29 | | | 1,190,000 | | | | 1,410,602 | |
| University of North Carolina, Greensboro, Rev., 5%, 4/01/39 | | | 955,000 | | | | 1,102,204 | |
| | | | | | | | |
| | | | | | | $ | 17,133,052 | |
| North Dakota - 0.1% | | | | | | | | |
| North Dakota Housing Finance Agency Rev. (Home Mortgage Finance Program), “A”, 4%, 7/01/34 | | $ | 905,000 | | | $ | 971,789 | |
| North Dakota Housing Finance Agency Rev., (Home Mortgage Finance Program), “B”, 4%, 1/01/36 | | | 1,630,000 | | | | 1,778,982 | |
| | | | | | | | |
| | | | | | | $ | 2,750,771 | |
| Ohio - 6.9% | | | | | | | | |
| American Municipal Power, Inc. (Prairie State Energy Campus Project), “A”, 5%, 2/15/42 | | $ | 3,440,000 | | | $ | 3,868,280 | |
| Bowling Green, OH, Student Housing Rev. (State University Project), 6%, 6/01/45 | | | 5,990,000 | | | | 6,477,346 | |
| Buckeye, OH, Tobacco Settlement Financing Authority, “A-2”, 5.125%, 6/01/24 | | | 10,000,000 | | | | 9,136,700 | |
| Buckeye, OH, Tobacco Settlement Financing Authority, “A-2”, 5.875%, 6/01/30 | | | 3,310,000 | | | | 2,971,586 | |
| Buckeye, OH, Tobacco Settlement Financing Authority, “A-2”, 5.75%, 6/01/34 | | | 4,485,000 | | | | 3,954,155 | |
| Buckeye, OH, Tobacco Settlement Financing Authority, “A-2”, 6%, 6/01/42 | | | 21,225,000 | | | | 18,917,843 | |
| Buckeye, OH, Tobacco Settlement Financing Authority, “A-2”, 5.875%, 6/01/47 | | | 45,445,000 | | | | 39,992,054 | |
| Buckeye, OH, Tobacco Settlement Financing Authority, “A-2”, 6.5%, 6/01/47 | | | 69,705,000 | | | | 66,044,093 | |
| Buckeye, OH, Tobacco Settlement Financing Authority, “A-3”, 6.25%, 6/01/37 | | | 11,535,000 | | | | 10,672,297 | |
| Butler County, OH, Hospital Facilities Rev. (UC Health), 5.5%, 11/01/40 | | | 5,435,000 | | | | 6,379,983 | |
| Butler County, OH, Hospital Facilities Rev. (UC Health), 5.75%, 11/01/40 | | | 2,210,000 | | | | 2,622,740 | |
| Cleveland-Cuyahoga County, OH, Port Authority Development Rev. (Euclid Avenue Development Corp. Project), 5%, 8/01/44 | | | 1,025,000 | | | | 1,097,314 | |
| Cleveland-Cuyahoga County, OH, Port Authority Rev. (Fairmount), “B”, 5.125%, 5/15/25 | | | 380,000 | | | | 381,079 | |
| Cleveland-Cuyahoga County, OH, Port Authority Rev. (Flats East Development Project), 7%, 5/15/40 | | | 1,140,000 | | | | 1,304,502 | |
51
Portfolio of Investments – continued
| | | | | | | | |
| Issuer | | Shares/Par | | | Value ($) | |
| Municipal Bonds - continued | | | | | | | | |
| Ohio - continued | | | | | | | | |
| Franklin County, OH, Health Care Facilities Improvement Rev. (Friendship Village of Dublin, OH, Inc.), 5%, 11/15/34 | | $ | 1,380,000 | | | $ | 1,539,887 | |
| Franklin County, OH, Health Care Facilities Improvement Rev. (Friendship Village of Dublin, OH, Inc.), 5%, 11/15/44 | | | 2,055,000 | | | | 2,263,603 | |
| Gallia County, OH, Hospital Facilities Rev. (Holzer Health Systems), “A”, 8%, 7/01/42 | | | 8,480,000 | | | | 9,844,602 | |
| Lake County, OH, Hospital Facilities Rev., 6%, 8/15/43 (Prerefunded 8/15/18) | | | 2,410,000 | | | | 2,725,999 | |
| Lake County, OH, Hospital Facilities Rev., 6%, 8/15/43 | | | 460,000 | | | | 507,109 | |
| Montgomery County, OH, Health Care & Multifamily Housing Rev. (St. Leonard), 6.375%, 4/01/30 | | | 2,235,000 | | | | 2,489,634 | |
| Montgomery County, OH, Health Care & Multifamily Housing Rev. (St. Leonard), 6.625%, 4/01/40 | | | 3,230,000 | | | | 3,601,870 | |
| Ohio Air Quality Development Authority Rev. (FirstEnergy Corp.), “A”, 5.7%, 8/01/20 | | | 4,335,000 | | | | 4,863,653 | |
| Ohio Tax Exempt Private Activity (Portsmouth Bypass Project), AGM, 5%, 12/31/35 | | | 7,865,000 | | | | 8,939,752 | |
| Riversouth, OH, Authority Rev. (Lazarus Building), “A”, 5.75%, 12/01/27 | | | 3,975,000 | | | | 4,219,582 | |
| Scioto County, OH, Hospital Facilities Rev. (Southern Ohio Medical Center), 5.625%, 2/15/31 | | | 1,370,000 | | | | 1,481,326 | |
| Scioto County, OH, Hospital Facilities Rev. (Southern Ohio Medical Center), 5.75%, 2/15/38 | | | 4,100,000 | | | | 4,421,030 | |
| Southeastern Ohio Port Authority, Hospital Facilities Improvement Rev. (Memorial Health System Obligated Group Project), 5.5%, 12/01/29 | | | 690,000 | | | | 758,828 | |
| Southeastern Ohio Port Authority, Hospital Facilities Improvement Rev. (Memorial Health System Obligated Group Project), 5.75%, 12/01/32 | | | 3,725,000 | | | | 4,047,585 | |
| Southeastern Ohio Port Authority, Hospital Facilities Improvement Rev. (Memorial Health System Obligated Group Project), 5%, 12/01/35 | | | 1,520,000 | | | | 1,577,076 | |
| Southeastern Ohio Port Authority, Hospital Facilities Improvement Rev. (Memorial Health System Obligated Group Project), 5%, 12/01/43 | | | 1,715,000 | | | | 1,765,507 | |
| Southeastern Ohio Port Authority, Hospital Facilities Improvement Rev. (Memorial Health System Obligated Group Project), 5.5%, 12/01/43 | | | 2,100,000 | | | | 2,269,113 | |
| Summit County, OH, Port Authority Building Rev. (Flats East Development Recovery Zone Facility Bonds), 6.875%, 5/15/40 | | | 425,000 | | | | 479,179 | |
| Summit County, OH, Port Authority Building Rev. (Seville Project), “A”, 5.1%, 5/15/25 | | | 475,000 | | | | 475,371 | |
| Summit County, OH, Port Authority Building Rev. (Workforce Policy Board), “F”, 4.875%, 11/15/25 | | | 2,260,000 | | | | 2,264,497 | |
52
Portfolio of Investments – continued
| | | | | | | | |
| Issuer | | Shares/Par | | | Value ($) | |
| Municipal Bonds - continued | | | | | | | | |
| Ohio - continued | | | | | | | | |
| The Ohio State University, Special Purpose Rev., “A”, 5%, 6/01/38 (u) | | $ | 3,355,000 | | | $ | 3,850,366 | |
| The Ohio State University, Special Purpose Rev., “A”, 5%, 6/01/43 (u) | | | 8,150,000 | | | | 9,266,469 | |
| | | | | | | | |
| | | | | | | $ | 247,472,010 | |
| Oklahoma - 0.9% | | | | | | | | |
| Fort Sill Apache Tribe, OK, Economic Development Authority, Gaming Enterprise., “A”, 8.5%, 8/25/26 (n) | | $ | 2,710,000 | | | $ | 3,190,104 | |
| Norman, OK, Regional Hospital Authority Rev., 5%, 9/01/27 | | | 1,350,000 | | | | 1,394,321 | |
| Norman, OK, Regional Hospital Authority Rev., 5.375%, 9/01/29 | | | 795,000 | | | | 807,259 | |
| Oklahoma Development Finance Authority Continuing Care Retirement Community Rev. (Inverness Village), 5.75%, 1/01/37 | | | 3,720,000 | | | | 3,884,722 | |
| Oklahoma Development Finance Authority, First Mortgage Rev. (Sommerset Project), 5%, 7/01/42 | | | 1,390,000 | | | | 1,448,269 | |
| Tulsa County, OK, Industrial Authority, Senior Living Community Rev. (Montereau, Inc.), “A”, 7.25%, 11/01/45 | | | 3,500,000 | | | | 3,844,505 | |
| Tulsa, OK, Airport Improvement Trust Rev., “A”, 5%, 6/01/45 | | | 660,000 | | | | 718,575 | |
| Tulsa, OK, Industrial Authority Rev. (University of Tulsa), 6%, 10/01/27 | | | 4,795,000 | | | | 5,477,329 | |
| Tulsa, OK, Municipal Airport Trust Rev. (American Airlines, Inc.), 5%, 6/01/35 (Put Date 6/01/25) | | | 2,005,000 | | | | 2,240,527 | |
| Tulsa, OK, Municipal Airport Trust Rev. (American Airlines, Inc.), “B”, 5.5%, 6/01/35 | | | 3,205,000 | | | | 3,501,559 | |
| Tulsa, OK, Municipal Airport Trust Rev. (American Airlines, Inc.), “B”, 5.5%, 12/01/35 | | | 6,615,000 | | | | 7,227,086 | |
| | | | | | | | |
| | | | | | | $ | 33,734,256 | |
| Oregon - 0.4% | | | | | | | | |
| Forest Grove, OR, Campus Improvement Rev. (Pacific University Project), “A”, 4.5%, 5/01/29 | | $ | 655,000 | | | $ | 716,374 | |
| Forest Grove, OR, Campus Improvement Rev. (Pacific University Project), “A”, 5%, 5/01/30 | | | 215,000 | | | | 251,159 | |
| Forest Grove, OR, Campus Improvement Rev. (Pacific University Project), “A”, 5%, 5/01/36 | | | 1,100,000 | | | | 1,258,422 | |
| Forest Grove, OR, Campus Improvement Rev. (Pacific University Project), “A”, 5%, 5/01/40 | | | 815,000 | | | | 885,489 | |
| Forest Grove, OR, Student Housing Rev. (Oak Tree Foundation, Inc.), 5.5%, 3/01/37 | | | 2,815,000 | | | | 2,879,407 | |
| Oregon Facilities Authority Rev. (Concordia University Project), “A”, 6.125%, 9/01/30 | | | 2,475,000 | | | | 2,648,423 | |
| Oregon Facilities Authority Rev. (Concordia University Project), “A”, 6.375%, 9/01/40 | | | 4,100,000 | | | | 4,427,672 | |
| | | | | | | | |
| | | | | | | $ | 13,066,946 | |
53
Portfolio of Investments – continued
| | | | | | | | |
| Issuer | | Shares/Par | | | Value ($) | |
| Municipal Bonds - continued | | | | | | | | |
| Pennsylvania - 5.1% | | | | | | | | |
| Allegheny County, PA, Higher Education Building Authority Rev. (Robert Morris University), “A”, 5.9%, 10/15/28 | | $ | 1,305,000 | | | $ | 1,412,336 | |
| Allegheny County, PA, Higher Education Building Authority Rev. (Robert Morris University), “A”, 6%, 10/15/38 | | | 2,025,000 | | | | 2,189,916 | |
| Allentown, PA, Neighborhood Improvement Zone Development Authority Tax Rev., “A”, 5%, 5/01/35 | | | 1,110,000 | | | | 1,192,862 | |
| Allentown, PA, Neighborhood Improvement Zone Development Authority Tax Rev., “A”, 5%, 5/01/42 | | | 4,605,000 | | | | 4,888,760 | |
| Bucks County, PA, Industrial Development Authority Rev. (Lutheran Community Telford Center), 5.75%, 1/01/27 | | | 620,000 | | | | 627,961 | |
| Bucks County, PA, Industrial Development Authority Rev. (Lutheran Community Telford Center), 5.75%, 1/01/37 | | | 800,000 | | | | 807,208 | |
| Chartiers Valley, PA, Industrial & Commercial Development Authority (Asbury Health Center Project), 5.75%, 12/01/22 | | | 500,000 | | | | 508,945 | |
| Chester County, PA, Health & Educational Facilities Authority Rev. (Simpson Senior Services Project), “A”, 5.25%, 12/01/45 | | | 1,730,000 | | | | 1,771,278 | |
| Chester County, PA, Health & Educational Facilities Authority Rev. (Simpson Senior Services Project), “A”, 5%, 12/01/30 | | | 815,000 | | | | 851,015 | |
| Chester County, PA, Health & Educational Facilities Authority Rev. (Simpson Senior Services Project), “A”, 5%, 12/01/35 | | | 815,000 | | | | 831,455 | |
| Clairton, PA, Municipal Authority, “B”, 5%, 12/01/37 | | | 1,735,000 | | | | 1,898,611 | |
| Clarion County, PA, Industrial Development Authority, Student Housing Rev. (Clarion University Foundation, Inc.), 5%, 7/01/34 | | | 330,000 | | | | 351,688 | |
| Commonwealth of Pennsylvania, State Public School Building Authority Lease Rev. (School District of Philadelphia Project), 5%, 4/01/28 | | | 1,740,000 | | | | 1,893,503 | |
| Cumberland County, PA, Municipal Authority Rev. (Asbury Atlantic, Inc.), 6%, 1/01/30 | | | 1,035,000 | | | | 1,112,522 | |
| Cumberland County, PA, Municipal Authority Rev. (Asbury Atlantic, Inc.), 6%, 1/01/40 | | | 4,300,000 | | | | 4,594,679 | |
| Cumberland County, PA, Municipal Authority Rev. (Asbury Atlantic, Inc.), 5.25%, 1/01/41 | | | 965,000 | | | | 1,011,166 | |
| Cumberland County, PA, Municipal Authority Rev. (Asbury Atlantic, Inc.), 6.125%, 1/01/45 | | | 7,220,000 | | | | 7,735,003 | |
| Cumberland County, PA, Municipal Authority Rev. (Diakon Lutheran Social Ministries Project), 5%, 1/01/21 | | | 685,000 | | | | 773,660 | |
| Cumberland County, PA, Municipal Authority Rev. (Diakon Lutheran Social Ministries Project), 5%, 1/01/22 | | | 1,660,000 | | | | 1,899,870 | |
| Cumberland County, PA, Municipal Authority Rev. (Diakon Lutheran Social Ministries Project), 5%, 1/01/23 | | | 855,000 | | | | 985,379 | |
| Cumberland County, PA, Municipal Authority Rev. (Diakon Lutheran Social Ministries Project), 6.125%, 1/01/29 (Prerefunded 1/01/19) | | | 815,000 | | | | 935,750 | |
54
Portfolio of Investments – continued
| | | | | | | | |
| Issuer | | Shares/Par | | | Value ($) | |
| Municipal Bonds - continued | | | | | | | | |
| Pennsylvania - continued | | | | | | | | |
| Cumberland County, PA, Municipal Authority Rev. (Diakon Lutheran Social Ministries Project), 6.125%, 1/01/29 | | $ | 90,000 | | | $ | 101,829 | |
| Cumberland County, PA, Municipal Authority Rev. (Diakon Lutheran Social Ministries Project), 6.375%, 1/01/39 (Prerefunded 1/01/19) | | | 6,355,000 | | | | 7,342,249 | |
| Cumberland County, PA, Municipal Authority Rev. (Diakon Lutheran Social Ministries Project), 6.375%, 1/01/39 | | | 705,000 | | | | 805,075 | |
| Dallas, PA, Area Municipal Authority Rev. (Misericordia University Project), 5%, 5/01/29 | | | 1,335,000 | | | | 1,478,446 | |
| Delaware County, PA, Authority College Rev. (Neumann University), 6%, 10/01/25 | | | 510,000 | | | | 579,238 | |
| Delaware County, PA, Authority University Rev. (Neumann University), 6.125%, 10/01/34 | | | 250,000 | | | | 284,765 | |
| Delaware Valley, PA, Regional Finance Authority, 5.75%, 7/01/17 | | | 3,520,000 | | | | 3,762,246 | |
| Delaware Valley, PA, Regional Finance Authority, AMBAC, 5.5%, 8/01/18 | | | 1,680,000 | | | | 1,846,303 | |
| East Hempfield, PA, Industrial Development Authority Rev. (Millersville University Student Services), 5%, 7/01/39 | | | 325,000 | | | | 342,095 | |
| East Hempfield, PA, Industrial Development Authority Rev. (Millersville University Student Services), 5%, 7/01/46 | | | 180,000 | | | | 188,559 | |
| East Hempfield, PA, Industrial Development Authority Rev. (Student Services, Inc., Student Housing Project at Millersville University of Pennsylvania), 5%, 7/01/30 | | | 330,000 | | | | 358,928 | |
| East Hempfield, PA, Industrial Development Authority Rev. (Student Services, Inc., Student Housing Project at Millersville University of Pennsylvania), 5%, 7/01/35 | | | 420,000 | | | | 448,946 | |
| Erie, PA, Water Authority Rev., AGM, 5%, 12/01/49 | | | 2,325,000 | | | | 2,666,147 | |
| Lancaster County, PA, Hospital Authority Health System Rev. (Landis Homes Retirement Community Project), “A”, 5%, 7/01/45 | | | 2,500,000 | | | | 2,606,750 | |
| Lancaster County, PA, Hospital Authority Health System Rev. (Masonic Villages Project), 5%, 11/01/27 | | | 580,000 | | | | 698,500 | |
| Lancaster County, PA, Hospital Authority Health System Rev. (Masonic Villages Project), 5%, 11/01/35 | | | 210,000 | | | | 240,608 | |
| Lehigh County, PA, Water and Sewer Authority Rev. (Allentown Concession), “A”, 5%, 12/01/43 | | | 7,735,000 | | | | 8,767,777 | |
| Luzerne County, PA, “A”, AGM, 5%, 11/15/29 | | | 6,760,000 | | | | 7,785,086 | |
| Montgomery County, PA, Higher Education & Health Authority Rev. (AHF/Montgomery), 6.875%, 4/01/36 | | | 4,385,000 | | | | 4,488,574 | |
| Montgomery County, PA, Industrial Development Authority Pollution Control Rev. (Peco Energy Company Project), “A”, 2.55%, 6/01/29 (Put Date 6/01/20) | | | 1,025,000 | | | | 1,033,815 | |
| Montgomery County, PA, Industrial Development Authority Rev. (Albert Einstein Healthcare Network Issue), “A”, 5.25%, 1/15/36 | | | 8,510,000 | | | | 9,453,248 | |
55
Portfolio of Investments – continued
| | | | | | | | |
| Issuer | | Shares/Par | | | Value ($) | |
| Municipal Bonds - continued | | | | | | | | |
| Pennsylvania - continued | | | | | | | | |
| Montgomery County, PA, Industrial Development Authority Rev. (Whitemarsh Continuing Care Retirement Community Project), 5.375%, 1/01/50 | | $ | 8,275,000 | | | $ | 8,349,061 | |
| Moon Industrial Development Authority Rev. (Baptist Homes Society), 6.125%, 7/01/50 | | | 3,915,000 | | | | 3,985,392 | |
| Northampton County, PA, General Purpose Authority Hospital Rev. (St. Luke’s Hospital), “A”, 5.5%, 8/15/40 | | | 1,075,000 | | | | 1,167,321 | |
| Pennsylvania Economic Development Finance Authority Rev, Solid Waste Disposal Rev. (Waste Management, Inc. Project), 0.6%, 8/01/45 (Put Date 5/02/16) | | | 12,500,000 | | | | 12,500,000 | |
| Pennsylvania Economic Development Financing Authority Rev. (The Pennsylvania Rapid Bridge Replacement Project), 5%, 6/30/26 | | | 590,000 | | | | 697,528 | |
| Pennsylvania Economic Development Financing Authority Rev. (The Pennsylvania Rapid Bridge Replacement Project), 5%, 12/31/30 | | | 1,410,000 | | | | 1,611,827 | |
| Pennsylvania Economic Development Financing Authority Rev. (The Pennsylvania Rapid Bridge Replacement Project), 5%, 12/31/34 | | | 14,350,000 | | | | 16,055,785 | |
| Pennsylvania Economic Development Financing Authority, Sewer Sludge Disposal Rev. (Philadelphia Biosolids Facility), 6.25%, 1/01/32 | | | 3,415,000 | | | | 3,783,342 | |
| Pennsylvania Higher Educational Facilities Authority Rev. (East Stroudsburg University), 5%, 7/01/42 | | | 2,525,000 | | | | 2,603,603 | |
| Pennsylvania Higher Educational Facilities Authority Rev. (Edinboro University Foundation), 5.8%, 7/01/30 | | | 740,000 | | | | 797,513 | |
| Pennsylvania Higher Educational Facilities Authority Rev. (Saint Francis University Project), “JJ2”, 6.25%, 11/01/41 | | | 1,545,000 | | | | 1,762,057 | |
| Pennsylvania Higher Educational Facilities Authority Rev. (Shippensburg University Student Services), 6.25%, 10/01/43 | | | 5,500,000 | | | | 6,163,575 | |
| Philadelphia, PA, Authority for Industrial Development Rev. (Discovery Charter School Project), 6.25%, 4/01/37 | | | 1,065,000 | | | | 1,046,501 | |
| Philadelphia, PA, Authority for Industrial Development Rev. (Discovery Charter School Project), 6.25%, 4/01/42 | | | 1,950,000 | | | | 1,893,606 | |
| Philadelphia, PA, Authority for Industrial Development Rev. (MaST Charter School), 6%, 8/01/35 | | | 470,000 | | | | 523,350 | |
| Philadelphia, PA, Authority for Industrial Development Rev. (Philadelphia Performing Arts Charter School Project), 6.5%, 6/15/33 | | | 2,780,000 | | | | 2,973,460 | |
| Philadelphia, PA, Authority for Industrial Development Rev. (Philadelphia Performing Arts Charter School Project), 6.75%, 6/15/43 | | | 5,820,000 | | | | 6,239,215 | |
| Philadelphia, PA, Authority for Industrial Development Rev. (Tacony Academy Charter School Project), 6.875%, 6/15/33 | | | 1,145,000 | | | | 1,298,487 | |
56
Portfolio of Investments – continued
| | | | | | | | |
| Issuer | | Shares/Par | | | Value ($) | |
| Municipal Bonds - continued | | | | | | | | |
| Pennsylvania - continued | | | | | | | | |
| Philadelphia, PA, Authority for Industrial Development Rev. (Tacony Academy Charter School Project), 7.375%, 6/15/43 | | $ | 1,975,000 | | | $ | 2,284,364 | |
| Philadelphia, PA, Authority for Industrial Development Rev. (Tacony Academy Charter School Project), “A-1”, 6.75%, 6/15/33 | | | 850,000 | | | | 974,338 | |
| Philadelphia, PA, Authority for Industrial Development Rev. (Tacony Academy Charter School Project), “A-1”, 7%, 6/15/43 | | | 1,670,000 | | | | 1,926,145 | |
| Philadelphia, PA, Municipal Authority Rev., 6.5%, 4/01/34 | | | 1,060,000 | | | | 1,205,358 | |
| Southcentral, PA, General Authority Rev. (WellSpan Health Obligated Group), “A”, 5%, 6/01/44 | | | 3,000,000 | | | | 3,390,030 | |
| Washington County, PA, Redevelopment Authority (Victory Centre Project), “A”, 5.45%, 7/01/35 | | | 730,000 | | | | 740,410 | |
| West Shore, PA, Area Authority Rev. (Messiah Village Project) “A”, 5%, 7/01/30 | | | 395,000 | | | | 437,182 | |
| West Shore, PA, Area Authority Rev. (Messiah Village Project) “A”, 5%, 7/01/35 | | | 690,000 | | | | 748,781 | |
| Wilkes-Barre, PA, Finance Authority Rev. (Wilkes University), 5%, 3/01/37 | | | 3,000,000 | | | | 3,066,000 | |
| | | | | | | | |
| | | | | | | $ | 181,776,982 | |
| Puerto Rico - 3.3% | | | | | | | | |
| Commonwealth of Puerto Rico Aqueduct & Sewer Authority Rev., “A”, ASSD GTY, 5.125%, 7/01/47 | | $ | 885,000 | | | $ | 888,354 | |
| Commonwealth of Puerto Rico Highway & Transportation Authority Rev., AGM, 5.5%, 7/01/29 | | | 80,000 | | | | 84,597 | |
| Commonwealth of Puerto Rico Highway & Transportation Authority Rev., AGM, 5.25%, 7/01/33 | | | 1,060,000 | | | | 1,096,793 | |
| Commonwealth of Puerto Rico Highway & Transportation Authority Rev., ASSD GTY, 5.25%, 7/01/34 | | | 940,000 | | | | 968,040 | |
| Commonwealth of Puerto Rico Highway & Transportation Authority Rev., “BB”, AMBAC, 5.25%, 7/01/18 | | | 1,305,000 | | | | 1,320,777 | |
| Commonwealth of Puerto Rico Highway & Transportation Authority Rev., “D”, AGM, 5%, 7/01/32 | | | 7,695,000 | | | | 7,694,923 | |
| Commonwealth of Puerto Rico Highway & Transportation Authority Rev., “J”, NATL, 5%, 7/01/29 | | | 440,000 | | | | 430,725 | |
| Commonwealth of Puerto Rico Highway & Transportation Authority Rev., “L”, NATL, 5.25%, 7/01/35 | | | 2,645,000 | | | | 2,569,644 | |
| Commonwealth of Puerto Rico Highway & Transportation Authority Rev., “L”, AMBAC, 5.25%, 7/01/38 | | | 13,150,000 | | | | 11,949,800 | |
| Commonwealth of Puerto Rico Highway & Transportation Authority Rev., “N”, AMBAC, 5.25%, 7/01/30 | | | 520,000 | | | | 494,671 | |
| Commonwealth of Puerto Rico Highway & Transportation Authority Rev., “N”, AMBAC, 5.25%, 7/01/31 | | | 2,100,000 | | | | 1,987,104 | |
| Commonwealth of Puerto Rico Infrastructure Financing Authority Rev., “C”, AMBAC, 5.5%, 7/01/25 | | | 650,000 | | | | 646,763 | |
57
Portfolio of Investments – continued
| | | | | | | | |
| Issuer | | Shares/Par | | | Value ($) | |
| Municipal Bonds - continued | | | | | | | | |
| Puerto Rico - continued | | | | | | | | |
| Commonwealth of Puerto Rico, “A”, NATL, 5.5%, 7/01/20 | | $ | 2,205,000 | | | $ | 2,256,068 | |
| Commonwealth of Puerto Rico, “A”, NATL, 5.5%, 7/01/21 | | | 440,000 | | | | 451,788 | |
| Commonwealth of Puerto Rico, “A”, AGM, 5.375%, 7/01/25 | | | 750,000 | | | | 772,508 | |
| Commonwealth of Puerto Rico, Public Improvement, “A”, NATL, 5.5%, 7/01/16 | | | 345,000 | | | | 348,578 | |
| Commonwealth of Puerto Rico, Public Improvement, “A”, AGM, 5.125%, 7/01/30 | | | 7,405,000 | | | | 7,415,515 | |
| Commonwealth of Puerto Rico, Public Improvement, “A”, AGM, 5%, 7/01/35 | | | 5,505,000 | | | | 5,510,780 | |
| Commonwealth of Puerto Rico, Public Improvement, “C”, AGM, 5.25%, 7/01/27 | | | 465,000 | | | | 468,534 | |
| Commonwealth of Puerto Rico, Public Improvement, “C-7”, NATL, 6%, 7/01/27 | | | 3,540,000 | | | | 3,606,871 | |
| Puerto Rico Convention Center District Authority, Hotel Occupancy Tax Rev., “A”, AMBAC, 5%, 7/01/20 | | | 840,000 | | | | 835,792 | |
| Puerto Rico Convention Center District Authority, Hotel Occupancy Tax Rev., “A”, AMBAC, 5%, 7/01/31 | | | 5,655,000 | | | | 5,202,543 | |
| Puerto Rico Electric Power Authority Rev., “DDD”, AGM, 3.625%, 7/01/23 | | | 555,000 | | | | 522,954 | |
| Puerto Rico Electric Power Authority Rev., “DDD”, AGM, 3.65%, 7/01/24 | | | 2,345,000 | | | | 2,175,292 | |
| Puerto Rico Electric Power Authority Rev., “KK”, NATL, 5.5%, 7/01/16 | | | 175,000 | | | | 176,801 | |
| Puerto Rico Electric Power Authority Rev., “LL”, NATL, 5.5%, 7/01/17 | | | 145,000 | | | | 149,454 | |
| Puerto Rico Electric Power Authority Rev., “MM”, NATL, 5%, 7/01/20 | | | 65,000 | | | | 65,125 | |
| Puerto Rico Electric Power Authority Rev., “NN”, NATL, 4.75%, 7/01/33 | | | 215,000 | | | | 195,940 | |
| Puerto Rico Electric Power Authority Rev., “NN”, NATL, 5.25%, 7/01/22 | | | 2,165,000 | | | | 2,188,404 | |
| Puerto Rico Electric Power Authority Rev., “PP”, NATL, 5%, 7/01/24 | | | 240,000 | | | | 238,039 | |
| Puerto Rico Electric Power Authority Rev., “SS”, NATL, 5%, 7/01/19 | | | 3,825,000 | | | | 3,825,536 | |
| Puerto Rico Electric Power Authority Rev., “SS”, ASSD GTY, 4.375%, 7/01/30 | | | 280,000 | | | | 259,980 | |
| Puerto Rico Electric Power Authority Rev., “TT”, NATL, 5%, 7/01/26 | | | 65,000 | | | | 63,451 | |
| Puerto Rico Electric Power Authority Rev., “UU”, NATL, 4.5%, 7/01/18 | | | 155,000 | | | | 155,383 | |
| Puerto Rico Electric Power Authority Rev., “UU”, NATL, 5%, 7/01/19 | | | 740,000 | | | | 745,520 | |
58
Portfolio of Investments – continued
| | | | | | | | |
| Issuer | | Shares/Par | | | Value ($) | |
| Municipal Bonds - continued | | | | | | | | |
| Puerto Rico - continued | | | | | | | | |
| Puerto Rico Electric Power Authority Rev., “UU”, AGM, 5%, 7/01/22 | | $ | 490,000 | | | $ | 492,582 | |
| Puerto Rico Electric Power Authority Rev., “UU”, ASSD GTY, 4.25%, 7/01/27 | | | 1,705,000 | | | | 1,608,872 | |
| Puerto Rico Electric Power Authority Rev., “VV”, NATL, 5.25%, 7/01/32 | | | 425,000 | | | | 418,098 | |
| Puerto Rico Industrial, Tourist, Educational, Medical & Environmental Control Facilities Financing Authority (Ana G. Mendez University Project), 5%, 3/01/21 | | | 100,000 | | | | 95,918 | |
| Puerto Rico Industrial, Tourist, Educational, Medical & Environmental Control Facilities Financing Authority (Ana G. Mendez University Project), 5.375%, 12/01/21 | | | 665,000 | | | | 646,633 | |
| Puerto Rico Industrial, Tourist, Educational, Medical & Environmental Control Facilities Financing Authority (Cogeneration Facilities - AES Puerto Rico Project), 6.625%, 6/01/26 | | | 4,530,000 | | | | 4,362,164 | |
| Puerto Rico Industrial, Tourist, Educational, Medical & Environmental Control Facilities Financing Authority, Educational Facilities Rev. (University Plaza Project), NATL, 5%, 7/01/33 | | | 3,145,000 | | | | 2,891,639 | |
| Puerto Rico Industrial, Tourist, Educational, Medical & Environmental Control Facilities Financing Authority, Higher Education Rev. (Ana G. Mendez University System Project), 5%, 4/01/17 | | | 505,000 | | | | 498,985 | |
| Puerto Rico Industrial, Tourist, Educational, Medical & Environmental Control Facilities Financing Authority, Higher Education Rev. (Ana G. Mendez University System Project), 5%, 4/01/18 | | | 320,000 | | | | 313,040 | |
| Puerto Rico Industrial, Tourist, Educational, Medical & Environmental Control Facilities Financing Authority, Higher Education Rev. (Ana G. Mendez University System Project), 4%, 4/01/20 | | | 165,000 | | | | 152,508 | |
| Puerto Rico Industrial, Tourist, Educational, Medical & Environmental Control Facilities Financing Authority, Higher Education Rev. (Ana G. Mendez University System Project), 5%, 4/01/21 | | | 570,000 | | | | 543,951 | |
| Puerto Rico Industrial, Tourist, Educational, Medical & Environmental Control Facilities Financing Authority, Higher Education Rev. (Ana G. Mendez University System Project), 5%, 4/01/22 | | | 645,000 | | | | 601,043 | |
| Puerto Rico Industrial, Tourist, Educational, Medical & Environmental Control Facilities Financing Authority, Higher Education Rev. (Ana G. Mendez University System Project), 5%, 4/01/27 | | | 1,340,000 | | | | 1,189,799 | |
59
Portfolio of Investments – continued
| | | | | | | | |
| Issuer | | Shares/Par | | | Value ($) | |
| Municipal Bonds - continued | | | | | | | | |
| Puerto Rico - continued | | | | | | | | |
| Puerto Rico Industrial, Tourist, Educational, Medical & Environmental Control Facilities Financing Authority, Higher Education Rev. (Ana G. Mendez University System Project), 5.5%, 12/01/31 | | $ | 980,000 | | | $ | 891,085 | |
| Puerto Rico Industrial, Tourist, Educational, Medical & Environmental Control Facilities Financing Authority, Higher Education Rev. (Ana G. Mendez University System Project), 5.125%, 4/01/32 | | | 1,330,000 | | | | 1,152,126 | |
| Puerto Rico Industrial, Tourist, Educational, Medical & Environmental Control Facilities Financing Authority, Higher Education Rev. (Ana G. Mendez University System Project), 5%, 3/01/36 | | | 1,015,000 | | | | 853,524 | |
| Puerto Rico Industrial, Tourist, Educational, Medical & Environmental Control Facilities Financing Authority, Higher Education Rev. (Ana G. Mendez University System Project), 5.375%, 4/01/42 | | | 1,625,000 | | | | 1,398,134 | |
| Puerto Rico Industrial, Tourist, Medical, & Environmental Central Facilities (University of Sacred Heart), 4.375%, 10/01/31 | | | 525,000 | | | | 374,467 | |
| Puerto Rico Industrial, Tourist, Medical, & Environmental Central Facilities (University of Sacred Heart), 5%, 10/01/42 | | | 260,000 | | | | 185,008 | |
| Puerto Rico Infrastructure Financing Authority Special Tax Rev., “C”, AMBAC, 5.5%, 7/01/18 | | | 545,000 | | | | 553,170 | |
| Puerto Rico Infrastructure Financing Authority Special Tax Rev., “C”, AMBAC, 5.5%, 7/01/23 | | | 3,420,000 | | | | 3,428,516 | |
| Puerto Rico Infrastructure Financing Authority Special Tax Rev., “C”, AMBAC, 5.5%, 7/01/24 | | | 6,295,000 | | | | 6,287,131 | |
| Puerto Rico Infrastructure Financing Authority Special Tax Rev., “C”, AMBAC, 5.5%, 7/01/26 | | | 4,475,000 | | | | 4,430,429 | |
| Puerto Rico Infrastructure Financing Authority Special Tax Rev., “C”, AMBAC, 5.5%, 7/01/27 | | | 1,765,000 | | | | 1,738,472 | |
| Puerto Rico Infrastructure Financing Authority Special Tax Rev., “C”, AMBAC, 5.5%, 7/01/28 | | | 1,075,000 | | | | 1,053,468 | |
| Puerto Rico Municipal Finance Agency, “A”, AGM, 5%, 8/01/27 | | | 325,000 | | | | 325,192 | |
| Puerto Rico Public Buildings Authority Government Facilities Rev., “M-3”, NATL, 6%, 7/01/27 | | | 1,470,000 | | | | 1,497,768 | |
| Puerto Rico Public Buildings Authority Government Facilities Rev., “M-3”, NATL, 6%, 7/01/28 | | | 490,000 | | | | 497,345 | |
| Puerto Rico Public Buildings Authority Rev., “M-2”, AMBAC, 5.5%, 7/01/35 (Put Date 7/01/17) | | | 6,085,000 | | | | 6,198,850 | |
| Puerto Rico Sales Tax Financing Corp., Sales Tax Rev., “C”, 5%, 8/01/40 | | | 5,570,000 | | | | 3,517,845 | |
| Puerto Rico Sales Tax Financing Corp., Sales Tax Rev., Capital Appreciation, “A”, AMBAC, 0%, 8/01/47 | | | 14,305,000 | | | | 1,517,188 | |
60
Portfolio of Investments – continued
| | | | | | | | |
| Issuer | | Shares/Par | | | Value ($) | |
| Municipal Bonds - continued | | | | | | | | |
| Puerto Rico - continued | | | | | | | | |
| University of Puerto Rico Rev., “P”, NATL, 5%, 6/01/25 | | $ | 595,000 | | | $ | 585,813 | |
| | | | | | | | |
| | | | | | | $ | 118,063,810 | |
| South Carolina - 1.0% | | | | | | | | |
| Lancaster County, SC, Assessment Rev. (Sun City Carolina Lakes), 5.45%, 12/01/37 | | $ | 1,300,000 | | | $ | 1,301,352 | |
| North Charleston, SC, Housing Authority Rev. (Horizon Village), “A”, GNMA, 5.15%, 2/20/48 | | | 1,380,000 | | | | 1,381,256 | |
| Richland County, SC, Environmental Improvement Rev. (International Paper), “A”, 3.875%, 4/01/23 | | | 4,130,000 | | | | 4,444,376 | |
| South Carolina Housing, Finance & Development Authority Mortgage Rev., “A-1”, 4%, 7/01/41 | | | 9,775,000 | | | | 10,564,038 | |
| South Carolina Jobs & Economic Development Authority Hospital Rev. (Palmetto Health), 5.75%, 8/01/39 | | | 940,000 | | | | 1,023,124 | |
| South Carolina Jobs & Economic Development Authority Rev. (Woodlands at Furman), “A”, 6%, 11/15/32 | | | 1,499,418 | | | | 1,542,556 | |
| South Carolina Jobs & Economic Development Authority Rev. (Woodlands at Furman), “A”, 6%, 11/15/47 | | | 1,627,958 | | | | 1,644,010 | |
| South Carolina Jobs & Economic Development Authority Rev. (Woodlands at Furman), Capital Appreciation, “B”, 0%, 11/15/47 | | | 562,212 | | | | 58,234 | |
| South Carolina Jobs & Economic Development Authority Rev. (Woodlands at Furman), Capital Appreciation, “B”, 0%, 11/15/47 | | | 516,379 | | | | 53,487 | |
| South Carolina Jobs & Economic Development Authority, Health Facilities Rev. (Lutheran Homes of South Carolina, Inc.), 5.125%, 5/01/48 | | | 805,000 | | | | 835,091 | |
| South Carolina Public Service Authority Rev., “A”, 5%, 12/01/46 | | | 1,800,000 | | | | 2,025,522 | |
| South Carolina Public Service Authority Rev., “A”, 5%, 12/01/49 | | | 10,000,000 | | | | 11,058,600 | |
| York County, SC, Industrial Rev. (Hoechst Celanese), 5.7%, 1/01/24 | | | 130,000 | | | | 130,368 | |
| | | | | | | | |
| | | | | | | $ | 36,062,014 | |
| South Dakota - 0.1% | | | | | | | | |
| South Dakota Health & Educational Facilities Authority Rev. (Sanford Obligated Group), “B”, 5%, 11/01/34 | | $ | 1,520,000 | | | $ | 1,751,222 | |
| South Dakota Health & Educational Facilities Authority Rev. (Sanford Obligated Group), “B”, 5%, 11/01/44 | | | 1,455,000 | | | | 1,642,870 | |
| | | | | | | | |
| | | | | | | $ | 3,394,092 | |
| Tennessee - 2.0% | | | | | | | | |
| Chattanooga, TN, Health Educational & Housing Facility Board Rev. (Catholic Health Initiatives), “A”, 5.25%, 1/01/45 | | $ | 2,270,000 | | | $ | 2,553,841 | |
| Claiborne County, TN, Industrial Development Board Rev. (Lincoln Memorial University Project), 6.125%, 10/01/40 | | | 5,000,000 | | | | 5,432,850 | |
61
Portfolio of Investments – continued
| | | | | | | | |
| Issuer | | Shares/Par | | | Value ($) | |
| Municipal Bonds - continued | | | | | | | | |
| Tennessee - continued | | | | | | | | |
| Hardeman County, TN, Correctional Facilities Rev., 7.75%, 8/01/17 | | $ | 1,520,000 | | | $ | 1,519,954 | |
| Johnson City, TN, Health & Educational Facilities Board Rev. (Appalachian Christian Village Project), “A”, 5%, 2/15/43 | | | 3,000,000 | | | | 3,126,390 | |
| Johnson City, TN, Health & Educational Facilities Board, Hospital Rev. (Mountain States Health Alliance), 6%, 7/01/38 | | | 1,700,000 | | | | 1,934,617 | |
| Metropolitan Government of Nashville, TN, Airport Authority Improvement Rev., “B”, 5%, 7/01/40 | | | 3,000,000 | | | | 3,397,050 | |
| Nashville & Davidson County, TN, Metropolitan Government Health & Educational Facilities Board (Vanderbilt University), “A”, 5%, 10/01/39 (u) | | | 10,000,000 | | | | 11,211,700 | |
| Nashville & Davidson County, TN, Metropolitan Government Health & Educational Facilities Board (Vanderbilt University), “B”, 5%, 10/01/39 (u) | | | 10,000,000 | | | | 11,211,700 | |
| Shelby County, TN, Health, Educational & Housing Board Residential Care Facility Mortgage Rev. (Village at Germantown), 5%, 12/01/34 | | | 500,000 | | | | 522,115 | |
| Shelby County, TN, Health, Educational & Housing Board Residential Care Facility Mortgage Rev. (Village at Germantown), 5.25%, 12/01/44 | | | 1,000,000 | | | | 1,036,780 | |
| Shelby County, TN, Health, Educational & Housing Board Residential Care Facility Mortgage Rev. (Village at Germantown), 5.25%, 12/01/49 | | | 2,265,000 | | | | 2,320,379 | |
| Tennessee Energy Acquisition Corp., Gas Rev., “A”, 5.25%, 9/01/19 | | | 12,055,000 | | | | 13,547,650 | |
| Tennessee Energy Acquisition Corp., Gas Rev., “A”, 5.25%, 9/01/22 | | | 2,105,000 | | | | 2,526,758 | |
| Tennessee Energy Acquisition Corp., Gas Rev., “A”, 5.25%, 9/01/24 | | | 3,625,000 | | | | 4,394,261 | |
| Tennessee Energy Acquisition Corp., Gas Rev., “A”, 5.25%, 9/01/26 | | | 250,000 | | | | 308,108 | |
| Tennessee Housing Development Agency Rev., Housing Finance Program, “A”, 3.5%, 7/01/45 | | | 5,775,000 | | | | 6,151,703 | |
| Tennessee Housing Development Agency, Residential Financing Program Rev., “2-C”, 4%, 1/01/45 | | | 1,945,000 | | | | 2,099,803 | |
| | | | | | | | |
| | | | | | | $ | 73,295,659 | |
| Texas - 8.3% | | | | | | | | |
| Austin, TX, Convention Center (Convention Enterprises, Inc.), “A”, SYNCORA, 5.25%, 1/01/17 | | $ | 845,000 | | | $ | 872,792 | |
| Austin, TX, Convention Center (Convention Enterprises, Inc.), “A”, SYNCORA, 5.25%, 1/01/20 | | | 830,000 | | | | 850,377 | |
| Austin, TX, Convention Center (Convention Enterprises, Inc.), “A”, SYNCORA, 5.25%, 1/01/24 | | | 4,640,000 | | | | 4,765,141 | |
62
Portfolio of Investments – continued
| | | | | | | | |
| Issuer | | Shares/Par | | | Value ($) | |
| Municipal Bonds - continued | | | | | | | | |
| Texas - continued | | | | | | | | |
| Bell County, TX, Health Facility Development Corp. (Advanced Living Technologies, Inc.), 8%, 12/15/36 (a)(d) | | $ | 4,650,000 | | | $ | 47 | |
| Brazos River, TX, Brazoria County Environmental Rev. (Dow Chemical, Co.), “A-3”, 5.125%, 5/15/33 | | | 4,685,000 | | | | 4,937,147 | |
| Brazos River, TX, Harbor Navigation District (Dow Chemical Co.), “A”, 5.95%, 5/15/33 | | | 8,455,000 | | | | 9,278,348 | |
| Brazos River, TX, Harbor Navigation District (Dow Chemical Co.), “B-2”, 4.95%, 5/15/33 | | | 1,625,000 | | | | 1,714,879 | |
| Cass County, TX, Industrial Development Corp. (International Paper Co.), “A”, 4.625%, 3/01/27 | | | 3,750,000 | | | | 3,790,575 | |
| Central Texas Regional Mobility Authority Senior Lien Rev., “A”, 5%, 1/01/45 | | | 1,315,000 | | | | 1,479,993 | |
| Clifton, TX, Higher Education Finance Corp. Rev. (Idea Public Schools), 6%, 8/15/33 | | | 845,000 | | | | 1,013,113 | |
| Clifton, TX, Higher Education Finance Corp. Rev. (Idea Public Schools), 5.75%, 8/15/41 | | | 695,000 | | | | 779,498 | |
| Clifton, TX, Higher Education Finance Corp. Rev. (Idea Public Schools), 5%, 8/15/42 | | | 3,385,000 | | | | 3,608,444 | |
| Clifton, TX, Higher Education Finance Corp. Rev. (Idea Public Schools), 6%, 8/15/43 | | | 1,850,000 | | | | 2,208,419 | |
| Clifton, TX, Higher Education Finance Corp. Rev. (Uplift Education), “A”, 6.125%, 12/01/40 | | | 4,940,000 | | | | 5,654,225 | |
| Clifton, TX, Higher Education Finance Corp. Rev. (Uplift Education), “A”, 6.25%, 12/01/45 | | | 1,670,000 | | | | 1,916,743 | |
| Clifton, TX, Higher Education Finance Corp., Education Rev. (Uplift Education), “A”, 3.375%, 12/01/24 | | | 490,000 | | | | 497,296 | |
| Dallas and Fort Worth, TX, International Airport Rev., “A”, 5%, 11/01/38 | | | 4,430,000 | | | | 4,890,631 | |
| Dallas and Fort Worth, TX, International Airport Rev., “B”, 5%, 11/01/44 | | | 4,370,000 | | | | 4,886,490 | |
| Dallas and Fort Worth, TX, International Airport Rev., “C”, 5%, 11/01/45 | | | 9,175,000 | | | | 10,153,330 | |
| Deaf Smith County, TX, Hospital District, “A”, 6.5%, 3/01/40 | | | 3,800,000 | | | | 4,253,720 | |
| Decatur Hospital Authority Rev. (Wise Regional Health System), “A”, 5.25%, 9/01/44 | | | 1,860,000 | | | | 1,988,452 | |
| Gregg County, TX, Health Facilities Development Corp. Hospital Rev., (Good Shepherd Obligated Group), “A”, FRN, 4.199%, 10/01/29 (Put Date 3/01/17) | | | 5,125,000 | | | | 5,179,274 | |
| Gulf Coast Waste Disposal Authority (Waste Management, Inc.), 5.2%, 5/01/28 | | | 3,260,000 | | | | 3,319,430 | |
| Gulf Coast, TX, Industrial Development Authority Rev. (CITGO Petroleum Corp.), 4.875%, 5/01/25 | | | 2,345,000 | | | | 2,472,005 | |
| Gulf Coast, TX, Industrial Development Authority Rev. (Microgy Holdings Project), 7%, 12/01/36 (a)(d) | | | 746,831 | | | | 5,601 | |
63
Portfolio of Investments – continued
| | | | | | | | |
| Issuer | | Shares/Par | | | Value ($) | |
| Municipal Bonds - continued | | | | | | | | |
| Texas - continued | | | | | | | | |
| Harris County, Houston, TX, Sports Authority Rev., Capital Appreciation, “A”, 0%, 11/15/34 | | $ | 4,580,000 | | | $ | 2,114,494 | |
| Harris County, Houston, TX, Sports Authority Rev., Capital Appreciation, “A”, 0%, 11/15/38 | | | 40,280,000 | | | | 14,157,614 | |
| Harris County, TX, 5.625%, 5/01/20 | | | 860,895 | | | | 862,849 | |
| Harris County, TX, Cultural Education Facilities Finance Corp. Medical Facilities Rev. (Baylor College of Medicine), “D”, 5.625%, 11/15/32 | | | 4,535,000 | | | | 4,966,687 | |
| Harris County, TX, Cultural Education Facilities Finance Corp. Rev. (Brazos Presbyterian Homes Inc. Project), 7%, 1/01/43 | | | 2,265,000 | | | | 2,697,275 | |
| Harris County, TX, Health Facilities Development Corp., Hospital Rev. (Memorial Hermann Healthcare Systems), “B”, 7.25%, 12/01/35 (Prerefunded 12/01/18) | | | 2,400,000 | | | | 2,830,632 | |
| Harris County-Houston, TX, Sports Authority Rev., “C”, 5%, 11/15/31 | | | 1,425,000 | | | | 1,646,189 | |
| Harris County-Houston, TX, Sports Authority Rev., “C”, 5%, 11/15/32 | | | 185,000 | | | | 211,868 | |
| Harris County-Houston, TX, Sports Authority Rev., “C”, 5%, 11/15/33 | | | 450,000 | | | | 513,864 | |
| Harris County-Houston, TX, Sports Authority Rev., Capital Appreciation, “A”, AGM, 0%, 11/15/41 | | | 745,000 | | | | 242,125 | |
| Harris County-Houston, TX, Sports Authority Rev., Capital Appreciation, “A”, AGM, 0%, 11/15/46 | | | 1,865,000 | | | | 468,227 | |
| Houston, TX, Airport System Rev., “B”, 5%, 7/01/26 | | | 1,335,000 | | | | 1,572,497 | |
| Houston, TX, Airport System Rev., Special Facilities Rev. (Continental Airlines, Inc.), 6.625%, 7/15/38 | | | 7,680,000 | | | | 8,896,589 | |
| Houston, TX, Airport System Rev., Special Facilities Rev. (United Airlines, Inc. Terminal E Project), 4.5%, 7/01/20 | | | 3,075,000 | | | | 3,293,602 | |
| Houston, TX, Airport System Rev., Special Facilities Rev. (United Airlines, Inc. Terminal E Project), 4.75%, 7/01/24 | | | 9,305,000 | | | | 10,413,226 | |
| Houston, TX, Airport System Rev., Special Facilities Rev. (United Airlines, Inc. Terminal E Project), 5%, 7/01/29 | | | 9,905,000 | | | | 10,776,838 | |
| Houston, TX, Airport System Rev., Special Facilities Rev. (United Airlines, Inc. Terminal Improvement Projects), “B-1”, 5%, 7/15/30 | | | 6,515,000 | | | | 7,034,571 | |
| Houston, TX, Airport System Rev., Special Facilities Rev. (United Airlines, Inc. Terminal Improvement Projects), “B-2”, 5%, 7/15/20 | | | 7,970,000 | | | | 8,710,971 | |
| Houston, TX, Industrial Development Corp. (United Parcel Service, Inc.), 6%, 3/01/23 | | | 185,000 | | | | 185,194 | |
| La Vernia, TX, Higher Education Finance Corp. Rev. (KIPP, Inc.), “A”, 6.25%, 8/15/39 (Prerefunded 8/15/19) | | | 1,670,000 | | | | 1,973,923 | |
| La Vernia, TX, Higher Education Finance Corp. Rev. (Lifeschool of Dallas), “A”, 7.5%, 8/15/41 (Prerefunded 8/15/19) | | | 4,385,000 | | | | 5,364,828 | |
| Lufkin, TX, Health Facilities Development Corp. Rev. (Memorial Health System), 5.5%, 2/15/37 (Prerefunded 2/15/17) | | | 6,400,000 | | | | 6,732,416 | |
64
Portfolio of Investments – continued
| | | | | | | | |
| Issuer | | Shares/Par | | | Value ($) | |
| Municipal Bonds - continued | | | | | | | | |
| Texas - continued | | | | | | | | |
| Lufkin, TX, Health Facilities Development Corp. Rev. (Memorial Health System), 6.25%, 2/15/37 (Prerefunded 2/15/19) | | $ | 4,340,000 | | | $ | 5,034,660 | |
| Matagorda County, TX, Pollution Control Rev. (Central Power & Light Co.), “A”, 6.3%, 11/01/29 | | | 2,680,000 | | | | 3,060,882 | |
| Mesquite, TX, Health Facilities Development Corp., Retirement Facility Rev. (Christian Care Centers, Inc.), 5%, 2/15/24 | | | 300,000 | | | | 331,755 | |
| Mesquite, TX, Health Facilities Development Corp., Retirement Facility Rev. (Christian Care Centers, Inc.), 5.125%, 2/15/30 | | | 750,000 | | | | 810,210 | |
| Mesquite, TX, Health Facilities Development Corp., Retirement Facility Rev. (Christian Care Centers, Inc.), 5%, 2/15/36 | | | 500,000 | | | | 525,315 | |
| Mesquite, TX, Health Facilities Development Corp., Retirement Facility Rev. (Christian Care Centers, Inc.), 5.125%, 2/15/42 | | | 1,750,000 | | | | 1,841,193 | |
| Mission, TX, Economic Development Corp., Solid Waste Disposal Rev. (Republic Services, Inc. Project), 0.65%, 1/01/26 (Put Date 5/02/16) | | | 7,000,000 | | | | 7,000,000 | |
| New Hope, TX, Cultural Education Facilities Finance Corp. Retirement Facility Rev (Wesleyan Homes, Inc. Project), 5.5%, 1/01/35 | | | 1,325,000 | | | | 1,372,157 | |
| New Hope, TX, Cultural Education Facilities Finance Corp. Retirement Facility Rev (Wesleyan Homes, Inc. Project), 5.5%, 1/01/43 | | | 1,420,000 | | | | 1,459,220 | |
| New Hope, TX, Cultural Education Facilities Finance Corp. Retirement Facility Rev (Wesleyan Homes, Inc. Project), 5.5%, 1/01/49 | | | 1,470,000 | | | | 1,491,918 | |
| New Hope, TX, Cultural Education Facilities Finance Corp. Student Housing Rev. (Texas A&M University Project), “A”, AGM, 5%, 4/01/46 | | | 1,295,000 | | | | 1,423,270 | |
| New Hope, TX, Cultural Education Facilities Finance Corp., Student Housing Rev. (CHF - Collegiate Housing Stephenville III, L.L.C. - Tarleton State University Project), 5%, 4/01/30 | | | 310,000 | | | | 340,836 | |
| New Hope, TX, Cultural Education Facilities Finance Corp., Student Housing Rev. (CHF - Collegiate Housing Stephenville III, L.L.C. - Tarleton State University Project), 5%, 4/01/35 | | | 310,000 | | | | 334,577 | |
| New Hope, TX, Cultural Education Facilities Finance Corp., Student Housing Rev. (CHF - Collegiate Housing Stephenville III, L.L.C. - Tarleton State University Project), 5%, 4/01/47 | | | 770,000 | | | | 815,846 | |
| New Hope, TX, Cultural Education Facilities Finance Corp., Student Housing Rev. (Texas A&M University Project), “A”, 5%, 4/01/44 | | | 5,000,000 | | | | 5,235,250 | |
| Newark, TX, Higher Education Authority Rev. (A+ Charter Schools, Inc.), “A”, 5.5%, 8/15/35 | | | 1,530,000 | | | | 1,572,259 | |
| Newark, TX, Higher Education Finance Corp Authority Rev. (A+ Charter Schools, Inc.), “A”, 5.75%, 8/15/45 | | | 1,025,000 | | | | 1,044,557 | |
65
Portfolio of Investments – continued
| | | | | | | | |
| Issuer | | Shares/Par | | | Value ($) | |
| Municipal Bonds - continued | | | | | | | | |
| Texas - continued | | | | | | | | |
| North Texas Education Finance Corp., Education Rev. (Uplift Education), “A”, 5.125%, 12/01/42 | | $ | 2,355,000 | | | $ | 2,493,804 | |
| North Texas Tollway Authority Rev., 6%, 1/01/43 | | | 1,280,000 | | | | 1,514,893 | |
| Port of Bay, TX, City Authority (Hoechst Celanese Corp.), 6.5%, 5/01/26 | | | 2,500,000 | | | | 2,508,775 | |
| Red River Authority, TX, Pollution Control Rev. (Celanese Project) “A”, 6.45%, 11/01/30 | | | 430,000 | | | | 431,492 | |
| Red River Authority, TX, Pollution Control Rev. (Celanese Project) “B”, 6.7%, 11/01/30 | | | 5,380,000 | | | | 5,399,798 | |
| Red River, TX, Health Facilities Development Corp., Retirement Facilities Rev. (MRC The Crossings Project), “A”, 7.5%, 11/15/34 | | | 1,075,000 | | | | 1,260,061 | |
| Red River, TX, Health Facilities Development Corp., Retirement Facilities Rev. (MRC The Crossings Project), “A”, 7.75%, 11/15/44 | | | 1,970,000 | | | | 2,320,739 | |
| Red River, TX, Health Facilities Development Corp., Retirement Facilities Rev. (MRC The Crossings Project), “A”, 8%, 11/15/49 | | | 1,680,000 | | | | 2,004,509 | |
| SA Energy Acquisition Public Facility Corp. (Tex Gas Supply), 5.5%, 8/01/27 | | | 4,000,000 | | | | 5,056,040 | |
| San Juan, TX, Higher Education Finance Authority Education Rev. (Idea Public Schools), “A”, 6.7%, 8/15/40 | | | 2,955,000 | | | | 3,436,665 | |
| San Leanna, TX, Educational Facilities Corp., Higher Education Rev. (St. Edwards University), 5.125%, 6/01/36 | | | 1,055,000 | | | | 1,085,848 | |
| Tarrant County, TX, Cultural Education Facilities Finance Corp. Retirement Facility (Air Force Village Foundation, Inc.), 5.75%, 11/15/19 | | | 615,000 | | | | 670,842 | |
| Tarrant County, TX, Cultural Education Facilities Finance Corp. Retirement Facility (Air Force Village Foundation, Inc.), 6.125%, 11/15/29 | | | 520,000 | | | | 575,874 | |
| Tarrant County, TX, Cultural Education Facilities Finance Corp. Retirement Facility (Air Force Village Foundation, Inc.), 5.125%, 5/15/37 | | | 835,000 | | | | 844,369 | |
| Tarrant County, TX, Cultural Education Facilities Finance Corp. Retirement Facility (Air Force Village Foundation, Inc.), 6.375%, 11/15/44 | | | 8,515,000 | | | | 9,428,319 | |
| Tarrant County, TX, Cultural Education Facilities Finance Corp. Retirement Facility (Barton Creek Senior Living Center, Inc., Querencia Project), 5%, 11/15/35 | | | 2,470,000 | | | | 2,584,732 | |
| Tarrant County, TX, Cultural Education Facilities Finance Corp. Retirement Facility (Barton Creek Senior Living Center, Inc., Querencia Project), 5%, 11/15/40 | | | 3,310,000 | | | | 3,410,591 | |
| Tarrant County, TX, Cultural Education Facilities Finance Corp. Retirement Facility (Buckingham Senior Living Community, Inc. Project), 3.875%, 11/15/20 | | | 2,785,000 | | | | 2,800,095 | |
66
Portfolio of Investments – continued
| | | | | | | | |
| Issuer | | Shares/Par | | | Value ($) | |
| Municipal Bonds - continued | | | | | | | | |
| Texas - continued | | | | | | | | |
| Tarrant County, TX, Cultural Education Facilities Finance Corp. Retirement Facility (Buckingham Senior Living Community, Inc. Project), 5.625%, 11/15/41 | | $ | 2,750,000 | | | $ | 2,884,338 | |
| Tarrant County, TX, Cultural Education Facilities Finance Corp. Retirement Facility (Buckingham Senior Living Community, Inc. Project), “A”, 5.25%, 11/15/35 | | | 845,000 | | | | 876,713 | |
| Tarrant County, TX, Cultural Education Facilities Finance Corp. Retirement Facility (Buckingham Senior Living Community, Inc. Project), “A”, 5.5%, 11/15/45 | | | 3,750,000 | | | | 3,914,175 | |
| Tarrant County, TX, Cultural Education Facilities Finance Corp. Retirement Facility (Stayton at Museum Way), 8%, 11/15/28 | | | 1,000,000 | | | | 1,007,900 | |
| Tarrant County, TX, Cultural Education Facilities Finance Corp. Retirement Facility (Stayton at Museum Way), 8.25%, 11/15/44 | | | 7,500,000 | | | | 7,576,575 | |
| Tarrant County, TX, Cultural Education Facilities Finance Corp. Rev. (Trinity Terrace Project), “A-1”, 5%, 10/01/44 | | | 660,000 | | | | 714,971 | |
| Tarrant County, TX, Cultural Education Facilities Finance Corp. Rev. (Trinity Terrace Project), “A-1”, 5%, 10/01/49 | | | 450,000 | | | | 485,415 | |
| Tarrant Cultural Education Facilities Finance Corp. Retirement Facility (Northwest Senior Housing Corporation Edgemere Project), “A”, 5%, 11/15/30 | | | 2,000,000 | | | | 2,232,780 | |
| Tarrant Cultural Education Facilities Finance Corp. Retirement Facility (Northwest Senior Housing Corporation Edgemere Project), “A”, 5%, 11/15/35 | | | 2,350,000 | | | | 2,556,636 | |
| Tarrant Cultural Education Facilities Finance Corp. Retirement Facility (Northwest Senior Housing Corporation Edgemere Project), “B”, 5%, 11/15/30 | | | 2,055,000 | | | | 2,276,282 | |
| Tarrant Cultural Education Facilities Finance Corp. Retirement Facility (Northwest Senior Housing Corporation Edgemere Project), “B”, 5%, 11/15/36 | | | 3,840,000 | | | | 4,047,552 | |
| Texas Private Activity Surface Transportation Corp. Senior Lien Rev. (NTE Mobility Partners Segments 3 LLC Segments 3A & 3B Facility), 7%, 12/31/38 | | | 1,375,000 | | | | 1,729,805 | |
| Texas Private Activity Surface Transportation Corp. Senior Lien Rev. (NTE Mobility Partners Segments 3 LLC Segments 3A & 3B Facility), 6.75%, 6/30/43 | | | 1,105,000 | | | | 1,365,736 | |
| Texas Transportation Commission, Central Texas Turnpike System Rev., Capital Appreciation, “B”, 0%, 8/15/36 | | | 4,605,000 | | | | 1,990,235 | |
| Travis County, TX, Health Facilities Development Corp. Rev. (Westminster Manor Health), 7%, 11/01/30 | | | 3,940,000 | | | | 4,565,199 | |
| Travis County, TX, Health Facilities Development Corp. Rev. (Westminster Manor Health), 7.125%, 11/01/40 | | | 3,560,000 | | | | 4,094,676 | |
| | | | | | | | |
| | | | | | | $ | 300,022,788 | |
67
Portfolio of Investments – continued
| | | | | | | | |
| Issuer | | Shares/Par | | | Value ($) | |
| Municipal Bonds - continued | | | | | | | | |
| U.S. Virgin Islands - 0.2% | | | | | | | | |
| Virgin Islands Public Finance Authority Rev. (Diageo Project), “A”, 6.75%, 10/01/37 | | $ | 4,090,000 | | | $ | 4,611,148 | |
| Virgin Islands Public Finance Authority Rev., Matching Fund Loan Note, “A”, 6%, 10/01/39 | | | 1,500,000 | | | | 1,653,645 | |
| | | | | | | | |
| | | | | | | $ | 6,264,793 | |
| Utah - 0.6% | | | | | | | | |
| Utah Charter School Finance Authority Rev. (Spectrum Academy), 5%, 4/15/30 | | $ | 745,000 | | | $ | 752,830 | |
| Utah Charter School Finance Authority Rev. (Spectrum Academy), 6%, 4/15/45 | | | 1,765,000 | | | | 1,845,431 | |
| Utah County, UT, Charter School Finance Authority, Charter School Rev. (Early Light Academy Project), 8.25%, 7/15/35 | | | 3,710,000 | | | | 4,191,076 | |
| Utah County, UT, Charter School Finance Authority, Charter School Rev. (Hawthorn Academy Project), 8.25%, 7/15/35 (Prerefunded 7/15/18) | | | 3,995,000 | | | | 4,676,187 | |
| Utah County, UT, Charter School Rev. (Renaissance Academy), “A”, 5.625%, 7/15/37 | | | 2,405,000 | | | | 2,420,825 | |
| Utah County, UT, Charter School Rev. (Ronald Wilson Reagan Academy), “A”, 6%, 2/15/38 | | | 6,070,000 | | | | 6,213,616 | |
| | | | | | | | |
| | | | | | | $ | 20,099,965 | |
| Vermont - 0.4% | | | | | | | | |
| Burlington, VT, Airport Rev., “A”, 5%, 7/01/22 | | $ | 3,785,000 | | | $ | 4,291,471 | |
| Burlington, VT, Airport Rev., “A”, AGM, 5%, 7/01/24 | | | 110,000 | | | | 130,716 | |
| Burlington, VT, Airport Rev., “A”, 4%, 7/01/28 | | | 4,645,000 | | | | 4,839,115 | |
| Burlington, VT, Airport Rev., “A”, AGM, 5%, 7/01/30 | | | 190,000 | | | | 219,853 | |
| Vermont Economic Development Authority, Solid Waste Disposal Rev. (Casella Waste Systems, Inc.), 4.75%, 4/01/36 (Put Date 4/02/18) | | | 3,275,000 | | | | 3,301,986 | |
| | | | | | | | |
| | | | | | | $ | 12,783,141 | |
| Virginia - 1.0% | | | | | | | | |
| Alexandria, VA, Industrial Development Authority, Residential Care Facilities Mortgage Rev. (Goodwin House, Inc.), 5%, 10/01/35 | | $ | 1,685,000 | | | $ | 1,921,978 | |
| Embrey Mill Community Development Authority, VA, Special Assessment Rev., 7.25%, 3/01/43 | | | 4,780,000 | | | | 5,192,275 | |
| Giles County, VA, Industrial Development Authority Rev. (Celanese Corp.), 6.45%, 5/01/26 | | | 1,000,000 | | | | 1,003,470 | |
| James City County, VA, Economic Development Authority, Residential Care Facilities Rev. (Virginia United Methodist Homes of Williamsburg), “A”, 2%, 10/01/48 | | | 981,912 | | | | 44,176 | |
68
Portfolio of Investments – continued
| | | | | | | | |
| Issuer | | Shares/Par | | | Value ($) | |
| Municipal Bonds - continued | | | | | | | | |
| Virginia - continued | | | | | | | | |
| Norfolk, VA, Redevelopment & Housing Authority Rev. (Fort Norfolk Retirement Community), 5%, 1/01/46 | | $ | 995,000 | | | $ | 985,806 | |
| Norfolk, VA, Redevelopment & Housing Authority Rev. (Fort Norfolk Retirement Community), 5.375%, 1/01/46 | | | 2,390,000 | | | | 2,447,288 | |
| Prince William County, VA, Cherry Hill Community Development Authority Rev. (Potomac Shores Project), 5.4%, 3/01/45 | | | 1,780,000 | | | | 1,844,169 | |
| Virginia College Building Authority, Educational Facilities Rev. (Marymount University), “B”, 5.25%, 7/01/30 | | | 2,810,000 | | | | 3,058,067 | |
| Virginia College Building Authority, Educational Facilities Rev. (Marymount University), “B”, 5.25%, 7/01/35 | | | 2,590,000 | | | | 2,766,457 | |
| Virginia Small Business Financing Authority Rev. (Elizabeth River Crossings Opco LLC Project), 6%, 1/01/37 | | | 6,065,000 | | | | 7,009,381 | |
| Virginia Small Business Financing Authority Rev. (Elizabeth River Crossings Opco LLC Project), 5.5%, 1/01/42 | | | 9,705,000 | | | | 10,783,031 | |
| West Point, VA, Industrial Development Authority, Solid Waste Disposal Rev. (Chesapeake Corp.), “A”, 6.375%, 3/01/19 (a)(d) | | | 769,496 | | | | 8 | |
| West Point, VA, Industrial Development Authority, Solid Waste Disposal Rev. (Chesapeake Corp.), “B”, 6.25%, 3/01/19 (a)(d) | | | 6,569,571 | | | | 66 | |
| Winchester, VA, Economic Development Authority Hospital Rev. (Valley Health System Obligated Group), “A”, 5%, 1/01/44 | | | 605,000 | | | | 681,563 | |
| | | | | | | | |
| | | | | | | $ | 37,737,735 | |
| Washington - 1.2% | | | | | | | | |
| Port Seattle, WA, Industrial Development Corp., Special Facilities Rev. (Delta Airlines, Inc.), 5%, 4/01/30 | | $ | 4,000,000 | | | $ | 4,224,080 | |
| Skagit County, WA, Public Hospital District No. 001 Rev. (Skagit Valley Hospital), 5.5%, 12/01/30 | | | 2,750,000 | | | | 2,758,443 | |
| Skagit County, WA, Public Hospital District No. 001 Rev. (Skagit Valley Hospital), 5.75%, 12/01/32 | | | 2,205,000 | | | | 2,343,584 | |
| Washington Health Care Facilities Authority Rev. (Central Washington Health Services), 6.75%, 7/01/29 (Prerefunded 7/01/19) | | | 1,550,000 | | | | 1,853,149 | |
| Washington Health Care Facilities Authority Rev. (Central Washington Health Services), 7%, 7/01/39 (Prerefunded 7/01/19) | | | 3,665,000 | | | | 4,412,587 | |
| Washington Health Care Facilities Authority Rev. (Highline Medical Center), FHA, 6.25%, 8/01/36 (Prerefunded 8/01/18) | | | 5,670,000 | | | | 6,433,466 | |
| Washington Health Care Facilities Authority Rev. (Virginia Mason Medical Center), “A”, 6.25%, 8/15/42 | | | 5,075,000 | | | | 5,423,044 | |
| Washington Health Care Facilities Authority Rev. (Virginia Mason Medical Center), “B”, ACA, 5.75%, 8/15/37 | | | 1,000,000 | | | | 1,061,780 | |
| Washington Higher Education Facilities Authority Rev. (Whitworth University), 5.875%, 10/01/34 | | | 2,435,000 | | | | 2,669,491 | |
| Washington Housing Finance Community Nonprofit Housing Rev. (Heron’s Key Senior Living), “A”, 7%, 7/01/45 | | | 1,570,000 | | | | 1,640,289 | |
69
Portfolio of Investments – continued
| | | | | | | | |
| Issuer | | Shares/Par | | | Value ($) | |
| Municipal Bonds - continued | | | | | | | | |
| Washington - continued | | | | | | | | |
| Washington Housing Finance Community Nonprofit Housing Rev. (Heron’s Key Senior Living), “A”, 7%, 7/01/50 | | $ | 1,480,000 | | | $ | 1,535,648 | |
| Washington Housing Finance Community Nonprofit Housing Rev. (Heron’s Key Senior Living), “B-1”, 5.5%, 1/01/24 | | | 1,095,000 | | | | 1,104,067 | |
| Washington Housing Finance Community Nonprofit Housing Rev. (Heron’s Key Senior Living), “B-2”, 4.875%, 1/01/22 | | | 2,100,000 | | | | 2,113,104 | |
| Washington Housing Finance Community Nonprofit Housing Rev. (Heron’s Key Senior Living), “B-3”, 4.375%, 1/01/21 | | | 3,020,000 | | | | 3,068,622 | |
| Washington Housing Finance Community Nonprofit Housing Rev. (Rockwood Retirement Communities), 5.125%, 1/01/20 | | | 4,095,000 | | | | 4,097,867 | |
| | | | | | | | |
| | | | | | | $ | 44,739,221 | |
| West Virginia - 0.3% | | | | | | | | |
| Monongalia County, WV, Building Commission Improvement Rev. (Monongalia Health System Obligated Group), 5%, 7/01/28 | | $ | 1,285,000 | | | $ | 1,520,605 | |
| Monongalia County, WV, Building Commission Improvement Rev. (Monongalia Health System Obligated Group), 5%, 7/01/29 | | | 515,000 | | | | 605,455 | |
| Monongalia County, WV, Building Commission Improvement Rev. (Monongalia Health System Obligated Group), 5%, 7/01/30 | | | 1,005,000 | | | | 1,175,177 | |
| Ohio County, WV, Commission Tax Increment Rev. (Fort Henry Centre), “A”, 5.85%, 6/01/34 | | | 865,000 | | | | 884,134 | |
| West Virginia Hospital Finance Authority Hospital Rev. (Charleston Area Medical Center), “A”, 5%, 9/01/28 | | | 1,000,000 | | | | 1,164,680 | |
| West Virginia Hospital Finance Authority Hospital Rev. (Thomas Health System), 6.5%, 10/01/38 | | | 3,450,000 | | | | 3,651,032 | |
| West Virginia Hospital Finance Authority Hospital Rev. (Valley Health System Obligation Group), 5%, 1/01/44 | | | 605,000 | | | | 675,277 | |
| West Virginia Hospital Finance Authority Rev. (Charleston Area Medical Center), “A”, 5%, 9/01/27 | | | 2,100,000 | | | | 2,456,874 | |
| | | | | | | | |
| | | | | | | $ | 12,133,234 | |
| Wisconsin - 2.2% | | | | | | | | |
| Wisconsin Health & Educational Facilities Authority Rev. (American Eagle Nursing Home), 7.15%, 6/01/28 | | $ | 3,165,000 | | | $ | 3,380,695 | |
| Wisconsin Health & Educational Facilities Authority Rev. (Aurora Healthcare, Inc.), “B-1”, 1.25%, 8/15/25 (Put Date 8/15/17) | | | 2,115,000 | | | | 2,123,185 | |
| Wisconsin Health & Educational Facilities Authority Rev. (Beloit College), “A”, 6.125%, 6/01/35 | | | 710,000 | | | | 794,568 | |
| Wisconsin Health & Educational Facilities Authority Rev. (Beloit College), “A”, 6.125%, 6/01/39 | | | 1,435,000 | | | | 1,598,174 | |
| Wisconsin Health & Educational Facilities Authority Rev. (Meritor Hospital), “A”, 5.5%, 5/01/31 (Prerefunded 5/01/21) | | | 1,855,000 | | | | 2,268,554 | |
| Wisconsin Health & Educational Facilities Authority Rev. (Meritor Hospital), “A”, 6%, 5/01/41 (Prerefunded 5/01/21) | | | 1,405,000 | | | | 1,753,988 | |
70
Portfolio of Investments – continued
| | | | | | | | |
| Issuer | | Shares/Par | | | Value ($) | |
| Municipal Bonds - continued | | | | | | | | |
| Wisconsin - continued | | | | | | | | |
| Wisconsin Health & Educational Facilities Authority Rev. (Sauk-Prairie Memorial Hospital), 5.25%, 2/01/43 | | $ | 4,870,000 | | | $ | 4,947,238 | |
| Wisconsin Health & Educational Facilities Authority Rev. (Sauk-Prairie Memorial Hospital), “A”, 5.125%, 2/01/38 | | | 5,110,000 | | | | 5,303,209 | |
| Wisconsin Health & Educational Facilities Authority Rev. (St. John’s Community, Inc.), “A”, 7.25%, 9/15/29 | | | 485,000 | | | | 583,542 | |
| Wisconsin Health & Educational Facilities Authority Rev. (St. John’s Community, Inc.), “A”, 7.625%, 9/15/39 | | | 1,960,000 | | | | 2,410,682 | |
| Wisconsin Health & Educational Facilities Authority Rev. (St. John’s Community, Inc.), “B”, 5%, 9/15/45 | | | 435,000 | | | | 466,629 | |
| Wisconsin Health & Educational Facilities Authority Rev. (St. John’s Community, Inc.), “B”, 5%, 9/15/37 | | | 290,000 | | | | 313,206 | |
| Wisconsin Health & Educational Facilities Authority Rev. (Wheaton Franciscan Services), 5.25%, 8/15/34 | | | 4,155,000 | | | | 4,236,147 | |
| Wisconsin Public Finance Authority Education Rev. (Pine Lake Preparatory), 4.95%, 3/01/30 | | | 1,025,000 | | | | 1,036,931 | |
| Wisconsin Public Finance Authority Education Rev. (Pine Lake Preparatory), 5.25%, 3/01/35 | | | 1,005,000 | | | | 1,015,804 | |
| Wisconsin Public Finance Authority Education Rev. (Pine Lake Preparatory), 5.5%, 3/01/45 | | | 2,770,000 | | | | 2,787,562 | |
| Wisconsin Public Finance Authority Healthcare Facility (Church Home of Hartford, Inc. Project), “A” , 4%, 9/01/20 | | | 740,000 | | | | 771,272 | |
| Wisconsin Public Finance Authority Healthcare Facility (Church Home of Hartford, Inc. Project), “A” , 5%, 9/01/25 | | | 520,000 | | | | 561,059 | |
| Wisconsin Public Finance Authority Healthcare Facility (Church Home of Hartford, Inc. Project), “A” , 5%, 9/01/30 | | | 895,000 | | | | 925,260 | |
| Wisconsin Public Finance Authority Healthcare Facility (Church Home of Hartford, Inc. Project), “A”, 5%, 9/01/38 | | | 1,185,000 | | | | 1,202,301 | |
| Wisconsin Public Finance Authority Rev. (Roseman University of Health Sciences Project), 5.75%, 4/01/35 | | | 2,805,000 | | | | 2,907,887 | |
| Wisconsin Public Finance Authority Senior Living Rev. (Rose Villa Project), “A”, 5.125%, 11/15/29 | | | 1,905,000 | | | | 1,988,801 | |
| Wisconsin Public Finance Authority Senior Living Rev. (Rose Villa Project), “A”, 5.5%, 11/15/34 | | | 1,730,000 | | | | 1,840,166 | |
| Wisconsin Public Finance Authority Senior Living Rev. (Rose Villa Project), “A”, 5.75%, 11/15/44 | | | 1,685,000 | | | | 1,810,482 | |
| Wisconsin Public Finance Authority Senior Living Rev. (Rose Villa Project), “A”, 6%, 11/15/49 | | | 3,465,000 | | | | 3,770,613 | |
| Wisconsin Public Finance Authority Senior Living Rev. (Rose Villa Project), “B-3”, 3.75%, 11/15/19 | | | 150,000 | | | | 150,176 | |
| Wisconsin Public Finance Authority Student Housing Rev., (Western Carolina University Project), 5.25%, 7/01/47 | | | 2,480,000 | | | | 2,615,879 | |
| Wisconsin Public Finance Authority, Airport Facilities Rev. (Transportation Infrastructure Properties LLC), “B”, 5%, 7/01/22 | | | 1,425,000 | | | | 1,519,834 | |
71
Portfolio of Investments – continued
| | | | | | | | |
| Issuer | | Shares/Par | | | Value ($) | |
| Municipal Bonds - continued | | | | | | | | |
| Wisconsin - continued | | | | | | | | |
| Wisconsin Public Finance Authority, Airport Facilities Rev. (Transportation Infrastructure Properties LLC), “B”, 5.25%, 7/01/28 | | $ | 3,815,000 | | | $ | 4,156,977 | |
| Wisconsin Public Finance Authority, Airport Facilities Rev. (Transportation Infrastructure Properties LLC), “B”, 5%, 7/01/42 | | | 17,610,000 | | | | 18,405,268 | |
| | | | | | | | |
| | | | | | | $ | 77,646,089 | |
| Total Municipal Bonds (Identified Cost, $3,321,900,016) | | | | | | $ | 3,543,619,167 | |
| | |
| Bonds - 0.1% | | | | | | | | |
| Metals & Mining - 0.1% | | | | | | | | |
| Consol Energy, Inc., 5.875%, 4/15/22 | | $ | 7,000,000 | | | $ | 4,523,750 | |
| Total Bonds (Identified Cost, $4,725,977) | | | | | | $ | 4,523,750 | |
| | |
| Money Market Funds - 2.5% | | | | | | | | |
MFS Institutional Money Market Portfolio, 0.28%,
at Cost and Net Asset Value (v) | | | 88,246,100 | | | $ | 88,246,100 | |
| Total Investments (Identified Cost, $3,414,872,093) | | | | | | $ | 3,636,389,017 | |
| | |
| Other Assets, Less Liabilities - (1.1)% | | | | | | | (39,829,780 | ) |
| Net Assets - 100.0% | | | | | | $ | 3,596,559,237 | |
| (a) | Non-income producing security. |
| (n) | Securities exempt from registration under Rule 144A of the Securities Act of 1933. These securities may be sold in the ordinary course of business in transactions exempt from registration, normally to qualified institutional buyers. At period end, the aggregate value of these securities was $31,553,274 representing 0.9% of net assets. |
| (q) | Interest received was less than stated coupon rate. |
| (u) | Underlying security deposited into special purpose trust (“the trust”) by investment banker upon creation of self-deposited inverse floaters. |
| (v) | Underlying affiliated fund that is available only to investment companies managed by MFS. The rate quoted for the MFS Institutional Money Market Portfolio is the annualized seven-day yield of the fund at period end. |
The following abbreviations are used in this report and are defined:
| COP | | Certificate of Participation |
| FRN | | Floating Rate Note. Interest rate resets periodically and the current rate may not be the rate reported at period end. |
72
Portfolio of Investments – continued
| | |
| Insurers | | |
| ACA | | ACA Financial Guaranty Corp. |
| AGM | | Assured Guaranty Municipal |
| AMBAC | | AMBAC Indemnity Corp. |
| ASSD GTY | | Assured Guaranty Insurance Co. |
| BAM | | Build America Mutual |
| CALHF | | California Health Facility Construction Loan Insurance Program |
| FHA | | Federal Housing Administration |
| FHLMC | | Federal Home Loan Mortgage Corp. |
| GNMA | | Government National Mortgage Assn. |
| NATL | | National Public Finance Guarantee Corp. |
| SYNCORA | | Syncora Guarantee Inc. |
See Notes to Financial Statements
73
Financial Statements
STATEMENT OF ASSETS AND LIABILITIES
At 1/31/16
This statement represents your fund’s balance sheet, which details the assets and liabilities comprising the total value of the fund.
| | | | |
| Assets | | | | |
Investments | | | | |
Non-affiliated issuers, at value (identified cost, $3,326,625,993) | | | $3,548,142,917 | |
Underlying affiliated funds, at cost and value | | | 88,246,100 | |
Total investments, at value (identified cost, $3,414,872,093) | | | $3,636,389,017 | |
Receivables for | | | | |
Investments sold | | | 21,226,033 | |
Fund shares sold | | | 13,778,959 | |
Interest | | | 39,359,677 | |
Receivable from investment adviser | | | 46,209 | |
Other assets | | | 17,634 | |
Total assets | | | $3,710,817,529 | |
| Liabilities | | | | |
Payable to custodian | | | $40,917 | |
Payables for | | | | |
Distributions | | | 1,811,440 | |
Investments purchased | | | 64,144,054 | |
Interest expense and fees | | | 62,591 | |
Fund shares reacquired | | | 8,657,445 | |
Payable to the holders of the floating rate certificates from trust assets | | | 38,360,110 | |
Payable to affiliates | | | | |
Shareholder servicing costs | | | 837,085 | |
Distribution and service fees | | | 32,899 | |
Payable for independent Trustees’ compensation | | | 9,434 | |
Accrued expenses and other liabilities | | | 302,317 | |
Total liabilities | | | $114,258,292 | |
Net assets | | | $3,596,559,237 | |
| Net assets consist of | | | | |
Paid-in capital | | | $3,491,348,297 | |
Unrealized appreciation (depreciation) on investments | | | 221,516,924 | |
Accumulated net realized gain (loss) on investments | | | (124,826,931 | ) |
Undistributed net investment income | | | 8,520,947 | |
Net assets | | | $3,596,559,237 | |
Shares of beneficial interest outstanding | | | 435,895,457 | |
| | | | | | | | | | | | |
| | | Net assets | | | Shares
outstanding | | | Net asset value
per share (a) | |
Class A | | | $1,974,564,059 | | | | 239,267,306 | | | | $8.25 | |
Class B | | | 30,537,224 | | | | 3,696,719 | | | | 8.26 | |
Class C | | | 271,642,609 | | | | 32,883,540 | | | | 8.26 | |
Class I | | | 1,319,815,345 | | | | 160,047,892 | | | | 8.25 | |
| (a) | Maximum offering price per share was equal to the net asset value per share for all share classes, except for Class A, for which the maximum offering price per share was $8.62 [100 / 95.75 x $8.25]. On sales of $100,000 or more, the maximum offering price of Class A shares is reduced. A contingent deferred sales charge may be imposed on redemptions of Class A, Class B, and Class C shares. |
See Notes to Financial Statements
74
Financial Statements
STATEMENT OF OPERATIONS
Year ended 1/31/16
This statement describes how much your fund earned in investment income and accrued in expenses. It also describes any gains and/or losses generated by fund operations.
| | | | |
| Net investment income | | | | |
Income | | | | |
Interest | | | $166,731,046 | |
Dividends from underlying affiliated funds | | | 133,336 | |
Total investment income | | | $166,864,382 | |
Expenses | | | | |
Management fee | | | $17,626,690 | |
Distribution and service fees | | | 2,889,269 | |
Shareholder servicing costs | | | 3,254,238 | |
Administrative services fee | | | 508,820 | |
Independent Trustees’ compensation | | | 48,729 | |
Custodian fee | | | 229,842 | |
Shareholder communications | | | 158,410 | |
Audit and tax fees | | | 62,398 | |
Legal fees | | | 50,729 | |
Interest expense and fees | | | 308,510 | |
Miscellaneous | | | 363,133 | |
Total expenses | | | $25,500,768 | |
Fees paid indirectly | | | (76 | ) |
Reduction of expenses by investment adviser | | | (1,468,305 | ) |
Net expenses | | | $24,032,387 | |
Net investment income | | | $142,831,995 | |
| Realized and unrealized gain (loss) on investments | |
Realized gain (loss) (identified cost basis) | | | | |
Investments | | | $(2,951,898 | ) |
Futures contracts | | | (622,299 | ) |
Net realized gain (loss) on investments | | | $(3,574,197 | ) |
Change in unrealized appreciation (depreciation) on investments | | | $(11,495,910 | ) |
Net realized and unrealized gain (loss) on investments | | | $(15,070,107 | ) |
Change in net assets from operations | | | $127,761,888 | |
See Notes to Financial Statements
75
Financial Statements
STATEMENTS OF CHANGES IN NET ASSETS
These statements describe the increases and/or decreases in net assets resulting from operations, any distributions, and any shareholder transactions.
| | | | | | | | |
| | | Years ended 1/31 | |
| | | 2016 | | | 2015 | |
| Change in net assets | | | | | | |
| From operations | | | | | | | | |
Net investment income | | | $142,831,995 | | | | $118,076,918 | |
Net realized gain (loss) on investments | | | (3,574,197 | ) | | | (2,864,708 | ) |
Net unrealized gain (loss) on investments | | | (11,495,910 | ) | | | 209,385,873 | |
Change in net assets from operations | | | $127,761,888 | | | | $324,598,083 | |
| Distributions declared to shareholders | | | | | | | | |
From net investment income | | | $(134,145,179 | ) | | | $(111,076,945 | ) |
Change in net assets from fund share transactions | | | $698,955,690 | | | | $602,075,864 | |
Total change in net assets | | | $692,572,399 | | | | $815,597,002 | |
| Net assets | | | | | | | | |
At beginning of period | | | 2,903,986,838 | | | | 2,088,389,836 | |
At end of period (including undistributed net investment income of $8,520,947 and $9,992,298, respectively) | | | $3,596,559,237 | | | | $2,903,986,838 | |
See Notes to Financial Statements
76
Financial Statements
FINANCIAL HIGHLIGHTS
The financial highlights table is intended to help you understand the fund’s financial performance for the past 5 years (or life of a particular share class, if shorter). Certain information reflects financial results for a single fund share. The total returns in the table represent the rate by which an investor would have earned (or lost) on an investment in the fund share class (assuming reinvestment of all distributions) held for the entire period.
| | | | | | | | | | | | | | | | | | | | |
| Class A | | Years ended 1/31 | |
| | | 2016 | | | 2015 | | | 2014 | | | 2013 | | | 2012 | |
Net asset value, beginning of period | | | $8.29 | | | | $7.61 | | | | $8.34 | | | | $7.89 | | | | $7.13 | |
| Income (loss) from investment operations | | | | | | | | | | | | | |
Net investment income (d) | | | $0.37 | | | | $0.39 | | | | $0.40 | | | | $0.39 | | | | $0.41 | |
Net realized and unrealized gain (loss)
on investments | | | (0.06 | ) | | | 0.65 | | | | (0.74 | ) | | | 0.44 | | | | 0.75 | |
Total from investment operations | | | $0.31 | | | | $1.04 | | | | $(0.34 | ) | | | $0.83 | | | | $1.16 | |
| Less distributions declared to shareholders | | | | | | | | | | | | | |
From net investment income | | | $(0.35 | ) | | | $(0.36 | ) | | | $(0.39 | ) | | | $(0.38 | ) | | | $(0.40 | ) |
Net asset value, end of period (x) | | | $8.25 | | | | $8.29 | | | | $7.61 | | | | $8.34 | | | | $7.89 | |
Total return (%) (r)(s)(t)(x) | | | 3.86 | | | | 14.01 | | | | (4.05 | ) | | | 10.72 | | | | 16.83 | |
Ratios (%) (to average net assets)
and Supplemental data: | | | | | | | | | | | | | | | | | |
Expenses before expense reductions (f) | | | 0.70 | | | | 0.71 | | | | 0.72 | | | | 0.72 | | | | 0.71 | |
Expenses after expense reductions (f) | | | 0.66 | | | | 0.68 | | | | 0.69 | | | | 0.70 | | | | 0.70 | |
Net investment income | | | 4.54 | | | | 4.85 | | | | 5.03 | | | | 4.83 | | | | 5.49 | |
Portfolio turnover | | | 17 | | | | 12 | | | | 18 | | | | 18 | | | | 21 | |
Net assets at end of period
(000 omitted) | | | $1,974,564 | | | | $1,583,324 | | | | $1,445,607 | | | | $2,161,677 | | | | $1,858,416 | |
| Supplemental Ratios (%): | | | | | | | | | | | | | | | | | | | | |
Ratio of expenses to average net assets
after expense reductions and
excluding interest expense
and fees (f)(l) | | | 0.65 | | | | 0.67 | | | | 0.67 | | | | 0.67 | | | | 0.67 | |
See Notes to Financial Statements
77
Financial Highlights – continued
| | | | | | | | | | | | | | | | | | | | |
| Class B | | Years ended 1/31 | |
| | | 2016 | | | 2015 | | | 2014 | | | 2013 | | | 2012 | |
Net asset value, beginning of period | | | $8.30 | | | | $7.61 | | | | $8.35 | | | | $7.90 | | | | $7.13 | |
| Income (loss) from investment operations | | | | | | | | | | | | | |
Net investment income (d) | | | $0.31 | | | | $0.33 | | | | $0.33 | | | | $0.33 | | | | $0.35 | |
Net realized and unrealized gain (loss)
on investments | | | (0.06 | ) | | | 0.66 | | | | (0.74 | ) | | | 0.43 | | | | 0.76 | |
Total from investment operations | | | $0.25 | | | | $0.99 | | | | $(0.41 | ) | | | $0.76 | | | | $1.11 | |
| Less distributions declared to shareholders | | | | | | | | | | | | | |
From net investment income | | | $(0.29 | ) | | | $(0.30 | ) | | | $(0.33 | ) | | | $(0.31 | ) | | | $(0.34 | ) |
Net asset value, end of period (x) | | | $8.26 | | | | $8.30 | | | | $7.61 | | | | $8.35 | | | | $7.90 | |
Total return (%) (r)(s)(t)(x) | | | 3.06 | | | | 13.27 | | | | (4.92 | ) | | | 9.82 | | | | 16.06 | |
Ratios (%) (to average net assets)
and Supplemental data: | | | | | | | | | | | | | | | | | |
Expenses before expense reductions (f) | | | 1.70 | | | | 1.71 | | | | 1.72 | | | | 1.71 | | | | 1.71 | |
Expenses after expense reductions (f) | | | 1.44 | | | | 1.45 | | | | 1.48 | | | | 1.51 | | | | 1.49 | |
Net investment income | | | 3.78 | | | | 4.08 | | | | 4.25 | | | | 4.02 | | | | 4.74 | |
Portfolio turnover | | | 17 | | | | 12 | | | | 18 | | | | 18 | | | | 21 | |
Net assets at end of period
(000 omitted) | | | $30,537 | | | | $33,622 | | | | $34,969 | | | | $52,886 | | | | $47,927 | |
| Supplemental Ratios (%): | | | | | | | | | | | | | | | | | | | | |
Ratio of expenses to average net assets
after expense reductions and
excluding interest expense
and fees (f)(l) | | | 1.43 | | | | 1.44 | | | | 1.46 | | | | 1.48 | | | | 1.46 | |
See Notes to Financial Statements
78
Financial Highlights – continued
| | | | | | | | | | | | | | | | | | | | |
| Class C | | Years ended 1/31 | |
| | | 2016 | | | 2015 | | | 2014 | | | 2013 | | | 2012 | |
Net asset value, beginning of period | | | $8.30 | | | | $7.61 | | | | $8.35 | | | | $7.90 | | | | $7.13 | |
| Income (loss) from investment operations | | | | | | | | | | | | | |
Net investment income (d) | | | $0.29 | | | | $0.31 | | | | $0.32 | | | | $0.31 | | | | $0.33 | |
Net realized and unrealized gain (loss)
on investments | | | (0.06 | ) | | | 0.66 | | | | (0.75 | ) | | | 0.44 | | | | 0.77 | |
Total from investment operations | | | $0.23 | | | | $0.97 | | | | $(0.43 | ) | | | $0.75 | | | | $1.10 | |
| Less distributions declared to shareholders | | | | | | | | | | | | | |
From net investment income | | | $(0.27 | ) | | | $(0.28 | ) | | | $(0.31 | ) | | | $(0.30 | ) | | | $(0.33 | ) |
Net asset value, end of period (x) | | | $8.26 | | | | $8.30 | | | | $7.61 | | | | $8.35 | | | | $7.90 | |
Total return (%) (r)(s)(t)(x) | | | 2.83 | | | | 13.01 | | | | (5.12 | ) | | | 9.61 | | | | 15.82 | |
Ratios (%) (to average net assets)
and Supplemental data: | | | | | | | | | | | | | | | | | |
Expenses before expense reductions (f) | | | 1.70 | | | | 1.71 | | | | 1.72 | | | | 1.71 | | | | 1.71 | |
Expenses after expense reductions (f) | | | 1.66 | | | | 1.68 | | | | 1.69 | | | | 1.70 | | | | 1.70 | |
Net investment income | | | 3.55 | | | | 3.84 | | | | 4.05 | | | | 3.82 | | | | 4.51 | |
Portfolio turnover | | | 17 | | | | 12 | | | | 18 | | | | 18 | | | | 21 | |
Net assets at end of period
(000 omitted) | | | $271,643 | | | | $254,973 | | | | $221,393 | | | | $299,381 | | | | $236,487 | |
| Supplemental Ratios (%): | | | | | | | | | | | | | | | | | | | | |
Ratio of expenses to average net assets
after expense reductions and
excluding interest expense
and fees (f)(l) | | | 1.65 | | | | 1.66 | | | | 1.67 | | | | 1.67 | | | | 1.67 | |
See Notes to Financial Statements
79
Financial Highlights – continued
| | | | | | | | | | | | | | | | | | | | |
| Class I | | Years ended 1/31 | |
| | | 2016 | | | 2015 | | | 2014 | | | 2013 | | | 2012 (i) | |
Net asset value, beginning of period | | | $8.29 | | | | $7.60 | | | | $8.34 | | | | $7.89 | | | | $7.28 | |
| Income (loss) from investment operations | | | | | | | | | | | | | |
Net investment income (d) | | | $0.37 | | | | $0.38 | | | | $0.40 | | | | $0.39 | | | | $0.26 | |
Net realized and unrealized gain (loss)
on investments | | | (0.06 | ) | | | 0.67 | | | | (0.75 | ) | | | 0.44 | | | | 0.61 | |
Total from investment operations | | | $0.31 | | | | $1.05 | | | | $(0.35 | ) | | | $0.83 | | | | $0.87 | |
| Less distributions declared to shareholders | | | | | | | | | | | | | |
From net investment income | | | $(0.35 | ) | | | $(0.36 | ) | | | $(0.39 | ) | | | $(0.38 | ) | | | $(0.26 | ) |
Net asset value, end of period (x) | | | $8.25 | | | | $8.29 | | | | $7.60 | | | | $8.34 | | | | $7.89 | |
Total return (%) (r)(s)(x) | | | 3.86 | | | | 14.14 | | | | (4.18 | ) | | | 10.71 | | | | 12.22 | (n) |
Ratios (%) (to average net assets)
and Supplemental data: | | | | | | | | | | | | | | | | | |
Expenses before expense reductions (f) | | | 0.71 | | | | 0.71 | | | | 0.72 | | | | 0.72 | | | | 0.72 | (a) |
Expenses after expense reductions (f) | | | 0.66 | | | | 0.68 | | | | 0.69 | | | | 0.70 | | | | 0.69 | (a) |
Net investment income | | | 4.55 | | | | 4.78 | | | | 5.04 | | | | 4.82 | | | | 5.03 | (a) |
Portfolio turnover | | | 17 | | | | 12 | | | | 18 | | | | 18 | | | | 21 | |
Net assets at end of period
(000 omitted) | | | $1,319,815 | | | | $1,032,069 | | | | $386,421 | | | | $445,195 | | | | $145,622 | |
| Supplemental Ratios (%): | | | | | | | | | | | | | | | | | | | | |
Ratio of expenses to average net assets
after expense reductions and
excluding interest expense
and fees (f)(l) | | | 0.65 | | | | 0.66 | | | | 0.67 | | | | 0.67 | | | | 0.67 | (a) |
| (d) | Per share data is based on average shares outstanding. |
| (f) | Ratios do not reflect reductions from fees paid indirectly, if applicable. |
| (i) | For Class I, the period is from inception, June 1, 2011, through the stated period end. |
| (l) | Interest expense and fees relate to payments made to the holders of the floating rate certificates from trust assets. |
| (r) | Certain expenses have been reduced without which performance would have been lower. |
| (s) | From time to time the fund may receive proceeds from litigation settlements, without which performance would be lower. |
| (t) | Total returns do not include any applicable sales charges. |
| (x) | The net asset values and total returns have been calculated on net assets which include adjustments made in accordance with U.S. generally accepted accounting principles required at period end for financial reporting purposes. |
See Notes to Financial Statements
80
NOTES TO FINANCIAL STATEMENTS
(1) Business and Organization
MFS Municipal High Income Fund (the fund) is a diversified series of MFS Series Trust III which is organized as a Massachusetts business trust and is registered under the Investment Company Act of 1940, as amended, as an open-end management investment company.
The fund is an investment company and accordingly follows the investment company accounting and reporting guidance of the Financial Accounting Standards Board (FASB) Accounting Standards Codification Topic 946 Financial Services – Investment Companies.
(2) Significant Accounting Policies
General – The preparation of financial statements in conformity with U.S. generally accepted accounting principles requires management to make estimates and assumptions that affect the reported amounts of assets and liabilities, and disclosure of contingent assets and liabilities at the date of the financial statements and the reported amounts of increases and decreases in net assets from operations during the reporting period. Actual results could differ from those estimates. In the preparation of these financial statements, management has evaluated subsequent events occurring after the date of the fund’s Statement of Assets and Liabilities through the date that the financial statements were issued. The fund invests primarily in municipal instruments. The value of municipal instruments can be affected by changes in their actual or perceived credit quality. The credit quality of municipal instruments can be affected by, among other things, the financial condition of the issuer or guarantor, the issuer’s future borrowing plans and sources of revenue, the economic feasibility of the revenue bond project or general borrowing purpose, political or economic developments in the region where the instrument is issued and the liquidity of the security. Municipal instruments generally trade in the over-the-counter market. Municipal instruments backed by current and anticipated revenues from a specific project or specific assets can be negatively affected by the discontinuance of the taxation supporting the projects or assets or the inability to collect revenues for the project or from the assets. If the Internal Revenue Service determines an issuer of a municipal instrument has not complied with the applicable tax requirements, interest from the security could become taxable, the security could decline in value, and distributions made by the fund could be taxable to shareholders. The fund invests in high-yield securities rated below investment grade. Investments in high-yield securities involve greater degrees of credit and market risk than investments in higher-rated securities and tend to be more sensitive to economic conditions.
In January 2016, FASB issued Accounting Standards Update 2016-01, Financial Instruments – Overall (Subtopic 825-10) – Recognition and Measurement of Financial Assets and Financial Liabilities (“ASU 2016-01”) which would first be effective for annual reporting periods beginning after December 15, 2017, and interim periods therein. ASU 2016-01, which changes the accounting for equity investments and for certain financial liabilities, also modifies the presentation and disclosure requirements for financial instruments. Investment companies are specifically exempted from ASU 2016-01’s equity investment accounting provisions and will continue to follow the
81
Notes to Financial Statements – continued
industry specific guidance for investment accounting under ASC 946. Although still evaluating the potential impacts of ASU 2016-01 to the fund, management expects that the impact of the fund’s adoption will be limited to additional financial statement disclosures.
Balance Sheet Offsetting – The fund’s accounting policy with respect to balance sheet offsetting is that, absent an event of default by the counterparty or a termination of the agreement, the International Swaps and Derivatives Association (ISDA) Master Agreement does not result in an offset of reported amounts of financial assets and financial liabilities in the Statement of Assets and Liabilities across transactions between the fund and the applicable counterparty. The fund’s right to setoff may be restricted or prohibited by the bankruptcy or insolvency laws of the particular jurisdiction to which a specific master netting agreement counterparty is subject. Balance sheet offsetting disclosures, to the extent applicable to the fund, have been included in the fund’s Significant Accounting Policies note under the captions for each of the fund’s in-scope financial instruments and transactions.
Investment Valuations – Debt instruments and floating rate loans, including restricted debt instruments, are generally valued at an evaluated or composite bid as provided by a third-party pricing service. Short-term instruments with a maturity at issuance of 60 days or less may be valued at amortized cost, which approximates market value. Open-end investment companies are generally valued at net asset value per share. Securities and other assets generally valued on the basis of information from a third-party pricing service may also be valued at a broker/dealer bid quotation. Values obtained from third-party pricing services can utilize both transaction data and market information such as yield, quality, coupon rate, maturity, type of issue, trading characteristics, and other market data.
The Board of Trustees has delegated primary responsibility for determining or causing to be determined the value of the fund’s investments (including any fair valuation) to the adviser pursuant to valuation policies and procedures approved by the Board. If the adviser determines that reliable market quotations are not readily available, investments are valued at fair value as determined in good faith by the adviser in accordance with such procedures under the oversight of the Board of Trustees. Under the fund’s valuation policies and procedures, market quotations are not considered to be readily available for most types of debt instruments and floating rate loans and many types of derivatives. These investments are generally valued at fair value based on information from third-party pricing services. In addition, investments may be valued at fair value if the adviser determines that an investment’s value has been materially affected by events occurring after the close of the exchange or market on which the investment is principally traded (such as foreign exchange or market) and prior to the determination of the fund’s net asset value, or after the halting of trading of a specific security where trading does not resume prior to the close of the exchange or market on which the security is principally traded. The adviser generally relies on third-party pricing services or other information (such as the correlation with price movements of similar securities in the same or other markets; the type, cost and investment characteristics of the security; the business and financial condition of the issuer; and trading and other market data) to assist in determining whether to fair value and at what value to fair value an investment. The value of an investment for purposes of calculating the fund’s
82
Notes to Financial Statements – continued
net asset value can differ depending on the source and method used to determine value. When fair valuation is used, the value of an investment used to determine the fund’s net asset value may differ from quoted or published prices for the same investment. There can be no assurance that the fund could obtain the fair value assigned to an investment if it were to sell the investment at the same time at which the fund determines its net asset value per share.
Various inputs are used in determining the value of the fund’s assets or liabilities. These inputs are categorized into three broad levels. In certain cases, the inputs used to measure fair value may fall into different levels of the fair value hierarchy. In such cases, an investment’s level within the fair value hierarchy is based on the lowest level of input that is significant to the fair value measurement. The fund’s assessment of the significance of a particular input to the fair value measurement in its entirety requires judgment, and considers factors specific to the investment. Level 1 includes unadjusted quoted prices in active markets for identical assets or liabilities. Level 2 includes other significant observable market-based inputs (including quoted prices for similar securities, interest rates, prepayment speed, and credit risk). Level 3 includes unobservable inputs, which may include the adviser’s own assumptions in determining the fair value of investments. The following is a summary of the levels used as of January 31, 2016 in valuing the fund’s assets or liabilities:
| | | | | | | | | | | | | | | | |
| Investments at Value | | Level 1 | | | Level 2 | | | Level 3 | | | Total | |
| Municipal Bonds | | | $— | | | | $3,543,619,167 | | | | $— | | | | $3,543,619,167 | |
| U.S. Corporate Bonds | | | — | | | | 4,523,750 | | | | — | | | | 4,523,750 | |
| Mutual Funds | | | 88,246,100 | | | | — | | | | — | | | | 88,246,100 | |
| Total Investments | | | $88,246,100 | | | | $3,548,142,917 | | | | $— | | | | $3,636,389,017 | |
For further information regarding security characteristics, see the Portfolio of Investments.
Derivatives – The fund uses derivatives for different purposes, primarily to increase or decrease exposure to a particular market or segment of the market, or security, to increase or decrease interest rate exposure, or as alternatives to direct investments. Derivatives are used for hedging or non-hedging purposes. While hedging can reduce or eliminate losses, it can also reduce or eliminate gains. When the fund uses derivatives as an investment to increase market exposure, or for hedging purposes, gains and losses from derivative instruments may be substantially greater than the derivative’s original cost.
The derivative instruments used by the fund were futures contracts. At January 31, 2016, the fund did not have any outstanding derivative instruments.
The following table presents, by major type of derivative contract, the realized gain (loss) on derivatives held by the fund for the year ended January 31, 2016 as reported in the Statement of Operations:
| | | | |
| Risk | | Futures Contracts | |
| Interest Rate | | | $(622,299 | ) |
There is no change in unrealized appreciation (depreciation) on derivative transactions at period end.
83
Notes to Financial Statements – continued
Derivative counterparty credit risk is managed through formal evaluation of the creditworthiness of all potential counterparties. On certain, but not all, uncleared derivatives, the fund attempts to reduce its exposure to counterparty credit risk whenever possible by entering into an ISDA Master Agreement on a bilateral basis. The ISDA Master Agreement gives each party to the agreement the right to terminate all transactions traded under such agreement if there is a certain deterioration in the credit quality of the other party. Upon an event of default or a termination of the ISDA Master Agreement, the non-defaulting party has the right to close out all transactions traded under such agreement and to net amounts owed under each transaction to one net amount payable by one party to the other. This right to close out and net payments across all transactions traded under the ISDA Master Agreement could result in a reduction of the fund’s credit risk to such counterparty equal to any amounts payable by the fund under the applicable transactions, if any.
Collateral and margin requirements differ by type of derivative. Margin requirements are set by the clearing broker and the clearing house for cleared derivatives (e.g., futures contracts, cleared swaps, and exchange-traded options) while collateral terms are contract specific for uncleared derivatives (e.g., forward foreign currency exchange contracts, uncleared swap agreements, and uncleared options). For derivatives traded under an ISDA Master Agreement, which contains a collateral support annex, the collateral requirements are netted across all transactions traded under such agreement and one amount is posted from one party to the other to collateralize such obligations. Cash that has been segregated to cover the fund’s collateral or margin obligations under derivative contracts, if any, will be reported separately in the Statement of Assets and Liabilities as “Restricted cash” or “Deposits with brokers.” Securities pledged as collateral or margin for the same purpose, if any, are noted in the Portfolio of Investments.
Futures Contracts – The fund entered into futures contracts which may be used to hedge against or obtain broad market exposure, interest rate exposure, or to manage duration. A futures contract represents a commitment for the future purchase or sale of an asset at a specified price on a specified date.
Upon entering into a futures contract, the fund is required to deposit with the broker, either in cash or securities, an initial margin in an amount equal to a certain percentage of the notional amount of the contract. Subsequent payments (variation margin) are made or received by the fund each day, depending on the daily fluctuations in the value of the contract, and are recorded for financial statement purposes as unrealized gain or loss by the fund until the contract is closed or expires at which point the gain or loss on futures contracts is realized.
The fund bears the risk of interest rates or securities prices moving unexpectedly, in which case, the fund may not achieve the anticipated benefits of the futures contracts and may realize a loss. While futures contracts may present less counterparty risk to the fund since the contracts are exchange traded and the exchange’s clearinghouse guarantees payments to the broker, there is still counterparty credit risk due to the insolvency of the broker. The fund’s maximum risk of loss due to counterparty credit risk is equal to the margin posted by the fund to the broker plus any gains or minus any losses on the outstanding futures contracts.
84
Notes to Financial Statements – continued
Inverse Floaters – The fund invests in municipal inverse floating rate securities which are structured by the issuer (known as primary market inverse floating rate securities) or by an investment banker utilizing municipal bonds which have already been issued (known as secondary market inverse floating rate securities) to have variable rates of interest which typically move in the opposite direction of short term interest rates. A secondary market inverse floating rate security is created when an investment banker transfers a fixed rate municipal bond to a special purpose trust, and causes the trust to (a) issue floating rate certificates to third parties, in an amount equal to a fraction of the par amount of the deposited bonds (these certificates usually pay tax-exempt interest at short-term interest rates that typically reset weekly; and the certificate holders typically, on seven days notice, have the option to tender their certificates to the investment banker or another party for redemption at par plus accrued interest), and (b) issue inverse floating rate certificates (sometimes referred to as “inverse floaters”). If the holders of the inverse floaters transfer the municipal bonds to an investment banker for the purpose of depositing the municipal bonds into the special purpose trust, the inverse floating rate certificates that are issued by the trust are referred to as “self-deposited inverse floaters.” If the bonds held by the trust are purchased by the investment banker for deposit into the trust from someone other than the purchasers of the inverse floaters, the inverse floating rate certificates that are issued by the trust are referred to as “externally deposited inverse floaters.” Such self-deposited inverse floaters held by the fund are accounted for as secured borrowings, with the municipal bonds reflected in the investments of the fund and amounts owed to the holders of the floating rate certificates under the provisions of the trust, which amounts are paid solely from the assets of the trust, reflected as liabilities of the fund in the Statement of Assets and Liabilities under the caption, “Payable to the holders of the floating rate certificates from trust assets”. The carrying value of the fund’s payable to the holders of the floating rate certificates from trust assets as reported in the fund’s Statement of Assets and Liabilities approximates its fair value. The value of the payable to the holders of the floating rate certificates from trust assets as of the reporting date is considered level 2 under the fair value hierarchy disclosure. At January 31, 2016, the fund’s payable to the holders of the floating rate certificates from trust assets was $38,360,110 and the interest rate on the floating rate certificates issued by the trust was 0.02%. For the year ended January 31, 2016, the average payable to the holders of the floating rate certificates from trust assets was $45,398,825 at a weighted average interest rate of 0.05%. Interest expense and fees relate to interest payments made to the holders of certain floating rate certificates and associated fees, both of which are made from trust assets. Interest expense and fees are recorded as incurred. For the year ended January 31, 2016, interest expense and fees related to self-deposited inverse floaters amounted to $308,510 and are included in “Interest expense and fees” in the Statement of Operations. Primary and externally deposited inverse floaters held by the fund are not accounted for as secured borrowings.
Indemnifications – Under the fund’s organizational documents, its officers and Trustees may be indemnified against certain liabilities and expenses arising out of the performance of their duties to the fund. Additionally, in the normal course of business, the fund enters into agreements with service providers that may contain
85
Notes to Financial Statements – continued
indemnification clauses. The fund’s maximum exposure under these agreements is unknown as this would involve future claims that may be made against the fund that have not yet occurred.
Investment Transactions and Income – Investment transactions are recorded on the trade date. Interest income is recorded on the accrual basis. All premium and discount is amortized or accreted for financial statement purposes in accordance with U.S. generally accepted accounting principles. Interest payments received in additional securities are recorded on the ex-interest date in an amount equal to the value of the security on such date. Debt obligations may be placed on non-accrual status or set to accrue at a rate of interest less than the contractual coupon when the collection of all or a portion of interest has become doubtful. Interest income for those debt obligations may be further reduced by the write-off of the related interest receivables when deemed uncollectible.
The fund may receive proceeds from litigation settlements. Any proceeds received from litigation involving portfolio holdings are reflected in the Statement of Operations in realized gain/loss if the security has been disposed of by the fund or in unrealized gain/loss if the security is still held by the fund. Any other proceeds from litigation not related to portfolio holdings are reflected as other income in the Statement of Operations.
Legal fees and other related expenses incurred to preserve and protect the value of a security owned are added to the cost of the security; other legal fees are expensed. Capital infusions made directly to the security issuer, which are generally non-recurring, incurred to protect or enhance the value of high-yield debt securities, are reported as additions to the cost basis of the security. Costs that are incurred to negotiate the terms or conditions of capital infusions or that are expected to result in a plan of reorganization are reported as realized losses. Ongoing costs incurred to protect or enhance an investment, or costs incurred to pursue other claims or legal actions, are expensed.
Fees Paid Indirectly – The fund’s custody fee may be reduced by a credit earned under an arrangement that measures the value of U.S. dollars deposited with the custodian by the fund. The amount of the credit, for the year ended January 31, 2016, is shown as a reduction of total expenses in the Statement of Operations.
Tax Matters and Distributions – The fund intends to qualify as a regulated investment company, as defined under Subchapter M of the Internal Revenue Code, and to distribute all of its taxable and tax-exempt income, including realized capital gains. As a result, no provision for federal income tax is required. The fund’s federal tax returns, when filed, will remain subject to examination by the Internal Revenue Service for a three year period. Management has analyzed the fund’s tax positions taken on federal and state tax returns for all open tax years and does not believe that there are any uncertain tax positions that require recognition of a tax liability.
Distributions to shareholders are recorded on the ex-dividend date. Income and capital gain distributions are determined in accordance with income tax regulations, which may differ from U.S. generally accepted accounting principles. Certain capital accounts in the financial statements are periodically adjusted for permanent differences in order
86
Notes to Financial Statements – continued
to reflect their tax character. These adjustments have no impact on net assets or net asset value per share. Temporary differences which arise from recognizing certain items of income, expense, gain or loss in different periods for financial statement and tax purposes will reverse at some time in the future. Distributions in excess of net investment income or net realized gains are temporary overdistributions for financial statement purposes resulting from differences in the recognition or classification of income or distributions for financial statement and tax purposes.
Book/tax differences primarily relate to amortization and accretion of debt securities.
The tax character of distributions declared to shareholders for the last two fiscal years is as follows:
| | | | | | | | |
| | | 1/31/16 | | | 1/31/15 | |
Ordinary income (including any
short-term capital gains) | | | $757,135 | | | | $1,434,566 | |
| Tax-exempt income | | | 133,388,044 | | | | 109,642,379 | |
| Total distributions | | | $134,145,179 | | | | $111,076,945 | |
The federal tax cost and the tax basis components of distributable earnings were as follows:
| | | | |
| As of 1/31/16 | | | |
| Cost of investments | | | $3,355,461,627 | |
| Gross appreciation | | | 267,553,849 | |
| Gross depreciation | | | (24,986,569 | ) |
| Net unrealized appreciation (depreciation) | | | $242,567,280 | |
| Undistributed ordinary income | | | 1,294,664 | |
| Undistributed tax-exempt income | | | 20,551,220 | |
| Capital loss carryforwards | | | (145,877,287 | ) |
| Other temporary differences | | | (13,324,937 | ) |
Under the Regulated Investment Company Modernization Act of 2010 (the “Act”), net capital losses recognized for fund fiscal years beginning after January 31, 2011 may be carried forward indefinitely, and their character is retained as short-term and/or long-term losses (“post-enactment losses”). Previously, net capital losses were carried forward for eight years and treated as short-term losses (“pre-enactment losses”). As a transition rule, the Act requires that all post-enactment net capital losses be used before pre-enactment net capital losses.
As of January 31, 2016, the fund had capital loss carryforwards available to offset future realized gains as follows:
| | | | |
Pre-enactment losses which
expire as follows: | |
| 1/31/17 | | | $(18,935,036 | ) |
| 1/31/18 | | | (28,497,487 | ) |
| 1/31/19 | | | (16,085,714 | ) |
| Total | | | $(63,518,237 | ) |
87
Notes to Financial Statements – continued
| | | | |
Post-enactment losses which are
characterized as follows: | |
| Short-Term | | | $(20,248,969 | ) |
| Long-Term | | | (62,110,081 | ) |
| Total | | | $(82,359,050 | ) |
Multiple Classes of Shares of Beneficial Interest – The fund offers multiple classes of shares, which differ in their respective distribution and service fees. The fund’s income and common expenses are allocated to shareholders based on the value of settled shares outstanding of each class. The fund’s realized and unrealized gain (loss) are allocated to shareholders based on the daily net assets of each class. Dividends are declared separately for each class. Differences in per share dividend rates are generally due to differences in separate class expenses. Class B shares will convert to Class A shares approximately eight years after purchase. The fund’s distributions declared to shareholders as reported in the Statements of Changes in Net Assets are presented by class as follows:
| | | | | | | | |
| | | From net investment
income | |
| | | Year
ended
1/31/16 | | | Year
ended
1/31/15 | |
| Class A | | | $76,506,613 | | | | $68,292,682 | |
| Class B | | | 1,087,399 | | | | 1,294,498 | |
| Class C | | | 8,455,546 | | | | 8,380,411 | |
| Class I | | | 48,095,621 | | | | 33,109,354 | |
| Total | | | $134,145,179 | | | | $111,076,945 | |
(3) Transactions with Affiliates
Investment Adviser – The fund has an investment advisory agreement with MFS to provide overall investment management and related administrative services and facilities to the fund. The management fee is computed daily and paid monthly at an annual rate of 0.55% of the fund’s average daily net assets.
The investment adviser has agreed in writing to reduce its management fee to 0.50% of average daily net assets in excess of $2.5 billion. This written agreement will continue until modified by the fund’s Board of Trustees, but such agreement will continue at least until May 31, 2017. For the year ended January 31, 2016, this management fee reduction amounted to $352,724, which is included in the reduction of total expenses in the Statement of Operations. MFS has also agreed in writing to reduce its management fee by a specified amount if certain MFS mutual fund assets exceed thresholds agreed to by MFS and the fund’s Board of Trustees. For the year ended January 31, 2016, this management fee reduction amounted to $227,328 which is included in the reduction of total expenses in the Statement of Operations. The management fee incurred for the year ended January 31, 2016 was equivalent to an annual effective rate of 0.53% of the fund’s average daily net assets.
The investment adviser has agreed in writing to pay a portion of the fund’s operating expenses, exclusive of management fee, distribution and service fees, interest, taxes, extraordinary expenses, brokerage and transaction costs and investment-related expenses (such as interest expenses and fees associated with investments in inverse
88
Notes to Financial Statements – continued
floating rate instruments), such that fund operating expenses do not exceed 0.12% annually of the fund’s average daily net assets. This written agreement will continue until modified by the fund’s Board of Trustees, but such agreement will continue at least until May 31, 2017. For the year ended January 31, 2016, this reduction amounted to $818,998, which is included in the reduction of total expenses in the Statement of Operations.
Distributor – MFS Fund Distributors, Inc. (MFD), a wholly-owned subsidiary of MFS, as distributor, received $152,362 for the year ended January 31, 2016, as its portion of the initial sales charge on sales of Class A shares of the fund.
The Board of Trustees has adopted a distribution plan for certain share classes pursuant to Rule 12b-1 of the Investment Company Act of 1940.
The fund’s distribution plan provides that the fund will pay MFD for services provided by MFD and financial intermediaries in connection with the distribution and servicing of certain share classes. One component of the plan is a distribution fee paid to MFD and another component of the plan is a service fee paid to MFD. MFD may subsequently pay all, or a portion, of the distribution and/or service fees to financial intermediaries.
Distribution Plan Fee Table:
| | | | | | | | | | | | | | | | | | | | |
| | | Distribution
Fee Rate (d) | | | Service
Fee Rate (d) | | | Total
Distribution
Plan (d) | | | Annual
Effective
Rate (e) | | | Distribution
and Service
Fee | |
| Class B | | | 0.75% | | | | 0.25% | | | | 1.00% | | | | 0.78% | | | | $309,976 | |
| Class C | | | 0.75% | | | | 0.25% | | | | 1.00% | | | | 1.00% | | | | 2,579,293 | |
| Total Distribution and Service Fees | | | | $2,889,269 | |
| (d) | In accordance with the distribution plan for certain classes, the fund pays distribution and/or service fees equal to these annual percentage rates of each class’s average daily net assets. The distribution and service fee rates disclosed by class represent the current rates in effect at the end of the reporting period. Any rate changes, if applicable, are detailed below. |
| (e) | The annual effective rates represent actual fees incurred under the distribution plan for the year ended January 31, 2016 based on each class’s average daily net assets. For one year from the date of sale of Class B shares, assets attributable to such Class B shares are subject to the 0.25% annual Class B service fee. On assets attributable to all other Class B shares, MFD has agreed in writing to waive the service fee. This agreement will continue until modified by the fund’s Board of Trustees, but such agreement will continue at least until May 31, 2016. For the year ended January 31, 2016, this waiver amounted to $68,609 which is included in the reduction of total expenses in the Statement of Operations. MFD has voluntarily agreed to rebate a portion of each class’s 0.25% service fee attributable to accounts for which MFD retains the 0.25% service fee except for accounts attributable to MFS or its affiliates’ seed money. For the year ended January 31, 2016, this rebate amounted to $646 for Class C shares which is included in the reduction of total expenses in the Statement of Operations. |
Certain Class A shares are subject to a contingent deferred sales charge (CDSC) in the event of a shareholder redemption within 18 months of purchase. Class C shares are subject to a CDSC in the event of a shareholder redemption within 12 months of purchase. Class B shares are subject to a CDSC in the event of a shareholder
89
Notes to Financial Statements – continued
redemption within six years of purchase. All contingent deferred sales charges are paid to MFD and during the year ended January 31, 2016, were as follows:
| | | | |
| | | Amount | |
| Class A | | | $12,683 | |
| Class B | | | 41,699 | |
| Class C | | | 16,934 | |
Shareholder Servicing Agent – MFS Service Center, Inc. (MFSC), a wholly-owned subsidiary of MFS, receives a fee from the fund for its services as shareholder servicing agent calculated as a percentage of the average daily net assets of the fund as determined periodically under the supervision of the fund’s Board of Trustees. For the year ended January 31, 2016, the fee was $161,358, which equated to 0.005% annually of the fund’s average daily net assets. MFSC also receives payment from the fund for out-of-pocket expenses, sub-accounting and other shareholder servicing costs which may be paid to affiliated and unaffiliated service providers. For the year ended January 31, 2016, these out-of-pocket expenses, sub-accounting and other shareholder servicing costs amounted to $3,092,880.
Administrator – MFS provides certain financial, legal, shareholder communications, compliance, and other administrative services to the fund. Under an administrative services agreement, the fund reimburses MFS the costs incurred to provide these services. The fund is charged an annual fixed amount of $17,500 plus a fee based on average daily net assets. The administrative services fee incurred for the year ended January 31, 2016 was equivalent to an annual effective rate of 0.0159% of the fund’s average daily net assets.
Trustees’ and Officers’ Compensation – The fund pays compensation to independent Trustees in the form of a retainer, attendance fees, and additional compensation to Board and Committee chairpersons. The fund does not pay compensation directly to Trustees or officers of the fund who are also officers of the investment adviser, all of whom receive remuneration for their services to the fund from MFS. Certain officers and Trustees of the fund are officers or directors of MFS, MFD, and MFSC.
Prior to December 31, 2001, the fund had an unfunded defined benefit plan (“DB plan”) for independent Trustees. As of December 31, 2001, the Board took action to terminate the DB plan with respect to then-current and any future independent Trustees, such that the DB plan covers only certain of those former independent Trustees who retired on or before December 31, 2001. The DB plan resulted in a pension expense of $2,890 and is included in “Independent Trustees’ compensation” in the Statement of Operations for the year ended January 31, 2016. The liability for deferred retirement benefits payable to certain independent Trustees under the DB plan amounted to $9,420 at January 31, 2016, and is included in “Payable for independent Trustees’ compensation” in the Statement of Assets and Liabilities.
Other – This fund and certain other funds managed by MFS (the funds) have entered into a service agreement (the ISO Agreement) which provides for payment of fees solely by the funds to Tarantino LLC in return for the provision of services of an Independent Senior Officer (ISO) for the funds. Frank L. Tarantino serves as the ISO and is an officer of the funds and the sole member of Tarantino LLC. The funds can
90
Notes to Financial Statements – continued
terminate the ISO Agreement with Tarantino LLC at any time under the terms of the ISO Agreement. For the year ended January 31, 2016, the fee paid by the fund under this agreement was $9,838 and is included in “Miscellaneous” expense in the Statement of Operations. MFS has agreed to bear all expenses associated with office space, other administrative support, and supplies provided to the ISO.
The fund invests in the MFS Institutional Money Market Portfolio which is managed by MFS and seeks current income consistent with preservation of capital and liquidity. Income earned on this investment is included in “Dividends from underlying affiliated funds” in the Statement of Operations. This money market fund does not pay a management fee to MFS.
(4) Portfolio Securities
For the year ended January 31, 2016, purchases and sales of investments, other than short-term obligations, aggregated $1,186,464,527 and $521,543,866, respectively.
(5) Shares of Beneficial Interest
The fund’s Declaration of Trust permits the Trustees to issue an unlimited number of full and fractional shares of beneficial interest. Transactions in fund shares were as follows:
| | | | | | | | | | | | | | | | |
| | | Year ended
1/31/16 | | | Year ended
1/31/15 | |
| | | Shares | | | Amount | | | Shares | | | Amount | |
| Shares sold | | | | | | | | | | | | | | | | |
Class A | | | 76,456,144 | | | | $624,038,964 | | | | 40,473,485 | | | | $322,376,840 | |
Class B | | | 416,244 | | | | 3,387,125 | | | | 414,499 | | | | 3,300,718 | |
Class C | | | 5,476,902 | | | | 44,620,971 | | | | 5,587,973 | | | | 44,672,670 | |
Class I | | | 63,029,868 | | | | 512,262,871 | | | | 92,690,200 | | | | 736,618,572 | |
| | | 145,379,158 | | | | $1,184,309,931 | | | | 139,166,157 | | | | $1,106,968,800 | |
|
Shares issued to shareholders in
reinvestment of distributions | |
Class A | | | 8,709,395 | | | | $70,835,448 | | | | 7,675,250 | | | | $61,221,837 | |
Class B | | | 110,201 | | | | 897,084 | | | | 132,594 | | | | 1,057,981 | |
Class C | | | 815,313 | | | | 6,637,686 | | | | 791,805 | | | | 6,325,389 | |
Class I | | | 4,439,858 | | | | 36,091,153 | | | | 3,039,284 | | | | 24,362,211 | |
| | | 14,074,767 | | | | $114,461,371 | | | | 11,638,933 | | | | $92,967,418 | |
|
| Shares reacquired | |
Class A | | | (36,844,265 | ) | | | $(299,291,613 | ) | | | (47,280,505 | ) | | | $(374,787,539 | ) |
Class B | | | (880,349 | ) | | | (7,157,569 | ) | | | (1,089,824 | ) | | | (8,648,821 | ) |
Class C | | | (4,125,717 | ) | | | (33,547,728 | ) | | | (4,742,412 | ) | | | (37,720,457 | ) |
Class I | | | (31,974,993 | ) | | | (259,818,702 | ) | | | (22,021,899 | ) | | | (176,703,537 | ) |
| | | (73,825,324 | ) | | | $(599,815,612 | ) | | | (75,134,640 | ) | | | $(597,860,354 | ) |
91
Notes to Financial Statements – continued
| | | | | | | | | | | | | | | | |
| | | Year ended
1/31/16 | | | Year ended
1/31/15 | |
| | | Shares | | | Amount | | | Shares | | | Amount | |
| Net change | |
Class A | | | 48,321,274 | | | | $395,582,799 | | | | 868,230 | | | | $8,811,138 | |
Class B | | | (353,904 | ) | | | (2,873,360 | ) | | | (542,731 | ) | | | (4,290,122 | ) |
Class C | | | 2,166,498 | | | | 17,710,929 | | | | 1,637,366 | | | | 13,277,602 | |
Class I | | | 35,494,733 | | | | 288,535,322 | | | | 73,707,585 | | | | 584,277,246 | |
| | | 85,628,601 | | | | $698,955,690 | | | | 75,670,450 | | | | $602,075,864 | |
(6) Line of Credit
The fund and certain other funds managed by MFS participate in a $1.25 billion unsecured committed line of credit, subject to a $1 billion sublimit, provided by a syndication of banks under a credit agreement. Borrowings may be made for temporary financing needs. Interest is charged to each fund, based on its borrowings, generally at a rate equal to the higher of the Overnight Federal Reserve funds rate or daily one month LIBOR plus an agreed upon spread. A commitment fee, based on the average daily, unused portion of the committed line of credit, is allocated among the participating funds at the end of each calendar quarter. In addition, the fund and other funds managed by MFS have established unsecured uncommitted borrowing arrangements with certain banks for temporary financing needs. Interest is charged to each fund, based on its borrowings, at a rate equal to the Overnight Federal Reserve funds rate plus an agreed upon spread. For the year ended January 31, 2016, the fund’s commitment fee and interest expense were $10,486 and $0, respectively, and are included in “Miscellaneous” expense in the Statement of Operations.
(7) Transactions in Underlying Affiliated Funds-Affiliated Issuers
An affiliated issuer may be considered one in which the fund owns 5% or more of the outstanding voting securities, or a company which is under common control. For the purposes of this report, the fund assumes the following to be an affiliated issuer:
| | | | | | | | | | | | | | | | |
| Underlying Affiliated Fund | | Beginning Shares/Par Amount | | | Acquisitions Shares/Par Amount | | | Dispositions Shares/Par Amount | | | Ending Shares/Par Amount | |
MFS Institutional Money
Market Portfolio | | | 89,848,064 | | | | 788,918,809 | | | | (790,520,773 | ) | | | 88,246,100 | |
| | | | |
| Underlying Affiliated Fund | | Realized Gain (Loss) | | | Capital Gain Distributions | | | Dividend Income | | | Ending Value | |
MFS Institutional Money
Market Portfolio | | | $— | | | | $— | | | | $133,336 | | | | $88,246,100 | |
92
REPORT OF INDEPENDENT REGISTERED PUBLIC ACCOUNTING FIRM
To the Board of Trustees of MFS Series Trust III and Shareholders of MFS Municipal High Income Fund:
We have audited the accompanying statement of assets and liabilities of MFS Municipal High Income Fund (the Fund) (one of the series constituting MFS Series Trust III), including the portfolio of investments, as of January 31, 2016, and the related statement of operations for the year then ended, the statements of changes in net assets for each of the two years in the period then ended and the financial highlights for each of the periods indicated therein. These financial statements and financial highlights are the responsibility of the Fund’s management. Our responsibility is to express an opinion on these financial statements and financial highlights based on our audits.
We conducted our audits in accordance with the standards of the Public Company Accounting Oversight Board (United States). Those standards require that we plan and perform the audit to obtain reasonable assurance about whether the financial statements and financial highlights are free of material misstatement. We were not engaged to perform an audit of the Fund’s internal control over financial reporting. Our audits included consideration of internal control over financial reporting as a basis for designing audit procedures that are appropriate in the circumstances, but not for the purpose of expressing an opinion on the effectiveness of the Fund’s internal control over financial reporting. Accordingly, we express no such opinion. An audit also includes examining, on a test basis, evidence supporting the amounts and disclosures in the financial statements and financial highlights, assessing the accounting principles used and significant estimates made by management, and evaluating the overall financial statement presentation. Our procedures included confirmation of securities owned as of January 31, 2016, by correspondence with the custodian and others or by other appropriate auditing procedures where replies from others were not received. We believe that our audits provide a reasonable basis for our opinion.
In our opinion, the financial statements and financial highlights referred to above present fairly, in all material respects, the financial position of MFS Municipal High Income Fund (one of the series constituting MFS Series Trust III) at January 31, 2016, the results of its operations for the year then ended, the changes in its net assets for each of the two years in the period then ended and the financial highlights for each of the periods indicated therein, in conformity with U.S. generally accepted accounting principles.

Boston, Massachusetts
March 17, 2016
93
TRUSTEES AND OFFICERS — IDENTIFICATION AND BACKGROUND
The Trustees and Officers of the Trust, as of March 1, 2016, are listed below, together with their principal occupations during the past five years. (Their titles may have varied during that period.) The address of each Trustee and Officer is 111 Huntington Avenue, Boston, Massachusetts 02199-7618.
| | | | | | | | |
Name, Age | | Position(s)
Held with Fund | | Trustee/Officer
Since (h) | | Principal
Occupations During the Past Five Years | | Other Directorships (j) |
| INTERESTED TRUSTEES |
Robert J. Manning (k)
(age 52) | | Trustee | | February 2004 | | Massachusetts Financial Services Company, Chairman, Co-Chief Executive Officer and Director | | N/A |
Robin A. Stelmach (k)
(age 54) | | Trustee and President | | January 2014 | | Massachusetts Financial Services Company, Executive Vice President and Chief Operating Officer | | N/A |
| INDEPENDENT TRUSTEES | | | | | | |
David H. Gunning
(age 73) | | Trustee and Chair of Trustees | | January 2004 | | Private investor | | Lincoln Electric Holdings, Inc., Director; Development Alternatives, Inc., Director/Non-Executive Chairman |
Steven E. Buller
(age 64) | | Trustee | | February 2014 | | Chairman, Financial Accounting Standards Advisory Council; Standing Advisory Group, Public Company Accounting Oversight Board, Member (until 2014); BlackRock, Inc. (investment management), Managing Director (until 2014), BlackRock Finco UK (investment management), Director (until 2014) | | N/A |
Robert E. Butler
(age 74) | | Trustee | | January 2006 | | Consultant – investment company industry regulatory and compliance matters | | N/A |
Maureen R. Goldfarb
(age 60) | | Trustee | | January 2009 | | Private investor | | N/A |
94
Trustees and Officers – continued
| | | | | | | | |
Name, Age | | Position(s)
Held with Fund | | Trustee/Officer
Since (h) | | Principal
Occupations During the Past Five Years | | Other Directorships (j) |
William R. Gutow
(age 74) | | Trustee | | December 1993 | | Private investor and real estate consultant; Capitol Entertainment Management Company (video franchise), Vice Chairman (until 2014) | | Texas Donuts, Vice Chairman (until 2010) |
Michael Hegarty
(age 71) | | Trustee | | December 2004 | | Private investor | | Rouse Properties Inc., Director; Capmark Financial Group Inc., Director (until 2015) |
John P. Kavanaugh
(age 61) | | Trustee | | January 2009 | | Private investor | | N/A |
Maryanne L. Roepke
(age 60) | | Trustee | | May 2014 | | American Century Investments (investment management), Senior Vice President and Chief Compliance Officer (until 2014) | | N/A |
Laurie J. Thomsen
(age 58) | | Trustee | | March 2005 | | Private investor | | The Travelers Companies, Director; Dycom Industries, Inc., Director |
Robert W. Uek
(age 74) | | Trustee | | January 2006 | | Consultant to investment company industry | | N/A |
| OFFICERS | | | | | | | | |
Christopher R. Bohane (k)
(age 42) | | Assistant Secretary and Assistant Clerk | | July 2005 | | Massachusetts Financial Services Company, Vice President and Assistant General Counsel | | N/A |
Kino Clark (k)
(age 47) | | Assistant Treasurer | | January 2012 | | Massachusetts Financial Services Company, Vice President | | N/A |
Kristin V. Collins (k)
(age 43) | | Assistant Secretary and Assistant Clerk | | September 2015 | | Massachusetts Financial Services Company, Vice President and Assistant General Counsel | | N/A |
95
Trustees and Officers – continued
| | | | | | | | |
Name, Age | | Position(s)
Held with Fund | | Trustee/Officer
Since (h) | | Principal
Occupations During the Past Five Years | | Other Directorships (j) |
Thomas H. Connors (k)
(age 56) | | Assistant Secretary and Assistant Clerk | | September 2012 | | Massachusetts Financial Services Company, Vice President and Senior Counsel; Deutsche Investment Management Americas Inc. (financial service provider), Director and Senior Counsel (until 2012) | | N/A |
Ethan D. Corey (k)
(age 52) | | Assistant Secretary and Assistant Clerk | | July 2005 | | Massachusetts Financial Services Company, Senior Vice President and Associate General Counsel | | N/A |
David L. DiLorenzo (k)
(age 47) | | Treasurer | | July 2005 | | Massachusetts Financial Services Company, Senior Vice President | | N/A |
Brian E. Langenfeld (k)
(age 42) | | Assistant Secretary and Assistant Clerk | | June 2006 | | Massachusetts Financial Services Company, Vice President and Senior Counsel | | N/A |
Kenneth Paek (k)
(age 41) | | Assistant Treasurer | | February 2015 | | Massachusetts Financial Services Company, Vice President; Cohen & Steers, Vice President/Head of Fund Administration (until 2014); Morgan Stanley, Executive Director/Head of European Fund Administration (until 2012) | | N/A |
Susan A. Pereira (k)
(age 45) | | Assistant Secretary and Assistant Clerk | | July 2005 | | Massachusetts Financial Services Company, Vice President and Senior Counsel | | N/A |
96
Trustees and Officers – continued
| | | | | | | | |
Name, Age | | Position(s)
Held with Fund | | Trustee/Officer
Since (h) | | Principal
Occupations During the Past Five Years | | Other Directorships (j) |
Kasey L. Phillips (k)
(age 45) | | Assistant Treasurer | | September 2012 | | Massachusetts Financial Services Company, Vice President; Wells Fargo Funds Management, LLC, Senior Vice President, Fund Treasurer (until 2012) | | N/A |
Mark N. Polebaum (k)
(age 63) | | Secretary and Clerk | | January 2006 | | Massachusetts Financial Services Company, Executive Vice President, General Counsel and Secretary | | N/A |
Matthew A. Stowe (k)
(age 41) | | Assistant Secretary and Assistant Clerk | | October 2014 | | Massachusetts Financial Services Company, Vice President and Assistant General Counsel | | N/A |
Frank L. Tarantino
(age 71) | | Independent Senior Officer | | June 2004 | | Tarantino LLC (provider of compliance services), Principal | | N/A |
Richard S. Weitzel (k)
(age 45) | | Assistant Secretary and Assistant Clerk | | October 2007 | | Massachusetts Financial Services Company, Senior Vice President and Associate General Counsel | | N/A |
Martin J. Wolin (k)
(age 48) | | Chief Compliance Officer | | July 2015 | | Massachusetts Financial Services Company, Senior Vice President and Chief Compliance Officer (since July 2015); Mercer (financial service provider), Chief Risk and Compliance Officer, North America and Latin America (until June 2015) | | N/A |
James O. Yost (k)
(age 55) | | Deputy Treasurer | | September 1990 | | Massachusetts Financial Services Company, Senior Vice President | | N/A |
| (h) | Date first appointed to serve as Trustee/officer of an MFS Fund. Each Trustee has served continuously since appointment unless indicated otherwise. For the period from December 15, 2004 until February 22, 2005, Mr. Manning served as Advisory Trustee. Prior to January 2012, Messrs. DiLorenzo and Yost served as Assistant Treasurers of the Funds. Ms. Stelmach was appointed as President of the Funds as of October 1, 2014. |
97
Trustees and Officers – continued
| (j) | Directorships or trusteeships of companies required to report to the Securities and Exchange Commission (i.e., “public companies”). |
| (k) | “Interested person” of the Trust within the meaning of the Investment Company Act of 1940 (referred to as the 1940 Act), which is the principal federal law governing investment companies like the fund, as a result of a position with MFS. The address of MFS is 111 Huntington Avenue, Boston, Massachusetts 02199-7618. |
Each Trustee (except Ms. Stelmach, Mr. Buller and Ms. Roepke) has been elected by shareholders and each Trustee and officer holds office until his or her successor is chosen and qualified or until his or her earlier death, resignation, retirement or removal. The Trust does not hold annual meetings for the purpose of electing Trustees, and Trustees are not elected for fixed terms. Messrs. Buller, Butler, Kavanaugh, Uek and Ms. Roepke are members of the Trust’s Audit Committee.
Each of the Fund’s Trustees and officers holds comparable positions with certain other funds of which MFS or a subsidiary is the investment adviser or distributor, and, in the case of the officers, with certain affiliates of MFS. As of March 1, 2016, the Trustees served as board members of 137 funds within the MFS Family of Funds.
The Statement of Additional Information for a Fund includes further information about the Trustees and is available without charge upon request by calling 1-800-225-2606.
| | |
| Investment Adviser | | Custodian |
Massachusetts Financial Services Company
111 Huntington Avenue
Boston, MA 02199-7618 | | JPMorgan Chase Bank, NA 4 Metrotech Center New York, NY 11245 |
| Distributor | | Independent Registered Public Accounting Firm |
MFS Fund Distributors, Inc.
111 Huntington Avenue
Boston, MA 02199-7618 | | Ernst & Young LLP 200 Clarendon Street Boston, MA 02116 |
| Portfolio Managers | | |
Gary Lasman Geoffrey Schechter | | |
98
PROXY VOTING POLICIES AND INFORMATION
MFS votes proxies on behalf of the fund pursuant to proxy voting policies and procedures that are available without charge, upon request, by calling 1-800-225-2606, by visiting the Proxy Voting section of mfs.com or by visiting the SEC’s Web site at http://www.sec.gov.
Information regarding how the fund voted proxies relating to portfolio securities during the most recent twelve-month period ended June 30 is available without charge by visiting the Proxy Voting section of mfs.com or by visiting the SEC’s Web site at http://www.sec.gov.
QUARTERLY PORTFOLIO DISCLOSURE
The fund will file a complete schedule of portfolio holdings with the Securities and Exchange Commission (the Commission) for the first and third quarters of each fiscal year on Form N-Q. A shareholder can obtain the quarterly portfolio holdings report at mfs.com. The fund’s Form N-Q is also available on the EDGAR database on the Commission’s Internet Web site at http://www.sec.gov, and may be reviewed and copied at the:
Public Reference Room
Securities and Exchange Commission
100 F Street, NE, Room 1580
Washington, D.C. 20549
Information on the operation of the Public Reference Room may be obtained by calling the Commission at 1-800-SEC-0330. Copies of the fund’s Form N-Q also may be obtained, upon payment of a duplicating fee, by electronic request at the following e-mail address: publicinfo@sec.gov or by writing the Public Reference Section at the above address.
FURTHER INFORMATION
From time to time, MFS may post important information about the fund or the MFS funds on the MFS web site (mfs.com). This information is available by visiting the “Market Commentary” and “Announcements” sub sections in the “Market Outlooks” section of mfs.com or by clicking on the fund’s name under “Mutual Funds” in the “Products” section of mfs.com.
FEDERAL TAX INFORMATION (unaudited)
The fund will notify shareholders of amounts for use in preparing 2016 income tax forms in January 2017. The following information is provided pursuant to provisions of the Internal Revenue Code.
Of the dividends paid from net investment income during the fiscal year, 99.44% is designated as exempt interest dividends for federal income tax purposes. If the fund has earned income on private activity bonds, a portion of the dividends paid may be considered a tax preference item for purposes of computing a shareholder’s alternative minimum tax.
99
rev. 3/11
| | | | |
| | | |
FACTS | | WHAT DOES MFS DO WITH YOUR PERSONAL INFORMATION? | |  |
| | |
| Why? | | Financial companies choose how they share your personal information. Federal law gives consumers the right to limit some but not all sharing. Federal law also requires us to tell you how we collect, share, and protect your personal information. Please read this notice carefully to understand what we do. |
| | |
| What? | | The types of personal information we collect and share depend on the product or service you have with us. This information can include: • Social Security number and account balances • Account transactions and transaction history • Checking account information and wire transfer instructions When you are no longer our customer, we continue to share your information as described in this notice. |
| | |
| How? | | All financial companies need to share customers’ personal information to run their everyday business. In the section below, we list the reasons financial companies can share their customers’ personal information; the reasons MFS chooses to share; and whether you can limit this sharing. |
| | | | |
Reasons we can share your
personal information | | Does MFS
share? | | Can you limit
this sharing? |
For our everyday business purposes – such as to process your transactions, maintain your account(s), respond to court orders and legal investigations, or report to credit bureaus | | Yes | | No |
For our marketing purposes – to offer our products and services to you | | No | | We don’t share |
| For joint marketing with other financial companies | | No | | We don’t share |
For our affiliates’ everyday business purposes – information about your transactions and experiences | | No | | We don’t share |
For our affiliates’ everyday business purposes – information about your creditworthiness | | No | | We don’t share |
| For nonaffiliates to market to you | | No | | We don’t share |
| | |
| Questions? | | Call 800-225-2606 or go to mfs.com. |
100
| | |
| Who we are |
| Who is providing this notice? | | MFS Funds, MFS Investment Management, MFS Institutional Advisors, Inc., MFS Fund Distributors, Inc., MFS Heritage Trust Company, and MFS Service Center, Inc. |
| | |
| What we do |
| How does MFS protect my personal information? | | To protect your personal information from unauthorized access and use, we use security measures that comply with federal law. These measures include procedural, electronic, and physical safeguards for the protection of the personal information we collect about you. |
| How does MFS collect my personal information? | | We collect your personal information, for example, when you • open an account or provide account information • direct us to buy securities or direct us to sell your securities • make a wire transfer We also collect your personal information from others, such as credit bureaus, affiliates and other companies. |
| Why can’t I limit all sharing? | | Federal law gives you the right to limit only • sharing for affiliates’ everyday business purposes – information about your creditworthiness • affiliates from using your information to market to you • sharing for nonaffiliates to market to you State laws and individual companies may give you additional rights to limit sharing. |
| | |
| Definitions |
| Affiliates | | Companies related by common ownership or control. They can be financial and nonfinancial companies. • MFS does not share personal information with affiliates, except for everyday business purposes as described on page one of this notice. |
| Nonaffiliates | | Companies not related by common ownership or control. They can be financial and nonfinancial companies. • MFS does not share with nonaffiliates so they can market to you. |
| Joint Marketing | | A formal agreement between nonaffiliated financial companies that together market financial products or services to you. • MFS doesn’t jointly market. |
| | |
| Other important information |
| If you own an MFS product or receive an MFS service in the name of a third party such as a bank or broker-dealer, their privacy policy may apply to you instead of ours. |
101
Save paper with eDelivery.

| MFS® will send you prospectuses, |
reports, and proxies directly via e-mail so you will get information faster with less mailbox clutter.
To sign up:
1. Go to mfs.com.
2. Log in via MFS® Access.
3. Select eDelivery.
If you own your MFS fund shares through a financial institution or a retirement plan, MFS® TALK, MFS® Access, or eDelivery may not be available to you.
CONTACT
WEB SITE
mfs.com
MFS TALK
1-800-637-8255
24 hours a day
ACCOUNT SERVICE AND LITERATURE
Shareholders
1-800-225-2606
Financial advisors
1-800-343-2829
Retirement plan services
1-800-637-1255
MAILING ADDRESS
MFS Service Center, Inc.
P.O. Box 55824
Boston, MA 02205-5824
OVERNIGHT MAIL
MFS Service Center, Inc.
c/o Boston Financial Data Services
30 Dan Road
Canton, MA 02021-2809
The Registrant has adopted a Code of Ethics pursuant to Section 406 of the Sarbanes-Oxley Act and as defined in Form N-CSR that applies to the Registrant’s principal executive officer and principal financial and accounting officer. During the period covered by this report, the Registrant has not amended any provision in its Code of Ethics (the “Code”) that relates to an element of the Code’s definition enumerated in paragraph (b) of Item 2 of this Form N-CSR. During the period covered by this report, the Registrant did not grant a waiver, including an implicit waiver, from any provision of the Code.
A copy of the Code of Ethics is filed as an exhibit to this Form N-CSR.
| ITEM 3. | AUDIT COMMITTEE FINANCIAL EXPERT. |
Messrs. Robert E. Butler, John P. Kavanaugh and Robert W. Uek and Mses. Maryanne L. Roepke and Laurie J. Thomsen, members of the Audit Committee, have been determined by the Board of Trustees in their reasonable business judgment to meet the definition of “audit committee financial expert” as such term is defined in Form N-CSR. In addition, Messrs. Butler, Kavanaugh and Uek and Mses. Roepke and Thomsen are “independent” members of the Audit Committee (as such term has been defined by the Securities and Exchange Commission in regulations implementing Section 407 of the Sarbanes-Oxley Act of 2002). The Securities and Exchange Commission has stated that the designation of a person as an audit committee financial expert pursuant to this Item 3 on the Form N-CSR does not impose on such a person any duties, obligations or liability that are greater than the duties, obligations or liability imposed on such person as a member of the Audit Committee and the Board of Trustees in the absence of such designation or identification. Effective January 1, 2016, Mr. Steven E. Buller became a member of the Audit Committee and has been determined by the Board of Trustees in their reasonable business judgment to meet the definition of “audit committee financial expert” as such term is defined in Form N-CSR. In addition, Mr. Buller is an “independent” member of the Audit Committee (as such term has been defined by the Securities and Exchange Commission in regulations implementing Section 407 of the Sarbanes-Oxley Act of 2002). Effective January 1, 2016, Ms. Laurie J. Thomsen is no longer a member of the Audit Committee.
| ITEM 4. | PRINCIPAL ACCOUNTANT FEES AND SERVICES. |
Items 4(a) through 4(d) and 4(g):
The Board of Trustees has appointed Deloitte & Touche LLP (“Deloitte”) to serve as independent accountants to certain series of the Registrant and Ernst & Young LLP (“E&Y”) to serve in the same capacity to certain other series of the Registrant (each a “Fund” and collectively the “Funds”). The tables below set forth the audit fees billed to each Fund as well as fees for non-audit services provided to each Fund and/or to each Fund’s investment adviser, Massachusetts Financial Services Company (“MFS”), and to various entities either controlling, controlled by, or under common control with MFS that provide ongoing services to the Funds (“MFS Related Entities”).
For the fiscal years ended January 31, 2016 and 2015, audit fees billed to each Fund by Deloitte and E&Y were as follows:
| | | | | | | | |
| | | Audit Fees | |
| | | 2016 | | | 2015 | |
Fees billed by Deloitte: | | | | | | | | |
MFS High Income Fund | | | 68,273 | | | | 68,273 | |
MFS Global High Yield Fund | | | 72,879 | | | | 72,879 | |
MFS High Yield Pooled Portfolio | | | 31,410 | | | | 31,410 | |
| | | | | | | | |
Total | | | 172,562 | | | | 172,562 | |
| |
| | | Audit Fees | |
| | | 2016 | | | 2015 | |
Fees billed by E&Y: | | | | | | | | |
MFS Municipal High Income Fund | | | 50,763 | | | | 50,763 | |
For the fiscal years ended January 31, 2016 and 2015, fees billed by Deloitte and E&Y for audit-related, tax and other services provided to each Fund and for audit-related, tax and other services provided to MFS and MFS Related Entities were as follows:
| | | | | | | | | | | | | | | | | | | | | | | | |
| | | Audit-Related Fees1 | | | Tax Fees2 | | | All Other Fees3 | |
| | | 2016 | | | 2015 | | | 2016 | | | 2015 | | | 2016 | | | 2015 | |
Fees billed by Deloitte: | | | | | | | | | | | | | | | | | | | | | | | | |
To MFS High Income Fund | | | 0 | | | | 0 | | | | 8,376 | | | | 8,376 | | | | 0 | | | | 1,373 | |
To MFS Global High Yield Fund | | | 0 | | | | 0 | | | | 6,474 | | | | 6,474 | | | | 0 | | | | 1,150 | |
To MFS High Yield Pooled Portfolio | | | 0 | | | | 0 | | | | 8,136 | | | | 8,136 | | | | 0 | | | | 1,313 | |
Total fees billed by Deloitte To above Funds | | | 0 | | | | 0 | | | | 22,986 | | | | 22,986 | | | | 0 | | | | 3,836 | |
| | | |
| | | Audit-Related Fees1 | | | Tax Fees2 | | | All Other Fees3 | |
| | | 2016 | | | 2015 | | | 2016 | | | 2015 | | | 2016 | | | 2015 | |
Fees billed by Deloitte: | | | | | | | | | | | | | | | | | | | | | | | | |
To MFS and MFS Related Entities of MFS High Income Fund* | | | 55,409 | | | | 1,401,341 | | | | 0 | | | | 0 | | | | 5,000 | | | | 0 | |
To MFS and MFS Related Entities of MFS Global High Yield Fund* | | | 55,409 | | | | 1,401,341 | | | | 0 | | | | 0 | | | | 5,000 | | | | 0 | |
To MFS and MFS Related Entities of MFS High Yield Pooled Portfolio* | | | 55,409 | | | | 1,401,341 | | | | 0 | | | | 0 | | | | 5,000 | | | | 0 | |
| | | | | | | | |
| | | Aggregate Fees for Non-audit
Services | |
| | | 2016 | | | 2015 | |
Fees billed by Deloitte: | | | | | | | | |
To MFS High Income Fund, MFS and MFS Related Entities# | | | 68,785 | | | | 1,414,428 | |
To MFS Global High Yield Fund, MFS and MFS Related Entities# | | | 66,883 | | | | 1,412,303 | |
To MFS High Yield Pooled Portfolio, MFS and MFS Related Entities# | | | 68,545 | | | | 1,414,128 | |
| | | | | | | | | | | | | | | | | | | | | | | | |
| | | Audit-Related Fees1 | | | Tax Fees2 | | | All Other Fees4 | |
| | | 2016 | | | 2015 | | | 2016 | | | 2015 | | | 2016 | | | 2015 | |
Fees billed by E&Y: | | | | | | | | | | | | | | | | | | | | | | | | |
To MFS Municipal High Income Fund | | | 0 | | | | 0 | | | | 9,249 | | | | 9,249 | | | | 2,182 | | | | 0 | |
| | | |
| | | Audit-Related Fees1 | | | Tax Fees2 | | | All Other Fees4 | |
| | | 2016 | | | 2015 | | | 2016 | | | 2015 | | | 2016 | | | 2015 | |
Fees billed by E&Y: | | | | | | | | | | | | | | | | | | | | | | | | |
To MFS and MFS Related Entities of MFS Municipal High Income Fund* | | | 1,786,175 | | | | 0 | | | | 0 | | | | 0 | | | | 149,169 | | | | 0 | |
| | | | | | | | |
| | | Aggregate Fees for Non-audit
Services | |
| | 2016 | | | 2015 | |
Fees billed by E&Y: | | | | | | | | |
To MFS Municipal High Income Fund, MFS and MFS Related Entities# | | | 2,157,775 | | | | 124,249 | |
| * | This amount reflects the fees billed to MFS and MFS Related Entities for non-audit services relating directly to the operations and financial reporting of the Funds (portions of which services also related to the operations and financial reporting of other funds within the MFS Funds complex). |
| # | This amount reflects the aggregate fees billed by Deloitte or E&Y, as the case may be, for non-audit services rendered to the Funds and for non-audit services rendered to MFS and the MFS Related Entities. |
| 1 | The fees included under “Audit-Related Fees” are fees related to assurance and related services that are reasonably related to the performance of the audit or review of financial statements, but not reported under ‘‘Audit Fees,’’ including accounting consultations, agreed-upon procedure reports, attestation reports, comfort letters and internal control reviews. |
| 2 | The fees included under “Tax Fees” are fees associated with tax compliance, tax advice and tax planning, including services relating to the filing or amendment of federal, state or local income tax returns, regulated investment company qualification reviews and tax distribution and analysis. |
| 3 | The fees included under “All Other Fees” are fees for products and services provided by Deloitte other than those reported under “Audit Fees,” “Audit-Related Fees” and “Tax Fees,” including fees for services related to the review of internal controls and Rule 38a-1 compliance program. |
| 4 | The fees included under “All Other Fees” are fees for products and services provided by E&Y other than those reported under “Audit Fees,” “Audit-Related Fees” and “Tax Fees,” including fees for services related to the review of internal controls and Rule 38a-1 compliance program. |
Item 4(e)(1):
Set forth below are the policies and procedures established by the Audit Committee of the Board of Trustees relating to the pre-approval of audit and non-audit related services:
To the extent required by applicable law, pre-approval by the Audit Committee of the Board is needed for all audit and permissible non-audit services rendered to the Funds and all permissible non-audit services rendered to MFS or MFS Related Entities if the services relate directly to the operations and financial reporting of the Registrant. Pre-approval is currently on an engagement-by-engagement basis. In the event pre-approval of such services is necessary between regular meetings of the Audit Committee and it is not practical to wait to seek pre-approval at the next regular meeting of the Audit Committee, pre-approval of such services may be referred to the Chair of the Audit Committee for approval; provided that the Chair may not pre-approve any individual engagement for such services exceeding $50,000 or multiple engagements for such services in the aggregate exceeding $100,000 in each period between regular meetings of the Audit Committee. Any engagement pre-approved by the Chair between regular meetings of the Audit Committee shall be presented for ratification by the entire Audit Committee at its next regularly scheduled meeting.
Item 4(e)(2):
None, or 0%, of the services relating to the Audit-Related Fees, Tax Fees and All Other Fees paid by the Fund and MFS and MFS Related Entities relating directly to the operations and financial reporting of the Registrant disclosed above were approved by the audit committee pursuant to paragraphs (c)(7)(i)(C) of Rule 2-01 of Regulation S-X (which permits audit committee approval after the start of the engagement with respect to services other than audit, review or attest services, if certain conditions are satisfied).
Item 4(f): Not applicable.
Item 4(h): The Registrant’s Audit Committee has considered whether the provision by a Registrant’s independent registered public accounting firm of non-audit services to MFS and MFS Related Entities that were not pre-approved by the Committee (because such services did not relate directly to the operations and financial reporting of the Registrant) was compatible with maintaining the independence of the independent registered public accounting firm as the Registrant’s principal auditors.
| ITEM 5. | AUDIT COMMITTEE OF LISTED REGISTRANTS. |
Not applicable to the Registrant.
A schedule of investments of the Registrant is included as part of the report to shareholders of such series under Item 1 of this Form N-CSR.
| ITEM 7. | DISCLOSURE OF PROXY VOTING POLICIES AND PROCEDURES FOR CLOSED-END MANAGEMENT INVESTMENT COMPANIES. |
Not applicable to the Registrant.
| ITEM 8. | PORTFOLIO MANAGERS OF CLOSED-END MANAGEMENT INVESTMENT COMPANIES. |
Not applicable to the Registrant.
| ITEM 9. | PURCHASES OF EQUITY SECURITIES BY CLOSED-END MANAGEMENT INVESTMENT COMPANY AND AFFILIATED PURCHASERS. |
Not applicable to the Registrant.
| ITEM 10. | SUBMISSION OF MATTERS TO A VOTE OF SECURITY HOLDERS. |
There were no material changes to the procedures by which shareholders may send recommendations to the Board for nominees to the Registrant’s Board since the Registrant last provided disclosure as to such procedures in response to the requirements of Item 407 (c)(2)(iv) of Regulation S-K or this Item.
| ITEM 11. | CONTROLS AND PROCEDURES. |
| (a) | Based upon their evaluation of the effectiveness of the registrant’s disclosure controls and procedures (as defined in Rule 30a-3(c) under the Investment Company Act of 1940 (the “Act”)) as conducted within 90 days of the filing date of this report on Form N-CSR, the registrant’s principal financial officer and principal executive officer have concluded that those disclosure controls and procedures provide reasonable assurance that the material information required to be disclosed by the registrant on this report is recorded, processed, summarized and reported within the time periods specified in the Securities and Exchange Commission’s rules and forms. |
| (b) | There were no changes in the registrant’s internal controls over financial reporting (as defined in Rule 30a-3(d) under the Act) that occurred during the second fiscal quarter of the period covered by the report that have materially affected, or are reasonably likely to materially affect, the registrant’s internal control over financial reporting. |
| (a) | File the exhibits listed below as part of this form. Letter or number the exhibits in the sequence indicated. |
| | (1) | Any code of ethics, or amendment thereto, that is the subject of the disclosure required by Item 2, to the extent that the registrant intends to satisfy the Item 2 requirements through filing of an exhibit: Code of Ethics attached hereto. |
| | (2) | A separate certification for each principal executive officer and principal financial officer of the registrant as required by Rule 30a-2(a) under the Act (17 CFR 270.30a-2): Attached hereto. |
| (b) | If the report is filed under Section 13(a) or 15(d) of the Exchange Act, provide the certifications required by Rule 30a-2(b) under the Act (17 CFR 270.30a-2(b)), Rule 13a-14(b) or Rule 15d-14(b) under the Exchange Act (17 CFR 240.13a-14(b) or 240.15d-14(b)) and Section 1350 of Chapter 63 of Title 18 of the United States Code (18 U.S.C. 1350) as an exhibit. A certification furnished pursuant to this paragraph will not be deemed “filed” for the purposes of Section 18 of the Exchange Act (15 U.S.C. 78r), or otherwise subject to the liability of that section. Such certification will not be deemed to be incorporated by reference into any filing under the Securities Act of 1933 or the Exchange Act, except to the extent that the registrant specifically incorporates it by reference: Attached hereto. |
Notice
A copy of the Amended and Restated Declaration of Trust, as amended, of the Registrant is on file with the Secretary of State of The Commonwealth of Massachusetts and notice is hereby given that this instrument is executed on behalf of the Registrant by an officer of the Registrant as an officer and not individually and the obligations of or arising out of this instrument are not binding upon any of the Trustees or shareholders individually, but are binding only upon the assets and property of the respective constituent series of the Registrant.
SIGNATURES
Pursuant to the requirements of the Securities Exchange Act of 1934 and the Investment Company Act of 1940, the registrant has duly caused this report to be signed on its behalf by the undersigned, thereunto duly authorized.
(Registrant) MFS SERIES TRUST III
| | |
| By (Signature and Title)* | | ROBIN A. STELMACH |
| | Robin A. Stelmach, President |
Date: March 17, 2016
Pursuant to the requirements of the Securities Exchange Act of 1934 and the Investment Company Act of 1940, this report has been signed below by the following persons on behalf of the registrant and in the capacities and on the dates indicated.
| | |
| By (Signature and Title)* | | ROBIN A. STELMACH |
| | Robin A. Stelmach, President (Principal Executive Officer) |
Date: March 17, 2016
| | |
| By (Signature and Title)* | | DAVID L. DILORENZO |
| | David L. DiLorenzo, Treasurer (Principal Financial Officer and Accounting Officer) |
Date: March 17, 2016
| * | Print name and title of each signing officer under his or her signature. |