UNITED STATES
SECURITIES AND EXCHANGE COMMISSION
Washington, D.C. 20549
FORMN-CSR
CERTIFIED SHAREHOLDER REPORT OF
REGISTERED MANAGEMENT INVESTMENT COMPANIES
Investment Company Act file number811-02794
MFS SERIES TRUST III
(Exact name of registrant as specified in charter)
111 Huntington Avenue, Boston, Massachusetts 02199
(Address of principal executive offices) (Zip code)
Christopher R. Bohane
Massachusetts Financial Services Company
111 Huntington Avenue
Boston, Massachusetts 02199
(Name and address of agents for service)
Registrant’s telephone number, including area code: (617)954-5000
Date of fiscal year end: January 31
Date of reporting period: January 31, 2019
| ITEM 1. | REPORTS TO STOCKHOLDERS. |
Annual Report
January 31, 2019

MFS® Global High Yield Fund

Beginning on January 1, 2021, as permitted by regulations adopted by the U.S. Securities and Exchange Commission, paper copies of the fund’s annual and semiannual shareholder reports will no longer be sent by mail, unless you specifically request paper copies of the reports. Instead, the complete reports will be made available on the fund’s Web site (funds.mfs.com), and you will be notified by mail each time a report is posted and provided with a Web site link to access the report.
If you are already signed up to receive shareholder reports by email, you will not be affected by this change and you need not take any action. You may sign up to receive shareholder reports and other communications from the fund by email by contacting your financial intermediary (such as a broker-dealer or bank) or, if you hold your shares directly with the fund, by calling 1-800-225-2606 or by logging on to MFS Access at mfs.com.
Beginning on January 1, 2019, you may elect to receive all future reports in paper free of charge. Contact your financial intermediary to request that you continue to receive paper copies of your shareholder reports. If you invest directly with the fund, you can call 1-800-225-2606 or send an email request to orderliterature@mfs.com to let the fund know that you wish to continue receiving paper copies of your shareholder reports. Your election to receive reports in paper will apply to all funds held in your account if you invest through your financial intermediary or all funds held with the MFS fund complex if you invest directly.
HYO-ANN
MFS® Global High Yield Fund
CONTENTS
The report is prepared for the general information of shareholders.
It is authorized for distribution to prospective investors only when preceded or accompanied by a current prospectus.
NOT FDIC INSURED• MAY LOSE VALUE• NO BANK GUARANTEE

LETTER FROM THE EXECUTIVE CHAIRMAN
Dear Shareholders:
Higher interest rates, international trade friction, and geopolitical uncertainty surrounding issues such as Brexit have contributed to an uptick in market volatility in recent quarters — a departure from thelow-volatility environment that has prevailed for much of the past
several years. Against this more challenging backdrop, equity markets in the United States have outperformed most international markets on a relative basis over the past 12 months, though broad market returns have been modestly negative on an absolute basis. Global economic growth has become less synchronized over the past few quarters, with Europe, China, and some emerging markets having shown signs of significantly slowing growth. While U.S. growth has remained above average, its pace slowed in the second half of 2018.
A decelerating global economy and tighter financial conditions have prompted the U.S. Federal Reserve to reassess its monetary policy outlook. Fed chairman Jerome Powell recently acknowledged that the next change in policy rates could be either a hike or a cut, suggesting that the tightening cycle begun in late 2015 may have come to an
end. The Fed has also signaled that it is likely to maintain a larger-than-expected balance sheet, meaning that monetary conditions will likely tighten less over time than earlier feared. U.S. tax reforms adopted in late 2017 have been welcomed by equity markets while emerging market economies have recently had to contend with tighter financial conditions as a result of firmer U.S. short-term interest rates, declining equity valuations, and a stronger dollar. With the Republicans losing control of the U.S. House of Representatives, further meaningful U.S. fiscal stimulus appears less likely over the remainder of this presidential term. The recent partial U.S. government shutdown has also added to political uncertainty as the competing budgetary priorities of the House of Representatives and the White House will likely remain a source of friction going forward.
Globally, inflation remains largely subdued thanks in part to lower oil prices, but tight labor markets will keep investors on the lookout for its potential reappearance. Increased U.S. protectionism is also a growing concern, as investors fear trade disputes could dampen business sentiment, leading to even slower global growth. While there has been progress on this front — a NAFTA replacement has been worked out between the U.S., Mexico, and Canada; the free trade pact with Korea has been updated; and a negotiating framework with the European Union has been agreed upon — tensions between the U.S. and China remain high, though the two sides recently returned to the negotiating table.
As a global investment manager with nearly a century of expertise, MFS® firmly believes active risk management offers downside mitigation and may help improve investment outcomes. We built our active investment platform with this belief in mind. Our long-term perspective influences nearly every aspect of our business, ensuring that our investment decisions align with the investing time horizons of our clients.
Respectfully,

Robert J. Manning
Executive Chairman
MFS Investment Management
March 19, 2019
The opinions expressed in this letter are subject to change and may not be relied upon for investment advice. No forecasts can be guaranteed.
1
PORTFOLIO COMPOSITION
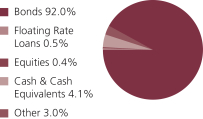
Portfolio structure (i)
| | | | |
| Top five industries (i) | |
| Cable TV | | | 7.9% | |
| Utilities – Electrical Power | | | 4.9% | |
| Metals & Mining | | | 4.3% | |
| Wireless Communications | | | 4.3% | |
| Conglomerates | | | 3.8% | |
|
| Composition including fixed income credit quality (a)(i) | |
| BBB | | | 2.6% | |
| BB | | | 50.6% | |
| B | | | 35.0% | |
| CCC | | | 6.9% | |
| CC | | | 0.2% | |
| C (o) | | | 0.0% | |
| Not Rated | | | (2.8)% | |
| Non-Fixed Income | | | 0.4% | |
| Cash & Cash Equivalents | | | 4.1% | |
| Other | | | 3.0% | |
| | | | |
| Portfolio facts (i) | |
| Average Duration (d) | | | 3.9 | |
| Average Effective Maturity (m) | | | 6.4 yrs. | |
|
| Issuer country weightings (i)(x) | |
| United States | | | 57.1% | |
| United Kingdom | | | 5.0% | |
| Brazil | | | 4.4% | |
| Canada | | | 3.7% | |
| France | | | 3.0% | |
| Germany | | | 2.9% | |
| Netherlands | | | 2.5% | |
| Luxembourg | | | 2.3% | |
| South Africa | | | 1.7% | |
| Other Countries | | | 17.4% | |
| (a) | For all securities other than those specifically described below, ratings are assigned to underlying securities utilizing ratings from Moody’s, Fitch, and Standard & Poor’s rating agencies and applying the following hierarchy: If all three agencies provide a rating, the middle rating (after dropping the highest and lowest ratings) is assigned; if two of the three agencies rate a security, the lower of the two is assigned. Ratings are shown in the S&P and Fitch scale (e.g., AAA). Securities rated BBB or higher are considered investment grade. All ratings are subject to change. Not Rated includes fixed income securities and including fixed income derivatives, which have not been rated by any rating agency.Non-Fixed Income includes any equity securities (including convertible bonds and equity derivatives) and/or commodity-linked derivatives. The fund may or may not hold all of these instruments. The fund is not rated by these agencies. |
2
Portfolio Composition – continued
| (d) | Duration is a measure of how much a bond’s price is likely to fluctuate with general changes in interest rates, e.g., if rates rise 1.00%, a bond with a5-year duration is likely to lose about 5.00% of its value due to the interest rate move. |
| (i) | For purposes of this presentation, the components include the value of securities, and reflect the impact of the equivalent exposure of derivative positions, if any. These amounts may be negative from time to time. Equivalent exposure is a calculated amount that translates the derivative position into a reasonable approximation of the amount of the underlying asset that the portfolio would have to hold at a given point in time to have the same price sensitivity that results from the portfolio’s ownership of the derivative contract. When dealing with derivatives, equivalent exposure is a more representative measure of the potential impact of a position on portfolio performance than value. The bond component will include any accrued interest amounts. |
| (m) | In determining each instrument’s effective maturity for purposes of calculating the fund’s dollar-weighted average effective maturity, MFS uses the instrument’s stated maturity or, if applicable, an earlier date on which MFS believes it is probable that a maturity-shortening device (such as a put,pre-refunding or prepayment) will cause the instrument to be repaid. Such an earlier date can be substantially shorter than the instrument’s stated maturity. |
| (x) | Represents the portfolio’s exposure to issuer countries as a percentage of the portfolio’s net assets. For purposes of this presentation, United States includes Cash & Cash Equivalents and Other. |
Where the fund holds convertible bonds, they are treated as part of the equity portion of the portfolio.
The fund invests a portion of its assets in the MFS High Yield Pooled Portfolio. Percentages include the indirect exposure to the underlying holdings, including investments in money market funds and Other, of the MFS High Yield Pooled Portfolio and not the direct exposure from investing in the MFS High Yield Pooled Portfolio itself.
Cash & Cash Equivalents includes any direct exposure to cash, direct and indirect exposure to investments in money market funds, cash equivalents, short-term securities, and other assets less liabilities. Please see the Statement of Assets and Liabilities for additional information related to the fund’s direct cash position and other assets and liabilities.
Other includes the direct and indirect equivalent exposure from currency derivatives and/or any offsets to derivative positions.
Percentages are based on net assets as of January 31, 2019.
The portfolio is actively managed and current holdings may be different.
3
MANAGEMENT REVIEW
Summary of Results
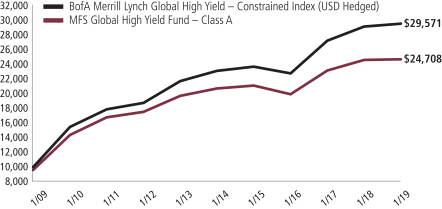
For the twelve months ended January 31, 2019, Class A shares of the MFS Global High Yield Fund (“fund”) provided a total return of 0.50%, at net asset value. This compares with a return of 1.38% for the fund’s benchmark, the BofA Merrill Lynch Global High Yield – Constrained Index (USD Hedged).
In addition to investing directly in portfolio securities, the fund also invests indirectly in portfolio securities through investment in the MFS High Yield Pooled Portfolio, a mutual fund also advised by MFS. The discussion below reflects both the fund’s direct and indirect investments.
Market Environment
The global economy decelerated during the reporting period, led by weakness in China and Europe as business and investor sentiment was undermined by growing trade frictions. Slower growth, along with tighter financial conditions, contributed to an uptick in market volatility late in the period. Equity valuations fell and credit spreads widened, fueled in part by concerns that the US Federal Reserve was on course to further tighten monetary policy after it lifted rates for a fourth time during the period and indicated its intention to hike several more times while allowing its balance sheet to run off at its predetermined pace.
The market’s negative reaction to these policy signals prompted the Fed to reverse course at the end of the period and indicated that its policy was on hold as inflation pressures abated. The Fed also indicated that it will maintain a larger balance sheet than it had previously. These dovish shifts helped equity valuations rebound, reduced volatility and narrowed credit spreads. Central banks globally are tilting more dovish as well, with China lowering reserve requirements, The Bank of Canada and Bank of England holding rates steady and the European Central Bank acknowledging that it may not be able to hike rates in the fall of 2019 as it had earlier projected.
Emerging markets experienced considerable volatility during the period as tighter global financial conditions exposed structural weakness in some countries. Those pressures were somewhat relieved at the end of the period as the Fed adopted its more dovish posture. However, slowing global growth and ongoing trade frictions remained concerns.
From a geopolitical perspective, a fractious Eurosceptic Italian coalition government, large-scale protests in France over stagnant wages and news that Germany’s Angela Merkel will not seek another term as chancellor were sources of uncertainty in Europe. In emerging markets, new Brazilian president Jair Bolsanaro took office, with markets generally encouraged by his market-friendly agenda. In contrast, markets were nervous about the less-market-friendly approach of Mexico’s new president Andres Manuel Lopez Obrador. For much of the period, the contentiousUS-China trading relationship was a drag on global sentiment, although tentative signs of progress toward resolution helped steady markets late in the period. Concerns persisted about slowing Chinese economic activity.
4
Management Review – continued
Detractors from Performance
Relative to the BofA Merrill Lynch Global High Yield – Constrained Index (USD Hedged), the fund’s asset allocation decisions detracted from performance, led by its underweight exposure to bonds in theother industrialssector, itsout-of-benchmark exposure tosovereignbonds and its overweight position in thebasic industry sector. From a quality perspective, an underweight position in strong-performing ‘C’-rated (r) bonds weakened relative results. Additionally, the fund’s cash and/or cash equivalents position, which was greater than that of the benchmark, hindered relative returns.
Security selection, notably within the United States, within the ‘B’ and ‘CCC’-rated bonds and within theenergy andcommunications sectors further weakened relative returns.
Top individual detractors for the reporting period included the fund’s overweight exposures to independent exploration and production company Alta Mesa Resources (h)(energy) and auto manufacturer Jaguar Land Rover Automotive (consumer cyclical).
Contributors to Performance
During the reporting period, the fund’s yield curve (y) positioning, particularly the fund’s lesser exposure to shifts in the short end (centered around maturities of two or less years) of the yield curve, and greater exposure to shifts in the middle (centered around maturities of 5 to 10 years) of the yield curve, benefited relative performance asshort-term interest rates generally increased more than rates in the middle of the yield curve throughout the period.
Security selection outside of the United States was also a positive factor that impacted relative returns. Specifically, strong selection within the Europe/UK region, within ‘B’ and ‘CCC’ rated bonds and within theenergy andcommunications sectors helped relative returns. Security selection with the emerging markets region, within ‘B’-rated securities and within theelectric utility sector also helped relative results.
Top individual contributors for the reporting period included the fund’s overweight positions in metering company Blitz (other industrials)and chemicals producer Consolidated Energy Finance (basic industry).
Respectfully,
Portfolio Manager(s)
David Cole, Matt Ryan, and Michael Skatrud
| (h) | Security was not held in the fund at period end. |
| (r) | Bonds rated “BBB”, “Baa”, or higher are considered investment grade; bonds rated “BB”, “Ba”, or below are considerednon-investment grade. The source for bond quality ratings is Moody’s Investors Service, Standard & Poor’s and Fitch, Inc. and are applied using the following hierarchy: If all three agencies provide a rating, the middle rating (after dropping the highest and lowest ratings) is assigned; if two of the three agencies rate a security, the lower of the two is assigned. Ratings are shown in the S&P and Fitch scale (e.g., AAA). For securities which are not rated by any of the three agencies, the security is considered Not Rated. |
| (y) | A yield curve graphically depicts the yields of different maturity bonds of the same credit quality and type; a normal yield curve is upward sloping, with short-term rates lower than long-term rates. |
5
Management Review – continued
Note to Shareholders: Effective March 1, 2018, Michael Skatrud became a Portfolio Manager of the Fund. Effective September 1, 2018, William Adams is no longer a Portfolio Manager of the Fund.
The views expressed in this report are those of the portfolio manager(s) only through the end of the period of the report as stated on the cover and do not necessarily reflect the views of MFS or any other person in the MFS organization. These views are subject to change at any time based on market or other conditions, and MFS disclaims any responsibility to update such views. These views may not be relied upon as investment advice or an indication of trading intent on behalf of any MFS portfolio. References to specific securities are not recommendations of such securities, and may not be representative of any MFS portfolio’s current or future investments.
6
PERFORMANCE SUMMARYTHROUGH1/31/19
The following chart illustrates a representative class of the fund’s historical performance in comparison to its benchmark(s). Performance results include the deduction of the maximum applicable sales charge and reflect the percentage change in net asset value, including reinvestment of dividends and capital gains distributions. The performance of other share classes will be greater than or less than that of the class depicted below. Benchmarks are unmanaged and may not be invested in directly. Benchmark returns do not reflect sales charges, commissions or expenses. (See Notes to Performance Summary.)
Performance data shown represents past performance and is no guarantee of future results. Investment return and principal value fluctuate so your shares, when sold, may be worth more or less than the original cost; current performance may be lower or higher than quoted. The performance shown does not reflect the deduction of taxes, if any, that a shareholder would pay on fund distributions or the redemption of fund shares.
Growth of a Hypothetical $10,000 Investment
7
Performance Summary – continued
Total Returns through 1/31/19
Average annual without sales charge
| | | | | | | | | | | | |
| | | Share Class | | Class Inception Date | | 1-yr | | 5-yr | | 10-yr | | |
| | | A | | 7/01/98 | | 0.50% | | 3.60% | | 9.94% | | |
| | | B | | 7/01/98 | | (0.25)% | | 2.80% | | 9.12% | | |
| | | C | | 7/01/98 | | (0.26)% | | 2.83% | | 9.14% | | |
| | | I | | 7/01/98 | | 0.75% | | 3.83% | | 10.19% | | |
| | | R1 | | 6/02/08 | | (0.42)% | | 2.80% | | 9.10% | | |
| | | R2 | | 6/02/08 | | 0.25% | | 3.32% | | 9.67% | | |
| | | R3 | | 6/02/08 | | 0.50% | | 3.60% | | 9.94% | | |
| | | R4 | | 6/02/08 | | 0.77% | | 3.81% | | 10.27% | | |
| | | R6 | | 6/02/08 | | 0.85% | | 3.93% | | 10.23% | | |
| | | | |
| Comparative benchmark(s) | | | | | | | | |
| | | BofA Merrill Lynch Global High Yield – Constrained Index
(USD Hedged) (f) | | 1.38% | | 5.05% | | 11.45% | | |
| | | | |
| Average annual with sales charge | | | | | | | | |
| | | A
With Initial Sales Charge (4.25%) | | (3.77)% | | 2.71% | | 9.47% | | |
| | | B
With CDSC (Declining over six years from 4% to 0%) (v) | | (4.09)% | | 2.47% | | 9.12% | | |
| | | C
With CDSC (1% for 12 months) (v) | | (1.22)% | | 2.83% | | 9.14% | | |
CDSC – Contingent Deferred Sales Charge.
Class I, R1, R2, R3, R4, and R6 shares do not have a sales charge.
| (f) | Source: FactSet Research Systems Inc. |
| (v) | Assuming redemption at the end of the applicable period. |
Benchmark Definition(s)
BofA Merrill Lynch Global High Yield – Constrained Index (USD Hedged) – tracks the performance of below investment grade corporate debt of issuers domiciled in countries having an investment grade foreign currency long-term debt rating (based on an average of Moody’s and S&P). The Index is weighted by outstanding issuance, but constrained such that the percentage of any one issuer may not represent more than 2% of the Index.
It is not possible to invest directly in an index.
Notes to Performance Summary
Average annual total return represents the average annual change in value for each share class for the periods presented.
Performance results reflect any applicable expense subsidies and waivers in effect during the periods shown. Without such subsidies and waivers the fund’s performance results would be less favorable. Please see the prospectus and financial statements for complete details.
8
Performance Summary – continued
Performance results do not include adjustments made for financial reporting purposes in accordance with U.S. generally accepted accounting principles and may differ from amounts reported in the financial highlights.
From time to time the fund may receive proceeds from litigation settlements, without which performance would be lower.
9
EXPENSE TABLE
Fund expenses borne by the shareholders during the period, August 1, 2018 through January 31, 2019
As a shareholder of the fund, you incur two types of costs: (1) transaction costs, including sales charges (loads) on certain purchase or redemption payments, and (2) ongoing costs, including management fees; distribution and service(12b-1) fees; and other fund expenses. This example is intended to help you understand your ongoing costs (in dollars) of investing in the fund and to compare these costs with the ongoing costs of investing in other mutual funds.
In addition to the fees and expenses which the fund bears directly, the fund indirectly bears a pro rata share of the fees and expenses of the underlying MFS Pooled Portfolio in which the fund invests. MFS Pooled Portfolios are mutual funds advised by MFS that do not pay management fees to MFS but do incur investment and operating costs. If these transactional and indirect costs were included, your costs would have been higher.
The example is based on an investment of $1,000 invested at the beginning of the period and held for the entire period August 1, 2018 through January 31, 2019.
Actual Expenses
The first line for each share class in the following table provides information about actual account values and actual expenses. You may use the information in this line, together with the amount you invested, to estimate the expenses that you paid over the period. Simply divide your account value by $1,000 (for example, an $8,600 account value divided by $1,000 = 8.6), then multiply the result by the number in the first line under the heading entitled “Expenses Paid During Period” to estimate the expenses you paid on your account during this period.
Hypothetical Example for Comparison Purposes
The second line for each share class in the following table provides information about hypothetical account values and hypothetical expenses based on the fund’s actual expense ratio and an assumed rate of return of 5% per year before expenses, which is not the fund’s actual return. The hypothetical account values and expenses may not be used to estimate the actual ending account balance or expenses you paid for the period. You may use this information to compare the ongoing costs of investing in the fund and other funds. To do so, compare this 5% hypothetical example with the 5% hypothetical examples that appear in the shareholder reports of the other funds.
Please note that the expenses shown in the table are meant to highlight your ongoing costs only and do not reflect any transactional costs, such as sales charges (loads). Therefore, the second line for each share class in the table is useful in comparing ongoing costs only, and will not help you determine the relative total costs of owning different funds. In addition, if these transactional costs were included, your costs would have been higher.
10
Expense Table – continued
| | | | | | | | | | | | | | | | | | |
Share
Class | | | | Annualized
Expense Ratio | | | Beginning
Account Value
8/01/18 | | | Ending Account Value 1/31/19 | | | Expenses Paid During
Period (p) 8/01/18-1/31/19 | |
| A | | Actual | | | 1.05% | | | | $1,000.00 | | | | $1,012.76 | | | | $5.33 | |
| | Hypothetical (h) | | | 1.05% | | | | $1,000.00 | | | | $1,019.91 | | | | $5.35 | |
| B | | Actual | | | 1.80% | | | | $1,000.00 | | | | $1,008.98 | | | | $9.11 | |
| | Hypothetical (h) | | | 1.80% | | | | $1,000.00 | | | | $1,016.13 | | | | $9.15 | |
| C | | Actual | | | 1.80% | | | | $1,000.00 | | | | $1,007.29 | | | | $9.11 | |
| | Hypothetical (h) | | | 1.80% | | | | $1,000.00 | | | | $1,016.13 | | | | $9.15 | |
| I | | Actual | | | 0.80% | | | | $1,000.00 | | | | $1,014.02 | | | | $4.06 | |
| | Hypothetical (h) | | | 0.80% | | | | $1,000.00 | | | | $1,021.17 | | | | $4.08 | |
| R1 | | Actual | | | 1.80% | | | | $1,000.00 | | | | $1,007.31 | | | | $9.11 | |
| | Hypothetical (h) | | | 1.80% | | | | $1,000.00 | | | | $1,016.13 | | | | $9.15 | |
| R2 | | Actual | | | 1.29% | | | | $1,000.00 | | | | $1,011.51 | | | | $6.54 | |
| | Hypothetical (h) | | | 1.29% | | | | $1,000.00 | | | | $1,018.70 | | | | $6.56 | |
| R3 | | Actual | | | 1.05% | | | | $1,000.00 | | | | $1,012.76 | | | | $5.33 | |
| | Hypothetical (h) | | | 1.05% | | | | $1,000.00 | | | | $1,019.91 | | | | $5.35 | |
| R4 | | Actual | | | 0.80% | | | | $1,000.00 | | | | $1,014.09 | | | | $4.06 | |
| | Hypothetical (h) | | | 0.80% | | | | $1,000.00 | | | | $1,021.17 | | | | $4.08 | |
| R6 | | Actual | | | 0.70% | | | | $1,000.00 | | | | $1,014.52 | | | | $3.55 | |
| | Hypothetical (h) | | | 0.70% | | | | $1,000.00 | | | | $1,021.68 | | | | $3.57 | |
| (h) | 5% class return per year before expenses. |
| (p) | “Expenses Paid During Period” are equal to each class’s annualized expense ratio, as shown above, multiplied by the average account value over the period, multiplied by 184/365 (to reflect theone-half year period). Expenses paid do not include any applicable sales charges (loads). If these transaction costs had been included, your costs would have been higher. In addition to the fees and expenses which the fund bears directly, the fund indirectly bears a pro rata share of the fees and expenses of the underlying funds in which the fund invests. If these indirect costs were included, your costs would have been higher. |
Notes to Expense Table
Each class with a Rule12b-1 service fee is subject to a rebate of a portion of such fee. Such rebates are included in the expense ratios above and are outside of the expense limitation arrangement. For Class R2 shares, this rebate reduced the expense ratio above by 0.01%. See Note 3 in the Notes to Financial Statements for additional information.
11
PORTFOLIO OF INVESTMENTS
1/31/19
The Portfolio of Investments is a complete list of all securities owned by your fund. It is categorized by broad-based asset classes.
| | | | | | | | |
| Bonds - 34.5% | | | | | | | | |
| | |
| Issuer | | Shares/Par | | | Value ($) | |
| Aerospace - 0.4% | | | | | | | | |
| TA Manufacturing Ltd., 3.625%, 4/15/2023 | | EUR | 1,225,000 | | | $ | 1,419,606 | |
| | |
| Apparel Manufacturers - 0.2% | | | | | | | | |
| PVH Corp., 3.125%, 12/15/2027 | | EUR | 720,000 | | | $ | 800,154 | |
| | |
| Asset-Backed & Securitized - 0.0% | | | | | | | | |
| Lehman Brothers Commercial Conduit Mortgage Trust, 1.119%, 2/18/2030 (i) | | $ | 26,189 | | | $ | 0 | |
| | |
| Automotive - 1.2% | | | | | | | | |
| IHO Verwaltungs GmbH, 3.75%, 9/15/2026 | | EUR | 1,200,000 | | | $ | 1,294,213 | |
| Jaguar Land Rover Automotive PLC, 4.5%, 10/01/2027 (n) | | $ | 990,000 | | | | 732,600 | |
| LKQ European Holdings B.V., 3.625%, 4/01/2026 (n) | | EUR | 350,000 | | | | 393,759 | |
| LKQ Italia Bondco S.p.A., 3.875%, 4/01/2024 | | | 1,155,000 | | | | 1,367,821 | |
| | | | | | | | |
| | | | | | | $ | 3,788,393 | |
| Broadcasting - 1.1% | | | | | | | | |
| Arqiva Broadcast Finance PLC, 6.75%, 9/30/2023 | | GBP | 1,100,000 | | | $ | 1,500,309 | |
| United Group B.V., 4.375%, 7/01/2022 (n) | | EUR | 1,127,000 | | | | 1,293,187 | |
| United Group B.V., 4.375%, 7/01/2022 | | | 285,000 | | | | 327,026 | |
| WMG Acquisition Corp., 4.125%, 11/01/2024 | | | 495,000 | | | | 589,217 | |
| | | | | | | | |
| | | | | | | $ | 3,709,739 | |
| Building - 0.8% | | | | | | | | |
| Elementia S.A. de C.V., 5.5%, 1/15/2025 (n) | | $ | 1,264,000 | | | $ | 1,185,000 | |
Grupo Cementos de Chihuahua S.A.B. de C.V.,
5.25%, 6/23/2024 (n) | | | 1,355,000 | | | | 1,334,675 | |
| | | | | | | | |
| | | | | | | $ | 2,519,675 | |
| Business Services - 0.4% | | | | | | | | |
| Worldpay Finance PLC, 3.75%, 11/15/2022 | | EUR | 1,019,000 | | | $ | 1,251,514 | |
| | |
| Cable TV - 2.3% | | | | | | | | |
| Altice Financing S.A., 7.5%, 5/15/2026 (n) | | $ | 525,000 | | | $ | 497,438 | |
| Unitymedia Hessen NRW GmbH, 6.25%, 1/15/2029 | | EUR | 1,525,500 | | | | 1,920,696 | |
| Unitymedia KabelBW GmbH, 6.125%, 1/15/2025 (n) | | $ | 200,000 | | | | 206,500 | |
| Videotron Ltd., 5.375%, 6/15/2024 (n) | | | 1,590,000 | | | | 1,660,596 | |
| Virgin Media Secured Finance PLC, 5.25%, 1/15/2026 (n) | | | 485,000 | | | | 477,725 | |
| VTR Finance B.V., 6.875%, 1/15/2024 (n) | | | 1,456,000 | | | | 1,499,534 | |
| Ziggo Bond Co. B.V., 3.75%, 1/15/2025 | | EUR | 1,000,000 | | | | 1,165,580 | |
12
Portfolio of Investments – continued
| | | | | | | | |
| | |
| Issuer | | Shares/Par | | | Value ($) | |
| Bonds - continued | | | | | | | | |
| Cable TV - continued | | | | | | | | |
| Ziggo Bond Finance B.V., 5.875%, 1/15/2025 (n) | | $ | 265,000 | | | $ | 248,438 | |
| | | | | | | | |
| | | | | | | $ | 7,676,507 | |
| Chemicals - 1.7% | | | | | | | | |
| Consolidated Energy Finance S.A., 6.875%, 6/15/2025 (n) | | $ | 1,664,000 | | | $ | 1,639,040 | |
| OCI N.V., 5%, 4/15/2023 | | EUR | 600,000 | | | | 720,157 | |
| Sasol Financing USA LLC, 6.5%, 9/27/2028 | | $ | 951,000 | | | | 1,003,961 | |
| SPCM S.A., 2.875%, 6/15/2023 | | EUR | 1,367,000 | | | | 1,580,271 | |
| Starfruit U.S. Holding Co. LLC/Starfruit Finance B.V. , 6.5%, 10/01/2026 (n) | | | 350,000 | | | | 385,948 | |
| Starfruit U.S. Holding Co. LLC/Starfruit Finance B.V. , 6.5%, 10/01/2026 | | | 130,000 | | | | 143,352 | |
| | | | | | | | |
| | | | | | | $ | 5,472,729 | |
| Conglomerates - 1.3% | | | | | | | | |
| BlitzF18-674 GmbH, 6%, 7/30/2026 | | EUR | 1,100,000 | | | $ | 1,257,486 | |
| Colfax Corp., 3.25%, 5/15/2025 | | | 1,325,000 | | | | 1,460,936 | |
| Grupo KUO S.A.B. de C.V., 5.75%, 7/07/2027 (n) | | $ | 1,555,000 | | | | 1,488,912 | |
| | | | | | | | |
| | | | | | | $ | 4,207,334 | |
| Construction - 0.3% | | | | | | | | |
| Empresas ICA S.A.B. de C.V., 8.375%, 7/24/2019 (a)(d)(n) | | $ | 150,000 | | | $ | 24,375 | |
| Empresas ICA S.A.B. de C.V., 8.375%, 7/24/2019 (a)(d) | | | 291,000 | | | | 47,288 | |
| Empresas ICA S.A.B. de C.V., 8.875%, 5/29/2024 (a)(d)(n) | | | 915,000 | | | | 144,113 | |
| Empresas ICA S.A.B. de C.V., 8.9%, 2/04/2021 (a)(d) | | | 1,639,000 | | | | 258,142 | |
| Mattamy Group Corp., 6.5%, 10/01/2025 (n) | | | 515,000 | | | | 477,662 | |
| | | | | | | | |
| | | | | | | $ | 951,580 | |
| Consumer Products - 0.7% | | | | | | | | |
| Coty, Inc., 4.75%, 4/15/2026 (n) | | EUR | 870,000 | | | $ | 882,529 | |
| Energizer Gamma Acquisition B.V. , 4.625%, 7/15/2026 | | | 395,000 | | | | 443,251 | |
| International Design Group S.P.A., 6.5%, 11/15/2025 | | | 170,000 | | | | 185,339 | |
| International Design Group S.P.A., 6.5%, 11/15/2025 (n) | | | 715,000 | | | | 779,516 | |
| | | | | | | | |
| | | | | | | $ | 2,290,635 | |
| Containers - 0.5% | | | | | | | | |
| ARD Finance S.A., 6.625%, 9/15/2023 | | EUR | 160,000 | | | $ | 175,353 | |
| San Miguel Industrias PET S.A., 4.5%, 9/18/2022 (n) | | $ | 1,359,000 | | | | 1,332,567 | |
| | | | | | | | |
| | | | | | | $ | 1,507,920 | |
| Emerging Market Quasi-Sovereign - 2.7% | | | | | | | | |
| CEMIG Geracao e Transmissao S.A., 9.25%, 12/05/2024 (n) | | $ | 1,450,000 | | | $ | 1,585,212 | |
| Eskom Holdings SOC Ltd., 6.35%, 8/10/2028 (n) | | | 1,000,000 | | | | 1,024,550 | |
| KazAgro National Management Holding, 4.625%, 5/24/2023 | | | 1,400,000 | | | | 1,418,267 | |
13
Portfolio of Investments – continued
| | | | | | | | |
| | |
| Issuer | | Shares/Par | | | Value ($) | |
| Bonds - continued | | | | | | | | |
| Emerging Market Quasi-Sovereign - continued | | | | | | | | |
| Petrobras Global Finance B.V., 6.25%, 3/17/2024 | | $ | 500,000 | | | $ | 526,125 | |
| Petrobras Global Finance B.V., 5.299%, 1/27/2025 | | | 813,000 | | | | 812,472 | |
| Petrobras Global Finance B.V., 5.999%, 1/27/2028 | | | 1,413,000 | | | | 1,410,174 | |
| PT Indonesia Asahan Aluminium (Persero), 5.71%, 11/15/2023 (n) | | | 577,000 | | | | 607,402 | |
| Southern Gas Corridor CJSC, 6.875%, 3/24/2026 (n) | | | 1,272,000 | | | | 1,411,920 | |
| | | | | | | | |
| | | | | | | $ | 8,796,122 | |
| Emerging Market Sovereign - 1.8% | | | | | | | | |
| Federal Republic of Nigeria, 7.625%, 11/21/2025 (n) | | $ | 1,023,000 | | | $ | 1,061,424 | |
| Government of Ukraine, 8.994%, 2/01/2024 (n) | | | 400,000 | | | | 393,000 | |
| Government of Ukraine, 7.75%, 9/01/2024 | | | 1,258,000 | | | | 1,176,147 | |
| Government of Ukraine, 7.375%, 9/25/2032 (n) | | | 500,000 | | | | 425,548 | |
| Republic of Argentina, 5.875%, 1/11/2028 | | | 1,833,000 | | | | 1,457,235 | |
| Republic of South Africa, 4.875%, 4/14/2026 | | | 1,385,000 | | | | 1,369,876 | |
| | | | | | | | |
| | | | | | | $ | 5,883,230 | |
| Energy - Independent - 0.0% | | | | | | | | |
| Afren PLC, 11.5%, 2/01/2020 (a)(d)(z) | | $ | 1,000,000 | | | $ | 820 | |
| Afren PLC, 6.625%, 12/09/2020 (a)(d)(z) | | | 528,000 | | | | 180 | |
| | | | | | | | |
| | | | | | | $ | 1,000 | |
| Energy - Integrated - 0.3% | | | | | | | | |
| Inkia Energy Ltd., 5.875%, 11/09/2027 (n) | | $ | 999,000 | | | $ | 952,796 | |
| | |
| Financial Institutions - 1.4% | | | | | | | | |
| AnaCap Financial Europe S.A. SICAV-RAIF, FLR, 5% (EURIBOR -3mo. + 5%), 8/01/2024 | | EUR | 1,035,000 | | | $ | 969,408 | |
| Arrow Global Finance PLC, 5.125%, 9/15/2024 | | GBP | 1,405,000 | | | | 1,709,195 | |
| Cabot Financial (Luxembourg) S.A. , 7.5%, 10/01/2023 | | | 915,000 | | | | 1,130,208 | |
| Park Aerospace Holdings Ltd., 5.5%, 2/15/2024 (n) | | $ | 740,000 | | | | 751,100 | |
| | | | | | | | |
| | | | | | | $ | 4,559,911 | |
| Food & Beverages - 1.5% | | | | | | | | |
| Central American Bottling Corp., 5.75%, 1/31/2027 (n) | | $ | 1,775,000 | | | $ | 1,768,343 | |
| Cott Holdings, Inc., 5.5%, 4/01/2025 (n) | | | 570,000 | | | | 564,300 | |
| Grupo Bimbo S.A.B. de C.V., 5.95% to 7/17/2023, FLR (CMT - 5yr. + 3.28%) to 4/17/2059 (n) | | | 674,000 | | | | 666,384 | |
| Marb Bondco PLC, 7%, 3/15/2024 (n) | | | 997,000 | | | | 974,069 | |
| Marb Bondco PLC, 6.875%, 1/19/2025 (n) | | | 1,076,000 | | | | 1,028,129 | |
| | | | | | | | |
| | | | | | | $ | 5,001,225 | |
| Gaming & Lodging - 0.3% | | | | | | | | |
| Scientific Games International, Inc., 5.5%, 2/15/2026 | | EUR | 1,095,000 | | | $ | 1,084,136 | |
14
Portfolio of Investments – continued
| | | | | | | | |
| | |
| Issuer | | Shares/Par | | | Value ($) | |
| Bonds - continued | | | | | | | | |
| Industrial - 0.6% | | | | | | | | |
| KAEFER Isoliertechnik GmbH & Co., 5.5%, 1/10/2024 (n) | | EUR | 1,060,000 | | | $ | 1,197,112 | |
| KAEFER Isoliertechnik GmbH & Co., 5.5%, 1/10/2024 | | | 150,000 | | | | 169,403 | |
| Platin 1426. GmbH, 5.375%, 6/15/2023 | | | 685,000 | | | | 729,332 | |
| | | | | | | | |
| | | | | | | $ | 2,095,847 | |
| International Market Quasi-Sovereign - 0.4% | | | | | | | | |
| Electricite de France S.A., 5.375% to 1/29/2025, FLR (EUR SwapRate-5yr. + 3.794%) to 1/29/2045, (EUR Swap Rate - 5yr. + 4.544%) to 12/31/2049 | | EUR | 1,100,000 | | | $ | 1,331,657 | |
| | |
| Major Banks - 0.9% | | | | | | | | |
| Barclays PLC, 8% to 12/15/2020, FLR (EUR Swap Rate - 5yr. + 6.75%) to 12/31/2049 | | EUR | 1,645,000 | | | $ | 2,053,839 | |
| UBS Group AG, 6.875% to 8/07/2025, FLR (Swap Rate - 5yr. + 4.59%) to 12/29/2049 | | $ | 910,000 | | | | 911,257 | |
| | | | | | | | |
| | | | | | | $ | 2,965,096 | |
| Medical & Health Technology & Services - 0.2% | | | | | | | | |
| IQVIA Holdings, Inc., 3.25%, 3/15/2025 | | EUR | 645,000 | | | $ | 747,150 | |
| | |
| Metals & Mining - 1.4% | | | | | | | | |
Baffinland Iron Mines Corp./Baffinland Iron Mines LP,
8.75%, 7/15/2026 (n) | | $ | 170,000 | | | $ | 168,725 | |
| First Quantum Minerals Ltd., 7.25%, 4/01/2023 (n) | | | 200,000 | | | | 191,502 | |
| Freeport-McMoRan, Inc., 6.875%, 2/15/2023 | | | 205,000 | | | | 214,225 | |
| KME AG, 6.75%, 2/01/2023 | | EUR | 1,290,000 | | | | 1,353,613 | |
| Northwest Acquisitions ULC/Dominion Finco, Inc., 7.125%, 11/01/2022 (n) | | $ | 390,000 | | | | 388,518 | |
| Petra Diamonds U.S. Treasury PLC, 7.25%, 5/01/2022 (n) | | | 1,315,000 | | | | 1,236,100 | |
| Vale S.A., 6.25%, 8/10/2026 | | | 845,000 | | | | 900,981 | |
| | | | | | | | |
| | | | | | | $ | 4,453,664 | |
| Midstream - 0.3% | | | | | | | | |
| AI Candelaria Spain SLU, 7.5%, 12/15/2028 (n) | | $ | 1,052,000 | | | $ | 1,035,168 | |
| | |
| Network & Telecom - 0.5% | | | | | | | | |
| Telecom Italia S.p.A., 5.303%, 5/30/2024 (n) | | $ | 1,805,000 | | | $ | 1,714,750 | |
| | |
| Oil Services - 0.1% | | | | | | | | |
| Shelf Drill Holdings Ltd., 8.25%, 2/15/2025 (n) | | $ | 485,000 | | | $ | 440,138 | |
| | |
| Other Banks & Diversified Financials - 0.4% | | | | | | | | |
| Kazkommertsbank JSC, 5.5%, 12/21/2022 | | $ | 1,400,000 | | | $ | 1,393,000 | |
15
Portfolio of Investments – continued
| | | | | | | | |
| | |
| Issuer | | Shares/Par | | | Value ($) | |
| Bonds - continued | | | | | | | | |
| Pharmaceuticals - 1.2% | | | | | | | | |
| Catalent Pharma Solutions, Inc., 4.75%, 12/15/2024 | | EUR | 1,095,000 | | | $ | 1,301,805 | |
| Grifols S.A., 3.2%, 5/01/2025 | | | 1,680,000 | | | | 1,918,120 | |
| Rossini S.a r.l., 6.75%, 10/30/2025 (n) | | | 310,000 | | | | 362,810 | |
| Rossini S.a r.l., 6.75%, 10/30/2025 | | | 213,000 | | | | 249,285 | |
| | | | | | | | |
| | | | | | | $ | 3,832,020 | |
| Pollution Control - 0.6% | | | | | | | | |
| Aegea Finance S.à r.l., 5.75%, 10/10/2024 (n) | | $ | 1,304,000 | | | $ | 1,264,880 | |
| Paprec Holding S.A., 4%, 3/31/2025 | | EUR | 890,000 | | | | 865,890 | |
| | | | | | | | |
| | | | | | | $ | 2,130,770 | |
| Restaurants - 0.4% | | | | | | | | |
| Stonegate Pub Co. Financing PLC, 4.875%, 3/15/2022 | | GBP | 1,085,000 | | | $ | 1,377,547 | |
| | |
| Retailers - 0.8% | | | | | | | | |
| 3AB Optique Developpement S.A.S, 4%, 10/01/2023 | | EUR | 1,200,000 | | | $ | 1,318,539 | |
| Dufry Finance S.C.A., 4.5%, 8/01/2023 | | | 1,080,000 | | | | 1,277,333 | |
| | | | | | | | |
| | | | | | | $ | 2,595,872 | |
| Supermarkets - 1.0% | | | | | | | | |
| Casino Guichard Perrachon S.A., 4.498%, 3/07/2024 | | EUR | 1,100,000 | | | $ | 1,213,927 | |
| Evrotorg LLC, 8.75%, 10/30/2022 (n) | | $ | 1,547,000 | | | | 1,556,127 | |
| Tesco PLC, 6.15%, 11/15/2037 (n) | | | 410,000 | | | | 423,848 | |
| | | | | | | | |
| | | | | | | $ | 3,193,902 | |
| Telecommunications - Wireless - 1.1% | | | | | | | | |
| Altice France S.A., 8.125%, 2/01/2027 (n) | | $ | 405,000 | | | $ | 397,872 | |
| Altice Luxembourg S.A., 7.75%, 5/15/2022 (n) | | | 790,000 | | | | 766,300 | |
| Digicel Group Ltd., 6.75%, 3/01/2023 (n) | | | 400,000 | | | | 326,880 | |
| Digicel Group Ltd., 6.75%, 3/01/2023 | | | 341,000 | | | | 278,665 | |
| Millicom International Cellular S.A., 5.125%, 1/15/2028 (n) | | | 1,486,000 | | | | 1,400,555 | |
| SFR Group S.A., 7.375%, 5/01/2026 (n) | | | 420,000 | | | | 404,771 | |
| | | | | | | | |
| | | | | | | $ | 3,575,043 | |
| Transportation - Services - 2.5% | | | | | | | | |
| Aeropuertos Dominicanos Siglo XXI S.A., 6.75%, 3/30/2029 | | $ | 408,000 | | | $ | 406,572 | |
| Heathrow Finance PLC, 3.875%, 3/01/2027 | | GBP | 1,440,000 | | | | 1,746,441 | |
| JSL Europe S.A., 7.75%, 7/26/2024 (n) | | $ | 1,497,000 | | | | 1,482,030 | |
| Navios South American Logistics, Inc., 7.25%, 5/01/2022 | | | 335,000 | | | | 313,225 | |
| Navios South American Logistics, Inc./Navios Logistics Finance | | | | | | | | |
| (U.S.), Inc., 7.25%, 5/01/2022 (n) | | | 990,000 | | | | 925,650 | |
| Rumo Luxembourg S.à r.l., 5.875%, 1/18/2025 (n) | | | 663,000 | | | | 657,633 | |
| Rumo Luxembourg S.à r.l., “A”, 7.375%, 2/09/2024 (n) | | | 1,580,000 | | | | 1,675,590 | |
| Topaz Marine S.A., 9.125%, 7/26/2022 (n) | | | 518,000 | | | | 515,659 | |
16
Portfolio of Investments – continued
| | | | | | | | |
| | |
| Issuer | | Shares/Par | | | Value ($) | |
| Bonds - continued | | | | | | | | |
| Transportation - Services - continued | | | | | | | | |
| Topaz Marine S.A., 9.125%, 7/26/2022 | | $ | 444,000 | | | $ | 441,993 | |
| | | | | | | | |
| | | | | | | $ | 8,164,793 | |
| Utilities - Electric Power - 3.2% | | | | | | | | |
| Azure Power Energy Ltd., 5.5%, 11/03/2022 (n) | | $ | 1,250,000 | | | $ | 1,213,612 | |
| Drax Finco PLC, 6.625%, 11/01/2025 (n) | | | 590,000 | | | | 587,050 | |
| Genneia S.A., 8.75%, 1/20/2022 (n) | | | 736,000 | | | | 682,419 | |
| Genneia S.A., 8.75%, 1/20/2022 | | | 699,000 | | | | 648,113 | |
| Greenko Dutch B.V., 5.25%, 7/24/2024 (n) | | | 1,749,000 | | | | 1,621,498 | |
| Light S.A., 7.25%, 5/03/2023 (n) | | | 946,000 | | | | 948,079 | |
| LLPL Capital Pte. Ltd., 6.875%, 2/04/2039 (z) | | | 330,000 | | | | 344,740 | |
| MSU Energy Group (Rio Energy S.A./UGEN S.A./Uensa S.A.), 6.875%, 2/01/2025 (n) | | | 811,000 | | | | 646,772 | |
Star Energy Geothermal (Wayang Windu) Ltd.,
6.75%, 4/24/2033 (n) | | | 1,179,600 | | | | 1,144,982 | |
Star Energy Geothermal (Wayang Windu) Ltd.,
6.75%, 4/24/2033 | | | 398,115 | | | | 386,432 | |
| Stoneway Capital Corp., 10%, 3/01/2027 (n) | | | 1,678,621 | | | | 1,577,904 | |
| TerraForm Global Operating LLC, 6.125%, 3/01/2026 (n) | | | 886,000 | | | | 846,130 | |
| | | | | | | | |
| | | | | | | $ | 10,647,731 | |
| Total Bonds (Identified Cost, $119,687,774) | | | $ | 113,568,354 | |
| | |
| Common Stocks - 0.1% | | | | | | | | |
| Energy - Independent - 0.1% | | | | | | | | |
| Frontera Energy Corp. (Identified Cost, $463,979) | | | 26,510 | | | $ | 237,511 | |
| | |
| Investment Companies (h) - 65.0% | | | | | | | | |
| Bond Funds - 62.1% | | | | | | | | |
| MFS High Yield Pooled Portfolio (v)(y) | | | 22,838,746 | | | $ | 204,178,389 | |
| | |
| Money Market Funds - 2.9% | | | | | | | | |
| MFS Institutional Money Market Portfolio, 2.47% (v) | | | 9,717,529 | | | $ | 9,716,557 | |
| Total Investment Companies (Identified Cost, $235,803,347) | | | $ | 213,894,946 | |
| | |
| Other Assets, Less Liabilities - 0.4% | | | | | | | 1,328,442 | |
| Net Assets - 100.0% | | | | | | $ | 329,029,253 | |
| (a) | Non-income producing security. |
| (h) | An affiliated issuer, which may be considered one in which the fund owns 5% or more of the outstanding voting securities, or a company which is under common control. At period end, the aggregate values of the fund’s investments in affiliated issuers and in unaffiliated issuers were $213,894,946 and $113,805,865, respectively. |
17
Portfolio of Investments – continued
| (i) | Interest only security for which the fund receives interest on notional principal (Par amount). Par amount shown is the notional principal and does not reflect the cost of the security. |
| (n) | Securities exempt from registration under Rule 144A of the Securities Act of 1933. These securities may be sold in the ordinary course of business in transactions exempt from registration, normally to qualified institutional buyers. At period end, the aggregate value of these securities was $57,699,355, representing 17.5% of net assets. |
| (v) | Affiliated issuer that is available only to investment companies managed by MFS. The rate quoted for the MFS Institutional Money Market Portfolio is the annualizedseven-day yield of the fund at period end. |
| (y) | The annual report for MFS High Yield Pooled Portfolio as of January 31, 2019 has been included as Appendix A. |
| (z) | Restricted securities are not registered under the Securities Act of 1933 and are subject to legal restrictions on resale. These securities generally may be resold in transactions exempt from registration or to the public if the securities are subsequently registered. Disposal of these securities may involve time-consuming negotiations and prompt sale at an acceptable price may be difficult. The fund holds the following restricted securities: |
| | | | | | | | | | |
| Restricted Securities | | Acquisition
Date | | Cost | | | Value | |
| Afren PLC, 11.5%, 2/01/2020 | | 11/20/15 | | | $986,320 | | | | $820 | |
| Afren PLC, 6.625%, 12/09/2020 | | 11/20/15 | | | 515,241 | | | | 180 | |
| LLPL Capital Pte. Ltd., 6.875%, 2/04/2039 | | 1/29/19 | | | 330,000 | | | | 344,740 | |
| Total Restricted Securities | | | | | | | | | $345,740 | |
| % of Net assets | | | | | | | | | 0.1% | |
The following abbreviations are used in this report and are defined:
| CJSC | | Closed Joint Stock Company |
| CMT | | Constant Maturity Treasury |
| EURIBOR | | Euro Interbank Offered Rate |
| FLR | | Floating Rate. Interest rate resets periodically based on the parenthetically disclosed reference rate plus a spread (if any). Theperiod-end rate reported may not be the current rate. All reference rates are USD unless otherwise noted. |
| PLC | | Public Limited Company |
Abbreviations indicate amounts shown in currencies other than the U.S. dollar. All amounts are stated in U.S. dollars unless otherwise indicated. A list of abbreviations is shown below:
Derivative Contracts at 1/31/19
Forward Foreign Currency Exchange Contracts
| | | | | | | | | | | | | | | | | | |
Currency
Purchased | | | Currency
Sold | | Counterparty | | Settlement
Date | | | Unrealized
Appreciation
(Depreciation) | |
| Asset Derivatives | | | | | | | | | | |
| USD | | | 38,134,792 | | | EUR | | 32,961,002 | | Goldman Sachs International | | | 4/12/2019 | | | | $189,573 | |
| | | | | | | | | | | | | | | | | | |
| Liability Derivatives | | | | | | | | | | |
| USD | | | 7,245,398 | | | GBP | | 5,649,346 | | JPMorgan Chase Bank N.A. | | | 4/12/2019 | | | | $(189,835 | ) |
| | | | | | | | | | | | | | | | | | |
18
Portfolio of Investments – continued
Futures Contracts
| | | | | | | | | | | | | | | | | | | | | | |
| Description | | Long/
Short | | | Currency | | | Contracts | | Notional
Amount | | | Expiration
Date | | | Value/
Unrealized
Appreciation
(Depreciation) | |
| Liability Derivatives | | | | | | | | | | | | | | | | | | | | | | |
| | | | | | |
| Interest Rate Futures | | | | | | | | | | | | | | | | | | | | | | |
| U.S. Treasury Note 10 yr | | | Short | | | | USD | | | 49 | | | $6,000,969 | | | | March - 2019 | | | | $(170,147 | ) |
| | | | | | | | | | | | | | | | | | | | | | |
At January 31, 2019, the fund had cash collateral of $56,350 to cover any collateral or margin obligations for certain derivative contracts. Restricted cash and/or deposits with brokers in the Statement of Assets and Liabilities are comprised of cash collateral.
See Notes to Financial Statements
19
Financial Statements
STATEMENT OF ASSETS AND LIABILITIES
At 1/31/19
This statement represents your fund’s balance sheet, which details the assets and liabilities comprising the total value of the fund.
| | | | |
| Assets | | | | |
Investments in unaffiliated issuers, at value (identified cost, $120,151,753) | | | $113,805,865 | |
Investments in affiliated issuers, at value (identified cost, $235,803,347) | | | 213,894,946 | |
Cash | | | 487,238 | |
Foreign currency, at value (identified cost, $366,554) | | | 366,444 | |
Deposits with brokers for | | | | |
Futures contracts | | | 56,350 | |
Receivables for | | | | |
Forward foreign currency exchange contracts | | | 189,573 | |
Investments sold | | | 510,419 | |
Fund shares sold | | | 254,915 | |
Interest and dividends | | | 2,597,513 | |
Other assets | | | 1,747 | |
Total assets | | | $332,165,010 | |
| |
| Liabilities | | | | |
Payables for | | | | |
Distributions | | | $175,340 | |
Forward foreign currency exchange contracts | | | 189,835 | |
Net daily variation margin on open futures contracts | | | 22,962 | |
Investments purchased | | | 1,568,013 | |
Fund shares reacquired | | | 931,495 | |
Payable to affiliates | | | | |
Investment adviser | | | 9,130 | |
Shareholder servicing costs | | | 113,048 | |
Distribution and service fees | | | 4,776 | |
Payable for independent Trustees’ compensation | | | 2 | |
Accrued expenses and other liabilities | | | 121,156 | |
Total liabilities | | | $3,135,757 | |
Net assets | | | $329,029,253 | |
| |
| Net assets consist of | | | | |
Paid-in capital | | | $382,633,934 | |
Total distributable earnings (loss) | | | (53,604,681 | ) |
Net assets | | | $329,029,253 | |
Shares of beneficial interest outstanding | | | 54,838,247 | |
20
Statement of Assets and Liabilities – continued
| | | | | | | | | | | | |
| | | |
| | | Net assets | | | Shares
outstanding | | | Net asset value
per share (a) | |
Class A | | | $191,589,703 | | | | 31,932,673 | | | | $6.00 | |
Class B | | | 7,941,414 | | | | 1,321,131 | | | | 6.01 | |
Class C | | | 29,121,980 | | | | 4,858,013 | | | | 5.99 | |
Class I | | | 63,670,509 | | | | 10,608,927 | | | | 6.00 | |
Class R1 | | | 61,383 | | | | 10,226 | | | | 6.00 | |
Class R2 | | | 296,904 | | | | 49,387 | | | | 6.01 | |
Class R3 | | | 10,444,035 | | | | 1,740,793 | | | | 6.00 | |
Class R4 | | | 6,884,542 | | | | 1,142,138 | | | | 6.03 | |
Class R6 | | | 19,018,783 | | | | 3,174,959 | | | | 5.99 | |
| (a) | Maximum offering price per share was equal to the net asset value per share for all share classes, except for Class A, for which the maximum offering price per share was $6.27 [100 / 95.75 x $6.00]. On sales of $100,000 or more, the maximum offering price of Class A shares is reduced. A contingent deferred sales charge may be imposed on redemptions of Class A, Class B, and Class C shares. Redemption price per share was equal to the net asset value per share for Classes I, R1, R2, R3, R4, and R6. |
See Notes to Financial Statements
21
Financial Statements
STATEMENT OF OPERATIONS
Year ended 1/31/19
This statement describes how much your fund earned in investment income and accrued in expenses. It also describes any gains and/or losses generated by fund operations.
| | | | |
| Net investment income (loss) | | | | |
Income | | | | |
Dividends from affiliated issuers | | | $13,572,944 | |
Interest | | | 6,879,898 | |
Other | | | 127,584 | |
Dividends | | | 6,579 | |
Foreign taxes withheld | | | (987 | ) |
Total investment income | | | $20,586,018 | |
Expenses | | | | |
Management fee | | | $2,331,937 | |
Distribution and service fees | | | 1,007,832 | |
Shareholder servicing costs | | | 443,722 | |
Administrative services fee | | | 61,060 | |
Independent Trustees’ compensation | | | 7,335 | |
Custodian fee | | | 36,518 | |
Shareholder communications | | | 44,962 | |
Audit and tax fees | | | 85,868 | |
Legal fees | | | 11,288 | |
Miscellaneous | | | 163,320 | |
Total expenses | | | $4,193,842 | |
Fees paid indirectly | | | (8,635 | ) |
Reduction of expenses by investment adviser and distributor | | | (338,191 | ) |
Net expenses | | | $3,847,016 | |
Net investment income (loss) | | | $16,739,002 | |
| |
| Realized and unrealized gain (loss) | | | | |
Realized gain (loss) (identified cost basis) | | | | |
Unaffiliated issuers | | | $(698,705 | ) |
Affiliated issuers | | | (9,388,573 | ) |
Futures contracts | | | 126,061 | |
Forward foreign currency exchange contracts | | | 3,534,572 | |
Foreign currency | | | (49,921 | ) |
Net realized gain (loss) | | | $(6,476,566 | ) |
Change in unrealized appreciation or depreciation | | | | |
Unaffiliated issuers | | | $(10,748,856 | ) |
Affiliated issuers | | | (788,050 | ) |
Futures contracts | | | (228,157 | ) |
Forward foreign currency exchange contracts | | | 2,209,971 | |
Translation of assets and liabilities in foreign currencies | | | (13,418 | ) |
Net unrealized gain (loss) | | | $(9,568,510 | ) |
Net realized and unrealized gain (loss) | | | $(16,045,076 | ) |
Change in net assets from operations | | | $693,926 | |
See Notes to Financial Statements
22
Financial Statements
STATEMENTS OF CHANGES IN NET ASSETS
These statements describe the increases and/or decreases in net assets resulting from operations, any distributions, and any shareholder transactions.
| | | | | | | | |
| | | Year ended | |
| | | 1/31/19 | | | 1/31/18 | |
| Change in net assets | | | | | | |
| | |
| From operations | | | | | | | | |
Net investment income (loss) | | | $16,739,002 | | | | $19,057,092 | |
Net realized gain (loss) | | | (6,476,566 | ) | | | (6,509,471 | ) |
Net unrealized gain (loss) | | | (9,568,510 | ) | | | 11,910,615 | |
Change in net assets from operations | | | $693,926 | | | | $24,458,236 | |
Distributions to shareholders (a) | | | $(16,281,461 | ) | | | $(16,082,515 | ) |
Tax return of capital distributions to shareholders | | | $— | | | | $(3,041,314 | ) |
Change in net assets from fund share transactions | | | $(53,181,780 | ) | | | $(36,863,586 | ) |
Total change in net assets | | | $(68,769,315 | ) | | | $(31,529,179 | ) |
| | |
| Net assets | | | | | | | | |
At beginning of period | | | 397,798,568 | | | | 429,327,747 | |
At end of period (b) | | | $329,029,253 | | | | $397,798,568 | |
| (a) | Distributions from net investment income and from net realized gain are no longer required to be separately disclosed. See Note 2. For the year ended January 31, 2018, distributions from net investment income were $16,082,515. |
| (b) | Parenthetical disclosure of accumulated distributions in excess of net investment income is no longer required. See Note 2. For the year ended January 31, 2018, end of period net assets included accumulated distributions in excess of net investment income of $3,157,738. |
See Notes to Financial Statements
23
Financial Statements
FINANCIAL HIGHLIGHTS
The financial highlights table is intended to help you understand the fund’s financial performance for the past 5 years. Certain information reflects financial results for a single fund share. The total returns in the table represent the rate that an investor would have earned (or lost) on an investment in the fund share class (assuming reinvestment of all distributions) held for the entire period.
| | | | | | | | | | | | | | | | | | | | |
| Class A | | Year ended | |
| | | | | |
| | | 1/31/19 | | | 1/31/18 | | | 1/31/17 | | | 1/31/16 | | | 1/31/15 | |
Net asset value, beginning of period | | | $6.25 | | | | $6.17 | | | | $5.62 | | | | $6.32 | | | | $6.57 | |
| | | | |
| Income (loss) from investment operations | | | | | | | | | | | | | | | | | |
Net investment income (loss) (d) | | | $0.28 | | | | $0.29 | | | | $0.32 | | | | $0.33 | | | | $0.36 | |
Net realized and unrealized gain (loss) | | | (0.25 | ) | | | 0.08 | | | | 0.57 | | | | (0.66 | ) | | | (0.23 | ) |
Total from investment operations | | | $0.03 | | | | $0.37 | | | | $0.89 | | | | $(0.33 | ) | | | $0.13 | |
| | | | |
| Less distributions declared to shareholders | | | | | | | | | | | | | | | | | |
From net investment income | | | $(0.28 | ) | | | $(0.24 | ) | | | $(0.34 | ) | | | $(0.37 | ) | | | $(0.38 | ) |
From tax return of capital | | | — | | | | (0.05 | ) | | | — | | | | — | | | | — | |
Total distributions declared to shareholders | | | $(0.28 | ) | | | $(0.29 | ) | | | $(0.34 | ) | | | $(0.37 | ) | | | $(0.38 | ) |
Net asset value, end of period (x) | | | $6.00 | | | | $6.25 | | | | $6.17 | | | | $5.62 | | | | $6.32 | |
Total return (%) (r)(s)(t)(x) | | | 0.50 | | | | 6.12 | | | | 16.19 | | | | (5.54 | ) | | | 1.97 | |
| | | | |
Ratios (%) (to average net assets)
and Supplemental data: | | | | | | | | | | | | | | | | | |
Expenses before expense reductions (f)(h) | | | 1.14 | | | | 1.16 | | | | 1.16 | | | | 1.13 | | | | 1.12 | |
Expenses after expense reductions (f)(h) | | | 1.05 | | | | 1.05 | | | | 1.05 | | | | 1.05 | | | | 1.05 | |
Net investment income (loss) | | | 4.70 | | | | 4.67 | | | | 5.37 | | | | 5.38 | | | | 5.42 | |
Portfolio turnover | | | 13 | | | | 26 | | | | 16 | | | | 16 | | | | 18 | |
Net assets at end of period (000 omitted) | | | $191,590 | | | | $204,150 | | | | $235,889 | | | | $226,692 | | | | $281,874 | |
See Notes to Financial Statements
24
Financial Highlights – continued
| | | | | | | | | | | | | | | | | | | | |
| Class B | | Year ended | |
| | | | | |
| | | 1/31/19 | | | 1/31/18 | | | 1/31/17 | | | 1/31/16 | | | 1/31/15 | |
Net asset value, beginning of period | | | $6.26 | | | | $6.18 | | | | $5.63 | | | | $6.33 | | | | $6.59 | |
| | | | |
| Income (loss) from investment operations | | | | | | | | | | | | | | | | | |
Net investment income (loss) (d) | | | $0.24 | | | | $0.25 | | | | $0.28 | | | | $0.29 | | | | $0.31 | |
Net realized and unrealized gain (loss) | | | (0.26 | ) | | | 0.08 | | | | 0.57 | | | | (0.67 | ) | | | (0.24 | ) |
Total from investment operations | | | $(0.02 | ) | | | $0.33 | | | | $0.85 | | | | $(0.38 | ) | | | $0.07 | |
| | | | |
| Less distributions declared to shareholders | | | | | | | | | | | | | | | | | |
From net investment income | | | $(0.23 | ) | | | $(0.21 | ) | | | $(0.30 | ) | | | $(0.32 | ) | | | $(0.33 | ) |
From tax return of capital | | | — | | | | (0.04 | ) | | | — | | | | — | | | | — | |
Total distributions declared to shareholders | | | $(0.23 | ) | | | $(0.25 | ) | | | $(0.30 | ) | | | $(0.32 | ) | | | $(0.33 | ) |
Net asset value, end of period (x) | | | $6.01 | | | | $6.26 | | | | $6.18 | | | | $5.63 | | | | $6.33 | |
Total return (%) (r)(s)(t)(x) | | | (0.25 | ) | | | 5.33 | | | | 15.32 | | | | (6.23 | ) | | | 1.06 | |
| | | | |
Ratios (%) (to average net assets)
and Supplemental data: | | | | | | | | | | | | | | | | | |
Expenses before expense reductions (f)(h) | | | 1.90 | | | | 1.91 | | | | 1.91 | | | | 1.88 | | | | 1.87 | |
Expenses after expense reductions (f)(h) | | | 1.80 | | | | 1.80 | | | | 1.80 | | | | 1.80 | | | | 1.80 | |
Net investment income (loss) | | | 3.94 | | | | 3.92 | | | | 4.62 | | | | 4.62 | | | | 4.65 | |
Portfolio turnover | | | 13 | | | | 26 | | | | 16 | | | | 16 | | | | 18 | |
Net assets at end of period (000 omitted) | | | $7,941 | | | | $12,262 | | | | $14,772 | | | | $16,518 | | | | $23,026 | |
| |
| Class C | | Year ended | |
| | | | | |
| | | 1/31/19 | | | 1/31/18 | | | 1/31/17 | | | 1/31/16 | | | 1/31/15 | |
Net asset value, beginning of period | | | $6.24 | | | | $6.16 | | | | $5.61 | | | | $6.32 | | | | $6.56 | |
| | | | |
| Income (loss) from investment operations | | | | | | | | | | | | | | | | | |
Net investment income (loss) (d) | | | $0.24 | | | | $0.25 | | | | $0.28 | | | | $0.29 | | | | $0.31 | |
Net realized and unrealized gain (loss) | | | (0.26 | ) | | | 0.07 | | | | 0.57 | | | | (0.68 | ) | | | (0.22 | ) |
Total from investment operations | | | $(0.02 | ) | | | $0.32 | | | | $0.85 | | | | $(0.39 | ) | | | $0.09 | |
| | | | |
| Less distributions declared to shareholders | | | | | | | | | | | | | | | | | |
From net investment income | | | $(0.23 | ) | | | $(0.20 | ) | | | $(0.30 | ) | | | $(0.32 | ) | | | $(0.33 | ) |
From tax return of capital | | | — | | | | (0.04 | ) | | | — | | | | — | | | | — | |
Total distributions declared to shareholders | | | $(0.23 | ) | | | $(0.24 | ) | | | $(0.30 | ) | | | $(0.32 | ) | | | $(0.33 | ) |
Net asset value, end of period (x) | | | $5.99 | | | | $6.24 | | | | $6.16 | | | | $5.61 | | | | $6.32 | |
Total return (%) (r)(s)(t)(x) | | | (0.26 | ) | | | 5.33 | | | | 15.35 | | | | (6.41 | ) | | | 1.36 | |
| | | | |
Ratios (%) (to average net assets)
and Supplemental data: | | | | | | | | | | | | | | | | | |
Expenses before expense reductions (f)(h) | | | 1.90 | | | | 1.91 | | | | 1.91 | | | | 1.88 | | | | 1.88 | |
Expenses after expense reductions (f)(h) | | | 1.80 | | | | 1.80 | | | | 1.80 | | | | 1.80 | | | | 1.80 | |
Net investment income (loss) | | | 3.93 | | | | 3.92 | | | | 4.63 | | | | 4.64 | | | | 4.66 | |
Portfolio turnover | | | 13 | | | | 26 | | | | 16 | | | | 16 | | | | 18 | |
Net assets at end of period (000 omitted) | | | $29,122 | | | | $57,556 | | | | $65,782 | | | | $65,213 | | | | $81,975 | |
See Notes to Financial Statements
25
Financial Highlights – continued
| | | | | | | | | | | | | | | | | | | | |
| Class I | | Year ended | |
| | | | | |
| | | 1/31/19 | | | 1/31/18 | | | 1/31/17 | | | 1/31/16 | | | 1/31/15 | |
Net asset value, beginning of period | | | $6.25 | | | | $6.17 | | | | $5.62 | | | | $6.33 | | | | $6.58 | |
| | | | |
| Income (loss) from investment operations | | | | | | | | | | | | | | | | | |
Net investment income (loss) (d) | | | $0.30 | | | | $0.31 | | | | $0.33 | | | | $0.35 | | | | $0.37 | |
Net realized and unrealized gain (loss) | | | (0.26 | ) | | | 0.08 | | | | 0.58 | | | | (0.67 | ) | | | (0.22 | ) |
Total from investment operations | | | $0.04 | | | | $0.39 | | | | $0.91 | | | | $(0.32 | ) | | | $0.15 | |
| | | | |
| Less distributions declared to shareholders | | | | | | | | | | | | | | | | | |
From net investment income | | | $(0.29 | ) | | | $(0.26 | ) | | | $(0.36 | ) | | | $(0.39 | ) | | | $(0.40 | ) |
From tax return of capital | | | — | | | | (0.05 | ) | | | — | | | | — | | | | — | |
Total distributions declared to shareholders | | | $(0.29 | ) | | | $(0.31 | ) | | | $(0.36 | ) | | | $(0.39 | ) | | | $(0.40 | ) |
Net asset value, end of period (x) | | | $6.00 | | | | $6.25 | | | | $6.17 | | | | $5.62 | | | | $6.33 | |
Total return (%) (r)(s)(t)(x) | | | 0.75 | | | | 6.38 | | | | 16.47 | | | | (5.45 | ) | | | 2.23 | |
| | | | |
Ratios (%) (to average net assets)
and Supplemental data: | | | | | | | | | | | | | | | | | |
Expenses before expense reductions (f)(h) | | | 0.89 | | | | 0.91 | | | | 0.91 | | | | 0.88 | | | | 0.87 | |
Expenses after expense reductions (f)(h) | | | 0.80 | | | | 0.80 | | | | 0.80 | | | | 0.80 | | | | 0.80 | |
Net investment income (loss) | | | 4.93 | | | | 4.91 | | | | 5.59 | | | | 5.61 | | | | 5.61 | |
Portfolio turnover | | | 13 | | | | 26 | | | | 16 | | | | 16 | | | | 18 | |
Net assets at end of period (000 omitted) | | | $63,671 | | | | $88,762 | | | | $92,227 | | | | $84,620 | | | | $130,780 | |
| |
| Class R1 | | Year ended | |
| | | | | |
| | | 1/31/19 | | | 1/31/18 | | | 1/31/17 | | | 1/31/16 | | | 1/31/15 | |
Net asset value, beginning of period | | | $6.26 | | | | $6.18 | | | | $5.63 | | | | $6.33 | | | | $6.58 | |
| | | | |
| Income (loss) from investment operations | | | | | | | | | | | | | | | | | |
Net investment income (loss) (d) | | | $0.24 | | | | $0.25 | | | | $0.28 | | | | $0.29 | | | | $0.31 | |
Net realized and unrealized gain (loss) | | | (0.27 | ) | | | 0.08 | | | | 0.57 | | | | (0.67 | ) | | | (0.23 | ) |
Total from investment operations | | | $(0.03 | ) | | | $0.33 | | | | $0.85 | | | | $(0.38 | ) | | | $0.08 | |
| | | | |
| Less distributions declared to shareholders | | | | | | | | | | | | | | | | | |
From net investment income | | | $(0.23 | ) | | | $(0.21 | ) | | | $(0.30 | ) | | | $(0.32 | ) | | | $(0.33 | ) |
From tax return of capital | | | — | | | | (0.04 | ) | | | — | | | | — | | | | — | |
Total distributions declared to shareholders | | | $(0.23 | ) | | | $(0.25 | ) | | | $(0.30 | ) | | | $(0.32 | ) | | | $(0.33 | ) |
Net asset value, end of period (x) | | | $6.00 | | | | $6.26 | | | | $6.18 | | | | $5.63 | | | | $6.33 | |
Total return (%) (r)(s)(t)(x) | | | (0.42 | ) | | | 5.33 | | | | 15.32 | | | | (6.23 | ) | | | 1.21 | |
| | | | |
Ratios (%) (to average net assets)
and Supplemental data: | | | | | | | | | | | | | | | | | |
Expenses before expense reductions (f)(h) | | | 1.90 | | | | 1.90 | | | | 1.91 | | | | 1.88 | | | | 1.87 | |
Expenses after expense reductions (f)(h) | | | 1.80 | | | | 1.80 | | | | 1.80 | | | | 1.80 | | | | 1.80 | |
Net investment income (loss) | | | 3.95 | | | | 3.94 | | | | 4.62 | | | | 4.65 | | | | 4.65 | |
Portfolio turnover | | | 13 | | | | 26 | | | | 16 | | | | 16 | | | | 18 | |
Net assets at end of period (000 omitted) | | | $61 | | | | $62 | | | | $103 | | | | $163 | | | | $227 | |
See Notes to Financial Statements
26
Financial Highlights – continued
| | | | | | | | | | | | | | | | | | | | |
| Class R2 | | Year ended | |
| | | | | |
| | | 1/31/19 | | | 1/31/18 | | | 1/31/17 | | | 1/31/16 | | | 1/31/15 | |
Net asset value, beginning of period | | | $6.26 | | | | $6.18 | | | | $5.63 | | | | $6.33 | | | | $6.59 | |
| | | | |
| Income (loss) from investment operations | | | | | | | | | | | | | | | | | |
Net investment income (loss) (d) | | | $0.27 | | | | $0.27 | | | | $0.31 | | | | $0.32 | | | | $0.34 | |
Net realized and unrealized gain (loss) | | | (0.26 | ) | | | 0.09 | | | | 0.57 | | | | (0.67 | ) | | | (0.23 | ) |
Total from investment operations | | | $0.01 | | | | $0.36 | | | | $0.88 | | | | $(0.35 | ) | | | $0.11 | |
| | | | |
| Less distributions declared to shareholders | | | | | | | | | | | | | | | | | |
From net investment income | | | $(0.26 | ) | | | $(0.24 | ) | | | $(0.33 | ) | | | $(0.35 | ) | | | $(0.37 | ) |
From tax return of capital | | | — | | | | (0.04 | ) | | | — | | | | — | | | | — | |
Total distributions declared to shareholders | | | $(0.26 | ) | | | $(0.28 | ) | | | $(0.33 | ) | | | $(0.35 | ) | | | $(0.37 | ) |
Net asset value, end of period (x) | | | $6.01 | | | | $6.26 | | | | $6.18 | | | | $5.63 | | | | $6.33 | |
Total return (%) (r)(s)(t)(x) | | | 0.25 | | | | 5.85 | | | | 15.88 | | | | (5.75 | ) | | | 1.57 | |
| | | | |
Ratios (%) (to average net assets)
and Supplemental data: | | | | | | | | | | | | | | | | | |
Expenses before expense reductions (f)(h) | | | 1.39 | | | | 1.41 | | | | 1.41 | | | | 1.38 | | | | 1.37 | |
Expenses after expense reductions (f)(h) | | | 1.29 | | | | 1.29 | | | | 1.30 | | | | 1.30 | | | | 1.30 | |
Net investment income (loss) | | | 4.46 | | | | 4.38 | | | | 5.10 | | | | 5.16 | | | | 5.14 | |
Portfolio turnover | | | 13 | | | | 26 | | | | 16 | | | | 16 | | | | 18 | |
Net assets at end of period (000 omitted) | | | $297 | | | | $291 | | | | $211 | | | | $175 | | | | $248 | |
| |
| Class R3 | | Year ended | |
| | | | | |
| | | 1/31/19 | | | 1/31/18 | | | 1/31/17 | | | 1/31/16 | | | 1/31/15 | |
Net asset value, beginning of period | | | $6.25 | | | | $6.17 | | | | $5.62 | | | | $6.32 | | | | $6.57 | |
| | | | |
| Income (loss) from investment operations | | | | | | | | | | | | | | | | | |
Net investment income (loss) (d) | | | $0.28 | | | | $0.29 | | | | $0.32 | | | | $0.33 | | | | $0.36 | |
Net realized and unrealized gain (loss) | | | (0.25 | ) | | | 0.08 | | | | 0.57 | | | | (0.66 | ) | | | (0.23 | ) |
Total from investment operations | | | $0.03 | | | | $0.37 | | | | $0.89 | | | | $(0.33 | ) | | | $0.13 | |
| | | | |
| Less distributions declared to shareholders | | | | | | | | | | | | | | | | | |
From net investment income | | | $(0.28 | ) | | | $(0.24 | ) | | | $(0.34 | ) | | | $(0.37 | ) | | | $(0.38 | ) |
From tax return of capital | | | — | | | | (0.05 | ) | | | — | | | | — | | | | — | |
Total distributions declared to shareholders | | | $(0.28 | ) | | | $(0.29 | ) | | | $(0.34 | ) | | | $(0.37 | ) | | | $(0.38 | ) |
Net asset value, end of period (x) | | | $6.00 | | | | $6.25 | | | | $6.17 | | | | $5.62 | | | | $6.32 | |
Total return (%) (r)(s)(t)(x) | | | 0.50 | | | | 6.12 | | | | 16.19 | | | | (5.54 | ) | | | 1.97 | |
| | | | |
Ratios (%) (to average net assets)
and Supplemental data: | | | | | | | | | | | | | | | | | |
Expenses before expense reductions (f)(h) | | | 1.14 | | | | 1.16 | | | | 1.16 | | | | 1.13 | | | | 1.13 | |
Expenses after expense reductions (f)(h) | | | 1.05 | | | | 1.05 | | | | 1.05 | | | | 1.05 | | | | 1.05 | |
Net investment income (loss) | | | 4.70 | | | | 4.64 | | | | 5.35 | | | | 5.39 | | | | 5.41 | |
Portfolio turnover | | | 13 | | | | 26 | | | | 16 | | | | 16 | | | | 18 | |
Net assets at end of period (000 omitted) | | | $10,444 | | | | $10,392 | | | | $9,012 | | | | $7,153 | | | | $7,722 | |
See Notes to Financial Statements
27
Financial Highlights – continued
| | | | | | | | | | | | | | | | | | | | |
| Class R4 | | Year ended | |
| | | | | |
| | | 1/31/19 | | | 1/31/18 | | | 1/31/17 | | | 1/31/16 | | | 1/31/15 | |
Net asset value, beginning of period | | | $6.28 | | | | $6.20 | | | | $5.65 | | | | $6.36 | | | | $6.62 | |
| | | | |
| Income (loss) from investment operations | | | | | | | | | | | | | | | | | |
Net investment income (loss) (d) | | | $0.30 | | | | $0.31 | | | | $0.34 | | | | $0.35 | | | | $0.37 | |
Net realized and unrealized gain (loss) | | | (0.26 | ) | | | 0.08 | | | | 0.57 | | | | (0.67 | ) | | | (0.23 | ) |
Total from investment operations | | | $0.04 | | | | $0.39 | | | | $0.91 | | | | $(0.32 | ) | | | $0.14 | |
| | | | |
| Less distributions declared to shareholders | | | | | | | | | | | | | | | | | |
From net investment income | | | $(0.29 | ) | | | $(0.26 | ) | | | $(0.36 | ) | | | $(0.39 | ) | | | $(0.40 | ) |
From tax return of capital | | | — | | | | (0.05 | ) | | | — | | | | — | | | | — | |
Total distributions declared to shareholders | | | $(0.29 | ) | | | $(0.31 | ) | | | $(0.36 | ) | | | $(0.39 | ) | | | $(0.40 | ) |
Net asset value, end of period (x) | | | $6.03 | | | | $6.28 | | | | $6.20 | | | | $5.65 | | | | $6.36 | |
Total return (%) (r)(s)(t)(x) | | | 0.77 | | | | 6.38 | | | | 16.42 | | | | (5.39 | ) | | | 2.09 | |
| | | | |
Ratios (%) (to average net assets)
and Supplemental data: | | | | | | | | | | | | | | | | | |
Expenses before expense reductions (f)(h) | | | 0.89 | | | | 0.91 | | | | 0.90 | | | | 0.87 | | | | 0.87 | |
Expenses after expense reductions (f)(h) | | | 0.80 | | | | 0.80 | | | | 0.80 | | | | 0.80 | | | | 0.80 | |
Net investment income (loss) | | | 4.94 | | | | 4.89 | | | | 5.58 | | | | 5.58 | | | | 5.60 | |
Portfolio turnover | | | 13 | | | | 26 | | | | 16 | | | | 16 | | | | 18 | |
Net assets at end of period (000 omitted) | | | $6,885 | | | | $7,381 | | | | $6,996 | | | | $6,495 | | | | $3,690 | |
| |
| Class R6 | | Year ended | |
| | | | | |
| | | 1/31/19 | | | 1/31/18 | | | 1/31/17 | | | 1/31/16 | | | 1/31/15 | |
Net asset value, beginning of period | | | $6.24 | | | | $6.16 | | | | $5.61 | | | | $6.32 | | | | $6.57 | |
| | | | |
| Income (loss) from investment operations | | | | | | | | | | | | | | | | | |
Net investment income (loss) (d) | | | $0.30 | | | | $0.31 | | | | $0.34 | | | | $0.34 | | | | $0.38 | |
Net realized and unrealized gain (loss) | | | (0.25 | ) | | | 0.08 | | | | 0.57 | | | | (0.66 | ) | | | (0.22 | ) |
Total from investment operations | | | $0.05 | | | | $0.39 | | | | $0.91 | | | | $(0.32 | ) | | | $0.16 | |
| | | | |
| Less distributions declared to shareholders | | | | | | | | | | | | | | | | | |
From net investment income | | | $(0.30 | ) | | | $(0.26 | ) | | | $(0.36 | ) | | | $(0.39 | ) | | | $(0.41 | ) |
From tax return of capital | | | — | | | | (0.05 | ) | | | — | | | | — | | | | — | |
Total distributions declared to shareholders | | | $(0.30 | ) | | | $(0.31 | ) | | | $(0.36 | ) | | | $(0.39 | ) | | | $(0.41 | ) |
Net asset value, end of period (x) | | | $5.99 | | | | $6.24 | | | | $6.16 | | | | $5.61 | | | | $6.32 | |
Total return (%) (r)(s)(t)(x) | | | 0.85 | | | | 6.49 | | | | 16.61 | | | | (5.37 | ) | | | 2.33 | |
| | | | |
Ratios (%) (to average net assets)
and Supplemental data: | | | | | | | | | | | | | | | | | |
Expenses before expense reductions (f)(h) | | | 0.79 | | | | 0.81 | | | | 0.81 | | | | 0.76 | | | | 0.77 | |
Expenses after expense reductions (f)(h) | | | 0.70 | | | | 0.70 | | | | 0.70 | | | | 0.70 | | | | 0.70 | |
Net investment income (loss) | | | 5.04 | | | | 4.90 | | | | 5.72 | | | | 5.64 | | | | 5.74 | |
Portfolio turnover | | | 13 | | | | 26 | | | | 16 | | | | 16 | | | | 18 | |
Net assets at end of period (000 omitted) | | | $19,019 | | | | $16,943 | | | | $4,336 | | | | $3,829 | | | | $561 | |
See Notes to Financial Statements
28
Financial Highlights – continued
| (d) | Per share data is based on average shares outstanding. |
| (f) | Ratios do not reflect reductions from fees paid indirectly, if applicable. |
| (h) | In addition to the fees and expenses which the fund bears directly, the fund indirectly bears a pro rata share of the fees and expenses of the underlying affiliated funds in which the fund invests. Accordingly, the expense ratio for the fund reflects only those fees and expenses borne directly by the fund. Because the underlying affiliated funds have varied expense and fee levels and the fund may own different proportions of the underlying affiliated funds at different times, the amount of fees and expenses incurred indirectly by the fund will vary. |
| (r) | Certain expenses have been reduced without which performance would have been lower. |
| (s) | From time to time the fund may receive proceeds from litigation settlements, without which performance would be lower. |
| (t) | Total returns do not include any applicable sales charges. |
| (x) | The net asset values and total returns have been calculated on net assets which include adjustments made in accordance with U.S. generally accepted accounting principles required at period end for financial reporting purposes. |
See Notes to Financial Statements
29
NOTES TO FINANCIAL STATEMENTS
(1) Business and Organization
MFS Global High Yield Fund (the fund) is a diversified series of MFS Series Trust III (the trust). The trust is organized as a Massachusetts business trust and is registered under the Investment Company Act of 1940, as amended, as anopen-end management investment company.
The fund is an investment company and accordingly follows the investment company accounting and reporting guidance of the Financial Accounting Standards Board (FASB) Accounting Standards Codification Topic 946 Financial Services – Investment Companies.
(2) Significant Accounting Policies
General– The preparation of financial statements in conformity with U.S. generally accepted accounting principles requires management to make estimates and assumptions that affect the reported amounts of assets and liabilities, and disclosure of contingent assets and liabilities at the date of the financial statements and the reported amounts of increases and decreases in net assets from operations during the reporting period. Actual results could differ from those estimates. In the preparation of these financial statements, management has evaluated subsequent events occurring after the date of the fund’s Statement of Assets and Liabilities through the date that the financial statements were issued. As of January 31, 2019, 62.1% of the fund’s net assets was invested in the MFS High Yield Pooled Portfolio (“High Yield Pooled Portfolio”). MFS does not receive a management fee from the High Yield Pooled Portfolio. The High Yield Pooled Portfolio’s investment objective is to seek total return with an emphasis on high current income, but also considering capital appreciation. The accounting policies of the High Yield Pooled Portfolio are outlined in its shareholder report. The accounting policies detailed in the Significant Accounting Policies note cover both the fund and the High Yield Pooled Portfolio. For purposes of this policy disclosure, “fund” refers to both the fund and the High Yield Pooled Portfolio in which the fund invests. The High Yield Pooled Portfolio’s shareholder report is not covered by this report. The current shareholder report for the High Yield Pooled Portfolio as of January 31, 2019 has been included as Appendix A, and should be read in conjunction with the fund’s financial statements. The fund and the High Yield Pooled Portfolio invest in high-yield securities rated below investment grade. Investments in below investment grade quality securities can involve a substantially greater risk of default or can already be in default, and their values can decline significantly. Below investment grade quality securities tend to be more sensitive to adverse news about the issuer, or the market or economy in general, than higher quality debt instruments. The fund and the High Yield Pooled Portfolio invest in foreign securities. Investments in foreign securities are vulnerable to the effects of changes in the relative values of the local currency and the U.S. dollar and to the effects of changes in each country’s market, economic, industrial, political, regulatory, geopolitical, and other conditions.
In March 2017, the FASB issued Accounting Standards Update2017-08, Receivables –Nonrefundable Fees and Other Costs (Subtopic310-20) – Premium Amortization on Purchased Callable Debt Securities (“ASU2017-08”). For entities that hold callable
30
Notes to Financial Statements – continued
debt securities at a premium, ASU2017-08 requires that the premium be amortized to the earliest call date. ASU2017-08 will be effective for fiscal years beginning after December 15, 2018, and interim periods within those fiscal years. Management has evaluated the potential impacts of ASU2017-08 and believes that adoption of ASU2017-08 will not have a material effect on the fund’s overall financial position or its overall results of operations.
In August 2018, the FASB issued Accounting Standards Update2018-13, Fair Value Measurement (Topic 820) – Disclosure Framework – Changes to the Disclosure Requirements for Fair Value Measurement (“ASU2018-13”) which introduces new fair value disclosure requirements as well as eliminates and modifies certain existing fair value disclosure requirements. ASU2018-13 would be effective for fiscal years beginning after December 15, 2019, and interim periods within those fiscal years; however, management has elected to early adopt ASU2018-13 effective with the current reporting period. The impact of the fund’s adoption was limited to changes in the fund’s financial statement disclosures regarding fair value, primarily those disclosures related to transfers between levels of the fair value hierarchy.
In August 2018, the Securities and Exchange Commission (SEC) released its Final Rule on Disclosure Update and Simplification (the “Final Rule”) which is intended to simplify an issuer’s disclosure compliance efforts by removing redundant or outdated disclosure requirements without significantly altering the mix of information provided to investors. Effective with the current reporting period, the fund adopted the Final Rule with the impacts being that the fund is no longer required to present the components of distributable earnings on the Statement of Assets and Liabilities or the sources of distributions to shareholders and the amount of undistributed net investment income on the Statements of Changes in Net Assets.
Balance Sheet Offsetting – The fund’s accounting policy with respect to balance sheet offsetting is that, absent an event of default by the counterparty or a termination of the agreement, the International Swaps and Derivatives Association (ISDA) Master Agreement, or similar agreement, does not result in an offset of reported amounts of financial assets and financial liabilities in the Statement of Assets and Liabilities across transactions between the fund and the applicable counterparty. The fund’s right to setoff may be restricted or prohibited by the bankruptcy or insolvency laws of the particular jurisdiction to which a specific master netting agreement counterparty is subject. Balance sheet offsetting disclosures, to the extent applicable to the fund, have been included in the fund’s Significant Accounting Policies note under the captions for each of the fund’sin-scope financial instruments and transactions.
Investment Valuations – The investments of the fund and the High Yield Pooled Portfolio are valued as described below.
Equity securities, including restricted equity securities, are generally valued at the last sale or official closing price on their primary market or exchange as provided by athird-party pricing service. Equity securities, for which there were no sales reported that day, are generally valued at the last quoted daily bid quotation on their primary market or exchange as provided by a third-party pricing service. Debt instruments and floating rate loans, including restricted debt instruments, are generally valued at an evaluated or composite bid as provided by a third-party pricing service. Short-term instruments
31
Notes to Financial Statements – continued
with a maturity at issuance of 60 days or less may be valued at amortized cost, which approximates market value. Futures contracts are generally valued at last posted settlement price on their primary exchange as provided by a third-party pricing service. Futures contracts for which there were no trades that day for a particular position are generally valued at the closing bid quotation on their primary exchange as provided by a third-party pricing service. Forward foreign currency exchange contracts are generally valued at the mean of bid and asked prices for the time period interpolated from rates provided by a third-party pricing service for proximate time periods.Open-end investment companies are generally valued at net asset value per share. Securities and other assets generally valued on the basis of information from a third-party pricing service may also be valued at a broker/dealer bid quotation. In determining values, third-party pricing services can utilize both transaction data and market information such as yield, quality, coupon rate, maturity, type of issue, trading characteristics, and other market data. The values of foreign securities and other assets and liabilities expressed in foreign currencies are converted to U.S. dollars using the mean of bid and asked prices for rates provided by a third-party pricing service.
The Board of Trustees has delegated primary responsibility for determining or causing to be determined the value of the fund’s investments (including any fair valuation) to the adviser pursuant to valuation policies and procedures approved by the Board. If the adviser determines that reliable market quotations are not readily available, investments are valued at fair value as determined in good faith by the adviser in accordance with such procedures under the oversight of the Board of Trustees. Under the fund’s valuation policies and procedures, market quotations are not considered to be readily available for most types of debt instruments and floating rate loans and many types of derivatives. These investments are generally valued at fair value based on information from third-party pricing services. In addition, investments may be valued at fair value if the adviser determines that an investment’s value has been materially affected by events occurring after the close of the exchange or market on which the investment is principally traded (such as foreign exchange or market) and prior to the determination of the fund’s net asset value, or after the halting of trading of a specific security where trading does not resume prior to the close of the exchange or market on which the security is principally traded. The adviser generally relies on third-party pricing services or other information (such as the correlation with price movements of similar securities in the same or other markets; the type, cost and investment characteristics of the security; the business and financial condition of the issuer; and trading and other market data) to assist in determining whether to fair value and at what value to fair value an investment. The value of an investment for purposes of calculating the fund’s net asset value can differ depending on the source and method used to determine value. When fair valuation is used, the value of an investment used to determine the fund’s net asset value may differ from quoted or published prices for the same investment. There can be no assurance that the fund could obtain the fair value assigned to an investment if it were to sell the investment at the same time at which the fund determines its net asset value per share.
Various inputs are used in determining the value of the fund’s assets or liabilities. These inputs are categorized into three broad levels. In certain cases, the inputs used to measure fair value may fall into different levels of the fair value hierarchy. In such cases,
32
Notes to Financial Statements – continued
an investment’s level within the fair value hierarchy is based on the lowest level of input that is significant to the fair value measurement. The fund’s assessment of the significance of a particular input to the fair value measurement in its entirety requires judgment, and considers factors specific to the investment. Level 1 includes unadjusted quoted prices in active markets for identical assets or liabilities. Level 2 includes other significant observable market-based inputs (including quoted prices for similar securities, interest rates, prepayment speed, and credit risk). Level 3 includes unobservable inputs, which may include the adviser’s own assumptions in determining the fair value of investments. Other financial instruments are derivative instruments, such as futures contracts and forward foreign currency exchange contracts. The following is a summary of the levels used as of January 31, 2019 in valuing the fund’s assets or liabilities:
| | | | | | | | | | | | | | | | |
| | | | |
| Financial Instruments | | Level 1 | | | Level 2 | | | Level 3 | | | Total | |
| Equity Securities | | | $237,511 | | | | $— | | | | $— | | | | $237,511 | |
| Non-U.S. Sovereign Debt | | | — | | | | 16,011,009 | | | | — | | | | 16,011,009 | |
| U.S. Corporate Bonds | | | — | | | | 11,093,108 | | | | — | | | | 11,093,108 | |
| Foreign Bonds | | | — | | | | 86,464,237 | | | | — | | | | 86,464,237 | |
| Mutual Funds | | | 213,894,946 | | | | — | | | | — | | | | 213,894,946 | |
| Total | | | $214,132,457 | | | | $113,568,354 | | | | $— | | | | $327,700,811 | |
| | | | |
| Other Financial Instruments | | | | | | | | | | | | |
| Futures Contracts – Liabilities | | | $(170,147 | ) | | | $— | | | | $— | | | | $(170,147 | ) |
| Forward Foreign Currency Exchange | | | | | | | | | | | | | | | | |
| Contracts – Assets | | | — | | | | 189,573 | | | | — | | | | 189,573 | |
| Forward Foreign Currency Exchange | | | | | | | | | | | | | | | | |
| Contracts – Liabilities | | | — | | | | (189,835 | ) | | | — | | | | (189,835 | ) |
For further information regarding security characteristics, see the Portfolio of Investments. Please refer to the High Yield Pooled Portfolio’s shareholder report for further information regarding the levels used in valuing its assets or liabilities.
Foreign Currency Translation– Purchases and sales of foreign investments, income, and expenses are converted into U.S. dollars based upon currency exchange rates prevailing on the respective dates of such transactions or on the reporting date for foreign denominated receivables and payables. Gains and losses attributable to foreign currency exchange rates on sales of securities are recorded for financial statement purposes as net realized gains and losses on investments. Gains and losses attributable to foreign exchange rate movements on receivables, payables, income and expenses are recorded for financial statement purposes as foreign currency transaction gains and losses. That portion of both realized and unrealized gains and losses on investments that results from fluctuations in foreign currency exchange rates is not separately disclosed.
Derivatives – The fund uses derivatives primarily to increase or decrease exposure to a particular market or segment of the market, or security, to increase or decrease interest rate or currency exposure, or as alternatives to direct investments. Derivatives are used
33
Notes to Financial Statements – continued
for hedging ornon-hedging purposes. While hedging can reduce or eliminate losses, it can also reduce or eliminate gains. When the fund uses derivatives as an investment to increase market exposure, or for hedging purposes, gains and losses from derivative instruments may be substantially greater than the derivative’s original cost.
The derivative instruments used by the fund during the period were futures contracts and forward foreign currency exchange contracts. Depending on the type of derivative, the fund may exit a derivative position by entering into an offsetting transaction with a counterparty or exchange, negotiating an agreement with the derivative counterparty, or novating the position to a third party. The fund may be unable to promptly close out a futures position in instances where the daily fluctuation in the price for that type of future exceeds the daily limit set by the exchange. The fund’s period end derivatives, as presented in the Portfolio of Investments and the associated Derivative Contract tables, generally are indicative of the volume of its derivative activity during the period.
The following table presents, by major type of derivative contract, the fair value, on a gross basis, of the asset and liability components of derivatives held by the fund at January 31, 2019 as reported in the Statement of Assets and Liabilities:
| | | | | | | | | | |
| | | | | Fair Value (a) | |
| | | |
| Risk | | Derivative Contracts | | Asset Derivatives | | | Liability Derivatives | |
| Interest Rate | | Interest Rate Futures | | | $— | | | | $(170,147 | ) |
| Foreign Exchange | | Forward Foreign Currency | | | | | | | | |
| | | Exchange Contracts | | | 189,573 | | | | (189,835 | ) |
| Total | | | | | $189,573 | | | | $(359,982 | ) |
| (a) | Values presented in this table for futures contracts correspond to the values reported in the fund’s Portfolio of Investments. Only the current day net variation margin for futures contracts is separately reported within the fund’s Statement of Assets and Liabilities. |
The following table presents, by major type of derivative contract, the realized gain (loss) on derivatives held by the fund for the year ended January 31, 2019 as reported in the Statement of Operations:
| | | | | | | | |
| | |
| Risk | | Futures
Contracts | | | Forward
Foreign
Currency
Exchange
Contracts | |
| Interest Rate | | | $126,061 | | | | $— | |
| Foreign Exchange | | | — | | | | 3,534,572 | |
| Total | | | $126,061 | | | | $3,534,572 | |
34
Notes to Financial Statements – continued
The following table presents, by major type of derivative contract, the change in unrealized appreciation or depreciation on derivatives held by the fund for the year ended January 31, 2019 as reported in the Statement of Operations:
| | | | | | | | |
| | |
| Risk | | Futures
Contracts | | | Forward
Foreign
Currency
Exchange
Contracts | |
| Interest Rate | | | $(228,157 | ) | | | $— | |
| Foreign Exchange | | | — | | | | 2,209,971 | |
| Total | | | $(228,157 | ) | | | $2,209,971 | |
Derivative counterparty credit risk is managed through formal evaluation of the creditworthiness of all potential counterparties. On certain, but not all, uncleared derivatives, the fund attempts to reduce its exposure to counterparty credit risk whenever possible by entering into an ISDA Master Agreement on a bilateral basis. The ISDA Master Agreement gives each party to the agreement the right to terminate all transactions traded under such agreement if there is a specified deterioration in the credit quality of the other party. Upon an event of default or a termination of the ISDA Master Agreement, thenon-defaulting party has the right to close out all transactions traded under such agreement and to net amounts owed under each agreement to one net amount payable by one party to the other. This right to close out and net payments across all transactions traded under the ISDA Master Agreement could result in a reduction of the fund’s credit risk to such counterparty equal to any amounts payable by the fund under the applicable transactions, if any.
Collateral and margin requirements differ by type of derivative. For cleared derivatives (e.g., futures contracts, cleared swaps, and exchange-traded options), margin requirements are set by the clearing broker and the clearing house and collateral, in the form of cash or securities, is posted by the fund directly with the clearing broker. Collateral terms are counterparty agreement specific for uncleared derivatives (e.g., forward foreign currency exchange contracts, uncleared swap agreements, and uncleared options) and collateral, in the form of cash and securities, is held in segregated accounts with the fund’s custodian in connection with these agreements. For derivatives traded under an ISDA Master Agreement, which contains a collateral support annex, the collateral requirements are netted across all transactions traded under such counterparty-specific agreement and an amount is posted from one party to the other to collateralize such obligations. Cash that has been segregated or delivered to cover the fund’s collateral or margin obligations under derivative contracts, if any, will be reported separately in the Statement of Assets and Liabilities as restricted cash for uncleared derivatives and/or deposits with brokers for cleared derivatives. Securities pledged as collateral or margin for the same purpose, if any, are noted in the Portfolio of Investments. The fund may be required to make payments of interest on uncovered collateral or margin obligations with the broker. Any such payments are included in “Miscellaneous” expense in the Statement of Operations.
35
Notes to Financial Statements – continued
Futures Contracts– The fund entered into futures contracts which may be used to hedge against or obtain broad market exposure, interest rate exposure, currency exposure, or to manage duration. A futures contract represents a commitment for the future purchase or sale of an asset at a specified price on a specified date.
Upon entering into a futures contract, the fund is required to deposit with the broker, either in cash or securities, an initial margin in an amount equal to a specified percentage of the notional amount of the contract. Subsequent payments (variation margin) are made or received by the fund each day, depending on the daily fluctuations in the value of the contract, and are recorded for financial statement purposes as unrealized gain or loss by the fund until the contract is closed or expires at which point the gain or loss on futures contracts is realized.
The fund bears the risk of interest rates, exchange rates or securities prices moving unexpectedly, in which case, the fund may not achieve the anticipated benefits of the futures contracts and may realize a loss. While futures contracts may present less counterparty risk to the fund since the contracts are exchange traded and the exchange’s clearinghouse guarantees payments to the broker, there is still counterparty credit risk due to the insolvency of the broker. The fund’s maximum risk of loss due to counterparty credit risk is equal to the margin posted by the fund to the broker plus any gains or minus any losses on the outstanding futures contracts.
Forward Foreign Currency Exchange Contracts– The fund entered into forward foreign currency exchange contracts for the purchase or sale of a specific foreign currency at a fixed price on a future date. These contracts may be used to hedge the fund’s currency risk or fornon-hedging purposes. For hedging purposes, the fund may enter into contracts to deliver or receive foreign currency that the fund will receive from or use in its normal investment activities. The fund may also use contracts to hedge against declines in the value of foreign currency denominated securities due to unfavorable exchange rate movements. Fornon-hedging purposes, the fund may enter into contracts with the intent of changing the relative exposure of the fund’s portfolio of securities to different currencies to take advantage of anticipated exchange rate changes.
Forward foreign currency exchange contracts are adjusted by the daily exchange rate of the underlying currency and any unrealized gains or losses are recorded as a receivable or payable for forward foreign currency exchange contracts until the contract settlement date. On contract settlement date, any gain or loss on the contract is recorded as realized gains or losses on forward foreign currency exchange contracts.
Risks may arise upon entering into these contracts from unanticipated movements in the value of the contract and from the potential inability of counterparties to meet the terms of their contracts. Generally, the fund’s maximum risk due to counterparty credit risk is the unrealized gain on the contract due to the use of Continuous Linked Settlement, a multicurrency cash settlement system for the centralized settlement of foreign transactions. This risk is mitigated in cases where there is an ISDA Master Agreement between the fund and the counterparty providing for netting as described above and, where applicable, by the posting of collateral by the counterparty to the fund to cover the fund’s exposure to the counterparty under such ISDA Master Agreement.
36
Notes to Financial Statements – continued
Loans and Other Direct Debt Instruments– The fund invests in loans and loan participations or other receivables. These investments may include standby financing commitments, including revolving credit facilities, which contractually obligate the fund to supply additional cash to the borrower on demand. The fund generally provides this financial support in order to preserve its existing investment or to obtain a more senior secured interest in the assets of the borrower. Loan participations involve a risk of insolvency of the lending bank or other financial intermediary.
Indemnifications– Under the fund’s organizational documents, its officers and Trustees may be indemnified against certain liabilities and expenses arising out of the performance of their duties to the fund. Additionally, in the normal course of business, the fund enters into agreements with service providers that may contain indemnification clauses. The fund’s maximum exposure under these agreements is unknown as this would involve future claims that may be made against the fund that have not yet occurred.
Investment Transactions and Income– Investment transactions are recorded on the trade date. Interest income is recorded on the accrual basis. All premium and discount is amortized or accreted for financial statement purposes in accordance with U.S. generally accepted accounting principles. The fund earns certain fees in connection with its floating rate loan purchasing activities. These fees are in addition to interest payments earned and may include amendment fees, commitment fees, facility fees, consent fees, and prepayment fees. Commitment fees are recorded on an accrual basis as income in the accompanying financial statements. Distributions of income and capital gains from the High Yield Pooled Portfolio are recorded on theex-dividend date. Dividends received in cash are recorded on theex-dividend date. Certain dividends from foreign securities will be recorded when the fund is informed of the dividend if such information is obtained subsequent to theex-dividend date. Dividend and interest payments received in additional securities are recorded on theex-dividend orex-interest date in an amount equal to the value of the security on such date. Debt obligations may be placed onnon-accrual status or set to accrue at a rate of interest less than the contractual coupon when the collection of all or a portion of interest has become doubtful. Interest income for those debt obligations may be further reduced by thewrite-off of the related interest receivables when deemed uncollectible.
The fund and/or the High Yield Pooled Portfolio may receive proceeds from litigation settlements. Any proceeds received from litigation involving portfolio holdings are reflected in the Statement of Operations in realized gain/loss if the security has been disposed of by the fund or in unrealized gain/loss if the security is still held by the fund. Any other proceeds from litigation not related to portfolio holdings are reflected as other income in the Statement of Operations.
Fees Paid Indirectly– The fund’s custody fee may be reduced by a credit earned under an arrangement that measures the value of U.S. dollars deposited with the custodian by the fund. The amount of the credit, for the year ended January 31, 2019, is shown as a reduction of total expenses in the Statement of Operations.
Tax Matters and Distributions– The fund intends to qualify as a regulated investment company, as defined under Subchapter M of the Internal Revenue Code, and to distribute all of its taxable income, including realized capital gains. As a result,
37
Notes to Financial Statements – continued
no provision for federal income tax is required. The fund’s federal tax returns, when filed, will remain subject to examination by the Internal Revenue Service for a three year period. Management has analyzed the fund’s tax positions taken on federal and state tax returns for all open tax years and does not believe that there are any uncertain tax positions that require recognition of a tax liability. Foreign taxes, if any, have been accrued by the fund in the accompanying financial statements in accordance with the applicable foreign tax law. Foreign income taxes may be withheld by certain countries in which the fund invests. Additionally, capital gains realized by the fund on securities issued in or by certain foreign countries may be subject to capital gains tax imposed by those countries.
Distributions to shareholders are recorded on theex-dividend date. Income and capital gain distributions are determined in accordance with income tax regulations, which may differ from U.S. generally accepted accounting principles. Certain capital accounts in the financial statements are periodically adjusted for permanent differences in order to reflect their tax character. These adjustments have no impact on net assets or net asset value per share. Temporary differences which arise from recognizing certain items of income, expense, gain or loss in different periods for financial statement and tax purposes will reverse at some time in the future. Distributions in excess of net investment income or net realized gains are temporary overdistributions for financial statement purposes resulting from differences in the recognition or classification of income or distributions for financial statement and tax purposes.
Book/tax differences primarily relate to defaulted bonds, amortization and accretion of debt securities, and wash sale loss deferrals.
The tax character of distributions declared to shareholders for the last two fiscal years is as follows:
| | | | | | | | |
| | |
| | | Year ended
1/31/19 | | | Year ended
1/31/18 | |
| Ordinary income (including any short-term capital gains) | | | $16,281,461 | | | | $16,082,515 | |
| Tax return of capital (b) | | | — | | | | 3,041,314 | |
| | |
| Total distributions | | | $16,281,461 | | | | $19,123,829 | |
| (b) | Distributions in excess of tax basis earnings and profits are reported in the financial statements as a tax return of capital. |
The federal tax cost and the tax basis components of distributable earnings were as follows:
| | | | |
| |
| As of 1/31/19 | | | |
| |
| Cost of investments | | | $358,553,465 | |
| Gross appreciation | | | 1,854,239 | |
| |
| Gross depreciation | | | (32,877,302 | ) |
| Net unrealized appreciation (depreciation) | | | $(31,023,063 | ) |
| |
| Undistributed ordinary income | | | 3,425,942 | |
| Capital loss carryforwards | | | (24,637,659 | ) |
| Other temporary differences | | | (1,369,901 | ) |
38
Notes to Financial Statements – continued
As of January 31, 2019, the fund had capital loss carryforwards available to offset future realized gains. These net capital losses may be carried forward indefinitely and their character is retained as short-term and/or long-term losses. Such losses are characterized as follows:
| | | | |
| Short-Term | | | $(1,796,775 | ) |
| Long-Term | | | (22,840,884 | ) |
| Total | | | $(24,637,659 | ) |
Multiple Classes of Shares of Beneficial Interest– The fund offers multiple classes of shares, which differ in their respective distribution and service fees. The fund’s income and common expenses are allocated to shareholders based on the value of settled shares outstanding of each class. The fund’s realized and unrealized gain (loss) are allocated to shareholders based on the daily net assets of each class. Dividends are declared separately for each class. Differences in per share dividend rates are generally due to differences in separate class expenses. Class B shares will convert to Class A shares approximately eight years after purchase. Class C shares will convert to Class A shares approximately ten years after purchase. The fund’s distributions declared to shareholders as reported in the Statements of Changes in Net Assets are presented by class as follows:
| | | | | | | | | | | | | | | | |
| | | From net investment
income | | | From tax return of
capital | |
| | | | |
| | | Year
ended
1/31/19 | | | Year
ended
1/31/18 | | | Year
ended
1/31/19 | | | Year
ended
1/31/18 | |
| Class A | | | $9,096,094 | | | | $8,304,893 | | | | $— | | | | $1,570,513 | |
| Class B | | | 386,305 | | | | 442,170 | | | | — | | | | 83,617 | |
| Class C | | | 1,440,752 | | | | 2,031,503 | | | | — | | | | 384,171 | |
| Class I | | | 3,654,916 | | | | 4,159,401 | | | | — | | | | 786,571 | |
| Class R1 | | | 3,019 | | | | 2,717 | | | | — | | | | 514 | |
| Class R2 | | | 12,251 | | | | 9,493 | | | | — | | | | 1,796 | |
| Class R3 | | | 467,177 | | | | 378,258 | | | | — | | | | 71,531 | |
| Class R4 | | | 345,887 | | | | 307,648 | | | | — | | | | 58,178 | |
| Class R6 | | | 875,060 | | | | 446,432 | | | | — | | | | 84,423 | |
| Total | | | $16,281,461 | | | | $16,082,515 | | | | $— | | | | $3,041,314 | |
(3) Transactions with Affiliates
Investment Adviser– The fund has an investment advisory agreement with MFS to provide overall investment management and related administrative services and facilities to the fund. The management fee is computed daily and paid monthly at the following annual rates based on the fund’s average daily net assets:
| | | | |
| Up to $1.5 billion | | | 0.65 | % |
| In excess of $1.5 billion and up to $2.5 billion | | | 0.60 | % |
| In excess of $2.5 billion | | | 0.55 | % |
MFS has agreed in writing to reduce its management fee by a specified amount if certain MFS mutual fund assets exceed thresholds agreed to by MFS and the fund’s Board of Trustees. For the year ended January 31, 2019, this management fee
39
Notes to Financial Statements – continued
reduction amounted to $34,512, which is included in the reduction of total expenses in the Statement of Operations. The management fee incurred for the year ended January 31, 2019 was equivalent to an annual effective rate of 0.64% of the fund’s average daily net assets.
The investment adviser has agreed in writing to pay a portion of the fund’s total annual operating expenses, excluding interest, taxes, extraordinary expenses, brokerage and transaction costs, and investment-related expenses (such as fees and expenses associated with investments in investment companies and other similar investment vehicles), such that total fund operating expenses do not exceed the following rates annually of each class’s average daily net assets:
| | | | | | | | | | | | | | | | | | | | | | | | | | | | | | | | |
| Classes | |
| | | | | | | | |
| A | | B | | | C | | | I | | | R1 | | | R2 | | | R3 | | | R4 | | | R6 | |
| 1.05% | | | 1.80% | | | | 1.80% | | | | 0.80% | | | | 1.80% | | | | 1.30% | | | | 1.05% | | | | 0.80% | | | | 0.73% | |
This written agreement will continue until modified by the fund’s Board of Trustees, but such agreement will continue at least until May 31, 2020. For the year ended January 31, 2019, this reduction amounted to $297,516, which is included in the reduction of total expenses in the Statement of Operations.
Distributor– MFS Fund Distributors, Inc. (MFD), a wholly-owned subsidiary of MFS, as distributor, received $5,306 for the year ended January 31, 2019, as its portion of the initial sales charge on sales of Class A shares of the fund.
The Board of Trustees has adopted a distribution plan for certain share classes pursuant to Rule12b-1 of the Investment Company Act of 1940.
The fund’s distribution plan provides that the fund will pay MFD for services provided by MFD and financial intermediaries in connection with the distribution and servicing of certain share classes. One component of the plan is a distribution fee paid to MFD and another component of the plan is a service fee paid to MFD. MFD may subsequently pay all, or a portion, of the distribution and/or service fees to financial intermediaries.
Distribution Plan Fee Table:
| | | | | | | | | | | | | | | | | | | | |
| | | | | |
| | | Distribution
Fee Rate (d) | | | Service
Fee Rate (d) | | | Total
Distribution
Plan (d) | | | Annual
Effective
Rate (e) | | | Distribution
and Service
Fee | |
| Class A | | | — | | | | 0.25% | | | | 0.25% | | | | 0.25% | | | | $497,418 | |
| Class B | | | 0.75% | | | | 0.25% | | | | 1.00% | | | | 1.00% | | | | 101,850 | |
| Class C | | | 0.75% | | | | 0.25% | | | | 1.00% | | | | 1.00% | | | | 380,830 | |
| Class R1 | | | 0.75% | | | | 0.25% | | | | 1.00% | | | | 1.00% | | | | 796 | |
| Class R2 | | | 0.25% | | | | 0.25% | | | | 0.50% | | | | 0.49% | | | | 1,412 | |
| Class R3 | | | — | | | | 0.25% | | | | 0.25% | | | | 0.25% | | | | 25,526 | |
| Total Distribution and Service Fees | | | | | | | | | | | | $1,007,832 | |
| (d) | In accordance with the distribution plan for certain classes, the fund pays distribution and/or service fees equal to these annual percentage rates of each class’s average daily net assets. The distribution and service fee rates disclosed by class represent the current rates in effect at the end of the reporting period. Any rate changes, if applicable, are detailed below. |
| (e) | The annual effective rates represent actual fees incurred under the distribution plan for the year ended January 31, 2019 based on each class’s average daily net assets. MFD has voluntarily agreed to rebate a portion of each class’s 0.25% service fee attributable to |
40
Notes to Financial Statements – continued
| | accounts for which MFD retains the 0.25% service fee except for accounts attributable to MFS or its affiliates’ seed money. For the year ended January 31, 2019, this rebate amounted to $5,841, $50, $250, and $22 for Class A, Class B, Class C, and Class R2 respectively, and is included in the reduction of total expenses in the Statement of Operations. |
Certain Class A shares are subject to a contingent deferred sales charge (CDSC) in the event of a shareholder redemption within 18 months of purchase. Class B shares are subject to a CDSC in the event of a shareholder redemption within six years of purchase. Class C shares are subject to a CDSC in the event of a shareholder redemption within 12 months of purchase. All contingent deferred sales charges are paid to MFD and during the year ended January 31, 2019, were as follows:
| | | | |
| |
| | | Amount | |
| Class A | | | $10,776 | |
| Class B | | | 15,165 | |
| Class C | | | 1,433 | |
Shareholder Servicing Agent– MFS Service Center, Inc. (MFSC), a wholly-owned subsidiary of MFS, receives a fee from the fund for its services as shareholder servicing agent calculated as a percentage of the average daily net assets of the fund as determined periodically under the supervision of the fund’s Board of Trustees. For the year ended January 31, 2019, the fee was $58,540, which equated to 0.0163% annually of the fund’s average daily net assets. MFSC also receives payment from the fund forout-of-pocket expenses,sub-accounting and other shareholder servicing costs which may be paid to affiliated and unaffiliated service providers. Class R6 shares do not incursub-accounting fees. For the year ended January 31, 2019, theseout-of-pocket expenses,sub-accounting and other shareholder servicing costs amounted to $385,182.
Administrator– MFS provides certain financial, legal, shareholder communications, compliance, and other administrative services to the fund. Under an administrative services agreement, the fund reimburses MFS the costs incurred to provide these services. The fund is charged an annual fixed amount of $17,500 plus a fee based on average daily net assets. The administrative services fee incurred for the year ended January 31, 2019 was equivalent to an annual effective rate of 0.0170% of the fund’s average daily net assets.
Trustees’ and Officers’ Compensation– The fund pays compensation to independent Trustees in the form of a retainer, attendance fees, and additional compensation to Board and Committee chairpersons. The fund does not pay compensation directly to Trustees or officers of the fund who are also officers of the investment adviser, all of whom receive remuneration for their services to the fund from MFS. Certain officers and Trustees of the fund are officers or directors of MFS, MFD, and MFSC.
Prior to December 31, 2001, the fund had an unfunded defined benefit plan (“DB plan”) for independent Trustees. As of December 31, 2001, the Board took action to terminate the DB plan with respect to then-current and any future independent Trustees. Effective January 1, 2002, accrued benefits under the DB plan forthen-current independent Trustees who continued were credited to an unfunded retirement deferral plan (the “Retirement Deferral plan”), which was established for
41
Notes to Financial Statements – continued
and exists solely with respect to these credited amounts, and is not available for other deferrals by these or other independent Trustees. Although the Retirement Deferral plan is unfunded, amounts deferred under the plan are periodically adjusted for investment experience as if they had been invested in shares of the fund. The Retirement Deferral plan, which was terminated on December 31, 2018, resulted in a net decrease in expense of $59 and is included in “Independent Trustees’ compensation” in the Statement of Operations for the year ended January 31, 2019.
Other– This fund and certain other funds managed by MFS (the funds) have entered into a service agreement (the ISO Agreement) which provides for payment of fees solely by the funds to Tarantino LLC in return for the provision of services of an Independent Senior Officer (ISO) for the funds. Frank L. Tarantino serves as the ISO and is an officer of the funds and the sole member of Tarantino LLC. The funds can terminate the ISO Agreement with Tarantino LLC at any time under the terms of the ISO Agreement. For the year ended January 31, 2019, the fee paid by the fund under this agreement was $599 and is included in “Miscellaneous” expense in the Statement of Operations. MFS has agreed to bear all expenses associated with office space, other administrative support, and supplies provided to the ISO.
The fund invests in the MFS Institutional Money Market Portfolio which is managed by MFS and seeks current income consistent with preservation of capital and liquidity. This money market fund does not pay a management fee to MFS.
The fund invests in the High Yield Pooled Portfolio, which is a mutual fund advised by MFS that does not pay management fees to MFS but does incur investment and operating costs. The fund invests in the High Yield Pooled Portfolio to gain exposure to high income debt instruments, rather than investing in high income debt instruments directly (see Appendix A). Income earned on this investment is included in “Dividends from affiliated issuers” in the Statement of Operations. The High Yield Pooled Portfolio does not pay a management fee to MFS or distribution and/or service fee to MFD.
At January 31, 2019, MFS held approximately 93% of the outstanding shares of Class R1.
(4) Portfolio Securities
For the year ended January 31, 2019, purchases and sales of investments, other than short-term obligations, aggregated $46,257,197 and $110,233,967, respectively.
42
Notes to Financial Statements – continued
(5) Shares of Beneficial Interest
The fund’s Declaration of Trust permits the Trustees to issue an unlimited number of full and fractional shares of beneficial interest. Transactions in fund shares were as follows:
| | | | | | | | | | | | | | | | |
| | | Year ended
1/31/19 | | | Year ended
1/31/18 | |
| | | | |
| | | Shares | | | Amount | | | Shares | | | Amount | |
| Shares sold | | | | | | | | | | | | | | | | |
Class A | | | 7,357,943 | | | | $44,571,418 | | | | 7,639,525 | | | | $47,733,000 | |
Class B | | | 74,653 | | | | 453,327 | | | | 305,349 | | | | 1,918,771 | |
Class C | | | 301,026 | | | | 1,830,793 | | | | 624,776 | | | | 3,901,637 | |
Class I | | | 2,356,919 | | | | 14,288,904 | | | | 8,099,080 | | | | 50,463,587 | |
Class R1 | | | 12,559 | | | | 75,987 | | | | 331 | | | | 2,071 | |
Class R2 | | | 7,062 | | | | 42,853 | | | | 26,584 | | | | 166,478 | |
Class R3 | | | 307,978 | | | | 1,850,461 | | | | 346,981 | | | | 2,168,517 | |
Class R4 | | | 219,367 | | | | 1,331,118 | | | | 312,234 | | | | 1,947,349 | |
Class R6 | | | 1,106,527 | | | | 6,637,489 | | | | 2,316,871 | | | | 14,460,274 | |
| | | 11,744,034 | | | | $71,082,350 | | | | 19,671,731 | | | | $122,761,684 | |
|
Shares issued to shareholders in
reinvestment of distributions | |
Class A | | | 1,225,086 | | | | $7,372,743 | | | | 1,282,694 | | | | $8,027,226 | |
Class B | | | 61,505 | | | | 371,355 | | | | 79,164 | | | | 496,310 | |
Class C | | | 218,293 | | | | 1,316,013 | | | | 343,275 | | | | 2,146,611 | |
Class I | | | 596,702 | | | | 3,596,008 | | | | 755,898 | | | | 4,731,119 | |
Class R1 | | | 468 | | | | 2,823 | | | | 516 | | | | 3,231 | |
Class R2 | | | 1,827 | | | | 11,010 | | | | 1,542 | | | | 9,664 | |
Class R3 | | | 77,631 | | | | 467,172 | | | | 71,815 | | | | 449,486 | |
Class R4 | | | 57,084 | | | | 345,225 | | | | 58,170 | | | | 365,817 | |
Class R6 | | | 117,381 | | | | 705,059 | | | | 57,287 | | | | 358,727 | |
| | | 2,355,977 | | | | $14,187,408 | | | | 2,650,361 | | | | $16,588,191 | |
|
| Shares reacquired | |
Class A | | | (9,321,373 | ) | | | $(56,147,099 | ) | | | (14,486,173 | ) | | | $(90,252,680 | ) |
Class B | | | (773,858 | ) | | | (4,667,827 | ) | | | (815,607 | ) | | | (5,103,770 | ) |
Class C | | | (4,881,060 | ) | | | (29,689,400 | ) | | | (2,421,124 | ) | | | (15,115,570 | ) |
Class I | | | (6,545,786 | ) | | | (39,498,217 | ) | | | (9,598,008 | ) | | | (59,950,427 | ) |
Class R1 | | | (12,722 | ) | | | (77,345 | ) | | | (7,539 | ) | | | (47,303 | ) |
Class R2 | | | (5,927 | ) | | | (35,879 | ) | | | (15,789 | ) | | | (98,691 | ) |
Class R3 | | | (308,108 | ) | | | (1,856,204 | ) | | | (216,156 | ) | | | (1,352,503 | ) |
Class R4 | | | (310,121 | ) | | | (1,882,529 | ) | | | (322,951 | ) | | | (20,256,976 | ) |
Class R6 | | | (764,509 | ) | | | (4,597,038 | ) | | | (362,565 | ) | | | (2,266,820 | ) |
| | | (22,923,464 | ) | | | $(138,451,538 | ) | | | (28,245,912 | ) | | | $(176,213,461 | ) |
43
Notes to Financial Statements – continued
| | | | | | | | | | | | | | | | |
| | | Year ended
1/31/19 | | | Year ended
1/31/18 | |
| | | | |
| | | Shares | | | Amount | | | Shares | | | Amount | |
| Net change | |
Class A | | | (738,344 | ) | | | $(4,202,938 | ) | | | (5,563,955 | ) | | | $(34,492,454 | ) |
Class B | | | (637,700 | ) | | | (3,843,145 | ) | | | (431,094 | ) | | | (2,688,689 | ) |
Class C | | | (4,361,741 | ) | | | (26,542,594 | ) | | | (1,453,073 | ) | | | (9,067,322 | ) |
Class I | | | (3,592,165 | ) | | | (21,613,305 | ) | | | (743,030 | ) | | | (4,755,721 | ) |
Class R1 | | | 305 | | | | 1,465 | | | | (6,692 | ) | | | (42,001 | ) |
Class R2 | | | 2,962 | | | | 17,984 | | | | 12,337 | | | | 77,451 | |
Class R3 | | | 77,501 | | | | 461,429 | | | | 202,640 | | | | 1,265,500 | |
Class R4 | | | (33,670 | ) | | | (206,186 | ) | | | 47,453 | | | | 287,469 | |
Class R6 | | | 459,399 | | | | 2,745,510 | | | | 2,011,593 | | | | 12,552,181 | |
| | | (8,823,453 | ) | | | $(53,181,780 | ) | | | (5,923,820 | ) | | | $(36,863,586 | ) |
Class T shares were not publicly available for sale during the period. Please see the fund’s prospectus for details.
Effective June 1, 2019, purchases of the fund’s Class B shares are closed to new and existing investors subject to certain exceptions. Please see the fund’s prospectus for details.
(6) Line of Credit
The fund and certain other funds managed by MFS participate in a $1.25 billion unsecured committed line of credit, subject to a $1 billion sublimit, provided by a syndication of banks under a credit agreement. Borrowings may be made for temporary financing needs. Interest is charged to each fund, based on its borrowings, generally at a rate equal to the higher of the Overnight Bank Funding rate or daily one month LIBOR plus an agreed upon spread. A commitment fee, based on the average daily, unused portion of the committed line of credit, is allocated among the participating funds. In addition, the fund and other funds managed by MFS have established unsecured uncommitted borrowing arrangements with certain banks for temporary financing needs. Interest is charged to each fund, based on its borrowings, at a rate equal to the Overnight Bank Funding rate plus an agreed upon spread. For the year ended January 31, 2019, the fund’s commitment fee and interest expense were $2,200 and $0, respectively, and are included in “Miscellaneous” expense in the Statement of Operations.
44
Notes to Financial Statements – continued
(7) Investments in Affiliated Issuers
An affiliated issuer may be considered one in which the fund owns 5% or more of the outstanding voting securities, or a company which is under common control. For the purposes of this report, the fund assumes the following to be affiliated issuers:
| | | | | | | | | | | | | | | | | | | | |
| | | | | |
| Affiliated Issuers | | | | | Beginning
Shares/Par
Amount | | | Acquisitions
Shares/Par
Amount | | | Dispositions
Shares/Par
Amount | | | Ending
Shares/Par
Amount | |
| MFS High Yield Pooled Portfolio | | | | | | | 26,769,063 | | | | 2,138,404 | | | | (6,068,721 | ) | | | 22,838,746 | |
| MFS Institutional Money Market Portfolio | | | | | | | 7,285,502 | | | | 65,994,202 | | | | (63,562,175 | ) | | | 9,717,529 | |
| | | | | |
| Affiliated Issuers | | Realized
Gain (Loss) | | | Change in
Unrealized
Appreciation/
Depreciation | | | Capital Gain
Distributions | | | Dividend
Income | | | Ending
Value | |
| MFS High Yield Pooled Portfolio | | | $(9,388,344 | ) | | | $(788,061 | ) | | | $— | | | | $13,434,862 | | | | $204,178,389 | |
| MFS Institutional Money Market Portfolio | | | (229 | ) | | | 11 | | | | — | | | | 138,082 | | | | 9,716,557 | |
| | | $(9,388,573 | ) | | | $(788,050 | ) | | | $— | | | | $13,572,944 | | | | $213,894,946 | |
(8) Legal Proceedings
In May 2015, the Motors Liquidation Company Avoidance Action Trust (hereafter, “AAT”) served upon the fund a complaint in an adversary proceeding in the U.S. Bankruptcy Court for the Southern District of New York, captionedMotors Liquidation Company Avoidance Action Trust v. JPMorgan Chase Bank, N.A., et al.(No.09-00504 (REG)). The complaint, which was originally filed in 2009 but not served on the fund until 2015, names as defendants over 500 entities (including the fund) that held an interest in a $1.5 billion General Motors (GM) term loan in 2009, when GM filed for bankruptcy. The AAT alleges that the fund and the other term loan lenders were improperly treated as secured lenders with respect to the term loan shortly before and immediately after GM’s bankruptcy, receiving full principal and interest payments under the loan. The AAT alleges that the fund and other term loan lenders should have been treated as unsecured (or partially unsecured) creditors because the main lien securing the collateral was allegedly not perfected at the time of GM’s bankruptcy due to an erroneous filing in October 2008 that terminated the financing statement perfecting the lien. The AAT seeks to claw back payments made to the fund and the other term loan lenders after, and during the 90 days before, GM’s June 2009 bankruptcy petition. During that time period, the fund received term loan payments of approximately $3,030,000. The fund cannot predict the outcome of this proceeding. Among other things, it is unclear whether the AAT’s claims will succeed; what the fund would be entitled to as an unsecured (or partially unsecured) creditor, given the existence of other collateral not impacted by the erroneous October 2008 filing; whether third parties responsible for the erroneous October 2008 filing would bear some or all of any liability; and the degree to which the fund may be entitled to indemnification from a third party for any amount required to be disgorged. The fund has and will continue to incur legal expenses associated with the defense of this action and in related claims against third parties.
45
REPORT OF INDEPENDENT REGISTERED PUBLIC ACCOUNTING FIRM
To the Board of Trustees of MFS Series Trust III and the Shareholders of MFS Global High Yield Fund:
Opinion on the Financial Statements and Financial Highlights
We have audited the accompanying statement of assets and liabilities of MFS Global High Yield Fund (the “Fund”), including the portfolio of investments, as of January 31, 2019, the related statement of operations for the year then ended, the statements of changes in net assets for each of the two years in the period then ended, the financial highlights for each of the five years in the period then ended, and the related notes. In our opinion, the financial statements and financial highlights present fairly, in all material respects, the financial position of the Fund as of January 31, 2019, and the results of its operations for the year then ended, the changes in its net assets for each of the two years in the period then ended, and the financial highlights for each of the five years in the period then ended, in conformity with accounting principles generally accepted in the United States of America.
Basis for Opinion
These financial statements and financial highlights are the responsibility of the Fund’s management. Our responsibility is to express an opinion on the Fund’s financial statements and financial highlights based on our audits. We are a public accounting firm registered with the Public Company Accounting Oversight Board (United States) (PCAOB) and are required to be independent with respect to the Fund in accordance with the U.S. federal securities laws and the applicable rules and regulations of the Securities and Exchange Commission and the PCAOB.
We conducted our audits in accordance with the standards of the PCAOB. Those standards require that we plan and perform the audit to obtain reasonable assurance about whether the financial statements and financial highlights are free of material misstatement, whether due to error or fraud. The Fund is not required to have, nor were we engaged to perform, an audit of its internal control over financial reporting. As part of our audits we are required to obtain an understanding of internal control over financial reporting but not for the purpose of expressing an opinion on the effectiveness of the Fund’s internal control over financial reporting. Accordingly, we express no such opinion.
Our audits included performing procedures to assess the risks of material misstatement of the financial statements and financial highlights, whether due to error or fraud, and performing procedures that respond to those risks. Such procedures included examining, on a test basis, evidence regarding the amounts and disclosures in the financial statements and financial highlights. Our audits also included evaluating the accounting principles used and significant estimates made by management, as well as evaluating the overall presentation of the financial statements and financial highlights. Our procedures included confirmation of securities owned as of January 31, 2019, by
46
Report of Independent Registered Public Accounting Firm – continued
correspondence with the custodian, brokers and agent banks; when replies were not received from brokers or agent banks, we performed other auditing procedures. We believe that our audits provide a reasonable basis for our opinion.
DELOITTE & TOUCHE LLP
Boston, Massachusetts
March 19, 2019
We have served as the auditor of one or more of the MFS investment companies since 1924.
47
TRUSTEES AND OFFICERS — IDENTIFICATION AND BACKGROUND
The Trustees and Officers of the Trust, as of March 1, 2019, are listed below, together with their principal occupations during the past five years. (Their titles may have varied during that period.) The address of each Trustee and Officer is 111 Huntington Avenue, Boston, Massachusetts 02199-7618.
| | | | | | | | | | |
Name, Age | | Position(s) Held with Fund | | Trustee/Officer Since (h) | | Number of
MFS Funds
overseen
by the Trustee | | Principal
Occupations During the Past Five Years | | Other Directorships
During the Past
Five Years (j) |
| INTERESTED TRUSTEES |
Robert J. Manning (k)
(age 55) | | Trustee | | February 2004 | | 135 | | Massachusetts Financial Services Company, Executive Chairman (since January 2017); Director; Chairman of the Board; Chief Executive Officer (until 2015);Co-Chief Executive Officer (2015-2016) | | N/A |
| | | | | |
Robin A. Stelmach (k) (age 57) | | Trustee | | January 2014 | | 135 | | Massachusetts Financial Services Company, Vice Chair (since January 2017); Chief Operating Officer and Executive Vice President (until January 2017) | | N/A |
| INDEPENDENT TRUSTEES |
John P. Kavanaugh (age 64) | | Trustee and Chair of Trustees | | January 2009 | | 135 | | Private investor | | N/A |
| | | | | |
Steven E. Buller (age 67) | | Trustee | | February 2014 | | 135 | | Financial Accounting Standards Advisory Council, Chairman (2014-2015); Public Company Accounting Oversight Board, Standing Advisory Group, Member (until 2014); BlackRock, Inc. (investment management), Managing Director (until 2014), BlackRock Finco UK (investment management), Director (until 2014) | | N/A |
48
Trustees and Officers – continued
| | | | | | | | | | |
Name, Age | | Position(s) Held with Fund | | Trustee/Officer Since (h) | | Number of
MFS Funds
overseen
by the Trustee | | Principal
Occupations During the Past Five Years | | Other Directorships
During the Past
Five Years (j) |
John A. Caroselli (age 64) | | Trustee | | March 2017 | | 135 | | JC Global Advisors, LLC (management consulting), President (since 2015); First Capital Corporation (commercial finance), Executive Vice President (until 2015) | | N/A |
| | | | | |
Maureen R. Goldfarb (age 63) | | Trustee | | January 2009 | | 135 | | Private investor | | N/A |
| | | | | |
Michael Hegarty
(age 74) | | Trustee | | December 2004 | | 135 | | Private investor | | Rouse Properties Inc., Director (until 2016); Capmark Financial Group Inc., Director (until 2015) |
| | | | | |
Peter D. Jones
(age 63) | | Trustee | | January 2019 | | 135 | | Franklin Templeton Distributors, Inc. (investment management), President (until 2015); Franklin Templeton Institutional, LLC (investment management), Chairman (until 2015) | | N/A |
| | | | | |
James W. Kilman, Jr.
(age 57) | | Trustee | | January 2019 | | 135 | | KielStrand Capital LLC (family office and merchant bank), Chief Executive Officer (since 2016); Morgan Stanley & Co. (financial services), Vice Chairman of Investment Banking,Co-Head of Diversified Financials Coverage – Financial Institutions Investment Banking Group (until 2016) | | Alpha-En Corporation, Director (since 2016) |
49
Trustees and Officers – continued
| | | | | | | | | | |
Name, Age | | Position(s) Held with Fund | | Trustee/Officer Since (h) | | Number of
MFS Funds
overseen
by the Trustee | | Principal
Occupations During the Past Five Years | | Other Directorships
During the Past
Five Years (j) |
Clarence Otis, Jr. (age 62) | | Trustee | | March 2017 | | 135 | | Darden Restaurants, Inc., Chief Executive Officer (until 2014) | | VF Corporation, Director; Verizon Communications, Inc., Director; The Travelers Companies, Director; Federal Reserve Bank of Atlanta, Director (until 2015) |
| | | | | |
Maryanne L. Roepke (age 63) | | Trustee | | May 2014 | | 135 | | American Century Investments (investment management), Senior Vice President and Chief Compliance Officer (until 2014) | | N/A |
| | | | | |
Laurie J. Thomsen
(age 61) | | Trustee | | March 2005 | | 135 | | Private investor | | The Travelers Companies, Director; Dycom Industries, Inc., Director (since 2015) |
| | | | | | | | |
Name, Age | | Position(s) Held with Fund | | Trustee/Officer
Since (h) | | Number of
MFS Funds
for which
the Person
is an Officer | | Principal
Occupations During the Past Five Years |
| OFFICERS | | | | | | | | |
Christopher R. Bohane (k)
(age 45) | | Assistant Secretary and Assistant Clerk | | July 2005 | | 135 | | Massachusetts Financial Services Company, Vice President and Assistant General Counsel |
| | | | |
Kino Clark (k) (age 50) | | Assistant Treasurer | | January 2012 | | 135 | | Massachusetts Financial Services Company, Vice President |
50
Trustees and Officers – continued
| | | | | | | | |
Name, Age | | Position(s) Held with Fund | | Trustee/Officer
Since (h) | | Number of
MFS Funds
for which
the Person
is an Officer | | Principal
Occupations During the Past Five Years |
John W. Clark, Jr. (k) (age 51) | | Assistant Treasurer | | April 2017 | | 135 | | Massachusetts Financial Services Company, Vice President (since March 2017); Deutsche Bank (financial services), Department Head – Treasurer’s Office (until February 2017) |
| | | | |
Thomas H. Connors (k) (age 59) | | Assistant Secretary and Assistant Clerk | | September 2012 | | 135 | | Massachusetts Financial Services Company, Vice President and Senior Counsel |
| | | | |
Ethan D. Corey (k)
(age 55) | | Assistant Secretary and Assistant Clerk | | July 2005 | | 135 | | Massachusetts Financial Services Company, Senior Vice President and Associate General Counsel |
| | | | |
David L. DiLorenzo (k)
(age 50) | | President | | July 2005 | | 135 | | Massachusetts Financial Services Company, Senior Vice President |
| | | | |
Heidi W. Hardin (k) (age 51) | | Secretary and Clerk | | April 2017 | | 135 | | Massachusetts Financial Services Company, Executive Vice President and General Counsel (since March 2017); Harris Associates (investment management), General Counsel (from September 2015 to January 2017); Janus Capital Management LLC (investment management), Senior Vice President and General Counsel (until September 2015) |
| | | | |
Brian E. Langenfeld (k) (age 45) | | Assistant
Secretary and Assistant Clerk | | June 2006 | | 135 | | Massachusetts Financial Services Company, Vice President and Senior Counsel |
51
Trustees and Officers – continued
| | | | | | | | |
Name, Age | | Position(s) Held with Fund | | Trustee/Officer
Since (h) | | Number of
MFS Funds
for which
the Person
is an Officer | | Principal
Occupations During the Past Five Years |
Amanda S. Mooradian (k) (age 40) | | Assistant
Secretary and Assistant Clerk | | September 2018 | | 135 | | Massachusetts Financial Services Company, Assistant Vice President and Counsel |
| | | | |
Susan A. Pereira (k)
(age 48) | | Assistant
Secretary and Assistant Clerk | | July 2005 | | 135 | | Massachusetts Financial Services Company, Vice President and Senior Counsel |
| | | | |
Kasey L. Phillips (k) (age 48) | | Assistant Treasurer | | September 2012 | | 135 | | Massachusetts Financial Services Company, Vice President |
| | | | |
Matthew A. Stowe (k) (age 44) | | Assistant Secretary and Assistant Clerk | | October 2014 | | 135 | | Massachusetts Financial Services Company, Vice President and Assistant General Counsel |
| | | | |
Frank L. Tarantino
(age 74) | | Independent
Senior Officer | | June 2004 | | 135 | | Tarantino LLC (provider of compliance services), Principal |
| | | | |
Richard S. Weitzel (k)
(age 48) | | Assistant Secretary and Assistant Clerk | | October 2007 | | 135 | | Massachusetts Financial Services Company, Senior Vice President and Associate General Counsel |
| | | | |
Martin J. Wolin (k) (age 51) | | Chief Compliance Officer | | July 2015 | | 135 | | Massachusetts Financial Services Company, Senior Vice President and Chief Compliance Officer (since July 2015); Mercer (financial service provider), Chief Risk and Compliance Officer, North America and Latin America (until June 2015) |
| | | | |
James O. Yost (k)
(age 58) | | Treasurer | | September 1990 | | 135 | | Massachusetts Financial Services Company, Senior Vice President |
52
Trustees and Officers – continued
| (h) | Date first appointed to serve as Trustee/officer of an MFS Fund. Each Trustee has served continuously since appointment unless indicated otherwise. For the period from December 15, 2004 until February 22, 2005, Mr. Manning served as Advisory Trustee. From January 2012 through December 2016, Messrs. DiLorenzo and Yost served as Treasurer and Deputy Treasurer of the Funds, respectively. |
| (j) | Directorships or trusteeships of companies required to report to the Securities and Exchange Commission (i.e., “public companies”). |
| (k) | “Interested person” of the Trust within the meaning of the Investment Company Act of 1940 (referred to as the 1940 Act), which is the principal federal law governing investment companies like the fund, as a result of a position with MFS. The address of MFS is 111 Huntington Avenue, Boston, Massachusetts 02199-7618. |
Each Trustee (other than Messrs. Jones and Kilman) has been elected by shareholders and each Trustee and officer holds office until his or her successor is chosen and qualified or until his or her earlier death, resignation, retirement or removal. The Trust does not hold annual meetings for the purpose of electing Trustees, and Trustees are not elected for fixed terms. Under the terms of the Board’s retirement policy, an Independent Trustee shall retire at the end of the calendar year in which he or she reaches the earlier of 75 years of age or 15 years of service on the Board (or, in the case of any Independent Trustee who joined the Board prior to 2015, 20 years of service on the Board).
Messrs. Buller, Hegarty, Kilman and Otis and Ms. Roepke are members of the Trust’s Audit Committee.
Each of the Interested Trustees and certain Officers hold comparable officer positions with certain affiliates of MFS.
The Statement of Additional Information for a Fund includes further information about the Trustees and is available without charge upon request by calling1-800-225-2606.
| | |
| Investment Adviser | | Custodian |
Massachusetts Financial Services Company
111 Huntington Avenue Boston, MA 02199-7618 | | JPMorgan Chase Bank, NA 4 Metrotech Center New York, NY 11245 |
| Distributor | | Independent Registered Public Accounting Firm |
MFS Fund Distributors, Inc.
111 Huntington Avenue Boston, MA 02199-7618 | | Deloitte & Touche LLP 200 Berkeley Street Boston, MA 02116 |
| Portfolio Manager(s) | | |
| David Cole | | |
| Matt Ryan | | |
| Michael Skatrud | | |
53
PROXY VOTING POLICIES AND INFORMATION
MFS votes proxies on behalf of the fund pursuant to proxy voting policies and procedures that are available without charge, upon request, by calling1-800-225-2606, by visitingmfs.com/proxyvoting,or by visiting the SEC’s Web site athttp://www.sec.gov.
Information regarding how the fund voted proxies relating to portfolio securities during the most recent twelve-month period ended June 30 is available by August 31 of each year without charge by visitingmfs.com/proxyvoting,or by visiting the SEC’s Web site athttp://www.sec.gov.
QUARTERLY PORTFOLIO DISCLOSURE
The fund files a complete schedule of portfolio holdings with the SEC for the first and third quarters of each fiscal year on Form N-Q. The fund’s Form N-Q is available on the SEC’s website athttp://www.sec.gov. A shareholder can obtain the portfolio holdings report for the first and third quarters of the fund’s fiscal year atmfs.com/openendfundsby choosing the fund’s name and then selecting the “Resources” tab and clicking on “Prospectus and Reports”.
FURTHER INFORMATION
From time to time, MFS may post important information about the fund or the MFS funds on the MFS web site (mfs.com). This information is available athttps://www.mfs.com/en-us/what-we-do/announcements.htmlor atmfs.com/openendfundsby choosing the fund’s name.
INFORMATION ABOUT FUND CONTRACTS AND LEGAL CLAIMS
The fund has entered into contractual arrangements with an investment adviser, administrator, distributor, shareholder servicing agent, 529 program manager (if applicable), and custodian who each provide services to the fund. Unless expressly stated otherwise, shareholders are not parties to, or intended beneficiaries of these contractual arrangements, and these contractual arrangements are not intended to create any shareholder right to enforce them against the service providers or to seek any remedy under them against the service providers, either directly or on behalf of the fund.
Under the Trust’s By-Laws and Declaration of Trust, any claims asserted against or on behalf of the MFS Funds, including claims against Trustees and Officers, must be brought in state and federal courts located within the Commonwealth of Massachusetts.
FEDERAL TAX INFORMATION (unaudited)
The fund will notify shareholders of amounts for use in preparing 2019 income tax forms in January 2020.
54
rev. 3/16
| | | | |
| | | |
FACTS | | WHAT DOES MFS DO WITH YOUR PERSONAL INFORMATION? | |  |
| | |
| Why? | | Financial companies choose how they share your personal information. Federal law gives consumers the right to limit some but not all sharing. Federal law also requires us to tell you how we collect, share, and protect your personal information. Please read this notice carefully to understand what we do. |
| | |
| What? | | The types of personal information we collect and share depend on the product or service you have with us. This information can include: • Social Security number and account balances • Account transactions and transaction history • Checking account information and wire transfer instructions When you areno longer our customer, we continue to share your information as described in this notice. |
| | |
| How? | | All financial companies need to share customers’ personal information to run their everyday business. In the section below, we list the reasons financial companies can share their customers’ personal information; the reasons MFS chooses to share; and whether you can limit this sharing. |
| | | | |
Reasons we can share your
personal information | | Does MFS
share? | | Can you limit
this sharing? |
For our everyday business purposes – such as to process your transactions, maintain your account(s), respond to court orders and legal investigations, or report to credit bureaus | | Yes | | No |
For our marketing purposes – to offer our products and services to you | | No | | We don’t share |
For joint marketing with other financial companies | | No | | We don’t share |
For our affiliates’ everyday business purposes – information about your transactions and experiences | | No | | We don’t share |
For our affiliates’ everyday business purposes – information about your creditworthiness | | No | | We don’t share |
| For nonaffiliates to market to you | | No | | We don’t share |
| | |
| | |
| Questions? | | Call800-225-2606 or go tomfs.com. |
55
| | |
| Who we are |
| Who is providing this notice? | | MFS Funds, MFS Investment Management, MFS Institutional Advisors, Inc., and MFS Heritage Trust Company. |
| | |
| What we do |
| How does MFS protect my personal information? | | To protect your personal information from unauthorized access and use, we use security measures that comply with federal law. These measures include procedural, electronic, and physical safeguards for the protection of the personal information we collect about you. |
| How does MFS collect my personal information? | | We collect your personal information, for example, when you • open an account or provide account information • direct us to buy securities or direct us to sell your securities • make a wire transfer We also collect your personal information from others, such as credit bureaus, affiliates, or other companies. |
| Why can’t I limit all sharing? | | Federal law gives you the right to limit only • sharing for affiliates’ everyday business purposes – information about your creditworthiness • affiliates from using your information to market to you • sharing for nonaffiliates to market to you State laws and individual companies may give you additional rights to limit sharing. |
| | |
| Definitions |
| Affiliates | | Companies related by common ownership or control. They can be financial and nonfinancial companies. • MFS does not share personal information with affiliates, except for everyday business purposes as described on page one of this notice. |
| Nonaffiliates | | Companies not related by common ownership or control. They can be financial and nonfinancial companies. • MFS does not share with nonaffiliates so they can market to you. |
| Joint marketing | | A formal agreement between nonaffiliated financial companies that together market financial products or services to you. • MFS doesn’t jointly market. |
| | |
| Other important information |
| If you own an MFS product or receive an MFS service in the name of a third party such as a bank or broker-dealer, their privacy policy may apply to you instead of ours. |
56
Save paper with eDelivery.

| MFS® will send you prospectuses, |
reports, and proxies directly viae-mail so you will get information faster with less mailbox clutter.
To sign up:
1. Go to mfs.com.
2. Log in via MFS® Access.
3. Select eDelivery.
If you own your MFS fund shares through a financial institution or a retirement plan, MFS® TALK, MFS® Access, or eDelivery may not be available to you.
CONTACT
WEB SITE
mfs.com
MFS TALK
1-800-637-8255
24 hours a day
ACCOUNT SERVICE AND LITERATURE
Shareholders
1-800-225-2606
Financial advisors
1-800-343-2829
Retirement plan services
1-800-637-1255
MAILING ADDRESS
MFS Service Center, Inc.
P.O. Box 219341
Kansas City, MO 64121-9341
OVERNIGHT MAIL
MFS Service Center, Inc.
Suite 219341
430 W 7th Street
Kansas City, MO 64105-1407
Appendix A
Annual Report
January 31, 2019
MFS® High Yield Pooled Portfolio
HYP-ANN
MFS® High Yield Pooled Portfolio
CONTENTS
The report is prepared for the general information of shareholders.
It is authorized for distribution to prospective investors only when preceded or accompanied by a current prospectus.
NOT FDIC INSURED• MAY LOSE VALUE• NO BANK GUARANTEE

LETTER FROM THE EXECUTIVE CHAIRMAN
Dear Shareholders:
Higher interest rates, international trade friction, and geopolitical uncertainty surrounding issues such as Brexit have contributed to an uptick in market volatility in recent quarters — a departure from thelow-volatility environment that has prevailed for much of the past
several years. Against this more challenging backdrop, equity markets in the United States have outperformed most international markets on a relative basis over the past 12 months, though broad market returns have been modestly negative on an absolute basis. Global economic growth has become less synchronized over the past few quarters, with Europe, China, and some emerging markets having shown signs of significantly slowing growth. While U.S. growth has remained above average, its pace slowed in the second half of 2018.
A decelerating global economy and tighter financial conditions have prompted the U.S. Federal Reserve to reassess its monetary policy outlook. Fed chairman Jerome Powell recently acknowledged that the next change in policy rates could be either a hike or a cut, suggesting that the tightening cycle begun in late 2015 may have come to an
end. The Fed has also signaled that it is likely to maintain a larger-than-expected balance sheet, meaning that monetary conditions will likely tighten less over time than earlier feared. U.S. tax reforms adopted in late 2017 have been welcomed by equity markets while emerging market economies have recently had to contend with tighter financial conditions as a result of firmer U.S. short-term interest rates, declining equity valuations, and a stronger dollar. With the Republicans losing control of the U.S. House of Representatives, further meaningful U.S. fiscal stimulus appears less likely over the remainder of this presidential term. The recent partial U.S. government shutdown has also added to political uncertainty as the competing budgetary priorities of the House of Representatives and the White House will likely remain a source of friction going forward.
Globally, inflation remains largely subdued thanks in part to lower oil prices, but tight labor markets will keep investors on the lookout for its potential reappearance. Increased U.S. protectionism is also a growing concern, as investors fear trade disputes could dampen business sentiment, leading to even slower global growth. While there has been progress on this front — a NAFTA replacement has been worked out between the U.S., Mexico, and Canada; the free trade pact with Korea has been updated; and a negotiating framework with the European Union has been agreed upon — tensions between the U.S. and China remain high, though the two sides recently returned to the negotiating table.
As a global investment manager with nearly a century of expertise, MFS® firmly believes active risk management offers downside mitigation and may help improve investment outcomes. We built our active investment platform with this belief in mind. Our long-term perspective influences nearly every aspect of our business, ensuring that our investment decisions align with the investing time horizons of our clients.
Respectfully,

Robert J. Manning
Executive Chairman
MFS Investment Management
March 19, 2019
The opinions expressed in this letter are subject to change and may not be relied upon for investment advice. No forecasts can be guaranteed.
1
PORTFOLIO COMPOSITION
Portfolio structure (i)

| | | | |
| Top five industries (i) | | | | |
| Cable TV | | | 8.8% | |
| Midstream | | | 5.5% | |
| Medical & Health Technology & Services | | | 5.3% | |
| Wireless Communications | | | 5.0% | |
| Energy – Independent | | | 5.0% | |
| | | | |
| Composition including fixed income credit quality (a)(i) | |
| BBB | | | 2.0% | |
| BB | | | 50.5% | |
| B | | | 35.0% | |
| CCC | | | 8.6% | |
| CC | | | 0.3% | |
| Not Rated | | | (1.8)% | |
| Non-Fixed Income | | | 0.5% | |
| Cash & Cash Equivalents | | | 2.9% | |
| Other | | | 2.0% | |
| |
| Portfolio facts (i) | | | | |
| Average Duration (d) | | | 4.0 | |
| Average Effective Maturity (m) | | | 6.4 yrs. | |
| (a) | For all securities other than those specifically described below, ratings are assigned to underlying securities utilizing ratings from Moody’s, Fitch, and Standard & Poor’s rating agencies and applying the following hierarchy: If all three agencies provide a rating, the middle rating (after dropping the highest and lowest ratings) is assigned; if two of the three agencies rate a security, the lower of the two is assigned. Ratings are shown in the S&P and Fitch scale (e.g., AAA). Securities rated BBB or higher are considered investment grade. All ratings are subject to change. Not Rated includes fixed income securities and fixed income derivatives, which have not been rated by any rating agency.Non-Fixed Income includes equity securities (including convertible bonds and equity derivatives) and/orcommodity-linked derivatives. The fund may or may not have held all of these instruments on this date. The fund is not rated by these agencies. |
| (d) | Duration is a measure of how much a bond’s price is likely to fluctuate with general changes in interest rates, e.g., if rates rise 1.00%, a bond with a5-year duration is likely to lose about 5.00% of its value due to the interest rate move. |
| (i) | For purposes of this presentation, the components include the value of securities, and reflect the impact of the equivalent exposure of derivative positions, if any. These amounts may be negative from time to time. Equivalent exposure is a calculated amount that translates the derivative position into a reasonable approximation of the amount of the underlying asset that the portfolio would have to hold at a given point in time to have the same price sensitivity that results from the portfolio’s ownership of the derivative contract. When dealing with derivatives, equivalent exposure is a more representative measure of the potential impact of a position on portfolio performance than value. The bond component will include any accrued interest amounts. |
2
Portfolio Composition – continued
| (m) | In determining each instrument’s effective maturity for purposes of calculating the fund’s dollar-weighted average effective maturity, MFS uses the instrument’s stated maturity or, if applicable, an earlier date on which MFS believes it is probable that a maturity-shortening device (such as a put,pre-refunding or prepayment) will cause the instrument to be repaid. Such an earlier date can be substantially shorter than the instrument’s stated maturity. |
Where the fund holds convertible bonds, they are treated as part of the equity portion of the portfolio.
Cash & Cash Equivalents includes any cash, investments in money market funds, short-term securities, and other assets less liabilities. Please see the Statement of Assets and Liabilities for additional information related to the fund’s cash position and other assets and liabilities.
Other includes equivalent exposure from currency derivatives and/or any offsets to derivative positions.
Percentages are based on net assets as of January 31, 2019.
The portfolio is actively managed and current holdings may be different.
3
MANAGEMENT REVIEW
Summary of Results
For the twelve months ended January 31, 2019, shares of the MFS High Yield Pooled Portfolio (“fund”) provided a total return of 1.86%, at net asset value. This compares with a return of 1.73% for the fund’s benchmark, the Bloomberg Barclays U.S.High-Yield Corporate Bond 2% Issuer Capped Index.
Market Environment
The global economy decelerated during the reporting period, led by weakness in China and Europe as business and investor sentiment was undermined by growing trade frictions. Slower growth, along with tighter financial conditions, contributed to an uptick in market volatility late in the period. Equity valuations fell and credit spreads widened, fueled in part by concerns that the US Federal Reserve was on course to further tighten monetary policy after it lifted rates for a fourth time during the period and indicated its intention to hike several more times while allowing its balance sheet to run off at its predetermined pace.
The market’s negative reaction to these policy signals prompted the Fed to reverse course at the end of the period and indicated that its policy was on hold as inflation pressures abated. The Fed also indicated that it will maintain a larger balance sheet than it had previously. These dovish shifts helped equity valuations rebound, reduced volatility and narrowed credit spreads. Central banks globally are tilting more dovish as well, with China lowering reserve requirements, The Bank of Canada and Bank of England holding rates steady and the European Central Bank acknowledging that it may not be able to hike rates in the fall of 2019 as it had earlier projected.
Emerging markets experienced considerable volatility during the period as tighter global financial conditions exposed structural weakness in some countries. Those pressures were somewhat relieved at the end of the period as the Fed adopted its more dovish posture. However, slowing global growth and ongoing trade frictions remained concerns.
From a geopolitical perspective, a fractious Eurosceptic Italian coalition government, large-scale protests in France over stagnant wages and news that Germany’s Angela Merkel will not seek another term as chancellor were sources of uncertainty in Europe. In emerging markets, new Brazilian president Jair Bolsanaro took office, with markets generally encouraged by his market-friendly agenda. In contrast, markets were nervous about the less-market-friendly approach of Mexico’s new president Andres Manuel Lopez Obrador. For much of the period, the contentiousUS-China trading relationship was a drag on global sentiment, although tentative signs of progress toward resolution helped steady markets late in the period. Concerns persisted about slowing Chinese economic activity.
Contributors to Performance
Relative to the Bloomberg Barclays U.S. High-Yield Corporate Bond 2% Issuer Capped Index, the fund’s underweight exposure to “CCC”-rated (r) securities, most notably within theenergy sector, contributed to performance. Additionally, the fund’s yield curve (y) positioning benefited relative performance as short-term interest rates generally
4
Management Review – continued
increased more than rates in the middle of the yield curve throughout the reporting period. A longer duration (d) stance also helped relative results as yields tightened during the reporting period.
Top individual contributors for the reporting period included the fund’s underweight exposure to wireless service providerSprint Nextel (communications), and overweight exposures to industrial and specialty chemicals distributor Univar USA(basic industry)and aircraft leasing company Park Aerospace Holdings(finance).
Detractors from Performance
During the reporting period, the fund’s security selection within “B” rated securities, particularly within thecommunicationsand energysectors, detracted from relative performance.
Top individual detractors during the reporting period included the fund’s overweight exposures to independent exploration and production companies Alta Mesa Holdings(energy)and Sanchez Energy(energy) and mobile telecommunication services provider Digicel Group (communications).
Respectfully,
Portfolio Manager(s)
David Cole and Michael Skatrud
| (d) | Duration is a measure of how much a bond’s price is likely to fluctuate with general changes in interest rates, e.g., if rates rise 1.00%, a bond with a5-year duration is likely to lose about 5.00% of its value. |
| (r) | Bonds rated “BBB”, “Baa”, or higher are considered investment grade; bonds rated “BB”, “Ba”, or below are considerednon-investment grade. The source for bond quality ratings is Moody’s Investors Service, Standard & Poor’s and Fitch, Inc. and are applied using the following hierarchy: If all three agencies provide a rating, the middle rating (after dropping the highest and lowest ratings) is assigned; if two of the three agencies rate a security, the lower of the two is assigned. Ratings are shown in the S&P and Fitch scale (e.g., AAA). For securities which are not rated by any of the three agencies, the security is considered Not Rated. |
| (y) | A yield curve graphically depicts the yields of different maturity bonds of the same credit quality and type; a normal yield curve is upward sloping, with short-term rates lower than long-term rates. |
Note to Shareholders: Effective March 1, 2018, Michael Skatrud became a Portfolio Manager of the Fund. Effective September 1, 2018, William Adams is no longer a Portfolio Manager of the Fund.
The views expressed in this report are those of the portfolio manager(s) only through the end of the period of the report as stated on the cover and do not necessarily reflect the views of MFS or any other person in the MFS organization. These views are subject to change at any time based on market or other conditions, and MFS disclaims any responsibility to update such views. These views may not be relied upon as investment advice or an indication of trading intent on behalf of any MFS portfolio. References to specific securities are not recommendations of such securities, and may not be representative of any MFS portfolio’s current or future investments.
5
PERFORMANCE SUMMARYTHROUGH 1/31/19
The following chart illustrates the fund’s historical performance in comparison to its benchmark(s). Performance results reflect the percentage change in net asset value, including reinvestment of dividends and capital gains distributions. Benchmarks are unmanaged and may not be invested in directly. Benchmark returns do not reflect sales charges, commissions or expenses. (See Notes to Performance Summary.)
Performance data shown represents past performance and is no guarantee of future results. Investment return and principal value fluctuate so your shares, when sold, may be worth more or less than the original cost; current performance may be lower or higher than quoted. The performance shown does not reflect the deduction of taxes, if any, that a shareholder would pay on fund distributions or the redemption of fund shares.
Growth of a Hypothetical $10,000 Investment (t)
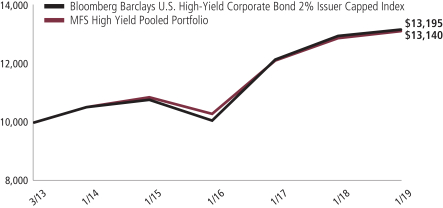
Total Returns through 1/31/19
Average annual without sales charge
| | | | | | | | | | | | |
| | | Fund Inception Date | | | | 1-yr | | 5-yr | | Life (t) | | |
| | | 3/25/13 | | | | 1.86% | | 4.54% | | 4.77% | | |
| | | | |
| Comparative benchmark(s) | | | | | | | | |
| | | Bloomberg Barclays U.S. High-Yield Corporate Bond 2% Issuer Capped
Index (f) | | 1.73% | | 4.61% | | 4.84% | | |
| (f) | Source: FactSet Research Systems Inc. |
| (t) | For the period from the fund inception date through the stated period end. (See Notes to Performance Summary.) |
Benchmark Definition(s)
Bloomberg Barclays U.S. High-Yield Corporate Bond 2% Issuer Capped Index – a component of the Bloomberg Barclays U.S. High-Yield Corporate Bond Index, which measures performance of non-investment grade, fixed rate debt. The index limits the maximum exposure to any one issuer to 2%.
6
Performance Summary – continued
It is not possible to invest directly in an index.
Notes to Performance Summary
Average annual total return represents the average annual change in value for the fund for the periods presented. Life returns are presented where the fund has less than 10 years of performance history and represent the average annual total return from the fund inception date to the stated period end date.
Performance results reflect any applicable expense subsidies and waivers in effect during the periods shown. Without such subsidies and waivers the fund’s performance results would be less favorable. Please see the prospectus and financial statements for complete details.
Performance results do not include adjustments made for financial reporting purposes in accordance with U.S. generally accepted accounting principles and may differ from amounts reported in the financial highlights.
From time to time the fund may receive proceeds from litigation settlements, without which performance would be lower.
7
EXPENSE TABLE
Fund expenses borne by the shareholders during the period, August 1, 2018 through January 31, 2019
As a shareholder of the fund, you incur ongoing costs, including fund expenses. This example is intended to help you understand your ongoing costs (in dollars) of investing in the fund and to compare these costs with the ongoing costs of investing in other mutual funds.
The example is based on an investment of $1,000 invested at the beginning of the period and held for the entire period August 1, 2018 through January 31, 2019.
Actual Expenses
The first line of the following table provides information about actual account values and actual expenses. You may use the information in this line, together with the amount you invested, to estimate the expenses that you paid over the period. Simply divide your account value by $1,000 (for example, an $8,600 account value divided by $1,000 = 8.6), then multiply the result by the number in the first line under the heading entitled “Expenses Paid During Period” to estimate the expenses you paid on your account during this period.
Hypothetical Example for Comparison Purposes
The second line of the following table provides information about hypothetical account values and hypothetical expenses based on the fund’s actual expense ratio and an assumed rate of return of 5% per year before expenses, which is not the fund’s actual return. The hypothetical account values and expenses may not be used to estimate the actual ending account balance or expenses you paid for the period. You may use this information to compare the ongoing costs of investing in the fund and other funds. To do so, compare this 5% hypothetical example with the 5% hypothetical examples that appear in the shareholder reports of the other funds.
Please note that the expenses shown in the table are meant to highlight your ongoing costs only and do not reflect any transactional costs, such as sales charges (loads). Therefore, the second line of the table is useful in comparing ongoing costs only, and will not help you determine the relative total costs of owning different funds. In addition, if these transactional costs were included, your costs would have been higher.
| | | | | | | | | | | | | | | | |
| | | Annualized Expense Ratio | | | Beginning
Account Value
8/01/18 | | | Ending Account Value
1/31/19 | | | Expenses Paid During
Period (p) 8/01/18-1/31/19 | |
| Actual | | | 0.02% | | | | $1,000.00 | | | | $1,017.76 | | | | $0.10 | |
| Hypothetical (h) | | | 0.02% | | | | $1,000.00 | | | | $1,025.10 | | | | $0.10 | |
| (h) | 5% fund return per year before expenses. |
| (p) | “Expenses Paid During Period” are equal to the fund’s annualized expense ratio, as shown above, multiplied by the average account value over the period, multiplied by 184/365 (to reflect theone-half year period). |
8
PORTFOLIO OF INVESTMENTS
1/31/19
The Portfolio of Investments is a complete list of all securities owned by your fund. It is categorized by broad-based asset classes.
| | | | | | | | |
| Bonds - 94.3% | | | | | | | | |
| | |
| Issuer | | Shares/Par | | | Value ($) | |
| Aerospace - 0.9% | | | | | | | | |
| Bombardier, Inc., 7.5%, 3/15/2025 (n) | | $ | 1,415,000 | | | $ | 1,363,706 | |
| TransDigm, Inc., 6.5%, 7/15/2024 | | | 2,385,000 | | | | 2,352,206 | |
| TransDigm, Inc., 6.25%, 3/15/2026 (z) | | | 2,427,000 | | | | 2,463,405 | |
| TransDigm, Inc., 6.375%, 6/15/2026 | | | 1,255,000 | | | | 1,207,938 | |
| | | | | | | | |
| | | | | | | $ | 7,387,255 | |
| Automotive - 1.4% | | | | | | | | |
| Allison Transmission, Inc., 5%, 10/01/2024 (n) | | $ | 6,764,000 | | | $ | 6,654,085 | |
| IHO Verwaltungs GmbH, 4.75%, (4.75% cash or 5.5% PIK) 9/15/2026 (n)(p) | | | 3,815,000 | | | | 3,452,575 | |
| Jaguar Land Rover Automotive PLC, 4.5%, 10/01/2027 (n) | | | 1,025,000 | | | | 758,500 | |
| | | | | | | | |
| | | | | | | $ | 10,865,160 | |
| Broadcasting - 2.9% | | | | | | | | |
| Liberty Media Corp. - Liberty Formula One, 8.5%, 7/15/2029 | | $ | 3,210,000 | | | $ | 3,258,150 | |
| Liberty Media Corp. - Liberty Formula One, 8.25%, 2/01/2030 | | | 935,000 | | | | 946,688 | |
| Match Group, Inc., 6.375%, 6/01/2024 | | | 3,480,000 | | | | 3,636,600 | |
| Netflix, Inc., 5.875%, 2/15/2025 | | | 2,090,000 | | | | 2,165,135 | |
| Netflix, Inc., 4.875%, 4/15/2028 | | | 1,220,000 | | | | 1,160,525 | |
| Netflix, Inc., 5.875%, 11/15/2028 (n) | | | 4,565,000 | | | | 4,627,769 | |
| Netflix, Inc., 4.625%, 5/15/2029 (n) | | EUR | 1,485,000 | | | | 1,712,479 | |
| WMG Acquisition Corp., 5%, 8/01/2023 (n) | | $ | 1,045,000 | | | | 1,037,162 | |
| WMG Acquisition Corp., 4.875%, 11/01/2024 (n) | | | 3,210,000 | | | | 3,145,800 | |
| WMG Acquisition Corp., 5.5%, 4/15/2026 (n) | | | 815,000 | | | | 804,813 | |
| | | | | | | | |
| | | | | | | $ | 22,495,121 | |
| Building - 4.4% | | | | | | | | |
| ABC Supply Co., Inc., 5.75%, 12/15/2023 (n) | | $ | 3,935,000 | | | $ | 4,043,212 | |
| ABC Supply Co., Inc., 5.875%, 5/15/2026 (n) | | | 2,685,000 | | | | 2,690,773 | |
| Beacon Escrow Corp., 4.875%, 11/01/2025 (n) | | | 3,625,000 | | | | 3,375,781 | |
| Core & Main LP, 6.125%, 8/15/2025 (z) | | | 1,345,000 | | | | 1,281,113 | |
| James Hardie International Finance Ltd., 4.75%, 1/15/2025 (n) | | | 445,000 | | | | 422,750 | |
| James Hardie International Finance Ltd., 5%, 1/15/2028 (n) | | | 2,905,000 | | | | 2,614,500 | |
| NCI Building Systems, Inc., 8%, 4/15/2026 (n) | | | 1,420,000 | | | | 1,343,675 | |
| New Enterprise Stone & Lime Co., Inc., 10.125%, 4/01/2022 (n) | | | 2,880,000 | | | | 2,880,000 | |
| New Enterprise Stone & Lime Co., Inc., 6.25%, 3/15/2026 (n) | | | 2,709,000 | | | | 2,587,095 | |
| PriSo Acquisition Corp., 9%, 5/15/2023 (n) | | | 1,653,000 | | | | 1,653,000 | |
| Standard Industries, Inc., 5.375%, 11/15/2024 (n) | | | 2,080,000 | | | | 2,064,400 | |
| Standard Industries, Inc., 6%, 10/15/2025 (n) | | | 4,735,000 | | | | 4,758,675 | |
| Summit Materials LLC/Summit Materials Finance Co., 6.125%, 7/15/2023 | | | 3,690,000 | | | | 3,716,568 | |
9
Portfolio of Investments – continued
| | | | | | | | |
| | |
| Issuer | | Shares/Par | | | Value ($) | |
| Bonds - continued | | | | | | | | |
| Building - continued | | | | | | | | |
| Summit Materials LLC/Summit Materials Finance Co., 5.125%, 6/01/2025 (n) | | $ | 935,000 | | | $ | 877,731 | |
| | | | | | | | |
| | | | | | | $ | 34,309,273 | |
| Business Services - 4.2% | | | | | | | | |
| Alliance Data Systems Corp., 5.875%, 11/01/2021 (n) | | $ | 1,170,000 | | | $ | 1,178,775 | |
| CDK Global, Inc., 4.875%, 6/01/2027 | | | 4,485,000 | | | | 4,350,450 | |
| Equinix, Inc., 5.375%, 4/01/2023 | | | 1,955,000 | | | | 1,976,994 | |
| Equinix, Inc., 5.75%, 1/01/2025 | | | 1,540,000 | | | | 1,590,050 | |
| Equinix, Inc., 5.875%, 1/15/2026 | | | 2,470,000 | | | | 2,551,016 | |
| Financial & Risk U.S. Holdings, Inc., 8.25%, 11/15/2026 (n) | | | 3,445,000 | | | | 3,229,687 | |
| First Data Corp., 5%, 1/15/2024 (n) | | | 6,405,000 | | | | 6,545,109 | |
| MSCI, Inc., 4.75%, 8/01/2026 (n) | | | 3,400,000 | | | | 3,387,250 | |
| Travelport Worldwide Ltd., 6%, 3/15/2026 (n) | | | 1,975,000 | | | | 2,042,881 | |
| Vantiv LLC/Vantiv Issuer Corp., 4.375%, 11/15/2025 (n) | | | 4,060,000 | | | | 3,897,519 | |
| Verscend Escrow Corp., 9.75%, 8/15/2026 (n) | | | 2,140,000 | | | | 2,154,552 | |
| | | | | | | | |
| | | | | | | $ | 32,904,283 | |
| Cable TV - 8.6% | | | | | | | | |
| Altice Financing S.A., 6.625%, 2/15/2023 (n) | | $ | 1,575,000 | | | $ | 1,583,347 | |
| Altice Financing S.A., 7.5%, 5/15/2026 (n) | | | 750,000 | | | | 710,625 | |
| CCO Holdings LLC/CCO Holdings Capital Corp., 5.75%, 1/15/2024 | | | 5,290,000 | | | | 5,395,800 | |
| CCO Holdings LLC/CCO Holdings Capital Corp., 5.375%, 5/01/2025 (n) | | | 1,325,000 | | | | 1,332,023 | |
| CCO Holdings LLC/CCO Holdings Capital Corp., 5.75%, 2/15/2026 (n) | | | 6,560,000 | | | | 6,658,400 | |
| CCO Holdings LLC/CCO Holdings Capital Corp., 5.875%, 5/01/2027 (n) | | | 3,755,000 | | | | 3,765,514 | |
| CSC Holdings LLC, 5.5%, 5/15/2026 (n) | | | 2,635,000 | | | | 2,608,650 | |
| CSC Holdings LLC, 5.5%, 4/15/2027 (n) | | | 6,985,000 | | | | 6,827,698 | |
| CSC Holdings LLC, 7.5%, 4/01/2028 (n) | | | 2,030,000 | | | | 2,085,825 | |
| DISH DBS Corp., 5.875%, 11/15/2024 | | | 975,000 | | | | 808,031 | |
| Intelsat Connect Finance, 9.5%, 2/15/2023 (n) | | | 1,245,000 | | | | 1,164,075 | |
| Intelsat Jackson Holdings S.A., 5.5%, 8/01/2023 | | | 3,795,000 | | | | 3,453,450 | |
| Sirius XM Radio, Inc., 4.625%, 5/15/2023 (n) | | | 1,745,000 | | | | 1,742,819 | |
| Sirius XM Radio, Inc., 6%, 7/15/2024 (n) | | | 4,055,000 | | | | 4,212,131 | |
| Sirius XM Radio, Inc., 5.375%, 4/15/2025 (n) | | | 1,600,000 | | | | 1,620,000 | |
| Telenet Finance Luxembourg S.A., 5.5%, 3/01/2028 (n) | | | 5,400,000 | | | | 5,103,000 | |
| Unitymedia KabelBW GmbH, 6.125%, 1/15/2025 (n) | | | 3,970,000 | | | | 4,099,025 | |
| Videotron Ltd., 5.375%, 6/15/2024 (n) | | | 930,000 | | | | 971,292 | |
| Videotron Ltd., 5.125%, 4/15/2027 (n) | | | 5,200,000 | | | | 5,213,000 | |
| Virgin Media Finance PLC, 5.75%, 1/15/2025 (n) | | | 830,000 | | | | 817,865 | |
| Virgin Media Secured Finance PLC, 5.25%, 1/15/2026 (n) | | | 3,560,000 | | | | 3,506,600 | |
| Ziggo Bond Finance B.V., 5.875%, 1/15/2025 (n) | | | 4,240,000 | | | | 3,975,000 | |
| | | | | | | | |
| | | | | | | $ | 67,654,170 | |
10
Portfolio of Investments – continued
| | | | | | | | |
| | |
| Issuer | | Shares/Par | | | Value ($) | |
| Bonds - continued | | | | | | | | |
| Chemicals - 2.9% | | | | | | | | |
| Axalta Coating Systems Co., 4.875%, 8/15/2024 (n) | | $ | 4,495,000 | | | $ | 4,388,244 | |
| Consolidated Energy Finance S.A., 6.875%, 6/15/2025 (n) | | | 2,628,000 | | | | 2,588,580 | |
| OCI N.V., 6.625%, 4/15/2023 (n) | | | 4,450,000 | | | | 4,572,375 | |
| PolyOne Corp., 5.25%, 3/15/2023 | | | 3,455,000 | | | | 3,472,275 | |
| SPCM S.A., 4.875%, 9/15/2025 (n) | | | 4,965,000 | | | | 4,667,100 | |
| Starfruit U.S. Holding Co. LLC/Starfruit Finance B.V. , 6.5%, 10/01/2026 (n) | | EUR | 2,205,000 | | | | 2,431,470 | |
| Starfruit U.S. Holding Co. LLC/Starfruit Finance B.V. , 6.5%, 10/01/2026 | | | 375,000 | | | | 413,515 | |
| | | | | | | | |
| | | | | | | $ | 22,533,559 | |
| Computer Software - 0.6% | | | | | | | | |
| Diamond 1 Finance Corp./Diamond 2 Finance Corp., 5.875%, 6/15/2021 (n) | | $ | 2,965,000 | | | $ | 3,013,363 | |
| Diamond 1 Finance Corp./Diamond 2 Finance Corp., 6.02%, 6/15/2026 (n) | | | 1,670,000 | | | | 1,746,757 | |
| | | | | | | | |
| | | | | | | $ | 4,760,120 | |
| Computer Software - Systems - 1.7% | | | | | | | | |
| CDW LLC/CDW Finance Corp., 5.5%, 12/01/2024 | | $ | 815,000 | | | $ | 843,118 | |
| CDW LLC/CDW Finance Corp., 5%, 9/01/2025 | | | 1,215,000 | | | | 1,205,887 | |
| Fair Isaac Corp., 5.25%, 5/15/2026 (n) | | | 4,095,000 | | | | 4,115,475 | |
| JDA Software Group, Inc., 7.375%, 10/15/2024 (n) | | | 2,400,000 | | | | 2,442,000 | |
| Sabre GLBL, Inc., 5.375%, 4/15/2023 (n) | | | 5,035,000 | | | | 5,097,937 | |
| | | | | | | | |
| | | | | | | $ | 13,704,417 | |
| Conglomerates - 3.9% | | | | | | | | |
| Amsted Industries Co., 5%, 3/15/2022 (n) | | $ | 5,085,000 | | | $ | 5,034,150 | |
| BWX Technologies, Inc., 5.375%, 7/15/2026 (n) | | | 3,590,000 | | | | 3,625,900 | |
| CFX Escrow Corp., 6%, 2/15/2024 (z) | | | 705,000 | | | | 705,000 | |
| CFX Escrow Corp., 6.375%, 2/15/2026 (z) | | | 455,000 | | | | 455,000 | |
| EnerSys, 5%, 4/30/2023 (n) | | | 6,335,000 | | | | 6,287,488 | |
| Entegris, Inc., 4.625%, 2/10/2026 (n) | | | 5,115,000 | | | | 4,961,550 | |
| Gates Global LLC, 6%, 7/15/2022 (n) | | | 1,927,000 | | | | 1,937,213 | |
| Stevens Holding Co., Inc., 6.125%, 10/01/2026 (n) | | | 3,335,000 | | | | 3,369,617 | |
| TriMas Corp., 4.875%, 10/15/2025 (n) | | | 4,345,000 | | | | 4,214,650 | |
| | | | | | | | |
| | | | | | | $ | 30,590,568 | |
| Construction - 1.1% | | | | | | | | |
| Empresas ICA S.A.B. de C.V., 8.875%, 5/29/2024 (a)(d)(n) | | $ | 1,723,000 | | | $ | 271,372 | |
| Empresas ICA S.A.B. de C.V., 8.9%, 2/04/2021 (a)(d) | | | 1,320,000 | | | | 207,900 | |
| Mattamy Group Corp., 6.5%, 10/01/2025 (n) | | | 4,150,000 | | | | 3,849,125 | |
| Toll Brothers Finance Corp., 4.875%, 11/15/2025 | | | 1,370,000 | | | | 1,332,325 | |
| Toll Brothers Finance Corp., 4.35%, 2/15/2028 | | | 3,355,000 | | | | 3,053,050 | |
| | | | | | | | |
| | | | | | | $ | 8,713,772 | |
11
Portfolio of Investments – continued
| | | | | | | | |
| | |
| Issuer | | Shares/Par | | | Value ($) | |
| Bonds - continued | | | | | | | | |
| Consumer Products - 0.7% | | | | | | | | |
| Coty, Inc., 6.5%, 4/15/2026 (n) | | $ | 1,905,000 | | | $ | 1,714,500 | |
| Energizer Holdings, Inc., 6.375%, 7/15/2026 (n) | | | 3,325,000 | | | | 3,233,563 | |
| Energizer Holdings, Inc., 7.75%, 1/15/2027 (z) | | | 240,000 | | | | 247,284 | |
| | | | | | | | |
| | | | | | | $ | 5,195,347 | |
| Consumer Services - 1.9% | | | | | | | | |
| Cimpress N.V., 7%, 6/15/2026 (n) | | $ | 2,920,000 | | | $ | 2,847,000 | |
| Frontdoor, Inc., 6.75%, 8/15/2026 (n) | | | 2,805,000 | | | | 2,783,962 | |
| Matthews International Corp., 5.25%, 12/01/2025 (n) | | | 2,900,000 | | | | 2,733,250 | |
| NVA Holdings, Inc., 6.875%, 4/01/2026 (n) | | | 2,885,000 | | | | 2,754,310 | |
| ServiceMaster Co. LLC, 5.125%, 11/15/2024 (n) | | | 3,805,000 | | | | 3,719,387 | |
| | | | | | | | |
| | | | | | | $ | 14,837,909 | |
| Containers - 4.8% | | | | | | | | |
| ARD Finance S.A., 6.625%, 9/15/2023 | | EUR | 1,055,000 | | | $ | 1,156,232 | |
| ARD Finance S.A., 7.125%, 9/15/2023 | | $ | 2,495,000 | | | | 2,407,675 | |
ARD Securities Finance, 8.75%, (8.75% cash or
8.75% PIK) 1/31/2023 (n)(p) | | | 1,993,562 | | | | 1,659,640 | |
| Berry Global Group, Inc., 5.5%, 5/15/2022 | | | 1,405,000 | | | | 1,414,189 | |
| Berry Global Group, Inc., 6%, 10/15/2022 | | | 2,355,000 | | | | 2,407,987 | |
| BWAY Holding Co., Inc., 7.25%, 4/15/2025 (n) | | | 1,395,000 | | | | 1,286,888 | |
| Crown American LLC, 4.5%, 1/15/2023 | | | 2,872,000 | | | | 2,886,360 | |
| Crown Americas LLC/Crown Americas Capital Corp. V, 4.25%, 9/30/2026 | | | 2,440,000 | | | | 2,318,000 | |
| Crown Americas LLC/Crown Americas Capital Corp. VI, 4.75%, 2/01/2026 | | | 1,675,000 | | | | 1,641,500 | |
| Flex Acquisition Co., Inc., 6.875%, 1/15/2025 (n) | | | 3,030,000 | | | | 2,833,050 | |
| Multi-Color Corp., 6.125%, 12/01/2022 (n) | | | 4,202,000 | | | | 4,233,515 | |
| Reynolds Group, 5.75%, 10/15/2020 | | | 1,599,028 | | | | 1,605,104 | |
| Reynolds Group, 5.125%, 7/15/2023 (n) | | | 2,080,000 | | | | 2,083,848 | |
| Reynolds Group, 7%, 7/15/2024 (n) | | | 775,000 | | | | 792,438 | |
| Sealed Air Corp., 4.875%, 12/01/2022 (n) | | | 3,635,000 | | | | 3,671,350 | |
| Silgan Holdings, Inc., 4.75%, 3/15/2025 | | | 2,825,000 | | | | 2,712,000 | |
| W/S Packaging Group, Inc., 9%, 4/15/2023 (n) | | | 2,615,000 | | | | 2,628,075 | |
| | | | | | | | |
| | | | | | | $ | 37,737,851 | |
| Electrical Equipment - 0.7% | | | | | | | | |
| CommScope Technologies LLC, 5%, 3/15/2027 (n) | | $ | 6,865,000 | | | $ | 5,851,726 | |
| | |
| Electronics - 1.2% | | | | | | | | |
| Qorvo, Inc., 5.5%, 7/15/2026 (n) | | $ | 3,160,000 | | | $ | 3,136,300 | |
| Sensata Technologies B.V., 5.625%, 11/01/2024 (n) | | | 2,185,000 | | | | 2,266,937 | |
| Sensata Technologies B.V., 5%, 10/01/2025 (n) | | | 3,840,000 | | | | 3,859,200 | |
| | | | | | | | |
| | | | | | | $ | 9,262,437 | |
12
Portfolio of Investments – continued
| | | | | | | | |
| | |
| Issuer | | Shares/Par | | | Value ($) | |
| Bonds - continued | | | | | | | | |
| Emerging Market Quasi-Sovereign - 1.0% | | | | | | | | |
| DAE Funding LLC, 5.75%, 11/15/2023 (n) | | $ | 2,485,000 | | | $ | 2,509,850 | |
| DAE Funding LLC, 5%, 8/01/2024 (n) | | | 5,240,000 | | | | 5,150,920 | |
| | | | | | | | |
| | | | | | | $ | 7,660,770 | |
| Energy - Independent - 4.9% | | | | | | | | |
| Alta Mesa Holdings LP/Alta Mesa Finance Services Corp., 7.875%, 12/15/2024 | | $ | 4,180,000 | | | $ | 2,885,454 | |
| Callon Petroleum Co., 6.375%, 7/01/2026 | | | 3,600,000 | | | | 3,609,000 | |
| Carrizo Oil & Gas, Inc., 6.25%, 4/15/2023 | | | 1,640,000 | | | | 1,619,500 | |
| CrownRock LP/CrownRock Finance, Inc., 5.625%, 10/15/2025 (n) | | | 4,575,000 | | | | 4,392,000 | |
| Diamondback Energy, Inc., 5.375%, 5/31/2025 | | | 5,590,000 | | | | 5,725,837 | |
| Gulfport Energy Corp., 6%, 10/15/2024 | | | 2,315,000 | | | | 2,176,100 | |
| Indigo Natural Resources LLC, 6.875%, 2/15/2026 (n) | | | 2,330,000 | | | | 2,038,750 | |
| Magnolia Oil & Gas Operating LLC/Magnolia Oil & Gas Finance Corp., 6%, 8/01/2026 (n) | | | 3,490,000 | | | | 3,455,100 | |
| Oasis Petroleum, Inc., 6.25%, 5/01/2026 (n) | | | 2,900,000 | | | | 2,751,375 | |
| Parsley Energy LLC/Parsley Finance Corp., 5.25%, 8/15/2025 (n) | | | 1,000,000 | | | | 990,000 | |
| Parsley Energy LLC/Parsley Finance Corp., 5.625%, 10/15/2027 (n) | | | 5,350,000 | | | | 5,303,187 | |
| Sanchez Energy Corp., 6.125%, 1/15/2023 | | | 2,180,000 | | | | 381,500 | |
| SM Energy Co., 6.75%, 9/15/2026 | | | 3,510,000 | | | | 3,457,877 | |
| | | | | | | | |
| | | | | | | $ | 38,785,680 | |
| Entertainment - 1.7% | | | | | | | | |
| AMC Entertainment Holdings, Inc., 5.75%, 6/15/2025 | | $ | 1,420,000 | | | $ | 1,309,808 | |
| Constellation Merger Sub, Inc., 8.5%, 9/15/2025 (z) | | | 925,000 | | | | 889,156 | |
| Live Nation Entertainment, Inc., 5.625%, 3/15/2026 (n) | | | 3,655,000 | | | | 3,691,550 | |
| Six Flags Entertainment Corp., 4.875%, 7/31/2024 (n) | | | 7,280,000 | | | | 7,207,200 | |
| | | | | | | | |
| | | | | | | $ | 13,097,714 | |
| Financial Institutions - 1.3% | | | | | | | | |
| Avolon Holdings Funding Ltd., 5.125%, 10/01/2023 | | $ | 1,915,000 | | | $ | 1,944,108 | |
| Park Aerospace Holdings Ltd., 5.5%, 2/15/2024 (n) | | | 6,135,000 | | | | 6,227,025 | |
| Wand Merger Corp., 8.125%, 7/15/2023 (n) | | | 1,695,000 | | | | 1,715,679 | |
| | | | | | | | |
| | | | | | | $ | 9,886,812 | |
| Food & Beverages - 3.4% | | | | | | | | |
| Aramark Services, Inc., 4.75%, 6/01/2026 | | $ | 3,645,000 | | | $ | 3,581,212 | |
| Aramark Services, Inc., 5%, 2/01/2028 (n) | | | 2,040,000 | | | | 1,991,550 | |
| Cott Holdings, Inc., 5.5%, 4/01/2025 (n) | | | 4,820,000 | | | | 4,771,800 | |
| JBS USA LLC/JBS USA Finance, Inc., 6.75%, 2/15/2028 (n) | | | 2,635,000 | | | | 2,694,287 | |
| JBS USA Lux S.A./JBS USA Finance, Inc., 5.875%, 7/15/2024 (n) | | | 1,155,000 | | | | 1,166,550 | |
| Lamb Weston Holdings, Inc., 4.625%, 11/01/2024 (n) | | | 2,295,000 | | | | 2,283,525 | |
| Lamb Weston Holdings, Inc., 4.875%, 11/01/2026 (n) | | | 1,695,000 | | | | 1,680,593 | |
| Pilgrim’s Pride Corp., 5.875%, 9/30/2027 (n) | | | 4,175,000 | | | | 4,028,875 | |
| U.S. Foods Holding Corp., 5.875%, 6/15/2024 (n) | | | 4,275,000 | | | | 4,348,915 | |
| | | | | | | | |
| | | | | | | $ | 26,547,307 | |
13
Portfolio of Investments – continued
| | | | | | | | |
| | |
| Issuer | | Shares/Par | | | Value ($) | |
| Bonds - continued | | | | | | | | |
| Gaming & Lodging - 4.2% | | | | | | | | |
| CCM Merger, Inc., 6%, 3/15/2022 (n) | | $ | 2,945,000 | | | $ | 2,974,450 | |
| GLP Capital LP/GLP Financing II, Inc., 5.375%, 11/01/2023 | | | 1,755,000 | | | | 1,809,826 | |
| GLP Capital LP/GLP Financing II, Inc., 5.25%, 6/01/2025 | | | 2,320,000 | | | | 2,371,110 | |
| GLP Capital LP/GLP Financing II, Inc., 5.375%, 4/15/2026 | | | 680,000 | | | | 694,504 | |
| Hilton Domestic Operating Co., Inc., 5.125%, 5/01/2026 (n) | | | 3,215,000 | | | | 3,239,112 | |
| Hilton Worldwide Finance LLC, 4.625%, 4/01/2025 | | | 4,245,000 | | | | 4,181,325 | |
| Marriot Ownership Resorts, Inc., 5.625%, 4/15/2023 (z) | | | 2,695,000 | | | | 2,654,575 | |
| MGM Resorts International, 6.625%, 12/15/2021 | | | 1,770,000 | | | | 1,869,474 | |
| MGM Resorts International, 6%, 3/15/2023 | | | 1,360,000 | | | | 1,411,000 | |
| MGM Resorts International, 5.75%, 6/15/2025 | | | 3,510,000 | | | | 3,527,550 | |
| Ryman Hospitality Properties, Inc., REIT, 5%, 4/15/2021 | | | 3,265,000 | | | | 3,269,081 | |
| Ryman Hospitality Properties, Inc., REIT, 5%, 4/15/2023 | | | 2,030,000 | | | | 2,037,613 | |
| Wyndham Hotels Group, LLC, 5.375%, 4/15/2026 (n) | | | 3,270,000 | | | | 3,270,000 | |
| | | | | | | | |
| | | | | | | $ | 33,309,620 | |
| Industrial - 0.9% | | | | | | | | |
| Cleaver Brooks, Inc., 7.875%, 3/01/2023 (n) | | $ | 2,695,000 | | | $ | 2,668,050 | |
| KAR Auction Services, Inc., 5.125%, 6/01/2025 (n) | | | 4,575,000 | | | | 4,408,379 | |
| | | | | | | | |
| | | | | | | $ | 7,076,429 | |
| Insurance - Health - 0.8% | | | | | | | | |
| Centene Corp., 6.125%, 2/15/2024 | | $ | 2,190,000 | | | $ | 2,294,025 | |
| Centene Corp., 5.375%, 6/01/2026 (n) | | | 3,795,000 | | | | 3,918,338 | |
| | | | | | | | |
| | | | | | | $ | 6,212,363 | |
| Insurance - Property & Casualty - 0.8% | | | | | | | | |
| AssuredPartners Inc., 7%, 8/15/2025 (n) | | $ | 3,020,000 | | | $ | 2,884,100 | |
| Hub International Ltd., 7%, 5/01/2026 (n) | | | 3,235,000 | | | | 3,137,950 | |
| | | | | | | | |
| | | | | | | $ | 6,022,050 | |
| Machinery & Tools - 0.4% | | | | | | | | |
| Ashtead Capital, Inc., 5.625%, 10/01/2024 (n) | | $ | 3,395,000 | | | $ | 3,479,875 | |
| | |
| Major Banks - 0.5% | | | | | | | | |
UBS Group AG, 6.875% to 8/07/2025, FLR (Swap Rate - 5yr. +
4.59%) to 12/29/2049 | | $ | 3,990,000 | | | $ | 3,995,514 | |
| | |
| Medical & Health Technology & Services - 4.9% | | | | | | | | |
| Acadia Healthcare Co., Inc., 5.625%, 2/15/2023 | | $ | 2,990,000 | | | $ | 2,937,675 | |
| Avantor, Inc., 9%, 10/01/2025 (n) | | | 2,815,000 | | | | 2,899,450 | |
| DaVita, Inc., 5%, 5/01/2025 | | | 1,720,000 | | | | 1,655,500 | |
| Encompass Health Corp., 5.75%, 9/15/2025 | | | 1,000,000 | | | | 1,010,000 | |
| HCA, Inc., 7.5%, 2/15/2022 | | | 2,050,000 | | | | 2,244,750 | |
| HCA, Inc., 5%, 3/15/2024 | | | 3,315,000 | | | | 3,449,257 | |
| HCA, Inc., 5.375%, 2/01/2025 | | | 4,685,000 | | | | 4,835,810 | |
| HCA, Inc., 5.875%, 2/15/2026 | | | 2,775,000 | | | | 2,927,625 | |
14
Portfolio of Investments – continued
| | | | | | | | |
| | |
| Issuer | | Shares/Par | | | Value ($) | |
| Bonds - continued | | | | | | | | |
| Medical & Health Technology & Services - continued | | | | | | | | |
| HealthSouth Corp., 5.125%, 3/15/2023 | | $ | 3,610,000 | | | $ | 3,631,479 | |
| HealthSouth Corp., 5.75%, 11/01/2024 | | | 1,260,000 | | | | 1,274,175 | |
| Heartland Dental, LLC, 8.5%, 5/01/2026 (n) | | | 2,545,000 | | | | 2,379,575 | |
| Polaris, 8.5%, (8.5% cash or 8.5% PIK) 12/01/2022 (n)(p) | | | 1,985,000 | | | | 1,920,488 | |
| Quintiles IMS Holdings, Inc., 5%, 10/15/2026 (n) | | | 1,935,000 | | | | 1,937,419 | |
| Regional Care/LifePoint Health, Inc., 9.75%, 12/01/2026 (n) | | | 3,000,000 | | | | 2,993,400 | |
| West Street Merger Sub, Inc., 6.375%, 9/01/2025 (n) | | | 2,840,000 | | | | 2,570,200 | |
| | | | | | | | |
| | | | | | | $ | 38,666,803 | |
| Medical Equipment - 0.8% | | | | | | | | |
| Teleflex, Inc., 5.25%, 6/15/2024 | | $ | 2,895,000 | | | $ | 2,916,713 | |
| Teleflex, Inc., 4.875%, 6/01/2026 | | | 1,670,000 | | | | 1,677,849 | |
| Teleflex, Inc., 4.625%, 11/15/2027 | | | 2,115,000 | | | | 2,062,125 | |
| | | | | | | | |
| | | | | | | $ | 6,656,687 | |
| Metals & Mining - 4.5% | | | | | | | | |
| Baffinland Iron Mines Corp./Baffinland Iron Mines LP, 8.75%, 7/15/2026 (n) | | $ | 3,095,000 | | | $ | 3,071,787 | |
| Cleveland-Cliffs, Inc., 5.75%, 3/01/2025 | | | 1,125,000 | | | | 1,088,438 | |
| First Quantum Minerals Ltd., 7.25%, 4/01/2023 (n) | | | 1,690,000 | | | | 1,618,192 | |
| Freeport-McMoRan Copper & Gold, Inc., 5.4%, 11/14/2034 | | | 4,305,000 | | | | 3,820,687 | |
| Freeport-McMoRan, Inc., 6.875%, 2/15/2023 | | | 5,657,000 | | | | 5,911,565 | |
| Kaiser Aluminum Corp., 5.875%, 5/15/2024 | | | 4,495,000 | | | | 4,562,425 | |
| Northwest Acquisitions ULC/Dominion Finco, Inc., 7.125%, 11/01/2022 (n) | | | 3,455,000 | | | | 3,441,871 | |
| Novelis Corp., 5.875%, 9/30/2026 (n) | | | 5,045,000 | | | | 4,868,425 | |
| Petra Diamonds U.S. Treasury PLC, 7.25%, 5/01/2022 (n) | | | 3,230,000 | | | | 3,036,200 | |
| Steel Dynamics, Inc., 4.125%, 9/15/2025 | | | 1,635,000 | | | | 1,553,250 | |
| TMS International Corp., 7.25%, 8/15/2025 (n) | | | 2,755,000 | | | | 2,589,700 | |
| | | | | | | | |
| | | | | | | $ | 35,562,540 | |
| Midstream - 5.5% | | | | | | | | |
| Blue Racer Midstream LLC/Blue Racer Finance Corp., 6.125%, 11/15/2022 (n) | | $ | 1,510,000 | | | $ | 1,525,100 | |
| Blue Racer Midstream LLC/Blue Racer Finance Corp., 6.625%, 7/15/2026 (n) | | | 2,900,000 | | | | 2,852,875 | |
| Cheniere Energy, Inc., 5.875%, 3/31/2025 | | | 3,800,000 | | | | 4,003,148 | |
| DCP Midstream Operating LP, 4.95%, 4/01/2022 | | | 1,572,000 | | | | 1,587,720 | |
| DCP Midstream Operating LP, 3.875%, 3/15/2023 | | | 2,845,000 | | | | 2,766,763 | |
| DCP Midstream Operating LP, 5.375%, 7/15/2025 (n) | | | 2,055,000 | | | | 2,096,100 | |
| DCP Midstream Operating LP, 5.6%, 4/01/2044 | | | 1,945,000 | | | | 1,765,088 | |
| Energy Transfer Equity LP, 5.875%, 1/15/2024 | | | 3,965,000 | | | | 4,212,812 | |
| EnLink Midstream Partners LP, 4.4%, 4/01/2024 | | | 4,670,000 | | | | 4,483,200 | |
| Tallgrass Energy Partners LP, 5.5%, 1/15/2028 (n) | | | 6,440,000 | | | | 6,276,746 | |
| Targa Resources Partners LP/Targa Resources Finance Corp., 5.25%, 5/01/2023 | | | 3,185,000 | | | | 3,188,981 | |
15
Portfolio of Investments – continued
| | | | | | | | |
| | |
| Issuer | | Shares/Par | | | Value ($) | |
| Bonds - continued | | | | | | | | |
| Midstream - continued | | | | | | | | |
| Targa Resources Partners LP/Targa Resources Finance Corp., 5.125%, 2/01/2025 (n) | | $ | 2,020,000 | | | $ | 1,984,650 | |
| Targa Resources Partners LP/Targa Resources Finance Corp., 5.375%, 2/01/2027 | | | 6,570,000 | | | | 6,340,050 | |
| | | | | | | | |
| | | | | | | $ | 43,083,233 | |
| Network & Telecom - 0.6% | | | | | | | | |
| Zayo Group LLC/Zayo Capital, Inc., 6.375%, 5/15/2025 | | $ | 1,155,000 | | | $ | 1,127,569 | |
| Zayo Group LLC/Zayo Capital, Inc., 5.75%, 1/15/2027 (n) | | | 3,600,000 | | | | 3,478,284 | |
| | | | | | | | |
| | | | | | | $ | 4,605,853 | |
| Oil Services - 0.9% | | | | | | | | |
| Apergy Corp., 6.375%, 5/01/2026 | | $ | 3,420,000 | | | $ | 3,364,425 | |
| Diamond Offshore Drill Co., 5.7%, 10/15/2039 | | | 3,235,000 | | | | 2,215,975 | |
| Nabors Industries, Inc., 5.75%, 2/01/2025 | | | 1,875,000 | | | | 1,631,250 | |
| | | | | | | | |
| | | | | | | $ | 7,211,650 | |
| Oils - 0.8% | | | | | | | | |
| Parkland Fuel Corp., 6%, 4/01/2026 (n) | | $ | 5,745,000 | | | $ | 5,486,475 | |
| PBF Holding Co. LLC/PBF Finance Corp., 7%, 11/15/2023 | | | 505,000 | | | | 506,111 | |
| | | | | | | | |
| | | | | | | $ | 5,992,586 | |
| Pharmaceuticals - 1.2% | | | | | | | | |
| Endo Finance LLC/Endo Finco, Inc., 5.375%, 1/15/2023 (n) | | $ | 1,175,000 | | | $ | 959,094 | |
| Mallinckrodt International Finance S.A., 5.75%, 8/01/2022 (n) | | | 1,785,000 | | | | 1,619,887 | |
| Valeant Pharmaceuticals International, Inc., 5.5%, 3/01/2023 (n) | | | 2,755,000 | | | | 2,672,350 | |
| Valeant Pharmaceuticals International, Inc., 6.125%, 4/15/2025 (n) | | | 4,470,000 | | | | 4,224,150 | |
| | | | | | | | |
| | | | | | | $ | 9,475,481 | |
| Precious Metals & Minerals - 0.4% | | | | | | | | |
| Teck Resources Ltd., 6%, 8/15/2040 | | $ | 440,000 | | | $ | 441,100 | |
| Teck Resources Ltd., 6.25%, 7/15/2041 | | | 2,845,000 | | | | 2,965,913 | |
| | | | | | | | |
| | | | | | | $ | 3,407,013 | |
| Printing & Publishing - 0.4% | | | | | | | | |
| Nielsen Finance LLC, 5%, 4/15/2022 (n) | | $ | 3,344,000 | | | $ | 3,338,984 | |
| | |
| Real Estate - Healthcare - 0.9% | | | | | | | | |
| MPT Operating Partnership LP/MPT Financial Co., REIT, 5.25%, 8/01/2026 | | $ | 2,265,000 | | | $ | 2,276,325 | |
| MPT Operating Partnership LP/MPT Financial Co., REIT, 5%, 10/15/2027 | | | 5,265,000 | | | | 5,125,478 | |
| | | | | | | | |
| | | | | | | $ | 7,401,803 | |
16
Portfolio of Investments – continued
| | | | | | | | |
| | |
| Issuer | | Shares/Par | | | Value ($) | |
| Bonds - continued | | | | | | | | |
| Real Estate - Other - 0.8% | | | | | | | | |
| CyrusOne LP/CyrusOne Finance Corp., REIT, 5%, 3/15/2024 | | $ | 4,200,000 | | | $ | 4,231,500 | |
| CyrusOne LP/CyrusOne Finance Corp., REIT, 5.375%, 3/15/2027 | | | 2,230,000 | | | | 2,235,575 | |
| | | | | | | | |
| | | | | | | $ | 6,467,075 | |
| Restaurants - 0.7% | | | | | | | | |
| Golden Nugget, Inc., 6.75%, 10/15/2024 (n) | | $ | 1,605,000 | | | $ | 1,605,000 | |
| KFC Holding Co./Pizza Hut Holdings LLC/Taco Bell of America LLC, 5.25%, 6/01/2026 (n) | | | 4,055,000 | | | | 4,105,688 | |
| | | | | | | | |
| | | | | | | $ | 5,710,688 | |
| Retailers - 0.8% | | | | | | | | |
| DriveTime Automotive Group, Inc./DT Acceptance Corp., 8%, 6/01/2021 (n) | | $ | 1,865,000 | | | $ | 1,860,338 | |
| Hanesbrands, Inc., 4.875%, 5/15/2026 (n) | | | 2,975,000 | | | | 2,848,562 | |
| Sally Beauty Holdings, Inc., 5.625%, 12/01/2025 | | | 1,655,000 | | | | 1,612,798 | |
| | | | | | | | |
| | | | | | | $ | 6,321,698 | |
| Specialty Chemicals - 0.6% | | | | | | | | |
| Univar USA, Inc., 6.75%, 7/15/2023 (n) | | $ | 4,890,000 | | | $ | 5,024,475 | |
| | |
| Specialty Stores - 0.3% | | | | | | | | |
| Penske Automotive Group Co., 5.375%, 12/01/2024 | | $ | 690,000 | | | $ | 681,375 | |
| Penske Automotive Group Co., 5.5%, 5/15/2026 | | | 1,755,000 | | | | 1,715,513 | |
| | | | | | | | |
| | | | | | | $ | 2,396,888 | |
| Supermarkets - 0.2% | | | | | | | | |
| Albertsons Cos. LLC/Safeway Co., 6.625%, 6/15/2024 | | $ | 1,615,000 | | | $ | 1,594,813 | |
| | |
| Telecommunications - Wireless - 4.9% | | | | | | | | |
| Altice France S.A., 6.25%, 5/15/2024 (n) | | $ | 1,245,000 | | | $ | 1,220,473 | |
| Altice France S.A., 8.125%, 2/01/2027 (n) | | | 2,505,000 | | | | 2,460,912 | |
| Altice Luxembourg S.A., 7.75%, 5/15/2022 (n) | | | 1,675,000 | | | | 1,624,750 | |
| Altice Luxembourg S.A., 7.625%, 2/15/2025 (n) | | | 3,035,000 | | | | 2,579,750 | |
| Digicel Group Ltd., 6.75%, 3/01/2023 (n) | | | 3,988,000 | | | | 3,258,994 | |
| SBA Communications Corp., 4%, 10/01/2022 | | | 3,990,000 | | | | 3,940,125 | |
| SBA Communications Corp., 4.875%, 9/01/2024 | | | 1,995,000 | | | | 1,997,494 | |
| SFR Group S.A., 7.375%, 5/01/2026 (n) | | | 985,000 | | | | 949,284 | |
| Sprint Corp., 7.875%, 9/15/2023 | | | 2,620,000 | | | | 2,783,750 | |
| Sprint Corp., 7.125%, 6/15/2024 | | | 4,805,000 | | | | 4,916,116 | |
| Sprint Nextel Corp., 6%, 11/15/2022 | | | 4,810,000 | | | | 4,864,112 | |
| T-Mobile USA, Inc., 6.5%, 1/15/2024 | | | 1,765,000 | | | | 1,826,775 | |
| T-Mobile USA, Inc., 5.125%, 4/15/2025 | | | 2,095,000 | | | | 2,115,950 | |
| T-Mobile USA, Inc., 6.5%, 1/15/2026 | | | 2,020,000 | | | | 2,136,150 | |
| T-Mobile USA, Inc., 5.375%, 4/15/2027 | | | 2,115,000 | | | | 2,130,862 | |
| | | | | | | | |
| | | | | | | $ | 38,805,497 | |
17
Portfolio of Investments – continued
| | | | | | | | |
| | |
| Issuer | | Shares/Par | | | Value ($) | |
| Bonds - continued | | | | | | | | |
| Telephone Services - 0.6% | | | | | | | | |
| Level 3 Financing, Inc., 5.375%, 1/15/2024 | | $ | 1,900,000 | | | $ | 1,890,500 | |
| Level 3 Financing, Inc., 5.375%, 5/01/2025 | | | 3,155,000 | | | | 3,115,563 | |
| | | | | | | | |
| | | | | | | $ | 5,006,063 | |
| Transportation - Services - 0.2% | | | | | | | | |
| Navios South American Logistics, Inc., 7.25%, 5/01/2022 | | $ | 1,110,000 | | | $ | 1,037,850 | |
| Syncreon Group BV/Syncre, 8.625%, 11/01/2021 (n) | | | 1,168,000 | | | | 934,400 | |
| | | | | | | | |
| | | | | | | $ | 1,972,250 | |
| Utilities - Electric Power - 2.5% | | | | | | | | |
| Clearway Energy Operating LLC, 5.75%, 10/15/2025 (n) | | $ | 4,505,000 | | | $ | 4,161,494 | |
| Covanta Holding Corp., 5.875%, 3/01/2024 | | | 2,515,000 | | | | 2,508,712 | |
| Covanta Holding Corp., 5.875%, 7/01/2025 | | | 2,235,000 | | | | 2,190,300 | |
| Covanta Holding Corp., 6%, 1/01/2027 | | | 3,280,000 | | | | 3,140,600 | |
| Drax Finco PLC, 6.625%, 11/01/2025 (n) | | | 3,520,000 | | | | 3,502,400 | |
| NextEra Energy Operating Co., 4.25%, 9/15/2024 (n) | | | 4,560,000 | | | | 4,344,768 | |
| TerraForm Global Operating LLC, 6.125%, 3/01/2026 (n) | | | 75,000 | | | | 71,625 | |
| | | | | | | | |
| | | | | | | $ | 19,919,899 | |
| Total Bonds (Identified Cost, $758,248,716) | | | | | | $ | 743,499,081 | |
| | |
| Floating Rate Loans (r) - 0.8% | | | | | | | | |
| Broadcasting - 0.1% | | | | | | | | |
| Warner Music Group, Term Loan F, 4.623%, 11/01/2023 | | $ | 662,000 | | | $ | 646,829 | |
| | |
| Conglomerates - 0.1% | | | | | | | | |
| Gates Global LLC, Term Loan B2, 5.248%, 3/31/2024 | | $ | 786,010 | | | $ | 768,106 | |
| | |
| Entertainment - 0.1% | | | | | | | | |
| Live Nation Entertainment, Inc., Term Loan B3, 4.125%, 10/31/2023 | | $ | 1,017,411 | | | $ | 1,011,477 | |
| | |
| Food & Beverages - 0.1% | | | | | | | | |
| U.S. Foods Holding Corp., Term Loan B, 4.344%, 6/27/2023 | | $ | 660,307 | | | $ | 648,917 | |
| | |
| Medical & Health Technology & Services - 0.3% | | | | | | | | |
| DaVita Healthcare Partners, Inc., Term Loan B, 5.248%, 6/24/2021 | | $ | 2,272,740 | | | $ | 2,267,058 | |
| | |
| Oil Services - 0.1% | | | | | | | | |
| Apergy Corp., Term Loan B, 5.162%, 5/09/2025 | | $ | 955,443 | | | $ | 933,348 | |
| Total Floating Rate Loans (Identified Cost, $6,253,161) | | | | | | $ | 6,275,735 | |
| | |
| Common Stocks - 0.4% | | | | | | | | |
| Oil Services - 0.4% | | | | | | | | |
| LTRI Holdings LP (a)(u) (Identified Cost, $1,188,000) | | | 3,300 | | | $ | 2,935,086 | |
18
Portfolio of Investments - continued
| | | | | | | | |
| Convertible Bonds - 0.1% | | | | | | | | |
| | |
| Issuer | | Shares/Par | | | Value ($) | |
| Cable TV - 0.1% | | | | | | | | |
DISH Network Corp., 3.375%, 8/15/2026
(Identified Cost, $1,064,116) | | $ | 1,180,000 | | | $ | 1,002,410 | |
| | | | | | | | | | | | | | | | |
| | | | |
| | | Strike Price | | | First Exercise | | | | | | | |
| Warrants - 0.0% | | | | | | | | | | | | | | | | |
| Forest & Paper Products - 0.0% | | | | | | | | | |
| Appvion Holdings Corp. - Tranche A (1 share for 1 warrant) (a) | | $ | 27.17 | | | | 8/24/18 | | | | 2,021 | | | $ | 2,021 | |
Appvion Holdings Corp. - Tranche B (1 share for 1 warrant) (a) | | | 31.25 | | | | 8/24/18 | | | | 2,021 | | | | 1,010 | |
| Total Warrants (Identified Cost, $0) | | | | | | | $ | 3,031 | |
| | | | | | | | |
| | |
| Investment Companies (h) - 3.8% | | | | | | | | |
| Money Market Funds - 3.8% | | | | | | | | |
| MFS Institutional Money Market Portfolio, 2.47% (v) (Identified Cost, $29,838,451) | | | 29,841,435 | | | $ | 29,838,451 | |
| | |
| Other Assets, Less Liabilities - 0.6% | | | | | | | 4,883,184 | |
| Net Assets - 100.0% | | | | | | $ | 788,436,978 | |
| (a) | Non-income producing security. |
| (h) | An affiliated issuer, which may be considered one in which the fund owns 5% or more of the outstanding voting securities, or a company which is under common control. At period end, the aggregate values of the fund’s investments in affiliated issuers and in unaffiliated issuers were $29,838,451 and $753,715,343, respectively. |
| (n) | Securities exempt from registration under Rule 144A of the Securities Act of 1933. These securities may be sold in the ordinary course of business in transactions exempt from registration, normally to qualified institutional buyers. At period end, the aggregate value of these securities was $464,777,748, representing 58.9% of net assets. |
| (p) | Payment-in-kind (PIK) security for which interest income may be received in additional securities and/or cash. |
| (r) | The remaining maturities of floating rate loans may be less than the stated maturities shown as a result of contractual or optional prepayments by the borrower. Such prepayments cannot be predicted with certainty. These loans may be subject to restrictions on resale. The interest rate shown represents the weighted average of the floating interest rates on settled contracts within the loan facility at period end, unless otherwise indicated. The floating interest rates on settled contracts are determined periodically by reference to a base lending rate and a spread. |
| (u) | The security was valued using significant unobservable inputs and is considered level 3 under the fair value hierarchy. For further information about the fund’s level 3 holdings, please see Note 2 in the Notes to Financial Statements. |
| (v) | Affiliated issuer that is available only to investment companies managed by MFS. The rate quoted for the MFS Institutional Money Market Portfolio is the annualizedseven-day yield of the fund at period end. |
19
Portfolio of Investments – continued
| (z) | Restricted securities are not registered under the Securities Act of 1933 and are subject to legal restrictions on resale. These securities generally may be resold in transactions exempt from registration or to the public if the securities are subsequently registered. Disposal of these securities may involve time-consuming negotiations and prompt sale at an acceptable price may be difficult. The fund holds the following restricted securities: |
| | | | | | | | | | |
| Restricted Securities | | Acquistion
Date | | Cost | | | Value | |
| CFX Escrow Corp., 6%, 2/15/2024 | | 1/31/19 | | | $705,000 | | | | $705,000 | |
| CFX Escrow Corp., 6.375%, 2/15/2026 | | 1/31/19 | | | 455,000 | | | | 455,000 | |
| Constellation Merger Sub, Inc., 8.5%, 9/15/2025 | | 1/29/19-1/30/19 | | | 888,640 | | | | 889,156 | |
| Core & Main LP, 6.125%, 8/15/2025 | | 1/04/19-1/25/19 | | | 1,259,523 | | | | 1,281,113 | |
| Energizer Holdings, Inc., 7.75%, 1/15/2027 | | 1/17/19 | | | 240,000 | | | | 247,284 | |
| Marriot Ownership Resorts, Inc., 5.625%, 4/15/2023 | | 4/02/15-12/17/15 | | | 2,691,880 | | | | 2,654,575 | |
| TransDigm, Inc., 6.25%, 3/15/2026 | | 1/30/19 | | | 2,427,000 | | | | 2,463,405 | |
| Total Restricted Securities | | | | | | | | | $8,695,533 | |
| % of Net assets | | | | | | | | | 1.1% | |
The following abbreviations are used in this report and are defined:
| FLR | | Floating Rate. Interest rate resets periodically based on the parenthetically disclosed reference rate plus a spread (if any). Theperiod-end rate reported may not be the current rate. All reference rates are USD unless otherwise noted. |
| PLC | | Public Limited Company |
| REIT | | Real Estate Investment Trust |
Abbreviations indicate amounts shown in currencies other than the U.S. dollar. All amounts are stated in U.S. dollars unless otherwise indicated. A list of abbreviations is shown below:
Derivative Contracts at 1/31/19
Forward Foreign Currency Exchange Contracts
| | | | | | | | | | | | | | | | | | |
Currency
Purchased | | | Currency
Sold | | Counterparty | | Settlement
Date | | | Unrealized
Appreciation
(Depreciation) | |
| Asset Derivatives | | | | | | | | | | | | |
| USD | | | 5,642,582 | | | EUR | | 4,877,047 | | Goldman Sachs International | | | 4/12/2019 | | | | $28,050 | |
| USD | | | 405,957 | | | EUR | | 350,429 | | NatWest Markets PLC | | | 4/12/2019 | | | | 2,538 | |
| | | | | | | | | | | | | | | | | | |
| | | | | | | | | | | | | | | | | $30,588 | |
| | | | | | | | | | | | | | | | | | |
20
Portfolio of Investments – continued
Futures Contracts
| | | | | | | | | | | | | | | | | | | | | | |
| Description | | Long/
Short | | | Currency | | | Contracts | | Notional
Amount | | | Expiration
Date | | | Value/
Unrealized
Appreciation
(Depreciation) | |
| Liability Derivatives | | | | | | | | | | | | | | | |
| | | | |
| Interest Rate Futures | | | | | | | | | | | | | | | |
| GermanEuro-Bobl 5 yr | | | Short | | | | EUR | | | 13 | | | $1,977,972 | | | | March - 2019 | | | | $(10,743 | ) |
| U.S. Treasury Note 10 yr | | | Short | | | | USD | | | 110 | | | 13,471,562 | | | | March - 2019 | | | | (381,962 | ) |
| | | | | | | | | | | | | | | | | | | | | | |
| | | | | | | | | | | | | | | | | | | | | $(392,705 | ) |
| | | | | | | | | | | | | | | | | | | | | | |
At January 31, 2019, the fund had cash collateral of $143,744 to cover any collateral or margin obligations for certain derivative contracts. Restricted cash and/or deposits with brokers in the Statement of Assets and Liabilities are comprised of cash collateral.
See Notes to Financial Statements
21
Financial Statements
STATEMENT OF ASSETS AND LIABILITIES
At 1/31/19
This statement represents your fund’s balance sheet, which details the assets and liabilities comprising the total value of the fund.
| | | | |
| Assets | | | | |
Investments in unaffiliated issuers, at value (identified cost, $766,753,993) | | | $753,715,343 | |
Investments in affiliated issuers, at value (identified cost, $29,838,451) | | | 29,838,451 | |
Deposits with brokers for | | | | |
Futures contracts | | | 143,744 | |
Receivables for | | | | |
Forward foreign currency exchange contracts | | | 30,588 | |
Investments sold | | | 510,932 | |
Fund shares sold | | | 236,036 | |
Interest and dividends | | | 11,770,946 | |
Other assets | | | 3,299 | |
Total assets | | | $796,249,339 | |
| |
| Liabilities | | | | |
Payable to custodian | | | $65,510 | |
Payables for | | | | |
Net daily variation margin on open futures contracts | | | 53,063 | |
Investments purchased | | | 7,409,846 | |
Fund shares reacquired | | | 210,291 | |
Payable to affiliates | | | | |
Administrator | | | 94 | |
Shareholder servicing costs | | | 13 | |
Accrued expenses and other liabilities | | | 73,544 | |
Total liabilities | | | $7,812,361 | |
Net assets | | | $788,436,978 | |
| |
| Net assets consist of | | | | |
Paid-in capital | | | $871,449,011 | |
Total distributable earnings (loss) | | | (83,012,033 | ) |
Net assets | | | $788,436,978 | |
Shares of beneficial interest outstanding | | | 88,191,880 | |
Net asset value per share (net assets of $788,436,978 / 88,191,880 shares of beneficial interest outstanding) | | | $8.94 | |
See Notes to Financial Statements
22
Financial Statements
STATEMENT OF OPERATIONS
Year ended 1/31/19
This statement describes how much your fund earned in investment income and accrued in expenses. It also describes any gains and/or losses generated by fund operations.
| | | | |
| Net investment income (loss) | | | | |
Income | | | | |
Interest | | | $53,577,787 | |
Dividends from affiliated issuers | | | 396,975 | |
Other | | | 278,324 | |
Total investment income | | | $54,253,086 | |
Expenses | | | | |
Shareholder servicing costs | | | $46 | |
Administrative services fee | | | 17,500 | |
Custodian fee | | | 60,296 | |
Shareholder communications | | | 5,951 | |
Audit and tax fees | | | 43,516 | |
Legal fees | | | 8,084 | |
Pricing service fees | | | 20,848 | |
Miscellaneous | | | 30,522 | |
Total expenses | | | $186,763 | |
Fees paid indirectly | | | (2,411 | ) |
Net expenses | | | $184,352 | |
Net investment income (loss) | | | $54,068,734 | |
| |
| Realized and unrealized gain (loss) | | | | |
Realized gain (loss) (identified cost basis) | | | | |
Unaffiliated issuers | | | $(16,095,589 | ) |
Affiliated issuers | | | 104 | |
Futures contracts | | | 1,091,612 | |
Forward foreign currency exchange contracts | | | 259,212 | |
Foreign currency | | | (533 | ) |
Net realized gain (loss) | | | $(14,745,194 | ) |
Change in unrealized appreciation or depreciation | | | | |
Unaffiliated issuers | | | $(26,518,416 | ) |
Futures contracts | | | (1,297,981 | ) |
Forward foreign currency exchange contracts | | | 35,198 | |
Translation of assets and liabilities in foreign currencies | | | 431 | |
Net unrealized gain (loss) | | | $(27,780,768 | ) |
Net realized and unrealized gain (loss) | | | $(42,525,962 | ) |
Change in net assets from operations | | | $11,542,772 | |
See Notes to Financial Statements
23
Financial Statements
STATEMENTS OF CHANGES IN NET ASSETS
These statements describe the increases and/or decreases in net assets resulting from operations, any distributions, and any shareholder transactions.
| | | | | | | | |
| | | Year ended | |
| | | 1/31/19 | | | 1/31/18 | |
| Change in net assets | | | | | | |
| | |
| From operations | | | | | | | | |
Net investment income (loss) | | | $54,068,734 | | | | $72,887,935 | |
Net realized gain (loss) | | | (14,745,194 | ) | | | 15,418,353 | |
Net unrealized gain (loss) | | | (27,780,768 | ) | | | (6,830,932 | ) |
Change in net assets from operations | | | $11,542,772 | | | | $81,475,356 | |
Total distributions to shareholders (a) | | | $(55,299,759 | ) | | | $(75,880,650 | ) |
Change in net assets from fund share transactions | | | $(365,738,413 | ) | | | $(229,459,345 | ) |
Total change in net assets | | | $(409,495,400 | ) | | | $(223,864,639 | ) |
| | |
| Net assets | | | | | | | | |
At beginning of period | | | 1,197,932,378 | | | | 1,421,797,017 | |
At end of period (b) | | | $788,436,978 | | | | $1,197,932,378 | |
| (a) | Distributions from net investment income and from net realized gain are no longer required to be separately disclosed. See Note 2. For the year ended January 31, 2018, distributions from net investment income were $75,880,650. |
| (b) | Parenthetical disclosure of accumulated distributions in excess of net investment income is no longer required. See Note 2. For the year ended January 31, 2018, end of period net assets included accumulated distributions in excess of net investment income of $2,496,747. |
See Notes to Financial Statements
24
Financial Statements
FINANCIAL HIGHLIGHTS
The financial highlights table is intended to help you understand the fund’s financial performance for the past 5 years. Certain information reflects financial results for a single fund share. The total returns in the table represent the rate that an investor would have earned (or lost) on an investment in the fund share class (assuming reinvestment of all distributions) held for the entire period.
| | | | | | | | | | | | | | | | | | | | |
| | | Year ended | |
| | | | | |
| | | 1/31/19 | | | 1/31/18 | | | 1/31/17 | | | 1/31/16 | | | 1/31/15 | |
Net asset value, beginning of period | | | $9.31 | | | | $9.28 | | | | $8.41 | | | | $9.47 | | | | $9.85 | |
| | | |
| Income (loss) from investment operations | | | | | | | | | | | | | |
Net investment income (loss) (d) | | | $0.52 | | | | $0.53 | | | | $0.56 | | | | $0.57 | | | | $0.61 | |
Net realized and unrealized gain (loss) | | | (0.36 | ) | | | 0.05 | | | | 0.90 | | | | (1.03 | ) | | | (0.29 | ) |
Total from investment operations | | | $0.16 | | | | $0.58 | | | | $1.46 | | | | $(0.46 | ) | | | $0.32 | |
| | | |
| Less distributions declared to shareholders | | | | | | | | | | | | | |
From net investment income | | | $(0.53 | ) | | | $(0.55 | ) | | | $(0.59 | ) | | | $(0.59 | ) | | | $(0.63 | ) |
From net realized gain | | | — | | | | — | | | | — | | | | (0.01 | ) | | | (0.07 | ) |
Total distributions declared to shareholders | | | $(0.53 | ) | | | $(0.55 | ) | | | $(0.59 | ) | | | $(0.60 | ) | | | $(0.70 | ) |
Net asset value, end of period (x) | | | $8.94 | | | | $9.31 | | | | $9.28 | | | | $8.41 | | | | $9.47 | |
Total return (%) (r)(s)(x) | | | 1.86 | | | | 6.33 | | | | 17.77 | | | | (5.23 | ) | | | 3.28 | |
| | | | |
Ratios (%) (to average net assets)
and Supplemental data: | | | | | | | | | | | | | | | | | |
Expenses before expense reductions (f) | | | 0.02 | | | | 0.02 | | | | 0.02 | | | | 0.02 | | | | 0.03 | |
Expenses after expense reductions (f) | | | N/A | | | | N/A | | | | N/A | | | | N/A | | | | 0.03 | |
Net investment income (loss) | | | 5.77 | | | | 5.63 | | | | 6.28 | | | | 6.19 | | | | 6.18 | |
Portfolio turnover | | | 38 | | | | 46 | | | | 44 | | | | 33 | | | | 43 | |
Net assets at end of period (000 omitted) | | | $788,437 | | | | $1,197,932 | | | | $1,421,797 | | | | $1,350,666 | | | | $1,337,532 | |
| (d) | Per share data is based on average shares outstanding. |
| (f) | Ratios do not reflect reductions from fees paid indirectly, if applicable. |
| (r) | Certain expenses have been reduced without which performance would have been lower. |
| (s) | From time to time the fund may receive proceeds from litigation settlements, without which performance would be lower. |
| (x) | The net asset values and total returns have been calculated on net assets which include adjustments made in accordance with U.S. generally accepted accounting principles required at period end for financial reporting purposes. |
See Notes to Financial Statements
25
NOTES TO FINANCIAL STATEMENTS
(1) Business and Organization
MFS High Yield Pooled Portfolio (the fund) is a diversified series of MFS Series Trust III (the trust). The trust is organized as a Massachusetts business trust and is registered under the Investment Company Act of 1940, as amended, as anopen-end management investment company. This fund is available only to certain U.S. registered investment companies managed by MFS. MFS does not receive a management fee from this fund.
The fund is an investment company and accordingly follows the investment company accounting and reporting guidance of the Financial Accounting Standards Board (FASB) Accounting Standards Codification Topic 946 Financial Services – Investment Companies.
(2) Significant Accounting Policies
General– The preparation of financial statements in conformity with U.S. generally accepted accounting principles requires management to make estimates and assumptions that affect the reported amounts of assets and liabilities, and disclosure of contingent assets and liabilities at the date of the financial statements and the reported amounts of increases and decreases in net assets from operations during the reporting period. Actual results could differ from those estimates. In the preparation of these financial statements, management has evaluated subsequent events occurring after the date of the fund’s Statement of Assets and Liabilities through the date that the financial statements were issued. The fund invests in high-yield securities rated below investment grade. Investments in below investment grade quality securities can involve a substantially greater risk of default or can already be in default, and their values can decline significantly. Below investment grade quality securities tend to be more sensitive to adverse news about the issuer, or the market or economy in general, than higher quality debt instruments. The fund invests in foreign securities. Investments in foreign securities are vulnerable to the effects of changes in the relative values of the local currency and the U.S. dollar and to the effects of changes in each country’s market, economic, industrial, political, regulatory, geopolitical, and other conditions.
In March 2017, the FASB issued Accounting Standards Update2017-08, Receivables – Nonrefundable Fees and Other Costs (Subtopic310-20) – Premium Amortization on Purchased Callable Debt Securities (“ASU2017-08”). For entities that hold callable debt securities at a premium, ASU2017-08 requires that the premium be amortized to the earliest call date. ASU2017-08 will be effective for fiscal years beginning after December 15, 2018, and interim periods within those fiscal years. Management has evaluated the potential impacts of ASU2017-08 and believes that adoption of ASU2017-08 will not have a material effect on the fund’s overall financial position or its overall results of operations.
In August 2018, the FASB issued Accounting Standards Update2018-13, Fair Value Measurement (Topic 820) – Disclosure Framework – Changes to the Disclosure Requirements for Fair Value Measurement (“ASU2018-13”) which introduces new fair value disclosure requirements as well as eliminates and modifies certain existing fair value disclosure requirements. ASU2018-13 would be effective for fiscal years
26
Notes to Financial Statements – continued
beginning after December 15, 2019, and interim periods within those fiscal years; however, management has elected to early adopt ASU2018-13 effective with the current reporting period. The impact of the fund’s adoption was limited to changes in the fund’s financial statement disclosures regarding fair value, primarily those disclosures related to transfers between levels of the fair value hierarchy.
In August 2018, the Securities and Exchange Commission (SEC) released its Final Rule on Disclosure Update and Simplification (the “Final Rule”) which is intended to simplify an issuer’s disclosure compliance efforts by removing redundant or outdated disclosure requirements without significantly altering the mix of information provided to investors. Effective with the current reporting period, the fund adopted the Final Rule with the impacts being that the fund is no longer required to present the components of distributable earnings on the Statement of Assets and Liabilities or the sources of distributions to shareholders and the amount of undistributed net investment income on the Statements of Changes in Net Assets.
Balance Sheet Offsetting– The fund’s accounting policy with respect to balance sheet offsetting is that, absent an event of default by the counterparty or a termination of the agreement, the International Swaps and Derivatives Association (ISDA) Master Agreement, or similar agreement, does not result in an offset of reported amounts of financial assets and financial liabilities in the Statement of Assets and Liabilities across transactions between the fund and the applicable counterparty. The fund’s right to setoff may be restricted or prohibited by the bankruptcy or insolvency laws of the particular jurisdiction to which a specific master netting agreement counterparty is subject. Balance sheet offsetting disclosures, to the extent applicable to the fund, have been included in the fund’s Significant Accounting Policies note under the captions for each of the fund’sin-scope financial instruments and transactions.
Investment Valuations– Equity securities, including restricted equity securities, are generally valued at the last sale or official closing price on their primary market or exchange as provided by a third-party pricing service. Equity securities, for which there were no sales reported that day, are generally valued at the last quoted daily bid quotation on their primary market or exchange as provided by a third-party pricing service. Debt instruments and floating rate loans, including restricted debt instruments, are generally valued at an evaluated or composite bid as provided by a third-party pricing service. Short-term instruments with a maturity at issuance of 60 days or less may be valued at amortized cost, which approximates market value. Futures contracts are generally valued at last posted settlement price on their primary exchange as provided by a third-party pricing service. Futures contracts for which there were no trades that day for a particular position are generally valued at the closing bid quotation on their primary exchange as provided by a third-party pricing service. Forward foreign currency exchange contracts are generally valued at the mean of bid and asked prices for the time period interpolated from rates provided by a third-party pricing service for proximate time periods.Open-end investment companies are generally valued at net asset value per share. Securities and other assets generally valued on the basis of information from a third-party pricing service may also be valued at a broker/dealer bid quotation. In determining values, third-party pricing services can utilize both transaction data and market information such as yield, quality, coupon
27
Notes to Financial Statements – continued
rate, maturity, type of issue, trading characteristics, and other market data. The values of foreign securities and other assets and liabilities expressed in foreign currencies are converted to U.S. dollars using the mean of bid and asked prices for rates provided by a third-party pricing service.
The Board of Trustees has delegated primary responsibility for determining or causing to be determined the value of the fund’s investments (including any fair valuation) to the adviser pursuant to valuation policies and procedures approved by the Board. If the adviser determines that reliable market quotations are not readily available, investments are valued at fair value as determined in good faith by the adviser in accordance with such procedures under the oversight of the Board of Trustees. Under the fund’s valuation policies and procedures, market quotations are not considered to be readily available for most types of debt instruments and floating rate loans and many types of derivatives. These investments are generally valued at fair value based on information from third-party pricing services. In addition, investments may be valued at fair value if the adviser determines that an investment’s value has been materially affected by events occurring after the close of the exchange or market on which the investment is principally traded (such as foreign exchange or market) and prior to the determination of the fund’s net asset value, or after the halting of trading of a specific security where trading does not resume prior to the close of the exchange or market on which the security is principally traded. The adviser generally relies on third-party pricing services or other information (such as the correlation with price movements of similar securities in the same or other markets; the type, cost and investment characteristics of the security; the business and financial condition of the issuer; and trading and other market data) to assist in determining whether to fair value and at what value to fair value an investment. The value of an investment for purposes of calculating the fund’s net asset value can differ depending on the source and method used to determine value. When fair valuation is used, the value of an investment used to determine the fund’s net asset value may differ from quoted or published prices for the same investment. There can be no assurance that the fund could obtain the fair value assigned to an investment if it were to sell the investment at the same time at which the fund determines its net asset value per share.
Various inputs are used in determining the value of the fund’s assets or liabilities. These inputs are categorized into three broad levels. In certain cases, the inputs used to measure fair value may fall into different levels of the fair value hierarchy. In such cases, an investment’s level within the fair value hierarchy is based on the lowest level of input that is significant to the fair value measurement. The fund’s assessment of the significance of a particular input to the fair value measurement in its entirety requires judgment, and considers factors specific to the investment. Level 1 includes unadjusted quoted prices in active markets for identical assets or liabilities. Level 2 includes other significant observable market-based inputs (including quoted prices for similar securities, interest rates, prepayment speed, and credit risk). Level 3 includes unobservable inputs, which may include the adviser’s own assumptions in determining the fair value of investments. Other financial instruments are derivative instruments,
28
Notes to Financial Statements – continued
such as futures contracts and forward foreign currency exchange contracts. The following is a summary of the levels used as of January 31, 2019 in valuing the fund’s assets or liabilities:
| | | | | | | | | | | | | | | | |
| | | | |
| Financial Instruments | | Level 1 | | | Level 2 | | | Level 3 | | | Total | |
| Equity Securities | | | $— | | | | $3,031 | | | | $2,935,086 | | | | $2,938,117 | |
| Non-U.S. Sovereign Debt | | | — | | | | 7,660,770 | | | | — | | | | 7,660,770 | |
| U.S. Corporate Bonds | | | — | | | | 603,792,760 | | | | — | | | | 603,792,760 | |
| Foreign Bonds | | | — | | | | 133,047,961 | | | | — | | | | 133,047,961 | |
| Floating Rate Loans | | | — | | | | 6,275,735 | | | | — | | | | 6,275,735 | |
| Mutual Funds | | | 29,838,451 | | | | — | | | | — | | | | 29,838,451 | |
| Total | | | $29,838,451 | | | | $750,780,257 | | | | $2,935,086 | | | | $783,553,794 | |
| | | | |
| Other Financial Instruments | | | | | | | | | | | | |
| Futures Contracts – Liabilities | | | $(392,705 | ) | | | $— | | | | $— | | | | $(392,705 | ) |
| Forward Foreign Currency | | | | | | | | | | | | | | | | |
| Exchange Contracts – Assets | | | — | | | | 30,588 | | | | — | | | | 30,588 | |
For further information regarding security characteristics, see the Portfolio of Investments.
The following is a reconciliation of level 3 assets for which significant unobservable inputs were used to determine fair value. The table presents the activity of level 3 securities held at the beginning and the end of the period.
| | | | |
| |
| | | Equity Securities | |
| Balance as of 1/31/18 | | | $2,935,086 | |
Change in unrealized appreciation or depreciation | | | 0 | |
| Balance as of 1/31/19 | | | $2,935,086 | |
The net change in unrealized appreciation or depreciation from investments held as level 3 at January 31, 2019 is $0. At January 31, 2019, the fund held one level 3 security.
Foreign Currency Translation– Purchases and sales of foreign investments, income, and expenses are converted into U.S. dollars based upon currency exchange rates prevailing on the respective dates of such transactions or on the reporting date for foreign denominated receivables and payables. Gains and losses attributable to foreign currency exchange rates on sales of securities are recorded for financial statement purposes as net realized gains and losses on investments. Gains and losses attributable to foreign exchange rate movements on receivables, payables, income and expenses are recorded for financial statement purposes as foreign currency transaction gains and losses. That portion of both realized and unrealized gains and losses on investments that results from fluctuations in foreign currency exchange rates is not separately disclosed.
Derivatives– The fund uses derivatives primarily to increase or decrease exposure to a particular market or segment of the market, or security, to increase or decrease interest rate or currency exposure, or as alternatives to direct investments. Derivatives are used for hedging ornon-hedging purposes. While hedging can reduce or eliminate losses, it can also reduce or eliminate gains. When the fund uses derivatives as an investment to
29
Notes to Financial Statements – continued
increase market exposure, or for hedging purposes, gains and losses from derivative instruments may be substantially greater than the derivative’s original cost.
The derivative instruments used by the fund during the period were futures contracts and forward foreign currency exchange contracts. Depending on the type of derivative, the fund may exit a derivative position by entering into an offsetting transaction with a counterparty or exchange, negotiating an agreement with the derivative counterparty, or novating the position to a third party. The fund may be unable to promptly close out a futures position in instances where the daily fluctuation in the price for that type of future exceeds the daily limit set by the exchange. The fund’s period end derivatives, as presented in the Portfolio of Investments and the associated Derivative Contract tables, generally are indicative of the volume of its derivative activity during the period.
The following table presents, by major type of derivative contract, the fair value, on a gross basis, of the asset and liability components of derivatives held by the fund at January 31, 2019 as reported in the Statement of Assets and Liabilities:
| | | | | | | | | | |
| | | | | Fair Value (a) | |
| | | |
| Risk | | Derivative Contracts | | Asset Derivatives | | | Liability Derivatives | |
| Interest Rate | | Interest Rate Futures | | | $— | | | | $(392,705 | ) |
| Foreign Exchange | | Forward Foreign Currency Exchange Contracts | | | 30,588 | | | | — | |
| Total | | | | | $30,588 | | | | $(392,705 | ) |
| (a) | Values presented in this table for futures contracts correspond to the values reported in the fund’s Portfolio of Investments. Only the current day net variation margin for futures contracts is separately reported within the fund’s Statement of Assets and Liabilities. |
The following table presents, by major type of derivative contract, the realized gain (loss) on derivatives held by the fund for the year ended January 31, 2019 as reported in the Statement of Operations:
| | | | | | | | |
| | |
| Risk | | Futures
Contracts | | | Forward
Foreign
Currency
Exchange
Contracts | |
| Interest Rate | | | $1,091,612 | | | | $— | |
| Foreign Exchange | | | — | | | | 259,212 | |
| Total | | | $1,091,612 | | | | $259,212 | |
The following table presents, by major type of derivative contract, the change in unrealized appreciation or depreciation on derivatives held by the fund for the year ended January 31, 2019 as reported in the Statement of Operations:
| | | | | | | | |
| | |
| Risk | | Futures
Contracts | | | Forward
Foreign
Currency
Exchange
Contracts | |
| Interest Rate | | | $(1,297,981 | ) | | | $— | |
| Foreign Exchange | | | — | | | | 35,198 | |
| Total | | | $(1,297,981 | ) | | | $35,198 | |
30
Notes to Financial Statements – continued
Derivative counterparty credit risk is managed through formal evaluation of the creditworthiness of all potential counterparties. On certain, but not all, uncleared derivatives, the fund attempts to reduce its exposure to counterparty credit risk whenever possible by entering into an ISDA Master Agreement on a bilateral basis. The ISDA Master Agreement gives each party to the agreement the right to terminate all transactions traded under such agreement if there is a specified deterioration in the credit quality of the other party. Upon an event of default or a termination of the ISDA Master Agreement, thenon-defaulting party has the right to close out all transactions traded under such agreement and to net amounts owed under each agreement to one net amount payable by one party to the other. This right to close out and net payments across all transactions traded under the ISDA Master Agreement could result in a reduction of the fund’s credit risk to such counterparty equal to any amounts payable by the fund under the applicable transactions, if any.
Collateral and margin requirements differ by type of derivative. For cleared derivatives (e.g., futures contracts, cleared swaps, and exchange-traded options), margin requirements are set by the clearing broker and the clearing house and collateral, in the form of cash or securities, is posted by the fund directly with the clearing broker. Collateral terms are counterparty agreement specific for uncleared derivatives (e.g., forward foreign currency exchange contracts, uncleared swap agreements, and uncleared options) and collateral, in the form of cash and securities, is held in segregated accounts with the fund’s custodian in connection with these agreements. For derivatives traded under an ISDA Master Agreement, which contains a collateral support annex, the collateral requirements are netted across all transactions traded under such counterparty-specific agreement and an amount is posted from one party to the other to collateralize such obligations. Cash that has been segregated or delivered to cover the fund’s collateral or margin obligations under derivative contracts, if any, will be reported separately in the Statement of Assets and Liabilities as restricted cash for uncleared derivatives and/or deposits with brokers for cleared derivatives. Securities pledged as collateral or margin for the same purpose, if any, are noted in the Portfolio of Investments. The fund may be required to make payments of interest on uncovered collateral or margin obligations with the broker. Any such payments are included in “Miscellaneous” expense in the Statement of Operations.
Futures Contracts– The fund entered into futures contracts which may be used to hedge against or obtain broad market exposure, interest rate exposure, currency exposure, or to manage duration. A futures contract represents a commitment for the future purchase or sale of an asset at a specified price on a specified date.
Upon entering into a futures contract, the fund is required to deposit with the broker, either in cash or securities, an initial margin in an amount equal to a specified percentage of the notional amount of the contract. Subsequent payments (variation margin) are made or received by the fund each day, depending on the daily fluctuations in the value of the contract, and are recorded for financial statement purposes as unrealized gain or loss by the fund until the contract is closed or expires at which point the gain or loss on futures contracts is realized.
The fund bears the risk of interest rates, exchange rates or securities prices moving unexpectedly, in which case, the fund may not achieve the anticipated benefits of the futures contracts and may realize a loss. While futures contracts may present less
31
Notes to Financial Statements – continued
counterparty risk to the fund since the contracts are exchange traded and the exchange’s clearinghouse guarantees payments to the broker, there is still counterparty credit risk due to the insolvency of the broker. The fund’s maximum risk of loss due to counterparty credit risk is equal to the margin posted by the fund to the broker plus any gains or minus any losses on the outstanding futures contracts.
Forward Foreign Currency Exchange Contracts– The fund entered into forward foreign currency exchange contracts for the purchase or sale of a specific foreign currency at a fixed price on a future date. These contracts may be used to hedge the fund’s currency risk or fornon-hedging purposes. For hedging purposes, the fund may enter into contracts to deliver or receive foreign currency that the fund will receive from or use in its normal investment activities. The fund may also use contracts to hedge against declines in the value of foreign currency denominated securities due to unfavorable exchange rate movements. Fornon-hedging purposes, the fund may enter into contracts with the intent of changing the relative exposure of the fund’s portfolio of securities to different currencies to take advantage of anticipated exchange rate changes.
Forward foreign currency exchange contracts are adjusted by the daily exchange rate of the underlying currency and any unrealized gains or losses are recorded as a receivable or payable for forward foreign currency exchange contracts until the contract settlement date. On contract settlement date, any gain or loss on the contract is recorded as realized gains or losses on forward foreign currency exchange contracts.
Risks may arise upon entering into these contracts from unanticipated movements in the value of the contract and from the potential inability of counterparties to meet the terms of their contracts. Generally, the fund’s maximum risk due to counterparty credit risk is the unrealized gain on the contract due to the use of Continuous Linked Settlement, a multicurrency cash settlement system for the centralized settlement of foreign transactions. This risk is mitigated in cases where there is an ISDA Master Agreement between the fund and the counterparty providing for netting as described above and, where applicable, by the posting of collateral by the counterparty to the fund to cover the fund’s exposure to the counterparty under such ISDA Master Agreement.
Loans and Other Direct Debt Instruments– The fund invests in loans and loan participations or other receivables. These investments may include standby financing commitments, including revolving credit facilities, which contractually obligate the fund to supply additional cash to the borrower on demand. The fund generally provides this financial support in order to preserve its existing investment or to obtain a more senior secured interest in the assets of the borrower. Loan participations involve a risk of insolvency of the lending bank or other financial intermediary.
Indemnifications– Under the fund’s organizational documents, its officers and Trustees may be indemnified against certain liabilities and expenses arising out of the performance of their duties to the fund. Additionally, in the normal course of business, the fund enters into agreements with service providers that may contain indemnification clauses. The fund’s maximum exposure under these agreements is unknown as this would involve future claims that may be made against the fund that have not yet occurred.
32
Notes to Financial Statements – continued
Investment Transactions and Income– Investment transactions are recorded on the trade date. Interest income is recorded on the accrual basis. All premium and discount is amortized or accreted for financial statement purposes in accordance with U.S. generally accepted accounting principles. The fund earns certain fees in connection with its floating rate loan purchasing activities. These fees are in addition to interest payments earned and may include amendment fees, commitment fees, facility fees, consent fees, and prepayment fees. Commitment fees are recorded on an accrual basis as income in the accompanying financial statements. Dividends received in cash are recorded on theex-dividend date. Certain dividends from foreign securities will be recorded when the fund is informed of the dividend if such information is obtained subsequent to theex-dividend date. Dividend and interest payments received in additional securities are recorded on theex-dividend orex-interest date in an amount equal to the value of the security on such date. Debt obligations may be placed onnon-accrual status or set to accrue at a rate of interest less than the contractual coupon when the collection of all or a portion of interest has become doubtful. Interest income for those debt obligations may be further reduced by thewrite-off of the related interest receivables when deemed uncollectible.
The fund may receive proceeds from litigation settlements. Any proceeds received from litigation involving portfolio holdings are reflected in the Statement of Operations in realized gain/loss if the security has been disposed of by the fund or in unrealized gain/loss if the security is still held by the fund. Any other proceeds from litigation not related to portfolio holdings are reflected as other income in the Statement of Operations.
Fees Paid Indirectly– The fund’s custody fee may be reduced by a credit earned under an arrangement that measures the value of U.S. dollars deposited with the custodian by the fund. The amount of the credit, for the year ended January 31, 2019, is shown as a reduction of total expenses in the Statement of Operations.
Tax Matters and Distributions– The fund intends to qualify as a regulated investment company, as defined under Subchapter M of the Internal Revenue Code, and to distribute all of its taxable income, including realized capital gains. As a result, no provision for federal income tax is required. The fund’s federal tax returns, when filed, will remain subject to examination by the Internal Revenue Service for a three year period. Management has analyzed the fund’s tax positions taken on federal and state tax returns for all open tax years and does not believe that there are any uncertain tax positions that require recognition of a tax liability. Foreign taxes, if any, have been accrued by the fund in the accompanying financial statements in accordance with the applicable foreign tax law. Foreign income taxes may be withheld by certain countries in which the fund invests. Additionally, capital gains realized by the fund on securities issued in or by certain foreign countries may be subject to capital gains tax imposed by those countries.
Distributions to shareholders are recorded on theex-dividend date. Income and capital gain distributions are determined in accordance with income tax regulations, which may differ from U.S. generally accepted accounting principles. Certain capital accounts in the financial statements are periodically adjusted for permanent differences in order to reflect their tax character. These adjustments have no impact on net assets or net asset value per share. Temporary differences which arise from recognizing certain items
33
Notes to Financial Statements – continued
of income, expense, gain or loss in different periods for financial statement and tax purposes will reverse at some time in the future. Distributions in excess of net investment income or net realized gains are temporary overdistributions for financial statement purposes resulting from differences in the recognition or classification of income or distributions for financial statement and tax purposes.
Book/tax differences primarily relate to defaulted bonds, amortization and accretion of debt securities, and wash sale loss deferrals.
The tax character of distributions declared to shareholders for the last two fiscal years is as follows:
| | | | | | | | |
| | |
| | | Year ended
1/31/19 | | | Year ended
1/31/18 | |
| Ordinary income (including any short-term capital gains) | | | $55,299,759 | | | | $75,880,650 | |
The federal tax cost and the tax basis components of distributable earnings were as follows:
| | | | |
| |
| As of 1/31/19 | | | |
| |
| Cost of investments | | | $798,926,559 | |
| Gross appreciation | | | 7,801,467 | |
| |
| Gross depreciation | | | (23,536,349 | ) |
| Net unrealized appreciation (depreciation) | | | $(15,734,882 | ) |
| |
| Undistributed ordinary income | | | 2,396,257 | |
| Capital loss carryforwards | | | (65,801,806 | ) |
| Other temporary differences | | | (3,871,602 | ) |
As of January 31, 2019, the fund had capital loss carryforwards available to offset future realized gains. These net capital losses may be carried forward indefinitely and their character is retained as short-term and/or long-term losses. Such losses are characterized as follows:
| | | | |
| Short-Term | | | $(12,598,314 | ) |
| Long-Term | | | (53,203,492 | ) |
| Total | | | $(65,801,806 | ) |
(3) Transactions with Affiliates
Investment Adviser– The fund has an investment advisory agreement with MFS to provide overall investment management and related administrative services and facilities to the fund. MFS receives no compensation under this agreement; however MFS receives management fees from MFS funds that invest in the fund.
Shareholder Servicing Agent– MFS Service Center, Inc. (MFSC), a wholly-owned subsidiary of MFS, provides transfer agent and recordkeeping functions in connection with the issuance, transfer, and redemption of shares of the fund under a Shareholder Servicing Agent Agreement. MFSC is not paid a fee for providing these services. MFSC receives payment from the fund forout-of-pocket expenses paid by MFSC on behalf of the fund. For the year ended January 31, 2019, these costs amounted to $46.
34
Notes to Financial Statements – continued
Administrator– MFS provides certain financial, legal, shareholder communications, compliance, and other administrative services to the fund. Under an administrative services agreement, the fund reimburses MFS the costs incurred to provide these services. The fund is charged an annual fixed amount of $17,500. The administrative services fee incurred for the year ended January 31, 2019 was equivalent to an annual effective rate of 0.0019% of the fund’s average daily net assets.
Trustees’ and Officers’ Compensation– The fund may pay compensation to independent Trustees in the form of a retainer, attendance fees, and additional compensation to Board and Committee chairpersons. The fund does not pay compensation directly to Trustees or officers of the fund who are also officers of the investment adviser, all of whom receive remuneration for their services to the fund from MFS. Certain officers and Trustees of the fund are officers or directors of MFS, MFS Fund Distributors, Inc. (MFD), and MFSC. The independent Trustees do not currently receive compensation from the fund.
Other– This fund and certain other funds managed by MFS (the funds) have entered into a service agreement (the ISO Agreement) which provides for payment of fees solely by the funds to Tarantino LLC in return for the provision of services of an Independent Senior Officer (ISO) for the funds. Frank L. Tarantino serves as the ISO and is an officer of the funds and the sole member of Tarantino LLC. The funds can terminate the ISO Agreement with Tarantino LLC at any time under the terms of the ISO Agreement. For the year ended January 31, 2019, the fee paid by the fund under this agreement was $1,659 and is included in “Miscellaneous” expense in the Statement of Operations. MFS has agreed to bear all expenses associated with office space, other administrative support, and supplies provided to the ISO.
The fund invests in the MFS Institutional Money Market Portfolio which is managed by MFS and seeks current income consistent with preservation of capital and liquidity. This money market fund does not pay a management fee to MFS.
(4) Portfolio Securities
For the year ended January 31, 2019, purchases and sales of investments, other than short-term obligations, aggregated $352,750,013 and $719,662,180, respectively.
(5) Shares of Beneficial Interest
The fund’s Declaration of Trust permits the Trustees to issue an unlimited number of full and fractional shares of beneficial interest. Transactions in fund shares were as follows:
| | | | | | | | | | | | | | | | |
| | | Year ended
1/31/19 | | | Year ended
1/31/18 | |
| | | | |
| | | Shares | | | Amount | | | Shares | | | Amount | |
| Shares sold | | | 1,404,859 | | | | $12,591,447 | | | | 10,158,880 | | | | $94,970,838 | |
| Shares issued to shareholders in reinvestment of distributions | | | 6,146,645 | | | | 55,299,759 | | | | 8,095,660 | | | | 75,880,650 | |
| Shares reacquired | | | (47,999,465 | ) | | | (433,629,619 | ) | | | (42,753,651 | ) | | | (400,310,833 | ) |
| Net change | | | (40,447,961 | ) | | | $(365,738,413 | ) | | | (24,499,111 | ) | | | $(229,459,345 | ) |
35
Notes to Financial Statements – continued
The fund is an MFS Pooled Portfolio, which is designed to be used by certain MFS funds to invest in a particular security type rather than invest in the security type directly. The fund is solely invested in by other MFS funds for the purpose of gaining exposure to high income debt instruments, rather than investing in high income debt instruments directly. The MFS funds do not invest in this fund for the purpose of exercising management or control. At the end of the period, the MFS Diversified Income Fund, the MFS Global High Yield Fund, and the MFS Strategic Income Portfolio were the owners of record of approximately 73%, 26%, and 1%, respectively, of the value of outstanding voting shares of the fund.
(6) Line of Credit
The fund and certain other funds managed by MFS participate in a $1.25 billion unsecured committed line of credit, subject to a $1 billion sublimit, provided by a syndication of banks under a credit agreement. Borrowings may be made for temporary financing needs. Interest is charged to each fund, based on its borrowings, generally at a rate equal to the higher of the Overnight Bank Funding rate or daily one month LIBOR plus an agreed upon spread. A commitment fee, based on the average daily, unused portion of the committed line of credit, is allocated among the participating funds. In addition, the fund and other funds managed by MFS have established unsecured uncommitted borrowing arrangements with certain banks for temporary financing needs. Interest is charged to each fund, based on its borrowings, at a rate equal to the Overnight Bank Funding rate plus an agreed upon spread. For the year ended January 31, 2019, the fund’s commitment fee and interest expense were $5,582 and $0, respectively, and are included in “Miscellaneous” expense in the Statement of Operations.
(7) Investments in Affiliated Issuers
An affiliated issuer may be considered one in which the fund owns 5% or more of the outstanding voting securities, or a company which is under common control. For the purposes of this report, the fund assumes the following to be affiliated issuers:
| | | | | | | | | | | | | | | | | | | | |
| | | | | |
| Affiliated Issuers | | | | | Beginning
Shares/Par
Amount | | | Acquisitions
Shares/Par
Amount | | | Dispositions
Shares/Par
Amount | | | Ending
Shares/Par
Amount | |
| MFS Institutional Money Market Portfolio | | | | | | | 17,092,907 | | | | 272,989,999 | | | | (260,241,471 | ) | | | 29,841,435 | |
| | | | | |
| Affiliated Issuers | | Realized
Gain (Loss) | | | Change in
Unrealized
Appreciation/
Depreciation | | | Capital Gain
Distributions | | | Dividend
Income | | | Ending
Value | |
| MFS Institutional Money Market Portfolio | | | $104 | | | | $— | | | | $— | | | | $396,975 | | | | $29,838,451 | |
36
REPORT OF INDEPENDENT REGISTERED PUBLIC ACCOUNTING FIRM
To the Board of Trustees of MFS Series Trust III and the Shareholders of MFS High Yield Pooled Portfolio:
Opinion on the Financial Statements and Financial Highlights
We have audited the accompanying statement of assets and liabilities of MFS High Yield Pooled Portfolio (the “Fund”), including the portfolio of investments, as of January 31, 2019, the related statement of operations for the year then ended, the statements of changes in net assets for each of the two years in the period then ended, the financial highlights for each of the five years in the period then ended, and the related notes. In our opinion, the financial statements and financial highlights present fairly, in all material respects, the financial position of the Fund as of January 31, 2019, and the results of its operations for the year then ended, the changes in its net assets for each of the two years in the period then ended, and the financial highlights for each of the five years in the period then ended, in conformity with accounting principles generally accepted in the United States of America.
Basis for Opinion
These financial statements and financial highlights are the responsibility of the Fund’s management. Our responsibility is to express an opinion on the Fund’s financial statements and financial highlights based on our audits. We are a public accounting firm registered with the Public Company Accounting Oversight Board (United States) (PCAOB) and are required to be independent with respect to the Fund in accordance with the U.S. federal securities laws and the applicable rules and regulations of the Securities and Exchange Commission and the PCAOB.
We conducted our audits in accordance with the standards of the PCAOB. Those standards require that we plan and perform the audit to obtain reasonable assurance about whether the financial statements and financial highlights are free of material misstatement, whether due to error or fraud. The Fund is not required to have, nor were we engaged to perform, an audit of its internal control over financial reporting. As part of our audits we are required to obtain an understanding of internal control over financial reporting but not for the purpose of expressing an opinion on the effectiveness of the Fund’s internal control over financial reporting. Accordingly, we express no such opinion.
Our audits included performing procedures to assess the risks of material misstatement of the financial statements and financial highlights, whether due to error or fraud, and performing procedures that respond to those risks. Such procedures included examining, on a test basis, evidence regarding the amounts and disclosures in the financial statements and financial highlights. Our audits also included evaluating the accounting principles used and significant estimates made by management, as well as evaluating the overall presentation of the financial statements and financial highlights. Our procedures included confirmation of securities owned as of January 31, 2019,
37
Report of Independent Registered Public Accounting Firm – continued
by correspondence with the custodian, brokers, and agent banks; when replies were not received from brokers and agent banks, we performed other auditing procedures. We believe that our audits provide a reasonable basis for our opinion.
DELOITTE & TOUCHE LLP
Boston, Massachusetts
March 19, 2019
We have served as the auditor of one or more of the MFS investment companies since 1924.
38
TRUSTEES AND OFFICERS — IDENTIFICATION AND BACKGROUND
The Trustees and Officers of the Trust, as of March 1, 2019, are listed below, together with their principal occupations during the past five years. (Their titles may have varied during that period.) The address of each Trustee and Officer is 111 Huntington Avenue, Boston, Massachusetts 02199-7618.
| | | | | | | | | | |
Name, Age | | Position(s) Held with Fund | | Trustee/Officer Since (h) | | Number of
MFS Funds
overseen
by the Trustee | | Principal
Occupations During the Past Five Years | | Other Directorships
During the Past
Five Years (j) |
| INTERESTED TRUSTEES |
Robert J. Manning (k)
(age 55) | | Trustee | | February 2004 | | 135 | | Massachusetts Financial Services Company, Executive Chairman (since January 2017); Director; Chairman of the Board; Chief Executive Officer (until 2015);Co-Chief Executive Officer (2015-2016) | | N/A |
| | | | | |
Robin A. Stelmach (k) (age 57) | | Trustee | | January 2014 | | 135 | | Massachusetts Financial Services Company, Vice Chair (since January 2017); Chief Operating Officer and Executive Vice President (until January 2017) | | N/A |
| INDEPENDENT TRUSTEES |
John P. Kavanaugh (age 64) | | Trustee and Chair of Trustees | | January 2009 | | 135 | | Private investor | | N/A |
| | | | | |
Steven E. Buller (age 67) | | Trustee | | February 2014 | | 135 | | Financial Accounting Standards Advisory Council, Chairman (2014-2015); Public Company Accounting Oversight Board, Standing Advisory Group, Member (until 2014); BlackRock, Inc. (investment management), Managing Director (until 2014), BlackRock Finco UK (investment management), Director (until 2014) | | N/A |
39
Trustees and Officers – continued
| | | | | | | | | | |
Name, Age | | Position(s) Held with Fund | | Trustee/Officer Since (h) | | Number of
MFS Funds
overseen
by the Trustee | | Principal
Occupations During the Past Five Years | | Other Directorships
During the Past
Five Years (j) |
John A. Caroselli (age 64) | | Trustee | | March 2017 | | 135 | | JC Global Advisors, LLC (management consulting), President (since 2015); First Capital Corporation (commercial finance), Executive Vice President (until 2015) | | N/A |
| | | | | |
Maureen R. Goldfarb (age 63) | | Trustee | | January 2009 | | 135 | | Private investor | | N/A |
| | | | | |
Michael Hegarty
(age 74) | | Trustee | | December 2004 | | 135 | | Private investor | | Rouse Properties Inc., Director (until 2016); Capmark Financial Group Inc., Director (until 2015) |
| | | | | |
Peter D. Jones
(age 63) | | Trustee | | January 2019 | | 135 | | Franklin Templeton Distributors, Inc. (investment management), President (until 2015); Franklin Templeton Institutional, LLC (investment management), Chairman (until 2015) | | N/A |
| | | | | |
James W. Kilman, Jr.
(age 57) | | Trustee | | January 2019 | | 135 | | KielStrand Capital LLC (family office and merchant bank), Chief Executive Officer (since 2016); Morgan Stanley & Co. (financial services), Vice Chairman of Investment Banking,Co-Head of Diversified Financials Coverage – Financial Institutions Investment Banking Group (until 2016) | | Alpha-En Corporation, Director (since 2016) |
40
Trustees and Officers – continued
| | | | | | | | | | |
Name, Age | | Position(s) Held with Fund | | Trustee/Officer Since (h) | | Number of
MFS Funds
overseen
by the Trustee | | Principal
Occupations During the Past Five Years | | Other Directorships
During the Past
Five Years (j) |
Clarence Otis, Jr. (age 62) | | Trustee | | March 2017 | | 135 | | Darden Restaurants, Inc., Chief Executive Officer (until 2014) | | VF Corporation, Director; Verizon Communications, Inc., Director; The Travelers Companies, Director; Federal Reserve Bank of Atlanta, Director (until 2015) |
| | | | | |
Maryanne L. Roepke (age 63) | | Trustee | | May 2014 | | 135 | | American Century Investments (investment management), Senior Vice President and Chief Compliance Officer (until 2014) | | N/A |
| | | | | |
Laurie J. Thomsen
(age 61) | | Trustee | | March 2005 | | 135 | | Private investor | | The Travelers Companies, Director; Dycom Industries, Inc., Director (since 2015) |
| | | | | | | | |
Name, Age | | Position(s) Held with Fund | | Trustee/Officer
Since (h) | | Number of
MFS Funds
for which
the Person
is an Officer | | Principal
Occupations During the Past Five Years |
| OFFICERS | | | | | | | | |
Christopher R. Bohane (k)
(age 45) | | Assistant Secretary and Assistant Clerk | | July 2005 | | 135 | | Massachusetts Financial Services Company, Vice President and Assistant General Counsel |
| | | | |
Kino Clark (k) (age 50) | | Assistant Treasurer | | January 2012 | | 135 | | Massachusetts Financial Services Company, Vice President |
41
Trustees and Officers – continued
| | | | | | | | |
Name, Age | | Position(s) Held with Fund | | Trustee/Officer
Since (h) | | Number of
MFS Funds
for which
the Person
is an Officer | | Principal
Occupations During the Past Five Years |
John W. Clark, Jr. (k) (age 51) | | Assistant Treasurer | | April 2017 | | 135 | | Massachusetts Financial Services Company, Vice President (since March 2017); Deutsche Bank (financial services), Department Head – Treasurer’s Office (until February 2017) |
| | | | |
Thomas H. Connors (k) (age 59) | | Assistant Secretary and Assistant Clerk | | September 2012 | | 135 | | Massachusetts Financial Services Company, Vice President and Senior Counsel |
| | | | |
Ethan D. Corey (k)
(age 55) | | Assistant Secretary and Assistant Clerk | | July 2005 | | 135 | | Massachusetts Financial Services Company, Senior Vice President and Associate General Counsel |
| | | | |
David L. DiLorenzo (k)
(age 50) | | President | | July 2005 | | 135 | | Massachusetts Financial Services Company, Senior Vice President |
| | | | |
Heidi W. Hardin (k) (age 51) | | Secretary and Clerk | | April 2017 | | 135 | | Massachusetts Financial Services Company, Executive Vice President and General Counsel (since March 2017); Harris Associates (investment management), General Counsel (from September 2015 to January 2017); Janus Capital Management LLC (investment management), Senior Vice President and General Counsel (until September 2015) |
| | | | |
Brian E. Langenfeld (k) (age 45) | | Assistant
Secretary and Assistant Clerk | | June 2006 | | 135 | | Massachusetts Financial Services Company, Vice President and Senior Counsel |
42
Trustees and Officers – continued
| | | | | | | | |
Name, Age | | Position(s) Held with Fund | | Trustee/Officer
Since (h) | | Number of
MFS Funds
for which
the Person
is an Officer | | Principal
Occupations During the Past Five Years |
Amanda S. Mooradian (k) (age 40) | | Assistant
Secretary and Assistant Clerk | | September 2018 | | 135 | | Massachusetts Financial Services Company, Assistant Vice President and Counsel |
| | | | |
Susan A. Pereira (k)
(age 48) | | Assistant
Secretary and Assistant Clerk | | July 2005 | | 135 | | Massachusetts Financial Services Company, Vice President and Senior Counsel |
| | | | |
Kasey L. Phillips (k) (age 48) | | Assistant Treasurer | | September 2012 | | 135 | | Massachusetts Financial Services Company, Vice President |
| | | | |
Matthew A. Stowe (k) (age 44) | | Assistant Secretary and Assistant Clerk | | October 2014 | | 135 | | Massachusetts Financial Services Company, Vice President and Assistant General Counsel |
| | | | |
Frank L. Tarantino
(age 74) | | Independent
Senior Officer | | June 2004 | | 135 | | Tarantino LLC (provider of compliance services), Principal |
| | | | |
Richard S. Weitzel (k)
(age 48) | | Assistant Secretary and Assistant Clerk | | October 2007 | | 135 | | Massachusetts Financial Services Company, Senior Vice President and Associate General Counsel |
| | | | |
Martin J. Wolin (k) (age 51) | | Chief Compliance Officer | | July 2015 | | 135 | | Massachusetts Financial Services Company, Senior Vice President and Chief Compliance Officer (since July 2015); Mercer (financial service provider), Chief Risk and Compliance Officer, North America and Latin America (until June 2015) |
| | | | |
James O. Yost (k)
(age 58) | | Treasurer | | September 1990 | | 135 | | Massachusetts Financial Services Company, Senior Vice President |
43
Trustees and Officers – continued
| (h) | Date first appointed to serve as Trustee/officer of an MFS Fund. Each Trustee has served continuously since appointment unless indicated otherwise. For the period from December 15, 2004 until February 22, 2005, Mr. Manning served as Advisory Trustee. From January 2012 through December 2016, Messrs. DiLorenzo and Yost served as Treasurer and Deputy Treasurer of the Funds, respectively. |
| (j) | Directorships or trusteeships of companies required to report to the Securities and Exchange Commission (i.e., “public companies”). |
| (k) | “Interested person” of the Trust within the meaning of the Investment Company Act of 1940 (referred to as the 1940 Act), which is the principal federal law governing investment companies like the fund, as a result of a position with MFS. The address of MFS is 111 Huntington Avenue, Boston, Massachusetts 02199-7618. |
Each Trustee (other than Messrs. Jones and Kilman) has been elected by shareholders and each Trustee and officer holds office until his or her successor is chosen and qualified or until his or her earlier death, resignation, retirement or removal. The Trust does not hold annual meetings for the purpose of electing Trustees, and Trustees are not elected for fixed terms. Under the terms of the Board’s retirement policy, an Independent Trustee shall retire at the end of the calendar year in which he or she reaches the earlier of 75 years of age or 15 years of service on the Board (or, in the case of any Independent Trustee who joined the Board prior to 2015, 20 years of service on the Board).
Messrs. Buller, Hegarty, Kilman and Otis and Ms. Roepke are members of the Trust’s Audit Committee.
Each of the Interested Trustees and certain Officers hold comparable officer positions with certain affiliates of MFS.
The Statement of Additional Information for a Fund includes further information about the Trustees and is available without charge upon request by calling1-800-225-2606.
| | |
| Investment Adviser | | Custodian |
Massachusetts Financial Services Company
111 Huntington Avenue Boston, MA 02199-7618 | | JPMorgan Chase Bank, NA 4 Metrotech Center New York, NY 11245 |
| Distributor | | Independent Registered Public Accounting Firm |
MFS Fund Distributors, Inc.
111 Huntington Avenue Boston, MA 02199-7618 | | Deloitte & Touche LLP 200 Berkeley Street Boston, MA 02116 |
| Portfolio Manager(s) | | |
David Cole | | |
Michael Skatrud | | |
44
PROXY VOTING POLICIES AND INFORMATION
MFS votes proxies on behalf of the fund pursuant to proxy voting policies and procedures that are available without charge, upon request, by calling1-800-225-2606, by visitingmfs.com/proxyvoting,or by visiting the SEC’s Web site athttp://www.sec.gov.
Information regarding how the fund voted proxies relating to portfolio securities during the most recent twelve-month period ended June 30 is available by August 31 of each year without charge by visitingmfs.com/proxyvoting,or by visiting the SEC’s Web site athttp://www.sec.gov.
QUARTERLY PORTFOLIO DISCLOSURE
The fund files a complete schedule of portfolio holdings with the SEC for the first and third quarters of each fiscal year on Form N-Q. The fund’s Form N-Q is available on the SEC’s website at http://www.sec.gov.
FURTHER INFORMATION
From time to time, MFS may post important information about the fund or the MFS funds on the MFS web site (mfs.com). This information is available athttps://www.mfs.com/en-us/what-we-do/announcements.html.
INFORMATION ABOUT FUND CONTRACTS AND LEGAL CLAIMS
The fund has entered into contractual arrangements with an investment adviser, administrator, distributor, shareholder servicing agent, 529 program manager (if applicable), and custodian who each provide services to the fund. Unless expressly stated otherwise, shareholders are not parties to, or intended beneficiaries of these contractual arrangements, and these contractual arrangements are not intended to create any shareholder right to enforce them against the service providers or to seek any remedy under them against the service providers, either directly or on behalf of the fund.
Under the Trust’s By-Laws and Declaration of Trust, any claims asserted against or on behalf of the MFS Funds, including claims against Trustees and Officers, must be brought in state and federal courts located within the Commonwealth of Massachusetts.
45
rev. 3/16
| | | | |
| | | |
FACTS | | WHAT DOES MFS DO WITH YOUR PERSONAL INFORMATION? | |  |
| | |
| Why? | | Financial companies choose how they share your personal information. Federal law gives consumers the right to limit some but not all sharing. Federal law also requires us to tell you how we collect, share, and protect your personal information. Please read this notice carefully to understand what we do. |
| | |
| What? | | The types of personal information we collect and share depend on the product or service you have with us. This information can include: • Social Security number and account balances • Account transactions and transaction history • Checking account information and wire transfer instructions When you areno longer our customer, we continue to share your information as described in this notice. |
| | |
| How? | | All financial companies need to share customers’ personal information to run their everyday business. In the section below, we list the reasons financial companies can share their customers’ personal information; the reasons MFS chooses to share; and whether you can limit this sharing. |
| | | | |
Reasons we can share your
personal information | | Does MFS
share? | | Can you limit
this sharing? |
For our everyday business purposes – such as to process your transactions, maintain your account(s), respond to court orders and legal investigations, or report to credit bureaus | | Yes | | No |
For our marketing purposes – to offer our products and services to you | | No | | We don’t share |
For joint marketing with other financial companies | | No | | We don’t share |
For our affiliates’ everyday business purposes – information about your transactions and experiences | | No | | We don’t share |
For our affiliates’ everyday business purposes – information about your creditworthiness | | No | | We don’t share |
| For nonaffiliates to market to you | | No | | We don’t share |
| | |
| | |
| Questions? | | Call800-225-2606 or go tomfs.com. |
46
| | |
| Who we are |
| Who is providing this notice? | | MFS Funds, MFS Investment Management, MFS Institutional Advisors, Inc., and MFS Heritage Trust Company. |
| | |
| What we do |
| How does MFS protect my personal information? | | To protect your personal information from unauthorized access and use, we use security measures that comply with federal law. These measures include procedural, electronic, and physical safeguards for the protection of the personal information we collect about you. |
| How does MFS collect my personal information? | | We collect your personal information, for example, when you • open an account or provide account information • direct us to buy securities or direct us to sell your securities • make a wire transfer We also collect your personal information from others, such as credit bureaus, affiliates, or other companies. |
| Why can’t I limit all sharing? | | Federal law gives you the right to limit only • sharing for affiliates’ everyday business purposes – information about your creditworthiness • affiliates from using your information to market to you • sharing for nonaffiliates to market to you State laws and individual companies may give you additional rights to limit sharing. |
| | |
| Definitions |
| Affiliates | | Companies related by common ownership or control. They can be financial and nonfinancial companies. • MFS does not share personal information with affiliates, except for everyday business purposes as described on page one of this notice. |
| Nonaffiliates | | Companies not related by common ownership or control. They can be financial and nonfinancial companies. • MFS does not share with nonaffiliates so they can market to you. |
| Joint marketing | | A formal agreement between nonaffiliated financial companies that together market financial products or services to you. • MFS doesn’t jointly market. |
| | |
| Other important information |
| If you own an MFS product or receive an MFS service in the name of a third party such as a bank or broker-dealer, their privacy policy may apply to you instead of ours. |
47

Save paper with eDelivery.

| MFS® will send you prospectuses, |
reports, and proxies directly viae-mail so you will get information faster with less mailbox clutter.
To sign up:
1. Go to mfs.com.
2. Log in via MFS® Access.
3. Select eDelivery.
If you own your MFS fund shares through a financial institution or a retirement plan, MFS® TALK, MFS® Access, or eDelivery may not be available to you.
CONTACT
WEB SITE
mfs.com
MFS TALK
1-800-637-8255
24 hours a day
ACCOUNT SERVICE AND LITERATURE
Shareholders
1-800-225-2606
Financial advisors
1-800-343-2829
Retirement plan services
1-800-637-1255
MAILING ADDRESS
MFS Service Center, Inc.
P.O. Box 219341
Kansas City, MO 64121-9341
OVERNIGHT MAIL
MFS Service Center, Inc.
Suite 219341
430 W 7th Street
Kansas City, MO 64105-1407
Annual Report
January 31, 2019

MFS® High Income Fund

Beginning on January 1, 2021, as permitted by regulations adopted by the U.S. Securities and Exchange Commission, paper copies of the fund’s annual and semiannual shareholder reports will no longer be sent by mail, unless you specifically request paper copies of the reports. Instead, the complete reports will be made available on the fund’s Web site (funds.mfs.com), and you will be notified by mail each time a report is posted and provided with a Web site link to access the report.
If you are already signed up to receive shareholder reports by email, you will not be affected by this change and you need not take any action. You may sign up to receive shareholder reports and other communications from the fund by email by contacting your financial intermediary (such as a broker-dealer or bank) or, if you hold your shares directly with the fund, by calling 1-800-225-2606 or by logging on to MFS Access at mfs.com.
Beginning on January 1, 2019, you may elect to receive all future reports in paper free of charge. Contact your financial intermediary to request that you continue to receive paper copies of your shareholder reports. If you invest directly with the fund, you can call 1-800-225-2606 or send an email request to orderliterature@mfs.com to let the fund know that you wish to continue receiving paper copies of your shareholder reports. Your election to receive reports in paper will apply to all funds held in your account if you invest through your financial intermediary or all funds held with the MFS fund complex if you invest directly.
MFH-ANN
MFS® High Income Fund
CONTENTS
The report is prepared for the general information of shareholders.
It is authorized for distribution to prospective investors only when preceded or accompanied by a current prospectus.
NOT FDIC INSURED• MAY LOSE VALUE• NO BANK GUARANTEE

LETTER FROM THE EXECUTIVE CHAIRMAN
Dear Shareholders:
Higher interest rates, international trade friction, and geopolitical uncertainty surrounding issues such as Brexit have contributed to an uptick in market volatility in recent quarters — a departure from thelow-volatility environment that has prevailed for much of the past
several years. Against this more challenging backdrop, equity markets in the United States have outperformed most international markets on a relative basis over the past 12 months, though broad market returns have been modestly negative on an absolute basis. Global economic growth has become less synchronized over the past few quarters, with Europe, China, and some emerging markets having shown signs of significantly slowing growth. While U.S. growth has remained above average, its pace slowed in the second half of 2018.
A decelerating global economy and tighter financial conditions have prompted the U.S. Federal Reserve to reassess its monetary policy outlook. Fed chairman Jerome Powell recently acknowledged that the next change in policy rates could be either a hike or a cut, suggesting that the tightening cycle begun in late 2015 may have come to an
end. The Fed has also signaled that it is likely to maintain a larger-than-expected balance sheet, meaning that monetary conditions will likely tighten less over time than earlier feared. U.S. tax reforms adopted in late 2017 have been welcomed by equity markets while emerging market economies have recently had to contend with tighter financial conditions as a result of firmer U.S. short-term interest rates, declining equity valuations, and a stronger dollar. With the Republicans losing control of the U.S. House of Representatives, further meaningful U.S. fiscal stimulus appears less likely over the remainder of this presidential term. The recent partial U.S. government shutdown has also added to political uncertainty as the competing budgetary priorities of the House of Representatives and the White House will likely remain a source of friction going forward.
Globally, inflation remains largely subdued thanks in part to lower oil prices, but tight labor markets will keep investors on the lookout for its potential reappearance. Increased U.S. protectionism is also a growing concern, as investors fear trade disputes could dampen business sentiment, leading to even slower global growth. While there has been progress on this front — a NAFTA replacement has been worked out between the U.S., Mexico, and Canada; the free trade pact with Korea has been updated; and a negotiating framework with the European Union has been agreed upon — tensions between the U.S. and China remain high, though the two sides recently returned to the negotiating table.
As a global investment manager with nearly a century of expertise, MFS® firmly believes active risk management offers downside mitigation and may help improve investment outcomes. We built our active investment platform with this belief in mind. Our long-term perspective influences nearly every aspect of our business, ensuring that our investment decisions align with the investing time horizons of our clients.
Respectfully,

Robert J. Manning
Executive Chairman
MFS Investment Management
March 19, 2019
The opinions expressed in this letter are subject to change and may not be relied upon for investment advice. No forecasts can be guaranteed.
1
PORTFOLIO COMPOSITION
Portfolio structure (i)
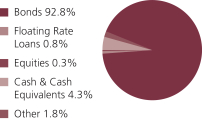
| | | | |
| Top five industries (i) | |
| Cable TV | | | 8.6% | |
| Midstream | | | 5.5% | |
| Medical & Health Technology & Services | | | 5.3% | |
| Wireless Communications | | | 5.0% | |
| Energy – Independent | | | 4.9% | |
| | | | |
| Composition including fixed income credit quality (a)(i) | |
| BBB | | | 1.9% | |
| BB | | | 50.0% | |
| B | | | 34.6% | |
| CCC | | | 8.5% | |
| CC | | | 0.3% | |
| C (o) | | | 0.0% | |
| Not Rated | | | (1.7)% | |
| Non-Fixed Income | | | 0.3% | |
| Cash & Cash Equivalents | | | 4.3% | |
| Other | | | 1.8% | |
|
| Portfolio facts (i) | |
| Average Duration (d) | | | 3.9 | |
| Average Effective Maturity (m) | | | 6.4 yrs. | |
| (a) | For all securities other than those specifically described below, ratings are assigned to underlying securities utilizing ratings from Moody’s, Fitch, and Standard & Poor’s rating agencies and applying the following hierarchy: If all three agencies provide a rating, the middle rating (after dropping the highest and lowest ratings) is assigned; if two of the three agencies rate a security, the lower of the two is assigned. Ratings are shown in the S&P and Fitch scale (e.g., AAA). Securities rated BBB or higher are considered investment grade. All ratings are subject to change. Not Rated includes fixed income securities and fixed income derivatives, which have not been rated by any rating agency.Non-Fixed Income includes any equity securities (including convertible bonds and equity derivatives) and/or commodity-linked derivatives. The fund may or may not have held all of these instruments on this date. The fund is not rated by these agencies. |
| (d) | Duration is a measure of how much a bond’s price is likely to fluctuate with general changes in interest rates, e.g., if rates rise 1.00%, a bond with a5-year duration is likely to lose about 5.00% of its value due to the interest rate move. |
| (i) | For purposes of this presentation, the components include the value of securities, and reflect the impact of the equivalent exposure of derivative positions, if any. These amounts may be negative from time to time. Equivalent exposure is a calculated amount that translates the derivative position into a reasonable approximation of the amount of the underlying asset that the portfolio would have to hold at a given point in time to have the same price sensitivity that results from the portfolio’s ownership of the derivative contract. When dealing with derivatives, equivalent exposure is a more representative measure of the potential impact of a position on portfolio performance than value. The bond component will include any accrued interest amounts. |
2
Portfolio Composition – continued
| (m) | In determining each instrument’s effective maturity for purposes of calculating the fund’s dollar-weighted average effective maturity, MFS uses the instrument’s stated maturity or, if applicable, an earlier date on which MFS believes it is probable that a maturity-shortening device (such as a put,pre-refunding or prepayment) will cause the instrument to be repaid. Such an earlier date can be substantially shorter than the instrument’s stated maturity. |
Where the fund holds convertible bonds, they are treated as part of the equity portion of the portfolio.
Cash & Cash Equivalents includes any cash, investments in money market funds, short-term securities, and other assets less liabilities. Please see the Statement of Assets and Liabilities for additional information related to the fund’s cash position and other assets and liabilities.
Other includes equivalent exposure from currency derivatives and/or any offsets to derivative positions.
Percentages are based on net assets as of January 31, 2019.
The portfolio is actively managed and current holdings may be different.
3
MANAGEMENT REVIEW
Summary of Results
For the twelve months ended January 31, 2019, Class A shares of the MFS High Income Fund (“fund”) provided a total return of 0.68%, at net asset value. This compares with a return of 1.73% for the fund’s benchmark, the Bloomberg Barclays U.S. High-Yield Corporate Bond 2% Issuer Capped Index.
Market Environment
The global economy decelerated during the reporting period, led by weakness in China and Europe as business and investor sentiment was undermined by growing trade frictions. Slower growth, along with tighter financial conditions, contributed to an uptick in market volatility late in the period. Equity valuations fell and credit spreads widened, fueled in part by concerns that the US Federal Reserve was on course to further tighten monetary policy after it lifted rates for a fourth time during the period and indicated its intention to hike several more times while allowing its balance sheet to run off at its predetermined pace.
The market’s negative reaction to these policy signals prompted the Fed to reverse course at the end of the period and indicated that its policy was on hold as inflation pressures abated. The Fed also indicated that it will maintain a larger balance sheet than it had previously. These dovish shifts helped equity valuations rebound, reduced volatility and narrowed credit spreads. Central banks globally are tilting more dovish as well, with China lowering reserve requirements, The Bank of Canada and Bank of England holding rates steady and the European Central Bank acknowledging that it may not be able to hike rates in the fall of 2019 as it had earlier projected.
Emerging markets experienced considerable volatility during the period as tighter global financial conditions exposed structural weakness in some countries. Those pressures were somewhat relieved at the end of the period as the Fed adopted its more dovish posture. However, slowing global growth and ongoing trade frictions remained concerns.
From a geopolitical perspective, a fractious Eurosceptic Italian coalition government, large-scale protests in France over stagnant wages and news that Germany’s Angela Merkel will not seek another term as chancellor were sources of uncertainty in Europe. In emerging markets, new Brazilian president Jair Bolsanaro took office, with markets generally encouraged by his market-friendly agenda. In contrast, markets were nervous about the less-market-friendly approach of Mexico’s new president Andres Manuel Lopez Obrador. For much of the period, the contentiousUS-China trading relationship was a drag on global sentiment, although tentative signs of progress toward resolution helped steady markets late in the period. Concerns persisted about slowing Chinese economic activity.
Detractors from Performance
Relative to the Bloomberg Barclays U.S. High-Yield Corporate Bond 2% Issuer Capped Index, the fund’s lesser exposure to “C”-rated (r) securities held back relative performance. Security selection within “B”-rated bonds, particularly within both thecommunicationsandenergysectors, also detracted from relative returns. Within the
4
Management Review – continued
communicationssector, holding bonds of wireless services provider Digicel, and an overweight position in fiber-based bandwidth infrastructure provider Zayo Group, negatively impacted relative results. Within theenergysector, overweight positions in oil & gas producer Alta Mesa and offshore drilling company Diamond Offshore Drilling also weakened relative returns. The fund’s security selection within theelectric utilitysector further weighed on relative results led by overweight positions in waste management services provider Covanta and electric energy services provider NRG Yield Operating.
Contributors to Performance
An underweight allocation to “CCC”-rated bonds, particularly within theenergysector, and an overweight allocation and security selection within “BB”-rated bonds, contributed to the fund’s relative performance. Within “BB”-rated bonds, overweight exposures to aircraft leasing company Park Aerospace and healthcare insurance provider Centene Escrow boosted relative results. Favorable security selection within thebasic industrysector was another positive factor for relative returns. The fund’s shorter duration (d) stance at the beginning of the reporting period as interest rates generally rose, and its longer duration stance towards the end of the reporting period as yields tightened, also benefited relative performance.
Respectfully,
Portfolio Manager(s)
David Cole and Michael Skatrud
| (d) | Duration is a measure of how much a bond’s price is likely to fluctuate with general changes in interest rates, e.g., if rates rise 1.00%, a bond with a5-year duration is likely to lose about 5.00% of its value. |
| (r) | Bonds rated “BBB”, “Baa”, or higher are considered investment grade; bonds rated “BB”, “Ba”, or below are considerednon-investment grade. The source for bond quality ratings is Moody’s Investors Service, Standard & Poor’s and Fitch, Inc. and are applied using the following hierarchy: If all three agencies provide a rating, the middle rating (after dropping the highest and lowest ratings) is assigned; if two of the three agencies rate a security, the lower of the two is assigned. Ratings are shown in the S&P and Fitch scale (e.g., AAA). For securities which are not rated by any of the three agencies, the security is considered Not Rated. |
Note to Shareholders: Effective March 1, 2018, Michael Skatrud became a Portfolio Manager of the Fund. Effective September 1, 2018, William Adams is no longer a Portfolio Manager of the Fund.
The views expressed in this report are those of the portfolio manager(s) only through the end of the period of the report as stated on the cover and do not necessarily reflect the views of MFS or any other person in the MFS organization. These views are subject to change at any time based on market or other conditions, and MFS disclaims any responsibility to update such views. These views may not be relied upon as investment advice or an indication of trading intent on behalf of any MFS portfolio. References to specific securities are not recommendations of such securities, and may not be representative of any MFS portfolio’s current or future investments.
5
PERFORMANCE SUMMARYTHROUGH 1/31/19
The following chart illustrates a representative class of the fund’s historical performance in comparison to its benchmark(s). Performance results include the deduction of the maximum applicable sales charge and reflect the percentage change in net asset value, including reinvestment of dividends and capital gains distributions. The performance of other share classes will be greater than or less than that of the class depicted below. Benchmarks are unmanaged and may not be invested in directly. Benchmark returns do not reflect sales charges, commissions or expenses. (See Notes to Performance Summary.)
Performance data shown represents past performance and is no guarantee of future results. Investment return and principal value fluctuate so your shares, when sold, may be worth more or less than the original cost; current performance may be lower or higher than quoted. The performance shown does not reflect the deduction of taxes, if any, that a shareholder would pay on fund distributions or the redemption of fund shares.
Growth of a Hypothetical $10,000 Investment
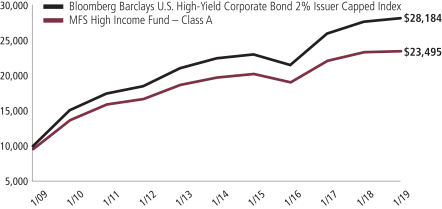
6
Performance Summary – continued
Total Returns through 1/31/19
Average annual without sales charge
| | | | | | | | | | | | | | |
| | | Share Class | | Class Inception Date | | 1-yr | | 5-yr | | 10-yr | | Life (t) | | |
| | | A | | 2/17/78 | | 0.68% | | 3.54% | | 9.39% | | N/A | | |
| | | B | | 9/27/93 | | (0.07)% | | 2.76% | | 8.54% | | N/A | | |
| | | C | | 1/03/94 | | 0.23% | | 2.77% | | 8.57% | | N/A | | |
| | | I | | 1/02/97 | | 0.92% | | 3.79% | | 9.63% | | N/A | | |
| | | R1 | | 4/01/05 | | (0.07)% | | 2.76% | | 8.54% | | N/A | | |
| | | R2 | | 10/31/03 | | 0.72% | | 3.28% | | 9.12% | | N/A | | |
| | | R3 | | 4/01/05 | | 0.98% | | 3.53% | | 9.39% | | N/A | | |
| | | R4 | | 4/01/05 | | 1.23% | | 3.79% | | 9.66% | | N/A | | |
| | | R6 | | 6/01/12 | | 1.33% | | 3.89% | | N/A | | 5.41% | | |
| | | 529A | | 7/31/02 | | 0.93% | | 3.50% | | 9.33% | | N/A | | |
| | | 529B | | 7/31/02 | | 0.17% | | 2.71% | | 8.51% | | N/A | | |
| | | 529C | | 7/31/02 | | (0.12)% | | 2.71% | | 8.47% | | N/A | | |
| | | | | |
| Comparative benchmark(s) | | | | | | | | | | |
| | | Bloomberg Barclays U.S. High-Yield Corporate Bond 2%
Issuer Capped Index (f) | | 1.73% | | 4.61% | | 10.92% | | N/A | | |
|
| Average annual with sales charge |
| | | A
With Initial Sales Charge (4.25%) | | (3.60)% | | 2.64% | | 8.92% | | N/A | | |
| | | B
With CDSC (Declining over six years from 4% to 0%) (v) | | (3.91)% | | 2.43% | | 8.54% | | N/A | | |
| | | C
With CDSC (1% for 12 months) (v) | | (0.73)% | | 2.77% | | 8.57% | | N/A | | |
| | | 529A
With Initial Sales Charge (4.25%) | | (3.36)% | | 2.60% | | 8.86% | | N/A | | |
| | | 529B
With CDSC (Declining over six years from 4% to 0%) (v) | | (3.68)% | | 2.38% | | 8.51% | | N/A | | |
| | | 529C
With CDSC (1% for 12 months) (v) | | (1.08)% | | 2.71% | | 8.47% | | N/A | | |
CDSC – Contingent Deferred Sales Charge.
Class I, R1, R2, R3, R4, and R6 shares do not have a sales charge.
| (f) | Source: FactSet Research Systems Inc. |
| (t) | For the period from the class inception date through the stated period end (for those share classes with less than 10 years of performance history). No comparative benchmark performance information is provided for “life” periods. (See Notes to Performance Summary.) |
| (v) | Assuming redemption at the end of the applicable period. |
7
Performance Summary – continued
Benchmark Definition(s)
Bloomberg Barclays U.S. High-Yield Corporate Bond 2% Issuer Capped Index – a component of the Bloomberg Barclays U.S. High-Yield Corporate Bond Index, which measures performance of non-investment grade, fixed rate debt. The index limits the maximum exposure to any one issuer to 2%.
It is not possible to invest directly in an index.
Notes to Performance Summary
Class 529 shares are only available in conjunction with qualified tuition programs, such as the MFS 529 Savings Plan. There also is an additional fee, which is detailed in the program description, on qualified tuition programs. If this fee was reflected, the performance for Class 529 shares would have been lower. This annual fee is waived for Oregon residents and for those accounts with assets of $25,000 or more.
Average annual total return represents the average annual change in value for each share class for the periods presented. Life returns are presented where the share class has less than 10 years of performance history and represent the average annual total return from the class inception date to the stated period end date. As the fund’s share classes may have different inception dates, the life returns may represent different time periods and may not be comparable. As a result, no comparative benchmark performance information is provided for life periods.
Performance results reflect any applicable expense subsidies and waivers in effect during the periods shown. Without such subsidies and waivers the fund’s performance results would be less favorable. Please see the prospectus and financial statements for complete details.
Performance results do not include adjustments made for financial reporting purposes in accordance with U.S. generally accepted accounting principles and may differ from amounts reported in the financial highlights.
From time to time the fund may receive proceeds from litigation settlements, without which performance would be lower.
8
EXPENSE TABLE
Fund expenses borne by the shareholders during the period, August 1, 2018 through January 31, 2019
As a shareholder of the fund, you incur two types of costs: (1) transaction costs, including sales charges (loads) on certain purchase or redemption payments, and (2) ongoing costs, including management fees; distribution and service(12b-1) fees; and other fund expenses. This example is intended to help you understand your ongoing costs (in dollars) of investing in the fund and to compare these costs with the ongoing costs of investing in other mutual funds.
The example is based on an investment of $1,000 invested at the beginning of the period and held for the entire period August 1, 2018 through January 31, 2019.
The expenses include the payment of a portion of the transfer-agent-related expenses of MFS funds that invest in the fund. For further information, please see the Notes to Financial Statements.
Actual Expenses
The first line for each share class in the following table provides information about actual account values and actual expenses. You may use the information in this line, together with the amount you invested, to estimate the expenses that you paid over the period. Simply divide your account value by $1,000 (for example, an $8,600 account value divided by $1,000 = 8.6), then multiply the result by the number in the first line under the heading entitled “Expenses Paid During Period” to estimate the expenses you paid on your account during this period.
Hypothetical Example for Comparison Purposes
The second line for each share class in the following table provides information about hypothetical account values and hypothetical expenses based on the fund’s actual expense ratio and an assumed rate of return of 5% per year before expenses, which is not the fund’s actual return. The hypothetical account values and expenses may not be used to estimate the actual ending account balance or expenses you paid for the period. You may use this information to compare the ongoing costs of investing in the fund and other funds. To do so, compare this 5% hypothetical example with the 5% hypothetical examples that appear in the shareholder reports of the other funds.
Please note that the expenses shown in the table are meant to highlight your ongoing costs only and do not reflect any transactional costs, such as sales charges (loads). Therefore, the second line for each share class in the table is useful in comparing ongoing costs only, and will not help you determine the relative total costs of owning different funds. In addition, if these transactional costs were included, your costs would have been higher.
9
Expense Table – continued
| | | | | | | | | | | | | | | | | | |
Share Class | | | | Annualized Expense Ratio | | | Beginning Account Value 8/01/18 | | | Ending Account Value 1/31/19 | | | Expenses Paid During Period (p) 8/01/18-1/31/19 | |
| A | | Actual | | | 0.91% | | | | $1,000.00 | | | | $1,012.67 | | | | $4.62 | |
| | Hypothetical (h) | | | 0.91% | | | | $1,000.00 | | | | $1,020.62 | | | | $4.63 | |
| B | | Actual | | | 1.67% | | | | $1,000.00 | | | | $1,008.85 | | | | $8.46 | |
| | Hypothetical (h) | | | 1.67% | | | | $1,000.00 | | | | $1,016.79 | | | | $8.49 | |
| C | | Actual | | | 1.67% | | | | $1,000.00 | | | | $1,008.90 | | | | $8.46 | |
| | Hypothetical (h) | | | 1.67% | | | | $1,000.00 | | | | $1,016.79 | | | | $8.49 | |
| I | | Actual | | | 0.67% | | | | $1,000.00 | | | | $1,013.89 | | | | $3.40 | |
| | Hypothetical (h) | | | 0.67% | | | | $1,000.00 | | | | $1,021.83 | | | | $3.41 | |
| R1 | | Actual | | | 1.67% | | | | $1,000.00 | | | | $1,008.87 | | | | $8.46 | |
| | Hypothetical (h) | | | 1.67% | | | | $1,000.00 | | | | $1,016.79 | | | | $8.49 | |
| R2 | | Actual | | | 1.17% | | | | $1,000.00 | | | | $1,011.39 | | | | $5.93 | |
| | Hypothetical (h) | | | 1.17% | | | | $1,000.00 | | | | $1,019.31 | | | | $5.96 | |
| R3 | | Actual | | | 0.92% | | | | $1,000.00 | | | | $1,015.69 | | | | $4.67 | |
| | Hypothetical (h) | | | 0.92% | | | | $1,000.00 | | | | $1,020.57 | | | | $4.69 | |
| R4 | | Actual | | | 0.67% | | | | $1,000.00 | | | | $1,013.93 | | | | $3.40 | |
| | Hypothetical (h) | | | 0.67% | | | | $1,000.00 | | | | $1,021.83 | | | | $3.41 | |
| R6 | | Actual | | | 0.57% | | | | $1,000.00 | | | | $1,014.43 | | | | $2.89 | |
| | Hypothetical (h) | | | 0.57% | | | | $1,000.00 | | | | $1,022.33 | | | | $2.91 | |
| 529A | | Actual | | | 0.96% | | | | $1,000.00 | | | | $1,012.45 | | | | $4.87 | |
| | Hypothetical (h) | | | 0.96% | | | | $1,000.00 | | | | $1,020.37 | | | | $4.89 | |
| 529B | | Actual | | | 1.72% | | | | $1,000.00 | | | | $1,008.62 | | | | $8.71 | |
| | Hypothetical (h) | | | 1.72% | | | | $1,000.00 | | | | $1,016.53 | | | | $8.74 | |
| 529C | | Actual | | | 1.72% | | | | $1,000.00 | | | | $1,008.60 | | | | $8.71 | |
| | Hypothetical (h) | | | 1.72% | | | | $1,000.00 | | | | $1,016.53 | | | | $8.74 | |
| (h) | 5% class return per year before expenses. |
| (p) | “Expenses Paid During Period” are equal to each class’s annualized expense ratio, as shown above, multiplied by the average account value over the period, multiplied by 184/365 (to reflect theone-half year period). Expenses paid do not include any applicable sales charges (loads). If these transaction costs had been included, your costs would have been higher. |
Notes to Expense Table
Each class with a Rule12b-1 service fee is subject to a rebate of a portion of such fee. Such rebates are included in the expense ratios above. For Class A and Class 529A shares, this rebate reduced the expense ratios above by 0.01%. See Note 3 in the Notes to Financial Statements for additional information.
10
PORTFOLIO OF INVESTMENTS
1/31/19
The Portfolio of Investments is a complete list of all securities owned by your fund. It is categorized by broad-based asset classes.
| | | | | | | | |
| Bonds - 93.2% | | | | | | | | |
| | |
| Issuer | | Shares/Par | | | Value ($) | |
| Aerospace - 0.9% | | | | | | | | |
| Bombardier, Inc., 7.5%, 3/15/2025 (n) | | $ | 2,650,000 | | | $ | 2,553,938 | |
| TransDigm, Inc., 6.5%, 7/15/2024 | | | 4,015,000 | | | | 3,959,794 | |
| TransDigm, Inc., 6.25%, 3/15/2026 (z) | | | 4,542,000 | | | | 4,610,130 | |
| TransDigm, Inc., 6.375%, 6/15/2026 | | | 2,815,000 | | | | 2,709,437 | |
| | | | | | | | |
| | | | | | | $ | 13,833,299 | |
| Asset-Backed & Securitized - 0.0% | | | | | | | | |
| CW Capital Cobalt Commercial Mortgage Trust, CDO, “F”, FLR, 4.065% (LIBOR - 3mo. + 1.3%), 4/26/2050 (p)(z) | | $ | 733,222 | | | $ | 73 | |
| CW Capital Cobalt Commercial Mortgage Trust, CDO, “G”, FLR, 4.265% (LIBOR - 3mo. + 1.5%), 4/26/2050 (p)(z) | | | 2,314,633 | | | | 232 | |
| Lehman Brothers Commercial Conduit Mortgage Trust, 1.119%, 2/18/2030 (i) | | | 178,428 | | | | 2 | |
| | | | | | | | |
| | | | | | | $ | 307 | |
| Automotive - 1.4% | | | | | | | | |
| Allison Transmission, Inc., 5%, 10/01/2024 (n) | | $ | 12,478,000 | | | $ | 12,275,232 | |
| IHO Verwaltungs GmbH, 4.75%, (4.75% cash or 5.5% PIK) 9/15/2026 (n)(p) | | | 7,240,000 | | | | 6,552,200 | |
| Jaguar Land Rover Automotive PLC, 4.5%, 10/01/2027 (n) | | | 1,675,000 | | | | 1,239,500 | |
| | | | | | | | |
| | | | | | | $ | 20,066,932 | |
| Broadcasting - 2.9% | | | | | | | | |
| Liberty Media Corp. - Liberty Formula One, 8.5%, 7/15/2029 | | $ | 5,450,000 | | | $ | 5,531,750 | |
| Liberty Media Corp. - Liberty Formula One, 8.25%, 2/01/2030 | | | 2,480,000 | | | | 2,511,000 | |
| Match Group, Inc., 6.375%, 6/01/2024 | | | 6,560,000 | | | | 6,855,200 | |
| Netflix, Inc., 5.875%, 2/15/2025 | | | 5,390,000 | | | | 5,583,771 | |
| Netflix, Inc., 4.875%, 4/15/2028 | | | 1,900,000 | | | | 1,807,375 | |
| Netflix, Inc., 5.875%, 11/15/2028 (n) | | | 7,590,000 | | | | 7,694,362 | |
| Netflix, Inc., 4.625%, 5/15/2029 (n) | | EUR | 2,745,000 | | | | 3,165,491 | |
| WMG Acquisition Corp., 5%, 8/01/2023 (n) | | $ | 1,780,000 | | | | 1,766,650 | |
| WMG Acquisition Corp., 4.875%, 11/01/2024 (n) | | | 6,050,000 | | | | 5,929,000 | |
| WMG Acquisition Corp., 5.5%, 4/15/2026 (n) | | | 1,490,000 | | | | 1,471,375 | |
| | | | | | | | |
| | | | | | | $ | 42,315,974 | |
| Building - 4.3% | | | | | | | | |
| ABC Supply Co., Inc., 5.75%, 12/15/2023 (n) | | $ | 7,605,000 | | | $ | 7,814,137 | |
| ABC Supply Co., Inc., 5.875%, 5/15/2026 (n) | | | 4,970,000 | | | | 4,980,686 | |
| Beacon Escrow Corp., 4.875%, 11/01/2025 (n) | | | 6,705,000 | | | | 6,244,031 | |
| Core & Main LP, 6.125%, 8/15/2025 (z) | | | 2,500,000 | | | | 2,381,250 | |
11
Portfolio of Investments – continued
| | | | | | | | |
| | |
| Issuer | | Shares/Par | | | Value ($) | |
| Bonds - continued | | | | | | | | |
| Building - continued | | | | | | | | |
| James Hardie International Finance Ltd., 4.75%, 1/15/2025 (n) | | $ | 1,115,000 | | | $ | 1,059,250 | |
| James Hardie International Finance Ltd., 5%, 1/15/2028 (n) | | | 5,035,000 | | | | 4,531,500 | |
| NCI Building Systems, Inc., 8%, 4/15/2026 (n) | | | 2,660,000 | | | | 2,517,025 | |
| New Enterprise Stone & Lime Co., Inc., 10.125%, 4/01/2022 (n) | | | 6,150,000 | | | | 6,150,000 | |
| New Enterprise Stone & Lime Co., Inc., 6.25%, 3/15/2026 (n) | | | 4,888,000 | | | | 4,668,040 | |
| PriSo Acquisition Corp., 9%, 5/15/2023 (n) | | | 2,646,000 | | | | 2,646,000 | |
| Standard Industries, Inc., 5.375%, 11/15/2024 (n) | | | 3,680,000 | | | | 3,652,400 | |
| Standard Industries, Inc., 6%, 10/15/2025 (n) | | | 8,935,000 | | | | 8,979,675 | |
| Summit Materials LLC/Summit Materials Finance Co., 6.125%, 7/15/2023 | | | 6,865,000 | | | | 6,914,428 | |
| Summit Materials LLC/Summit Materials Finance Co., 5.125%, 6/01/2025 (n) | | | 1,720,000 | | | | 1,614,650 | |
| | | | | | | | |
| | | | | | | $ | 64,153,072 | |
| Business Services - 4.1% | | | | | | | | |
| Alliance Data Systems Corp., 5.875%, 11/01/2021 (n) | | $ | 2,155,000 | | | $ | 2,171,162 | |
| CDK Global, Inc., 4.875%, 6/01/2027 | | | 8,050,000 | | | | 7,808,500 | |
| Equinix, Inc., 5.375%, 4/01/2023 | | | 3,135,000 | | | | 3,170,269 | |
| Equinix, Inc., 5.75%, 1/01/2025 | | | 4,260,000 | | | | 4,398,450 | |
| Equinix, Inc., 5.875%, 1/15/2026 | | | 3,720,000 | | | | 3,842,016 | |
| Financial & Risk U.S. Holdings, Inc., 8.25%, 11/15/2026 (n) | | | 6,195,000 | | | | 5,807,812 | |
| First Data Corp., 5%, 1/15/2024 (n) | | | 11,495,000 | | | | 11,746,453 | |
| MSCI, Inc., 4.75%, 8/01/2026 (n) | | | 6,075,000 | | | | 6,052,219 | |
| Travelport Worldwide Ltd., 6%, 3/15/2026 (n) | | | 3,675,000 | | | | 3,801,310 | |
| Vantiv LLC/Vantiv Issuer Corp., 4.375%, 11/15/2025 (n) | | | 7,510,000 | | | | 7,209,450 | |
| Verscend Escrow Corp., 9.75%, 8/15/2026 (n) | | | 3,860,000 | | | | 3,886,248 | |
| | | | | | | | |
| | | | | | | $ | 59,893,889 | |
| Cable TV - 8.4% | | | | | | | | |
| Altice Financing S.A., 6.625%, 2/15/2023 (n) | | $ | 2,690,000 | | | $ | 2,704,257 | |
| Altice Financing S.A., 7.5%, 5/15/2026 (n) | | | 925,000 | | | | 876,438 | |
| CCO Holdings LLC/CCO Holdings Capital Corp., 5.75%, 1/15/2024 | | | 10,830,000 | | | | 11,046,600 | |
| CCO Holdings LLC/CCO Holdings Capital Corp., 5.375%, 5/01/2025 (n) | | | 2,185,000 | | | | 2,196,581 | |
| CCO Holdings LLC/CCO Holdings Capital Corp., 5.75%, 2/15/2026 (n) | | | 12,525,000 | | | | 12,712,875 | |
| CCO Holdings LLC/CCO Holdings Capital Corp., 5.875%, 5/01/2027 (n) | | | 5,765,000 | | | | 5,781,142 | |
| CSC Holdings LLC, 5.5%, 5/15/2026 (n) | | | 5,145,000 | | | | 5,093,550 | |
| CSC Holdings LLC, 5.5%, 4/15/2027 (n) | | | 12,105,000 | | | | 11,832,395 | |
| CSC Holdings LLC, 7.5%, 4/01/2028 (n) | | | 3,705,000 | | | | 3,806,887 | |
| DISH DBS Corp., 5.875%, 11/15/2024 | | | 2,670,000 | | | | 2,212,763 | |
12
Portfolio of Investments – continued
| | | | | | | | |
| | |
| Issuer | | Shares/Par | | | Value ($) | |
| Bonds - continued | | | | | | | | |
| Cable TV - continued | | | | | | | | |
| Intelsat Connect Finance, 9.5%, 2/15/2023 (n) | | $ | 1,995,000 | | | $ | 1,865,325 | |
| Intelsat Jackson Holdings S.A., 5.5%, 8/01/2023 | | | 7,085,000 | | | | 6,447,350 | |
| Sirius XM Radio, Inc., 4.625%, 5/15/2023 (n) | | | 2,750,000 | | | | 2,746,563 | |
| Sirius XM Radio, Inc., 6%, 7/15/2024 (n) | | | 8,125,000 | | | | 8,439,844 | |
| Sirius XM Radio, Inc., 5.375%, 4/15/2025 (n) | | | 2,785,000 | | | | 2,819,812 | |
| Telenet Finance Luxembourg S.A., 5.5%, 3/01/2028 (n) | | | 9,600,000 | | | | 9,072,000 | |
| Unitymedia KabelBW GmbH, 6.125%, 1/15/2025 (n) | | | 7,195,000 | | | | 7,428,837 | |
| Videotron Ltd., 5.375%, 6/15/2024 (n) | | | 1,535,000 | | | | 1,603,154 | |
| Videotron Ltd., 5.125%, 4/15/2027 (n) | | | 9,755,000 | | | | 9,779,387 | |
| Virgin Media Finance PLC, 5.75%, 1/15/2025 (n) | | | 1,125,000 | | | | 1,108,553 | |
| Virgin Media Secured Finance PLC, 5.25%, 1/15/2026 (n) | | | 7,210,000 | | | | 7,101,850 | |
| Ziggo Bond Finance B.V., 5.875%, 1/15/2025 (n) | | | 7,610,000 | | | | 7,134,375 | |
| | | | | | | | |
| | | | | | | $ | 123,810,538 | |
| Chemicals - 2.8% | | | | | | | | |
| Axalta Coating Systems Co., 4.875%, 8/15/2024 (n) | | $ | 8,090,000 | | | $ | 7,897,862 | |
| Consolidated Energy Finance S.A., 6.875%, 6/15/2025 (n) | | | 4,769,000 | | | | 4,697,465 | |
| OCI N.V., 6.625%, 4/15/2023 (n) | | | 8,005,000 | | | | 8,225,137 | |
| PolyOne Corp., 5.25%, 3/15/2023 | | | 6,075,000 | | | | 6,105,375 | |
| SPCM S.A., 4.875%, 9/15/2025 (n) | | | 9,385,000 | | | | 8,821,900 | |
| Starfruit U.S. Holding Co. LLC/Starfruit Finance B.V. , 6.5%, 10/01/2026 (n) | | EUR | 3,575,000 | | | | 3,942,180 | |
| Starfruit U.S. Holding Co. LLC/Starfruit Finance B.V. , 6.5%, 10/01/2026 | | | 1,195,000 | | | | 1,317,736 | |
| | | | | | | | |
| | | | | | | $ | 41,007,655 | |
| Computer Software - 0.6% | | | | | | | | |
| Diamond 1 Finance Corp./Diamond 2 Finance Corp., 5.875%, 6/15/2021 (n) | | $ | 5,440,000 | | | $ | 5,528,734 | |
| Diamond 1 Finance Corp./Diamond 2 Finance Corp., 6.02%, 6/15/2026 (n) | | | 3,320,000 | | | | 3,472,595 | |
| | | | | | | | |
| | | | | | | $ | 9,001,329 | |
| Computer Software - Systems - 1.7% | | | | | | | | |
| CDW LLC/CDW Finance Corp., 5.5%, 12/01/2024 | | $ | 1,425,000 | | | $ | 1,474,163 | |
| CDW LLC/CDW Finance Corp., 5%, 9/01/2025 | | | 2,190,000 | | | | 2,173,575 | |
| Fair Isaac Corp., 5.25%, 5/15/2026 (n) | | | 7,320,000 | | | | 7,356,600 | |
| JDA Software Group, Inc., 7.375%, 10/15/2024 (n) | | | 4,705,000 | | | | 4,787,337 | |
| Sabre GLBL, Inc., 5.375%, 4/15/2023 (n) | | | 9,280,000 | | | | 9,396,000 | |
| | | | | | | | |
| | | | | | | $ | 25,187,675 | |
| Conglomerates - 3.8% | | | | | | | | |
| Amsted Industries Co., 5%, 3/15/2022 (n) | | $ | 9,520,000 | | | $ | 9,424,800 | |
| BWX Technologies, Inc., 5.375%, 7/15/2026 (n) | | | 6,440,000 | | | | 6,504,400 | |
13
Portfolio of Investments – continued
| | | | | | | | |
| | |
| Issuer | | Shares/Par | | | Value ($) | |
| Bonds - continued | | | | | | | | |
| Conglomerates - continued | | | | | | | | |
| CFX Escrow Corp., 6%, 2/15/2024 (z) | | $ | 1,325,000 | | | $ | 1,325,000 | |
| CFX Escrow Corp., 6.375%, 2/15/2026 (z) | | | 860,000 | | | | 860,000 | |
| EnerSys, 5%, 4/30/2023 (n) | | | 11,775,000 | | | | 11,686,687 | |
| Entegris, Inc., 4.625%, 2/10/2026 (n) | | | 9,800,000 | | | | 9,506,000 | |
| Gates Global LLC, 6%, 7/15/2022 (n) | | | 3,312,000 | | | | 3,329,554 | |
| Stevens Holding Co., Inc., 6.125%, 10/01/2026 (n) | | | 6,475,000 | | | | 6,542,211 | |
| TriMas Corp., 4.875%, 10/15/2025 (n) | | | 7,835,000 | | | | 7,599,950 | |
| | | | | | | | |
| | | | | | | $ | 56,778,602 | |
| Construction - 1.1% | | | | | | | | |
| Empresas ICA S.A.B. de C.V., 8.875%, 5/29/2024 (a)(d)(n) | | $ | 1,546,000 | | | $ | 243,495 | |
| Empresas ICA S.A.B. de C.V., 8.9%, 2/04/2021 (a)(d) | | | 2,555,000 | | | | 402,413 | |
| Mattamy Group Corp., 6.5%, 10/01/2025 (n) | | | 7,680,000 | | | | 7,123,200 | |
| Toll Brothers Finance Corp., 4.875%, 11/15/2025 | | | 2,665,000 | | | | 2,591,712 | |
| Toll Brothers Finance Corp., 4.35%, 2/15/2028 | | | 6,505,000 | | | | 5,919,550 | |
| | | | | | | | |
| | | | | | | $ | 16,280,370 | |
| Consumer Products - 0.7% | | | | | | | | |
| Coty, Inc., 6.5%, 4/15/2026 (n) | | $ | 3,490,000 | | | $ | 3,141,000 | |
| Energizer Holdings, Inc., 6.375%, 7/15/2026 (n) | | | 6,155,000 | | | | 5,985,738 | |
| Energizer Holdings, Inc., 7.75%, 1/15/2027 (z) | | | 455,000 | | | | 468,809 | |
| | | | | | | | |
| | | | | | | $ | 9,595,547 | |
| Consumer Services - 1.8% | | | | | | | | |
| Cimpress N.V., 7%, 6/15/2026 (n) | | $ | 5,250,000 | | | $ | 5,118,750 | |
| Frontdoor, Inc., 6.75%, 8/15/2026 (n) | | | 5,290,000 | | | | 5,250,325 | |
| Matthews International Corp., 5.25%, 12/01/2025 (n) | | | 5,390,000 | | | | 5,080,075 | |
| NVA Holdings, Inc., 6.875%, 4/01/2026 (n) | | | 5,465,000 | | | | 5,217,436 | |
| ServiceMaster Co. LLC, 5.125%, 11/15/2024 (n) | | | 6,705,000 | | | | 6,554,137 | |
| | | | | | | | |
| | | | | | | $ | 27,220,723 | |
| Containers - 4.7% | | | | | | | | |
| ARD Finance S.A., 6.625%, 9/15/2023 | | EUR | 1,940,000 | | | $ | 2,126,152 | |
| ARD Finance S.A., 7.125%, 9/15/2023 | | $ | 4,600,000 | | | | 4,439,000 | |
| ARD Securities Finance, 8.75%, (8.75% cash or 8.75% PIK) 1/31/2023 (n)(p) | | | 3,449,593 | | | | 2,871,786 | |
| Berry Global Group, Inc., 5.5%, 5/15/2022 | | | 2,865,000 | | | | 2,883,737 | |
| Berry Global Group, Inc., 6%, 10/15/2022 | | | 4,140,000 | | | | 4,233,150 | |
| BWAY Holding Co., Inc., 7.25%, 4/15/2025 (n) | | | 2,605,000 | | | | 2,403,113 | |
| Crown American LLC, 4.5%, 1/15/2023 | | | 5,430,000 | | | | 5,457,150 | |
| Crown Americas LLC/Crown Americas Capital Corp. V, 4.25%, 9/30/2026 | | | 4,805,000 | | | | 4,564,750 | |
14
Portfolio of Investments – continued
| | | | | | | | |
| | |
| Issuer | | Shares/Par | | | Value ($) | |
| Bonds - continued | | | | | | | | |
| Containers - continued | | | | | | | | |
| Crown Americas LLC/Crown Americas Capital Corp. VI, 4.75%, 2/01/2026 | | $ | 2,790,000 | | | $ | 2,734,200 | |
| Flex Acquisition Co., Inc., 6.875%, 1/15/2025 (n) | | | 5,360,000 | | | | 5,011,600 | |
| Multi-Color Corp., 6.125%, 12/01/2022 (n) | | | 7,761,000 | | | | 7,819,207 | |
| Reynolds Group, 5.75%, 10/15/2020 | | | 2,674,737 | | | | 2,684,901 | |
| Reynolds Group, 5.125%, 7/15/2023 (n) | | | 4,330,000 | | | | 4,338,011 | |
| Reynolds Group, 7%, 7/15/2024 (n) | | | 1,450,000 | | | | 1,482,625 | |
| Sealed Air Corp., 4.875%, 12/01/2022 (n) | | | 6,300,000 | | | | 6,363,000 | |
| Silgan Holdings, Inc., 4.75%, 3/15/2025 | | | 5,270,000 | | | | 5,059,200 | |
| W/S Packaging Group, Inc., 9%, 4/15/2023 (n) | | | 4,880,000 | | | | 4,904,400 | |
| | | | | | | | |
| | | | | | | $ | 69,375,982 | |
| Electrical Equipment - 0.7% | | | | | | | | |
| CommScope Technologies LLC, 5%, 3/15/2027 (n) | | $ | 12,760,000 | | | $ | 10,876,624 | |
| | |
| Electronics - 1.2% | | | | | | | | |
| Qorvo, Inc., 5.5%, 7/15/2026 (n) | | $ | 6,070,000 | | | $ | 6,024,475 | |
| Sensata Technologies B.V., 5.625%, 11/01/2024 (n) | | | 4,215,000 | | | | 4,373,062 | |
| Sensata Technologies B.V., 5%, 10/01/2025 (n) | | | 7,065,000 | | | | 7,100,325 | |
| | | | | | | | |
| | | | | | | $ | 17,497,862 | |
| Emerging Market Quasi-Sovereign - 1.0% | | | | | | | | |
| DAE Funding LLC, 5.75%, 11/15/2023 (n) | | $ | 4,580,000 | | | $ | 4,625,800 | |
| DAE Funding LLC, 5%, 8/01/2024 (n) | | | 9,770,000 | | | | 9,603,910 | |
| | | | | | | | |
| | | | | | | $ | 14,229,710 | |
| Energy - Independent - 4.8% | | | | | | | | |
| Alta Mesa Holdings LP/Alta Mesa Finance Services Corp., 7.875%, 12/15/2024 | | $ | 6,945,000 | | | $ | 4,794,134 | |
| Callon Petroleum Co., 6.375%, 7/01/2026 | | | 6,650,000 | | | | 6,666,625 | |
| Carrizo Oil & Gas, Inc., 6.25%, 4/15/2023 | | | 3,080,000 | | | | 3,041,500 | |
| CrownRock LP/CrownRock Finance, Inc., 5.625%, 10/15/2025 (n) | | | 8,420,000 | | | | 8,083,200 | |
| Diamondback Energy, Inc., 5.375%, 5/31/2025 | | | 10,420,000 | | | | 10,673,206 | |
| Gulfport Energy Corp., 6%, 10/15/2024 | | | 4,340,000 | | | | 4,079,600 | |
| Indigo Natural Resources LLC, 6.875%, 2/15/2026 (n) | | | 4,125,000 | | | | 3,609,375 | |
| Magnolia Oil & Gas Operating LLC/Magnolia Oil & Gas Finance Corp., 6%, 8/01/2026 (n) | | | 6,445,000 | | | | 6,380,550 | |
| Oasis Petroleum, Inc., 6.25%, 5/01/2026 (n) | | | 5,195,000 | | | | 4,928,756 | |
| Parsley Energy LLC/Parsley Finance Corp., 5.25%, 8/15/2025 (n) | | | 1,585,000 | | | | 1,569,150 | |
| Parsley Energy LLC/Parsley Finance Corp., 5.625%, 10/15/2027 (n) | | | 10,225,000 | | | | 10,135,531 | |
| Sanchez Energy Corp., 6.125%, 1/15/2023 | | | 4,285,000 | | | | 749,875 | |
15
Portfolio of Investments – continued
| | | | | | | | |
| | |
| Issuer | | Shares/Par | | | Value ($) | |
| Bonds - continued | | | | | | | | |
| Energy - Independent - continued | | | | | | | | |
| SM Energy Co., 6.75%, 9/15/2026 | | $ | 6,600,000 | | | $ | 6,501,990 | |
| | | | | | | | |
| | | | | | | $ | 71,213,492 | |
| Entertainment - 1.7% | | | | | | | | |
| AMC Entertainment Holdings, Inc., 5.75%, 6/15/2025 | | $ | 2,650,000 | | | $ | 2,444,360 | |
| Constellation Merger Sub, Inc., 8.5%, 9/15/2025 (z) | | | 1,725,000 | | | | 1,658,156 | |
| Live Nation Entertainment, Inc., 5.625%, 3/15/2026 (n) | | | 6,750,000 | | | | 6,817,500 | |
| Six Flags Entertainment Corp., 4.875%, 7/31/2024 (n) | | | 13,565,000 | | | | 13,429,350 | |
| | | | | | | | |
| | | | | | | $ | 24,349,366 | |
| Financial Institutions - 1.2% | | | | | | | | |
| Avolon Holdings Funding Ltd., 5.125%, 10/01/2023 | | $ | 4,100,000 | | | $ | 4,162,320 | |
| Park Aerospace Holdings Ltd., 5.5%, 2/15/2024 (n) | | | 10,875,000 | | | | 11,038,125 | |
| Wand Merger Corp., 8.125%, 7/15/2023 (n) | | | 3,070,000 | | | | 3,107,454 | |
| | | | | | | | |
| | | | | | | $ | 18,307,899 | |
| Food & Beverages - 3.3% | | | | | | | | |
| Aramark Services, Inc., 4.75%, 6/01/2026 | | $ | 6,440,000 | | | $ | 6,327,300 | |
| Aramark Services, Inc., 5%, 2/01/2028 (n) | | | 4,040,000 | | | | 3,944,050 | |
| Cott Holdings, Inc., 5.5%, 4/01/2025 (n) | | | 8,775,000 | | | | 8,687,250 | |
| JBS USA LLC/JBS USA Finance, Inc., 6.75%, 2/15/2028 (n) | | | 4,935,000 | | | | 5,046,037 | |
| JBS USA Lux S.A./JBS USA Finance, Inc., 5.875%, 7/15/2024 (n) | | | 2,160,000 | | | | 2,181,600 | |
| Lamb Weston Holdings, Inc., 4.625%, 11/01/2024 (n) | | | 4,555,000 | | | | 4,532,225 | |
| Lamb Weston Holdings, Inc., 4.875%, 11/01/2026 (n) | | | 2,420,000 | | | | 2,399,430 | |
| Pilgrim’s Pride Corp., 5.875%, 9/30/2027 (n) | | | 8,190,000 | | | | 7,903,350 | |
| U.S. Foods Holding Corp., 5.875%, 6/15/2024 (n) | | | 7,555,000 | | | | 7,685,626 | |
| | | | | | | | |
| | | | | | | $ | 48,706,868 | |
| Gaming & Lodging - 4.1% | | | | | | | | |
| CCM Merger, Inc., 6%, 3/15/2022 (n) | | $ | 5,265,000 | | | $ | 5,317,650 | |
| GLP Capital LP/GLP Financing II, Inc., 5.375%, 11/01/2023 | | | 3,185,000 | | | | 3,284,499 | |
| GLP Capital LP/GLP Financing II, Inc., 5.25%, 6/01/2025 | | | 4,545,000 | | | | 4,645,126 | |
| GLP Capital LP/GLP Financing II, Inc., 5.375%, 4/15/2026 | | | 730,000 | | | | 745,571 | |
| Hilton Domestic Operating Co., Inc., 5.125%, 5/01/2026 (n) | | | 5,790,000 | | | | 5,833,425 | |
| Hilton Worldwide Finance LLC, 4.625%, 4/01/2025 | | | 7,420,000 | | | | 7,308,700 | |
| Marriot Ownership Resorts, Inc., 5.625%, 4/15/2023 (z) | | | 4,425,000 | | | | 4,358,625 | |
| MGM Resorts International, 6.625%, 12/15/2021 | | | 2,815,000 | | | | 2,973,203 | |
| MGM Resorts International, 6%, 3/15/2023 | | | 2,980,000 | | | | 3,091,750 | |
| MGM Resorts International, 5.75%, 6/15/2025 | | | 6,690,000 | | | | 6,723,450 | |
| Ryman Hospitality Properties, Inc., REIT, 5%, 4/15/2021 | | | 6,215,000 | | | | 6,222,769 | |
| Ryman Hospitality Properties, Inc., REIT, 5%, 4/15/2023 | | | 3,640,000 | | | | 3,653,650 | |
| Wyndham Hotels Group, LLC, 5.375%, 4/15/2026 (n) | | | 6,165,000 | | | | 6,165,000 | |
| | | | | | | | |
| | | | | | | $ | 60,323,418 | |
16
Portfolio of Investments – continued
| | | | | | | | |
| | |
| Issuer | | Shares/Par | | | Value ($) | |
| Bonds - continued | | | | | | | | |
| Industrial - 0.9% | | | | | | | | |
| Cleaver Brooks, Inc., 7.875%, 3/01/2023 (n) | | $ | 5,025,000 | | | $ | 4,974,750 | |
| KAR Auction Services, Inc., 5.125%, 6/01/2025 (n) | | | 8,255,000 | | | | 7,954,353 | |
| | | | | | | | |
| | | | | | | $ | 12,929,103 | |
| Insurance - Health - 0.8% | | | | | | | | |
| Centene Corp., 6.125%, 2/15/2024 | | $ | 3,530,000 | | | $ | 3,697,675 | |
| Centene Corp., 5.375%, 6/01/2026 (n) | | | 7,780,000 | | | | 8,032,850 | |
| | | | | | | | |
| | | | | | | $ | 11,730,525 | |
| Insurance - Property & Casualty - 0.7% | | | | | | | | |
| AssuredPartners Inc., 7%, 8/15/2025 (n) | | $ | 5,630,000 | | | $ | 5,376,650 | |
| Hub International Ltd., 7%, 5/01/2026 (n) | | | 5,805,000 | | | | 5,630,850 | |
| | | | | | | | |
| | | | | | | $ | 11,007,500 | |
| Machinery & Tools - 0.4% | | | | | | | | |
| Ashtead Capital, Inc., 5.625%, 10/01/2024 (n) | | $ | 5,925,000 | | | $ | 6,073,125 | |
| | |
| Major Banks - 0.5% | | | | | | | | |
| UBS Group AG, 6.875% to 8/07/2025, FLR (Swap Rate - 5yr. + 4.59%) to 12/29/2049 | | $ | 7,030,000 | | | $ | 7,039,715 | |
| | |
| Medical & Health Technology & Services - 4.9% | | | | | | | | |
| Acadia Healthcare Co., Inc., 5.625%, 2/15/2023 | | $ | 5,590,000 | | | $ | 5,492,175 | |
| Avantor, Inc., 9%, 10/01/2025 (n) | | | 5,300,000 | | | | 5,459,000 | |
| DaVita, Inc., 5%, 5/01/2025 | | | 3,955,000 | | | | 3,806,687 | |
| Encompass Health Corp., 5.75%, 9/15/2025 | | | 2,625,000 | | | | 2,651,250 | |
| HCA, Inc., 7.5%, 2/15/2022 | | | 6,000,000 | | | | 6,570,000 | |
| HCA, Inc., 5%, 3/15/2024 | | | 5,230,000 | | | | 5,441,815 | |
| HCA, Inc., 5.375%, 2/01/2025 | | | 8,315,000 | | | | 8,582,660 | |
| HCA, Inc., 5.875%, 2/15/2026 | | | 4,300,000 | | | | 4,536,500 | |
| HealthSouth Corp., 5.125%, 3/15/2023 | | | 5,855,000 | | | | 5,889,837 | |
| HealthSouth Corp., 5.75%, 11/01/2024 | | | 2,105,000 | | | | 2,128,681 | |
| Heartland Dental, LLC, 8.5%, 5/01/2026 (n) | | | 4,745,000 | | | | 4,436,575 | |
| Polaris, 8.5%, (8.5% cash or 8.5% PIK) 12/01/2022 (n)(p) | | | 3,735,000 | | | | 3,613,613 | |
| Quintiles IMS Holdings, Inc., 5%, 10/15/2026 (n) | | | 3,615,000 | | | | 3,619,519 | |
| Regional Care/LifePoint Health, Inc., 9.75%, 12/01/2026 (n) | | | 5,530,000 | | | | 5,517,834 | |
| West Street Merger Sub, Inc., 6.375%, 9/01/2025 (n) | | | 5,200,000 | | | | 4,706,000 | |
| | | | | | | | |
| | | | | | | $ | 72,452,146 | |
| Medical Equipment - 0.8% | | | | | | | | |
| Teleflex, Inc., 5.25%, 6/15/2024 | | $ | 5,595,000 | | | $ | 5,636,963 | |
| Teleflex, Inc., 4.875%, 6/01/2026 | | | 3,310,000 | | | | 3,325,557 | |
| Teleflex, Inc., 4.625%, 11/15/2027 | | | 3,330,000 | | | | 3,246,750 | |
| | | | | | | | |
| | | | | | | $ | 12,209,270 | |
17
Portfolio of Investments – continued
| | | | | | | | |
| | |
| Issuer | | Shares/Par | | | Value ($) | |
| Bonds - continued | | | | | | | | |
| Metals & Mining - 4.5% | | | | | | | | |
| Baffinland Iron Mines Corp./Baffinland Iron Mines LP, 8.75%, 7/15/2026 (n) | | $ | 5,715,000 | | | $ | 5,672,137 | |
| Cleveland-Cliffs, Inc., 5.75%, 3/01/2025 | | | 2,105,000 | | | | 2,036,588 | |
| First Quantum Minerals Ltd., 7.25%, 4/01/2023 (n) | | | 2,835,000 | | | | 2,714,541 | |
| Freeport-McMoRan Copper & Gold, Inc., 5.4%, 11/14/2034 | | | 7,110,000 | | | | 6,310,125 | |
| Freeport-McMoRan, Inc., 6.875%, 2/15/2023 | | | 12,021,000 | | | | 12,561,945 | |
| Kaiser Aluminum Corp., 5.875%, 5/15/2024 | | | 8,155,000 | | | | 8,277,325 | |
| Northwest Acquisitions ULC/Dominion Finco, Inc., 7.125%, 11/01/2022 (n) | | | 6,360,000 | | | | 6,335,832 | |
| Novelis Corp., 5.875%, 9/30/2026 (n) | | | 9,340,000 | | | | 9,013,100 | |
| Petra Diamonds U.S. Treasury PLC, 7.25%, 5/01/2022 (n) | | | 5,945,000 | | | | 5,588,300 | |
| Steel Dynamics, Inc., 4.125%, 9/15/2025 | | | 3,060,000 | | | | 2,907,000 | |
| TMS International Corp., 7.25%, 8/15/2025 (n) | | | 5,105,000 | | | | 4,798,700 | |
| | | | | | | | |
| | | | | | | $ | 66,215,593 | |
| Midstream - 5.5% | | | | | | | | |
| Blue Racer Midstream LLC/Blue Racer Finance Corp., 6.125%, 11/15/2022 (n) | | $ | 2,810,000 | | | $ | 2,838,100 | |
| Blue Racer Midstream LLC/Blue Racer Finance Corp., 6.625%, 7/15/2026 (n) | | | 6,015,000 | | | | 5,917,256 | |
| Cheniere Energy, Inc., 5.875%, 3/31/2025 | | | 6,995,000 | | | | 7,368,953 | |
| DCP Midstream Operating LP, 4.95%, 4/01/2022 | | | 2,916,000 | | | | 2,945,160 | |
| DCP Midstream Operating LP, 3.875%, 3/15/2023 | | | 5,170,000 | | | | 5,027,825 | |
| DCP Midstream Operating LP, 5.375%, 7/15/2025 (n) | | | 3,840,000 | | | | 3,916,800 | |
| DCP Midstream Operating LP, 5.6%, 4/01/2044 | | | 3,605,000 | | | | 3,271,537 | |
| Energy Transfer Equity LP, 5.875%, 1/15/2024 | | | 7,340,000 | | | | 7,798,750 | |
| EnLink Midstream Partners LP, 4.4%, 4/01/2024 | | | 8,710,000 | | | | 8,361,600 | |
| Tallgrass Energy Partners LP, 5.5%, 1/15/2028 (n) | | | 12,230,000 | | | | 11,919,969 | |
| Targa Resources Partners LP/Targa Resources Finance Corp., 5.25%, 5/01/2023 | | | 5,640,000 | | | | 5,647,050 | |
| Targa Resources Partners LP/Targa Resources Finance Corp., 5.125%, 2/01/2025 (n) | | | 2,645,000 | | | | 2,598,713 | |
| Targa Resources Partners LP/Targa Resources Finance Corp., 5.375%, 2/01/2027 | | | 13,790,000 | | | | 13,307,350 | |
| | | | | | | | |
| | | | | | | $ | 80,919,063 | |
| Network & Telecom - 0.6% | | | | | | | | |
| Zayo Group LLC/Zayo Capital, Inc., 6.375%, 5/15/2025 | | $ | 2,205,000 | | | $ | 2,152,631 | |
| Zayo Group LLC/Zayo Capital, Inc., 5.75%, 1/15/2027 (n) | | | 6,710,000 | | | | 6,483,135 | |
| | | | | | | | |
| | | | | | | $ | 8,635,766 | |
| Oil Services - 0.9% | | | | | | | | |
| Apergy Corp., 6.375%, 5/01/2026 | | $ | 6,400,000 | | | $ | 6,296,000 | |
| Diamond Offshore Drill Co., 5.7%, 10/15/2039 | | | 6,490,000 | | | | 4,445,650 | |
18
Portfolio of Investments – continued
| | | | | | | | |
| | |
| Issuer | | Shares/Par | | | Value ($) | |
| Bonds - continued | | | | | | | | |
| Oil Services - continued | | | | | | | | |
| Nabors Industries, Inc., 5.75%, 2/01/2025 | | $ | 3,495,000 | | | $ | 3,040,650 | |
| | | | | | | | |
| | | | | | | $ | 13,782,300 | |
| Oils - 0.8% | | | | | | | | |
| Parkland Fuel Corp., 6%, 4/01/2026 (n) | | $ | 10,715,000 | | | $ | 10,232,825 | |
| PBF Holding Co. LLC/PBF Finance Corp., 7%, 11/15/2023 | | | 945,000 | | | | 947,079 | |
| | | | | | | | |
| | | | | | | $ | 11,179,904 | |
| Pharmaceuticals - 1.3% | | | | | | | | |
| Endo Finance LLC/Endo Finco, Inc., 5.375%, 1/15/2023 (n) | | $ | 2,170,000 | | | $ | 1,771,262 | |
| Mallinckrodt International Finance S.A., 5.75%, 8/01/2022 (n) | | | 3,660,000 | | | | 3,321,450 | |
| Valeant Pharmaceuticals International, Inc., 5.5%, 3/01/2023 (n) | | | 5,760,000 | | | | 5,587,200 | |
| Valeant Pharmaceuticals International, Inc., 6.125%, 4/15/2025 (n) | | | 8,300,000 | | | | 7,843,500 | |
| | | | | | | | |
| | | | | | | $ | 18,523,412 | |
| Precious Metals & Minerals - 0.4% | | | | | | | | |
| Teck Resources Ltd., 6%, 8/15/2040 | | $ | 825,000 | | | $ | 827,063 | |
| Teck Resources Ltd., 6.25%, 7/15/2041 | | | 5,355,000 | | | | 5,582,587 | |
| | | | | | | | |
| | | | | | | $ | 6,409,650 | |
| Printing & Publishing - 0.4% | | | | | | | | |
| Nielsen Finance LLC, 5%, 4/15/2022 (n) | | $ | 6,216,000 | | | $ | 6,206,676 | |
| | |
| Real Estate - Healthcare - 0.9% | | | | | | | | |
| MPT Operating Partnership LP/MPT Financial Co., REIT, 5.25%, 8/01/2026 | | $ | 4,370,000 | | | $ | 4,391,850 | |
| MPT Operating Partnership LP/MPT Financial Co., REIT, 5%, 10/15/2027 | | | 9,580,000 | | | | 9,326,130 | |
| | | | | | | | |
| | | | | | | $ | 13,717,980 | |
| Real Estate - Other - 0.8% | | | | | | | | |
| CyrusOne LP/CyrusOne Finance Corp., REIT, 5%, 3/15/2024 | | $ | 8,580,000 | | | $ | 8,644,350 | |
| CyrusOne LP/CyrusOne Finance Corp., REIT, 5.375%, 3/15/2027 | | | 3,795,000 | | | | 3,804,487 | |
| | | | | | | | |
| | | | | | | $ | 12,448,837 | |
| Restaurants - 0.7% | | | | | | | | |
| Golden Nugget, Inc., 6.75%, 10/15/2024 (n) | | $ | 2,970,000 | | | $ | 2,970,000 | |
| KFC Holding Co./Pizza Hut Holdings LLC/Taco Bell of America LLC, 5.25%, 6/01/2026 (n) | | | 7,080,000 | | | | 7,168,500 | |
| | | | | | | | |
| | | | | | | $ | 10,138,500 | |
19
Portfolio of Investments – continued
| | | | | | | | |
| | |
| Issuer | | Shares/Par | | | Value ($) | |
| Bonds - continued | | | | | | | | |
| Retailers - 0.8% | | | | | | | | |
| DriveTime Automotive Group, Inc./DT Acceptance Corp., 8%, 6/01/2021 (n) | | $ | 3,405,000 | | | $ | 3,396,487 | |
| Hanesbrands, Inc., 4.875%, 5/15/2026 (n) | | | 5,650,000 | | | | 5,409,875 | |
| Sally Beauty Holdings, Inc., 5.625%, 12/01/2025 | | | 3,075,000 | | | | 2,996,588 | |
| | | | | | | | |
| | | | | | | $ | 11,802,950 | |
| Specialty Chemicals - 0.6% | | | | | | | | |
| Univar USA, Inc., 6.75%, 7/15/2023 (n) | | $ | 9,100,000 | | | $ | 9,350,250 | |
| | |
| Specialty Stores - 0.3% | | | | | | | | |
| Penske Automotive Group Co., 5.375%, 12/01/2024 | | $ | 1,115,000 | | | $ | 1,101,063 | |
| Penske Automotive Group Co., 5.5%, 5/15/2026 | | | 3,480,000 | | | | 3,401,700 | |
| | | | | | | | |
| | | | | | | $ | 4,502,763 | |
| Supermarkets - 0.2% | | | | | | | | |
| Albertsons Cos. LLC/Safeway Co., 6.625%, 6/15/2024 | | $ | 2,855,000 | | | $ | 2,819,313 | |
| | |
| Telecommunications - Wireless - 4.9% | | | | | | | | |
| Altice France S.A., 6.25%, 5/15/2024 (n) | | $ | 2,050,000 | | | $ | 2,009,615 | |
| Altice France S.A., 8.125%, 2/01/2027 (n) | | | 4,760,000 | | | | 4,676,224 | |
| Altice Luxembourg S.A., 7.75%, 5/15/2022 (n) | | | 3,050,000 | | | | 2,958,500 | |
| Altice Luxembourg S.A., 7.625%, 2/15/2025 (n) | | | 5,270,000 | | | | 4,479,500 | |
| Digicel Group Ltd., 6.75%, 3/01/2023 (n) | | | 7,337,000 | | | | 5,995,796 | |
| SBA Communications Corp., 4%, 10/01/2022 | | | 7,520,000 | | | | 7,426,000 | |
| SBA Communications Corp., 4.875%, 9/01/2024 | | | 3,640,000 | | | | 3,644,550 | |
| SFR Group S.A., 7.375%, 5/01/2026 (n) | | | 1,835,000 | | | | 1,768,463 | |
| Sprint Corp., 7.875%, 9/15/2023 | | | 5,255,000 | | | | 5,583,438 | |
| Sprint Corp., 7.125%, 6/15/2024 | | | 10,160,000 | | | | 10,394,950 | |
| Sprint Nextel Corp., 6%, 11/15/2022 | | | 7,625,000 | | | | 7,710,781 | |
| T-Mobile USA, Inc., 6.5%, 1/15/2024 | | | 2,830,000 | | | | 2,929,050 | |
| T-Mobile USA, Inc., 5.125%, 4/15/2025 | | | 4,325,000 | | | | 4,368,250 | |
| T-Mobile USA, Inc., 6.5%, 1/15/2026 | | | 4,610,000 | | | | 4,875,075 | |
| T-Mobile USA, Inc., 5.375%, 4/15/2027 | | | 3,255,000 | | | | 3,279,413 | |
| | | | | | | | |
| | | | | | | $ | 72,099,605 | |
| Telephone Services - 0.6% | | | | | | | | |
| Level 3 Financing, Inc., 5.375%, 1/15/2024 | | $ | 3,985,000 | | | $ | 3,965,075 | |
| Level 3 Financing, Inc., 5.375%, 5/01/2025 | | | 5,385,000 | | | | 5,317,688 | |
| | | | | | | | |
| | | | | | | $ | 9,282,763 | |
| Transportation - Services - 0.3% | | | | | | | | |
| Navios South American Logistics, Inc., 7.25%, 5/01/2022 | | $ | 2,045,000 | | | $ | 1,912,075 | |
| Syncreon Group BV/Syncre, 8.625%, 11/01/2021 (n) | | | 2,324,000 | | | | 1,859,200 | |
| | | | | | | | |
| | | | | | | $ | 3,771,275 | |
20
Portfolio of Investments – continued
| | | | | | | | |
| | |
| Issuer | | Shares/Par | | | Value ($) | |
| Bonds - continued | | | | | | | | |
| Utilities - Electric Power - 2.5% | | | | | | | | |
| Clearway Energy Operating LLC, 5.75%, 10/15/2025 (n) | | $ | 8,450,000 | | | $ | 7,805,687 | |
| Covanta Holding Corp., 5.875%, 3/01/2024 | | | 4,795,000 | | | | 4,783,013 | |
| Covanta Holding Corp., 5.875%, 7/01/2025 | | | 4,625,000 | | | | 4,532,500 | |
| Covanta Holding Corp., 6%, 1/01/2027 | | | 5,685,000 | | | | 5,443,387 | |
| Drax Finco PLC, 6.625%, 11/01/2025 (n) | | | 6,280,000 | | | | 6,248,600 | |
| NextEra Energy Operating Co., 4.25%, 9/15/2024 (n) | | | 8,250,000 | | | | 7,860,600 | |
| TerraForm Global Operating LLC, 6.125%, 3/01/2026 (n) | | | 140,000 | | | | 133,700 | |
| | | | | | | | |
| | | | | | | $ | 36,807,487 | |
| Total Bonds (Identified Cost, $1,416,419,334) | | | $ | 1,376,082,604 | |
| | |
| Floating Rate Loans (r) - 0.7% | | | | | | | | |
| Broadcasting - 0.1% | | | | | | | | |
| Warner Music Group, Term Loan F, 4.623%, 11/01/2023 (o) | | $ | 1,241,000 | | | $ | 1,212,560 | |
| | |
| Conglomerates - 0.1% | | | | | | | | |
| Gates Global LLC, Term Loan B2, 5.248%, 3/31/2024 | | $ | 1,473,270 | | | $ | 1,439,712 | |
| | |
| Entertainment - 0.1% | | | | | | | | |
| Live Nation Entertainment, Inc., Term Loan B3, 4.125%, 10/31/2023 (o) | | $ | 1,909,142 | | | $ | 1,898,006 | |
| | |
| Food & Beverages - 0.1% | | | | | | | | |
| U.S. Foods Holding Corp., Term Loan B, 4.344%, 6/27/2023 (o) | | $ | 1,237,827 | | | $ | 1,216,474 | |
| | |
| Medical & Health Technology & Services - 0.2% | | | | | | | | |
| Davita Healthcare Partners, Inc., Term Loan B, 5.248%, 6/24/2021 | | $ | 3,575,891 | | | $ | 3,566,951 | |
| | |
| Oil Services - 0.1% | | | | | | | | |
| Apergy Corp., Term Loan B, 5.162%, 5/09/2025 | | $ | 1,792,861 | | | $ | 1,751,401 | |
Total Floating Rate Loans
(Identified Cost, $11,041,705) | | | $ | 11,085,104 | |
| | |
| Common Stocks - 0.2% | | | | | | | | |
| Oil Services - 0.2% | | | | | | | | |
| LTRI Holdings LP (a)(u) (Identified Cost, $1,170,000) | | | 3,250 | | | $ | 2,890,615 | |
| | |
| Convertible Bonds - 0.1% | | | | | | | | |
| Cable TV - 0.1% | | | | | | | | |
DISH Network Corp., 3.375%, 8/15/2026
(Identified Cost, $1,961,401) | | $ | 2,175,000 | | | $ | 1,847,663 | |
21
Portfolio of Investments – continued
| | | | | | | | | | | | | | | | |
| Warrants - 0.0% | | | | | | | | | | | | | | | | |
| | | | |
| Issuer | | Strike
Price | | | First
Exercise | | | Shares/Par | | | Value ($) | |
| Forest & Paper Products - 0.0% | | | | | | | | | | | | | | | | |
| Appvion Holdings Corp. - Tranche A (1 share for 1 warrant) (a) | | $ | 27.17 | | | | 8/24/18 | | | | 2,104 | | | $ | 2,105 | |
| Appvion Holdings Corp. - Tranche B (1 share for 1 warrant) (a) | | | 31.25 | | | | 8/24/18 | | | | 2,105 | | | | 1,052 | |
| Total Warrants (Identified Cost, $0) | | | | | | | $ | 3,157 | |
| | |
| Investment Companies (h) - 5.0% | | | | | | | | | |
| Money Market Funds - 5.0% | | | | | | | | | | | | | | | | |
MFS Institutional Money Market Portfolio, 2.47% (v)
(Identified Cost, $73,476,945) | | | | 73,484,293 | | | $ | 73,476,944 | |
| | |
| Other Assets, Less Liabilities - 0.8% | | | | | | | | 11,159,292 | |
| Net Assets - 100.0% | | | | | | | | | | | | | | $ | 1,476,545,379 | |
| (a) | Non-income producing security. |
| (h) | An affiliated issuer, which may be considered one in which the fund owns 5% or more of the outstanding voting securities, or a company which is under common control. At period end, the aggregate values of the fund’s investments in affiliated issuers and in unaffiliated issuers were $73,476,944 and $1,391,909,143, respectively. |
| (i) | Interest only security for which the fund receives interest on notional principal (Par amount). Par amount shown is the notional principal and does not reflect the cost of the security. |
| (n) | Securities exempt from registration under Rule 144A of the Securities Act of 1933. These securities may be sold in the ordinary course of business in transactions exempt from registration, normally to qualified institutional buyers. At period end, the aggregate value of these securities was $853,555,373, representing 57.8% of net assets. |
| (o) | All or a portion of this position has not settled. Upon settlement date, interest rates for unsettled amounts will be determined. The rate shown, if any, represents the weighted average coupon rate for settled amounts. |
| (p) | Payment-in-kind (PIK) security for which interest income may be received in additional securities and/or cash. |
| (r) | The remaining maturities of floating rate loans may be less than the stated maturities shown as a result of contractual or optional prepayments by the borrower. Such prepayments cannot be predicted with certainty. These loans may be subject to restrictions on resale. The interest rate shown represents the weighted average of the floating interest rates on settled contracts within the loan facility at period end, unless otherwise indicated. The floating interest rates on settled contracts are determined periodically by reference to a base lending rate and a spread. |
| (u) | The security was valued using significant unobservable inputs and is considered level 3 under the fair value hierarchy. For further information about the fund’s level 3 holdings, please see Note 2 in the Notes to Financial Statements. |
| (v) | Affiliated issuer that is available only to investment companies managed by MFS. The rate quoted for the MFS Institutional Money Market Portfolio is the annualizedseven-day yield of the fund at period end. |
22
Portfolio of Investments – continued
| (z) | Restricted securities are not registered under the Securities Act of 1933 and are subject to legal restrictions on resale. These securities generally may be resold in transactions exempt from registration or to the public if the securities are subsequently registered. Disposal of these securities may involve time-consuming negotiations and prompt sale at an acceptable price may be difficult. The fund holds the following restricted securities: |
| | | | | | | | | | |
| Restricted Securities | | Acquisition
Date | | Cost | | | Value | |
| CFX Escrow Corp., 6%, 2/15/2024 | | 1/31/19 | | | $1,325,000 | | | | $1,325,000 | |
| CFX Escrow Corp., 6.375%, 2/15/2026 | | 1/31/19 | | | 860,000 | | | | 860,000 | |
| Constellation Merger Sub, Inc., 8.5%, 9/15/2025 | | 1/29/19-1/30/19 | | | 1,657,260 | | | | 1,658,156 | |
| Core & Main LP, 6.125%, 8/15/2025 | | 1/04/19-1/25/19 | | | 2,341,472 | | | | 2,381,250 | |
| CW Capital Cobalt Commercial Mortgage Trust, CDO, “F”, FLR, 4.065% (LIBOR - 3mo. + 1.3%), 4/26/2050 | | 4/12/06-1/31/19 | | | 670,930 | | | | 73 | |
| CW Capital Cobalt Commercial Mortgage Trust, CDO, “G”, FLR, 4.265% (LIBOR - 3mo. + 1.5%), 4/26/2050 | | 4/12/06-1/31/19 | | | 2,141,473 | | | | 232 | |
| Energizer Holdings, Inc., 7.75%, 1/15/2027 | | 1/17/19 | | | 455,000 | | | | 468,809 | |
| Marriot Ownership Resorts, Inc., 5.625%, 4/15/2023 | | 4/08/15-8/08/17 | | | 4,493,113 | | | | 4,358,625 | |
| TransDigm, Inc., 6.25%, 3/15/2026 | | 1/30/19 | | | 4,542,000 | | | | 4,610,130 | |
| Total Restricted Securities | | | | | | | | | $15,662,275 | |
| % of Net assets | | | | | | | | | 1.1% | |
The following abbreviations are used in this report and are defined:
| CDO | | Collateralized Debt Obligation |
| FLR | | Floating Rate. Interest rate resets periodically based on the parenthetically disclosed reference rate plus a spread (if any). Theperiod-end rate reported may not be the current rate. All reference rates are USD unless otherwise noted. |
| LIBOR | | London Interbank Offered Rate |
| PLC | | Public Limited Company |
| REIT | | Real Estate Investment Trust |
Abbreviations indicate amounts shown in currencies other than the U.S. dollar. All amounts are stated in U.S. dollars unless otherwise indicated. A list of abbreviations is shown below:
Derivative Contracts at 1/31/19
Forward Foreign Currency Exchange Contracts
| | | | | | | | | | | | | | | | | | |
Currency Purchased | | | Currency Sold | | Counterparty | | Settlement
Date | | | Unrealized
Appreciation
(Depreciation) | |
| Asset Derivatives | | | | | | | | | | |
| USD | | | 10,445,766 | | | EUR | | 9,028,577 | | Goldman Sachs International | | | 4/12/2019 | | | | $51,927 | |
| USD | | | 658,945 | | | EUR | | 568,812 | | NatWest Markets PLC | | | 4/12/2019 | | | | 4,120 | |
| | | | | | | | | | | | | | | | | | |
| | | | | | | | | | | | | | | | | $56,047 | |
| | | | | | | | | | | | | | | | | | |
23
Portfolio of Investments – continued
Futures Contracts
| | | | | | | | | | | | | | | | | | | | | | |
| Description | | Long/
Short | | | Currency | | | Contracts | | Notional
Amount | | | Expiration
Date | | | Value/
Unrealized
Appreciation
(Depreciation) | |
| Liability Derivatives | | | | | | | | | | | | | | | | | | | |
| | | | | |
| Interest Rate Futures | | | | | | | | | | | | | | | | | | | |
| Euro-Bobl 5 yr | | | Short | | | | EUR | | | 23 | | | $3,499,488 | | | | March - 2019 | | | | $(19,008 | ) |
| U.S. Treasury Note 10 yr | | | Short | | | | USD | | | 193 | | | 23,636,469 | | | | March - 2019 | | | | (670,170 | ) |
| | | | | | | | | | | | | | | | | | | | | | |
| | | | | | | | | | | | | | | | | | | | | $(689,178 | ) |
| | | | | | | | | | | | | | | | | | | | | | |
At January 31, 2019, the fund had cash collateral of $252,488 to cover any collateral or margin obligations for certain derivative contracts. Restricted cash and/or deposits with brokers in the Statement of Assets and Liabilities are comprised of cash collateral.
See Notes to Financial Statements
24
Financial Statements
STATEMENT OF ASSETS AND LIABILITIES
At 1/31/19
This statement represents your fund’s balance sheet, which details the assets and liabilities comprising the total value of the fund.
| | | | |
| Assets | | | | |
Investments in unaffiliated issuers, at value (identified cost, $1,430,592,440) | | | $1,391,909,143 | |
Investments in affiliated issuers, at value (identified cost, $73,476,945) | | | 73,476,944 | |
Deposits with brokers for | | | | |
Futures contracts | | | 252,488 | |
Receivables for | | | | |
Forward foreign currency exchange contracts | | | 56,047 | |
Investments sold | | | 952,204 | |
Fund shares sold | | | 4,314,883 | |
Interest and dividends | | | 21,854,460 | |
Other assets | | | 6,220 | |
Total assets | | | $1,492,822,389 | |
| |
| Liabilities | | | | |
Payable to custodian | | | $113,852 | |
Payables for | | | | |
Distributions | | | 214,206 | |
Net daily variation margin on open futures contracts | | | 93,150 | |
Investments purchased | | | 13,794,259 | |
Fund shares reacquired | | | 1,370,457 | |
Payable to affiliates | | | | |
Investment adviser | | | 37,245 | |
Shareholder servicing costs | | | 472,987 | |
Distribution and service fees | | | 9,668 | |
Program manager fees | | | 14 | |
Payable for independent Trustees’ compensation | | | 6,548 | |
Accrued expenses and other liabilities | | | 164,624 | |
Total liabilities | | | $16,277,010 | |
Net assets | | | $1,476,545,379 | |
| |
| Net assets consist of | | | | |
Paid-in capital | | | $1,596,263,283 | |
Total distributable earnings (loss) | | | (119,717,904 | ) |
Net assets | | | $1,476,545,379 | |
Shares of beneficial interest outstanding | | | 447,447,413 | |
25
Statement of Assets and Liabilities – continued
| | | | | | | | | | | | |
| | | |
| | | Net assets | | | Shares
outstanding | | | Net asset value
per share (a) | |
Class A | | | $489,120,312 | | | | 148,171,615 | | | | $3.30 | |
Class B | | | 13,360,993 | | | | 4,042,880 | | | | 3.30 | |
Class C | | | 31,793,287 | | | | 9,604,558 | | | | 3.31 | |
Class I | | | 89,637,249 | | | | 27,222,042 | | | | 3.29 | |
Class R1 | | | 867,052 | | | | 262,509 | | | | 3.30 | |
Class R2 | | | 14,618,089 | | | | 4,432,363 | | | | 3.30 | |
Class R3 | | | 2,192,777 | | | | 665,399 | | | | 3.30 | |
Class R4 | | | 446,543 | | | | 135,220 | | | | 3.30 | |
Class R6 | | | 829,450,752 | | | | 251,377,471 | | | | 3.30 | |
Class 529A | | | 3,795,537 | | | | 1,151,108 | | | | 3.30 | |
Class 529B | | | 259,403 | | | | 78,589 | | | | 3.30 | |
Class 529C | | | 1,003,385 | | | | 303,659 | | | | 3.30 | |
| (a) | Maximum offering price per share was equal to the net asset value per share for all share classes, except for Classes A and 529A, for which the maximum offering prices per share were $3.45 [100 / 95.75 x $3.30] and $3.45 [100 / 95.75 x $3.30], respectively. On sales of $100,000 or more, the maximum offering prices of Class A and Class 529A shares are reduced. A contingent deferred sales charge may be imposed on redemptions of Class A, Class B, Class C, Class 529B, and Class 529C shares. Redemption price per share was equal to the net asset value per share for Classes I, R1, R2, R3, R4, R6, and 529A. |
See Notes to Financial Statements
26
Financial Statements
STATEMENT OF OPERATIONS
Year ended 1/31/19
This statement describes how much your fund earned in investment income and accrued in expenses. It also describes any gains and/or losses generated by fund operations.
| | | | |
| Net investment income (loss) | | | | |
Income | | | | |
Interest | | | $83,183,641 | |
Dividends from affiliated issuers | | | 1,074,376 | |
Other | | | 410,569 | |
Total investment income | | | $84,668,586 | |
Expenses | | | | |
Management fee | | | $6,941,267 | |
Distribution and service fees | | | 1,831,454 | |
Shareholder servicing costs | | | 1,755,177 | |
Program manager fees | | | 2,646 | |
Administrative services fee | | | 223,397 | |
Independent Trustees’ compensation | | | 30,122 | |
Custodian fee | | | 93,013 | |
Shareholder communications | | | 141,089 | |
Audit and tax fees | | | 83,263 | |
Legal fees | | | 29,464 | |
Miscellaneous | | | 242,596 | |
Total expenses | | | $11,373,488 | |
Fees paid indirectly | | | (2,759 | ) |
Reduction of expenses by investment adviser and distributor | | | (181,247 | ) |
Net expenses | | | $11,189,482 | |
Net investment income (loss) | | | $73,479,104 | |
| |
| Realized and unrealized gain (loss) | | | | |
Realized gain (loss) (identified cost basis) | | | | |
Unaffiliated issuers | | | $(17,834,967 | ) |
Affiliated issuers | | | (3,524 | ) |
Futures contracts | | | 1,454,306 | |
Forward foreign currency exchange contracts | | | 355,780 | |
Foreign currency | | | 644 | |
Net realized gain (loss) | | | $(16,027,761 | ) |
Change in unrealized appreciation or depreciation | | | | |
Unaffiliated issuers | | | $(42,059,574 | ) |
Affiliated issuers | | | 436 | |
Futures contracts | | | (1,879,393 | ) |
Forward foreign currency exchange contracts | | | 62,084 | |
Translation of assets and liabilities in foreign currencies | | | 871 | |
Net unrealized gain (loss) | | | $(43,875,576 | ) |
Net realized and unrealized gain (loss) | | | $(59,903,337 | ) |
Change in net assets from operations | | | $13,575,767 | |
See Notes to Financial Statements
27
Financial Statements
STATEMENTS OF CHANGES IN NET ASSETS
These statements describe the increases and/or decreases in net assets resulting from operations, any distributions, and any shareholder transactions.
| | | | | | | | |
| | | Year ended | |
| | | 1/31/19 | | | 1/31/18 | |
| Change in net assets | | | | | | |
| | |
| From operations | | | | | | | | |
Net investment income (loss) | | | $73,479,104 | | | | $74,307,069 | |
Net realized gain (loss) | | | (16,027,761 | ) | | | 10,842,556 | |
Net unrealized gain (loss) | | | (43,875,576 | ) | | | (2,056,345 | ) |
Change in net assets from operations | | | $13,575,767 | | | | $83,093,280 | |
Total distributions to shareholders (a) | | | $(76,037,494 | ) | | | $(78,226,662 | ) |
Change in net assets from fund share transactions | | | $(38,006,483 | ) | | | $27,273,760 | |
Total change in net assets | | | $(100,468,210 | ) | | | $32,140,378 | |
| | |
| Net assets | | | | | | | | |
At beginning of period | | | 1,577,013,589 | | | | 1,544,873,211 | |
At end of period (b) | | | $1,476,545,379 | | | | $1,577,013,589 | |
| (a) | Distributions from net investment income and from net realized gain are no longer required to be separately disclosed. See Note 2. For the year ended January 31, 2018, distributions from net investment income were $78,226,662. |
| (b) | Parenthetical disclosure of accumulated distributions in excess of net investment income is no longer required. See Note 2. For the year ended January 31, 2018, end of period net assets included accumulated distributions in excess of net investment income of $2,534,864. |
See Notes to Financial Statements
28
Financial Statements
FINANCIAL HIGHLIGHTS
The financial highlights table is intended to help you understand the fund’s financial performance for the past 5 years. Certain information reflects financial results for a single fund share. The total returns in the table represent the rate that an investor would have earned (or lost) on an investment in the fund share class (assuming reinvestment of all distributions) held for the entire period.
| | | | | | | | | | | | | | | | | | | | |
| Class A | | Year ended | |
| | | | | |
| | | 1/31/19 | | | 1/31/18 | | | 1/31/17 | | | 1/31/16 | | | 1/31/15 | |
Net asset value, beginning of period | | | $3.44 | | | | $3.42 | | | | $3.11 | | | | $3.49 | | | | $3.60 | |
| | | |
| Income (loss) from investment operations | | | | | | | | | | | | | |
Net investment income (loss) (d) | | | $0.15 | | | | $0.16 | | | | $0.17 | (c) | | | $0.18 | | | | $0.19 | |
Net realized and unrealized gain (loss) | | | (0.13 | ) | | | 0.02 | | | | 0.32 | | | | (0.37 | ) | | | (0.10 | ) |
Total from investment operations | | | $0.02 | | | | $0.18 | | | | $0.49 | | | | $(0.19 | ) | | | $0.09 | |
| | | |
| Less distributions declared to shareholders | | | | | | | | | | | | | |
From net investment income | | | $(0.16 | ) | | | $(0.16 | ) | | | $(0.18 | ) | | | $(0.19 | ) | | | $(0.20 | ) |
Net asset value, end of period (x) | | | $3.30 | | | | $3.44 | | | | $3.42 | | | | $3.11 | | | | $3.49 | |
Total return (%) (r)(s)(t)(x) | | | 0.68 | | | | 5.47 | | | | 16.18 | (c) | | | (5.87 | ) | | | 2.45 | |
| | | |
Ratios (%) (to average net assets)
and Supplemental data: | | | | | | | | | | | | | |
Expenses before expense reductions (f) | | | 0.94 | | | | 0.96 | | | | 0.97 | (c) | | | 0.95 | | | | 0.95 | |
Expenses after expense reductions (f) | | | 0.92 | | | | 0.94 | | | | 0.96 | (c) | | | 0.94 | | | | 0.93 | |
Net investment income (loss) | | | 4.67 | | | | 4.52 | | | | 5.16 | (c) | | | 5.20 | | | | 5.25 | |
Portfolio turnover | | | 44 | | | | 54 | | | | 43 | | | | 36 | | | | 43 | |
Net assets at end of period (000 omitted) | | | $489,120 | | | | $477,817 | | | | $514,238 | | | | $398,206 | | | | $452,587 | |
See Notes to Financial Statements
29
Financial Highlights – continued
| | | | | | | | | | | | | | | | | | | | |
| Class B | | Year ended | |
| | | | | |
| | | 1/31/19 | | | 1/31/18 | | | 1/31/17 | | | 1/31/16 | | | 1/31/15 | |
Net asset value, beginning of period | | | $3.44 | | | | $3.43 | | | | $3.11 | | | | $3.49 | | | | $3.60 | |
| | | | |
| Income (loss) from investment operations | | | | | | | | | | | | | | | | | |
Net investment income (loss) (d) | | | $0.13 | | | | $0.13 | | | | $0.15 | (c) | | | $0.15 | | | | $0.16 | |
Net realized and unrealized gain (loss) | | | (0.13 | ) | | | 0.02 | | | | 0.33 | | | | (0.37 | ) | | | (0.10 | ) |
Total from investment operations | | | $0.00 | (w) | | | $0.15 | | | | $0.48 | | | | $(0.22 | ) | | | $0.06 | |
| | | | |
| Less distributions declared to shareholders | | | | | | | | | | | | | | | | | |
From net investment income | | | $(0.14 | ) | | | $(0.14 | ) | | | $(0.16 | ) | | | $(0.16 | ) | | | $(0.17 | ) |
Net asset value, end of period (x) | | | $3.30 | | | | $3.44 | | | | $3.43 | | | | $3.11 | | | | $3.49 | |
Total return (%) (r)(s)(t)(x) | | | (0.07 | ) | | | 4.39 | | | | 15.65 | (c) | | | (6.57 | ) | | | 1.68 | |
| | | | |
Ratios (%) (to average net assets)
and Supplemental data: | | | | | | | | | | | | | | | | | |
Expenses before expense reductions (f) | | | 1.69 | | | | 1.71 | | | | 1.72 | (c) | | | 1.70 | | | | 1.70 | |
Expenses after expense reductions (f) | | | 1.68 | | | | 1.70 | | | | 1.71 | (c) | | | 1.69 | | | | 1.69 | |
Net investment income (loss) | | | 3.91 | | | | 3.77 | | | | 4.43 | (c) | | | 4.44 | | | | 4.49 | |
Portfolio turnover | | | 44 | | | | 54 | | | | 43 | | | | 36 | | | | 43 | |
Net assets at end of period (000 omitted) | | | $13,361 | | | | $18,329 | | | | $21,515 | | | | $20,420 | | | | $27,034 | |
| |
| Class C | | Year ended | |
| | | | | |
| | | 1/31/19 | | | 1/31/18 | | | 1/31/17 | | | 1/31/16 | | | 1/31/15 | |
Net asset value, beginning of period | | | $3.44 | | | | $3.43 | | | | $3.12 | | | | $3.50 | | | | $3.61 | |
| | | |
| Income (loss) from investment operations | | | | | | | | | | | | | |
Net investment income (loss) (d) | | | $0.13 | | | | $0.13 | | | | $0.15 | (c) | | | $0.15 | | | | $0.16 | |
Net realized and unrealized gain (loss) | | | (0.12 | ) | | | 0.02 | | | | 0.32 | | | | (0.37 | ) | | | (0.10 | ) |
Total from investment operations | | | $0.01 | | | | $0.15 | | | | $0.47 | | | | $(0.22 | ) | | | $0.06 | |
| | | |
| Less distributions declared to shareholders | | | | | | | | | | | | | |
From net investment income | | | $(0.14 | ) | | | $(0.14 | ) | | | $(0.16 | ) | | | $(0.16 | ) | | | $(0.17 | ) |
Net asset value, end of period (x) | | | $3.31 | | | | $3.44 | | | | $3.43 | | | | $3.12 | | | | $3.50 | |
Total return (%) (r)(s)(t)(x) | | | 0.23 | | | | 4.39 | | | | 15.29 | (c) | | | (6.55 | ) | | | 1.69 | |
| | | | |
Ratios (%) (to average net assets)
and Supplemental data: | | | | | | | | | | | | | | | | | |
Expenses before expense reductions (f) | | | 1.69 | | | | 1.70 | | | | 1.72 | (c) | | | 1.70 | | | | 1.69 | |
Expenses after expense reductions (f) | | | 1.68 | | | | 1.70 | | | | 1.71 | (c) | | | 1.69 | | | | 1.69 | |
Net investment income (loss) | | | 3.91 | | | | 3.77 | | | | 4.41 | (c) | | | 4.42 | | | | 4.48 | |
Portfolio turnover | | | 44 | | | | 54 | | | | 43 | | | | 36 | | | | 43 | |
Net assets at end of period (000 omitted) | | | $31,793 | | | | $57,509 | | | | $66,241 | | | | $57,442 | | | | $69,162 | |
See Notes to Financial Statements
30
Financial Highlights – continued
| | | | | | | | | | | | | | | | | | | | |
| Class I | | Year ended | |
| | | | | |
| | | 1/31/19 | | | 1/31/18 | | | 1/31/17 | | | 1/31/16 | | | 1/31/15 | |
Net asset value, beginning of period | | | $3.43 | | | | $3.42 | | | | $3.10 | | | | $3.48 | | | | $3.59 | |
| | | |
| Income (loss) from investment operations | | | | | | | | | | | | | |
Net investment income (loss) (d) | | | $0.16 | | | | $0.16 | | | | $0.18 | (c) | | | $0.19 | | | | $0.19 | |
Net realized and unrealized gain (loss) | | | (0.13 | ) | | | 0.02 | | | | 0.33 | | | | (0.38 | ) | | | (0.09 | ) |
Total from investment operations | | | $0.03 | | | | $0.18 | | | | $0.51 | | | | $(0.19 | ) | | | $0.10 | |
| | | |
| Less distributions declared to shareholders | | | | | | | | | | | | | |
From net investment income | | | $(0.17 | ) | | | $(0.17 | ) | | | $(0.19 | ) | | | $(0.19 | ) | | | $(0.21 | ) |
Net asset value, end of period (x) | | | $3.29 | | | | $3.43 | | | | $3.42 | | | | $3.10 | | | | $3.48 | |
Total return (%) (r)(s)(t)(x) | | | 0.92 | | | | 5.43 | | | | 16.83 | (c) | | | (5.66 | ) | | | 2.70 | |
| | | | |
Ratios (%) (to average net assets)
and Supplemental data: | | | | | | | | | | | | | | | | | |
Expenses before expense reductions (f) | | | 0.69 | | | | 0.70 | | | | 0.73 | (c) | | | 0.70 | | | | 0.69 | |
Expenses after expense reductions (f) | | | 0.68 | | | | 0.69 | | | | 0.72 | (c) | | | 0.69 | | | | 0.69 | |
Net investment income (loss) | | | 4.90 | | | | 4.77 | | | | 5.31 | (c) | | | 5.43 | | | | 5.44 | |
Portfolio turnover | | | 44 | | | | 54 | | | | 43 | | | | 36 | | | | 43 | |
Net assets at end of period (000 omitted) | | | $89,637 | | | | $111,450 | | | | $122,732 | | | | $49,917 | | | | $95,887 | |
| | | | | | | | | | | | | | | | | | | | |
| Class R1 | | Year ended | |
| | | | | |
| | | 1/31/19 | | | 1/31/18 | | | 1/31/17 | | | 1/31/16 | | | 1/31/15 | |
Net asset value, beginning of period | | | $3.44 | | | | $3.43 | | | | $3.11 | | | | $3.49 | | | | $3.60 | |
| | | |
| Income (loss) from investment operations | | | | | | | | | | | | | |
Net investment income (loss) (d) | | | $0.13 | | | | $0.13 | | | | $0.15 | (c) | | | $0.15 | | | | $0.16 | |
Net realized and unrealized gain (loss) | | | (0.13 | ) | | | 0.02 | | | | 0.33 | | | | (0.37 | ) | | | (0.10 | ) |
Total from investment operations | | | $0.00 | (w) | | | $0.15 | | | | $0.48 | | | | $(0.22 | ) | | | $0.06 | |
| | | |
| Less distributions declared to shareholders | | | | | | | | | | | | | |
From net investment income | | | $(0.14 | ) | | | $(0.14 | ) | | | $(0.16 | ) | | | $(0.16 | ) | | | $(0.17 | ) |
Net asset value, end of period (x) | | | $3.30 | | | | $3.44 | | | | $3.43 | | | | $3.11 | | | | $3.49 | |
Total return (%) (r)(s)(t)(x) | | | (0.07 | ) | | | 4.39 | | | | 15.65 | (c) | | | (6.58 | ) | | | 1.68 | |
| | | | |
Ratios (%) (to average net assets)
and Supplemental data: | | | | | | | | | | | | | | | | | |
Expenses before expense reductions (f) | | | 1.69 | | | | 1.70 | | | | 1.72 | (c) | | | 1.70 | | | | 1.70 | |
Expenses after expense reductions (f) | | | 1.68 | | | | 1.70 | | | | 1.71 | (c) | | | 1.70 | | | | 1.69 | |
Net investment income (loss) | | | 3.92 | | | | 3.76 | | | | 4.43 | (c) | | | 4.44 | | | | 4.47 | |
Portfolio turnover | | | 44 | | | | 54 | | | | 43 | | | | 36 | | | | 43 | |
Net assets at end of period (000 omitted) | | | $867 | | | | $1,029 | | | | $1,134 | | | | $1,007 | | | | $1,317 | |
See Notes to Financial Statements
31
Financial Highlights – continued
| | | | | | | | | | | | | | | | | | | | |
| Class R2 | | Year ended | |
| | | | | |
| | | 1/31/19 | | | 1/31/18 | | | 1/31/17 | | | 1/31/16 | | | 1/31/15 | |
Net asset value, beginning of period | | | $3.43 | | | | $3.42 | | | | $3.11 | | | | $3.49 | | | | $3.60 | |
| | | |
| Income (loss) from investment operations | | | | | | | | | | | | | |
Net investment income (loss) (d) | | | $0.15 | | | | $0.15 | | | | $0.16 | (c) | | | $0.17 | | | | $0.18 | |
Net realized and unrealized gain (loss) | | | (0.13 | ) | | | 0.02 | | | | 0.32 | | | | (0.37 | ) | | | (0.10 | ) |
Total from investment operations | | | $0.02 | | | | $0.17 | | | | $0.48 | | | | $(0.20 | ) | | | $0.08 | |
| | | |
| Less distributions declared to shareholders | | | | | | | | | | | | | |
From net investment income | | | $(0.15 | ) | | | $(0.16 | ) | | | $(0.17 | ) | | | $(0.18 | ) | | | $(0.19 | ) |
Net asset value, end of period (x) | | | $3.30 | | | | $3.43 | | | | $3.42 | | | | $3.11 | | | | $3.49 | |
Total return (%) (r)(s)(t)(x) | | | 0.72 | | | | 4.91 | | | | 15.89 | (c) | | | (6.11 | ) | | | 2.19 | |
| | | | |
Ratios (%) (to average net assets)
and Supplemental data: | | | | | | | | | | | | | | | | | |
Expenses before expense reductions (f) | | | 1.19 | | | | 1.21 | | | | 1.22 | (c) | | | 1.20 | | | | 1.20 | |
Expenses after expense reductions (f) | | | 1.18 | | | | 1.20 | | | | 1.21 | (c) | | | 1.20 | | | | 1.19 | |
Net investment income (loss) | | | 4.42 | | | | 4.27 | | | | 4.88 | (c) | | | 4.94 | | | | 5.00 | |
Portfolio turnover | | | 44 | | | | 54 | | | | 43 | | | | 36 | | | | 43 | |
Net assets at end of period (000 omitted) | | | $14,618 | | | | $15,702 | | | | $15,156 | | | | $2,618 | | | | $3,036 | |
| | | | | | | | | | | | | | | | | | | | |
| Class R3 | | Year ended | |
| | | | | |
| | | 1/31/19 | | | 1/31/18 | | | 1/31/17 | | | 1/31/16 | | | 1/31/15 | |
Net asset value, beginning of period | | | $3.43 | | | | $3.42 | | | | $3.11 | | | | $3.49 | | | | $3.60 | |
| | | |
| Income (loss) from investment operations | | | | | | | | | | | | | |
Net investment income (loss) (d) | | | $0.15 | | | | $0.16 | | | | $0.17 | (c) | | | $0.18 | | | | $0.19 | |
Net realized and unrealized gain (loss) | | | (0.12 | ) | | | 0.01 | | | | 0.32 | | | | (0.37 | ) | | | (0.10 | ) |
Total from investment operations | | | $0.03 | | | | $0.17 | | | | $0.49 | | | | $(0.19 | ) | | | $0.09 | |
| | | |
| Less distributions declared to shareholders | | | | | | | | | | | | | |
From net investment income | | | $(0.16 | ) | | | $(0.16 | ) | | | $(0.18 | ) | | | $(0.19 | ) | | | $(0.20 | ) |
Net asset value, end of period (x) | | | $3.30 | | | | $3.43 | | | | $3.42 | | | | $3.11 | | | | $3.49 | |
Total return (%) (r)(s)(t)(x) | | | 0.98 | | | | 5.17 | | | | 16.17 | (c) | | | (5.87 | ) | | | 2.45 | |
| | | | |
Ratios (%) (to average net assets)
and Supplemental data: | | | | | | | | | | | | | | | | | |
Expenses before expense reductions (f) | | | 0.94 | | | | 0.96 | | | | 0.97 | (c) | | | 0.95 | | | | 0.95 | |
Expenses after expense reductions (f) | | | 0.93 | | | | 0.95 | | | | 0.96 | (c) | | | 0.95 | | | | 0.94 | |
Net investment income (loss) | | | 4.66 | | | | 4.54 | | | | 5.19 | (c) | | | 5.20 | | | | 5.26 | |
Portfolio turnover | | | 44 | | | | 54 | | | | 43 | | | | 36 | | | | 43 | |
Net assets at end of period (000 omitted) | | | $2,193 | | | | $3,111 | | | | $6,369 | | | | $6,359 | | | | $6,755 | |
See Notes to Financial Statements
32
Financial Highlights – continued
| | | | | | | | | | | | | | | | | | | | |
| Class R4 | | Year ended | |
| | | | | |
| | | 1/31/19 | | | 1/31/18 | | | 1/31/17 | | | 1/31/16 | | | 1/31/15 | |
Net asset value, beginning of period | | | $3.43 | | | | $3.42 | | | | $3.11 | | | | $3.49 | | | | $3.60 | |
| | | |
| Income (loss) from investment operations | | | | | | | | | | | | | |
Net investment income (loss) (d) | | | $0.16 | | | | $0.16 | | | | $0.18 | (c) | | | $0.19 | | | | $0.20 | |
Net realized and unrealized gain (loss) | | | (0.12 | ) | | | 0.02 | | | | 0.32 | | | | (0.38 | ) | | | (0.10 | ) |
Total from investment operations | | | $0.04 | | | | $0.18 | | | | $0.50 | | | | $(0.19 | ) | | | $0.10 | |
| | | |
| Less distributions declared to shareholders | | | | | | | | | | | | | |
From net investment income | | | $(0.17 | ) | | | $(0.17 | ) | | | $(0.19 | ) | | | $(0.19 | ) | | | $(0.21 | ) |
Net asset value, end of period (x) | | | $3.30 | | | | $3.43 | | | | $3.42 | | | | $3.11 | | | | $3.49 | |
Total return (%) (r)(s)(t)(x) | | | 1.23 | | | | 5.43 | | | | 16.46 | (c) | | | (5.63 | ) | | | 2.71 | |
| | | | |
Ratios (%) (to average net assets)
and Supplemental data: | | | | | | | | | | | | | | | | | |
Expenses before expense reductions (f) | | | 0.69 | | | | 0.71 | | | | 0.72 | (c) | | | 0.70 | | | | 0.70 | |
Expenses after expense reductions (f) | | | 0.68 | | | | 0.70 | | | | 0.72 | (c) | | | 0.70 | | | | 0.69 | |
Net investment income (loss) | | | 4.91 | | | | 4.78 | | | | 5.40 | (c) | | | 5.44 | | | | 5.47 | |
Portfolio turnover | | | 44 | | | | 54 | | | | 43 | | | | 36 | | | | 43 | |
Net assets at end of period (000 omitted) | | | $447 | | | | $312 | | | | $398 | | | | $300 | | | | $571 | |
| | | | | | | | | | | | | | | | | | | | |
| Class R6 | | Year ended | |
| | | | | |
| | | 1/31/19 | | | 1/31/18 | | | 1/31/17 | | | 1/31/16 | | | 1/31/15 | |
Net asset value, beginning of period | | | $3.43 | | | | $3.42 | | | | $3.11 | | | | $3.49 | | | | $3.60 | |
| | | |
| Income (loss) from investment operations | | | | | | | | | | | | | |
Net investment income (loss) (d) | | | $0.17 | | | | $0.17 | | | | $0.18 | (c) | | | $0.19 | | | | $0.20 | |
Net realized and unrealized gain (loss) | | | (0.13 | ) | | | 0.02 | | | | 0.32 | | | | (0.37 | ) | | | (0.10 | ) |
Total from investment operations | | | $0.04 | | | | $0.19 | | | | $0.50 | | | | $(0.18 | ) | | | $0.10 | |
| | | |
| Less distributions declared to shareholders | | | | | | | | | | | | | |
From net investment income | | | $(0.17 | ) | | | $(0.18 | ) | | | $(0.19 | ) | | | $(0.20 | ) | | | $(0.21 | ) |
Net asset value, end of period (x) | | | $3.30 | | | | $3.43 | | | | $3.42 | | | | $3.11 | | | | $3.49 | |
Total return (%) (r)(s)(t)(x) | | | 1.33 | | | | 5.54 | | | | 16.58 | (c) | | | (5.55 | ) | | | 2.79 | |
| | | | |
Ratios (%) (to average net assets)
and Supplemental data: | | | | | | | | | | | | | | | | | |
Expenses before expense reductions (f) | | | 0.58 | | | | 0.60 | | | | 0.62 | (c) | | | 0.61 | | | | 0.62 | |
Expenses after expense reductions (f) | | | 0.57 | | | | 0.59 | | | | 0.61 | (c) | | | 0.61 | | | | 0.61 | |
Net investment income (loss) | | | 5.02 | | | | 4.87 | | | | 5.55 | (c) | | | 5.54 | | | | 5.57 | |
Portfolio turnover | | | 44 | | | | 54 | | | | 43 | | | | 36 | | | | 43 | |
Net assets at end of period (000 omitted) | | | $829,451 | | | | $886,418 | | | | $791,825 | | | | $769,246 | | | | $784,830 | |
See Notes to Financial Statements
33
Financial Highlights – continued
| | | | | | | | | | | | | | | | | | | | |
| Class 529A | | Year ended | |
| | | | | |
| | | 1/31/19 | | | 1/31/18 | | | 1/31/17 | | | 1/31/16 | | | 1/31/15 | |
Net asset value, beginning of period | | | $3.43 | | | | $3.42 | | | | $3.10 | | | | $3.49 | | | | $3.60 | |
| | | |
| Income (loss) from investment operations | | | | | | | | | | | | | |
Net investment income (loss) (d) | | | $0.15 | | | | $0.15 | | | | $0.17 | (c) | | | $0.18 | | | | $0.19 | |
Net realized and unrealized gain (loss) | | | (0.12 | ) | | | 0.02 | | | | 0.33 | | | | (0.39 | ) | | | (0.10 | ) |
Total from investment operations | | | $0.03 | | | | $0.17 | | | | $0.50 | | | | $(0.21 | ) | | | $0.09 | |
| | | |
| Less distributions declared to shareholders | | | | | | | | | | | | | |
From net investment income | | | $(0.16 | ) | | | $(0.16 | ) | | | $(0.18 | ) | | | $(0.18 | ) | | | $(0.20 | ) |
Net asset value, end of period (x) | | | $3.30 | | | | $3.43 | | | | $3.42 | | | | $3.10 | | | | $3.49 | |
Total return (%) (r)(s)(t)(x) | | | 0.93 | | | | 5.13 | | | | 16.51 | (c) | | | (6.20 | ) | | | 2.41 | |
| | | | |
Ratios (%) (to average net assets)
and Supplemental data: | | | | | | | | | | | | | | | | | |
Expenses before expense reductions (f) | | | 0.99 | | | | 1.05 | | | | 1.07 | (c) | | | 1.05 | | | | 1.05 | |
Expenses after expense reductions (f) | | | 0.97 | | | | 0.99 | | | | 1.00 | (c) | | | 0.98 | | | | 0.98 | |
Net investment income (loss) | | | 4.62 | | | | 4.47 | | | | 5.13 | (c) | | | 5.16 | | | | 5.21 | |
Portfolio turnover | | | 44 | | | | 54 | | | | 43 | | | | 36 | | | | 43 | |
Net assets at end of period (000 omitted) | | | $3,796 | | | | $3,816 | | | | $3,549 | | | | $2,925 | | | | $3,270 | |
| | | | | | | | | | | | | | | | | | | | |
| Class 529B | | Year ended | |
| | | | | |
| | | 1/31/19 | | | 1/31/18 | | | 1/31/17 | | | 1/31/16 | | | 1/31/15 | |
Net asset value, beginning of period | | | $3.43 | | | | $3.42 | | | | $3.11 | | | | $3.49 | | | | $3.60 | |
| | | |
| Income (loss) from investment operations | | | | | | | | | | | | | |
Net investment income (loss) (d) | | | $0.13 | | | | $0.13 | | | | $0.15 | (c) | | | $0.15 | | | | $0.16 | |
Net realized and unrealized gain (loss) | | | (0.13 | ) | | | 0.02 | | | | 0.32 | | | | (0.37 | ) | | | (0.10 | ) |
Total from investment operations | | | $0.00 | (w) | | | $0.15 | | | | $0.47 | | | | $(0.22 | ) | | | $0.06 | |
| | | |
| Less distributions declared to shareholders | | | | | | | | | | | | | |
From net investment income | | | $(0.13 | ) | | | $(0.14 | ) | | | $(0.16 | ) | | | $(0.16 | ) | | | $(0.17 | ) |
Net asset value, end of period (x) | | | $3.30 | | | | $3.43 | | | | $3.42 | | | | $3.11 | | | | $3.49 | |
Total return (%) (r)(s)(t)(x) | | | 0.17 | | | | 4.34 | | | | 15.26 | (c) | | | (6.63 | ) | | | 1.63 | |
| | | | |
Ratios (%) (to average net assets)
and Supplemental data: | | | | | | | | | | | | | | | | | |
Expenses before expense reductions (f) | | | 1.74 | | | | 1.80 | | | | 1.82 | (c) | | | 1.80 | | | | 1.80 | |
Expenses after expense reductions (f) | | | 1.73 | | | | 1.75 | | | | 1.76 | (c) | | | 1.75 | | | | 1.74 | |
Net investment income (loss) | | | 3.86 | | | | 3.72 | | | | 4.38 | (c) | | | 4.40 | | | | 4.45 | |
Portfolio turnover | | | 44 | | | | 54 | | | | 43 | | | | 36 | | | | 43 | |
Net assets at end of period (000 omitted) | | | $259 | | | | $301 | | | | $355 | | | | $308 | | | | $334 | |
See Notes to Financial Statements
34
Financial Highlights – continued
| | | | | | | | | | | | | | | | | | | | |
| Class 529C | | Year ended | |
| | | | | |
| | | 1/31/19 | | | 1/31/18 | | | 1/31/17 | | | 1/31/16 | | | 1/31/15 | |
Net asset value, beginning of period | | | $3.44 | | | | $3.43 | | | | $3.11 | | | | $3.49 | | | | $3.60 | |
| | | |
| Income (loss) from investment operations | | | | | | | | | | | | | |
Net investment income (loss) (d) | | | $0.13 | | | | $0.13 | | | | $0.15 | (c) | | | $0.15 | | | | $0.16 | |
Net realized and unrealized gain (loss) | | | (0.14 | ) | | | 0.02 | | | | 0.33 | | | | (0.37 | ) | | | (0.10 | ) |
Total from investment operations | | | $(0.01 | ) | | | $0.15 | | | | $0.48 | | | | $(0.22 | ) | | | $0.06 | |
| | | |
| Less distributions declared to shareholders | | | | | | | | | | | | | |
From net investment income | | | $(0.13 | ) | | | $(0.14 | ) | | | $(0.16 | ) | | | $(0.16 | ) | | | $(0.17 | ) |
Net asset value, end of period (x) | | | $3.30 | | | | $3.44 | | | | $3.43 | | | | $3.11 | | | | $3.49 | |
Total return (%) (r)(s)(t)(x) | | | (0.12 | ) | | | 4.34 | | | | 15.60 | (c) | | | (6.62 | ) | | | 1.63 | |
| | | | |
Ratios (%) (to average net assets)
and Supplemental data: | | | | | | | | | | | | | | | | | |
Expenses before expense reductions (f) | | | 1.74 | | | | 1.80 | | | | 1.82 | (c) | | | 1.80 | | | | 1.79 | |
Expenses after expense reductions (f) | | | 1.73 | | | | 1.74 | | | | 1.76 | (c) | | | 1.75 | | | | 1.74 | |
Net investment income (loss) | | | 3.86 | | | | 3.72 | | | | 4.37 | (c) | | | 4.38 | | | | 4.43 | |
Portfolio turnover | | | 44 | | | | 54 | | | | 43 | | | | 36 | | | | 43 | |
Net assets at end of period (000 omitted) | | | $1,003 | | | | $1,221 | | | | $1,360 | | | | $1,257 | | | | $1,593 | |
| (c) | Amount reflects aone-time reimbursement of expenses by the custodian (or former custodian) without which net investment income and performance would be lower and expenses would be higher. |
| (d) | Per share data is based on average shares outstanding. |
| (f) | Ratios do not reflect reductions from fees paid indirectly, if applicable. |
| (r) | Certain expenses have been reduced without which performance would have been lower. |
| (s) | From time to time the fund may receive proceeds from litigation settlements, without which performance would be lower. |
| (t) | Total returns do not include any applicable sales charges. |
| (w) | Per share amount was less than $0.01. |
| (x) | The net asset values and total returns have been calculated on net assets which include adjustments made in accordance with U.S. generally accepted accounting principles required at period end for financial reporting purposes. |
See Notes to Financial Statements
35
NOTES TO FINANCIAL STATEMENTS
(1) Business and Organization
MFS High Income Fund (the fund) is a diversified series of MFS Series Trust III (the trust). The trust is organized as a Massachusetts business trust and is registered under the Investment Company Act of 1940, as amended, as anopen-end management investment company.
The fund is an investment company and accordingly follows the investment company accounting and reporting guidance of the Financial Accounting Standards Board (FASB) Accounting Standards Codification Topic 946 Financial Services – Investment Companies.
(2) Significant Accounting Policies
General– The preparation of financial statements in conformity with U.S. generally accepted accounting principles requires management to make estimates and assumptions that affect the reported amounts of assets and liabilities, and disclosure of contingent assets and liabilities at the date of the financial statements and the reported amounts of increases and decreases in net assets from operations during the reporting period. Actual results could differ from those estimates. In the preparation of these financial statements, management has evaluated subsequent events occurring after the date of the fund’s Statement of Assets and Liabilities through the date that the financial statements were issued. The fund invests in high-yield securities rated below investment grade. Investments in below investment grade quality securities can involve a substantially greater risk of default or can already be in default, and their values can decline significantly. Below investment grade quality securities tend to be more sensitive to adverse news about the issuer, or the market or economy in general, than higher quality debt instruments. The fund invests in foreign securities. Investments in foreign securities are vulnerable to the effects of changes in the relative values of the local currency and the U.S. dollar and to the effects of changes in each country’s market, economic, industrial, political, regulatory, geopolitical, and other conditions.
In March 2017, the FASB issued Accounting Standards Update2017-08, Receivables – Nonrefundable Fees and Other Costs (Subtopic310-20) – Premium Amortization on Purchased Callable Debt Securities (“ASU2017-08”). For entities that hold callable debt securities at a premium, ASU2017-08 requires that the premium be amortized to the earliest call date. ASU2017-08 will be effective for fiscal years beginning after December 15, 2018, and interim periods within those fiscal years. Management has evaluated the potential impacts of ASU2017-08 and believes that adoption of ASU2017-08 will not have a material effect on the fund’s overall financial position or its overall results of operations.
In August 2018, the FASB issued Accounting Standards Update2018-13, Fair Value Measurement (Topic 820) – Disclosure Framework – Changes to the Disclosure Requirements for Fair Value Measurement (“ASU2018-13”) which introduces new fair value disclosure requirements as well as eliminates and modifies certain existing fair value disclosure requirements. ASU2018-13 would be effective for fiscal years beginning after December 15, 2019, and interim periods within those fiscal years; however, management has elected to early adopt ASU2018-13 effective with the current reporting period. The impact of the fund’s adoption was limited to changes in
36
Notes to Financial Statements – continued
the fund’s financial statement disclosures regarding fair value, primarily those disclosures related to transfers between levels of the fair value hierarchy.
In August 2018, the Securities and Exchange Commission (SEC) released its Final Rule on Disclosure Update and Simplification (the “Final Rule”) which is intended to simplify an issuer’s disclosure compliance efforts by removing redundant or outdated disclosure requirements without significantly altering the mix of information provided to investors. Effective with the current reporting period, the fund adopted the Final Rule with the impacts being that the fund is no longer required to present the components of distributable earnings on the Statement of Assets and Liabilities or the sources of distributions to shareholders and the amount of undistributed net investment income on the Statements of Changes in Net Assets.
Balance Sheet Offsetting– The fund’s accounting policy with respect to balance sheet offsetting is that, absent an event of default by the counterparty or a termination of the agreement, the International Swaps and Derivatives Association (ISDA) Master Agreement, or similar agreement, does not result in an offset of reported amounts of financial assets and financial liabilities in the Statement of Assets and Liabilities across transactions between the fund and the applicable counterparty. The fund’s right to setoff may be restricted or prohibited by the bankruptcy or insolvency laws of the particular jurisdiction to which a specific master netting agreement counterparty is subject. Balance sheet offsetting disclosures, to the extent applicable to the fund, have been included in the fund’s Significant Accounting Policies note under the captions for each of the fund’sin-scope financial instruments and transactions.
Investment Valuations– Equity securities, including restricted equity securities, are generally valued at the last sale or official closing price on their primary market or exchange as provided by a third-party pricing service. Equity securities, for which there were no sales reported that day, are generally valued at the last quoted daily bid quotation on their primary market or exchange as provided by a third-party pricing service. Debt instruments and floating rate loans, including restricted debt instruments, are generally valued at an evaluated or composite bid as provided by a third-party pricing service. Short-term instruments with a maturity at issuance of 60 days or less may be valued at amortized cost, which approximates market value. Futures contracts are generally valued at last posted settlement price on their primary exchange as provided by a third-party pricing service. Futures contracts for which there were no trades that day for a particular position are generally valued at the closing bid quotation on their primary exchange as provided by a third-party pricing service. Forward foreign currency exchange contracts are generally valued at the mean of bid and asked prices for the time period interpolated from rates provided by a third-party pricing service for proximate time periods.Open-end investment companies are generally valued at net asset value per share. Securities and other assets generally valued on the basis of information from a third-party pricing service may also be valued at a broker/dealer bid quotation. In determining values, third-party pricing services can utilize both transaction data and market information such as yield, quality, coupon rate, maturity, type of issue, trading characteristics, and other market data. The values of foreign securities and other assets and liabilities expressed in foreign currencies are converted to U.S. dollars using the mean of bid and asked prices for rates provided by a third-party pricing service.
37
Notes to Financial Statements – continued
The Board of Trustees has delegated primary responsibility for determining or causing to be determined the value of the fund’s investments (including any fair valuation) to the adviser pursuant to valuation policies and procedures approved by the Board. If the adviser determines that reliable market quotations are not readily available, investments are valued at fair value as determined in good faith by the adviser in accordance with such procedures under the oversight of the Board of Trustees. Under the fund’s valuation policies and procedures, market quotations are not considered to be readily available for most types of debt instruments and floating rate loans and many types of derivatives. These investments are generally valued at fair value based on information from third-party pricing services. In addition, investments may be valued at fair value if the adviser determines that an investment’s value has been materially affected by events occurring after the close of the exchange or market on which the investment is principally traded (such as foreign exchange or market) and prior to the determination of the fund’s net asset value, or after the halting of trading of a specific security where trading does not resume prior to the close of the exchange or market on which the security is principally traded. The adviser generally relies on third-party pricing services or other information (such as the correlation with price movements of similar securities in the same or other markets; the type, cost and investment characteristics of the security; the business and financial condition of the issuer; and trading and other market data) to assist in determining whether to fair value and at what value to fair value an investment. The value of an investment for purposes of calculating the fund’s net asset value can differ depending on the source and method used to determine value. When fair valuation is used, the value of an investment used to determine the fund’s net asset value may differ from quoted or published prices for the same investment. There can be no assurance that the fund could obtain the fair value assigned to an investment if it were to sell the investment at the same time at which the fund determines its net asset value per share.
Various inputs are used in determining the value of the fund’s assets or liabilities. These inputs are categorized into three broad levels. In certain cases, the inputs used to measure fair value may fall into different levels of the fair value hierarchy. In such cases, an investment’s level within the fair value hierarchy is based on the lowest level of input that is significant to the fair value measurement. The fund’s assessment of the significance of a particular input to the fair value measurement in its entirety requires judgment, and considers factors specific to the investment. Level 1 includes unadjusted quoted prices in active markets for identical assets or liabilities. Level 2 includes other significant observable market-based inputs (including quoted prices for similar securities, interest rates, prepayment speed, and credit risk). Level 3 includes unobservable inputs, which may include the adviser’s own assumptions in determining the fair value of investments. Other financial instruments are derivative instruments,
38
Notes to Financial Statements – continued
such as futures contracts and forward foreign currency exchange contracts. The following is a summary of the levels used as of January 31, 2019 in valuing the fund’s assets or liabilities:
| | | | | | | | | | | | | | | | |
| | | | |
| Financial Instruments | | Level 1 | | | Level 2 | | | Level 3 | | | Total | |
| Equity Securities | | | $— | | | | $3,157 | | | | $2,890,615 | | | | $2,893,772 | |
| Non-U.S. Sovereign Debt | | | — | | | | 14,229,710 | | | | — | | | | 14,229,710 | |
| U.S. Corporate Bonds | | | — | | | | 1,120,608,574 | | | | — | | | | 1,120,608,574 | |
| Commercial Mortgage-Backed Securities | | | — | | | | 2 | | | | — | | | | 2 | |
| Asset-Backed Securities (including CDOs) | | | — | | | | 305 | | | | — | | | | 305 | |
| Foreign Bonds | | | — | | | | 243,091,676 | | | | — | | | | 243,091,676 | |
| Floating Rate Loans | | | — | | | | 11,085,104 | | | | — | | | | 11,085,104 | |
| Mutual Funds | | | 73,476,944 | | | | — | | | | — | | | | 73,476,944 | |
| Total | | | $73,476,944 | | | | $1,389,018,528 | | | | $2,890,615 | | | | $1,465,386,087 | |
| | | | |
| Other Financial Instruments | | | | | | | | | | | | |
| Futures Contracts – Liabilities | | | $(689,178 | ) | | | $— | | | | $— | | | | $(689,178 | ) |
| Forward Foreign Currency Exchange Contracts – Assets | | | — | | | | 56,047 | | | | — | | | | 56,047 | |
For further information regarding security characteristics, see the Portfolio of Investments.
The following is a reconciliation of level 3 assets for which significant unobservable inputs were used to determine fair value. The table presents the activity of level 3 securities held at the beginning and the end of the period.
| | | | |
| |
| | | Equity
Securities | |
| Balance as of 1/31/18 | | | $2,890,615 | |
Change in unrealized appreciation or depreciation | | | 0 | |
| Balance as of 1/31/19 | | | $2,890,615 | |
The net change in unrealized appreciation or depreciation from investments held as level 3 at January 31, 2019 is $0. At January 31, 2019, the fund held one level 3 security.
Foreign Currency Translation– Purchases and sales of foreign investments, income, and expenses are converted into U.S. dollars based upon currency exchange rates prevailing on the respective dates of such transactions or on the reporting date for foreign denominated receivables and payables. Gains and losses attributable to foreign currency exchange rates on sales of securities are recorded for financial statement purposes as net realized gains and losses on investments. Gains and losses attributable to foreign exchange rate movements on receivables, payables, income and expenses are recorded for financial statement purposes as foreign currency transaction gains and losses. That portion of both realized and unrealized gains and losses on investments that results from fluctuations in foreign currency exchange rates is not separately disclosed.
39
Notes to Financial Statements – continued
Derivatives– The fund uses derivatives primarily to increase or decrease exposure to a particular market or segment of the market, or security, to increase or decrease interest rate or currency exposure, or as alternatives to direct investments. Derivatives are used for hedging ornon-hedging purposes. While hedging can reduce or eliminate losses, it can also reduce or eliminate gains. When the fund uses derivatives as an investment to increase market exposure, or for hedging purposes, gains and losses from derivative instruments may be substantially greater than the derivative’s original cost.
The derivative instruments used by the fund during the period were futures contracts and forward foreign currency exchange contracts. Depending on the type of derivative, the fund may exit a derivative position by entering into an offsetting transaction with a counterparty or exchange, negotiating an agreement with the derivative counterparty, or novating the position to a third party. The fund may be unable to promptly close out a futures position in instances where the daily fluctuation in the price for that type of future exceeds the daily limit set by the exchange. The fund’s period end derivatives, as presented in the Portfolio of Investments and the associated Derivative Contract tables, generally are indicative of the volume of its derivative activity during the period.
The following table presents, by major type of derivative contract, the fair value, on a gross basis, of the asset and liability components of derivatives held by the fund at January 31, 2019 as reported in the Statement of Assets and Liabilities:
| | | | | | | | | | |
| | | | | Fair Value (a) | |
| | | |
| Risk | | Derivative Contracts | | Asset Derivatives | | | Liability Derivatives | |
| Interest Rate | | Interest Rate Futures | | | $— | | | $ | (689,178 | ) |
| Foreign Exchange | | Forward Foreign Currency Exchange Contracts | | | 56,047 | | | | — | |
| Total | | | | | $56,047 | | | $ | (689,178 | ) |
| (a) | Values presented in this table for futures contracts correspond to the values reported in the fund’s Portfolio of Investments. Only the current day net variation margin for futures contracts is separately reported within the fund’s Statement of Assets and Liabilities. |
The following table presents, by major type of derivative contract, the realized gain (loss) on derivatives held by the fund for the year ended January 31, 2019 as reported in the Statement of Operations:
| | | | | | | | |
| | |
| Risk | | Futures
Contracts | | | Forward
Foreign
Currency
Exchange
Contracts | |
| Interest Rate | | | $1,454,306 | | | | $— | |
| Foreign | | | | | | | | |
| Exchange | | | — | | | | 355,780 | |
| Total | | | $1,454,306 | | | | $355,780 | |
40
Notes to Financial Statements – continued
The following table presents, by major type of derivative contract, the change in unrealized appreciation or depreciation on derivatives held by the fund for the year ended January 31, 2019 as reported in the Statement of Operations:
| | | | | | | | |
| | |
| Risk | | Futures
Contracts | | | Forward
Foreign
Currency
Exchange
Contracts | |
| Interest Rate | | | $(1,879,393 | ) | | | $— | |
| Foreign Exchange | | | — | | | | 62,084 | |
| Total | | | $(1,879,393 | ) | | | $62,084 | |
Derivative counterparty credit risk is managed through formal evaluation of the creditworthiness of all potential counterparties. On certain, but not all, uncleared derivatives, the fund attempts to reduce its exposure to counterparty credit risk whenever possible by entering into an ISDA Master Agreement on a bilateral basis. The ISDA Master Agreement gives each party to the agreement the right to terminate all transactions traded under such agreement if there is a specified deterioration in the credit quality of the other party. Upon an event of default or a termination of the ISDA Master Agreement, thenon-defaulting party has the right to close out all transactions traded under such agreement and to net amounts owed under each agreement to one net amount payable by one party to the other. This right to close out and net payments across all transactions traded under the ISDA Master Agreement could result in a reduction of the fund’s credit risk to such counterparty equal to any amounts payable by the fund under the applicable transactions, if any.
Collateral and margin requirements differ by type of derivative. For cleared derivatives (e.g., futures contracts, cleared swaps, and exchange-traded options), margin requirements are set by the clearing broker and the clearing house and collateral, in the form of cash or securities, is posted by the fund directly with the clearing broker. Collateral terms are counterparty agreement specific for uncleared derivatives (e.g., forward foreign currency exchange contracts, uncleared swap agreements, and uncleared options) and collateral, in the form of cash and securities, is held in segregated accounts with the fund’s custodian in connection with these agreements. For derivatives traded under an ISDA Master Agreement, which contains a collateral support annex, the collateral requirements are netted across all transactions traded under such counterparty-specific agreement and an amount is posted from one party to the other to collateralize such obligations. Cash that has been segregated or delivered to cover the fund’s collateral or margin obligations under derivative contracts, if any, will be reported separately in the Statement of Assets and Liabilities as restricted cash for uncleared derivatives and/or deposits with brokers for cleared derivatives. Securities pledged as collateral or margin for the same purpose, if any, are noted in the Portfolio of Investments. The fund may be required to make payments of interest on uncovered collateral or margin obligations with the broker. Any such payments are included in “Miscellaneous” expense in the Statement of Operations.
Futures Contracts– The fund entered into futures contracts which may be used to hedge against or obtain broad market exposure, interest rate exposure, currency
41
Notes to Financial Statements – continued
exposure, or to manage duration. A futures contract represents a commitment for the future purchase or sale of an asset at a specified price on a specified date.
Upon entering into a futures contract, the fund is required to deposit with the broker, either in cash or securities, an initial margin in an amount equal to a specified percentage of the notional amount of the contract. Subsequent payments (variation margin) are made or received by the fund each day, depending on the daily fluctuations in the value of the contract, and are recorded for financial statement purposes as unrealized gain or loss by the fund until the contract is closed or expires at which point the gain or loss on futures contracts is realized.
The fund bears the risk of interest rates, exchange rates or securities prices moving unexpectedly, in which case, the fund may not achieve the anticipated benefits of the futures contracts and may realize a loss. While futures contracts may present less counterparty risk to the fund since the contracts are exchange traded and the exchange’s clearinghouse guarantees payments to the broker, there is still counterparty credit risk due to the insolvency of the broker. The fund’s maximum risk of loss due to counterparty credit risk is equal to the margin posted by the fund to the broker plus any gains or minus any losses on the outstanding futures contracts.
Forward Foreign Currency Exchange Contracts– The fund entered into forward foreign currency exchange contracts for the purchase or sale of a specific foreign currency at a fixed price on a future date. These contracts may be used to hedge the fund’s currency risk or fornon-hedging purposes. For hedging purposes, the fund may enter into contracts to deliver or receive foreign currency that the fund will receive from or use in its normal investment activities. The fund may also use contracts to hedge against declines in the value of foreign currency denominated securities due to unfavorable exchange rate movements. Fornon-hedging purposes, the fund may enter into contracts with the intent of changing the relative exposure of the fund’s portfolio of securities to different currencies to take advantage of anticipated exchange rate changes.
Forward foreign currency exchange contracts are adjusted by the daily exchange rate of the underlying currency and any unrealized gains or losses are recorded as a receivable or payable for forward foreign currency exchange contracts until the contract settlement date. On contract settlement date, any gain or loss on the contract is recorded as realized gains or losses on forward foreign currency exchange contracts.
Risks may arise upon entering into these contracts from unanticipated movements in the value of the contract and from the potential inability of counterparties to meet the terms of their contracts. Generally, the fund’s maximum risk due to counterparty credit risk is the unrealized gain on the contract due to the use of Continuous Linked Settlement, a multicurrency cash settlement system for the centralized settlement of foreign transactions. This risk is mitigated in cases where there is an ISDA Master Agreement between the fund and the counterparty providing for netting as described above and, where applicable, by the posting of collateral by the counterparty to the fund to cover the fund’s exposure to the counterparty under such ISDA Master Agreement.
Loans and Other Direct Debt Instruments– The fund invests in loans and loan participations or other receivables. These investments may include standby financing
42
Notes to Financial Statements – continued
commitments, including revolving credit facilities, which contractually obligate the fund
to supply additional cash to the borrower on demand. The fund generally provides this financial support in order to preserve its existing investment or to obtain a more senior secured interest in the assets of the borrower. Loan participations involve a risk of insolvency of the lending bank or other financial intermediary.
Indemnifications– Under the fund’s organizational documents, its officers and Trustees may be indemnified against certain liabilities and expenses arising out of the performance of their duties to the fund. Additionally, in the normal course of business, the fund enters into agreements with service providers that may contain indemnification clauses. The fund’s maximum exposure under these agreements is unknown as this would involve future claims that may be made against the fund that have not yet occurred.
Investment Transactions and Income– Investment transactions are recorded on the trade date. Interest income is recorded on the accrual basis. All premium and discount is amortized or accreted for financial statement purposes in accordance with U.S. generally accepted accounting principles. The fund earns certain fees in connection with its floating rate loan purchasing activities. These fees are in addition to interest payments earned and may include amendment fees, commitment fees, facility fees, consent fees, and prepayment fees. Commitment fees are recorded on an accrual basis as income in the accompanying financial statements. Dividends received in cash are recorded on the ex-dividend date. Certain dividends from foreign securities will be recorded when the fund is informed of the dividend if such information is obtained subsequent to the ex-dividend date. Dividend and interest payments received in additional securities are recorded on theex-dividend orex-interest date in an amount equal to the value of the security on such date. Debt obligations may be placed onnon-accrual status or set to accrue at a rate of interest less than the contractual coupon when the collection of all or a portion of interest has become doubtful. Interest income for those debt obligations may be further reduced by thewrite-off of the related interest receivables when deemed uncollectible.
The fund may receive proceeds from litigation settlements. Any proceeds received from litigation involving portfolio holdings are reflected in the Statement of Operations in realized gain/loss if the security has been disposed of by the fund or in unrealized gain/loss if the security is still held by the fund. Any other proceeds from litigation not related to portfolio holdings are reflected as other income in the Statement of Operations.
Fees Paid Indirectly– The fund’s custody fee may be reduced by a credit earned under an arrangement that measures the value of U.S. dollars deposited with the custodian by the fund. The amount of the credit, for the year ended January 31, 2019, is shown as a reduction of total expenses in the Statement of Operations.
Tax Matters and Distributions– The fund intends to qualify as a regulated investment company, as defined under Subchapter M of the Internal Revenue Code, and to distribute all of its taxable income, including realized capital gains. As a result, no provision for federal income tax is required. The fund’s federal tax returns, when filed, will remain subject to examination by the Internal Revenue Service for a three year period. Management has analyzed the fund’s tax positions taken on federal and
43
Notes to Financial Statements – continued
state tax returns for all open tax years and does not believe that there are any uncertain tax positions that require recognition of a tax liability. Foreign taxes, if any, have been accrued by the fund in the accompanying financial statements in accordance with the applicable foreign tax law. Foreign income taxes may be withheld by certain countries in which the fund invests. Additionally, capital gains realized by the fund on securities issued in or by certain foreign countries may be subject to capital gains tax imposed by those countries.
Distributions to shareholders are recorded on theex-dividend date. Income and capital gain distributions are determined in accordance with income tax regulations, which may differ from U.S. generally accepted accounting principles. Certain capital accounts in the financial statements are periodically adjusted for permanent differences in order to reflect their tax character. These adjustments have no impact on net assets or net asset value per share. Temporary differences which arise from recognizing certain items of income, expense, gain or loss in different periods for financial statement and tax purposes will reverse at some time in the future. Distributions in excess of net investment income or net realized gains are temporary overdistributions for financial statement purposes resulting from differences in the recognition or classification of income or distributions for financial statement and tax purposes.
Book/tax differences primarily relate to amortization and accretion of debt securities.
The tax character of distributions declared to shareholders for the last two fiscal years is as follows:
| | | | | | | | |
| | |
| | | Year ended
1/31/19 | | | Year ended
1/31/18 | |
| Ordinary income (including any short-term capital gains) | | | $76,037,494 | | | | $78,226,662 | |
The federal tax cost and the tax basis components of distributable earnings were as follows:
| | | | |
| |
| As of 1/31/19 | | | |
| |
| Cost of investments | | | $1,509,730,264 | |
| Gross appreciation | | | 6,323,172 | |
| |
| Gross depreciation | | | (51,300,480 | ) |
| Net unrealized appreciation (depreciation) | | | $(44,977,308 | ) |
| |
| Undistributed ordinary income | | | 5,609,845 | |
| Capital loss carryforwards | | | (74,123,384 | ) |
| Other temporary differences | | | (6,227,057 | ) |
As of January 31, 2019, the fund had capital loss carryforwards available to offset future realized gains. These net capital losses may be carried forward indefinitely and their character is retained as short-term and/or long-term losses. Such losses are characterized as follows:
| | | | |
| Short-Term | | | $(7,079,181 | ) |
| Long-Term | | | (67,044,203 | ) |
| Total | | | $(74,123,384 | ) |
44
Notes to Financial Statements – continued
Multiple Classes of Shares of Beneficial Interest– The fund offers multiple classes of shares, which differ in their respective distribution, service, and program manager fees. The fund’s income and common expenses are allocated to shareholders based on the value of settled shares outstanding of each class. The fund’s realized and unrealized
gain (loss) are allocated to shareholders based on the daily net assets of each class. Dividends are declared separately for each class. Differences in per share dividend rates are generally due to differences in separate class expenses. Class B and Class 529B shares will convert to Class A and Class 529A shares, respectively approximately eight years after purchase. Class C and Class 529C shares will convert to Class A and Class 529A shares, respectively, approximately ten years after purchase. The fund’s distributions declared to shareholders as reported in the Statements of Changes in Net Assets are presented by class as follows:
| | | | | | | | |
| | | From net investment
income | |
| | |
| | | Year
ended
1/31/19 | | | Year
ended
1/31/18 | |
| Class A | | | $22,915,886 | | | | $24,178,073 | |
| Class B | | | 623,822 | | | | 828,947 | |
| Class C | | | 1,546,121 | | | | 2,514,237 | |
| Class I | | | 4,999,884 | | | | 6,318,732 | |
| Class R1 | | | 41,068 | | | | 45,289 | |
| Class R2 | | | 669,917 | | | | 703,832 | |
| Class R3 | | | 141,128 | | | | 276,112 | |
| Class R4 | | | 20,345 | | | | 18,244 | |
| Class R6 | | | 44,836,278 | | | | 43,096,943 | |
| Class 529A | | | 188,159 | | | | 181,356 | |
| Class 529B | | | 12,319 | | | | 13,965 | |
| Class 529C | | | 42,567 | | | | 50,932 | |
| Total | | | $76,037,494 | | | | $78,226,662 | |
(3) Transactions with Affiliates
Investment Adviser– The fund has an investment advisory agreement with MFS to provide overall investment management and related administrative services and facilities to the fund. The management fee is computed daily and paid monthly at the following annual rates based on the fund’s average daily net assets:
| | | | |
| Up to $1.4 billion | | | 0.46 | % |
| In excess of $1.4 billion and up to $3 billion | | | 0.44 | % |
| In excess of $3 billion | | | 0.42 | % |
MFS has agreed in writing to reduce its management fee by a specified amount if certain MFS mutual fund assets exceed thresholds agreed to by MFS and the fund’s Board of Trustees. For the year ended January 31, 2019, this management fee reduction amounted to $145,821, which is included in the reduction of total expenses in the Statement of Operations. The management fee incurred for the year ended January 31, 2019 was equivalent to an annual effective rate of 0.45% of the fund’s average daily net assets.
45
Notes to Financial Statements – continued
Distributor– MFS Fund Distributors, Inc. (MFD), a wholly-owned subsidiary of MFS, as distributor, received $33,438 and $476 for the year ended January 31, 2019, as its portion of the initial sales charge on sales of Class A and Class 529A shares of the fund, respectively.
The Board of Trustees has adopted a distribution plan for certain share classes pursuant to Rule12b-1 of the Investment Company Act of 1940.
The fund’s distribution plan provides that the fund will pay MFD for services provided by MFD and financial intermediaries in connection with the distribution and servicing of certain share classes. One component of the plan is a distribution fee paid to MFD and another component of the plan is a service fee paid to MFD. MFD may subsequently pay all, or a portion, of the distribution and/or service fees to financial intermediaries.
Distribution Plan Fee Table:
| | | | | | | | | | | | | | | | | | | | |
| | | | | |
| | | Distribution
Fee Rate (d) | | | Service
Fee Rate (d) | | | Total
Distribution
Plan (d) | | | Annual
Effective
Rate (e) | | | Distribution
and Service
Fee | |
| Class A | | | — | | | | 0.25% | | | | 0.25% | | | | 0.24% | | | | $1,185,057 | |
| Class B | | | 0.75% | | | | 0.25% | | | | 1.00% | | | | 1.00% | | | | 153,043 | |
| Class C | | | 0.75% | | | | 0.25% | | | | 1.00% | | | | 1.00% | | | | 379,410 | |
| Class R1 | | | 0.75% | | | | 0.25% | | | | 1.00% | | | | 1.00% | | | | 10,068 | |
| Class R2 | | | 0.25% | | | | 0.25% | | | | 0.50% | | | | 0.50% | | | | 73,100 | |
| Class R3 | | | — | | | | 0.25% | | | | 0.25% | | | | 0.25% | | | | 7,313 | |
| Class 529A | | | — | | | | 0.25% | | | | 0.25% | | | | 0.24% | | | | 9,821 | |
| Class 529B | | | 0.75% | | | | 0.25% | | | | 1.00% | | | | 1.00% | | | | 3,065 | |
| Class 529C | | | 0.75% | | | | 0.25% | | | | 1.00% | | | | 1.00% | | | | 10,577 | |
| Total Distribution and Service Fees | | | | | | | | | | | | $1,831,454 | |
| (d) | In accordance with the distribution plan for certain classes, the fund pays distribution and/or service fees equal to these annual percentage rates of each class’s average daily net assets. The distribution and service fee rates disclosed by class represent the current rates in effect at the end of the reporting period. Any rate changes, if applicable, are detailed below. |
| (e) | The annual effective rates represent actual fees incurred under the distribution plan for the year ended January 31, 2019 based on each class’s average daily net assets. MFD has voluntarily agreed to rebate a portion of each class’s 0.25% service fee attributable to accounts for which MFD retains the 0.25% service fee except for accounts attributable to MFS or its affiliates’ seed money. For the year ended January 31, 2019, this rebate amounted to $34,443, $323, $182, $37, $425, and $16 for Class A, Class B, Class C, Class R2, Class 529A, and Class 529C, respectively, and is included in the reduction of total expenses in the Statement of Operations. |
Certain Class A shares are subject to a contingent deferred sales charge (CDSC) in the event of a shareholder redemption within 18 months of purchase. Class B and Class 529B shares are subject to a CDSC in the event of a shareholder redemption within six years of purchase. Class C and Class 529C shares are subject to a CDSC in
46
Notes to Financial Statements – continued
the event of a shareholder redemption within 12 months of purchase. All contingent deferred sales charges are paid to MFD and during the year ended January 31, 2019, were as follows:
| | | | |
| |
| | | Amount | |
| Class A | | | $19,521 | |
| Class B | | | 32,129 | |
| Class C | | | 2,583 | |
| Class 529B | | | 162 | |
| Class 529C | | | 29 | |
The fund has entered into and may from time to time enter into contracts with program managers and other parties which administer the tuition programs through which an investment in the fund’s 529 share classes is made. The fund has entered into an agreement with MFD pursuant to which MFD receives an annual fee of up to 0.05% of the average daily net assets attributable to each 529 share class. The services provided by MFD, or a third party with which MFD contracts, include recordkeeping and tax reporting and account services, as well as services designed to maintain the program’s compliance with the Internal Revenue Code and other regulatory requirements. Program manager fees for the year ended January 31, 2019, were as follows:
| | | | |
| |
| | | Fee | |
| Class 529A | | | $1,964 | |
| Class 529B | | | 153 | |
| Class 529C | | | 529 | |
| Total Program Manager Fees | | | $2,646 | |
Shareholder Servicing Agent– MFS Service Center, Inc. (MFSC), a wholly-owned subsidiary of MFS, receives a fee from the fund for its services as shareholder servicing agent calculated as a percentage of the average daily net assets of the fund as determined periodically under the supervision of the fund’s Board of Trustees. For the year ended January 31, 2019, the fee was $193,731, which equated to 0.0128% annually of the fund’s average daily net assets. MFSC also receives payment from the fund forout-of-pocket expenses,sub-accounting and other shareholder servicing costs which may be paid to affiliated and unaffiliated service providers. Class R6 shares do not incursub-accounting fees. For the year ended January 31, 2019, theseout-of-pocket expenses,sub-accounting and other shareholder servicing costs amounted to $812,100.
Under a Special Servicing Agreement among MFS, certain MFS funds which invest in other MFS funds (“MFSfund-of-funds”) and certain underlying funds in which a MFSfund-of-funds invests (“underlying funds”), each underlying fund may pay a portion of each MFSfund-of-funds’ transfer agent-related expenses, includingsub-accounting fees payable to financial intermediaries, to the extent such payments do not exceed the benefits realized or expected to be realized by the underlying fund from the investment in the underlying fund by the MFSfund-of-funds. For the year ended January 31, 2019, these costs for the fund amounted to $749,346 and are included in “Shareholder servicing costs” in the Statement of Operations.
47
Notes to Financial Statements – continued
Administrator– MFS provides certain financial, legal, shareholder communications, compliance, and other administrative services to the fund. Under an administrative services agreement, the fund reimburses MFS the costs incurred to provide these services. The fund is charged an annual fixed amount of $17,500 plus a fee based on average daily net assets. The administrative services fee incurred for the year ended January 31, 2019 was equivalent to an annual effective rate of 0.0148% of the fund’s average daily net assets.
Trustees’ and Officers’ Compensation– The fund pays compensation to independent Trustees in the form of a retainer, attendance fees, and additional compensation to Board and Committee chairpersons. The fund does not pay
compensation directly to Trustees or officers of the fund who are also officers of the investment adviser, all of whom receive remuneration for their services to the fund from MFS. Certain officers and Trustees of the fund are officers or directors of MFS, MFD, and MFSC.
Prior to December 31, 2001, the fund had an unfunded defined benefit plan (“DB plan”) for independent Trustees. As of December 31, 2001, the Board took action to terminate the DB plan with respect to then-current and any future independent Trustees, such that the DB plan covers only certain of those former independent Trustees who retired on or before December 31, 2001. Effective January 1, 2002, accrued benefits under the DB plan for then-current independent Trustees who continued were credited to an unfunded retirement deferral plan (the “Retirement Deferral plan”), which was established for and exists solely with respect to these credited amounts, and is not available for other deferrals by these or other independent Trustees. Although the Retirement Deferral plan is unfunded, amounts deferred under the plan are periodically adjusted for investment experience as if they had been invested in shares of the fund. The DB plan resulted in a pension expense of $4,572. The Retirement Deferral plan, which terminated on December 31, 2018, resulted in a net decrease in expense of $460. Both amounts are included in “Independent Trustees’ compensation” in the Statement of Operations for the year ended January 31, 2019. The liability for deferred retirement benefits payable to those former independent Trustees under the DB plan amounted to $6,537 at January 31, 2019, and is included in “Payable for independent Trustees’ compensation” in the Statement of Assets and Liabilities.
Other– This fund and certain other funds managed by MFS (the funds) have entered into a service agreement (the ISO Agreement) which provides for payment of fees solely by the funds to Tarantino LLC in return for the provision of services of an Independent Senior Officer (ISO) for the funds. Frank L. Tarantino serves as the ISO and is an officer of the funds and the sole member of Tarantino LLC. The funds can terminate the ISO Agreement with Tarantino LLC at any time under the terms of the ISO Agreement. For the year ended January 31, 2019, the fee paid by the fund under this agreement was $2,453 and is included in “Miscellaneous” expense in the Statement of Operations. MFS has agreed to bear all expenses associated with office space, other administrative support, and supplies provided to the ISO.
The fund invests in the MFS Institutional Money Market Portfolio which is managed by MFS and seeks current income consistent with preservation of capital and liquidity. This money market fund does not pay a management fee to MFS.
48
Notes to Financial Statements – continued
(4) Portfolio Securities
For the year ended January 31, 2019, purchases and sales of investments, other than short-term obligations, aggregated $633,936,158 and $700,766,889, respectively.
(5) Shares of Beneficial Interest
The fund’s Declaration of Trust permits the Trustees to issue an unlimited number of full and fractional shares of beneficial interest. Transactions in fund shares were as follows:
| | | | | | | | | | | | | | | | |
| | | Year ended
1/31/19 | | | Year ended
1/31/18 | |
| | | | |
| | | Shares | | | Amount | | | Shares | | | Amount | |
| Shares sold | | | | | | | | | | | | | | | | |
Class A | | | 32,383,337 | | | | $107,329,012 | | | | 31,368,359 | | | | $108,287,546 | |
Class B | | | 413,653 | | | | 1,369,873 | | | | 540,930 | | | | 1,867,578 | |
Class C | | | 1,745,419 | | | | 5,763,332 | | | | 1,750,101 | | | | 6,061,786 | |
Class I | | | 12,237,985 | | | | 40,484,964 | | | | 25,284,757 | | | | 87,026,052 | |
Class R1 | | | 59,740 | | | | 199,223 | | | | 44,199 | | | | 152,282 | |
Class R2 | | | 1,213,513 | | | | 4,029,580 | | | | 1,386,764 | | | | 4,780,839 | |
Class R3 | | | 213,553 | | | | 719,855 | | | | 223,836 | | | | 771,920 | |
Class R4 | | | 94,173 | | | | 313,271 | | | | 27,983 | | | | 96,206 | |
Class R6 | | | 15,136,909 | | | | 50,332,454 | | | | 35,633,112 | | | | 122,971,060 | |
Class 529A | | | 226,412 | | | | 755,795 | | | | 251,381 | | | | 864,814 | |
Class 529B | | | 19,908 | | | | 67,368 | | | | 4,714 | | | | 16,276 | |
Class 529C | | | 48,242 | | | | 161,025 | | | | 57,414 | | | | 198,398 | |
| | | 63,792,844 | | | | $211,525,752 | | | | 96,573,550 | | | | $333,094,757 | |
| | | |
Shares issued to shareholders in
reinvestment of distributions | | | | | | | | | | | | | |
Class A | | | 6,491,193 | | | | $21,493,695 | | | | 6,531,652 | | | | $22,595,475 | |
Class B | | | 177,035 | | | | 587,710 | | | | 224,131 | | | | 775,897 | |
Class C | | | 414,932 | | | | 1,381,226 | | | | 656,950 | | | | 2,277,518 | |
Class I | | | 1,280,777 | | | | 4,237,911 | | | | 1,716,599 | | | | 5,922,020 | |
Class R1 | | | 12,373 | | | | 41,013 | | | | 13,065 | | | | 45,206 | |
Class R2 | | | 200,870 | | | | 665,082 | | | | 201,267 | | | | 695,048 | |
Class R3 | | | 42,576 | | | | 141,124 | | | | 79,888 | | | | 276,089 | |
Class R4 | | | 6,148 | | | | 20,344 | | | | 5,277 | | | | 18,243 | |
Class R6 | | | 13,391,447 | | | | 44,356,065 | | | | 12,326,645 | | | | 42,607,490 | |
Class 529A | | | 56,564 | | | | 187,242 | | | | 52,351 | | | | 180,744 | |
Class 529B | | | 3,683 | | | | 12,212 | | | | 4,039 | | | | 13,962 | |
Class 529C | | | 12,746 | | | | 42,292 | | | | 14,639 | | | | 50,673 | |
| | | 22,090,344 | | | | $73,165,916 | | | | 21,826,503 | | | | $75,458,365 | |
49
Notes to Financial Statements – continued
| | | | | | | | | | | | | | | | |
| | | Year ended
1/31/19 | | | Year ended
1/31/18 | |
| | | | |
| | | Shares | | | Amount | | | Shares | | | Amount | |
| Shares reacquired | | | | | | | | | | | | | | | | |
Class A | | | (29,794,185 | ) | | | $(98,787,216 | ) | | | (49,024,195 | ) | | | $(169,091,322 | ) |
Class B | | | (1,877,615 | ) | | | (6,248,277 | ) | | | (1,712,735 | ) | | | (5,923,323 | ) |
Class C | | | (9,253,012 | ) | | | (31,014,318 | ) | | | (5,007,694 | ) | | | (17,343,943 | ) |
Class I | | | (18,820,134 | ) | | | (62,241,245 | ) | | | (30,391,996 | ) | | | (104,717,611 | ) |
Class R1 | | | (108,895 | ) | | | (362,083 | ) | | | (88,901 | ) | | | (307,606 | ) |
Class R2 | | | (1,556,761 | ) | | | (5,183,292 | ) | | | (1,444,469 | ) | | | (4,985,615 | ) |
Class R3 | | | (497,854 | ) | | | (1,645,850 | ) | | | (1,257,925 | ) | | | (4,331,475 | ) |
Class R4 | | | (55,833 | ) | | | (185,443 | ) | | | (58,949 | ) | | | (202,708 | ) |
Class R6 | | | (35,306,806 | ) | | | (115,740,555 | ) | | | (21,193,856 | ) | | | (73,103,231 | ) |
Class 529A | | | (243,979 | ) | | | (806,119 | ) | | | (229,515 | ) | | | (791,430 | ) |
Class 529B | | | (32,590 | ) | | | (107,933 | ) | | | (24,929 | ) | | | (86,114 | ) |
Class 529C | | | (112,553 | ) | | | (375,820 | ) | | | (113,721 | ) | | | (394,984 | ) |
| | | (97,660,217 | ) | | | $(322,698,151 | ) | | | (110,548,885 | ) | | | $(381,279,362 | ) |
| | | | |
| Net change | | | | | | | | | | | | | | | | |
Class A | | | 9,080,345 | | | | $30,035,491 | | | | (11,124,184 | ) | | | $(38,208,301 | ) |
Class B | | | (1,286,927 | ) | | | (4,290,694 | ) | | | (947,674 | ) | | | (3,279,848 | ) |
Class C | | | (7,092,661 | ) | | | (23,869,760 | ) | | | (2,600,643 | ) | | | (9,004,639 | ) |
Class I | | | (5,301,372 | ) | | | (17,518,370 | ) | | | (3,390,640 | ) | | | (11,769,539 | ) |
Class R1 | | | (36,782 | ) | | | (121,847 | ) | | | (31,637 | ) | | | (110,118 | ) |
Class R2 | | | (142,378 | ) | | | (488,630 | ) | | | 143,562 | | | | 490,272 | |
Class R3 | | | (241,725 | ) | | | (784,871 | ) | | | (954,201 | ) | | | (3,283,466 | ) |
Class R4 | | | 44,488 | | | | 148,172 | | | | (25,689 | ) | | | (88,259 | ) |
Class R6 | | | (6,778,450 | ) | | | (21,052,036 | ) | | | 26,765,901 | | | | 92,475,319 | |
Class 529A | | | 38,997 | | | | 136,918 | | | | 74,217 | | | | 254,128 | |
Class 529B | | | (8,999 | ) | | | (28,353 | ) | | | (16,176 | ) | | | (55,876 | ) |
Class 529C | | | (51,565 | ) | | | (172,503 | ) | | | (41,668 | ) | | | (145,913 | ) |
| | | (11,777,029 | ) | | | $(38,006,483 | ) | | | 7,851,168 | | | | $27,273,760 | |
Class T shares were not publicly available for sale during the period. Please see the fund’s prospectus for details.
Effective June 1, 2019, purchases of the fund’s Class B and Class 529B shares are closed to new and existing investors subject to certain exceptions. Please see the fund’s prospectus for details.
The fund is one of several mutual funds in which certain MFS funds may invest. The MFS funds do not invest in the underlying funds for the purpose of exercising management or control. At the end of the period, the MFS Moderate Allocation Fund, the MFS Growth Allocation Fund, the MFS Conservative Allocation Fund, the MFS Lifetime 2030 Fund, and the MFS Lifetime Income Fund were the owners of record of approximately 18%, 16%, 9%, 2%, and 1%, respectively, of the value of outstanding voting shares of the fund. In addition, the MFS Lifetime 2020 Fund, the MFS Lifetime 2025 Fund, the MFS Lifetime 2035 Fund, and the MFS Lifetime 2040 Fund were each the owners of record of less than 1% of the value of outstanding voting shares of the fund.
50
Notes to Financial Statements – continued
(6) Line of Credit
The fund and certain other funds managed by MFS participate in a $1.25 billion unsecured committed line of credit, subject to a $1 billion sublimit, provided by a syndication of banks under a credit agreement. Borrowings may be made for temporary financing needs. Interest is charged to each fund, based on its borrowings, generally at a rate equal to the higher of the Overnight Bank Funding rate or daily one month LIBOR plus an agreed upon spread. A commitment fee, based on the average daily, unused portion of the committed line of credit, is allocated among the participating funds. In addition, the fund and other funds managed by MFS have established unsecured uncommitted borrowing arrangements with certain banks for temporary financing needs. Interest is charged to each fund, based on its borrowings, at a rate equal to the Overnight Bank Funding rate plus an agreed upon spread. For the year ended January 31, 2019, the fund’s commitment fee and interest expense were $9,193 and $0, respectively, and are included in “Miscellaneous” expense in the Statement of Operations.
(7) Investments in Affiliated Issuers
An affiliated issuer may be considered one in which the fund owns 5% or more of the outstanding voting securities, or a company which is under common control. For the purposes of this report, the fund assumes the following to be affiliated issuers:
| | | | | | | | | | | | | | | | | | | | |
| | | | | |
| Affiliated Issuers | | | | | Beginning
Shares/Par
Amount | | | Acquisitions
Shares/Par
Amount | | | Dispositions
Shares/Par
Amount | | | Ending
Shares/Par
Amount | |
| MFS Institutional Money Market Portfolio | | | | | | | 31,457,059 | | | | 370,849,959 | | | | (328,822,725 | ) | | | 73,484,293 | |
| | | | | |
| Affiliated Issuers | | Realized
Gain (Loss) | | | Change in
Unrealized
Appreciation/
Depreciation | | | Capital Gain
Distributions | | | Dividend
Income | | | Ending
Value | |
| MFS Institutional Money Market Portfolio | | | $(3,524 | ) | | | $436 | | | | $— | | | | $1,074,376 | | | | $73,476,944 | |
(8) Legal Proceedings
In May 2015, the Motors Liquidation Company Avoidance Action Trust (hereafter, “AAT”) served upon the fund a complaint in an adversary proceeding in the U.S. Bankruptcy Court for the Southern District of New York, captionedMotors Liquidation Company Avoidance Action Trust v. JPMorgan Chase Bank, N.A., et al.(No.09-00504 (REG)). The complaint, which was originally filed in 2009 but not served on the fund until 2015, names as defendants over 500 entities (including the fund) that held an interest in a $1.5 billion General Motors (GM) term loan in 2009, when GM filed for bankruptcy. The AAT alleges that the fund and the other term loan lenders were improperly treated as secured lenders with respect to the term loan shortly before and immediately after GM’s bankruptcy, receiving full principal and interest payments under the loan. The AAT alleges that the fund and other term loan lenders should have been treated as unsecured (or partially unsecured) creditors because the main lien securing the collateral was allegedly not perfected at the time of GM’s bankruptcy due to an erroneous filing in October 2008 that terminated the financing statement
51
Notes to Financial Statements – continued
perfecting the lien. The AAT seeks to claw back payments made to the fund and the other term loan lenders after, and during the 90 days before, GM’s June 2009 bankruptcy petition. During that time period, the fund received term loan payments of approximately $6,084,000. The fund cannot predict the outcome of this proceeding. Among other things, it is unclear whether the AAT’s claims will succeed; what the fund would be entitled to as an unsecured (or partially unsecured) creditor, given the existence of other collateral not impacted by the erroneous October 2008 filing; whether third parties responsible for the erroneous October 2008 filing would bear some or all of any liability; and the degree to which the fund may be entitled to indemnification from a third party for any amount required to be disgorged. The fund has and will continue to incur legal expenses associated with the defense of this action and in related claims against third parties.
52
REPORT OF INDEPENDENT REGISTERED PUBLIC ACCOUNTING FIRM
To the Board of Trustees of MFS Series Trust III and the Shareholders of MFS High Income Fund:
Opinion on the Financial Statements and Financial Highlights
We have audited the accompanying statement of assets and liabilities of MFS High Income Fund (the “Fund”), including the portfolio of investments, as of January 31, 2019, the related statement of operations for the year then ended, the statements of changes in net assets for each of the two years in the period then ended, the financial highlights for each of the five years in the period then ended, and the related notes. In our opinion, the financial statements and financial highlights present fairly, in all material respects, the financial position of the Fund as of January 31, 2019, and the results of its operations for the year then ended, the changes in its net assets for each of the two years in the period then ended, and the financial highlights for each of the five years in the period then ended, in conformity with accounting principles generally accepted in the United States of America.
Basis for Opinion
These financial statements and financial highlights are the responsibility of the Fund’s management. Our responsibility is to express an opinion on the Fund’s financial statements and financial highlights based on our audits. We are a public accounting firm registered with the Public Company Accounting Oversight Board (United States) (PCAOB) and are required to be independent with respect to the Fund in accordance with the U.S. federal securities laws and the applicable rules and regulations of the Securities and Exchange Commission and the PCAOB.
We conducted our audits in accordance with the standards of the PCAOB. Those standards require that we plan and perform the audit to obtain reasonable assurance about whether the financial statements and financial highlights are free of material misstatement, whether due to error or fraud. The Fund is not required to have, nor were we engaged to perform, an audit of its internal control over financial reporting. As part of our audits we are required to obtain an understanding of internal control over financial reporting but not for the purpose of expressing an opinion on the effectiveness of the Fund’s internal control over financial reporting. Accordingly, we express no such opinion.
Our audits included performing procedures to assess the risks of material misstatement of the financial statements and financial highlights, whether due to error or fraud, and performing procedures that respond to those risks. Such procedures included examining, on a test basis, evidence regarding the amounts and disclosures in the financial statements and financial highlights. Our audits also included evaluating the accounting principles used and significant estimates made by management, as well as evaluating the overall presentation of the financial statements and financial highlights. Our procedures included confirmation of securities owned as of January 31, 2019,
53
Report of Independent Registered Public Accounting Firm – continued
by correspondence with the custodian, brokers and agent banks; when replies were not received from brokers or agent banks, we performed other auditing procedures. We believe that our audits provide a reasonable basis for our opinion.
DELOITTE & TOUCHE LLP
Boston, Massachusetts
March 19, 2019
We have served as the auditor of one or more of the MFS investment companies since 1924.
54
TRUSTEES AND OFFICERS — IDENTIFICATION AND BACKGROUND
The Trustees and Officers of the Trust, as of March 1, 2019, are listed below, together with their principal occupations during the past five years. (Their titles may have varied during that period.) The address of each Trustee and Officer is 111 Huntington Avenue, Boston, Massachusetts 02199-7618.
| | | | | | | | | | |
Name, Age | | Position(s) Held with Fund | | Trustee/Officer Since (h) | | Number of
MFS Funds
overseen
by the Trustee | | Principal
Occupations During the Past Five Years | | Other Directorships
During the Past
Five Years (j) |
| INTERESTED TRUSTEES |
Robert J. Manning (k)
(age 55) | | Trustee | | February 2004 | | 135 | | Massachusetts Financial Services Company, Executive Chairman (since January 2017); Director; Chairman of the Board; Chief Executive Officer (until 2015);Co-Chief Executive Officer (2015-2016) | | N/A |
| | | | | |
Robin A. Stelmach (k) (age 57) | | Trustee | | January 2014 | | 135 | | Massachusetts Financial Services Company, Vice Chair (since January 2017); Chief Operating Officer and Executive Vice President (until January 2017) | | N/A |
| INDEPENDENT TRUSTEES |
John P. Kavanaugh (age 64) | | Trustee and Chair of Trustees | | January 2009 | | 135 | | Private investor | | N/A |
| | | | | |
Steven E. Buller (age 67) | | Trustee | | February 2014 | | 135 | | Financial Accounting Standards Advisory Council, Chairman (2014-2015); Public Company Accounting Oversight Board, Standing Advisory Group, Member (until 2014); BlackRock, Inc. (investment management), Managing Director (until 2014), BlackRock Finco UK (investment management), Director (until 2014) | | N/A |
55
Trustees and Officers – continued
| | | | | | | | | | |
Name, Age | | Position(s) Held with Fund | | Trustee/Officer Since (h) | | Number of
MFS Funds
overseen
by the Trustee | | Principal
Occupations During the Past Five Years | | Other Directorships
During the Past
Five Years (j) |
John A. Caroselli (age 64) | | Trustee | | March 2017 | | 135 | | JC Global Advisors, LLC (management consulting), President (since 2015); First Capital Corporation (commercial finance), Executive Vice President (until 2015) | | N/A |
| | | | | |
Maureen R. Goldfarb (age 63) | | Trustee | | January 2009 | | 135 | | Private investor | | N/A |
| | | | | |
Michael Hegarty
(age 74) | | Trustee | | December 2004 | | 135 | | Private investor | | Rouse Properties Inc., Director (until 2016); Capmark Financial Group Inc., Director (until 2015) |
| | | | | |
Peter D. Jones
(age 63) | | Trustee | | January 2019 | | 135 | | Franklin Templeton Distributors, Inc. (investment management), President (until 2015); Franklin Templeton Institutional, LLC (investment management), Chairman (until 2015) | | N/A |
| | | | | |
James W. Kilman, Jr.
(age 57) | | Trustee | | January 2019 | | 135 | | KielStrand Capital LLC (family office and merchant bank), Chief Executive Officer (since 2016); Morgan Stanley & Co. (financial services), Vice Chairman of Investment Banking,Co-Head of Diversified Financials Coverage – Financial Institutions Investment Banking Group (until 2016) | | Alpha-En Corporation, Director (since 2016) |
56
Trustees and Officers – continued
| | | | | | | | | | |
Name, Age | | Position(s) Held with Fund | | Trustee/Officer Since (h) | | Number of
MFS Funds
overseen
by the Trustee | | Principal
Occupations During the Past Five Years | | Other Directorships
During the Past
Five Years (j) |
Clarence Otis, Jr. (age 62) | | Trustee | | March 2017 | | 135 | | Darden Restaurants, Inc., Chief Executive Officer (until 2014) | | VF Corporation, Director; Verizon Communications, Inc., Director; The Travelers Companies, Director; Federal Reserve Bank of Atlanta, Director (until 2015) |
| | | | | |
Maryanne L. Roepke (age 63) | | Trustee | | May 2014 | | 135 | | American Century Investments (investment management), Senior Vice President and Chief Compliance Officer (until 2014) | | N/A |
| | | | | |
Laurie J. Thomsen
(age 61) | | Trustee | | March 2005 | | 135 | | Private investor | | The Travelers Companies, Director; Dycom Industries, Inc., Director (since 2015) |
| | | | | | | | |
Name, Age | | Position(s) Held with Fund | | Trustee/Officer
Since (h) | | Number of
MFS Funds
for which
the Person
is an Officer | | Principal
Occupations During the Past Five Years |
| OFFICERS | | | | | | | | |
Christopher R. Bohane (k)
(age 45) | | Assistant Secretary and Assistant Clerk | | July 2005 | | 135 | | Massachusetts Financial Services Company, Vice President and Assistant General Counsel |
| | | | |
Kino Clark (k) (age 50) | | Assistant Treasurer | | January 2012 | | 135 | | Massachusetts Financial Services Company, Vice President |
57
Trustees and Officers – continued
| | | | | | | | |
Name, Age | | Position(s) Held with Fund | | Trustee/Officer
Since (h) | | Number of
MFS Funds
for which
the Person
is an Officer | | Principal
Occupations During the Past Five Years |
John W. Clark, Jr. (k) (age 51) | | Assistant Treasurer | | April 2017 | | 135 | | Massachusetts Financial Services Company, Vice President (since March 2017); Deutsche Bank (financial services), Department Head – Treasurer’s Office (until February 2017) |
| | | | |
Thomas H. Connors (k) (age 59) | | Assistant Secretary and Assistant Clerk | | September 2012 | | 135 | | Massachusetts Financial Services Company, Vice President and Senior Counsel |
| | | | |
Ethan D. Corey (k)
(age 55) | | Assistant Secretary and Assistant Clerk | | July 2005 | | 135 | | Massachusetts Financial Services Company, Senior Vice President and Associate General Counsel |
| | | | |
David L. DiLorenzo (k)
(age 50) | | President | | July 2005 | | 135 | | Massachusetts Financial Services Company, Senior Vice President |
| | | | |
Heidi W. Hardin (k) (age 51) | | Secretary and Clerk | | April 2017 | | 135 | | Massachusetts Financial Services Company, Executive Vice President and General Counsel (since March 2017); Harris Associates (investment management), General Counsel (from September 2015 to January 2017); Janus Capital Management LLC (investment management), Senior Vice President and General Counsel (until September 2015) |
| | | | |
Brian E. Langenfeld (k) (age 45) | | Assistant
Secretary and Assistant Clerk | | June 2006 | | 135 | | Massachusetts Financial Services Company, Vice President and Senior Counsel |
58
Trustees and Officers – continued
| | | | | | | | |
Name, Age | | Position(s) Held with Fund | | Trustee/Officer
Since (h) | | Number of
MFS Funds
for which
the Person
is an Officer | | Principal
Occupations During the Past Five Years |
Amanda S. Mooradian (k) (age 40) | | Assistant
Secretary and Assistant Clerk | | September 2018 | | 135 | | Massachusetts Financial Services Company, Assistant Vice President and Counsel |
| | | | |
Susan A. Pereira (k)
(age 48) | | Assistant
Secretary and Assistant Clerk | | July 2005 | | 135 | | Massachusetts Financial Services Company, Vice President and Senior Counsel |
| | | | |
Kasey L. Phillips (k) (age 48) | | Assistant Treasurer | | September 2012 | | 135 | | Massachusetts Financial Services Company, Vice President |
| | | | |
Matthew A. Stowe (k) (age 44) | | Assistant Secretary and Assistant Clerk | | October 2014 | | 135 | | Massachusetts Financial Services Company, Vice President and Assistant General Counsel |
| | | | |
Frank L. Tarantino
(age 74) | | Independent
Senior Officer | | June 2004 | | 135 | | Tarantino LLC (provider of compliance services), Principal |
| | | | |
Richard S. Weitzel (k)
(age 48) | | Assistant Secretary and Assistant Clerk | | October 2007 | | 135 | | Massachusetts Financial Services Company, Senior Vice President and Associate General Counsel |
Martin J. Wolin (k) (age 51) | | Chief Compliance Officer | | July 2015 | | 135 | | Massachusetts Financial Services Company, Senior Vice President and Chief Compliance Officer (since July 2015); Mercer (financial service provider), Chief Risk and Compliance Officer, North America and Latin America (until June 2015) |
| | | | |
James O. Yost (k)
(age 58) | | Treasurer | | September 1990 | | 135 | | Massachusetts Financial Services Company, Senior Vice President |
59
Trustees and Officers – continued
| (h) | Date first appointed to serve as Trustee/officer of an MFS Fund. Each Trustee has served continuously since appointment unless indicated otherwise. For the period from December 15, 2004 until February 22, 2005, Mr. Manning served as Advisory Trustee. From January 2012 through December 2016, Messrs. DiLorenzo and Yost served as Treasurer and Deputy Treasurer of the Funds, respectively. |
| (j) | Directorships or trusteeships of companies required to report to the Securities and Exchange Commission (i.e., “public companies”). |
| (k) | “Interested person” of the Trust within the meaning of the Investment Company Act of 1940 (referred to as the 1940 Act), which is the principal federal law governing investment companies like the fund, as a result of a position with MFS. The address of MFS is 111 Huntington Avenue, Boston, Massachusetts 02199-7618. |
Each Trustee (other than Messrs. Jones and Kilman) has been elected by shareholders and each Trustee and officer holds office until his or her successor is chosen and qualified or until his or her earlier death, resignation, retirement or removal. The Trust does not hold annual meetings for the purpose of electing Trustees, and Trustees are not elected for fixed terms. Under the terms of the Board’s retirement policy, an Independent Trustee shall retire at the end of the calendar year in which he or she reaches the earlier of 75 years of age or 15 years of service on the Board (or, in the case of any Independent Trustee who joined the Board prior to 2015, 20 years of service on the Board).
Messrs. Buller, Hegarty, Kilman and Otis and Ms. Roepke are members of the Trust’s Audit Committee.
Each of the Interested Trustees and certain Officers hold comparable officer positions with certain affiliates of MFS.
The Statement of Additional Information for a Fund includes further information about the Trustees and is available without charge upon request by calling1-800-225-2606.
| | |
| Investment Adviser | | Custodian |
Massachusetts Financial Services Company
111 Huntington Avenue Boston, MA 02199-7618 | | JPMorgan Chase Bank, NA 4 Metrotech Center New York, NY 11245 |
| Distributor | | Independent Registered Public Accounting Firm |
MFS Fund Distributors, Inc.
111 Huntington Avenue Boston, MA 02199-7618 | | Deloitte & Touche LLP 200 Berkeley Street Boston, MA 02116 |
| Portfolio Manager(s) | | |
| David Cole | | |
| Michael Skatrud | | |
60
PROXY VOTING POLICIES AND INFORMATION
MFS votes proxies on behalf of the fund pursuant to proxy voting policies and procedures that are available without charge, upon request, by calling1-800-225-2606, by visitingmfs.com/proxyvoting,or by visiting the SEC’s Web site athttp://www.sec.gov.
Information regarding how the fund voted proxies relating to portfolio securities during the most recent twelve-month period ended June 30 is available by August 31 of each year without charge by visitingmfs.com/proxyvoting,or by visiting the SEC’s Web site athttp://www.sec.gov.
QUARTERLY PORTFOLIO DISCLOSURE
The fund files a complete schedule of portfolio holdings with the SEC for the first and third quarters of each fiscal year on Form N-Q. The fund’s Form N-Q is available on the SEC’s website athttp://www.sec.gov. A shareholder can obtain the portfolio holdings report for the first and third quarters of the fund’s fiscal year atmfs.com/openendfundsby choosing the fund’s name and then selecting the “Resources” tab and clicking on “Prospectus and Reports”.
FURTHER INFORMATION
From time to time, MFS may post important information about the fund or the MFS funds on the MFS web site (mfs.com). This information is available athttps://www.mfs.com/en-us/what-we-do/announcements.htmlor atmfs.com/openendfundsby choosing the fund’s name.
INFORMATION ABOUT FUND CONTRACTS AND LEGAL CLAIMS
The fund has entered into contractual arrangements with an investment adviser, administrator, distributor, shareholder servicing agent, 529 program manager (if applicable), and custodian who each provide services to the fund. Unless expressly stated otherwise, shareholders are not parties to, or intended beneficiaries of these contractual arrangements, and these contractual arrangements are not intended to create any shareholder right to enforce them against the service providers or to seek any remedy under them against the service providers, either directly or on behalf of the fund.
Under the Trust’s By-Laws and Declaration of Trust, any claims asserted against or on behalf of the MFS Funds, including claims against Trustees and Officers, must be brought in state and federal courts located within the Commonwealth of Massachusetts.
FEDERAL TAX INFORMATION (unaudited)
The fund will notify shareholders of amounts for use in preparing 2019 income tax forms in January 2020.
61
rev. 3/16
| | | | |
| | | |
FACTS | | WHAT DOES MFS DO WITH YOUR PERSONAL INFORMATION? | |  |
| | |
| Why? | | Financial companies choose how they share your personal information. Federal law gives consumers the right to limit some but not all sharing. Federal law also requires us to tell you how we collect, share, and protect your personal information. Please read this notice carefully to understand what we do. |
| | |
| What? | | The types of personal information we collect and share depend on the product or service you have with us. This information can include: • Social Security number and account balances • Account transactions and transaction history • Checking account information and wire transfer instructions When you areno longer our customer, we continue to share your information as described in this notice. |
| | |
| How? | | All financial companies need to share customers’ personal information to run their everyday business. In the section below, we list the reasons financial companies can share their customers’ personal information; the reasons MFS chooses to share; and whether you can limit this sharing. |
| | | | |
Reasons we can share your
personal information | | Does MFS
share? | | Can you limit
this sharing? |
For our everyday business purposes – such as to process your transactions, maintain your account(s), respond to court orders and legal investigations, or report to credit bureaus | | Yes | | No |
For our marketing purposes – to offer our products and services to you | | No | | We don’t share |
For joint marketing with other financial companies | | No | | We don’t share |
For our affiliates’ everyday business purposes – information about your transactions and experiences | | No | | We don’t share |
For our affiliates’ everyday business purposes – information about your creditworthiness | | No | | We don’t share |
| For nonaffiliates to market to you | | No | | We don’t share |
| | |
| | |
| Questions? | | Call800-225-2606 or go tomfs.com. |
62
| | |
| Who we are |
| Who is providing this notice? | | MFS Funds, MFS Investment Management, MFS Institutional Advisors, Inc., and MFS Heritage Trust Company. |
| | |
| What we do |
| How does MFS protect my personal information? | | To protect your personal information from unauthorized access and use, we use security measures that comply with federal law. These measures include procedural, electronic, and physical safeguards for the protection of the personal information we collect about you. |
| How does MFS collect my personal information? | | We collect your personal information, for example, when you • open an account or provide account information • direct us to buy securities or direct us to sell your securities • make a wire transfer We also collect your personal information from others, such as credit bureaus, affiliates, or other companies. |
| Why can’t I limit all sharing? | | Federal law gives you the right to limit only • sharing for affiliates’ everyday business purposes – information about your creditworthiness • affiliates from using your information to market to you • sharing for nonaffiliates to market to you State laws and individual companies may give you additional rights to limit sharing. |
| | |
| Definitions |
| Affiliates | | Companies related by common ownership or control. They can be financial and nonfinancial companies. • MFS does not share personal information with affiliates, except for everyday business purposes as described on page one of this notice. |
| Nonaffiliates | | Companies not related by common ownership or control. They can be financial and nonfinancial companies. • MFS does not share with nonaffiliates so they can market to you. |
| Joint marketing | | A formal agreement between nonaffiliated financial companies that together market financial products or services to you. • MFS doesn’t jointly market. |
| | |
| Other important information |
| If you own an MFS product or receive an MFS service in the name of a third party such as a bank or broker-dealer, their privacy policy may apply to you instead of ours. |
63
Save paper with eDelivery.

| MFS® will send you prospectuses, |
reports, and proxies directly viae-mail so you will get information faster with less mailbox clutter.
To sign up:
1. Go to mfs.com.
2. Log in via MFS® Access.
3. Select eDelivery.
If you own your MFS fund shares through a financial institution or a retirement plan, MFS® TALK, MFS® Access, or eDelivery may not be available to you.
CONTACT
WEB SITE
mfs.com
MFS TALK
1-800-637-8255
24 hours a day
ACCOUNT SERVICE AND LITERATURE
Shareholders
1-800-225-2606
Financial advisors
1-800-343-2829
Retirement plan services
1-800-637-1255
MAILING ADDRESS
MFS Service Center, Inc.
P.O. Box 219341
Kansas City, MO 64121-9341
OVERNIGHT MAIL
MFS Service Center, Inc.
Suite 219341
430 W 7th Street
Kansas City, MO 64105-1407
Annual Report
January 31, 2019
MFS® High Yield Pooled Portfolio

HYP-ANN
MFS® High Yield Pooled Portfolio
CONTENTS
The report is prepared for the general information of shareholders.
It is authorized for distribution to prospective investors only when preceded or accompanied by a current prospectus.
NOT FDIC INSURED• MAY LOSE VALUE• NO BANK GUARANTEE
LETTER FROM THE EXECUTIVE CHAIRMAN
Dear Shareholders:
Higher interest rates, international trade friction, and geopolitical uncertainty surrounding issues such as Brexit have contributed to an uptick in market volatility in recent quarters — a departure from thelow-volatility environment that has prevailed for much of the past
several years. Against this more challenging backdrop, equity markets in the United States have outperformed most international markets on a relative basis over the past 12 months, though broad market returns have been modestly negative on an absolute basis. Global economic growth has become less synchronized over the past few quarters, with Europe, China, and some emerging markets having shown signs of significantly slowing growth. While U.S. growth has remained above average, its pace slowed in the second half of 2018.
A decelerating global economy and tighter financial conditions have prompted the U.S. Federal Reserve to reassess its monetary policy outlook. Fed chairman Jerome Powell recently acknowledged that the next change in policy rates could be either a hike or a cut, suggesting that the tightening cycle begun in late 2015 may have come to an
end. The Fed has also signaled that it is likely to maintain a larger-than-expected balance sheet, meaning that monetary conditions will likely tighten less over time than earlier feared. U.S. tax reforms adopted in late 2017 have been welcomed by equity markets while emerging market economies have recently had to contend with tighter financial conditions as a result of firmer U.S. short-term interest rates, declining equity valuations, and a stronger dollar. With the Republicans losing control of the U.S. House of Representatives, further meaningful U.S. fiscal stimulus appears less likely over the remainder of this presidential term. The recent partial U.S. government shutdown has also added to political uncertainty as the competing budgetary priorities of the House of Representatives and the White House will likely remain a source of friction going forward.
Globally, inflation remains largely subdued thanks in part to lower oil prices, but tight labor markets will keep investors on the lookout for its potential reappearance. Increased U.S. protectionism is also a growing concern, as investors fear trade disputes could dampen business sentiment, leading to even slower global growth. While there has been progress on this front — a NAFTA replacement has been worked out between the U.S., Mexico, and Canada; the free trade pact with Korea has been updated; and a negotiating framework with the European Union has been agreed upon — tensions between the U.S. and China remain high, though the two sides recently returned to the negotiating table.
As a global investment manager with nearly a century of expertise, MFS® firmly believes active risk management offers downside mitigation and may help improve investment outcomes. We built our active investment platform with this belief in mind. Our long-term perspective influences nearly every aspect of our business, ensuring that our investment decisions align with the investing time horizons of our clients.
Respectfully,
Robert J. Manning
Executive Chairman
MFS Investment Management
March 19, 2019
The opinions expressed in this letter are subject to change and may not be relied upon for investment advice. No forecasts can be guaranteed.
1
PORTFOLIO COMPOSITION
Portfolio structure (i)
| | | | |
| Top five industries (i) | | | | |
| Cable TV | | | 8.8% | |
| Midstream | | | 5.5% | |
| Medical & Health Technology & Services | | | 5.3% | |
| Wireless Communications | | | 5.0% | |
| Energy – Independent | | | 5.0% | |
| | | | |
| Composition including fixed income credit quality (a)(i) | |
| BBB | | | 2.0% | |
| BB | | | 50.5% | |
| B | | | 35.0% | |
| CCC | | | 8.6% | |
| CC | | | 0.3% | |
| Not Rated | | | (1.8)% | |
| Non-Fixed Income | | | 0.5% | |
| Cash & Cash Equivalents | | | 2.9% | |
| Other | | | 2.0% | |
| |
| Portfolio facts (i) | | | | |
| Average Duration (d) | | | 4.0 | |
| Average Effective Maturity (m) | | | 6.4 yrs. | |
| (a) | For all securities other than those specifically described below, ratings are assigned to underlying securities utilizing ratings from Moody’s, Fitch, and Standard & Poor’s rating agencies and applying the following hierarchy: If all three agencies provide a rating, the middle rating (after dropping the highest and lowest ratings) is assigned; if two of the three agencies rate a security, the lower of the two is assigned. Ratings are shown in the S&P and Fitch scale (e.g., AAA). Securities rated BBB or higher are considered investment grade. All ratings are subject to change. Not Rated includes fixed income securities and fixed income derivatives, which have not been rated by any rating agency.Non-Fixed Income includes equity securities (including convertible bonds and equity derivatives) and/orcommodity-linked derivatives. The fund may or may not have held all of these instruments on this date. The fund is not rated by these agencies. |
| (d) | Duration is a measure of how much a bond’s price is likely to fluctuate with general changes in interest rates, e.g., if rates rise 1.00%, a bond with a5-year duration is likely to lose about 5.00% of its value due to the interest rate move. |
| (i) | For purposes of this presentation, the components include the value of securities, and reflect the impact of the equivalent exposure of derivative positions, if any. These amounts may be negative from time to time. Equivalent exposure is a calculated amount that translates the derivative position into a reasonable approximation of the amount of the underlying asset that the portfolio would have to hold at a given point in time to have the same price sensitivity that results from the portfolio’s ownership of the derivative contract. When dealing with derivatives, equivalent exposure is a more representative measure of the potential impact of a position on portfolio performance than value. The bond component will include any accrued interest amounts. |
2
Portfolio Composition – continued
| (m) | In determining each instrument’s effective maturity for purposes of calculating the fund’s dollar-weighted average effective maturity, MFS uses the instrument’s stated maturity or, if applicable, an earlier date on which MFS believes it is probable that a maturity-shortening device (such as a put,pre-refunding or prepayment) will cause the instrument to be repaid. Such an earlier date can be substantially shorter than the instrument’s stated maturity. |
Where the fund holds convertible bonds, they are treated as part of the equity portion of the portfolio.
Cash & Cash Equivalents includes any cash, investments in money market funds, short-term securities, and other assets less liabilities. Please see the Statement of Assets and Liabilities for additional information related to the fund’s cash position and other assets and liabilities.
Other includes equivalent exposure from currency derivatives and/or any offsets to derivative positions.
Percentages are based on net assets as of January 31, 2019.
The portfolio is actively managed and current holdings may be different.
3
MANAGEMENT REVIEW
Summary of Results
For the twelve months ended January 31, 2019, shares of the MFS High Yield Pooled Portfolio (“fund”) provided a total return of 1.86%, at net asset value. This compares with a return of 1.73% for the fund’s benchmark, the Bloomberg Barclays U.S.High-Yield Corporate Bond 2% Issuer Capped Index.
Market Environment
The global economy decelerated during the reporting period, led by weakness in China and Europe as business and investor sentiment was undermined by growing trade frictions. Slower growth, along with tighter financial conditions, contributed to an uptick in market volatility late in the period. Equity valuations fell and credit spreads widened, fueled in part by concerns that the US Federal Reserve was on course to further tighten monetary policy after it lifted rates for a fourth time during the period and indicated its intention to hike several more times while allowing its balance sheet to run off at its predetermined pace.
The market’s negative reaction to these policy signals prompted the Fed to reverse course at the end of the period and indicated that its policy was on hold as inflation pressures abated. The Fed also indicated that it will maintain a larger balance sheet than it had previously. These dovish shifts helped equity valuations rebound, reduced volatility and narrowed credit spreads. Central banks globally are tilting more dovish as well, with China lowering reserve requirements, The Bank of Canada and Bank of England holding rates steady and the European Central Bank acknowledging that it may not be able to hike rates in the fall of 2019 as it had earlier projected.
Emerging markets experienced considerable volatility during the period as tighter global financial conditions exposed structural weakness in some countries. Those pressures were somewhat relieved at the end of the period as the Fed adopted its more dovish posture. However, slowing global growth and ongoing trade frictions remained concerns.
From a geopolitical perspective, a fractious Eurosceptic Italian coalition government, large-scale protests in France over stagnant wages and news that Germany’s Angela Merkel will not seek another term as chancellor were sources of uncertainty in Europe. In emerging markets, new Brazilian president Jair Bolsanaro took office, with markets generally encouraged by his market-friendly agenda. In contrast, markets were nervous about the less-market-friendly approach of Mexico’s new president Andres Manuel Lopez Obrador. For much of the period, the contentiousUS-China trading relationship was a drag on global sentiment, although tentative signs of progress toward resolution helped steady markets late in the period. Concerns persisted about slowing Chinese economic activity.
Contributors to Performance
Relative to the Bloomberg Barclays U.S. High-Yield Corporate Bond 2% Issuer Capped Index, the fund’s underweight exposure to “CCC”-rated (r) securities, most notably within theenergy sector, contributed to performance. Additionally, the fund’s yield curve (y) positioning benefited relative performance as short-term interest rates generally
4
Management Review – continued
increased more than rates in the middle of the yield curve throughout the reporting period. A longer duration (d) stance also helped relative results as yields tightened during the reporting period.
Top individual contributors for the reporting period included the fund’s underweight exposure to wireless service providerSprint Nextel (communications), and overweight exposures to industrial and specialty chemicals distributor Univar USA(basic industry)and aircraft leasing company Park Aerospace Holdings(finance).
Detractors from Performance
During the reporting period, the fund’s security selection within “B” rated securities, particularly within thecommunicationsand energysectors, detracted from relative performance.
Top individual detractors during the reporting period included the fund’s overweight exposures to independent exploration and production companies Alta Mesa Holdings(energy)and Sanchez Energy(energy) and mobile telecommunication services provider Digicel Group (communications).
Respectfully,
Portfolio Manager(s)
David Cole and Michael Skatrud
| (d) | Duration is a measure of how much a bond’s price is likely to fluctuate with general changes in interest rates, e.g., if rates rise 1.00%, a bond with a5-year duration is likely to lose about 5.00% of its value. |
| (r) | Bonds rated “BBB”, “Baa”, or higher are considered investment grade; bonds rated “BB”, “Ba”, or below are considerednon-investment grade. The source for bond quality ratings is Moody’s Investors Service, Standard & Poor’s and Fitch, Inc. and are applied using the following hierarchy: If all three agencies provide a rating, the middle rating (after dropping the highest and lowest ratings) is assigned; if two of the three agencies rate a security, the lower of the two is assigned. Ratings are shown in the S&P and Fitch scale (e.g., AAA). For securities which are not rated by any of the three agencies, the security is considered Not Rated. |
| (y) | A yield curve graphically depicts the yields of different maturity bonds of the same credit quality and type; a normal yield curve is upward sloping, with short-term rates lower than long-term rates. |
Note to Shareholders: Effective March 1, 2018, Michael Skatrud became a Portfolio Manager of the Fund. Effective September 1, 2018, William Adams is no longer a Portfolio Manager of the Fund.
The views expressed in this report are those of the portfolio manager(s) only through the end of the period of the report as stated on the cover and do not necessarily reflect the views of MFS or any other person in the MFS organization. These views are subject to change at any time based on market or other conditions, and MFS disclaims any responsibility to update such views. These views may not be relied upon as investment advice or an indication of trading intent on behalf of any MFS portfolio. References to specific securities are not recommendations of such securities, and may not be representative of any MFS portfolio’s current or future investments.
5
PERFORMANCE SUMMARYTHROUGH 1/31/19
The following chart illustrates the fund’s historical performance in comparison to its benchmark(s). Performance results reflect the percentage change in net asset value, including reinvestment of dividends and capital gains distributions. Benchmarks are unmanaged and may not be invested in directly. Benchmark returns do not reflect sales charges, commissions or expenses. (See Notes to Performance Summary.)
Performance data shown represents past performance and is no guarantee of future results. Investment return and principal value fluctuate so your shares, when sold, may be worth more or less than the original cost; current performance may be lower or higher than quoted. The performance shown does not reflect the deduction of taxes, if any, that a shareholder would pay on fund distributions or the redemption of fund shares.
Growth of a Hypothetical $10,000 Investment (t)
Total Returns through 1/31/19
Average annual without sales charge
| | | | | | | | | | | | |
| | | Fund Inception Date | | | | 1-yr | | 5-yr | | Life (t) | | |
| | | 3/25/13 | | | | 1.86% | | 4.54% | | 4.77% | | |
| | | | |
| Comparative benchmark(s) | | | | | | | | |
| | | Bloomberg Barclays U.S. High-Yield Corporate Bond 2% Issuer Capped
Index (f) | | 1.73% | | 4.61% | | 4.84% | | |
| (f) | Source: FactSet Research Systems Inc. |
| (t) | For the period from the fund inception date through the stated period end. (See Notes to Performance Summary.) |
Benchmark Definition(s)
Bloomberg Barclays U.S. High-Yield Corporate Bond 2% Issuer Capped Index – a component of the Bloomberg Barclays U.S. High-Yield Corporate Bond Index, which measures performance of non-investment grade, fixed rate debt. The index limits the maximum exposure to any one issuer to 2%.
6
Performance Summary – continued
It is not possible to invest directly in an index.
Notes to Performance Summary
Average annual total return represents the average annual change in value for the fund for the periods presented. Life returns are presented where the fund has less than 10 years of performance history and represent the average annual total return from the fund inception date to the stated period end date.
Performance results reflect any applicable expense subsidies and waivers in effect during the periods shown. Without such subsidies and waivers the fund’s performance results would be less favorable. Please see the prospectus and financial statements for complete details.
Performance results do not include adjustments made for financial reporting purposes in accordance with U.S. generally accepted accounting principles and may differ from amounts reported in the financial highlights.
From time to time the fund may receive proceeds from litigation settlements, without which performance would be lower.
7
EXPENSE TABLE
Fund expenses borne by the shareholders during the period, August 1, 2018 through January 31, 2019
As a shareholder of the fund, you incur ongoing costs, including fund expenses. This example is intended to help you understand your ongoing costs (in dollars) of investing in the fund and to compare these costs with the ongoing costs of investing in other mutual funds.
The example is based on an investment of $1,000 invested at the beginning of the period and held for the entire period August 1, 2018 through January 31, 2019.
Actual Expenses
The first line of the following table provides information about actual account values and actual expenses. You may use the information in this line, together with the amount you invested, to estimate the expenses that you paid over the period. Simply divide your account value by $1,000 (for example, an $8,600 account value divided by $1,000 = 8.6), then multiply the result by the number in the first line under the heading entitled “Expenses Paid During Period” to estimate the expenses you paid on your account during this period.
Hypothetical Example for Comparison Purposes
The second line of the following table provides information about hypothetical account values and hypothetical expenses based on the fund’s actual expense ratio and an assumed rate of return of 5% per year before expenses, which is not the fund’s actual return. The hypothetical account values and expenses may not be used to estimate the actual ending account balance or expenses you paid for the period. You may use this information to compare the ongoing costs of investing in the fund and other funds. To do so, compare this 5% hypothetical example with the 5% hypothetical examples that appear in the shareholder reports of the other funds.
Please note that the expenses shown in the table are meant to highlight your ongoing costs only and do not reflect any transactional costs, such as sales charges (loads). Therefore, the second line of the table is useful in comparing ongoing costs only, and will not help you determine the relative total costs of owning different funds. In addition, if these transactional costs were included, your costs would have been higher.
| | | | | | | | | | | | | | | | |
| | | Annualized Expense Ratio | | | Beginning
Account Value
8/01/18 | | | Ending Account Value
1/31/19 | | | Expenses Paid During
Period (p) 8/01/18-1/31/19 | |
| Actual | | | 0.02% | | | | $1,000.00 | | | | $1,017.76 | | | | $0.10 | |
| Hypothetical (h) | | | 0.02% | | | | $1,000.00 | | | | $1,025.10 | | | | $0.10 | |
| (h) | 5% fund return per year before expenses. |
| (p) | “Expenses Paid During Period” are equal to the fund’s annualized expense ratio, as shown above, multiplied by the average account value over the period, multiplied by 184/365 (to reflect theone-half year period). |
8
PORTFOLIO OF INVESTMENTS
1/31/19
The Portfolio of Investments is a complete list of all securities owned by your fund. It is categorized by broad-based asset classes.
| | | | | | | | |
| Bonds - 94.3% | | | | | | | | |
| | |
| Issuer | | Shares/Par | | | Value ($) | |
| Aerospace - 0.9% | | | | | | | | |
| Bombardier, Inc., 7.5%, 3/15/2025 (n) | | $ | 1,415,000 | | | $ | 1,363,706 | |
| TransDigm, Inc., 6.5%, 7/15/2024 | | | 2,385,000 | | | | 2,352,206 | |
| TransDigm, Inc., 6.25%, 3/15/2026 (z) | | | 2,427,000 | | | | 2,463,405 | |
| TransDigm, Inc., 6.375%, 6/15/2026 | | | 1,255,000 | | | | 1,207,938 | |
| | | | | | | | |
| | | | | | | $ | 7,387,255 | |
| Automotive - 1.4% | | | | | | | | |
| Allison Transmission, Inc., 5%, 10/01/2024 (n) | | $ | 6,764,000 | | | $ | 6,654,085 | |
| IHO Verwaltungs GmbH, 4.75%, (4.75% cash or 5.5% PIK) 9/15/2026 (n)(p) | | | 3,815,000 | | | | 3,452,575 | |
| Jaguar Land Rover Automotive PLC, 4.5%, 10/01/2027 (n) | | | 1,025,000 | | | | 758,500 | |
| | | | | | | | |
| | | | | | | $ | 10,865,160 | |
| Broadcasting - 2.9% | | | | | | | | |
| Liberty Media Corp. - Liberty Formula One, 8.5%, 7/15/2029 | | $ | 3,210,000 | | | $ | 3,258,150 | |
| Liberty Media Corp. - Liberty Formula One, 8.25%, 2/01/2030 | | | 935,000 | | | | 946,688 | |
| Match Group, Inc., 6.375%, 6/01/2024 | | | 3,480,000 | | | | 3,636,600 | |
| Netflix, Inc., 5.875%, 2/15/2025 | | | 2,090,000 | | | | 2,165,135 | |
| Netflix, Inc., 4.875%, 4/15/2028 | | | 1,220,000 | | | | 1,160,525 | |
| Netflix, Inc., 5.875%, 11/15/2028 (n) | | | 4,565,000 | | | | 4,627,769 | |
| Netflix, Inc., 4.625%, 5/15/2029 (n) | | EUR | 1,485,000 | | | | 1,712,479 | |
| WMG Acquisition Corp., 5%, 8/01/2023 (n) | | $ | 1,045,000 | | | | 1,037,162 | |
| WMG Acquisition Corp., 4.875%, 11/01/2024 (n) | | | 3,210,000 | | | | 3,145,800 | |
| WMG Acquisition Corp., 5.5%, 4/15/2026 (n) | | | 815,000 | | | | 804,813 | |
| | | | | | | | |
| | | | | | | $ | 22,495,121 | |
| Building - 4.4% | | | | | | | | |
| ABC Supply Co., Inc., 5.75%, 12/15/2023 (n) | | $ | 3,935,000 | | | $ | 4,043,212 | |
| ABC Supply Co., Inc., 5.875%, 5/15/2026 (n) | | | 2,685,000 | | | | 2,690,773 | |
| Beacon Escrow Corp., 4.875%, 11/01/2025 (n) | | | 3,625,000 | | | | 3,375,781 | |
| Core & Main LP, 6.125%, 8/15/2025 (z) | | | 1,345,000 | | | | 1,281,113 | |
| James Hardie International Finance Ltd., 4.75%, 1/15/2025 (n) | | | 445,000 | | | | 422,750 | |
| James Hardie International Finance Ltd., 5%, 1/15/2028 (n) | | | 2,905,000 | | | | 2,614,500 | |
| NCI Building Systems, Inc., 8%, 4/15/2026 (n) | | | 1,420,000 | | | | 1,343,675 | |
| New Enterprise Stone & Lime Co., Inc., 10.125%, 4/01/2022 (n) | | | 2,880,000 | | | | 2,880,000 | |
| New Enterprise Stone & Lime Co., Inc., 6.25%, 3/15/2026 (n) | | | 2,709,000 | | | | 2,587,095 | |
| PriSo Acquisition Corp., 9%, 5/15/2023 (n) | | | 1,653,000 | | | | 1,653,000 | |
| Standard Industries, Inc., 5.375%, 11/15/2024 (n) | | | 2,080,000 | | | | 2,064,400 | |
| Standard Industries, Inc., 6%, 10/15/2025 (n) | | | 4,735,000 | | | | 4,758,675 | |
| Summit Materials LLC/Summit Materials Finance Co., 6.125%, 7/15/2023 | | | 3,690,000 | | | | 3,716,568 | |
9
Portfolio of Investments – continued
| | | | | | | | |
| | |
| Issuer | | Shares/Par | | | Value ($) | |
| Bonds - continued | | | | | | | | |
| Building - continued | | | | | | | | |
| Summit Materials LLC/Summit Materials Finance Co., 5.125%, 6/01/2025 (n) | | $ | 935,000 | | | $ | 877,731 | |
| | | | | | | | |
| | | | | | | $ | 34,309,273 | |
| Business Services - 4.2% | | | | | | | | |
| Alliance Data Systems Corp., 5.875%, 11/01/2021 (n) | | $ | 1,170,000 | | | $ | 1,178,775 | |
| CDK Global, Inc., 4.875%, 6/01/2027 | | | 4,485,000 | | | | 4,350,450 | |
| Equinix, Inc., 5.375%, 4/01/2023 | | | 1,955,000 | | | | 1,976,994 | |
| Equinix, Inc., 5.75%, 1/01/2025 | | | 1,540,000 | | | | 1,590,050 | |
| Equinix, Inc., 5.875%, 1/15/2026 | | | 2,470,000 | | | | 2,551,016 | |
| Financial & Risk U.S. Holdings, Inc., 8.25%, 11/15/2026 (n) | | | 3,445,000 | | | | 3,229,687 | |
| First Data Corp., 5%, 1/15/2024 (n) | | | 6,405,000 | | | | 6,545,109 | |
| MSCI, Inc., 4.75%, 8/01/2026 (n) | | | 3,400,000 | | | | 3,387,250 | |
| Travelport Worldwide Ltd., 6%, 3/15/2026 (n) | | | 1,975,000 | | | | 2,042,881 | |
| Vantiv LLC/Vantiv Issuer Corp., 4.375%, 11/15/2025 (n) | | | 4,060,000 | | | | 3,897,519 | |
| Verscend Escrow Corp., 9.75%, 8/15/2026 (n) | | | 2,140,000 | | | | 2,154,552 | |
| | | | | | | | |
| | | | | | | $ | 32,904,283 | |
| Cable TV - 8.6% | | | | | | | | |
| Altice Financing S.A., 6.625%, 2/15/2023 (n) | | $ | 1,575,000 | | | $ | 1,583,347 | |
| Altice Financing S.A., 7.5%, 5/15/2026 (n) | | | 750,000 | | | | 710,625 | |
| CCO Holdings LLC/CCO Holdings Capital Corp., 5.75%, 1/15/2024 | | | 5,290,000 | | | | 5,395,800 | |
| CCO Holdings LLC/CCO Holdings Capital Corp., 5.375%, 5/01/2025 (n) | | | 1,325,000 | | | | 1,332,023 | |
| CCO Holdings LLC/CCO Holdings Capital Corp., 5.75%, 2/15/2026 (n) | | | 6,560,000 | | | | 6,658,400 | |
| CCO Holdings LLC/CCO Holdings Capital Corp., 5.875%, 5/01/2027 (n) | | | 3,755,000 | | | | 3,765,514 | |
| CSC Holdings LLC, 5.5%, 5/15/2026 (n) | | | 2,635,000 | | | | 2,608,650 | |
| CSC Holdings LLC, 5.5%, 4/15/2027 (n) | | | 6,985,000 | | | | 6,827,698 | |
| CSC Holdings LLC, 7.5%, 4/01/2028 (n) | | | 2,030,000 | | | | 2,085,825 | |
| DISH DBS Corp., 5.875%, 11/15/2024 | | | 975,000 | | | | 808,031 | |
| Intelsat Connect Finance, 9.5%, 2/15/2023 (n) | | | 1,245,000 | | | | 1,164,075 | |
| Intelsat Jackson Holdings S.A., 5.5%, 8/01/2023 | | | 3,795,000 | | | | 3,453,450 | |
| Sirius XM Radio, Inc., 4.625%, 5/15/2023 (n) | | | 1,745,000 | | | | 1,742,819 | |
| Sirius XM Radio, Inc., 6%, 7/15/2024 (n) | | | 4,055,000 | | | | 4,212,131 | |
| Sirius XM Radio, Inc., 5.375%, 4/15/2025 (n) | | | 1,600,000 | | | | 1,620,000 | |
| Telenet Finance Luxembourg S.A., 5.5%, 3/01/2028 (n) | | | 5,400,000 | | | | 5,103,000 | |
| Unitymedia KabelBW GmbH, 6.125%, 1/15/2025 (n) | | | 3,970,000 | | | | 4,099,025 | |
| Videotron Ltd., 5.375%, 6/15/2024 (n) | | | 930,000 | | | | 971,292 | |
| Videotron Ltd., 5.125%, 4/15/2027 (n) | | | 5,200,000 | | | | 5,213,000 | |
| Virgin Media Finance PLC, 5.75%, 1/15/2025 (n) | | | 830,000 | | | | 817,865 | |
| Virgin Media Secured Finance PLC, 5.25%, 1/15/2026 (n) | | | 3,560,000 | | | | 3,506,600 | |
| Ziggo Bond Finance B.V., 5.875%, 1/15/2025 (n) | | | 4,240,000 | | | | 3,975,000 | |
| | | | | | | | |
| | | | | | | $ | 67,654,170 | |
10
Portfolio of Investments – continued
| | | | | | | | |
| | |
| Issuer | | Shares/Par | | | Value ($) | |
| Bonds - continued | | | | | | | | |
| Chemicals - 2.9% | | | | | | | | |
| Axalta Coating Systems Co., 4.875%, 8/15/2024 (n) | | $ | 4,495,000 | | | $ | 4,388,244 | |
| Consolidated Energy Finance S.A., 6.875%, 6/15/2025 (n) | | | 2,628,000 | | | | 2,588,580 | |
| OCI N.V., 6.625%, 4/15/2023 (n) | | | 4,450,000 | | | | 4,572,375 | |
| PolyOne Corp., 5.25%, 3/15/2023 | | | 3,455,000 | | | | 3,472,275 | |
| SPCM S.A., 4.875%, 9/15/2025 (n) | | | 4,965,000 | | | | 4,667,100 | |
| Starfruit U.S. Holding Co. LLC/Starfruit Finance B.V. , 6.5%, 10/01/2026 (n) | | EUR | 2,205,000 | | | | 2,431,470 | |
| Starfruit U.S. Holding Co. LLC/Starfruit Finance B.V. , 6.5%, 10/01/2026 | | | 375,000 | | | | 413,515 | |
| | | | | | | | |
| | | | | | | $ | 22,533,559 | |
| Computer Software - 0.6% | | | | | | | | |
| Diamond 1 Finance Corp./Diamond 2 Finance Corp., 5.875%, 6/15/2021 (n) | | $ | 2,965,000 | | | $ | 3,013,363 | |
| Diamond 1 Finance Corp./Diamond 2 Finance Corp., 6.02%, 6/15/2026 (n) | | | 1,670,000 | | | | 1,746,757 | |
| | | | | | | | |
| | | | | | | $ | 4,760,120 | |
| Computer Software - Systems - 1.7% | | | | | | | | |
| CDW LLC/CDW Finance Corp., 5.5%, 12/01/2024 | | $ | 815,000 | | | $ | 843,118 | |
| CDW LLC/CDW Finance Corp., 5%, 9/01/2025 | | | 1,215,000 | | | | 1,205,887 | |
| Fair Isaac Corp., 5.25%, 5/15/2026 (n) | | | 4,095,000 | | | | 4,115,475 | |
| JDA Software Group, Inc., 7.375%, 10/15/2024 (n) | | | 2,400,000 | | | | 2,442,000 | |
| Sabre GLBL, Inc., 5.375%, 4/15/2023 (n) | | | 5,035,000 | | | | 5,097,937 | |
| | | | | | | | |
| | | | | | | $ | 13,704,417 | |
| Conglomerates - 3.9% | | | | | | | | |
| Amsted Industries Co., 5%, 3/15/2022 (n) | | $ | 5,085,000 | | | $ | 5,034,150 | |
| BWX Technologies, Inc., 5.375%, 7/15/2026 (n) | | | 3,590,000 | | | | 3,625,900 | |
| CFX Escrow Corp., 6%, 2/15/2024 (z) | | | 705,000 | | | | 705,000 | |
| CFX Escrow Corp., 6.375%, 2/15/2026 (z) | | | 455,000 | | | | 455,000 | |
| EnerSys, 5%, 4/30/2023 (n) | | | 6,335,000 | | | | 6,287,488 | |
| Entegris, Inc., 4.625%, 2/10/2026 (n) | | | 5,115,000 | | | | 4,961,550 | |
| Gates Global LLC, 6%, 7/15/2022 (n) | | | 1,927,000 | | | | 1,937,213 | |
| Stevens Holding Co., Inc., 6.125%, 10/01/2026 (n) | | | 3,335,000 | | | | 3,369,617 | |
| TriMas Corp., 4.875%, 10/15/2025 (n) | | | 4,345,000 | | | | 4,214,650 | |
| | | | | | | | |
| | | | | | | $ | 30,590,568 | |
| Construction - 1.1% | | | | | | | | |
| Empresas ICA S.A.B. de C.V., 8.875%, 5/29/2024 (a)(d)(n) | | $ | 1,723,000 | | | $ | 271,372 | |
| Empresas ICA S.A.B. de C.V., 8.9%, 2/04/2021 (a)(d) | | | 1,320,000 | | | | 207,900 | |
| Mattamy Group Corp., 6.5%, 10/01/2025 (n) | | | 4,150,000 | | | | 3,849,125 | |
| Toll Brothers Finance Corp., 4.875%, 11/15/2025 | | | 1,370,000 | | | | 1,332,325 | |
| Toll Brothers Finance Corp., 4.35%, 2/15/2028 | | | 3,355,000 | | | | 3,053,050 | |
| | | | | | | | |
| | | | | | | $ | 8,713,772 | |
11
Portfolio of Investments – continued
| | | | | | | | |
| | |
| Issuer | | Shares/Par | | | Value ($) | |
| Bonds - continued | | | | | | | | |
| Consumer Products - 0.7% | | | | | | | | |
| Coty, Inc., 6.5%, 4/15/2026 (n) | | $ | 1,905,000 | | | $ | 1,714,500 | |
| Energizer Holdings, Inc., 6.375%, 7/15/2026 (n) | | | 3,325,000 | | | | 3,233,563 | |
| Energizer Holdings, Inc., 7.75%, 1/15/2027 (z) | | | 240,000 | | | | 247,284 | |
| | | | | | | | |
| | | | | | | $ | 5,195,347 | |
| Consumer Services - 1.9% | | | | | | | | |
| Cimpress N.V., 7%, 6/15/2026 (n) | | $ | 2,920,000 | | | $ | 2,847,000 | |
| Frontdoor, Inc., 6.75%, 8/15/2026 (n) | | | 2,805,000 | | | | 2,783,962 | |
| Matthews International Corp., 5.25%, 12/01/2025 (n) | | | 2,900,000 | | | | 2,733,250 | |
| NVA Holdings, Inc., 6.875%, 4/01/2026 (n) | | | 2,885,000 | | | | 2,754,310 | |
| ServiceMaster Co. LLC, 5.125%, 11/15/2024 (n) | | | 3,805,000 | | | | 3,719,387 | |
| | | | | | | | |
| | | | | | | $ | 14,837,909 | |
| Containers - 4.8% | | | | | | | | |
| ARD Finance S.A., 6.625%, 9/15/2023 | | EUR | 1,055,000 | | | $ | 1,156,232 | |
| ARD Finance S.A., 7.125%, 9/15/2023 | | $ | 2,495,000 | | | | 2,407,675 | |
ARD Securities Finance, 8.75%, (8.75% cash or
8.75% PIK) 1/31/2023 (n)(p) | | | 1,993,562 | | | | 1,659,640 | |
| Berry Global Group, Inc., 5.5%, 5/15/2022 | | | 1,405,000 | | | | 1,414,189 | |
| Berry Global Group, Inc., 6%, 10/15/2022 | | | 2,355,000 | | | | 2,407,987 | |
| BWAY Holding Co., Inc., 7.25%, 4/15/2025 (n) | | | 1,395,000 | | | | 1,286,888 | |
| Crown American LLC, 4.5%, 1/15/2023 | | | 2,872,000 | | | | 2,886,360 | |
| Crown Americas LLC/Crown Americas Capital Corp. V, 4.25%, 9/30/2026 | | | 2,440,000 | | | | 2,318,000 | |
| Crown Americas LLC/Crown Americas Capital Corp. VI, 4.75%, 2/01/2026 | | | 1,675,000 | | | | 1,641,500 | |
| Flex Acquisition Co., Inc., 6.875%, 1/15/2025 (n) | | | 3,030,000 | | | | 2,833,050 | |
| Multi-Color Corp., 6.125%, 12/01/2022 (n) | | | 4,202,000 | | | | 4,233,515 | |
| Reynolds Group, 5.75%, 10/15/2020 | | | 1,599,028 | | | | 1,605,104 | |
| Reynolds Group, 5.125%, 7/15/2023 (n) | | | 2,080,000 | | | | 2,083,848 | |
| Reynolds Group, 7%, 7/15/2024 (n) | | | 775,000 | | | | 792,438 | |
| Sealed Air Corp., 4.875%, 12/01/2022 (n) | | | 3,635,000 | | | | 3,671,350 | |
| Silgan Holdings, Inc., 4.75%, 3/15/2025 | | | 2,825,000 | | | | 2,712,000 | |
| W/S Packaging Group, Inc., 9%, 4/15/2023 (n) | | | 2,615,000 | | | | 2,628,075 | |
| | | | | | | | |
| | | | | | | $ | 37,737,851 | |
| Electrical Equipment - 0.7% | | | | | | | | |
| CommScope Technologies LLC, 5%, 3/15/2027 (n) | | $ | 6,865,000 | | | $ | 5,851,726 | |
| | |
| Electronics - 1.2% | | | | | | | | |
| Qorvo, Inc., 5.5%, 7/15/2026 (n) | | $ | 3,160,000 | | | $ | 3,136,300 | |
| Sensata Technologies B.V., 5.625%, 11/01/2024 (n) | | | 2,185,000 | | | | 2,266,937 | |
| Sensata Technologies B.V., 5%, 10/01/2025 (n) | | | 3,840,000 | | | | 3,859,200 | |
| | | | | | | | |
| | | | | | | $ | 9,262,437 | |
12
Portfolio of Investments – continued
| | | | | | | | |
| | |
| Issuer | | Shares/Par | | | Value ($) | |
| Bonds - continued | | | | | | | | |
| Emerging Market Quasi-Sovereign - 1.0% | | | | | | | | |
| DAE Funding LLC, 5.75%, 11/15/2023 (n) | | $ | 2,485,000 | | | $ | 2,509,850 | |
| DAE Funding LLC, 5%, 8/01/2024 (n) | | | 5,240,000 | | | | 5,150,920 | |
| | | | | | | | |
| | | | | | | $ | 7,660,770 | |
| Energy - Independent - 4.9% | | | | | | | | |
| Alta Mesa Holdings LP/Alta Mesa Finance Services Corp., 7.875%, 12/15/2024 | | $ | 4,180,000 | | | $ | 2,885,454 | |
| Callon Petroleum Co., 6.375%, 7/01/2026 | | | 3,600,000 | | | | 3,609,000 | |
| Carrizo Oil & Gas, Inc., 6.25%, 4/15/2023 | | | 1,640,000 | | | | 1,619,500 | |
| CrownRock LP/CrownRock Finance, Inc., 5.625%, 10/15/2025 (n) | | | 4,575,000 | | | | 4,392,000 | |
| Diamondback Energy, Inc., 5.375%, 5/31/2025 | | | 5,590,000 | | | | 5,725,837 | |
| Gulfport Energy Corp., 6%, 10/15/2024 | | | 2,315,000 | | | | 2,176,100 | |
| Indigo Natural Resources LLC, 6.875%, 2/15/2026 (n) | | | 2,330,000 | | | | 2,038,750 | |
| Magnolia Oil & Gas Operating LLC/Magnolia Oil & Gas Finance Corp., 6%, 8/01/2026 (n) | | | 3,490,000 | | | | 3,455,100 | |
| Oasis Petroleum, Inc., 6.25%, 5/01/2026 (n) | | | 2,900,000 | | | | 2,751,375 | |
| Parsley Energy LLC/Parsley Finance Corp., 5.25%, 8/15/2025 (n) | | | 1,000,000 | | | | 990,000 | |
| Parsley Energy LLC/Parsley Finance Corp., 5.625%, 10/15/2027 (n) | | | 5,350,000 | | | | 5,303,187 | |
| Sanchez Energy Corp., 6.125%, 1/15/2023 | | | 2,180,000 | | | | 381,500 | |
| SM Energy Co., 6.75%, 9/15/2026 | | | 3,510,000 | | | | 3,457,877 | |
| | | | | | | | |
| | | | | | | $ | 38,785,680 | |
| Entertainment - 1.7% | | | | | | | | |
| AMC Entertainment Holdings, Inc., 5.75%, 6/15/2025 | | $ | 1,420,000 | | | $ | 1,309,808 | |
| Constellation Merger Sub, Inc., 8.5%, 9/15/2025 (z) | | | 925,000 | | | | 889,156 | |
| Live Nation Entertainment, Inc., 5.625%, 3/15/2026 (n) | | | 3,655,000 | | | | 3,691,550 | |
| Six Flags Entertainment Corp., 4.875%, 7/31/2024 (n) | | | 7,280,000 | | | | 7,207,200 | |
| | | | | | | | |
| | | | | | | $ | 13,097,714 | |
| Financial Institutions - 1.3% | | | | | | | | |
| Avolon Holdings Funding Ltd., 5.125%, 10/01/2023 | | $ | 1,915,000 | | | $ | 1,944,108 | |
| Park Aerospace Holdings Ltd., 5.5%, 2/15/2024 (n) | | | 6,135,000 | | | | 6,227,025 | |
| Wand Merger Corp., 8.125%, 7/15/2023 (n) | | | 1,695,000 | | | | 1,715,679 | |
| | | | | | | | |
| | | | | | | $ | 9,886,812 | |
| Food & Beverages - 3.4% | | | | | | | | |
| Aramark Services, Inc., 4.75%, 6/01/2026 | | $ | 3,645,000 | | | $ | 3,581,212 | |
| Aramark Services, Inc., 5%, 2/01/2028 (n) | | | 2,040,000 | | | | 1,991,550 | |
| Cott Holdings, Inc., 5.5%, 4/01/2025 (n) | | | 4,820,000 | | | | 4,771,800 | |
| JBS USA LLC/JBS USA Finance, Inc., 6.75%, 2/15/2028 (n) | | | 2,635,000 | | | | 2,694,287 | |
| JBS USA Lux S.A./JBS USA Finance, Inc., 5.875%, 7/15/2024 (n) | | | 1,155,000 | | | | 1,166,550 | |
| Lamb Weston Holdings, Inc., 4.625%, 11/01/2024 (n) | | | 2,295,000 | | | | 2,283,525 | |
| Lamb Weston Holdings, Inc., 4.875%, 11/01/2026 (n) | | | 1,695,000 | | | | 1,680,593 | |
| Pilgrim’s Pride Corp., 5.875%, 9/30/2027 (n) | | | 4,175,000 | | | | 4,028,875 | |
| U.S. Foods Holding Corp., 5.875%, 6/15/2024 (n) | | | 4,275,000 | | | | 4,348,915 | |
| | | | | | | | |
| | | | | | | $ | 26,547,307 | |
13
Portfolio of Investments – continued
| | | | | | | | |
| | |
| Issuer | | Shares/Par | | | Value ($) | |
| Bonds - continued | | | | | | | | |
| Gaming & Lodging - 4.2% | | | | | | | | |
| CCM Merger, Inc., 6%, 3/15/2022 (n) | | $ | 2,945,000 | | | $ | 2,974,450 | |
| GLP Capital LP/GLP Financing II, Inc., 5.375%, 11/01/2023 | | | 1,755,000 | | | | 1,809,826 | |
| GLP Capital LP/GLP Financing II, Inc., 5.25%, 6/01/2025 | | | 2,320,000 | | | | 2,371,110 | |
| GLP Capital LP/GLP Financing II, Inc., 5.375%, 4/15/2026 | | | 680,000 | | | | 694,504 | |
| Hilton Domestic Operating Co., Inc., 5.125%, 5/01/2026 (n) | | | 3,215,000 | | | | 3,239,112 | |
| Hilton Worldwide Finance LLC, 4.625%, 4/01/2025 | | | 4,245,000 | | | | 4,181,325 | |
| Marriot Ownership Resorts, Inc., 5.625%, 4/15/2023 (z) | | | 2,695,000 | | | | 2,654,575 | |
| MGM Resorts International, 6.625%, 12/15/2021 | | | 1,770,000 | | | | 1,869,474 | |
| MGM Resorts International, 6%, 3/15/2023 | | | 1,360,000 | | | | 1,411,000 | |
| MGM Resorts International, 5.75%, 6/15/2025 | | | 3,510,000 | | | | 3,527,550 | |
| Ryman Hospitality Properties, Inc., REIT, 5%, 4/15/2021 | | | 3,265,000 | | | | 3,269,081 | |
| Ryman Hospitality Properties, Inc., REIT, 5%, 4/15/2023 | | | 2,030,000 | | | | 2,037,613 | |
| Wyndham Hotels Group, LLC, 5.375%, 4/15/2026 (n) | | | 3,270,000 | | | | 3,270,000 | |
| | | | | | | | |
| | | | | | | $ | 33,309,620 | |
| Industrial - 0.9% | | | | | | | | |
| Cleaver Brooks, Inc., 7.875%, 3/01/2023 (n) | | $ | 2,695,000 | | | $ | 2,668,050 | |
| KAR Auction Services, Inc., 5.125%, 6/01/2025 (n) | | | 4,575,000 | | | | 4,408,379 | |
| | | | | | | | |
| | | | | | | $ | 7,076,429 | |
| Insurance - Health - 0.8% | | | | | | | | |
| Centene Corp., 6.125%, 2/15/2024 | | $ | 2,190,000 | | | $ | 2,294,025 | |
| Centene Corp., 5.375%, 6/01/2026 (n) | | | 3,795,000 | | | | 3,918,338 | |
| | | | | | | | |
| | | | | | | $ | 6,212,363 | |
| Insurance - Property & Casualty - 0.8% | | | | | | | | |
| AssuredPartners Inc., 7%, 8/15/2025 (n) | | $ | 3,020,000 | | | $ | 2,884,100 | |
| Hub International Ltd., 7%, 5/01/2026 (n) | | | 3,235,000 | | | | 3,137,950 | |
| | | | | | | | |
| | | | | | | $ | 6,022,050 | |
| Machinery & Tools - 0.4% | | | | | | | | |
| Ashtead Capital, Inc., 5.625%, 10/01/2024 (n) | | $ | 3,395,000 | | | $ | 3,479,875 | |
| | |
| Major Banks - 0.5% | | | | | | | | |
UBS Group AG, 6.875% to 8/07/2025, FLR (Swap Rate - 5yr. +
4.59%) to 12/29/2049 | | $ | 3,990,000 | | | $ | 3,995,514 | |
| | |
| Medical & Health Technology & Services - 4.9% | | | | | | | | |
| Acadia Healthcare Co., Inc., 5.625%, 2/15/2023 | | $ | 2,990,000 | | | $ | 2,937,675 | |
| Avantor, Inc., 9%, 10/01/2025 (n) | | | 2,815,000 | | | | 2,899,450 | |
| DaVita, Inc., 5%, 5/01/2025 | | | 1,720,000 | | | | 1,655,500 | |
| Encompass Health Corp., 5.75%, 9/15/2025 | | | 1,000,000 | | | | 1,010,000 | |
| HCA, Inc., 7.5%, 2/15/2022 | | | 2,050,000 | | | | 2,244,750 | |
| HCA, Inc., 5%, 3/15/2024 | | | 3,315,000 | | | | 3,449,257 | |
| HCA, Inc., 5.375%, 2/01/2025 | | | 4,685,000 | | | | 4,835,810 | |
| HCA, Inc., 5.875%, 2/15/2026 | | | 2,775,000 | | | | 2,927,625 | |
14
Portfolio of Investments – continued
| | | | | | | | |
| | |
| Issuer | | Shares/Par | | | Value ($) | |
| Bonds - continued | | | | | | | | |
| Medical & Health Technology & Services - continued | | | | | | | | |
| HealthSouth Corp., 5.125%, 3/15/2023 | | $ | 3,610,000 | | | $ | 3,631,479 | |
| HealthSouth Corp., 5.75%, 11/01/2024 | | | 1,260,000 | | | | 1,274,175 | |
| Heartland Dental, LLC, 8.5%, 5/01/2026 (n) | | | 2,545,000 | | | | 2,379,575 | |
| Polaris, 8.5%, (8.5% cash or 8.5% PIK) 12/01/2022 (n)(p) | | | 1,985,000 | | | | 1,920,488 | |
| Quintiles IMS Holdings, Inc., 5%, 10/15/2026 (n) | | | 1,935,000 | | | | 1,937,419 | |
| Regional Care/LifePoint Health, Inc., 9.75%, 12/01/2026 (n) | | | 3,000,000 | | | | 2,993,400 | |
| West Street Merger Sub, Inc., 6.375%, 9/01/2025 (n) | | | 2,840,000 | | | | 2,570,200 | |
| | | | | | | | |
| | | | | | | $ | 38,666,803 | |
| Medical Equipment - 0.8% | | | | | | | | |
| Teleflex, Inc., 5.25%, 6/15/2024 | | $ | 2,895,000 | | | $ | 2,916,713 | |
| Teleflex, Inc., 4.875%, 6/01/2026 | | | 1,670,000 | | | | 1,677,849 | |
| Teleflex, Inc., 4.625%, 11/15/2027 | | | 2,115,000 | | | | 2,062,125 | |
| | | | | | | | |
| | | | | | | $ | 6,656,687 | |
| Metals & Mining - 4.5% | | | | | | | | |
| Baffinland Iron Mines Corp./Baffinland Iron Mines LP, 8.75%, 7/15/2026 (n) | | $ | 3,095,000 | | | $ | 3,071,787 | |
| Cleveland-Cliffs, Inc., 5.75%, 3/01/2025 | | | 1,125,000 | | | | 1,088,438 | |
| First Quantum Minerals Ltd., 7.25%, 4/01/2023 (n) | | | 1,690,000 | | | | 1,618,192 | |
| Freeport-McMoRan Copper & Gold, Inc., 5.4%, 11/14/2034 | | | 4,305,000 | | | | 3,820,687 | |
| Freeport-McMoRan, Inc., 6.875%, 2/15/2023 | | | 5,657,000 | | | | 5,911,565 | |
| Kaiser Aluminum Corp., 5.875%, 5/15/2024 | | | 4,495,000 | | | | 4,562,425 | |
| Northwest Acquisitions ULC/Dominion Finco, Inc., 7.125%, 11/01/2022 (n) | | | 3,455,000 | | | | 3,441,871 | |
| Novelis Corp., 5.875%, 9/30/2026 (n) | | | 5,045,000 | | | | 4,868,425 | |
| Petra Diamonds U.S. Treasury PLC, 7.25%, 5/01/2022 (n) | | | 3,230,000 | | | | 3,036,200 | |
| Steel Dynamics, Inc., 4.125%, 9/15/2025 | | | 1,635,000 | | | | 1,553,250 | |
| TMS International Corp., 7.25%, 8/15/2025 (n) | | | 2,755,000 | | | | 2,589,700 | |
| | | | | | | | |
| | | | | | | $ | 35,562,540 | |
| Midstream - 5.5% | | | | | | | | |
| Blue Racer Midstream LLC/Blue Racer Finance Corp., 6.125%, 11/15/2022 (n) | | $ | 1,510,000 | | | $ | 1,525,100 | |
| Blue Racer Midstream LLC/Blue Racer Finance Corp., 6.625%, 7/15/2026 (n) | | | 2,900,000 | | | | 2,852,875 | |
| Cheniere Energy, Inc., 5.875%, 3/31/2025 | | | 3,800,000 | | | | 4,003,148 | |
| DCP Midstream Operating LP, 4.95%, 4/01/2022 | | | 1,572,000 | | | | 1,587,720 | |
| DCP Midstream Operating LP, 3.875%, 3/15/2023 | | | 2,845,000 | | | | 2,766,763 | |
| DCP Midstream Operating LP, 5.375%, 7/15/2025 (n) | | | 2,055,000 | | | | 2,096,100 | |
| DCP Midstream Operating LP, 5.6%, 4/01/2044 | | | 1,945,000 | | | | 1,765,088 | |
| Energy Transfer Equity LP, 5.875%, 1/15/2024 | | | 3,965,000 | | | | 4,212,812 | |
| EnLink Midstream Partners LP, 4.4%, 4/01/2024 | | | 4,670,000 | | | | 4,483,200 | |
| Tallgrass Energy Partners LP, 5.5%, 1/15/2028 (n) | | | 6,440,000 | | | | 6,276,746 | |
| Targa Resources Partners LP/Targa Resources Finance Corp., 5.25%, 5/01/2023 | | | 3,185,000 | | | | 3,188,981 | |
15
Portfolio of Investments – continued
| | | | | | | | |
| | |
| Issuer | | Shares/Par | | | Value ($) | |
| Bonds - continued | | | | | | | | |
| Midstream - continued | | | | | | | | |
| Targa Resources Partners LP/Targa Resources Finance Corp., 5.125%, 2/01/2025 (n) | | $ | 2,020,000 | | | $ | 1,984,650 | |
| Targa Resources Partners LP/Targa Resources Finance Corp., 5.375%, 2/01/2027 | | | 6,570,000 | | | | 6,340,050 | |
| | | | | | | | |
| | | | | | | $ | 43,083,233 | |
| Network & Telecom - 0.6% | | | | | | | | |
| Zayo Group LLC/Zayo Capital, Inc., 6.375%, 5/15/2025 | | $ | 1,155,000 | | | $ | 1,127,569 | |
| Zayo Group LLC/Zayo Capital, Inc., 5.75%, 1/15/2027 (n) | | | 3,600,000 | | | | 3,478,284 | |
| | | | | | | | |
| | | | | | | $ | 4,605,853 | |
| Oil Services - 0.9% | | | | | | | | |
| Apergy Corp., 6.375%, 5/01/2026 | | $ | 3,420,000 | | | $ | 3,364,425 | |
| Diamond Offshore Drill Co., 5.7%, 10/15/2039 | | | 3,235,000 | | | | 2,215,975 | |
| Nabors Industries, Inc., 5.75%, 2/01/2025 | | | 1,875,000 | | | | 1,631,250 | |
| | | | | | | | |
| | | | | | | $ | 7,211,650 | |
| Oils - 0.8% | | | | | | | | |
| Parkland Fuel Corp., 6%, 4/01/2026 (n) | | $ | 5,745,000 | | | $ | 5,486,475 | |
| PBF Holding Co. LLC/PBF Finance Corp., 7%, 11/15/2023 | | | 505,000 | | | | 506,111 | |
| | | | | | | | |
| | | | | | | $ | 5,992,586 | |
| Pharmaceuticals - 1.2% | | | | | | | | |
| Endo Finance LLC/Endo Finco, Inc., 5.375%, 1/15/2023 (n) | | $ | 1,175,000 | | | $ | 959,094 | |
| Mallinckrodt International Finance S.A., 5.75%, 8/01/2022 (n) | | | 1,785,000 | | | | 1,619,887 | |
| Valeant Pharmaceuticals International, Inc., 5.5%, 3/01/2023 (n) | | | 2,755,000 | | | | 2,672,350 | |
| Valeant Pharmaceuticals International, Inc., 6.125%, 4/15/2025 (n) | | | 4,470,000 | | | | 4,224,150 | |
| | | | | | | | |
| | | | | | | $ | 9,475,481 | |
| Precious Metals & Minerals - 0.4% | | | | | | | | |
| Teck Resources Ltd., 6%, 8/15/2040 | | $ | 440,000 | | | $ | 441,100 | |
| Teck Resources Ltd., 6.25%, 7/15/2041 | | | 2,845,000 | | | | 2,965,913 | |
| | | | | | | | |
| | | | | | | $ | 3,407,013 | |
| Printing & Publishing - 0.4% | | | | | | | | |
| Nielsen Finance LLC, 5%, 4/15/2022 (n) | | $ | 3,344,000 | | | $ | 3,338,984 | |
| | |
| Real Estate - Healthcare - 0.9% | | | | | | | | |
| MPT Operating Partnership LP/MPT Financial Co., REIT, 5.25%, 8/01/2026 | | $ | 2,265,000 | | | $ | 2,276,325 | |
| MPT Operating Partnership LP/MPT Financial Co., REIT, 5%, 10/15/2027 | | | 5,265,000 | | | | 5,125,478 | |
| | | | | | | | |
| | | | | | | $ | 7,401,803 | |
16
Portfolio of Investments – continued
| | | | | | | | |
| | |
| Issuer | | Shares/Par | | | Value ($) | |
| Bonds - continued | | | | | | | | |
| Real Estate - Other - 0.8% | | | | | | | | |
| CyrusOne LP/CyrusOne Finance Corp., REIT, 5%, 3/15/2024 | | $ | 4,200,000 | | | $ | 4,231,500 | |
| CyrusOne LP/CyrusOne Finance Corp., REIT, 5.375%, 3/15/2027 | | | 2,230,000 | | | | 2,235,575 | |
| | | | | | | | |
| | | | | | | $ | 6,467,075 | |
| Restaurants - 0.7% | | | | | | | | |
| Golden Nugget, Inc., 6.75%, 10/15/2024 (n) | | $ | 1,605,000 | | | $ | 1,605,000 | |
| KFC Holding Co./Pizza Hut Holdings LLC/Taco Bell of America LLC, 5.25%, 6/01/2026 (n) | | | 4,055,000 | | | | 4,105,688 | |
| | | | | | | | |
| | | | | | | $ | 5,710,688 | |
| Retailers - 0.8% | | | | | | | | |
| DriveTime Automotive Group, Inc./DT Acceptance Corp., 8%, 6/01/2021 (n) | | $ | 1,865,000 | | | $ | 1,860,338 | |
| Hanesbrands, Inc., 4.875%, 5/15/2026 (n) | | | 2,975,000 | | | | 2,848,562 | |
| Sally Beauty Holdings, Inc., 5.625%, 12/01/2025 | | | 1,655,000 | | | | 1,612,798 | |
| | | | | | | | |
| | | | | | | $ | 6,321,698 | |
| Specialty Chemicals - 0.6% | | | | | | | | |
| Univar USA, Inc., 6.75%, 7/15/2023 (n) | | $ | 4,890,000 | | | $ | 5,024,475 | |
| | |
| Specialty Stores - 0.3% | | | | | | | | |
| Penske Automotive Group Co., 5.375%, 12/01/2024 | | $ | 690,000 | | | $ | 681,375 | |
| Penske Automotive Group Co., 5.5%, 5/15/2026 | | | 1,755,000 | | | | 1,715,513 | |
| | | | | | | | |
| | | | | | | $ | 2,396,888 | |
| Supermarkets - 0.2% | | | | | | | | |
| Albertsons Cos. LLC/Safeway Co., 6.625%, 6/15/2024 | | $ | 1,615,000 | | | $ | 1,594,813 | |
| | |
| Telecommunications - Wireless - 4.9% | | | | | | | | |
| Altice France S.A., 6.25%, 5/15/2024 (n) | | $ | 1,245,000 | | | $ | 1,220,473 | |
| Altice France S.A., 8.125%, 2/01/2027 (n) | | | 2,505,000 | | | | 2,460,912 | |
| Altice Luxembourg S.A., 7.75%, 5/15/2022 (n) | | | 1,675,000 | | | | 1,624,750 | |
| Altice Luxembourg S.A., 7.625%, 2/15/2025 (n) | | | 3,035,000 | | | | 2,579,750 | |
| Digicel Group Ltd., 6.75%, 3/01/2023 (n) | | | 3,988,000 | | | | 3,258,994 | |
| SBA Communications Corp., 4%, 10/01/2022 | | | 3,990,000 | | | | 3,940,125 | |
| SBA Communications Corp., 4.875%, 9/01/2024 | | | 1,995,000 | | | | 1,997,494 | |
| SFR Group S.A., 7.375%, 5/01/2026 (n) | | | 985,000 | | | | 949,284 | |
| Sprint Corp., 7.875%, 9/15/2023 | | | 2,620,000 | | | | 2,783,750 | |
| Sprint Corp., 7.125%, 6/15/2024 | | | 4,805,000 | | | | 4,916,116 | |
| Sprint Nextel Corp., 6%, 11/15/2022 | | | 4,810,000 | | | | 4,864,112 | |
| T-Mobile USA, Inc., 6.5%, 1/15/2024 | | | 1,765,000 | | | | 1,826,775 | |
| T-Mobile USA, Inc., 5.125%, 4/15/2025 | | | 2,095,000 | | | | 2,115,950 | |
| T-Mobile USA, Inc., 6.5%, 1/15/2026 | | | 2,020,000 | | | | 2,136,150 | |
| T-Mobile USA, Inc., 5.375%, 4/15/2027 | | | 2,115,000 | | | | 2,130,862 | |
| | | | | | | | |
| | | | | | | $ | 38,805,497 | |
17
Portfolio of Investments – continued
| | | | | | | | |
| | |
| Issuer | | Shares/Par | | | Value ($) | |
| Bonds - continued | | | | | | | | |
| Telephone Services - 0.6% | | | | | | | | |
| Level 3 Financing, Inc., 5.375%, 1/15/2024 | | $ | 1,900,000 | | | $ | 1,890,500 | |
| Level 3 Financing, Inc., 5.375%, 5/01/2025 | | | 3,155,000 | | | | 3,115,563 | |
| | | | | | | | |
| | | | | | | $ | 5,006,063 | |
| Transportation - Services - 0.2% | | | | | | | | |
| Navios South American Logistics, Inc., 7.25%, 5/01/2022 | | $ | 1,110,000 | | | $ | 1,037,850 | |
| Syncreon Group BV/Syncre, 8.625%, 11/01/2021 (n) | | | 1,168,000 | | | | 934,400 | |
| | | | | | | | |
| | | | | | | $ | 1,972,250 | |
| Utilities - Electric Power - 2.5% | | | | | | | | |
| Clearway Energy Operating LLC, 5.75%, 10/15/2025 (n) | | $ | 4,505,000 | | | $ | 4,161,494 | |
| Covanta Holding Corp., 5.875%, 3/01/2024 | | | 2,515,000 | | | | 2,508,712 | |
| Covanta Holding Corp., 5.875%, 7/01/2025 | | | 2,235,000 | | | | 2,190,300 | |
| Covanta Holding Corp., 6%, 1/01/2027 | | | 3,280,000 | | | | 3,140,600 | |
| Drax Finco PLC, 6.625%, 11/01/2025 (n) | | | 3,520,000 | | | | 3,502,400 | |
| NextEra Energy Operating Co., 4.25%, 9/15/2024 (n) | | | 4,560,000 | | | | 4,344,768 | |
| TerraForm Global Operating LLC, 6.125%, 3/01/2026 (n) | | | 75,000 | | | | 71,625 | |
| | | | | | | | |
| | | | | | | $ | 19,919,899 | |
| Total Bonds (Identified Cost, $758,248,716) | | | | | | $ | 743,499,081 | |
| | |
| Floating Rate Loans (r) - 0.8% | | | | | | | | |
| Broadcasting - 0.1% | | | | | | | | |
| Warner Music Group, Term Loan F, 4.623%, 11/01/2023 | | $ | 662,000 | | | $ | 646,829 | |
| | |
| Conglomerates - 0.1% | | | | | | | | |
| Gates Global LLC, Term Loan B2, 5.248%, 3/31/2024 | | $ | 786,010 | | | $ | 768,106 | |
| | |
| Entertainment - 0.1% | | | | | | | | |
| Live Nation Entertainment, Inc., Term Loan B3, 4.125%, 10/31/2023 | | $ | 1,017,411 | | | $ | 1,011,477 | |
| | |
| Food & Beverages - 0.1% | | | | | | | | |
| U.S. Foods Holding Corp., Term Loan B, 4.344%, 6/27/2023 | | $ | 660,307 | | | $ | 648,917 | |
| | |
| Medical & Health Technology & Services - 0.3% | | | | | | | | |
| DaVita Healthcare Partners, Inc., Term Loan B, 5.248%, 6/24/2021 | | $ | 2,272,740 | | | $ | 2,267,058 | |
| | |
| Oil Services - 0.1% | | | | | | | | |
| Apergy Corp., Term Loan B, 5.162%, 5/09/2025 | | $ | 955,443 | | | $ | 933,348 | |
| Total Floating Rate Loans (Identified Cost, $6,253,161) | | | | | | $ | 6,275,735 | |
| | |
| Common Stocks - 0.4% | | | | | | | | |
| Oil Services - 0.4% | | | | | | | | |
| LTRI Holdings LP (a)(u) (Identified Cost, $1,188,000) | | | 3,300 | | | $ | 2,935,086 | |
18
Portfolio of Investments - continued
| | | | | | | | |
| Convertible Bonds - 0.1% | | | | | | | | |
| | |
| Issuer | | Shares/Par | | | Value ($) | |
| Cable TV - 0.1% | | | | | | | | |
DISH Network Corp., 3.375%, 8/15/2026
(Identified Cost, $1,064,116) | | $ | 1,180,000 | | | $ | 1,002,410 | |
| | | | | | | | | | | | | | | | |
| | | | |
| | | Strike Price | | | First Exercise | | | | | | | |
| Warrants - 0.0% | | | | | | | | | | | | | | | | |
| Forest & Paper Products - 0.0% | | | | | | | | | |
| Appvion Holdings Corp. - Tranche A (1 share for 1 warrant) (a) | | $ | 27.17 | | | | 8/24/18 | | | | 2,021 | | | $ | 2,021 | |
Appvion Holdings Corp. - Tranche B (1 share for 1 warrant) (a) | | | 31.25 | | | | 8/24/18 | | | | 2,021 | | | | 1,010 | |
| Total Warrants (Identified Cost, $0) | | | | | | | $ | 3,031 | |
| | | | | | | | |
| | |
| Investment Companies (h) - 3.8% | | | | | | | | |
| Money Market Funds - 3.8% | | | | | | | | |
| MFS Institutional Money Market Portfolio, 2.47% (v) (Identified Cost, $29,838,451) | | | 29,841,435 | | | $ | 29,838,451 | |
| | |
| Other Assets, Less Liabilities - 0.6% | | | | | | | 4,883,184 | |
| Net Assets - 100.0% | | | | | | $ | 788,436,978 | |
| (a) | Non-income producing security. |
| (h) | An affiliated issuer, which may be considered one in which the fund owns 5% or more of the outstanding voting securities, or a company which is under common control. At period end, the aggregate values of the fund’s investments in affiliated issuers and in unaffiliated issuers were $29,838,451 and $753,715,343, respectively. |
| (n) | Securities exempt from registration under Rule 144A of the Securities Act of 1933. These securities may be sold in the ordinary course of business in transactions exempt from registration, normally to qualified institutional buyers. At period end, the aggregate value of these securities was $464,777,748, representing 58.9% of net assets. |
| (p) | Payment-in-kind (PIK) security for which interest income may be received in additional securities and/or cash. |
| (r) | The remaining maturities of floating rate loans may be less than the stated maturities shown as a result of contractual or optional prepayments by the borrower. Such prepayments cannot be predicted with certainty. These loans may be subject to restrictions on resale. The interest rate shown represents the weighted average of the floating interest rates on settled contracts within the loan facility at period end, unless otherwise indicated. The floating interest rates on settled contracts are determined periodically by reference to a base lending rate and a spread. |
| (u) | The security was valued using significant unobservable inputs and is considered level 3 under the fair value hierarchy. For further information about the fund’s level 3 holdings, please see Note 2 in the Notes to Financial Statements. |
| (v) | Affiliated issuer that is available only to investment companies managed by MFS. The rate quoted for the MFS Institutional Money Market Portfolio is the annualizedseven-day yield of the fund at period end. |
19
Portfolio of Investments – continued
| (z) | Restricted securities are not registered under the Securities Act of 1933 and are subject to legal restrictions on resale. These securities generally may be resold in transactions exempt from registration or to the public if the securities are subsequently registered. Disposal of these securities may involve time-consuming negotiations and prompt sale at an acceptable price may be difficult. The fund holds the following restricted securities: |
| | | | | | | | | | |
| Restricted Securities | | Acquistion
Date | | Cost | | | Value | |
| CFX Escrow Corp., 6%, 2/15/2024 | | 1/31/19 | | | $705,000 | | | | $705,000 | |
| CFX Escrow Corp., 6.375%, 2/15/2026 | | 1/31/19 | | | 455,000 | | | | 455,000 | |
| Constellation Merger Sub, Inc., 8.5%, 9/15/2025 | | 1/29/19-1/30/19 | | | 888,640 | | | | 889,156 | |
| Core & Main LP, 6.125%, 8/15/2025 | | 1/04/19-1/25/19 | | | 1,259,523 | | | | 1,281,113 | |
| Energizer Holdings, Inc., 7.75%, 1/15/2027 | | 1/17/19 | | | 240,000 | | | | 247,284 | |
| Marriot Ownership Resorts, Inc., 5.625%, 4/15/2023 | | 4/02/15-12/17/15 | | | 2,691,880 | | | | 2,654,575 | |
| TransDigm, Inc., 6.25%, 3/15/2026 | | 1/30/19 | | | 2,427,000 | | | | 2,463,405 | |
| Total Restricted Securities | | | | | | | | | $8,695,533 | |
| % of Net assets | | | | | | | | | 1.1% | |
The following abbreviations are used in this report and are defined:
| FLR | | Floating Rate. Interest rate resets periodically based on the parenthetically disclosed reference rate plus a spread (if any). Theperiod-end rate reported may not be the current rate. All reference rates are USD unless otherwise noted. |
| PLC | | Public Limited Company |
| REIT | | Real Estate Investment Trust |
Abbreviations indicate amounts shown in currencies other than the U.S. dollar. All amounts are stated in U.S. dollars unless otherwise indicated. A list of abbreviations is shown below:
Derivative Contracts at 1/31/19
Forward Foreign Currency Exchange Contracts
| | | | | | | | | | | | | | | | | | |
Currency
Purchased | | | Currency
Sold | | Counterparty | | Settlement
Date | | | Unrealized
Appreciation
(Depreciation) | |
| Asset Derivatives | | | | | | | | | | | | |
| USD | | | 5,642,582 | | | EUR | | 4,877,047 | | Goldman Sachs International | | | 4/12/2019 | | | | $28,050 | |
| USD | | | 405,957 | | | EUR | | 350,429 | | NatWest Markets PLC | | | 4/12/2019 | | | | 2,538 | |
| | | | | | | | | | | | | | | | | | |
| | | | | | | | | | | | | | | | | $30,588 | |
| | | | | | | | | | | | | | | | | | |
20
Portfolio of Investments – continued
Futures Contracts
| | | | | | | | | | | | | | | | | | | | | | |
| Description | | Long/
Short | | | Currency | | | Contracts | | Notional
Amount | | | Expiration
Date | | | Value/
Unrealized
Appreciation
(Depreciation) | |
| Liability Derivatives | | | | | | | | | | | | | | | |
| | | | |
| Interest Rate Futures | | | | | | | | | | | | | | | |
| GermanEuro-Bobl 5 yr | | | Short | | | | EUR | | | 13 | | | $1,977,972 | | | | March - 2019 | | | | $(10,743 | ) |
| U.S. Treasury Note 10 yr | | | Short | | | | USD | | | 110 | | | 13,471,562 | | | | March - 2019 | | | | (381,962 | ) |
| | | | | | | | | | | | | | | | | | | | | | |
| | | | | | | | | | | | | | | | | | | | | $(392,705 | ) |
| | | | | | | | | | | | | | | | | | | | | | |
At January 31, 2019, the fund had cash collateral of $143,744 to cover any collateral or margin obligations for certain derivative contracts. Restricted cash and/or deposits with brokers in the Statement of Assets and Liabilities are comprised of cash collateral.
See Notes to Financial Statements
21
Financial Statements
STATEMENT OF ASSETS AND LIABILITIES
At 1/31/19
This statement represents your fund’s balance sheet, which details the assets and liabilities comprising the total value of the fund.
| | | | |
| Assets | | | | |
Investments in unaffiliated issuers, at value (identified cost, $766,753,993) | | | $753,715,343 | |
Investments in affiliated issuers, at value (identified cost, $29,838,451) | | | 29,838,451 | |
Deposits with brokers for | | | | |
Futures contracts | | | 143,744 | |
Receivables for | | | | |
Forward foreign currency exchange contracts | | | 30,588 | |
Investments sold | | | 510,932 | |
Fund shares sold | | | 236,036 | |
Interest and dividends | | | 11,770,946 | |
Other assets | | | 3,299 | |
Total assets | | | $796,249,339 | |
| |
| Liabilities | | | | |
Payable to custodian | | | $65,510 | |
Payables for | | | | |
Net daily variation margin on open futures contracts | | | 53,063 | |
Investments purchased | | | 7,409,846 | |
Fund shares reacquired | | | 210,291 | |
Payable to affiliates | | | | |
Administrator | | | 94 | |
Shareholder servicing costs | | | 13 | |
Accrued expenses and other liabilities | | | 73,544 | |
Total liabilities | | | $7,812,361 | |
Net assets | | | $788,436,978 | |
| |
| Net assets consist of | | | | |
Paid-in capital | | | $871,449,011 | |
Total distributable earnings (loss) | | | (83,012,033 | ) |
Net assets | | | $788,436,978 | |
Shares of beneficial interest outstanding | | | 88,191,880 | |
Net asset value per share (net assets of $788,436,978 / 88,191,880 shares of beneficial interest outstanding) | | | $8.94 | |
See Notes to Financial Statements
22
Financial Statements
STATEMENT OF OPERATIONS
Year ended 1/31/19
This statement describes how much your fund earned in investment income and accrued in expenses. It also describes any gains and/or losses generated by fund operations.
| | | | |
| Net investment income (loss) | | | | |
Income | | | | |
Interest | | | $53,577,787 | |
Dividends from affiliated issuers | | | 396,975 | |
Other | | | 278,324 | |
Total investment income | | | $54,253,086 | |
Expenses | | | | |
Shareholder servicing costs | | | $46 | |
Administrative services fee | | | 17,500 | |
Custodian fee | | | 60,296 | |
Shareholder communications | | | 5,951 | |
Audit and tax fees | | | 43,516 | |
Legal fees | | | 8,084 | |
Pricing service fees | | | 20,848 | |
Miscellaneous | | | 30,522 | |
Total expenses | | | $186,763 | |
Fees paid indirectly | | | (2,411 | ) |
Net expenses | | | $184,352 | |
Net investment income (loss) | | | $54,068,734 | |
| |
| Realized and unrealized gain (loss) | | | | |
Realized gain (loss) (identified cost basis) | | | | |
Unaffiliated issuers | | | $(16,095,589 | ) |
Affiliated issuers | | | 104 | |
Futures contracts | | | 1,091,612 | |
Forward foreign currency exchange contracts | | | 259,212 | |
Foreign currency | | | (533 | ) |
Net realized gain (loss) | | | $(14,745,194 | ) |
Change in unrealized appreciation or depreciation | | | | |
Unaffiliated issuers | | | $(26,518,416 | ) |
Futures contracts | | | (1,297,981 | ) |
Forward foreign currency exchange contracts | | | 35,198 | |
Translation of assets and liabilities in foreign currencies | | | 431 | |
Net unrealized gain (loss) | | | $(27,780,768 | ) |
Net realized and unrealized gain (loss) | | | $(42,525,962 | ) |
Change in net assets from operations | | | $11,542,772 | |
See Notes to Financial Statements
23
Financial Statements
STATEMENTS OF CHANGES IN NET ASSETS
These statements describe the increases and/or decreases in net assets resulting from operations, any distributions, and any shareholder transactions.
| | | | | | | | |
| | | Year ended | |
| | | 1/31/19 | | | 1/31/18 | |
| Change in net assets | | | | | | |
| | |
| From operations | | | | | | | | |
Net investment income (loss) | | | $54,068,734 | | | | $72,887,935 | |
Net realized gain (loss) | | | (14,745,194 | ) | | | 15,418,353 | |
Net unrealized gain (loss) | | | (27,780,768 | ) | | | (6,830,932 | ) |
Change in net assets from operations | | | $11,542,772 | | | | $81,475,356 | |
Total distributions to shareholders (a) | | | $(55,299,759 | ) | | | $(75,880,650 | ) |
Change in net assets from fund share transactions | | | $(365,738,413 | ) | | | $(229,459,345 | ) |
Total change in net assets | | | $(409,495,400 | ) | | | $(223,864,639 | ) |
| | |
| Net assets | | | | | | | | |
At beginning of period | | | 1,197,932,378 | | | | 1,421,797,017 | |
At end of period (b) | | | $788,436,978 | | | | $1,197,932,378 | |
| (a) | Distributions from net investment income and from net realized gain are no longer required to be separately disclosed. See Note 2. For the year ended January 31, 2018, distributions from net investment income were $75,880,650. |
| (b) | Parenthetical disclosure of accumulated distributions in excess of net investment income is no longer required. See Note 2. For the year ended January 31, 2018, end of period net assets included accumulated distributions in excess of net investment income of $2,496,747. |
See Notes to Financial Statements
24
Financial Statements
FINANCIAL HIGHLIGHTS
The financial highlights table is intended to help you understand the fund’s financial performance for the past 5 years. Certain information reflects financial results for a single fund share. The total returns in the table represent the rate that an investor would have earned (or lost) on an investment in the fund share class (assuming reinvestment of all distributions) held for the entire period.
| | | | | | | | | | | | | | | | | | | | |
| | | Year ended | |
| | | | | |
| | | 1/31/19 | | | 1/31/18 | | | 1/31/17 | | | 1/31/16 | | | 1/31/15 | |
Net asset value, beginning of period | | | $9.31 | | | | $9.28 | | | | $8.41 | | | | $9.47 | | | | $9.85 | |
| | | |
| Income (loss) from investment operations | | | | | | | | | | | | | |
Net investment income (loss) (d) | | | $0.52 | | | | $0.53 | | | | $0.56 | | | | $0.57 | | | | $0.61 | |
Net realized and unrealized gain (loss) | | | (0.36 | ) | | | 0.05 | | | | 0.90 | | | | (1.03 | ) | | | (0.29 | ) |
Total from investment operations | | | $0.16 | | | | $0.58 | | | | $1.46 | | | | $(0.46 | ) | | | $0.32 | |
| | | |
| Less distributions declared to shareholders | | | | | | | | | | | | | |
From net investment income | | | $(0.53 | ) | | | $(0.55 | ) | | | $(0.59 | ) | | | $(0.59 | ) | | | $(0.63 | ) |
From net realized gain | | | — | | | | — | | | | — | | | | (0.01 | ) | | | (0.07 | ) |
Total distributions declared to shareholders | | | $(0.53 | ) | | | $(0.55 | ) | | | $(0.59 | ) | | | $(0.60 | ) | | | $(0.70 | ) |
Net asset value, end of period (x) | | | $8.94 | | | | $9.31 | | | | $9.28 | | | | $8.41 | | | | $9.47 | |
Total return (%) (r)(s)(x) | | | 1.86 | | | | 6.33 | | | | 17.77 | | | | (5.23 | ) | | | 3.28 | |
| | | | |
Ratios (%) (to average net assets)
and Supplemental data: | | | | | | | | | | | | | | | | | |
Expenses before expense reductions (f) | | | 0.02 | | | | 0.02 | | | | 0.02 | | | | 0.02 | | | | 0.03 | |
Expenses after expense reductions (f) | | | N/A | | | | N/A | | | | N/A | | | | N/A | | | | 0.03 | |
Net investment income (loss) | | | 5.77 | | | | 5.63 | | | | 6.28 | | | | 6.19 | | | | 6.18 | |
Portfolio turnover | | | 38 | | | | 46 | | | | 44 | | | | 33 | | | | 43 | |
Net assets at end of period (000 omitted) | | | $788,437 | | | | $1,197,932 | | | | $1,421,797 | | | | $1,350,666 | | | | $1,337,532 | |
| (d) | Per share data is based on average shares outstanding. |
| (f) | Ratios do not reflect reductions from fees paid indirectly, if applicable. |
| (r) | Certain expenses have been reduced without which performance would have been lower. |
| (s) | From time to time the fund may receive proceeds from litigation settlements, without which performance would be lower. |
| (x) | The net asset values and total returns have been calculated on net assets which include adjustments made in accordance with U.S. generally accepted accounting principles required at period end for financial reporting purposes. |
See Notes to Financial Statements
25
NOTES TO FINANCIAL STATEMENTS
(1) Business and Organization
MFS High Yield Pooled Portfolio (the fund) is a diversified series of MFS Series Trust III (the trust). The trust is organized as a Massachusetts business trust and is registered under the Investment Company Act of 1940, as amended, as anopen-end management investment company. This fund is available only to certain U.S. registered investment companies managed by MFS. MFS does not receive a management fee from this fund.
The fund is an investment company and accordingly follows the investment company accounting and reporting guidance of the Financial Accounting Standards Board (FASB) Accounting Standards Codification Topic 946 Financial Services – Investment Companies.
(2) Significant Accounting Policies
General– The preparation of financial statements in conformity with U.S. generally accepted accounting principles requires management to make estimates and assumptions that affect the reported amounts of assets and liabilities, and disclosure of contingent assets and liabilities at the date of the financial statements and the reported amounts of increases and decreases in net assets from operations during the reporting period. Actual results could differ from those estimates. In the preparation of these financial statements, management has evaluated subsequent events occurring after the date of the fund’s Statement of Assets and Liabilities through the date that the financial statements were issued. The fund invests in high-yield securities rated below investment grade. Investments in below investment grade quality securities can involve a substantially greater risk of default or can already be in default, and their values can decline significantly. Below investment grade quality securities tend to be more sensitive to adverse news about the issuer, or the market or economy in general, than higher quality debt instruments. The fund invests in foreign securities. Investments in foreign securities are vulnerable to the effects of changes in the relative values of the local currency and the U.S. dollar and to the effects of changes in each country’s market, economic, industrial, political, regulatory, geopolitical, and other conditions.
In March 2017, the FASB issued Accounting Standards Update2017-08, Receivables – Nonrefundable Fees and Other Costs (Subtopic310-20) – Premium Amortization on Purchased Callable Debt Securities (“ASU2017-08”). For entities that hold callable debt securities at a premium, ASU2017-08 requires that the premium be amortized to the earliest call date. ASU2017-08 will be effective for fiscal years beginning after December 15, 2018, and interim periods within those fiscal years. Management has evaluated the potential impacts of ASU2017-08 and believes that adoption of ASU2017-08 will not have a material effect on the fund’s overall financial position or its overall results of operations.
In August 2018, the FASB issued Accounting Standards Update2018-13, Fair Value Measurement (Topic 820) – Disclosure Framework – Changes to the Disclosure Requirements for Fair Value Measurement (“ASU2018-13”) which introduces new fair value disclosure requirements as well as eliminates and modifies certain existing fair value disclosure requirements. ASU2018-13 would be effective for fiscal years
26
Notes to Financial Statements – continued
beginning after December 15, 2019, and interim periods within those fiscal years; however, management has elected to early adopt ASU2018-13 effective with the current reporting period. The impact of the fund’s adoption was limited to changes in the fund’s financial statement disclosures regarding fair value, primarily those disclosures related to transfers between levels of the fair value hierarchy.
In August 2018, the Securities and Exchange Commission (SEC) released its Final Rule on Disclosure Update and Simplification (the “Final Rule”) which is intended to simplify an issuer’s disclosure compliance efforts by removing redundant or outdated disclosure requirements without significantly altering the mix of information provided to investors. Effective with the current reporting period, the fund adopted the Final Rule with the impacts being that the fund is no longer required to present the components of distributable earnings on the Statement of Assets and Liabilities or the sources of distributions to shareholders and the amount of undistributed net investment income on the Statements of Changes in Net Assets.
Balance Sheet Offsetting– The fund’s accounting policy with respect to balance sheet offsetting is that, absent an event of default by the counterparty or a termination of the agreement, the International Swaps and Derivatives Association (ISDA) Master Agreement, or similar agreement, does not result in an offset of reported amounts of financial assets and financial liabilities in the Statement of Assets and Liabilities across transactions between the fund and the applicable counterparty. The fund’s right to setoff may be restricted or prohibited by the bankruptcy or insolvency laws of the particular jurisdiction to which a specific master netting agreement counterparty is subject. Balance sheet offsetting disclosures, to the extent applicable to the fund, have been included in the fund’s Significant Accounting Policies note under the captions for each of the fund’sin-scope financial instruments and transactions.
Investment Valuations– Equity securities, including restricted equity securities, are generally valued at the last sale or official closing price on their primary market or exchange as provided by a third-party pricing service. Equity securities, for which there were no sales reported that day, are generally valued at the last quoted daily bid quotation on their primary market or exchange as provided by a third-party pricing service. Debt instruments and floating rate loans, including restricted debt instruments, are generally valued at an evaluated or composite bid as provided by a third-party pricing service. Short-term instruments with a maturity at issuance of 60 days or less may be valued at amortized cost, which approximates market value. Futures contracts are generally valued at last posted settlement price on their primary exchange as provided by a third-party pricing service. Futures contracts for which there were no trades that day for a particular position are generally valued at the closing bid quotation on their primary exchange as provided by a third-party pricing service. Forward foreign currency exchange contracts are generally valued at the mean of bid and asked prices for the time period interpolated from rates provided by a third-party pricing service for proximate time periods.Open-end investment companies are generally valued at net asset value per share. Securities and other assets generally valued on the basis of information from a third-party pricing service may also be valued at a broker/dealer bid quotation. In determining values, third-party pricing services can utilize both transaction data and market information such as yield, quality, coupon
27
Notes to Financial Statements – continued
rate, maturity, type of issue, trading characteristics, and other market data. The values of foreign securities and other assets and liabilities expressed in foreign currencies are converted to U.S. dollars using the mean of bid and asked prices for rates provided by a third-party pricing service.
The Board of Trustees has delegated primary responsibility for determining or causing to be determined the value of the fund’s investments (including any fair valuation) to the adviser pursuant to valuation policies and procedures approved by the Board. If the adviser determines that reliable market quotations are not readily available, investments are valued at fair value as determined in good faith by the adviser in accordance with such procedures under the oversight of the Board of Trustees. Under the fund’s valuation policies and procedures, market quotations are not considered to be readily available for most types of debt instruments and floating rate loans and many types of derivatives. These investments are generally valued at fair value based on information from third-party pricing services. In addition, investments may be valued at fair value if the adviser determines that an investment’s value has been materially affected by events occurring after the close of the exchange or market on which the investment is principally traded (such as foreign exchange or market) and prior to the determination of the fund’s net asset value, or after the halting of trading of a specific security where trading does not resume prior to the close of the exchange or market on which the security is principally traded. The adviser generally relies on third-party pricing services or other information (such as the correlation with price movements of similar securities in the same or other markets; the type, cost and investment characteristics of the security; the business and financial condition of the issuer; and trading and other market data) to assist in determining whether to fair value and at what value to fair value an investment. The value of an investment for purposes of calculating the fund’s net asset value can differ depending on the source and method used to determine value. When fair valuation is used, the value of an investment used to determine the fund’s net asset value may differ from quoted or published prices for the same investment. There can be no assurance that the fund could obtain the fair value assigned to an investment if it were to sell the investment at the same time at which the fund determines its net asset value per share.
Various inputs are used in determining the value of the fund’s assets or liabilities. These inputs are categorized into three broad levels. In certain cases, the inputs used to measure fair value may fall into different levels of the fair value hierarchy. In such cases, an investment’s level within the fair value hierarchy is based on the lowest level of input that is significant to the fair value measurement. The fund’s assessment of the significance of a particular input to the fair value measurement in its entirety requires judgment, and considers factors specific to the investment. Level 1 includes unadjusted quoted prices in active markets for identical assets or liabilities. Level 2 includes other significant observable market-based inputs (including quoted prices for similar securities, interest rates, prepayment speed, and credit risk). Level 3 includes unobservable inputs, which may include the adviser’s own assumptions in determining the fair value of investments. Other financial instruments are derivative instruments,
28
Notes to Financial Statements – continued
such as futures contracts and forward foreign currency exchange contracts. The following is a summary of the levels used as of January 31, 2019 in valuing the fund’s assets or liabilities:
| | | | | | | | | | | | | | | | |
| | | | |
| Financial Instruments | | Level 1 | | | Level 2 | | | Level 3 | | | Total | |
| Equity Securities | | | $— | | | | $3,031 | | | | $2,935,086 | | | | $2,938,117 | |
| Non-U.S. Sovereign Debt | | | — | | | | 7,660,770 | | | | — | | | | 7,660,770 | |
| U.S. Corporate Bonds | | | — | | | | 603,792,760 | | | | — | | | | 603,792,760 | |
| Foreign Bonds | | | — | | | | 133,047,961 | | | | — | | | | 133,047,961 | |
| Floating Rate Loans | | | — | | | | 6,275,735 | | | | — | | | | 6,275,735 | |
| Mutual Funds | | | 29,838,451 | | | | — | | | | — | | | | 29,838,451 | |
| Total | | | $29,838,451 | | | | $750,780,257 | | | | $2,935,086 | | | | $783,553,794 | |
| | | | |
| Other Financial Instruments | | | | | | | | | | | | |
| Futures Contracts – Liabilities | | | $(392,705 | ) | | | $— | | | | $— | | | | $(392,705 | ) |
| Forward Foreign Currency | | | | | | | | | | | | | | | | |
| Exchange Contracts – Assets | | | — | | | | 30,588 | | | | — | | | | 30,588 | |
For further information regarding security characteristics, see the Portfolio of Investments.
The following is a reconciliation of level 3 assets for which significant unobservable inputs were used to determine fair value. The table presents the activity of level 3 securities held at the beginning and the end of the period.
| | | | |
| |
| | | Equity Securities | |
| Balance as of 1/31/18 | | | $2,935,086 | |
Change in unrealized appreciation or depreciation | | | 0 | |
| Balance as of 1/31/19 | | | $2,935,086 | |
The net change in unrealized appreciation or depreciation from investments held as level 3 at January 31, 2019 is $0. At January 31, 2019, the fund held one level 3 security.
Foreign Currency Translation– Purchases and sales of foreign investments, income, and expenses are converted into U.S. dollars based upon currency exchange rates prevailing on the respective dates of such transactions or on the reporting date for foreign denominated receivables and payables. Gains and losses attributable to foreign currency exchange rates on sales of securities are recorded for financial statement purposes as net realized gains and losses on investments. Gains and losses attributable to foreign exchange rate movements on receivables, payables, income and expenses are recorded for financial statement purposes as foreign currency transaction gains and losses. That portion of both realized and unrealized gains and losses on investments that results from fluctuations in foreign currency exchange rates is not separately disclosed.
Derivatives– The fund uses derivatives primarily to increase or decrease exposure to a particular market or segment of the market, or security, to increase or decrease interest rate or currency exposure, or as alternatives to direct investments. Derivatives are used for hedging ornon-hedging purposes. While hedging can reduce or eliminate losses, it can also reduce or eliminate gains. When the fund uses derivatives as an investment to
29
Notes to Financial Statements – continued
increase market exposure, or for hedging purposes, gains and losses from derivative instruments may be substantially greater than the derivative’s original cost.
The derivative instruments used by the fund during the period were futures contracts and forward foreign currency exchange contracts. Depending on the type of derivative, the fund may exit a derivative position by entering into an offsetting transaction with a counterparty or exchange, negotiating an agreement with the derivative counterparty, or novating the position to a third party. The fund may be unable to promptly close out a futures position in instances where the daily fluctuation in the price for that type of future exceeds the daily limit set by the exchange. The fund’s period end derivatives, as presented in the Portfolio of Investments and the associated Derivative Contract tables, generally are indicative of the volume of its derivative activity during the period.
The following table presents, by major type of derivative contract, the fair value, on a gross basis, of the asset and liability components of derivatives held by the fund at January 31, 2019 as reported in the Statement of Assets and Liabilities:
| | | | | | | | | | |
| | | | | Fair Value (a) | |
| | | |
| Risk | | Derivative Contracts | | Asset Derivatives | | | Liability Derivatives | |
| Interest Rate | | Interest Rate Futures | | | $— | | | | $(392,705 | ) |
| Foreign Exchange | | Forward Foreign Currency Exchange Contracts | | | 30,588 | | | | — | |
| Total | | | | | $30,588 | | | | $(392,705 | ) |
| (a) | Values presented in this table for futures contracts correspond to the values reported in the fund’s Portfolio of Investments. Only the current day net variation margin for futures contracts is separately reported within the fund’s Statement of Assets and Liabilities. |
The following table presents, by major type of derivative contract, the realized gain (loss) on derivatives held by the fund for the year ended January 31, 2019 as reported in the Statement of Operations:
| | | | | | | | |
| | |
| Risk | | Futures
Contracts | | | Forward
Foreign
Currency
Exchange
Contracts | |
| Interest Rate | | | $1,091,612 | | | | $— | |
| Foreign Exchange | | | — | | | | 259,212 | |
| Total | | | $1,091,612 | | | | $259,212 | |
The following table presents, by major type of derivative contract, the change in unrealized appreciation or depreciation on derivatives held by the fund for the year ended January 31, 2019 as reported in the Statement of Operations:
| | | | | | | | |
| | |
| Risk | | Futures
Contracts | | | Forward
Foreign
Currency
Exchange
Contracts | |
| Interest Rate | | | $(1,297,981 | ) | | | $— | |
| Foreign Exchange | | | — | | | | 35,198 | |
| Total | | | $(1,297,981 | ) | | | $35,198 | |
30
Notes to Financial Statements – continued
Derivative counterparty credit risk is managed through formal evaluation of the creditworthiness of all potential counterparties. On certain, but not all, uncleared derivatives, the fund attempts to reduce its exposure to counterparty credit risk whenever possible by entering into an ISDA Master Agreement on a bilateral basis. The ISDA Master Agreement gives each party to the agreement the right to terminate all transactions traded under such agreement if there is a specified deterioration in the credit quality of the other party. Upon an event of default or a termination of the ISDA Master Agreement, thenon-defaulting party has the right to close out all transactions traded under such agreement and to net amounts owed under each agreement to one net amount payable by one party to the other. This right to close out and net payments across all transactions traded under the ISDA Master Agreement could result in a reduction of the fund’s credit risk to such counterparty equal to any amounts payable by the fund under the applicable transactions, if any.
Collateral and margin requirements differ by type of derivative. For cleared derivatives (e.g., futures contracts, cleared swaps, and exchange-traded options), margin requirements are set by the clearing broker and the clearing house and collateral, in the form of cash or securities, is posted by the fund directly with the clearing broker. Collateral terms are counterparty agreement specific for uncleared derivatives (e.g., forward foreign currency exchange contracts, uncleared swap agreements, and uncleared options) and collateral, in the form of cash and securities, is held in segregated accounts with the fund’s custodian in connection with these agreements. For derivatives traded under an ISDA Master Agreement, which contains a collateral support annex, the collateral requirements are netted across all transactions traded under such counterparty-specific agreement and an amount is posted from one party to the other to collateralize such obligations. Cash that has been segregated or delivered to cover the fund’s collateral or margin obligations under derivative contracts, if any, will be reported separately in the Statement of Assets and Liabilities as restricted cash for uncleared derivatives and/or deposits with brokers for cleared derivatives. Securities pledged as collateral or margin for the same purpose, if any, are noted in the Portfolio of Investments. The fund may be required to make payments of interest on uncovered collateral or margin obligations with the broker. Any such payments are included in “Miscellaneous” expense in the Statement of Operations.
Futures Contracts– The fund entered into futures contracts which may be used to hedge against or obtain broad market exposure, interest rate exposure, currency exposure, or to manage duration. A futures contract represents a commitment for the future purchase or sale of an asset at a specified price on a specified date.
Upon entering into a futures contract, the fund is required to deposit with the broker, either in cash or securities, an initial margin in an amount equal to a specified percentage of the notional amount of the contract. Subsequent payments (variation margin) are made or received by the fund each day, depending on the daily fluctuations in the value of the contract, and are recorded for financial statement purposes as unrealized gain or loss by the fund until the contract is closed or expires at which point the gain or loss on futures contracts is realized.
The fund bears the risk of interest rates, exchange rates or securities prices moving unexpectedly, in which case, the fund may not achieve the anticipated benefits of the futures contracts and may realize a loss. While futures contracts may present less
31
Notes to Financial Statements – continued
counterparty risk to the fund since the contracts are exchange traded and the exchange’s clearinghouse guarantees payments to the broker, there is still counterparty credit risk due to the insolvency of the broker. The fund’s maximum risk of loss due to counterparty credit risk is equal to the margin posted by the fund to the broker plus any gains or minus any losses on the outstanding futures contracts.
Forward Foreign Currency Exchange Contracts– The fund entered into forward foreign currency exchange contracts for the purchase or sale of a specific foreign currency at a fixed price on a future date. These contracts may be used to hedge the fund’s currency risk or fornon-hedging purposes. For hedging purposes, the fund may enter into contracts to deliver or receive foreign currency that the fund will receive from or use in its normal investment activities. The fund may also use contracts to hedge against declines in the value of foreign currency denominated securities due to unfavorable exchange rate movements. Fornon-hedging purposes, the fund may enter into contracts with the intent of changing the relative exposure of the fund’s portfolio of securities to different currencies to take advantage of anticipated exchange rate changes.
Forward foreign currency exchange contracts are adjusted by the daily exchange rate of the underlying currency and any unrealized gains or losses are recorded as a receivable or payable for forward foreign currency exchange contracts until the contract settlement date. On contract settlement date, any gain or loss on the contract is recorded as realized gains or losses on forward foreign currency exchange contracts.
Risks may arise upon entering into these contracts from unanticipated movements in the value of the contract and from the potential inability of counterparties to meet the terms of their contracts. Generally, the fund’s maximum risk due to counterparty credit risk is the unrealized gain on the contract due to the use of Continuous Linked Settlement, a multicurrency cash settlement system for the centralized settlement of foreign transactions. This risk is mitigated in cases where there is an ISDA Master Agreement between the fund and the counterparty providing for netting as described above and, where applicable, by the posting of collateral by the counterparty to the fund to cover the fund’s exposure to the counterparty under such ISDA Master Agreement.
Loans and Other Direct Debt Instruments– The fund invests in loans and loan participations or other receivables. These investments may include standby financing commitments, including revolving credit facilities, which contractually obligate the fund to supply additional cash to the borrower on demand. The fund generally provides this financial support in order to preserve its existing investment or to obtain a more senior secured interest in the assets of the borrower. Loan participations involve a risk of insolvency of the lending bank or other financial intermediary.
Indemnifications– Under the fund’s organizational documents, its officers and Trustees may be indemnified against certain liabilities and expenses arising out of the performance of their duties to the fund. Additionally, in the normal course of business, the fund enters into agreements with service providers that may contain indemnification clauses. The fund’s maximum exposure under these agreements is unknown as this would involve future claims that may be made against the fund that have not yet occurred.
32
Notes to Financial Statements – continued
Investment Transactions and Income– Investment transactions are recorded on the trade date. Interest income is recorded on the accrual basis. All premium and discount is amortized or accreted for financial statement purposes in accordance with U.S. generally accepted accounting principles. The fund earns certain fees in connection with its floating rate loan purchasing activities. These fees are in addition to interest payments earned and may include amendment fees, commitment fees, facility fees, consent fees, and prepayment fees. Commitment fees are recorded on an accrual basis as income in the accompanying financial statements. Dividends received in cash are recorded on theex-dividend date. Certain dividends from foreign securities will be recorded when the fund is informed of the dividend if such information is obtained subsequent to theex-dividend date. Dividend and interest payments received in additional securities are recorded on theex-dividend orex-interest date in an amount equal to the value of the security on such date. Debt obligations may be placed onnon-accrual status or set to accrue at a rate of interest less than the contractual coupon when the collection of all or a portion of interest has become doubtful. Interest income for those debt obligations may be further reduced by thewrite-off of the related interest receivables when deemed uncollectible.
The fund may receive proceeds from litigation settlements. Any proceeds received from litigation involving portfolio holdings are reflected in the Statement of Operations in realized gain/loss if the security has been disposed of by the fund or in unrealized gain/loss if the security is still held by the fund. Any other proceeds from litigation not related to portfolio holdings are reflected as other income in the Statement of Operations.
Fees Paid Indirectly– The fund’s custody fee may be reduced by a credit earned under an arrangement that measures the value of U.S. dollars deposited with the custodian by the fund. The amount of the credit, for the year ended January 31, 2019, is shown as a reduction of total expenses in the Statement of Operations.
Tax Matters and Distributions– The fund intends to qualify as a regulated investment company, as defined under Subchapter M of the Internal Revenue Code, and to distribute all of its taxable income, including realized capital gains. As a result, no provision for federal income tax is required. The fund’s federal tax returns, when filed, will remain subject to examination by the Internal Revenue Service for a three year period. Management has analyzed the fund’s tax positions taken on federal and state tax returns for all open tax years and does not believe that there are any uncertain tax positions that require recognition of a tax liability. Foreign taxes, if any, have been accrued by the fund in the accompanying financial statements in accordance with the applicable foreign tax law. Foreign income taxes may be withheld by certain countries in which the fund invests. Additionally, capital gains realized by the fund on securities issued in or by certain foreign countries may be subject to capital gains tax imposed by those countries.
Distributions to shareholders are recorded on theex-dividend date. Income and capital gain distributions are determined in accordance with income tax regulations, which may differ from U.S. generally accepted accounting principles. Certain capital accounts in the financial statements are periodically adjusted for permanent differences in order to reflect their tax character. These adjustments have no impact on net assets or net asset value per share. Temporary differences which arise from recognizing certain items
33
Notes to Financial Statements – continued
of income, expense, gain or loss in different periods for financial statement and tax purposes will reverse at some time in the future. Distributions in excess of net investment income or net realized gains are temporary overdistributions for financial statement purposes resulting from differences in the recognition or classification of income or distributions for financial statement and tax purposes.
Book/tax differences primarily relate to defaulted bonds, amortization and accretion of debt securities, and wash sale loss deferrals.
The tax character of distributions declared to shareholders for the last two fiscal years is as follows:
| | | | | | | | |
| | |
| | | Year ended
1/31/19 | | | Year ended
1/31/18 | |
| Ordinary income (including any short-term capital gains) | | | $55,299,759 | | | | $75,880,650 | |
The federal tax cost and the tax basis components of distributable earnings were as follows:
| | | | |
| |
| As of 1/31/19 | | | |
| |
| Cost of investments | | | $798,926,559 | |
| Gross appreciation | | | 7,801,467 | |
| |
| Gross depreciation | | | (23,536,349 | ) |
| Net unrealized appreciation (depreciation) | | | $(15,734,882 | ) |
| |
| Undistributed ordinary income | | | 2,396,257 | |
| Capital loss carryforwards | | | (65,801,806 | ) |
| Other temporary differences | | | (3,871,602 | ) |
As of January 31, 2019, the fund had capital loss carryforwards available to offset future realized gains. These net capital losses may be carried forward indefinitely and their character is retained as short-term and/or long-term losses. Such losses are characterized as follows:
| | | | |
| Short-Term | | | $(12,598,314 | ) |
| Long-Term | | | (53,203,492 | ) |
| Total | | | $(65,801,806 | ) |
(3) Transactions with Affiliates
Investment Adviser– The fund has an investment advisory agreement with MFS to provide overall investment management and related administrative services and facilities to the fund. MFS receives no compensation under this agreement; however MFS receives management fees from MFS funds that invest in the fund.
Shareholder Servicing Agent– MFS Service Center, Inc. (MFSC), a wholly-owned subsidiary of MFS, provides transfer agent and recordkeeping functions in connection with the issuance, transfer, and redemption of shares of the fund under a Shareholder Servicing Agent Agreement. MFSC is not paid a fee for providing these services. MFSC receives payment from the fund forout-of-pocket expenses paid by MFSC on behalf of the fund. For the year ended January 31, 2019, these costs amounted to $46.
34
Notes to Financial Statements – continued
Administrator– MFS provides certain financial, legal, shareholder communications, compliance, and other administrative services to the fund. Under an administrative services agreement, the fund reimburses MFS the costs incurred to provide these services. The fund is charged an annual fixed amount of $17,500. The administrative services fee incurred for the year ended January 31, 2019 was equivalent to an annual effective rate of 0.0019% of the fund’s average daily net assets.
Trustees’ and Officers’ Compensation– The fund may pay compensation to independent Trustees in the form of a retainer, attendance fees, and additional compensation to Board and Committee chairpersons. The fund does not pay compensation directly to Trustees or officers of the fund who are also officers of the investment adviser, all of whom receive remuneration for their services to the fund from MFS. Certain officers and Trustees of the fund are officers or directors of MFS, MFS Fund Distributors, Inc. (MFD), and MFSC. The independent Trustees do not currently receive compensation from the fund.
Other– This fund and certain other funds managed by MFS (the funds) have entered into a service agreement (the ISO Agreement) which provides for payment of fees solely by the funds to Tarantino LLC in return for the provision of services of an Independent Senior Officer (ISO) for the funds. Frank L. Tarantino serves as the ISO and is an officer of the funds and the sole member of Tarantino LLC. The funds can terminate the ISO Agreement with Tarantino LLC at any time under the terms of the ISO Agreement. For the year ended January 31, 2019, the fee paid by the fund under this agreement was $1,659 and is included in “Miscellaneous” expense in the Statement of Operations. MFS has agreed to bear all expenses associated with office space, other administrative support, and supplies provided to the ISO.
The fund invests in the MFS Institutional Money Market Portfolio which is managed by MFS and seeks current income consistent with preservation of capital and liquidity. This money market fund does not pay a management fee to MFS.
(4) Portfolio Securities
For the year ended January 31, 2019, purchases and sales of investments, other than short-term obligations, aggregated $352,750,013 and $719,662,180, respectively.
(5) Shares of Beneficial Interest
The fund’s Declaration of Trust permits the Trustees to issue an unlimited number of full and fractional shares of beneficial interest. Transactions in fund shares were as follows:
| | | | | | | | | | | | | | | | |
| | | Year ended
1/31/19 | | | Year ended
1/31/18 | |
| | | | |
| | | Shares | | | Amount | | | Shares | | | Amount | |
| Shares sold | | | 1,404,859 | | | | $12,591,447 | | | | 10,158,880 | | | | $94,970,838 | |
| Shares issued to shareholders in reinvestment of distributions | | | 6,146,645 | | | | 55,299,759 | | | | 8,095,660 | | | | 75,880,650 | |
| Shares reacquired | | | (47,999,465 | ) | | | (433,629,619 | ) | | | (42,753,651 | ) | | | (400,310,833 | ) |
| Net change | | | (40,447,961 | ) | | | $(365,738,413 | ) | | | (24,499,111 | ) | | | $(229,459,345 | ) |
35
Notes to Financial Statements – continued
The fund is an MFS Pooled Portfolio, which is designed to be used by certain MFS funds to invest in a particular security type rather than invest in the security type directly. The fund is solely invested in by other MFS funds for the purpose of gaining exposure to high income debt instruments, rather than investing in high income debt instruments directly. The MFS funds do not invest in this fund for the purpose of exercising management or control. At the end of the period, the MFS Diversified Income Fund, the MFS Global High Yield Fund, and the MFS Strategic Income Portfolio were the owners of record of approximately 73%, 26%, and 1%, respectively, of the value of outstanding voting shares of the fund.
(6) Line of Credit
The fund and certain other funds managed by MFS participate in a $1.25 billion unsecured committed line of credit, subject to a $1 billion sublimit, provided by a syndication of banks under a credit agreement. Borrowings may be made for temporary financing needs. Interest is charged to each fund, based on its borrowings, generally at a rate equal to the higher of the Overnight Bank Funding rate or daily one month LIBOR plus an agreed upon spread. A commitment fee, based on the average daily, unused portion of the committed line of credit, is allocated among the participating funds. In addition, the fund and other funds managed by MFS have established unsecured uncommitted borrowing arrangements with certain banks for temporary financing needs. Interest is charged to each fund, based on its borrowings, at a rate equal to the Overnight Bank Funding rate plus an agreed upon spread. For the year ended January 31, 2019, the fund’s commitment fee and interest expense were $5,582 and $0, respectively, and are included in “Miscellaneous” expense in the Statement of Operations.
(7) Investments in Affiliated Issuers
An affiliated issuer may be considered one in which the fund owns 5% or more of the outstanding voting securities, or a company which is under common control. For the purposes of this report, the fund assumes the following to be affiliated issuers:
| | | | | | | | | | | | | | | | | | | | |
| | | | | |
| Affiliated Issuers | | | | | Beginning
Shares/Par
Amount | | | Acquisitions
Shares/Par
Amount | | | Dispositions
Shares/Par
Amount | | | Ending
Shares/Par
Amount | |
| MFS Institutional Money Market Portfolio | | | | | | | 17,092,907 | | | | 272,989,999 | | | | (260,241,471 | ) | | | 29,841,435 | |
| | | | | |
| Affiliated Issuers | | Realized
Gain (Loss) | | | Change in
Unrealized
Appreciation/
Depreciation | | | Capital Gain
Distributions | | | Dividend
Income | | | Ending
Value | |
| MFS Institutional Money Market Portfolio | | | $104 | | | | $— | | | | $— | | | | $396,975 | | | | $29,838,451 | |
36
REPORT OF INDEPENDENT REGISTERED PUBLIC ACCOUNTING FIRM
To the Board of Trustees of MFS Series Trust III and the Shareholders of MFS High Yield Pooled Portfolio:
Opinion on the Financial Statements and Financial Highlights
We have audited the accompanying statement of assets and liabilities of MFS High Yield Pooled Portfolio (the “Fund”), including the portfolio of investments, as of January 31, 2019, the related statement of operations for the year then ended, the statements of changes in net assets for each of the two years in the period then ended, the financial highlights for each of the five years in the period then ended, and the related notes. In our opinion, the financial statements and financial highlights present fairly, in all material respects, the financial position of the Fund as of January 31, 2019, and the results of its operations for the year then ended, the changes in its net assets for each of the two years in the period then ended, and the financial highlights for each of the five years in the period then ended, in conformity with accounting principles generally accepted in the United States of America.
Basis for Opinion
These financial statements and financial highlights are the responsibility of the Fund’s management. Our responsibility is to express an opinion on the Fund’s financial statements and financial highlights based on our audits. We are a public accounting firm registered with the Public Company Accounting Oversight Board (United States) (PCAOB) and are required to be independent with respect to the Fund in accordance with the U.S. federal securities laws and the applicable rules and regulations of the Securities and Exchange Commission and the PCAOB.
We conducted our audits in accordance with the standards of the PCAOB. Those standards require that we plan and perform the audit to obtain reasonable assurance about whether the financial statements and financial highlights are free of material misstatement, whether due to error or fraud. The Fund is not required to have, nor were we engaged to perform, an audit of its internal control over financial reporting. As part of our audits we are required to obtain an understanding of internal control over financial reporting but not for the purpose of expressing an opinion on the effectiveness of the Fund’s internal control over financial reporting. Accordingly, we express no such opinion.
Our audits included performing procedures to assess the risks of material misstatement of the financial statements and financial highlights, whether due to error or fraud, and performing procedures that respond to those risks. Such procedures included examining, on a test basis, evidence regarding the amounts and disclosures in the financial statements and financial highlights. Our audits also included evaluating the accounting principles used and significant estimates made by management, as well as evaluating the overall presentation of the financial statements and financial highlights. Our procedures included confirmation of securities owned as of January 31, 2019,
37
Report of Independent Registered Public Accounting Firm – continued
by correspondence with the custodian, brokers, and agent banks; when replies were not received from brokers and agent banks, we performed other auditing procedures. We believe that our audits provide a reasonable basis for our opinion.
DELOITTE & TOUCHE LLP
Boston, Massachusetts
March 19, 2019
We have served as the auditor of one or more of the MFS investment companies since 1924.
38
TRUSTEES AND OFFICERS — IDENTIFICATION AND BACKGROUND
The Trustees and Officers of the Trust, as of March 1, 2019, are listed below, together with their principal occupations during the past five years. (Their titles may have varied during that period.) The address of each Trustee and Officer is 111 Huntington Avenue, Boston, Massachusetts 02199-7618.
| | | | | | | | | | |
Name, Age | | Position(s) Held with Fund | | Trustee/Officer Since (h) | | Number of
MFS Funds
overseen
by the Trustee | | Principal
Occupations During the Past Five Years | | Other Directorships
During the Past
Five Years (j) |
| INTERESTED TRUSTEES |
Robert J. Manning (k)
(age 55) | | Trustee | | February 2004 | | 135 | | Massachusetts Financial Services Company, Executive Chairman (since January 2017); Director; Chairman of the Board; Chief Executive Officer (until 2015);Co-Chief Executive Officer (2015-2016) | | N/A |
| | | | | |
Robin A. Stelmach (k) (age 57) | | Trustee | | January 2014 | | 135 | | Massachusetts Financial Services Company, Vice Chair (since January 2017); Chief Operating Officer and Executive Vice President (until January 2017) | | N/A |
| INDEPENDENT TRUSTEES |
John P. Kavanaugh (age 64) | | Trustee and Chair of Trustees | | January 2009 | | 135 | | Private investor | | N/A |
| | | | | |
Steven E. Buller (age 67) | | Trustee | | February 2014 | | 135 | | Financial Accounting Standards Advisory Council, Chairman (2014-2015); Public Company Accounting Oversight Board, Standing Advisory Group, Member (until 2014); BlackRock, Inc. (investment management), Managing Director (until 2014), BlackRock Finco UK (investment management), Director (until 2014) | | N/A |
39
Trustees and Officers – continued
| | | | | | | | | | |
Name, Age | | Position(s) Held with Fund | | Trustee/Officer Since (h) | | Number of
MFS Funds
overseen
by the Trustee | | Principal
Occupations During the Past Five Years | | Other Directorships
During the Past
Five Years (j) |
John A. Caroselli (age 64) | | Trustee | | March 2017 | | 135 | | JC Global Advisors, LLC (management consulting), President (since 2015); First Capital Corporation (commercial finance), Executive Vice President (until 2015) | | N/A |
| | | | | |
Maureen R. Goldfarb (age 63) | | Trustee | | January 2009 | | 135 | | Private investor | | N/A |
| | | | | |
Michael Hegarty
(age 74) | | Trustee | | December 2004 | | 135 | | Private investor | | Rouse Properties Inc., Director (until 2016); Capmark Financial Group Inc., Director (until 2015) |
| | | | | |
Peter D. Jones
(age 63) | | Trustee | | January 2019 | | 135 | | Franklin Templeton Distributors, Inc. (investment management), President (until 2015); Franklin Templeton Institutional, LLC (investment management), Chairman (until 2015) | | N/A |
| | | | | |
James W. Kilman, Jr.
(age 57) | | Trustee | | January 2019 | | 135 | | KielStrand Capital LLC (family office and merchant bank), Chief Executive Officer (since 2016); Morgan Stanley & Co. (financial services), Vice Chairman of Investment Banking,Co-Head of Diversified Financials Coverage – Financial Institutions Investment Banking Group (until 2016) | | Alpha-En Corporation, Director (since 2016) |
40
Trustees and Officers – continued
| | | | | | | | | | |
Name, Age | | Position(s) Held with Fund | | Trustee/Officer Since (h) | | Number of
MFS Funds
overseen
by the Trustee | | Principal
Occupations During the Past Five Years | | Other Directorships
During the Past
Five Years (j) |
Clarence Otis, Jr. (age 62) | | Trustee | | March 2017 | | 135 | | Darden Restaurants, Inc., Chief Executive Officer (until 2014) | | VF Corporation, Director; Verizon Communications, Inc., Director; The Travelers Companies, Director; Federal Reserve Bank of Atlanta, Director (until 2015) |
| | | | | |
Maryanne L. Roepke (age 63) | | Trustee | | May 2014 | | 135 | | American Century Investments (investment management), Senior Vice President and Chief Compliance Officer (until 2014) | | N/A |
| | | | | |
Laurie J. Thomsen
(age 61) | | Trustee | | March 2005 | | 135 | | Private investor | | The Travelers Companies, Director; Dycom Industries, Inc., Director (since 2015) |
| | | | | | | | |
Name, Age | | Position(s) Held with Fund | | Trustee/Officer
Since (h) | | Number of
MFS Funds
for which
the Person
is an Officer | | Principal
Occupations During the Past Five Years |
| OFFICERS | | | | | | | | |
Christopher R. Bohane (k)
(age 45) | | Assistant Secretary and Assistant Clerk | | July 2005 | | 135 | | Massachusetts Financial Services Company, Vice President and Assistant General Counsel |
| | | | |
Kino Clark (k) (age 50) | | Assistant Treasurer | | January 2012 | | 135 | | Massachusetts Financial Services Company, Vice President |
41
Trustees and Officers – continued
| | | | | | | | |
Name, Age | | Position(s) Held with Fund | | Trustee/Officer
Since (h) | | Number of
MFS Funds
for which
the Person
is an Officer | | Principal
Occupations During the Past Five Years |
John W. Clark, Jr. (k) (age 51) | | Assistant Treasurer | | April 2017 | | 135 | | Massachusetts Financial Services Company, Vice President (since March 2017); Deutsche Bank (financial services), Department Head – Treasurer’s Office (until February 2017) |
| | | | |
Thomas H. Connors (k) (age 59) | | Assistant Secretary and Assistant Clerk | | September 2012 | | 135 | | Massachusetts Financial Services Company, Vice President and Senior Counsel |
| | | | |
Ethan D. Corey (k)
(age 55) | | Assistant Secretary and Assistant Clerk | | July 2005 | | 135 | | Massachusetts Financial Services Company, Senior Vice President and Associate General Counsel |
| | | | |
David L. DiLorenzo (k)
(age 50) | | President | | July 2005 | | 135 | | Massachusetts Financial Services Company, Senior Vice President |
| | | | |
Heidi W. Hardin (k) (age 51) | | Secretary and Clerk | | April 2017 | | 135 | | Massachusetts Financial Services Company, Executive Vice President and General Counsel (since March 2017); Harris Associates (investment management), General Counsel (from September 2015 to January 2017); Janus Capital Management LLC (investment management), Senior Vice President and General Counsel (until September 2015) |
| | | | |
Brian E. Langenfeld (k) (age 45) | | Assistant
Secretary and Assistant Clerk | | June 2006 | | 135 | | Massachusetts Financial Services Company, Vice President and Senior Counsel |
42
Trustees and Officers – continued
| | | | | | | | |
Name, Age | | Position(s) Held with Fund | | Trustee/Officer
Since (h) | | Number of
MFS Funds
for which
the Person
is an Officer | | Principal
Occupations During the Past Five Years |
Amanda S. Mooradian (k) (age 40) | | Assistant
Secretary and Assistant Clerk | | September 2018 | | 135 | | Massachusetts Financial Services Company, Assistant Vice President and Counsel |
| | | | |
Susan A. Pereira (k)
(age 48) | | Assistant
Secretary and Assistant Clerk | | July 2005 | | 135 | | Massachusetts Financial Services Company, Vice President and Senior Counsel |
| | | | |
Kasey L. Phillips (k) (age 48) | | Assistant Treasurer | | September 2012 | | 135 | | Massachusetts Financial Services Company, Vice President |
| | | | |
Matthew A. Stowe (k) (age 44) | | Assistant Secretary and Assistant Clerk | | October 2014 | | 135 | | Massachusetts Financial Services Company, Vice President and Assistant General Counsel |
| | | | |
Frank L. Tarantino
(age 74) | | Independent
Senior Officer | | June 2004 | | 135 | | Tarantino LLC (provider of compliance services), Principal |
| | | | |
Richard S. Weitzel (k)
(age 48) | | Assistant Secretary and Assistant Clerk | | October 2007 | | 135 | | Massachusetts Financial Services Company, Senior Vice President and Associate General Counsel |
| | | | |
Martin J. Wolin (k) (age 51) | | Chief Compliance Officer | | July 2015 | | 135 | | Massachusetts Financial Services Company, Senior Vice President and Chief Compliance Officer (since July 2015); Mercer (financial service provider), Chief Risk and Compliance Officer, North America and Latin America (until June 2015) |
| | | | |
James O. Yost (k)
(age 58) | | Treasurer | | September 1990 | | 135 | | Massachusetts Financial Services Company, Senior Vice President |
43
Trustees and Officers – continued
| (h) | Date first appointed to serve as Trustee/officer of an MFS Fund. Each Trustee has served continuously since appointment unless indicated otherwise. For the period from December 15, 2004 until February 22, 2005, Mr. Manning served as Advisory Trustee. From January 2012 through December 2016, Messrs. DiLorenzo and Yost served as Treasurer and Deputy Treasurer of the Funds, respectively. |
| (j) | Directorships or trusteeships of companies required to report to the Securities and Exchange Commission (i.e., “public companies”). |
| (k) | “Interested person” of the Trust within the meaning of the Investment Company Act of 1940 (referred to as the 1940 Act), which is the principal federal law governing investment companies like the fund, as a result of a position with MFS. The address of MFS is 111 Huntington Avenue, Boston, Massachusetts 02199-7618. |
Each Trustee (other than Messrs. Jones and Kilman) has been elected by shareholders and each Trustee and officer holds office until his or her successor is chosen and qualified or until his or her earlier death, resignation, retirement or removal. The Trust does not hold annual meetings for the purpose of electing Trustees, and Trustees are not elected for fixed terms. Under the terms of the Board’s retirement policy, an Independent Trustee shall retire at the end of the calendar year in which he or she reaches the earlier of 75 years of age or 15 years of service on the Board (or, in the case of any Independent Trustee who joined the Board prior to 2015, 20 years of service on the Board).
Messrs. Buller, Hegarty, Kilman and Otis and Ms. Roepke are members of the Trust’s Audit Committee.
Each of the Interested Trustees and certain Officers hold comparable officer positions with certain affiliates of MFS.
The Statement of Additional Information for a Fund includes further information about the Trustees and is available without charge upon request by calling1-800-225-2606.
| | |
| Investment Adviser | | Custodian |
Massachusetts Financial Services Company
111 Huntington Avenue Boston, MA 02199-7618 | | JPMorgan Chase Bank, NA 4 Metrotech Center New York, NY 11245 |
| Distributor | | Independent Registered Public Accounting Firm |
MFS Fund Distributors, Inc.
111 Huntington Avenue Boston, MA 02199-7618 | | Deloitte & Touche LLP 200 Berkeley Street Boston, MA 02116 |
| Portfolio Manager(s) | | |
David Cole | | |
Michael Skatrud | | |
44
PROXY VOTING POLICIES AND INFORMATION
MFS votes proxies on behalf of the fund pursuant to proxy voting policies and procedures that are available without charge, upon request, by calling1-800-225-2606, by visitingmfs.com/proxyvoting,or by visiting the SEC’s Web site athttp://www.sec.gov.
Information regarding how the fund voted proxies relating to portfolio securities during the most recent twelve-month period ended June 30 is available by August 31 of each year without charge by visitingmfs.com/proxyvoting,or by visiting the SEC’s Web site athttp://www.sec.gov.
QUARTERLY PORTFOLIO DISCLOSURE
The fund files a complete schedule of portfolio holdings with the SEC for the first and third quarters of each fiscal year on Form N-Q. The fund’s Form N-Q is available on the SEC’s website at http://www.sec.gov.
FURTHER INFORMATION
From time to time, MFS may post important information about the fund or the MFS funds on the MFS web site (mfs.com). This information is available athttps://www.mfs.com/en-us/what-we-do/announcements.html.
INFORMATION ABOUT FUND CONTRACTS AND LEGAL CLAIMS
The fund has entered into contractual arrangements with an investment adviser, administrator, distributor, shareholder servicing agent, 529 program manager (if applicable), and custodian who each provide services to the fund. Unless expressly stated otherwise, shareholders are not parties to, or intended beneficiaries of these contractual arrangements, and these contractual arrangements are not intended to create any shareholder right to enforce them against the service providers or to seek any remedy under them against the service providers, either directly or on behalf of the fund.
Under the Trust’s By-Laws and Declaration of Trust, any claims asserted against or on behalf of the MFS Funds, including claims against Trustees and Officers, must be brought in state and federal courts located within the Commonwealth of Massachusetts.
45
rev. 3/16
| | | | |
| | | |
FACTS | | WHAT DOES MFS DO WITH YOUR PERSONAL INFORMATION? | | |
| | |
| Why? | | Financial companies choose how they share your personal information. Federal law gives consumers the right to limit some but not all sharing. Federal law also requires us to tell you how we collect, share, and protect your personal information. Please read this notice carefully to understand what we do. |
| | |
| What? | | The types of personal information we collect and share depend on the product or service you have with us. This information can include: • Social Security number and account balances • Account transactions and transaction history • Checking account information and wire transfer instructions When you areno longer our customer, we continue to share your information as described in this notice. |
| | |
| How? | | All financial companies need to share customers’ personal information to run their everyday business. In the section below, we list the reasons financial companies can share their customers’ personal information; the reasons MFS chooses to share; and whether you can limit this sharing. |
| | | | |
Reasons we can share your
personal information | | Does MFS
share? | | Can you limit
this sharing? |
For our everyday business purposes – such as to process your transactions, maintain your account(s), respond to court orders and legal investigations, or report to credit bureaus | | Yes | | No |
For our marketing purposes – to offer our products and services to you | | No | | We don’t share |
For joint marketing with other financial companies | | No | | We don’t share |
For our affiliates’ everyday business purposes – information about your transactions and experiences | | No | | We don’t share |
For our affiliates’ everyday business purposes – information about your creditworthiness | | No | | We don’t share |
| For nonaffiliates to market to you | | No | | We don’t share |
| | |
| | |
| Questions? | | Call800-225-2606 or go tomfs.com. |
46
| | |
| Who we are |
| Who is providing this notice? | | MFS Funds, MFS Investment Management, MFS Institutional Advisors, Inc., and MFS Heritage Trust Company. |
| | |
| What we do |
| How does MFS protect my personal information? | | To protect your personal information from unauthorized access and use, we use security measures that comply with federal law. These measures include procedural, electronic, and physical safeguards for the protection of the personal information we collect about you. |
| How does MFS collect my personal information? | | We collect your personal information, for example, when you • open an account or provide account information • direct us to buy securities or direct us to sell your securities • make a wire transfer We also collect your personal information from others, such as credit bureaus, affiliates, or other companies. |
| Why can’t I limit all sharing? | | Federal law gives you the right to limit only • sharing for affiliates’ everyday business purposes – information about your creditworthiness • affiliates from using your information to market to you • sharing for nonaffiliates to market to you State laws and individual companies may give you additional rights to limit sharing. |
| | |
| Definitions |
| Affiliates | | Companies related by common ownership or control. They can be financial and nonfinancial companies. • MFS does not share personal information with affiliates, except for everyday business purposes as described on page one of this notice. |
| Nonaffiliates | | Companies not related by common ownership or control. They can be financial and nonfinancial companies. • MFS does not share with nonaffiliates so they can market to you. |
| Joint marketing | | A formal agreement between nonaffiliated financial companies that together market financial products or services to you. • MFS doesn’t jointly market. |
| | |
| Other important information |
| If you own an MFS product or receive an MFS service in the name of a third party such as a bank or broker-dealer, their privacy policy may apply to you instead of ours. |
47
Save paper with eDelivery.
| MFS® will send you prospectuses, |
reports, and proxies directly viae-mail so you will get information faster with less mailbox clutter.
To sign up:
1. Go to mfs.com.
2. Log in via MFS® Access.
3. Select eDelivery.
If you own your MFS fund shares through a financial institution or a retirement plan, MFS® TALK, MFS® Access, or eDelivery may not be available to you.
CONTACT
WEB SITE
mfs.com
MFS TALK
1-800-637-8255
24 hours a day
ACCOUNT SERVICE AND LITERATURE
Shareholders
1-800-225-2606
Financial advisors
1-800-343-2829
Retirement plan services
1-800-637-1255
MAILING ADDRESS
MFS Service Center, Inc.
P.O. Box 219341
Kansas City, MO 64121-9341
OVERNIGHT MAIL
MFS Service Center, Inc.
Suite 219341
430 W 7th Street
Kansas City, MO 64105-1407
Annual Report
January 31, 2019

MFS® Municipal High Income Fund

Beginning on January 1, 2021, as permitted by regulations adopted by the U.S. Securities and Exchange Commission, paper copies of the fund’s annual and semiannual shareholder reports will no longer be sent by mail, unless you specifically request paper copies of the reports. Instead, the complete reports will be made available on the fund’s Web site (funds.mfs.com), and you will be notified by mail each time a report is posted and provided with a Web site link to access the report.
If you are already signed up to receive shareholder reports by email, you will not be affected by this change and you need not take any action. You may sign up to receive shareholder reports and other communications from the fund by email by contacting your financial intermediary (such as a broker-dealer or bank) or, if you hold your shares directly with the fund, by calling 1-800-225-2606 or by logging on to MFS Access at mfs.com.
Beginning on January 1, 2019, you may elect to receive all future reports in paper free of charge. Contact your financial intermediary to request that you continue to receive paper copies of your shareholder reports. If you invest directly with the fund, you can call 1-800-225-2606 or send an email request to orderliterature@mfs.com to let the fund know that you wish to continue receiving paper copies of your shareholder reports. Your election to receive reports in paper will apply to all funds held in your account if you invest through your financial intermediary or all funds held with the MFS fund complex if you invest directly.
MMH-ANN
MFS® Municipal High Income Fund
CONTENTS
The report is prepared for the general information of shareholders.
It is authorized for distribution to prospective investors only when preceded or accompanied by a current prospectus.
NOT FDIC INSURED• MAY LOSE VALUE• NO BANK GUARANTEE

LETTER FROM THE EXECUTIVE CHAIRMAN
Dear Shareholders:
Higher interest rates, international trade friction, and geopolitical uncertainty surrounding issues such as Brexit have contributed to an uptick in market volatility in recent quarters — a departure from thelow-volatility environment that has prevailed for much of the past
several years. Against this more challenging backdrop, equity markets in the United States have outperformed most international markets on a relative basis over the past 12 months, though broad market returns have been modestly negative on an absolute basis. Global economic growth has become less synchronized over the past few quarters, with Europe, China, and some emerging markets having shown signs of significantly slowing growth. While U.S. growth has remained above average, its pace slowed in the second half of 2018.
A decelerating global economy and tighter financial conditions have prompted the U.S. Federal Reserve to reassess its monetary policy outlook. Fed chairman Jerome Powell recently acknowledged that the next change in policy rates could be either a hike or a cut, suggesting that the tightening cycle begun in late 2015 may have come to an
end. The Fed has also signaled that it is likely to maintain a larger-than-expected balance sheet, meaning that monetary conditions will likely tighten less over time than earlier feared. U.S. tax reforms adopted in late 2017 have been welcomed by equity markets while emerging market economies have recently had to contend with tighter financial conditions as a result of firmer U.S. short-term interest rates, declining equity valuations, and a stronger dollar. With the Republicans losing control of the U.S. House of Representatives, further meaningful U.S. fiscal stimulus appears less likely over the remainder of this presidential term. The recent partial U.S. government shutdown has also added to political uncertainty as the competing budgetary priorities of the House of Representatives and the White House will likely remain a source of friction going forward.
Globally, inflation remains largely subdued thanks in part to lower oil prices, but tight labor markets will keep investors on the lookout for its potential reappearance. Increased U.S. protectionism is also a growing concern, as investors fear trade disputes could dampen business sentiment, leading to even slower global growth. While there has been progress on this front — a NAFTA replacement has been worked out between the U.S., Mexico, and Canada; the free trade pact with Korea has been updated; and a negotiating framework with the European Union has been agreed upon — tensions between the U.S. and China remain high, though the two sides recently returned to the negotiating table.
As a global investment manager with nearly a century of expertise, MFS® firmly believes active risk management offers downside mitigation and may help improve investment outcomes. We built our active investment platform with this belief in mind. Our long-term perspective influences nearly every aspect of our business, ensuring that our investment decisions align with the investing time horizons of our clients.
Respectfully,

Robert J. Manning
Executive Chairman
MFS Investment Management
March 19, 2019
The opinions expressed in this letter are subject to change and may not be relied upon for investment advice. No forecasts can be guaranteed.
1
PORTFOLIO COMPOSITION
Portfolio structure (i)

| | | | |
| Top ten industries (i) | | | | |
| Healthcare Revenue-Hospitals | | | 15.0% | |
| Healthcare Revenue-Long Term Care | | | 13.7% | |
| Universities-Secondary Schools | | | 7.1% | |
| Universities-Colleges | | | 6.0% | |
| General Obligations-General Purpose | | | 4.8% | |
| Miscellaneous Revenue-Other | | | 4.7% | |
| Tobacco | | | 4.6% | |
| Tax Assessment | | | 4.3% | |
| Transportation-Special Tax | | | 4.1% | |
| General Obligations-Schools | | | 3.8% | |
| | | | |
| Composition including fixed income credit quality (a)(i) | |
| AAA | | | 2.6% | |
| AA | | | 9.1% | |
| A | | | 17.3% | |
| BBB | | | 23.2% | |
| BB | | | 13.3% | |
| B | | | 5.4% | |
| CCC | | | 1.8% | |
| CC | | | 0.3% | |
| C | | | 3.4% | |
| D | | | 3.2% | |
| Not Rated | | | 21.1% | |
| Cash & Cash Equivalents | | | 0.9% | |
| Other | | | (1.6)% | |
| |
| Portfolio facts (i) | | | | |
| Average Duration (d) | | | 9.0 | |
| Average Effective Maturity (m) | | | 18.9 yrs. | |
| (a) | For all securities other than those specifically described below, ratings are assigned to underlying securities utilizing ratings from Moody’s, Fitch, and Standard & Poor’s rating agencies and applying the following hierarchy: If all three agencies provide a rating, the middle rating (after dropping the highest and lowest ratings) is assigned; if two of the three agencies rate a security, the lower of the two is assigned. Ratings are shown in the S&P and Fitch scale (e.g., AAA). Securities rated BBB or higher are considered investment grade. All ratings are subject to change. Not Rated includes fixed income securities and fixed income derivatives, which have not been rated by any rating agency. The fund may or may not have held all of these instruments on this date. The fund is not rated by these agencies. |
| (d) | Duration is a measure of how much a bond’s price is likely to fluctuate with general changes in interest rates, e.g., if rates rise 1.00%, a bond with a5-year duration is likely to lose about 5.00% of its value due to the interest rate move. |
2
Portfolio Composition – continued
| (i) | For purposes of this presentation, the components include the value of securities, and reflect the impact of the equivalent exposure of derivative positions, if any. These amounts may be negative from time to time. Equivalent exposure is a calculated amount that translates the derivative position into a reasonable approximation of the amount of the underlying asset that the portfolio would have to hold at a given point in time to have the same price sensitivity that results from the portfolio’s ownership of the derivative contract. When dealing with derivatives, equivalent exposure is a more representative measure of the potential impact of a position on portfolio performance than value. The bond component will include any accrued interest amounts. |
| (m) | In determining each instrument’s effective maturity for purposes of calculating the fund’s dollar-weighted average effective maturity, MFS uses the instrument’s stated maturity or, if applicable, an earlier date on which MFS believes it is probable that a maturity-shortening device (such as a put,pre-refunding or prepayment) will cause the instrument to be repaid. Such an earlier date can be substantially shorter than the instrument’s stated maturity. |
Cash & Cash Equivalents includes any cash, investments in money market funds, short-term securities, and other assets less liabilities. Please see the Statement of Assets and Liabilities for additional information related to the fund’s cash position and other assets and liabilities.
Other includes currency derivatives and/or any offsets to derivative positions and/or the leverage created through the issuance of self-deposited inverse floaters and may be negative.
Percentages are based on net assets as of January 31, 2019.
The portfolio is actively managed and current holdings may be different.
3
MANAGEMENT REVIEW
Summary of Results
For the twelve months ended January 31, 2019, Class A shares of the MFS Municipal High Income Fund (“fund”) provided a total return of 3.31%, at net asset value. This compares with a return of 3.26% for the fund’s benchmark, the Bloomberg Barclays Municipal Bond Index.
Market Environment
The global economy decelerated during the reporting period, led by weakness in China and Europe as business and investor sentiment was undermined by growing trade frictions. Slower growth, along with tighter financial conditions, contributed to an uptick in market volatility late in the period. Equity valuations fell and credit spreads widened, fueled in part by concerns that the US Federal Reserve was on course to further tighten monetary policy after it lifted rates for a fourth time during the period and indicated its intention to hike several more times while allowing its balance sheet to run off at its predetermined pace.
The market’s negative reaction to these policy signals prompted the Fed to reverse course at the end of the period and indicated that its policy was on hold as inflation pressures abated. The Fed also indicated that it will maintain a larger balance sheet than it had previously. These dovish shifts helped equity valuations rebound, reduced volatility and narrowed credit spreads. Central banks globally are tilting more dovish as well, with China lowering reserve requirements, The Bank of Canada and Bank of England holding rates steady and the European Central Bank acknowledging that it may not be able to hike rates in the fall of 2019 as it had earlier projected.
Emerging markets experienced considerable volatility during the period as tighter global financial conditions exposed structural weakness in some countries. Those pressures were somewhat relieved at the end of the period as the Fed adopted its more dovish posture. However, slowing global growth and ongoing trade frictions remained concerns.
From a geopolitical perspective, a fractious Eurosceptic Italian coalition government, large-scale protests in France over stagnant wages and news that Germany’s Angela Merkel will not seek another term as chancellor were sources of uncertainty in Europe. In emerging markets, new Brazilian president Jair Bolsanaro took office, with markets generally encouraged by his market-friendly agenda. In contrast, markets were nervous about the less-market-friendly approach of Mexico’s new president Andres Manuel Lopez Obrador. For much of the period, the contentiousUS-China trading relationship was a drag on global sentiment, although tentative signs of progress toward resolution helped steady markets late in the period. Concerns persisted about slowing Chinese economic activity.
Against this backdrop, municipal bonds provided positive total returns, with the yield generated by the asset class offsetting the modest negative price returns for the period amid the rise in municipal yields. Technicals were generally supportive for municipal bonds, with reduced primary market supply during the period. Supply was also impacted in 2018 as issuances were pulled forward into 2017 before, and in anticipation of, proposed tax law changes, which impacted municipal issuers. Other
4
Management Review – continued
notable events during the year included a strong recovery in bonds issued by Puerto Rico, which were boosted by ongoing progress in restructuring negotiations. Fundamentals in municipals were generally stable for the period amidstable-to-improving tax revenue.
Factors Affecting Performance
Relative to the Bloomberg Barclays Municipal Bond Index, the fund’sout-of-benchmark allocation to “D”, “C” and “B” rated (r) bonds, most notably within thespecial tax, industrial revenue, transportand powersectors, contributed to performance. A longer duration (d) stance also benefited relative results as yields tightened during the reporting period.
Conversely, security selection within thehealth care sector, particularly within“non-rated” and “BBB” rated bonds, detracted from relative results. Additionally, the fund’s positioning along the yield curve (y), particularly a greater exposure to the longer end of the yield curve (represented by bonds with maturities of 20 years and beyond) held back relative results during the reporting period.
Respectfully,
Portfolio Manager(s)
Gary Lasman and Geoffrey Schechter
| (d) | Duration is a measure of how much a bond’s price is likely to fluctuate with general changes in interest rates, e.g., if rates rise 1.00%, a bond with a5-year duration is likely to lose about 5.00% of its value. |
| (r) | Bonds rated “BBB”, “Baa”, or higher are considered investment grade; bonds rated “BB”, “Ba”, or below are considerednon-investment grade. The source for bond quality ratings is Moody’s Investors Service, Standard & Poor’s and Fitch, Inc. and are applied using the following hierarchy: If all three agencies provide a rating, the middle rating (after dropping the highest and lowest ratings) is assigned; if two of the three agencies rate a security, the lower of the two is assigned. Ratings are shown in the S&P and Fitch scale (e.g., AAA). For securities which are not rated by any of the three agencies, the security is considered Not Rated. |
| (y) | A yield curve graphically depicts the yields of different maturity bonds of the same credit quality and type; a normal yield curve is upward sloping, with short-term rates lower than long-term rates. |
The views expressed in this report are those of the portfolio manager(s) only through the end of the period of the report as stated on the cover and do not necessarily reflect the views of MFS or any other person in the MFS organization. These views are subject to change at any time based on market or other conditions, and MFS disclaims any responsibility to update such views. These views may not be relied upon as investment advice or an indication of trading intent on behalf of any MFS portfolio. References to specific securities are not recommendations of such securities, and may not be representative of any MFS portfolio’s current or future investments.
5
PERFORMANCE SUMMARYTHROUGH 1/31/19
The following chart illustrates a representative class of the fund’s historical performance in comparison to its benchmark(s). Performance results include the deduction of the maximum applicable sales charge and reflect the percentage change in net asset value, including reinvestment of dividends and capital gains distributions. The performance of other share classes will be greater than or less than that of the class depicted below. Benchmarks are unmanaged and may not be invested in directly. Benchmark returns do not reflect sales charges, commissions or expenses. (See Notes to Performance Summary.)
Performance data shown represents past performance and is no guarantee of future results. Investment return and principal value fluctuate so your shares, when sold, may be worth more or less than the original cost; current performance may be lower or higher than quoted. The performance shown does not reflect the deduction of taxes, if any, that a shareholder would pay on fund distributions or the redemption of fund shares.
Growth of a Hypothetical $10,000 Investment
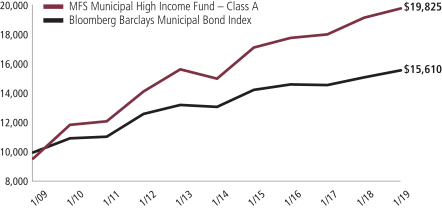
6
Performance Summary – continued
Total Returns through 1/31/19
Average annual without sales charge
| | | | | | | | | | | | | | |
| | | Share Class | | Class Inception Date | | 1-yr | | 5-yr | | 10-yr | | Life (t) | | |
| | | A | | 2/24/84 | | 3.31% | | 5.68% | | 7.55% | | N/A | | |
| | | B | | 9/07/93 | | 2.68% | | 4.90% | | 6.73% | | N/A | | |
| | | C | | 9/25/98 | | 2.42% | | 4.66% | | 6.50% | | N/A | | |
| | | I | | 6/01/11 | | 3.44% | | 5.70% | | N/A | | 6.06% | | |
| | | R6 | | 6/02/17 | | 3.40% | | N/A | | N/A | | 3.22% | | |
| | | | | |
| Comparative benchmark(s) | | | | | | | | | | |
| | | Bloomberg Barclays Municipal Bond Index (f) | | 3.26% | | 3.57% | | 4.55% | | N/A | | |
| | | | | |
| Average annual with sales charge | | | | | | | | | | |
| | | A
With Initial Sales Charge (4.25%) | | (1.08)% | | 4.77% | | 7.08% | | N/A | | |
| | | B
With CDSC (Declining over six years from 4% to 0%) (v) | | (1.29)% | | 4.57% | | 6.73% | | N/A | | |
| | | C
With CDSC (1% for 12 months) (v) | | 1.43% | | 4.66% | | 6.50% | | N/A | | |
CDSC – Contingent Deferred Sales Charge.
Class I and R6 shares do not have a sales charge.
| (f) | Source: FactSet Research Systems Inc. |
| (t) | For the period from the class inception date through the stated period end (for those share classes with less than 10 years of performance history). No comparative benchmark performance information is provided for “life” periods. (See Notes to Performance Summary.) |
| (v) | Assuming redemption at the end of the applicable period. |
Benchmark Definition(s)
Bloomberg Barclays Municipal Bond Index – a market capitalization-weighted index that measures the performance of the tax-exempt bond market.
It is not possible to invest directly in an index.
Notes to Performance Summary
Average annual total return represents the average annual change in value for each share class for the periods presented. Life returns are presented where the share class has less than 10 years of performance history and represent the average annual total return from the class inception date to the stated period end date. As the fund’s share classes may have different inception dates, the life returns may represent different time periods and may not be comparable. As a result, no comparative benchmark performance information is provided for life periods.
Performance results reflect any applicable expense subsidies and waivers in effect during the periods shown. Without such subsidies and waivers the fund’s performance results would be less favorable. Please see the prospectus and financial statements for complete details.
7
Performance Summary – continued
Performance results do not include adjustments made for financial reporting purposes in accordance with U.S. generally accepted accounting principles and may differ from amounts reported in the financial highlights.
A portion of income may be subject to state, federal, and/or alternative minimum tax. Capital gains, if any, are subject to a capital gains tax.
From time to time the fund may receive proceeds from litigation settlements, without which performance would be lower.
8
EXPENSE TABLE
Fund expenses borne by the shareholders during the period,
August 1, 2018 through January 31, 2019
As a shareholder of the fund, you incur two types of costs: (1) transaction costs, including sales charges (loads) on certain purchase or redemption payments, and (2) ongoing costs, including management fees; distribution and service(12b-1) fees; and other fund expenses. This example is intended to help you understand your ongoing costs (in dollars) of investing in the fund and to compare these costs with the ongoing costs of investing in other mutual funds.
The example is based on an investment of $1,000 invested at the beginning of the period and held for the entire period August 1, 2018 through January 31, 2019.
Actual Expenses
The first line for each share class in the following table provides information about actual account values and actual expenses. You may use the information in this line, together with the amount you invested, to estimate the expenses that you paid over the period. Simply divide your account value by $1,000 (for example, an $8,600 account value divided by $1,000 = 8.6), then multiply the result by the number in the first line under the heading entitled “Expenses Paid During Period” to estimate the expenses you paid on your account during this period.
Hypothetical Example for Comparison Purposes
The second line for each share class in the following table provides information about hypothetical account values and hypothetical expenses based on the fund’s actual expense ratio and an assumed rate of return of 5% per year before expenses, which is not the fund’s actual return. The hypothetical account values and expenses may not be used to estimate the actual ending account balance or expenses you paid for the period. You may use this information to compare the ongoing costs of investing in the fund and other funds. To do so, compare this 5% hypothetical example with the 5% hypothetical examples that appear in the shareholder reports of the other funds.
Please note that the expenses shown in the table are meant to highlight your ongoing costs only and do not reflect any transactional costs, such as sales charges (loads). Therefore, the second line for each share class in the table is useful in comparing ongoing costs only, and will not help you determine the relative total costs of owning different funds. In addition, if these transactional costs were included, your costs would have been higher.
9
Expense Table – continued
| | | | | | | | | | | | | | | | | | |
Share
Class | | | | Annualized
Expense
Ratio | | | Beginning
Account Value
8/01/18 | | | Ending
Account Value
1/31/19 | | | Expenses
Paid During
Period (p)
8/01/18-1/31/19 | |
| A | | Actual | | | 0.66% | | | | $1,000.00 | | | | $1,008.21 | | | | $3.34 | |
| | Hypothetical (h) | | | 0.66% | | | | $1,000.00 | | | | $1,021.88 | | | | $3.36 | |
| B | | Actual | | | 1.41% | | | | $1,000.00 | | | | $1,004.45 | | | | $7.12 | |
| | Hypothetical (h) | | | 1.41% | | | | $1,000.00 | | | | $1,018.10 | | | | $7.17 | |
| C | | Actual | | | 1.66% | | | | $1,000.00 | | | | $1,003.18 | | | | $8.38 | |
| | Hypothetical (h) | | | 1.66% | | | | $1,000.00 | | | | $1,016.84 | | | | $8.44 | |
| I | | Actual | | | 0.66% | | | | $1,000.00 | | | | $1,009.41 | | | | $3.34 | |
| | Hypothetical (h) | | | 0.66% | | | | $1,000.00 | | | | $1,021.88 | | | | $3.36 | |
| R6 | | Actual | | | 0.58% | | | | $1,000.00 | | | | $1,008.59 | | | | $2.94 | |
| | Hypothetical (h) | | | 0.58% | | | | $1,000.00 | | | | $1,022.28 | | | | $2.96 | |
| (h) | 5% class return per year before expenses. |
| (p) | “Expenses Paid During Period” are equal to each class’s annualized expense ratio, as shown above, multiplied by the average account value over the period, multiplied by 184/365 (to reflect theone-half year period). Expenses paid do not include any applicable sales charges (loads). If these transaction costs had been included, your costs would have been higher. |
Notes to Expense Table
Expense ratios include 0.02% of investment related expenses from self-deposited inverse floaters (as described in Note 2 of the Notes to Financial Statements) that are outside of the expense limitation arrangement (See Note 3 of the Notes to Financial Statements).
10
PORTFOLIO OF INVESTMENTS
1/31/19
The Portfolio of Investments is a complete list of all securities owned by your fund. It is categorized by jurisdiction.
| | | | | | | | |
| Municipal Bonds - 99.7% | | | | | | | | |
| | |
| Issuer | | Shares/Par | | | Value ($) | |
| Alabama - 1.1% | | | | | | | | |
| Birmingham, AL, Special Care Facilities Financing Authority Rev. (Methodist Home for the Aging), 5.5%, 6/01/2030 | | $ | 1,630,000 | | | $ | 1,758,053 | |
| Birmingham, AL, Special Care Facilities Financing Authority Rev. (Methodist Home for the Aging), 5.75%, 6/01/2035 | | | 1,685,000 | | | | 1,819,446 | |
| Birmingham, AL, Special Care Facilities Financing Authority Rev. (Methodist Home for the Aging), 5.75%, 6/01/2045 | | | 3,945,000 | | | | 4,173,850 | |
| Birmingham, AL, Special Care Facilities Financing Authority Rev. (Methodist Home for the Aging), 6%, 6/01/2050 | | | 2,565,000 | | | | 2,744,832 | |
| Black Belt Energy Gas District, AL, Gas Prepay Rev., “A”, 4%, 12/01/2048 (Put Date 12/01/2023) | | | 7,535,000 | | | | 7,915,894 | |
| Huntsville - Redstone Village, AL, Special Care Facilities Financing Authority (Redstone Village Project), 5.5%, 1/01/2028 (a)(d) | | | 1,485,000 | | | | 1,206,815 | |
| Huntsville - Redstone Village, AL, Special Care Facilities Financing Authority (Redstone Village Project), 5.5%, 1/01/2043 (a)(d) | | | 1,560,000 | | | | 1,102,811 | |
| Jefferson County, AL, Sewer Rev. Warrants, Capital Appreciation, Senior Lien, “B”, AGM, 0%, 10/01/2026 | | | 805,000 | | | | 619,013 | |
| Jefferson County, AL, Sewer Rev. Warrants, Capital Appreciation, Senior Lien, “B”, AGM, 0%, 10/01/2029 | | | 1,130,000 | | | | 710,668 | |
| Jefferson County, AL, Sewer Rev. Warrants, Capital Appreciation, Senior Lien, “B”, AGM, 0%, 10/01/2034 | | | 1,620,000 | | | | 713,059 | |
| Jefferson County, AL, Sewer Rev. Warrants, Capital Appreciation, Senior Lien, “B”, AGM, 0%, 10/01/2035 | | | 3,080,000 | | | | 1,267,820 | |
| Jefferson County, AL, Sewer Rev. Warrants, Subordinate Lien, “D”, 5%, 10/01/2021 | | | 1,380,000 | | | | 1,467,782 | |
| Jefferson County, AL, Sewer Rev. Warrants, Subordinate Lien, “D”, 5%, 10/01/2023 | | | 2,020,000 | | | | 2,223,879 | |
| Lower, AL, Gas District Project Rev., “A”, 5%, 9/01/2046 | | | 3,970,000 | | | | 4,629,377 | |
| Pell City, AL, Special Care Facilities, Financing Authority Rev. (Noland Health Services, Inc.), 5%, 12/01/2039 | | | 1,670,000 | | | | 1,790,223 | |
| Selma, AL, Industrial Development Board Rev., Gulf Opportunity Zone (International Paper Co.), “A”, 6.25%, 11/01/2033 | | | 6,750,000 | | | | 6,940,080 | |
| Selma, AL, Industrial Development Board Rev., Gulf Opportunity Zone (International Paper Co.), “A”, 5.375%, 12/01/2035 | | | 1,635,000 | | | | 1,757,282 | |
| University of South Alabama, Facilities Rev., “A”, BAM, 5%, 4/01/2044 | | | 5,790,000 | | | | 6,458,166 | |
| University of South Alabama, Facilities Rev., “A”, BAM, 5%, 4/01/2049 | | | 3,535,000 | | | | 3,911,301 | |
| | | | | | | | |
| | | | | | | $ | 53,210,351 | |
11
Portfolio of Investments – continued
| | | | | | | | |
| | |
| Issuer | | Shares/Par | | | Value ($) | |
| Municipal Bonds - continued | | | | | | | | |
| Alaska - 0.1% | | | | | | | | |
| Alaska Industrial Development & Export Authority Power Rev. (Snettisham Hydroelectric Project), 5%, 1/01/2030 | | $ | 875,000 | | | $ | 935,734 | |
| Alaska Industrial Development & Export Authority Power Rev. (Snettisham Hydroelectric Project), 5%, 1/01/2031 | | | 1,270,000 | | | | 1,354,429 | |
| Koyukuk, AK, Tanana Chiefs Conference (Healthcare Facilities Project), 7.75%, 10/01/2041 (Prerefunded 10/01/2019) | | | 3,315,000 | | | | 3,444,053 | |
| | | | | | | | |
| | | | | | | $ | 5,734,216 | |
| Arizona - 2.2% | | | | | | | | |
| Arizona Industrial Development Authority (Inspirada and St. Rose Campus Projects), “A”, 5%, 7/15/2028 | | $ | 1,580,000 | | | $ | 1,653,912 | |
| Arizona Industrial Development Authority (Inspirada and St. Rose Campus Projects), “A”, 5.75%, 7/15/2038 | | | 1,810,000 | | | | 1,909,604 | |
| Arizona Industrial Development Authority (Inspirada and St. Rose Campus Projects), “A”, 5.75%, 7/15/2048 | | | 3,100,000 | | | | 3,231,254 | |
| Arizona Industrial Development Authority Education Rev. (Academies of Math & Science), “A”, 5%, 7/01/2038 | | | 340,000 | | | | 376,812 | |
| Arizona Industrial Development Authority Education Rev. (Academies of Math & Science), “A”, 5%, 7/01/2048 | | | 910,000 | | | | 991,845 | |
| Arizona Industrial Development Authority Education Rev. (Academies of Math & Science), “A”, 5%, 7/01/2052 | | | 1,140,000 | | | | 1,238,040 | |
| Arizona Industrial Development Authority Education Rev. (Academies of Math & Science), “B”, 5.5%, 7/01/2038 | | | 1,065,000 | | | | 1,079,931 | |
| Arizona Industrial Development Authority Education Rev. (Academies of Math & Science), “B”, 5.625%, 7/01/2048 | | | 2,050,000 | | | | 2,074,005 | |
| Arizona Industrial Development Authority Education Rev. (Academies of Math & Science), “B”, 5.75%, 7/01/2053 | | | 3,190,000 | | | | 3,232,236 | |
| Arizona Industrial Development Authority Education Rev. (Basis Schools Projects), “D”, 5%, 7/01/2037 | | | 450,000 | | | | 460,211 | |
| Arizona Industrial Development Authority Education Rev. (Basis Schools Projects), “D”, 5%, 7/01/2047 | | | 740,000 | | | | 746,542 | |
| Arizona Industrial Development Authority Education Rev. (Basis Schools Projects), “D”, 5%, 7/01/2051 | | | 1,970,000 | | | | 1,973,940 | |
| Arizona Industrial Development Authority Education Rev. (Basis Schools Projects), “G”, 5%, 7/01/2037 | | | 770,000 | | | | 787,471 | |
| Arizona Industrial Development Authority Education Rev. (Basis Schools Projects), “G”, 5%, 7/01/2047 | | | 770,000 | | | | 776,807 | |
| Arizona Industrial Development Authority Education Rev. (Basis Schools Projects), “G”, 5%, 7/01/2051 | | | 735,000 | | | | 736,470 | |
| Florence, AZ, Industrial Development Authority Education Rev. (Legacy Traditional School Project - Queen Creek & Casa Grande Campuses), 6%, 7/01/2043 | | | 3,150,000 | | | | 3,275,590 | |
12
Portfolio of Investments – continued
| | | | | | | | |
| | |
| Issuer | | Shares/Par | | | Value ($) | |
| Municipal Bonds - continued | | | | | | | | |
| Arizona - continued | | | | | | | | |
| Glendale, AZ, Industrial Development Authority Refunding Rev. (The Terraces of Phoenix Project), “A”, 4%, 7/01/2028 | | $ | 300,000 | | | $ | 296,055 | |
| Glendale, AZ, Industrial Development Authority Refunding Rev. (The Terraces of Phoenix Project), “A”, 5%, 7/01/2033 | | | 250,000 | | | | 259,725 | |
| Glendale, AZ, Industrial Development Authority Refunding Rev. (The Terraces of Phoenix Project), “A”, 5%, 7/01/2038 | | | 300,000 | | | | 306,597 | |
| Glendale, AZ, Industrial Development Authority Refunding Rev. (The Terraces of Phoenix Project), “A”, 5%, 7/01/2048 | | | 610,000 | | | | 616,228 | |
| La Paz County, AZ, Industrial Development Authority Education Facility Lease Rev. (Charter School Solutions-Harmony Public Schools Project), “A”, 5%, 2/15/2038 | | | 800,000 | | | | 852,632 | |
| La Paz County, AZ, Industrial Development Authority Education Facility Lease Rev. (Charter School Solutions-Harmony Public Schools Project), “A”, 5%, 2/15/2048 | | | 435,000 | | | | 456,585 | |
| Maricopa County, AZ, Pollution Control Rev. (El Paso Electric), “B”, 7.25%, 4/01/2040 | | | 1,790,000 | | | | 1,804,875 | |
| Maricopa County, AZ, Pollution Control Rev. (Southern California Edison Co.), “A”, 5%, 6/01/2035 | | | 4,700,000 | | | | 4,757,622 | |
| Phoenix, AZ, Industrial Development Authority Education Facility Rev. (Basis Schools Projects), “A”, 5%, 7/01/2035 | | | 2,070,000 | | | | 2,118,873 | |
| Phoenix, AZ, Industrial Development Authority Education Facility Rev. (Basis Schools Projects), “A”, 5%, 7/01/2035 | | | 700,000 | | | | 716,527 | |
| Phoenix, AZ, Industrial Development Authority Education Facility Rev. (Basis Schools Projects), “A”, 5%, 7/01/2045 | | | 3,065,000 | | | | 3,089,918 | |
| Phoenix, AZ, Industrial Development Authority Education Facility Rev. (Basis Schools Projects), “A”, 5%, 7/01/2046 | | �� | 1,770,000 | | | | 1,783,434 | |
| Phoenix, AZ, Industrial Development Authority Education Facility Rev. (Choice Academies, Inc. Project), 5.625%, 9/01/2042 | | | 2,205,000 | | | | 2,252,407 | |
| Phoenix, AZ, Industrial Development Authority Education Facility Rev. (Great Hearts Academies Project), “A”, 5%, 7/01/2034 | | | 6,355,000 | | | | 6,617,144 | |
| Phoenix, AZ, Industrial Development Authority Education Facility Rev. (Great Hearts Academies Project), “A”, 5%, 7/01/2036 | | | 815,000 | | | | 849,874 | |
| Phoenix, AZ, Industrial Development Authority Education Facility Rev. (Great Hearts Academies Project), “A”, 5%, 7/01/2041 | | | 660,000 | | | | 681,879 | |
| Phoenix, AZ, Industrial Development Authority Education Facility Rev. (Great Hearts Academies Project), “A”, 5%, 7/01/2044 | | | 3,970,000 | | | | 4,077,627 | |
| Phoenix, AZ, Industrial Development Authority Education Facility Rev. (Great Hearts Academies Project), “A”, 5%, 7/01/2046 | | | 1,235,000 | | | | 1,272,458 | |
| Phoenix, AZ, Industrial Development Authority Education Facility Rev. (Legacy Traditional Schools Project), 6.5%, 7/01/2034 | | | 1,970,000 | | | | 2,143,380 | |
| Phoenix, AZ, Industrial Development Authority Education Facility Rev. (Legacy Traditional Schools Project), 5%, 7/01/2035 | | | 1,430,000 | | | | 1,455,025 | |
13
Portfolio of Investments – continued
| | | | | | | | |
| | |
| Issuer | | Shares/Par | | | Value ($) | |
| Municipal Bonds - continued | | | | | | | | |
| Arizona - continued | | | | | | | | |
| Phoenix, AZ, Industrial Development Authority Education Facility Rev. (Legacy Traditional Schools Project), 6.75%, 7/01/2044 | | $ | 3,255,000 | | | $ | 3,539,487 | |
| Phoenix, AZ, Industrial Development Authority Education Facility Rev. (Legacy Traditional Schools Project), 5%, 7/01/2045 | | | 1,570,000 | | | | 1,580,189 | |
| Phoenix, AZ, Industrial Development Authority Education Facility Rev. (Legacy Traditional Schools Project), 5%, 7/01/2046 | | | 3,935,000 | | | | 3,968,762 | |
| Phoenix, AZ, Industrial Development Authority Rev. (Guam Facilities Foundation, Inc.), 5.125%, 2/01/2034 | | | 4,545,000 | | | | 4,372,472 | |
| Phoenix, AZ, Industrial Development Authority Rev. (Guam Facilities Foundation, Inc.), 5.375%, 2/01/2041 | | | 4,380,000 | | | | 4,141,728 | |
| Phoenix, AZ, Industrial Development Authority Student Housing Refunding Rev. (Downtown Phoenix Student Housing, LLC-Arizona State University Project), “A”, 5%, 7/01/2030 | | | 150,000 | | | | 168,411 | |
| Phoenix, AZ, Industrial Development Authority Student Housing Refunding Rev. (Downtown Phoenix Student Housing, LLC-Arizona State University Project), “A”, 5%, 7/01/2031 | | | 375,000 | | | | 418,159 | |
| Phoenix, AZ, Industrial Development Authority Student Housing Refunding Rev. (Downtown Phoenix Student Housing, LLC-Arizona State University Project), “A”, 5%, 7/01/2033 | | | 150,000 | | | | 165,621 | |
| Phoenix, AZ, Industrial Development Authority Student Housing Refunding Rev. (Downtown Phoenix Student Housing, LLC-Arizona State University Project), “A”, 5%, 7/01/2037 | | | 500,000 | | | | 541,310 | |
| Phoenix, AZ, Industrial Development Authority Student Housing Refunding Rev. (Downtown Phoenix Student Housing, LLC-Arizona State University Project), “A”, 5%, 7/01/2042 | | | 555,000 | | | | 591,863 | |
| Pima County, AZ, Industrial Development Authority Education Facility Rev. (American Leadership Academy Project), 4.75%, 6/15/2037 | | | 3,740,000 | | | | 3,628,286 | |
| Pima County, AZ, Industrial Development Authority Education Facility Rev. (American Leadership Academy Project), 5%, 6/15/2047 | | | 3,495,000 | | | | 3,366,629 | |
| Pima County, AZ, Industrial Development Authority Education Facility Rev. (American Leadership Academy Project), 5%, 6/15/2052 | | | 3,960,000 | | | | 3,745,170 | |
| Pima County, AZ, Industrial Development Authority Rev. (Tucson Electric Power Co.), “A”, 5.25%, 10/01/2040 | | | 4,755,000 | | | | 4,958,847 | |
| Salt Verde Financial Corp., AZ, Senior Gas Rev., 5%, 12/01/2032 | | | 2,940,000 | | | | 3,441,094 | |
| Tempe, AZ, Industrial Development Authority Rev. (Friendship Village), “A”, 6%, 12/01/2032 | | | 1,100,000 | | | | 1,156,342 | |
| Tempe, AZ, Industrial Development Authority Rev. (Friendship Village), “A”, 6.25%, 12/01/2042 | | | 3,505,000 | | | | 3,689,503 | |
14
Portfolio of Investments – continued
| | | | | | | | |
| | |
| Issuer | | Shares/Par | | | Value ($) | |
| Municipal Bonds - continued | | | | | | | | |
| Arizona - continued | | | | | | | | |
| Tempe, AZ, Industrial Development Authority Rev. (Friendship Village), “A”, 6.25%, 12/01/2046 | | $ | 1,275,000 | | | $ | 1,340,726 | |
| | | | | | | | |
| | | | | | | $ | 105,768,134 | |
| Arkansas - 0.4% | | | | | | | | |
| Arkansas Development Finance Authority Hospital Rev. (Washington Regional Medical Center), 5%, 2/01/2038 | | $ | 2,115,000 | | | $ | 2,364,845 | |
| Arkansas Development Finance Authority Hospital Rev. (Washington Regional Medical Center), “A”, 5%, 2/01/2035 | | | 365,000 | | | | 398,069 | |
| Arkansas Development Finance Authority Hospital Rev. (Washington Regional Medical Center), “C”, 5%, 2/01/2033 | | | 540,000 | | | | 593,233 | |
| Arkansas Development Finance Authority, Charter School Capital Improvement Rev. (LISA Academy Project), 4%, 7/01/2028 | | | 800,000 | | | | 817,176 | |
| Arkansas Development Finance Authority, Charter School Capital Improvement Rev. (LISA Academy Project), 4.5%, 7/01/2033 | | | 1,620,000 | | | | 1,647,151 | |
| Arkansas Development Finance Authority, Charter School Capital Improvement Rev. (LISA Academy Project), 4.5%, 7/01/2039 | | | 170,000 | | | | 161,704 | |
| Arkansas Development Finance Authority, Tobacco Settlement Rev. (Cancer Research Center Project), Capital Appreciation, AAC, 0%, 7/01/2046 | | | 6,455,000 | | | | 1,969,937 | |
| Bentonville, AR, School District No. 6 Construction Refunding, “B”, 4%, 6/01/2047 | | | 5,750,000 | | | | 5,881,790 | |
| Pulaski County, AR, Public Facilities Board, Healthcare Rev. (Baptist Health), 5%, 12/01/2039 | | | 4,510,000 | | | | 4,895,650 | |
| | | | | | | | |
| | | | | | | $ | 18,729,555 | |
| California - 6.8% | | | | | | | | |
| ABAG Finance Authority for Non-Profit Corps., CA, Rev. (Episcopal Senior Communities), 6.125%, 7/01/2041 | | $ | 4,000,000 | | | $ | 4,294,964 | |
| Acton-Agua Dulce, CA, Unified School District (Election of 2008), Capital Appreciation, AGM, 0%, 5/01/2039 | | | 7,550,000 | | | | 3,183,608 | |
| Beverly Hills, CA, Unified School District (Election of 2008), Capital Appreciation, 0%, 8/01/2031 | | | 2,060,000 | | | | 1,421,874 | |
| Beverly Hills, CA, Unified School District (Election of 2008), Capital Appreciation, 0%, 8/01/2032 | | | 2,095,000 | | | | 1,383,370 | |
| Beverly Hills, CA, Unified School District (Election of 2008), Capital Appreciation, 0%, 8/01/2033 | | | 4,185,000 | | | | 2,641,739 | |
| California Educational Facilities Authority Rev. (Stanford University),“U-7”, 5%, 6/01/2046 | | | 13,795,000 | | | | 17,906,600 | |
| California Health Facilities Financing Authority Rev. (St. Joseph Health System), “A”, 5.75%, 7/01/2039 | | | 2,765,000 | | | | 2,811,341 | |
| California M-S-R Energy Authority Gas Rev., “A”, 7%, 11/01/2034 | | | 1,135,000 | | | | 1,607,455 | |
| California M-S-R Energy Authority Gas Rev., “A”, 6.5%, 11/01/2039 | | | 4,000,000 | | | | 5,497,560 | |
15
Portfolio of Investments – continued
| | | | | | | | |
| | |
| Issuer | | Shares/Par | | | Value ($) | |
| Municipal Bonds - continued | | | | | | | | |
| California - continued | | | | | | | | |
| California Municipal Finance Authority Charter School Lease Rev. (Nova Academy Project), “A”, 5%, 6/15/2036 | | $ | 1,100,000 | | | $ | 1,125,091 | |
| California Municipal Finance Authority Charter School Lease Rev. (Nova Academy Project), “A”, 5%, 6/15/2046 | | | 2,425,000 | | | | 2,447,164 | |
| California Municipal Finance Authority Charter School Lease Rev. (The Palmdale Aerospace Academy Project), “A”, 3.875%, 7/01/2028 | | | 1,200,000 | | | | 1,212,468 | |
| California Municipal Finance Authority Charter School Lease Rev. (The Palmdale Aerospace Academy Project), “A”, 5%, 7/01/2049 | | | 1,600,000 | | | | 1,649,600 | |
| California Municipal Finance Authority Rev. (California Baptist University), “A”, 5%, 11/01/2046 | | | 4,500,000 | | | | 4,787,550 | |
| California Municipal Finance Authority Rev. (Community Medical Centers), “A”, 5%, 2/01/2042 | | | 1,385,000 | | | | 1,512,586 | |
| California Municipal Finance Authority Rev. (LINXS APM Project), “A”, 5%, 12/31/2043 | | | 955,000 | | | | 1,041,733 | |
| California Municipal Finance Authority Rev. (NorthBay Healthcare Group), 5%, 11/01/2035 | | | 475,000 | | | | 507,666 | |
| California Municipal Finance Authority Rev. (NorthBay Healthcare Group), “A”, 5.25%, 11/01/2036 | | | 1,370,000 | | | | 1,471,640 | |
| California Municipal Finance Authority Rev. (NorthBay Healthcare Group), “A”, 5.25%, 11/01/2041 | | | 1,265,000 | | | | 1,339,066 | |
| California Municipal Finance Authority Rev. (NorthBay Healthcare Group), “A”, 5.25%, 11/01/2047 | | | 210,000 | | | | 221,590 | |
| California Municipal Finance Authority Rev. (Partnerships to Uplift Communities Project), “A”, 5%, 8/01/2032 | | | 1,585,000 | | | | 1,600,644 | |
| California Municipal Finance Authority Rev. (University of La Verne), “A”, 6.25%, 6/01/2040 (Prerefunded 6/01/2020) | | | 900,000 | | | | 955,611 | |
| California Pollution Control Financing Authority, Solid Waste Disposal Rev. (CalPlant I Project), 8%, 7/01/2039 | | | 11,405,000 | | | | 12,164,231 | |
| California Pollution Control Financing Authority, Water Facilities Rev. (American Water Capital Corp. Project), 5.25%, 8/01/2040 | | | 3,500,000 | | | | 3,688,090 | |
| California Pollution Control Financing Authority, Water Furnishing Rev. (Poseidon Resources Desalination Project), 5%, 11/21/2045 | | | 4,080,000 | | | | 4,241,609 | |
| California Pollution Control Financing Authority, Water Furnishing Rev. (San Diego County Water Desalination Project Pipeline), 5%, 11/21/2045 | | | 2,935,000 | | | | 2,969,926 | |
| California Public Finance Authority Rev. (Henry Mayo Newhall Hospital), 5%, 10/15/2033 | | | 215,000 | | | | 235,674 | |
| California Public Finance Authority Rev. (Henry Mayo Newhall Hospital), 5%, 10/15/2037 | | | 435,000 | | | | 469,830 | |
| California Public Finance Authority Rev. (Henry Mayo Newhall Hospital), 5%, 10/15/2047 | | | 435,000 | | | | 464,145 | |
16
Portfolio of Investments – continued
| | | | | | | | |
| | |
| Issuer | | Shares/Par | | | Value ($) | |
| Municipal Bonds - continued | | | | | | | | |
| California - continued | | | | | | | | |
| California Public Works Board Lease Rev. (Various Capital Projects),“G-1”, 5.75%, 10/01/2030 (Prerefunded 10/01/2019) | | $ | 3,380,000 | | | $ | 3,474,370 | |
| California School Finance Authority, Charter School Rev. (Aspire Public Schools), 5%, 8/01/2036 | | | 865,000 | | | | 921,147 | |
| California School Finance Authority, Charter School Rev. (Aspire Public Schools), 5%, 8/01/2041 | | | 675,000 | | | | 710,100 | |
| California School Finance Authority, Charter School Rev. (Downtown Prep), 5%, 6/01/2046 | | | 1,325,000 | | | | 1,340,304 | |
| California School Finance Authority, School Facility Rev. (Alliance For College-Ready Public Schools Projects), “A”, 4%, 7/01/2024 | | | 730,000 | | | | 769,165 | |
| California School Finance Authority, School Facility Rev. (Alliance For College-Ready Public Schools Projects), “A”, 4%, 7/01/2025 | | | 760,000 | | | | 801,724 | |
| California School Finance Authority, School Facility Rev. (Alliance For College-Ready Public Schools Projects), “A”, 5%, 7/01/2030 | | | 435,000 | | | | 472,675 | |
| California School Finance Authority, School Facility Rev. (Alliance For College-Ready Public Schools Projects), “A”, 5%, 7/01/2045 | | | 1,150,000 | | | | 1,201,175 | |
| California School Finance Authority, School Facility Rev. (Green Dot Public Schools California Projects), “A”, 5%, 8/01/2048 | | | 750,000 | | | | 797,175 | |
| California School Finance Authority, School Facility Rev. (ICEF View Park Elementary and Middle Schools), “A”, 4.75%, 10/01/2024 | | | 405,000 | | | | 417,041 | |
| California School Finance Authority, School Facility Rev. (ICEF View Park Elementary and Middle Schools), “A”, 5.625%, 10/01/2034 | | | 575,000 | | | | 606,079 | |
| California School Finance Authority, School Facility Rev. (ICEF View Park Elementary and Middle Schools), “A”, 5.875%, 10/01/2044 | | | 545,000 | | | | 570,119 | |
| California School Finance Authority, School Facility Rev. (ICEF View Park Elementary and Middle Schools), “A”, 6%, 10/01/2049 | | | 1,320,000 | | | | 1,385,578 | |
| California School Finance Authority, School Facility Rev. (Kipp LA Projects), “A”, 4.125%, 7/01/2024 | | | 250,000 | | | | 260,585 | |
| California School Finance Authority, School Facility Rev. (Kipp LA Projects), “A”, 5.125%, 7/01/2044 | | | 430,000 | | | | 454,157 | |
| California Statewide Communities Development Authority Environmental Facilities Rev. (Microgy Holdings Project), 9%, 12/01/2038 (a)(d) | | | 100,980 | | | | 1 | |
| California Statewide Communities Development Authority Rev. (899 Charleston Project), “A”, 5.25%, 11/01/2044 | | | 760,000 | | | | 790,453 | |
| California Statewide Communities Development Authority Rev. (899 Charleston Project), “A”, 5.375%, 11/01/2049 | | | 945,000 | | | | 988,791 | |
| California Statewide Communities Development Authority Rev. (American Baptist Homes of the West), 6.25%, 10/01/2039 | | | 2,985,000 | | | | 3,063,685 | |
17
Portfolio of Investments – continued
| | | | | | | | |
| | |
| Issuer | | Shares/Par | | | Value ($) | |
| Municipal Bonds - continued | | | | | | | | |
| California - continued | | | | | | | | |
| California Statewide Communities Development Authority Rev. (California Baptist University), “A”, 5.125%, 11/01/2023 | | $ | 540,000 | | | $ | 571,828 | |
| California Statewide Communities Development Authority Rev. (California Baptist University), “A”, 5%, 11/01/2032 | | | 1,370,000 | | | | 1,508,918 | |
| California Statewide Communities Development Authority Rev. (California Baptist University), “A”, 6.125%, 11/01/2033 | | | 1,600,000 | | | | 1,808,048 | |
| California Statewide Communities Development Authority Rev. (California Baptist University), “A”, 5%, 11/01/2041 | | | 2,045,000 | | | | 2,202,301 | |
| California Statewide Communities Development Authority Rev. (California Baptist University), “A”, 6.375%, 11/01/2043 | | | 1,335,000 | | | | 1,504,371 | |
| California Statewide Communities Development Authority Rev. (Enloe Medical Center), CALHF, 5%, 8/15/2038 | | | 2,500,000 | | | | 2,814,800 | |
| California Statewide Communities Development Authority Rev. (Lancer Educational Student Housing Project), 7.5%, 6/01/2042 (Prerefunded 6/01/2019) | | | 1,465,000 | | | | 1,493,480 | |
| California Statewide Communities Development Authority Rev. (Lancer Plaza Project), 5.125%, 11/01/2023 | | | 420,000 | | | | 451,156 | |
| California Statewide Communities Development Authority Rev. (Lancer Plaza Project), 5.625%, 11/01/2033 | | | 780,000 | | | | 857,158 | |
| California Statewide Communities Development Authority Rev. (Lancer Plaza Project), 5.875%, 11/01/2043 | | | 1,315,000 | | | | 1,441,253 | |
| California Statewide Communities Development Authority Rev. (Loma Linda University Medical Center), “A”, 5.25%, 12/01/2034 | | | 3,400,000 | | | | 3,668,158 | |
| California Statewide Communities Development Authority Rev. (Loma Linda University Medical Center), “A”, 5%, 12/01/2041 | | | 3,000,000 | | | | 3,142,110 | |
| California Statewide Communities Development Authority Rev. (Loma Linda University Medical Center), “A”, 5.25%, 12/01/2044 | | | 8,255,000 | | | | 8,733,212 | |
| California Statewide Communities Development Authority Rev. (Loma Linda University Medical Center), “A”, 5%, 12/01/2046 | | | 11,360,000 | | | | 11,839,960 | |
| California Statewide Communities Development Authority Rev. (Loma Linda University Medical Center), “A”, 5.25%, 12/01/2056 | | | 11,040,000 | | | | 11,621,477 | |
| California Statewide Communities Development Authority Rev. (Los Angeles Jewish Home for The Aging - Fountainview at Gonda), “A”, CALHF, 5%, 8/01/2034 | | | 1,000,000 | | | | 1,110,700 | |
| California Statewide Communities Development Authority Rev. (Los Angeles Jewish Home for The Aging - Fountainview at Gonda), “A”, CALHF, 5%, 8/01/2044 | | | 2,400,000 | | | | 2,655,384 | |
| California Statewide Communities Development Authority Rev. (Southern California Presbyterian Homes), 7%, 11/15/2029 | | | 1,400,000 | | | | 1,447,222 | |
| California Statewide Communities Development Authority Rev. (Southern California Presbyterian Homes), 7.25%, 11/15/2041 | | | 560,000 | | | | 579,914 | |
| California Statewide Communities Development Authority Rev. (The Terraces at San Joaquin Gardens), “A”, 5.625%, 10/01/2032 | | | 1,000,000 | | | | 1,053,340 | |
18
Portfolio of Investments – continued
| | | | | | | | |
| | |
| Issuer | | Shares/Par | | | Value ($) | |
| Municipal Bonds - continued | | | | | | | | |
| California - continued | | | | | | | | |
| California Statewide Communities Development Authority Rev. (The Terraces at San Joaquin Gardens), “A”, 6%, 10/01/2042 | | $ | 1,000,000 | | | $ | 1,062,130 | |
| California Statewide Communities Development Authority Rev. (University of California, Irvine East Campus Apartments), 5.375%, 5/15/2038 | | | 3,000,000 | | | | 3,183,750 | |
| California Statewide Communities Development Authority, College Housing Rev. (NCCD-Hooper Street LLC College of the Arts Project), 5%, 7/01/2029 | | | 560,000 | | | | 614,527 | |
| California Statewide Communities Development Authority, College Housing Rev. (NCCD-Hooper Street LLC College of the Arts Project), 5.25%, 7/01/2039 | | | 725,000 | | | | 768,529 | |
| California Statewide Communities Development Authority, College Housing Rev. (NCCD-Hooper Street LLC College of the Arts Project), 5.25%, 7/01/2049 | | | 1,730,000 | | | | 1,811,898 | |
| California Statewide Communities Development Authority, College Housing Rev. (NCCD-Hooper Street LLC College of the Arts Project), 5.25%, 7/01/2052 | | | 830,000 | | | | 865,815 | |
| California Statewide Financing Authority, Tobacco Settlement, 5.625%, 5/01/2029 | | | 1,680,000 | | | | 1,691,894 | |
| Chula Vista, CA, Industrial Development Rev. (San Diego Gas & Electric Co.), “E”, 5.875%, 1/01/2034 | | | 1,940,000 | | | | 1,959,866 | |
| Escondido, CA, Union High School District (Election of 2008), Capital Appreciation, “A”, ASSD GTY, 0%, 8/01/2030 | | | 4,785,000 | | | | 3,409,935 | |
| Escondido, CA, Union High School District (Election of 2008), Capital Appreciation, “A”, ASSD GTY, 0%, 8/01/2031 | | | 4,280,000 | | | | 2,903,723 | |
| Escondido, CA, Union High School District (Election of 2008), Capital Appreciation, “A”, ASSD GTY, 0%, 8/01/2032 | | | 3,010,000 | | | | 1,948,343 | |
| Golden State, CA, Tobacco Securitization Corp., Tobacco Settlement Rev. “A”, AGM, 5%, 6/01/2040 | | | 2,735,000 | | | | 3,098,399 | |
| Golden State, CA, Tobacco Securitization Corp., Tobacco Settlement Rev., “A”, 3.5%, 6/01/2036 | | | 2,545,000 | | | | 2,503,924 | |
| Golden State, CA, Tobacco Securitization Corp., Tobacco Settlement Rev., “A”, 5.25%, 6/01/2047 | | | 3,525,000 | | | | 3,468,353 | |
| Hartnell, CA, Community College District (Monterey and San Benito Counties Election of 2002), General Obligation, Capital Appreciation, “D”, 0%, 8/01/2039 (Prerefunded 8/01/2019) | | | 10,355,000 | | | | 2,390,038 | |
| Hollister, CA (Community Development Project), BAM, 5%, 10/01/2029 | | | 1,480,000 | | | | 1,692,528 | |
| Hollister, CA (Community Development Project), BAM, 5%, 10/01/2031 | | | 1,675,000 | | | | 1,905,028 | |
| Inland Valley, CA, Development Successor Agency Tax Allocation, “A”, AGM, 5%, 9/01/2044 | | | 1,745,000 | | | | 1,906,395 | |
19
Portfolio of Investments – continued
| | | | | | | | |
| | |
| Issuer | | Shares/Par | | | Value ($) | |
| Municipal Bonds - continued | | | | | | | | |
| California - continued | | | | | | | | |
| Irvine, CA, Special Tax Bonds, Community Facilities District No. 2013-3, 5%, 9/01/2039 | | $ | 1,000,000 | | | $ | 1,062,850 | |
| Irvine, CA, Special Tax Bonds, Community Facilities District No. 2013-3, 5%, 9/01/2044 | | | 1,500,000 | | | | 1,589,625 | |
| Jurupa, CA, Public Financing Authority, Special Tax Rev., “A”, 5%, 9/01/2042 | | | 1,535,000 | | | | 1,703,144 | |
| La Verne, CA, Brethren Hillcrest Homes, COP, 5%, 5/15/2036 | | | 455,000 | | | | 470,839 | |
| Lake Tahoe, CA, Unified School District (Election of 2008), Convertible Capital Appreciation, AGM, 0% to 8/01/2032, 6.375% to 8/01/2045 | | | 4,240,000 | | | | 3,061,153 | |
| Long Beach, CA, Marina Rev. (Alamitos Bay Marina Project), 5%, 5/15/2035 | | | 450,000 | | | | 494,393 | |
| Los Angeles County, CA, Regional Financing Authority Rev. (Montecedro, Inc. Project), “A”, CALHF, 5%, 11/15/2034 | | | 330,000 | | | | 364,343 | |
| Los Angeles County, CA, Regional Financing Authority Rev. (Montecedro, Inc. Project), “A”, CALHF, 5%, 11/15/2044 | | | 555,000 | | | | 608,940 | |
| Los Angeles County, CA, Rio Hondo Community College District, “C”, Convertible Capital Appreciation, 0% to 8/01/2024, 6.85% to 8/01/2042 | | | 10,000,000 | | | | 10,584,300 | |
| Los Angeles, CA, Department of Airports Rev. (Los Angeles International), “A”, 5%, 5/15/2034 | | | 660,000 | | | | 763,891 | |
| Los Angeles, CA, Department of Airports Rev. (Los Angeles International), “A”, 5%, 5/15/2036 | | | 775,000 | | | | 890,235 | |
| Los Angeles, CA, Department of Airports Rev. (Los Angeles International), “A”, 5%, 5/15/2037 | | | 970,000 | | | | 1,109,195 | |
| Los Angeles, CA, Department of Airports Rev. (Los Angeles International), “A”, 5%, 5/15/2044 | | | 3,395,000 | | | | 3,815,437 | |
| Los Angeles, CA, Unified School District, “D”, 5%, 1/01/2034 | | | 525,000 | | | | 531,683 | |
| Madera, CA, Irrigation Financing Authority Water Rev., 6.5%, 1/01/2040 (Prerefunded 1/01/2020) | | | 5,970,000 | | | | 6,235,426 | |
| Merced, CA, Union High School District, Capital Appreciation, “A”, ASSD GTY, 0%, 8/01/2030 | | | 645,000 | | | | 456,537 | |
| Morongo Band of Mission Indians California Rev., “B”, 5%, 10/01/2042 (n) | | | 3,605,000 | | | | 3,690,763 | |
| Mount San Antonio, CA, Community College District Rev. (Election of 2008), Convertible Capital Appreciation, “A”, 0% to 8/01/2028, 6.25% to 8/01/2043 | | | 7,025,000 | | | | 5,954,952 | |
| Newport Mesa, CA, Unified School District (Election of 2005), Capital Appreciation, 0%, 8/01/2041 (Prerefunded 8/01/2021) | | | 12,965,000 | | | | 3,047,553 | |
| Oceanside, CA, Unified School District, Capital Appreciation, ASSD GTY, 0%, 8/01/2027 | | | 2,070,000 | | | | 1,672,063 | |
| Oceanside, CA, Unified School District, Capital Appreciation, ASSD GTY, 0%, 8/01/2029 | | | 4,025,000 | | | | 3,009,653 | |
20
Portfolio of Investments – continued
| | | | | | | | |
| | |
| Issuer | | Shares/Par | | | Value ($) | |
| Municipal Bonds - continued | | | | | | | | |
| California - continued | | | | | | | | |
| Oceanside, CA, Unified School District, Capital Appreciation, ASSD GTY, 0%, 8/01/2030 | | $ | 4,455,000 | | | $ | 3,178,375 | |
| Oceanside, CA, Unified School District, Capital Appreciation, ETM, ASSD GTY, 0%, 8/01/2024 | | | 380,000 | | | | 340,659 | |
| Oceanside, CA, Unified School District, Capital Appreciation, Unrefunded Balance, ASSD GTY, 0%, 8/01/2024 | | | 2,730,000 | | | | 2,431,447 | |
| Palomar Health, CA, Refunding Rev., 5%, 11/01/2042 | | | 10,000,000 | | | | 10,624,800 | |
| Palomar Health, CA, Refunding Rev., AGM, 5%, 11/01/2047 | | | 20,000,000 | | | | 22,546,400 | |
| Palomar Pomerado Health Care District, CA, COP, 6.75%, 11/01/2039 (Prerefunded 11/01/2019) | | | 4,080,000 | | | | 4,232,918 | |
| Pioneers Memorial Healthcare District, CA, Rev., 5%, 10/01/2032 | | | 1,765,000 | | | | 1,866,911 | |
| Pioneers Memorial Healthcare District, CA, Rev., 5%, 10/01/2040 | | | 1,365,000 | | | | 1,417,129 | |
| Pittsburg, CA, Redevelopment Successor Agency, Tax Allocation (Los Medanos Community Development Project), AGM, 5%, 8/01/2028 | | | 635,000 | | | | 725,792 | |
| San Buenaventura, CA, Rev. (Community Memorial Health System), 7.5%, 12/01/2041 | | | 6,000,000 | | | | 6,548,520 | |
| San Francisco, CA, City & County Airports Commission, International Airport Rev., “A”, 5%, 5/01/2049 | | | 15,635,000 | | | | 17,550,913 | |
| San Francisco, CA, City & County Redevelopment Successor Agency, Community Facilities District No. 6 (Mission Bay South Public Improvements), Capital Appreciation, “A”, 0%, 8/01/2043 | | | 8,725,000 | | | | 2,292,232 | |
| San Francisco, CA, City & County Redevelopment Successor Agency, Tax Allocation (Mission Bay South Redevelopment Project), “A”, 5%, 8/01/2043 | | | 225,000 | | | | 249,431 | |
| San Jose, CA, Airport Rev., “C”, 5%, 3/01/2030 | | | 885,000 | | | | 998,829 | |
| Upland, CA, COP (San Antonio Community Hospital), 6.375%, 1/01/2032 (Prerefunded 1/01/2021) | | | 600,000 | | | | 653,742 | |
| West Contra Costa, CA, Unified School District (Election of 2005), Capital Appreciation, “C”, ASSD GTY, 0%, 8/01/2029 | | | 3,665,000 | | | | 2,709,461 | |
| Whittier, CA, Union High School District, Capital Appreciation, 0%, 8/01/2034 | | | 2,270,000 | | | | 871,635 | |
| | | | | | | | |
| | | | | | | $ | 331,924,783 | |
| Colorado - 2.4% | | | | | | | | |
| Arkansas River Power Authority, CO, Power Supply System Rev., “A”, 5%, 10/01/2043 | | $ | 5,000,000 | | | $ | 5,318,700 | |
| Central Platte Valley, CO, General Obligation, 5%, 12/01/2043 | | | 1,250,000 | | | | 1,305,962 | |
| Colorado Educational & Cultural Facilities Authority Rev. (Liberty Common Project), 5%, 1/15/2029 | | | 305,000 | | | | 335,055 | |
| Colorado Educational & Cultural Facilities Authority Rev. (Liberty Common Project), 5%, 1/15/2039 | | | 560,000 | | | | 592,626 | |
| Colorado Educational & Cultural Facilities Authority Rev. (Liberty Common Project), 5%, 1/15/2044 | | | 395,000 | | | | 415,094 | |
21
Portfolio of Investments – continued
| | | | | | | | |
| | |
| Issuer | | Shares/Par | | | Value ($) | |
| Municipal Bonds - continued | | | | | | | | |
| Colorado - continued | | | | | | | | |
| Colorado Educational & Cultural Facilities Authority Rev. (Littleton Preparatory Charter School Project), 5%, 12/01/2033 | | $ | 450,000 | | | $ | 454,176 | |
| Colorado Educational & Cultural Facilities Authority Rev. (Littleton Preparatory Charter School Project), 5%, 12/01/2042 | | | 1,120,000 | | | | 1,085,056 | |
| Colorado Educational & Cultural Facilities Authority Rev. (Montessori Charter School Project), 5%, 7/15/2037 | | | 490,000 | | | | 520,209 | |
| Colorado Educational & Cultural Facilities Authority Rev. (Peak to Peak Charter School Project), 5%, 8/15/2030 | | | 350,000 | | | | 382,998 | |
| Colorado Educational & Cultural Facilities Authority Rev. (Peak to Peak Charter School Project), 5%, 8/15/2034 | | | 350,000 | | | | 377,283 | |
| Colorado Educational & Cultural Facilities Authority Rev. (Science, Technology, Engineering and Math School Project), 5%, 11/01/2044 | | | 885,000 | | | | 850,264 | |
| Colorado Educational & Cultural Facilities Authority Rev. (Science, Technology, Engineering and Math School Project), 5.125%, 11/01/2049 | | | 765,000 | | | | 741,354 | |
| Colorado Educational & Cultural Facilities Authority Rev. (Stargate Charter School Project), “A”, 5%, 12/01/2038 | | | 1,665,000 | | | | 1,860,771 | |
| Colorado Educational & Cultural Facilities Authority Rev. (Stargate Charter School Project), “A”, 4%, 12/01/2048 | | | 4,310,000 | | | | 4,309,828 | |
| Colorado Educational & Cultural Facilities Authority Rev. (The Classical Academy Project), “A”, 5%, 12/01/2038 | | | 895,000 | | | | 962,214 | |
| Colorado Educational & Cultural Facilities Authority Rev. (Union Colony School Project), 5%, 4/01/2038 | | | 295,000 | | | | 330,140 | |
| Colorado Educational & Cultural Facilities Authority Rev. (Union Colony School Project), 5%, 4/01/2048 | | | 350,000 | | | | 383,915 | |
| Colorado Educational & Cultural Facilities Authority Rev. (Union Colony School Project), 5%, 4/01/2053 | | | 365,000 | | | | 396,824 | |
| Colorado Educational & Cultural Facilities Authority Rev. (University Lab School Project), 5%, 12/15/2035 | | | 2,000,000 | | | | 2,082,340 | |
| Colorado Educational & Cultural Facilities Authority Rev. (University Lab School Project), 5%, 12/15/2045 | | | 2,675,000 | | | | 2,749,900 | |
| Colorado Health Facilities Authority Rev. (American Baptist Homes), 8%, 8/01/2043 | | | 2,975,000 | | | | 3,324,652 | |
| Colorado Health Facilities Authority Rev. (Christian Living Communities Project), 6.375%, 1/01/2041 | | | 1,620,000 | | | | 1,727,325 | |
| Colorado Health Facilities Authority Rev. (Covenant Retirement Communities, Inc.), “A”, 5%, 12/01/2021 | | | 105,000 | | | | 112,828 | |
| Colorado Health Facilities Authority Rev. (Covenant Retirement Communities, Inc.), “A”, 5%, 12/01/2033 | | | 4,295,000 | | | | 4,568,763 | |
| Colorado Health Facilities Authority Rev. (Evangelical Lutheran Good Samaritan Society), 5.625%, 6/01/2043 | | | 825,000 | | | | 895,100 | |
��
22
Portfolio of Investments – continued
| | | | | | | | |
| | |
| Issuer | | Shares/Par | | | Value ($) | |
| Municipal Bonds - continued | | | | | | | | |
| Colorado - continued | | | | | | | | |
| Colorado Health Facilities Authority Rev. (Total Longterm Care, Inc.), “A”, 6%, 11/15/2030 (Prerefunded 11/15/2020) | | $ | 700,000 | | | $ | 751,009 | |
| Colorado Health Facilities Authority Rev. (Total Longterm Care, Inc.), “A”, 6.25%, 11/15/2040 (Prerefunded 11/15/2020) | | | 1,150,000 | | | | 1,238,814 | |
| Colorado Health Facilities Authority Rev., Improvement Bonds (Frasier Meadows Retirement Community Project), “B”, 5%, 5/15/2039 | | | 1,685,000 | | | | 1,749,923 | |
| Colorado Health Facilities Authority Rev., Improvement Bonds (Frasier Meadows Retirement Community Project), “B”, 5%, 5/15/2048 | | | 5,750,000 | | | | 5,941,820 | |
| Colorado Health Facilities Hospital Authority Rev. (Adventist Health System/Sunbelt Obligated Group), “2014-E”, 5%, 11/15/2034 | | | 6,530,000 | | | | 7,210,099 | |
| Colorado High Performance Transportation Enterprise Rev. (C-470 Express Lanes), 5%, 12/31/2056 | | | 2,890,000 | | | | 3,059,354 | |
| Colorado Housing & Finance Authority Rev., “B-1”, GNMA, 4%, 11/01/2048 | | | 2,885,000 | | | | 3,048,897 | |
| Colorado Housing & Finance Authority Rev., Single Family Mortgage Class I, “C”, 4.75%, 5/01/2049 (u) | | | 8,790,000 | | | | 9,641,927 | |
| Colorado Regional Transportation District, Private Activity Rev. (Denver Transportation Partners), 6%, 1/15/2034 | | | 8,490,000 | | | | 8,575,409 | |
| Denver, CO, City & County Special Facilities Airport Refunding Rev. (United Airlines), 5%, 10/01/2032 | | | 5,355,000 | | | | 5,638,387 | |
| Denver, CO, Convention Center Hotel Authority Rev., 5%, 12/01/2035 | | | 1,070,000 | | | | 1,178,979 | |
| Denver, CO, Convention Center Hotel Authority Rev., 5%, 12/01/2036 | | | 675,000 | | | | 737,370 | |
| Denver, CO, Convention Center Hotel Authority Rev., 5%, 12/01/2040 | | | 1,800,000 | | | | 1,931,274 | |
| Denver, CO, Health & Hospital Authority Rev. COP (550 Acoma, Inc.), 5%, 12/01/2048 | | | 2,670,000 | | | | 2,885,015 | |
| Denver, CO, Health & Hospital Authority Rev., “A”, 5%, 12/01/2039 | | | 3,660,000 | | | | 3,881,576 | |
| Denver, CO, Health & Hospital Authority Rev., “A”, 5.25%, 12/01/2045 | | | 795,000 | | | | 850,038 | |
| E-470 Public Highway Authority Rev., CO, Capital Appreciation, “B”, NATL, 0%, 9/01/2027 | | | 12,305,000 | | | | 8,008,709 | |
| Garfield & Mesa Counties, CO, Grand River Hospital District Rev., AGM, 5.25%, 12/01/2035 | | | 2,000,000 | | | | 2,306,740 | |
| Public Authority for Colorado Energy Natural Gas Purchase Rev., 6.25%, 11/15/2028 | | | 6,860,000 | | | | 8,537,819 | |
| Tallyn’s Reach, CO, Metropolitan District No. 3, 5%, 12/01/2033 | | | 403,000 | | | | 420,144 | |
23
Portfolio of Investments – continued
| | | | | | | | |
| | |
| Issuer | | Shares/Par | | | Value ($) | |
| Municipal Bonds - continued | | | | | | | | |
| Colorado - continued | | | | | | | | |
| Tallyn’s Reach, CO, Metropolitan District No. 3, 5.125%, 11/01/2038 | | $ | 824,000 | | | $ | 858,023 | |
| | | | | | | | |
| | | | | | | $ | 114,534,703 | |
| Connecticut - 0.7% | | | | | | | | |
| Connecticut Health & Educational Facilities Authority Rev. (Masonicare), “F”, 5%, 7/01/2043 | | $ | 8,535,000 | | | $ | 8,860,867 | |
| Connecticut Housing Finance Authority Rev. (Housing Mortgage Finance Program), “D-1”, 4%, 11/15/2044 | | | 1,275,000 | | | | 1,308,749 | |
| Hartford County, CT, Metropolitan District, “C”, AGM, 5%, 11/01/2029 | | | 3,325,000 | | | | 3,886,260 | |
| Hartford County, CT, Metropolitan District, “C”, AGM, 5%, 11/01/2031 | | | 2,830,000 | | | | 3,290,469 | |
| Mohegan Tribal Finance Authority, CT, Economic Development Bonds, 7%, 2/01/2045 (n) | | | 12,430,000 | | | | 12,632,236 | |
| Mohegan Tribe Indians, CT, Gaming Authority Rev., “C”, 4.75%, 2/01/2020 (n) | | | 1,505,000 | | | | 1,516,860 | |
| University of Connecticut, General Obligation, “A”, 5%, 4/15/2027 | | | 1,150,000 | | | | 1,334,115 | |
| University of Connecticut, General Obligation, “A”, 5%, 1/15/2034 | | | 2,940,000 | | | | 3,258,637 | |
| | | | | | | | |
| | | | | | | $ | 36,088,193 | |
| Delaware - 0.5% | | | | | | | | |
| Delaware Economic Development Authority Charter School Rev. (Aspira of Delaware Charter Operations, Inc. Project), “A”, 5%, 6/01/2036 | | $ | 920,000 | | | $ | 918,868 | |
| Delaware Economic Development Authority Charter School Rev. (Aspira of Delaware Charter Operations, Inc. Project), “A”, 5%, 6/01/2046 | | | 1,635,000 | | | | 1,578,216 | |
| Delaware Economic Development Authority Rev. (Delaware Military Academy, Inc. Project), 4.625%, 9/01/2034 | | | 915,000 | | | | 939,156 | |
| Delaware Economic Development Authority Rev. (Delaware Military Academy, Inc. Project), 5%, 9/01/2044 | | | 1,030,000 | | | | 1,072,312 | |
| Delaware Economic Development Authority Rev. (Delaware Military Academy, Inc. Project), 5%, 9/01/2049 | | | 1,210,000 | | | | 1,243,384 | |
| Delaware Economic Development Authority Rev. (Newark Charter School, Inc.), 5%, 9/01/2042 | | | 1,420,000 | | | | 1,461,904 | |
| Delaware Economic Development Authority Rev. (Newark Charter School, Inc.), “A”, 5%, 9/01/2036 | | | 285,000 | | | | 307,125 | |
| Delaware Economic Development Authority Rev. (Newark Charter School, Inc.), “A”, 5%, 9/01/2046 | | | 620,000 | | | | 654,763 | |
| Delaware Health Facilities Authority Rev., 5%, 6/01/2043 | | | 4,230,000 | | | | 4,563,493 | |
24
Portfolio of Investments – continued
| | | | | | | | |
| | |
| Issuer | | Shares/Par | | | Value ($) | |
| Municipal Bonds - continued | | | | | | | | |
| Delaware - continued | | | | | | | | |
| Delaware Health Facilities Authority Rev., 5%, 6/01/2048 | | $ | 2,115,000 | | | $ | 2,272,864 | |
| Delaware Health Facilities Authority Rev. (Beebe Medical Center Project), 5%, 6/01/2050 | | | 4,250,000 | | | | 4,560,080 | |
| Kent County, DE, Student Housing and Dining Facility Rev.(CHF-Dover, LLC-Delaware State University Project), “A”, 5%, 7/01/2040 | | | 750,000 | | | | 797,048 | |
| Kent County, DE, Student Housing and Dining Facility Rev.(CHF-Dover, LLC-Delaware State University Project), “A”, 5%, 7/01/2048 | | | 1,025,000 | | | | 1,080,699 | |
| Kent County, DE, Student Housing and Dining Facility Rev.(CHF-Dover, LLC-Delaware State University Project), “A”, 5%, 7/01/2053 | | | 895,000 | | | | 940,251 | |
| Kent County, DE, Student Housing and Dining Facility Rev.(CHF-Dover, LLC-Delaware State University Project), “A”, 5%, 7/01/2058 | | | 1,165,000 | | | | 1,214,268 | |
| | | | | | | | |
| | | | | | | $ | 23,604,431 | |
| District of Columbia - 0.5% | | | | | | | | |
| District of Columbia Rev. (Friendship Public Charter School), “A”, 5%, 6/01/2036 | | $ | 2,845,000 | | | $ | 3,076,469 | |
| District of Columbia Rev. (Friendship Public Charter School), “A”, 5%, 6/01/2046 | | | 755,000 | | | | 801,999 | |
| District of Columbia Rev. (Kipp, D.C. Charter School), “A”, 6%, 7/01/2033 (Prerefunded 7/01/2023) | | | 420,000 | | | | 494,231 | |
| District of Columbia Rev. (Kipp, D.C. Charter School), “A”, 6%, 7/01/2043 (Prerefunded 7/01/2023) | | | 1,095,000 | | | | 1,288,530 | |
| District of Columbia Rev. (Methodist Home of the District of Columbia Issue), 4.5%, 1/01/2025 | | | 905,000 | | | | 880,710 | |
| District of Columbia Rev. (Methodist Home of the District of Columbia Issue), “A”, 5.125%, 1/01/2035 | | | 1,175,000 | | | | 1,113,113 | |
| District of Columbia Rev. (Methodist Home of the District of Columbia Issue), “A”, 5.25%, 1/01/2039 | | | 775,000 | | | | 730,244 | |
| District of Columbia Student Dormitory Rev. (Provident Group - Howard Properties LLC), 5%, 10/01/2030 | | | 1,475,000 | | | | 1,509,028 | |
| District of Columbia Student Dormitory Rev. (Provident Group - Howard Properties LLC), 5%, 10/01/2035 | | | 5,605,000 | | | | 5,679,378 | |
| District of Columbia Student Dormitory Rev. (Provident Group - Howard Properties LLC), 5%, 10/01/2045 | | | 8,820,000 | | | | 8,834,024 | |
| District of Columbia, Tobacco Settlement, 6.75%, 5/15/2040 | | | 885,000 | | | | 915,665 | |
| | | | | | | | |
| | | | | | | $ | 25,323,391 | |
| Florida - 6.1% | | | | | | | | |
| Alachua County, FL, Health Facilities Authority Rev. (East Ridge Retirement Village, Inc.), 6%, 11/15/2034 | | $ | 1,180,000 | | | $ | 1,050,648 | |
25
Portfolio of Investments – continued
| | | | | | | | |
| | |
| Issuer | | Shares/Par | | | Value ($) | |
| Municipal Bonds - continued | | | | | | | | |
| Florida - continued | | | | | | | | |
| Alachua County, FL, Health Facilities Authority Rev. (East Ridge Retirement Village, Inc.), 6.25%, 11/15/2044 | | $ | 2,955,000 | | | $ | 2,547,831 | |
| Alachua County, FL, Health Facilities Authority Rev. (East Ridge Retirement Village, Inc.), 6.375%, 11/15/2049 | | | 1,970,000 | | | | 1,713,270 | |
| Alachua County, FL, Health Facilities Authority, Continuing Care Rev. (Oak Hammock at the University of Florida, Inc.), “A”, 8%, 10/01/2032 | | | 1,250,000 | | | | 1,414,013 | |
| Alachua County, FL, Health Facilities Authority, Continuing Care Rev. (Oak Hammock at the University of Florida, Inc.), “A”, 8%, 10/01/2042 | | | 2,000,000 | | | | 2,251,580 | |
| Alachua County, FL, Health Facilities Authority, Continuing Care Rev. (Oak Hammock at the University of Florida, Inc.), “A”, 8%, 10/01/2046 | | | 1,000,000 | | | | 1,122,200 | |
| Arborwood Community Development District, FL, Capital Improvement Refunding Rev. (Subordinate Lien), “A-2”, 4.125%, 5/01/2023 | | | 755,000 | | | | 749,889 | |
| Arborwood Community Development District, FL, Capital Improvement Refunding Rev. (Subordinate Lien), “A-2”, 4.625%, 5/01/2028 | | | 700,000 | | | | 689,871 | |
| Arborwood Community Development District, FL, Capital Improvement Refunding Rev. (Subordinate Lien), “A-2”, 5%, 5/01/2036 | | | 970,000 | | | | 946,933 | |
| Arborwood Community Development District, FL, Capital Improvement Rev., “A-1”, 6.9%, 5/01/2036 | | | 280,000 | | | | 303,565 | |
| Arborwood Community Development District, FL, Capital Improvement Rev., “B”, 6.9%, 5/01/2025 | | | 240,000 | | | | 263,494 | |
| Arborwood Community Development District, FL, Capital Improvement Rev., “B”, 6.9%, 5/01/2036 | | | 25,000 | | | | 26,843 | |
| Baker, FL, Correctional Development Corp. (Baker County Detention Center), 8.5%, 2/01/2030 (Put Date 5/01/2020) | | | 1,516,200 | | | | 1,246,180 | |
| Bellalago, FL, Educational Facilities Benefit District (Osceola County) Capital Improvement Refunding Rev., 4.375%, 5/01/2030 | | | 690,000 | | | | 729,151 | |
| Bellalago, FL, Educational Facilities Benefit District (Osceola County) Capital Improvement Refunding Rev., 4.5%, 5/01/2033 | | | 320,000 | | | | 337,542 | |
| Bellalago, FL, Educational Facilities Benefit District (Osceola County) Capital Improvement Refunding Rev., 4.6%, 5/01/2034 | | | 1,355,000 | | | | 1,434,403 | |
| Brevard County, FL, Industrial Development Rev. (TUFF Florida Tech LLC Project), 6.75%, 11/01/2039 | | | 4,720,000 | | | | 4,805,290 | |
| Cape Coral, FL, Health Facilities Authority, Senior Housing Rev. (Gulf Care, Inc. Project), 5.875%, 7/01/2040 | | | 3,590,000 | | | | 3,780,342 | |
| Capital Region Community Development District, FL, Capital Improvement Rev., “A-1”, 4.125%, 5/01/2023 | | | 400,000 | | | | 397,672 | |
26
Portfolio of Investments – continued
| | | | | | | | |
| | |
| Issuer | | Shares/Par | | | Value ($) | |
| Municipal Bonds - continued | | | | | | | | |
| Florida - continued | | | | | | | | |
| Capital Region Community Development District, FL, Capital Improvement Rev., “A-1”, 4.625%, 5/01/2028 | | $ | 400,000 | | | $ | 394,944 | |
| Capital Region Community Development District, FL, Capital Improvement Rev., “A-1”, 5.125%, 5/01/2039 | | | 2,755,000 | | | | 2,697,035 | |
| Century Gardens Village Community Development District, FL, Special Assessment, 5.1%, 5/01/2037 | | | 915,000 | | | | 909,556 | |
| Collier County, FL, Educational Facilities Authority Rev. (Ave Maria University, Inc. Project), “A”, 6.125%, 6/01/2043 | | | 5,910,000 | | | | 6,268,914 | |
| Collier County, FL, Industrial Development Authority Continuing Care Community Rev. (The Arlington of Naples Project), “A”, 5.5%, 5/15/2025 | | | 300,000 | | | | 288,879 | |
| Collier County, FL, Industrial Development Authority Continuing Care Community Rev. (The Arlington of Naples Project), “A”, 6.25%, 5/15/2035 | | | 300,000 | | | | 275,853 | |
| Collier County, FL, Industrial Development Authority Continuing Care Community Rev. (The Arlington of Naples Project), “A”, 7.75%, 5/15/2035 | | | 1,055,000 | | | | 1,029,522 | |
| Collier County, FL, Industrial Development Authority Continuing Care Community Rev. (The Arlington of Naples Project), “A”, 8.125%, 5/15/2044 | | | 10,590,000 | | | | 10,283,631 | |
| Collier County, FL, Industrial Development Authority Continuing Care Community Rev. (The Arlington of Naples Project), “A”, 6.5%, 5/15/2049 | | | 805,000 | | | | 715,629 | |
| Creekside Community Development District, FL, Special Assessment, 5.2%, 5/01/2038 (a)(d) | | | 1,400,000 | | | | 630,000 | |
| Cypress Bluff Community Development District, 3.75%, 5/01/2024 | | | 1,375,000 | | | | 1,376,636 | |
| Cypress Bluff Community Development District, 4.125%, 5/01/2029 | | | 1,275,000 | | | | 1,279,399 | |
| Cypress Bluff Community Development District, 4.9%, 5/01/2039 | | | 3,650,000 | | | | 3,667,228 | |
| Cypress Bluff Community Development District, 5.1%, 5/01/2048 | | | 2,630,000 | | | | 2,642,282 | |
| Daytona Beach, FL, Halifax Hospital Medical Center Rev., 5%, 6/01/2020 | | | 395,000 | | | | 410,144 | |
| Daytona Beach, FL, Halifax Hospital Medical Center Rev., 5%, 6/01/2024 | | | 575,000 | | | | 647,456 | |
| Daytona Beach, FL, Halifax Hospital Medical Center Rev., 5%, 6/01/2025 | | | 670,000 | | | | 765,301 | |
| Daytona Beach, FL, Halifax Hospital Medical Center Rev., 5%, 6/01/2035 | | | 1,650,000 | | | | 1,781,488 | |
| Daytona Beach, FL, Halifax Hospital Medical Center Rev., 5%, 6/01/2046 | | | 2,245,000 | | | | 2,375,681 | |
| Escambia County, FL, Health Facilities Authority (Baptist Hospital, Inc.), “A”, 5.75%, 8/15/2029 | | | 1,000,000 | | | | 1,051,740 | |
27
Portfolio of Investments – continued
| | | | | | | | |
| | |
| Issuer | | Shares/Par | | | Value ($) | |
| Municipal Bonds - continued | | | | | | | | |
| Florida - continued | | | | | | | | |
| Escambia County, FL, Health Facilities Authority (Baptist Hospital, Inc.), “A”, 6%, 8/15/2036 | | $ | 3,050,000 | | | $ | 3,215,889 | |
| Florida Capital Trust Agency, Education Facilities Rev. (The Florida Charter Educational Foundation, Inc. Project), “A”, 4.5%, 6/15/2028 | | | 1,180,000 | | | | 1,174,596 | |
| Florida Capital Trust Agency, Education Facilities Rev. (The Florida Charter Educational Foundation, Inc. Project), “A”, 5.375%, 6/15/2038 | | | 1,005,000 | | | | 990,076 | |
| Florida Capital Trust Agency, Education Facilities Rev. (The Florida Charter Educational Foundation, Inc. Project), “A”, 5.375%, 6/15/2048 | | | 1,700,000 | | | | 1,645,056 | |
| Florida Capital Trust Agency, Education Facilities Rev. (Viera Charter Schools, Inc. Project), “A”, 5%, 10/15/2037 | | | 510,000 | | | | 508,123 | |
| Florida Capital Trust Agency, Education Facilities Rev. (Viera Charter Schools, Inc. Project), “A”, 5%, 10/15/2047 | | | 1,180,000 | | | | 1,144,930 | |
| Florida Capital Trust Agency, Education Facilities Rev. (Viera Charter Schools, Inc. Project), “A”, 5%, 10/15/2052 | | | 1,295,000 | | | | 1,234,174 | |
| Florida Development Finance Corp. Educational Facilities Rev. (Bay Area Charter Foundation LLC), “A”, 7.75%, 6/15/2042 | | | 3,480,000 | | | | 3,686,816 | |
| Florida Development Finance Corp. Educational Facilities Rev. (Florida Charter Educational Foundation Project), “A”, 6.25%, 6/15/2036 | | | 1,155,000 | | | | 1,216,053 | |
| Florida Development Finance Corp. Educational Facilities Rev. (Florida Charter Educational Foundation Project, Inc.), “A”, 6.375%, 6/15/2046 | | | 1,980,000 | | | | 2,083,594 | |
| Florida Development Finance Corp. Educational Facilities Rev. (Renaissance Charter School), “A”, 6%, 9/15/2030 | | | 2,575,000 | | | | 2,666,438 | |
| Florida Development Finance Corp. Educational Facilities Rev. (Renaissance Charter School), “A”, 6%, 6/15/2032 | | | 1,950,000 | | | | 2,010,157 | |
| Florida Development Finance Corp. Educational Facilities Rev. (Renaissance Charter School), “A”, 6%, 9/15/2040 | | | 7,490,000 | | | | 7,702,566 | |
| Florida Development Finance Corp. Educational Facilities Rev. (Renaissance Charter School), “A”, 7.625%, 6/15/2041 | | | 13,110,000 | | | | 14,069,783 | |
| Florida Development Finance Corp. Educational Facilities Rev. (Renaissance Charter School), “A”, 6.125%, 6/15/2043 | | | 4,070,000 | | | | 4,148,266 | |
| Florida Development Finance Corp. Educational Facilities Rev. (Renaissance Charter School), “A”, 6.125%, 6/15/2044 | | | 5,000,000 | | | | 5,220,800 | |
| Florida Development Finance Corp. Educational Facilities Rev. (Southwest Charter Foundation, Inc. Project), “A”, 6%, 6/15/2037 | | | 1,510,000 | | | | 1,520,721 | |
| Florida Development Finance Corp. Educational Facilities Rev. (Southwest Charter Foundation, Inc. Project), “A”, 6.125%, 6/15/2047 | | | 4,445,000 | | | | 4,435,665 | |
28
Portfolio of Investments – continued
| | | | | | | | |
| | |
| Issuer | | Shares/Par | | | Value ($) | |
| Municipal Bonds - continued | | | | | | | | |
| Florida - continued | | | | | | | | |
| Florida Higher Educational Facilities Financing Authority Rev. (Jacksonville University Project), “A”, 4.5%, 6/01/2033 | | $ | 2,220,000 | | | $ | 2,258,828 | |
| Florida Higher Educational Facilities Financing Authority Rev. (Jacksonville University Project), “A”, 4.75%, 6/01/2038 | | | 2,070,000 | | | | 2,115,271 | |
| Florida Higher Educational Facilities Financing Authority Rev. (Jacksonville University Project), “A”, 5%, 6/01/2048 | | | 3,195,000 | | | | 3,298,135 | |
| Florida Housing Finance Corp, Homeowner Mortgage Rev. “1”, 4%, 7/01/2049 (u) | | | 4,890,000 | | | | 5,192,887 | |
| Florida Mid-Bay Bridge Authority Rev., “A”, 5%, 10/01/2035 | | | 5,000,000 | | | | 5,463,950 | |
| Jacksonville, FL, Educational Facilities Rev. (Jacksonville University Project), “B”, 5%, 6/01/2053 | | | 2,345,000 | | | | 2,402,804 | |
| Jacksonville, FL, Electric Authority Systems Rev., “B”, 5%, 10/01/2032 | | | 3,325,000 | | | | 3,765,795 | |
| Lakewood Ranch Stewardship District, FL, Special Assessment Rev. (Lakewood Centre North Project), 4.25%, 5/01/2025 | | | 690,000 | | | | 694,333 | |
| Lakewood Ranch Stewardship District, FL, Special Assessment Rev. (Lakewood Centre North Project), 4.875%, 5/01/2035 | | | 1,355,000 | | | | 1,357,425 | |
| Lakewood Ranch Stewardship District, FL, Special Assessment Rev. (Lakewood Centre North Project), 4.875%, 5/01/2045 | | | 2,450,000 | | | | 2,387,843 | |
| Lakewood Ranch Stewardship District, FL, Special Assessment Rev. (Lakewood National and Polo Run Projects), 5.375%, 5/01/2047 | | | 2,825,000 | | | | 2,907,151 | |
| Lee County, FL, Industrial Development Authority Healthcare Facilities Rev. (Shell Point Alliance), “B”, 6.5%, 11/15/2031 | | | 1,600,000 | | | | 1,754,512 | |
| Legends Bay Community Development District, FL, “A”, 5.875%, 5/01/2038 | | | 1,650,000 | | | | 1,650,297 | |
| Live Oak Lake Community Development District, FL, Capital Improvement Rev., 4.5%, 5/01/2036 | | | 4,680,000 | | | | 4,447,778 | |
| Live Oak Lake Community Development District, FL, Capital Improvement Rev., 4.625%, 5/01/2047 | | | 2,720,000 | | | | 2,523,725 | |
| Marshall Creek, FL, Community Development District Rev. (St. John’s County), “A”, 5%, 5/01/2032 | | | 1,560,000 | | | | 1,559,875 | |
| Miami Beach, FL, Health Facilities Authority Hospital Rev. (Mount Sinai Medical Center of Florida), 5%, 11/15/2039 | | | 1,000,000 | | | | 1,057,970 | |
| Miami-Dade County, FL, Health Facilities Authority Hospital Rev. (Miami Children’s Hospital), 6%, 8/01/2046 (Prerefunded 8/01/2021) | | | 7,250,000 | | | | 7,992,400 | |
| Miami-Dade County, FL, Industrial Development Authority Rev. (Doral Academy Project), 5%, 1/15/2032 | | | 1,000,000 | | | | 1,069,140 | |
| Miami-Dade County, FL, Industrial Development Authority Rev. (Doral Academy Project), 5%, 1/15/2037 | | | 1,215,000 | | | | 1,277,585 | |
| Miami-Dade County, FL, Industrial Development Authority Rev. (Doral Academy Project), 5%, 1/15/2048 | | | 3,255,000 | | | | 3,371,269 | |
29
Portfolio of Investments – continued
| | | | | | | | |
| | |
| Issuer | | Shares/Par | | | Value ($) | |
| Municipal Bonds - continued | | | | | | | | |
| Florida - continued | | | | | | | | |
| Miami-Dade County, FL, Industrial Development Authority Rev. (Pinecrest Academy Project), 5%, 9/15/2024 | | $ | 345,000 | | | $ | 369,944 | |
| Miami-Dade County, FL, Industrial Development Authority Rev. (Pinecrest Academy Project), 5.25%, 9/15/2044 | | | 2,895,000 | | | | 3,027,794 | |
| Miami-Dade County, FL, Rickenbacker Causeway Rev., 5%, 10/01/2043 | | | 2,000,000 | | | | 2,170,880 | |
| Mid-Bay Bridge Authority Rev., FL, Springing Lien, “A”, 7.25%, 10/01/2034 (Prerefunded 10/01/2021) | | | 300,000 | | | | 341,991 | |
| Mid-Bay Bridge Authority Rev., FL, Springing Lien, “A”, 7.25%, 10/01/2040 (Prerefunded 10/01/2021) | | | 8,365,000 | | | | 9,535,849 | |
| Midtown Miami, FL, Community Development District Special Assessment (Infrastructure Project), “B”, 5%, 5/01/2029 | | | 1,210,000 | | | | 1,261,026 | |
| Midtown Miami, FL, Community Development District Special Assessment (Infrastructure Project), “B”, 5%, 5/01/2037 | | | 740,000 | | | | 764,191 | |
| Midtown Miami, FL, Community Development District Special Assessment (Parking Garage Project), “A”, 5%, 5/01/2037 | | | 1,055,000 | | | | 1,089,488 | |
| Miromar Lakes, FL, Community Development District, Capital Improvement Rev., 4.875%, 5/01/2022 | | | 425,000 | | | | 438,005 | |
| Miromar Lakes, FL, Community Development District, Capital Improvement Rev., 5.375%, 5/01/2032 | | | 940,000 | | | | 956,243 | |
| Naturewalk Community Development District, FL, Capital Improvement Rev., “B��, 2.65%, 5/01/2019 (d)(q) | | | 1,575,000 | | | | 1,244,250 | |
| North Broward, FL, Hospital District Rev. (Broward Health), “B”, 5%, 1/01/2042 | | | 7,340,000 | | | | 7,789,208 | |
| Orlando, FL, Senior Tourist Development Tax Refunding Rev. (6th Cent Contract Payments), “A”, AGM, 5%, 11/01/2034 | | | 405,000 | | | | 460,850 | |
| OTC Community Development District, FL, Special Assessment, “A”, 5.3%, 5/01/2038 | | | 3,910,000 | | | | 3,803,961 | |
| Palm Beach County, FL, Health Facilities Authority Hospital Rev. (BRRH Corp. Obligated Group), 5%, 12/01/2031 | | | 1,000,000 | | | | 1,091,590 | |
| Palm Beach County, FL, Health Facilities Rev. (Sinai Residences of Boca Raton Project), 7.5%, 6/01/2049 | | | 2,030,000 | | | | 2,280,522 | |
| Palm River, FL, Community Development District, Special Assessment Rev., “A”, 5.375%, 5/01/2036 (a)(d) | | | 895,000 | | | | 447,500 | |
| Palm River, FL, Community Development District, Special Assessment Rev., “B”, 5.15%, 5/01/2019 (a)(d) | | | 1,000,000 | | | | 500,000 | |
| Pasco County, FL, Bexley Community Development District, Special Assessment Rev., 3.5%, 5/01/2021 | | | 315,000 | | | | 314,172 | |
| Pasco County, FL, Bexley Community Development District, Special Assessment Rev., 4.1%, 5/01/2026 | | | 500,000 | | | | 498,115 | |
| Pasco County, FL, Bexley Community Development District, Special Assessment Rev., 4.7%, 5/01/2036 | | | 1,370,000 | | | | 1,360,314 | |
30
Portfolio of Investments – continued
| | | | | | | | |
| | |
| Issuer | | Shares/Par | | | Value ($) | |
| Municipal Bonds - continued | | | | | | | | |
| Florida - continued | | | | | | | | |
| Pasco County, FL, Bexley Community Development District, Special Assessment Rev., 4.875%, 5/01/2047 | | $ | 2,530,000 | | | $ | 2,486,003 | |
| Pasco County, FL, Concord Station Community Development District,“A-1”, 3.5%, 5/01/2032 | | | 1,435,000 | | | | 1,438,602 | |
| Pasco County, FL, Concord Station Community Development District,“A-1”, 3.625%, 5/01/2035 | | | 865,000 | | | | 864,438 | |
| Pasco County, FL, Concord Station Community Development District,“A-1”, 3.75%, 5/01/2046 | | | 1,000,000 | | | | 965,150 | |
| Pasco County, FL, Del Webb Bexley Community Development District, Special Assessment Rev., 5.3%, 5/01/2039 | | | 990,000 | | | | 993,128 | |
| Pasco County, FL, Del Webb Bexley Community Development District, Special Assessment Rev., 5.4%, 5/01/2049 | | | 1,270,000 | | | | 1,274,001 | |
| Pasco County, FL, Estancia At Wiregrass Community Development District, Capital Improvement, 5.25%, 11/01/2035 | | | 450,000 | | | | 461,030 | |
| Pasco County, FL, Estancia At Wiregrass Community Development District, Capital Improvement, 7%, 11/01/2045 | | | 1,995,000 | | | | 2,333,591 | |
| Pasco County, FL, Estancia At Wiregrass Community Development District, Capital Improvement, 5.375%, 11/01/2046 | | | 390,000 | | | | 398,962 | |
| Pinellas County, FL, Educational Facilities Authority Rev. (Barry University), 6%, 10/01/2041 | | | 5,330,000 | | | | 5,606,947 | |
| Sarasota County, FL, Health Facility Authority Retirement Facility Improvement Rev. (Village on the Isle Project), “A”, 5%, 1/01/2047 | | | 1,020,000 | | | | 1,043,358 | |
| Sarasota County, FL, Health Facility Authority Retirement Facility Improvement Rev. (Village on the Isle Project), “A”, 5%, 1/01/2052 | | | 1,875,000 | | | | 1,911,712 | |
| Seminole County, FL, Industrial Development Authority Rev. (Choices in Learning, Inc.), “A”, 7.375%, 11/15/2041 | | | 3,900,000 | | | | 4,121,637 | |
| South Lake County, FL, Hospital District Rev. (South Lake Hospital), “A”, 6%, 4/01/2029 | | | 1,155,000 | | | | 1,161,041 | |
| South Lake County, FL, Hospital District Rev. (South Lake Hospital), “A”, 6.25%, 4/01/2039 | | | 1,715,000 | | | | 1,724,364 | |
| St. John’s County, FL, Industrial Development Authority Rev. (Bayview Project), “A”, 5.2%, 10/01/2027 | | | 1,475,000 | | | | 1,355,835 | |
| St. John’s County, FL, Industrial Development Authority Rev. (Bayview Project), “A”, 5.25%, 10/01/2041 | | | 2,800,000 | | | | 2,265,928 | |
| St. John’s County, FL, Industrial Development Authority Rev. (Presbyterian Retirement), “A”, 6%, 8/01/2045 (Prerefunded 8/01/2020) | | | 7,715,000 | | | | 8,187,467 | |
| Sterling Hill Community Development District, FL, Capital Improvement Rev., “B”, 5.5%, 11/01/2019 (d) | | | 498,884 | | | | 319,286 | |
| Sumter County, FL, Industrial Development Authority Hospital Rev. (Central Florida Health Alliance Projects), “A”, 5%, 7/01/2026 | | | 155,000 | | | | 173,628 | |
31
Portfolio of Investments – continued
| | | | | | | | |
| | |
| Issuer | | Shares/Par | | | Value ($) | |
| Municipal Bonds - continued | | | | | | | | |
| Florida - continued | | | | | | | | |
| Sumter County, FL, Industrial Development Authority Hospital Rev. (Central Florida Health Alliance Projects), “A”, 5%, 7/01/2029 | | $ | 145,000 | | | $ | 159,881 | |
| Sumter County, FL, Industrial Development Authority Hospital Rev. (Central Florida Health Alliance Projects), “A”, 5.125%, 7/01/2034 | | | 315,000 | | | | 341,142 | |
| Sumter County, FL, Industrial Development Authority Hospital Rev. (Central Florida Health Alliance Projects), “A”, 5.25%, 7/01/2044 | | | 935,000 | | | | 1,002,077 | |
| Tallahassee, FL, Health Facilities Rev. (Tallahassee Memorial Healthcare, Inc.), “A”, 5%, 12/01/2040 | | | 5,935,000 | | | | 6,373,181 | |
| Tallahassee, FL, Health Facilities Rev. (Tallahassee Memorial Healthcare, Inc.), “A”, 5%, 12/01/2044 | | | 2,695,000 | | | | 2,872,061 | |
| Tallahassee, FL, Health Facilities Rev. (Tallahassee Memorial Healthcare, Inc.), “A”, 5%, 12/01/2055 | | | 3,500,000 | | | | 3,711,330 | |
| Tampa, FL (University of Tampa Project), 5%, 4/01/2040 | | | 965,000 | | | | 1,064,192 | |
| Trout Creek Community Development District, FL, Capital Improvement Rev., 5.5%, 5/01/2035 | | | 2,280,000 | | | | 2,308,591 | |
| Trout Creek Community Development District, FL, Capital Improvement Rev., 5.625%, 5/01/2045 | | | 4,115,000 | | | | 4,147,961 | |
| Tuscany Reserve Community Development District, FL, Special Assessment, “B”, 5.25%, 5/01/2021 | | | 240,000 | | | | 240,079 | |
| University of South Florida Financing Corp, Refunding Certificates of Participation, “A”, 5%, 7/01/2031 | | | 5,420,000 | | | | 6,190,019 | |
| Villa Portofino East Community Development District, FL, Special Assessment, 5.2%, 5/01/2037 | | | 1,680,000 | | | | 1,588,978 | |
| Wiregrass Community Development District, FL, Capital Improvement Rev., 5.375%, 5/01/2035 | | | 455,000 | | | | 471,412 | |
| Wiregrass Community Development District, FL, Capital Improvement Rev., 4.875%, 5/01/2036 | | | 915,000 | | | | 915,210 | |
| Wiregrass Community Development District, FL, Capital Improvement Rev., 5.625%, 5/01/2045 | | | 1,000,000 | | | | 1,035,780 | |
| Wiregrass Community Development District, FL, Capital Improvement Rev., 5%, 5/01/2047 | | | 1,695,000 | | | | 1,664,659 | |
| | | | | | | | |
| | | | | | | $ | 295,443,265 | |
| Georgia - 0.7% | | | | | | | | |
| Americus and Sumter County, GA, Hospital Authority Rev. (Magnolia Manor Obligated Group), “A”, 6.25%, 5/15/2033 | | $ | 1,060,000 | | | $ | 1,136,097 | |
| Americus and Sumter County, GA, Hospital Authority Rev. (Magnolia Manor Obligated Group), “A”, 6.375%, 5/15/2043 | | | 1,060,000 | | | | 1,135,239 | |
| Atlanta, GA, Water & Wastewater Rev., “A”, 6%, 11/01/2022 (Prerefunded 11/01/2019) | | | 2,895,000 | | | | 2,987,814 | |
32
Portfolio of Investments – continued
| | | | | | | | |
| | |
| Issuer | | Shares/Par | | | Value ($) | |
| Municipal Bonds - continued | | | | | | | | |
| Georgia - continued | | | | | | | | |
| Clayton County, GA, Development Authority Special Facilities Rev. (Delta Airlines, Inc.), “A”, 8.75%, 6/01/2029 | | $ | 4,070,000 | | | $ | 4,407,077 | |
| Cobb County, GA, Development Authority, Student Housing Rev. (Kennesaw State University Real Estate Foundations), “C”, 5%, 7/15/2030 | | | 580,000 | | | | 632,612 | |
| Cobb County, GA, Development Authority, Student Housing Rev. (Kennesaw State University Real Estate Foundations), “C”, 5%, 7/15/2033 | | | 1,025,000 | | | | 1,100,789 | |
| Cobb County, GA, Development Authority, Student Housing Rev. (Kennesaw State University Real Estate Foundations), “C”, 5%, 7/15/2038 | | | 1,100,000 | | | | 1,154,934 | |
| DeKalb County, GA, Hospital Authority Rev. (DeKalb Medical Center, Inc. Project), 6.125%, 9/01/2040 (Prerefunded 9/01/2020) | | | 7,170,000 | | | | 7,641,212 | |
| Georgia Housing & Finance Authority Rev., Single Family Mortgage, “A-1”, 4%, 6/01/2044 | | | 670,000 | | | | 692,257 | |
| Georgia Main Street Natural Gas, Inc., Gas Project Rev., “A”, 5.5%, 9/15/2028 | | | 2,245,000 | | | | 2,754,862 | |
| Hall County and Gainesville, GA, Hospital Authority Rev. (Northeast Georgia Health System, Inc.), “A”, 5.5%, 8/15/2054 | | | 3,465,000 | | | | 3,931,424 | |
| Marietta, GA, Development Facilities Authority Rev. (Life University, Inc. Project), “A”, 5%, 11/01/2037 | | | 2,880,000 | | | | 3,010,464 | |
| Marietta, GA, Development Facilities Authority Rev. (Life University, Inc. Project), “A”, 5%, 11/01/2047 | | | 1,960,000 | | | | 2,030,050 | |
| Private Colleges & Universities, GA, Authority Rev. (Mercer University Project), “C”, 5.25%, 10/01/2027 | | | 920,000 | | | | 991,834 | |
| | | | | | | | |
| | | | | | | $ | 33,606,665 | |
| Guam - 0.7% | | | | | | | | |
| Guam Education Financing Foundation, COP (Guam Public School Facilities Project), “B”, 5%, 10/01/2026 | | $ | 12,905,000 | | | $ | 12,941,392 | |
| Guam Government Business Privilege Tax Rev., “A”, 5.25%, 1/01/2036 | | | 970,000 | | | | 1,012,147 | |
| Guam Government Department of Education (John F. Kennedy High School), “A”, COP, 6.625%, 12/01/2030 | | | 4,245,000 | | | | 4,341,956 | |
| Guam Government Department of Education (John F. Kennedy High School), “A”, COP, 6.875%, 12/01/2040 | | | 10,975,000 | | | | 11,264,740 | |
| Guam Government, “A”, 7%, 11/15/2039 (Prerefunded 11/15/2019) | | | 1,115,000 | | | | 1,161,217 | |
| Guam Waterworks Authority Rev. (Water and Wastewater System), 5%, 7/01/2036 | | | 355,000 | | | | 380,375 | |
| Guam Waterworks Authority Rev. (Water and Wastewater System), 5%, 1/01/2046 | | | 1,620,000 | | | | 1,702,490 | |
| | | | | | | | |
| | | | | | | $ | 32,804,317 | |
33
Portfolio of Investments – continued
| | | | | | | | |
| | |
| Issuer | | Shares/Par | | | Value ($) | |
| Municipal Bonds - continued | | | | | | | | |
| Hawaii - 0.4% | | | | | | | | |
| Hawaii Department of Budget & Finance, Special Purpose Rev. (15 Craigside Project), “A”, 8.75%, 11/15/2029 (Prerefunded 11/15/2019) | | $ | 830,000 | | | $ | 874,272 | |
| Hawaii Department of Budget & Finance, Special Purpose Rev. (15 Craigside Project), “A”, 9%, 11/15/2044 (Prerefunded 11/15/2019) | | | 1,190,000 | | | | 1,255,569 | |
| Hawaii Department of Budget & Finance, Special Purpose Rev. (Chaminade University), 5%, 1/01/2030 | | | 2,015,000 | | | | 2,024,108 | |
| Hawaii Department of Budget & Finance, Special Purpose Rev. (Chaminade University), 5%, 1/01/2035 | | | 1,125,000 | | | | 1,104,379 | |
| Hawaii Department of Budget & Finance, Special Purpose Rev. (Chaminade University), 5%, 1/01/2045 | | | 1,140,000 | | | | 1,069,172 | |
| Hawaii Department of Budget & Finance, Special Purpose Rev. (Hawaiian Electric Co. & Subsidiary), 6.5%, 7/01/2039 | | | 10,580,000 | | | | 10,768,324 | |
| | | | | | | | |
| | | | | | | $ | 17,095,824 | |
| Idaho - 0.1% | | | | | | | | |
| Idaho Health Facilities Authority Rev. (Madison Memorial Hospital Project), 5%, 9/01/2037 | | $ | 830,000 | | | $ | 878,746 | |
| Idaho Health Facilities Authority Rev. (St. Luke’s Health System Project), “A”, 4%, 3/01/2038 | | | 3,880,000 | | | | 3,889,118 | |
| Idaho Housing and Finance Association Nonprofit Facilities Rev. (Compass Public Charter School, Inc. Project), “A”, 4.625%, 7/01/2029 | | | 185,000 | | | | 184,162 | |
| Idaho Housing and Finance Association Nonprofit Facilities Rev. (Compass Public Charter School, Inc. Project), “A”, 6%, 7/01/2039 | | | 1,100,000 | | | | 1,160,566 | |
| Idaho Housing and Finance Association Nonprofit Facilities Rev. (Compass Public Charter School, Inc. Project), “A”, 6%, 7/01/2054 | | | 565,000 | | | | 585,922 | |
| Idaho Housing and Finance Association Nonprofit Facilities Rev. (Compass Public Charter School, Inc. Project), “A”, 6%, 7/01/2049 | | | 515,000 | | | | 537,917 | |
| | | | | | | | |
| | | | | | | $ | 7,236,431 | |
| Illinois - 10.7% | | | | | | | | |
| Burbank, IL, Educational Facility Rev. (Intercultural Montessori Language School Project), “A”, 6%, 9/01/2035 | | $ | 2,170,000 | | | $ | 2,245,993 | |
| Burbank, IL, Educational Facility Rev. (Intercultural Montessori Language School Project), “A”, 6.25%, 9/01/2045 | | | 3,565,000 | | | | 3,696,762 | |
| Chicago, IL, “A”, 5%, 1/01/2026 | | | 1,000,000 | | | | 1,048,670 | |
| Chicago, IL, “A”, 5.25%, 1/01/2028 | | | 2,095,000 | | | | 2,210,581 | |
| Chicago, IL, “A”, 5.25%, 1/01/2028 | | | 5,245,000 | | | | 5,575,435 | |
34
Portfolio of Investments – continued
| | | | | | | | |
| | |
| Issuer | | Shares/Par | | | Value ($) | |
| Municipal Bonds - continued | | | | | | | | |
| Illinois - continued | | | | | | | | |
| Chicago, IL, “A”, 5.25%, 1/01/2033 | | $ | 5,230,000 | | | $ | 5,449,869 | |
| Chicago, IL, “A”, 5%, 1/01/2034 | | | 5,405,000 | | | | 5,565,799 | |
| Chicago, IL, “A”, 5%, 1/01/2036 | | | 1,920,000 | | | | 1,968,576 | |
| Chicago, IL, “A”, 5.5%, 1/01/2039 | | | 2,380,000 | | | | 2,507,211 | |
| Chicago, IL, “A”, 5%, 1/01/2040 | | | 7,775,000 | | | | 7,850,651 | |
| Chicago, IL, “A”, AAC, 5%, 1/01/2024 | | | 1,365,000 | | | | 1,366,911 | |
| Chicago, IL, “A”, AGM, 5%, 1/01/2027 | | | 280,000 | | | | 282,187 | |
| Chicago, IL, “A”, AGM, 5%, 1/01/2028 (Prerefunded 1/01/2020) | | | 15,070,000 | | | | 15,462,272 | |
| Chicago, IL, “A”, AGM, 4.75%, 1/01/2030 | | | 355,000 | | | | 356,427 | |
| Chicago, IL, “A”, AGM, 4.625%, 1/01/2031 | | | 655,000 | | | | 657,378 | |
| Chicago, IL, “A”, AGM, 5%, 1/01/2037 | | | 4,740,000 | | | | 4,775,740 | |
| Chicago, IL, “A”, Capital Appreciation, NATL, 0%, 1/01/2027 | | | 2,610,000 | | | | 1,950,062 | |
| Chicago, IL, “B”, 5.25%, 1/01/2029 | | | 3,150,000 | | | | 3,338,244 | |
| Chicago, IL, “C”, 5%, 1/01/2026 | | | 1,960,000 | | | | 2,101,669 | |
| Chicago, IL, “C”, NATL, 5%, 1/01/2028 | | | 275,000 | | | | 275,839 | |
| Chicago, IL, “C”, NATL, 5%, 1/01/2029 | | | 5,205,000 | | | | 5,220,563 | |
| Chicago, IL, “D”, 5.5%, 1/01/2033 | | | 1,630,000 | | | | 1,733,652 | |
| Chicago, IL, Board of Education, 5%, 12/01/2042 | | | 12,000,000 | | | | 12,028,080 | |
| Chicago, IL, Board of Education (School Reform), Capital Appreciation, “A”, NATL, 0%, 12/01/2022 | | | 1,810,000 | | | | 1,598,809 | |
| Chicago, IL, Board of Education (School Reform), Capital Appreciation, “A”, NATL, 0%, 12/01/2023 | | | 1,540,000 | | | | 1,305,704 | |
| Chicago, IL, Board of Education (School Reform), Capital Appreciation, “A”, NATL, 0%, 12/01/2028 | | | 12,640,000 | | | | 8,606,829 | |
| Chicago, IL, Board of Education (School Reform), Capital Appreciation, “A”, NATL, 0%, 12/01/2029 | | | 4,250,000 | | | | 2,750,600 | |
| Chicago, IL, Board of Education (School Reform), Capital Appreciation, “A”, NATL, 0%, 12/01/2030 | | | 1,730,000 | | | | 1,064,400 | |
| Chicago, IL, Board of Education (School Reform), Capital Appreciation, “B-1”, NATL, 0%, 12/01/2019 | | | 1,105,000 | | | | 1,079,850 | |
| Chicago, IL, Board of Education (School Reform), Capital Appreciation, “B-1”, NATL, 0%, 12/01/2022 | | | 835,000 | | | | 737,572 | |
| Chicago, IL, Board of Education (School Reform), Capital Appreciation, “B-1”, NATL, 0%, 12/01/2023 | | | 1,020,000 | | | | 864,817 | |
| Chicago, IL, Board of Education (School Reform), Capital Appreciation, “B-1”, NATL, 0%, 12/01/2026 | | | 4,335,000 | | | | 3,233,910 | |
| Chicago, IL, Board of Education (School Reform), Capital Appreciation, “B-1”, NATL, 0%, 12/01/2028 | | | 5,515,000 | | | | 3,740,825 | |
| Chicago, IL, Board of Education, Dedicated Capital Improvement Tax Bond, 5%, 4/01/2033 | | | 380,000 | | | | 409,499 | |
| Chicago, IL, Board of Education, Dedicated Capital Improvement Tax Bond, 5%, 4/01/2042 | | | 2,015,000 | | | | 2,140,998 | |
35
Portfolio of Investments – continued
| | | | | | | | |
| | |
| Issuer | | Shares/Par | | | Value ($) | |
| Municipal Bonds - continued | | | | | | | | |
| Illinois - continued | | | | | | | | |
| Chicago, IL, Board of Education, Dedicated Capital Improvement Tax Bond, 5%, 4/01/2046 | | $ | 1,780,000 | | | $ | 1,886,230 | |
| Chicago, IL, Board of Education, Dedicated Capital Improvement Tax Bond, 6%, 4/01/2046 | | | 19,865,000 | | | | 22,606,171 | |
| Chicago, IL, Board of Education, Unlimited Tax General Obligation Dedicated Rev., “C”, AGM, 5%, 12/01/2030 | | | 3,910,000 | | | | 4,432,141 | |
| Chicago, IL, Board of Education, Unlimited Tax General Obligation Dedicated Rev., “C”, AGM, 5%, 12/01/2031 | | | 7,500,000 | | | | 8,441,400 | |
| Chicago, IL, Board of Education, Unlimited Tax General Obligation Dedicated Rev., “C”, AGM, 5%, 12/01/2032 | | | 6,425,000 | | | | 7,191,760 | |
| Chicago, IL, Board of Education, Unlimited Tax General Obligation Refunding Dedicated Rev., “A”, 5%, 12/01/2034 | | | 1,250,000 | | | | 1,298,100 | |
| Chicago, IL, Board of Education, Unlimited Tax General Obligation Refunding Dedicated Rev., “A”, 5%, 12/01/2035 | | | 1,500,000 | | | | 1,551,705 | |
| Chicago, IL, Board of Education, Unlimited Tax General Obligation Refunding Dedicated Rev., “A”, 7%, 12/01/2046 | | | 7,105,000 | | | | 8,358,038 | |
| Chicago, IL, Board of Education, Unlimited Tax General Obligation Refunding Dedicated Rev., “A”, AAC, 5.5%, 12/01/2019 | | | 450,000 | | | | 459,302 | |
| Chicago, IL, Board of Education, Unlimited Tax General Obligation Refunding Dedicated Rev., “A”, AGM, 5%, 12/01/2029 | | | 1,230,000 | | | | 1,398,879 | |
| Chicago, IL, Board of Education, Unlimited Tax General Obligation Refunding Dedicated Rev., “A”, AGM, 5%, 12/01/2030 | | | 800,000 | | | | 903,976 | |
| Chicago, IL, Board of Education, Unlimited Tax General Obligation Refunding Dedicated Rev., “A”, AGM, 5%, 12/01/2031 | | | 800,000 | | | | 897,584 | |
| Chicago, IL, Board of Education, Unlimited Tax General Obligation Refunding Dedicated Rev., “A”, AGM, 5%, 12/01/2032 | | | 800,000 | | | | 891,952 | |
| Chicago, IL, Board of Education, Unlimited Tax General Obligation Refunding Dedicated Rev., “A”, AGM, 5%, 12/01/2033 | | | 715,000 | | | | 794,680 | |
| Chicago, IL, Board of Education, Unlimited Tax General Obligation Refunding Dedicated Rev., “A”, AGM, 5%, 12/01/2034 | | | 715,000 | | | | 790,919 | |
| Chicago, IL, Board of Education, Unlimited Tax General Obligation Refunding Dedicated Rev., “A”, AGM, 5%, 12/01/2035 | | | 515,000 | | | | 567,473 | |
| Chicago, IL, Board of Education, Unlimited Tax General Obligation Refunding Dedicated Rev., “G”, 5%, 12/01/2034 | | | 5,735,000 | | | | 5,928,900 | |
| Chicago, IL, Board of Education, Unlimited Tax General Obligation Refunding Dedicated Rev., “H”, 5%, 12/01/2036 | | | 8,650,000 | | | | 8,879,138 | |
| Chicago, IL, Board of Education, Unlimited Tax General Obligation Refunding Dedicated Rev., “H”, 5%, 12/01/2046 | | | 10,610,000 | | | | 10,654,350 | |
| Chicago, IL, City Colleges of Chicago Capital Improvement Project, Capital Appreciation, NATL, 0%, 1/01/2027 | | | 3,180,000 | | | | 2,375,937 | |
| Chicago, IL, General Obligation, “A”, 6%, 1/01/2038 | | | 10,525,000 | | | | 11,750,636 | |
| Chicago, IL, O’Hare International Airport Rev., Special Facilities, 5%, 7/01/2033 | | | 740,000 | | | | 832,093 | |
36
Portfolio of Investments – continued
| | | | | | | | |
| | |
| Issuer | | Shares/Par | | | Value ($) | |
| Municipal Bonds - continued | | | | | | | | |
| Illinois - continued | | | | | | | | |
| Chicago, IL, O’Hare International Airport Rev., Special Facilities, 5%, 7/01/2038 | | $ | 2,065,000 | | | $ | 2,273,152 | |
| Chicago, IL, O’Hare International Airport Rev., Special Facilities, 5%, 7/01/2048 | | | 6,550,000 | | | | 7,112,645 | |
| Chicago, IL, O’Hare International Airport Rev., Customer Facility Charge, AGM, 5.25%, 1/01/2032 | | | 675,000 | | | | 742,635 | |
| Chicago, IL, O’Hare International Airport Rev., Customer Facility Charge, AGM, 5.25%, 1/01/2033 | | | 335,000 | | | | 367,910 | |
| Chicago, IL, O’Hare International Airport Rev., Customer Facility Charge, AGM, 5.5%, 1/01/2043 | | | 1,350,000 | | | | 1,485,594 | |
| Chicago, IL, O’Hare International Airport Rev., Senior Lien, “A”, 5%, 1/01/2048 | | | 4,695,000 | | | | 5,123,982 | |
| Chicago, IL, O’Hare International Airport Rev., Senior Lien, “A”, 5%, 1/01/2053 | | | 2,610,000 | | | | 2,821,697 | |
| Chicago, IL, O’Hare International Airport Rev., Senior Lien, “B”, 5%, 1/01/2030 | | | 4,970,000 | | | | 5,572,960 | |
| Chicago, IL, O’Hare International Airport Rev., Third Lien, “A”, Unrefunded Balance, 5.625%, 1/01/2035 | | | 1,055,000 | | | | 1,117,456 | |
| Chicago, IL, Transit Authority Sales Tax Receipts Rev., 5.25%, 12/01/2031 | | | 540,000 | | | | 572,800 | |
| Cook County, IL, 5%, 11/15/2034 | | | 835,000 | | | | 914,859 | |
| Cook County, IL, 5%, 11/15/2035 | | | 3,030,000 | | | | 3,311,184 | |
| Cook County, IL, Community College District No. 508 (City Colleges), BAM, 5%, 12/01/2047 | | | 7,945,000 | | | | 8,536,585 | |
| Du Page County, IL, Special Service Area No. 31 Special Tax (Monarch Landing Project), 5.625%, 3/01/2036 | | | 855,000 | | | | 856,513 | |
| Illinois Finance Authority Charter School Rev. (Uno Charter School Network, Inc.), “A”, 7.125%, 10/01/2041 | | | 2,000,000 | | | | 2,091,720 | |
| Illinois Finance Authority Educational Facility Rev. (Rogers Park Montessori School Project), 6%, 2/01/2034 | | | 700,000 | | | | 732,151 | |
| Illinois Finance Authority Educational Facility Rev. (Rogers Park Montessori School Project), 6.125%, 2/01/2045 | | | 1,800,000 | | | | 1,864,350 | |
| Illinois Finance Authority Rev. (Christian Homes, Inc.), 6.125%, 5/15/2027 (Prerefunded 5/15/2020) | | | 1,470,000 | | | | 1,549,689 | |
| Illinois Finance Authority Rev. (Christian Homes, Inc.), 6.125%, 5/15/2027 | | | 2,680,000 | | | | 2,772,969 | |
| Illinois Finance Authority Rev. (Christian Homes, Inc.), 5%, 5/15/2036 | | | 760,000 | | | | 785,224 | |
| Illinois Finance Authority Rev. (Christian Homes, Inc.), 5%, 5/15/2040 | | | 1,690,000 | | | | 1,731,304 | |
| Illinois Finance Authority Rev. (Edward-Elmhurst Healthcare), “A”, 5%, 1/01/2034 | | | 2,000,000 | | | | 2,217,280 | |
37
Portfolio of Investments – continued
| | | | | | | | |
| | |
| Issuer | | Shares/Par | | | Value ($) | |
| Municipal Bonds - continued | | | | | | | | |
| Illinois - continued | | | | | | | | |
| Illinois Finance Authority Rev. (Edward-Elmhurst Healthcare), “A”, 5%, 1/01/2035 | | $ | 2,000,000 | | | $ | 2,207,080 | |
| Illinois Finance Authority Rev. (Franciscan Communities, Inc.), “A”, 4.75%, 5/15/2033 | | | 2,745,000 | | | | 2,763,831 | |
| Illinois Finance Authority Rev. (Franciscan Communities, Inc.), “A”, 5.125%, 5/15/2043 | | | 3,410,000 | | | | 3,481,269 | |
| Illinois Finance Authority Rev. (Lutheran Home & Services), 5.5%, 5/15/2027 | | | 680,000 | | | | 708,050 | |
| Illinois Finance Authority Rev. (Lutheran Home & Services), 5.5%, 5/15/2030 | | | 6,200,000 | | | | 6,409,622 | |
| Illinois Finance Authority Rev. (Lutheran Home & Services), 5.625%, 5/15/2042 | | | 6,505,000 | | | | 6,630,026 | |
| Illinois Finance Authority Rev. (Mercy Health Corp.), 5%, 12/01/2040 | | | 3,020,000 | | | | 3,227,746 | |
| Illinois Finance Authority Rev. (OSF Healthcare), “A”, 7%, 11/15/2029 (Prerefunded 5/15/2019) | | | 3,025,000 | | | | 3,069,468 | |
| Illinois Finance Authority Rev. (OSF Healthcare), “A”, 7.125%, 11/15/2037 (Prerefunded 5/15/2019) | | | 2,555,000 | | | | 2,593,427 | |
| Illinois Finance Authority Rev. (Presbyterian Homes Obligated Group), “B”, FLR, 3.114% (70% of LIBOR - 1mo. + 1.35%), 5/01/2036 (Put Date 5/01/2021) | | | 1,070,000 | | | | 1,073,456 | |
| Illinois Finance Authority Rev. (Presence Health Network), “A”, 7.75%, 8/15/2034 (Prerefunded 8/15/2019) | | | 3,830,000 | | | | 3,950,798 | |
| Illinois Finance Authority Rev. (Presence Health Network), “C”, 5%, 2/15/2036 | | | 2,625,000 | | | | 2,957,246 | |
| Illinois Finance Authority Rev. (Presence Health Network), “C”, 4%, 2/15/2041 | | | 9,860,000 | | | | 9,947,655 | |
| Illinois Finance Authority Rev. (Presence Health Network), “C”, 5%, 2/15/2041 | | | 5,515,000 | | | | 6,105,987 | |
| Illinois Finance Authority Rev. (Provena Health), “A”, 6%, 5/01/2028 (Prerefunded 5/01/2020) | | | 4,125,000 | | | | 4,338,221 | |
| Illinois Finance Authority Rev. (Rehabilitation Institute of Chicago), “A”, 6%, 7/01/2043 | | | 1,305,000 | | | | 1,429,902 | |
| Illinois Finance Authority Rev. (Resurrection Health Care Corp.), 6.125%, 5/15/2025 (Prerefunded 5/15/2019) | | | 2,455,000 | | | | 2,485,467 | |
| Illinois Finance Authority Rev. (Roosevelt University Project), 6.25%, 4/01/2029 (Prerefunded 10/01/2019) | | | 6,045,000 | | | | 6,223,328 | |
| Illinois Finance Authority Rev. (Rosalind Franklin University), “A”, 5%, 8/01/2042 | | | 640,000 | | | | 684,269 | |
| Illinois Finance Authority Rev. (Rosalind Franklin University), “A”, 5%, 8/01/2047 | | | 940,000 | | | | 1,000,846 | |
| Illinois Finance Authority Rev. (Rosalind Franklin University, Research Building Project), “C”, 5%, 8/01/2046 | | | 755,000 | | | | 804,430 | |
38
Portfolio of Investments – continued
| | | | | | | | |
| | |
| Issuer | | Shares/Par | | | Value ($) | |
| Municipal Bonds - continued | | | | | | | | |
| Illinois - continued | | | | | | | | |
| Illinois Finance Authority Rev. (Rosalind Franklin University, Research Building Project), “C”, 5%, 8/01/2049 | | $ | 970,000 | | | $ | 1,030,635 | |
| Illinois Finance Authority Rev. (Silver Cross Hospital & Medical Centers), 6.875%, 8/15/2038 (Prerefunded 8/15/2019) | | | 1,500,000 | | | | 1,540,740 | |
| Illinois Finance Authority Rev. (Silver Cross Hospital & Medical Centers), 7%, 8/15/2044 (Prerefunded 8/15/2019) | | | 2,545,000 | | | | 2,615,242 | |
| Illinois Finance Authority Rev. (Southern Illinois Healthcare Enterprises, Inc.), “C”, 5%, 3/01/2034 | | | 115,000 | | | | 128,066 | |
| Illinois Finance Authority Rev. (Friendship Village of Schaumburg), 5%, 2/15/2037 | | | 12,490,000 | | | | 11,512,657 | |
| Illinois Finance Authority Rev. (Friendship Village of Schaumburg), ETM, 7.25%, 2/15/2045 (Prerefunded 2/15/2020) | | | 3,600,000 | | | | 3,799,404 | |
| Illinois Finance Authority Student Housing and Academic Facility Rev. (CHF-Chicago, LLC-University of Illinois at Chicago Project), “A”, 5%, 2/15/2037 | | | 415,000 | | | | 448,789 | |
| Illinois Finance Authority Student Housing and Academic Facility Rev. (CHF-Chicago, LLC-University of Illinois at Chicago Project), “A”, 5%, 2/15/2047 | | | 825,000 | | | | 875,548 | |
| Illinois Finance Authority Student Housing and Academic Facility Rev. (CHF-Chicago, LLC-University of Illinois at Chicago Project), “A”, 5%, 2/15/2050 | | | 415,000 | | | | 439,506 | |
| Illinois Finance Authority Student Housing Rev. (Illinois State University), 6.75%, 4/01/2031 (Prerefunded 4/01/2021) | | | 1,875,000 | | | | 2,069,288 | |
| Illinois Finance Authority Student Housing Rev. (Northern Illinois University Project), 6.625%, 10/01/2031 | | | 5,785,000 | | | | 6,153,447 | |
| Illinois Railsplitter Tobacco Settlement Authority Rev., 6%, 6/01/2028 (Prerefunded 6/01/2021) | | | 14,375,000 | | | | 15,750,256 | |
| Illinois Sports Facilities Authority, AAC, 5.5%, 6/15/2030 | | | 1,600,000 | | | | 1,603,776 | |
| Illinois Sports Facilities Authority, State Tax Supported Refunding Rev., AGM, 5%, 6/15/2027 | | | 2,325,000 | | | | 2,563,406 | |
| Illinois Toll Highway Authority Rev., “C”, 5%, 1/01/2037 | | | 7,500,000 | | | | 8,388,225 | |
| Lincolnshire, IL, Special Service Area No. 1 (Sedgebrook Project), 6.25%, 3/01/2034 | | | 2,569,000 | | | | 2,573,239 | |
| Metropolitan Pier & Exposition Authority Refunding Bonds (McCormick Place Expansion Project), “B-1”, Capital Appreciation, AGM, 0%, 6/15/2046 | | | 15,000,000 | | | | 4,321,350 | |
| Metropolitan Pier & Exposition Authority Refunding Bonds (McCormick Place Expansion Project), “B-1”, Capital Appreciation, AGM, 0%, 6/15/2047 | | | 29,475,000 | | | | 8,069,076 | |
| Metropolitan Pier & Exposition Authority Refunding Bonds (McCormick Place Expansion Project), “A”, Capital Appreciation, AGM, 0%, 6/15/2026 | | | 3,390,000 | | | | 2,618,063 | |
39
Portfolio of Investments – continued
| | | | | | | | |
| | |
| Issuer | | Shares/Par | | | Value ($) | |
| Municipal Bonds - continued | | | | | | | | |
| Illinois - continued | | | | | | | | |
| Romeoville, IL, Rev. (Lewis University Project), “A”, 5%, 10/01/2042 | | $ | 1,450,000 | | | $ | 1,513,090 | |
| Romeoville, IL, Rev. (Lewis University Project), “B”, 5%, 10/01/2039 | | | 1,500,000 | | | | 1,573,575 | |
| Romeoville, IL, Rev. (Lewis University Project), “B”, 4.125%, 10/01/2041 | | | 1,130,000 | | | | 1,082,529 | |
| Romeoville, IL, Rev. (Lewis University Project), “B”, 4.125%, 10/01/2046 | | | 1,120,000 | | | | 1,055,555 | |
| State of Illinois, 5%, 6/01/2020 | | | 5,595,000 | | | | 5,775,271 | |
| State of Illinois, 5%, 11/01/2027 | | | 20,135,000 | | | | 21,838,824 | |
| State of Illinois, 5%, 1/01/2028 | | | 550,000 | | | | 566,616 | |
| State of Illinois, 5%, 5/01/2028 | | | 4,130,000 | | | | 4,337,243 | |
| State of Illinois, 5.25%, 7/01/2028 | | | 3,260,000 | | | | 3,432,519 | |
| State of Illinois, 5%, 11/01/2028 | | | 2,595,000 | | | | 2,782,229 | |
| State of Illinois, 5%, 2/01/2029 | | | 2,820,000 | | | | 3,009,278 | |
| State of Illinois, 4.125%, 11/01/2031 | | | 2,195,000 | | | | 2,119,843 | |
| State of Illinois, 4.5%, 11/01/2039 | | | 2,420,000 | | | | 2,346,795 | |
| State of Illinois, AGM, 5%, 2/01/2027 | | | 2,040,000 | | | | 2,239,736 | |
| State of Illinois, NATL, 6%, 11/01/2026 | | | 5,955,000 | | | | 6,826,097 | |
| State of Illinois, “A”, 5%, 12/01/2020 | | | 3,995,000 | | | | 4,157,397 | |
| State of Illinois, “B”, 5%, 12/01/2020 | | | 2,205,000 | | | | 2,294,633 | |
| State of Illinois, “D”, 5%, 11/01/2028 | | | 7,380,000 | | | | 7,970,326 | |
| Upper Illinois River Valley Development Authority (Pleasant View Lutheran Home), 7.25%, 11/15/2040 | | | 1,080,000 | | | | 1,106,914 | |
| Upper Illinois River Valley Development Authority (Pleasant View Lutheran Home), 7.375%, 11/15/2045 | | | 1,250,000 | | | | 1,282,900 | |
| Upper Illinois River Valley Development Authority Multifamily Housing Rev. (Prairie View and Timber Oaks Apartments), 5%, 12/01/2043 | | | 5,470,000 | | | | 5,491,880 | |
| Upper Illinois River Valley Development Authority Rev. (Morris Hospital), 5%, 12/01/2043 | | | 8,455,000 | | | | 8,980,478 | |
| Upper Illinois River Valley Development Authority Rev. (Morris Hospital), 5%, 12/01/2048 | | | 8,460,000 | | | | 8,943,912 | |
| | | | | | | | |
| | | | | | | $ | 521,968,884 | |
| Indiana - 1.3% | | | | | | | | |
| Carmel, IN, Rev. (Barrington of Carmel Project), “A”, 7.125%, 11/15/2042 | | $ | 2,500,000 | | | $ | 2,250,000 | |
| Indiana Development Finance Authority Solid Water Disposal Rev. (Waste Management, Inc. Project), 2.95%, 10/01/2031 (Put Date 10/01/2021) | | | 1,580,000 | | | | 1,580,000 | |
| Indiana Finance Authority Health Facilities Rev. (Baptist Healthcare System Obligated Group), 5%, 8/15/2051 | | | 10,605,000 | | | | 11,317,550 | |
40
Portfolio of Investments – continued
| | | | | | | | |
| | |
| Issuer | | Shares/Par | | | Value ($) | |
| Municipal Bonds - continued | | | | | | | | |
| Indiana - continued | | | | | | | | |
| Indiana Finance Authority Rev. (Marquette Project), 4.75%, 3/01/2032 | | $ | 1,790,000 | | | $ | 1,810,854 | |
| Indiana Finance Authority Rev. (Marquette Project), 5%, 3/01/2039 | | | 1,215,000 | | | | 1,246,250 | |
| Indiana Finance Authority Rev. (Marquette Project), “A”, 5%, 3/01/2030 | | | 460,000 | | | | 486,100 | |
| Indiana Finance Authority Rev. (Marquette Project), “A”, 5%, 3/01/2039 | | | 1,155,000 | | | | 1,200,911 | |
| Indiana Finance Authority Rev. (Ohio River Bridges East End Crossing Project), “A”, 5%, 7/01/2035 | | | 2,095,000 | | | | 2,230,211 | |
| Indiana Finance Authority Rev. (Ohio River Bridges East End Crossing Project), “A”, 5%, 7/01/2040 | | | 5,350,000 | | | | 5,652,757 | |
| Indiana Finance Authority Rev. (Ohio River Bridges East End Crossing Project), “A”, 5%, 7/01/2044 | | | 3,260,000 | | | | 3,433,530 | |
| Indiana Housing & Community Development Authority, Single Family Mortgage Rev., “A”, GNMA, 4%, 7/01/2048 | | | 3,230,000 | | | | 3,430,518 | |
| Knox County, IN, Economic Development Rev. (Good Samaritan Hospital), “A”, 5%, 4/01/2042 | | | 1,430,000 | | | | 1,397,296 | |
| Lake County, IN, Hammond Multi-School Building Corp., 5%, 7/15/2032 | | | 600,000 | | | | 684,444 | |
| Lake County, IN, Hammond Multi-School Building Corp., 5%, 7/15/2033 | | | 440,000 | | | | 499,360 | |
| Lake County, IN, Hammond Multi-School Building Corp., 5%, 7/15/2035 | | | 550,000 | | | | 618,288 | |
| Lake County, IN, Hammond Multi-School Building Corp., 5%, 7/15/2038 | | | 1,640,000 | | | | 1,812,938 | |
| Terre Haute, IN, Rev. (Westminster Village), 6%, 8/01/2039 | | | 4,600,000 | | | | 4,613,846 | |
| University of Southern Indiana Rev. (Student Fee), “J”, ASSD GTY, 5.75%, 10/01/2028 (Prerefunded 10/01/2019) | | | 1,445,000 | | | | 1,483,408 | |
| Valparaiso, IN, Exempt Facilities Rev. (Pratt Paper LLC Project), 6.75%, 1/01/2034 | | | 4,370,000 | | | | 4,984,073 | |
| Valparaiso, IN, Exempt Facilities Rev. (Pratt Paper LLC Project), 7%, 1/01/2044 | | | 10,875,000 | | | | 12,461,336 | |
| | | | | | | | |
| | | | | | | $ | 63,193,670 | |
| Iowa - 0.5% | | | | | | | | |
| Iowa Finance Authority Health Facilities Rev. (UnityPoint Health), “C”, 5%, 2/15/2030 | | $ | 800,000 | | | $ | 889,184 | |
| Iowa Finance Authority Health Facilities Rev. (UnityPoint Health), “C”, 5%, 2/15/2031 | | | 1,480,000 | | | | 1,635,444 | |
| Iowa Finance Authority Health Facilities Rev. (UnityPoint Health), “C”, 5%, 2/15/2032 | | | 715,000 | | | | 787,265 | |
41
Portfolio of Investments – continued
| | | | | | | | |
| | |
| Issuer | | Shares/Par | | | Value ($) | |
| Municipal Bonds - continued | | | | | | | | |
| Iowa - continued | | | | | | | | |
| Iowa Finance Authority Senior Housing Rev. (Northcrest, Inc. Project), “A”, 5%, 3/01/2033 | | $ | 1,060,000 | | | $ | 1,093,348 | |
| Iowa Finance Authority Senior Housing Rev. (Northcrest, Inc. Project), “A”, 5%, 3/01/2038 | | | 865,000 | | | | 877,594 | |
| Iowa Finance Authority Senior Housing Rev. (Northcrest, Inc. Project), “A”, 5%, 3/01/2048 | | | 1,590,000 | | | | 1,598,332 | |
| Iowa Finance Authority, Single Family Mortgage Rev., “A”, FNMA, 4%, 7/01/2047 | | | 1,215,000 | | | | 1,287,645 | |
| Iowa Student Loan Liquidity Corp. Rev., “A”, 3.75%, 12/01/2033 | | | 5,310,000 | | | | 5,342,072 | |
| Iowa Student Loan Liquidity Corp. Rev., “A-1”, 4.625%, 12/01/2019 | | | 845,000 | | | | 858,360 | |
| Iowa Student Loan Liquidity Corp. Rev., “A-1”, 4.875%, 12/01/2020 | | | 160,000 | | | | 164,650 | |
| Iowa Student Loan Liquidity Corp. Rev., “A-2”, 5.5%, 12/01/2025 | | | 385,000 | | | | 400,804 | |
| Iowa Student Loan Liquidity Corp. Rev., “A-2”, 5.6%, 12/01/2026 | | | 385,000 | | | | 400,696 | |
| Iowa Student Loan Liquidity Corp. Rev., “A-2”, 5.7%, 12/01/2027 | | | 45,000 | | | | 46,791 | |
| Iowa Student Loan Liquidity Corp. Rev., “A-2”, 5.75%, 12/01/2028 | | | 785,000 | | | | 815,694 | |
| Iowa Tobacco Settlement Authority, Tobacco Settlement Rev., Asset Backed, “B”, 5.6%, 6/01/2034 | | | 4,295,000 | | | | 4,295,644 | |
| Iowa Tobacco Settlement Authority, Tobacco Settlement Rev., Asset Backed, “C”, 5.375%, 6/01/2038 | | | 4,500,000 | | | | 4,459,590 | |
| | | | | | | | |
| | | | | | | $ | 24,953,113 | |
| Kansas - 0.7% | | | | | | | | |
| Coffeyville, KS, Electric Utility System Rev., “B”, NATL, 5%, 6/01/2038 | | $ | 3,600,000 | | | $ | 3,968,244 | |
| Coffeyville, KS, Electric Utility System Rev., “B”, NATL, 5%, 6/01/2042 | | | 1,500,000 | | | | 1,641,735 | |
| Hutchinson, KS, Hospital Facilities Rev. (Hutchinson Regional Medical Center, Inc.), 5%, 12/01/2036 | | | 1,405,000 | | | | 1,486,911 | |
| Hutchinson, KS, Hospital Facilities Rev. (Hutchinson Regional Medical Center, Inc.), 5%, 12/01/2041 | | | 615,000 | | | | 643,315 | |
| Lenexa, KS, Health Care Facility Rev. (Lakeview Village, Inc.), 7.125%, 5/15/2029 (Prerefunded 5/15/2019) | | | 1,555,000 | | | | 1,578,169 | |
| Lenexa, KS, Health Care Facility Rev. (Lakeview Village, Inc.), “A”, 5%, 5/15/2030 | | | 1,085,000 | | | | 1,153,648 | |
| Lenexa, KS, Health Care Facility Rev. (Lakeview Village, Inc.), “A”, 5%, 5/15/2032 | | | 985,000 | | | | 1,038,781 | |
| Lenexa, KS, Health Care Facility Rev. (Lakeview Village, Inc.), “A”, 5%, 5/15/2039 | | | 1,280,000 | | | | 1,312,397 | |
| Lenexa, KS, Health Care Facility Rev. (Lakeview Village, Inc.), “A”, 5%, 5/15/2043 | | | 4,000,000 | | | | 4,064,760 | |
42
Portfolio of Investments – continued
| | | | | | | | |
| | |
| Issuer | | Shares/Par | | | Value ($) | |
| Municipal Bonds - continued | | | | | | | | |
| Kansas - continued | | | | | | | | |
| Wichita, KS, Health Care Facilities Rev. (Kansas Masonic Home),“II-A”, 5%, 12/01/2031 | | $ | 620,000 | | | $ | 634,874 | |
| Wichita, KS, Health Care Facilities Rev. (Presbyterian Manors, Inc.), “A”, 6.375%, 5/15/2043 | | | 4,165,000 | | | | 4,419,065 | |
| Wichita, KS, Health Care Facilities Rev. (Presbyterian Manors, Inc.), “I”, 5%, 5/15/2033 | | | 605,000 | | | | 628,631 | |
| Wichita, KS, Health Care Facilities Rev. (Presbyterian Manors, Inc.), “I”, 5%, 5/15/2038 | | | 710,000 | | | | 727,430 | |
| Wichita, KS, Health Care Facilities Rev. (Presbyterian Manors, Inc.), “I”, 4.625%, 5/15/2041 | | | 605,000 | | | | 588,145 | |
| Wichita, KS, Health Care Facilities Rev. (Presbyterian Manors, Inc.), “I”, 5%, 5/15/2047 | | | 1,860,000 | | | | 1,886,077 | |
| Wichita, KS, Health Care Facilities Rev. (Presbyterian Manors, Inc.), “IV-A”, 5%, 5/15/2029 | | | 500,000 | | | | 501,185 | |
| Wichita, KS, Health Care Facilities Rev. (Presbyterian Manors, Inc.), “IV-A”, 6.5%, 5/15/2048 | | | 1,500,000 | | | | 1,598,670 | |
| Wichita, KS, Sales Tax Special Obligations Rev. (K-96 Greenwich Star Bond Project), 3%, 9/01/2023 | | | 1,535,000 | | | | 1,533,680 | |
| Wichita, KS, Sales Tax Special Obligations Rev. (K-96 Greenwich Star Bond Project), 4.2%, 9/01/2027 | | | 2,845,000 | | | | 2,842,895 | |
| Wyandotte County, KS, Unified Government Community Improvement District Sales Tax Rev. (Legends Apartments Garage & West Lawn Project), 4.5%, 6/01/2040 | | | 1,660,000 | | | | 1,641,956 | |
| Wyandotte County/Kansas City, KS, Unified Government Utility System Improvement Rev., “A”, 5%, 9/01/2044 | | | 1,740,000 | | | | 1,922,091 | |
| | | | | | | | |
| | | | | | | $ | 35,812,659 | |
| Kentucky - 1.9% | | | | | | | | |
| Commonwealth of Kentucky State Property & Buildings Commission Rev. (Project No. 119), BAM, 5%, 5/01/2032 | | $ | 765,000 | | | $ | 884,983 | |
| Commonwealth of Kentucky State Property & Buildings Commission Rev. (Project No. 119), BAM, 5%, 5/01/2033 | | | 760,000 | | | | 874,570 | |
| Commonwealth of Kentucky State Property & Buildings Commission Rev. (Project No. 119), BAM, 5%, 5/01/2034 | | | 870,000 | | | | 995,889 | |
| Glasgow, KY, Healthcare Rev. (TJ Samson Community Hospital), 6.375%, 2/01/2035 | | | 2,840,000 | | | | 3,010,911 | |
| Kentucky Economic Development Finance Authority Healthcare Facilities Rev. (Baptist Life Communities Project), “A”, 6.25%, 11/15/2046 | | | 5,105,000 | | | | 4,922,190 | |
| Kentucky Economic Development Finance Authority Healthcare Facilities Rev. (Baptist Life Communities Project), “A”, 6.375%, 11/15/2051 | | | 4,855,000 | | | | 4,689,639 | |
43
Portfolio of Investments – continued
| | | | | | | | |
| | |
| Issuer | | Shares/Par | | | Value ($) | |
| Municipal Bonds - continued | | | | | | | | |
| Kentucky - continued | | | | | | | | |
| Kentucky Economic Development Finance Authority Healthcare Facilities Rev. (Masonic Homes of Kentucky, Inc.), 5.375%, 11/15/2042 | | $ | 2,915,000 | | | $ | 2,998,486 | |
| Kentucky Economic Development Finance Authority Healthcare Facilities Rev. (Masonic Homes of Kentucky, Inc.), 5.5%, 11/15/2045 | | | 1,325,000 | | | | 1,366,777 | |
| Kentucky Economic Development Finance Authority Hospital Rev. (Baptist Healthcare System), “B”, 5%, 8/15/2037 | | | 1,250,000 | | | | 1,355,562 | |
| Kentucky Economic Development Finance Authority Hospital Rev. (Baptist Healthcare System), “B”, 5%, 8/15/2041 | | | 13,475,000 | | | | 14,511,227 | |
| Kentucky Economic Development Finance Authority Hospital Rev. (Baptist Healthcare System), “B”, 5%, 8/15/2046 | | | 5,245,000 | | | | 5,616,923 | |
| Kentucky Economic Development Finance Authority Hospital Rev. (Owensboro Health, Inc.), “A”, 5%, 6/01/2037 | | | 3,040,000 | | | | 3,233,374 | |
| Kentucky Economic Development Finance Authority Hospital Rev. (Owensboro Health, Inc.), “A”, 5%, 6/01/2041 | | | 1,995,000 | | | | 2,104,605 | |
| Kentucky Economic Development Finance Authority Hospital Rev. (Owensboro Health, Inc.), “A”, 5.25%, 6/01/2041 | | | 1,555,000 | | | | 1,678,825 | |
| Kentucky Economic Development Finance Authority Hospital Rev. (Owensboro Health, Inc.), “A”, 5%, 6/01/2045 | | | 2,490,000 | | | | 2,614,301 | |
| Kentucky Economic Development Finance Authority Hospital Rev. (Owensboro Medical Health System, Inc.), “A”, 6%, 6/01/2030 (Prerefunded 6/01/2020) | | | 3,460,000 | | | | 3,650,715 | |
| Kentucky Economic Development Finance Authority Hospital Rev. (Owensboro Medical Health System, Inc.), “A”, 6.375%, 6/01/2040 (Prerefunded 6/01/2020) | | | 6,255,000 | | | | 6,630,363 | |
| Kentucky Economic Development Finance Authority Hospital Rev. (Owensboro Medical Health System, Inc.), “A”, 6.5%, 3/01/2045 (Prerefunded 6/01/2020) | | | 1,955,000 | | | | 2,075,252 | |
| Kentucky Economic Development Finance Authority Louisville Arena Project Rev. (Louisville Arena Authority, Inc.), “A”, AGM, 5%, 12/01/2045 | | | 2,860,000 | | | | 3,125,951 | |
| Kentucky Economic Development Finance Authority Louisville Arena Project Rev. (Louisville Arena Authority, Inc.), “A”, AGM, 5%, 12/01/2047 | | | 1,605,000 | | | | 1,733,994 | |
| Kentucky Economic Development Finance Authority Rev. (Masonic Home Independent Living II, Inc. - Miralea Project), 7.25%, 5/15/2041 (Prerefunded 5/15/2021) | | | 3,000,000 | | | | 3,361,440 | |
| Kentucky Economic Development Finance Authority Rev. (Masonic Home Independent Living II, Inc. - Miralea Project), 7.375%, 5/15/2046 (Prerefunded 5/15/2021) | | | 1,495,000 | | | | 1,679,274 | |
| Kentucky Economic Development Finance Authority Rev. (Masonic Home Independent Living II, Inc. - The Meadow Project and Grove Pointe Project), “A”, 5%, 5/15/2036 | | | 2,505,000 | | | | 2,560,010 | |
44
Portfolio of Investments – continued
| | | | | | | | |
| | |
| Issuer | | Shares/Par | | | Value ($) | |
| Municipal Bonds - continued | | | | | | | | |
| Kentucky - continued | | | | | | | | |
| Kentucky Economic Development Finance Authority Rev. (Masonic Home Independent Living II, Inc. - The Meadow Project and Grove Pointe Project), “A”, 5%, 5/15/2046 | | $ | 6,945,000 | | | $ | 6,973,891 | |
| Kentucky Economic Development Finance Authority Rev. (Masonic Home Independent Living II, Inc. - The Meadow Project and Grove Pointe Project), “A”, 5%, 5/15/2051 | | | 1,755,000 | | | | 1,746,506 | |
| Louisville & Jefferson County, KY, Metro Government College Improvement Rev. (Bellarmine University Project), “A”, 5%, 5/01/2034 | | | 1,440,000 | | | | 1,547,496 | |
| Louisville & Jefferson County, KY, Metro Government College Improvement Rev. (Bellarmine University Project), “A”, 5%, 5/01/2035 | | | 2,290,000 | | | | 2,452,613 | |
| Owen County, KY, Waterworks System Rev. (American Water Co. Project), “A”, 6.25%, 6/01/2039 | | | 1,635,000 | | | | 1,655,814 | |
| Owen County, KY, Waterworks System Rev. (American Water Co. Project), “B”, 5.625%, 9/01/2039 | | | 1,830,000 | | | | 1,864,733 | |
| University of Kentucky, General Receipts, “A”, 5%, 4/01/2036 | | | 1,460,000 | | | | 1,648,909 | |
| | | | | | | | |
| | | | | | | $ | 93,565,223 | |
| Louisiana - 1.3% | | | | | | | | |
| Jefferson Parish, LA, Hospital Service District No. 1 (West Jefferson Medical Center), “A”, 6%, 1/01/2039 (Prerefunded 1/01/2021) | | $ | 1,500,000 | | | $ | 1,615,575 | |
| Jefferson Parish, LA, Hospital Service District No. 2 Hospital Rev. (East Jefferson General Hospital), 6.25%, 7/01/2031 | | | 3,200,000 | | | | 3,040,000 | |
| Jefferson Parish, LA, Hospital Service District No. 2 Hospital Rev. (East Jefferson General Hospital), 6.375%, 7/01/2041 | | | 2,000,000 | | | | 1,900,000 | |
| Louisiana Housing Corp. Single Family Mortgage Rev. (Home Ownership Program), “A-1”, 4.5%, 12/01/2047 | | | 1,125,000 | | | | 1,220,749 | |
| Louisiana Local Government, Environmental Facilities & Community Development Authority Rev. (Westside Habilitation Center Project), “A”, 5.75%, 2/01/2032 | | | 900,000 | | | | 918,468 | |
| Louisiana Local Government, Environmental Facilities & Community Development Authority Rev. (Cameron Parish, Louisiana Gomesa Project), 5.65%, 11/01/2037 | | | 1,200,000 | | | | 1,234,284 | |
| Louisiana Local Government, Environmental Facilities & Community Development Authority Rev. (CDF Healthcare), “A”, 5.625%, 6/01/2045 | | | 7,880,000 | | | | 7,939,730 | |
| Louisiana Local Government, Environmental Facilities & Community Development Authority Rev. (Ragin’ Cajun Facilities, Inc. - Student Housing & Parking Project), AGM, 5%, 10/01/2043 | | | 560,000 | | | | 617,411 | |
| Louisiana Local Government, Environmental Facilities & Community Development Authority Rev. (Ragin’ Cajun Facilities, Inc. - Student Housing & Parking Project), AGM, 5%, 10/01/2048 | | | 2,445,000 | | | | 2,669,867 | |
45
Portfolio of Investments – continued
| | | | | | | | |
| | |
| Issuer | | Shares/Par | | | Value ($) | |
| Municipal Bonds - continued | | | | | | | | |
| Louisiana - continued | | | | | | | | |
| Louisiana Local Government, Environmental Facilities & Community Development Authority Rev. (St. James Place of Baton Rouge Project), “A”, 6%, 11/15/2035 | | $ | 1,145,000 | | | $ | 1,229,787 | |
| Louisiana Local Government, Environmental Facilities & Community Development Authority Rev. (St. James Place of Baton Rouge Project), “A”, 6.25%, 11/15/2045 | | | 4,435,000 | | | | 4,800,400 | |
| Louisiana Local Government, Environmental Facilities & Community Development Authority Rev. (Tangipahoa Parish, Louisiana Gomesa Project), 5.375%, 11/01/2038 | | | 2,175,000 | | | | 2,195,336 | |
| Louisiana Local Government, Environmental Facilities & Community Development Authority Rev. (Terrebonne Parish, Louisiana Gomesa Project), 5.5%, 11/01/2039 | | | 1,905,000 | | | | 1,934,813 | |
| Louisiana Local Government, Environmental Facilities & Community Development Authority Rev. (Westlake Chemical), “A”, 6.5%, 8/01/2029 | | | 2,990,000 | | | | 3,168,114 | |
| Louisiana Local Government, Environmental Facilities & Community Development Authority Rev. (Westlake Chemical),“A-2”, 6.5%, 11/01/2035 | | | 4,000,000 | | | | 4,257,400 | |
| Louisiana Local Government, Environmental Facilities & Community Development Authority Rev. (Westside Rehab Center Project), “A”, 6.125%, 2/01/2037 | | | 3,480,000 | | | | 3,594,144 | |
| Louisiana Local Government, Environmental Facilities & Community Development Authority Rev. (Westside Rehab Center Project), “A”, 6.25%, 2/01/2047 | | | 2,830,000 | | | | 2,921,239 | |
| Louisiana Public Facilities Authority Hospital Rev. (Lake Charles Memorial Hospital), 6.375%, 12/01/2034 | | | 6,470,000 | | | | 6,725,824 | |
| Louisiana Public Facilities Authority Rev. (Loyola University Project), Convertible Capital Appreciation, 0% to 10/01/2023, 5.25% to 10/01/2046 | | | 4,725,000 | | | | 4,095,488 | |
| New Orleans, LA, Aviation Board Special Facility Rev. (Parking Facilities Corp. Consolidated Garage System), “A”, AGM, 5%, 10/01/2043 | | | 1,100,000 | | | | 1,234,189 | |
| New Orleans, LA, Aviation Board Special Facility Rev. (Parking Facilities Corp. Consolidated Garage System), “A”, AGM, 5%, 10/01/2048 | | | 1,790,000 | | | | 1,998,123 | |
| New Orleans, LA, Sewerage Service Rev., 5%, 12/01/2040 | | | 875,000 | | | | 944,108 | |
| New Orleans, LA, Sewerage Service Rev., 5%, 6/01/2045 | | | 2,405,000 | | | | 2,575,563 | |
| New Orleans, LA, Sewerage Service Rev., 5%, 12/01/2045 | | | 1,095,000 | | | | 1,169,219 | |
| | | | | | | | |
| | | | | | | $ | 63,999,831 | |
| Maine - 0.2% | | | | | | | | |
| Maine Finance Authority Solid Waste Disposal Rev. (Casella Waste Systems, Inc.), “R-2”, 4.375%, 8/01/2035 (Put Date 8/01/2025) | | $ | 2,685,000 | | | $ | 2,703,849 | |
46
Portfolio of Investments – continued
| | | | | | | | |
| | |
| Issuer | | Shares/Par | | | Value ($) | |
| Municipal Bonds - continued | | | | | | | | |
| Maine - continued | | | | | | | | |
| Maine Finance Authority Solid Waste Disposal Rev. (Casella Waste Systems, Inc.), “R-3”, 5.25%, 1/01/2025 | | $ | 6,170,000 | | | $ | 6,642,622 | |
| | | | | | | | |
| | | | | | | $ | 9,346,471 | |
| Maryland - 1.3% | | | | | | | | |
| Baltimore, MD, Convention Center Hotel Rev., 5%, 9/01/2039 | | $ | 1,465,000 | | | $ | 1,589,891 | |
| Baltimore, MD, Convention Center Hotel Rev., 5%, 9/01/2042 | | | 1,300,000 | | | | 1,401,374 | |
| Baltimore, MD, Convention Center Hotel Rev., 5%, 9/01/2046 | | | 2,090,000 | | | | 2,246,666 | |
| Baltimore, MD, Special Obligation (East Baltimore Research Park Project), “A”, 5%, 9/01/2038 | | | 2,680,000 | | | | 2,809,337 | |
| Howard County, MD, Retirement Community Rev. (Vantage House Facility), 5%, 4/01/2036 | | | 2,930,000 | | | | 2,968,998 | |
| Howard County, MD, Retirement Community Rev. (Vantage House Facility), 5%, 4/01/2036 | | | 1,225,000 | | | | 1,241,305 | |
| Howard County, MD, Special Obligation (Downtown Columbia Project), “A”, 4.125%, 2/15/2034 | | | 850,000 | | | | 839,205 | |
| Howard County, MD, Special Obligation (Downtown Columbia Project), “A”, 4.375%, 2/15/2039 | | | 745,000 | | | | 741,528 | |
| Howard County, MD, Special Obligation (Downtown Columbia Project), “A”, 4.5%, 2/15/2047 | | | 2,190,000 | | | | 2,186,496 | |
| Maryland Department of Housing & Community Development Administration, “A”, 4.5%, 9/01/2048 (u) | | | 8,570,000 | | | | 9,286,452 | |
| Maryland Department of Housing & Community Development Administration, “B”, 4.5%, 9/01/2048 (u) | | | 6,965,000 | | | | 7,495,524 | |
| Maryland Economic Development Corp. Rev. (Port America Chesapeake Terminal Project), “B”, 5.375%, 6/01/2025 (Prerefunded 6/01/2020) | | | 885,000 | | | | 927,772 | |
| Maryland Economic Development Corp. Rev. (Transportation Facilities Project), “A”, 5%, 6/01/2030 | | | 1,070,000 | | | | 1,239,135 | |
| Maryland Economic Development Corp. Rev. (Transportation Facilities Project), “A”, 5%, 6/01/2031 | | | 350,000 | | | | 401,650 | |
| Maryland Economic Development Corp. Rev. (Transportation Facilities Project), “A”, 5%, 6/01/2032 | | | 985,000 | | | | 1,120,969 | |
| Maryland Economic Development Corp. Rev. (Transportation Facilities Project), “A”, 5%, 6/01/2035 | | | 1,775,000 | | | | 1,995,846 | |
| Maryland Economic Development Corp., Subordinate Parking Facilities Rev. (Baltimore City Project), “C”, 4%, 6/01/2038 | | | 175,000 | | | | 170,844 | |
| Maryland Economic Development Corp., Subordinate Parking Facilities Rev. (Baltimore City Project), “C”, 4%, 6/01/2048 | | | 525,000 | | | | 503,417 | |
| Maryland Economic Development Corp., Subordinate Parking Facilities Rev. (Baltimore City Project), “C”, 4%, 6/01/2058 | | | 1,960,000 | | | | 1,796,810 | |
| Maryland Health & Higher Educational Facilities Authority Rev. (Adventist Healthcare Issue), “A”, 5.5%, 1/01/2036 | | | 2,290,000 | | | | 2,609,020 | |
47
Portfolio of Investments – continued
| | | | | | | | |
| | |
| Issuer | | Shares/Par | | | Value ($) | |
| Municipal Bonds - continued | | | | | | | | |
| Maryland - continued | | | | | | | | |
| Maryland Health & Higher Educational Facilities Authority Rev. (Charlestown Community), 6.25%, 1/01/2041 (Prerefunded 1/01/2021) | | $ | 2,360,000 | | | $ | 2,555,172 | |
| Maryland Health & Higher Educational Facilities Authority Rev. (Doctors Community Hospital), “A”, 5%, 7/01/2033 | | | 1,380,000 | | | | 1,526,432 | |
| Maryland Health & Higher Educational Facilities Authority Rev. (Doctors Community Hospital), “A”, 5%, 7/01/2034 | | | 860,000 | | | | 947,307 | |
| Maryland Health & Higher Educational Facilities Authority Rev. (Doctors Community Hospital), “A”, 5%, 7/01/2038 | | | 3,835,000 | | | | 4,137,658 | |
| Prince George’s County, MD, Special Obligation Bonds (Westphalia Town Center Project), 5.125%, 7/01/2039 | | | 790,000 | | | | 807,838 | |
| Prince George’s County, MD, Special Obligation Bonds (Westphalia Town Center Project), 5.25%, 7/01/2048 | | | 775,000 | | | | 785,881 | |
| Rockville, MD, Mayor & Council Economic Development Refunding Rev. (Ingleside at King Farm Project), “A-1”, 5%, 11/01/2037 | | | 890,000 | | | | 930,317 | |
| Rockville, MD, Mayor & Council Economic Development Rev. (Ingleside at King Farm Project), “B”, 5%, 11/01/2042 | | | 1,530,000 | | | | 1,579,098 | |
| Rockville, MD, Mayor & Council Economic Development Rev. (Ingleside at King Farm Project), “B”, 5%, 11/01/2047 | | | 1,605,000 | | | | 1,649,507 | |
| Westminster, MD, Refunding Rev. (Carroll Lutheran Village, Inc.), 5.125%, 7/01/2040 | | | 2,600,000 | | | | 2,707,510 | |
| | | | | | | | |
| | | | | | | $ | 61,198,959 | |
| Massachusetts - 2.6% | | | | | | | | |
| Commonwealth of Massachusetts, “A”, 5%, 1/01/2047 | | $ | 13,375,000 | | | $ | 15,161,365 | |
| Massachusetts College Building Authority Rev., “A”, 5%, 5/01/2031 | | | 2,535,000 | | | | 2,826,956 | |
| Massachusetts Development Finance Agency Rev. (Adventcare), “A”, 6.75%, 10/15/2037 | | | 9,250,000 | | | | 9,261,932 | |
| Massachusetts Development Finance Agency Rev. (Emerson College), 5%, 1/01/2029 | | | 1,450,000 | | | | 1,604,251 | |
| Massachusetts Development Finance Agency Rev. (Emerson College), 5%, 1/01/2030 | | | 3,015,000 | | | | 3,320,299 | |
| Massachusetts Development Finance Agency Rev. (Emerson College), 5%, 1/01/2031 | | | 835,000 | | | | 912,012 | |
| Massachusetts Development Finance Agency Rev. (Emerson College), 5%, 1/01/2035 | | | 9,160,000 | | | | 9,862,022 | |
| Massachusetts Development Finance Agency Rev. (Emmanuel College), “A”, 5%, 10/01/2043 | | | 2,930,000 | | | | 3,093,787 | |
| Massachusetts Development Finance Agency Rev. (Foxborough Regional Charter School), “B”, 5%, 7/01/2027 | | | 3,690,000 | | | | 4,036,602 | |
48
Portfolio of Investments – continued
| | | | | | | | |
| | |
| Issuer | | Shares/Par | | | Value ($) | |
| Municipal Bonds - continued | | | | | | | | |
| Massachusetts - continued | | | | | | | | |
| Massachusetts Development Finance Agency Rev. (Foxborough Regional Charter School), “B”, 5%, 7/01/2037 | | $ | 1,000,000 | | | $ | 1,053,250 | |
| Massachusetts Development Finance Agency Rev. (Foxborough Regional Charter School), “B”, 5%, 7/01/2042 | | | 3,000,000 | | | | 3,135,990 | |
| Massachusetts Development Finance Agency Rev. (Lawrence General Hospital), 5%, 7/01/2042 | | | 2,900,000 | | | | 3,037,692 | |
| Massachusetts Development Finance Agency Rev. (Lawrence General Hospital), 5%, 7/01/2047 | | | 7,500,000 | | | | 7,791,750 | |
| Massachusetts Development Finance Agency Rev. (Linden Ponds, Inc.), Capital Appreciation, “B”, 0%, 11/15/2056 | | | 289,249 | | | | 72,431 | |
| Massachusetts Development Finance Agency Rev. (Newbridge On The Charles, Inc.), 5%, 10/01/2037 | | | 400,000 | | | | 419,748 | |
| Massachusetts Development Finance Agency Rev. (Newbridge On The Charles, Inc.), 5%, 10/01/2047 | | | 3,140,000 | | | | 3,240,009 | |
| Massachusetts Development Finance Agency Rev. (Newbridge On The Charles, Inc.), 5%, 10/01/2057 | | | 5,755,000 | | | | 5,909,234 | |
| Massachusetts Development Finance Agency Rev. (North Hill Communities), “A”, 6.25%, 11/15/2033 (Prerefunded 11/15/2023) | | | 1,350,000 | | | | 1,605,542 | |
| Massachusetts Development Finance Agency Rev. (North Hill Communities), “A”, 6.5%, 11/15/2043 (Prerefunded 11/15/2023) | | | 2,080,000 | | | | 2,495,168 | |
| Massachusetts Development Finance Agency Rev. (Sabis International Charter School Issue), 4%, 4/15/2020 | | | 40,000 | | | | 40,527 | |
| Massachusetts Development Finance Agency Rev. (Sabis International Charter School Issue), 5%, 4/15/2025 | | | 170,000 | | | | 186,369 | |
| Massachusetts Development Finance Agency Rev. (Simmons College), “H”, SYNCORA, 5.25%, 10/01/2033 | | | 430,000 | | | | 503,702 | |
| Massachusetts Development Finance Agency Rev. (Simmons College), “K-1”, 5%, 10/01/2024 | | | 1,400,000 | | | | 1,579,620 | |
| Massachusetts Development Finance Agency Rev. (Simmons College), “K-1”, 5%, 10/01/2025 | | | 800,000 | | | | 912,464 | |
| Massachusetts Development Finance Agency Rev. (Suffolk University), 5%, 7/01/2033 | | | 480,000 | | | | 533,885 | |
| Massachusetts Development Finance Agency Rev. (Suffolk University), 5%, 7/01/2034 | | | 645,000 | | | | 714,434 | |
| Massachusetts Development Finance Agency Rev. (Suffolk University), 5%, 7/01/2035 | | | 325,000 | | | | 357,994 | |
| Massachusetts Development Finance Agency Rev. (UMass Memorial Health Care Obligated Group), “I”, 5%, 7/01/2036 | | | 1,685,000 | | | | 1,848,630 | |
| Massachusetts Development Finance Agency Rev. (UMass Memorial Health Care Obligated Group), “K”, 5%, 7/01/2038 | | | 1,120,000 | | | | 1,218,202 | |
| Massachusetts Development Finance Agency Rev. (Wentworth Institute of Technology Issue), 5%, 10/01/2046 | | | 985,000 | | | | 1,060,815 | |
49
Portfolio of Investments – continued
| | | | | | | | |
| | |
| Issuer | | Shares/Par | | | Value ($) | |
| Municipal Bonds - continued | | | | | | | | |
| Massachusetts - continued | | | | | | | | |
| Massachusetts Development Finance Agency Rev. (Western New England University), 5%, 9/01/2028 | | $ | 960,000 | | | $ | 1,075,603 | |
| Massachusetts Educational Financing Authority, Education Loan Rev, “A”, 4.25%, 1/01/2030 | | | 755,000 | | | | 785,374 | |
| Massachusetts Educational Financing Authority, Education Loan Rev, “A”, 4.25%, 1/01/2031 | | | 515,000 | | | | 532,937 | |
| Massachusetts Educational Financing Authority, Education Loan Rev., “I-A”, 5.5%, 1/01/2022 | | | 250,000 | | | | 258,430 | |
| Massachusetts Educational Financing Authority, Education Loan Rev., “E”, “C”, 4.125%, 7/01/2046 | | | 6,585,000 | | | | 6,628,263 | |
| Massachusetts Educational Financing Authority, Education Loan Rev., “J”, 4.7%, 7/01/2026 | | | 930,000 | | | | 957,268 | |
| Massachusetts Educational Financing Authority, Education Loan Rev., “J”, 4.9%, 7/01/2028 | | | 965,000 | | | | 1,009,786 | |
| Massachusetts Educational Financing Authority, Education Loan Rev., “J”, 3.5%, 7/01/2033 (u) | | | 14,205,000 | | | | 14,232,558 | |
| Massachusetts Educational Financing Authority, Education Loan Rev., “J”, 3.5%, 7/01/2033 | | | 2,095,000 | | | | 2,099,064 | |
| Massachusetts Health & Higher Educational Facilities Authority Refunding Bonds Rev. (Suffolk University), 6.25%, 7/01/2030 (Prerefunded 7/01/2019) | | | 3,900,000 | | | | 3,973,593 | |
| Massachusetts Health & Higher Educational Facilities Authority Refunding Bonds Rev., Unrefunded Balance (Suffolk University), 6.25%, 7/01/2030 | | | 2,230,000 | | | | 2,267,642 | |
| Massachusetts Housing Finance Agency, Single Family Housing Rev., “169”, 4%, 12/01/2029 | | | 60,000 | | | | 60,104 | |
| Massachusetts Housing Finance Agency, Single Family Housing Rev., “177”, 4%, 6/01/2039 | | | 740,000 | | | | 765,212 | |
| Massachusetts Port Authority Special Facilities Rev. (ConRAC Project), “A”, 5.125%, 7/01/2041 | | | 340,000 | | | | 359,581 | |
| Massachusetts Port Authority Special Facilities Rev. (Delta Air Lines Project, Inc.), “A”, AAC, 5%, 1/01/2027 | | | 2,760,000 | | | | 2,816,304 | |
| | | | | | | | |
| | | | | | | $ | 125,618,401 | |
| Michigan - 1.8% | | | | | | | | |
| Detroit, MI, Downtown Development Authority Tax Increment Rev. (Catalyst Development), “A”, AGM, 5%, 7/01/2043 | | $ | 2,220,000 | | | $ | 2,375,933 | |
| Detroit, MI, Water & Sewerage Department, Senior Lien Sewage Disposal System Rev., “A”, 5.25%, 7/01/2039 | | | 9,635,000 | | | | 10,380,749 | |
| Detroit, MI, Water & Sewerage Department, Senior Lien Sewage Disposal System Rev., “A”, AGM, 5%, 7/01/2039 | | | 3,190,000 | | | | 3,412,247 | |
| Detroit, MI, Water Supply System Rev., Senior Lien, “A”, 5%, 7/01/2036 | | | 375,000 | | | | 393,450 | |
50
Portfolio of Investments – continued
| | | | | | | | |
| | |
| Issuer | | Shares/Par | | | Value ($) | |
| Municipal Bonds - continued | | | | | | | | |
| Michigan - continued | | | | | | | | |
| Detroit, MI, Water Supply System Rev., Senior Lien, “A”, 5.25%, 7/01/2041 | | $ | 2,055,000 | | | $ | 2,188,226 | |
| Detroit, MI, Water Supply System Rev., Senior Lien, “C”, 5%, 7/01/2041 | | | 535,000 | | | | 560,049 | |
| Downriver, MI, Utility Wastewater Authority, Sewer System Rev., AGM, 5%, 4/01/2036 | | | 725,000 | | | | 816,205 | |
| Downriver, MI, Utility Wastewater Authority, Sewer System Rev., AGM, 5%, 4/01/2038 | | | 665,000 | | | | 743,104 | |
| Downriver, MI, Utility Wastewater Authority, Sewer System Rev., AGM, 5%, 4/01/2043 | | | 1,185,000 | | | | 1,309,508 | |
| Grand Rapids, MI, Economic Development Corp. Rev. (Beacon Hill at Eastgate Project), “A”, 5%, 11/01/2037 | | | 1,155,000 | | | | 1,183,690 | |
| Grand Rapids, MI, Economic Development Corp. Rev. (Beacon Hill at Eastgate Project), “A”, 5%, 11/01/2047 | | | 2,660,000 | | | | 2,678,540 | |
| Grand Rapids, MI, Economic Development Corp. Rev. (Beacon Hill at Eastgate Project), “A”, 5%, 11/01/2052 | | | 1,185,000 | | | | 1,188,235 | |
| Kalamazoo, MI, Economic Development Corp. Rev. (Heritage Community), 5.375%, 5/15/2027 | | | 750,000 | | | | 750,248 | |
| Kalamazoo, MI, Economic Development Corp. Rev. (Heritage Community), 5.5%, 5/15/2036 | | | 3,050,000 | | | | 3,049,908 | |
| Michigan Finance Authority (City of Detroit Financial Recovery Income Tax Rev.), “F”, 3.875%, 10/01/2023 | | | 635,000 | | | | 666,032 | |
| Michigan Finance Authority (City of Detroit Financial Recovery Income Tax Rev.), “F”, 4%, 10/01/2024 | | | 800,000 | | | | 850,320 | |
| Michigan Finance Authority Hospital Rev. (Beaumont Health Credit Group), “A”, 5%, 8/01/2033 | | | 1,105,000 | | | | 1,219,655 | |
| Michigan Finance Authority Hospital Rev. (Sparrow Obligated Group), 5%, 11/15/2045 | | | 7,000,000 | | | | 7,574,770 | |
| Michigan Finance Authority Hospital Rev. (Trinity Health Credit Group), 5%, 12/01/2034 | | | 2,225,000 | | | | 2,565,825 | |
| Michigan Finance Authority Hospital Rev. (Trinity Health Credit Group), 5%, 12/01/2037 | | | 1,000,000 | | | | 1,135,750 | |
| Michigan Finance Authority Hospital Rev. (Trinity Health Credit Group), 5%, 12/01/2048 | | | 5,215,000 | | | | 5,854,203 | |
| Michigan Finance Authority Local Government Loan Program Rev. (Detroit Water and Sewerage Department Sewage Disposal System Rev. Refunding Second Lien Local Project), “C”, 5%, 7/01/2033 | | | 875,000 | | | | 971,469 | |
| Michigan Finance Authority Local Government Loan Program Rev. (Detroit Water and Sewerage Department Sewage Disposal System Rev. Refunding Second Lien Local Project), “C”, 5%, 7/01/2034 | | | 2,070,000 | | | | 2,289,627 | |
51
Portfolio of Investments – continued
| | | | | | | | |
| | |
| Issuer | | Shares/Par | | | Value ($) | |
| Municipal Bonds - continued | | | | | | | | |
| Michigan - continued | | | | | | | | |
| Michigan Finance Authority Local Government Loan Program Rev. (Detroit Water and Sewerage Department Sewage Disposal System Rev. Refunding Second Lien Local Project), “C”, 5%, 7/01/2035 | | $ | 1,355,000 | | | $ | 1,496,584 | |
| Michigan Finance Authority Local Government Loan Program Rev. (Detroit Water and Sewerage Department Sewage Disposal System Rev. Senior Lien Local Project), “C-1”, 5%, 7/01/2044 | | | 2,375,000 | | | | 2,532,011 | |
| Michigan Finance Authority Local Government Loan Program Rev. (Detroit Water and Sewerage Department Sewage Disposal System Rev. Senior Lien Local Project), “C-2”, 5%, 7/01/2044 | | | 1,365,000 | | | | 1,443,706 | |
| Michigan Finance Authority Local Government Loan Program Rev. (Detroit Water and Sewerage Department Sewage Disposal System Rev. Senior Lien Local Project), “C-6”, 5%, 7/01/2033 | | | 2,280,000 | | | | 2,503,645 | |
| Michigan Finance Authority Local Government Loan Program Rev. (Detroit Water and Sewerage Department Water Supply System Rev. Refunding Local Project), “D-2”, 5%, 7/01/2034 | | | 885,000 | | | | 978,899 | |
| Michigan Hospital Finance Authority Rev. (Henry Ford Health System), 5.75%, 11/15/2039 (Prerefunded 11/15/2019) | | | 4,405,000 | | | | 4,541,555 | |
| Michigan Housing Development Authority, “A”, 4%, 6/01/2046 | | | 4,885,000 | | | | 5,083,868 | |
| Michigan Strategic Fund Ltd. (Canterbury Health Care, Inc.), 5%, 7/01/2046 | | | 1,635,000 | | | | 1,645,987 | |
| Michigan Strategic Fund Ltd. (Canterbury Health Care, Inc.), 5%, 7/01/2051 | | | 900,000 | | | | 903,276 | |
| Michigan Strategic Fund Ltd. Obligation Rev. (Detroit Edison Co.), 5.625%, 7/01/2020 | | | 1,050,000 | | | | 1,101,072 | |
| Waterford Township, MI, Economic Development Corp. (Canterbury Health Care, Inc.), “A”, 5%, 7/01/2046 | | | 2,070,000 | | | | 2,083,910 | |
| Waterford Township, MI, Economic Development Corp. (Canterbury Health Care, Inc.), “A”, 5%, 7/01/2051 | | | 2,070,000 | | | | 2,077,535 | |
| Wayne County, MI, Airport Authority Rev. (Detroit Metropolitan Wayne County Airport), “B”, 5%, 12/01/2044 | | | 2,215,000 | | | | 2,437,608 | |
| Wayne County, MI, Airport Authority Rev. (Detroit Metropolitan Wayne County Airport), “B”, BAM, 5%, 12/01/2039 | | | 750,000 | | | | 831,705 | |
| Wayne County, MI, Airport Authority Rev. (Detroit Metropolitan Wayne County Airport), “C”, 5%, 12/01/2039 | | | 575,000 | | | | 627,986 | |
| Wayne County, MI, Airport Authority Rev. (Detroit Metropolitan Wayne County Airport), “C”, 5%, 12/01/2044 | | | 1,240,000 | | | | 1,347,396 | |
| Western Michigan University Rev., “A”, 5%, 11/15/2040 | | | 1,250,000 | | | | 1,408,863 | |
| | | | | | | | |
| | | | | | | $ | 87,203,349 | |
| Minnesota - 0.6% | | | | | | | | |
| Deephaven, MN, Charter School Lease Rev. (Eagle Ridge Academy Project), “A”, 5.25%, 7/01/2040 | | $ | 500,000 | | | $ | 517,840 | |
52
Portfolio of Investments – continued
| | | | | | | | |
| | |
| Issuer | | Shares/Par | | | Value ($) | |
| Municipal Bonds - continued | | | | | | | | |
| Minnesota - continued | | | | | | | | |
| Deephaven, MN, Charter School Lease Rev. (Eagle Ridge Academy Project), “A”, 5.5%, 7/01/2050 | | $ | 3,000,000 | | | $ | 3,127,650 | |
| Duluth, MN, Economic Development Authority, Health Care Facilities Rev. (Essentia Health), “A”, 4.25%, 2/15/2043 | | | 2,070,000 | | | | 2,083,890 | |
| Duluth, MN, Economic Development Authority, Health Care Facilities Rev. (Essentia Health), “A”, 5%, 2/15/2043 | | | 3,680,000 | | | | 4,023,675 | |
| Duluth, MN, Economic Development Authority, Health Care Facilities Rev. (Essentia Health), “A”, 4.25%, 2/15/2048 | | | 2,065,000 | | | | 2,074,210 | |
| Duluth, MN, Economic Development Authority, Health Care Facilities Rev. (Essentia Health), “A”, 5%, 2/15/2048 | | | 2,905,000 | | | | 3,164,707 | |
| Minnesota Housing Finance Agency, Residential Housing, “A”, 4%, 1/01/2041 | | | 1,090,000 | | | | 1,130,014 | |
| Minnesota Office of Higher Education Supplemental Student Loan Program Rev., 4%, 11/01/2037 (u) | | | 8,390,000 | | | | 8,569,043 | |
| St. Paul, MN, Housing & Redevelopment Authority Charter School Lease Rev. (Great River School Project), “A”, 4.75%, 7/01/2029 | | | 250,000 | | | | 253,975 | |
| St. Paul, MN, Housing & Redevelopment Authority Charter School Lease Rev. (Great River School Project), “A”, 5.25%, 7/01/2033 | | | 420,000 | | | | 432,932 | |
| St. Paul, MN, Housing & Redevelopment Authority Charter School Lease Rev. (Great River School Project), “A”, 5.5%, 7/01/2052 | | | 705,000 | | | | 717,034 | |
| St. Paul, MN, Housing & Redevelopment Authority Charter School Lease Rev. (Nova Classical Academy), “A”, 6.375%, 9/01/2031 | | | 630,000 | | | | 678,075 | |
| St. Paul, MN, Housing & Redevelopment Authority Charter School Lease Rev. (Nova Classical Academy), “A”, 6.625%, 9/01/2042 (Prerefunded 9/01/2021) | | | 1,260,000 | | | | 1,410,923 | |
| St. Paul, MN, Port Authority Rev. (Energy Park Utility Co. Project), 5.45%, 8/01/2028 | | | 250,000 | | | | 255,005 | |
| St. Paul, MN, Port Authority Rev. (Energy Park Utility Co. Project), 5.7%, 8/01/2036 | | | 1,250,000 | | | | 1,270,512 | |
| | | | | | | | |
| | | | | | | $ | 29,709,485 | |
| Mississippi - 0.7% | | | | | | | | |
| Mississippi Development Bank Special Obligation (Magnolia Regional Health Center Project), “A”, 6.25%, 10/01/2026 | | $ | 1,350,000 | | | $ | 1,418,135 | |
| Mississippi Development Bank Special Obligation (Magnolia Regional Health Center Project), “A”, 6.5%, 10/01/2031 | | | 2,045,000 | | | | 2,142,076 | |
| Mississippi Home Corp. Single Family Mortgage Rev., “A”, 4%, 12/01/2044 | | | 2,975,000 | | | | 3,165,043 | |
| Mississippi Hospital Equipment & Facilities Authority Rev. (Baptist Memorial Healthcare), “A”, 5%, 9/01/2022 | | | 1,845,000 | | | | 2,001,105 | |
| Mississippi Hospital Equipment & Facilities Authority Rev. (Baptist Memorial Healthcare), “A”, 5%, 9/01/2023 | | | 4,810,000 | | | | 5,309,182 | |
| West Rankin, MS, Utility Authority Rev., AGM, 5%, 1/01/2043 | | | 8,920,000 | | | | 9,864,271 | |
53
Portfolio of Investments – continued
| | | | | | | | |
| | |
| Issuer | | Shares/Par | | | Value ($) | |
| Municipal Bonds - continued | | | | | | | | |
| Mississippi - continued | | | | | | | | |
| West Rankin, MS, Utility Authority Rev., AGM, 5%, 1/01/2048 | | $ | 7,750,000 | | | $ | 8,526,938 | |
| | | | | | | | |
| | | | | | | $ | 32,426,750 | |
| Missouri - 1.3% | | | | | | | | |
| Dardenne, MO, Town Square Transportation Development District, “A”, 3.5%, 5/01/2026 (d)(q) | | $ | 2,495,000 | | | $ | 1,284,925 | |
| Grundy County, MO, Industrial Development Authority Health Facilities Rev. (Wright Memorial Hospital), 6.125%, 9/01/2025 | | | 1,070,000 | | | | 1,084,713 | |
| Grundy County, MO, Industrial Development Authority Health Facilities Rev. (Wright Memorial Hospital), 6.75%, 9/01/2034 | | | 1,590,000 | | | | 1,614,279 | |
| Kansas City, MO, Land Clearance for Redevelopment Authority Rev. (Convention Center Hotel Project - TIF Financing), “B”, 4.375%, 2/01/2031 | | | 1,795,000 | | | | 1,802,288 | |
| Kansas City, MO, Land Clearance for Redevelopment Authority Rev. (Convention Center Hotel Project - TIF Financing), “B”, 5%, 2/01/2040 | | | 2,140,000 | | | | 2,185,924 | |
| Kansas City, MO, Land Clearance for Redevelopment Authority Rev. (Convention Center Hotel Project - TIF Financing), “B”, 5%, 2/01/2050 | | | 5,740,000 | | | | 5,768,757 | |
| Missouri Health & Educational Facilities Authority Rev. (A.T. Still University Health Services), 5%, 10/01/2039 | | | 465,000 | | | | 510,649 | |
| Missouri Health & Educational Facilities Authority Rev. (Bethesda Health Group, Inc.), 5%, 8/01/2040 | | | 1,650,000 | | | | 1,717,419 | |
| Missouri Health & Educational Facilities Authority Rev. (Bethesda Health Group, Inc.), 5%, 8/01/2045 | | | 2,300,000 | | | | 2,388,251 | |
| Missouri Health & Educational Facilities Authority Rev. (SSM Health Care), “A”, 5%, 6/01/2031 | | | 1,735,000 | | | | 1,926,180 | |
| Missouri Housing Development Commission, Single Family Mortgage Rev. (First Place Homeownership Loan Program), “A”, 3.75%, 5/01/2038 | | | 865,000 | | | | 896,253 | |
| Missouri Housing Development Commission, Single Family Mortgage Rev. (First Place Homeownership Loan Program), “B”, FNMA, 4.75%, 5/01/2049 | | | 4,800,000 | | | | 5,269,248 | |
| Missouri Housing Development Commission, Single Family Mortgage Rev. (Special Home Ownership Loan Program), “B”, GNMA, 4%, 11/01/2040 | | | 710,000 | | | | 737,931 | |
| Osage Beach, MO, Tax Increment Rev. (Prewitts), 5%, 5/01/2023 | | | 1,170,000 | | | | 1,140,703 | |
| St. Louis County, MO, Industrial Development Authority Health Facilities Rev. (Nazareth Living Center), “A”, 5%, 8/15/2030 | | | 695,000 | | | | 718,039 | |
| St. Louis County, MO, Industrial Development Authority Health Facilities Rev. (Nazareth Living Center), “A”, 5%, 8/15/2035 | | | 490,000 | | | | 499,281 | |
| St. Louis County, MO, Industrial Development Authority Health Facilities Rev. (Nazareth Living Center), “A”, 5.125%, 8/15/2045 | | | 1,355,000 | | | | 1,379,417 | |
54
Portfolio of Investments – continued
| | | | | | | | |
| | |
| Issuer | | Shares/Par | | | Value ($) | |
| Municipal Bonds - continued | | | | | | | | |
| Missouri - continued | | | | | | | | |
| St. Louis County, MO, Industrial Development Authority Health Facilities Rev. (Ranken-Jordan Project), 4%, 11/15/2036 | | $ | 1,165,000 | | | $ | 1,106,494 | |
| St. Louis County, MO, Industrial Development Authority Health Facilities Rev. (Ranken-Jordan Project), 5%, 11/15/2041 | | | 1,195,000 | | | | 1,218,303 | |
| St. Louis, MO, Industrial Development Authority Financing Rev. (Ballpark Village Development Project), “A”, 3.875%, 11/15/2029 | | | 1,170,000 | | | | 1,194,804 | |
| St. Louis, MO, Industrial Development Authority Financing Rev. (Ballpark Village Development Project), “A”, 4.375%, 11/15/2035 | | | 2,110,000 | | | | 2,132,788 | |
| St. Louis, MO, Industrial Development Authority Financing Rev. (Ballpark Village Development Project), “A”, 4.75%, 11/15/2047 | | | 4,220,000 | | | | 4,274,522 | |
| St. Louis, MO, Industrial Development Authority Rev. (Friendship Village St. Louis Obligated Group), “A”, 5.25%, 9/01/2053 | | | 13,665,000 | | | | 13,684,814 | |
| St. Louis, MO, Industrial Development Authority Rev. (St. Andrew’s Resources for Seniors Obligated Group), “A”, 5.125%, 12/01/2045 | | | 3,620,000 | | | | 3,725,740 | |
| St. Louis, MO, Land Clearance Redevelopment Authority, Facilities Improvement Special Rev. (Kiel Opera House), “B”, 7%, 9/01/2035 | | | 3,625,000 | | | | 3,704,098 | |
| | | | | | | | |
| | | | | | | $ | 61,965,820 | |
| Montana - 0.2% | | | | | | | | |
| Montana Board of Housing Single Family Program (Federally Insured or Guaranteed Mortgage Loans), “A”, 4%, 6/01/2049 | | $ | 1,035,000 | | | $ | 1,095,517 | |
| Montana Finance Authority, Health Care Facilities Rev. (Kalispell Regional Medical Center), “B”, 5%, 7/01/2043 | | | 3,840,000 | | | | 4,154,150 | |
| Montana Finance Authority, Health Care Facilities Rev. (Kalispell Regional Medical Center), “B”, 5%, 7/01/2048 | | | 5,530,000 | | | | 5,964,326 | |
| | | | | | | | |
| | | | | | | $ | 11,213,993 | |
| Nebraska - 0.3% | | | | | | | | |
| Central Plains Energy Project, NE, Gas Project Rev. (Project No.3), “A”, 5%, 9/01/2034 | | $ | 1,200,000 | | | $ | 1,398,924 | |
| Central Plains Energy Project, NE, Gas Project Rev. (Project No.3), “A”, 5%, 9/01/2036 | | | 1,940,000 | | | | 2,258,218 | |
| Central Plains Energy Project, NE, Gas Project Rev. (Project No.3), “A”, 5%, 9/01/2042 | | | 3,875,000 | | | | 4,462,799 | |
| Nebraska Investment Finance Authority, Single Family Housing Rev., “A”, 3%, 3/01/2044 | | | 255,000 | | | | 255,694 | |
| Nebraska Investment Finance Authority, Single Family Housing Rev., “A”, 4%, 9/01/2044 | | | 1,240,000 | | | | 1,286,388 | |
| Nebraska Investment Finance Authority, Single Family Housing Rev., “C”, 4%, 9/01/2048 (u) | | | 5,155,000 | | | | 5,475,744 | |
| | | | | | | | |
| | | | | | | $ | 15,137,767 | |
55
Portfolio of Investments – continued
| | | | | | | | |
| | |
| Issuer | | Shares/Par | | | Value ($) | |
| Municipal Bonds - continued | | | | | | | | |
| Nevada - 0.3% | | | | | | | | |
| Director of the State of Nevada, Department of Business and Industry, Charter School Lease Rev. (Somerset Academy), “A”, 4.5%, 12/15/2029 | | $ | 595,000 | | | $ | 597,065 | |
| Director of the State of Nevada, Department of Business and Industry, Charter School Lease Rev. (Somerset Academy), “A”, 5%, 12/15/2035 | | | 1,715,000 | | | | 1,739,765 | |
| Director of the State of Nevada, Department of Business and Industry, Charter School Lease Rev. (Somerset Academy), “A”, 5%, 12/15/2038 | | | 945,000 | | | | 952,588 | |
| Director of the State of Nevada, Department of Business and Industry, Charter School Lease Rev. (Somerset Academy), “A”, 5.125%, 12/15/2045 | | | 2,205,000 | | | | 2,227,094 | |
| Director of the State of Nevada, Department of Business and Industry, Charter School Lease Rev. (Somerset Academy), “A”, 5%, 12/15/2048 | | | 1,625,000 | | | | 1,626,771 | |
| Nevada Department of Business & Industry Charter School Rev. (Doral Academy of Nevada), “A”, 5%, 7/15/2037 | | | 1,000,000 | | | | 1,010,400 | |
| Nevada Department of Business & Industry Charter School Rev. (Doral Academy of Nevada), “A”, 5%, 7/15/2047 | | | 1,015,000 | | | | 1,016,624 | |
| Reno, NV, Sales Tax Rev. (Retrac-Reno Transportation Rail Access Corridor Project), “B”, AGM, 5%, 6/01/2033 | | | 85,000 | | | | 97,628 | |
| Reno, NV, Sales Tax Rev. (Retrac-Reno Transportation Rail Access Corridor Project), “B”, AGM, 5%, 6/01/2038 | | | 110,000 | | | | 123,905 | |
| Reno, NV, Sales Tax Rev. (Retrac-Reno Transportation Rail Access Corridor Project), “B”, AGM, 4%, 6/01/2048 | | | 435,000 | | | | 434,983 | |
| Reno, NV, Sales Tax Rev. (Retrac-Reno Transportation Rail Access Corridor Project), “B”, AGM, 4.125%, 6/01/2058 | | | 545,000 | | | | 541,294 | |
| Reno, NV, Sales Tax Rev. (Retrac-Reno Transportation Rail Access Corridor Project), Capital Appreciation, “C”, 0%, 7/01/2058 | | | 52,000,000 | | | | 5,930,600 | |
| | | | | | | | |
| | | | | | | $ | 16,298,717 | |
| New Hampshire - 0.6% | | | | | | | | |
| National Finance Authority, New Hampshire Resource Recovery Refunding Rev. (Covanta Project), “C”, 4.875%, 11/01/2042 | | $ | 7,730,000 | | | $ | 7,585,449 | |
| New Hampshire Business Finance Authority Rev. (Elliot Hospital Obligated Group), “A”, 6%, 10/01/2027 (Prerefunded 10/01/2019) | | | 4,935,000 | | | | 5,072,538 | |
| New Hampshire Business Finance Authority Rev. (Huggins Hospital), 6.875%, 10/01/2039 (Prerefunded 10/01/2019) | | | 760,000 | | | | 785,460 | |
| New Hampshire Business Finance Authority, Solid Waste Disposal Rev. (Casella Waste Systems, Inc. Project), 4%, 4/01/2029 (Put Date 10/01/2019) | | | 985,000 | | | | 991,018 | |
| New Hampshire Health & Education Facilities Authority Rev. (Elliot Hospital), 5%, 10/01/2033 | | | 3,475,000 | | | | 3,812,562 | |
56
Portfolio of Investments – continued
| | | | | | | | |
| | |
| Issuer | | Shares/Par | | | Value ($) | |
| Municipal Bonds - continued | | | | | | | | |
| New Hampshire - continued | | | | | | | | |
| New Hampshire Health & Education Facilities Authority Rev. (Elliot Hospital), 5%, 10/01/2038 | | $ | 3,500,000 | | | $ | 3,764,600 | |
| New Hampshire Health & Education Facilities Authority Rev. (Memorial Hospital), 5.5%, 6/01/2031 | | | 1,820,000 | | | | 2,070,942 | |
| New Hampshire Health & Education Facilities Authority Rev. (Memorial Hospital), 5.5%, 6/01/2036 | | | 1,825,000 | | | | 2,038,963 | |
| New Hampshire Health & Education Facilities Authority Rev. (Rivermead), “A”, 6.875%, 7/01/2041 | | | 2,625,000 | | | | 2,781,030 | |
| | | | | | | | |
| | | | | | | $ | 28,902,562 | |
| New Jersey - 4.5% | | | | | | | | |
| Atlantic City, NJ, Tax Appeal Refunding Bonds (Qualified Pursuant to the Provisions of the Municipal Qualified Bond Act), “A”, BAM, 5%, 3/01/2032 | | $ | 295,000 | | | $ | 333,860 | |
| Atlantic City, NJ, Tax Appeal Refunding Bonds (Qualified Pursuant to the Provisions of the Municipal Qualified Bond Act), “A”, BAM, 5%, 3/01/2037 | | | 390,000 | | | | 431,410 | |
| Atlantic City, NJ, Tax Appeal Refunding Bonds (Qualified Pursuant to the Provisions of the Municipal Qualified Bond Act), “A”, BAM, 5%, 3/01/2042 | | | 490,000 | | | | 535,531 | |
| Bayonne, NJ, Redevelopment Agency (Royal Caribbean Project), “A”, 5.375%, 11/01/2035 | | | 2,340,000 | | | | 2,320,672 | |
| New Jersey Building Authority Rev., Unrefunded Balance, “A”, BAM, 5%, 6/15/2029 | | | 430,000 | | | | 491,004 | |
| New Jersey Casino Reinvestment Development Authority, Luxury Tax Rev., AGM, 5%, 11/01/2029 | | | 445,000 | | | | 488,646 | |
| New Jersey Casino Reinvestment Development Authority, Luxury Tax Rev., AGM, 5%, 11/01/2030 | | | 690,000 | | | | 755,398 | |
| New Jersey Casino Reinvestment Development Authority, Luxury Tax Rev., AGM, 5%, 11/01/2031 | | | 2,570,000 | | | | 2,806,543 | |
| New Jersey Casino Reinvestment Development Authority, Luxury Tax Rev., AGM, 5%, 11/01/2032 | | | 1,305,000 | | | | 1,422,959 | |
| New Jersey Economic Development Authority Rev. (Kapkowski Road Landfill Project), 5.75%, 10/01/2021 | | | 120,000 | | | | 125,047 | |
| New Jersey Economic Development Authority Rev. (Kapkowski Road Landfill Project), 6.5%, 4/01/2028 | | | 1,500,000 | | | | 1,718,790 | |
| New Jersey Economic Development Authority Rev. (Kapkowski Road Landfill Project), 6.5%, 4/01/2031 | | | 9,985,000 | | | | 11,176,610 | |
| New Jersey Economic Development Authority Rev. (Lions Gate Project), 4.375%, 1/01/2024 | | | 650,000 | | | | 649,551 | |
| New Jersey Economic Development Authority Rev. (Lions Gate Project), 4.875%, 1/01/2029 | | | 2,300,000 | | | | 2,301,380 | |
| New Jersey Economic Development Authority Rev. (Lions Gate Project), 5%, 1/01/2034 | | | 4,350,000 | | | | 4,331,730 | |
57
Portfolio of Investments – continued
| | | | | | | | |
| | |
| Issuer | | Shares/Par | | | Value ($) | |
| Municipal Bonds - continued | | | | | | | | |
| New Jersey - continued | | | | | | | | |
| New Jersey Economic Development Authority Rev. (Lions Gate Project), 5.125%, 1/01/2039 | | $ | 1,625,000 | | | $ | 1,615,900 | |
| New Jersey Economic Development Authority Rev. (Lions Gate Project), 5.25%, 1/01/2044 | | | 4,625,000 | | | | 4,626,757 | |
| New Jersey Economic Development Authority Rev. (Provident Group - Montclair Properties LLC - Montclair State University Student Housing Project), ASSD GTY, 5%, 6/01/2037 | | | 2,530,000 | | | | 2,794,208 | |
| New Jersey Economic Development Authority Rev. (Provident Group - Montclair Properties LLC - Montclair State University Student Housing Project), ASSD GTY, 5%, 6/01/2042 | | | 2,810,000 | | | | 3,065,345 | |
| New Jersey Economic Development Authority Rev. (Provident Group - Rowan Properties LLC - Rowan University Student Housing Project), “A”, 5%, 1/01/2021 | | | 105,000 | | | | 109,401 | |
| New Jersey Economic Development Authority Rev. (Provident Group - Rowan Properties LLC - Rowan University Student Housing Project), “A”, 5%, 1/01/2022 | | | 615,000 | | | | 651,642 | |
| New Jersey Economic Development Authority Rev. (Provident Group - Rowan Properties LLC - Rowan University Student Housing Project), “A”, 5%, 1/01/2023 | | | 705,000 | | | | 757,424 | |
| New Jersey Economic Development Authority Rev. (Provident Group - Rowan Properties LLC - Rowan University Student Housing Project), “A”, 5%, 1/01/2030 | | | 985,000 | | | | 1,056,688 | |
| New Jersey Economic Development Authority Rev. (Provident Group - Rowan Properties LLC - Rowan University Student Housing Project), “A”, 5%, 1/01/2035 | | | 1,510,000 | | | | 1,596,840 | |
| New Jersey Economic Development Authority Rev. (The Goethals Bridge Replacement Project), 5.5%, 1/01/2027 | | | 325,000 | | | | 364,813 | |
| New Jersey Economic Development Authority Rev. (The Goethals Bridge Replacement Project), 5%, 1/01/2028 | | | 325,000 | | | | 354,452 | |
| New Jersey Economic Development Authority Rev. (The Goethals Bridge Replacement Project), AGM, 5%, 1/01/2031 | | | 975,000 | | | | 1,058,255 | |
| New Jersey Economic Development Authority Rev. (The Goethals Bridge Replacement Project), AGM, 5.125%, 1/01/2039 | | | 1,060,000 | | | | 1,136,532 | |
| New Jersey Economic Development Authority Rev. (The Goethals Bridge Replacement Project), AGM, 5.125%, 7/01/2042 | | | 530,000 | | | | 567,280 | |
| New Jersey Economic Development Authority Rev., School Facilities Construction, “DDD”, 5%, 6/15/2034 | | | 825,000 | | | | 884,936 | |
| New Jersey Economic Development Authority Rev., School Facilities Construction, “DDD”, 5%, 6/15/2035 | | | 690,000 | | | | 737,596 | |
| New Jersey Economic Development Authority Rev., School Facilities Construction, “DDD”, 5%, 6/15/2042 | | | 3,850,000 | | | | 4,026,445 | |
| New Jersey Economic Development Authority Rev., School Facilities Construction, “NN”, 5%, 3/01/2027 | | | 5,865,000 | | | | 6,304,640 | |
58
Portfolio of Investments – continued
| | | | | | | | |
| | |
| Issuer | | Shares/Par | | | Value ($) | |
| Municipal Bonds - continued | | | | | | | | |
| New Jersey - continued | | | | | | | | |
| New Jersey Economic Development Authority, Special Facilities Rev. (Continental Airlines, Inc.), 4.875%, 9/15/2019 | | $ | 2,335,000 | | | $ | 2,367,363 | |
| New Jersey Economic Development Authority, Special Facilities Rev. (Continental Airlines, Inc.), 5.125%, 9/15/2023 | | | 7,870,000 | | | | 8,487,087 | |
| New Jersey Economic Development Authority, Special Facilities Rev. (Continental Airlines, Inc.), 5.25%, 9/15/2029 | | | 5,770,000 | | | | 6,259,354 | |
| New Jersey Economic Development Authority, Special Facilities Rev. (Continental Airlines, Inc.), “A”, 5.625%, 11/15/2030 | | | 1,820,000 | | | | 2,052,050 | |
| New Jersey Economic Development Authority, Special Facilities Rev. (Continental Airlines, Inc.), “B”, 5.625%, 11/15/2030 | | | 8,595,000 | | | | 9,686,479 | |
| New Jersey Economic Development Authority, State Lease Rev. (Juvenile Justice Commission Facilities Project), “C”, 5%, 6/15/2042 | | | 3,685,000 | | | | 3,862,175 | |
| New Jersey Economic Development Motor Vehicle Surcharges Subordinate Refunding Rev., “A”, 3.125%, 7/01/2029 | | | 1,585,000 | | | | 1,587,029 | |
| New Jersey Economic Development Motor Vehicle Surcharges Subordinate Refunding Rev., “A”, 3.125%, 7/01/2031 (u) | | | 8,500,000 | | | | 8,222,900 | |
| New Jersey Economic Development Motor Vehicle Surcharges Subordinate Refunding Rev., “A”, 5%, 7/01/2033 | | | 400,000 | | | | 430,976 | |
| New Jersey Economic Development Motor Vehicle Surcharges Subordinate Refunding Rev., “A”, BAM, 5%, 7/01/2027 | | | 5,075,000 | | | | 5,873,247 | |
| New Jersey Economic Development Motor Vehicle Surcharges Subordinate Refunding Rev., “A”, BAM, 5%, 7/01/2028 | | | 1,560,000 | | | | 1,794,062 | |
| New Jersey Educational Facilities Authority Rev. (University of Medicine & Dentistry), “B”, 7.5%, 12/01/2032 (Prerefunded 6/01/2019) | | | 4,280,000 | | | | 4,361,063 | |
| New Jersey Health Care Facilities, Financing Authority Rev. (University Hospital), “A”, AGM, 5%, 7/01/2046 | | | 10,225,000 | | | | 11,142,796 | |
| New Jersey Health Care Facilities, Financing Authority, State Contract Refunding Bonds (Hospital Asset Transformation Program), 5%, 10/01/2031 | | | 1,710,000 | | | | 1,872,929 | |
| New Jersey Health Care Facilities, Financing Authority, State Contract Refunding Bonds (Hospital Asset Transformation Program), 5%, 10/01/2032 | | | 1,710,000 | | | | 1,856,359 | |
| New Jersey Health Care Facilities, Financing Authority, State Contract Refunding Bonds (Hospital Asset Transformation Program), 5%, 10/01/2033 | | | 1,450,000 | | | | 1,570,611 | |
| New Jersey Health Care Facilities, Financing Authority, State Contract Refunding Bonds (Hospital Asset Transformation Program), 5%, 10/01/2034 | | | 1,455,000 | | | | 1,569,057 | |
| New Jersey Health Care Facilities, Financing Authority, State Contract Refunding Bonds (Hospital Asset Transformation Program), 5%, 10/01/2035 | | | 1,285,000 | | | | 1,380,617 | |
59
Portfolio of Investments – continued
| | | | | | | | |
| | |
| Issuer | | Shares/Par | | | Value ($) | |
| Municipal Bonds - continued | | | | | | | | |
| New Jersey - continued | | | | | | | | |
| New Jersey Health Care Facilities, Financing Authority, State Contract Refunding Bonds (Hospital Asset Transformation Program), 5%, 10/01/2036 | | $ | 1,490,000 | | | $ | 1,594,985 | |
| New Jersey Health Care Facilities, Financing Authority, State Contract Refunding Bonds (Hospital Asset Transformation Program), 5%, 10/01/2037 | | | 2,475,000 | | | | 2,637,682 | |
| New Jersey Higher Education Student Assistance Authority, Senior Student Loan Rev., “1A”, 2.75%, 12/01/2027 | | | 4,555,000 | | | | 4,501,661 | |
| New Jersey Higher Education Student Assistance Authority, Senior Student Loan Rev., “1A”, 3.5%, 12/01/2029 | | | 1,100,000 | | | | 1,105,291 | |
| New Jersey Transportation Trust Fund Authority, “B”, AAC, 5.5%, 9/01/2026 | | | 4,490,000 | | | | 5,308,841 | |
| New Jersey Transportation Trust Fund Authority, Federal Highway Reimbursement Rev., “A”, 5%, 6/15/2029 | | | 3,270,000 | | | | 3,662,433 | |
| New Jersey Transportation Trust Fund Authority, Federal Highway Reimbursement Rev., “A”, 5%, 6/15/2031 | | | 2,180,000 | | | | 2,409,925 | |
| New Jersey Transportation Trust Fund Authority, Federal Highway Reimbursement Rev., “A-1”, 5%, 6/15/2027 | | | 4,395,000 | | | | 4,990,391 | |
| New Jersey Transportation Trust Fund Authority, Transportation Program, “AA”, 5%, 6/15/2038 | | | 2,500,000 | | | | 2,620,725 | |
| New Jersey Transportation Trust Fund Authority, Transportation System, “A”, 5%, 6/15/2019 | | | 610,000 | | | | 616,692 | |
| New Jersey Transportation Trust Fund Authority, Transportation System, “A”, 5%, 12/15/2035 | | | 5,000,000 | | | | 5,395,550 | |
| New Jersey Transportation Trust Fund Authority, Transportation System, “A”, 5%, 12/15/2036 | | | 5,000,000 | | | | 5,374,450 | |
| New Jersey Transportation Trust Fund Authority, Transportation System, “C”, 5%, 6/15/2042 | | | 3,350,000 | | | | 3,453,682 | |
| New Jersey Transportation Trust Fund Authority, Transportation System, Capital Appreciation, “A”, 0%, 12/15/2037 | | | 50,000,000 | | | | 21,163,500 | |
| New Jersey Transportation Trust Fund Authority, Transportation System, Capital Appreciation, “C”, AAC, 0%, 12/15/2035 | | | 4,750,000 | | | | 2,287,552 | |
| New Jersey Transportation Trust Fund Authority, Transportation System, Capital Appreciation, “C”, AAC, 0%, 12/15/2036 | | | 12,405,000 | | | | 5,661,146 | |
| New Jersey Transportation Trust Fund Authority, Transportation System, Capital Appreciation, “C”, AGM, 0%, 12/15/2032 | | | 4,765,000 | | | | 2,819,879 | |
| New Jersey Transportation Trust Fund Authority, Transportation System, Capital Appreciation, “C”, NATL, 0%, 12/15/2031 | | | 15,000,000 | | | | 8,989,500 | |
| | | | | | | | |
| | | | | | | $ | 220,568,324 | |
| New Mexico - 0.4% | | | | | | | | |
| Farmington, NM, Pollution Control Rev. (Public Service New Mexico), “D”, 5.9%, 6/01/2040 | | $ | 11,915,000 | | | $ | 12,439,260 | |
60
Portfolio of Investments – continued
| | | | | | | | |
| | |
| Issuer | | Shares/Par | | | Value ($) | |
| Municipal Bonds - continued | | | | | | | | |
| New Mexico - continued | | | | | | | | |
| New Mexico Mortgage Finance Authority, Single Family Mortgage Program, “A-1”, FNMA, 4%, 1/01/2049 | | $ | 1,790,000 | | | $ | 1,897,669 | |
| New Mexico Mortgage Finance Authority, Single Family Mortgage Program, “C”, FNMA, 4%, 1/01/2049 | | | 3,380,000 | | | | 3,591,047 | |
| | | | | | | | |
| | | | | | | $ | 17,927,976 | |
| New York - 3.9% | | | | | | | | |
| Brooklyn, NY, Arena Local Development Corp. (Barclays Center Project), 6%, 7/15/2030 (Prerefunded 1/15/2020) | | $ | 2,265,000 | | | $ | 2,359,179 | |
| Buffalo & Erie County, NY, Industrial Land Development Corp. Rev. (Charter School for Applied Technologies Project), “A”, 5%, 6/01/2035 | | | 1,000,000 | | | | 1,067,680 | |
| Build NYC Resource Corp. Rev. (Albert Einstein School of Medicine, Inc.), 5.5%, 9/01/2045 | | | 2,075,000 | | | | 2,199,458 | |
| Build NYC Resource Corp. Rev. (International Leadership Charter High School Project), “A”, 6.25%, 7/01/2046 | | | 1,315,000 | | | | 1,217,900 | |
| Build NYC Resource Corp. Rev. (International Leadership Charter High School Project), “B”, 5%, 7/01/2021 | | | 170,000 | | | | 168,101 | |
| Build NYC Resource Corp. Rev. (International Leadership Charter School Project), 5.75%, 7/01/2033 | | | 3,860,000 | | | | 3,657,157 | |
| Build NYC Resource Corp. Rev. (International Leadership Charter School Project), 6%, 7/01/2043 | | | 4,025,000 | | | | 3,677,240 | |
| Glen Cove, NY, Local Economic Assistance Corp. (Garvies Point Public Improvement Project), Capital Appreciation, “B”, 0%, 1/01/2045 | | | 7,565,000 | | | | 1,887,921 | |
| Glen Cove, NY, Local Economic Assistance Corp. (Garvies Point Public Improvement Project), Convertible Capital Appreciation, “C”, 0% to 1/01/2024, 5.625% to 1/01/2055 | | | 8,890,000 | | | | 7,198,944 | |
| Hudson Yards, NY, Infrastructure Corp. Rev., “A”, 5.75%, 2/15/2047 (Prerefunded 2/15/2021) | | | 2,000,000 | | | | 2,163,900 | |
| Hudson Yards, NY, Infrastructure Corp. Rev., “A”, Unrefunded Balance, 5.75%, 2/15/2047 | | | 1,230,000 | | | | 1,321,069 | |
| New Rochelle, NY, Corp. for Local Development Rev. (Iona College Project), “A”, 5%, 7/01/2034 | | | 785,000 | | | | 864,348 | |
| New Rochelle, NY, Corp. for Local Development Rev. (Iona College Project), “A”, 5%, 7/01/2040 | | | 2,130,000 | | | | 2,314,479 | |
| New Rochelle, NY, Corp. for Local Development Rev. (Iona College Project), “A”, 5%, 7/01/2045 | | | 990,000 | | | | 1,072,784 | |
| New York Dormitory Authority Rev. (Orange Regional Medical Center Obligated Group Rev.), 5%, 12/01/2033 | | | 800,000 | | | | 888,416 | |
| New York Dormitory Authority Rev., Non-State Supported Debt (Bronx-Lebanon Hospital Center), LOC, 6.5%, 8/15/2030 (Prerefunded 2/15/2019) | | | 1,570,000 | | | | 1,572,386 | |
61
Portfolio of Investments – continued
| | | | | | | | |
| | |
| Issuer | | Shares/Par | | | Value ($) | |
| Municipal Bonds - continued | | | | | | | | |
| New York - continued | | | | | | | | |
| New York Dormitory Authority Rev., Non-State Supported Debt (Bronx-Lebanon Hospital Center), LOC, 6.25%, 2/15/2035 (Prerefunded 2/15/2019) | | $ | 975,000 | | | $ | 976,404 | |
| New York Dormitory Authority Rev., Non-State Supported Debt (Orange Regional Medical Center), 5%, 12/01/2040 | | | 1,000,000 | | | | 1,072,670 | |
| New York Dormitory Authority Rev., Non-State Supported Debt (Orange Regional Medical Center), “A”, 5%, 12/01/2035 | | | 1,500,000 | | | | 1,653,240 | |
| New York Liberty Development Corp. Rev. (Goldman Sachs Headquarters), 5.25%, 10/01/2035 | | | 23,495,000 | | | | 28,684,106 | |
| New York Liberty Development Corp., Liberty Rev. (3 World Trade Center Project), “1”, 5%, 11/15/2044 | | | 24,520,000 | | | | 25,388,744 | |
| New York Liberty Development Corp., Liberty Rev. (3 World Trade Center Project), “2”, 5.375%, 11/15/2040 | | | 5,850,000 | | | | 6,186,843 | |
| New York Liberty Development Corp., Liberty Rev. (One Bryant Park LLC), 6.375%, 7/15/2049 | | | 4,760,000 | | | | 4,942,451 | |
| New York Mortgage Agency Rev., “208”, 4%, 10/01/2048 | | | 8,410,000 | | | | 8,853,712 | |
| New York Transportation Development Corp., Special Facilities Rev. (American Airlines, Inc. John F. Kennedy International Airport Project), 5%, 8/01/2026 | | | 8,340,000 | | | | 8,729,395 | |
| New York Transportation Development Corp., Special Facilities Rev. (American Airlines, Inc. John F. Kennedy International Airport Project), 5%, 8/01/2031 | | | 5,220,000 | | | | 5,410,321 | |
| New York Transportation Development Corp., Special Facilities Rev. (Delta Airlines, Inc. LaGuardia Airport Terminals C&D Redevelopment Project), 5%, 1/01/2032 | | | 5,275,000 | | | | 5,970,825 | |
| New York Transportation Development Corp., Special Facilities Rev. (Delta Airlines, Inc. LaGuardia Airport Terminals C&D Redevelopment Project), 5%, 1/01/2033 | | | 3,080,000 | | | | 3,466,016 | |
| New York Transportation Development Corp., Special Facilities Rev. (Delta Airlines, Inc. LaGuardia Airport Terminals C&D Redevelopment Project), 5%, 1/01/2034 | | | 1,730,000 | | | | 1,938,327 | |
| New York Transportation Development Corp., Special Facilities Rev. (Delta Airlines, Inc. LaGuardia Airport Terminals C&D Redevelopment Project), 4%, 1/01/2036 | | | 1,270,000 | | | | 1,277,544 | |
| New York, NY, City Housing Development Corp., Multifamily Housing Rev. (8 Spruce Street), “F”, 4.5%, 2/15/2048 | | | 10,911,318 | | | | 11,302,816 | |
| New York, NY, City Transitional Finance Authority Building Aid Rev.,“S-3”, 5%, 7/15/2043 | | | 975,000 | | | | 1,105,192 | |
| Niagara County, NY, Industrial Development Agency, Solid Waste Disposal Rev. (Covanta Energy Project), “A”, 4.75%, 11/01/2042 | | | 6,865,000 | | | | 6,664,679 | |
| Onondaga, NY, Civic Development Corp. Rev. (St. Joseph’s Hospital Health Center), 5%, 7/01/2025 (Prerefunded 7/01/2019) | | | 505,000 | | | | 511,888 | |
62
Portfolio of Investments – continued
| | | | | | | | |
| | |
| Issuer | | Shares/Par | | | Value ($) | |
| Municipal Bonds - continued | | | | | | | | |
| New York - continued | | | | | | | | |
| Onondaga, NY, Civic Development Corp. Rev. (St. Joseph’s Hospital Health Center), 5.125%, 7/01/2031 (Prerefunded 7/01/2019) | | $ | 510,000 | | | $ | 517,217 | |
| Onondaga, NY, Civic Development Corp. Rev. (St. Joseph’s Hospital Health Center), 5%, 7/01/2042 (Prerefunded 7/01/2022) | | | 3,110,000 | | | | 3,448,399 | |
| Orange County, NY, Funding Corp. Assisted Living Residence Rev. (The Hamlet at Wallkill Assisted Living Project), 6.5%, 1/01/2046 | | | 7,000,000 | | | | 7,176,050 | |
| Port Authority of NY & NJ, Special Obligation Rev. (JFK International Air Terminal LLC), 6%, 12/01/2036 | | | 2,435,000 | | | | 2,581,538 | |
| Port Authority of NY & NJ, Special Obligation Rev. (JFK International Air Terminal LLC), 6%, 12/01/2042 | | | 2,780,000 | | | | 2,942,686 | |
| Tobacco Settlement Asset Securitization Corp., NY, “A”, 5%, 6/01/2034 | | | 825,000 | | | | 901,816 | |
| Tobacco Settlement Asset Securitization Corp., NY, “A”, 5%, 6/01/2035 | | | 410,000 | | | | 446,338 | |
| Tobacco Settlement Asset Securitization Corp., NY, “A”, 5%, 6/01/2041 | | | 3,020,000 | | | | 3,121,563 | |
| Ulster County, NY, Capital Resource Corp. Rev. (Woodland Pond at New Paltz Project), 4%, 9/15/2025 | | | 3,490,000 | | | | 3,360,032 | |
| Ulster County, NY, Capital Resource Corp. Rev. (Woodland Pond at New Paltz Project), 5%, 9/15/2037 | | | 7,780,000 | | | | 7,338,563 | |
| | | | | | | | |
| | | | | | | $ | 189,600,337 | |
| North Carolina - 0.5% | | | | | | | | |
| Charlotte, NC, Water & Sewer Systems Rev., 4%, 7/01/2047 | | $ | 2,500,000 | | | $ | 2,597,375 | |
| North Carolina Medical Care Commission, Health Care Facilities Rev. (Pennybyrn at Maryfield), 5%, 10/01/2025 | | | 1,040,000 | | | | 1,121,640 | |
| North Carolina Medical Care Commission, Health Care Facilities Rev. (Pennybyrn at Maryfield), 5%, 10/01/2030 | | | 1,320,000 | | | | 1,376,668 | |
| North Carolina Medical Care Commission, Health Care Facilities Rev. (Pennybyrn at Maryfield), 5%, 10/01/2035 | | | 765,000 | | | | 791,209 | |
| North Carolina Medical Care Commission, Retirement Facilities First Mortgage Rev. (Salemtowne), “A”, 5%, 10/01/2026 | | | 3,585,000 | | | | 3,816,878 | |
| North Carolina Medical Care Commission, Retirement Facilities First Mortgage Rev. (Salemtowne), “A”, 5%, 10/01/2030 | | | 1,500,000 | | | | 1,563,840 | |
| North Carolina Medical Care Commission, Retirement Facilities First Mortgage Rev. (Southminster), 5%, 10/01/2037 | | | 2,700,000 | | | | 2,788,236 | |
| North Carolina Medical Care Commission, Retirement Facilities First Mortgage Rev. (United Church Homes and Services), “A”, 5%, 9/01/2037 | | | 1,265,000 | | | | 1,316,068 | |
| North Carolina Medical Care Commission, Retirement Facilities First Mortgage Rev. (United Church Homes and Services), “C”, 5%, 9/01/2041 | | | 1,745,000 | | | | 1,790,283 | |
63
Portfolio of Investments – continued
| | | | | | | | |
| | |
| Issuer | | Shares/Par | | | Value ($) | |
| Municipal Bonds - continued | | | | | | | | |
| North Carolina - continued | | | | | | | | |
| North Carolina Medical Care Commission, Retirement Facilities First Mortgage Rev. (United Church Homes and Services), “C”, 5%, 9/01/2046 | | $ | 1,815,000 | | | $ | 1,856,273 | |
| North Carolina Turnpike Authority, Monroe Expressway Toll Rev., “A”, 5%, 7/01/2042 | | | 505,000 | | | | 542,107 | |
| North Carolina Turnpike Authority, Monroe Expressway Toll Rev., “A”, 5%, 7/01/2047 | | | 990,000 | | | | 1,058,795 | |
| North Carolina Turnpike Authority, Monroe Expressway Toll Rev., “A”, 5%, 7/01/2051 | | | 2,015,000 | | | | 2,149,682 | |
| North Carolina Turnpike Authority, Monroe Expressway Toll Rev., “A”, 5%, 7/01/2054 | | | 805,000 | | | | 857,735 | |
| University of North Carolina at Wilmington (Student Housing Projects), 5%, 6/01/2029 | | | 1,190,000 | | | | 1,367,905 | |
| University of North Carolina, Greensboro, Rev., 5%, 4/01/2039 | | | 955,000 | | | | 1,076,591 | |
| | | | | | | | |
| | | | | | | $ | 26,071,285 | |
| North Dakota - 0.5% | | | | | | | | |
| Country of Ward, ND, Health Care Facilities Rev. (Trinity Obligated Group), “C”, 5%, 6/01/2034 | | $ | 2,610,000 | | | $ | 2,860,299 | |
| Country of Ward, ND, Health Care Facilities Rev. (Trinity Obligated Group), “C”, 5%, 6/01/2038 | | | 3,050,000 | | | | 3,273,016 | |
| Country of Ward, ND, Health Care Facilities Rev. (Trinity Obligated Group), “C”, 5%, 6/01/2043 | | | 9,245,000 | | | | 9,839,638 | |
| North Dakota Housing Finance Agency Rev. (Home Mortgage Finance Program), “A”, 4%, 7/01/2034 | | | 450,000 | | | | 465,530 | |
| North Dakota Housing Finance Agency Rev. (Home Mortgage Finance Program), “B”, 4%, 1/01/2036 | | | 1,070,000 | | | | 1,111,634 | |
| North Dakota Housing Finance Agency Rev. (Home Mortgage Finance Program), “D”, 4.25%, 1/01/2049 (u) | | | 7,075,000 | | | | 7,592,607 | |
| | | | | | | | |
| | | | | | | $ | 25,142,724 | |
| Ohio - 7.5% | | | | | | | | |
| American Municipal Power, Inc. (Prairie State Energy Campus Project), “A”, 5%, 2/15/2042 | | $ | 3,440,000 | | | $ | 3,745,575 | |
| Bowling Green, OH, Student Housing Rev. (State University Project), 6%, 6/01/2045 (Prerefunded 6/01/2020) | | | 5,990,000 | | | | 6,324,242 | |
Buckeye, OH, Tobacco Settlement Financing Authority Rev.,
“A-2”, 5.125%, 6/01/2024 | | | 32,585,000 | | | | 30,484,897 | |
Buckeye, OH, Tobacco Settlement Financing Authority Rev.,
“A-2”, 5.375%, 6/01/2024 | | | 16,330,000 | | | | 15,421,399 | |
Buckeye, OH, Tobacco Settlement Financing Authority Rev.,
“A-2”, 5.875%, 6/01/2030 | | | 18,715,000 | | | | 17,471,575 | |
Buckeye, OH, Tobacco Settlement Financing Authority Rev.,
“A-2”, 5.75%, 6/01/2034 | | | 4,485,000 | | | | 4,191,277 | |
64
Portfolio of Investments – continued
| | | | | | | | |
| | |
| Issuer | | Shares/Par | | | Value ($) | |
| Municipal Bonds - continued | | | | | | | | |
| Ohio - continued | | | | | | | | |
| Buckeye, OH, Tobacco Settlement Financing Authority Rev.,“A-2”, 6%, 6/01/2042 | | $ | 11,225,000 | | | $ | 10,758,264 | |
| Buckeye, OH, Tobacco Settlement Financing Authority Rev.,“A-2”, 6.5%, 6/01/2047 | | | 91,630,000 | | | | 90,600,079 | |
| Buckeye, OH, Tobacco Settlement Financing Authority Rev.,“A-3”, 6.25%, 6/01/2037 | | | 14,535,000 | | | | 14,269,446 | |
| Butler County, OH, Hospital Facilities Rev. (UC Health), 4%, 11/15/2035 | | | 1,500,000 | | | | 1,532,280 | |
| Butler County, OH, Hospital Facilities Rev. (UC Health), 4%, 11/15/2036 | | | 2,000,000 | | | | 2,029,540 | |
| Butler County, OH, Hospital Facilities Rev. (UC Health), 4%, 11/15/2037 | | | 1,250,000 | | | | 1,262,875 | |
| Butler County, OH, Hospital Facilities Rev. (UC Health), 5.5%, 11/01/2040 (Prerefunded 11/01/2020) | | | 1,820,000 | | | | 1,934,260 | |
| Butler County, OH, Hospital Facilities Rev. (UC Health), 5.75%, 11/01/2040 (Prerefunded 11/01/2020) | | | 2,210,000 | | | | 2,358,158 | |
| Butler County, OH, Hospital Facilities Rev. (UC Health), ETM, 5.5%, 11/01/2040 (Prerefunded 11/01/2020) | | | 3,615,000 | | | | 3,841,950 | |
| Centerville, OH, Health Care Improvement and Refunding Rev. (Graceworks Lutheran Services), 5.25%, 11/01/2037 | | | 920,000 | | | | 959,210 | |
| Centerville, OH, Health Care Improvement and Refunding Rev. (Graceworks Lutheran Services), 5.25%, 11/01/2047 | | | 2,480,000 | | | | 2,553,358 | |
| Centerville, OH, Health Care Improvement and Refunding Rev. (Graceworks Lutheran Services), 5.25%, 11/01/2050 | | | 915,000 | | | | 938,790 | |
| Cleveland-Cuyahoga County, OH, Port Authority Development Rev. (Euclid Avenue Development Corp. Project), 5%, 8/01/2044 | | | 1,025,000 | | | | 1,037,997 | |
| Cleveland-Cuyahoga County, OH, Port Authority Development Rev. (Flats East Development Project), “B”, 7%, 5/15/2040 | | | 1,085,000 | | | | 1,162,176 | |
| Cuyahoga County, OH, Hospital Rev. (The Metrohealth System), 5%, 2/15/2042 | | | 3,915,000 | | | | 4,088,552 | |
| Cuyahoga County, OH, Hospital Rev. (The Metrohealth System), 4.75%, 2/15/2047 | | | 5,240,000 | | | | 5,271,230 | |
| Cuyahoga County, OH, Hospital Rev. (The Metrohealth System), 5.25%, 2/15/2047 | | | 14,205,000 | | | | 15,033,862 | |
| Cuyahoga County, OH, Hospital Rev. (The Metrohealth System), 5.5%, 2/15/2052 | | | 875,000 | | | | 940,739 | |
| Cuyahoga County, OH, Hospital Rev. (The Metrohealth System), 5%, 2/15/2057 | | | 3,355,000 | | | | 3,464,675 | |
| Cuyahoga County, OH, Hospital Rev. (The Metrohealth System), 5.5%, 2/15/2057 | | | 13,520,000 | | | | 14,516,830 | |
| Franklin County, OH, Health Care Facilities Improvement Rev. (Friendship Village of Dublin, OH, Inc.), 5%, 11/15/2034 | | | 1,380,000 | | | | 1,446,157 | |
65
Portfolio of Investments – continued
| | | | | | | | |
| | |
| Issuer | | Shares/Par | | | Value ($) | |
| Municipal Bonds - continued | | | | | | | | |
| Ohio - continued | | | | | | | | |
| Franklin County, OH, Health Care Facilities Improvement Rev. (Friendship Village of Dublin, OH, Inc.), 5%, 11/15/2044 | | $ | 2,055,000 | | | $ | 2,130,994 | |
| Gallia County, OH, Hospital Facilities Rev. (Holzer Health Systems), “A”, 8%, 7/01/2042 | | | 8,185,000 | | | | 9,026,009 | |
| Lake County, OH, Hospital Facilities Rev., 6%, 8/15/2043 | | | 460,000 | | | | 461,518 | |
| Lucas County, OH, Hospital Rev. (Promedica Healthcare), “A”, 5.25%, 11/15/2048 | | | 1,700,000 | | | | 1,839,026 | |
| Miami County, OH, Hospital Facilities Rev., “A”, 5%, 8/01/2049 | | | 13,945,000 | | | | 15,303,103 | |
| Montgomery County, OH, Health Care & Multifamily Housing Rev. (St. Leonard), 6.375%, 4/01/2030 | | | 2,235,000 | | | | 2,312,622 | |
| Montgomery County, OH, Health Care & Multifamily Housing Rev. (St. Leonard), 6.625%, 4/01/2040 | | | 3,230,000 | | | | 3,358,780 | |
| Ohio Air Quality Development Authority, Facilities Rev. (Pratt Paper LLC Project), 3.75%, 1/15/2028 | | | 1,835,000 | | | | 1,828,064 | |
| Ohio Air Quality Development Authority, Facilities Rev. (Pratt Paper LLC Project), 4.25%, 1/15/2038 | | | 2,325,000 | | | | 2,312,980 | |
| Ohio Air Quality Development Authority, Facilities Rev. (Pratt Paper LLC Project), 4.5%, 1/15/2048 | | | 3,115,000 | | | | 3,137,771 | |
| Ohio Educational Facility Commission Rev. (The Cleveland Institute of Art Project), 5%, 12/01/2038 | | | 680,000 | | | | 679,952 | |
| Ohio Educational Facility Commission Rev. (The Cleveland Institute of Art Project), 5.25%, 12/01/2043 | | | 1,390,000 | | | | 1,408,000 | |
| Ohio Educational Facility Commission Rev. (The Cleveland Institute of Art Project), 5.25%, 12/01/2048 | | | 1,000,000 | | | | 1,009,100 | |
| Ohio Educational Facility Commission Rev. (The Cleveland Institute of Art Project), 5.5%, 12/01/2053 | | | 1,000,000 | | | | 1,024,300 | |
| Ohio Housing Finance Agency, 4.5%, 9/01/2049 (u) | | | 13,220,000 | | | | 14,408,742 | |
| Ohio Housing Finance Agency Residential Mortgage Rev. (Mortgage-Backed Securities Program), “A”, 4.5%, 9/01/2048 (u) | | | 10,000,000 | | | | 10,844,100 | |
| Ohio Tax Exempt Private Activity (Portsmouth Bypass Project), AGM, 5%, 12/31/2035 | | | 7,865,000 | | | | 8,731,723 | |
| Riversouth, OH, Authority Rev. (Lazarus Building), “A”, 5.75%, 12/01/2027 | | | 3,480,000 | | | | 3,487,343 | |
| Southeastern Ohio Port Authority, Hospital Facilities Improvement Rev. (Memorial Health System Obligated Group Project), 5.5%, 12/01/2029 | | | 690,000 | | | | 761,353 | |
| Southeastern Ohio Port Authority, Hospital Facilities Improvement Rev. (Memorial Health System Obligated Group Project), 5.75%, 12/01/2032 | | | 3,725,000 | | | | 3,982,472 | |
| Southeastern Ohio Port Authority, Hospital Facilities Improvement Rev. (Memorial Health System Obligated Group Project), 5%, 12/01/2035 | | | 2,645,000 | | | | 2,772,674 | |
66
Portfolio of Investments – continued
| | | | | | | | |
| | |
| Issuer | | Shares/Par | | | Value ($) | |
| Municipal Bonds - continued | | | | | | | | |
| Ohio - continued | | | | | | | | |
| Southeastern Ohio Port Authority, Hospital Facilities Improvement Rev. (Memorial Health System Obligated Group Project), 5%, 12/01/2043 | | $ | 1,715,000 | | | $ | 1,734,740 | |
| Southeastern Ohio Port Authority, Hospital Facilities Improvement Rev. (Memorial Health System Obligated Group Project), 5.5%, 12/01/2043 | | | 2,100,000 | | | | 2,187,843 | |
| Summit County, OH, Port Authority Building Rev. (Flats East Development Recovery Zone Facility Bonds), 6.875%, 5/15/2040 | | | 400,000 | | | | 427,592 | |
| The Ohio State University, Special Purpose Rev., “A”, 5%, 6/01/2038 (u) | | | 3,355,000 | | | | 3,715,562 | |
| The Ohio State University, Special Purpose Rev., “A”, 5%, 6/01/2043 (u) | | | 8,150,000 | | | | 8,990,591 | |
| | | | | | | | |
| | | | | | | $ | 365,516,347 | |
| Oklahoma - 1.1% | | | | | | | | |
| Catoosa, OK, Industrial Authority Sales Tax Rev., 4%, 10/01/2028 | | $ | 835,000 | | | $ | 832,979 | |
| Fort Sill Apache Tribe, OK, Economic Development Authority, Gaming Enterprise., “A”, 8.5%, 8/25/2026 (n) | | | 2,610,000 | | | | 2,950,553 | |
| Oklahoma Development Finance Authority, First Mortgage Rev. (Sommerset Project), 5%, 7/01/2042 | | | 1,390,000 | | | | 1,446,309 | |
| Oklahoma Development Finance Authority, Health System Rev. (OU Medicine Project), “B”, 5%, 8/15/2029 | | | 695,000 | | | | 800,140 | |
| Oklahoma Development Finance Authority, Health System Rev. (OU Medicine Project), “B”, 5%, 8/15/2033 | | | 3,525,000 | | | | 3,908,097 | |
| Oklahoma Development Finance Authority, Health System Rev. | | | | | | | | |
| (OU Medicine Project), “B”, 5%, 8/15/2038 | | | 4,935,000 | | | | 5,306,605 | |
| Oklahoma Development Finance Authority, Health System Rev. (OU Medicine Project), “B”, 5.25%, 8/15/2043 | | | 5,285,000 | | | | 5,782,266 | |
| Oklahoma Development Finance Authority, Health System Rev. (OU Medicine Project), “B”, 5.25%, 8/15/2048 | | | 4,930,000 | | | | 5,369,411 | |
| Oklahoma Housing Finance Agency, Single Family Mortgage Rev. (Homeownership Loan Project), “A”, 4.75%, 9/01/2048 | | | 4,475,000 | | | | 4,909,970 | |
| Tulsa County, OK, Industrial Authority, Senior Living Community Rev. (Montereau, Inc.), “A”, 7.25%, 11/01/2045 (Prerefunded 5/01/2020) | | | 3,500,000 | | | | 3,727,675 | |
| Tulsa, OK, Airport Improvement Trust Rev., “A”, 5%, 6/01/2045 | | | 660,000 | | | | 712,008 | |
| Tulsa, OK, Industrial Authority Rev. (University of Tulsa), 6%, 10/01/2027 | | | 4,795,000 | | | | 4,907,539 | |
| Tulsa, OK, Municipal Airport Trust Rev. (American Airlines, Inc.), 5%, 6/01/2035 (Put Date 6/01/2025) | | | 2,005,000 | | | | 2,163,595 | |
| Tulsa, OK, Municipal Airport Trust Rev. (American Airlines, Inc.), “B”, 5.5%, 6/01/2035 | | | 5,260,000 | | | | 5,621,888 | |
67
Portfolio of Investments – continued
| | | | | | | | |
| | |
| Issuer | | Shares/Par | | | Value ($) | |
| Municipal Bonds - continued | | | | | | | | |
| Oklahoma - continued | | | | | | | | |
| Tulsa, OK, Municipal Airport Trust Rev. (American Airlines, Inc.), “B”, 5.5%, 12/01/2035 | | $ | 6,615,000 | | | $ | 7,070,112 | |
| | | | | | | | |
| | | | | | | $ | 55,509,147 | |
| Oregon - 0.5% | | | | | | | | |
| Forest Grove, OR, Campus Improvement Rev. (Pacific University Project), “A”, 4.5%, 5/01/2029 | | $ | 655,000 | | | $ | 689,460 | |
| Forest Grove, OR, Campus Improvement Rev. (Pacific University Project), “A”, 5%, 5/01/2036 | | | 1,100,000 | | | | 1,178,991 | |
| Forest Grove, OR, Campus Improvement Rev. (Pacific University Project), “A”, 5%, 5/01/2040 | | | 815,000 | | | | 851,096 | |
| Oregon Facilities Authority Rev. (Concordia University Project), “A”, 6.125%, 9/01/2030 (Prerefunded 9/01/2020) | | | 2,195,000 | | | | 2,319,434 | |
| Oregon Facilities Authority Rev. (Concordia University Project), “A”, 6.375%, 9/01/2040 (Prerefunded 9/01/2020) | | | 4,100,000 | | | | 4,388,599 | |
| Port of Portland, OR, International Airport Rev., “24B”, 5%, 7/01/2042 | | | 1,160,000 | | | | 1,277,578 | |
| State of Oregon, Housing & Community Services Department Mortgage Rev. (Single-Family Mortgage Program), “D”, 4.75%, 1/01/2050 (u) | | | 11,720,000 | | | | 12,860,825 | |
| | | | | | | | |
| | | | | | | $ | 23,565,983 | |
| Pennsylvania - 7.5% | | | | | | | | |
| Allegheny County, PA, Higher Education Building Authority Rev. (Robert Morris University), 5%, 10/15/2037 | | $ | 700,000 | | | $ | 746,711 | |
| Allegheny County, PA, Higher Education Building Authority Rev. (Robert Morris University), 5%, 10/15/2047 | | | 930,000 | | | | 981,596 | |
| Allegheny County, PA, Hospital Development Authority Rev. (Allegheny Health Network Obligated Group), “A”, 4%, 4/01/2044 | | | 17,450,000 | | | | 17,231,002 | |
| Allentown, PA, Neighborhood Improvement Zone Development Authority Tax Rev. (City Center Project), 5%, 5/01/2023 | | | 395,000 | | | | 417,187 | |
| Allentown, PA, Neighborhood Improvement Zone Development Authority Tax Rev. (City Center Project), 5%, 5/01/2028 | | | 765,000 | | | | 835,066 | |
| Allentown, PA, Neighborhood Improvement Zone Development Authority Tax Rev. (City Center Project), 5%, 5/01/2033 | | | 765,000 | | | | 824,800 | |
| Allentown, PA, Neighborhood Improvement Zone Development Authority Tax Rev. (City Center Project), 5%, 5/01/2042 | | | 2,175,000 | | | | 2,310,415 | |
| Allentown, PA, Neighborhood Improvement Zone Development Authority Tax Rev. (City Center Project), 5.375%, 5/01/2042 | | | 6,700,000 | | | | 6,789,512 | |
| Allentown, PA, Neighborhood Improvement Zone Development Authority Tax Rev. (City Center Refunding Project), 5%, 5/01/2032 | | | 2,505,000 | | | | 2,691,998 | |
| Allentown, PA, Neighborhood Improvement Zone Development Authority Tax Rev. (City Center Refunding Project), 5%, 5/01/2042 | | | 1,990,000 | | | | 2,102,654 | |
68
Portfolio of Investments – continued
| | | | | | | | |
| | |
| Issuer | | Shares/Par | | | Value ($) | |
| Municipal Bonds - continued | | | | | | | | |
| Pennsylvania - continued | | | | | | | | |
| Allentown, PA, Neighborhood Improvement Zone Development Authority Tax Rev., “A”, 5%, 5/01/2035 | | $ | 1,110,000 | | | $ | 1,146,286 | |
| Allentown, PA, Neighborhood Improvement Zone Development Authority Tax Rev., “A”, 5%, 5/01/2042 | | | 4,605,000 | | | | 4,709,718 | |
| Berks County, PA, Reading School District, AGM, 5%, 3/01/2035 | | | 445,000 | | | | 504,982 | |
| Berks County, PA, Reading School District, AGM, 5%, 3/01/2036 | | | 460,000 | | | | 520,127 | |
| Berks County, PA, Reading School District, AGM, 5%, 3/01/2037 | | | 390,000 | | | | 438,711 | |
| Berks County, PA, Reading School District, AGM, 5%, 3/01/2038 | | | 175,000 | | | | 196,198 | |
| Blythe Township, PA, Solid Waste Authority Rev., 7.75%, 12/01/2037 | | | 7,825,000 | | | | 8,295,126 | |
| Chester County, PA, Health & Education Facilities Authority Rev. (Simpson Senior Services Project), “A”, 5%, 12/01/2030 | | | 815,000 | | | | 828,602 | |
| Chester County, PA, Health & Education Facilities Authority Rev. (Simpson Senior Services Project), “A”, 5%, 12/01/2035 | | | 815,000 | | | | 819,621 | |
| Chester County, PA, Health & Education Facilities Authority Rev. (Simpson Senior Services Project), “A”, 5.25%, 12/01/2045 | | | 1,730,000 | | | | 1,758,631 | |
| Chester County, PA, Industrial Development Authority Educational Facilities Rev. (Avon Grove Charter School), “A”, 4.75%, 12/15/2037 | | | 885,000 | | | | 895,815 | |
| Chester County, PA, Industrial Development Authority Educational Facilities Rev. (Avon Grove Charter School), “A”, 5%, 12/15/2047 | | | 2,040,000 | | | | 2,079,392 | |
| Chester County, PA, Industrial Development Authority Educational Facilities Rev. (Avon Grove Charter School), “A”, 5%, 12/15/2051 | | | 610,000 | | | | 617,369 | |
| Clairton, PA, Municipal Authority Sewer Rev., “B”, 5%, 12/01/2037 | | | 1,735,000 | | | | 1,842,657 | |
| Commonwealth of Pennsylvania, Tobacco Master Settlement Financing Authority Rev., 5%, 6/01/2032 | | | 1,395,000 | | | | 1,589,965 | |
| Commonwealth of Pennsylvania, Tobacco Master Settlement Financing Authority Rev., 5%, 6/01/2033 | | | 1,195,000 | | | | 1,351,748 | |
| Commonwealth of Pennsylvania, Tobacco Master Settlement Financing Authority Rev., 5%, 6/01/2034 | | | 605,000 | | | | 681,260 | |
| Cumberland County, PA, Municipal Authority Rev. (Asbury Atlantic, Inc.), 6%, 1/01/2030 | | | 1,035,000 | | | | 1,057,894 | |
| Cumberland County, PA, Municipal Authority Rev. (Asbury Atlantic, Inc.), 6%, 1/01/2040 | | | 4,300,000 | | | | 4,384,667 | |
| Cumberland County, PA, Municipal Authority Rev. (Asbury Atlantic, Inc.), 5.25%, 1/01/2041 | | | 965,000 | | | | 979,755 | |
| Cumberland County, PA, Municipal Authority Rev. (Asbury Atlantic, Inc.), 6.125%, 1/01/2045 | | | 7,220,000 | | | | 7,367,505 | |
| Cumberland County, PA, Municipal Authority Rev. (Diakon Lutheran Social Ministries Project), 5%, 1/01/2022 | | | 1,660,000 | | | | 1,766,539 | |
| Cumberland County, PA, Municipal Authority Rev. (Diakon Lutheran Social Ministries Project), 5%, 1/01/2023 | | | 855,000 | | | | 924,819 | |
69
Portfolio of Investments – continued
| | | | | | | | |
| | |
| Issuer | | Shares/Par | | | Value ($) | |
| Municipal Bonds - continued | | | | | | | | |
| Pennsylvania - continued | | | | | | | | |
| Dallas, PA, Municipal Authority, University Rev. (Misericordia University Project), 5%, 5/01/2029 | | $ | 1,335,000 | | | $ | 1,409,760 | |
| East Hempfield Township, PA, Industrial Development Authority Rev. (Student Services, Inc., Student Housing Project at Millersville University of Pennsylvania), 5%, 7/01/2030 | | | 330,000 | | | | 355,047 | |
| East Hempfield Township, PA, Industrial Development Authority Rev. (Student Services, Inc., Student Housing Project at Millersville University of Pennsylvania), 5%, 7/01/2035 | | | 420,000 | | | | 443,764 | |
| East Hempfield Township, PA, Industrial Development Authority Rev. (Student Services, Inc., Student Housing Project at Millersville University of Pennsylvania), 5%, 7/01/2039 | | | 325,000 | | | | 337,132 | |
| East Hempfield Township, PA, Industrial Development Authority Rev. (Student Services, Inc., Student Housing Project at Millersville University of Pennsylvania), 5%, 7/01/2046 | | | 180,000 | | | | 185,578 | |
| Erie County, PA, Water Authority Rev., “D”, BAM, 4%, 12/01/2038 | | | 750,000 | | | | 778,388 | |
| Franklin County, PA, Industrial Development Authority Rev. (Menno-Haven, Inc. Project), 5%, 12/01/2038 | | | 2,795,000 | | | | 2,849,167 | |
| Franklin County, PA, Industrial Development Authority Rev. (Menno-Haven, Inc. Project), 5%, 12/01/2043 | | | 3,685,000 | | | | 3,727,562 | |
| Franklin County, PA, Industrial Development Authority Rev. (Menno-Haven, Inc. Project), 5%, 12/01/2048 | | | 3,730,000 | | | | 3,758,572 | |
| Franklin County, PA, Industrial Development Authority Rev. (Menno-Haven, Inc. Project), 5%, 12/01/2053 | | | 3,660,000 | | | | 3,673,835 | |
| Fulton County, PA, Industrial Development Authority Hospital Rev. (Medical Center Project), 5%, 7/01/2040 | | | 5,045,000 | | | | 5,072,697 | |
| Fulton County, PA, Industrial Development Authority Hospital Rev. (Medical Center Project), “B”, 5%, 7/01/2046 | | | 3,450,000 | | | | 3,444,721 | |
| Fulton County, PA, Industrial Development Authority Hospital Rev. (Medical Center Project), “B”, 5%, 7/01/2051 | | | 4,280,000 | | | | 4,245,846 | |
| Lehigh County, PA, Water and Sewer Authority Rev. (Allentown Concession), “A”, 5%, 12/01/2043 | | | 7,735,000 | | | | 8,497,748 | |
| Luzerne County, PA, “A”, AGM, 5%, 11/15/2029 | | | 6,760,000 | | | | 7,726,207 | |
| Montgomery County, PA, Industrial Development Authority Rev. (Albert Einstein Healthcare Network Issue), “A”, 5.25%, 1/15/2036 | | | 8,510,000 | | | | 9,222,372 | |
| Montgomery County, PA, Industrial Development Authority Rev. (Whitemarsh Continuing Care Retirement Community Project), 5.375%, 1/01/2050 | | | 8,275,000 | | | | 8,206,731 | |
| Moon Industrial Development Authority Rev. (Baptist Homes Society), 6.125%, 7/01/2050 | | | 3,915,000 | | | | 4,116,544 | |
| Northeastern PA, Hospital & Education Authority Rev. (Wilkes University Project), “A”, 5%, 3/01/2037 | | | 1,355,000 | | | | 1,430,053 | |
70
Portfolio of Investments – continued
| | | | | | | | |
| | |
| Issuer | | Shares/Par | | | Value ($) | |
| Municipal Bonds - continued | | | | | | | | |
| Pennsylvania - continued | | | | | | | | |
| Pennsylvania Economic Development Financing Authority Rev. (The Pennsylvania Rapid Bridge Replacement Project), 5%, 12/31/2030 | | $ | 2,010,000 | | | $ | 2,237,009 | |
| Pennsylvania Economic Development Financing Authority Rev. (The Pennsylvania Rapid Bridge Replacement Project), 5%, 12/31/2034 | | | 9,950,000 | | | | 10,882,016 | |
| Pennsylvania Economic Development Financing Authority, Sewer Sludge Disposal Rev. (Philadelphia Biosolids Facility), 6.25%, 1/01/2032 | | | 3,415,000 | | | | 3,505,532 | |
| Pennsylvania Higher Educational Facilities Authority Rev. (East Stroudsburg University), 5%, 7/01/2042 | | | 2,525,000 | | | | 2,558,456 | |
| Pennsylvania Higher Educational Facilities Authority Rev. (Edinboro University Foundation), 5.8%, 7/01/2030 (Prerefunded 7/01/2020) | | | 740,000 | | | | 780,219 | |
| Pennsylvania Higher Educational Facilities Authority Rev. (Saint Francis University Project), “JJ2”, 6.25%, 11/01/2041 (Prerefunded 11/01/2021) | | | 1,545,000 | | | | 1,728,948 | |
| Pennsylvania Higher Educational Facilities Authority Rev. (Shippensburg University Student Services, Inc. Housing Project), 6.25%, 10/01/2043 (Prerefunded 10/01/2021) | | | 8,435,000 | | | | 9,397,855 | |
| Pennsylvania Higher Educational Facilities Authority Rev. (Shippensburg University Student Services, Inc. Housing Project), 5%, 10/01/2044 (Prerefunded 10/01/2022) | | | 4,990,000 | | | | 5,541,545 | |
| Pennsylvania Higher Educational Facilities Authority Rev. (University of Pennsylvania), “A”, 5%, 2/15/2048 | | | 29,795,000 | | | | 34,123,022 | |
| Pennsylvania Housing Finance Agency, Single Family Mortgage Rev., “128A”, 4.75%, 4/01/2033 (u) | | | 7,635,000 | | | | 8,226,636 | |
| Philadelphia, PA, Authority for Industrial Development Rev. (Discovery Charter School Project), 6.25%, 4/01/2037 | | | 1,065,000 | | | | 1,074,276 | |
| Philadelphia, PA, Authority for Industrial Development Rev. (Discovery Charter School Project), 6.25%, 4/01/2042 | | | 1,950,000 | | | | 1,962,538 | |
| Philadelphia, PA, Authority for Industrial Development Rev. (KIPP Charter School Project), “B”, 4%, 4/01/2026 | | | 1,535,000 | | | | 1,520,755 | |
| Philadelphia, PA, Authority for Industrial Development Rev. (KIPP Charter School Project), “B”, 5%, 4/01/2046 | | | 3,500,000 | | | | 3,448,620 | |
| Philadelphia, PA, Authority for Industrial Development Rev. (MaST Charter School Project), 6%, 8/01/2035 (Prerefunded 8/01/2020) | | | 470,000 | | | | 498,421 | |
| Philadelphia, PA, Authority for Industrial Development Rev. (MaST Charter School Project), “A”, 5.625%, 8/01/2036 | | | 885,000 | | | | 893,877 | |
| Philadelphia, PA, Authority for Industrial Development Rev. (MaST Charter School Project), “A”, 5.25%, 8/01/2046 | | | 2,620,000 | | | | 2,634,489 | |
| Philadelphia, PA, Authority for Industrial Development Rev. (MaST Charter School Project), “A”, 5.75%, 8/01/2046 | | | 4,790,000 | | | | 4,816,010 | |
71
Portfolio of Investments – continued
| | | | | | | | |
| | |
| Issuer | | Shares/Par | | | Value ($) | |
| Municipal Bonds - continued | | | | | | | | |
| Pennsylvania - continued | | | | | | | | |
| Philadelphia, PA, Authority for Industrial Development Rev. (MaST Charter School Project), “A”, 5.375%, 8/01/2051 | | $ | 1,910,000 | | | $ | 1,923,446 | |
| Philadelphia, PA, Authority for Industrial Development Rev. (MaST Charter School Project), “B”, 6%, 8/01/2051 | | | 3,310,000 | | | | 3,357,763 | |
| Philadelphia, PA, Authority for Industrial Development Rev. (Philadelphia Performing Arts Charter School Project), 6.5%, 6/15/2033 | | | 2,780,000 | | | | 2,867,070 | |
| Philadelphia, PA, Authority for Industrial Development Rev. (Philadelphia Performing Arts Charter School Project), 6.75%, 6/15/2043 | | | 5,820,000 | | | | 5,997,161 | |
| Philadelphia, PA, Authority for Industrial Development Rev. (Tacony Academy Charter School Project), 6.875%, 6/15/2033 | | | 1,145,000 | | | | 1,233,257 | |
| Philadelphia, PA, Authority for Industrial Development Rev. (Tacony Academy Charter School Project), 7.375%, 6/15/2043 | | | 1,975,000 | | | | 2,150,242 | |
| Philadelphia, PA, Authority for Industrial Development Rev. (Tacony Academy Charter School Project),“A-1”, 6.75%, 6/15/2033 | | | 850,000 | | | | 911,387 | |
| Philadelphia, PA, Authority for Industrial Development Rev. (Tacony Academy Charter School Project),“A-1”, 7%, 6/15/2043 | | | 1,670,000 | | | | 1,793,947 | |
| Philadelphia, PA, Authority for Industrial Development Rev. (Thomas Jefferson University), “A”, 5%, 9/01/2035 | | | 895,000 | | | | 1,001,389 | |
| Philadelphia, PA, Authority for Industrial Development Rev. (Thomas Jefferson University), “A”, 5%, 9/01/2042 | | | 3,135,000 | | | | 3,440,568 | |
| Philadelphia, PA, Authority for Industrial Development, Multifamily Housing Rev. (University Square Apartment Project- Section 8), “I”, 5%, 12/01/2037 | | | 2,655,000 | | | | 2,868,781 | |
| Philadelphia, PA, Authority for Industrial Development, Multifamily Housing Rev. (University Square Apartment Project- Section 8), “I”, 5%, 12/01/2058 | | | 10,580,000 | | | | 11,131,747 | |
| Philadelphia, PA, Authority for Industrial Development, Multifamily Housing Rev. (University Square Apartment Project- Section 8), “III”, 5.25%, 12/01/2047 | | | 3,245,000 | | | | 3,146,352 | |
| Philadelphia, PA, Authority for Industrial Development, Multifamily Housing Rev. (University Square Apartment Project- Section 8), “III”, 5.5%, 12/01/2058 | | | 4,690,000 | | | | 4,568,763 | |
| Philadelphia, PA, Authority for Industrial Development, Senior Living Facilities Rev. (Wesley Enhanced Living Obligated Group), “A”, 5%, 7/01/2037 | | | 2,290,000 | | | | 2,330,808 | |
| Philadelphia, PA, Authority for Industrial Development, Senior Living Facilities Rev. (Wesley Enhanced Living Obligated Group), “A”, 5%, 7/01/2042 | | | 2,600,000 | | | | 2,626,546 | |
| Philadelphia, PA, Authority for Industrial Development, Senior Living Facilities Rev. (Wesley Enhanced Living Obligated Group), “A”, 5%, 7/01/2049 | | | 3,655,000 | | | | 3,674,774 | |
72
Portfolio of Investments – continued
| | | | | | | | |
| | |
| Issuer | | Shares/Par | | | Value ($) | |
| Municipal Bonds - continued | | | | | | | | |
| Pennsylvania - continued | | | | | | | | |
| Philadelphia, PA, Gas Works Rev. (1998 General Ordinance), “15”, 5%, 8/01/2042 | | $ | 8,405,000 | | | $ | 9,239,953 | |
| Philadelphia, PA, Municipal Authority Rev., 6.5%, 4/01/2034 | | | 1,060,000 | | | | 1,068,226 | |
| Philadelphia, PA, School District, “A”, 5%, 9/01/2033 | | | 405,000 | | | | 459,387 | |
| Philadelphia, PA, School District, “A”, 5%, 9/01/2035 | | | 1,015,000 | | | | 1,139,693 | |
| Philadelphia, PA, School District, “A”, 5%, 9/01/2036 | | | 510,000 | | | | 569,573 | |
| Philadelphia, PA, School District, “A”, 5%, 9/01/2037 | | | 510,000 | | | | 566,508 | |
| Philadelphia, PA, School District, “A”, 5%, 9/01/2038 | | | 510,000 | | | | 563,897 | |
| Philadelphia, PA, School District, “B”, 5%, 9/01/2043 | | | 1,525,000 | | | | 1,661,747 | |
| Philadelphia, PA, School District, “F”, 5%, 9/01/2037 | | | 980,000 | | | | 1,079,098 | |
| Philadelphia, PA, School District, “F”, 5%, 9/01/2038 | | | 245,000 | | | | 268,919 | |
| Scranton-Lackawanna, PA, Health and Welfare Authority, University Rev. (Marywood University Project), 5%, 6/01/2046 | | | 10,015,000 | | | | 9,867,479 | |
| Southcentral, PA, General Authority Rev. (WellSpan Health Obligated Group), “A”, 5%, 6/01/2044 | | | 3,000,000 | | | | 3,227,310 | |
| State Public School Building Authority, PA, School Lease Rev. (The School District of Philadelphia Project), 5%, 4/01/2028 | | | 1,740,000 | | | | 1,848,907 | |
| State Public School Building Authority, PA, School Lease Rev. (The School District of Philadelphia Project), “A”, AGM, 5%, 6/01/2032 | | | 11,030,000 | | | | 12,426,839 | |
| State Public School Building Authority, PA, School Lease Rev. (The School District of Philadelphia Project), “A”, AGM, 5%, 6/01/2033 | | | 19,350,000 | | | | 21,696,187 | |
| Washington County, PA, Redevelopment Authority Refunding Rev. (Victory Centre Tax Increment Financing Project), 4%, 7/01/2023 | | | 605,000 | | | | 604,498 | |
| Washington County, PA, Redevelopment Authority Refunding Rev. (Victory Centre Tax Increment Financing Project), 5%, 7/01/2035 | | | 355,000 | | | | 358,032 | |
| West Shore, PA, Area Authority Rev. (Messiah Village Project) “A”, 5%, 7/01/2030 | | | 395,000 | | | | 416,666 | |
| West Shore, PA, Area Authority Rev. (Messiah Village Project) “A”, 5%, 7/01/2035 | | | 390,000 | | | | 405,799 | |
| | | | | | | | |
| | | | | | | $ | 367,492,995 | |
| Puerto Rico - 8.9% | | | | | | | | |
| Commonwealth of Puerto Rico Aqueduct & Sewer Authority Rev., “A”, 6%, 7/01/2044 | | $ | 10,000,000 | | | $ | 9,525,000 | |
| Commonwealth of Puerto Rico Aqueduct & Sewer Authority Rev., “A”, ASSD GTY, 5%, 7/01/2028 | | | 810,000 | | | | 835,151 | |
| Commonwealth of Puerto Rico Aqueduct & Sewer Authority Rev., “A”, ASSD GTY, 5.125%, 7/01/2047 | | | 3,355,000 | | | | 3,395,059 | |
| Commonwealth of Puerto Rico Highway & Transportation Authority Rev., ASSD GTY, 5.25%, 7/01/2041 | | | 5,790,000 | | | | 6,173,703 | |
| Commonwealth of Puerto Rico Highway & Transportation Authority Rev., “A”, NATL, 4.75%, 7/01/2038 | | | 4,800,000 | | | | 4,739,952 | |
| Commonwealth of Puerto Rico Highway & Transportation Authority Rev., “CC”, AGM, 5.5%, 7/01/2029 | | | 1,085,000 | | | | 1,218,466 | |
73
Portfolio of Investments – continued
| | | | | | | | |
| | |
| Issuer | | Shares/Par | | | Value ($) | |
| Municipal Bonds - continued | | | | | | | | |
| Puerto Rico - continued | | | | | | | | |
| Commonwealth of Puerto Rico Highway & Transportation Authority Rev., “CC”, AGM, 5.25%, 7/01/2032 | | $ | 1,080,000 | | | $ | 1,185,991 | |
| Commonwealth of Puerto Rico Highway & Transportation Authority Rev., “CC”, AGM, 5.25%, 7/01/2033 | | | 2,800,000 | | | | 3,067,540 | |
| Commonwealth of Puerto Rico Highway & Transportation Authority Rev., “CC”, AGM, 5.25%, 7/01/2036 | | | 4,440,000 | | | | 4,816,956 | |
| Commonwealth of Puerto Rico Highway & Transportation Authority Rev., “D”, AGM, 5%, 7/01/2032 | | | 8,365,000 | | | | 8,581,235 | |
| Commonwealth of Puerto Rico Highway & Transportation Authority Rev., “J”, NATL, 5%, 7/01/2029 | | | 630,000 | | | | 630,473 | |
| Commonwealth of Puerto Rico Highway & Transportation Authority Rev., “L”, AAC, 5.25%, 7/01/2038 | | | 27,620,000 | | | | 29,202,626 | |
| Commonwealth of Puerto Rico Highway & Transportation Authority Rev., “L”, ASSD GTY, 5.25%, 7/01/2041 | | | 15,420,000 | | | | 16,441,883 | |
| Commonwealth of Puerto Rico Highway & Transportation Authority Rev., “L”, NATL, 5.25%, 7/01/2035 | | | 11,750,000 | | | | 12,380,387 | |
| Commonwealth of Puerto Rico Highway & Transportation Authority Rev., “M”, ASSD GTY, 5%, 7/01/2032 | | | 1,130,000 | | | | 1,149,764 | |
| Commonwealth of Puerto Rico Highway & Transportation Authority Rev., “N”, AAC, 5.25%, 7/01/2030 | | | 5,575,000 | | | | 6,016,986 | |
| Commonwealth of Puerto Rico Highway & Transportation Authority Rev., “N”, AAC, 5.25%, 7/01/2031 | | | 3,090,000 | | | | 3,329,691 | |
| Commonwealth of Puerto Rico Highway & Transportation Authority Rev., “N”, ASSD GTY, 5.25%, 7/01/2036 | | | 9,105,000 | | | | 9,877,559 | |
| Commonwealth of Puerto Rico Highway & Transportation Authority Rev., “N”, NATL, 5.25%, 7/01/2032 | | | 2,140,000 | | | | 2,277,902 | |
| Commonwealth of Puerto Rico Highway & Transportation Authority Rev., “N”, NATL, 5.25%, 7/01/2033 | | | 5,265,000 | | | | 5,593,694 | |
| Commonwealth of Puerto Rico Highway & Transportation Authority Rev., “Y”, AGM, 6.25%, 7/01/2021 | | | 9,540,000 | | | | 9,954,418 | |
| Commonwealth of Puerto Rico Highway & Transportation Authority Rev., Capital Appreciation, “N”, AAC, 0%, 7/01/2019 | | | 1,425,000 | | | | 1,402,100 | |
| Commonwealth of Puerto Rico Highway & Transportation Authority Rev., Capital Appreciation, “N”, AAC, 0%, 7/01/2020 | | | 1,545,000 | | | | 1,450,338 | |
| Commonwealth of Puerto Rico Highway & Transportation Authority Unrefunded Rev., “A”, NATL, 5%, 7/01/2038 | | | 810,000 | | | | 810,032 | |
| Commonwealth of Puerto Rico, “A”, AGM, 5.375%, 7/01/2025 | | | 750,000 | | | | 795,285 | |
| Commonwealth of Puerto Rico, “A”, NATL, 5.5%, 7/01/2020 | | | 2,320,000 | | | | 2,382,501 | |
| Commonwealth of Puerto Rico, “A”, NATL, 5.5%, 7/01/2021 | | | 875,000 | | | | 910,534 | |
| Commonwealth of Puerto Rico, Public Improvement, AAC, 4.5%, 7/01/2023 | | | 515,000 | | | | 515,304 | |
| Commonwealth of Puerto Rico, Public Improvement, “A”, AGM, 5%, 7/01/2035 | | | 12,830,000 | | | | 13,300,733 | |
74
Portfolio of Investments – continued
| | | | | | | | |
| | |
| Issuer | | Shares/Par | | | Value ($) | |
| Municipal Bonds - continued | | | | | | | | |
| Puerto Rico - continued | | | | | | | | |
| Commonwealth of Puerto Rico, Public Improvement,“A-4”, AGM, 5.25%, 7/01/2030 | | $ | 1,345,000 | | | $ | 1,383,992 | |
| Commonwealth of Puerto Rico, Public Improvement,“C-7”, NATL, 6%, 7/01/2027 | | | 3,665,000 | | | | 3,793,165 | |
| Puerto Rico Convention Center District Authority, Hotel Occupancy Tax Rev., “A”, AAC, 5%, 7/01/2020 | | | 840,000 | | | | 842,134 | |
| Puerto Rico Convention Center District Authority, Hotel Occupancy Tax Rev., “A”, AAC, 5%, 7/01/2031 | | | 11,555,000 | | | | 11,561,355 | |
| Puerto Rico Electric Power Authority Rev., “DDD”, AGM, 3.625%, 7/01/2023 | | | 555,000 | | | | 555,017 | |
| Puerto Rico Electric Power Authority Rev., “DDD”, AGM, 3.65%, 7/01/2024 | | | 2,345,000 | | | | 2,344,906 | |
| Puerto Rico Electric Power Authority Rev., “MM”, NATL, 5%, 7/01/2020 | | | 65,000 | | | | 66,308 | |
| Puerto Rico Electric Power Authority Rev., “NN”, NATL, 5.25%, 7/01/2022 | | | 2,165,000 | | | | 2,263,681 | |
| Puerto Rico Electric Power Authority Rev., “NN”, NATL, 4.75%, 7/01/2033 | | | 380,000 | | | | 380,019 | |
| Puerto Rico Electric Power Authority Rev., “PP”, NATL, 5%, 7/01/2022 | | | 1,150,000 | | | | 1,157,521 | |
| Puerto Rico Electric Power Authority Rev., “PP”, NATL, 5%, 7/01/2024 | | | 240,000 | | | | 240,970 | |
| Puerto Rico Electric Power Authority Rev., “PP”, NATL, 5%, 7/01/2025 | | | 260,000 | | | | 260,881 | |
| Puerto Rico Electric Power Authority Rev., “RR”, ASSD GTY, 5%, 7/01/2028 | | | 185,000 | | | | 190,744 | |
| Puerto Rico Electric Power Authority Rev., “RR”, NATL, 5%, 7/01/2021 | | | 2,010,000 | | | | 2,026,261 | |
| Puerto Rico Electric Power Authority Rev., “RR”, NATL, 5%, 7/01/2022 | | | 695,000 | | | | 699,545 | |
| Puerto Rico Electric Power Authority Rev., “SS”, ASSD GTY, 4.375%, 7/01/2030 | | | 280,000 | | | | 279,992 | |
| Puerto Rico Electric Power Authority Rev., “SS”, NATL, 5%, 7/01/2019 | | | 3,825,000 | | | | 3,844,852 | |
| Puerto Rico Electric Power Authority Rev., “SS”, NATL, 5%, 7/01/2020 | | | 815,000 | | | | 821,960 | |
| Puerto Rico Electric Power Authority Rev., “TT”, NATL, 5%, 7/01/2024 | | | 1,230,000 | | | | 1,234,969 | |
| Puerto Rico Electric Power Authority Rev., “TT”, NATL, 5%, 7/01/2026 | | | 65,000 | | | | 65,176 | |
| Puerto Rico Electric Power Authority Rev., “UU”, AGM, 5%, 7/01/2022 | | | 490,000 | | | | 501,201 | |
| Puerto Rico Electric Power Authority Rev., “UU”, ASSD GTY, 4.25%, 7/01/2027 | | | 1,705,000 | | | | 1,705,341 | |
75
Portfolio of Investments – continued
| | | | | | | | |
| | |
| Issuer | | Shares/Par | | | Value ($) | |
| Municipal Bonds - continued | | | | | | | | |
| Puerto Rico - continued | | | | | | | | |
| Puerto Rico Electric Power Authority Rev., “UU”, NATL, 5%, 7/01/2019 | | $ | 885,000 | | | $ | 890,868 | |
| Puerto Rico Electric Power Authority Rev., “V”, AGM, 5.25%, 7/01/2027 | | | 375,000 | | | | 411,821 | |
| Puerto Rico Electric Power Authority Rev., “V”, NATL, 5.25%, 7/01/2033 | | | 8,935,000 | | | | 9,492,812 | |
| Puerto Rico Electric Power Authority Rev., “VV”, NATL, 5.25%, 7/01/2025 | | | 475,000 | | | | 506,298 | |
| Puerto Rico Electric Power Authority Rev., “VV”, NATL, 5.25%, 7/01/2026 | | | 1,070,000 | | | | 1,144,322 | |
| Puerto Rico Electric Power Authority Rev., “VV”, NATL, 5.25%, 7/01/2029 | | | 3,765,000 | | | | 4,029,717 | |
| Puerto Rico Electric Power Authority Rev., “VV”, NATL, 5.25%, 7/01/2030 | | | 5,165,000 | | | | 5,516,891 | |
| Puerto Rico Electric Power Authority Rev., “VV”, NATL, 5.25%, 7/01/2032 | | | 35,080,000 | | | | 37,340,555 | |
| Puerto Rico Industrial, Tourist, Educational, Medical & Environmental Control Facilities Financing Authority (Cogeneration Facilities - AES Puerto Rico Project), 6.625%, 6/01/2026 | | | 4,530,000 | | | | 4,411,087 | |
| Puerto Rico Industrial, Tourist, Educational, Medical & Environmental Control Facilities Financing Authority, Educational Facilities Rev. (University Plaza Project), NATL, 5%, 7/01/2033 | | | 4,780,000 | | | | 4,787,266 | |
| Puerto Rico Industrial, Tourist, Educational, Medical & Environmental Control Facilities Financing Authority, Higher Education Rev. (Ana G. Mendez University System Project), 4%, 4/01/2020 | | | 165,000 | | | | 163,274 | |
| Puerto Rico Industrial, Tourist, Educational, Medical & Environmental Control Facilities Financing Authority, Higher Education Rev. (Ana G. Mendez University System Project), 5%, 3/01/2021 | | | 45,000 | | | | 44,909 | |
| Puerto Rico Industrial, Tourist, Educational, Medical & Environmental Control Facilities Financing Authority, Higher Education Rev. (Ana G. Mendez University System Project), 5%, 4/01/2021 | | | 570,000 | | | | 573,870 | |
| Puerto Rico Industrial, Tourist, Educational, Medical & Environmental Control Facilities Financing Authority, Higher Education Rev. (Ana G. Mendez University System Project), 5.375%, 12/01/2021 | | | 550,000 | | | | 548,895 | |
| Puerto Rico Industrial, Tourist, Educational, Medical & Environmental Control Facilities Financing Authority, Higher Education Rev. (Ana G. Mendez University System Project), 5%, 4/01/2022 | | | 645,000 | | | | 645,426 | |
76
Portfolio of Investments – continued
| | | | | | | | |
| | |
| Issuer | | Shares/Par | | | Value ($) | |
| Municipal Bonds - continued | | | | | | | | |
| Puerto Rico - continued | | | | | | | | |
| Puerto Rico Industrial, Tourist, Educational, Medical & Environmental Control Facilities Financing Authority, Higher Education Rev. (Ana G. Mendez University System Project), 5%, 3/01/2026 | | $ | 200,000 | | | $ | 196,500 | |
| Puerto Rico Industrial, Tourist, Educational, Medical & Environmental Control Facilities Financing Authority, Higher Education Rev. (Ana G. Mendez University System Project), 5%, 4/01/2027 | | | 2,645,000 | | | | 2,585,487 | |
| Puerto Rico Industrial, Tourist, Educational, Medical & Environmental Control Facilities Financing Authority, Higher Education Rev. (Ana G. Mendez University System Project), 5.5%, 12/01/2031 | | | 980,000 | | | | 967,750 | |
| Puerto Rico Industrial, Tourist, Educational, Medical & Environmental Control Facilities Financing Authority, Higher Education Rev. (Ana G. Mendez University System Project), 5.125%, 4/01/2032 | | | 1,330,000 | | | | 1,273,475 | |
| Puerto Rico Industrial, Tourist, Educational, Medical & Environmental Control Facilities Financing Authority, Higher Education Rev. (Ana G. Mendez University System Project), 5%, 3/01/2036 | | | 1,120,000 | | | | 1,045,800 | |
| Puerto Rico Industrial, Tourist, Educational, Medical & Environmental Control Facilities Financing Authority, Higher Education Rev. (Ana G. Mendez University System Project), 5.375%, 4/01/2042 | | | 1,625,000 | | | | 1,537,656 | |
| Puerto Rico Industrial, Tourist, Educational, Medical & Environmental Control Facilities Financing Authority, Higher Education Rev. (University of Sacred Heart), 4.375%, 10/01/2031 | | | 525,000 | | | | 471,188 | |
| Puerto Rico Industrial, Tourist, Educational, Medical & Environmental Control Facilities Financing Authority, Higher Education Rev. (University of Sacred Heart), 5%, 10/01/2042 | | | 1,330,000 | | | | 1,180,375 | |
| Puerto Rico Infrastructure Financing Authority Special Tax Rev., “C”, AAC, 5.5%, 7/01/2023 | | | 5,450,000 | | | | 5,826,431 | |
| Puerto Rico Infrastructure Financing Authority Special Tax Rev., “C”, AAC, 5.5%, 7/01/2024 | | | 11,530,000 | | | | 12,437,411 | |
| Puerto Rico Infrastructure Financing Authority Special Tax Rev., “C”, AAC, 5.5%, 7/01/2025 | | | 1,145,000 | | | | 1,244,455 | |
| Puerto Rico Infrastructure Financing Authority Special Tax Rev., “C”, AAC, 5.5%, 7/01/2026 | | | 9,895,000 | | | | 10,817,511 | |
| Puerto Rico Infrastructure Financing Authority Special Tax Rev., “C”, AAC, 5.5%, 7/01/2027 | | | 17,840,000 | | | | 19,572,978 | |
| Puerto Rico Infrastructure Financing Authority Special Tax Rev., “C”, AAC, 5.5%, 7/01/2028 | | | 1,075,000 | | | | 1,182,597 | |
| Puerto Rico Infrastructure Financing Authority Special Tax Rev., Capital Appreciation, “A”, AAC, 0%, 7/01/2029 | | | 13,415,000 | | | | 7,479,802 | |
77
Portfolio of Investments – continued
| | | | | | | | |
| | |
| Issuer | | Shares/Par | | | Value ($) | |
| Municipal Bonds - continued | | | | | | | | |
| Puerto Rico - continued | | | | | | | | |
| Puerto Rico Infrastructure Financing Authority Special Tax Rev., Capital Appreciation, “A”, AAC, 0%, 7/01/2037 | | $ | 8,455,000 | | | $ | 3,009,050 | |
| Puerto Rico Infrastructure Financing Authority Special Tax Rev., Capital Appreciation, “A”, AAC, 0%, 7/01/2043 | | | 2,295,000 | | | | 583,274 | |
| Puerto Rico Infrastructure Financing Authority Special Tax Rev., Capital Appreciation, “A”, AAC, 0%, 7/01/2044 | | | 7,350,000 | | | | 1,766,058 | |
| Puerto Rico Infrastructure Financing Authority Special Tax Rev., Capital Appreciation, “C”, AAC, 0%, 7/01/2028 | | | 1,085,000 | | | | 639,890 | |
| Puerto Rico Municipal Finance Agency, “A”, AGM, 5%, 8/01/2027 | | | 325,000 | | | | 335,374 | |
| Puerto Rico Public Buildings Authority Government Facilities Rev., “I”, ASSD GTY, 5%, 7/01/2036 | | | 735,000 | | | | 748,972 | |
| Puerto Rico Public Buildings Authority Government Facilities Rev.,“M-3”, NATL, 6%, 7/01/2023 | | | 3,400,000 | | | | 3,686,348 | |
| Puerto Rico Public Buildings Authority Government Facilities Rev.,“M-3”, NATL, 6%, 7/01/2027 | | | 1,470,000 | | | | 1,521,406 | |
| Puerto Rico Public Buildings Authority Government Facilities Rev.,“M-3”, NATL, 6%, 7/01/2028 | | | 490,000 | | | | 505,881 | |
| Puerto Rico Public Buildings Authority Government Facilities Rev., “N”, ASSD GTY, 5%, 7/01/2032 | | | 690,000 | | | | 707,837 | |
| Puerto Rico Public Buildings Authority Rev.,“M-2”, AAC, 10%, 7/01/2035 | | | 6,225,000 | | | | 6,570,114 | |
| Puerto Rico Sales Tax Financing Corp., Sales Tax Rev., 5.5%, 8/01/2021 (a)(d) | | | 525,000 | | | | 255,938 | |
| Puerto Rico Sales Tax Financing Corp., Sales Tax Rev., 5.5%, 8/01/2023 (a)(d) | | | 305,000 | | | | 148,688 | |
| Puerto Rico Sales Tax Financing Corp., Sales Tax Rev., 5.25%, 8/01/2027 (a)(d) | | | 430,000 | | | | 209,625 | |
| Puerto Rico Sales Tax Financing Corp., Sales Tax Rev., 5.5%, 8/01/2028 (a)(d) | | | 12,995,000 | | | | 6,335,062 | |
| Puerto Rico Sales Tax Financing Corp., Sales Tax Rev., 5.25%, 8/01/2030 (a)(d) | | | 1,925,000 | | | | 938,437 | |
| Puerto Rico Sales Tax Financing Corp., Sales Tax Rev., 5.5%, 8/01/2037 (a)(d) | | | 620,000 | | | | 302,250 | |
| Puerto Rico Sales Tax Financing Corp., Sales Tax Rev., 5.375%, 8/01/2038 (a)(d) | | | 910,000 | | | | 443,625 | |
| Puerto Rico Sales Tax Financing Corp., Sales Tax Rev., 5.375%, 8/01/2039 (a)(d) | | | 3,085,000 | | | | 1,503,937 | |
| Puerto Rico Sales Tax Financing Corp., Sales Tax Rev., 5.5%, 8/01/2040 (a)(d) | | | 935,000 | | | | 455,813 | |
| Puerto Rico Sales Tax Financing Corp., Sales Tax Rev., 5.25%, 8/01/2041 (a)(d) | | | 5,560,000 | | | | 2,710,500 | |
| Puerto Rico Sales Tax Financing Corp., Sales Tax Rev., 5.5%, 8/01/2042 (a)(d) | | | 660,000 | | | | 321,750 | |
78
Portfolio of Investments – continued
| | | | | | | | |
| | |
| Issuer | | Shares/Par | | | Value ($) | |
| Municipal Bonds - continued | | | | | | | | |
| Puerto Rico - continued | | | | | | | | |
| Puerto Rico Sales Tax Financing Corp., Sales Tax Rev., 6%, 8/01/2042 (a)(d) | | $ | 1,330,000 | | | $ | 651,700 | |
| Puerto Rico Sales Tax Financing Corp., Sales Tax Rev., 5%, 8/01/2043 (a)(d) | | | 515,000 | | | | 251,063 | |
| Puerto Rico Sales Tax Financing Corp., Sales Tax Rev., 6.5%, 8/01/2044 (a)(d) | | | 5,570,000 | | | | 2,729,300 | |
| Puerto Rico Sales Tax Financing Corp., Sales Tax Rev., “A”, AGM, 5%, 8/01/2040 | | | 1,940,000 | | | | 1,953,910 | |
| Puerto Rico Sales Tax Financing Corp., Sales Tax Rev., “C”, 5.25%, 8/01/2040 (a)(d) | | | 7,565,000 | | | | 6,241,125 | |
| Puerto Rico Sales Tax Financing Corp., Sales Tax Rev., Capital Appreciation, “A”, AAC, 0%, 8/01/2047 | | | 78,835,000 | | | | 15,800,899 | |
| Puerto Rico Sales Tax Financing Corp., Sales Tax Rev., Capital Appreciation, “A”, AAC, 0%, 8/01/2054 | | | 12,535,000 | | | | 1,692,726 | |
| Puerto Rico Sales Tax Financing Corp., Sales Tax Rev., Capital Appreciation, “A”, NATL, 0%, 8/01/2040 | | | 7,690,000 | | | | 2,282,930 | |
| Puerto Rico Sales Tax Financing Corp., Sales Tax Rev., Capital Appreciation, “A”, NATL, 0%, 8/01/2041 | | | 17,675,000 | | | | 4,958,898 | |
| Puerto Rico Sales Tax Financing Corp., Sales Tax Rev., Capital Appreciation, “A”, NATL, 0%, 8/01/2042 | | | 19,970,000 | | | | 5,295,045 | |
| Puerto Rico Sales Tax Financing Corp., Sales Tax Rev., Capital Appreciation, “A”, NATL, 0%, 8/01/2043 | | | 12,205,000 | | | | 3,058,207 | |
| Puerto Rico Sales Tax Financing Corp., Sales Tax Rev., Capital Appreciation, “A”, NATL, 0%, 8/01/2044 | | | 40,250,000 | | | | 9,531,602 | |
| Puerto Rico Sales Tax Financing Corp., Sales Tax Rev., Capital Appreciation, “A”, NATL, 0%, 8/01/2045 | | | 2,720,000 | | | | 608,627 | |
| Puerto Rico Sales Tax Financing Corp., Sales Tax Rev., Capital Appreciation, “A”, NATL, 0%, 8/01/2046 | | | 43,880,000 | | | | 9,280,181 | |
| University of Puerto Rico Rev., “P”, NATL, 5%, 6/01/2025 | | | 595,000 | | | | 597,017 | |
| | | | | | | | |
| | | | | | | $ | 435,141,739 | |
| Rhode Island - 0.1% | | | | | | | | |
| Rhode Island Student Loan Authority, Student Loan Rev., “A”, 3.8%, 12/01/2031 | | $ | 1,925,000 | | | $ | 1,967,023 | |
| Rhode Island Student Loan Authority, Student Loan Rev., “A”, 3.5%, 12/01/2034 | | | 2,845,000 | | | | 2,870,747 | |
| | | | | | | | |
| | | | | | | $ | 4,837,770 | |
| South Carolina - 0.8% | | | | | | | | |
| Richland County, SC, Environmental Improvement Rev. (International Paper), “A”, 3.875%, 4/01/2023 | | $ | 4,130,000 | | | $ | 4,306,310 | |
| South Carolina Jobs & Economic Development Authority, 5%, 4/01/2048 | | | 1,500,000 | | | | 1,505,880 | |
79
Portfolio of Investments – continued
| | | | | | | | |
| | |
| Issuer | | Shares/Par | | | Value ($) | |
| Municipal Bonds - continued | | | | | | | | |
| South Carolina - continued | | | | | | | | |
| South Carolina Jobs & Economic Development Authority, 5.25%, 4/01/2053 | | $ | 2,060,000 | | | $ | 2,088,510 | |
| South Carolina Jobs & Economic Development Authority, Health Facilities Rev. (Lutheran Homes of South Carolina, Inc.), 5.125%, 5/01/2048 | | | 805,000 | | | | 804,332 | |
| South Carolina Jobs & Economic Development Authority, Health Facilities Rev. (Lutheran Homes of South Carolina, Inc.), “B”, 5%, 5/01/2037 | | | 925,000 | | | | 928,654 | |
| South Carolina Jobs & Economic Development Authority, Health Facilities Rev. (Wesley Commons), 5%, 10/01/2036 | | | 5,735,000 | | | | 5,800,092 | |
| South Carolina Jobs & Economic Development Authority, Hospital Rev. (Hampton Regional Medical Center Project), 4%, 11/01/2029 | | | 3,240,000 | | | | 3,255,908 | |
| South Carolina Jobs & Economic Development Authority, Hospital Rev. (Hampton Regional Medical Center Project), 5%, 11/01/2033 | | | 3,570,000 | | | | 3,811,939 | |
| South Carolina Jobs & Economic Development Authority, Hospital Rev. (Hampton Regional Medical Center Project), 5%, 11/01/2037 | | | 1,380,000 | | | | 1,449,676 | |
| South Carolina Jobs & Economic Development Authority, Hospital Rev. (Hampton Regional Medical Center Project), 5%, 11/01/2042 | | | 3,515,000 | | | | 3,645,758 | |
| South Carolina Jobs & Economic Development Authority, Hospital Rev. (Hampton Regional Medical Center Project), 5%, 11/01/2046 | | | 1,905,000 | | | | 1,970,303 | |
| South Carolina Jobs & Economic Development Authority, Hospital Rev. (Palmetto Health), 5.75%, 8/01/2039 (Prerefunded 8/01/2019) | | | 940,000 | | | | 958,556 | |
| South Carolina Jobs & Economic Development Authority, Residential Care Facilities Rev. (South Carolina Episcopal Home at Still Hopes), 5%, 4/01/2047 | | | 2,655,000 | | | | 2,665,408 | |
| South Carolina Jobs & Economic Development Authority, Residential Care Facilities Rev. (South Carolina Episcopal Home at Still Hopes), 5%, 4/01/2052 | | | 2,610,000 | | | | 2,597,263 | |
| South Carolina Port Authority Rev., 5.25%, 7/01/2050 | | | 1,485,000 | | | | 1,613,438 | |
| South Carolina Public Service Authority Rev., “A”, 5%, 12/01/2049 | | | 1,750,000 | | | | 1,833,090 | |
| | | | | | | | |
| | | | | | | $ | 39,235,117 | |
| Tennessee - 1.2% | | | | | | | | |
| Blount County, TN, Health & Educational Facilities Board Rev. (Asbury, Inc.), “A”, 5%, 1/01/2037 | | $ | 750,000 | | | $ | 769,170 | |
| Blount County, TN, Health & Educational Facilities Board Rev. (Asbury, Inc.), “A”, 5%, 1/01/2047 | | | 1,575,000 | | | | 1,601,681 | |
| Chattanooga, TN, Health Educational & Housing Facility Board Rev. (Catholic Health Initiatives), “A”, 5.25%, 1/01/2045 | | | 2,270,000 | | | | 2,404,498 | |
| Claiborne County, TN, Industrial Development Board Rev. (Lincoln Memorial University Project), 6.125%, 10/01/2040 | | | 5,000,000 | | | | 5,207,750 | |
80
Portfolio of Investments – continued
| | | | | | | | |
| | |
| Issuer | | Shares/Par | | | Value ($) | |
| Municipal Bonds - continued | | | | | | | | |
| Tennessee - continued | | | | | | | | |
| Johnson City, TN, Health & Educational Facilities Board Rev. (Appalachian Christian Village Project), “A”, 5%, 2/15/2043 | | $ | 3,000,000 | | | $ | 2,546,550 | |
| Johnson City, TN, Health & Educational Facilities Board, Hospital Rev. (Mountain States Health Alliance), 6%, 7/01/2038 (Prerefunded 7/01/2020) | | | 1,700,000 | | | | 1,799,552 | |
| Knox County, TN, Health, Educational & Housing Facility Board Rev. (University Health System, Inc.), 5%, 4/01/2030 | | | 680,000 | | | | 744,736 | |
| Knox County, TN, Health, Educational & Housing Facility Board Rev. (University Health System, Inc.), 5%, 4/01/2031 | | | 800,000 | | | | 870,272 | |
| Knox County, TN, Health, Educational & Housing Facility Board Rev. (University Health System, Inc.), 5%, 4/01/2036 | | | 500,000 | | | | 533,410 | |
| Metropolitan Government of Nashville & Davidson County, TN, Health & Educational Facilities Board Rev. (Trousdale Foundation Properties), “A”, 6.25%, 4/01/2049 | | | 9,915,000 | | | | 9,873,952 | |
| Metropolitan Government of Nashville, TN, Airport Authority Improvement Rev., “B”, 5%, 7/01/2040 | | | 3,000,000 | | | | 3,276,030 | |
| Shelby County, TN, Health, Educational & Housing Board Residential Care Facility Mortgage Rev. (Village at Germantown), 5%, 12/01/2034 | | | 500,000 | | | | 508,810 | |
| Shelby County, TN, Health, Educational & Housing Board Residential Care Facility Mortgage Rev. (Village at Germantown), 5.25%, 12/01/2044 | | | 1,000,000 | | | | 1,026,140 | |
| Tennessee Energy Acquisition Corp., Gas Rev., “A”, 5.25%, 9/01/2022 | | | 2,105,000 | | | | 2,297,986 | |
| Tennessee Energy Acquisition Corp., Gas Rev., “A”, 5.25%, 9/01/2024 | | | 3,625,000 | | | | 4,074,427 | |
| Tennessee Housing Development Agency, Residential Financing Program Rev., “1”, 4%, 1/01/2043 | | | 2,665,000 | | | | 2,824,953 | |
| Tennessee Housing Development Agency, Residential Financing Program Rev., “3”, 4.25%, 7/01/2049 | | | 2,915,000 | | | | 3,127,795 | |
| Tennessee Housing Development Agency, Residential Financing Program Rev., “4”, 4.5%, 7/01/2049 (u) | | | 13,525,000 | | | | 14,691,802 | |
| | | | | | | | |
| | | | | | | $ | 58,179,514 | |
| Texas - 6.3% | | | | | | | | |
| Arlington, TX (Tarrant County), Senior Lien Special Tax Rev., “A”, AGM, 5%, 2/15/2037 | | $ | 800,000 | | | $ | 919,600 | |
| Arlington, TX (Tarrant County), Senior Lien Special Tax Rev., “A”, AGM, 5%, 2/15/2038 | | | 655,000 | | | | 750,145 | |
| Arlington, TX (Tarrant County), Senior Lien Special Tax Rev., “A”, AGM, 5%, 2/15/2043 | | | 3,400,000 | | | | 3,831,188 | |
| Arlington, TX, Higher Education Finance Corp. Education Rev. (Newman International Academy), “A”, 5.375%, 8/15/2036 | | | 820,000 | | | | 830,873 | |
81
Portfolio of Investments – continued
| | | | | | | | |
| | |
| Issuer | | Shares/Par | | | Value ($) | |
| Municipal Bonds - continued | | | | | | | | |
| Texas - continued | | | | | | | | |
| Arlington, TX, Higher Education Finance Corp. Education Rev. (Newman International Academy), “A”, 5.5%, 8/15/2046 | | $ | 3,680,000 | | | $ | 3,706,974 | |
| Arlington, TX, Higher Education Finance Corp. Education Rev. (UME Preparatory Academy), “A”, 5%, 8/15/2038 | | | 1,060,000 | | | | 1,024,077 | |
| Arlington, TX, Higher Education Finance Corp. Education Rev. (UME Preparatory Academy), “A”, 5%, 8/15/2048 | | | 1,750,000 | | | | 1,647,205 | |
| Arlington, TX, Higher Education Finance Corp. Education Rev. (UME Preparatory Academy), “A”, 5%, 8/15/2053 | | | 1,695,000 | | | | 1,563,841 | |
| Arlington, TX, Higher Education Finance Corp. Education Rev. (Wayside Schools), “A”, 4.375%, 8/15/2036 | | | 555,000 | | | | 538,128 | |
| Arlington, TX, Higher Education Finance Corp. Education Rev. (Wayside Schools), “A”, 4.625%, 8/15/2046 | | | 1,040,000 | | | | 1,006,169 | |
| Austin, TX, (Travis, Williamson and Hays Counties) Airport System Rev., “B”, 5%, 11/15/2041 | | | 930,000 | | | | 1,020,266 | |
| Austin, TX, Convention Center (Convention Enterprises, Inc.), “A”, 5%, 1/01/2029 | | | 890,000 | | | | 1,007,587 | |
| Austin, TX, Convention Center (Convention Enterprises, Inc.), “A”, 5%, 1/01/2031 | | | 1,325,000 | | | | 1,494,388 | |
| Austin, TX, Convention Center (Convention Enterprises, Inc.), “A”, 5%, 1/01/2034 | | | 260,000 | | | | 279,110 | |
| Austin, TX, Convention Center (Convention Enterprises, Inc.), “B”, 5%, 1/01/2026 | | | 615,000 | | | | 683,917 | |
| Austin, TX, Convention Center (Convention Enterprises, Inc.), “B”, 5%, 1/01/2028 | | | 400,000 | | | | 439,384 | |
| Austin, TX, Convention Center (Convention Enterprises, Inc.), “B”, 5%, 1/01/2030 | | | 585,000 | | | | 637,129 | |
| Central Texas Regional Mobility Authority Senior Lien Rev., “A”, 5%, 1/01/2045 | | | 1,315,000 | | | | 1,423,395 | |
| Clifton, TX, Higher Education Finance Corp. Rev. (Idea Public Schools), 6%, 8/15/2033 | | | 845,000 | | | | 952,011 | |
| Clifton, TX, Higher Education Finance Corp. Rev. (Idea Public Schools), 5.75%, 8/15/2041 (Prerefunded 8/15/2021) | | | 695,000 | | | | 761,164 | |
| Clifton, TX, Higher Education Finance Corp. Rev. (Idea Public Schools), 6%, 8/15/2043 | | | 1,850,000 | | | | 2,046,285 | |
| Clifton, TX, Higher Education Finance Corp. Rev. (Uplift Education), “A”, 3.375%, 12/01/2024 | | | 360,000 | | | | 354,834 | |
| Clifton, TX, Higher Education Finance Corp. Rev. (Uplift Education), “A”, 6.125%, 12/01/2040 (Prerefunded 12/01/2020) | | | 4,940,000 | | | | 5,319,886 | |
| Clifton, TX, Higher Education Finance Corp. Rev. (Uplift Education), “A”, 6.25%, 12/01/2045 (Prerefunded 12/01/2020) | | | 1,670,000 | | | | 1,802,147 | |
| Dallas and Fort Worth, TX, International Airport Rev., “A”, 5%, 11/01/2038 | | | 4,430,000 | | | | 4,606,624 | |
| Dallas and Fort Worth, TX, International Airport Rev., “B”, 5%, 11/01/2044 | | | 4,370,000 | | | | 4,694,604 | |
82
Portfolio of Investments – continued
| | | | | | | | |
| | |
| Issuer | | Shares/Par | | | Value ($) | |
| Municipal Bonds - continued | | | | | | | | |
| Texas - continued | | | | | | | | |
| Dallas and Fort Worth, TX, International Airport Rev., “C”, 5%, 11/01/2045 | | $ | 9,175,000 | | | $ | 9,718,710 | |
| Deaf Smith County, TX, Hospital District, “A”, 6.5%, 3/01/2040 (Prerefunded 3/01/2020) | | | 3,800,000 | | | | 3,986,314 | |
| Decatur Hospital Authority Rev. (Wise Regional Health System), “A”, 5.25%, 9/01/2044 | | | 1,860,000 | | | | 1,972,232 | |
| Gulf Coast, TX, Industrial Development Authority Rev. (CITGO Petroleum Corp.), 4.875%, 5/01/2025 | | | 2,345,000 | | | | 2,391,666 | |
| Gulf Coast, TX, Industrial Development Authority Rev. (CITGO Petroleum Corp.), 8%, 4/01/2028 | | | 875,000 | | | | 881,353 | |
| Gulf Coast, TX, Industrial Development Authority Rev. (Microgy Holdings Project), 7%, 12/01/2036 (a)(d) | | | 746,831 | | | | 7 | |
| Harris County, TX, Cultural Education Facilities Finance Corp. Rev. (Brazos Presbyterian Homes Inc. Project), 7%, 1/01/2043 (Prerefunded 1/01/2023) | | | 2,265,000 | | | | 2,694,308 | |
| Harris County-Houston, TX, Sports Authority Rev., “C”, 5%, 11/15/2031 | | | 1,425,000 | | | | 1,586,353 | |
| Harris County-Houston, TX, Sports Authority Rev., “C”, 5%, 11/15/2032 | | | 185,000 | | | | 205,635 | |
| Harris County-Houston, TX, Sports Authority Rev., “C”, 5%, 11/15/2033 | | | 450,000 | | | | 498,677 | |
| Harris County-Houston, TX, Sports Authority Rev., Capital Appreciation, “A”, AGM, 0%, 11/15/2034 | | | 4,580,000 | | | | 2,351,876 | |
| Harris County-Houston, TX, Sports Authority Rev., Capital Appreciation, “A”, AGM, 0%, 11/15/2038 | | | 40,280,000 | | | | 15,941,213 | |
| Harris County-Houston, TX, Sports Authority Rev., Capital Appreciation, “A”, AGM, 0%, 11/15/2041 | | | 745,000 | | | | 276,142 | |
| Harris County-Houston, TX, Sports Authority Rev., Capital Appreciation, “A”, AGM, 0%, 11/15/2046 | | | 1,865,000 | | | | 532,644 | |
| Houston, TX, Airport System Rev., “B”, 5%, 7/01/2026 | | | 1,335,000 | | | | 1,429,344 | |
| Houston, TX, Airport System Rev., Special Facilities Rev. (Continental Airlines, Inc.), 6.625%, 7/15/2038 | | | 7,680,000 | | | | 8,234,266 | |
| Houston, TX, Airport System Rev., Special Facilities Rev. (United Airlines, Inc. Terminal E Project), 4.5%, 7/01/2020 | | | 3,075,000 | | | | 3,150,061 | |
| Houston, TX, Airport System Rev., Special Facilities Rev. (United Airlines, Inc. Terminal E Project), 4.75%, 7/01/2024 | | | 4,655,000 | | | | 5,009,478 | |
| Houston, TX, Airport System Rev., Special Facilities Rev. (United Airlines, Inc. Terminal E Project), 5%, 7/01/2029 | | | 9,905,000 | | | | 10,804,275 | |
| Houston, TX, Airport System Rev., Special Facilities Rev. (United Airlines, Inc. Terminal Improvement Projects),“B-1”, 5%, 7/15/2030 | | | 6,515,000 | | | | 7,074,508 | |
| Houston, TX, Industrial Development Corp. (United Parcel Service, Inc.), 6%, 3/01/2023 | | | 100,000 | | | | 100,233 | |
83
Portfolio of Investments – continued
| | | | | | | | |
| | |
| Issuer | | Shares/Par | | | Value ($) | |
| Municipal Bonds - continued | | | | | | | | |
| Texas - continued | | | | | | | | |
| Irving, TX, Hospital Authority Rev. (Baylor Scott & White Medical Center-Irving), “A”, 5%, 10/15/2044 | | $ | 1,290,000 | | | $ | 1,383,035 | |
| La Vernia, TX, Higher Education Finance Corp. Rev. (KIPP, Inc.), “A”, 6.25%, 8/15/2039 (Prerefunded 8/15/2019) | | | 1,670,000 | | | | 1,709,779 | |
| La Vernia, TX, Higher Education Finance Corp. Rev. (Lifeschool of Dallas), “A”, 7.5%, 8/15/2041 (Prerefunded 8/15/2019) | | | 4,385,000 | | | | 4,520,628 | |
| Lufkin, TX, Health Facilities Development Corp. Rev. (Memorial Health System), 6.25%, 2/15/2037 (Prerefunded 2/15/2019) | | | 4,340,000 | | | | 4,346,163 | |
| Matagorda County, TX, Pollution Control Rev. (Central Power & Light Co.), ”A“, 6.3%, 11/01/2029 | | | 2,680,000 | | | | 2,776,882 | |
| Mesquite, TX, Health Facilities Development Corp., Retirement Facility Rev. (Christian Care Centers, Inc.), 5%, 2/15/2024 | | | 300,000 | | | | 312,018 | |
| Mesquite, TX, Health Facilities Development Corp., Retirement Facility Rev. (Christian Care Centers, Inc.), 5%, 2/15/2030 | | | 905,000 | | | | 925,978 | |
| Mesquite, TX, Health Facilities Development Corp., Retirement Facility Rev. (Christian Care Centers, Inc.), 5.125%, 2/15/2030 | | | 750,000 | | | | 770,543 | |
| Mesquite, TX, Health Facilities Development Corp., Retirement Facility Rev. (Christian Care Centers, Inc.), 5%, 2/15/2036 | | | 500,000 | | | | 502,420 | |
| Mesquite, TX, Health Facilities Development Corp., Retirement Facility Rev. (Christian Care Centers, Inc.), 5.125%, 2/15/2042 | | | 1,750,000 | | | | 1,753,430 | |
| Mission, TX, Economic Development Corp. (NatGasoline Project), 4.625%, 10/01/2031 | | | 4,240,000 | | | | 4,323,316 | |
| New Hope, TX, Cultural Education Facilities Finance Corp., Capital Improvement Rev. (CHF - Collegiate Housing Denton, L.L.C. - Texas Woman’s University Housing Project),“A-1”, AGM, 5%, 7/01/2038 | | | 460,000 | | | | 507,053 | |
| New Hope, TX, Cultural Education Facilities Finance Corp., Capital Improvement Rev. (CHF - Collegiate Housing Denton, L.L.C. - Texas Woman’s University Housing Project),“A-1”, AGM, 5%, 7/01/2048 | | | 1,905,000 | | | | 2,069,573 | |
| New Hope, TX, Cultural Education Facilities Finance Corp., Capital Improvement Rev. (CHF - Collegiate Housing Denton, L.L.C. - Texas Woman’s University Housing Project),“A-1”, AGM, 5%, 7/01/2058 | | | 1,685,000 | | | | 1,807,988 | |
| New Hope, TX, Cultural Education Facilities Finance Corp., Retirement Facility Rev. (Longhorn Village Project), 5%, 1/01/2037 | | | 2,000,000 | | | | 2,022,040 | |
| New Hope, TX, Cultural Education Facilities Finance Corp., Retirement Facility Rev. (Longhorn Village Project), 5%, 1/01/2042 | | | 2,000,000 | | | | 2,005,080 | |
| New Hope, TX, Cultural Education Facilities Finance Corp., Retirement Facility Rev. (MRC Senior Living - The Langford Project), ”A“, 5%, 11/15/2026 | | | 295,000 | | | | 295,445 | |
| New Hope, TX, Cultural Education Facilities Finance Corp., Retirement Facility Rev. (MRC Senior Living - The Langford Project), ”A“, 5.375%, 11/15/2036 | | | 420,000 | | | | 416,875 | |
84
Portfolio of Investments – continued
| | | | | | | | |
| | |
| Issuer | | Shares/Par | | | Value ($) | |
| Municipal Bonds - continued | | | | | | | | |
| Texas - continued | | | | | | | | |
| New Hope, TX, Cultural Education Facilities Finance Corp., Retirement Facility Rev. (MRC Senior Living - The Langford Project), ”A“, 5.5%, 11/15/2046 | | $ | 835,000 | | | $ | 829,046 | |
| New Hope, TX, Cultural Education Facilities Finance Corp., Retirement Facility Rev. (MRC Senior Living - The Langford Project), ”A“, 5.5%, 11/15/2052 | | | 960,000 | | | | 945,418 | |
| New Hope, TX, Cultural Education Facilities Finance Corp., Retirement Facility Rev. (MRC Senior Living - The Langford Project),”B-1“, 3.25%, 11/15/2022 | | | 995,000 | | | | 975,856 | |
| New Hope, TX, Cultural Education Facilities Finance Corp., Retirement Facility Rev. (Wesleyan Homes, Inc. Project), 5.5%, 1/01/2035 | | | 1,325,000 | | | | 1,392,310 | |
| New Hope, TX, Cultural Education Facilities Finance Corp., Retirement Facility Rev. (Wesleyan Homes, Inc. Project), 5.5%, 1/01/2043 | | | 1,420,000 | | | | 1,484,653 | |
| New Hope, TX, Cultural Education Facilities Finance Corp., Retirement Facility Rev. (Wesleyan Homes, Inc. Project), 5.5%, 1/01/2049 | | | 1,470,000 | | | | 1,532,299 | |
| New Hope, TX, Cultural Education Facilities Finance Corp., Senior Living Rev.(4-K Housing, Inc. - Stoney Brook Project),”A-1“, 4.25%, 7/01/2037 | | | 445,000 | | | | 444,987 | |
| New Hope, TX, Cultural Education Facilities Finance Corp., Senior Living Rev.(4-K Housing, Inc. - Stoney Brook Project),”A-1“, 4.5%, 7/01/2042 | | | 445,000 | | | | 448,395 | |
| New Hope, TX, Cultural Education Facilities Finance Corp., Senior Living Rev.(4-K Housing, Inc. - Stoney Brook Project),”A-1“, 5%, 7/01/2047 | | | 445,000 | | | | 462,626 | |
| New Hope, TX, Cultural Education Facilities Finance Corp., Senior Living Rev.(4-K Housing, Inc. - Stoney Brook Project),”A-1“, 4.75%, 7/01/2052 | | | 665,000 | | | | 677,436 | |
| New Hope, TX, Cultural Education Facilities Finance Corp., Senior Living Rev. (Cardinal Bay, Inc. - Village on the Park/Carriage Inn Project),”A-1“, 5%, 7/01/2031 | | | 230,000 | | | | 258,237 | |
| New Hope, TX, Cultural Education Facilities Finance Corp., Senior Living Rev. (Cardinal Bay, Inc. - Village on the Park/Carriage Inn Project),”A-1“, 4%, 7/01/2036 | | | 1,170,000 | | | | 1,191,013 | |
| New Hope, TX, Cultural Education Facilities Finance Corp., Senior Living Rev. (Cardinal Bay, Inc. - Village on the Park/Carriage Inn Project),”A-1“, 5%, 7/01/2046 | | | 2,330,000 | | | | 2,515,654 | |
| New Hope, TX, Cultural Education Facilities Finance Corp., Senior Living Rev. (Cardinal Bay, Inc. - Village on the Park/Carriage Inn Project),”A-1“, 5%, 7/01/2051 | | | 2,330,000 | | | | 2,509,363 | |
85
Portfolio of Investments – continued
| | | | | | | | |
| | |
| Issuer | | Shares/Par | | | Value ($) | |
| Municipal Bonds - continued | | | | | | | | |
| Texas - continued | | | | | | | | |
| New Hope, TX, Cultural Education Facilities Finance Corp., Senior Living Rev. (Cardinal Bay, Inc. - Village on the Park/Carriage Inn Project), ”B“, 4%, 7/01/2031 | | $ | 525,000 | | | $ | 531,715 | |
| New Hope, TX, Cultural Education Facilities Finance Corp., Senior Living Rev. (Cardinal Bay, Inc. - Village on the Park/Carriage Inn Project), ”B“, 4.25%, 7/01/2036 | | | 790,000 | | | | 801,013 | |
| New Hope, TX, Cultural Education Facilities Finance Corp., Senior Living Rev. (Cardinal Bay, Inc. - Village on the Park/Carriage Inn Project), ”B“, 5%, 7/01/2046 | | | 2,105,000 | | | | 2,198,925 | |
| New Hope, TX, Cultural Education Facilities Finance Corp., Senior Living Rev. (Cardinal Bay, Inc. - Village on the Park/Carriage Inn Project), ”B“, 4.75%, 7/01/2051 | | | 1,845,000 | | | | 1,893,597 | |
| New Hope, TX, Cultural Education Facilities Finance Corp., Student Housing Rev. (CHF - Collegiate Housing Stephenville III, L.L.C. - Tarleton State University Project), 5%, 4/01/2030 | | | 310,000 | | | | 333,058 | |
| New Hope, TX, Cultural Education Facilities Finance Corp., Student Housing Rev. (CHF - Collegiate Housing Stephenville III, L.L.C. - Tarleton State University Project), 5%, 4/01/2035 | | | 310,000 | | | | 326,929 | |
| New Hope, TX, Cultural Education Facilities Finance Corp., Student Housing Rev. (CHF - Collegiate Housing Stephenville III, L.L.C. - Tarleton State University Project), 5%, 4/01/2047 | | | 770,000 | | | | 796,319 | |
| New Hope, TX, Cultural Education Facilities Finance Corp., Student Housing Rev. (Texas A&M University Project), ”A“, AGM, 5%, 4/01/2046 | | | 1,295,000 | | | | 1,393,925 | |
| Newark, TX, Higher Education Finance Corp. Rev. (A+ Charter Schools, Inc.), ”A“, 5.5%, 8/15/2035 | | | 1,530,000 | | | | 1,596,371 | |
| Newark, TX, Higher Education Finance Corp. Rev. (A+ Charter Schools, Inc.), ”A“, 5.75%, 8/15/2045 | | | 2,250,000 | | | | 2,350,643 | |
| Newark, TX, Higher Education Finance Corp. Rev. (Austin Achieve Public Schools, Inc.), 5%, 6/15/2033 | | | 140,000 | | | | 141,632 | |
| Newark, TX, Higher Education Finance Corp. Rev. (Austin Achieve Public Schools, Inc.), 5%, 6/15/2038 | | | 355,000 | | | | 357,272 | |
| Newark, TX, Higher Education Finance Corp. Rev. (Austin Achieve Public Schools, Inc.), 5%, 6/15/2048 | | | 705,000 | | | | 707,305 | |
| Newark, TX, Higher Education Finance Corp. Rev. (Austin Achieve Public Schools, Inc.), ”A“, 5%, 6/15/2032 | | | 540,000 | | | | 538,925 | |
| Newark, TX, Higher Education Finance Corp. Rev. (Austin Achieve Public Schools, Inc.), ”A“, 5%, 6/15/2037 | | | 595,000 | | | | 581,684 | |
| Newark, TX, Higher Education Finance Corp. Rev. (Austin Achieve Public Schools, Inc.), ”A“, 5%, 6/15/2042 | | | 715,000 | | | | 685,478 | |
| Newark, TX, Higher Education Finance Corp. Rev. (Austin Achieve Public Schools, Inc.), ”A“, 5.25%, 6/15/2048 | | | 1,435,000 | | | | 1,401,306 | |
| North Texas Tollway Authority Rev., 6%, 1/01/2043 (Prerefunded 1/01/2021) | | | 1,280,000 | | | | 1,381,133 | |
86
Portfolio of Investments – continued
| | | | | | | | |
| | |
| Issuer | | Shares/Par | | | Value ($) | |
| Municipal Bonds - continued | | | | | | | | |
| Texas - continued | | | | | | | | |
| Red River, TX, Education Finance Corp., Higher Education Rev. (Houston Baptist University Project), 5.5%, 10/01/2046 | | $ | 6,020,000 | | | $ | 6,421,895 | |
| Red River, TX, Health Facilities Development Corp., Retirement Facilities Rev. (MRC The Crossings Project), ”A“, 7.5%, 11/15/2034 | | | 1,075,000 | | | | 1,199,797 | |
| Red River, TX, Health Facilities Development Corp., Retirement Facilities Rev. (MRC The Crossings Project), ”A“, 7.75%, 11/15/2044 | | | 1,970,000 | | | | 2,207,385 | |
| Red River, TX, Health Facilities Development Corp., Retirement Facilities Rev. (MRC The Crossings Project), ”A“, 8%, 11/15/2049 | | | 1,680,000 | | | | 1,898,652 | |
| SA Energy Acquisition Public Facility Corp. (Tex Gas Supply), 5.5%, 8/01/2027 | | | 4,000,000 | | | | 4,715,160 | |
| San Juan, TX, Higher Education Finance Authority Education Rev. (Idea Public Schools), ”A“, 6.7%, 8/15/2040 (Prerefunded 8/15/2020) | | | 2,955,000 | | | | 3,171,217 | |
| Tarrant County, TX, Cultural Education Facilities Finance Corp. Retirement Facility Rev. (Air Force Village Foundation, Inc.), ETM, 5.75%, 11/15/2019 | | | 175,000 | | | | 180,467 | |
| Tarrant County, TX, Cultural Education Facilities Finance Corp. Retirement Facility Rev. (Air Force Village Obligated Group Project), 6.125%, 11/15/2029 (Prerefunded 11/15/2019) | | | 520,000 | | | | 537,545 | |
| Tarrant County, TX, Cultural Education Facilities Finance Corp. Retirement Facility Rev. (Barton Creek Senior Living Center, Inc., Querencia Project), 5%, 11/15/2030 | | | 1,500,000 | | | | 1,554,840 | |
| Tarrant County, TX, Cultural Education Facilities Finance Corp. Retirement Facility Rev. (Barton Creek Senior Living Center, Inc., Querencia Project), 5%, 11/15/2035 | | | 3,345,000 | | | | 3,427,822 | |
| Tarrant County, TX, Cultural Education Facilities Finance Corp. Retirement Facility Rev. (Barton Creek Senior Living Center, Inc., Querencia Project), 5%, 11/15/2040 | | | 4,210,000 | | | | 4,304,388 | |
| Tarrant County, TX, Cultural Education Facilities Finance Corp. Retirement Facility Rev. (Buckingham Senior Living Community, Inc. Project), 5.625%, 11/15/2041 (a) | | | 2,750,000 | | | | 2,172,500 | |
| Tarrant County, TX, Cultural Education Facilities Finance Corp. Retirement Facility Rev. (Buckingham Senior Living Community, Inc. Project), ”A“, 5.25%, 11/15/2035 (a) | | | 845,000 | | | | 667,550 | |
| Tarrant County, TX, Cultural Education Facilities Finance Corp. Retirement Facility Rev. (Buckingham Senior Living Community, Inc. Project), ”A“, 5.5%, 11/15/2045 (a) | | | 3,750,000 | | | | 2,962,500 | |
| Tarrant County, TX, Cultural Education Facilities Finance Corp. Retirement Facility Rev. (Buckner Retirement Services, Inc. Project), ”B“, 5%, 11/15/2040 | | | 2,000,000 | | | | 2,132,480 | |
87
Portfolio of Investments – continued
| | | | | | | | |
| | |
| Issuer | | Shares/Par | | | Value ($) | |
| Municipal Bonds - continued | | | | | | | | |
| Texas - continued | | | | | | | | |
| Tarrant County, TX, Cultural Education Facilities Finance Corp. Retirement Facility Rev. (Buckner Retirement Services, Inc. Project), ”B“, 5%, 11/15/2046 | | $ | 7,180,000 | | | $ | 7,601,394 | |
| Tarrant County, TX, Cultural Education Facilities Finance Corp. Retirement Facility Rev. (Buckner Senior Living - Ventana Project),”B-3“, 3.875%, 11/15/2022 | | | 1,740,000 | | | | 1,719,137 | |
| Tarrant County, TX, Cultural Education Facilities Finance Corp. Retirement Facility Rev. (Northwest Senior Housing Corporation Edgemere Project), ”A“, 5%, 11/15/2030 | | | 2,000,000 | | | | 2,044,840 | |
| Tarrant County, TX, Cultural Education Facilities Finance Corp. Retirement Facility Rev. (Northwest Senior Housing Corporation Edgemere Project), ”A“, 5%, 11/15/2035 | | | 2,350,000 | | | | 2,372,701 | |
| Tarrant County, TX, Cultural Education Facilities Finance Corp. Retirement Facility Rev. (Northwest Senior Housing Corporation Edgemere Project), ”A“, 5%, 11/15/2045 | | | 2,515,000 | | | | 2,507,455 | |
| Tarrant County, TX, Cultural Education Facilities Finance Corp. Retirement Facility Rev. (Northwest Senior Housing Corporation Edgemere Project), ”B“, 5%, 11/15/2030 | | | 3,855,000 | | | | 3,941,429 | |
| Tarrant County, TX, Cultural Education Facilities Finance Corp. Retirement Facility Rev. (Northwest Senior Housing Corporation Edgemere Project), ”B“, 5%, 11/15/2036 | | | 5,105,000 | | | | 5,151,353 | |
| Tarrant County, TX, Cultural Education Facilities Finance Corp. Retirement Facility Rev. (Stayton at Museum Way), 8%, 11/15/2028 | | | 1,000,000 | | | | 900,000 | |
| Tarrant County, TX, Cultural Education Facilities Finance Corp. Retirement Facility Rev. (Stayton at Museum Way), 8.25%, 11/15/2044 | | | 14,305,000 | | | | 12,874,500 | |
| Tarrant County, TX, Cultural Education Facilities Finance Corp. Retirement Facility Rev. (Trinity Terrace Project),”A-1“, 5%, 10/01/2044 | | | 660,000 | | | | 688,677 | |
| Texas Department of Housing & Community Affairs Single Family Mortgage Rev., ”A“, 4.75%, 3/01/2049 (u) | | | 3,920,000 | | | | 4,289,578 | |
| Texas Private Activity Surface Transportation Corp., Senior Lien Rev. (NTE Mobility Partners Segments 3 LLC Segments 3A & 3B Facility), 7%, 12/31/2038 | | | 1,375,000 | | | | 1,589,981 | |
| Texas Private Activity Surface Transportation Corp., Senior Lien Rev. (NTE Mobility Partners Segments 3 LLC Segments 3A & 3B Facility), 6.75%, 6/30/2043 | | | 1,105,000 | | | | 1,261,081 | |
| Texas Transportation Commission, Central Texas Turnpike System Rev., Capital Appreciation, ”B“, 0%, 8/15/2036 | | | 4,605,000 | | | | 2,232,228 | |
| Texas Water Development Board State Water Implementation Rev., ”B“, 4%, 10/15/2043 | | | 23,625,000 | | | | 24,430,849 | |
88
Portfolio of Investments – continued
| | | | | | | | |
| | |
| Issuer | | Shares/Par | | | Value ($) | |
| Municipal Bonds - continued | | | | | | | | |
| Texas - continued | | | | | | | | |
| Travis County, TX, Health Facilities Development Corp. Rev. (Westminster Manor Health), 7%, 11/01/2030 (Prerefunded 11/01/2020) | | $ | 3,165,000 | | | $ | 3,441,843 | |
| Travis County, TX, Health Facilities Development Corp. Rev. (Westminster Manor Health), 7.125%, 11/01/2040 (Prerefunded 11/01/2020) | | | 3,560,000 | | | | 3,878,976 | |
| Travis County, TX, Health Facilities Development Corp. Rev., Unrefunded Balance (Westminster Manor Health), 7%, 11/01/2030 | | | 410,000 | | | | 429,090 | |
| | | | | | | | |
| | | | | | | $ | 307,222,305 | |
| Utah - 0.4% | | | | | | | | |
| Salt Lake City, UT, Salt Lake City International Airport Rev., ”A“, 5%, 7/01/2043 | | $ | 9,190,000 | | | $ | 10,208,804 | |
| Utah Charter School Finance Authority, Charter School Rev. (Reagan Academy Project), 5%, 2/15/2036 | | | 715,000 | | | | 721,735 | |
| Utah Charter School Finance Authority, Charter School Rev. (Reagan Academy Project), 5%, 2/15/2046 | | | 1,285,000 | | | | 1,277,431 | |
| Utah Charter School Finance Authority, Charter School Rev. (Reagan Academy Project), ”A“, 3.5%, 2/15/2026 | | | 385,000 | | | | 368,214 | |
| Utah Charter School Finance Authority, Charter School Rev. (Spectrum Academy), 5%, 4/15/2030 | | | 745,000 | | | | 750,453 | |
| Utah Charter School Finance Authority, Charter School Rev. (Spectrum Academy), 6%, 4/15/2045 | | | 2,395,000 | | | | 2,433,991 | |
| Utah County, UT, Charter School Rev. (Renaissance Academy), ”A“, 5.625%, 7/15/2037 | | | 2,325,000 | | | | 2,324,977 | |
| | | | | | | | |
| | | | | | | $ | 18,085,605 | |
| Vermont - 0.3% | | | | | | | | |
| Burlington, VT, Airport Rev., ”A“, 5%, 7/01/2022 | | $ | 3,785,000 | | | $ | 3,993,705 | |
| Burlington, VT, Airport Rev., ”A“, 4%, 7/01/2028 | | | 4,645,000 | | | | 4,826,434 | |
| State of Vermont, Student Assistance Corp. Education Loan Rev., ”A“, 3.625%, 6/15/2029 | | | 560,000 | | | | 564,855 | |
| State of Vermont, Student Assistance Corp. Education Loan Rev., ”A“, 3.75%, 6/15/2030 | | | 620,000 | | | | 626,752 | |
| State of Vermont, Student Assistance Corp. Education Loan Rev., ”A“, 4%, 6/15/2033 | | | 570,000 | | | | 576,144 | |
| State of Vermont, Student Assistance Corp. Education Loan Rev., ”A“, 4%, 6/15/2034 | | | 615,000 | | | | 620,842 | |
| State of Vermont, Student Assistance Corp. Education Loan Rev., ”B“, 4.375%, 6/15/2046 | | | 755,000 | | | | 739,032 | |
| Vermont Economic Development Authority, Solid Waste Disposal Rev. (Casella Waste Systems, Inc.), 4.625%, 4/01/2036 (Put Date 4/03/2028) | | | 2,445,000 | | | | 2,445,758 | |
| | | | | | | | |
| | | | | | | $ | 14,393,522 | |
89
Portfolio of Investments – continued
| | | | | | | | |
| | |
| Issuer | | Shares/Par | | | Value ($) | |
| Municipal Bonds - continued | | | | | | | | |
| Virginia - 1.0% | | | | | | | | |
| Embrey Mill Community Development Authority, VA, Special Assessment Rev., 7.25%, 3/01/2043 | | $ | 4,760,000 | | | $ | 5,076,207 | |
| James City County, VA, Economic Development Authority, Residential Care Facilities Rev. (Virginia United Methodist Homes of Williamsburg), ”A“, 2%, 10/01/2048 | | | 981,912 | | | | 85,917 | |
| Norfolk, VA, Redevelopment & Housing Authority Rev. (Fort Norfolk Retirement Community), 5%, 1/01/2046 | | | 995,000 | | | | 1,002,035 | |
| Norfolk, VA, Redevelopment & Housing Authority Rev. (Fort Norfolk Retirement Community), 5.375%, 1/01/2046 | | | 2,390,000 | | | | 2,471,045 | |
| Peninsula Town Center Community Development Authority, VA, Special Obligation Refunding, 4%, 9/01/2023 | | | 335,000 | | | | 340,571 | |
| Peninsula Town Center Community Development Authority, VA, Special Obligation Refunding, 4.5%, 9/01/2028 | | | 580,000 | | | | 602,806 | |
| Peninsula Town Center Community Development Authority, VA, Special Obligation Refunding, 5%, 9/01/2037 | | | 1,105,000 | | | | 1,152,703 | |
| Peninsula Town Center Community Development Authority, VA, Special Obligation Refunding, 4.5%, 9/01/2045 | | | 3,880,000 | | | | 3,867,933 | |
| Peninsula Town Center Community Development Authority, VA, Special Obligation Refunding, 5%, 9/01/2045 | | | 960,000 | | | | 992,419 | |
| Prince William County, VA, Cherry Hill Community Development Authority Rev. (Potomac Shores Project), 5.4%, 3/01/2045 | | | 1,780,000 | | | | 1,813,108 | |
| Roanoke, VA, Economic Development Authority, Educational Facilities Rev. (Lynchburg College), ”A“, 5%, 9/01/2032 | | | 1,140,000 | | | | 1,283,013 | |
| Roanoke, VA, Economic Development Authority, Educational Facilities Rev. (Lynchburg College), ”A“, 5%, 9/01/2034 | | | 490,000 | | | | 545,973 | |
| Virginia College Building Authority, Educational Facilities Rev. (Marymount University), ”B“, 5.25%, 7/01/2030 | | | 2,810,000 | | | | 2,996,921 | |
| Virginia College Building Authority, Educational Facilities Rev. (Marymount University), ”B“, 5.25%, 7/01/2035 | | | 2,590,000 | | | | 2,726,441 | |
| Virginia Small Business Financing Authority Rev., 5%, 6/01/2047 | | | 1,500,000 | | | | 1,549,110 | |
| Virginia Small Business Financing Authority Rev., 5%, 6/01/2052 | | | 3,880,000 | | | | 3,994,809 | |
| Virginia Small Business Financing Authority Rev. (Elizabeth River Crossings Opco LLC Project), 6%, 1/01/2037 | | | 4,975,000 | | | | 5,436,382 | |
| Virginia Small Business Financing Authority Rev. (Elizabeth River Crossings Opco LLC Project), 5.5%, 1/01/2042 | | | 9,705,000 | | | | 10,361,835 | |
| Virginia Small Business Financing Authority Rev., Solid Waste Disposal (Covanta Project), 5%, 1/01/2048 (Put Date 7/01/2038) | | | 715,000 | | | | 728,263 | |
| West Point, VA, Industrial Development Authority, Solid Waste Disposal Rev. (Chesapeake Corp.), ”A“, 6.375%, 3/01/2019 (a)(d) | | | 769,496 | | | | 15 | |
| West Point, VA, Industrial Development Authority, Solid Waste Disposal Rev. (Chesapeake Corp.), ”B“, 6.25%, 3/01/2019 (a)(d) | | | 6,569,570 | | | | 131 | |
| | | | | | | | |
| | | | | | | $ | 47,027,637 | |
90
Portfolio of Investments – continued
| | | | | | | | |
| | |
| Issuer | | Shares/Par | | | Value ($) | |
| Municipal Bonds - continued | | | | | | | | |
| Washington - 1.4% | | | | | | | | |
| Grays Harbor County, WA, Public Hospital District No. 2, Limited Tax General Obligation Refunding, 5%, 12/15/2033 | | $ | 2,675,000 | | | $ | 2,828,518 | |
| Grays Harbor County, WA, Public Hospital District No. 2, Limited Tax General Obligation Refunding, 5%, 12/15/2038 | | | 3,415,000 | | | | 3,533,125 | |
| Grays Harbor County, WA, Public Hospital District No. 2, Limited Tax General Obligation Refunding, 5%, 12/15/2048 | | | 6,565,000 | | | | 6,651,395 | |
| Kalispel Tribe Indians, WA, Priority District Rev., ”A“, 5%, 1/01/2032 (n) | | | 2,220,000 | | | | 2,388,365 | |
| Kalispel Tribe Indians, WA, Priority District Rev., ”A“, 5.25%, 1/01/2038 (n) | | | 2,500,000 | | | | 2,662,700 | |
| Kalispel Tribe Indians, WA, Priority District Rev., ”B“, 5%, 1/01/2032 (n) | | | 700,000 | | | | 753,088 | |
| Kalispel Tribe Indians, WA, Priority District Rev., ”B“, 5.25%, 1/01/2038 (n) | | | 900,000 | | | | 958,572 | |
| Port Seattle, WA, Industrial Development Corp., Special Facilities Rev. (Delta Airlines, Inc.), 5%, 4/01/2030 | | | 4,000,000 | | | | 4,289,360 | |
| Seattle, WA, Municipal Light & Power Improvement Rev., ”C“, 4%, 9/01/2037 | | | 7,000,000 | | | | 7,325,920 | |
| Washington Health Care Facilities Authority Rev. (Central Washington Health Services), 6.75%, 7/01/2029 (Prerefunded 7/01/2019) | | | 1,550,000 | | | | 1,581,357 | |
| Washington Health Care Facilities Authority Rev. (Central Washington Health Services), 7%, 7/01/2039 (Prerefunded 7/01/2019) | | | 3,665,000 | | | | 3,742,222 | |
| Washington Health Care Facilities Authority Rev. (Virginia Mason Medical Center), 5%, 8/15/2035 | | | 1,775,000 | | | | 1,939,755 | |
| Washington Health Care Facilities Authority Rev. (Virginia Mason Medical Center), 5%, 8/15/2037 | | | 1,805,000 | | | | 1,957,432 | |
| Washington Higher Education Facilities Authority Rev. (Whitworth University), 5.875%, 10/01/2034 (Prerefunded 10/01/2019) | | | 2,435,000 | | | | 2,500,063 | |
| Washington Housing Finance Commission Nonprofit Housing Refunding Rev. (Judson Park Project), 4%, 7/01/2028 | | | 225,000 | | | | 220,840 | |
| Washington Housing Finance Commission Nonprofit Housing Refunding Rev. (Judson Park Project), 5%, 7/01/2033 | | | 225,000 | | | | 232,954 | |
| Washington Housing Finance Commission Nonprofit Housing Refunding Rev. (Judson Park Project), 5%, 7/01/2038 | | | 325,000 | | | | 332,829 | |
| Washington Housing Finance Commission Nonprofit Housing Refunding Rev. (Judson Park Project), 5%, 7/01/2048 | | | 450,000 | | | | 457,083 | |
| Washington Housing Finance Commission Nonprofit Housing Refunding Rev. (The Hearthstone Project), ”A“, 5%, 7/01/2038 | | | 830,000 | | | | 844,301 | |
| Washington Housing Finance Commission Nonprofit Housing Refunding Rev. (The Hearthstone Project), ”A“, 5%, 7/01/2048 | | | 1,420,000 | | | | 1,428,406 | |
91
Portfolio of Investments – continued
| | | | | | | | |
| | |
| Issuer | | Shares/Par | | | Value ($) | |
| Municipal Bonds - continued | | | | | | | | |
| Washington - continued | | | | | | | | |
| Washington Housing Finance Commission Nonprofit Housing Refunding Rev. (The Hearthstone Project), ”A“, 5%, 7/01/2053 | | $ | 1,375,000 | | | $ | 1,379,029 | |
| Washington Housing Finance Commission Nonprofit Housing Rev. (Presbyterian Retirement Communities Northwest Projects), ”A“, 5%, 1/01/2036 | | | 2,460,000 | | | | 2,579,359 | |
| Washington Housing Finance Commission Nonprofit Housing Rev. (Presbyterian Retirement Communities Northwest Projects), ”A“, 5%, 1/01/2046 | | | 4,675,000 | | | | 4,850,967 | |
| Washington Housing Finance Commission Nonprofit Housing Rev. (Presbyterian Retirement Communities Northwest Projects), ”A“, 5%, 1/01/2051 | | | 2,970,000 | | | | 3,071,782 | |
| Washington Housing Finance Commission Nonprofit Housing Rev. (Wesley Homes at Lea Hill Project), 5%, 7/01/2036 | | | 1,000,000 | | | | 1,017,290 | |
| Washington Housing Finance Commission Nonprofit Housing Rev. (Wesley Homes at Lea Hill Project), 5%, 7/01/2041 | | | 2,000,000 | | | | 2,022,120 | |
| Washington Housing Finance Commission Nonprofit Housing Rev. (Wesley Homes at Lea Hill Project), 5%, 7/01/2046 | | | 2,385,000 | | | | 2,403,985 | |
| Washington Housing Finance Commission Nonprofit Housing Rev. (Wesley Homes at Lea Hill Project), 5%, 7/01/2051 | | | 3,635,000 | | | | 3,652,702 | |
| | | | | | | | |
| | | | | | | $ | 67,605,519 | |
| West Virginia - 0.7% | | | | | | | | |
| Monongalia County, WV, Building Commission Improvement Rev. (Monongalia Health System Obligated Group), 5%, 7/01/2028 | | $ | 1,285,000 | | | $ | 1,405,559 | |
| Monongalia County, WV, Building Commission Improvement Rev. (Monongalia Health System Obligated Group), 5%, 7/01/2029 | | | 515,000 | | | | 561,453 | |
| Monongalia County, WV, Building Commission Improvement Rev. (Monongalia Health System Obligated Group), 5%, 7/01/2030 | | | 1,005,000 | | | | 1,089,038 | |
| Monongalia County, WV, Special District Excise Tax Rev., Refunding & Improvement Bonds (University Town Centre Economic Opportunity Development District), ”A“, 4.5%, 6/01/2027 | | | 740,000 | | | | 731,364 | |
| Monongalia County, WV, Special District Excise Tax Rev., Refunding & Improvement Bonds (University Town Centre Economic Opportunity Development District), ”A“, 5.5%, 6/01/2037 | | | 1,760,000 | | | | 1,795,165 | |
| Ohio County, WV, Commission Tax Increment Rev. (Fort Henry Centre), 4.75%, 6/01/2031 | | | 1,000,000 | | | | 1,029,680 | |
| West Virginia Hospital Finance Authority Hospital Rev. (Cabell Huntington Hospital Obligated Group), ”A“, 5%, 1/01/2043 | | | 6,455,000 | | | | 7,072,614 | |
| West Virginia Hospital Finance Authority Hospital Rev. (Charleston Area Medical Center), ”A“, 5%, 9/01/2027 | | | 2,100,000 | | | | 2,300,550 | |
| West Virginia Hospital Finance Authority Hospital Rev. (Charleston Area Medical Center), ”A“, 5%, 9/01/2028 | | | 1,000,000 | | | | 1,091,220 | |
92
Portfolio of Investments – continued
| | | | | | | | |
| | |
| Issuer | | Shares/Par | | | Value ($) | |
| Municipal Bonds - continued | | | | | | | | |
| West Virginia - continued | | | | | | | | |
| West Virginia Hospital Finance Authority Hospital Rev. (Thomas Health System), 6.5%, 10/01/2038 | | $ | 3,450,000 | | | $ | 2,565,040 | |
| West Virginia Hospital Finance Authority Hospital Rev. (West Virginia University Health System Obligated Group), ”A“, 4%, 6/01/2051 | | | 15,000,000 | | | | 14,574,750 | |
| West Virginia Housing Development Fund, ”A“, FHA, 3.45%, 11/01/2033 | | | 610,000 | | | | 612,153 | |
| West Virginia Housing Development Fund, ”A“, FHA, 3.75%, 11/01/2038 | | | 585,000 | | | | 585,796 | |
| West Virginia Housing Development Fund, ”A“, FHA, 3.9%, 11/01/2048 | | | 360,000 | | | | 358,726 | |
| | | | | | | | |
| | | | | | | $ | 35,773,108 | |
| Wisconsin - 3.2% | | | | | | | | |
| Wisconsin Health & Educational Facilities Authority Refunding Rev. (American Baptist Homes), 5%, 8/01/2027 | | $ | 2,530,000 | | | $ | 2,638,410 | |
| Wisconsin Health & Educational Facilities Authority Refunding Rev. (American Baptist Homes), 5%, 8/01/2032 | | | 2,315,000 | | | | 2,366,416 | |
| Wisconsin Health & Educational Facilities Authority Refunding Rev. (American Baptist Homes), 5%, 8/01/2037 | | | 1,265,000 | | | | 1,272,818 | |
| Wisconsin Health & Educational Facilities Authority Refunding Rev. (American Baptist Homes), 5%, 8/01/2039 | | | 1,265,000 | | | | 1,269,339 | |
| Wisconsin Health & Educational Facilities Authority Rev. (American Eagle Nursing Home), 7.15%, 6/01/2028 | | | 2,675,000 | | | | 1,337,500 | |
| Wisconsin Health & Educational Facilities Authority Rev. (Beloit College), ”A“, 6.125%, 6/01/2035 (Prerefunded 6/01/2020) | | | 710,000 | | | | 750,293 | |
| Wisconsin Health & Educational Facilities Authority Rev. (Beloit College), ”A“, 6.125%, 6/01/2039 (Prerefunded 6/01/2020) | | | 1,435,000 | | | | 1,516,436 | |
| Wisconsin Health & Educational Facilities Authority Rev. (Benevolent Corp. Cedar Community), 5%, 6/01/2037 | | | 1,110,000 | | | | 1,137,362 | |
| Wisconsin Health & Educational Facilities Authority Rev. (Benevolent Corp. Cedar Community), 5%, 6/01/2041 | | | 955,000 | | | | 970,595 | |
| Wisconsin Health & Educational Facilities Authority Rev. (Marshfield Clinic Health System, Inc.), ”C“, 5%, 2/15/2047 | | | 2,035,000 | | | | 2,186,587 | |
| Wisconsin Health & Educational Facilities Authority Rev. (Meriter Hospital), ”A“, 5.5%, 5/01/2031 (Prerefunded 5/01/2021) | | | 1,855,000 | | | | 2,005,923 | |
| Wisconsin Health & Educational Facilities Authority Rev. (Meriter Hospital), ”A“, 6%, 5/01/2041 (Prerefunded 5/01/2021) | | | 1,405,000 | | | | 1,534,681 | |
| Wisconsin Health & Educational Facilities Authority Rev. (Sauk-Prairie Memorial Hospital), 5.25%, 2/01/2043 | | | 4,870,000 | | | | 4,971,783 | |
| Wisconsin Health & Educational Facilities Authority Rev. (Sauk-Prairie Memorial Hospital), ”A“, 5.125%, 2/01/2038 | | | 5,110,000 | | | | 5,203,053 | |
93
Portfolio of Investments – continued
| | | | | | | | |
| | |
| Issuer | | Shares/Par | | | Value ($) | |
| Municipal Bonds - continued | | | | | | | | |
| Wisconsin - continued | | | | | | | | |
| Wisconsin Health & Educational Facilities Authority Rev. (St. John’s Community, Inc.), ”A“, 7.25%, 9/15/2029 (Prerefunded 9/15/2019) | | $ | 485,000 | | | $ | 501,175 | |
| Wisconsin Health & Educational Facilities Authority Rev. (St. John’s Community, Inc.), ”A“, 7.625%, 9/15/2039 (Prerefunded 9/15/2019) | | | 1,960,000 | | | | 2,029,835 | |
| Wisconsin Health & Educational Facilities Authority Rev. (St. John’s Community, Inc.), ”A“, 5%, 9/15/2040 | | | 445,000 | | | | 454,158 | |
| Wisconsin Health & Educational Facilities Authority Rev. (St. John’s Community, Inc.), ”A“, 5%, 9/15/2045 | | | 595,000 | | | | 605,508 | |
| Wisconsin Health & Educational Facilities Authority Rev. (St. John’s Community, Inc.), ”A“, 5%, 9/15/2050 | | | 2,430,000 | | | | 2,467,859 | |
| Wisconsin Housing & Economic Development Authority, Home Ownership Rev., ”D“, 4%, 3/01/2047 (u) | | | 8,820,000 | | | | 9,372,573 | |
| Wisconsin Public Finance Authority Education Rev. (Mountain Island Charter School), 5%, 7/01/2037 | | | 665,000 | | | | 682,416 | |
| Wisconsin Public Finance Authority Education Rev. (Mountain Island Charter School), 5%, 7/01/2047 | | | 1,015,000 | | | | 1,034,204 | |
| Wisconsin Public Finance Authority Education Rev. (Pine Lake Preparatory), 4.95%, 3/01/2030 | | | 1,025,000 | | | | 1,050,892 | |
| Wisconsin Public Finance Authority Education Rev. (Pine Lake Preparatory), 5.25%, 3/01/2035 | | | 1,005,000 | | | | 1,030,145 | |
| Wisconsin Public Finance Authority Education Rev. (Pine Lake Preparatory), 5.5%, 3/01/2045 | | | 2,815,000 | | | | 2,876,001 | |
| Wisconsin Public Finance Authority Educational Facilities Rev. (Community School of Davidson Project), 5%, 10/01/2033 | | | 670,000 | | | | 688,036 | |
| Wisconsin Public Finance Authority Educational Facilities Rev. (Community School of Davidson Project), 5%, 10/01/2048 | | | 3,265,000 | | | | 3,267,253 | |
| Wisconsin Public Finance Authority Educational Facilities Rev. (Community School of Davidson Project), 3.75%, 10/01/2023 | | | 365,000 | | | | 363,598 | |
| Wisconsin Public Finance Authority Healthcare Facility (Church Home of Hartford, Inc. Project), ”A“, 4%, 9/01/2020 | | | 310,000 | | | | 315,016 | |
| Wisconsin Public Finance Authority Healthcare Facility (Church Home of Hartford, Inc. Project), ”A“, 5%, 9/01/2025 | | | 520,000 | | | | 555,365 | |
| Wisconsin Public Finance Authority Healthcare Facility (Church Home of Hartford, Inc. Project), ”A“, 5%, 9/01/2030 | | | 920,000 | | | | 951,593 | |
| Wisconsin Public Finance Authority Healthcare Facility (Church Home of Hartford, Inc. Project), ”A“, 5%, 9/01/2038 | | | 1,215,000 | | | | 1,232,654 | |
| Wisconsin Public Finance Authority Higher Education Facilities Rev. (Gannon University Project), 5%, 5/01/2042 | | | 595,000 | | | | 629,962 | |
| Wisconsin Public Finance Authority Higher Education Facilities Rev. (Gannon University Project), 5%, 5/01/2047 | | | 545,000 | | | | 575,073 | |
94
Portfolio of Investments – continued
| | | | | | | | |
| | |
| Issuer | | Shares/Par | | | Value ($) | |
| Municipal Bonds - continued | | | | | | | | |
| Wisconsin - continued | | | | | | | | |
| Wisconsin Public Finance Authority Limited Obligation Grant Rev. (American Dream at Meadowlands Project), ”A“, 6.25%, 8/01/2027 | | $ | 12,340,000 | | | $ | 13,308,073 | |
| Wisconsin Public Finance Authority Limited Obligation PILOT Rev. (American Dream at Meadowlands Project), 6.5%, 12/01/2037 | | | 8,145,000 | | | | 9,019,692 | |
| Wisconsin Public Finance Authority Limited Obligation PILOT Rev. (American Dream at Meadowlands Project), 7%, 12/01/2050 | | | 4,260,000 | | | | 4,777,547 | |
| Wisconsin Public Finance Authority Rev. (Celanese Corp.), ”B“, 5%, 12/01/2025 | | | 3,055,000 | | | | 3,321,243 | |
| Wisconsin Public Finance Authority Rev. (Denver International Airport Great Hall Project), 5%, 9/30/2037 | | | 3,030,000 | | | | 3,319,335 | |
| Wisconsin Public Finance Authority Rev. (Roseman University of Health Sciences Project), 5.75%, 4/01/2035 | | | 2,805,000 | | | | 2,989,625 | |
| Wisconsin Public Finance Authority Senior Living Refunding Bonds Rev. (Mary’s Woods at Marylhurst Project), ”A“, 5.25%, 5/15/2037 | | | 1,995,000 | | | | 2,086,112 | |
| Wisconsin Public Finance Authority Senior Living Refunding Bonds Rev. (Mary’s Woods at Marylhurst Project), ”A“, 5.25%, 5/15/2042 | | | 3,915,000 | | | | 4,063,731 | |
| Wisconsin Public Finance Authority Senior Living Refunding Bonds Rev. (Mary’s Woods at Marylhurst Project), ”A“, 5.25%, 5/15/2047 | | | 3,830,000 | | | | 3,962,212 | |
| Wisconsin Public Finance Authority Senior Living Refunding Bonds Rev. (Mary’s Woods at Marylhurst Project), ”A“, 5.25%, 5/15/2052 | | | 8,800,000 | | | | 9,055,200 | |
| Wisconsin Public Finance Authority Senior Living Rev. (Rose Villa Project), ”A“, 5.125%, 11/15/2029 | | | 1,905,000 | | | | 1,970,761 | |
| Wisconsin Public Finance Authority Senior Living Rev. (Rose Villa Project), ”A“, 5.5%, 11/15/2034 | | | 1,730,000 | | | | 1,803,663 | |
| Wisconsin Public Finance Authority Senior Living Rev. (Rose Villa Project), ”A“, 5.75%, 11/15/2044 | | | 1,685,000 | | | | 1,773,513 | |
| Wisconsin Public Finance Authority Senior Living Rev. (Rose Villa Project), ”A“, 6%, 11/15/2049 | | | 3,465,000 | | | | 3,681,424 | |
| Wisconsin Public Finance Authority Student Housing Rev. (Western Carolina University Project), 5.25%, 7/01/2047 | | | 2,480,000 | | | | 2,582,449 | |
| Wisconsin Public Finance Authority, Airport Facilities Rev. (Transportation Infrastructure Properties LLC), ”B“, 5%, 7/01/2022 | | | 955,000 | | | | 1,004,593 | |
| Wisconsin Public Finance Authority, Airport Facilities Rev. (Transportation Infrastructure Properties LLC), ”B“, 5.25%, 7/01/2028 | | | 3,815,000 | | | | 4,114,134 | |
| Wisconsin Public Finance Authority, Airport Facilities Rev. (Transportation Infrastructure Properties LLC), ”B“, 5%, 7/01/2042 | | | 17,610,000 | | | | 18,462,676 | |
95
Portfolio of Investments – continued
| | | | | | | | |
| | |
| Issuer | | Shares/Par | | | Value ($) | |
| Municipal Bonds - continued | | | | | | | | |
| Wisconsin - continued | | | | | | | | |
| Wisconsin Public Finance Authority, Airport Facilities Rev. (Transportation Infrastructure Properties LLC), ”C“, 5%, 7/01/2042 | | $ | 2,870,000 | | | $ | 3,005,206 | |
| | | | | | | | |
| | | | | | | $ | 154,145,701 | |
Total Municipal Bonds
(Identified Cost, $4,764,562,956) | | | $ | 4,856,662,568 | |
| | |
| Investment Companies (h) - 2.3% | | | | | | | | |
| Money Market Funds - 2.3% | | | | | | | | |
MFS Institutional Money Market Portfolio, 2.47% (v)
(Identified Cost, $114,920,811) | | | 114,932,319 | | | $ | 114,920,825 | |
| | |
| Other Assets, Less Liabilities - (2.0)% | | | | | | | (98,899,042 | ) |
| Net Assets - 100.0% | | | | | | $ | 4,872,684,351 | |
| (a) | Non-income producing security. |
| (h) | An affiliated issuer, which may be considered one in which the fund owns 5% or more of the outstanding voting securities, or a company which is under common control. At period end, the aggregate values of the fund’s investments in affiliated issuers and in unaffiliated issuers were $114,920,825 and $4,856,662,568, respectively. |
| (n) | Securities exempt from registration under Rule 144A of the Securities Act of 1933. These securities may be sold in the ordinary course of business in transactions exempt from registration, normally to qualified institutional buyers. At period end, the aggregate value of these securities was $27,553,137, representing 0.6% of net assets. |
| (q) | Interest received was less than stated coupon rate. |
| (u) | Underlying security deposited into special purpose trust upon creation of self-deposited inverse floaters. |
| (v) | Affiliated issuer that is available only to investment companies managed by MFS. The rate quoted for the MFS Institutional Money Market Portfolio is the annualizedseven-day yield of the fund at period end. |
The following abbreviations are used in this report and are defined:
| AAC | | Ambac Assurance Corp. |
| AGM | | Assured Guaranty Municipal |
| ASSD GTY | | Assured Guaranty Insurance Co. |
| CALHF | | California Health Facility Construction Loan Insurance Program |
| COP | | Certificate of Participation |
| FHA | | Federal Housing Administration |
| FLR | | Floating Rate. Interest rate resets periodically based on the parenthetically disclosed reference rate plus a spread (if any). Theperiod-end rate reported may not be the current rate. All reference rates are USD unless otherwise noted. |
| FNMA | | Federal National Mortgage Assn. |
| GNMA | | Government National Mortgage Assn. |
96
Portfolio of Investments – continued
| LIBOR | | London Interbank Offered Rate |
| NATL | | National Public Finance Guarantee Corp. |
| SYNCORA | | Syncora Guarantee Inc. |
See Notes to Financial Statements
97
Financial Statements
STATEMENT OF ASSETS AND LIABILITIES
At 1/31/19
This statement represents your fund’s balance sheet, which details the assets and liabilities comprising the total value of the fund.
| | | | |
| Assets | | | | |
Investments in unaffiliated issuers, at value (identified cost, $4,764,562,956) | | | $4,856,662,568 | |
Investments in affiliated issuers, at value (identified cost, $114,920,811) | | | 114,920,825 | |
Receivables for | | | | |
Investments sold | | | 13,129,980 | |
Fund shares sold | | | 13,040,605 | |
Interest | | | 49,200,029 | |
Receivable for floating rate certificates issued | | | 10,430,000 | |
Other assets | | | 19,106 | |
Total assets | | | $5,057,403,113 | |
| Liabilities | | | | |
Payables for | | | | |
Distributions | | | $1,989,569 | |
Investments purchased | | | 94,217,335 | |
Fund shares reacquired | | | 10,034,255 | |
Interest expense and fees | | | 272,225 | |
Payable to the holders of the floating rate certificates | | | 76,507,939 | |
Payable to affiliates | | | | |
Investment adviser | | | 140,452 | |
Shareholder servicing costs | | | 1,258,976 | |
Distribution and service fees | | | 13,279 | |
Payable for independent Trustees’ compensation | | | 5,603 | |
Accrued expenses and other liabilities | | | 279,129 | |
Total liabilities | | | $184,718,762 | |
Net assets | | | $4,872,684,351 | |
| Net assets consist of | | | | |
Paid-in capital | | | $4,805,937,837 | |
Total distributable earnings (loss) | | | 66,746,514 | |
Net assets | | | $4,872,684,351 | |
Shares of beneficial interest outstanding | | | 602,523,828 | |
| | | | | | | | | | | | |
| | | |
| | | Net assets | | | Shares
outstanding | | | Net asset value
per share (a) | |
Class A | | | $1,623,004,120 | | | | 200,617,723 | | | | $8.09 | |
Class B | | | 17,392,004 | | | | 2,147,668 | | | | 8.10 | |
Class C | | | 230,386,913 | | | | 28,448,389 | | | | 8.10 | |
Class I | | | 2,145,125,445 | | | | 265,312,563 | | | | 8.09 | |
Class R6 | | | 856,775,869 | | | | 105,997,485 | | | | 8.08 | |
| (a) | Maximum offering price per share was equal to the net asset value per share for all share classes, except for Class A, for which the maximum offering price per share was $8.45 [100 /95.75 x $8.09]. On sales of $100,000 or more, the maximum offering price of Class A shares is reduced. A contingent deferred sales charge may be imposed on redemptions of Class A, Class B, and Class C shares. Redemption price per share was equal to the net asset value per share for Classes I and R6. |
See Notes to Financial Statements
98
Financial Statements
STATEMENT OF OPERATIONS
Year ended 1/31/19
This statement describes how much your fund earned in investment income and accrued in expenses. It also describes any gains and/or losses generated by fund operations.
| | | | |
| Net investment income (loss) | | | | |
Income | | | | |
Interest | | | $234,589,043 | |
Dividends from affiliated issuers | | | 1,621,972 | |
Other | | | 552 | |
Total investment income | | | $236,211,567 | |
Expenses | | | | |
Management fee | | | $24,881,242 | |
Distribution and service fees | | | 2,680,714 | |
Shareholder servicing costs | | | 3,662,630 | |
Administrative services fee | | | 607,567 | |
Independent Trustees’ compensation | | | 40,657 | |
Custodian fee | | | 355,360 | |
Shareholder communications | | | 231,609 | |
Audit and tax fees | | | 66,916 | |
Legal fees | | | 41,617 | |
Interest expense and fees | | | 719,247 | |
Miscellaneous | | | 331,498 | |
Total expenses | | | $33,619,057 | |
Fees paid indirectly | | | (1,401 | ) |
Reduction of expenses by investment adviser and distributor | | | (506,218 | ) |
Net expenses | | | $33,111,438 | |
Net investment income (loss) | | | $203,100,129 | |
| |
| Realized and unrealized gain (loss) | | | | |
Realized gain (loss) (identified cost basis) | | | | |
Unaffiliated issuers | | | $(10,726,258 | ) |
Affiliated issuers | | | (50 | ) |
Net realized gain (loss) | | | $(10,726,308 | ) |
Change in unrealized appreciation or depreciation | | | | |
Unaffiliated issuers | | | $(38,950,868 | ) |
Affiliated issuers | | | 5,890 | |
Net unrealized gain (loss) | | | $(38,944,978 | ) |
Net realized and unrealized gain (loss) | | | $(49,671,286 | ) |
Change in net assets from operations | | | $153,428,843 | |
See Notes to Financial Statements
99
Financial Statements
STATEMENTS OF CHANGES IN NET ASSETS
These statements describe the increases and/or decreases in net assets resulting from operations, any distributions, and any shareholder transactions.
| | | | | | | | |
| | | Year ended | |
| | | 1/31/19 | | | 1/31/18 | |
| Change in net assets | | | | | | |
| | |
| From operations | | | | | | | | |
Net investment income (loss) | | | $203,100,129 | | | | $172,929,806 | |
Net realized gain (loss) | | | (10,726,308 | ) | | | 13,295,967 | |
Net unrealized gain (loss) | | | (38,944,978 | ) | | | 40,610,301 | |
Change in net assets from operations | | | $153,428,843 | | | | $226,836,074 | |
Total distributions to shareholders (a) | | | $(193,104,583 | ) | | | $(170,448,372 | ) |
Change in net assets from fund share transactions | | | $357,845,640 | | | | $856,860,511 | |
Total change in net assets | | | $318,169,900 | | | | $913,248,213 | |
| | |
| Net assets | | | | | | | | |
At beginning of period | | | 4,554,514,451 | | | | 3,641,266,238 | |
At end of period (b) | | | $4,872,684,351 | | | | $4,554,514,451 | |
| (a) | Distributions from net investment income and from net realized gain are no longer required to be separately disclosed. See Note 2. For the year ended January 31, 2018, distributions from net investment income were $170,448,372. |
| (b) | Parenthetical disclosure of undistributed net investment income is no longer required. See Note 2. For the year ended January 31, 2018, end of period net assets included undistributed net investment income of $7,452,119. |
See Notes to Financial Statements
100
Financial Statements
FINANCIAL HIGHLIGHTS
The financial highlights table is intended to help you understand the fund’s financial performance for the past 5 years (or life of a particular share class, if shorter). Certain information reflects financial results for a single fund share. The total returns in the table represent the rate that an investor would have earned (or lost) on an investment in the fund share class (assuming reinvestment of all distributions) held for the entire period.
| | | | | | | | | | | | | | | | | | | | |
| Class A | | Year ended | |
| | | | | |
| | | 1/31/19 | | | 1/31/18 | | | 1/31/17 | | | 1/31/16 | | | 1/31/15 | |
Net asset value, beginning of period | | | $8.16 | | | | $8.02 | | | | $8.25 | | | | $8.29 | | | | $7.61 | |
| | | |
| Income (loss) from investment operations | | | | | | | | | | | | | |
Net investment income (loss) (d) | | | $0.35 | | | | $0.36 | | | | $0.37 | (c) | | | $0.37 | | | | $0.39 | |
Net realized and unrealized gain (loss) | | | (0.08 | ) | | | 0.14 | | | | (0.25 | ) | | | (0.06 | ) | | | 0.65 | |
Total from investment operations | | | $0.27 | | | | $0.50 | | | | $0.12 | | | | $0.31 | | | | $1.04 | |
| | | |
| Less distributions declared to shareholders | | | | | | | | | | | | | |
From net investment income | | | $(0.34 | ) | | | $(0.36 | ) | | | $(0.35 | ) | | | $(0.35 | ) | | | $(0.36 | ) |
Net asset value, end of period (x) | | | $8.09 | | | | $8.16 | | | | $8.02 | | | | $8.25 | | | | $8.29 | |
Total return (%) (r)(s)(t)(x) | | | 3.31 | | | | 6.29 | | | | 1.38 | (c) | | | 3.86 | | | | 14.01 | |
| | | | |
Ratios (%) (to average net assets)
and Supplemental data: | | | | | | | | | | | | | | | | | |
Expenses before expense reductions (f) | | | 0.67 | | | | 0.68 | | | | 0.71 | (c) | | | 0.70 | | | | 0.71 | |
Expenses after expense reductions (f) | | | 0.66 | | | | 0.65 | | | | 0.66 | (c) | | | 0.66 | | | | 0.68 | |
Net investment income (loss) | | | 4.35 | | | | 4.44 | | | | 4.41 | (c) | | | 4.54 | | | | 4.85 | |
Portfolio turnover | | | 24 | | | | 17 | | | | 23 | | | | 17 | | | | 12 | |
Net assets at end of period (000 omitted) | | | $1,623,004 | | | | $1,589,868 | | | | $1,781,515 | | | | $1,974,564 | | | | $1,583,324 | |
| | | | |
| Supplemental Ratios (%): | | | | | | | | | | | | | | | | | |
Ratios of expenses to average net assets
after expense reductions and excluding
interest expense and fees (f)(l) | | | 0.64 | | | | 0.64 | | | | 0.65 | (c) | | | 0.65 | | | | 0.67 | |
See Notes to Financial Statements
101
Financial Highlights – continued
| | | | | | | | | | | | | | | | | | | | |
| Class B | | Year ended | |
| | | | | |
| | | 1/31/19 | | | 1/31/18 | | | 1/31/17 | | | 1/31/16 | | | 1/31/15 | |
Net asset value, beginning of period | | | $8.16 | | | | $8.03 | | | | $8.26 | | | | $8.30 | | | | $7.61 | |
| | | | |
| Income (loss) from investment operations | | | | | | | | | | | | | | | | | |
Net investment income (loss) (d) | | | $0.29 | | | | $0.30 | | | | $0.30 | (c) | | | $0.31 | | | | $0.33 | |
Net realized and unrealized gain (loss) | | | (0.07 | ) | | | 0.13 | | | | (0.25 | ) | | | (0.06 | ) | | | 0.66 | |
Total from investment operations | | | $0.22 | | | | $0.43 | | | | $0.05 | | | | $0.25 | | | | $0.99 | |
| | | | |
| Less distributions declared to shareholders | | | | | | | | | | | | | | | | | |
From net investment income | | | $(0.28 | ) | | | $(0.30 | ) | | | $(0.28 | ) | | | $(0.29 | ) | | | $(0.30 | ) |
Net asset value, end of period (x) | | | $8.10 | | | | $8.16 | | | | $8.03 | | | | $8.26 | | | | $8.30 | |
Total return (%) (r)(s)(t)(x) | | | 2.68 | | | | 5.35 | | | | 0.59 | (c) | | | 3.06 | | | | 13.27 | |
| | | | |
Ratios (%) (to average net assets)
and Supplemental data: | | | | | | | | | | | | | | | | | |
Expenses before expense reductions (f) | | | 1.67 | | | | 1.68 | | | | 1.71 | (c) | | | 1.70 | | | | 1.71 | |
Expenses after expense reductions (f) | | | 1.41 | | | | 1.41 | | | | 1.44 | (c) | | | 1.44 | | | | 1.45 | |
Net investment income (loss) | | | 3.61 | | | | 3.68 | | | | 3.62 | (c) | | | 3.78 | | | | 4.08 | |
Portfolio turnover | | | 24 | | | | 17 | | | | 23 | | | | 17 | | | | 12 | |
Net assets at end of period (000 omitted) | | | $17,392 | | | | $22,213 | | | | $26,528 | | | | $30,537 | | | | $33,622 | |
| | | | |
| Supplemental Ratios (%): | | | | | | | | | | | | | | | | | |
Ratios of expenses to average net assets
after expense reductions and excluding
interest expense and fees (f)(l) | | | 1.40 | | | | 1.40 | | | | 1.43 | (c) | | | 1.43 | | | | 1.44 | |
See Notes to Financial Statements
102
Financial Highlights – continued
| | | | | | | | | | | | | | | | | | | | |
| Class C | | Year ended | |
| | | | | |
| | | 1/31/19 | | | 1/31/18 | | | 1/31/17 | | | 1/31/16 | | | 1/31/15 | |
Net asset value, beginning of period | | | $8.16 | | | | $8.03 | | | | $8.26 | | | | $8.30 | | | | $7.61 | |
| | | | |
| Income (loss) from investment operations | | | | | | | | | | | | | | | | | |
Net investment income (loss) (d) | | | $0.27 | | | | $0.28 | | | | $0.28 | (c) | | | $0.29 | | | | $0.31 | |
Net realized and unrealized gain (loss) | | | (0.08 | ) | | | 0.13 | | | | (0.24 | ) | | | (0.06 | ) | | | 0.66 | |
Total from investment operations | | | $0.19 | | | | $0.41 | | | | $0.04 | | | | $0.23 | | | | $0.97 | |
| | | | |
| Less distributions declared to shareholders | | | | | | | | | | | | | | | | | |
From net investment income | | | $(0.25 | ) | | | $(0.28 | ) | | | $(0.27 | ) | | | $(0.27 | ) | | | $(0.28 | ) |
Net asset value, end of period (x) | | | $8.10 | | | | $8.16 | | | | $8.03 | | | | $8.26 | | | | $8.30 | |
Total return (%) (r)(s)(t)(x) | | | 2.42 | | | | 5.10 | | | | 0.37 | (c) | | | 2.83 | | | | 13.01 | |
| | | | |
Ratios (%) (to average net assets)
and Supplemental data: | | | | | | | | | | | | | | | | | |
Expenses before expense reductions (f) | | | 1.67 | | | | 1.68 | | | | 1.71 | (c) | | | 1.70 | | | | 1.71 | |
Expenses after expense reductions (f) | | | 1.66 | | | | 1.65 | | | | 1.66 | (c) | | | 1.66 | | | | 1.68 | |
Net investment income (loss) | | | 3.35 | | | | 3.43 | | | | 3.41 | (c) | | | 3.55 | | | | 3.84 | |
Portfolio turnover | | | 24 | | | | 17 | | | | 23 | | | | 17 | | | | 12 | |
Net assets at end of period (000 omitted) | | | $230,387 | | | | $282,931 | | | | $285,224 | | | | $271,643 | | | | $254,973 | |
| | | | |
| Supplemental Ratios (%): | | | | | | | | | | | | | | | | | |
Ratios of expenses to average net assets
after expense reductions and excluding
interest expense and fees (f)(l) | | | 1.64 | | | | 1.64 | | | | 1.65 | (c) | | | 1.65 | | | | 1.66 | |
See Notes to Financial Statements
103
Financial Highlights – continued
| | | | | | | | | | | | | | | | | | | | |
| Class I | | Year ended | |
| | | | | |
| | | 1/31/19 | | | 1/31/18 | | | 1/31/17 | | | 1/31/16 | | | 1/31/15 | |
Net asset value, beginning of period | | | $8.15 | | | | $8.02 | | | | $8.25 | | | | $8.29 | | | | $7.60 | |
| | | |
| Income (loss) from investment operations | | | | | | | | | | | | | |
Net investment income (loss) (d) | | | $0.35 | | | | $0.36 | | | | $0.37 | (c) | | | $0.37 | | | | $0.38 | |
Net realized and unrealized gain (loss) | | | (0.08 | ) | | | 0.13 | | | | (0.25 | ) | | | (0.06 | ) | | | 0.67 | |
Total from investment operations | | | $0.27 | | | | $0.49 | | | | $0.12 | | | | $0.31 | | | | $1.05 | |
| | | |
| Less distributions declared to shareholders | | | | | | | | | | | | | |
From net investment income | | | $(0.33 | ) | | | $(0.36 | ) | | | $(0.35 | ) | | | $(0.35 | ) | | | $(0.36 | ) |
Net asset value, end of period (x) | | | $8.09 | | | | $8.15 | | | | $8.02 | | | | $8.25 | | | | $8.29 | |
Total return (%) (r)(s)(t)(x) | | | 3.44 | | | | 6.15 | | | | 1.38 | (c) | | | 3.86 | | | | 14.14 | |
| | | | |
Ratios (%) (to average net assets)
and Supplemental data: | | | | | | | | | | | | | | | | | |
Expenses before expense reductions (f) | | | 0.67 | | | | 0.68 | | | | 0.71 | (c) | | | 0.71 | | | | 0.71 | |
Expenses after expense reductions (f) | | | 0.66 | | | | 0.65 | | | | 0.66 | (c) | | | 0.66 | | | | 0.68 | |
Net investment income (loss) | | | 4.34 | | | | 4.42 | | | | 4.42 | (c) | | | 4.55 | | | | 4.78 | |
Portfolio turnover | | | 24 | | | | 17 | | | | 23 | | | | 17 | | | | 12 | |
Net assets at end of period (000 omitted) | | | $2,145,125 | | | | $2,261,507 | | | | $1,547,999 | | | | $1,319,815 | | | | $1,032,069 | |
| | | | |
| Supplemental Ratios (%): | | | | | | | | | | | | | | | | | |
Ratios of expenses to average net assets
after expense reductions and excluding
interest expense and fees (f)(l) | | | 0.64 | | | | 0.64 | | | | 0.65 | (c) | | | 0.65 | | | | 0.66 | |
See Notes to Financial Statements
104
Financial Highlights – continued
| | | | | | | | |
| Class R6 | | Year ended | |
| | |
| | | 1/31/19 | | | 1/31/18 (i) | |
Net asset value, beginning of period | | | $8.15 | | | | $8.23 | |
| | |
| Income (loss) from investment operations | | | | | | | | |
Net investment income (loss) (d) | | | $0.36 | | | | $0.22 | |
Net realized and unrealized gain (loss) | | | (0.09 | ) | | | (0.06 | )(g) |
Total from investment operations | | | $0.27 | | | | $0.16 | |
| | |
| Less distributions declared to shareholders | | | | | | | | |
From net investment income | | | $(0.34 | ) | | | $(0.24 | ) |
Net asset value, end of period (x) | | | $8.08 | | | | $8.15 | |
Total return (%) (r)(s)(t)(x) | | | 3.40 | | | | 1.97 | (n) |
| | |
Ratios (%) (to average net assets)
and Supplemental data: | | | | | | | | |
Expenses before expense reductions (f) | | | 0.58 | | | | 0.57 | (a) |
Expenses after expense reductions (f) | | | 0.57 | | | | 0.56 | (a) |
Net investment income (loss) | | | 4.41 | | | | 4.12 | (a) |
Portfolio turnover | | | 24 | | | | 17 | |
Net assets at end of period (000 omitted) | | | $856,776 | | | | $397,994 | |
| | |
| Supplemental Ratios (%): | | | | | | | | |
Ratios of expenses to average net assets
after expense reductions and excluding
interest expense and fees (f)(l) | | | 0.56 | | | | 0.55 | (a) |
| (c) | Amount reflects aone-time reimbursement of expenses by the custodian (or former custodian) without which net investment income and performance would be lower and expenses would be higher. |
| (d) | Per share data is based on average shares outstanding. |
| (f) | Ratios do not reflect reductions from fees paid indirectly, if applicable. |
| (g) | The per share amount varies from the net realized and unrealized gain/loss for the period because of the timing of sales of fund shares and the per share amount of realized and unrealized gains and losses at such time. |
| (i) | For Class R6, the period is from the class inception, June 2, 2017, through the stated period end. |
| (l) | Interest expense and fees relate to payments made to the holders of the floating rate certificates. |
| (r) | Certain expenses have been reduced without which performance would have been lower. |
| (s) | From time to time the fund may receive proceeds from litigation settlements, without which performance would be lower. |
| (t) | Total returns do not include any applicable sales charges. |
| (x) | The net asset values and total returns have been calculated on net assets which include adjustments made in accordance with U.S. generally accepted accounting principles required at period end for financial reporting purposes. |
See Notes to Financial Statements
105
NOTES TO FINANCIAL STATEMENTS
(1) Business and Organization
MFS Municipal High Income Fund (the fund) is a diversified series of MFS Series Trust III which is organized as a Massachusetts business trust and is registered under the Investment Company Act of 1940, as amended, as anopen-end management investment company.
The fund is an investment company and accordingly follows the investment company accounting and reporting guidance of the Financial Accounting Standards Board (FASB) Accounting Standards Codification Topic 946 Financial Services – Investment Companies.
(2) Significant Accounting Policies
General– The preparation of financial statements in conformity with U.S. generally accepted accounting principles requires management to make estimates and assumptions that affect the reported amounts of assets and liabilities, and disclosure of contingent assets and liabilities at the date of the financial statements and the reported amounts of increases and decreases in net assets from operations during the reporting period. Actual results could differ from those estimates. In the preparation of these financial statements, management has evaluated subsequent events occurring after the date of the fund’s Statement of Assets and Liabilities through the date that the financial statements were issued. The fund invests primarily in municipal instruments, which generally trade in theover-the-counter market. The value of municipal instruments can be affected by changes in their actual or perceived credit quality. The credit quality of, and the ability to pay principal and interest when due by, an issuer of a municipal instrument depends on the credit quality of the entity supporting the municipal instrument, how essential any services supported by the municipal instrument are, the sufficiency of any revenues or taxes that support the municipal instrument, and/or the willingness or ability of the appropriate government entity to approve any appropriations necessary to support the municipal instrument. Municipal instruments may be supported by insurance which typically guarantees the timely payment of all principal and interest due on the underlying municipal instrument. The value of a municipal instrument can be volatile and significantly affected by adverse tax changes or court rulings, legislative or political changes, changes in specific or general market and economic conditions in the region where the instrument is issued, and the financial condition of municipal issuers and of municipal instrument insurers of which there are a limited number. Also, because many municipal instruments are issued to finance similar projects, conditions in certain industries can significantly affect the fund and the overall municipal market. If the Internal Revenue Service determines an issuer of a municipal instrument has not complied with the applicable tax requirements, interest from the security could become taxable, the security could decline in value, and distributions made by the fund could be taxable to shareholders. The fund invests in high-yield securities rated below investment grade. Investments in below investment grade quality securities can involve a substantially greater risk of default or can already be in default, and their values can decline significantly. Below investment grade quality securities tend to be more sensitive to adverse news about the issuer, or the market or economy in general, than higher quality debt instruments.
106
Notes to Financial Statements – continued
In March 2017, the FASB issued Accounting Standards Update2017-08, Receivables –Nonrefundable Fees and Other Costs (Subtopic310-20) – Premium Amortization on Purchased Callable Debt Securities (“ASU2017-08”). For entities that hold callable debt securities at a premium, ASU2017-08 requires that the premium be amortized to the earliest call date. ASU2017-08 will be effective for fiscal years beginning after December 15, 2018, and interim periods within those fiscal years. Management has evaluated the potential impacts of ASU2017-08 and believes that adoption of ASU2017-08 will not have a material effect on the fund’s overall financial position or its overall results of operations.
In August 2018, the FASB issued Accounting Standards Update2018-13, Fair Value Measurement (Topic 820) – Disclosure Framework – Changes to the Disclosure Requirements for Fair Value Measurement (“ASU2018-13”) which introduces new fair value disclosure requirements as well as eliminates and modifies certain existing fair value disclosure requirements. ASU2018-13 would be effective for fiscal years beginning after December 15, 2019, and interim periods within those fiscal years; however, management has elected to early adopt ASU2018-13 effective with the current reporting period. The impact of the fund’s adoption was limited to changes in the fund’s financial statement disclosures regarding fair value, primarily those disclosures related to transfers between levels of the fair value hierarchy.
In August 2018, the Securities and Exchange Commission (SEC) released its Final Rule on Disclosure Update and Simplification (the “Final Rule”) which is intended to simplify an issuer’s disclosure compliance efforts by removing redundant or outdated disclosure requirements without significantly altering the mix of information provided to investors. Effective with the current reporting period, the fund adopted the Final Rule with the impacts being that the fund is no longer required to present the components of distributable earnings on the Statement of Assets and Liabilities or the sources of distributions to shareholders and the amount of undistributed net investment income on the Statements of Changes in Net Assets.
Balance Sheet Offsetting– The fund’s accounting policy with respect to balance sheet offsetting is that, absent an event of default by the counterparty or a termination of the agreement, the International Swaps and Derivatives Association (ISDA) Master Agreement, or similar agreement, does not result in an offset of reported amounts of financial assets and financial liabilities in the Statement of Assets and Liabilities across transactions between the fund and the applicable counterparty. The fund’s right to setoff may be restricted or prohibited by the bankruptcy or insolvency laws of the particular jurisdiction to which a specific master netting agreement counterparty is subject. Balance sheet offsetting disclosures, to the extent applicable to the fund, have been included in the fund’s Significant Accounting Policies note under the captions for each of the fund’sin-scope financial instruments and transactions.
Investment Valuations– Debt instruments and floating rate loans, including restricted debt instruments, are generally valued at an evaluated or composite bid as provided by a third-party pricing service. Short-term instruments with a maturity at issuance of 60 days or less may be valued at amortized cost, which approximates market value.Open-end investment companies are generally valued at net asset value per share. Securities and other assets generally valued on the basis of information from
107
Notes to Financial Statements – continued
a third-party pricing service may also be valued at a broker/dealer bid quotation. In determining values, third-party pricing services can utilize both transaction data and market information such as yield, quality, coupon rate, maturity, type of issue, trading characteristics, and other market data.
The Board of Trustees has delegated primary responsibility for determining or causing to be determined the value of the fund’s investments (including any fair valuation) to the adviser pursuant to valuation policies and procedures approved by the Board. If the adviser determines that reliable market quotations are not readily available, investments are valued at fair value as determined in good faith by the adviser in accordance with such procedures under the oversight of the Board of Trustees. Under the fund’s valuation policies and procedures, market quotations are not considered to be readily available for most types of debt instruments and floating rate loans and many types of derivatives. These investments are generally valued at fair value based on information from third-party pricing services. In addition, investments may be valued at fair value if the adviser determines that an investment’s value has been materially affected by events occurring after the close of the exchange or market on which the investment is principally traded (such as foreign exchange or market) and prior to the determination of the fund’s net asset value, or after the halting of trading of a specific security where trading does not resume prior to the close of the exchange or market on which the security is principally traded. The adviser generally relies on third-party pricing services or other information (such as the correlation with price movements of similar securities in the same or other markets; the type, cost and investment characteristics of the security; the business and financial condition of the issuer; and trading and other market data) to assist in determining whether to fair value and at what value to fair value an investment. The value of an investment for purposes of calculating the fund’s net asset value can differ depending on the source and method used to determine value. When fair valuation is used, the value of an investment used to determine the fund’s net asset value may differ from quoted or published prices for the same investment. There can be no assurance that the fund could obtain the fair value assigned to an investment if it were to sell the investment at the same time at which the fund determines its net asset value per share.
Various inputs are used in determining the value of the fund’s assets or liabilities. These inputs are categorized into three broad levels. In certain cases, the inputs used to measure fair value may fall into different levels of the fair value hierarchy. In such cases, an investment’s level within the fair value hierarchy is based on the lowest level of input that is significant to the fair value measurement. The fund’s assessment of the significance of a particular input to the fair value measurement in its entirety requires judgment, and considers factors specific to the investment. Level 1 includes unadjusted quoted prices in active markets for identical assets or liabilities. Level 2 includes other significant observable market-based inputs (including quoted prices for similar securities, interest rates, prepayment speed, and credit risk). Level 3 includes unobservable inputs, which may include the adviser’s own assumptions in determining
108
Notes to Financial Statements – continued
the fair value of investments. The following is a summary of the levels used as of January 31, 2019 in valuing the fund’s assets or liabilities:
| | | | | | | | | | | | | | | | |
| | | | |
| Financial Instruments | | Level 1 | | | Level 2 | | | Level 3 | | | Total | |
| Municipal Bonds | | | $— | | | | $4,856,662,568 | | | | $— | | | | $4,856,662,568 | |
| Mutual Funds | | | 114,920,825 | | | | — | | | | — | | | | 114,920,825 | |
| Total | | | $114,920,825 | | | | $4,856,662,568 | | | | $— | | | | $4,971,583,393 | |
For further information regarding security characteristics, see the Portfolio of Investments.
Inverse Floaters– The fund invests in municipal inverse floating rate securities which are structured by the issuer (known as primary market inverse floating rate securities) or by the fund utilizing the fund’s municipal bonds which have already been issued (known as self-deposited secondary market inverse floating rate securities) to have variable rates of interest which typically move in the opposite direction of short-term interest rates. A self-deposited secondary market inverse floating rate security is created when the fund transfers a fixed rate municipal bond to a special purpose trust (“the trust”), and causes the trust to (a) issue floating rate certificates to third parties, in an amount equal to a fraction of the par amount of the deposited bonds (these certificates usually paytax-exempt interest at short-term interest rates that typically reset weekly; and the certificate holders typically, on seven days notice, have the option to tender their certificates to the trust or another party for redemption at par plus accrued interest), and (b) issue inverse floating rate certificates (sometimes referred to as “inverse floaters”) which are held by the fund. Such self-deposited inverse floaters held by the fund are accounted for as secured borrowings, with the municipal bonds reflected in the investments of the fund and amounts owed to the holders of the floating rate certificates under the provisions of the trust, which amounts are paid solely from the assets of the trust, reflected as liabilities of the fund in the Statement of Assets and Liabilities under the caption, “Payable to the holders of the floating rate certificates”. The carrying value of the fund’s payable to the holders of the floating rate certificates from trust assets as reported in the fund’s Statement of Assets and Liabilities approximates its fair value. The value of the payable to the holders of the floating rate certificates from trust assets as of the reporting date is considered level 2 under the fair value hierarchy disclosure. At January 31, 2019, the fund’s payable to the holders of the floating rate certificates from trust assets was $76,507,939 and the weighted average interest rate on the settled floating rate certificates issued by the trust was 1.50%. For the year ended January 31, 2019, the average payable to the holders of the settled floating rate certificates from trust assets was $34,238,534 at a weighted average interest rate of 1.56%. Interest expense and fees relate to interest payments made to the holders of certain floating rate certificates and associated fees, both of which are made from trust assets. Interest expense and fees are recorded as incurred. For the year ended January 31, 2019, interest expense and fees related to self-deposited inverse floaters amounted to $689,542 and are included in “Interest expense and fees” in the Statement of Operations.
Indemnifications– Under the fund’s organizational documents, its officers and Trustees may be indemnified against certain liabilities and expenses arising out of the performance of their duties to the fund. Additionally, in the normal course of business,
109
Notes to Financial Statements – continued
the fund enters into agreements with service providers that may contain indemnification clauses. The fund’s maximum exposure under these agreements is unknown as this would involve future claims that may be made against the fund that have not yet occurred.
Investment Transactions and Income– Investment transactions are recorded on the trade date. Interest income is recorded on the accrual basis. All premium and discount is amortized or accreted for financial statement purposes in accordance with U.S. generally accepted accounting principles. Interest payments received in additional securities are recorded on theex-interest date in an amount equal to the value of the security on such date. Debt obligations may be placed onnon-accrual status or set to accrue at a rate of interest less than the contractual coupon when the collection of all or a portion of interest has become doubtful. Interest income for those debt obligations may be further reduced by thewrite-off of the related interest receivables when deemed uncollectible.
The fund may receive proceeds from litigation settlements. Any proceeds received from litigation involving portfolio holdings are reflected in the Statement of Operations in realized gain/loss if the security has been disposed of by the fund or in unrealized gain/loss if the security is still held by the fund. Any other proceeds from litigation not related to portfolio holdings are reflected as other income in the Statement of Operations.
Legal fees and other related expenses incurred to preserve and protect the value of a security owned are added to the cost of the security; other legal fees are expensed. Capital infusions made directly to the security issuer, which are generallynon-recurring, incurred to protect or enhance the value of high-yield debt securities, are reported as additions to the cost basis of the security. Costs that are incurred to negotiate the terms or conditions of capital infusions or that are expected to result in a plan of reorganization are reported as realized losses. Ongoing costs incurred to protect or enhance an investment, or costs incurred to pursue other claims or legal actions, are expensed.
Fees Paid Indirectly– The fund’s custody fee may be reduced by a credit earned under an arrangement that measures the value of U.S. dollars deposited with the custodian by the fund. The amount of the credit, for the year ended January 31, 2019, is shown as a reduction of total expenses in the Statement of Operations.
Tax Matters and Distributions– The fund intends to qualify as a regulated investment company, as defined under Subchapter M of the Internal Revenue Code, and to distribute all of its taxable and tax-exempt income, including realized capital gains. As a result, no provision for federal income tax is required. The fund’s federal tax returns, when filed, will remain subject to examination by the Internal Revenue Service for a three year period. Management has analyzed the fund’s tax positions taken on federal and state tax returns for all open tax years and does not believe that there are any uncertain tax positions that require recognition of a tax liability.
Distributions to shareholders are recorded on theex-dividend date. Income and capital gain distributions are determined in accordance with income tax regulations, which may differ from U.S. generally accepted accounting principles. Certain capital accounts in the financial statements are periodically adjusted for permanent differences in order
110
Notes to Financial Statements – continued
to reflect their tax character. These adjustments have no impact on net assets or net asset value per share. Temporary differences which arise from recognizing certain items of income, expense, gain or loss in different periods for financial statement and tax purposes will reverse at some time in the future. Distributions in excess of net investment income or net realized gains are temporary overdistributions for financial statement purposes resulting from differences in the recognition or classification of income or distributions for financial statement and tax purposes.
Book/tax differences primarily relate to expiration of capital loss carryforwards and amortization and accretion of debt securities.
The tax character of distributions declared to shareholders for the last two fiscal years is as follows:
| | | | | | | | |
| | |
| | | Year ended
1/31/19 | | | Year ended
1/31/18 | |
| Ordinary income (including any short-term capital gains) | | | $6,814,996 | | | | $7,555,000 | |
| Tax-exempt income | | | 186,289,587 | | | | 162,893,372 | |
| | |
| Total distributions | | | $193,104,583 | | | | $170,448,372 | |
The federal tax cost and the tax basis components of distributable earnings were as follows:
| | | | |
| |
| As of 1/31/19 | | | |
| |
| Cost of investments | | | $4,777,058,595 | |
| Gross appreciation | | | 160,083,288 | |
| |
| Gross depreciation | | | (42,066,429 | ) |
| Net unrealized appreciation (depreciation) | | | $118,016,859 | |
| |
| Undistributed ordinary income | | | 748,774 | |
| Undistributedtax-exempt income | | | 23,084,452 | |
| Capital loss carryforwards | | | (58,791,341 | ) |
| Other temporary differences | | | (16,312,230 | ) |
As of January 31, 2019, the fund had capital loss carryforwards available to offset future realized gains. These net capital losses may be carried forward indefinitely and their character is retained as short-term and/or long-term losses. Such losses are characterized as follows:
| | | | |
| Short-Term | | | $(33,029,465 | ) |
| Long-Term | | | (25,761,876 | ) |
| |
| Total | | | $(58,791,341 | ) |
Multiple Classes of Shares of Beneficial Interest– The fund offers multiple classes of shares, which differ in their respective distribution and service fees. The fund’s income and common expenses are allocated to shareholders based on the value of settled shares outstanding of each class. The fund’s realized and unrealized gain (loss) are allocated to shareholders based on the daily net assets of each class. Dividends are declared separately for each class. Differences in per share dividend rates are generally due to differences in separate class expenses. Class B shares will convert to Class A
111
Notes to Financial Statements – continued
shares approximately eight years after purchase. Class C shares will convert to Class A shares approximately ten years after purchase. The fund’s distributions declared to shareholders as reported in the Statements of Changes in Net Assets are presented by class as follows:
| | | | | | | | |
| | | From net investment
income | |
| | |
| | | Year
ended
1/31/19 | | | Year
ended
1/31/18 (i) | |
| Class A | | | $66,395,275 | | | | $67,868,751 | |
| Class B | | | 677,458 | | | | 887,337 | |
| Class C | | | 7,775,203 | | | | 9,528,995 | |
| Class I | | | 85,633,971 | | | | 90,606,772 | |
| Class R6 | | | 32,622,676 | | | | 1,556,517 | |
| Total | | | $193,104,583 | | | | $170,448,372 | |
| (i) | For Class R6, the period is from the class inception, June 2, 2017, through the stated period end. |
(3) Transactions with Affiliates
Investment Adviser– The fund has an investment advisory agreement with MFS to provide overall investment management and related administrative services and facilities to the fund. For the period from February 1, 2018 through July 31, 2018, the management fee was computed daily and paid monthly at the following annual rates based on the fund’s average daily net assets:
| | | | |
| Up to $2.5 billion | | | 0.55 | % |
| In excess of $2.5 billion and up to $5 billion | | | 0.50 | % |
| In excess of $5 billion | | | 0.45 | % |
Effective August 1, 2018, the management fee is computed daily and paid monthly at the following annual rates based on the fund’s average daily net assets:
| | | | |
| Up to $2.5 billion | | | 0.55 | % |
| In excess of $2.5 billion and up to $5 billion | | | 0.50 | % |
| In excess of $5 billion and up to $10 billion | | | 0.45 | % |
| In excess of $10 billion | | | 0.425 | % |
MFS has also agreed in writing to reduce its management fee by a specified amount if certain MFS mutual fund assets exceed thresholds agreed to by MFS and the fund’s Board of Trustees. For the year ended January 31, 2019, this management fee reduction amounted to $455,819, which is included in the reduction of total expenses in the Statement of Operations. The management fee incurred for the year ended January 31, 2019 was equivalent to an annual effective rate of 0.52% of the fund’s average daily net assets.
The investment adviser has agreed in writing to pay a portion of the fund’s total annual operating expenses, excluding interest, taxes, extraordinary expenses, brokerage and transaction costs, and investment-related expenses (such as interest expenses and fees
112
Notes to Financial Statements – continued
associated with investments in inverse floating rate instruments), such that total fund operating expenses do not exceed the following rates annually of each class’s average daily net assets:
| | | | | | | | | | | | | | | | | | |
| | | | |
| Class A | | | Class B | | | Class C | | | Class I | | | Class R6 | |
| | 0.65% | | | | 1.40 | % | | | 1.65 | % | | | 0.65 | % | | | 0.56 | % |
This written agreement will continue until modified by the fund’s Board of Trustees, but such agreement will continue at least until May 31, 2020. For the year ended January 31, 2019, the fund’s actual operating expenses did not exceed the limit and therefore, the investment adviser did not pay any portion of the fund’s expenses related to this agreement.
Distributor– MFS Fund Distributors, Inc. (MFD), a wholly-owned subsidiary of MFS, as distributor, received $120,486 for the year ended January 31, 2019, as its portion of the initial sales charge on sales of Class A shares of the fund.
The Board of Trustees has adopted a distribution plan for certain share classes pursuant to Rule12b-1 of the Investment Company Act of 1940.
The fund’s distribution plan provides that the fund will pay MFD for services provided by MFD and financial intermediaries in connection with the distribution and servicing of certain share classes. One component of the plan is a distribution fee paid to MFD and another component of the plan is a service fee paid to MFD. MFD may subsequently pay all, or a portion, of the distribution and/or service fees to financial intermediaries.
Distribution Plan Fee Table:
| | | | | | | | | | | | | | | | | | | | |
| | | | | |
| | | Distribution
Fee Rate (d) | | | Service
Fee Rate (d) | | | Total
Distribution
Plan (d) | | | Annual
Effective
Rate (e) | | | Distribution
and Service
Fee | |
| Class B | | | 0.75% | | | | 0.25% | | | | 1.00% | | | | 0.75% | | | | $199,776 | |
| Class C | | | 0.75% | | | | 0.25% | | | | 1.00% | | | | 1.00% | | | | 2,480,938 | |
| Total Distribution and Service Fees | | | | | | | | | | | | | | | | $2,680,714 | |
| (d) | In accordance with the distribution plan for certain classes, the fund pays distribution and/or service fees equal to these annual percentage rates of each class’s average daily net assets. The distribution and service fee rates disclosed by class represent the current rates in effect at the end of the reporting period. Any rate changes, if applicable, are detailed below. |
| (e) | The annual effective rates represent actual fees incurred under the distribution plan for the year ended January 31, 2019 based on each class’s average daily net assets. MFD has agreed in writing to reduce the Class B service fee rate to 0.00% for all Class B shares. This agreement will continue until modified by the fund’s Board of Trustees, but such agreement will continue until at least May 31, 2020. For the year ended January 31, 2019, the waiver amounted to $49,944, which is included in the reduction of total expenses on the Statement of Operations. MFD has also voluntarily agreed to rebate a portion of each class’s 0.25% service fee attributable to accounts for which MFD retains the 0.25% service fee except for accounts attributable to MFS or its affiliates’ seed money. For the year ended January 31, 2019, this rebate amounted to $455 for Class C shares, which is included in the reduction of total expenses in the Statement of Operations. |
Certain Class A shares are subject to a contingent deferred sales charge (CDSC) in the event of a shareholder redemption within 18 months of purchase. Class B shares are
113
Notes to Financial Statements – continued
subject to a CDSC in the event of a shareholder redemption within six years of purchase. Class C shares are subject to a CDSC in the event of a shareholder redemption within 12 months of purchase. All contingent deferred sales charges are paid to MFD and during the year ended January 31, 2019, were as follows:
| | | | |
| |
| | | Amount | |
| Class A | | | $160,249 | |
| Class B | | | 22,686 | |
| Class C | | | 26,634 | |
Shareholder Servicing Agent– MFS Service Center, Inc. (MFSC), a wholly-owned subsidiary of MFS, receives a fee from the fund for its services as shareholder servicing agent calculated as a percentage of the average daily net assets of the fund as determined periodically under the supervision of the fund’s Board of Trustees. For the year ended January 31, 2019, the fee was $177,879, which equated to 0.0038% annually of the fund’s average daily net assets. MFSC also receives payment from the fund forout-of-pocket expenses,sub-accounting and other shareholder servicing costs which may be paid to affiliated and unaffiliated service providers. Class R6 shares do not incursub-accounting fees. For the year ended January 31, 2019, theseout-of-pocket expenses,sub-accounting and other shareholder servicing costs amounted to $3,484,751.
Administrator– MFS provides certain financial, legal, shareholder communications, compliance, and other administrative services to the fund. Under an administrative services agreement, the fund reimburses MFS the costs incurred to provide these services. The fund is charged an annual fixed amount of $17,500 plus a fee based on average daily net assets. The administrative services fee incurred for the year ended January 31, 2019 was equivalent to an annual effective rate of 0.0129% of the fund’s average daily net assets.
Trustees’ and Officers’ Compensation– The fund pays compensation to independent Trustees in the form of a retainer, attendance fees, and additional compensation to Board and Committee chairpersons. The fund does not pay compensation directly to Trustees or officers of the fund who are also officers of the investment adviser, all of whom receive remuneration for their services to the fund from MFS. Certain officers and Trustees of the fund are officers or directors of MFS, MFD, and MFSC.
Prior to December 31, 2001, the fund had an unfunded defined benefit plan (“DB plan”) for independent Trustees. As of December 31, 2001, the Board took action to terminate the DB plan with respect to then-current and any future independent Trustees, such that the DB plan covers only certain of those former independent Trustees who retired on or before December 31, 2001. The DB plan resulted in a pension expense of $3,569 and is included in “Independent Trustees’ compensation” in the Statement of Operations for the year ended January 31, 2019. The liability for deferred retirement benefits payable to those former independent Trustees under the DB plan amounted to $5,589 at January 31, 2019, and is included in “Payable for independent Trustees’ compensation” in the Statement of Assets and Liabilities.
114
Notes to Financial Statements – continued
Other– This fund and certain other funds managed by MFS (the funds) have entered into a service agreement (the ISO Agreement) which provides for payment of fees solely by the funds to Tarantino LLC in return for the provision of services of an Independent Senior Officer (ISO) for the funds. Frank L. Tarantino serves as the ISO and is an officer of the funds and the sole member of Tarantino LLC. The funds can terminate the ISO Agreement with Tarantino LLC at any time under the terms of the ISO Agreement. For the year ended January 31, 2019, the fee paid by the fund under this agreement was $7,575 and is included in “Miscellaneous” expense in the Statement of Operations. MFS has agreed to bear all expenses associated with office space, other administrative support, and supplies provided to the ISO.
The fund invests in the MFS Institutional Money Market Portfolio which is managed by MFS and seeks current income consistent with preservation of capital and liquidity. This money market fund does not pay a management fee to MFS.
On June 1, 2017, MFS purchased 6,075 shares of Class R6 for an aggregate amount of $50,000 as an initial investment in the class. On December 14, 2018, MFS redeemed 6,477 shares of Class R6 for an aggregate amount of $52,011.
(4) Portfolio Securities
For the year ended January 31, 2019, purchases and sales of investments, other than short-term obligations, aggregated $1,634,220,644 and $1,121,161,978, respectively.
(5) Shares of Beneficial Interest
The fund’s Declaration of Trust permits the Trustees to issue an unlimited number of full and fractional shares of beneficial interest. Transactions in fund shares were as follows:
| | | | | | | | | | | | | | | | |
| | | Year ended
1/31/19 | | | Year ended
1/31/18 (i) | |
| | | | |
| | | Shares | | | Amount | | | Shares | | | Amount | |
| Shares sold | | | | | | | | | | | | | | | | |
Class A | | | 50,684,626 | | | | $411,486,006 | | | | 47,431,359 | | | | $388,366,464 | |
Class B | | | 144,923 | | | | 1,179,012 | | | | 168,828 | | | | 1,382,452 | |
Class C | | | 4,826,236 | | | | 39,221,787 | | | | 5,503,262 | | | | 45,140,939 | |
Class I | | | 103,128,132 | | | | 836,319,781 | | | | 150,222,175 | | | | 1,222,508,235 | |
Class R6 | | | 87,485,395 | | | | 709,665,745 | | | | 50,281,508 | | | | 411,742,022 | |
| | | 246,269,312 | | | | $1,997,872,331 | | | | 253,607,132 | | | | $2,069,140,112 | |
| | | | |
| Shares issued to shareholders in reinvestment of distributions | | | | | | | | | | | | | | | | |
Class A | | | 7,436,249 | | | | $60,380,090 | | | | 7,539,633 | | | | $61,727,025 | |
Class B | | | 67,594 | | | | 549,658 | | | | 87,028 | | | | 713,135 | |
Class C | | | 812,535 | | | | 6,606,551 | | | | 972,679 | | | | 7,972,745 | |
Class I | | | 8,733,196 | | | | 70,865,003 | | | | 9,368,649 | | | | 76,731,193 | |
Class R6 | | | 3,736,812 | | | | 30,311,492 | | | | 179,800 | | | | 1,469,197 | |
| | | 20,786,386 | | | | $168,712,794 | | | | 18,147,789 | | | | $148,613,295 | |
115
Notes to Financial Statements – continued
| | | | | | | | | | | | | | | | |
| | | Year ended
1/31/19 | | | Year ended
1/31/18 (i) | |
| | | | |
| | | Shares | | | Amount | | | Shares | | | Amount | |
| Shares reacquired | | | | | | | | | | | | | | | | |
Class A | | | (52,458,057 | ) | | | $(425,697,347 | ) | | | (82,094,828 | ) | | | $(665,446,477 | ) |
Class B | | | (786,039 | ) | | | (6,383,597 | ) | | | (838,466 | ) | | | (6,875,496 | ) |
Class C | | | (11,849,783 | ) | | | (96,240,131 | ) | | | (7,337,782 | ) | | | (60,101,557 | ) |
Class I | | | (124,029,436 | ) | | | (1,004,740,888 | ) | | | (75,216,162 | ) | | | (615,252,943 | ) |
Class R6 | | | (34,075,768 | ) | | | (275,677,522 | ) | | | (1,610,262 | ) | | | (13,216,423 | ) |
| | | (223,199,083 | ) | | | $(1,808,739,485 | ) | | | (167,097,500 | ) | | | $(1,360,892,896 | ) |
| | | | |
| Net change | | | | | | | | | | | | | | | | |
Class A | | | 5,662,818 | | | | $46,168,749 | | | | (27,123,836 | ) | | | $(215,352,988 | ) |
Class B | | | (573,522 | ) | | | (4,654,927 | ) | | | (582,610 | ) | | | (4,779,909 | ) |
Class C | | | (6,211,012 | ) | | | (50,411,793 | ) | | | (861,841 | ) | | | (6,987,873 | ) |
Class I | | | (12,168,108 | ) | | | (97,556,104 | ) | | | 84,374,662 | | | | 683,986,485 | |
Class R6 | | | 57,146,439 | | | | 464,299,715 | | | | 48,851,046 | | | | 399,994,796 | |
| | | 43,856,615 | | | | $357,845,640 | | | | 104,657,421 | | | | $856,860,511 | |
| (i) | For Class R6, the period is from the class inception, June 2, 2017, through the stated period end. |
Class T shares were not publicly available for sale during the period. Please see the fund’s prospectus for details.
Effective June 1, 2019, purchases of the fund’s Class B shares are closed to new and existing investors subject to certain exceptions. Please see the fund’s prospectus for details.
(6) Line of Credit
The fund and certain other funds managed by MFS participate in a $1.25 billion unsecured committed line of credit, subject to a $1 billion sublimit, provided by a syndication of banks under a credit agreement. Borrowings may be made for temporary financing needs. Interest is charged to each fund, based on its borrowings, generally at a rate equal to the higher of the Overnight Bank Funding rate or daily one month LIBOR plus an agreed upon spread. A commitment fee, based on the average daily, unused portion of the committed line of credit, is allocated among the participating funds. In addition, the fund and other funds managed by MFS have established unsecured uncommitted borrowing arrangements with certain banks for temporary financing needs. Interest is charged to each fund, based on its borrowings, at a rate equal to the Overnight Bank Funding rate plus an agreed upon spread. For the year ended January 31, 2019, the fund’s commitment fee and interest expense were $27,968 and $0, respectively, and are included in “Interest expense and fees” in the Statement of Operations.
116
Notes to Financial Statements – continued
(7) Investments in Affiliated Issuers
An affiliated issuer may be considered one in which the fund owns 5% or more of the outstanding voting securities, or a company which is under common control. For the purposes of this report, the fund assumes the following to be affiliated issuers:
| | | | | | | | | | | | | | | | | | | | |
| | | | |
| Affiliated Issuers | | | Beginning
Shares/Par
Amount | | | Acquisitions
Shares/Par
Amount | | | Dispositions
Shares/Par
Amount | | | Ending
Shares/Par
Amount | |
MFS Institutional Money
Market Portfolio | | | | 71,284,047 | | | | 1,141,912,941 | | | | (1,098,264,669 | ) | | | 114,932,319 | |
| | | | | |
| Affiliated Issuers | | Realized
Gain (Loss) | | | Change in
Unrealized
Appreciation/
Depreciation | | | Capital Gain
Distributions | | | Dividend
Income | | | Ending
Value | |
MFS Institutional Money
Market Portfolio | | | $(50 | ) | | | $5,890 | | | | $— | | | | $1,621,972 | | | | $114,920,825 | |
117
REPORT OF INDEPENDENT REGISTERED PUBLIC ACCOUNTING FIRM
To the Shareholders of MFS Municipal High Income Fund and the Board of Trustees of MFS Series Trust III
Opinion on the Financial Statements
We have audited the accompanying statement of assets and liabilities of MFS Municipal High Income Fund (the “Fund”) (one of the funds constituting MFS Series Trust III (the “Trust”)), including the portfolio of investments, as of January 31, 2019,and the related statement of operations for the year then ended, the statements of changes in net assets for each of the two years in the period then ended, the financial highlights for each of the five years in the period then ended and the related notes (collectively referred to as the “financial statements”). In our opinion, the financial statements present fairly, in all material respects, the financial position of the Fund (one of the funds constituting MFS Series Trust III) at January 31, 2019, the results of its operations for the year then ended, the changes in its net assets for each of the two years in the period then ended and its financial highlights for each of the five years in the period then ended, in conformity with U.S. generally accepted accounting principles.
Basis for Opinion
These financial statements are the responsibility of the Trust’s management. Our responsibility is to express an opinion on the Fund’s financial statements based on our audits. We are a public accounting firm registered with the Public Company Accounting Oversight Board (United States) (“PCAOB”) and are required to be independent with respect to the Trust in accordance with the U.S. federal securities laws and the applicable rules and regulations of the Securities and Exchange Commission and the PCAOB.
We conducted our audits in accordance with the standards of the PCAOB. Those standards require that we plan and perform the audit to obtain reasonable assurance about whether the financial statements are free of material misstatement, whether due to error or fraud. The Trust is not required to have, nor were we engaged to perform, an audit of the Trust’s internal control over financial reporting. As part of our audits, we are required to obtain an understanding of internal control over financial reporting, but not for the purpose of expressing an opinion on the effectiveness of the Trust’s internal control over financial reporting. Accordingly, we express no such opinion.
Our audits included performing procedures to assess the risks of material misstatement of the financial statements, whether due to error or fraud, and performing procedures that respond to those risks. Such procedures included examining, on a test basis, evidence regarding the amounts and disclosures in the financial statements. Our procedures included confirmation of securities owned as of January 31, 2019,by correspondence with the custodian andothers or by other appropriate auditing procedures where replies from others were not received. Our audits also included
118
Report of Independent Registered Public Accounting Firm – continued
evaluating the accounting principles used and significant estimates made by management, as well as evaluating the overall presentation of the financial statements. We believe that our audits provide a reasonable basis for our opinion.

We have served as the auditor of one or more MFS investment companies since 1993.
Boston, Massachusetts
March 19, 2019
119
TRUSTEES AND OFFICERS — IDENTIFICATION AND BACKGROUND
The Trustees and Officers of the Trust, as of March 1, 2019, are listed below, together with their principal occupations during the past five years. (Their titles may have varied during that period.) The address of each Trustee and Officer is 111 Huntington Avenue, Boston, Massachusetts 02199-7618.
| | | | | | | | | | |
Name, Age | | Position(s) Held with Fund | | Trustee/Officer Since (h) | | Number of
MFS Funds
overseen
by the Trustee | | Principal
Occupations During the Past Five Years | | Other Directorships
During the Past
Five Years (j) |
| INTERESTED TRUSTEES |
Robert J. Manning (k)
(age 55) | | Trustee | | February 2004 | | 135 | | Massachusetts Financial Services Company, Executive Chairman (since January 2017); Director; Chairman of the Board; Chief Executive Officer (until 2015);Co-Chief Executive Officer (2015-2016) | | N/A |
| | | | | |
Robin A. Stelmach (k) (age 57) | | Trustee | | January 2014 | | 135 | | Massachusetts Financial Services Company, Vice Chair (since January 2017); Chief Operating Officer and Executive Vice President (until January 2017) | | N/A |
| INDEPENDENT TRUSTEES |
John P. Kavanaugh (age 64) | | Trustee and Chair of Trustees | | January 2009 | | 135 | | Private investor | | N/A |
| | | | | |
Steven E. Buller (age 67) | | Trustee | | February 2014 | | 135 | | Financial Accounting Standards Advisory Council, Chairman (2014-2015); Public Company Accounting Oversight Board, Standing Advisory Group, Member (until 2014); BlackRock, Inc. (investment management), Managing Director (until 2014), BlackRock Finco UK (investment management), Director (until 2014) | | N/A |
120
Trustees and Officers – continued
| | | | | | | | | | |
Name, Age | | Position(s) Held with Fund | | Trustee/Officer Since (h) | | Number of
MFS Funds
overseen
by the Trustee | | Principal
Occupations During the Past Five Years | | Other Directorships
During the Past
Five Years (j) |
John A. Caroselli (age 64) | | Trustee | | March 2017 | | 135 | | JC Global Advisors, LLC (management consulting), President (since 2015); First Capital Corporation (commercial finance), Executive Vice President (until 2015) | | N/A |
| | | | | |
Maureen R. Goldfarb (age 63) | | Trustee | | January 2009 | | 135 | | Private investor | | N/A |
| | | | | |
Michael Hegarty
(age 74) | | Trustee | | December 2004 | | 135 | | Private investor | | Rouse Properties Inc., Director (until 2016); Capmark Financial Group Inc., Director (until 2015) |
| | | | | |
Peter D. Jones
(age 63) | | Trustee | | January 2019 | | 135 | | Franklin Templeton Distributors, Inc. (investment management), President (until 2015); Franklin Templeton Institutional, LLC (investment management), Chairman (until 2015) | | N/A |
| | | | | |
James W. Kilman, Jr.
(age 57) | | Trustee | | January 2019 | | 135 | | KielStrand Capital LLC (family office and merchant bank), Chief Executive Officer (since 2016); Morgan Stanley & Co. (financial services), Vice Chairman of Investment Banking,Co-Head of Diversified Financials Coverage – Financial Institutions Investment Banking Group (until 2016) | | Alpha-En Corporation, Director (since 2016) |
121
Trustees and Officers – continued
| | | | | | | | | | |
Name, Age | | Position(s) Held with Fund | | Trustee/Officer Since (h) | | Number of
MFS Funds
overseen
by the Trustee | | Principal
Occupations During the Past Five Years | | Other Directorships
During the Past
Five Years (j) |
Clarence Otis, Jr. (age 62) | | Trustee | | March 2017 | | 135 | | Darden Restaurants, Inc., Chief Executive Officer (until 2014) | | VF Corporation, Director; Verizon Communications, Inc., Director; The Travelers Companies, Director; Federal Reserve Bank of Atlanta, Director (until 2015) |
| | | | | |
Maryanne L. Roepke (age 63) | | Trustee | | May 2014 | | 135 | | American Century Investments (investment management), Senior Vice President and Chief Compliance Officer (until 2014) | | N/A |
| | | | | |
Laurie J. Thomsen
(age 61) | | Trustee | | March 2005 | | 135 | | Private investor | | The Travelers Companies, Director; Dycom Industries, Inc., Director (since 2015) |
| | | | | | | | |
Name, Age | | Position(s) Held with Fund | | Trustee/Officer
Since (h) | | Number of
MFS Funds
for which
the Person
is an Officer | | Principal
Occupations During the Past Five Years |
| OFFICERS | | | | | | | | |
Christopher R. Bohane (k)
(age 45) | | Assistant Secretary and Assistant Clerk | | July 2005 | | 135 | | Massachusetts Financial Services Company, Vice President and Assistant General Counsel |
| | | | |
Kino Clark (k) (age 50) | | Assistant Treasurer | | January 2012 | | 135 | | Massachusetts Financial Services Company, Vice President |
122
Trustees and Officers – continued
| | | | | | | | |
Name, Age | | Position(s) Held with Fund | | Trustee/Officer
Since (h) | | Number of
MFS Funds
for which
the Person
is an Officer | | Principal
Occupations During the Past Five Years |
John W. Clark, Jr. (k) (age 51) | | Assistant Treasurer | | April 2017 | | 135 | | Massachusetts Financial Services Company, Vice President (since March 2017); Deutsche Bank (financial services), Department Head – Treasurer’s Office (until February 2017) |
| | | | |
Thomas H. Connors (k) (age 59) | | Assistant Secretary and Assistant Clerk | | September 2012 | | 135 | | Massachusetts Financial Services Company, Vice President and Senior Counsel |
| | | | |
Ethan D. Corey (k)
(age 55) | | Assistant Secretary and Assistant Clerk | | July 2005 | | 135 | | Massachusetts Financial Services Company, Senior Vice President and Associate General Counsel |
| | | | |
David L. DiLorenzo (k)
(age 50) | | President | | July 2005 | | 135 | | Massachusetts Financial Services Company, Senior Vice President |
| | | | |
Heidi W. Hardin (k) (age 51) | | Secretary and Clerk | | April 2017 | | 135 | | Massachusetts Financial Services Company, Executive Vice President and General Counsel (since March 2017); Harris Associates (investment management), General Counsel (from September 2015 to January 2017); Janus Capital Management LLC (investment management), Senior Vice President and General Counsel (until September 2015) |
| | | | |
Brian E. Langenfeld (k) (age 45) | | Assistant
Secretary and Assistant Clerk | | June 2006 | | 135 | | Massachusetts Financial Services Company, Vice President and Senior Counsel |
123
Trustees and Officers – continued
| | | | | | | | |
Name, Age | | Position(s) Held with Fund | | Trustee/Officer
Since (h) | | Number of
MFS Funds
for which
the Person
is an Officer | | Principal
Occupations During the Past Five Years |
Amanda S. Mooradian (k) (age 40) | | Assistant
Secretary and Assistant Clerk | | September 2018 | | 135 | | Massachusetts Financial Services Company, Assistant Vice President and Counsel |
| | | | |
Susan A. Pereira (k)
(age 48) | | Assistant
Secretary and Assistant Clerk | | July 2005 | | 135 | | Massachusetts Financial Services Company, Vice President and Senior Counsel |
| | | | |
Kasey L. Phillips (k) (age 48) | | Assistant Treasurer | | September 2012 | | 135 | | Massachusetts Financial Services Company, Vice President |
| | | | |
Matthew A. Stowe (k) (age 44) | | Assistant Secretary and Assistant Clerk | | October 2014 | | 135 | | Massachusetts Financial Services Company, Vice President and Assistant General Counsel |
| | | | |
Frank L. Tarantino
(age 74) | | Independent
Senior Officer | | June 2004 | | 135 | | Tarantino LLC (provider of compliance services), Principal |
| | | | |
Richard S. Weitzel (k)
(age 48) | | Assistant Secretary and Assistant Clerk | | October 2007 | | 135 | | Massachusetts Financial Services Company, Senior Vice President and Associate General Counsel |
Martin J. Wolin (k) (age 51) | | Chief Compliance Officer | | July 2015 | | 135 | | Massachusetts Financial Services Company, Senior Vice President and Chief Compliance Officer (since July 2015); Mercer (financial service provider), Chief Risk and Compliance Officer, North America and Latin America (until June 2015) |
| | | | |
James O. Yost (k)
(age 58) | | Treasurer | | September 1990 | | 135 | | Massachusetts Financial Services Company, Senior Vice President |
124
Trustees and Officers – continued
| (h) | Date first appointed to serve as Trustee/officer of an MFS Fund. Each Trustee has served continuously since appointment unless indicated otherwise. For the period from December 15, 2004 until February 22, 2005, Mr. Manning served as Advisory Trustee. From January 2012 through December 2016, Messrs. DiLorenzo and Yost served as Treasurer and Deputy Treasurer of the Funds, respectively. |
| (j) | Directorships or trusteeships of companies required to report to the Securities and Exchange Commission (i.e., “public companies”). |
| (k) | “Interested person” of the Trust within the meaning of the Investment Company Act of 1940 (referred to as the 1940 Act), which is the principal federal law governing investment companies like the fund, as a result of a position with MFS. The address of MFS is 111 Huntington Avenue, Boston, Massachusetts 02199-7618. |
Each Trustee (other than Messrs. Jones and Kilman) has been elected by shareholders and each Trustee and officer holds office until his or her successor is chosen and qualified or until his or her earlier death, resignation, retirement or removal. The Trust does not hold annual meetings for the purpose of electing Trustees, and Trustees are not elected for fixed terms. Under the terms of the Board’s retirement policy, an Independent Trustee shall retire at the end of the calendar year in which he or she reaches the earlier of 75 years of age or 15 years of service on the Board (or, in the case of any Independent Trustee who joined the Board prior to 2015, 20 years of service on the Board).
Messrs. Buller, Hegarty, Kilman and Otis and Ms. Roepke are members of the Trust’s Audit Committee.
Each of the Interested Trustees and certain Officers hold comparable officer positions with certain affiliates of MFS.
The Statement of Additional Information for a Fund includes further information about the Trustees and is available without charge upon request by calling1-800-225-2606.
| | |
| Investment Adviser | | Custodian |
Massachusetts Financial Services Company
111 Huntington Avenue Boston, MA 02199-7618 | | JPMorgan Chase Bank, NA 4 Metrotech Center New York, NY 11245 |
| Distributor | | Independent Registered Public Accounting Firm |
MFS Fund Distributors, Inc.
111 Huntington Avenue Boston, MA 02199-7618 | | Ernst & Young LLP 200 Clarendon Street Boston, MA 02116 |
| Portfolio Manager(s) | | |
| Gary Lasman | | |
| Geoffrey Schechter | | |
125
PROXY VOTING POLICIES AND INFORMATION
MFS votes proxies on behalf of the fund pursuant to proxy voting policies and procedures that are available without charge, upon request, by calling1-800-225-2606, by visitingmfs.com/proxyvoting,or by visiting the SEC’s Web site athttp://www.sec.gov.
Information regarding how the fund voted proxies relating to portfolio securities during the most recent twelve-month period ended June 30 is available by August 31 of each year without charge by visitingmfs.com/proxyvoting,or by visiting the SEC’s Web site athttp://www.sec.gov.
QUARTERLY PORTFOLIO DISCLOSURE
The fund files a complete schedule of portfolio holdings with the SEC for the first and third quarters of each fiscal year on Form N-Q. The fund’s Form N-Q is available on the SEC’s website athttp://www.sec.gov. A shareholder can obtain the portfolio holdings report for the first and third quarters of the fund’s fiscal year atmfs.com/openendfundsby choosing the fund’s name and then selecting the “Resources” tab and clicking on “Prospectus and Reports”.
FURTHER INFORMATION
From time to time, MFS may post important information about the fund or the MFS funds on the MFS web site (mfs.com). This information is available athttps://www.mfs.com/en-us/what-we-do/announcements.htmlor atmfs.com/openendfundsby choosing the fund’s name.
INFORMATION ABOUT FUND CONTRACTS AND LEGAL CLAIMS
The fund has entered into contractual arrangements with an investment adviser, administrator, distributor, shareholder servicing agent, 529 program manager (if applicable), and custodian who each provide services to the fund. Unless expressly stated otherwise, shareholders are not parties to, or intended beneficiaries of these contractual arrangements, and these contractual arrangements are not intended to create any shareholder right to enforce them against the service providers or to seek any remedy under them against the service providers, either directly or on behalf of the fund.
Under the Trust’s By-Laws and Declaration of Trust, any claims asserted against or on behalf of the MFS Funds, including claims against Trustees and Officers, must be brought in state and federal courts located within the Commonwealth of Massachusetts.
FEDERAL TAX INFORMATION (unaudited)
The fund will notify shareholders of amounts for use in preparing 2019 income tax forms in January 2020. The following information is provided pursuant to provisions of the Internal Revenue Code.
Of the dividends paid from net investment income during the fiscal year, 96.47% is designated as exempt interest dividends for federal income tax purposes. If the fund has earned income on private activity bonds, a portion of the dividends paid may be considered a tax preference item for purposes of computing a shareholder’s alternative minimum tax.
126
rev. 3/16
| | | | |
| | | |
FACTS | | WHAT DOES MFS DO WITH YOUR PERSONAL INFORMATION? | |  |
| | |
| Why? | | Financial companies choose how they share your personal information. Federal law gives consumers the right to limit some but not all sharing. Federal law also requires us to tell you how we collect, share, and protect your personal information. Please read this notice carefully to understand what we do. |
| | |
| What? | | The types of personal information we collect and share depend on the product or service you have with us. This information can include: • Social Security number and account balances • Account transactions and transaction history • Checking account information and wire transfer instructions When you areno longer our customer, we continue to share your information as described in this notice. |
| | |
| How? | | All financial companies need to share customers’ personal information to run their everyday business. In the section below, we list the reasons financial companies can share their customers’ personal information; the reasons MFS chooses to share; and whether you can limit this sharing. |
| | | | |
Reasons we can share your
personal information | | Does MFS
share? | | Can you limit
this sharing? |
For our everyday business purposes – such as to process your transactions, maintain your account(s), respond to court orders and legal investigations, or report to credit bureaus | | Yes | | No |
For our marketing purposes – to offer our products and services to you | | No | | We don’t share |
For joint marketing with other financial companies | | No | | We don’t share |
For our affiliates’ everyday business purposes – information about your transactions and experiences | | No | | We don’t share |
For our affiliates’ everyday business purposes – information about your creditworthiness | | No | | We don’t share |
| For nonaffiliates to market to you | | No | | We don’t share |
| | |
| | |
| Questions? | | Call800-225-2606 or go tomfs.com. |
127
| | |
| Who we are |
| Who is providing this notice? | | MFS Funds, MFS Investment Management, MFS Institutional Advisors, Inc., and MFS Heritage Trust Company. |
| | |
| What we do |
| How does MFS protect my personal information? | | To protect your personal information from unauthorized access and use, we use security measures that comply with federal law. These measures include procedural, electronic, and physical safeguards for the protection of the personal information we collect about you. |
| How does MFS collect my personal information? | | We collect your personal information, for example, when you • open an account or provide account information • direct us to buy securities or direct us to sell your securities • make a wire transfer We also collect your personal information from others, such as credit bureaus, affiliates, or other companies. |
| Why can’t I limit all sharing? | | Federal law gives you the right to limit only • sharing for affiliates’ everyday business purposes – information about your creditworthiness • affiliates from using your information to market to you • sharing for nonaffiliates to market to you State laws and individual companies may give you additional rights to limit sharing. |
| | |
| Definitions |
| Affiliates | | Companies related by common ownership or control. They can be financial and nonfinancial companies. • MFS does not share personal information with affiliates, except for everyday business purposes as described on page one of this notice. |
| Nonaffiliates | | Companies not related by common ownership or control. They can be financial and nonfinancial companies. • MFS does not share with nonaffiliates so they can market to you. |
| Joint marketing | | A formal agreement between nonaffiliated financial companies that together market financial products or services to you. • MFS doesn’t jointly market. |
| | |
| Other important information |
| If you own an MFS product or receive an MFS service in the name of a third party such as a bank or broker-dealer, their privacy policy may apply to you instead of ours. |
128
Save paper with eDelivery.

| MFS® will send you prospectuses, |
reports, and proxies directly viae-mail so you will get information faster with less mailbox clutter.
To sign up:
1. Go to mfs.com.
2. Log in via MFS® Access.
3. Select eDelivery.
If you own your MFS fund shares through a financial institution or a retirement plan, MFS® TALK, MFS® Access, or eDelivery may not be available to you.
CONTACT
WEB SITE
mfs.com
MFS TALK
1-800-637-8255
24 hours a day
ACCOUNT SERVICE AND LITERATURE
Shareholders
1-800-225-2606
Financial advisors
1-800-343-2829
Retirement plan services
1-800-637-1255
MAILING ADDRESS
MFS Service Center, Inc.
P.O. Box 219341
Kansas City, MO 64121-9341
OVERNIGHT MAIL
MFS Service Center, Inc.
Suite 219341
430 W 7th Street
Kansas City, MO 64105-1407
The Registrant has adopted a Code of Ethics (the “Code”) pursuant to Section 406 of the Sarbanes-Oxley Act and as defined in FormN-CSR that applies to the Registrant’s principal executive officer and principal financial and accounting officer. During the period covered by this report, the Registrant has not amended any provision in the Code that relates to an element of the Code’s definition enumerated in paragraph (b) of Item 2 of this FormN-CSR. During the period covered by this report, the Registrant did not grant a waiver, including an implicit waiver, from any provision of the Code.
A copy of the Code is filed as an exhibit to this FormN-CSR.
| ITEM 3. | AUDIT COMMITTEE FINANCIAL EXPERT. |
Messrs. Steven E. Buller, Michael Hegarty, James Kilman and Clarence Otis, Jr. and Ms. Maryanne L. Roepke, members of the Audit Committee, have been determined by the Board of Trustees in their reasonable business judgment to meet the definition of “audit committee financial expert” as such term is defined in FormN-CSR. In addition, Messrs. Buller, Hegarty, Kilman and Otis and Ms. Roepke are “independent” members of the Audit Committee (as such term has been defined by the Securities and Exchange Commission in regulations implementing Section 407 of the Sarbanes-Oxley Act of 2002). The Securities and Exchange Commission has stated that the designation of a person as an audit committee financial expert pursuant to this Item 3 on the FormN-CSR does not impose on such a person any duties, obligations or liability that are greater than the duties, obligations or liability imposed on such person as a member of the Audit Committee and the Board of Trustees in the absence of such designation or identification.
| ITEM 4. | PRINCIPAL ACCOUNTANT FEES AND SERVICES. |
Items 4(a) through 4(d) and 4(g):
The Board of Trustees has appointed Deloitte & Touche LLP (“Deloitte”) to serve as independent accountants to certain series of the Registrant and Ernst & Young LLP (“E&Y”) to serve in the same capacity to certain other series of the Registrant (each a “Fund” and collectively the “Funds”). The tables below set forth the audit fees billed to each Fund as well as fees fornon-audit services provided to each Fund and/or to each Fund’s investment adviser, Massachusetts Financial Services Company (“MFS”), and to various entities either controlling, controlled by, or under common control with MFS that provide ongoing services to the Funds (“MFS Related Entities”).
For the fiscal years ended January 31, 2019 and 2018, audit fees billed to each Fund by Deloitte and E&Y were as follows:
| | | | | | | | |
| | | Audit Fees | |
| | | 2019 | | | 2018 | |
Fees billed by Deloitte: | | | | | | | | |
MFS Global High Yield Fund | | | 77,665 | | | | 75,937 | |
MFS High Income Fund | | | 72,754 | | | | 71,136 | |
MFS High Yield Pooled Portfolio | | | 33,443 | | | | 32,709 | |
| | | | | | | | |
Total | | | 183,862 | | | | 179,782 | |
| |
| | | Audit Fees | |
| | | 2019 | | | 2018 | |
Fees billed by E&Y: | | | | | | | | |
MFS Municipal High Income Fund | | | 55,127 | | | | 53,905 | |
For the fiscal years ended January 31, 2019 and 2018, fees billed by Deloitte and E&Y for audit-related, tax and other services provided to each Fund and for audit-related, tax and other services provided to MFS and MFS Related Entities were as follows:
| | | | | | | | | | | | | | | | | | | | | | | | |
| | | Audit-Related Fees1 | | | Tax Fees2 | | | All Other Fees3 | |
| | | 2019 | | | 2018 | | | 2019 | | | 2018 | | | 2019 | | | 2018 | |
Fees billed by Deloitte: | | | | | | | | | | | | | | | | | | | | | | | | |
To MFS Global High Yield Fund | | | 0 | | | | 0 | | | | 6,870 | | | | 6,716 | | | | 0 | | | | 0 | |
To MFS High Income Fund | | | 0 | | | | 0 | | | | 8,889 | | | | 8,689 | | | | 0 | | | | 0 | |
To MFS High Yield Pooled Portfolio | | | 0 | | | | 0 | | | | 8,634 | | | | 8,440 | | | | 0 | | | | 0 | |
Total fees billed by Deloitte To above Funds | | | 0 | | | | 0 | | | | 24,393 | | | | 23,845 | | | | 0 | | | | 0 | |
| | | |
| | | Audit-Related Fees1 | | | Tax Fees2 | | | All Other Fees3 | |
| | | 2019 | | | 2018 | | | 2019 | | | 2018 | | | 2019 | | | 2018 | |
Fees billed by Deloitte: | | | | | | | | | | | | | | | | | | | | | | | | |
To MFS and MFS Related Entities of MFS Global High Yield Fund* | | | 0 | | | | 0 | | | | 0 | | | | 0 | | | | 5,390 | | | | 5,390 | |
To MFS and MFS Related Entities of MFS High Income Fund* | | | 0 | | | | 0 | | | | 0 | | | | 0 | | | | 5,390 | | | | 5,390 | |
To MFS and MFS Related Entities of MFS High Yield Pooled Portfolio* | | | 0 | | | | 0 | | | | 0 | | | | 0 | | | | 5,390 | | | | 5,390 | |
| | | | | | | | |
| | | Aggregate Fees for Non-audit
Services | |
| | | 2019 | | | 2018 | |
Fees billed by Deloitte: | | | | | | | | |
To MFS Global High Yield Fund, MFS and MFS Related Entities# | | | 12,260 | | | | 758,636 | |
To MFS High Income Fund, MFS and MFS Related Entities# | | | 14,279 | | | | 760,609 | |
To MFS High Yield Pooled Portfolio, MFS and MFS Related Entities# | | | 14,024 | | | | 760,360 | |
| | | | | | | | | | | | | | | | | | | | | | | | |
| | | Audit-Related Fees1 | | | Tax Fees2 | | | All Other Fees4 | |
| | | 2019 | | | 2018 | | | 2019 | | | 2018 | | | 2019 | | | 2018 | |
Fees billed by E&Y: | | | | | | | | | | | | | | | | | | | | | | | | |
To MFS Municipal High Income Fund | | | 0 | | | | 0 | | | | 9,815 | | | | 9,595 | | | | 2,232 | | | | 2,050 | |
| | | |
| | | Audit-Related Fees1 | | | Tax Fees2 | | | All Other Fees4 | |
| | | 2019 | | | 2018 | | | 2019 | | | 2018 | | | 2019 | | | 2018 | |
Fees billed by E&Y: | | | | | | | | | | | | | | | | | | | | | | | | |
To MFS and MFS Related Entities of MFS Municipal High Income Fund* | | | 1,743,310 | | | | 1,767,893 | | | | 0 | | | | 0 | | | | 138,900 | | | | 68,300 | |
| | | | | | | | |
| | | Aggregate Fees for Non-audit
Services | |
| | | 2019 | | | 2018 | |
Fees billed by E&Y: | | | | | | | | |
To MFS Municipal High Income Fund, MFS and MFS Related Entities# | | | 2,128,157 | | | | 1,993,838 | |
| * | This amount reflects the fees billed to MFS and MFS Related Entities fornon-audit services relating directly to the operations and financial reporting of the Funds (portions of which services also related to the operations and financial reporting of other funds within the MFS Funds complex). |
| # | This amount reflects the aggregate fees billed by Deloitte or E&Y, as the case may be, fornon-audit services rendered to the Funds and fornon-audit services rendered to MFS and the MFS Related Entities. |
| 1 | The fees included under “Audit-Related Fees” are fees related to assurance and related services that are reasonably related to the performance of the audit or review of financial statements, but not reported under “Audit Fees,” including accounting consultations, agreed-upon procedure reports, attestation reports, comfort letters and internal control reviews. |
| 2 | The fees included under “Tax Fees” are fees associated with tax compliance, tax advice and tax planning, including services relating to the filing or amendment of federal, state or local income tax returns, regulated investment company qualification reviews and tax distribution and analysis. |
| 3 | The fees included under “All Other Fees” are fees for products and services provided by Deloitte other than those reported under “Audit Fees,” “Audit-Related Fees” and “Tax Fees”. |
| 4 | The fees included under “All Other Fees” are fees for products and services provided by E&Y other than those reported under “Audit Fees,” “Audit-Related Fees” and “Tax Fees,” including fees for services related to the review of internal controls and Rule38a-1 compliance program. |
Item 4(e)(1):
Set forth below are the policies and procedures established by the Audit Committee of the Board of Trustees relating to thepre-approval of audit andnon-audit related services:
To the extent required by applicable law,pre-approval by the Audit Committee of the Board is needed for all audit and permissiblenon-audit services rendered to the Funds and all permissiblenon-audit services rendered to MFS or MFS Related Entities if the services relate directly to the operations and financial reporting of the Registrant.Pre-approval is currently on anengagement-by-engagement basis. In the eventpre-approval of such services is necessary between regular meetings of the Audit Committee and it is not practical to wait to seekpre-approval at the next regular meeting of the Audit Committee,pre-approval of such services may be referred to the Chair of the Audit Committee for approval; provided that the Chair may notpre-approve any individual engagement for such services exceeding $50,000 or multiple engagements for such services in the aggregate exceeding $100,000 in each period between regular meetings of the Audit Committee. Any engagementpre-approved by the Chair between regular meetings of the Audit Committee shall be presented for ratification by the entire Audit Committee at its next regularly scheduled meeting.
Item 4(e)(2):
None, or 0%, of the services relating to the Audit-Related Fees, Tax Fees and All Other Fees paid by the Fund and MFS and MFS Related Entities relating directly to the operations and financial reporting of the Registrant disclosed above were approved by the audit committee pursuant to paragraphs (c)(7)(i)(C) of Rule2-01 of RegulationS-X (which permits audit committee approval after the start of the engagement with respect to services other than audit, review or attest services, if certain conditions are satisfied).
Item 4(f):
Not applicable.
Item 4(h):
The Registrant’s Audit Committee has considered whether the provision by a Registrant’s independent registered public accounting firm ofnon-audit services to MFS and MFS Related Entities that were notpre-approved by the Committee (because such services did not relate directly to the operations and financial reporting of the Registrant) was compatible with maintaining the independence of the independent registered public accounting firm as the Registrant’s principal auditors.
| ITEM 5. | AUDIT COMMITTEE OF LISTED REGISTRANTS. |
Not applicable to the Registrant.
A schedule of investments of the Registrant is included as part of the report to shareholders of such series under Item 1 of this FormN-CSR.
| ITEM 7. | DISCLOSURE OF PROXY VOTING POLICIES AND PROCEDURES FORCLOSED-END MANAGEMENT INVESTMENT COMPANIES. |
Not applicable to the Registrant.
| ITEM 8. | PORTFOLIO MANAGERS OFCLOSED-END MANAGEMENT INVESTMENT COMPANIES. |
Not applicable to the Registrant.
| ITEM 9. | PURCHASES OF EQUITY SECURITIES BYCLOSED-END MANAGEMENT INVESTMENT COMPANY AND AFFILIATED PURCHASERS. |
Not applicable to the Registrant.
| ITEM 10. | SUBMISSION OF MATTERS TO A VOTE OF SECURITY HOLDERS. |
There were no material changes to the procedures by which shareholders may send recommendations to the Board for nominees to the Registrant’s Board since the Registrant last provided disclosure as to such procedures in response to the requirements of Item 407 (c)(2)(iv) of RegulationS-K or this Item.
| ITEM 11. | CONTROLS AND PROCEDURES. |
| (a) | Based upon their evaluation of the effectiveness of the registrant’s disclosure controls and procedures (as defined in Rule30a-3(c) under the Investment Company Act of 1940 (the “Act”)) as conducted within 90 days of the filing date of this report on FormN-CSR, the registrant’s principal financial officer and principal executive officer have concluded that those disclosure controls and procedures provide reasonable assurance that the material information required to be disclosed by the registrant on this report is recorded, processed, summarized and reported within the time periods specified in the Securities and Exchange Commission’s rules and forms. |
| (b) | There were no changes in the registrant’s internal controls over financial reporting (as defined in Rule30a-3(d) under the Act) that occurred during the second fiscal quarter of the period covered by the report that have materially affected, or are reasonably likely to materially affect, the registrant’s internal control over financial reporting. |
| ITEM 12. | DISCLOSURE OF SECURITIES LENDING ACTIVITIES FORCLOSED-END MANAGEMENT INVESTMENT COMPANIES. |
Not applicable to the Registrant.
| (a) (1) | Any code of ethics, or amendment thereto, that is the subject of the disclosure required by Item 2, to the extent that the registrant intends to satisfy the Item 2 requirements through filing of an exhibit: Attached hereto asEX-99.COE. |
| | (2) | A separate certification for each principal executive officer and principal financial officer of the registrant as required by Rule30a-2(a) under the Act (17 CFR270.30a-2): Attached hereto asEX-99.302CERT. |
| | (3) | Any written solicitation to purchase securities under Rule23c-1 under the Act (17 CFR270.23c-1) sent or given during the period covered by the report by or on behalf of the registrant to 10 or more persons. Not applicable. |
| | (4) | Change in the registrant’s independent public accountant. Not applicable. |
| (b) | If the report is filed under Section 13(a) or 15(d) of the Exchange Act, provide the certifications required by Rule30a-2(b) under the Act (17 CFR270.30a-2(b)), Rule13a-14(b) or Rule15d-14(b) under the Exchange Act (17 CFR240.13a-14(b) or240.15d-14(b)) and Section 1350 of Chapter 63 of Title 18 of the United States Code (18 U.S.C. 1350) as an exhibit. A certification furnished pursuant to this paragraph will not be deemed “filed” for the purposes of Section 18 of the Exchange Act (15 U.S.C. 78r), or otherwise subject to the liability of that section. Such certification will not be deemed to be incorporated by reference into any filing under the Securities Act of 1933 or the Exchange Act, except to the extent that the registrant specifically incorporates it by reference. Attached hereto asEX-99.906CERT. |
Notice
A copy of the Amended and Restated Declaration of Trust, as amended, of the Registrant is on file with the Secretary of State of The Commonwealth of Massachusetts and notice is hereby given that this instrument is executed on behalf of the Registrant by an officer of the Registrant as an officer and not individually and the obligations of or arising out of this instrument are not binding upon any of the Trustees or shareholders individually, but are binding only upon the assets and property of the respective constituent series of the Registrant.
SIGNATURES
Pursuant to the requirements of the Securities Exchange Act of 1934 and the Investment Company Act of 1940, the registrant has duly caused this report to be signed on its behalf by the undersigned, thereunto duly authorized.
(Registrant) MFS SERIES TRUST III
| | |
| By (Signature and Title)* | | /S/ DAVID L. DILORENZO |
| | David L. DiLorenzo, President |
Date: March 19, 2019
Pursuant to the requirements of the Securities Exchange Act of 1934 and the Investment Company Act of 1940, this report has been signed below by the following persons on behalf of the registrant and in the capacities and on the dates indicated.
| | |
| By (Signature and Title)* | | /S/ DAVID L. DILORENZO |
| | David L. DiLorenzo, President (Principal Executive Officer) |
Date: March 19, 2019
| | |
| By (Signature and Title)* | | /S/ JAMES O. YOST |
| | James O. Yost, Treasurer (Principal Financial Officer and Accounting Officer) |
Date: March 19, 2019
| * | Print name and title of each signing officer under his or her signature. |