UNITED STATES
SECURITIES AND EXCHANGE COMMISSION
Washington, D.C. 20549
FORM N-CSR
CERTIFIED SHAREHOLDER REPORT OF
REGISTERED MANAGEMENT INVESTMENT COMPANIES
Investment Company Act file number 811-02794
MFS SERIES TRUST III
(Exact name of registrant as specified in charter)
111 Huntington Avenue, Boston, Massachusetts 02199
(Address of principal executive offices) (Zip code)
Christopher R. Bohane
Massachusetts Financial Services Company
111 Huntington Avenue
Boston, Massachusetts 02199
(Name and address of agents for service)
Registrant’s telephone number, including area code: (617) 954-5000
Date of fiscal year end: January 31
Date of reporting period: January 31, 2022
| ITEM 1. | REPORTS TO STOCKHOLDERS. |
Item 1(a):
Annual Report
January 31, 2022
MFS® Global High Yield Fund
MFS® Global High Yield Fund
| 1 |
| 2 |
| 4 |
| 6 |
| 9 |
| 11 |
| 20 |
| 22 |
| 24 |
| 25 |
| 31 |
| 47 |
| 49 |
| 53 |
| 53 |
| 53 |
| 53 |
| 53 |
| 54 |
The report is prepared for the general information of shareholders. It is authorized for distribution to prospective investors only when preceded or accompanied by a current prospectus.
NOT FDIC INSURED • MAY LOSE VALUE • NO BANK GUARANTEE
LETTER FROM THE CHAIR AND CEO
Dear Shareholders:
As a result of Russia’s invasion of Ukraine, the danger of wider geopolitical conflict has risen to levels not seen in decades, and this comes as sanctions aimed at countering Russia’s actions are exacerbating already mounting inflation. Consequently, at a time when global growth faces multiple headwinds, central banks have been presented with the challenge of reining in rising prices without tipping economies into recession. This has in turn led to increased volatility.
There are, however, encouraging signs for the markets. The Omicron wave of the coronavirus is receding outside Asia, unemployment is low, and there are signs that some global supply chain bottlenecks are beginning to ease, though events in Ukraine could hamper these advances. Additionally, easier Chinese monetary policy and the record pace of corporate stock buybacks are supportive elements, albeit amid an otherwise turbulent investment environment.
It is important to have a deep understanding of company fundamentals during times of market transition, and we have built our global research platform to do just that.
At MFS®, we put our clients’ assets to work responsibly by carefully navigating the increasing complexity of global markets and economies. Guided by our commitment to long-term investing, we tune out the noise and try to uncover what we believe are the best, most durable investment opportunities in the market. Our unique global investment platform combines collective expertise, long-term discipline, and thoughtful risk management to create sustainable value for investors over time.
Respectfully,
Michael W. Roberge
Chair and Chief Executive Officer
MFS Investment Management
March 18, 2022
The opinions expressed in this letter are subject to change and may not be relied upon for investment advice. No forecasts can be guaranteed.
Portfolio structure (i)
Top five industries (i)
| Utilities - Electrical Power | 7.1% |
| Cable TV | 6.1% |
| Medical & Health Technology & Services | 4.4% |
| Gaming & Lodging | 4.4% |
| Wireless Communications | 4.2% |
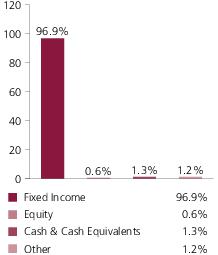
Composition including fixed income credit quality (a)(i)
| BBB | 0.6% |
| BB | 47.7% |
| B | 37.7% |
| CCC | 11.4% |
| CC | 0.1% |
| C | 0.1% |
| Not Rated | (0.7)% |
| Non-Fixed Income | 0.6% |
| Cash & Cash Equivalents | 1.3% |
| Other | 1.2% |
Portfolio facts (i)
| Average Duration (d) | 3.9 |
| Average Effective Maturity (m) | 5.5 yrs. |
Issuer country weightings (i)(x)
| United States | 54.9% |
| United Kingdom | 4.1% |
| Mexico | 3.2% |
| India | 3.0% |
| Brazil | 2.8% |
| Canada | 2.7% |
| Italy | 2.5% |
| Netherlands | 2.2% |
| Luxembourg | 2.1% |
| Other Countries | 22.5% |
Portfolio Composition - continued
| (a) | For all securities other than those specifically described below, ratings are assigned to underlying securities utilizing ratings from Moody’s, Fitch, and Standard & Poor’s rating agencies and applying the following hierarchy: If all three agencies provide a rating, the middle rating (after dropping the highest and lowest ratings) is assigned; if two of the three agencies rate a security, the lower of the two is assigned. If none of the 3 rating agencies above assign a rating, but the security is rated by DBRS Morningstar, then the DBRS Morningstar rating is assigned. If none of the 4 rating agencies listed above rate the security, but the security is rated by the Kroll Bond Rating Agency (KBRA), then the KBRA rating is assigned. Ratings are shown in the S&P and Fitch scale (e.g., AAA). Securities rated BBB or higher are considered investment grade. All ratings are subject to change. Not Rated includes fixed income securities and fixed income derivatives that have not been rated by any rating agency. Non-Fixed Income includes equity securities (including convertible bonds and equity derivatives) and/or commodity-linked derivatives. The fund may or may not have held all of these instruments on this date. The fund is not rated by these agencies. |
| (d) | Duration is a measure of how much a bond’s price is likely to fluctuate with general changes in interest rates, e.g., if rates rise 1.00%, a bond with a 5-year duration is likely to lose about 5.00% of its value due to the interest rate move. |
| (i) | For purposes of this presentation, the components include the value of securities, and reflect the impact of the equivalent exposure of derivative positions, if any. These amounts may be negative from time to time. Equivalent exposure is a calculated amount that translates the derivative position into a reasonable approximation of the amount of the underlying asset that the portfolio would have to hold at a given point in time to have the same price sensitivity that results from the portfolio’s ownership of the derivative contract. When dealing with derivatives, equivalent exposure is a more representative measure of the potential impact of a position on portfolio performance than value. The bond component will include any accrued interest amounts. |
| (m) | In determining each instrument’s effective maturity for purposes of calculating the fund’s dollar-weighted average effective maturity, MFS uses the instrument’s stated maturity or, if applicable, an earlier date on which MFS believes it is probable that a maturity-shortening device (such as a put, pre-refunding or prepayment) will cause the instrument to be repaid. Such an earlier date can be substantially shorter than the instrument’s stated maturity. |
| (x) | Represents the portfolio’s exposure to issuer countries as a percentage of a portfolio’s net assets. For purposes of this presentation, United States includes Cash & Cash Equivalents and Other. |
Where the fund holds convertible bonds, they are treated as part of the equity portion of the portfolio.
The fund invests a portion of its assets in the MFS High Yield Pooled Portfolio. Percentages include the indirect exposure to the underlying holdings, including investments in money market funds and Other, of the MFS High Yield Pooled Portfolio and not the direct exposure from investing in the MFS High Yield Pooled Portfolio itself.
Cash & Cash Equivalents includes any direct exposure to cash, direct and indirect exposure to investments in money market funds, cash equivalents, short-term securities, and other assets less liabilities. Please see the Statement of Assets and Liabilities for additional information related to the fund’s direct cash position and other assets and liabilities.
Other includes the direct and indirect equivalent exposure from currency derivatives and/or any offsets to derivative positions and may be negative.
Percentages are based on net assets as of January 31, 2022.
The portfolio is actively managed and current holdings may be different.
Management Review
Summary of Results
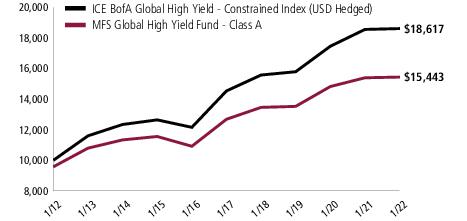
For the twelve months ended January 31, 2022, Class A shares of the MFS Global High Yield Fund (fund) provided a total return of 0.31%, at net asset value. This compares with a return of 0.32% for the fund’s benchmark, the ICE BofA Global High Yield - Constrained Index (USD Hedged).
In addition to investing directly in portfolio securities, the fund also invests indirectly in portfolio securities through investment in the MFS High Yield Pooled Portfolio, a mutual fund also advised by MFS. The discussion below reflects both the fund’s direct and indirect investments.
Market Environment
Over the past year, the global economy was buffeted by an array of crosscurrents as it adjusted to the ebbs and flows of the pandemic. Among the supportive currents were ample fiscal stimulus, loose monetary policy and the rollout of several highly effective coronavirus vaccines. Negative currents included the rapid spread of several coronavirus variants, widespread global production bottlenecks and a surge in inflation. After experiencing a burst of exceptionally strong economic activity as the global economy began to reopen, activity became more muted in the second half of the period amid ongoing supply chain disruptions and a new wave of coronavirus infections, albeit seemingly milder strains.
Amid rising inflation, markets anticipated a transition from an exceptionally accommodative monetary environment to a significantly more restrictive one ahead, which resulted in a rise in market volatility. Indeed, several central banks in emerging markets have already tightened policy, as has the Bank of England, while the US Federal Reserve signaled it intends to tighten policy soon. The European Central Bank, which had been expected to move slowly toward tighter policy, has indicated it, too, may need to dial back accommodation in coming months. However, the Bank of Japan and the People's Bank of China are expected to maintain accommodative policies. As a result of the shifting monetary backdrop, sovereign bond yields moved higher during the period, but remain quite low relative to history.
A harsher Chinese regulatory environment toward industries such as online gaming, food delivery and education increased market volatility as has stress in China's highly leveraged property development sector. Trade relations between the United States and China remained quite strained despite a change in presidential administrations. Geopolitical tensions ramped up during the period with Russia amassing troops along its border with Ukraine and Chinese forces repeatedly entering airspace claimed by Taiwan.
An increase in market volatility saw speculative activity abate somewhat as “meme” stocks and cryptocurrencies came under pressure near the end of the period.
Management Review - continued
Detractors from Performance
Relative to the ICE BofA Global High Yield – Constrained Index (USD Hedged), the fund's greater-than-benchmark exposure to non-rated(r) issuers held back performance. From a sector perspective, an underweight allocation to the energy, banking and agency government owned, no guarantee sectors, dampened relative returns.
Top individual detractors for the reporting period included the fund’s overweight position in real estate company ADLER Group (other financial institutions) and an underweight position in food and beverage products manufacturer Kraft Heinz Company (consumer non-cyclicals).
Contributors to Performance
Security selection and a slightly greater-than-benchmark exposure to the other financial institutions sector contributed to relative performance, most notably the fund’s favorable bond selection across “B” and “BB” rated bonds within emerging markets.
The fund’s shorter duration(d) stance aided relative performance as interest rates generally rose over the reporting period.
Top individual contributors for the reporting period included the fund’s overweight positions in both real estate development company Dar Al Arkan Real Estate Development Co. (other financial institutions) and personal and business loans provider Muthoot Finance (other financial institutions).
Respectfully,
Portfolio Manager(s)
David Cole, Matt Ryan, and Michael Skatrud
| (d) | Duration is a measure of how much a bond’s price is likely to fluctuate with general changes in interest rates, e.g., if rates rise 1.00%, a bond with a 5-year duration is likely to lose about 5.00% of its value. |
| (r) | Securities rated “BBB”, “Baa”, or higher are considered investment grade; securities rated “BB”, “Ba”, or below are considered non-investment grade. Ratings are assigned to underlying securities utilizing ratings from Moody's, Fitch, and Standard & Poor's and applying the following hierarchy: If all three agencies provide a rating, the middle rating (after dropping the highest and lowest ratings) is assigned; if two of the three agencies rate a security, the lower of the two is assigned. If none of the 3 rating agencies above assign a rating, but the security is rated by DBRS Morningstar, then the DBRS Morningstar rating is assigned. If none of the 4 rating agencies listed above rate the security, but the security is rated by the Kroll Bond Rating Agency (KBRA), then the KBRA rating is assigned. Ratings are shown in the S&P and Fitch scale (e.g., AAA). For securities that are not rated by any of the rating agencies, the security is considered Not Rated. |
The views expressed in this report are those of the portfolio manager(s) only through the end of the period of the report as stated on the cover and do not necessarily reflect the views of MFS or any other person in the MFS organization. These views are subject to change at any time based on market or other conditions, and MFS disclaims any responsibility to update such views. These views may not be relied upon as investment advice or an indication of trading intent on behalf of any MFS portfolio. References to specific securities are not recommendations of such securities, and may not be representative of any MFS portfolio’s current or future investments.
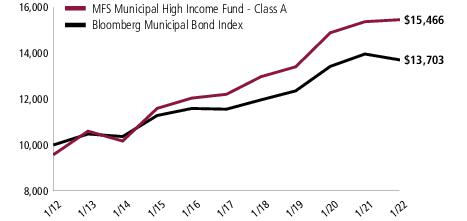
Performance Summary THROUGH 1/31/22
The following chart illustrates a representative class of the fund’s historical performance in comparison to its benchmark(s). Performance results include the deduction of the maximum applicable sales charge and reflect the percentage change in net asset value, including reinvestment of dividends and capital gains distributions. The performance of other share classes will be greater than or less than that of the class depicted below. Benchmarks are unmanaged and may not be invested in directly. Benchmark returns do not reflect sales charges, commissions or expenses. (See Notes to Performance Summary.)
Performance data shown represents past performance and is no guarantee of future results. Investment return and principal value fluctuate so your shares, when sold, may be worth more or less than the original cost; current performance may be lower or higher than quoted. The performance shown does not reflect the deduction of taxes, if any, that a shareholder would pay on fund distributions or the redemption of fund shares.
Growth of a Hypothetical $10,000 Investment
Performance Summary - continued
Total Returns through 1/31/22
Average annual without sales charge
| Share Class | Class Inception Date | 1-yr | 5-yr | 10-yr |
| A | 7/01/98 | 0.31% | 4.02% | 4.90% |
| B | 7/01/98 | (0.59)% | 3.24% | 4.10% |
| C | 7/01/98 | (0.61)% | 3.20% | 4.10% |
| I | 7/01/98 | 0.56% | 4.27% | 5.14% |
| R1 | 6/02/08 | (0.45)% | 3.21% | 4.08% |
| R2 | 6/02/08 | 0.06% | 3.76% | 4.62% |
| R3 | 6/02/08 | 0.17% | 4.12% | 4.93% |
| R4 | 6/02/08 | 0.58% | 4.28% | 5.21% |
| R6 | 6/02/08 | 0.65% | 4.38% | 5.25% |
Comparative benchmark(s)
| ICE BofA Global High Yield - Constrained Index (USD Hedged) (f) | 0.32% | 5.07% | 6.41% |
Average annual with sales charge
| | | | |
A
With Initial Sales Charge (4.25%) | (3.96)% | 3.12% | 4.44% |
B
With CDSC (Declining over six years from 4% to 0%) (v) | (4.40)% | 2.90% | 4.10% |
C
With CDSC (1% for 12 months) (v) | (1.56)% | 3.20% | 4.10% |
CDSC – Contingent Deferred Sales Charge.
Class I, R1, R2, R3, R4, and R6 shares do not have a sales charge.
| (f) | Source: FactSet Research Systems Inc. |
| (v) | Assuming redemption at the end of the applicable period. |
Benchmark Definition(s)
ICE BofA Global High Yield – Constrained Index(d) (USD Hedged) – tracks the performance of below investment grade corporate debt of issuers domiciled in countries having an investment grade foreign currency long-term debt rating (based on an average of Moody’s and S&P). The Index is weighted by outstanding issuance, but constrained such that the percentage of any one issuer may not represent more than 2% of the Index.
It is not possible to invest directly in an index.
| (d) | Source ICE Data Indices, LLC (“ICE Data”), is used with permission. ICE Data, its affiliates and their respective third party suppliers disclaim any and all warranties and representations, express and/or implied, including any warranties of merchantability or fitness for a particular purpose or use, including the indices, index data and any data included in, related to, or derived therefrom. Neither ICE Data, its affiliates nor their respective third party suppliers shall be subject to any damages or liability with respect the adequacy, accuracy, timeliness or completeness of the indices or the index data or any component thereof, and the indices and the index data and all components thereof are provided on an “as is” basis and your use is at |
Performance Summary - continued
your own risk. ICE Data, its affiliates and their respective third party suppliers do not sponsor, endorse or recommend MFS, or any of its products or services.
Notes to Performance Summary
Average annual total return represents the average annual change in value for each share class for the periods presented.
Performance results reflect any applicable expense subsidies and waivers in effect during the periods shown. Without such subsidies and waivers the fund's performance results would be less favorable. Please see the prospectus and financial statements for complete details.
Performance results do not include adjustments made for financial reporting purposes in accordance with U.S. generally accepted accounting principles and may differ from amounts reported in the financial highlights.
From time to time the fund may receive proceeds from litigation settlements, without which performance would be lower.
Expense Table
Fund expenses borne by the shareholders during the period,
August 1, 2021 through January 31, 2022
As a shareholder of the fund, you incur two types of costs: (1) transaction costs, including sales charges (loads) on certain purchase or redemption payments, and (2) ongoing costs, including management fees; distribution and service (12b-1) fees; and other fund expenses. This example is intended to help you understand your ongoing costs (in dollars) of investing in the fund and to compare these costs with the ongoing costs of investing in other mutual funds.
In addition to the fees and expenses which the fund bears directly, the fund indirectly bears a pro rata share of the fees and expenses of the MFS High Yield Pooled Portfolio, an underlying MFS Pooled Portfolio in which the fund invests. MFS Pooled Portfolios are mutual funds advised by MFS that do not pay management fees to MFS but do incur investment and operating costs. If these transactional and indirect costs were included, your costs would have been higher.
The example is based on an investment of $1,000 invested at the beginning of the period and held for the entire period August 1, 2021 through January 31, 2022.
Actual Expenses
The first line for each share class in the following table provides information about actual account values and actual expenses. You may use the information in this line, together with the amount you invested, to estimate the expenses that you paid over the period. Simply divide your account value by $1,000 (for example, an $8,600 account value divided by $1,000 = 8.6), then multiply the result by the number in the first line under the heading entitled “Expenses Paid During Period” to estimate the expenses you paid on your account during this period.
Hypothetical Example for Comparison Purposes
The second line for each share class in the following table provides information about hypothetical account values and hypothetical expenses based on the fund’s actual expense ratio and an assumed rate of return of 5% per year before expenses, which is not the fund’s actual return. The hypothetical account values and expenses may not be used to estimate the actual ending account balance or expenses you paid for the period. You may use this information to compare the ongoing costs of investing in the fund and other funds. To do so, compare this 5% hypothetical example with the 5% hypothetical examples that appear in the shareholder reports of the other funds.
Please note that the expenses shown in the table are meant to highlight your ongoing costs only and do not reflect any transactional costs, such as sales charges (loads). Therefore, the second line for each share class in the table is useful in comparing ongoing costs only, and will not help you determine the relative total costs of owning different funds. In addition, if these transactional costs were included, your costs would have been higher.
Expense Table - continued
Share
Class | | Annualized
Expense
Ratio | Beginning
Account Value
8/01/21 | Ending
Account Value
1/31/22 | Expenses
Paid During
Period (p)
8/01/21-1/31/22 |
| A | Actual | 1.05% | $1,000.00 | $976.03 | $5.23 |
| Hypothetical (h) | 1.05% | $1,000.00 | $1,019.91 | $5.35 |
| B | Actual | 1.80% | $1,000.00 | $972.47 | $8.95 |
| Hypothetical (h) | 1.80% | $1,000.00 | $1,016.13 | $9.15 |
| C | Actual | 1.80% | $1,000.00 | $972.28 | $8.95 |
| Hypothetical (h) | 1.80% | $1,000.00 | $1,016.13 | $9.15 |
| I | Actual | 0.80% | $1,000.00 | $977.26 | $3.99 |
| Hypothetical (h) | 0.80% | $1,000.00 | $1,021.17 | $4.08 |
| R1 | Actual | 1.80% | $1,000.00 | $972.35 | $8.95 |
| Hypothetical (h) | 1.80% | $1,000.00 | $1,016.13 | $9.15 |
| R2 | Actual | 1.30% | $1,000.00 | $974.89 | $6.47 |
| Hypothetical (h) | 1.30% | $1,000.00 | $1,018.65 | $6.61 |
| R3 | Actual | 1.05% | $1,000.00 | $976.33 | $5.23 |
| Hypothetical (h) | 1.05% | $1,000.00 | $1,019.91 | $5.35 |
| R4 | Actual | 0.80% | $1,000.00 | $977.53 | $3.99 |
| Hypothetical (h) | 0.80% | $1,000.00 | $1,021.17 | $4.08 |
| R6 | Actual | 0.69% | $1,000.00 | $979.25 | $3.44 |
| Hypothetical (h) | 0.69% | $1,000.00 | $1,021.73 | $3.52 |
| (h) | 5% class return per year before expenses. |
| (p) | “Expenses Paid During Period” are equal to each class’s annualized expense ratio, as shown above, multiplied by the average account value over the period, multiplied by 184/365 (to reflect the one-half year period). Expenses paid do not include any applicable sales charges (loads). If these transaction costs had been included, your costs would have been higher. In addition to the fees and expenses which the fund bears directly, the fund indirectly bears a pro rata share of the fees and expenses of the underlying funds in which the fund invests. If these indirect costs were included, your costs would have been higher. |
Portfolio of Investments
1/31/22
The Portfolio of Investments is a complete list of all securities owned by your fund. It is categorized by broad-based asset classes.
| Issuer | | | Shares/Par | Value ($) |
| Bonds – 38.5% |
| Asset-Backed & Securitized – 0.0% |
| Lehman Brothers Commercial Conduit Mortgage Trust, 1.084%, 2/18/2030 (i) | | $ | 9,230 | $ 0 |
| Automotive – 0.9% |
| RAC Bond Co. PLC, 5.25%, 11/04/2027 (n) | | GBP | 699,000 | $ 906,493 |
| RENK AG, 5.75%, 7/15/2025 | | EUR | 100,000 | 115,210 |
| Renk GmbH (Frankfurt), 5.75%, 7/15/2025 (n) | | | 465,000 | 535,725 |
| TI Automotive Finance PLC, 3.75%, 4/15/2029 (n) | | | 815,000 | 899,977 |
| | | | | $2,457,405 |
| Basic Industry – 0.2% |
| Peoplecert Wisdom Issuer PLC, 5.75%, 9/15/2026 (n) | | EUR | 535,000 | $ 614,381 |
| Broadcasting – 0.4% |
| Summer (BC) Holdco S.à r.l., “A”, 9.25%, 10/31/2027 | | EUR | 292,842 | $ 347,830 |
| WMG Acquisition Corp., 2.25%, 8/15/2031 (n) | | | 610,000 | 650,944 |
| | | | | $998,774 |
| Brokerage & Asset Managers – 0.4% |
| Vivion Investments S.à r.l., 3%, 8/08/2024 | | EUR | 1,000,000 | $ 1,067,536 |
| Building – 0.2% |
| Standard Industries, Inc., 2.25%, 11/21/2026 (n) | | EUR | 530,000 | $ 561,400 |
| Business Services – 1.1% |
| Centurion Bidco S.p.A., 5.875%, 9/30/2026 | | EUR | 475,000 | $ 547,458 |
| IPD 3 B.V., 5.5%, 12/01/2025 | | | 570,000 | 650,670 |
| Nexi S.p.A., 2.125%, 4/30/2029 | | | 930,000 | 995,040 |
| StoneCo Ltd., 3.95%, 6/16/2028 (n) | | $ | 1,029,000 | 874,650 |
| | | | | $3,067,818 |
| Cable TV – 1.6% |
| Summer BidCo B.V., 9%, 11/15/2025 | | EUR | 492,913 | $ 560,449 |
| Telenet Finance Luxembourg Notes S.à r.l., 3.5%, 3/01/2028 | | | 500,000 | 567,539 |
| United Group B.V., 3.125%, 2/15/2026 | | | 220,000 | 234,489 |
| Virgin Media Finance PLC, 3.75%, 7/15/2030 | | | 470,000 | 500,432 |
| Virgin Media Vendor Financing Notes III DAC, 4.875%, 7/15/2028 | | GBP | 470,000 | 611,840 |
| VTR Comunicaciones S.p.A., 5.125%, 1/15/2028 (n) | | $ | 638,000 | 626,918 |
| VTR Finance N.V., 6.375%, 7/15/2028 (n) | | | 322,000 | 328,440 |
| Ziggo B.V. , 2.875%, 1/15/2030 (n) | | EUR | 760,000 | 809,594 |
| | | | | $4,239,701 |
Portfolio of Investments – continued
| Issuer | | | Shares/Par | Value ($) |
| Bonds – continued |
| Chemicals – 0.7% |
| Herens Midco S.à r.l., 5.25%, 5/15/2029 (n) | | EUR | 275,000 | $ 279,219 |
| Sasol Financing (USA) LLC, 5.5%, 3/18/2031 | | $ | 940,000 | 918,850 |
| SCIL IV LLC/SCIL USA Holdings LLC, 4.375%, 11/01/2026 (n) | | EUR | 715,000 | 799,250 |
| | | | | $1,997,319 |
| Conglomerates – 1.1% |
| Grupo KUO S.A.B. de C.V., 5.75%, 7/07/2027 (n) | | $ | 1,555,000 | $ 1,597,762 |
| Industria Macchine Automatiche S.p.A., 3.75%, 1/15/2028 | | EUR | 465,000 | 502,825 |
| Thyssenkrupp AG, 2.875%, 2/22/2024 | | | 770,000 | 877,738 |
| | | | | $2,978,325 |
| Consumer Products – 0.8% |
| Ideal Standard International S.A., 6.375%, 7/30/2026 (n) | | EUR | 475,000 | $ 476,166 |
| International Design Group S.p.A., 6.5%, 11/15/2025 | | | 680,000 | 785,910 |
| Ontex Group N.V., 3.5%, 7/15/2026 | | | 900,000 | 930,014 |
| | | | | $2,192,090 |
| Consumer Services – 0.3% |
| Verisure Midholding AB, 5.25%, 2/15/2029 | | EUR | 710,000 | $ 786,801 |
| Containers – 1.3% |
| ARD Finance S.A., 5% (5% cash or 5.75% PIK), 6/30/2027 (n)(p) | | EUR | 235,000 | $ 266,387 |
| Ardagh Metal Packaging, 3%, 9/01/2029 (n) | | | 180,000 | 190,082 |
| Ardagh Packaging Finance PLC/Ardagh MP Holdings USA, Inc., 3%, 9/01/2029 | | | 300,000 | 316,803 |
| Can-Pack S.A., 3.875%, 11/15/2029 (n) | | $ | 834,000 | 798,702 |
| San Miguel Industrias PET S.A., 3.5%, 8/02/2028 (n) | | | 1,240,000 | 1,197,840 |
| Titan Holdings II B.V. , 5.125%, 7/15/2029 (n) | | EUR | 635,000 | 682,972 |
| | | | | $3,452,786 |
| Electronics – 0.3% |
| Infineon Technologies AG, 3.625% to 4/1/2028, FLR (EUR Swap Rate - 5yr. + 3.996%) to 4/1/2033, FLR (EUR Swap Rate - 5yr. + 4.246%) to 4/01/2048, FLR (EUR Swap Rate - 5yr. + 4.99%) to 12/31/2049 | | EUR | 700,000 | $ 825,509 |
| Emerging Market Quasi-Sovereign – 3.1% |
| Bulgarian Energy Holding EAD, 2.45%, 7/22/2028 | | EUR | 700,000 | $ 766,322 |
| Eskom Holdings SOC Ltd. (Republic of South Africa), 7.125%, 2/11/2025 | | $ | 905,000 | 917,199 |
| Export Credit Bank of Turkey, 6.125%, 5/03/2024 | | | 680,000 | 676,097 |
| Greenko Dutch B.V. (Republic of India), 3.85%, 3/29/2026 (n) | | | 727,915 | 715,672 |
| National Bank of Uzbekistan, 4.85%, 10/21/2025 | | | 465,000 | 450,469 |
| Oryx Funding Ltd. (Sultanate of Oman), 5.8%, 2/03/2031 (n) | | | 740,000 | 766,831 |
| Petroleos Mexicanos, 6.5%, 3/13/2027 | | | 695,000 | 726,275 |
Portfolio of Investments – continued
| Issuer | | | Shares/Par | Value ($) |
| Bonds – continued |
| Emerging Market Quasi-Sovereign – continued |
| Petroleos Mexicanos, 5.35%, 2/12/2028 | | $ | 905,000 | $ 885,067 |
| Petroleos Mexicanos, 6.84%, 1/23/2030 | | | 450,000 | 460,575 |
| Petroleos Mexicanos, 6.5%, 6/02/2041 | | | 1,585,000 | 1,373,688 |
| Petroleos Mexicanos, 7.69%, 1/23/2050 | | | 740,000 | 685,610 |
| | | | | $8,423,805 |
| Energy - Independent – 0.5% |
| Energean PLC, 6.5%, 4/30/2027 (n) | | $ | 581,000 | $ 561,391 |
| Leviathan Bond Ltd., 6.5%, 6/30/2027 (n) | | | 617,000 | 656,359 |
| | | | | $1,217,750 |
| Entertainment – 0.3% |
| CPUK Finance Ltd., 4.875%, 8/28/2025 | | GBP | 590,000 | $ 788,326 |
| CPUK Finance Ltd., 4.5%, 8/28/2027 | | | 100,000 | 133,805 |
| | | | | $922,131 |
| Financial Institutions – 2.6% |
| Adler Group S.A., 2.25%, 1/14/2029 | | EUR | 100,000 | $ 88,237 |
| Adler Group, Inc., 3.25%, 8/05/2025 | | | 700,000 | 673,498 |
| Atrium European Real Estate Ltd., 3.625% to 11/4/2026, FLR (EUR Swap Rate - 5yr. + 3.625%) to 11/04/2031, FLR (EUR Swap Rate - 5yr. + 4.625%) to 12/31/2164 | | | 625,000 | 603,030 |
| Encore Capital Group, Inc., 5.375%, 2/15/2026 (n) | | GBP | 635,000 | 875,958 |
| Encore Capital Group, Inc., 4.25%, 6/01/2028 (n) | | | 390,000 | 505,340 |
| Garfunkelux Holdco 3 S.A., 7.75%, 11/01/2025 | | | 595,000 | 818,477 |
| Kaisa Group Holdings Ltd., 9.95%, 7/23/2025 | | $ | 520,000 | 139,100 |
| Muthoot Finance Ltd., 4.4%, 9/02/2023 (n) | | | 895,000 | 899,654 |
| Samhallsbyggnadsbolaget i Norden AB, 2.625% to 3/14/2026, FLR (EUR Swap Rate - 5yr. + 3.227%) to 3/14/2031, FLR (EUR Swap Rate - 5yr. + 3.227%) to 12/31/2164 | | EUR | 690,000 | 737,553 |
| Shimao Group Holdings Ltd., 5.6%, 7/15/2026 | | $ | 565,000 | 259,900 |
| Shriram Transport Finance Co. Ltd., 5.1%, 7/16/2023 (n) | | | 696,000 | 697,044 |
| Sunac China Holdings Ltd., 5.95%, 4/26/2024 | | | 465,000 | 272,025 |
| Sunac China Holdings Ltd., 6.5%, 1/10/2025 | | | 280,000 | 165,200 |
| Times China Holdings Ltd., 6.75%, 7/08/2025 | | | 300,000 | 139,500 |
| | | | | $6,874,516 |
| Food & Beverages – 1.4% |
| Aragvi Finance International DAC, 8.45%, 4/29/2026 (n) | | $ | 400,000 | $ 401,306 |
| Central America Bottling Co., 5.25%, 4/27/2029 (n) | | | 916,000 | 928,714 |
| Coca-Cola Icecek A.S., 4.5%, 1/20/2029 (n) | | | 920,000 | 924,440 |
| Nomad Foods Bondco PLC, 2.5%, 6/24/2028 (n) | | EUR | 625,000 | 684,378 |
| Premier Foods Finance PLC, 3.5%, 10/15/2026 | | GBP | 600,000 | 778,729 |
| | | | | $3,717,567 |
Portfolio of Investments – continued
| Issuer | | | Shares/Par | Value ($) |
| Bonds – continued |
| Gaming & Lodging – 0.3% |
| NH Hotel Group S.A., 4%, 7/02/2026 (n) | | EUR | 415,000 | $ 464,087 |
| NH Hotel Group S.A., 4%, 7/02/2026 | | | 225,000 | 251,614 |
| | | | | $715,701 |
| Industrial – 1.9% |
| Arabian Centres Sukuk II Ltd., 5.625%, 10/07/2026 (n) | | $ | 938,000 | $ 907,140 |
| BCP V Modular Services Finance II PLC, 4.75%, 11/30/2028 (n) | | EUR | 693,000 | 744,273 |
| Dar Al-Arkan Sukuk Co. Ltd., 6.875%, 3/21/2023 | | $ | 870,000 | 895,056 |
| GEMS Menasa Cayman Ltd./GEMS Education Delaware LLC, 7.125%, 7/31/2026 (n) | | | 415,000 | 426,412 |
| GMR Hyderabad International Airport Ltd., 4.25%, 10/27/2027 | | | 1,055,000 | 983,787 |
| Peach Property Finance GmbH, 3.5%, 2/15/2023 (n) | | EUR | 1,075,000 | 1,208,074 |
| | | | | $5,164,742 |
| Internet – 0.4% |
| XP, Inc., 3.25%, 7/01/2026 (n) | | $ | 1,000,000 | $ 941,795 |
| Machinery & Tools – 0.5% |
| Kapla Holding S.A.S., 3.375%, 12/15/2026 | | EUR | 590,000 | $ 630,039 |
| Sarens Finance Co. N.V., 5.75%, 2/21/2027 | | | 655,000 | 707,185 |
| | | | | $1,337,224 |
| Major Banks – 0.2% |
| UniCredit S.p.A., 3.875% to 6/03/2027, FLR (EUR ICE Swap Rate - 5yr. + 4.081%) to 6/03/2070 | | EUR | 645,000 | $ 663,032 |
| Medical & Health Technology & Services – 0.4% |
| Chrome Holdco S.A.S., 5%, 5/31/2029 (n) | | EUR | 465,000 | $ 506,732 |
| IQVIA, Inc., 1.75%, 3/15/2026 (n) | | | 550,000 | 614,097 |
| | | | | $1,120,829 |
| Metals & Mining – 0.7% |
| Baffinland Iron Mines Corp./Baffinland Iron Mines LP, 8.75%, 7/15/2026 (n) | | $ | 140,000 | $ 145,775 |
| Ero Copper Corp., 6.5%, 2/15/2030 (n)(w) | | | 193,000 | 190,711 |
| First Quantum Minerals Ltd., 7.25%, 4/01/2023 (n) | | | 360,000 | 361,342 |
| First Quantum Minerals Ltd., 6.875%, 10/15/2027 (n) | | | 200,000 | 212,500 |
| Novelis Sheet Ingot GmbH, 3.375%, 4/15/2029 (n) | | EUR | 460,000 | 506,658 |
| Petra Diamonds US$ Treasury PLC, 10.5% PIK to 12/31/2022, 10.5% PIK/9.75% Cash to 6/30/2023, 9.75% Cash to 3/08/2026 (n)(p) | | $ | 372,695 | 379,466 |
| | | | | $1,796,452 |
| Midstream – 0.3% |
| Peru LNG, 5.375%, 3/22/2030 | | $ | 845,000 | $ 730,274 |
Portfolio of Investments – continued
| Issuer | | | Shares/Par | Value ($) |
| Bonds – continued |
| Network & Telecom – 1.1% |
| DKT Finance ApS, 7%, 6/17/2023 | | EUR | 560,000 | $ 632,744 |
| Iliad Holding S.A.S., 5.625%, 10/15/2028 (n) | | | 580,000 | 662,547 |
| Kaixo Bondco Telecom S.A., 5.125%, 9/30/2029 (n) | | | 935,000 | 1,023,629 |
| Total Play Telecomunicaciones S.A. de C.V., 6.375%, 9/20/2028 (n) | | $ | 695,000 | 648,088 |
| | | | | $2,967,008 |
| Oil Services – 0.3% |
| MV24 Capital B.V., 6.748%, 6/01/2034 (n) | | $ | 903,070 | $ 900,821 |
| Oils – 0.5% |
| FS Luxembourg S.à r.l., 10%, 12/15/2025 (n) | | $ | 555,000 | $ 591,075 |
| MC Brazil Downstream Trading S.à r.l., 7.25%, 6/30/2031 (n) | | | 762,000 | 730,758 |
| | | | | $1,321,833 |
| Other Banks & Diversified Financials – 1.3% |
| Banco General S.A., 5.25% to 5/07/2031, FLR (CMT - 10yr. + 3.665%) to 5/07/2071 (n) | | $ | 760,000 | $ 761,907 |
| Banco GNB Sudameris S.A., 7.5% to 4/16/2026, FLR (CMT - 5yr. + 6.66%) to 4/16/2031 | | | 755,000 | 745,476 |
| doValue S.p.A., 3.375%, 7/31/2026 (n) | | EUR | 1,055,000 | 1,179,906 |
| Intesa Sanpaolo S.p.A., 4.125% to 2/27/2030, FLR (EUR Swap Rate - 5yr. + 4.274%) to 2/27/2070 | | | 645,000 | 676,619 |
| | | | | $3,363,908 |
| Pharmaceuticals – 1.0% |
| Gruenenthal GmbH, 4.125%, 5/15/2028 | | EUR | 465,000 | $ 521,098 |
| Organon Finance 1 LLC, 2.875%, 4/30/2028 (n) | | | 235,000 | 256,284 |
| Rossini S.à r.l., 6.75%, 10/30/2025 | | | 723,000 | 837,637 |
| Teva Pharmaceutical Finance Netherlands III B.V., 4.75%, 5/09/2027 | | $ | 1,075,000 | 1,040,063 |
| | | | | $2,655,082 |
| Restaurants – 0.4% |
| MIDCO GB , 7.75%, 11/01/2027 (n) | | EUR | 465,000 | $ 532,863 |
| Punch Finance PLC, 6.125%, 6/30/2026 (n) | | GBP | 435,000 | 579,585 |
| | | | | $1,112,448 |
| Retailers – 0.8% |
| Goldstory S.A.S., 5.375%, 3/01/2026 (n) | | EUR | 450,000 | $ 510,774 |
| Grupo Axo S.A.P.I. de C.V., 5.75%, 6/08/2026 (n) | | $ | 944,000 | 940,469 |
| Mobilux Finance S.A.S., 4.25%, 7/15/2028 (n) | | EUR | 700,000 | 764,348 |
| | | | | $2,215,591 |
| Specialty Chemicals – 0.2% |
| CTEC II GmbH, 5.25%, 2/15/2030 (n)(w) | | EUR | 453,000 | $ 498,108 |
Portfolio of Investments – continued
| Issuer | | | Shares/Par | Value ($) |
| Bonds – continued |
| Supermarkets – 0.3% |
| Iceland Bondco PLC, 4.625%, 3/15/2025 | | GBP | 700,000 | $ 854,423 |
| Telecommunications - Wireless – 2.7% |
| Altice France S.A., 4%, 2/15/2028 (n) | | EUR | 380,000 | $ 387,848 |
| Cellnex Finance Co. S.A., 2%, 2/15/2033 | | | 900,000 | 924,870 |
| Cellnex Finance Co. S.A. , 1.5%, 6/08/2028 | | | 900,000 | 969,907 |
| Digicel International Finance Ltd., 8.75%, 5/25/2024 (n) | | $ | 455,000 | 466,375 |
| Millicom International Cellular S.A., 5.125%, 1/15/2028 (n) | | | 977,400 | 990,888 |
| PLT VII Finance S.à r.l., 4.625%, 1/05/2026 | | EUR | 655,000 | 725,631 |
| PPF Telecom Group B.V., 3.25%, 9/29/2027 | | | 695,000 | 823,226 |
| Vodafone Group PLC, 3% to 8/27/2030, FLR (EUR Swap Rate - 5yr. + 3.477%) to 8/27/2050, FLR (EUR Swap Rate - 5yr. + 4.227%) to 8/27/2080 | | | 1,155,000 | 1,258,982 |
| WP/AP Telecom Holdings III B.V., 5.5%, 1/15/2030 (n) | | | 730,000 | 801,436 |
| | | | | $7,349,163 |
| Transportation - Services – 2.0% |
| Aeropuertos Dominicanos Siglo XXI S.A., 6.75%, 3/30/2029 | | $ | 672,000 | $ 680,407 |
| Arena Luxembourg Finance S.à r.l., 1.875%, 2/01/2028 (n) | | EUR | 1,280,000 | 1,315,785 |
| Cliffton Ltd., 6.25%, 10/25/2025 (n) | | $ | 1,263,000 | 1,212,480 |
| Promontoria Holding 264 B.V., 6.75%, 8/15/2023 | | EUR | 505,000 | 575,370 |
| Q-Park Holding I B.V., 1.5%, 3/01/2025 (n) | | | 1,165,000 | 1,237,436 |
| Q-Park Operations Holding B.V., 1.5%, 3/01/2025 | | | 400,000 | 424,871 |
| | | | | $5,446,349 |
| Utilities - Electric Power – 5.4% |
| Adani Green Energy (UP) Ltd./Prayatna Developers Private Ltd., 6.25%, 12/10/2024 (n) | | $ | 961,000 | $ 1,019,140 |
| Adani Green Energy (UP) Ltd./Prayatna Developers Private Ltd., 6.25%, 12/10/2024 | | | 475,000 | 503,738 |
| AES Gener S.A., 7.125% to 7/06/2024, FLR (Swap Rate - 5yr. + 4.644%) to 7/06/2029, FLR (Swap Rate - 5yr. + 4.894%) to 7/06/2044, FLR (Swap Rate - 5yr. + 5.644%) to 3/26/2079 | | | 645,000 | 659,545 |
| Azure Power Energy Ltd., 3.575%, 8/19/2026 (n) | | | 545,000 | 533,838 |
| Azure Power Solar Energy Private Ltd., 5.65%, 12/24/2024 (n) | | | 502,000 | 519,570 |
| ContourGlobal Power Holdings S.A., 2.75%, 1/01/2026 (n) | | EUR | 740,000 | 786,063 |
| ContourGlobal Power Holdings S.A., 2.75%, 1/01/2026 | | | 200,000 | 212,449 |
| Electricidad Firme de Mexico, 4.9%, 11/20/2026 (n) | | $ | 952,000 | 932,970 |
| Empresa Generadora de Electricidad Haina S.A., 5.625%, 11/08/2028 (n) | | | 570,000 | 570,855 |
| Inkia Energy Ltd., 5.875%, 11/09/2027 (n) | | | 1,249,000 | 1,255,170 |
| Investment Energy Resources Ltd., 6.25%, 4/26/2029 (n) | | | 718,000 | 759,949 |
| Listrindo Capital B.V., 4.95%, 9/14/2026 | | | 1,555,000 | 1,564,796 |
| Mercury Chile Holdco LLC, 6.5%, 1/24/2027 (n) | | | 687,000 | 676,283 |
Portfolio of Investments – continued
| Issuer | | | Shares/Par | Value ($) |
| Bonds – continued |
| Utilities - Electric Power – continued |
| Public Power Corp. S.A., 3.875%, 3/30/2026 | | EUR | 925,000 | $ 1,039,025 |
| ReNew Wind Energy AP2/ReNew Power Private Ltd., 4.5%, 7/14/2028 (n) | | $ | 929,000 | 883,505 |
| Star Energy Geothermal (Wayang Windu) Ltd., 6.75%, 4/24/2033 (n) | | | 239,868 | 255,160 |
| Stoneway Capital Corp., 10%, 3/01/2027 (a)(d)(z) | | | 1,542,686 | 447,394 |
| Termocandelaria Power Ltd., 7.875%, 1/30/2029 | | | 170,000 | 170,214 |
| TermoCandelaria Power Ltd., 7.875%, 1/30/2029 (n) | | | 600,950 | 601,707 |
| TerraForm Global Operating LLC, 6.125%, 3/01/2026 (n) | | | 1,186,000 | 1,200,825 |
| | | | | $14,592,196 |
| Utilities - Water – 0.6% |
| Aegea Finance S.à r.l., 5.75%, 10/10/2024 (n) | | $ | 1,504,000 | $ 1,537,840 |
| Total Bonds (Identified Cost, $109,668,565) | | $ 103,680,433 |
| Common Stocks – 0.1% |
| Construction – 0.1% | |
| ICA Tenedora S.A. de C.V. (u) | | 253,322 | $ 208,768 |
| Precious Metals & Minerals – 0.0% | |
| Petra Diamonds Ltd. (a) | | 80,293 | $ 91,195 |
| Total Common Stocks (Identified Cost, $71,595) | | $ 299,963 |
| Investment Companies (h) – 61.6% |
| Mutual Funds – 60.5% |
| MFS High Yield Pooled Portfolio (v)(y) | | | 18,345,049 | $ 162,904,037 |
| Money Market Funds – 1.1% | |
| MFS Institutional Money Market Portfolio, 0.06% (v) | | | 2,852,095 | $ 2,852,095 |
| Total Investment Companies (Identified Cost, $175,596,738) | $ 165,756,132 |
|
|
| Other Assets, Less Liabilities – (0.2)% | | (618,936) |
| Net Assets – 100.0% | $ 269,117,592 |
| (a) | Non-income producing security. |
| (d) | In default. |
| (h) | An affiliated issuer, which may be considered one in which the fund owns 5% or more of the outstanding voting securities, or a company which is under common control. At period end, the aggregate values of the fund's investments in affiliated issuers and in unaffiliated issuers were $165,756,132 and $103,980,396, respectively. |
| (i) | Interest only security for which the fund receives interest on notional principal (Par amount). Par amount shown is the notional principal and does not reflect the cost of the security. |
Portfolio of Investments – continued
| (n) | Securities exempt from registration under Rule 144A of the Securities Act of 1933. These securities may be sold in the ordinary course of business in transactions exempt from registration, normally to qualified institutional buyers. At period end, the aggregate value of these securities was $57,849,336, representing 21.5% of net assets. |
| (p) | Payment-in-kind (PIK) security for which interest income may be received in additional securities and/or cash. |
| (u) | The security was valued using significant unobservable inputs and is considered level 3 under the fair value hierarchy. For further information about the fund’s level 3 holdings, please see Note 2 in the Notes to Financial Statements. |
| (v) | Affiliated issuer that is available only to investment companies managed by MFS. The rate quoted for the MFS Institutional Money Market Portfolio is the annualized seven-day yield of the fund at period end. |
| (w) | When-issued security. |
| (y) | The annual report for MFS High Yield Pooled Portfolio as of January 31, 2022 has been included as Appendix A. |
| (z) | Restricted securities are not registered under the Securities Act of 1933 and are subject to legal restrictions on resale. These securities generally may be resold in transactions exempt from registration or to the public if the securities are subsequently registered. Disposal of these securities may involve time-consuming negotiations and prompt sale at an acceptable price may be difficult. The fund holds the following restricted securities: |
| Restricted Securities | Acquisition
Date | Cost | Value |
| Stoneway Capital Corp., 10%, 3/01/2027 | 2/10/17-7/18/18 | $1,554,216 | $447,394 |
| % of Net assets | | | 0.2% |
| The following abbreviations are used in this report and are defined: |
| CMT | Constant Maturity Treasury |
| FLR | Floating Rate. Interest rate resets periodically based on the parenthetically disclosed reference rate plus a spread (if any). The period-end rate reported may not be the current rate. All reference rates are USD unless otherwise noted. |
| ICE | Intercontinental Exchange |
| Abbreviations indicate amounts shown in currencies other than the U.S. dollar. All amounts are stated in U.S. dollars unless otherwise indicated. A list of abbreviations is shown below: |
| EUR | Euro |
| GBP | British Pound |
Derivative Contracts at 1/31/22
| Forward Foreign Currency Exchange Contracts |
Currency
Purchased | Currency
Sold | Counterparty | Settlement
Date | Unrealized
Appreciation
(Depreciation) |
| Asset Derivatives |
| USD | 46,642,588 | EUR | 40,997,589 | Citibank N.A. | 4/08/2022 | $512,060 |
| USD | 257,594 | EUR | 226,700 | HSBC Bank | 4/08/2022 | 2,511 |
| USD | 2,577,473 | EUR | 2,265,784 | JPMorgan Chase Bank N.A. | 4/08/2022 | 28,010 |
| USD | 514,894 | EUR | 453,000 | Morgan Stanley Capital Services, Inc. | 4/08/2022 | 5,178 |
| USD | 7,327,986 | GBP | 5,399,197 | JPMorgan Chase Bank N.A. | 4/08/2022 | 69,293 |
| | | | | | | $617,052 |
Portfolio of Investments – continued
| Forward Foreign Currency Exchange Contracts - continued |
Currency
Purchased | Currency
Sold | Counterparty | Settlement
Date | Unrealized
Appreciation
(Depreciation) |
| Liability Derivatives |
| EUR | 747,459 | USD | 847,988 | Citibank N.A. | 4/08/2022 | $(6,946) |
At January 31, 2022, the fund had cash collateral of $37,000 to cover any collateral or margin obligations for certain derivative contracts. Restricted cash and/or deposits with brokers in the Statement of Assets and Liabilities are comprised of cash collateral.
See Notes to Financial Statements
Financial Statements
Statement of Assets and Liabilities
At 1/31/22
This statement represents your fund’s balance sheet, which details the assets and liabilities comprising the total value of the fund.
| Assets | |
| Investments in unaffiliated issuers, at value (identified cost, $109,740,160) | $103,980,396 |
| Investments in affiliated issuers, at value (identified cost, $175,596,738) | 165,756,132 |
| Restricted cash for | |
| Forward foreign currency exchange contracts | 37,000 |
| Receivables for | |
| Forward foreign currency exchange contracts | 617,052 |
| Investments sold | 2,943,331 |
| Fund shares sold | 128,232 |
| Interest and dividends | 2,006,410 |
| Receivable from investment adviser | 22,504 |
| Other assets | 1,174 |
| Total assets | $275,492,231 |
| Liabilities | |
| Payable to custodian | $177,852 |
| Payables for | |
| Distributions | 27,702 |
| Forward foreign currency exchange contracts | 6,946 |
| Investments purchased | 460,088 |
| Fund shares reacquired | 4,781,308 |
| When-issued investments purchased | 701,923 |
| Payable to affiliates | |
| Administrative services fee | 511 |
| Shareholder servicing costs | 94,758 |
| Distribution and service fees | 4,763 |
| Payable for independent Trustees' compensation | 46 |
| Accrued expenses and other liabilities | 118,742 |
| Total liabilities | $6,374,639 |
| Net assets | $269,117,592 |
| Net assets consist of | |
| Paid-in capital | $326,446,892 |
| Total distributable earnings (loss) | (57,329,300) |
| Net assets | $269,117,592 |
| Shares of beneficial interest outstanding | 45,294,826 |
Statement of Assets and Liabilities – continued
| | Net assets | Shares
outstanding | Net asset value
per share (a) |
| Class A | $133,192,553 | 22,414,041 | $5.94 |
| Class B | 1,831,050 | 307,517 | 5.95 |
| Class C | 7,408,423 | 1,248,457 | 5.93 |
| Class I | 96,925,210 | 16,316,885 | 5.94 |
| Class R1 | 68,496 | 11,529 | 5.94 |
| Class R2 | 443,399 | 74,510 | 5.95 |
| Class R3 | 2,566,795 | 429,688 | 5.97 |
| Class R4 | 6,316,410 | 1,058,076 | 5.97 |
| Class R6 | 20,365,256 | 3,434,123 | 5.93 |
| (a) | Maximum offering price per share was equal to the net asset value per share for all share classes, except for Class A, for which the maximum offering price per share was $6.20 [100 / 95.75 x $5.94]. On sales of $100,000 or more, the maximum offering price of Class A shares is reduced. A contingent deferred sales charge may be imposed on redemptions of Class A, Class B, and Class C shares. Redemption price per share was equal to the net asset value per share for Classes I, R1, R2, R3, R4, and R6. |
See Notes to Financial Statements
Financial Statements
Statement of Operations
Year ended 1/31/22
This statement describes how much your fund earned in investment income and accrued in expenses. It also describes any gains and/or losses generated by fund operations.
| Net investment income (loss) | |
| Income | |
| Dividends from affiliated issuers | $10,089,099 |
| Interest | 5,242,140 |
| Dividends | 174,117 |
| Other | 93,525 |
| Foreign taxes withheld | (17,412) |
| Total investment income | $15,581,469 |
| Expenses | |
| Management fee | $1,943,046 |
| Distribution and service fees | 528,750 |
| Shareholder servicing costs | 364,574 |
| Administrative services fee | 49,893 |
| Independent Trustees' compensation | 6,397 |
| Custodian fee | 34,537 |
| Shareholder communications | 41,954 |
| Audit and tax fees | 93,137 |
| Legal fees | 1,650 |
| Miscellaneous | 167,421 |
| Total expenses | $3,231,359 |
| Fees paid indirectly | (190) |
| Reduction of expenses by investment adviser and distributor | (332,500) |
| Net expenses | $2,898,669 |
| Net investment income (loss) | $12,682,800 |
Statement of Operations – continued
| Realized and unrealized gain (loss) |
| Realized gain (loss) (identified cost basis) | |
| Unaffiliated issuers | $1,692,294 |
| Affiliated issuers | (4,603,894) |
| Futures contracts | 256,549 |
| Forward foreign currency exchange contracts | 3,546,620 |
| Foreign currency | 19,128 |
| Net realized gain (loss) | $910,697 |
| Change in unrealized appreciation or depreciation | |
| Unaffiliated issuers (net of $25,450 decrease in deferred country tax) | $(9,981,432) |
| Affiliated issuers | (2,618,552) |
| Futures contracts | (37,700) |
| Forward foreign currency exchange contracts | 534,736 |
| Translation of assets and liabilities in foreign currencies | (19,153) |
| Net unrealized gain (loss) | $(12,122,101) |
| Net realized and unrealized gain (loss) | $(11,211,404) |
| Change in net assets from operations | $1,471,396 |
See Notes to Financial Statements
Financial Statements
Statements of Changes in Net Assets
These statements describe the increases and/or decreases in net assets resulting from operations, any distributions, and any shareholder transactions.
| | Year ended |
| | 1/31/22 | 1/31/21 |
| Change in net assets | | |
| From operations | | |
| Net investment income (loss) | $12,682,800 | $13,207,223 |
| Net realized gain (loss) | 910,697 | (9,316,344) |
| Net unrealized gain (loss) | (12,122,101) | 4,763,100 |
| Change in net assets from operations | $1,471,396 | $8,653,979 |
| Total distributions to shareholders | $(15,713,464) | $(13,094,506) |
| Change in net assets from fund share transactions | $(16,843,338) | $(22,117,406) |
| Total change in net assets | $(31,085,406) | $(26,557,933) |
| Net assets | | |
| At beginning of period | 300,202,998 | 326,760,931 |
| At end of period | $269,117,592 | $300,202,998 |
See Notes to Financial Statements
Financial Statements
Financial Highlights
The financial highlights table is intended to help you understand the fund's financial performance for the past 5 years. Certain information reflects financial results for a single fund share. The total returns in the table represent the rate that an investor would have earned (or lost) on an investment in the fund share class (assuming reinvestment of all distributions) held for the entire period.
| Class A | Year ended |
| | 1/31/22 | 1/31/21 | 1/31/20 | 1/31/19 | 1/31/18 |
| Net asset value, beginning of period | $6.24 | $6.28 | $6.00 | $6.25 | $6.17 |
| Income (loss) from investment operations |
| Net investment income (loss) (d) | $0.26 | $0.27 | $0.28 | $0.28 | $0.29 |
| Net realized and unrealized gain (loss) | (0.24) | (0.04) | 0.28 | (0.25) | 0.08 |
| Total from investment operations | $0.02 | $0.23 | $0.56 | $0.03 | $0.37 |
| Less distributions declared to shareholders |
| From net investment income | $(0.32) | $(0.27) | $(0.28) | $(0.28) | $(0.24) |
| From tax return of capital | — | — | — | — | (0.05) |
| Total distributions declared to shareholders | $(0.32) | $(0.27) | $(0.28) | $(0.28) | $(0.29) |
| Net asset value, end of period (x) | $5.94 | $6.24 | $6.28 | $6.00 | $6.25 |
| Total return (%) (r)(s)(t)(x) | 0.31 | 3.86 | 9.59 | 0.50 | 6.12 |
Ratios (%) (to average net assets)
and Supplemental data: |
| Expenses before expense reductions (f)(h) | 1.16 | 1.17 | 1.15 | 1.14 | 1.16 |
| Expenses after expense reductions (f)(h) | 1.05 | 1.05 | 1.05 | 1.05 | 1.05 |
| Net investment income (loss) | 4.16 | 4.47 | 4.50 | 4.70 | 4.67 |
| Portfolio turnover | 38 | 22 | 26 | 13 | 26 |
| Net assets at end of period (000 omitted) | $133,193 | $182,411 | $203,428 | $191,590 | $204,150 |
See Notes to Financial Statements
Financial Highlights – continued
| Class B | Year ended |
| | 1/31/22 | 1/31/21 | 1/31/20 | 1/31/19 | 1/31/18 |
| Net asset value, beginning of period | $6.25 | $6.29 | $6.01 | $6.26 | $6.18 |
| Income (loss) from investment operations |
| Net investment income (loss) (d) | $0.21 | $0.22 | $0.23 | $0.24 | $0.25 |
| Net realized and unrealized gain (loss) | (0.23) | (0.04) | 0.29 | (0.26) | 0.08 |
| Total from investment operations | $(0.02) | $0.18 | $0.52 | $(0.02) | $0.33 |
| Less distributions declared to shareholders |
| From net investment income | $(0.28) | $(0.22) | $(0.24) | $(0.23) | $(0.21) |
| From tax return of capital | — | — | — | — | (0.04) |
| Total distributions declared to shareholders | $(0.28) | $(0.22) | $(0.24) | $(0.23) | $(0.25) |
| Net asset value, end of period (x) | $5.95 | $6.25 | $6.29 | $6.01 | $6.26 |
| Total return (%) (r)(s)(t)(x) | (0.44) | 3.09 | 8.77 | (0.25) | 5.33 |
Ratios (%) (to average net assets)
and Supplemental data: |
| Expenses before expense reductions (f)(h) | 1.91 | 1.92 | 1.90 | 1.90 | 1.91 |
| Expenses after expense reductions (f)(h) | 1.80 | 1.80 | 1.80 | 1.80 | 1.80 |
| Net investment income (loss) | 3.42 | 3.74 | 3.78 | 3.94 | 3.92 |
| Portfolio turnover | 38 | 22 | 26 | 13 | 26 |
| Net assets at end of period (000 omitted) | $1,831 | $3,032 | $5,741 | $7,941 | $12,262 |
| Class C | Year ended |
| | 1/31/22 | 1/31/21 | 1/31/20 | 1/31/19 | 1/31/18 |
| Net asset value, beginning of period | $6.23 | $6.28 | $5.99 | $6.24 | $6.16 |
| Income (loss) from investment operations |
| Net investment income (loss) (d) | $0.21 | $0.22 | $0.23 | $0.24 | $0.25 |
| Net realized and unrealized gain (loss) | (0.23) | (0.05) | 0.30 | (0.26) | 0.07 |
| Total from investment operations | $(0.02) | $0.17 | $0.53 | $(0.02) | $0.32 |
| Less distributions declared to shareholders |
| From net investment income | $(0.28) | $(0.22) | $(0.24) | $(0.23) | $(0.20) |
| From tax return of capital | — | — | — | — | (0.04) |
| Total distributions declared to shareholders | $(0.28) | $(0.22) | $(0.24) | $(0.23) | $(0.24) |
| Net asset value, end of period (x) | $5.93 | $6.23 | $6.28 | $5.99 | $6.24 |
| Total return (%) (r)(s)(t)(x) | (0.45) | 2.92 | 8.96 | (0.26) | 5.33 |
Ratios (%) (to average net assets)
and Supplemental data: |
| Expenses before expense reductions (f)(h) | 1.91 | 1.92 | 1.90 | 1.90 | 1.91 |
| Expenses after expense reductions (f)(h) | 1.80 | 1.80 | 1.80 | 1.80 | 1.80 |
| Net investment income (loss) | 3.42 | 3.74 | 3.79 | 3.93 | 3.92 |
| Portfolio turnover | 38 | 22 | 26 | 13 | 26 |
| Net assets at end of period (000 omitted) | $7,408 | $8,855 | $21,084 | $29,122 | $57,556 |
See Notes to Financial Statements
Financial Highlights – continued
| Class I | Year ended |
| | 1/31/22 | 1/31/21 | 1/31/20 | 1/31/19 | 1/31/18 |
| Net asset value, beginning of period | $6.24 | $6.28 | $6.00 | $6.25 | $6.17 |
| Income (loss) from investment operations |
| Net investment income (loss) (d) | $0.27 | $0.28 | $0.29 | $0.30 | $0.31 |
| Net realized and unrealized gain (loss) | (0.23) | (0.04) | 0.29 | (0.26) | 0.08 |
| Total from investment operations | $0.04 | $0.24 | $0.58 | $0.04 | $0.39 |
| Less distributions declared to shareholders |
| From net investment income | $(0.34) | $(0.28) | $(0.30) | $(0.29) | $(0.26) |
| From tax return of capital | — | — | — | — | (0.05) |
| Total distributions declared to shareholders | $(0.34) | $(0.28) | $(0.30) | $(0.29) | $(0.31) |
| Net asset value, end of period (x) | $5.94 | $6.24 | $6.28 | $6.00 | $6.25 |
| Total return (%) (r)(s)(t)(x) | 0.56 | 4.12 | 9.86 | 0.75 | 6.38 |
Ratios (%) (to average net assets)
and Supplemental data: |
| Expenses before expense reductions (f)(h) | 0.91 | 0.91 | 0.90 | 0.89 | 0.91 |
| Expenses after expense reductions (f)(h) | 0.80 | 0.80 | 0.80 | 0.80 | 0.80 |
| Net investment income (loss) | 4.42 | 4.69 | 4.75 | 4.93 | 4.91 |
| Portfolio turnover | 38 | 22 | 26 | 13 | 26 |
| Net assets at end of period (000 omitted) | $96,925 | $73,648 | $65,250 | $63,671 | $88,762 |
| Class R1 | Year ended |
| | 1/31/22 | 1/31/21 | 1/31/20 | 1/31/19 | 1/31/18 |
| Net asset value, beginning of period | $6.24 | $6.28 | $6.00 | $6.26 | $6.18 |
| Income (loss) from investment operations |
| Net investment income (loss) (d) | $0.21 | $0.22 | $0.23 | $0.24 | $0.25 |
| Net realized and unrealized gain (loss) | (0.23) | (0.04) | 0.29 | (0.27) | 0.08 |
| Total from investment operations | $(0.02) | $0.18 | $0.52 | $(0.03) | $0.33 |
| Less distributions declared to shareholders |
| From net investment income | $(0.28) | $(0.22) | $(0.24) | $(0.23) | $(0.21) |
| From tax return of capital | — | — | — | — | (0.04) |
| Total distributions declared to shareholders | $(0.28) | $(0.22) | $(0.24) | $(0.23) | $(0.25) |
| Net asset value, end of period (x) | $5.94 | $6.24 | $6.28 | $6.00 | $6.26 |
| Total return (%) (r)(s)(t)(x) | (0.45) | 3.09 | 8.78 | (0.42) | 5.33 |
Ratios (%) (to average net assets)
and Supplemental data: |
| Expenses before expense reductions (f)(h) | 1.91 | 1.92 | 1.90 | 1.90 | 1.90 |
| Expenses after expense reductions (f)(h) | 1.80 | 1.80 | 1.80 | 1.80 | 1.80 |
| Net investment income (loss) | 3.42 | 3.72 | 3.75 | 3.95 | 3.94 |
| Portfolio turnover | 38 | 22 | 26 | 13 | 26 |
| Net assets at end of period (000 omitted) | $68 | $70 | $67 | $61 | $62 |
See Notes to Financial Statements
Financial Highlights – continued
| Class R2 | Year ended |
| | 1/31/22 | 1/31/21 | 1/31/20 | 1/31/19 | 1/31/18 |
| Net asset value, beginning of period | $6.25 | $6.29 | $6.01 | $6.26 | $6.18 |
| Income (loss) from investment operations |
| Net investment income (loss) (d) | $0.24 | $0.25 | $0.26 | $0.27 | $0.27 |
| Net realized and unrealized gain (loss) | (0.23) | (0.04) | 0.29 | (0.26) | 0.09 |
| Total from investment operations | $0.01 | $0.21 | $0.55 | $0.01 | $0.36 |
| Less distributions declared to shareholders |
| From net investment income | $(0.31) | $(0.25) | $(0.27) | $(0.26) | $(0.24) |
| From tax return of capital | — | — | — | — | (0.04) |
| Total distributions declared to shareholders | $(0.31) | $(0.25) | $(0.27) | $(0.26) | $(0.28) |
| Net asset value, end of period (x) | $5.95 | $6.25 | $6.29 | $6.01 | $6.26 |
| Total return (%) (r)(s)(t)(x) | 0.06 | 3.60 | 9.31 | 0.25 | 5.85 |
Ratios (%) (to average net assets)
and Supplemental data: |
| Expenses before expense reductions (f)(h) | 1.41 | 1.41 | 1.40 | 1.39 | 1.41 |
| Expenses after expense reductions (f)(h) | 1.30 | 1.30 | 1.30 | 1.29 | 1.29 |
| Net investment income (loss) | 3.92 | 4.17 | 4.26 | 4.46 | 4.38 |
| Portfolio turnover | 38 | 22 | 26 | 13 | 26 |
| Net assets at end of period (000 omitted) | $443 | $519 | $308 | $297 | $291 |
| Class R3 | Year ended |
| | 1/31/22 | 1/31/21 | 1/31/20 | 1/31/19 | 1/31/18 |
| Net asset value, beginning of period | $6.28 | $6.32 | $6.00 | $6.25 | $6.17 |
| Income (loss) from investment operations |
| Net investment income (loss) (d) | $0.26 | $0.27 | $0.29 | $0.28 | $0.29 |
| Net realized and unrealized gain (loss) | (0.24) | (0.04) | 0.32 | (0.25) | 0.08 |
| Total from investment operations | $0.02 | $0.23 | $0.61 | $0.03 | $0.37 |
| Less distributions declared to shareholders |
| From net investment income | $(0.33) | $(0.27) | $(0.29) | $(0.28) | $(0.24) |
| From tax return of capital | — | — | — | — | (0.05) |
| Total distributions declared to shareholders | $(0.33) | $(0.27) | $(0.29) | $(0.28) | $(0.29) |
| Net asset value, end of period (x) | $5.97 | $6.28 | $6.32 | $6.00 | $6.25 |
| Total return (%) (r)(s)(t)(x) | 0.17 | 3.87 | 10.28 | 0.50 | 6.12 |
Ratios (%) (to average net assets)
and Supplemental data: |
| Expenses before expense reductions (f)(h) | 1.16 | 1.17 | 1.15 | 1.14 | 1.16 |
| Expenses after expense reductions (f)(h) | 1.05 | 1.05 | 1.05 | 1.05 | 1.05 |
| Net investment income (loss) | 4.18 | 4.47 | 4.62 | 4.70 | 4.64 |
| Portfolio turnover | 38 | 22 | 26 | 13 | 26 |
| Net assets at end of period (000 omitted) | $2,567 | $2,286 | $2,347 | $10,444 | $10,392 |
See Notes to Financial Statements
Financial Highlights – continued
| Class R4 | Year ended |
| | 1/31/22 | 1/31/21 | 1/31/20 | 1/31/19 | 1/31/18 |
| Net asset value, beginning of period | $6.27 | $6.31 | $6.03 | $6.28 | $6.20 |
| Income (loss) from investment operations |
| Net investment income (loss) (d) | $0.28 | $0.28 | $0.30 | $0.30 | $0.31 |
| Net realized and unrealized gain (loss) | (0.24) | (0.04) | 0.28 | (0.26) | 0.08 |
| Total from investment operations | $0.04 | $0.24 | $0.58 | $0.04 | $0.39 |
| Less distributions declared to shareholders |
| From net investment income | $(0.34) | $(0.28) | $(0.30) | $(0.29) | $(0.26) |
| From tax return of capital | — | — | — | — | (0.05) |
| Total distributions declared to shareholders | $(0.34) | $(0.28) | $(0.30) | $(0.29) | $(0.31) |
| Net asset value, end of period (x) | $5.97 | $6.27 | $6.31 | $6.03 | $6.28 |
| Total return (%) (r)(s)(t)(x) | 0.58 | 4.13 | 9.83 | 0.77 | 6.38 |
Ratios (%) (to average net assets)
and Supplemental data: |
| Expenses before expense reductions (f)(h) | 0.91 | 0.92 | 0.90 | 0.89 | 0.91 |
| Expenses after expense reductions (f)(h) | 0.80 | 0.80 | 0.80 | 0.80 | 0.80 |
| Net investment income (loss) | 4.42 | 4.72 | 4.76 | 4.94 | 4.89 |
| Portfolio turnover | 38 | 22 | 26 | 13 | 26 |
| Net assets at end of period (000 omitted) | $6,316 | $6,406 | $6,689 | $6,885 | $7,381 |
| Class R6 | Year ended |
| | 1/31/22 | 1/31/21 | 1/31/20 | 1/31/19 | 1/31/18 |
| Net asset value, beginning of period | $6.23 | $6.27 | $5.99 | $6.24 | $6.16 |
| Income (loss) from investment operations |
| Net investment income (loss) (d) | $0.28 | $0.29 | $0.30 | $0.30 | $0.31 |
| Net realized and unrealized gain (loss) | (0.23) | (0.04) | 0.29 | (0.25) | 0.08 |
| Total from investment operations | $0.05 | $0.25 | $0.59 | $0.05 | $0.39 |
| Less distributions declared to shareholders |
| From net investment income | $(0.35) | $(0.29) | $(0.31) | $(0.30) | $(0.26) |
| From tax return of capital | — | — | — | — | (0.05) |
| Total distributions declared to shareholders | $(0.35) | $(0.29) | $(0.31) | $(0.30) | $(0.31) |
| Net asset value, end of period (x) | $5.93 | $6.23 | $6.27 | $5.99 | $6.24 |
| Total return (%) (r)(s)(t)(x) | 0.65 | 4.23 | 9.98 | 0.85 | 6.49 |
Ratios (%) (to average net assets)
and Supplemental data: |
| Expenses before expense reductions (f)(h) | 0.81 | 0.81 | 0.80 | 0.79 | 0.81 |
| Expenses after expense reductions (f)(h) | 0.70 | 0.70 | 0.70 | 0.70 | 0.70 |
| Net investment income (loss) | 4.53 | 4.81 | 4.84 | 5.04 | 4.90 |
| Portfolio turnover | 38 | 22 | 26 | 13 | 26 |
| Net assets at end of period (000 omitted) | $20,365 | $22,976 | $21,846 | $19,019 | $16,943 |
See Notes to Financial Statements
Financial Highlights – continued
| (d) | Per share data is based on average shares outstanding. |
| (f) | Ratios do not reflect reductions from fees paid indirectly, if applicable. See Note 2 in the Notes to Financial Statements for additional information. |
| (h) | In addition to the fees and expenses which the fund bears directly, the fund indirectly bears a pro rata share of the fees and expenses of the underlying affiliated funds in which the fund invests. Accordingly, the expense ratio for the fund reflects only those fees and expenses borne directly by the fund. Because the underlying affiliated funds have varied expense and fee levels and the fund may own different proportions of the underlying affiliated funds at different times, the amount of fees and expenses incurred indirectly by the fund will vary. |
| (r) | Certain expenses have been reduced without which performance would have been lower. |
| (s) | From time to time the fund may receive proceeds from litigation settlements, without which performance would be lower. |
| (t) | Total returns do not include any applicable sales charges. |
| (x) | The net asset values and total returns have been calculated on net assets which include adjustments made in accordance with U.S. generally accepted accounting principles required at period end for financial reporting purposes. |
See Notes to Financial Statements
Notes to Financial Statements
(1) Business and Organization
MFS Global High Yield Fund (the fund) is a diversified series of MFS Series Trust III (the trust). The trust is organized as a Massachusetts business trust and is registered under the Investment Company Act of 1940, as amended, as an open-end management investment company.
The fund is an investment company and accordingly follows the investment company accounting and reporting guidance of the Financial Accounting Standards Board (FASB) Accounting Standards Codification Topic 946 Financial Services - Investment Companies.
(2) Significant Accounting Policies
General — The preparation of financial statements in conformity with U.S. generally accepted accounting principles requires management to make estimates and assumptions that affect the reported amounts of assets and liabilities, and disclosure of contingent assets and liabilities at the date of the financial statements and the reported amounts of increases and decreases in net assets from operations during the reporting period. Actual results could differ from those estimates. In the preparation of these financial statements, management has evaluated subsequent events occurring after the date of the fund’s Statement of Assets and Liabilities through the date that the financial statements were issued. As of January 31, 2022, 60.5% of the fund’s net assets was invested in the MFS High Yield Pooled Portfolio (“High Yield Pooled Portfolio”). MFS does not receive a management fee from the High Yield Pooled Portfolio. The High Yield Pooled Portfolio’s investment objective is to seek total return with an emphasis on high current income, but also considering capital appreciation. The accounting policies of the High Yield Pooled Portfolio are outlined in its shareholder report. The accounting policies detailed in the Significant Accounting Policies note cover both the fund and the High Yield Pooled Portfolio. For purposes of this policy disclosure, “fund” refers to both the fund and the High Yield Pooled Portfolio in which the fund invests. The High Yield Pooled Portfolio’s shareholder report is not covered by this report. The current shareholder report for the High Yield Pooled Portfolio as of January 31, 2022 has been included as Appendix A, and should be read in conjunction with the fund's financial statements. The fund and the High Yield Pooled Portfolio invest in high-yield securities rated below investment grade. Investments in below investment grade quality securities can involve a substantially greater risk of default or can already be in default, and their values can decline significantly. Below investment grade quality securities tend to be more sensitive to adverse news about the issuer, or the market or economy in general, than higher quality debt instruments. The fund and the High Yield Pooled Portfolio invest in foreign securities. Investments in foreign securities are vulnerable to the effects of changes in the relative values of the local currency and the U.S. dollar and to the effects of changes in each country’s market, economic, industrial, political, regulatory, geopolitical, environmental, public health, and other conditions.
Balance Sheet Offsetting — The fund's accounting policy with respect to balance sheet offsetting is that, absent an event of default by the counterparty or a termination of the agreement, the International Swaps and Derivatives Association (ISDA) Master Agreement, or similar agreement, does not result in an offset of reported amounts of financial assets and financial liabilities in the Statement of Assets and Liabilities across transactions between the fund and the applicable counterparty. The fund's right to
Notes to Financial Statements - continued
setoff may be restricted or prohibited by the bankruptcy or insolvency laws of the particular jurisdiction to which a specific master netting agreement counterparty is subject. Balance sheet offsetting disclosures, to the extent applicable to the fund, have been included in the fund’s Significant Accounting Policies note under the captions for each of the fund’s in-scope financial instruments and transactions.
Investment Valuations — The investments of the fund and the High Yield Pooled Portfolio are valued as described below.
Equity securities, including restricted equity securities, are generally valued at the last sale or official closing price on their primary market or exchange as provided by a third-party pricing service. Equity securities, for which there were no sales reported that day, are generally valued at the last quoted daily bid quotation on their primary market or exchange as provided by a third-party pricing service. Debt instruments and floating rate loans, including restricted debt instruments, are generally valued at an evaluated or composite bid as provided by a third-party pricing service. Short-term instruments with a maturity at issuance of 60 days or less may be valued at amortized cost, which approximates market value. Futures contracts are generally valued at last posted settlement price on their primary exchange as provided by a third-party pricing service. Futures contracts for which there were no trades that day for a particular position are generally valued at the closing bid quotation on their primary exchange as provided by a third-party pricing service. Forward foreign currency exchange contracts are generally valued at the mean of bid and asked prices for the time period interpolated from rates provided by a third-party pricing service for proximate time periods. Open-end investment companies are generally valued at net asset value per share. Securities and other assets generally valued on the basis of information from a third-party pricing service may also be valued at a broker/dealer bid quotation. In determining values, third-party pricing services can utilize both transaction data and market information such as yield, quality, coupon rate, maturity, type of issue, trading characteristics, and other market data. The values of foreign securities and other assets and liabilities expressed in foreign currencies are converted to U.S. dollars using the mean of bid and asked prices for rates provided by a third-party pricing service.
The Board of Trustees has delegated primary responsibility for determining or causing to be determined the value of the fund’s investments (including any fair valuation) to the adviser pursuant to valuation policies and procedures approved by the Board. If the adviser determines that reliable market quotations are not readily available, investments are valued at fair value as determined in good faith by the adviser in accordance with such procedures under the oversight of the Board of Trustees. Under the fund’s valuation policies and procedures, market quotations are not considered to be readily available for most types of debt instruments and floating rate loans and many types of derivatives. These investments are generally valued at fair value based on information from third-party pricing services. In addition, investments may be valued at fair value if the adviser determines that an investment’s value has been materially affected by events occurring after the close of the exchange or market on which the investment is principally traded (such as foreign exchange or market) and prior to the determination of the fund’s net asset value, or after the halt of trading of a specific security where trading does not resume prior to the close of the exchange or market on which the security is principally traded. The adviser generally relies on third-party pricing services or other information (such as the correlation with price movements of similar securities in the same or other markets; the type, cost and investment characteristics of the security; the business and financial condition of the issuer; and trading and other
Notes to Financial Statements - continued
market data) to assist in determining whether to fair value and at what value to fair value an investment. The value of an investment for purposes of calculating the fund’s net asset value can differ depending on the source and method used to determine value. When fair valuation is used, the value of an investment used to determine the fund’s net asset value may differ from quoted or published prices for the same investment. There can be no assurance that the fund could obtain the fair value assigned to an investment if it were to sell the investment at the same time at which the fund determines its net asset value per share.
Various inputs are used in determining the value of the fund's assets or liabilities. These inputs are categorized into three broad levels. In certain cases, the inputs used to measure fair value may fall into different levels of the fair value hierarchy. In such cases, an investment's level within the fair value hierarchy is based on the lowest level of input that is significant to the fair value measurement. The fund's assessment of the significance of a particular input to the fair value measurement in its entirety requires judgment, and considers factors specific to the investment. Level 1 includes unadjusted quoted prices in active markets for identical assets or liabilities. Level 2 includes other significant observable market-based inputs (including quoted prices for similar securities, interest rates, prepayment speed, and credit risk). Level 3 includes unobservable inputs, which may include the adviser's own assumptions in determining the fair value of investments. Other financial instruments are derivative instruments, such as forward foreign currency exchange contracts. The following is a summary of the levels used as of January 31, 2022 in valuing the fund's assets and liabilities:
| Financial Instruments | Level 1 | Level 2 | Level 3 | Total |
| Equity Securities: | | | | |
| Mexico | $— | $— | $208,768 | $208,768 |
| United Kingdom | — | 91,195 | — | 91,195 |
| Non - U.S. Sovereign Debt | — | 8,423,805 | — | 8,423,805 |
| U.S. Corporate Bonds | — | 6,176,793 | — | 6,176,793 |
| Commercial Mortgage-Backed Securities | — | 0 | — | 0 |
| Foreign Bonds | — | 89,079,835 | — | 89,079,835 |
| Mutual Funds | 165,756,132 | — | — | 165,756,132 |
| Total | $165,756,132 | $103,771,628 | $208,768 | $269,736,528 |
| Other Financial Instruments | | | | |
| Forward Foreign Currency Exchange Contracts – Assets | $— | $617,052 | $— | $617,052 |
| Forward Foreign Currency Exchange Contracts – Liabilities | — | (6,946) | — | (6,946) |
For further information regarding security characteristics, see the Portfolio of Investments. Please refer to the High Yield Pooled Portfolio's shareholder report for further information regarding the levels used in valuing its assets or liabilities.
Notes to Financial Statements - continued
The following is a reconciliation of level 3 assets for which significant unobservable inputs were used to determine fair value. The table presents the activity of level 3 securities held at the beginning and the end of the period.
| | Equity
Securities | Fixed Income
Securities |
| Balance as of 1/31/21 | $— | $0 |
| Realized gain (loss) | — | (1,502,685) |
| Change in unrealized appreciation or depreciation | — | 1,502,685 |
| Transfers into level 3 | 208,768 | — |
| Disposition of worthless securities | — | 0 |
| Balance as of 1/31/22 | $208,768 | $— |
At January 31, 2022, the fund held one level 3 security.
Foreign Currency Translation — Purchases and sales of foreign investments, income, and expenses are converted into U.S. dollars based upon currency exchange rates prevailing on the respective dates of such transactions or on the reporting date for foreign denominated receivables and payables. Gains and losses attributable to foreign currency exchange rates on sales of securities are recorded for financial statement purposes as net realized gains and losses on investments. Gains and losses attributable to foreign exchange rate movements on receivables, payables, income and expenses are recorded for financial statement purposes as foreign currency transaction gains and losses. That portion of both realized and unrealized gains and losses on investments that results from fluctuations in foreign currency exchange rates is not separately disclosed.
Derivatives — The fund uses derivatives primarily to increase or decrease exposure to a particular market or segment of the market, or security, to increase or decrease interest rate or currency exposure, or as alternatives to direct investments. Derivatives are used for hedging or non-hedging purposes. While hedging can reduce or eliminate losses, it can also reduce or eliminate gains. When the fund uses derivatives as an investment to increase market exposure, or for hedging purposes, gains and losses from derivative instruments may be substantially greater than the derivative’s original cost.
The derivative instruments used by the fund during the period were futures contracts and forward foreign currency exchange contracts. Depending on the type of derivative, a fund may exit a derivative position by entering into an offsetting transaction with a counterparty or exchange, negotiating an agreement with the derivative counterparty, or novating the position to a third party. The fund may be unable to promptly close out a futures position in instances where the daily fluctuation in the price for that type of future exceeds the daily limit set by the exchange. The fund's period end derivatives, as presented in the Portfolio of Investments and the associated Derivative Contract tables, generally are indicative of the volume of its derivative activity during the period.
Notes to Financial Statements - continued
The following table presents, by major type of derivative contract, the fair value, on a gross basis, of the asset and liability components of derivatives held by the fund at January 31, 2022 as reported in the Statement of Assets and Liabilities:
| | | Fair Value |
| Risk | Derivative Contracts | Asset Derivatives | Liability Derivatives |
| Foreign Exchange | Forward Foreign Currency Exchange Contracts | $617,052 | $(6,946) |
The following table presents, by major type of derivative contract, the realized gain (loss) on derivatives held by the fund for the year ended January 31, 2022 as reported in the Statement of Operations:
| Risk | Futures
Contracts | Forward Foreign
Currency
Exchange
Contracts |
| Interest Rate | $256,549 | $ — |
| Foreign Exchange | — | 3,546,620 |
| Total | $256,549 | $3,546,620 |
The following table presents, by major type of derivative contract, the change in unrealized appreciation or depreciation on derivatives held by the fund for the year ended January 31, 2022 as reported in the Statement of Operations:
| Risk | Futures
Contracts | Forward Foreign
Currency
Exchange
Contracts |
| Interest Rate | $(37,700) | $ — |
| Foreign Exchange | — | 534,736 |
| Total | $(37,700) | $534,736 |
Derivative counterparty credit risk is managed through formal evaluation of the creditworthiness of all potential counterparties. On certain, but not all, uncleared derivatives, the fund attempts to reduce its exposure to counterparty credit risk whenever possible by entering into an ISDA Master Agreement on a bilateral basis. The ISDA Master Agreement gives each party to the agreement the right to terminate all transactions traded under such agreement if there is a specified deterioration in the credit quality of the other party. Upon an event of default or a termination of the ISDA Master Agreement, the non-defaulting party has the right to close out all transactions traded under such agreement and to net amounts owed under each agreement to one net amount payable by one party to the other. This right to close out and net payments across all transactions traded under the ISDA Master Agreement could result in a reduction of the fund's credit risk to such counterparty equal to any amounts payable by the fund under the applicable transactions, if any.
Collateral and margin requirements differ by type of derivative. For cleared derivatives (e.g., futures contracts, cleared swaps, and exchange-traded options), margin requirements are set by the clearing broker and the clearing house and collateral, in the form of cash or securities, is posted by the fund directly with the clearing broker.
Notes to Financial Statements - continued
Collateral terms are counterparty agreement specific for uncleared derivatives (e.g., forward foreign currency exchange contracts, uncleared swap agreements, and uncleared options) and collateral, in the form of cash and securities, is held in segregated accounts with the fund's custodian in connection with these agreements. For derivatives traded under an ISDA Master Agreement, which contains a collateral support annex, the collateral requirements are netted across all transactions traded under such counterparty-specific agreement and an amount is posted from one party to the other to collateralize such obligations. Cash that has been segregated or delivered to cover the fund's collateral or margin obligations under derivative contracts, if any, will be reported separately in the Statement of Assets and Liabilities as restricted cash for uncleared derivatives and/or deposits with brokers for cleared derivatives. Securities pledged as collateral or margin for the same purpose, if any, are noted in the Portfolio of Investments. The fund may be required to make payments of interest on uncovered collateral or margin obligations with the broker. Any such payments are included in “Miscellaneous” expense in the Statement of Operations.
Futures Contracts — The fund entered into futures contracts which may be used to hedge against or obtain broad market exposure, interest rate exposure, currency exposure, or to manage duration. A futures contract represents a commitment for the future purchase or sale of an asset at a specified price on a specified date.
Upon entering into a futures contract, the fund is required to deposit with the broker, either in cash or securities, an initial margin in an amount equal to a specified percentage of the notional amount of the contract. Subsequent payments (variation margin) are made or received by the fund each day, depending on the daily fluctuations in the value of the contract, and are recorded for financial statement purposes as unrealized gain or loss by the fund until the contract is closed or expires at which point the gain or loss on futures contracts is realized.
The fund bears the risk of interest rates, exchange rates or securities prices moving unexpectedly, in which case, the fund may not achieve the anticipated benefits of the futures contracts and may realize a loss. While futures contracts may present less counterparty risk to the fund since the contracts are exchange traded and the exchange’s clearinghouse guarantees payments to the broker, there is still counterparty credit risk due to the insolvency of the broker. The fund’s maximum risk of loss due to counterparty credit risk is equal to the margin posted by the fund to the broker plus any gains or minus any losses on the outstanding futures contracts.
Forward Foreign Currency Exchange Contracts — The fund entered into forward foreign currency exchange contracts for the purchase or sale of a specific foreign currency at a fixed price on a future date. These contracts may be used to hedge the fund’s currency risk or for non-hedging purposes. For hedging purposes, the fund may enter into contracts to deliver or receive foreign currency that the fund will receive from or use in its normal investment activities. The fund may also use contracts to hedge against declines in the value of foreign currency denominated securities due to unfavorable exchange rate movements. For non-hedging purposes, the fund may enter into contracts with the intent of changing the relative exposure of the fund’s portfolio of securities to different currencies to take advantage of anticipated exchange rate changes.
Notes to Financial Statements - continued
Forward foreign currency exchange contracts are adjusted by the daily exchange rate of the underlying currency and any unrealized gains or losses are recorded as a receivable or payable for forward foreign currency exchange contracts until the contract settlement date. On contract settlement date, any gain or loss on the contract is recorded as realized gains or losses on forward foreign currency exchange contracts.
Risks may arise upon entering into these contracts from unanticipated movements in the value of the contract and from the potential inability of counterparties to meet the terms of their contracts. Generally, the fund’s maximum risk due to counterparty credit risk is the unrealized gain on the contract due to the use of Continuous Linked Settlement, a multicurrency cash settlement system for the centralized settlement of foreign transactions. This risk is mitigated in cases where there is an ISDA Master Agreement between the fund and the counterparty providing for netting as described above and, where applicable, by the posting of collateral by the counterparty to the fund to cover the fund’s exposure to the counterparty under such ISDA Master Agreement.
Loans and Other Direct Debt Instruments — The fund invests in loans and loan participations or other receivables. These investments may include standby financing commitments, including revolving credit facilities, which contractually obligate the fund to supply additional cash to the borrower on demand. The fund generally provides this financial support in order to preserve its existing investment or to obtain a more senior secured interest in the assets of the borrower. Loan participations involve a risk of insolvency of the lending bank or other financial intermediary.
Indemnifications — Under the fund's organizational documents, its officers and Trustees may be indemnified against certain liabilities and expenses arising out of the performance of their duties to the fund. Additionally, in the normal course of business, the fund enters into agreements with service providers that may contain indemnification clauses. The fund's maximum exposure under these agreements is unknown as this would involve future claims that may be made against the fund that have not yet occurred.
Investment Transactions and Income — Investment transactions are recorded on the trade date. Some securities may be purchased or sold on an extended settlement basis, which means that the receipt or delivery of the securities by the fund and related payments occur at a future date, usually beyond the customary settlement period.
Interest income is recorded on the accrual basis. All premium and discount is amortized or accreted for financial statement purposes in accordance with U.S. generally accepted accounting principles. Dividends received in cash are recorded on the ex-dividend date. Certain dividends from foreign securities will be recorded when the fund is informed of the dividend if such information is obtained subsequent to the ex-dividend date. Dividend and interest payments received in additional securities are recorded on the ex-dividend or ex-interest date in an amount equal to the value of the security on such date. In determining the net gain or loss on securities sold, the cost of securities is determined on the identified cost basis. The fund earns certain fees in connection with its floating rate loan purchasing activities. These fees are in addition to interest payments earned and may include amendment fees, commitment fees, facility fees, consent fees, and prepayment fees. Commitment fees are recorded on an accrual basis as income in the accompanying financial statements. Distributions of income and capital gains from the High Yield Pooled Portfolio are recorded on the ex-dividend date.
Debt obligations may be placed on non-accrual status or set to accrue at a rate of
Notes to Financial Statements - continued
interest less than the contractual coupon when the collection of all or a portion of interest has become doubtful. Interest income for those debt obligations may be further reduced by the write-off of the related interest receivables when deemed uncollectible.
The MFS Global High Yield Fund may receive proceeds from litigation settlements. Any proceeds received from litigation involving portfolio holdings are reflected in the Statement of Operations in realized gain/loss if the security has been disposed of by the fund or in unrealized gain/loss if the security is still held by the fund. Any other proceeds from litigation not related to portfolio holdings are reflected as other income in the Statement of Operations.
The fund may purchase or sell securities on a when-issued or delayed delivery basis. In these extended settlement transactions, the receipt or delivery of the securities by the fund and related payments occur at a future date, usually beyond the normal settlement period. The price of such security and the date that the security will be settled are generally fixed at the time the transaction is negotiated. The value of the security varies with market fluctuations and for debt securities no interest accrues to the fund until settlement takes place. When the fund sells securities on a when-issued or delayed delivery basis, the fund typically owns or has the right to acquire securities equivalent in kind and amount to the securities sold. Purchase and sale commitments for when-issued or delayed delivery securities are held at carrying amount, which approximates fair value and are categorized as level 2 within the fair value hierarchy, and included in When-issued investments purchased in the Statement of Assets and Liabilities. Losses may arise due to changes in the value of the underlying securities prior to settlement date or if the counterparty does not perform under the contract’s terms, or if the issuer does not issue the securities due to political, economic or other factors. At the time that it enters into a when-issued or delayed delivery transaction, the fund is required to have sufficient cash and/or liquid securities to cover its commitments.
Fees Paid Indirectly — The fund's custody fee may be reduced by a credit earned under an arrangement that measures the value of U.S. dollars deposited with the custodian by the fund. The amount of the credit, for the year ended January 31, 2022, is shown as a reduction of total expenses in the Statement of Operations.
Tax Matters and Distributions — The fund intends to qualify as a regulated investment company, as defined under Subchapter M of the Internal Revenue Code, and to distribute all of its taxable income, including realized capital gains. As a result, no provision for federal income tax is required. The fund’s federal tax returns, when filed, will remain subject to examination by the Internal Revenue Service for a three year period. Management has analyzed the fund’s tax positions taken on federal and state tax returns for all open tax years and does not believe that there are any uncertain tax positions that require recognition of a tax liability. Foreign taxes, if any, have been accrued by the fund in the accompanying financial statements in accordance with the applicable foreign tax law. Foreign income taxes may be withheld by certain countries in which the fund invests. Additionally, capital gains realized by the fund on securities issued in or by certain foreign countries may be subject to capital gains tax imposed by those countries.
Distributions to shareholders are recorded on the ex-dividend date. Income and capital gain distributions are determined in accordance with income tax regulations, which may differ from U.S. generally accepted accounting principles. Certain capital accounts
Notes to Financial Statements - continued
in the financial statements are periodically adjusted for permanent differences in order to reflect their tax character. These adjustments have no impact on net assets or net asset value per share. Temporary differences which arise from recognizing certain items of income, expense, gain or loss in different periods for financial statement and tax purposes will reverse at some time in the future.
Book/tax differences primarily relate to defaulted bonds, amortization and accretion of debt securities, wash sale loss deferrals, and derivative transactions.
The tax character of distributions declared to shareholders for the last two fiscal years is as follows:
| | Year ended
1/31/22 | Year ended
1/31/21 |
| Ordinary income (including any short-term capital gains) | $15,713,464 | $13,094,506 |
The federal tax cost and the tax basis components of distributable earnings were as follows:
| As of 1/31/22 | |
| Cost of investments | $295,086,875 |
| Gross appreciation | 1,102,525 |
| Gross depreciation | (25,842,766) |
| Net unrealized appreciation (depreciation) | $ (24,740,241) |
| Undistributed ordinary income | 4,875,228 |
| Capital loss carryforwards | (36,523,284) |
| Other temporary differences | (941,003) |
| Total distributable earnings (loss) | $ (57,329,300) |
As of January 31, 2022, the fund had capital loss carryforwards available to offset future realized gains. These net capital losses may be carried forward indefinitely and their character is retained as short-term and/or long-term losses. Such losses are characterized as follows:
| Short-Term | $(2,035,240) |
| Long-Term | (34,488,044) |
| Total | $(36,523,284) |
Multiple Classes of Shares of Beneficial Interest — The fund offers multiple classes of shares, which differ in their respective distribution and service fees. The fund's income and common expenses are allocated to shareholders based on the value of settled shares outstanding of each class. The fund's realized and unrealized gain (loss) are allocated to shareholders based on the daily net assets of each class. Dividends are declared separately for each class. Differences in per share dividend rates are generally due to differences in separate class expenses. Class B and Class C shares will convert to
Notes to Financial Statements - continued
Class A shares approximately eight years after purchase. The fund’s distributions declared to shareholders as reported in the Statements of Changes in Net Assets are presented by class as follows:
| | Year ended
1/31/22 | Year ended
1/31/21 |
| Class A | $8,376,919 | $7,952,561 |
| Class B | 101,337 | 149,724 |
| Class C | 359,031 | 598,157 |
| Class I | 5,165,871 | 2,999,478 |
| Class R1 | 3,185 | 2,394 |
| Class R2 | 24,610 | 18,155 |
| Class R3 | 130,568 | 98,517 |
| Class R4 | 352,580 | 294,498 |
| Class R6 | 1,199,363 | 981,022 |
| Total | $15,713,464 | $13,094,506 |
(3) Transactions with Affiliates
Investment Adviser — The fund has an investment advisory agreement with MFS to provide overall investment management and related administrative services and facilities to the fund. The management fee is computed daily and paid monthly at the following annual rates based on the fund's average daily net assets:
| Up to $1.5 billion | 0.65% |
| In excess of $1.5 billion and up to $2.5 billion | 0.60% |
| In excess of $2.5 billion | 0.55% |
MFS has agreed in writing to reduce its management fee by a specified amount if certain MFS mutual fund assets exceed thresholds agreed to by MFS and the fund's Board of Trustees. For the year ended January 31, 2022, this management fee reduction amounted to $38,587, which is included in the reduction of total expenses in the Statement of Operations. The management fee incurred for the year ended January 31, 2022 was equivalent to an annual effective rate of 0.64% of the fund's average daily net assets.
The investment adviser has agreed in writing to pay a portion of the fund’s total annual operating expenses, excluding interest, taxes, extraordinary expenses, brokerage and transaction costs, and investment-related expenses (such as fees and expenses associated with investments in investment companies and other similar investment vehicles), such that total fund operating expenses do not exceed the following rates annually of each class’s average daily net assets:
| | | | | Classes | | | | |
| A | B | C | I | R1 | R2 | R3 | R4 | R6 |
| 1.05% | 1.80% | 1.80% | 0.80% | 1.80% | 1.30% | 1.05% | 0.80% | 0.73% |
This written agreement will continue until modified by the fund’s Board of Trustees, but such agreement will continue at least until May 31, 2023. For the year ended January 31, 2022, this reduction amounted to $293,848, which is included in the reduction of total expenses in the Statement of Operations.
Notes to Financial Statements - continued
Distributor — MFS Fund Distributors, Inc. (MFD), a wholly-owned subsidiary of MFS, as distributor, received $1,997 for the year ended January 31, 2022, as its portion of the initial sales charge on sales of Class A shares of the fund.
The Board of Trustees has adopted a distribution plan for certain share classes pursuant to Rule 12b-1 of the Investment Company Act of 1940.
The fund's distribution plan provides that the fund will pay MFD for services provided by MFD and financial intermediaries in connection with the distribution and servicing of certain share classes. One component of the plan is a distribution fee paid to MFD and another component of the plan is a service fee paid to MFD. MFD may subsequently pay all, or a portion, of the distribution and/or service fees to financial intermediaries.
Distribution Plan Fee Table:
| | Distribution
Fee Rate (d) | Service
Fee Rate (d) | Total
Distribution
Plan (d) | Annual
Effective
Rate (e) | Distribution
and Service
Fee |
| Class A | — | 0.25% | 0.25% | 0.25% | $ 414,432 |
| Class B | 0.75% | 0.25% | 1.00% | 1.00% | 23,550 |
| Class C | 0.75% | 0.25% | 1.00% | 1.00% | 81,421 |
| Class R1 | 0.75% | 0.25% | 1.00% | 1.00% | 717 |
| Class R2 | 0.25% | 0.25% | 0.50% | 0.50% | 2,564 |
| Class R3 | — | 0.25% | 0.25% | 0.25% | 6,066 |
| Total Distribution and Service Fees | | | | | $528,750 |
| (d) | In accordance with the distribution plan for certain classes, the fund pays distribution and/or service fees equal to these annual percentage rates of each class’s average daily net assets. The distribution and service fee rates disclosed by class represent the current rates in effect at the end of the reporting period. Any rate changes, if applicable, are detailed below. |
| (e) | The annual effective rates represent actual fees incurred under the distribution plan for the year ended January 31, 2022 based on each class's average daily net assets. MFD has voluntarily agreed to rebate a portion of each class's 0.25% service fee attributable to accounts for which there is no financial intermediary specified on the account except for accounts attributable to MFS or its affiliates' seed money. For the year ended January 31, 2022, this rebate amounted to $62 and $3 for Class A and Class B, respectively, and is included in the reduction of total expenses in the Statement of Operations. |
Certain Class A shares are subject to a contingent deferred sales charge (CDSC) in the event of a shareholder redemption within 18 months of purchase. Class B shares are subject to a CDSC in the event of a shareholder redemption within six years of purchase. Class C shares are subject to a CDSC in the event of a shareholder redemption within 12 months of purchase. All contingent deferred sales charges are paid to MFD and during the year ended January 31, 2022, were as follows:
| | Amount |
| Class A | $1,693 |
| Class B | 1,355 |
| Class C | 423 |
Shareholder Servicing Agent — MFS Service Center, Inc. (MFSC), a wholly-owned subsidiary of MFS, receives a fee from the fund for its services as shareholder servicing agent calculated as a percentage of the average daily net assets of the fund as
Notes to Financial Statements - continued
determined periodically under the supervision of the fund's Board of Trustees. For the year ended January 31, 2022, the fee was $54,507, which equated to 0.0182% annually of the fund's average daily net assets. MFSC also receives reimbursement from the fund for out-of-pocket expenses, sub-accounting and other shareholder servicing costs which may be paid to affiliated and unaffiliated service providers. Class R6 shares do not incur sub-accounting fees. For the year ended January 31, 2022, these out-of-pocket expenses, sub-accounting and other shareholder servicing costs amounted to $310,067.
Administrator — MFS provides certain financial, legal, shareholder communications, compliance, and other administrative services to the fund. Under an administrative services agreement, the fund reimburses MFS the costs incurred to provide these services. The fund is charged an annual fixed amount of $17,500 plus a fee based on average daily net assets. The administrative services fee incurred for the year ended January 31, 2022 was equivalent to an annual effective rate of 0.0167% of the fund's average daily net assets.
Trustees’ and Officers’ Compensation — The fund pays compensation to independent Trustees in the form of a retainer, attendance fees, and additional compensation to Board and Committee chairpersons. The fund does not pay compensation directly to Trustees or officers of the fund who are also officers of the investment adviser, all of whom receive remuneration from MFS for their services to the fund. Certain officers and Trustees of the fund are officers or directors of MFS, MFD, and MFSC.
Other — The fund invests in the MFS Institutional Money Market Portfolio which is managed by MFS and seeks current income consistent with preservation of capital and liquidity. This money market fund does not pay a management fee to MFS but does incur investment and operating costs.
The fund invests in the High Yield Pooled Portfolio, which is a mutual fund advised by MFS that does not pay management fees to MFS but does incur investment and operating costs. The fund invests in the High Yield Pooled Portfolio to gain exposure to high income debt instruments, rather than investing in high income debt instruments directly (see Appendix A). Income earned on this investment is included in “Dividends from affiliated issuers” in the Statement of Operations. The High Yield Pooled Portfolio does not pay distribution and/or service fees to MFD.
At January 31, 2022, MFS held approximately 93% of the outstanding shares of Class R1.
(4) Portfolio Securities
For the year ended January 31, 2022, purchases and sales of investments, other than short-term obligations, aggregated $110,883,538 and $134,311,276, respectively.
Notes to Financial Statements - continued
(5) Shares of Beneficial Interest
The fund's Declaration of Trust permits the Trustees to issue an unlimited number of full and fractional shares of beneficial interest. Transactions in fund shares were as follows:
| | Year ended
1/31/22 | | Year ended
1/31/21 |
| | Shares | Amount | | Shares | Amount |
| Shares sold | | | | | |
| Class A | 3,464,556 | $21,572,803 | | 5,725,315 | $34,409,637 |
| Class B | 7,482 | 45,873 | | 23,272 | 133,786 |
| Class C | 146,805 | 914,045 | | 158,476 | 954,066 |
| Class I | 12,064,096 | 75,652,026 | | 6,965,308 | 41,408,714 |
| Class R1 | 468 | 2,923 | | 708 | 4,219 |
| Class R2 | 11,835 | 73,366 | | 49,325 | 290,500 |
| Class R3 | 113,303 | 707,062 | | 49,191 | 293,428 |
| Class R4 | 169,088 | 1,055,204 | | 200,417 | 1,170,546 |
| Class R6 | 615,739 | 3,826,706 | | 1,089,373 | 6,609,153 |
| | 16,593,372 | $103,850,008 | | 14,261,385 | $85,274,049 |
Shares issued to shareholders
in reinvestment of distributions | | | | | |
| Class A | 1,147,855 | $7,096,313 | | 1,031,302 | $6,165,462 |
| Class B | 16,030 | 99,360 | | 24,773 | 147,728 |
| Class C | 57,976 | 357,833 | | 93,885 | 559,009 |
| Class I | 833,939 | 5,145,310 | | 496,620 | 2,980,992 |
| Class R1 | 516 | 3,185 | | 399 | 2,391 |
| Class R2 | 3,942 | 24,427 | | 3,008 | 18,147 |
| Class R3 | 21,038 | 130,568 | | 16,368 | 98,488 |
| Class R4 | 56,752 | 352,525 | | 48,997 | 294,498 |
| Class R6 | 173,957 | 1,073,072 | | 132,609 | 792,187 |
| | 2,312,005 | $14,282,593 | | 1,847,961 | $11,058,902 |
| Shares reacquired | | | | | |
| Class A | (11,421,204) | $(71,490,927) | | (9,917,270) | $(58,814,474) |
| Class B | (200,740) | (1,250,781) | | (475,473) | (2,811,624) |
| Class C | (376,995) | (2,343,120) | | (2,191,176) | (13,323,226) |
| Class I | (8,379,025) | (51,651,218) | | (6,048,805) | (35,169,181) |
| Class R1 | (692) | (4,303) | | (573) | (3,430) |
| Class R2 | (24,272) | (150,870) | | (18,249) | (110,637) |
| Class R3 | (68,978) | (426,592) | | (72,930) | (429,722) |
| Class R4 | (189,152) | (1,181,485) | | (287,910) | (1,742,687) |
| Class R6 | (1,043,161) | (6,476,643) | | (1,017,694) | (6,045,376) |
| | (21,704,219) | $(134,975,939) | | (20,030,080) | $(118,450,357) |
Notes to Financial Statements - continued
| | Year ended
1/31/22 | | Year ended
1/31/21 |
| | Shares | Amount | | Shares | Amount |
| Net change | | | | | |
| Class A | (6,808,793) | $(42,821,811) | | (3,160,653) | $(18,239,375) |
| Class B | (177,228) | (1,105,548) | | (427,428) | (2,530,110) |
| Class C | (172,214) | (1,071,242) | | (1,938,815) | (11,810,151) |
| Class I | 4,519,010 | 29,146,118 | | 1,413,123 | 9,220,525 |
| Class R1 | 292 | 1,805 | | 534 | 3,180 |
| Class R2 | (8,495) | (53,077) | | 34,084 | 198,010 |
| Class R3 | 65,363 | 411,038 | | (7,371) | (37,806) |
| Class R4 | 36,688 | 226,244 | | (38,496) | (277,643) |
| Class R6 | (253,465) | (1,576,865) | | 204,288 | 1,355,964 |
| | (2,798,842) | $(16,843,338) | | (3,920,734) | $(22,117,406) |
Effective June 1, 2019, purchases of the fund’s Class B shares are closed to new and existing investors subject to certain exceptions. Please see the fund’s prospectus for details.
(6) Line of Credit
The fund and certain other funds managed by MFS participate in a $1.25 billion unsecured committed line of credit of which $1 billion is reserved for use by the fund and certain other MFS U.S. funds. The line of credit is provided by a syndicate of banks under a credit agreement. Borrowings may be made for temporary financing needs. Interest is charged to each fund, based on its borrowings, generally at a rate equal to the highest of one month LIBOR, the Federal Funds Effective Rate and the Overnight Bank Funding Rate, plus an agreed upon spread. A commitment fee, based on the average daily, unused portion of the committed line of credit, is allocated among the participating funds. In addition, the fund and other funds managed by MFS have established unsecured uncommitted borrowing arrangements with certain banks for temporary financing needs. Interest is charged to each fund, based on its borrowings, at rates equal to customary reference rates plus an agreed upon spread. For the year ended January 31, 2022, the fund’s commitment fee and interest expense were $1,120 and $0, respectively, and are included in “Miscellaneous” expense in the Statement of Operations.
Notes to Financial Statements - continued
(7) Investments in Affiliated Issuers
An affiliated issuer may be considered one in which the fund owns 5% or more of the outstanding voting securities, or a company which is under common control. For the purposes of this report, the following were affiliated issuers:
| Affiliated Issuers | Beginning
Value | Purchases | Sales
Proceeds | Realized
Gain
(Loss) | Change in
Unrealized
Appreciation or
Depreciation | Ending
Value |
| MFS High Yield Pooled Portfolio | $192,015,146 | $32,908,475 | $54,797,138 | $(4,603,894) | $(2,618,552) | $162,904,037 |
| MFS Institutional Money Market Portfolio | 3,980,465 | 99,154,525 | 100,282,895 | — | — | 2,852,095 |
| | $195,995,611 | $132,063,000 | $155,080,033 | $(4,603,894) | $(2,618,552) | $165,756,132 |
| Affiliated Issuers | Dividend
Income | Capital Gain
Distributions |
| MFS High Yield Pooled Portfolio | $10,086,946 | $— |
| MFS Institutional Money Market Portfolio | 2,153 | — |
| | $10,089,099 | $— |
(8) Impacts of COVID-19
The pandemic related to the global spread of novel coronavirus disease (COVID-19), which was first detected in December 2019, has resulted in significant disruptions to global business activity and the global economy, as well as the economies of individual countries, the financial performance of individual companies and sectors, and the securities and commodities markets in general. Multiple surges in cases globally, the availability and widespread adoption of vaccines, and the emergence of variant strains of the virus continue to create uncertainty as to the future and long-term impacts resulting from the pandemic including impacts to the prices and liquidity of the fund's investments and the fund's performance.
(9) LIBOR Transition
Certain of the fund's investments, including investments in certain debt instruments and derivatives (if any), as well as borrowings by the fund and certain other contractual arrangements of the fund, may be based on the London Interbank Offered Rate (“LIBOR”). In 2017, the regulatory authority that oversees financial services firms in the United Kingdom announced plans to transition away from LIBOR by the end of 2021. In March 2021, the administrator of LIBOR announced the extension of the publication of the more commonly used U.S. dollar LIBOR settings to the end of June 2023. Although the full impacts of the transition away from LIBOR are not fully known, the transition may result in, among other things, an increase in volatility or illiquidity of the markets for instruments that currently rely on LIBOR to determine interest rates and this could have an adverse impact on the fund's performance. With respect to the fund's accounting for investments, including investments in certain debt instruments and derivatives, as well as borrowings by the fund and any other contractual arrangements of the fund that undergo reference rate-related modifications as a result of the transition, management will rely upon the relief provided by FASB Codification Topic
Notes to Financial Statements - continued
848 – Reference Rate Reform (Topic 848). The guidance in Topic 848 permits the fund to account for those modified contracts as a continuation of the existing contracts. Management is still evaluating the impact to the fund of the June 30, 2023 planned discontinuation of the more commonly used U.S. dollar LIBOR settings.
(10) Subsequent Event
The market disruptions, which began in late February 2022, associated with geopolitical events related to the conflict between Russia and Ukraine may adversely affect the value of the fund’s assets and thus the fund’s performance. Management continues to monitor these events and to evaluate the related impacts, if any, to the fund.
Report of Independent Registered Public Accounting Firm
To the Board of Trustees of MFS Series Trust III and the Shareholders of MFS Global High Yield Fund:
Opinion on the Financial Statements and Financial Highlights
We have audited the accompanying statement of assets and liabilities of MFS Global High Yield Fund (the “Fund”), including the portfolio of investments, as of January 31, 2022, the related statement of operations for the year then ended, the statements of changes in net assets for each of the two years in the period then ended, the financial highlights for each of the five years in the period then ended, and the related notes. In our opinion, the financial statements and financial highlights present fairly, in all material respects, the financial position of the Fund as of January 31, 2022, and the results of its operations for the year then ended, the changes in its net assets for each of the two years in the period then ended, and the financial highlights for each of the five years in the period then ended, in conformity with accounting principles generally accepted in the United States of America.
Basis for Opinion
These financial statements and financial highlights are the responsibility of the Fund's management. Our responsibility is to express an opinion on the Fund's financial statements and financial highlights based on our audits. We are a public accounting firm registered with the Public Company Accounting Oversight Board (United States) (PCAOB) and are required to be independent with respect to the Fund in accordance with the U.S. federal securities laws and the applicable rules and regulations of the Securities and Exchange Commission and the PCAOB.
We conducted our audits in accordance with the standards of the PCAOB. Those standards require that we plan and perform the audit to obtain reasonable assurance about whether the financial statements and financial highlights are free of material misstatement, whether due to error or fraud. The Fund is not required to have, nor were we engaged to perform, an audit of its internal control over financial reporting. As part of our audits, we are required to obtain an understanding of internal control over financial reporting but not for the purpose of expressing an opinion on the effectiveness of the Fund's internal control over financial reporting. Accordingly, we express no such opinion.
Our audits included performing procedures to assess the risks of material misstatement of the financial statements and financial highlights, whether due to error or fraud, and performing procedures that respond to those risks. Such procedures included examining, on a test basis, evidence regarding the amounts and disclosures in the financial statements and financial highlights. Our audits also included evaluating the accounting principles used and significant estimates made by management, as well as evaluating the overall presentation of the financial statements and financial highlights.
Report of Independent Registered Public Accounting Firm – continued
Our procedures included confirmation of securities owned as of January 31, 2022, by correspondence with the custodian and brokers; when replies were not received from brokers, we performed other auditing procedures. We believe that our audits provide a reasonable basis for our opinion.
DELOITTE & TOUCHE LLP
Boston, Massachusetts
March 18, 2022
We have served as the auditor of one or more of the MFS investment companies since 1924.
Trustees and Officers — Identification and Background
The Trustees and Officers of the Trust, as of March 1, 2022, are listed below, together with their principal occupations during the past five years. (Their titles may have varied during that period.) The address of each Trustee and Officer is 111 Huntington Avenue, Boston, Massachusetts 02199-7618.
| Name, Age | | Position(s) Held with Fund | | Trustee/Officer Since(h) | | Number of MFS Funds overseen by the Trustee | | Principal Occupations During
the Past Five Years | | Other Directorships During
the Past Five Years (j) |
| INTERESTED TRUSTEES | | | | | | | | | | |
Michael W. Roberge (k)
(age 55) | | Trustee | | January 2021 | | 135 | | Massachusetts Financial Services Company, Chairman (since January 2021); Chief Executive Officer (since January 2017); Director; Chairman of the Board (since January 2022); President (until December 2018); Chief Investment Officer (until December 2018) | | N/A |
| INDEPENDENT TRUSTEES | | | | | | | | | | |
John P. Kavanaugh
(age 67) | | Trustee and Chair of Trustees | | January 2009 | | 135 | | Private investor | | N/A |
Steven E. Buller
(age 70) | | Trustee | | February 2014 | | 135 | | Private investor | | N/A |
John A. Caroselli
(age 67) | | Trustee | | March 2017 | | 135 | | Private investor; JC Global Advisors, LLC (management consulting), President (since 2015) | | N/A |
Maureen R. Goldfarb
(age 66) | | Trustee | | January 2009 | | 135 | | Private investor | | N/A |
Peter D. Jones
(age 66) | | Trustee | | January 2019 | | 135 | | Private investor | | N/A |
James W. Kilman, Jr.
(age 60) | | Trustee | | January 2019 | | 135 | | Burford Capital Limited (finance and investment management), Senior Advisor (since May 3, 2021), Chief Financial Officer (2019 - May 2, 2021); KielStrand Capital LLC (family office), Chief Executive Officer (since 2016) | | Alpha-En Corporation, Director (2016-2019) |
Trustees and Officers - continued
| Name, Age | | Position(s) Held with Fund | | Trustee/Officer Since(h) | | Number of MFS Funds overseen by the Trustee | | Principal Occupations During
the Past Five Years | | Other Directorships During
the Past Five Years (j) |
Clarence Otis, Jr.
(age 65) | | Trustee | | March 2017 | | 135 | | Private investor | | VF Corporation, Director; Verizon Communications, Inc., Director; The Travelers Companies, Director |
Maryanne L. Roepke
(age 66) | | Trustee | | May 2014 | | 135 | | Private investor | | N/A |
Laurie J. Thomsen
(age 64) | | Trustee | | March 2005 | | 135 | | Private investor | | The Travelers Companies, Director; Dycom Industries, Inc., Director |
| Name, Age | | Position(s) Held with
Fund | | Trustee/Officer Since(h) | | Number of MFS Funds for which the Person is an Officer | | Principal Occupations During
the Past Five Years |
| OFFICERS | | | | | | | | |
Christopher R. Bohane (k)
(age 48) | | Assistant Secretary and Assistant Clerk | | July 2005 | | 135 | | Massachusetts Financial Services Company, Senior Vice President and Associate General Counsel |
Kino Clark (k)
(age 53) | | Assistant Treasurer | | January 2012 | | 135 | | Massachusetts Financial Services Company, Vice President |
John W. Clark, Jr. (k)
(age 54) | | Assistant Treasurer | | April 2017 | | 135 | | Massachusetts Financial Services Company, Vice President (since March 2017); Deutsche Bank (financial services), Department Head - Treasurer's Office (until February 2017) |
Thomas H. Connors (k)
(age 62) | | Assistant Secretary and Assistant Clerk | | September 2012 | | 135 | | Massachusetts Financial Services Company, Vice President and Senior Counsel |
David L. DiLorenzo (k)
(age 53) | | President | | July 2005 | | 135 | | Massachusetts Financial Services Company, Senior Vice President |
Heidi W. Hardin (k)
(age 54) | | Secretary and Clerk | | April 2017 | | 135 | | Massachusetts Financial Services Company, Executive Vice President and General Counsel (since March 2017); Harris Associates (investment management), General Counsel (until January 2017) |
Trustees and Officers - continued
| Name, Age | | Position(s) Held with
Fund | | Trustee/Officer Since(h) | | Number of MFS Funds for which the Person is an Officer | | Principal Occupations During
the Past Five Years |
Brian E. Langenfeld (k)
(age 48) | | Assistant Secretary and Assistant Clerk | | June 2006 | | 135 | | Massachusetts Financial Services Company, Vice President and Senior Counsel |
Rosa E. Licea-Mailloux(k)
(age 45) | | Chief Compliance Officer | | March 2022 | | 135 | | Massachusetts Financial Services Company, Vice President (since 2018); Director of Corporate Compliance (2018-2021), Senior Director Compliance (2021-2022), Senior Managing Director of North American Compliance & Chief Compliance Officer (since March 2022); Natixis Investment Managers (investment management), Funds Chief Compliance Officer, Deputy General Counsel & Senior Vice President (until 2018) |
Amanda S. Mooradian (k)
(age 43) | | Assistant Secretary and Assistant Clerk | | September 2018 | | 135 | | Massachusetts Financial Services Company, Assistant Vice President and Senior Counsel |
Susan A. Pereira (k)
(age 51) | | Assistant Secretary and Assistant Clerk | | July 2005 | | 135 | | Massachusetts Financial Services Company, Vice President and Assistant General Counsel |
Kasey L. Phillips (k)
(age 51) | | Assistant Treasurer | | September 2012 | | 135 | | Massachusetts Financial Services Company, Vice President |
Matthew A. Stowe (k)
(age 47) | | Assistant Secretary and Assistant Clerk | | October 2014 | | 135 | | Massachusetts Financial Services Company, Vice President and Assistant General Counsel |
James O. Yost (k)
(age 61) | | Treasurer | | September 1990 | | 135 | | Massachusetts Financial Services Company, Senior Vice President |
| (h) | Date first appointed to serve as Trustee/Officer of an MFS Fund. Each Trustee has served continuously since appointment unless indicated otherwise. From January 2012 through December 2016, Messrs. DiLorenzo and Yost served as Treasurer and Deputy Treasurer of the Funds, respectively. |
| (j) | Directorships or trusteeships of companies required to report to the Securities and Exchange Commission (i.e., “public companies”). |
| (k) | “Interested person” of the Trust within the meaning of the Investment Company Act of 1940 (referred to as the 1940 Act), which is the principal federal law governing investment companies like the fund, as a result of a position with MFS. The address of MFS is 111 Huntington Avenue, Boston, Massachusetts 02199-7618. |
Trustees and Officers - continued
Each Trustee (other than Messrs. Jones, Kilman and Roberge) has been elected by shareholders and each Trustee and Officer holds office until his or her successor is chosen and qualified or until his or her earlier death, resignation, retirement or removal. Mr. Roberge became a Trustee of the Funds on January 1, 2021 and Messrs. Jones and Kilman became Trustees of the Funds on January 1, 2019. The Trust does not hold annual meetings for the purpose of electing Trustees, and Trustees are not elected for fixed terms. Under the terms of the Board's retirement policy, an Independent Trustee shall retire at the end of the calendar year in which he or she reaches the earlier of 75 years of age or 15 years of service on the Board (or, in the case of any Independent Trustee who joined the Board prior to 2015, 20 years of service on the Board).
Messrs. Buller, Kilman and Otis and Ms. Roepke are members of the Trust’s Audit Committee.
Each of the Interested Trustees and certain Officers hold comparable officer positions with certain affiliates of MFS.
The Statement of Additional Information for a Fund includes further information about the Trustees and is available without charge upon request by calling 1-800-225-2606.
| Investment Adviser | Custodian |
Massachusetts Financial Services Company
111 Huntington Avenue
Boston, MA 02199-7618 | JPMorgan Chase Bank, NA
4 Metrotech Center
New York, NY 11245 |
| Distributor | Independent Registered Public Accounting Firm |
MFS Fund Distributors, Inc.
111 Huntington Avenue
Boston, MA 02199-7618 | Deloitte & Touche LLP
200 Berkeley Street
Boston, MA 02116 |
| Portfolio Manager(s) | |
David Cole
Matt Ryan
Michael Skatrud | |
Proxy Voting Policies and Information
MFS votes proxies on behalf of the fund pursuant to proxy voting policies and procedures that are available without charge, upon request, by calling 1-800-225-2606, by visiting mfs.com/proxyvoting, or by visiting the SEC’s Web site at http://www.sec.gov.
Information regarding how the fund voted proxies relating to portfolio securities during the most recent twelve-month period ended June 30 is available by August 31 of each year without charge by visiting mfs.com/proxyvoting, or by visiting the SEC’s Web site at http://www.sec.gov.
Quarterly Portfolio Disclosure
The fund files a complete schedule of portfolio holdings with the SEC for the first and third quarters of each fiscal year as an exhibit to its reports on Form N-PORT. The fund's Form N-PORT reports are available on the SEC's Web site at http://www.sec.gov. A shareholder can obtain the portfolio holdings report for the first and third quarters of the fund's fiscal year at mfs.com/openendfunds by choosing the fund's name and then scrolling to the “Resources” section and clicking on the “Prospectus and Reports” tab.
Further Information
From time to time, MFS may post important information about the fund or the MFS Funds on the MFS Web site (mfs.com). This information is available at https://www.mfs.com/announcements or at mfs.com/openendfunds by choosing the fund’s name and then scrolling to the “Resources” section and clicking on the “Announcements” tab, if any.
Information About Fund Contracts and Legal Claims
The fund has entered into contractual arrangements with an investment adviser, administrator, distributor, shareholder servicing agent, 529 program manager (if applicable), and custodian who each provide services to the fund. Unless expressly stated otherwise, shareholders are not parties to, or intended beneficiaries of these contractual arrangements, and these contractual arrangements are not intended to create any shareholder right to enforce them against the service providers or to seek any remedy under them against the service providers, either directly or on behalf of the fund.
Under the Trust’s By-Laws and Declaration of Trust, any claims asserted against or on behalf of the MFS Funds, including claims against Trustees and Officers, must be brought in state and federal courts located within the Commonwealth of Massachusetts.
Federal Tax Information (unaudited)
The fund will notify shareholders of amounts for use in preparing 2022 income tax forms in January 2023. The following information is provided pursuant to provisions of the Internal Revenue Code.
The fund intends to pass through the maximum amount allowable as Section 163(j) Interest Dividends as defined in Treasury Regulation §1.163(j)-1(b).
| FACTS | WHAT DOES MFS DO WITH YOUR PERSONAL INFORMATION? |
| Why? | Financial companies choose how they share your personal information. Federal law gives consumers the right to limit some but not all sharing. Federal law also requires us to tell you how we collect, share, and protect your personal information. Please read this notice carefully to understand what we do. |
| What? | The types of personal information we collect and share depend on the product or service you have with us. This information can include: |
| • Social Security number and account balances |
| • Account transactions and transaction history |
| • Checking account information and wire transfer instructions |
| When you are no longer our customer, we continue to share your information as described in this notice. |
| How? | All financial companies need to share customers' personal information to run their everyday business. In the section below, we list the reasons financial companies can share their customers' personal information; the reasons MFS chooses to share; and whether you can limit this sharing. |
Reasons we can share your
personal information | Does MFS share? | Can you limit
this sharing? |
For our everyday business purposes –
such as to process your transactions, maintain your
account(s), respond to court orders and legal
investigations, or report to credit bureaus | Yes | No |
For our marketing purposes –
to offer our products and services to you | No | We don't share |
For joint marketing with other
financial companies | No | We don't share |
For our affiliates' everyday business purposes –
information about your transactions and experiences | No | We don't share |
For our affiliates' everyday business purposes –
information about your creditworthiness | No | We don't share |
| For nonaffiliates to market to you | No | We don't share |
| Questions? | Call 800-225-2606 or go to mfs.com. |
| Who we are |
| Who is providing this notice? | MFS Funds, MFS Investment Management, MFS Institutional Advisors, Inc., and MFS Heritage Trust Company. |
| What we do |
How does MFS
protect my personal
information? | To protect your personal information from unauthorized access and use, we use security measures that comply with federal law. These measures include procedural, electronic, and physical safeguards for the protection of the personal information we collect about you. |
How does MFS
collect my personal
information? | We collect your personal information, for example, when you |
| • open an account or provide account information |
| • direct us to buy securities or direct us to sell your securities |
| • make a wire transfer |
| We also collect your personal information from others, such as credit bureaus, affiliates, or other companies. |
| Why can't I limit all sharing? | Federal law gives you the right to limit only |
| • sharing for affiliates' everyday business purposes – information about your creditworthiness |
| • affiliates from using your information to market to you |
| • sharing for nonaffiliates to market to you |
| State laws and individual companies may give you additional rights to limit sharing. |
| Definitions |
| Affiliates | Companies related by common ownership or control. They can be financial and nonfinancial companies. |
| • MFS does not share personal information with affiliates, except for everyday business purposes as described on page one of this notice. |
| Nonaffiliates | Companies not related by common ownership or control. They can be financial and nonfinancial companies. |
| • MFS does not share with nonaffiliates so they can market to you. |
| Joint marketing | A formal agreement between nonaffiliated financial companies that together market financial products or services to you. |
| • MFS doesn't jointly market. |
| Other important information |
| If you own an MFS product or receive an MFS service in the name of a third party such as a bank or broker-dealer, their privacy policy may apply to you instead of ours. |
Save paper with eDelivery.
MFS® will send you prospectuses, reports, and proxies directly via e-mail so you will get information faster with less mailbox clutter.
To sign up:
1. Go to mfs.com.
2. Log in via MFS® Access.
3. Select eDelivery.
If you own your MFS fund shares through a financial institution or a retirement plan, MFS® TALK, MFS® Access, or eDelivery may not be available to you.
CONTACT
WEB SITE
mfs.com
MFS TALK
1-800-637-8255
24 hours a day
ACCOUNT SERVICE AND LITERATURE
Shareholders
1-800-225-2606
Financial advisors
1-800-343-2829
Retirement plan services
1-800-637-1255
MAILING ADDRESS
MFS Service Center, Inc.
P.O. Box 219341
Kansas City, MO 64121-9341
OVERNIGHT MAIL
MFS Service Center, Inc.
Suite 219341
430 W 7th Street
Kansas City, MO 64105-1407
Appendix A
Annual Report
January 31, 2022
MFS® High Yield Pooled Portfolio
MFS® High Yield Pooled Portfolio
| 1 |
| 2 |
| 4 |
| 6 |
| 8 |
| 9 |
| 24 |
| 25 |
| 26 |
| 27 |
| 28 |
| 40 |
| 42 |
| 46 |
| 46 |
| 46 |
| 46 |
| 46 |
| 47 |
The report is prepared for the general information of shareholders. It is authorized for distribution to prospective investors only when preceded or accompanied by a current prospectus.
NOT FDIC INSURED • MAY LOSE VALUE • NO BANK GUARANTEE
LETTER FROM THE CHAIR AND CEO
Dear Shareholders:
As a result of Russia’s invasion of Ukraine, the danger of wider geopolitical conflict has risen to levels not seen in decades, and this comes as sanctions aimed at countering Russia’s actions are exacerbating already mounting inflation. Consequently, at a time when global growth faces multiple headwinds, central banks have been presented with the challenge of reining in rising prices without tipping economies into recession. This has in turn led to increased volatility.
There are, however, encouraging signs for the markets. The Omicron wave of the coronavirus is receding outside Asia, unemployment is low, and there are signs that some global supply chain bottlenecks are beginning to ease, though events in Ukraine could hamper these advances. Additionally, easier Chinese monetary policy and the record pace of corporate stock buybacks are supportive elements, albeit amid an otherwise turbulent investment environment.
It is important to have a deep understanding of company fundamentals during times of market transition, and we have built our global research platform to do just that.
At MFS®, we put our clients’ assets to work responsibly by carefully navigating the increasing complexity of global markets and economies. Guided by our commitment to long-term investing, we tune out the noise and try to uncover what we believe are the best, most durable investment opportunities in the market. Our unique global investment platform combines collective expertise, long-term discipline, and thoughtful risk management to create sustainable value for investors over time.
Respectfully,
Michael W. Roberge
Chair and Chief Executive Officer
MFS Investment Management
March 18, 2022
The opinions expressed in this letter are subject to change and may not be relied upon for investment advice. No forecasts can be guaranteed.
Portfolio structure (i)
Top five industries (i)
| Cable TV | 7.5% |
| Gaming & Lodging | 6.9% |
| Medical & Health Technology & Services | 6.6% |
| Midstream | 4.5% |
| Consumer Services | 3.9% |
Composition including fixed income credit quality (a)(i)
| BBB | 0.5% |
| BB | 44.0% |
| B | 38.7% |
| CCC | 13.7% |
| CC | 0.1% |
| C (o) | 0.0% |
| Not Rated | (1.4)% |
| Non-Fixed Income | 0.8% |
| Cash & Cash Equivalents | 2.0% |
| Other | 1.6% |
Portfolio facts (i)
| Average Duration (d) | 4.0 |
| Average Effective Maturity (m) | 5.5 yrs. |
| (a) | For all securities other than those specifically described below, ratings are assigned to underlying securities utilizing ratings from Moody’s, Fitch, and Standard & Poor’s rating agencies and applying the following hierarchy: If all three agencies provide a rating, the middle rating (after dropping the highest and lowest ratings) is assigned; if two of the three agencies rate a security, the lower of the two is assigned. If none of the 3 rating agencies above assign a rating, but the security is rated by DBRS Morningstar, then the DBRS Morningstar rating is assigned. If none of the 4 rating agencies listed above rate the security, but the security is rated by the Kroll Bond Rating Agency (KBRA), then the KBRA rating is assigned. Ratings are shown in the S&P and Fitch scale (e.g., AAA). Securities rated BBB or higher are considered investment grade. All ratings are subject to change. Not Rated includes fixed income securities and fixed income derivatives that have not been rated by any rating agency. Non-Fixed Income includes equity securities (including convertible bonds and equity derivatives) and/or commodity-linked derivatives. The fund may or may not have held all of these instruments on this date. The fund is not rated by these agencies. |
| (d) | Duration is a measure of how much a bond’s price is likely to fluctuate with general changes in interest rates, e.g., if rates rise 1.00%, a bond with a 5-year duration is likely to lose about 5.00% of its value due to the interest rate move. |
Portfolio Composition - continued
| (i) | For purposes of this presentation, the components include the value of securities, and reflect the impact of the equivalent exposure of derivative positions, if any. These amounts may be negative from time to time. Equivalent exposure is a calculated amount that translates the derivative position into a reasonable approximation of the amount of the underlying asset that the portfolio would have to hold at a given point in time to have the same price sensitivity that results from the portfolio’s ownership of the derivative contract. When dealing with derivatives, equivalent exposure is a more representative measure of the potential impact of a position on portfolio performance than value. The bond component will include any accrued interest amounts. |
| (m) | In determining each instrument’s effective maturity for purposes of calculating the fund’s dollar-weighted average effective maturity, MFS uses the instrument’s stated maturity or, if applicable, an earlier date on which MFS believes it is probable that a maturity-shortening device (such as a put, pre-refunding or prepayment) will cause the instrument to be repaid. Such an earlier date can be substantially shorter than the instrument’s stated maturity. |
Where the fund holds convertible bonds, they are treated as part of the equity portion of the portfolio.
Cash & Cash Equivalents includes any cash, investments in money market funds, short-term securities, and other assets less liabilities. Please see the Statement of Assets and Liabilities for additional information related to the fund’s cash position and other assets and liabilities.
Other includes equivalent exposure from currency derivatives and/or any offsets to derivative positions and may be negative.
Percentages are based on net assets as of January 31, 2022.
The portfolio is actively managed and current holdings may be different.
Management Review
Summary of Results
For the twelve months ended January 31, 2022, shares of the MFS High Yield Pooled Portfolio (fund) provided a total return of 1.39%, at net asset value. This compares with a return of 2.05% for the fund’s benchmark, the Bloomberg U.S. Corporate High-Yield Bond 2% Issuer Capped Index.
Market Environment
Over the past year, the global economy was buffeted by an array of crosscurrents as it adjusted to the ebbs and flows of the pandemic. Among the supportive currents were ample fiscal stimulus, loose monetary policy and the rollout of several highly effective coronavirus vaccines. Negative currents included the rapid spread of several coronavirus variants, widespread global production bottlenecks and a surge in inflation. After experiencing a burst of exceptionally strong economic activity as the global economy began to reopen, activity became more muted in the second half of the period amid ongoing supply chain disruptions and a new wave of coronavirus infections, albeit seemingly milder strains.
Amid rising inflation, markets anticipated a transition from an exceptionally accommodative monetary environment to a significantly more restrictive one ahead, which resulted in a rise in market volatility. Indeed, several central banks in emerging markets have already tightened policy, as has the Bank of England, while the US Federal Reserve signaled it intends to tighten policy soon. The European Central Bank, which had been expected to move slowly toward tighter policy, has indicated it, too, may need to dial back accommodation in coming months. However, the Bank of Japan and the People's Bank of China are expected to maintain accommodative policies. As a result of the shifting monetary backdrop, sovereign bond yields moved higher during the period, but remain quite low relative to history.
A harsher Chinese regulatory environment toward industries such as online gaming, food delivery and education increased market volatility as has stress in China's highly leveraged property development sector. Trade relations between the United States and China remained quite strained despite a change in presidential administrations. Geopolitical tensions ramped up during the period with Russia amassing troops along its border with Ukraine and Chinese forces repeatedly entering airspace claimed by Taiwan.
An increase in market volatility saw speculative activity abate somewhat as “meme” stocks and cryptocurrencies came under pressure near the end of the period.
Detractors from Performance
Relative to the Bloomberg U.S. Corporate High-Yield Bond 2% Issuer Capped Index, the fund's underweight allocation to “B” and “CCC” rated(r) bonds within the energy sector detracted from performance. The fund's out-of-benchmark exposure to non-rated issuers also hindered relative returns.
Security selection in “CCC” rated bonds, particularly within the technology sector, and in “B” and “BB” rated bonds, notably within both the consumer cyclicals and basic industry sectors, weakened relative results.
Management Review - continued
Top individual detractors during the reporting period included the fund’s underweight position in Kraft Heinz Company(h) (consumer non-cyclical) and its overweight position in Virgin Media (communications).
Contributors to Performance
On the positive side, the fund's shorter average duration(d) stance, relative to the benchmark, contributed to performance as interest rates generally appreciated over the reporting period.
The fund's overweight allocation to the “CCC” credit quality segment, overall, and security selection in both the communications and energy sectors, also benefited relative performance.
The top individual contributor for the reporting period was the fund’s overweight exposure to PBF Holding (energy).
Respectfully,
Portfolio Manager(s)
David Cole and Michael Skatrud
| (d) | Duration is a measure of how much a bond’s price is likely to fluctuate with general changes in interest rates, e.g., if rates rise 1.00%, a bond with a 5-year duration is likely to lose about 5.00% of its value. |
| (h) | Security was not held in the portfolio at period end. |
| (r) | Securities rated “BBB”, “Baa”, or higher are considered investment grade; securities rated “BB”, “Ba”, or below are considered non-investment grade. Ratings are assigned to underlying securities utilizing ratings from Moody's, Fitch, and Standard & Poor's and applying the following hierarchy: If all three agencies provide a rating, the middle rating (after dropping the highest and lowest ratings) is assigned; if two of the three agencies rate a security, the lower of the two is assigned. If none of the 3 rating agencies above assign a rating, but the security is rated by DBRS Morningstar, then the DBRS Morningstar rating is assigned. If none of the 4 rating agencies listed above rate the security, but the security is rated by the Kroll Bond Rating Agency (KBRA), then the KBRA rating is assigned. Ratings are shown in the S&P and Fitch scale (e.g., AAA). For securities that are not rated by any of the rating agencies, the security is considered Not Rated. |
The views expressed in this report are those of the portfolio manager(s) only through the end of the period of the report as stated on the cover and do not necessarily reflect the views of MFS or any other person in the MFS organization. These views are subject to change at any time based on market or other conditions, and MFS disclaims any responsibility to update such views. These views may not be relied upon as investment advice or an indication of trading intent on behalf of any MFS portfolio. References to specific securities are not recommendations of such securities, and may not be representative of any MFS portfolio’s current or future investments.
Performance Summary THROUGH 1/31/22
The following chart illustrates the fund’s historical performance in comparison to its benchmark(s). Performance results reflect the percentage change in net asset value, including reinvestment of dividends and capital gains distributions. Benchmarks are unmanaged and may not be invested in directly. Benchmark returns do not reflect sales charges, commissions or expenses. (See Notes to Performance Summary.)
Performance data shown represents past performance and is no guarantee of future results. Investment return and principal value fluctuate so your shares, when sold, may be worth more or less than the original cost; current performance may be lower or higher than quoted. The performance shown does not reflect the deduction of taxes, if any, that a shareholder would pay on fund distributions or the redemption of fund shares.
Growth of a Hypothetical $10,000 Investment (t)
Performance Summary - continued
Total Returns through 1/31/22
Average annual without sales charge
| Fund Inception Date | 1-yr | 5-yr | Life (t) |
| 3/25/13 | 1.39% | 4.93% | 5.02% |
Comparative benchmark(s)
| | | | |
| Bloomberg U.S. Corporate High-Yield Bond 2% Issuer Capped Index (f) | 2.05% | 5.39% | 5.31% |
| (f) | Source: FactSet Research Systems Inc. |
| (t) | For the period from the fund inception date through the stated period end. (See Notes to Performance Summary.) |
Benchmark Definition(s)
Bloomberg U.S. Corporate High-Yield Bond 2% Issuer Capped Index(a) – a component of the Bloomberg U.S. Corporate High-Yield Bond Index, which measures performance of non-investment grade, fixed rate debt. The index limits the maximum exposure to any one issuer to 2%.
It is not possible to invest directly in an index.
| (a) | Source: Bloomberg Index Services Limited. BLOOMBERG® is a trademark and service mark of Bloomberg Finance L.P. and its affiliates (collectively “Bloomberg”). Bloomberg or Bloomberg's licensors own all proprietary rights in the Bloomberg Indices. Bloomberg neither approves or endorses this material, or guarantees the accuracy or completeness of any information herein, or makes any warranty, express or implied, as to the results to be obtained therefrom and, to the maximum extent allowed by law, neither shall have any liability or responsibility for injury or damages arising in connection therewith. |
Notes to Performance Summary
Average annual total return represents the average annual change in value for the fund for the periods presented. Life returns are presented where the fund has less than 10 years of performance history and represent the average annual total return from the fund inception date to the stated period end date.
Performance results reflect any applicable expense subsidies and waivers in effect during the periods shown. Without such subsidies and waivers the fund's performance results would be less favorable. Please see the prospectus and financial statements for complete details.
Performance results do not include adjustments made for financial reporting purposes in accordance with U.S. generally accepted accounting principles and may differ from amounts reported in the financial highlights.
From time to time the fund may receive proceeds from litigation settlements, without which performance would be lower.
Expense Table
Fund expenses borne by the shareholders during the period,
August 1, 2021 through January 31, 2022
As a shareholder of the fund, you incur ongoing costs, including fund expenses. This example is intended to help you understand your ongoing costs (in dollars) of investing in the fund and to compare these costs with the ongoing costs of investing in other mutual funds.
The example is based on an investment of $1,000 invested at the beginning of the period and held for the entire period August 1, 2021 through January 31, 2022.
Actual Expenses
The first line of the following table provides information about actual account values and actual expenses. You may use the information in this line, together with the amount you invested, to estimate the expenses that you paid over the period. Simply divide your account value by $1,000 (for example, an $8,600 account value divided by $1,000 = 8.6), then multiply the result by the number in the first line under the heading entitled “Expenses Paid During Period” to estimate the expenses you paid on your account during this period.
Hypothetical Example for Comparison Purposes
The second line of the following table provides information about hypothetical account values and hypothetical expenses based on the fund’s actual expense ratio and an assumed rate of return of 5% per year before expenses, which is not the fund’s actual return. The hypothetical account values and expenses may not be used to estimate the actual ending account balance or expenses you paid for the period. You may use this information to compare the ongoing costs of investing in the fund and other funds. To do so, compare this 5% hypothetical example with the 5% hypothetical examples that appear in the shareholder reports of the other funds.
Please note that the expenses shown in the table are meant to highlight your ongoing costs only and do not reflect any transactional costs, such as sales charges (loads). Therefore, the second line of the table is useful in comparing ongoing costs only, and will not help you determine the relative total costs of owning different funds. In addition, if these transactional costs were included, your costs would have been higher.
| | Annualized
Expense
Ratio | Beginning
Account Value
8/01/21 | Ending
Account Value
1/31/22 | Expenses
Paid During
Period (p)
8/01/21-1/31/22 |
| Actual | 0.02% | $1,000.00 | $982.44 | $0.10 |
| Hypothetical (h) | 0.02% | $1,000.00 | $1,025.10 | $0.10 |
| (h) | 5% fund return per year before expenses. |
| (p) | “Expenses Paid During Period” are equal to the fund’s annualized expense ratio, as shown above, multiplied by the average account value over the period, multiplied by 184/365 (to reflect the one-half year period). |
Portfolio of Investments
1/31/22
The Portfolio of Investments is a complete list of all securities owned by your fund. It is categorized by broad-based asset classes.
| Issuer | | | Shares/Par | Value ($) |
| Bonds – 95.9% |
| Aerospace & Defense – 2.3% |
| Bombardier, Inc., 7.5%, 3/15/2025 (n) | | $ | 2,300,000 | $ 2,328,750 |
| Bombardier, Inc., 7.125%, 6/15/2026 (n) | | | 2,292,000 | 2,329,245 |
| F-Brasile S.p.A./F-Brasile U.S. LLC, 7.375%, 8/15/2026 (n) | | | 3,150,000 | 3,106,089 |
| Moog, Inc., 4.25%, 12/15/2027 (n) | | | 4,430,000 | 4,445,726 |
| TransDigm, Inc., 6.25%, 3/15/2026 (n) | | | 3,472,000 | 3,584,840 |
| TransDigm, Inc., 6.375%, 6/15/2026 | | | 2,775,000 | 2,823,563 |
| TransDigm, Inc., 5.5%, 11/15/2027 | | | 2,015,000 | 2,025,075 |
| TransDigm, Inc., 4.625%, 1/15/2029 | | | 2,196,000 | 2,085,453 |
| | | | | $22,728,741 |
| Automotive – 2.6% |
| Clarios Global LP/Clarios US Finance Cois, 8.5%, 5/15/2027 (n) | | $ | 4,775,000 | $ 4,992,644 |
| Dana, Inc., 5.375%, 11/15/2027 | | | 2,121,000 | 2,192,584 |
| Dana, Inc., 5.625%, 6/15/2028 | | | 516,000 | 536,640 |
| Dana, Inc., 4.25%, 9/01/2030 | | | 1,495,000 | 1,448,281 |
| Dornoch Debt Merger Sub Inc., 6.625%, 10/15/2029 (n) | | | 2,050,000 | 1,980,813 |
| Ford Motor Co., 5.113%, 5/03/2029 | | | 2,255,000 | 2,413,526 |
| Ford Motor Co., 4.75%, 1/15/2043 | | | 2,520,000 | 2,575,541 |
| Ford Motor Credit Co. LLC, 4.134%, 8/04/2025 | | | 2,005,000 | 2,050,814 |
| IAA Spinco, Inc., 5.5%, 6/15/2027 (n) | | | 3,360,000 | 3,448,234 |
| Real Hero Merger Sub 2, Inc., 6.25%, 2/01/2029 (n) | | | 2,175,000 | 2,129,934 |
| Wheel Pros, Inc., 6.5%, 5/15/2029 (n) | | | 2,005,000 | 1,864,650 |
| | | | | $25,633,661 |
| Broadcasting – 2.9% |
| Advantage Sales & Marketing, Inc., 6.5%, 11/15/2028 (n) | | $ | 3,040,000 | $ 3,017,200 |
| Gray Escrow II, Inc., 5.375%, 11/15/2031 (n) | | | 5,005,000 | 4,934,905 |
| iHeartCommunications, Inc., 8.375%, 5/01/2027 | | | 2,795,000 | 2,923,193 |
| Scripps Escrow II, Inc., 5.875%, 7/15/2027 (n) | | | 3,385,000 | 3,452,700 |
| Summer (BC) Bidco B LLC, 5.5%, 10/31/2026 (n) | | | 2,545,000 | 2,491,555 |
| Summer (BC) Holdco S.à r.l., “A”, 9.25%, 10/31/2027 | | EUR | 923,579 | 1,097,003 |
| Univision Communications, Inc., 4.5%, 5/01/2029 (n) | | $ | 5,835,000 | 5,779,218 |
| WMG Acquisition Corp., 3.875%, 7/15/2030 (n) | | | 5,559,000 | 5,304,342 |
| | | | | $29,000,116 |
| Brokerage & Asset Managers – 1.6% |
| Aretec Escrow Issuer, Inc., 7.5%, 4/01/2029 (n) | | $ | 2,025,000 | $ 2,065,419 |
| LPL Holdings, Inc., 4.625%, 11/15/2027 (n) | | | 4,280,000 | 4,349,165 |
| LPL Holdings, Inc., 4%, 3/15/2029 (n) | | | 3,146,000 | 3,053,319 |
| LPL Holdings, Inc., 4.375%, 5/15/2031 (n) | | | 1,955,000 | 1,916,037 |
Portfolio of Investments – continued
| Issuer | | | Shares/Par | Value ($) |
| Bonds – continued |
| Brokerage & Asset Managers – continued |
| NFP Corp., 4.875%, 8/15/2028 (n) | | $ | 2,555,000 | $ 2,496,107 |
| NFP Corp., 6.875%, 8/15/2028 (n) | | | 2,010,000 | 1,912,012 |
| | | | | $15,792,059 |
| Building – 3.7% |
| ABC Supply Co., Inc., 4%, 1/15/2028 (n) | | $ | 6,720,000 | $ 6,577,536 |
| Foundation Building Materials LLC, 6%, 3/01/2029 (n) | | | 125,000 | 120,649 |
| GYP Holding III Corp., 4.625%, 5/01/2029 (n) | | | 3,965,000 | 3,851,006 |
| Interface, Inc., 5.5%, 12/01/2028 (n) | | | 3,400,000 | 3,493,500 |
| MIWD Holdco II LLC/MIWD Finance Co., 5.5%, 2/01/2030 (n) | | | 1,855,000 | 1,838,175 |
| New Enterprise Stone & Lime Co., Inc., 5.25%, 7/15/2028 (n) | | | 2,000,000 | 2,000,000 |
| New Enterprise Stone & Lime Co., Inc., 9.75%, 7/15/2028 (n) | | | 1,713,000 | 1,802,933 |
| Park River Holdings, Inc., 5.625%, 2/01/2029 (n) | | | 1,055,000 | 962,688 |
| Patrick Industries, Inc., 7.5%, 10/15/2027 (n) | | | 3,305,000 | 3,470,250 |
| SRM Escrow Issuer LLC, 6%, 11/01/2028 (n) | | | 3,130,000 | 3,213,884 |
| SRS Distribution, Inc., 6.125%, 7/01/2029 (n) | | | 3,070,000 | 3,008,600 |
| Standard Industries, Inc., 4.375%, 7/15/2030 (n) | | | 3,443,000 | 3,288,065 |
| Standard Industries, Inc., 3.375%, 1/15/2031 (n) | | | 830,000 | 759,367 |
| White Cap Buyer LLC, 6.875%, 10/15/2028 (n) | | | 2,370,000 | 2,431,667 |
| | | | | $36,818,320 |
| Business Services – 2.3% |
| Austin BidCo, Inc., 7.125%, 12/15/2028 (n) | | $ | 1,905,000 | $ 1,933,575 |
| HealthEquity, Inc., 4.5%, 10/01/2029 (n) | | | 3,065,000 | 2,996,038 |
| Iron Mountain, Inc., 5.25%, 3/15/2028 (n) | | | 1,980,000 | 2,008,829 |
| Iron Mountain, Inc., REIT, 4.875%, 9/15/2027 (n) | | | 2,785,000 | 2,793,313 |
| Nielsen Finance LLC, 4.5%, 7/15/2029 (n) | | | 3,335,000 | 3,109,887 |
| Paysafe Finance PLC, 4%, 6/15/2029 (z) | | | 3,075,000 | 2,773,404 |
| Switch Ltd., 3.75%, 9/15/2028 (n) | | | 3,819,000 | 3,642,868 |
| Switch Ltd., 4.125%, 6/15/2029 (n) | | | 1,140,000 | 1,110,337 |
| Verscend Escrow Corp., 9.75%, 8/15/2026 (n) | | | 2,430,000 | 2,551,962 |
| | | | | $22,920,213 |
| Cable TV – 7.4% |
| CCO Holdings LLC/CCO Holdings Capital Corp., 4.75%, 3/01/2030 (n) | | $ | 7,275,000 | $ 7,218,946 |
| CCO Holdings LLC/CCO Holdings Capital Corp., 4.5%, 8/15/2030 (n) | | | 2,945,000 | 2,871,375 |
| CCO Holdings LLC/CCO Holdings Capital Corp., 4.25%, 2/01/2031 (n) | | | 5,165,000 | 4,927,307 |
| CCO Holdings LLC/CCO Holdings Capital Corp., 4.25%, 1/15/2034 (n) | | | 2,640,000 | 2,442,660 |
| CSC Holdings LLC, 5.375%, 2/01/2028 (n) | | | 1,500,000 | 1,504,410 |
| CSC Holdings LLC, 5.75%, 1/15/2030 (n) | | | 4,790,000 | 4,513,521 |
Portfolio of Investments – continued
| Issuer | | | Shares/Par | Value ($) |
| Bonds – continued |
| Cable TV – continued |
| CSC Holdings LLC, 4.125%, 12/01/2030 (n) | | $ | 5,080,000 | $ 4,649,165 |
| DISH DBS Corp., 7.75%, 7/01/2026 | | | 1,305,000 | 1,342,989 |
| DISH DBS Corp., 5.25%, 12/01/2026 (n) | | | 2,510,000 | 2,434,700 |
| DISH DBS Corp., 5.125%, 6/01/2029 | | | 2,110,000 | 1,840,975 |
| Intelsat Jackson Holdings S.A., 5.5%, 8/01/2023 (a)(d) | | | 2,115,000 | 922,669 |
| Intelsat Jackson Holdings S.A., 9.75%, 7/15/2025 (a)(d)(n) | | | 1,635,000 | 721,853 |
| LCPR Senior Secured Financing DAC, 6.75%, 10/15/2027 (n) | | | 2,919,000 | 3,028,404 |
| LCPR Senior Secured Financing DAC, 5.125%, 7/15/2029 (n) | | | 930,000 | 912,051 |
| Sirius XM Holdings, Inc., 3.875%, 9/01/2031 (n) | | | 3,845,000 | 3,556,625 |
| Sirius XM Radio, Inc., 4%, 7/15/2028 (n) | | | 3,327,000 | 3,218,872 |
| Sirius XM Radio, Inc., 5.5%, 7/01/2029 (n) | | | 6,460,000 | 6,704,091 |
| Telenet Finance Luxembourg S.A., 5.5%, 3/01/2028 (n) | | | 5,200,000 | 5,304,000 |
| Videotron Ltd., 5.125%, 4/15/2027 (n) | | | 2,985,000 | 3,051,028 |
| Virgin Media Finance PLC, 5%, 7/15/2030 (n) | | | 3,840,000 | 3,619,584 |
| Virgin Media Vendor Financing Notes IV DAC, 5%, 7/15/2028 (n) | | | 4,590,000 | 4,326,075 |
| Ziggo Bond Finance B.V., 5.125%, 2/28/2030 (n) | | | 5,100,000 | 4,838,038 |
| | | | | $73,949,338 |
| Chemicals – 2.5% |
| Axalta Coating Systems Ltd., 4.75%, 6/15/2027 (n) | | $ | 2,624,000 | $ 2,695,839 |
| Axalta Coating Systems Ltd., 3.375%, 2/15/2029 (n) | | | 3,855,000 | 3,551,419 |
| Consolidated Energy Finance S.A., 5.625%, 10/15/2028 (n) | | | 3,144,000 | 2,956,209 |
| Element Solutions, Inc., 3.875%, 9/01/2028 (n) | | | 3,904,000 | 3,747,840 |
| Herens Holdco S.à r.l., 4.75%, 5/15/2028 (n) | | | 2,795,000 | 2,668,694 |
| Ingevity Corp., 3.875%, 11/01/2028 (n) | | | 3,912,000 | 3,703,490 |
| LSF11 A5 HoldCo LLC, 6.625%, 10/15/2029 (n) | | | 2,050,000 | 2,009,000 |
| S.P.C.M. S.A., 3.125%, 3/15/2027 (n) | | | 945,000 | 902,475 |
| S.P.C.M. S.A., 3.375%, 3/15/2030 (n) | | | 3,325,000 | 3,121,011 |
| | | | | $25,355,977 |
| Computer Software – 1.2% |
| Camelot Finance S.A., 4.5%, 11/01/2026 (n) | | $ | 1,855,000 | $ 1,883,011 |
| Clarivate Science Holdings Corp., 3.875%, 7/01/2028 (n) | | | 745,000 | 710,693 |
| Clarivate Science Holdings Corp., 4.875%, 7/01/2029 (n) | | | 3,585,000 | 3,414,712 |
| Dun & Bradstreet Corp., 5%, 12/15/2029 (n) | | | 1,990,000 | 1,985,025 |
| PTC, Inc., 3.625%, 2/15/2025 (n) | | | 2,230,000 | 2,238,362 |
| PTC, Inc., 4%, 2/15/2028 (n) | | | 2,090,000 | 2,071,472 |
| | | | | $12,303,275 |
| Computer Software - Systems – 1.5% |
| Fair Isaac Corp., 5.25%, 5/15/2026 (n) | | $ | 5,306,000 | $ 5,674,316 |
| Fair Isaac Corp., 4%, 6/15/2028 (n) | | | 1,066,000 | 1,055,340 |
| SS&C Technologies Holdings, Inc., 5.5%, 9/30/2027 (n) | | | 4,040,000 | 4,172,189 |
Portfolio of Investments – continued
| Issuer | | | Shares/Par | Value ($) |
| Bonds – continued |
| Computer Software - Systems – continued |
| Viavi Solutions, Inc., 3.75%, 10/01/2029 (n) | | $ | 3,835,000 | $ 3,719,950 |
| | | | | $14,621,795 |
| Conglomerates – 3.1% |
| Amsted Industries Co., 5.625%, 7/01/2027 (n) | | $ | 4,195,000 | $ 4,303,860 |
| BWX Technologies, Inc., 4.125%, 6/30/2028 (n) | | | 938,000 | 925,102 |
| BWX Technologies, Inc., 4.125%, 4/15/2029 (n) | | | 5,109,000 | 5,032,365 |
| Gates Global LLC, 6.25%, 1/15/2026 (n) | | | 2,615,000 | 2,701,295 |
| Granite Holdings U.S. Acquisition Co., 11%, 10/01/2027 (n) | | | 2,330,000 | 2,493,100 |
| Griffon Corp., 5.75%, 3/01/2028 | | | 2,992,000 | 2,989,068 |
| Madison IAQ LLC, 5.875%, 6/30/2029 (n) | | | 2,725,000 | 2,518,459 |
| Stevens Holding Co., Inc., 6.125%, 10/01/2026 (n) | | | 2,985,000 | 3,115,594 |
| TriMas Corp., 4.125%, 4/15/2029 (n) | | | 7,048,000 | 6,907,040 |
| | | | | $30,985,883 |
| Construction – 1.3% |
| Empire Communities Corp., 7%, 12/15/2025 (n) | | $ | 2,250,000 | $ 2,288,970 |
| Mattamy Group Corp., 5.25%, 12/15/2027 (n) | | | 1,260,000 | 1,282,214 |
| Mattamy Group Corp., 4.625%, 3/01/2030 (n) | | | 2,520,000 | 2,484,544 |
| Taylor Morrison Communities, Inc., 5.75%, 1/15/2028 (n) | | | 2,650,000 | 2,822,250 |
| Taylor Morrison Communities, Inc., 5.125%, 8/01/2030 (n) | | | 1,675,000 | 1,736,070 |
| Weekley Homes LLC/Weekley Finance Corp., 4.875%, 9/15/2028 (n) | | | 2,921,000 | 2,873,008 |
| | | | | $13,487,056 |
| Consumer Products – 1.2% |
| Mattel, Inc., 3.375%, 4/01/2026 (n) | | $ | 2,670,000 | $ 2,658,652 |
| Mattel, Inc., 5.875%, 12/15/2027 (n) | | | 1,485,000 | 1,577,812 |
| Mattel, Inc., 5.45%, 11/01/2041 | | | 975,000 | 1,092,000 |
| Prestige Consumer Healthcare, Inc., 5.125%, 1/15/2028 (n) | | | 2,480,000 | 2,498,600 |
| Prestige Consumer Healthcare, Inc., 3.75%, 4/01/2031 (n) | | | 1,435,000 | 1,302,263 |
| SWF Escrow Issuer Corp., 6.5%, 10/01/2029 (n) | | | 2,560,000 | 2,380,800 |
| | | | | $11,510,127 |
| Consumer Services – 3.9% |
| Allied Universal Holdco LLC, 6.625%, 7/15/2026 (n) | | $ | 925,000 | $ 949,850 |
| Allied Universal Holdco LLC, 9.75%, 7/15/2027 (n) | | | 3,000,000 | 3,165,000 |
| Allied Universal Holdco LLC, 6%, 6/01/2029 (n) | | | 1,480,000 | 1,402,899 |
| ANGI Group LLC, 3.875%, 8/15/2028 (n) | | | 3,536,000 | 3,236,890 |
| Arches Buyer, Inc., 6.125%, 12/01/2028 (n) | | | 2,905,000 | 2,821,481 |
| GoDaddy, Inc., 3.5%, 3/01/2029 (n) | | | 5,411,000 | 5,046,190 |
| GW B-CR Security Corp., 9.5%, 11/01/2027 (n) | | | 2,322,000 | 2,440,422 |
| Match Group Holdings II LLC, 3.625%, 10/01/2031 (n) | | | 245,000 | 224,501 |
| Match Group, Inc., 5%, 12/15/2027 (n) | | | 2,465,000 | 2,535,869 |
Portfolio of Investments – continued
| Issuer | | | Shares/Par | Value ($) |
| Bonds – continued |
| Consumer Services – continued |
| Match Group, Inc., 4.625%, 6/01/2028 (n) | | $ | 3,815,000 | $ 3,767,313 |
| Match Group, Inc., 4.125%, 8/01/2030 (n) | | | 1,030,000 | 988,800 |
| Realogy Group LLC/Realogy Co-Issuer Corp., 9.375%, 4/01/2027 (n) | | | 2,340,000 | 2,533,518 |
| Realogy Group LLC/Realogy Co-Issuer Corp., 5.75%, 1/15/2029 (n) | | | 1,530,000 | 1,502,919 |
| Realogy Group LLC/Realogy Co-Issuer Corp., 5.25%, 4/15/2030 (n) | | | 1,860,000 | 1,780,950 |
| TriNet Group, Inc., 3.5%, 3/01/2029 (n) | | | 4,288,000 | 4,071,971 |
| WASH Multifamily Acquisition, Inc., 5.75%, 4/15/2026 (n) | | | 1,955,000 | 1,979,438 |
| | | | | $38,448,011 |
| Containers – 2.3% |
| ARD Finance S.A., 6.5% (6.5% cash or 7.25% PIK), 6/30/2027 (n)(p) | | $ | 1,397,076 | $ 1,411,047 |
| Ardagh Metal Packaging, 3.25%, 9/01/2028 (n) | | | 1,735,000 | 1,656,005 |
| Ardagh Metal Packaging, 4%, 9/01/2029 (n) | | | 2,951,000 | 2,810,828 |
| Ardagh Packaging Finance PLC/Ardagh MP Holdings USA, Inc., 5.25%, 8/15/2027 (n) | | | 3,700,000 | 3,626,000 |
| Can-Pack S.A., 3.875%, 11/15/2029 (n) | | | 4,505,000 | 4,314,333 |
| Crown Americas LLC/Crown Americas Capital Corp. V, 4.25%, 9/30/2026 | | | 4,670,000 | 4,815,937 |
| Crown Americas LLC/Crown Americas Capital Corp. VI, 4.75%, 2/01/2026 | | | 1,280,000 | 1,305,971 |
| Greif, Inc., 6.5%, 3/01/2027 (n) | | | 2,825,000 | 2,924,158 |
| | | | | $22,864,279 |
| Electrical Equipment – 0.4% |
| CommScope Technologies LLC, 5%, 3/15/2027 (n) | | $ | 4,720,000 | $ 4,203,302 |
| Electronics – 1.8% |
| Diebold Nixdorf, Inc., 8.5%, 4/15/2024 | | $ | 1,155,000 | $ 1,146,338 |
| Diebold Nixdorf, Inc., 9.375%, 7/15/2025 (n) | | | 1,686,000 | 1,770,941 |
| Entegris, Inc., 4.375%, 4/15/2028 (n) | | | 1,175,000 | 1,166,187 |
| Entegris, Inc., 3.625%, 5/01/2029 (n) | | | 1,577,000 | 1,510,356 |
| Sensata Technologies B.V., 5.625%, 11/01/2024 (n) | | | 2,330,000 | 2,458,150 |
| Sensata Technologies B.V., 5%, 10/01/2025 (n) | | | 4,320,000 | 4,552,200 |
| Sensata Technologies, Inc., 4.375%, 2/15/2030 (n) | | | 1,985,000 | 1,984,206 |
| Synaptics, Inc., 4%, 6/15/2029 (n) | | | 3,570,000 | 3,500,742 |
| | | | | $18,089,120 |
Portfolio of Investments – continued
| Issuer | | | Shares/Par | Value ($) |
| Bonds – continued |
| Energy - Independent – 3.8% |
| Callon Petroleum Co., 6.125%, 10/01/2024 | | $ | 1,540,000 | $ 1,540,000 |
| Callon Petroleum Co., 8%, 8/01/2028 (n) | | | 1,735,000 | 1,767,531 |
| CNX Resources Corp., 6%, 1/15/2029 (n) | | | 3,600,000 | 3,708,000 |
| Colgate Energy Partners III LLC, 5.875%, 7/01/2029 (n) | | | 1,240,000 | 1,260,150 |
| Comstock Resources, Inc., 6.75%, 3/01/2029 (n) | | | 2,505,000 | 2,577,119 |
| CrownRock LP/CrownRock Finance, Inc., “F”, 5%, 5/01/2029 (n) | | | 1,980,000 | 1,998,652 |
| Encino Acquisition Partners Holdings LLC, 8.5%, 5/01/2028 (n) | | | 1,715,000 | 1,734,294 |
| EQT Corp., 5%, 1/15/2029 | | | 2,645,000 | 2,783,862 |
| Laredo Petroleum, Inc., 10.125%, 1/15/2028 | | | 495,000 | 520,988 |
| Moss Creek Resources Holdings, Inc., 7.5%, 1/15/2026 (n) | | | 495,000 | 453,034 |
| Occidental Petroleum Corp., 5.875%, 9/01/2025 | | | 2,350,000 | 2,511,562 |
| Occidental Petroleum Corp., 5.5%, 12/01/2025 | | | 2,110,000 | 2,239,042 |
| Occidental Petroleum Corp., 6.625%, 9/01/2030 | | | 3,480,000 | 4,083,815 |
| Occidental Petroleum Corp., 6.45%, 9/15/2036 | | | 1,265,000 | 1,536,596 |
| Occidental Petroleum Corp., 6.6%, 3/15/2046 | | | 1,865,000 | 2,344,645 |
| SM Energy Co., 5.625%, 6/01/2025 | | | 1,590,000 | 1,578,075 |
| SM Energy Co., 6.5%, 7/15/2028 | | | 1,560,000 | 1,611,480 |
| Southwestern Energy Co., 5.95%, 1/23/2025 | | | 186,400 | 197,118 |
| Southwestern Energy Co., 8.375%, 9/15/2028 | | | 1,415,000 | 1,552,538 |
| Southwestern Energy Co., 5.375%, 3/15/2030 | | | 1,525,000 | 1,562,530 |
| | | | | $37,561,031 |
| Entertainment – 3.6% |
| AMC Entertainment Holdings, Inc., 10% (10% cash or 12% PIK), 6/15/2026 (n)(p) | | $ | 1,025,000 | $ 955,720 |
| Carnival Corp. PLC, 7.625%, 3/01/2026 (n) | | | 6,195,000 | 6,318,900 |
| Carnival Corp. PLC, 5.75%, 3/01/2027 (n) | | | 2,435,000 | 2,335,652 |
| Carnival Corp. PLC, 6%, 5/01/2029 (n) | | | 770,000 | 740,740 |
| Cedar Fair LP/Canada's Wonderland Co./Magnum Management Corp./Millennium Operations LLC, 5.375%, 4/15/2027 | | | 1,585,000 | 1,604,813 |
| Life Time, Inc., 5.75%, 1/15/2026 (n) | | | 2,475,000 | 2,484,900 |
| Live Nation Entertainment, Inc., 5.625%, 3/15/2026 (n) | | | 3,695,000 | 3,759,662 |
| Live Nation Entertainment, Inc., 3.75%, 1/15/2028 (n) | | | 1,660,000 | 1,601,900 |
| Motion Bondco DAC, 6.625%, 11/15/2027 (n) | | | 2,685,000 | 2,678,287 |
| NCL Corp. Ltd., 3.625%, 12/15/2024 (n) | | | 2,100,000 | 1,936,557 |
| NCL Corp. Ltd., 5.875%, 3/15/2026 (n) | | | 1,915,000 | 1,824,038 |
| Royal Caribbean Cruises Ltd., 5.375%, 7/15/2027 (n) | | | 1,240,000 | 1,198,336 |
| Royal Caribbean Cruises Ltd., 5.5%, 4/01/2028 (n) | | | 3,705,000 | 3,594,924 |
| SeaWorld Parks & Entertainment, 5.25%, 8/15/2029 (n) | | | 3,970,000 | 3,868,011 |
| Viking Cruises Ltd. Co., 5.875%, 9/15/2027 (n) | | | 1,535,000 | 1,400,688 |
| | | | | $36,303,128 |
Portfolio of Investments – continued
| Issuer | | | Shares/Par | Value ($) |
| Bonds – continued |
| Financial Institutions – 2.9% |
| Avation Capital S.A., 8.25% (8.25% cash or 9% PIK), 10/31/2026 (n)(p) | | $ | 1,950,749 | $ 1,638,629 |
| Credit Acceptance Corp., 5.125%, 12/31/2024 (n) | | | 3,660,000 | 3,696,600 |
| Freedom Mortgage Corp., 7.625%, 5/01/2026 (n) | | | 2,380,000 | 2,272,900 |
| Global Aircraft Leasing Co. Ltd., 6.5% (6.5% cash or 7.25% PIK), 9/15/2024 (n)(p) | | | 7,301,980 | 6,830,466 |
| Howard Hughes Corp., 4.125%, 2/01/2029 (n) | | | 4,258,000 | 4,092,917 |
| Nationstar Mortgage Holdings, Inc., 6%, 1/15/2027 (n) | | | 3,275,000 | 3,397,419 |
| Nationstar Mortgage Holdings, Inc., 5.75%, 11/15/2031 (n) | | | 1,250,000 | 1,208,738 |
| OneMain Finance Corp., 6.875%, 3/15/2025 | | | 2,085,000 | 2,262,225 |
| OneMain Finance Corp., 8.875%, 6/01/2025 | | | 1,413,000 | 1,499,772 |
| OneMain Finance Corp., 7.125%, 3/15/2026 | | | 1,350,000 | 1,484,101 |
| Rocket Mortgage Co-Issuer, Inc., 3.625%, 3/01/2029 (n) | | | 995,000 | 930,216 |
| | | | | $29,313,983 |
| Food & Beverages – 3.1% |
| Aramark Services, Inc., 6.375%, 5/01/2025 (n) | | $ | 4,085,000 | $ 4,233,081 |
| Aramark Services, Inc., 5%, 2/01/2028 (n) | | | 995,000 | 987,538 |
| JBS USA Lux S.A./JBS USA Finance, Inc., 6.75%, 2/15/2028 (n) | | | 4,250,000 | 4,531,605 |
| Lamb Weston Holdings, Inc., 4.125%, 1/31/2030 (n) | | | 4,825,000 | 4,766,642 |
| Performance Food Group Co., 5.5%, 10/15/2027 (n) | | | 3,225,000 | 3,299,368 |
| Post Holdings, Inc., 5.625%, 1/15/2028 (n) | | | 2,405,000 | 2,469,502 |
| Post Holdings, Inc., 4.625%, 4/15/2030 (n) | | | 3,995,000 | 3,850,181 |
| Primo Water Holding, Inc., 4.375%, 4/30/2029 (n) | | | 3,125,000 | 2,983,063 |
| U.S. Foods Holding Corp., 4.75%, 2/15/2029 (n) | | | 3,800,000 | 3,729,510 |
| | | | | $30,850,490 |
| Gaming & Lodging – 6.8% |
| Boyd Gaming Corp., 4.75%, 12/01/2027 | | $ | 3,110,000 | $ 3,094,232 |
| Boyd Gaming Corp., 4.75%, 6/15/2031 (n) | | | 1,250,000 | 1,226,925 |
| Caesars Entertainment, Inc., 4.625%, 10/15/2029 (n) | | | 2,565,000 | 2,455,737 |
| Caesars Resort Collection LLC/CRC Finco, Inc., 5.75%, 7/01/2025 (n) | | | 2,006,000 | 2,065,578 |
| Caesars Resort Collection LLC/CRC Finco, Inc., 8.125%, 7/01/2027 (n) | | | 2,691,000 | 2,896,189 |
| CCM Merger, Inc., 6.375%, 5/01/2026 (n) | | | 2,675,000 | 2,768,625 |
| Hilton Domestic Operating Co., Inc., 3.75%, 5/01/2029 (n) | | | 3,947,000 | 3,845,878 |
| Hilton Domestic Operating Co., Inc., 3.625%, 2/15/2032 (n) | | | 3,527,000 | 3,346,876 |
| International Game Technology PLC, 4.125%, 4/15/2026 (n) | | | 4,170,000 | 4,180,425 |
| International Game Technology PLC, 6.25%, 1/15/2027 (n) | | | 1,030,000 | 1,120,872 |
| Marriott Ownership Resorts, Inc., 4.5%, 6/15/2029 (n) | | | 3,080,000 | 3,021,603 |
| MGM China Holdings Ltd., 5.375%, 5/15/2024 (n) | | | 1,035,000 | 1,029,825 |
| MGM China Holdings Ltd., 5.875%, 5/15/2026 (n) | | | 1,670,000 | 1,663,738 |
| MGM China Holdings Ltd., 4.75%, 2/01/2027 (n) | | | 1,043,000 | 998,673 |
Portfolio of Investments – continued
| Issuer | | | Shares/Par | Value ($) |
| Bonds – continued |
| Gaming & Lodging – continued |
| MGM Growth Properties LLC, 4.625%, 6/15/2025 (n) | | $ | 3,050,000 | $ 3,187,250 |
| MGM Growth Properties LLC, 5.75%, 2/01/2027 | | | 1,110,000 | 1,226,550 |
| MGM Growth Properties LLC, 3.875%, 2/15/2029 (n) | | | 2,152,000 | 2,211,180 |
| Penn National Gaming, Inc., 4.125%, 7/01/2029 (n) | | | 2,415,000 | 2,270,100 |
| Scientific Games Corp., 8.625%, 7/01/2025 (n) | | | 770,000 | 816,200 |
| Scientific Games Corp., 8.25%, 3/15/2026 (n) | | | 1,910,000 | 1,993,563 |
| Scientific Games International, Inc., 7%, 5/15/2028 (n) | | | 1,950,000 | 2,047,987 |
| VICI Properties LP, REIT, 4.25%, 12/01/2026 (n) | | | 2,865,000 | 2,897,231 |
| VICI Properties LP, REIT, 3.75%, 2/15/2027 (n) | | | 2,580,000 | 2,554,522 |
| Wyndham Hotels & Resorts, Inc., 4.375%, 8/15/2028 (n) | | | 4,663,000 | 4,626,629 |
| Wynn Las Vegas LLC/Wynn Las Vegas Capital Corp., 5.25%, 5/15/2027 (n) | | | 2,055,000 | 2,021,750 |
| Wynn Macau Ltd., 4.875%, 10/01/2024 (n) | | | 870,000 | 826,035 |
| Wynn Macau Ltd., 5.5%, 1/15/2026 (n) | | | 2,100,000 | 1,970,430 |
| Wynn Macau Ltd., 5.625%, 8/26/2028 (n) | | | 2,854,000 | 2,611,410 |
| Wynn Resorts Finance LLC/Wynn Resorts Capital Corp., 5.125%, 10/01/2029 (n) | | | 2,525,000 | 2,454,047 |
| | | | | $67,430,060 |
| Industrial – 1.1% |
| Albion Financing 2 S.à r.l., 8.75%, 4/15/2027 (n) | | $ | 1,010,000 | $ 1,002,425 |
| APi Escrow Corp., 4.75%, 10/15/2029 (n) | | | 3,470,000 | 3,409,275 |
| Dycom Industries, Inc., 4.5%, 4/15/2029 (n) | | | 1,980,000 | 1,939,074 |
| Williams Scotsman International, Inc., 4.625%, 8/15/2028 (n) | | | 4,351,000 | 4,389,071 |
| | | | | $10,739,845 |
| Insurance - Property & Casualty – 1.3% |
| Alliant Holdings Intermediate LLC, 6.75%, 10/15/2027 (n) | | $ | 4,755,000 | $ 4,699,747 |
| AssuredPartners, Inc., 5.625%, 1/15/2029 (n) | | | 2,370,000 | 2,203,247 |
| GTCR (AP) Finance, Inc., 8%, 5/15/2027 (n) | | | 700,000 | 710,500 |
| Hub International Ltd., 5.625%, 12/01/2029 (n) | | | 2,920,000 | 2,868,900 |
| Ryan Specialty Group, 4.375%, 2/01/2030 (n) | | | 2,404,000 | 2,391,980 |
| | | | | $12,874,374 |
| Machinery & Tools – 0.7% |
| Ritchie Bros. Holdings Ltd., 4.75%, 12/15/2031 (n) | | $ | 3,220,000 | $ 3,243,184 |
| Terex Corp., 5%, 5/15/2029 (n) | | | 3,715,000 | 3,684,908 |
| | | | | $6,928,092 |
| Medical & Health Technology & Services – 6.5% |
| 180 Medical, Inc., 3.875%, 10/15/2029 (n) | | $ | 3,525,000 | $ 3,428,063 |
| Avantor Funding, Inc., 4.625%, 7/15/2028 (n) | | | 3,865,000 | 3,855,338 |
| Catalent, Inc., 3.125%, 2/15/2029 (n) | | | 5,609,000 | 5,244,415 |
Portfolio of Investments – continued
| Issuer | | | Shares/Par | Value ($) |
| Bonds – continued |
| Medical & Health Technology & Services – continued |
| Charles River Laboratories International, Inc., 3.75%, 3/15/2029 (n) | | $ | 6,825,000 | $ 6,584,077 |
| CHS/Community Health Systems, Inc., 8%, 12/15/2027 (n) | | | 1,780,000 | 1,886,800 |
| CHS/Community Health Systems, Inc., 6.125%, 4/01/2030 (n) | | | 4,435,000 | 4,223,029 |
| CHS/Community Health Systems, Inc., 5.25%, 5/15/2030 (n) | | | 745,000 | 741,797 |
| DaVita, Inc., 4.625%, 6/01/2030 (n) | | | 2,290,000 | 2,227,918 |
| DaVita, Inc., 3.75%, 2/15/2031 (n) | | | 2,193,000 | 2,014,709 |
| Encompass Health Corp., 5.125%, 3/15/2023 | | | 875,000 | 873,906 |
| Encompass Health Corp., 5.75%, 9/15/2025 | | | 1,940,000 | 1,959,400 |
| HCA, Inc., 5.875%, 2/15/2026 | | | 4,395,000 | 4,784,001 |
| IQVIA Holdings, Inc., 5%, 10/15/2026 (n) | | | 3,078,000 | 3,148,794 |
| IQVIA Holdings, Inc., 5%, 5/15/2027 (n) | | | 5,440,000 | 5,563,488 |
| Legacy LifePoint Health LLC, 4.375%, 2/15/2027 (n) | | | 995,000 | 974,951 |
| MPH Acquisition Holdings LLC, 5.5%, 9/01/2028 (n) | | | 1,925,000 | 1,848,481 |
| Regional Care/LifePoint Health, Inc., 9.75%, 12/01/2026 (n) | | | 2,110,000 | 2,219,783 |
| Syneos Health, Inc., 3.625%, 1/15/2029 (n) | | | 4,441,000 | 4,209,091 |
| Tenet Healthcare Corp., 6.125%, 10/01/2028 (n) | | | 4,005,000 | 4,018,096 |
| U.S. Renal Care, Inc., 10.625%, 7/15/2027 (n) | | | 2,235,000 | 2,279,700 |
| US Acute Care Solutions LLC, 6.375%, 3/01/2026 (n) | | | 2,255,000 | 2,266,275 |
| US Acute Care Solutions LLC, 6.375%, 3/01/2026 (n)(w) | | | 745,000 | 748,725 |
| | | | | $65,100,837 |
| Medical Equipment – 0.4% |
| Teleflex, Inc., 4.625%, 11/15/2027 | | $ | 3,890,000 | $ 3,967,800 |
| Metals & Mining – 3.7% |
| Baffinland Iron Mines Corp./Baffinland Iron Mines LP, 8.75%, 7/15/2026 (n) | | $ | 3,620,000 | $ 3,769,325 |
| Coeur Mining, Inc., 5.125%, 2/15/2029 (n) | | | 3,590,000 | 3,423,962 |
| Compass Minerals International, Inc., 6.75%, 12/01/2027 (n) | | | 2,885,000 | 3,022,614 |
| Eldorado Gold Corp., 6.25%, 9/01/2029 (n) | | | 2,820,000 | 2,819,803 |
| Ero Copper Corp., 6.5%, 2/15/2030 (n)(w) | | | 1,307,000 | 1,291,499 |
| First Quantum Minerals Ltd., 6.875%, 3/01/2026 (n) | | | 1,645,000 | 1,698,463 |
| First Quantum Minerals Ltd., 6.875%, 10/15/2027 (n) | | | 1,968,000 | 2,091,000 |
| FMG Resources Ltd., 4.375%, 4/01/2031 (n) | | | 3,740,000 | 3,763,375 |
| GrafTech Finance, Inc., 4.625%, 12/15/2028 (n) | | | 2,315,000 | 2,235,896 |
| Kaiser Aluminum Corp., 4.625%, 3/01/2028 (n) | | | 4,670,000 | 4,480,024 |
| Kaiser Aluminum Corp., 4.5%, 6/01/2031 (n) | | | 2,070,000 | 1,966,500 |
| Novelis Corp., 3.25%, 11/15/2026 (n) | | | 1,265,000 | 1,225,406 |
| Novelis Corp., 4.75%, 1/30/2030 (n) | | | 2,985,000 | 2,970,075 |
| Novelis Corp., 3.875%, 8/15/2031 (n) | | | 1,517,000 | 1,428,665 |
Portfolio of Investments – continued
| Issuer | | | Shares/Par | Value ($) |
| Bonds – continued |
| Metals & Mining – continued |
| Petra Diamonds US$ Treasury PLC, 10.5% PIK to 12/31/2022, 10.5% PIK/9.75% Cash to 6/30/2023, 9.75% Cash to 3/08/2026 (n)(p) | | $ | 1,115,912 | $ 1,146,600 |
| | | | | $37,333,207 |
| Midstream – 4.5% |
| Cheniere Energy Partners LP, 4.5%, 10/01/2029 | | $ | 1,339,000 | $ 1,368,753 |
| Cheniere Energy Partners LP, 4%, 3/01/2031 | | | 3,970,000 | 3,949,932 |
| DT Midstream, Inc., 4.125%, 6/15/2029 (n) | | | 2,398,000 | 2,365,603 |
| DT Midstream, Inc., 4.375%, 6/15/2031 (n) | | | 4,043,000 | 3,992,462 |
| EnLink Midstream Partners LP, 5.625%, 1/15/2028 (n) | | | 2,125,000 | 2,181,737 |
| EQM Midstream Partners LP, 6%, 7/01/2025 (n) | | | 916,000 | 945,770 |
| EQM Midstream Partners LP, 6.5%, 7/01/2027 (n) | | | 246,000 | 257,070 |
| EQM Midstream Partners LP, 5.5%, 7/15/2028 | | | 5,725,000 | 5,794,330 |
| EQM Midstream Partners LP, 4.5%, 1/15/2029 (n) | | | 1,505,000 | 1,437,305 |
| Genesis Energy LP/Genesis Energy Finance Corp., 6.25%, 5/15/2026 | | | 1,287,200 | 1,235,712 |
| Northriver Midstream Finance LP, 5.625%, 2/15/2026 (n) | | | 3,440,000 | 3,491,600 |
| Targa Resources Partners LP/Targa Resources Finance Corp., 6.875%, 1/15/2029 | | | 4,245,000 | 4,642,969 |
| Targa Resources Partners LP/Targa Resources Finance Corp., 4.875%, 2/01/2031 | | | 2,130,000 | 2,225,850 |
| Targa Resources Partners LP/Targa Resources Finance Corp., 4%, 1/31/2032 (n) | | | 1,245,000 | 1,239,273 |
| Venture Global Calcasieu Pass LLC, 3.875%, 8/15/2029 (n) | | | 2,255,000 | 2,251,031 |
| Venture Global Calcasieu Pass LLC, 4.125%, 8/15/2031 (n) | | | 2,255,000 | 2,269,636 |
| Western Midstream Operating LP, 5.3%, 2/01/2030 | | | 2,650,000 | 2,762,625 |
| Western Midstream Operation LP, 4.65%, 7/01/2026 | | | 995,000 | 1,041,377 |
| Western Midstream Operation LP, 5.5%, 8/15/2048 | | | 910,000 | 1,005,550 |
| | | | | $44,458,585 |
| Municipals – 0.0% |
| Puerto Rico Industrial, Tourist, Educational, Medical & Environmental Control Facilities Financing Authority Rev. (Cogeneration Facilities - AES Puerto Rico Project), 9.12%, 6/01/2022 | | $ | 415,000 | $ 425,375 |
| Network & Telecom – 0.5% |
| Iliad Holding S.A.S., 7%, 10/15/2028 (n) | | $ | 2,782,000 | $ 2,828,209 |
| Zayo Group Holdings, Inc., 6.125%, 3/01/2028 (n) | | | 2,300,000 | 2,169,820 |
| | | | | $4,998,029 |
Portfolio of Investments – continued
| Issuer | | | Shares/Par | Value ($) |
| Bonds – continued |
| Oil Services – 0.2% |
| Nabors Industries, Inc., 5.75%, 2/01/2025 | | $ | 495,000 | $ 457,875 |
| Solaris Midstream Holding LLC, 7.625%, 4/01/2026 (n) | | | 1,640,000 | 1,693,513 |
| | | | | $2,151,388 |
| Oils – 0.7% |
| Parkland Corp., 4.625%, 5/01/2030 (n) | | $ | 4,070,000 | $ 3,907,200 |
| PBF Holding Co. LLC/PBF Finance Corp., 7.25%, 6/15/2025 | | | 2,240,000 | 1,777,339 |
| PBF Holding Co. LLC/PBF Finance Corp., 6%, 2/15/2028 | | | 1,960,000 | 1,376,900 |
| | | | | $7,061,439 |
| Personal Computers & Peripherals – 0.5% |
| NCR Corp., 5%, 10/01/2028 (n) | | $ | 3,780,000 | $ 3,755,657 |
| NCR Corp., 5.125%, 4/15/2029 (n) | | | 1,760,000 | 1,756,145 |
| | | | | $5,511,802 |
| Pharmaceuticals – 2.5% |
| Bausch Health Companies, Inc., 6.125%, 4/15/2025 (n) | | $ | 5,838,000 | $ 5,950,381 |
| Bausch Health Companies, Inc., 5%, 1/30/2028 (n) | | | 5,415,000 | 4,562,138 |
| Bausch Health Companies, Inc., 5%, 2/15/2029 (n) | | | 1,810,000 | 1,457,050 |
| Endo Luxembourg Finance Co I S.à r.l., 6.125%, 4/01/2029 (n) | | | 1,735,000 | 1,648,632 |
| Jazz Securities DAC, 4.375%, 1/15/2029 (n) | | | 4,190,000 | 4,136,997 |
| Organon Finance 1 LLC, 4.125%, 4/30/2028 (n) | | | 2,461,000 | 2,421,673 |
| Organon Finance 1 LLC, 5.125%, 4/30/2031 (n) | | | 3,101,000 | 3,101,000 |
| Par Pharmaceutical, Inc., 7.5%, 4/01/2027 (n) | | | 1,865,000 | 1,876,656 |
| | | | | $25,154,527 |
| Pollution Control – 0.8% |
| GFL Environmental, Inc., 4%, 8/01/2028 (n) | | $ | 2,970,000 | $ 2,767,060 |
| GFL Environmental, Inc., 4.75%, 6/15/2029 (n) | | | 1,000,000 | 970,000 |
| GFL Environmental, Inc., 4.375%, 8/15/2029 (n) | | | 1,285,000 | 1,226,263 |
| Stericycle, Inc., 3.875%, 1/15/2029 (n) | | | 3,470,000 | 3,296,500 |
| | | | | $8,259,823 |
| Precious Metals & Minerals – 0.4% |
| IAMGOLD Corp., 5.75%, 10/15/2028 (n) | | $ | 2,520,000 | $ 2,365,272 |
| Taseko Mines Ltd., 7%, 2/15/2026 (n) | | | 2,000,000 | 2,027,800 |
| | | | | $4,393,072 |
| Printing & Publishing – 0.4% |
| Cimpress N.V., 7%, 6/15/2026 (n) | | $ | 3,565,000 | $ 3,664,570 |
| Railroad & Shipping – 0.2% |
| Watco Cos. LLC/Watco Finance Corp., 6.5%, 6/15/2027 (n) | | $ | 2,022,000 | $ 2,092,770 |
Portfolio of Investments – continued
| Issuer | | | Shares/Par | Value ($) |
| Bonds – continued |
| Real Estate - Other – 0.7% |
| Park Intermediate Holdings LLC/PK Domestic Property LLC/PK Finance Co-Issuer, 5.875%, 10/01/2028 (n) | | $ | 3,890,000 | $ 3,981,065 |
| XHR LP, REIT, 4.875%, 6/01/2029 (n) | | | 2,695,000 | 2,642,447 |
| | | | | $6,623,512 |
| Restaurants – 0.2% |
| Fertitta Entertainment LLC, 6.75%, 1/15/2030 (n) | | $ | 1,980,000 | $ 1,923,966 |
| Retailers – 1.2% |
| Asbury Automotive Group, Inc., 4.625%, 11/15/2029 (n) | | $ | 1,714,000 | $ 1,686,610 |
| Bath & Body Works, Inc., 5.25%, 2/01/2028 | | | 6,740,000 | 7,077,000 |
| Victoria's Secret & Co., 4.625%, 7/15/2029 (n) | | | 2,975,000 | 2,866,785 |
| | | | | $11,630,395 |
| Specialty Chemicals – 0.3% |
| Univar Solutions USA, Inc., 5.125%, 12/01/2027 (n) | | $ | 2,996,000 | $ 3,048,430 |
| Specialty Stores – 1.0% |
| Group 1 Automotive, Inc., 4%, 8/15/2028 (n) | | $ | 2,634,000 | $ 2,520,922 |
| Michael Cos., Inc., 5.25%, 5/01/2028 (n) | | | 1,710,000 | 1,646,610 |
| Michael Cos., Inc., 7.875%, 5/01/2029 (n) | | | 2,055,000 | 1,880,325 |
| Penske Automotive Group Co., 3.75%, 6/15/2029 | | | 3,967,000 | 3,734,058 |
| | | | | $9,781,915 |
| Supermarkets – 0.6% |
| Albertsons Cos. LLC/Safeway, Inc., 4.625%, 1/15/2027 (n) | | $ | 3,535,000 | $ 3,618,072 |
| Albertsons Cos. LLC/Safeway, Inc., 3.5%, 3/15/2029 (n) | | | 2,425,000 | 2,289,588 |
| | | | | $5,907,660 |
| Telecommunications - Wireless – 2.3% |
| Altice France S.A., 6%, 2/15/2028 (n) | | $ | 3,180,000 | $ 2,902,227 |
| SBA Communications Corp., 3.875%, 2/15/2027 | | | 2,448,000 | 2,472,480 |
| SBA Communications Corp., 3.125%, 2/01/2029 | | | 4,805,000 | 4,478,020 |
| Sprint Capital Corp., 6.875%, 11/15/2028 | | | 4,250,000 | 5,055,375 |
| Sprint Corp., 7.125%, 6/15/2024 | | | 1,510,000 | 1,645,900 |
| Sprint Corp., 7.625%, 3/01/2026 | | | 5,280,000 | 6,045,600 |
| | | | | $22,599,602 |
| Tobacco – 0.3% |
| Vector Group Ltd., 10.5%, 11/01/2026 (n) | | $ | 1,450,000 | $ 1,486,830 |
| Vector Group Ltd., 5.75%, 2/01/2029 (n) | | | 1,650,000 | 1,524,897 |
| | | | | $3,011,727 |
Portfolio of Investments – continued
| Issuer | | | Shares/Par | Value ($) |
| Bonds – continued |
| Utilities - Electric Power – 2.7% |
| Calpine Corp., 4.5%, 2/15/2028 (n) | | $ | 3,110,000 | $ 3,039,714 |
| Calpine Corp., 5.125%, 3/15/2028 (n) | | | 3,750,000 | 3,658,237 |
| Clearway Energy Operating LLC, 4.75%, 3/15/2028 (n) | | | 1,590,000 | 1,636,635 |
| Clearway Energy Operating LLC, 3.75%, 2/15/2031 (n) | | | 5,940,000 | 5,592,332 |
| NextEra Energy, Inc., 4.25%, 7/15/2024 (n) | | | 2,022,000 | 2,081,396 |
| NextEra Energy, Inc., 4.25%, 9/15/2024 (n) | | | 488,000 | 503,250 |
| NextEra Energy, Inc., 4.5%, 9/15/2027 (n) | | | 2,255,000 | 2,283,188 |
| TerraForm Global Operating LLC, 6.125%, 3/01/2026 (n) | | | 1,805,000 | 1,827,563 |
| TerraForm Power Operating LLC, 5%, 1/31/2028 (n) | | | 4,745,000 | 4,804,312 |
| TerraForm Power Operating LLC, 4.75%, 1/15/2030 (n) | | | 1,505,000 | 1,512,826 |
| | | | | $26,939,453 |
| Total Bonds (Identified Cost, $968,733,065) | | $ 956,752,160 |
| Common Stocks – 0.8% |
| Construction – 0.0% | |
| ICA Tenedora S.A. de C.V. (u) | | 258,532 | $ 213,062 |
| Oil Services – 0.1% | |
| LTRI Holdings LP (a)(u) | | 3,300 | $ 949,047 |
| Precious Metals & Minerals – 0.0% | |
| Petra Diamonds Ltd. (a) | | 161,793 | $ 183,760 |
| Special Products & Services – 0.7% | |
| iShares iBoxx $ High Yield Corporate Bond ETF | | 73,200 | $ 6,200,040 |
| Total Common Stocks (Identified Cost, $6,976,280) | | $ 7,545,909 |
| | Strike
Price | First
Exercise | | |
| Warrants – 0.0% | | | | |
| Other Banks & Diversified Financials – 0.0% |
| Avation Capital S.A. (1 share for 1 warrant, Expiration 10/31/26) (a)(u) (Identified Cost, $0) | GBP 1.14 | 3/16/21 | 42,350 | $ 6,820 |
| | | | | |
| Investment Companies (h) – 2.4% |
| Money Market Funds – 2.4% | |
| MFS Institutional Money Market Portfolio, 0.06% (v) (Identified Cost, $24,340,169) | | | 24,340,223 | $ 24,340,223 |
|
|
| Other Assets, Less Liabilities – 0.9% | | 8,720,895 |
| Net Assets – 100.0% | $997,366,007 |
| (a) | Non-income producing security. |
| (d) | In default. |
Portfolio of Investments – continued
| (h) | An affiliated issuer, which may be considered one in which the fund owns 5% or more of the outstanding voting securities, or a company which is under common control. At period end, the aggregate values of the fund's investments in affiliated issuers and in unaffiliated issuers were $24,340,223 and $964,304,889, respectively. |
| (n) | Securities exempt from registration under Rule 144A of the Securities Act of 1933. These securities may be sold in the ordinary course of business in transactions exempt from registration, normally to qualified institutional buyers. At period end, the aggregate value of these securities was $810,959,065, representing 81.3% of net assets. |
| (p) | Payment-in-kind (PIK) security for which interest income may be received in additional securities and/or cash. |
| (u) | The security was valued using significant unobservable inputs and is considered level 3 under the fair value hierarchy. For further information about the fund’s level 3 holdings, please see Note 2 in the Notes to Financial Statements. |
| (v) | Affiliated issuer that is available only to investment companies managed by MFS. The rate quoted for the MFS Institutional Money Market Portfolio is the annualized seven-day yield of the fund at period end. |
| (w) | When-issued security. |
| (z) | Restricted securities are not registered under the Securities Act of 1933 and are subject to legal restrictions on resale. These securities generally may be resold in transactions exempt from registration or to the public if the securities are subsequently registered. Disposal of these securities may involve time-consuming negotiations and prompt sale at an acceptable price may be difficult. The fund holds the following restricted securities: |
| Restricted Securities | Acquisition
Date | Cost | Value |
| Paysafe Finance PLC, 4%, 6/15/2029 | 6/11/21 | $3,056,927 | $2,773,404 |
| % of Net assets | | | 0.3% |
| The following abbreviations are used in this report and are defined: |
| ETF | Exchange-Traded Fund |
| REIT | Real Estate Investment Trust |
| Abbreviations indicate amounts shown in currencies other than the U.S. dollar. All amounts are stated in U.S. dollars unless otherwise indicated. A list of abbreviations is shown below: |
| EUR | Euro |
| GBP | British Pound |
Derivative Contracts at 1/31/22
| Forward Foreign Currency Exchange Contracts |
Currency
Purchased | Currency
Sold | Counterparty | Settlement
Date | Unrealized
Appreciation
(Depreciation) |
| Asset Derivatives |
| USD | 1,165,021 | EUR | 1,022,469 | JPMorgan Chase Bank N.A. | 4/08/2022 | $14,539 |
Portfolio of Investments – continued
| Futures Contracts |
| Description | Long/
Short | Currency | Contracts | Notional
Amount | Expiration
Date | Value/Unrealized
Appreciation
(Depreciation) |
| Asset Derivatives |
| Interest Rate Futures | | |
| U.S. Treasury Note 10 yr | Short | USD | 268 | $34,295,625 | March – 2022 | $281,683 |
| Liability Derivatives |
| Interest Rate Futures | | |
| U.S. Treasury Bond | Long | USD | 98 | $15,251,250 | March – 2022 | $(240,860) |
| U.S. Treasury Ultra Bond | Long | USD | 17 | 3,211,937 | March – 2022 | (54,251) |
| | | | | | | $(295,111) |
At January 31, 2022, the fund had cash collateral of 192,200 to cover any collateral or margin obligations for certain derivative contracts. Restricted cash and/or deposits with brokers in the Statement of Assets and Liabilities are comprised of cash collateral.
See Notes to Financial Statements
Financial Statements
Statement of Assets and Liabilities
At 1/31/22
This statement represents your fund’s balance sheet, which details the assets and liabilities comprising the total value of the fund.
| Assets | |
| Investments in unaffiliated issuers, at value (identified cost, $975,709,345) | $964,304,889 |
| Investments in affiliated issuers, at value (identified cost, $24,340,169) | 24,340,223 |
| Cash | 993,595 |
| Deposits with brokers for | |
| Futures contracts | 192,200 |
| Receivables for | |
| Forward foreign currency exchange contracts | 14,539 |
| Investments sold | 4,789,596 |
| Fund shares sold | 22,081 |
| Interest and dividends | 13,290,787 |
| Other assets | 3,010 |
| Total assets | $1,007,950,920 |
| Liabilities | |
| Payables for | |
| Distributions | $68 |
| Net daily variation margin on open futures contracts | 26,531 |
| Investments purchased | 4,552,445 |
| Fund shares reacquired | 3,848,004 |
| When-issued investments purchased | 2,082,652 |
| Payable to affiliates | |
| Administrative services fee | 190 |
| Shareholder servicing costs | 8 |
| Accrued expenses and other liabilities | 75,015 |
| Total liabilities | $10,584,913 |
| Net assets | $997,366,007 |
| Net assets consist of | |
| Paid-in capital | $1,054,923,322 |
| Total distributable earnings (loss) | (57,557,315) |
| Net assets | $997,366,007 |
| Shares of beneficial interest outstanding | 112,350,889 |
| Net asset value per share (net assets of $997,366,007 / 112,350,889 shares of beneficial interest outstanding) | $8.88 |
See Notes to Financial Statements
Financial Statements
Statement of Operations
Year ended 1/31/22
This statement describes how much your fund earned in investment income and accrued in expenses. It also describes any gains and/or losses generated by fund operations.
| Net investment income (loss) | |
| Income | |
| Interest | $54,795,613 |
| Dividends | 798,641 |
| Other | 481,474 |
| Dividends from affiliated issuers | 9,500 |
| Foreign taxes withheld | (14,590) |
| Total investment income | $56,070,638 |
| Expenses | |
| Shareholder servicing costs | $36 |
| Administrative services fee | 17,500 |
| Custodian fee | 66,889 |
| Shareholder communications | 7,597 |
| Audit and tax fees | 47,156 |
| Legal fees | 5,321 |
| Pricing service fees | 11,946 |
| Form N-CEN/N-PORT preparation fees | 9,800 |
| Miscellaneous | 24,104 |
| Total expenses | $190,349 |
| Fees paid indirectly | (188) |
| Net expenses | $190,161 |
| Net investment income (loss) | $55,880,477 |
| Realized and unrealized gain (loss) |
| Realized gain (loss) (identified cost basis) | |
| Unaffiliated issuers | $34,191,431 |
| Futures contracts | (18,646) |
| Forward foreign currency exchange contracts | 55,275 |
| Foreign currency | (637) |
| Net realized gain (loss) | $34,227,423 |
| Change in unrealized appreciation or depreciation | |
| Unaffiliated issuers | $(72,489,816) |
| Futures contracts | (13,428) |
| Forward foreign currency exchange contracts | 14,539 |
| Translation of assets and liabilities in foreign currencies | (251) |
| Net unrealized gain (loss) | $(72,488,956) |
| Net realized and unrealized gain (loss) | $(38,261,533) |
| Change in net assets from operations | $17,618,944 |
See Notes to Financial Statements
Financial Statements
Statements of Changes in Net Assets
These statements describe the increases and/or decreases in net assets resulting from operations, any distributions, and any shareholder transactions.
| | Year ended |
| | 1/31/22 | 1/31/21 |
| Change in net assets | | |
| From operations | | |
| Net investment income (loss) | $55,880,477 | $65,011,400 |
| Net realized gain (loss) | 34,227,423 | (2,259,931) |
| Net unrealized gain (loss) | (72,488,956) | 37,311,221 |
| Change in net assets from operations | $17,618,944 | $100,062,690 |
| Total distributions to shareholders | $(60,026,693) | $(67,143,934) |
| Change in net assets from fund share transactions | $(188,544,337) | $306,368,694 |
| Total change in net assets | $(230,952,086) | $339,287,450 |
| Net assets | | |
| At beginning of period | 1,228,318,093 | 889,030,643 |
| At end of period | $997,366,007 | $1,228,318,093 |
See Notes to Financial Statements
Financial Statements
Financial Highlights
The financial highlights table is intended to help you understand the fund's financial performance for the past 5 years. Certain information reflects financial results for a single fund share. The total returns in the table represent the rate that an investor would have earned (or lost) on an investment in the fund share class (assuming reinvestment of all distributions) held for the entire period.
| | Year ended |
| | 1/31/22 | 1/31/21 | 1/31/20 | 1/31/19 | 1/31/18 |
| Net asset value, beginning of period | $9.25 | $9.33 | $8.94 | $9.31 | $9.28 |
| Income (loss) from investment operations |
| Net investment income (loss) (d) | $0.47 | $0.50 | $0.51 | $0.52 | $0.53 |
| Net realized and unrealized gain (loss) | (0.34) | (0.06)(g) | 0.39 | (0.36) | 0.05 |
| Total from investment operations | $0.13 | $0.44 | $0.90 | $0.16 | $0.58 |
| Less distributions declared to shareholders |
| From net investment income | $(0.50) | $(0.52) | $(0.51) | $(0.53) | $(0.55) |
| Net asset value, end of period (x) | $8.88 | $9.25 | $9.33 | $8.94 | $9.31 |
| Total return (%) (s)(x) | 1.39 | 5.02 | 10.29 | 1.86 | 6.33 |
Ratios (%) (to average net assets)
and Supplemental data: |
| Expenses (f) | 0.02 | 0.02 | 0.02 | 0.02 | 0.02 |
| Net investment income (loss) | 5.09 | 5.58 | 5.51 | 5.77 | 5.63 |
| Portfolio turnover | 60 | 66 | 59 | 38 | 46 |
| Net assets at end of period (000 omitted) | $997,366 | $1,228,318 | $889,031 | $788,437 | $1,197,932 |
| (d) | Per share data is based on average shares outstanding. |
| (f) | Ratios do not reflect reductions from fees paid indirectly, if applicable. See Note 2 in the Notes to Financial Statements for additional information. |
| (g) | The per share amount varies from the net realized and unrealized gain/loss for the period because of the timing of sales of fund shares and the per share amount of realized and unrealized gains and losses at such time. |
| (s) | From time to time the fund may receive proceeds from litigation settlements, without which performance would be lower. |
| (x) | The net asset values and total returns have been calculated on net assets which include adjustments made in accordance with U.S. generally accepted accounting principles required at period end for financial reporting purposes. |
See Notes to Financial Statements
Notes to Financial Statements
(1) Business and Organization
MFS High Yield Pooled Portfolio (the fund) is a diversified series of MFS Series Trust III (the trust). The trust is organized as a Massachusetts business trust and is registered under the Investment Company Act of 1940, as amended, as an open-end management investment company. This fund is available only to certain U.S. registered investment companies managed by MFS. MFS does not receive a management fee from this fund.
The fund is an investment company and accordingly follows the investment company accounting and reporting guidance of the Financial Accounting Standards Board (FASB) Accounting Standards Codification Topic 946 Financial Services - Investment Companies.
(2) Significant Accounting Policies
General — The preparation of financial statements in conformity with U.S. generally accepted accounting principles requires management to make estimates and assumptions that affect the reported amounts of assets and liabilities, and disclosure of contingent assets and liabilities at the date of the financial statements and the reported amounts of increases and decreases in net assets from operations during the reporting period. Actual results could differ from those estimates. In the preparation of these financial statements, management has evaluated subsequent events occurring after the date of the fund’s Statement of Assets and Liabilities through the date that the financial statements were issued. The fund invests in high-yield securities rated below investment grade. Investments in below investment grade quality securities can involve a substantially greater risk of default or can already be in default, and their values can decline significantly. Below investment grade quality securities tend to be more sensitive to adverse news about the issuer, or the market or economy in general, than higher quality debt instruments. The fund invests in foreign securities. Investments in foreign securities are vulnerable to the effects of changes in the relative values of the local currency and the U.S. dollar and to the effects of changes in each country’s market, economic, industrial, political, regulatory, geopolitical, environmental, public health, and other conditions.
Balance Sheet Offsetting — The fund's accounting policy with respect to balance sheet offsetting is that, absent an event of default by the counterparty or a termination of the agreement, the International Swaps and Derivatives Association (ISDA) Master Agreement, or similar agreement, does not result in an offset of reported amounts of financial assets and financial liabilities in the Statement of Assets and Liabilities across transactions between the fund and the applicable counterparty. The fund's right to setoff may be restricted or prohibited by the bankruptcy or insolvency laws of the particular jurisdiction to which a specific master netting agreement counterparty is subject. Balance sheet offsetting disclosures, to the extent applicable to the fund, have been included in the fund’s Significant Accounting Policies note under the captions for each of the fund’s in-scope financial instruments and transactions.
Investment Valuations — Equity securities, including restricted equity securities, are generally valued at the last sale or official closing price on their primary market or exchange as provided by a third-party pricing service. Equity securities, for which there were no sales reported that day, are generally valued at the last quoted daily bid quotation on their primary market or exchange as provided by a third-party pricing service. Debt instruments and floating rate loans, including restricted debt instruments,
Notes to Financial Statements - continued
are generally valued at an evaluated or composite bid as provided by a third-party pricing service. Short-term instruments with a maturity at issuance of 60 days or less may be valued at amortized cost, which approximates market value. Futures contracts are generally valued at last posted settlement price on their primary exchange as provided by a third-party pricing service. Futures contracts for which there were no trades that day for a particular position are generally valued at the closing bid quotation on their primary exchange as provided by a third-party pricing service.
Forward foreign currency exchange contracts are generally valued at the mean of bid and asked prices for the time period interpolated from rates provided by a third-party pricing service for proximate time periods. Open-end investment companies are generally valued at net asset value per share. Securities and other assets generally valued on the basis of information from a third-party pricing service may also be valued at a broker/dealer bid quotation. In determining values, third-party pricing services can utilize both transaction data and market information such as yield, quality, coupon rate, maturity, type of issue, trading characteristics, and other market data. The values of foreign securities and other assets and liabilities expressed in foreign currencies are converted to U.S. dollars using the mean of bid and asked prices for rates provided by a third-party pricing service.
The Board of Trustees has delegated primary responsibility for determining or causing to be determined the value of the fund’s investments (including any fair valuation) to the adviser pursuant to valuation policies and procedures approved by the Board. If the adviser determines that reliable market quotations are not readily available, investments are valued at fair value as determined in good faith by the adviser in accordance with such procedures under the oversight of the Board of Trustees. Under the fund’s valuation policies and procedures, market quotations are not considered to be readily available for most types of debt instruments and floating rate loans and many types of derivatives. These investments are generally valued at fair value based on information from third-party pricing services. In addition, investments may be valued at fair value if the adviser determines that an investment’s value has been materially affected by events occurring after the close of the exchange or market on which the investment is principally traded (such as foreign exchange or market) and prior to the determination of the fund’s net asset value, or after the halt of trading of a specific security where trading does not resume prior to the close of the exchange or market on which the security is principally traded. The adviser generally relies on third-party pricing services or other information (such as the correlation with price movements of similar securities in the same or other markets; the type, cost and investment characteristics of the security; the business and financial condition of the issuer; and trading and other market data) to assist in determining whether to fair value and at what value to fair value an investment. The value of an investment for purposes of calculating the fund’s net asset value can differ depending on the source and method used to determine value. When fair valuation is used, the value of an investment used to determine the fund’s net asset value may differ from quoted or published prices for the same investment. There can be no assurance that the fund could obtain the fair value assigned to an investment if it were to sell the investment at the same time at which the fund determines its net asset value per share.
Various inputs are used in determining the value of the fund's assets or liabilities. These inputs are categorized into three broad levels. In certain cases, the inputs used to measure fair value may fall into different levels of the fair value hierarchy. In such cases, an investment's level within the fair value hierarchy is based on the lowest level of
Notes to Financial Statements - continued
input that is significant to the fair value measurement. The fund's assessment of the significance of a particular input to the fair value measurement in its entirety requires judgment, and considers factors specific to the investment. Level 1 includes unadjusted quoted prices in active markets for identical assets or liabilities. Level 2 includes other significant observable market-based inputs (including quoted prices for similar securities, interest rates, prepayment speed, and credit risk). Level 3 includes unobservable inputs, which may include the adviser's own assumptions in determining the fair value of investments. Other financial instruments are derivative instruments, such as futures contract and forward foreign currency exchange contracts. The following is a summary of the levels used as of January 31, 2022 in valuing the fund's assets and liabilities:
| Financial Instruments | Level 1 | Level 2 | Level 3 | Total |
| Equity Securities: | | | | |
| United States | $6,200,040 | $— | $949,047 | $7,149,087 |
| Mexico | — | — | 213,062 | 213,062 |
| United Kingdom | — | 183,760 | 6,820 | 190,580 |
| Municipal Bonds | — | 425,375 | — | 425,375 |
| U.S. Corporate Bonds | — | 825,350,475 | — | 825,350,475 |
| Foreign Bonds | — | 130,976,310 | — | 130,976,310 |
| Mutual Funds | 24,340,223 | — | — | 24,340,223 |
| Total | $30,540,263 | $956,935,920 | $1,168,929 | $988,645,112 |
| Other Financial Instruments | | | | |
| Futures Contracts – Assets | $281,683 | $— | $— | $281,683 |
| Futures Contracts – Liabilities | (295,111) | — | — | (295,111) |
| Forward Foreign Currency Exchange Contracts – Assets | — | 14,539 | — | 14,539 |
For further information regarding security characteristics, see the Portfolio of Investments.
The following is a reconciliation of level 3 assets for which significant unobservable inputs were used to determine fair value. The table presents the activity of level 3 securities held at the beginning and the end of the period.
| | Equity
Securities |
| Balance as of 1/31/21 | $932,316 |
| Change in unrealized appreciation or depreciation | 16,731 |
| Transfers into level 3 | 213,062 |
| Received as part of a corporate action | 6,820 |
| Balance as of 1/31/22 | $1,168,929 |
The net change in unrealized appreciation or depreciation from investments held as level 3 at January 31, 2022 is $16,731. At January 31, 2022, the fund held three level 3 securities.
Foreign Currency Translation — Purchases and sales of foreign investments, income, and expenses are converted into U.S. dollars based upon currency exchange rates prevailing on the respective dates of such transactions or on the reporting date for foreign denominated receivables and payables. Gains and losses attributable to foreign
Notes to Financial Statements - continued
currency exchange rates on sales of securities are recorded for financial statement purposes as net realized gains and losses on investments. Gains and losses attributable to foreign exchange rate movements on receivables, payables, income and expenses are recorded for financial statement purposes as foreign currency transaction gains and losses. That portion of both realized and unrealized gains and losses on investments that results from fluctuations in foreign currency exchange rates is not separately disclosed.
Derivatives — The fund uses derivatives primarily to increase or decrease exposure to a particular market or segment of the market, or security, to increase or decrease interest rate exposure, or as alternatives to direct investments. Derivatives are used for hedging or non-hedging purposes. While hedging can reduce or eliminate losses, it can also reduce or eliminate gains. When the fund uses derivatives as an investment to increase market exposure, or for hedging purposes, gains and losses from derivative instruments may be substantially greater than the derivative’s original cost.
The derivative instruments used by the fund during the period were futures contracts and forward foreign currency exchange contracts. Depending on the type of derivative, a fund may exit a derivative position by entering into an offsetting transaction with a counterparty or exchange, negotiating an agreement with the derivative counterparty, or novating the position to a third party. The fund may be unable to promptly close out a futures position in instances where the daily fluctuation in the price for that type of future exceeds the daily limit set by the exchange. The fund's period end derivatives, as presented in the Portfolio of Investments and the associated Derivative Contract tables, generally are indicative of the volume of its derivative activity during the period.
The following table presents, by major type of derivative contract, the fair value, on a gross basis, of the asset and liability components of derivatives held by the fund at January 31, 2022 as reported in the Statement of Assets and Liabilities:
| | | Fair Value (a) |
| Risk | Derivative Contracts | Asset Derivatives | Liability Derivatives |
| Interest Rate | Futures Contracts | $281,683 | $(295,111) |
| Foreign Exchange | Forward Foreign Currency Exchange Contracts | 14,539 | — |
| Total | | $296,222 | $(295,111) |
| (a) | Values presented in this table for futures contracts correspond to the values reported in the Portfolio of Investments. Only the current day net variation margin for futures contracts is separately reported within the Statement of Assets and Liabilities. |
Notes to Financial Statements - continued
The following table presents, by major type of derivative contract, the realized gain (loss) on derivatives held by the fund for the year ended January 31, 2022 as reported in the Statement of Operations:
| Risk | Futures
Contracts | Forward Foreign
Currency
Exchange
Contracts |
| Interest Rate | $(18,646) | $ — |
| Foreign Exchange | — | 55,275 |
| Total | $(18,646) | $55,275 |
The following table presents, by major type of derivative contract, the change in unrealized appreciation or depreciation on derivatives held by the fund for the year ended January 31, 2022 as reported in the Statement of Operations:
| Risk | Futures
Contracts | Forward Foreign
Currency
Exchange
Contracts |
| Interest Rate | $(13,428) | $ — |
| Foreign Exchange | — | 14,539 |
| Total | $(13,428) | $14,539 |
Derivative counterparty credit risk is managed through formal evaluation of the creditworthiness of all potential counterparties. On certain, but not all, uncleared derivatives, the fund attempts to reduce its exposure to counterparty credit risk whenever possible by entering into an ISDA Master Agreement on a bilateral basis. The ISDA Master Agreement gives each party to the agreement the right to terminate all transactions traded under such agreement if there is a specified deterioration in the credit quality of the other party. Upon an event of default or a termination of the ISDA Master Agreement, the non-defaulting party has the right to close out all transactions traded under such agreement and to net amounts owed under each agreement to one net amount payable by one party to the other. This right to close out and net payments across all transactions traded under the ISDA Master Agreement could result in a reduction of the fund's credit risk to such counterparty equal to any amounts payable by the fund under the applicable transactions, if any.
Collateral and margin requirements differ by type of derivative. For cleared derivatives (e.g., futures contracts, cleared swaps, and exchange-traded options), margin requirements are set by the clearing broker and the clearing house and collateral, in the form of cash or securities, is posted by the fund directly with the clearing broker. Collateral terms are counterparty agreement specific for uncleared derivatives (e.g., forward foreign currency exchange contracts, uncleared swap agreements, and uncleared options) and collateral, in the form of cash and securities, is held in segregated accounts with the fund's custodian in connection with these agreements. For derivatives traded under an ISDA Master Agreement, which contains a collateral support annex, the collateral requirements are netted across all transactions traded under such counterparty-specific agreement and an amount is posted from one party to the other to collateralize such obligations. Cash that has been segregated or
Notes to Financial Statements - continued
delivered to cover the fund's collateral or margin obligations under derivative contracts, if any, will be reported separately in the Statement of Assets and Liabilities as restricted cash for uncleared derivatives and/or deposits with brokers for cleared derivatives. Securities pledged as collateral or margin for the same purpose, if any, are noted in the Portfolio of Investments. The fund may be required to make payments of interest on uncovered collateral or margin obligations with the broker. Any such payments are included in “Miscellaneous” expense in the Statement of Operations.
Futures Contracts — The fund entered into futures contracts which may be used to hedge against or obtain broad market exposure, interest rate exposure, currency exposure, or to manage duration. A futures contract represents a commitment for the future purchase or sale of an asset at a specified price on a specified date.
Upon entering into a futures contract, the fund is required to deposit with the broker, either in cash or securities, an initial margin in an amount equal to a specified percentage of the notional amount of the contract. Subsequent payments (variation margin) are made or received by the fund each day, depending on the daily fluctuations in the value of the contract, and are recorded for financial statement purposes as unrealized gain or loss by the fund until the contract is closed or expires at which point the gain or loss on futures contracts is realized.
The fund bears the risk of interest rates, exchange rates or securities prices moving unexpectedly, in which case, the fund may not achieve the anticipated benefits of the futures contracts and may realize a loss. While futures contracts may present less counterparty risk to the fund since the contracts are exchange traded and the exchange’s clearinghouse guarantees payments to the broker, there is still counterparty credit risk due to the insolvency of the broker. The fund’s maximum risk of loss due to counterparty credit risk is equal to the margin posted by the fund to the broker plus any gains or minus any losses on the outstanding futures contracts.
Forward Foreign Currency Exchange Contracts — The fund entered into forward foreign currency exchange contracts for the purchase or sale of a specific foreign currency at a fixed price on a future date. These contracts may be used to hedge the fund’s currency risk or for non-hedging purposes. For hedging purposes, the fund may enter into contracts to deliver or receive foreign currency that the fund will receive from or use in its normal investment activities. The fund may also use contracts to hedge against declines in the value of foreign currency denominated securities due to unfavorable exchange rate movements. For non-hedging purposes, the fund may enter into contracts with the intent of changing the relative exposure of the fund’s portfolio of securities to different currencies to take advantage of anticipated exchange rate changes.
Forward foreign currency exchange contracts are adjusted by the daily exchange rate of the underlying currency and any unrealized gains or losses are recorded as a receivable or payable for forward foreign currency exchange contracts until the contract settlement date. On contract settlement date, any gain or loss on the contract is recorded as realized gains or losses on forward foreign currency exchange contracts.
Risks may arise upon entering into these contracts from unanticipated movements in the value of the contract and from the potential inability of counterparties to meet the terms of their contracts. Generally, the fund’s maximum risk due to counterparty credit risk is the unrealized gain on the contract due to the use of Continuous Linked Settlement, a multicurrency cash settlement system for the centralized settlement of
Notes to Financial Statements - continued
foreign transactions. This risk is mitigated in cases where there is an ISDA Master Agreement between the fund and the counterparty providing for netting as described above and, where applicable, by the posting of collateral by the counterparty to the fund to cover the fund’s exposure to the counterparty under such ISDA Master Agreement.
Loans and Other Direct Debt Instruments — The fund invests in loans and loan participations or other receivables. These investments may include standby financing commitments, including revolving credit facilities, which contractually obligate the fund to supply additional cash to the borrower on demand. The fund generally provides this financial support in order to preserve its existing investment or to obtain a more senior secured interest in the assets of the borrower. Loan participations involve a risk of insolvency of the lending bank or other financial intermediary.
Indemnifications — Under the fund's organizational documents, its officers and Trustees may be indemnified against certain liabilities and expenses arising out of the performance of their duties to the fund. Additionally, in the normal course of business, the fund enters into agreements with service providers that may contain indemnification clauses. The fund's maximum exposure under these agreements is unknown as this would involve future claims that may be made against the fund that have not yet occurred.
Investment Transactions and Income — Investment transactions are recorded on the trade date. Some securities may be purchased or sold on an extended settlement basis, which means that the receipt or delivery of the securities by the fund and related payments occur at a future date, usually beyond the customary settlement period.
Interest income is recorded on the accrual basis. All premium and discount is amortized or accreted for financial statement purposes in accordance with U.S. generally accepted accounting principles. Dividends received in cash are recorded on the ex-dividend date. Certain dividends from foreign securities will be recorded when the fund is informed of the dividend if such information is obtained subsequent to the ex-dividend date. Dividend and interest payments received in additional securities are recorded on the ex-dividend or ex-interest date in an amount equal to the value of the security on such date. In determining the net gain or loss on securities sold, the cost of securities is determined on the identified cost basis. The fund earns certain fees in connection with its floating rate loan purchasing activities. These fees are in addition to interest payments earned and may include amendment fees, commitment fees, facility fees, consent fees, and prepayment fees. Commitment fees are recorded on an accrual basis as income in the accompanying financial statements. Debt obligations may be placed on non-accrual status or set to accrue at a rate of interest less than the contractual coupon when the collection of all or a portion of interest has become doubtful. Interest income for those debt obligations may be further reduced by the write-off of the related interest receivables when deemed uncollectible.
The fund may receive proceeds from litigation settlements. Any proceeds received from litigation involving portfolio holdings are reflected in the Statement of Operations in realized gain/loss if the security has been disposed of by the fund or in unrealized gain/loss if the security is still held by the fund. Any other proceeds from litigation not related to portfolio holdings are reflected as other income in the Statement of Operations.
Notes to Financial Statements - continued
The fund may purchase or sell securities on a when-issued or delayed delivery basis. In these extended settlement transactions, the receipt or delivery of the securities by the fund and related payments occur at a future date, usually beyond the normal settlement period. The price of such security and the date that the security will be settled are generally fixed at the time the transaction is negotiated. The value of the security varies with market fluctuations and for debt securities no interest accrues to the fund until settlement takes place. When the fund sells securities on a when-issued or delayed delivery basis, the fund typically owns or has the right to acquire securities equivalent in kind and amount to the securities sold. Purchase and sale commitments for when-issued or delayed delivery securities are held at carrying amount, which approximates fair value and are categorized as level 2 within the fair value hierarchy, and included in When-issued investments purchased and When-issued investments sold in the Statement of Assets and Liabilities. Losses may arise due to changes in the value of the underlying securities prior to settlement date or if the counterparty does not perform under the contract’s terms, or if the issuer does not issue the securities due to political, economic or other factors. At the time that it enters into a when-issued or delayed delivery transaction, the fund is required to have sufficient cash and/or liquid securities to cover its commitments.
Fees Paid Indirectly — The fund's custody fee may be reduced by a credit earned under an arrangement that measures the value of U.S. dollars deposited with the custodian by the fund. The amount of the credit, for the year ended January 31, 2022, is shown as a reduction of total expenses in the Statement of Operations.
Tax Matters and Distributions — The fund intends to qualify as a regulated investment company, as defined under Subchapter M of the Internal Revenue Code, and to distribute all of its taxable income, including realized capital gains. As a result, no provision for federal income tax is required. The fund’s federal tax returns, when filed, will remain subject to examination by the Internal Revenue Service for a three year period. Management has analyzed the fund’s tax positions taken on federal and state tax returns for all open tax years and does not believe that there are any uncertain tax positions that require recognition of a tax liability. Foreign taxes, if any, have been accrued by the fund in the accompanying financial statements in accordance with the applicable foreign tax law. Foreign income taxes may be withheld by certain countries in which the fund invests. Additionally, capital gains realized by the fund on securities issued in or by certain foreign countries may be subject to capital gains tax imposed by those countries.
Distributions to shareholders are recorded on the ex-dividend date. Income and capital gain distributions are determined in accordance with income tax regulations, which may differ from U.S. generally accepted accounting principles. Certain capital accounts in the financial statements are periodically adjusted for permanent differences in order to reflect their tax character. These adjustments have no impact on net assets or net asset value per share. Temporary differences which arise from recognizing certain items of income, expense, gain or loss in different periods for financial statement and tax purposes will reverse at some time in the future.
Book/tax differences primarily relate to amortization and accretion of debt securities and wash sale loss deferrals.
Notes to Financial Statements - continued
The tax character of distributions declared to shareholders for the last two fiscal years is as follows:
| | Year ended
1/31/22 | Year ended
1/31/21 |
| Ordinary income (including any short-term capital gains) | $60,026,693 | $67,143,934 |
The federal tax cost and the tax basis components of distributable earnings were as follows:
| As of 1/31/22 | |
| Cost of investments | $1,004,045,494 |
| Gross appreciation | 15,861,306 |
| Gross depreciation | (31,260,577) |
| Net unrealized appreciation (depreciation) | $ (15,399,271) |
| Undistributed ordinary income | 3,295,117 |
| Capital loss carryforwards | (41,053,445) |
| Other temporary differences | (4,399,716) |
| Total distributable earnings (loss) | $ (57,557,315) |
As of January 31, 2022, the fund had capital loss carryforwards available to offset future realized gains. These net capital losses may be carried forward indefinitely and their character is retained as short-term and/or long-term losses. Such losses are characterized as follows:
| Short-Term | $(1,278,441) |
| Long-Term | (39,775,004) |
| Total | $(41,053,445) |
(3) Transactions with Affiliates
Investment Adviser — The fund has an investment advisory agreement with MFS to provide overall investment management and related administrative services and facilities to the fund. MFS receives no compensation under this agreement; however MFS receives management fees from MFS funds that invest in the fund.
Shareholder Servicing Agent — MFS Service Center, Inc. (MFSC), a wholly-owned subsidiary of MFS, provides transfer agent and recordkeeping functions in connection with the issuance, transfer, and redemption of shares of the fund under a Shareholder Servicing Agent Agreement. MFSC is not paid a fee for providing these services. MFSC receives reimbursement from the fund for out-of-pocket expenses paid by MFSC on behalf of the fund. For the year ended January 31, 2022, these costs amounted to $36.
Administrator — MFS provides certain financial, legal, shareholder communications, compliance, and other administrative services to the fund. Under an administrative services agreement, the fund reimburses MFS the costs incurred to provide these services. The fund pays an annual fixed amount of $17,500. The administrative services fee incurred for the year ended January 31, 2022 was equivalent to an annual effective rate of 0.0016% of the fund's average daily net assets.
Trustees’ and Officers’ Compensation - The fund may pay compensation to independent Trustees in the form of a retainer, attendance fees, and additional compensation to Board and Committee chairpersons. The fund does not pay
Notes to Financial Statements - continued
compensation directly to Trustees or officers of the fund who are also officers of the investment adviser, all of whom receive remuneration from MFS for their services to the fund. Certain officers and Trustees of the fund are officers or directors of MFS, MFS Fund Distributors, Inc. (MFD), and MFSC. The independent Trustees do not currently receive compensation from the fund.
Other — The fund invests in the MFS Institutional Money Market Portfolio which is managed by MFS and seeks current income consistent with preservation of capital and liquidity. This money market fund does not pay a management fee to MFS but does incur investment and operating costs.
(4) Portfolio Securities
For the year ended January 31, 2022, purchases and sales of investments, other than short-term obligations, aggregated $641,509,957 and $851,882,927, respectively.
(5) Shares of Beneficial Interest
The fund's Declaration of Trust permits the Trustees to issue an unlimited number of full and fractional shares of beneficial interest. Transactions in fund shares were as follows:
| | Year ended
1/31/22 | | Year ended
1/31/21 |
| | Shares | Amount | | Shares | Amount |
| Shares sold | 3,868,865 | $35,660,117 | | 55,616,565 | $466,064,098 |
Shares issued to shareholders in
reinvestment of distributions | 6,526,801 | 60,026,693 | | 7,504,349 | 67,143,934 |
| Shares reacquired | (30,844,235) | (284,231,147) | | (25,651,819) | (226,839,338) |
| Net change | (20,448,569) | $(188,544,337) | | 37,469,095 | $306,368,694 |
The fund is an MFS Pooled Portfolio, which is designed to be used by certain MFS funds to invest in a particular security type rather than invest in the security type directly. The fund is solely invested in by other MFS funds for the purpose of gaining exposure to high income debt instruments, rather than investing in high income debt instruments directly. The MFS funds do not invest in this fund for the purpose of exercising management or control. At the end of the period, the MFS Diversified Income Fund, the MFS Global High Yield Fund, and the MFS Income Portfolio were the owners of record of approximately 83%, 16%, and 1%, respectively, of the value of outstanding voting shares of the fund.
(6) Line of Credit
The fund and certain other funds managed by MFS participate in a $1.25 billion unsecured committed line of credit of which $1 billion is reserved for use by the fund and certain other MFS U.S. funds. The line of credit is provided by a syndicate of banks under a credit agreement. Borrowings may be made for temporary financing needs. Interest is charged to each fund, based on its borrowings, generally at a rate equal to the highest of one month LIBOR, the Federal Funds Effective Rate and the Overnight Bank Funding Rate, plus an agreed upon spread. A commitment fee, based on the average daily, unused portion of the committed line of credit, is allocated among the participating funds. In addition, the fund and other funds managed by MFS have established unsecured uncommitted borrowing arrangements with certain banks for
Notes to Financial Statements - continued
temporary financing needs. Interest is charged to each fund, based on its borrowings, at rates equal to customary reference rates plus an agreed upon spread. For the year ended January 31, 2022, the fund’s commitment fee and interest expense were $4,142 and $0, respectively, and are included in “Miscellaneous” expense in the Statement of Operations.
(7) Investments in Affiliated Issuers
An affiliated issuer may be considered one in which the fund owns 5% or more of the outstanding voting securities, or a company which is under common control. For the purposes of this report, the following were affiliated issuers:
| Affiliated Issuers | Beginning
Value | Purchases | Sales
Proceeds | Realized
Gain
(Loss) | Change in
Unrealized
Appreciation or
Depreciation | Ending
Value |
| MFS Institutional Money Market Portfolio | $6,504,549 | $425,392,916 | $407,557,242 | $— | $— | $24,340,223 |
| Affiliated Issuers | Dividend
Income | Capital Gain
Distributions |
| MFS Institutional Money Market Portfolio | $9,500 | $— |
(8) Impacts of COVID-19
The pandemic related to the global spread of novel coronavirus disease (COVID-19), which was first detected in December 2019, has resulted in significant disruptions to global business activity and the global economy, as well as the economies of individual countries, the financial performance of individual companies and sectors, and the securities and commodities markets in general. Multiple surges in cases globally, the availability and widespread adoption of vaccines, and the emergence of variant strains of the virus continue to create uncertainty as to the future and long-term impacts resulting from the pandemic including impacts to the prices and liquidity of the fund's investments and the fund's performance.
(9) LIBOR Transition
Certain of the fund's investments, including investments in certain debt instruments and derivatives (if any), as well as borrowings by the fund and certain other contractual arrangements of the fund, may be based on the London Interbank Offered Rate (“LIBOR”). In 2017, the regulatory authority that oversees financial services firms in the United Kingdom announced plans to transition away from LIBOR by the end of 2021. In March 2021, the administrator of LIBOR announced the extension of the publication of the more commonly used U.S. dollar LIBOR settings to the end of June 2023. Although the full impacts of the transition away from LIBOR are not fully known, the transition may result in, among other things, an increase in volatility or illiquidity of the markets for instruments that currently rely on LIBOR to determine interest rates and this could have an adverse impact on the fund's performance. With respect to the fund's accounting for investments, including investments in certain debt instruments and derivatives, as well as borrowings by the fund and any other contractual arrangements of the fund that undergo reference rate-related modifications as a result of the transition, management will rely upon the relief provided by FASB Codification Topic
Notes to Financial Statements - continued
848 – Reference Rate Reform (Topic 848). The guidance in Topic 848 permits the fund to account for those modified contracts as a continuation of the existing contracts. Management is still evaluating the impact to the fund of the June 30, 2023 planned discontinuation of the more commonly used U.S. dollar LIBOR settings.
(10) Subsequent Event
The market disruptions, which began in late February 2022, associated with geopolitical events related to the conflict between Russia and Ukraine may adversely affect the value of the fund’s assets and thus the fund’s performance. Management continues to monitor these events and to evaluate the related impacts, if any, to the fund.
Report of Independent Registered Public Accounting Firm
To the Board of Trustees of MFS Series Trust III and the Shareholders of MFS High Yield Pooled Portfolio:
Opinion on the Financial Statements and Financial Highlights
We have audited the accompanying statement of assets and liabilities of MFS High Yield Pooled Portfolio (the “Fund”), including the portfolio of investments, as of January 31, 2022, the related statement of operations for the year then ended, the statements of changes in net assets for each of the two years in the period then ended, the financial highlights for each of the five years in the period then ended, and the related notes. In our opinion, the financial statements and financial highlights present fairly, in all material respects, the financial position of the Fund as of January 31, 2022, and the results of its operations for the year then ended, the changes in its net assets for each of the two years in the period then ended, and the financial highlights for each of the five years in the period then ended, in conformity with accounting principles generally accepted in the United States of America.
Basis for Opinion
These financial statements and financial highlights are the responsibility of the Fund's management. Our responsibility is to express an opinion on the Fund's financial statements and financial highlights based on our audits. We are a public accounting firm registered with the Public Company Accounting Oversight Board (United States) (PCAOB) and are required to be independent with respect to the Fund in accordance with the U.S. federal securities laws and the applicable rules and regulations of the Securities and Exchange Commission and the PCAOB.
We conducted our audits in accordance with the standards of the PCAOB. Those standards require that we plan and perform the audit to obtain reasonable assurance about whether the financial statements and financial highlights are free of material misstatement, whether due to error or fraud. The Fund is not required to have, nor were we engaged to perform, an audit of its internal control over financial reporting. As part of our audits, we are required to obtain an understanding of internal control over financial reporting but not for the purpose of expressing an opinion on the effectiveness of the Fund's internal control over financial reporting. Accordingly, we express no such opinion.
Our audits included performing procedures to assess the risks of material misstatement of the financial statements and financial highlights, whether due to error or fraud, and performing procedures that respond to those risks. Such procedures included examining, on a test basis, evidence regarding the amounts and disclosures in the financial statements and financial highlights. Our audits also included evaluating the accounting principles used and significant estimates made by management, as well as evaluating the overall presentation of the financial statements and financial highlights.
Report of Independent Registered Public Accounting Firm – continued
Our procedures included confirmation of securities owned as of January 31, 2022, by correspondence with the custodian and brokers; when replies were not received from brokers, we performed other auditing procedures. We believe that our audits provide a reasonable basis for our opinion.
DELOITTE & TOUCHE LLP
Boston, Massachusetts
March 18, 2022
We have served as the auditor of one or more of the MFS investment companies since 1924.
Trustees and Officers — Identification and Background
The Trustees and Officers of the Trust, as of March 1, 2022, are listed below, together with their principal occupations during the past five years. (Their titles may have varied during that period.) The address of each Trustee and Officer is 111 Huntington Avenue, Boston, Massachusetts 02199-7618.
| Name, Age | | Position(s) Held with Fund | | Trustee/Officer Since(h) | | Number of MFS Funds overseen by the Trustee | | Principal Occupations During
the Past Five Years | | Other Directorships During
the Past Five Years (j) |
| INTERESTED TRUSTEES | | | | | | | | | | |
Michael W. Roberge (k)
(age 55) | | Trustee | | January 2021 | | 135 | | Massachusetts Financial Services Company, Chairman (since January 2021); Chief Executive Officer (since January 2017); Director; Chairman of the Board (since January 2022); President (until December 2018); Chief Investment Officer (until December 2018) | | N/A |
| INDEPENDENT TRUSTEES | | | | | | | | | | |
John P. Kavanaugh
(age 67) | | Trustee and Chair of Trustees | | January 2009 | | 135 | | Private investor | | N/A |
Steven E. Buller
(age 70) | | Trustee | | February 2014 | | 135 | | Private investor | | N/A |
John A. Caroselli
(age 67) | | Trustee | | March 2017 | | 135 | | Private investor; JC Global Advisors, LLC (management consulting), President (since 2015) | | N/A |
Maureen R. Goldfarb
(age 66) | | Trustee | | January 2009 | | 135 | | Private investor | | N/A |
Peter D. Jones
(age 66) | | Trustee | | January 2019 | | 135 | | Private investor | | N/A |
James W. Kilman, Jr.
(age 60) | | Trustee | | January 2019 | | 135 | | Burford Capital Limited (finance and investment management), Senior Advisor (since May 3, 2021), Chief Financial Officer (2019 - May 2, 2021); KielStrand Capital LLC (family office), Chief Executive Officer (since 2016) | | Alpha-En Corporation, Director (2016-2019) |
Trustees and Officers - continued
| Name, Age | | Position(s) Held with Fund | | Trustee/Officer Since(h) | | Number of MFS Funds overseen by the Trustee | | Principal Occupations During
the Past Five Years | | Other Directorships During
the Past Five Years (j) |
Clarence Otis, Jr.
(age 65) | | Trustee | | March 2017 | | 135 | | Private investor | | VF Corporation, Director; Verizon Communications, Inc., Director; The Travelers Companies, Director |
Maryanne L. Roepke
(age 66) | | Trustee | | May 2014 | | 135 | | Private investor | | N/A |
Laurie J. Thomsen
(age 64) | | Trustee | | March 2005 | | 135 | | Private investor | | The Travelers Companies, Director; Dycom Industries, Inc., Director |
| Name, Age | | Position(s) Held with
Fund | | Trustee/Officer Since(h) | | Number of MFS Funds for which the Person is an Officer | | Principal Occupations During
the Past Five Years |
| OFFICERS | | | | | | | | |
Christopher R. Bohane (k)
(age 48) | | Assistant Secretary and Assistant Clerk | | July 2005 | | 135 | | Massachusetts Financial Services Company, Senior Vice President and Associate General Counsel |
Kino Clark (k)
(age 53) | | Assistant Treasurer | | January 2012 | | 135 | | Massachusetts Financial Services Company, Vice President |
John W. Clark, Jr. (k)
(age 54) | | Assistant Treasurer | | April 2017 | | 135 | | Massachusetts Financial Services Company, Vice President (since March 2017); Deutsche Bank (financial services), Department Head - Treasurer's Office (until February 2017) |
Thomas H. Connors (k)
(age 62) | | Assistant Secretary and Assistant Clerk | | September 2012 | | 135 | | Massachusetts Financial Services Company, Vice President and Senior Counsel |
David L. DiLorenzo (k)
(age 53) | | President | | July 2005 | | 135 | | Massachusetts Financial Services Company, Senior Vice President |
Heidi W. Hardin (k)
(age 54) | | Secretary and Clerk | | April 2017 | | 135 | | Massachusetts Financial Services Company, Executive Vice President and General Counsel (since March 2017); Harris Associates (investment management), General Counsel (until January 2017) |
Trustees and Officers - continued
| Name, Age | | Position(s) Held with
Fund | | Trustee/Officer Since(h) | | Number of MFS Funds for which the Person is an Officer | | Principal Occupations During
the Past Five Years |
Brian E. Langenfeld (k)
(age 48) | | Assistant Secretary and Assistant Clerk | | June 2006 | | 135 | | Massachusetts Financial Services Company, Vice President and Senior Counsel |
Rosa E. Licea-Mailloux(k)
(age 45) | | Chief Compliance Officer | | March 2022 | | 135 | | Massachusetts Financial Services Company, Vice President (since 2018); Director of Corporate Compliance (2018-2021), Senior Director Compliance (2021-2022), Senior Managing Director of North American Compliance & Chief Compliance Officer (since March 2022); Natixis Investment Managers (investment management), Funds Chief Compliance Officer, Deputy General Counsel & Senior Vice President (until 2018) |
Amanda S. Mooradian (k)
(age 43) | | Assistant Secretary and Assistant Clerk | | September 2018 | | 135 | | Massachusetts Financial Services Company, Assistant Vice President and Senior Counsel |
Susan A. Pereira (k)
(age 51) | | Assistant Secretary and Assistant Clerk | | July 2005 | | 135 | | Massachusetts Financial Services Company, Vice President and Assistant General Counsel |
Kasey L. Phillips (k)
(age 51) | | Assistant Treasurer | | September 2012 | | 135 | | Massachusetts Financial Services Company, Vice President |
Matthew A. Stowe (k)
(age 47) | | Assistant Secretary and Assistant Clerk | | October 2014 | | 135 | | Massachusetts Financial Services Company, Vice President and Assistant General Counsel |
James O. Yost (k)
(age 61) | | Treasurer | | September 1990 | | 135 | | Massachusetts Financial Services Company, Senior Vice President |
| (h) | Date first appointed to serve as Trustee/Officer of an MFS Fund. Each Trustee has served continuously since appointment unless indicated otherwise. From January 2012 through December 2016, Messrs. DiLorenzo and Yost served as Treasurer and Deputy Treasurer of the Funds, respectively. |
| (j) | Directorships or trusteeships of companies required to report to the Securities and Exchange Commission (i.e., “public companies”). |
| (k) | “Interested person” of the Trust within the meaning of the Investment Company Act of 1940 (referred to as the 1940 Act), which is the principal federal law governing investment companies like the fund, as a result of a position with MFS. The address of MFS is 111 Huntington Avenue, Boston, Massachusetts 02199-7618. |
Trustees and Officers - continued
Each Trustee (other than Messrs. Jones, Kilman and Roberge) has been elected by shareholders and each Trustee and Officer holds office until his or her successor is chosen and qualified or until his or her earlier death, resignation, retirement or removal. Mr. Roberge became a Trustee of the Funds on January 1, 2021 and Messrs. Jones and Kilman became Trustees of the Funds on January 1, 2019. The Trust does not hold annual meetings for the purpose of electing Trustees, and Trustees are not elected for fixed terms. Under the terms of the Board's retirement policy, an Independent Trustee shall retire at the end of the calendar year in which he or she reaches the earlier of 75 years of age or 15 years of service on the Board (or, in the case of any Independent Trustee who joined the Board prior to 2015, 20 years of service on the Board).
Messrs. Buller, Kilman and Otis and Ms. Roepke are members of the Trust’s Audit Committee.
Each of the Interested Trustees and certain Officers hold comparable officer positions with certain affiliates of MFS.
The Statement of Additional Information for a Fund includes further information about the Trustees and is available without charge upon request by calling 1-800-225-2606.
| Investment Adviser | Custodian |
Massachusetts Financial Services Company
111 Huntington Avenue
Boston, MA 02199-7618 | JPMorgan Chase Bank, NA
4 Metrotech Center
New York, NY 11245 |
| Distributor | Independent Registered Public Accounting Firm |
MFS Fund Distributors, Inc.
111 Huntington Avenue
Boston, MA 02199-7618 | Deloitte & Touche LLP
200 Berkeley Street
Boston, MA 02116 |
| Portfolio Manager(s) | |
David Cole
Michael Skatrud | |
Proxy Voting Policies and Information
MFS votes proxies on behalf of the fund pursuant to proxy voting policies and procedures that are available without charge, upon request, by calling 1-800-225-2606, by visiting mfs.com/proxyvoting, or by visiting the SEC’s Web site at http://www.sec.gov.
Information regarding how the fund voted proxies relating to portfolio securities during the most recent twelve-month period ended June 30 is available by August 31 of each year without charge by visiting mfs.com/proxyvoting, or by visiting the SEC’s Web site at http://www.sec.gov.
Quarterly Portfolio Disclosure
The fund files a complete schedule of portfolio holdings with the SEC for the first and third quarters of each fiscal year as an exhibit to its reports on Form N-PORT. The fund’s Form N-PORT reports are available on the SEC’s Web site at http://www.sec.gov.
Further Information
From time to time, MFS may post important information about the fund or the MFS Funds on the MFS Web site (mfs.com). This information is available at https://www.mfs.com/announcements.
Information About Fund Contracts and Legal Claims
The fund has entered into contractual arrangements with an investment adviser, administrator, distributor, shareholder servicing agent, 529 program manager (if applicable), and custodian who each provide services to the fund. Unless expressly stated otherwise, shareholders are not parties to, or intended beneficiaries of these contractual arrangements, and these contractual arrangements are not intended to create any shareholder right to enforce them against the service providers or to seek any remedy under them against the service providers, either directly or on behalf of the fund.
Under the Trust’s By-Laws and Declaration of Trust, any claims asserted against or on behalf of the MFS Funds, including claims against Trustees and Officers, must be brought in state and federal courts located within the Commonwealth of Massachusetts.
Federal Tax Information (unaudited)
The fund will notify shareholders of amounts for use in preparing 2022 income tax forms in January 2023. The following information is provided pursuant to provisions of the Internal Revenue Code.
The fund intends to pass through the maximum amount allowable as Section 163(j) Interest Dividends as defined in Treasury Regulation §1.163(j)-1(b).
| FACTS | WHAT DOES MFS DO WITH YOUR PERSONAL INFORMATION? |
| Why? | Financial companies choose how they share your personal information. Federal law gives consumers the right to limit some but not all sharing. Federal law also requires us to tell you how we collect, share, and protect your personal information. Please read this notice carefully to understand what we do. |
| What? | The types of personal information we collect and share depend on the product or service you have with us. This information can include: |
| • Social Security number and account balances |
| • Account transactions and transaction history |
| • Checking account information and wire transfer instructions |
| When you are no longer our customer, we continue to share your information as described in this notice. |
| How? | All financial companies need to share customers' personal information to run their everyday business. In the section below, we list the reasons financial companies can share their customers' personal information; the reasons MFS chooses to share; and whether you can limit this sharing. |
Reasons we can share your
personal information | Does MFS share? | Can you limit
this sharing? |
For our everyday business purposes –
such as to process your transactions, maintain your
account(s), respond to court orders and legal
investigations, or report to credit bureaus | Yes | No |
For our marketing purposes –
to offer our products and services to you | No | We don't share |
For joint marketing with other
financial companies | No | We don't share |
For our affiliates' everyday business purposes –
information about your transactions and experiences | No | We don't share |
For our affiliates' everyday business purposes –
information about your creditworthiness | No | We don't share |
| For nonaffiliates to market to you | No | We don't share |
| Questions? | Call 800-225-2606 or go to mfs.com. |
| Who we are |
| Who is providing this notice? | MFS Funds, MFS Investment Management, MFS Institutional Advisors, Inc., and MFS Heritage Trust Company. |
| What we do |
How does MFS
protect my personal
information? | To protect your personal information from unauthorized access and use, we use security measures that comply with federal law. These measures include procedural, electronic, and physical safeguards for the protection of the personal information we collect about you. |
How does MFS
collect my personal
information? | We collect your personal information, for example, when you |
| • open an account or provide account information |
| • direct us to buy securities or direct us to sell your securities |
| • make a wire transfer |
| We also collect your personal information from others, such as credit bureaus, affiliates, or other companies. |
| Why can't I limit all sharing? | Federal law gives you the right to limit only |
| • sharing for affiliates' everyday business purposes – information about your creditworthiness |
| • affiliates from using your information to market to you |
| • sharing for nonaffiliates to market to you |
| State laws and individual companies may give you additional rights to limit sharing. |
| Definitions |
| Affiliates | Companies related by common ownership or control. They can be financial and nonfinancial companies. |
| • MFS does not share personal information with affiliates, except for everyday business purposes as described on page one of this notice. |
| Nonaffiliates | Companies not related by common ownership or control. They can be financial and nonfinancial companies. |
| • MFS does not share with nonaffiliates so they can market to you. |
| Joint marketing | A formal agreement between nonaffiliated financial companies that together market financial products or services to you. |
| • MFS doesn't jointly market. |
| Other important information |
| If you own an MFS product or receive an MFS service in the name of a third party such as a bank or broker-dealer, their privacy policy may apply to you instead of ours. |
Save paper with eDelivery.
MFS® will send you prospectuses, reports, and proxies directly via e-mail so you will get information faster with less mailbox clutter.
To sign up:
1. Go to mfs.com.
2. Log in via MFS® Access.
3. Select eDelivery.
If you own your MFS fund shares through a financial institution or a retirement plan, MFS® TALK, MFS® Access, or eDelivery may not be available to you.
CONTACT
WEB SITE
mfs.com
MFS TALK
1-800-637-8255
24 hours a day
ACCOUNT SERVICE AND LITERATURE
Shareholders
1-800-225-2606
Financial advisors
1-800-343-2829
Retirement plan services
1-800-637-1255
MAILING ADDRESS
MFS Service Center, Inc.
P.O. Box 219341
Kansas City, MO 64121-9341
OVERNIGHT MAIL
MFS Service Center, Inc.
Suite 219341
430 W 7th Street
Kansas City, MO 64105-1407
Annual Report
January 31, 2022
| 1 |
| 2 |
| 4 |
| 6 |
| 9 |
| 12 |
| 27 |
| 29 |
| 31 |
| 32 |
| 39 |
| 56 |
| 58 |
| 62 |
| 62 |
| 62 |
| 62 |
| 62 |
| 63 |
The report is prepared for the general information of shareholders. It is authorized for distribution to prospective investors only when preceded or accompanied by a current prospectus.
NOT FDIC INSURED • MAY LOSE VALUE • NO BANK GUARANTEE
LETTER FROM THE CHAIR AND CEO
Dear Shareholders:
As a result of Russia’s invasion of Ukraine, the danger of wider geopolitical conflict has risen to levels not seen in decades, and this comes as sanctions aimed at countering Russia’s actions are exacerbating already mounting inflation. Consequently, at a time when global growth faces multiple headwinds, central banks have been presented with the challenge of reining in rising prices without tipping economies into recession. This has in turn led to increased volatility.
There are, however, encouraging signs for the markets. The Omicron wave of the coronavirus is receding outside Asia, unemployment is low, and there are signs that some global supply chain bottlenecks are beginning to ease, though events in Ukraine could hamper these advances. Additionally, easier Chinese monetary policy and the record pace of corporate stock buybacks are supportive elements, albeit amid an otherwise turbulent investment environment.
It is important to have a deep understanding of company fundamentals during times of market transition, and we have built our global research platform to do just that.
At MFS®, we put our clients’ assets to work responsibly by carefully navigating the increasing complexity of global markets and economies. Guided by our commitment to long-term investing, we tune out the noise and try to uncover what we believe are the best, most durable investment opportunities in the market. Our unique global investment platform combines collective expertise, long-term discipline, and thoughtful risk management to create sustainable value for investors over time.
Respectfully,
Michael W. Roberge
Chair and Chief Executive Officer
MFS Investment Management
March 18, 2022
The opinions expressed in this letter are subject to change and may not be relied upon for investment advice. No forecasts can be guaranteed.
Portfolio structure (i)
Top five industries (i)
| Cable TV | 7.5% |
| Gaming & Lodging | 6.7% |
| Medical & Health Technology & Services | 6.5% |
| Midstream | 4.3% |
| Consumer Services | 3.8% |
Composition including fixed income credit quality (a)(i)
| BBB | 0.5% |
| BB | 42.9% |
| B | 37.8% |
| CCC | 13.2% |
| CC | 0.1% |
| C (o) | 0.0% |
| Not Rated | (1.4)% |
| Non-Fixed Income | 1.0% |
| Cash & Cash Equivalents | 4.3% |
| Other | 1.6% |
Portfolio facts (i)
| Average Duration (d) | 3.9 |
| Average Effective Maturity (m) | 5.5 yrs. |
| (a) | For all securities other than those specifically described below, ratings are assigned to underlying securities utilizing ratings from Moody’s, Fitch, and Standard & Poor’s rating agencies and applying the following hierarchy: If all three agencies provide a rating, the middle rating (after dropping the highest and lowest ratings) is assigned; if two of the three agencies rate a security, the lower of the two is assigned. If none of the 3 rating agencies above assign a rating, but the security is rated by DBRS Morningstar, then the DBRS Morningstar rating is assigned. If none of the 4 rating agencies listed above rate the security, but the security is rated by the Kroll Bond Rating Agency (KBRA), then the KBRA rating is assigned. Ratings are shown in the S&P and Fitch scale (e.g., AAA). Securities rated BBB or higher are considered investment grade. All ratings are subject to change. Not Rated includes fixed income securities and fixed income derivatives that have not been rated by any rating agency. Non-Fixed Income includes equity securities (including convertible bonds and equity derivatives) and/or commodity-linked derivatives. The fund may or may not have held all of these instruments on this date. The fund is not rated by these agencies. |
| (d) | Duration is a measure of how much a bond’s price is likely to fluctuate with general changes in interest rates, e.g., if rates rise 1.00%, a bond with a 5-year duration is likely to lose about 5.00% of its value due to the interest rate move. |
Portfolio Composition - continued
| (i) | For purposes of this presentation, the components include the value of securities, and reflect the impact of the equivalent exposure of derivative positions, if any. These amounts may be negative from time to time. Equivalent exposure is a calculated amount that translates the derivative position into a reasonable approximation of the amount of the underlying asset that the portfolio would have to hold at a given point in time to have the same price sensitivity that results from the portfolio’s ownership of the derivative contract. When dealing with derivatives, equivalent exposure is a more representative measure of the potential impact of a position on portfolio performance than value. The bond component will include any accrued interest amounts. |
| (m) | In determining each instrument’s effective maturity for purposes of calculating the fund’s dollar-weighted average effective maturity, MFS uses the instrument’s stated maturity or, if applicable, an earlier date on which MFS believes it is probable that a maturity-shortening device (such as a put, pre-refunding or prepayment) will cause the instrument to be repaid. Such an earlier date can be substantially shorter than the instrument’s stated maturity. |
Where the fund holds convertible bonds, they are treated as part of the equity portion of the portfolio.
Cash & Cash Equivalents includes any cash, investments in money market funds, short-term securities, and other assets less liabilities. Please see the Statement of Assets and Liabilities for additional information related to the fund’s cash position and other assets and liabilities.
Other includes equivalent exposure from currency derivatives and/or any offsets to derivative positions and may be negative.
Percentages are based on net assets as of January 31, 2022.
The portfolio is actively managed and current holdings may be different.
Management Review
Summary of Results
For the twelve months ended January 31, 2022, Class A shares of the MFS High Income Fund (fund) provided a total return of 0.48%, at net asset value. This compares with a return of 2.05% for the fund’s benchmark, the Bloomberg U.S. Corporate High-Yield Bond 2% Issuer Capped Index.
Market Environment
Over the past year, the global economy was buffeted by an array of crosscurrents as it adjusted to the ebbs and flows of the pandemic. Among the supportive currents were ample fiscal stimulus, loose monetary policy and the rollout of several highly effective coronavirus vaccines. Negative currents included the rapid spread of several coronavirus variants, widespread global production bottlenecks and a surge in inflation. After experiencing a burst of exceptionally strong economic activity as the global economy began to reopen, activity became more muted in the second half of the period amid ongoing supply chain disruptions and a new wave of coronavirus infections, albeit seemingly milder strains.
Amid rising inflation, markets anticipated a transition from an exceptionally accommodative monetary environment to a significantly more restrictive one ahead, which resulted in a rise in market volatility. Indeed, several central banks in emerging markets have already tightened policy, as has the Bank of England, while the US Federal Reserve signaled it intends to tighten policy soon. The European Central Bank, which had been expected to move slowly toward tighter policy, has indicated it, too, may need to dial back accommodation in coming months. However, the Bank of Japan and the People's Bank of China are expected to maintain accommodative policies. As a result of the shifting monetary backdrop, sovereign bond yields moved higher during the period, but remain quite low relative to history.
A harsher Chinese regulatory environment toward industries such as online gaming, food delivery and education increased market volatility as has stress in China's highly leveraged property development sector. Trade relations between the United States and China remained quite strained despite a change in presidential administrations. Geopolitical tensions ramped up during the period with Russia amassing troops along its border with Ukraine and Chinese forces repeatedly entering airspace claimed by Taiwan.
An increase in market volatility saw speculative activity abate somewhat as “meme” stocks and cryptocurrencies came under pressure near the end of the period.
Detractors from Performance
Relative to the Bloomberg U.S. Corporate High-Yield Bond 2% Issuer Capped Index, the fund's asset allocation decisions detracted from performance over the reporting period, led by an underweight allocation to the energy sector. Additionally, the fund's greater allocation to cash held back relative results.
Bond selection also weakened the fund’s relative performance. From a quality perspective, security selection within the “CCC”, “B”, and “BB” rated credit quality segments hindered relative returns. From a sector perspective, bond selection in the consumer cyclical, basic industry and technology sectors weighed on relative results.
Management Review - continued
The fund's yield curve(y) positioning further detracted from relative returns. Here, the fund's greater exposure to the 5-year key rate, and lesser exposure to both the 20-year and 30-year key rates, weakened relative performance.
Top individual detractors during the reporting period included the fund’s overweight exposures to cable television service provider Virgin Media Finance (communications) and iron ore miner Baffinland Iron Mines (basic industry) and its underweight exposure to food and beverage products manufacturer Kraft Heinz Company(h) (consumer non-cyclical).
Contributors to Performance
The fund's shorter duration(d) stance supported relative performance as interest rates generally rose over the reporting period.
Top individual contributors for the reporting period included the fund’s overweight exposures to oil refiner PBF Holding (energy), beauty products manufacturer Coty(h) (consumer non-cyclical) and aircraft leasing firm Global Air Lease (institutional finance companies).
Respectfully,
Portfolio Manager(s)
David Cole and Michael Skatrud
| (d) | Duration is a measure of how much a bond’s price is likely to fluctuate with general changes in interest rates, e.g., if rates rise 1.00%, a bond with a 5-year duration is likely to lose about 5.00% of its value. |
| (h) | Security was not held in the portfolio at period end. |
| (r) | Securities rated “BBB”, “Baa”, or higher are considered investment grade; securities rated “BB”, “Ba”, or below are considered non-investment grade. Ratings are assigned to underlying securities utilizing ratings from Moody's, Fitch, and Standard & Poor's and applying the following hierarchy: If all three agencies provide a rating, the middle rating (after dropping the highest and lowest ratings) is assigned; if two of the three agencies rate a security, the lower of the two is assigned. If none of the 3 rating agencies above assign a rating, but the security is rated by DBRS Morningstar, then the DBRS Morningstar rating is assigned. If none of the 4 rating agencies listed above rate the security, but the security is rated by the Kroll Bond Rating Agency (KBRA), then the KBRA rating is assigned. Ratings are shown in the S&P and Fitch scale (e.g., AAA). For securities that are not rated by any of the rating agencies, the security is considered Not Rated. |
| (y) | A yield curve graphically depicts the yields of different maturity bonds of the same credit quality and type; a normal yield curve is upward sloping, with short-term rates lower than long-term rates. |
The views expressed in this report are those of the portfolio manager(s) only through the end of the period of the report as stated on the cover and do not necessarily reflect the views of MFS or any other person in the MFS organization. These views are subject to change at any time based on market or other conditions, and MFS disclaims any responsibility to update such views. These views may not be relied upon as investment advice or an indication of trading intent on behalf of any MFS portfolio. References to specific securities are not recommendations of such securities, and may not be representative of any MFS portfolio’s current or future investments.
Performance Summary THROUGH 1/31/22
The following chart illustrates a representative class of the fund’s historical performance in comparison to its benchmark(s). Performance results include the deduction of the maximum applicable sales charge and reflect the percentage change in net asset value, including reinvestment of dividends and capital gains distributions. The performance of other share classes will be greater than or less than that of the class depicted below. Benchmarks are unmanaged and may not be invested in directly. Benchmark returns do not reflect sales charges, commissions or expenses. (See Notes to Performance Summary.)
Performance data shown represents past performance and is no guarantee of future results. Investment return and principal value fluctuate so your shares, when sold, may be worth more or less than the original cost; current performance may be lower or higher than quoted. The performance shown does not reflect the deduction of taxes, if any, that a shareholder would pay on fund distributions or the redemption of fund shares.
Growth of a Hypothetical $10,000 Investment
Performance Summary - continued
Total Returns through 1/31/22
Average annual without sales charge
| Share Class | Class Inception Date | 1-yr | 5-yr | 10-yr | Life (t) |
| A | 2/17/78 | 0.48% | 4.07% | 4.94% | N/A |
| B | 9/27/93 | (0.28)% | 3.23% | 4.16% | N/A |
| C | 1/03/94 | (0.27)% | 3.29% | 4.16% | N/A |
| I | 1/02/97 | 0.71% | 4.26% | 5.17% | N/A |
| R1 | 4/01/05 | (0.28)% | 3.23% | 4.16% | N/A |
| R2 | 10/31/03 | (0.09)% | 3.68% | 4.62% | N/A |
| R3 | 4/01/05 | 0.46% | 4.00% | 4.91% | N/A |
| R4 | 4/01/05 | 0.72% | 4.32% | 5.20% | N/A |
| R6 | 6/01/12 | 0.84% | 4.44% | N/A | 5.32% |
| 529A | 7/31/02 | 0.44% | 3.96% | 4.90% | N/A |
| 529B | 7/31/02 | (0.33)% | 3.24% | 4.11% | N/A |
| 529C | 7/31/02 | (0.33)% | 3.18% | 4.11% | N/A |
Comparative benchmark(s)
| | | | | |
| Bloomberg U.S. Corporate High Yield Bond 2% Issuer Capped Index (f) | 2.05% | 5.39% | 6.21% | N/A |
Average annual with sales charge
| | | | | |
A
With Initial Sales Charge (4.25%) | (3.79)% | 3.17% | 4.49% | N/A |
B
With CDSC (Declining over six years from 4% to 0%) (v) | (4.13)% | 2.88% | 4.16% | N/A |
C
With CDSC (1% for 12 months) (v) | (1.23)% | 3.29% | 4.16% | N/A |
529A
With Initial Sales Charge (4.25%) | (3.83)% | 3.07% | 4.45% | N/A |
529B
With CDSC (Declining over six years from 4% to 0%) (v) | (4.18)% | 2.89% | 4.11% | N/A |
529C
With CDSC (1% for 12 months) (v) | (1.29)% | 3.18% | 4.11% | N/A |
CDSC – Contingent Deferred Sales Charge.
Class I, R1, R2, R3, R4, and R6 shares do not have a sales charge.
| (f) | Source: FactSet Research Systems Inc. |
| (t) | For the period from the class inception date through the stated period end (for those share classes with less than 10 years of performance history). No comparative benchmark performance information is provided for “life” periods. (See Notes to Performance Summary.) |
| (v) | Assuming redemption at the end of the applicable period. |
Performance Summary - continued
Benchmark Definition(s)
Bloomberg U.S. Corporate High-Yield Bond 2% Issuer Capped Index(a) – a component of the Bloomberg U.S. Corporate High-Yield Bond Index, which measures performance of non-investment grade, fixed rate debt. The index limits the maximum exposure to any one issuer to 2%.
It is not possible to invest directly in an index.
| (a) | Source: Bloomberg Index Services Limited. BLOOMBERG® is a trademark and service mark of Bloomberg Finance L.P. and its affiliates (collectively “Bloomberg”). Bloomberg or Bloomberg's licensors own all proprietary rights in the Bloomberg Indices. Bloomberg neither approves or endorses this material, or guarantees the accuracy or completeness of any information herein, or makes any warranty, express or implied, as to the results to be obtained therefrom and, to the maximum extent allowed by law, neither shall have any liability or responsibility for injury or damages arising in connection therewith. |
Notes to Performance Summary
Class 529 shares are only available in conjunction with qualified tuition programs, such as the MFS 529 Savings Plan. There also is an additional fee, which is detailed in the program description, on qualified tuition programs. If this fee was reflected, the performance for Class 529 shares would have been lower. This annual fee is waived for Oregon residents and for those accounts with assets of $25,000 or more.
Average annual total return represents the average annual change in value for each share class for the periods presented. Life returns are presented where the share class has less than 10 years of performance history and represent the average annual total return from the class inception date to the stated period end date. As the fund's share classes may have different inception dates, the life returns may represent different time periods and may not be comparable. As a result, no comparative benchmark performance information is provided for life periods.
Performance results reflect any applicable expense subsidies and waivers in effect during the periods shown. Without such subsidies and waivers the fund's performance results would be less favorable. Please see the prospectus and financial statements for complete details.
Performance results do not include adjustments made for financial reporting purposes in accordance with U.S. generally accepted accounting principles and may differ from amounts reported in the financial highlights.
From time to time the fund may receive proceeds from litigation settlements, without which performance would be lower.
Expense Table
Fund expenses borne by the shareholders during the period,
August 1, 2021 through January 31, 2022
As a shareholder of the fund, you incur two types of costs: (1) transaction costs, including sales charges (loads) on certain purchase or redemption payments, and (2) ongoing costs, including management fees; distribution and service (12b-1) fees; and other fund expenses. This example is intended to help you understand your ongoing costs (in dollars) of investing in the fund and to compare these costs with the ongoing costs of investing in other mutual funds.
The example is based on an investment of $1,000 invested at the beginning of the period and held for the entire period August 1, 2021 through January 31, 2022.
The expenses include the payment of a portion of the transfer-agent-related expenses of MFS funds that invest in the fund. For further information, please see the Notes to Financial Statements.
Actual Expenses
The first line for each share class in the following table provides information about actual account values and actual expenses. You may use the information in this line, together with the amount you invested, to estimate the expenses that you paid over the period. Simply divide your account value by $1,000 (for example, an $8,600 account value divided by $1,000 = 8.6), then multiply the result by the number in the first line under the heading entitled “Expenses Paid During Period” to estimate the expenses you paid on your account during this period.
Hypothetical Example for Comparison Purposes
The second line for each share class in the following table provides information about hypothetical account values and hypothetical expenses based on the fund’s actual expense ratio and an assumed rate of return of 5% per year before expenses, which is not the fund’s actual return. The hypothetical account values and expenses may not be used to estimate the actual ending account balance or expenses you paid for the period. You may use this information to compare the ongoing costs of investing in the fund and other funds. To do so, compare this 5% hypothetical example with the 5% hypothetical examples that appear in the shareholder reports of the other funds.
Please note that the expenses shown in the table are meant to highlight your ongoing costs only and do not reflect any transactional costs, such as sales charges (loads). Therefore, the second line for each share class in the table is useful in comparing ongoing costs only, and will not help you determine the relative total costs of owning different funds. In addition, if these transactional costs were included, your costs would have been higher.
Expense Table - continued
Share
Class | | Annualized
Expense
Ratio | Beginning
Account Value
8/01/21 | Ending
Account Value
1/31/22 | Expenses
Paid During
Period (p)
8/01/21-1/31/22 |
| A | Actual | 0.88% | $1,000.00 | $978.29 | $4.39 |
| Hypothetical (h) | 0.88% | $1,000.00 | $1,020.77 | $4.48 |
| B | Actual | 1.63% | $1,000.00 | $974.59 | $8.11 |
| Hypothetical (h) | 1.63% | $1,000.00 | $1,016.99 | $8.29 |
| C | Actual | 1.63% | $1,000.00 | $974.73 | $8.11 |
| Hypothetical (h) | 1.63% | $1,000.00 | $1,016.99 | $8.29 |
| I | Actual | 0.63% | $1,000.00 | $979.39 | $3.14 |
| Hypothetical (h) | 0.63% | $1,000.00 | $1,022.03 | $3.21 |
| R1 | Actual | 1.63% | $1,000.00 | $974.59 | $8.11 |
| Hypothetical (h) | 1.63% | $1,000.00 | $1,016.99 | $8.29 |
| R2 | Actual | 1.15% | $1,000.00 | $973.98 | $5.72 |
| Hypothetical (h) | 1.15% | $1,000.00 | $1,019.41 | $5.85 |
| R3 | Actual | 0.88% | $1,000.00 | $978.15 | $4.39 |
| Hypothetical (h) | 0.88% | $1,000.00 | $1,020.77 | $4.48 |
| R4 | Actual | 0.64% | $1,000.00 | $979.51 | $3.19 |
| Hypothetical (h) | 0.64% | $1,000.00 | $1,021.98 | $3.26 |
| R6 | Actual | 0.52% | $1,000.00 | $982.95 | $2.60 |
| Hypothetical (h) | 0.52% | $1,000.00 | $1,022.58 | $2.65 |
| 529A | Actual | 0.91% | $1,000.00 | $978.05 | $4.54 |
| Hypothetical (h) | 0.91% | $1,000.00 | $1,020.62 | $4.63 |
| 529B | Actual | 1.68% | $1,000.00 | $974.35 | $8.36 |
| Hypothetical (h) | 1.68% | $1,000.00 | $1,016.74 | $8.54 |
| 529C | Actual | 1.68% | $1,000.00 | $974.34 | $8.36 |
| Hypothetical (h) | 1.68% | $1,000.00 | $1,016.74 | $8.54 |
| (h) | 5% class return per year before expenses. |
| (p) | “Expenses Paid During Period” are equal to each class’s annualized expense ratio, as shown above, multiplied by the average account value over the period, multiplied by 184/365 (to reflect the one-half year period). Expenses paid do not include any applicable sales charges (loads). If these transaction costs had been included, your costs would have been higher. |
Notes to Expense Table
Changes to the fund's fee arrangements occurred during the six month period. Had these fee changes been in effect throughout the entire six month period, the annualized expense ratios, the actual expenses paid during the period, and the hypothetical expenses paid during the period would have been approximately 0.86%, $4.29, and $4.38 for Class A, 1.61%, $8.01, and $8.19 for Class B, 1.61%, $8.01, and $8.19 for Class C, 0.61%, $3.04, and $3.11 for Class I, 1.61%, $8.01, and $8.19
Expense Table - continued
for Class R1, 1.11%, $5.52, and $5.65 for Class R2, 0.86%, $4.29, and $4.38 for Class R3, 0.62%, $3.09, and $3.16 for Class R4, 0.50%, $2.50, and $2.55 for Class R6, 0.89%, $4.44, and $4.53 for Class 529A, 1.67%, $8.31, and $8.49 for Class 529B, and 1.66%, $8.26, and $8.44 for Class 529C, respectively. For further information about the fund’s fee arrangements and changes to those fee arrangements, please see Note 3 in the Notes to Financial Statements.
Each class with a Rule 12b-1 service fee is subject to a rebate of a portion of such fee. Such rebates are included in the expense ratios above. For Class 529A shares, this rebate reduced the expense ratio above by 0.02%. See Note 3 in the Notes to Financial Statements for additional information.
Portfolio of Investments
1/31/22
The Portfolio of Investments is a complete list of all securities owned by your fund. It is categorized by broad-based asset classes.
| Issuer | | | Shares/Par | Value ($) |
| Bonds – 93.4% |
| Aerospace & Defense – 2.2% |
| Bombardier, Inc., 7.5%, 3/15/2025 (n) | | $ | 4,272,000 | $ 4,325,400 |
| Bombardier, Inc., 7.125%, 6/15/2026 (n) | | | 4,284,000 | 4,353,615 |
| F-Brasile S.p.A./F-Brasile U.S. LLC, 7.375%, 8/15/2026 (n) | | | 5,985,000 | 5,901,569 |
| Moog, Inc., 4.25%, 12/15/2027 (n) | | | 8,270,000 | 8,299,358 |
| TransDigm, Inc., 6.25%, 3/15/2026 (n) | | | 6,757,000 | 6,976,602 |
| TransDigm, Inc., 6.375%, 6/15/2026 | | | 4,535,000 | 4,614,363 |
| TransDigm, Inc., 5.5%, 11/15/2027 | | | 5,000,000 | 5,025,000 |
| TransDigm, Inc., 4.625%, 1/15/2029 | | | 4,051,000 | 3,847,073 |
| | | | | $43,342,980 |
| Asset-Backed & Securitized – 0.0% |
| CW Capital Cobalt Commercial Mortgage Trust, 2006-2A, “F”, FLR, 2.291% (0% cash or 2.291% PIK) (LIBOR - 3mo. + 1.3%), 4/26/2050 (a)(n)(p) | | $ | 786,028 | $ 79 |
| CW Capital Cobalt Commercial Mortgage Trust, 2006-2A, “G”, FLR, 2.491% (0% cash or 2.491% PIK) (LIBOR - 3mo. + 1.5%), 4/26/2050 (a)(n)(p) | | | 2,495,094 | 249 |
| Lehman Brothers Commercial Conduit Mortgage Trust, 1.084%, 2/18/2030 (i) | | | 66,449 | 1 |
| | | | | $329 |
| Automotive – 2.5% |
| Clarios Global LP/Clarios US Finance Cois, 8.5%, 5/15/2027 (n) | | $ | 8,905,000 | $ 9,310,890 |
| Dana, Inc., 5.375%, 11/15/2027 | | | 4,014,000 | 4,149,473 |
| Dana, Inc., 5.625%, 6/15/2028 | | | 1,233,000 | 1,282,320 |
| Dana, Inc., 4.25%, 9/01/2030 | | | 2,740,000 | 2,654,375 |
| Dornoch Debt Merger Sub Inc., 6.625%, 10/15/2029 (n) | | | 3,805,000 | 3,676,581 |
| Ford Motor Co., 5.113%, 5/03/2029 | | | 4,205,000 | 4,500,611 |
| Ford Motor Co., 4.75%, 1/15/2043 | | | 4,695,000 | 4,798,478 |
| Ford Motor Credit Co. LLC, 4.134%, 8/04/2025 | | | 3,870,000 | 3,958,430 |
| IAA Spinco, Inc., 5.5%, 6/15/2027 (n) | | | 6,300,000 | 6,465,438 |
| Real Hero Merger Sub 2, Inc., 6.25%, 2/01/2029 (n) | | | 4,040,000 | 3,956,291 |
| Wheel Pros, Inc., 6.5%, 5/15/2029 (n) | | | 3,680,000 | 3,422,400 |
| | | | | $48,175,287 |
| Broadcasting – 2.8% |
| Advantage Sales & Marketing, Inc., 6.5%, 11/15/2028 (n) | | $ | 5,630,000 | $ 5,587,775 |
| Gray Escrow II, Inc., 5.375%, 11/15/2031 (n) | | | 10,355,000 | 10,209,978 |
| iHeartCommunications, Inc., 8.375%, 5/01/2027 | | | 5,255,000 | 5,496,021 |
| Scripps Escrow II, Inc., 5.875%, 7/15/2027 (n) | | | 6,610,000 | 6,742,200 |
Portfolio of Investments – continued
| Issuer | | | Shares/Par | Value ($) |
| Bonds – continued |
| Broadcasting – continued |
| Summer (BC) Bidco B LLC, 5.5%, 10/31/2026 (n) | | $ | 4,655,000 | $ 4,557,245 |
| Summer (BC) Holdco S.à r.l., “A”, 9.25%, 10/31/2027 | | EUR | 1,707,495 | 2,028,118 |
| Univision Communications, Inc., 4.5%, 5/01/2029 (n) | | $ | 11,210,000 | 11,102,833 |
| WMG Acquisition Corp., 3.875%, 7/15/2030 (n) | | | 10,449,000 | 9,970,331 |
| | | | | $55,694,501 |
| Brokerage & Asset Managers – 1.5% |
| Aretec Escrow Issuer, Inc., 7.5%, 4/01/2029 (n) | | $ | 3,780,000 | $ 3,855,449 |
| LPL Holdings, Inc., 4.625%, 11/15/2027 (n) | | | 8,080,000 | 8,210,573 |
| LPL Holdings, Inc., 4%, 3/15/2029 (n) | | | 6,348,000 | 6,160,988 |
| LPL Holdings, Inc., 4.375%, 5/15/2031 (n) | | | 3,830,000 | 3,753,668 |
| NFP Corp., 4.875%, 8/15/2028 (n) | | | 4,780,000 | 4,669,821 |
| NFP Corp., 6.875%, 8/15/2028 (n) | | | 3,845,000 | 3,657,556 |
| | | | | $30,308,055 |
| Building – 3.6% |
| ABC Supply Co., Inc., 4%, 1/15/2028 (n) | | $ | 12,925,000 | $ 12,650,990 |
| Foundation Building Materials LLC, 6%, 3/01/2029 (n) | | | 245,000 | 236,472 |
| GYP Holding III Corp., 4.625%, 5/01/2029 (n) | | | 7,345,000 | 7,133,831 |
| Interface, Inc., 5.5%, 12/01/2028 (n) | | | 6,375,000 | 6,550,312 |
| MIWD Holdco II LLC/MIWD Finance Co., 5.5%, 2/01/2030 (n) | | | 3,630,000 | 3,597,076 |
| New Enterprise Stone & Lime Co., Inc., 5.25%, 7/15/2028 (n) | | | 4,065,000 | 4,065,000 |
| New Enterprise Stone & Lime Co., Inc., 9.75%, 7/15/2028 (n) | | | 3,222,000 | 3,391,155 |
| Park River Holdings, Inc., 5.625%, 2/01/2029 (n) | | | 2,070,000 | 1,888,875 |
| Patrick Industries, Inc., 7.5%, 10/15/2027 (n) | | | 5,975,000 | 6,273,750 |
| SRM Escrow Issuer LLC, 6%, 11/01/2028 (n) | | | 5,800,000 | 5,955,440 |
| SRS Distribution, Inc., 6.125%, 7/01/2029 (n) | | | 6,000,000 | 5,880,000 |
| Standard Industries, Inc., 4.375%, 7/15/2030 (n) | | | 6,995,000 | 6,680,225 |
| Standard Industries, Inc., 3.375%, 1/15/2031 (n) | | | 1,385,000 | 1,267,137 |
| White Cap Buyer LLC, 6.875%, 10/15/2028 (n) | | | 4,445,000 | 4,560,659 |
| | | | | $70,130,922 |
| Business Services – 2.2% |
| Austin BidCo, Inc., 7.125%, 12/15/2028 (n) | | $ | 3,495,000 | $ 3,547,425 |
| HealthEquity, Inc., 4.5%, 10/01/2029 (n) | | | 5,730,000 | 5,601,075 |
| Iron Mountain, Inc., 5.25%, 3/15/2028 (n) | | | 3,760,000 | 3,814,746 |
| Iron Mountain, Inc., REIT, 4.875%, 9/15/2027 (n) | | | 5,210,000 | 5,225,552 |
| Nielsen Finance LLC, 4.5%, 7/15/2029 (n) | | | 6,260,000 | 5,837,450 |
| Paysafe Finance PLC, 4%, 6/15/2029 (z) | | | 5,700,000 | 5,140,944 |
| Switch Ltd., 3.75%, 9/15/2028 (n) | | | 7,336,000 | 6,997,664 |
| Switch Ltd., 4.125%, 6/15/2029 (n) | | | 2,280,000 | 2,220,674 |
| Verscend Escrow Corp., 9.75%, 8/15/2026 (n) | | | 4,545,000 | 4,773,113 |
| | | | | $43,158,643 |
Portfolio of Investments – continued
| Issuer | | | Shares/Par | Value ($) |
| Bonds – continued |
| Cable TV – 7.4% |
| CCO Holdings LLC/CCO Holdings Capital Corp., 4.75%, 3/01/2030 (n) | | $ | 14,425,000 | $ 14,313,855 |
| CCO Holdings LLC/CCO Holdings Capital Corp., 4.5%, 8/15/2030 (n) | | | 5,735,000 | 5,591,625 |
| CCO Holdings LLC/CCO Holdings Capital Corp., 4.25%, 2/01/2031 (n) | | | 10,625,000 | 10,136,037 |
| CCO Holdings LLC/CCO Holdings Capital Corp., 4.25%, 1/15/2034 (n) | | | 4,885,000 | 4,519,846 |
| CSC Holdings LLC, 5.375%, 2/01/2028 (n) | | | 3,040,000 | 3,048,938 |
| CSC Holdings LLC, 5.75%, 1/15/2030 (n) | | | 9,270,000 | 8,734,936 |
| CSC Holdings LLC, 4.125%, 12/01/2030 (n) | | | 10,455,000 | 9,568,311 |
| DISH DBS Corp., 7.75%, 7/01/2026 | | | 3,415,000 | 3,514,411 |
| DISH DBS Corp., 5.25%, 12/01/2026 (n) | | | 4,705,000 | 4,563,850 |
| DISH DBS Corp., 5.125%, 6/01/2029 | | | 3,990,000 | 3,481,275 |
| Intelsat Jackson Holdings S.A., 5.5%, 8/01/2023 (a)(d) | | | 4,060,000 | 1,771,175 |
| Intelsat Jackson Holdings S.A., 9.75%, 7/15/2025 (a)(d)(n) | | | 2,230,000 | 984,545 |
| LCPR Senior Secured Financing DAC, 6.75%, 10/15/2027 (n) | | | 5,518,000 | 5,724,815 |
| LCPR Senior Secured Financing DAC, 5.125%, 7/15/2029 (n) | | | 1,905,000 | 1,868,234 |
| Sirius XM Holdings, Inc., 3.875%, 9/01/2031 (n) | | | 7,920,000 | 7,326,000 |
| Sirius XM Radio, Inc., 4%, 7/15/2028 (n) | | | 7,801,000 | 7,547,467 |
| Sirius XM Radio, Inc., 5.5%, 7/01/2029 (n) | | | 11,485,000 | 11,918,961 |
| Telenet Finance Luxembourg S.A., 5.5%, 3/01/2028 (n) | | | 10,000,000 | 10,200,000 |
| Videotron Ltd., 5.125%, 4/15/2027 (n) | | | 5,860,000 | 5,989,623 |
| Virgin Media Finance PLC, 5%, 7/15/2030 (n) | | | 8,020,000 | 7,559,652 |
| Virgin Media Vendor Financing Notes IV DAC, 5%, 7/15/2028 (n) | | | 9,000,000 | 8,482,500 |
| Ziggo Bond Finance B.V., 5.125%, 2/28/2030 (n) | | | 9,920,000 | 9,410,459 |
| | | | | $146,256,515 |
| Chemicals – 2.5% |
| Axalta Coating Systems Ltd., 4.75%, 6/15/2027 (n) | | $ | 4,914,000 | $ 5,048,533 |
| Axalta Coating Systems Ltd., 3.375%, 2/15/2029 (n) | | | 8,035,000 | 7,402,244 |
| Consolidated Energy Finance S.A., 5.625%, 10/15/2028 (n) | | | 5,844,000 | 5,494,938 |
| Element Solutions, Inc., 3.875%, 9/01/2028 (n) | | | 7,168,000 | 6,881,280 |
| Herens Holdco S.à r.l., 4.75%, 5/15/2028 (n) | | | 5,350,000 | 5,108,234 |
| Ingevity Corp., 3.875%, 11/01/2028 (n) | | | 7,622,000 | 7,215,747 |
| LSF11 A5 HoldCo LLC, 6.625%, 10/15/2029 (n) | | | 3,800,000 | 3,724,000 |
| S.P.C.M. S.A., 3.125%, 3/15/2027 (n) | | | 1,740,000 | 1,661,700 |
| S.P.C.M. S.A., 3.375%, 3/15/2030 (n) | | | 6,182,000 | 5,802,734 |
| | | | | $48,339,410 |
Portfolio of Investments – continued
| Issuer | | | Shares/Par | Value ($) |
| Bonds – continued |
| Computer Software – 1.2% |
| Camelot Finance S.A., 4.5%, 11/01/2026 (n) | | $ | 3,650,000 | $ 3,705,115 |
| Clarivate Science Holdings Corp., 3.875%, 7/01/2028 (n) | | | 1,460,000 | 1,392,767 |
| Clarivate Science Holdings Corp., 4.875%, 7/01/2029 (n) | | | 6,650,000 | 6,334,125 |
| Dun & Bradstreet Corp., 5%, 12/15/2029 (n) | | | 3,870,000 | 3,860,325 |
| PTC, Inc., 3.625%, 2/15/2025 (n) | | | 4,645,000 | 4,662,419 |
| PTC, Inc., 4%, 2/15/2028 (n) | | | 3,730,000 | 3,696,933 |
| | | | | $23,651,684 |
| Computer Software - Systems – 1.4% |
| Fair Isaac Corp., 5.25%, 5/15/2026 (n) | | $ | 10,425,000 | $ 11,148,651 |
| Fair Isaac Corp., 4%, 6/15/2028 (n) | | | 1,687,000 | 1,670,130 |
| SS&C Technologies Holdings, Inc., 5.5%, 9/30/2027 (n) | | | 7,580,000 | 7,828,018 |
| Viavi Solutions, Inc., 3.75%, 10/01/2029 (n) | | | 7,120,000 | 6,906,400 |
| | | | | $27,553,199 |
| Conglomerates – 3.0% |
| Amsted Industries Co., 5.625%, 7/01/2027 (n) | | $ | 7,770,000 | $ 7,971,631 |
| BWX Technologies, Inc., 4.125%, 6/30/2028 (n) | | | 1,839,000 | 1,813,714 |
| BWX Technologies, Inc., 4.125%, 4/15/2029 (n) | | | 9,329,000 | 9,189,065 |
| Gates Global LLC, 6.25%, 1/15/2026 (n) | | | 4,925,000 | 5,087,525 |
| Granite Holdings U.S. Acquisition Co., 11%, 10/01/2027 (n) | | | 4,930,000 | 5,275,100 |
| Griffon Corp., 5.75%, 3/01/2028 | | | 5,871,000 | 5,865,246 |
| Madison IAQ LLC, 5.875%, 6/30/2029 (n) | | | 5,335,000 | 4,930,634 |
| Stevens Holding Co., Inc., 6.125%, 10/01/2026 (n) | | | 5,610,000 | 5,855,438 |
| TriMas Corp., 4.125%, 4/15/2029 (n) | | | 13,213,000 | 12,948,740 |
| | | | | $58,937,093 |
| Construction – 1.3% |
| Empire Communities Corp., 7%, 12/15/2025 (n) | | $ | 4,250,000 | $ 4,323,610 |
| Mattamy Group Corp., 5.25%, 12/15/2027 (n) | | | 2,275,000 | 2,315,108 |
| Mattamy Group Corp., 4.625%, 3/01/2030 (n) | | | 5,115,000 | 5,043,032 |
| Taylor Morrison Communities, Inc., 5.75%, 1/15/2028 (n) | | | 5,345,000 | 5,692,425 |
| Taylor Morrison Communities, Inc., 5.125%, 8/01/2030 (n) | | | 3,130,000 | 3,244,120 |
| Weekley Homes LLC/Weekley Finance Corp., 4.875%, 9/15/2028 (n) | | | 5,417,000 | 5,327,999 |
| | | | | $25,946,294 |
| Consumer Products – 1.1% |
| Mattel, Inc., 3.375%, 4/01/2026 (n) | | $ | 5,508,000 | $ 5,484,591 |
| Mattel, Inc., 5.875%, 12/15/2027 (n) | | | 2,240,000 | 2,380,000 |
| Mattel, Inc., 5.45%, 11/01/2041 | | | 1,890,000 | 2,116,800 |
| Prestige Consumer Healthcare, Inc., 5.125%, 1/15/2028 (n) | | | 5,235,000 | 5,274,262 |
| Prestige Consumer Healthcare, Inc., 3.75%, 4/01/2031 (n) | | | 2,400,000 | 2,178,000 |
Portfolio of Investments – continued
| Issuer | | | Shares/Par | Value ($) |
| Bonds – continued |
| Consumer Products – continued |
| SWF Escrow Issuer Corp., 6.5%, 10/01/2029 (n) | | $ | 4,755,000 | $ 4,422,150 |
| | | | | $21,855,803 |
| Consumer Services – 3.7% |
| Allied Universal Holdco LLC, 6.625%, 7/15/2026 (n) | | $ | 1,697,000 | $ 1,742,590 |
| Allied Universal Holdco LLC, 9.75%, 7/15/2027 (n) | | | 5,935,000 | 6,261,425 |
| Allied Universal Holdco LLC, 6%, 6/01/2029 (n) | | | 2,855,000 | 2,706,269 |
| ANGI Group LLC, 3.875%, 8/15/2028 (n) | | | 6,518,000 | 5,966,642 |
| Arches Buyer, Inc., 6.125%, 12/01/2028 (n) | | | 5,460,000 | 5,303,025 |
| GoDaddy, Inc., 3.5%, 3/01/2029 (n) | | | 10,143,000 | 9,459,159 |
| GW B-CR Security Corp., 9.5%, 11/01/2027 (n) | | | 4,382,000 | 4,605,482 |
| Match Group Holdings II LLC, 3.625%, 10/01/2031 (n) | | | 455,000 | 416,931 |
| Match Group, Inc., 5%, 12/15/2027 (n) | | | 5,040,000 | 5,184,900 |
| Match Group, Inc., 4.625%, 6/01/2028 (n) | | | 7,255,000 | 7,164,312 |
| Match Group, Inc., 4.125%, 8/01/2030 (n) | | | 2,010,000 | 1,929,600 |
| Realogy Group LLC/Realogy Co-Issuer Corp., 9.375%, 4/01/2027 (n) | | | 4,340,000 | 4,698,918 |
| Realogy Group LLC/Realogy Co-Issuer Corp., 5.75%, 1/15/2029 (n) | | | 2,875,000 | 2,824,113 |
| Realogy Group LLC/Realogy Co-Issuer Corp., 5.25%, 4/15/2030 (n) | | | 3,630,000 | 3,475,725 |
| TriNet Group, Inc., 3.5%, 3/01/2029 (n) | | | 8,535,000 | 8,105,007 |
| WASH Multifamily Acquisition, Inc., 5.75%, 4/15/2026 (n) | | | 3,700,000 | 3,746,250 |
| | | | | $73,590,348 |
| Containers – 2.3% |
| ARD Finance S.A., 6.5% (6.5% cash or 7.25% PIK), 6/30/2027 (n)(p) | | $ | 2,552,419 | $ 2,577,943 |
| Ardagh Metal Packaging, 3.25%, 9/01/2028 (n) | | | 3,245,000 | 3,097,255 |
| Ardagh Metal Packaging, 4%, 9/01/2029 (n) | | | 6,424,000 | 6,118,860 |
| Ardagh Packaging Finance PLC/Ardagh MP Holdings USA, Inc., 5.25%, 8/15/2027 (n) | | | 7,260,000 | 7,114,800 |
| Can-Pack S.A., 3.875%, 11/15/2029 (n) | | | 9,349,000 | 8,953,318 |
| Crown Americas LLC/Crown Americas Capital Corp. V, 4.25%, 9/30/2026 | | | 8,660,000 | 8,930,625 |
| Crown Americas LLC/Crown Americas Capital Corp. VI, 4.75%, 2/01/2026 | | | 3,345,000 | 3,412,870 |
| Greif, Inc., 6.5%, 3/01/2027 (n) | | | 5,225,000 | 5,408,397 |
| | | | | $45,614,068 |
| Electrical Equipment – 0.4% |
| CommScope Technologies LLC, 5%, 3/15/2027 (n) | | $ | 8,805,000 | $ 7,841,117 |
Portfolio of Investments – continued
| Issuer | | | Shares/Par | Value ($) |
| Bonds – continued |
| Electronics – 1.8% |
| Diebold Nixdorf, Inc., 8.5%, 4/15/2024 | | $ | 2,155,000 | $ 2,138,837 |
| Diebold Nixdorf, Inc., 9.375%, 7/15/2025 (n) | | | 3,204,000 | 3,365,418 |
| Entegris, Inc., 4.375%, 4/15/2028 (n) | | | 2,190,000 | 2,173,575 |
| Entegris, Inc., 3.625%, 5/01/2029 (n) | | | 3,093,000 | 2,962,290 |
| Sensata Technologies B.V., 5.625%, 11/01/2024 (n) | | | 4,255,000 | 4,489,025 |
| Sensata Technologies B.V., 5%, 10/01/2025 (n) | | | 8,420,000 | 8,872,575 |
| Sensata Technologies, Inc., 4.375%, 2/15/2030 (n) | | | 3,755,000 | 3,753,498 |
| Synaptics, Inc., 4%, 6/15/2029 (n) | | | 6,685,000 | 6,555,311 |
| | | | | $34,310,529 |
| Energy - Independent – 3.7% |
| Callon Petroleum Co., 6.125%, 10/01/2024 | | $ | 2,870,000 | $ 2,870,000 |
| Callon Petroleum Co., 8%, 8/01/2028 (n) | | | 3,400,000 | 3,463,750 |
| CNX Resources Corp., 6%, 1/15/2029 (n) | | | 6,730,000 | 6,931,900 |
| Colgate Energy Partners III LLC, 5.875%, 7/01/2029 (n) | | | 2,425,000 | 2,464,406 |
| Comstock Resources, Inc., 6.75%, 3/01/2029 (n) | | | 4,680,000 | 4,814,737 |
| CrownRock LP/CrownRock Finance, Inc., “F”, 5%, 5/01/2029 (n) | | | 3,880,000 | 3,916,550 |
| Encino Acquisition Partners Holdings LLC, 8.5%, 5/01/2028 (n) | | | 3,265,000 | 3,301,731 |
| EQT Corp., 5%, 1/15/2029 | | | 4,971,000 | 5,231,977 |
| Laredo Petroleum, Inc., 10.125%, 1/15/2028 | | | 955,000 | 1,005,138 |
| Moss Creek Resources Holdings, Inc., 7.5%, 1/15/2026 (n) | | | 955,000 | 874,035 |
| Occidental Petroleum Corp., 5.875%, 9/01/2025 | | | 4,890,000 | 5,226,187 |
| Occidental Petroleum Corp., 5.5%, 12/01/2025 | | | 4,100,000 | 4,350,746 |
| Occidental Petroleum Corp., 6.625%, 9/01/2030 | | | 6,980,000 | 8,191,100 |
| Occidental Petroleum Corp., 6.45%, 9/15/2036 | | | 2,340,000 | 2,842,398 |
| Occidental Petroleum Corp., 6.6%, 3/15/2046 | | | 3,435,000 | 4,318,422 |
| SM Energy Co., 5.625%, 6/01/2025 | | | 2,965,000 | 2,942,763 |
| SM Energy Co., 6.5%, 7/15/2028 | | | 3,195,000 | 3,300,435 |
| Southwestern Energy Co., 5.95%, 1/23/2025 | | | 396,000 | 418,770 |
| Southwestern Energy Co., 8.375%, 9/15/2028 | | | 2,595,000 | 2,847,234 |
| Southwestern Energy Co., 5.375%, 3/15/2030 | | | 2,990,000 | 3,063,584 |
| | | | | $72,375,863 |
| Entertainment – 3.6% |
| AMC Entertainment Holdings, Inc., 10% (10% cash or 12% PIK), 6/15/2026 (n)(p) | | $ | 1,880,000 | $ 1,752,931 |
| Carnival Corp. PLC, 7.625%, 3/01/2026 (n) | | | 12,125,000 | 12,367,500 |
| Carnival Corp. PLC, 5.75%, 3/01/2027 (n) | | | 4,860,000 | 4,661,712 |
| Carnival Corp. PLC, 6%, 5/01/2029 (n) | | | 1,430,000 | 1,375,660 |
| Cedar Fair LP/Canada's Wonderland Co./Magnum Management Corp./Millennium Operations LLC, 5.375%, 4/15/2027 | | | 2,995,000 | 3,032,437 |
| Life Time, Inc., 5.75%, 1/15/2026 (n) | | | 4,850,000 | 4,869,400 |
Portfolio of Investments – continued
| Issuer | | | Shares/Par | Value ($) |
| Bonds – continued |
| Entertainment – continued |
| Live Nation Entertainment, Inc., 5.625%, 3/15/2026 (n) | | $ | 6,922,000 | $ 7,043,135 |
| Live Nation Entertainment, Inc., 3.75%, 1/15/2028 (n) | | | 3,080,000 | 2,972,200 |
| Motion Bondco DAC, 6.625%, 11/15/2027 (n) | | | 4,970,000 | 4,957,575 |
| NCL Corp. Ltd., 3.625%, 12/15/2024 (n) | | | 4,305,000 | 3,969,942 |
| NCL Corp. Ltd., 5.875%, 3/15/2026 (n) | | | 3,565,000 | 3,395,662 |
| Royal Caribbean Cruises Ltd., 5.375%, 7/15/2027 (n) | | | 2,420,000 | 2,338,688 |
| Royal Caribbean Cruises Ltd., 5.5%, 4/01/2028 (n) | | | 7,845,000 | 7,611,925 |
| SeaWorld Parks & Entertainment, 5.25%, 8/15/2029 (n) | | | 7,375,000 | 7,185,536 |
| Viking Cruises Ltd. Co., 5.875%, 9/15/2027 (n) | | | 2,865,000 | 2,614,313 |
| | | | | $70,148,616 |
| Financial Institutions – 2.8% |
| Avation Capital S.A., 8.25% (8.25% cash or 9% PIK), 10/31/2026 (n)(p) | | $ | 3,632,255 | $ 3,051,094 |
| Credit Acceptance Corp., 5.125%, 12/31/2024 (n) | | | 6,850,000 | 6,918,500 |
| Freedom Mortgage Corp., 7.625%, 5/01/2026 (n) | | | 4,665,000 | 4,455,075 |
| Global Aircraft Leasing Co. Ltd., 6.5% (6.5% cash or 7.25% PIK), 9/15/2024 (n)(p) | | | 14,417,411 | 13,488,832 |
| Howard Hughes Corp., 4.125%, 2/01/2029 (n) | | | 7,923,000 | 7,615,825 |
| Nationstar Mortgage Holdings, Inc., 6%, 1/15/2027 (n) | | | 6,145,000 | 6,374,700 |
| Nationstar Mortgage Holdings, Inc., 5.75%, 11/15/2031 (n) | | | 2,415,000 | 2,335,281 |
| OneMain Finance Corp., 6.875%, 3/15/2025 | | | 3,945,000 | 4,280,325 |
| OneMain Finance Corp., 8.875%, 6/01/2025 | | | 2,550,000 | 2,706,596 |
| OneMain Finance Corp., 7.125%, 3/15/2026 | | | 2,600,000 | 2,858,269 |
| Rocket Mortgage Co-Issuer, Inc., 3.625%, 3/01/2029 (n) | | | 1,945,000 | 1,818,361 |
| | | | | $55,902,858 |
| Food & Beverages – 3.0% |
| Aramark Services, Inc., 6.375%, 5/01/2025 (n) | | $ | 7,630,000 | $ 7,906,587 |
| Aramark Services, Inc., 5%, 2/01/2028 (n) | | | 1,945,000 | 1,930,413 |
| JBS USA Lux S.A./JBS USA Finance, Inc., 6.75%, 2/15/2028 (n) | | | 8,340,000 | 8,892,608 |
| Lamb Weston Holdings, Inc., 4.125%, 1/31/2030 (n) | | | 9,460,000 | 9,345,581 |
| Performance Food Group Co., 5.5%, 10/15/2027 (n) | | | 6,030,000 | 6,169,052 |
| Post Holdings, Inc., 5.625%, 1/15/2028 (n) | | | 4,435,000 | 4,553,947 |
| Post Holdings, Inc., 4.625%, 4/15/2030 (n) | | | 8,120,000 | 7,825,650 |
| Primo Water Holding, Inc., 4.375%, 4/30/2029 (n) | | | 6,120,000 | 5,842,030 |
| U.S. Foods Holding Corp., 4.75%, 2/15/2029 (n) | | | 7,065,000 | 6,933,944 |
| | | | | $59,399,812 |
| Gaming & Lodging – 6.6% |
| Boyd Gaming Corp., 4.75%, 12/01/2027 | | $ | 5,840,000 | $ 5,810,391 |
| Boyd Gaming Corp., 4.75%, 6/15/2031 (n) | | | 2,410,000 | 2,365,511 |
| Caesars Entertainment, Inc., 4.625%, 10/15/2029 (n) | | | 5,750,000 | 5,505,064 |
Portfolio of Investments – continued
| Issuer | | | Shares/Par | Value ($) |
| Bonds – continued |
| Gaming & Lodging – continued |
| Caesars Resort Collection LLC/CRC Finco, Inc., 5.75%, 7/01/2025 (n) | | $ | 3,804,000 | $ 3,916,979 |
| Caesars Resort Collection LLC/CRC Finco, Inc., 8.125%, 7/01/2027 (n) | | | 4,896,000 | 5,269,320 |
| CCM Merger, Inc., 6.375%, 5/01/2026 (n) | | | 4,975,000 | 5,149,125 |
| Hilton Domestic Operating Co., Inc., 3.75%, 5/01/2029 (n) | | | 8,061,000 | 7,854,477 |
| Hilton Domestic Operating Co., Inc., 3.625%, 2/15/2032 (n) | | | 6,570,000 | 6,234,470 |
| International Game Technology PLC, 4.125%, 4/15/2026 (n) | | | 8,715,000 | 8,736,787 |
| International Game Technology PLC, 6.25%, 1/15/2027 (n) | | | 1,885,000 | 2,051,304 |
| Marriott Ownership Resorts, Inc., 4.5%, 6/15/2029 (n) | | | 5,680,000 | 5,572,307 |
| MGM China Holdings Ltd., 5.375%, 5/15/2024 (n) | | | 2,030,000 | 2,019,850 |
| MGM China Holdings Ltd., 5.875%, 5/15/2026 (n) | | | 3,015,000 | 3,003,694 |
| MGM China Holdings Ltd., 4.75%, 2/01/2027 (n) | | | 2,091,000 | 2,002,133 |
| MGM Growth Properties LLC, 4.625%, 6/15/2025 (n) | | | 5,895,000 | 6,160,275 |
| MGM Growth Properties LLC, 5.75%, 2/01/2027 | | | 2,150,000 | 2,375,750 |
| MGM Growth Properties LLC, 3.875%, 2/15/2029 (n) | | | 3,920,000 | 4,027,800 |
| Penn National Gaming, Inc., 4.125%, 7/01/2029 (n) | | | 4,550,000 | 4,277,000 |
| Scientific Games Corp., 8.625%, 7/01/2025 (n) | | | 1,420,000 | 1,505,200 |
| Scientific Games Corp., 8.25%, 3/15/2026 (n) | | | 3,160,000 | 3,298,250 |
| Scientific Games International, Inc., 7%, 5/15/2028 (n) | | | 4,655,000 | 4,888,914 |
| VICI Properties LP, REIT, 4.25%, 12/01/2026 (n) | | | 5,340,000 | 5,400,075 |
| VICI Properties LP, REIT, 3.75%, 2/15/2027 (n) | | | 4,870,000 | 4,821,909 |
| Wyndham Hotels & Resorts, Inc., 4.375%, 8/15/2028 (n) | | | 9,073,000 | 9,002,231 |
| Wynn Las Vegas LLC/Wynn Las Vegas Capital Corp., 5.25%, 5/15/2027 (n) | | | 3,780,000 | 3,718,840 |
| Wynn Macau Ltd., 4.875%, 10/01/2024 (n) | | | 2,650,000 | 2,516,082 |
| Wynn Macau Ltd., 5.5%, 1/15/2026 (n) | | | 3,750,000 | 3,518,625 |
| Wynn Macau Ltd., 5.625%, 8/26/2028 (n) | | | 5,369,000 | 4,912,635 |
| Wynn Resorts Finance LLC/Wynn Resorts Capital Corp., 5.125%, 10/01/2029 (n) | | | 4,765,000 | 4,631,104 |
| | | | | $130,546,102 |
| Industrial – 1.1% |
| Albion Financing 2 S.à r.l., 8.75%, 4/15/2027 (n) | | $ | 1,955,000 | $ 1,940,338 |
| APi Escrow Corp., 4.75%, 10/15/2029 (n) | | | 6,790,000 | 6,671,175 |
| Dycom Industries, Inc., 4.5%, 4/15/2029 (n) | | | 3,875,000 | 3,794,904 |
| Williams Scotsman International, Inc., 4.625%, 8/15/2028 (n) | | | 8,522,000 | 8,596,567 |
| | | | | $21,002,984 |
| Insurance - Property & Casualty – 1.2% |
| Alliant Holdings Intermediate LLC, 6.75%, 10/15/2027 (n) | | $ | 8,910,000 | $ 8,806,466 |
| AssuredPartners, Inc., 5.625%, 1/15/2029 (n) | | | 4,350,000 | 4,043,934 |
| GTCR (AP) Finance, Inc., 8%, 5/15/2027 (n) | | | 1,400,000 | 1,421,000 |
| Hub International Ltd., 5.625%, 12/01/2029 (n) | | | 5,500,000 | 5,403,750 |
Portfolio of Investments – continued
| Issuer | | | Shares/Par | Value ($) |
| Bonds – continued |
| Insurance - Property & Casualty – continued |
| Ryan Specialty Group, 4.375%, 2/01/2030 (n) | | $ | 4,713,000 | $ 4,689,435 |
| | | | | $24,364,585 |
| Machinery & Tools – 0.7% |
| Ritchie Bros. Holdings Ltd., 4.75%, 12/15/2031 (n) | | $ | 6,310,000 | $ 6,355,432 |
| Terex Corp., 5%, 5/15/2029 (n) | | | 7,275,000 | 7,216,072 |
| | | | | $13,571,504 |
| Medical & Health Technology & Services – 6.4% |
| 180 Medical, Inc., 3.875%, 10/15/2029 (n) | | $ | 6,525,000 | $ 6,345,562 |
| Avantor Funding, Inc., 4.625%, 7/15/2028 (n) | | | 7,632,000 | 7,612,920 |
| Catalent, Inc., 3.125%, 2/15/2029 (n) | | | 11,159,000 | 10,433,665 |
| Charles River Laboratories International, Inc., 3.75%, 3/15/2029 (n) | | | 13,061,000 | 12,599,947 |
| CHS/Community Health Systems, Inc., 8%, 12/15/2027 (n) | | | 3,340,000 | 3,540,400 |
| CHS/Community Health Systems, Inc., 6.125%, 4/01/2030 (n) | | | 9,330,000 | 8,884,073 |
| CHS/Community Health Systems, Inc., 5.25%, 5/15/2030 (n) | | | 1,455,000 | 1,448,744 |
| DaVita, Inc., 4.625%, 6/01/2030 (n) | | | 4,565,000 | 4,441,242 |
| DaVita, Inc., 3.75%, 2/15/2031 (n) | | | 4,159,000 | 3,820,873 |
| Encompass Health Corp., 5.125%, 3/15/2023 | | | 1,701,000 | 1,698,874 |
| Encompass Health Corp., 5.75%, 9/15/2025 | | | 3,565,000 | 3,600,650 |
| HCA, Inc., 5.875%, 2/15/2026 | | | 8,505,000 | 9,257,778 |
| IQVIA Holdings, Inc., 5%, 10/15/2026 (n) | | | 5,727,000 | 5,858,721 |
| IQVIA Holdings, Inc., 5%, 5/15/2027 (n) | | | 10,630,000 | 10,871,301 |
| Legacy LifePoint Health LLC, 4.375%, 2/15/2027 (n) | | | 1,785,000 | 1,749,032 |
| MPH Acquisition Holdings LLC, 5.5%, 9/01/2028 (n) | | | 3,565,000 | 3,423,291 |
| Regional Care/LifePoint Health, Inc., 9.75%, 12/01/2026 (n) | | | 3,875,000 | 4,076,616 |
| Syneos Health, Inc., 3.625%, 1/15/2029 (n) | | | 8,637,000 | 8,185,976 |
| Tenet Healthcare Corp., 6.125%, 10/01/2028 (n) | | | 7,715,000 | 7,740,228 |
| U.S. Renal Care, Inc., 10.625%, 7/15/2027 (n) | | | 4,140,000 | 4,222,800 |
| US Acute Care Solutions LLC, 6.375%, 3/01/2026 (n) | | | 4,165,000 | 4,185,825 |
| US Acute Care Solutions LLC, 6.375%, 3/01/2026 (n)(w) | | | 1,455,000 | 1,462,275 |
| | | | | $125,460,793 |
| Medical Equipment – 0.4% |
| Teleflex, Inc., 4.625%, 11/15/2027 | | $ | 7,290,000 | $ 7,435,800 |
| Metals & Mining – 3.6% |
| Baffinland Iron Mines Corp./Baffinland Iron Mines LP, 8.75%, 7/15/2026 (n) | | $ | 6,760,000 | $ 7,038,850 |
| Coeur Mining, Inc., 5.125%, 2/15/2029 (n) | | | 6,630,000 | 6,323,363 |
| Compass Minerals International, Inc., 6.75%, 12/01/2027 (n) | | | 5,400,000 | 5,657,580 |
| Eldorado Gold Corp., 6.25%, 9/01/2029 (n) | | | 5,200,000 | 5,199,636 |
| Ero Copper Corp., 6.5%, 2/15/2030 (n)(w) | | | 2,562,000 | 2,531,615 |
Portfolio of Investments – continued
| Issuer | | | Shares/Par | Value ($) |
| Bonds – continued |
| Metals & Mining – continued |
| First Quantum Minerals Ltd., 6.875%, 3/01/2026 (n) | | $ | 3,010,000 | $ 3,107,825 |
| First Quantum Minerals Ltd., 6.875%, 10/15/2027 (n) | | | 3,728,000 | 3,961,000 |
| FMG Resources Ltd., 4.375%, 4/01/2031 (n) | | | 6,960,000 | 7,003,500 |
| GrafTech Finance, Inc., 4.625%, 12/15/2028 (n) | | | 4,346,000 | 4,197,497 |
| Kaiser Aluminum Corp., 4.625%, 3/01/2028 (n) | | | 9,714,000 | 9,318,834 |
| Kaiser Aluminum Corp., 4.5%, 6/01/2031 (n) | | | 3,885,000 | 3,690,750 |
| Novelis Corp., 3.25%, 11/15/2026 (n) | | | 2,340,000 | 2,266,758 |
| Novelis Corp., 4.75%, 1/30/2030 (n) | | | 5,595,000 | 5,567,025 |
| Novelis Corp., 3.875%, 8/15/2031 (n) | | | 2,807,000 | 2,643,548 |
| Petra Diamonds US$ Treasury PLC, 10.5% PIK to 12/31/2022, 10.5% PIK/9.75% Cash to 6/30/2023, 9.75% Cash to 3/08/2026 (n)(p) | | | 2,073,185 | 2,130,197 |
| | | | | $70,637,978 |
| Midstream – 4.3% |
| Cheniere Energy Partners LP, 4.5%, 10/01/2029 | | $ | 2,576,000 | $ 2,633,239 |
| Cheniere Energy Partners LP, 4%, 3/01/2031 | | | 7,260,000 | 7,223,301 |
| DT Midstream, Inc., 4.125%, 6/15/2029 (n) | | | 4,616,000 | 4,553,638 |
| DT Midstream, Inc., 4.375%, 6/15/2031 (n) | | | 7,956,000 | 7,856,550 |
| EnLink Midstream Partners LP, 5.625%, 1/15/2028 (n) | | | 3,944,000 | 4,049,305 |
| EQM Midstream Partners LP, 6%, 7/01/2025 (n) | | | 1,230,000 | 1,269,975 |
| EQM Midstream Partners LP, 6.5%, 7/01/2027 (n) | | | 592,000 | 618,640 |
| EQM Midstream Partners LP, 5.5%, 7/15/2028 | | | 11,500,000 | 11,639,265 |
| EQM Midstream Partners LP, 4.5%, 1/15/2029 (n) | | | 3,090,000 | 2,951,012 |
| Genesis Energy LP/Genesis Energy Finance Corp., 6.25%, 5/15/2026 | | | 2,411,000 | 2,314,560 |
| Northriver Midstream Finance LP, 5.625%, 2/15/2026 (n) | | | 6,450,000 | 6,546,750 |
| Targa Resources Partners LP/Targa Resources Finance Corp., 6.875%, 1/15/2029 | | | 8,250,000 | 9,023,437 |
| Targa Resources Partners LP/Targa Resources Finance Corp., 4.875%, 2/01/2031 | | | 4,355,000 | 4,550,975 |
| Targa Resources Partners LP/Targa Resources Finance Corp., 4%, 1/31/2032 (n) | | | 2,310,000 | 2,299,374 |
| Venture Global Calcasieu Pass LLC, 3.875%, 8/15/2029 (n) | | | 4,150,000 | 4,142,696 |
| Venture Global Calcasieu Pass LLC, 4.125%, 8/15/2031 (n) | | | 4,150,000 | 4,176,936 |
| Western Midstream Operating LP, 5.3%, 2/01/2030 | | | 4,895,000 | 5,103,037 |
| Western Midstream Operation LP, 4.65%, 7/01/2026 | | | 1,935,000 | 2,025,190 |
| Western Midstream Operation LP, 5.5%, 8/15/2048 | | | 1,550,000 | 1,712,750 |
| | | | | $84,690,630 |
Portfolio of Investments – continued
| Issuer | | | Shares/Par | Value ($) |
| Bonds – continued |
| Municipals – 0.0% |
| Puerto Rico Industrial, Tourist, Educational, Medical & Environmental Control Facilities Financing Authority Rev. (Cogeneration Facilities - AES Puerto Rico Project), 9.12%, 6/01/2022 | | $ | 815,000 | $ 835,375 |
| Network & Telecom – 0.5% |
| Iliad Holding S.A.S., 7%, 10/15/2028 (n) | | $ | 5,482,000 | $ 5,573,056 |
| Zayo Group Holdings, Inc., 6.125%, 3/01/2028 (n) | | | 4,315,000 | 4,070,771 |
| | | | | $9,643,827 |
| Oil Services – 0.2% |
| Nabors Industries, Inc., 5.75%, 2/01/2025 | | $ | 955,000 | $ 883,375 |
| Solaris Midstream Holding LLC, 7.625%, 4/01/2026 (n) | | | 2,950,000 | 3,046,258 |
| | | | | $3,929,633 |
| Oils – 0.7% |
| Parkland Corp., 4.625%, 5/01/2030 (n) | | $ | 7,615,000 | $ 7,310,400 |
| PBF Holding Co. LLC/PBF Finance Corp., 7.25%, 6/15/2025 | | | 4,265,000 | 3,384,086 |
| PBF Holding Co. LLC/PBF Finance Corp., 6%, 2/15/2028 | | | 3,220,000 | 2,262,050 |
| | | | | $12,956,536 |
| Personal Computers & Peripherals – 0.5% |
| NCR Corp., 5%, 10/01/2028 (n) | | $ | 7,245,000 | $ 7,198,342 |
| NCR Corp., 5.125%, 4/15/2029 (n) | | | 3,460,000 | 3,452,423 |
| | | | | $10,650,765 |
| Pharmaceuticals – 2.5% |
| Bausch Health Companies, Inc., 6.125%, 4/15/2025 (n) | | $ | 11,395,000 | $ 11,614,354 |
| Bausch Health Companies, Inc., 5%, 1/30/2028 (n) | | | 11,090,000 | 9,343,325 |
| Bausch Health Companies, Inc., 5%, 2/15/2029 (n) | | | 3,480,000 | 2,801,400 |
| Endo Luxembourg Finance Co I S.à r.l., 6.125%, 4/01/2029 (n) | | | 3,225,000 | 3,064,459 |
| Jazz Securities DAC, 4.375%, 1/15/2029 (n) | | | 8,175,000 | 8,071,586 |
| Organon Finance 1 LLC, 4.125%, 4/30/2028 (n) | | | 5,027,000 | 4,946,669 |
| Organon Finance 1 LLC, 5.125%, 4/30/2031 (n) | | | 5,759,000 | 5,759,000 |
| Par Pharmaceutical, Inc., 7.5%, 4/01/2027 (n) | | | 3,430,000 | 3,451,437 |
| | | | | $49,052,230 |
| Pollution Control – 0.8% |
| GFL Environmental, Inc., 4%, 8/01/2028 (n) | | $ | 5,580,000 | $ 5,198,718 |
| GFL Environmental, Inc., 4.75%, 6/15/2029 (n) | | | 1,935,000 | 1,876,950 |
| GFL Environmental, Inc., 4.375%, 8/15/2029 (n) | | | 2,355,000 | 2,247,353 |
| Stericycle, Inc., 3.875%, 1/15/2029 (n) | | | 6,390,000 | 6,070,500 |
| | | | | $15,393,521 |
Portfolio of Investments – continued
| Issuer | | | Shares/Par | Value ($) |
| Bonds – continued |
| Precious Metals & Minerals – 0.4% |
| IAMGOLD Corp., 5.75%, 10/15/2028 (n) | | $ | 5,005,000 | $ 4,697,693 |
| Taseko Mines Ltd., 7%, 2/15/2026 (n) | | | 3,730,000 | 3,781,847 |
| | | | | $8,479,540 |
| Printing & Publishing – 0.4% |
| Cimpress N.V., 7%, 6/15/2026 (n) | | $ | 6,635,000 | $ 6,820,316 |
| Railroad & Shipping – 0.2% |
| Watco Cos. LLC/Watco Finance Corp., 6.5%, 6/15/2027 (n) | | $ | 3,984,000 | $ 4,123,440 |
| Real Estate - Other – 0.6% |
| Park Intermediate Holdings LLC/PK Domestic Property LLC/PK Finance Co-Issuer, 5.875%, 10/01/2028 (n) | | $ | 7,245,000 | $ 7,414,605 |
| XHR LP, REIT, 4.875%, 6/01/2029 (n) | | | 5,320,000 | 5,216,260 |
| | | | | $12,630,865 |
| Restaurants – 0.2% |
| Fertitta Entertainment LLC, 6.75%, 1/15/2030 (n) | | $ | 3,880,000 | $ 3,770,196 |
| Retailers – 1.1% |
| Asbury Automotive Group, Inc., 4.625%, 11/15/2029 (n) | | $ | 3,206,000 | $ 3,154,768 |
| Bath & Body Works, Inc., 5.25%, 2/01/2028 | | | 12,640,000 | 13,272,000 |
| Victoria's Secret & Co., 4.625%, 7/15/2029 (n) | | | 5,835,000 | 5,622,752 |
| | | | | $22,049,520 |
| Specialty Chemicals – 0.3% |
| Univar Solutions USA, Inc., 5.125%, 12/01/2027 (n) | | $ | 5,595,000 | $ 5,692,912 |
| Specialty Stores – 0.9% |
| Group 1 Automotive, Inc., 4%, 8/15/2028 (n) | | $ | 4,922,000 | $ 4,710,699 |
| Michael Cos., Inc., 5.25%, 5/01/2028 (n) | | | 3,220,000 | 3,100,635 |
| Michael Cos., Inc., 7.875%, 5/01/2029 (n) | | | 3,770,000 | 3,449,550 |
| Penske Automotive Group Co., 3.75%, 6/15/2029 | | | 7,423,000 | 6,987,121 |
| | | | | $18,248,005 |
| Supermarkets – 0.6% |
| Albertsons Cos. LLC/Safeway, Inc., 4.625%, 1/15/2027 (n) | | $ | 7,175,000 | $ 7,343,612 |
| Albertsons Cos. LLC/Safeway, Inc., 3.5%, 3/15/2029 (n) | | | 4,585,000 | 4,328,974 |
| | | | | $11,672,586 |
| Telecommunications - Wireless – 2.2% |
| Altice France S.A., 6%, 2/15/2028 (n) | | $ | 6,035,000 | $ 5,507,843 |
| SBA Communications Corp., 3.875%, 2/15/2027 | | | 5,433,000 | 5,487,330 |
| SBA Communications Corp., 3.125%, 2/01/2029 | | | 8,900,000 | 8,294,355 |
| Sprint Capital Corp., 6.875%, 11/15/2028 | | | 7,985,000 | 9,498,157 |
| Sprint Corp., 7.125%, 6/15/2024 | | | 2,590,000 | 2,823,100 |
Portfolio of Investments – continued
| Issuer | | | Shares/Par | Value ($) |
| Bonds – continued |
| Telecommunications - Wireless – continued |
| Sprint Corp., 7.625%, 3/01/2026 | | $ | 10,670,000 | $ 12,217,150 |
| | | | | $43,827,935 |
| Tobacco – 0.3% |
| Vector Group Ltd., 10.5%, 11/01/2026 (n) | | $ | 2,825,000 | $ 2,896,755 |
| Vector Group Ltd., 5.75%, 2/01/2029 (n) | | | 3,120,000 | 2,883,442 |
| | | | | $5,780,197 |
| Utilities - Electric Power – 2.7% |
| Calpine Corp., 4.5%, 2/15/2028 (n) | | $ | 5,840,000 | $ 5,708,016 |
| Calpine Corp., 5.125%, 3/15/2028 (n) | | | 7,800,000 | 7,609,134 |
| Clearway Energy Operating LLC, 4.75%, 3/15/2028 (n) | | | 3,040,000 | 3,129,163 |
| Clearway Energy Operating LLC, 3.75%, 2/15/2031 (n) | | | 11,655,000 | 10,972,833 |
| NextEra Energy, Inc., 4.25%, 7/15/2024 (n) | | | 4,473,000 | 4,604,394 |
| NextEra Energy, Inc., 4.25%, 9/15/2024 (n) | | | 728,000 | 750,750 |
| NextEra Energy, Inc., 4.5%, 9/15/2027 (n) | | | 4,330,000 | 4,384,125 |
| TerraForm Global Operating LLC, 6.125%, 3/01/2026 (n) | | | 3,325,000 | 3,366,563 |
| TerraForm Power Operating LLC, 5%, 1/31/2028 (n) | | | 9,040,000 | 9,153,000 |
| TerraForm Power Operating LLC, 4.75%, 1/15/2030 (n) | | | 3,240,000 | 3,256,848 |
| | | | | $52,934,826 |
| Total Bonds (Identified Cost, $1,881,126,107) | | $ 1,838,736,527 |
| Common Stocks – 1.0% |
| Construction – 0.0% | |
| ICA Tenedora S.A. de C.V. (u) | | 347,563 | $ 286,435 |
| Oil Services – 0.0% | |
| LTRI Holdings LP (a)(u) | | 3,250 | $ 934,667 |
| Precious Metals & Minerals – 0.0% | |
| Petra Diamonds Ltd. (a) | | 298,176 | $ 338,660 |
| Special Products & Services – 1.0% | |
| iShares iBoxx $ High Yield Corporate Bond ETF | | 223,400 | $ 18,921,980 |
| Total Common Stocks (Identified Cost, $20,001,416) | | $ 20,481,742 |
| | Strike
Price | First
Exercise | | |
| Warrants – 0.0% | | | | |
| Other Banks & Diversified Financials – 0.0% |
| Avation Capital S.A. (1 share for 1 warrant, Expiration 10/31/26) (a)(u) (Identified Cost, $0) | GBP 1.14 | 3/16/21 | 62,563 | $ 10,075 |
Portfolio of Investments – continued
| Issuer | | | Shares/Par | Value ($) |
| Investment Companies (h) – 4.5% |
| Money Market Funds – 4.5% | |
| MFS Institutional Money Market Portfolio, 0.06% (v) (Identified Cost, $88,966,963) | | | 88,969,191 | $ 88,969,191 |
|
|
| Other Assets, Less Liabilities – 1.1% | | 20,822,993 |
| Net Assets – 100.0% | $1,969,020,528 |
| (a) | Non-income producing security. |
| (d) | In default. |
| (h) | An affiliated issuer, which may be considered one in which the fund owns 5% or more of the outstanding voting securities, or a company which is under common control. At period end, the aggregate values of the fund's investments in affiliated issuers and in unaffiliated issuers were $88,969,191 and $1,859,228,344, respectively. |
| (i) | Interest only security for which the fund receives interest on notional principal (Par amount). Par amount shown is the notional principal and does not reflect the cost of the security. |
| (n) | Securities exempt from registration under Rule 144A of the Securities Act of 1933. These securities may be sold in the ordinary course of business in transactions exempt from registration, normally to qualified institutional buyers. At period end, the aggregate value of these securities was $1,558,174,604, representing 79.1% of net assets. |
| (p) | Payment-in-kind (PIK) security for which interest income may be received in additional securities and/or cash. |
| (u) | The security was valued using significant unobservable inputs and is considered level 3 under the fair value hierarchy. For further information about the fund’s level 3 holdings, please see Note 2 in the Notes to Financial Statements. |
| (v) | Affiliated issuer that is available only to investment companies managed by MFS. The rate quoted for the MFS Institutional Money Market Portfolio is the annualized seven-day yield of the fund at period end. |
| (w) | When-issued security. |
| (z) | Restricted securities are not registered under the Securities Act of 1933 and are subject to legal restrictions on resale. These securities generally may be resold in transactions exempt from registration or to the public if the securities are subsequently registered. Disposal of these securities may involve time-consuming negotiations and prompt sale at an acceptable price may be difficult. The fund holds the following restricted securities: |
| Restricted Securities | Acquisition
Date | Cost | Value |
| Paysafe Finance PLC, 4%, 6/15/2029 | 6/10/21-9/09/21 | $5,665,759 | $5,140,944 |
| % of Net assets | | | 0.3% |
Portfolio of Investments – continued
| The following abbreviations are used in this report and are defined: |
| ETF | Exchange-Traded Fund |
| FLR | Floating Rate. Interest rate resets periodically based on the parenthetically disclosed reference rate plus a spread (if any). The period-end rate reported may not be the current rate. All reference rates are USD unless otherwise noted. |
| LIBOR | London Interbank Offered Rate |
| REIT | Real Estate Investment Trust |
| Abbreviations indicate amounts shown in currencies other than the U.S. dollar. All amounts are stated in U.S. dollars unless otherwise indicated. A list of abbreviations is shown below: |
| EUR | Euro |
| GBP | British Pound |
Derivative Contracts at 1/31/22
| Forward Foreign Currency Exchange Contracts |
Currency
Purchased | Currency
Sold | Counterparty | Settlement
Date | Unrealized
Appreciation
(Depreciation) |
| Asset Derivatives |
| USD | 2,153,871 | EUR | 1,890,322 | JPMorgan Chase Bank N.A. | 4/08/2022 | $26,878 |
| Futures Contracts |
| Description | Long/
Short | Currency | Contracts | Notional
Amount | Expiration
Date | Value/Unrealized
Appreciation
(Depreciation) |
| Asset Derivatives |
| Interest Rate Futures | | |
| U.S. Treasury Note 10 yr | Short | USD | 503 | $64,368,281 | March – 2022 | $528,681 |
| Liability Derivatives |
| Interest Rate Futures | | |
| U.S. Treasury Bond | Long | USD | 183 | $28,479,375 | March – 2022 | $(449,768) |
| U.S. Treasury Ultra Bond | Long | USD | 30 | 5,668,125 | March – 2022 | (95,737) |
| | | | | | | $(545,505) |
At January 31, 2022, the fund had cash collateral of $345,075 to cover any collateral or margin obligations for certain derivative contracts. Restricted cash and/or deposits with brokers in the Statement of Assets and Liabilities are comprised of cash collateral.
See Notes to Financial Statements
Financial Statements
Statement of Assets and Liabilities
At 1/31/22
This statement represents your fund’s balance sheet, which details the assets and liabilities comprising the total value of the fund.
| Assets | |
| Investments in unaffiliated issuers, at value (identified cost, $1,901,127,523) | $1,859,228,344 |
| Investments in affiliated issuers, at value (identified cost, $88,966,963) | 88,969,191 |
| Cash | 2,938,137 |
| Deposits with brokers for | |
| Futures contracts | 345,075 |
| Receivables for | |
| Forward foreign currency exchange contracts | 26,878 |
| Investments sold | 7,058,724 |
| Fund shares sold | 2,197,038 |
| Interest and dividends | 25,503,270 |
| Other assets | 5,929 |
| Total assets | $1,986,272,586 |
| Liabilities | |
| Payables for | |
| Distributions | $238,121 |
| Net daily variation margin on open futures contracts | 48,546 |
| Investments purchased | 9,982,024 |
| Fund shares reacquired | 2,310,883 |
| When-issued investments purchased | 4,038,219 |
| Payable to affiliates | |
| Investment adviser | 94,764 |
| Administrative services fee | 2,928 |
| Shareholder servicing costs | 343,382 |
| Distribution and service fees | 21,282 |
| Program manager fees | 29 |
| Payable for independent Trustees' compensation | 2,578 |
| Accrued expenses and other liabilities | 169,302 |
| Total liabilities | $17,252,058 |
| Net assets | $1,969,020,528 |
| Net assets consist of | |
| Paid-in capital | $2,097,958,631 |
| Total distributable earnings (loss) | (128,938,103) |
| Net assets | $1,969,020,528 |
| Shares of beneficial interest outstanding | 595,778,847 |
Statement of Assets and Liabilities – continued
| | Net assets | Shares
outstanding | Net asset value
per share (a) |
| Class A | $679,622,311 | 205,523,140 | $3.31 |
| Class B | 4,729,338 | 1,428,220 | 3.31 |
| Class C | 16,636,392 | 5,016,602 | 3.32 |
| Class I | 208,682,036 | 63,282,955 | 3.30 |
| Class R1 | 945,534 | 285,745 | 3.31 |
| Class R2 | 2,029,370 | 617,016 | 3.29 |
| Class R3 | 2,574,374 | 779,937 | 3.30 |
| Class R4 | 371,019 | 112,151 | 3.31 |
| Class R6 | 1,048,136,813 | 317,130,885 | 3.31 |
| Class 529A | 4,802,295 | 1,453,810 | 3.30 |
| Class 529B | 68,842 | 20,801 | 3.31 |
| Class 529C | 422,204 | 127,585 | 3.31 |
| (a) | Maximum offering price per share was equal to the net asset value per share for all share classes, except for Classes A and 529A, for which the maximum offering prices per share were $3.46 [100 / 95.75 x $3.31] and $3.45 [100 / 95.75 x $3.30], respectively. On sales of $100,000 or more, the maximum offering prices of Class A and Class 529A shares are reduced. A contingent deferred sales charge may be imposed on redemptions of Class A, Class B, Class C, Class 529B, and Class 529C shares. Redemption price per share was equal to the net asset value per share for Classes I, R1, R2, R3, R4, R6, and 529A. |
See Notes to Financial Statements
Financial Statements
Statement of Operations
Year ended 1/31/22
This statement describes how much your fund earned in investment income and accrued in expenses. It also describes any gains and/or losses generated by fund operations.
| Net investment income (loss) | |
| Income | |
| Interest | $93,773,293 |
| Dividends | 1,659,170 |
| Other | 758,371 |
| Dividends from affiliated issuers | 34,488 |
| Foreign taxes withheld | (19,404) |
| Total investment income | $96,205,918 |
| Expenses | |
| Management fee | $9,143,591 |
| Distribution and service fees | 1,986,455 |
| Shareholder servicing costs | 1,881,685 |
| Program manager fees | 2,648 |
| Administrative services fee | 273,154 |
| Independent Trustees' compensation | 30,739 |
| Custodian fee | 118,468 |
| Shareholder communications | 127,940 |
| Audit and tax fees | 90,317 |
| Legal fees | 10,560 |
| Miscellaneous | 237,921 |
| Total expenses | $13,903,478 |
| Fees paid indirectly | (290) |
| Reduction of expenses by investment adviser and distributor | (264,601) |
| Net expenses | $13,638,587 |
| Net investment income (loss) | $82,567,331 |
Statement of Operations – continued
| Realized and unrealized gain (loss) |
| Realized gain (loss) (identified cost basis) | |
| Unaffiliated issuers | $35,712,024 |
| Futures contracts | (27,315) |
| Forward foreign currency exchange contracts | 102,241 |
| Foreign currency | (1,181) |
| Net realized gain (loss) | $35,785,769 |
| Change in unrealized appreciation or depreciation | |
| Unaffiliated issuers | $(104,080,634) |
| Futures contracts | (16,824) |
| Forward foreign currency exchange contracts | 26,878 |
| Translation of assets and liabilities in foreign currencies | (464) |
| Net unrealized gain (loss) | $(104,071,044) |
| Net realized and unrealized gain (loss) | $(68,285,275) |
| Change in net assets from operations | $14,282,056 |
See Notes to Financial Statements
Financial Statements
Statements of Changes in Net Assets
These statements describe the increases and/or decreases in net assets resulting from operations, any distributions, and any shareholder transactions.
| | Year ended |
| | 1/31/22 | 1/31/21 |
| Change in net assets | | |
| From operations | | |
| Net investment income (loss) | $82,567,331 | $79,439,365 |
| Net realized gain (loss) | 35,785,769 | (17,386,319) |
| Net unrealized gain (loss) | (104,071,044) | 25,278,834 |
| Change in net assets from operations | $14,282,056 | $87,331,880 |
| Total distributions to shareholders | $(91,361,732) | $(83,828,177) |
| Change in net assets from fund share transactions | $40,915,210 | $297,023,685 |
| Total change in net assets | $(36,164,466) | $300,527,388 |
| Net assets | | |
| At beginning of period | 2,005,184,994 | 1,704,657,606 |
| At end of period | $1,969,020,528 | $2,005,184,994 |
See Notes to Financial Statements
Financial Statements
Financial Highlights
The financial highlights table is intended to help you understand the fund's financial performance for the past 5 years. Certain information reflects financial results for a single fund share. The total returns in the table represent the rate that an investor would have earned (or lost) on an investment in the fund share class (assuming reinvestment of all distributions) held for the entire period.
| Class A | Year ended |
| | 1/31/22 | 1/31/21 | 1/31/20 | 1/31/19 | 1/31/18 |
| Net asset value, beginning of period | $3.44 | $3.44 | $3.30 | $3.44 | $3.42 |
| Income (loss) from investment operations |
| Net investment income (loss) (d) | $0.13 | $0.14 | $0.15 | $0.15 | $0.16 |
| Net realized and unrealized gain (loss) | (0.11) | 0.01 | 0.15 | (0.13) | 0.02 |
| Total from investment operations | $0.02 | $0.15 | $0.30 | $0.02 | $0.18 |
| Less distributions declared to shareholders |
| From net investment income | $(0.15) | $(0.15) | $(0.16) | $(0.16) | $(0.16) |
| Net asset value, end of period (x) | $3.31 | $3.44 | $3.44 | $3.30 | $3.44 |
| Total return (%) (r)(s)(t)(x) | 0.48 | 4.71 | 9.24 | 0.68 | 5.47 |
Ratios (%) (to average net assets)
and Supplemental data: |
| Expenses before expense reductions (f) | 0.90 | 0.93 | 0.94 | 0.94 | 0.96 |
| Expenses after expense reductions (f) | 0.89 | 0.91 | 0.92 | 0.92 | 0.94 |
| Net investment income (loss) | 3.88 | 4.34 | 4.46 | 4.67 | 4.52 |
| Portfolio turnover | 64 | 50 | 58 | 44 | 54 |
| Net assets at end of period (000 omitted) | $679,622 | $612,075 | $552,035 | $489,120 | $477,817 |
See Notes to Financial Statements
Financial Highlights – continued
| Class B | Year ended |
| | 1/31/22 | 1/31/21 | 1/31/20 | 1/31/19 | 1/31/18 |
| Net asset value, beginning of period | $3.44 | $3.45 | $3.30 | $3.44 | $3.43 |
| Income (loss) from investment operations |
| Net investment income (loss) (d) | $0.11 | $0.12 | $0.13 | $0.13 | $0.13 |
| Net realized and unrealized gain (loss) | (0.12) | 0.00(w) | 0.15 | (0.13) | 0.02 |
| Total from investment operations | $(0.01) | $0.12 | $0.28 | $0.00(w) | $0.15 |
| Less distributions declared to shareholders |
| From net investment income | $(0.12) | $(0.13) | $(0.13) | $(0.14) | $(0.14) |
| Net asset value, end of period (x) | $3.31 | $3.44 | $3.45 | $3.30 | $3.44 |
| Total return (%) (r)(s)(t)(x) | (0.28) | 3.62 | 8.74 | (0.07) | 4.39 |
Ratios (%) (to average net assets)
and Supplemental data: |
| Expenses before expense reductions (f) | 1.65 | 1.68 | 1.69 | 1.69 | 1.71 |
| Expenses after expense reductions (f) | 1.64 | 1.67 | 1.68 | 1.68 | 1.70 |
| Net investment income (loss) | 3.15 | 3.63 | 3.72 | 3.91 | 3.77 |
| Portfolio turnover | 64 | 50 | 58 | 44 | 54 |
| Net assets at end of period (000 omitted) | $4,729 | $6,914 | $10,650 | $13,361 | $18,329 |
| Class C | Year ended |
| | 1/31/22 | 1/31/21 | 1/31/20 | 1/31/19 | 1/31/18 |
| Net asset value, beginning of period | $3.45 | $3.45 | $3.31 | $3.44 | $3.43 |
| Income (loss) from investment operations |
| Net investment income (loss) (d) | $0.11 | $0.12 | $0.13 | $0.13 | $0.13 |
| Net realized and unrealized gain (loss) | (0.12) | 0.01 | 0.14 | (0.12) | 0.02 |
| Total from investment operations | $(0.01) | $0.13 | $0.27 | $0.01 | $0.15 |
| Less distributions declared to shareholders |
| From net investment income | $(0.12) | $(0.13) | $(0.13) | $(0.14) | $(0.14) |
| Net asset value, end of period (x) | $3.32 | $3.45 | $3.45 | $3.31 | $3.44 |
| Total return (%) (r)(s)(t)(x) | (0.27) | 3.93 | 8.42 | 0.23 | 4.39 |
Ratios (%) (to average net assets)
and Supplemental data: |
| Expenses before expense reductions (f) | 1.65 | 1.68 | 1.69 | 1.69 | 1.70 |
| Expenses after expense reductions (f) | 1.64 | 1.67 | 1.68 | 1.68 | 1.70 |
| Net investment income (loss) | 3.15 | 3.61 | 3.72 | 3.91 | 3.77 |
| Portfolio turnover | 64 | 50 | 58 | 44 | 54 |
| Net assets at end of period (000 omitted) | $16,636 | $21,918 | $27,415 | $31,793 | $57,509 |
See Notes to Financial Statements
Financial Highlights – continued
| Class I | Year ended |
| | 1/31/22 | 1/31/21 | 1/31/20 | 1/31/19 | 1/31/18 |
| Net asset value, beginning of period | $3.43 | $3.43 | $3.29 | $3.43 | $3.42 |
| Income (loss) from investment operations |
| Net investment income (loss) (d) | $0.14 | $0.15 | $0.16 | $0.16 | $0.16 |
| Net realized and unrealized gain (loss) | (0.11) | 0.01 | 0.15 | (0.13) | 0.02 |
| Total from investment operations | $0.03 | $0.16 | $0.31 | $0.03 | $0.18 |
| Less distributions declared to shareholders |
| From net investment income | $(0.16) | $(0.16) | $(0.17) | $(0.17) | $(0.17) |
| Net asset value, end of period (x) | $3.30 | $3.43 | $3.43 | $3.29 | $3.43 |
| Total return (%) (r)(s)(t)(x) | 0.71 | 4.97 | 9.52 | 0.92 | 5.43 |
Ratios (%) (to average net assets)
and Supplemental data: |
| Expenses before expense reductions (f) | 0.65 | 0.68 | 0.69 | 0.69 | 0.70 |
| Expenses after expense reductions (f) | 0.64 | 0.66 | 0.68 | 0.68 | 0.69 |
| Net investment income (loss) | 4.13 | 4.55 | 4.67 | 4.90 | 4.77 |
| Portfolio turnover | 64 | 50 | 58 | 44 | 54 |
| Net assets at end of period (000 omitted) | $208,682 | $216,905 | $147,591 | $89,637 | $111,450 |
| Class R1 | Year ended |
| | 1/31/22 | 1/31/21 | 1/31/20 | 1/31/19 | 1/31/18 |
| Net asset value, beginning of period | $3.44 | $3.44 | $3.30 | $3.44 | $3.43 |
| Income (loss) from investment operations |
| Net investment income (loss) (d) | $0.11 | $0.12 | $0.13 | $0.13 | $0.13 |
| Net realized and unrealized gain (loss) | (0.12) | 0.01 | 0.14 | (0.13) | 0.02 |
| Total from investment operations | $(0.01) | $0.13 | $0.27 | $0.00(w) | $0.15 |
| Less distributions declared to shareholders |
| From net investment income | $(0.12) | $(0.13) | $(0.13) | $(0.14) | $(0.14) |
| Net asset value, end of period (x) | $3.31 | $3.44 | $3.44 | $3.30 | $3.44 |
| Total return (%) (r)(s)(t)(x) | (0.28) | 3.92 | 8.43 | (0.07) | 4.39 |
Ratios (%) (to average net assets)
and Supplemental data: |
| Expenses before expense reductions (f) | 1.65 | 1.68 | 1.69 | 1.69 | 1.70 |
| Expenses after expense reductions (f) | 1.64 | 1.67 | 1.68 | 1.68 | 1.70 |
| Net investment income (loss) | 3.14 | 3.60 | 3.71 | 3.92 | 3.76 |
| Portfolio turnover | 64 | 50 | 58 | 44 | 54 |
| Net assets at end of period (000 omitted) | $946 | $957 | $963 | $867 | $1,029 |
See Notes to Financial Statements
Financial Highlights – continued
| Class R2 | Year ended |
| | 1/31/22 | 1/31/21 | 1/31/20 | 1/31/19 | 1/31/18 |
| Net asset value, beginning of period | $3.43 | $3.44 | $3.30 | $3.43 | $3.42 |
| Income (loss) from investment operations |
| Net investment income (loss) (d) | $0.13 | $0.14 | $0.14 | $0.15 | $0.15 |
| Net realized and unrealized gain (loss) | (0.13) | (0.01) | 0.15 | (0.13) | 0.02 |
| Total from investment operations | $0.00 | $0.13 | $0.29 | $0.02 | $0.17 |
| Less distributions declared to shareholders |
| From net investment income | $(0.14) | $(0.14) | $(0.15) | $(0.15) | $(0.16) |
| Net asset value, end of period (x) | $3.29 | $3.43 | $3.44 | $3.30 | $3.43 |
| Total return (%) (r)(s)(t)(x) | (0.09) | 4.14 | 8.96 | 0.72 | 4.91 |
Ratios (%) (to average net assets)
and Supplemental data: |
| Expenses before expense reductions (f) | 1.16 | 1.18 | 1.19 | 1.19 | 1.21 |
| Expenses after expense reductions (f) | 1.15 | 1.17 | 1.18 | 1.18 | 1.20 |
| Net investment income (loss) | 3.67 | 4.10 | 4.21 | 4.42 | 4.27 |
| Portfolio turnover | 64 | 50 | 58 | 44 | 54 |
| Net assets at end of period (000 omitted) | $2,029 | $13,943 | $15,270 | $14,618 | $15,702 |
| Class R3 | Year ended |
| | 1/31/22 | 1/31/21 | 1/31/20 | 1/31/19 | 1/31/18 |
| Net asset value, beginning of period | $3.43 | $3.44 | $3.30 | $3.43 | $3.42 |
| Income (loss) from investment operations |
| Net investment income (loss) (d) | $0.13 | $0.14 | $0.15 | $0.15 | $0.16 |
| Net realized and unrealized gain (loss) | (0.11) | 0.00(w) | 0.15 | (0.12) | 0.01 |
| Total from investment operations | $0.02 | $0.14 | $0.30 | $0.03 | $0.17 |
| Less distributions declared to shareholders |
| From net investment income | $(0.15) | $(0.15) | $(0.16) | $(0.16) | $(0.16) |
| Net asset value, end of period (x) | $3.30 | $3.43 | $3.44 | $3.30 | $3.43 |
| Total return (%) (r)(s)(t)(x) | 0.46 | 4.40 | 9.23 | 0.98 | 5.17 |
Ratios (%) (to average net assets)
and Supplemental data: |
| Expenses before expense reductions (f) | 0.90 | 0.93 | 0.94 | 0.94 | 0.96 |
| Expenses after expense reductions (f) | 0.89 | 0.92 | 0.93 | 0.93 | 0.95 |
| Net investment income (loss) | 3.90 | 4.31 | 4.47 | 4.66 | 4.54 |
| Portfolio turnover | 64 | 50 | 58 | 44 | 54 |
| Net assets at end of period (000 omitted) | $2,574 | $2,929 | $2,255 | $2,193 | $3,111 |
See Notes to Financial Statements
Financial Highlights – continued
| Class R4 | Year ended |
| | 1/31/22 | 1/31/21 | 1/31/20 | 1/31/19 | 1/31/18 |
| Net asset value, beginning of period | $3.44 | $3.44 | $3.30 | $3.43 | $3.42 |
| Income (loss) from investment operations |
| Net investment income (loss) (d) | $0.14 | $0.15 | $0.16 | $0.16 | $0.16 |
| Net realized and unrealized gain (loss) | (0.11) | 0.01 | 0.15 | (0.12) | 0.02 |
| Total from investment operations | $0.03 | $0.16 | $0.31 | $0.04 | $0.18 |
| Less distributions declared to shareholders |
| From net investment income | $(0.16) | $(0.16) | $(0.17) | $(0.17) | $(0.17) |
| Net asset value, end of period (x) | $3.31 | $3.44 | $3.44 | $3.30 | $3.43 |
| Total return (%) (r)(s)(t)(x) | 0.72 | 4.97 | 9.51 | 1.23 | 5.43 |
Ratios (%) (to average net assets)
and Supplemental data: |
| Expenses before expense reductions (f) | 0.65 | 0.68 | 0.69 | 0.69 | 0.71 |
| Expenses after expense reductions (f) | 0.64 | 0.67 | 0.68 | 0.68 | 0.70 |
| Net investment income (loss) | 4.15 | 4.63 | 4.68 | 4.91 | 4.78 |
| Portfolio turnover | 64 | 50 | 58 | 44 | 54 |
| Net assets at end of period (000 omitted) | $371 | $555 | $796 | $447 | $312 |
| Class R6 | Year ended |
| | 1/31/22 | 1/31/21 | 1/31/20 | 1/31/19 | 1/31/18 |
| Net asset value, beginning of period | $3.44 | $3.44 | $3.30 | $3.43 | $3.42 |
| Income (loss) from investment operations |
| Net investment income (loss) (d) | $0.15 | $0.16 | $0.16 | $0.17 | $0.17 |
| Net realized and unrealized gain (loss) | (0.12) | 0.00(w) | 0.15 | (0.13) | 0.02 |
| Total from investment operations | $0.03 | $0.16 | $0.31 | $0.04 | $0.19 |
| Less distributions declared to shareholders |
| From net investment income | $(0.16) | $(0.16) | $(0.17) | $(0.17) | $(0.18) |
| Net asset value, end of period (x) | $3.31 | $3.44 | $3.44 | $3.30 | $3.43 |
| Total return (%) (r)(s)(t)(x) | 0.84 | 5.08 | 9.63 | 1.33 | 5.54 |
Ratios (%) (to average net assets)
and Supplemental data: |
| Expenses before expense reductions (f) | 0.54 | 0.57 | 0.58 | 0.58 | 0.60 |
| Expenses after expense reductions (f) | 0.53 | 0.56 | 0.57 | 0.57 | 0.59 |
| Net investment income (loss) | 4.25 | 4.69 | 4.82 | 5.02 | 4.87 |
| Portfolio turnover | 64 | 50 | 58 | 44 | 54 |
| Net assets at end of period (000 omitted) | $1,048,137 | $1,123,867 | $942,482 | $829,451 | $886,418 |
See Notes to Financial Statements
Financial Highlights – continued
| Class 529A | Year ended |
| | 1/31/22 | 1/31/21 | 1/31/20 | 1/31/19 | 1/31/18 |
| Net asset value, beginning of period | $3.43 | $3.44 | $3.30 | $3.43 | $3.42 |
| Income (loss) from investment operations |
| Net investment income (loss) (d) | $0.13 | $0.14 | $0.15 | $0.15 | $0.15 |
| Net realized and unrealized gain (loss) | (0.11) | 0.00(w) | 0.15 | (0.12) | 0.02 |
| Total from investment operations | $0.02 | $0.14 | $0.30 | $0.03 | $0.17 |
| Less distributions declared to shareholders |
| From net investment income | $(0.15) | $(0.15) | $(0.16) | $(0.16) | $(0.16) |
| Net asset value, end of period (x) | $3.30 | $3.43 | $3.44 | $3.30 | $3.43 |
| Total return (%) (r)(s)(t)(x) | 0.44 | 4.37 | 9.19 | 0.93 | 5.13 |
Ratios (%) (to average net assets)
and Supplemental data: |
| Expenses before expense reductions (f) | 0.95 | 0.98 | 0.99 | 0.99 | 1.05 |
| Expenses after expense reductions (f) | 0.91 | 0.95 | 0.97 | 0.97 | 0.99 |
| Net investment income (loss) | 3.86 | 4.31 | 4.42 | 4.62 | 4.47 |
| Portfolio turnover | 64 | 50 | 58 | 44 | 54 |
| Net assets at end of period (000 omitted) | $4,802 | $4,489 | $3,922 | $3,796 | $3,816 |
| Class 529B | Year ended |
| | 1/31/22 | 1/31/21 | 1/31/20 | 1/31/19 | 1/31/18 |
| Net asset value, beginning of period | $3.44 | $3.44 | $3.30 | $3.43 | $3.42 |
| Income (loss) from investment operations |
| Net investment income (loss) (d) | $0.11 | $0.12 | $0.12 | $0.13 | $0.13 |
| Net realized and unrealized gain (loss) | (0.12) | 0.01 | 0.15 | (0.13) | 0.02 |
| Total from investment operations | $(0.01) | $0.13 | $0.27 | $0.00(w) | $0.15 |
| Less distributions declared to shareholders |
| From net investment income | $(0.12) | $(0.13) | $(0.13) | $(0.13) | $(0.14) |
| Net asset value, end of period (x) | $3.31 | $3.44 | $3.44 | $3.30 | $3.43 |
| Total return (%) (r)(s)(t)(x) | (0.33) | 3.87 | 8.38 | 0.17 | 4.34 |
Ratios (%) (to average net assets)
and Supplemental data: |
| Expenses before expense reductions (f) | 1.70 | 1.73 | 1.74 | 1.74 | 1.80 |
| Expenses after expense reductions (f) | 1.69 | 1.72 | 1.73 | 1.73 | 1.75 |
| Net investment income (loss) | 3.10 | 3.59 | 3.67 | 3.86 | 3.72 |
| Portfolio turnover | 64 | 50 | 58 | 44 | 54 |
| Net assets at end of period (000 omitted) | $69 | $103 | $210 | $259 | $301 |
See Notes to Financial Statements
Financial Highlights – continued
| Class 529C | Year ended |
| | 1/31/22 | 1/31/21 | 1/31/20 | 1/31/19 | 1/31/18 |
| Net asset value, beginning of period | $3.44 | $3.45 | $3.30 | $3.44 | $3.43 |
| Income (loss) from investment operations |
| Net investment income (loss) (d) | $0.11 | $0.12 | $0.12 | $0.13 | $0.13 |
| Net realized and unrealized gain (loss) | (0.12) | 0.00(w) | 0.16 | (0.14) | 0.02 |
| Total from investment operations | $(0.01) | $0.12 | $0.28 | $(0.01) | $0.15 |
| Less distributions declared to shareholders |
| From net investment income | $(0.12) | $(0.13) | $(0.13) | $(0.13) | $(0.14) |
| Net asset value, end of period (x) | $3.31 | $3.44 | $3.45 | $3.30 | $3.44 |
| Total return (%) (r)(s)(t)(x) | (0.33) | 3.57 | 8.69 | (0.12) | 4.34 |
Ratios (%) (to average net assets)
and Supplemental data: |
| Expenses before expense reductions (f) | 1.70 | 1.73 | 1.74 | 1.74 | 1.80 |
| Expenses after expense reductions (f) | 1.68 | 1.72 | 1.73 | 1.73 | 1.74 |
| Net investment income (loss) | 3.09 | 3.58 | 3.66 | 3.86 | 3.72 |
| Portfolio turnover | 64 | 50 | 58 | 44 | 54 |
| Net assets at end of period (000 omitted) | $422 | $529 | $1,068 | $1,003 | $1,221 |
| (d) | Per share data is based on average shares outstanding. |
| (f) | Ratios do not reflect reductions from fees paid indirectly, if applicable. See Note 2 in the Notes to Financial Statements for additional information. |
| (r) | Certain expenses have been reduced without which performance would have been lower. |
| (s) | From time to time the fund may receive proceeds from litigation settlements, without which performance would be lower. |
| (t) | Total returns do not include any applicable sales charges. |
| (w) | Per share amount was less than $0.01. |
| (x) | The net asset values and total returns have been calculated on net assets which include adjustments made in accordance with U.S. generally accepted accounting principles required at period end for financial reporting purposes. |
See Notes to Financial Statements
Notes to Financial Statements
(1) Business and Organization
MFS High Income Fund (the fund) is a diversified series of MFS Series Trust III (the trust). The trust is organized as a Massachusetts business trust and is registered under the Investment Company Act of 1940, as amended, as an open-end management investment company.
The fund is an investment company and accordingly follows the investment company accounting and reporting guidance of the Financial Accounting Standards Board (FASB) Accounting Standards Codification Topic 946 Financial Services - Investment Companies.
(2) Significant Accounting Policies
General — The preparation of financial statements in conformity with U.S. generally accepted accounting principles requires management to make estimates and assumptions that affect the reported amounts of assets and liabilities, and disclosure of contingent assets and liabilities at the date of the financial statements and the reported amounts of increases and decreases in net assets from operations during the reporting period. Actual results could differ from those estimates. In the preparation of these financial statements, management has evaluated subsequent events occurring after the date of the fund’s Statement of Assets and Liabilities through the date that the financial statements were issued. The fund invests in high-yield securities rated below investment grade. Investments in below investment grade quality securities can involve a substantially greater risk of default or can already be in default, and their values can decline significantly. Below investment grade quality securities tend to be more sensitive to adverse news about the issuer, or the market or economy in general, than higher quality debt instruments. The fund invests in foreign securities. Investments in foreign securities are vulnerable to the effects of changes in the relative values of the local currency and the U.S. dollar and to the effects of changes in each country’s market, economic, industrial, political, regulatory, geopolitical, environmental, public health, and other conditions.
Balance Sheet Offsetting — The fund's accounting policy with respect to balance sheet offsetting is that, absent an event of default by the counterparty or a termination of the agreement, the International Swaps and Derivatives Association (ISDA) Master Agreement, or similar agreement, does not result in an offset of reported amounts of financial assets and financial liabilities in the Statement of Assets and Liabilities across transactions between the fund and the applicable counterparty. The fund's right to setoff may be restricted or prohibited by the bankruptcy or insolvency laws of the particular jurisdiction to which a specific master netting agreement counterparty is subject. Balance sheet offsetting disclosures, to the extent applicable to the fund, have been included in the fund’s Significant Accounting Policies note under the captions for each of the fund’s in-scope financial instruments and transactions.
Investment Valuations — Equity securities, including restricted equity securities, are generally valued at the last sale or official closing price on their primary market or exchange as provided by a third-party pricing service. Equity securities, for which there were no sales reported that day, are generally valued at the last quoted daily bid quotation on their primary market or exchange as provided by a third-party pricing service. Debt instruments and floating rate loans, including restricted debt instruments, are generally valued at an evaluated or composite bid as provided by a third-party pricing service. Short-term instruments with a maturity at issuance of 60 days or less
Notes to Financial Statements - continued
may be valued at amortized cost, which approximates market value. Futures contracts are generally valued at last posted settlement price on their primary exchange as provided by a third-party pricing service. Futures contracts for which there were no trades that day for a particular position are generally valued at the closing bid quotation on their primary exchange as provided by a third-party pricing service.
Forward foreign currency exchange contracts are generally valued at the mean of bid and asked prices for the time period interpolated from rates provided by a third-party pricing service for proximate time periods. Open-end investment companies are generally valued at net asset value per share. Securities and other assets generally valued on the basis of information from a third-party pricing service may also be valued at a broker/dealer bid quotation. In determining values, third-party pricing services can utilize both transaction data and market information such as yield, quality, coupon rate, maturity, type of issue, trading characteristics, and other market data. The values of foreign securities and other assets and liabilities expressed in foreign currencies are converted to U.S. dollars using the mean of bid and asked prices for rates provided by a third-party pricing service.
The Board of Trustees has delegated primary responsibility for determining or causing to be determined the value of the fund’s investments (including any fair valuation) to the adviser pursuant to valuation policies and procedures approved by the Board. If the adviser determines that reliable market quotations are not readily available, investments are valued at fair value as determined in good faith by the adviser in accordance with such procedures under the oversight of the Board of Trustees. Under the fund’s valuation policies and procedures, market quotations are not considered to be readily available for most types of debt instruments and floating rate loans and many types of derivatives. These investments are generally valued at fair value based on information from third-party pricing services. In addition, investments may be valued at fair value if the adviser determines that an investment’s value has been materially affected by events occurring after the close of the exchange or market on which the investment is principally traded (such as foreign exchange or market) and prior to the determination of the fund’s net asset value, or after the halt of trading of a specific security where trading does not resume prior to the close of the exchange or market on which the security is principally traded. Events that occur after foreign markets close (such as developments in foreign markets and significant movements in the U.S. markets) and prior to the determination of the fund’s net asset value may be deemed to have a material effect on the value of securities traded in foreign markets. Accordingly, the fund’s foreign equity securities may often be valued at fair value. The adviser generally relies on third-party pricing services or other information (such as the correlation with price movements of similar securities in the same or other markets; the type, cost and investment characteristics of the security; the business and financial condition of the issuer; and trading and other market data) to assist in determining whether to fair value and at what value to fair value an investment. The value of an investment for purposes of calculating the fund’s net asset value can differ depending on the source and method used to determine value. When fair valuation is used, the value of an investment used to determine the fund’s net asset value may differ from quoted or published prices for the same investment. There can be no assurance that the fund could obtain the fair value assigned to an investment if it were to sell the investment at the same time at which the fund determines its net asset value per share.
Notes to Financial Statements - continued
Various inputs are used in determining the value of the fund's assets or liabilities. These inputs are categorized into three broad levels. In certain cases, the inputs used to measure fair value may fall into different levels of the fair value hierarchy. In such cases, an investment's level within the fair value hierarchy is based on the lowest level of input that is significant to the fair value measurement. The fund's assessment of the significance of a particular input to the fair value measurement in its entirety requires judgment, and considers factors specific to the investment. Level 1 includes unadjusted quoted prices in active markets for identical assets or liabilities. Level 2 includes other significant observable market-based inputs (including quoted prices for similar securities, interest rates, prepayment speed, and credit risk). Level 3 includes unobservable inputs, which may include the adviser's own assumptions in determining the fair value of investments. Other financial instruments are derivative instruments, such as futures contracts and forward foreign currency exchange contracts. The following is a summary of the levels used as of January 31, 2022 in valuing the fund's assets and liabilities:
| Financial Instruments | Level 1 | Level 2 | Level 3 | Total |
| Equity Securities: | | | | |
| United States | $18,921,980 | $— | $934,667 | $19,856,647 |
| United Kingdom | — | 338,660 | 10,075 | 348,735 |
| Mexico | — | — | 286,435 | 286,435 |
| Municipal Bonds | — | 835,375 | — | 835,375 |
| U.S. Corporate Bonds | — | 1,587,154,074 | — | 1,587,154,074 |
| Asset-Backed Securities (including CDOs) | — | 329 | — | 329 |
| Foreign Bonds | — | 250,746,749 | — | 250,746,749 |
| Mutual Funds | 88,969,191 | — | — | 88,969,191 |
| Total | $107,891,171 | $1,839,075,187 | $1,231,177 | $1,948,197,535 |
| Other Financial Instruments | | | | |
| Futures Contracts – Assets | $528,681 | $— | $— | $528,681 |
| Futures Contracts – Liabilities | (545,505) | — | — | (545,505) |
| Forward Foreign Currency Exchange Contracts – Assets | — | 26,878 | — | 26,878 |
For further information regarding security characteristics, see the Portfolio of Investments.
The following is a reconciliation of level 3 assets for which significant unobservable inputs were used to determine fair value. The table presents the activity of level 3 securities held at the beginning and the end of the period.
| | Equity
Securities |
| Balance as of 1/31/21 | $918,190 |
| Change in unrealized appreciation or depreciation | 16,477 |
| Transfers into level 3 | 286,435 |
| Received as part of a corporate action | 10,075 |
| Balance as of 1/31/22 | $1,231,177 |
Notes to Financial Statements - continued
The net change in unrealized appreciation or depreciation from investments held as level 3 at January 31, 2022 is $16,477. At January 31, 2022, the fund held three level 3 securities.
Foreign Currency Translation — Purchases and sales of foreign investments, income, and expenses are converted into U.S. dollars based upon currency exchange rates prevailing on the respective dates of such transactions or on the reporting date for foreign denominated receivables and payables. Gains and losses attributable to foreign currency exchange rates on sales of securities are recorded for financial statement purposes as net realized gains and losses on investments. Gains and losses attributable to foreign exchange rate movements on receivables, payables, income and expenses are recorded for financial statement purposes as foreign currency transaction gains and losses. That portion of both realized and unrealized gains and losses on investments that results from fluctuations in foreign currency exchange rates is not separately disclosed.
Derivatives — The fund uses derivatives primarily to increase or decrease exposure to a particular market or segment of the market, or security, to increase or decrease interest rate exposure, or as alternatives to direct investments. Derivatives are used for hedging or non-hedging purposes. While hedging can reduce or eliminate losses, it can also reduce or eliminate gains. When the fund uses derivatives as an investment to increase market exposure, or for hedging purposes, gains and losses from derivative instruments may be substantially greater than the derivative’s original cost.
The derivative instruments used by the fund during the period were futures contracts and forward foreign currency exchange contracts. Depending on the type of derivative, a fund may exit a derivative position by entering into an offsetting transaction with a counterparty or exchange, negotiating an agreement with the derivative counterparty, or novating the position to a third party.
The following table presents, by major type of derivative contract, the fair value, on a gross basis, of the asset and liability components of derivatives held by the fund at January 31, 2022 as reported in the Statement of Assets and Liabilities:
| | | Fair Value (a) |
| Risk | Derivative Contracts | Asset Derivatives | Liability Derivatives |
| Interest Rate | Futures Contracts | $528,681 | $(545,505) |
| Foreign Exchange | Forward Foreign Currency Exchange Contracts | 26,878 | — |
| Total | | $555,559 | $(545,505) |
(a) Values presented in this table for futures contracts correspond to the values reported in the Portfolio of Investments. Only the current day net variation margin for futures contracts is separately reported within the Statement of Assets and Liabilities.
Notes to Financial Statements - continued
The following table presents, by major type of derivative contract, the realized gain (loss) on derivatives held by the fund for the year ended January 31, 2022 as reported in the Statement of Operations:
| Risk | Futures
Contracts | Forward Foreign
Currency
Exchange
Contracts |
| Interest Rate | $(27,315) | $ — |
| Foreign Exchange | — | 102,241 |
| Total | $(27,315) | $102,241 |
The following table presents, by major type of derivative contract, the change in unrealized appreciation or depreciation on derivatives held by the fund for the year ended January 31, 2022 as reported in the Statement of Operations:
| Risk | Futures
Contracts | Forward Foreign
Currency
Exchange
Contracts |
| Interest Rate | $(16,824) | $ — |
| Foreign Exchange | — | 26,878 |
| Total | $(16,824) | $26,878 |
Derivative counterparty credit risk is managed through formal evaluation of the creditworthiness of all potential counterparties. On certain, but not all, uncleared derivatives, the fund attempts to reduce its exposure to counterparty credit risk whenever possible by entering into an ISDA Master Agreement on a bilateral basis. The ISDA Master Agreement gives each party to the agreement the right to terminate all transactions traded under such agreement if there is a specified deterioration in the credit quality of the other party. Upon an event of default or a termination of the ISDA Master Agreement, the non-defaulting party has the right to close out all transactions traded under such agreement and to net amounts owed under each agreement to one net amount payable by one party to the other. This right to close out and net payments across all transactions traded under the ISDA Master Agreement could result in a reduction of the fund's credit risk to such counterparty equal to any amounts payable by the fund under the applicable transactions, if any.
Collateral and margin requirements differ by type of derivative. For cleared derivatives (e.g., futures contracts, cleared swaps, and exchange-traded options), margin requirements are set by the clearing broker and the clearing house and collateral, in the form of cash or securities, is posted by the fund directly with the clearing broker. Collateral terms are counterparty agreement specific for uncleared derivatives (e.g., forward foreign currency exchange contracts, uncleared swap agreements, and uncleared options) and collateral, in the form of cash and securities, is held in segregated accounts with the fund's custodian in connection with these agreements. For derivatives traded under an ISDA Master Agreement, which contains a collateral support annex, the collateral requirements are netted across all transactions traded under such counterparty-specific agreement and an amount is posted from one party to the other to collateralize such obligations. Cash that has been segregated or
Notes to Financial Statements - continued
delivered to cover the fund's collateral or margin obligations under derivative contracts, if any, will be reported separately in the Statement of Assets and Liabilities as restricted cash for uncleared derivatives and/or deposits with brokers for cleared derivatives. Securities pledged as collateral or margin for the same purpose, if any, are noted in the Portfolio of Investments. The fund may be required to make payments of interest on uncovered collateral or margin obligations with the broker. Any such payments are included in “Miscellaneous” expense in the Statement of Operations.
Futures Contracts — The fund entered into futures contracts which may be used to hedge against or obtain broad market exposure, interest rate exposure, currency exposure, or to manage duration. A futures contract represents a commitment for the future purchase or sale of an asset at a specified price on a specified date.
Upon entering into a futures contract, the fund is required to deposit with the broker, either in cash or securities, an initial margin in an amount equal to a specified percentage of the notional amount of the contract. Subsequent payments (variation margin) are made or received by the fund each day, depending on the daily fluctuations in the value of the contract, and are recorded for financial statement purposes as unrealized gain or loss by the fund until the contract is closed or expires at which point the gain or loss on futures contracts is realized.
The fund bears the risk of interest rates, exchange rates or securities prices moving unexpectedly, in which case, the fund may not achieve the anticipated benefits of the futures contracts and may realize a loss. While futures contracts may present less counterparty risk to the fund since the contracts are exchange traded and the exchange’s clearinghouse guarantees payments to the broker, there is still counterparty credit risk due to the insolvency of the broker. The fund’s maximum risk of loss due to counterparty credit risk is equal to the margin posted by the fund to the broker plus any gains or minus any losses on the outstanding futures contracts.
Forward Foreign Currency Exchange Contracts — The fund entered into forward foreign currency exchange contracts for the purchase or sale of a specific foreign currency at a fixed price on a future date. These contracts may be used to hedge the fund’s currency risk or for non-hedging purposes. For hedging purposes, the fund may enter into contracts to deliver or receive foreign currency that the fund will receive from or use in its normal investment activities. The fund may also use contracts to hedge against declines in the value of foreign currency denominated securities due to unfavorable exchange rate movements. For non-hedging purposes, the fund may enter into contracts with the intent of changing the relative exposure of the fund’s portfolio of securities to different currencies to take advantage of anticipated exchange rate changes.
Forward foreign currency exchange contracts are adjusted by the daily exchange rate of the underlying currency and any unrealized gains or losses are recorded as a receivable or payable for forward foreign currency exchange contracts until the contract settlement date. On contract settlement date, any gain or loss on the contract is recorded as realized gains or losses on forward foreign currency exchange contracts.
Risks may arise upon entering into these contracts from unanticipated movements in the value of the contract and from the potential inability of counterparties to meet the terms of their contracts. Generally, the fund’s maximum risk due to counterparty credit risk is the unrealized gain on the contract due to the use of Continuous Linked Settlement, a multicurrency cash settlement system for the centralized settlement of
Notes to Financial Statements - continued
foreign transactions. This risk is mitigated in cases where there is an ISDA Master Agreement between the fund and the counterparty providing for netting as described above and, where applicable, by the posting of collateral by the counterparty to the fund to cover the fund’s exposure to the counterparty under such ISDA Master Agreement.
Loans and Other Direct Debt Instruments — The fund invests in loans and loan participations or other receivables. These investments may include standby financing commitments, including revolving credit facilities, which contractually obligate the fund to supply additional cash to the borrower on demand. The fund generally provides this financial support in order to preserve its existing investment or to obtain a more senior secured interest in the assets of the borrower. Loan participations involve a risk of insolvency of the lending bank or other financial intermediary.
Indemnifications — Under the fund's organizational documents, its officers and Trustees may be indemnified against certain liabilities and expenses arising out of the performance of their duties to the fund. Additionally, in the normal course of business, the fund enters into agreements with service providers that may contain indemnification clauses. The fund's maximum exposure under these agreements is unknown as this would involve future claims that may be made against the fund that have not yet occurred.
Investment Transactions and Income — Investment transactions are recorded on the trade date. Some securities may be purchased or sold on an extended settlement basis, which means that the receipt or delivery of the securities by the fund and related payments occur at a future date, usually beyond the customary settlement period.
Interest income is recorded on the accrual basis. All premium and discount is amortized or accreted for financial statement purposes in accordance with U.S. generally accepted accounting principles. Dividends received in cash are recorded on the ex-dividend date. Certain dividends from foreign securities will be recorded when the fund is informed of the dividend if such information is obtained subsequent to the ex-dividend date. Dividend and interest payments received in additional securities are recorded on the ex-dividend or ex-interest date in an amount equal to the value of the security on such date. In determining the net gain or loss on securities sold, the cost of securities is determined on the identified cost basis. The fund earns certain fees in connection with its floating rate loan purchasing activities. These fees are in addition to interest payments earned and may include amendment fees, commitment fees, facility fees, consent fees, and prepayment fees. Commitment fees are recorded on an accrual basis as income in the accompanying financial statements. Debt obligations may be placed on non-accrual status or set to accrue at a rate of interest less than the contractual coupon when the collection of all or a portion of interest has become doubtful. Interest income for those debt obligations may be further reduced by the write-off of the related interest receivables when deemed uncollectible.
The fund may receive proceeds from litigation settlements. Any proceeds received from litigation involving portfolio holdings are reflected in the Statement of Operations in realized gain/loss if the security has been disposed of by the fund or in unrealized gain/loss if the security is still held by the fund. Any other proceeds from litigation not related to portfolio holdings are reflected as other income in the Statement of Operations.
Notes to Financial Statements - continued
The fund may purchase or sell securities on a when-issued or delayed delivery basis. In these extended settlement transactions, the receipt or delivery of the securities by the fund and related payments occur at a future date, usually beyond the normal settlement period. The price of such security and the date that the security will be settled are generally fixed at the time the transaction is negotiated. The value of the security varies with market fluctuations and for debt securities no interest accrues to the fund until settlement takes place. When the fund sells securities on a when-issued or delayed delivery basis, the fund typically owns or has the right to acquire securities equivalent in kind and amount to the securities sold. Purchase and sale commitments for when-issued or delayed delivery securities are held at carrying amount, which approximates fair value and are categorized as level 2 within the fair value hierarchy, and included in When-issued investments purchased in the Statement of Assets and Liabilities. Losses may arise due to changes in the value of the underlying securities prior to settlement date or if the counterparty does not perform under the contract’s terms, or if the issuer does not issue the securities due to political, economic or other factors. At the time that it enters into a when-issued or delayed delivery transaction, the fund is required to have sufficient cash and/or liquid securities to cover its commitments.
Fees Paid Indirectly — The fund's custody fee may be reduced by a credit earned under an arrangement that measures the value of U.S. dollars deposited with the custodian by the fund. The amount of the credit, for the year ended January 31, 2022, is shown as a reduction of total expenses in the Statement of Operations.
Tax Matters and Distributions — The fund intends to qualify as a regulated investment company, as defined under Subchapter M of the Internal Revenue Code, and to distribute all of its taxable income, including realized capital gains. As a result, no provision for federal income tax is required. The fund’s federal tax returns, when filed, will remain subject to examination by the Internal Revenue Service for a three year period. Management has analyzed the fund’s tax positions taken on federal and state tax returns for all open tax years and does not believe that there are any uncertain tax positions that require recognition of a tax liability. Foreign taxes, if any, have been accrued by the fund in the accompanying financial statements in accordance with the applicable foreign tax law. Foreign income taxes may be withheld by certain countries in which the fund invests. Additionally, capital gains realized by the fund on securities issued in or by certain foreign countries may be subject to capital gains tax imposed by those countries.
Distributions to shareholders are recorded on the ex-dividend date. Income and capital gain distributions are determined in accordance with income tax regulations, which may differ from U.S. generally accepted accounting principles. Certain capital accounts in the financial statements are periodically adjusted for permanent differences in order to reflect their tax character. These adjustments have no impact on net assets or net asset value per share. Temporary differences which arise from recognizing certain items of income, expense, gain or loss in different periods for financial statement and tax purposes will reverse at some time in the future.
Book/tax differences primarily relate to amortization and accretion of debt securities.
Notes to Financial Statements - continued
The tax character of distributions declared to shareholders for the last two fiscal years is as follows:
| | Year ended
1/31/22 | Year ended
1/31/21 |
| Ordinary income (including any short-term capital gains) | $91,361,732 | $83,828,177 |
The federal tax cost and the tax basis components of distributable earnings were as follows:
| As of 1/31/22 | |
| Cost of investments | $1,998,923,429 |
| Gross appreciation | 15,007,525 |
| Gross depreciation | (65,723,365) |
| Net unrealized appreciation (depreciation) | $ (50,715,840) |
| Undistributed ordinary income | 7,115,644 |
| Capital loss carryforwards | (77,851,860) |
| Other temporary differences | (7,486,047) |
| Total distributable earnings (loss) | $ (128,938,103) |
As of January 31, 2022, the fund had capital loss carryforwards available to offset future realized gains. These net capital losses may be carried forward indefinitely and their character is retained as short-term and/or long-term losses. Such losses are characterized as follows:
| Short-Term | $(2,143,821) |
| Long-Term | (75,708,039) |
| Total | $(77,851,860) |
Multiple Classes of Shares of Beneficial Interest — The fund offers multiple classes of shares, which differ in their respective distribution, service, and program manager fees. The fund's income and common expenses are allocated to shareholders based on the value of settled shares outstanding of each class. The fund's realized and unrealized gain (loss) are allocated to shareholders based on the daily net assets of each class. Dividends are declared separately for each class. Differences in per share dividend rates are generally due to differences in separate class expenses. Class B and Class C shares will convert to Class A shares approximately eight years after purchase. Class 529B and Class 529C shares will convert to Class 529A shares approximately eight years after purchase. On December 29, 2021, the fund announced that effective on or about
Notes to Financial Statements - continued
March 21, 2022, all Class 529B and Class 529C shares will be converted into Class 529A shares. The fund’s distributions declared to shareholders as reported in the Statements of Changes in Net Assets are presented by class as follows:
| | Year ended
1/31/22 | Year ended
1/31/21 |
| Class A | $28,548,357 | $25,440,770 |
| Class B | 207,604 | 314,825 |
| Class C | 700,011 | 963,522 |
| Class I | 10,144,994 | 8,334,098 |
| Class R1 | 33,226 | 37,549 |
| Class R2 | 389,066 | 597,974 |
| Class R3 | 113,734 | 115,938 |
| Class R4 | 22,341 | 31,101 |
| Class R6 | 50,979,300 | 47,780,591 |
| Class 529A | 202,875 | 173,614 |
| Class 529B | 2,877 | 4,596 |
| Class 529C | 17,347 | 33,599 |
| Total | $91,361,732 | $83,828,177 |
(3) Transactions with Affiliates
Investment Adviser — The fund has an investment advisory agreement with MFS to provide overall investment management and related administrative services and facilities to the fund. The management fee is computed daily and paid monthly at the following annual rates based on the fund's average daily net assets:
| Up to $1.4 billion | 0.46% |
| In excess of $1.4 billion and up to $3 billion | 0.44% |
| In excess of $3 billion | 0.42% |
MFS has agreed in writing to reduce its management fee by a specified amount if certain MFS mutual fund assets exceed thresholds agreed to by MFS and the fund's Board of Trustees. For the year ended January 31, 2022, this management fee reduction amounted to $260,097, which is included in the reduction of total expenses in the Statement of Operations. The management fee incurred for the year ended January 31, 2022 was equivalent to an annual effective rate of 0.44% of the fund's average daily net assets.
Distributor — MFS Fund Distributors, Inc. (MFD), a wholly-owned subsidiary of MFS, as distributor, received $41,649 and $573 for the year ended January 31, 2022, as its portion of the initial sales charge on sales of Class A and Class 529A shares of the fund, respectively.
The Board of Trustees has adopted a distribution plan for certain share classes pursuant to Rule 12b-1 of the Investment Company Act of 1940.
The fund's distribution plan provides that the fund will pay MFD for services provided by MFD and financial intermediaries in connection with the distribution and servicing of certain share classes. One component of the plan is a distribution fee paid to MFD and another component of the plan is a service fee paid to MFD. MFD may subsequently pay all, or a portion, of the distribution and/or service fees to financial intermediaries.
Notes to Financial Statements - continued
Distribution Plan Fee Table:
| | Distribution
Fee Rate (d) | Service
Fee Rate (d) | Total
Distribution
Plan (d) | Annual
Effective
Rate (e) | Distribution
and Service
Fee |
| Class A | — | 0.25% | 0.25% | 0.25% | $ 1,649,329 |
| Class B | 0.75% | 0.25% | 1.00% | 1.00% | 58,358 |
| Class C | 0.75% | 0.25% | 1.00% | 1.00% | 196,465 |
| Class R1 | 0.75% | 0.25% | 1.00% | 1.00% | 9,291 |
| Class R2 | 0.25% | 0.25% | 0.50% | 0.50% | 48,883 |
| Class R3 | — | 0.25% | 0.25% | 0.25% | 6,572 |
| Class 529A | — | 0.25% | 0.25% | 0.23% | 11,800 |
| Class 529B | 0.75% | 0.25% | 1.00% | 1.00% | 820 |
| Class 529C | 0.75% | 0.25% | 1.00% | 1.00% | 4,937 |
| Total Distribution and Service Fees | | | | | $1,986,455 |
| (d) | In accordance with the distribution plan for certain classes, the fund pays distribution and/or service fees equal to these annual percentage rates of each class’s average daily net assets. The distribution and service fee rates disclosed by class represent the current rates in effect at the end of the reporting period. Any rate changes, if applicable, are detailed below. |
| (e) | The annual effective rates represent actual fees incurred under the distribution plan for the year ended January 31, 2022 based on each class's average daily net assets. MFD has voluntarily agreed to rebate a portion of each class's 0.25% service fee attributable to accounts for which there is no financial intermediary specified on the account except for accounts attributable to MFS or its affiliates' seed money. For the year ended January 31, 2022, this rebate amounted to $3,394, $7, $22, $2, $1,064, and $15, for Class A, Class B, Class C, Class R2, Class 529A, and Class 529C, respectively, and is included in the reduction of total expenses in the Statement of Operations. |
Certain Class A shares are subject to a contingent deferred sales charge (CDSC) in the event of a shareholder redemption within 18 months of purchase. Class B and Class 529B shares are subject to a CDSC in the event of a shareholder redemption within six years of purchase. Class C and Class 529C shares are subject to a CDSC in the event of a shareholder redemption within 12 months of purchase. All contingent deferred sales charges are paid to MFD and during the year ended January 31, 2022, were as follows:
| | Amount |
| Class A | $26,724 |
| Class B | 6,075 |
| Class C | 3,663 |
| Class 529B | 312 |
| Class 529C | 5 |
The fund has entered into and may from time to time enter into contracts with program managers and other parties which administer the tuition programs through which an investment in the fund’s 529 share classes is made. The fund has entered into an agreement with MFD pursuant to which MFD receives an annual fee of up to 0.05% of the average daily net assets attributable to each 529 share class. The services provided by MFD, or a third party with which MFD contracts, include recordkeeping and tax reporting and account services, as well as services designed to maintain the
Notes to Financial Statements - continued
program’s compliance with the Internal Revenue Code and other regulatory requirements. Program manager fees for the year ended January 31, 2022, were as follows:
| | Fee |
| Class 529A | $2,360 |
| Class 529B | 41 |
| Class 529C | 247 |
| Total Program Manager Fees | $2,648 |
Shareholder Servicing Agent — MFS Service Center, Inc. (MFSC), a wholly-owned subsidiary of MFS, receives a fee from the fund for its services as shareholder servicing agent calculated as a percentage of the average daily net assets of the fund as determined periodically under the supervision of the fund's Board of Trustees. For the year ended January 31, 2022, the fee was $200,210, which equated to 0.0099% annually of the fund's average daily net assets. MFSC also receives reimbursement from the fund for out-of-pocket expenses, sub-accounting and other shareholder servicing costs which may be paid to affiliated and unaffiliated service providers. Class R6 shares do not incur sub-accounting fees. For the year ended January 31, 2022, these out-of-pocket expenses, sub-accounting and other shareholder servicing costs amounted to $1,098,855.
Under a Special Servicing Agreement among MFS, certain MFS funds which invest in other MFS funds (“MFS fund-of-funds”) and certain underlying funds in which a MFS fund-of-funds invests (“underlying funds”), each underlying fund may pay a portion of each MFS fund-of-fund’s transfer agent-related expenses, including sub-accounting fees payable to financial intermediaries, to the extent such payments do not exceed the benefits realized or expected to be realized by the underlying fund from the investment in the underlying fund by the MFS fund-of-fund. For the period from February 1, 2021 through September 29, 2021, these costs for the fund amounted to $582,620 and are included in “Shareholder servicing costs” in the Statement of Operations. Effective September 30, 2021, the Special Servicing Agreement terminated and the fund no longer participates in the agreement.
Administrator — MFS provides certain financial, legal, shareholder communications, compliance, and other administrative services to the fund. Under an administrative services agreement, the fund reimburses MFS the costs incurred to provide these services. The fund is charged an annual fixed amount of $17,500 plus a fee based on average daily net assets. The administrative services fee incurred for the year ended January 31, 2022 was equivalent to an annual effective rate of 0.0136% of the fund's average daily net assets.
Trustees’ and Officers’ Compensation — The fund pays compensation to independent Trustees in the form of a retainer, attendance fees, and additional compensation to Board and Committee chairpersons. The fund does not pay compensation directly to Trustees or officers of the fund who are also officers of the investment adviser, all of whom receive remuneration from MFS for their services to the fund. Certain officers and Trustees of the fund are officers or directors of MFS, MFD, and MFSC.
Prior to December 31, 2001, the fund had an unfunded defined benefit plan (“DB plan”) for independent Trustees. As of December 31, 2001, the Board took action to terminate the DB plan with respect to then-current and any future independent
Notes to Financial Statements - continued
Trustees, such that the DB plan covers only certain of those former independent Trustees who retired on or before December 31, 2001. The DB plan resulted in a pension expense of $1,263 and is included in “Independent Trustees’ compensation” in the Statement of Operations for the year ended January 31, 2022. The liability for deferred retirement benefits payable to those former independent Trustees under the DB plan amounted to $2,562 at January 31, 2022, and is included in “Payable for independent Trustees’ compensation” in the Statement of Assets and Liabilities.
Other — The fund invests in the MFS Institutional Money Market Portfolio which is managed by MFS and seeks current income consistent with preservation of capital and liquidity. This money market fund does not pay a management fee to MFS but does incur investment and operating costs.
The fund is permitted to engage in purchase and sale transactions with funds and accounts for which MFS serves as investment adviser or sub-adviser (“cross-trades”) pursuant to a policy adopted by the Board of Trustees. This policy has been designed to ensure that cross-trades conducted by the fund comply with Rule 17a-7 under the Investment Company Act of 1940. During the year ended January 31, 2022, the fund engaged in sale transactions pursuant to this policy, which amounted to $12,436,993. The sales transactions resulted in net realized gains (losses) of $(43,962).
(4) Portfolio Securities
For the year ended January 31, 2022, purchases and sales of investments, other than short-term obligations, aggregated $1,240,477,893 and $1,238,058,075, respectively.
(5) Shares of Beneficial Interest
The fund's Declaration of Trust permits the Trustees to issue an unlimited number of full and fractional shares of beneficial interest. Transactions in fund shares were as follows:
| | Year ended
1/31/22 | | Year ended
1/31/21 |
| | Shares | Amount | | Shares | Amount |
| Shares sold | | | | | |
| Class A | 45,185,518 | $154,955,988 | | 44,305,985 | $147,128,591 |
| Class B | 36,268 | 123,975 | | 81,689 | 276,587 |
| Class C | 836,879 | 2,885,635 | | 2,092,906 | 6,842,670 |
| Class I | 23,312,134 | 79,800,708 | | 47,861,501 | 156,515,241 |
| Class R1 | 49,118 | 168,248 | | 41,573 | 135,138 |
| Class R2 | 702,264 | 2,410,270 | | 1,014,169 | 3,366,378 |
| Class R3 | 92,416 | 315,693 | | 354,130 | 1,183,039 |
| Class R4 | 48,503 | 166,368 | | 16,255 | 54,188 |
| Class R6 | 37,555,560 | 128,768,874 | | 68,754,292 | 228,245,149 |
| Class 529A | 346,062 | 1,186,679 | | 375,299 | 1,248,814 |
| Class 529B | 5,453 | 18,829 | | 68 | 225 |
| Class 529C | 25,821 | 88,552 | | 25,252 | 84,707 |
| | 108,195,996 | $370,889,819 | | 164,923,119 | $545,080,727 |
Notes to Financial Statements - continued
| | Year ended
1/31/22 | | Year ended
1/31/21 |
| | Shares | Amount | | Shares | Amount |
Shares issued to shareholders
in reinvestment of distributions | | | | | |
| Class A | 8,093,030 | $27,669,970 | | 7,360,405 | $24,403,540 |
| Class B | 57,744 | 197,920 | | 89,727 | 296,838 |
| Class C | 194,891 | 668,754 | | 269,502 | 894,369 |
| Class I | 2,462,678 | 8,401,089 | | 2,081,298 | 6,906,666 |
| Class R1 | 9,675 | 33,122 | | 11,331 | 37,549 |
| Class R2 | 112,453 | 386,037 | | 180,090 | 595,856 |
| Class R3 | 33,235 | 113,486 | | 34,902 | 115,887 |
| Class R4 | 6,518 | 22,341 | | 9,404 | 31,101 |
| Class R6 | 14,826,438 | 50,682,925 | | 14,249,484 | 47,246,575 |
| Class 529A | 58,768 | 200,643 | | 51,961 | 172,239 |
| Class 529B | 820 | 2,808 | | 1,355 | 4,482 |
| Class 529C | 5,016 | 17,177 | | 9,911 | 32,706 |
| | 25,861,266 | $88,396,272 | | 24,349,370 | $80,737,808 |
| Shares reacquired | | | | | |
| Class A | (25,818,531) | $(88,456,841) | | (33,967,962) | $(111,567,123) |
| Class B | (674,723) | (2,313,771) | | (1,252,703) | (4,119,564) |
| Class C | (2,373,571) | (8,157,319) | | (3,946,351) | (13,123,053) |
| Class I | (25,770,254) | (87,960,422) | | (29,646,666) | (96,958,410) |
| Class R1 | (51,357) | (175,939) | | (54,277) | (178,859) |
| Class R2 | (4,257,607) | (14,705,690) | | (1,574,310) | (5,198,451) |
| Class R3 | (199,219) | (683,231) | | (191,813) | (648,542) |
| Class R4 | (104,348) | (357,514) | | (95,291) | (306,597) |
| Class R6 | (62,376,654) | (214,427,243) | | (29,787,231) | (95,118,507) |
| Class 529A | (258,497) | (884,688) | | (260,331) | (837,927) |
| Class 529B | (15,370) | (52,866) | | (32,485) | (97,454) |
| Class 529C | (57,085) | (195,357) | | (191,377) | (640,363) |
| | (121,957,216) | $(418,370,881) | | (101,000,797) | $(328,794,850) |
Notes to Financial Statements - continued
| | Year ended
1/31/22 | | Year ended
1/31/21 |
| | Shares | Amount | | Shares | Amount |
| Net change | | | | | |
| Class A | 27,460,017 | $94,169,117 | | 17,698,428 | $59,965,008 |
| Class B | (580,711) | (1,991,876) | | (1,081,287) | (3,546,139) |
| Class C | (1,341,801) | (4,602,930) | | (1,583,943) | (5,386,014) |
| Class I | 4,558 | 241,375 | | 20,296,133 | 66,463,497 |
| Class R1 | 7,436 | 25,431 | | (1,373) | (6,172) |
| Class R2 | (3,442,890) | (11,909,383) | | (380,051) | (1,236,217) |
| Class R3 | (73,568) | (254,052) | | 197,219 | 650,384 |
| Class R4 | (49,327) | (168,805) | | (69,632) | (221,308) |
| Class R6 | (9,994,656) | (34,975,444) | | 53,216,545 | 180,373,217 |
| Class 529A | 146,333 | 502,634 | | 166,929 | 583,126 |
| Class 529B | (9,097) | (31,229) | | (31,062) | (92,747) |
| Class 529C | (26,248) | (89,628) | | (156,214) | (522,950) |
| | 12,100,046 | $40,915,210 | | 88,271,692 | $297,023,685 |
Effective June 1, 2019, purchases of the fund’s Class B and Class 529B shares are closed to new and existing investors subject to certain exceptions. On December 29, 2021, the fund announced the termination of the fund's Class 529A, Class 529B, and Class 529C shares effective on or about June 9, 2022. In connection with the termination, all sales of Class 529B and Class 529C shares will be suspended effective after the close of business on or about March 18, 2022, and Class 529B and Class 529C shares will be converted into Class 529A shares of the fund effective on or about March 21, 2022. In addition, effective after the close of business on or about May 13, 2022, all sales and redemptions of Class 529A shares will be suspended in anticipation of a complete redemption of Class 529A shares on or about May 20, 2022. Please see the fund’s prospectus for details.
The fund is one of several mutual funds in which certain MFS funds may invest. The MFS funds do not invest in the underlying funds for the purpose of exercising management or control. At the end of the period, the MFS Moderate Allocation Fund, the MFS Growth Allocation Fund, the MFS Conservative Allocation Fund, the MFS Lifetime 2030 Fund, the MFS Lifetime 2035 Fund, the MFS Lifetime 2025 Fund, the MFS Lifetime 2040 Fund, and the MFS Lifetime Income Fund were the owners of record of approximately 15%, 14%, 9%, 2%, 1%, 1%, 1%, and 1%, respectively, of the value of outstanding voting shares of the fund. In addition, the MFS Lifetime 2020 Fund, and the MFS Lifetime 2045 Fund were each the owners of record of less than 1% of the value of outstanding voting shares of the fund.
(6) Line of Credit
The fund and certain other funds managed by MFS participate in a $1.25 billion unsecured committed line of credit of which $1 billion is reserved for use by the fund and certain other MFS U.S. funds. The line of credit is provided by a syndicate of banks under a credit agreement. Borrowings may be made for temporary financing needs. Interest is charged to each fund, based on its borrowings, generally at a rate equal to
Notes to Financial Statements - continued
the highest of one month LIBOR, the Federal Funds Effective Rate and the Overnight Bank Funding Rate, plus an agreed upon spread. A commitment fee, based on the average daily, unused portion of the committed line of credit, is allocated among the participating funds. In addition, the fund and other funds managed by MFS have established unsecured uncommitted borrowing arrangements with certain banks for temporary financing needs. Interest is charged to each fund, based on its borrowings, at rates equal to customary reference rates plus an agreed upon spread. For the year ended January 31, 2022, the fund’s commitment fee and interest expense were $7,782 and $0, respectively, and are included in “Miscellaneous” expense in the Statement of Operations.
(7) Investments in Affiliated Issuers
An affiliated issuer may be considered one in which the fund owns 5% or more of the outstanding voting securities, or a company which is under common control. For the purposes of this report, the following were affiliated issuers:
| Affiliated Issuers | Beginning
Value | Purchases | Sales
Proceeds | Realized
Gain
(Loss) | Change in
Unrealized
Appreciation or
Depreciation | Ending
Value |
| MFS Institutional Money Market Portfolio | $70,252,493 | $529,289,722 | $510,573,024 | $— | $— | $88,969,191 |
| Affiliated Issuers | Dividend
Income | Capital Gain
Distributions |
| MFS Institutional Money Market Portfolio | $34,488 | $— |
(8) Impacts of COVID-19
The pandemic related to the global spread of novel coronavirus disease (COVID-19), which was first detected in December 2019, has resulted in significant disruptions to global business activity and the global economy, as well as the economies of individual countries, the financial performance of individual companies and sectors, and the securities and commodities markets in general. Multiple surges in cases globally, the availability and widespread adoption of vaccines, and the emergence of variant strains of the virus continue to create uncertainty as to the future and long-term impacts resulting from the pandemic including impacts to the prices and liquidity of the fund's investments and the fund's performance.
(9) LIBOR Transition
Certain of the fund's investments, including investments in certain debt instruments and derivatives (if any), as well as borrowings by the fund and certain other contractual arrangements of the fund, may be based on the London Interbank Offered Rate (“LIBOR”). In 2017, the regulatory authority that oversees financial services firms in the United Kingdom announced plans to transition away from LIBOR by the end of 2021. In March 2021, the administrator of LIBOR announced the extension of the publication of the more commonly used U.S. dollar LIBOR settings to the end of June 2023. Although the full impacts of the transition away from LIBOR are not fully known, the transition may result in, among other things, an increase in volatility or illiquidity of the markets for instruments that currently rely on LIBOR to determine interest rates and this
Notes to Financial Statements - continued
could have an adverse impact on the fund's performance. With respect to the fund's accounting for investments, including investments in certain debt instruments and derivatives, as well as borrowings by the fund and any other contractual arrangements of the fund that undergo reference rate-related modifications as a result of the transition, management will rely upon the relief provided by FASB Codification Topic 848 – Reference Rate Reform (Topic 848). The guidance in Topic 848 permits the fund to account for those modified contracts as a continuation of the existing contracts. Management is still evaluating the impact to the fund of the June 30, 2023 planned discontinuation of the more commonly used U.S. dollar LIBOR settings.
(10) Subsequent Event
The market disruptions, which began in late February 2022, associated with geopolitical events related to the conflict between Russia and Ukraine may adversely affect the value of the fund’s assets and thus the fund’s performance. Management continues to monitor these events and to evaluate the related impacts, if any, to the fund.
Report of Independent Registered Public Accounting Firm
To the Board of Trustees of MFS Series Trust III and the Shareholders of
MFS High Income Fund:
Opinion on the Financial Statements and Financial Highlights
We have audited the accompanying statement of assets and liabilities of MFS High Income Fund (the “Fund”), including the portfolio of investments, as of January 31, 2022, the related statement of operations for the year then ended, the statements of changes in net assets for each of the two years in the period then ended, the financial highlights for each of the five years in the period then ended, and the related notes. In our opinion, the financial statements and financial highlights present fairly, in all material respects, the financial position of the Fund as of January 31, 2022, and the results of its operations for the year then ended, the changes in its net assets for each of the two years in the period then ended, and the financial highlights for each of the five years in the period then ended, in conformity with accounting principles generally accepted in the United States of America.
Basis for Opinion
These financial statements and financial highlights are the responsibility of the Fund's management. Our responsibility is to express an opinion on the Fund's financial statements and financial highlights based on our audits. We are a public accounting firm registered with the Public Company Accounting Oversight Board (United States) (PCAOB) and are required to be independent with respect to the Fund in accordance with the U.S. federal securities laws and the applicable rules and regulations of the Securities and Exchange Commission and the PCAOB.
We conducted our audits in accordance with the standards of the PCAOB. Those standards require that we plan and perform the audit to obtain reasonable assurance about whether the financial statements and financial highlights are free of material misstatement, whether due to error or fraud. The Fund is not required to have, nor were we engaged to perform, an audit of its internal control over financial reporting. As part of our audits, we are required to obtain an understanding of internal control over financial reporting but not for the purpose of expressing an opinion on the effectiveness of the Fund's internal control over financial reporting. Accordingly, we express no such opinion.
Our audits included performing procedures to assess the risks of material misstatement of the financial statements and financial highlights, whether due to error or fraud, and performing procedures that respond to those risks. Such procedures included examining, on a test basis, evidence regarding the amounts and disclosures in the financial statements and financial highlights. Our audits also included evaluating the accounting principles used and significant estimates made by management, as well as evaluating the overall presentation of the financial statements and financial highlights.
Report of Independent Registered Public Accounting Firm – continued
Our procedures included confirmation of securities owned as of January 31, 2022, by correspondence with the custodian and brokers; when replies were not received from brokers, we performed other auditing procedures. We believe that our audits provide a reasonable basis for our opinion.
DELOITTE & TOUCHE LLP
Boston, Massachusetts
March 18, 2022
We have served as the auditor of one or more of the MFS investment companies since 1924.
Trustees and Officers — Identification and Background
The Trustees and Officers of the Trust, as of March 1, 2022, are listed below, together with their principal occupations during the past five years. (Their titles may have varied during that period.) The address of each Trustee and Officer is 111 Huntington Avenue, Boston, Massachusetts 02199-7618.
| Name, Age | | Position(s) Held with Fund | | Trustee/Officer Since(h) | | Number of MFS Funds overseen by the Trustee | | Principal Occupations During
the Past Five Years | | Other Directorships During
the Past Five Years (j) |
| INTERESTED TRUSTEES | | | | | | | | | | |
Michael W. Roberge (k)
(age 55) | | Trustee | | January 2021 | | 135 | | Massachusetts Financial Services Company, Chairman (since January 2021); Chief Executive Officer (since January 2017); Director; Chairman of the Board (since January 2022); President (until December 2018); Chief Investment Officer (until December 2018) | | N/A |
| INDEPENDENT TRUSTEES | | | | | | | | | | |
John P. Kavanaugh
(age 67) | | Trustee and Chair of Trustees | | January 2009 | | 135 | | Private investor | | N/A |
Steven E. Buller
(age 70) | | Trustee | | February 2014 | | 135 | | Private investor | | N/A |
John A. Caroselli
(age 67) | | Trustee | | March 2017 | | 135 | | Private investor; JC Global Advisors, LLC (management consulting), President (since 2015) | | N/A |
Maureen R. Goldfarb
(age 66) | | Trustee | | January 2009 | | 135 | | Private investor | | N/A |
Peter D. Jones
(age 66) | | Trustee | | January 2019 | | 135 | | Private investor | | N/A |
James W. Kilman, Jr.
(age 60) | | Trustee | | January 2019 | | 135 | | Burford Capital Limited (finance and investment management), Senior Advisor (since May 3, 2021), Chief Financial Officer (2019 - May 2, 2021); KielStrand Capital LLC (family office), Chief Executive Officer (since 2016) | | Alpha-En Corporation, Director (2016-2019) |
Trustees and Officers - continued
| Name, Age | | Position(s) Held with Fund | | Trustee/Officer Since(h) | | Number of MFS Funds overseen by the Trustee | | Principal Occupations During
the Past Five Years | | Other Directorships During
the Past Five Years (j) |
Clarence Otis, Jr.
(age 65) | | Trustee | | March 2017 | | 135 | | Private investor | | VF Corporation, Director; Verizon Communications, Inc., Director; The Travelers Companies, Director |
Maryanne L. Roepke
(age 66) | | Trustee | | May 2014 | | 135 | | Private investor | | N/A |
Laurie J. Thomsen
(age 64) | | Trustee | | March 2005 | | 135 | | Private investor | | The Travelers Companies, Director; Dycom Industries, Inc., Director |
| Name, Age | | Position(s) Held with
Fund | | Trustee/Officer Since(h) | | Number of MFS Funds for which the Person is an Officer | | Principal Occupations During
the Past Five Years |
| OFFICERS | | | | | | | | |
Christopher R. Bohane (k)
(age 48) | | Assistant Secretary and Assistant Clerk | | July 2005 | | 135 | | Massachusetts Financial Services Company, Senior Vice President and Associate General Counsel |
Kino Clark (k)
(age 53) | | Assistant Treasurer | | January 2012 | | 135 | | Massachusetts Financial Services Company, Vice President |
John W. Clark, Jr. (k)
(age 54) | | Assistant Treasurer | | April 2017 | | 135 | | Massachusetts Financial Services Company, Vice President (since March 2017); Deutsche Bank (financial services), Department Head - Treasurer's Office (until February 2017) |
Thomas H. Connors (k)
(age 62) | | Assistant Secretary and Assistant Clerk | | September 2012 | | 135 | | Massachusetts Financial Services Company, Vice President and Senior Counsel |
David L. DiLorenzo (k)
(age 53) | | President | | July 2005 | | 135 | | Massachusetts Financial Services Company, Senior Vice President |
Heidi W. Hardin (k)
(age 54) | | Secretary and Clerk | | April 2017 | | 135 | | Massachusetts Financial Services Company, Executive Vice President and General Counsel (since March 2017); Harris Associates (investment management), General Counsel (until January 2017) |
Trustees and Officers - continued
| Name, Age | | Position(s) Held with
Fund | | Trustee/Officer Since(h) | | Number of MFS Funds for which the Person is an Officer | | Principal Occupations During
the Past Five Years |
Brian E. Langenfeld (k)
(age 48) | | Assistant Secretary and Assistant Clerk | | June 2006 | | 135 | | Massachusetts Financial Services Company, Vice President and Senior Counsel |
Rosa E. Licea-Mailloux(k)
(age 45) | | Chief Compliance Officer | | March 2022 | | 135 | | Massachusetts Financial Services Company, Vice President (since 2018); Director of Corporate Compliance (2018-2021), Senior Director Compliance (2021-2022), Senior Managing Director of North American Compliance & Chief Compliance Officer (since March 2022); Natixis Investment Managers (investment management), Funds Chief Compliance Officer, Deputy General Counsel & Senior Vice President (until 2018) |
Amanda S. Mooradian (k)
(age 43) | | Assistant Secretary and Assistant Clerk | | September 2018 | | 135 | | Massachusetts Financial Services Company, Assistant Vice President and Senior Counsel |
Susan A. Pereira (k)
(age 51) | | Assistant Secretary and Assistant Clerk | | July 2005 | | 135 | | Massachusetts Financial Services Company, Vice President and Assistant General Counsel |
Kasey L. Phillips (k)
(age 51) | | Assistant Treasurer | | September 2012 | | 135 | | Massachusetts Financial Services Company, Vice President |
Matthew A. Stowe (k)
(age 47) | | Assistant Secretary and Assistant Clerk | | October 2014 | | 135 | | Massachusetts Financial Services Company, Vice President and Assistant General Counsel |
James O. Yost (k)
(age 61) | | Treasurer | | September 1990 | | 135 | | Massachusetts Financial Services Company, Senior Vice President |
| (h) | Date first appointed to serve as Trustee/Officer of an MFS Fund. Each Trustee has served continuously since appointment unless indicated otherwise. From January 2012 through December 2016, Messrs. DiLorenzo and Yost served as Treasurer and Deputy Treasurer of the Funds, respectively. |
| (j) | Directorships or trusteeships of companies required to report to the Securities and Exchange Commission (i.e., “public companies”). |
| (k) | “Interested person” of the Trust within the meaning of the Investment Company Act of 1940 (referred to as the 1940 Act), which is the principal federal law governing investment companies like the fund, as a result of a position with MFS. The address of MFS is 111 Huntington Avenue, Boston, Massachusetts 02199-7618. |
Trustees and Officers - continued
Each Trustee (other than Messrs. Jones, Kilman and Roberge) has been elected by shareholders and each Trustee and Officer holds office until his or her successor is chosen and qualified or until his or her earlier death, resignation, retirement or removal. Mr. Roberge became a Trustee of the Funds on January 1, 2021 and Messrs. Jones and Kilman became Trustees of the Funds on January 1, 2019. The Trust does not hold annual meetings for the purpose of electing Trustees, and Trustees are not elected for fixed terms. Under the terms of the Board's retirement policy, an Independent Trustee shall retire at the end of the calendar year in which he or she reaches the earlier of 75 years of age or 15 years of service on the Board (or, in the case of any Independent Trustee who joined the Board prior to 2015, 20 years of service on the Board).
Messrs. Buller, Kilman and Otis and Ms. Roepke are members of the Trust’s Audit Committee.
Each of the Interested Trustees and certain Officers hold comparable officer positions with certain affiliates of MFS.
The Statement of Additional Information for a Fund includes further information about the Trustees and is available without charge upon request by calling 1-800-225-2606.
| Investment Adviser | Custodian |
Massachusetts Financial Services Company
111 Huntington Avenue
Boston, MA 02199-7618 | JPMorgan Chase Bank, NA
4 Metrotech Center
New York, NY 11245 |
| Distributor | Independent Registered Public Accounting Firm |
MFS Fund Distributors, Inc.
111 Huntington Avenue
Boston, MA 02199-7618 | Deloitte & Touche LLP
200 Berkeley Street
Boston, MA 02116 |
| Portfolio Manager(s) | |
David Cole
Michael Skatrud | |
Proxy Voting Policies and Information
MFS votes proxies on behalf of the fund pursuant to proxy voting policies and procedures that are available without charge, upon request, by calling 1-800-225-2606, by visiting mfs.com/proxyvoting, or by visiting the SEC’s Web site at http://www.sec.gov.
Information regarding how the fund voted proxies relating to portfolio securities during the most recent twelve-month period ended June 30 is available by August 31 of each year without charge by visiting mfs.com/proxyvoting, or by visiting the SEC’s Web site at http://www.sec.gov.
Quarterly Portfolio Disclosure
The fund files a complete schedule of portfolio holdings with the SEC for the first and third quarters of each fiscal year as an exhibit to its reports on Form N-PORT. The fund's Form N-PORT reports are available on the SEC's Web site at http://www.sec.gov. A shareholder can obtain the portfolio holdings report for the first and third quarters of the fund's fiscal year at mfs.com/openendfunds by choosing the fund's name and then scrolling to the “Resources” section and clicking on the “Prospectus and Reports” tab.
Further Information
From time to time, MFS may post important information about the fund or the MFS Funds on the MFS Web site (mfs.com). This information is available at https://www.mfs.com/announcements or at mfs.com/openendfunds by choosing the fund’s name and then scrolling to the “Resources” section and clicking on the “Announcements” tab, if any.
Information About Fund Contracts and Legal Claims
The fund has entered into contractual arrangements with an investment adviser, administrator, distributor, shareholder servicing agent, 529 program manager (if applicable), and custodian who each provide services to the fund. Unless expressly stated otherwise, shareholders are not parties to, or intended beneficiaries of these contractual arrangements, and these contractual arrangements are not intended to create any shareholder right to enforce them against the service providers or to seek any remedy under them against the service providers, either directly or on behalf of the fund.
Under the Trust’s By-Laws and Declaration of Trust, any claims asserted against or on behalf of the MFS Funds, including claims against Trustees and Officers, must be brought in state and federal courts located within the Commonwealth of Massachusetts.
Federal Tax Information (unaudited)
The fund will notify shareholders of amounts for use in preparing 2022 income tax forms in January 2023. The following information is provided pursuant to provisions of the Internal Revenue Code.
The fund intends to pass through the maximum amount allowable as Section 163(j) Interest Dividends as defined in Treasury Regulation §1.163(j)-1(b).
| FACTS | WHAT DOES MFS DO WITH YOUR PERSONAL INFORMATION? |
| Why? | Financial companies choose how they share your personal information. Federal law gives consumers the right to limit some but not all sharing. Federal law also requires us to tell you how we collect, share, and protect your personal information. Please read this notice carefully to understand what we do. |
| What? | The types of personal information we collect and share depend on the product or service you have with us. This information can include: |
| • Social Security number and account balances |
| • Account transactions and transaction history |
| • Checking account information and wire transfer instructions |
| When you are no longer our customer, we continue to share your information as described in this notice. |
| How? | All financial companies need to share customers' personal information to run their everyday business. In the section below, we list the reasons financial companies can share their customers' personal information; the reasons MFS chooses to share; and whether you can limit this sharing. |
Reasons we can share your
personal information | Does MFS share? | Can you limit
this sharing? |
For our everyday business purposes –
such as to process your transactions, maintain your
account(s), respond to court orders and legal
investigations, or report to credit bureaus | Yes | No |
For our marketing purposes –
to offer our products and services to you | No | We don't share |
For joint marketing with other
financial companies | No | We don't share |
For our affiliates' everyday business purposes –
information about your transactions and experiences | No | We don't share |
For our affiliates' everyday business purposes –
information about your creditworthiness | No | We don't share |
| For nonaffiliates to market to you | No | We don't share |
| Questions? | Call 800-225-2606 or go to mfs.com. |
| Who we are |
| Who is providing this notice? | MFS Funds, MFS Investment Management, MFS Institutional Advisors, Inc., and MFS Heritage Trust Company. |
| What we do |
How does MFS
protect my personal
information? | To protect your personal information from unauthorized access and use, we use security measures that comply with federal law. These measures include procedural, electronic, and physical safeguards for the protection of the personal information we collect about you. |
How does MFS
collect my personal
information? | We collect your personal information, for example, when you |
| • open an account or provide account information |
| • direct us to buy securities or direct us to sell your securities |
| • make a wire transfer |
| We also collect your personal information from others, such as credit bureaus, affiliates, or other companies. |
| Why can't I limit all sharing? | Federal law gives you the right to limit only |
| • sharing for affiliates' everyday business purposes – information about your creditworthiness |
| • affiliates from using your information to market to you |
| • sharing for nonaffiliates to market to you |
| State laws and individual companies may give you additional rights to limit sharing. |
| Definitions |
| Affiliates | Companies related by common ownership or control. They can be financial and nonfinancial companies. |
| • MFS does not share personal information with affiliates, except for everyday business purposes as described on page one of this notice. |
| Nonaffiliates | Companies not related by common ownership or control. They can be financial and nonfinancial companies. |
| • MFS does not share with nonaffiliates so they can market to you. |
| Joint marketing | A formal agreement between nonaffiliated financial companies that together market financial products or services to you. |
| • MFS doesn't jointly market. |
| Other important information |
| If you own an MFS product or receive an MFS service in the name of a third party such as a bank or broker-dealer, their privacy policy may apply to you instead of ours. |
Save paper with eDelivery.
MFS® will send you prospectuses, reports, and proxies directly via e-mail so you will get information faster with less mailbox clutter.
To sign up:
1. Go to mfs.com.
2. Log in via MFS® Access.
3. Select eDelivery.
If you own your MFS fund shares through a financial institution or a retirement plan, MFS® TALK, MFS® Access, or eDelivery may not be available to you.
CONTACT
WEB SITE
mfs.com
MFS TALK
1-800-637-8255
24 hours a day
ACCOUNT SERVICE AND LITERATURE
Shareholders
1-800-225-2606
Financial advisors
1-800-343-2829
Retirement plan services
1-800-637-1255
MAILING ADDRESS
MFS Service Center, Inc.
P.O. Box 219341
Kansas City, MO 64121-9341
OVERNIGHT MAIL
MFS Service Center, Inc.
Suite 219341
430 W 7th Street
Kansas City, MO 64105-1407
Annual Report
January 31, 2022
MFS® High Yield Pooled Portfolio
MFS® High Yield Pooled Portfolio
| 1 |
| 2 |
| 4 |
| 6 |
| 8 |
| 9 |
| 24 |
| 25 |
| 26 |
| 27 |
| 28 |
| 40 |
| 42 |
| 46 |
| 46 |
| 46 |
| 46 |
| 46 |
| 47 |
The report is prepared for the general information of shareholders. It is authorized for distribution to prospective investors only when preceded or accompanied by a current prospectus.
NOT FDIC INSURED • MAY LOSE VALUE • NO BANK GUARANTEE
LETTER FROM THE CHAIR AND CEO
Dear Shareholders:
As a result of Russia’s invasion of Ukraine, the danger of wider geopolitical conflict has risen to levels not seen in decades, and this comes as sanctions aimed at countering Russia’s actions are exacerbating already mounting inflation. Consequently, at a time when global growth faces multiple headwinds, central banks have been presented with the challenge of reining in rising prices without tipping economies into recession. This has in turn led to increased volatility.
There are, however, encouraging signs for the markets. The Omicron wave of the coronavirus is receding outside Asia, unemployment is low, and there are signs that some global supply chain bottlenecks are beginning to ease, though events in Ukraine could hamper these advances. Additionally, easier Chinese monetary policy and the record pace of corporate stock buybacks are supportive elements, albeit amid an otherwise turbulent investment environment.
It is important to have a deep understanding of company fundamentals during times of market transition, and we have built our global research platform to do just that.
At MFS®, we put our clients’ assets to work responsibly by carefully navigating the increasing complexity of global markets and economies. Guided by our commitment to long-term investing, we tune out the noise and try to uncover what we believe are the best, most durable investment opportunities in the market. Our unique global investment platform combines collective expertise, long-term discipline, and thoughtful risk management to create sustainable value for investors over time.
Respectfully,
Michael W. Roberge
Chair and Chief Executive Officer
MFS Investment Management
March 18, 2022
The opinions expressed in this letter are subject to change and may not be relied upon for investment advice. No forecasts can be guaranteed.
Portfolio structure (i)
Top five industries (i)
| Cable TV | 7.5% |
| Gaming & Lodging | 6.9% |
| Medical & Health Technology & Services | 6.6% |
| Midstream | 4.5% |
| Consumer Services | 3.9% |
Composition including fixed income credit quality (a)(i)
| BBB | 0.5% |
| BB | 44.0% |
| B | 38.7% |
| CCC | 13.7% |
| CC | 0.1% |
| C (o) | 0.0% |
| Not Rated | (1.4)% |
| Non-Fixed Income | 0.8% |
| Cash & Cash Equivalents | 2.0% |
| Other | 1.6% |
Portfolio facts (i)
| Average Duration (d) | 4.0 |
| Average Effective Maturity (m) | 5.5 yrs. |
| (a) | For all securities other than those specifically described below, ratings are assigned to underlying securities utilizing ratings from Moody’s, Fitch, and Standard & Poor’s rating agencies and applying the following hierarchy: If all three agencies provide a rating, the middle rating (after dropping the highest and lowest ratings) is assigned; if two of the three agencies rate a security, the lower of the two is assigned. If none of the 3 rating agencies above assign a rating, but the security is rated by DBRS Morningstar, then the DBRS Morningstar rating is assigned. If none of the 4 rating agencies listed above rate the security, but the security is rated by the Kroll Bond Rating Agency (KBRA), then the KBRA rating is assigned. Ratings are shown in the S&P and Fitch scale (e.g., AAA). Securities rated BBB or higher are considered investment grade. All ratings are subject to change. Not Rated includes fixed income securities and fixed income derivatives that have not been rated by any rating agency. Non-Fixed Income includes equity securities (including convertible bonds and equity derivatives) and/or commodity-linked derivatives. The fund may or may not have held all of these instruments on this date. The fund is not rated by these agencies. |
| (d) | Duration is a measure of how much a bond’s price is likely to fluctuate with general changes in interest rates, e.g., if rates rise 1.00%, a bond with a 5-year duration is likely to lose about 5.00% of its value due to the interest rate move. |
Portfolio Composition - continued
| (i) | For purposes of this presentation, the components include the value of securities, and reflect the impact of the equivalent exposure of derivative positions, if any. These amounts may be negative from time to time. Equivalent exposure is a calculated amount that translates the derivative position into a reasonable approximation of the amount of the underlying asset that the portfolio would have to hold at a given point in time to have the same price sensitivity that results from the portfolio’s ownership of the derivative contract. When dealing with derivatives, equivalent exposure is a more representative measure of the potential impact of a position on portfolio performance than value. The bond component will include any accrued interest amounts. |
| (m) | In determining each instrument’s effective maturity for purposes of calculating the fund’s dollar-weighted average effective maturity, MFS uses the instrument’s stated maturity or, if applicable, an earlier date on which MFS believes it is probable that a maturity-shortening device (such as a put, pre-refunding or prepayment) will cause the instrument to be repaid. Such an earlier date can be substantially shorter than the instrument’s stated maturity. |
Where the fund holds convertible bonds, they are treated as part of the equity portion of the portfolio.
Cash & Cash Equivalents includes any cash, investments in money market funds, short-term securities, and other assets less liabilities. Please see the Statement of Assets and Liabilities for additional information related to the fund’s cash position and other assets and liabilities.
Other includes equivalent exposure from currency derivatives and/or any offsets to derivative positions and may be negative.
Percentages are based on net assets as of January 31, 2022.
The portfolio is actively managed and current holdings may be different.
Management Review
Summary of Results
For the twelve months ended January 31, 2022, shares of the MFS High Yield Pooled Portfolio (fund) provided a total return of 1.39%, at net asset value. This compares with a return of 2.05% for the fund’s benchmark, the Bloomberg U.S. Corporate High-Yield Bond 2% Issuer Capped Index.
Market Environment
Over the past year, the global economy was buffeted by an array of crosscurrents as it adjusted to the ebbs and flows of the pandemic. Among the supportive currents were ample fiscal stimulus, loose monetary policy and the rollout of several highly effective coronavirus vaccines. Negative currents included the rapid spread of several coronavirus variants, widespread global production bottlenecks and a surge in inflation. After experiencing a burst of exceptionally strong economic activity as the global economy began to reopen, activity became more muted in the second half of the period amid ongoing supply chain disruptions and a new wave of coronavirus infections, albeit seemingly milder strains.
Amid rising inflation, markets anticipated a transition from an exceptionally accommodative monetary environment to a significantly more restrictive one ahead, which resulted in a rise in market volatility. Indeed, several central banks in emerging markets have already tightened policy, as has the Bank of England, while the US Federal Reserve signaled it intends to tighten policy soon. The European Central Bank, which had been expected to move slowly toward tighter policy, has indicated it, too, may need to dial back accommodation in coming months. However, the Bank of Japan and the People's Bank of China are expected to maintain accommodative policies. As a result of the shifting monetary backdrop, sovereign bond yields moved higher during the period, but remain quite low relative to history.
A harsher Chinese regulatory environment toward industries such as online gaming, food delivery and education increased market volatility as has stress in China's highly leveraged property development sector. Trade relations between the United States and China remained quite strained despite a change in presidential administrations. Geopolitical tensions ramped up during the period with Russia amassing troops along its border with Ukraine and Chinese forces repeatedly entering airspace claimed by Taiwan.
An increase in market volatility saw speculative activity abate somewhat as “meme” stocks and cryptocurrencies came under pressure near the end of the period.
Detractors from Performance
Relative to the Bloomberg U.S. Corporate High-Yield Bond 2% Issuer Capped Index, the fund's underweight allocation to “B” and “CCC” rated(r) bonds within the energy sector detracted from performance. The fund's out-of-benchmark exposure to non-rated issuers also hindered relative returns.
Security selection in “CCC” rated bonds, particularly within the technology sector, and in “B” and “BB” rated bonds, notably within both the consumer cyclicals and basic industry sectors, weakened relative results.
Management Review - continued
Top individual detractors during the reporting period included the fund’s underweight position in Kraft Heinz Company(h) (consumer non-cyclical) and its overweight position in Virgin Media (communications).
Contributors to Performance
On the positive side, the fund's shorter average duration(d) stance, relative to the benchmark, contributed to performance as interest rates generally appreciated over the reporting period.
The fund's overweight allocation to the “CCC” credit quality segment, overall, and security selection in both the communications and energy sectors, also benefited relative performance.
The top individual contributor for the reporting period was the fund’s overweight exposure to PBF Holding (energy).
Respectfully,
Portfolio Manager(s)
David Cole and Michael Skatrud
| (d) | Duration is a measure of how much a bond’s price is likely to fluctuate with general changes in interest rates, e.g., if rates rise 1.00%, a bond with a 5-year duration is likely to lose about 5.00% of its value. |
| (h) | Security was not held in the portfolio at period end. |
| (r) | Securities rated “BBB”, “Baa”, or higher are considered investment grade; securities rated “BB”, “Ba”, or below are considered non-investment grade. Ratings are assigned to underlying securities utilizing ratings from Moody's, Fitch, and Standard & Poor's and applying the following hierarchy: If all three agencies provide a rating, the middle rating (after dropping the highest and lowest ratings) is assigned; if two of the three agencies rate a security, the lower of the two is assigned. If none of the 3 rating agencies above assign a rating, but the security is rated by DBRS Morningstar, then the DBRS Morningstar rating is assigned. If none of the 4 rating agencies listed above rate the security, but the security is rated by the Kroll Bond Rating Agency (KBRA), then the KBRA rating is assigned. Ratings are shown in the S&P and Fitch scale (e.g., AAA). For securities that are not rated by any of the rating agencies, the security is considered Not Rated. |
The views expressed in this report are those of the portfolio manager(s) only through the end of the period of the report as stated on the cover and do not necessarily reflect the views of MFS or any other person in the MFS organization. These views are subject to change at any time based on market or other conditions, and MFS disclaims any responsibility to update such views. These views may not be relied upon as investment advice or an indication of trading intent on behalf of any MFS portfolio. References to specific securities are not recommendations of such securities, and may not be representative of any MFS portfolio’s current or future investments.
Performance Summary THROUGH 1/31/22
The following chart illustrates the fund’s historical performance in comparison to its benchmark(s). Performance results reflect the percentage change in net asset value, including reinvestment of dividends and capital gains distributions. Benchmarks are unmanaged and may not be invested in directly. Benchmark returns do not reflect sales charges, commissions or expenses. (See Notes to Performance Summary.)
Performance data shown represents past performance and is no guarantee of future results. Investment return and principal value fluctuate so your shares, when sold, may be worth more or less than the original cost; current performance may be lower or higher than quoted. The performance shown does not reflect the deduction of taxes, if any, that a shareholder would pay on fund distributions or the redemption of fund shares.
Growth of a Hypothetical $10,000 Investment (t)
Performance Summary - continued
Total Returns through 1/31/22
Average annual without sales charge
| Fund Inception Date | 1-yr | 5-yr | Life (t) |
| 3/25/13 | 1.39% | 4.93% | 5.02% |
Comparative benchmark(s)
| | | | |
| Bloomberg U.S. Corporate High-Yield Bond 2% Issuer Capped Index (f) | 2.05% | 5.39% | 5.31% |
| (f) | Source: FactSet Research Systems Inc. |
| (t) | For the period from the fund inception date through the stated period end. (See Notes to Performance Summary.) |
Benchmark Definition(s)
Bloomberg U.S. Corporate High-Yield Bond 2% Issuer Capped Index(a) – a component of the Bloomberg U.S. Corporate High-Yield Bond Index, which measures performance of non-investment grade, fixed rate debt. The index limits the maximum exposure to any one issuer to 2%.
It is not possible to invest directly in an index.
| (a) | Source: Bloomberg Index Services Limited. BLOOMBERG® is a trademark and service mark of Bloomberg Finance L.P. and its affiliates (collectively “Bloomberg”). Bloomberg or Bloomberg's licensors own all proprietary rights in the Bloomberg Indices. Bloomberg neither approves or endorses this material, or guarantees the accuracy or completeness of any information herein, or makes any warranty, express or implied, as to the results to be obtained therefrom and, to the maximum extent allowed by law, neither shall have any liability or responsibility for injury or damages arising in connection therewith. |
Notes to Performance Summary
Average annual total return represents the average annual change in value for the fund for the periods presented. Life returns are presented where the fund has less than 10 years of performance history and represent the average annual total return from the fund inception date to the stated period end date.
Performance results reflect any applicable expense subsidies and waivers in effect during the periods shown. Without such subsidies and waivers the fund's performance results would be less favorable. Please see the prospectus and financial statements for complete details.
Performance results do not include adjustments made for financial reporting purposes in accordance with U.S. generally accepted accounting principles and may differ from amounts reported in the financial highlights.
From time to time the fund may receive proceeds from litigation settlements, without which performance would be lower.
Expense Table
Fund expenses borne by the shareholders during the period,
August 1, 2021 through January 31, 2022
As a shareholder of the fund, you incur ongoing costs, including fund expenses. This example is intended to help you understand your ongoing costs (in dollars) of investing in the fund and to compare these costs with the ongoing costs of investing in other mutual funds.
The example is based on an investment of $1,000 invested at the beginning of the period and held for the entire period August 1, 2021 through January 31, 2022.
Actual Expenses
The first line of the following table provides information about actual account values and actual expenses. You may use the information in this line, together with the amount you invested, to estimate the expenses that you paid over the period. Simply divide your account value by $1,000 (for example, an $8,600 account value divided by $1,000 = 8.6), then multiply the result by the number in the first line under the heading entitled “Expenses Paid During Period” to estimate the expenses you paid on your account during this period.
Hypothetical Example for Comparison Purposes
The second line of the following table provides information about hypothetical account values and hypothetical expenses based on the fund’s actual expense ratio and an assumed rate of return of 5% per year before expenses, which is not the fund’s actual return. The hypothetical account values and expenses may not be used to estimate the actual ending account balance or expenses you paid for the period. You may use this information to compare the ongoing costs of investing in the fund and other funds. To do so, compare this 5% hypothetical example with the 5% hypothetical examples that appear in the shareholder reports of the other funds.
Please note that the expenses shown in the table are meant to highlight your ongoing costs only and do not reflect any transactional costs, such as sales charges (loads). Therefore, the second line of the table is useful in comparing ongoing costs only, and will not help you determine the relative total costs of owning different funds. In addition, if these transactional costs were included, your costs would have been higher.
| | Annualized
Expense
Ratio | Beginning
Account Value
8/01/21 | Ending
Account Value
1/31/22 | Expenses
Paid During
Period (p)
8/01/21-1/31/22 |
| Actual | 0.02% | $1,000.00 | $982.44 | $0.10 |
| Hypothetical (h) | 0.02% | $1,000.00 | $1,025.10 | $0.10 |
| (h) | 5% fund return per year before expenses. |
| (p) | “Expenses Paid During Period” are equal to the fund’s annualized expense ratio, as shown above, multiplied by the average account value over the period, multiplied by 184/365 (to reflect the one-half year period). |
Portfolio of Investments
1/31/22
The Portfolio of Investments is a complete list of all securities owned by your fund. It is categorized by broad-based asset classes.
| Issuer | | | Shares/Par | Value ($) |
| Bonds – 95.9% |
| Aerospace & Defense – 2.3% |
| Bombardier, Inc., 7.5%, 3/15/2025 (n) | | $ | 2,300,000 | $ 2,328,750 |
| Bombardier, Inc., 7.125%, 6/15/2026 (n) | | | 2,292,000 | 2,329,245 |
| F-Brasile S.p.A./F-Brasile U.S. LLC, 7.375%, 8/15/2026 (n) | | | 3,150,000 | 3,106,089 |
| Moog, Inc., 4.25%, 12/15/2027 (n) | | | 4,430,000 | 4,445,726 |
| TransDigm, Inc., 6.25%, 3/15/2026 (n) | | | 3,472,000 | 3,584,840 |
| TransDigm, Inc., 6.375%, 6/15/2026 | | | 2,775,000 | 2,823,563 |
| TransDigm, Inc., 5.5%, 11/15/2027 | | | 2,015,000 | 2,025,075 |
| TransDigm, Inc., 4.625%, 1/15/2029 | | | 2,196,000 | 2,085,453 |
| | | | | $22,728,741 |
| Automotive – 2.6% |
| Clarios Global LP/Clarios US Finance Cois, 8.5%, 5/15/2027 (n) | | $ | 4,775,000 | $ 4,992,644 |
| Dana, Inc., 5.375%, 11/15/2027 | | | 2,121,000 | 2,192,584 |
| Dana, Inc., 5.625%, 6/15/2028 | | | 516,000 | 536,640 |
| Dana, Inc., 4.25%, 9/01/2030 | | | 1,495,000 | 1,448,281 |
| Dornoch Debt Merger Sub Inc., 6.625%, 10/15/2029 (n) | | | 2,050,000 | 1,980,813 |
| Ford Motor Co., 5.113%, 5/03/2029 | | | 2,255,000 | 2,413,526 |
| Ford Motor Co., 4.75%, 1/15/2043 | | | 2,520,000 | 2,575,541 |
| Ford Motor Credit Co. LLC, 4.134%, 8/04/2025 | | | 2,005,000 | 2,050,814 |
| IAA Spinco, Inc., 5.5%, 6/15/2027 (n) | | | 3,360,000 | 3,448,234 |
| Real Hero Merger Sub 2, Inc., 6.25%, 2/01/2029 (n) | | | 2,175,000 | 2,129,934 |
| Wheel Pros, Inc., 6.5%, 5/15/2029 (n) | | | 2,005,000 | 1,864,650 |
| | | | | $25,633,661 |
| Broadcasting – 2.9% |
| Advantage Sales & Marketing, Inc., 6.5%, 11/15/2028 (n) | | $ | 3,040,000 | $ 3,017,200 |
| Gray Escrow II, Inc., 5.375%, 11/15/2031 (n) | | | 5,005,000 | 4,934,905 |
| iHeartCommunications, Inc., 8.375%, 5/01/2027 | | | 2,795,000 | 2,923,193 |
| Scripps Escrow II, Inc., 5.875%, 7/15/2027 (n) | | | 3,385,000 | 3,452,700 |
| Summer (BC) Bidco B LLC, 5.5%, 10/31/2026 (n) | | | 2,545,000 | 2,491,555 |
| Summer (BC) Holdco S.à r.l., “A”, 9.25%, 10/31/2027 | | EUR | 923,579 | 1,097,003 |
| Univision Communications, Inc., 4.5%, 5/01/2029 (n) | | $ | 5,835,000 | 5,779,218 |
| WMG Acquisition Corp., 3.875%, 7/15/2030 (n) | | | 5,559,000 | 5,304,342 |
| | | | | $29,000,116 |
| Brokerage & Asset Managers – 1.6% |
| Aretec Escrow Issuer, Inc., 7.5%, 4/01/2029 (n) | | $ | 2,025,000 | $ 2,065,419 |
| LPL Holdings, Inc., 4.625%, 11/15/2027 (n) | | | 4,280,000 | 4,349,165 |
| LPL Holdings, Inc., 4%, 3/15/2029 (n) | | | 3,146,000 | 3,053,319 |
| LPL Holdings, Inc., 4.375%, 5/15/2031 (n) | | | 1,955,000 | 1,916,037 |
Portfolio of Investments – continued
| Issuer | | | Shares/Par | Value ($) |
| Bonds – continued |
| Brokerage & Asset Managers – continued |
| NFP Corp., 4.875%, 8/15/2028 (n) | | $ | 2,555,000 | $ 2,496,107 |
| NFP Corp., 6.875%, 8/15/2028 (n) | | | 2,010,000 | 1,912,012 |
| | | | | $15,792,059 |
| Building – 3.7% |
| ABC Supply Co., Inc., 4%, 1/15/2028 (n) | | $ | 6,720,000 | $ 6,577,536 |
| Foundation Building Materials LLC, 6%, 3/01/2029 (n) | | | 125,000 | 120,649 |
| GYP Holding III Corp., 4.625%, 5/01/2029 (n) | | | 3,965,000 | 3,851,006 |
| Interface, Inc., 5.5%, 12/01/2028 (n) | | | 3,400,000 | 3,493,500 |
| MIWD Holdco II LLC/MIWD Finance Co., 5.5%, 2/01/2030 (n) | | | 1,855,000 | 1,838,175 |
| New Enterprise Stone & Lime Co., Inc., 5.25%, 7/15/2028 (n) | | | 2,000,000 | 2,000,000 |
| New Enterprise Stone & Lime Co., Inc., 9.75%, 7/15/2028 (n) | | | 1,713,000 | 1,802,933 |
| Park River Holdings, Inc., 5.625%, 2/01/2029 (n) | | | 1,055,000 | 962,688 |
| Patrick Industries, Inc., 7.5%, 10/15/2027 (n) | | | 3,305,000 | 3,470,250 |
| SRM Escrow Issuer LLC, 6%, 11/01/2028 (n) | | | 3,130,000 | 3,213,884 |
| SRS Distribution, Inc., 6.125%, 7/01/2029 (n) | | | 3,070,000 | 3,008,600 |
| Standard Industries, Inc., 4.375%, 7/15/2030 (n) | | | 3,443,000 | 3,288,065 |
| Standard Industries, Inc., 3.375%, 1/15/2031 (n) | | | 830,000 | 759,367 |
| White Cap Buyer LLC, 6.875%, 10/15/2028 (n) | | | 2,370,000 | 2,431,667 |
| | | | | $36,818,320 |
| Business Services – 2.3% |
| Austin BidCo, Inc., 7.125%, 12/15/2028 (n) | | $ | 1,905,000 | $ 1,933,575 |
| HealthEquity, Inc., 4.5%, 10/01/2029 (n) | | | 3,065,000 | 2,996,038 |
| Iron Mountain, Inc., 5.25%, 3/15/2028 (n) | | | 1,980,000 | 2,008,829 |
| Iron Mountain, Inc., REIT, 4.875%, 9/15/2027 (n) | | | 2,785,000 | 2,793,313 |
| Nielsen Finance LLC, 4.5%, 7/15/2029 (n) | | | 3,335,000 | 3,109,887 |
| Paysafe Finance PLC, 4%, 6/15/2029 (z) | | | 3,075,000 | 2,773,404 |
| Switch Ltd., 3.75%, 9/15/2028 (n) | | | 3,819,000 | 3,642,868 |
| Switch Ltd., 4.125%, 6/15/2029 (n) | | | 1,140,000 | 1,110,337 |
| Verscend Escrow Corp., 9.75%, 8/15/2026 (n) | | | 2,430,000 | 2,551,962 |
| | | | | $22,920,213 |
| Cable TV – 7.4% |
| CCO Holdings LLC/CCO Holdings Capital Corp., 4.75%, 3/01/2030 (n) | | $ | 7,275,000 | $ 7,218,946 |
| CCO Holdings LLC/CCO Holdings Capital Corp., 4.5%, 8/15/2030 (n) | | | 2,945,000 | 2,871,375 |
| CCO Holdings LLC/CCO Holdings Capital Corp., 4.25%, 2/01/2031 (n) | | | 5,165,000 | 4,927,307 |
| CCO Holdings LLC/CCO Holdings Capital Corp., 4.25%, 1/15/2034 (n) | | | 2,640,000 | 2,442,660 |
| CSC Holdings LLC, 5.375%, 2/01/2028 (n) | | | 1,500,000 | 1,504,410 |
| CSC Holdings LLC, 5.75%, 1/15/2030 (n) | | | 4,790,000 | 4,513,521 |
Portfolio of Investments – continued
| Issuer | | | Shares/Par | Value ($) |
| Bonds – continued |
| Cable TV – continued |
| CSC Holdings LLC, 4.125%, 12/01/2030 (n) | | $ | 5,080,000 | $ 4,649,165 |
| DISH DBS Corp., 7.75%, 7/01/2026 | | | 1,305,000 | 1,342,989 |
| DISH DBS Corp., 5.25%, 12/01/2026 (n) | | | 2,510,000 | 2,434,700 |
| DISH DBS Corp., 5.125%, 6/01/2029 | | | 2,110,000 | 1,840,975 |
| Intelsat Jackson Holdings S.A., 5.5%, 8/01/2023 (a)(d) | | | 2,115,000 | 922,669 |
| Intelsat Jackson Holdings S.A., 9.75%, 7/15/2025 (a)(d)(n) | | | 1,635,000 | 721,853 |
| LCPR Senior Secured Financing DAC, 6.75%, 10/15/2027 (n) | | | 2,919,000 | 3,028,404 |
| LCPR Senior Secured Financing DAC, 5.125%, 7/15/2029 (n) | | | 930,000 | 912,051 |
| Sirius XM Holdings, Inc., 3.875%, 9/01/2031 (n) | | | 3,845,000 | 3,556,625 |
| Sirius XM Radio, Inc., 4%, 7/15/2028 (n) | | | 3,327,000 | 3,218,872 |
| Sirius XM Radio, Inc., 5.5%, 7/01/2029 (n) | | | 6,460,000 | 6,704,091 |
| Telenet Finance Luxembourg S.A., 5.5%, 3/01/2028 (n) | | | 5,200,000 | 5,304,000 |
| Videotron Ltd., 5.125%, 4/15/2027 (n) | | | 2,985,000 | 3,051,028 |
| Virgin Media Finance PLC, 5%, 7/15/2030 (n) | | | 3,840,000 | 3,619,584 |
| Virgin Media Vendor Financing Notes IV DAC, 5%, 7/15/2028 (n) | | | 4,590,000 | 4,326,075 |
| Ziggo Bond Finance B.V., 5.125%, 2/28/2030 (n) | | | 5,100,000 | 4,838,038 |
| | | | | $73,949,338 |
| Chemicals – 2.5% |
| Axalta Coating Systems Ltd., 4.75%, 6/15/2027 (n) | | $ | 2,624,000 | $ 2,695,839 |
| Axalta Coating Systems Ltd., 3.375%, 2/15/2029 (n) | | | 3,855,000 | 3,551,419 |
| Consolidated Energy Finance S.A., 5.625%, 10/15/2028 (n) | | | 3,144,000 | 2,956,209 |
| Element Solutions, Inc., 3.875%, 9/01/2028 (n) | | | 3,904,000 | 3,747,840 |
| Herens Holdco S.à r.l., 4.75%, 5/15/2028 (n) | | | 2,795,000 | 2,668,694 |
| Ingevity Corp., 3.875%, 11/01/2028 (n) | | | 3,912,000 | 3,703,490 |
| LSF11 A5 HoldCo LLC, 6.625%, 10/15/2029 (n) | | | 2,050,000 | 2,009,000 |
| S.P.C.M. S.A., 3.125%, 3/15/2027 (n) | | | 945,000 | 902,475 |
| S.P.C.M. S.A., 3.375%, 3/15/2030 (n) | | | 3,325,000 | 3,121,011 |
| | | | | $25,355,977 |
| Computer Software – 1.2% |
| Camelot Finance S.A., 4.5%, 11/01/2026 (n) | | $ | 1,855,000 | $ 1,883,011 |
| Clarivate Science Holdings Corp., 3.875%, 7/01/2028 (n) | | | 745,000 | 710,693 |
| Clarivate Science Holdings Corp., 4.875%, 7/01/2029 (n) | | | 3,585,000 | 3,414,712 |
| Dun & Bradstreet Corp., 5%, 12/15/2029 (n) | | | 1,990,000 | 1,985,025 |
| PTC, Inc., 3.625%, 2/15/2025 (n) | | | 2,230,000 | 2,238,362 |
| PTC, Inc., 4%, 2/15/2028 (n) | | | 2,090,000 | 2,071,472 |
| | | | | $12,303,275 |
| Computer Software - Systems – 1.5% |
| Fair Isaac Corp., 5.25%, 5/15/2026 (n) | | $ | 5,306,000 | $ 5,674,316 |
| Fair Isaac Corp., 4%, 6/15/2028 (n) | | | 1,066,000 | 1,055,340 |
| SS&C Technologies Holdings, Inc., 5.5%, 9/30/2027 (n) | | | 4,040,000 | 4,172,189 |
Portfolio of Investments – continued
| Issuer | | | Shares/Par | Value ($) |
| Bonds – continued |
| Computer Software - Systems – continued |
| Viavi Solutions, Inc., 3.75%, 10/01/2029 (n) | | $ | 3,835,000 | $ 3,719,950 |
| | | | | $14,621,795 |
| Conglomerates – 3.1% |
| Amsted Industries Co., 5.625%, 7/01/2027 (n) | | $ | 4,195,000 | $ 4,303,860 |
| BWX Technologies, Inc., 4.125%, 6/30/2028 (n) | | | 938,000 | 925,102 |
| BWX Technologies, Inc., 4.125%, 4/15/2029 (n) | | | 5,109,000 | 5,032,365 |
| Gates Global LLC, 6.25%, 1/15/2026 (n) | | | 2,615,000 | 2,701,295 |
| Granite Holdings U.S. Acquisition Co., 11%, 10/01/2027 (n) | | | 2,330,000 | 2,493,100 |
| Griffon Corp., 5.75%, 3/01/2028 | | | 2,992,000 | 2,989,068 |
| Madison IAQ LLC, 5.875%, 6/30/2029 (n) | | | 2,725,000 | 2,518,459 |
| Stevens Holding Co., Inc., 6.125%, 10/01/2026 (n) | | | 2,985,000 | 3,115,594 |
| TriMas Corp., 4.125%, 4/15/2029 (n) | | | 7,048,000 | 6,907,040 |
| | | | | $30,985,883 |
| Construction – 1.3% |
| Empire Communities Corp., 7%, 12/15/2025 (n) | | $ | 2,250,000 | $ 2,288,970 |
| Mattamy Group Corp., 5.25%, 12/15/2027 (n) | | | 1,260,000 | 1,282,214 |
| Mattamy Group Corp., 4.625%, 3/01/2030 (n) | | | 2,520,000 | 2,484,544 |
| Taylor Morrison Communities, Inc., 5.75%, 1/15/2028 (n) | | | 2,650,000 | 2,822,250 |
| Taylor Morrison Communities, Inc., 5.125%, 8/01/2030 (n) | | | 1,675,000 | 1,736,070 |
| Weekley Homes LLC/Weekley Finance Corp., 4.875%, 9/15/2028 (n) | | | 2,921,000 | 2,873,008 |
| | | | | $13,487,056 |
| Consumer Products – 1.2% |
| Mattel, Inc., 3.375%, 4/01/2026 (n) | | $ | 2,670,000 | $ 2,658,652 |
| Mattel, Inc., 5.875%, 12/15/2027 (n) | | | 1,485,000 | 1,577,812 |
| Mattel, Inc., 5.45%, 11/01/2041 | | | 975,000 | 1,092,000 |
| Prestige Consumer Healthcare, Inc., 5.125%, 1/15/2028 (n) | | | 2,480,000 | 2,498,600 |
| Prestige Consumer Healthcare, Inc., 3.75%, 4/01/2031 (n) | | | 1,435,000 | 1,302,263 |
| SWF Escrow Issuer Corp., 6.5%, 10/01/2029 (n) | | | 2,560,000 | 2,380,800 |
| | | | | $11,510,127 |
| Consumer Services – 3.9% |
| Allied Universal Holdco LLC, 6.625%, 7/15/2026 (n) | | $ | 925,000 | $ 949,850 |
| Allied Universal Holdco LLC, 9.75%, 7/15/2027 (n) | | | 3,000,000 | 3,165,000 |
| Allied Universal Holdco LLC, 6%, 6/01/2029 (n) | | | 1,480,000 | 1,402,899 |
| ANGI Group LLC, 3.875%, 8/15/2028 (n) | | | 3,536,000 | 3,236,890 |
| Arches Buyer, Inc., 6.125%, 12/01/2028 (n) | | | 2,905,000 | 2,821,481 |
| GoDaddy, Inc., 3.5%, 3/01/2029 (n) | | | 5,411,000 | 5,046,190 |
| GW B-CR Security Corp., 9.5%, 11/01/2027 (n) | | | 2,322,000 | 2,440,422 |
| Match Group Holdings II LLC, 3.625%, 10/01/2031 (n) | | | 245,000 | 224,501 |
| Match Group, Inc., 5%, 12/15/2027 (n) | | | 2,465,000 | 2,535,869 |
Portfolio of Investments – continued
| Issuer | | | Shares/Par | Value ($) |
| Bonds – continued |
| Consumer Services – continued |
| Match Group, Inc., 4.625%, 6/01/2028 (n) | | $ | 3,815,000 | $ 3,767,313 |
| Match Group, Inc., 4.125%, 8/01/2030 (n) | | | 1,030,000 | 988,800 |
| Realogy Group LLC/Realogy Co-Issuer Corp., 9.375%, 4/01/2027 (n) | | | 2,340,000 | 2,533,518 |
| Realogy Group LLC/Realogy Co-Issuer Corp., 5.75%, 1/15/2029 (n) | | | 1,530,000 | 1,502,919 |
| Realogy Group LLC/Realogy Co-Issuer Corp., 5.25%, 4/15/2030 (n) | | | 1,860,000 | 1,780,950 |
| TriNet Group, Inc., 3.5%, 3/01/2029 (n) | | | 4,288,000 | 4,071,971 |
| WASH Multifamily Acquisition, Inc., 5.75%, 4/15/2026 (n) | | | 1,955,000 | 1,979,438 |
| | | | | $38,448,011 |
| Containers – 2.3% |
| ARD Finance S.A., 6.5% (6.5% cash or 7.25% PIK), 6/30/2027 (n)(p) | | $ | 1,397,076 | $ 1,411,047 |
| Ardagh Metal Packaging, 3.25%, 9/01/2028 (n) | | | 1,735,000 | 1,656,005 |
| Ardagh Metal Packaging, 4%, 9/01/2029 (n) | | | 2,951,000 | 2,810,828 |
| Ardagh Packaging Finance PLC/Ardagh MP Holdings USA, Inc., 5.25%, 8/15/2027 (n) | | | 3,700,000 | 3,626,000 |
| Can-Pack S.A., 3.875%, 11/15/2029 (n) | | | 4,505,000 | 4,314,333 |
| Crown Americas LLC/Crown Americas Capital Corp. V, 4.25%, 9/30/2026 | | | 4,670,000 | 4,815,937 |
| Crown Americas LLC/Crown Americas Capital Corp. VI, 4.75%, 2/01/2026 | | | 1,280,000 | 1,305,971 |
| Greif, Inc., 6.5%, 3/01/2027 (n) | | | 2,825,000 | 2,924,158 |
| | | | | $22,864,279 |
| Electrical Equipment – 0.4% |
| CommScope Technologies LLC, 5%, 3/15/2027 (n) | | $ | 4,720,000 | $ 4,203,302 |
| Electronics – 1.8% |
| Diebold Nixdorf, Inc., 8.5%, 4/15/2024 | | $ | 1,155,000 | $ 1,146,338 |
| Diebold Nixdorf, Inc., 9.375%, 7/15/2025 (n) | | | 1,686,000 | 1,770,941 |
| Entegris, Inc., 4.375%, 4/15/2028 (n) | | | 1,175,000 | 1,166,187 |
| Entegris, Inc., 3.625%, 5/01/2029 (n) | | | 1,577,000 | 1,510,356 |
| Sensata Technologies B.V., 5.625%, 11/01/2024 (n) | | | 2,330,000 | 2,458,150 |
| Sensata Technologies B.V., 5%, 10/01/2025 (n) | | | 4,320,000 | 4,552,200 |
| Sensata Technologies, Inc., 4.375%, 2/15/2030 (n) | | | 1,985,000 | 1,984,206 |
| Synaptics, Inc., 4%, 6/15/2029 (n) | | | 3,570,000 | 3,500,742 |
| | | | | $18,089,120 |
Portfolio of Investments – continued
| Issuer | | | Shares/Par | Value ($) |
| Bonds – continued |
| Energy - Independent – 3.8% |
| Callon Petroleum Co., 6.125%, 10/01/2024 | | $ | 1,540,000 | $ 1,540,000 |
| Callon Petroleum Co., 8%, 8/01/2028 (n) | | | 1,735,000 | 1,767,531 |
| CNX Resources Corp., 6%, 1/15/2029 (n) | | | 3,600,000 | 3,708,000 |
| Colgate Energy Partners III LLC, 5.875%, 7/01/2029 (n) | | | 1,240,000 | 1,260,150 |
| Comstock Resources, Inc., 6.75%, 3/01/2029 (n) | | | 2,505,000 | 2,577,119 |
| CrownRock LP/CrownRock Finance, Inc., “F”, 5%, 5/01/2029 (n) | | | 1,980,000 | 1,998,652 |
| Encino Acquisition Partners Holdings LLC, 8.5%, 5/01/2028 (n) | | | 1,715,000 | 1,734,294 |
| EQT Corp., 5%, 1/15/2029 | | | 2,645,000 | 2,783,862 |
| Laredo Petroleum, Inc., 10.125%, 1/15/2028 | | | 495,000 | 520,988 |
| Moss Creek Resources Holdings, Inc., 7.5%, 1/15/2026 (n) | | | 495,000 | 453,034 |
| Occidental Petroleum Corp., 5.875%, 9/01/2025 | | | 2,350,000 | 2,511,562 |
| Occidental Petroleum Corp., 5.5%, 12/01/2025 | | | 2,110,000 | 2,239,042 |
| Occidental Petroleum Corp., 6.625%, 9/01/2030 | | | 3,480,000 | 4,083,815 |
| Occidental Petroleum Corp., 6.45%, 9/15/2036 | | | 1,265,000 | 1,536,596 |
| Occidental Petroleum Corp., 6.6%, 3/15/2046 | | | 1,865,000 | 2,344,645 |
| SM Energy Co., 5.625%, 6/01/2025 | | | 1,590,000 | 1,578,075 |
| SM Energy Co., 6.5%, 7/15/2028 | | | 1,560,000 | 1,611,480 |
| Southwestern Energy Co., 5.95%, 1/23/2025 | | | 186,400 | 197,118 |
| Southwestern Energy Co., 8.375%, 9/15/2028 | | | 1,415,000 | 1,552,538 |
| Southwestern Energy Co., 5.375%, 3/15/2030 | | | 1,525,000 | 1,562,530 |
| | | | | $37,561,031 |
| Entertainment – 3.6% |
| AMC Entertainment Holdings, Inc., 10% (10% cash or 12% PIK), 6/15/2026 (n)(p) | | $ | 1,025,000 | $ 955,720 |
| Carnival Corp. PLC, 7.625%, 3/01/2026 (n) | | | 6,195,000 | 6,318,900 |
| Carnival Corp. PLC, 5.75%, 3/01/2027 (n) | | | 2,435,000 | 2,335,652 |
| Carnival Corp. PLC, 6%, 5/01/2029 (n) | | | 770,000 | 740,740 |
| Cedar Fair LP/Canada's Wonderland Co./Magnum Management Corp./Millennium Operations LLC, 5.375%, 4/15/2027 | | | 1,585,000 | 1,604,813 |
| Life Time, Inc., 5.75%, 1/15/2026 (n) | | | 2,475,000 | 2,484,900 |
| Live Nation Entertainment, Inc., 5.625%, 3/15/2026 (n) | | | 3,695,000 | 3,759,662 |
| Live Nation Entertainment, Inc., 3.75%, 1/15/2028 (n) | | | 1,660,000 | 1,601,900 |
| Motion Bondco DAC, 6.625%, 11/15/2027 (n) | | | 2,685,000 | 2,678,287 |
| NCL Corp. Ltd., 3.625%, 12/15/2024 (n) | | | 2,100,000 | 1,936,557 |
| NCL Corp. Ltd., 5.875%, 3/15/2026 (n) | | | 1,915,000 | 1,824,038 |
| Royal Caribbean Cruises Ltd., 5.375%, 7/15/2027 (n) | | | 1,240,000 | 1,198,336 |
| Royal Caribbean Cruises Ltd., 5.5%, 4/01/2028 (n) | | | 3,705,000 | 3,594,924 |
| SeaWorld Parks & Entertainment, 5.25%, 8/15/2029 (n) | | | 3,970,000 | 3,868,011 |
| Viking Cruises Ltd. Co., 5.875%, 9/15/2027 (n) | | | 1,535,000 | 1,400,688 |
| | | | | $36,303,128 |
Portfolio of Investments – continued
| Issuer | | | Shares/Par | Value ($) |
| Bonds – continued |
| Financial Institutions – 2.9% |
| Avation Capital S.A., 8.25% (8.25% cash or 9% PIK), 10/31/2026 (n)(p) | | $ | 1,950,749 | $ 1,638,629 |
| Credit Acceptance Corp., 5.125%, 12/31/2024 (n) | | | 3,660,000 | 3,696,600 |
| Freedom Mortgage Corp., 7.625%, 5/01/2026 (n) | | | 2,380,000 | 2,272,900 |
| Global Aircraft Leasing Co. Ltd., 6.5% (6.5% cash or 7.25% PIK), 9/15/2024 (n)(p) | | | 7,301,980 | 6,830,466 |
| Howard Hughes Corp., 4.125%, 2/01/2029 (n) | | | 4,258,000 | 4,092,917 |
| Nationstar Mortgage Holdings, Inc., 6%, 1/15/2027 (n) | | | 3,275,000 | 3,397,419 |
| Nationstar Mortgage Holdings, Inc., 5.75%, 11/15/2031 (n) | | | 1,250,000 | 1,208,738 |
| OneMain Finance Corp., 6.875%, 3/15/2025 | | | 2,085,000 | 2,262,225 |
| OneMain Finance Corp., 8.875%, 6/01/2025 | | | 1,413,000 | 1,499,772 |
| OneMain Finance Corp., 7.125%, 3/15/2026 | | | 1,350,000 | 1,484,101 |
| Rocket Mortgage Co-Issuer, Inc., 3.625%, 3/01/2029 (n) | | | 995,000 | 930,216 |
| | | | | $29,313,983 |
| Food & Beverages – 3.1% |
| Aramark Services, Inc., 6.375%, 5/01/2025 (n) | | $ | 4,085,000 | $ 4,233,081 |
| Aramark Services, Inc., 5%, 2/01/2028 (n) | | | 995,000 | 987,538 |
| JBS USA Lux S.A./JBS USA Finance, Inc., 6.75%, 2/15/2028 (n) | | | 4,250,000 | 4,531,605 |
| Lamb Weston Holdings, Inc., 4.125%, 1/31/2030 (n) | | | 4,825,000 | 4,766,642 |
| Performance Food Group Co., 5.5%, 10/15/2027 (n) | | | 3,225,000 | 3,299,368 |
| Post Holdings, Inc., 5.625%, 1/15/2028 (n) | | | 2,405,000 | 2,469,502 |
| Post Holdings, Inc., 4.625%, 4/15/2030 (n) | | | 3,995,000 | 3,850,181 |
| Primo Water Holding, Inc., 4.375%, 4/30/2029 (n) | | | 3,125,000 | 2,983,063 |
| U.S. Foods Holding Corp., 4.75%, 2/15/2029 (n) | | | 3,800,000 | 3,729,510 |
| | | | | $30,850,490 |
| Gaming & Lodging – 6.8% |
| Boyd Gaming Corp., 4.75%, 12/01/2027 | | $ | 3,110,000 | $ 3,094,232 |
| Boyd Gaming Corp., 4.75%, 6/15/2031 (n) | | | 1,250,000 | 1,226,925 |
| Caesars Entertainment, Inc., 4.625%, 10/15/2029 (n) | | | 2,565,000 | 2,455,737 |
| Caesars Resort Collection LLC/CRC Finco, Inc., 5.75%, 7/01/2025 (n) | | | 2,006,000 | 2,065,578 |
| Caesars Resort Collection LLC/CRC Finco, Inc., 8.125%, 7/01/2027 (n) | | | 2,691,000 | 2,896,189 |
| CCM Merger, Inc., 6.375%, 5/01/2026 (n) | | | 2,675,000 | 2,768,625 |
| Hilton Domestic Operating Co., Inc., 3.75%, 5/01/2029 (n) | | | 3,947,000 | 3,845,878 |
| Hilton Domestic Operating Co., Inc., 3.625%, 2/15/2032 (n) | | | 3,527,000 | 3,346,876 |
| International Game Technology PLC, 4.125%, 4/15/2026 (n) | | | 4,170,000 | 4,180,425 |
| International Game Technology PLC, 6.25%, 1/15/2027 (n) | | | 1,030,000 | 1,120,872 |
| Marriott Ownership Resorts, Inc., 4.5%, 6/15/2029 (n) | | | 3,080,000 | 3,021,603 |
| MGM China Holdings Ltd., 5.375%, 5/15/2024 (n) | | | 1,035,000 | 1,029,825 |
| MGM China Holdings Ltd., 5.875%, 5/15/2026 (n) | | | 1,670,000 | 1,663,738 |
| MGM China Holdings Ltd., 4.75%, 2/01/2027 (n) | | | 1,043,000 | 998,673 |
Portfolio of Investments – continued
| Issuer | | | Shares/Par | Value ($) |
| Bonds – continued |
| Gaming & Lodging – continued |
| MGM Growth Properties LLC, 4.625%, 6/15/2025 (n) | | $ | 3,050,000 | $ 3,187,250 |
| MGM Growth Properties LLC, 5.75%, 2/01/2027 | | | 1,110,000 | 1,226,550 |
| MGM Growth Properties LLC, 3.875%, 2/15/2029 (n) | | | 2,152,000 | 2,211,180 |
| Penn National Gaming, Inc., 4.125%, 7/01/2029 (n) | | | 2,415,000 | 2,270,100 |
| Scientific Games Corp., 8.625%, 7/01/2025 (n) | | | 770,000 | 816,200 |
| Scientific Games Corp., 8.25%, 3/15/2026 (n) | | | 1,910,000 | 1,993,563 |
| Scientific Games International, Inc., 7%, 5/15/2028 (n) | | | 1,950,000 | 2,047,987 |
| VICI Properties LP, REIT, 4.25%, 12/01/2026 (n) | | | 2,865,000 | 2,897,231 |
| VICI Properties LP, REIT, 3.75%, 2/15/2027 (n) | | | 2,580,000 | 2,554,522 |
| Wyndham Hotels & Resorts, Inc., 4.375%, 8/15/2028 (n) | | | 4,663,000 | 4,626,629 |
| Wynn Las Vegas LLC/Wynn Las Vegas Capital Corp., 5.25%, 5/15/2027 (n) | | | 2,055,000 | 2,021,750 |
| Wynn Macau Ltd., 4.875%, 10/01/2024 (n) | | | 870,000 | 826,035 |
| Wynn Macau Ltd., 5.5%, 1/15/2026 (n) | | | 2,100,000 | 1,970,430 |
| Wynn Macau Ltd., 5.625%, 8/26/2028 (n) | | | 2,854,000 | 2,611,410 |
| Wynn Resorts Finance LLC/Wynn Resorts Capital Corp., 5.125%, 10/01/2029 (n) | | | 2,525,000 | 2,454,047 |
| | | | | $67,430,060 |
| Industrial – 1.1% |
| Albion Financing 2 S.à r.l., 8.75%, 4/15/2027 (n) | | $ | 1,010,000 | $ 1,002,425 |
| APi Escrow Corp., 4.75%, 10/15/2029 (n) | | | 3,470,000 | 3,409,275 |
| Dycom Industries, Inc., 4.5%, 4/15/2029 (n) | | | 1,980,000 | 1,939,074 |
| Williams Scotsman International, Inc., 4.625%, 8/15/2028 (n) | | | 4,351,000 | 4,389,071 |
| | | | | $10,739,845 |
| Insurance - Property & Casualty – 1.3% |
| Alliant Holdings Intermediate LLC, 6.75%, 10/15/2027 (n) | | $ | 4,755,000 | $ 4,699,747 |
| AssuredPartners, Inc., 5.625%, 1/15/2029 (n) | | | 2,370,000 | 2,203,247 |
| GTCR (AP) Finance, Inc., 8%, 5/15/2027 (n) | | | 700,000 | 710,500 |
| Hub International Ltd., 5.625%, 12/01/2029 (n) | | | 2,920,000 | 2,868,900 |
| Ryan Specialty Group, 4.375%, 2/01/2030 (n) | | | 2,404,000 | 2,391,980 |
| | | | | $12,874,374 |
| Machinery & Tools – 0.7% |
| Ritchie Bros. Holdings Ltd., 4.75%, 12/15/2031 (n) | | $ | 3,220,000 | $ 3,243,184 |
| Terex Corp., 5%, 5/15/2029 (n) | | | 3,715,000 | 3,684,908 |
| | | | | $6,928,092 |
| Medical & Health Technology & Services – 6.5% |
| 180 Medical, Inc., 3.875%, 10/15/2029 (n) | | $ | 3,525,000 | $ 3,428,063 |
| Avantor Funding, Inc., 4.625%, 7/15/2028 (n) | | | 3,865,000 | 3,855,338 |
| Catalent, Inc., 3.125%, 2/15/2029 (n) | | | 5,609,000 | 5,244,415 |
Portfolio of Investments – continued
| Issuer | | | Shares/Par | Value ($) |
| Bonds – continued |
| Medical & Health Technology & Services – continued |
| Charles River Laboratories International, Inc., 3.75%, 3/15/2029 (n) | | $ | 6,825,000 | $ 6,584,077 |
| CHS/Community Health Systems, Inc., 8%, 12/15/2027 (n) | | | 1,780,000 | 1,886,800 |
| CHS/Community Health Systems, Inc., 6.125%, 4/01/2030 (n) | | | 4,435,000 | 4,223,029 |
| CHS/Community Health Systems, Inc., 5.25%, 5/15/2030 (n) | | | 745,000 | 741,797 |
| DaVita, Inc., 4.625%, 6/01/2030 (n) | | | 2,290,000 | 2,227,918 |
| DaVita, Inc., 3.75%, 2/15/2031 (n) | | | 2,193,000 | 2,014,709 |
| Encompass Health Corp., 5.125%, 3/15/2023 | | | 875,000 | 873,906 |
| Encompass Health Corp., 5.75%, 9/15/2025 | | | 1,940,000 | 1,959,400 |
| HCA, Inc., 5.875%, 2/15/2026 | | | 4,395,000 | 4,784,001 |
| IQVIA Holdings, Inc., 5%, 10/15/2026 (n) | | | 3,078,000 | 3,148,794 |
| IQVIA Holdings, Inc., 5%, 5/15/2027 (n) | | | 5,440,000 | 5,563,488 |
| Legacy LifePoint Health LLC, 4.375%, 2/15/2027 (n) | | | 995,000 | 974,951 |
| MPH Acquisition Holdings LLC, 5.5%, 9/01/2028 (n) | | | 1,925,000 | 1,848,481 |
| Regional Care/LifePoint Health, Inc., 9.75%, 12/01/2026 (n) | | | 2,110,000 | 2,219,783 |
| Syneos Health, Inc., 3.625%, 1/15/2029 (n) | | | 4,441,000 | 4,209,091 |
| Tenet Healthcare Corp., 6.125%, 10/01/2028 (n) | | | 4,005,000 | 4,018,096 |
| U.S. Renal Care, Inc., 10.625%, 7/15/2027 (n) | | | 2,235,000 | 2,279,700 |
| US Acute Care Solutions LLC, 6.375%, 3/01/2026 (n) | | | 2,255,000 | 2,266,275 |
| US Acute Care Solutions LLC, 6.375%, 3/01/2026 (n)(w) | | | 745,000 | 748,725 |
| | | | | $65,100,837 |
| Medical Equipment – 0.4% |
| Teleflex, Inc., 4.625%, 11/15/2027 | | $ | 3,890,000 | $ 3,967,800 |
| Metals & Mining – 3.7% |
| Baffinland Iron Mines Corp./Baffinland Iron Mines LP, 8.75%, 7/15/2026 (n) | | $ | 3,620,000 | $ 3,769,325 |
| Coeur Mining, Inc., 5.125%, 2/15/2029 (n) | | | 3,590,000 | 3,423,962 |
| Compass Minerals International, Inc., 6.75%, 12/01/2027 (n) | | | 2,885,000 | 3,022,614 |
| Eldorado Gold Corp., 6.25%, 9/01/2029 (n) | | | 2,820,000 | 2,819,803 |
| Ero Copper Corp., 6.5%, 2/15/2030 (n)(w) | | | 1,307,000 | 1,291,499 |
| First Quantum Minerals Ltd., 6.875%, 3/01/2026 (n) | | | 1,645,000 | 1,698,463 |
| First Quantum Minerals Ltd., 6.875%, 10/15/2027 (n) | | | 1,968,000 | 2,091,000 |
| FMG Resources Ltd., 4.375%, 4/01/2031 (n) | | | 3,740,000 | 3,763,375 |
| GrafTech Finance, Inc., 4.625%, 12/15/2028 (n) | | | 2,315,000 | 2,235,896 |
| Kaiser Aluminum Corp., 4.625%, 3/01/2028 (n) | | | 4,670,000 | 4,480,024 |
| Kaiser Aluminum Corp., 4.5%, 6/01/2031 (n) | | | 2,070,000 | 1,966,500 |
| Novelis Corp., 3.25%, 11/15/2026 (n) | | | 1,265,000 | 1,225,406 |
| Novelis Corp., 4.75%, 1/30/2030 (n) | | | 2,985,000 | 2,970,075 |
| Novelis Corp., 3.875%, 8/15/2031 (n) | | | 1,517,000 | 1,428,665 |
Portfolio of Investments – continued
| Issuer | | | Shares/Par | Value ($) |
| Bonds – continued |
| Metals & Mining – continued |
| Petra Diamonds US$ Treasury PLC, 10.5% PIK to 12/31/2022, 10.5% PIK/9.75% Cash to 6/30/2023, 9.75% Cash to 3/08/2026 (n)(p) | | $ | 1,115,912 | $ 1,146,600 |
| | | | | $37,333,207 |
| Midstream – 4.5% |
| Cheniere Energy Partners LP, 4.5%, 10/01/2029 | | $ | 1,339,000 | $ 1,368,753 |
| Cheniere Energy Partners LP, 4%, 3/01/2031 | | | 3,970,000 | 3,949,932 |
| DT Midstream, Inc., 4.125%, 6/15/2029 (n) | | | 2,398,000 | 2,365,603 |
| DT Midstream, Inc., 4.375%, 6/15/2031 (n) | | | 4,043,000 | 3,992,462 |
| EnLink Midstream Partners LP, 5.625%, 1/15/2028 (n) | | | 2,125,000 | 2,181,737 |
| EQM Midstream Partners LP, 6%, 7/01/2025 (n) | | | 916,000 | 945,770 |
| EQM Midstream Partners LP, 6.5%, 7/01/2027 (n) | | | 246,000 | 257,070 |
| EQM Midstream Partners LP, 5.5%, 7/15/2028 | | | 5,725,000 | 5,794,330 |
| EQM Midstream Partners LP, 4.5%, 1/15/2029 (n) | | | 1,505,000 | 1,437,305 |
| Genesis Energy LP/Genesis Energy Finance Corp., 6.25%, 5/15/2026 | | | 1,287,200 | 1,235,712 |
| Northriver Midstream Finance LP, 5.625%, 2/15/2026 (n) | | | 3,440,000 | 3,491,600 |
| Targa Resources Partners LP/Targa Resources Finance Corp., 6.875%, 1/15/2029 | | | 4,245,000 | 4,642,969 |
| Targa Resources Partners LP/Targa Resources Finance Corp., 4.875%, 2/01/2031 | | | 2,130,000 | 2,225,850 |
| Targa Resources Partners LP/Targa Resources Finance Corp., 4%, 1/31/2032 (n) | | | 1,245,000 | 1,239,273 |
| Venture Global Calcasieu Pass LLC, 3.875%, 8/15/2029 (n) | | | 2,255,000 | 2,251,031 |
| Venture Global Calcasieu Pass LLC, 4.125%, 8/15/2031 (n) | | | 2,255,000 | 2,269,636 |
| Western Midstream Operating LP, 5.3%, 2/01/2030 | | | 2,650,000 | 2,762,625 |
| Western Midstream Operation LP, 4.65%, 7/01/2026 | | | 995,000 | 1,041,377 |
| Western Midstream Operation LP, 5.5%, 8/15/2048 | | | 910,000 | 1,005,550 |
| | | | | $44,458,585 |
| Municipals – 0.0% |
| Puerto Rico Industrial, Tourist, Educational, Medical & Environmental Control Facilities Financing Authority Rev. (Cogeneration Facilities - AES Puerto Rico Project), 9.12%, 6/01/2022 | | $ | 415,000 | $ 425,375 |
| Network & Telecom – 0.5% |
| Iliad Holding S.A.S., 7%, 10/15/2028 (n) | | $ | 2,782,000 | $ 2,828,209 |
| Zayo Group Holdings, Inc., 6.125%, 3/01/2028 (n) | | | 2,300,000 | 2,169,820 |
| | | | | $4,998,029 |
Portfolio of Investments – continued
| Issuer | | | Shares/Par | Value ($) |
| Bonds – continued |
| Oil Services – 0.2% |
| Nabors Industries, Inc., 5.75%, 2/01/2025 | | $ | 495,000 | $ 457,875 |
| Solaris Midstream Holding LLC, 7.625%, 4/01/2026 (n) | | | 1,640,000 | 1,693,513 |
| | | | | $2,151,388 |
| Oils – 0.7% |
| Parkland Corp., 4.625%, 5/01/2030 (n) | | $ | 4,070,000 | $ 3,907,200 |
| PBF Holding Co. LLC/PBF Finance Corp., 7.25%, 6/15/2025 | | | 2,240,000 | 1,777,339 |
| PBF Holding Co. LLC/PBF Finance Corp., 6%, 2/15/2028 | | | 1,960,000 | 1,376,900 |
| | | | | $7,061,439 |
| Personal Computers & Peripherals – 0.5% |
| NCR Corp., 5%, 10/01/2028 (n) | | $ | 3,780,000 | $ 3,755,657 |
| NCR Corp., 5.125%, 4/15/2029 (n) | | | 1,760,000 | 1,756,145 |
| | | | | $5,511,802 |
| Pharmaceuticals – 2.5% |
| Bausch Health Companies, Inc., 6.125%, 4/15/2025 (n) | | $ | 5,838,000 | $ 5,950,381 |
| Bausch Health Companies, Inc., 5%, 1/30/2028 (n) | | | 5,415,000 | 4,562,138 |
| Bausch Health Companies, Inc., 5%, 2/15/2029 (n) | | | 1,810,000 | 1,457,050 |
| Endo Luxembourg Finance Co I S.à r.l., 6.125%, 4/01/2029 (n) | | | 1,735,000 | 1,648,632 |
| Jazz Securities DAC, 4.375%, 1/15/2029 (n) | | | 4,190,000 | 4,136,997 |
| Organon Finance 1 LLC, 4.125%, 4/30/2028 (n) | | | 2,461,000 | 2,421,673 |
| Organon Finance 1 LLC, 5.125%, 4/30/2031 (n) | | | 3,101,000 | 3,101,000 |
| Par Pharmaceutical, Inc., 7.5%, 4/01/2027 (n) | | | 1,865,000 | 1,876,656 |
| | | | | $25,154,527 |
| Pollution Control – 0.8% |
| GFL Environmental, Inc., 4%, 8/01/2028 (n) | | $ | 2,970,000 | $ 2,767,060 |
| GFL Environmental, Inc., 4.75%, 6/15/2029 (n) | | | 1,000,000 | 970,000 |
| GFL Environmental, Inc., 4.375%, 8/15/2029 (n) | | | 1,285,000 | 1,226,263 |
| Stericycle, Inc., 3.875%, 1/15/2029 (n) | | | 3,470,000 | 3,296,500 |
| | | | | $8,259,823 |
| Precious Metals & Minerals – 0.4% |
| IAMGOLD Corp., 5.75%, 10/15/2028 (n) | | $ | 2,520,000 | $ 2,365,272 |
| Taseko Mines Ltd., 7%, 2/15/2026 (n) | | | 2,000,000 | 2,027,800 |
| | | | | $4,393,072 |
| Printing & Publishing – 0.4% |
| Cimpress N.V., 7%, 6/15/2026 (n) | | $ | 3,565,000 | $ 3,664,570 |
| Railroad & Shipping – 0.2% |
| Watco Cos. LLC/Watco Finance Corp., 6.5%, 6/15/2027 (n) | | $ | 2,022,000 | $ 2,092,770 |
Portfolio of Investments – continued
| Issuer | | | Shares/Par | Value ($) |
| Bonds – continued |
| Real Estate - Other – 0.7% |
| Park Intermediate Holdings LLC/PK Domestic Property LLC/PK Finance Co-Issuer, 5.875%, 10/01/2028 (n) | | $ | 3,890,000 | $ 3,981,065 |
| XHR LP, REIT, 4.875%, 6/01/2029 (n) | | | 2,695,000 | 2,642,447 |
| | | | | $6,623,512 |
| Restaurants – 0.2% |
| Fertitta Entertainment LLC, 6.75%, 1/15/2030 (n) | | $ | 1,980,000 | $ 1,923,966 |
| Retailers – 1.2% |
| Asbury Automotive Group, Inc., 4.625%, 11/15/2029 (n) | | $ | 1,714,000 | $ 1,686,610 |
| Bath & Body Works, Inc., 5.25%, 2/01/2028 | | | 6,740,000 | 7,077,000 |
| Victoria's Secret & Co., 4.625%, 7/15/2029 (n) | | | 2,975,000 | 2,866,785 |
| | | | | $11,630,395 |
| Specialty Chemicals – 0.3% |
| Univar Solutions USA, Inc., 5.125%, 12/01/2027 (n) | | $ | 2,996,000 | $ 3,048,430 |
| Specialty Stores – 1.0% |
| Group 1 Automotive, Inc., 4%, 8/15/2028 (n) | | $ | 2,634,000 | $ 2,520,922 |
| Michael Cos., Inc., 5.25%, 5/01/2028 (n) | | | 1,710,000 | 1,646,610 |
| Michael Cos., Inc., 7.875%, 5/01/2029 (n) | | | 2,055,000 | 1,880,325 |
| Penske Automotive Group Co., 3.75%, 6/15/2029 | | | 3,967,000 | 3,734,058 |
| | | | | $9,781,915 |
| Supermarkets – 0.6% |
| Albertsons Cos. LLC/Safeway, Inc., 4.625%, 1/15/2027 (n) | | $ | 3,535,000 | $ 3,618,072 |
| Albertsons Cos. LLC/Safeway, Inc., 3.5%, 3/15/2029 (n) | | | 2,425,000 | 2,289,588 |
| | | | | $5,907,660 |
| Telecommunications - Wireless – 2.3% |
| Altice France S.A., 6%, 2/15/2028 (n) | | $ | 3,180,000 | $ 2,902,227 |
| SBA Communications Corp., 3.875%, 2/15/2027 | | | 2,448,000 | 2,472,480 |
| SBA Communications Corp., 3.125%, 2/01/2029 | | | 4,805,000 | 4,478,020 |
| Sprint Capital Corp., 6.875%, 11/15/2028 | | | 4,250,000 | 5,055,375 |
| Sprint Corp., 7.125%, 6/15/2024 | | | 1,510,000 | 1,645,900 |
| Sprint Corp., 7.625%, 3/01/2026 | | | 5,280,000 | 6,045,600 |
| | | | | $22,599,602 |
| Tobacco – 0.3% |
| Vector Group Ltd., 10.5%, 11/01/2026 (n) | | $ | 1,450,000 | $ 1,486,830 |
| Vector Group Ltd., 5.75%, 2/01/2029 (n) | | | 1,650,000 | 1,524,897 |
| | | | | $3,011,727 |
Portfolio of Investments – continued
| Issuer | | | Shares/Par | Value ($) |
| Bonds – continued |
| Utilities - Electric Power – 2.7% |
| Calpine Corp., 4.5%, 2/15/2028 (n) | | $ | 3,110,000 | $ 3,039,714 |
| Calpine Corp., 5.125%, 3/15/2028 (n) | | | 3,750,000 | 3,658,237 |
| Clearway Energy Operating LLC, 4.75%, 3/15/2028 (n) | | | 1,590,000 | 1,636,635 |
| Clearway Energy Operating LLC, 3.75%, 2/15/2031 (n) | | | 5,940,000 | 5,592,332 |
| NextEra Energy, Inc., 4.25%, 7/15/2024 (n) | | | 2,022,000 | 2,081,396 |
| NextEra Energy, Inc., 4.25%, 9/15/2024 (n) | | | 488,000 | 503,250 |
| NextEra Energy, Inc., 4.5%, 9/15/2027 (n) | | | 2,255,000 | 2,283,188 |
| TerraForm Global Operating LLC, 6.125%, 3/01/2026 (n) | | | 1,805,000 | 1,827,563 |
| TerraForm Power Operating LLC, 5%, 1/31/2028 (n) | | | 4,745,000 | 4,804,312 |
| TerraForm Power Operating LLC, 4.75%, 1/15/2030 (n) | | | 1,505,000 | 1,512,826 |
| | | | | $26,939,453 |
| Total Bonds (Identified Cost, $968,733,065) | | $ 956,752,160 |
| Common Stocks – 0.8% |
| Construction – 0.0% | |
| ICA Tenedora S.A. de C.V. (u) | | 258,532 | $ 213,062 |
| Oil Services – 0.1% | |
| LTRI Holdings LP (a)(u) | | 3,300 | $ 949,047 |
| Precious Metals & Minerals – 0.0% | |
| Petra Diamonds Ltd. (a) | | 161,793 | $ 183,760 |
| Special Products & Services – 0.7% | |
| iShares iBoxx $ High Yield Corporate Bond ETF | | 73,200 | $ 6,200,040 |
| Total Common Stocks (Identified Cost, $6,976,280) | | $ 7,545,909 |
| | Strike
Price | First
Exercise | | |
| Warrants – 0.0% | | | | |
| Other Banks & Diversified Financials – 0.0% |
| Avation Capital S.A. (1 share for 1 warrant, Expiration 10/31/26) (a)(u) (Identified Cost, $0) | GBP 1.14 | 3/16/21 | 42,350 | $ 6,820 |
| | | | | |
| Investment Companies (h) – 2.4% |
| Money Market Funds – 2.4% | |
| MFS Institutional Money Market Portfolio, 0.06% (v) (Identified Cost, $24,340,169) | | | 24,340,223 | $ 24,340,223 |
|
|
| Other Assets, Less Liabilities – 0.9% | | 8,720,895 |
| Net Assets – 100.0% | $997,366,007 |
| (a) | Non-income producing security. |
| (d) | In default. |
Portfolio of Investments – continued
| (h) | An affiliated issuer, which may be considered one in which the fund owns 5% or more of the outstanding voting securities, or a company which is under common control. At period end, the aggregate values of the fund's investments in affiliated issuers and in unaffiliated issuers were $24,340,223 and $964,304,889, respectively. |
| (n) | Securities exempt from registration under Rule 144A of the Securities Act of 1933. These securities may be sold in the ordinary course of business in transactions exempt from registration, normally to qualified institutional buyers. At period end, the aggregate value of these securities was $810,959,065, representing 81.3% of net assets. |
| (p) | Payment-in-kind (PIK) security for which interest income may be received in additional securities and/or cash. |
| (u) | The security was valued using significant unobservable inputs and is considered level 3 under the fair value hierarchy. For further information about the fund’s level 3 holdings, please see Note 2 in the Notes to Financial Statements. |
| (v) | Affiliated issuer that is available only to investment companies managed by MFS. The rate quoted for the MFS Institutional Money Market Portfolio is the annualized seven-day yield of the fund at period end. |
| (w) | When-issued security. |
| (z) | Restricted securities are not registered under the Securities Act of 1933 and are subject to legal restrictions on resale. These securities generally may be resold in transactions exempt from registration or to the public if the securities are subsequently registered. Disposal of these securities may involve time-consuming negotiations and prompt sale at an acceptable price may be difficult. The fund holds the following restricted securities: |
| Restricted Securities | Acquisition
Date | Cost | Value |
| Paysafe Finance PLC, 4%, 6/15/2029 | 6/11/21 | $3,056,927 | $2,773,404 |
| % of Net assets | | | 0.3% |
| The following abbreviations are used in this report and are defined: |
| ETF | Exchange-Traded Fund |
| REIT | Real Estate Investment Trust |
| Abbreviations indicate amounts shown in currencies other than the U.S. dollar. All amounts are stated in U.S. dollars unless otherwise indicated. A list of abbreviations is shown below: |
| EUR | Euro |
| GBP | British Pound |
Derivative Contracts at 1/31/22
| Forward Foreign Currency Exchange Contracts |
Currency
Purchased | Currency
Sold | Counterparty | Settlement
Date | Unrealized
Appreciation
(Depreciation) |
| Asset Derivatives |
| USD | 1,165,021 | EUR | 1,022,469 | JPMorgan Chase Bank N.A. | 4/08/2022 | $14,539 |
Portfolio of Investments – continued
| Futures Contracts |
| Description | Long/
Short | Currency | Contracts | Notional
Amount | Expiration
Date | Value/Unrealized
Appreciation
(Depreciation) |
| Asset Derivatives |
| Interest Rate Futures | | |
| U.S. Treasury Note 10 yr | Short | USD | 268 | $34,295,625 | March – 2022 | $281,683 |
| Liability Derivatives |
| Interest Rate Futures | | |
| U.S. Treasury Bond | Long | USD | 98 | $15,251,250 | March – 2022 | $(240,860) |
| U.S. Treasury Ultra Bond | Long | USD | 17 | 3,211,937 | March – 2022 | (54,251) |
| | | | | | | $(295,111) |
At January 31, 2022, the fund had cash collateral of 192,200 to cover any collateral or margin obligations for certain derivative contracts. Restricted cash and/or deposits with brokers in the Statement of Assets and Liabilities are comprised of cash collateral.
See Notes to Financial Statements
Financial Statements
Statement of Assets and Liabilities
At 1/31/22
This statement represents your fund’s balance sheet, which details the assets and liabilities comprising the total value of the fund.
| Assets | |
| Investments in unaffiliated issuers, at value (identified cost, $975,709,345) | $964,304,889 |
| Investments in affiliated issuers, at value (identified cost, $24,340,169) | 24,340,223 |
| Cash | 993,595 |
| Deposits with brokers for | |
| Futures contracts | 192,200 |
| Receivables for | |
| Forward foreign currency exchange contracts | 14,539 |
| Investments sold | 4,789,596 |
| Fund shares sold | 22,081 |
| Interest and dividends | 13,290,787 |
| Other assets | 3,010 |
| Total assets | $1,007,950,920 |
| Liabilities | |
| Payables for | |
| Distributions | $68 |
| Net daily variation margin on open futures contracts | 26,531 |
| Investments purchased | 4,552,445 |
| Fund shares reacquired | 3,848,004 |
| When-issued investments purchased | 2,082,652 |
| Payable to affiliates | |
| Administrative services fee | 190 |
| Shareholder servicing costs | 8 |
| Accrued expenses and other liabilities | 75,015 |
| Total liabilities | $10,584,913 |
| Net assets | $997,366,007 |
| Net assets consist of | |
| Paid-in capital | $1,054,923,322 |
| Total distributable earnings (loss) | (57,557,315) |
| Net assets | $997,366,007 |
| Shares of beneficial interest outstanding | 112,350,889 |
| Net asset value per share (net assets of $997,366,007 / 112,350,889 shares of beneficial interest outstanding) | $8.88 |
See Notes to Financial Statements
Financial Statements
Statement of Operations
Year ended 1/31/22
This statement describes how much your fund earned in investment income and accrued in expenses. It also describes any gains and/or losses generated by fund operations.
| Net investment income (loss) | |
| Income | |
| Interest | $54,795,613 |
| Dividends | 798,641 |
| Other | 481,474 |
| Dividends from affiliated issuers | 9,500 |
| Foreign taxes withheld | (14,590) |
| Total investment income | $56,070,638 |
| Expenses | |
| Shareholder servicing costs | $36 |
| Administrative services fee | 17,500 |
| Custodian fee | 66,889 |
| Shareholder communications | 7,597 |
| Audit and tax fees | 47,156 |
| Legal fees | 5,321 |
| Pricing service fees | 11,946 |
| Form N-CEN/N-PORT preparation fees | 9,800 |
| Miscellaneous | 24,104 |
| Total expenses | $190,349 |
| Fees paid indirectly | (188) |
| Net expenses | $190,161 |
| Net investment income (loss) | $55,880,477 |
| Realized and unrealized gain (loss) |
| Realized gain (loss) (identified cost basis) | |
| Unaffiliated issuers | $34,191,431 |
| Futures contracts | (18,646) |
| Forward foreign currency exchange contracts | 55,275 |
| Foreign currency | (637) |
| Net realized gain (loss) | $34,227,423 |
| Change in unrealized appreciation or depreciation | |
| Unaffiliated issuers | $(72,489,816) |
| Futures contracts | (13,428) |
| Forward foreign currency exchange contracts | 14,539 |
| Translation of assets and liabilities in foreign currencies | (251) |
| Net unrealized gain (loss) | $(72,488,956) |
| Net realized and unrealized gain (loss) | $(38,261,533) |
| Change in net assets from operations | $17,618,944 |
See Notes to Financial Statements
Financial Statements
Statements of Changes in Net Assets
These statements describe the increases and/or decreases in net assets resulting from operations, any distributions, and any shareholder transactions.
| | Year ended |
| | 1/31/22 | 1/31/21 |
| Change in net assets | | |
| From operations | | |
| Net investment income (loss) | $55,880,477 | $65,011,400 |
| Net realized gain (loss) | 34,227,423 | (2,259,931) |
| Net unrealized gain (loss) | (72,488,956) | 37,311,221 |
| Change in net assets from operations | $17,618,944 | $100,062,690 |
| Total distributions to shareholders | $(60,026,693) | $(67,143,934) |
| Change in net assets from fund share transactions | $(188,544,337) | $306,368,694 |
| Total change in net assets | $(230,952,086) | $339,287,450 |
| Net assets | | |
| At beginning of period | 1,228,318,093 | 889,030,643 |
| At end of period | $997,366,007 | $1,228,318,093 |
See Notes to Financial Statements
Financial Statements
Financial Highlights
The financial highlights table is intended to help you understand the fund's financial performance for the past 5 years. Certain information reflects financial results for a single fund share. The total returns in the table represent the rate that an investor would have earned (or lost) on an investment in the fund share class (assuming reinvestment of all distributions) held for the entire period.
| | Year ended |
| | 1/31/22 | 1/31/21 | 1/31/20 | 1/31/19 | 1/31/18 |
| Net asset value, beginning of period | $9.25 | $9.33 | $8.94 | $9.31 | $9.28 |
| Income (loss) from investment operations |
| Net investment income (loss) (d) | $0.47 | $0.50 | $0.51 | $0.52 | $0.53 |
| Net realized and unrealized gain (loss) | (0.34) | (0.06)(g) | 0.39 | (0.36) | 0.05 |
| Total from investment operations | $0.13 | $0.44 | $0.90 | $0.16 | $0.58 |
| Less distributions declared to shareholders |
| From net investment income | $(0.50) | $(0.52) | $(0.51) | $(0.53) | $(0.55) |
| Net asset value, end of period (x) | $8.88 | $9.25 | $9.33 | $8.94 | $9.31 |
| Total return (%) (s)(x) | 1.39 | 5.02 | 10.29 | 1.86 | 6.33 |
Ratios (%) (to average net assets)
and Supplemental data: |
| Expenses (f) | 0.02 | 0.02 | 0.02 | 0.02 | 0.02 |
| Net investment income (loss) | 5.09 | 5.58 | 5.51 | 5.77 | 5.63 |
| Portfolio turnover | 60 | 66 | 59 | 38 | 46 |
| Net assets at end of period (000 omitted) | $997,366 | $1,228,318 | $889,031 | $788,437 | $1,197,932 |
| (d) | Per share data is based on average shares outstanding. |
| (f) | Ratios do not reflect reductions from fees paid indirectly, if applicable. See Note 2 in the Notes to Financial Statements for additional information. |
| (g) | The per share amount varies from the net realized and unrealized gain/loss for the period because of the timing of sales of fund shares and the per share amount of realized and unrealized gains and losses at such time. |
| (s) | From time to time the fund may receive proceeds from litigation settlements, without which performance would be lower. |
| (x) | The net asset values and total returns have been calculated on net assets which include adjustments made in accordance with U.S. generally accepted accounting principles required at period end for financial reporting purposes. |
See Notes to Financial Statements
Notes to Financial Statements
(1) Business and Organization
MFS High Yield Pooled Portfolio (the fund) is a diversified series of MFS Series Trust III (the trust). The trust is organized as a Massachusetts business trust and is registered under the Investment Company Act of 1940, as amended, as an open-end management investment company. This fund is available only to certain U.S. registered investment companies managed by MFS. MFS does not receive a management fee from this fund.
The fund is an investment company and accordingly follows the investment company accounting and reporting guidance of the Financial Accounting Standards Board (FASB) Accounting Standards Codification Topic 946 Financial Services - Investment Companies.
(2) Significant Accounting Policies
General — The preparation of financial statements in conformity with U.S. generally accepted accounting principles requires management to make estimates and assumptions that affect the reported amounts of assets and liabilities, and disclosure of contingent assets and liabilities at the date of the financial statements and the reported amounts of increases and decreases in net assets from operations during the reporting period. Actual results could differ from those estimates. In the preparation of these financial statements, management has evaluated subsequent events occurring after the date of the fund’s Statement of Assets and Liabilities through the date that the financial statements were issued. The fund invests in high-yield securities rated below investment grade. Investments in below investment grade quality securities can involve a substantially greater risk of default or can already be in default, and their values can decline significantly. Below investment grade quality securities tend to be more sensitive to adverse news about the issuer, or the market or economy in general, than higher quality debt instruments. The fund invests in foreign securities. Investments in foreign securities are vulnerable to the effects of changes in the relative values of the local currency and the U.S. dollar and to the effects of changes in each country’s market, economic, industrial, political, regulatory, geopolitical, environmental, public health, and other conditions.
Balance Sheet Offsetting — The fund's accounting policy with respect to balance sheet offsetting is that, absent an event of default by the counterparty or a termination of the agreement, the International Swaps and Derivatives Association (ISDA) Master Agreement, or similar agreement, does not result in an offset of reported amounts of financial assets and financial liabilities in the Statement of Assets and Liabilities across transactions between the fund and the applicable counterparty. The fund's right to setoff may be restricted or prohibited by the bankruptcy or insolvency laws of the particular jurisdiction to which a specific master netting agreement counterparty is subject. Balance sheet offsetting disclosures, to the extent applicable to the fund, have been included in the fund’s Significant Accounting Policies note under the captions for each of the fund’s in-scope financial instruments and transactions.
Investment Valuations — Equity securities, including restricted equity securities, are generally valued at the last sale or official closing price on their primary market or exchange as provided by a third-party pricing service. Equity securities, for which there were no sales reported that day, are generally valued at the last quoted daily bid quotation on their primary market or exchange as provided by a third-party pricing service. Debt instruments and floating rate loans, including restricted debt instruments,
Notes to Financial Statements - continued
are generally valued at an evaluated or composite bid as provided by a third-party pricing service. Short-term instruments with a maturity at issuance of 60 days or less may be valued at amortized cost, which approximates market value. Futures contracts are generally valued at last posted settlement price on their primary exchange as provided by a third-party pricing service. Futures contracts for which there were no trades that day for a particular position are generally valued at the closing bid quotation on their primary exchange as provided by a third-party pricing service.
Forward foreign currency exchange contracts are generally valued at the mean of bid and asked prices for the time period interpolated from rates provided by a third-party pricing service for proximate time periods. Open-end investment companies are generally valued at net asset value per share. Securities and other assets generally valued on the basis of information from a third-party pricing service may also be valued at a broker/dealer bid quotation. In determining values, third-party pricing services can utilize both transaction data and market information such as yield, quality, coupon rate, maturity, type of issue, trading characteristics, and other market data. The values of foreign securities and other assets and liabilities expressed in foreign currencies are converted to U.S. dollars using the mean of bid and asked prices for rates provided by a third-party pricing service.
The Board of Trustees has delegated primary responsibility for determining or causing to be determined the value of the fund’s investments (including any fair valuation) to the adviser pursuant to valuation policies and procedures approved by the Board. If the adviser determines that reliable market quotations are not readily available, investments are valued at fair value as determined in good faith by the adviser in accordance with such procedures under the oversight of the Board of Trustees. Under the fund’s valuation policies and procedures, market quotations are not considered to be readily available for most types of debt instruments and floating rate loans and many types of derivatives. These investments are generally valued at fair value based on information from third-party pricing services. In addition, investments may be valued at fair value if the adviser determines that an investment’s value has been materially affected by events occurring after the close of the exchange or market on which the investment is principally traded (such as foreign exchange or market) and prior to the determination of the fund’s net asset value, or after the halt of trading of a specific security where trading does not resume prior to the close of the exchange or market on which the security is principally traded. The adviser generally relies on third-party pricing services or other information (such as the correlation with price movements of similar securities in the same or other markets; the type, cost and investment characteristics of the security; the business and financial condition of the issuer; and trading and other market data) to assist in determining whether to fair value and at what value to fair value an investment. The value of an investment for purposes of calculating the fund’s net asset value can differ depending on the source and method used to determine value. When fair valuation is used, the value of an investment used to determine the fund’s net asset value may differ from quoted or published prices for the same investment. There can be no assurance that the fund could obtain the fair value assigned to an investment if it were to sell the investment at the same time at which the fund determines its net asset value per share.
Various inputs are used in determining the value of the fund's assets or liabilities. These inputs are categorized into three broad levels. In certain cases, the inputs used to measure fair value may fall into different levels of the fair value hierarchy. In such cases, an investment's level within the fair value hierarchy is based on the lowest level of
Notes to Financial Statements - continued
input that is significant to the fair value measurement. The fund's assessment of the significance of a particular input to the fair value measurement in its entirety requires judgment, and considers factors specific to the investment. Level 1 includes unadjusted quoted prices in active markets for identical assets or liabilities. Level 2 includes other significant observable market-based inputs (including quoted prices for similar securities, interest rates, prepayment speed, and credit risk). Level 3 includes unobservable inputs, which may include the adviser's own assumptions in determining the fair value of investments. Other financial instruments are derivative instruments, such as futures contract and forward foreign currency exchange contracts. The following is a summary of the levels used as of January 31, 2022 in valuing the fund's assets and liabilities:
| Financial Instruments | Level 1 | Level 2 | Level 3 | Total |
| Equity Securities: | | | | |
| United States | $6,200,040 | $— | $949,047 | $7,149,087 |
| Mexico | — | — | 213,062 | 213,062 |
| United Kingdom | — | 183,760 | 6,820 | 190,580 |
| Municipal Bonds | — | 425,375 | — | 425,375 |
| U.S. Corporate Bonds | — | 825,350,475 | — | 825,350,475 |
| Foreign Bonds | — | 130,976,310 | — | 130,976,310 |
| Mutual Funds | 24,340,223 | — | — | 24,340,223 |
| Total | $30,540,263 | $956,935,920 | $1,168,929 | $988,645,112 |
| Other Financial Instruments | | | | |
| Futures Contracts – Assets | $281,683 | $— | $— | $281,683 |
| Futures Contracts – Liabilities | (295,111) | — | — | (295,111) |
| Forward Foreign Currency Exchange Contracts – Assets | — | 14,539 | — | 14,539 |
For further information regarding security characteristics, see the Portfolio of Investments.
The following is a reconciliation of level 3 assets for which significant unobservable inputs were used to determine fair value. The table presents the activity of level 3 securities held at the beginning and the end of the period.
| | Equity
Securities |
| Balance as of 1/31/21 | $932,316 |
| Change in unrealized appreciation or depreciation | 16,731 |
| Transfers into level 3 | 213,062 |
| Received as part of a corporate action | 6,820 |
| Balance as of 1/31/22 | $1,168,929 |
The net change in unrealized appreciation or depreciation from investments held as level 3 at January 31, 2022 is $16,731. At January 31, 2022, the fund held three level 3 securities.
Foreign Currency Translation — Purchases and sales of foreign investments, income, and expenses are converted into U.S. dollars based upon currency exchange rates prevailing on the respective dates of such transactions or on the reporting date for foreign denominated receivables and payables. Gains and losses attributable to foreign
Notes to Financial Statements - continued
currency exchange rates on sales of securities are recorded for financial statement purposes as net realized gains and losses on investments. Gains and losses attributable to foreign exchange rate movements on receivables, payables, income and expenses are recorded for financial statement purposes as foreign currency transaction gains and losses. That portion of both realized and unrealized gains and losses on investments that results from fluctuations in foreign currency exchange rates is not separately disclosed.
Derivatives — The fund uses derivatives primarily to increase or decrease exposure to a particular market or segment of the market, or security, to increase or decrease interest rate exposure, or as alternatives to direct investments. Derivatives are used for hedging or non-hedging purposes. While hedging can reduce or eliminate losses, it can also reduce or eliminate gains. When the fund uses derivatives as an investment to increase market exposure, or for hedging purposes, gains and losses from derivative instruments may be substantially greater than the derivative’s original cost.
The derivative instruments used by the fund during the period were futures contracts and forward foreign currency exchange contracts. Depending on the type of derivative, a fund may exit a derivative position by entering into an offsetting transaction with a counterparty or exchange, negotiating an agreement with the derivative counterparty, or novating the position to a third party. The fund may be unable to promptly close out a futures position in instances where the daily fluctuation in the price for that type of future exceeds the daily limit set by the exchange. The fund's period end derivatives, as presented in the Portfolio of Investments and the associated Derivative Contract tables, generally are indicative of the volume of its derivative activity during the period.
The following table presents, by major type of derivative contract, the fair value, on a gross basis, of the asset and liability components of derivatives held by the fund at January 31, 2022 as reported in the Statement of Assets and Liabilities:
| | | Fair Value (a) |
| Risk | Derivative Contracts | Asset Derivatives | Liability Derivatives |
| Interest Rate | Futures Contracts | $281,683 | $(295,111) |
| Foreign Exchange | Forward Foreign Currency Exchange Contracts | 14,539 | — |
| Total | | $296,222 | $(295,111) |
| (a) | Values presented in this table for futures contracts correspond to the values reported in the Portfolio of Investments. Only the current day net variation margin for futures contracts is separately reported within the Statement of Assets and Liabilities. |
Notes to Financial Statements - continued
The following table presents, by major type of derivative contract, the realized gain (loss) on derivatives held by the fund for the year ended January 31, 2022 as reported in the Statement of Operations:
| Risk | Futures
Contracts | Forward Foreign
Currency
Exchange
Contracts |
| Interest Rate | $(18,646) | $ — |
| Foreign Exchange | — | 55,275 |
| Total | $(18,646) | $55,275 |
The following table presents, by major type of derivative contract, the change in unrealized appreciation or depreciation on derivatives held by the fund for the year ended January 31, 2022 as reported in the Statement of Operations:
| Risk | Futures
Contracts | Forward Foreign
Currency
Exchange
Contracts |
| Interest Rate | $(13,428) | $ — |
| Foreign Exchange | — | 14,539 |
| Total | $(13,428) | $14,539 |
Derivative counterparty credit risk is managed through formal evaluation of the creditworthiness of all potential counterparties. On certain, but not all, uncleared derivatives, the fund attempts to reduce its exposure to counterparty credit risk whenever possible by entering into an ISDA Master Agreement on a bilateral basis. The ISDA Master Agreement gives each party to the agreement the right to terminate all transactions traded under such agreement if there is a specified deterioration in the credit quality of the other party. Upon an event of default or a termination of the ISDA Master Agreement, the non-defaulting party has the right to close out all transactions traded under such agreement and to net amounts owed under each agreement to one net amount payable by one party to the other. This right to close out and net payments across all transactions traded under the ISDA Master Agreement could result in a reduction of the fund's credit risk to such counterparty equal to any amounts payable by the fund under the applicable transactions, if any.
Collateral and margin requirements differ by type of derivative. For cleared derivatives (e.g., futures contracts, cleared swaps, and exchange-traded options), margin requirements are set by the clearing broker and the clearing house and collateral, in the form of cash or securities, is posted by the fund directly with the clearing broker. Collateral terms are counterparty agreement specific for uncleared derivatives (e.g., forward foreign currency exchange contracts, uncleared swap agreements, and uncleared options) and collateral, in the form of cash and securities, is held in segregated accounts with the fund's custodian in connection with these agreements. For derivatives traded under an ISDA Master Agreement, which contains a collateral support annex, the collateral requirements are netted across all transactions traded under such counterparty-specific agreement and an amount is posted from one party to the other to collateralize such obligations. Cash that has been segregated or
Notes to Financial Statements - continued
delivered to cover the fund's collateral or margin obligations under derivative contracts, if any, will be reported separately in the Statement of Assets and Liabilities as restricted cash for uncleared derivatives and/or deposits with brokers for cleared derivatives. Securities pledged as collateral or margin for the same purpose, if any, are noted in the Portfolio of Investments. The fund may be required to make payments of interest on uncovered collateral or margin obligations with the broker. Any such payments are included in “Miscellaneous” expense in the Statement of Operations.
Futures Contracts — The fund entered into futures contracts which may be used to hedge against or obtain broad market exposure, interest rate exposure, currency exposure, or to manage duration. A futures contract represents a commitment for the future purchase or sale of an asset at a specified price on a specified date.
Upon entering into a futures contract, the fund is required to deposit with the broker, either in cash or securities, an initial margin in an amount equal to a specified percentage of the notional amount of the contract. Subsequent payments (variation margin) are made or received by the fund each day, depending on the daily fluctuations in the value of the contract, and are recorded for financial statement purposes as unrealized gain or loss by the fund until the contract is closed or expires at which point the gain or loss on futures contracts is realized.
The fund bears the risk of interest rates, exchange rates or securities prices moving unexpectedly, in which case, the fund may not achieve the anticipated benefits of the futures contracts and may realize a loss. While futures contracts may present less counterparty risk to the fund since the contracts are exchange traded and the exchange’s clearinghouse guarantees payments to the broker, there is still counterparty credit risk due to the insolvency of the broker. The fund’s maximum risk of loss due to counterparty credit risk is equal to the margin posted by the fund to the broker plus any gains or minus any losses on the outstanding futures contracts.
Forward Foreign Currency Exchange Contracts — The fund entered into forward foreign currency exchange contracts for the purchase or sale of a specific foreign currency at a fixed price on a future date. These contracts may be used to hedge the fund’s currency risk or for non-hedging purposes. For hedging purposes, the fund may enter into contracts to deliver or receive foreign currency that the fund will receive from or use in its normal investment activities. The fund may also use contracts to hedge against declines in the value of foreign currency denominated securities due to unfavorable exchange rate movements. For non-hedging purposes, the fund may enter into contracts with the intent of changing the relative exposure of the fund’s portfolio of securities to different currencies to take advantage of anticipated exchange rate changes.
Forward foreign currency exchange contracts are adjusted by the daily exchange rate of the underlying currency and any unrealized gains or losses are recorded as a receivable or payable for forward foreign currency exchange contracts until the contract settlement date. On contract settlement date, any gain or loss on the contract is recorded as realized gains or losses on forward foreign currency exchange contracts.
Risks may arise upon entering into these contracts from unanticipated movements in the value of the contract and from the potential inability of counterparties to meet the terms of their contracts. Generally, the fund’s maximum risk due to counterparty credit risk is the unrealized gain on the contract due to the use of Continuous Linked Settlement, a multicurrency cash settlement system for the centralized settlement of
Notes to Financial Statements - continued
foreign transactions. This risk is mitigated in cases where there is an ISDA Master Agreement between the fund and the counterparty providing for netting as described above and, where applicable, by the posting of collateral by the counterparty to the fund to cover the fund’s exposure to the counterparty under such ISDA Master Agreement.
Loans and Other Direct Debt Instruments — The fund invests in loans and loan participations or other receivables. These investments may include standby financing commitments, including revolving credit facilities, which contractually obligate the fund to supply additional cash to the borrower on demand. The fund generally provides this financial support in order to preserve its existing investment or to obtain a more senior secured interest in the assets of the borrower. Loan participations involve a risk of insolvency of the lending bank or other financial intermediary.
Indemnifications — Under the fund's organizational documents, its officers and Trustees may be indemnified against certain liabilities and expenses arising out of the performance of their duties to the fund. Additionally, in the normal course of business, the fund enters into agreements with service providers that may contain indemnification clauses. The fund's maximum exposure under these agreements is unknown as this would involve future claims that may be made against the fund that have not yet occurred.
Investment Transactions and Income — Investment transactions are recorded on the trade date. Some securities may be purchased or sold on an extended settlement basis, which means that the receipt or delivery of the securities by the fund and related payments occur at a future date, usually beyond the customary settlement period.
Interest income is recorded on the accrual basis. All premium and discount is amortized or accreted for financial statement purposes in accordance with U.S. generally accepted accounting principles. Dividends received in cash are recorded on the ex-dividend date. Certain dividends from foreign securities will be recorded when the fund is informed of the dividend if such information is obtained subsequent to the ex-dividend date. Dividend and interest payments received in additional securities are recorded on the ex-dividend or ex-interest date in an amount equal to the value of the security on such date. In determining the net gain or loss on securities sold, the cost of securities is determined on the identified cost basis. The fund earns certain fees in connection with its floating rate loan purchasing activities. These fees are in addition to interest payments earned and may include amendment fees, commitment fees, facility fees, consent fees, and prepayment fees. Commitment fees are recorded on an accrual basis as income in the accompanying financial statements. Debt obligations may be placed on non-accrual status or set to accrue at a rate of interest less than the contractual coupon when the collection of all or a portion of interest has become doubtful. Interest income for those debt obligations may be further reduced by the write-off of the related interest receivables when deemed uncollectible.
The fund may receive proceeds from litigation settlements. Any proceeds received from litigation involving portfolio holdings are reflected in the Statement of Operations in realized gain/loss if the security has been disposed of by the fund or in unrealized gain/loss if the security is still held by the fund. Any other proceeds from litigation not related to portfolio holdings are reflected as other income in the Statement of Operations.
Notes to Financial Statements - continued
The fund may purchase or sell securities on a when-issued or delayed delivery basis. In these extended settlement transactions, the receipt or delivery of the securities by the fund and related payments occur at a future date, usually beyond the normal settlement period. The price of such security and the date that the security will be settled are generally fixed at the time the transaction is negotiated. The value of the security varies with market fluctuations and for debt securities no interest accrues to the fund until settlement takes place. When the fund sells securities on a when-issued or delayed delivery basis, the fund typically owns or has the right to acquire securities equivalent in kind and amount to the securities sold. Purchase and sale commitments for when-issued or delayed delivery securities are held at carrying amount, which approximates fair value and are categorized as level 2 within the fair value hierarchy, and included in When-issued investments purchased and When-issued investments sold in the Statement of Assets and Liabilities. Losses may arise due to changes in the value of the underlying securities prior to settlement date or if the counterparty does not perform under the contract’s terms, or if the issuer does not issue the securities due to political, economic or other factors. At the time that it enters into a when-issued or delayed delivery transaction, the fund is required to have sufficient cash and/or liquid securities to cover its commitments.
Fees Paid Indirectly — The fund's custody fee may be reduced by a credit earned under an arrangement that measures the value of U.S. dollars deposited with the custodian by the fund. The amount of the credit, for the year ended January 31, 2022, is shown as a reduction of total expenses in the Statement of Operations.
Tax Matters and Distributions — The fund intends to qualify as a regulated investment company, as defined under Subchapter M of the Internal Revenue Code, and to distribute all of its taxable income, including realized capital gains. As a result, no provision for federal income tax is required. The fund’s federal tax returns, when filed, will remain subject to examination by the Internal Revenue Service for a three year period. Management has analyzed the fund’s tax positions taken on federal and state tax returns for all open tax years and does not believe that there are any uncertain tax positions that require recognition of a tax liability. Foreign taxes, if any, have been accrued by the fund in the accompanying financial statements in accordance with the applicable foreign tax law. Foreign income taxes may be withheld by certain countries in which the fund invests. Additionally, capital gains realized by the fund on securities issued in or by certain foreign countries may be subject to capital gains tax imposed by those countries.
Distributions to shareholders are recorded on the ex-dividend date. Income and capital gain distributions are determined in accordance with income tax regulations, which may differ from U.S. generally accepted accounting principles. Certain capital accounts in the financial statements are periodically adjusted for permanent differences in order to reflect their tax character. These adjustments have no impact on net assets or net asset value per share. Temporary differences which arise from recognizing certain items of income, expense, gain or loss in different periods for financial statement and tax purposes will reverse at some time in the future.
Book/tax differences primarily relate to amortization and accretion of debt securities and wash sale loss deferrals.
Notes to Financial Statements - continued
The tax character of distributions declared to shareholders for the last two fiscal years is as follows:
| | Year ended
1/31/22 | Year ended
1/31/21 |
| Ordinary income (including any short-term capital gains) | $60,026,693 | $67,143,934 |
The federal tax cost and the tax basis components of distributable earnings were as follows:
| As of 1/31/22 | |
| Cost of investments | $1,004,045,494 |
| Gross appreciation | 15,861,306 |
| Gross depreciation | (31,260,577) |
| Net unrealized appreciation (depreciation) | $ (15,399,271) |
| Undistributed ordinary income | 3,295,117 |
| Capital loss carryforwards | (41,053,445) |
| Other temporary differences | (4,399,716) |
| Total distributable earnings (loss) | $ (57,557,315) |
As of January 31, 2022, the fund had capital loss carryforwards available to offset future realized gains. These net capital losses may be carried forward indefinitely and their character is retained as short-term and/or long-term losses. Such losses are characterized as follows:
| Short-Term | $(1,278,441) |
| Long-Term | (39,775,004) |
| Total | $(41,053,445) |
(3) Transactions with Affiliates
Investment Adviser — The fund has an investment advisory agreement with MFS to provide overall investment management and related administrative services and facilities to the fund. MFS receives no compensation under this agreement; however MFS receives management fees from MFS funds that invest in the fund.
Shareholder Servicing Agent — MFS Service Center, Inc. (MFSC), a wholly-owned subsidiary of MFS, provides transfer agent and recordkeeping functions in connection with the issuance, transfer, and redemption of shares of the fund under a Shareholder Servicing Agent Agreement. MFSC is not paid a fee for providing these services. MFSC receives reimbursement from the fund for out-of-pocket expenses paid by MFSC on behalf of the fund. For the year ended January 31, 2022, these costs amounted to $36.
Administrator — MFS provides certain financial, legal, shareholder communications, compliance, and other administrative services to the fund. Under an administrative services agreement, the fund reimburses MFS the costs incurred to provide these services. The fund pays an annual fixed amount of $17,500. The administrative services fee incurred for the year ended January 31, 2022 was equivalent to an annual effective rate of 0.0016% of the fund's average daily net assets.
Trustees’ and Officers’ Compensation - The fund may pay compensation to independent Trustees in the form of a retainer, attendance fees, and additional compensation to Board and Committee chairpersons. The fund does not pay
Notes to Financial Statements - continued
compensation directly to Trustees or officers of the fund who are also officers of the investment adviser, all of whom receive remuneration from MFS for their services to the fund. Certain officers and Trustees of the fund are officers or directors of MFS, MFS Fund Distributors, Inc. (MFD), and MFSC. The independent Trustees do not currently receive compensation from the fund.
Other — The fund invests in the MFS Institutional Money Market Portfolio which is managed by MFS and seeks current income consistent with preservation of capital and liquidity. This money market fund does not pay a management fee to MFS but does incur investment and operating costs.
(4) Portfolio Securities
For the year ended January 31, 2022, purchases and sales of investments, other than short-term obligations, aggregated $641,509,957 and $851,882,927, respectively.
(5) Shares of Beneficial Interest
The fund's Declaration of Trust permits the Trustees to issue an unlimited number of full and fractional shares of beneficial interest. Transactions in fund shares were as follows:
| | Year ended
1/31/22 | | Year ended
1/31/21 |
| | Shares | Amount | | Shares | Amount |
| Shares sold | 3,868,865 | $35,660,117 | | 55,616,565 | $466,064,098 |
Shares issued to shareholders in
reinvestment of distributions | 6,526,801 | 60,026,693 | | 7,504,349 | 67,143,934 |
| Shares reacquired | (30,844,235) | (284,231,147) | | (25,651,819) | (226,839,338) |
| Net change | (20,448,569) | $(188,544,337) | | 37,469,095 | $306,368,694 |
The fund is an MFS Pooled Portfolio, which is designed to be used by certain MFS funds to invest in a particular security type rather than invest in the security type directly. The fund is solely invested in by other MFS funds for the purpose of gaining exposure to high income debt instruments, rather than investing in high income debt instruments directly. The MFS funds do not invest in this fund for the purpose of exercising management or control. At the end of the period, the MFS Diversified Income Fund, the MFS Global High Yield Fund, and the MFS Income Portfolio were the owners of record of approximately 83%, 16%, and 1%, respectively, of the value of outstanding voting shares of the fund.
(6) Line of Credit
The fund and certain other funds managed by MFS participate in a $1.25 billion unsecured committed line of credit of which $1 billion is reserved for use by the fund and certain other MFS U.S. funds. The line of credit is provided by a syndicate of banks under a credit agreement. Borrowings may be made for temporary financing needs. Interest is charged to each fund, based on its borrowings, generally at a rate equal to the highest of one month LIBOR, the Federal Funds Effective Rate and the Overnight Bank Funding Rate, plus an agreed upon spread. A commitment fee, based on the average daily, unused portion of the committed line of credit, is allocated among the participating funds. In addition, the fund and other funds managed by MFS have established unsecured uncommitted borrowing arrangements with certain banks for
Notes to Financial Statements - continued
temporary financing needs. Interest is charged to each fund, based on its borrowings, at rates equal to customary reference rates plus an agreed upon spread. For the year ended January 31, 2022, the fund’s commitment fee and interest expense were $4,142 and $0, respectively, and are included in “Miscellaneous” expense in the Statement of Operations.
(7) Investments in Affiliated Issuers
An affiliated issuer may be considered one in which the fund owns 5% or more of the outstanding voting securities, or a company which is under common control. For the purposes of this report, the following were affiliated issuers:
| Affiliated Issuers | Beginning
Value | Purchases | Sales
Proceeds | Realized
Gain
(Loss) | Change in
Unrealized
Appreciation or
Depreciation | Ending
Value |
| MFS Institutional Money Market Portfolio | $6,504,549 | $425,392,916 | $407,557,242 | $— | $— | $24,340,223 |
| Affiliated Issuers | Dividend
Income | Capital Gain
Distributions |
| MFS Institutional Money Market Portfolio | $9,500 | $— |
(8) Impacts of COVID-19
The pandemic related to the global spread of novel coronavirus disease (COVID-19), which was first detected in December 2019, has resulted in significant disruptions to global business activity and the global economy, as well as the economies of individual countries, the financial performance of individual companies and sectors, and the securities and commodities markets in general. Multiple surges in cases globally, the availability and widespread adoption of vaccines, and the emergence of variant strains of the virus continue to create uncertainty as to the future and long-term impacts resulting from the pandemic including impacts to the prices and liquidity of the fund's investments and the fund's performance.
(9) LIBOR Transition
Certain of the fund's investments, including investments in certain debt instruments and derivatives (if any), as well as borrowings by the fund and certain other contractual arrangements of the fund, may be based on the London Interbank Offered Rate (“LIBOR”). In 2017, the regulatory authority that oversees financial services firms in the United Kingdom announced plans to transition away from LIBOR by the end of 2021. In March 2021, the administrator of LIBOR announced the extension of the publication of the more commonly used U.S. dollar LIBOR settings to the end of June 2023. Although the full impacts of the transition away from LIBOR are not fully known, the transition may result in, among other things, an increase in volatility or illiquidity of the markets for instruments that currently rely on LIBOR to determine interest rates and this could have an adverse impact on the fund's performance. With respect to the fund's accounting for investments, including investments in certain debt instruments and derivatives, as well as borrowings by the fund and any other contractual arrangements of the fund that undergo reference rate-related modifications as a result of the transition, management will rely upon the relief provided by FASB Codification Topic
Notes to Financial Statements - continued
848 – Reference Rate Reform (Topic 848). The guidance in Topic 848 permits the fund to account for those modified contracts as a continuation of the existing contracts. Management is still evaluating the impact to the fund of the June 30, 2023 planned discontinuation of the more commonly used U.S. dollar LIBOR settings.
(10) Subsequent Event
The market disruptions, which began in late February 2022, associated with geopolitical events related to the conflict between Russia and Ukraine may adversely affect the value of the fund’s assets and thus the fund’s performance. Management continues to monitor these events and to evaluate the related impacts, if any, to the fund.
Report of Independent Registered Public Accounting Firm
To the Board of Trustees of MFS Series Trust III and the Shareholders of MFS High Yield Pooled Portfolio:
Opinion on the Financial Statements and Financial Highlights
We have audited the accompanying statement of assets and liabilities of MFS High Yield Pooled Portfolio (the “Fund”), including the portfolio of investments, as of January 31, 2022, the related statement of operations for the year then ended, the statements of changes in net assets for each of the two years in the period then ended, the financial highlights for each of the five years in the period then ended, and the related notes. In our opinion, the financial statements and financial highlights present fairly, in all material respects, the financial position of the Fund as of January 31, 2022, and the results of its operations for the year then ended, the changes in its net assets for each of the two years in the period then ended, and the financial highlights for each of the five years in the period then ended, in conformity with accounting principles generally accepted in the United States of America.
Basis for Opinion
These financial statements and financial highlights are the responsibility of the Fund's management. Our responsibility is to express an opinion on the Fund's financial statements and financial highlights based on our audits. We are a public accounting firm registered with the Public Company Accounting Oversight Board (United States) (PCAOB) and are required to be independent with respect to the Fund in accordance with the U.S. federal securities laws and the applicable rules and regulations of the Securities and Exchange Commission and the PCAOB.
We conducted our audits in accordance with the standards of the PCAOB. Those standards require that we plan and perform the audit to obtain reasonable assurance about whether the financial statements and financial highlights are free of material misstatement, whether due to error or fraud. The Fund is not required to have, nor were we engaged to perform, an audit of its internal control over financial reporting. As part of our audits, we are required to obtain an understanding of internal control over financial reporting but not for the purpose of expressing an opinion on the effectiveness of the Fund's internal control over financial reporting. Accordingly, we express no such opinion.
Our audits included performing procedures to assess the risks of material misstatement of the financial statements and financial highlights, whether due to error or fraud, and performing procedures that respond to those risks. Such procedures included examining, on a test basis, evidence regarding the amounts and disclosures in the financial statements and financial highlights. Our audits also included evaluating the accounting principles used and significant estimates made by management, as well as evaluating the overall presentation of the financial statements and financial highlights.
Report of Independent Registered Public Accounting Firm – continued
Our procedures included confirmation of securities owned as of January 31, 2022, by correspondence with the custodian and brokers; when replies were not received from brokers, we performed other auditing procedures. We believe that our audits provide a reasonable basis for our opinion.
DELOITTE & TOUCHE LLP
Boston, Massachusetts
March 18, 2022
We have served as the auditor of one or more of the MFS investment companies since 1924.
Trustees and Officers — Identification and Background
The Trustees and Officers of the Trust, as of March 1, 2022, are listed below, together with their principal occupations during the past five years. (Their titles may have varied during that period.) The address of each Trustee and Officer is 111 Huntington Avenue, Boston, Massachusetts 02199-7618.
| Name, Age | | Position(s) Held with Fund | | Trustee/Officer Since(h) | | Number of MFS Funds overseen by the Trustee | | Principal Occupations During
the Past Five Years | | Other Directorships During
the Past Five Years (j) |
| INTERESTED TRUSTEES | | | | | | | | | | |
Michael W. Roberge (k)
(age 55) | | Trustee | | January 2021 | | 135 | | Massachusetts Financial Services Company, Chairman (since January 2021); Chief Executive Officer (since January 2017); Director; Chairman of the Board (since January 2022); President (until December 2018); Chief Investment Officer (until December 2018) | | N/A |
| INDEPENDENT TRUSTEES | | | | | | | | | | |
John P. Kavanaugh
(age 67) | | Trustee and Chair of Trustees | | January 2009 | | 135 | | Private investor | | N/A |
Steven E. Buller
(age 70) | | Trustee | | February 2014 | | 135 | | Private investor | | N/A |
John A. Caroselli
(age 67) | | Trustee | | March 2017 | | 135 | | Private investor; JC Global Advisors, LLC (management consulting), President (since 2015) | | N/A |
Maureen R. Goldfarb
(age 66) | | Trustee | | January 2009 | | 135 | | Private investor | | N/A |
Peter D. Jones
(age 66) | | Trustee | | January 2019 | | 135 | | Private investor | | N/A |
James W. Kilman, Jr.
(age 60) | | Trustee | | January 2019 | | 135 | | Burford Capital Limited (finance and investment management), Senior Advisor (since May 3, 2021), Chief Financial Officer (2019 - May 2, 2021); KielStrand Capital LLC (family office), Chief Executive Officer (since 2016) | | Alpha-En Corporation, Director (2016-2019) |
Trustees and Officers - continued
| Name, Age | | Position(s) Held with Fund | | Trustee/Officer Since(h) | | Number of MFS Funds overseen by the Trustee | | Principal Occupations During
the Past Five Years | | Other Directorships During
the Past Five Years (j) |
Clarence Otis, Jr.
(age 65) | | Trustee | | March 2017 | | 135 | | Private investor | | VF Corporation, Director; Verizon Communications, Inc., Director; The Travelers Companies, Director |
Maryanne L. Roepke
(age 66) | | Trustee | | May 2014 | | 135 | | Private investor | | N/A |
Laurie J. Thomsen
(age 64) | | Trustee | | March 2005 | | 135 | | Private investor | | The Travelers Companies, Director; Dycom Industries, Inc., Director |
| Name, Age | | Position(s) Held with
Fund | | Trustee/Officer Since(h) | | Number of MFS Funds for which the Person is an Officer | | Principal Occupations During
the Past Five Years |
| OFFICERS | | | | | | | | |
Christopher R. Bohane (k)
(age 48) | | Assistant Secretary and Assistant Clerk | | July 2005 | | 135 | | Massachusetts Financial Services Company, Senior Vice President and Associate General Counsel |
Kino Clark (k)
(age 53) | | Assistant Treasurer | | January 2012 | | 135 | | Massachusetts Financial Services Company, Vice President |
John W. Clark, Jr. (k)
(age 54) | | Assistant Treasurer | | April 2017 | | 135 | | Massachusetts Financial Services Company, Vice President (since March 2017); Deutsche Bank (financial services), Department Head - Treasurer's Office (until February 2017) |
Thomas H. Connors (k)
(age 62) | | Assistant Secretary and Assistant Clerk | | September 2012 | | 135 | | Massachusetts Financial Services Company, Vice President and Senior Counsel |
David L. DiLorenzo (k)
(age 53) | | President | | July 2005 | | 135 | | Massachusetts Financial Services Company, Senior Vice President |
Heidi W. Hardin (k)
(age 54) | | Secretary and Clerk | | April 2017 | | 135 | | Massachusetts Financial Services Company, Executive Vice President and General Counsel (since March 2017); Harris Associates (investment management), General Counsel (until January 2017) |
Trustees and Officers - continued
| Name, Age | | Position(s) Held with
Fund | | Trustee/Officer Since(h) | | Number of MFS Funds for which the Person is an Officer | | Principal Occupations During
the Past Five Years |
Brian E. Langenfeld (k)
(age 48) | | Assistant Secretary and Assistant Clerk | | June 2006 | | 135 | | Massachusetts Financial Services Company, Vice President and Senior Counsel |
Rosa E. Licea-Mailloux(k)
(age 45) | | Chief Compliance Officer | | March 2022 | | 135 | | Massachusetts Financial Services Company, Vice President (since 2018); Director of Corporate Compliance (2018-2021), Senior Director Compliance (2021-2022), Senior Managing Director of North American Compliance & Chief Compliance Officer (since March 2022); Natixis Investment Managers (investment management), Funds Chief Compliance Officer, Deputy General Counsel & Senior Vice President (until 2018) |
Amanda S. Mooradian (k)
(age 43) | | Assistant Secretary and Assistant Clerk | | September 2018 | | 135 | | Massachusetts Financial Services Company, Assistant Vice President and Senior Counsel |
Susan A. Pereira (k)
(age 51) | | Assistant Secretary and Assistant Clerk | | July 2005 | | 135 | | Massachusetts Financial Services Company, Vice President and Assistant General Counsel |
Kasey L. Phillips (k)
(age 51) | | Assistant Treasurer | | September 2012 | | 135 | | Massachusetts Financial Services Company, Vice President |
Matthew A. Stowe (k)
(age 47) | | Assistant Secretary and Assistant Clerk | | October 2014 | | 135 | | Massachusetts Financial Services Company, Vice President and Assistant General Counsel |
James O. Yost (k)
(age 61) | | Treasurer | | September 1990 | | 135 | | Massachusetts Financial Services Company, Senior Vice President |
| (h) | Date first appointed to serve as Trustee/Officer of an MFS Fund. Each Trustee has served continuously since appointment unless indicated otherwise. From January 2012 through December 2016, Messrs. DiLorenzo and Yost served as Treasurer and Deputy Treasurer of the Funds, respectively. |
| (j) | Directorships or trusteeships of companies required to report to the Securities and Exchange Commission (i.e., “public companies”). |
| (k) | “Interested person” of the Trust within the meaning of the Investment Company Act of 1940 (referred to as the 1940 Act), which is the principal federal law governing investment companies like the fund, as a result of a position with MFS. The address of MFS is 111 Huntington Avenue, Boston, Massachusetts 02199-7618. |
Trustees and Officers - continued
Each Trustee (other than Messrs. Jones, Kilman and Roberge) has been elected by shareholders and each Trustee and Officer holds office until his or her successor is chosen and qualified or until his or her earlier death, resignation, retirement or removal. Mr. Roberge became a Trustee of the Funds on January 1, 2021 and Messrs. Jones and Kilman became Trustees of the Funds on January 1, 2019. The Trust does not hold annual meetings for the purpose of electing Trustees, and Trustees are not elected for fixed terms. Under the terms of the Board's retirement policy, an Independent Trustee shall retire at the end of the calendar year in which he or she reaches the earlier of 75 years of age or 15 years of service on the Board (or, in the case of any Independent Trustee who joined the Board prior to 2015, 20 years of service on the Board).
Messrs. Buller, Kilman and Otis and Ms. Roepke are members of the Trust’s Audit Committee.
Each of the Interested Trustees and certain Officers hold comparable officer positions with certain affiliates of MFS.
The Statement of Additional Information for a Fund includes further information about the Trustees and is available without charge upon request by calling 1-800-225-2606.
| Investment Adviser | Custodian |
Massachusetts Financial Services Company
111 Huntington Avenue
Boston, MA 02199-7618 | JPMorgan Chase Bank, NA
4 Metrotech Center
New York, NY 11245 |
| Distributor | Independent Registered Public Accounting Firm |
MFS Fund Distributors, Inc.
111 Huntington Avenue
Boston, MA 02199-7618 | Deloitte & Touche LLP
200 Berkeley Street
Boston, MA 02116 |
| Portfolio Manager(s) | |
David Cole
Michael Skatrud | |
Proxy Voting Policies and Information
MFS votes proxies on behalf of the fund pursuant to proxy voting policies and procedures that are available without charge, upon request, by calling 1-800-225-2606, by visiting mfs.com/proxyvoting, or by visiting the SEC’s Web site at http://www.sec.gov.
Information regarding how the fund voted proxies relating to portfolio securities during the most recent twelve-month period ended June 30 is available by August 31 of each year without charge by visiting mfs.com/proxyvoting, or by visiting the SEC’s Web site at http://www.sec.gov.
Quarterly Portfolio Disclosure
The fund files a complete schedule of portfolio holdings with the SEC for the first and third quarters of each fiscal year as an exhibit to its reports on Form N-PORT. The fund’s Form N-PORT reports are available on the SEC’s Web site at http://www.sec.gov.
Further Information
From time to time, MFS may post important information about the fund or the MFS Funds on the MFS Web site (mfs.com). This information is available at https://www.mfs.com/announcements.
Information About Fund Contracts and Legal Claims
The fund has entered into contractual arrangements with an investment adviser, administrator, distributor, shareholder servicing agent, 529 program manager (if applicable), and custodian who each provide services to the fund. Unless expressly stated otherwise, shareholders are not parties to, or intended beneficiaries of these contractual arrangements, and these contractual arrangements are not intended to create any shareholder right to enforce them against the service providers or to seek any remedy under them against the service providers, either directly or on behalf of the fund.
Under the Trust’s By-Laws and Declaration of Trust, any claims asserted against or on behalf of the MFS Funds, including claims against Trustees and Officers, must be brought in state and federal courts located within the Commonwealth of Massachusetts.
Federal Tax Information (unaudited)
The fund will notify shareholders of amounts for use in preparing 2022 income tax forms in January 2023. The following information is provided pursuant to provisions of the Internal Revenue Code.
The fund intends to pass through the maximum amount allowable as Section 163(j) Interest Dividends as defined in Treasury Regulation §1.163(j)-1(b).
| FACTS | WHAT DOES MFS DO WITH YOUR PERSONAL INFORMATION? |
| Why? | Financial companies choose how they share your personal information. Federal law gives consumers the right to limit some but not all sharing. Federal law also requires us to tell you how we collect, share, and protect your personal information. Please read this notice carefully to understand what we do. |
| What? | The types of personal information we collect and share depend on the product or service you have with us. This information can include: |
| • Social Security number and account balances |
| • Account transactions and transaction history |
| • Checking account information and wire transfer instructions |
| When you are no longer our customer, we continue to share your information as described in this notice. |
| How? | All financial companies need to share customers' personal information to run their everyday business. In the section below, we list the reasons financial companies can share their customers' personal information; the reasons MFS chooses to share; and whether you can limit this sharing. |
Reasons we can share your
personal information | Does MFS share? | Can you limit
this sharing? |
For our everyday business purposes –
such as to process your transactions, maintain your
account(s), respond to court orders and legal
investigations, or report to credit bureaus | Yes | No |
For our marketing purposes –
to offer our products and services to you | No | We don't share |
For joint marketing with other
financial companies | No | We don't share |
For our affiliates' everyday business purposes –
information about your transactions and experiences | No | We don't share |
For our affiliates' everyday business purposes –
information about your creditworthiness | No | We don't share |
| For nonaffiliates to market to you | No | We don't share |
| Questions? | Call 800-225-2606 or go to mfs.com. |
| Who we are |
| Who is providing this notice? | MFS Funds, MFS Investment Management, MFS Institutional Advisors, Inc., and MFS Heritage Trust Company. |
| What we do |
How does MFS
protect my personal
information? | To protect your personal information from unauthorized access and use, we use security measures that comply with federal law. These measures include procedural, electronic, and physical safeguards for the protection of the personal information we collect about you. |
How does MFS
collect my personal
information? | We collect your personal information, for example, when you |
| • open an account or provide account information |
| • direct us to buy securities or direct us to sell your securities |
| • make a wire transfer |
| We also collect your personal information from others, such as credit bureaus, affiliates, or other companies. |
| Why can't I limit all sharing? | Federal law gives you the right to limit only |
| • sharing for affiliates' everyday business purposes – information about your creditworthiness |
| • affiliates from using your information to market to you |
| • sharing for nonaffiliates to market to you |
| State laws and individual companies may give you additional rights to limit sharing. |
| Definitions |
| Affiliates | Companies related by common ownership or control. They can be financial and nonfinancial companies. |
| • MFS does not share personal information with affiliates, except for everyday business purposes as described on page one of this notice. |
| Nonaffiliates | Companies not related by common ownership or control. They can be financial and nonfinancial companies. |
| • MFS does not share with nonaffiliates so they can market to you. |
| Joint marketing | A formal agreement between nonaffiliated financial companies that together market financial products or services to you. |
| • MFS doesn't jointly market. |
| Other important information |
| If you own an MFS product or receive an MFS service in the name of a third party such as a bank or broker-dealer, their privacy policy may apply to you instead of ours. |
Save paper with eDelivery.
MFS® will send you prospectuses, reports, and proxies directly via e-mail so you will get information faster with less mailbox clutter.
To sign up:
1. Go to mfs.com.
2. Log in via MFS® Access.
3. Select eDelivery.
If you own your MFS fund shares through a financial institution or a retirement plan, MFS® TALK, MFS® Access, or eDelivery may not be available to you.
CONTACT
WEB SITE
mfs.com
MFS TALK
1-800-637-8255
24 hours a day
ACCOUNT SERVICE AND LITERATURE
Shareholders
1-800-225-2606
Financial advisors
1-800-343-2829
Retirement plan services
1-800-637-1255
MAILING ADDRESS
MFS Service Center, Inc.
P.O. Box 219341
Kansas City, MO 64121-9341
OVERNIGHT MAIL
MFS Service Center, Inc.
Suite 219341
430 W 7th Street
Kansas City, MO 64105-1407
Annual Report
January 31, 2022
MFS® Municipal High
Income Fund
MFS® Municipal High
Income Fund
| 1 |
| 2 |
| 4 |
| 6 |
| 9 |
| 11 |
| 142 |
| 144 |
| 145 |
| 146 |
| 151 |
| 163 |
| 165 |
| 169 |
| 169 |
| 169 |
| 169 |
| 169 |
| 171 |
The report is prepared for the general information of shareholders. It is authorized for distribution to prospective investors only when preceded or accompanied by a current prospectus.
NOT FDIC INSURED • MAY LOSE VALUE • NO BANK GUARANTEE
LETTER FROM THE CHAIR AND CEO
Dear Shareholders:
As a result of Russia’s invasion of Ukraine, the danger of wider geopolitical conflict has risen to levels not seen in decades, and this comes as sanctions aimed at countering Russia’s actions are exacerbating already mounting inflation. Consequently, at a time when global growth faces multiple headwinds, central banks have been presented with the challenge of reining in rising prices without tipping economies into recession. This has in turn led to increased volatility.
There are, however, encouraging signs for the markets. The Omicron wave of the coronavirus is receding outside Asia, unemployment is low, and there are signs that some global supply chain bottlenecks are beginning to ease, though events in Ukraine could hamper these advances. Additionally, easier Chinese monetary policy and the record pace of corporate stock buybacks are supportive elements, albeit amid an otherwise turbulent investment environment.
It is important to have a deep understanding of company fundamentals during times of market transition, and we have built our global research platform to do just that.
At MFS®, we put our clients’ assets to work responsibly by carefully navigating the increasing complexity of global markets and economies. Guided by our commitment to long-term investing, we tune out the noise and try to uncover what we believe are the best, most durable investment opportunities in the market. Our unique global investment platform combines collective expertise, long-term discipline, and thoughtful risk management to create sustainable value for investors over time.
Respectfully,
Michael W. Roberge
Chair and Chief Executive Officer
MFS Investment Management
March 18, 2022
The opinions expressed in this letter are subject to change and may not be relied upon for investment advice. No forecasts can be guaranteed.
Portfolio structure (i)
Top ten industries (i)
| Healthcare Revenue - Hospitals | 12.9% |
| Healthcare Revenue - Long Term Care | 10.8% |
| General Obligations - General Purpose | 7.9% |
| Universities - Secondary Schools | 6.9% |
| Miscellaneous Revenue - Other | 5.9% |
| Tax - Sales | 5.1% |
| Tax - Other | 4.1% |
| Universities - Colleges | 3.9% |
| Tobacco | 3.6% |
| General Obligations - Schools | 3.5% |
Composition including fixed income credit quality (a)(i)
| AAA | 2.1% |
| AA | 11.1% |
| A | 14.3% |
| BBB | 22.8% |
| BB | 12.4% |
| B | 3.1% |
| CCC | 0.4% |
| CC | 0.9% |
| C | 0.2% |
| D | 1.7% |
| Federal Agencies (o) | 0.0% |
| Not Rated | 30.7% |
| Cash & Cash Equivalents | 1.2% |
| Other | (0.9)% |
Portfolio facts (i)
| Average Duration (d) | 7.2 |
| Average Effective Maturity (m) | 18.2 yrs. |
| (a) | For all securities other than those specifically described below, ratings are assigned to underlying securities utilizing ratings from Moody’s, Fitch, and Standard & Poor’s rating agencies and applying the following hierarchy: If all three agencies provide a rating, the middle rating (after dropping the highest and lowest ratings) is assigned; if two of the three agencies rate a security, the lower of the two is assigned. If none of the 3 rating agencies above assign a rating, but the security is rated by DBRS Morningstar, then the DBRS Morningstar rating is assigned. If none of the 4 rating agencies listed above rate the security, but the security is rated by the Kroll Bond Rating Agency (KBRA), then the KBRA rating is assigned. Ratings are shown in the S&P and Fitch scale (e.g., AAA). Securities rated BBB or higher are considered investment grade. All ratings are subject to change. Federal Agencies includes rated and unrated U.S. Agency fixed-income securities, U.S. Agency mortgage-backed securities, and collateralized mortgage obligations of U.S. Agency mortgage-backed securities. Not Rated includes fixed income securities and fixed income derivatives that have not been rated by any rating agency. The fund may or may not have held |
Portfolio Composition - continued
all of these instruments on this date. The fund is not rated by these agencies.
| (d) | Duration is a measure of how much a bond’s price is likely to fluctuate with general changes in interest rates, e.g., if rates rise 1.00%, a bond with a 5-year duration is likely to lose about 5.00% of its value due to the interest rate move. |
| (i) | For purposes of this presentation, the components include the value of securities, and reflect the impact of the equivalent exposure of derivative positions, if any. These amounts may be negative from time to time. Equivalent exposure is a calculated amount that translates the derivative position into a reasonable approximation of the amount of the underlying asset that the portfolio would have to hold at a given point in time to have the same price sensitivity that results from the portfolio’s ownership of the derivative contract. When dealing with derivatives, equivalent exposure is a more representative measure of the potential impact of a position on portfolio performance than value. The bond component will include any accrued interest amounts. |
| (m) | In determining each instrument’s effective maturity for purposes of calculating the fund’s dollar-weighted average effective maturity, MFS uses the instrument’s stated maturity or, if applicable, an earlier date on which MFS believes it is probable that a maturity-shortening device (such as a put, pre-refunding or prepayment) will cause the instrument to be repaid. Such an earlier date can be substantially shorter than the instrument’s stated maturity. |
Cash & Cash Equivalents includes any cash, investments in money market funds, short-term securities, and other assets less liabilities. Please see the Statement of Assets and Liabilities for additional information related to the fund’s cash position and other assets and liabilities.
Other includes equivalent exposure from currency derivatives and/or any offsets to derivative positions and/or the leverage created through the issuance of self-deposited inverse floaters and may be negative.
Percentages are based on net assets as of January 31, 2022.
The portfolio is actively managed and current holdings may be different.
Management Review
Summary of Results
For the twelve months ended January 31, 2022, Class A shares of the MFS Municipal High Income Fund (fund) provided a total return of 0.58%, at net asset value. This compares with a return of -1.89% for the fund’s benchmark, the Bloomberg Municipal Bond Index.
Market Environment
Over the past year, the global economy was buffeted by an array of crosscurrents as it adjusted to the ebbs and flows of the pandemic. Among the supportive currents were ample fiscal stimulus, loose monetary policy and the rollout of several highly effective coronavirus vaccines. Negative currents included the rapid spread of several coronavirus variants, widespread global production bottlenecks and a surge in inflation. After experiencing a burst of exceptionally strong economic activity as the global economy began to reopen, activity became more muted in the second half of the period amid ongoing supply chain disruptions and a new wave of coronavirus infections, albeit seemingly milder strains.
Amid rising inflation, markets anticipated a transition from an exceptionally accommodative monetary environment to a significantly more restrictive one ahead, which resulted in a rise in market volatility. Indeed, several central banks in emerging markets have already tightened policy, as has the Bank of England, while the US Federal Reserve signaled it intends to tighten policy soon. The European Central Bank, which had been expected to move slowly toward tighter policy, has indicated it, too, may need to dial back accommodation in coming months. However, the Bank of Japan and the People's Bank of China are expected to maintain accommodative policies. As a result of the shifting monetary backdrop, sovereign bond yields moved higher during the period, but remain quite low relative to history.
A harsher Chinese regulatory environment toward industries such as online gaming, food delivery and education increased market volatility as has stress in China's highly leveraged property development sector. Trade relations between the United States and China remained quite strained despite a change in presidential administrations. Geopolitical tensions ramped up during the period with Russia amassing troops along its border with Ukraine and Chinese forces repeatedly entering airspace claimed by Taiwan.
An increase in market volatility saw speculative activity abate somewhat as “meme” stocks and cryptocurrencies came under pressure near the end of the period.
Strong economic growth drove the fundamental recovery of municipal issuers over the last 12 months. Improving rates of employment, resilient consumer spending and higher property values spurred growth in state and local tax revenues to levels 17% higher than 2020 and 14% higher than 2019. At the same time, federal stimulus bolstered liquidity of state/local governments and many revenue sectors. In addition to fundamental strength, technicals also provided a tailwind. Inflows into municipal mutual funds and exchange traded funds (ETFs) in 2021 reached $102 billion, the most for any calendar year in history dating to 1992. With the supportive fundamental and technical backdrop, credit spreads tightened across the quality spectrum. As an illustration, the yield differential between high yield and investment grade municipals
Management Review - continued
decreased from 260 bps to 187 bps over the period, reaching its lowest level since 2007. The tightening in valuations proved to be a headwind to performance as the period progressed. Higher interest rates, reflecting above-trend levels of growth and unexpectedly high inflation rates, also impacted returns later in the period. For the year, higher-yielding municipal assets, in general, outperformed higher-quality assets, and sectors exposed to the economic reopening, such as transportation, education and hospitals, performed well. Although fundamentals were broadly strong across municipal issuers during the reporting period, the current municipal market is characterized by tight spreads and the prospect of interest rates continuing to move higher.
Factors Affecting Performance
Relative to the Bloomberg Municipal Bond Index, the fund’s out-of-benchmark allocation to “non-rated”(r) and “BB” rated securities, and its greater allocation to “BBB” rated issuers, contributed to performance. From a sector perspective, the fund's overweight allocation to the health care sector strengthened relative results. Favorable bond selection within the health care sector further aided relative performance.
Conversely, the fund's longer duration(d) stance held back relative performance.
Respectfully,
Portfolio Manager(s)
Jason Kosty, Gary Lasman, and Geoffrey Schechter
Note to Shareholders: Effective March 31, 2021, Jason Kosty was added as a Portfolio Manager of the fund. Effective March 1, 2022, Megan Poplowski was added as a Portfolio Manager of the fund. Effective April 30, 2023, Gary Lasman will no longer be a Portfolio Manager of the fund.
| (d) | Duration is a measure of how much a bond’s price is likely to fluctuate with general changes in interest rates, e.g., if rates rise 1.00%, a bond with a 5-year duration is likely to lose about 5.00% of its value. |
| (r) | Securities rated “BBB”, “Baa”, or higher are considered investment grade; securities rated “BB”, “Ba”, or below are considered non-investment grade. Ratings are assigned to underlying securities utilizing ratings from Moody's, Fitch, and Standard & Poor's and applying the following hierarchy: If all three agencies provide a rating, the middle rating (after dropping the highest and lowest ratings) is assigned; if two of the three agencies rate a security, the lower of the two is assigned. If none of the 3 rating agencies above assign a rating, but the security is rated by DBRS Morningstar, then the DBRS Morningstar rating is assigned. If none of the 4 rating agencies listed above rate the security, but the security is rated by the Kroll Bond Rating Agency (KBRA), then the KBRA rating is assigned. Ratings are shown in the S&P and Fitch scale (e.g., AAA). For securities that are not rated by any of the rating agencies, the security is considered Not Rated. |
The views expressed in this report are those of the portfolio manager(s) only through the end of the period of the report as stated on the cover and do not necessarily reflect the views of MFS or any other person in the MFS organization. These views are subject to change at any time based on market or other conditions, and MFS disclaims any responsibility to update such views. These views may not be relied upon as investment advice or an indication of trading intent on behalf of any MFS portfolio. References to specific securities are not recommendations of such securities, and may not be representative of any MFS portfolio’s current or future investments.
Performance Summary THROUGH 1/31/22
The following chart illustrates a representative class of the fund’s historical performance in comparison to its benchmark(s). Performance results include the deduction of the maximum applicable sales charge and reflect the percentage change in net asset value, including reinvestment of dividends and capital gains distributions. The performance of other share classes will be greater than or less than that of the class depicted below. Benchmarks are unmanaged and may not be invested in directly. Benchmark returns do not reflect sales charges, commissions or expenses. (See Notes to Performance Summary.)
Performance data shown represents past performance and is no guarantee of future results. Investment return and principal value fluctuate so your shares, when sold, may be worth more or less than the original cost; current performance may be lower or higher than quoted. The performance shown does not reflect the deduction of taxes, if any, that a shareholder would pay on fund distributions or the redemption of fund shares.
Growth of a Hypothetical $10,000 Investment
Performance Summary - continued
Total Returns through 1/31/22
Average annual without sales charge
| Share Class | Class Inception Date | 1-yr | 5-yr | 10-yr | Life (t) |
| A | 2/24/84 | 0.58% | 4.84% | 4.91% | N/A |
| B | 9/07/93 | (0.28)% | 4.03% | 4.10% | N/A |
| C | 9/25/98 | (0.53)% | 3.77% | 3.86% | N/A |
| I | 6/01/11 | 0.46% | 4.81% | 4.89% | N/A |
| R6 | 6/02/17 | 0.54% | N/A | N/A | 4.33% |
Comparative benchmark(s)
| | | | | |
| Bloomberg Municipal Bond Index (f) | (1.89)% | 3.46% | 3.20% | N/A |
Average annual with sales charge
| | | | | |
A
With Initial Sales Charge (4.25%) | (3.69)% | 3.93% | 4.46% | N/A |
B
With CDSC (Declining over six years from 4% to 0%) (v) | (4.18)% | 3.69% | 4.10% | N/A |
C
With CDSC (1% for 12 months) (v) | (1.51)% | 3.77% | 3.86% | N/A |
CDSC – Contingent Deferred Sales Charge.
Class I and R6 shares do not have a sales charge.
| (f) | Source: FactSet Research Systems Inc. |
| (t) | For the period from the class inception date through the stated period end (for those share classes with less than 10 years of performance history). No comparative benchmark performance information is provided for “life” periods. (See Notes to Performance Summary.) |
| (v) | Assuming redemption at the end of the applicable period. |
Benchmark Definition(s)
Bloomberg Municipal Bond Index(a) – a market capitalization-weighted index that measures the performance of the tax-exempt bond market.
It is not possible to invest directly in an index.
| (a) | Source: Bloomberg Index Services Limited. BLOOMBERG® is a trademark and service mark of Bloomberg Finance L.P. and its affiliates (collectively “Bloomberg”). Bloomberg or Bloomberg's licensors own all proprietary rights in the Bloomberg Indices. Bloomberg neither approves or endorses this material, or guarantees the accuracy or completeness of any information herein, or makes any warranty, express or implied, as to the results to be obtained therefrom and, to the maximum extent allowed by law, neither shall have any liability or responsibility for injury or damages arising in connection therewith. |
Notes to Performance Summary
Average annual total return represents the average annual change in value for each share class for the periods presented. Life returns are presented where the share class has less than 10 years of performance history and represent the average annual total return from the class inception date to the stated period end date. As the fund's share classes may have different inception dates, the life returns may represent different time periods and may not be comparable. As a result, no comparative benchmark
Performance Summary - continued
performance information is provided for life periods.
Performance results reflect any applicable expense subsidies and waivers in effect during the periods shown. Without such subsidies and waivers the fund's performance results would be less favorable. Please see the prospectus and financial statements for complete details.
Performance results do not include adjustments made for financial reporting purposes in accordance with U.S. generally accepted accounting principles and may differ from amounts reported in the financial highlights.
A portion of the fund’s monthly distributions may be subject to state, federal, and/or alternative minimum tax. Capital gains, if any, are subject to a capital gains tax.
From time to time the fund may receive proceeds from litigation settlements, without which performance would be lower.
Expense Table
Fund expenses borne by the shareholders during the period, August 1, 2021 through January 31, 2022
As a shareholder of the fund, you incur two types of costs: (1) transaction costs, including sales charges (loads) on certain purchase or redemption payments, and (2) ongoing costs, including management fees; distribution and service (12b-1) fees; and other fund expenses. This example is intended to help you understand your ongoing costs (in dollars) of investing in the fund and to compare these costs with the ongoing costs of investing in other mutual funds.
The example is based on an investment of $1,000 invested at the beginning of the period and held for the entire period August 1, 2021 through January 31, 2022.
Actual Expenses
The first line for each share class in the following tables provides information about actual account values and actual expenses. You may use the information in this line, together with the amount you invested, to estimate the expenses that you paid over the period. Simply divide your account value by $1,000 (for example, an $8,600 account value divided by $1,000 = 8.6), then multiply the result by the number in the first line under the heading entitled “Expenses Paid During Period” to estimate the expenses you paid on your account during this period.
Hypothetical Example for Comparison Purposes
The second line for each share class in the following tables provides information about hypothetical account values and hypothetical expenses based on each fund’s actual expense ratio and an assumed rate of return of 5% per year before expenses, which is not each fund’s actual return. The hypothetical account values and expenses may not be used to estimate the actual ending account balance or expenses you paid for the period. You may use this information to compare the ongoing costs of investing in each fund and other funds. To do so, compare this 5% hypothetical example with the 5% hypothetical examples that appear in the shareholder reports of the other funds.
Please note that the expenses shown in the tables are meant to highlight your ongoing costs only and do not reflect any transactional costs, such as sales charges (loads). Therefore, the second line for each share class in the tables is useful in comparing ongoing costs only, and will not help you determine the relative total costs of owning different funds. In addition, if these transactional costs were included, your costs would have been higher.
Expense Table - continued
Share
Class | | Annualized
Expense
Ratio | Beginning
Account Value
8/01/21 | Ending
Account Value
1/31/22 | Expenses
Paid During
Period (p)
8/01/21-1/31/22 |
| A | Actual | 0.62% | $1,000.00 | $968.34 | $3.08 |
| Hypothetical (h) | 0.62% | $1,000.00 | $1,022.08 | $3.16 |
| B | Actual | 1.37% | $1,000.00 | $964.69 | $6.78 |
| Hypothetical (h) | 1.37% | $1,000.00 | $1,018.30 | $6.97 |
| C | Actual | 1.62% | $1,000.00 | $962.37 | $8.01 |
| Hypothetical (h) | 1.62% | $1,000.00 | $1,017.04 | $8.24 |
| I | Actual | 0.62% | $1,000.00 | $968.28 | $3.08 |
| Hypothetical (h) | 0.62% | $1,000.00 | $1,022.08 | $3.16 |
| R6 | Actual | 0.53% | $1,000.00 | $968.72 | $2.63 |
| Hypothetical (h) | 0.53% | $1,000.00 | $1,022.53 | $2.70 |
| (h) | 5% class return per year before expenses. |
| (p) | “Expenses Paid During Period” are equal to each class’s annualized expense ratio, as shown above, multiplied by the average account value over the period, multiplied by 184/365 (to reflect the one-half year period). Expenses paid do not include any applicable sales charges (loads). If these transaction costs had been included, your costs would have been higher. |
Notes to Expense Table
Expense ratios include 0.01% of investment related expenses from self-deposited inverse floaters (See Note 2 of the Notes to Financial Statements) that are outside of the expense limitation arrangement (See Note 3 of the Notes to Financial Statements).
Portfolio of Investments
1/31/22
The Portfolio of Investments is a complete list of all securities owned by your fund. It is categorized by jurisdiction.
| Issuer | | | Shares/Par | Value ($) |
| Municipal Bonds - 98.3% |
| Alabama - 1.3% |
| Alabama Stadium Trace Village Improvement District Development Incentive Anticipation, 3.625%, 3/01/2036 | | $ | 1,985,000 | $ 1,911,626 |
| Birmingham, AL, Airport Authority Rev., BAM, 4%, 7/01/2035 | | | 335,000 | 383,953 |
| Birmingham, AL, Airport Authority Rev., BAM, 4%, 7/01/2036 | | | 1,185,000 | 1,356,760 |
| Birmingham, AL, Airport Authority Rev., BAM, 4%, 7/01/2037 | | | 260,000 | 297,053 |
| Birmingham, AL, Airport Authority Rev., BAM, 4%, 7/01/2038 | | | 1,745,000 | 1,989,966 |
| Birmingham, AL, Airport Authority Rev., BAM, 4%, 7/01/2039 | | | 340,000 | 386,607 |
| Birmingham, AL, Airport Authority Rev., BAM, 4%, 7/01/2040 | | | 175,000 | 198,368 |
| Birmingham, AL, Special Care Facilities Financing Authority Rev. (Methodist Home for the Aging), 5.5%, 6/01/2030 | | | 1,630,000 | 1,715,643 |
| Birmingham, AL, Special Care Facilities Financing Authority Rev. (Methodist Home for the Aging), 5.75%, 6/01/2035 | | | 1,685,000 | 1,783,221 |
| Birmingham, AL, Special Care Facilities Financing Authority Rev. (Methodist Home for the Aging), 5.75%, 6/01/2045 | | | 6,355,000 | 6,681,829 |
| Birmingham, AL, Special Care Facilities Financing Authority Rev. (Methodist Home for the Aging), 6%, 6/01/2050 | | | 2,565,000 | 2,714,810 |
| Huntsville-Redstone Village, AL, Special Care Facilities Financing Authority (Redstone Village Project), 5.5%, 1/01/2028 (a)(d) | | | 1,485,000 | 996,523 |
| Huntsville-Redstone Village, AL, Special Care Facilities Financing Authority (Redstone Village Project), 5.5%, 1/01/2043 (a)(d) | | | 1,560,000 | 990,569 |
| Jefferson County, AL, Sewer Rev. Warrants, Capital Appreciation, Senior Lien, “B”, AGM, 0%, 10/01/2026 | | | 805,000 | 691,063 |
| Jefferson County, AL, Sewer Rev. Warrants, Capital Appreciation, Senior Lien, “B”, AGM, 0%, 10/01/2029 | | | 1,130,000 | 796,580 |
| Jefferson County, AL, Sewer Rev. Warrants, Capital Appreciation, Senior Lien, “B”, AGM, 0%, 10/01/2034 | | | 1,620,000 | 804,630 |
| Jefferson County, AL, Sewer Rev. Warrants, Capital Appreciation, Senior Lien, “B”, AGM, 0%, 10/01/2035 | | | 3,080,000 | 1,432,556 |
| Jefferson County, AL, Sewer Rev. Warrants, Subordinate Lien, “D”, 5%, 10/01/2023 | | | 2,020,000 | 2,154,669 |
| Muscle Shoals, Sheffield, and Tuscumbia, AL, Solid Waste Disposal Authority Rev. (Cherokee Industrial Landfill Project), “A”, 6%, 5/01/2040 (n) | | | 4,200,000 | 4,625,443 |
| Muscle Shoals, Sheffield, and Tuscumbia, AL, Solid Waste Disposal Authority Rev. (Cherokee Industrial Landfill Project), “B”, 8%, 5/01/2029 (n) | | | 1,500,000 | 1,542,086 |
| Prichard, AL, Water Works & Sewer Board Rev., 4%, 11/01/2044 | | | 1,800,000 | 1,929,982 |
| Prichard, AL, Water Works & Sewer Board Rev., 4%, 11/01/2049 | | | 3,500,000 | 3,726,191 |
Portfolio of Investments – continued
| Issuer | | | Shares/Par | Value ($) |
| Municipal Bonds - continued |
| Alabama - continued |
| Southeast Alabama Gas Supply District Rev. (Project No. 1), “A”, 4%, 4/01/2049 (Put Date 4/01/2024) | | $ | 24,710,000 | $ 25,977,467 |
| Tuscaloosa County, AL, Industrial Development Authority, Gulf Opportunity Zone (Hunt Refining Project), “A”, 4.5%, 5/01/2032 (n) | | | 1,583,945 | 1,647,416 |
| Tuscaloosa County, AL, Industrial Development Authority, Gulf Opportunity Zone (Hunt Refining Project), “A”, 5.25%, 5/01/2044 (n) | | | 16,335,000 | 17,714,530 |
| University of South Alabama, Facilities Rev., “A”, BAM, 5%, 4/01/2049 | | | 3,535,000 | 4,180,856 |
| | | | | $88,630,397 |
| Alaska - 0.2% |
| Alaska Industrial Development & Export Authority Power Rev. (Snettisham Hydroelectric Project), 5%, 1/01/2030 | | $ | 875,000 | $ 938,627 |
| Alaska Industrial Development & Export Authority Power Rev. (Snettisham Hydroelectric Project), 5%, 1/01/2031 | | | 1,270,000 | 1,359,771 |
| Northern Alaska Tobacco Securitization Corp., Tobacco Settlement Asset-Backed, Capital Appreciation, “B2”, 0%, 6/01/2066 | | | 61,290,000 | 10,272,559 |
| | | | | $12,570,957 |
| American Samoa - 0.0% |
| American Samoa Economic Development Authority General Rev. “A”, 5%, 9/01/2038 (n) | | $ | 1,500,000 | $ 1,784,513 |
| Arizona - 2.6% |
| Arizona Industrial Development Authority Education Rev. (Academies of Math & Science), 4%, 7/01/2029 (n) | | $ | 725,000 | $ 775,368 |
| Arizona Industrial Development Authority Education Rev. (Academies of Math & Science), 5%, 7/01/2039 (n) | | | 870,000 | 986,269 |
| Arizona Industrial Development Authority Education Rev. (Academies of Math & Science), 5%, 7/01/2049 (n) | | | 1,395,000 | 1,557,866 |
| Arizona Industrial Development Authority Education Rev. (Academies of Math & Science), 5%, 7/01/2054 (n) | | | 2,185,000 | 2,432,021 |
| Arizona Industrial Development Authority Education Rev. (Academies of Math & Science), “A”, 5%, 7/01/2038 | | | 340,000 | 389,961 |
| Arizona Industrial Development Authority Education Rev. (Academies of Math & Science), “A”, 5%, 7/01/2048 | | | 910,000 | 1,031,678 |
| Arizona Industrial Development Authority Education Rev. (Academies of Math & Science), “A”, 5%, 7/01/2052 | | | 1,140,000 | 1,289,651 |
| Arizona Industrial Development Authority Education Rev. (Academies of Math & Science), “B”, 5.5%, 7/01/2038 (n) | | | 1,065,000 | 1,204,483 |
Portfolio of Investments – continued
| Issuer | | | Shares/Par | Value ($) |
| Municipal Bonds - continued |
| Arizona - continued |
| Arizona Industrial Development Authority Education Rev. (Academies of Math & Science), “B”, 5.625%, 7/01/2048 (n) | | $ | 2,050,000 | $ 2,305,070 |
| Arizona Industrial Development Authority Education Rev. (Academies of Math & Science), “B”, 5.75%, 7/01/2053 (n) | | | 3,190,000 | 3,597,265 |
| Arizona Industrial Development Authority Education Rev. (Basis Schools Projects), “D”, 5%, 7/01/2037 (n) | | | 450,000 | 509,792 |
| Arizona Industrial Development Authority Education Rev. (Basis Schools Projects), “D”, 5%, 7/01/2047 (n) | | | 740,000 | 829,135 |
| Arizona Industrial Development Authority Education Rev. (Basis Schools Projects), “D”, 5%, 7/01/2051 (n) | | | 1,970,000 | 2,202,014 |
| Arizona Industrial Development Authority Education Rev. (Basis Schools Projects), “G”, 5%, 7/01/2037 (n) | | | 770,000 | 872,311 |
| Arizona Industrial Development Authority Education Rev. (Basis Schools Projects), “G”, 5%, 7/01/2047 (n) | | | 770,000 | 862,748 |
| Arizona Industrial Development Authority Education Rev. (Basis Schools Projects), “G”, 5%, 7/01/2051 (n) | | | 735,000 | 821,564 |
| Arizona Industrial Development Authority Education Rev. (Inspirada and St. Rose Campus Projects), “A”, 5%, 7/15/2028 (n) | | | 2,025,000 | 2,221,263 |
| Arizona Industrial Development Authority Education Rev. (Inspirada and St. Rose Campus Projects), “A”, 5.75%, 7/15/2038 (n) | | | 1,810,000 | 2,050,687 |
| Arizona Industrial Development Authority Education Rev. (Inspirada and St. Rose Campus Projects), “A”, 5.75%, 7/15/2048 (n) | | | 3,100,000 | 3,477,538 |
| Arizona Industrial Development Authority Education Rev. (Mater Academy of Nevada - Bonanza Campus Project), “A”, 4%, 12/15/2030 (n) | | | 2,455,000 | 2,665,664 |
| Arizona Industrial Development Authority Education Rev. (Mater Academy of Nevada - Bonanza Campus Project), “A”, 5%, 12/15/2040 (n) | | | 1,000,000 | 1,121,970 |
| Arizona Industrial Development Authority Education Rev. (Mater Academy of Nevada - Bonanza Campus Project), “A”, 5%, 12/15/2050 (n) | | | 1,700,000 | 1,881,779 |
| Arizona Industrial Development Authority Education Rev. (Pinecrest Academy of Nevada - Cadence Campus Project), “A”, 4%, 7/15/2030 (n) | | | 625,000 | 671,127 |
| Arizona Industrial Development Authority Education Rev. (Pinecrest Academy of Nevada - Cadence Campus Project), “A”, 4%, 7/15/2040 (n) | | | 1,425,000 | 1,499,466 |
| Arizona Industrial Development Authority Education Rev. (Pinecrest Academy of Nevada - Cadence Campus Project), “A”, 4%, 7/15/2050 (n) | | | 1,600,000 | 1,663,651 |
Portfolio of Investments – continued
| Issuer | | | Shares/Par | Value ($) |
| Municipal Bonds - continued |
| Arizona - continued |
| Arizona Industrial Development Authority Education Rev. (Somerset Academy of Las Vegas - Aliante & Skye Canyon Campus Projects), “A”, 3%, 12/15/2031 (n) | | $ | 605,000 | $ 608,792 |
| Arizona Industrial Development Authority Education Rev. (Somerset Academy of Las Vegas - Aliante & Skye Canyon Campus Projects), “A”, 4%, 12/15/2041 (n) | | | 680,000 | 717,560 |
| Arizona Industrial Development Authority Education Rev. (Somerset Academy of Las Vegas - Aliante & Skye Canyon Campus Projects), “A”, 4%, 12/15/2051 (n) | | | 845,000 | 879,722 |
| Arizona Industrial Development Authority Education Rev. (Somerset Academy of Las Vegas - Lone Mountain Campus), “A”, 3.75%, 12/15/2029 (n) | | | 460,000 | 485,276 |
| Arizona Industrial Development Authority Education Rev. (Somerset Academy of Las Vegas - Lone Mountain Campus), “A”, 5%, 12/15/2039 (n) | | | 340,000 | 380,411 |
| Arizona Industrial Development Authority Education Rev. (Somerset Academy of Las Vegas - Lone Mountain Campus), “A”, 5%, 12/15/2049 (n) | | | 600,000 | 662,082 |
| Arizona Industrial Development Authority Hospital Rev. (Phoenix Children's Hospital), “A”, 5%, 2/01/2040 | | | 310,000 | 379,469 |
| Arizona Industrial Development Authority National Charter School Revolving Loan Fund Rev., “A”, 4%, 11/01/2045 | | | 1,085,000 | 1,196,268 |
| Arizona Industrial Development Authority National Charter School Revolving Loan Fund Rev., “A”, 4%, 11/01/2050 | | | 1,470,000 | 1,613,718 |
| Florence, AZ, Industrial Development Authority Education Rev. (Legacy Traditional School Project - Queen Creek & Casa Grande Campuses), 6%, 7/01/2043 (Prerefunded 7/01/2023) | | | 3,150,000 | 3,371,910 |
| Glendale, AZ, Industrial Development Authority Refunding Rev. (Terraces of Phoenix Project), “A”, 4%, 7/01/2028 | | | 300,000 | 308,705 |
| Glendale, AZ, Industrial Development Authority Refunding Rev. (Terraces of Phoenix Project), “A”, 5%, 7/01/2033 | | | 250,000 | 264,571 |
| Glendale, AZ, Industrial Development Authority Refunding Rev. (Terraces of Phoenix Project), “A”, 5%, 7/01/2038 | | | 300,000 | 315,998 |
| Glendale, AZ, Industrial Development Authority Refunding Rev. (Terraces of Phoenix Project), “A”, 5%, 7/01/2048 | | | 1,800,000 | 1,876,989 |
| Glendale, AZ, Industrial Development Authority, Graduate & Professional Student Loan Program Rev. (Midwestern University Foundation), “A”, 2.125%, 7/01/2033 | | | 1,405,000 | 1,297,846 |
| Glendale, AZ, Industrial Development Authority, Graduate & Professional Student Loan Program Rev. (Midwestern University Foundation), “A”, 3%, 7/01/2035 | | | 2,705,000 | 2,780,479 |
| Glendale, AZ, Industrial Development Authority, Senior Living Rev. (Royal Oaks - Inspirata Pointe Project), “A”, 5%, 5/15/2041 | | | 1,000,000 | 1,114,430 |
Portfolio of Investments – continued
| Issuer | | | Shares/Par | Value ($) |
| Municipal Bonds - continued |
| Arizona - continued |
| Glendale, AZ, Industrial Development Authority, Senior Living Rev. (Royal Oaks - Inspirata Pointe Project), “A”, 5%, 5/15/2056 | | $ | 5,955,000 | $ 6,564,703 |
| La Paz County, AZ, Industrial Development Authority (Harmony Education Foundation-Harmony Public Schools Project), “A”, 4%, 2/15/2041 | | | 430,000 | 466,346 |
| La Paz County, AZ, Industrial Development Authority (Harmony Education Foundation-Harmony Public Schools Project), “A”, 4%, 2/15/2046 | | | 345,000 | 372,444 |
| La Paz County, AZ, Industrial Development Authority (Harmony Education Foundation-Harmony Public Schools Project), “A”, 4%, 2/15/2051 | | | 580,000 | 624,498 |
| La Paz County, AZ, Industrial Development Authority Education Facility Lease Rev. (Charter School Solutions-Harmony Public Schools Project), “A”, 5%, 2/15/2038 | | | 800,000 | 907,770 |
| La Paz County, AZ, Industrial Development Authority Education Facility Lease Rev. (Charter School Solutions-Harmony Public Schools Project), “A”, 5%, 2/15/2048 | | | 435,000 | 488,073 |
| Maricopa County, AZ, Industrial Development Authority Education Rev. (Legacy Traditional Schools Projects), “A”, 4%, 7/01/2034 | | | 215,000 | 239,821 |
| Maricopa County, AZ, Industrial Development Authority Education Rev. (Legacy Traditional Schools Projects), “A”, 5%, 7/01/2039 | | | 380,000 | 450,534 |
| Maricopa County, AZ, Industrial Development Authority Education Rev. (Legacy Traditional Schools Projects), “A”, 5%, 7/01/2039 (n) | | | �� 1,115,000 | 1,289,483 |
| Maricopa County, AZ, Industrial Development Authority Education Rev. (Legacy Traditional Schools Projects), “A”, 5%, 7/01/2049 (n) | | | 705,000 | 824,299 |
| Maricopa County, AZ, Industrial Development Authority Education Rev. (Legacy Traditional Schools Projects), “A”, 5%, 7/01/2049 (n) | | | 590,000 | 672,952 |
| Maricopa County, AZ, Industrial Development Authority Education Rev. (Legacy Traditional Schools Projects), “A”, 5%, 7/01/2054 | | | 895,000 | 1,043,496 |
| Maricopa County, AZ, Industrial Development Authority Education Rev. (Legacy Traditional Schools Projects), “A”, 5%, 7/01/2054 (n) | | | 2,660,000 | 3,024,475 |
| Maricopa County, AZ, Pollution Control Corp. Rev. (Public Service Company of New Mexico Palo Verde Project), “A”, 0.875%, 6/01/2043 (Put Date 10/01/2026) | | | 1,715,000 | 1,673,183 |
Portfolio of Investments – continued
| Issuer | | | Shares/Par | Value ($) |
| Municipal Bonds - continued |
| Arizona - continued |
| Maricopa County, AZ, Pollution Control Corp. Rev. (Public Service Company of New Mexico Palo Verde Project), “B”, 0.875%, 6/01/2043 (Put Date 10/01/2026) | | $ | 855,000 | $ 834,152 |
| Phoenix, AZ, Industrial Development Authority Hotel Rev. (Provident Group - Falcon Properties LLC, Project), “A”, 4%, 12/01/2041 (n) | | | 2,605,000 | 2,577,273 |
| Phoenix, AZ, Industrial Development Authority Hotel Rev. (Provident Group - Falcon Properties LLC, Project), “A”, 4%, 12/01/2051 (n) | | | 8,630,000 | 8,248,160 |
| Phoenix, AZ, Industrial Development Authority Hotel Rev. (Provident Group - Falcon Properties LLC, Project), “A”, 4.15%, 12/01/2057 (n) | | | 3,245,000 | 3,092,979 |
| Phoenix, AZ, Industrial Development Authority Hotel Rev. (Provident Group - Falcon Properties LLC, Project), “B”, 5.75%, 12/15/2057 (n) | | | 8,330,000 | 8,010,719 |
| Phoenix, AZ, Industrial Development Authority Rev. (Guam Facilities Foundation, Inc.), 5.125%, 2/01/2034 | | | 4,545,000 | 4,620,587 |
| Phoenix, AZ, Industrial Development Authority Rev. (Guam Facilities Foundation, Inc.), 5.375%, 2/01/2041 | | | 3,980,000 | 4,069,578 |
| Phoenix, AZ, Industrial Development Authority, Education Facility Rev. (Basis Schools Projects), “A”, 5%, 7/01/2035 (n) | | | 2,070,000 | 2,256,013 |
| Phoenix, AZ, Industrial Development Authority, Education Facility Rev. (Basis Schools Projects), “A”, 5%, 7/01/2035 (n) | | | 700,000 | 762,903 |
| Phoenix, AZ, Industrial Development Authority, Education Facility Rev. (Basis Schools Projects), “A”, 5%, 7/01/2045 (n) | | | 3,065,000 | 3,316,271 |
| Phoenix, AZ, Industrial Development Authority, Education Facility Rev. (Basis Schools Projects), “A”, 5%, 7/01/2046 (n) | | | 1,770,000 | 1,914,502 |
| Phoenix, AZ, Industrial Development Authority, Education Facility Rev. (Great Hearts Academies Project), “A”, 5%, 7/01/2034 | | | 6,355,000 | 6,760,572 |
| Phoenix, AZ, Industrial Development Authority, Education Facility Rev. (Great Hearts Academies Project), “A”, 5%, 7/01/2036 | | | 815,000 | 886,540 |
| Phoenix, AZ, Industrial Development Authority, Education Facility Rev. (Great Hearts Academies Project), “A”, 5%, 7/01/2041 | | | 660,000 | 715,043 |
| Phoenix, AZ, Industrial Development Authority, Education Facility Rev. (Great Hearts Academies Project), “A”, 5%, 7/01/2044 | | | 3,970,000 | 4,203,884 |
| Phoenix, AZ, Industrial Development Authority, Education Facility Rev. (Great Hearts Academies Project), “A”, 5%, 7/01/2046 | | | 1,235,000 | 1,332,510 |
Portfolio of Investments – continued
| Issuer | | | Shares/Par | Value ($) |
| Municipal Bonds - continued |
| Arizona - continued |
| Phoenix, AZ, Industrial Development Authority, Education Facility Rev. (Legacy Traditional Schools Project), 6.5%, 7/01/2034 (n) | | $ | 1,970,000 | $ 2,209,625 |
| Phoenix, AZ, Industrial Development Authority, Education Facility Rev. (Legacy Traditional Schools Project), 5%, 7/01/2035 (n) | | | 1,430,000 | 1,553,590 |
| Phoenix, AZ, Industrial Development Authority, Education Facility Rev. (Legacy Traditional Schools Project), 6.75%, 7/01/2044 (n) | | | 3,255,000 | 3,649,495 |
| Phoenix, AZ, Industrial Development Authority, Education Facility Rev. (Legacy Traditional Schools Project), 5%, 7/01/2045 (n) | | | 1,570,000 | 1,691,231 |
| Phoenix, AZ, Industrial Development Authority, Education Facility Rev. (Legacy Traditional Schools Project), 5%, 7/01/2046 (n) | | | 3,935,000 | 4,310,843 |
| Phoenix, AZ, Industrial Development Authority, Student Housing Refunding Rev. (Downtown Phoenix Student Housing II LLC-Arizona State University Project), “A”, 5%, 7/01/2044 | | | 540,000 | 622,540 |
| Phoenix, AZ, Industrial Development Authority, Student Housing Refunding Rev. (Downtown Phoenix Student Housing II LLC-Arizona State University Project), “A”, 5%, 7/01/2049 | | | 1,325,000 | 1,520,818 |
| Phoenix, AZ, Industrial Development Authority, Student Housing Refunding Rev. (Downtown Phoenix Student Housing II LLC-Arizona State University Project), “A”, 5%, 7/01/2059 | | | 1,085,000 | 1,237,547 |
| Phoenix, AZ, Industrial Development Authority, Student Housing Refunding Rev. (Downtown Phoenix Student Housing LLC-Arizona State University Project), “A”, 5%, 7/01/2030 | | | 150,000 | 175,678 |
| Phoenix, AZ, Industrial Development Authority, Student Housing Refunding Rev. (Downtown Phoenix Student Housing LLC-Arizona State University Project), “A”, 5%, 7/01/2031 | | | 570,000 | 663,493 |
| Phoenix, AZ, Industrial Development Authority, Student Housing Refunding Rev. (Downtown Phoenix Student Housing LLC-Arizona State University Project), “A”, 5%, 7/01/2033 | | | 315,000 | 365,035 |
| Phoenix, AZ, Industrial Development Authority, Student Housing Refunding Rev. (Downtown Phoenix Student Housing LLC-Arizona State University Project), “A”, 5%, 7/01/2037 | | | 500,000 | 576,523 |
Portfolio of Investments – continued
| Issuer | | | Shares/Par | Value ($) |
| Municipal Bonds - continued |
| Arizona - continued |
| Phoenix, AZ, Industrial Development Authority, Student Housing Refunding Rev. (Downtown Phoenix Student Housing LLC-Arizona State University Project), “A”, 5%, 7/01/2042 | | $ | 555,000 | $ 634,973 |
| Pima County, AZ, Industrial Development Authority Education Facility Rev. (American Leadership Academy Project), 5%, 6/15/2034 (n) | | | 730,000 | 779,090 |
| Pima County, AZ, Industrial Development Authority Education Facility Rev. (American Leadership Academy Project), 4.75%, 6/15/2037 (n) | | | 3,740,000 | 3,798,120 |
| Pima County, AZ, Industrial Development Authority Education Facility Rev. (American Leadership Academy Project), 5%, 6/15/2039 (n) | | | 655,000 | 696,662 |
| Pima County, AZ, Industrial Development Authority Education Facility Rev. (American Leadership Academy Project), 4%, 6/15/2041 (n) | | | 510,000 | 525,238 |
| Pima County, AZ, Industrial Development Authority Education Facility Rev. (American Leadership Academy Project), 4%, 6/15/2041 (n)(w) | | | 2,735,000 | 2,791,614 |
| Pima County, AZ, Industrial Development Authority Education Facility Rev. (American Leadership Academy Project), 5%, 6/15/2047 (n) | | | 3,495,000 | 3,552,525 |
| Pima County, AZ, Industrial Development Authority Education Facility Rev. (American Leadership Academy Project), 5%, 6/15/2049 (n) | | | 1,235,000 | 1,303,808 |
| Pima County, AZ, Industrial Development Authority Education Facility Rev. (American Leadership Academy Project), 4%, 6/15/2051 (n)(w) | | | 3,020,000 | 3,046,869 |
| Pima County, AZ, Industrial Development Authority Education Facility Rev. (American Leadership Academy Project), 4%, 6/15/2051 (n) | | | 780,000 | 793,663 |
| Pima County, AZ, Industrial Development Authority Education Facility Rev. (American Leadership Academy Project), 5%, 6/15/2052 (n) | | | 3,960,000 | 4,025,182 |
| Pima County, AZ, Industrial Development Authority Education Facility Rev. (American Leadership Academy Project), 4%, 6/15/2057 (n) | | | 685,000 | 692,783 |
| Pima County, AZ, Industrial Development Authority Education Facility Rev. (American Leadership Academy Project), 4%, 6/15/2057 (n)(w) | | | 3,420,000 | 3,429,109 |
| Salt Verde Financial Corp., AZ, Senior Gas Rev., 5%, 12/01/2032 | | | 2,940,000 | 3,690,534 |
| | | | | $177,754,918 |
Portfolio of Investments – continued
| Issuer | | | Shares/Par | Value ($) |
| Municipal Bonds - continued |
| Arkansas - 0.3% |
| Arkansas Development Finance Authority, Charter School Capital Improvement Rev. (LISA Academy Project), 4%, 7/01/2028 | | $ | 800,000 | $ 819,926 |
| Arkansas Development Finance Authority, Charter School Capital Improvement Rev. (LISA Academy Project), 4.5%, 7/01/2033 | | | 1,620,000 | 1,664,476 |
| Arkansas Development Finance Authority, Charter School Capital Improvement Rev. (LISA Academy Project), 4.5%, 7/01/2039 | | | 170,000 | 174,166 |
| Arkansas Development Finance Authority, Health Care Rev. (Baptist Health), 5%, 12/01/2047 | | | 1,165,000 | 1,380,451 |
| Arkansas Development Finance Authority, Health Care Rev. (Baptist Memorial Health Care Corp.), “B-1”, 5%, 9/01/2036 | | | 930,000 | 1,121,023 |
| Arkansas Development Finance Authority, Health Care Rev. (Baptist Memorial Health Care Corp.), “B-1”, 5%, 9/01/2037 | | | 645,000 | 777,112 |
| Arkansas Development Finance Authority, Health Care Rev. (Baptist Memorial Health Care Corp.), “B-1”, 5%, 9/01/2038 | | | 1,450,000 | 1,743,779 |
| Arkansas Development Finance Authority, Health Care Rev. (Baptist Memorial Health Care Corp.), “B-1”, 5%, 9/01/2039 | | | 520,000 | 624,458 |
| Arkansas Development Finance Authority, Health Care Rev. (Baptist Memorial Health Care Corp.), “B-1”, 5%, 9/01/2040 | | | 570,000 | 683,370 |
| Arkansas Development Finance Authority, Health Care Rev. (Baptist Memorial Health Care Corp.), “B-1”, 5%, 9/01/2044 | | | 1,965,000 | 2,338,887 |
| Arkansas Development Finance Authority, Healthcare Facilities Rev. (Carti Surgery Center Project), “B”, 3%, 7/01/2032 | | | 180,000 | 174,533 |
| Arkansas Development Finance Authority, Healthcare Facilities Rev. (Carti Surgery Center Project), “B”, 3.125%, 7/01/2036 | | | 520,000 | 503,769 |
| Arkansas Development Finance Authority, Healthcare Facilities Rev. (Carti Surgery Center Project), “B”, 4.25%, 7/01/2041 | | | 195,000 | 207,850 |
| Arkansas Development Finance Authority, Healthcare Facilities Rev. (Carti Surgery Center Project), “B”, 3.5%, 7/01/2046 | | | 1,185,000 | 1,130,772 |
| Arkansas Development Finance Authority, Healthcare Facilities Rev. (Carti Surgery Center Project), “B”, 4%, 7/01/2052 | | | 850,000 | 882,073 |
| Arkansas Development Finance Authority, Hospital Rev. (Washington Regional Medical Center), “A”, 5%, 2/01/2035 | | | 365,000 | 396,913 |
| Arkansas Development Finance Authority, Hospital Rev. (Washington Regional Medical Center), “C”, 5%, 2/01/2033 | | | 540,000 | 588,357 |
| Arkansas Development Finance Authority, Tobacco Settlement Rev. (Cancer Research Center Project), Capital Appreciation, AAC, 0%, 7/01/2046 | | | 6,455,000 | 2,892,142 |
| Pulaski County, AR, Public Facilities Board, Healthcare Rev. (Baptist Health), 5%, 12/01/2039 (Prerefunded 12/01/2024) | | | 4,510,000 | 4,987,571 |
| | | | | $23,091,628 |
Portfolio of Investments – continued
| Issuer | | | Shares/Par | Value ($) |
| Municipal Bonds - continued |
| California - 8.2% |
| Acton-Agua Dulce, CA, Unified School District (Election of 2008), Capital Appreciation, AGM, 0%, 5/01/2039 | | $ | 7,550,000 | $ 4,591,064 |
| Beverly Hills, CA, Unified School District (Election of 2008), Capital Appreciation, 0%, 8/01/2031 | | | 2,060,000 | 1,707,405 |
| Beverly Hills, CA, Unified School District (Election of 2008), Capital Appreciation, 0%, 8/01/2032 | | | 2,095,000 | 1,693,303 |
| Beverly Hills, CA, Unified School District (Election of 2008), Capital Appreciation, 0%, 8/01/2033 | | | 4,185,000 | 3,300,979 |
| California Community Housing Agency, Essential Housing Rev. (Aster), “A-1”, 4%, 2/01/2056 (n) | | | 9,360,000 | 9,404,127 |
| California Community Housing Agency, Essential Housing Rev. (Aster), “A-2”, 4%, 2/01/2043 (n) | | | 6,950,000 | 6,700,863 |
| California County Tobacco Securitization Agency Settlement (Gold Country Settlement Funding Corp.), Capital Appreciation, “B-2”, 0%, 6/01/2055 | | | 8,415,000 | 2,139,721 |
| California County Tobacco Securitization Agency Settlement (Los Angeles County Securitization Corp.), “A”, 5%, 6/01/2032 | | | 160,000 | 198,552 |
| California County Tobacco Securitization Agency Settlement (Los Angeles County Securitization Corp.), “A”, 4%, 6/01/2035 | | | 210,000 | 243,273 |
| California County Tobacco Securitization Agency Settlement (Los Angeles County Securitization Corp.), “A”, 4%, 6/01/2037 | | | 340,000 | 392,122 |
| California County Tobacco Securitization Agency Settlement (Los Angeles County Securitization Corp.), “A”, 4%, 6/01/2038 | | | 145,000 | 166,834 |
| California County Tobacco Securitization Agency Settlement (Los Angeles County Securitization Corp.), “A”, 4%, 6/01/2039 | | | 185,000 | 212,323 |
| California Health Facilities Financing Authority Rev., (Cedars-Sinai Health System), “A”, 4%, 8/15/2048 | | | 27,965,000 | 31,683,081 |
| California Health Facilities Financing Authority Rev., (Cedars-Sinai Health System), “A”, 5%, 8/15/2051 | | | 16,245,000 | 20,023,351 |
| California Housing Finance Agency Municipal Certificates, “X”, 0.764%, 8/20/2036 (i)(n) | | | 27,562,723 | 1,916,417 |
| California Housing Finance Agency, “A”, 3.5%, 11/20/2035 | | | 10,725,322 | 11,656,308 |
| California Infrastructure & Economic Development Bank Refunding Rev. (Los Angeles County Museum of Art Project), “B”, FLR, 0.76% (MUNIPSA + 0.70%), 12/01/2050 (Put Date 6/01/2026) | | | 2,810,000 | 2,838,646 |
| California M-S-R Energy Authority Gas Rev., “A”, 7%, 11/01/2034 | | | 1,135,000 | 1,648,345 |
| California Municipal Finance Authority Rev. (California Baptist University), “A”, 5%, 11/01/2046 (n) | | | 4,500,000 | 5,030,408 |
| California Municipal Finance Authority Rev. (Community Medical Centers), “A”, 5%, 2/01/2042 | | | 1,385,000 | 1,604,254 |
Portfolio of Investments – continued
| Issuer | | | Shares/Par | Value ($) |
| Municipal Bonds - continued |
| California - continued |
| California Municipal Finance Authority Rev. (NorthBay Healthcare Group), 5%, 11/01/2035 | | $ | 475,000 | $ 511,562 |
| California Municipal Finance Authority Rev. (NorthBay Healthcare Group), “A”, 5.25%, 11/01/2036 | | | 1,370,000 | 1,564,906 |
| California Municipal Finance Authority Rev. (NorthBay Healthcare Group), “A”, 5.25%, 11/01/2041 | | | 1,265,000 | 1,443,586 |
| California Municipal Finance Authority Rev. (NorthBay Healthcare Group), “A”, 5.25%, 11/01/2047 | | | 210,000 | 237,547 |
| California Municipal Finance Authority Rev. (Partnerships to Uplift Communities Project), “A”, 5%, 8/01/2032 | | | 1,585,000 | 1,602,333 |
| California Municipal Finance Authority Rev. (William Jessup University), 5%, 8/01/2039 | | | 3,955,000 | 4,294,340 |
| California Municipal Finance Authority, Charter School Lease Rev. (Palmdale Aerospace Academy Project), “A”, 3.875%, 7/01/2028 (n) | | | 1,100,000 | 1,167,864 |
| California Municipal Finance Authority, Charter School Lease Rev. (Palmdale Aerospace Academy Project), “A”, 5%, 7/01/2049 (n) | | | 1,600,000 | 1,804,307 |
| California Municipal Finance Authority, Multi-Family Housing Rev. (CityView Apartments), “A”, 4%, 11/01/2036 (n) | | | 2,120,000 | 2,203,256 |
| California Municipal Finance Authority, Solid Waste Disposal Rev. (Waste Management, Inc. Project), “A”, 2.4%, 10/01/2044 (Put Date 10/01/2029) | | | 5,665,000 | 5,828,381 |
| California Municipal Finance Authority, Student Housing Rev. (CHF-Davis II LLC - Orchard Park Student Housing Project), BAM, 4%, 5/15/2033 | | | 310,000 | 357,378 |
| California Municipal Finance Authority, Student Housing Rev. (CHF-Davis II LLC - Orchard Park Student Housing Project), BAM, 4%, 5/15/2037 | | | 730,000 | 837,160 |
| California Municipal Finance Authority, Student Housing Rev. (CHF-Davis II LLC - Orchard Park Student Housing Project), BAM, 4%, 5/15/2038 | | | 425,000 | 486,400 |
| California Municipal Finance Authority, Student Housing Rev. (CHF-Davis II LLC - Orchard Park Student Housing Project), BAM, 4%, 5/15/2040 | | | 250,000 | 285,371 |
| California Pollution Control Financing Authority, Solid Waste Disposal Rev. (CalPlant I Project), 7.5%, 7/01/2032 (a)(d)(z) | | | 2,250,000 | 1,350,000 |
| California Pollution Control Financing Authority, Solid Waste Disposal Rev. (CalPlant I Project), 8%, 7/01/2039 (a)(d)(z) | | | 11,405,000 | 6,843,000 |
| California Pollution Control Financing Authority, Solid Waste Disposal Rev. (CalPlant I Project), 7.5%, 12/01/2039 (a)(d)(z) | | | 12,890,000 | 644,500 |
| California Public Finance Authority Rev. (Henry Mayo Newhall Hospital), 5%, 10/15/2033 | | | 215,000 | 246,766 |
Portfolio of Investments – continued
| Issuer | | | Shares/Par | Value ($) |
| Municipal Bonds - continued |
| California - continued |
| California Public Finance Authority Rev. (Henry Mayo Newhall Hospital), 5%, 10/15/2037 | | $ | 435,000 | $ 497,277 |
| California Public Finance Authority Rev. (Henry Mayo Newhall Hospital), 5%, 10/15/2047 | | | 435,000 | 491,086 |
| California Public Finance Authority, Senior Living Refunding Rev. (Enso Village Project), “A”, 5%, 11/15/2046 (n) | | | 4,770,000 | 5,319,588 |
| California Public Finance Authority, Senior Living Refunding Rev. (Enso Village Project), “A”, 5%, 11/15/2051 (n) | | | 2,350,000 | 2,615,644 |
| California Public Finance Authority, Senior Living Refunding Rev. (Enso Village Project), “A”, 5%, 11/15/2056 (n) | | | 3,445,000 | 3,824,448 |
| California Public Finance Authority, Senior Living Rev. (Enso Village Project), “A”, 5%, 11/15/2036 (n) | | | 1,670,000 | 1,905,466 |
| California Public Finance Authority, Senior Living Rev. (Enso Village Project), “B-1”, 3.125%, 5/15/2029 (n) | | | 2,200,000 | 2,213,461 |
| California Public Finance Authority, Senior Living Rev. (Enso Village Project), “B-2”, 2.375%, 11/15/2028 (n) | | | 1,465,000 | 1,470,620 |
| California Public Finance Authority, Senior Living Rev. (Enso Village Project), “B-3”, 2.125%, 11/15/2027 (n) | | | 2,230,000 | 2,236,600 |
| California Public Works Board Lease Rev. (Various Capital Projects), “A”, 5%, 8/01/2035 (w) | | | 5,945,000 | 7,510,112 |
| California Public Works Board Lease Rev., “A”, 5%, 8/01/2034 (w) | | | 10,000,000 | 12,650,394 |
| California School Finance Authority, Charter School Refunding Rev. (Aspire Public Schools), 5%, 8/01/2036 (Prerefunded 8/01/2025) (n) | | | 75,000 | 84,636 |
| California School Finance Authority, Charter School Refunding Rev. (Aspire Public Schools), 5%, 8/01/2036 (n) | | | 790,000 | 874,692 |
| California School Finance Authority, Charter School Refunding Rev. (Aspire Public Schools), 5%, 8/01/2041 (Prerefunded 8/01/2025) (n) | | | 50,000 | 56,424 |
| California School Finance Authority, Charter School Refunding Rev. (Aspire Public Schools), 5%, 8/01/2041 (n) | | | 625,000 | 688,953 |
| California School Finance Authority, Charter School Rev. (Downtown Prep), 5%, 6/01/2046 (n) | | | 1,325,000 | 1,408,542 |
| California School Finance Authority, School Facility Rev. (Alliance for College-Ready Public Schools Projects), “A”, 4%, 7/01/2024 (n) | | | 730,000 | 773,702 |
| California School Finance Authority, School Facility Rev. (Alliance for College-Ready Public Schools Projects), “A”, 4%, 7/01/2025 (n) | | | 760,000 | 818,874 |
| California School Finance Authority, School Facility Rev. (Alliance for College-Ready Public Schools Projects), “A”, 5%, 7/01/2030 (n) | | | 435,000 | 479,312 |
Portfolio of Investments – continued
| Issuer | | | Shares/Par | Value ($) |
| Municipal Bonds - continued |
| California - continued |
| California School Finance Authority, School Facility Rev. (Alliance for College-Ready Public Schools Projects), “A”, 5%, 7/01/2045 (n) | | $ | 1,150,000 | $ 1,255,845 |
| California School Finance Authority, School Facility Rev. (Green Dot Public Schools California Projects), “A”, 5%, 8/01/2048 (n) | | | 750,000 | 851,233 |
| California School Finance Authority, School Facility Rev. (ICEF View Park Elementary and Middle Schools), “A”, 4.75%, 10/01/2024 | | | 145,000 | 152,401 |
| California School Finance Authority, School Facility Rev. (ICEF View Park Elementary and Middle Schools), “A”, 5.625%, 10/01/2034 | | | 575,000 | 622,091 |
| California School Finance Authority, School Facility Rev. (ICEF View Park Elementary and Middle Schools), “A”, 5.875%, 10/01/2044 | | | 545,000 | 590,043 |
| California School Finance Authority, School Facility Rev. (ICEF View Park Elementary and Middle Schools), “A”, 6%, 10/01/2049 | | | 1,320,000 | 1,430,474 |
| California School Finance Authority, School Facility Rev. (Kipp LA Projects), “A”, 5.125%, 7/01/2044 | | | 430,000 | 460,979 |
| California Statewide Communities Development Authority Rev. (899 Charleston Project), “A”, 5.25%, 11/01/2044 (n) | | | 760,000 | 796,743 |
| California Statewide Communities Development Authority Rev. (899 Charleston Project), “A”, 5.375%, 11/01/2049 (n) | | | 945,000 | 991,479 |
| California Statewide Communities Development Authority Rev. (California Baptist University), “A”, 5.125%, 11/01/2023 | | | 260,000 | 272,528 |
| California Statewide Communities Development Authority Rev. (California Baptist University), “A”, 3.5%, 11/01/2027 (n) | | | 2,630,000 | 2,823,393 |
| California Statewide Communities Development Authority Rev. (California Baptist University), “A”, 5%, 11/01/2032 (n) | | | 1,370,000 | 1,582,390 |
| California Statewide Communities Development Authority Rev. (California Baptist University), “A”, 6.125%, 11/01/2033 | | | 1,600,000 | 1,723,632 |
| California Statewide Communities Development Authority Rev. (California Baptist University), “A”, 5%, 11/01/2041 (n) | | | 2,045,000 | 2,321,725 |
| California Statewide Communities Development Authority Rev. (California Baptist University), “A”, 6.375%, 11/01/2043 | | | 1,335,000 | 1,434,744 |
| California Statewide Communities Development Authority Rev. (Enloe Medical Center), CALHF, 5%, 8/15/2038 | | | 2,500,000 | 2,846,087 |
| California Statewide Communities Development Authority Rev. (Lancer Plaza Project), 5.125%, 11/01/2023 | | | 165,000 | 172,547 |
| California Statewide Communities Development Authority Rev. (Lancer Plaza Project), 5.625%, 11/01/2033 | | | 780,000 | 827,927 |
| California Statewide Communities Development Authority Rev. (Lancer Plaza Project), 5.875%, 11/01/2043 | | | 1,315,000 | 1,396,404 |
Portfolio of Investments – continued
| Issuer | | | Shares/Par | Value ($) |
| Municipal Bonds - continued |
| California - continued |
| California Statewide Communities Development Authority Rev. (Loma Linda University Medical Center), “A”, 5.25%, 12/01/2034 | | $ | 3,400,000 | $ 3,751,271 |
| California Statewide Communities Development Authority Rev. (Loma Linda University Medical Center), “A”, 5%, 12/01/2041 (n) | | | 3,000,000 | 3,384,994 |
| California Statewide Communities Development Authority Rev. (Loma Linda University Medical Center), “A”, 5.25%, 12/01/2044 | | | 8,435,000 | 9,285,988 |
| California Statewide Communities Development Authority Rev. (Loma Linda University Medical Center), “A”, 5%, 12/01/2046 (n) | | | 11,095,000 | 12,494,036 |
| California Statewide Communities Development Authority Rev. (Loma Linda University Medical Center), “A”, 5.25%, 12/01/2056 (n) | | | 11,040,000 | 12,520,468 |
| California Statewide Communities Development Authority Rev. (Loma Linda University Medical Center), “A”, 5.5%, 12/01/2058 | | | 8,600,000 | 10,139,607 |
| California Statewide Communities Development Authority Rev. (Los Angeles Jewish Home for the Aging - Fountainview at Gonda), “A”, CALHF, 5%, 8/01/2034 (Prerefunded 8/01/2022) | | | 1,000,000 | 1,042,535 |
| California Statewide Communities Development Authority Rev. (Los Angeles Jewish Home for the Aging - Fountainview at Gonda), “A”, CALHF, 5%, 8/01/2044 (Prerefunded 8/01/2022) | | | 2,400,000 | 2,502,084 |
| California Statewide Communities Development Authority Rev. (Terraces at San Joaquin Gardens), “A”, 5.625%, 10/01/2032 (Prerefunded 10/01/2022) | | | 1,000,000 | 1,033,160 |
| California Statewide Communities Development Authority Rev. (Terraces at San Joaquin Gardens), “A”, 6%, 10/01/2042 (Prerefunded 10/01/2022) | | | 1,000,000 | 1,035,504 |
| California Statewide Communities Development Authority, College Housing Rev. (NCCD-Hooper Street LLC College of the Arts Project), 5%, 7/01/2029 (n) | | | 880,000 | 915,658 |
| California Statewide Communities Development Authority, College Housing Rev. (NCCD-Hooper Street LLC College of the Arts Project), 5.25%, 7/01/2039 (n) | | | 725,000 | 759,858 |
| California Statewide Communities Development Authority, College Housing Rev. (NCCD-Hooper Street LLC College of the Arts Project), 5.25%, 7/01/2049 (n) | | | 2,550,000 | 2,632,002 |
| California Statewide Communities Development Authority, College Housing Rev. (NCCD-Hooper Street LLC College of the Arts Project), 5.25%, 7/01/2052 (n) | | | 1,280,000 | 1,318,741 |
Portfolio of Investments – continued
| Issuer | | | Shares/Par | Value ($) |
| Municipal Bonds - continued |
| California - continued |
| California Statewide Communities Development Authority, Essential Housing Rev. (City of Orange Portfolio), “B”, 4%, 3/01/2057 (n) | | $ | 2,630,000 | $ 2,310,896 |
| California Statewide Communities Development Authority, Essential Housing Rev. (Oceanaire-Long Beach), “A-2”, 4%, 9/01/2056 (n) | | | 4,795,000 | 4,785,943 |
| California Statewide Communities Development Authority, Essential Housing Rev. (Pasadena Portfolio), “A-1”, 2.65%, 12/01/2046 (n) | | | 9,950,000 | 8,689,912 |
| CMFA Special Finance Agency XII, Essential Housing Rev. (Allure Apartments), “A-1”, 3.25%, 2/01/2057 (n) | | | 1,650,000 | 1,353,464 |
| CMFA Special Finance Agency, Essential Housing Rev. (Solana at Grand), “A-1”, 4%, 8/01/2056 (n) | | | 3,380,000 | 3,324,021 |
| Escondido, CA, Union High School District (Election of 2008), Capital Appreciation, “A”, AGM, 0%, 8/01/2030 | | | 4,785,000 | 4,017,392 |
| Escondido, CA, Union High School District (Election of 2008), Capital Appreciation, “A”, AGM, 0%, 8/01/2031 | | | 4,280,000 | 3,487,909 |
| Escondido, CA, Union High School District (Election of 2008), Capital Appreciation, “A”, AGM, 0%, 8/01/2032 | | | 3,010,000 | 2,385,321 |
| Golden State, CA, Tobacco Securitization Corp., Tobacco Settlement Rev., “B-1”, 3.85%, 6/01/2050 | | | 28,000,000 | 27,978,908 |
| Golden State, CA, Tobacco Securitization Corp., Tobacco Settlement Rev., “A”, 3.5%, 6/01/2036 (Prerefunded 6/01/2022) | | | 1,345,000 | 1,358,516 |
| Golden State, CA, Tobacco Securitization Corp., Tobacco Settlement Rev., “A”, 5.25%, 6/01/2047 (Prerefunded 6/01/2022) | | | 645,000 | 655,248 |
| Golden State, CA, Tobacco Securitization Corp., Tobacco Settlement Rev., “A”, AGM, 5%, 6/01/2040 (Prerefunded 6/01/2025) | | | 2,735,000 | 3,076,358 |
| Golden State, CA, Tobacco Securitization Corp., Tobacco Settlement Rev., Capital Appreciation, “B-2”, 0%, 6/01/2066 | | | 164,230,000 | 26,127,975 |
| Hollister, CA (Community Development Project), BAM, 5%, 10/01/2031 | | | 1,675,000 | 1,841,234 |
| Inland Valley, CA, Development Successor Agency Tax Allocation, “A”, AGM, 5%, 9/01/2044 | | | 1,745,000 | 1,879,336 |
| Irvine, CA, Special Tax Bonds, Community Facilities District No. 2013-3, 5%, 9/01/2039 | | | 1,000,000 | 1,080,959 |
| Irvine, CA, Special Tax Bonds, Community Facilities District No. 2013-3, 5%, 9/01/2044 | | | 1,500,000 | 1,621,274 |
| Jurupa, CA, Public Financing Authority, Special Tax Rev., “A”, 5%, 9/01/2042 | | | 1,535,000 | 1,671,475 |
Portfolio of Investments – continued
| Issuer | | | Shares/Par | Value ($) |
| Municipal Bonds - continued |
| California - continued |
| La Verne, CA, Brethren Hillcrest Homes, COP, 5%, 5/15/2036 (Prerefunded 5/15/2022) | | $ | 455,000 | $ 465,450 |
| Lake Tahoe, CA, Unified School District (Election of 2008), Convertible Capital Appreciation, AGM, 0% to 8/01/2032, 6.375% to 8/01/2045 | | | 4,240,000 | 4,200,520 |
| Long Beach, CA, Marina Rev. (Alamitos Bay Marina Project), 5%, 5/15/2035 | | | 450,000 | 487,861 |
| Los Angeles County, CA, Regional Financing Authority Rev. (Montecedro, Inc. Project), “A”, CALHF, 5%, 11/15/2034 | | | 330,000 | 339,153 |
| Los Angeles County, CA, Regional Financing Authority Rev. (Montecedro, Inc. Project), “A”, CALHF, 5%, 11/15/2044 | | | 555,000 | 570,023 |
| Los Angeles County, CA, Rio Hondo Community College District, “C”, Convertible Capital Appreciation, 0% to 8/01/2024, 6.85% to 8/01/2042 | | | 10,000,000 | 13,174,936 |
| Los Angeles, CA, Department of Airports Refunding Rev. (Los Angeles International), “A”, 5%, 5/15/2033 | | | 1,495,000 | 1,844,334 |
| Los Angeles, CA, Department of Airports Refunding Rev. (Los Angeles International), “A”, 5%, 5/15/2034 | | | 1,560,000 | 1,922,888 |
| Los Angeles, CA, Department of Airports Refunding Rev. (Los Angeles International), “A”, 5%, 5/15/2035 | | | 2,465,000 | 3,033,690 |
| Los Angeles, CA, Department of Airports Refunding Rev. (Los Angeles International), “A”, 5%, 5/15/2036 | | | 1,955,000 | 2,403,478 |
| Los Angeles, CA, Department of Airports Refunding Rev. (Los Angeles International), “A”, 5%, 5/15/2037 | | | 2,520,000 | 3,095,379 |
| Los Angeles, CA, Department of Airports Refunding Rev. (Los Angeles International), “A”, 5%, 5/15/2038 | | | 2,130,000 | 2,611,179 |
| Los Angeles, CA, Department of Airports Refunding Rev. (Los Angeles International), “A”, 5%, 5/15/2039 | | | 2,290,000 | 2,803,016 |
| Los Angeles, CA, Department of Airports Refunding Rev. (Los Angeles International), “A”, 5%, 5/15/2040 | | | 2,400,000 | 2,932,458 |
| Los Angeles, CA, Department of Airports Refunding Rev. (Los Angeles International), “A”, 5%, 5/15/2041 | | | 2,570,000 | 3,135,495 |
| Los Angeles, CA, Department of Airports Rev. (Los Angeles International), “A”, 5%, 5/15/2034 | | | 660,000 | 782,203 |
| Los Angeles, CA, Department of Airports Rev. (Los Angeles International), “A”, 5%, 5/15/2036 | | | 775,000 | 918,286 |
| Los Angeles, CA, Department of Airports Rev. (Los Angeles International), “A”, 5%, 5/15/2037 | | | 970,000 | 1,143,575 |
| Los Angeles, CA, Department of Airports Rev. (Los Angeles International), “A”, 5%, 5/15/2044 | | | 3,395,000 | 3,987,153 |
| Merced, CA, Union High School District, Capital Appreciation, “A”, AGM, 0%, 8/01/2030 | | | 645,000 | 536,995 |
Portfolio of Investments – continued
| Issuer | | | Shares/Par | Value ($) |
| Municipal Bonds - continued |
| California - continued |
| Morongo Band of Mission Indians California Rev., “A”, 5%, 10/01/2042 (n) | | $ | 4,180,000 | $ 4,823,209 |
| Morongo Band of Mission Indians California Rev., “B”, 5%, 10/01/2042 (n) | | | 3,605,000 | 4,159,729 |
| Mount San Antonio, CA, Community College District Rev. (Election of 2008), Convertible Capital Appreciation, “A”, 0% to 8/01/2028, 6.25% to 8/01/2043 | | | 7,025,000 | 7,680,538 |
| Oceanside, CA, Unified School District, Capital Appreciation, AGM, 0%, 8/01/2030 | | | 4,455,000 | 3,721,507 |
| Oceanside, CA, Unified School District, Capital Appreciation, “A”, AGM, 0%, 8/01/2027 | | | 1,865,000 | 1,689,852 |
| Oceanside, CA, Unified School District, Capital Appreciation, “A”, AGM, 0%, 8/01/2029 | | | 3,625,000 | 3,114,614 |
| Oceanside, CA, Unified School District, Capital Appreciation, “A”, ETM, AGM, 0%, 8/01/2027 | | | 205,000 | 187,477 |
| Oceanside, CA, Unified School District, Capital Appreciation, “A”, ETM, AGM, 0%, 8/01/2029 | | | 400,000 | 349,602 |
| Oceanside, CA, Unified School District, Capital Appreciation, ETM, AGM, 0%, 8/01/2024 | | | 380,000 | 368,304 |
| Palomar Health, CA, Refunding Rev., 5%, 11/01/2042 | | | 10,000,000 | 11,564,255 |
| Palomar Health, CA, Refunding Rev., AGM, 5%, 11/01/2047 | | | 12,500,000 | 14,767,716 |
| Pittsburg, CA, Redevelopment Successor Agency, Tax Allocation (Los Medanos Community Development Project), AGM, 5%, 8/01/2028 | | | 635,000 | 693,938 |
| Sacramento County, CA, Tobacco Securitization Corp., Tobacco Settlement Rev., Capital Appreciation, “A-1”, 0%, 6/01/2060 | | | 18,750,000 | 4,002,030 |
| San Diego County, CA, Regional Airport Authority Rev., “B”, 4%, 7/01/2041 | | | 1,835,000 | 2,048,516 |
| San Diego County, CA, Regional Airport Authority Rev., “B”, 4%, 7/01/2046 | | | 2,095,000 | 2,303,776 |
| San Diego County, CA, Regional Airport Authority Rev., “B”, 5%, 7/01/2046 | | | 2,620,000 | 3,132,638 |
| San Diego County, CA, Regional Airport Authority Rev., “B”, 5%, 7/01/2051 | | | 2,620,000 | 3,119,547 |
| San Diego County, CA, Regional Airport Authority Rev., “B”, 4%, 7/01/2056 | | | 2,885,000 | 3,141,989 |
| San Diego County, CA, Regional Airport Authority Rev., “B”, 5%, 7/01/2056 | | | 4,950,000 | 5,867,607 |
| San Francisco, CA, City & County Airports Commission, International Airport Rev., “A”, 5%, 1/01/2047 | | | 1,720,000 | 2,014,617 |
Portfolio of Investments – continued
| Issuer | | | Shares/Par | Value ($) |
| Municipal Bonds - continued |
| California - continued |
| San Francisco, CA, City & County Redevelopment Successor Agency, Community Facilities District No. 6 (Mission Bay South Public Improvements), Capital Appreciation, “A”, 0%, 8/01/2043 | | $ | 8,725,000 | $ 2,539,898 |
| San Francisco, CA, City & County Redevelopment Successor Agency, Tax Allocation (Mission Bay South Redevelopment Project), “A”, 5%, 8/01/2043 | | | 225,000 | 245,466 |
| San Francisco, CA, Hastings Campus Housing Finance Authority, Campus Housing Rev., “A”, 5%, 7/01/2045 (n) | | | 7,455,000 | 8,490,860 |
| San Francisco, CA, Hastings Campus Housing Finance Authority, Campus Housing Rev., “A”, 5%, 7/01/2061 (n) | | | 9,125,000 | 10,263,392 |
| San Francisco, CA, Hastings Campus Housing Finance Authority, Campus Housing Rev., Convertible Capital Appreciation, “B”, 0% to 7/01/2035, 6.75% to 7/01/2061 (n) | | | 12,970,000 | 7,466,357 |
| State of California, Various Purpose General Obligation Refunding, 5%, 9/01/2041 | | | 23,960,000 | 30,201,959 |
| Transbay Joint Powers Authority, CA, Senior Tax Allocation, “A”, 5%, 10/01/2045 | | | 1,050,000 | 1,272,346 |
| Transbay Joint Powers Authority, CA, Senior Tax Allocation, “A”, 5%, 10/01/2049 | | | 960,000 | 1,157,744 |
| West Contra Costa, CA, Unified School District (Election of 2005), Capital Appreciation, “C”, AGM, 0%, 8/01/2029 | | | 3,665,000 | 3,141,980 |
| | | | | $561,714,111 |
| Colorado - 1.9% |
| Arvada, CO, Vauxmont Metropolitan District Rev., AGM, 5%, 12/15/2027 | | $ | 73,000 | $ 82,268 |
| Arvada, CO, Vauxmont Metropolitan District Rev., AGM, 5%, 12/01/2028 | | | 118,000 | 142,458 |
| Arvada, CO, Vauxmont Metropolitan District Rev., AGM, 5%, 12/15/2028 | | | 70,000 | 78,800 |
| Arvada, CO, Vauxmont Metropolitan District Rev., AGM, 5%, 12/01/2029 | | | 118,000 | 145,101 |
| Arvada, CO, Vauxmont Metropolitan District Rev., AGM, 5%, 12/15/2029 | | | 70,000 | 78,755 |
| Arvada, CO, Vauxmont Metropolitan District Rev., AGM, 5%, 12/01/2030 | | | 124,000 | 152,164 |
| Arvada, CO, Vauxmont Metropolitan District Rev., AGM, 5%, 12/15/2030 | | | 17,000 | 19,121 |
| Arvada, CO, Vauxmont Metropolitan District Rev., AGM, 5%, 12/01/2031 | | | 129,000 | 158,294 |
| Arvada, CO, Vauxmont Metropolitan District Rev., AGM, 5%, 12/15/2031 | | | 76,000 | 85,412 |
Portfolio of Investments – continued
| Issuer | | | Shares/Par | Value ($) |
| Municipal Bonds - continued |
| Colorado - continued |
| Arvada, CO, Vauxmont Metropolitan District Rev., AGM, 5%, 12/01/2032 | | $ | 140,000 | $ 172,002 |
| Arvada, CO, Vauxmont Metropolitan District Rev., AGM, 5%, 12/15/2032 | | | 90,000 | 101,089 |
| Arvada, CO, Vauxmont Metropolitan District Rev., AGM, 5%, 12/01/2033 | | | 140,000 | 171,932 |
| Arvada, CO, Vauxmont Metropolitan District Rev., AGM, 5%, 12/01/2034 | | | 160,000 | 196,225 |
| Arvada, CO, Vauxmont Metropolitan District Rev., AGM, 5%, 12/01/2035 | | | 56,000 | 68,612 |
| Arvada, CO, Vauxmont Metropolitan District Rev., AGM, 5%, 12/01/2050 | | | 676,000 | 812,245 |
| Colorado Educational & Cultural Facilities Authority Rev. (Classical Academy Project), “A”, 5%, 12/01/2038 | | | 895,000 | 963,744 |
| Colorado Educational & Cultural Facilities Authority Rev. (Liberty Common Project), 5%, 1/15/2029 | | | 305,000 | 321,436 |
| Colorado Educational & Cultural Facilities Authority Rev. (Liberty Common Project), 5%, 1/15/2039 | | | 560,000 | 586,013 |
| Colorado Educational & Cultural Facilities Authority Rev. (Liberty Common Project), 5%, 1/15/2044 | | | 395,000 | 412,240 |
| Colorado Educational & Cultural Facilities Authority Rev. (Littleton Preparatory Charter School Project), 5%, 12/01/2033 | | | 450,000 | 458,502 |
| Colorado Educational & Cultural Facilities Authority Rev. (Littleton Preparatory Charter School Project), 5%, 12/01/2042 | | | 1,120,000 | 1,137,638 |
| Colorado Educational & Cultural Facilities Authority Rev. (Montessori Charter School Project), 5%, 7/15/2037 | | | 490,000 | 496,787 |
| Colorado Educational & Cultural Facilities Authority Rev. (Peak to Peak Charter School Project), 5%, 8/15/2030 | | | 350,000 | 377,092 |
| Colorado Educational & Cultural Facilities Authority Rev. (Peak to Peak Charter School Project), 5%, 8/15/2034 | | | 350,000 | 376,105 |
| Colorado Educational & Cultural Facilities Authority Rev. (Science, Technology, Engineering and Math School Project), 5%, 11/01/2044 | | | 1,770,000 | 1,887,199 |
| Colorado Educational & Cultural Facilities Authority Rev. (Science, Technology, Engineering and Math School Project), 5.125%, 11/01/2049 | | | 1,530,000 | 1,633,145 |
| Colorado Educational & Cultural Facilities Authority Rev. (Stargate Charter School Project), “A”, 5%, 12/01/2038 | | | 1,665,000 | 1,961,927 |
| Colorado Educational & Cultural Facilities Authority Rev. (Stargate Charter School Project), “A”, 4%, 12/01/2048 | | | 4,310,000 | 4,702,335 |
| Colorado Educational & Cultural Facilities Authority Rev. (Union Colony School Project), 5%, 4/01/2038 | | | 295,000 | 342,440 |
Portfolio of Investments – continued
| Issuer | | | Shares/Par | Value ($) |
| Municipal Bonds - continued |
| Colorado - continued |
| Colorado Educational & Cultural Facilities Authority Rev. (Union Colony School Project), 5%, 4/01/2048 | | $ | 350,000 | $ 400,987 |
| Colorado Educational & Cultural Facilities Authority Rev. (Union Colony School Project), 5%, 4/01/2053 | | | 365,000 | 417,462 |
| Colorado Educational & Cultural Facilities Authority Rev. (University Lab School Project), 5%, 12/15/2035 | | | 2,000,000 | 2,192,382 |
| Colorado Educational & Cultural Facilities Authority Rev. (University Lab School Project), 5%, 12/15/2045 | | | 2,675,000 | 2,907,045 |
| Colorado Educational & Cultural Facilities Authority, Charter School Refunding and Improvement Rev. (Thomas MacLaren State Charter School Project), “A”, 5%, 6/01/2035 | | | 570,000 | 694,484 |
| Colorado Educational & Cultural Facilities Authority, Charter School Refunding and Improvement Rev. (Thomas MacLaren State Charter School Project), “A”, 5%, 6/01/2040 | | | 840,000 | 1,013,925 |
| Colorado Educational & Cultural Facilities Authority, Charter School Refunding and Improvement Rev. (Thomas MacLaren State Charter School Project), “A”, 5%, 6/01/2050 | | | 3,440,000 | 4,101,487 |
| Colorado Educational & Cultural Facilities Authority, Charter School Refunding Rev. (Windsor Charter Academy Project), 4%, 9/01/2050 | | | 515,000 | 565,333 |
| Colorado Educational & Cultural Facilities Authority, Charter School Refunding Rev. (Windsor Charter Academy Project), 4%, 9/01/2055 | | | 925,000 | 1,011,262 |
| Colorado Educational & Cultural Facilities Authority, Charter School Rev. (Aspen View Academy Project), 4%, 5/01/2036 | | | 175,000 | 190,435 |
| Colorado Educational & Cultural Facilities Authority, Charter School Rev. (Aspen View Academy Project), 4%, 5/01/2041 | | | 175,000 | 188,470 |
| Colorado Educational & Cultural Facilities Authority, Charter School Rev. (Aspen View Academy Project), 4%, 5/01/2051 | | | 350,000 | 372,731 |
| Colorado Educational & Cultural Facilities Authority, Charter School Rev. (Aspen View Academy Project), 4%, 5/01/2061 | | | 610,000 | 641,722 |
| Colorado Educational & Cultural Facilities Authority, Charter School Rev. (New Summit Charter Academy Project), “A”, 4%, 7/01/2031 (n) | | | 450,000 | 481,552 |
| Colorado Educational & Cultural Facilities Authority, Charter School Rev. (New Summit Charter Academy Project), “A”, 4%, 7/01/2041 (n) | | | 600,000 | 628,287 |
| Colorado Educational & Cultural Facilities Authority, Charter School Rev. (New Summit Charter Academy Project), “A”, 4%, 7/01/2051 (n) | | | 715,000 | 737,070 |
| Colorado Educational & Cultural Facilities Authority, Charter School Rev. (New Summit Charter Academy Project), “A”, 4%, 7/01/2061 (n) | | | 2,030,000 | 2,076,365 |
Portfolio of Investments – continued
| Issuer | | | Shares/Par | Value ($) |
| Municipal Bonds - continued |
| Colorado - continued |
| Colorado Health Facilities Authority Rev. (American Baptist Homes), 8%, 8/01/2043 | | $ | 2,975,000 | $ 3,146,705 |
| Colorado Health Facilities Authority Rev. (Christian Living Neighborhoods), 4%, 1/01/2042 | | | 2,635,000 | 2,799,405 |
| Colorado Health Facilities Authority Rev. (CommonSpirit Health), “A-2”, 5%, 8/01/2037 | | | 2,625,000 | 3,138,464 |
| Colorado Health Facilities Authority Rev. (Covenant Retirement Communities, Inc.), “A”, 5%, 12/01/2033 (Prerefunded 12/01/2022) | | | 4,295,000 | 4,452,228 |
| Colorado Health Facilities Authority Rev. (Evangelical Lutheran Good Samaritan Society), 5.625%, 6/01/2043 (Prerefunded 6/01/2023) | | | 825,000 | 876,846 |
| Colorado Health Facilities Authority Rev. (Frasier Project), “A”, 4%, 5/15/2041 (w) | | | 1,375,000 | 1,422,839 |
| Colorado Health Facilities Authority Rev. (Frasier Project), “A”, 4%, 5/15/2048 (w) | | | 2,100,000 | 2,133,876 |
| Colorado Health Facilities Authority, Hospital Rev. (AdventHealth Obligated Group), “A”, 4%, 11/15/2038 | | | 4,355,000 | 4,984,836 |
| Colorado Housing & Finance Authority Rev., “B-1”, GNMA, 4%, 11/01/2048 | | | 1,695,000 | 1,796,554 |
| Colorado Housing & Finance Authority Rev., Single Family Mortgage Class I, “C”, 4.75%, 5/01/2049 (u) | | | 6,290,000 | 6,833,613 |
| Colorado Regional Transportation District, Private Activity Rev. (Denver Transit Partners Eagle P3 Project), “A-B”, 5%, 1/15/2030 | | | 265,000 | 324,148 |
| Colorado Regional Transportation District, Private Activity Rev. (Denver Transit Partners Eagle P3 Project), “A-B”, 5%, 7/15/2030 | | | 185,000 | 228,192 |
| Colorado Regional Transportation District, Private Activity Rev. (Denver Transit Partners Eagle P3 Project), “A-B”, 5%, 1/15/2031 | | | 315,000 | 391,946 |
| Colorado Regional Transportation District, Private Activity Rev. (Denver Transit Partners Eagle P3 Project), “A-B”, 5%, 7/15/2031 | | | 265,000 | 329,256 |
| Colorado Regional Transportation District, Private Activity Rev. (Denver Transit Partners Eagle P3 Project), “A-B”, 5%, 1/15/2032 | | | 420,000 | 520,738 |
| Colorado Regional Transportation District, Private Activity Rev. (Denver Transit Partners Eagle P3 Project), “A-B”, 5%, 7/15/2032 | | | 420,000 | 520,172 |
| Colorado Regional Transportation District, Private Activity Rev. (Denver Transit Partners Eagle P3 Project), “A-B”, 4%, 1/15/2033 | | | 395,000 | 453,136 |
Portfolio of Investments – continued
| Issuer | | | Shares/Par | Value ($) |
| Municipal Bonds - continued |
| Colorado - continued |
| Colorado Regional Transportation District, Private Activity Rev. (Denver Transit Partners Eagle P3 Project), “A-B”, 4%, 7/15/2033 | | $ | 395,000 | $ 467,321 |
| Colorado Regional Transportation District, Private Activity Rev. (Denver Transit Partners Eagle P3 Project), “A-B”, 4%, 7/15/2034 | | | 790,000 | 904,405 |
| Colorado Regional Transportation District, Private Activity Rev. (Denver Transit Partners Eagle P3 Project), “A-B”, 4%, 7/15/2036 | | | 660,000 | 753,106 |
| Colorado Regional Transportation District, Private Activity Rev. (Denver Transit Partners Eagle P3 Project), “A-B”, 4%, 7/15/2038 | | | 470,000 | 534,893 |
| Denver, CO, Broadway Station Metropolitan District No. 2, “A”, 5%, 12/01/2035 | | | 729,000 | 779,551 |
| Denver, CO, Broadway Station Metropolitan District No. 2, “A”, 5.125%, 12/01/2048 | | | 1,500,000 | 1,594,479 |
| Denver, CO, Convention Center Hotel Authority Rev., 5%, 12/01/2035 | | | 1,070,000 | 1,201,768 |
| Denver, CO, Convention Center Hotel Authority Rev., 5%, 12/01/2036 | | | 675,000 | 755,316 |
| Denver, CO, Convention Center Hotel Authority Rev., 5%, 12/01/2040 | | | 1,800,000 | 2,007,068 |
| Denver, CO, Health & Hospital Authority Rev. (550 Acoma, Inc.), COP, 5%, 12/01/2048 | | | 2,670,000 | 3,112,268 |
| Denver, CO, Health & Hospital Authority Rev., “A”, 5%, 12/01/2039 | | | 3,660,000 | 3,867,445 |
| Denver, CO, Health & Hospital Authority Rev., “A”, 5.25%, 12/01/2045 | | | 795,000 | 840,944 |
| Garfield & Mesa Counties, CO, Grand River Hospital District Rev., AGM, 5.25%, 12/01/2035 | | | 2,000,000 | 2,366,511 |
| Loretto Heights, CO, Community Authority Special Rev., 4.875%, 12/01/2051 (n) | | | 14,945,000 | 14,700,442 |
| Public Authority for Colorado Energy Natural Gas Purchase Rev., 6.25%, 11/15/2028 | | | 6,860,000 | 8,310,093 |
| State of Colorado (Building Excellent Schools Today), “S”, COP, 4%, 3/15/2046 | | | 17,000,000 | 19,336,716 |
| Tallyn's Reach, CO, Metropolitan District No. 3, 5%, 12/01/2033 (Prerefunded 12/01/2023) | | | 358,000 | 381,516 |
| | | | | $133,008,876 |
Portfolio of Investments – continued
| Issuer | | | Shares/Par | Value ($) |
| Municipal Bonds - continued |
| Connecticut - 0.7% |
| Connecticut Health & Educational Facilities Authority Rev. (Griffin Hospital), “G-1”, 5%, 7/01/2039 (n) | | $ | 900,000 | $ 1,056,321 |
| Connecticut Health & Educational Facilities Authority Rev. (Griffin Hospital), “G-1”, 5%, 7/01/2050 (n) | | | 2,250,000 | 2,602,876 |
| Connecticut Health & Educational Facilities Authority Rev. (Masonicare), “F”, 5%, 7/01/2043 | | | 8,535,000 | 9,380,057 |
| Connecticut Health & Educational Facilities Authority Rev. (McLean Issue), “A”, 5%, 1/01/2030 (n) | | | 500,000 | 556,787 |
| Connecticut Health & Educational Facilities Authority Rev. (McLean Issue), “A”, 5%, 1/01/2045 (n) | | | 1,500,000 | 1,633,753 |
| Connecticut Health & Educational Facilities Authority Rev. (McLean Issue), “A”, 5%, 1/01/2055 (n) | | | 2,800,000 | 3,033,407 |
| Connecticut Health & Educational Facilities Authority Rev. (McLean Issue), “B-2”, 2.75%, 1/01/2026 (n) | | | 340,000 | 341,096 |
| Connecticut Housing Finance Authority Rev. (Housing Mortgage Finance Program), “D-1”, 4%, 11/15/2044 | | | 50,000 | 50,657 |
| Hartford County, CT, Metropolitan District, “C”, AGM, 5%, 11/01/2031 | | | 2,830,000 | 3,246,558 |
| Mohegan Tribal Finance Authority, CT, Economic Development Bonds, 7%, 2/01/2045 (n) | | | 18,395,000 | 19,097,807 |
| Steel Point Infrastructure Improvement District, CT, Special Obligation Rev. (Steel Point Harbor Project), 4%, 4/01/2031 (n) | | | 155,000 | 162,817 |
| Steel Point Infrastructure Improvement District, CT, Special Obligation Rev. (Steel Point Harbor Project), 4%, 4/01/2036 (n) | | | 255,000 | 264,527 |
| Steel Point Infrastructure Improvement District, CT, Special Obligation Rev. (Steel Point Harbor Project), 4%, 4/01/2041 (n) | | | 300,000 | 307,984 |
| Steel Point Infrastructure Improvement District, CT, Special Obligation Rev. (Steel Point Harbor Project), 4%, 4/01/2051 (n) | | | 860,000 | 873,754 |
| University of Connecticut, General Obligation, “A”, 5%, 4/15/2027 | | | 1,150,000 | 1,353,612 |
| University of Connecticut, General Obligation, “A”, 5%, 1/15/2034 | | | 2,940,000 | 3,397,844 |
| | | | | $47,359,857 |
Portfolio of Investments – continued
| Issuer | | | Shares/Par | Value ($) |
| Municipal Bonds - continued |
| Delaware - 0.4% |
| Delaware Economic Development Authority Rev. (Delaware Military Academy, Inc. Project), 4.625%, 9/01/2034 (Prerefunded 9/01/2024) | | $ | 1,105,000 | $ 1,199,241 |
| Delaware Economic Development Authority Rev. (Delaware Military Academy, Inc. Project), 5%, 9/01/2044 (Prerefunded 9/01/2024) | | | 1,030,000 | 1,127,622 |
| Delaware Economic Development Authority Rev. (Delaware Military Academy, Inc. Project), 5%, 9/01/2049 (Prerefunded 9/01/2024) | | | 1,210,000 | 1,324,682 |
| Delaware Economic Development Authority Rev. (Newark Charter School, Inc.), 5%, 9/01/2042 | | | 1,420,000 | 1,425,232 |
| Delaware Economic Development Authority Rev. (Newark Charter School, Inc.), “A”, 5%, 9/01/2036 | | | 285,000 | 320,469 |
| Delaware Economic Development Authority Rev. (Newark Charter School, Inc.), “A”, 5%, 9/01/2046 | | | 620,000 | 689,552 |
| Delaware Economic Development Authority, Charter School Rev. (Aspira of Delaware Charter Operations, Inc. Project), “A”, 5%, 6/01/2036 | | | 920,000 | 988,744 |
| Delaware Economic Development Authority, Charter School Rev. (Aspira of Delaware Charter Operations, Inc. Project), “A”, 5%, 6/01/2046 | | | 1,635,000 | 1,738,765 |
| Delaware Economic Development Authority, Exempt Facility Refunding Rev. (NRG Energy Project), “A”, 1.25%, 10/01/2045 (Put Date 10/01/2025) | | | 5,650,000 | 5,564,624 |
| Delaware Health Facilities Authority Rev. (Beebe Medical Center Project), 5%, 6/01/2043 | | | 4,230,000 | 4,931,391 |
| Delaware Health Facilities Authority Rev. (Beebe Medical Center Project), 5%, 6/01/2048 | | | 2,115,000 | 2,442,245 |
| Kent County, DE, Student Housing and Dining Facility Rev. (CHF-Dover LLC-Delaware State University Project), “A”, 5%, 7/01/2040 | | | 750,000 | 825,164 |
| Kent County, DE, Student Housing and Dining Facility Rev. (CHF-Dover LLC-Delaware State University Project), “A”, 5%, 7/01/2048 | | | 1,025,000 | 1,116,171 |
| Kent County, DE, Student Housing and Dining Facility Rev. (CHF-Dover LLC-Delaware State University Project), “A”, 5%, 7/01/2058 | | | 1,165,000 | 1,262,118 |
| Kent County, DE, Student Housing and Dining Facility Rev. (CHF-Dover, LLC-Delaware State University Project), “A”, 5%, 7/01/2053 | | | 895,000 | 972,105 |
| | | | | $25,928,125 |
Portfolio of Investments – continued
| Issuer | | | Shares/Par | Value ($) |
| Municipal Bonds - continued |
| District of Columbia - 0.5% |
| District of Columbia Rev. (Rocketship D.C.), “A”, 5%, 6/01/2039 (n) | | $ | 2,090,000 | $ 2,303,076 |
| District of Columbia Rev. (Rocketship D.C.), “A”, 5%, 6/01/2049 (n) | | | 1,330,000 | 1,448,453 |
| District of Columbia Rev. (Rocketship D.C.), “A”, 5%, 6/01/2051 (n) | | | 1,000,000 | 1,117,410 |
| District of Columbia Rev. (Rocketship D.C.), “A”, 5%, 6/01/2056 (n) | | | 1,680,000 | 1,823,615 |
| District of Columbia Rev. (Rocketship D.C.), “A”, 5%, 6/01/2061 (n) | | | 1,100,000 | 1,221,588 |
| District of Columbia Student Dormitory Rev. (Provident Group - Howard Properties LLC), 5%, 10/01/2030 | | | 1,745,000 | 1,780,825 |
| District of Columbia Student Dormitory Rev. (Provident Group - Howard Properties LLC), 5%, 10/01/2035 | | | 5,605,000 | 5,721,199 |
| District of Columbia Student Dormitory Rev. (Provident Group - Howard Properties LLC), 5%, 10/01/2045 | | | 9,810,000 | 10,013,374 |
| District of Columbia, Tobacco Settlement, 6.75%, 5/15/2040 | | | 885,000 | 914,326 |
| Metropolitan Washington, D.C., Airport Authority System Refunding Rev., “A”, 5%, 10/01/2046 | | | 5,000,000 | 6,072,436 |
| | | | | $32,416,302 |
| Florida - 6.0% |
| Alachua County, FL, Health Facilities Authority, Continuing Care Rev. (Oak Hammock at the University of Florida, Inc.), “A”, 8%, 10/01/2032 | | $ | 1,250,000 | $ 1,334,311 |
| Alachua County, FL, Health Facilities Authority, Continuing Care Rev. (Oak Hammock at the University of Florida, Inc.), “A”, 8%, 10/01/2042 | | | 2,000,000 | 2,134,897 |
| Alachua County, FL, Health Facilities Authority, Continuing Care Rev. (Oak Hammock at the University of Florida, Inc.), “A”, 8%, 10/01/2046 | | | 1,000,000 | 1,067,448 |
| Alachua County, FL, Health Facilities Authority, Health Facilities Rev. (Shands Teaching Hospital and Clinics, Inc. at the University of Florida), “B-1”, 5%, 12/01/2035 | | | 1,330,000 | 1,630,622 |
| Alachua County, FL, Health Facilities Authority, Health Facilities Rev. (Shands Teaching Hospital and Clinics, Inc. at the University of Florida), “B-1”, 5%, 12/01/2036 | | | 2,260,000 | 2,767,950 |
| Arborwood Community Development District, FL, Capital Improvement Refunding Rev. (Subordinate Lien), “A-2”, 4.125%, 5/01/2023 | | | 330,000 | 333,215 |
| Arborwood Community Development District, FL, Capital Improvement Refunding Rev. (Subordinate Lien), “A-2”, 4.625%, 5/01/2028 | | | 690,000 | 725,013 |
Portfolio of Investments – continued
| Issuer | | | Shares/Par | Value ($) |
| Municipal Bonds - continued |
| Florida - continued |
| Arborwood Community Development District, FL, Capital Improvement Refunding Rev. (Subordinate Lien), “A-2”, 5%, 5/01/2036 | | $ | 870,000 | $ 941,298 |
| Arborwood Community Development District, FL, Capital Improvement Rev., “A-1”, 6.9%, 5/01/2036 | | | 250,000 | 253,534 |
| Arborwood Community Development District, FL, Capital Improvement Rev., “B”, 6.9%, 5/01/2025 | | | 15,000 | 15,303 |
| Arborwood Community Development District, FL, Capital Improvement Rev., “B”, 6.9%, 5/01/2036 | | | 20,000 | 20,199 |
| Bellalago, FL, Educational Facilities Benefit District Capital Improvement Refunding Rev., 4.375%, 5/01/2030 | | | 690,000 | 737,352 |
| Bellalago, FL, Educational Facilities Benefit District Capital Improvement Refunding Rev., 4.5%, 5/01/2033 | | | 320,000 | 342,622 |
| Bellalago, FL, Educational Facilities Benefit District Capital Improvement Refunding Rev., 4.6%, 5/01/2034 | | | 1,355,000 | 1,453,156 |
| Capital Region Community Development District, FL, Capital Improvement Rev., “A-1”, 4.125%, 5/01/2023 | | | 175,000 | 176,662 |
| Capital Region Community Development District, FL, Capital Improvement Rev., “A-1”, 4.625%, 5/01/2028 | | | 400,000 | 420,822 |
| Capital Region Community Development District, FL, Capital Improvement Rev., “A-1”, 5.125%, 5/01/2039 | | | 2,735,000 | 2,924,483 |
| Collier County, FL, Industrial Development Authority, Continuing Care Community Rev. (Arlington of Naples Project), “A”, 5.5%, 5/15/2025 (a)(d)(z) | | | 300,000 | 204,000 |
| Collier County, FL, Industrial Development Authority, Continuing Care Community Rev. (Arlington of Naples Project), “A”, 6.25%, 5/15/2035 (a)(d)(z) | | | 300,000 | 204,000 |
| Collier County, FL, Industrial Development Authority, Continuing Care Community Rev. (Arlington of Naples Project), “A”, 7.75%, 5/15/2035 (a)(d)(z) | | | 1,055,000 | 717,400 |
| Collier County, FL, Industrial Development Authority, Continuing Care Community Rev. (Arlington of Naples Project), “A”, 8.125%, 5/15/2044 (a)(d)(z) | | | 10,590,000 | 7,201,200 |
| Collier County, FL, Industrial Development Authority, Continuing Care Community Rev. (Arlington of Naples Project), “A”, 6.5%, 5/15/2049 (a)(d)(z) | | | 805,000 | 547,400 |
| Creekside Community Development District, FL, Special Assessment, 5.2%, 5/01/2038 (a)(d) | | | 1,400,000 | 630,000 |
| Cypress Bluff Community Development District, 3.75%, 5/01/2024 | | | 650,000 | 662,274 |
| Cypress Bluff Community Development District, 4.125%, 5/01/2029 | | | 1,270,000 | 1,356,929 |
Portfolio of Investments – continued
| Issuer | | | Shares/Par | Value ($) |
| Municipal Bonds - continued |
| Florida - continued |
| Cypress Bluff Community Development District, 4.9%, 5/01/2039 | | $ | 3,625,000 | $ 3,949,615 |
| Cypress Bluff Community Development District, 5.1%, 5/01/2048 | | | 2,605,000 | 2,838,291 |
| Daytona Beach, FL, Halifax Hospital Medical Center Rev., 5%, 6/01/2024 | | | 575,000 | 624,551 |
| Daytona Beach, FL, Halifax Hospital Medical Center Rev., 5%, 6/01/2025 | | | 670,000 | 748,957 |
| Daytona Beach, FL, Halifax Hospital Medical Center Rev., 5%, 6/01/2035 | | | 1,650,000 | 1,825,673 |
| Daytona Beach, FL, Halifax Hospital Medical Center Rev., 5%, 6/01/2036 | | | 825,000 | 932,941 |
| Daytona Beach, FL, Halifax Hospital Medical Center Rev., 5%, 6/01/2046 | | | 5,415,000 | 5,963,769 |
| Florida Capital Trust Agency, Educational Facilities Rev. (Florida Charter Educational Foundation, Inc. Project), “A”, 4.5%, 6/15/2028 (n) | | | 1,095,000 | 1,154,579 |
| Florida Capital Trust Agency, Educational Facilities Rev. (Florida Charter Educational Foundation, Inc. Project), “A”, 5.375%, 6/15/2038 (n) | | | 1,005,000 | 1,098,509 |
| Florida Capital Trust Agency, Educational Facilities Rev. (Florida Charter Educational Foundation, Inc. Project), “A”, 5.375%, 6/15/2048 (n) | | | 1,700,000 | 1,830,205 |
| Florida Capital Trust Agency, Educational Facilities Rev. (Imagine School at North Manatee Project), “A”, 3.25%, 6/01/2031 (n) | | | 240,000 | 236,568 |
| Florida Capital Trust Agency, Educational Facilities Rev. (Imagine School at North Manatee Project), “A”, 5%, 6/01/2041 (n) | | | 325,000 | 359,145 |
| Florida Capital Trust Agency, Educational Facilities Rev. (Imagine School at North Manatee Project), “A”, 5%, 6/01/2056 (n) | | | 900,000 | 976,031 |
| Florida Capital Trust Agency, Educational Facilities Rev. (Imagine School at North Manatee Project), “C”, 5%, 6/01/2041 (n) | | | 230,000 | 254,164 |
| Florida Capital Trust Agency, Educational Facilities Rev. (Imagine School at North Manatee Project), “C”, 5%, 6/01/2056 (n) | | | 520,000 | 563,929 |
| Florida Capital Trust Agency, Educational Facilities Rev. (Liza Jackson Preparatory School, Inc. Project), “A”, 4%, 8/01/2030 | | | 115,000 | 123,809 |
| Florida Capital Trust Agency, Educational Facilities Rev. (Liza Jackson Preparatory School, Inc. Project), “A”, 5%, 8/01/2040 | | | 165,000 | 189,871 |
Portfolio of Investments – continued
| Issuer | | | Shares/Par | Value ($) |
| Municipal Bonds - continued |
| Florida - continued |
| Florida Capital Trust Agency, Educational Facilities Rev. (Liza Jackson Preparatory School, Inc. Project), “A”, 5%, 8/01/2055 | | $ | 515,000 | $ 582,628 |
| Florida Capital Trust Agency, Educational Facilities Rev. (Renaissance Charter School, Inc. Project), “A”, 5%, 6/15/2039 (n) | | | 3,090,000 | 3,308,499 |
| Florida Capital Trust Agency, Educational Facilities Rev. (Renaissance Charter School, Inc. Project), “A”, 5%, 6/15/2049 (n) | | | 11,995,000 | 12,716,670 |
| Florida Capital Trust Agency, Educational Facilities Rev. (Viera Charter Schools, Inc. Project), “A”, 4%, 10/15/2029 (n) | | | 450,000 | 481,451 |
| Florida Capital Trust Agency, Educational Facilities Rev. (Viera Charter Schools, Inc. Project), “A”, 5%, 10/15/2037 (n) | | | 510,000 | 560,552 |
| Florida Capital Trust Agency, Educational Facilities Rev. (Viera Charter Schools, Inc. Project), “A”, 5%, 10/15/2039 (n) | | | 1,130,000 | 1,237,057 |
| Florida Capital Trust Agency, Educational Facilities Rev. (Viera Charter Schools, Inc. Project), “A”, 5%, 10/15/2047 (n) | | | 1,180,000 | 1,277,067 |
| Florida Capital Trust Agency, Educational Facilities Rev. (Viera Charter Schools, Inc. Project), “A”, 5%, 10/15/2049 (n) | | | 1,860,000 | 2,011,001 |
| Florida Capital Trust Agency, Educational Facilities Rev. (Viera Charter Schools, Inc. Project), “A”, 5%, 10/15/2052 (n) | | | 1,295,000 | 1,398,043 |
| Florida Capital Trust Agency, Educational Facilities Rev. (Viera Charter Schools, Inc. Project), “A”, 5%, 10/15/2054 (n) | | | 1,345,000 | 1,450,576 |
| Florida Development Finance Corp. Educational Facilities Rev. (Drs. Kiran & Pallavi Patel 2017 Foundation for Global Understanding, Inc. Project), “A”, 3%, 7/01/2031 (n) | | | 175,000 | 176,578 |
| Florida Development Finance Corp. Educational Facilities Rev. (Drs. Kiran & Pallavi Patel 2017 Foundation for Global Understanding, Inc. Project), “A”, 4%, 7/01/2051 (n) | | | 1,005,000 | 1,049,439 |
| Florida Development Finance Corp. Educational Facilities Rev. (Florida Charter Educational Foundation, Inc. Project), “A”, 6.25%, 6/15/2036 (n) | | | 1,155,000 | 1,315,215 |
| Florida Development Finance Corp. Educational Facilities Rev. (Florida Charter Educational Foundation, Inc. Project), “A”, 6.375%, 6/15/2046 (n) | | | 1,980,000 | 2,235,220 |
| Florida Development Finance Corp. Educational Facilities Rev. (Imagine School at Broward Project), “A”, 5%, 12/15/2034 (n) | | | 525,000 | 595,026 |
| Florida Development Finance Corp. Educational Facilities Rev. (Imagine School at Broward Project), “A”, 5%, 12/15/2039 (n) | | | 610,000 | 688,736 |
| Florida Development Finance Corp. Educational Facilities Rev. (Imagine School at Broward Project), “A”, 5%, 12/15/2049 (n) | | | 4,340,000 | 4,829,611 |
| Florida Development Finance Corp. Educational Facilities Rev. (Renaissance Charter School), “A”, 6%, 6/15/2032 (n) | | | 1,950,000 | 1,974,917 |
Portfolio of Investments – continued
| Issuer | | | Shares/Par | Value ($) |
| Municipal Bonds - continued |
| Florida - continued |
| Florida Development Finance Corp. Educational Facilities Rev. (Renaissance Charter School), “A”, 6.125%, 6/15/2043 (n) | | $ | 4,070,000 | $ 4,119,910 |
| Florida Development Finance Corp. Educational Facilities Rev. (Renaissance Charter School), “A”, 6.125%, 6/15/2044 | | | 5,000,000 | 5,372,417 |
| Florida Development Finance Corp. Educational Facilities Rev. (Renaissance Charter School), “C”, 4%, 9/15/2030 (n) | | | 240,000 | 254,360 |
| Florida Development Finance Corp. Educational Facilities Rev. (Renaissance Charter School), “C”, 5%, 9/15/2040 (n) | | | 550,000 | 601,121 |
| Florida Development Finance Corp. Educational Facilities Rev. (Renaissance Charter School), “C”, 5%, 9/15/2050 (n) | | | 1,080,000 | 1,167,675 |
| Florida Development Finance Corp. Educational Facilities Rev. (River City Science Academy Projects), “A”, 4%, 7/01/2035 | | | 175,000 | 187,074 |
| Florida Development Finance Corp. Educational Facilities Rev. (River City Science Academy Projects), “A”, 4%, 7/01/2045 | | | 320,000 | 337,261 |
| Florida Development Finance Corp. Educational Facilities Rev. (River City Science Academy Projects), “A”, 4%, 7/01/2055 | | | 445,000 | 466,246 |
| Florida Development Finance Corp. Educational Facilities Rev. (Southwest Charter Foundation, Inc. Project), “A”, 6%, 6/15/2037 (n) | | | 1,510,000 | 1,603,575 |
| Florida Development Finance Corp. Educational Facilities Rev. (Southwest Charter Foundation, Inc. Project), “A”, 6.125%, 6/15/2047 (n) | | | 4,365,000 | 4,593,444 |
| Florida Development Finance Corp. Senior Living Rev. (Glenridge on Palmer Ranch Project), 5%, 6/01/2031 (n) | | | 430,000 | 490,186 |
| Florida Development Finance Corp. Senior Living Rev. (Glenridge on Palmer Ranch Project), 5%, 6/01/2035 (n) | | | 330,000 | 373,104 |
| Florida Development Finance Corp. Senior Living Rev. (Glenridge on Palmer Ranch Project), 5%, 6/01/2051 (n) | | | 11,890,000 | 13,195,088 |
| Florida Development Finance Corp. Senior Living Rev. (Mayflower Retirement Community Project), “A”, 4%, 6/01/2036 (n) | | | 2,110,000 | 2,302,496 |
| Florida Development Finance Corp. Senior Living Rev. (Mayflower Retirement Community Project), “A”, 5.125%, 6/01/2040 (n) | | | 3,760,000 | 4,287,214 |
| Florida Development Finance Corp. Senior Living Rev. (Mayflower Retirement Community Project), “A”, 4%, 6/01/2041 (n) | | | 2,325,000 | 2,507,029 |
| Florida Development Finance Corp. Senior Living Rev. (Mayflower Retirement Community Project), “A”, 4%, 6/01/2046 (n) | | | 2,000,000 | 2,131,441 |
| Florida Development Finance Corp. Senior Living Rev. (Mayflower Retirement Community Project), “A”, 5.25%, 6/01/2050 (n) | | | 7,500,000 | 8,509,243 |
Portfolio of Investments – continued
| Issuer | | | Shares/Par | Value ($) |
| Municipal Bonds - continued |
| Florida - continued |
| Florida Development Finance Corp. Senior Living Rev. (Mayflower Retirement Community Project), “A”, 4%, 6/01/2055 (n) | | $ | 840,000 | $ 888,939 |
| Florida Development Finance Corp. Senior Living Rev. (Mayflower Retirement Community Project), “B-1”, 2.375%, 6/01/2027 (n) | | | 435,000 | 428,443 |
| Florida Development Finance Corp. Senior Living Rev. (Mayflower Retirement Community Project), “B-2”, 1.75%, 6/01/2026 (n) | | | 435,000 | 425,187 |
| Florida Higher Educational Facilities Financing Authority Rev. (Florida Institute of Technology), 5%, 10/01/2031 | | | 1,235,000 | 1,468,737 |
| Florida Higher Educational Facilities Financing Authority Rev. (Florida Institute of Technology), 5%, 10/01/2032 | | | 995,000 | 1,177,429 |
| Florida Higher Educational Facilities Financing Authority Rev. (Florida Institute of Technology), 5%, 10/01/2033 | | | 720,000 | 848,902 |
| Florida Higher Educational Facilities Financing Authority Rev. (Florida Institute of Technology), 5%, 10/01/2034 | | | 1,395,000 | 1,634,357 |
| Florida Higher Educational Facilities Financing Authority Rev. (Florida Institute of Technology), 5%, 10/01/2035 | | | 780,000 | 909,909 |
| Florida Higher Educational Facilities Financing Authority Rev. (Florida Institute of Technology), 5%, 10/01/2036 | | | 1,070,000 | 1,245,373 |
| Florida Higher Educational Facilities Financing Authority Rev. (Florida Institute of Technology), 4%, 10/01/2037 | | | 1,490,000 | 1,599,744 |
| Florida Higher Educational Facilities Financing Authority Rev. (Florida Institute of Technology), 4%, 10/01/2038 | | | 2,030,000 | 2,174,363 |
| Florida Higher Educational Facilities Financing Authority Rev. (Florida Institute of Technology), 4%, 10/01/2039 | | | 2,420,000 | 2,585,234 |
| Florida Higher Educational Facilities Financing Authority Rev. (Florida Institute of Technology), 4%, 10/01/2044 | | | 2,625,000 | 2,770,298 |
| Florida Higher Educational Facilities Financing Authority Rev. (Jacksonville University Project), “A”, 4.5%, 6/01/2033 (n) | | | 2,220,000 | 2,456,476 |
| Florida Higher Educational Facilities Financing Authority Rev. (Jacksonville University Project), “A”, 4.75%, 6/01/2038 (n) | | | 2,070,000 | 2,298,799 |
| Florida Higher Educational Facilities Financing Authority Rev. (Jacksonville University Project), “A”, 5%, 6/01/2048 (n) | | | 3,195,000 | 3,547,193 |
| Florida Housing Finance Corp., Homeowner Mortgage Rev., “1”, 4%, 7/01/2049 (u) | | | 3,500,000 | 3,706,912 |
| Florida Housing Finance Corp., Homeowner Mortgage Rev., “1”, GNMA, 3%, 1/01/2052 | | | 7,980,000 | 8,350,416 |
| Florida Housing Finance Corp., Homeowner Mortgage Rev., “2”, GNMA, 3%, 7/01/2052 | | | 9,020,000 | 9,472,506 |
| Florida Mid-Bay Bridge Authority Rev., “A”, 5%, 10/01/2035 | | | 5,000,000 | 5,534,813 |
Portfolio of Investments – continued
| Issuer | | | Shares/Par | Value ($) |
| Municipal Bonds - continued |
| Florida - continued |
| Jacksonville, FL, Educational Facilities Rev. (Jacksonville University Project), “B”, 5%, 6/01/2053 (n) | | $ | 2,345,000 | $ 2,596,384 |
| Jacksonville, FL, Electric Authority Systems Rev., “B”, 5%, 10/01/2032 | | | 3,325,000 | 3,903,599 |
| Lakewood Ranch Stewardship District, FL, Special Assessment Rev. (Lakewood Centre North Project), 4.25%, 5/01/2025 | | | 415,000 | 428,306 |
| Lakewood Ranch Stewardship District, FL, Special Assessment Rev. (Lakewood Centre North Project), 4.875%, 5/01/2035 | | | 1,295,000 | 1,363,273 |
| Lakewood Ranch Stewardship District, FL, Special Assessment Rev. (Lakewood Centre North Project), 4.875%, 5/01/2045 | | | 2,305,000 | 2,405,779 |
| Lakewood Ranch Stewardship District, FL, Special Assessment Rev. (Lakewood National and Polo Run Projects), 5.375%, 5/01/2047 | | | 2,825,000 | 3,086,938 |
| Legends Bay Community Development District, FL, “A”, 5.875%, 5/01/2038 | | | 1,105,000 | 1,106,746 |
| Live Oak Lake Community Development District, FL, Capital Improvement Rev., 4.5%, 5/01/2036 | | | 4,155,000 | 4,360,992 |
| Live Oak Lake Community Development District, FL, Capital Improvement Rev., 4.625%, 5/01/2047 | | | 2,720,000 | 2,841,847 |
| Marshall Creek, FL, Community Development District Rev. (St. John's County), “A”, 5%, 5/01/2032 | | | 1,460,000 | 1,524,904 |
| Martin County, FL, Health Facilities Authority Hospital Rev. (Cleveland Clinic Health System), “A”, 4%, 1/01/2046 | | | 3,540,000 | 3,918,108 |
| Miami Beach, FL, Health Facilities Authority Hospital Rev. (Mount Sinai Medical Center of Florida), 5%, 11/15/2039 | | | 1,000,000 | 1,101,022 |
| Miami-Dade County, FL, Aviation Refunding Rev., “A”, 5%, 10/01/2030 | | | 270,000 | 336,851 |
| Miami-Dade County, FL, Aviation Refunding Rev., “A”, 5%, 10/01/2031 | | | 1,105,000 | 1,377,160 |
| Miami-Dade County, FL, Aviation Refunding Rev., “A”, 5%, 10/01/2032 | | | 465,000 | 577,151 |
| Miami-Dade County, FL, Aviation Refunding Rev., “A”, 5%, 10/01/2033 | | | 1,450,000 | 1,797,601 |
| Miami-Dade County, FL, Aviation Refunding Rev., “A”, 4%, 10/01/2034 | | | 840,000 | 966,295 |
| Miami-Dade County, FL, Aviation Refunding Rev., “A”, 4%, 10/01/2035 | | | 840,000 | 964,404 |
| Miami-Dade County, FL, Aviation Refunding Rev., “A”, 4%, 10/01/2036 | | | 1,055,000 | 1,208,990 |
| Miami-Dade County, FL, Aviation Refunding Rev., “A”, 4%, 10/01/2037 | | | 1,055,000 | 1,208,511 |
| Miami-Dade County, FL, Aviation Refunding Rev., “A”, 4%, 10/01/2038 | | | 1,185,000 | 1,353,827 |
Portfolio of Investments – continued
| Issuer | | | Shares/Par | Value ($) |
| Municipal Bonds - continued |
| Florida - continued |
| Miami-Dade County, FL, Aviation Refunding Rev., “A”, 4%, 10/01/2039 | | $ | 880,000 | $ 1,001,645 |
| Miami-Dade County, FL, Aviation Refunding Rev., “A”, 4%, 10/01/2041 | | | 790,000 | 895,034 |
| Miami-Dade County, FL, Housing Finance Authority Multi-Family Rev. (Platform 3750), GNMA, 0.25%, 8/01/2024 (Put Date 8/01/2023) | | | 4,415,000 | 4,378,455 |
| Miami-Dade County, FL, Industrial Development Authority Rev. (Doral Academy Project), 5%, 1/15/2032 | | | 1,000,000 | 1,113,272 |
| Miami-Dade County, FL, Industrial Development Authority Rev. (Doral Academy Project), 5%, 1/15/2037 | | | 1,215,000 | 1,345,159 |
| Miami-Dade County, FL, Industrial Development Authority Rev. (Doral Academy Project), 5%, 1/15/2048 | | | 4,185,000 | 4,576,168 |
| Miami-Dade County, FL, Industrial Development Authority Rev. (Pinecrest Academy Project), 5%, 9/15/2024 | | | 205,000 | 215,406 |
| Miami-Dade County, FL, Industrial Development Authority Rev. (Pinecrest Academy Project), 5.25%, 9/15/2044 | | | 2,895,000 | 3,109,293 |
| Miami-Dade County, FL, Rickenbacker Causeway Rev., 5%, 10/01/2043 | | | 2,000,000 | 2,184,446 |
| Midtown Miami, FL, Community Development District Special Assessment (Infrastructure Project), “B”, 5%, 5/01/2029 | | | 1,200,000 | 1,234,772 |
| Midtown Miami, FL, Community Development District Special Assessment (Infrastructure Project), “B”, 5%, 5/01/2037 | | | 740,000 | 757,526 |
| Midtown Miami, FL, Community Development District Special Assessment (Parking Garage Project), “A”, 5%, 5/01/2037 | | | 1,055,000 | 1,079,987 |
| Miromar Lakes, FL, Community Development District, Capital Improvement Rev., 4.875%, 5/01/2022 | | | 115,000 | 115,828 |
| Miromar Lakes, FL, Community Development District, Capital Improvement Rev., 5.375%, 5/01/2032 | | | 925,000 | 929,628 |
| Naturewalk Community Development District, FL, Capital Improvement Rev., “B”, 5.3%, 5/01/2016 (a)(d) | | | 1,575,000 | 567,000 |
| North Broward, FL, Hospital District Rev. (Broward Health), “B”, 5%, 1/01/2042 | | | 7,340,000 | 8,409,633 |
| Okeechobee County, FL, Solid Waste Disposal Rev. (Waste Management, Inc./Okeechobee Landfill Project), “A”, 0.55%, 7/01/2039 (Put Date 7/01/2024) | | | 1,475,000 | 1,455,031 |
| Orlando, FL, Senior Tourist Development Tax Refunding Rev. (6th Cent Contract Payments), “A”, AGM, 5%, 11/01/2034 | | | 405,000 | 477,721 |
| Osceola County, FL, Transportation Improvement and Refunding Rev. (Osceola Parkway), “A-1”, 5%, 10/01/2044 | | | 1,000,000 | 1,177,834 |
| Osceola County, FL, Transportation Improvement and Refunding Rev. (Osceola Parkway), “A-1”, 5%, 10/01/2049 | | | 1,295,000 | 1,515,485 |
Portfolio of Investments – continued
| Issuer | | | Shares/Par | Value ($) |
| Municipal Bonds - continued |
| Florida - continued |
| Osceola County, FL, Transportation Improvement and Refunding Rev. (Osceola Parkway), Capital Appreciation, “A-2”, 0%, 10/01/2035 | | $ | 700,000 | $ 463,150 |
| Osceola County, FL, Transportation Improvement and Refunding Rev. (Osceola Parkway), Capital Appreciation, “A-2”, 0%, 10/01/2036 | | | 840,000 | 534,647 |
| Osceola County, FL, Transportation Improvement and Refunding Rev. (Osceola Parkway), Capital Appreciation, “A-2”, 0%, 10/01/2037 | | | 320,000 | 196,095 |
| Osceola County, FL, Transportation Improvement and Refunding Rev. (Osceola Parkway), Capital Appreciation, “A-2”, 0%, 10/01/2038 | | | 980,000 | 577,299 |
| Osceola County, FL, Transportation Improvement and Refunding Rev. (Osceola Parkway), Capital Appreciation, “A-2”, 0%, 10/01/2039 | | | 1,180,000 | 668,117 |
| Osceola County, FL, Transportation Improvement and Refunding Rev. (Osceola Parkway), Capital Appreciation, “A-2”, 0%, 10/01/2040 | | | 1,265,000 | 687,872 |
| Osceola County, FL, Transportation Improvement and Refunding Rev. (Osceola Parkway), Capital Appreciation, “A-2”, 0%, 10/01/2041 | | | 1,405,000 | 734,076 |
| Osceola County, FL, Transportation Improvement and Refunding Rev. (Osceola Parkway), Capital Appreciation, “A-2”, 0%, 10/01/2042 | | | 1,125,000 | 564,089 |
| Osceola County, FL, Transportation Improvement and Refunding Rev. (Osceola Parkway), Capital Appreciation, “A-2”, 0%, 10/01/2043 | | | 1,545,000 | 742,853 |
| Osceola County, FL, Transportation Improvement and Refunding Rev. (Osceola Parkway), Capital Appreciation, “A-2”, 0%, 10/01/2044 | | | 1,685,000 | 779,197 |
| Osceola County, FL, Transportation Improvement and Refunding Rev. (Osceola Parkway), Capital Appreciation, “A-2”, 0%, 10/01/2045 | | | 1,965,000 | 874,189 |
| OTC Community Development District, FL, Special Assessment, “A”, 5.3%, 5/01/2038 | | | 3,465,000 | 3,468,757 |
| Palm Beach County, FL, Health Facilities Authority Hospital Rev. (BRRH Corp. Obligated Group), 5%, 12/01/2031 (Prerefunded 12/01/2024) | | | 1,000,000 | 1,107,368 |
| Palm Beach County, FL, Health Facilities Authority Retirement Communities Rev. (Acts Retirement-Life Communities, Inc. Obligated Group), “B”, 5%, 11/15/2042 | | | 985,000 | 1,161,858 |
| Palm Beach County, FL, Health Facilities Authority Rev. (Sinai Residences of Boca Raton Project), “A”, 7.5%, 6/01/2049 | | | 2,030,000 | 2,116,518 |
Portfolio of Investments – continued
| Issuer | | | Shares/Par | Value ($) |
| Municipal Bonds - continued |
| Florida - continued |
| Palm Beach County, FL, Health Facilities Authority Rev. (Toby & Leon Cooperman Sinai Residences of Boca Raton Expansion), “A”, 5%, 6/01/2055 | | $ | 2,770,000 | $ 2,954,369 |
| Palm Beach County, FL, Health Facilities Authority Rev. (Toby & Leon Cooperman Sinai Residences of Boca Raton Expansion), “B-1”, 3%, 6/01/2027 | | | 1,000,000 | 1,010,807 |
| Palm Beach County, FL, Health Facilities Authority Rev. (Toby & Leon Cooperman Sinai Residences of Boca Raton Expansion), “B-2”, 2.625%, 6/01/2025 | | | 3,610,000 | 3,627,720 |
| Palm Beach County, FL, Health Facilities Authority Rev. (Toby & Leon Cooperman Sinai Residences of Boca Raton), 4%, 6/01/2031 (w) | | | 860,000 | 888,036 |
| Palm Beach County, FL, Health Facilities Authority Rev. (Toby & Leon Cooperman Sinai Residences of Boca Raton), 4%, 6/01/2036 (w) | | | 1,380,000 | 1,410,109 |
| Palm Beach County, FL, Health Facilities Authority Rev. (Toby & Leon Cooperman Sinai Residences of Boca Raton), 4%, 6/01/2041 (w) | | | 1,450,000 | 1,466,194 |
| Palm Beach County, FL, Health Facilities Authority Rev. (Toby & Leon Cooperman Sinai Residences of Boca Raton), 4.25%, 6/01/2056 (w) | | | 2,820,000 | 2,847,220 |
| Palm Beach County, FL, Provident Group Rev. (Lynn University Housing Project), “A”, 4.25%, 6/01/2031 (n) | | | 1,500,000 | 1,607,388 |
| Palm Beach County, FL, Provident Group Rev. (Lynn University Housing Project), “A”, 5%, 6/01/2057 (n) | | | 14,925,000 | 16,986,281 |
| Palm Beach County, FL, Provident Group Rev. (Lynn University Housing Project), “B”, 5%, 6/01/2027 (n) | | | 1,120,000 | 1,125,639 |
| Palm River, FL, Community Development District, Special Assessment Rev., “A”, 5.375%, 5/01/2036 (a)(d) | | | 895,000 | 286,400 |
| Palm River, FL, Community Development District, Special Assessment Rev., “B”, 5.15%, 5/01/2022 (a)(d) | | | 1,000,000 | 320,000 |
| Pasco County, FL, Bexley Community Development District, Special Assessment Rev., 4.1%, 5/01/2026 | | | 500,000 | 527,895 |
| Pasco County, FL, Bexley Community Development District, Special Assessment Rev., 4.7%, 5/01/2036 | | | 1,370,000 | 1,444,699 |
| Pasco County, FL, Bexley Community Development District, Special Assessment Rev., 4.875%, 5/01/2047 | | | 2,530,000 | 2,666,057 |
| Pasco County, FL, Concord Station Community Development District, “A-1”, 3.5%, 5/01/2032 | | | 1,435,000 | 1,502,097 |
| Pasco County, FL, Concord Station Community Development District, “A-1”, 3.625%, 5/01/2035 | | | 865,000 | 907,730 |
| Pasco County, FL, Concord Station Community Development District, “A-1”, 3.75%, 5/01/2046 | | | 1,000,000 | 1,043,520 |
Portfolio of Investments – continued
| Issuer | | | Shares/Par | Value ($) |
| Municipal Bonds - continued |
| Florida - continued |
| Pasco County, FL, Del Webb Bexley Community Development District, Special Assessment Rev., 5.3%, 5/01/2039 | | $ | 990,000 | $ 1,113,169 |
| Pasco County, FL, Del Webb Bexley Community Development District, Special Assessment Rev., 5.4%, 5/01/2049 | | | 1,270,000 | 1,427,036 |
| Pasco County, FL, Estancia at Wiregrass Community Development District, Capital Improvement, 5.25%, 11/01/2035 | | | 430,000 | 458,343 |
| Pasco County, FL, Estancia at Wiregrass Community Development District, Capital Improvement, 7%, 11/01/2045 | | | 1,995,000 | 2,317,580 |
| Pasco County, FL, Estancia at Wiregrass Community Development District, Capital Improvement, 5.375%, 11/01/2046 | | | 375,000 | 399,612 |
| Pinellas County, FL, Educational Facilities Authority Rev. (Barry University), 6%, 10/01/2041 | | | 5,330,000 | 5,348,147 |
| Pompano Beach, FL, Refunding Rev. (John Knox Village Project), “A”, 4%, 9/01/2051 | | | 1,785,000 | 1,914,929 |
| Pompano Beach, FL, Refunding Rev. (John Knox Village Project), “A”, 4%, 9/01/2056 | | | 3,010,000 | 3,217,353 |
| Pompano Beach, FL, Refunding Rev. (John Knox Village Project), “B-2”, 1.45%, 1/01/2027 | | | 810,000 | 787,017 |
| Sarasota County, FL, Health Facility Authority Retirement Facility Improvement Rev. (Village on the Isle Project), “A”, 5%, 1/01/2047 | | | 1,020,000 | 1,081,801 |
| Sarasota County, FL, Health Facility Authority Retirement Facility Improvement Rev. (Village on the Isle Project), “A”, 5%, 1/01/2052 | | | 1,875,000 | 1,986,793 |
| Seminole County, FL, Industrial Development Authority, Educational Facilities Rev. (Galileo Schools for Gifted Learning Project), “A”, 4%, 6/15/2036 (n) | | | 315,000 | 345,682 |
| Seminole County, FL, Industrial Development Authority, Educational Facilities Rev. (Galileo Schools for Gifted Learning Project), “A”, 4%, 6/15/2041 (n) | | | 425,000 | 460,562 |
| Seminole County, FL, Industrial Development Authority, Educational Facilities Rev. (Galileo Schools for Gifted Learning Project), “A”, 4%, 6/15/2051 (n) | | | 505,000 | 540,425 |
| Seminole County, FL, Industrial Development Authority, Educational Facilities Rev. (Galileo Schools for Gifted Learning Project), “A”, 4%, 6/15/2056 (n) | | | 705,000 | 748,564 |
| St. John's & Duval County, FL, Tolomato Community Development District Special Assessment Refunding, “A-2”, 3.5%, 5/01/2024 (n) | | | 420,000 | 428,594 |
Portfolio of Investments – continued
| Issuer | | | Shares/Par | Value ($) |
| Municipal Bonds - continued |
| Florida - continued |
| St. John's & Duval County, FL, Tolomato Community Development District Special Assessment Refunding, “A-2”, 3.85%, 5/01/2029 (n) | | $ | 700,000 | $ 747,544 |
| St. John's & Duval County, FL, Tolomato Community Development District Special Assessment Refunding, “A-2”, 4.25%, 5/01/2037 (n) | | | 1,000,000 | 1,074,035 |
| St. John's County, FL, Industrial Development Authority Rev. (Bayview Project), “A”, 5.2%, 10/01/2027 (a)(d) | | | 1,345,000 | 1,347,188 |
| St. John's County, FL, Industrial Development Authority Rev. (Bayview Project), “A”, 5.25%, 10/01/2041 (a)(d) | | | 2,800,000 | 2,804,603 |
| St. John's County, FL, Industrial Development Authority, Senior Living Rev. (Vicars Landing Project), “A”, 4%, 12/15/2027 | | | 110,000 | 118,766 |
| St. John's County, FL, Industrial Development Authority, Senior Living Rev. (Vicars Landing Project), “A”, 4%, 12/15/2028 | | | 105,000 | 113,641 |
| St. John's County, FL, Industrial Development Authority, Senior Living Rev. (Vicars Landing Project), “A”, 4%, 12/15/2029 | | | 120,000 | 130,104 |
| St. John's County, FL, Industrial Development Authority, Senior Living Rev. (Vicars Landing Project), “A”, 4%, 12/15/2030 | | | 105,000 | 113,790 |
| St. John's County, FL, Industrial Development Authority, Senior Living Rev. (Vicars Landing Project), “A”, 4%, 12/15/2031 | | | 110,000 | 118,775 |
| St. John's County, FL, Industrial Development Authority, Senior Living Rev. (Vicars Landing Project), “A”, 4%, 12/15/2036 | | | 525,000 | 558,446 |
| St. John's County, FL, Industrial Development Authority, Senior Living Rev. (Vicars Landing Project), “A”, 4%, 12/15/2041 | | | 390,000 | 408,690 |
| St. John's County, FL, Industrial Development Authority, Senior Living Rev. (Vicars Landing Project), “A”, 4%, 12/15/2046 | | | 390,000 | 404,746 |
| St. John's County, FL, Industrial Development Authority, Senior Living Rev. (Vicars Landing Project), “A”, 4%, 12/15/2050 | | | 380,000 | 392,608 |
| Sterling Hill Community Development District, FL, Capital Improvement Rev., “B”, 5.5%, 11/01/2022 (d) | | | 498,908 | 299,345 |
| Sumter County, FL, Industrial Development Authority Hospital Rev. (Central Florida Health Alliance Projects), “A”, 5%, 7/01/2026 | | | 155,000 | 165,311 |
| Sumter County, FL, Industrial Development Authority Hospital Rev. (Central Florida Health Alliance Projects), “A”, 5%, 7/01/2029 | | | 145,000 | 154,475 |
| Sumter County, FL, Industrial Development Authority Hospital Rev. (Central Florida Health Alliance Projects), “A”, 5.125%, 7/01/2034 | | | 315,000 | 336,016 |
| Sumter County, FL, Industrial Development Authority Hospital Rev. (Central Florida Health Alliance Projects), “A”, 5.25%, 7/01/2044 | | | 935,000 | 996,829 |
Portfolio of Investments – continued
| Issuer | | | Shares/Par | Value ($) |
| Municipal Bonds - continued |
| Florida - continued |
| Tallahassee, FL, Health Facilities Rev. (Tallahassee Memorial Healthcare, Inc.), “A”, 5%, 12/01/2040 | | $ | 5,935,000 | $ 6,562,584 |
| Tallahassee, FL, Health Facilities Rev. (Tallahassee Memorial Healthcare, Inc.), “A”, 5%, 12/01/2044 | | | 2,695,000 | 2,971,592 |
| Tallahassee, FL, Health Facilities Rev. (Tallahassee Memorial Healthcare, Inc.), “A”, 5%, 12/01/2055 | | | 6,100,000 | 6,749,757 |
| Tampa, FL (University of Tampa Project), 5%, 4/01/2040 | | | 965,000 | 1,066,157 |
| Tampa, FL, Capital Improvement Cigarette Tax Allocation (H. Lee Moffitt Cancer Center Project), Capital Appreciation, “A”, 0%, 9/01/2034 | | | 1,570,000 | 1,085,781 |
| Tampa, FL, Capital Improvement Cigarette Tax Allocation (H. Lee Moffitt Cancer Center Project), Capital Appreciation, “A”, 0%, 9/01/2035 | | | 865,000 | 571,631 |
| Tampa, FL, Capital Improvement Cigarette Tax Allocation (H. Lee Moffitt Cancer Center Project), Capital Appreciation, “A”, 0%, 9/01/2036 | | | 1,340,000 | 846,405 |
| Tampa, FL, Capital Improvement Cigarette Tax Allocation (H. Lee Moffitt Cancer Center Project), Capital Appreciation, “A”, 0%, 9/01/2037 | | | 630,000 | 379,907 |
| Tampa, FL, Capital Improvement Cigarette Tax Allocation (H. Lee Moffitt Cancer Center Project), Capital Appreciation, “A”, 0%, 9/01/2038 | | | 865,000 | 496,921 |
| Tampa, FL, Capital Improvement Cigarette Tax Allocation (H. Lee Moffitt Cancer Center Project), Capital Appreciation, “A”, 0%, 9/01/2039 | | | 865,000 | 474,994 |
| Tampa, FL, Capital Improvement Cigarette Tax Allocation (H. Lee Moffitt Cancer Center Project), Capital Appreciation, “A”, 0%, 9/01/2040 | | | 1,180,000 | 617,965 |
| Tampa, FL, Capital Improvement Cigarette Tax Allocation (H. Lee Moffitt Cancer Center Project), Capital Appreciation, “A”, 0%, 9/01/2041 | | | 525,000 | 262,328 |
| Tampa, FL, Capital Improvement Cigarette Tax Allocation (H. Lee Moffitt Cancer Center Project), Capital Appreciation, “A”, 0%, 9/01/2042 | | | 525,000 | 250,346 |
| Tampa, FL, Hospital Rev. (H. Lee Moffitt Cancer Center Project), “B”, 4%, 7/01/2038 | | | 340,000 | 384,934 |
| Tampa, FL, Hospital Rev. (H. Lee Moffitt Cancer Center Project), “B”, 4%, 7/01/2039 | | | 345,000 | 390,029 |
| Tampa, FL, Hospital Rev. (H. Lee Moffitt Cancer Center Project), “B”, 5%, 7/01/2040 | | | 525,000 | 645,537 |
| Tampa, FL, Hospital Rev. (H. Lee Moffitt Cancer Center Project), “B”, 4%, 7/01/2045 | | | 1,835,000 | 2,043,134 |
Portfolio of Investments – continued
| Issuer | | | Shares/Par | Value ($) |
| Municipal Bonds - continued |
| Florida - continued |
| Tampa, FL, Hospital Rev. (H. Lee Moffitt Cancer Center Project), “B”, 5%, 7/01/2050 | | $ | 3,715,000 | $ 4,508,274 |
| Trout Creek Community Development District, FL, Capital Improvement Rev., 5.5%, 5/01/2035 | | | 2,255,000 | 2,382,937 |
| Trout Creek Community Development District, FL, Capital Improvement Rev., 5.625%, 5/01/2045 | | | 3,995,000 | 4,210,501 |
| University of South Florida Financing Corp, Refunding Certificates of Participation, “A”, 5%, 7/01/2031 | | | 5,420,000 | 6,047,725 |
| Wiregrass Community Development District, FL, Capital Improvement Rev., 5.375%, 5/01/2035 | | | 385,000 | 411,117 |
| Wiregrass Community Development District, FL, Capital Improvement Rev., 4.875%, 5/01/2036 | | | 915,000 | 979,953 |
| Wiregrass Community Development District, FL, Capital Improvement Rev., 5.625%, 5/01/2045 | | | 1,000,000 | 1,069,420 |
| Wiregrass Community Development District, FL, Capital Improvement Rev., 5%, 5/01/2047 | | | 1,695,000 | 1,813,235 |
| | | | | $408,733,837 |
| Georgia - 0.7% |
| Atlanta, GA, Geo. L. Smith II World Congress Center Authority Convention Center Hotel Rev., “A”, 4%, 1/01/2054 | | $ | 4,675,000 | $ 5,072,048 |
| Atlanta, GA, Geo. L. Smith II World Congress Center Authority Convention Center Hotel Rev., “B”, 3.625%, 1/01/2031 (n) | | | 2,175,000 | 2,250,739 |
| Atlanta, GA, Geo. L. Smith II World Congress Center Authority Convention Center Hotel Rev., “B”, 5%, 1/01/2036 (n) | | | 1,995,000 | 2,276,054 |
| Atlanta, GA, Geo. L. Smith II World Congress Center Authority Convention Center Hotel Rev., “B”, 5%, 1/01/2054 (n) | | | 6,200,000 | 6,911,156 |
| Cobb County, GA, Development Authority, Student Housing Rev. (Kennesaw State University Real Estate Foundations), “C”, 5%, 7/15/2030 | | | 580,000 | 632,090 |
| Cobb County, GA, Development Authority, Student Housing Rev. (Kennesaw State University Real Estate Foundations), “C”, 5%, 7/15/2033 | | | 1,025,000 | 1,110,310 |
| Cobb County, GA, Development Authority, Student Housing Rev. (Kennesaw State University Real Estate Foundations), “C”, 5%, 7/15/2038 | | | 1,100,000 | 1,184,742 |
| Cobb County, GA, Kennestone Hospital Authority Rev. (WellStar Health System, Inc. Project), “B”, 5%, 4/01/2031 | | | 325,000 | 401,286 |
| Cobb County, GA, Kennestone Hospital Authority Rev. (WellStar Health System, Inc. Project), “B”, 4%, 4/01/2032 | | | 365,000 | 417,774 |
| Cobb County, GA, Kennestone Hospital Authority Rev. (WellStar Health System, Inc. Project), “B”, 4%, 4/01/2033 | | | 210,000 | 240,252 |
Portfolio of Investments – continued
| Issuer | | | Shares/Par | Value ($) |
| Municipal Bonds - continued |
| Georgia - continued |
| Cobb County, GA, Kennestone Hospital Authority Rev. (WellStar Health System, Inc. Project), “B”, 4%, 4/01/2034 | | $ | 385,000 | $ 440,183 |
| Cobb County, GA, Kennestone Hospital Authority Rev. (WellStar Health System, Inc. Project), “B”, 4%, 4/01/2036 | | | 340,000 | 386,135 |
| Cobb County, GA, Kennestone Hospital Authority Rev. (WellStar Health System, Inc. Project), “B”, 5%, 4/01/2037 | | | 350,000 | 428,128 |
| Cobb County, GA, Kennestone Hospital Authority Rev. (WellStar Health System, Inc. Project), “B”, 5%, 4/01/2038 | | | 370,000 | 451,790 |
| Cobb County, GA, Kennestone Hospital Authority Rev. (WellStar Health System, Inc. Project), “B”, 4%, 4/01/2039 | | | 320,000 | 361,142 |
| Cobb County, GA, Kennestone Hospital Authority Rev. (WellStar Health System, Inc. Project), “B”, 5%, 4/01/2040 | | | 225,000 | 273,921 |
| Fulton County, GA, Development Authority Hospital Rev. (WellStar Health System, Inc. Project), “A”, 4%, 4/01/2050 | | | 3,705,000 | 4,102,837 |
| Georgia Housing & Finance Authority Rev., Single Family Mortgage, “A-1”, 4%, 6/01/2044 | | | 140,000 | 143,952 |
| Georgia Main Street Natural Gas, Inc., Gas Project Rev., “A”, 5.5%, 9/15/2028 | | | 2,245,000 | 2,730,394 |
| Georgia Municipal Electric Authority (Plant Vogtle Units 3 & 4 Project), “A”, 5%, 1/01/2056 | | | 2,580,000 | 3,033,320 |
| Georgia Municipal Electric Authority (Plant Vogtle Units 3 & 4 Project), “A”, 5%, 1/01/2063 | | | 2,580,000 | 3,033,320 |
| Georgia Municipal Electric Authority (Project One), “A”, 5%, 1/01/2044 | | | 3,880,000 | 4,611,529 |
| Georgia Private Colleges & Universities Authority Rev. (Mercer University Project), “C”, 5.25%, 10/01/2027 | | | 920,000 | 944,125 |
| Glynn-Brunswick, GA, Memorial Hospital Authority Rev., Anticipation Certificates (Southeast Georgia Health System Project), 4%, 8/01/2035 | | | 380,000 | 434,096 |
| Glynn-Brunswick, GA, Memorial Hospital Authority Rev., Anticipation Certificates (Southeast Georgia Health System Project), 4%, 8/01/2036 | | | 415,000 | 473,576 |
| Glynn-Brunswick, GA, Memorial Hospital Authority Rev., Anticipation Certificates (Southeast Georgia Health System Project), 4%, 8/01/2037 | | | 285,000 | 325,036 |
| Hall County and Gainesville, GA, Hospital Authority Rev. (Northeast Georgia Health System, Inc. Project), “A”, 5.5%, 8/15/2054 (Prerefunded 2/15/2025) | | | 3,465,000 | 3,907,521 |
| | | | | $46,577,456 |
Portfolio of Investments – continued
| Issuer | | | Shares/Par | Value ($) |
| Municipal Bonds - continued |
| Guam - 0.5% |
| Guam Education Financing Foundation (Guam Public School Facilities Project), “B”, COP, 5%, 10/01/2026 (n) | | $ | 12,905,000 | $ 13,308,054 |
| Guam Government Business Privilege Tax Refunding, “F”, 5%, 1/01/2029 | | | 400,000 | 473,079 |
| Guam Government Business Privilege Tax Refunding, “F”, 5%, 1/01/2030 | | | 300,000 | 359,906 |
| Guam Government Business Privilege Tax Refunding, “F”, 5%, 1/01/2031 | | | 400,000 | 487,553 |
| Guam Government Business Privilege Tax Refunding, “F”, 4%, 1/01/2036 | | | 1,710,000 | 1,884,644 |
| Guam Government Business Privilege Tax Refunding, “F”, 4%, 1/01/2042 | | | 2,315,000 | 2,518,239 |
| Guam Government Department of Education (John F. Kennedy High School Energy Efficiency Project), “A”, COP, 3.625%, 2/01/2025 | | | 995,000 | 1,018,631 |
| Guam Government Department of Education (John F. Kennedy High School Energy Efficiency Project), “A”, COP, 4.25%, 2/01/2030 | | | 1,750,000 | 1,871,270 |
| Guam Government Department of Education (John F. Kennedy High School Energy Efficiency Project), “A”, COP, 5%, 2/01/2040 | | | 2,375,000 | 2,621,817 |
| Guam Government, Hotel Occupancy Tax Rev., “A”, 5%, 11/01/2027 | | | 250,000 | 290,871 |
| Guam Government, Hotel Occupancy Tax Rev., “A”, 5%, 11/01/2028 | | | 250,000 | 295,248 |
| Guam Government, Hotel Occupancy Tax Rev., “A”, 5%, 11/01/2029 | | | 325,000 | 388,933 |
| Guam Government, Hotel Occupancy Tax Rev., “A”, 5%, 11/01/2030 | | | 250,000 | 304,011 |
| Guam Government, Hotel Occupancy Tax Rev., “A”, 5%, 11/01/2035 | | | 1,000,000 | 1,213,452 |
| Guam Government, Hotel Occupancy Tax Rev., “A”, 5%, 11/01/2040 | | | 1,000,000 | 1,198,927 |
| Guam International Airport Authority Rev. (A.B. Won Pat Airport), “A”, 3.839%, 10/01/2036 | | | 930,000 | 931,709 |
| Guam International Airport Authority Rev. (A.B. Won Pat Airport), “A”, 4.46%, 10/01/2043 | | | 1,070,000 | 1,089,291 |
| Guam Waterworks Authority Rev. (Water and Wastewater System), 5%, 7/01/2036 | | | 355,000 | 396,736 |
| Guam Waterworks Authority Rev. (Water and Wastewater System), 5%, 1/01/2046 | | | 1,620,000 | 1,798,329 |
| | | | | $32,450,700 |
Portfolio of Investments – continued
| Issuer | | | Shares/Par | Value ($) |
| Municipal Bonds - continued |
| Hawaii - 0.1% |
| Hawaii Department of Budget & Finance, Special Purpose Rev. (Chaminade University), 5%, 1/01/2030 (n) | | $ | 1,960,000 | $ 2,044,584 |
| Hawaii Department of Budget & Finance, Special Purpose Rev. (Chaminade University), 5%, 1/01/2035 (n) | | | 1,125,000 | 1,165,327 |
| Hawaii Department of Budget & Finance, Special Purpose Rev. (Chaminade University), 5%, 1/01/2045 (n) | | | 1,140,000 | 1,168,742 |
| Hawaii Harbor System Rev., “A”, 4%, 7/01/2033 | | | 525,000 | 607,957 |
| Hawaii Harbor System Rev., “A”, 4%, 7/01/2034 | | | 460,000 | 530,247 |
| Hawaii Harbor System Rev., “A”, 4%, 7/01/2035 | | | 330,000 | 379,871 |
| Hawaii Harbor System Rev., “A”, 4%, 7/01/2036 | | | 30,000 | 34,498 |
| | | | | $5,931,226 |
| Idaho - 0.1% |
| Idaho Health Facilities Authority Rev. (Madison Memorial Hospital Project), 5%, 9/01/2037 | | $ | 830,000 | $ 925,738 |
| Idaho Health Facilities Authority Rev. (St. Luke's Health System Project), “A”, 4%, 3/01/2038 | | | 3,880,000 | 4,314,253 |
| Idaho Housing and Finance Association Nonprofit Facilities Rev. (Compass Public Charter School, Inc. Project), “A”, 4.625%, 7/01/2029 (n) | | | 185,000 | 203,284 |
| Idaho Housing and Finance Association Nonprofit Facilities Rev. (Compass Public Charter School, Inc. Project), “A”, 6%, 7/01/2039 (n) | | | 1,100,000 | 1,302,479 |
| Idaho Housing and Finance Association Nonprofit Facilities Rev. (Compass Public Charter School, Inc. Project), “A”, 6%, 7/01/2049 (n) | | | 515,000 | 600,924 |
| Idaho Housing and Finance Association Nonprofit Facilities Rev. (Compass Public Charter School, Inc. Project), “A”, 6%, 7/01/2054 (n) | | | 565,000 | 657,482 |
| | | | | $8,004,160 |
| Illinois - 11.3% |
| Bridgeview, IL, Stadium and Redevelopment Projects, AAC, 5.14%, 12/01/2036 | | $ | 12,665,000 | $ 13,267,138 |
| Burbank, IL, Educational Facility Rev. (Intercultural Montessori Language School Project), “A”, 6%, 9/01/2035 (n) | | | 2,170,000 | 2,330,589 |
| Burbank, IL, Educational Facility Rev. (Intercultural Montessori Language School Project), “A”, 6.25%, 9/01/2045 (n) | | | 3,565,000 | 3,815,245 |
| Chicago, IL, “A”, 5%, 1/01/2034 | | | 40,000,000 | 47,593,380 |
| Chicago, IL, “A”, 5.5%, 1/01/2039 | | | 2,380,000 | 2,635,015 |
| Chicago, IL, “C”, 5%, 1/01/2026 | | | 1,960,000 | 2,189,766 |
| Chicago, IL, Board of Education, 5%, 12/01/2042 | | | 12,065,000 | 12,353,256 |
| Chicago, IL, Board of Education (School Reform), Capital Appreciation, “A”, NPFG, 0%, 12/01/2022 | | | 1,810,000 | 1,794,108 |
Portfolio of Investments – continued
| Issuer | | | Shares/Par | Value ($) |
| Municipal Bonds - continued |
| Illinois - continued |
| Chicago, IL, Board of Education (School Reform), Capital Appreciation, “A”, NPFG, 0%, 12/01/2023 | | $ | 1,540,000 | $ 1,498,579 |
| Chicago, IL, Board of Education (School Reform), Capital Appreciation, “A”, NPFG, 0%, 12/01/2028 | | | 12,640,000 | 10,830,214 |
| Chicago, IL, Board of Education (School Reform), Capital Appreciation, “A”, NPFG, 0%, 12/01/2029 | | | 4,250,000 | 3,532,004 |
| Chicago, IL, Board of Education (School Reform), Capital Appreciation, “A”, NPFG, 0%, 12/01/2030 | | | 1,835,000 | �� 1,477,604 |
| Chicago, IL, Board of Education (School Reform), Capital Appreciation, “B-1”, NPFG, 0%, 12/01/2022 | | | 4,075,000 | 4,039,221 |
| Chicago, IL, Board of Education (School Reform), Capital Appreciation, “B-1”, NPFG, 0%, 12/01/2023 | | | 1,020,000 | 992,565 |
| Chicago, IL, Board of Education (School Reform), Capital Appreciation, “B-1”, NPFG, 0%, 12/01/2026 | | | 4,335,000 | 3,935,654 |
| Chicago, IL, Board of Education (School Reform), Capital Appreciation, “B-1”, NPFG, 0%, 12/01/2028 | | | 5,515,000 | 4,725,366 |
| Chicago, IL, Board of Education, “A”, 5.5%, 12/01/2039 | | | 3,125,000 | 3,130,847 |
| Chicago, IL, Board of Education, Dedicated Capital Improvement Tax Bond, 5%, 4/01/2033 | | | 380,000 | 428,488 |
| Chicago, IL, Board of Education, Dedicated Capital Improvement Tax Bond, 5%, 4/01/2033 | | | 280,000 | 321,124 |
| Chicago, IL, Board of Education, Dedicated Capital Improvement Tax Bond, 5%, 4/01/2036 | | | 1,110,000 | 1,246,142 |
| Chicago, IL, Board of Education, Dedicated Capital Improvement Tax Bond, 5%, 4/01/2037 | | | 1,115,000 | 1,250,314 |
| Chicago, IL, Board of Education, Dedicated Capital Improvement Tax Bond, 5%, 4/01/2042 | | | 2,015,000 | 2,248,084 |
| Chicago, IL, Board of Education, Dedicated Capital Improvement Tax Bond, 5%, 4/01/2046 | | | 2,755,000 | 3,058,664 |
| Chicago, IL, Board of Education, Dedicated Capital Improvement Tax Bond, 6%, 4/01/2046 | | | 19,865,000 | 23,158,788 |
| Chicago, IL, Board of Education, Unlimited Tax General Obligation Dedicated Rev., “A”, AAC, 5.5%, 12/01/2025 | | | 3,335,000 | 3,785,797 |
| Chicago, IL, Board of Education, Unlimited Tax General Obligation Dedicated Rev., “A”, AAC, 5.5%, 12/01/2026 | | | 1,290,000 | 1,501,349 |
| Chicago, IL, Board of Education, Unlimited Tax General Obligation Dedicated Rev., “A”, AAC, 5.5%, 12/01/2027 | | | 3,270,000 | 3,891,989 |
| Chicago, IL, Board of Education, Unlimited Tax General Obligation Dedicated Rev., “A”, AAC, 5.5%, 12/01/2028 | | | 1,550,000 | 1,882,005 |
| Chicago, IL, Board of Education, Unlimited Tax General Obligation Dedicated Rev., “A”, AAC, 5.5%, 12/01/2029 | | | 1,030,000 | 1,270,133 |
| Chicago, IL, Board of Education, Unlimited Tax General Obligation Dedicated Rev., “A”, AAC, 5.5%, 12/01/2030 | | | 775,000 | 972,269 |
Portfolio of Investments – continued
| Issuer | | | Shares/Par | Value ($) |
| Municipal Bonds - continued |
| Illinois - continued |
| Chicago, IL, Board of Education, Unlimited Tax General Obligation Dedicated Rev., “A”, AAC, 5.5%, 12/01/2031 | | $ | 2,135,000 | $ 2,722,441 |
| Chicago, IL, Board of Education, Unlimited Tax General Obligation Dedicated Rev., “C”, AGM, 5%, 12/01/2030 | | | 3,910,000 | 4,675,117 |
| Chicago, IL, Board of Education, Unlimited Tax General Obligation Dedicated Rev., “C”, AGM, 5%, 12/01/2031 | | | 7,500,000 | 8,946,129 |
| Chicago, IL, Board of Education, Unlimited Tax General Obligation Dedicated Rev., “C”, AGM, 5%, 12/01/2032 | | | 6,425,000 | 7,658,579 |
| Chicago, IL, Board of Education, Unlimited Tax General Obligation Refunding Dedicated Rev., “A”, 5%, 12/01/2034 | | | 1,250,000 | 1,433,089 |
| Chicago, IL, Board of Education, Unlimited Tax General Obligation Refunding Dedicated Rev., “A”, 5%, 12/01/2035 | | | 1,500,000 | 1,717,918 |
| Chicago, IL, Board of Education, Unlimited Tax General Obligation Refunding Dedicated Rev., “A”, 7%, 12/01/2046 (n) | | | 7,105,000 | 8,807,187 |
| Chicago, IL, Board of Education, Unlimited Tax General Obligation Refunding Dedicated Rev., “A”, AGM, 5%, 12/01/2029 | | | 1,230,000 | 1,474,256 |
| Chicago, IL, Board of Education, Unlimited Tax General Obligation Refunding Dedicated Rev., “A”, AGM, 5%, 12/01/2030 | | | 800,000 | 956,546 |
| Chicago, IL, Board of Education, Unlimited Tax General Obligation Refunding Dedicated Rev., “A”, AGM, 5%, 12/01/2031 | | | 800,000 | 954,254 |
| Chicago, IL, Board of Education, Unlimited Tax General Obligation Refunding Dedicated Rev., “A”, AGM, 5%, 12/01/2032 | | | 800,000 | 953,597 |
| Chicago, IL, Board of Education, Unlimited Tax General Obligation Refunding Dedicated Rev., “A”, AGM, 5%, 12/01/2033 | | | 715,000 | 851,970 |
| Chicago, IL, Board of Education, Unlimited Tax General Obligation Refunding Dedicated Rev., “A”, AGM, 5%, 12/01/2034 | | | 715,000 | 850,938 |
| Chicago, IL, Board of Education, Unlimited Tax General Obligation Refunding Dedicated Rev., “A”, AGM, 5%, 12/01/2035 | | | 515,000 | 612,384 |
| Chicago, IL, Board of Education, Unlimited Tax General Obligation Refunding Dedicated Rev., “G”, 5%, 12/01/2034 | | | 5,735,000 | 6,477,751 |
| Chicago, IL, Board of Education, Unlimited Tax General Obligation Refunding Dedicated Rev., “H”, 5%, 12/01/2036 | | | 8,650,000 | 9,747,099 |
| Chicago, IL, Board of Education, Unlimited Tax General Obligation Refunding Dedicated Rev., “H”, 5%, 12/01/2046 | | | 10,610,000 | 11,790,287 |
| Chicago, IL, Capital Appreciation “A”, NPFG, 0%, 1/01/2027 | | | 2,610,000 | 2,360,279 |
Portfolio of Investments – continued
| Issuer | | | Shares/Par | Value ($) |
| Municipal Bonds - continued |
| Illinois - continued |
| Chicago, IL, City Colleges of Chicago Capital Improvement Project, Capital Appreciation, NPFG, 0%, 1/01/2027 | | $ | 3,180,000 | $ 2,875,742 |
| Chicago, IL, General Obligation (Neighborhood Alive 21 Program), “B”, 5.5%, 1/01/2037 | | | 2,680,000 | 2,967,160 |
| Chicago, IL, General Obligation, “A”, 5%, 1/01/2025 | | | 1,045,000 | 1,144,326 |
| Chicago, IL, General Obligation, “A”, 5%, 1/01/2027 | | | 3,365,000 | 3,830,249 |
| Chicago, IL, General Obligation, “A”, 5%, 1/01/2028 | | | 760,000 | 877,408 |
| Chicago, IL, General Obligation, “A”, 5%, 1/01/2029 | | | 8,860,000 | 10,368,803 |
| Chicago, IL, General Obligation, “A”, 5%, 1/01/2031 | | | 780,000 | 920,085 |
| Chicago, IL, General Obligation, “A”, 5%, 1/01/2033 | | | 32,000,000 | 38,130,829 |
| Chicago, IL, General Obligation, “A”, 5.5%, 1/01/2033 | | | 3,940,000 | 4,369,295 |
| Chicago, IL, General Obligation, “A”, 5.5%, 1/01/2035 | | | 2,925,000 | 3,493,889 |
| Chicago, IL, General Obligation, “A”, 5%, 1/01/2039 | | | 4,170,000 | 4,788,665 |
| Chicago, IL, General Obligation, “A”, 5%, 1/01/2040 | | | 800,000 | 917,414 |
| Chicago, IL, General Obligation, “A”, 5%, 1/01/2044 | | | 12,975,000 | 14,792,511 |
| Chicago, IL, General Obligation, “A”, 5.5%, 1/01/2049 | | | 16,030,000 | 18,760,823 |
| Chicago, IL, General Obligation, “D”, 5.5%, 1/01/2033 | | | 1,630,000 | 1,807,602 |
| Chicago, IL, General Obligation, “D”, 5.5%, 1/01/2040 | | | 1,100,000 | 1,217,081 |
| Chicago, IL, General Obligation, “F”, 5.5%, 1/01/2042 | | | 8,225,000 | 9,111,407 |
| Chicago, IL, Greater Chicago Metropolitan Water Reclamation District, “A”, 4%, 12/01/2046 | | | 1,665,000 | 1,922,423 |
| Chicago, IL, Metropolitan Pier & Exposition Authority Refunding Bonds (McCormick Place Expansion Project), Capital Appreciation, “B-1”, AGM, 0%, 6/15/2046 | | | 15,000,000 | 7,003,395 |
| Chicago, IL, Metropolitan Pier & Exposition Authority Refunding Bonds (McCormick Place Expansion Project), Capital Appreciation, “B-1”, AGM, 0%, 6/15/2047 | | | 29,475,000 | 13,271,752 |
| Chicago, IL, Metropolitan Pier & Exposition Authority Refunding Rev. (McCormick Place Expansion Project), Capital Appreciation, “B-1”, AGM, 0%, 6/15/2026 | | | 3,390,000 | 3,104,271 |
| Chicago, IL, O’Hare International Airport Rev., Special Facilities, 5%, 7/01/2033 | | | 745,000 | 872,339 |
| Chicago, IL, O’Hare International Airport Rev., Special Facilities, 5%, 7/01/2038 | | | 2,065,000 | 2,377,629 |
| Chicago, IL, O’Hare International Airport Rev., Special Facilities, 5%, 7/01/2048 | | | 6,550,000 | 7,506,544 |
| Chicago, IL, O'Hare International Airport Rev., Customer Facility Charge, AGM, 5.25%, 1/01/2032 | | | 675,000 | 701,764 |
| Chicago, IL, O'Hare International Airport Rev., Customer Facility Charge, AGM, 5.25%, 1/01/2033 | | | 335,000 | 348,283 |
| Chicago, IL, O'Hare International Airport Rev., Customer Facility Charge, AGM, 5.5%, 1/01/2043 | | | 1,350,000 | 1,404,315 |
Portfolio of Investments – continued
| Issuer | | | Shares/Par | Value ($) |
| Municipal Bonds - continued |
| Illinois - continued |
| Chicago, IL, O'Hare International Airport Rev., Senior Lien, “A”, 5%, 1/01/2048 | | $ | 4,695,000 | $ 5,429,618 |
| Chicago, IL, Transit Authority Rev. (Section 5307 Urbanized Area Formula Funds), 5%, 6/01/2027 | | | 1,235,000 | 1,451,749 |
| Chicago, IL, Transit Authority Rev. (Section 5307 Urbanized Area Formula Funds), 5%, 6/01/2028 | | | 1,300,000 | 1,560,708 |
| Chicago, IL, Transit Authority Rev. (Section 5307 Urbanized Area Formula Funds), 5%, 6/01/2029 | | | 975,000 | 1,193,377 |
| Chicago, IL, Transit Authority Rev. (Section 5337 State of Good Repair Formula Funds), 5%, 6/01/2027 | | | 650,000 | 764,078 |
| Chicago, IL, Transit Authority Rev. (Section 5337 State of Good Repair Formula Funds), 5%, 6/01/2028 | | | 1,300,000 | 1,560,708 |
| Chicago, IL, Transit Authority Second Lien Sales Tax Rev., “A”, 5%, 12/01/2045 | | | 1,955,000 | 2,345,668 |
| Chicago, IL, Transit Authority Second Lien Sales Tax Rev., “A”, 5%, 12/01/2055 | | | 1,805,000 | 2,133,751 |
| Cook County, IL, General Obligation Refunding, 5%, 11/15/2034 | | | 835,000 | 957,499 |
| Cook County, IL, General Obligation Refunding, 5%, 11/15/2035 | | | 3,030,000 | 3,473,018 |
| Cook County, IL, General Obligation Refunding, “A”, 5%, 11/15/2031 | | | 1,945,000 | 2,395,818 |
| Cook County, IL, General Obligation Refunding, “A”, 5%, 11/15/2032 | | | 1,280,000 | 1,574,040 |
| Cook County, IL, General Obligation Refunding, “A”, 5%, 11/15/2033 | | | 1,250,000 | 1,535,332 |
| Cook County, IL, Sales Tax Rev., “A”, 5%, 11/15/2030 | | | 960,000 | 1,200,119 |
| Cook County, IL, Sales Tax Rev., “A”, 5%, 11/15/2031 | | | 1,200,000 | 1,504,394 |
| Cook County, IL, Sales Tax Rev., “A”, 5%, 11/15/2032 | | | 700,000 | 876,088 |
| Cook County, IL, Sales Tax Rev., “A”, 5%, 11/15/2035 | | | 895,000 | 1,112,684 |
| Cook County, IL, Sales Tax Rev., “A”, 5%, 11/15/2036 | | | 755,000 | 932,084 |
| Cook County, IL, Sales Tax Rev., “A”, 5%, 11/15/2037 | | | 920,000 | 1,133,845 |
| Cook County, IL, Sales Tax Rev., “A”, 5%, 11/15/2038 | | | 1,255,000 | 1,541,539 |
| Cook County, IL, Sales Tax Rev., “A”, 4%, 11/15/2039 | | | 1,600,000 | 1,810,355 |
| Cook County, IL, Sales Tax Rev., “A”, 4%, 11/15/2040 | | | 1,465,000 | 1,653,489 |
| Du Page County, IL, Special Service Area No. 31 Special Tax (Monarch Landing Project), 5.625%, 3/01/2036 | | | 723,000 | 728,424 |
| Illinois Finance Authority Rev. (Carle Foundation), “A”, 4%, 8/15/2037 | | | 4,350,000 | 5,040,502 |
| Illinois Finance Authority Rev. (Carle Foundation), “A”, 4%, 8/15/2038 | | | 4,100,000 | 4,740,963 |
| Illinois Finance Authority Rev. (Edward-Elmhurst Healthcare), “A”, 5%, 1/01/2034 | | | 2,000,000 | 2,284,766 |
Portfolio of Investments – continued
| Issuer | | | Shares/Par | Value ($) |
| Municipal Bonds - continued |
| Illinois - continued |
| Illinois Finance Authority Rev. (Edward-Elmhurst Healthcare), “A”, 5%, 1/01/2035 | | $ | 2,000,000 | $ 2,281,743 |
| Illinois Finance Authority Rev. (Franciscan Communities), “A”, 4.75%, 5/15/2033 (Prerefunded 5/15/2023) | | | 350,000 | 367,019 |
| Illinois Finance Authority Rev. (Franciscan Communities), “A”, 4.75%, 5/15/2033 | | | 2,395,000 | 2,460,549 |
| Illinois Finance Authority Rev. (Franciscan Communities), “A”, 5.125%, 5/15/2043 (Prerefunded 5/15/2023) | | | 430,000 | 452,965 |
| Illinois Finance Authority Rev. (Franciscan Communities), “A”, 5.125%, 5/15/2043 | | | 2,980,000 | 3,064,124 |
| Illinois Finance Authority Rev. (McKinley Foundation), “A”, 5.125%, 11/01/2055 (n) | | | 3,570,000 | 3,737,513 |
| Illinois Finance Authority Rev. (McKinley Foundation), “B”, 7%, 11/01/2037 (n) | | | 1,105,000 | 1,231,972 |
| Illinois Finance Authority Rev. (Mercy Health Corp.), 5%, 12/01/2040 | | | 3,020,000 | 3,427,263 |
| Illinois Finance Authority Rev. (Plymouth Place, Inc.), “A”, 5%, 5/15/2041 | | | 400,000 | 459,454 |
| Illinois Finance Authority Rev. (Plymouth Place, Inc.), “A”, 5%, 5/15/2051 | | | 1,000,000 | 1,130,592 |
| Illinois Finance Authority Rev. (Plymouth Place, Inc.), “A”, 5%, 5/15/2056 | | | 815,000 | 916,425 |
| Illinois Finance Authority Rev. (Presence Health Network), 4%, 2/15/2041 (Prerefunded 2/15/2027) | | | 20,000 | 22,382 |
| Illinois Finance Authority Rev. (Presence Health Network), “C”, 5%, 2/15/2036 | | | 2,625,000 | 3,049,929 |
| Illinois Finance Authority Rev. (Presence Health Network), “C”, 4%, 2/15/2041 (Prerefunded 2/15/2027) | | | 435,000 | 486,803 |
| Illinois Finance Authority Rev. (Presence Health Network), “C”, 4%, 2/15/2041 | | | 9,405,000 | 10,274,466 |
| Illinois Finance Authority Rev. (Presence Health Network), “C”, 5%, 2/15/2041 | | | 5,515,000 | 6,387,509 |
| Illinois Finance Authority Rev. (Rehabilitation Institute of Chicago), “A”, 6%, 7/01/2043 | | | 1,305,000 | 1,394,445 |
| Illinois Finance Authority Rev. (Rosalind Franklin University), “A”, 5%, 8/01/2042 | | | 640,000 | 723,593 |
| Illinois Finance Authority Rev. (Rosalind Franklin University), “A”, 5%, 8/01/2047 | | | 1,310,000 | 1,472,559 |
| Illinois Finance Authority Rev. (Rosalind Franklin University, Research Building Project), “C”, 5%, 8/01/2046 | | | 1,005,000 | 1,130,068 |
| Illinois Finance Authority Rev. (Rosalind Franklin University, Research Building Project), “C”, 5%, 8/01/2049 | | | 970,000 | 1,089,788 |
Portfolio of Investments – continued
| Issuer | | | Shares/Par | Value ($) |
| Municipal Bonds - continued |
| Illinois - continued |
| Illinois Finance Authority Rev. (Southern Illinois Healthcare Enterprises, Inc.), “C”, 5%, 3/01/2034 | | $ | 115,000 | $ 131,218 |
| Illinois Finance Authority, Academic Facilities Lease Rev. (Provident Group - UIUC Properties LLC - University of Illinois at Urbana-Champaign Project), “A”, 5%, 10/01/2044 | | | 580,000 | 690,790 |
| Illinois Finance Authority, Academic Facilities Lease Rev. (Provident Group - UIUC Properties LLC - University of Illinois at Urbana-Champaign Project), “A”, 5%, 10/01/2049 | | | 725,000 | 858,095 |
| Illinois Finance Authority, Academic Facilities Lease Rev. (Provident Group - UIUC Properties LLC - University of Illinois at Urbana-Champaign Project), “A”, 5%, 10/01/2051 | | | 580,000 | 685,721 |
| Illinois Finance Authority, Educational Facility Rev. (Rogers Park Montessori School Project), 6%, 2/01/2034 | | | 700,000 | 737,074 |
| Illinois Finance Authority, Educational Facility Rev. (Rogers Park Montessori School Project), 6.125%, 2/01/2045 | | | 1,800,000 | 1,886,124 |
| Illinois Finance Authority, Graduate & Professional Student Loan Program Rev. (Midwestern University Foundation), “A”, 2.25%, 7/01/2033 | | | 610,000 | 562,836 |
| Illinois Finance Authority, Graduate & Professional Student Loan Program Rev. (Midwestern University Foundation), “A”, 3%, 7/01/2035 | | | 1,050,000 | 1,065,948 |
| Illinois Finance Authority, Student Housing and Academic Facility Rev. (CHF-Chicago LLC-University of Illinois at Chicago Project), “A”, 5%, 2/15/2028 | | | 210,000 | 240,607 |
| Illinois Finance Authority, Student Housing and Academic Facility Rev. (CHF-Chicago LLC-University of Illinois at Chicago Project), “A”, 5%, 2/15/2037 | | | 1,415,000 | 1,589,037 |
| Illinois Finance Authority, Student Housing and Academic Facility Rev. (CHF-Chicago LLC-University of Illinois at Chicago Project), “A”, 5%, 2/15/2047 | | | 825,000 | 916,579 |
| Illinois Finance Authority, Student Housing and Academic Facility Rev. (CHF-Chicago LLC-University of Illinois at Chicago Project), “A”, 5%, 2/15/2050 | | | 415,000 | 460,393 |
| Illinois Housing Development Authority Rev., “A”, 3.87%, 11/15/2035 (z) | | | 9,098,315 | 9,998,105 |
| Illinois Housing Development Authority Rev., “A”, GNMA, 3%, 4/01/2051 | | | 4,075,000 | 4,263,628 |
| Illinois Housing Development Authority Rev., “B”, 3.87%, 11/15/2035 (z) | | | 3,710,500 | 4,077,455 |
| Illinois Housing Development Authority Rev., “C”, 3.87%, 11/15/2035 (z) | | | 3,702,592 | 4,068,765 |
| Illinois Housing Development Authority Rev., “D”, FHLMC, 3.87%, 11/15/2035 (z) | | | 3,378,609 | 3,712,741 |
Portfolio of Investments – continued
| Issuer | | | Shares/Par | Value ($) |
| Municipal Bonds - continued |
| Illinois - continued |
| Illinois Housing Development Authority Rev., “E”, FHLMC, 3.87%, 11/15/2035 (z) | | $ | 2,326,354 | $ 2,556,422 |
| Illinois Sales Tax Securitization Corp., “A”, 5%, 1/01/2029 | | | 160,000 | 187,789 |
| Illinois Sales Tax Securitization Corp., “A”, 5%, 1/01/2030 | | | 205,000 | 240,474 |
| Illinois Sales Tax Securitization Corp., Second Lien, “A”, 5%, 1/01/2026 | | | 2,300,000 | 2,593,836 |
| Illinois Sales Tax Securitization Corp., Second Lien, “A”, 5%, 1/01/2027 | | | 4,995,000 | 5,764,471 |
| Illinois Sales Tax Securitization Corp., Second Lien, “A”, 5%, 1/01/2028 | | | 4,170,000 | 4,907,057 |
| Illinois Sales Tax Securitization Corp., Second Lien, “A”, 5%, 1/01/2029 | | | 930,000 | 1,114,444 |
| Illinois Sales Tax Securitization Corp., Second Lien, “A”, 5%, 1/01/2030 | | | 2,185,000 | 2,663,802 |
| Illinois Sales Tax Securitization Corp., Second Lien, “A”, 5%, 1/01/2036 | | | 1,960,000 | 2,365,624 |
| Illinois Sales Tax Securitization Corp., Second Lien, “A”, 5%, 1/01/2037 | | | 2,735,000 | 3,346,205 |
| Illinois Sales Tax Securitization Corp., Second Lien, “A”, 4%, 1/01/2038 | | | 1,315,000 | 1,473,285 |
| Illinois Sales Tax Securitization Corp., Second Lien, “A”, 4%, 1/01/2039 | | | 765,000 | 855,904 |
| Illinois Sales Tax Securitization Corp., Second Lien, “A”, 4%, 1/01/2040 | | | 1,315,000 | 1,483,092 |
| Illinois Sports Facilities Authority, State Tax Supported Refunding Rev., BAM, 5%, 6/15/2028 | | | 1,090,000 | 1,300,871 |
| Illinois Sports Facilities Authority, State Tax Supported Refunding Rev., BAM, 5%, 6/15/2029 | | | 1,365,000 | 1,659,311 |
| Illinois Sports Facilities Authority, State Tax Supported Refunding Rev., BAM, 5%, 6/15/2030 | | | 820,000 | 981,495 |
| Illinois Toll Highway Authority Rev., “C”, 5%, 1/01/2037 | | | 7,500,000 | 8,244,715 |
| Lincolnshire, IL, Special Service Area No. 1 (Sedgebrook Project), 6.25%, 3/01/2034 | | | 2,251,000 | 2,252,321 |
| Macon County, IL, Decatur School District No. 61 General Obligation School Rev., “C”, AGM, 4%, 1/01/2040 | | | 1,290,000 | 1,395,870 |
| Macon County, IL, Decatur School District No. 61 General Obligation School Rev., “C”, AGM, 4%, 1/01/2045 | | | 1,610,000 | 1,732,022 |
| Metropolitan Pier & Exposition Authority Refunding Bonds (McCormick Place Expansion Project), Capital Appreciation, “B”, BAM, 0%, 12/15/2054 | | | 11,735,000 | 4,040,777 |
| Metropolitan Pier & Exposition Authority Rev. (McCormick Place Expansion Project), Capital Appreciation, “A”, AGM, 0%, 12/15/2056 | | | 5,495,000 | 1,767,203 |
Portfolio of Investments – continued
| Issuer | | | Shares/Par | Value ($) |
| Municipal Bonds - continued |
| Illinois - continued |
| Northern Illinois University, Auxiliary Facilities System Refunding Rev., BAM, 4%, 10/01/2039 | | $ | 445,000 | $ 504,979 |
| Northern Illinois University, Auxiliary Facilities System Refunding Rev., BAM, 4%, 10/01/2041 | | | 430,000 | 486,342 |
| Northern Illinois University, Auxiliary Facilities System Refunding Rev., BAM, 4%, 10/01/2043 | | | 260,000 | 292,732 |
| Northern Illinois University, Auxiliary Facilities System Refunding Rev., “B”, BAM, 4%, 4/01/2036 | | | 755,000 | 852,025 |
| Northern Illinois University, Auxiliary Facilities System Refunding Rev., “B”, BAM, 4%, 4/01/2038 | | | 850,000 | 955,916 |
| Northern Illinois University, Auxiliary Facilities System Refunding Rev., “B”, BAM, 4%, 4/01/2040 | | | 810,000 | 908,163 |
| Northern Illinois University, Auxiliary Facilities System Refunding Rev., “B”, BAM, 4%, 4/01/2041 | | | 385,000 | 431,066 |
| Romeoville, IL, Rev. (Lewis University Project), “A”, 5%, 10/01/2042 | | | 1,450,000 | 1,561,576 |
| Romeoville, IL, Rev. (Lewis University Project), “B”, 5%, 10/01/2039 | | | 1,500,000 | 1,619,245 |
| Romeoville, IL, Rev. (Lewis University Project), “B”, 4.125%, 10/01/2041 | | | 1,130,000 | 1,180,636 |
| Romeoville, IL, Rev. (Lewis University Project), “B”, 4.125%, 10/01/2046 | | | 1,120,000 | 1,165,675 |
| State of Illinois, 5%, 2/01/2025 | | | 2,670,000 | 2,947,187 |
| State of Illinois, 5%, 1/01/2028 | | | 550,000 | 551,873 |
| State of Illinois, 5%, 5/01/2028 | | | 4,130,000 | 4,451,014 |
| State of Illinois, 5.25%, 7/01/2028 | | | 3,260,000 | 3,449,256 |
| State of Illinois, 5%, 11/01/2028 | | | 2,595,000 | 2,958,450 |
| State of Illinois, 5%, 2/01/2029 | | | 2,820,000 | 3,209,652 |
| State of Illinois, 4.125%, 11/01/2031 | | | 2,195,000 | 2,400,581 |
| State of Illinois, 5%, 1/01/2033 | | | 300,000 | 335,155 |
| State of Illinois, 4.5%, 11/01/2039 | | | 2,420,000 | 2,640,495 |
| State of Illinois, 5%, 11/01/2040 | | | 10,180,000 | 11,492,192 |
| State of Illinois, AGM, 5%, 2/01/2027 | | | 2,040,000 | 2,202,225 |
| State of Illinois, AGM, 4%, 2/01/2030 | | | 900,000 | 998,312 |
| State of Illinois, NPFG, 6%, 11/01/2026 | | | 5,955,000 | 6,933,037 |
| State of Illinois, “A”, 5%, 11/01/2027 | | | 12,495,000 | 14,455,464 |
| State of Illinois, “A”, 5%, 11/01/2028 | | | 16,990,000 | 19,948,231 |
| State of Illinois, “A”, 5%, 4/01/2036 | | | 2,295,000 | 2,385,930 |
| State of Illinois, “B”, 5%, 10/01/2030 | | | 5,000,000 | 6,033,074 |
| State of Illinois, “B”, 5%, 11/01/2030 | | | 3,000,000 | 3,583,731 |
| State of Illinois, “B”, 5%, 10/01/2031 | | | 5,000,000 | 6,006,020 |
| State of Illinois, “A”, 5%, 12/01/2024 | | | 470,000 | 516,965 |
| State of Illinois, “A”, 5%, 12/01/2038 | | | 1,185,000 | 1,350,604 |
Portfolio of Investments – continued
| Issuer | | | Shares/Par | Value ($) |
| Municipal Bonds - continued |
| Illinois - continued |
| State of Illinois, General Obligation, 5.5%, 5/01/2039 | | $ | 8,810,000 | $ 10,726,882 |
| State of Illinois, General Obligation, 5.75%, 5/01/2045 | | | 9,310,000 | 11,387,688 |
| State of Illinois, General Obligation, “A”, 5%, 3/01/2033 | | | 5,000,000 | 6,040,509 |
| State of Illinois, General Obligation, “A”, 5%, 3/01/2034 | | | 4,000,000 | 4,829,641 |
| State of Illinois, General Obligation, “A”, 5%, 3/01/2035 | | | 2,700,000 | 3,253,079 |
| State of Illinois, General Obligation, “A”, 5%, 3/01/2036 | | | 3,250,000 | 3,911,443 |
| State of Illinois, General Obligation, “A”, 5%, 3/01/2046 | | | 5,095,000 | 6,008,935 |
| University of Illinois, Auxiliary Facilities System Rev., “A”, BAM, 4%, 4/01/2033 | | | 2,615,000 | 3,004,411 |
| University of Illinois, Auxiliary Facilities System Rev., “A”, BAM, 4%, 4/01/2034 | | | 2,930,000 | 3,364,192 |
| University of Illinois, Auxiliary Facilities System Rev., “A”, BAM, 4%, 4/01/2036 | | | 1,660,000 | 1,901,281 |
| University of Illinois, Auxiliary Facilities System Rev., “A”, BAM, 4%, 4/01/2039 | | | 1,870,000 | 2,131,360 |
| University of Illinois, Auxiliary Facilities System Rev., “A”, BAM, 4%, 4/01/2044 | | | 1,055,000 | 1,190,290 |
| University of Illinois, Auxiliary Facilities System Rev., “A”, BAM, 4%, 4/01/2050 | | | 1,205,000 | 1,349,486 |
| Upper Illinois River Valley Development Authority Rev. (Morris Hospital), 5%, 12/01/2043 | | | 8,455,000 | 9,571,786 |
| Upper Illinois River Valley Development Authority Rev. (Morris Hospital), 5%, 12/01/2048 | | | 8,460,000 | 9,525,740 |
| | | | | $769,403,931 |
| Indiana - 1.0% |
| Indiana Finance Authority Rev. (Marquette Project), 4.75%, 3/01/2032 (Prerefunded 3/01/2022) | | $ | 1,790,000 | $ 1,796,384 |
| Indiana Finance Authority Rev. (Marquette Project), 5%, 3/01/2039 (Prerefunded 3/01/2022) | | | 1,215,000 | 1,219,577 |
| Indiana Finance Authority Rev. (Marquette Project), “A”, 5%, 3/01/2030 | | | 460,000 | 499,728 |
| Indiana Finance Authority Rev. (Marquette Project), “A”, 5%, 3/01/2039 | | | 1,155,000 | 1,241,856 |
| Indiana Finance Authority Rev. (Ohio River Bridges East End Crossing Project), “A”, 5%, 7/01/2035 (Prerefunded 7/01/2023) | | | 2,095,000 | 2,212,633 |
| Indiana Finance Authority Rev. (Ohio River Bridges East End Crossing Project), “A”, 5%, 7/01/2040 (Prerefunded 7/01/2023) | | | 5,350,000 | 5,650,400 |
| Indiana Finance Authority Taxable Refunding Rev. (BHI Senior Living), “B”, 3.21%, 11/15/2028 | | | 785,000 | 762,706 |
| Indiana Finance Authority Taxable Refunding Rev. (BHI Senior Living), “B”, 3.26%, 11/15/2029 | | | 930,000 | 903,893 |
Portfolio of Investments – continued
| Issuer | | | Shares/Par | Value ($) |
| Municipal Bonds - continued |
| Indiana - continued |
| Indiana Finance Authority Taxable Refunding Rev. (BHI Senior Living), “B”, 3.3%, 11/15/2030 | | $ | 720,000 | $ 700,744 |
| Indiana Finance Authority Taxable Refunding Rev. (BHI Senior Living), “B”, 3.39%, 11/15/2031 | | | 570,000 | 555,783 |
| Indiana Finance Authority, Educational Facilities Multipurpose Rev. (KIPP Indianapolis, Inc. Project), “A”, 4%, 7/01/2030 | | | 210,000 | 225,975 |
| Indiana Finance Authority, Educational Facilities Multipurpose Rev. (KIPP Indianapolis, Inc. Project), “A”, 5%, 7/01/2040 | | | 340,000 | 376,679 |
| Indiana Finance Authority, Educational Facilities Multipurpose Rev. (KIPP Indianapolis, Inc. Project), “A”, 5%, 7/01/2055 | | | 915,000 | 999,255 |
| Indiana Finance Authority, Educational Facilities Rev. (Valparaiso University Project), 5%, 10/01/2030 | | | 235,000 | 283,382 |
| Indiana Finance Authority, Educational Facilities Rev. (Valparaiso University Project), 5%, 10/01/2032 | | | 265,000 | 323,609 |
| Indiana Finance Authority, Educational Facilities Tax-Exempt Rev. (Marian University Project), 5%, 9/15/2039 | | | 1,755,000 | 2,033,115 |
| Indiana Finance Authority, Educational Facilities Tax-Exempt Rev. (Marian University Project), 4%, 9/15/2044 | | | 470,000 | 501,460 |
| Indiana Finance Authority, Educational Facilities Tax-Exempt Rev. (Marian University Project), 4%, 9/15/2049 | | | 460,000 | 488,653 |
| Indiana Finance Authority, Health Facilities Rev. (Baptist Healthcare System Obligated Group), 5%, 8/15/2051 | | | 10,605,000 | 12,206,770 |
| Indiana Housing & Community Development Authority, Single Family Mortgage Rev., “A”, GNMA, 4%, 7/01/2048 | | | 2,225,000 | 2,365,532 |
| Indiana Housing & Community Development Authority, Single Family Mortgage Rev., “A”, GNMA, 3%, 7/01/2051 | | | 1,590,000 | 1,662,497 |
| Indiana Housing & Community Development Authority, Single Family Mortgage Rev., “B”, 3%, 7/01/2050 | | | 3,140,000 | 3,287,591 |
| Knox County, IN, Economic Development Rev. (Good Samaritan Hospital), “A”, 5%, 4/01/2042 | | | 1,430,000 | 1,440,363 |
| Lake County, IN, Hammond Multi-School Building Corp., 5%, 7/15/2032 | | | 600,000 | 712,467 |
| Lake County, IN, Hammond Multi-School Building Corp., 5%, 7/15/2033 | | | 440,000 | 522,027 |
| Lake County, IN, Hammond Multi-School Building Corp., 5%, 7/15/2035 | | | 550,000 | 649,373 |
| Lake County, IN, Hammond Multi-School Building Corp., 5%, 7/15/2038 | | | 1,640,000 | 1,927,309 |
| Terre Haute, IN, Rev. (Westminster Village), 6%, 8/01/2039 | | | 4,600,000 | 4,646,197 |
| Valparaiso, IN, Exempt Facilities Rev. (Pratt Paper LLC Project), 6.75%, 1/01/2034 | | | 4,370,000 | 4,769,869 |
Portfolio of Investments – continued
| Issuer | | | Shares/Par | Value ($) |
| Municipal Bonds - continued |
| Indiana - continued |
| Valparaiso, IN, Exempt Facilities Rev. (Pratt Paper LLC Project), 7%, 1/01/2044 | | $ | 10,875,000 | $ 11,953,453 |
| | | | | $66,919,280 |
| Iowa - 0.7% |
| Iowa Finance Authority Health Facilities Rev. (UnityPoint Health), “C”, 5%, 2/15/2030 | | $ | 800,000 | $ 861,750 |
| Iowa Finance Authority Health Facilities Rev. (UnityPoint Health), “C”, 5%, 2/15/2031 | | | 1,480,000 | 1,593,614 |
| Iowa Finance Authority Health Facilities Rev. (UnityPoint Health), “C”, 5%, 2/15/2032 | | | 715,000 | 769,587 |
| Iowa Finance Authority Senior Housing Rev. (Northcrest, Inc. Project), “A”, 5%, 3/01/2033 | | | 1,095,000 | 1,173,874 |
| Iowa Finance Authority Senior Housing Rev. (Northcrest, Inc. Project), “A”, 5%, 3/01/2038 | | | 865,000 | 924,560 |
| Iowa Finance Authority Senior Housing Rev. (Northcrest, Inc. Project), “A”, 5%, 3/01/2048 | | | 1,590,000 | 1,691,440 |
| Iowa Finance Authority, Single Family Mortgage Rev., “A”, FNMA, 4%, 7/01/2047 | | | 700,000 | 743,001 |
| Iowa Finance Authority, Single Family Mortgage Rev., “A”, GNMA, 3%, 1/01/2047 | | | 4,575,000 | 4,789,177 |
| Iowa Student Loan Liquidity Corp. Rev., “B”, 3%, 12/01/2039 | | | 2,595,000 | 2,627,302 |
| Iowa Student Loan Liquidity Corp. Rev., “B”, 3.5%, 12/01/2044 | | | 7,710,000 | 7,578,637 |
| Iowa Tobacco Settlement Authority Asset-Backed, Senior Capital Appreciation, “B-2”, 0%, 6/01/2065 | | | 146,780,000 | 23,230,548 |
| | | | | $45,983,490 |
| Kansas - 0.7% |
| Coffeyville, KS, Electric Utility System Rev., “B”, NPFG, 5%, 6/01/2038 (Prerefunded 6/01/2025) (n) | | $ | 3,600,000 | $ 4,003,084 |
| Coffeyville, KS, Electric Utility System Rev., “B”, NPFG, 5%, 6/01/2042 (Prerefunded 6/01/2025) (n) | | | 1,500,000 | 1,667,952 |
| Hutchinson, KS, Hospital Facilities Rev. (Hutchinson Regional Medical Center, Inc.), 5%, 12/01/2036 | | | 1,405,000 | 1,533,250 |
| Hutchinson, KS, Hospital Facilities Rev. (Hutchinson Regional Medical Center, Inc.), 5%, 12/01/2041 | | | 615,000 | 668,506 |
| Lenexa, KS, Health Care Facility Rev. (Lakeview Village, Inc.), “A”, 5%, 5/15/2030 | | | 1,085,000 | 1,204,788 |
| Lenexa, KS, Health Care Facility Rev. (Lakeview Village, Inc.), “A”, 5%, 5/15/2032 | | | 985,000 | 1,089,087 |
| Lenexa, KS, Health Care Facility Rev. (Lakeview Village, Inc.), “A”, 5%, 5/15/2039 | | | 1,280,000 | 1,401,961 |
| Lenexa, KS, Health Care Facility Rev. (Lakeview Village, Inc.), “A”, 5%, 5/15/2043 | | | 4,000,000 | 4,400,522 |
Portfolio of Investments – continued
| Issuer | | | Shares/Par | Value ($) |
| Municipal Bonds - continued |
| Kansas - continued |
| Manhattan, KS, Health Care Facilities Rev. (Meadowlark Hills), “A”, 4%, 6/01/2036 | | $ | 1,000,000 | $ 1,072,404 |
| Manhattan, KS, Health Care Facilities Rev. (Meadowlark Hills), “A”, 4%, 6/01/2046 | | | 890,000 | 933,083 |
| Overland Park, KS, Development Corp. Improvement and Refunding Rev. (Overland Park Convention Center Hotel), 5%, 3/01/2032 | | | 1,360,000 | 1,409,518 |
| Overland Park, KS, Development Corp. Improvement and Refunding Rev. (Overland Park Convention Center Hotel), 5%, 3/01/2033 | | | 1,430,000 | 1,485,008 |
| Overland Park, KS, Development Corp. Improvement and Refunding Rev. (Overland Park Convention Center Hotel), 5%, 3/01/2034 | | | 1,500,000 | 1,560,713 |
| Overland Park, KS, Development Corp. Improvement and Refunding Rev. (Overland Park Convention Center Hotel), 5%, 3/01/2036 | | | 1,660,000 | 1,731,752 |
| Overland Park, KS, Development Corp. Improvement and Refunding Rev. (Overland Park Convention Center Hotel), 5%, 3/01/2038 | | | 1,835,000 | 1,914,255 |
| Overland Park, KS, Development Corp. Improvement and Refunding Rev. (Overland Park Convention Center Hotel), 5%, 3/01/2044 | | | 1,990,000 | 2,064,350 |
| Overland Park, KS, Development Corp. Improvement and Refunding Rev. (Overland Park Convention Center Hotel), 5%, 3/01/2049 | | | 4,150,000 | 4,288,125 |
| Wichita, KS, Health Care Facilities Rev. (Presbyterian Manors, Inc.), “A”, 6.375%, 5/15/2043 | | | 4,165,000 | 4,313,501 |
| Wichita, KS, Health Care Facilities Rev. (Presbyterian Manors, Inc.), “I”, 5%, 5/15/2033 | | | 605,000 | 645,964 |
| Wichita, KS, Health Care Facilities Rev. (Presbyterian Manors, Inc.), “I”, 5%, 5/15/2038 | | | 710,000 | 753,500 |
| Wichita, KS, Health Care Facilities Rev. (Presbyterian Manors, Inc.), “I”, 4.625%, 5/15/2041 | | | 605,000 | 624,102 |
| Wichita, KS, Health Care Facilities Rev. (Presbyterian Manors, Inc.), “I”, 5%, 5/15/2047 | | | 1,860,000 | 1,947,624 |
| Wichita, KS, Health Care Facilities Rev. (Presbyterian Manors, Inc.), “III”, 5%, 5/15/2034 | | | 1,750,000 | 1,884,905 |
| Wichita, KS, Health Care Facilities Rev. (Presbyterian Manors, Inc.), “IV-A”, 6.5%, 5/15/2048 | | | 1,500,000 | 1,554,089 |
| Wichita, KS, Sales Tax Special Obligations Rev. (K-96 Greenwich Star Bond Project), 4.2%, 9/01/2027 | | | 1,895,000 | 1,911,338 |
Portfolio of Investments – continued
| Issuer | | | Shares/Par | Value ($) |
| Municipal Bonds - continued |
| Kansas - continued |
| Wyandotte County/Kansas City, KS, Unified Government Community Improvement District Sales Tax Rev. (Legends Apartments Garage & West Lawn Project), 4.5%, 6/01/2040 | | $ | 1,410,000 | $ 1,449,982 |
| Wyandotte County/Kansas City, KS, Unified Government Utility System Improvement Rev., “A”, 5%, 9/01/2044 | | | 1,740,000 | 1,894,701 |
| | | | | $49,408,064 |
| Kentucky - 1.3% |
| Commonwealth of Kentucky State Property & Buildings Commission Rev. (Project No. 119), BAM, 5%, 5/01/2032 | | $ | 765,000 | $ 914,179 |
| Commonwealth of Kentucky State Property & Buildings Commission Rev. (Project No. 119), BAM, 5%, 5/01/2033 | | | 760,000 | 907,880 |
| Commonwealth of Kentucky State Property & Buildings Commission Rev. (Project No. 119), BAM, 5%, 5/01/2034 | | | 870,000 | 1,038,692 |
| Hazard, KY, Healthcare Rev. (Appalachian Regional Healthcare Project), 3%, 7/01/2046 | | | 2,475,000 | 2,497,502 |
| Kentucky Economic Development Finance Authority Healthcare Facilities Rev. (Baptist Life Communities Project), “A”, 6%, 11/15/2036 | | | 2,385,000 | 2,434,349 |
| Kentucky Economic Development Finance Authority Healthcare Facilities Rev. (Baptist Life Communities Project), “A”, 6.25%, 11/15/2046 | | | 5,105,000 | 5,224,915 |
| Kentucky Economic Development Finance Authority Healthcare Facilities Rev. (Baptist Life Communities Project), “A”, 6.375%, 11/15/2051 | | | 5,415,000 | 5,570,206 |
| Kentucky Economic Development Finance Authority Healthcare Facilities Rev. (Masonic Homes of Kentucky, Inc.), 5.375%, 11/15/2042 | | | 2,915,000 | 2,927,330 |
| Kentucky Economic Development Finance Authority Healthcare Facilities Rev. (Masonic Homes of Kentucky, Inc.), 5.5%, 11/15/2045 | | | 1,325,000 | 1,330,950 |
| Kentucky Economic Development Finance Authority Hospital Rev. (Baptist Healthcare System), “B”, 5%, 8/15/2037 | | | 1,250,000 | 1,450,141 |
| Kentucky Economic Development Finance Authority Hospital Rev. (Baptist Healthcare System), “B”, 5%, 8/15/2041 | | | 13,475,000 | 15,555,970 |
| Kentucky Economic Development Finance Authority Hospital Rev. (Baptist Healthcare System), “B”, 5%, 8/15/2046 | | | 5,245,000 | 6,052,026 |
| Kentucky Economic Development Finance Authority Hospital Rev. (Owensboro Health, Inc.), “A”, 5%, 6/01/2037 | | | 3,040,000 | 3,479,017 |
| Kentucky Economic Development Finance Authority Hospital Rev. (Owensboro Health, Inc.), “A”, 5%, 6/01/2041 | | | 1,995,000 | 2,280,024 |
| Kentucky Economic Development Finance Authority Hospital Rev. (Owensboro Health, Inc.), “A”, 5.25%, 6/01/2041 | | | 1,555,000 | 1,791,561 |
Portfolio of Investments – continued
| Issuer | | | Shares/Par | Value ($) |
| Municipal Bonds - continued |
| Kentucky - continued |
| Kentucky Economic Development Finance Authority Hospital Rev. (Owensboro Health, Inc.), “A”, 5%, 6/01/2045 | | $ | 2,490,000 | $ 2,837,888 |
| Kentucky Economic Development Finance Authority Louisville Arena Project Rev. (Louisville Arena Authority, Inc.), “A”, AGM, 5%, 12/01/2045 | | | 2,860,000 | 3,380,963 |
| Kentucky Economic Development Finance Authority Louisville Arena Project Rev. (Louisville Arena Authority, Inc.), “A”, AGM, 5%, 12/01/2047 | | | 1,605,000 | 1,657,476 |
| Kentucky Economic Development Finance Authority Rev. (Masonic Home Independent Living II, Inc. - Meadow Project and Grove Pointe Project), “A”, 5%, 5/15/2036 | | | 2,505,000 | 2,618,080 |
| Kentucky Economic Development Finance Authority Rev. (Masonic Home Independent Living II, Inc. - Meadow Project and Grove Pointe Project), “A”, 5%, 5/15/2046 | | | 6,945,000 | 7,174,189 |
| Kentucky Economic Development Finance Authority Rev. (Masonic Home Independent Living II, Inc. - Meadow Project and Grove Pointe Project), “A”, 5%, 5/15/2051 | | | 1,755,000 | 1,809,439 |
| Kentucky Higher Education Student Loan Corp. Rev., Tax-Exempt, “B-1”, 5%, 6/01/2036 | | | 8,965,000 | 9,813,539 |
| Kentucky State University, Certificates of Participation, BAM, 4%, 11/01/2033 | | | 135,000 | 158,590 |
| Kentucky State University, Certificates of Participation, BAM, 4%, 11/01/2035 | | | 140,000 | 164,267 |
| Kentucky State University, Certificates of Participation, BAM, 4%, 11/01/2036 | | | 80,000 | 93,594 |
| Kentucky State University, Certificates of Participation, BAM, 4%, 11/01/2038 | | | 170,000 | 200,206 |
| Kentucky State University, Certificates of Participation, BAM, 4%, 11/01/2041 | | | 130,000 | 151,187 |
| Kentucky State University, Certificates of Participation, BAM, 4%, 11/01/2046 | | | 230,000 | 264,420 |
| Kentucky State University, Certificates of Participation, BAM, 4%, 11/01/2051 | | | 275,000 | 313,975 |
| Kentucky State University, Certificates of Participation, BAM, 4%, 11/01/2056 | | | 265,000 | 301,867 |
| Louisville & Jefferson County, KY, Metro Government College Improvement Rev. (Bellarmine University Project), “A”, 5%, 5/01/2034 | | | 1,440,000 | 1,585,159 |
| Louisville & Jefferson County, KY, Metro Government College Improvement Rev. (Bellarmine University Project), “A”, 5%, 5/01/2035 | | | 2,290,000 | 2,517,248 |
| | | | | $88,496,829 |
Portfolio of Investments – continued
| Issuer | | | Shares/Par | Value ($) |
| Municipal Bonds - continued |
| Louisiana - 1.8% |
| Louisiana Gas and Fuels Tax Rev., 0.55%, 5/01/2043 (Put Date 5/01/2022) | | $ | 2,170,000 | $ 2,170,430 |
| Louisiana Gas and Fuels Tax Rev., 0.6%, 5/01/2043 (Put Date 5/01/2023) | | | 2,170,000 | 2,170,894 |
| Louisiana Local Government, Environmental Facilities & Community Development Authority Rev. (Cameron Parish Gomesa Project), 5.65%, 11/01/2037 (n) | | | 1,355,000 | 1,567,412 |
| Louisiana Local Government, Environmental Facilities & Community Development Authority Rev. (CDF Healthcare), “A”, 5.625%, 6/01/2045 | | | 11,125,000 | 11,451,869 |
| Louisiana Local Government, Environmental Facilities & Community Development Authority Rev. (Jefferson Parish Gomesa Project), 4%, 11/01/2044 (n) | | | 4,905,000 | 5,148,110 |
| Louisiana Local Government, Environmental Facilities & Community Development Authority Rev. (Lafourche Parish Gomesa Project), 3.95%, 11/01/2043 (n) | | | 3,855,000 | 4,041,050 |
| Louisiana Local Government, Environmental Facilities & Community Development Authority Rev. (Ragin' Cajun Facilities, Inc. - Student Housing & Parking Project), AGM, 5%, 10/01/2043 | | | 560,000 | 655,510 |
| Louisiana Local Government, Environmental Facilities & Community Development Authority Rev. (Ragin' Cajun Facilities, Inc. - Student Housing & Parking Project), AGM, 5%, 10/01/2048 | | | 2,445,000 | 2,860,210 |
| Louisiana Local Government, Environmental Facilities & Community Development Authority Rev. (St. Bernard Parish Gomesa Project), 4%, 11/01/2045 (n) | | | 4,220,000 | 4,044,691 |
| Louisiana Local Government, Environmental Facilities & Community Development Authority Rev. (St. James Parish Gomesa Project), 3.9%, 11/01/2044 (n) | | | 4,605,000 | 4,801,954 |
| Louisiana Local Government, Environmental Facilities & Community Development Authority Rev. (St. James Place of Baton Rouge Project), “A”, 6%, 11/15/2035 | | | 1,145,000 | 1,227,131 |
| Louisiana Local Government, Environmental Facilities & Community Development Authority Rev. (St. James Place of Baton Rouge Project), “A”, 6.25%, 11/15/2045 | | | 4,435,000 | 4,732,260 |
| Louisiana Local Government, Environmental Facilities & Community Development Authority Rev. (St. Mary's Parish Gomesa Project), 4.4%, 11/01/2044 (n) | | | 3,295,000 | 3,518,661 |
| Louisiana Local Government, Environmental Facilities & Community Development Authority Rev. (St. Tammany Parish Gomesa Project), 3.875%, 11/01/2045 (n) | | | 5,500,000 | 5,714,426 |
Portfolio of Investments – continued
| Issuer | | | Shares/Par | Value ($) |
| Municipal Bonds - continued |
| Louisiana - continued |
| Louisiana Local Government, Environmental Facilities & Community Development Authority Rev. (Tangipahoa Parish Gomesa Project), 5.375%, 11/01/2038 (n) | | $ | 2,090,000 | $ 2,378,742 |
| Louisiana Local Government, Environmental Facilities & Community Development Authority Rev. (Terrebonne Parish Gomesa Project), 5.5%, 11/01/2039 (n) | | | 1,515,000 | 1,732,780 |
| Louisiana Local Government, Environmental Facilities & Community Development Authority Rev. (Vermilion Parish Gomesa Project), 4.625%, 11/01/2038 (n) | | | 1,635,000 | 1,786,725 |
| Louisiana Local Government, Environmental Facilities & Community Development Authority Rev. (Westside Habilitation Center Project), “A”, 5.75%, 2/01/2032 (n) | | | 900,000 | 964,388 |
| Louisiana Local Government, Environmental Facilities & Community Development Authority Rev. (Westside Habilitation Center Project), “A”, 6.125%, 2/01/2037 (n) | | | 3,480,000 | 3,754,761 |
| Louisiana Local Government, Environmental Facilities & Community Development Authority Rev. (Westside Habilitation Center Project), “A”, 6.25%, 2/01/2047 (n) | | | 2,830,000 | 3,033,752 |
| Louisiana Local Government, Environmental Facilities & Community Development Authority Student Housing Rev. (Provident Group - ULM Properties LLC - University of Louisiana at Monroe Project), “A”, 5%, 7/01/2029 (n) | | | 670,000 | 694,590 |
| Louisiana Local Government, Environmental Facilities & Community Development Authority Student Housing Rev. (Provident Group - ULM Properties LLC - University of Louisiana at Monroe Project), “A”, 5%, 7/01/2039 (n) | | | 1,660,000 | 1,699,153 |
| Louisiana Local Government, Environmental Facilities & Community Development Authority Student Housing Rev. (Provident Group - ULM Properties LLC - University of Louisiana at Monroe Project), “A”, 5%, 7/01/2054 (n) | | | 2,635,000 | 2,655,992 |
| Louisiana Public Facilities Authority Rev. (BBR Schools - Materra Campus Project), “A”, 4%, 6/01/2031 (n) | | | 580,000 | 596,710 |
| Louisiana Public Facilities Authority Rev. (BBR Schools - Materra Campus Project), “A”, 4%, 6/01/2041 (n) | | | 1,330,000 | 1,355,384 |
| Louisiana Public Facilities Authority Rev. (BBR Schools - Materra Campus Project), “A”, 4%, 6/01/2051 (n) | | | 1,865,000 | 1,884,888 |
| Louisiana Public Facilities Authority Rev. (BBR Schools - Materra Campus Project), “A”, 4%, 6/01/2056 (n) | | | 2,200,000 | 2,218,200 |
| Louisiana Public Facilities Authority Rev. (BBR Schools - Materra Campus Project), “C”, 4%, 6/01/2031 (n) | | | 485,000 | 498,973 |
| Louisiana Public Facilities Authority Rev. (BBR Schools - Materra Campus Project), “C”, 4%, 6/01/2041 (n) | | | 880,000 | 896,795 |
Portfolio of Investments – continued
| Issuer | | | Shares/Par | Value ($) |
| Municipal Bonds - continued |
| Louisiana - continued |
| Louisiana Public Facilities Authority Rev. (BBR Schools - Materra Campus Project), “C”, 4%, 6/01/2056 (n) | | $ | 1,160,000 | $ 1,169,596 |
| Louisiana Public Facilities Authority Rev. (BBR Schools - Mid City Campus Project), “C”, 4%, 6/01/2051 (n) | | | 1,250,000 | 1,263,330 |
| Louisiana Public Facilities Authority Rev. (Loyola University Project), Convertible Capital Appreciation, 0% to 10/01/2023, 5.25% to 10/01/2046 | | | 4,725,000 | 5,012,744 |
| Louisiana Public Facilities Authority Rev. (Provident Group - HSC Properties, Inc., LSU Health Foundation, New Orleans Project), “A-1”, 5.375%, 1/01/2040 (n) | | | 4,365,000 | 4,872,009 |
| Louisiana Public Facilities Authority Rev. (Provident Group - HSC Properties, Inc., LSU Health Foundation, New Orleans Project), “A-1”, 5.5%, 1/01/2050 (n) | | | 2,995,000 | 3,320,646 |
| Louisiana Public Facilities Authority Rev. (Provident Group - HSC Properties, Inc., LSU Health Foundation, New Orleans Project), “A-1”, 5.1%, 1/01/2057 (n) | | | 10,045,000 | 10,794,952 |
| Louisiana Public Facilities Authority Rev. (Provident Group - HSC Properties, Inc., LSU Health Foundation, New Orleans Project), “A-2”, 7%, 1/01/2057 (n) | | | 10,000,000 | 11,025,533 |
| New Orleans, LA, Aviation Board Special Facility Rev. (Parking Facilities Corp. Consolidated Garage System), “A”, AGM, 5%, 10/01/2043 | | | 1,100,000 | 1,318,786 |
| New Orleans, LA, Aviation Board Special Facility Rev. (Parking Facilities Corp. Consolidated Garage System), “A”, AGM, 5%, 10/01/2048 | | | 1,790,000 | 2,133,330 |
| New Orleans, LA, Sewerage Services Rev., 5%, 12/01/2040 (Prerefunded 12/01/2025) | | | 875,000 | 995,957 |
| New Orleans, LA, Sewerage Services Rev., 5%, 6/01/2045 (Prerefunded 6/01/2025) | | | 2,405,000 | 2,699,294 |
| New Orleans, LA, Sewerage Services Rev., 5%, 12/01/2045 (Prerefunded 12/01/2025) | | | 1,095,000 | 1,246,369 |
| | | | | $126,108,987 |
| Maine - 0.2% |
| Maine Finance Authority Solid Waste Disposal Rev. (Casella Waste Systems, Inc.), “R-2”, 4.375%, 8/01/2035 (Put Date 8/01/2025) (n) | | $ | 2,685,000 | $ 2,936,477 |
| Maine Finance Authority Solid Waste Disposal Rev. (Casella Waste Systems, Inc.), “R-3”, 5.25%, 1/01/2025 (n) | | | 6,170,000 | 6,806,718 |
| Maine Health and Higher Educational Facilities Authority Rev. (MaineHealth), “A”, 4%, 7/01/2045 | | | 3,335,000 | 3,750,984 |
| | | | | $13,494,179 |
Portfolio of Investments – continued
| Issuer | | | Shares/Par | Value ($) |
| Municipal Bonds - continued |
| Maryland - 1.1% |
| Baltimore, MD, Convention Center Hotel Rev., 5%, 9/01/2025 | | $ | 1,550,000 | $ 1,605,182 |
| Baltimore, MD, Convention Center Hotel Rev., 5%, 9/01/2026 | | | 520,000 | 542,625 |
| Baltimore, MD, Convention Center Hotel Rev., 5%, 9/01/2029 | | | 590,000 | 618,926 |
| Baltimore, MD, Convention Center Hotel Rev., 5%, 9/01/2033 | | | 1,170,000 | 1,225,873 |
| Baltimore, MD, Convention Center Hotel Rev., 5%, 9/01/2035 | | | 900,000 | 942,365 |
| Baltimore, MD, Convention Center Hotel Rev., 5%, 9/01/2042 | | | 1,480,000 | 1,545,329 |
| Baltimore, MD, Convention Center Hotel Rev., 5%, 9/01/2046 | | | 2,490,000 | 2,590,761 |
| Baltimore, MD, Special Obligation (East Baltimore Research Park Project), “A”, 5%, 9/01/2038 | | | 2,680,000 | 2,953,472 |
| Brunswick, MD, Special Obligation Refunding (Brunswick Crossing Special Taxing District), 4%, 7/01/2029 | | | 500,000 | 553,365 |
| Brunswick, MD, Special Obligation Refunding (Brunswick Crossing Special Taxing District), 5%, 7/01/2036 | | | 550,000 | 627,050 |
| Frederick County, MD, Limited Obligation (Jefferson Technology Park Project), “B”, 4.625%, 7/01/2043 (n) | | | 1,025,000 | 1,172,236 |
| Howard County, MD, Retirement Community Rev. (Vantage House Facility), 5%, 4/01/2036 | | | 1,225,000 | 1,271,730 |
| Howard County, MD, Retirement Community Rev. (Vantage House Facility), 5%, 4/01/2036 | | | 3,930,000 | 4,079,919 |
| Howard County, MD, Special Obligation (Downtown Columbia Project), “A”, 4.125%, 2/15/2034 (n) | | | 850,000 | 880,518 |
| Howard County, MD, Special Obligation (Downtown Columbia Project), “A”, 4.375%, 2/15/2039 (n) | | | 745,000 | 773,881 |
| Howard County, MD, Special Obligation (Downtown Columbia Project), “A”, 4.5%, 2/15/2047 (n) | | | 2,190,000 | 2,265,079 |
| Maryland Community Development Administration, Department of Housing & Community Development Housing Rev., “A”, 4.5%, 9/01/2048 (u) | | | 5,495,000 | 5,970,929 |
| Maryland Community Development Administration, Department of Housing & Community Development Housing Rev., “B”, 4.5%, 9/01/2048 (u) | | | 4,465,000 | 4,826,416 |
| Maryland Community Development Administration, Department of Housing & Community Development Residential Rev., “B”, 3%, 9/01/2051 | | | 9,565,000 | 10,044,135 |
| Maryland Economic Development Corp. Rev. (Transportation Facilities Project), “A”, 5%, 6/01/2030 | | | 1,070,000 | 1,261,453 |
| Maryland Economic Development Corp. Rev. (Transportation Facilities Project), “A”, 5%, 6/01/2031 | | | 350,000 | 410,989 |
| Maryland Economic Development Corp. Rev. (Transportation Facilities Project), “A”, 5%, 6/01/2032 | | | 985,000 | 1,154,296 |
| Maryland Economic Development Corp. Rev. (Transportation Facilities Project), “A”, 5%, 6/01/2035 | | | 1,775,000 | 2,075,699 |
Portfolio of Investments – continued
| Issuer | | | Shares/Par | Value ($) |
| Municipal Bonds - continued |
| Maryland - continued |
| Maryland Economic Development Corp., Special Obligation (Port Covington Project), 3.25%, 9/01/2030 (n) | | $ | 265,000 | $ 281,435 |
| Maryland Economic Development Corp., Special Obligation (Port Covington Project), 4%, 9/01/2040 (n) | | | 920,000 | 1,006,637 |
| Maryland Economic Development Corp., Subordinate Parking Facilities Rev. (Baltimore City Project), “C”, 4%, 6/01/2038 | | | 175,000 | 162,455 |
| Maryland Economic Development Corp., Subordinate Parking Facilities Rev. (Baltimore City Project), “C”, 4%, 6/01/2048 | | | 525,000 | 455,498 |
| Maryland Economic Development Corp., Subordinate Parking Facilities Rev. (Baltimore City Project), “C”, 4%, 6/01/2058 | | | 1,800,000 | 1,499,755 |
| Maryland Health & Higher Educational Facilities Authority Rev. (Adventist Healthcare), 5%, 1/01/2036 | | | 810,000 | 1,007,522 |
| Maryland Health & Higher Educational Facilities Authority Rev. (Adventist Healthcare), “A”, 5.5%, 1/01/2036 | | | 2,290,000 | 2,704,131 |
| Maryland Health & Higher Educational Facilities Authority Rev. (Doctors Community Hospital), “A”, 5%, 7/01/2033 | | | 1,380,000 | 1,538,543 |
| Maryland Health & Higher Educational Facilities Authority Rev. (Doctors Community Hospital), “A”, 5%, 7/01/2034 | | | 860,000 | 957,277 |
| Maryland Health & Higher Educational Facilities Authority Rev. (Doctors Community Hospital), “A”, 5%, 7/01/2038 | | | 3,835,000 | 4,238,617 |
| Prince George's County, MD, Special Obligation (Westphalia Town Center Project), 5.125%, 7/01/2039 (n) | | | 790,000 | 865,532 |
| Prince George's County, MD, Special Obligation (Westphalia Town Center Project), 5.25%, 7/01/2048 (n) | | | 775,000 | 848,236 |
| Rockville, MD, Mayor & Council Economic Development Refunding Rev. (Ingleside at King Farm Project), “A-1”, 5%, 11/01/2037 | | | 890,000 | 952,562 |
| Rockville, MD, Mayor & Council Economic Development Rev. (Ingleside at King Farm Project), “B”, 5%, 11/01/2042 | | | 1,530,000 | 1,630,425 |
| Rockville, MD, Mayor & Council Economic Development Rev. (Ingleside at King Farm Project), “B”, 5%, 11/01/2047 | | | 1,605,000 | 1,705,531 |
| Westminster, MD, Refunding Rev. (Carroll Lutheran Village, Inc.), 5.125%, 7/01/2040 | | | 2,600,000 | 2,717,772 |
| | | | | $71,964,156 |
| Massachusetts - 1.5% |
| Lowell, MA, Collegiate Charter School Rev., 4%, 6/15/2024 | | $ | 300,000 | $ 305,833 |
| Lowell, MA, Collegiate Charter School Rev., 5%, 6/15/2029 | | | 455,000 | 493,349 |
| Lowell, MA, Collegiate Charter School Rev., 5%, 6/15/2049 | | | 750,000 | 792,693 |
| Lowell, MA, Collegiate Charter School Rev., 5%, 6/15/2054 | | | 580,000 | 611,815 |
| Massachusetts Development Finance Agency Rev. (Adventcare), “A”, 6.75%, 10/15/2037 (a)(d) | | | 9,250,000 | 2,775,000 |
Portfolio of Investments – continued
| Issuer | | | Shares/Par | Value ($) |
| Municipal Bonds - continued |
| Massachusetts - continued |
| Massachusetts Development Finance Agency Rev. (Atrius Health Issue), “A”, 5%, 6/01/2039 | | $ | 1,300,000 | $ 1,559,187 |
| Massachusetts Development Finance Agency Rev. (Emerson College), 5%, 1/01/2029 | | | 1,450,000 | 1,586,638 |
| Massachusetts Development Finance Agency Rev. (Emerson College), 5%, 1/01/2030 | | | 3,015,000 | 3,298,178 |
| Massachusetts Development Finance Agency Rev. (Emerson College), 5%, 1/01/2031 | | | 835,000 | 911,924 |
| Massachusetts Development Finance Agency Rev. (Emerson College), 5%, 1/01/2035 | | | 9,160,000 | 9,983,146 |
| Massachusetts Development Finance Agency Rev. (Emmanuel College), “A”, 5%, 10/01/2043 | | | 2,930,000 | 3,290,701 |
| Massachusetts Development Finance Agency Rev. (Emmanuel College), “A”, 4%, 10/01/2046 | | | 870,000 | 928,323 |
| Massachusetts Development Finance Agency Rev. (Foxborough Regional Charter School), “B”, 5%, 7/01/2027 | | | 3,690,000 | 4,007,023 |
| Massachusetts Development Finance Agency Rev. (Foxborough Regional Charter School), “B”, 5%, 7/01/2037 | | | 1,000,000 | 1,099,758 |
| Massachusetts Development Finance Agency Rev. (Foxborough Regional Charter School), “B”, 5%, 7/01/2042 | | | 3,000,000 | 3,277,907 |
| Massachusetts Development Finance Agency Rev. (Lasell University), 4%, 7/01/2040 | | | 1,075,000 | 1,153,447 |
| Massachusetts Development Finance Agency Rev. (Lasell University), 4%, 7/01/2045 | | | 495,000 | 525,716 |
| Massachusetts Development Finance Agency Rev. (Linden Ponds, Inc.), Capital Appreciation, “B”, 0%, 11/15/2056 | | | 243,117 | 162,246 |
| Massachusetts Development Finance Agency Rev. (Newbridge on the Charles, Inc.), 5%, 10/01/2037 (n) | | | 400,000 | 430,055 |
| Massachusetts Development Finance Agency Rev. (Newbridge on the Charles, Inc.), 5%, 10/01/2047 (n) | | | 3,140,000 | 3,370,375 |
| Massachusetts Development Finance Agency Rev. (Newbridge on the Charles, Inc.), 5%, 10/01/2057 (n) | | | 7,070,000 | 7,586,215 |
| Massachusetts Development Finance Agency Rev. (North Hill Communities), “A”, 6.25%, 11/15/2033 (Prerefunded 11/15/2023) (n) | | | 1,350,000 | 1,474,421 |
| Massachusetts Development Finance Agency Rev. (Sabis International Charter School Issue), 5%, 4/15/2025 | | | 310,000 | 327,334 |
| Massachusetts Development Finance Agency Rev. (Simmons College), “K-1”, 5%, 10/01/2024 | | | 1,400,000 | 1,526,881 |
| Massachusetts Development Finance Agency Rev. (Simmons College), “K-1”, 5%, 10/01/2025 | | | 800,000 | 895,731 |
| Massachusetts Development Finance Agency Rev. (Springfield College), “B”, 4%, 6/01/2035 | | | 2,300,000 | 2,509,953 |
Portfolio of Investments – continued
| Issuer | | | Shares/Par | Value ($) |
| Municipal Bonds - continued |
| Massachusetts - continued |
| Massachusetts Development Finance Agency Rev. (Springfield College), “B”, 4%, 6/01/2041 | | $ | 2,750,000 | $ 2,976,921 |
| Massachusetts Development Finance Agency Rev. (Springfield College), “B”, 4%, 6/01/2050 | | | 2,700,000 | 2,884,225 |
| Massachusetts Development Finance Agency Rev. (Suffolk University), 5%, 7/01/2033 | | | 480,000 | 552,094 |
| Massachusetts Development Finance Agency Rev. (Suffolk University), 5%, 7/01/2034 | | | 645,000 | 741,046 |
| Massachusetts Development Finance Agency Rev. (UMass Memorial Health Care Obligated Group), “I”, 5%, 7/01/2036 | | | 1,685,000 | 1,923,504 |
| Massachusetts Development Finance Agency Rev. (UMass Memorial Health Care Obligated Group), “K”, 5%, 7/01/2038 | | | 1,120,000 | 1,282,377 |
| Massachusetts Development Finance Agency Rev. (Wellforce, Inc.), “A”, 5%, 7/01/2044 | | | 1,305,000 | 1,522,664 |
| Massachusetts Development Finance Agency Rev. (Wentworth Institute of Technology Issue), 5%, 10/01/2046 | | | 985,000 | 1,098,769 |
| Massachusetts Development Finance Agency Rev. (Western New England University), 5%, 9/01/2028 | | | 960,000 | 1,067,718 |
| Massachusetts Educational Financing Authority, Education Loan Rev., “B”, 3%, 7/01/2035 | | | 2,585,000 | 2,629,446 |
| Massachusetts Educational Financing Authority, Education Loan Rev., “B”, 2%, 7/01/2037 | | | 485,000 | 463,541 |
| Massachusetts Educational Financing Authority, Education Loan Rev., “C”, 2.625%, 7/01/2036 | | | 885,000 | 876,324 |
| Massachusetts Educational Financing Authority, Education Loan Rev., “C”, 4.125%, 7/01/2046 | | | 6,585,000 | 6,740,371 |
| Massachusetts Educational Financing Authority, Education Loan Rev., “C”, 3.75%, 7/01/2047 | | | 10,430,000 | 10,518,160 |
| Massachusetts Educational Financing Authority, Education Loan Rev., “J”, 4.7%, 7/01/2026 | | | 515,000 | 516,073 |
| Massachusetts Educational Financing Authority, Education Loan Rev., “J”, 4.9%, 7/01/2028 | | | 535,000 | 536,189 |
| Massachusetts Educational Financing Authority, Education Loan Rev., “J”, 3.5%, 7/01/2033 (u) | | | 7,485,000 | 7,533,799 |
| Massachusetts Educational Financing Authority, Education Loan Rev., “J”, 3.5%, 7/01/2033 | | | 1,105,000 | 1,112,204 |
| Massachusetts Educational Financing Authority, Education Loan Subordinate Rev., “C”, 3%, 7/01/2051 | | | 2,025,000 | 1,884,677 |
| Massachusetts Housing Finance Agency, Single Family Housing Rev., “177”, 4%, 6/01/2039 | | | 275,000 | 285,040 |
| Massachusetts Port Authority Rev., “C”, 5%, 7/01/2036 | | | 2,000,000 | 2,406,812 |
| | | | | $104,435,803 |
Portfolio of Investments – continued
| Issuer | | | Shares/Par | Value ($) |
| Municipal Bonds - continued |
| Michigan - 1.5% |
| Detroit, MI, Downtown Development Authority Tax Increment Rev. (Catalyst Development), “A”, AGM, 5%, 7/01/2043 | | $ | 2,220,000 | $ 2,396,006 |
| Detroit, MI, General Obligation, 5.5%, 4/01/2045 | | | 1,250,000 | 1,497,075 |
| Detroit, MI, General Obligation, 5.5%, 4/01/2050 | | | 1,850,000 | 2,203,986 |
| Detroit, MI, Water & Sewerage Department, Senior Lien Sewage Disposal System Rev., “A”, 5.25%, 7/01/2039 (Prerefunded 7/01/2022) | | | 9,635,000 | 9,827,215 |
| Detroit, MI, Water & Sewerage Department, Senior Lien Sewage Disposal System Rev., “A”, AGM, 5%, 7/01/2039 (Prerefunded 7/01/2022) | | | 3,190,000 | 3,250,346 |
| Downriver, MI, Utility Wastewater Authority, Sewer System Rev., AGM, 5%, 4/01/2036 | | | 725,000 | 865,528 |
| Downriver, MI, Utility Wastewater Authority, Sewer System Rev., AGM, 5%, 4/01/2038 | | | 665,000 | 792,216 |
| Downriver, MI, Utility Wastewater Authority, Sewer System Rev., AGM, 5%, 4/01/2043 | | | 1,185,000 | 1,392,639 |
| Grand Rapids, MI, Economic Development Corp. Rev. (Beacon Hill at Eastgate Project), “A”, 5%, 11/01/2037 | | | 1,155,000 | 1,247,998 |
| Grand Rapids, MI, Economic Development Corp. Rev. (Beacon Hill at Eastgate Project), “A”, 5%, 11/01/2047 | | | 2,660,000 | 2,852,104 |
| Grand Rapids, MI, Economic Development Corp. Rev. (Beacon Hill at Eastgate Project), “A”, 5%, 11/01/2052 | | | 1,185,000 | 1,268,950 |
| Kent County, MI, Gerald R. Ford International Airport Authority Rev., 5%, 1/01/2046 | | | 1,050,000 | 1,295,950 |
| Kent County, MI, Gerald R. Ford International Airport Authority Rev., 5%, 1/01/2051 | | | 1,380,000 | 1,695,788 |
| Kentwood, MI, Economic Development Corp Rev. (Holland Home Obligated Group), 4%, 11/15/2031 (w) | | | 645,000 | 707,883 |
| Kentwood, MI, Economic Development Corp Rev. (Holland Home Obligated Group), 4%, 11/15/2043 (w) | | | 1,445,000 | 1,546,089 |
| Kentwood, MI, Economic Development Corp Rev. (Holland Home Obligated Group), 4%, 11/15/2045 | | | 255,000 | 273,122 |
| Michigan Building Authority Rev., “I”, 4%, 10/15/2049 | | | 3,810,000 | 4,314,658 |
| Michigan Finance Authority (Detroit Financial Recovery Income Tax Rev.), “F”, 3.875%, 10/01/2023 | | | 635,000 | 652,888 |
| Michigan Finance Authority (Detroit Financial Recovery Income Tax Rev.), “F”, 4%, 10/01/2024 | | | 800,000 | 834,398 |
| Michigan Finance Authority Hospital Rev. (Beaumont Health Credit Group), “A”, 5%, 8/01/2033 (Prerefunded 8/01/2024) | | | 20,000 | 21,892 |
| Michigan Finance Authority Hospital Rev. (Beaumont Health Credit Group), “A”, 5%, 8/01/2033 | | | 1,085,000 | 1,179,805 |
| Michigan Finance Authority Hospital Rev. (Sparrow Obligated Group), 5%, 11/15/2045 | | | 7,000,000 | 7,701,238 |
Portfolio of Investments – continued
| Issuer | | | Shares/Par | Value ($) |
| Municipal Bonds - continued |
| Michigan - continued |
| Michigan Finance Authority Hospital Rev. (Trinity Health Credit Group), 5%, 12/01/2034 | | $ | 2,225,000 | $ 2,612,741 |
| Michigan Finance Authority Hospital Rev. (Trinity Health Credit Group), 5%, 12/01/2037 | | | 1,000,000 | 1,170,645 |
| Michigan Finance Authority Hospital Rev. (Trinity Health Credit Group), 5%, 12/01/2048 | | | 5,215,000 | 6,143,639 |
| Michigan Finance Authority Hospital Rev. (Trinity Health Credit Group), “2”, 4%, 12/01/2036 | | | 6,610,000 | 7,457,686 |
| Michigan Finance Authority Local Government Loan Program Rev. (Detroit Water and Sewerage Department Sewage Disposal System Rev. Refunding Second Lien Local Project), “C”, 5%, 7/01/2033 | | | 875,000 | 974,483 |
| Michigan Finance Authority Local Government Loan Program Rev. (Detroit Water and Sewerage Department Sewage Disposal System Rev. Refunding Second Lien Local Project), “C”, 5%, 7/01/2034 | | | 2,070,000 | 2,307,543 |
| Michigan Finance Authority Local Government Loan Program Rev. (Detroit Water and Sewerage Department Sewage Disposal System Rev. Refunding Second Lien Local Project), “C”, 5%, 7/01/2035 | | | 1,355,000 | 1,506,666 |
| Michigan Finance Authority Local Government Loan Program Rev. (Detroit Water and Sewerage Department Sewage Disposal System Rev. Senior Lien Local Project), “C-1”, 5%, 7/01/2044 (Prerefunded 7/01/2022) | | | 2,375,000 | 2,419,928 |
| Michigan Finance Authority Local Government Loan Program Rev. (Detroit Water and Sewerage Department Sewage Disposal System Rev. Senior Lien Local Project), “C-6”, 5%, 7/01/2033 | | | 2,280,000 | 2,481,729 |
| Michigan Finance Authority Local Government Loan Program Rev. (Detroit Water and Sewerage Department Sewage Disposal System Rev. Senior Lien Local Project), “C-2”, 5%, 7/01/2044 (Prerefunded 7/01/2022) | | | 1,365,000 | 1,390,245 |
| Michigan Finance Authority Local Government Loan Program Rev. (Detroit Water and Sewerage Department Water Supply System Rev. Refunding Local Project), “D-2”, 5%, 7/01/2034 | | | 885,000 | 984,995 |
| Michigan Finance Authority Tobacco Settlement Asset-Backed Rev. (2007 Sold Tobacco Receipts), “B-1”, 5%, 6/01/2049 | | | 1,295,000 | 1,500,008 |
| Michigan Finance Authority Tobacco Settlement Asset-Backed Rev. (2007 Sold Tobacco Receipts), Capital Appreciation, “B-2”, 0%, 6/01/2065 | | | 40,000,000 | 5,152,036 |
| Michigan Housing Development Authority, “A”, 4%, 6/01/2046 | | | 2,070,000 | 2,147,764 |
| Michigan Strategic Fund Ltd. (Canterbury Health Care, Inc.), 5%, 7/01/2046 (n) | | | 1,000,000 | 812,363 |
Portfolio of Investments – continued
| Issuer | | | Shares/Par | Value ($) |
| Municipal Bonds - continued |
| Michigan - continued |
| Michigan Strategic Fund Ltd. (Canterbury Health Care, Inc.), 5%, 7/01/2051 (n) | | $ | 900,000 | $ 714,076 |
| Michigan Strategic Fund Ltd. Variable Rate Limited Obligation Rev. (Graphic Packaging International LLC Coated Recycled Board Machine Project), 4%, 10/01/2061 (Put Date 10/01/2026) | | | 1,835,000 | 2,004,442 |
| Waterford Township, MI, Economic Development Corp. (Canterbury Health Care, Inc.), “A”, 5%, 7/01/2046 (n) | | | 2,070,000 | 1,681,590 |
| Waterford Township, MI, Economic Development Corp. (Canterbury Health Care, Inc.), “A”, 5%, 7/01/2051 (n) | | | 2,070,000 | 1,642,374 |
| Wayne County, MI, Airport Authority Rev. (Detroit Metropolitan Wayne County Airport), “B”, 5%, 12/01/2044 | | | 2,215,000 | 2,430,680 |
| Wayne County, MI, Airport Authority Rev. (Detroit Metropolitan Wayne County Airport), “B”, BAM, 5%, 12/01/2039 | | | 750,000 | 824,346 |
| Wayne County, MI, Airport Authority Rev. (Detroit Metropolitan Wayne County Airport), “C”, 5%, 12/01/2039 | | | 575,000 | 627,304 |
| Wayne County, MI, Airport Authority Rev. (Detroit Metropolitan Wayne County Airport), “C”, 5%, 12/01/2044 | | | 1,240,000 | 1,347,408 |
| Western Michigan University Rev., “A”, 5%, 11/15/2040 | | | 1,250,000 | 1,381,543 |
| | | | | $99,534,008 |
| Minnesota - 0.6% |
| Deephaven, MN, Charter School Lease Rev. (Eagle Ridge Academy Project), “A”, 5.25%, 7/01/2040 | | $ | 500,000 | $ 544,373 |
| Deephaven, MN, Charter School Lease Rev. (Eagle Ridge Academy Project), “A”, 5.5%, 7/01/2050 | | | 3,000,000 | 3,268,024 |
| Duluth, MN, Economic Development Authority Rev. (Benedictine Health System), “A”, 4%, 7/01/2031 | | | 1,340,000 | 1,432,132 |
| Duluth, MN, Economic Development Authority Rev. (Benedictine Health System), “A”, 4%, 7/01/2036 | | | 2,645,000 | 2,787,191 |
| Duluth, MN, Economic Development Authority Rev. (Benedictine Health System), “A”, 4%, 7/01/2041 | | | 2,755,000 | 2,875,319 |
| Duluth, MN, Economic Development Authority, Health Care Facilities Rev. (Essentia Health), “A”, 4.25%, 2/15/2043 | | | 2,070,000 | 2,306,510 |
| Duluth, MN, Economic Development Authority, Health Care Facilities Rev. (Essentia Health), “A”, 5%, 2/15/2043 | | | 3,680,000 | 4,287,234 |
| Duluth, MN, Economic Development Authority, Health Care Facilities Rev. (Essentia Health), “A”, 4.25%, 2/15/2048 | | | 2,065,000 | 2,287,091 |
| Duluth, MN, Economic Development Authority, Health Care Facilities Rev. (Essentia Health), “A”, 5%, 2/15/2048 | | | 2,905,000 | 3,364,263 |
| Duluth, MN, Independent School District No. 709, “A”, COP, 4%, 3/01/2032 | | | 1,570,000 | 1,625,448 |
Portfolio of Investments – continued
| Issuer | | | Shares/Par | Value ($) |
| Municipal Bonds - continued |
| Minnesota - continued |
| Duluth, MN, Independent School District No. 709, “A”, COP, 4.2%, 3/01/2034 | | $ | 420,000 | $ 436,541 |
| Minnesota Housing Finance Agency, Residential Housing, “A”, 4%, 1/01/2041 | | | 395,000 | 408,432 |
| Minnesota Office of Higher Education Supplemental Student Loan Program Rev., 4%, 11/01/2037 (u) | | | 4,785,000 | 5,000,919 |
| Minnesota Office of Higher Education Supplemental Student Loan Program Rev., 2.65%, 11/01/2038 | | | 3,890,000 | 3,809,402 |
| St. Paul, MN, Housing & Redevelopment Authority Charter School Lease Rev. (Great River School Project), “A”, 4.75%, 7/01/2029 (n) | | | 250,000 | 267,359 |
| St. Paul, MN, Housing & Redevelopment Authority Charter School Lease Rev. (Great River School Project), “A”, 5.25%, 7/01/2033 (n) | | | 420,000 | 464,897 |
| St. Paul, MN, Housing & Redevelopment Authority Charter School Lease Rev. (Great River School Project), “A”, 5.5%, 7/01/2052 (n) | | | 705,000 | 771,059 |
| St. Paul, MN, Port Authority Rev. (Energy Park Utility Co. Project), 5.45%, 8/01/2028 (Prerefunded 8/01/2022) | | | 250,000 | 255,886 |
| St. Paul, MN, Port Authority Rev. (Energy Park Utility Co. Project), 5.7%, 8/01/2036 (Prerefunded 8/01/2022) | | | 1,250,000 | 1,280,976 |
| Woodbury, MN Charter School Lease Rev. (Woodbury Leadership Academy Project), “A”, 4%, 7/01/2031 | | | 690,000 | 750,752 |
| Woodbury, MN Charter School Lease Rev. (Woodbury Leadership Academy Project), “A”, 4%, 7/01/2041 | | | 850,000 | 903,455 |
| Woodbury, MN Charter School Lease Rev. (Woodbury Leadership Academy Project), “A”, 4%, 7/01/2051 | | | 660,000 | 692,201 |
| Woodbury, MN Charter School Lease Rev. (Woodbury Leadership Academy Project), “A”, 4%, 7/01/2056 | | | 575,000 | 600,693 |
| | | | | $40,420,157 |
| Mississippi - 0.6% |
| Jackson County, MS, Development Bank Special Obligation (Gomesa Project), 3.625%, 11/01/2036 (n) | | $ | 2,165,000 | $ 2,051,935 |
| Mississippi Business Finance Corp. Refunding Rev. (System Energy Resources, Inc. Project), 2.375%, 6/01/2044 | | | 4,730,000 | 4,201,430 |
| Mississippi Development Bank Special Obligation (Hancock County Gomesa Project), 4.55%, 11/01/2039 (n) | | | 3,800,000 | 4,128,162 |
| Mississippi Home Corp., Single Family Mortgage Rev., “A”, 4%, 12/01/2044 | | | 2,020,000 | 2,156,132 |
| Mississippi Home Corp., Single Family Mortgage Rev., “A”, GNMA, 3%, 12/01/2050 | | | 1,850,000 | 1,934,815 |
Portfolio of Investments – continued
| Issuer | | | Shares/Par | Value ($) |
| Municipal Bonds - continued |
| Mississippi - continued |
| Mississippi Hospital Equipment & Facilities Authority Rev. (Baptist Memorial Healthcare), “A”, 5%, 9/01/2022 | | $ | 1,845,000 | $ 1,889,214 |
| Mississippi Hospital Equipment & Facilities Authority Rev. (Baptist Memorial Healthcare), “A”, 5%, 9/01/2023 | | | 4,810,000 | 5,094,165 |
| Mississippi Hospital Equipment & Facilities Authority Rev. (Baptist Memorial Healthcare), “A”, 5%, 9/01/2046 | | | 2,635,000 | 2,996,792 |
| Mississippi Hospital Equipment & Facilities Authority Rev. (Forrest County General Hospital Refunding Project), “A”, 4%, 1/01/2036 | | | 1,155,000 | 1,292,516 |
| Mississippi Hospital Equipment & Facilities Authority Rev. (Forrest County General Hospital Refunding Project), “A”, 4%, 1/01/2037 | | | 1,040,000 | 1,162,453 |
| Mississippi Hospital Equipment & Facilities Authority Rev. (Forrest County General Hospital Refunding Project), “A”, 4%, 1/01/2039 | | | 1,040,000 | 1,158,811 |
| Mississippi Hospital Equipment & Facilities Authority Rev. (Forrest County General Hospital Refunding Project), “A”, 4%, 1/01/2040 | | | 575,000 | 638,798 |
| West Rankin, MS, Utility Authority Rev., AGM, 5%, 1/01/2048 (Prerefunded 1/01/2028) | | | 7,750,000 | 9,292,859 |
| | | | | $37,998,082 |
| Missouri - 1.2% |
| Cape Girardeau County, MO, Industrial Development Authority, Health Facilities Rev. (SoutheastHealth), 4%, 3/01/2041 | | $ | 460,000 | $ 507,145 |
| Cape Girardeau County, MO, Industrial Development Authority, Health Facilities Rev. (SoutheastHealth), 4%, 3/01/2046 | | | 520,000 | 567,155 |
| Dardenne, MO, Town Square Transportation Development District, “A”, 5%, 5/01/2026 (d)(q) | | | 2,495,000 | 1,197,600 |
| Kansas City, MO, Industrial Development Authority, Airport Rev. (Kansas City International Airport Terminal Modernization Project), “B”, AGM, 5%, 3/01/2055 | | | 7,785,000 | 9,084,013 |
| Kansas City, MO, Land Clearance for Redevelopment Authority Rev. (Convention Center Hotel Project - TIF Financing), “B”, 5%, 2/01/2040 (n) | | | 2,140,000 | 2,130,949 |
| Kansas City, MO, Land Clearance for Redevelopment Authority Rev. (Convention Center Hotel Project - TIF Financing), “B”, 5%, 2/01/2050 (n) | | | 4,845,000 | 4,751,946 |
| Missouri Development Finance Board, Infrastructure Facilities Rev. (Crackerneck Creek Project), 4%, 3/01/2036 | | | 1,300,000 | 1,444,652 |
| Missouri Development Finance Board, Infrastructure Facilities Rev. (Crackerneck Creek Project), 4%, 3/01/2037 | | | 415,000 | 459,946 |
Portfolio of Investments – continued
| Issuer | | | Shares/Par | Value ($) |
| Municipal Bonds - continued |
| Missouri - continued |
| Missouri Development Finance Board, Infrastructure Facilities Rev. (Crackerneck Creek Project), 4%, 3/01/2041 | | $ | 520,000 | $ 571,537 |
| Missouri Development Finance Board, Infrastructure Facilities Rev. (Crackerneck Creek Project), 4%, 3/01/2051 | | | 1,480,000 | 1,600,128 |
| Missouri Health & Educational Facilities Authority Rev. (A.T. Still University Health Services), 5%, 10/01/2039 (Prerefunded 10/01/2023) | | | 465,000 | 496,641 |
| Missouri Health & Educational Facilities Authority Rev. (Bethesda Health Group, Inc.), 5%, 8/01/2040 | | | 1,650,000 | 1,770,827 |
| Missouri Health & Educational Facilities Authority Rev. (Bethesda Health Group, Inc.), 5%, 8/01/2045 | | | 2,300,000 | 2,446,987 |
| Missouri Health & Educational Facilities Authority Rev. (Capital Regional Medical Center), 5%, 11/01/2035 | | | 1,700,000 | 2,067,672 |
| Missouri Health & Educational Facilities Authority Rev. (Capital Regional Medical Center), 5%, 11/01/2040 | | | 2,000,000 | 2,408,196 |
| Missouri Health & Educational Facilities Authority Rev. (SSM Health Care), “A”, 5%, 6/01/2031 | | | 1,735,000 | 1,881,586 |
| Missouri Housing Development Commission, Single Family Mortgage Rev. (First Place Homeownership Loan Program), “A”, 3.75%, 5/01/2038 | | | 380,000 | 395,764 |
| Missouri Housing Development Commission, Single Family Mortgage Rev. (First Place Homeownership Loan Program), “B”, FNMA, 4.75%, 5/01/2049 | | | 3,295,000 | 3,589,350 |
| Plaza at Noah's Ark Community District, MO, Increment and Improvement Rev., 3%, 5/01/2030 | | | 345,000 | 339,309 |
| Plaza at Noah's Ark Community District, MO, Increment and Improvement Rev., 3.125%, 5/01/2035 | | | 240,000 | 228,441 |
| St. Louis County, MO, Industrial Development Authority Health Facilities Rev. (Nazareth Living Center), “A”, 5%, 8/15/2030 | | | 695,000 | 737,938 |
| St. Louis County, MO, Industrial Development Authority Health Facilities Rev. (Nazareth Living Center), “A”, 5%, 8/15/2035 | | | 490,000 | 516,242 |
| St. Louis County, MO, Industrial Development Authority Health Facilities Rev. (Nazareth Living Center), “A”, 5.125%, 8/15/2045 | | | 1,355,000 | 1,410,221 |
| St. Louis County, MO, Industrial Development Authority Health Facilities Rev. (Ranken-Jordan Project), 5%, 11/15/2030 | | | 1,015,000 | 1,100,730 |
| St. Louis County, MO, Industrial Development Authority Health Facilities Rev. (Ranken-Jordan Project), 4%, 11/15/2036 | | | 1,165,000 | 1,210,172 |
| St. Louis County, MO, Industrial Development Authority Health Facilities Rev. (Ranken-Jordan Project), 5%, 11/15/2041 | | | 3,445,000 | 3,682,062 |
| St. Louis, MO, Industrial Development Authority Financing Rev. (Ballpark Village Development Project), “A”, 3.875%, 11/15/2029 | | | 1,100,000 | 1,063,628 |
Portfolio of Investments – continued
| Issuer | | | Shares/Par | Value ($) |
| Municipal Bonds - continued |
| Missouri - continued |
| St. Louis, MO, Industrial Development Authority Financing Rev. (Ballpark Village Development Project), “A”, 4.375%, 11/15/2035 | | $ | 2,110,000 | $ 2,036,779 |
| St. Louis, MO, Industrial Development Authority Financing Rev. (Ballpark Village Development Project), “A”, 4.75%, 11/15/2047 | | | 4,220,000 | 4,107,223 |
| St. Louis, MO, Industrial Development Authority Rev. (Friendship Village St. Louis Obligated Group), “A”, 5.25%, 9/01/2053 | | | 11,005,000 | 12,124,252 |
| St. Louis, MO, Industrial Development Authority Rev. (St. Andrew's Resources for Seniors Obligated Group), “A”, 5.125%, 12/01/2045 | | | 3,620,000 | 3,871,883 |
| St. Louis, MO, Land Clearance Redevelopment Authority Rev. (Kiel Opera House Renovation Project), 3.875%, 10/01/2035 | | | 2,515,000 | 2,408,056 |
| St. Louis, MO, Municipal Finance Corp. Leasehold Rev. (Convention Center Expansion and Improvement Projects), AGM, 5%, 10/01/2040 | | | 1,910,000 | 2,324,844 |
| St. Louis, MO, Municipal Finance Corp. Leasehold Rev. (Convention Center Expansion and Improvement Projects), AGM, 5%, 10/01/2045 | | | 6,475,000 | 7,786,445 |
| | | | | $82,320,319 |
| Montana - 0.2% |
| Montana Board of Housing Single Family Mortgage, “B”, 3%, 12/01/2051 | | $ | 1,300,000 | $ 1,364,701 |
| Montana Board of Housing Single Family Program (Federally Insured or Guaranteed Mortgage Loans), “A”, 4%, 6/01/2049 | | | 690,000 | 729,831 |
| Montana Finance Authority, Health Care Facilities Rev. (Kalispell Regional Medical Center), “B”, 5%, 7/01/2043 | | | 3,840,000 | 4,386,726 |
| Montana Finance Authority, Health Care Facilities Rev. (Kalispell Regional Medical Center), “B”, 5%, 7/01/2048 | | | 5,530,000 | 6,277,980 |
| | | | | $12,759,238 |
| Nebraska - 0.2% |
| Central Plains Energy Project, NE, Gas Project Rev. (Project No. 3), “A”, 5%, 9/01/2034 | | $ | 1,200,000 | $ 1,521,909 |
| Central Plains Energy Project, NE, Gas Project Rev. (Project No. 3), “A”, 5%, 9/01/2036 | | | 1,940,000 | 2,512,049 |
| Nebraska Investment Finance Authority, Single Family Housing Rev., “A”, 4%, 9/01/2044 | | | 440,000 | 456,431 |
| Nebraska Investment Finance Authority, Single Family Housing Rev., “A”, GNMA, 3%, 9/01/2045 | | | 4,145,000 | 4,337,581 |
Portfolio of Investments – continued
| Issuer | | | Shares/Par | Value ($) |
| Municipal Bonds - continued |
| Nebraska - continued |
| Nebraska Investment Finance Authority, Single Family Housing Rev., “C”, 4%, 9/01/2048 (u) | | $ | 3,375,000 | $ 3,587,629 |
| | | | | $12,415,599 |
| Nevada - 0.3% |
| Director of the State of Nevada, Department of Business and Industry, Charter School Lease Rev. (Somerset Academy), “A”, 4.5%, 12/15/2029 (n) | | $ | 525,000 | $ 564,488 |
| Director of the State of Nevada, Department of Business and Industry, Charter School Lease Rev. (Somerset Academy), “A”, 5%, 12/15/2035 (n) | | | 1,715,000 | 1,867,515 |
| Director of the State of Nevada, Department of Business and Industry, Charter School Lease Rev. (Somerset Academy), “A”, 5%, 12/15/2038 (n) | | | 1,395,000 | 1,512,627 |
| Director of the State of Nevada, Department of Business and Industry, Charter School Lease Rev. (Somerset Academy), “A”, 5.125%, 12/15/2045 (n) | | | 2,205,000 | 2,373,228 |
| Director of the State of Nevada, Department of Business and Industry, Charter School Lease Rev. (Somerset Academy), “A”, 5%, 12/15/2048 (n) | | | 4,115,000 | 4,405,638 |
| Director of the State of Nevada, Department of Business and Industry, Solid Waste Disposal Rev. (Republic Services, Inc. Project), 0.28%, 12/01/2026 (Put Date 6/01/2022) (n) | | | 3,500,000 | 3,498,025 |
| Nevada Department of Business & Industry Charter School Rev. (Doral Academy of Nevada), “A”, 5%, 7/15/2037 (n) | | | 1,000,000 | 1,090,506 |
| Nevada Department of Business & Industry Charter School Rev. (Doral Academy of Nevada), “A”, 5%, 7/15/2047 (n) | | | 1,015,000 | 1,097,728 |
| Reno, NV, Sales Tax Rev. (Retrac-Reno Transportation Rail Access Corridor Project), “B”, AGM, 5%, 6/01/2033 | | | 85,000 | 99,115 |
| Reno, NV, Sales Tax Rev. (Retrac-Reno Transportation Rail Access Corridor Project), “B”, AGM, 5%, 6/01/2038 | | | 110,000 | 127,647 |
| Reno, NV, Sales Tax Rev. (Retrac-Reno Transportation Rail Access Corridor Project), “B”, AGM, 4%, 6/01/2048 | | | 435,000 | 468,090 |
| Reno, NV, Sales Tax Rev. (Retrac-Reno Transportation Rail Access Corridor Project), “B”, AGM, 4.125%, 6/01/2058 | | | 545,000 | 589,556 |
| | | | | $17,694,163 |
Portfolio of Investments – continued
| Issuer | | | Shares/Par | Value ($) |
| Municipal Bonds - continued |
| New Hampshire - 0.6% |
| National Finance Authority, New Hampshire Resource Recovery Refunding Rev. (Covanta Project), “C”, 4.875%, 11/01/2042 (n) | | $ | 7,730,000 | $ 7,947,399 |
| National Finance Authority, New Hampshire Resource Recovery Refunding Rev., “A”, 3.625%, 7/01/2043 (Put Date 7/02/2040) (n) | | | 1,805,000 | 1,848,984 |
| National Finance Authority, New Hampshire Resource Recovery Refunding Rev., “B”, 3.75%, 7/01/2045 (Put Date 7/02/2040) (n) | | | 3,090,000 | 3,176,756 |
| National Finance Authority, New Hampshire Senior Living Rev. (Springpoint Senior Living Project), 4%, 1/01/2041 | | | 1,200,000 | 1,282,968 |
| National Finance Authority, New Hampshire, Municipal Certificates, “A”, 4.125%, 1/20/2034 | | | 10,877,770 | 12,188,646 |
| New Hampshire Health & Education Facilities Authority Rev. (Elliot Hospital), 5%, 10/01/2033 | | | 3,475,000 | 3,943,917 |
| New Hampshire Health & Education Facilities Authority Rev. (Elliot Hospital), 5%, 10/01/2038 | | | 3,500,000 | 3,957,272 |
| New Hampshire Health & Education Facilities Authority Rev. (Memorial Hospital), 5.5%, 6/01/2031 | | | 1,820,000 | 2,081,136 |
| New Hampshire Health & Education Facilities Authority Rev. (Memorial Hospital), 5.5%, 6/01/2036 | | | 1,825,000 | 2,086,039 |
| | | | | $38,513,117 |
| New Jersey - 5.9% |
| Atlantic City, NJ, Improvement Authority Lease Rev. (Stockton University Campus Phase II Project), “A”, AGM, 5%, 7/01/2033 | | $ | 170,000 | $ 214,325 |
| Atlantic City, NJ, Improvement Authority Lease Rev. (Stockton University Campus Phase II Project), “A”, AGM, 5%, 7/01/2035 | | | 170,000 | 213,789 |
| Atlantic City, NJ, Improvement Authority Lease Rev. (Stockton University Campus Phase II Project), “A”, AGM, 4%, 7/01/2038 | | | 275,000 | 317,239 |
| Atlantic City, NJ, Improvement Authority Lease Rev. (Stockton University Campus Phase II Project), “A”, AGM, 4%, 7/01/2039 | | | 235,000 | 270,662 |
| Atlantic City, NJ, Improvement Authority Lease Rev. (Stockton University Campus Phase II Project), “A”, AGM, 4%, 7/01/2040 | | | 340,000 | 390,874 |
| Atlantic City, NJ, Tax Appeal Refunding Bonds (Qualified Pursuant to the Provisions of the Municipal Qualified Bond Act), “A”, BAM, 5%, 3/01/2037 | | | 5,875,000 | 6,796,159 |
| Atlantic City, NJ, Tax Appeal Refunding Bonds (Qualified Pursuant to the Provisions of the Municipal Qualified Bond Act), “A”, BAM, 5%, 3/01/2042 | | | 490,000 | 563,838 |
| Bayonne, NJ, Redevelopment Agency (Royal Caribbean Project), “A”, 5.375%, 11/01/2035 | | | 2,060,000 | 2,020,619 |
| New Jersey Building Authority Rev., Unrefunded Balance, “A”, BAM, 5%, 6/15/2029 (Prerefunded 6/15/2026) | | | 430,000 | 494,749 |
Portfolio of Investments – continued
| Issuer | | | Shares/Par | Value ($) |
| Municipal Bonds - continued |
| New Jersey - continued |
| New Jersey Casino Reinvestment Development Authority, Luxury Tax Rev., AGM, 5%, 11/01/2029 | | $ | 445,000 | $ 479,489 |
| New Jersey Casino Reinvestment Development Authority, Luxury Tax Rev., AGM, 5%, 11/01/2030 | | | 690,000 | 742,294 |
| New Jersey Casino Reinvestment Development Authority, Luxury Tax Rev., AGM, 5%, 11/01/2031 | | | 2,570,000 | 2,761,748 |
| New Jersey Casino Reinvestment Development Authority, Luxury Tax Rev., AGM, 5%, 11/01/2032 | | | 1,305,000 | 1,401,854 |
| New Jersey Economic Development Authority Rev. (Goethals Bridge Replacement Project), 5.5%, 1/01/2027 | | | 325,000 | 351,257 |
| New Jersey Economic Development Authority Rev. (Goethals Bridge Replacement Project), 5%, 1/01/2028 | | | 325,000 | 347,873 |
| New Jersey Economic Development Authority Rev. (Goethals Bridge Replacement Project), AGM, 5%, 1/01/2031 | | | 975,000 | 1,044,002 |
| New Jersey Economic Development Authority Rev. (Goethals Bridge Replacement Project), AGM, 5.125%, 1/01/2039 | | | 1,060,000 | 1,135,634 |
| New Jersey Economic Development Authority Rev. (Goethals Bridge Replacement Project), AGM, 5.125%, 7/01/2042 | | | 530,000 | 567,817 |
| New Jersey Economic Development Authority Rev. (Kapkowski Road Landfill Project), 6.5%, 4/01/2028 | | | 4,000,000 | 4,286,283 |
| New Jersey Economic Development Authority Rev. (Kapkowski Road Landfill Project), 6.5%, 4/01/2031 | | | 8,595,000 | 9,547,801 |
| New Jersey Economic Development Authority Rev. (Provident Group - Montclair Properties LLC - Montclair State University Student Housing Project), AGM, 5%, 6/01/2037 | | | 2,530,000 | 2,956,517 |
| New Jersey Economic Development Authority Rev. (Provident Group - Montclair Properties LLC - Montclair State University Student Housing Project), AGM, 5%, 6/01/2042 | | | 2,810,000 | 3,278,068 |
| New Jersey Economic Development Authority Rev. (Provident Group - Rowan Properties LLC - Rowan University Student Housing Project), “A”, 5%, 1/01/2023 | | | 705,000 | 717,791 |
| New Jersey Economic Development Authority Rev. (Provident Group - Rowan Properties LLC - Rowan University Student Housing Project), “A”, 5%, 1/01/2030 | | | 3,485,000 | 3,632,444 |
| New Jersey Economic Development Authority Rev. (Provident Group - Rowan Properties LLC - Rowan University Student Housing Project), “A”, 5%, 1/01/2035 | | | 1,510,000 | 1,568,786 |
| New Jersey Economic Development Authority Rev. (School Facilities Construction), 5%, 6/15/2032 | | | 1,260,000 | 1,538,194 |
| New Jersey Economic Development Authority Rev. (School Facilities Construction), 5%, 6/15/2033 | | | 665,000 | 810,267 |
| New Jersey Economic Development Authority Rev. (School Facilities Construction), 4%, 6/15/2036 | | | 1,175,000 | 1,311,973 |
Portfolio of Investments – continued
| Issuer | | | Shares/Par | Value ($) |
| Municipal Bonds - continued |
| New Jersey - continued |
| New Jersey Economic Development Authority Rev. (School Facilities Construction), 4%, 6/15/2037 | | $ | 1,130,000 | $ 1,258,585 |
| New Jersey Economic Development Authority Rev. (School Facilities Construction), 4%, 6/15/2038 | | | 1,430,000 | 1,589,523 |
| New Jersey Economic Development Authority Rev. (School Facilities Construction), “DDD”, 5%, 6/15/2034 | | | 825,000 | 948,001 |
| New Jersey Economic Development Authority Rev. (School Facilities Construction), “DDD”, 5%, 6/15/2035 | | | 690,000 | 791,943 |
| New Jersey Economic Development Authority Rev. (School Facilities Construction), “DDD”, 5%, 6/15/2042 | | | 3,850,000 | 4,380,486 |
| New Jersey Economic Development Authority Rev. (School Facilities Construction), “NN”, 5%, 3/01/2027 | | | 5,865,000 | 6,103,726 |
| New Jersey Economic Development Authority, Motor Vehicle Surcharges Subordinate Refunding Rev., “A”, 3.125%, 7/01/2029 | | | 705,000 | 710,267 |
| New Jersey Economic Development Authority, Motor Vehicle Surcharges Subordinate Refunding Rev., “A”, 3.125%, 7/01/2031 (u) | | | 8,500,000 | 8,912,046 |
| New Jersey Economic Development Authority, Motor Vehicle Surcharges Subordinate Refunding Rev., “A”, 5%, 7/01/2033 | | | 400,000 | 457,956 |
| New Jersey Economic Development Authority, Motor Vehicle Surcharges Subordinate Refunding Rev., “A”, BAM, 5%, 7/01/2027 | | | 5,075,000 | 6,007,218 |
| New Jersey Economic Development Authority, Motor Vehicle Surcharges Subordinate Refunding Rev., “A”, BAM, 5%, 7/01/2028 | | | 1,560,000 | 1,836,351 |
| New Jersey Economic Development Authority, Special Facilities Rev. (Continental Airlines, Inc.), 5.125%, 9/15/2023 | | | 4,170,000 | 4,290,800 |
| New Jersey Economic Development Authority, Special Facilities Rev. (Continental Airlines, Inc.), 5.25%, 9/15/2029 | | | 3,370,000 | 3,464,884 |
| New Jersey Economic Development Authority, Special Facilities Rev. (Continental Airlines, Inc.), “A”, 5.625%, 11/15/2030 | | | 6,850,000 | 7,398,607 |
| New Jersey Economic Development Authority, State Lease Rev. (Juvenile Justice Commission Facilities Project), “C”, 5%, 6/15/2042 | | | 3,685,000 | 4,237,084 |
| New Jersey Economic Development Authority, Water Facilities Rev. (Middlesex Water Co.), 5%, 8/01/2059 | | | 2,155,000 | 2,497,116 |
| New Jersey Health Care Facilities, Financing Authority Rev. (University Hospital), “A”, AGM, 5%, 7/01/2046 | | | 10,225,000 | 11,357,458 |
| New Jersey Health Care Facilities, Financing Authority, State Contract Refunding Bonds (Hospital Asset Transformation Program), 5%, 10/01/2031 | | | 1,710,000 | 1,990,383 |
Portfolio of Investments – continued
| Issuer | | | Shares/Par | Value ($) |
| Municipal Bonds - continued |
| New Jersey - continued |
| New Jersey Health Care Facilities, Financing Authority, State Contract Refunding Bonds (Hospital Asset Transformation Program), 5%, 10/01/2032 | | $ | 1,710,000 | $ 1,984,650 |
| New Jersey Health Care Facilities, Financing Authority, State Contract Refunding Bonds (Hospital Asset Transformation Program), 5%, 10/01/2033 | | | 1,450,000 | 1,680,693 |
| New Jersey Health Care Facilities, Financing Authority, State Contract Refunding Bonds (Hospital Asset Transformation Program), 5%, 10/01/2034 | | | 1,455,000 | 1,684,882 |
| New Jersey Health Care Facilities, Financing Authority, State Contract Refunding Bonds (Hospital Asset Transformation Program), 5%, 10/01/2035 | | | 1,285,000 | 1,486,355 |
| New Jersey Health Care Facilities, Financing Authority, State Contract Refunding Bonds (Hospital Asset Transformation Program), 5%, 10/01/2036 | | | 1,490,000 | 1,722,307 |
| New Jersey Health Care Facilities, Financing Authority, State Contract Refunding Bonds (Hospital Asset Transformation Program), 5%, 10/01/2037 | | | 2,475,000 | 2,856,004 |
| New Jersey Higher Education Student Assistance Authority, Senior Student Loan Rev., “B”, 3.25%, 12/01/2039 | | | 7,810,000 | 8,032,626 |
| New Jersey Higher Education Student Assistance Authority, Senior Student Loan Rev., ”B“, 2.5%, 12/01/2040 | | | 2,330,000 | 2,275,861 |
| New Jersey Higher Education Student Assistance Authority, Senior Student Loan Rev., ”C“, 3.25%, 12/01/2051 | | | 960,000 | 905,009 |
| New Jersey Housing & Mortgage Finance Agency, Single Family Housing Rev., “C”, 4.75%, 10/01/2050 (u) | | | 11,745,000 | 12,818,109 |
| New Jersey Housing & Mortgage Finance Agency, Single Family Housing Rev., “H”, 3%, 10/01/2052 | | | 11,590,000 | 12,191,115 |
| New Jersey Transportation Trust Fund Authority, “A”, 4%, 6/15/2038 (w) | | | 1,825,000 | 2,021,380 |
| New Jersey Transportation Trust Fund Authority, “A”, 4%, 6/15/2039 (w) | | | 3,725,000 | 4,113,764 |
| New Jersey Transportation Trust Fund Authority, “A”, 4%, 6/15/2040 (w) | | | 3,520,000 | 3,877,659 |
| New Jersey Transportation Trust Fund Authority, “A”, 4%, 6/15/2041 (w) | | | 3,070,000 | 3,371,561 |
| New Jersey Transportation Trust Fund Authority, “A”, 4%, 6/15/2042 (w) | | | 3,070,000 | 3,360,733 |
| New Jersey Transportation Trust Fund Authority, “AA”, 5%, 6/15/2029 (w) | | | 3,685,000 | 4,392,454 |
| New Jersey Transportation Trust Fund Authority, “AA”, 5%, 6/15/2030 (w) | | | 3,335,000 | 4,040,434 |
Portfolio of Investments – continued
| Issuer | | | Shares/Par | Value ($) |
| Municipal Bonds - continued |
| New Jersey - continued |
| New Jersey Transportation Trust Fund Authority, “AA”, 5%, 6/15/2031 (w) | | $ | 5,280,000 | $ 6,488,649 |
| New Jersey Transportation Trust Fund Authority, “AA”, 5%, 6/15/2032 (w) | | | 3,680,000 | 4,575,406 |
| New Jersey Transportation Trust Fund Authority, “AA”, 5%, 6/15/2033 (w) | | | 4,870,000 | 6,024,497 |
| New Jersey Transportation Trust Fund Authority, “AA”, 5%, 6/15/2034 (w) | | | 4,600,000 | 5,672,815 |
| New Jersey Transportation Trust Fund Authority, “AA”, 5%, 6/15/2035 | | | 1,180,000 | 1,431,947 |
| New Jersey Transportation Trust Fund Authority, “AA”, 5%, 6/15/2035 (w) | | | 4,450,000 | 5,456,316 |
| New Jersey Transportation Trust Fund Authority, “AA”, 5%, 6/15/2036 | | | 1,580,000 | 1,912,338 |
| New Jersey Transportation Trust Fund Authority, “AA”, 5%, 6/15/2036 (w) | | | 4,600,000 | 5,610,635 |
| New Jersey Transportation Trust Fund Authority, “AA”, 5%, 6/15/2037 | | | 1,580,000 | 1,907,202 |
| New Jersey Transportation Trust Fund Authority, “AA”, 5%, 6/15/2037 (w) | | | 2,300,000 | 2,792,651 |
| New Jersey Transportation Trust Fund Authority, “AA”, 4%, 6/15/2038 | | | 1,580,000 | 1,756,411 |
| New Jersey Transportation Trust Fund Authority, “AA”, 5%, 6/15/2038 | | | 1,690,000 | 2,031,561 |
| New Jersey Transportation Trust Fund Authority, “AA”, 5%, 6/15/2039 | | | 1,580,000 | 1,896,475 |
| New Jersey Transportation Trust Fund Authority, “AA”, 5%, 6/15/2040 | | | 1,185,000 | 1,419,906 |
| New Jersey Transportation Trust Fund Authority, “AA”, 5%, 6/15/2045 | | | 3,220,000 | 3,820,089 |
| New Jersey Transportation Trust Fund Authority, “B”, AAC, 5.5%, 9/01/2026 | | | 4,490,000 | 5,274,597 |
| New Jersey Transportation Trust Fund Authority, Federal Highway Reimbursement Rev., “A”, 5%, 6/15/2029 | | | 3,270,000 | 3,737,968 |
| New Jersey Transportation Trust Fund Authority, Federal Highway Reimbursement Rev., “A”, 5%, 6/15/2031 | | | 2,180,000 | 2,484,445 |
| New Jersey Transportation Trust Fund Authority, Federal Highway Reimbursement Rev., “A-1”, 5%, 6/15/2027 | | | 4,395,000 | 5,047,172 |
| New Jersey Transportation Trust Fund Authority, Transportation Program, “A”, 5%, 12/15/2039 | | | 625,000 | 739,771 |
| New Jersey Transportation Trust Fund Authority, Transportation Program, “AA”, 5%, 6/15/2038 | | | 2,500,000 | 2,706,101 |
Portfolio of Investments – continued
| Issuer | | | Shares/Par | Value ($) |
| Municipal Bonds - continued |
| New Jersey - continued |
| New Jersey Transportation Trust Fund Authority, Transportation Program, “BB”, 5%, 6/15/2044 | | $ | 625,000 | $ 725,090 |
| New Jersey Transportation Trust Fund Authority, Transportation System, “A”, 5%, 12/15/2035 | | | 5,000,000 | 5,865,212 |
| New Jersey Transportation Trust Fund Authority, Transportation System, “A”, 5%, 12/15/2036 | | | 5,000,000 | 5,858,019 |
| New Jersey Transportation Trust Fund Authority, Transportation System, Capital Appreciation, “A”, 0%, 12/15/2037 | | | 50,000,000 | 30,496,080 |
| New Jersey Transportation Trust Fund Authority, Transportation System, Capital Appreciation, “C”, AAC, 0%, 12/15/2028 | | | 16,430,000 | 14,119,165 |
| New Jersey Transportation Trust Fund Authority, Transportation System, Capital Appreciation, “C”, AAC, 0%, 12/15/2035 | | | 4,750,000 | 3,207,056 |
| New Jersey Transportation Trust Fund Authority, Transportation System, Capital Appreciation, “C”, AAC, 0%, 12/15/2036 | | | 12,405,000 | 8,075,329 |
| New Jersey Transportation Trust Fund Authority, Transportation System, Capital Appreciation, “C”, AGM, 0%, 12/15/2032 | | | 4,765,000 | 3,684,208 |
| New Jersey Transportation Trust Fund Authority, Transportation System, Capital Appreciation, “C”, NPFG, 0%, 12/15/2027 | | | 9,360,000 | 8,280,729 |
| New Jersey Transportation Trust Fund Authority, Transportation System, Capital Appreciation, “C”, NPFG, 0%, 12/15/2031 | | | 15,000,000 | 11,703,548 |
| New Jersey Turnpike Authority, Turnpike Rev., “A”, 4%, 1/01/2042 | | | 2,660,000 | 3,048,801 |
| Newark, NJ, Board of Education, Energy Savings Obligation Refunding, BAM, 5%, 7/15/2032 | | | 214,000 | 269,718 |
| Newark, NJ, Board of Education, Energy Savings Obligation Refunding, BAM, 5%, 7/15/2033 | | | 261,000 | 328,791 |
| Newark, NJ, Board of Education, Energy Savings Obligation Refunding, BAM, 4%, 7/15/2034 | | | 413,000 | 481,563 |
| Newark, NJ, Board of Education, Energy Savings Obligation Refunding, BAM, 4%, 7/15/2036 | | | 402,000 | 466,006 |
| State of New Jersey, COVID-19 General Obligation, “A”, 4%, 6/01/2023 | | | 7,035,000 | 7,311,901 |
| State of New Jersey, COVID-19 General Obligation, “A”, 5%, 6/01/2024 | | | 3,520,000 | 3,819,941 |
| State of New Jersey, COVID-19 General Obligation, “A”, 5%, 6/01/2027 | | | 20,195,000 | 23,626,559 |
| State of New Jersey, COVID-19 General Obligation, “A”, 4%, 6/01/2030 | | | 4,070,000 | 4,675,360 |
| | | | | $399,640,404 |
Portfolio of Investments – continued
| Issuer | | | Shares/Par | Value ($) |
| Municipal Bonds - continued |
| New Mexico - 0.3% |
| Farmington, NM, Pollution Control Rev. (Public Service Company of New Mexico San Juan Project), “A”, 0.875%, 6/01/2040 (Put Date 10/01/2026) | | $ | 1,700,000 | $ 1,658,405 |
| Los Ranchos de Albuquerque, NM, Education Facilities Rev. (Albuquerque Academy Project), 4%, 9/01/2040 | | | 575,000 | 639,868 |
| New Mexico Educational Assistance Foundation, “B-1”, 2.106%, 9/01/2051 | | | 6,405,000 | 6,343,511 |
| New Mexico Mortgage Finance Authority, Single Family Mortgage Program, “A-1”, FNMA, 4%, 1/01/2049 | | | 1,145,000 | 1,223,823 |
| New Mexico Mortgage Finance Authority, Single Family Mortgage Program, “C”, FNMA, 4%, 1/01/2049 | | | 2,335,000 | 2,491,850 |
| New Mexico Mortgage Finance Authority, Single Family Mortgage Program, “I”, 3%, 1/01/2052 | | | 4,025,000 | 4,224,272 |
| Santa Fe, NM, Retirement Facility Rev. (El Castillo Retirement Residences Project), “A”, 5%, 5/15/2034 | | | 355,000 | 395,008 |
| Santa Fe, NM, Retirement Facility Rev. (El Castillo Retirement Residences Project), “A”, 5%, 5/15/2039 | | | 275,000 | 304,216 |
| Santa Fe, NM, Retirement Facility Rev. (El Castillo Retirement Residences Project), “A”, 5%, 5/15/2044 | | | 285,000 | 313,450 |
| Santa Fe, NM, Retirement Facility Rev. (El Castillo Retirement Residences Project), “A”, 5%, 5/15/2049 | | | 735,000 | 806,181 |
| | | | | $18,400,584 |
| New York - 6.2% |
| Buffalo & Erie County, NY, Industrial Land Development Corp. Rev. (Charter School for Applied Technologies Project), “A”, 5%, 6/01/2035 | | $ | 1,000,000 | $ 1,089,935 |
| Build NYC Resource Corp. Rev. (Albert Einstein School of Medicine, Inc.), 5.5%, 9/01/2045 (n) | | | 3,370,000 | 3,725,100 |
| Build NYC Resource Corp. Rev. (International Leadership Charter High School Project), “A”, 6.25%, 7/01/2046 (n) | | | 1,315,000 | 1,424,175 |
| Build NYC Resource Corp. Rev. (International Leadership Charter School Project), 5.75%, 7/01/2033 | | | 3,860,000 | 3,967,352 |
| Build NYC Resource Corp. Rev. (International Leadership Charter School Project), 6%, 7/01/2043 | | | 4,025,000 | 4,137,222 |
| Jefferson County, NY, Civic Development Corp. Rev. (Samaritan Medical Center), “A”, 4%, 11/01/2032 | | | 535,000 | 565,933 |
| Metropolitan Transportation Authority Rev., NY, Anticipation Note, “B-1”, 5%, 5/15/2022 | | | 6,545,000 | 6,622,106 |
| New Rochelle, NY, Corp. for Local Development Rev. (Iona College Project), “A”, 5%, 7/01/2034 | | | 785,000 | 863,218 |
| New Rochelle, NY, Corp. for Local Development Rev. (Iona College Project), “A”, 5%, 7/01/2040 | | | 2,130,000 | 2,336,198 |
Portfolio of Investments – continued
| Issuer | | | Shares/Par | Value ($) |
| Municipal Bonds - continued |
| New York - continued |
| New Rochelle, NY, Corp. for Local Development Rev. (Iona College Project), “A”, 5%, 7/01/2045 | | $ | 990,000 | $ 1,080,778 |
| New York Dormitory Authority Rev., Non-State Supported Debt (Orange Regional Medical Center Obligated Group Rev.), 5%, 12/01/2033 (n) | | | 800,000 | 925,729 |
| New York Dormitory Authority Rev., Non-State Supported Debt (Orange Regional Medical Center Obligated Group Rev.), 5%, 12/01/2035 (n) | | | 1,500,000 | 1,731,204 |
| New York Dormitory Authority Rev., Non-State Supported Debt (Orange Regional Medical Center Obligated Group Rev.), 5%, 12/01/2040 (n) | | | 1,000,000 | 1,109,173 |
| New York Environmental Facilities Corp. Rev., Solid Waste Disposal (Casella Waste Management, Inc. Project), 2.75%, 9/01/2050 (Put Date 9/02/2025) (n) | | | 620,000 | 642,879 |
| New York Liberty Development Corp. Rev. (Goldman Sachs Headquarters), 5.25%, 10/01/2035 | | | 15,000,000 | 19,873,047 |
| New York Liberty Development Corp., Liberty Rev. (3 World Trade Center Project), “1”, 5%, 11/15/2044 (n) | | | 22,365,000 | 24,035,044 |
| New York Liberty Development Corp., Liberty Rev. (3 World Trade Center Project), “2”, 5.375%, 11/15/2040 (n) | | | 5,850,000 | 6,380,597 |
| New York State Thruway Authority, Personal Income Rev., “A-1”, 4%, 3/15/2046 | | | 20,165,000 | 22,567,182 |
| New York Transportation Development Corp., Special Facilities Rev. (American Airlines, Inc. John F. Kennedy International Airport Project), 5%, 8/01/2026 | | | 8,340,000 | 8,424,034 |
| New York Transportation Development Corp., Special Facilities Rev. (American Airlines, Inc. John F. Kennedy International Airport Project), 3%, 8/01/2031 | | | 765,000 | 795,842 |
| New York Transportation Development Corp., Special Facilities Rev. (American Airlines, Inc. John F. Kennedy International Airport Project), 5%, 8/01/2031 | | | 5,220,000 | 5,272,597 |
| New York Transportation Development Corp., Special Facilities Rev. (American Airlines, Inc. John F. Kennedy International Airport Project), 5.25%, 8/01/2031 | | | 2,100,000 | 2,413,025 |
| New York Transportation Development Corp., Special Facilities Rev. (American Airlines, Inc. John F. Kennedy International Airport Project), 5.375%, 8/01/2036 | | | 3,500,000 | 4,231,943 |
| New York Transportation Development Corp., Special Facilities Rev. (Delta Airlines, Inc. LaGuardia Airport Terminals C&D Redevelopment Project), 5%, 1/01/2031 | | | 10,485,000 | 12,134,428 |
| New York Transportation Development Corp., Special Facilities Rev. (Delta Airlines, Inc. LaGuardia Airport Terminals C&D Redevelopment Project), 5%, 1/01/2032 | | | 4,100,000 | 4,735,056 |
Portfolio of Investments – continued
| Issuer | | | Shares/Par | Value ($) |
| Municipal Bonds - continued |
| New York - continued |
| New York Transportation Development Corp., Special Facilities Rev. (Delta Airlines, Inc. LaGuardia Airport Terminals C&D Redevelopment Project), 5%, 10/01/2035 | | $ | 1,415,000 | $ 1,676,978 |
| New York Transportation Development Corp., Special Facilities Rev. (Delta Airlines, Inc. LaGuardia Airport Terminals C&D Redevelopment Project), 4%, 1/01/2036 | | | 1,270,000 | 1,381,530 |
| New York Transportation Development Corp., Special Facilities Rev. (Delta Airlines, Inc. LaGuardia Airport Terminals C&D Redevelopment Project), 5%, 10/01/2040 | | | 4,000,000 | 4,675,776 |
| New York Transportation Development Corp., Special Facilities Rev. (Delta Airlines, Inc. LaGuardia Airport Terminals C&D Redevelopment Project), 4.375%, 10/01/2045 | | | 19,055,000 | 21,174,177 |
| New York Transportation Development Corp., Special Facilities Rev. (John F. Kennedy International Airport Project), 2.25%, 8/01/2026 | | | 1,265,000 | 1,271,477 |
| New York Transportation Development Corp., Special Facilities Rev. (Terminal 4 John F. Kennedy International Airport Project), “A”, 5%, 12/01/2030 | | | 395,000 | 476,336 |
| New York Transportation Development Corp., Special Facilities Rev. (Terminal 4 John F. Kennedy International Airport Project), “A”, 5%, 12/01/2034 | | | 710,000 | 851,269 |
| New York Transportation Development Corp., Special Facilities Rev. (Terminal 4 John F. Kennedy International Airport Project), “A”, 5%, 12/01/2035 | | | 345,000 | 412,297 |
| New York Transportation Development Corp., Special Facilities Rev. (Terminal 4 John F. Kennedy International Airport Project), “A”, 5%, 12/01/2036 | | | 55,000 | 65,605 |
| New York Transportation Development Corp., Special Facilities Rev. (Terminal 4 John F. Kennedy International Airport Project), “A”, 5%, 12/01/2037 | | | 570,000 | 679,779 |
| New York Transportation Development Corp., Special Facilities Rev. (Terminal 4 John F. Kennedy International Airport Project), “A”, 4%, 12/01/2038 | | | 235,000 | 256,810 |
| New York Transportation Development Corp., Special Facilities Rev. (Terminal 4 John F. Kennedy International Airport Project), “A”, 4%, 12/01/2039 | | | 570,000 | 621,965 |
| New York Transportation Development Corp., Special Facilities Rev. (Terminal 4 John F. Kennedy International Airport Project), “C”, 5%, 12/01/2029 | | | 640,000 | 765,327 |
| New York Transportation Development Corp., Special Facilities Rev. (Terminal 4 John F. Kennedy International Airport Project), “C”, 5%, 12/01/2030 | | | 525,000 | 633,105 |
Portfolio of Investments – continued
| Issuer | | | Shares/Par | Value ($) |
| Municipal Bonds - continued |
| New York - continued |
| New York Transportation Development Corp., Special Facilities Rev. (Terminal 4 John F. Kennedy International Airport Project), “C”, 5%, 12/01/2031 | | $ | 580,000 | $ 699,913 |
| New York Transportation Development Corp., Special Facilities Rev. (Terminal 4 John F. Kennedy International Airport Project), “C”, 5%, 12/01/2033 | | | 1,685,000 | 2,033,702 |
| New York Transportation Development Corp., Special Facilities Rev. (Terminal 4 John F. Kennedy International Airport Project), “C”, 5%, 12/01/2034 | | | 1,555,000 | 1,873,981 |
| New York Transportation Development Corp., Special Facilities Rev. (Terminal 4 John F. Kennedy International Airport Project), “C”, 5%, 12/01/2035 | | | 580,000 | 698,229 |
| New York Transportation Development Corp., Special Facilities Rev. (Terminal 4 John F. Kennedy International Airport Project), “C”, 5%, 12/01/2036 | | | 1,055,000 | 1,268,601 |
| New York Transportation Development Corp., Special Facilities Rev. (Terminal 4 John F. Kennedy International Airport Project), “C”, 5%, 12/01/2037 | | | 1,265,000 | 1,520,823 |
| New York Transportation Development Corp., Special Facilities Rev. (Terminal 4 John F. Kennedy International Airport Project), “C”, 5%, 12/01/2038 | | | 295,000 | 353,990 |
| New York, NY, Housing Development Corp., Multi-Family Housing Rev. (8 Spruce Street), “E”, 3.5%, 2/15/2048 | | | 2,308,324 | 2,342,777 |
| New York, NY, Housing Development Corp., Multi-Family Housing Rev. (8 Spruce Street), “F”, 4.5%, 2/15/2048 | | | 46,653,261 | 47,403,777 |
| New York, NY, Industrial Development Agency Pilot Refunding Rev. (Yankee Stadium Project), “A”, AGM, 4%, 3/01/2045 | | | 945,000 | 1,055,640 |
| New York, NY, Industrial Development Agency, Airport Facilities Rev. (Transportation Infrastructure Properties LLC), 5%, 7/01/2028 | | | 1,075,000 | 1,089,513 |
| New York, NY, Transitional Finance Authority Building Aid Rev., “S-3”, 5%, 7/15/2043 | | | 975,000 | 1,167,741 |
| New York, NY, Transitional Finance Authority Future Tax Secured Subordinate, “C”, 4%, 2/01/2041 (w) | | | 19,165,000 | 21,915,603 |
| New York, NY, Transitional Finance Authority Future Tax Secured Subordinate, “E-1”, 5%, 2/01/2035 | | | 1,335,000 | 1,670,650 |
| New York, NY, Transitional Finance Authority Future Tax Secured Subordinate, “E-1”, 5%, 2/01/2036 | | | 935,000 | 1,168,076 |
| New York, NY, Transitional Finance Authority Future Tax Secured Subordinate, “E-1”, 5%, 2/01/2037 | | | 4,980,000 | 6,209,259 |
| New York, NY, Trust for Cultural Resources (Lincoln Center for the Performing Arts, Inc.), “A”, 4%, 12/01/2035 | | | 260,000 | 294,874 |
Portfolio of Investments – continued
| Issuer | | | Shares/Par | Value ($) |
| Municipal Bonds - continued |
| New York - continued |
| New York, NY, Trust for Cultural Resources Refunding Rev. (Lincoln Center for the Performing Arts, Inc.), “A”, 5%, 12/01/2031 | | $ | 350,000 | $ 441,095 |
| New York, NY, Trust for Cultural Resources Refunding Rev. (Lincoln Center for the Performing Arts, Inc.), “A”, 5%, 12/01/2032 | | | 1,160,000 | 1,460,660 |
| New York, NY, Trust for Cultural Resources Refunding Rev. (Lincoln Center for the Performing Arts, Inc.), “A”, 4%, 12/01/2034 | | | 965,000 | 1,103,937 |
| Niagara County, NY, Industrial Development Agency, Solid Waste Disposal Rev. (Covanta Energy Project), “A”, 4.75%, 11/01/2042 (n) | | | 6,865,000 | 7,044,340 |
| Orange County, NY, Funding Corp. Assisted Living Residence Rev. (Hamlet at Wallkill Assisted Living Project), 6.5%, 1/01/2046 | | | 6,700,000 | 6,714,769 |
| Port Authority of NY & NJ (214th Series), 4%, 9/01/2037 | | | 2,780,000 | 3,080,477 |
| Port Authority of NY & NJ (214th Series), 4%, 9/01/2039 | | | 1,245,000 | 1,372,690 |
| Port Authority of NY & NJ (214th Series), 4%, 9/01/2043 | | | 2,015,000 | 2,206,901 |
| Port Authority of NY & NJ (221st Series), 4%, 7/15/2045 | | | 1,570,000 | 1,719,982 |
| Port Authority of NY & NJ (223th Series), 5%, 7/15/2033 | | | 1,025,000 | 1,276,222 |
| Port Authority of NY & NJ (223th Series), 4%, 7/15/2034 | | | 1,170,000 | 1,329,769 |
| Port Authority of NY & NJ (223th Series), 4%, 7/15/2035 | | | 1,200,000 | 1,358,594 |
| Port Authority of NY & NJ (223th Series), 4%, 7/15/2036 | | | 730,000 | 824,214 |
| Port Authority of NY & NJ (223th Series), 4%, 7/15/2037 | | | 1,595,000 | 1,795,301 |
| Port Authority of NY & NJ (223th Series), 4%, 7/15/2038 | | | 3,195,000 | 3,583,148 |
| Port Authority of NY & NJ (223th Series), 4%, 7/15/2039 | | | 2,130,000 | 2,383,055 |
| Port Authority of NY & NJ (223th Series), 4%, 7/15/2040 | | | 930,000 | 1,037,747 |
| Port Authority of NY & NJ (226th Series), 5%, 10/15/2030 | | | 985,000 | 1,224,312 |
| Port Authority of NY & NJ (226th Series), 5%, 10/15/2032 | | | 650,000 | 815,994 |
| Port Authority of NY & NJ (226th Series), 5%, 10/15/2033 | | | 770,000 | 963,090 |
| Port Authority of NY & NJ (226th Series), 5%, 10/15/2034 | | | 1,280,000 | 1,597,378 |
| Port Authority of NY & NJ (226th Series), 5%, 10/15/2035 | | | 1,175,000 | 1,460,997 |
| Port Authority of NY & NJ (226th Series), 5%, 10/15/2036 | | | 1,225,000 | 1,517,704 |
| Port Authority of NY & NJ (226th Series), 5%, 10/15/2037 | | | 1,730,000 | 2,137,473 |
| Port Authority of NY & NJ (226th Series), 5%, 10/15/2038 | | | 3,410,000 | 4,201,229 |
| Port Authority of NY & NJ (226th Series), 5%, 10/15/2039 | | | 2,530,000 | 3,109,615 |
| Port Authority of NY & NJ (226th Series), 5%, 10/15/2040 | | | 2,480,000 | 3,040,155 |
| Port Authority of NY & NJ (226th Series), 5%, 10/15/2041 | | | 2,025,000 | 2,478,551 |
| Suffolk, NY, Tobacco Asset Securitization Corp., Tobacco Settlement, “B-1”, 4%, 6/01/2050 | | | 960,000 | 1,040,451 |
| Suffolk, NY, Tobacco Asset Securitization Corp., Tobacco Settlement, Capital Appreciation, “B-2”, 0%, 6/01/2066 | | | 12,995,000 | 2,178,037 |
Portfolio of Investments – continued
| Issuer | | | Shares/Par | Value ($) |
| Municipal Bonds - continued |
| New York - continued |
| Syracuse, NY, Industrial Development Agency PILOT Rev. (Carousel Center Project), “A”, 5%, 1/01/2028 | | $ | 1,905,000 | $ 1,836,203 |
| Syracuse, NY, Industrial Development Agency PILOT Rev. (Carousel Center Project), “A”, 5%, 1/01/2029 | | | 2,955,000 | 2,815,895 |
| Syracuse, NY, Industrial Development Agency PILOT Rev. (Carousel Center Project), “A”, 5%, 1/01/2030 | | | 2,135,000 | 2,008,687 |
| Syracuse, NY, Industrial Development Agency PILOT Rev. (Carousel Center Project), “A”, 5%, 1/01/2031 | | | 5,765,000 | 5,362,502 |
| Syracuse, NY, Industrial Development Agency PILOT Rev. (Carousel Center Project), “A”, 5%, 1/01/2032 | | | 7,900,000 | 7,277,327 |
| Syracuse, NY, Industrial Development Agency PILOT Rev. (Carousel Center Project), “A”, 5%, 1/01/2033 | | | 4,625,000 | 4,206,573 |
| Syracuse, NY, Industrial Development Agency PILOT Rev. (Carousel Center Project), “A”, 5%, 1/01/2034 | | | 17,535,000 | 15,812,570 |
| Syracuse, NY, Industrial Development Agency PILOT Rev. (Carousel Center Project), “A”, 5%, 1/01/2035 | | | 13,015,000 | 11,686,027 |
| Syracuse, NY, Industrial Development Agency PILOT Rev. (Carousel Center Project), “A”, 5%, 1/01/2036 | | | 4,435,000 | 3,944,200 |
| Tobacco Settlement Asset Securitization Corp., NY, “A”, 5%, 6/01/2034 | | | 825,000 | 952,748 |
| Tobacco Settlement Asset Securitization Corp., NY, “A”, 5%, 6/01/2035 | | | 410,000 | 472,769 |
| Tobacco Settlement Asset Securitization Corp., NY, “A”, 5%, 6/01/2041 | | | 3,020,000 | 3,421,910 |
| Triborough Bridge & Tunnel Authority Rev., NY, “A”, FLR, 0.407% (67% of SOFR - 1 day + 0.38%), 1/01/2032 (Put Date 2/01/2024) | | | 2,890,000 | 2,890,426 |
| Triborough Bridge & Tunnel Authority Rev., NY, Payroll Mobility Tax (MTA Bridges and Tunnels), ”A-2“, 5%, 5/15/2051 | | | 16,090,000 | 19,834,656 |
| Ulster County, NY, Capital Resource Corp. Rev. (Woodland Pond at New Paltz Project), 4%, 9/15/2025 | | | 2,080,000 | 2,029,266 |
| Ulster County, NY, Capital Resource Corp. Rev. (Woodland Pond at New Paltz Project), 5%, 9/15/2037 | | | 7,780,000 | 7,525,666 |
| | | | | $425,368,689 |
Portfolio of Investments – continued
| Issuer | | | Shares/Par | Value ($) |
| Municipal Bonds - continued |
| North Carolina - 0.7% |
| North Carolina Medical Care Commission, Health Care Facilities First Mortgage Rev. (Lutheran Services for the Aging), “A”, 4%, 3/01/2030 | | $ | 285,000 | $ 312,599 |
| North Carolina Medical Care Commission, Health Care Facilities First Mortgage Rev. (Lutheran Services for the Aging), “A”, 4%, 3/01/2036 | | | 860,000 | 927,900 |
| North Carolina Medical Care Commission, Health Care Facilities First Mortgage Rev. (Lutheran Services for the Aging), “A”, 4%, 3/01/2041 | | | 505,000 | 536,608 |
| North Carolina Medical Care Commission, Health Care Facilities First Mortgage Rev. (Lutheran Services for the Aging), “A”, 4%, 3/01/2051 | | | 8,915,000 | 9,336,794 |
| North Carolina Medical Care Commission, Health Care Facilities First Mortgage Rev. (Lutheran Services for the Aging), “C”, 4%, 3/01/2036 | | | 635,000 | 671,152 |
| North Carolina Medical Care Commission, Health Care Facilities First Mortgage Rev. (Lutheran Services for the Aging), “C”, 4%, 3/01/2042 | | | 240,000 | 249,830 |
| North Carolina Medical Care Commission, Health Care Facilities First Mortgage Rev. (Pennybyrn at Maryfield), 5%, 10/01/2025 | | | 845,000 | 894,318 |
| North Carolina Medical Care Commission, Health Care Facilities First Mortgage Rev. (Pennybyrn at Maryfield), 5%, 10/01/2030 | | | 1,320,000 | 1,389,132 |
| North Carolina Medical Care Commission, Health Care Facilities First Mortgage Rev. (Pennybyrn at Maryfield), 5%, 10/01/2035 | | | 765,000 | 801,059 |
| North Carolina Medical Care Commission, Health Care Facilities First Mortgage Rev. (Presbyterian Homes Obligated Group), “A”, 5%, 10/01/2040 | | | 975,000 | 1,148,897 |
| North Carolina Medical Care Commission, Health Care Facilities First Mortgage Rev. (Presbyterian Homes Obligated Group), “A”, 5%, 10/01/2045 | | | 925,000 | 1,079,105 |
| North Carolina Medical Care Commission, Health Care Facilities First Mortgage Rev. (Presbyterian Homes Obligated Group), “A”, 5%, 10/01/2050 | | | 595,000 | 690,661 |
| North Carolina Medical Care Commission, Health Care Facilities Rev. (Novant Health Obligated Group), “A”, 4%, 11/01/2052 | | | 3,085,000 | 3,450,228 |
| North Carolina Medical Care Commission, Retirement Facilities First Mortgage Refunding Rev. (United Church Homes and Services), “C”, 5%, 9/01/2041 (Prerefunded 9/01/2023) | | | 1,745,000 | 1,904,408 |
Portfolio of Investments – continued
| Issuer | | | Shares/Par | Value ($) |
| Municipal Bonds - continued |
| North Carolina - continued |
| North Carolina Medical Care Commission, Retirement Facilities First Mortgage Rev. (Pennybyrn at Maryfield Project), “A”, 5%, 10/01/2040 | | $ | 1,075,000 | $ 1,189,531 |
| North Carolina Medical Care Commission, Retirement Facilities First Mortgage Rev. (Pennybyrn at Maryfield Project), “A”, 5%, 10/01/2045 | | | 1,000,000 | 1,094,534 |
| North Carolina Medical Care Commission, Retirement Facilities First Mortgage Rev. (Salemtowne), “A”, 5%, 10/01/2026 | | | 3,055,000 | 3,319,352 |
| North Carolina Medical Care Commission, Retirement Facilities First Mortgage Rev. (Salemtowne), “A”, 5%, 10/01/2030 | | | 1,500,000 | 1,610,736 |
| North Carolina Medical Care Commission, Retirement Facilities First Mortgage Rev. (Sharon Towers), “A”, 5%, 7/01/2039 | | | 1,540,000 | 1,698,779 |
| North Carolina Medical Care Commission, Retirement Facilities First Mortgage Rev. (Sharon Towers), “A”, 5%, 7/01/2044 | | | 1,030,000 | 1,129,436 |
| North Carolina Medical Care Commission, Retirement Facilities First Mortgage Rev. (Southminster), 5%, 10/01/2037 | | | 2,700,000 | 2,873,379 |
| North Carolina Medical Care Commission, Retirement Facilities First Mortgage Rev. (United Church Homes and Services), “A”, 5%, 9/01/2037 (Prerefunded 9/01/2024) | | | 1,265,000 | 1,384,894 |
| North Carolina Medical Care Commission, Retirement Facilities First Mortgage Rev. (United Church Homes and Services), “C”, 5%, 9/01/2046 (Prerefunded 9/01/2023) | | | 1,815,000 | 1,980,803 |
| North Carolina Turnpike Authority, Monroe Expressway Toll Rev., “A”, 5%, 7/01/2042 | | | 505,000 | 561,994 |
| North Carolina Turnpike Authority, Monroe Expressway Toll Rev., “A”, 5%, 7/01/2047 | | | 990,000 | 1,096,065 |
| North Carolina Turnpike Authority, Monroe Expressway Toll Rev., “A”, 5%, 7/01/2051 | | | 2,015,000 | 2,227,509 |
| North Carolina Turnpike Authority, Monroe Expressway Toll Rev., “A”, 5%, 7/01/2054 | | | 805,000 | 888,553 |
| University of North Carolina at Wilmington (Student Housing Projects), 5%, 6/01/2029 | | | 1,190,000 | 1,326,729 |
| University of North Carolina, Greensboro, Rev., 5%, 4/01/2039 | | | 955,000 | 1,035,002 |
| | | | | $46,809,987 |
| North Dakota - 0.3% |
| North Dakota Housing Finance Agency Rev. (Home Mortgage Finance Program), “B”, 4%, 1/01/2036 | | $ | 415,000 | $ 430,073 |
| North Dakota Housing Finance Agency Rev. (Home Mortgage Finance Program), “D”, 4.25%, 1/01/2049 (u) | | | 4,960,000 | 5,312,029 |
| Ward County, ND, Health Care Facilities Rev. (Trinity Obligated Group), “C”, 5%, 6/01/2034 | | | 5,445,000 | 6,297,517 |
Portfolio of Investments – continued
| Issuer | | | Shares/Par | Value ($) |
| Municipal Bonds - continued |
| North Dakota - continued |
| Ward County, ND, Health Care Facilities Rev. (Trinity Obligated Group), “C”, 5%, 6/01/2038 | | $ | 3,050,000 | $ 3,513,893 |
| Ward County, ND, Health Care Facilities Rev. (Trinity Obligated Group), “C”, 5%, 6/01/2048 | | | 710,000 | 805,321 |
| Ward County, ND, Health Care Facilities Rev. (Trinity Obligated Group), “C”, 5%, 6/01/2053 | | | 5,310,000 | 5,995,974 |
| | | | | $22,354,807 |
| Ohio - 4.5% |
| Akron, Bath, & Copley, OH, Joint Township Hospital District Facilities Rev. (Summa Health Obligated Group), 5%, 11/15/2032 | | $ | 385,000 | $ 474,136 |
| American Municipal Power, Inc. (Prairie State Energy Campus Project), “A”, 5%, 2/15/2042 | | | 3,440,000 | 3,681,736 |
| Buckeye, OH, Tobacco Settlement Financing Authority Rev., “A-3”, 6.25%, 6/01/2037 (Prerefunded 6/01/2022) | | | 14,535,000 | 14,815,367 |
| Buckeye, OH, Tobacco Settlement Financing Authority Senior Asset-Backed Refunding, 2020A-2, “1”, 5%, 6/01/2031 | | | 2,200,000 | 2,717,626 |
| Buckeye, OH, Tobacco Settlement Financing Authority Senior Asset-Backed Refunding, 2020A-2, “1”, 5%, 6/01/2034 | | | 1,100,000 | 1,348,010 |
| Buckeye, OH, Tobacco Settlement Financing Authority Senior Asset-Backed Refunding, 2020A-2, “1”, 5%, 6/01/2035 | | | 550,000 | 671,819 |
| Buckeye, OH, Tobacco Settlement Financing Authority Senior Asset-Backed Refunding, 2020A-2, “1”, 5%, 6/01/2036 | | | 1,720,000 | 2,092,155 |
| Buckeye, OH, Tobacco Settlement Financing Authority Senior Asset-Backed Refunding, 2020A-2, “1”, 4%, 6/01/2039 | | | 550,000 | 618,726 |
| Buckeye, OH, Tobacco Settlement Financing Authority Senior Asset-Backed Refunding, 2020B-2, “2”, 5%, 6/01/2055 | | | 83,285,000 | 91,545,981 |
| Buckeye, OH, Tobacco Settlement Financing Authority Senior Asset-Backed Refunding, Capital Appreciation, 2020B-3, “2”, 0%, 6/01/2057 | | | 76,490,000 | 11,990,832 |
| Butler County, OH, Hospital Facilities Rev. (UC Health), 4%, 11/15/2035 | | | 1,500,000 | 1,647,584 |
| Butler County, OH, Hospital Facilities Rev. (UC Health), 4%, 11/15/2036 | | | 2,000,000 | 2,192,216 |
| Butler County, OH, Hospital Facilities Rev. (UC Health), 4%, 11/15/2037 | | | 1,250,000 | 1,368,712 |
| Centerville, OH, Health Care Improvement and Refunding Rev. (Graceworks Lutheran Services), 5.25%, 11/01/2037 | | | 920,000 | 1,001,112 |
| Centerville, OH, Health Care Improvement and Refunding Rev. (Graceworks Lutheran Services), 5.25%, 11/01/2047 | | | 2,480,000 | 2,663,946 |
| Centerville, OH, Health Care Improvement and Refunding Rev. (Graceworks Lutheran Services), 5.25%, 11/01/2050 | | | 915,000 | 981,402 |
Portfolio of Investments – continued
| Issuer | | | Shares/Par | Value ($) |
| Municipal Bonds - continued |
| Ohio - continued |
| Cuyahoga County, OH, Hospital Rev. (Metrohealth System), 5%, 2/15/2037 | | $ | 1,250,000 | $ 1,438,501 |
| Cuyahoga County, OH, Hospital Rev. (Metrohealth System), 5%, 2/15/2042 | | | 3,915,000 | 4,504,124 |
| Cuyahoga County, OH, Hospital Rev. (Metrohealth System), 4.75%, 2/15/2047 | | | 5,240,000 | 5,885,532 |
| Cuyahoga County, OH, Hospital Rev. (Metrohealth System), 5.25%, 2/15/2047 | | | 3,160,000 | 3,670,167 |
| Cuyahoga County, OH, Hospital Rev. (Metrohealth System), 5%, 2/15/2057 | | | 3,355,000 | 3,836,425 |
| Cuyahoga County, OH, Hospital Rev. (Metrohealth System), 5.5%, 2/15/2057 | | | 14,395,000 | 16,894,352 |
| Cuyahoga County, OH, Port Authority Tax Increment Financing Rev. (Flats East Bank Project), “A”, 4%, 12/01/2055 (n) | | | 910,000 | 927,755 |
| Cuyahoga County, OH, Port Authority Tax Increment Financing Rev. (Flats East Bank Project), “B”, 4.5%, 12/01/2055 (n) | | | 520,000 | 536,247 |
| Darke County, OH, Hospital Facilities Rev. (Wayne Healthcare Project), “A”, 4%, 9/01/2040 | | | 860,000 | 900,715 |
| Darke County, OH, Hospital Facilities Rev. (Wayne Healthcare Project), “A”, 4%, 9/01/2045 | | | 1,545,000 | 1,604,695 |
| Darke County, OH, Hospital Facilities Rev. (Wayne Healthcare Project), “A”, 5%, 9/01/2049 | | | 1,725,000 | 1,928,027 |
| Franklin County, OH, Health Care Facilities Improvement Rev. (Friendship Village of Dublin, Inc.), 5%, 11/15/2034 | | | 1,380,000 | 1,488,877 |
| Franklin County, OH, Health Care Facilities Improvement Rev. (Friendship Village of Dublin, Inc.), 5%, 11/15/2044 | | | 2,055,000 | 2,198,090 |
| Gallia County, OH, Hospital Facilities Rev. (Holzer Health Systems), “A”, 8%, 7/01/2042 (Prerefunded 7/01/2022) | | | 7,810,000 | 8,043,139 |
| Hickory Chase, OH, Community Authority Infrastructure Improvement Rev. (Hickory Chase Project), “A”, 5%, 12/01/2040 (n) | | | 1,930,000 | 2,033,966 |
| Lucas County, OH, Hospital Rev. (Promedica Healthcare), “A”, 5.25%, 11/15/2048 | | | 2,215,000 | 2,597,544 |
| Miami County, OH, Hospital Facilities Rev. (Kettering Health), “A”, 5%, 8/01/2049 | | | 13,945,000 | 16,513,503 |
| Middleburg Heights, OH, Hospital Facilities Improvement Rev. (Southwest General Health Center Project), “A”, 4%, 8/01/2041 | | | 3,455,000 | 3,922,465 |
| Middleburg Heights, OH, Hospital Facilities Improvement Rev. (Southwest General Health Center Project), “A”, 4%, 8/01/2047 | | | 1,910,000 | 2,119,561 |
| Montgomery County, OH, Hospital Facilities Improvement and Refunding Rev. (Kettering Health Network Obligated Group Project), 4%, 8/01/2041 | | | 390,000 | 443,660 |
Portfolio of Investments – continued
| Issuer | | | Shares/Par | Value ($) |
| Municipal Bonds - continued |
| Ohio - continued |
| Montgomery County, OH, Hospital Facilities Rev. (Premier Health Partners Obligated Group), “A”, 4%, 11/15/2038 | | $ | 5,490,000 | $ 6,075,046 |
| Montgomery County, OH, Hospital Facilities Rev. (Premier Health Partners Obligated Group), “A”, 5%, 11/15/2035 | | | 1,000,000 | 1,196,072 |
| Northeast Ohio Medical University, General Receipts, “A”, 4%, 12/01/2035 | | | 160,000 | 177,545 |
| Northeast Ohio Medical University, General Receipts, “A”, 4%, 12/01/2045 | | | 120,000 | 130,344 |
| Ohio Air Quality Development Authority, Facilities Rev. (Pratt Paper LLC Project), 3.75%, 1/15/2028 (n) | | | 5,000,000 | 5,481,782 |
| Ohio Air Quality Development Authority, Facilities Rev. (Pratt Paper LLC Project), 4.25%, 1/15/2038 (n) | | | 2,325,000 | 2,588,175 |
| Ohio Air Quality Development Authority, Facilities Rev. (Pratt Paper LLC Project), 4.5%, 1/15/2048 (n) | | | 3,115,000 | 3,510,811 |
| Ohio Educational Facility Commission Rev. (Cleveland Institute of Art Project), 5%, 12/01/2038 | | | 1,360,000 | 1,496,803 |
| Ohio Educational Facility Commission Rev. (Cleveland Institute of Art Project), 5.25%, 12/01/2043 | | | 1,390,000 | 1,533,030 |
| Ohio Educational Facility Commission Rev. (Cleveland Institute of Art Project), 5.25%, 12/01/2048 | | | 1,600,000 | 1,755,481 |
| Ohio Educational Facility Commission Rev. (Cleveland Institute of Art Project), 5.5%, 12/01/2053 | | | 1,000,000 | 1,108,987 |
| Ohio Higher Educational Facility Rev. (Kenyon College 2020 Project), 5%, 7/01/2035 | | | 1,495,000 | 1,829,519 |
| Ohio Higher Educational Facility Rev. (Kenyon College 2020 Project), 5%, 7/01/2038 | | | 1,425,000 | 1,736,558 |
| Ohio Higher Educational Facility Rev. (Kenyon College 2020 Project), 5%, 7/01/2039 | | | 1,505,000 | 1,831,454 |
| Ohio Higher Educational Facility Rev. (Kenyon College 2020 Project), 5%, 7/01/2042 | | | 2,575,000 | 3,118,039 |
| Ohio Housing Finance Agency Residential Mortgage Rev. (Mortgage-Backed Securities Program), “A”, 4.5%, 9/01/2048 (u) | | | 7,340,000 | 7,909,367 |
| Ohio Housing Finance Agency Residential Mortgage Rev. (Mortgage-Backed Securities Program), “A”, 4.5%, 9/01/2049 (u) | | | 10,600,000 | 11,455,066 |
| Ohio State Hospital Rev. (Premier Health Partners Obligated Group), 5%, 11/15/2035 | | | 825,000 | 991,000 |
| Ohio State Hospital Rev. (Premier Health Partners Obligated Group), 4%, 11/15/2037 | | | 675,000 | 748,223 |
| Ohio State Hospital Rev. (Premier Health Partners Obligated Group), 4%, 11/15/2038 | | | 660,000 | 730,734 |
Portfolio of Investments – continued
| Issuer | | | Shares/Par | Value ($) |
| Municipal Bonds - continued |
| Ohio - continued |
| Ohio State Hospital Rev. (Premier Health Partners Obligated Group), 4%, 11/15/2040 | | $ | 725,000 | $ 800,112 |
| Ohio State Hospital Rev. (University Hospitals Health System, Inc.), “E”, 4%, 1/15/2038 | | | 1,000,000 | 1,112,334 |
| Ohio State Hospital Rev. (University Hospitals Health System, Inc.), “E”, 4%, 1/15/2039 | | | 1,500,000 | 1,666,453 |
| Ohio State Hospital Rev. (University Hospitals Health System, Inc.), “E”, 4%, 1/15/2041 | | | 1,925,000 | 2,133,040 |
| Ohio State University, Special Purpose Rev., “A”, 5%, 6/01/2038 (u) | | | 3,355,000 | 3,527,606 |
| Ohio State University, Special Purpose Rev., “A”, 5%, 6/01/2043 (u) | | | 8,150,000 | 8,569,297 |
| Ohio Tax Exempt Private Activity (Portsmouth Bypass Project), AGM, 5%, 12/31/2035 | | | 7,865,000 | 8,629,215 |
| Riversouth, OH, Authority Rev. (Lazarus Building), “A”, 5.75%, 12/01/2027 | | | 2,615,000 | 2,620,210 |
| | | | | $305,761,008 |
| Oklahoma - 0.7% |
| Catoosa, OK, Industrial Authority Sales Tax Rev., 4%, 10/01/2028 | | $ | 455,000 | $ 457,483 |
| Norman, OK, Regional Hospital Authority Rev., 5%, 9/01/2045 | | | 3,015,000 | 3,588,256 |
| Oklahoma Development Finance Authority, First Mortgage Rev. (Sommerset Project), 5%, 7/01/2042 | | | 1,390,000 | 1,463,366 |
| Oklahoma Development Finance Authority, Health System Rev. (OU Medicine Project), “B”, 5%, 8/15/2029 | | | 695,000 | 825,091 |
| Oklahoma Development Finance Authority, Health System Rev. (OU Medicine Project), “B”, 5%, 8/15/2033 | | | 3,525,000 | 4,166,374 |
| Oklahoma Development Finance Authority, Health System Rev. (OU Medicine Project), “B”, 5%, 8/15/2038 | | | 4,935,000 | ��� 5,806,170 |
| Oklahoma Development Finance Authority, Health System Rev. (OU Medicine Project), “B”, 5.25%, 8/15/2043 | | | 4,280,000 | 5,103,084 |
| Oklahoma Development Finance Authority, Health System Rev. (OU Medicine Project), “B”, 5.25%, 8/15/2048 | | | 4,930,000 | 5,857,379 |
| Oklahoma Development Finance Authority, Health System Rev. (OU Medicine Project), “B”, 5.5%, 8/15/2052 | | | 11,495,000 | 13,807,154 |
| Oklahoma Development Finance Authority, Health System Rev. (OU Medicine Project), “B”, 5.5%, 8/15/2057 | | | 2,805,000 | 3,363,538 |
| Oklahoma Housing Finance Agency, Single Family Mortgage Rev. (Homeownership Loan Project), “A”, 4.75%, 9/01/2048 | | | 3,005,000 | 3,269,446 |
| Tulsa, OK, Airport Improvement Trust Rev., “A”, 5%, 6/01/2045 (Prerefunded 6/01/2024) | | | 660,000 | 717,035 |
| | | | | $48,424,376 |
Portfolio of Investments – continued
| Issuer | | | Shares/Par | Value ($) |
| Municipal Bonds - continued |
| Oregon - 1.0% |
| Clackamas County, OR, Hospital Facility Authority Senior Living Rev. (Rose Villa Project), “A”, 5.125%, 11/15/2040 (n) | | $ | 1,000,000 | $ 1,081,701 |
| Clackamas County, OR, Hospital Facility Authority Senior Living Rev. (Rose Villa Project), “A”, 5.25%, 11/15/2050 (n) | | | 2,000,000 | 2,161,041 |
| Clackamas County, OR, Hospital Facility Authority Senior Living Rev. (Rose Villa Project), “A”, 5.375%, 11/15/2055 (n) | | | 3,000,000 | 3,249,174 |
| Clackamas County, OR, Hospital Facility Authority Senior Living Rev. (Rose Villa Project), “B-2”, 2.75%, 11/15/2025 (n) | | | 1,050,000 | 1,050,598 |
| Forest Grove, OR, Campus Improvement Rev. (Pacific University Project), “A”, 4.5%, 5/01/2029 (Prerefunded 5/01/2022) | | | 655,000 | 661,373 |
| Forest Grove, OR, Campus Improvement Rev. (Pacific University Project), “A”, 5%, 5/01/2036 | | | 1,100,000 | 1,210,224 |
| Forest Grove, OR, Campus Improvement Rev. (Pacific University Project), “A”, 5%, 5/01/2040 (Prerefunded 5/01/2022) | | | 815,000 | 823,935 |
| Medford, OR, Hospital Facilities Authority Rev. (Asante Projects), “A”, 5%, 8/15/2045 | | | 2,360,000 | 2,825,649 |
| Medford, OR, Hospital Facilities Authority Rev. (Asante Projects), “A”, 5%, 8/15/2050 | | | 1,575,000 | 1,875,268 |
| Medford, OR, Hospital Facilities Authority Rev. (Asante Projects), “A”, AGM, 4%, 8/15/2045 | | | 4,330,000 | 4,877,221 |
| Multnomah County, OR, Hospital Facilities Authority Refunding Rev. (Terwilliger Plaza - Parkview Project), “A”, 4%, 12/01/2041 | | | 2,860,000 | 2,982,811 |
| Multnomah County, OR, Hospital Facilities Authority Refunding Rev. (Terwilliger Plaza - Parkview Project), “A”, 4%, 12/01/2051 | | | 11,165,000 | 11,447,751 |
| Multnomah County, OR, Hospital Facilities Authority Refunding Rev. (Terwilliger Plaza - Parkview Project), “A”, 4%, 12/01/2056 | | | 7,000,000 | 7,148,275 |
| Multnomah County, OR, Hospital Facilities Authority Refunding Rev. (Terwilliger Plaza - Parkview Project), “B”, 1.2%, 6/01/2028 | | | 860,000 | 805,530 |
| Multnomah County, OR, Hospital Facilities Authority Refunding Rev. (Terwilliger Plaza - Parkview Project), “B-2”, 0.95%, 6/01/2027 | | | 2,225,000 | 2,103,077 |
| Multnomah County, OR, Hospital Facilities Authority Refunding Rev. (Terwilliger Plaza - Parkview Project), “C”, 1.25%, 6/01/2026 | | | 1,065,000 | 1,045,856 |
| Oregon Facilities Authority Rev. (Samaritan Health Services Project), “A”, 5%, 10/01/2040 | | | 830,000 | 998,671 |
| Oregon Housing & Community Services Department Mortgage Rev. (Single-Family Mortgage Program), “D”, 4.75%, 1/01/2050 (u) | | | 9,120,000 | 9,865,405 |
| Port of Portland, OR, International Airport Rev., “24B”, 5%, 7/01/2042 | | | 1,160,000 | 1,328,737 |
Portfolio of Investments – continued
| Issuer | | | Shares/Par | Value ($) |
| Municipal Bonds - continued |
| Oregon - continued |
| Yamhill County, OR, Hospital Authority Rev. (Friendsview), “A”, 5%, 11/15/2036 | | $ | 795,000 | $ 922,128 |
| Yamhill County, OR, Hospital Authority Rev. (Friendsview), “A”, 5%, 11/15/2046 | | | 1,695,000 | 1,922,937 |
| Yamhill County, OR, Hospital Authority Rev. (Friendsview), “A”, 5%, 11/15/2051 | | | 2,225,000 | 2,516,872 |
| Yamhill County, OR, Hospital Authority Rev. (Friendsview), “A”, 5%, 11/15/2056 | | | 4,995,000 | 5,610,932 |
| Yamhill County, OR, Hospital Authority Rev. (Friendsview), “B-1”, 2.5%, 11/15/2028 | | | 965,000 | 952,495 |
| Yamhill County, OR, Hospital Authority Rev. (Friendsview), “B-2”, 2.125%, 11/15/2027 | | | 385,000 | 377,873 |
| Yamhill County, OR, Hospital Authority Rev. (Friendsview), “B-3”, 1.75%, 11/15/2026 | | | 770,000 | 763,336 |
| | | | | $70,608,870 |
| Pennsylvania - 6.2% |
| Allegheny County, PA, Hospital Development Authority Rev. (Allegheny Health Network Obligated Group), “A”, 4%, 4/01/2044 | | $ | 3,110,000 | $ 3,378,585 |
| Allentown, PA, Neighborhood Improvement Zone Development Authority Tax Refunding Rev., 5%, 5/01/2042 (w) | | | 2,345,000 | 2,816,495 |
| Allentown, PA, Neighborhood Improvement Zone Development Authority Tax Rev. (City Center Project), 5%, 5/01/2028 (n) | | | 900,000 | 1,041,621 |
| Allentown, PA, Neighborhood Improvement Zone Development Authority Tax Rev. (City Center Project), 5%, 5/01/2033 (n) | | | 765,000 | 874,851 |
| Allentown, PA, Neighborhood Improvement Zone Development Authority Tax Rev. (City Center Project), 5%, 5/01/2042 (n) | | | 2,175,000 | 2,461,370 |
| Allentown, PA, Neighborhood Improvement Zone Development Authority Tax Rev. (City Center Project), 5.375%, 5/01/2042 (n) | | | 6,700,000 | 7,671,450 |
| Allentown, PA, Neighborhood Improvement Zone Development Authority Tax Rev. (City Center Refunding Project), 5%, 5/01/2032 (n) | | | 2,505,000 | 2,824,205 |
| Allentown, PA, Neighborhood Improvement Zone Development Authority Tax Rev. (City Center Refunding Project), 5%, 5/01/2042 (n) | | | 1,990,000 | 2,216,573 |
| Allentown, PA, Neighborhood Improvement Zone Development Authority Tax Rev., “A”, 5%, 5/01/2035 | | | 1,110,000 | 1,121,468 |
| Allentown, PA, Neighborhood Improvement Zone Development Authority Tax Rev., “A”, 5%, 5/01/2042 | | | 4,605,000 | 4,652,577 |
| Berks County, PA, Industrial Development Authority Health System Rev. (Tower Health Project), 4%, 11/01/2038 | | | 990,000 | 1,011,087 |
Portfolio of Investments – continued
| Issuer | | | Shares/Par | Value ($) |
| Municipal Bonds - continued |
| Pennsylvania - continued |
| Berks County, PA, Industrial Development Authority Health System Rev. (Tower Health Project), 4%, 11/01/2047 | | $ | 1,840,000 | $ 1,823,736 |
| Berks County, PA, Industrial Development Authority Health System Rev. (Tower Health Project), 5%, 11/01/2047 | | | 12,200,000 | 12,958,289 |
| Berks County, PA, Industrial Development Authority Health System Rev. (Tower Health Project), 5%, 11/01/2050 | | | 22,365,000 | 23,684,088 |
| Berks County, PA, Municipal Authority Rev. (Tower Health Project), “B”, 5%, 2/01/2040 (Put Date 2/01/2030) | | | 2,690,000 | 3,068,173 |
| Berks County, PA, Municipal Authority Rev. (Tower Health Project), “B-1”, 5%, 2/01/2040 (Put Date 2/01/2025) | | | 8,255,000 | 8,830,362 |
| Berks County, PA, Reading School District, AGM, 5%, 3/01/2036 | | | 460,000 | 533,053 |
| Blythe Township, PA, Solid Waste Authority Rev., 7.75%, 12/01/2037 (Prerefunded 12/01/2027) | | | 10,395,000 | 13,539,268 |
| Cambria County, PA, General Obligation, “B”, AGM, 4%, 8/01/2032 | | | 275,000 | 305,586 |
| Cambria County, PA, General Obligation, “B”, AGM, 4%, 8/01/2033 | | | 330,000 | 365,428 |
| Cambria County, PA, General Obligation, “B”, AGM, 4%, 8/01/2034 | | | 415,000 | 456,368 |
| Cambria County, PA, General Obligation, “B”, AGM, 4%, 8/01/2035 | | | 400,000 | 439,436 |
| Cambria County, PA, General Obligation, “B”, AGM, 4%, 8/01/2036 | | | 215,000 | 235,963 |
| Chester County, PA, Health & Education Facilities Authority Rev. (Simpson Senior Services Project), 4%, 12/01/2035 | | | 6,355,000 | 6,558,323 |
| Chester County, PA, Health & Education Facilities Authority Rev. (Simpson Senior Services Project), 4%, 12/01/2040 | | | 4,915,000 | 5,010,993 |
| Chester County, PA, Health & Education Facilities Authority Rev. (Simpson Senior Services Project), 4%, 12/01/2044 | | | 4,455,000 | 4,483,651 |
| Chester County, PA, Health & Education Facilities Authority Rev. (Simpson Senior Services Project), 4%, 12/01/2051 | | | 3,445,000 | 3,427,001 |
| Chester County, PA, Health & Education Facilities Authority Rev. (Simpson Senior Services Project), 5%, 12/01/2051 | | | 2,600,000 | 2,757,110 |
| Chester County, PA, Health & Education Facilities Authority Rev. (Simpson Senior Services Project), “A”, 5%, 12/01/2030 | | | 815,000 | 862,930 |
| Chester County, PA, Health & Education Facilities Authority Rev. (Simpson Senior Services Project), “A”, 5%, 12/01/2035 | | | 1,000,000 | 1,051,091 |
| Chester County, PA, Health & Education Facilities Authority Rev. (Simpson Senior Services Project), “A”, 5.25%, 12/01/2045 | | | 1,730,000 | 1,814,772 |
| Chester County, PA, Industrial Development Authority Educational Facilities Rev. (Avon Grove Charter School), “A”, 4.75%, 12/15/2037 | | | 885,000 | 979,804 |
Portfolio of Investments – continued
| Issuer | | | Shares/Par | Value ($) |
| Municipal Bonds - continued |
| Pennsylvania - continued |
| Chester County, PA, Industrial Development Authority Educational Facilities Rev. (Avon Grove Charter School), “A”, 5%, 12/15/2047 | | $ | 2,040,000 | $ 2,271,327 |
| Chester County, PA, Industrial Development Authority Educational Facilities Rev. (Avon Grove Charter School), “A”, 5%, 12/15/2051 | | | 610,000 | 677,853 |
| Clairton, PA, Municipal Authority Sewer Rev., “B”, 5%, 12/01/2037 | | | 1,735,000 | 1,779,504 |
| Commonwealth of Pennsylvania, Tobacco Master Settlement Financing Authority Rev., 5%, 6/01/2032 | | | 1,395,000 | 1,651,110 |
| Commonwealth of Pennsylvania, Tobacco Master Settlement Financing Authority Rev., 5%, 6/01/2033 | | | 1,195,000 | 1,412,323 |
| Commonwealth of Pennsylvania, Tobacco Master Settlement Financing Authority Rev., 5%, 6/01/2034 | | | 605,000 | 714,163 |
| Cumberland County, PA, Municipal Authority Rev. (Diakon Lutheran Social Ministries), 5%, 1/01/2023 | | | 440,000 | 455,434 |
| Cumberland County, PA, Municipal Authority Rev. (Diakon Lutheran Social Ministries), 4%, 1/01/2033 (Prerefunded 1/01/2025) | | | 335,000 | 361,339 |
| Cumberland County, PA, Municipal Authority Rev. (Diakon Lutheran Social Ministries), 4%, 1/01/2033 (Prerefunded 1/01/2025) | | | 1,185,000 | 1,278,169 |
| Cumberland County, PA, Municipal Authority Rev. (Diakon Lutheran Social Ministries), 4%, 1/01/2033 | | | 865,000 | 911,709 |
| Cumberland County, PA, Municipal Authority Rev. (Diakon Lutheran Social Ministries), 5%, 1/01/2038 (Prerefunded 1/01/2025) | | | 40,000 | 44,286 |
| Cumberland County, PA, Municipal Authority Rev. (Diakon Lutheran Social Ministries), 5%, 1/01/2038 (Prerefunded 1/01/2025) | | | 155,000 | 171,609 |
| Cumberland County, PA, Municipal Authority Rev. (Diakon Lutheran Social Ministries), 5%, 1/01/2038 | | | 190,000 | 205,604 |
| Cumberland County, PA, Municipal Authority Rev. (Diakon Lutheran Social Ministries), ETM, 5%, 1/01/2023 | | | 110,000 | 114,235 |
| Cumberland County, PA, Municipal Authority Rev. (Diakon Lutheran Social Ministries), ETM, 5%, 1/01/2023 | | | 305,000 | 316,887 |
| Dallas, PA, Municipal Authority, University Rev. (Misericordia University Project), 5%, 5/01/2029 | | | 1,335,000 | 1,419,504 |
| Dallas, PA, Municipal Authority, University Rev. (Misericordia University Project), 5%, 5/01/2048 | | | 715,000 | 799,257 |
| Doylestown, PA, Hospital Rev., “A”, 4%, 7/01/2045 | | | 765,000 | 812,006 |
| Doylestown, PA, Hospital Rev., “A”, 5%, 7/01/2049 | | | 770,000 | 872,419 |
Portfolio of Investments – continued
| Issuer | | | Shares/Par | Value ($) |
| Municipal Bonds - continued |
| Pennsylvania - continued |
| East Hempfield Township, PA, Industrial Development Authority Rev. (Student Services, Inc., Student Housing Project at Millersville University of Pennsylvania), 5%, 7/01/2030 (Prerefunded 7/01/2025) | | $ | 330,000 | $ 371,271 |
| East Hempfield Township, PA, Industrial Development Authority Rev. (Student Services, Inc., Student Housing Project at Millersville University of Pennsylvania), 5%, 7/01/2035 (Prerefunded 7/01/2025) | | | 420,000 | 472,527 |
| East Hempfield Township, PA, Industrial Development Authority Rev. (Student Services, Inc., Student Housing Project at Millersville University of Pennsylvania), 5%, 7/01/2039 (Prerefunded 7/01/2024) | | | 325,000 | 354,813 |
| East Hempfield Township, PA, Industrial Development Authority Rev. (Student Services, Inc., Student Housing Project at Millersville University of Pennsylvania), 5%, 7/01/2046 (Prerefunded 7/01/2024) | | | 180,000 | 196,511 |
| Erie County, PA, Water Authority Rev., “D”, BAM, 4%, 12/01/2038 | | | 750,000 | 848,083 |
| Franklin County, PA, Industrial Development Authority Rev. (Menno-Haven, Inc. Project), 5%, 12/01/2029 | | | 195,000 | 215,731 |
| Franklin County, PA, Industrial Development Authority Rev. (Menno-Haven, Inc. Project), 5%, 12/01/2032 | | | 1,250,000 | 1,371,316 |
| Franklin County, PA, Industrial Development Authority Rev. (Menno-Haven, Inc. Project), 5%, 12/01/2038 | | | 2,795,000 | 3,047,015 |
| Franklin County, PA, Industrial Development Authority Rev. (Menno-Haven, Inc. Project), 5%, 12/01/2039 | | | 385,000 | 419,128 |
| Franklin County, PA, Industrial Development Authority Rev. (Menno-Haven, Inc. Project), 5%, 12/01/2043 | | | 3,685,000 | 3,993,470 |
| Franklin County, PA, Industrial Development Authority Rev. (Menno-Haven, Inc. Project), 5%, 12/01/2048 | | | 3,730,000 | 4,026,744 |
| Franklin County, PA, Industrial Development Authority Rev. (Menno-Haven, Inc. Project), 5%, 12/01/2049 | | | 510,000 | 550,382 |
| Franklin County, PA, Industrial Development Authority Rev. (Menno-Haven, Inc. Project), 5%, 12/01/2053 | | | 3,660,000 | 3,944,288 |
| Fulton County, PA, Industrial Development Authority Hospital Rev. (Medical Center Project), 5%, 7/01/2040 | | | 7,745,000 | 8,311,454 |
| Fulton County, PA, Industrial Development Authority Hospital Rev. (Medical Center Project), “B”, 5%, 7/01/2046 | | | 3,450,000 | 3,678,924 |
| Fulton County, PA, Industrial Development Authority Hospital Rev. (Medical Center Project), “B”, 5%, 7/01/2051 | | | 5,280,000 | 5,618,227 |
| Lancaster County, PA, Hospital Authority Health System Rev. (Saint Anne's Retirement Community, Inc. Project), 5%, 3/01/2050 | | | 500,000 | 549,647 |
Portfolio of Investments – continued
| Issuer | | | Shares/Par | Value ($) |
| Municipal Bonds - continued |
| Pennsylvania - continued |
| Lehigh County, PA, Water & Sewer Authority Rev., “A”, 5%, 12/01/2043 | | $ | 3,620,000 | $ 3,864,516 |
| Lehigh County, PA, Water & Sewer Authority Rev., “A”, 5%, 12/01/2043 (Prerefunded 12/01/2023) | | | 4,115,000 | 4,410,825 |
| Luzerne County, PA, “A”, AGM, 5%, 11/15/2029 | | | 6,760,000 | 7,642,186 |
| Luzerne County, PA, Wilkes-Barre Area School District, General Obligation, BAM, 5%, 4/15/2059 | | | 1,305,000 | 1,551,803 |
| Montgomery County, PA, Higher Education & Health Authority Rev. (Thomas Jefferson University), 4%, 9/01/2044 | | | 2,765,000 | 3,047,746 |
| Montgomery County, PA, Higher Education & Health Authority Rev. (Thomas Jefferson University), 4%, 9/01/2049 | | | 2,635,000 | 2,886,093 |
| Montgomery County, PA, Higher Education & Health Authority Rev. (Thomas Jefferson University), 4%, 9/01/2051 | | | 4,795,000 | 5,246,076 |
| Montgomery County, PA, Higher Education & Health Authority Rev. (Thomas Jefferson University), “A”, 5%, 9/01/2048 | | | 8,850,000 | 10,325,127 |
| Montgomery County, PA, Industrial Development Authority Retirement Communities Rev. (Acts Retirement-Life Communities, Inc. Obligated Group), “C”, 5%, 11/15/2045 | | | 1,525,000 | 1,790,561 |
| Montgomery County, PA, Industrial Development Authority Rev. (Whitemarsh Continuing Care Retirement Community Project), 5.375%, 1/01/2050 | | | 9,775,000 | 10,319,883 |
| Moon Industrial Development Authority Rev. (Baptist Homes Society), 6.125%, 7/01/2050 | | | 3,915,000 | 4,186,886 |
| Northeastern, PA, Hospital & Education Authority College Rev. (King's College Project), 5%, 5/01/2044 | | | 1,810,000 | 2,059,299 |
| Northeastern, PA, Hospital & Education Authority College Rev. (King's College Project), 5%, 5/01/2049 | | | 1,095,000 | 1,239,978 |
| Pennsylvania Economic Development Financing Authority Rev. (Presbyterian Senior Living Project), 4%, 7/01/2030 | | | 1,600,000 | 1,782,841 |
| Pennsylvania Economic Development Financing Authority Rev. (Presbyterian Senior Living Project), 4%, 7/01/2033 | | | 1,750,000 | 1,937,317 |
| Pennsylvania Economic Development Financing Authority Rev. (Presbyterian Senior Living Project), 4%, 7/01/2041 | | | 1,050,000 | 1,150,632 |
| Pennsylvania Economic Development Financing Authority Rev. (Presbyterian Senior Living Project), 4%, 7/01/2046 | | | 2,000,000 | 2,180,139 |
| Pennsylvania Economic Development Financing Authority, Private Activity Rev. (Pennsylvania Rapid Bridge Replacement Project), 5%, 12/31/2030 | | | 2,010,000 | 2,299,625 |
| Pennsylvania Economic Development Financing Authority, Private Activity Rev. (Pennsylvania Rapid Bridge Replacement Project), 5%, 12/31/2034 | | | 9,950,000 | 11,413,056 |
Portfolio of Investments – continued
| Issuer | | | Shares/Par | Value ($) |
| Municipal Bonds - continued |
| Pennsylvania - continued |
| Pennsylvania Economic Development Financing Authority, Solid Waste Disposal Rev. (Republic Services, Inc. Project), “B-2”, 0.3%, 4/01/2049 (Put Date 7/15/2022) | | $ | 2,050,000 | $ 2,048,123 |
| Pennsylvania Economic Development Financing Authority, Solid Waste Disposal Rev. (Waste Management, Inc. Project), 0.57%, 6/01/2041 (Put Date 6/03/2024) | | | 6,295,000 | 6,268,330 |
| Pennsylvania Economic Development Financing Authority, Solid Waste Disposal Rev. (Waste Management, Inc. Project), 0.18%, 8/01/2045 (Put Date 5/01/2022) | | | 12,430,000 | 12,430,000 |
| Pennsylvania Economic Development Financing Authority, Solid Waste Disposal Rev. (Waste Management, Inc. Project), “A”, 0.58%, 8/01/2037 (Put Date 8/01/2024) | | | 2,200,000 | 2,170,825 |
| Pennsylvania Higher Educational Assistance Agency, Education Loan Rev., “A”, 2.625%, 6/01/2042 | | | 1,130,000 | 1,095,003 |
| Pennsylvania Higher Educational Assistance Agency, Education Loan Rev., “B”, 3.125%, 6/01/2048 | | | 1,800,000 | 1,702,405 |
| Pennsylvania Higher Educational Facilities Authority Rev. (Drexel University), “A”, AGM, 4%, 5/01/2040 | | | 1,440,000 | 1,620,720 |
| Pennsylvania Housing Finance Agency, Single Family Mortgage Rev., “128A”, 4.75%, 4/01/2033 (u) | | | 4,795,000 | 5,107,020 |
| Pennsylvania Public School Building Authority, School Lease Rev. (School District of Philadelphia Project), 5%, 4/01/2028 (Prerefunded 4/01/2022) | | | 1,740,000 | 1,753,193 |
| Pennsylvania Public School Building Authority, School Lease Rev. (School District of Philadelphia Project), “A”, AGM, 5%, 6/01/2032 | | | 11,030,000 | 12,834,991 |
| Pennsylvania Turnpike Commission Rev., “A”, 5%, 12/01/2044 | | | 2,590,000 | 3,140,080 |
| Philadelphia, PA, Authority for Industrial Development Charter School Rev. (Philadelphia Performing Arts: A String Theory Charter School Project), 5%, 6/15/2050 (n) | | | 1,700,000 | 1,909,539 |
| Philadelphia, PA, Authority for Industrial Development Rev. (Discovery Charter School Project), 6.25%, 4/01/2037 | �� | | 1,065,000 | 1,071,053 |
| Philadelphia, PA, Authority for Industrial Development Rev. (Discovery Charter School Project), 6.25%, 4/01/2042 | | | 1,950,000 | 1,960,462 |
| Philadelphia, PA, Authority for Industrial Development Rev. (Kipp Charter School Project), “B”, 4%, 4/01/2026 | | | 1,065,000 | 1,108,104 |
| Philadelphia, PA, Authority for Industrial Development Rev. (Kipp Charter School Project), “B”, 5%, 4/01/2046 | | | 3,500,000 | 3,745,038 |
| Philadelphia, PA, Authority for Industrial Development Rev. (MaST Charter School Project), “A”, 5.625%, 8/01/2036 | | | 885,000 | 970,344 |
| Philadelphia, PA, Authority for Industrial Development Rev. (MaST Charter School Project), “A”, 5.75%, 8/01/2046 | | | 2,515,000 | 2,734,403 |
Portfolio of Investments – continued
| Issuer | | | Shares/Par | Value ($) |
| Municipal Bonds - continued |
| Pennsylvania - continued |
| Philadelphia, PA, Authority for Industrial Development Rev. (MaST Charter School Project), “A”, 5.375%, 8/01/2051 | | $ | 1,910,000 | $ 2,117,049 |
| Philadelphia, PA, Authority for Industrial Development Rev. (MaST Charter School Project), “B”, 6%, 8/01/2051 | | | 3,310,000 | 3,625,620 |
| Philadelphia, PA, Authority for Industrial Development Rev. (MaST Community Charter School II Project), 5%, 8/01/2030 | | | 460,000 | 524,439 |
| Philadelphia, PA, Authority for Industrial Development Rev. (MaST Community Charter School II Project), 5%, 8/01/2040 | | | 600,000 | 700,738 |
| Philadelphia, PA, Authority for Industrial Development Rev. (MaST Community Charter School II Project), 5%, 8/01/2050 | | | 575,000 | 662,779 |
| Philadelphia, PA, Authority for Industrial Development Rev. (Tacony Academy Charter School Project), 6.875%, 6/15/2033 | | | 1,145,000 | 1,222,900 |
| Philadelphia, PA, Authority for Industrial Development Rev. (Tacony Academy Charter School Project), 7.375%, 6/15/2043 | | | 1,975,000 | 2,113,172 |
| Philadelphia, PA, Authority for Industrial Development Rev. (Tacony Academy Charter School Project), “A-1”, 6.75%, 6/15/2033 | | | 850,000 | 906,399 |
| Philadelphia, PA, Authority for Industrial Development Rev. (Tacony Academy Charter School Project), “A-1”, 7%, 6/15/2043 | | | 1,670,000 | 1,778,432 |
| Philadelphia, PA, Authority for Industrial Development Rev. (Thomas Jefferson University), “A”, 5%, 9/01/2035 | | | 895,000 | 1,031,637 |
| Philadelphia, PA, Authority for Industrial Development Rev. (Thomas Jefferson University), “A”, 5%, 9/01/2042 | | | 3,135,000 | 3,605,771 |
| Philadelphia, PA, Authority for Industrial Development, Multi-Family Housing Rev. (University Square Apartment Project-Section 8), “I”, 5%, 12/01/2037 | | | 2,655,000 | 2,991,243 |
| Philadelphia, PA, Authority for Industrial Development, Multi-Family Housing Rev. (University Square Apartment Project-Section 8), “I”, 5%, 12/01/2058 | | | 10,580,000 | 11,745,058 |
| Philadelphia, PA, Authority for Industrial Development, Multi-Family Housing Rev. (University Square Apartment Project-Section 8), “III”, 5.25%, 12/01/2047 (n) | | | 3,245,000 | 3,372,241 |
| Philadelphia, PA, Authority for Industrial Development, Multi-Family Housing Rev. (University Square Apartment Project-Section 8), “III”, 5.5%, 12/01/2058 (n) | | | 4,690,000 | 4,893,293 |
| Philadelphia, PA, Authority for Industrial Development, Senior Living Facilities Rev. (Wesley Enhanced Living Obligated Group), “A”, 5%, 7/01/2037 | | | 2,290,000 | 2,474,426 |
| Philadelphia, PA, Authority for Industrial Development, Senior Living Facilities Rev. (Wesley Enhanced Living Obligated Group), “A”, 5%, 7/01/2042 | | | 3,665,000 | 3,928,281 |
Portfolio of Investments – continued
| Issuer | | | Shares/Par | Value ($) |
| Municipal Bonds - continued |
| Pennsylvania - continued |
| Philadelphia, PA, Authority for Industrial Development, Senior Living Facilities Rev. (Wesley Enhanced Living Obligated Group), “A”, 5%, 7/01/2049 | | $ | 3,790,000 | $ 4,033,430 |
| Philadelphia, PA, School District General Obligation, “F”, 5%, 9/01/2038 (Prerefunded 9/01/2026) | | | 5,000 | 5,817 |
| Philadelphia, PA, School District General Obligation, “F”, 5%, 9/01/2038 | | | 240,000 | 273,489 |
| Philadelphia, PA, School District, “A”, 5%, 9/01/2033 | | | 405,000 | 486,611 |
| Philadelphia, PA, School District, “A”, 5%, 9/01/2035 | | | 1,540,000 | 1,842,558 |
| Philadelphia, PA, School District, “A”, 4%, 9/01/2036 | | | 2,045,000 | 2,315,453 |
| Philadelphia, PA, School District, “A”, 5%, 9/01/2036 | | | 510,000 | 608,982 |
| Philadelphia, PA, School District, “A”, 4%, 9/01/2037 | | | 1,560,000 | 1,765,530 |
| Philadelphia, PA, School District, “A”, 5%, 9/01/2037 | | | 510,000 | 608,401 |
| Philadelphia, PA, School District, “A”, 4%, 9/01/2038 | | | 2,410,000 | 2,722,874 |
| Philadelphia, PA, School District, “A”, 5%, 9/01/2038 | | | 510,000 | 607,852 |
| Philadelphia, PA, School District, “A”, 4%, 9/01/2039 | | | 1,260,000 | 1,421,690 |
| Philadelphia, PA, School District, “B”, 5%, 9/01/2043 | | | 1,525,000 | 1,807,091 |
| Philadelphia, PA, School District, “F”, 5%, 9/01/2037 | | | 980,000 | 1,118,602 |
| Pittsburgh, PA, Water & Sewer Authority Rev., “A”, AGM, 5%, 9/01/2033 | | | 785,000 | 1,037,357 |
| Pittsburgh, PA, Water & Sewer Authority Rev., “A”, AGM, 4%, 9/01/2035 | | | 390,000 | 448,796 |
| Pittsburgh, PA, Water & Sewer Authority Rev., “A”, AGM, 5%, 9/01/2044 | | | 2,615,000 | 3,168,326 |
| Scranton-Lackawanna, PA, Health and Welfare Authority, University Rev. (Marywood University Project), 5%, 6/01/2046 | | | 10,015,000 | 10,543,351 |
| Southcentral, PA, General Authority Rev. (WellSpan Health Obligated Group), “A”, 5%, 6/01/2044 (Prerefunded 6/01/2024) | | | 3,000,000 | 3,273,768 |
| Washington County, PA, Canon-McMillan School District, BAM, 4%, 6/01/2044 | | | 2,555,000 | 2,782,929 |
| Washington County, PA, Canon-McMillan School District, BAM, 4%, 6/01/2046 | | | 3,920,000 | 4,253,255 |
| Washington County, PA, Canon-McMillan School District, BAM, 4%, 6/01/2048 | | | 2,685,000 | 2,904,848 |
| Washington County, PA, Redevelopment Authority Refunding Rev. (Victory Centre Tax Increment Financing Project), 4%, 7/01/2023 | | | 270,000 | 274,261 |
| Washington County, PA, Redevelopment Authority Refunding Rev. (Victory Centre Tax Increment Financing Project), 5%, 7/01/2035 | | | 355,000 | 384,594 |
| Washington County, PA, Trinity Area School District, AGM, 4%, 11/01/2041 | | | 655,000 | 750,671 |
Portfolio of Investments – continued
| Issuer | | | Shares/Par | Value ($) |
| Municipal Bonds - continued |
| Pennsylvania - continued |
| Washington County, PA, Trinity Area School District, AGM, 4%, 11/01/2043 | | $ | 695,000 | $ 795,514 |
| Washington County, PA, Trinity Area School District, AGM, 4%, 11/01/2046 | | | 1,175,000 | 1,342,054 |
| Washington County, PA, Trinity Area School District, AGM, 4%, 11/01/2051 | | | 1,655,000 | 1,878,297 |
| West Shore, PA, Area Authority Rev. (Messiah Village Project), “A”, 5%, 7/01/2030 | | | 395,000 | 428,597 |
| West Shore, PA, Area Authority Rev. (Messiah Village Project), “A”, 5%, 7/01/2035 | | | 390,000 | 419,982 |
| Westmoreland County, PA, Industrial Development Authority, Health System Rev. (Excela Health Project), “A”, 4%, 7/01/2025 | | | 395,000 | 428,890 |
| Westmoreland County, PA, Industrial Development Authority, Health System Rev. (Excela Health Project), “A”, 5%, 7/01/2027 | | | 630,000 | 739,438 |
| Westmoreland County, PA, Industrial Development Authority, Health System Rev. (Excela Health Project), “A”, 5%, 7/01/2029 | | | 710,000 | 864,342 |
| | | | | $424,529,326 |
| Puerto Rico - 8.5% |
| Commonwealth of Puerto Rico Highway & Transportation Authority Rev., “A”, NPFG, 4.75%, 7/01/2038 | | $ | 7,680,000 | $ 7,791,441 |
| Commonwealth of Puerto Rico Highway & Transportation Authority Rev., “D”, AGM, 5%, 7/01/2032 | | | 8,365,000 | 8,431,848 |
| Commonwealth of Puerto Rico Highway & Transportation Authority Rev., “J”, NPFG, 5%, 7/01/2029 | | | 630,000 | 640,012 |
| Commonwealth of Puerto Rico Highway & Transportation Authority Rev., “M”, AGM, 5%, 7/01/2032 | | | 1,130,000 | 1,139,105 |
| Commonwealth of Puerto Rico Highway & Transportation Authority Rev., “N”, AAC, 5.25%, 7/01/2030 | | | 8,340,000 | 8,475,667 |
| Commonwealth of Puerto Rico Highway & Transportation Authority Rev., “N”, AAC, 5.25%, 7/01/2031 | | | 3,345,000 | 3,396,043 |
| Commonwealth of Puerto Rico Highway & Transportation Authority Rev., Unrefunded Balance, “A”, NPFG, 5%, 7/01/2038 | | | 810,000 | 822,872 |
| Commonwealth of Puerto Rico, “A”, AGM, 5.375%, 7/01/2025 | | | 750,000 | 756,929 |
| Commonwealth of Puerto Rico, General Obligation, “A”, 8%, 7/01/2035 (a)(d) | | | 71,630,000 | 64,467,000 |
| Commonwealth of Puerto Rico, Public Improvement, AAC, 4.5%, 7/01/2023 | | | 185,000 | 185,316 |
| Commonwealth of Puerto Rico, Public Improvement, “A”, AGM, 5%, 7/01/2035 | | | 9,505,000 | 9,571,385 |
| Commonwealth of Puerto Rico, Public Improvement, “A-4”, AGM, 5.25%, 7/01/2030 | | | 1,345,000 | 1,354,188 |
Portfolio of Investments – continued
| Issuer | | | Shares/Par | Value ($) |
| Municipal Bonds - continued |
| Puerto Rico - continued |
| Commonwealth of Puerto Rico, Public Improvement, “C-7”, NPFG, 6%, 7/01/2027 | | $ | 3,665,000 | $ 3,708,626 |
| Puerto Rico Convention Center District Authority, Hotel Occupancy Tax Rev., “A”, AAC, 5%, 7/01/2031 | | | 11,555,000 | 11,820,527 |
| Puerto Rico Electric Aqueduct and Sewer Authority Rev., “A”, 5%, 7/01/2030 (n) | | | 20,000,000 | 24,679,602 |
| Puerto Rico Electric Aqueduct and Sewer Authority Rev., “A”, 5%, 7/01/2035 (n) | | | 10,000,000 | 12,088,236 |
| Puerto Rico Electric Power Authority Rev., “A”, 5%, 7/01/2029 (a)(d) | | | 27,420,000 | 28,242,600 |
| Puerto Rico Electric Power Authority Rev., “A”, 5%, 7/01/2042 (a)(d) | | | 2,965,000 | 3,053,950 |
| Puerto Rico Electric Power Authority Rev., “AAA”, 5.25%, 7/01/2022 (a)(d) | | | 1,075,000 | 1,111,281 |
| Puerto Rico Electric Power Authority Rev., “AAA”, 5.25%, 7/01/2030 (a)(d) | | | 500,000 | 516,875 |
| Puerto Rico Electric Power Authority Rev., “CCC”, 5.25%, 7/01/2027 (a)(d) | | | 6,605,000 | 6,827,919 |
| Puerto Rico Electric Power Authority Rev., “DDD”, 5%, 7/01/2022 (a)(d) | | | 8,560,000 | 8,816,800 |
| Puerto Rico Electric Power Authority Rev., “DDD”, 5%, 7/01/2022 (a)(d) | | | 14,860,000 | 15,305,800 |
| Puerto Rico Electric Power Authority Rev., “DDD”, 5%, 7/01/2022 (a)(d) | | | 525,000 | 540,750 |
| Puerto Rico Electric Power Authority Rev., “DDD”, AGM, 3.625%, 7/01/2023 | | | 555,000 | 561,814 |
| Puerto Rico Electric Power Authority Rev., “DDD”, AGM, 3.65%, 7/01/2024 | | | 2,345,000 | 2,373,795 |
| Puerto Rico Electric Power Authority Rev., “EEE”, 6.05%, 7/01/2032 (a)(d) | | | 10,450,000 | 10,632,875 |
| Puerto Rico Electric Power Authority Rev., “NN”, NPFG, 5.25%, 7/01/2022 | | | 2,165,000 | 2,173,687 |
| Puerto Rico Electric Power Authority Rev., “NN”, NPFG, 4.75%, 7/01/2033 | | | 380,000 | 387,150 |
| Puerto Rico Electric Power Authority Rev., “PP”, NPFG, 5%, 7/01/2022 | | | 1,150,000 | 1,176,422 |
| Puerto Rico Electric Power Authority Rev., “PP”, NPFG, 5%, 7/01/2024 | | | 240,000 | 245,514 |
| Puerto Rico Electric Power Authority Rev., “PP”, NPFG, 5%, 7/01/2025 | | | 260,000 | 265,974 |
| Puerto Rico Electric Power Authority Rev., “RR”, AGM, 5%, 7/01/2028 | | | 185,000 | 188,801 |
Portfolio of Investments – continued
| Issuer | | | Shares/Par | Value ($) |
| Municipal Bonds - continued |
| Puerto Rico - continued |
| Puerto Rico Electric Power Authority Rev., “RR”, NPFG, 5%, 7/01/2022 | | $ | 695,000 | $ 710,968 |
| Puerto Rico Electric Power Authority Rev., “SS”, AGM, 4.375%, 7/01/2030 | | | 280,000 | 283,829 |
| Puerto Rico Electric Power Authority Rev., “TT”, 5%, 7/01/2022 (a)(d) | | | 2,425,000 | 2,497,750 |
| Puerto Rico Electric Power Authority Rev., “TT”, 5%, 7/01/2023 (a)(d) | | | 3,275,000 | 3,373,250 |
| Puerto Rico Electric Power Authority Rev., “TT”, 5%, 7/01/2027 (a)(d) | | | 425,000 | 437,750 |
| Puerto Rico Electric Power Authority Rev., “TT”, 5%, 7/01/2037 (a)(d) | | | 11,890,000 | 12,246,700 |
| Puerto Rico Electric Power Authority Rev., “TT”, NPFG, 5%, 7/01/2024 | | | 1,230,000 | 1,258,260 |
| Puerto Rico Electric Power Authority Rev., “TT”, NPFG, 5%, 7/01/2026 | | | 65,000 | 66,493 |
| Puerto Rico Electric Power Authority Rev., “UU”, AGM, 5%, 7/01/2022 | | | 490,000 | 500,068 |
| Puerto Rico Electric Power Authority Rev., “UU”, AGM, 4.25%, 7/01/2027 | | | 1,705,000 | 1,725,977 |
| Puerto Rico Electric Power Authority Rev., “VV”, NPFG, 5.25%, 7/01/2025 | | | 475,000 | 493,340 |
| Puerto Rico Electric Power Authority Rev., “VV”, NPFG, 5.25%, 7/01/2026 | | | 1,070,000 | 1,116,640 |
| Puerto Rico Electric Power Authority Rev., “VV”, NPFG, 5.25%, 7/01/2029 | | | 3,765,000 | 3,956,756 |
| Puerto Rico Electric Power Authority Rev., “VV”, NPFG, 5.25%, 7/01/2030 | | | 5,250,000 | 5,473,642 |
| Puerto Rico Electric Power Authority Rev., “VV”, NPFG, 5.25%, 7/01/2034 | | | 630,000 | 666,650 |
| Puerto Rico Electric Power Authority Rev., “WW”, 5.375%, 7/01/2022 (a)(d) | | | 445,000 | 460,575 |
| Puerto Rico Electric Power Authority Rev., “WW”, 5.25%, 7/01/2025 (a)(d) | | | 1,010,000 | 1,044,087 |
| Puerto Rico Electric Power Authority Rev., “XX-RSA-1”, 5.75%, 7/01/2036 (a)(d) | | | 4,890,000 | 5,091,712 |
| Puerto Rico Electric Power Authority Rev., “ZZ”, 5%, 7/01/2018 (a)(d) | | | 4,720,000 | 4,861,600 |
| Puerto Rico Electric Power Authority Rev., “ZZ”, 5.25%, 7/01/2023 (a)(d) | | | 5,265,000 | 5,442,694 |
| Puerto Rico Electric Power Authority Rev., “ZZ”, 5.25%, 7/01/2024 (a)(d) | | | 1,180,000 | 1,219,825 |
Portfolio of Investments – continued
| Issuer | | | Shares/Par | Value ($) |
| Municipal Bonds - continued |
| Puerto Rico - continued |
| Puerto Rico Electric Power Authority Rev., “ZZ”, 5.25%, 7/01/2026 (a)(d) | | $ | 3,705,000 | $ 3,830,044 |
| Puerto Rico Industrial, Tourist, Educational, Medical & Environmental Control Facilities Financing Authority Rev. (Cogeneration Facilities - AES Puerto Rico Project), 9.12%, 6/01/2022 | | | 5,700,000 | 5,842,500 |
| Puerto Rico Industrial, Tourist, Educational, Medical & Environmental Control Facilities Financing Authority Rev. (Cogeneration Facilities - AES Puerto Rico Project), 6.625%, 6/01/2026 | | | 4,530,000 | 4,677,225 |
| Puerto Rico Industrial, Tourist, Educational, Medical & Environmental Control Facilities Financing Authority, Educational Facilities Rev. (University Plaza Project), NPFG, 5%, 7/01/2033 | | | 4,780,000 | 4,850,147 |
| Puerto Rico Industrial, Tourist, Educational, Medical & Environmental Control Facilities Financing Authority, Higher Education Rev. (Ana G. Mendez University System Project), 5%, 4/01/2022 | | | 645,000 | 653,677 |
| Puerto Rico Industrial, Tourist, Educational, Medical & Environmental Control Facilities Financing Authority, Higher Education Rev. (Ana G. Mendez University System Project), 5%, 3/01/2026 | | | 165,000 | 165,412 |
| Puerto Rico Industrial, Tourist, Educational, Medical & Environmental Control Facilities Financing Authority, Higher Education Rev. (Ana G. Mendez University System Project), 5%, 4/01/2027 | | | 2,645,000 | 2,677,431 |
| Puerto Rico Industrial, Tourist, Educational, Medical & Environmental Control Facilities Financing Authority, Higher Education Rev. (Ana G. Mendez University System Project), 5.5%, 12/01/2031 | | | 980,000 | 982,450 |
| Puerto Rico Industrial, Tourist, Educational, Medical & Environmental Control Facilities Financing Authority, Higher Education Rev. (Ana G. Mendez University System Project), 5.125%, 4/01/2032 | | | 1,330,000 | 1,347,627 |
| Puerto Rico Industrial, Tourist, Educational, Medical & Environmental Control Facilities Financing Authority, Higher Education Rev. (Ana G. Mendez University System Project), 5%, 3/01/2036 | | | 1,155,000 | 1,157,887 |
| Puerto Rico Industrial, Tourist, Educational, Medical & Environmental Control Facilities Financing Authority, Higher Education Rev. (Ana G. Mendez University System Project), 5.375%, 4/01/2042 | | | 1,625,000 | 1,649,375 |
Portfolio of Investments – continued
| Issuer | | | Shares/Par | Value ($) |
| Municipal Bonds - continued |
| Puerto Rico - continued |
| Puerto Rico Industrial, Tourist, Educational, Medical & Environmental Control Facilities Financing Authority, Higher Education Rev. (University of Sacred Heart), 4.375%, 10/01/2031 | | $ | 525,000 | $ 528,451 |
| Puerto Rico Industrial, Tourist, Educational, Medical & Environmental Control Facilities Financing Authority, Higher Education Rev. (University of Sacred Heart), 5%, 10/01/2042 | | | 1,330,000 | 1,349,950 |
| Puerto Rico Infrastructure Financing Authority Special Tax Rev., “C”, AAC, 5.5%, 7/01/2023 | | | 5,450,000 | 5,615,115 |
| Puerto Rico Infrastructure Financing Authority Special Tax Rev., “C”, AAC, 5.5%, 7/01/2024 | | | 11,530,000 | 11,821,976 |
| Puerto Rico Infrastructure Financing Authority Special Tax Rev., “C”, AAC, 5.5%, 7/01/2025 | | | 1,145,000 | 1,179,733 |
| Puerto Rico Infrastructure Financing Authority Special Tax Rev., “C”, AAC, 5.5%, 7/01/2026 | | | 9,895,000 | 10,213,441 |
| Puerto Rico Infrastructure Financing Authority Special Tax Rev., “C”, AAC, 5.5%, 7/01/2028 | | | 1,075,000 | 1,112,425 |
| Puerto Rico Infrastructure Financing Authority Special Tax Rev., Capital Appreciation, “A”, AAC, 0%, 7/01/2037 | | | 8,455,000 | 4,132,909 |
| Puerto Rico Infrastructure Financing Authority Special Tax Rev., Capital Appreciation, “A”, AAC, 0%, 7/01/2043 | | | 2,295,000 | 825,539 |
| Puerto Rico Infrastructure Financing Authority Special Tax Rev., Capital Appreciation, “A”, AAC, 0%, 7/01/2044 | | | 7,350,000 | 2,510,804 |
| Puerto Rico Municipal Finance Agency, “A”, AGM, 5%, 8/01/2027 | | | 325,000 | 327,597 |
| Puerto Rico Public Buildings Authority Government Facilities Rev., “I”, AGM, 5%, 7/01/2036 | | | 735,000 | 740,874 |
| Puerto Rico Public Buildings Authority Government Facilities Rev., “M-2”, AAC, 10%, 7/01/2035 | | | 6,225,000 | 6,439,751 |
| Puerto Rico Public Buildings Authority Government Facilities Rev., “M-3”, NPFG, 6%, 7/01/2027 | | | 1,470,000 | 1,487,498 |
| Puerto Rico Public Buildings Authority Government Facilities Rev., “M-3”, NPFG, 6%, 7/01/2028 | | | 600,000 | 607,142 |
| Puerto Rico Public Buildings Authority Government Facilities Rev., “N”, AGM, 5%, 7/01/2032 | | | 690,000 | 695,514 |
| Puerto Rico Sales Tax Financing Corp., Restructured Sales Tax Rev., “2019A-1”, 4.55%, 7/01/2040 | | | 1,542,000 | 1,693,726 |
| Puerto Rico Sales Tax Financing Corp., Restructured Sales Tax Rev., “2019A-1”, 4.75%, 7/01/2053 | | | 5,000,000 | 5,488,024 |
| Puerto Rico Sales Tax Financing Corp., Restructured Sales Tax Rev., “2019A-1”, 5%, 7/01/2058 | | | 100,138,000 | 111,306,031 |
| Puerto Rico Sales Tax Financing Corp., Restructured Sales Tax Rev., “2019A-2”, 4.329%, 7/01/2040 | | | 31,098,000 | 33,756,640 |
Portfolio of Investments – continued
| Issuer | | | Shares/Par | Value ($) |
| Municipal Bonds - continued |
| Puerto Rico - continued |
| Puerto Rico Sales Tax Financing Corp., Restructured Sales Tax Rev., “2019A-2”, 4.536%, 7/01/2053 | | $ | 298,000 | $ 323,393 |
| Puerto Rico Sales Tax Financing Corp., Restructured Sales Tax Rev., “2019A-2”, 4.784%, 7/01/2058 | | | 9,051,000 | 9,919,573 |
| Puerto Rico Sales Tax Financing Corp., Restructured Sales Tax Rev., Capital Appreciation, “2019A-1”, 0%, 7/01/2024 | | | 400,000 | 380,329 |
| Puerto Rico Sales Tax Financing Corp., Restructured Sales Tax Rev., Capital Appreciation, “2019A-1”, 0%, 7/01/2027 | | | 2,598,000 | 2,318,703 |
| Puerto Rico Sales Tax Financing Corp., Restructured Sales Tax Rev., Capital Appreciation, “2019A-1”, 0%, 7/01/2029 | | | 825,000 | 690,703 |
| Puerto Rico Sales Tax Financing Corp., Restructured Sales Tax Rev., Capital Appreciation, “2019A-1”, 0%, 7/01/2031 | | | 20,100,000 | 15,676,627 |
| Puerto Rico Sales Tax Financing Corp., Restructured Sales Tax Rev., Capital Appreciation, “2019A-1”, 0%, 7/01/2033 | | | 20,115,000 | 14,589,685 |
| Puerto Rico Sales Tax Financing Corp., Restructured Sales Tax Rev., Capital Appreciation, “2019A-1”, 0%, 7/01/2046 | | | 35,757,000 | 11,609,383 |
| University of Puerto Rico Rev., “P”, NPFG, 5%, 6/01/2025 | | | 595,000 | 604,456 |
| | | | | $580,459,137 |
| Rhode Island - 0.1% |
| Rhode Island Student Loan Authority, Education Loan Rev., “A”, 2.25%, 12/01/2039 | | $ | 2,705,000 | $ 2,612,281 |
| Rhode Island Student Loan Authority, Student Loan Rev., “A”, 3.5%, 12/01/2034 | | | 1,280,000 | 1,292,077 |
| | | | | $3,904,358 |
| South Carolina - 0.8% |
| Berkeley County, SC, Assessment Rev. (Nexton Improvement District), 4%, 11/01/2030 (n) | | $ | 425,000 | $ 463,880 |
| Berkeley County, SC, Assessment Rev. (Nexton Improvement District), 4.25%, 11/01/2040 (n) | | | 1,000,000 | 1,086,114 |
| Berkeley County, SC, Assessment Rev. (Nexton Improvement District), 4.375%, 11/01/2049 (n) | | | 500,000 | 539,988 |
| Richland County, SC, Environmental Improvement Rev. (International Paper), “A”, 3.875%, 4/01/2023 | | | 4,130,000 | 4,266,054 |
| South Carolina Jobs & Economic Development Authority, 5%, 4/01/2048 | | | 1,500,000 | 1,598,291 |
| South Carolina Jobs & Economic Development Authority, 5.25%, 4/01/2053 | | | 4,060,000 | 4,344,425 |
| South Carolina Jobs & Economic Development Authority, Educational Facilities Rev. (Green Charter Schools Project), “A”, 4%, 6/01/2036 (n) | | | 520,000 | 544,562 |
Portfolio of Investments – continued
| Issuer | | | Shares/Par | Value ($) |
| Municipal Bonds - continued |
| South Carolina - continued |
| South Carolina Jobs & Economic Development Authority, Educational Facilities Rev. (Green Charter Schools Project), “A”, 4%, 6/01/2046 (n) | | $ | 330,000 | $ 339,284 |
| South Carolina Jobs & Economic Development Authority, Educational Facilities Rev. (Green Charter Schools Project), “A”, 4%, 6/01/2056 (n) | | | 130,000 | 133,210 |
| South Carolina Jobs & Economic Development Authority, Health Facilities Rev. (Lutheran Homes of South Carolina, Inc.), 5.125%, 5/01/2048 | | | 805,000 | 809,620 |
| South Carolina Jobs & Economic Development Authority, Health Facilities Rev. (Lutheran Homes of South Carolina, Inc.), “B”, 5%, 5/01/2037 | | | 925,000 | 958,584 |
| South Carolina Jobs & Economic Development Authority, Health Facilities Rev. (Wesley Commons), 5%, 10/01/2036 (n) | | | 5,735,000 | 6,201,963 |
| South Carolina Jobs & Economic Development Authority, Hospital Rev. (Hampton Regional Medical Center Project), 4%, 11/01/2029 | | | 3,240,000 | 3,444,439 |
| South Carolina Jobs & Economic Development Authority, Hospital Rev. (Hampton Regional Medical Center Project), 5%, 11/01/2033 | | | 3,570,000 | 3,890,757 |
| South Carolina Jobs & Economic Development Authority, Hospital Rev. (Hampton Regional Medical Center Project), 5%, 11/01/2037 | | | 1,380,000 | 1,501,516 |
| South Carolina Jobs & Economic Development Authority, Hospital Rev. (Hampton Regional Medical Center Project), 5%, 11/01/2042 | | | 3,515,000 | 3,814,066 |
| South Carolina Jobs & Economic Development Authority, Hospital Rev. (Hampton Regional Medical Center Project), 5%, 11/01/2046 | | | 1,905,000 | 2,048,946 |
| South Carolina Jobs & Economic Development Authority, Hospital Rev. (Prisma Health Obligated Group), “A”, 5%, 5/01/2048 | | | 9,330,000 | 10,799,829 |
| South Carolina Jobs & Economic Development Authority, Residential Care Facilities Rev. (South Carolina Episcopal Home at Still Hopes), 5%, 4/01/2047 | | | 2,655,000 | 2,847,295 |
| South Carolina Jobs & Economic Development Authority, Residential Care Facilities Rev. (South Carolina Episcopal Home at Still Hopes), 5%, 4/01/2052 | | | 2,610,000 | 2,796,577 |
| South Carolina Ports Authority Rev., 5.25%, 7/01/2050 (Prerefunded 7/01/2025) | | | 1,485,000 | 1,680,960 |
| Spartanburg County, SC, Regional Health Services District Hospital Rev., “A”, 5%, 4/15/2048 | | | 1,330,000 | 1,554,060 |
Portfolio of Investments – continued
| Issuer | | | Shares/Par | Value ($) |
| Municipal Bonds - continued |
| South Carolina - continued |
| Spartanburg County, SC, Regional Health Services District Hospital Rev., “A”, AGM, 4%, 4/15/2045 | | $ | 1,200,000 | $ 1,351,026 |
| | | | | $57,015,446 |
| South Dakota - 0.0% |
| South Dakota Housing Development Authority, Homeownership Mortgage, “A”, 3%, 11/01/2051 | | $ | 3,345,000 | $ 3,498,216 |
| Tennessee - 0.6% |
| Chattanooga, TN, Health, Educational & Housing Facility Board Rev. (Catholic Health Initiatives), “A”, 5.25%, 1/01/2045 (Prerefunded 1/01/2023) | | $ | 2,270,000 | $ 2,362,562 |
| Chattanooga, TN, Health, Educational & Housing Facility Board Rev. (CommonSpirit Health), “A-2”, 5%, 8/01/2049 | | | 295,000 | 344,558 |
| Knox County, TN, Health, Educational & Housing Facility Board Rev. (University Health Systems, Inc.), 5%, 4/01/2030 | | | 680,000 | 778,928 |
| Knox County, TN, Health, Educational & Housing Facility Board Rev. (University Health Systems, Inc.), 5%, 4/01/2031 | | | 800,000 | 914,038 |
| Knox County, TN, Health, Educational & Housing Facility Board Rev. (University Health Systems, Inc.), 5%, 4/01/2036 | | | 1,380,000 | 1,570,743 |
| Knox County, TN, Health, Educational & Housing Facility Board Rev. (University Health Systems, Inc.), “A”, 5%, 9/01/2040 | | | 10,535,000 | 12,352,050 |
| Memphis-Shelby County, TN, Economic Development Growth Engine Industrial Development Board, Senior Tax Rev. (Graceland Project), “A”, 4.75%, 7/01/2027 | | | 100,000 | 93,971 |
| Memphis-Shelby County, TN, Economic Development Growth Engine Industrial Development Board, Senior Tax Rev. (Graceland Project), “A”, 5.625%, 1/01/2046 | | | 250,000 | 217,822 |
| Metropolitan Government of Nashville & Davidson County, TN, Health & Educational Facilities Board Rev., Refunding & Improvement (Trevecca Nazarene University Project), 5%, 10/01/2034 | | | 240,000 | 277,918 |
| Metropolitan Nashville, TN, Airport Authority Improvement Rev., “B”, 5%, 7/01/2040 | | | 3,000,000 | 3,321,027 |
| Shelby County, TN, Health, Educational & Housing Board Residential Care Facility Mortgage Rev. (Village at Germantown), 5%, 12/01/2034 | | | 500,000 | 532,807 |
| Shelby County, TN, Health, Educational & Housing Board Residential Care Facility Mortgage Rev. (Village at Germantown), 5.25%, 12/01/2044 | | | 1,000,000 | 1,063,379 |
| Shelby County, TN, New Memphis Arena Public Building Authority, Local Government Public Improvement (City of Memphis Project), Capital Appreciation, 0%, 4/01/2032 | | | 610,000 | 478,367 |
Portfolio of Investments – continued
| Issuer | | | Shares/Par | Value ($) |
| Municipal Bonds - continued |
| Tennessee - continued |
| Shelby County, TN, New Memphis Arena Public Building Authority, Local Government Public Improvement (City of Memphis Project), Capital Appreciation, 0%, 4/01/2033 | | $ | 875,000 | $ 666,532 |
| Shelby County, TN, New Memphis Arena Public Building Authority, Local Government Public Improvement (City of Memphis Project), Capital Appreciation, 0%, 4/01/2034 | | | 520,000 | 384,305 |
| Shelby County, TN, New Memphis Arena Public Building Authority, Local Government Public Improvement (City of Memphis Project), Capital Appreciation, 0%, 4/01/2035 | | | 680,000 | 486,304 |
| Shelby County, TN, New Memphis Arena Public Building Authority, Local Government Public Improvement (City of Memphis Project), Capital Appreciation, 0%, 4/01/2036 | | | 650,000 | 449,786 |
| Shelby County, TN, New Memphis Arena Public Building Authority, Local Government Public Improvement (City of Memphis Project), Capital Appreciation, 0%, 4/01/2037 | | | 780,000 | 522,486 |
| Shelby County, TN, New Memphis Arena Public Building Authority, Local Government Public Improvement (City of Memphis Project), Capital Appreciation, 0%, 4/01/2038 | | | 650,000 | 420,296 |
| Tennessee Energy Acquisition Corp., Gas Rev., “A”, 5.25%, 9/01/2022 | | | 2,105,000 | 2,158,984 |
| Tennessee Housing Development Agency, Residential Finance Program Rev., “1”, 4%, 1/01/2043 | | | 1,565,000 | 1,662,451 |
| Tennessee Housing Development Agency, Residential Finance Program Rev., “3”, 4.25%, 7/01/2049 | | | 1,910,000 | 2,045,932 |
| Tennessee Housing Development Agency, Residential Finance Program Rev., “4”, 4.5%, 7/01/2049 (u) | | | 9,095,000 | 9,852,755 |
| | | | | $42,958,001 |
| Texas - 5.6% |
| Arlington, TX, Higher Education Finance Corp. Education Rev. (Basis Texas Charter Schools, Inc.), “A”, 4%, 6/15/2030 (n) | | $ | 985,000 | $ 1,015,039 |
| Arlington, TX, Higher Education Finance Corp. Education Rev. (Basis Texas Charter Schools, Inc.), “A”, 4%, 6/15/2040 (n) | | | 1,810,000 | 1,829,279 |
| Arlington, TX, Higher Education Finance Corp. Education Rev. (Basis Texas Charter Schools, Inc.), “A”, 4%, 6/15/2050 (n) | | | 4,810,000 | 4,829,399 |
| Arlington, TX, Higher Education Finance Corp. Education Rev. (Brooks Academies of Texas), “A”, 4%, 6/15/2031 (n) | | | 1,000,000 | 1,014,387 |
| Arlington, TX, Higher Education Finance Corp. Education Rev. (Brooks Academies of Texas), “A”, 5%, 6/15/2041 (n) | | | 8,445,000 | 8,793,839 |
| Arlington, TX, Higher Education Finance Corp. Education Rev. (Brooks Academies of Texas), “A”, 5%, 6/15/2051 (n) | | | 3,500,000 | 3,614,777 |
| Arlington, TX, Higher Education Finance Corp. Education Rev. (Newman International Academy), “A”, 4%, 8/15/2031 | | | 355,000 | 369,499 |
Portfolio of Investments – continued
| Issuer | | | Shares/Par | Value ($) |
| Municipal Bonds - continued |
| Texas - continued |
| Arlington, TX, Higher Education Finance Corp. Education Rev. (Newman International Academy), “A”, 5.375%, 8/15/2036 | | $ | 820,000 | $ 885,746 |
| Arlington, TX, Higher Education Finance Corp. Education Rev. (Newman International Academy), “A”, 5%, 8/15/2041 | | | 900,000 | 962,513 |
| Arlington, TX, Higher Education Finance Corp. Education Rev. (Newman International Academy), “A”, 5.5%, 8/15/2046 | | | 3,680,000 | 3,944,698 |
| Arlington, TX, Higher Education Finance Corp. Education Rev. (Newman International Academy), “A”, 5%, 8/15/2051 | | | 1,500,000 | 1,578,451 |
| Arlington, TX, Higher Education Finance Corp. Education Rev. (UME Preparatory Academy), “A”, 5%, 8/15/2038 | | | 1,060,000 | 1,146,583 |
| Arlington, TX, Higher Education Finance Corp. Education Rev. (UME Preparatory Academy), “A”, 5%, 8/15/2048 | | | 1,750,000 | 1,865,626 |
| Arlington, TX, Higher Education Finance Corp. Education Rev. (UME Preparatory Academy), “A”, 5%, 8/15/2053 | | | 1,695,000 | 1,802,625 |
| Arlington, TX, Senior Lien Special Tax Rev., “A”, AGM, 5%, 2/15/2037 | | | 800,000 | 946,806 |
| Arlington, TX, Senior Lien Special Tax Rev., “A”, AGM, 5%, 2/15/2038 | | | 655,000 | 774,138 |
| Arlington, TX, Senior Lien Special Tax Rev., “A”, AGM, 5%, 2/15/2043 | | | 3,400,000 | 3,988,411 |
| Austin, TX, Airport System Rev., “B”, 5%, 11/15/2041 | | | 930,000 | 1,062,260 |
| Austin, TX, Convention Center (Convention Enterprises, Inc.), “A”, 5%, 1/01/2029 | | | 890,000 | 982,615 |
| Austin, TX, Convention Center (Convention Enterprises, Inc.), “A”, 5%, 1/01/2031 | | | 1,325,000 | 1,455,806 |
| Austin, TX, Convention Center (Convention Enterprises, Inc.), “A”, 5%, 1/01/2034 | | | 260,000 | 274,728 |
| Austin, TX, Convention Center (Convention Enterprises, Inc.), “B”, 5%, 1/01/2026 | | | 615,000 | 654,055 |
| Austin, TX, Convention Center (Convention Enterprises, Inc.), “B”, 5%, 1/01/2028 | | | 400,000 | 428,120 |
| Austin, TX, Convention Center (Convention Enterprises, Inc.), “B”, 5%, 1/01/2030 | | | 585,000 | 621,758 |
| Brazos, TX, Higher Education Authority, Inc., Student Loan Program Rev., “1A”, 2.35%, 4/01/2040 | | | 350,000 | 350,843 |
| Brazos, TX, Higher Education Authority, Inc., Student Loan Program Rev., “1A”, 3%, 4/01/2040 | | | 1,100,000 | 1,000,291 |
| Brazos, TX, Higher Education Authority, Inc., Taxable Student Loan Program Rev., “1A”, 3.414%, 4/01/2040 | | | 705,000 | 712,253 |
| Capital Area, TX, Housing Finance Corp., Multi-Family Housing Rev. (Grand Ave. Flats), 0.29%, 8/01/2039 (Put Date 8/01/2024) | | | 4,550,000 | 4,453,298 |
| Central Texas Regional Mobility Authority Senior Lien Rev., “A”, 5%, 1/01/2045 (Prerefunded 7/01/2025) | | | 1,315,000 | 1,480,401 |
Portfolio of Investments – continued
| Issuer | | | Shares/Par | Value ($) |
| Municipal Bonds - continued |
| Texas - continued |
| Clear Creek, TX, Independent School District Variable Rate Unlimited Tax School Building, “B”, 0.28%, 2/15/2038 (Put Date 8/15/2024) | | $ | 2,015,000 | $ 1,971,776 |
| Clifton, TX, Higher Education Finance Corp. Rev. (Idea Public Schools), 6%, 8/15/2033 | | | 845,000 | 902,059 |
| Clifton, TX, Higher Education Finance Corp. Rev. (Idea Public Schools), 6%, 8/15/2043 | | | 1,850,000 | 1,967,853 |
| Clifton, TX, Higher Education Finance Corp. Rev. (Uplift Education), “A”, 3.375%, 12/01/2024 | | | 190,000 | 194,431 |
| Conroe, TX, Local Government Corp., First Lien Hotel Rev. (Convention Center Hotel), “A”, 2.5%, 10/01/2031 | | | 470,000 | 448,394 |
| Conroe, TX, Local Government Corp., First Lien Hotel Rev. (Convention Center Hotel), “A”, 4%, 10/01/2050 | | | 995,000 | 1,055,986 |
| Conroe, TX, Local Government Corp., Second Lien Hotel Rev. (Convention Center Hotel), “B”, 3.5%, 10/01/2031 (n) | | | 385,000 | 368,111 |
| Conroe, TX, Local Government Corp., Second Lien Hotel Rev. (Convention Center Hotel), “B”, 5%, 10/01/2050 (n) | | | 730,000 | 772,669 |
| Conroe, TX, Local Government Corp., Third Lien Hotel Rev. (Convention Center Hotel), “C”, 4%, 10/01/2041 | | | 310,000 | 347,193 |
| Conroe, TX, Local Government Corp., Third Lien Hotel Rev. (Convention Center Hotel), “C”, 4%, 10/01/2046 | | | 365,000 | 400,914 |
| Conroe, TX, Local Government Corp., Third Lien Hotel Rev. (Convention Center Hotel), “C”, 4%, 10/01/2050 | | | 265,000 | 290,219 |
| Dallas, TX, Dallas Area Rapid Transit Rev., “B”, 5%, 12/01/2047 | | | 3,145,000 | 3,877,878 |
| Dallas, TX, Dallas Area Rapid Transit Rev., “B”, 4%, 12/01/2051 | | | 3,165,000 | 3,583,711 |
| Decatur, TX, Hospital Authority Rev. (Wise Regional Health System), “C”, 4%, 9/01/2044 | | | 1,894,000 | 2,065,498 |
| Ector County, TX, Hospital District General Obligation Refunding, 5%, 9/15/2033 | | | 550,000 | 639,092 |
| Ector County, TX, Hospital District General Obligation Refunding, 4%, 9/15/2034 | | | 1,270,000 | 1,361,584 |
| El Paso, TX, Independent School District, Maintenance Tax Notes, 2%, 2/01/2040 (Put Date 8/01/2023) | | | 1,880,000 | 1,909,352 |
| Galveston, TX, Public Facility Corp., Multi-Family Housing Rev. (Oleanders At Broadway), 0.47%, 8/01/2025 (Put Date 8/01/2024) | | | 2,465,000 | 2,410,964 |
| Gulf Coast, TX, Industrial Development Authority Rev. (CITGO Petroleum Corp.), 4.875%, 5/01/2025 | | | 2,845,000 | 2,871,628 |
| Gulf Coast, TX, Industrial Development Authority Rev. (CITGO Petroleum Corp.), 8%, 4/01/2028 | | | 875,000 | 876,079 |
| Harris County, TX, Cultural Education Facilities Finance Corp. Rev. (Brazos Presbyterian Homes Inc. Project), 7%, 1/01/2043 (Prerefunded 1/01/2023) | | | 2,265,000 | 2,392,307 |
Portfolio of Investments – continued
| Issuer | | | Shares/Par | Value ($) |
| Municipal Bonds - continued |
| Texas - continued |
| Harris County-Houston, TX, Sports Authority Rev., “C”, 5%, 11/15/2031 | | $ | 1,425,000 | $ 1,546,823 |
| Harris County-Houston, TX, Sports Authority Rev., “C”, 5%, 11/15/2032 | | | 185,000 | 200,853 |
| Harris County-Houston, TX, Sports Authority Rev., “C”, 5%, 11/15/2033 | | | 450,000 | 488,611 |
| Harris County-Houston, TX, Sports Authority Rev., Capital Appreciation, “A”, AGM, 0%, 11/15/2034 | | | 5,165,000 | 3,078,238 |
| Harris County-Houston, TX, Sports Authority Rev., Capital Appreciation, “A”, AGM, 0%, 11/15/2038 | | | 40,280,000 | 18,663,851 |
| Harris County-Houston, TX, Sports Authority Rev., Capital Appreciation, “A”, AGM, 0%, 11/15/2041 | | | 745,000 | 339,236 |
| Harris County-Houston, TX, Sports Authority Rev., Capital Appreciation, “A”, AGM, 0%, 11/15/2046 | | | 1,865,000 | 653,881 |
| Housing Options, Inc., Texas Multi-Family Housing Rev. (Brooks Manor - The Oaks Project), 0.5%, 8/01/2041 (Put Date 3/01/2025) | | | 2,085,000 | 2,033,247 |
| Houston, TX, Airport System Rev., Special Facilities Rev. (Continental Airlines, Inc.), 6.625%, 7/15/2038 | | | 7,680,000 | 7,725,436 |
| Houston, TX, Airport System Rev., Special Facilities Rev. (United Airlines, Inc. Terminal E Project), 4.75%, 7/01/2024 | | | 3,060,000 | 3,199,357 |
| Houston, TX, Airport System Rev., Special Facilities Rev. (United Airlines, Inc. Terminal E Project), 5%, 7/01/2029 | | | 160,000 | 169,310 |
| Houston, TX, Airport System Rev., Special Facilities Rev. (United Airlines, Inc. Terminal E Project), “A”, 5%, 7/01/2027 | | | 730,000 | 827,926 |
| Houston, TX, Airport System Rev., Special Facilities Rev. (United Airlines, Inc. Terminal Improvement Projects), “B-1”, 5%, 7/15/2030 | | | 16,260,000 | 17,553,068 |
| Houston, TX, Airport System Rev., Special Facilities Rev. (United Airlines, Inc. Terminal Improvement Projects), “B-2”, 5%, 7/15/2027 | | | 1,005,000 | 1,140,420 |
| Houston, TX, Higher Education Finance Corp. University Rev. (Houston Baptist University Project), 3.375%, 10/01/2037 | | | 260,000 | 260,342 |
| Houston, TX, Higher Education Finance Corp. University Rev. (Houston Baptist University Project), 4%, 10/01/2051 | | | 880,000 | 930,968 |
| Houston, TX, Industrial Development Corp. (United Parcel Service, Inc.), 6%, 3/01/2023 | | | 100,000 | 100,317 |
| Irving, TX, Hospital Authority Rev. (Baylor Scott & White Medical Center-Irving), “A”, 5%, 10/15/2044 | | | 1,290,000 | 1,452,681 |
| Irving, TX, Hotel Occupancy Tax Rev., 5%, 8/15/2035 | | | 190,000 | 222,471 |
| Irving, TX, Hotel Occupancy Tax Rev., 5%, 8/15/2037 | | | 285,000 | 332,172 |
| Irving, TX, Hotel Occupancy Tax Rev., 5%, 8/15/2038 | | | 310,000 | 360,715 |
| Irving, TX, Hotel Occupancy Tax Rev., 5%, 8/15/2043 | | | 565,000 | 651,528 |
Portfolio of Investments – continued
| Issuer | | | Shares/Par | Value ($) |
| Municipal Bonds - continued |
| Texas - continued |
| Mission, TX, Economic Development Corp. (NatGasoline Project), 4.625%, 10/01/2031 (n) | | $ | 4,240,000 | $ 4,458,942 |
| New Hope, TX, Cultural Education Facilities Finance Corp., Capital Improvement Rev. (CHF - Collegiate Housing Denton LLC - Texas Woman's University Housing Project), “A-1”, AGM, 5%, 7/01/2038 | | | 460,000 | 539,602 |
| New Hope, TX, Cultural Education Facilities Finance Corp., Capital Improvement Rev. (CHF - Collegiate Housing Denton LLC - Texas Woman's University Housing Project), “A-1”, AGM, 5%, 7/01/2048 | | | 1,905,000 | 2,226,713 |
| New Hope, TX, Cultural Education Facilities Finance Corp., Capital Improvement Rev. (CHF - Collegiate Housing Denton LLC - Texas Woman's University Housing Project), “A-1”, AGM, 5%, 7/01/2058 | | | 1,685,000 | 1,963,720 |
| New Hope, TX, Cultural Education Facilities Finance Corp., Education Rev. (Beta Academy), “A”, 3.375%, 8/15/2029 (n) | | | 780,000 | 793,200 |
| New Hope, TX, Cultural Education Facilities Finance Corp., Education Rev. (Beta Academy), “A”, 5%, 8/15/2039 (n) | | | 2,550,000 | 2,685,112 |
| New Hope, TX, Cultural Education Facilities Finance Corp., Education Rev. (Beta Academy), “A”, 5%, 8/15/2049 (n) | | | 1,555,000 | 1,628,058 |
| New Hope, TX, Cultural Education Facilities Finance Corp., Education Rev. (Cumberland Academy), “A”, 5%, 8/15/2040 (n) | | | 3,500,000 | 3,762,372 |
| New Hope, TX, Cultural Education Facilities Finance Corp., Education Rev. (Cumberland Academy), “A”, 5%, 8/15/2050 (n) | | | 3,000,000 | 3,202,964 |
| New Hope, TX, Cultural Education Facilities Finance Corp., Education Rev. (Jubilee Academic Center), 4%, 8/15/2046 (n) | | | 3,040,000 | 3,212,777 |
| New Hope, TX, Cultural Education Facilities Finance Corp., Education Rev. (Jubilee Academic Center), 4%, 8/15/2051 (n) | | | 4,515,000 | 4,752,716 |
| New Hope, TX, Cultural Education Facilities Finance Corp., Retirement Facility Rev. (Longhorn Village Project), 5%, 1/01/2037 | | | 2,000,000 | 2,130,097 |
| New Hope, TX, Cultural Education Facilities Finance Corp., Retirement Facility Rev. (Longhorn Village Project), 5%, 1/01/2042 | | | 3,000,000 | 3,184,089 |
| New Hope, TX, Cultural Education Facilities Finance Corp., Retirement Facility Rev. (MRC Senior Living - Langford Project), “A”, 5%, 11/15/2026 | | | 295,000 | 307,823 |
| New Hope, TX, Cultural Education Facilities Finance Corp., Retirement Facility Rev. (MRC Senior Living - Langford Project), “A”, 5.375%, 11/15/2036 | | | 420,000 | 442,284 |
| New Hope, TX, Cultural Education Facilities Finance Corp., Retirement Facility Rev. (MRC Senior Living - Langford Project), “A”, 5.5%, 11/15/2046 | | | 835,000 | 875,294 |
Portfolio of Investments – continued
| Issuer | | | Shares/Par | Value ($) |
| Municipal Bonds - continued |
| Texas - continued |
| New Hope, TX, Cultural Education Facilities Finance Corp., Retirement Facility Rev. (MRC Senior Living - Langford Project), “A”, 5.5%, 11/15/2052 | | $ | 960,000 | $ 1,003,374 |
| New Hope, TX, Cultural Education Facilities Finance Corp., Retirement Facility Rev. (Wesleyan Homes, Inc. Project), 3%, 1/01/2024 | | | 140,000 | 138,968 |
| New Hope, TX, Cultural Education Facilities Finance Corp., Retirement Facility Rev. (Wesleyan Homes, Inc. Project), 4%, 1/01/2029 | | | 440,000 | 440,251 |
| New Hope, TX, Cultural Education Facilities Finance Corp., Retirement Facility Rev. (Wesleyan Homes, Inc. Project), 5.5%, 1/01/2035 | | | 1,325,000 | 1,373,936 |
| New Hope, TX, Cultural Education Facilities Finance Corp., Retirement Facility Rev. (Wesleyan Homes, Inc. Project), 5%, 1/01/2039 | | | 465,000 | 479,781 |
| New Hope, TX, Cultural Education Facilities Finance Corp., Retirement Facility Rev. (Wesleyan Homes, Inc. Project), 5.5%, 1/01/2043 | | | 1,420,000 | 1,460,658 |
| New Hope, TX, Cultural Education Facilities Finance Corp., Retirement Facility Rev. (Wesleyan Homes, Inc. Project), 5.5%, 1/01/2049 | | | 1,470,000 | 1,508,049 |
| New Hope, TX, Cultural Education Facilities Finance Corp., Retirement Facility Rev. (Wesleyan Homes, Inc. Project), 5%, 1/01/2050 | | | 550,000 | 559,622 |
| New Hope, TX, Cultural Education Facilities Finance Corp., Retirement Facility Rev. (Wesleyan Homes, Inc. Project), 5%, 1/01/2055 | | | 2,050,000 | 2,079,819 |
| New Hope, TX, Cultural Education Facilities Finance Corp., Student Housing Rev. (CHF - Collegiate Housing Stephenville III LLC - Tarleton State University Project), 5%, 4/01/2030 (Prerefunded 4/01/2025) | | | 310,000 | 346,761 |
| New Hope, TX, Cultural Education Facilities Finance Corp., Student Housing Rev. (CHF - Collegiate Housing Stephenville III LLC - Tarleton State University Project), 5%, 4/01/2035 (Prerefunded 4/01/2025) | | | 310,000 | 346,761 |
| New Hope, TX, Cultural Education Facilities Finance Corp., Student Housing Rev. (CHF - Collegiate Housing Stephenville III LLC - Tarleton State University Project), 5%, 4/01/2047 (Prerefunded 4/01/2025) | | | 770,000 | 861,311 |
| New Hope, TX, Cultural Education Facilities Finance Corp., Student Housing Rev. (Collegiate Housing Island Campus LLC - Texas A&M University - Corpus Christi Island Campus Project), “A”, 5%, 4/01/2029 (Prerefunded 4/01/2027) | | | 265,000 | 310,919 |
Portfolio of Investments – continued
| Issuer | | | Shares/Par | Value ($) |
| Municipal Bonds - continued |
| Texas - continued |
| New Hope, TX, Cultural Education Facilities Finance Corp., Student Housing Rev. (Texas A&M University Project), “A”, AGM, 5%, 4/01/2046 | | $ | 1,295,000 | $ 1,392,020 |
| Newark, TX, Higher Education Finance Corp. Rev. (A+ Charter Schools, Inc.), “A”, 5.5%, 8/15/2035 (n) | | | 1,530,000 | 1,680,160 |
| Newark, TX, Higher Education Finance Corp. Rev. (A+ Charter Schools, Inc.), “A”, 5.75%, 8/15/2045 (n) | | | 2,250,000 | 2,469,032 |
| Newark, TX, Higher Education Finance Corp. Rev. (Austin Achieve Public Schools, Inc.), 5%, 6/15/2033 | | | 155,000 | 156,906 |
| Newark, TX, Higher Education Finance Corp. Rev. (Austin Achieve Public Schools, Inc.), 5%, 6/15/2038 | | | 385,000 | 389,562 |
| Newark, TX, Higher Education Finance Corp. Rev. (Austin Achieve Public Schools, Inc.), 5%, 6/15/2048 | | | 1,155,000 | 1,167,862 |
| Newark, TX, Higher Education Finance Corp. Rev. (Austin Achieve Public Schools, Inc.), “A”, 5%, 6/15/2032 (Prerefunded 6/15/2022) | | | 595,000 | 604,793 |
| Newark, TX, Higher Education Finance Corp. Rev. (Austin Achieve Public Schools, Inc.), “A”, 5%, 6/15/2037 (Prerefunded 6/15/2022) | | | 655,000 | 665,781 |
| Newark, TX, Higher Education Finance Corp. Rev. (Austin Achieve Public Schools, Inc.), “A”, 5%, 6/15/2042 (Prerefunded 6/15/2022) | | | 785,000 | 797,921 |
| Newark, TX, Higher Education Finance Corp. Rev. (Austin Achieve Public Schools, Inc.), “A”, 5.25%, 6/15/2048 (Prerefunded 6/15/2022) | | | 1,435,000 | 1,459,941 |
| North Central, TX, Housing Finance Corp., Multifamily Housing Rev. (Bluebonnet Ridge Apartments), 0.375%, 8/01/2040 (Put Date 8/01/2024) | | | 1,575,000 | 1,544,048 |
| North Texas Tollway Authority System Rev., “B”, 4%, 1/01/2039 | | | 1,300,000 | 1,491,193 |
| Port Beaumont, TX, Industrial Development Authority Facility Taxable Rev. (Jefferson Gulf Coast Energy Project), “B”, 4.1%, 1/01/2028 (n) | | | 23,050,000 | 21,940,975 |
| Port Beaumont, TX, Navigation District Facility Rev. (Jefferson Gulf Coast Energy Project), “A”, 3.625%, 1/01/2035 (n) | | | 3,655,000 | 3,686,655 |
| Port Beaumont, TX, Navigation District Facility Rev. (Jefferson Gulf Coast Energy Project), “A”, 4%, 1/01/2050 (n) | | | 9,200,000 | 9,285,476 |
| Port Beaumont, TX, Navigation District Facility Rev. (Jefferson Gulf Coast Energy Project), “B”, 6%, 1/01/2025 (n) | | | 10,945,000 | 11,291,902 |
| Red River, TX, Education Finance Corp., Higher Education Rev. (Houston Baptist University Project), 5.5%, 10/01/2046 | | | 9,170,000 | 10,408,748 |
| Red River, TX, Health Facilities Development Corp., Retirement Facilities Rev. (MRC Crossings Project), “A”, 7.5%, 11/15/2034 (Prerefunded 11/15/2024) | | | 1,075,000 | 1,257,255 |
Portfolio of Investments – continued
| Issuer | | | Shares/Par | Value ($) |
| Municipal Bonds - continued |
| Texas - continued |
| Red River, TX, Health Facilities Development Corp., Retirement Facilities Rev. (MRC Crossings Project), “A”, 7.75%, 11/15/2044 (Prerefunded 11/15/2024) | | $ | 1,970,000 | $ 2,317,428 |
| Red River, TX, Health Facilities Development Corp., Retirement Facilities Rev. (MRC Crossings Project), “A”, 8%, 11/15/2049 (Prerefunded 11/15/2024) | | | 1,680,000 | 1,985,199 |
| SA Energy Acquisition Public Facility Corp. (Tex Gas Supply), 5.5%, 8/01/2027 | | | 4,000,000 | 4,780,105 |
| San Antonio, TX, Airport System Rev., “A”, 5%, 7/01/2029 | | | 545,000 | 658,857 |
| San Antonio, TX, Airport System Rev., “A”, 5%, 7/01/2030 | | | 680,000 | 822,852 |
| San Antonio, TX, Airport System Rev., “A”, 5%, 7/01/2031 | | | 540,000 | 651,372 |
| San Antonio, TX, Airport System Rev., “A”, 5%, 7/01/2032 | | | 540,000 | 651,198 |
| San Antonio, TX, Passenger Facility Charge and Subordinate Lien Airport System Rev., “A”, 5%, 7/01/2028 | | | 830,000 | 983,136 |
| San Antonio, TX, Passenger Facility Charge and Subordinate Lien Airport System Rev., “A”, 5%, 7/01/2029 | | | 810,000 | 974,262 |
| San Antonio, TX, Passenger Facility Charge and Subordinate Lien Airport System Rev., “A”, 5%, 7/01/2030 | | | 675,000 | 811,638 |
| San Antonio, TX, Passenger Facility Charge and Subordinate Lien Airport System Rev., “A”, 5%, 7/01/2031 | | | 485,000 | 582,069 |
| San Antonio, TX, Passenger Facility Charge and Subordinate Lien Airport System Rev., “A”, 5%, 7/01/2032 | | | 595,000 | 714,346 |
| Tarrant County, TX, Cultural Education Facilities Finance Corp. Retirement Facility Rev. (Barton Creek Senior Living Center, Inc., Querencia Project), 5%, 11/15/2024 | | | 1,095,000 | 1,202,007 |
| Tarrant County, TX, Cultural Education Facilities Finance Corp. Retirement Facility Rev. (Barton Creek Senior Living Center, Inc., Querencia Project), 5%, 11/15/2030 | | | 1,500,000 | 1,660,940 |
| Tarrant County, TX, Cultural Education Facilities Finance Corp. Retirement Facility Rev. (Barton Creek Senior Living Center, Inc., Querencia Project), 5%, 11/15/2035 | | | 3,345,000 | 3,666,749 |
| Tarrant County, TX, Cultural Education Facilities Finance Corp. Retirement Facility Rev. (Barton Creek Senior Living Center, Inc., Querencia Project), 5%, 11/15/2040 | | | 5,210,000 | 5,681,483 |
| Tarrant County, TX, Cultural Education Facilities Finance Corp. Retirement Facility Rev. (Stayton at Museum Way), 5.75%, 12/01/2054 | | | 22,954,217 | 24,045,791 |
| Tarrant County, TX, Cultural Education Facilities Finance Corp. Retirement Facility Rev. (Trinity Terrace Project), “A-1”, 5%, 10/01/2044 | | | 660,000 | 707,541 |
| Temple, TX, Reinvestment Zone 1 Rev., “A”, BAM, 4%, 8/01/2032 | | | 425,000 | 480,890 |
Portfolio of Investments – continued
| Issuer | | | Shares/Par | Value ($) |
| Municipal Bonds - continued |
| Texas - continued |
| Temple, TX, Reinvestment Zone 1 Rev., “A”, BAM, 4%, 8/01/2036 | | $ | 455,000 | $ 511,704 |
| Temple, TX, Reinvestment Zone 1 Rev., “A”, BAM, 4%, 8/01/2040 | | | 415,000 | 464,785 |
| Texas Department of Housing & Community Affairs, Residential Mortgage Rev., “A”, 4.75%, 1/01/2049 (u) | | | 5,475,000 | 5,948,718 |
| Texas Department of Housing & Community Affairs, Single Family Mortgage Rev., “A”, 4.75%, 3/01/2049 (u) | | | 2,925,000 | 3,156,302 |
| Texas Department of Housing & Community Affairs, Single Family Mortgage Rev., “A”, GNMA, 3%, 3/01/2052 | | | 15,090,000 | 15,889,082 |
| Texas Municipal Gas Acquisition and Supply Corp. III, Gas Supply Rev., 5%, 12/15/2030 | | | 5,860,000 | 7,111,952 |
| Texas Municipal Gas Acquisition and Supply Corp. III, Gas Supply Rev., 5%, 12/15/2031 | | | 5,325,000 | 6,555,975 |
| Texas Municipal Gas Acquisition and Supply Corp. III, Gas Supply Rev., 5%, 12/15/2032 | | | 5,330,000 | 6,659,946 |
| Texas Private Activity Surface Transportation Corp., Senior Lien Rev. (NTE Mobility Partners Segments 3 LLC Segments 3A & 3B Facility), 7%, 12/31/2038 | | | 1,375,000 | 1,505,407 |
| Texas Private Activity Surface Transportation Corp., Senior Lien Rev. (NTE Mobility Partners Segments 3 LLC Segments 3A & 3B Facility), 6.75%, 6/30/2043 | | | 1,105,000 | 1,204,926 |
| Texas Transportation Commission, Central Texas Turnpike System Rev., Capital Appreciation, “B”, 0%, 8/15/2036 | | | 4,605,000 | 2,615,859 |
| Texas Transportation Commission, State Highway 249 System Rev., “A”, 5%, 8/01/2057 | | | 5,725,000 | 6,457,822 |
| Texas Transportation Commission, State Highway 249 System Rev., Capital Appreciation, “A”, 0%, 8/01/2037 | | | 640,000 | 359,940 |
| Texas Transportation Commission, State Highway 249 System Rev., Capital Appreciation, “A”, 0%, 8/01/2038 | | | 470,000 | 250,374 |
| Texas Transportation Commission, State Highway 249 System Rev., Capital Appreciation, “A”, 0%, 8/01/2039 | | | 520,000 | 262,665 |
| Texas Transportation Commission, State Highway 249 System Rev., Capital Appreciation, “A”, 0%, 8/01/2040 | | | 520,000 | 248,210 |
| Texas Transportation Commission, State Highway 249 System Rev., Capital Appreciation, “A”, 0%, 8/01/2041 | | | 1,040,000 | 470,049 |
| Texas Transportation Commission, State Highway 249 System Rev., Capital Appreciation, “A”, 0%, 8/01/2042 | | | 1,430,000 | 611,424 |
| Texas Transportation Commission, State Highway 249 System Rev., Capital Appreciation, “A”, 0%, 8/01/2043 | | | 1,170,000 | 474,117 |
| | | | | $378,380,716 |
Portfolio of Investments – continued
| Issuer | | | Shares/Par | Value ($) |
| Municipal Bonds - continued |
| Utah - 0.4% |
| Utah Charter School Finance Authority, Charter School Rev. (Bridge Elementary Project), “A”, 4%, 6/15/2031 (n) | | $ | 560,000 | $ 571,286 |
| Utah Charter School Finance Authority, Charter School Rev. (Bridge Elementary Project), “A”, 4%, 6/15/2041 (n) | | | 890,000 | 874,642 |
| Utah Charter School Finance Authority, Charter School Rev. (Bridge Elementary Project), “A”, 4.25%, 6/15/2051 (n) | | | 1,315,000 | 1,286,846 |
| Utah Charter School Finance Authority, Charter School Rev. (Mountain Sunrise Academy), “A”, 4%, 12/15/2041 (n) | | | 2,770,000 | 2,710,364 |
| Utah Charter School Finance Authority, Charter School Rev. (Mountain Sunrise Academy), “A”, 4%, 12/15/2051 (n) | | | 4,120,000 | 3,847,357 |
| Utah Charter School Finance Authority, Charter School Rev. (Mountain Sunrise Academy), “A”, 4%, 12/15/2056 (n) | | | 2,770,000 | 2,527,316 |
| Utah Charter School Finance Authority, Charter School Rev. (Reagan Academy Project), 5%, 2/15/2036 (n) | | | 1,530,000 | 1,637,672 |
| Utah Charter School Finance Authority, Charter School Rev. (Reagan Academy Project), 5%, 2/15/2046 (n) | | | 1,285,000 | 1,358,445 |
| Utah Charter School Finance Authority, Charter School Rev. (Reagan Academy Project), “A”, 3.5%, 2/15/2026 (n) | | | 185,000 | 188,395 |
| Utah Charter School Finance Authority, Charter School Rev. (Summit Academy, Inc.), “A”, 5%, 4/15/2039 | | | 400,000 | 469,680 |
| Utah Charter School Finance Authority, Charter School Rev. (Summit Academy, Inc.), “A”, 5%, 4/15/2044 | | | 355,000 | 413,665 |
| Utah Charter School Finance Authority, Charter School Rev. (Summit Academy, Inc.), “A”, 5%, 4/15/2049 | | | 650,000 | 752,940 |
| Utah Housing Corp., Tax Exempt Mortgage-Backed Securities, “G”, GNMA, 4.5%, 7/21/2049 | | | 1,566,904 | 1,619,309 |
| Utah Housing Corp., Tax Exempt Mortgage-Backed Securities, “H”, GNMA, 4.5%, 8/21/2049 | | | 830,715 | 858,498 |
| Utah Housing Corp., Tax Exempt Mortgage-Backed Securities, “I”, 2.5%, 8/21/2051 | | | 4,219,187 | 4,255,200 |
| Utah Housing Corp., Tax Exempt Mortgage-Backed Securities, “I”, GNMA, 4%, 9/21/2049 | | | 1,631,796 | 1,678,984 |
| Utah Housing Corp., Tax-Exempt Mortgage-Backed Securities, “G”, GNMA, 3.5%, 2/21/2050 | | | 2,259,724 | 2,329,586 |
| | | | | $27,380,185 |
| Vermont - 0.2% |
| Burlington, VT, Airport Rev., “A”, 5%, 7/01/2022 | | $ | 1,020,000 | $ 1,038,546 |
| Burlington, VT, Airport Rev., “A”, 4%, 7/01/2028 | | | 4,645,000 | 4,683,239 |
| Vermont Economic Development Authority, Solid Waste Disposal Rev. (Casella Waste Systems, Inc.), 4.625%, 4/01/2036 (Put Date 4/03/2028) (n) | | | 2,445,000 | 2,789,787 |
Portfolio of Investments – continued
| Issuer | | | Shares/Par | Value ($) |
| Municipal Bonds - continued |
| Vermont - continued |
| Vermont Student Assistance Corp., Education Loan Rev., “A”, 3.625%, 6/15/2029 | | $ | 305,000 | $ 313,895 |
| Vermont Student Assistance Corp., Education Loan Rev., “A”, 3.75%, 6/15/2030 | | | 340,000 | 350,096 |
| Vermont Student Assistance Corp., Education Loan Rev., “A”, 4%, 6/15/2033 | | | 310,000 | 319,820 |
| Vermont Student Assistance Corp., Education Loan Rev., “A”, 4%, 6/15/2034 | | | 340,000 | 350,454 |
| Vermont Student Assistance Corp., Education Loan Rev., “A”, 2.375%, 6/15/2039 | | | 1,555,000 | 1,459,278 |
| Vermont Student Assistance Corp., Education Loan Rev., “B”, 4.375%, 6/15/2046 | | | 755,000 | 760,931 |
| Vermont Student Assistance Corp., Education Loan Rev., “B”, 4%, 6/15/2047 | | | 1,740,000 | 1,713,914 |
| | | | | $13,779,960 |
| Virginia - 1.0% |
| Amelia County, VA, Industrial Development Authority, Solid Waste Disposal Rev. (Waste Management, Inc. Project), 1.45%, 4/01/2027 | | $ | 940,000 | $ 932,570 |
| Charles City County, VA, Industrial Development Authority, Solid Waste Disposal Rev. (Waste Management, Inc. Project), 1.45%, 4/01/2027 | | | 440,000 | 436,522 |
| Embrey Mill Community Development Authority, VA, Special Assessment Rev., 7.25%, 3/01/2043 (Prerefunded 3/01/2023) | | | 4,600,000 | 4,903,368 |
| James City County, VA, Economic Development Authority, Residential Care Facility Rev. (United Methodist Homes of Williamsburg, Inc.), “A”, 4%, 6/01/2041 | | | 1,250,000 | 1,327,276 |
| James City County, VA, Economic Development Authority, Residential Care Facility Rev. (United Methodist Homes of Williamsburg, Inc.), “A”, 4%, 6/01/2047 | | | 2,055,000 | 2,146,759 |
| Peninsula Town Center Community Development Authority, VA, Special Obligation Refunding, 4%, 9/01/2023 (n) | | | 330,000 | 333,444 |
| Peninsula Town Center Community Development Authority, VA, Special Obligation Refunding, 4.5%, 9/01/2028 (n) | | | 580,000 | 607,957 |
| Peninsula Town Center Community Development Authority, VA, Special Obligation Refunding, 5%, 9/01/2037 (n) | | | 1,105,000 | 1,178,578 |
| Peninsula Town Center Community Development Authority, VA, Special Obligation Refunding, 4.5%, 9/01/2045 (n) | | | 3,775,000 | 3,920,508 |
| Peninsula Town Center Community Development Authority, VA, Special Obligation Refunding, 5%, 9/01/2045 (n) | | | 960,000 | 1,021,362 |
| Prince William County, VA, Cherry Hill Community Development Authority Rev. (Potomac Shores Project), 5.4%, 3/01/2045 (n) | | | 1,780,000 | 1,867,281 |
Portfolio of Investments – continued
| Issuer | | | Shares/Par | Value ($) |
| Municipal Bonds - continued |
| Virginia - continued |
| Roanoke, VA, Economic Development Authority, Educational Facilities Rev. (Lynchburg College), “A”, 5%, 9/01/2032 | | $ | 1,140,000 | $ 1,325,532 |
| Roanoke, VA, Economic Development Authority, Educational Facilities Rev. (Lynchburg College), “A”, 5%, 9/01/2034 | | | 490,000 | 568,369 |
| Virginia College Building Authority, Educational Facilities Rev. (Marymount University Project), “B”, 5.25%, 7/01/2030 (n) | | | 2,810,000 | 2,988,264 |
| Virginia College Building Authority, Educational Facilities Rev. (Marymount University Project), “B”, 5.25%, 7/01/2035 (n) | | | 2,590,000 | 2,737,995 |
| Virginia Small Business Financing Authority Rev., 5%, 6/01/2047 | | | 1,500,000 | 1,588,569 |
| Virginia Small Business Financing Authority Rev., 5%, 6/01/2052 | | | 3,880,000 | 4,106,451 |
| Virginia Small Business Financing Authority Rev. (95 Express Lanes LLC Project), 5%, 7/01/2049 | | | 1,655,000 | 1,657,494 |
| Virginia Small Business Financing Authority Rev. (Elizabeth River Crossings Opco LLC Project), 6%, 1/01/2037 | | | 4,975,000 | 5,079,004 |
| Virginia Small Business Financing Authority Rev. (Elizabeth River Crossings Opco LLC Project), 5.5%, 1/01/2042 | | | 9,705,000 | 9,882,744 |
| Virginia Small Business Financing Authority Rev. (Obligated Group of National Senior Campuses, Inc.), “A”, 4%, 1/01/2036 | | | 2,500,000 | 2,800,188 |
| Virginia Small Business Financing Authority Rev. (Obligated Group of National Senior Campuses, Inc.), “A”, 4%, 1/01/2037 | | | 2,750,000 | 3,073,082 |
| Virginia Small Business Financing Authority Rev. (Obligated Group of National Senior Campuses, Inc.), “A”, 4%, 1/01/2039 | | | 3,500,000 | 3,896,682 |
| Virginia Small Business Financing Authority Rev. (Obligated Group of National Senior Campuses, Inc.), “A”, 4%, 1/01/2040 | | | 1,965,000 | 2,182,017 |
| Virginia Small Business Financing Authority Rev., Solid Waste Disposal (Covanta Project), 5%, 1/01/2048 (Put Date 7/01/2038) (n) | | | 715,000 | 737,143 |
| Virginia Small Business Financing Authority Senior Lien Rev. (95 Express Lanes LLC Project), 5%, 1/01/2044 | | | 7,855,000 | 7,866,838 |
| West Point, VA, Industrial Development Authority, Solid Waste Disposal Rev. (Chesapeake Corp.), “A”, 6.375%, 3/01/2019 (a)(d) | | | 769,496 | 77 |
| West Point, VA, Industrial Development Authority, Solid Waste Disposal Rev. (Chesapeake Corp.), “B”, 6.25%, 3/01/2019 (a)(d) | | | 6,569,570 | 657 |
| | | | | $69,166,731 |
Portfolio of Investments – continued
| Issuer | | | Shares/Par | Value ($) |
| Municipal Bonds - continued |
| Washington - 1.9% |
| Grays Harbor County, WA, Public Hospital District No. 2, Limited Tax General Obligation Refunding, 5%, 12/15/2033 | | $ | 2,675,000 | $ 3,019,534 |
| Grays Harbor County, WA, Public Hospital District No. 2, Limited Tax General Obligation Refunding, 5%, 12/15/2038 | | | 3,415,000 | 3,834,743 |
| Grays Harbor County, WA, Public Hospital District No. 2, Limited Tax General Obligation Refunding, 5%, 12/15/2048 | | | 6,565,000 | 7,271,450 |
| Kalispel Tribe Indians, WA, Priority District Rev., “A”, 5%, 1/01/2032 (n) | | | 2,220,000 | 2,569,086 |
| Kalispel Tribe Indians, WA, Priority District Rev., “A”, 5.25%, 1/01/2038 (n) | | | 2,500,000 | 2,897,559 |
| Kalispel Tribe Indians, WA, Priority District Rev., “B”, 5%, 1/01/2032 (n) | | | 700,000 | 810,072 |
| Kalispel Tribe Indians, WA, Priority District Rev., “B”, 5.25%, 1/01/2038 (n) | | | 900,000 | 1,043,121 |
| Port of Seattle, WA, Industrial Development Corp., Special Facilities Rev. (Delta Airlines, Inc.), 5%, 4/01/2030 | | | 4,000,000 | 4,170,010 |
| Seattle, WA, Municipal Light & Power Improvement Rev., “C”, 4%, 9/01/2037 | | | 7,000,000 | 7,798,281 |
| Washington Economic Development Finance Authority, Environmental Facilities Rev. (Mura Cascade ELP LLC Project), 0.33%, 12/01/2041 (Put Date 12/08/2022) (n) | | | 4,315,000 | 4,302,052 |
| Washington Health Care Facilities Authority Rev. (CommonSpirit Health), “A-2”, 5%, 8/01/2044 | | | 5,000,000 | 5,879,644 |
| Washington Health Care Facilities Authority Rev. (Seattle Cancer Care Alliance), 5%, 9/01/2055 | | | 3,640,000 | 4,388,341 |
| Washington Health Care Facilities Authority Rev. (Virginia Mason Medical Center), 5%, 8/15/2035 | | | 1,775,000 | 2,030,920 |
| Washington Health Care Facilities Authority Rev. (Virginia Mason Medical Center), 5%, 8/15/2037 | | | 1,805,000 | 2,063,014 |
| Washington Housing Finance Commission Nonprofit Housing Refunding Rev. (Hearthstone Project), “A”, 5%, 7/01/2038 (n) | | | 830,000 | 876,038 |
| Washington Housing Finance Commission Nonprofit Housing Refunding Rev. (Hearthstone Project), “A”, 5%, 7/01/2048 (n) | | | 1,420,000 | 1,475,966 |
| Washington Housing Finance Commission Nonprofit Housing Refunding Rev. (Hearthstone Project), “A”, 5%, 7/01/2053 (n) | | | 1,375,000 | 1,425,282 |
| Washington Housing Finance Commission Nonprofit Housing Refunding Rev. (Judson Park Project), 4%, 7/01/2028 (n) | | | 225,000 | 233,424 |
| Washington Housing Finance Commission Nonprofit Housing Refunding Rev. (Judson Park Project), 5%, 7/01/2033 (n) | | | 225,000 | 239,988 |
| Washington Housing Finance Commission Nonprofit Housing Refunding Rev. (Judson Park Project), 5%, 7/01/2038 (n) | | | 325,000 | 345,022 |
| Washington Housing Finance Commission Nonprofit Housing Refunding Rev. (Judson Park Project), 5%, 7/01/2048 (n) | | | 450,000 | 474,145 |
Portfolio of Investments – continued
| Issuer | | | Shares/Par | Value ($) |
| Municipal Bonds - continued |
| Washington - continued |
| Washington Housing Finance Commission Nonprofit Housing Rev. (Presbyterian Retirement Communities Northwest Projects), “A”, 5%, 1/01/2036 (n) | | $ | 2,460,000 | $ 2,601,545 |
| Washington Housing Finance Commission Nonprofit Housing Rev. (Presbyterian Retirement Communities Northwest Projects), “A”, 5%, 1/01/2046 (n) | | | 4,675,000 | 4,897,422 |
| Washington Housing Finance Commission Nonprofit Housing Rev. (Presbyterian Retirement Communities Northwest Projects), “A”, 5%, 1/01/2051 (n) | | | 2,970,000 | 3,105,250 |
| Washington Housing Finance Commission Nonprofit Housing Rev. (Wesley Homes at Lea Hill Project), 5%, 7/01/2036 (n) | | | 1,000,000 | 1,068,421 |
| Washington Housing Finance Commission Nonprofit Housing Rev. (Wesley Homes at Lea Hill Project), 5%, 7/01/2041 (n) | | | 2,000,000 | 2,122,492 |
| Washington Housing Finance Commission Nonprofit Housing Rev. (Wesley Homes at Lea Hill Project), 5%, 7/01/2046 (n) | | | 2,385,000 | 2,516,086 |
| Washington Housing Finance Commission Nonprofit Housing Rev. (Wesley Homes at Lea Hill Project), 5%, 7/01/2051 (n) | | | 3,635,000 | 3,827,212 |
| Washington State Convention Center, Public Facilities District, Junior Lodging Tax Green Notes, 4%, 7/01/2031 | | | 24,600,000 | 27,408,088 |
| Washington State Housing Finance Commission Municipal Certificates, “X”, 0.725%, 12/20/2035 (i) | | | 68,524,768 | 3,989,190 |
| Washington State Housing Finance Commission, Municipal Certificates, “A”, 3.5%, 12/20/2035 | | | 17,667,095 | 18,673,259 |
| | | | | $127,356,657 |
| West Virginia - 0.4% |
| Monongalia County, WV, Commission Special District Excise Tax Refunding & Improvement Rev. (University Town Centre Economic Opportunity Development District), “A”, 4.125%, 6/01/2043 (n) | | $ | 1,510,000 | $ 1,625,624 |
| Monongalia County, WV, Special District Excise Tax Rev. (University Town Centre Economic Opportunity Development District), “B”, 4.875%, 6/01/2043 (n) | | | 1,545,000 | 1,616,229 |
| Ohio County, WV, Commission Tax Increment Rev. (Fort Henry Centre), 4.75%, 6/01/2031 | | | 1,000,000 | 1,005,626 |
| West Virginia Hospital Finance Authority Hospital Improvement Rev. (Cabell Huntington Hospital Obligated Group), “A”, 5%, 1/01/2043 | | | 6,455,000 | 7,430,729 |
| West Virginia Hospital Finance Authority Hospital Improvement Rev. (Charleston Area Medical Center, Inc.), “A”, 5%, 9/01/2027 | | | 2,100,000 | 2,284,774 |
| West Virginia Hospital Finance Authority Hospital Improvement Rev. (Charleston Area Medical Center, Inc.), “A”, 5%, 9/01/2028 | | | 1,000,000 | 1,085,532 |
Portfolio of Investments – continued
| Issuer | | | Shares/Par | Value ($) |
| Municipal Bonds - continued |
| West Virginia - continued |
| West Virginia Hospital Finance Authority Hospital Improvement Rev. (Charleston Area Medical Center, Inc.), “A”, 5%, 9/01/2038 | | $ | 1,160,000 | $ 1,385,109 |
| West Virginia Hospital Finance Authority Hospital Improvement Rev. (Charleston Area Medical Center, Inc.), “A”, 5%, 9/01/2039 | | | 350,000 | 417,380 |
| West Virginia Hospital Finance Authority Hospital Rev. (West Virginia University Health System Obligated Group), “A”, 4%, 6/01/2051 | | | 8,000,000 | 8,745,819 |
| West Virginia Housing Development Fund, “A”, FHA, 3.45%, 11/01/2033 | | | 610,000 | 644,906 |
| West Virginia Housing Development Fund, “A”, FHA, 3.75%, 11/01/2038 | | | 585,000 | 621,750 |
| Wheeling, WV, Combined Waterworks and Sewerage System Rev., “A”, BAM, 4%, 6/01/2041 | | | 655,000 | 755,232 |
| Wheeling, WV, Combined Waterworks and Sewerage System Rev., “A”, BAM, 4%, 6/01/2046 | | | 650,000 | 741,196 |
| Wheeling, WV, Combined Waterworks and Sewerage System Rev., “A”, BAM, 4%, 6/01/2051 | | | 475,000 | 539,748 |
| | | | | $28,899,654 |
| Wisconsin - 4.7% |
| Wisconsin Center District Junior Dedicated Tax Rev., Capital Appreciation, “D”, AGM, 0%, 12/15/2032 | | $ | 725,000 | $ 540,758 |
| Wisconsin Center District Junior Dedicated Tax Rev., Capital Appreciation, “D”, AGM, 0%, 12/15/2033 | | | 1,105,000 | 794,750 |
| Wisconsin Center District Junior Dedicated Tax Rev., Capital Appreciation, “D”, AGM, 0%, 12/15/2034 | | | 1,050,000 | 728,243 |
| Wisconsin Center District Junior Dedicated Tax Rev., Capital Appreciation, “D”, AGM, 0%, 12/15/2035 | | | 1,580,000 | 1,054,167 |
| Wisconsin Center District Junior Dedicated Tax Rev., Capital Appreciation, “D”, AGM, 0%, 12/15/2036 | | | 1,620,000 | 1,038,596 |
| Wisconsin Center District Junior Dedicated Tax Rev., Capital Appreciation, “D”, AGM, 0%, 12/15/2037 | | | 2,630,000 | 1,621,030 |
| Wisconsin Center District Junior Dedicated Tax Rev., Capital Appreciation, “D”, AGM, 0%, 12/15/2038 | | | 2,845,000 | 1,679,058 |
| Wisconsin Center District Junior Dedicated Tax Rev., Capital Appreciation, “D”, AGM, 0%, 12/15/2039 | | | 3,095,000 | 1,749,025 |
| Wisconsin Center District Junior Dedicated Tax Rev., Capital Appreciation, “D”, AGM, 0%, 12/15/2040 | | | 1,340,000 | 724,042 |
| Wisconsin Center District Senior Dedicated Tax Rev., Capital Appreciation, “C”, AGM, 0%, 12/15/2031 | | | 545,000 | 418,767 |
| Wisconsin Center District Senior Dedicated Tax Rev., Capital Appreciation, “C”, AGM, 0%, 12/15/2032 | | | 740,000 | 549,272 |
Portfolio of Investments – continued
| Issuer | | | Shares/Par | Value ($) |
| Municipal Bonds - continued |
| Wisconsin - continued |
| Wisconsin Center District Senior Dedicated Tax Rev., Capital Appreciation, “C”, AGM, 0%, 12/15/2033 | | $ | 710,000 | $ 507,836 |
| Wisconsin Center District Senior Dedicated Tax Rev., Capital Appreciation, “C”, AGM, 0%, 12/15/2034 | | | 655,000 | 450,683 |
| Wisconsin Center District Senior Dedicated Tax Rev., Capital Appreciation, “C”, AGM, 0%, 12/15/2035 | | | 840,000 | 556,110 |
| Wisconsin Center District Senior Dedicated Tax Rev., Capital Appreciation, “C”, AGM, 0%, 12/15/2036 | | | 815,000 | 518,567 |
| Wisconsin Center District Senior Dedicated Tax Rev., Capital Appreciation, “C”, AGM, 0%, 12/15/2037 | | | 815,000 | 498,305 |
| Wisconsin Center District Senior Dedicated Tax Rev., Capital Appreciation, “C”, AGM, 0%, 12/15/2038 | | | 840,000 | 492,210 |
| Wisconsin Center District Senior Dedicated Tax Rev., Capital Appreciation, “C”, AGM, 0%, 12/15/2039 | | | 790,000 | 443,340 |
| Wisconsin Center District Senior Dedicated Tax Rev., Capital Appreciation, “C”, AGM, 0%, 12/15/2040 | | | 195,000 | 104,653 |
| Wisconsin Health & Educational Facilities Authority Refunding Rev. (American Baptist Homes), 5%, 8/01/2027 | | | 2,530,000 | 2,694,008 |
| Wisconsin Health & Educational Facilities Authority Refunding Rev. (American Baptist Homes), 5%, 8/01/2032 | | | 2,315,000 | 2,442,664 |
| Wisconsin Health & Educational Facilities Authority Refunding Rev. (American Baptist Homes), 5%, 8/01/2037 | | | 1,265,000 | 1,322,427 |
| Wisconsin Health & Educational Facilities Authority Refunding Rev. (American Baptist Homes), 5%, 8/01/2039 | | | 1,315,000 | 1,372,064 |
| Wisconsin Health & Educational Facilities Authority Refunding Rev. (Saint John's Communities, Inc.), 4%, 9/15/2036 | | | 530,000 | 573,542 |
| Wisconsin Health & Educational Facilities Authority Refunding Rev. (Saint John's Communities, Inc.), 4%, 9/15/2036 (w) | | | 800,000 | 824,881 |
| Wisconsin Health & Educational Facilities Authority Refunding Rev. (Saint John's Communities, Inc.), 4%, 9/15/2041 (w) | | | 770,000 | 785,335 |
| Wisconsin Health & Educational Facilities Authority Refunding Rev. (Saint John's Communities, Inc.), 4%, 9/15/2045 (w) | | | 650,000 | 658,000 |
| Wisconsin Health & Educational Facilities Authority Rev. (American Baptist Homes of the Midwest Obligated Group), 4.375%, 8/01/2027 | | | 100,000 | 104,500 |
| Wisconsin Health & Educational Facilities Authority Rev. (Bellin Memorial Hospital, Inc.), “A”, 5%, 12/01/2030 | | | 160,000 | 196,734 |
| Wisconsin Health & Educational Facilities Authority Rev. (Bellin Memorial Hospital, Inc.), “A”, 5%, 12/01/2031 | | | 170,000 | 208,466 |
| Wisconsin Health & Educational Facilities Authority Rev. (Bellin Memorial Hospital, Inc.), “A”, 5%, 12/01/2032 | | | 200,000 | 245,064 |
| Wisconsin Health & Educational Facilities Authority Rev. (Bellin Memorial Hospital, Inc.), “A”, 5%, 12/01/2033 | | | 215,000 | 263,336 |
Portfolio of Investments – continued
| Issuer | | | Shares/Par | Value ($) |
| Municipal Bonds - continued |
| Wisconsin - continued |
| Wisconsin Health & Educational Facilities Authority Rev. (Bellin Memorial Hospital, Inc.), “A”, 5%, 12/01/2034 | | $ | 200,000 | $ 244,630 |
| Wisconsin Health & Educational Facilities Authority Rev. (Bellin Memorial Hospital, Inc.), “A”, 5%, 12/01/2035 | | | 260,000 | 317,709 |
| Wisconsin Health & Educational Facilities Authority Rev. (Benevolent Corp. Cedar Community), 5%, 6/01/2037 | | | 1,110,000 | 1,199,604 |
| Wisconsin Health & Educational Facilities Authority Rev. (Benevolent Corp. Cedar Community), 5%, 6/01/2041 | | | 1,910,000 | 2,054,067 |
| Wisconsin Health & Educational Facilities Authority Rev. (Marshfield Clinic Health System, Inc.), “C”, 5%, 2/15/2047 | | | 675,000 | 766,421 |
| Wisconsin Health & Educational Facilities Authority Rev. (Oakwood Lutheran Senior Ministries), 4%, 1/01/2037 | | | 765,000 | 809,667 |
| Wisconsin Health & Educational Facilities Authority Rev. (Oakwood Lutheran Senior Ministries), 4%, 1/01/2047 | | | 1,365,000 | 1,416,545 |
| Wisconsin Health & Educational Facilities Authority Rev. (Oakwood Lutheran Senior Ministries), 4%, 1/01/2057 | | | 2,100,000 | 2,155,890 |
| Wisconsin Health & Educational Facilities Authority Rev. (Rogers Memorial Hospital, Inc.), “A”, 5%, 7/01/2038 | | | 520,000 | 590,801 |
| Wisconsin Health & Educational Facilities Authority Rev. (Rogers Memorial Hospital, Inc.), “A”, 5%, 7/01/2044 | | | 600,000 | 678,151 |
| Wisconsin Health & Educational Facilities Authority Rev. (Rogers Memorial Hospital, Inc.), “A”, 5%, 7/01/2049 | | | 2,515,000 | 2,831,223 |
| Wisconsin Health & Educational Facilities Authority Rev. (Sauk-Prairie Memorial Hospital), 5.25%, 2/01/2043 | | | 4,870,000 | 4,980,241 |
| Wisconsin Health & Educational Facilities Authority Rev. (Sauk-Prairie Memorial Hospital), “A”, 5.125%, 2/01/2038 | | | 5,110,000 | 5,219,441 |
| Wisconsin Health & Educational Facilities Authority Rev. (St. Camillus Health System, Inc.), “A”, 5%, 11/01/2039 | | | 1,060,000 | 1,162,788 |
| Wisconsin Health & Educational Facilities Authority Rev. (St. Camillus Health System, Inc.), “A”, 5%, 11/01/2046 | | | 1,335,000 | 1,451,471 |
| Wisconsin Health & Educational Facilities Authority Rev. (St. Camillus Health System, Inc.), “A”, 5%, 11/01/2054 | | | 11,510,000 | 12,466,568 |
| Wisconsin Health & Educational Facilities Authority Rev. (St. Camillus Health System, Inc.), “B-3”, 2.25%, 11/01/2026 | | | 2,265,000 | 2,272,805 |
| Wisconsin Health & Educational Facilities Authority Rev. (St. John's Community, Inc.), “A”, 5%, 9/15/2040 (Prerefunded 9/15/2023) | | | 1,195,000 | 1,272,697 |
| Wisconsin Health & Educational Facilities Authority Rev. (St. John's Community, Inc.), “A”, 5%, 9/15/2045 (Prerefunded 9/15/2023) | | | 1,595,000 | 1,698,704 |
| Wisconsin Health & Educational Facilities Authority Rev. (St. John's Community, Inc.), “A”, 5%, 9/15/2050 (Prerefunded 9/15/2023) | | | 6,430,000 | 6,848,068 |
Portfolio of Investments – continued
| Issuer | | | Shares/Par | Value ($) |
| Municipal Bonds - continued |
| Wisconsin - continued |
| Wisconsin Housing & Economic Development Authority Home Ownership, “A”, 3%, 3/01/2052 | | $ | 4,380,000 | $ 4,594,010 |
| Wisconsin Housing & Economic Development Authority Home Ownership, “D”, 4%, 3/01/2047 (u) | | | 6,315,000 | 6,719,831 |
| Wisconsin Public Finance Authority Airport Facilities Rev. (Transportation Infrastructure Properties LLC), “B”, 5%, 7/01/2022 | | | 170,000 | 171,037 |
| Wisconsin Public Finance Authority Airport Facilities Rev. (Transportation Infrastructure Properties LLC), “B”, 5.25%, 7/01/2028 | | | 3,815,000 | 3,867,703 |
| Wisconsin Public Finance Authority Airport Facilities Rev. (Transportation Infrastructure Properties LLC), “B”, 5%, 7/01/2042 | | | 17,855,000 | 18,094,673 |
| Wisconsin Public Finance Authority Airport Facilities Rev. (Transportation Infrastructure Properties LLC), “C”, 5%, 7/01/2042 | | | 2,870,000 | 2,907,205 |
| Wisconsin Public Finance Authority Charter School Rev. (Alamance Community School Project), “A”, 5%, 6/15/2051 (n) | | | 930,000 | 929,945 |
| Wisconsin Public Finance Authority Charter School Rev. (Eno River Academy Project), “A”, 4%, 6/15/2030 (n) | | | 475,000 | 508,460 |
| Wisconsin Public Finance Authority Charter School Rev. (Eno River Academy Project), “A”, 5%, 6/15/2040 (n) | | | 815,000 | 906,748 |
| Wisconsin Public Finance Authority Charter School Rev. (Eno River Academy Project), “A”, 5%, 6/15/2054 (n) | | | 1,380,000 | 1,510,135 |
| Wisconsin Public Finance Authority Education Facilities Rev. (Piedmont Community Charter School), 5%, 6/15/2039 | | | 285,000 | 329,441 |
| Wisconsin Public Finance Authority Education Facilities Rev. (Piedmont Community Charter School), 5%, 6/15/2049 | | | 865,000 | 987,416 |
| Wisconsin Public Finance Authority Education Facilities Rev. (Piedmont Community Charter School), 5%, 6/15/2053 | | | 580,000 | 660,230 |
| Wisconsin Public Finance Authority Education Rev. (Mountain Island Charter School), 5%, 7/01/2037 | | | 665,000 | 708,205 |
| Wisconsin Public Finance Authority Education Rev. (Mountain Island Charter School), 5%, 7/01/2047 | | | 1,015,000 | 1,074,911 |
| Wisconsin Public Finance Authority Education Rev. (Pine Lake Preparatory), 4.95%, 3/01/2030 (n) | | | 1,025,000 | 1,105,201 |
| Wisconsin Public Finance Authority Education Rev. (Pine Lake Preparatory), 5.25%, 3/01/2035 (n) | | | 1,005,000 | 1,088,235 |
| Wisconsin Public Finance Authority Education Rev. (Signature Preparatory), “A”, 5%, 6/15/2041 (n) | | | 1,945,000 | 2,073,106 |
| Wisconsin Public Finance Authority Education Rev. (Signature Preparatory), “A”, 5%, 6/15/2051 (n) | | | 2,435,000 | 2,563,559 |
Portfolio of Investments – continued
| Issuer | | | Shares/Par | Value ($) |
| Municipal Bonds - continued |
| Wisconsin - continued |
| Wisconsin Public Finance Authority Education Rev. (Wilson Preparatory Academy), “A”, 4.125%, 6/15/2029 (n) | | $ | 475,000 | $ 499,903 |
| Wisconsin Public Finance Authority Education Rev. (Wilson Preparatory Academy), “A”, 5%, 6/15/2039 (n) | | | 500,000 | 537,043 |
| Wisconsin Public Finance Authority Education Rev. (Wilson Preparatory Academy), “A”, 5%, 6/15/2049 (n) | | | 1,100,000 | 1,169,941 |
| Wisconsin Public Finance Authority Educational Facilities Rev. (Community School of Davidson Project), 3.75%, 10/01/2023 (n) | | | 150,000 | 152,714 |
| Wisconsin Public Finance Authority Educational Facilities Rev. (Community School of Davidson Project), 5%, 10/01/2033 (n) | | | 670,000 | 751,656 |
| Wisconsin Public Finance Authority Educational Facilities Rev. (Community School of Davidson Project), 5%, 10/01/2048 (n) | | | 3,265,000 | 3,590,361 |
| Wisconsin Public Finance Authority Entrance Fee Principal Redemption Accredited Rev. (Searstone CCRC Project), “B-2”, 2.25%, 6/01/2027 (n) | | | 1,595,000 | 1,572,050 |
| Wisconsin Public Finance Authority Entrance Fee Principal Redemption Accredited Rev. (Searstone CCRC Project), “C”, 2.75%, 6/01/2026 (n) | | | 1,295,000 | 1,278,932 |
| Wisconsin Public Finance Authority Healthcare Facility Rev. (Blue Ridge Healthcare), “A”, 4%, 1/01/2045 | | | 715,000 | 793,364 |
| Wisconsin Public Finance Authority Healthcare Facility Rev. (Church Home of Hartford, Inc. Project), “A”, 5%, 9/01/2025 (n) | | | 445,000 | 470,179 |
| Wisconsin Public Finance Authority Healthcare Facility Rev. (Church Home of Hartford, Inc. Project), “A”, 5%, 9/01/2030 (n) | | | 920,000 | 974,509 |
| Wisconsin Public Finance Authority Healthcare Facility Rev. (Church Home of Hartford, Inc. Project), “A”, 5%, 9/01/2038 (n) | | | 1,215,000 | 1,277,043 |
| Wisconsin Public Finance Authority Higher Education Facilities Rev. (Gannon University Project), 5%, 5/01/2042 | | | 595,000 | 669,692 |
| Wisconsin Public Finance Authority Higher Education Facilities Rev. (Gannon University Project), 5%, 5/01/2047 | | | 545,000 | 610,871 |
| Wisconsin Public Finance Authority Hotel & Conference Center Facilities Rev. (Foundation of the University of North Carolina at Charlotte, Inc.), “A”, 4%, 9/01/2036 (n) | | | 2,040,000 | 2,145,588 |
| Wisconsin Public Finance Authority Hotel & Conference Center Facilities Rev. (Foundation of the University of North Carolina at Charlotte, Inc.), “A”, 4%, 9/01/2041 (n) | | | 1,860,000 | 1,936,881 |
| Wisconsin Public Finance Authority Hotel & Conference Center Facilities Rev. (Foundation of the University of North Carolina at Charlotte, Inc.), “A”, 4%, 9/01/2051 (n) | | | 3,445,000 | 3,523,955 |
| Wisconsin Public Finance Authority Hotel & Conference Center Facilities Rev. (Foundation of the University of North Carolina at Charlotte, Inc.), “A”, 4%, 9/01/2056 (n) | | | 1,825,000 | 1,855,341 |
Portfolio of Investments – continued
| Issuer | | | Shares/Par | Value ($) |
| Municipal Bonds - continued |
| Wisconsin - continued |
| Wisconsin Public Finance Authority Limited Obligation Grant Rev. (American Dream at Meadowlands Project), “A”, 6.25%, 8/01/2027 (n) | | $ | 25,170,000 | $ 26,297,430 |
| Wisconsin Public Finance Authority Limited Obligation Grant Rev. (American Dream at Meadowlands Project), ”A“, 5.625%, 8/01/2024 (n) | | | 5,730,000 | 5,807,490 |
| Wisconsin Public Finance Authority Limited Obligation PILOT Rev. (American Dream at Meadowlands Project), 6.5%, 12/01/2037 (n) | | | 8,355,000 | 8,821,502 |
| Wisconsin Public Finance Authority Limited Obligation PILOT Rev. (American Dream at Meadowlands Project), 7%, 12/01/2050 | | | 7,930,000 | 8,499,365 |
| Wisconsin Public Finance Authority Refunding Rev. (Roseman University of Health Sciences Project), 4%, 4/01/2052 (n)(w) | | | 1,105,000 | 1,139,157 |
| Wisconsin Public Finance Authority Retirement Communities Rev. (Acts Retirement-Life Communities, Inc. Obligated Group), “A”, 5%, 11/15/2041 | | | 1,115,000 | 1,317,218 |
| Wisconsin Public Finance Authority Retirement Facilities First Mortgage Rev. (United Methodist Retirement Homes), “A”, 4%, 10/01/2041 | | | 265,000 | 291,663 |
| Wisconsin Public Finance Authority Retirement Facilities First Mortgage Rev. (United Methodist Retirement Homes), “A”, 4%, 10/01/2046 | | | 360,000 | 392,743 |
| Wisconsin Public Finance Authority Retirement Facilities First Mortgage Rev. (United Methodist Retirement Homes), “A”, 4%, 10/01/2051 | | | 1,010,000 | 1,098,576 |
| Wisconsin Public Finance Authority Retirement Facilities Rev. (Penick Village), 5%, 9/01/2039 (n) | | | 770,000 | 818,347 |
| Wisconsin Public Finance Authority Retirement Facilities Rev. (Penick Village), 5%, 9/01/2049 (n) | | | 1,455,000 | 1,523,119 |
| Wisconsin Public Finance Authority Retirement Facilities Rev. (Penick Village), 5%, 9/01/2054 (n) | | | 1,365,000 | 1,424,412 |
| Wisconsin Public Finance Authority Rev. (Alamance Community School Project), “A”, 4.25%, 6/15/2031 (n) | | | 170,000 | 166,772 |
| Wisconsin Public Finance Authority Rev. (Alamance Community School Project), “A”, 5%, 6/15/2041 (n) | | | 515,000 | 523,539 |
| Wisconsin Public Finance Authority Rev. (Alamance Community School Project), “A”, 5%, 6/15/2056 (n) | | | 900,000 | 885,424 |
| Wisconsin Public Finance Authority Rev. (Celanese Corp.), “B”, 5%, 12/01/2025 | | | 3,055,000 | 3,457,627 |
| Wisconsin Public Finance Authority Rev. (McLemore Hotel & Conference Center), “B”, 6.5%, 6/01/2056 (n) | | | 6,165,000 | 6,063,551 |
Portfolio of Investments – continued
| Issuer | | | Shares/Par | Value ($) |
| Municipal Bonds - continued |
| Wisconsin - continued |
| Wisconsin Public Finance Authority Rev. (Roseman University of Health Sciences Project), 3%, 4/01/2025 (n) | | $ | 225,000 | $ 228,441 |
| Wisconsin Public Finance Authority Rev. (Roseman University of Health Sciences Project), 5%, 4/01/2030 (n) | | | 600,000 | 683,464 |
| Wisconsin Public Finance Authority Rev. (Roseman University of Health Sciences Project), 4%, 4/01/2032 (n)(w) | | | 915,000 | 980,876 |
| Wisconsin Public Finance Authority Rev. (Roseman University of Health Sciences Project), 5.75%, 4/01/2035 | | | 2,805,000 | 3,135,924 |
| Wisconsin Public Finance Authority Rev. (Roseman University of Health Sciences Project), 5%, 4/01/2040 (n) | | | 1,150,000 | 1,305,598 |
| Wisconsin Public Finance Authority Rev. (Roseman University of Health Sciences Project), 4%, 4/01/2042 (n)(w) | | | 1,000,000 | 1,045,632 |
| Wisconsin Public Finance Authority Rev. (Roseman University of Health Sciences Project), 5%, 4/01/2050 (n) | | | 2,000,000 | 2,244,546 |
| Wisconsin Public Finance Authority Rev., “B-1”, 4%, 12/28/2044 (n)(w) | | | 13,297,280 | 13,139,193 |
| Wisconsin Public Finance Authority Senior Living Refunding Bonds Rev. (Mary's Woods at Marylhurst Project), “A”, 5.25%, 5/15/2037 (n) | | | 1,995,000 | 2,138,625 |
| Wisconsin Public Finance Authority Senior Living Refunding Bonds Rev. (Mary's Woods at Marylhurst Project), “A”, 5.25%, 5/15/2042 (n) | | | 3,965,000 | 4,244,036 |
| Wisconsin Public Finance Authority Senior Living Refunding Bonds Rev. (Mary's Woods at Marylhurst Project), “A”, 5.25%, 5/15/2047 (n) | | | 3,955,000 | 4,228,224 |
| Wisconsin Public Finance Authority Senior Living Refunding Bonds Rev. (Mary's Woods at Marylhurst Project), “A”, 5.25%, 5/15/2052 (n) | | | 8,800,000 | 9,396,579 |
| Wisconsin Public Finance Authority Senior Living Rev. (Rose Villa Project), “A”, 5.125%, 11/15/2029 (n) | | | 1,905,000 | 2,017,055 |
| Wisconsin Public Finance Authority Senior Living Rev. (Rose Villa Project), “A”, 5.5%, 11/15/2034 (n) | | | 1,730,000 | 1,839,445 |
| Wisconsin Public Finance Authority Senior Living Rev. (Rose Villa Project), “A”, 5.75%, 11/15/2044 (n) | | | 1,685,000 | 1,788,854 |
| Wisconsin Public Finance Authority Senior Living Rev. (Rose Villa Project), “A”, 6%, 11/15/2049 (n) | | | 3,465,000 | 3,696,637 |
| Wisconsin Public Finance Authority Senior Secured Rev. (McLemore Hotel & Conference Center), “A”, 4.5%, 6/01/2056 (n) | | | 17,295,000 | 16,704,201 |
| Wisconsin Public Finance Authority Student Housing Rev. (Beyond Boone LLC - Appalachian State University Project), “A”, AGM, 5%, 7/01/2044 | | | 520,000 | 605,630 |
Portfolio of Investments – continued
| Issuer | | | Shares/Par | Value ($) |
| Municipal Bonds - continued |
| Wisconsin - continued |
| Wisconsin Public Finance Authority Student Housing Rev. (Beyond Boone LLC - Appalachian State University Project), “A”, AGM, 4%, 7/01/2045 | | $ | 995,000 | $ 1,086,823 |
| Wisconsin Public Finance Authority Student Housing Rev. (Beyond Boone LLC - Appalachian State University Project), “A”, AGM, 4%, 7/01/2050 | | | 855,000 | 929,747 |
| Wisconsin Public Finance Authority Student Housing Rev. (Beyond Boone LLC - Appalachian State University Project), “A”, AGM, 5%, 7/01/2054 | | | 680,000 | 785,333 |
| Wisconsin Public Finance Authority Student Housing Rev. (Beyond Boone LLC - Appalachian State University Project), “A”, AGM, 4%, 7/01/2055 | | | 965,000 | 1,046,036 |
| Wisconsin Public Finance Authority Student Housing Rev. (Beyond Boone LLC - Appalachian State University Project), “A”, AGM, 5%, 7/01/2058 | | | 780,000 | 899,820 |
| Wisconsin Public Finance Authority Student Housing Rev. (NC A&T Real Estate Foundation LLC Project), “B”, 5%, 6/01/2034 | | | 2,380,000 | 2,790,063 |
| Wisconsin Public Finance Authority Student Housing Rev. (NC A&T Real Estate Foundation LLC Project), “B”, 5%, 6/01/2039 | | | 1,490,000 | 1,729,380 |
| Wisconsin Public Finance Authority Student Housing Rev. (NC A&T Real Estate Foundation LLC Project), “B”, 5%, 6/01/2044 | | | 1,770,000 | 2,032,700 |
| Wisconsin Public Finance Authority Student Housing Rev. (NC A&T Real Estate Foundation LLC Project), “B”, 5%, 6/01/2049 | | | 2,540,000 | 2,900,680 |
| Wisconsin Public Finance Authority Student Housing Rev. (University of Hawai'i Foundation Project), “A-1”, 4%, 7/01/2041 (n) | | | 365,000 | 391,019 |
| Wisconsin Public Finance Authority Student Housing Rev. (University of Hawai'i Foundation Project), “A-1”, 4%, 7/01/2051 (n) | | | 1,835,000 | 1,933,613 |
| Wisconsin Public Finance Authority Student Housing Rev. (University of Hawai'i Foundation Project), “A-1”, 4%, 7/01/2061 (n) | | | 3,235,000 | 3,368,894 |
| Wisconsin Public Finance Authority Student Housing Rev. (University of Hawai'i Foundation Project), “A-2”, 4.85%, 7/01/2031 (n) | | | 365,000 | 358,248 |
| Wisconsin Public Finance Authority Student Housing Rev. (University of Hawai'i Foundation Project), “A-2”, 5.35%, 7/01/2040 (n) | | | 1,575,000 | 1,538,349 |
| Wisconsin Public Finance Authority Student Housing Rev. (University of Hawai'i Foundation Project), “B”, 5.25%, 7/01/2061 (n) | | | 1,795,000 | 1,805,512 |
| Wisconsin Public Finance Authority Student Housing Rev. (Western Carolina University Project), 5.25%, 7/01/2047 | | | 2,480,000 | 2,663,890 |
Portfolio of Investments – continued
| Issuer | | | Shares/Par | Value ($) |
| Municipal Bonds - continued |
| Wisconsin - continued |
| Wisconsin Public Finance Authority, Healthcare Facility Rev. (Appalachian Regional Healthcare System Obligated Group), “A”, 5%, 7/01/2039 | | $ | 500,000 | $ 613,849 |
| Wisconsin Public Finance Authority, Healthcare Facility Rev. (Appalachian Regional Healthcare System Obligated Group), “A”, 4%, 7/01/2046 | | | 1,100,000 | 1,228,409 |
| | | | | $317,261,258 |
| Wyoming - 0.0% |
| Laramie County, WY, Hospital Refunding Rev. (Cheyenne Regional Medical Center Project), 4%, 5/01/2031 | | $ | 265,000 | $ 308,387 |
| Laramie County, WY, Hospital Refunding Rev. (Cheyenne Regional Medical Center Project), 4%, 5/01/2032 | | | 160,000 | 185,768 |
| Laramie County, WY, Hospital Refunding Rev. (Cheyenne Regional Medical Center Project), 4%, 5/01/2033 | | | 265,000 | 307,520 |
| Laramie County, WY, Hospital Refunding Rev. (Cheyenne Regional Medical Center Project), 4%, 5/01/2035 | | | 255,000 | 295,193 |
| Laramie County, WY, Hospital Refunding Rev. (Cheyenne Regional Medical Center Project), 4%, 5/01/2037 | | | 225,000 | 259,937 |
| | | | | $1,356,805 |
| Total Municipal Bonds (Identified Cost, $6,440,405,326) | | $ 6,697,141,640 |
| Bonds – 0.5% |
| Consumer Services – 0.5% | |
| Toll Road Investors Partnership II LP, Capital Appreciation, NPFG, 0%, 2/15/2025 (n) | | $ | 8,970,000 | $ 7,982,201 |
| Toll Road Investors Partnership II LP, Capital Appreciation, NPFG, 0%, 2/15/2026 (n) | | | 8,338,000 | 7,020,258 |
| Toll Road Investors Partnership II LP, Capital Appreciation, NPFG, 0%, 2/15/2027 (n) | | | 1,149,000 | 926,051 |
| Toll Road Investors Partnership II LP, Capital Appreciation, NPFG, 0%, 2/15/2028 (n) | | | 2,923,000 | 2,248,146 |
| Toll Road Investors Partnership II LP, Capital Appreciation, NPFG, 0%, 2/15/2043 (n) | | | 34,400,000 | 10,835,525 |
| Toll Road Investors Partnership II LP, Capital Appreciation, “A”, NPFG, 0%, 2/15/2045 (n) | | | 579,494 | 143,041 |
| Toll Road Investors Partnership II LP, Capital Appreciation, “B”, NPFG, 0%, 2/15/2033 (n) | | | 4,735,000 | 2,854,955 |
| Total Bonds (Identified Cost, $32,654,240) | | $ 32,010,177 |
Portfolio of Investments – continued
| Issuer | | | Shares/Par | Value ($) |
| Other Municipal Bonds – 0.2% |
| Multi-Family Housing Revenue – 0.2% | |
| FRETE 2021-ML10 Trust, “X-CA”, FHLMC, 1.518%, 6/25/2038 (i)(n) | | $ | 30,644,213 | $ 4,504,960 |
| FRETE 2021-ML10 Trust, “X-US”, FHLMC, 2.055%, 1/25/2038 (i)(n) | | | 28,829,172 | 5,756,525 |
| FRETE 2021-ML12 Trust, “X-US”, FHLMC, 1.219%, 1/25/2041 (i)(n) | | | 17,743,216 | 2,236,461 |
| Total Other Municipal Bonds (Identified Cost, $12,910,945) | | $ 12,497,946 |
| Investment Companies (h) - 2.7% |
| Money Market Funds – 2.7% | |
| MFS Institutional Money Market Portfolio, 0.06% (v) (Identified Cost, $186,790,070) | | | 186,790,392 | $ 186,790,392 |
|
|
| Other Assets, Less Liabilities - (1.7)% | | (113,551,873) |
| Net Assets - 100.0% | | $6,814,888,282 |
| (a) | Non-income producing security. |
| (d) | In default. |
| (h) | An affiliated issuer, which may be considered one in which the fund owns 5% or more of the outstanding voting securities, or a company which is under common control. At period end, the aggregate values of the fund's investments in affiliated issuers and in unaffiliated issuers were $186,790,392 and $6,741,649,763, respectively. |
| (i) | Interest only security for which the fund receives interest on notional principal (Par amount). Par amount shown is the notional principal and does not reflect the cost of the security. |
| (n) | Securities exempt from registration under Rule 144A of the Securities Act of 1933. These securities may be sold in the ordinary course of business in transactions exempt from registration, normally to qualified institutional buyers. At period end, the aggregate value of these securities was $1,221,718,079, representing 17.9% of net assets. |
| (q) | Interest received was less than stated coupon rate. |
| (u) | Underlying security deposited into special purpose trust upon creation of self-deposited inverse floaters. |
| (v) | Affiliated issuer that is available only to investment companies managed by MFS. The rate quoted for the MFS Institutional Money Market Portfolio is the annualized seven-day yield of the fund at period end. |
| (w) | When-issued security. |
| (z) | Restricted securities are not registered under the Securities Act of 1933 and are subject to legal restrictions on resale. These securities generally may be resold in transactions exempt from registration or to the public if the securities are subsequently registered. Disposal of these securities may involve time-consuming negotiations and prompt sale at an acceptable price may be difficult. The fund holds the following restricted securities: |
Portfolio of Investments – continued
| Restricted Securities | Acquisition
Date | Cost | Value |
| California Pollution Control Financing Authority, Solid Waste Disposal Rev. (CalPlant I Project), 7.5%, 7/01/2032 | 10/8/20 | $1,800,000 | $1,350,000 |
| California Pollution Control Financing Authority, Solid Waste Disposal Rev. (CalPlant I Project), 8%, 7/01/2039 | 5/25/17-6/01/18 | 11,564,858 | 6,843,000 |
| California Pollution Control Financing Authority, Solid Waste Disposal Rev. (CalPlant I Project), 7.5%, 12/01/2039 | 7/26/19 | 11,288,456 | 644,500 |
| Collier County, FL, Industrial Development Authority, Continuing Care Community Rev. (Arlington of Naples Project), “A”, 5.5%, 5/15/2025 | 6/30/15 | 300,000 | 204,000 |
| Collier County, FL, Industrial Development Authority, Continuing Care Community Rev. (Arlington of Naples Project), “A”, 6.25%, 5/15/2035 | 6/30/15 | 300,000 | 204,000 |
| Collier County, FL, Industrial Development Authority, Continuing Care Community Rev. (Arlington of Naples Project), “A”, 7.75%, 5/15/2035 | 11/15/17 | 1,140,291 | 717,400 |
| Collier County, FL, Industrial Development Authority, Continuing Care Community Rev. (Arlington of Naples Project), “A”, 8.125%, 5/15/2044 | 12/16/13-8/29/18 | 10,935,573 | 7,201,200 |
| Collier County, FL, Industrial Development Authority, Continuing Care Community Rev. (Arlington of Naples Project), “A”, 6.5%, 5/15/2049 | 6/30/15 | 805,000 | 547,400 |
| Illinois Housing Development Authority Rev., “A”, 3.87%, 11/15/2035 | 2/04/21 | 10,815,303 | 9,998,105 |
| Illinois Housing Development Authority Rev., “B”, 3.87%, 11/15/2035 | 2/04/21 | 4,410,727 | 4,077,455 |
| Illinois Housing Development Authority Rev., “C”, 3.87%, 11/15/2035 | 2/04/21 | 4,401,326 | 4,068,765 |
| Illinois Housing Development Authority Rev., “D”, 3.87%, 11/15/2035 | 2/04/21 | 4,016,203 | 3,712,741 |
| Illinois Housing Development Authority Rev., “E”, 3.87%, 11/15/2035 | 2/04/21 | 2,765,372 | 2,556,422 |
| Total Restricted Securities | | | $42,124,988 |
| % of Net assets | | | 0.6% |
| The following abbreviations are used in this report and are defined: |
| AAC | Ambac Assurance Corp. |
| AGM | Assured Guaranty Municipal |
| BAM | Build America Mutual |
| CALHF | California Health Facility Construction Loan Insurance Program |
| COP | Certificate of Participation |
| ETM | Escrowed to Maturity |
| FHA | Federal Housing Administration |
| FHLMC | Federal Home Loan Mortgage Corp. |
Portfolio of Investments – continued
| FLR | Floating Rate. Interest rate resets periodically based on the parenthetically disclosed reference rate plus a spread (if any). The period-end rate reported may not be the current rate. All reference rates are USD unless otherwise noted. |
| FNMA | Federal National Mortgage Assn. |
| GNMA | Government National Mortgage Assn. |
| MUNIPSA | SIFMA Municipal Swap Index |
| NPFG | National Public Finance Guarantee Corp. |
| SOFR | Secured Overnight Financing Rate |
See Notes to Financial Statements
Financial Statements
Statement of Assets and Liabilities
At 1/31/22
This statement represents your fund’s balance sheet, which details the assets and liabilities comprising the total value of the fund.
| Assets | |
| Investments in unaffiliated issuers, at value (identified cost, $6,485,970,511) | $6,741,649,763 |
| Investments in affiliated issuers, at value (identified cost, $186,790,070) | 186,790,392 |
| Cash | 197,726 |
| Receivables for | |
| Investments sold | 53,583,780 |
| Fund shares sold | 14,725,062 |
| Interest | 56,419,060 |
| Other assets | 17,040 |
| Total assets | $7,053,382,823 |
| Liabilities | |
| Payables for | |
| Distributions | $2,154,801 |
| Investments purchased | 6,215,000 |
| Fund shares reacquired | 16,205,744 |
| When-issued investments purchased | 147,750,645 |
| Interest expense and fees | 127,887 |
| Payable to the holders of the floating rate certificates | 64,037,842 |
| Payable to affiliates | |
| Investment adviser | 367,089 |
| Administrative services fee | 6,198 |
| Shareholder servicing costs | 1,287,211 |
| Distribution and service fees | 16,677 |
| Payable for independent Trustees' compensation | 1,506 |
| Accrued expenses and other liabilities | 323,941 |
| Total liabilities | $238,494,541 |
| Net assets | $6,814,888,282 |
| Net assets consist of | |
| Paid-in capital | $6,605,619,468 |
| Total distributable earnings (loss) | 209,268,814 |
| Net assets | $6,814,888,282 |
| Shares of beneficial interest outstanding | 810,171,699 |
Statement of Assets and Liabilities – continued
| | Net assets | Shares
outstanding | Net asset value
per share (a) |
| Class A | $2,066,743,872 | 245,587,973 | $8.42 |
| Class B | 5,096,450 | 605,020 | 8.42 |
| Class C | 148,124,139 | 17,582,794 | 8.42 |
| Class I | 2,792,474,765 | 332,027,665 | 8.41 |
| Class R6 | 1,802,449,056 | 214,368,247 | 8.41 |
| (a) | Maximum offering price per share was equal to the net asset value per share for all share classes, except for Class A, for which the maximum offering price per share was $8.79 [100 / 95.75 x $8.42]. On sales of $100,000 or more, the maximum offering price of Class A shares is reduced. A contingent deferred sales charge may be imposed on redemptions of Class A, Class B, and Class C shares. Redemption price per share was equal to the net asset value per share for Classes I and R6. |
See Notes to Financial Statements
Financial Statements
Statement of Operations
Year ended 1/31/22
This statement describes how much your fund earned in investment income and accrued in expenses. It also describes any gains and/or losses generated by fund operations.
| Net investment income (loss) | |
| Income | |
| Interest | $236,015,319 |
| Other | 101,683 |
| Dividends from affiliated issuers | 82,587 |
| Total investment income | $236,199,589 |
| Expenses | |
| Management fee | $33,655,056 |
| Distribution and service fees | 1,661,648 |
| Shareholder servicing costs | 4,412,024 |
| Administrative services fee | 564,108 |
| Independent Trustees' compensation | 91,728 |
| Custodian fee | 408,278 |
| Shareholder communications | 171,403 |
| Audit and tax fees | 72,709 |
| Legal fees | 103,717 |
| Interest expense and fees | 504,689 |
| Miscellaneous | 413,281 |
| Total expenses | $42,058,641 |
| Fees paid indirectly | (89) |
| Reduction of expenses by investment adviser and distributor | (874,889) |
| Net expenses | $41,183,663 |
| Net investment income (loss) | $195,015,926 |
| Realized and unrealized gain (loss) |
| Realized gain (loss) (identified cost basis) | |
| Unaffiliated issuers | $18,980,376 |
| Change in unrealized appreciation or depreciation | |
| Unaffiliated issuers | $(200,389,124) |
| Net realized and unrealized gain (loss) | $(181,408,748) |
| Change in net assets from operations | $13,607,178 |
See Notes to Financial Statements
Financial Statements
Statements of Changes in Net Assets
These statements describe the increases and/or decreases in net assets resulting from operations, any distributions, and any shareholder transactions.
| | Year ended |
| | 1/31/22 | 1/31/21 |
| Change in net assets | | |
| From operations | | |
| Net investment income (loss) | $195,015,926 | $206,408,548 |
| Net realized gain (loss) | 18,980,376 | (48,454,672) |
| Net unrealized gain (loss) | (200,389,124) | 4,267,651 |
| Change in net assets from operations | $13,607,178 | $162,221,527 |
| Total distributions to shareholders | $(193,615,712) | $(206,724,905) |
| Change in net assets from fund share transactions | $620,726,829 | $279,866,360 |
| Total change in net assets | $440,718,295 | $235,362,982 |
| Net assets | | |
| At beginning of period | 6,374,169,987 | 6,138,807,005 |
| At end of period | $6,814,888,282 | $6,374,169,987 |
See Notes to Financial Statements
Financial Statements
Financial Highlights
The financial highlights table is intended to help you understand the fund's financial performance for the past 5 years (or life of a particular share class, if shorter). Certain information reflects financial results for a single fund share. The total returns in the table represent the rate that an investor would have earned (or lost) on an investment in the fund share class (assuming reinvestment of all distributions) held for the entire period.
| Class A | Year ended |
| | 1/31/22 | 1/31/21 | 1/31/20 | 1/31/19 | 1/31/18 |
| Net asset value, beginning of period | $8.62 | $8.66 | $8.09 | $8.16 | $8.02 |
| Income (loss) from investment operations |
| Net investment income (loss) (d) | $0.26 | $0.30 | $0.32 | $0.35 | $0.36 |
| Net realized and unrealized gain (loss) | (0.21) | (0.04) | 0.56 | (0.08) | 0.14 |
| Total from investment operations | $0.05 | $0.26 | $0.88 | $0.27 | $0.50 |
| Less distributions declared to shareholders |
| From net investment income | $(0.25) | $(0.30) | $(0.31) | $(0.34) | $(0.36) |
| Net asset value, end of period (x) | $8.42 | $8.62 | $8.66 | $8.09 | $8.16 |
| Total return (%) (r)(s)(t)(x) | 0.58 | 3.24 | 11.06 | 3.31 | 6.29 |
Ratios (%) (to average net assets)
and Supplemental data: |
| Expenses before expense reductions (f) | 0.63 | 0.65 | 0.67 | 0.67 | 0.68 |
| Expenses after expense reductions (f) | 0.62 | 0.64 | 0.66 | 0.66 | 0.65 |
| Net investment income (loss) | 2.94 | 3.65 | 3.82 | 4.35 | 4.44 |
| Portfolio turnover | 17 | 30 | 12 | 24 | 17 |
| Net assets at end of period (000 omitted) | $2,066,744 | $1,971,228 | $1,999,299 | $1,623,004 | $1,589,868 |
| Supplemental Ratios (%): |
| Ratios of expenses to average net assets after expense reductions and excluding interest expense and fees (f)(l) | 0.61 | 0.62 | 0.63 | 0.64 | 0.64 |
See Notes to Financial Statements
Financial Highlights – continued
| Class B | Year ended |
| | 1/31/22 | 1/31/21 | 1/31/20 | 1/31/19 | 1/31/18 |
| Net asset value, beginning of period | $8.63 | $8.67 | $8.10 | $8.16 | $8.03 |
| Income (loss) from investment operations |
| Net investment income (loss) (d) | $0.19 | $0.25 | $0.26 | $0.29 | $0.30 |
| Net realized and unrealized gain (loss) | (0.21) | (0.05) | 0.56 | (0.07) | 0.13 |
| Total from investment operations | $(0.02) | $0.20 | $0.82 | $0.22 | $0.43 |
| Less distributions declared to shareholders |
| From net investment income | $(0.19) | $(0.24) | $(0.25) | $(0.28) | $(0.30) |
| Net asset value, end of period (x) | $8.42 | $8.63 | $8.67 | $8.10 | $8.16 |
| Total return (%) (r)(s)(t)(x) | (0.28) | 2.49 | 10.24 | 2.68 | 5.35 |
Ratios (%) (to average net assets)
and Supplemental data: |
| Expenses before expense reductions (f) | 1.63 | 1.66 | 1.67 | 1.67 | 1.68 |
| Expenses after expense reductions (f) | 1.37 | 1.40 | 1.41 | 1.41 | 1.41 |
| Net investment income (loss) | 2.21 | 3.00 | 3.12 | 3.61 | 3.68 |
| Portfolio turnover | 17 | 30 | 12 | 24 | 17 |
| Net assets at end of period (000 omitted) | $5,096 | $6,519 | $13,733 | $17,392 | $22,213 |
| Supplemental Ratios (%): |
| Ratios of expenses to average net assets after expense reductions and excluding interest expense and fees (f)(l) | 1.36 | 1.38 | 1.38 | 1.40 | 1.40 |
See Notes to Financial Statements
Financial Highlights – continued
| Class C | Year ended |
| | 1/31/22 | 1/31/21 | 1/31/20 | 1/31/19 | 1/31/18 |
| Net asset value, beginning of period | $8.63 | $8.67 | $8.10 | $8.16 | $8.03 |
| Income (loss) from investment operations |
| Net investment income (loss) (d) | $0.17 | $0.22 | $0.24 | $0.27 | $0.28 |
| Net realized and unrealized gain (loss) | (0.21) | (0.04) | 0.56 | (0.08) | 0.13 |
| Total from investment operations | $(0.04) | $0.18 | $0.80 | $0.19 | $0.41 |
| Less distributions declared to shareholders |
| From net investment income | $(0.17) | $(0.22) | $(0.23) | $(0.25) | $(0.28) |
| Net asset value, end of period (x) | $8.42 | $8.63 | $8.67 | $8.10 | $8.16 |
| Total return (%) (r)(s)(t)(x) | (0.53) | 2.23 | 9.96 | 2.42 | 5.10 |
Ratios (%) (to average net assets)
and Supplemental data: |
| Expenses before expense reductions (f) | 1.63 | 1.66 | 1.67 | 1.67 | 1.68 |
| Expenses after expense reductions (f) | 1.62 | 1.64 | 1.66 | 1.66 | 1.65 |
| Net investment income (loss) | 1.95 | 2.69 | 2.84 | 3.35 | 3.43 |
| Portfolio turnover | 17 | 30 | 12 | 24 | 17 |
| Net assets at end of period (000 omitted) | $148,124 | $167,087 | $242,387 | $230,387 | $282,931 |
| Supplemental Ratios (%): |
| Ratios of expenses to average net assets after expense reductions and excluding interest expense and fees (f)(l) | 1.61 | 1.63 | 1.63 | 1.64 | 1.64 |
See Notes to Financial Statements
Financial Highlights – continued
| Class I | Year ended |
| | 1/31/22 | 1/31/21 | 1/31/20 | 1/31/19 | 1/31/18 |
| Net asset value, beginning of period | $8.62 | $8.66 | $8.09 | $8.15 | $8.02 |
| Income (loss) from investment operations |
| Net investment income (loss) (d) | $0.25 | $0.30 | $0.32 | $0.35 | $0.36 |
| Net realized and unrealized gain (loss) | (0.21) | (0.04) | 0.56 | (0.08) | 0.13 |
| Total from investment operations | $0.04 | $0.26 | $0.88 | $0.27 | $0.49 |
| Less distributions declared to shareholders |
| From net investment income | $(0.25) | $(0.30) | $(0.31) | $(0.33) | $(0.36) |
| Net asset value, end of period (x) | $8.41 | $8.62 | $8.66 | $8.09 | $8.15 |
| Total return (%) (r)(s)(t)(x) | 0.46 | 3.24 | 11.06 | 3.44 | 6.15 |
Ratios (%) (to average net assets)
and Supplemental data: |
| Expenses before expense reductions (f) | 0.63 | 0.65 | 0.67 | 0.67 | 0.68 |
| Expenses after expense reductions (f) | 0.62 | 0.64 | 0.66 | 0.66 | 0.65 |
| Net investment income (loss) | 2.94 | 3.64 | 3.82 | 4.34 | 4.42 |
| Portfolio turnover | 17 | 30 | 12 | 24 | 17 |
| Net assets at end of period (000 omitted) | $2,792,475 | $2,831,021 | $2,687,508 | $2,145,125 | $2,261,507 |
| Supplemental Ratios (%): |
| Ratios of expenses to average net assets after expense reductions and excluding interest expense and fees (f)(l) | 0.61 | 0.62 | 0.63 | 0.64 | 0.64 |
See Notes to Financial Statements
Financial Highlights – continued
| Class R6 | Year ended |
| | 1/31/22 | 1/31/21 | 1/31/20 | 1/31/19 | 1/31/18(i) |
| Net asset value, beginning of period | $8.62 | $8.65 | $8.08 | $8.15 | $8.23 |
| Income (loss) from investment operations |
| Net investment income (loss) (d) | $0.26 | $0.31 | $0.33 | $0.36 | $0.22 |
| Net realized and unrealized gain (loss) | (0.21) | (0.03) | 0.56 | (0.09) | (0.06)(g) |
| Total from investment operations | $0.05 | $0.28 | $0.89 | $0.27 | $0.16 |
| Less distributions declared to shareholders |
| From net investment income | $(0.26) | $(0.31) | $(0.32) | $(0.34) | $(0.24) |
| Net asset value, end of period (x) | $8.41 | $8.62 | $8.65 | $8.08 | $8.15 |
| Total return (%) (r)(s)(t)(x) | 0.54 | 3.44 | 11.16 | 3.40 | 1.97(n) |
Ratios (%) (to average net assets)
and Supplemental data: |
| Expenses before expense reductions (f) | 0.54 | 0.57 | 0.59 | 0.58 | 0.57(a) |
| Expenses after expense reductions (f) | 0.53 | 0.56 | 0.58 | 0.57 | 0.56(a) |
| Net investment income (loss) | 3.01 | 3.73 | 3.89 | 4.41 | 4.12(a) |
| Portfolio turnover | 17 | 30 | 12 | 24 | 17 |
| Net assets at end of period (000 omitted) | $1,802,449 | $1,398,315 | $1,195,880 | $856,776 | $397,994 |
| Supplemental Ratios (%): |
| Ratios of expenses to average net assets after expense reductions and excluding interest expense and fees (f)(l) | 0.52 | 0.54 | 0.55 | 0.56 | 0.55(a) |
| (a) | Annualized. |
| (d) | Per share data is based on average shares outstanding. |
| (f) | Ratios do not reflect reductions from fees paid indirectly, if applicable. See Note 2 in the Notes to Financial Statements for additional information. |
| (g) | The per share amount varies from the net realized and unrealized gain/loss for the period because of the timing of sales of fund shares and the per share amount of realized and unrealized gains and losses at such time. |
| (i) | For Class R6, the period is from the class inception, June 2, 2017, through the stated period end. |
| (l) | Interest expense and fees include payments made to the holders of the floating rate certificates. |
| (n) | Not annualized. |
| (r) | Certain expenses have been reduced without which performance would have been lower. |
| (s) | From time to time the fund may receive proceeds from litigation settlements, without which performance would be lower. |
| (t) | Total returns do not include any applicable sales charges. |
| (x) | The net asset values and total returns have been calculated on net assets which include adjustments made in accordance with U.S. generally accepted accounting principles required at period end for financial reporting purposes. |
See Notes to Financial Statements
Notes to Financial Statements
(1) Business and Organization
MFS Municipal High Income Fund (the fund) is a diversified series of MFS Series Trust III which is organized as a Massachusetts business trust and is registered under the Investment Company Act of 1940, as amended, as an open-end management investment company.
The fund is an investment company and accordingly follows the investment company accounting and reporting guidance of the Financial Accounting Standards Board (FASB) Accounting Standards Codification Topic 946 Financial Services - Investment Companies.
(2) Significant Accounting Policies
General — The preparation of financial statements in conformity with U.S. generally accepted accounting principles requires management to make estimates and assumptions that affect the reported amounts of assets and liabilities, and disclosure of contingent assets and liabilities at the date of the financial statements and the reported amounts of increases and decreases in net assets from operations during the reporting period. Actual results could differ from those estimates. In the preparation of these financial statements, management has evaluated subsequent events occurring after the date of the fund’s Statement of Assets and Liabilities through the date that the financial statements were issued. The fund invests primarily in municipal instruments, which generally trade in the over-the-counter market. The value of municipal instruments can be affected by changes in their actual or perceived credit quality. The credit quality of, and the ability to pay principal and interest when due by, an issuer of a municipal instrument depends on the credit quality of the entity supporting the municipal instrument, how essential any services supported by the municipal instrument are, the sufficiency of any revenues or taxes that support the municipal instrument, and/or the willingness or ability of the appropriate government entity to approve any appropriations necessary to support the municipal instrument. Municipal instruments may be supported by insurance which typically guarantees the timely payment of all principal and interest due on the underlying municipal instrument. The value of a municipal instrument can be volatile and significantly affected by adverse tax changes or court rulings, legislative or political changes, changes in specific or general market and economic conditions in the region where the instrument is issued, and the financial condition of municipal issuers and of municipal instrument insurers of which there are a limited number. Also, because many municipal instruments are issued to finance similar projects, conditions in certain industries can significantly affect the fund and the overall municipal market. If the Internal Revenue Service determines an issuer of a municipal instrument has not complied with the applicable tax requirements, interest from the security could become taxable, the security could decline in value, and distributions made by the fund could be taxable to shareholders. The fund invests in high-yield securities rated below investment grade. Investments in below investment grade quality securities can involve a substantially greater risk of default or can already be in default, and their values can decline significantly. Below investment grade quality securities tend to be more sensitive to adverse news about the issuer, or the market or economy in general, than higher quality debt instruments.
Balance Sheet Offsetting — The fund's accounting policy with respect to balance sheet offsetting is that, absent an event of default by the counterparty or a termination of the agreement, the International Swaps and Derivatives Association (ISDA) Master
Notes to Financial Statements - continued
Agreement, or similar agreement, does not result in an offset of reported amounts of financial assets and financial liabilities in the Statement of Assets and Liabilities across transactions between the fund and the applicable counterparty. The fund's right to setoff may be restricted or prohibited by the bankruptcy or insolvency laws of the particular jurisdiction to which a specific master netting agreement counterparty is subject. Balance sheet offsetting disclosures, to the extent applicable to the fund, have been included in the fund’s Significant Accounting Policies note under the captions for each of the fund’s in-scope financial instruments and transactions.
Investment Valuations — Debt instruments and floating rate loans, including restricted debt instruments, are generally valued at an evaluated or composite bid as provided by a third-party pricing service. Short-term instruments with a maturity at issuance of 60 days or less may be valued at amortized cost, which approximates market value. Open-end investment companies are generally valued at net asset value per share. Securities and other assets generally valued on the basis of information from a third-party pricing service may also be valued at a broker/dealer bid quotation. In determining values, third-party pricing services can utilize both transaction data and market information such as yield, quality, coupon rate, maturity, type of issue, trading characteristics, and other market data.
The Board of Trustees has delegated primary responsibility for determining or causing to be determined the value of the fund’s investments (including any fair valuation) to the adviser pursuant to valuation policies and procedures approved by the Board. If the adviser determines that reliable market quotations are not readily available, investments are valued at fair value as determined in good faith by the adviser in accordance with such procedures under the oversight of the Board of Trustees. Under the fund’s valuation policies and procedures, market quotations are not considered to be readily available for most types of debt instruments and floating rate loans and many types of derivatives. These investments are generally valued at fair value based on information from third-party pricing services. In addition, investments may be valued at fair value if the adviser determines that an investment’s value has been materially affected by events occurring after the close of the exchange or market on which the investment is principally traded (such as foreign exchange or market) and prior to the determination of the fund’s net asset value, or after the halt of trading of a specific security where trading does not resume prior to the close of the exchange or market on which the security is principally traded. The adviser generally relies on third-party pricing services or other information (such as the correlation with price movements of similar securities in the same or other markets; the type, cost and investment characteristics of the security; the business and financial condition of the issuer; and trading and other market data) to assist in determining whether to fair value and at what value to fair value an investment. The value of an investment for purposes of calculating the fund’s net asset value can differ depending on the source and method used to determine value. When fair valuation is used, the value of an investment used to determine the fund’s net asset value may differ from quoted or published prices for the same investment. There can be no assurance that the fund could obtain the fair value assigned to an investment if it were to sell the investment at the same time at which the fund determines its net asset value per share.
Various inputs are used in determining the value of the fund's assets or liabilities. These inputs are categorized into three broad levels. In certain cases, the inputs used to measure fair value may fall into different levels of the fair value hierarchy. In such cases, an investment's level within the fair value hierarchy is based on the lowest level of
Notes to Financial Statements - continued
input that is significant to the fair value measurement. The fund's assessment of the significance of a particular input to the fair value measurement in its entirety requires judgment, and considers factors specific to the investment. Level 1 includes unadjusted quoted prices in active markets for identical assets or liabilities. Level 2 includes other significant observable market-based inputs (including quoted prices for similar securities, interest rates, prepayment speed, and credit risk). Level 3 includes unobservable inputs, which may include the adviser's own assumptions in determining the fair value of investments. The following is a summary of the levels used as of January 31, 2022 in valuing the fund's assets and liabilities:
| Financial Instruments | Level 1 | Level 2 | Level 3 | Total |
| Municipal Bonds | $— | $6,709,639,586 | $— | $6,709,639,586 |
| U.S. Corporate Bonds | — | 32,010,177 | — | 32,010,177 |
| Mutual Funds | 186,790,392 | — | — | 186,790,392 |
| Total | $186,790,392 | $6,741,649,763 | $— | $6,928,440,155 |
For further information regarding security characteristics, see the Portfolio of Investments.
Inverse Floaters — The fund invests in municipal inverse floating rate securities which are structured by the fund utilizing the fund's municipal bonds which have already been issued (known as self-deposited secondary market inverse floating rate securities) to have variable rates of interest which typically move in the opposite direction of short-term interest rates. A self-deposited secondary market inverse floating rate security is created when the fund transfers a fixed rate municipal bond to a special purpose trust (“the trust”), and causes the trust to (a) issue floating rate certificates to third parties, in an amount equal to a fraction of the par amount of the deposited bonds (these certificates usually pay tax-exempt interest at short-term interest rates that typically reset weekly; and the certificate holders typically, on seven days notice, have the option to tender their certificates to the trust or another party for redemption at par plus accrued interest), and (b) issue inverse floating rate certificates (sometimes referred to as “inverse floaters”) which are held by the fund. Such self-deposited inverse floaters held by the fund are accounted for as secured borrowings, with the municipal bonds reflected in the investments of the fund and amounts owed to the holders of the floating rate certificates under the provisions of the trust, which amounts are paid solely from the assets of the trust, reflected as liabilities of the fund in the Statement of Assets and Liabilities under the caption, “Payable to the holders of the floating rate certificates”. The carrying value of the fund’s payable to the holders of the floating rate certificates as reported in the fund’s Statement of Assets and Liabilities approximates its fair value. The value of the payable to the holders of the floating rate certificates as of the reporting date is considered level 2 under the fair value hierarchy disclosure. At January 31, 2022, the fund’s payable to the holders of the floating rate certificates was $64,037,842 and the weighted average interest rate on the settled floating rate certificates issued by the trust was 0.11%. For the year ended January 31, 2022, the average payable to the holders of the settled floating rate certificates was $70,462,612 at a weighted average interest rate of 0.11%. Interest expense and fees include interest payments made to the holders of certain floating rate certificates and associated fees, both of which are made from trust assets. Interest expense and fees are recorded as incurred. For the year ended January 31, 2022, interest expense and fees related to self-deposited inverse floaters amounted to $480,761 and are included in “Interest expense and fees” in the Statement of Operations.
Notes to Financial Statements - continued
Indemnifications — Under the fund's organizational documents, its officers and Trustees may be indemnified against certain liabilities and expenses arising out of the performance of their duties to the fund. Additionally, in the normal course of business, the fund enters into agreements with service providers that may contain indemnification clauses. The fund's maximum exposure under these agreements is unknown as this would involve future claims that may be made against the fund that have not yet occurred.
Investment Transactions and Income — Investment transactions are recorded on the trade date. Some securities may be purchased or sold on an extended settlement basis, which means that the receipt or delivery of the securities by the fund and related payments occur at a future date, usually beyond the customary settlement period.
Interest income is recorded on the accrual basis. All premium and discount is amortized or accreted for financial statement purposes in accordance with U.S. generally accepted accounting principles. Interest payments received in additional securities are recorded on the ex-interest date in an amount equal to the value of the security on such date. In determining the net gain or loss on securities sold, the cost of securities is determined on the identified cost basis. Debt obligations may be placed on non-accrual status or set to accrue at a rate of interest less than the contractual coupon when the collection of all or a portion of interest has become doubtful. Interest income for those debt obligations may be further reduced by the write-off of the related interest receivables when deemed uncollectible.
The fund may receive proceeds from litigation settlements. Any proceeds received from litigation involving portfolio holdings are reflected in the Statement of Operations in realized gain/loss if the security has been disposed of by the fund or in unrealized gain/loss if the security is still held by the fund. Any other proceeds from litigation not related to portfolio holdings are reflected as other income in the Statement of Operations.
The fund may purchase or sell securities on a when-issued or delayed delivery basis. In these extended settlement transactions, the receipt or delivery of the securities by the fund and related payments occur at a future date, usually beyond the normal settlement period. The price of such security and the date that the security will be settled are generally fixed at the time the transaction is negotiated. The value of the security varies with market fluctuations and for debt securities no interest accrues to the fund until settlement takes place. When the fund sells securities on a when-issued or delayed delivery basis, the fund typically owns or has the right to acquire securities equivalent in kind and amount to the securities sold. Purchase and sale commitments for when-issued or delayed delivery securities are held at carrying amount, which approximates fair value and are categorized as level 2 within the fair value hierarchy, and included in When-issued investments purchased in the Statement of Assets and Liabilities. Losses may arise due to changes in the value of the underlying securities prior to settlement date or if the counterparty does not perform under the contract’s terms, or if the issuer does not issue the securities due to political, economic or other factors. At the time that it enters into a when-issued or delayed delivery transaction, the fund is required to have sufficient cash and/or liquid securities to cover its commitments.
Legal fees and other related expenses incurred to preserve and protect the value of a security owned are added to the cost of the security; other legal fees are expensed. Capital infusions made directly to the security issuer, which are generally non-recurring,
Notes to Financial Statements - continued
incurred to protect or enhance the value of high-yield debt securities, are reported as additions to the cost basis of the security. Costs that are incurred to negotiate the terms or conditions of capital infusions or that are expected to result in a plan of reorganization are reported as realized losses. Ongoing costs incurred to protect or enhance an investment, or costs incurred to pursue other claims or legal actions, are expensed.
Fees Paid Indirectly — The fund's custody fee may be reduced by a credit earned under an arrangement that measures the value of U.S. dollars deposited with the custodian by the fund. The amount of the credit, for the year ended January 31, 2022, is shown as a reduction of total expenses in the Statement of Operations.
Tax Matters and Distributions — The fund intends to qualify as a regulated investment company, as defined under Subchapter M of the Internal Revenue Code, and to distribute all of its taxable and tax-exempt income, including realized capital gains. As a result, no provision for federal income tax is required. The fund’s federal tax returns, when filed, will remain subject to examination by the Internal Revenue Service for a three year period. Management has analyzed the fund’s tax positions taken on federal and state tax returns for all open tax years and does not believe that there are any uncertain tax positions that require recognition of a tax liability.
Distributions to shareholders are recorded on the ex-dividend date. Income and capital gain distributions are determined in accordance with income tax regulations, which may differ from U.S. generally accepted accounting principles. Certain capital accounts in the financial statements are periodically adjusted for permanent differences in order to reflect their tax character. These adjustments have no impact on net assets or net asset value per share. Temporary differences which arise from recognizing certain items of income, expense, gain or loss in different periods for financial statement and tax purposes will reverse at some time in the future.
Book/tax differences primarily relate to defaulted bonds.
The tax character of distributions declared to shareholders for the last two fiscal years is as follows:
| | Year ended
1/31/22 | Year ended
1/31/21 |
| Ordinary income (including any short-term capital gains) | $2,809,813 | $11,818,609 |
| Tax-exempt income | 190,805,899 | 194,906,296 |
| Total distributions | $193,615,712 | $206,724,905 |
Notes to Financial Statements - continued
The federal tax cost and the tax basis components of distributable earnings were as follows:
| As of 1/31/22 | |
| Cost of investments | $6,639,322,160 |
| Gross appreciation | 339,572,878 |
| Gross depreciation | (114,492,725) |
| Net unrealized appreciation (depreciation) | $ 225,080,153 |
| Undistributed ordinary income | 1,438,285 |
| Undistributed tax-exempt income | 60,201,484 |
| Capital loss carryforwards | (60,893,828) |
| Other temporary differences | (16,557,280) |
| Total distributable earnings (loss) | $ 209,268,814 |
As of January 31, 2022, the fund had capital loss carryforwards available to offset future realized gains. These net capital losses may be carried forward indefinitely and their character is retained as short-term and/or long-term losses. Such losses are characterized as follows:
Multiple Classes of Shares of Beneficial Interest — The fund offers multiple classes of shares, which differ in their respective distribution and service fees. The fund's income and common expenses are allocated to shareholders based on the value of settled shares outstanding of each class. The fund's realized and unrealized gain (loss) are allocated to shareholders based on the daily net assets of each class. Dividends are declared separately for each class. Differences in per share dividend rates are generally due to differences in separate class expenses. Class B and Class C shares will convert to Class A shares approximately eight years after purchase. The fund’s distributions declared to shareholders as reported in the Statements of Changes in Net Assets are presented by class as follows:
| | Year ended
1/31/22 | Year ended
1/31/21 |
| Class A | $60,230,580 | $67,375,712 |
| Class B | 126,101 | 266,852 |
| Class C | 3,093,572 | 5,375,754 |
| Class I | 80,273,036 | 93,361,821 |
| Class R6 | 49,892,423 | 40,344,766 |
| Total | $193,615,712 | $206,724,905 |
Notes to Financial Statements - continued
(3) Transactions with Affiliates
Investment Adviser — The fund has an investment advisory agreement with MFS to provide overall investment management and related administrative services and facilities to the fund. The management fee is computed daily and paid monthly at the following annual rates based on the fund's average daily net assets:
| Up to $2.5 billion | 0.55% |
| In excess of $2.5 billion and up to $5 billion | 0.50% |
| In excess of $5 billion and up to $10 billion | 0.45% |
| In excess of $10 billion | 0.425% |
MFS has also agreed in writing to reduce its management fee by a specified amount if certain MFS mutual fund assets exceed thresholds agreed to by MFS and the fund's Board of Trustees. For the year ended January 31, 2022, this management fee reduction amounted to $860,460, which is included in the reduction of total expenses in the Statement of Operations. The management fee incurred for the year ended January 31, 2022 was equivalent to an annual effective rate of 0.49% of the fund's average daily net assets.
The investment adviser has agreed in writing to pay a portion of the fund’s total annual operating expenses, excluding interest, taxes, extraordinary expenses, brokerage and transaction costs, and investment-related expenses (such as interest expense and fees associated with investments in inverse floating rate instruments), such that total fund operating expenses do not exceed the following rates annually of each class’s average daily net assets:
| | | Classes | | |
| A | B | C | I | R6 |
| 0.65% | 1.40% | 1.65% | 0.65% | 0.56% |
This written agreement will continue until modified by the fund’s Board of Trustees, but such agreement will continue at least until May 31, 2023. For the year ended January 31, 2022, the fund’s actual operating expenses did not exceed the limit and therefore, the investment adviser did not pay any portion of the fund’s expenses related to this agreement.
Distributor — MFS Fund Distributors, Inc. (MFD), a wholly-owned subsidiary of MFS, as distributor, received $88,578 for the year ended January 31, 2022, as its portion of the initial sales charge on sales of Class A shares of the fund.
The Board of Trustees has adopted a distribution plan for certain share classes pursuant to Rule 12b-1 of the Investment Company Act of 1940.
The fund's distribution plan provides that the fund will pay MFD for services provided by MFD and financial intermediaries in connection with the distribution and servicing of certain share classes. One component of the plan is a distribution fee paid to MFD and another component of the plan is a service fee paid to MFD. MFD may subsequently pay all, or a portion, of the distribution and/or service fees to financial intermediaries.
Notes to Financial Statements - continued
Distribution Plan Fee Table:
| | Distribution
Fee Rate (d) | Service
Fee Rate (d) | Total
Distribution
Plan (d) | Annual
Effective
Rate (e) | Distribution
and Service
Fee |
| Class B | 0.75% | 0.25% | 1.00% | 0.75% | $ 57,717 |
| Class C | 0.75% | 0.25% | 1.00% | 1.00% | 1,603,931 |
| Total Distribution and Service Fees | | | | | $1,661,648 |
| (d) | In accordance with the distribution plan for certain classes, the fund pays distribution and/or service fees equal to these annual percentage rates of each class’s average daily net assets. The distribution and service fee rates disclosed by class represent the current rates in effect at the end of the reporting period. Any rate changes, if applicable, are detailed below. |
| (e) | The annual effective rates represent actual fees incurred under the distribution plan for the year ended January 31, 2022 based on each class's average daily net assets. MFD has agreed in writing to reduce the Class B service fee rate to 0.00% for all Class B shares. This agreement will continue until modified by the fund’s Board of Trustees, but such agreement will continue until at least May 31, 2023. For the year ended January 31, 2022, this waiver amounted to $14,429, which is included in the reduction of total expenses in the Statement of Operations. MFD has also voluntarily agreed to rebate a portion of each class’s 0.25% service fee attributable to accounts for which there is no financial intermediary specified on the account except for accounts attributable to MFS or its affiliates’ seed money. For the year ended January 31, 2022, there were no service fee rebates. |
Certain Class A shares are subject to a contingent deferred sales charge (CDSC) in the event of a shareholder redemption within 18 months of purchase. Class B shares are subject to a CDSC in the event of a shareholder redemption within six years of purchase. Class C shares are subject to a CDSC in the event of a shareholder redemption within 12 months of purchase. All contingent deferred sales charges are paid to MFD and during the year ended January 31, 2022, were as follows:
| | Amount |
| Class A | $88,997 |
| Class B | 4,531 |
| Class C | 8,056 |
Shareholder Servicing Agent — MFS Service Center, Inc. (MFSC), a wholly-owned subsidiary of MFS, receives a fee from the fund for its services as shareholder servicing agent calculated as a percentage of the average daily net assets of the fund as determined periodically under the supervision of the fund's Board of Trustees. For the year ended January 31, 2022, the fee was $195,489, which equated to 0.0029% annually of the fund's average daily net assets. MFSC also receives reimbursement from the fund for out-of-pocket expenses, sub-accounting and other shareholder servicing costs which may be paid to affiliated and unaffiliated service providers. Class R6 shares do not incur sub-accounting fees. For the year ended January 31, 2022, these out-of-pocket expenses, sub-accounting and other shareholder servicing costs amounted to $4,216,535.
Administrator — MFS provides certain financial, legal, shareholder communications, compliance, and other administrative services to the fund. Under an administrative services agreement, the fund reimburses MFS the costs incurred to provide these
Notes to Financial Statements - continued
services. The fund is charged an annual fixed amount of $17,500 plus a fee based on average daily net assets. The administrative services fee incurred for the year ended January 31, 2022 was equivalent to an annual effective rate of 0.0085% of the fund's average daily net assets.
Trustees’ and Officers’ Compensation — The fund pays compensation to independent Trustees in the form of a retainer, attendance fees, and additional compensation to Board and Committee chairpersons. The fund does not pay compensation directly to Trustees or officers of the fund who are also officers of the investment adviser, all of whom receive remuneration from MFS for their services to the fund. Certain officers and Trustees of the fund are officers or directors of MFS, MFD, and MFSC.
Prior to December 31, 2001, the fund had an unfunded defined benefit plan (“DB plan”) for independent Trustees. As of December 31, 2001, the Board took action to terminate the DB plan with respect to then-current and any future independent Trustees, such that the DB plan covers only certain of those former independent Trustees who retired on or before December 31, 2001. The DB plan resulted in a pension expense of $1,429 and is included in “Independent Trustees’ compensation” in the Statement of Operations for the year ended January 31, 2022. The liability for deferred retirement benefits payable to those former independent Trustees under the DB plan amounted to $1,492 at January 31, 2022, and is included in “Payable for independent Trustees’ compensation” in the Statement of Assets and Liabilities.
Other — The fund invests in the MFS Institutional Money Market Portfolio which is managed by MFS and seeks current income consistent with preservation of capital and liquidity. This money market fund does not pay a management fee to MFS but does incur investment and operating costs.
(4) Portfolio Securities
For the year ended January 31, 2022, purchases and sales of investments, other than short-term obligations, were as follows:
| | Purchases | Sales |
| U.S. Government securities | $13,436,645 | $— |
| Non-U.S. Government securities | 1,756,621,754 | 1,149,666,434 |
Notes to Financial Statements - continued
(5)��Shares of Beneficial Interest
The fund's Declaration of Trust permits the Trustees to issue an unlimited number of full and fractional shares of beneficial interest. Transactions in fund shares were as follows:
| | Year ended
1/31/22 | | Year ended
1/31/21 |
| | Shares | Amount | | Shares | Amount |
| Shares sold | | | | | |
| Class A | 40,037,108 | $347,009,592 | | 41,685,865 | $344,479,434 |
| Class B | 7,307 | 62,707 | | 3,860 | 32,779 |
| Class C | 2,392,645 | 20,767,125 | | 2,813,618 | 23,348,058 |
| Class I | 88,439,826 | 765,619,870 | | 132,192,517 | 1,076,180,486 |
| Class R6 | 98,856,243 | 856,361,341 | | 80,075,619 | 664,146,738 |
| | 229,733,129 | $1,989,820,635 | | 256,771,479 | $2,108,187,495 |
Shares issued to shareholders
in reinvestment of distributions | | | | | |
| Class A | 6,461,532 | $55,843,129 | | 7,538,855 | $62,071,649 |
| Class B | 11,364 | 98,265 | | 26,552 | 217,894 |
| Class C | 330,541 | 2,859,594 | | 586,468 | 4,821,847 |
| Class I | 8,125,477 | 70,157,314 | | 9,991,986 | 82,250,526 |
| Class R6 | 4,527,776 | 39,092,462 | | 3,917,680 | 32,245,439 |
| | 19,456,690 | $168,050,764 | | 22,061,541 | $181,607,355 |
| Shares reacquired | | | | | |
| Class A | (29,461,794) | $(255,087,424) | | (51,485,828) | $(417,374,935) |
| Class B | (168,790) | (1,460,062) | | (859,178) | (7,014,512) |
| Class C | (4,492,320) | (38,959,121) | | (12,001,887) | (98,931,509) |
| Class I | (92,977,544) | (797,612,088) | | (124,193,568) | (1,004,658,303) |
| Class R6 | (51,278,592) | (444,025,875) | | (59,913,397) | (481,949,231) |
| | (178,379,040) | $(1,537,144,570) | | (248,453,858) | $(2,009,928,490) |
| Net change | | | | | |
| Class A | 17,036,846 | $147,765,297 | | (2,261,108) | $(10,823,852) |
| Class B | (150,119) | (1,299,090) | | (828,766) | (6,763,839) |
| Class C | (1,769,134) | (15,332,402) | | (8,601,801) | (70,761,604) |
| Class I | 3,587,759 | 38,165,096 | | 17,990,935 | 153,772,709 |
| Class R6 | 52,105,427 | 451,427,928 | | 24,079,902 | 214,442,946 |
| | 70,810,779 | $620,726,829 | | 30,379,162 | $279,866,360 |
Effective June 1, 2019, purchases of the fund’s Class B shares are closed to new and existing investors subject to certain exceptions. Please see the fund’s prospectus for details.
Notes to Financial Statements - continued
(6) Line of Credit
The fund and certain other funds managed by MFS participate in a $1.25 billion unsecured committed line of credit of which $1 billion is reserved for use by the fund and certain other MFS U.S. funds. The line of credit is provided by a syndicate of banks under a credit agreement. Borrowings may be made for temporary financing needs. Interest is charged to each fund, based on its borrowings, generally at a rate equal to the highest of one month LIBOR, the Federal Funds Effective Rate and the Overnight Bank Funding Rate, plus an agreed upon spread. A commitment fee, based on the average daily, unused portion of the committed line of credit, is allocated among the participating funds. In addition, the fund and other funds managed by MFS have established unsecured uncommitted borrowing arrangements with certain banks for temporary financing needs. Interest is charged to each fund, based on its borrowings, at rates equal to customary reference rates plus an agreed upon spread. For the year ended January 31, 2022, the fund’s commitment fee and interest expense were $23,564 and $0, respectively, and are included in “Interest expense and fees” in the Statement of Operations.
(7) Investments in Affiliated Issuers
An affiliated issuer may be considered one in which the fund owns 5% or more of the outstanding voting securities, or a company which is under common control. For the purposes of this report, the following were affiliated issuers:
| Affiliated Issuers | Beginning
Value | Purchases | Sales
Proceeds | Realized
Gain
(Loss) | Change in
Unrealized
Appreciation or
Depreciation | Ending
Value |
| MFS Institutional Money Market Portfolio | $209,885,766 | $1,461,744,619 | $1,484,839,993 | $— | $— | $186,790,392 |
| Affiliated Issuers | Dividend
Income | Capital Gain
Distributions |
| MFS Institutional Money Market Portfolio | $82,587 | $— |
(8) Impacts of COVID-19
The pandemic related to the global spread of novel coronavirus disease (COVID-19), which was first detected in December 2019, has resulted in significant disruptions to global business activity and the global economy, as well as the economies of individual countries, the financial performance of individual companies and sectors, and the securities and commodities markets in general. Multiple surges in cases globally, the availability and widespread adoption of vaccines, and the emergence of variant strains of the virus continue to create uncertainty as to the future and long-term impacts resulting from the pandemic including impacts to the prices and liquidity of the fund's investments and the fund's performance.
(9) LIBOR Transition
Certain of the fund's investments, including investments in certain debt instruments and derivatives (if any), as well as borrowings by the fund and certain other contractual arrangements of the fund, may be based on the London Interbank Offered Rate (“LIBOR”). In 2017, the regulatory authority that oversees financial services firms in the
Notes to Financial Statements - continued
United Kingdom announced plans to transition away from LIBOR by the end of 2021. In March 2021, the administrator of LIBOR announced the extension of the publication of the more commonly used U.S. dollar LIBOR settings to the end of June 2023. Although the full impacts of the transition away from LIBOR are not fully known, the transition may result in, among other things, an increase in volatility or illiquidity of the markets for instruments that currently rely on LIBOR to determine interest rates and this could have an adverse impact on the fund's performance. With respect to the fund's accounting for investments, including investments in certain debt instruments and derivatives, as well as borrowings by the fund and any other contractual arrangements of the fund that undergo reference rate-related modifications as a result of the transition, management will rely upon the relief provided by FASB Codification Topic 848 – Reference Rate Reform (Topic 848). The guidance in Topic 848 permits the fund to account for those modified contracts as a continuation of the existing contracts. Management is still evaluating the impact to the fund of the June 30, 2023 planned discontinuation of the more commonly used U.S. dollar LIBOR settings.
(10) Subsequent Event
The market disruptions, which began in late February 2022, associated with geopolitical events related to the conflict between Russia and Ukraine may adversely affect the value of the fund’s assets and thus the fund’s performance. Management continues to monitor these events and to evaluate the related impacts, if any, to the fund.
Report of Independent Registered Public Accounting Firm
To the Shareholders of MFS Municipal High Income Fund and the Board of Trustees of MFS Series Trust III
Opinion on the Financial Statements
We have audited the accompanying statement of assets and liabilities of MFS Municipal High Income Fund (the “Fund”) (one of the funds constituting MFS Series Trust III (the “Trust”)), including the portfolio of investments, as of January 31, 2022, and the related statement of operations for the year then ended, the statements of changes in net assets for each of the two years in the period then ended, the financial highlights for each of the five years in the period then ended and the related notes (collectively referred to as the “financial statements”). In our opinion, the financial statements present fairly, in all material respects, the financial position of the Fund (one of the funds constituting MFS Series Trust III) at January 31, 2022, the results of its operations for the year then ended, the changes in its net assets for each of the two years in the period then ended and its financial highlights for each of the five years in the period then ended, in conformity with U.S. generally accepted accounting principles.
Basis for Opinion
These financial statements are the responsibility of the Trust’s management. Our responsibility is to express an opinion on the Fund’s financial statements based on our audits. We are a public accounting firm registered with the Public Company Accounting Oversight Board (United States) (“PCAOB”) and are required to be independent with respect to the Trust in accordance with the U.S. federal securities laws and the applicable rules and regulations of the Securities and Exchange Commission and the PCAOB.
We conducted our audits in accordance with the standards of the PCAOB. Those standards require that we plan and perform the audit to obtain reasonable assurance about whether the financial statements are free of material misstatement, whether due to error or fraud. The Trust is not required to have, nor were we engaged to perform, an audit of the Trust’s internal control over financial reporting. As part of our audits, we are required to obtain an understanding of internal control over financial reporting, but not for the purpose of expressing an opinion on the effectiveness of the Trust’s internal control over financial reporting. Accordingly, we express no such opinion.
Report of Independent Registered Public Accounting Firm – continued
Our audits included performing procedures to assess the risks of material misstatement of the financial statements, whether due to error or fraud, and performing procedures that respond to those risks. Such procedures included examining, on a test basis, evidence regarding the amounts and disclosures in the financial statements. Our procedures included confirmation of securities owned as of January 31, 2022, by correspondence with the custodian and others or by other appropriate auditing procedures where replies from others were not received. Our audits also included evaluating the accounting principles used and significant estimates made by management, as well as evaluating the overall presentation of the financial statements. We believe that our audits provide a reasonable basis for our opinion.
We have served as the auditor of one or more MFS investment companies since 1993.
Boston, Massachusetts
March 18, 2022
Trustees and Officers — Identification and Background
The Trustees and Officers of the Trust, as of March 1, 2022, are listed below, together with their principal occupations during the past five years. (Their titles may have varied during that period.) The address of each Trustee and Officer is 111 Huntington Avenue, Boston, Massachusetts 02199-7618.
| Name, Age | | Position(s) Held with Fund | | Trustee/Officer Since(h) | | Number of MFS Funds overseen by the Trustee | | Principal Occupations During
the Past Five Years | | Other Directorships During
the Past Five Years (j) |
| INTERESTED TRUSTEES | | | | | | | | | | |
Michael W. Roberge (k)
(age 55) | | Trustee | | January 2021 | | 135 | | Massachusetts Financial Services Company, Chairman (since January 2021); Chief Executive Officer (since January 2017); Director; Chairman of the Board (since January 2022); President (until December 2018); Chief Investment Officer (until December 2018) | | N/A |
| INDEPENDENT TRUSTEES | | | | | | | | | | |
John P. Kavanaugh
(age 67) | | Trustee and Chair of Trustees | | January 2009 | | 135 | | Private investor | | N/A |
Steven E. Buller
(age 70) | | Trustee | | February 2014 | | 135 | | Private investor | | N/A |
John A. Caroselli
(age 67) | | Trustee | | March 2017 | | 135 | | Private investor; JC Global Advisors, LLC (management consulting), President (since 2015) | | N/A |
Maureen R. Goldfarb
(age 66) | | Trustee | | January 2009 | | 135 | | Private investor | | N/A |
Peter D. Jones
(age 66) | | Trustee | | January 2019 | | 135 | | Private investor | | N/A |
James W. Kilman, Jr.
(age 60) | | Trustee | | January 2019 | | 135 | | Burford Capital Limited (finance and investment management), Senior Advisor (since May 3, 2021), Chief Financial Officer (2019 - May 2, 2021); KielStrand Capital LLC (family office), Chief Executive Officer (since 2016) | | Alpha-En Corporation, Director (2016-2019) |
Trustees and Officers - continued
| Name, Age | | Position(s) Held with Fund | | Trustee/Officer Since(h) | | Number of MFS Funds overseen by the Trustee | | Principal Occupations During
the Past Five Years | | Other Directorships During
the Past Five Years (j) |
Clarence Otis, Jr.
(age 65) | | Trustee | | March 2017 | | 135 | | Private investor | | VF Corporation, Director; Verizon Communications, Inc., Director; The Travelers Companies, Director |
Maryanne L. Roepke
(age 66) | | Trustee | | May 2014 | | 135 | | Private investor | | N/A |
Laurie J. Thomsen
(age 64) | | Trustee | | March 2005 | | 135 | | Private investor | | The Travelers Companies, Director; Dycom Industries, Inc., Director |
| Name, Age | | Position(s) Held with
Fund | | Trustee/Officer Since(h) | | Number of MFS Funds for which the Person is an Officer | | Principal Occupations During
the Past Five Years |
| OFFICERS | | | | | | | | |
Christopher R. Bohane (k)
(age 48) | | Assistant Secretary and Assistant Clerk | | July 2005 | | 135 | | Massachusetts Financial Services Company, Senior Vice President and Associate General Counsel |
Kino Clark (k)
(age 53) | | Assistant Treasurer | | January 2012 | | 135 | | Massachusetts Financial Services Company, Vice President |
John W. Clark, Jr. (k)
(age 54) | | Assistant Treasurer | | April 2017 | | 135 | | Massachusetts Financial Services Company, Vice President (since March 2017); Deutsche Bank (financial services), Department Head - Treasurer's Office (until February 2017) |
Thomas H. Connors (k)
(age 62) | | Assistant Secretary and Assistant Clerk | | September 2012 | | 135 | | Massachusetts Financial Services Company, Vice President and Senior Counsel |
David L. DiLorenzo (k)
(age 53) | | President | | July 2005 | | 135 | | Massachusetts Financial Services Company, Senior Vice President |
Heidi W. Hardin (k)
(age 54) | | Secretary and Clerk | | April 2017 | | 135 | | Massachusetts Financial Services Company, Executive Vice President and General Counsel (since March 2017); Harris Associates (investment management), General Counsel (until January 2017) |
Trustees and Officers - continued
| Name, Age | | Position(s) Held with
Fund | | Trustee/Officer Since(h) | | Number of MFS Funds for which the Person is an Officer | | Principal Occupations During
the Past Five Years |
Brian E. Langenfeld (k)
(age 48) | | Assistant Secretary and Assistant Clerk | | June 2006 | | 135 | | Massachusetts Financial Services Company, Vice President and Senior Counsel |
Rosa E. Licea-Mailloux(k)
(age 45) | | Chief Compliance Officer | | March 2022 | | 135 | | Massachusetts Financial Services Company, Vice President (since 2018); Director of Corporate Compliance (2018-2021), Senior Director Compliance (2021-2022), Senior Managing Director of North American Compliance & Chief Compliance Officer (since March 2022); Natixis Investment Managers (investment management), Funds Chief Compliance Officer, Deputy General Counsel & Senior Vice President (until 2018) |
Amanda S. Mooradian (k)
(age 43) | | Assistant Secretary and Assistant Clerk | | September 2018 | | 135 | | Massachusetts Financial Services Company, Assistant Vice President and Senior Counsel |
Susan A. Pereira (k)
(age 51) | | Assistant Secretary and Assistant Clerk | | July 2005 | | 135 | | Massachusetts Financial Services Company, Vice President and Assistant General Counsel |
Kasey L. Phillips (k)
(age 51) | | Assistant Treasurer | | September 2012 | | 135 | | Massachusetts Financial Services Company, Vice President |
Matthew A. Stowe (k)
(age 47) | | Assistant Secretary and Assistant Clerk | | October 2014 | | 135 | | Massachusetts Financial Services Company, Vice President and Assistant General Counsel |
James O. Yost (k)
(age 61) | | Treasurer | | September 1990 | | 135 | | Massachusetts Financial Services Company, Senior Vice President |
| (h) | Date first appointed to serve as Trustee/Officer of an MFS Fund. Each Trustee has served continuously since appointment unless indicated otherwise. From January 2012 through December 2016, Messrs. DiLorenzo and Yost served as Treasurer and Deputy Treasurer of the Funds, respectively. |
| (j) | Directorships or trusteeships of companies required to report to the Securities and Exchange Commission (i.e., “public companies”). |
| (k) | “Interested person” of the Trust within the meaning of the Investment Company Act of 1940 (referred to as the 1940 Act), which is the principal federal law governing investment companies like the fund, as a result of a position with MFS. The address of MFS is 111 Huntington Avenue, Boston, Massachusetts 02199-7618. |
Trustees and Officers - continued
Each Trustee (other than Messrs. Jones, Kilman and Roberge) has been elected by shareholders and each Trustee and Officer holds office until his or her successor is chosen and qualified or until his or her earlier death, resignation, retirement or removal. Mr. Roberge became a Trustee of the Funds on January 1, 2021 and Messrs. Jones and Kilman became Trustees of the Funds on January 1, 2019. The Trust does not hold annual meetings for the purpose of electing Trustees, and Trustees are not elected for fixed terms. Under the terms of the Board's retirement policy, an Independent Trustee shall retire at the end of the calendar year in which he or she reaches the earlier of 75 years of age or 15 years of service on the Board (or, in the case of any Independent Trustee who joined the Board prior to 2015, 20 years of service on the Board).
Messrs. Buller, Kilman and Otis and Ms. Roepke are members of the Trust’s Audit Committee.
Each of the Interested Trustees and certain Officers hold comparable officer positions with certain affiliates of MFS.
The Statement of Additional Information for a Fund includes further information about the Trustees and is available without charge upon request by calling 1-800-225-2606.
| Investment Adviser | Custodian |
Massachusetts Financial Services Company
111 Huntington Avenue
Boston, MA 02199-7618 | JPMorgan Chase Bank, NA
4 Metrotech Center
New York, NY 11245 |
| Distributor | Independent Registered Public Accounting Firm |
MFS Fund Distributors, Inc.
111 Huntington Avenue
Boston, MA 02199-7618 | Ernst & Young LLP
200 Clarendon Street
Boston, MA 02116 |
| Portfolio Manager(s) | |
Jason Kosty
Gary Lasman
Geoffrey Schechter | |
Proxy Voting Policies and Information
MFS votes proxies on behalf of the fund pursuant to proxy voting policies and procedures that are available without charge, upon request, by calling 1-800-225-2606, by visiting mfs.com/proxyvoting, or by visiting the SEC’s Web site at http://www.sec.gov.
Information regarding how the fund voted proxies relating to portfolio securities during the most recent twelve-month period ended June 30 is available by August 31 of each year without charge by visiting mfs.com/proxyvoting, or by visiting the SEC’s Web site at http://www.sec.gov.
Quarterly Portfolio Disclosure
The fund files a complete schedule of portfolio holdings with the SEC for the first and third quarters of each fiscal year as an exhibit to its reports on Form N-PORT. The fund's Form N-PORT reports are available on the SEC's Web site at http://www.sec.gov. A shareholder can obtain the portfolio holdings report for the first and third quarters of the fund's fiscal year at mfs.com/openendfunds by choosing the fund's name and then scrolling to the “Resources” section and clicking on the “Prospectus and Reports” tab.
Further Information
From time to time, MFS may post important information about the fund or the MFS Funds on the MFS Web site (mfs.com). This information is available at https://www.mfs.com/announcements or at mfs.com/openendfunds by choosing the fund’s name and then scrolling to the “Resources” section and clicking on the “Announcements” tab, if any.
Information About Fund Contracts and Legal Claims
The fund has entered into contractual arrangements with an investment adviser, administrator, distributor, shareholder servicing agent, 529 program manager (if applicable), and custodian who each provide services to the fund. Unless expressly stated otherwise, shareholders are not parties to, or intended beneficiaries of these contractual arrangements, and these contractual arrangements are not intended to create any shareholder right to enforce them against the service providers or to seek any remedy under them against the service providers, either directly or on behalf of the fund.
Under the Trust’s By-Laws and Declaration of Trust, any claims asserted against or on behalf of the MFS Funds, including claims against Trustees and Officers, must be brought in state and federal courts located within the Commonwealth of Massachusetts.
Federal Tax Information (unaudited)
The fund will notify shareholders of amounts for use in preparing 2022 income tax forms in January 2023. The following information is provided pursuant to provisions of the Internal Revenue Code.
Of the dividends paid from net investment income during the fiscal year, 98.55% is designated as exempt interest dividends for federal income tax purposes. If the fund has earned income on private activity bonds, a portion of the dividends paid may be considered a tax preference item for purposes of computing a shareholder’s alternative minimum tax.
Federal Tax Information (unaudited) - continued
The fund intends to pass through the maximum amount allowable as Section 163(j) Interest Dividends as defined in Treasury Regulation §1.163(j)-1(b).
| FACTS | WHAT DOES MFS DO WITH YOUR PERSONAL INFORMATION? |
| Why? | Financial companies choose how they share your personal information. Federal law gives consumers the right to limit some but not all sharing. Federal law also requires us to tell you how we collect, share, and protect your personal information. Please read this notice carefully to understand what we do. |
| What? | The types of personal information we collect and share depend on the product or service you have with us. This information can include: |
| • Social Security number and account balances |
| • Account transactions and transaction history |
| • Checking account information and wire transfer instructions |
| When you are no longer our customer, we continue to share your information as described in this notice. |
| How? | All financial companies need to share customers' personal information to run their everyday business. In the section below, we list the reasons financial companies can share their customers' personal information; the reasons MFS chooses to share; and whether you can limit this sharing. |
Reasons we can share your
personal information | Does MFS share? | Can you limit
this sharing? |
For our everyday business purposes –
such as to process your transactions, maintain your
account(s), respond to court orders and legal
investigations, or report to credit bureaus | Yes | No |
For our marketing purposes –
to offer our products and services to you | No | We don't share |
For joint marketing with other
financial companies | No | We don't share |
For our affiliates' everyday business purposes –
information about your transactions and experiences | No | We don't share |
For our affiliates' everyday business purposes –
information about your creditworthiness | No | We don't share |
| For nonaffiliates to market to you | No | We don't share |
| Questions? | Call 800-225-2606 or go to mfs.com. |
| Who we are |
| Who is providing this notice? | MFS Funds, MFS Investment Management, MFS Institutional Advisors, Inc., and MFS Heritage Trust Company. |
| What we do |
How does MFS
protect my personal
information? | To protect your personal information from unauthorized access and use, we use security measures that comply with federal law. These measures include procedural, electronic, and physical safeguards for the protection of the personal information we collect about you. |
How does MFS
collect my personal
information? | We collect your personal information, for example, when you |
| • open an account or provide account information |
| • direct us to buy securities or direct us to sell your securities |
| • make a wire transfer |
| We also collect your personal information from others, such as credit bureaus, affiliates, or other companies. |
| Why can't I limit all sharing? | Federal law gives you the right to limit only |
| • sharing for affiliates' everyday business purposes – information about your creditworthiness |
| • affiliates from using your information to market to you |
| • sharing for nonaffiliates to market to you |
| State laws and individual companies may give you additional rights to limit sharing. |
| Definitions |
| Affiliates | Companies related by common ownership or control. They can be financial and nonfinancial companies. |
| • MFS does not share personal information with affiliates, except for everyday business purposes as described on page one of this notice. |
| Nonaffiliates | Companies not related by common ownership or control. They can be financial and nonfinancial companies. |
| • MFS does not share with nonaffiliates so they can market to you. |
| Joint marketing | A formal agreement between nonaffiliated financial companies that together market financial products or services to you. |
| • MFS doesn't jointly market. |
| Other important information |
| If you own an MFS product or receive an MFS service in the name of a third party such as a bank or broker-dealer, their privacy policy may apply to you instead of ours. |
Save paper with eDelivery.
MFS® will send you prospectuses, reports, and proxies directly via e-mail so you will get information faster with less mailbox clutter.
To sign up:
1. Go to mfs.com.
2. Log in via MFS® Access.
3. Select eDelivery.
If you own your MFS fund shares through a financial institution or a retirement plan, MFS® TALK, MFS® Access, or eDelivery may not be available to you.
CONTACT
WEB SITE
mfs.com
MFS TALK
1-800-637-8255
24 hours a day
ACCOUNT SERVICE AND LITERATURE
Shareholders
1-800-225-2606
Financial advisors
1-800-343-2829
Retirement plan services
1-800-637-1255
MAILING ADDRESS
MFS Service Center, Inc.
P.O. Box 219341
Kansas City, MO 64121-9341
OVERNIGHT MAIL
MFS Service Center, Inc.
Suite 219341
430 W 7th Street
Kansas City, MO 64105-1407
Item 1(b):
Not applicable.
The Registrant has adopted a Code of Ethics (the “Code”) pursuant to Section 406 of the Sarbanes-Oxley Act and as defined in Form N-CSR that applies to the Registrant’s principal executive officer and principal financial and accounting officer. During the period covered by this report, the Registrant has not amended any provision in the Code that relates to an element of the Code’s definition enumerated in paragraph (b) of Item 2 of this Form N-CSR. During the period covered by this report, the Registrant did not grant a waiver, including an implicit waiver, from any provision of the Code.
A copy of the Code is filed as an exhibit to this Form N-CSR.
| ITEM 3. | AUDIT COMMITTEE FINANCIAL EXPERT. |
Messrs. Steven E. Buller, James Kilman and Clarence Otis, Jr. and Ms. Maryanne L. Roepke, members of the Audit Committee, have been determined by the Board of Trustees in their reasonable business judgment to meet the definition of “audit committee financial expert” as such term is defined in Form N-CSR. In addition, Messrs. Buller, Kilman and Otis and Ms. Roepke are “independent” members of the Audit Committee (as such term has been defined by the Securities and Exchange Commission in regulations implementing Section 407 of the Sarbanes-Oxley Act of 2002). The Securities and Exchange Commission has stated that the designation of a person as an audit committee financial expert pursuant to this Item 3 on the Form N-CSR does not impose on such a person any duties, obligations or liability that are greater than the duties, obligations or liability imposed on such person as a member of the Audit Committee and the Board of Trustees in the absence of such designation or identification.
| ITEM 4. | PRINCIPAL ACCOUNTANT FEES AND SERVICES. |
Items 4(a) through 4(d) and 4(g):
The Board of Trustees has appointed Deloitte & Touche LLP (“Deloitte”) to serve as independent accountants to certain series of the Registrant and Ernst & Young LLP (“E&Y”) to serve in the same capacity to certain other series of the Registrant (each a “Fund” and collectively the “Funds”). The tables below set forth the audit fees billed to each Fund as well as fees for non-audit services provided to each Fund and/or to each Fund’s investment adviser, Massachusetts Financial Services Company (“MFS”), and to various entities either controlling, controlled by, or under common control with MFS that provide ongoing services to the Funds (“MFS Related Entities”).
For the fiscal years ended January 31, 2022 and 2021, audit fees billed to each Fund by Deloitte and E&Y were as follows:
| | | | | | | | |
| | | Audit Fees | |
| | 2022 | | | 2021 | |
Fees billed by Deloitte: | | | | | | | | |
MFS Global High Yield Fund | | | 84,346 | | | | 80,066 | |
MFS High Income Fund | | | 79,008 | | | | 75,001 | |
MFS High Yield Pooled Portfolio | | | 36,281 | | | | 34,463 | |
| | | | | | | | |
Total | | | 199,635 | | | | 189,530 | |
| | | | | | | | |
| | | Audit Fees | |
| | 2022 | | | 2021 | |
Fees billed by E&Y: | | | | | | | | |
MFS Municipal High Income Fund | | | 59,849 | | | | 56,824 | |
For the fiscal years ended January 31, 2022 and 2021, fees billed by Deloitte and E&Y for audit-related, tax and other services provided to each Fund and for audit-related, tax and other services provided to MFS and MFS Related Entities were as follows:
| | | | | | | | | | | | | | | | | | | | | | | | |
| | | Audit-Related Fees1 | | | Tax Fees2 | | | All Other Fees3 | |
| | 2022 | | | 2021 | | | 2022 | | | 2021 | | | 2022 | | | 2021 | |
Fees billed by Deloitte: | | | | | | | | | | | | | | | | | | | | | | | | |
To MFS Global High Yield Fund | | | 0 | | | | 0 | | | | 7,868 | | | | 7,485 | | | | 0 | | | | 0 | |
To MFS High Income Fund | | | 0 | | | | 0 | | | | 10,062 | | | | 9,817 | | | | 0 | | | | 0 | |
To MFS High Yield Pooled Portfolio | | | 0 | | | | 0 | | | | 9,785 | | | | 9,304 | | | | 0 | | | | 0 | |
Total fees billed by Deloitte To above Funds | | | 0 | | | | 0 | | | | 27,715 | | | | 26,606 | | | | 0 | | | | 0 | |
| | | |
| | | Audit-Related Fees1 | | | Tax Fees2 | | | All Other Fees3 | |
| | 2022 | | | 2021 | | | 2022 | | | 2021 | | | 2022 | | | 2021 | |
Fees billed by Deloitte: | | | | | | | | | | | | | | | | | | | | | | | | |
To MFS and MFS Related Entities of MFS Global High Yield Fund* | | | 0 | | | | 0 | | | | 0 | | | | 0 | | | | 5,390 | | | | 5,390 | |
To MFS and MFS Related Entities of MFS High Income Fund * | | | 0 | | | | 0 | | | | 0 | | | | 0 | | | | 5,390 | | | | 5,390 | |
To MFS and MFS Related Entities of MFS High Yield Pooled Portfolio* | | | 0 | | | | 0 | | | | 0 | | | | 0 | | | | 5,390 | | | | 5,390 | |
| | | | | | | | |
| | | Aggregate Fees for Non-audit
Services | |
| | 2022 | | | 2021 | |
Fees billed by Deloitte: | | | | | | | | |
To MFS Global High Yield Fund, MFS and MFS Related Entities# | | | 13,258 | | | | 556,625 | |
To MFS High Income Fund, MFS and MFS Related Entities# | | | 15,452 | | | | 558,957 | |
To MFS High Yield Pooled Portfolio, MFS and MFS Related Entities# | | | 15,175 | | | | 558,444 | |
| | | | | | | | | | | | | | | | | | | | | | | | |
| | | Audit-Related Fees1 | | | Tax Fees2 | | | All Other Fees4 | |
| | 2022 | | | 2021 | | | 2022 | | | 2021 | | | 2022 | | | 2021 | |
Fees billed by E&Y: | | | | | | | | | | | | | | | | | | | | | | | | |
To MFS Municipal High Income Fund | | | 0 | | | | 0 | | | | 10,669 | | | | 10,122 | | | | 2,224 | | | | 2,389 | |
| | | | | | | | | | | | | | | | | | | | | | | | |
| | | Audit-Related Fees1 | | | Tax Fees2 | | | All Other Fees4 | |
| | 2022 | | | 2021 | | | 2022 | | | 2021 | | | 2022 | | | 2021 | |
Fees billed by E&Y: | | | | | | | | | | | | | | | | | | | | | | | | |
To MFS and MFS Related Entities of MFS Municipal High Income Fund* | | | 1,795,090 | | | | 1,783,260 | | | | 0 | | | | 0 | | | | 111,720 | | | | 107,150 | |
| | | | | | | | |
| | | Aggregate Fees for Non-audit
Services | |
| | 2022 | | | 2021 | |
Fees billed by E&Y: | | | | | | | | |
To MFS Municipal High Income Fund, MFS and MFS Related Entities# | | | 2,174,333 | | | | 2,145,151 | |
| * | This amount reflects the fees billed to MFS and MFS Related Entities for non-audit services relating directly to the operations and financial reporting of the Funds (portions of which services also related to the operations and financial reporting of other funds within the MFS Funds complex). |
| # | This amount reflects the aggregate fees billed by Deloitte or E&Y, as the case may be, for non-audit services rendered to the Funds and for non-audit services rendered to MFS and the MFS Related Entities. |
| 1 | The fees included under “Audit-Related Fees” are fees related to assurance and related services that are reasonably related to the performance of the audit or review of financial statements, but not reported under ‘‘Audit Fees,’’ including accounting consultations, agreed-upon procedure reports, attestation reports, comfort letters and internal control reviews. |
| 2 | The fees included under “Tax Fees” are fees associated with tax compliance, tax advice and tax planning, including services relating to the filing or amendment of federal, state or local income tax returns, regulated investment company qualification reviews and tax distribution and analysis. |
| 3 | The fees included under “All Other Fees” are fees for products and services provided by Deloitte other than those reported under “Audit Fees,” “Audit-Related Fees” and “Tax Fees”. |
| 4 | The fees included under “All Other Fees” are fees for products and services provided by E&Y other than those reported under “Audit Fees,” “Audit-Related Fees” and “Tax Fees,” including fees for services related to the review of internal controls and Rule 38a-1 compliance program. |
Item 4(e)(1):
Set forth below are the policies and procedures established by the Audit Committee of the Board of Trustees relating to the pre-approval of audit and non-audit related services:
To the extent required by applicable law, pre-approval by the Audit Committee of the Board is needed for all audit and permissible non-audit services rendered to the Funds and all permissible non-audit services rendered to MFS or MFS Related Entities if the services relate directly to the operations and financial reporting of the Registrant. Pre-approval is currently on an engagement-by-engagement basis. In the event pre-approval of such services is necessary between regular meetings of the Audit Committee and it is not practical to wait to seek pre-approval at the next regular meeting of the Audit Committee, pre-approval of such services may be referred to the Chair of the Audit Committee for approval; provided that the Chair may not pre-approve any individual engagement for such services exceeding $50,000 or multiple engagements for such services in the aggregate exceeding $100,000 in each period between regular meetings of the Audit Committee. Any engagement pre-approved by the Chair between regular meetings of the Audit Committee shall be presented for ratification by the entire Audit Committee at its next regularly scheduled meeting.
Item 4(e)(2):
None, or 0%, of the services relating to the Audit-Related Fees, Tax Fees and All Other Fees paid by the Fund and MFS and MFS Related Entities relating directly to the operations and financial reporting of the Registrant disclosed above were approved by the audit committee pursuant to paragraphs (c)(7)(i)(C) of Rule 2-01 of Regulation S-X (which permits audit committee approval after the start of the engagement with respect to services other than audit, review or attest services, if certain conditions are satisfied).
Item 4(f):
Not applicable.
Item 4(h):
The Registrant’s Audit Committee has considered whether the provision by a Registrant’s independent registered public accounting firm of non-audit services to MFS and MFS Related Entities that were not pre-approved by the Committee (because such services did not relate directly to the operations and financial reporting of the Registrant) was compatible with maintaining the independence of the independent registered public accounting firm as the Registrant’s principal auditors.
| ITEM 5. | AUDIT COMMITTEE OF LISTED REGISTRANTS. |
Not applicable to the Registrant.
A schedule of investments of each series of the Registrant is included as part of the report to shareholders of such series under Item 1(a) of this Form N-CSR.
| ITEM 7. | DISCLOSURE OF PROXY VOTING POLICIES AND PROCEDURES FOR CLOSED-END MANAGEMENT INVESTMENT COMPANIES. |
Not applicable to the Registrant.
| ITEM 8. | PORTFOLIO MANAGERS OF CLOSED-END MANAGEMENT INVESTMENT COMPANIES. |
Not applicable to the Registrant.
| ITEM 9. | PURCHASES OF EQUITY SECURITIES BY CLOSED-END MANAGEMENT INVESTMENT COMPANY AND AFFILIATED PURCHASERS. |
Not applicable to the Registrant.
| ITEM 10. | SUBMISSION OF MATTERS TO A VOTE OF SECURITY HOLDERS. |
There were no material changes to the procedures by which shareholders may send recommendations to the Board for nominees to the Registrant’s Board since the Registrant last provided disclosure as to such procedures in response to the requirements of Item 407 (c)(2)(iv) of Regulation S-K or this Item.
| ITEM 11. | CONTROLS AND PROCEDURES. |
| (a) | Based upon their evaluation of the effectiveness of the registrant’s disclosure controls and procedures (as defined in Rule 30a-3(c) under the Investment Company Act of 1940 (the “Act”)) as conducted within 90 days of the filing date of this report on Form N-CSR, the registrant’s principal financial officer and principal executive officer have concluded that those disclosure controls and procedures provide reasonable assurance that the material information required to be disclosed by the registrant on this report is recorded, processed, summarized and reported within the time periods specified in the Securities and Exchange Commission’s rules and forms. |
| (b) | There were no changes in the registrant’s internal controls over financial reporting (as defined in Rule 30a-3(d) under the Act) that occurred during the period covered by the report that have materially affected, or are reasonably likely to materially affect, the registrant’s internal control over financial reporting. |
| ITEM 12. | DISCLOSURE OF SECURITIES LENDING ACTIVITIES FOR CLOSED-END MANAGEMENT INVESTMENT COMPANIES. |
Not applicable to the Registrant.
| (a) (1) | Any code of ethics, or amendment thereto, that is the subject of the disclosure required by Item 2, to the extent that the registrant intends to satisfy the Item 2 requirements through filing of an exhibit: Attached hereto as EX-99.COE. |
| | (2) | A separate certification for each principal executive officer and principal financial officer of the registrant as required by Rule 30a-2(a) under the Act (17 CFR 270.30a-2): Attached hereto as EX-99.302CERT. |
| | (3) | Any written solicitation to purchase securities under Rule 23c-1 under the Act (17 CFR 270.23c-1) sent or given during the period covered by the report by or on behalf of the registrant to 10 or more persons. Not applicable. |
| | (4) | Change in the registrant’s independent public accountant. Not applicable. |
| (b) | If the report is filed under Section 13(a) or 15(d) of the Exchange Act, provide the certifications required by Rule 30a-2(b) under the Act (17 CFR 270.30a-2(b)), Rule 13a-14(b) or Rule 15d-14(b) under the Exchange Act (17 CFR 240.13a-14(b) or 240.15d-14(b)) and Section 1350 of Chapter 63 of Title 18 of the United States Code (18 U.S.C. 1350) as an exhibit. A certification furnished pursuant to this paragraph will not be deemed “filed” for the purposes of Section 18 of the Exchange Act (15 U.S.C. 78r), or otherwise subject to the liability of that section. Such certification will not be deemed to be incorporated by reference into any filing under the Securities Act of 1933 or the Exchange Act, except to the extent that the registrant specifically incorporates it by reference. Attached hereto as EX-99.906CERT. |
Notice
A copy of the Amended and Restated Declaration of Trust, as amended, of the Registrant is on file with the Secretary of State of The Commonwealth of Massachusetts and notice is hereby given that this instrument is executed on behalf of the Registrant by an officer of the Registrant as an officer and not individually and the obligations of or arising out of this instrument are not binding upon any of the Trustees or shareholders individually, but are binding only upon the assets and property of the respective constituent series of the Registrant.
SIGNATURES
Pursuant to the requirements of the Securities Exchange Act of 1934 and the Investment Company Act of 1940, the registrant has duly caused this report to be signed on its behalf by the undersigned, thereunto duly authorized.
(Registrant) MFS SERIES TRUST III
| | |
| By (Signature and Title)* | | /S/ DAVID L. DILORENZO |
| | David L. DiLorenzo, President |
Date: March 18, 2022
Pursuant to the requirements of the Securities Exchange Act of 1934 and the Investment Company Act of 1940, this report has been signed below by the following persons on behalf of the registrant and in the capacities and on the dates indicated.
| | |
| By (Signature and Title)* | | /S/ DAVID L. DILORENZO |
| | David L. DiLorenzo, President (Principal Executive Officer) |
Date: March 18, 2022
| | |
| By (Signature and Title)* | | /S/ JAMES O. YOST |
| | James O. Yost, Treasurer (Principal Financial Officer and Accounting Officer) |
Date: March 18, 2022
| * | Print name and title of each signing officer under his or her signature. |