UNITED STATES
SECURITIES AND EXCHANGE COMMISSION Washington, D.C. 20549
FORM N-CSR
CERTIFIED SHAREHOLDER REPORT OF REGISTERED MANAGEMENT INVESTMENT COMPANIES
Investment Company Act file number 811-02794
MFS SERIES TRUST III
(Exact name of registrant as specified in charter)
111 Huntington Avenue, Boston, Massachusetts 02199 (Address of principal executive offices) (Zip code)
Christopher R. Bohane
Massachusetts Financial Services Company
111Huntington Avenue Boston, Massachusetts 02199
(Name and address of agents for service)
Registrant's telephone number, including area code: (617) 954-5000
Date of fiscal year end: January 31
Date of reporting period: January 31, 2024
ITEM 1. REPORTS TO STOCKHOLDERS.
Item 1(a):
Annual Report
January 31, 2024
| 1 |
| 3 |
| 5 |
| 8 |
| 10 |
| 24 |
| 26 |
| 28 |
| 29 |
| 35 |
| 50 |
| 52 |
| 56 |
| 56 |
| 56 |
| 56 |
| 56 |
| 57 |
The report is prepared for the general information of shareholders. It is authorized for distribution to prospective investors only when preceded or accompanied by a current prospectus.
NOT FDIC INSURED • MAY LOSE VALUE • NO BANK GUARANTEE
Portfolio structure (i)
Top five industries (i)
| Cable TV | 7.9% |
| Medical & Health Technology & Services | 5.7% |
| Midstream | 4.6% |
| Financial Institutions | 4.3% |
| Consumer Services | 4.1% |
Composition including fixed income credit quality (a)(i)
| BBB | 1.2% |
| BB | 39.5% |
| B | 40.2% |
| CCC | 12.9% |
| CC | 0.2% |
| U.S. Government | 0.5% |
| Not Rated | 0.2% |
| Non-Fixed Income | 0.1% |
| Cash & Cash Equivalents | 5.0% |
| Other | 0.2% |
Portfolio facts
| Average Duration (d) | 3.1 |
| Average Effective Maturity (m) | 4.4 yrs. |
| (a) | For all securities other than those specifically described below, ratings are assigned to underlying securities utilizing ratings from Moody’s, Fitch, and Standard & Poor’s rating agencies and applying the following hierarchy: If all three agencies provide a rating, the middle rating (after dropping the highest and lowest ratings) is assigned; if two of the three agencies rate a security, the lower of the two is assigned. If none of the 3 rating agencies above assign a rating, but the security is rated by DBRS Morningstar, then the DBRS Morningstar rating is assigned. If none of the 4 rating agencies listed above rate the security, but the security is rated by the Kroll Bond Rating Agency (KBRA), then the KBRA rating is assigned. Ratings are shown in the S&P and Fitch scale (e.g., AAA). Securities rated BBB or higher are considered investment grade. All ratings are subject to change. Not Rated includes fixed income securities and fixed income derivatives that have not been rated by any rating agency. Non-Fixed Income includes equity securities (including convertible bonds and equity derivatives), ETFs and Options on ETFs, and/or commodity-linked derivatives. The fund may or may not have held all of these instruments on this date. The fund is not rated by these agencies. |
| (d) | Duration is a measure of how much a bond’s price is likely to fluctuate with general changes in interest rates, e.g., if rates rise 1.00%, a bond with a 5-year duration is likely to lose about 5.00% of its value due to the interest rate move. The Average Duration calculation reflects the impact of the equivalent exposure of derivative positions, if any. |
Portfolio Composition - continued
| (i) | For purposes of this presentation, the components include the value of securities, and reflect the impact of the equivalent exposure of derivative positions, if any. These amounts may be negative from time to time. Equivalent exposure is a calculated amount that translates the derivative position into a reasonable approximation of the amount of the underlying asset that the portfolio would have to hold at a given point in time to have the same price sensitivity that results from the portfolio’s ownership of the derivative contract. When dealing with derivatives, equivalent exposure is a more representative measure of the potential impact of a position on portfolio performance than value. The bond component will include any accrued interest amounts. |
| (m) | In determining each instrument’s effective maturity for purposes of calculating the fund’s dollar-weighted average effective maturity, MFS uses the instrument’s stated maturity or, if applicable, an earlier date on which MFS believes it is probable that a maturity-shortening feature (such as a put, pre-refunding or prepayment) will cause the instrument to be repaid. Such an earlier date can be substantially shorter than the instrument’s stated maturity. |
Where the fund holds convertible bonds, they are treated as part of the equity portion of the portfolio.
Cash & Cash Equivalents includes any cash, investments in money market funds, short-term securities, and other assets less liabilities. Please see the Statement of Assets and Liabilities for additional information related to the fund’s cash position and other assets and liabilities.
Other includes equivalent exposure from currency derivatives and/or any offsets to derivative positions and may be negative.
Percentages are based on net assets as of January 31, 2024.
The portfolio is actively managed and current holdings may be different.
Management Review
Summary of Results
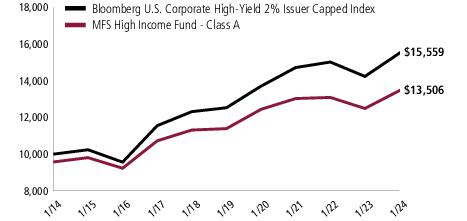
For the twelve months ended January 31, 2024, Class A shares of the MFS High Income Fund (fund) provided a total return of 8.13%, at net asset value. This compares with a return of 9.28% for the fund’s benchmark, the Bloomberg U.S. Corporate High-Yield 2% Issuer Capped Index.
Market Environment
During the reporting period, central banks around the world had to combat the strongest inflationary pressures in four decades, fueled by the global fiscal response to the pandemic, disrupted supply chains and the dislocations to energy markets stemming from the war in Ukraine. Interest rates rose substantially, but the effects of a tighter monetary policy may not have been fully experienced yet, given that monetary policy works with long and variable lags. Strains resulting from the abrupt tightening of monetary policy began to affect some parts of the economy, most acutely among small and regional US banks, which suffered from deposit flight as depositors sought higher yields on their savings. Additionally, activity in the US housing sector has slowed as a result of higher mortgage rates. China’s abandonment of its Zero-COVID policy ushered in a brief uptick in economic activity in the world’s second-largest economy in early 2023, although its momentum soon stalled as the focus turned to the country’s highly indebted property development sector. In developed markets, consumer demand for services remained stronger than the demand for goods.
Despite the challenging macroeconomic and geopolitical environment, central banks focused on controlling price pressures while also confronting increasing financial stability concerns. Central banks had to juggle achieving their inflation mandates while using tools aimed at safeguarding the stability of the financial system to keep banking systems liquid as banks grappled with exposures to commercial real estate. As inflationary pressures eased toward the end of the period, financial conditions loosened in anticipation of easier monetary policy, boosting the market’s appetite for risk as near-term recession risks diminished. Rapid advancements in artificial intelligence were a focus for investors.
Normalizing supply chains, low levels of unemployment across developed markets and signs that inflation levels have peaked were supportive factors for the macroeconomic backdrop.
Detractors from Performance
Relative to the Bloomberg U.S. Corporate High-Yield 2% Issuer Capped Index, the fund’s underweight allocation to “CC” rated(r) bonds and overweight allocation to “BBB” rated bonds detracted from performance. Security selection within the “B” and “CCC” rated credit quality segments also hindered relative returns.
From a sector perspective, bond selection within both the technology and finance sectors also weakened relative performance.
The fund's yield curve(y) positioning further detracted from relative performance.
Management Review - continued
Top individual detractors for the reporting period included the fund’s overweight positions in graphite electrode manufacturer GrafTech Finance (basic industry) and media and entertainment services provider iHeartMedia(h) (communications).
The fund’s cash and/or cash equivalents position during the period was also a detractor from relative performance.
Contributors to Performance
From a quality perspective, favorable bond selection within the “BB” rated credit quality segment contributed to the fund’s relative performance.
From a sector perspective, the fund’s overweight allocation to the brokerage sector and underweight allocation to the transportation sector boosted relative returns. Bond selection within the insurance sector also supported relative results.
Top individual contributors for the reporting period included the fund’s overweight positions in American Irish-domiciled mass customization business operator Cimpress (communications) and British telecommunications company Virgin Media Finance (communications).
Respectfully,
Portfolio Manager(s)
David Cole and Michael Skatrud
| (h) | Security was not held in the portfolio at period end. |
| (r) | Securities rated “BBB”, “Baa”, or higher are considered investment grade; securities rated “BB”, “Ba”, or below are considered non-investment grade. Ratings are assigned to underlying securities utilizing ratings from Moody's, Fitch, and Standard & Poor's and applying the following hierarchy: If all three agencies provide a rating, the middle rating (after dropping the highest and lowest ratings) is assigned; if two of the three agencies rate a security, the lower of the two is assigned. If none of the 3 rating agencies above assign a rating, but the security is rated by DBRS Morningstar, then the DBRS Morningstar rating is assigned. If none of the 4 rating agencies listed above rate the security, but the security is rated by the Kroll Bond Rating Agency (KBRA), then the KBRA rating is assigned. Ratings are shown in the S&P and Fitch scale (e.g., AAA). For securities that are not rated by any of the rating agencies, the security is considered Not Rated. |
| (y) | A yield curve graphically depicts the yields of different maturity bonds of the same credit quality and type; a normal yield curve is upward sloping, with short-term rates lower than long-term rates. |
The views expressed in this report are those of the portfolio manager(s) only through the end of the period of the report as stated on the cover and do not necessarily reflect the views of MFS or any other person in the MFS organization. These views are subject to change at any time based on market or other conditions, and MFS disclaims any responsibility to update such views. These views may not be relied upon as investment advice or an indication of trading intent on behalf of any MFS portfolio. References to specific securities are not recommendations of such securities, and may not be representative of any MFS portfolio’s current or future investments.
Performance Summary THROUGH 1/31/24
The following chart illustrates a representative class of the fund’s historical performance in comparison to its benchmark(s). Performance results include the deduction of the maximum applicable sales charge and reflect the percentage change in net asset value, including reinvestment of dividends and capital gains distributions. The performance of other share classes will be greater than or less than that of the class depicted below. Benchmarks are unmanaged and may not be invested in directly. Benchmark returns do not reflect sales charges, commissions or expenses. (See Notes to Performance Summary.)
Performance data shown represents past performance and is no guarantee of future results. Investment return and principal value fluctuate so your shares, when sold, may be worth more or less than the original cost; current performance may be lower or higher than quoted. The performance shown does not reflect the deduction of taxes, if any, that a shareholder would pay on fund distributions or the redemption of fund shares.
Growth of a Hypothetical $10,000 Investment
Performance Summary - continued
Total Returns through 1/31/24
Average annual without sales charge
| Share Class | Class Inception Date | 1-yr | 5-yr | 10-yr |
| A | 2/17/1978 | 8.13% | 3.46% | 3.50% |
| B | 9/27/1993 | 7.34% | 2.69% | 2.73% |
| C | 1/03/1994 | 7.32% | 2.70% | 2.73% |
| I | 1/02/1997 | 8.41% | 3.72% | 3.75% |
| R1 | 4/01/2005 | 7.33% | 2.69% | 2.73% |
| R2 | 10/31/2003 | 7.88% | 3.07% | 3.17% |
| R3 | 4/01/2005 | 8.14% | 3.39% | 3.46% |
| R4 | 4/01/2005 | 8.39% | 3.72% | 3.76% |
| R6 | 6/01/2012 | 8.52% | 3.84% | 3.86% |
Comparative benchmark(s)
| Bloomberg U.S. Corporate High-Yield 2% Issuer Capped Index (f) | 9.28% | 4.43% | 4.52% |
Average annual with sales charge
| | | | |
A
With Initial Sales Charge (4.25%) | 3.54% | 2.57% | 3.05% |
B
With CDSC (Declining over six years from 4% to 0%) (v) | 3.34% | 2.36% | 2.73% |
C
With CDSC (1% for 12 months) (v) | 6.32% | 2.70% | 2.73% |
CDSC – Contingent Deferred Sales Charge.
Class I, R1, R2, R3, R4, and R6 shares do not have a sales charge.
| (f) | Source: FactSet Research Systems Inc. |
| (v) | Assuming redemption at the end of the applicable period. |
Benchmark Definition(s)
Bloomberg U.S. Corporate High-Yield 2% Issuer Capped Index(a) – a component of the Bloomberg U.S. Corporate High-Yield Index, which measures performance of non-investment grade, fixed rate debt. The index limits the maximum exposure to any one issuer to 2%.
It is not possible to invest directly in an index.
| (a) | Source: Bloomberg Index Services Limited. BLOOMBERG® is a trademark and service mark of Bloomberg Finance L.P. and its affiliates (collectively “Bloomberg”). Bloomberg or Bloomberg's licensors own all proprietary rights in the Bloomberg Indices. Bloomberg neither approves or endorses this material, or guarantees the accuracy or completeness of any information herein, or makes any warranty, express or implied, as to the results to be obtained therefrom and, to the maximum extent allowed by law, neither shall have any liability or responsibility for injury or damages arising in connection therewith. |
Performance Summary - continued
Notes to Performance Summary
Average annual total return represents the average annual change in value for each share class for the periods presented.
Performance results reflect any applicable expense subsidies and waivers in effect during the periods shown. Without such subsidies and waivers the fund's performance results would be less favorable. Please see the prospectus and financial statements for complete details.
Performance results do not include adjustments made for financial reporting purposes in accordance with U.S. generally accepted accounting principles and may differ from amounts reported in the financial highlights.
From time to time the fund may receive proceeds from litigation settlements, without which performance would be lower.
Expense Table
Fund expenses borne by the shareholders during the period,
August 1, 2023 through January 31, 2024
As a shareholder of the fund, you incur two types of costs: (1) transaction costs, including sales charges (loads) on certain purchase or redemption payments, and (2) ongoing costs, including management fees; distribution and service (12b-1) fees; and other fund expenses. This example is intended to help you understand your ongoing costs (in dollars) of investing in the fund and to compare these costs with the ongoing costs of investing in other mutual funds.
The example is based on an investment of $1,000 invested at the beginning of the period and held for the entire period August 1, 2023 through January 31, 2024.
Actual Expenses
The first line for each share class in the following table provides information about actual account values and actual expenses. You may use the information in this line, together with the amount you invested, to estimate the expenses that you paid over the period. Simply divide your account value by $1,000 (for example, an $8,600 account value divided by $1,000 = 8.6), then multiply the result by the number in the first line under the heading entitled “Expenses Paid During Period” to estimate the expenses you paid on your account during this period.
Hypothetical Example for Comparison Purposes
The second line for each share class in the following table provides information about hypothetical account values and hypothetical expenses based on the fund’s actual expense ratio and an assumed rate of return of 5% per year before expenses, which is not the fund’s actual return. The hypothetical account values and expenses may not be used to estimate the actual ending account balance or expenses you paid for the period. You may use this information to compare the ongoing costs of investing in the fund and other funds. To do so, compare this 5% hypothetical example with the 5% hypothetical examples that appear in the shareholder reports of the other funds.
Please note that the expenses shown in the table are meant to highlight your ongoing costs only and do not reflect any transactional costs, such as sales charges (loads). Therefore, the second line for each share class in the table is useful in comparing ongoing costs only, and will not help you determine the relative total costs of owning different funds. In addition, if these transactional costs were included, your costs would have been higher.
Expense Table - continued
Share
Class | | Annualized
Expense
Ratio | Beginning
Account Value
8/01/23 | Ending
Account Value
1/31/24 | Expenses
Paid During
Period (p)
8/01/23-1/31/24 |
| A | Actual | 0.87% | $1,000.00 | $1,057.93 | $4.51 |
| Hypothetical (h) | 0.87% | $1,000.00 | $1,020.82 | $4.43 |
| B | Actual | 1.62% | $1,000.00 | $1,050.52 | $8.37 |
| Hypothetical (h) | 1.62% | $1,000.00 | $1,017.04 | $8.24 |
| C | Actual | 1.62% | $1,000.00 | $1,053.92 | $8.39 |
| Hypothetical (h) | 1.62% | $1,000.00 | $1,017.04 | $8.24 |
| I | Actual | 0.62% | $1,000.00 | $1,059.35 | $3.22 |
| Hypothetical (h) | 0.62% | $1,000.00 | $1,022.08 | $3.16 |
| R1 | Actual | 1.62% | $1,000.00 | $1,050.51 | $8.37 |
| Hypothetical (h) | 1.62% | $1,000.00 | $1,017.04 | $8.24 |
| R2 | Actual | 1.12% | $1,000.00 | $1,053.27 | $5.80 |
| Hypothetical (h) | 1.12% | $1,000.00 | $1,019.56 | $5.70 |
| R3 | Actual | 0.87% | $1,000.00 | $1,054.49 | $4.51 |
| Hypothetical (h) | 0.87% | $1,000.00 | $1,020.82 | $4.43 |
| R4 | Actual | 0.62% | $1,000.00 | $1,055.69 | $3.21 |
| Hypothetical (h) | 0.62% | $1,000.00 | $1,022.08 | $3.16 |
| R6 | Actual | 0.51% | $1,000.00 | $1,059.83 | $2.65 |
| Hypothetical (h) | 0.51% | $1,000.00 | $1,022.63 | $2.60 |
| (h) | 5% class return per year before expenses. |
| (p) | “Expenses Paid During Period” are equal to each class’s annualized expense ratio, as shown above, multiplied by the average account value over the period, multiplied by 184/365 (to reflect the one-half year period). Expenses paid do not include any applicable sales charges (loads). If these transaction costs had been included, your costs would have been higher. |
Portfolio of Investments
1/31/24
The Portfolio of Investments is a complete list of all securities owned by your fund. It is categorized by broad-based asset classes.
| Issuer | | | Shares/Par | Value ($) |
| Bonds – 93.3% |
| Aerospace & Defense – 3.5% |
| Bombardier, Inc., 7.125%, 6/15/2026 (n) | | $ | 2,800,000 | $2,823,332 |
| Bombardier, Inc., 7.5%, 2/01/2029 (n) | | | 2,639,000 | 2,689,822 |
| Bombardier, Inc., 8.75%, 11/15/2030 (n) | | | 1,861,000 | 1,953,041 |
| F-Brasile S.p.A./F-Brasile U.S. LLC, 7.375%, 8/15/2026 (n) | | | 5,985,000 | 5,917,669 |
| Moog, Inc., 4.25%, 12/15/2027 (n) | | | 6,263,000 | 5,864,172 |
| Spirit AeroSystems, Inc., 9.75%, 11/15/2030 (n) | | | 8,610,000 | 9,036,715 |
| TransDigm, Inc., 6.25%, 3/15/2026 (n) | | | 5,592,000 | 5,553,968 |
| TransDigm, Inc., 5.5%, 11/15/2027 | | | 6,679,000 | 6,498,057 |
| TransDigm, Inc., 6.75%, 8/15/2028 (n) | | | 5,455,000 | 5,544,260 |
| TransDigm, Inc., 4.625%, 1/15/2029 | | | 5,570,000 | 5,208,340 |
| TransDigm, Inc., 6.875%, 12/15/2030 (n) | | | 10,590,000 | 10,837,912 |
| | | | | $61,927,288 |
| Airlines – 0.8% |
| Air Canada, 3.875%, 8/15/2026 (n) | | $ | 8,791,000 | $8,360,933 |
| American Airlines, Inc./AAdvantage Loyalty IP Ltd., 5.75%, 4/20/2029 (n) | | | 5,921,219 | 5,814,814 |
| | | | | $14,175,747 |
| Apparel Manufacturers – 0.2% |
| Wolverine World Wide, Inc., 4%, 8/15/2029 (n) | | $ | 4,307,000 | $3,470,581 |
| Asset-Backed & Securitized – 0.0% |
| COBALT CMBS Commercial Mortgage Trust, 2006-2A, “F”, CDO, FLR, 5.627% ((SOFR - 3mo. + 0.26161%) + 1.3% Cash or PIK) to 4/26/2050 (a)(n)(p) | | $ | 858,042 | $86 |
| COBALT CMBS Commercial Mortgage Trust, 2006-2A, “G”, CDO, FLR, 5.827% ((SOFR - 3mo. + 0.26161%) + 1.5% Cash or PIK) to 4/26/2050 (a)(n)(p) | | | 2,734,631 | 273 |
| | | | | $359 |
| Automotive – 1.7% |
| Clarios Global LP/Clarios U.S. Finance Co., 8.5%, 5/15/2027 (n) | | $ | 5,579,000 | $5,563,708 |
| Clarios Global LP/Clarios U.S. Finance Co., 6.75%, 5/15/2028 (n) | | | 2,546,000 | 2,579,785 |
| Dana, Inc., 5.375%, 11/15/2027 | | | 4,884,000 | 4,766,296 |
| Dana, Inc., 4.25%, 9/01/2030 | | | 3,189,000 | 2,788,366 |
| Dornoch Debt Merger Sub, Inc., 6.625%, 10/15/2029 (n) | | | 5,301,000 | 4,811,816 |
| Real Hero Merger Sub 2, Inc., 6.25%, 2/01/2029 (n) | | | 4,358,000 | 3,780,826 |
| Wabash National Corp., 4.5%, 10/15/2028 (n) | | | 5,922,000 | 5,389,020 |
| | | | | $29,679,817 |
Portfolio of Investments – continued
| Issuer | | | Shares/Par | Value ($) |
| Bonds – continued |
| Broadcasting – 0.8% |
| AMC Networks, Inc., 4.75%, 8/01/2025 | | $ | 1,614,000 | $1,555,132 |
| Banijay Group S.A.S., 8.125%, 5/01/2029 (n) | | | 5,697,000 | 5,890,683 |
| Midas OpCo Holdings LLC, 5.625%, 8/15/2029 (n) | | | 7,317,000 | 6,695,494 |
| | | | | $14,141,309 |
| Brokerage & Asset Managers – 1.9% |
| AG TTMT Escrow Issuer LLC, 8.625%, 9/30/2027 (n) | | $ | 4,740,000 | $4,920,773 |
| Aretec Escrow Issuer 2, Inc., 10%, 8/15/2030 (n) | | | 5,294,000 | 5,717,637 |
| Aretec Escrow Issuer, Inc., 7.5%, 4/01/2029 (n) | | | 4,781,000 | 4,450,258 |
| LPL Holdings, Inc., 4%, 3/15/2029 (n) | | | 3,699,000 | 3,409,069 |
| LPL Holdings, Inc., 4.375%, 5/15/2031 (n) | | | 5,239,000 | 4,762,199 |
| NFP Corp., 4.875%, 8/15/2028 (n) | | | 5,810,000 | 5,762,939 |
| NFP Corp., 6.875%, 8/15/2028 (n) | | | 4,582,000 | 4,607,682 |
| | | | | $33,630,557 |
| Building – 3.8% |
| ABC Supply Co., Inc., 3.875%, 11/15/2029 (n) | | $ | 3,452,000 | $3,075,891 |
| Foundation Building Materials LLC, 6%, 3/01/2029 (n) | | | 6,382,000 | 5,608,182 |
| GYP Holding III Corp., 4.625%, 5/01/2029 (n) | | | 8,115,000 | 7,517,006 |
| Interface, Inc., 5.5%, 12/01/2028 (n) | | | 6,297,000 | 5,892,984 |
| MIWD Holdco II LLC/MIWD Finance Co., 5.5%, 2/01/2030 (n) | | | 5,263,000 | 4,789,330 |
| New Enterprise Stone & Lime Co., Inc., 5.25%, 7/15/2028 (n) | | | 6,907,000 | 6,636,245 |
| New Enterprise Stone & Lime Co., Inc., 9.75%, 7/15/2028 (n) | | | 2,174,000 | 2,185,621 |
| Patrick Industries, Inc., 7.5%, 10/15/2027 (n) | | | 7,298,000 | 7,334,490 |
| SRM Concrete, 8.875%, 11/15/2031 (n) | | | 7,309,000 | 7,678,552 |
| Standard Industries, Inc., 4.75%, 1/15/2028 (n) | | | 3,317,000 | 3,172,455 |
| Standard Industries, Inc., 4.375%, 7/15/2030 (n) | | | 8,162,000 | 7,417,237 |
| White Cap Buyer LLC, 6.875%, 10/15/2028 (n) | | | 6,517,000 | 6,378,970 |
| | | | | $67,686,963 |
| Business Services – 1.2% |
| Entegris Escrow Corp., 5.95%, 6/15/2030 (n) | | $ | 2,890,000 | $2,854,674 |
| Iron Mountain, Inc., 4.875%, 9/15/2027 (n) | | | 4,410,000 | 4,261,425 |
| Iron Mountain, Inc., 5.25%, 3/15/2028 (n) | | | 4,853,000 | 4,706,471 |
| Verscend Escrow Corp., 9.75%, 8/15/2026 (n) | | | 8,785,000 | 8,820,008 |
| | | | | $20,642,578 |
| Cable TV – 7.7% |
| Cable One, Inc., 4%, 11/15/2030 (n) | | $ | 9,956,000 | $8,014,580 |
| CCO Holdings LLC/CCO Holdings Capital Corp., 5.125%, 5/01/2027 (n) | | | 3,761,000 | 3,627,545 |
| CCO Holdings LLC/CCO Holdings Capital Corp., 4.75%, 3/01/2030 (n) | | | 20,365,000 | 18,096,488 |
Portfolio of Investments – continued
| Issuer | | | Shares/Par | Value ($) |
| Bonds – continued |
| Cable TV – continued |
| CCO Holdings LLC/CCO Holdings Capital Corp., 4.5%, 8/15/2030 (n) | | $ | 10,984,000 | $9,552,347 |
| CCO Holdings LLC/CCO Holdings Capital Corp., 4.25%, 2/01/2031 (n) | | | 5,651,000 | 4,778,182 |
| CCO Holdings LLC/CCO Holdings Capital Corp., 4.25%, 1/15/2034 (n) | | | 4,218,000 | 3,353,742 |
| CSC Holdings LLC, 5.375%, 2/01/2028 (n) | | | 8,240,000 | 7,078,860 |
| CSC Holdings LLC, 7.5%, 4/01/2028 (n) | | | 3,000,000 | 1,997,033 |
| CSC Holdings LLC, 11.75%, 1/31/2029 (n) | | | 3,339,000 | 3,391,523 |
| CSC Holdings LLC, 5.75%, 1/15/2030 (n) | | | 7,090,000 | 3,752,666 |
| CSC Holdings LLC, 4.125%, 12/01/2030 (n) | | | 2,725,000 | 1,968,813 |
| DIRECTV Financing LLC, 8.875%, 2/01/2030 (n) | | | 1,308,000 | 1,334,233 |
| DISH DBS Corp., 7.75%, 7/01/2026 | | | 3,815,000 | 2,247,893 |
| DISH DBS Corp., 5.25%, 12/01/2026 (n) | | | 4,675,000 | 3,681,586 |
| DISH DBS Corp., 5.125%, 6/01/2029 | | | 3,990,000 | 1,528,365 |
| DISH Network Corp., 11.75%, 11/15/2027 (n) | | | 2,540,000 | 2,651,013 |
| LCPR Senior Secured Financing DAC, 6.75%, 10/15/2027 (n) | | | 7,318,000 | 7,049,149 |
| LCPR Senior Secured Financing DAC, 5.125%, 7/15/2029 (n) | | | 1,905,000 | 1,676,514 |
| Sirius XM Radio, Inc., 4%, 7/15/2028 (n) | | | 3,246,000 | 2,947,719 |
| Sirius XM Radio, Inc., 5.5%, 7/01/2029 (n) | | | 10,470,000 | 9,946,500 |
| Sirius XM Radio, Inc., 3.875%, 9/01/2031 (n) | | | 4,977,000 | 4,149,320 |
| Videotron Ltd., 5.125%, 4/15/2027 (n) | | | 4,027,000 | 3,966,595 |
| Videotron Ltd., 3.625%, 6/15/2029 (n) | | | 3,653,000 | 3,333,180 |
| Virgin Media Finance PLC, 5%, 7/15/2030 (n) | | | 9,220,000 | 8,234,472 |
| Virgin Media Vendor Financing Notes IV DAC, 5%, 7/15/2028 (n) | | | 8,403,000 | 7,910,191 |
| Ziggo Bond Finance B.V., 5.125%, 2/28/2030 (n) | | | 13,965,000 | 11,781,775 |
| | | | | $138,050,284 |
| Chemicals – 2.4% |
| Axalta Coating Systems Ltd., 4.75%, 6/15/2027 (n) | | $ | 5,414,000 | $5,211,570 |
| Axalta Coating Systems Ltd., 3.375%, 2/15/2029 (n) | | | 2,331,000 | 2,071,418 |
| Element Solutions, Inc., 3.875%, 9/01/2028 (n) | | | 5,613,000 | 5,127,757 |
| LSF11 A5 HoldCo LLC, 6.625%, 10/15/2029 (n) | | | 6,382,000 | 5,403,233 |
| SCIH Salt Holdings, Inc., 6.625%, 5/01/2029 (n) | | | 6,408,000 | 5,820,733 |
| SCIL IV LLC/SCIL USA Holdings LLC, 9.5%, 7/15/2028 (n) | | EUR | 3,080,000 | 3,591,512 |
| SNF Group SACA, 3.375%, 3/15/2030 (n) | | $ | 9,169,000 | 7,874,940 |
| Windsor Holdings III, LLC, 8.5%, 6/15/2030 (n) | | | 7,879,000 | 8,111,465 |
| | | | | $43,212,628 |
Portfolio of Investments – continued
| Issuer | | | Shares/Par | Value ($) |
| Bonds – continued |
| Computer Software – 0.6% |
| Central Parent LLC/CDK Global II LLC/CDK Financing Co., Inc., 8%, 6/15/2029 (n) | | $ | 5,344,000 | $5,484,654 |
| Dun & Bradstreet Corp., 5%, 12/15/2029 (n) | | | 5,809,000 | 5,400,274 |
| | | | | $10,884,928 |
| Computer Software - Systems – 1.6% |
| Fair Isaac Corp., 5.25%, 5/15/2026 (n) | | $ | 10,153,000 | $10,026,088 |
| Sabre GLBL, Inc., 8.625%, 6/01/2027 (n) | | | 3,349,000 | 3,131,316 |
| Sabre GLBL, Inc., 11.25%, 12/15/2027 (n) | | | 2,577,000 | 2,580,221 |
| SS&C Technologies Holdings, Inc., 5.5%, 9/30/2027 (n) | | | 10,611,000 | 10,416,163 |
| Virtusa Corp., 7.125%, 12/15/2028 (n) | | | 3,340,000 | 2,928,909 |
| | | | | $29,082,697 |
| Conglomerates – 3.1% |
| BWX Technologies, Inc., 4.125%, 6/30/2028 (n) | | $ | 4,184,000 | $3,928,023 |
| BWX Technologies, Inc., 4.125%, 4/15/2029 (n) | | | 10,769,000 | 9,975,540 |
| Chart Industries, Inc., 9.5%, 1/01/2031 (n) | | | 3,579,000 | 3,817,101 |
| Emerald Debt Merger, 6.625%, 12/15/2030 (n) | | | 7,608,000 | 7,684,613 |
| Gates Global LLC, 6.25%, 1/15/2026 (n) | | | 4,509,000 | 4,509,451 |
| Griffon Corp., 5.75%, 3/01/2028 | | | 6,482,000 | 6,352,360 |
| Madison IAQ LLC, 5.875%, 6/30/2029 (n) | | | 5,538,000 | 4,921,011 |
| Regal Rexnord Corp., 6.3%, 2/15/2030 (n) | | | 4,286,000 | 4,405,535 |
| TriMas Corp., 4.125%, 4/15/2029 (n) | | | 11,496,000 | 10,235,129 |
| | | | | $55,828,763 |
| Construction – 0.7% |
| Mattamy Group Corp., 5.25%, 12/15/2027 (n) | | $ | 2,630,000 | $2,537,616 |
| Mattamy Group Corp., 4.625%, 3/01/2030 (n) | | | 4,490,000 | 4,093,523 |
| Weekley Homes LLC/Weekley Finance Corp., 4.875%, 9/15/2028 (n) | | | 6,179,000 | 5,758,927 |
| | | | | $12,390,066 |
| Consumer Products – 1.5% |
| Energizer Gamma Acquisition B.V., 3.5%, 6/30/2029 | | EUR | 3,000,000 | $2,869,820 |
| Energizer Holdings, Inc., 4.375%, 3/31/2029 (n) | | $ | 6,560,000 | 5,938,178 |
| HFC Prestige Products, Inc./HFC Prestige International US LLC, 6.625%, 7/15/2030 (n) | | | 7,451,000 | 7,589,365 |
| Prestige Consumer Healthcare, Inc., 5.125%, 1/15/2028 (n) | | | 6,333,000 | 6,198,867 |
| Prestige Consumer Healthcare, Inc., 3.75%, 4/01/2031 (n) | | | 4,484,000 | 3,888,421 |
| | | | | $26,484,651 |
Portfolio of Investments – continued
| Issuer | | | Shares/Par | Value ($) |
| Bonds – continued |
| Consumer Services – 4.0% |
| Allied Universal Holdco LLC, 9.75%, 7/15/2027 (n) | | $ | 7,641,000 | $7,471,299 |
| Allied Universal Holdco LLC, 6%, 6/01/2029 (n) | | | 3,155,000 | 2,619,565 |
| Arches Buyer, Inc., 6.125%, 12/01/2028 (n) | | | 5,863,000 | 5,064,518 |
| Cushman & Wakefield PLC, 6.75%, 5/15/2028 (n) | | | 5,435,000 | 5,360,649 |
| GoDaddy, Inc., 3.5%, 3/01/2029 (n) | | | 10,458,000 | 9,468,672 |
| GW B-CR Security Corp., 9.5%, 11/01/2027 (n) | | | 6,499,000 | 6,538,225 |
| Match Group Holdings II LLC, 5%, 12/15/2027 (n) | | | 5,498,000 | 5,319,230 |
| Match Group Holdings II LLC, 4.625%, 6/01/2028 (n) | | | 8,030,000 | 7,558,800 |
| Match Group Holdings II LLC, 4.125%, 8/01/2030 (n) | | | 2,010,000 | 1,808,518 |
| Match Group Holdings II LLC, 3.625%, 10/01/2031 (n) | | | 1,095,000 | 936,225 |
| Realogy Group LLC/Realogy Co-Issuer Corp., 5.75%, 1/15/2029 (n) | | | 4,578,000 | 3,400,401 |
| Realogy Group LLC/Realogy Co-Issuer Corp., 5.25%, 4/15/2030 (n) | | | 4,445,000 | 3,125,183 |
| TriNet Group, Inc., 3.5%, 3/01/2029 (n) | | | 9,278,000 | 8,188,303 |
| WASH Multi-Family Acquisition, Inc., 5.75%, 4/15/2026 (n) | | | 5,068,000 | 4,871,970 |
| | | | | $71,731,558 |
| Containers – 2.8% |
| ARD Finance S.A., 6.5% (6.5% Cash or 7.25% PIK), 6/30/2027 (n)(p) | | $ | 2,167,000 | $1,047,073 |
| Ardagh Metal Packaging Finance USA LLC, 3.25%, 9/01/2028 (n) | | | 6,515,000 | 5,693,896 |
| Ardagh Metal Packaging Finance USA LLC, 4%, 9/01/2029 (n) | | | 7,475,000 | 6,058,274 |
| Ardagh Packaging Finance PLC/Ardagh MP Holdings USA, Inc., 5.25%, 8/15/2027 (n) | | | 7,614,000 | 5,691,326 |
| Can-Pack S.A./Eastern PA Land Investment Holding LLC, 3.875%, 11/15/2029 (n) | | | 11,149,000 | 9,825,725 |
| Crown Americas LLC, 5.25%, 4/01/2030 | | | 3,061,000 | 2,957,691 |
| Crown Americas LLC/Crown Americas Capital Corp. V, 4.25%, 9/30/2026 | | | 7,168,000 | 6,908,662 |
| Crown Americas LLC/Crown Americas Capital Corp. VI, 4.75%, 2/01/2026 | | | 3,345,000 | 3,275,349 |
| Crown European Holdings S.A., 4.75%, 3/15/2029 (n) | | EUR | 3,375,000 | 3,695,690 |
| Trivium Packaging Finance B.V., 8.5%, 8/15/2027 (n) | | $ | 4,618,000 | 4,506,235 |
| | | | | $49,659,921 |
| Electronics – 1.2% |
| Entegris, Inc., 4.375%, 4/15/2028 (n) | | $ | 4,307,000 | $4,061,852 |
| Entegris, Inc., 3.625%, 5/01/2029 (n) | | | 3,723,000 | 3,358,183 |
| Sensata Technologies B.V., 5%, 10/01/2025 (n) | | | 8,322,000 | 8,284,342 |
| Sensata Technologies B.V., 5.875%, 9/01/2030 (n) | | | 3,585,000 | 3,542,960 |
| Sensata Technologies, Inc., 4.375%, 2/15/2030 (n) | | | 1,548,000 | 1,426,396 |
| | | | | $20,673,733 |
Portfolio of Investments – continued
| Issuer | | | Shares/Par | Value ($) |
| Bonds – continued |
| Energy - Independent – 3.6% |
| Callon Petroleum Co., 8%, 8/01/2028 (n) | | $ | 4,709,000 | $4,870,383 |
| Callon Petroleum Co., 7.5%, 6/15/2030 (n) | | | 1,575,000 | 1,659,177 |
| Civitas Resources, Inc., 8.375%, 7/01/2028 (n) | | | 4,997,000 | 5,255,405 |
| Civitas Resources, Inc., 8.625%, 11/01/2030 (n) | | | 1,555,000 | 1,658,500 |
| Civitas Resources, Inc., 8.75%, 7/01/2031 (n) | | | 3,169,000 | 3,368,977 |
| Comstock Resources, Inc., 6.75%, 3/01/2029 (n) | | | 9,001,000 | 8,265,159 |
| CrownRock LP/CrownRock Finance, Inc., “F”, 5%, 5/01/2029 (n) | | | 6,102,000 | 6,026,152 |
| Matador Resources Co., 6.875%, 4/15/2028 (n) | | | 5,936,000 | 6,078,583 |
| Moss Creek Resources Holdings, Inc., 7.5%, 1/15/2026 (n) | | | 4,570,000 | 4,553,006 |
| Permian Resources Operating LLC, 7.75%, 2/15/2026 (n) | | | 985,000 | 1,000,758 |
| Permian Resources Operating LLC, 5.875%, 7/01/2029 (n) | | | 8,270,000 | 8,088,718 |
| Permian Resources Operating LLC, 7%, 1/15/2032 (n) | | | 3,370,000 | 3,479,197 |
| Sitio Royalties Operating Partnership, LP, 7.875%, 11/01/2028 (n) | | | 6,385,000 | 6,547,658 |
| SM Energy Co., 6.5%, 7/15/2028 | | | 4,121,000 | 4,121,000 |
| | | | | $64,972,673 |
| Energy - Integrated – 0.3% |
| Citgo Petroleum Corp., 8.375%, 1/15/2029 (n) | | $ | 5,468,000 | $5,681,070 |
| Entertainment – 3.2% |
| Carnival Corp. PLC, 7.625%, 3/01/2026 (n) | | $ | 4,869,000 | $4,945,828 |
| Carnival Corp. PLC, 5.75%, 3/01/2027 (n) | | | 9,275,000 | 9,137,750 |
| Carnival Corp. PLC, 4%, 8/01/2028 (n) | | | 3,434,000 | 3,176,492 |
| Carnival Corp. PLC, 6%, 5/01/2029 (n) | | | 4,339,000 | 4,202,656 |
| Merlin Entertainments, 7.375%, 2/15/2031 (n) | | | 4,554,000 | 4,560,186 |
| NCL Corp. Ltd., 5.875%, 3/15/2026 (n) | | | 4,912,000 | 4,789,544 |
| NCL Corp. Ltd., 7.75%, 2/15/2029 (n) | | | 3,229,000 | 3,260,304 |
| Royal Caribbean Cruises Ltd., 5.375%, 7/15/2027 (n) | | | 4,580,000 | 4,506,773 |
| Royal Caribbean Cruises Ltd., 5.5%, 4/01/2028 (n) | | | 6,463,000 | 6,380,755 |
| SeaWorld Parks & Entertainment, 5.25%, 8/15/2029 (n) | | | 4,257,000 | 3,964,629 |
| Viking Cruises Ltd. Co., 5.875%, 9/15/2027 (n) | | | 2,142,000 | 2,064,502 |
| Viking Ocean Cruises Ship VII Ltd., 5.625%, 2/15/2029 (n) | | | 3,750,000 | 3,651,563 |
| VOC Escrow Ltd., 5%, 2/15/2028 (n) | | | 3,091,000 | 2,951,595 |
| | | | | $57,592,577 |
| Financial Institutions – 5.2% |
| Avation Capital S.A., 8.25% (8.25% Cash or 9% PIK), 10/31/2026 (n)(p) | | $ | 5,615,454 | $4,808,232 |
| Castlelake Aviation Finance Designated Activity Co., 5%, 4/15/2027 (n) | | | 1,295,000 | 1,229,270 |
| Credit Acceptance Corp., 6.625%, 3/15/2026 | | | 711,000 | 710,853 |
| Credit Acceptance Corp., 9.25%, 12/15/2028 (n) | | | 5,410,000 | 5,680,538 |
| Freedom Mortgage Corp., 7.625%, 5/01/2026 (n) | | | 4,284,000 | 4,266,553 |
Portfolio of Investments – continued
| Issuer | | | Shares/Par | Value ($) |
| Bonds – continued |
| Financial Institutions – continued |
| Freedom Mortgage Holdings LLC, 9.25%, 2/01/2029 (n) | | $ | 1,344,000 | $1,360,934 |
| FTAI Aviation Ltd., 5.5%, 5/01/2028 (n) | | | 3,132,000 | 3,034,850 |
| FTAI Aviation Ltd., 7.875%, 12/01/2030 (n) | | | 3,624,000 | 3,822,548 |
| Global Aircraft Leasing Co. Ltd., 6.5% (6.5% Cash or 7.25% PIK), 9/15/2024 (n)(p) | | | 12,822,310 | 12,327,084 |
| Howard Hughes Corp., 4.125%, 2/01/2029 (n) | | | 7,819,000 | 7,051,546 |
| Jefferson Capital Holdings LLC, 9.5%, 2/15/2029 (n)(w) | | | 4,758,000 | 4,792,134 |
| Macquarie AirFinance Holdings Ltd., 8.375%, 5/01/2028 (n) | | | 6,644,000 | 6,979,190 |
| Macquarie AirFinance Holdings Ltd., 8.125%, 3/30/2029 (n) | | | 1,171,000 | 1,214,994 |
| Nationstar Mortgage Holdings, Inc., 6%, 1/15/2027 (n) | | | 9,253,000 | 9,072,761 |
| OneMain Finance Corp., 6.875%, 3/15/2025 | | | 5,245,000 | 5,264,669 |
| OneMain Finance Corp., 7.125%, 3/15/2026 | | | 7,359,000 | 7,459,329 |
| OneMain Finance Corp., 5.375%, 11/15/2029 | | | 3,690,000 | 3,414,197 |
| PRA Group, Inc., 8.375%, 2/01/2028 (n) | | | 2,152,000 | 2,049,865 |
| Rocket Mortgage Co-Issuer, Inc., 3.625%, 3/01/2029 (n) | | | 4,371,000 | 3,885,195 |
| Rocket Mortgage Co-Issuer, Inc., 3.875%, 3/01/2031 (n) | | | 1,597,000 | 1,395,475 |
| SLM Corp., 3.125%, 11/02/2026 | | | 3,280,000 | 3,071,130 |
| | | | | $92,891,347 |
| Food & Beverages – 3.0% |
| B&G Foods, Inc., 5.25%, 9/15/2027 | | $ | 2,662,000 | $2,401,001 |
| B&G Foods, Inc., 8%, 9/15/2028 (n) | | | 3,117,000 | 3,249,130 |
| Chobani LLC/Chobani Finance Corp., 7.625%, 7/01/2029 (n) | | | 537,000 | 543,692 |
| Fiesta Purchaser, Inc., 7.875%, 3/01/2031 (n)(w) | | | 4,314,000 | 4,364,344 |
| Performance Food Group Co., 5.5%, 10/15/2027 (n) | | | 6,580,000 | 6,417,468 |
| Post Holdings, Inc., 5.625%, 1/15/2028 (n) | | | 5,488,000 | 5,400,754 |
| Post Holdings, Inc., 4.625%, 4/15/2030 (n) | | | 8,465,000 | 7,784,826 |
| Primo Water Holding, Inc., 4.375%, 4/30/2029 (n) | | | 9,420,000 | 8,575,991 |
| TreeHouse Foods, Inc., 4%, 9/01/2028 | | | 5,855,000 | 5,222,660 |
| U.S. Foods Holding Corp., 4.75%, 2/15/2029 (n) | | | 7,476,000 | 7,092,985 |
| United Natural Foods, Inc., 6.75%, 10/15/2028 (n) | | | 3,487,000 | 2,929,080 |
| | | | | $53,981,931 |
| Gaming & Lodging – 3.2% |
| Caesars Entertainment, Inc., 4.625%, 10/15/2029 (n) | | $ | 3,038,000 | $2,777,090 |
| Caesars Entertainment, Inc., 7%, 2/15/2030 (n) | | | 5,461,000 | 5,611,991 |
| Caesars Entertainment, Inc., 6.5%, 2/15/2032 (n) | | | 1,614,000 | 1,631,853 |
| Caesars Resort Collection LLC/CRC Finco, Inc., 8.125%, 7/01/2027 (n) | | | 6,032,000 | 6,190,316 |
| CCM Merger, Inc., 6.375%, 5/01/2026 (n) | | | 5,550,000 | 5,481,072 |
| CDI Escrow Issuer, Inc., 5.75%, 4/01/2030 (n) | | | 7,479,000 | 7,235,407 |
| Penn National Gaming, Inc., 4.125%, 7/01/2029 (n) | | | 6,953,000 | 5,944,709 |
| Wyndham Hotels & Resorts, Inc., 4.375%, 8/15/2028 (n) | | | 6,868,000 | 6,412,332 |
| Wynn Macau Ltd., 5.5%, 10/01/2027 (n) | | | 7,053,000 | 6,631,245 |
Portfolio of Investments – continued
| Issuer | | | Shares/Par | Value ($) |
| Bonds – continued |
| Gaming & Lodging – continued |
| Wynn Macau Ltd., 5.625%, 8/26/2028 (n) | | $ | 2,744,000 | $2,553,844 |
| Wynn Resorts Finance LLC/Wynn Resorts Capital Corp., 5.125%, 10/01/2029 (n) | | | 7,059,000 | 6,668,683 |
| | | | | $57,138,542 |
| Industrial – 1.3% |
| Albion Financing 1 S.à r.l., 6.125%, 10/15/2026 (n) | | $ | 2,500,000 | $2,455,820 |
| Albion Financing 2 S.à r.l., 8.75%, 4/15/2027 (n) | | | 3,835,000 | 3,830,950 |
| APi Escrow Corp., 4.75%, 10/15/2029 (n) | | | 8,917,000 | 8,349,165 |
| Williams Scotsman International, Inc., 4.625%, 8/15/2028 (n) | | | 8,219,000 | 7,779,900 |
| | | | | $22,415,835 |
| Insurance - Property & Casualty – 2.9% |
| Acrisure LLC/Acrisure Finance, Inc., 8.25%, 2/01/2029 (n) | | $ | 3,241,000 | $3,249,307 |
| Acrisure LLC/Acrisure Finance, Inc., 4.25%, 2/15/2029 (n) | | | 1,719,000 | 1,541,414 |
| Acrisure LLC/Acrisure Finance, Inc., 6%, 8/01/2029 (n) | | | 3,207,000 | 2,941,897 |
| Alliant Holdings Intermediate LLC/Alliant Holdings Co-Issuer, 6.75%, 10/15/2027 (n) | | | 4,238,000 | 4,137,644 |
| Alliant Holdings Intermediate LLC/Alliant Holdings Co-Issuer, 5.875%, 11/01/2029 (n) | | | 7,935,000 | 7,514,683 |
| Alliant Holdings Intermediate LLC/Alliant Holdings Co-Issuer, 7%, 1/15/2031 (n) | | | 4,222,000 | 4,266,753 |
| AmWINS Group Benefits, Inc., 4.875%, 6/30/2029 (n) | | | 6,388,000 | 5,962,224 |
| AssuredPartners, Inc., 5.625%, 1/15/2029 (n) | | | 5,395,000 | 5,095,127 |
| GTCR (AP) Finance, Inc., 8%, 5/15/2027 (n) | | | 3,620,000 | 3,626,838 |
| Hub International Ltd., 5.625%, 12/01/2029 (n) | | | 5,322,000 | 5,021,891 |
| Hub International Ltd., 7.25%, 6/15/2030 (n) | | | 4,319,000 | 4,442,813 |
| Hub International Ltd., 7.375%, 1/31/2032 (n) | | | 3,927,000 | 4,021,624 |
| | | | | $51,822,215 |
| Machinery & Tools – 0.9% |
| Husky Injection Molding Systems Ltd., 9%, 2/15/2029 (n)(w) | | $ | 537,000 | $537,000 |
| Ritchie Bros Holdings, Inc., 7.75%, 3/15/2031 (n) | | | 8,681,000 | 9,148,211 |
| Terex Corp., 5%, 5/15/2029 (n) | | | 6,081,000 | 5,746,556 |
| | | | | $15,431,767 |
| Major Banks – 0.5% |
| Toronto-Dominion Bank, 8.125% to 10/31/2027, FLR (CMT - 5yr. + 4.075%) to 10/31/2082 | | $ | 8,275,000 | $8,594,655 |
| Medical & Health Technology & Services – 5.6% |
| 180 Medical, Inc., 3.875%, 10/15/2029 (n) | | $ | 6,625,000 | $5,921,692 |
| Avantor Funding, Inc., 4.625%, 7/15/2028 (n) | | | 9,162,000 | 8,722,600 |
| Bausch & Lomb Escrow Corp., 8.375%, 10/01/2028 (n) | | | 5,625,000 | 5,836,331 |
Portfolio of Investments – continued
| Issuer | | | Shares/Par | Value ($) |
| Bonds – continued |
| Medical & Health Technology & Services – continued |
| Charles River Laboratories International, Inc., 3.75%, 3/15/2029 (n) | | $ | 10,993,000 | $9,997,816 |
| CHS/Community Health Systems, Inc., 8%, 12/15/2027 (n) | | | 3,888,000 | 3,828,825 |
| CHS/Community Health Systems, Inc., 6.125%, 4/01/2030 (n) | | | 7,174,000 | 4,669,362 |
| CHS/Community Health Systems, Inc., 5.25%, 5/15/2030 (n) | | | 7,934,000 | 6,568,743 |
| Encompass Health Corp., 5.75%, 9/15/2025 | | | 2,365,000 | 2,349,938 |
| Encompass Health Corp., 4.75%, 2/01/2030 | | | 6,387,000 | 5,990,149 |
| Encompass Health Corp., 4.625%, 4/01/2031 | | | 1,030,000 | 946,289 |
| IQVIA, Inc., 5%, 5/15/2027 (n) | | | 9,830,000 | 9,607,202 |
| IQVIA, Inc., 6.5%, 5/15/2030 (n) | | | 3,700,000 | 3,774,259 |
| Legacy LifePoint Health LLC, 4.375%, 2/15/2027 (n) | | | 5,340,000 | 4,973,249 |
| Star Parent, Inc., 9%, 10/01/2030 (n) | | | 4,757,000 | 5,002,001 |
| Tenet Healthcare Corp., 6.125%, 10/01/2028 | | | 4,454,000 | 4,437,609 |
| Tenet Healthcare Corp., 4.375%, 1/15/2030 | | | 3,572,000 | 3,305,240 |
| Tenet Healthcare Corp., 6.125%, 6/15/2030 | | | 6,413,000 | 6,410,610 |
| Tenet Healthcare Corp., 6.75%, 5/15/2031 (n) | | | 2,577,000 | 2,635,852 |
| U.S. Acute Care Solutions LLC, 6.375%, 3/01/2026 (n) | | | 5,111,000 | 4,466,043 |
| | | | | $99,443,810 |
| Medical Equipment – 1.2% |
| Embecta Corp., 5%, 2/15/2030 (n) | | $ | 6,305,000 | $5,159,255 |
| Garden SpinCo Corp., 8.625%, 7/20/2030 (n) | | | 5,624,000 | 6,017,680 |
| Medline Borrower LP, 5.25%, 10/01/2029 (n) | | | 7,985,000 | 7,445,287 |
| Teleflex, Inc., 4.625%, 11/15/2027 | | | 3,116,000 | 3,022,925 |
| | | | | $21,645,147 |
| Metals & Mining – 3.2% |
| Baffinland Iron Mines Corp./Baffinland Iron Mines LP, 8.75%, 7/15/2026 (n) | | $ | 5,859,000 | $5,361,024 |
| FMG Resources Ltd., 4.375%, 4/01/2031 (n) | | | 15,311,000 | 13,779,797 |
| GrafTech Finance, Inc., 4.625%, 12/15/2028 (n) | | | 7,423,000 | 4,914,984 |
| GrafTech Finance, Inc., 9.875%, 12/15/2028 (n) | | | 1,727,000 | 1,290,604 |
| Kaiser Aluminum Corp., 4.625%, 3/01/2028 (n) | | | 7,475,000 | 6,888,169 |
| Kaiser Aluminum Corp., 4.5%, 6/01/2031 (n) | | | 3,924,000 | 3,350,268 |
| Novelis Corp., 3.25%, 11/15/2026 (n) | | | 5,176,000 | 4,846,413 |
| Novelis Corp., 4.75%, 1/30/2030 (n) | | | 6,187,000 | 5,738,416 |
| Novelis Corp., 3.875%, 8/15/2031 (n) | | | 2,807,000 | 2,434,614 |
| Petra Diamonds US$ Treasury PLC, 9.75%, 3/08/2026 (n) | | | 3,109,340 | 2,518,565 |
| Taseko Mines Ltd., 7%, 2/15/2026 (n) | | | 5,045,000 | 4,956,712 |
| | | | | $56,079,566 |
Portfolio of Investments – continued
| Issuer | | | Shares/Par | Value ($) |
| Bonds – continued |
| Midstream – 4.6% |
| DT Midstream, Inc., 4.125%, 6/15/2029 (n) | | $ | 5,904,000 | $5,424,287 |
| DT Midstream, Inc., 4.375%, 6/15/2031 (n) | | | 8,290,000 | 7,425,947 |
| EQM Midstream Partners LP, 5.5%, 7/15/2028 | | | 11,896,000 | 11,787,675 |
| Kinetik Holdings, Inc., 5.875%, 6/15/2030 (n) | | | 7,337,000 | 7,206,806 |
| NuStar Logistics, LP, 6.375%, 10/01/2030 | | | 5,234,000 | 5,260,170 |
| Tallgrass Energy Partners LP, 5.5%, 1/15/2028 (n) | | | 9,016,000 | 8,679,433 |
| Tallgrass Energy Partners LP, 7.375%, 2/15/2029 (n) | | | 3,176,000 | 3,168,102 |
| Venture Global Calcasieu Pass LLC, 3.875%, 8/15/2029 (n) | | | 7,487,000 | 6,691,605 |
| Venture Global Calcasieu Pass LLC, 6.25%, 1/15/2030 (n) | | | 2,732,000 | 2,734,169 |
| Venture Global Calcasieu Pass LLC, 4.125%, 8/15/2031 (n) | | | 5,430,000 | 4,801,863 |
| Venture Global LNG, Inc., 8.125%, 6/01/2028 (n) | | | 5,484,000 | 5,542,616 |
| Venture Global LNG, Inc., 9.5%, 2/01/2029 (n) | | | 6,091,000 | 6,468,880 |
| Venture Global LNG, Inc., 8.375%, 6/01/2031 (n) | | | 6,238,000 | 6,299,359 |
| | | | | $81,490,912 |
| Network & Telecom – 0.5% |
| Iliad Holding S.A.S., 6.5%, 10/15/2026 (n) | | $ | 1,907,000 | $1,869,351 |
| Iliad Holding S.A.S., 7%, 10/15/2028 (n) | | | 7,862,000 | 7,799,364 |
| | | | | $9,668,715 |
| Oil Services – 0.4% |
| Nabors Industries Ltd., 7.25%, 1/15/2026 (n) | | $ | 4,036,000 | $3,935,382 |
| Nabors Industries Ltd., 9.125%, 1/31/2030 (n) | | | 2,567,000 | 2,612,051 |
| | | | | $6,547,433 |
| Oils – 1.1% |
| Parkland Corp., 4.625%, 5/01/2030 (n) | | $ | 11,354,000 | $10,460,668 |
| PBF Holding Co. LLC/PBF Finance Corp., 6%, 2/15/2028 | | | 6,066,000 | 5,928,719 |
| Puma International Financing S.A., 5%, 1/24/2026 | | | 2,433,000 | 2,304,440 |
| | | | | $18,693,827 |
| Personal Computers & Peripherals – 0.6% |
| NCR Corp., 5%, 10/01/2028 (n) | | $ | 6,858,000 | $6,465,505 |
| NCR Corp., 5.125%, 4/15/2029 (n) | | | 4,146,000 | 3,879,109 |
| | | | | $10,344,614 |
| Pharmaceuticals – 1.0% |
| 1375209 BC Ltd., 9%, 1/30/2028 (n) | | $ | 3,603,000 | $3,494,910 |
| Bausch Health Co., Inc., 11%, 9/30/2028 (n) | | | 3,989,000 | 2,713,717 |
| Bausch Health Co., Inc., 14%, 10/15/2030 (n) | | | 799,000 | 446,668 |
| Grifols S.A., 3.2%, 5/01/2025 | | EUR | 1,610,000 | 1,656,950 |
| Organon Finance 1 LLC, 4.125%, 4/30/2028 (n) | | $ | 4,302,000 | 3,936,113 |
| Organon Finance 1 LLC, 5.125%, 4/30/2031 (n) | | | 6,184,000 | 5,312,840 |
| | | | | $17,561,198 |
Portfolio of Investments – continued
| Issuer | | | Shares/Par | Value ($) |
| Bonds – continued |
| Pollution Control – 1.1% |
| GFL Environmental, Inc., 4.25%, 6/01/2025 (n) | | $ | 2,160,000 | $2,122,091 |
| GFL Environmental, Inc., 4%, 8/01/2028 (n) | | | 6,063,000 | 5,561,364 |
| GFL Environmental, Inc., 4.75%, 6/15/2029 (n) | | | 1,935,000 | 1,816,476 |
| GFL Environmental, Inc., 4.375%, 8/15/2029 (n) | | | 2,355,000 | 2,159,827 |
| GFL Environmental, Inc., 6.75%, 1/15/2031 (n) | | | 1,190,000 | 1,217,106 |
| Stericycle, Inc., 3.875%, 1/15/2029 (n) | | | 7,781,000 | 7,073,162 |
| | | | | $19,950,026 |
| Precious Metals & Minerals – 0.7% |
| Coeur Mining, Inc., 5.125%, 2/15/2029 (n) | | $ | 3,783,000 | $3,443,477 |
| Eldorado Gold Corp., 6.25%, 9/01/2029 (n) | | | 3,880,000 | 3,700,490 |
| IAMGOLD Corp., 5.75%, 10/15/2028 (n) | | | 6,778,000 | 5,964,640 |
| | | | | $13,108,607 |
| Printing & Publishing – 0.3% |
| Cimpress PLC, 7%, 6/15/2026 | | $ | 5,918,000 | $5,829,230 |
| Real Estate - Other – 0.8% |
| RHP Hotel Properties, LP/RHP Finance Corp., 7.25%, 7/15/2028 (n) | | $ | 9,008,000 | $9,285,491 |
| XHR LP, REIT, 4.875%, 6/01/2029 (n) | | | 5,108,000 | 4,711,159 |
| | | | | $13,996,650 |
| Restaurants – 0.3% |
| Fertitta Entertainment LLC, 6.75%, 1/15/2030 (n) | | $ | 6,482,000 | $5,827,623 |
| Retailers – 1.7% |
| Asbury Automotive Group, Inc., 4.625%, 11/15/2029 (n) | | $ | 5,003,000 | $4,609,195 |
| Lithia Motors, Inc., 3.875%, 6/01/2029 (n) | | | 5,273,000 | 4,732,518 |
| Macy's Retail Holdings LLC, 5.875%, 4/01/2029 (n) | | | 6,227,000 | 6,040,190 |
| NMG Holding Co. Inc./Neiman Marcus Group LLC, 7.125%, 4/01/2026 (n) | | | 4,569,000 | 4,454,842 |
| Penske Automotive Group Co., 3.75%, 6/15/2029 | | | 7,145,000 | 6,367,803 |
| Victoria's Secret & Co., 4.625%, 7/15/2029 (n) | | | 5,550,000 | 4,692,408 |
| | | | | $30,896,956 |
| Specialty Stores – 1.0% |
| Global Auto Holdings Ltd./Aag FH UK Ltd., 8.375%, 1/15/2029 (n) | | $ | 5,375,000 | $5,067,976 |
| Michael Cos., Inc., 5.25%, 5/01/2028 (n) | | | 3,600,000 | 2,827,696 |
| Michael Cos., Inc., 7.875%, 5/01/2029 (n) | | | 3,830,000 | 2,449,643 |
| PetSmart, Inc./PetSmart Finance Corp., 7.75%, 2/15/2029 (n) | | | 7,620,000 | 7,366,119 |
| | | | | $17,711,434 |
Portfolio of Investments – continued
| Issuer | | | Shares/Par | Value ($) |
| Bonds – continued |
| Supermarkets – 0.7% |
| KeHE Distributors LLC/KeHE Finance Corp., 9%, 2/15/2029 (n) | | $ | 4,328,000 | $4,352,345 |
| Ocado Group PLC, 3.875%, 10/08/2026 | | GBP | 3,890,000 | 4,270,437 |
| Picard Bondco S.A., 5.375%, 7/01/2027 | | EUR | 3,770,000 | 3,870,119 |
| | | | | $12,492,901 |
| Telecommunications - Wireless – 1.0% |
| Altice France S.A., 5.5%, 1/15/2028 (n) | | $ | 2,680,000 | $2,092,443 |
| Altice France S.A., 6%, 2/15/2028 (n) | | | 3,359,000 | 1,499,530 |
| Altice France S.A., 5.125%, 7/15/2029 (n) | | | 1,913,000 | 1,398,584 |
| SBA Communications Corp., 3.875%, 2/15/2027 | | | 5,075,000 | 4,843,179 |
| SBA Communications Corp., 3.125%, 2/01/2029 | | | 9,720,000 | 8,662,784 |
| | | | | $18,496,520 |
| U.S. Treasury Obligations – 0.5% |
| U.S. Treasury Notes, 3%, 6/30/2024 | | $ | 8,912,000 | $8,833,324 |
| Utilities - Electric Power – 3.4% |
| Calpine Corp., 4.5%, 2/15/2028 (n) | | $ | 7,722,000 | $7,343,368 |
| Calpine Corp., 5.125%, 3/15/2028 (n) | | | 5,692,000 | 5,431,398 |
| Clearway Energy Operating LLC, 4.75%, 3/15/2028 (n) | | | 4,823,000 | 4,591,991 |
| Clearway Energy Operating LLC, 3.75%, 2/15/2031 (n) | | | 12,478,000 | 10,816,327 |
| Clearway Energy Operating LLC, 3.75%, 1/15/2032 (n) | | | 1,626,000 | 1,381,040 |
| NextEra Energy, Inc., 4.25%, 7/15/2024 (n) | | | 1,521,000 | 1,504,956 |
| NextEra Energy, Inc., 4.25%, 9/15/2024 (n) | | | 728,000 | 711,620 |
| NextEra Energy, Inc., 4.5%, 9/15/2027 (n) | | | 6,004,000 | 5,637,976 |
| NextEra Energy, Inc., 7.25%, 1/15/2029 (n) | | | 6,346,000 | 6,536,406 |
| TerraForm Global Operating LLC, 6.125%, 3/01/2026 (n) | | | 5,065,000 | 4,998,635 |
| TerraForm Power Operating LLC, 5%, 1/31/2028 (n) | | | 8,444,000 | 8,138,496 |
| TerraForm Power Operating LLC, 4.75%, 1/15/2030 (n) | | | 3,754,000 | 3,466,106 |
| | | | | $60,558,319 |
| Total Bonds (Identified Cost, $1,715,293,706) | | $1,663,053,852 |
| Common Stocks – 0.2% |
| Cable TV – 0.1% | |
| Intelsat Emergence S.A. (a) | | 59,284 | $1,556,205 |
| Oil Services – 0.1% | |
| LTRI Holdings LP (a)(u) | | 3,250 | $1,645,052 |
| Total Common Stocks (Identified Cost, $3,122,016) | | $3,201,257 |
Portfolio of Investments – continued
| Issuer | | | Shares/Par | Value ($) |
| Convertible Bonds – 0.1% |
| Utilities - Electric Power – 0.1% | |
| Pacific Gas and Electric Corp., 4.25%, 12/01/2027 (n) (Identified Cost, $2,464,000) | | $ | 2,464,000 | $2,507,120 |
| | Strike
Price | First
Exercise | | |
| Warrants – 0.0% | | | | |
| Other Banks & Diversified Financials – 0.0% |
Avation Capital S.A. (1 share for 1 warrant, Expiration 10/31/26) (a)
(Identified Cost, $0) | GBP 1.14 | 6/24/22 | 62,563 | $11,893 |
| | | | | |
| Investment Companies (h) – 5.7% |
| Money Market Funds – 5.7% | |
| MFS Institutional Money Market Portfolio, 5.4% (v) (Identified Cost, $100,703,210) | | | 100,698,538 | $100,708,608 |
| Underlying/Expiration Date/Exercise Price | Put/Call | Counterparty | Notional
Amount | Par Amount/
Number of
Contracts | |
| Purchased Options – 0.0% | |
| Market Index Securities – 0.0% | |
| Russell 2000 Index – December 2024 @ $1,500 (Premiums Paid, $1,267,143) | Put | Exchange Traded | $ 34,467,948 | 177 | $490,290 |
|
|
| Other Assets, Less Liabilities – 0.7% | | 12,846,223 |
| Net Assets – 100.0% | $1,782,819,243 |
| (a) | Non-income producing security. | | | |
| (h) | An affiliated issuer, which may be considered one in which the fund owns 5% or more of the outstanding voting securities, or a company which is under common control. At period end, the aggregate values of the fund's investments in affiliated issuers and in unaffiliated issuers were $100,708,608 and $1,669,264,412, respectively. | | | |
| (n) | Securities exempt from registration under Rule 144A of the Securities Act of 1933. These securities may be sold in the ordinary course of business in transactions exempt from registration, normally to qualified institutional buyers. At period end, the aggregate value of these securities was $1,482,267,557, representing 83.1% of net assets. | | | |
| (p) | Payment-in-kind (PIK) security for which interest income may be received in additional securities and/or cash. | | | |
| (u) | The security was valued using significant unobservable inputs and is considered level 3 under the fair value hierarchy. For further information about the fund’s level 3 holdings, please see Note 2 in the Notes to Financial Statements. | | | |
| (v) | Affiliated issuer that is available only to investment companies managed by MFS. The rate quoted for the MFS Institutional Money Market Portfolio is the annualized seven-day yield of the fund at period end. | | | |
Portfolio of Investments – continued
| The following abbreviations are used in this report and are defined: |
| CDI | Interbank Deposit Certificates |
| CDO | Collateralized Debt Obligation |
| CMT | Constant Maturity Treasury |
| FLR | Floating Rate. Interest rate resets periodically based on the parenthetically disclosed reference rate plus a spread (if any). The period-end rate reported may not be the current rate. All reference rates are USD unless otherwise noted. |
| REIT | Real Estate Investment Trust |
| SOFR | Secured Overnight Financing Rate |
| Abbreviations indicate amounts shown in currencies other than the U.S. dollar. All amounts are stated in U.S. dollars unless otherwise indicated. A list of abbreviations is shown below: |
| EUR | Euro |
| GBP | British Pound |
Derivative Contracts at 1/31/24
| Forward Foreign Currency Exchange Contracts |
Currency
Purchased | Currency
Sold | Counterparty | Settlement
Date | Unrealized
Appreciation
(Depreciation) |
| Asset Derivatives |
| GBP | 364,436 | USD | 461,658 | State Street Bank Corp. | 4/19/2024 | $450 |
| USD | 18,908,607 | EUR | 17,322,616 | State Street Bank Corp. | 4/19/2024 | 126,557 |
| USD | 4,423,371 | GBP | 3,468,421 | State Street Bank Corp. | 4/19/2024 | 25,375 |
| | | | | | | $152,382 |
| Liability Derivatives |
| EUR | 1,759,116 | USD | 1,921,919 | HSBC Bank | 4/19/2024 | $(14,596) |
| EUR | 1,453,155 | USD | 1,583,139 | JPMorgan Chase Bank N.A. | 4/19/2024 | (7,556) |
| | | | | | | $(22,152) |
See Notes to Financial Statements
Financial Statements
Statement of Assets and Liabilities
At 1/31/24
This statement represents your fund’s balance sheet, which details the assets and liabilities comprising the total value of the fund.
| Assets | |
| Investments in unaffiliated issuers, at value (identified cost, $1,722,146,865) | $1,669,264,412 |
| Investments in affiliated issuers, at value (identified cost, $100,703,210) | 100,708,608 |
| Cash | 556,580 |
| Receivables for | |
| Forward foreign currency exchange contracts | 152,382 |
| Investments sold | 7,659,846 |
| Fund shares sold | 11,292,793 |
| Interest and dividends | 25,400,377 |
| Other assets | 5,688 |
| Total assets | $1,815,040,686 |
| Liabilities | |
| Payables for | |
| Distributions | $116,486 |
| Forward foreign currency exchange contracts | 22,152 |
| Investments purchased | 19,247,785 |
| When-issued investments purchased | 9,646,551 |
| Fund shares reacquired | 2,742,309 |
| Payable to affiliates | |
| Investment adviser | 42,882 |
| Administrative services fee | 1,438 |
| Shareholder servicing costs | 220,360 |
| Distribution and service fees | 9,727 |
| Payable for independent Trustees' compensation | 506 |
| Accrued expenses and other liabilities | 171,247 |
| Total liabilities | $32,221,443 |
| Net assets | $1,782,819,243 |
| Net assets consist of | |
| Paid-in capital | $2,062,177,339 |
| Total distributable earnings (loss) | (279,358,096) |
| Net assets | $1,782,819,243 |
| Shares of beneficial interest outstanding | 582,820,290 |
Statement of Assets and Liabilities – continued
| | Net assets | Shares
outstanding | Net asset value
per share (a) |
| Class A | $659,654,202 | 215,541,567 | $3.06 |
| Class B | 2,314,593 | 755,367 | 3.06 |
| Class C | 9,778,006 | 3,185,397 | 3.07 |
| Class I | 127,671,880 | 41,849,011 | 3.05 |
| Class R1 | 774,960 | 253,003 | 3.06 |
| Class R2 | 1,484,740 | 487,837 | 3.04 |
| Class R3 | 908,961 | 297,698 | 3.05 |
| Class R4 | 414,608 | 135,410 | 3.06 |
| Class R6 | 979,817,293 | 320,315,000 | 3.06 |
| (a) | Maximum offering price per share was equal to the net asset value per share for all share classes, except for Class A, for which the maximum offering price per share was $3.20 [100 / 95.75 x $3.06]. On sales of $100,000 or more, the maximum offering price of Class A shares is reduced. A contingent deferred sales charge may be imposed on redemptions of Class A, Class B, and Class C shares. Redemption price per share was equal to the net asset value per share for Classes I, R1, R2, R3, R4, and R6. |
See Notes to Financial Statements
Financial Statements
Statement of Operations
Year ended 1/31/24
This statement describes how much your fund earned in investment income and accrued in expenses. It also describes any gains and/or losses generated by fund operations.
| Net investment income (loss) | |
| Income | |
| Interest | $107,777,045 |
| Dividends from affiliated issuers | 4,112,659 |
| Other | 215,532 |
| Dividends | 193,360 |
| Total investment income | $112,298,596 |
| Expenses | |
| Management fee | $7,821,802 |
| Distribution and service fees | 1,723,499 |
| Shareholder servicing costs | 1,143,029 |
| Administrative services fee | 256,513 |
| Independent Trustees' compensation | 31,846 |
| Custodian fee | 101,470 |
| Shareholder communications | 110,846 |
| Audit and tax fees | 98,652 |
| Legal fees | 9,244 |
| Miscellaneous | 233,003 |
| Total expenses | $11,529,904 |
| Fees paid indirectly | (939) |
| Reduction of expenses by investment adviser and distributor | (220,979) |
| Net expenses | $11,307,986 |
| Net investment income (loss) | $100,990,610 |
Statement of Operations – continued
| Realized and unrealized gain (loss) |
| Realized gain (loss) (identified cost basis) | |
| Unaffiliated issuers | $(69,412,443) |
| Affiliated issuers | 6,151 |
| Futures contracts | (1,846,390) |
| Forward foreign currency exchange contracts | 175,388 |
| Foreign currency | (8,283) |
| Net realized gain (loss) | $(71,085,577) |
| Change in unrealized appreciation or depreciation | |
| Unaffiliated issuers | $108,525,307 |
| Affiliated issuers | (2,520) |
| Futures contracts | (35,170) |
| Forward foreign currency exchange contracts | 184,762 |
| Translation of assets and liabilities in foreign currencies | (4,078) |
| Net unrealized gain (loss) | $108,668,301 |
| Net realized and unrealized gain (loss) | $37,582,724 |
| Change in net assets from operations | $138,573,334 |
See Notes to Financial Statements
Financial Statements
Statements of Changes in Net Assets
These statements describe the increases and/or decreases in net assets resulting from operations, any distributions, and any shareholder transactions.
| | Year ended |
| | 1/31/24 | 1/31/23 |
| Change in net assets | | |
| From operations | | |
| Net investment income (loss) | $100,990,610 | $86,712,586 |
| Net realized gain (loss) | (71,085,577) | (58,003,285) |
| Net unrealized gain (loss) | 108,668,301 | (119,528,825) |
| Change in net assets from operations | $138,573,334 | $(90,819,524) |
| Total distributions to shareholders | $(104,124,037) | $(94,049,766) |
| Change in net assets from fund share transactions | $(5,174,694) | $(30,606,598) |
| Total change in net assets | $29,274,603 | $(215,475,888) |
| Net assets | | |
| At beginning of period | 1,753,544,640 | 1,969,020,528 |
| At end of period | $1,782,819,243 | $1,753,544,640 |
See Notes to Financial Statements
Financial Statements
Financial Highlights
The financial highlights table is intended to help you understand the fund's financial performance for the past 5 years. Certain information reflects financial results for a single fund share. The total returns in the table represent the rate that an investor would have earned (or lost) on an investment in the fund share class (assuming reinvestment of all distributions) held for the entire period.
| Class A | Year ended |
| | 1/31/24 | 1/31/23 | 1/31/22 | 1/31/21 | 1/31/20 |
| Net asset value, beginning of period | $3.00 | $3.31 | $3.44 | $3.44 | $3.30 |
| Income (loss) from investment operations |
| Net investment income (loss) (d) | $0.17 | $0.14 | $0.13 | $0.14 | $0.15 |
| Net realized and unrealized gain (loss) | 0.06 | (0.30) | (0.11) | 0.01 | 0.15 |
| Total from investment operations | $0.23 | $(0.16) | $0.02 | $0.15 | $0.30 |
| Less distributions declared to shareholders |
| From net investment income | $(0.17) | $(0.15) | $(0.15) | $(0.15) | $(0.16) |
| Net asset value, end of period (x) | $3.06 | $3.00 | $3.31 | $3.44 | $3.44 |
| Total return (%) (r)(s)(t)(x) | 8.13 | (4.60) | 0.48 | 4.71 | 9.24 |
Ratios (%) (to average net assets)
and Supplemental data: |
| Expenses before expense reductions (f) | 0.88 | 0.89 | 0.90 | 0.93 | 0.94 |
| Expenses after expense reductions (f) | 0.87 | 0.87 | 0.89 | 0.91 | 0.92 |
| Net investment income (loss) | 5.68 | 4.69 | 3.88 | 4.34 | 4.46 |
| Portfolio turnover | 48 | 33 | 64 | 50 | 58 |
| Net assets at end of period (000 omitted) | $659,654 | $625,602 | $679,622 | $612,075 | $552,035 |
See Notes to Financial Statements
Financial Highlights – continued
| Class B | Year ended |
| | 1/31/24 | 1/31/23 | 1/31/22 | 1/31/21 | 1/31/20 |
| Net asset value, beginning of period | $3.00 | $3.31 | $3.44 | $3.45 | $3.30 |
| Income (loss) from investment operations |
| Net investment income (loss) (d) | $0.15 | $0.12 | $0.11 | $0.12 | $0.13 |
| Net realized and unrealized gain (loss) | 0.06 | (0.30) | (0.12) | 0.00(w) | 0.15 |
| Total from investment operations | $0.21 | $(0.18) | $(0.01) | $0.12 | $0.28 |
| Less distributions declared to shareholders |
| From net investment income | $(0.15) | $(0.13) | $(0.12) | $(0.13) | $(0.13) |
| Net asset value, end of period (x) | $3.06 | $3.00 | $3.31 | $3.44 | $3.45 |
| Total return (%) (r)(s)(t)(x) | 7.34 | (5.31) | (0.28) | 3.62 | 8.74 |
Ratios (%) (to average net assets)
and Supplemental data: |
| Expenses before expense reductions (f) | 1.63 | 1.64 | 1.65 | 1.68 | 1.69 |
| Expenses after expense reductions (f) | 1.62 | 1.62 | 1.64 | 1.67 | 1.68 |
| Net investment income (loss) | 4.93 | 3.91 | 3.15 | 3.63 | 3.72 |
| Portfolio turnover | 48 | 33 | 64 | 50 | 58 |
| Net assets at end of period (000 omitted) | $2,315 | $2,986 | $4,729 | $6,914 | $10,650 |
| Class C | Year ended |
| | 1/31/24 | 1/31/23 | 1/31/22 | 1/31/21 | 1/31/20 |
| Net asset value, beginning of period | $3.01 | $3.32 | $3.45 | $3.45 | $3.31 |
| Income (loss) from investment operations |
| Net investment income (loss) (d) | $0.15 | $0.12 | $0.11 | $0.12 | $0.13 |
| Net realized and unrealized gain (loss) | 0.06 | (0.30) | (0.12) | 0.01 | 0.14 |
| Total from investment operations | $0.21 | $(0.18) | $(0.01) | $0.13 | $0.27 |
| Less distributions declared to shareholders |
| From net investment income | $(0.15) | $(0.13) | $(0.12) | $(0.13) | $(0.13) |
| Net asset value, end of period (x) | $3.07 | $3.01 | $3.32 | $3.45 | $3.45 |
| Total return (%) (r)(s)(t)(x) | 7.32 | (5.29) | (0.27) | 3.93 | 8.42 |
Ratios (%) (to average net assets)
and Supplemental data: |
| Expenses before expense reductions (f) | 1.63 | 1.64 | 1.65 | 1.68 | 1.69 |
| Expenses after expense reductions (f) | 1.62 | 1.62 | 1.64 | 1.67 | 1.68 |
| Net investment income (loss) | 4.93 | 3.92 | 3.15 | 3.61 | 3.72 |
| Portfolio turnover | 48 | 33 | 64 | 50 | 58 |
| Net assets at end of period (000 omitted) | $9,778 | $11,888 | $16,636 | $21,918 | $27,415 |
See Notes to Financial Statements
Financial Highlights – continued
| Class I | Year ended |
| | 1/31/24 | 1/31/23 | 1/31/22 | 1/31/21 | 1/31/20 |
| Net asset value, beginning of period | $2.99 | $3.30 | $3.43 | $3.43 | $3.29 |
| Income (loss) from investment operations |
| Net investment income (loss) (d) | $0.17 | $0.15 | $0.14 | $0.15 | $0.16 |
| Net realized and unrealized gain (loss) | 0.07 | (0.30) | (0.11) | 0.01 | 0.15 |
| Total from investment operations | $0.24 | $(0.15) | $0.03 | $0.16 | $0.31 |
| Less distributions declared to shareholders |
| From net investment income | $(0.18) | $(0.16) | $(0.16) | $(0.16) | $(0.17) |
| Net asset value, end of period (x) | $3.05 | $2.99 | $3.30 | $3.43 | $3.43 |
| Total return (%) (r)(s)(t)(x) | 8.41 | (4.38) | 0.71 | 4.97 | 9.52 |
Ratios (%) (to average net assets)
and Supplemental data: |
| Expenses before expense reductions (f) | 0.63 | 0.63 | 0.65 | 0.68 | 0.69 |
| Expenses after expense reductions (f) | 0.62 | 0.62 | 0.64 | 0.66 | 0.68 |
| Net investment income (loss) | 5.91 | 4.93 | 4.13 | 4.55 | 4.67 |
| Portfolio turnover | 48 | 33 | 64 | 50 | 58 |
| Net assets at end of period (000 omitted) | $127,672 | $189,210 | $208,682 | $216,905 | $147,591 |
| Class R1 | Year ended |
| | 1/31/24 | 1/31/23 | 1/31/22 | 1/31/21 | 1/31/20 |
| Net asset value, beginning of period | $3.00 | $3.31 | $3.44 | $3.44 | $3.30 |
| Income (loss) from investment operations |
| Net investment income (loss) (d) | $0.15 | $0.12 | $0.11 | $0.12 | $0.13 |
| Net realized and unrealized gain (loss) | 0.06 | (0.30) | (0.12) | 0.01 | 0.14 |
| Total from investment operations | $0.21 | $(0.18) | $(0.01) | $0.13 | $0.27 |
| Less distributions declared to shareholders |
| From net investment income | $(0.15) | $(0.13) | $(0.12) | $(0.13) | $(0.13) |
| Net asset value, end of period (x) | $3.06 | $3.00 | $3.31 | $3.44 | $3.44 |
| Total return (%) (r)(s)(t)(x) | 7.33 | (5.32) | (0.28) | 3.92 | 8.43 |
Ratios (%) (to average net assets)
and Supplemental data: |
| Expenses before expense reductions (f) | 1.63 | 1.64 | 1.65 | 1.68 | 1.69 |
| Expenses after expense reductions (f) | 1.62 | 1.62 | 1.64 | 1.67 | 1.68 |
| Net investment income (loss) | 4.93 | 3.94 | 3.14 | 3.60 | 3.71 |
| Portfolio turnover | 48 | 33 | 64 | 50 | 58 |
| Net assets at end of period (000 omitted) | $775 | $695 | $946 | $957 | $963 |
See Notes to Financial Statements
Financial Highlights – continued
| Class R2 | Year ended |
| | 1/31/24 | 1/31/23 | 1/31/22 | 1/31/21 | 1/31/20 |
| Net asset value, beginning of period | $2.98 | $3.29 | $3.43 | $3.44 | $3.30 |
| Income (loss) from investment operations |
| Net investment income (loss) (d) | $0.16 | $0.13 | $0.13 | $0.14 | $0.14 |
| Net realized and unrealized gain (loss) | 0.07 | (0.29) | (0.13) | (0.01) | 0.15 |
| Total from investment operations | $0.23 | $(0.16) | $0.00 | $0.13 | $0.29 |
| Less distributions declared to shareholders |
| From net investment income | $(0.17) | $(0.15) | $(0.14) | $(0.14) | $(0.15) |
| Net asset value, end of period (x) | $3.04 | $2.98 | $3.29 | $3.43 | $3.44 |
| Total return (%) (r)(s)(t)(x) | 7.88 | (4.90) | (0.09) | 4.14 | 8.96 |
Ratios (%) (to average net assets)
and Supplemental data: |
| Expenses before expense reductions (f) | 1.13 | 1.14 | 1.16 | 1.18 | 1.19 |
| Expenses after expense reductions (f) | 1.12 | 1.12 | 1.15 | 1.17 | 1.18 |
| Net investment income (loss) | 5.43 | 4.44 | 3.67 | 4.10 | 4.21 |
| Portfolio turnover | 48 | 33 | 64 | 50 | 58 |
| Net assets at end of period (000 omitted) | $1,485 | $1,606 | $2,029 | $13,943 | $15,270 |
| Class R3 | Year ended |
| | 1/31/24 | 1/31/23 | 1/31/22 | 1/31/21 | 1/31/20 |
| Net asset value, beginning of period | $2.99 | $3.30 | $3.43 | $3.44 | $3.30 |
| Income (loss) from investment operations |
| Net investment income (loss) (d) | $0.17 | $0.14 | $0.13 | $0.14 | $0.15 |
| Net realized and unrealized gain (loss) | 0.06 | (0.30) | (0.11) | 0.00(w) | 0.15 |
| Total from investment operations | $0.23 | $(0.16) | $0.02 | $0.14 | $0.30 |
| Less distributions declared to shareholders |
| From net investment income | $(0.17) | $(0.15) | $(0.15) | $(0.15) | $(0.16) |
| Net asset value, end of period (x) | $3.05 | $2.99 | $3.30 | $3.43 | $3.44 |
| Total return (%) (r)(s)(t)(x) | 8.14 | (4.63) | 0.46 | 4.40 | 9.23 |
Ratios (%) (to average net assets)
and Supplemental data: |
| Expenses before expense reductions (f) | 0.88 | 0.89 | 0.90 | 0.93 | 0.94 |
| Expenses after expense reductions (f) | 0.87 | 0.87 | 0.89 | 0.92 | 0.93 |
| Net investment income (loss) | 5.68 | 4.60 | 3.90 | 4.31 | 4.47 |
| Portfolio turnover | 48 | 33 | 64 | 50 | 58 |
| Net assets at end of period (000 omitted) | $909 | $1,295 | $2,574 | $2,929 | $2,255 |
See Notes to Financial Statements
Financial Highlights – continued
| Class R4 | Year ended |
| | 1/31/24 | 1/31/23 | 1/31/22 | 1/31/21 | 1/31/20 |
| Net asset value, beginning of period | $3.00 | $3.31 | $3.44 | $3.44 | $3.30 |
| Income (loss) from investment operations |
| Net investment income (loss) (d) | $0.18 | $0.15 | $0.14 | $0.15 | $0.16 |
| Net realized and unrealized gain (loss) | 0.06 | (0.30) | (0.11) | 0.01 | 0.15 |
| Total from investment operations | $0.24 | $(0.15) | $0.03 | $0.16 | $0.31 |
| Less distributions declared to shareholders |
| From net investment income | $(0.18) | $(0.16) | $(0.16) | $(0.16) | $(0.17) |
| Net asset value, end of period (x) | $3.06 | $3.00 | $3.31 | $3.44 | $3.44 |
| Total return (%) (r)(s)(t)(x) | 8.39 | (4.35) | 0.72 | 4.97 | 9.51 |
Ratios (%) (to average net assets)
and Supplemental data: |
| Expenses before expense reductions (f) | 0.63 | 0.64 | 0.65 | 0.68 | 0.69 |
| Expenses after expense reductions (f) | 0.62 | 0.62 | 0.64 | 0.67 | 0.68 |
| Net investment income (loss) | 5.93 | 4.95 | 4.15 | 4.63 | 4.68 |
| Portfolio turnover | 48 | 33 | 64 | 50 | 58 |
| Net assets at end of period (000 omitted) | $415 | $362 | $371 | $555 | $796 |
| Class R6 | Year ended |
| | 1/31/24 | 1/31/23 | 1/31/22 | 1/31/21 | 1/31/20 |
| Net asset value, beginning of period | $3.00 | $3.31 | $3.44 | $3.44 | $3.30 |
| Income (loss) from investment operations |
| Net investment income (loss) (d) | $0.18 | $0.15 | $0.15 | $0.16 | $0.16 |
| Net realized and unrealized gain (loss) | 0.06 | (0.30) | (0.12) | 0.00(w) | 0.15 |
| Total from investment operations | $0.24 | $(0.15) | $0.03 | $0.16 | $0.31 |
| Less distributions declared to shareholders |
| From net investment income | $(0.18) | $(0.16) | $(0.16) | $(0.16) | $(0.17) |
| Net asset value, end of period (x) | $3.06 | $3.00 | $3.31 | $3.44 | $3.44 |
| Total return (%) (r)(s)(t)(x) | 8.52 | (4.25) | 0.84 | 5.08 | 9.63 |
Ratios (%) (to average net assets)
and Supplemental data: |
| Expenses before expense reductions (f) | 0.52 | 0.52 | 0.54 | 0.57 | 0.58 |
| Expenses after expense reductions (f) | 0.51 | 0.51 | 0.53 | 0.56 | 0.57 |
| Net investment income (loss) | 6.04 | 5.05 | 4.25 | 4.69 | 4.82 |
| Portfolio turnover | 48 | 33 | 64 | 50 | 58 |
| Net assets at end of period (000 omitted) | $979,817 | $919,902 | $1,048,137 | $1,123,867 | $942,482 |
See Notes to Financial Statements
Financial Highlights – continued
| (d) | Per share data is based on average shares outstanding. |
| (f) | Ratios do not reflect reductions from fees paid indirectly, if applicable. See Note 2 in the Notes to Financial Statements for additional information. |
| (r) | Certain expenses have been reduced without which performance would have been lower. |
| (s) | From time to time the fund may receive proceeds from litigation settlements, without which performance would be lower. |
| (t) | Total returns do not include any applicable sales charges. |
| (w) | Per share amount was less than $0.01. |
| (x) | The net asset values and total returns have been calculated on net assets which include adjustments made in accordance with U.S. generally accepted accounting principles required at period end for financial reporting purposes. |
See Notes to Financial Statements
Notes to Financial Statements
(1) Business and Organization
MFS High Income Fund (the fund) is a diversified series of MFS Series Trust III (the trust). The trust is organized as a Massachusetts business trust and is registered under the Investment Company Act of 1940, as amended, as an open-end management investment company.
The fund is an investment company and accordingly follows the investment company accounting and reporting guidance of the Financial Accounting Standards Board (FASB) Accounting Standards Codification Topic 946 Financial Services - Investment Companies.
(2) Significant Accounting Policies
General — The preparation of financial statements in conformity with U.S. generally accepted accounting principles requires management to make estimates and assumptions that affect the reported amounts of assets and liabilities, and disclosure of contingent assets and liabilities at the date of the financial statements and the reported amounts of increases and decreases in net assets from operations during the reporting period. Actual results could differ from those estimates. In the preparation of these financial statements, management has evaluated subsequent events occurring after the date of the fund’s Statement of Assets and Liabilities through the date that the financial statements were issued. The fund invests in high-yield securities rated below investment grade. Investments in below investment grade quality securities can involve a substantially greater risk of default or can already be in default, and their values can decline significantly. Below investment grade quality securities tend to be more sensitive to adverse news about the issuer, or the market or economy in general, than higher quality debt instruments. The fund invests in foreign securities. Investments in foreign securities are vulnerable to the effects of changes in the relative values of the local currency and the U.S. dollar and to the effects of changes in each country’s market, economic, industrial, political, regulatory, geopolitical, environmental, public health, and other conditions.
Balance Sheet Offsetting — The fund's accounting policy with respect to balance sheet offsetting is that, absent an event of default by the counterparty or a termination of the agreement, the International Swaps and Derivatives Association (ISDA) Master Agreement, or similar agreement, does not result in an offset of reported amounts of financial assets and financial liabilities in the Statement of Assets and Liabilities across transactions between the fund and the applicable counterparty. The fund's right to setoff may be restricted or prohibited by the bankruptcy or insolvency laws of the particular jurisdiction to which a specific master netting agreement counterparty is subject. Balance sheet offsetting disclosures, to the extent applicable to the fund, have been included in the fund’s Significant Accounting Policies note under the captions for each of the fund’s in-scope financial instruments and transactions.
Investment Valuations — Subject to its oversight, the fund's Board of Trustees has delegated primary responsibility for determining or causing to be determined the value of the fund’s investments to MFS as the fund's adviser, pursuant to the fund’s valuation policy and procedures which have been adopted by the adviser and approved by the Board. In accordance with Rule 2a-5 under the Investment Company Act of 1940, the Board of Trustees designated the adviser as the “valuation designee” of the fund. If the
Notes to Financial Statements - continued
adviser, as valuation designee, determines that reliable market quotations are not readily available for an investment, the investment is valued at fair value as determined in good faith by the adviser in accordance with the adviser’s fair valuation policy and procedures.
Under the fund's valuation policy and procedures, equity securities, including restricted equity securities, are generally valued at the last sale or official closing price on their primary market or exchange as provided by a third-party pricing service. Equity securities, for which there were no sales reported that day, are generally valued at the last quoted daily bid quotation on their primary market or exchange as provided by a third-party pricing service. Debt instruments and floating rate loans, including restricted debt instruments, are generally valued at an evaluated or composite bid as provided by a third-party pricing service. Short-term instruments with a maturity at issuance of 60 days or less may be valued at amortized cost, which approximates market value.
Exchange-traded options are generally valued at the last sale or official closing price on their primary exchange as provided by a third-party pricing service. Exchange-traded options for which there were no sales reported that day are generally valued at the last daily bid quotation on their primary exchange as provided by a third-party pricing service. For put options, the position may be valued at the last daily ask quotation if there are no trades reported during the day. Options not traded on an exchange are generally valued at a broker/dealer bid quotation. Foreign currency options are generally valued at valuations provided by a third-party pricing service. Futures contracts are generally valued at last posted settlement price on their primary exchange as provided by a third-party pricing service. Futures contracts for which there were no trades that day for a particular position are generally valued at the closing bid quotation on their primary exchange as provided by a third-party pricing service.
Forward foreign currency exchange contracts are generally valued at the mean of bid and asked prices for the time period interpolated from rates provided by a third-party pricing service for proximate time periods. Open-end investment companies are generally valued at net asset value per share. The values of foreign securities and other assets and liabilities expressed in foreign currencies are converted to U.S. dollars using the mean of bid and asked prices for rates provided by a third-party pricing service.
Under the fund’s valuation policy and procedures, market quotations are not considered to be readily available for debt instruments, floating rate loans, and many types of derivatives. These investments are generally valued at fair value based on information from third-party pricing services or otherwise determined by the adviser in accordance with the adviser’s fair valuation policy and procedures. Securities and other assets generally valued on the basis of information from a third-party pricing service may also be valued at a broker/dealer bid quotation. In determining values, third-party pricing services can utilize both transaction data and market information such as yield, quality, coupon rate, maturity, type of issue, trading characteristics, spreads and other market data. An investment may also be valued at fair value if the adviser determines that the investment’s value has been materially affected by events occurring after the close of the exchange or market on which the investment is principally traded (such as foreign exchange or market) and prior to the determination of the fund’s net asset value, or after the halt of trading of a specific security where trading does not resume prior to the close of the exchange or market on which the security is principally traded. The adviser generally relies on third-party pricing services or other information (such as the correlation with price movements of similar securities in the same or other markets; the type, cost and investment characteristics of the security; the business and
Notes to Financial Statements - continued
financial condition of the issuer; and trading and other market data) to assist in determining whether to fair value and at what value to fair value an investment. The value of an investment for purposes of calculating the fund’s net asset value can differ depending on the source and method used to determine value. When fair valuation is used, the value of an investment used to determine the fund’s net asset value may differ from quoted or published prices for the same investment. There can be no assurance that the fund could obtain the fair value assigned to an investment if it were to sell the investment at the same time at which the fund determines its net asset value per share.
Various inputs are used in determining the value of the fund's assets or liabilities. These inputs are categorized into three broad levels. In certain cases, the inputs used to measure fair value may fall into different levels of the fair value hierarchy. In such cases, an investment's level within the fair value hierarchy is based on the lowest level of input that is significant to the fair value measurement. The fund's assessment of the significance of a particular input to the fair value measurement in its entirety requires judgment, and considers factors specific to the investment. Level 1 includes unadjusted quoted prices in active markets for identical assets or liabilities. Level 2 includes other significant observable market-based inputs (including quoted prices for similar securities, interest rates, prepayment speed, and credit risk). Level 3 includes significant unobservable inputs, which may include the adviser's own assumptions in determining the fair value of investments. Other financial instruments are derivative instruments, such as forward foreign currency exchange contracts. The following is a summary of the levels used as of January 31, 2024 in valuing the fund's assets and liabilities:
| Financial Instruments | Level 1 | Level 2 | Level 3 | Total |
| Equity Securities: | | | | |
| United States | $— | $490,290 | $1,645,052 | $2,135,342 |
| Luxembourg | — | 1,556,205 | — | 1,556,205 |
| United Kingdom | — | 11,893 | — | 11,893 |
| U.S. Treasury Bonds & U.S. Government Agencies & Equivalents | — | 8,833,324 | — | 8,833,324 |
| U.S. Corporate Bonds | — | 1,373,532,436 | — | 1,373,532,436 |
| Asset-Backed Securities (including CDOs) | — | 359 | — | 359 |
| Foreign Bonds | — | 283,194,853 | — | 283,194,853 |
| Mutual Funds | 100,708,608 | — | — | 100,708,608 |
| Total | $100,708,608 | $1,667,619,360 | $1,645,052 | $1,769,973,020 |
| Other Financial Instruments | | | | |
| Forward Foreign Currency Exchange Contracts – Assets | $— | $152,382 | $— | $152,382 |
| Forward Foreign Currency Exchange Contracts – Liabilities | — | (22,152) | — | (22,152) |
For further information regarding security characteristics, see the Portfolio of Investments.
Notes to Financial Statements - continued
The following is a reconciliation of level 3 assets for which significant unobservable inputs were used to determine fair value. The table presents the activity of level 3 securities held at the beginning and the end of the period.
| | Equity
Securities |
| Balance as of 1/31/23 | $1,402,657 |
| Realized gain (loss) | 391,535 |
| Change in unrealized appreciation or depreciation | 242,395 |
| Sales | (391,535) |
| Balance as of 1/31/24 | $1,645,052 |
The net change in unrealized appreciation or depreciation from investments held as level 3 at January 31, 2024 is $556,172. At January 31, 2024, the fund held one level 3 security.
Foreign Currency Translation — Purchases and sales of foreign investments, income, and expenses are converted into U.S. dollars based upon currency exchange rates prevailing on the respective dates of such transactions or on the reporting date for foreign denominated receivables and payables. Gains and losses attributable to foreign currency exchange rates on sales of securities are recorded for financial statement purposes as net realized gains and losses on investments. Gains and losses attributable to foreign exchange rate movements on receivables, payables, income and expenses are recorded for financial statement purposes as foreign currency transaction gains and losses. That portion of both realized and unrealized gains and losses on investments that results from fluctuations in foreign currency exchange rates is not separately disclosed.
Derivatives — The fund uses derivatives primarily to increase or decrease exposure to a particular market or segment of the market, or security, to increase or decrease interest rate exposure, or as alternatives to direct investments. Derivatives are used for hedging or non-hedging purposes. While hedging can reduce or eliminate losses, it can also reduce or eliminate gains. When the fund uses derivatives as an investment to increase market exposure, or for hedging purposes, gains and losses from derivative instruments may be substantially greater than the derivative’s original cost.
The derivative instruments used by the fund during the period were purchased options, futures contracts and forward foreign currency exchange contracts. Depending on the type of derivative, a fund may exit a derivative position by entering into an offsetting transaction with a counterparty or exchange, negotiating an agreement with the derivative counterparty, or novating the position to a third party. The fund’s period end derivatives, as presented in the Portfolio of Investments and the associated Derivative Contract tables, generally are indicative of the volume of its derivative activity during the period.
Notes to Financial Statements - continued
The following table presents, by major type of derivative contract, the fair value, on a gross basis, of the asset and liability components of derivatives held by the fund at January 31, 2024 as reported in the Statement of Assets and Liabilities:
| | | Fair Value (a) |
| Risk | Derivative Contracts | Asset Derivatives | Liability Derivatives |
| Equity | Purchased Option Contracts | $490,290 | $— |
| Foreign Exchange | Forward Foreign Currency Exchange Contracts | 152,382 | (22,152) |
| Total | | $642,672 | $(22,152) |
| (a) | The value of purchased options outstanding is included in investments in unaffiliated issuers, at value, within the Statement of Assets and Liabilities. |
The following table presents, by major type of derivative contract, the realized gain (loss) on derivatives held by the fund for the year ended January 31, 2024 as reported in the Statement of Operations:
| Risk | Futures
Contracts | Forward Foreign
Currency
Exchange
Contracts | Unaffiliated Issuers
(Purchased
Options) |
| Interest Rate | $(1,846,390) | $— | $— |
| Foreign Exchange | — | 175,388 | — |
| Equity | — | — | (819,188) |
| Total | $(1,846,390) | $175,388 | $(819,188) |
The following table presents, by major type of derivative contract, the change in unrealized appreciation or depreciation on derivatives held by the fund for the year ended January 31, 2024 as reported in the Statement of Operations:
| Risk | Futures
Contracts | Forward Foreign
Currency
Exchange
Contracts | Unaffiliated Issuers
(Purchased
Options) |
| Interest Rate | $(35,170) | $— | $— |
| Foreign Exchange | — | 184,762 | — |
| Equity | — | — | (776,853) |
| Total | $(35,170) | $184,762 | $(776,853) |
Derivative counterparty credit risk is managed through formal evaluation of the creditworthiness of all potential counterparties. On certain, but not all, uncleared derivatives, the fund attempts to reduce its exposure to counterparty credit risk whenever possible by entering into an ISDA Master Agreement on a bilateral basis. The ISDA Master Agreement gives each party to the agreement the right to terminate all transactions traded under such agreement if there is a specified deterioration in the credit quality of the other party. Upon an event of default or a termination of the ISDA Master Agreement, the non-defaulting party has the right to close out all transactions traded under such agreement and to net amounts owed under each agreement to one net amount payable by one party to the other. This right to close out and net payments
Notes to Financial Statements - continued
across all transactions traded under the ISDA Master Agreement could result in a reduction of the fund's credit risk to such counterparty equal to any amounts payable by the fund under the applicable transactions, if any.
Collateral and margin requirements differ by type of derivative. For cleared derivatives (e.g., futures contracts, cleared swaps, and exchange-traded options), margin requirements are set by the clearing broker and the clearing house and collateral, in the form of cash or securities, is posted by the fund directly with the clearing broker. Collateral terms are counterparty agreement specific for uncleared derivatives (e.g., forward foreign currency exchange contracts, uncleared swap agreements, and uncleared options) and collateral, in the form of cash and securities, is held in segregated accounts with the fund's custodian in connection with these agreements. For derivatives traded under an ISDA Master Agreement, which contains a credit support annex, the collateral requirements are netted across all transactions traded under such counterparty-specific agreement and an amount is posted from one party to the other to collateralize such obligations. Cash that has been segregated or delivered to cover the fund's collateral or margin obligations under derivative contracts, if any, will be reported separately in the Statement of Assets and Liabilities as restricted cash for uncleared derivatives and/or deposits with brokers for cleared derivatives. Securities pledged as collateral or margin for the same purpose, if any, are noted in the Portfolio of Investments. The fund may be required to make payments of interest on uncovered collateral or margin obligations with the broker. Any such payments are included in “Miscellaneous” expense in the Statement of Operations.
Purchased Options — The fund purchased put options for a premium. Purchased put options entitle the holder to sell a specified number of shares or units of a particular security, currency or index at a specified price at a specified date or within a specified period of time. Purchasing put options may hedge against an anticipated decline in the value of portfolio securities or currency or decrease the fund's exposure to an underlying instrument.
The premium paid is initially recorded as an investment in the Statement of Assets and Liabilities. That investment is subsequently marked-to-market daily with the difference between the premium paid and the market value of the purchased option being recorded as unrealized appreciation or depreciation. Premiums paid for purchased put options which have expired are treated as realized losses on investments in the Statement of Operations. Upon the exercise or closing of a purchased put option, the premium paid is added to the cost of the security or financial instrument purchased.
Whether or not the option is exercised, the fund's maximum risk of loss from purchasing an option is the amount of premium paid. All option contracts involve credit risk if the counterparty to the option contract fails to perform. For uncleared options, this risk is mitigated in cases where there is an ISDA Master Agreement between the fund and the counterparty providing for netting as described above and, where applicable, by the posting of collateral by the counterparty to the fund to cover the fund’s exposure to the counterparty under such ISDA Master Agreement.
Futures Contracts — The fund entered into futures contracts which may be used to hedge against or obtain broad market exposure, interest rate exposure, currency exposure, or to manage duration. A futures contract represents a commitment for the future purchase or sale of an asset at a specified price on a specified date.
Notes to Financial Statements - continued
Upon entering into a futures contract, the fund is required to deposit with the broker, either in cash or securities, an initial margin in an amount equal to a specified percentage of the notional amount of the contract. Subsequent payments (variation margin) are made or received by the fund each day, depending on the daily fluctuations in the value of the contract, and are recorded for financial statement purposes as unrealized gain or loss by the fund until the contract is closed or expires at which point the gain or loss on futures contracts is realized.
The fund bears the risk of interest rates, exchange rates or securities prices moving unexpectedly, in which case, the fund may not achieve the anticipated benefits of the futures contracts and may realize a loss. While futures contracts may present less counterparty risk to the fund since the contracts are exchange traded and the exchange’s clearinghouse guarantees payments to the broker, there is still counterparty credit risk due to the insolvency of the broker. The fund’s maximum risk of loss due to counterparty credit risk is equal to the margin posted by the fund to the broker plus any gains or minus any losses on the outstanding futures contracts.
Forward Foreign Currency Exchange Contracts — The fund entered into forward foreign currency exchange contracts for the purchase or sale of a specific foreign currency at a fixed price on a future date. These contracts may be used to hedge the fund’s currency risk or for non-hedging purposes. For hedging purposes, the fund may enter into contracts to deliver or receive foreign currency that the fund will receive from or use in its normal investment activities. The fund may also use contracts to hedge against declines in the value of foreign currency denominated securities due to unfavorable exchange rate movements. For non-hedging purposes, the fund may enter into contracts with the intent of changing the relative exposure of the fund’s portfolio of securities to different currencies to take advantage of anticipated exchange rate changes.
Forward foreign currency exchange contracts are adjusted by the daily exchange rate of the underlying currency and any unrealized gains or losses are recorded as a receivable or payable for forward foreign currency exchange contracts until the contract settlement date. On contract settlement date, any gain or loss on the contract is recorded as realized gains or losses on forward foreign currency exchange contracts.
Risks may arise upon entering into these contracts from unanticipated movements in the value of the contract and from the potential inability of counterparties to meet the terms of their contracts. Generally, the fund’s maximum risk due to counterparty credit risk is the unrealized gain on the contract due to the use of Continuous Linked Settlement, a multicurrency cash settlement system for the centralized settlement of foreign transactions. This risk is mitigated in cases where there is an ISDA Master Agreement between the fund and the counterparty providing for netting as described above and, where applicable, by the posting of collateral by the counterparty to the fund to cover the fund’s exposure to the counterparty under such ISDA Master Agreement.
Indemnifications — Under the fund's organizational documents, its officers and Trustees may be indemnified against certain liabilities and expenses arising out of the performance of their duties to the fund. Additionally, in the normal course of business, the fund enters into agreements with service providers that may contain indemnification clauses. The fund's maximum exposure under these agreements is unknown as this would involve future claims that may be made against the fund that have not yet occurred.
Notes to Financial Statements - continued
Investment Transactions and Income — Interest income is recorded on the accrual basis. All premium and discount is amortized or accreted for financial statement purposes in accordance with U.S. generally accepted accounting principles. Dividends received in cash are recorded on the ex-dividend date. Certain dividends from foreign securities will be recorded when the fund is informed of the dividend if such information is obtained subsequent to the ex-dividend date. Dividend and interest payments received in additional securities are recorded on the ex-dividend or ex-interest date in an amount equal to the value of the security on such date.
The fund may receive proceeds from litigation settlements. Any proceeds received from litigation involving portfolio holdings are reflected in the Statement of Operations in realized gain/loss if the security has been disposed of by the fund or in unrealized gain/loss if the security is still held by the fund. Any other proceeds from litigation not related to portfolio holdings are reflected as other income in the Statement of Operations.
Investment transactions are recorded on the trade date. In determining the net gain or loss on securities sold, the cost of securities is determined on the identified cost basis.
The fund may purchase or sell securities on a when-issued or delayed delivery basis. In these extended settlement transactions, the receipt or delivery of the securities by the fund and related payments occur at a future date, usually beyond the customary settlement period. The price of such security and the date that the security will be settled are generally fixed at the time the transaction is negotiated. The value of the security varies with market fluctuations and for debt securities no interest accrues to the fund until settlement takes place. When the fund sells securities on a when-issued or delayed delivery basis, the fund typically owns or has the right to acquire securities equivalent in kind and amount to the securities sold. Purchase and sale commitments for when-issued or delayed delivery securities are held at carrying amount, which approximates fair value and are categorized as level 2 within the fair value hierarchy, and included in When-issued investments purchased and When-issued investments sold in the Statement of Assets and Liabilities, as applicable. Losses may arise due to changes in the value of the underlying securities prior to settlement date or if the counterparty does not perform under the contract’s terms, or if the issuer does not issue the securities due to political, economic or other factors.
Fees Paid Indirectly — The fund's custody fee may be reduced by a credit earned under an arrangement that measures the value of U.S. dollars deposited with the custodian by the fund. The amount of the credit, for the year ended January 31, 2024, is shown as a reduction of total expenses in the Statement of Operations.
Tax Matters and Distributions — The fund intends to qualify as a regulated investment company, as defined under Subchapter M of the Internal Revenue Code, and to distribute all of its taxable income, including realized capital gains. As a result, no provision for federal income tax is required. The fund’s federal tax returns, when filed, will remain subject to examination by the Internal Revenue Service for a three year period. Management has analyzed the fund’s tax positions taken on federal and state tax returns for all open tax years and does not believe that there are any uncertain tax positions that require recognition of a tax liability. Foreign taxes, if any, have been accrued by the fund in the accompanying financial statements in accordance with the
Notes to Financial Statements - continued
applicable foreign tax law. Foreign income taxes may be withheld by certain countries in which the fund invests. Additionally, capital gains realized by the fund on securities issued in or by certain foreign countries may be subject to capital gains tax imposed by those countries.
Distributions to shareholders are recorded on the ex-dividend date. Income and capital gain distributions are determined in accordance with income tax regulations, which may differ from U.S. generally accepted accounting principles. Certain capital accounts in the financial statements are periodically adjusted for permanent differences in order to reflect their tax character. These adjustments have no impact on net assets or net asset value per share. Temporary differences which arise from recognizing certain items of income, expense, gain or loss in different periods for financial statement and tax purposes will reverse at some time in the future.
Book/tax differences primarily relate to amortization of premium and accretion of discount of debt securities.
The tax character of distributions declared to shareholders for the last two fiscal years is as follows:
| | Year ended
1/31/24 | Year ended
1/31/23 |
| Ordinary income (including any short-term capital gains) | $104,124,037 | $94,049,766 |
The federal tax cost and the tax basis components of distributable earnings were as follows:
| As of 1/31/24 | |
| Cost of investments | $1,831,618,119 |
| Gross appreciation | 31,635,324 |
| Gross depreciation | (93,150,193) |
| Net unrealized appreciation (depreciation) | $(61,514,869) |
| Undistributed ordinary income | 6,688,932 |
| Capital loss carryforwards | (215,570,439) |
| Other temporary differences | (8,961,720) |
| Total distributable earnings (loss) | $(279,358,096) |
As of January 31, 2024, the fund had capital loss carryforwards available to offset future realized gains. These net capital losses may be carried forward indefinitely and their character is retained as short-term and/or long-term losses. Such losses are characterized as follows:
| Short-Term | $(24,623,902) |
| Long-Term | (190,946,537) |
| Total | $(215,570,439) |
Multiple Classes of Shares of Beneficial Interest — The fund offers multiple classes of shares, which differ in their respective distribution and service fees. The fund's income and common expenses are allocated to shareholders based on the value of settled shares outstanding of each class. The fund's realized and unrealized gain (loss) are allocated to shareholders based on the daily net assets of each class. Dividends are declared separately for each class. Differences in per share dividend rates are generally
Notes to Financial Statements - continued
due to differences in separate class expenses. Class B and Class C shares will convert to Class A shares approximately eight years after purchase. Effective March 21, 2022, all Class 529B and Class 529C shares were converted into Class 529A shares. Effective May 20, 2022, all Class 529A shares were redeemed. The fund’s distributions declared to shareholders as reported in the Statements of Changes in Net Assets are presented by class as follows:
| | Year ended
1/31/24 | Year ended
1/31/23 |
| Class A | $36,868,951 | $31,925,762 |
| Class B | 133,055 | 160,560 |
| Class C | 557,765 | 569,072 |
| Class I | 8,617,330 | 9,621,986 |
| Class R1 | 36,949 | 29,527 |
| Class R2 | 82,056 | 86,874 |
| Class R3 | 58,047 | 87,286 |
| Class R4 | 21,868 | 18,781 |
| Class R6 | 57,748,016 | 51,479,518 |
| Class 529A | — | 68,059 |
| Class 529B | — | 340 |
| Class 529C | — | 2,001 |
| Total | $104,124,037 | $94,049,766 |
(3) Transactions with Affiliates
Investment Adviser — The fund has an investment advisory agreement with MFS to provide overall investment management and related administrative services and facilities to the fund. The management fee is computed daily and paid monthly at the following annual rates based on the fund's average daily net assets:
| Up to $1.4 billion | 0.46% |
| In excess of $1.4 billion and up to $3 billion | 0.44% |
| In excess of $3 billion | 0.42% |
MFS has agreed in writing to reduce its management fee by a specified amount if certain MFS mutual fund assets exceed thresholds agreed to by MFS and the fund's Board of Trustees. MFS has also agreed in writing to waive at least 0.01% of its management fee as part of this agreement. The agreement to waive at least 0.01% of the management fee will continue until modified by the fund's Board of Trustees, but such agreement will continue at least until May 31, 2025. For the year ended January 31, 2024, this management fee reduction amounted to $218,921, which is included in the reduction of total expenses in the Statement of Operations. The management fee incurred for the year ended January 31, 2024 was equivalent to an annual effective rate of 0.44% of the fund's average daily net assets.
Distributor — MFS Fund Distributors, Inc. (MFD), a wholly-owned subsidiary of MFS, as distributor, received $25,048 for the year ended January 31, 2024, as its portion of the initial sales charge on sales of Class A shares of the fund.
The Board of Trustees has adopted a distribution plan for certain share classes pursuant to Rule 12b-1 of the Investment Company Act of 1940.
Notes to Financial Statements - continued
The fund's distribution plan provides that the fund will pay MFD for services provided by MFD and financial intermediaries in connection with the distribution and servicing of certain share classes. One component of the plan is a distribution fee paid to MFD and another component of the plan is a service fee paid to MFD. MFD may subsequently pay all, or a portion, of the distribution and/or service fees to financial intermediaries. The distribution and service fees are computed daily and paid monthly.
Distribution Plan Fee Table:
| | Distribution
Fee Rate (d) | Service
Fee Rate (d) | Total
Distribution
Plan (d) | Annual
Effective
Rate (e) | Distribution
and Service
Fee |
| Class A | — | 0.25% | 0.25% | 0.25% | $ 1,571,424 |
| Class B | 0.75% | 0.25% | 1.00% | 1.00% | 26,016 |
| Class C | 0.75% | 0.25% | 1.00% | 1.00% | 109,068 |
| Class R1 | 0.75% | 0.25% | 1.00% | 1.00% | 7,210 |
| Class R2 | 0.25% | 0.25% | 0.50% | 0.50% | 7,307 |
| Class R3 | — | 0.25% | 0.25% | 0.25% | 2,474 |
| Total Distribution and Service Fees | | | | | $1,723,499 |
| (d) | In accordance with the distribution plan for certain classes, the fund pays distribution and/or service fees equal to these annual percentage rates of each class’s average daily net assets. The distribution and service fee rates disclosed by class represent the current rates in effect at the end of the reporting period. Any rate changes, if applicable, are detailed below. |
| (e) | The annual effective rates represent actual fees incurred under the distribution plan for the year ended January 31, 2024 based on each class's average daily net assets. MFD has voluntarily agreed to rebate a portion of each class's 0.25% service fee attributable to accounts for which there is no financial intermediary specified on the account except for accounts attributable to MFS or its affiliates' seed money. For the year ended January 31, 2024, this rebate amounted to $2,057 and $1 for Class A and Class C shares, respectively, and is included in the reduction of total expenses in the Statement of Operations. |
Certain Class A shares are subject to a contingent deferred sales charge (CDSC) in the event of a shareholder redemption within 18 months of purchase. Class B shares are subject to a CDSC in the event of a shareholder redemption within six years of purchase. Class C shares are subject to a CDSC in the event of a shareholder redemption within 12 months of purchase. All contingent deferred sales charges are paid to MFD and during the year ended January 31, 2024, were as follows:
| | Amount |
| Class A | $13,232 |
| Class B | 1,193 |
| Class C | 2,316 |
Shareholder Servicing Agent — MFS Service Center, Inc. (MFSC), a wholly-owned subsidiary of MFS, receives a fee from the fund for its services as shareholder servicing agent calculated as a percentage of the average daily net assets of the fund as determined periodically under the supervision of the fund's Board of Trustees. For the year ended January 31, 2024, the fee was $188,099, which equated to 0.0110% annually of the fund's average daily net assets. MFSC also receives reimbursement from the fund for out-of-pocket expenses, sub-accounting and other shareholder servicing
Notes to Financial Statements - continued
costs which may be paid to affiliated and unaffiliated service providers. Class R6 shares do not incur sub-accounting fees. For the year ended January 31, 2024, these out-of-pocket expenses, sub-accounting and other shareholder servicing costs amounted to $954,930.
Administrator — MFS provides certain financial, legal, shareholder communications, compliance, and other administrative services to the fund. Under an administrative services agreement, the fund reimburses MFS the costs incurred to provide these services. The fund is charged an annual fixed amount of $17,500 plus a fee based on average daily net assets. The administrative services fee is computed daily and paid monthly. The administrative services fee incurred for the year ended January 31, 2024 was equivalent to an annual effective rate of 0.0150% of the fund's average daily net assets.
Trustees’ and Officers’ Compensation — The fund pays compensation to independent Trustees in the form of a retainer, attendance fees, and additional compensation to Board and Committee chairpersons. Independent Trustees’ compensation is accrued daily and paid subsequent to each Trustee Board meeting. The fund does not pay compensation directly to Trustees or officers of the fund who are also officers of the investment adviser, all of whom receive remuneration from MFS for their services to the fund. Certain officers and Trustees of the fund are officers or directors of MFS, MFD, and MFSC.
Prior to December 31, 2001, the fund had an unfunded defined benefit plan (“DB plan”) for independent Trustees. As of December 31, 2001, the Board took action to terminate the DB plan with respect to then-current and any future independent Trustees, such that the DB plan covers only certain of those former independent Trustees who retired on or before December 31, 2001. The DB plan resulted in a pension expense of $1,668 and is included in “Independent Trustees’ compensation” in the Statement of Operations for the year ended January 31, 2024. The liability for deferred retirement benefits payable to those former independent Trustees under the DB plan amounted to $494 at January 31, 2024, and is included in “Payable for independent Trustees’ compensation” in the Statement of Assets and Liabilities. The deferred retirement benefits compensation fee is accrued daily and paid monthly.
Other — The fund invests in the MFS Institutional Money Market Portfolio which is managed by MFS and seeks current income consistent with preservation of capital and liquidity. This money market fund does not pay a management fee to MFS but does incur investment and operating costs.
(4) Portfolio Securities
For the year ended January 31, 2024, purchases and sales of investments, other than purchased options with an expiration date of less than one year from the time of purchase and short-term obligations, aggregated $783,284,130 and $840,600,822, respectively.
Notes to Financial Statements - continued
(5) Shares of Beneficial Interest
The fund's Declaration of Trust permits the Trustees to issue an unlimited number of full and fractional shares of beneficial interest. Transactions in fund shares were as follows:
| | Year ended
1/31/24 | | Year ended
1/31/23 |
| | Shares | Amount | | Shares | Amount |
| Shares sold | | | | | |
| Class A | 32,906,809 | $97,748,923 | | 34,239,361 | $103,975,427 |
| Class B | 41,018 | 123,801 | | 57,318 | 172,695 |
| Class C | 855,472 | 2,563,892 | | 510,661 | 1,531,529 |
| Class I | 14,751,784 | 43,491,363 | | 38,542,522 | 115,441,933 |
| Class R1 | 30,778 | 92,265 | | 26,943 | 81,037 |
| Class R2 | 36,749 | 108,254 | | 236,743 | 739,407 |
| Class R3 | 56,541 | 166,675 | | 222,741 | 712,439 |
| Class R4 | 20,211 | 60,740 | | 8,221 | 25,343 |
| Class R6 | 31,948,406 | 95,106,948 | | 21,815,819 | 66,118,697 |
| Class 529A | — | — | | 194,427 | 621,092 |
| Class 529C | — | — | | 4,009 | 13,074 |
| | 80,647,768 | $239,462,861 | | 95,858,765 | $289,432,673 |
Shares issued to shareholders
in reinvestment of distributions | | | | | |
| Class A | 12,126,417 | $36,021,744 | | 10,385,501 | $31,089,436 |
| Class B | 43,013 | 127,859 | | 51,185 | 153,778 |
| Class C | 182,253 | 543,056 | | 183,364 | 551,602 |
| Class I | 2,529,275 | 7,487,313 | | 2,645,976 | 7,896,443 |
| Class R1 | 12,416 | 36,937 | | 9,847 | 29,511 |
| Class R2 | 27,775 | 82,052 | | 29,102 | 86,684 |
| Class R3 | 19,570 | 57,975 | | 28,937 | 87,242 |
| Class R4 | 7,354 | 21,867 | | 6,275 | 18,779 |
| Class R6 | 19,346,197 | 57,466,471 | | 17,115,265 | 51,246,373 |
| Class 529A | — | — | | 17,073 | 54,383 |
| Class 529B | — | — | | 61 | 251 |
| Class 529C | — | — | | 379 | 1,239 |
| | 34,294,270 | $101,845,274 | | 30,472,965 | $91,215,721 |
Notes to Financial Statements - continued
| | Year ended
1/31/24 | | Year ended
1/31/23 |
| | Shares | Amount | | Shares | Amount |
| Shares reacquired | | | | | |
| Class A | (38,164,982) | $(113,144,522) | | (41,474,679) | $(124,583,060) |
| Class B | (323,278) | (953,524) | | (542,109) | (1,625,622) |
| Class C | (1,806,183) | (5,407,020) | | (1,756,772) | (5,346,479) |
| Class I | (38,737,942) | (114,134,783) | | (41,165,559) | (125,307,188) |
| Class R1 | (21,762) | (65,749) | | (90,964) | (292,009) |
| Class R2 | (115,257) | (338,280) | | (344,291) | (1,055,962) |
| Class R3 | (211,169) | (623,272) | | (598,859) | (1,809,442) |
| Class R4 | (12,774) | (37,538) | | (6,028) | (18,457) |
| Class R6 | (37,975,431) | (111,778,141) | | (49,066,141) | (145,737,382) |
| Class 529A | — | — | | (1,665,310) | (4,989,975) |
| Class 529B | — | — | | (20,862) | (66,973) |
| Class 529C | — | — | | (131,973) | (422,443) |
| | (117,368,778) | $(346,482,829) | | (136,863,547) | $(411,254,992) |
| Net change | | | | | |
| Class A | 6,868,244 | $20,626,145 | | 3,150,183 | $10,481,803 |
| Class B | (239,247) | (701,864) | | (433,606) | (1,299,149) |
| Class C | (768,458) | (2,300,072) | | (1,062,747) | (3,263,348) |
| Class I | (21,456,883) | (63,156,107) | | 22,939 | (1,968,812) |
| Class R1 | 21,432 | 63,453 | | (54,174) | (181,461) |
| Class R2 | (50,733) | (147,974) | | (78,446) | (229,871) |
| Class R3 | (135,058) | (398,622) | | (347,181) | (1,009,761) |
| Class R4 | 14,791 | 45,069 | | 8,468 | 25,665 |
| Class R6 | 13,319,172 | 40,795,278 | | (10,135,057) | (28,372,312) |
| Class 529A | — | — | | (1,453,810) | (4,314,500) |
| Class 529B | — | — | | (20,801) | (66,722) |
| Class 529C | — | — | | (127,585) | (408,130) |
| | (2,426,740) | $(5,174,694) | | (10,531,817) | $(30,606,598) |
Effective June 1, 2019, purchases of the fund’s Class B and Class 529B shares were closed to new and existing investors subject to certain exceptions. Effective after the close of business on March 18, 2022, all sales of Class 529B and Class 529C shares were suspended, and Class 529B and Class 529C shares were converted into Class 529A shares of the fund effective March 21, 2022. Effective after the close of business on May 13, 2022, all sales and redemptions of Class 529A shares were suspended, and all Class 529A shares were redeemed on May 20, 2022. Effective September 29, 2023, purchases of the fund's Class R1 and Class R2 shares were closed to new eligible investors.
The fund is one of several mutual funds in which certain MFS funds may invest. The MFS funds do not invest in the underlying funds for the purpose of exercising management or control. At the end of the period, the MFS Moderate Allocation Fund,
Notes to Financial Statements - continued
the MFS Growth Allocation Fund, the MFS Conservative Allocation Fund, the MFS Lifetime 2030 Fund, the MFS Lifetime 2035 Fund, the MFS Lifetime 2040 Fund, the MFS Lifetime Income Fund, and the MFS Lifetime 2025 Fund were the owners of record of approximately 15%, 14%, 8%, 2%, 1%, 1%, 1%, and 1%, respectively, of the value of outstanding voting shares of the fund. In addition, the MFS Lifetime 2045 Fund was the owner of record of less than 1% of the value of outstanding voting shares of the fund.
(6) Line of Credit
The fund and certain other funds managed by MFS participate in a $1.45 billion unsecured committed line of credit of which $1.2 billion is reserved for use by the fund and certain other MFS U.S. funds. The line of credit is provided by a syndicate of banks under a credit agreement. Borrowings may be made for temporary financing needs. Interest is charged to each fund, based on its borrowings, generally at a rate equal to the highest of 1) Daily Simple SOFR (Secured Overnight Financing Rate) plus 0.10%, 2) the Federal Funds Effective Rate, or 3) the Overnight Bank Funding Rate, each plus an agreed upon spread. A commitment fee, based on the average daily unused portion of the committed line of credit, is allocated among the participating funds. The line of credit expires on March 14, 2024 unless extended or renewed. In addition, the fund and other funds managed by MFS have established unsecured uncommitted borrowing arrangements with certain banks for temporary financing needs. Interest is charged to each fund, based on its borrowings, at rates equal to customary reference rates plus an agreed upon spread. For the year ended January 31, 2024, the fund’s commitment fee and interest expense were $8,703 and $0, respectively, and are included in “Miscellaneous” expense in the Statement of Operations.
(7) Investments in Affiliated Issuers
An affiliated issuer may be considered one in which the fund owns 5% or more of the outstanding voting securities, or a company which is under common control. For the purposes of this report, the following were affiliated issuers:
| Affiliated Issuers | Beginning
Value | Purchases | Sales
Proceeds | Realized
Gain
(Loss) | Change in
Unrealized
Appreciation or
Depreciation | Ending
Value |
| MFS Institutional Money Market Portfolio | $64,030,541 | $422,060,272 | $385,385,836 | $6,151 | $(2,520) | $100,708,608 |
| Affiliated Issuers | Dividend
Income | Capital Gain
Distributions |
| MFS Institutional Money Market Portfolio | $4,112,659 | $— |
Report of Independent Registered Public Accounting Firm
To the Board of Trustees of MFS Series Trust III and the Shareholders of
MFS High Income Fund:
Opinion on the Financial Statements and Financial Highlights
We have audited the accompanying statement of assets and liabilities of MFS High Income Fund (the “Fund”), including the portfolio of investments, as of January 31, 2024, the related statement of operations for the year then ended, the statements of changes in net assets for each of the two years in the period then ended, the financial highlights for each of the five years in the period then ended, and the related notes. In our opinion, the financial statements and financial highlights present fairly, in all material respects, the financial position of the Fund as of January 31, 2024, and the results of its operations for the year then ended, the changes in its net assets for each of the two years in the period then ended, and the financial highlights for each of the five years in the period then ended, in conformity with accounting principles generally accepted in the United States of America.
Basis for Opinion
These financial statements and financial highlights are the responsibility of the Fund's management. Our responsibility is to express an opinion on the Fund's financial statements and financial highlights based on our audits. We are a public accounting firm registered with the Public Company Accounting Oversight Board (United States) (PCAOB) and are required to be independent with respect to the Fund in accordance with the U.S. federal securities laws and the applicable rules and regulations of the Securities and Exchange Commission and the PCAOB.
We conducted our audits in accordance with the standards of the PCAOB. Those standards require that we plan and perform the audit to obtain reasonable assurance about whether the financial statements and financial highlights are free of material misstatement, whether due to error or fraud. The Fund is not required to have, nor were we engaged to perform, an audit of its internal control over financial reporting. As part of our audits, we are required to obtain an understanding of internal control over financial reporting but not for the purpose of expressing an opinion on the effectiveness of the Fund's internal control over financial reporting. Accordingly, we express no such opinion.
Our audits included performing procedures to assess the risks of material misstatement of the financial statements and financial highlights, whether due to error or fraud, and performing procedures that respond to those risks. Such procedures included examining, on a test basis, evidence regarding the amounts and disclosures in the financial statements and financial highlights. Our audits also included evaluating the accounting principles used and significant estimates made by management, as well as evaluating the overall presentation of the financial statements and financial highlights.
Report of Independent Registered Public Accounting Firm – continued
Our procedures included confirmation of securities owned as of January 31, 2024, by correspondence with the custodian and brokers; when replies were not received from brokers, we performed other auditing procedures. We believe that our audits provide a reasonable basis for our opinion.
DELOITTE & TOUCHE LLP
Boston, Massachusetts
March 14, 2024
We have served as the auditor of one or more of the MFS investment companies since 1924.
Trustees and Officers — Identification and Background
The Trustees and Officers of the Trust, as of March 1, 2024, are listed below, together with their principal occupations during the past five years. (Their titles may have varied during that period.) The address of each Trustee and Officer is 111 Huntington Avenue, Boston, Massachusetts 02199-7618.
| Name, Age | | Position(s) Held with Fund | | Trustee/Officer Since(h) | | Number of MFS Funds overseen by the Trustee | | Principal Occupations During
the Past Five Years | | Other Directorships During
the Past Five Years (j) |
| INTERESTED TRUSTEE | | | | | | | | | | |
Michael W. Roberge (k)
(age 57) | | Trustee | | January 2021 | | 136 | | Massachusetts Financial Services Company, Chairman (since January 2021); Chief Executive Officer (since January 2017); Director; Chairman of the Board (since January 2022) | | N/A |
| INDEPENDENT TRUSTEES | | | | | | | | | | |
John P. Kavanaugh
(age 69) | | Trustee and Chair of Trustees | | January 2009 | | 136 | | Private investor | | N/A |
Steven E. Buller
(age 72) | | Trustee | | February 2014 | | 136 | | Private investor | | N/A |
John A. Caroselli
(age 69) | | Trustee | | March 2017 | | 136 | | Private investor; JC Global Advisors, LLC (management consulting), President (since 2015) | | N/A |
Maureen R. Goldfarb
(age 68) | | Trustee | | January 2009 | | 136 | | Private investor | | N/A |
Peter D. Jones
(age 68) | | Trustee | | January 2019 | | 136 | | Private investor | | N/A |
James W. Kilman, Jr.
(age 62) | | Trustee | | January 2019 | | 136 | | Burford Capital Limited (finance and investment management), Senior Advisor (since May 3, 2021), Chief Financial Officer (2019 - May 2, 2021); KielStrand Capital LLC (family office), Chief Executive Officer (since 2016) | | Alpha-En Corporation, Director (2016-2019) |
Trustees and Officers - continued
| Name, Age | | Position(s) Held with Fund | | Trustee/Officer Since(h) | | Number of MFS Funds overseen by the Trustee | | Principal Occupations During
the Past Five Years | | Other Directorships During
the Past Five Years (j) |
Clarence Otis, Jr.
(age 67) | | Trustee | | March 2017 | | 136 | | Private investor | | VF Corporation, Director; Verizon Communications, Inc., Director; The Travelers Companies, Director |
Maryanne L. Roepke
(age 68) | | Trustee | | May 2014 | | 136 | | Private investor | | N/A |
Laurie J. Thomsen
(age 66) | | Trustee | | March 2005 | | 136 | | Private investor | | The Travelers Companies, Director; Dycom Industries, Inc., Director |
| Name, Age | | Position(s) Held with
Fund | | Trustee/Officer Since(h) | | Number of MFS Funds for which the Person is an Officer | | Principal Occupations During
the Past Five Years |
| OFFICERS | | | | | | | | |
Christopher R. Bohane (k)
(age 50) | | Assistant Secretary and Assistant Clerk | | July 2005 | | 136 | | Massachusetts Financial Services Company, Senior Vice President and Deputy General Counsel |
Kino Clark (k)
(age 55) | | Assistant Treasurer | | January 2012 | | 136 | | Massachusetts Financial Services Company, Vice President |
John W. Clark, Jr. (k)
(age 56) | | Assistant Treasurer | | April 2017 | | 136 | | Massachusetts Financial Services Company, Vice President |
David L. DiLorenzo (k)
(age 55) | | President | | July 2005 | | 136 | | Massachusetts Financial Services Company, Senior Vice President |
Heidi W. Hardin (k)
(age 56) | | Secretary and Clerk | | April 2017 | | 136 | | Massachusetts Financial Services Company, Executive Vice President and General Counsel |
Brian E. Langenfeld (k)
(age 50) | | Assistant Secretary and Assistant Clerk | | June 2006 | | 136 | | Massachusetts Financial Services Company, Vice President and Managing Counsel |
Rosa E. Licea-Mailloux (k)
(age 47) | | Chief Compliance Officer | | March 2022 | | 136 | | Massachusetts Financial Services Company, Vice President (since 2018); Director of Corporate Compliance (2018-2021), Senior Director Compliance (2021-2022), Senior Managing Director of North American Compliance & Chief Compliance Officer (since March 2022) |
Trustees and Officers - continued
| Name, Age | | Position(s) Held with
Fund | | Trustee/Officer Since(h) | | Number of MFS Funds for which the Person is an Officer | | Principal Occupations During
the Past Five Years |
Amanda S. Mooradian (k)
(age 45) | | Assistant Secretary and Assistant Clerk | | September 2018 | | 136 | | Massachusetts Financial Services Company, Vice President and Senior Counsel |
Susan A. Pereira (k)
(age 53) | | Assistant Secretary and Assistant Clerk | | July 2005 | | 136 | | Massachusetts Financial Services Company, Vice President and Managing Counsel |
Kasey L. Phillips (k)
(age 53) | | Assistant Treasurer | | September 2012 | | 136 | | Massachusetts Financial Services Company, Vice President |
Matthew A. Stowe (k)
(age 49) | | Assistant Secretary and Assistant Clerk | | October 2014 | | 136 | | Massachusetts Financial Services Company, Vice President and Senior Managing Counsel |
William B. Wilson (k)
(age 41) | | Assistant Secretary and Assistant Clerk | | October 2022 | | 136 | | Massachusetts Financial Services Company, Assistant Vice President and Senior Counsel |
James O. Yost (k)
(age 63) | | Treasurer | | September 1990 | | 136 | | Massachusetts Financial Services Company, Senior Vice President |
| (h) | Date first appointed to serve as Trustee/Officer of an MFS Fund. Each Trustee has served continuously since appointment unless indicated otherwise. From January 2012 through December 2016, Messrs. DiLorenzo and Yost served as Treasurer and Deputy Treasurer of the Funds, respectively. |
| (j) | Directorships or trusteeships of companies required to report to the Securities and Exchange Commission (i.e., “public companies”). |
| (k) | “Interested person” of the Trust within the meaning of the Investment Company Act of 1940 (referred to as the 1940 Act), which is the principal federal law governing investment companies like the fund, as a result of a position with MFS. The address of MFS is 111 Huntington Avenue, Boston, Massachusetts 02199-7618. |
Each Trustee (other than Messrs. Jones, Kilman and Roberge) has been elected by shareholders and each Trustee and Officer holds office until his or her successor is chosen and qualified or until his or her earlier death, resignation, retirement or removal. Mr. Roberge became a Trustee of the Funds on January 1, 2021 and Messrs. Jones and Kilman became Trustees of the Funds on January 1, 2019. The Trust does not hold annual meetings for the purpose of electing Trustees, and Trustees are not elected for fixed terms. Under the terms of the Board's retirement policy, an Independent Trustee shall retire at the end of the calendar year in which he or she reaches the earlier of 75 years of age or 15 years of service on the Board (or, in the case of any Independent Trustee who joined the Board prior to 2015, 20 years of service on the Board).
Messrs. Buller, Caroselli, Jones and Otis are members of the Trust’s Audit Committee.
Trustees and Officers - continued
Each of the Interested Trustees and certain Officers hold comparable officer positions with certain affiliates of MFS.
The Statement of Additional Information for a Fund includes further information about the Trustees and is available without charge upon request by calling 1-800-225-2606.
| Investment Adviser | Custodian |
Massachusetts Financial Services Company
111 Huntington Avenue
Boston, MA 02199-7618 | JPMorgan Chase Bank, NA
4 Metrotech Center
New York, NY 11245 |
| Distributor | Independent Registered Public Accounting Firm |
MFS Fund Distributors, Inc.
111 Huntington Avenue
Boston, MA 02199-7618 | Deloitte & Touche LLP
200 Berkeley Street
Boston, MA 02116 |
| Portfolio Manager(s) | |
David Cole
Michael Skatrud | |
Proxy Voting Policies and Information
MFS votes proxies on behalf of the fund pursuant to proxy voting policies and procedures that are available without charge, upon request, by calling 1-800-225-2606, by visiting mfs.com/proxyvoting, or by visiting the SEC’s Web site at http://www.sec.gov.
Information regarding how the fund voted proxies relating to portfolio securities during the most recent twelve-month period ended June 30 is available by August 31 of each year without charge by visiting mfs.com/proxyvoting, or by visiting the SEC’s Web site at http://www.sec.gov.
Quarterly Portfolio Disclosure
The fund files a complete schedule of portfolio holdings with the SEC for the first and third quarters of each fiscal year as an exhibit to its reports on Form N-PORT. The fund's Form N-PORT reports are available on the SEC's Web site at http://www.sec.gov. A shareholder can obtain the portfolio holdings report for the first and third quarters of the fund's fiscal year at mfs.com/openendfunds by choosing the fund's name and then scrolling to the “Resources” section and clicking on the “Prospectus and Reports” tab.
Further Information
From time to time, MFS may post important information about the fund or the MFS Funds on the MFS Web site (mfs.com). This information is available at https://www.mfs.com/announcements or at mfs.com/openendfunds by choosing the fund’s name and then scrolling to the “Resources” section and clicking on the “Announcements” tab, if any.
Information About Fund Contracts and Legal Claims
The fund has entered into contractual arrangements with an investment adviser, administrator, distributor, shareholder servicing agent, and custodian who each provide services to the fund. Unless expressly stated otherwise, shareholders are not parties to, or intended beneficiaries of these contractual arrangements, and these contractual arrangements are not intended to create any shareholder right to enforce them against the service providers or to seek any remedy under them against the service providers, either directly or on behalf of the fund.
Under the Trust’s By-Laws and Declaration of Trust, any claims asserted against or on behalf of the MFS Funds, including claims against Trustees and Officers, must be brought in state and federal courts located within the Commonwealth of Massachusetts.
Federal Tax Information (unaudited)
The fund will notify shareholders of amounts for use in preparing 2024 income tax forms in January 2025. The following information is provided pursuant to provisions of the Internal Revenue Code.
The fund intends to pass through the maximum amount allowable as Section 163(j) Interest Dividends as defined in Treasury Regulation §1.163(j)-1(b).
| FACTS | WHAT DOES MFS DO WITH YOUR PERSONAL INFORMATION? |
| Why? | Financial companies choose how they share your personal information. Federal law gives consumers the right to limit some but not all sharing. Federal law also requires us to tell you how we collect, share, and protect your personal information. Please read this notice carefully to understand what we do. |
| What? | The types of personal information we collect and share depend on the product or service you have with us. This information can include: |
| • Social Security number and account balances |
| • Account transactions and transaction history |
| • Checking account information and wire transfer instructions |
| When you are no longer our customer, we continue to share your information as described in this notice. |
| How? | All financial companies need to share customers' personal information to run their everyday business. In the section below, we list the reasons financial companies can share their customers' personal information; the reasons MFS chooses to share; and whether you can limit this sharing. |
Reasons we can share your
personal information | Does MFS share? | Can you limit
this sharing? |
For our everyday business purposes –
such as to process your transactions, maintain your
account(s), respond to court orders and legal
investigations, or report to credit bureaus | Yes | No |
For our marketing purposes –
to offer our products and services to you | No | We don't share |
For joint marketing with other
financial companies | No | We don't share |
For our affiliates' everyday business purposes –
information about your transactions and experiences | No | We don't share |
For our affiliates' everyday business purposes –
information about your creditworthiness | No | We don't share |
| For nonaffiliates to market to you | No | We don't share |
| Questions? | Call 800-225-2606 or go to mfs.com. |
| Who we are |
| Who is providing this notice? | MFS Funds, MFS Investment Management, MFS Institutional Advisors, Inc., and MFS Heritage Trust Company. |
| What we do |
How does MFS
protect my personal
information? | To protect your personal information from unauthorized access and use, we use security measures that comply with federal law. These measures include procedural, electronic, and physical safeguards for the protection of the personal information we collect about you. |
How does MFS
collect my personal
information? | We collect your personal information, for example, when you |
| • open an account or provide account information |
| • direct us to buy securities or direct us to sell your securities |
| • make a wire transfer |
| We also collect your personal information from others, such as credit bureaus, affiliates, or other companies. |
| Why can't I limit all sharing? | Federal law gives you the right to limit only |
| • sharing for affiliates' everyday business purposes – information about your creditworthiness |
| • affiliates from using your information to market to you |
| • sharing for nonaffiliates to market to you |
| State laws and individual companies may give you additional rights to limit sharing. |
| Definitions |
| Affiliates | Companies related by common ownership or control. They can be financial and nonfinancial companies. |
| • MFS does not share personal information with affiliates, except for everyday business purposes as described on page one of this notice. |
| Nonaffiliates | Companies not related by common ownership or control. They can be financial and nonfinancial companies. |
| • MFS does not share with nonaffiliates so they can market to you. |
| Joint marketing | A formal agreement between nonaffiliated financial companies that together market financial products or services to you. |
| • MFS doesn't jointly market. |
| Other important information |
| If you own an MFS product or receive an MFS service in the name of a third party such as a bank or broker-dealer, their privacy policy may apply to you instead of ours. |
Save paper with eDelivery.
MFS® will send you prospectuses, reports, and proxies directly via e-mail so you will get information faster with less mailbox clutter.
To sign up:
1. Go to mfs.com.
2. Log in via MFS® Access.
3. Select eDelivery.
If you own your MFS fund shares through a financial institution or a retirement plan, MFS® TALK, MFS® Access, or eDelivery may not be available to you.
CONTACT
WEB SITE
mfs.com
MFS TALK
1-800-637-8255
24 hours a day
ACCOUNT SERVICE AND LITERATURE
Shareholders
1-800-225-2606
Financial advisors
1-800-343-2829
Retirement plan services
1-800-637-1255
MAILING ADDRESS
MFS Service Center, Inc.
P.O. Box 219341
Kansas City, MO 64121-9341
OVERNIGHT MAIL
MFS Service Center, Inc.
Suite 219341
430 W 7th Street
Kansas City, MO 64105-1407
Annual Report
January 31, 2024
MFS® High Yield Pooled Portfolio
MFS® High Yield Pooled Portfolio
| 1 |
| 3 |
| 5 |
| 7 |
| 8 |
| 22 |
| 23 |
| 24 |
| 25 |
| 26 |
| 37 |
| 39 |
| 43 |
| 43 |
| 43 |
| 43 |
| 43 |
| 44 |
The report is prepared for the general information of shareholders. It is authorized for distribution to prospective investors only when preceded or accompanied by a current prospectus.
NOT FDIC INSURED • MAY LOSE VALUE • NO BANK GUARANTEE
Portfolio structure (i)
Top five industries (i)
| Cable TV | 8.2% |
| Medical & Health Technology & Services | 5.9% |
| Midstream | 4.8% |
| Financial Institutions | 4.5% |
| Consumer Services | 4.3% |
Composition including fixed income credit quality (a)(i)
| BBB | 1.3% |
| BB | 40.9% |
| B | 41.8% |
| CCC | 13.5% |
| CC | 0.2% |
| U.S. Government | 0.5% |
| Not Rated | 0.2% |
| Non-Fixed Income | 0.3% |
| Cash & Cash Equivalents | 1.0% |
| Other | 0.3% |
Portfolio facts
| Average Duration (d) | 3.2 |
| Average Effective Maturity (m) | 4.4 yrs. |
| (a) | For all securities other than those specifically described below, ratings are assigned to underlying securities utilizing ratings from Moody’s, Fitch, and Standard & Poor’s rating agencies and applying the following hierarchy: If all three agencies provide a rating, the middle rating (after dropping the highest and lowest ratings) is assigned; if two of the three agencies rate a security, the lower of the two is assigned. If none of the 3 rating agencies above assign a rating, but the security is rated by DBRS Morningstar, then the DBRS Morningstar rating is assigned. If none of the 4 rating agencies listed above rate the security, but the security is rated by the Kroll Bond Rating Agency (KBRA), then the KBRA rating is assigned. Ratings are shown in the S&P and Fitch scale (e.g., AAA). Securities rated BBB or higher are considered investment grade. All ratings are subject to change. U.S. Government includes securities issued by the U.S. Department of the Treasury. Not Rated includes fixed income securities and fixed income derivatives that have not been rated by any rating agency. |
Non-Fixed Income includes equity securities (including convertible bonds and equity derivatives), ETFs and Options on ETFs, and/or commodity-linked derivatives. The fund may or may not have held all of these instruments on this date. The fund is not rated by these agencies.
| (d) | Duration is a measure of how much a bond’s price is likely to fluctuate with general changes in interest rates, e.g., if rates rise 1.00%, a bond with a 5-year duration is likely to lose about 5.00% of its value due to the interest rate move. The Average Duration calculation reflects the impact of the equivalent exposure of derivative positions, if any. |
Portfolio Composition - continued
| (i) | For purposes of this presentation, the components include the value of securities, and reflect the impact of the equivalent exposure of derivative positions, if any. These amounts may be negative from time to time. Equivalent exposure is a calculated amount that translates the derivative position into a reasonable approximation of the amount of the underlying asset that the portfolio would have to hold at a given point in time to have the same price sensitivity that results from the portfolio’s ownership of the derivative contract. When dealing with derivatives, equivalent exposure is a more representative measure of the potential impact of a position on portfolio performance than value. The bond component will include any accrued interest amounts. |
| (m) | In determining each instrument’s effective maturity for purposes of calculating the fund’s dollar-weighted average effective maturity, MFS uses the instrument’s stated maturity or, if applicable, an earlier date on which MFS believes it is probable that a maturity-shortening feature (such as a put, pre-refunding or prepayment) will cause the instrument to be repaid. Such an earlier date can be substantially shorter than the instrument’s stated maturity. |
Where the fund holds convertible bonds, they are treated as part of the equity portion of the portfolio.
Cash & Cash Equivalents includes any cash, investments in money market funds, short-term securities, and other assets less liabilities. Please see the Statement of Assets and Liabilities for additional information related to the fund’s cash position and other assets and liabilities.
Other includes equivalent exposure from currency derivatives and/or any offsets to derivative positions and may be negative.
Percentages are based on net assets as of January 31, 2024.
The portfolio is actively managed and current holdings may be different.
Management Review
Summary of Results
For the twelve months ended January 31, 2024, shares of the MFS High Yield Pooled Portfolio (fund) provided a total return of 9.46%, at net asset value. This compares with a return of 9.28% for the fund’s benchmark, the Bloomberg U.S. Corporate High-Yield 2% Issuer Capped Index.
Market Environment
During the reporting period, central banks around the world had to combat the strongest inflationary pressures in four decades, fueled by the global fiscal response to the pandemic, disrupted supply chains and the dislocations to energy markets stemming from the war in Ukraine. Interest rates rose substantially, but the effects of a tighter monetary policy may not have been fully experienced yet, given that monetary policy works with long and variable lags. Strains resulting from the abrupt tightening of monetary policy began to affect some parts of the economy, most acutely among small and regional US banks, which suffered from deposit flight as depositors sought higher yields on their savings. Additionally, activity in the US housing sector has slowed as a result of higher mortgage rates. China’s abandonment of its Zero-COVID policy ushered in a brief uptick in economic activity in the world’s second-largest economy in early 2023, although its momentum soon stalled as the focus turned to the country’s highly indebted property development sector. In developed markets, consumer demand for services remained stronger than the demand for goods.
Despite the challenging macroeconomic and geopolitical environment, central banks focused on controlling price pressures while also confronting increasing financial stability concerns. Central banks had to juggle achieving their inflation mandates while using tools aimed at safeguarding the stability of the financial system to keep banking systems liquid as banks grappled with exposures to commercial real estate. As inflationary pressures eased toward the end of the period, financial conditions loosened in anticipation of easier monetary policy, boosting the market’s appetite for risk as near-term recession risks diminished. Rapid advancements in artificial intelligence were a focus for investors.
Normalizing supply chains, low levels of unemployment across developed markets and signs that inflation levels have peaked were supportive factors for the macroeconomic backdrop.
Contributors to Performance
Relative to the Bloomberg U.S. Corporate High-Yield 2% Issuer Capped Index, the fund's underweight allocation to both the communications and transportation sectors contributed to performance as these sectors underperformed the benchmark over the reporting period. Additionally, an overweight allocation to the brokerage sector further bolstered relative returns. The combination of favorable bond selection and an underweight allocation to the energy sector also supported relative results.
Top individual contributors for the reporting period included the fund’s overweight holdings of American Irish-domiciled mass customization business operator Cimpress (communications) and British telecommunications company Virgin Media (communications).
Management Review - continued
Detractors from Performance
During the reporting period, bond selection within both “B” and “CCC” rated(r) bonds detracted from relative performance. The fund’s overweight allocation to “BBB” rated bonds and underweight allocation to “CC” rated bonds also held back relative returns. From a sector perspective, bond selection within both the technology and financial institutions sectors weighed on the fund’s relative results.
Top individual detractors for the reporting period included the fund’s overweight holdings of graphite electrode manufacturer GrafTech Finance (basic industry) and media and entertainment services provider iHeartMedia(h) (communications).
The fund’s cash and/or cash equivalents position during the period was also a detractor from relative performance.
Respectfully,
Portfolio Manager(s)
David Cole and Michael Skatrud
| (h) | Security was not held in the portfolio at period end. |
| (r) | Securities rated “BBB”, “Baa”, or higher are considered investment grade; securities rated “BB”, “Ba”, or below are considered non-investment grade. Ratings are assigned to underlying securities utilizing ratings from Moody's, Fitch, and Standard & Poor's and applying the following hierarchy: If all three agencies provide a rating, the middle rating (after dropping the highest and lowest ratings) is assigned; if two of the three agencies rate a security, the lower of the two is assigned. If none of the 3 rating agencies above assign a rating, but the security is rated by DBRS Morningstar, then the DBRS Morningstar rating is assigned. If none of the 4 rating agencies listed above rate the security, but the security is rated by the Kroll Bond Rating Agency (KBRA), then the KBRA rating is assigned. Ratings are shown in the S&P and Fitch scale (e.g., AAA). For securities that are not rated by any of the rating agencies, the security is considered Not Rated. |
The views expressed in this report are those of the portfolio manager(s) only through the end of the period of the report as stated on the cover and do not necessarily reflect the views of MFS or any other person in the MFS organization. These views are subject to change at any time based on market or other conditions, and MFS disclaims any responsibility to update such views. These views may not be relied upon as investment advice or an indication of trading intent on behalf of any MFS portfolio. References to specific securities are not recommendations of such securities, and may not be representative of any MFS portfolio’s current or future investments.
Performance Summary THROUGH 1/31/24
The following chart illustrates the fund’s historical performance in comparison to its benchmark(s). Performance results reflect the percentage change in net asset value, including reinvestment of dividends and capital gains distributions. Benchmarks are unmanaged and may not be invested in directly. Benchmark returns do not reflect sales charges, commissions or expenses. (See Notes to Performance Summary.)
Performance data shown represents past performance and is no guarantee of future results. Investment return and principal value fluctuate so your shares, when sold, may be worth more or less than the original cost; current performance may be lower or higher than quoted. The performance shown does not reflect the deduction of taxes, if any, that a shareholder would pay on fund distributions or the redemption of fund shares.
Growth of a Hypothetical $10,000 Investment
Performance Summary - continued
Total Returns through 1/31/24
Average annual without sales charge
| Fund Inception Date | 1-yr | 5-yr | 10-yr |
| 3/25/2013 | 9.46% | 4.33% | 4.43% |
Comparative benchmark(s)
| Bloomberg U.S. Corporate High-Yield 2% Issuer Capped Index (f) | 9.28% | 4.43% | 4.52% |
| (f) | Source: FactSet Research Systems Inc. |
Benchmark Definition(s)
Bloomberg U.S. Corporate High-Yield 2% Issuer Capped Index(a) – a component of the Bloomberg U.S. Corporate High-Yield Index, which measures performance of non-investment grade, fixed rate debt. The index limits the maximum exposure to any one issuer to 2%.
It is not possible to invest directly in an index.
| (a) | Source: Bloomberg Index Services Limited. BLOOMBERG® is a trademark and service mark of Bloomberg Finance L.P. and its affiliates (collectively “Bloomberg”). Bloomberg or Bloomberg's licensors own all proprietary rights in the Bloomberg Indices. Bloomberg neither approves or endorses this material, or guarantees the accuracy or completeness of any information herein, or makes any warranty, express or implied, as to the results to be obtained therefrom and, to the maximum extent allowed by law, neither shall have any liability or responsibility for injury or damages arising in connection therewith. |
Notes to Performance Summary
Average annual total return represents the average annual change in value for the fund for the periods presented.
Performance results reflect any applicable expense subsidies and waivers in effect during the periods shown. Without such subsidies and waivers the fund's performance results would be less favorable. Please see the prospectus and financial statements for complete details.
Performance results do not include adjustments made for financial reporting purposes in accordance with U.S. generally accepted accounting principles and may differ from amounts reported in the financial highlights.
From time to time the fund may receive proceeds from litigation settlements, without which performance would be lower.
Expense Table
Fund expenses borne by the shareholders during the period,
August 1, 2023 through January 31, 2024
As a shareholder of the fund, you incur ongoing costs, including fund expenses. This example is intended to help you understand your ongoing costs (in dollars) of investing in the fund and to compare these costs with the ongoing costs of investing in other mutual funds.
The example is based on an investment of $1,000 invested at the beginning of the period and held for the entire period August 1, 2023 through January 31, 2024.
Actual Expenses
The first line of the following table provides information about actual account values and actual expenses. You may use the information in this line, together with the amount you invested, to estimate the expenses that you paid over the period. Simply divide your account value by $1,000 (for example, an $8,600 account value divided by $1,000 = 8.6), then multiply the result by the number in the first line under the heading entitled “Expenses Paid During Period” to estimate the expenses you paid on your account during this period.
Hypothetical Example for Comparison Purposes
The second line of the following table provides information about hypothetical account values and hypothetical expenses based on the fund’s actual expense ratio and an assumed rate of return of 5% per year before expenses, which is not the fund’s actual return. The hypothetical account values and expenses may not be used to estimate the actual ending account balance or expenses you paid for the period. You may use this information to compare the ongoing costs of investing in the fund and other funds. To do so, compare this 5% hypothetical example with the 5% hypothetical examples that appear in the shareholder reports of the other funds.
Please note that the expenses shown in the table are meant to highlight your ongoing costs only and do not reflect any transactional costs, such as sales charges (loads). Therefore, the second line of the table is useful in comparing ongoing costs only, and will not help you determine the relative total costs of owning different funds. In addition, if these transactional costs were included, your costs would have been higher.
| | Annualized
Expense
Ratio | Beginning
Account Value
8/01/23 | Ending
Account Value
1/31/24 | Expenses
Paid During
Period (p)
8/01/23-1/31/24 |
| Actual | 0.02% | $1,000.00 | $1,062.04 | $0.10 |
| Hypothetical (h) | 0.02% | $1,000.00 | $1,025.10 | $0.10 |
| (h) | 5% fund return per year before expenses. |
| (p) | “Expenses Paid During Period” are equal to the fund’s annualized expense ratio, as shown above, multiplied by the average account value over the period, multiplied by 184/365 (to reflect the one-half year period). |
Portfolio of Investments
1/31/24
The Portfolio of Investments is a complete list of all securities owned by your fund. It is categorized by broad-based asset classes.
| Issuer | | | Shares/Par | Value ($) |
| Bonds – 96.9% |
| Aerospace & Defense – 3.6% |
| Bombardier, Inc., 7.125%, 6/15/2026 (n) | | $ | 1,090,000 | $1,099,083 |
| Bombardier, Inc., 7.5%, 2/01/2029 (n) | | | 1,032,000 | 1,051,874 |
| Bombardier, Inc., 8.75%, 11/15/2030 (n) | | | 714,000 | 749,313 |
| F-Brasile S.p.A./F-Brasile U.S. LLC, 7.375%, 8/15/2026 (n) | | | 2,450,000 | 2,422,438 |
| Moog, Inc., 4.25%, 12/15/2027 (n) | | | 2,461,000 | 2,304,284 |
| Spirit AeroSystems, Inc., 9.75%, 11/15/2030 (n) | | | 3,201,000 | 3,359,643 |
| TransDigm, Inc., 6.25%, 3/15/2026 (n) | | | 2,058,000 | 2,044,003 |
| TransDigm, Inc., 5.5%, 11/15/2027 | | | 2,414,000 | 2,348,601 |
| TransDigm, Inc., 6.75%, 8/15/2028 (n) | | | 1,991,000 | 2,023,579 |
| TransDigm, Inc., 4.625%, 1/15/2029 | | | 2,147,000 | 2,007,595 |
| TransDigm, Inc., 6.875%, 12/15/2030 (n) | | | 4,145,000 | 4,242,034 |
| | | | | $23,652,447 |
| Airlines – 0.8% |
| Air Canada, 3.875%, 8/15/2026 (n) | | $ | 3,385,000 | $3,219,402 |
| American Airlines, Inc./AAdvantage Loyalty IP Ltd., 5.75%, 4/20/2029 (n) | | | 2,200,096 | 2,160,560 |
| | | | | $5,379,962 |
| Apparel Manufacturers – 0.2% |
| Wolverine World Wide, Inc., 4%, 8/15/2029 (n) | | $ | 1,601,000 | $1,290,086 |
| Automotive – 1.7% |
| Clarios Global LP/Clarios U.S. Finance Co., 8.5%, 5/15/2027 (n) | | $ | 2,013,000 | $2,007,483 |
| Clarios Global LP/Clarios U.S. Finance Co., 6.75%, 5/15/2028 (n) | | | 1,045,000 | 1,058,867 |
| Dana, Inc., 5.375%, 11/15/2027 | | | 1,897,000 | 1,851,282 |
| Dana, Inc., 4.25%, 9/01/2030 | | | 1,285,000 | 1,123,565 |
| Dornoch Debt Merger Sub, Inc., 6.625%, 10/15/2029 (n) | | | 2,072,000 | 1,880,793 |
| Real Hero Merger Sub 2, Inc., 6.25%, 2/01/2029 (n) | | | 1,705,000 | 1,479,190 |
| Wabash National Corp., 4.5%, 10/15/2028 (n) | | | 2,201,000 | 2,002,910 |
| | | | | $11,404,090 |
| Broadcasting – 0.8% |
| AMC Networks, Inc., 4.75%, 8/01/2025 | | $ | 599,000 | $577,153 |
| Banijay Group S.A.S., 8.125%, 5/01/2029 (n) | | | 2,153,000 | 2,226,196 |
| Midas OpCo Holdings LLC, 5.625%, 8/15/2029 (n) | | | 2,806,000 | 2,567,658 |
| | | | | $5,371,007 |
Portfolio of Investments – continued
| Issuer | | | Shares/Par | Value ($) |
| Bonds – continued |
| Brokerage & Asset Managers – 2.0% |
| AG TTMT Escrow Issuer LLC, 8.625%, 9/30/2027 (n) | | $ | 1,808,000 | $1,876,953 |
| Aretec Escrow Issuer 2, Inc., 10%, 8/15/2030 (n) | | | 2,049,000 | 2,212,965 |
| Aretec Escrow Issuer, Inc., 7.5%, 4/01/2029 (n) | | | 1,758,000 | 1,636,385 |
| LPL Holdings, Inc., 4%, 3/15/2029 (n) | | | 1,444,000 | 1,330,818 |
| LPL Holdings, Inc., 4.375%, 5/15/2031 (n) | | | 1,984,000 | 1,803,436 |
| NFP Corp., 4.875%, 8/15/2028 (n) | | | 2,230,000 | 2,211,937 |
| NFP Corp., 6.875%, 8/15/2028 (n) | | | 1,727,000 | 1,736,680 |
| | | | | $12,809,174 |
| Building – 4.0% |
| ABC Supply Co., Inc., 3.875%, 11/15/2029 (n) | | $ | 1,283,000 | $1,143,212 |
| Foundation Building Materials LLC, 6%, 3/01/2029 (n) | | | 2,495,000 | 2,192,481 |
| GYP Holding III Corp., 4.625%, 5/01/2029 (n) | | | 3,139,000 | 2,907,687 |
| Interface, Inc., 5.5%, 12/01/2028 (n) | | | 2,352,000 | 2,201,096 |
| MIWD Holdco II LLC/MIWD Finance Co., 5.5%, 2/01/2030 (n) | | | 2,149,000 | 1,955,590 |
| New Enterprise Stone & Lime Co., Inc., 5.25%, 7/15/2028 (n) | | | 2,658,000 | 2,553,806 |
| New Enterprise Stone & Lime Co., Inc., 9.75%, 7/15/2028 (n) | | | 840,000 | 844,490 |
| Patrick Industries, Inc., 7.5%, 10/15/2027 (n) | | | 2,885,000 | 2,899,425 |
| SRM Concrete, 8.875%, 11/15/2031 (n) | | | 2,796,000 | 2,937,369 |
| Standard Industries, Inc., 4.75%, 1/15/2028 (n) | | | 1,364,000 | 1,304,561 |
| Standard Industries, Inc., 4.375%, 7/15/2030 (n) | | | 3,063,000 | 2,783,509 |
| White Cap Buyer LLC, 6.875%, 10/15/2028 (n) | | | 2,494,000 | 2,441,177 |
| | | | | $26,164,403 |
| Business Services – 1.2% |
| Entegris Escrow Corp., 5.95%, 6/15/2030 (n) | | $ | 1,220,000 | $1,205,087 |
| Iron Mountain, Inc., 4.875%, 9/15/2027 (n) | | | 1,670,000 | 1,613,737 |
| Iron Mountain, Inc., 5.25%, 3/15/2028 (n) | | | 1,897,000 | 1,839,723 |
| Verscend Escrow Corp., 9.75%, 8/15/2026 (n) | | | 3,321,000 | 3,334,234 |
| | | | | $7,992,781 |
| Cable TV – 8.0% |
| Cable One, Inc., 4%, 11/15/2030 (n) | | $ | 3,771,000 | $3,035,655 |
| CCO Holdings LLC/CCO Holdings Capital Corp., 5.125%, 5/01/2027 (n) | | | 1,403,000 | 1,353,216 |
| CCO Holdings LLC/CCO Holdings Capital Corp., 4.75%, 3/01/2030 (n) | | | 7,598,000 | 6,751,639 |
| CCO Holdings LLC/CCO Holdings Capital Corp., 4.5%, 8/15/2030 (n) | | | 4,098,000 | 3,563,867 |
| CCO Holdings LLC/CCO Holdings Capital Corp., 4.25%, 2/01/2031 (n) | | | 2,101,000 | 1,776,493 |
| CCO Holdings LLC/CCO Holdings Capital Corp., 4.25%, 1/15/2034 (n) | | | 1,573,000 | 1,250,696 |
| CSC Holdings LLC, 5.375%, 2/01/2028 (n) | | | 3,050,000 | 2,620,209 |
| CSC Holdings LLC, 7.5%, 4/01/2028 (n) | | | 1,100,000 | 732,245 |
Portfolio of Investments – continued
| Issuer | | | Shares/Par | Value ($) |
| Bonds – continued |
| Cable TV – continued |
| CSC Holdings LLC, 11.75%, 1/31/2029 (n) | | $ | 1,264,000 | $1,283,883 |
| CSC Holdings LLC, 5.75%, 1/15/2030 (n) | | | 2,990,000 | 1,582,577 |
| CSC Holdings LLC, 4.125%, 12/01/2030 (n) | | | 975,000 | 704,438 |
| DIRECTV Financing LLC, 8.875%, 2/01/2030 (n) | | | 489,000 | 498,807 |
| DISH DBS Corp., 7.75%, 7/01/2026 | | | 1,380,000 | 813,131 |
| DISH DBS Corp., 5.25%, 12/01/2026 (n) | | | 1,815,000 | 1,429,322 |
| DISH DBS Corp., 5.125%, 6/01/2029 | | | 1,517,000 | 581,085 |
| DISH Network Corp., 11.75%, 11/15/2027 (n) | | | 1,067,000 | 1,113,634 |
| LCPR Senior Secured Financing DAC, 6.75%, 10/15/2027 (n) | | | 2,919,000 | 2,811,761 |
| LCPR Senior Secured Financing DAC, 5.125%, 7/15/2029 (n) | | | 630,000 | 554,438 |
| Sirius XM Radio, Inc., 4%, 7/15/2028 (n) | | | 1,241,000 | 1,126,962 |
| Sirius XM Radio, Inc., 5.5%, 7/01/2029 (n) | | | 4,004,000 | 3,803,800 |
| Sirius XM Radio, Inc., 3.875%, 9/01/2031 (n) | | | 1,868,000 | 1,557,350 |
| Videotron Ltd., 5.125%, 4/15/2027 (n) | | | 1,597,000 | 1,573,045 |
| Videotron Ltd., 3.625%, 6/15/2029 (n) | | | 1,483,000 | 1,353,163 |
| Virgin Media Finance PLC, 5%, 7/15/2030 (n) | | | 3,640,000 | 3,250,919 |
| Virgin Media Vendor Financing Notes IV DAC, 5%, 7/15/2028 (n) | | | 3,178,000 | 2,991,620 |
| Ziggo Bond Finance B.V., 5.125%, 2/28/2030 (n) | | | 5,300,000 | 4,471,422 |
| | | | | $52,585,377 |
| Chemicals – 2.6% |
| Axalta Coating Systems Ltd., 4.75%, 6/15/2027 (n) | | $ | 2,274,000 | $2,188,975 |
| Axalta Coating Systems Ltd., 3.375%, 2/15/2029 (n) | | | 701,000 | 622,936 |
| Element Solutions, Inc., 3.875%, 9/01/2028 (n) | | | 2,168,000 | 1,980,577 |
| LSF11 A5 HoldCo LLC, 6.625%, 10/15/2029 (n) | | | 2,508,000 | 2,123,364 |
| SCIH Salt Holdings, Inc., 6.625%, 5/01/2029 (n) | | | 2,425,000 | 2,202,759 |
| SCIL IV LLC/SCIL USA Holdings LLC, 9.5%, 7/15/2028 (n) | | EUR | 1,183,000 | 1,379,467 |
| SNF Group SACA, 3.375%, 3/15/2030 (n) | | $ | 3,508,000 | 3,012,901 |
| Windsor Holdings III, LLC, 8.5%, 6/15/2030 (n) | | | 3,143,000 | 3,235,732 |
| | | | | $16,746,711 |
| Computer Software – 0.7% |
| Central Parent LLC/CDK Global II LLC/CDK Financing Co., Inc., 8%, 6/15/2029 (n) | | $ | 2,019,000 | $2,072,140 |
| Dun & Bradstreet Corp., 5%, 12/15/2029 (n) | | | 2,329,000 | 2,165,129 |
| | | | | $4,237,269 |
| Computer Software - Systems – 1.7% |
| Fair Isaac Corp., 5.25%, 5/15/2026 (n) | | $ | 4,021,000 | $3,970,738 |
| Sabre GLBL, Inc., 8.625%, 6/01/2027 (n) | | | 1,121,000 | 1,048,135 |
| Sabre GLBL, Inc., 11.25%, 12/15/2027 (n) | | | 1,075,000 | 1,076,344 |
| SS&C Technologies Holdings, Inc., 5.5%, 9/30/2027 (n) | | | 3,979,000 | 3,905,938 |
Portfolio of Investments – continued
| Issuer | | | Shares/Par | Value ($) |
| Bonds – continued |
| Computer Software - Systems – continued |
| Virtusa Corp., 7.125%, 12/15/2028 (n) | | $ | 1,275,000 | $1,118,072 |
| | | | | $11,119,227 |
| Conglomerates – 3.3% |
| BWX Technologies, Inc., 4.125%, 6/30/2028 (n) | | $ | 1,658,000 | $1,556,563 |
| BWX Technologies, Inc., 4.125%, 4/15/2029 (n) | | | 4,316,000 | 3,997,997 |
| Chart Industries, Inc., 9.5%, 1/01/2031 (n) | | | 1,330,000 | 1,418,481 |
| Emerald Debt Merger, 6.625%, 12/15/2030 (n) | | | 2,916,000 | 2,945,364 |
| Gates Global LLC, 6.25%, 1/15/2026 (n) | | | 1,737,000 | 1,737,174 |
| Griffon Corp., 5.75%, 3/01/2028 | | | 2,493,000 | 2,443,140 |
| Madison IAQ LLC, 5.875%, 6/30/2029 (n) | | | 2,165,000 | 1,923,797 |
| Regal Rexnord Corp., 6.3%, 2/15/2030 (n) | | | 1,752,000 | 1,800,863 |
| TriMas Corp., 4.125%, 4/15/2029 (n) | | | 4,496,000 | 4,002,883 |
| | | | | $21,826,262 |
| Construction – 0.7% |
| Mattamy Group Corp., 5.25%, 12/15/2027 (n) | | $ | 1,110,000 | $1,071,009 |
| Mattamy Group Corp., 4.625%, 3/01/2030 (n) | | | 1,727,000 | 1,574,502 |
| Weekley Homes LLC/Weekley Finance Corp., 4.875%, 9/15/2028 (n) | | | 2,387,000 | 2,224,722 |
| | | | | $4,870,233 |
| Consumer Products – 1.5% |
| Energizer Gamma Acquisition B.V., 3.5%, 6/30/2029 | | EUR | 1,290,000 | $1,234,023 |
| Energizer Holdings, Inc., 4.375%, 3/31/2029 (n) | | $ | 2,343,000 | 2,120,907 |
| HFC Prestige Products, Inc./HFC Prestige International US LLC, 6.625%, 7/15/2030 (n) | | | 2,850,000 | 2,902,924 |
| Prestige Consumer Healthcare, Inc., 5.125%, 1/15/2028 (n) | | | 2,611,000 | 2,555,699 |
| Prestige Consumer Healthcare, Inc., 3.75%, 4/01/2031 (n) | | | 1,495,000 | 1,296,430 |
| | | | | $10,109,983 |
| Consumer Services – 4.2% |
| Allied Universal Holdco LLC, 9.75%, 7/15/2027 (n) | | $ | 2,989,000 | $2,922,617 |
| Allied Universal Holdco LLC, 6%, 6/01/2029 (n) | | | 1,080,000 | 896,713 |
| Arches Buyer, Inc., 6.125%, 12/01/2028 (n) | | | 2,257,000 | 1,949,619 |
| Cushman & Wakefield PLC, 6.75%, 5/15/2028 (n) | | | 2,022,000 | 1,994,339 |
| GoDaddy, Inc., 3.5%, 3/01/2029 (n) | | | 3,973,000 | 3,597,154 |
| GW B-CR Security Corp., 9.5%, 11/01/2027 (n) | | | 2,451,000 | 2,465,793 |
| Match Group Holdings II LLC, 5%, 12/15/2027 (n) | | | 2,052,000 | 1,985,278 |
| Match Group Holdings II LLC, 4.625%, 6/01/2028 (n) | | | 3,115,000 | 2,932,212 |
| Match Group Holdings II LLC, 4.125%, 8/01/2030 (n) | | | 810,000 | 728,806 |
| Match Group Holdings II LLC, 3.625%, 10/01/2031 (n) | | | 385,000 | 329,175 |
| Realogy Group LLC/Realogy Co-Issuer Corp., 5.75%, 1/15/2029 (n) | | | 1,772,000 | 1,316,188 |
| Realogy Group LLC/Realogy Co-Issuer Corp., 5.25%, 4/15/2030 (n) | | | 1,760,000 | 1,237,418 |
| TriNet Group, Inc., 3.5%, 3/01/2029 (n) | | | 3,712,000 | 3,276,027 |
Portfolio of Investments – continued
| Issuer | | | Shares/Par | Value ($) |
| Bonds – continued |
| Consumer Services – continued |
| WASH Multi-Family Acquisition, Inc., 5.75%, 4/15/2026 (n) | | $ | 2,073,000 | $1,992,816 |
| | | | | $27,624,155 |
| Containers – 2.9% |
| ARD Finance S.A., 6.5% (6.5% Cash or 7.25% PIK), 6/30/2027 (n)(p) | | $ | 859,000 | $415,060 |
| Ardagh Metal Packaging Finance USA LLC, 3.25%, 9/01/2028 (n) | | | 2,400,000 | 2,097,521 |
| Ardagh Metal Packaging Finance USA LLC, 4%, 9/01/2029 (n) | | | 2,677,000 | 2,169,632 |
| Ardagh Packaging Finance PLC/Ardagh MP Holdings USA, Inc., 5.25%, 8/15/2027 (n) | | | 3,001,000 | 2,243,193 |
| Can-Pack S.A./Eastern PA Land Investment Holding LLC, 3.875%, 11/15/2029 (n) | | | 4,405,000 | 3,882,171 |
| Crown Americas LLC, 5.25%, 4/01/2030 | | | 1,203,000 | 1,162,399 |
| Crown Americas LLC/Crown Americas Capital Corp. V, 4.25%, 9/30/2026 | | | 2,743,000 | 2,643,758 |
| Crown Americas LLC/Crown Americas Capital Corp. VI, 4.75%, 2/01/2026 | | | 1,280,000 | 1,253,347 |
| Crown European Holdings S.A., 4.75%, 3/15/2029 (n) | | EUR | 1,262,000 | 1,381,915 |
| Trivium Packaging Finance B.V., 8.5%, 8/15/2027 (n) | | $ | 1,765,000 | 1,722,283 |
| | | | | $18,971,279 |
| Electronics – 1.2% |
| Entegris, Inc., 4.375%, 4/15/2028 (n) | | $ | 1,696,000 | $1,599,466 |
| Entegris, Inc., 3.625%, 5/01/2029 (n) | | | 1,382,000 | 1,246,578 |
| Sensata Technologies B.V., 5%, 10/01/2025 (n) | | | 2,985,000 | 2,971,493 |
| Sensata Technologies B.V., 5.875%, 9/01/2030 (n) | | | 1,340,000 | 1,324,286 |
| Sensata Technologies, Inc., 4.375%, 2/15/2030 (n) | | | 673,000 | 620,132 |
| | | | | $7,761,955 |
| Energy - Independent – 3.9% |
| Callon Petroleum Co., 8%, 8/01/2028 (n) | | $ | 1,891,000 | $1,955,807 |
| Callon Petroleum Co., 7.5%, 6/15/2030 (n) | | | 629,000 | 662,618 |
| Civitas Resources, Inc., 8.375%, 7/01/2028 (n) | | | 1,975,000 | 2,077,131 |
| Civitas Resources, Inc., 8.625%, 11/01/2030 (n) | | | 602,000 | 642,069 |
| Civitas Resources, Inc., 8.75%, 7/01/2031 (n) | | | 1,235,000 | 1,312,934 |
| Comstock Resources, Inc., 6.75%, 3/01/2029 (n) | | | 3,394,000 | 3,116,537 |
| CrownRock LP/CrownRock Finance, Inc., “F”, 5%, 5/01/2029 (n) | | | 2,296,000 | 2,267,461 |
| Matador Resources Co., 6.875%, 4/15/2028 (n) | | | 2,371,000 | 2,427,951 |
| Moss Creek Resources Holdings, Inc., 7.5%, 1/15/2026 (n) | | | 1,869,000 | 1,862,050 |
| Permian Resources Operating LLC, 7.75%, 2/15/2026 (n) | | | 445,000 | 452,119 |
| Permian Resources Operating LLC, 5.875%, 7/01/2029 (n) | | | 3,098,000 | 3,030,090 |
| Permian Resources Operating LLC, 7%, 1/15/2032 (n) | | | 1,281,000 | 1,322,508 |
| Sitio Royalties Operating Partnership, LP, 7.875%, 11/01/2028 (n) | | | 2,403,000 | 2,464,216 |
Portfolio of Investments – continued
| Issuer | | | Shares/Par | Value ($) |
| Bonds – continued |
| Energy - Independent – continued |
| SM Energy Co., 6.5%, 7/15/2028 | | $ | 1,673,000 | $1,673,000 |
| | | | | $25,266,491 |
| Energy - Integrated – 0.3% |
| Citgo Petroleum Corp., 8.375%, 1/15/2029 (n) | | $ | 2,031,000 | $2,110,141 |
| Entertainment – 3.3% |
| Carnival Corp. PLC, 7.625%, 3/01/2026 (n) | | $ | 1,978,000 | $2,009,211 |
| Carnival Corp. PLC, 5.75%, 3/01/2027 (n) | | | 3,583,000 | 3,529,979 |
| Carnival Corp. PLC, 4%, 8/01/2028 (n) | | | 1,282,000 | 1,185,865 |
| Carnival Corp. PLC, 6%, 5/01/2029 (n) | | | 1,332,000 | 1,290,145 |
| Merlin Entertainments, 7.375%, 2/15/2031 (n) | | | 1,696,000 | 1,698,304 |
| NCL Corp. Ltd., 5.875%, 3/15/2026 (n) | | | 1,914,000 | 1,866,284 |
| NCL Corp. Ltd., 7.75%, 2/15/2029 (n) | | | 1,200,000 | 1,211,633 |
| Royal Caribbean Cruises Ltd., 5.375%, 7/15/2027 (n) | | | 1,616,000 | 1,590,163 |
| Royal Caribbean Cruises Ltd., 5.5%, 4/01/2028 (n) | | | 2,594,000 | 2,560,990 |
| SeaWorld Parks & Entertainment, 5.25%, 8/15/2029 (n) | | | 1,628,000 | 1,516,189 |
| Viking Cruises Ltd. Co., 5.875%, 9/15/2027 (n) | | | 807,000 | 777,803 |
| Viking Ocean Cruises Ship VII Ltd., 5.625%, 2/15/2029 (n) | | | 1,414,000 | 1,376,882 |
| VOC Escrow Ltd., 5%, 2/15/2028 (n) | | | 1,281,000 | 1,223,227 |
| | | | | $21,836,675 |
| Financial Institutions – 5.4% |
| Avation Capital S.A., 8.25% (8.25% Cash or 9% PIK), 10/31/2026 (n)(p) | | $ | 2,432,318 | $2,082,672 |
| Castlelake Aviation Finance Designated Activity Co., 5%, 4/15/2027 (n) | | | 498,000 | 472,723 |
| Credit Acceptance Corp., 6.625%, 3/15/2026 | | | 296,000 | 295,939 |
| Credit Acceptance Corp., 9.25%, 12/15/2028 (n) | | | 2,019,000 | 2,119,964 |
| Freedom Mortgage Corp., 7.625%, 5/01/2026 (n) | | | 1,613,000 | 1,606,431 |
| Freedom Mortgage Holdings LLC, 9.25%, 2/01/2029 (n) | | | 500,000 | 506,300 |
| FTAI Aviation Ltd., 5.5%, 5/01/2028 (n) | | | 1,152,000 | 1,116,267 |
| FTAI Aviation Ltd., 7.875%, 12/01/2030 (n) | | | 1,358,000 | 1,432,401 |
| Global Aircraft Leasing Co. Ltd., 6.5% (6.5% Cash or 7.25% PIK), 9/15/2024 (n)(p) | | | 5,039,595 | 4,843,734 |
| Howard Hughes Corp., 4.125%, 2/01/2029 (n) | | | 2,917,000 | 2,630,689 |
| Jefferson Capital Holdings LLC, 9.5%, 2/15/2029 (n)(w) | | | 1,768,000 | 1,780,684 |
| Macquarie AirFinance Holdings Ltd., 8.375%, 5/01/2028 (n) | | | 2,667,000 | 2,801,550 |
| Macquarie AirFinance Holdings Ltd., 8.125%, 3/30/2029 (n) | | | 440,000 | 456,531 |
| Nationstar Mortgage Holdings, Inc., 6%, 1/15/2027 (n) | | | 3,445,000 | 3,377,895 |
| OneMain Finance Corp., 6.875%, 3/15/2025 | | | 2,011,000 | 2,018,541 |
| OneMain Finance Corp., 7.125%, 3/15/2026 | | | 2,876,000 | 2,915,210 |
| OneMain Finance Corp., 5.375%, 11/15/2029 | | | 1,398,000 | 1,293,509 |
| PRA Group, Inc., 8.375%, 2/01/2028 (n) | | | 803,000 | 764,889 |
Portfolio of Investments – continued
| Issuer | | | Shares/Par | Value ($) |
| Bonds – continued |
| Financial Institutions – continued |
| Rocket Mortgage Co-Issuer, Inc., 3.625%, 3/01/2029 (n) | | $ | 1,755,000 | $1,559,944 |
| Rocket Mortgage Co-Issuer, Inc., 3.875%, 3/01/2031 (n) | | | 611,000 | 533,898 |
| SLM Corp., 3.125%, 11/02/2026 | | | 1,218,000 | 1,140,438 |
| | | | | $35,750,209 |
| Food & Beverages – 3.1% |
| B&G Foods, Inc., 5.25%, 9/15/2027 | | $ | 1,018,000 | $918,189 |
| B&G Foods, Inc., 8%, 9/15/2028 (n) | | | 1,156,000 | 1,205,003 |
| Chobani LLC/Chobani Finance Corp., 7.625%, 7/01/2029 (n) | | | 201,000 | 203,505 |
| Fiesta Purchaser, Inc., 7.875%, 3/01/2031 (n)(w) | | | 1,591,000 | 1,609,567 |
| Performance Food Group Co., 5.5%, 10/15/2027 (n) | | | 2,516,000 | 2,453,853 |
| Post Holdings, Inc., 5.625%, 1/15/2028 (n) | | | 2,130,000 | 2,096,138 |
| Post Holdings, Inc., 4.625%, 4/15/2030 (n) | | | 3,229,000 | 2,969,545 |
| Primo Water Holding, Inc., 4.375%, 4/30/2029 (n) | | | 3,556,000 | 3,237,391 |
| TreeHouse Foods, Inc., 4%, 9/01/2028 | | | 2,239,000 | 1,997,188 |
| U.S. Foods Holding Corp., 4.75%, 2/15/2029 (n) | | | 2,881,000 | 2,733,399 |
| United Natural Foods, Inc., 6.75%, 10/15/2028 (n) | | | 1,308,000 | 1,098,720 |
| | | | | $20,522,498 |
| Gaming & Lodging – 3.3% |
| Caesars Entertainment, Inc., 4.625%, 10/15/2029 (n) | | $ | 1,047,000 | $957,081 |
| Caesars Entertainment, Inc., 7%, 2/15/2030 (n) | | | 2,135,000 | 2,194,031 |
| Caesars Entertainment, Inc., 6.5%, 2/15/2032 (n) | | | 600,000 | 606,637 |
| Caesars Resort Collection LLC/CRC Finco, Inc., 8.125%, 7/01/2027 (n) | | | 2,284,000 | 2,343,946 |
| CCM Merger, Inc., 6.375%, 5/01/2026 (n) | | | 2,340,000 | 2,310,939 |
| CDI Escrow Issuer, Inc., 5.75%, 4/01/2030 (n) | | | 2,827,000 | 2,734,924 |
| Penn National Gaming, Inc., 4.125%, 7/01/2029 (n) | | | 2,631,000 | 2,249,465 |
| Wyndham Hotels & Resorts, Inc., 4.375%, 8/15/2028 (n) | | | 2,665,000 | 2,488,186 |
| Wynn Macau Ltd., 5.5%, 10/01/2027 (n) | | | 2,629,000 | 2,471,791 |
| Wynn Macau Ltd., 5.625%, 8/26/2028 (n) | | | 1,123,000 | 1,045,177 |
| Wynn Resorts Finance LLC/Wynn Resorts Capital Corp., 5.125%, 10/01/2029 (n) | | | 2,674,000 | 2,526,145 |
| | | | | $21,928,322 |
| Industrial – 1.3% |
| Albion Financing 1 S.à r.l., 6.125%, 10/15/2026 (n) | | $ | 980,000 | $962,682 |
| Albion Financing 2 S.à r.l., 8.75%, 4/15/2027 (n) | | | 1,530,000 | 1,528,384 |
| APi Escrow Corp., 4.75%, 10/15/2029 (n) | | | 3,525,000 | 3,300,528 |
| Williams Scotsman International, Inc., 4.625%, 8/15/2028 (n) | | | 3,162,000 | 2,993,070 |
| | | | | $8,784,664 |
Portfolio of Investments – continued
| Issuer | | | Shares/Par | Value ($) |
| Bonds – continued |
| Insurance - Property & Casualty – 3.0% |
| Acrisure LLC/Acrisure Finance, Inc., 8.25%, 2/01/2029 (n) | | $ | 1,195,000 | $1,198,063 |
| Acrisure LLC/Acrisure Finance, Inc., 4.25%, 2/15/2029 (n) | | | 641,000 | 574,780 |
| Acrisure LLC/Acrisure Finance, Inc., 6%, 8/01/2029 (n) | | | 1,214,000 | 1,113,646 |
| Alliant Holdings Intermediate LLC/Alliant Holdings Co-Issuer, 6.75%, 10/15/2027 (n) | | | 1,631,000 | 1,592,378 |
| Alliant Holdings Intermediate LLC/Alliant Holdings Co-Issuer, 5.875%, 11/01/2029 (n) | | | 3,111,000 | 2,946,210 |
| Alliant Holdings Intermediate LLC/Alliant Holdings Co-Issuer, 7%, 1/15/2031 (n) | | | 1,577,000 | 1,593,716 |
| AmWINS Group Benefits, Inc., 4.875%, 6/30/2029 (n) | | | 2,441,000 | 2,278,301 |
| AssuredPartners, Inc., 5.625%, 1/15/2029 (n) | | | 2,140,000 | 2,021,051 |
| GTCR (AP) Finance, Inc., 8%, 5/15/2027 (n) | | | 1,401,000 | 1,403,647 |
| Hub International Ltd., 5.625%, 12/01/2029 (n) | | | 2,034,000 | 1,919,302 |
| Hub International Ltd., 7.25%, 6/15/2030 (n) | | | 1,725,000 | 1,774,451 |
| Hub International Ltd., 7.375%, 1/31/2032 (n) | | | 1,295,000 | 1,326,204 |
| | | | | $19,741,749 |
| Machinery & Tools – 0.9% |
| Husky Injection Molding Systems Ltd., 9%, 2/15/2029 (n)(w) | | $ | 200,000 | $200,000 |
| Ritchie Bros Holdings, Inc., 7.75%, 3/15/2031 (n) | | | 3,378,000 | 3,559,804 |
| Terex Corp., 5%, 5/15/2029 (n) | | | 2,487,000 | 2,350,219 |
| | | | | $6,110,023 |
| Major Banks – 0.5% |
| Toronto-Dominion Bank, 8.125% to 10/31/2027, FLR (CMT - 5yr. + 4.075%) to 10/31/2082 | | $ | 3,045,000 | $3,162,625 |
| Medical & Health Technology & Services – 5.8% |
| 180 Medical, Inc., 3.875%, 10/15/2029 (n) | | $ | 2,475,000 | $2,212,255 |
| Avantor Funding, Inc., 4.625%, 7/15/2028 (n) | | | 3,520,000 | 3,351,184 |
| Bausch & Lomb Escrow Corp., 8.375%, 10/01/2028 (n) | | | 2,122,000 | 2,201,724 |
| Charles River Laboratories International, Inc., 3.75%, 3/15/2029 (n) | | | 4,163,000 | 3,786,128 |
| CHS/Community Health Systems, Inc., 8%, 12/15/2027 (n) | | | 1,400,000 | 1,378,692 |
| CHS/Community Health Systems, Inc., 6.125%, 4/01/2030 (n) | | | 2,934,000 | 1,909,661 |
| CHS/Community Health Systems, Inc., 5.25%, 5/15/2030 (n) | | | 3,001,000 | 2,484,598 |
| Encompass Health Corp., 5.75%, 9/15/2025 | | | 832,000 | 826,701 |
| Encompass Health Corp., 4.75%, 2/01/2030 | | | 2,633,000 | 2,469,401 |
| Encompass Health Corp., 4.625%, 4/01/2031 | | | 435,000 | 399,647 |
| IQVIA, Inc., 5%, 5/15/2027 (n) | | | 3,640,000 | 3,557,499 |
| IQVIA, Inc., 6.5%, 5/15/2030 (n) | | | 1,449,000 | 1,478,081 |
| Legacy LifePoint Health LLC, 4.375%, 2/15/2027 (n) | | | 1,989,000 | 1,852,395 |
| Star Parent, Inc., 9%, 10/01/2030 (n) | | | 1,776,000 | 1,867,470 |
| Tenet Healthcare Corp., 6.125%, 10/01/2028 | | | 1,606,000 | 1,600,090 |
| Tenet Healthcare Corp., 4.375%, 1/15/2030 | | | 1,432,000 | 1,325,057 |
Portfolio of Investments – continued
| Issuer | | | Shares/Par | Value ($) |
| Bonds – continued |
| Medical & Health Technology & Services – continued |
| Tenet Healthcare Corp., 6.125%, 6/15/2030 | | $ | 2,430,000 | $2,429,094 |
| Tenet Healthcare Corp., 6.75%, 5/15/2031 (n) | | | 1,053,000 | 1,077,048 |
| U.S. Acute Care Solutions LLC, 6.375%, 3/01/2026 (n) | | | 1,950,000 | 1,703,929 |
| | | | | $37,910,654 |
| Medical Equipment – 1.3% |
| Embecta Corp., 5%, 2/15/2030 (n) | | $ | 2,514,000 | $2,057,156 |
| Garden SpinCo Corp., 8.625%, 7/20/2030 (n) | | | 2,167,000 | 2,318,690 |
| Medline Borrower LP, 5.25%, 10/01/2029 (n) | | | 3,052,000 | 2,845,712 |
| Teleflex, Inc., 4.625%, 11/15/2027 | | | 1,223,000 | 1,186,469 |
| | | | | $8,408,027 |
| Metals & Mining – 3.3% |
| Baffinland Iron Mines Corp./Baffinland Iron Mines LP, 8.75%, 7/15/2026 (n) | | $ | 2,220,000 | $2,031,315 |
| FMG Resources Ltd., 4.375%, 4/01/2031 (n) | | | 5,690,000 | 5,120,962 |
| GrafTech Finance, Inc., 4.625%, 12/15/2028 (n) | | | 3,119,000 | 2,065,181 |
| GrafTech Finance, Inc., 9.875%, 12/15/2028 (n) | | | 502,000 | 375,150 |
| Kaiser Aluminum Corp., 4.625%, 3/01/2028 (n) | | | 2,821,000 | 2,599,535 |
| Kaiser Aluminum Corp., 4.5%, 6/01/2031 (n) | | | 1,455,000 | 1,242,263 |
| Novelis Corp., 3.25%, 11/15/2026 (n) | | | 1,665,000 | 1,558,979 |
| Novelis Corp., 4.75%, 1/30/2030 (n) | | | 2,527,000 | 2,343,781 |
| Novelis Corp., 3.875%, 8/15/2031 (n) | | | 1,367,000 | 1,185,649 |
| Petra Diamonds US$ Treasury PLC, 9.75%, 3/08/2026 (n) | | | 1,481,632 | 1,200,122 |
| Taseko Mines Ltd., 7%, 2/15/2026 (n) | | | 2,069,000 | 2,032,792 |
| | | | | $21,755,729 |
| Midstream – 4.7% |
| DT Midstream, Inc., 4.125%, 6/15/2029 (n) | | $ | 2,245,000 | $2,062,589 |
| DT Midstream, Inc., 4.375%, 6/15/2031 (n) | | | 3,288,000 | 2,945,297 |
| EQM Midstream Partners LP, 5.5%, 7/15/2028 | | | 4,471,000 | 4,430,287 |
| Kinetik Holdings, Inc., 5.875%, 6/15/2030 (n) | | | 2,806,000 | 2,756,208 |
| NuStar Logistics, LP, 6.375%, 10/01/2030 | | | 2,099,000 | 2,109,495 |
| Tallgrass Energy Partners LP, 5.5%, 1/15/2028 (n) | | | 3,391,000 | 3,264,414 |
| Tallgrass Energy Partners LP, 7.375%, 2/15/2029 (n) | | | 1,180,000 | 1,177,066 |
| Venture Global Calcasieu Pass LLC, 3.875%, 8/15/2029 (n) | | | 2,848,000 | 2,545,438 |
| Venture Global Calcasieu Pass LLC, 6.25%, 1/15/2030 (n) | | | 1,028,000 | 1,028,816 |
| Venture Global Calcasieu Pass LLC, 4.125%, 8/15/2031 (n) | | | 1,990,000 | 1,759,799 |
| Venture Global LNG, Inc., 8.125%, 6/01/2028 (n) | | | 2,116,000 | 2,138,617 |
| Venture Global LNG, Inc., 9.5%, 2/01/2029 (n) | | | 2,311,000 | 2,454,372 |
| Venture Global LNG, Inc., 8.375%, 6/01/2031 (n) | | | 2,363,000 | 2,386,243 |
| | | | | $31,058,641 |
Portfolio of Investments – continued
| Issuer | | | Shares/Par | Value ($) |
| Bonds – continued |
| Network & Telecom – 0.6% |
| Iliad Holding S.A.S., 6.5%, 10/15/2026 (n) | | $ | 693,000 | $679,318 |
| Iliad Holding S.A.S., 7%, 10/15/2028 (n) | | | 3,007,000 | 2,983,044 |
| | | | | $3,662,362 |
| Oil Services – 0.4% |
| Nabors Industries Ltd., 7.25%, 1/15/2026 (n) | | $ | 1,528,000 | $1,489,907 |
| Nabors Industries Ltd., 9.125%, 1/31/2030 (n) | | | 972,000 | 989,059 |
| | | | | $2,478,966 |
| Oils – 1.1% |
| Parkland Corp., 4.625%, 5/01/2030 (n) | | $ | 4,314,000 | $3,974,574 |
| PBF Holding Co. LLC/PBF Finance Corp., 6%, 2/15/2028 | | | 2,326,000 | 2,273,360 |
| Puma International Financing S.A., 5%, 1/24/2026 | | | 1,001,000 | 948,107 |
| | | | | $7,196,041 |
| Personal Computers & Peripherals – 0.6% |
| NCR Corp., 5%, 10/01/2028 (n) | | $ | 2,673,000 | $2,520,020 |
| NCR Corp., 5.125%, 4/15/2029 (n) | | | 1,559,000 | 1,458,642 |
| | | | | $3,978,662 |
| Pharmaceuticals – 1.0% |
| 1375209 BC Ltd., 9%, 1/30/2028 (n) | | $ | 1,495,000 | $1,450,150 |
| Bausch Health Co., Inc., 11%, 9/30/2028 (n) | | | 1,582,000 | 1,076,234 |
| Bausch Health Co., Inc., 14%, 10/15/2030 (n) | | | 375,000 | 209,638 |
| Grifols S.A., 3.2%, 5/01/2025 | | EUR | 600,000 | 617,497 |
| Organon Finance 1 LLC, 4.125%, 4/30/2028 (n) | | $ | 1,634,000 | 1,495,028 |
| Organon Finance 1 LLC, 5.125%, 4/30/2031 (n) | | | 2,301,000 | 1,976,851 |
| | | | | $6,825,398 |
| Pollution Control – 1.2% |
| GFL Environmental, Inc., 4.25%, 6/01/2025 (n) | | $ | 550,000 | $540,347 |
| GFL Environmental, Inc., 4%, 8/01/2028 (n) | | | 2,405,000 | 2,206,017 |
| GFL Environmental, Inc., 4.75%, 6/15/2029 (n) | | | 957,000 | 898,381 |
| GFL Environmental, Inc., 4.375%, 8/15/2029 (n) | | | 985,000 | 903,367 |
| GFL Environmental, Inc., 6.75%, 1/15/2031 (n) | | | 448,000 | 458,205 |
| Stericycle, Inc., 3.875%, 1/15/2029 (n) | | | 2,936,000 | 2,668,912 |
| | | | | $7,675,229 |
| Precious Metals & Minerals – 0.8% |
| Coeur Mining, Inc., 5.125%, 2/15/2029 (n) | | $ | 1,461,000 | $1,329,876 |
| Eldorado Gold Corp., 6.25%, 9/01/2029 (n) | | | 1,471,000 | 1,402,943 |
| IAMGOLD Corp., 5.75%, 10/15/2028 (n) | | | 2,750,000 | 2,420,000 |
| | | | | $5,152,819 |
Portfolio of Investments – continued
| Issuer | | | Shares/Par | Value ($) |
| Bonds – continued |
| Printing & Publishing – 0.3% |
| Cimpress PLC, 7%, 6/15/2026 | | $ | 2,256,000 | $2,222,160 |
| Real Estate - Other – 0.8% |
| RHP Hotel Properties, LP/RHP Finance Corp., 7.25%, 7/15/2028 (n) | | $ | 3,345,000 | $3,448,042 |
| XHR LP, REIT, 4.875%, 6/01/2029 (n) | | | 1,896,000 | 1,748,700 |
| | | | | $5,196,742 |
| Restaurants – 0.3% |
| Fertitta Entertainment LLC, 6.75%, 1/15/2030 (n) | | $ | 2,445,000 | $2,198,170 |
| Retailers – 1.8% |
| Asbury Automotive Group, Inc., 4.625%, 11/15/2029 (n) | | $ | 1,859,000 | $1,712,671 |
| Lithia Motors, Inc., 3.875%, 6/01/2029 (n) | | | 2,063,000 | 1,851,543 |
| Macy's Retail Holdings LLC, 5.875%, 4/01/2029 (n) | | | 2,435,000 | 2,361,950 |
| NMG Holding Co. Inc./Neiman Marcus Group LLC, 7.125%, 4/01/2026 (n) | | | 1,705,000 | 1,662,400 |
| Penske Automotive Group Co., 3.75%, 6/15/2029 | | | 2,702,000 | 2,408,090 |
| Victoria's Secret & Co., 4.625%, 7/15/2029 (n) | | | 2,086,000 | 1,763,669 |
| | | | | $11,760,323 |
| Specialty Stores – 1.0% |
| Global Auto Holdings Ltd./Aag FH UK Ltd., 8.375%, 1/15/2029 (n) | | $ | 2,007,000 | $1,892,359 |
| Michael Cos., Inc., 5.25%, 5/01/2028 (n) | | | 1,315,000 | 1,032,894 |
| Michael Cos., Inc., 7.875%, 5/01/2029 (n) | | | 1,486,000 | 950,436 |
| PetSmart, Inc./PetSmart Finance Corp., 7.75%, 2/15/2029 (n) | | | 2,915,000 | 2,817,879 |
| | | | | $6,693,568 |
| Supermarkets – 0.7% |
| KeHE Distributors LLC/KeHE Finance Corp., 9%, 2/15/2029 (n) | | $ | 1,608,000 | $1,617,045 |
| Ocado Group PLC, 3.875%, 10/08/2026 | | GBP | 1,425,000 | 1,564,363 |
| Picard Bondco S.A., 5.375%, 7/01/2027 | | EUR | 1,429,000 | 1,466,950 |
| | | | | $4,648,358 |
| Telecommunications - Wireless – 1.1% |
| Altice France S.A., 5.5%, 1/15/2028 (n) | | $ | 1,030,000 | $804,185 |
| Altice France S.A., 6%, 2/15/2028 (n) | | | 1,240,000 | 553,563 |
| Altice France S.A., 5.125%, 7/15/2029 (n) | | | 717,000 | 524,195 |
| SBA Communications Corp., 3.875%, 2/15/2027 | | | 1,776,000 | 1,694,874 |
| SBA Communications Corp., 3.125%, 2/01/2029 | | | 4,014,000 | 3,577,409 |
| | | | | $7,154,226 |
| U.S. Treasury Obligations – 0.5% |
| U.S. Treasury Notes, 3%, 6/30/2024 | | $ | 3,500,000 | $3,469,102 |
Portfolio of Investments – continued
| Issuer | | | Shares/Par | Value ($) |
| Bonds – continued |
| Utilities - Electric Power – 3.5% |
| Calpine Corp., 4.5%, 2/15/2028 (n) | | $ | 2,925,000 | $2,781,579 |
| Calpine Corp., 5.125%, 3/15/2028 (n) | | | 2,175,000 | 2,075,420 |
| Clearway Energy Operating LLC, 4.75%, 3/15/2028 (n) | | | 1,747,000 | 1,663,323 |
| Clearway Energy Operating LLC, 3.75%, 2/15/2031 (n) | | | 4,925,000 | 4,269,147 |
| Clearway Energy Operating LLC, 3.75%, 1/15/2032 (n) | | | 597,000 | 507,061 |
| NextEra Energy, Inc., 4.25%, 7/15/2024 (n) | | | 188,000 | 186,017 |
| NextEra Energy, Inc., 4.25%, 9/15/2024 (n) | | | 488,000 | 477,020 |
| NextEra Energy, Inc., 4.5%, 9/15/2027 (n) | | | 2,274,000 | 2,135,369 |
| NextEra Energy, Inc., 7.25%, 1/15/2029 (n) | | | 2,357,000 | 2,427,720 |
| TerraForm Global Operating LLC, 6.125%, 3/01/2026 (n) | | | 1,955,000 | 1,929,384 |
| TerraForm Power Operating LLC, 5%, 1/31/2028 (n) | | | 3,122,000 | 3,009,046 |
| TerraForm Power Operating LLC, 4.75%, 1/15/2030 (n) | | | 1,478,000 | 1,364,652 |
| | | | | $22,825,738 |
| Total Bonds (Identified Cost, $657,930,772) | | $637,400,713 |
| Common Stocks – 0.4% |
| Cable TV – 0.1% | |
| Intelsat Emergence S.A. (a) | | 35,390 | $928,987 |
| Oil Services – 0.3% | |
| LTRI Holdings LP (a)(u) | | 3,300 | $1,670,361 |
| Total Common Stocks (Identified Cost, $2,353,281) | | $2,599,348 |
| Convertible Bonds – 0.2% |
| Utilities - Electric Power – 0.2% | |
| Pacific Gas and Electric Corp., 4.25%, 12/01/2027 (n) (Identified Cost, $927,000) | | $ | 927,000 | $943,222 |
| | Strike
Price | First
Exercise | | |
| Warrants – 0.0% | | | | |
| Other Banks & Diversified Financials – 0.0% |
Avation Capital S.A. (1 share for 1 warrant, Expiration 10/31/26) (a)
(Identified Cost, $0) | GBP 1.14 | 6/24/22 | 42,350 | $8,051 |
| | | | | |
| Investment Companies (h) – 2.4% |
| Money Market Funds – 2.4% | |
| MFS Institutional Money Market Portfolio, 5.4% (v) (Identified Cost, $15,793,129) | | | 15,792,268 | $15,793,848 |
Portfolio of Investments – continued
| Underlying/Expiration Date/Exercise Price | Put/Call | Counterparty | Notional
Amount | Par Amount/
Number of
Contracts | Value ($) |
| Purchased Options – 0.0% | |
| Market Index Securities – 0.0% | |
| Russell 2000 Index – December 2024 @ $1,500 (Premiums Paid, $493,971) | Put | Exchange Traded | $ 13,436,658 | 69 | $191,130 |
|
|
| Other Assets, Less Liabilities – 0.1% | | 722,488 |
| Net Assets – 100.0% | $657,658,800 |
| (a) | Non-income producing security. | | | |
| (h) | An affiliated issuer, which may be considered one in which the fund owns 5% or more of the outstanding voting securities, or a company which is under common control. At period end, the aggregate values of the fund's investments in affiliated issuers and in unaffiliated issuers were $15,793,848 and $641,142,464, respectively. | | | |
| (n) | Securities exempt from registration under Rule 144A of the Securities Act of 1933. These securities may be sold in the ordinary course of business in transactions exempt from registration, normally to qualified institutional buyers. At period end, the aggregate value of these securities was $567,872,064, representing 86.3% of net assets. | | | |
| (p) | Payment-in-kind (PIK) security for which interest income may be received in additional securities and/or cash. | | | |
| (u) | The security was valued using significant unobservable inputs and is considered level 3 under the fair value hierarchy. For further information about the fund’s level 3 holdings, please see Note 2 in the Notes to Financial Statements. | | | |
| (v) | Affiliated issuer that is available only to investment companies managed by MFS. The rate quoted for the MFS Institutional Money Market Portfolio is the annualized seven-day yield of the fund at period end. | | | |
| (w) | When-issued security. | | | |
| The following abbreviations are used in this report and are defined: |
| CDI | Interbank Deposit Certificates |
| CMT | Constant Maturity Treasury |
| FLR | Floating Rate. Interest rate resets periodically based on the parenthetically disclosed reference rate plus a spread (if any). The period-end rate reported may not be the current rate. All reference rates are USD unless otherwise noted. |
| REIT | Real Estate Investment Trust |
| Abbreviations indicate amounts shown in currencies other than the U.S. dollar. All amounts are stated in U.S. dollars unless otherwise indicated. A list of abbreviations is shown below: |
| EUR | Euro |
| GBP | British Pound |
Portfolio of Investments – continued
Derivative Contracts at 1/31/24
| Forward Foreign Currency Exchange Contracts |
Currency
Purchased | Currency
Sold | Counterparty | Settlement
Date | Unrealized
Appreciation
(Depreciation) |
| Asset Derivatives |
| GBP | 197,752 | USD | 250,507 | State Street Bank Corp. | 4/19/2024 | $244 |
| USD | 6,854,930 | EUR | 6,274,118 | JPMorgan Chase Bank N.A. | 4/19/2024 | 52,217 |
| USD | 621,489 | EUR | 572,050 | State Street Bank Corp. | 4/19/2024 | 1,244 |
| USD | 1,620,387 | GBP | 1,270,566 | State Street Bank Corp. | 4/19/2024 | 9,295 |
| | | | | | | $63,000 |
| Liability Derivatives |
| EUR | 727,836 | USD | 795,195 | HSBC Bank | 4/19/2024 | $(6,039) |
| EUR | 616,062 | USD | 671,169 | JPMorgan Chase Bank N.A. | 4/19/2024 | (3,203) |
| | | | | | | $(9,242) |
See Notes to Financial Statements
Financial Statements
Statement of Assets and Liabilities
At 1/31/24
This statement represents your fund’s balance sheet, which details the assets and liabilities comprising the total value of the fund.
| Assets | |
| Investments in unaffiliated issuers, at value (identified cost, $661,705,024) | $641,142,464 |
| Investments in affiliated issuers, at value (identified cost, $15,793,129) | 15,793,848 |
| Receivables for | |
| Forward foreign currency exchange contracts | 63,000 |
| Investments sold | 3,066,547 |
| Fund shares sold | 9,208 |
| Interest and dividends | 9,760,452 |
| Other assets | 2,341 |
| Total assets | $669,837,860 |
| Liabilities | |
| Payable to custodian | $246 |
| Payables for | |
| Distributions | 197 |
| Forward foreign currency exchange contracts | 9,242 |
| Investments purchased | 6,836,386 |
| When-issued investments purchased | 3,572,823 |
| Fund shares reacquired | 1,691,239 |
| Payable to affiliates | |
| Administrative services fee | 94 |
| Shareholder servicing costs | 11 |
| Accrued expenses and other liabilities | 68,822 |
| Total liabilities | $12,179,060 |
| Net assets | $657,658,800 |
| Net assets consist of | |
| Paid-in capital | $793,334,929 |
| Total distributable earnings (loss) | (135,676,129) |
| Net assets | $657,658,800 |
| Shares of beneficial interest outstanding | 79,800,592 |
| Net asset value per share (net assets of $657,658,800 / 79,800,592 shares of beneficial interest outstanding) | $8.24 |
See Notes to Financial Statements
Financial Statements
Statement of Operations
Year ended 1/31/24
This statement describes how much your fund earned in investment income and accrued in expenses. It also describes any gains and/or losses generated by fund operations.
| Net investment income (loss) | |
| Income | |
| Interest | $43,981,773 |
| Dividends from affiliated issuers | 822,361 |
| Other | 88,031 |
| Dividends | 66,286 |
| Total investment income | $44,958,451 |
| Expenses | |
| Shareholder servicing costs | $36 |
| Administrative services fee | 17,500 |
| Custodian fee | 45,507 |
| Shareholder communications | 2,091 |
| Audit and tax fees | 52,350 |
| Legal fees | 3,545 |
| Pricing service fees | 8,714 |
| Form N-CEN/N-PORT preparation fees | 9,800 |
| Miscellaneous | 18,209 |
| Total expenses | $157,752 |
| Fees paid indirectly | (442) |
| Net expenses | $157,310 |
| Net investment income (loss) | $44,801,141 |
| Realized and unrealized gain (loss) |
| Realized gain (loss) (identified cost basis) | |
| Unaffiliated issuers | $(31,681,347) |
| Affiliated issuers | 3,852 |
| Futures contracts | (492,104) |
| Forward foreign currency exchange contracts | 71,581 |
| Foreign currency | (1,138) |
| Net realized gain (loss) | $(32,099,156) |
| Change in unrealized appreciation or depreciation | |
| Unaffiliated issuers | $46,111,487 |
| Affiliated issuers | (602) |
| Futures contracts | 106,337 |
| Forward foreign currency exchange contracts | 78,332 |
| Translation of assets and liabilities in foreign currencies | (3,140) |
| Net unrealized gain (loss) | $46,292,414 |
| Net realized and unrealized gain (loss) | $14,193,258 |
| Change in net assets from operations | $58,994,399 |
See Notes to Financial Statements
Financial Statements
Statements of Changes in Net Assets
These statements describe the increases and/or decreases in net assets resulting from operations, any distributions, and any shareholder transactions.
| | Year ended |
| | 1/31/24 | 1/31/23 |
| Change in net assets | | |
| From operations | | |
| Net investment income (loss) | $44,801,141 | $46,442,609 |
| Net realized gain (loss) | (32,099,156) | (35,574,607) |
| Net unrealized gain (loss) | 46,292,414 | (55,397,358) |
| Change in net assets from operations | $58,994,399 | $(44,529,356) |
| Total distributions to shareholders | $(45,493,975) | $(47,089,882) |
| Change in net assets from fund share transactions | $(82,456,705) | $(179,131,688) |
| Total change in net assets | $(68,956,281) | $(270,750,926) |
| Net assets | | |
| At beginning of period | 726,615,081 | 997,366,007 |
| At end of period | $657,658,800 | $726,615,081 |
See Notes to Financial Statements
Financial Statements
Financial Highlights
The financial highlights table is intended to help you understand the fund's financial performance for the past 5 years. Certain information reflects financial results for a single fund share. The total returns in the table represent the rate that an investor would have earned (or lost) on an investment in the fund share class (assuming reinvestment of all distributions) held for the entire period.
| | Year ended |
| | 1/31/24 | 1/31/23 | 1/31/22 | 1/31/21 | 1/31/20 |
| Net asset value, beginning of period | $8.05 | $8.88 | $9.25 | $9.33 | $8.94 |
| Income (loss) from investment operations |
| Net investment income (loss) (d) | $0.53 | $0.47 | $0.47 | $0.50 | $0.51 |
| Net realized and unrealized gain (loss) | 0.20 | (0.82) | (0.34) | (0.06)(g) | 0.39 |
| Total from investment operations | $0.73 | $(0.35) | $0.13 | $0.44 | $0.90 |
| Less distributions declared to shareholders |
| From net investment income | $(0.54) | $(0.48) | $(0.50) | $(0.52) | $(0.51) |
| Net asset value, end of period (x) | $8.24 | $8.05 | $8.88 | $9.25 | $9.33 |
| Total return (%) (s)(x) | 9.46 | (3.84) | 1.39 | 5.02 | 10.29 |
Ratios (%) (to average net assets)
and Supplemental data: |
| Expenses (f) | 0.02 | 0.02 | 0.02 | 0.02 | 0.02 |
| Net investment income (loss) | 6.63 | 5.77 | 5.09 | 5.58 | 5.51 |
| Portfolio turnover | 44 | 25 | 60 | 66 | 59 |
| Net assets at end of period (000 omitted) | $657,659 | $726,615 | $997,366 | $1,228,318 | $889,031 |
| (d) | Per share data is based on average shares outstanding. |
| (f) | Ratios do not reflect reductions from fees paid indirectly, if applicable. See Note 2 in the Notes to Financial Statements for additional information. |
| (g) | The per share amount varies from the net realized and unrealized gain/loss for the period because of the timing of sales of fund shares and the per share amount of realized and unrealized gains and losses at such time. |
| (s) | From time to time the fund may receive proceeds from litigation settlements, without which performance would be lower. |
| (x) | The net asset values and total returns have been calculated on net assets which include adjustments made in accordance with U.S. generally accepted accounting principles required at period end for financial reporting purposes. |
See Notes to Financial Statements
Notes to Financial Statements
(1) Business and Organization
MFS High Yield Pooled Portfolio (the fund) is a diversified series of MFS Series Trust III (the trust). The trust is organized as a Massachusetts business trust and is registered under the Investment Company Act of 1940, as amended, as an open-end management investment company. This fund is available only to certain U.S. registered investment companies managed by MFS. MFS does not receive a management fee from this fund.
The fund is an investment company and accordingly follows the investment company accounting and reporting guidance of the Financial Accounting Standards Board (FASB) Accounting Standards Codification Topic 946 Financial Services - Investment Companies.
(2) Significant Accounting Policies
General — The preparation of financial statements in conformity with U.S. generally accepted accounting principles requires management to make estimates and assumptions that affect the reported amounts of assets and liabilities, and disclosure of contingent assets and liabilities at the date of the financial statements and the reported amounts of increases and decreases in net assets from operations during the reporting period. Actual results could differ from those estimates. In the preparation of these financial statements, management has evaluated subsequent events occurring after the date of the fund’s Statement of Assets and Liabilities through the date that the financial statements were issued. The fund invests in high-yield securities rated below investment grade. Investments in below investment grade quality securities can involve a substantially greater risk of default or can already be in default, and their values can decline significantly. Below investment grade quality securities tend to be more sensitive to adverse news about the issuer, or the market or economy in general, than higher quality debt instruments. The fund invests in foreign securities. Investments in foreign securities are vulnerable to the effects of changes in the relative values of the local currency and the U.S. dollar and to the effects of changes in each country’s market, economic, industrial, political, regulatory, geopolitical, environmental, public health, and other conditions.
Balance Sheet Offsetting — The fund's accounting policy with respect to balance sheet offsetting is that, absent an event of default by the counterparty or a termination of the agreement, the International Swaps and Derivatives Association (ISDA) Master Agreement, or similar agreement, does not result in an offset of reported amounts of financial assets and financial liabilities in the Statement of Assets and Liabilities across transactions between the fund and the applicable counterparty. The fund's right to setoff may be restricted or prohibited by the bankruptcy or insolvency laws of the particular jurisdiction to which a specific master netting agreement counterparty is subject. Balance sheet offsetting disclosures, to the extent applicable to the fund, have been included in the fund’s Significant Accounting Policies note under the captions for each of the fund’s in-scope financial instruments and transactions.
Investment Valuations — Subject to its oversight, the fund's Board of Trustees has delegated primary responsibility for determining or causing to be determined the value of the fund’s investments to MFS as the fund's adviser, pursuant to the fund’s valuation policy and procedures which have been adopted by the adviser and approved by the Board. In accordance with Rule 2a-5 under the Investment Company Act of 1940, the Board of Trustees designated the adviser as the “valuation designee” of the fund. If the
Notes to Financial Statements - continued
adviser, as valuation designee, determines that reliable market quotations are not readily available for an investment, the investment is valued at fair value as determined in good faith by the adviser in accordance with the adviser’s fair valuation policy and procedures.
Under the fund's valuation policy and procedures, equity securities, including restricted equity securities, are generally valued at the last sale or official closing price on their primary market or exchange as provided by a third-party pricing service. Equity securities, for which there were no sales reported that day, are generally valued at the last quoted daily bid quotation on their primary market or exchange as provided by a third-party pricing service. Debt instruments and floating rate loans, including restricted debt instruments, are generally valued at an evaluated or composite bid as provided by a third-party pricing service. Short-term instruments with a maturity at issuance of 60 days or less may be valued at amortized cost, which approximates market value.
Exchange-traded options are generally valued at the last sale or official closing price on their primary exchange as provided by a third-party pricing service. Exchange-traded options for which there were no sales reported that day are generally valued at the last daily bid quotation on their primary exchange as provided by a third-party pricing service. For put options, the position may be valued at the last daily ask quotation if there are no trades reported during the day. Options not traded on an exchange are generally valued at a broker/dealer bid quotation. Foreign currency options are generally valued at valuations provided by a third-party pricing service. Futures contracts are generally valued at last posted settlement price on their primary exchange as provided by a third-party pricing service. Futures contracts for which there were no trades that day for a particular position are generally valued at the closing bid quotation on their primary exchange as provided by a third-party pricing service.
Forward foreign currency exchange contracts are generally valued at the mean of bid and asked prices for the time period interpolated from rates provided by a third-party pricing service for proximate time periods. Open-end investment companies are generally valued at net asset value per share. The values of foreign securities and other assets and liabilities expressed in foreign currencies are converted to U.S. dollars using the mean of bid and asked prices for rates provided by a third-party pricing service.
Under the fund’s valuation policy and procedures, market quotations are not considered to be readily available for debt instruments, floating rate loans, and many types of derivatives. These investments are generally valued at fair value based on information from third-party pricing services or otherwise determined by the adviser in accordance with the adviser’s fair valuation policy and procedures. Securities and other assets generally valued on the basis of information from a third-party pricing service may also be valued at a broker/dealer bid quotation. In determining values, third-party pricing services can utilize both transaction data and market information such as yield, quality, coupon rate, maturity, type of issue, trading characteristics, spreads and other market data. An investment may also be valued at fair value if the adviser determines that the investment’s value has been materially affected by events occurring after the close of the exchange or market on which the investment is principally traded (such as foreign exchange or market) and prior to the determination of the fund’s net asset value, or after the halt of trading of a specific security where trading does not resume prior to the close of the exchange or market on which the security is principally traded. The adviser generally relies on third-party pricing services or other information (such as the correlation with price movements of similar securities in the same or other markets; the type, cost and investment characteristics of the security; the business and financial
Notes to Financial Statements - continued
condition of the issuer; and trading and other market data) to assist in determining whether to fair value and at what value to fair value an investment. The value of an investment for purposes of calculating the fund’s net asset value can differ depending on the source and method used to determine value. When fair valuation is used, the value of an investment used to determine the fund’s net asset value may differ from quoted or published prices for the same investment. There can be no assurance that the fund could obtain the fair value assigned to an investment if it were to sell the investment at the same time at which the fund determines its net asset value per share.
Various inputs are used in determining the value of the fund's assets or liabilities. These inputs are categorized into three broad levels. In certain cases, the inputs used to measure fair value may fall into different levels of the fair value hierarchy. In such cases, an investment's level within the fair value hierarchy is based on the lowest level of input that is significant to the fair value measurement. The fund's assessment of the significance of a particular input to the fair value measurement in its entirety requires judgment, and considers factors specific to the investment. Level 1 includes unadjusted quoted prices in active markets for identical assets or liabilities. Level 2 includes other significant observable market-based inputs (including quoted prices for similar securities, interest rates, prepayment speed, and credit risk). Level 3 includes significant unobservable inputs, which may include the adviser's own assumptions in determining the fair value of investments. Other financial instruments are derivative instruments, such as forward foreign currency exchange contracts. The following is a summary of the levels used as of January 31, 2024 in valuing the fund's assets and liabilities:
| Financial Instruments | Level 1 | Level 2 | Level 3 | Total |
| Equity Securities: | | | | |
| United States | $— | $191,130 | $1,670,361 | $1,861,491 |
| Luxembourg | — | 928,987 | — | 928,987 |
| United Kingdom | — | 8,051 | — | 8,051 |
| U.S. Treasury Bonds & U.S. Government Agencies & Equivalents | — | 3,469,102 | — | 3,469,102 |
| U.S. Corporate Bonds | — | 525,235,439 | — | 525,235,439 |
| Foreign Bonds | — | 109,639,394 | — | 109,639,394 |
| Mutual Funds | 15,793,848 | — | — | 15,793,848 |
| Total | $15,793,848 | $639,472,103 | $1,670,361 | $656,936,312 |
| Other Financial Instruments | | | | |
| Forward Foreign Currency Exchange Contracts – Assets | $— | $63,000 | $— | $63,000 |
| Forward Foreign Currency Exchange Contracts – Liabilities | — | (9,242) | — | (9,242) |
For further information regarding security characteristics, see the Portfolio of Investments.
Notes to Financial Statements - continued
The following is a reconciliation of level 3 assets for which significant unobservable inputs were used to determine fair value. The table presents the activity of level 3 securities held at the beginning and the end of the period.
| | Equity
Securities |
| Balance as of 1/31/23 | $1,339,032 |
| Realized gain (loss) | 275,672 |
| Change in unrealized appreciation or depreciation | 331,329 |
| Sales | (275,672) |
| Balance as of 1/31/24 | $1,670,361 |
The net change in unrealized appreciation or depreciation from investments held as level 3 at January 31, 2024 is $564,729. At January 31, 2024, the fund held one level 3 security.
Foreign Currency Translation — Purchases and sales of foreign investments, income, and expenses are converted into U.S. dollars based upon currency exchange rates prevailing on the respective dates of such transactions or on the reporting date for foreign denominated receivables and payables. Gains and losses attributable to foreign currency exchange rates on sales of securities are recorded for financial statement purposes as net realized gains and losses on investments. Gains and losses attributable to foreign exchange rate movements on receivables, payables, income and expenses are recorded for financial statement purposes as foreign currency transaction gains and losses. That portion of both realized and unrealized gains and losses on investments that results from fluctuations in foreign currency exchange rates is not separately disclosed.
Derivatives — The fund uses derivatives primarily to increase or decrease exposure to a particular market or segment of the market, or security, to increase or decrease interest rate exposure, or as alternatives to direct investments. Derivatives are used for hedging or non-hedging purposes. While hedging can reduce or eliminate losses, it can also reduce or eliminate gains. When the fund uses derivatives as an investment to increase market exposure, or for hedging purposes, gains and losses from derivative instruments may be substantially greater than the derivative’s original cost.
The derivative instruments used by the fund during the period were purchased options, futures contracts, and forward foreign currency exchange contracts. Depending on the type of derivative, a fund may exit a derivative position by entering into an offsetting transaction with a counterparty or exchange, negotiating an agreement with the derivative counterparty, or novating the position to a third party. The fund's period end derivatives, as presented in the Portfolio of Investments and the associated Derivative Contract tables, generally are indicative of the volume of its derivative activity during the period.
Notes to Financial Statements - continued
The following table presents, by major type of derivative contract, the fair value, on a gross basis, of the asset and liability components of derivatives held by the fund at January 31, 2024 as reported in the Statement of Assets and Liabilities:
| | | Fair Value (a) |
| Risk | Derivative Contracts | Asset Derivatives | Liability Derivatives |
| Equity | Purchased Option Contracts | $191,130 | $— |
| Foreign Exchange | Forward Foreign Currency Exchange Contracts | 63,000 | (9,242) |
| Total | | $254,130 | $(9,242) |
| (a) | The value of purchased options outstanding is included in investments in unaffiliated issuers, at value, within the Statement of Assets and Liabilities. |
The following table presents, by major type of derivative contract, the realized gain (loss) on derivatives held by the fund for the year ended January 31, 2024 as reported in the Statement of Operations:
| Risk | Futures
Contracts | Forward Foreign
Currency
Exchange
Contracts | Unaffiliated Issuers
(Purchased
Options) |
| Interest Rate | $(492,104) | $— | $— |
| Foreign Exchange | — | 71,581 | — |
| Equity | — | — | (372,401) |
| Total | $(492,104) | $71,581 | $(372,401) |
The following table presents, by major type of derivative contract, the change in unrealized appreciation or depreciation on derivatives held by the fund for the year ended January 31, 2024 as reported in the Statement of Operations:
| Risk | Futures
Contracts | Forward Foreign
Currency
Exchange
Contracts | Unaffiliated Issuers
(Purchased
Options) |
| Interest Rate | $106,337 | $— | $— |
| Foreign Exchange | — | 78,332 | — |
| Equity | — | — | (302,841) |
| Total | $106,337 | $78,332 | $(302,841) |
Derivative counterparty credit risk is managed through formal evaluation of the creditworthiness of all potential counterparties. On certain, but not all, uncleared derivatives, the fund attempts to reduce its exposure to counterparty credit risk whenever possible by entering into an ISDA Master Agreement on a bilateral basis. The ISDA Master Agreement gives each party to the agreement the right to terminate all transactions traded under such agreement if there is a specified deterioration in the credit quality of the other party. Upon an event of default or a termination of the ISDA Master Agreement, the non-defaulting party has the right to close out all transactions traded under such agreement and to net amounts owed under each agreement to one net amount payable by one party to the other. This right to close out and net payments
Notes to Financial Statements - continued
across all transactions traded under the ISDA Master Agreement could result in a reduction of the fund's credit risk to such counterparty equal to any amounts payable by the fund under the applicable transactions, if any.
Collateral and margin requirements differ by type of derivative. For cleared derivatives (e.g., futures contracts, cleared swaps, and exchange-traded options), margin requirements are set by the clearing broker and the clearing house and collateral, in the form of cash or securities, is posted by the fund directly with the clearing broker. Collateral terms are counterparty agreement specific for uncleared derivatives (e.g., forward foreign currency exchange contracts, uncleared swap agreements, and uncleared options) and collateral, in the form of cash and securities, is held in segregated accounts with the fund's custodian in connection with these agreements. For derivatives traded under an ISDA Master Agreement, which contains a credit support annex, the collateral requirements are netted across all transactions traded under such counterparty-specific agreement and an amount is posted from one party to the other to collateralize such obligations. Cash that has been segregated or delivered to cover the fund's collateral or margin obligations under derivative contracts, if any, will be reported separately in the Statement of Assets and Liabilities as restricted cash for uncleared derivatives and/or deposits with brokers for cleared derivatives. Securities pledged as collateral or margin for the same purpose, if any, are noted in the Portfolio of Investments. The fund may be required to make payments of interest on uncovered collateral or margin obligations with the broker. Any such payments are included in “Miscellaneous” expense in the Statement of Operations.
Purchased Options — The fund purchased put options for a premium. Purchased put options entitle the holder to sell a specified number of shares or units of a particular security, currency or index at a specified price at a specified date or within a specified period of time. Purchasing put options may hedge against an anticipated decline in the value of portfolio securities or currency or decrease the fund's exposure to an underlying instrument.
The premium paid is initially recorded as an investment in the Statement of Assets and Liabilities. That investment is subsequently marked-to-market daily with the difference between the premium paid and the market value of the purchased option being recorded as unrealized appreciation or depreciation. Premiums paid for purchased put options which have expired are treated as realized losses on investments in the Statement of Operations. Upon the exercise or closing of a purchased put option, the premium paid is offset against the proceeds on the sale of the underlying security or financial instrument in order to determine the realized gain or loss on investments.
Whether or not the option is exercised, the fund's maximum risk of loss from purchasing an option is the amount of premium paid. All option contracts involve credit risk if the counterparty to the option contract fails to perform. For uncleared options, this risk is mitigated in cases where there is an ISDA Master Agreement between the fund and the counterparty providing for netting as described above and, where applicable, by the posting of collateral by the counterparty to the fund to cover the fund’s exposure to the counterparty under such ISDA Master Agreement.
Futures Contracts — The fund entered into futures contracts which may be used to hedge against or obtain broad market exposure, interest rate exposure, currency exposure, or to manage duration. A futures contract represents a commitment for the future purchase or sale of an asset at a specified price on a specified date.
Notes to Financial Statements - continued
Upon entering into a futures contract, the fund is required to deposit with the broker, either in cash or securities, an initial margin in an amount equal to a specified percentage of the notional amount of the contract. Subsequent payments (variation margin) are made or received by the fund each day, depending on the daily fluctuations in the value of the contract, and are recorded for financial statement purposes as unrealized gain or loss by the fund until the contract is closed or expires at which point the gain or loss on futures contracts is realized.
The fund bears the risk of interest rates, exchange rates or securities prices moving unexpectedly, in which case, the fund may not achieve the anticipated benefits of the futures contracts and may realize a loss. While futures contracts may present less counterparty risk to the fund since the contracts are exchange traded and the exchange’s clearinghouse guarantees payments to the broker, there is still counterparty credit risk due to the insolvency of the broker. The fund’s maximum risk of loss due to counterparty credit risk is equal to the margin posted by the fund to the broker plus any gains or minus any losses on the outstanding futures contracts.
Forward Foreign Currency Exchange Contracts — The fund entered into forward foreign currency exchange contracts for the purchase or sale of a specific foreign currency at a fixed price on a future date. These contracts may be used to hedge the fund’s currency risk or for non-hedging purposes. For hedging purposes, the fund may enter into contracts to deliver or receive foreign currency that the fund will receive from or use in its normal investment activities. The fund may also use contracts to hedge against declines in the value of foreign currency denominated securities due to unfavorable exchange rate movements. For non-hedging purposes, the fund may enter into contracts with the intent of changing the relative exposure of the fund’s portfolio of securities to different currencies to take advantage of anticipated exchange rate changes.
Forward foreign currency exchange contracts are adjusted by the daily exchange rate of the underlying currency and any unrealized gains or losses are recorded as a receivable or payable for forward foreign currency exchange contracts until the contract settlement date. On contract settlement date, any gain or loss on the contract is recorded as realized gains or losses on forward foreign currency exchange contracts.
Risks may arise upon entering into these contracts from unanticipated movements in the value of the contract and from the potential inability of counterparties to meet the terms of their contracts. Generally, the fund’s maximum risk due to counterparty credit risk is the unrealized gain on the contract due to the use of Continuous Linked Settlement, a multicurrency cash settlement system for the centralized settlement of foreign transactions. This risk is mitigated in cases where there is an ISDA Master Agreement between the fund and the counterparty providing for netting as described above and, where applicable, by the posting of collateral by the counterparty to the fund to cover the fund’s exposure to the counterparty under such ISDA Master Agreement.
Indemnifications — Under the fund's organizational documents, its officers and Trustees may be indemnified against certain liabilities and expenses arising out of the performance of their duties to the fund. Additionally, in the normal course of business, the fund enters into agreements with service providers that may contain indemnification clauses. The fund's maximum exposure under these agreements is unknown as this would involve future claims that may be made against the fund that have not yet occurred.
Notes to Financial Statements - continued
Investment Transactions and Income — Interest income is recorded on the accrual basis. All premium and discount is amortized or accreted for financial statement purposes in accordance with U.S. generally accepted accounting principles. Dividends received in cash are recorded on the ex-dividend date. Certain dividends from foreign securities will be recorded when the fund is informed of the dividend if such information is obtained subsequent to the ex-dividend date. Dividend and interest payments received in additional securities are recorded on the ex-dividend or ex-interest date in an amount equal to the value of the security on such date.
The fund may receive proceeds from litigation settlements. Any proceeds received from litigation involving portfolio holdings are reflected in the Statement of Operations in realized gain/loss if the security has been disposed of by the fund or in unrealized gain/loss if the security is still held by the fund. Any other proceeds from litigation not related to portfolio holdings are reflected as other income in the Statement of Operations.
Investment transactions are recorded on the trade date. In determining the net gain or loss on securities sold, the cost of securities is determined on the identified cost basis.
The fund may purchase or sell securities on a when-issued or delayed delivery basis. In these extended settlement transactions, the receipt or delivery of the securities by the fund and related payments occur at a future date, usually beyond the customary settlement period. The price of such security and the date that the security will be settled are generally fixed at the time the transaction is negotiated. The value of the security varies with market fluctuations and for debt securities no interest accrues to the fund until settlement takes place. When the fund sells securities on a when-issued or delayed delivery basis, the fund typically owns or has the right to acquire securities equivalent in kind and amount to the securities sold. Purchase and sale commitments for when-issued or delayed delivery securities are held at carrying amount, which approximates fair value and are categorized as level 2 within the fair value hierarchy, and included in When-issued investments purchased and When-issued investments sold in the Statement of Assets and Liabilities, as applicable. Losses may arise due to changes in the value of the underlying securities prior to settlement date or if the counterparty does not perform under the contract’s terms, or if the issuer does not issue the securities due to political, economic or other factors.
Fees Paid Indirectly — The fund's custody fee may be reduced by a credit earned under an arrangement that measures the value of U.S. dollars deposited with the custodian by the fund. The amount of the credit, for the year ended January 31, 2024, is shown as a reduction of total expenses in the Statement of Operations.
Tax Matters and Distributions — The fund intends to qualify as a regulated investment company, as defined under Subchapter M of the Internal Revenue Code, and to distribute all of its taxable income, including realized capital gains. As a result, no provision for federal income tax is required. The fund’s federal tax returns, when filed, will remain subject to examination by the Internal Revenue Service for a three year period. Management has analyzed the fund’s tax positions taken on federal and state tax returns for all open tax years and does not believe that there are any uncertain tax positions that require recognition of a tax liability. Foreign taxes, if any, have been accrued by the fund in the accompanying financial statements in accordance with the
Notes to Financial Statements - continued
applicable foreign tax law. Foreign income taxes may be withheld by certain countries in which the fund invests. Additionally, capital gains realized by the fund on securities issued in or by certain foreign countries may be subject to capital gains tax imposed by those countries.
Distributions to shareholders are recorded on the ex-dividend date. Income and capital gain distributions are determined in accordance with income tax regulations, which may differ from U.S. generally accepted accounting principles. Certain capital accounts in the financial statements are periodically adjusted for permanent differences in order to reflect their tax character. These adjustments have no impact on net assets or net asset value per share. Temporary differences which arise from recognizing certain items of income, expense, gain or loss in different periods for financial statement and tax purposes will reverse at some time in the future.
Book/tax differences primarily relate to amortization of premium and accretion of discount of debt securities and wash sale loss deferrals.
The tax character of distributions declared to shareholders for the last two fiscal years is as follows:
| | Year ended
1/31/24 | Year ended
1/31/23 |
| Ordinary income (including any short-term capital gains) | $45,493,975 | $47,089,882 |
The federal tax cost and the tax basis components of distributable earnings were as follows:
| As of 1/31/24 | |
| Cost of investments | $679,934,214 |
| Gross appreciation | 12,449,799 |
| Gross depreciation | (35,393,943) |
| Net unrealized appreciation (depreciation) | $(22,944,144) |
| Undistributed ordinary income | 4,064,213 |
| Capital loss carryforwards | (113,076,626) |
| Other temporary differences | (3,719,572) |
| Total distributable earnings (loss) | $(135,676,129) |
As of January 31, 2024, the fund had capital loss carryforwards available to offset future realized gains. These net capital losses may be carried forward indefinitely and their character is retained as short-term and/or long-term losses. Such losses are characterized as follows:
| Short-Term | $(13,716,208) |
| Long-Term | (99,360,418) |
| Total | $(113,076,626) |
(3) Transactions with Affiliates
Investment Adviser — The fund has an investment advisory agreement with MFS to provide overall investment management and related administrative services and facilities to the fund. MFS receives no compensation under this agreement; however MFS receives management fees from MFS funds that invest in the fund.
Notes to Financial Statements - continued
Shareholder Servicing Agent — MFS Service Center, Inc. (MFSC), a wholly-owned subsidiary of MFS, provides transfer agent and recordkeeping functions in connection with the issuance, transfer, and redemption of shares of the fund under a Shareholder Servicing Agent Agreement. MFSC is not paid a fee for providing these services. MFSC receives reimbursement from the fund for out-of-pocket expenses paid by MFSC on behalf of the fund. For the year ended January 31, 2024, these costs amounted to $36.
Administrator — MFS provides certain financial, legal, shareholder communications, compliance, and other administrative services to the fund. Under an administrative services agreement, the fund reimburses MFS the costs incurred to provide these services. The fund pays an annual fixed amount of $17,500. The administrative services fee is computed daily and paid monthly. The administrative services fee incurred for the year ended January 31, 2024 was equivalent to an annual effective rate of 0.0026% of the fund's average daily net assets.
Trustees’ and Officers’ Compensation - The fund may pay compensation to independent Trustees in the form of a retainer, attendance fees, and additional compensation to Board and Committee chairpersons. Independent Trustees’ compensation is accrued daily and paid subsequent to each Trustee Board meeting. The fund does not pay compensation directly to Trustees or officers of the fund who are also officers of the investment adviser, all of whom receive remuneration from MFS for their services to the fund. Certain officers and Trustees of the fund are officers or directors of MFS, MFS Fund Distributors, Inc. (MFD), and MFSC. The independent Trustees do not currently receive compensation from the fund.
Other — The fund invests in the MFS Institutional Money Market Portfolio which is managed by MFS and seeks current income consistent with preservation of capital and liquidity. This money market fund does not pay a management fee to MFS but does incur investment and operating costs.
(4) Portfolio Securities
For the year ended January 31, 2024, purchases and sales of investments, other than purchased options with an expiration date of less than one year from the time of purchase and short-term obligations, aggregated $290,204,227 and $372,085,944, respectively.
(5) Shares of Beneficial Interest
The fund's Declaration of Trust permits the Trustees to issue an unlimited number of full and fractional shares of beneficial interest. Transactions in fund shares were as follows:
| | Year ended
1/31/24 | | Year ended
1/31/23 |
| | Shares | Amount | | Shares | Amount |
| Shares sold | 5,187,193 | $41,214,207 | | 4,236,645 | $34,051,394 |
Shares issued to shareholders in
reinvestment of distributions | 5,697,188 | 45,493,975 | | 5,845,303 | 47,089,882 |
| Shares reacquired | (21,310,137) | (169,164,887) | | (32,206,489) | (260,272,964) |
| Net change | (10,425,756) | $(82,456,705) | | (22,124,541) | $(179,131,688) |
Notes to Financial Statements - continued
The fund is an MFS Pooled Portfolio, which is designed to be used by certain MFS funds to invest in a particular security type rather than invest in the security type directly. The fund is solely invested in by other MFS funds for the purpose of gaining exposure to high income debt instruments, rather than investing in high income debt instruments directly. The MFS funds do not invest in this fund for the purpose of exercising management or control. At the end of the period, the MFS Diversified Income Fund and the MFS Global High Yield Fund were the owners of record of approximately 79% and 21%, respectively, of the value of outstanding voting shares of the fund. In addition, the MFS Income Portfolio was the owner of record of less than 1% of the value of outstanding voting shares of the fund.
(6) Line of Credit
The fund and certain other funds managed by MFS participate in a $1.45 billion unsecured committed line of credit of which $1.2 billion is reserved for use by the fund and certain other MFS U.S. funds. The line of credit is provided by a syndicate of banks under a credit agreement. Borrowings may be made for temporary financing needs. Interest is charged to each fund, based on its borrowings, generally at a rate equal to the highest of 1) Daily Simple SOFR (Secured Overnight Financing Rate) plus 0.10%, 2) the Federal Funds Effective Rate, or 3) the Overnight Bank Funding Rate, each plus an agreed upon spread. A commitment fee, based on the average daily unused portion of the committed line of credit, is allocated among the participating funds. The line of credit expires on March 14, 2024 unless extended or renewed. In addition, the fund and other funds managed by MFS have established unsecured uncommitted borrowing arrangements with certain banks for temporary financing needs. Interest is charged to each fund, based on its borrowings, at rates equal to customary reference rates plus an agreed upon spread. For the year ended January 31, 2024, the fund’s commitment fee and interest expense were $3,572 and $0, respectively, and are included in “Miscellaneous” expense in the Statement of Operations.
(7) Investments in Affiliated Issuers
An affiliated issuer may be considered one in which the fund owns 5% or more of the outstanding voting securities, or a company which is under common control. For the purposes of this report, the following were affiliated issuers:
| Affiliated Issuers | Beginning
Value | Purchases | Sales
Proceeds | Realized
Gain
(Loss) | Change in
Unrealized
Appreciation or
Depreciation | Ending
Value |
| MFS Institutional Money Market Portfolio | $16,165,324 | $184,174,465 | $184,549,191 | $3,852 | $(602) | $15,793,848 |
| Affiliated Issuers | Dividend
Income | Capital Gain
Distributions |
| MFS Institutional Money Market Portfolio | $822,361 | $— |
Report of Independent Registered Public Accounting Firm
To the Board of Trustees of MFS Series Trust III and the Shareholders of
MFS High Yield Pooled Portfolio:
Opinion on the Financial Statements and Financial Highlights
We have audited the accompanying statement of assets and liabilities of MFS High Yield Pooled Portfolio (the “Fund”), including the portfolio of investments, as of January 31, 2024, the related statement of operations for the year then ended, the statements of changes in net assets for each of the two years in the period then ended, the financial highlights for each of the five years in the period then ended, and the related notes. In our opinion, the financial statements and financial highlights present fairly, in all material respects, the financial position of the Fund as of January 31, 2024, and the results of its operations for the year then ended, the changes in its net assets for each of the two years in the period then ended, and the financial highlights for each of the five years in the period then ended, in conformity with accounting principles generally accepted in the United States of America.
Basis for Opinion
These financial statements and financial highlights are the responsibility of the Fund's management. Our responsibility is to express an opinion on the Fund's financial statements and financial highlights based on our audits. We are a public accounting firm registered with the Public Company Accounting Oversight Board (United States) (PCAOB) and are required to be independent with respect to the Fund in accordance with the U.S. federal securities laws and the applicable rules and regulations of the Securities and Exchange Commission and the PCAOB.
We conducted our audits in accordance with the standards of the PCAOB. Those standards require that we plan and perform the audit to obtain reasonable assurance about whether the financial statements and financial highlights are free of material misstatement, whether due to error or fraud. The Fund is not required to have, nor were we engaged to perform, an audit of its internal control over financial reporting. As part of our audits, we are required to obtain an understanding of internal control over financial reporting but not for the purpose of expressing an opinion on the effectiveness of the Fund's internal control over financial reporting. Accordingly, we express no such opinion.
Our audits included performing procedures to assess the risks of material misstatement of the financial statements and financial highlights, whether due to error or fraud, and performing procedures that respond to those risks. Such procedures included examining, on a test basis, evidence regarding the amounts and disclosures in the financial statements and financial highlights. Our audits also included evaluating the accounting principles used and significant estimates made by management, as well as evaluating the overall presentation of the financial statements and financial highlights.
Report of Independent Registered Public Accounting Firm – continued
Our procedures included confirmation of securities owned as of January 31, 2024, by correspondence with the custodian and brokers; when replies were not received from brokers, we performed other auditing procedures. We believe that our audits provide a reasonable basis for our opinion.
DELOITTE & TOUCHE LLP
Boston, Massachusetts
March 14, 2024
We have served as the auditor of one or more of the MFS investment companies since 1924.
Trustees and Officers — Identification and Background
The Trustees and Officers of the Trust, as of March 1, 2024, are listed below, together with their principal occupations during the past five years. (Their titles may have varied during that period.) The address of each Trustee and Officer is 111 Huntington Avenue, Boston, Massachusetts 02199-7618.
| Name, Age | | Position(s) Held with Fund | | Trustee/Officer Since(h) | | Number of MFS Funds overseen by the Trustee | | Principal Occupations During
the Past Five Years | | Other Directorships During
the Past Five Years (j) |
| INTERESTED TRUSTEE | | | | | | | | | | |
Michael W. Roberge (k)
(age 57) | | Trustee | | January 2021 | | 136 | | Massachusetts Financial Services Company, Chairman (since January 2021); Chief Executive Officer (since January 2017); Director; Chairman of the Board (since January 2022) | | N/A |
| INDEPENDENT TRUSTEES | | | | | | | | | | |
John P. Kavanaugh
(age 69) | | Trustee and Chair of Trustees | | January 2009 | | 136 | | Private investor | | N/A |
Steven E. Buller
(age 72) | | Trustee | | February 2014 | | 136 | | Private investor | | N/A |
John A. Caroselli
(age 69) | | Trustee | | March 2017 | | 136 | | Private investor; JC Global Advisors, LLC (management consulting), President (since 2015) | | N/A |
Maureen R. Goldfarb
(age 68) | | Trustee | | January 2009 | | 136 | | Private investor | | N/A |
Peter D. Jones
(age 68) | | Trustee | | January 2019 | | 136 | | Private investor | | N/A |
James W. Kilman, Jr.
(age 62) | | Trustee | | January 2019 | | 136 | | Burford Capital Limited (finance and investment management), Senior Advisor (since May 3, 2021), Chief Financial Officer (2019 - May 2, 2021); KielStrand Capital LLC (family office), Chief Executive Officer (since 2016) | | Alpha-En Corporation, Director (2016-2019) |
Trustees and Officers - continued
| Name, Age | | Position(s) Held with Fund | | Trustee/Officer Since(h) | | Number of MFS Funds overseen by the Trustee | | Principal Occupations During
the Past Five Years | | Other Directorships During
the Past Five Years (j) |
Clarence Otis, Jr.
(age 67) | | Trustee | | March 2017 | | 136 | | Private investor | | VF Corporation, Director; Verizon Communications, Inc., Director; The Travelers Companies, Director |
Maryanne L. Roepke
(age 68) | | Trustee | | May 2014 | | 136 | | Private investor | | N/A |
Laurie J. Thomsen
(age 66) | | Trustee | | March 2005 | | 136 | | Private investor | | The Travelers Companies, Director; Dycom Industries, Inc., Director |
| Name, Age | | Position(s) Held with
Fund | | Trustee/Officer Since(h) | | Number of MFS Funds for which the Person is an Officer | | Principal Occupations During
the Past Five Years |
| OFFICERS | | | | | | | | |
Christopher R. Bohane (k)
(age 50) | | Assistant Secretary and Assistant Clerk | | July 2005 | | 136 | | Massachusetts Financial Services Company, Senior Vice President and Deputy General Counsel |
Kino Clark (k)
(age 55) | | Assistant Treasurer | | January 2012 | | 136 | | Massachusetts Financial Services Company, Vice President |
John W. Clark, Jr. (k)
(age 56) | | Assistant Treasurer | | April 2017 | | 136 | | Massachusetts Financial Services Company, Vice President |
David L. DiLorenzo (k)
(age 55) | | President | | July 2005 | | 136 | | Massachusetts Financial Services Company, Senior Vice President |
Heidi W. Hardin (k)
(age 56) | | Secretary and Clerk | | April 2017 | | 136 | | Massachusetts Financial Services Company, Executive Vice President and General Counsel |
Brian E. Langenfeld (k)
(age 50) | | Assistant Secretary and Assistant Clerk | | June 2006 | | 136 | | Massachusetts Financial Services Company, Vice President and Managing Counsel |
Rosa E. Licea-Mailloux (k)
(age 47) | | Chief Compliance Officer | | March 2022 | | 136 | | Massachusetts Financial Services Company, Vice President (since 2018); Director of Corporate Compliance (2018-2021), Senior Director Compliance (2021-2022), Senior Managing Director of North American Compliance & Chief Compliance Officer (since March 2022) |
Trustees and Officers - continued
| Name, Age | | Position(s) Held with
Fund | | Trustee/Officer Since(h) | | Number of MFS Funds for which the Person is an Officer | | Principal Occupations During
the Past Five Years |
Amanda S. Mooradian (k)
(age 45) | | Assistant Secretary and Assistant Clerk | | September 2018 | | 136 | | Massachusetts Financial Services Company, Vice President and Senior Counsel |
Susan A. Pereira (k)
(age 53) | | Assistant Secretary and Assistant Clerk | | July 2005 | | 136 | | Massachusetts Financial Services Company, Vice President and Managing Counsel |
Kasey L. Phillips (k)
(age 53) | | Assistant Treasurer | | September 2012 | | 136 | | Massachusetts Financial Services Company, Vice President |
Matthew A. Stowe (k)
(age 49) | | Assistant Secretary and Assistant Clerk | | October 2014 | | 136 | | Massachusetts Financial Services Company, Vice President and Senior Managing Counsel |
William B. Wilson (k)
(age 41) | | Assistant Secretary and Assistant Clerk | | October 2022 | | 136 | | Massachusetts Financial Services Company, Assistant Vice President and Senior Counsel |
James O. Yost (k)
(age 63) | | Treasurer | | September 1990 | | 136 | | Massachusetts Financial Services Company, Senior Vice President |
| (h) | Date first appointed to serve as Trustee/Officer of an MFS Fund. Each Trustee has served continuously since appointment unless indicated otherwise. From January 2012 through December 2016, Messrs. DiLorenzo and Yost served as Treasurer and Deputy Treasurer of the Funds, respectively. |
| (j) | Directorships or trusteeships of companies required to report to the Securities and Exchange Commission (i.e., “public companies”). |
| (k) | “Interested person” of the Trust within the meaning of the Investment Company Act of 1940 (referred to as the 1940 Act), which is the principal federal law governing investment companies like the fund, as a result of a position with MFS. The address of MFS is 111 Huntington Avenue, Boston, Massachusetts 02199-7618. |
Each Trustee (other than Messrs. Jones, Kilman and Roberge) has been elected by shareholders and each Trustee and Officer holds office until his or her successor is chosen and qualified or until his or her earlier death, resignation, retirement or removal. Mr. Roberge became a Trustee of the Funds on January 1, 2021 and Messrs. Jones and Kilman became Trustees of the Funds on January 1, 2019. The Trust does not hold annual meetings for the purpose of electing Trustees, and Trustees are not elected for fixed terms. Under the terms of the Board's retirement policy, an Independent Trustee shall retire at the end of the calendar year in which he or she reaches the earlier of 75 years of age or 15 years of service on the Board (or, in the case of any Independent Trustee who joined the Board prior to 2015, 20 years of service on the Board).
Messrs. Buller, Caroselli, Jones and Otis are members of the Trust’s Audit Committee.
Trustees and Officers - continued
Each of the Interested Trustees and certain Officers hold comparable officer positions with certain affiliates of MFS.
The Statement of Additional Information for a Fund includes further information about the Trustees and is available without charge upon request by calling 1-800-225-2606.
| Investment Adviser | Custodian |
Massachusetts Financial Services Company
111 Huntington Avenue
Boston, MA 02199-7618 | JPMorgan Chase Bank, NA
4 Metrotech Center
New York, NY 11245 |
| Distributor | Independent Registered Public Accounting Firm |
MFS Fund Distributors, Inc.
111 Huntington Avenue
Boston, MA 02199-7618 | Deloitte & Touche LLP
200 Berkeley Street
Boston, MA 02116 |
| Portfolio Manager(s) | |
David Cole
Michael Skatrud | |
Proxy Voting Policies and Information
MFS votes proxies on behalf of the fund pursuant to proxy voting policies and procedures that are available without charge, upon request, by calling 1-800-225-2606, by visiting mfs.com/proxyvoting, or by visiting the SEC’s Web site at http://www.sec.gov.
Information regarding how the fund voted proxies relating to portfolio securities during the most recent twelve-month period ended June 30 is available by August 31 of each year without charge by visiting mfs.com/proxyvoting, or by visiting the SEC’s Web site at http://www.sec.gov.
Quarterly Portfolio Disclosure
The fund files a complete schedule of portfolio holdings with the SEC for the first and third quarters of each fiscal year as an exhibit to its reports on Form N-PORT. The fund’s Form N-PORT reports are available on the SEC’s Web site at http://www.sec.gov.
Further Information
From time to time, MFS may post important information about the fund or the MFS Funds on the MFS Web site (mfs.com). This information is available at https://www.mfs.com/announcements.
Information About Fund Contracts and Legal Claims
The fund has entered into contractual arrangements with an investment adviser, administrator, distributor, shareholder servicing agent, and custodian who each provide services to the fund. Unless expressly stated otherwise, shareholders are not parties to, or intended beneficiaries of these contractual arrangements, and these contractual arrangements are not intended to create any shareholder right to enforce them against the service providers or to seek any remedy under them against the service providers, either directly or on behalf of the fund.
Under the Trust’s By-Laws and Declaration of Trust, any claims asserted against or on behalf of the MFS Funds, including claims against Trustees and Officers, must be brought in state and federal courts located within the Commonwealth of Massachusetts.
Federal Tax Information (unaudited)
The fund will notify shareholders of amounts for use in preparing 2024 income tax forms in January 2025. The following information is provided pursuant to provisions of the Internal Revenue Code.
The fund intends to pass through the maximum amount allowable as Section 163(j) Interest Dividends as defined in Treasury Regulation §1.163(j)-1(b).
| FACTS | WHAT DOES MFS DO WITH YOUR PERSONAL INFORMATION? |
| Why? | Financial companies choose how they share your personal information. Federal law gives consumers the right to limit some but not all sharing. Federal law also requires us to tell you how we collect, share, and protect your personal information. Please read this notice carefully to understand what we do. |
| What? | The types of personal information we collect and share depend on the product or service you have with us. This information can include: |
| • Social Security number and account balances |
| • Account transactions and transaction history |
| • Checking account information and wire transfer instructions |
| When you are no longer our customer, we continue to share your information as described in this notice. |
| How? | All financial companies need to share customers' personal information to run their everyday business. In the section below, we list the reasons financial companies can share their customers' personal information; the reasons MFS chooses to share; and whether you can limit this sharing. |
Reasons we can share your
personal information | Does MFS share? | Can you limit
this sharing? |
For our everyday business purposes –
such as to process your transactions, maintain your
account(s), respond to court orders and legal
investigations, or report to credit bureaus | Yes | No |
For our marketing purposes –
to offer our products and services to you | No | We don't share |
For joint marketing with other
financial companies | No | We don't share |
For our affiliates' everyday business purposes –
information about your transactions and experiences | No | We don't share |
For our affiliates' everyday business purposes –
information about your creditworthiness | No | We don't share |
| For nonaffiliates to market to you | No | We don't share |
| Questions? | Call 800-225-2606 or go to mfs.com. |
| Who we are |
| Who is providing this notice? | MFS Funds, MFS Investment Management, MFS Institutional Advisors, Inc., and MFS Heritage Trust Company. |
| What we do |
How does MFS
protect my personal
information? | To protect your personal information from unauthorized access and use, we use security measures that comply with federal law. These measures include procedural, electronic, and physical safeguards for the protection of the personal information we collect about you. |
How does MFS
collect my personal
information? | We collect your personal information, for example, when you |
| • open an account or provide account information |
| • direct us to buy securities or direct us to sell your securities |
| • make a wire transfer |
| We also collect your personal information from others, such as credit bureaus, affiliates, or other companies. |
| Why can't I limit all sharing? | Federal law gives you the right to limit only |
| • sharing for affiliates' everyday business purposes – information about your creditworthiness |
| • affiliates from using your information to market to you |
| • sharing for nonaffiliates to market to you |
| State laws and individual companies may give you additional rights to limit sharing. |
| Definitions |
| Affiliates | Companies related by common ownership or control. They can be financial and nonfinancial companies. |
| • MFS does not share personal information with affiliates, except for everyday business purposes as described on page one of this notice. |
| Nonaffiliates | Companies not related by common ownership or control. They can be financial and nonfinancial companies. |
| • MFS does not share with nonaffiliates so they can market to you. |
| Joint marketing | A formal agreement between nonaffiliated financial companies that together market financial products or services to you. |
| • MFS doesn't jointly market. |
| Other important information |
| If you own an MFS product or receive an MFS service in the name of a third party such as a bank or broker-dealer, their privacy policy may apply to you instead of ours. |
Save paper with eDelivery.
MFS® will send you prospectuses, reports, and proxies directly via e-mail so you will get information faster with less mailbox clutter.
To sign up:
1. Go to mfs.com.
2. Log in via MFS® Access.
3. Select eDelivery.
If you own your MFS fund shares through a financial institution or a retirement plan, MFS® TALK, MFS® Access, or eDelivery may not be available to you.
CONTACT
WEB SITE
mfs.com
MFS TALK
1-800-637-8255
24 hours a day
ACCOUNT SERVICE AND LITERATURE
Shareholders
1-800-225-2606
Financial advisors
1-800-343-2829
Retirement plan services
1-800-637-1255
MAILING ADDRESS
MFS Service Center, Inc.
P.O. Box 219341
Kansas City, MO 64121-9341
OVERNIGHT MAIL
MFS Service Center, Inc.
Suite 219341
430 W 7th Street
Kansas City, MO 64105-1407
Annual Report
January 31, 2024
MFS® Municipal High
Income Fund
MFS® Municipal High
Income Fund
| 1 |
| 3 |
| 5 |
| 8 |
| 10 |
| 110 |
| 112 |
| 113 |
| 114 |
| 119 |
| 130 |
| 132 |
| 136 |
| 136 |
| 136 |
| 136 |
| 136 |
| 137 |
The report is prepared for the general information of shareholders. It is authorized for distribution to prospective investors only when preceded or accompanied by a current prospectus.
NOT FDIC INSURED • MAY LOSE VALUE • NO BANK GUARANTEE
Portfolio structure (i)
Top ten industries (i)
| Healthcare Revenue - Long Term Care | 15.1% |
| Healthcare Revenue - Hospitals | 11.4% |
| Universities - Secondary Schools | 10.2% |
| Miscellaneous Revenue - Other | 7.5% |
| Multi-Family Housing Revenue | 5.3% |
| Tax - Sales | 4.9% |
| Universities - Colleges | 4.2% |
| General Obligations - General Purpose | 4.1% |
| Universities – Dormitories | 4.0% |
| Tobacco | 3.3% |
Composition including fixed income credit quality (a)(i)
| AAA | 1.2% |
| AA | 4.3% |
| A | 11.5% |
| BBB | 20.8% |
| BB | 16.7% |
| B | 1.9% |
| CCC | 1.2% |
| CC | 0.1% |
| C | 1.1% |
| D | 0.1% |
| Not Rated | 38.1% |
| Cash & Cash Equivalents | 3.3% |
| Other | (0.3)% |
Portfolio facts
| Average Duration (d) | 7.4 |
| Average Effective Maturity (m) | 20.0 yrs. |
| (a) | For all securities other than those specifically described below, ratings are assigned to underlying securities utilizing ratings from Moody’s, Fitch, and Standard & Poor’s rating agencies and applying the following hierarchy: If all three agencies provide a rating, the middle rating (after dropping the highest and lowest ratings) is assigned; if two of the three agencies rate a security, the lower of the two is assigned. If none of the 3 rating agencies above assign a rating, but the security is rated by DBRS Morningstar, then the DBRS Morningstar rating is assigned. If none of the 4 rating agencies listed above rate the security, but the security is rated by the Kroll Bond Rating Agency (KBRA), then the KBRA rating is assigned. Ratings are shown in the S&P and Fitch scale (e.g., AAA). Securities rated BBB or higher are considered investment grade. All ratings are subject to change. U.S. Government includes securities issued by the U.S. Department of the Treasury. Federal Agencies includes rated and unrated U.S. Agency fixed-income securities, U.S. Agency mortgage-backed securities, and collateralized mortgage obligations of U.S. Agency mortgage-backed securities. |
Not Rated includes fixed income securities and fixed income derivatives that have not been
Portfolio Composition - continued
rated by any rating agency. The fund may or may not have held all of these instruments on this date. The fund is not rated by these agencies.
| (d) | Duration is a measure of how much a bond’s price is likely to fluctuate with general changes in interest rates, e.g., if rates rise 1.00%, a bond with a 5-year duration is likely to lose about 5.00% of its value due to the interest rate move. The Average Duration calculation reflects the impact of the equivalent exposure of derivative positions, if any. |
| (i) | For purposes of this presentation, the components include the value of securities, and reflect the impact of the equivalent exposure of derivative positions, if any. These amounts may be negative from time to time. Equivalent exposure is a calculated amount that translates the derivative position into a reasonable approximation of the amount of the underlying asset that the portfolio would have to hold at a given point in time to have the same price sensitivity that results from the portfolio’s ownership of the derivative contract. When dealing with derivatives, equivalent exposure is a more representative measure of the potential impact of a position on portfolio performance than value. The bond component will include any accrued interest amounts. |
| (m) | In determining each instrument’s effective maturity for purposes of calculating the fund’s dollar-weighted average effective maturity, MFS uses the instrument’s stated maturity or, if applicable, an earlier date on which MFS believes it is probable that a maturity-shortening feature (such as a put, pre-refunding or prepayment) will cause the instrument to be repaid. Such an earlier date can be substantially shorter than the instrument’s stated maturity. |
Cash & Cash Equivalents includes any cash, investments in money market funds, short-term securities, and other assets less liabilities. Please see the Statement of Assets and Liabilities for additional information related to the fund’s cash position and other assets and liabilities.
Other includes equivalent exposure from currency derivatives and/or any offsets to derivative positions and/or the leverage created through the issuance of self-deposited inverse floaters and may be negative.
Percentages are based on net assets as of January 31, 2024.
The portfolio is actively managed and current holdings may be different.
Management Review
Summary of Results
For the twelve months ended January 31, 2024, Class A shares of the MFS Municipal High Income Fund (fund) provided a total return of 2.87%, at net asset value. This compares with a return of 2.90% for the fund’s benchmark, the Bloomberg Municipal Bond Index.
Market Environment
During the reporting period, central banks around the world had to combat the strongest inflationary pressures in four decades, fueled by the global fiscal response to the pandemic, disrupted supply chains and the dislocations to energy markets stemming from the war in Ukraine. Interest rates rose substantially, but the effects of a tighter monetary policy may not have been fully experienced yet, given that monetary policy works with long and variable lags. Strains resulting from the abrupt tightening of monetary policy began to affect some parts of the economy, most acutely among small and regional US banks, which suffered from deposit flight as depositors sought higher yields on their savings. Additionally, activity in the US housing sector has slowed as a result of higher mortgage rates. China’s abandonment of its Zero-COVID policy ushered in a brief uptick in economic activity in the world’s second-largest economy in early 2023, although its momentum soon stalled as the focus turned to the country’s highly indebted property development sector. In developed markets, consumer demand for services remained stronger than the demand for goods.
Despite the challenging macroeconomic and geopolitical environment, central banks focused on controlling price pressures while also confronting increasing financial stability concerns. Central banks had to juggle achieving their inflation mandates while using tools aimed at safeguarding the stability of the financial system to keep banking systems liquid as banks grappled with exposures to commercial real estate. As inflationary pressures eased toward the end of the period, financial conditions loosened in anticipation of easier monetary policy, boosting the market’s appetite for risk as near-term recession risks diminished. Rapid advancements in artificial intelligence were a focus for investors.
Normalizing supply chains, low levels of unemployment across developed markets and signs that inflation levels have peaked were supportive factors for the macroeconomic backdrop.
Amid this eventful backdrop, the investment grade and high-yield municipal markets generated positive returns over the period. Securities in the lower-rated credit quality tiers outperformed the highest-rated credit quality tiers in the municipal indices. Yields rose across the tax-exempt municipal curve but most notably in the short (within two years) segment. A positive for income-oriented investors, the yields (yield-to-worst) on the investment grade and high-yield municipal indices ended the period at 3.37% and 5.62%, respectively, both above their five- and 10-year averages.
Management Review - continued
Factors Affecting Performance
Relative to the Bloomberg Municipal Bond Index, security selection in the power sector, more specifically in “CC” and “D” rated(r) securities, for which the benchmark has no exposure, detracted from performance. The fund’s greater allocation to the health care sector, most notably to out-of-benchmark holdings of “not-rated“ and “CCC” rated bonds, weakened relative results. The fund's yield curve(y) positioning further detracted from relative returns.
On the positive side, the fund’s overweight allocation to both the special tax and education sectors, predominantly within “not-rated” issuers, benefited relative performance. Additionally, strong bond selection in the health care sector, particularly within investment grade securities, and bond selection within the local and special tax sectors supported relative returns.
Respectfully,
Portfolio Manager(s)
Jason Kosty, Megan Poplowski, and Geoffrey Schechter
Note to Shareholders: Effective March 28, 2023, Gary Lasman is no longer a Portfolio Manager of the fund.
| (r) | Securities rated ”BBB“, ”Baa“, or higher are considered investment grade; securities rated ”BB“, ”Ba“, or below are considered non-investment grade. Ratings are assigned to underlying securities utilizing ratings from Moody's, Fitch, and Standard & Poor's and applying the following hierarchy: If all three agencies provide a rating, the middle rating (after dropping the highest and lowest ratings) is assigned; if two of the three agencies rate a security, the lower of the two is assigned. If none of the 3 rating agencies above assign a rating, but the security is rated by DBRS Morningstar, then the DBRS Morningstar rating is assigned. If none of the 4 rating agencies listed above rate the security, but the security is rated by the Kroll Bond Rating Agency (KBRA), then the KBRA rating is assigned. Ratings are shown in the S&P and Fitch scale (e.g., AAA). For securities that are not rated by any of the rating agencies, the security is considered Not Rated. |
| (y) | A yield curve graphically depicts the yields of different maturity bonds of the same credit quality and type; a normal yield curve is upward sloping, with short-term rates lower than long-term rates. |
The views expressed in this report are those of the portfolio manager(s) only through the end of the period of the report as stated on the cover and do not necessarily reflect the views of MFS or any other person in the MFS organization. These views are subject to change at any time based on market or other conditions, and MFS disclaims any responsibility to update such views. These views may not be relied upon as investment advice or an indication of trading intent on behalf of any MFS portfolio. References to specific securities are not recommendations of such securities, and may not be representative of any MFS portfolio’s current or future investments.
Performance Summary THROUGH 1/31/24
The following chart illustrates a representative class of the fund’s historical performance in comparison to its benchmark(s). Performance results include the deduction of the maximum applicable sales charge and reflect the percentage change in net asset value, including reinvestment of dividends and capital gains distributions. The performance of other share classes will be greater than or less than that of the class depicted below. Benchmarks are unmanaged and may not be invested in directly. Benchmark returns do not reflect sales charges, commissions or expenses. (See Notes to Performance Summary.)
Performance data shown represents past performance and is no guarantee of future results. Investment return and principal value fluctuate so your shares, when sold, may be worth more or less than the original cost; current performance may be lower or higher than quoted. The performance shown does not reflect the deduction of taxes, if any, that a shareholder would pay on fund distributions or the redemption of fund shares.
Growth of a Hypothetical $10,000 Investment
Performance Summary - continued
Total Returns through 1/31/24
Average annual without sales charge
| Share Class | Class Inception Date | 1-yr | 5-yr | 10-yr | Life (t) |
| A | 2/24/1984 | 2.87% | 1.74% | 3.69% | N/A |
| B | 9/07/1993 | 2.11% | 0.99% | 2.93% | N/A |
| C | 9/25/1998 | 1.85% | 0.74% | 2.68% | N/A |
| I | 6/01/2011 | 2.86% | 1.74% | 3.70% | N/A |
| R6 | 6/02/2017 | 3.09% | 1.85% | N/A | 2.19% |
Comparative benchmark(s)
| | | | | |
| Bloomberg Municipal Bond Index (f) | 2.90% | 2.00% | 2.78% | N/A |
Average annual with sales charge
| | | | | |
A
With Initial Sales Charge (4.25%) | (1.50)% | 0.86% | 3.24% | N/A |
B
With CDSC (Declining over six years from 4% to 0%) (v) | (1.82)% | 0.64% | 2.93% | N/A |
C
With CDSC (1% for 12 months) (v) | 0.87% | 0.74% | 2.68% | N/A |
CDSC – Contingent Deferred Sales Charge.
Class I and R6 shares do not have a sales charge.
| (f) | Source: FactSet Research Systems Inc. |
| (t) | For the period from the class inception date through the stated period end (for those share classes with less than 10 years of performance history). No comparative benchmark performance information is provided for “life” periods. (See Notes to Performance Summary.) |
| (v) | Assuming redemption at the end of the applicable period. |
Benchmark Definition(s)
Bloomberg Municipal Bond Index(a) – a market capitalization-weighted index that measures the performance of the tax-exempt bond market.
It is not possible to invest directly in an index.
| (a) | Source: Bloomberg Index Services Limited. BLOOMBERG® is a trademark and service mark of Bloomberg Finance L.P. and its affiliates (collectively “Bloomberg”). Bloomberg or Bloomberg's licensors own all proprietary rights in the Bloomberg Indices. Bloomberg neither approves or endorses this material, or guarantees the accuracy or completeness of any information herein, or makes any warranty, express or implied, as to the results to be obtained therefrom and, to the maximum extent allowed by law, neither shall have any liability or responsibility for injury or damages arising in connection therewith. |
Notes to Performance Summary
Average annual total return represents the average annual change in value for each share class for the periods presented. Life returns are presented where the share class has less than 10 years of performance history and represent the average annual total return from the class inception date to the stated period end date. As the fund's share classes may have different inception dates, the life returns may represent different time
Performance Summary - continued
periods and may not be comparable. As a result, no comparative benchmark performance information is provided for life periods.
Performance results reflect any applicable expense subsidies and waivers in effect during the periods shown. Without such subsidies and waivers the fund's performance results would be less favorable. Please see the prospectus and financial statements for complete details.
Performance results do not include adjustments made for financial reporting purposes in accordance with U.S. generally accepted accounting principles and may differ from amounts reported in the financial highlights.
A portion of the fund’s monthly distributions may be subject to state, federal, and/or alternative minimum tax. Capital gains, if any, are subject to a capital gains tax.
From time to time the fund may receive proceeds from litigation settlements, without which performance would be lower.
Expense Table
Fund expenses borne by the shareholders during the period, August 1, 2023 through January 31, 2024
As a shareholder of the fund, you incur two types of costs: (1) transaction costs, including sales charges (loads) on certain purchase or redemption payments, and (2) ongoing costs, including management fees; distribution and service (12b-1) fees; and other fund expenses. This example is intended to help you understand your ongoing costs (in dollars) of investing in the fund and to compare these costs with the ongoing costs of investing in other mutual funds.
The example is based on an investment of $1,000 invested at the beginning of the period and held for the entire period August 1, 2023 through January 31, 2024.
Actual Expenses
The first line for each share class in the following tables provides information about actual account values and actual expenses. You may use the information in this line, together with the amount you invested, to estimate the expenses that you paid over the period. Simply divide your account value by $1,000 (for example, an $8,600 account value divided by $1,000 = 8.6), then multiply the result by the number in the first line under the heading entitled “Expenses Paid During Period” to estimate the expenses you paid on your account during this period.
Hypothetical Example for Comparison Purposes
The second line for each share class in the following tables provides information about hypothetical account values and hypothetical expenses based on each fund’s actual expense ratio and an assumed rate of return of 5% per year before expenses, which is not each fund’s actual return. The hypothetical account values and expenses may not be used to estimate the actual ending account balance or expenses you paid for the period. You may use this information to compare the ongoing costs of investing in each fund and other funds. To do so, compare this 5% hypothetical example with the 5% hypothetical examples that appear in the shareholder reports of the other funds.
Please note that the expenses shown in the tables are meant to highlight your ongoing costs only and do not reflect any transactional costs, such as sales charges (loads). Therefore, the second line for each share class in the tables is useful in comparing ongoing costs only, and will not help you determine the relative total costs of owning different funds. In addition, if these transactional costs were included, your costs would have been higher.
Expense Table - continued
Share
Class | | Annualized
Expense
Ratio | Beginning
Account Value
8/01/23 | Ending
Account Value
1/31/24 | Expenses
Paid During
Period (p)
8/01/23-1/31/24 |
| A | Actual | 0.60% | $1,000.00 | $1,037.45 | $3.08 |
| Hypothetical (h) | 0.60% | $1,000.00 | $1,022.18 | $3.06 |
| B | Actual | 1.35% | $1,000.00 | $1,033.58 | $6.92 |
| Hypothetical (h) | 1.35% | $1,000.00 | $1,018.40 | $6.87 |
| C | Actual | 1.60% | $1,000.00 | $1,032.25 | $8.20 |
| Hypothetical (h) | 1.60% | $1,000.00 | $1,017.14 | $8.13 |
| I | Actual | 0.60% | $1,000.00 | $1,037.41 | $3.08 |
| Hypothetical (h) | 0.60% | $1,000.00 | $1,022.18 | $3.06 |
| R6 | Actual | 0.52% | $1,000.00 | $1,037.87 | $2.67 |
| Hypothetical (h) | 0.52% | $1,000.00 | $1,022.58 | $2.65 |
| (h) | 5% class return per year before expenses. |
| (p) | “Expenses Paid During Period” are equal to each class’s annualized expense ratio, as shown above, multiplied by the average account value over the period, multiplied by 184/365 (to reflect the one-half year period). Expenses paid do not include any applicable sales charges (loads). If these transaction costs had been included, your costs would have been higher. |
Notes to Expense Table
Expense ratios include 0.02% of investment related expenses from self-deposited inverse floaters (See Note 2 of the Notes to Financial Statements) that are outside of the expense limitation arrangement (See Note 3 of the Notes to Financial Statements).
Portfolio of Investments
1/31/24
The Portfolio of Investments is a complete list of all securities owned by your fund. It is categorized by jurisdiction.
| Issuer | | | Shares/Par | Value ($) |
| Municipal Bonds - 94.5% |
| Alabama - 1.7% |
| Alabama Southeast Energy, Cooperative District Energy Supply Rev., “B-1”, 5.75%, 4/01/2054 (Put Date 11/01/2031) | | $ | 13,500,000 | $15,056,142 |
| Alabama Stadium Trace Village Improvement District Development Incentive Anticipation, 3.625%, 3/01/2036 | | | 1,825,000 | 1,507,335 |
| Birmingham, AL, Special Care Facilities Financing Authority Rev. (Methodist Home for the Aging), 5.5%, 6/01/2030 | | | 1,630,000 | 1,579,121 |
| Birmingham, AL, Special Care Facilities Financing Authority Rev. (Methodist Home for the Aging), 5.75%, 6/01/2035 | | | 1,685,000 | 1,614,517 |
| Birmingham, AL, Special Care Facilities Financing Authority Rev. (Methodist Home for the Aging), 5.75%, 6/01/2045 | | | 6,525,000 | 5,679,565 |
| Birmingham, AL, Special Care Facilities Financing Authority Rev. (Methodist Home for the Aging), 6%, 6/01/2050 | | | 2,565,000 | 2,266,511 |
| Black Belt Energy Gas District, AL, Gas Project Rev., “F”, 5.5%, 11/01/2053 (Put Date 12/01/2028) | | | 5,175,000 | 5,507,845 |
| Huntsville-Redstone Village, AL, Special Care Facilities Financing Authority (Redstone Village Project), 5.5%, 1/01/2028 (a)(d) | | | 1,485,000 | 846,450 |
| Huntsville-Redstone Village, AL, Special Care Facilities Financing Authority (Redstone Village Project), 5.5%, 1/01/2043 (a)(d) | | | 1,560,000 | 889,200 |
| Jacksonville, AL, Public Educational Building Authority Higher Education Facilities Rev. (Jacksonville State University Foundation), “A”, AGM, 5.25%, 8/01/2053 | | | 2,165,000 | 2,347,884 |
| Jacksonville, AL, Public Educational Building Authority Higher Education Facilities Rev. (Jacksonville State University Foundation), “A”, AGM, 5.5%, 8/01/2058 | | | 1,820,000 | 2,004,881 |
| Jefferson County, AL, Sewer Rev. Warrants, 5.25%, 10/01/2049 | | | 7,985,000 | 8,651,491 |
| Jefferson County, AL, Sewer Rev. Warrants, 5.5%, 10/01/2053 | | | 6,425,000 | 7,110,674 |
| Muscle Shoals, Sheffield, and Tuscumbia, AL, Solid Waste Disposal Authority Rev. (Cherokee Industrial Landfill Project), “A”, 6%, 5/01/2040 (z) | | | 4,200,000 | 4,543,922 |
| Muscle Shoals, Sheffield, and Tuscumbia, AL, Solid Waste Disposal Authority Rev., Taxable (Cherokee Industrial Landfill Project), “B”, 8%, 5/01/2029 (z) | | | 1,297,641 | 1,379,598 |
| Prichard, AL, Water Works & Sewer Board Rev., 4%, 11/01/2031 | | | 1,565,000 | 1,304,320 |
| Prichard, AL, Water Works & Sewer Board Rev., 4%, 11/01/2033 | | | 1,395,000 | 1,119,804 |
| Prichard, AL, Water Works & Sewer Board Rev., 4%, 11/01/2044 | | | 1,800,000 | 1,243,770 |
| Prichard, AL, Water Works & Sewer Board Rev., 4%, 11/01/2049 | | | 3,500,000 | 2,316,157 |
| Southeast Alabama Energy Authority Commodity Supply Rev. (Project No. 3), “A-1”, 5.5%, 1/01/2053 (Put Date 12/01/2029) | | | 4,980,000 | 5,398,845 |
| | | | | $72,368,032 |
Portfolio of Investments – continued
| Issuer | | | Shares/Par | Value ($) |
| Municipal Bonds - continued |
| Alaska - 0.2% |
| Alaska Industrial Development & Export Authority Power Rev. (Snettisham Hydroelectric Project), 5%, 1/01/2030 | | $ | 875,000 | $888,163 |
| Alaska Industrial Development & Export Authority Power Rev. (Snettisham Hydroelectric Project), 5%, 1/01/2031 | | | 1,270,000 | 1,288,857 |
| Northern Alaska Tobacco Securitization Corp., Tobacco Settlement Asset-Backed, Capital Appreciation, “B-2”, 0%, 6/01/2066 | | | 61,290,000 | 8,094,748 |
| | | | | $10,271,768 |
| Arizona - 3.5% |
| Arizona Industrial Development Authority Education Rev. (Academies of Math & Science Projects), 4%, 7/01/2029 (n) | | $ | 725,000 | $704,338 |
| Arizona Industrial Development Authority Education Rev. (Academies of Math & Science Projects), 5%, 7/01/2039 (n) | | | 870,000 | 853,473 |
| Arizona Industrial Development Authority Education Rev. (Academies of Math & Science Projects), 5.25%, 7/01/2043 | | | 120,000 | 118,129 |
| Arizona Industrial Development Authority Education Rev. (Academies of Math & Science Projects), 5%, 7/01/2049 (n) | | | 1,395,000 | 1,291,079 |
| Arizona Industrial Development Authority Education Rev. (Academies of Math & Science Projects), 5.375%, 7/01/2053 | | | 440,000 | 425,781 |
| Arizona Industrial Development Authority Education Rev. (Academies of Math & Science Projects), 5%, 7/01/2054 (n) | | | 2,185,000 | 1,994,427 |
| Arizona Industrial Development Authority Education Rev. (Academies of Math & Science Projects), 5.5%, 7/01/2058 | | | 410,000 | 401,301 |
| Arizona Industrial Development Authority Education Rev. (Academies of Math & Science Projects), “A”, 5%, 7/01/2052 | | | 1,140,000 | 1,155,103 |
| Arizona Industrial Development Authority Education Rev. (Academies of Math & Science Projects), “B”, 5.5%, 7/01/2038 (n) | | | 1,065,000 | 1,075,774 |
| Arizona Industrial Development Authority Education Rev. (Academies of Math & Science Projects), “B”, 5.625%, 7/01/2048 (n) | | | 2,050,000 | 2,055,064 |
| Arizona Industrial Development Authority Education Rev. (Academies of Math & Science Projects), “B”, 5.75%, 7/01/2053 (n) | | | 3,190,000 | 3,202,522 |
| Arizona Industrial Development Authority Education Rev. (Basis Schools Projects), “D”, 5%, 7/01/2037 (n) | | | 450,000 | 450,959 |
| Arizona Industrial Development Authority Education Rev. (Basis Schools Projects), “D”, 5%, 7/01/2047 (n) | | | 740,000 | 695,277 |
| Arizona Industrial Development Authority Education Rev. (Basis Schools Projects), “D”, 5%, 7/01/2051 (n) | | | 1,970,000 | 1,823,394 |
| Arizona Industrial Development Authority Education Rev. (Basis Schools Projects), “G”, 5%, 7/01/2037 (n) | | | 770,000 | 771,641 |
Portfolio of Investments – continued
| Issuer | | | Shares/Par | Value ($) |
| Municipal Bonds - continued |
| Arizona - continued |
| Arizona Industrial Development Authority Education Rev. (Basis Schools Projects), “G”, 5%, 7/01/2047 (n) | | $ | 770,000 | $723,463 |
| Arizona Industrial Development Authority Education Rev. (Basis Schools Projects), “G”, 5%, 7/01/2051 (n) | | | 735,000 | 680,302 |
| Arizona Industrial Development Authority Education Rev. (Benjamin Franklin Charter School Projects), “A”, 5.25%, 7/01/2053 | | | 440,000 | 416,080 |
| Arizona Industrial Development Authority Education Rev. (Benjamin Franklin Charter School Projects), “A”, 5.5%, 7/01/2058 | | | 440,000 | 428,061 |
| Arizona Industrial Development Authority Education Rev. (KIPP Nashville Projects), “A”, 5%, 7/01/2047 | | | 375,000 | 382,663 |
| Arizona Industrial Development Authority Education Rev. (KIPP Nashville Projects), “A”, 5%, 7/01/2057 | | | 475,000 | 481,312 |
| Arizona Industrial Development Authority Education Rev. (KIPP Nashville Projects), “A”, 5%, 7/01/2062 | | | 665,000 | 672,006 |
| Arizona Industrial Development Authority Education Rev. (Mater Academy of Nevada - Bonanza Campus Project), “A”, 4%, 12/15/2030 (n) | | | 2,190,000 | 2,118,270 |
| Arizona Industrial Development Authority Education Rev. (Mater Academy of Nevada - Bonanza Campus Project), “A”, 5%, 12/15/2040 (n) | | | 1,000,000 | 980,956 |
| Arizona Industrial Development Authority Education Rev. (Mater Academy of Nevada - Bonanza Campus Project), “A”, 5%, 12/15/2050 (n) | | | 3,200,000 | 2,997,875 |
| Arizona Industrial Development Authority Education Rev. (Pinecrest Academy of Nevada - Cadence Campus Project), “A”, 4%, 7/15/2030 (n) | | | 955,000 | 925,375 |
| Arizona Industrial Development Authority Education Rev. (Pinecrest Academy of Nevada - Cadence Campus Project), “A”, 4%, 7/15/2040 (n) | | | 1,425,000 | 1,214,841 |
| Arizona Industrial Development Authority Education Rev. (Pinecrest Academy of Nevada - Cadence Campus Project), “A”, 4%, 7/15/2050 (n) | | | 1,600,000 | 1,239,726 |
| Arizona Industrial Development Authority Education Rev. (Pinecrest Academy of Nevada - Inspirada and St. Rose Campus Projects), “A”, 5%, 7/15/2028 (n) | | | 1,565,000 | 1,584,756 |
| Arizona Industrial Development Authority Education Rev. (Pinecrest Academy of Nevada - Inspirada and St. Rose Campus Projects), “A”, 5.75%, 7/15/2038 (n) | | | 1,810,000 | 1,840,084 |
| Arizona Industrial Development Authority Education Rev. (Pinecrest Academy of Nevada - Inspirada and St. Rose Campus Projects), “A”, 5.75%, 7/15/2048 (n) | | | 3,100,000 | 3,110,415 |
Portfolio of Investments – continued
| Issuer | | | Shares/Par | Value ($) |
| Municipal Bonds - continued |
| Arizona - continued |
| Arizona Industrial Development Authority Education Rev. (Pinecrest Academy of Northern Nevada Project), “A”, 4.5%, 7/15/2029 | | $ | 250,000 | $234,318 |
| Arizona Industrial Development Authority Education Rev. (Somerset Academy of Las Vegas - Aliante & Skye Canyon Campus Projects), “A”, 3%, 12/15/2031 (n) | | | 545,000 | 480,656 |
| Arizona Industrial Development Authority Education Rev. (Somerset Academy of Las Vegas - Aliante & Skye Canyon Campus Projects), “A”, 4%, 12/15/2041 (n) | | | 1,090,000 | 910,888 |
| Arizona Industrial Development Authority Education Rev. (Somerset Academy of Las Vegas - Aliante & Skye Canyon Campus Projects), “A”, 4%, 12/15/2051 (n) | | | 435,000 | 327,899 |
| Arizona Industrial Development Authority Education Rev. (Somerset Academy of Las Vegas - Lone Mountain Campus Project), “A”, 3.75%, 12/15/2029 (n) | | | 355,000 | 336,985 |
| Arizona Industrial Development Authority Education Rev. (Somerset Academy of Las Vegas - Lone Mountain Campus Project), “A”, 5%, 12/15/2039 (n) | | | 340,000 | 332,692 |
| Arizona Industrial Development Authority Education Rev. (Somerset Academy of Las Vegas - Lone Mountain Campus Project), “A”, 5%, 12/15/2049 (n) | | | 600,000 | 548,025 |
| Arizona Industrial Development Authority National Charter School Revolving Loan Fund Rev., “A”, 4%, 11/01/2051 | | | 2,450,000 | 2,204,727 |
| Glendale, AZ, Industrial Development Authority Refunding Rev. (Terraces of Phoenix Project), “A”, 4%, 7/01/2028 | | | 300,000 | 291,823 |
| Glendale, AZ, Industrial Development Authority Refunding Rev. (Terraces of Phoenix Project), “A”, 5%, 7/01/2033 | | | 250,000 | 250,455 |
| Glendale, AZ, Industrial Development Authority Refunding Rev. (Terraces of Phoenix Project), “A”, 5%, 7/01/2038 | | | 300,000 | 290,407 |
| Glendale, AZ, Industrial Development Authority Refunding Rev. (Terraces of Phoenix Project), “A”, 5%, 7/01/2048 | | | 1,800,000 | 1,598,099 |
| Glendale, AZ, Industrial Development Authority, Graduate & Professional Student Loan Program Rev. (Midwestern University Foundation), “A”, 2.125%, 7/01/2033 | | | 1,405,000 | 1,184,056 |
| Glendale, AZ, Industrial Development Authority, Graduate & Professional Student Loan Program Rev. (Midwestern University Foundation), “A”, 3%, 7/01/2035 | | | 1,365,000 | 1,264,165 |
| Glendale, AZ, Industrial Development Authority, Senior Living Rev. (Royal Oaks - Inspirata Pointe Project), “A”, 5%, 5/15/2041 | | | 1,000,000 | 922,556 |
| Glendale, AZ, Industrial Development Authority, Senior Living Rev. (Royal Oaks - Inspirata Pointe Project), “A”, 5%, 5/15/2056 | | | 5,955,000 | 5,012,981 |
Portfolio of Investments – continued
| Issuer | | | Shares/Par | Value ($) |
| Municipal Bonds - continued |
| Arizona - continued |
| La Paz County, AZ, Industrial Development Authority (Harmony Education Foundation - Harmony Public Schools Project), “A”, 4%, 2/15/2041 | | $ | 430,000 | $384,566 |
| La Paz County, AZ, Industrial Development Authority (Harmony Education Foundation - Harmony Public Schools Project), “A”, 4%, 2/15/2046 | | | 345,000 | 294,406 |
| La Paz County, AZ, Industrial Development Authority (Harmony Education Foundation - Harmony Public Schools Project), “A”, 4%, 2/15/2051 | | | 580,000 | 473,372 |
| La Paz County, AZ, Industrial Development Authority Education Facility Lease Rev. (Charter School Solutions - Harmony Public Schools Project), “A”, 5%, 2/15/2038 | | | 800,000 | 811,696 |
| La Paz County, AZ, Industrial Development Authority Education Facility Lease Rev. (Charter School Solutions - Harmony Public Schools Project), “A”, 5%, 2/15/2048 | | | 435,000 | 428,871 |
| Maricopa County, AZ, Industrial Development Authority Education Rev. (Legacy Traditional Schools Projects), “A”, 4%, 7/01/2034 | | | 215,000 | 218,754 |
| Maricopa County, AZ, Industrial Development Authority Education Rev. (Legacy Traditional Schools Projects), “A”, 5%, 7/01/2039 | | | 380,000 | 397,217 |
| Maricopa County, AZ, Industrial Development Authority Education Rev. (Legacy Traditional Schools Projects), “A”, 5%, 7/01/2039 (n) | | | 1,115,000 | 1,110,210 |
| Maricopa County, AZ, Industrial Development Authority Education Rev. (Legacy Traditional Schools Projects), “A”, 5%, 7/01/2049 (n) | | | 705,000 | 721,234 |
| Maricopa County, AZ, Industrial Development Authority Education Rev. (Legacy Traditional Schools Projects), “A”, 5%, 7/01/2049 (n) | | | 590,000 | 558,330 |
| Maricopa County, AZ, Industrial Development Authority Education Rev. (Legacy Traditional Schools Projects), “A”, 5%, 7/01/2054 | | | 895,000 | 912,104 |
| Maricopa County, AZ, Industrial Development Authority Education Rev. (Legacy Traditional Schools Projects), “A”, 5%, 7/01/2054 (n) | | | 2,660,000 | 2,483,042 |
| Maricopa County, AZ, Pollution Control Corp. Rev. (Public Service Company of New Mexico Palo Verde Project), “B”, 0.875%, 6/01/2043 (Put Date 10/01/2026) | | | 855,000 | 775,715 |
| Phoenix, AZ, Industrial Development Authority Rev. (Guam Facilities Foundation, Inc.), 5.125%, 2/01/2034 | | | 4,545,000 | 4,434,141 |
| Phoenix, AZ, Industrial Development Authority Rev. (Guam Facilities Foundation, Inc.), 5.375%, 2/01/2041 | | | 3,980,000 | 3,752,241 |
Portfolio of Investments – continued
| Issuer | | | Shares/Par | Value ($) |
| Municipal Bonds - continued |
| Arizona - continued |
| Phoenix, AZ, Industrial Development Authority, Education Facility Rev. (Basis Schools Projects), “A”, 5%, 7/01/2035 (n) | | $ | 2,070,000 | $2,078,033 |
| Phoenix, AZ, Industrial Development Authority, Education Facility Rev. (Basis Schools Projects), “A”, 5%, 7/01/2035 (n) | | | 700,000 | 702,717 |
| Phoenix, AZ, Industrial Development Authority, Education Facility Rev. (Basis Schools Projects), “A”, 5%, 7/01/2045 (n) | | | 3,065,000 | 2,925,357 |
| Phoenix, AZ, Industrial Development Authority, Education Facility Rev. (Basis Schools Projects), “A”, 5%, 7/01/2046 (n) | | | 1,770,000 | 1,676,120 |
| Phoenix, AZ, Industrial Development Authority, Education Facility Rev. (Great Hearts Academies Project), “A”, 5%, 7/01/2034 | | | 6,355,000 | 6,372,061 |
| Phoenix, AZ, Industrial Development Authority, Education Facility Rev. (Great Hearts Academies Project), “A”, 5%, 7/01/2036 | | | 815,000 | 820,186 |
| Phoenix, AZ, Industrial Development Authority, Education Facility Rev. (Great Hearts Academies Project), “A”, 5%, 7/01/2041 | | | 660,000 | 660,298 |
| Phoenix, AZ, Industrial Development Authority, Education Facility Rev. (Great Hearts Academies Project), “A”, 5%, 7/01/2044 | | | 3,970,000 | 3,907,327 |
| Phoenix, AZ, Industrial Development Authority, Education Facility Rev. (Great Hearts Academies Project), “A”, 5%, 7/01/2046 | | | 1,235,000 | 1,199,721 |
| Phoenix, AZ, Industrial Development Authority, Education Facility Rev. (Legacy Traditional Schools Project), 6.5%, 7/01/2034 (n) | | | 1,970,000 | 1,987,757 |
| Phoenix, AZ, Industrial Development Authority, Education Facility Rev. (Legacy Traditional Schools Project), 5%, 7/01/2035 (n) | | | 1,430,000 | 1,438,252 |
| Phoenix, AZ, Industrial Development Authority, Education Facility Rev. (Legacy Traditional Schools Project), 6.75%, 7/01/2044 (n) | | | 3,255,000 | 3,277,180 |
| Phoenix, AZ, Industrial Development Authority, Education Facility Rev. (Legacy Traditional Schools Project), 5%, 7/01/2045 (n) | | | 1,570,000 | 1,515,877 |
| Phoenix, AZ, Industrial Development Authority, Education Facility Rev. (Legacy Traditional Schools Project), 5%, 7/01/2046 (n) | | | 3,935,000 | 3,776,059 |
| Phoenix, AZ, Industrial Development Authority, Hotel Rev. (Provident Group - Falcon Properties LLC, Project), “A”, 4%, 12/01/2041 (n) | | | 2,605,000 | 2,216,423 |
| Phoenix, AZ, Industrial Development Authority, Hotel Rev. (Provident Group - Falcon Properties LLC, Project), “A”, 4%, 12/01/2051 (n) | | | 8,630,000 | 6,708,820 |
| Phoenix, AZ, Industrial Development Authority, Hotel Rev. (Provident Group - Falcon Properties LLC, Project), “A”, 4.15%, 12/01/2057 (n) | | | 3,245,000 | 2,464,208 |
| Phoenix, AZ, Industrial Development Authority, Hotel Rev. (Provident Group - Falcon Properties LLC, Project), “B”, 5.75%, 12/15/2057 (n) | | | 8,330,000 | 6,650,472 |
| Phoenix, AZ, Industrial Development Authority, Student Housing Refunding Rev. (Downtown Phoenix Student Housing II LLC - Arizona State University Project), “A”, 5%, 7/01/2044 | | | 540,000 | 544,682 |
Portfolio of Investments – continued
| Issuer | | | Shares/Par | Value ($) |
| Municipal Bonds - continued |
| Arizona - continued |
| Phoenix, AZ, Industrial Development Authority, Student Housing Refunding Rev. (Downtown Phoenix Student Housing II LLC - Arizona State University Project), “A”, 5%, 7/01/2049 | | $ | 1,325,000 | $1,323,999 |
| Phoenix, AZ, Industrial Development Authority, Student Housing Refunding Rev. (Downtown Phoenix Student Housing II LLC - Arizona State University Project), “A”, 5%, 7/01/2059 | | | 1,085,000 | 1,064,393 |
| Phoenix, AZ, Industrial Development Authority, Student Housing Refunding Rev. (Downtown Phoenix Student Housing LLC - Arizona State University Project), “A”, 5%, 7/01/2037 | | | 500,000 | 512,960 |
| Phoenix, AZ, Industrial Development Authority, Student Housing Refunding Rev. (Downtown Phoenix Student Housing LLC - Arizona State University Project), “A”, 5%, 7/01/2042 | | | 555,000 | 560,902 |
| Pima County, AZ, Industrial Development Authority Education Facility Rev. (American Leadership Academy Project), 5%, 6/15/2034 (n) | | | 630,000 | 632,360 |
| Pima County, AZ, Industrial Development Authority Education Facility Rev. (American Leadership Academy Project), 5%, 6/15/2039 (n) | | | 655,000 | 637,160 |
| Pima County, AZ, Industrial Development Authority Education Facility Rev. (American Leadership Academy Project), 4%, 6/15/2041 (n) | | | 510,000 | 429,135 |
| Pima County, AZ, Industrial Development Authority Education Facility Rev. (American Leadership Academy Project), 4%, 6/15/2041 (n) | | | 2,735,000 | 2,301,340 |
| Pima County, AZ, Industrial Development Authority Education Facility Rev. (American Leadership Academy Project), 5%, 6/15/2049 (n) | | | 1,235,000 | 1,139,897 |
| Pima County, AZ, Industrial Development Authority Education Facility Rev. (American Leadership Academy Project), 4%, 6/15/2051 (n) | | | 3,020,000 | 2,311,847 |
| Pima County, AZ, Industrial Development Authority Education Facility Rev. (American Leadership Academy Project), 4%, 6/15/2051 (n) | | | 780,000 | 597,100 |
| Pima County, AZ, Industrial Development Authority Education Facility Rev. (American Leadership Academy Project), 4%, 6/15/2057 (n) | | | 685,000 | 503,922 |
| Pima County, AZ, Industrial Development Authority Education Facility Rev. (American Leadership Academy Project), 4%, 6/15/2057 (n) | | | 3,420,000 | 2,515,178 |
| Pima County, AZ, Industrial Development Authority Senior Living Rev. (La Posada at Pusch Ridge Project), “A”, 6.75%, 11/15/2042 (n) | | | 1,825,000 | 1,884,504 |
Portfolio of Investments – continued
| Issuer | | | Shares/Par | Value ($) |
| Municipal Bonds - continued |
| Arizona - continued |
| Pima County, AZ, Industrial Development Authority Senior Living Rev. (La Posada at Pusch Ridge Project), “A”, 6.875%, 11/15/2052 (n) | | $ | 5,160,000 | $5,290,764 |
| Pima County, AZ, Industrial Development Authority Senior Living Rev. (La Posada at Pusch Ridge Project), “A”, 7%, 11/15/2057 (n) | | | 2,320,000 | 2,390,154 |
| Pima County, AZ, Industrial Development Authority Senior Living Rev. (La Posada at Pusch Ridge Project), “B3”, 5.125%, 11/15/2029 (n) | | | 1,250,000 | 1,253,061 |
| Salt Verde Financial Corp., AZ, Senior Gas Rev., 5%, 12/01/2032 | | | 2,940,000 | 3,143,349 |
| Sierra Vista, AZ, Industrial Development Authority, Education Facility Rev. (American Leadership Academy Project), 5.75%, 6/15/2053 | | | 1,440,000 | 1,449,797 |
| Sierra Vista, AZ, Industrial Development Authority, Education Facility Rev. (American Leadership Academy Project), 5.75%, 6/15/2058 | | | 1,095,000 | 1,097,805 |
| | | | | $152,722,255 |
| Arkansas - 0.3% |
| Arkansas Development Finance Authority, Charter School Capital Improvement Rev. (LISA Academy Project), 4%, 7/01/2028 | | $ | 800,000 | $779,127 |
| Arkansas Development Finance Authority, Charter School Capital Improvement Rev. (LISA Academy Project), 4.5%, 7/01/2033 | | | 1,620,000 | 1,581,077 |
| Arkansas Development Finance Authority, Charter School Capital Improvement Rev. (LISA Academy Project), 4.5%, 7/01/2039 | | | 170,000 | 158,679 |
| Arkansas Development Finance Authority, Health Care Rev. (Baptist Memorial Health Care Corp.), “B-1”, 5%, 9/01/2037 | | | 645,000 | 666,263 |
| Arkansas Development Finance Authority, Health Care Rev. (Baptist Memorial Health Care Corp.), “B-1”, 5%, 9/01/2039 | | | 520,000 | 530,531 |
| Arkansas Development Finance Authority, Health Care Rev. (Baptist Memorial Health Care Corp.), “B-1”, 5%, 9/01/2040 | | | 570,000 | 579,371 |
| Arkansas Development Finance Authority, Healthcare Facilities Rev. (Carti Surgery Center Project), “B”, 3%, 7/01/2032 | | | 180,000 | 157,231 |
| Arkansas Development Finance Authority, Healthcare Facilities Rev. (Carti Surgery Center Project), “B”, 3.125%, 7/01/2036 | | | 520,000 | 426,911 |
| Arkansas Development Finance Authority, Healthcare Facilities Rev. (Carti Surgery Center Project), “B”, 4.25%, 7/01/2041 | | | 195,000 | 178,051 |
| Arkansas Development Finance Authority, Healthcare Facilities Rev. (Carti Surgery Center Project), “B”, 3.5%, 7/01/2046 | | | 1,235,000 | 933,729 |
| Arkansas Development Finance Authority, Healthcare Facilities Rev. (Carti Surgery Center Project), “B”, 4%, 7/01/2052 | | | 850,000 | 667,262 |
| Arkansas Development Finance Authority, Tobacco Settlement Rev. (Cancer Research Center Project), Capital Appreciation, AAC, 0%, 7/01/2046 | | | 6,455,000 | 2,259,471 |
Portfolio of Investments – continued
| Issuer | | | Shares/Par | Value ($) |
| Municipal Bonds - continued |
| Arkansas - continued |
| Pulaski County, AR, Public Facilities Board, Healthcare Rev. (Baptist Health), 5%, 12/01/2039 (Prerefunded 12/01/2024) | | $ | 4,510,000 | $4,572,077 |
| | | | | $13,489,780 |
| California - 6.8% |
| Acton-Agua Dulce, CA, Unified School District (Election of 2008), Capital Appreciation, AGM, 0%, 5/01/2039 | | $ | 7,550,000 | $4,048,498 |
| California Community Choice Financing Authority, Clean Energy Project Rev., “C”, 5.25%, 1/01/2054 (Put Date 10/01/2031) | | | 25,510,000 | 26,968,613 |
| California Community Choice Financing Authority, Clean Energy Project Rev., “F”, 5.5%, 10/01/2054 (Put Date 11/01/2030) | | | 7,570,000 | 8,335,052 |
| California Community College Financing Authority Student Housing Rev. (NCCD - Napa Valley Properties LLC - Napa Valley College Project), “A”, 5.75%, 7/01/2060 (n) | | | 12,810,000 | 12,936,809 |
| California Community Housing Agency, Essential Housing Rev. (Aster), “A-1”, 4%, 2/01/2056 (n) | | | 6,870,000 | 5,827,301 |
| California Community Housing Agency, Essential Housing Rev. (Aster), “A-2”, 4%, 2/01/2043 (n) | | | 6,855,000 | 6,090,064 |
| California County Tobacco Securitization Agency Settlement (Gold Country Settlement Funding Corp.), Capital Appreciation, “B-2”, 0%, 6/01/2055 | | | 8,415,000 | 1,816,207 |
| California County Tobacco Securitization Agency Settlement (Los Angeles County Securitization Corp.), “A”, 4%, 6/01/2038 | | | 145,000 | 147,018 |
| California County Tobacco Securitization Agency Settlement (Los Angeles County Securitization Corp.), “A”, 4%, 6/01/2039 | | | 185,000 | 186,686 |
| California Housing Finance Agency Municipal Certificates, “X”, 0.79%, 8/20/2036 (i)(n) | | | 26,641,809 | 1,401,386 |
| California Housing Finance Agency Municipal Certificates, “X”, 0.366%, 9/20/2036 (i) | | | 146,163,443 | 3,634,544 |
| California M-S-R Energy Authority Gas Rev., “A”, 7%, 11/01/2034 | | | 1,135,000 | 1,448,945 |
| California Municipal Finance Authority Rev. (California Baptist University), “A”, 5%, 11/01/2046 (n) | | | 5,470,000 | 5,317,513 |
| California Municipal Finance Authority Rev. (NorthBay Healthcare Group), “A”, 5.25%, 11/01/2036 | | | 1,370,000 | 1,386,344 |
| California Municipal Finance Authority Rev. (NorthBay Healthcare Group), “A”, 5.25%, 11/01/2041 | | | 1,265,000 | 1,274,106 |
| California Municipal Finance Authority Rev. (NorthBay Healthcare Group), “A”, 5.25%, 11/01/2047 | | | 210,000 | 209,774 |
| California Municipal Finance Authority Rev. (William Jessup University), 5%, 8/01/2039 | | | 6,550,000 | 6,139,935 |
| California Municipal Finance Authority Rev. (William Jessup University), 5%, 8/01/2048 | | | 2,325,000 | 2,055,682 |
Portfolio of Investments – continued
| Issuer | | | Shares/Par | Value ($) |
| Municipal Bonds - continued |
| California - continued |
| California Municipal Finance Authority, Charter School Lease Rev. (Palmdale Aerospace Academy Project), “A”, 3.875%, 7/01/2028 (n) | | $ | 900,000 | $868,596 |
| California Municipal Finance Authority, Charter School Lease Rev. (Palmdale Aerospace Academy Project), “A”, 5%, 7/01/2049 (n) | | | 1,600,000 | 1,472,645 |
| California Municipal Finance Authority, COP (Palomar Health), “A”, AGM, 5.25%, 11/01/2052 | | | 3,370,000 | 3,801,441 |
| California Municipal Finance Authority, Multi-Family Housing Rev. (CityView Apartments), “A”, 4%, 11/01/2036 (n) | | | 2,120,000 | 1,967,217 |
| California Municipal Special Finance Agency XII, Essential Housing Rev. (Allure Apartments), “A-1”, 3.25%, 2/01/2057 (n) | | | 1,650,000 | 1,183,609 |
| California Municipal Special Finance Agency, Essential Housing Rev. (Solana at Grand), “A-1”, 4%, 8/01/2056 (n) | | | 3,380,000 | 2,873,368 |
| California Pollution Control Financing Authority, Solid Waste Disposal Rev. (CalPlant I Project), 7.5%, 7/01/2032 (a)(d)(z) | | | 2,250,000 | 30,375 |
| California Pollution Control Financing Authority, Solid Waste Disposal Rev. (CalPlant I Project), 8%, 7/01/2039 (a)(d)(z) | | | 11,405,000 | 153,968 |
| California Pollution Control Financing Authority, Solid Waste Disposal Rev. (CalPlant I Project), 7.5%, 12/01/2039 (a)(d)(z) | | | 12,890,000 | 174,015 |
| California Public Finance Authority Rev. (Henry Mayo Newhall Hospital), 5%, 10/15/2037 | | | 435,000 | 441,434 |
| California Public Finance Authority Rev. (Henry Mayo Newhall Hospital), 5%, 10/15/2047 | | | 435,000 | 436,632 |
| California Public Finance Authority, Senior Living Refunding Rev. (Enso Village Project), “A”, 5%, 11/15/2036 (n) | | | 1,670,000 | 1,506,996 |
| California Public Finance Authority, Senior Living Refunding Rev. (Enso Village Project), “A”, 5%, 11/15/2046 (n) | | | 4,770,000 | 3,925,033 |
| California Public Finance Authority, Senior Living Refunding Rev. (Enso Village Project), “A”, 5%, 11/15/2051 (n) | | | 2,350,000 | 1,873,839 |
| California Public Finance Authority, Senior Living Refunding Rev. (Enso Village Project), “A”, 5%, 11/15/2056 (n) | | | 3,945,000 | 3,080,383 |
| California Public Finance Authority, Senior Living Rev. (Enso Village Project), “B-1”, 3.125%, 5/15/2029 (n) | | | 2,200,000 | 2,111,040 |
| California Public Finance Authority, Senior Living Rev. (Enso Village Project), “B-2”, 2.375%, 11/15/2028 (n) | | | 1,465,000 | 1,425,706 |
| California Public Finance Authority, Senior Living Rev., Bond Anticipation Notes (Kendal at Ventura Project), “A”, 10%, 5/15/2028 (n) | | | 7,490,000 | 8,093,544 |
| California School Finance Authority, Charter School Refunding Rev. (Aspire Public Schools), 5%, 8/01/2041 (Prerefunded 8/01/2025) (n) | | | 50,000 | 51,579 |
Portfolio of Investments – continued
| Issuer | | | Shares/Par | Value ($) |
| Municipal Bonds - continued |
| California - continued |
| California School Finance Authority, Charter School Refunding Rev. (Aspire Public Schools), 5%, 8/01/2041 (n) | | $ | 625,000 | $629,626 |
| California School Finance Authority, Charter School Rev. (Aspire Public Schools - Obligated Group - Issue No. 5), “A”, 4%, 8/01/2061 (n) | | | 1,145,000 | 937,630 |
| California School Finance Authority, Charter School Rev. (Downtown College Prep - Obligated Group), 5%, 6/01/2046 (n) | | | 1,325,000 | 1,245,169 |
| California School Finance Authority, Charter School Rev. (Hawking STEAM Charter School Project)., “A”, 5%, 7/01/2042 (n) | | | 1,610,000 | 1,619,787 |
| California School Finance Authority, Charter School Rev. (Hawking STEAM Charter School Project)., “A”, 5.25%, 7/01/2052 (n) | | | 2,000,000 | 2,009,251 |
| California School Finance Authority, Charter School Rev. (Hawking STEAM Charter School Project)., “A”, 5.375%, 7/01/2056 (n) | | | 995,000 | 1,003,543 |
| California School Finance Authority, Charter School Rev. (Hawking STEAM Charter School Project)., “A”, 5.5%, 7/01/2062 (n) | | | 1,775,000 | 1,795,588 |
| California School Finance Authority, School Facility Rev. (Alliance for College-Ready Public Schools Projects), “A”, 4%, 7/01/2024 (n) | | | 730,000 | 728,909 |
| California School Finance Authority, School Facility Rev. (Alliance for College-Ready Public Schools Projects), “A”, 5%, 7/01/2045 (n) | | | 1,150,000 | 1,151,606 |
| California School Finance Authority, School Facility Rev. (Green Dot Public Schools California Projects), “A”, 5%, 8/01/2048 (n) | | | 750,000 | 752,926 |
| California School Finance Authority, School Facility Rev. (ICEF View Park Elementary and Middle Schools), “A”, 4.75%, 10/01/2024 | | | 115,000 | 114,956 |
| California School Finance Authority, School Facility Rev. (ICEF View Park Elementary and Middle Schools), “A”, 5.625%, 10/01/2034 | | | 575,000 | 577,050 |
| California School Finance Authority, School Facility Rev. (ICEF View Park Elementary and Middle Schools), “A”, 5.875%, 10/01/2044 | | | 545,000 | 545,949 |
| California School Finance Authority, School Facility Rev. (ICEF View Park Elementary and Middle Schools), “A”, 6%, 10/01/2049 | | | 1,320,000 | 1,322,166 |
| California School Finance Authority, School Facility Rev. (KIPP LA Projects), “A”, 5.125%, 7/01/2044 | | | 430,000 | 430,837 |
| California School Finance Authority, School Facility Rev. (KIPP LA Projects), “A”, 4%, 7/01/2050 (n) | | | 3,360,000 | 2,890,903 |
Portfolio of Investments – continued
| Issuer | | | Shares/Par | Value ($) |
| Municipal Bonds - continued |
| California - continued |
| California Statewide Communities Development Authority Multi-Family Housing Rev. (Apple Tree Village Apartments), “R”, 3.95%, 4/01/2060 (Put Date 10/01/2037) | | $ | 8,800,000 | $7,616,227 |
| California Statewide Communities Development Authority Rev. (899 Charleston Project), “A”, 5.25%, 11/01/2044 (n) | | | 760,000 | 622,661 |
| California Statewide Communities Development Authority Rev. (899 Charleston Project), “A”, 5.375%, 11/01/2049 (n) | | | 945,000 | 763,781 |
| California Statewide Communities Development Authority Rev. (California Baptist University), “A”, 5%, 11/01/2032 (n) | | | 1,370,000 | 1,401,822 |
| California Statewide Communities Development Authority Rev. (California Baptist University), “A”, 6.125%, 11/01/2033 | | | 1,600,000 | 1,602,975 |
| California Statewide Communities Development Authority Rev. (California Baptist University), “A”, 5%, 11/01/2041 (n) | | | 2,045,000 | 2,040,074 |
| California Statewide Communities Development Authority Rev. (California Baptist University), “A”, 6.375%, 11/01/2043 | | | 1,335,000 | 1,336,786 |
| California Statewide Communities Development Authority Rev. (Enloe Medical Center), “A”, AGM, 5.25%, 8/15/2052 | | | 2,635,000 | 2,900,193 |
| California Statewide Communities Development Authority Rev. (Enloe Medical Center), “A”, AGM, 5.375%, 8/15/2057 | | | 2,515,000 | 2,784,728 |
| California Statewide Communities Development Authority Rev. (Lancer Plaza Project), 5.625%, 11/01/2033 | | | 780,000 | 780,773 |
| California Statewide Communities Development Authority Rev. (Lancer Plaza Project), 5.875%, 11/01/2043 | | | 1,315,000 | 1,315,598 |
| California Statewide Communities Development Authority Rev. (Loma Linda University Medical Center), “A”, 5%, 12/01/2041 (n) | | | 3,000,000 | 3,008,078 |
| California Statewide Communities Development Authority Rev. (Loma Linda University Medical Center), “A”, 5.5%, 12/01/2058 | | | 8,600,000 | 8,772,848 |
| California Statewide Communities Development Authority, College Housing Rev. (NCCD-Hooper Street LLC College of the Arts Project), 5%, 7/01/2029 (n) | | | 880,000 | 900,188 |
| California Statewide Communities Development Authority, College Housing Rev. (NCCD-Hooper Street LLC College of the Arts Project), 5.25%, 7/01/2039 (n) | | | 725,000 | 735,874 |
| California Statewide Communities Development Authority, College Housing Rev. (NCCD-Hooper Street LLC College of the Arts Project), 5.25%, 7/01/2049 (n) | | | 2,550,000 | 2,553,445 |
| California Statewide Communities Development Authority, College Housing Rev. (NCCD-Hooper Street LLC College of the Arts Project), 5.25%, 7/01/2052 (n) | | | 1,280,000 | 1,279,938 |
| California Statewide Communities Development Authority, Essential Housing Rev. (Oceanaire - Long Beach), “A-2”, 4%, 9/01/2056 (n) | | | 4,795,000 | 3,548,845 |
Portfolio of Investments – continued
| Issuer | | | Shares/Par | Value ($) |
| Municipal Bonds - continued |
| California - continued |
| California Statewide Communities Development Authority, Essential Housing Rev. (Orange Portfolio), “B”, 4%, 3/01/2057 (n) | | $ | 2,630,000 | $1,888,939 |
| Escondido, CA, Union High School District (Election of 2008), Capital Appreciation, “A”, AGM, 0%, 8/01/2032 | | | 3,010,000 | 2,309,980 |
| Golden State, CA, Tobacco Securitization Corp., Tobacco Settlement Rev., Taxable, “B-1”, 3.85%, 6/01/2050 | | | 24,930,000 | 22,966,017 |
| Lake Tahoe, CA, Unified School District (Election of 2008), Convertible Capital Appreciation, AGM, 0% to 8/01/2032, 6.375% to 8/01/2045 | | | 4,240,000 | 3,539,702 |
| Modesto, CA, Elementary School District, General Obligation, “B”, 3%, 8/01/2046 | | | 1,735,000 | 1,425,733 |
| Modesto, CA, Elementary School District, General Obligation, “B”, 3%, 8/01/2050 | | | 1,080,000 | 854,493 |
| Morongo Band of Mission Indians California Rev., “A”, 5%, 10/01/2042 (n) | | | 4,180,000 | 4,186,586 |
| Morongo Band of Mission Indians California Rev., “B”, 5%, 10/01/2042 (n) | | | 3,605,000 | 3,610,680 |
| Oceanside, CA, Unified School District General Obligation, Capital Appreciation, “A”, ETM, AGM, 0%, 8/01/2024 | | | 380,000 | 374,251 |
| Oceanside, CA, Unified School District General Obligation, Capital Appreciation, “A”, ETM, AGM, 0%, 8/01/2027 | | | 205,000 | 186,425 |
| Oceanside, CA, Unified School District General Obligation, Capital Appreciation, “A”, ETM, AGM, 0%, 8/01/2027 | | | 100,000 | 90,939 |
| Oceanside, CA, Unified School District General Obligation, Capital Appreciation, “A”, ETM, AGM, 0%, 8/01/2027 | | | 180,000 | 163,690 |
| Oceanside, CA, Unified School District General Obligation, Capital Appreciation, “A”, ETM, AGM, 0%, 8/01/2029 | | | 285,000 | 246,782 |
| Oceanside, CA, Unified School District General Obligation, Capital Appreciation, “A”, ETM, AGM, 0%, 8/01/2029 | | | 170,000 | 147,203 |
| Oceanside, CA, Unified School District General Obligation, Capital Appreciation, “A”, ETM, AGM, 0%, 8/01/2030 | | | 235,000 | 198,513 |
| Oceanside, CA, Unified School District General Obligation, Capital Appreciation, “A”, ETM, AGM, 0%, 8/01/2030 | | | 170,000 | 142,687 |
| Palomar Health, CA, Refunding Rev., 5%, 11/01/2042 | | | 10,000,000 | 10,063,984 |
| Pomona, CA, Unified School District, General Obligation, “F”, BAM, 3%, 8/01/2048 | | | 940,000 | 748,092 |
| Sacramento County, CA, Tobacco Securitization Corp., Tobacco Settlement Rev., Capital Appreciation, “A-1”, 0%, 6/01/2060 | | | 18,750,000 | 3,195,733 |
| San Francisco, CA, City & County Airports Commission, International Airport Rev., “C”, 5.5%, 5/01/2042 | | | 7,115,000 | 8,032,982 |
| San Francisco, CA, City & County Airports Commission, International Airport Rev., “C”, 5.5%, 5/01/2043 | | | 5,285,000 | 5,947,415 |
Portfolio of Investments – continued
| Issuer | | | Shares/Par | Value ($) |
| Municipal Bonds - continued |
| California - continued |
| San Francisco, CA, City & County Airports Commission, Refunding Rev., “C”, 5.75%, 5/01/2048 | | $ | 5,135,000 | $5,784,546 |
| San Francisco, CA, City & County Redevelopment Successor Agency, Community Facilities District No. 6 (Mission Bay South Public Improvements), Capital Appreciation, “A”, 0%, 8/01/2043 | | | 8,725,000 | 2,797,001 |
| San Francisco, CA, City & County Redevelopment Successor Agency, Tax Allocation (Mission Bay South Redevelopment Project), “A”, 5%, 8/01/2043 | | | 225,000 | 225,805 |
| Tulare and Kings Counties, CA, College of the Sequoias Community District (Area Improvement District No. 3), “E”, 3%, 8/01/2051 | | | 2,070,000 | 1,624,698 |
| University of California, Hastings Campus Housing Finance Authority, Campus Housing Rev., “A”, 5%, 7/01/2045 (n) | | | 8,810,000 | 7,971,597 |
| University of California, Hastings Campus Housing Finance Authority, Campus Housing Rev., “A”, 5%, 7/01/2061 (n) | | | 9,125,000 | 7,794,063 |
| University of California, Hastings Campus Housing Finance Authority, Campus Housing Rev., Convertible Capital Appreciation, “B”, 0% to 7/01/2035, 6.75% to 7/01/2061 (n) | | | 12,970,000 | 5,143,154 |
| West Contra Costa, CA, Unified School District (Election of 2005), Capital Appreciation, “C”, AGM, 0%, 8/01/2029 | | | 3,665,000 | 3,117,509 |
| | | | | $291,195,826 |
| Colorado - 1.9% |
| Arvada, CO, Vauxmont Metropolitan District Rev., AGM, 5%, 12/15/2032 | | $ | 90,000 | $93,963 |
| Colorado Educational & Cultural Facilities Authority Rev. (Classical Academy Project), “A”, 5%, 12/01/2038 | | | 895,000 | 902,228 |
| Colorado Educational & Cultural Facilities Authority Rev. (Liberty Common Project), 5%, 1/15/2039 | | | 560,000 | 560,227 |
| Colorado Educational & Cultural Facilities Authority Rev. (Liberty Common Project), 5%, 1/15/2044 | | | 395,000 | 395,068 |
| Colorado Educational & Cultural Facilities Authority Rev. (Littleton Preparatory Charter School Project), 5%, 12/01/2033 | | | 420,000 | 420,198 |
| Colorado Educational & Cultural Facilities Authority Rev. (Littleton Preparatory Charter School Project), 5%, 12/01/2042 | | | 1,120,000 | 1,119,951 |
| Colorado Educational & Cultural Facilities Authority Rev. (Montessori Charter School Project), 5%, 7/15/2037 | | | 490,000 | 490,726 |
| Colorado Educational & Cultural Facilities Authority Rev. (Peak to Peak Charter School Project), 5%, 8/15/2030 | | | 350,000 | 352,937 |
| Colorado Educational & Cultural Facilities Authority Rev. (Peak to Peak Charter School Project), 5%, 8/15/2034 | | | 350,000 | 352,860 |
Portfolio of Investments – continued
| Issuer | | | Shares/Par | Value ($) |
| Municipal Bonds - continued |
| Colorado - continued |
| Colorado Educational & Cultural Facilities Authority Rev. (Science, Technology, Engineering and Math School Project), 5%, 11/01/2044 | | $ | 1,770,000 | $1,768,670 |
| Colorado Educational & Cultural Facilities Authority Rev. (Science, Technology, Engineering and Math School Project), 5.125%, 11/01/2049 | | | 1,530,000 | 1,516,913 |
| Colorado Educational & Cultural Facilities Authority Rev. (Stargate Charter School Project), “A”, 4%, 12/01/2048 | | | 4,310,000 | 3,951,914 |
| Colorado Educational & Cultural Facilities Authority Rev. (Union Colony School Project), 5%, 4/01/2038 | | | 295,000 | 306,211 |
| Colorado Educational & Cultural Facilities Authority Rev. (Union Colony School Project), 5%, 4/01/2048 | | | 350,000 | 356,793 |
| Colorado Educational & Cultural Facilities Authority Rev. (Union Colony School Project), 5%, 4/01/2053 | | | 365,000 | 370,624 |
| Colorado Educational & Cultural Facilities Authority Rev. (University Lab School Project), 5%, 12/15/2035 | | | 2,000,000 | 2,027,455 |
| Colorado Educational & Cultural Facilities Authority Rev. (University Lab School Project), 5%, 12/15/2045 | | | 2,675,000 | 2,681,302 |
| Colorado Educational & Cultural Facilities Authority, Charter School Refunding Rev. (Windsor Charter Academy Project), 4%, 9/01/2050 | | | 515,000 | 470,590 |
| Colorado Educational & Cultural Facilities Authority, Charter School Refunding Rev. (Windsor Charter Academy Project), 4%, 9/01/2055 | | | 925,000 | 827,863 |
| Colorado Educational & Cultural Facilities Authority, Charter School Rev. (Aspen View Academy Project), 4%, 5/01/2036 | | | 175,000 | 169,758 |
| Colorado Educational & Cultural Facilities Authority, Charter School Rev. (Aspen View Academy Project), 4%, 5/01/2041 | | | 175,000 | 158,248 |
| Colorado Educational & Cultural Facilities Authority, Charter School Rev. (Aspen View Academy Project), 4%, 5/01/2051 | | | 350,000 | 288,920 |
| Colorado Educational & Cultural Facilities Authority, Charter School Rev. (Aspen View Academy Project), 4%, 5/01/2061 | | | 610,000 | 480,314 |
| Colorado Educational & Cultural Facilities Authority, Charter School Rev. (James Irwin Educational Foundation Project), 5%, 9/01/2052 | | | 750,000 | 755,437 |
| Colorado Educational & Cultural Facilities Authority, Charter School Rev. (James Irwin Educational Foundation Project), 5%, 9/01/2057 | | | 1,750,000 | 1,760,070 |
| Colorado Educational & Cultural Facilities Authority, Charter School Rev. (James Irwin Educational Foundation Project), 5%, 9/01/2062 | | | 2,200,000 | 2,205,023 |
Portfolio of Investments – continued
| Issuer | | | Shares/Par | Value ($) |
| Municipal Bonds - continued |
| Colorado - continued |
| Colorado Educational & Cultural Facilities Authority, Charter School Rev. (New Summit Charter Academy Project), “A”, 4%, 7/01/2031 (n) | | $ | 450,000 | $429,914 |
| Colorado Educational & Cultural Facilities Authority, Charter School Rev. (New Summit Charter Academy Project), “A”, 4%, 7/01/2041 (n) | | | 600,000 | 498,179 |
| Colorado Educational & Cultural Facilities Authority, Charter School Rev. (New Summit Charter Academy Project), “A”, 4%, 7/01/2051 (n) | | | 715,000 | 535,400 |
| Colorado Educational & Cultural Facilities Authority, Charter School Rev. (New Summit Charter Academy Project), “A”, 4%, 7/01/2061 (n) | | | 2,030,000 | 1,438,807 |
| Colorado Health Facilities Authority Rev. (American Baptist Homes), 8%, 8/01/2043 | | | 2,975,000 | 2,948,942 |
| Colorado Health Facilities Authority Rev. (Christian Living Neighborhoods), 4%, 1/01/2042 | | | 2,635,000 | 2,244,518 |
| Colorado Health Facilities Authority Rev. (CommonSpirit Health), “A”, 5.5%, 11/01/2047 | | | 3,210,000 | 3,501,933 |
| Colorado Health Facilities Authority Rev. (CommonSpirit Health), “A”, 5.25%, 11/01/2052 | | | 4,870,000 | 5,159,575 |
| Colorado Health Facilities Authority Rev. (CommonSpirit Health), “A-2”, 4%, 8/01/2049 | | | 3,880,000 | 3,655,442 |
| Colorado Health Facilities Authority Rev. (Frasier Project), “A”, 4%, 5/15/2041 | | | 1,375,000 | 1,208,300 |
| Colorado Health Facilities Authority Rev. (Frasier Project), “A”, 4%, 5/15/2048 | | | 2,600,000 | 2,113,587 |
| Colorado Housing & Finance Authority, Single Family Mortgage, Class I, “C”, 4.75%, 5/01/2049 (u) | | | 3,945,000 | 3,989,329 |
| Colorado Regional Transportation District (Denver Transit Partners Eagle P3 Project), “A”, 4%, 7/15/2038 | | | 470,000 | 479,053 |
| Denver, CO, City & County Airport System Rev., “A”, 4.125%, 11/15/2047 | | | 3,360,000 | 3,293,704 |
| Denver, CO, City & County Airport System Rev., “A”, 4.125%, 11/15/2053 | | | 3,150,000 | 2,997,973 |
| Denver, CO, Convention Center Hotel Authority Rev., 5%, 12/01/2036 | | | 675,000 | 684,396 |
| Denver, CO, Convention Center Hotel Authority Rev., 5%, 12/01/2040 | | | 1,800,000 | 1,813,761 |
| Denver, CO, Health & Hospital Authority Rev. (550 Acoma, Inc.), COP, 5%, 12/01/2048 | | | 2,670,000 | 2,657,687 |
| Denver, CO, Health & Hospital Authority Rev., “A”, 5%, 12/01/2039 | | | 3,660,000 | 3,661,270 |
Portfolio of Investments – continued
| Issuer | | | Shares/Par | Value ($) |
| Municipal Bonds - continued |
| Colorado - continued |
| Denver, CO, Health & Hospital Authority Rev., “A”, 5.25%, 12/01/2045 | | $ | 795,000 | $795,495 |
| Loretto Heights, CO, Community Authority Special Rev., 4.875%, 12/01/2051 (n) | | | 14,945,000 | 11,914,556 |
| | | | | $80,806,084 |
| Connecticut - 1.1% |
| Connecticut Health & Educational Facilities Authority Rev. (Connecticut Children's Medical Issue), “E”, 5.25%, 7/15/2048 | | $ | 1,790,000 | $1,953,118 |
| Connecticut Health & Educational Facilities Authority Rev. (Connecticut Children's Medical Issue), “E”, 4.25%, 7/15/2053 | | | 2,055,000 | 2,005,615 |
| Connecticut Health & Educational Facilities Authority Rev. (Griffin Hospital), “G-1”, 5%, 7/01/2039 (n) | | | 900,000 | 888,669 |
| Connecticut Health & Educational Facilities Authority Rev. (Griffin Hospital), “G-1”, 5%, 7/01/2050 (n) | | | 2,250,000 | 2,058,200 |
| Connecticut Health & Educational Facilities Authority Rev. (Masonicare), “F”, 5%, 7/01/2043 | | | 8,535,000 | 8,196,487 |
| Connecticut Health & Educational Facilities Authority Rev. (McLean Issue), “A”, 5%, 1/01/2030 (n) | | | 500,000 | 488,977 |
| Connecticut Health & Educational Facilities Authority Rev. (McLean Issue), “A”, 5%, 1/01/2045 (n) | | | 1,500,000 | 1,278,076 |
| Connecticut Health & Educational Facilities Authority Rev. (McLean Issue), “A”, 5%, 1/01/2055 (n) | | | 2,800,000 | 2,221,436 |
| Great Pond, CT, Improvement District Special Obligation Rev. (Great Pond Phase II Project), 5.5%, 10/01/2042 (n) | | | 2,120,000 | 2,193,155 |
| Great Pond, CT, Improvement District Special Obligation Rev. (Great Pond Phase II Project), 5.75%, 10/01/2052 (n) | | | 5,740,000 | 5,936,993 |
| Mohegan Tribal Finance Authority, CT, Economic Development Bonds, 7%, 2/01/2045 (n) | | | 18,095,000 | 18,101,972 |
| Steel Point Infrastructure Improvement District, CT, Special Obligation Rev. (Steel Point Harbor Project), 4%, 4/01/2031 (n) | | | 155,000 | 147,865 |
| Steel Point Infrastructure Improvement District, CT, Special Obligation Rev. (Steel Point Harbor Project), 4%, 4/01/2036 (n) | | | 255,000 | 227,690 |
| Steel Point Infrastructure Improvement District, CT, Special Obligation Rev. (Steel Point Harbor Project), 4%, 4/01/2041 (n) | | | 300,000 | 255,389 |
| Steel Point Infrastructure Improvement District, CT, Special Obligation Rev. (Steel Point Harbor Project), 4%, 4/01/2051 (n) | | | 860,000 | 667,204 |
| | | | | $46,620,846 |
Portfolio of Investments – continued
| Issuer | | | Shares/Par | Value ($) |
| Municipal Bonds - continued |
| Delaware - 0.4% |
| Delaware Economic Development Authority Rev. (Delaware Military Academy, Inc. Project), 5%, 9/01/2044 (Prerefunded 9/01/2024) | | $ | 1,030,000 | $1,039,929 |
| Delaware Economic Development Authority Rev. (Delaware Military Academy, Inc. Project), 5%, 9/01/2049 (Prerefunded 9/01/2024) | | | 1,210,000 | 1,221,664 |
| Delaware Economic Development Authority Rev. (Newark Charter School, Inc.), “A”, 5%, 9/01/2046 | | | 620,000 | 626,738 |
| Delaware Economic Development Authority, Charter School Rev. (Aspira of Delaware Charter Operations, Inc. Project), “A”, 5%, 6/01/2036 | | | 920,000 | 904,990 |
| Delaware Economic Development Authority, Charter School Rev. (Aspira of Delaware Charter Operations, Inc. Project), “A”, 5%, 6/01/2046 | | | 1,635,000 | 1,479,842 |
| Delaware Health Facilities Authority Rev. (Beebe Medical Center Project), 5%, 6/01/2043 | | | 4,230,000 | 4,266,978 |
| Delaware Health Facilities Authority Rev. (Beebe Medical Center Project), 5%, 6/01/2048 | | | 2,115,000 | 2,123,654 |
| Kent County, DE, Student Housing and Dining Facility Rev. (CHF - Dover LLC - Delaware State University Project), “A”, 5%, 7/01/2040 | | | 750,000 | 752,345 |
| Kent County, DE, Student Housing and Dining Facility Rev. (CHF - Dover LLC - Delaware State University Project), “A”, 5%, 7/01/2048 | | | 1,025,000 | 1,012,406 |
| Kent County, DE, Student Housing and Dining Facility Rev. (CHF - Dover LLC - Delaware State University Project), “A”, 5%, 7/01/2053 | | | 895,000 | 875,118 |
| Kent County, DE, Student Housing and Dining Facility Rev. (CHF - Dover LLC - Delaware State University Project), “A”, 5%, 7/01/2058 | | | 1,165,000 | 1,122,903 |
| | | | | $15,426,567 |
| District of Columbia - 0.6% |
| District of Columbia Rev. (Rocketship D.C.), “A”, 5%, 6/01/2039 (n) | | $ | 2,090,000 | $1,980,469 |
| District of Columbia Rev. (Rocketship D.C.), “A”, 5%, 6/01/2049 (n) | | | 1,330,000 | 1,184,710 |
| District of Columbia Rev. (Rocketship D.C.), “A”, 5%, 6/01/2051 (n) | | | 1,000,000 | 883,434 |
| District of Columbia Rev. (Rocketship D.C.), “A”, 5%, 6/01/2056 (n) | | | 1,680,000 | 1,460,535 |
| District of Columbia Rev. (Rocketship D.C.), “A”, 5%, 6/01/2061 (n) | | | 1,100,000 | 942,510 |
Portfolio of Investments – continued
| Issuer | | | Shares/Par | Value ($) |
| Municipal Bonds - continued |
| District of Columbia - continued |
| District of Columbia Student Dormitory Rev. (Provident Group - Howard Properties LLC), 5%, 10/01/2030 | | $ | 1,745,000 | $1,744,998 |
| District of Columbia Student Dormitory Rev. (Provident Group - Howard Properties LLC), 5%, 10/01/2035 | | | 5,605,000 | 5,580,138 |
| District of Columbia Student Dormitory Rev. (Provident Group - Howard Properties LLC), 5%, 10/01/2045 | | | 9,810,000 | 9,371,986 |
| District of Columbia, Tobacco Settlement, 6.75%, 5/15/2040 | | | 860,000 | 886,415 |
| Metropolitan Washington, D.C., Airport Authority, Dulles Toll Road Rev. (Dulles Metrorail and Capital Improvement Projects), “A”, AGM, 4%, 10/01/2052 | | | 2,670,000 | 2,568,421 |
| | | | | $26,603,616 |
| Florida - 6.6% |
| Alachua County, FL, Health Facilities Authority, Continuing Care Retirement Community Rev. (Oak Hammock, Inc. at the University of Florida), 4%, 10/01/2040 | | $ | 645,000 | $560,043 |
| Alachua County, FL, Health Facilities Authority, Continuing Care Retirement Community Rev. (Oak Hammock, Inc. at the University of Florida), 4%, 10/01/2046 | | | 860,000 | 693,026 |
| Arborwood Community Development District, FL, Capital Improvement Refunding Rev. (Subordinate Lien), “A-2”, 4.625%, 5/01/2028 | | | 680,000 | 684,558 |
| Arborwood Community Development District, FL, Capital Improvement Refunding Rev. (Subordinate Lien), “A-2”, 5%, 5/01/2036 | | | 860,000 | 867,594 |
| Arborwood Community Development District, FL, Capital Improvement Rev., “A-1”, 6.9%, 5/01/2036 | | | 230,000 | 230,189 |
| Arborwood Community Development District, FL, Capital Improvement Rev., “A-2”, 6.9%, 5/01/2036 | | | 20,000 | 20,006 |
| Bellalago, FL, Educational Facilities Benefit District Capital Improvement Refunding Rev., 4.375%, 5/01/2030 | | | 690,000 | 691,634 |
| Bellalago, FL, Educational Facilities Benefit District Capital Improvement Refunding Rev., 4.5%, 5/01/2033 | | | 320,000 | 320,671 |
| Collier County, FL, Industrial Development Authority, Continuing Care Community Rev. (Arlington of Naples Project), “A”, 5.5%, 5/15/2025 (a)(d)(z) | | | 225,921 | 7,229 |
| Collier County, FL, Industrial Development Authority, Continuing Care Community Rev. (Arlington of Naples Project), “A”, 6.25%, 5/15/2035 (a)(d)(z) | | | 225,921 | 7,229 |
| Collier County, FL, Industrial Development Authority, Continuing Care Community Rev. (Arlington of Naples Project), “A”, 7.75%, 5/15/2035 (a)(d)(z) | | | 786,707 | 25,175 |
Portfolio of Investments – continued
| Issuer | | | Shares/Par | Value ($) |
| Municipal Bonds - continued |
| Florida - continued |
| Collier County, FL, Industrial Development Authority, Continuing Care Community Rev. (Arlington of Naples Project), “A”, 8.125%, 5/15/2044 (a)(d)(z) | | $ | 7,896,896 | $252,701 |
| Collier County, FL, Industrial Development Authority, Continuing Care Community Rev. (Arlington of Naples Project), “A”, 6.5%, 5/15/2049 (a)(d)(z) | | | 606,221 | 19,399 |
| Creekside Community Development District, FL, Special Assessment, 5.2%, 5/01/2038 (a)(d) | | | 1,400,000 | 658,000 |
| Daytona Beach, FL, Halifax Hospital Medical Center Rev., 5%, 6/01/2036 | | | 825,000 | 842,146 |
| Florida Capital Region Community Development District, Capital Improvement Rev., “A-1”, 4.625%, 5/01/2028 | | | 400,000 | 402,703 |
| Florida Capital Region Community Development District, Capital Improvement Rev., “A-1”, 5.125%, 5/01/2039 | | | 2,730,000 | 2,749,444 |
| Florida Capital Trust Agency, Educational Facilities Rev. (Florida Charter Educational Foundation, Inc. Project), “A”, 4.5%, 6/15/2028 (n) | | | 860,000 | 841,284 |
| Florida Capital Trust Agency, Educational Facilities Rev. (Florida Charter Educational Foundation, Inc. Project), “A”, 5.375%, 6/15/2038 (n) | | | 1,005,000 | 979,906 |
| Florida Capital Trust Agency, Educational Facilities Rev. (Florida Charter Educational Foundation, Inc. Project), “A”, 5.375%, 6/15/2048 (n) | | | 1,700,000 | 1,570,842 |
| Florida Capital Trust Agency, Educational Facilities Rev. (Imagine School at North Manatee Project), “A”, 3.25%, 6/01/2031 (n) | | | 240,000 | 209,356 |
| Florida Capital Trust Agency, Educational Facilities Rev. (Imagine School at North Manatee Project), “A”, 5%, 6/01/2041 (n) | | | 325,000 | 296,789 |
| Florida Capital Trust Agency, Educational Facilities Rev. (Imagine School at North Manatee Project), “A”, 5%, 6/01/2056 (n) | | | 900,000 | 763,113 |
| Florida Capital Trust Agency, Educational Facilities Rev. (Imagine School at North Manatee Project), “C”, 5%, 6/01/2041 (n) | | | 230,000 | 210,035 |
| Florida Capital Trust Agency, Educational Facilities Rev. (Imagine School at North Manatee Project), “C”, 5%, 6/01/2056 (n) | | | 520,000 | 440,909 |
| Florida Capital Trust Agency, Educational Facilities Rev. (Liza Jackson Preparatory School, Inc. Project), “A”, 4%, 8/01/2030 | | | 100,000 | 99,921 |
| Florida Capital Trust Agency, Educational Facilities Rev. (Liza Jackson Preparatory School, Inc. Project), “A”, 5%, 8/01/2040 | | | 165,000 | 168,244 |
| Florida Capital Trust Agency, Educational Facilities Rev. (Liza Jackson Preparatory School, Inc. Project), “A”, 5%, 8/01/2055 | | | 515,000 | 508,847 |
| Florida Capital Trust Agency, Educational Facilities Rev. (Renaissance Charter School, Inc. Project), “A”, 5%, 6/15/2039 (n) | | | 3,090,000 | 3,031,362 |
Portfolio of Investments – continued
| Issuer | | | Shares/Par | Value ($) |
| Municipal Bonds - continued |
| Florida - continued |
| Florida Capital Trust Agency, Educational Facilities Rev. (Renaissance Charter School, Inc. Project), “A”, 5%, 6/15/2049 (n) | | $ | 11,995,000 | $11,179,065 |
| Florida Capital Trust Agency, Educational Facilities Rev. (Viera Charter Schools, Inc. Project), “A”, 4%, 10/15/2029 (n) | | | 370,000 | 358,774 |
| Florida Capital Trust Agency, Educational Facilities Rev. (Viera Charter Schools, Inc. Project), “A”, 5%, 10/15/2037 (n) | | | 510,000 | 503,493 |
| Florida Capital Trust Agency, Educational Facilities Rev. (Viera Charter Schools, Inc. Project), “A”, 5%, 10/15/2039 (n) | | | 1,130,000 | 1,097,597 |
| Florida Capital Trust Agency, Educational Facilities Rev. (Viera Charter Schools, Inc. Project), “A”, 5%, 10/15/2047 (n) | | | 1,180,000 | 1,096,379 |
| Florida Capital Trust Agency, Educational Facilities Rev. (Viera Charter Schools, Inc. Project), “A”, 5%, 10/15/2049 (n) | | | 1,860,000 | 1,713,498 |
| Florida Capital Trust Agency, Educational Facilities Rev. (Viera Charter Schools, Inc. Project), “A”, 5%, 10/15/2052 (n) | | | 1,295,000 | 1,181,136 |
| Florida Capital Trust Agency, Educational Facilities Rev. (Viera Charter Schools, Inc. Project), “A”, 5%, 10/15/2054 (n) | | | 1,345,000 | 1,221,748 |
| Florida Capital Trust Authority, Educational Facilities Rev. (Image School at West Pasco Project), “A”, 6.5%, 12/15/2053 (n) | | | 1,000,000 | 1,015,923 |
| Florida Capital Trust Authority, Educational Facilities Rev. (Image School at West Pasco Project), “A”, 6.5%, 12/15/2058 (n) | | | 2,000,000 | 2,020,726 |
| Florida Development Finance Corp. Educational Facilities Rev. (Drs. Kiran & Pallavi Patel 2017 Foundation for Global Understanding, Inc. Project), “A”, 3%, 7/01/2031 (n) | | | 170,000 | 156,501 |
| Florida Development Finance Corp. Educational Facilities Rev. (Drs. Kiran & Pallavi Patel 2017 Foundation for Global Understanding, Inc. Project), “A”, 4%, 7/01/2051 (n) | | | 1,005,000 | 837,507 |
| Florida Development Finance Corp. Educational Facilities Rev. (Florida Charter Educational Foundation, Inc. Project), “A”, 6.25%, 6/15/2036 (n) | | | 1,155,000 | 1,182,655 |
| Florida Development Finance Corp. Educational Facilities Rev. (Florida Charter Educational Foundation, Inc. Project), “A”, 6.375%, 6/15/2046 (n) | | | 1,980,000 | 2,008,190 |
| Florida Development Finance Corp. Educational Facilities Rev. (Imagine School at Broward Project), “A”, 5%, 12/15/2034 (n) | | | 525,000 | 540,308 |
| Florida Development Finance Corp. Educational Facilities Rev. (Imagine School at Broward Project), “A”, 5%, 12/15/2039 (n) | | | 610,000 | 615,873 |
| Florida Development Finance Corp. Educational Facilities Rev. (Imagine School at Broward Project), “A”, 5%, 12/15/2049 (n) | | | 4,340,000 | 4,190,131 |
| Florida Development Finance Corp. Educational Facilities Rev. (Mater Academy Projects), “A”, 5%, 6/15/2052 | | | 1,135,000 | 1,115,516 |
| Florida Development Finance Corp. Educational Facilities Rev. (Mater Academy Projects), “A”, 5%, 6/15/2056 | | | 1,660,000 | 1,614,148 |
Portfolio of Investments – continued
| Issuer | | | Shares/Par | Value ($) |
| Municipal Bonds - continued |
| Florida - continued |
| Florida Development Finance Corp. Educational Facilities Rev. (Renaissance Charter School Projects), “A”, 6.125%, 6/15/2044 | | $ | 9,870,000 | $9,887,849 |
| Florida Development Finance Corp. Educational Facilities Rev. (Renaissance Charter School Projects), “C”, 4%, 9/15/2030 (n) | | | 240,000 | 225,441 |
| Florida Development Finance Corp. Educational Facilities Rev. (Renaissance Charter School Projects), “C”, 5%, 9/15/2040 (n) | | | 550,000 | 507,290 |
| Florida Development Finance Corp. Educational Facilities Rev. (Renaissance Charter School Projects), “C”, 5%, 9/15/2050 (n) | | | 1,080,000 | 930,842 |
| Florida Development Finance Corp. Educational Facilities Rev. (River City Science Academy Projects), “A”, 4%, 7/01/2035 | | | 175,000 | 175,006 |
| Florida Development Finance Corp. Educational Facilities Rev. (River City Science Academy Projects), “A”, 4%, 7/01/2045 | | | 320,000 | 286,628 |
| Florida Development Finance Corp. Educational Facilities Rev. (River City Science Academy Projects), “A”, 4%, 7/01/2055 | | | 445,000 | 371,382 |
| Florida Development Finance Corp. Educational Facilities Rev. (River City Science Academy Projects), “A-1”, 5%, 7/01/2042 | | | 220,000 | 226,861 |
| Florida Development Finance Corp. Educational Facilities Rev. (River City Science Academy Projects), “A-1”, 5%, 7/01/2051 | | | 200,000 | 201,697 |
| Florida Development Finance Corp. Educational Facilities Rev. (River City Science Academy Projects), “A-1”, 5%, 2/01/2057 | | | 235,000 | 235,688 |
| Florida Development Finance Corp. Educational Facilities Rev. (Southwest Charter Foundation, Inc. Project), “A”, 6%, 6/15/2037 (n) | | | 1,510,000 | 1,522,669 |
| Florida Development Finance Corp. Educational Facilities Rev. (Southwest Charter Foundation, Inc. Project), “A”, 6.125%, 6/15/2047 (n) | | | 4,365,000 | 4,277,030 |
| Florida Development Finance Corp. Senior Living Rev. (Glenridge on Palmer Ranch Project), 5%, 6/01/2031 (n) | | | 560,000 | 543,580 |
| Florida Development Finance Corp. Senior Living Rev. (Glenridge on Palmer Ranch Project), 5%, 6/01/2035 (n) | | | 330,000 | 311,939 |
| Florida Development Finance Corp. Senior Living Rev. (Glenridge on Palmer Ranch Project), 5%, 6/01/2051 (n) | | | 11,890,000 | 9,779,299 |
| Florida Development Finance Corp. Senior Living Rev. (Mayflower Retirement Community Project), “A”, 4%, 6/01/2036 (n) | | | 2,905,000 | 2,374,833 |
| Florida Development Finance Corp. Senior Living Rev. (Mayflower Retirement Community Project), “A”, 5.125%, 6/01/2040 (n) | | | 3,760,000 | 3,337,649 |
| Florida Development Finance Corp. Senior Living Rev. (Mayflower Retirement Community Project), “A”, 4%, 6/01/2041 (n) | | | 2,730,000 | 2,019,412 |
Portfolio of Investments – continued
| Issuer | | | Shares/Par | Value ($) |
| Municipal Bonds - continued |
| Florida - continued |
| Florida Development Finance Corp. Senior Living Rev. (Mayflower Retirement Community Project), “A”, 4%, 6/01/2046 (n) | | $ | 3,755,000 | $2,559,156 |
| Florida Development Finance Corp. Senior Living Rev. (Mayflower Retirement Community Project), “A”, 5.25%, 6/01/2050 (n) | | | 7,500,000 | 6,234,622 |
| Florida Development Finance Corp. Senior Living Rev. (Mayflower Retirement Community Project), “A”, 4%, 6/01/2055 (n) | | | 840,000 | 522,368 |
| Florida Higher Educational Facilities Financing Authority Rev. (Florida Institute of Technology), 5%, 10/01/2036 | | | 1,070,000 | 1,114,433 |
| Florida Higher Educational Facilities Financing Authority Rev. (Florida Institute of Technology), 4%, 10/01/2037 | | | 1,490,000 | 1,431,246 |
| Florida Higher Educational Facilities Financing Authority Rev. (Florida Institute of Technology), 4%, 10/01/2038 | | | 2,030,000 | 1,921,620 |
| Florida Higher Educational Facilities Financing Authority Rev. (Florida Institute of Technology), 4%, 10/01/2039 | | | 2,420,000 | 2,259,391 |
| Florida Higher Educational Facilities Financing Authority Rev. (Florida Institute of Technology), 4%, 10/01/2044 | | | 3,480,000 | 3,085,960 |
| Florida Higher Educational Facilities Financing Authority Rev. (Jacksonville University Project), “A”, 4.5%, 6/01/2033 (n) | | | 2,220,000 | 2,166,986 |
| Florida Higher Educational Facilities Financing Authority Rev. (Jacksonville University Project), “A”, 4.75%, 6/01/2038 (n) | | | 3,475,000 | 3,271,233 |
| Florida Higher Educational Facilities Financing Authority Rev. (Jacksonville University Project), “A”, 5%, 6/01/2048 (n) | | | 3,995,000 | 3,629,059 |
| Florida Housing Finance Corp., Homeowner Mortgage Rev., “1”, FHLMC, 4%, 7/01/2049 | | | 1,865,000 | 1,858,691 |
| Hillsborough County FL, Industrial Development Authority, Hospital Rev. (Tampa General Hospital Project), “A”, 4%, 8/01/2055 | | | 2,315,000 | 2,100,703 |
| Jacksonville, FL, Cypress Bluff Community Development District, 3.75%, 5/01/2024 | | | 225,000 | 224,684 |
| Jacksonville, FL, Cypress Bluff Community Development District, 4.125%, 5/01/2029 | | | 1,255,000 | 1,253,707 |
| Jacksonville, FL, Cypress Bluff Community Development District, 4.9%, 5/01/2039 | | | 3,595,000 | 3,589,487 |
| Jacksonville, FL, Cypress Bluff Community Development District, 5.1%, 5/01/2048 | | | 2,600,000 | 2,571,254 |
| Jacksonville, FL, Educational Facilities Rev. (Jacksonville University Project), “B”, 5%, 6/01/2053 (n) | | | 2,345,000 | 2,087,856 |
| Lakewood Ranch Stewardship District, FL, Special Assessment Rev. (Lakewood Centre North Project), 4.25%, 5/01/2025 | | | 320,000 | 320,049 |
Portfolio of Investments – continued
| Issuer | | | Shares/Par | Value ($) |
| Municipal Bonds - continued |
| Florida - continued |
| Lakewood Ranch Stewardship District, FL, Special Assessment Rev. (Lakewood Centre North Project), 4.875%, 5/01/2035 | | $ | 1,295,000 | $1,298,712 |
| Lakewood Ranch Stewardship District, FL, Special Assessment Rev. (Lakewood Centre North Project), 4.875%, 5/01/2045 | | | 2,305,000 | 2,219,944 |
| Lakewood Ranch Stewardship District, FL, Special Assessment Rev. (Lakewood National and Polo Run Projects), 5.375%, 5/01/2047 | | | 2,820,000 | 2,857,774 |
| Lakewood Ranch Stewardship District, FL, Special Assessment Rev. (Taylor Ranch Project), 6.125%, 5/01/2043 | | | 1,170,000 | 1,225,354 |
| Lakewood Ranch Stewardship District, FL, Special Assessment Rev. (Taylor Ranch Project), 6.3%, 5/01/2054 | | | 1,615,000 | 1,679,077 |
| Legends Bay Community Development District, FL, “A”, 5.875%, 5/01/2038 | | | 830,000 | 830,654 |
| Live Oak Lake Community Development District, FL, Capital Improvement Rev., 4.5%, 5/01/2036 | | | 3,765,000 | 3,661,939 |
| Live Oak Lake Community Development District, FL, Capital Improvement Rev., 4.625%, 5/01/2047 | | | 2,720,000 | 2,470,335 |
| Marshall Creek, FL, Community Development District Rev. (St. John's County), “A”, 5%, 5/01/2032 | | | 1,265,000 | 1,271,506 |
| Miami Beach, FL, Health Facilities Authority Hospital Rev. (Mount Sinai Medical Center of Florida), “B”, 4%, 11/15/2046 | | | 2,000,000 | 1,931,054 |
| Miami Beach, FL, Health Facilities Authority Hospital Rev. (Mount Sinai Medical Center of Florida), “B”, 4%, 11/15/2051 | | | 4,030,000 | 3,741,726 |
| Miami-Dade County, FL, Industrial Development Authority Rev. (Doral Academy Project), 5%, 1/15/2037 | | | 1,215,000 | 1,236,577 |
| Miami-Dade County, FL, Industrial Development Authority Rev. (Doral Academy Project), 5%, 1/15/2048 | | | 4,185,000 | 4,080,925 |
| Miami-Dade County, FL, Industrial Development Authority Rev. (Pinecrest Academy Project), 5%, 9/15/2024 | | | 130,000 | 130,515 |
| Miami-Dade County, FL, Industrial Development Authority Rev. (Pinecrest Academy Project), 5.25%, 9/15/2044 | | | 2,895,000 | 2,899,448 |
| Miami-Dade County, FL, Rickenbacker Causeway Rev., 5%, 10/01/2043 | | | 2,000,000 | 2,009,034 |
| Miami-Dade County, FL, Seaport Refunding Rev., “A”, 5.25%, 10/01/2052 | | | 1,610,000 | 1,712,371 |
| Midtown Miami, FL, Community Development District Special Assessment (Infrastructure Project), “B”, 5%, 5/01/2029 | | | 1,195,000 | 1,195,251 |
| Midtown Miami, FL, Community Development District Special Assessment (Infrastructure Project), “B”, 5%, 5/01/2037 | | | 740,000 | 739,961 |
| Midtown Miami, FL, Community Development District Special Assessment (Parking Garage Project), “A”, 5%, 5/01/2037 | | | 1,055,000 | 1,054,945 |
| NatureWalk Community Development District, FL, Capital Improvement Rev., “B”, 5.3%, 5/01/2016 (a)(d) | | | 1,575,000 | 504,000 |
Portfolio of Investments – continued
| Issuer | | | Shares/Par | Value ($) |
| Municipal Bonds - continued |
| Florida - continued |
| Orange County, FL, Health Facilities Authority Rev. (Presbyterian Retirement Communities Obligated Group Project), “A”, 4%, 8/01/2047 | | $ | 3,850,000 | $3,356,263 |
| Osceola County, FL, Transportation Improvement and Refunding Rev. (Osceola Parkway), Capital Appreciation, “A-2”, 0%, 10/01/2035 | | | 700,000 | 419,268 |
| Osceola County, FL, Transportation Improvement and Refunding Rev. (Osceola Parkway), Capital Appreciation, “A-2”, 0%, 10/01/2036 | | | 840,000 | 472,319 |
| Osceola County, FL, Transportation Improvement and Refunding Rev. (Osceola Parkway), Capital Appreciation, “A-2”, 0%, 10/01/2037 | | | 320,000 | 170,476 |
| Osceola County, FL, Transportation Improvement and Refunding Rev. (Osceola Parkway), Capital Appreciation, “A-2”, 0%, 10/01/2038 | | | 980,000 | 491,656 |
| Osceola County, FL, Transportation Improvement and Refunding Rev. (Osceola Parkway), Capital Appreciation, “A-2”, 0%, 10/01/2039 | | | 1,180,000 | 552,495 |
| Osceola County, FL, Transportation Improvement and Refunding Rev. (Osceola Parkway), Capital Appreciation, “A-2”, 0%, 10/01/2040 | | | 1,265,000 | 558,938 |
| Osceola County, FL, Transportation Improvement and Refunding Rev. (Osceola Parkway), Capital Appreciation, “A-2”, 0%, 10/01/2041 | | | 1,405,000 | 585,628 |
| Osceola County, FL, Transportation Improvement and Refunding Rev. (Osceola Parkway), Capital Appreciation, “A-2”, 0%, 10/01/2042 | | | 1,125,000 | 439,481 |
| Osceola County, FL, Transportation Improvement and Refunding Rev. (Osceola Parkway), Capital Appreciation, “A-2”, 0%, 10/01/2043 | | | 1,545,000 | 570,381 |
| Osceola County, FL, Transportation Improvement and Refunding Rev. (Osceola Parkway), Capital Appreciation, “A-2”, 0%, 10/01/2044 | | | 1,685,000 | 584,449 |
| Osceola County, FL, Transportation Improvement and Refunding Rev. (Osceola Parkway), Capital Appreciation, “A-2”, 0%, 10/01/2045 | | | 1,965,000 | 642,633 |
| Palm Beach County, FL, Health Facilities Authority Hospital Rev. (BRRH Corp. Obligated Group), 5%, 12/01/2031 (Prerefunded 12/01/2024) | | | 1,000,000 | 1,014,176 |
| Palm Beach County, FL, Health Facilities Authority Hospital Rev. (Jupiter Medical Center Project), “A”, 5%, 11/01/2047 | | | 940,000 | 969,674 |
| Palm Beach County, FL, Health Facilities Authority Hospital Rev. (Jupiter Medical Center Project), “A”, 5%, 11/01/2052 | | | 1,220,000 | 1,249,881 |
Portfolio of Investments – continued
| Issuer | | | Shares/Par | Value ($) |
| Municipal Bonds - continued |
| Florida - continued |
| Palm Beach County, FL, Health Facilities Authority Retirement Communities Rev. (Acts Retirement-Life Communities, Inc. Obligated Group), “B”, 5%, 11/15/2042 | | $ | 985,000 | $1,022,210 |
| Palm Beach County, FL, Health Facilities Authority Rev. (Toby & Leon Cooperman Sinai Residences of Boca Raton Expansion), “A”, 5%, 6/01/2055 | | | 2,770,000 | 2,451,416 |
| Palm Beach County, FL, Health Facilities Authority Rev. (Toby & Leon Cooperman Sinai Residences of Boca Raton), 4%, 6/01/2031 | | | 1,015,000 | 965,866 |
| Palm Beach County, FL, Health Facilities Authority Rev. (Toby & Leon Cooperman Sinai Residences of Boca Raton), 4%, 6/01/2036 | | | 1,740,000 | 1,573,722 |
| Palm Beach County, FL, Health Facilities Authority Rev. (Toby & Leon Cooperman Sinai Residences of Boca Raton), 4%, 6/01/2041 | | | 1,450,000 | 1,216,059 |
| Palm Beach County, FL, Health Facilities Authority Rev. (Toby & Leon Cooperman Sinai Residences of Boca Raton), 4.25%, 6/01/2056 | | | 4,960,000 | 3,813,375 |
| Palm Beach County, FL, Provident Group Rev. (Lynn University Housing Project), “A”, 4.25%, 6/01/2031 (n) | | | 1,500,000 | 1,419,221 |
| Palm Beach County, FL, Provident Group Rev. (Lynn University Housing Project), “A”, 5%, 6/01/2057 (n) | | | 18,845,000 | 16,481,228 |
| Palm Beach County, FL, Provident Group Rev., Taxable (Lynn University Housing Project), “B”, 5%, 6/01/2027 (n) | | | 1,120,000 | 1,076,367 |
| Pasco County, FL, Bexley Community Development District, Special Assessment Rev., 4.1%, 5/01/2026 | | | 300,000 | 298,641 |
| Pasco County, FL, Bexley Community Development District, Special Assessment Rev., 4.7%, 5/01/2036 | | | 1,370,000 | 1,357,650 |
| Pasco County, FL, Bexley Community Development District, Special Assessment Rev., 4.875%, 5/01/2047 | | | 2,515,000 | 2,358,022 |
| Pasco County, FL, Concord Station Community Development District, “A-1”, 3.5%, 5/01/2032 | | | 1,435,000 | 1,417,919 |
| Pasco County, FL, Concord Station Community Development District, “A-1”, 3.625%, 5/01/2035 | | | 865,000 | 864,180 |
| Pasco County, FL, Concord Station Community Development District, “A-1”, 3.75%, 5/01/2046 | | | 1,000,000 | 900,095 |
| Pasco County, FL, Del Webb Bexley Community Development District, Special Assessment Rev., 5.3%, 5/01/2039 | | | 985,000 | 1,001,737 |
| Pasco County, FL, Del Webb Bexley Community Development District, Special Assessment Rev., 5.4%, 5/01/2049 | | | 1,265,000 | 1,270,617 |
| Pasco County, FL, Estancia at Wiregrass Community Development District, Capital Improvement, 5.25%, 11/01/2035 | | | 410,000 | 412,987 |
Portfolio of Investments – continued
| Issuer | | | Shares/Par | Value ($) |
| Municipal Bonds - continued |
| Florida - continued |
| Pasco County, FL, Estancia at Wiregrass Community Development District, Capital Improvement, 7%, 11/01/2045 | | $ | 1,990,000 | $2,097,334 |
| Pasco County, FL, Estancia at Wiregrass Community Development District, Capital Improvement, 5.375%, 11/01/2046 | | | 370,000 | 370,793 |
| Pompano Beach, FL, Refunding Rev. (John Knox Village Project), 4%, 9/01/2050 | | | 5,175,000 | 4,019,032 |
| Pompano Beach, FL, Refunding Rev. (John Knox Village Project), “A”, 4%, 9/01/2051 | | | 3,925,000 | 3,025,158 |
| Pompano Beach, FL, Refunding Rev. (John Knox Village Project), “A”, 4%, 9/01/2056 | | | 5,860,000 | 4,357,580 |
| Pompano Beach, FL, Refunding Rev. (John Knox Village Project), “B-2”, 1.45%, 1/01/2027 | | | 810,000 | 741,147 |
| Sarasota County, FL, Health Facility Authority Retirement Facility Improvement Rev. (Village on the Isle Project), “A”, 5%, 1/01/2047 | | | 1,020,000 | 928,030 |
| Sarasota County, FL, Health Facility Authority Retirement Facility Improvement Rev. (Village on the Isle Project), “A”, 5%, 1/01/2052 | | | 1,875,000 | 1,659,292 |
| Seminole County, FL, Industrial Development Authority, Educational Facilities Rev. (Galileo Schools for Gifted Learning Project), “A”, 4%, 6/15/2036 (n) | | | 315,000 | 282,333 |
| Seminole County, FL, Industrial Development Authority, Educational Facilities Rev. (Galileo Schools for Gifted Learning Project), “A”, 4%, 6/15/2041 (n) | | | 425,000 | 350,902 |
| Seminole County, FL, Industrial Development Authority, Educational Facilities Rev. (Galileo Schools for Gifted Learning Project), “A”, 4%, 6/15/2051 (n) | | | 505,000 | 377,726 |
| Seminole County, FL, Industrial Development Authority, Educational Facilities Rev. (Galileo Schools for Gifted Learning Project), “A”, 4%, 6/15/2056 (n) | | | 1,310,000 | 954,929 |
| St. John's & Duval County, FL, Tolomato Community Development District Special Assessment Refunding, “A-2”, 3.5%, 5/01/2024 (n) | | | 180,000 | 179,636 |
| St. John's & Duval County, FL, Tolomato Community Development District Special Assessment Refunding, “A-2”, 3.85%, 5/01/2029 (n) | | | 700,000 | 688,277 |
| St. John's & Duval County, FL, Tolomato Community Development District Special Assessment Refunding, “A-2”, 4.25%, 5/01/2037 (n) | | | 1,000,000 | 950,249 |
| St. John's County, FL, Industrial Development Authority, Senior Living Rev. (Vicars Landing Project), “A”, 4%, 12/15/2027 | | | 110,000 | 106,093 |
Portfolio of Investments – continued
| Issuer | | | Shares/Par | Value ($) |
| Municipal Bonds - continued |
| Florida - continued |
| St. John's County, FL, Industrial Development Authority, Senior Living Rev. (Vicars Landing Project), “A”, 4%, 12/15/2028 | | $ | 105,000 | $100,200 |
| St. John's County, FL, Industrial Development Authority, Senior Living Rev. (Vicars Landing Project), “A”, 4%, 12/15/2029 | | | 120,000 | 113,254 |
| St. John's County, FL, Industrial Development Authority, Senior Living Rev. (Vicars Landing Project), “A”, 4%, 12/15/2030 | | | 105,000 | 97,967 |
| St. John's County, FL, Industrial Development Authority, Senior Living Rev. (Vicars Landing Project), “A”, 4%, 12/15/2031 | | | 110,000 | 101,424 |
| St. John's County, FL, Industrial Development Authority, Senior Living Rev. (Vicars Landing Project), “A”, 4%, 12/15/2036 | | | 525,000 | 456,538 |
| St. John's County, FL, Industrial Development Authority, Senior Living Rev. (Vicars Landing Project), “A”, 4%, 12/15/2041 | | | 390,000 | 311,771 |
| St. John's County, FL, Industrial Development Authority, Senior Living Rev. (Vicars Landing Project), “A”, 4%, 12/15/2046 | | | 390,000 | 292,428 |
| St. John's County, FL, Industrial Development Authority, Senior Living Rev. (Vicars Landing Project), “A”, 4%, 12/15/2050 | | | 380,000 | 273,224 |
| Sterling Hill Community Development District, FL, Capital Improvement Rev., “B”, 5.5%, 11/01/2010 (d) | | | 498,907 | 234,487 |
| Sumter County, FL, Industrial Development Authority Hospital Rev. (Central Florida Health Alliance Projects), “A”, 5%, 7/01/2026 | | | 155,000 | 155,201 |
| Sumter County, FL, Industrial Development Authority Hospital Rev. (Central Florida Health Alliance Projects), “A”, 5%, 7/01/2029 | | | 145,000 | 145,174 |
| Sumter County, FL, Industrial Development Authority Hospital Rev. (Central Florida Health Alliance Projects), “A”, 5.125%, 7/01/2034 | | | 315,000 | 315,413 |
| Sumter County, FL, Industrial Development Authority Hospital Rev. (Central Florida Health Alliance Projects), “A”, 5.25%, 7/01/2044 | | | 935,000 | 935,748 |
| Tallahassee, FL, Health Facilities Rev. (Tallahassee Memorial Healthcare, Inc.), “A”, 5%, 12/01/2040 | | | 5,935,000 | 5,972,095 |
| Tallahassee, FL, Health Facilities Rev. (Tallahassee Memorial Healthcare, Inc.), “A”, 5%, 12/01/2044 | | | 2,695,000 | 2,703,231 |
| Tallahassee, FL, Health Facilities Rev. (Tallahassee Memorial Healthcare, Inc.), “A”, 5%, 12/01/2055 | | | 7,125,000 | 7,132,354 |
| Tampa, FL (University of Tampa Project), 5%, 4/01/2040 | | | 965,000 | 976,815 |
| Tampa, FL, Capital Improvement Cigarette Tax Allocation (H. Lee Moffitt Cancer Center Project), Capital Appreciation, “A”, 0%, 9/01/2034 | | | 1,570,000 | 1,053,350 |
| Tampa, FL, Capital Improvement Cigarette Tax Allocation (H. Lee Moffitt Cancer Center Project), Capital Appreciation, “A”, 0%, 9/01/2035 | | | 865,000 | 554,799 |
Portfolio of Investments – continued
| Issuer | | | Shares/Par | Value ($) |
| Municipal Bonds - continued |
| Florida - continued |
| Tampa, FL, Capital Improvement Cigarette Tax Allocation (H. Lee Moffitt Cancer Center Project), Capital Appreciation, “A”, 0%, 9/01/2036 | | $ | 1,340,000 | $816,390 |
| Tampa, FL, Capital Improvement Cigarette Tax Allocation (H. Lee Moffitt Cancer Center Project), Capital Appreciation, “A”, 0%, 9/01/2037 | | | 630,000 | 363,217 |
| Tampa, FL, Capital Improvement Cigarette Tax Allocation (H. Lee Moffitt Cancer Center Project), Capital Appreciation, “A”, 0%, 9/01/2038 | | | 865,000 | 470,261 |
| Tampa, FL, Capital Improvement Cigarette Tax Allocation (H. Lee Moffitt Cancer Center Project), Capital Appreciation, “A”, 0%, 9/01/2039 | | | 865,000 | 444,531 |
| Tampa, FL, Capital Improvement Cigarette Tax Allocation (H. Lee Moffitt Cancer Center Project), Capital Appreciation, “A”, 0%, 9/01/2040 | | | 1,180,000 | 574,744 |
| Tampa, FL, Capital Improvement Cigarette Tax Allocation (H. Lee Moffitt Cancer Center Project), Capital Appreciation, “A”, 0%, 9/01/2041 | | | 525,000 | 242,450 |
| Tampa, FL, Capital Improvement Cigarette Tax Allocation (H. Lee Moffitt Cancer Center Project), Capital Appreciation, “A”, 0%, 9/01/2042 | | | 525,000 | 229,264 |
| Tampa, FL, Hospital Rev. (H. Lee Moffitt Cancer Center Project), “B”, 4%, 7/01/2039 | | | 345,000 | 348,195 |
| Tampa, FL, Hospital Rev. (H. Lee Moffitt Cancer Center Project), “B”, 4%, 7/01/2045 | | | 1,835,000 | 1,800,810 |
| Trout Creek Community Development District, FL, Capital Improvement Rev., 5.5%, 5/01/2035 | | | 2,255,000 | 2,275,730 |
| Trout Creek Community Development District, FL, Capital Improvement Rev., 5.625%, 5/01/2045 | | | 3,965,000 | 3,981,416 |
| Wildwood, FL, Special Assessment Rev. (Village Community Development District No. 15), 4.85%, 5/01/2038 | | | 575,000 | 577,267 |
| Wildwood, FL, Special Assessment Rev. (Village Community Development District No. 15), 5%, 5/01/2043 | | | 900,000 | 911,606 |
| Wildwood, FL, Special Assessment Rev. (Village Community Development District No. 15), 5.25%, 5/01/2054 | | | 1,685,000 | 1,709,188 |
| Wiregrass Community Development District, FL, Capital Improvement Rev., 5.375%, 5/01/2035 | | | 385,000 | 388,315 |
| Wiregrass Community Development District, FL, Capital Improvement Rev., 4.875%, 5/01/2036 | | | 915,000 | 915,029 |
| Wiregrass Community Development District, FL, Capital Improvement Rev., 5.625%, 5/01/2045 | | | 1,000,000 | 1,004,739 |
Portfolio of Investments – continued
| Issuer | | | Shares/Par | Value ($) |
| Municipal Bonds - continued |
| Florida - continued |
| Wiregrass Community Development District, FL, Capital Improvement Rev., 5%, 5/01/2047 | | $ | 1,695,000 | $1,609,986 |
| | | | | $283,626,377 |
| Georgia - 0.5% |
| Atlanta, GA, Geo. L. Smith II World Congress Center Authority Convention Center Hotel Rev., “B”, 3.625%, 1/01/2031 (n) | | $ | 2,175,000 | $1,971,278 |
| Atlanta, GA, Geo. L. Smith II World Congress Center Authority Convention Center Hotel Rev., “B”, 5%, 1/01/2036 (n) | | | 1,995,000 | 1,970,383 |
| Atlanta, GA, Geo. L. Smith II World Congress Center Authority Convention Center Hotel Rev., “B”, 5%, 1/01/2054 (n) | | | 6,200,000 | 5,399,427 |
| Cobb County, GA, Development Authority Student Housing Refunding Rev. (Kennesaw State University Foundation, Inc.), “C”, 5%, 7/15/2030 | | | 570,000 | 576,802 |
| Cobb County, GA, Development Authority Student Housing Refunding Rev. (Kennesaw State University Foundation, Inc.), “C”, 5%, 7/15/2030 (Prerefunded 7/15/2025) | | | 10,000 | 10,290 |
| Cobb County, GA, Development Authority Student Housing Refunding Rev. (Kennesaw State University Foundation, Inc.), “C”, 5%, 7/15/2033 (Prerefunded 2/15/2025) | | | 50,000 | 51,449 |
| Cobb County, GA, Development Authority Student Housing Refunding Rev. (Kennesaw State University Foundation, Inc.), “C”, 5%, 7/15/2033 | | | 975,000 | 986,320 |
| Cobb County, GA, Development Authority Student Housing Refunding Rev. (Kennesaw State University Foundation, Inc.), “C”, 5%, 7/15/2038 (Prerefunded 7/15/2025) | | | 40,000 | 41,160 |
| Cobb County, GA, Development Authority Student Housing Refunding Rev. (Kennesaw State University Foundation, Inc.), “C”, 5%, 7/15/2038 | | | 1,060,000 | 1,063,605 |
| Fulton County, GA, Residential Care Facilities, Elderly Authority Rev. (Lenbrook Square Foundation, Inc. Project), 5%, 7/01/2042 | | | 5,030,000 | 4,746,419 |
| Georgia Main Street Natural Gas, Inc., Gas Project Rev., “A”, 5.5%, 9/15/2028 | | | 2,245,000 | 2,391,897 |
| Georgia Ports Authority Rev., 4%, 7/01/2047 | | | 2,340,000 | 2,355,351 |
| Glynn-Brunswick, GA, Memorial Hospital Authority Rev., Anticipation Certificates (Southeast Georgia Health System Project), 4%, 8/01/2035 | | | 380,000 | 382,699 |
| Glynn-Brunswick, GA, Memorial Hospital Authority Rev., Anticipation Certificates (Southeast Georgia Health System Project), 4%, 8/01/2036 | | | 415,000 | 417,416 |
Portfolio of Investments – continued
| Issuer | | | Shares/Par | Value ($) |
| Municipal Bonds - continued |
| Georgia - continued |
| Glynn-Brunswick, GA, Memorial Hospital Authority Rev., Anticipation Certificates (Southeast Georgia Health System Project), 4%, 8/01/2037 | | $ | 285,000 | $286,021 |
| | | | | $22,650,517 |
| Guam - 0.3% |
| Guam Government Business Privilege Tax Refunding, “F”, 5%, 1/01/2030 | | $ | 300,000 | $323,117 |
| Guam Government Business Privilege Tax Refunding, “F”, 4%, 1/01/2042 | | | 1,710,000 | 1,650,640 |
| Guam Government Department of Education (John F. Kennedy High School Energy Efficiency Project), “A”, COP, 3.625%, 2/01/2025 | | | 390,000 | 386,925 |
| Guam Government Department of Education (John F. Kennedy High School Energy Efficiency Project), “A”, COP, 4.25%, 2/01/2030 | | | 1,750,000 | 1,735,448 |
| Guam Government Department of Education (John F. Kennedy High School Energy Efficiency Project), “A”, COP, 5%, 2/01/2040 | | | 2,375,000 | 2,397,540 |
| Guam Government, Hotel Occupancy Tax Rev., “A”, 5%, 11/01/2027 | | | 250,000 | 262,435 |
| Guam Government, Hotel Occupancy Tax Rev., “A”, 5%, 11/01/2028 | | | 250,000 | 265,600 |
| Guam Government, Hotel Occupancy Tax Rev., “A”, 5%, 11/01/2029 | | | 325,000 | 349,239 |
| Guam Government, Hotel Occupancy Tax Rev., “A”, 5%, 11/01/2030 | | | 250,000 | 270,534 |
| Guam Government, Hotel Occupancy Tax Rev., “A”, 5%, 11/01/2040 | | | 1,000,000 | 1,036,451 |
| Guam International Airport Authority Rev., Taxable (A.B. Won Pat Airport), “A”, 3.839%, 10/01/2036 | | | 930,000 | 755,700 |
| Guam International Airport Authority Rev., Taxable (A.B. Won Pat Airport), “A”, 4.46%, 10/01/2043 | | | 1,070,000 | 825,736 |
| Guam Waterworks Authority Rev. (Water and Wastewater System), 5%, 7/01/2036 | | | 355,000 | 365,822 |
| Guam Waterworks Authority Rev. (Water and Wastewater System), 5%, 1/01/2046 | | | 1,620,000 | 1,645,407 |
| | | | | $12,270,594 |
Portfolio of Investments – continued
| Issuer | | | Shares/Par | Value ($) |
| Municipal Bonds - continued |
| Hawaii - 0.1% |
| Hawaii Department of Budget & Finance, Special Purpose Rev. (Chaminade University), 5%, 1/01/2030 (n) | | $ | 1,555,000 | $1,511,544 |
| Hawaii Department of Budget & Finance, Special Purpose Rev. (Chaminade University), 5%, 1/01/2035 (n) | | | 1,125,000 | 1,045,166 |
| Hawaii Department of Budget & Finance, Special Purpose Rev. (Chaminade University), 5%, 1/01/2045 (n) | | | 1,140,000 | 983,219 |
| | | | | $3,539,929 |
| Idaho - 0.1% |
| Idaho Health Facilities Authority Rev. (Madison Memorial Hospital Project), 5%, 9/01/2037 | | $ | 830,000 | $837,425 |
| Idaho Housing and Finance Association Nonprofit Facilities Rev. (Compass Public Charter School, Inc. Project), “A”, 4.625%, 7/01/2029 (n) | | | 160,000 | 159,200 |
| Idaho Housing and Finance Association Nonprofit Facilities Rev. (Compass Public Charter School, Inc. Project), “A”, 6%, 7/01/2039 (n) | | | 1,100,000 | 1,138,631 |
| Idaho Housing and Finance Association Nonprofit Facilities Rev. (Compass Public Charter School, Inc. Project), “A”, 6%, 7/01/2049 (n) | | | 515,000 | 526,558 |
| Idaho Housing and Finance Association Nonprofit Facilities Rev. (Compass Public Charter School, Inc. Project), “A”, 6%, 7/01/2054 (n) | | | 565,000 | 575,021 |
| Idaho Housing and Finance Association Nonprofit Facilities Rev. (Sage International School of Middleton Project), “A”, 4.75%, 5/01/2054 | | | 605,000 | 602,416 |
| Idaho Housing and Finance Association Nonprofit Facilities Rev. (Sage International School of Middleton Project), “A”, 5%, 5/01/2063 | | | 705,000 | 707,007 |
| Idaho Housing and Finance Association Nonprofit Facilities Rev. (White Pine Charter School Project), “A”, 5.75%, 5/01/2058 | | | 465,000 | 490,964 |
| | | | | $5,037,222 |
| Illinois - 8.8% |
| Bridgeview, IL, Stadium and Redevelopment Projects, Taxable, AAC, 5.14%, 12/01/2036 | | $ | 12,665,000 | $11,362,706 |
| Burbank, IL, Educational Facility Rev. (Intercultural Montessori Language School Project), “A”, 6%, 9/01/2035 (n) | | | 2,170,000 | 2,170,515 |
| Burbank, IL, Educational Facility Rev. (Intercultural Montessori Language School Project), “A”, 6.25%, 9/01/2045 (n) | | | 3,565,000 | 3,543,891 |
| Chicago, IL, Board of Education (School Reform), Capital Appreciation, “A”, NPFG, 0%, 12/01/2029 | | | 4,250,000 | 3,387,535 |
| Chicago, IL, Board of Education (School Reform), Capital Appreciation, “A”, NPFG, 0%, 12/01/2030 | | | 1,835,000 | 1,397,532 |
Portfolio of Investments – continued
| Issuer | | | Shares/Par | Value ($) |
| Municipal Bonds - continued |
| Illinois - continued |
| Chicago, IL, Board of Education (School Reform), Capital Appreciation, “B-1”, NPFG, 0%, 12/01/2026 | | $ | 4,335,000 | $3,894,705 |
| Chicago, IL, Board of Education (School Reform), Capital Appreciation, “B-1”, NPFG, 0%, 12/01/2028 | | | 5,515,000 | 4,579,879 |
| Chicago, IL, Board of Education, Dedicated Capital Improvement Tax Bond, 5%, 4/01/2033 | | | 380,000 | 394,287 |
| Chicago, IL, Board of Education, Dedicated Capital Improvement Tax Bond, 5%, 4/01/2033 | | | 280,000 | 294,162 |
| Chicago, IL, Board of Education, Dedicated Capital Improvement Tax Bond, 5%, 4/01/2036 | | | 1,110,000 | 1,145,758 |
| Chicago, IL, Board of Education, Dedicated Capital Improvement Tax Bond, 5%, 4/01/2037 | | | 1,115,000 | 1,146,745 |
| Chicago, IL, Board of Education, Dedicated Capital Improvement Tax Bond, 5%, 4/01/2042 | | | 2,015,000 | 2,048,385 |
| Chicago, IL, Board of Education, Dedicated Capital Improvement Tax Bond, 5%, 4/01/2045 | | | 2,700,000 | 2,827,564 |
| Chicago, IL, Board of Education, Dedicated Capital Improvement Tax Bond, 5%, 4/01/2046 | | | 2,755,000 | 2,784,235 |
| Chicago, IL, Board of Education, Dedicated Capital Improvement Tax Bond, 6%, 4/01/2046 | | | 19,865,000 | 20,743,081 |
| Chicago, IL, Board of Education, Dedicated Capital Improvement Tax Bond, 5.75%, 4/01/2048 | | | 6,135,000 | 6,782,922 |
| Chicago, IL, Board of Education, Unlimited Tax General Obligation Dedicated Rev., “A”, 5.5%, 12/01/2038 | | | 1,905,000 | 2,067,286 |
| Chicago, IL, Board of Education, Unlimited Tax General Obligation Dedicated Rev., “A”, 4%, 12/01/2047 | | | 10,385,000 | 9,039,885 |
| Chicago, IL, Board of Education, Unlimited Tax General Obligation Dedicated Rev., “A”, 5.875%, 12/01/2047 | | | 5,200,000 | 5,697,158 |
| Chicago, IL, Board of Education, Unlimited Tax General Obligation Refunding Dedicated Rev., “A”, 5%, 12/01/2042 | | | 14,200,000 | 14,181,837 |
| Chicago, IL, Board of Education, Unlimited Tax General Obligation Refunding Dedicated Rev., “A”, 7%, 12/01/2046 (n) | | | 7,105,000 | 7,707,757 |
| Chicago, IL, Board of Education, Unlimited Tax General Obligation Refunding Dedicated Rev., “A”, AGM, 5%, 12/01/2035 | | | 515,000 | 542,885 |
| Chicago, IL, Board of Education, Unlimited Tax General Obligation Refunding Dedicated Rev., “B”, 4%, 12/01/2036 | | | 1,215,000 | 1,192,107 |
| Chicago, IL, Board of Education, Unlimited Tax General Obligation Refunding Dedicated Rev., “B”, 4%, 12/01/2039 | | | 1,920,000 | 1,824,931 |
| Chicago, IL, Board of Education, Unlimited Tax General Obligation Refunding Dedicated Rev., “B”, 4%, 12/01/2040 | | | 1,255,000 | 1,175,941 |
| Chicago, IL, Board of Education, Unlimited Tax General Obligation Refunding Dedicated Rev., “B”, 4%, 12/01/2041 | | | 2,910,000 | 2,694,327 |
Portfolio of Investments – continued
| Issuer | | | Shares/Par | Value ($) |
| Municipal Bonds - continued |
| Illinois - continued |
| Chicago, IL, Board of Education, Unlimited Tax General Obligation Refunding Dedicated Rev., “H”, 5%, 12/01/2046 | | $ | 10,610,000 | $10,621,533 |
| Chicago, IL, Board of Education, Unlimited Tax General Obligation, “A”, 6%, 12/01/2049 | | | 10,700,000 | 11,762,861 |
| Chicago, IL, General Obligation (Chicago Works), “A”, 5.5%, 1/01/2039 | | | 4,935,000 | 5,387,124 |
| Chicago, IL, General Obligation (Chicago Works), “A”, 5.5%, 1/01/2041 | | | 1,740,000 | 1,849,215 |
| Chicago, IL, General Obligation (Chicago Works), “A”, 5.5%, 1/01/2043 | | | 435,000 | 459,433 |
| Chicago, IL, General Obligation (Neighborhood Alive 21 Program), “B”, 5.5%, 1/01/2037 | | | 2,680,000 | 2,705,233 |
| Chicago, IL, General Obligation, “A”, 5%, 1/01/2033 | | | 23,735,000 | 25,906,468 |
| Chicago, IL, General Obligation, “A”, 5.5%, 1/01/2035 | | | 2,925,000 | 3,144,491 |
| Chicago, IL, General Obligation, “A”, 5.25%, 1/01/2038 | | | 7,390,000 | 8,000,875 |
| Chicago, IL, General Obligation, “A”, 5%, 1/01/2039 | | | 4,170,000 | 4,327,242 |
| Chicago, IL, General Obligation, “A”, 5.5%, 1/01/2039 | | | 2,380,000 | 2,395,667 |
| Chicago, IL, General Obligation, “A”, 5%, 1/01/2040 | | | 800,000 | 827,684 |
| Chicago, IL, General Obligation, “A”, 5.5%, 1/01/2040 | | | 500,000 | 542,719 |
| Chicago, IL, General Obligation, “A”, 5%, 1/01/2044 | | | 12,975,000 | 13,274,878 |
| Chicago, IL, General Obligation, “D”, 5.5%, 1/01/2033 | | | 1,630,000 | 1,650,640 |
| Chicago, IL, General Obligation, “D”, 5.5%, 1/01/2040 | | | 1,100,000 | 1,106,548 |
| Chicago, IL, General Obligation, “F”, 5.5%, 1/01/2042 | | | 8,225,000 | 8,266,395 |
| Chicago, IL, Metropolitan Pier & Exposition Authority Refunding Bonds (McCormick Place Expansion Project), “A”, 4%, 6/15/2052 | | | 985,000 | 902,080 |
| Chicago, IL, Metropolitan Pier & Exposition Authority Refunding Bonds (McCormick Place Expansion Project), Capital Appreciation, “B”, BAM, 0%, 12/15/2054 | | | 11,735,000 | 2,692,278 |
| Chicago, IL, Metropolitan Pier & Exposition Authority Refunding Bonds (McCormick Place Expansion Project), Capital Appreciation, “B-1”, AGM, 0%, 6/15/2046 | | | 15,000,000 | 5,558,678 |
| Chicago, IL, Metropolitan Pier & Exposition Authority Refunding Bonds (McCormick Place Expansion Project), Capital Appreciation, “B-1”, AGM, 0%, 6/15/2047 | | | 29,475,000 | 10,259,231 |
| Chicago, IL, Metropolitan Pier & Exposition Authority Rev. (McCormick Place Expansion Project), Capital Appreciation, “A”, AGM, 0%, 12/15/2056 | | | 5,495,000 | 1,142,318 |
| Chicago, IL, O’Hare International Airport Rev., Special Facilities, 5%, 7/01/2038 | | | 2,065,000 | 2,116,652 |
| Chicago, IL, O'Hare International Airport Rev., Senior Lien, “A”, 4.5%, 1/01/2048 | | | 5,490,000 | 5,508,506 |
| Chicago, IL, O'Hare International Airport Rev., Senior Lien, “A”, 5%, 1/01/2048 | | | 4,695,000 | 4,778,174 |
Portfolio of Investments – continued
| Issuer | | | Shares/Par | Value ($) |
| Municipal Bonds - continued |
| Illinois - continued |
| Chicago, IL, O'Hare International Airport Rev., Senior Lien, “A”, 4.625%, 1/01/2053 | | $ | 6,585,000 | $6,595,346 |
| Du Page County, IL, Special Service Area No. 31 Special Tax (Monarch Landing Project), 5.625%, 3/01/2036 | | | 621,000 | 621,766 |
| Illinois Finance Authority Rev. (Dominican University), 5%, 3/01/2034 | | | 405,000 | 420,205 |
| Illinois Finance Authority Rev. (Dominican University), 5%, 3/01/2038 | | | 500,000 | 502,692 |
| Illinois Finance Authority Rev. (Dominican University), 5%, 3/01/2042 | | | 310,000 | 306,384 |
| Illinois Finance Authority Rev. (Dominican University), 5%, 3/01/2047 | | | 565,000 | 546,398 |
| Illinois Finance Authority Rev. (Dominican University), 5%, 3/01/2052 | | | 490,000 | 462,829 |
| Illinois Finance Authority Rev. (McKinley Foundation), “A”, 5.125%, 11/01/2055 (n) | | | 3,570,000 | 3,275,761 |
| Illinois Finance Authority Rev. (Mercy Health Corp.), 5%, 12/01/2040 | | | 3,020,000 | 3,066,857 |
| Illinois Finance Authority Rev. (Plymouth Place, Inc.), “A”, 5%, 5/15/2041 | | | 400,000 | 346,430 |
| Illinois Finance Authority Rev. (Plymouth Place, Inc.), “A”, 6.5%, 5/15/2042 | | | 1,745,000 | 1,803,708 |
| Illinois Finance Authority Rev. (Plymouth Place, Inc.), “A”, 6.5%, 5/15/2047 | | | 2,530,000 | 2,582,236 |
| Illinois Finance Authority Rev. (Plymouth Place, Inc.), “A”, 5%, 5/15/2051 | | | 1,000,000 | 806,180 |
| Illinois Finance Authority Rev. (Plymouth Place, Inc.), “A”, 6.625%, 5/15/2052 | | | 2,060,000 | 2,109,970 |
| Illinois Finance Authority Rev. (Plymouth Place, Inc.), “A”, 5%, 5/15/2056 | | | 1,330,000 | 1,048,531 |
| Illinois Finance Authority Rev. (Plymouth Place, Inc.), “A”, 6.75%, 5/15/2058 | | | 2,735,000 | 2,813,016 |
| Illinois Finance Authority Rev. (Presence Health Network), 4%, 2/15/2041 (Prerefunded 2/15/2027) | | | 20,000 | 20,608 |
| Illinois Finance Authority Rev. (Rosalind Franklin University), “A”, 5%, 8/01/2042 | | | 640,000 | 649,231 |
| Illinois Finance Authority Rev. (Rosalind Franklin University), “A”, 5%, 8/01/2047 | | | 1,310,000 | 1,319,708 |
| Illinois Finance Authority Rev. (Rosalind Franklin University, Research Building Project), “C”, 5%, 8/01/2046 | | | 1,005,000 | 1,013,738 |
| Illinois Finance Authority Rev. (Rosalind Franklin University, Research Building Project), “C”, 5%, 8/01/2049 | | | 970,000 | 975,402 |
Portfolio of Investments – continued
| Issuer | | | Shares/Par | Value ($) |
| Municipal Bonds - continued |
| Illinois - continued |
| Illinois Finance Authority Rev., Taxable (McKinley Foundation), “B”, 7%, 11/01/2037 (n) | | $ | 1,020,000 | $997,821 |
| Illinois Finance Authority, Academic Facilities Lease Rev. (Provident Group - UIUC Properties LLC - University of Illinois at Urbana-Champaign Project), “A”, 5%, 10/01/2051 | | | 580,000 | 592,915 |
| Illinois Finance Authority, Educational Facility Rev. (Rogers Park Montessori School Project), 6%, 2/01/2034 | | | 700,000 | 700,236 |
| Illinois Finance Authority, Educational Facility Rev. (Rogers Park Montessori School Project), 6.125%, 2/01/2045 | | | 1,800,000 | 1,800,381 |
| Illinois Finance Authority, Graduate & Professional Student Loan Program Rev. (Midwestern University Foundation), “A”, 2.25%, 7/01/2033 | | | 610,000 | 520,959 |
| Illinois Finance Authority, Graduate & Professional Student Loan Program Rev. (Midwestern University Foundation), “A”, 3%, 7/01/2035 | | | 595,000 | 551,046 |
| Illinois Finance Authority, Student Housing and Academic Facility Rev. (CHF - Chicago LLC - University of Illinois at Chicago Project), “A”, 5%, 2/15/2028 | | | 210,000 | 214,564 |
| Illinois Finance Authority, Student Housing and Academic Facility Rev. (CHF - Chicago LLC - University of Illinois at Chicago Project), “A”, 5%, 2/15/2037 | | | 1,415,000 | 1,426,821 |
| Illinois Finance Authority, Student Housing and Academic Facility Rev. (CHF - Chicago LLC - University of Illinois at Chicago Project), “A”, 5%, 2/15/2047 | | | 1,945,000 | 1,887,996 |
| Illinois Finance Authority, Student Housing and Academic Facility Rev. (CHF - Chicago LLC - University of Illinois at Chicago Project), “A”, 5%, 2/15/2050 | | | 415,000 | 398,650 |
| Illinois Housing Development Authority Rev., “A”, FHLMC, 3.87%, 11/15/2035 (z) | | | 9,080,561 | 8,462,852 |
| Illinois Housing Development Authority Rev., “B”, FHLMC, 3.87%, 11/15/2035 (z) | | | 3,703,245 | 3,451,330 |
| Illinois Housing Development Authority Rev., “C”, FHLMC, 3.87%, 11/15/2035 (z) | | | 3,695,366 | 3,443,987 |
| Illinois Housing Development Authority Rev., “D”, FHLMC, 3.87%, 11/15/2035 (z) | | | 3,372,016 | 3,142,633 |
| Illinois Housing Development Authority Rev., “E”, FHLMC, 3.87%, 11/15/2035 (z) | | | 2,321,814 | 2,163,872 |
| Lincolnshire, IL, Special Service Area No. 1 (Sedgebrook Project), 6.25%, 3/01/2034 | | | 1,964,000 | 1,965,961 |
| Northern Illinois University, Auxiliary Facilities System Refunding Rev., BAM, 4%, 10/01/2041 | | | 430,000 | 424,041 |
| Northern Illinois University, Auxiliary Facilities System Refunding Rev., BAM, 4%, 10/01/2043 | | | 260,000 | 251,783 |
Portfolio of Investments – continued
| Issuer | | | Shares/Par | Value ($) |
| Municipal Bonds - continued |
| Illinois - continued |
| Northern Illinois University, Auxiliary Facilities System Refunding Rev., “B”, BAM, 4%, 4/01/2036 | | $ | 755,000 | $777,354 |
| Northern Illinois University, Auxiliary Facilities System Refunding Rev., “B”, BAM, 4%, 4/01/2038 | | | 850,000 | 860,916 |
| Northern Illinois University, Auxiliary Facilities System Refunding Rev., “B”, BAM, 4%, 4/01/2040 | | | 810,000 | 811,691 |
| Northern Illinois University, Auxiliary Facilities System Refunding Rev., “B”, BAM, 4%, 4/01/2041 | | | 385,000 | 383,192 |
| Romeoville, IL, Rev. (Lewis University Project), “A”, 5%, 10/01/2042 | | | 1,450,000 | 1,452,513 |
| Romeoville, IL, Rev. (Lewis University Project), “B”, 5%, 10/01/2039 | | | 1,500,000 | 1,505,641 |
| Romeoville, IL, Rev. (Lewis University Project), “B”, 4.125%, 10/01/2041 | | | 1,130,000 | 1,035,576 |
| Romeoville, IL, Rev. (Lewis University Project), “B”, 4.125%, 10/01/2046 | | | 1,120,000 | 977,297 |
| State of Illinois, General Obligation, 5.5%, 5/01/2039 | | | 8,810,000 | 9,768,162 |
| State of Illinois, General Obligation, 4.5%, 11/01/2039 | | | 2,420,000 | 2,450,422 |
| State of Illinois, General Obligation, 5%, 11/01/2040 | | | 10,180,000 | 10,392,828 |
| State of Illinois, General Obligation, 5.75%, 5/01/2045 | | | 9,310,000 | 10,256,834 |
| State of Illinois, General Obligation, “B”, 4%, 11/01/2038 | | | 1,665,000 | 1,665,416 |
| State of Illinois, General Obligation, “B”, 5.5%, 5/01/2047 | | | 3,465,000 | 3,824,656 |
| University of Illinois, Auxiliary Facilities System Rev., “A”, BAM, 4%, 4/01/2050 | | | 1,205,000 | 1,160,089 |
| Upper Illinois River Valley Development Authority Rev. (Morris Hospital), 5%, 12/01/2043 | | | 8,455,000 | 8,609,159 |
| Upper Illinois River Valley Development Authority Rev. (Morris Hospital), 5%, 12/01/2048 | | | 8,460,000 | 8,538,067 |
| | | | | $377,969,596 |
| Indiana - 0.8% |
| Indiana Finance Authority Refunding Rev., Taxable (BHI Senior Living), “B”, 3.21%, 11/15/2028 | | $ | 785,000 | $712,344 |
| Indiana Finance Authority Refunding Rev., Taxable (BHI Senior Living), “B”, 3.26%, 11/15/2029 | | | 930,000 | 825,568 |
| Indiana Finance Authority Refunding Rev., Taxable (BHI Senior Living), “B”, 3.3%, 11/15/2030 | | | 720,000 | 625,426 |
| Indiana Finance Authority Refunding Rev., Taxable (BHI Senior Living), “B”, 3.39%, 11/15/2031 | | | 570,000 | 485,914 |
| Indiana Finance Authority Rev. (Marquette Project), “A”, 5%, 3/01/2030 | | | 460,000 | 461,516 |
| Indiana Finance Authority Rev. (Marquette Project), “A”, 5%, 3/01/2039 | | | 1,155,000 | 1,131,010 |
Portfolio of Investments – continued
| Issuer | | | Shares/Par | Value ($) |
| Municipal Bonds - continued |
| Indiana - continued |
| Indiana Finance Authority, Educational Facilities Multipurpose Rev. (KIPP Indianapolis, Inc. Project), “A”, 4%, 7/01/2030 | | $ | 210,000 | $200,477 |
| Indiana Finance Authority, Educational Facilities Multipurpose Rev. (KIPP Indianapolis, Inc. Project), “A”, 5%, 7/01/2040 | | | 340,000 | 331,439 |
| Indiana Finance Authority, Educational Facilities Multipurpose Rev. (KIPP Indianapolis, Inc. Project), “A”, 5%, 7/01/2055 | | | 915,000 | 848,188 |
| Indiana Finance Authority, Educational Facilities Tax-Exempt Rev. (Marian University Project), 4%, 9/15/2044 | | | 470,000 | 408,004 |
| Indiana Finance Authority, Educational Facilities Tax-Exempt Rev. (Marian University Project), 4%, 9/15/2049 | | | 460,000 | 379,771 |
| Indiana Finance Authority, Hospital Rev. (Reid Health), AGM, 4.25%, 1/01/2047 | | | 2,460,000 | 2,451,607 |
| Indiana Finance Authority, Student Housing Rev. (CHF - Tippecanoe LLC - Student Housing Project), “A”, 5%, 6/01/2053 | | | 960,000 | 981,667 |
| Indiana Finance Authority, Student Housing Rev. (CHF - Tippecanoe LLC - Student Housing Project), “A”, 5.125%, 6/01/2058 | | | 790,000 | 809,291 |
| Indiana Finance Authority, Student Housing Rev. (CHF - Tippecanoe LLC - Student Housing Project), “A”, 5.375%, 6/01/2064 | | | 2,360,000 | 2,443,621 |
| Indianapolis, IN, Local Public Improvement Bond Bank Senior Rev. (Convention Center Hotel), “E”, 6%, 3/01/2053 | | | 1,065,000 | 1,150,995 |
| Indianapolis, IN, Local Public Improvement Bond Bank Subordinate Rev. (Convention Center Hotel), “E”, 6.125%, 3/01/2057 | | | 1,190,000 | 1,289,735 |
| Terre Haute, IN, Rev. (Westminster Village), 6%, 8/01/2039 | | | 4,600,000 | 2,998,875 |
| Valparaiso, IN, Exempt Facilities Rev. (Pratt Paper LLC Project), 6.75%, 1/01/2034 | | | 4,370,000 | 4,381,368 |
| Valparaiso, IN, Exempt Facilities Rev. (Pratt Paper LLC Project), 7%, 1/01/2044 | | | 10,875,000 | 10,900,111 |
| | | | | $33,816,927 |
| Iowa - 0.8% |
| Iowa Finance Authority Senior Housing Rev. (Northcrest, Inc. Project), “A”, 5%, 3/01/2033 | | $ | 1,095,000 | $1,069,205 |
| Iowa Finance Authority Senior Housing Rev. (Northcrest, Inc. Project), “A”, 5%, 3/01/2038 | | | 865,000 | 805,290 |
| Iowa Finance Authority Senior Housing Rev. (Northcrest, Inc. Project), “A”, 5%, 3/01/2048 | | | 1,590,000 | 1,363,519 |
| Iowa Finance Authority, Single Family Mortgage Rev., “A”, FNMA, 4%, 7/01/2047 | | | 450,000 | 448,602 |
| Iowa Higher Education Loan Authority, Private College Facility Rev. (Des Moines University Project), 4.75%, 10/01/2042 | | | 775,000 | 785,150 |
Portfolio of Investments – continued
| Issuer | | | Shares/Par | Value ($) |
| Municipal Bonds - continued |
| Iowa - continued |
| Iowa Higher Education Loan Authority, Private College Facility Rev. (Des Moines University Project), 5%, 10/01/2047 | | $ | 820,000 | $836,828 |
| Iowa Higher Education Loan Authority, Private College Facility Rev. (Des Moines University Project), 5.375%, 10/01/2052 | | | 910,000 | 941,843 |
| Iowa Student Loan Liquidity Corp. Rev., “B”, 3%, 12/01/2039 | | | 260,000 | 249,275 |
| Iowa Student Loan Liquidity Corp. Rev., “C”, 3.5%, 12/01/2044 | | | 7,710,000 | 6,394,226 |
| Iowa Tobacco Settlement Authority Asset-Backed, Senior Capital Appreciation, “B-2”, 0%, 6/01/2065 | | | 157,900,000 | 21,266,683 |
| | | | | $34,160,621 |
| Kansas - 1.2% |
| Coffeyville, KS, Electric Utility System Rev., “B”, NPFG, 5%, 6/01/2038 (Prerefunded 6/01/2025) (n) | | $ | 3,600,000 | $3,680,705 |
| Coffeyville, KS, Electric Utility System Rev., “B”, NPFG, 5%, 6/01/2042 (Prerefunded 6/01/2025) (n) | | | 1,500,000 | 1,533,627 |
| Hutchinson, KS, Hospital Facilities Rev. (Hutchinson Regional Medical Center, Inc.), 5%, 12/01/2036 | | | 1,405,000 | 1,393,268 |
| Hutchinson, KS, Hospital Facilities Rev. (Hutchinson Regional Medical Center, Inc.), 5%, 12/01/2041 | | | 615,000 | 570,837 |
| Lenexa, KS, Health Care Facility Rev. (Lakeview Village, Inc.), “A”, 5%, 5/15/2030 | | | 1,085,000 | 1,102,900 |
| Lenexa, KS, Health Care Facility Rev. (Lakeview Village, Inc.), “A”, 5%, 5/15/2032 | | | 985,000 | 997,425 |
| Lenexa, KS, Health Care Facility Rev. (Lakeview Village, Inc.), “A”, 5%, 5/15/2039 | | | 1,280,000 | 1,254,452 |
| Lenexa, KS, Health Care Facility Rev. (Lakeview Village, Inc.), “A”, 5%, 5/15/2043 | | | 4,000,000 | 3,795,629 |
| Manhattan, KS, Health Care Facilities Rev. (Meadowlark Hills), “A”, 4%, 6/01/2036 | | | 1,000,000 | 912,180 |
| Manhattan, KS, Health Care Facilities Rev. (Meadowlark Hills), “A”, 4%, 6/01/2046 | | | 890,000 | 702,071 |
| Manhattan, KS, Health Care Facilities Rev. (Meadowlark Hills), “A”, 4%, 6/01/2052 | | | 4,390,000 | 3,253,048 |
| Overland Park, KS, Development Corp. Improvement and Refunding Rev. (Overland Park Convention Center Hotel), 5%, 3/01/2032 | | | 1,360,000 | 1,387,580 |
| Overland Park, KS, Development Corp. Improvement and Refunding Rev. (Overland Park Convention Center Hotel), 5%, 3/01/2033 | | | 1,430,000 | 1,458,127 |
| Overland Park, KS, Development Corp. Improvement and Refunding Rev. (Overland Park Convention Center Hotel), 5%, 3/01/2034 | | | 1,500,000 | 1,528,355 |
Portfolio of Investments – continued
| Issuer | | | Shares/Par | Value ($) |
| Municipal Bonds - continued |
| Kansas - continued |
| Overland Park, KS, Development Corp. Improvement and Refunding Rev. (Overland Park Convention Center Hotel), 5%, 3/01/2036 | | $ | 1,660,000 | $1,689,985 |
| Overland Park, KS, Development Corp. Improvement and Refunding Rev. (Overland Park Convention Center Hotel), 5%, 3/01/2038 | | | 1,835,000 | 1,860,237 |
| Overland Park, KS, Development Corp. Improvement and Refunding Rev. (Overland Park Convention Center Hotel), 5%, 3/01/2044 | | | 2,615,000 | 2,622,418 |
| Overland Park, KS, Development Corp. Improvement and Refunding Rev. (Overland Park Convention Center Hotel), 5%, 3/01/2049 | | | 5,640,000 | 5,548,697 |
| Overland Park, KS, Sales Tax Special Rev. (Bluhawk STAR Bond Project), “A”, 5.5%, 11/15/2028 (n) | | | 550,000 | 564,178 |
| Overland Park, KS, Sales Tax Special Rev. (Bluhawk STAR Bond Project), “A”, 6%, 11/15/2034 (n) | | | 2,415,000 | 2,533,340 |
| Topeka, KS, Health Care Facilities Rev. (Brewster Place), “A”, 6.25%, 12/01/2042 | | | 1,320,000 | 1,328,752 |
| Topeka, KS, Health Care Facilities Rev. (Brewster Place), “A”, 6.5%, 12/01/2052 | | | 2,420,000 | 2,435,857 |
| Wichita, KS, Health Care Facilities Rev. (Presbyterian Manors, Inc.), “A”, 6.375%, 5/15/2043 | | | 4,165,000 | 3,610,858 |
| Wichita, KS, Health Care Facilities Rev. (Presbyterian Manors, Inc.), “I”, 5%, 5/15/2033 | | | 605,000 | 549,883 |
| Wichita, KS, Health Care Facilities Rev. (Presbyterian Manors, Inc.), “I”, 5%, 5/15/2038 | | | 710,000 | 571,409 |
| Wichita, KS, Health Care Facilities Rev. (Presbyterian Manors, Inc.), “I”, 4.625%, 5/15/2041 | | | 605,000 | 432,882 |
| Wichita, KS, Health Care Facilities Rev. (Presbyterian Manors, Inc.), “I”, 5%, 5/15/2047 | | | 1,860,000 | 1,302,965 |
| Wichita, KS, Health Care Facilities Rev. (Presbyterian Manors, Inc.), “III”, 5%, 5/15/2034 | | | 1,750,000 | 1,533,596 |
| Wichita, KS, Health Care Facilities Rev. (Presbyterian Manors, Inc.), “IV-A”, 6.5%, 5/15/2048 | | | 1,500,000 | 1,283,000 |
| Wyandotte County/Kansas City, KS, Unified Government Community Improvement District Sales Tax Rev. (Legends Apartments Garage & West Lawn Project), 4.5%, 6/01/2040 | | | 1,180,000 | 1,118,152 |
| | | | | $52,556,413 |
Portfolio of Investments – continued
| Issuer | | | Shares/Par | Value ($) |
| Municipal Bonds - continued |
| Kentucky - 1.2% |
| Henderson, KY, Exempt Facilities Rev. (Pratt Paper LLC Project), “B”, 4.45%, 1/01/2042 (n) | | $ | 4,005,000 | $3,884,508 |
| Kentucky Economic Development Finance Authority Healthcare Facilities Rev. (Baptist Life Communities Project), “A”, 6%, 11/15/2036 | | | 2,385,000 | 2,020,647 |
| Kentucky Economic Development Finance Authority Healthcare Facilities Rev. (Baptist Life Communities Project), “A”, 6.25%, 11/15/2046 | | | 5,105,000 | 3,989,433 |
| Kentucky Economic Development Finance Authority Healthcare Facilities Rev. (Baptist Life Communities Project), “A”, 6.375%, 11/15/2051 | | | 5,415,000 | 4,185,034 |
| Kentucky Economic Development Finance Authority Healthcare Facilities Rev. (Masonic Homes of Kentucky, Inc.), 5.375%, 11/15/2042 | | | 2,915,000 | 2,340,788 |
| Kentucky Economic Development Finance Authority Healthcare Facilities Rev. (Masonic Homes of Kentucky, Inc.), 5.5%, 11/15/2045 | | | 1,325,000 | 1,050,890 |
| Kentucky Economic Development Finance Authority Hospital Rev. (Baptist Healthcare System), “B”, 5%, 8/15/2046 | | | 5,245,000 | 5,334,140 |
| Kentucky Economic Development Finance Authority Hospital Rev. (Owensboro Health, Inc.), “A”, 5%, 6/01/2041 | | | 1,995,000 | 2,019,054 |
| Kentucky Economic Development Finance Authority Hospital Rev. (Owensboro Health, Inc.), “A”, 5.25%, 6/01/2041 | | | 1,555,000 | 1,590,440 |
| Kentucky Economic Development Finance Authority Hospital Rev. (Owensboro Health, Inc.), “A”, 5%, 6/01/2045 | | | 2,490,000 | 2,510,838 |
| Kentucky Economic Development Finance Authority Rev. (Masonic Home Independent Living II, Inc. - Meadow Project and Grove Pointe Project), “A”, 5%, 5/15/2036 | | | 2,590,000 | 2,223,065 |
| Kentucky Economic Development Finance Authority Rev. (Masonic Home Independent Living II, Inc. - Meadow Project and Grove Pointe Project), “A”, 5%, 5/15/2046 | | | 6,945,000 | 5,242,115 |
| Kentucky Economic Development Finance Authority Rev. (Masonic Home Independent Living II, Inc. - Meadow Project and Grove Pointe Project), “A”, 5%, 5/15/2051 | | | 1,755,000 | 1,283,277 |
| Kentucky Higher Education Student Loan Corp. Rev., “B-1”, 5%, 6/01/2036 | | | 8,965,000 | 9,275,476 |
| Kentucky State University, Certificates of Participation, BAM, 4%, 11/01/2051 | | | 275,000 | 266,024 |
| Louisville & Jefferson County, KY, Metro Government College Improvement Rev. (Bellarmine University Project), “A”, 5%, 5/01/2034 | | | 1,440,000 | 1,358,782 |
Portfolio of Investments – continued
| Issuer | | | Shares/Par | Value ($) |
| Municipal Bonds - continued |
| Kentucky - continued |
| Louisville & Jefferson County, KY, Metro Government College Improvement Rev. (Bellarmine University Project), “A”, 5%, 5/01/2035 | | $ | 2,290,000 | $2,145,986 |
| | | | | $50,720,497 |
| Louisiana - 2.4% |
| Louisiana Local Government, Environmental Facilities & Community Development Authority Rev. (Cameron Parish GOMESA Project), 5.65%, 11/01/2037 (n) | | $ | 1,120,000 | $1,186,079 |
| Louisiana Local Government, Environmental Facilities & Community Development Authority Rev. (CDF Healthcare), “A”, 5.625%, 6/01/2045 | | | 10,650,000 | 8,915,435 |
| Louisiana Local Government, Environmental Facilities & Community Development Authority Rev. (Jefferson Parish GOMESA Project), 4%, 11/01/2044 (n) | | | 4,520,000 | 4,004,405 |
| Louisiana Local Government, Environmental Facilities & Community Development Authority Rev. (Lafourche Parish GOMESA Project), 3.95%, 11/01/2043 (n) | | | 3,474,045 | 3,087,530 |
| Louisiana Local Government, Environmental Facilities & Community Development Authority Rev. (St. Bernard Parish GOMESA Project), 4%, 11/01/2045 (n) | | | 4,220,000 | 3,725,452 |
| Louisiana Local Government, Environmental Facilities & Community Development Authority Rev. (St. James Parish GOMESA Project), 3.9%, 11/01/2044 (n) | | | 4,000,000 | 3,491,904 |
| Louisiana Local Government, Environmental Facilities & Community Development Authority Rev. (St. Mary's Parish GOMESA Project), 4.4%, 11/01/2044 (n) | | | 3,080,000 | 2,946,384 |
| Louisiana Local Government, Environmental Facilities & Community Development Authority Rev. (St. Tammany Parish GOMESA Project), 3.875%, 11/01/2045 (n) | | | 5,255,000 | 4,551,737 |
| Louisiana Local Government, Environmental Facilities & Community Development Authority Rev. (Tangipahoa Parish GOMESA Project), 5.375%, 11/01/2038 (n) | | | 1,815,000 | 1,895,474 |
| Louisiana Local Government, Environmental Facilities & Community Development Authority Rev. (Terrebonne Parish GOMESA Project), 5.5%, 11/01/2039 (n) | | | 1,220,000 | 1,275,247 |
| Louisiana Local Government, Environmental Facilities & Community Development Authority Rev. (Vermilion Parish GOMESA Project), 4.625%, 11/01/2038 (n) | | | 1,375,000 | 1,392,153 |
| Louisiana Local Government, Environmental Facilities & Community Development Authority Rev. (Westside Habilitation Center Project), “A”, 5.75%, 2/01/2032 (n) | | | 900,000 | 862,772 |
Portfolio of Investments – continued
| Issuer | | | Shares/Par | Value ($) |
| Municipal Bonds - continued |
| Louisiana - continued |
| Louisiana Local Government, Environmental Facilities & Community Development Authority Rev. (Westside Habilitation Center Project), “A”, 6.125%, 2/01/2037 (n) | | $ | 3,480,000 | $3,317,061 |
| Louisiana Local Government, Environmental Facilities & Community Development Authority Rev. (Westside Habilitation Center Project), “A”, 6.25%, 2/01/2047 (n) | | | 2,830,000 | 2,602,641 |
| Louisiana Local Government, Environmental Facilities & Community Development Authority Student Housing Rev. (Provident Group - ULM Properties LLC - University of Louisiana at Monroe Project), “A”, 5%, 7/01/2029 (n) | | | 635,000 | 615,084 |
| Louisiana Local Government, Environmental Facilities & Community Development Authority Student Housing Rev. (Provident Group - ULM Properties LLC - University of Louisiana at Monroe Project), “A”, 5%, 7/01/2039 (n) | | | 1,660,000 | 1,424,091 |
| Louisiana Local Government, Environmental Facilities & Community Development Authority Student Housing Rev. (Provident Group - ULM Properties LLC - University of Louisiana at Monroe Project), “A”, 5%, 7/01/2054 (n) | | | 2,635,000 | 2,042,406 |
| Louisiana Local Government, Environmental Facilities & Community Development Authority, Healthcare Refunding Rev. (St. James Place of Baton Rouge Project), “A”, 5.25%, 11/15/2025 | | | 665,000 | 660,592 |
| Louisiana Local Government, Environmental Facilities & Community Development Authority, Healthcare Refunding Rev. (St. James Place of Baton Rouge Project), “A”, 6%, 11/15/2035 | | | 1,145,000 | 1,133,455 |
| Louisiana Local Government, Environmental Facilities & Community Development Authority, Healthcare Refunding Rev. (St. James Place of Baton Rouge Project), “A”, 6.25%, 11/15/2045 | | | 5,405,000 | 5,211,509 |
| Louisiana Public Facilities Authority Rev. (BBR Schools - Materra Campus Project), “A”, 4%, 6/01/2031 (n) | | | 580,000 | 535,986 |
| Louisiana Public Facilities Authority Rev. (BBR Schools - Materra Campus Project), “A”, 4%, 6/01/2041 (n) | | | 1,330,000 | 1,056,730 |
| Louisiana Public Facilities Authority Rev. (BBR Schools - Materra Campus Project), “A”, 4%, 6/01/2051 (n) | | | 3,545,000 | 2,560,556 |
| Louisiana Public Facilities Authority Rev. (BBR Schools - Materra Campus Project), “A”, 4%, 6/01/2056 (n) | | | 2,200,000 | 1,539,257 |
| Louisiana Public Facilities Authority Rev. (BBR Schools - Materra Campus Project), “C”, 4%, 6/01/2031 (n) | | | 485,000 | 448,195 |
| Louisiana Public Facilities Authority Rev. (BBR Schools - Materra Campus Project), “C”, 4%, 6/01/2041 (n) | | | 880,000 | 699,190 |
| Louisiana Public Facilities Authority Rev. (BBR Schools - Materra Campus Project), “C”, 4%, 6/01/2056 (n) | | | 1,160,000 | 811,608 |
Portfolio of Investments – continued
| Issuer | | | Shares/Par | Value ($) |
| Municipal Bonds - continued |
| Louisiana - continued |
| Louisiana Public Facilities Authority Rev. (BBR Schools - Mid City Campus Project), “C”, 4%, 6/01/2051 (n) | | $ | 1,250,000 | $902,876 |
| Louisiana Public Facilities Authority Rev. (GEO Academies EBR - GEO Prep Mid-City Project), 5.625%, 6/01/2037 (n) | | | 415,000 | 421,309 |
| Louisiana Public Facilities Authority Rev. (GEO Academies EBR - GEO Prep Mid-City Project), 6.125%, 6/01/2052 (n) | | | 1,030,000 | 1,044,140 |
| Louisiana Public Facilities Authority Rev. (GEO Academies EBR - GEO Prep Mid-City Project), 6.25%, 6/01/2062 (n) | | | 1,425,000 | 1,446,577 |
| Louisiana Public Facilities Authority Rev. (Jefferson Rise Charter School Project), “A”, 6%, 6/01/2037 (n) | | | 500,000 | 484,802 |
| Louisiana Public Facilities Authority Rev. (Jefferson Rise Charter School Project), “A”, 6.25%, 6/01/2052 (n) | | | 1,000,000 | 960,222 |
| Louisiana Public Facilities Authority Rev. (Jefferson Rise Charter School Project), “A”, 6.375%, 6/01/2062 (n) | | | 1,545,000 | 1,469,766 |
| Louisiana Public Facilities Authority Rev. (Loyola University Project), 5.25%, 10/01/2046 | | | 8,470,000 | 9,178,862 |
| Louisiana Public Facilities Authority Rev. (Provident Group - HSC Properties, Inc., LSU Health Foundation, New Orleans Project), “A-1”, 5.375%, 1/01/2040 (n) | | | 4,365,000 | 4,275,705 |
| Louisiana Public Facilities Authority Rev. (Provident Group - HSC Properties, Inc., LSU Health Foundation, New Orleans Project), “A-1”, 5.5%, 1/01/2050 (n) | | | 2,995,000 | 2,848,203 |
| Louisiana Public Facilities Authority Rev. (Provident Group - HSC Properties, Inc., LSU Health Foundation, New Orleans Project), “A-1”, 5.1%, 1/01/2057 (n) | | | 10,045,000 | 8,791,781 |
| Louisiana Public Facilities Authority Rev. (Provident Group - HSC Properties, Inc., LSU Health Foundation, New Orleans Project), “A-2”, 7%, 1/01/2057 (n) | | | 10,000,000 | 9,426,198 |
| | | | | $103,243,374 |
| Maine - 0.2% |
| Maine Finance Authority Solid Waste Disposal Rev. (Casella Waste Systems, Inc.), “R-2”, 4.375%, 8/01/2035 (Put Date 8/01/2025) (n) | | $ | 2,685,000 | $2,664,121 |
| Maine Finance Authority Solid Waste Disposal Rev. (Casella Waste Systems, Inc.), “R-3”, 5.25%, 1/01/2025 (n) | | | 6,170,000 | 6,187,700 |
| | | | | $8,851,821 |
| Maryland - 1.2% |
| Baltimore, MD, Convention Center Hotel Rev., 5%, 9/01/2025 | | $ | 1,550,000 | $1,553,538 |
| Baltimore, MD, Convention Center Hotel Rev., 5%, 9/01/2026 | | | 520,000 | 520,155 |
| Baltimore, MD, Convention Center Hotel Rev., 5%, 9/01/2034 | | | 3,595,000 | 3,586,724 |
| Baltimore, MD, Convention Center Hotel Rev., 5%, 9/01/2042 | | | 2,375,000 | 2,294,271 |
| Baltimore, MD, Convention Center Hotel Rev., 5%, 9/01/2046 | | | 1,480,000 | 1,389,031 |
Portfolio of Investments – continued
| Issuer | | | Shares/Par | Value ($) |
| Municipal Bonds - continued |
| Maryland - continued |
| Baltimore, MD, Special Obligation (East Baltimore Research Park Project), “A”, 5%, 9/01/2038 | | $ | 2,680,000 | $2,700,866 |
| Brunswick, MD, Special Obligation Refunding (Brunswick Crossing Special Taxing District), 4%, 7/01/2029 | | | 500,000 | 493,750 |
| Brunswick, MD, Special Obligation Refunding (Brunswick Crossing Special Taxing District), 5%, 7/01/2036 | | | 550,000 | 563,159 |
| Frederick County, MD, Limited Obligation (Jefferson Technology Park Project), “B”, 4.625%, 7/01/2043 (n) | | | 1,020,000 | 998,184 |
| Howard County, MD, Retirement Community Rev. (Vantage House Facility), 5%, 4/01/2036 | | | 1,225,000 | 1,111,335 |
| Howard County, MD, Retirement Community Rev. (Vantage House Facility), 5%, 4/01/2036 | | | 3,930,000 | 3,565,343 |
| Howard County, MD, Special Obligation (Downtown Columbia Project), “A”, 4.125%, 2/15/2034 (n) | | | 850,000 | 826,692 |
| Howard County, MD, Special Obligation (Downtown Columbia Project), “A”, 4.375%, 2/15/2039 (n) | | | 745,000 | 718,094 |
| Howard County, MD, Special Obligation (Downtown Columbia Project), “A”, 4.5%, 2/15/2047 (n) | | | 2,190,000 | 2,044,298 |
| Maryland Community Development Administration, Department of Housing & Community Development Housing Rev., “A”, 4.5%, 9/01/2048 (u) | | | 4,080,000 | 4,115,247 |
| Maryland Community Development Administration, Department of Housing & Community Development Housing Rev., “B”, 4.5%, 9/01/2048 (u) | | | 3,320,000 | 3,327,581 |
| Maryland Economic Development Corp., Senior Student Housing Rev. (Morgan State University Project), “A”, 6%, 7/01/2058 | | | 2,250,000 | 2,464,924 |
| Maryland Economic Development Corp., Special Obligation (Port Covington Project), 3.25%, 9/01/2030 (n) | | | 265,000 | 252,586 |
| Maryland Economic Development Corp., Special Obligation (Port Covington Project), 4%, 9/01/2040 (n) | | | 920,000 | 853,269 |
| Maryland Economic Development Corp., Subordinate Parking Facilities Rev. (Baltimore City Project), “C”, 4%, 6/01/2038 | | | 175,000 | 151,711 |
| Maryland Economic Development Corp., Subordinate Parking Facilities Rev. (Baltimore City Project), “C”, 4%, 6/01/2048 | | | 525,000 | 408,854 |
| Maryland Economic Development Corp., Subordinate Parking Facilities Rev. (Baltimore City Project), “C”, 4%, 6/01/2058 | | | 1,800,000 | 1,326,055 |
| Maryland Health & Higher Educational Facilities Authority Rev. (Adventist Healthcare), “A”, 5.5%, 1/01/2036 | | | 2,290,000 | 2,381,640 |
| Maryland Stadium Authority Rev., Baltimore City Public Schools Construction & Revitalization Program, Capital Appreciation, “C”, 0%, 5/01/2051 | | | 6,160,000 | 1,725,577 |
Portfolio of Investments – continued
| Issuer | | | Shares/Par | Value ($) |
| Municipal Bonds - continued |
| Maryland - continued |
| Maryland Stadium Authority Rev., Baltimore City Public Schools Construction & Revitalization Program, Capital Appreciation, “C”, 0%, 5/01/2052 | | $ | 9,235,000 | $2,455,536 |
| Maryland Stadium Authority Rev., Baltimore City Public Schools Construction & Revitalization Program, Capital Appreciation, “C”, 0%, 5/01/2053 | | | 4,515,000 | 1,138,124 |
| Maryland Stadium Authority Rev., Baltimore City Public Schools Construction & Revitalization Program, Capital Appreciation, “C”, 0%, 5/01/2054 | | | 6,775,000 | 1,620,185 |
| Maryland Stadium Authority Rev., Baltimore City Public Schools Construction & Revitalization Program, Capital Appreciation, “C”, 0%, 5/01/2055 | | | 4,185,000 | 948,764 |
| Rockville, MD, Mayor & Council Economic Development Refunding Rev. (Ingleside at King Farm Project), “A-1”, 5%, 11/01/2037 | | | 890,000 | 816,770 |
| Rockville, MD, Mayor & Council Economic Development Rev. (Ingleside at King Farm Project), “B”, 5%, 11/01/2042 | | | 1,530,000 | 1,351,186 |
| Rockville, MD, Mayor & Council Economic Development Rev. (Ingleside at King Farm Project), “B”, 5%, 11/01/2047 | | | 1,605,000 | 1,377,746 |
| Westminster, MD, Refunding Rev. (Carroll Lutheran Village, Inc.), 5.125%, 7/01/2040 | | | 2,600,000 | 2,619,406 |
| | | | | $51,700,601 |
| Massachusetts - 2.2% |
| Collegiate Charter School of Lowell, MA, Rev., 4%, 6/15/2024 | | $ | 100,000 | $99,650 |
| Collegiate Charter School of Lowell, MA, Rev., 5%, 6/15/2029 | | | 905,000 | 913,799 |
| Collegiate Charter School of Lowell, MA, Rev., 5%, 6/15/2049 | | | 750,000 | 700,925 |
| Collegiate Charter School of Lowell, MA, Rev., 5%, 6/15/2054 | | | 580,000 | 538,996 |
| Massachusetts Development Finance Agency Rev. (Adventcare), “A”, 6.75%, 10/15/2037 (a)(d) | | | 7,684,178 | 76,842 |
| Massachusetts Development Finance Agency Rev. (Boston Medical Center), “G”, 4.375%, 7/01/2052 | | | 2,815,000 | 2,821,391 |
| Massachusetts Development Finance Agency Rev. (Emmanuel College), “A”, 5%, 10/01/2043 | | | 2,930,000 | 2,949,135 |
| Massachusetts Development Finance Agency Rev. (Emmanuel College), “A”, 4%, 10/01/2046 | | | 870,000 | 756,254 |
| Massachusetts Development Finance Agency Rev. (Foxborough Regional Charter School), “B”, 5%, 7/01/2037 | | | 1,000,000 | 1,012,549 |
| Massachusetts Development Finance Agency Rev. (Foxborough Regional Charter School), “B”, 5%, 7/01/2042 | | | 3,000,000 | 2,989,438 |
| Massachusetts Development Finance Agency Rev. (Lasell University), 4%, 7/01/2040 | | | 1,075,000 | 935,858 |
Portfolio of Investments – continued
| Issuer | | | Shares/Par | Value ($) |
| Municipal Bonds - continued |
| Massachusetts - continued |
| Massachusetts Development Finance Agency Rev. (Lasell University), 4%, 7/01/2045 | | $ | 495,000 | $409,297 |
| Massachusetts Development Finance Agency Rev. (Lowell General Hospital), “G”, 5%, 7/01/2037 | | | 2,085,000 | 2,085,531 |
| Massachusetts Development Finance Agency Rev. (Newbridge on the Charles, Inc.), 5%, 10/01/2037 (n) | | | 400,000 | 403,702 |
| Massachusetts Development Finance Agency Rev. (Newbridge on the Charles, Inc.), 5%, 10/01/2047 (n) | | | 3,140,000 | 3,034,117 |
| Massachusetts Development Finance Agency Rev. (Newbridge on the Charles, Inc.), 5%, 10/01/2057 (n) | | | 7,070,000 | 6,570,981 |
| Massachusetts Development Finance Agency Rev. (Sabis International Charter School Issue), 5%, 4/15/2025 | | | 160,000 | 160,306 |
| Massachusetts Development Finance Agency Rev. (Salem Community Corp.), 5.125%, 1/01/2040 (n) | | | 515,000 | 472,646 |
| Massachusetts Development Finance Agency Rev. (Salem Community Corp.), 5.25%, 1/01/2050 (n) | | | 1,355,000 | 1,175,896 |
| Massachusetts Development Finance Agency Rev. (Simmons University), “N”, 5.25%, 10/01/2037 | | | 545,000 | 586,618 |
| Massachusetts Development Finance Agency Rev. (Simmons University), “N”, 5.25%, 10/01/2038 | | | 550,000 | 586,855 |
| Massachusetts Development Finance Agency Rev. (Simmons University), “N”, 5.25%, 10/01/2039 | | | 580,000 | 614,746 |
| Massachusetts Development Finance Agency Rev. (Simmons University), “N”, 5%, 10/01/2043 | | | 1,750,000 | 1,788,439 |
| Massachusetts Development Finance Agency Rev. (Springfield College), “B”, 4%, 6/01/2041 | | | 2,750,000 | 2,531,578 |
| Massachusetts Development Finance Agency Rev. (Springfield College), “B”, 4%, 6/01/2050 | | | 2,700,000 | 2,295,364 |
| Massachusetts Development Finance Agency Rev. (Wellforce, Inc.), “A”, 5%, 7/01/2039 | | | 1,435,000 | 1,447,455 |
| Massachusetts Development Finance Agency Rev. (Wellforce, Inc.), “A”, 5%, 7/01/2044 | | | 1,520,000 | 1,492,231 |
| Massachusetts Development Finance Agency Rev. (Wentworth Institute of Technology), 5%, 10/01/2046 | | | 985,000 | 991,586 |
| Massachusetts Development Finance Agency Rev. (Western New England University), 5%, 9/01/2028 | | | 960,000 | 972,645 |
| Massachusetts Educational Financing Authority, Education Loan Rev., “B”, 3%, 7/01/2035 | | | 270,000 | 267,437 |
| Massachusetts Educational Financing Authority, Education Loan Rev., “B”, 2%, 7/01/2037 | | | 425,000 | 371,073 |
| Massachusetts Educational Financing Authority, Education Loan Rev., “C”, 2.625%, 7/01/2036 | | | 90,000 | 88,524 |
Portfolio of Investments – continued
| Issuer | | | Shares/Par | Value ($) |
| Municipal Bonds - continued |
| Massachusetts - continued |
| Massachusetts Educational Financing Authority, Education Loan Rev., “J”, 4.7%, 7/01/2026 | | $ | 415,000 | $415,099 |
| Massachusetts Educational Financing Authority, Education Loan Rev., “J”, 4.9%, 7/01/2028 | | | 430,000 | 430,103 |
| Massachusetts Educational Financing Authority, Education Loan Rev., “J”, 3.5%, 7/01/2033 | | | 10,920,000 | 10,520,372 |
| Massachusetts Educational Financing Authority, Education Loan Subordinate Rev., “C”, 4.125%, 7/01/2046 | | | 9,285,000 | 8,315,469 |
| Massachusetts Educational Financing Authority, Education Loan Subordinate Rev., “C”, 3.75%, 7/01/2047 | | | 12,070,000 | 10,093,414 |
| Massachusetts Educational Financing Authority, Education Loan Subordinate Rev., “C”, 3%, 7/01/2051 | | | 3,215,000 | 2,247,868 |
| Massachusetts Educational Financing Authority, Education Loan Subordinate Rev., “C”, 4.125%, 7/01/2052 | | | 10,360,000 | 8,915,151 |
| Massachusetts Educational Financing Authority, Education Loan Subordinate Rev., Issue L, “C”, 5%, 7/01/2053 | | | 4,500,000 | 4,474,003 |
| Massachusetts Housing Finance Agency, Single Family Housing Rev., “177”, 4%, 6/01/2039 | | | 95,000 | 94,631 |
| Tisbury, MA, General Obligation, Municipal Purpose Loan, Unlimited Tax, 3%, 8/15/2047 | | | 5,905,000 | 4,987,913 |
| Tisbury, MA, General Obligation, Municipal Purpose Loan, Unlimited Tax, 3%, 8/15/2052 | | | 3,715,000 | 3,007,058 |
| | | | | $95,642,945 |
| Michigan - 0.4% |
| Detroit, MI, General Obligation, 5.5%, 4/01/2045 | | $ | 1,250,000 | $1,314,262 |
| Detroit, MI, Unlimited Tax General Obligation, “C”, 6%, 5/01/2043 | | | 1,500,000 | 1,681,383 |
| Grand Rapids, MI, Economic Development Corp. Rev. (Beacon Hill at Eastgate Project), “A”, 5%, 11/01/2037 | | | 1,155,000 | 1,084,848 |
| Grand Rapids, MI, Economic Development Corp. Rev. (Beacon Hill at Eastgate Project), “A”, 5%, 11/01/2047 | | | 2,660,000 | 2,310,201 |
| Grand Rapids, MI, Economic Development Corp. Rev. (Beacon Hill at Eastgate Project), “A”, 5%, 11/01/2052 | | | 1,185,000 | 1,004,951 |
| Michigan Building Authority Rev. (Facilities Program), 4%, 10/15/2052 | | | 1,685,000 | 1,650,801 |
| Michigan Finance Authority Hospital Rev. (Beaumont Health Credit Group), “A”, 5%, 8/01/2033 (Prerefunded 8/01/2024) | | | 20,000 | 20,164 |
| Michigan Strategic Fund Ltd. (Canterbury Health Care, Inc.), 5%, 7/01/2046 (z) | | | 1,000,000 | 597,195 |
| Michigan Strategic Fund Ltd. (Canterbury Health Care, Inc.), 5%, 7/01/2051 (z) | | | 900,000 | 514,845 |
Portfolio of Investments – continued
| Issuer | | | Shares/Par | Value ($) |
| Municipal Bonds - continued |
| Michigan - continued |
| Waterford Township, MI, Economic Development Corp. (Canterbury Health Care, Inc.), “A”, 5%, 7/01/2046 (z) | | $ | 2,070,000 | $1,236,194 |
| Waterford Township, MI, Economic Development Corp. (Canterbury Health Care, Inc.), “A”, 5%, 7/01/2051 (z) | | | 2,070,000 | 1,184,143 |
| Wayne County, MI, Airport Authority Rev. (Detroit Metropolitan Wayne County Airport), “B”, BAM, 5%, 12/01/2039 | | | 750,000 | 756,401 |
| Wayne County, MI, Airport Authority Rev. (Detroit Metropolitan Wayne County Airport), “C”, 5%, 12/01/2039 | | | 575,000 | 575,940 |
| Wayne County, MI, Airport Authority Rev. (Detroit Metropolitan Wayne County Airport), “C”, 5%, 12/01/2044 | | | 1,240,000 | 1,240,661 |
| | | | | $15,171,989 |
| Minnesota - 0.6% |
| Deephaven, MN, Charter School Lease Rev. (Eagle Ridge Academy Project), “A”, 5.25%, 7/01/2040 | | $ | 500,000 | $501,393 |
| Deephaven, MN, Charter School Lease Rev. (Eagle Ridge Academy Project), “A”, 5.5%, 7/01/2050 | | | 3,000,000 | 3,003,068 |
| Duluth, MN, Economic Development Authority Rev. (Benedictine Health System), “A”, 4%, 7/01/2031 | | | 1,370,000 | 1,254,821 |
| Duluth, MN, Economic Development Authority Rev. (Benedictine Health System), “A”, 4%, 7/01/2036 | | | 3,335,000 | 2,835,285 |
| Duluth, MN, Economic Development Authority Rev. (Benedictine Health System), “A”, 4%, 7/01/2041 | | | 2,755,000 | 2,164,577 |
| Duluth, MN, Economic Development Authority, Health Care Facilities Rev. (Essentia Health), “A”, 4.25%, 2/15/2043 | | | 2,500,000 | 2,459,712 |
| Duluth, MN, Economic Development Authority, Health Care Facilities Rev. (Essentia Health), “A”, 4.25%, 2/15/2048 | | | 2,895,000 | 2,812,648 |
| Duluth, MN, Independent School District No. 709, “A”, COP, 4.2%, 3/01/2034 | | | 420,000 | 415,565 |
| Minnesota Higher Educational Facilities Authority Rev. (St. Catherine University), 5%, 10/01/2052 | | | 3,000,000 | 3,042,307 |
| Minnesota Housing Finance Agency, Residential Housing, “A”, 4%, 1/01/2041 | | | 85,000 | 84,742 |
| Minnesota Office of Higher Education Supplemental Student Loan Program Rev., 4%, 11/01/2037 | | | 1,655,000 | 1,646,755 |
| Minnesota Office of Higher Education Supplemental Student Loan Program Rev., 2.65%, 11/01/2038 | | | 2,840,000 | 2,530,015 |
| St. Paul, MN, Housing & Redevelopment Authority Charter School Lease Rev. (Great River School Project), “A”, 4.75%, 7/01/2029 (n) | | | 150,000 | 149,287 |
| St. Paul, MN, Housing & Redevelopment Authority Charter School Lease Rev. (Great River School Project), “A”, 5.25%, 7/01/2033 (n) | | | 420,000 | 425,736 |
Portfolio of Investments – continued
| Issuer | | | Shares/Par | Value ($) |
| Municipal Bonds - continued |
| Minnesota - continued |
| St. Paul, MN, Housing & Redevelopment Authority Charter School Lease Rev. (Great River School Project), “A”, 5.5%, 7/01/2052 (n) | | $ | 705,000 | $694,994 |
| Woodbury, MN Charter School Lease Rev. (Woodbury Leadership Academy Project), “A”, 4%, 7/01/2031 | | | 690,000 | 639,169 |
| Woodbury, MN Charter School Lease Rev. (Woodbury Leadership Academy Project), “A”, 4%, 7/01/2041 | | | 2,000,000 | 1,595,423 |
| Woodbury, MN Charter School Lease Rev. (Woodbury Leadership Academy Project), “A”, 4%, 7/01/2051 | | | 660,000 | 477,205 |
| Woodbury, MN Charter School Lease Rev. (Woodbury Leadership Academy Project), “A”, 4%, 7/01/2056 | | | 575,000 | 402,789 |
| | | | | $27,135,491 |
| Mississippi - 0.3% |
| Mississippi Development Bank Special Obligation (Hancock County GOMESA Project), 4.55%, 11/01/2039 (n) | | $ | 3,400,000 | $3,412,749 |
| Mississippi Development Bank Special Obligation (Jackson County GOMESA Project), 3.625%, 11/01/2036 (n) | | | 2,075,000 | 1,907,814 |
| Mississippi Home Corp., Single Family Mortgage Rev., “A”, 4%, 12/01/2044 | | | 1,235,000 | 1,231,855 |
| Mississippi Hospital Equipment & Facilities Authority Rev. (Baptist Memorial Healthcare), “A”, 5%, 9/01/2046 | | | 2,635,000 | 2,659,167 |
| Mississippi Hospital Equipment & Facilities Authority Rev. (Forrest County General Hospital Refunding Project), “A”, 4%, 1/01/2036 | | | 1,155,000 | 1,170,963 |
| Mississippi Hospital Equipment & Facilities Authority Rev. (Forrest County General Hospital Refunding Project), “A”, 4%, 1/01/2037 | | | 1,040,000 | 1,046,655 |
| Mississippi Hospital Equipment & Facilities Authority Rev. (Forrest County General Hospital Refunding Project), “A”, 4%, 1/01/2039 | | | 1,040,000 | 1,023,673 |
| Mississippi Hospital Equipment & Facilities Authority Rev. (Forrest County General Hospital Refunding Project), “A”, 4%, 1/01/2040 | | | 575,000 | 558,554 |
| | | | | $13,011,430 |
| Missouri - 1.0% |
| Cape Girardeau County, MO, Industrial Development Authority, Health Facilities Rev. (Southeast Health), 4%, 3/01/2041 | | $ | 460,000 | $458,452 |
| Cape Girardeau County, MO, Industrial Development Authority, Health Facilities Rev. (SoutheastHealth), 4%, 3/01/2046 | | | 520,000 | 499,928 |
| Dardenne, MO, Town Square Transportation Development District, “A”, 5%, 5/01/2026 (d)(q) | | | 2,495,000 | 1,197,600 |
Portfolio of Investments – continued
| Issuer | | | Shares/Par | Value ($) |
| Municipal Bonds - continued |
| Missouri - continued |
| Kansas City, MO, Land Clearance for Redevelopment Authority Rev. (Convention Center Hotel Project - TIF Financing), “B”, 5%, 2/01/2040 (n) | | $ | 2,140,000 | $1,982,842 |
| Kansas City, MO, Land Clearance for Redevelopment Authority Rev. (Convention Center Hotel Project - TIF Financing), “B”, 5%, 2/01/2050 (n) | | | 4,845,000 | 4,355,945 |
| Missouri Development Finance Board, Infrastructure Facilities Rev. (Crackerneck Creek Project), 4%, 3/01/2036 | | | 1,300,000 | 1,284,451 |
| Missouri Development Finance Board, Infrastructure Facilities Rev. (Crackerneck Creek Project), 4%, 3/01/2037 | | | 415,000 | 401,872 |
| Missouri Development Finance Board, Infrastructure Facilities Rev. (Crackerneck Creek Project), 4%, 3/01/2041 | | | 520,000 | 479,100 |
| Missouri Development Finance Board, Infrastructure Facilities Rev. (Crackerneck Creek Project), 4%, 3/01/2051 | | | 1,480,000 | 1,270,444 |
| Missouri Health & Educational Facilities Authority Rev. (Bethesda Health Group, Inc.), 5%, 8/01/2040 | | | 1,650,000 | 1,571,595 |
| Missouri Health & Educational Facilities Authority Rev. (Bethesda Health Group, Inc.), 5%, 8/01/2045 | | | 2,300,000 | 2,107,245 |
| Missouri Housing Development Commission, Single Family Mortgage Rev. (First Place Homeownership Loan Program), “A”, 3.75%, 5/01/2038 | | | 155,000 | 154,190 |
| Plaza at Noah's Ark Community District, MO, Tax Increment and Improvement Rev., 3%, 5/01/2030 | | | 345,000 | 313,521 |
| Plaza at Noah's Ark Community District, MO, Tax Increment and Improvement Rev., 3.125%, 5/01/2035 | | | 240,000 | 203,909 |
| Poplar Bluff, MO, Transportation Development District Convertible Transportation Sales Tax Refunding & Improvement Rev., “B”, 4%, 12/01/2037 | | | 1,090,000 | 1,095,425 |
| St. Louis County, MO, Industrial Development Authority Health Facilities Rev. (Nazareth Living Center), “A”, 5%, 8/15/2030 | | | 695,000 | 667,646 |
| St. Louis County, MO, Industrial Development Authority Health Facilities Rev. (Nazareth Living Center), “A”, 5%, 8/15/2035 | | | 490,000 | 450,763 |
| St. Louis County, MO, Industrial Development Authority Health Facilities Rev. (Nazareth Living Center), “A”, 5.125%, 8/15/2045 | | | 1,355,000 | 1,157,891 |
| St. Louis County, MO, Industrial Development Authority Health Facilities Rev. (Ranken-Jordan Project), 5%, 11/15/2030 | | | 1,015,000 | 1,023,086 |
| St. Louis County, MO, Industrial Development Authority Health Facilities Rev. (Ranken-Jordan Project), 4%, 11/15/2036 | | | 1,165,000 | 1,081,539 |
| St. Louis County, MO, Industrial Development Authority Rev. (Friendship Village St. Louis Obligated Group), “A”, 5.25%, 9/01/2053 | | | 11,920,000 | 10,965,875 |
Portfolio of Investments – continued
| Issuer | | | Shares/Par | Value ($) |
| Municipal Bonds - continued |
| Missouri - continued |
| St. Louis County, MO, Industrial Development Authority Rev. (St. Andrew's Resources for Seniors Obligated Group), “A”, 5.125%, 12/01/2045 | | $ | 3,620,000 | $3,192,957 |
| St. Louis, MO, Industrial Development Authority Financing Rev. (Ballpark Village Development Project), “A”, 3.875%, 11/15/2029 | | | 920,000 | 817,755 |
| St. Louis, MO, Industrial Development Authority Financing Rev. (Ballpark Village Development Project), “A”, 4.375%, 11/15/2035 | | | 2,110,000 | 1,738,941 |
| St. Louis, MO, Industrial Development Authority Financing Rev. (Ballpark Village Development Project), “A”, 4.75%, 11/15/2047 | | | 4,220,000 | 3,225,376 |
| St. Louis, MO, Land Clearance Redevelopment Authority Rev. (Kiel Opera House Renovation Project), 3.875%, 10/01/2035 | | | 2,005,000 | 1,815,630 |
| | | | | $43,513,978 |
| Montana - 0.2% |
| Montana Finance Authority, Health Care Facilities Rev. (Kalispell Regional Medical Center), “B”, 5%, 7/01/2043 | | $ | 3,840,000 | $3,921,947 |
| Montana Finance Authority, Health Care Facilities Rev. (Kalispell Regional Medical Center), “B”, 5%, 7/01/2048 | | | 5,530,000 | 5,602,708 |
| | | | | $9,524,655 |
| Nebraska - 0.1% |
| Central Plains Energy Project, NE, Gas Project Rev. (Project No. 3), “A”, 5%, 9/01/2034 | | $ | 1,200,000 | $1,306,137 |
| Central Plains Energy Project, NE, Gas Project Rev. (Project No. 3), “A”, 5%, 9/01/2036 | | | 1,940,000 | 2,096,735 |
| Nebraska Investment Finance Authority, Single Family Housing Rev., “A”, 4%, 9/01/2044 | | | 180,000 | 179,621 |
| Nebraska Investment Finance Authority, Single Family Housing Rev., “C”, FHLMC, 4%, 9/01/2048 | | | 2,225,000 | 2,218,647 |
| | | | | $5,801,140 |
| Nevada - 0.3% |
| Director of the State of Nevada, Department of Business and Industry, Charter School Lease Rev. (Somerset Academy), “A”, 4.5%, 12/15/2029 (n) | | $ | 425,000 | $419,591 |
| Director of the State of Nevada, Department of Business and Industry, Charter School Lease Rev. (Somerset Academy), “A”, 5%, 12/15/2035 (n) | | | 1,715,000 | 1,719,446 |
| Director of the State of Nevada, Department of Business and Industry, Charter School Lease Rev. (Somerset Academy), “A”, 5%, 12/15/2038 (n) | | | 1,825,000 | 1,789,263 |
| Director of the State of Nevada, Department of Business and Industry, Charter School Lease Rev. (Somerset Academy), “A”, 5.125%, 12/15/2045 (n) | | | 2,205,000 | 2,108,507 |
Portfolio of Investments – continued
| Issuer | | | Shares/Par | Value ($) |
| Municipal Bonds - continued |
| Nevada - continued |
| Director of the State of Nevada, Department of Business and Industry, Charter School Lease Rev. (Somerset Academy), “A”, 5%, 12/15/2048 (n) | | $ | 4,760,000 | $4,372,785 |
| Nevada Department of Business & Industry Charter School Rev. (Doral Academy of Nevada), “A”, 5%, 7/15/2037 (n) | | | 1,000,000 | 1,006,765 |
| Nevada Department of Business & Industry Charter School Rev. (Doral Academy of Nevada), “A”, 5%, 7/15/2047 (n) | | | 2,015,000 | 1,972,086 |
| Reno, NV, Sales Tax Rev. (Retrac-Reno Transportation Rail Access Corridor Project), “B”, AGM, 4%, 6/01/2048 | | | 435,000 | 417,747 |
| Reno, NV, Sales Tax Rev. (Retrac-Reno Transportation Rail Access Corridor Project), “B”, AGM, 4.125%, 6/01/2058 | | | 545,000 | 517,045 |
| | | | | $14,323,235 |
| New Hampshire - 1.9% |
| National Finance Authority, New Hampshire Rev., Taxable (Centurion Foundation), “C”, 11%, 12/15/2038 | | $ | 770,000 | $770,081 |
| National Finance Authority, New Hampshire Rev. (Presbyterian Senior Living Project), “A”, 5.25%, 7/01/2048 | | | 1,035,000 | 1,064,719 |
| National Finance Authority, New Hampshire Senior Living Rev. (Springpoint Senior Living Project), 4%, 1/01/2041 | | | 1,210,000 | 1,002,399 |
| National Finance Authority, NH, Lease Rent Rev. (Centurion Biosquare, Inc.), “A”, 5.88%, 12/15/2038 | | | 23,475,000 | 23,846,889 |
| National Finance Authority, NH, Lease Rent Rev., Taxable (Centurion Biosquare, Inc.), “B”, 9.58%, 12/15/2038 | | | 1,410,000 | 1,410,161 |
| National Finance Authority, NH, Lease Rev. (NCCD - UNR Properties LLC - University of Nevada, Reno Project), “A”, BAM, 5.25%, 6/01/2051 | | | 2,290,000 | 2,526,867 |
| National Finance Authority, NH, Lease Rev. (NCCD - UNR Properties LLC - University of Nevada, Reno Project), “A”, BAM, 4.5%, 6/01/2053 | | | 1,020,000 | 1,025,830 |
| National Finance Authority, NH, Municipal Certificates, “1-A”, 4.375%, 9/20/2036 | | | 11,729,008 | 11,635,999 |
| National Finance Authority, NH, Municipal Certificates, “1-X”, 0.35%, 9/20/2036 (i) | | | 73,935,067 | 1,664,685 |
| National Finance Authority, NH, Municipal Certificates, “1-X”, 0.813%, 1/20/2038 (i) | | | 124,250,707 | 7,203,223 |
| National Finance Authority, NH, Resource Recovery Refunding Rev. (Covanta Project), “C”, 4.875%, 11/01/2042 (n) | | | 7,730,000 | 6,894,243 |
| National Finance Authority, NH, Resource Recovery Refunding Rev., “B”, 3.75%, 7/01/2045 (Put Date 7/02/2040) (n) | | | 3,090,000 | 2,447,307 |
| New Hampshire Health & Education Facilities Authority Rev. (Covenant Health), 4%, 7/01/2037 | | | 12,080,000 | 11,146,140 |
Portfolio of Investments – continued
| Issuer | | | Shares/Par | Value ($) |
| Municipal Bonds - continued |
| New Hampshire - continued |
| New Hampshire National Finance Authority Municipal Certificates, “A-2”, 4%, 10/20/2036 | | $ | 7,697,239 | $7,392,596 |
| New Hampshire National Finance Authority Municipal Certificates, “X-2”, 0.674%, 10/20/2036 (i) | | | 34,320,000 | 1,677,929 |
| | | | | $81,709,068 |
| New Jersey - 1.7% |
| Bayonne, NJ, Redevelopment Agency (Royal Caribbean Project), “A”, 5.375%, 11/01/2035 | | $ | 1,845,000 | $1,575,623 |
| Camden County, NJ, Improvement Authority School Rev. (KIPP Cooper Norcross Academy), 6%, 6/15/2042 | | | 245,000 | 271,695 |
| Camden County, NJ, Improvement Authority School Rev. (KIPP Cooper Norcross Academy), 6%, 6/15/2047 | | | 665,000 | 727,971 |
| Camden County, NJ, Improvement Authority School Rev. (KIPP Cooper Norcross Academy), 6%, 6/15/2052 | | | 600,000 | 652,458 |
| Camden County, NJ, Improvement Authority School Rev. (KIPP Cooper Norcross Academy), 6%, 6/15/2062 | | | 2,000,000 | 2,161,192 |
| New Jersey Economic Development Authority Refunding Rev. (School Facilities Construction), “SSS”, 5.25%, 6/15/2036 (w) | | | 535,000 | 631,727 |
| New Jersey Economic Development Authority Refunding Rev. (School Facilities Construction), “SSS”, 5.25%, 6/15/2037 (w) | | | 535,000 | 625,638 |
| New Jersey Economic Development Authority Refunding Rev. (School Facilities Construction), “SSS”, 5.25%, 6/15/2038 (w) | | | 705,000 | 817,589 |
| New Jersey Economic Development Authority Refunding Rev. (School Facilities Construction), “SSS”, 5.25%, 6/15/2039 (w) | | | 640,000 | 739,092 |
| New Jersey Economic Development Authority Rev. (Goethals Bridge Replacement Project), 5.5%, 1/01/2027 | | | 325,000 | 325,330 |
| New Jersey Economic Development Authority Rev. (Goethals Bridge Replacement Project), 5%, 1/01/2028 | | | 325,000 | 325,170 |
| New Jersey Economic Development Authority Rev. (Goethals Bridge Replacement Project), AGM, 5%, 1/01/2031 | | | 975,000 | 975,569 |
| New Jersey Economic Development Authority Rev. (Goethals Bridge Replacement Project), AGM, 5.125%, 7/01/2042 | | | 530,000 | 530,019 |
| New Jersey Economic Development Authority Rev. (Kapkowski Road Landfill Reclamation Project), 6.5%, 4/01/2028 | | | 2,987,803 | 2,989,995 |
| New Jersey Economic Development Authority Rev. (Kapkowski Road Landfill Reclamation Project), 6.5%, 4/01/2031 | | | 7,370,000 | 7,453,369 |
| New Jersey Economic Development Authority Rev. (Provident Group - Rowan Properties LLC - Rowan University Student Housing Project), “A”, 5%, 1/01/2030 | | | 3,485,000 | 3,488,236 |
| New Jersey Economic Development Authority Rev. (Provident Group - Rowan Properties LLC - Rowan University Student Housing Project), “A”, 5%, 1/01/2035 | | | 1,510,000 | 1,510,468 |
Portfolio of Investments – continued
| Issuer | | | Shares/Par | Value ($) |
| Municipal Bonds - continued |
| New Jersey - continued |
| New Jersey Economic Development Authority, Special Facilities Rev. (Continental Airlines, Inc.), 5.25%, 9/15/2029 | | $ | 3,370,000 | $3,376,521 |
| New Jersey Economic Development Authority, Special Facilities Rev. (Continental Airlines, Inc.), “A”, 5.625%, 11/15/2030 | | | 6,850,000 | 6,919,958 |
| New Jersey Higher Education Student Assistance Authority, Senior Student Loan Rev., “B”, 3.25%, 12/01/2039 | | | 4,060,000 | 3,881,738 |
| New Jersey Higher Education Student Assistance Authority, Senior Student Loan Rev., “B”, 4%, 12/01/2041 | | | 15,165,000 | 14,873,881 |
| New Jersey Higher Education Student Assistance Authority, Senior Student Loan Rev., ”B“, 2.5%, 12/01/2040 | | | 2,330,000 | 2,153,391 |
| New Jersey Higher Education Student Assistance Authority, Senior Student Loan Rev., ”C“, 3.25%, 12/01/2051 | | | 960,000 | 739,476 |
| New Jersey Higher Education Student Assistance Authority, Student Loan Refunding Rev., “B”, 4%, 12/01/2044 | | | 12,080,000 | 11,960,449 |
| New Jersey Higher Education Student Assistance Authority, Student Loan Refunding Rev., “C”, 5%, 12/01/2053 | | | 1,380,000 | 1,355,219 |
| New Jersey Transportation Trust Fund Authority, “CC”, 5.5%, 6/15/2050 | | | 2,520,000 | 2,805,147 |
| | | | | $73,866,921 |
| New Mexico - 0.1% |
| New Mexico Mortgage Finance Authority, Single Family Mortgage Program, “A-1”, FNMA, 4%, 1/01/2049 | | $ | 710,000 | $707,595 |
| Santa Fe, NM, Retirement Facility Rev. (El Castillo Retirement Residences Project), 5%, 5/15/2042 | | | 105,000 | 93,964 |
| Santa Fe, NM, Retirement Facility Rev. (El Castillo Retirement Residences Project), “A”, 5%, 5/15/2034 | | | 565,000 | 545,134 |
| Santa Fe, NM, Retirement Facility Rev. (El Castillo Retirement Residences Project), “A”, 5%, 5/15/2039 | | | 275,000 | 251,569 |
| Santa Fe, NM, Retirement Facility Rev. (El Castillo Retirement Residences Project), “A”, 5%, 5/15/2044 | | | 285,000 | 251,791 |
| Santa Fe, NM, Retirement Facility Rev. (El Castillo Retirement Residences Project), “A”, 5%, 5/15/2049 | | | 735,000 | 618,939 |
| | | | | $2,468,992 |
| New York - 6.6% |
| Buffalo & Erie County, NY, Industrial Land Development Corp. Rev. (Charter School for Applied Technologies Project), “A”, 5%, 6/01/2035 | | $ | 1,000,000 | $1,033,230 |
| Build NYC Resource Corp. Rev. (Albert Einstein School of Medicine, Inc.), 5.5%, 9/01/2045 (n) | | | 12,455,000 | 12,461,822 |
| Build NYC Resource Corp. Rev. (Grand Concourse Academy Charter School Project), “A”, 5%, 7/01/2052 | | | 355,000 | 357,989 |
Portfolio of Investments – continued
| Issuer | | | Shares/Par | Value ($) |
| Municipal Bonds - continued |
| New York - continued |
| Build NYC Resource Corp. Rev. (Grand Concourse Academy Charter School Project), “B”, 5%, 7/01/2062 | | $ | 2,700,000 | $2,703,345 |
| Build NYC Resource Corp. Rev. (International Leadership Charter High School Project), “A”, 6.25%, 7/01/2046 (n) | | | 1,315,000 | 1,321,031 |
| Build NYC Resource Corp. Rev. (International Leadership Charter School Project), 5.75%, 7/01/2033 | | | 3,860,000 | 3,859,920 |
| Build NYC Resource Corp. Rev. (International Leadership Charter School Project), 6%, 7/01/2043 | | | 4,025,000 | 4,025,115 |
| Build NYC Resource Corp. Rev. (KIPP NYC Public Schools Facilities - Canal West Project), 5.25%, 7/01/2057 | | | 1,695,000 | 1,757,146 |
| Build NYC Resource Corp. Rev. (KIPP NYC Public Schools Facilities - Canal West Project), 5.25%, 7/01/2062 | | | 2,125,000 | 2,195,457 |
| Jefferson County, NY, Civic Development Corp. Rev. (Samaritan Medical Center), “A”, 4%, 11/01/2032 | | | 535,000 | 510,240 |
| New Rochelle, NY, Corp. for Local Development Rev. (Iona College Project), “A”, 5%, 7/01/2040 | | | 2,130,000 | 2,142,437 |
| New Rochelle, NY, Corp. for Local Development Rev. (Iona College Project), “A”, 5%, 7/01/2045 | | | 990,000 | 992,991 |
| New York Dormitory Authority Rev. (Northwell Health Obligated Group), “A”, 4%, 5/01/2045 | | | 5,630,000 | 5,455,604 |
| New York Dormitory Authority Rev. (Orange Regional Medical Center Obligated Group Rev.), 5%, 12/01/2033 (n) | | | 800,000 | 771,519 |
| New York Dormitory Authority Rev. (Orange Regional Medical Center Obligated Group Rev.), 5%, 12/01/2035 (n) | | | 1,500,000 | 1,424,967 |
| New York Dormitory Authority Rev. (Orange Regional Medical Center Obligated Group Rev.), 5%, 12/01/2040 (n) | | | 1,000,000 | 978,128 |
| New York Environmental Facilities Corp. Rev., Solid Waste Disposal (Casella Waste Management, Inc. Project), 2.75%, 9/01/2050 (Put Date 9/02/2025) (n) | | | 620,000 | 599,731 |
| New York Liberty Development Corp., Liberty Rev. (3 World Trade Center Project), “1”, 5%, 11/15/2044 (n) | | | 24,500,000 | 24,522,474 |
| New York Liberty Development Corp., Liberty Rev. (3 World Trade Center Project), “2”, 5.375%, 11/15/2040 (n) | | | 5,850,000 | 5,854,170 |
| New York Transportation Development Corp., Special Facilities Rev. (American Airlines, Inc. John F. Kennedy International Airport Project), 3%, 8/01/2031 | | | 765,000 | 701,236 |
| New York Transportation Development Corp., Special Facilities Rev. (American Airlines, Inc. John F. Kennedy International Airport Project), 5.25%, 8/01/2031 | | | 1,760,000 | 1,848,753 |
| New York Transportation Development Corp., Special Facilities Rev. (American Airlines, Inc. John F. Kennedy International Airport Project), 5.375%, 8/01/2036 | | | 4,205,000 | 4,374,690 |
Portfolio of Investments – continued
| Issuer | | | Shares/Par | Value ($) |
| Municipal Bonds - continued |
| New York - continued |
| New York Transportation Development Corp., Special Facilities Rev. (Delta Airlines, Inc. LaGuardia Airport Terminals C&D Redevelopment Project), 5.625%, 4/01/2040 | | $ | 7,370,000 | $7,983,706 |
| New York Transportation Development Corp., Special Facilities Rev. (Delta Airlines, Inc. LaGuardia Airport Terminals C&D Redevelopment Project), 5%, 10/01/2040 | | | 3,245,000 | 3,316,177 |
| New York Transportation Development Corp., Special Facilities Rev. (Delta Airlines, Inc. LaGuardia Airport Terminals C&D Redevelopment Project), 4.375%, 10/01/2045 | | | 19,055,000 | 18,565,367 |
| New York Transportation Development Corp., Special Facilities Rev. (John F. Kennedy International Airport New Terminal One Project), 6%, 6/30/2054 | | | 17,420,000 | 19,227,708 |
| New York Transportation Development Corp., Special Facilities Rev. (John F. Kennedy International Airport New Terminal One Project), AGM, 5.125%, 6/30/2060 | | | 24,605,000 | 25,743,313 |
| New York Transportation Development Corp., Special Facilities Rev. (Terminal 4 John F. Kennedy International Airport Project), “A”, 5%, 12/01/2036 | | | 55,000 | 58,328 |
| New York Transportation Development Corp., Special Facilities Rev. (Terminal 4 John F. Kennedy International Airport Project), “A”, 4%, 12/01/2038 | | | 235,000 | 229,971 |
| New York Transportation Development Corp., Special Facilities Rev. (Terminal 4 John F. Kennedy International Airport Project), “A”, 4%, 12/01/2039 | | | 570,000 | 551,205 |
| New York, NY, Housing Development Corp., Multi-Family Housing Rev. (8 Spruce Street), “E”, 3.5%, 2/15/2048 | | | 6,002,643 | 5,957,213 |
| New York, NY, Housing Development Corp., Multi-Family Housing Rev. (8 Spruce Street), “F”, 4.5%, 2/15/2048 | | | 46,653,261 | 46,131,706 |
| New York, NY, Industrial Development Agency, Airport Facilities Rev. (Transportation Infrastructure Properties LLC), 5%, 7/01/2028 | | | 925,000 | 925,266 |
| Niagara, NY, Area Development Agency, Solid Waste Disposal Rev. (Covanta Energy Project), “A”, 4.75%, 11/01/2042 (n) | | | 6,865,000 | 6,025,708 |
| Niagara, NY, Area Development Corp. Rev. (Catholic Health System, Inc. Project), 4.5%, 7/01/2052 | | | 4,115,000 | 3,033,219 |
| Niagara, NY, Area Development Corp. Rev. (Catholic Health System, Inc. Project), 5%, 7/01/2052 | | | 2,460,000 | 1,970,985 |
| Orange County, NY, Funding Corp. Assisted Living Residence Rev. (Hamlet at Wallkill Assisted Living Project), 6.5%, 1/01/2046 | | | 6,400,000 | 5,152,535 |
| Syracuse, NY, Industrial Development Agency PILOT Rev. (Carousel Center Project), “A”, 5%, 1/01/2028 | | | 1,905,000 | 1,434,840 |
| Syracuse, NY, Industrial Development Agency PILOT Rev. (Carousel Center Project), “A”, 5%, 1/01/2029 | | | 2,955,000 | 2,221,493 |
Portfolio of Investments – continued
| Issuer | | | Shares/Par | Value ($) |
| Municipal Bonds - continued |
| New York - continued |
| Syracuse, NY, Industrial Development Agency PILOT Rev. (Carousel Center Project), “A”, 5%, 1/01/2030 | | $ | 2,135,000 | $1,604,194 |
| Syracuse, NY, Industrial Development Agency PILOT Rev. (Carousel Center Project), “A”, 5%, 1/01/2031 | | | 5,765,000 | 4,332,619 |
| Syracuse, NY, Industrial Development Agency PILOT Rev. (Carousel Center Project), “A”, 5%, 1/01/2032 | | | 7,900,000 | 5,940,902 |
| Syracuse, NY, Industrial Development Agency PILOT Rev. (Carousel Center Project), “A”, 5%, 1/01/2033 | | | 4,625,000 | 3,481,096 |
| Syracuse, NY, Industrial Development Agency PILOT Rev. (Carousel Center Project), “A”, 5%, 1/01/2034 | | | 17,535,000 | 13,211,395 |
| Syracuse, NY, Industrial Development Agency PILOT Rev. (Carousel Center Project), “A”, 5%, 1/01/2035 | | | 13,015,000 | 9,816,500 |
| Syracuse, NY, Industrial Development Agency PILOT Rev. (Carousel Center Project), “A”, 5%, 1/01/2036 | | | 4,435,000 | 3,348,794 |
| Tobacco Settlement Asset Securitization Corp., NY, “A”, 5%, 6/01/2041 | | | 3,020,000 | 3,066,017 |
| Ulster County, NY, Capital Resource Corp. Rev. (Woodland Pond at New Paltz Project), 4%, 9/15/2025 | | | 1,090,000 | 1,047,556 |
| Ulster County, NY, Capital Resource Corp. Rev. (Woodland Pond at New Paltz Project), 5%, 9/15/2037 | | | 7,780,000 | 6,291,847 |
| Westchester County, NY, Local Development Corp. Rev. (Westchester Medical Center Obligated Group Project), AGM, 5.75%, 11/01/2049 | | | 1,075,000 | 1,222,290 |
| Westchester County, NY, Local Development Corp. Rev. (Westchester Medical Center Obligated Group Project), AGM, 5%, 11/01/2051 | | | 1,535,000 | 1,617,819 |
| Westchester County, NY, Local Development Corp. Rev. (Westchester Medical Center Obligated Group Project), AGM, 5.75%, 11/01/2053 | | | 1,630,000 | 1,840,346 |
| | | | | $285,242,110 |
| North Carolina - 1.0% |
| Greater Asheville, NC, Regional Airport Authority System Rev., AGM, 5.25%, 7/01/2048 | | $ | 690,000 | $746,822 |
| North Carolina Medical Care Commission, Health Care Facilities First Mortgage Rev. (Lutheran Services for the Aging), “A”, 4%, 3/01/2030 | | | 285,000 | 271,787 |
| North Carolina Medical Care Commission, Health Care Facilities First Mortgage Rev. (Lutheran Services for the Aging), “A”, 4%, 3/01/2036 | | | 1,435,000 | 1,283,101 |
| North Carolina Medical Care Commission, Health Care Facilities First Mortgage Rev. (Lutheran Services for the Aging), “A”, 4%, 3/01/2041 | | | 505,000 | 418,332 |
Portfolio of Investments – continued
| Issuer | | | Shares/Par | Value ($) |
| Municipal Bonds - continued |
| North Carolina - continued |
| North Carolina Medical Care Commission, Health Care Facilities First Mortgage Rev. (Lutheran Services for the Aging), “A”, 4%, 3/01/2051 | | $ | 8,915,000 | $6,542,383 |
| North Carolina Medical Care Commission, Health Care Facilities First Mortgage Rev. (Lutheran Services for the Aging), “C”, 4%, 3/01/2036 | | | 635,000 | 567,783 |
| North Carolina Medical Care Commission, Health Care Facilities First Mortgage Rev. (Lutheran Services for the Aging), “C”, 4%, 3/01/2042 | | | 280,000 | 228,631 |
| North Carolina Medical Care Commission, Health Care Facilities First Mortgage Rev. (Pennybyrn at Maryfield), 5%, 10/01/2025 | | | 445,000 | 445,019 |
| North Carolina Medical Care Commission, Health Care Facilities First Mortgage Rev. (Pennybyrn at Maryfield), 5%, 10/01/2030 | | | 1,320,000 | 1,309,591 |
| North Carolina Medical Care Commission, Health Care Facilities First Mortgage Rev. (Pennybyrn at Maryfield), 5%, 10/01/2035 | | | 765,000 | 743,225 |
| North Carolina Medical Care Commission, Health Care Facilities First Mortgage Rev. (Presbyterian Homes Obligated Group), “A”, 5%, 10/01/2040 | | | 975,000 | 1,008,984 |
| North Carolina Medical Care Commission, Health Care Facilities First Mortgage Rev. (Presbyterian Homes Obligated Group), “A”, 5%, 10/01/2045 | | | 925,000 | 945,439 |
| North Carolina Medical Care Commission, Health Care Facilities First Mortgage Rev. (Presbyterian Homes Obligated Group), “A”, 5%, 10/01/2050 | | | 595,000 | 604,053 |
| North Carolina Medical Care Commission, Retirement Facilities First Mortgage Refunding Rev. (Plantation Village, Inc.), “A”, 4%, 1/01/2052 | | | 1,760,000 | 1,346,364 |
| North Carolina Medical Care Commission, Retirement Facilities First Mortgage Rev. (Galloway Ridge), “A”, 5%, 1/01/2039 | | | 1,000,000 | 924,575 |
| North Carolina Medical Care Commission, Retirement Facilities First Mortgage Rev. (Pennybyrn at Maryfield Project), “A”, 5%, 10/01/2040 | | | 1,075,000 | 993,558 |
| North Carolina Medical Care Commission, Retirement Facilities First Mortgage Rev. (Pennybyrn at Maryfield Project), “A”, 5%, 10/01/2045 | | | 1,000,000 | 888,424 |
| North Carolina Medical Care Commission, Retirement Facilities First Mortgage Rev. (Salemtowne), “A”, 5%, 10/01/2026 | | | 1,920,000 | 1,912,781 |
| North Carolina Medical Care Commission, Retirement Facilities First Mortgage Rev. (Salemtowne), “A”, 5%, 10/01/2030 | | | 1,500,000 | 1,470,785 |
| North Carolina Medical Care Commission, Retirement Facilities First Mortgage Rev. (Sharon Towers), “A”, 5%, 7/01/2039 | | | 1,540,000 | 1,425,858 |
| North Carolina Medical Care Commission, Retirement Facilities First Mortgage Rev. (Sharon Towers), “A”, 5%, 7/01/2044 | | | 1,030,000 | 909,633 |
Portfolio of Investments – continued
| Issuer | | | Shares/Par | Value ($) |
| Municipal Bonds - continued |
| North Carolina - continued |
| North Carolina Medical Care Commission, Retirement Facilities First Mortgage Rev. (Southminster), 5%, 10/01/2037 | | $ | 2,700,000 | $2,529,362 |
| North Carolina Medical Care Commission, Retirement Facilities First Mortgage Rev. (United Church Homes and Services), “A”, 5%, 9/01/2037 (Prerefunded 9/01/2024) | | | 1,265,000 | 1,278,288 |
| North Carolina Turnpike Authority, Monroe Expressway Toll Rev., “A”, 5%, 7/01/2042 | | | 505,000 | 515,919 |
| North Carolina Turnpike Authority, Monroe Expressway Toll Rev., “A”, 5%, 7/01/2047 | | | 990,000 | 1,006,433 |
| North Carolina Turnpike Authority, Monroe Expressway Toll Rev., “A”, 5%, 7/01/2051 | | | 2,015,000 | 2,045,313 |
| North Carolina Turnpike Authority, Monroe Expressway Toll Rev., “A”, 5%, 7/01/2054 | | | 1,665,000 | 1,687,716 |
| North Carolina Turnpike Authority, Triangle Expressway System Senior Lien Rev., “A”, AGM, 5%, 1/01/2058 | | | 7,000,000 | 7,504,985 |
| | | | | $41,555,144 |
| North Dakota - 0.5% |
| Grand Forks, ND, Healthcare System Rev. (Altru Health System), “A”, AGM, 5%, 12/01/2048 | | $ | 465,000 | $495,367 |
| Grand Forks, ND, Healthcare System Rev. (Altru Health System), “A”, AGM, 5%, 12/01/2053 | | | 1,145,000 | 1,209,809 |
| Grand Forks, ND, Healthcare System Rev. (Altru Health System), “A”, AGM, 5.42%, 12/01/2053 | | | 2,770,000 | 2,910,329 |
| North Dakota Housing Finance Agency Rev. (Home Mortgage Finance Program), “B”, 4%, 1/01/2036 | | | 60,000 | 59,962 |
| North Dakota Housing Finance Agency Rev. (Home Mortgage Finance Program), “D”, 4.25%, 1/01/2049 (u) | | | 3,380,000 | 3,381,487 |
| Ward County, ND, Health Care Facilities Rev. (Trinity Obligated Group), “C”, 5%, 6/01/2034 | | | 5,445,000 | 5,258,039 |
| Ward County, ND, Health Care Facilities Rev. (Trinity Obligated Group), “C”, 5%, 6/01/2038 | | | 3,050,000 | 2,813,699 |
| Ward County, ND, Health Care Facilities Rev. (Trinity Obligated Group), “C”, 5%, 6/01/2048 | | | 710,000 | 597,198 |
| Ward County, ND, Health Care Facilities Rev. (Trinity Obligated Group), “C”, 5%, 6/01/2053 | | | 5,310,000 | 4,308,636 |
| | | | | $21,034,526 |
Portfolio of Investments – continued
| Issuer | | | Shares/Par | Value ($) |
| Municipal Bonds - continued |
| Ohio - 4.1% |
| Buckeye, OH, Tobacco Settlement Financing Authority Senior Asset-Backed Refunding, 2020A-2, “1”, 4%, 6/01/2048 | | $ | 7,300,000 | $6,742,881 |
| Buckeye, OH, Tobacco Settlement Financing Authority Senior Asset-Backed Refunding, 2020B-2, “2”, 5%, 6/01/2055 | | | 76,685,000 | 72,399,996 |
| Butler County, OH, Hospital Facilities Rev. (UC Health), 4%, 11/15/2035 | | | 1,500,000 | 1,450,688 |
| Butler County, OH, Hospital Facilities Rev. (UC Health), 4%, 11/15/2037 | | | 1,250,000 | 1,175,119 |
| Centerville, OH, Health Care Improvement and Refunding Rev. (Graceworks Lutheran Services), 5.25%, 11/01/2037 | | | 920,000 | 899,669 |
| Centerville, OH, Health Care Improvement and Refunding Rev. (Graceworks Lutheran Services), 5.25%, 11/01/2047 | | | 2,480,000 | 2,234,335 |
| Centerville, OH, Health Care Improvement and Refunding Rev. (Graceworks Lutheran Services), 5.25%, 11/01/2050 | | | 915,000 | 809,681 |
| Cuyahoga County, OH, Hospital Rev. (Metrohealth System), 5%, 2/15/2042 | | | 3,915,000 | 3,931,407 |
| Cuyahoga County, OH, Hospital Rev. (Metrohealth System), 4.75%, 2/15/2047 | | | 5,240,000 | 5,126,860 |
| Cuyahoga County, OH, Hospital Rev. (Metrohealth System), 5.25%, 2/15/2047 | | | 3,160,000 | 3,187,472 |
| Cuyahoga County, OH, Hospital Rev. (Metrohealth System), 5%, 2/15/2057 | | | 3,355,000 | 3,330,030 |
| Cuyahoga County, OH, Hospital Rev. (Metrohealth System), 5.5%, 2/15/2057 | | | 14,395,000 | 14,568,293 |
| Cuyahoga County, OH, Port Authority Tax Increment Financing Rev. (Flats East Bank Project), “A”, 4%, 12/01/2055 (n) | | | 910,000 | 751,160 |
| Cuyahoga County, OH, Port Authority Tax Increment Financing Rev. (Flats East Bank Project), “B”, 4.5%, 12/01/2055 (n) | | | 520,000 | 444,556 |
| Darke County, OH, Hospital Facilities Rev. (Wayne Healthcare Project), “A”, 4%, 9/01/2040 | | | 860,000 | 761,509 |
| Darke County, OH, Hospital Facilities Rev. (Wayne Healthcare Project), “A”, 4%, 9/01/2045 | | | 1,545,000 | 1,282,729 |
| Darke County, OH, Hospital Facilities Rev. (Wayne Healthcare Project), “A”, 5%, 9/01/2049 | | | 1,725,000 | 1,601,668 |
| Franklin County, OH, Health Care Facilities Improvement Rev. (Friendship Village of Dublin, Inc.), 5%, 11/15/2034 | | | 1,380,000 | 1,383,484 |
| Franklin County, OH, Health Care Facilities Improvement Rev. (Friendship Village of Dublin, Inc.), 5%, 11/15/2044 | | | 2,055,000 | 2,052,209 |
| Hamilton County, OH, Healthcare Rev. (Life Enriching Communities Project), “A”, 5.75%, 1/01/2053 | | | 2,105,000 | 2,159,465 |
| Hickory Chase, OH, Community Authority Infrastructure Improvement Rev. (Hickory Chase Project), “A”, 5%, 12/01/2040 (n) | | | 1,820,000 | 1,690,474 |
Portfolio of Investments – continued
| Issuer | | | Shares/Par | Value ($) |
| Municipal Bonds - continued |
| Ohio - continued |
| Middleburg Heights, OH, Hospital Facilities Improvement Rev. (Southwest General Health Center Project), “A”, 4%, 8/01/2041 | | $ | 3,455,000 | $3,272,872 |
| Middleburg Heights, OH, Hospital Facilities Improvement Rev. (Southwest General Health Center Project), “A”, 4%, 8/01/2047 | | | 2,075,000 | 1,857,488 |
| Montgomery County, OH, Hospital Facilities Rev. (Premier Health Partners Obligated Group), “A”, 4%, 11/15/2038 | | | 2,210,000 | 2,125,860 |
| Montgomery County, OH, Hospital Facilities Rev. (Premier Health Partners Obligated Group), “A”, 4%, 11/15/2045 | | | 1,100,000 | 992,401 |
| Northeast Ohio Medical University, General Receipts and Refunding Bonds, “A”, 4%, 12/01/2035 | | | 160,000 | 160,921 |
| Northeast Ohio Medical University, General Receipts and Refunding Bonds, “A”, 4%, 12/01/2045 | | | 120,000 | 109,471 |
| Ohio Air Quality Development Authority, Facilities Rev. (Pratt Paper LLC Project), 3.75%, 1/15/2028 (n) | | | 3,400,000 | 3,372,831 |
| Ohio Air Quality Development Authority, Facilities Rev. (Pratt Paper LLC Project), 4.25%, 1/15/2038 (n) | | | 2,325,000 | 2,262,857 |
| Ohio Air Quality Development Authority, Facilities Rev. (Pratt Paper LLC Project), 4.5%, 1/15/2048 (n) | | | 3,115,000 | 2,957,235 |
| Ohio Educational Facility Commission Rev. (Cleveland Institute of Art Project), 5%, 12/01/2038 | | | 2,045,000 | 1,918,403 |
| Ohio Educational Facility Commission Rev. (Cleveland Institute of Art Project), 5.25%, 12/01/2043 | | | 1,390,000 | 1,294,298 |
| Ohio Educational Facility Commission Rev. (Cleveland Institute of Art Project), 5.25%, 12/01/2048 | | | 1,600,000 | 1,455,523 |
| Ohio Educational Facility Commission Rev. (Cleveland Institute of Art Project), 5.5%, 12/01/2053 | | | 1,000,000 | 925,656 |
| Ohio Higher Educational Facility Commission Rev. (Cleveland Institute of Music 2022 Project), 5.125%, 12/01/2042 | | | 1,455,000 | 1,460,621 |
| Ohio Higher Educational Facility Commission Rev. (Cleveland Institute of Music 2022 Project), 5.375%, 12/01/2052 | | | 2,115,000 | 2,090,409 |
| Ohio Housing Finance Agency Residential Mortgage Rev. (Mortgage-Backed Securities Program), “A”, 4.5%, 9/01/2048 (u) | | | 5,135,000 | 5,165,712 |
| Ohio Housing Finance Agency Residential Mortgage Rev. (Mortgage-Backed Securities Program), “A”, 4.8%, 9/01/2048 | | | 8,555,000 | 8,722,669 |
| Ohio Housing Finance Agency Residential Mortgage Rev. (Mortgage-Backed Securities Program), “A”, 4.9%, 9/01/2053 | | | 4,095,000 | 4,204,939 |
| Ohio State Hospital Rev. (Premier Health Partners Obligated Group), 5%, 11/15/2035 | | | 825,000 | 873,102 |
| Ohio State Hospital Rev. (Premier Health Partners Obligated Group), 4%, 11/15/2037 | | | 675,000 | 651,293 |
| Ohio State Hospital Rev. (Premier Health Partners Obligated Group), 4%, 11/15/2038 | | | 660,000 | 626,571 |
Portfolio of Investments – continued
| Issuer | | | Shares/Par | Value ($) |
| Municipal Bonds - continued |
| Ohio - continued |
| Ohio State Hospital Rev. (Premier Health Partners Obligated Group), 4%, 11/15/2040 | | $ | 725,000 | $671,590 |
| Riversouth, OH, Authority Rev. (Lazarus Building), “A”, 5.75%, 12/01/2027 | | | 1,955,000 | 1,955,092 |
| | | | | $177,111,499 |
| Oklahoma - 1.2% |
| Catoosa, OK, Industrial Authority Sales Tax Rev., 4%, 10/01/2028 | | $ | 55,000 | $53,663 |
| Norman, OK, Regional Hospital Authority Rev., 4%, 9/01/2045 | | | 2,790,000 | 2,383,484 |
| Norman, OK, Regional Hospital Authority Rev., 5%, 9/01/2045 | | | 3,740,000 | 3,786,431 |
| Oklahoma Development Finance Authority, First Mortgage Rev. (Sommerset Project), 5%, 7/01/2042 | | | 1,390,000 | 1,174,527 |
| Oklahoma Development Finance Authority, Health System Rev. (OU Medicine Project), “A”, 5.5%, 8/15/2041 | | | 3,295,000 | 3,300,634 |
| Oklahoma Development Finance Authority, Health System Rev. (OU Medicine Project), “A”, 5.5%, 8/15/2044 | | | 3,340,000 | 3,309,403 |
| Oklahoma Development Finance Authority, Health System Rev. (OU Medicine Project), “B”, 5%, 8/15/2038 | | | 4,935,000 | 4,854,744 |
| Oklahoma Development Finance Authority, Health System Rev. (OU Medicine Project), “B”, 5.25%, 8/15/2043 | | | 4,280,000 | 4,282,710 |
| Oklahoma Development Finance Authority, Health System Rev. (OU Medicine Project), “B”, 5.25%, 8/15/2048 | | | 4,930,000 | 4,888,080 |
| Oklahoma Development Finance Authority, Health System Rev. (OU Medicine Project), “B”, 5.5%, 8/15/2057 | | | 14,300,000 | 14,392,816 |
| Oklahoma Development Finance Authority, Health System Rev., Taxable (OU Medicine Project), “C”, 5.45%, 8/15/2028 | | | 6,254,000 | 5,640,038 |
| Oklahoma Housing Finance Agency, Single Family Mortgage Rev. (Homeownership Loan Project), “A”, 4.75%, 9/01/2048 | | | 2,085,000 | 2,109,004 |
| | | | | $50,175,534 |
| Oregon - 1.1% |
| Clackamas County, OR, Hospital Facility Authority Senior Living Rev. (Rose Villa Project), “A”, 5.125%, 11/15/2040 (n) | | $ | 1,000,000 | $963,400 |
| Clackamas County, OR, Hospital Facility Authority Senior Living Rev. (Rose Villa Project), “A”, 5.25%, 11/15/2050 (z) | | | 2,000,000 | 1,835,939 |
| Clackamas County, OR, Hospital Facility Authority Senior Living Rev. (Rose Villa Project), “A”, 5.375%, 11/15/2055 (z) | | | 3,000,000 | 2,762,754 |
| Multnomah County, OR, Hospital Facilities Authority Refunding Rev. (Terwilliger Plaza - Parkview Project), “A”, 4%, 12/01/2041 | | | 2,860,000 | 2,284,295 |
| Multnomah County, OR, Hospital Facilities Authority Refunding Rev. (Terwilliger Plaza - Parkview Project), “A”, 4%, 12/01/2051 | | | 7,725,000 | 5,460,767 |
| Multnomah County, OR, Hospital Facilities Authority Refunding Rev. (Terwilliger Plaza - Parkview Project), “A”, 4%, 12/01/2056 | | | 10,440,000 | 7,125,221 |
Portfolio of Investments – continued
| Issuer | | | Shares/Par | Value ($) |
| Municipal Bonds - continued |
| Oregon - continued |
| Multnomah County, OR, Hospital Facilities Authority Refunding Rev. (Terwilliger Plaza - Parkview Project), “B-1”, 1.2%, 6/01/2028 | | $ | 860,000 | $752,235 |
| Multnomah County, OR, Hospital Facilities Authority Refunding Rev. (Terwilliger Plaza - Parkview Project), “B-2”, 0.95%, 6/01/2027 | | | 690,000 | 620,766 |
| Oregon Facilities Authority Lease Rent Rev. (Legacy Health System - Centurion Foundation), “A”, 4.9%, 9/15/2035 | | | 12,160,000 | 13,197,496 |
| Yamhill County, OR, Hospital Authority Rev. (Friendsview Retirement), “A”, 5%, 11/15/2036 | | | 795,000 | 725,313 |
| Yamhill County, OR, Hospital Authority Rev. (Friendsview Retirement), “A”, 5%, 11/15/2046 | | | 2,625,000 | 2,120,118 |
| Yamhill County, OR, Hospital Authority Rev. (Friendsview Retirement), “A”, 5%, 11/15/2051 | | | 725,000 | 567,429 |
| Yamhill County, OR, Hospital Authority Rev. (Friendsview Retirement), “A”, 5%, 11/15/2051 | | | 3,115,000 | 2,437,987 |
| Yamhill County, OR, Hospital Authority Rev. (Friendsview Retirement), “A”, 5%, 11/15/2056 | | | 6,520,000 | 5,013,768 |
| Yamhill County, OR, Hospital Authority Rev. (Friendsview Retirement), “B-1”, 2.5%, 11/15/2028 | | | 965,000 | 867,598 |
| Yamhill County, OR, Hospital Authority Rev. (Friendsview Retirement), “B-2”, 2.125%, 11/15/2027 | | | 60,000 | 57,633 |
| | | | | $46,792,719 |
| Pennsylvania - 5.7% |
| Allentown, PA, Commercial and Industrial Development Authority Education Facility Lease Rev. (Lincoln Leadership Academy Charter School Project), 6%, 6/15/2053 (n) | | $ | 920,000 | $958,368 |
| Allentown, PA, Neighborhood Improvement Zone Development Authority Tax Rev. (City Center Project), 5%, 5/01/2028 (n) | | | 900,000 | 931,909 |
| Allentown, PA, Neighborhood Improvement Zone Development Authority Tax Rev. (City Center Project), 5%, 5/01/2033 (n) | | | 765,000 | 786,253 |
| Allentown, PA, Neighborhood Improvement Zone Development Authority Tax Rev. (City Center Project), 5%, 5/01/2042 (n) | | | 2,175,000 | 2,180,983 |
| Allentown, PA, Neighborhood Improvement Zone Development Authority Tax Rev. (City Center Project), 5.25%, 5/01/2042 (n) | | | 6,405,000 | 6,474,765 |
| Allentown, PA, Neighborhood Improvement Zone Development Authority Tax Rev. (City Center Project), 5.375%, 5/01/2042 (n) | | | 6,700,000 | 6,614,764 |
| Allentown, PA, Neighborhood Improvement Zone Development Authority Tax Rev. (City Center Refunding Project), 5%, 5/01/2032 (n) | | | 2,505,000 | 2,560,459 |
Portfolio of Investments – continued
| Issuer | | | Shares/Par | Value ($) |
| Municipal Bonds - continued |
| Pennsylvania - continued |
| Allentown, PA, Neighborhood Improvement Zone Development Authority Tax Rev. (City Center Refunding Project), 5%, 5/01/2042 (n) | | $ | 1,990,000 | $1,994,844 |
| Berks County, PA, Industrial Development Authority Health System Rev. (Tower Health Project), 4%, 11/01/2038 | | | 990,000 | 511,484 |
| Berks County, PA, Industrial Development Authority Health System Rev. (Tower Health Project), 4%, 11/01/2047 | | | 1,840,000 | 951,072 |
| Berks County, PA, Industrial Development Authority Health System Rev. (Tower Health Project), 5%, 11/01/2047 | | | 12,200,000 | 6,302,591 |
| Berks County, PA, Industrial Development Authority Health System Rev. (Tower Health Project), 5%, 11/01/2050 | | | 22,365,000 | 11,519,440 |
| Berks County, PA, Municipal Authority Rev. (Tower Health Project), “B-2”, 5%, 2/01/2040 (Put Date 2/01/2027) | | | 8,255,000 | 5,096,649 |
| Berks County, PA, Municipal Authority Rev. (Tower Health Project), “B-3”, 5%, 2/01/2040 (Put Date 2/01/2030) | | | 2,690,000 | 1,429,680 |
| Blythe, PA, Solid Waste Authority Rev., 7.75%, 12/01/2037 (Prerefunded 12/01/2027) | | | 4,970,000 | 5,652,638 |
| Chester County, PA, Health & Education Facilities Authority Rev. (Simpson Senior Services Project), 4%, 12/01/2035 | | | 6,355,000 | 4,609,801 |
| Chester County, PA, Health & Education Facilities Authority Rev. (Simpson Senior Services Project), 4%, 12/01/2040 | | | 5,915,000 | 3,687,677 |
| Chester County, PA, Health & Education Facilities Authority Rev. (Simpson Senior Services Project), 4%, 12/01/2044 | | | 4,455,000 | 2,532,677 |
| Chester County, PA, Health & Education Facilities Authority Rev. (Simpson Senior Services Project), 4%, 12/01/2051 | | | 3,445,000 | 1,791,917 |
| Chester County, PA, Health & Education Facilities Authority Rev. (Simpson Senior Services Project), 5%, 12/01/2051 | | | 4,550,000 | 2,847,389 |
| Chester County, PA, Health & Education Facilities Authority Rev. (Simpson Senior Services Project), “A”, 5%, 12/01/2030 | | | 815,000 | 717,491 |
| Chester County, PA, Health & Education Facilities Authority Rev. (Simpson Senior Services Project), “A”, 5%, 12/01/2035 | | | 1,000,000 | 806,066 |
| Chester County, PA, Health & Education Facilities Authority Rev. (Simpson Senior Services Project), “A”, 5.25%, 12/01/2045 | | | 1,730,000 | 1,171,964 |
| Chester County, PA, Industrial Development Authority Educational Facilities Rev. (Avon Grove Charter School), “A”, 4.75%, 12/15/2037 | | | 885,000 | 888,360 |
| Chester County, PA, Industrial Development Authority Educational Facilities Rev. (Avon Grove Charter School), “A”, 5%, 12/15/2047 | | | 2,040,000 | 2,012,627 |
| Chester County, PA, Industrial Development Authority Educational Facilities Rev. (Avon Grove Charter School), “A”, 5%, 12/15/2051 | | | 610,000 | 592,530 |
Portfolio of Investments – continued
| Issuer | | | Shares/Par | Value ($) |
| Municipal Bonds - continued |
| Pennsylvania - continued |
| Cumberland County, PA, Municipal Authority Rev. (Diakon Lutheran Social Ministries), 4%, 1/01/2033 (Prerefunded 1/01/2025) | | $ | 335,000 | $337,429 |
| Cumberland County, PA, Municipal Authority Rev. (Diakon Lutheran Social Ministries), 4%, 1/01/2033 (Prerefunded 1/01/2025) | | | 1,185,000 | 1,193,592 |
| Cumberland County, PA, Municipal Authority Rev. (Diakon Lutheran Social Ministries), 4%, 1/01/2033 | | | 865,000 | 832,270 |
| Cumberland County, PA, Municipal Authority Rev. (Diakon Lutheran Social Ministries), 5%, 1/01/2038 (Prerefunded 1/01/2025) | | | 40,000 | 40,647 |
| Cumberland County, PA, Municipal Authority Rev. (Diakon Lutheran Social Ministries), 5%, 1/01/2038 (Prerefunded 1/01/2025) | | | 155,000 | 157,508 |
| Cumberland County, PA, Municipal Authority Rev. (Diakon Lutheran Social Ministries), 5%, 1/01/2038 | | | 190,000 | 190,631 |
| Cumberland County, PA, Municipal Authority Rev. (Penn State Health), 4%, 11/01/2049 | | | 4,310,000 | 4,022,994 |
| Dallas, PA, Municipal Authority, University Rev. (Misericordia University Project), 5%, 5/01/2048 | | | 715,000 | 644,211 |
| Doylestown, PA, Hospital Authority Rev., “A”, 4%, 7/01/2045 (Prerefunded 7/01/2029) | | | 75,000 | 79,681 |
| Doylestown, PA, Hospital Authority Rev., “A”, 4%, 7/01/2045 | | | 690,000 | 558,823 |
| Doylestown, PA, Hospital Authority Rev., “A”, 5%, 7/01/2049 (Prerefunded 7/01/2029) | | | 80,000 | 88,991 |
| Doylestown, PA, Hospital Authority Rev., “A”, 5%, 7/01/2049 | | | 690,000 | 641,257 |
| Franklin County, PA, Industrial Development Authority Rev. (Menno-Haven, Inc. Project), 5%, 12/01/2029 | | | 155,000 | 149,372 |
| Franklin County, PA, Industrial Development Authority Rev. (Menno-Haven, Inc. Project), 5%, 12/01/2032 | | | 1,250,000 | 1,184,032 |
| Franklin County, PA, Industrial Development Authority Rev. (Menno-Haven, Inc. Project), 5%, 12/01/2038 | | | 2,795,000 | 2,505,044 |
| Franklin County, PA, Industrial Development Authority Rev. (Menno-Haven, Inc. Project), 5%, 12/01/2039 | | | 385,000 | 341,284 |
| Franklin County, PA, Industrial Development Authority Rev. (Menno-Haven, Inc. Project), 5%, 12/01/2043 | | | 3,685,000 | 3,135,418 |
| Franklin County, PA, Industrial Development Authority Rev. (Menno-Haven, Inc. Project), 5%, 12/01/2048 | | | 3,730,000 | 3,052,613 |
| Franklin County, PA, Industrial Development Authority Rev. (Menno-Haven, Inc. Project), 5%, 12/01/2049 | | | 510,000 | 414,813 |
| Franklin County, PA, Industrial Development Authority Rev. (Menno-Haven, Inc. Project), 5%, 12/01/2053 | | | 5,560,000 | 4,411,919 |
Portfolio of Investments – continued
| Issuer | | | Shares/Par | Value ($) |
| Municipal Bonds - continued |
| Pennsylvania - continued |
| Fulton County, PA, Industrial Development Authority Hospital Rev. (Medical Center Project), 5%, 7/01/2040 | | $ | 7,745,000 | $6,407,975 |
| Fulton County, PA, Industrial Development Authority Hospital Rev. (Medical Center Project), “B”, 5%, 7/01/2046 | | | 3,450,000 | 2,744,818 |
| Fulton County, PA, Industrial Development Authority Hospital Rev. (Medical Center Project), “B”, 5%, 7/01/2051 | | | 5,280,000 | 4,086,624 |
| Lancaster County, PA, Hospital Authority Rev. (Saint Anne's Retirement Community, Inc. Project), 5%, 3/01/2040 | | | 500,000 | 433,484 |
| Lancaster County, PA, Hospital Authority Rev. (Saint Anne's Retirement Community, Inc. Project), 5%, 3/01/2045 | | | 750,000 | 620,326 |
| Lancaster County, PA, Hospital Authority Rev. (Saint Anne's Retirement Community, Inc. Project), 5%, 3/01/2050 | | | 1,500,000 | 1,203,143 |
| Maxatawny Township, PA, Municipal Authority Rev. (Diakon Lutheran Social Ministries), “A”, 5%, 1/01/2039 | | | 265,000 | 265,847 |
| Maxatawny Township, PA, Municipal Authority Rev. (Diakon Lutheran Social Ministries), “A”, 5%, 1/01/2040 | | | 930,000 | 925,921 |
| Maxatawny Township, PA, Municipal Authority Rev. (Diakon Lutheran Social Ministries), “A”, 5%, 1/01/2041 | | | 685,000 | 678,034 |
| Maxatawny Township, PA, Municipal Authority Rev. (Diakon Lutheran Social Ministries), “A”, 5%, 1/01/2042 | | | 710,000 | 697,605 |
| Maxatawny Township, PA, Municipal Authority Rev. (Diakon Lutheran Social Ministries), “A”, 4.5%, 1/01/2045 | | | 2,440,000 | 2,192,082 |
| Montgomery County, PA, Higher Education & Health Authority Rev. (Thomas Jefferson University), 4%, 9/01/2049 | | | 2,120,000 | 2,005,662 |
| Montgomery County, PA, Higher Education & Health Authority Rev. (Thomas Jefferson University), “A”, 4%, 9/01/2049 | | | 1,920,000 | 1,816,449 |
| Montgomery County, PA, Higher Education & Health Authority Rev. (Thomas Jefferson University), “B”, AGM, 3.125%, 5/01/2053 | | | 2,975,000 | 2,260,480 |
| Montgomery County, PA, Higher Education & Health Authority Rev., Taxable (Thomas Jefferson University), 4%, 9/01/2051 | | | 4,795,000 | 4,492,591 |
| Montgomery County, PA, Industrial Development Authority Retirement Communities Rev. (Acts Retirement - Life Communities, Inc. Obligated Group), “C”, 5%, 11/15/2045 | | | 1,525,000 | 1,569,063 |
| Montgomery County, PA, Industrial Development Authority Rev. (Whitemarsh Continuing Care Retirement Community Project), 5.375%, 1/01/2050 | | | 14,730,000 | 12,781,087 |
| Northeastern, PA, Hospital & Education Authority College Rev. (King's College Project), 5%, 5/01/2044 | | | 1,810,000 | 1,757,083 |
| Northeastern, PA, Hospital & Education Authority College Rev. (King's College Project), 5%, 5/01/2049 | | | 1,095,000 | 1,031,335 |
| Pennsylvania Economic Development Financing Authority Rev. (Presbyterian Senior Living Project), 4%, 7/01/2030 | | | 1,600,000 | 1,602,896 |
Portfolio of Investments – continued
| Issuer | | | Shares/Par | Value ($) |
| Municipal Bonds - continued |
| Pennsylvania - continued |
| Pennsylvania Economic Development Financing Authority Rev. (Presbyterian Senior Living Project), 4%, 7/01/2033 | | $ | 1,750,000 | $1,749,914 |
| Pennsylvania Economic Development Financing Authority Rev. (Presbyterian Senior Living Project), 4%, 7/01/2041 | | | 1,050,000 | 963,221 |
| Pennsylvania Economic Development Financing Authority Rev. (Presbyterian Senior Living Project), 4%, 7/01/2046 | | | 2,000,000 | 1,754,231 |
| Pennsylvania Economic Development Financing Authority Rev. (Presbyterian Senior Living Project), “B-1”, 5.25%, 7/01/2049 | | | 1,045,000 | 1,072,099 |
| Pennsylvania Economic Development Financing Authority Rev. (Presbyterian Senior Living Project), “B-2”, 5%, 7/01/2042 | | | 1,555,000 | 1,591,390 |
| Pennsylvania Economic Development Financing Authority Rev. (Presbyterian Senior Living Project), “B-2”, 5.25%, 7/01/2046 | | | 825,000 | 852,723 |
| Pennsylvania Economic Development Financing Authority, Guaranteed Parking Rev. (Capitol Region Parking System), Capital Appreciation, “B-2”, 0%, 1/01/2035 | | | 1,460,000 | 957,697 |
| Pennsylvania Economic Development Financing Authority, Guaranteed Parking Rev. (Capitol Region Parking System), Capital Appreciation, “B-2”, 0%, 1/01/2036 | | | 1,540,000 | 959,683 |
| Pennsylvania Economic Development Financing Authority, Guaranteed Parking Rev. (Capitol Region Parking System), Capital Appreciation, “B-2”, 0%, 1/01/2037 | | | 1,490,000 | 878,976 |
| Pennsylvania Economic Development Financing Authority, Guaranteed Parking Rev. (Capitol Region Parking System), Capital Appreciation, “B-2”, 0%, 1/01/2038 | | | 1,535,000 | 845,173 |
| Pennsylvania Economic Development Financing Authority, Guaranteed Parking Rev. (Capitol Region Parking System), Capital Appreciation, “B-2”, 0%, 1/01/2039 | | | 1,675,000 | 867,758 |
| Pennsylvania Economic Development Financing Authority, Guaranteed Parking Rev. (Capitol Region Parking System), Capital Appreciation, “B-2”, 0%, 1/01/2040 | | | 1,615,000 | 792,248 |
| Pennsylvania Economic Development Financing Authority, Guaranteed Parking Rev. (Capitol Region Parking System), Capital Appreciation, “B-2”, 0%, 1/01/2041 | | | 1,555,000 | 722,536 |
| Pennsylvania Economic Development Financing Authority, Guaranteed Parking Rev. (Capitol Region Parking System), Capital Appreciation, “B-2”, 0%, 1/01/2042 | | | 1,490,000 | 654,071 |
| Pennsylvania Economic Development Financing Authority, Guaranteed Parking Rev. (Capitol Region Parking System), Capital Appreciation, “B-2”, 0%, 1/01/2043 | | | 1,425,000 | 592,557 |
| Pennsylvania Economic Development Financing Authority, Guaranteed Parking Rev. (Capitol Region Parking System), Capital Appreciation, “B-3”, 0%, 1/01/2049 | | | 7,090,000 | 1,349,715 |
Portfolio of Investments – continued
| Issuer | | | Shares/Par | Value ($) |
| Municipal Bonds - continued |
| Pennsylvania - continued |
| Pennsylvania Economic Development Financing Authority, Private Activity Rev. (PennDOT Major Bridges Package One Project), 5.25%, 6/30/2053 | | $ | 5,000,000 | $5,302,823 |
| Pennsylvania Economic Development Financing Authority, Private Activity Rev. (PennDOT Major Bridges Package One Project), AGM, 5%, 12/31/2057 | | | 14,325,000 | 15,157,810 |
| Pennsylvania Economic Development Financing Authority, UPMC Rev., “A”, 4%, 5/15/2053 | | | 1,985,000 | 1,878,957 |
| Pennsylvania Higher Educational Assistance Agency, Education Loan Rev., “A”, 2.625%, 6/01/2042 | | | 1,290,000 | 1,138,346 |
| Pennsylvania Higher Educational Assistance Agency, Education Loan Rev., “A”, 4.5%, 6/01/2043 | | | 960,000 | 967,861 |
| Pennsylvania Higher Educational Assistance Agency, Education Loan Rev., “B”, 3.125%, 6/01/2048 | | | 1,800,000 | 1,384,498 |
| Pennsylvania Higher Educational Assistance Agency, Education Loan Rev., “B”, 5%, 6/01/2050 | | | 775,000 | 776,611 |
| Pennsylvania Housing Finance Agency, Single Family Mortgage Rev., “128A”, 4.75%, 4/01/2033 (u) | | | 3,125,000 | 3,131,186 |
| Philadelphia, PA, Authority for Industrial Development Charter School Rev. (Green Woods Charter School Project), “A”, 5.125%, 6/15/2042 | | | 415,000 | 396,198 |
| Philadelphia, PA, Authority for Industrial Development Charter School Rev. (Green Woods Charter School Project), “A”, 5.25%, 6/15/2052 | | | 470,000 | 442,910 |
| Philadelphia, PA, Authority for Industrial Development Charter School Rev. (Green Woods Charter School Project), “A”, 5.375%, 6/15/2057 | | | 225,000 | 212,205 |
| Philadelphia, PA, Authority for Industrial Development Charter School Rev. (Philadelphia Performing Arts: A String Theory Charter School Project), 5%, 6/15/2050 (n) | | | 1,700,000 | 1,641,937 |
| Philadelphia, PA, Authority for Industrial Development Charter School Rev. (Tacony Academy School Project), 5%, 6/15/2033 (n) | | | 2,000,000 | 2,035,832 |
| Philadelphia, PA, Authority for Industrial Development Charter School Rev. (Tacony Academy School Project), 5.375%, 6/15/2038 (n) | | | 1,500,000 | 1,512,532 |
| Philadelphia, PA, Authority for Industrial Development Charter School Rev. (Tacony Academy School Project), 5.5%, 6/15/2043 (n) | | | 550,000 | 551,958 |
| Philadelphia, PA, Authority for Industrial Development Rev. (KIPP Charter School Project), “B”, 4%, 4/01/2026 | | | 665,000 | 650,021 |
| Philadelphia, PA, Authority for Industrial Development Rev. (KIPP Charter School Project), “B”, 5%, 4/01/2036 | | | 230,000 | 225,672 |
Portfolio of Investments – continued
| Issuer | | | Shares/Par | Value ($) |
| Municipal Bonds - continued |
| Pennsylvania - continued |
| Philadelphia, PA, Authority for Industrial Development Rev. (KIPP Charter School Project), “B”, 5%, 4/01/2046 | | $ | 3,500,000 | $3,169,097 |
| Philadelphia, PA, Authority for Industrial Development Rev. (MaST Charter School Project), “A”, 5.625%, 8/01/2036 | | | 885,000 | 904,077 |
| Philadelphia, PA, Authority for Industrial Development Rev. (MaST Charter School Project), “A”, 5.75%, 8/01/2046 | | | 2,515,000 | 2,550,523 |
| Philadelphia, PA, Authority for Industrial Development Rev. (MaST Charter School Project), “A”, 5.375%, 8/01/2051 | | | 1,910,000 | 1,927,276 |
| Philadelphia, PA, Authority for Industrial Development Rev. (MaST Charter School Project), “B”, 6%, 8/01/2051 | | | 3,000,000 | 3,052,719 |
| Philadelphia, PA, Authority for Industrial Development Rev. (MaST Community Charter School II Project), 5%, 8/01/2030 | | | 455,000 | 469,310 |
| Philadelphia, PA, Authority for Industrial Development Rev. (MaST Community Charter School II Project), 5%, 8/01/2040 | | | 600,000 | 607,769 |
| Philadelphia, PA, Authority for Industrial Development Rev. (MaST Community Charter School II Project), 5%, 8/01/2050 | | | 575,000 | 563,984 |
| Philadelphia, PA, Authority for Industrial Development, Multi-Family Housing Rev. (University Square Apartment Project-Section 8), “I”, 5%, 12/01/2037 | | | 2,560,000 | 2,636,560 |
| Philadelphia, PA, Authority for Industrial Development, Multi-Family Housing Rev. (University Square Apartment Project-Section 8), “III”, 5.25%, 12/01/2047 (n) | | | 3,245,000 | 3,003,974 |
| Philadelphia, PA, Authority for Industrial Development, Multi-Family Housing Rev. (University Square Apartment Project-Section 8), “III”, 5.5%, 12/01/2058 (n) | | | 4,690,000 | 4,348,598 |
| Philadelphia, PA, Authority for Industrial Development, Senior Living Facilities Rev. (Wesley Enhanced Living Obligated Group), “A”, 5%, 7/01/2037 | | | 2,290,000 | 2,015,943 |
| Philadelphia, PA, Authority for Industrial Development, Senior Living Facilities Rev. (Wesley Enhanced Living Obligated Group), “A”, 5%, 7/01/2042 | | | 3,665,000 | 3,082,306 |
| Philadelphia, PA, Authority for Industrial Development, Senior Living Facilities Rev. (Wesley Enhanced Living Obligated Group), “A”, 5%, 7/01/2049 | | | 3,790,000 | 3,057,144 |
| Philadelphia, PA, School District General Obligation, “A”, 5%, 9/01/2038 | | | 510,000 | 536,813 |
| Philadelphia, PA, School District General Obligation, “F”, 5%, 9/01/2038 (Prerefunded 9/01/2026) | | | 5,000 | 5,284 |
| Philadelphia, PA, School District General Obligation, “F”, 5%, 9/01/2038 | | | 240,000 | 245,760 |
| Scranton-Lackawanna, PA, Health and Welfare Authority, University Rev. (Marywood University Project), 5%, 6/01/2046 | | | 10,015,000 | 8,779,689 |
Portfolio of Investments – continued
| Issuer | | | Shares/Par | Value ($) |
| Municipal Bonds - continued |
| Pennsylvania - continued |
| Washington County, PA, Redevelopment Authority Refunding Rev. (Victory Centre Tax Increment Financing Project), 5%, 7/01/2035 | | $ | 355,000 | $357,080 |
| West Shore, PA, Area Authority Rev. (Messiah Village Project), “A”, 5%, 7/01/2030 | | | 395,000 | 395,036 |
| West Shore, PA, Area Authority Rev. (Messiah Village Project), “A”, 5%, 7/01/2035 | | | 390,000 | 383,990 |
| | | | | $245,283,713 |
| Puerto Rico - 5.3% |
| Commonwealth of Puerto Rico, General Obligation Restructured Bonds, Capital Appreciation, Series 2022A, 0%, 7/01/2024 | | $ | 431,512 | $424,087 |
| Commonwealth of Puerto Rico, General Obligation Restructured Bonds, Capital Appreciation, Series 2022A, 0%, 7/01/2033 | | | 3,413,676 | 2,170,841 |
| Commonwealth of Puerto Rico, General Obligation Restructured Bonds, Series 2022A, 4%, 7/01/2033 | | | 2,652,627 | 2,573,470 |
| Commonwealth of Puerto Rico, General Obligation Restructured Bonds, Series 2022A, 4%, 7/01/2035 | | | 4,289,927 | 4,092,574 |
| Commonwealth of Puerto Rico, General Obligation Restructured Bonds, Series 2022A, 4%, 7/01/2037 | | | 2,046,409 | 1,918,586 |
| Commonwealth of Puerto Rico, General Obligation Restructured Bonds, Series 2022A, 4%, 7/01/2041 | | | 5,782,333 | 5,272,265 |
| Commonwealth of Puerto Rico, General Obligation Restructured Bonds, Series 2022A, 4%, 7/01/2046 | | | 2,893,588 | 2,566,853 |
| Puerto Rico Electric Power Authority Refunding Rev., “DDD”, 5%, 7/01/2020 (a)(d) | | | 525,000 | 161,438 |
| Puerto Rico Electric Power Authority Refunding Rev., “DDD”, 5%, 7/01/2021 (a)(d) | | | 8,560,000 | 2,632,200 |
| Puerto Rico Electric Power Authority Refunding Rev., “DDD”, 5%, 7/01/2022 (a)(d) | | | 14,860,000 | 4,569,450 |
| Puerto Rico Electric Power Authority Refunding Rev., “NN”, NPFG, 4.75%, 7/01/2033 | | | 1,530,000 | 1,488,064 |
| Puerto Rico Electric Power Authority Refunding Rev., “PP”, NPFG, 5%, 7/01/2024 | | | 270,000 | 270,057 |
| Puerto Rico Electric Power Authority Refunding Rev., “PP”, NPFG, 5%, 7/01/2025 | | | 260,000 | 260,055 |
| Puerto Rico Electric Power Authority Refunding Rev., “VV”, NPFG, 5.25%, 7/01/2025 | | | 475,000 | 472,212 |
| Puerto Rico Electric Power Authority Refunding Rev., “VV”, NPFG, 5.25%, 7/01/2026 | | | 1,260,000 | 1,248,876 |
| Puerto Rico Electric Power Authority Refunding Rev., “VV”, NPFG, 5.25%, 7/01/2029 | | | 5,090,000 | 5,026,363 |
Portfolio of Investments – continued
| Issuer | | | Shares/Par | Value ($) |
| Municipal Bonds - continued |
| Puerto Rico - continued |
| Puerto Rico Electric Power Authority Refunding Rev., “VV”, NPFG, 5.25%, 7/01/2030 | | $ | 5,270,000 | $5,199,330 |
| Puerto Rico Electric Power Authority Refunding Rev., “VV”, NPFG, 5.25%, 7/01/2034 | | | 630,000 | 623,504 |
| Puerto Rico Electric Power Authority Rev., “A”, 5%, 7/01/2029 (a)(d) | | | 27,420,000 | 8,431,650 |
| Puerto Rico Electric Power Authority Rev., “A”, 5%, 7/01/2042 (a)(d) | | | 2,965,000 | 911,737 |
| Puerto Rico Electric Power Authority Rev., “AAA”, 5.25%, 7/01/2021 (a)(d) | | | 1,075,000 | 330,563 |
| Puerto Rico Electric Power Authority Rev., “AAA”, 5.25%, 7/01/2030 (a)(d) | | | 500,000 | 153,750 |
| Puerto Rico Electric Power Authority Rev., “CCC”, 5.25%, 7/01/2027 (a)(d) | | | 6,605,000 | 2,031,037 |
| Puerto Rico Electric Power Authority Rev., “DDD”, AGM, 3.65%, 7/01/2024 | | | 2,345,000 | 2,331,563 |
| Puerto Rico Electric Power Authority Rev., “RR”, AGM, 5%, 7/01/2028 | | | 185,000 | 184,485 |
| Puerto Rico Electric Power Authority Rev., “SS”, AGM, 4.375%, 7/01/2030 | | | 515,000 | 497,302 |
| Puerto Rico Electric Power Authority Rev., “TT”, 5%, 7/01/2021 (a)(d) | | | 2,425,000 | 745,687 |
| Puerto Rico Electric Power Authority Rev., “TT”, 5%, 7/01/2023 (a)(d) | | | 3,275,000 | 1,007,062 |
| Puerto Rico Electric Power Authority Rev., “TT”, 5%, 7/01/2027 (a)(d) | | | 425,000 | 130,688 |
| Puerto Rico Electric Power Authority Rev., “TT”, 5%, 7/01/2037 (a)(d) | | | 11,890,000 | 3,656,175 |
| Puerto Rico Electric Power Authority Rev., “TT”, NPFG, 5%, 7/01/2024 | | | 1,230,000 | 1,230,753 |
| Puerto Rico Electric Power Authority Rev., “TT”, NPFG, 5%, 7/01/2026 | | | 65,000 | 65,040 |
| Puerto Rico Electric Power Authority Rev., “UU”, AGM, 4.25%, 7/01/2027 | | | 1,705,000 | 1,664,797 |
| Puerto Rico Electric Power Authority Rev., “WW”, 5.375%, 7/01/2020 (a)(d) | | | 445,000 | 136,838 |
| Puerto Rico Electric Power Authority Rev., “WW”, 5.25%, 7/01/2025 (a)(d) | | | 1,010,000 | 310,575 |
| Puerto Rico Electric Power Authority Rev., “XX”, 5.75%, 7/01/2036 (a)(d) | | | 4,890,000 | 1,503,675 |
| Puerto Rico Electric Power Authority Rev., “ZZ”, 5%, 7/01/2018 (a)(d) | | | 4,720,000 | 1,451,400 |
Portfolio of Investments – continued
| Issuer | | | Shares/Par | Value ($) |
| Municipal Bonds - continued |
| Puerto Rico - continued |
| Puerto Rico Electric Power Authority Rev., “ZZ”, 5.25%, 7/01/2023 (a)(d) | | $ | 5,265,000 | $1,618,987 |
| Puerto Rico Electric Power Authority Rev., “ZZ”, 5.25%, 7/01/2024 (a)(d) | | | 1,180,000 | 362,850 |
| Puerto Rico Electric Power Authority Rev., “ZZ”, 5.25%, 7/01/2026 (a)(d) | | | 3,705,000 | 1,139,287 |
| Puerto Rico Electric Power Authority Rev., Taxable, “EEE”, 6.05%, 7/01/2032 (a)(d) | | | 10,450,000 | 3,030,500 |
| Puerto Rico Industrial, Tourist, Educational, Medical & Environmental Control Facilities Financing Authority Rev. (Cogeneration Facilities - AES Puerto Rico Project), 6.625%, 6/01/2026 (a)(d) | | | 4,335,000 | 3,034,500 |
| Puerto Rico Industrial, Tourist, Educational, Medical & Environmental Control Facilities Financing Authority, Educational Facilities Rev. (University Plaza Project), NPFG, 5%, 7/01/2033 | | | 4,165,000 | 4,093,090 |
| Puerto Rico Industrial, Tourist, Educational, Medical & Environmental Control Facilities Financing Authority, Higher Education Rev. (University of Sacred Heart), 4.375%, 10/01/2031 | | | 525,000 | 525,511 |
| Puerto Rico Industrial, Tourist, Educational, Medical & Environmental Control Facilities Financing Authority, Higher Education Rev. (University of Sacred Heart), 5%, 10/01/2042 | | | 1,330,000 | 1,333,052 |
| Puerto Rico Municipal Finance Agency, “A”, AGM, 5%, 8/01/2027 | | | 215,000 | 216,487 |
| Puerto Rico Sales Tax Financing Corp., Restructured Sales Tax Rev., “2019A-1”, 4.55%, 7/01/2040 | | | 1,542,000 | 1,543,718 |
| Puerto Rico Sales Tax Financing Corp., Restructured Sales Tax Rev., “2019A-1”, 4.75%, 7/01/2053 | | | 8,003,000 | 7,841,097 |
| Puerto Rico Sales Tax Financing Corp., Restructured Sales Tax Rev., “2019A-1”, 5%, 7/01/2058 | | | 102,934,000 | 103,010,048 |
| Puerto Rico Sales Tax Financing Corp., Restructured Sales Tax Rev., “2019A-2”, 4.329%, 7/01/2040 | | | 14,758,000 | 14,665,802 |
| Puerto Rico Sales Tax Financing Corp., Restructured Sales Tax Rev., “2019A-2”, 4.329%, 7/01/2040 | | | 9,598,000 | 9,538,038 |
| Puerto Rico Sales Tax Financing Corp., Restructured Sales Tax Rev., “2019A-2”, 4.536%, 7/01/2053 | | | 298,000 | 282,037 |
| Puerto Rico Sales Tax Financing Corp., Restructured Sales Tax Rev., “2019A-2”, 4.784%, 7/01/2058 | | | 3,802,000 | 3,722,447 |
| Puerto Rico Sales Tax Financing Corp., Restructured Sales Tax Rev., Capital Appreciation, “2019A-1”, 0%, 7/01/2024 | | | 175,000 | 172,289 |
| Puerto Rico Sales Tax Financing Corp., Restructured Sales Tax Rev., Capital Appreciation, “2019A-1”, 0%, 7/01/2046 | | | 14,210,000 | 4,414,926 |
| University of Puerto Rico Rev., “P”, NPFG, 5%, 6/01/2025 | | | 595,000 | 595,677 |
| | | | | $228,885,345 |
Portfolio of Investments – continued
| Issuer | | | Shares/Par | Value ($) |
| Municipal Bonds - continued |
| Rhode Island - 0.1% |
| Rhode Island Student Loan Authority, Education Loan Rev., “A”, 2.25%, 12/01/2039 | | $ | 2,115,000 | $1,803,203 |
| Rhode Island Student Loan Authority, Student Loan Rev., “A”, 3.5%, 12/01/2034 | | | 1,120,000 | 1,055,944 |
| | | | | $2,859,147 |
| South Carolina - 1.0% |
| Berkeley County, SC, Assessment Rev. (Nexton Improvement District), 4%, 11/01/2030 (n) | | $ | 425,000 | $408,505 |
| Berkeley County, SC, Assessment Rev. (Nexton Improvement District), 4.25%, 11/01/2040 (n) | | | 1,000,000 | 885,932 |
| Berkeley County, SC, Assessment Rev. (Nexton Improvement District), 4.375%, 11/01/2049 (n) | | | 500,000 | 424,445 |
| South Carolina Jobs & Economic Development Authority, Educational Facilities Rev. (Green Charter Schools Project), “A”, 4%, 6/01/2036 (n) | | | 520,000 | 436,697 |
| South Carolina Jobs & Economic Development Authority, Educational Facilities Rev. (Green Charter Schools Project), “A”, 4%, 6/01/2046 (n) | | | 330,000 | 235,921 |
| South Carolina Jobs & Economic Development Authority, Educational Facilities Rev. (Green Charter Schools Project), “A”, 4%, 6/01/2056 (n) | | | 1,195,000 | 786,435 |
| South Carolina Jobs & Economic Development Authority, Health Facilities Rev. (Lutheran Homes of South Carolina, Inc.), 5.125%, 5/01/2048 | | | 805,000 | 648,240 |
| South Carolina Jobs & Economic Development Authority, Health Facilities Rev. (Lutheran Homes of South Carolina, Inc.), “B”, 5%, 5/01/2037 | | | 925,000 | 813,412 |
| South Carolina Jobs & Economic Development Authority, Health Facilities Rev. (Wesley Commons), 5%, 10/01/2036 (n) | | | 5,735,000 | 5,395,644 |
| South Carolina Jobs & Economic Development Authority, Hospital Facilities Rev. (Bon Secours Mercy Health, Inc.), “A”, 4%, 12/01/2044 | | | 6,215,000 | 6,201,278 |
| South Carolina Jobs & Economic Development Authority, Hospital Rev. (Hampton Regional Medical Center Project), 4%, 11/01/2029 | | | 3,240,000 | 3,260,916 |
| South Carolina Jobs & Economic Development Authority, Hospital Rev. (Hampton Regional Medical Center Project), 5%, 11/01/2033 | | | 3,570,000 | 3,666,495 |
| South Carolina Jobs & Economic Development Authority, Hospital Rev. (Hampton Regional Medical Center Project), 5%, 11/01/2037 | | | 1,380,000 | 1,396,058 |
Portfolio of Investments – continued
| Issuer | | | Shares/Par | Value ($) |
| Municipal Bonds - continued |
| South Carolina - continued |
| South Carolina Jobs & Economic Development Authority, Hospital Rev. (Hampton Regional Medical Center Project), 5%, 11/01/2042 | | $ | 3,515,000 | $3,326,766 |
| South Carolina Jobs & Economic Development Authority, Hospital Rev. (Hampton Regional Medical Center Project), 5%, 11/01/2046 | | | 1,905,000 | 1,766,384 |
| South Carolina Jobs & Economic Development Authority, Residential Care Facilities Rev. (Episcopal Home at Still Hopes), 5%, 4/01/2047 | | | 3,480,000 | 2,954,764 |
| South Carolina Jobs & Economic Development Authority, Residential Care Facilities Rev. (Episcopal Home at Still Hopes), 5%, 4/01/2048 | | | 1,500,000 | 1,266,226 |
| South Carolina Jobs & Economic Development Authority, Residential Care Facilities Rev. (Episcopal Home at Still Hopes), 5%, 4/01/2052 | | | 2,610,000 | 2,156,194 |
| South Carolina Jobs & Economic Development Authority, Residential Care Facilities Rev. (Episcopal Home at Still Hopes), 5.25%, 4/01/2053 | | | 4,060,000 | 3,474,684 |
| South Carolina Ports Authority Rev., 5.25%, 7/01/2050 (Prerefunded 7/01/2025) | | | 1,485,000 | 1,521,616 |
| Spartanburg County, SC, Regional Health Services District Hospital Rev., “A”, AGM, 4%, 4/15/2045 | | | 1,200,000 | 1,156,243 |
| | | | | $42,182,855 |
| Tennessee - 0.6% |
| Knox County, TN, Health, Educational & Housing Facility Board Rev. (University Health Systems, Inc.), 5%, 4/01/2030 | | $ | 680,000 | $705,703 |
| Knox County, TN, Health, Educational & Housing Facility Board Rev. (University Health Systems, Inc.), 5%, 4/01/2031 | | | 800,000 | 828,806 |
| Knox County, TN, Health, Educational & Housing Facility Board, Student Housing Rev. (Provident Group - UTK Properties LLC - University of Tennessee Project), “A-1”, BAM, 5.25%, 7/01/2049 | | | 485,000 | 527,193 |
| Knox County, TN, Health, Educational & Housing Facility Board, Student Housing Rev. (Provident Group - UTK Properties LLC - University of Tennessee Project), “A-1”, BAM, 5.5%, 7/01/2054 | | | 570,000 | 626,809 |
| Knox County, TN, Health, Educational & Housing Facility Board, Student Housing Rev. (Provident Group - UTK Properties LLC - University of Tennessee Project), “A-1”, BAM, 5.5%, 7/01/2059 | | | 530,000 | 579,374 |
| Knox County, TN, Health, Educational & Housing Facility Board, Student Housing Rev. (Provident Group - UTK Properties LLC - University of Tennessee Project), “A-1”, BAM, 5%, 7/01/2064 | | | 1,360,000 | 1,418,412 |
Portfolio of Investments – continued
| Issuer | | | Shares/Par | Value ($) |
| Municipal Bonds - continued |
| Tennessee - continued |
| Memphis-Shelby County, TN, Economic Development Growth Engine Industrial Development Board, Senior Tax Rev. (Graceland Project), “A”, 4.75%, 7/01/2027 | | $ | 485,000 | $418,155 |
| Memphis-Shelby County, TN, Economic Development Growth Engine Industrial Development Board, Senior Tax Rev. (Graceland Project), “A”, 5.5%, 7/01/2037 | | | 3,425,000 | 2,377,895 |
| Memphis-Shelby County, TN, Economic Development Growth Engine Industrial Development Board, Senior Tax Rev. (Graceland Project), “A”, 5.625%, 1/01/2046 | | | 250,000 | 148,659 |
| Shelby County, TN, Health, Educational & Housing Board Residential Care Facility Mortgage Rev. (Village at Germantown), 5%, 12/01/2034 | | | 500,000 | 480,158 |
| Shelby County, TN, Health, Educational & Housing Board Residential Care Facility Mortgage Rev. (Village at Germantown), 5.25%, 12/01/2044 | | | 1,000,000 | 918,070 |
| Shelby County, TN, New Memphis Arena Public Building Authority, Local Government Public Improvement (City of Memphis Project), Capital Appreciation, 0%, 4/01/2032 | | | 610,000 | 440,496 |
| Shelby County, TN, New Memphis Arena Public Building Authority, Local Government Public Improvement (City of Memphis Project), Capital Appreciation, 0%, 4/01/2033 | | | 875,000 | 604,195 |
| Shelby County, TN, New Memphis Arena Public Building Authority, Local Government Public Improvement (City of Memphis Project), Capital Appreciation, 0%, 4/01/2034 | | | 520,000 | 343,166 |
| Shelby County, TN, New Memphis Arena Public Building Authority, Local Government Public Improvement (City of Memphis Project), Capital Appreciation, 0%, 4/01/2035 | | | 680,000 | 427,169 |
| Shelby County, TN, New Memphis Arena Public Building Authority, Local Government Public Improvement (City of Memphis Project), Capital Appreciation, 0%, 4/01/2036 | | | 650,000 | 387,558 |
| Shelby County, TN, New Memphis Arena Public Building Authority, Local Government Public Improvement (City of Memphis Project), Capital Appreciation, 0%, 4/01/2037 | | | 780,000 | 438,777 |
| Shelby County, TN, New Memphis Arena Public Building Authority, Local Government Public Improvement (City of Memphis Project), Capital Appreciation, 0%, 4/01/2038 | | | 650,000 | 344,702 |
| Tennergy Corp., TN, Gas Supply Rev., “A”, 5.5%, 10/01/2053 (Put Date 12/01/2030) | | | 13,735,000 | 14,654,870 |
| Tennessee Housing Development Agency, Residential Finance Program Rev., “3”, 4.25%, 7/01/2049 | | | 1,180,000 | 1,180,673 |
| | | | | $27,850,840 |
Portfolio of Investments – continued
| Issuer | | | Shares/Par | Value ($) |
| Municipal Bonds - continued |
| Texas - 6.7% |
| Arlington, TX, Higher Education Finance Corp. Education Rev. (Basis Texas Charter Schools, Inc.), “A”, 4%, 6/15/2030 (n) | | $ | 985,000 | $925,121 |
| Arlington, TX, Higher Education Finance Corp. Education Rev. (Basis Texas Charter Schools, Inc.), “A”, 4%, 6/15/2040 (n) | | | 3,620,000 | 2,977,187 |
| Arlington, TX, Higher Education Finance Corp. Education Rev. (Basis Texas Charter Schools, Inc.), “A”, 4%, 6/15/2050 (n) | | | 5,810,000 | 4,323,717 |
| Arlington, TX, Higher Education Finance Corp. Education Rev. (Brooks Academies of Texas), “A”, 4%, 6/15/2031 (n) | | | 4,035,000 | 3,718,200 |
| Arlington, TX, Higher Education Finance Corp. Education Rev. (Brooks Academies of Texas), “A”, 5%, 6/15/2041 (n) | | | 8,445,000 | 7,574,595 |
| Arlington, TX, Higher Education Finance Corp. Education Rev. (Brooks Academies of Texas), “A”, 5%, 6/15/2051 (n) | | | 3,500,000 | 2,909,287 |
| Arlington, TX, Higher Education Finance Corp. Education Rev. (Newman International Academy), “A”, 4%, 8/15/2031 | | | 355,000 | 326,003 |
| Arlington, TX, Higher Education Finance Corp. Education Rev. (Newman International Academy), “A”, 5.375%, 8/15/2036 | | | 820,000 | 802,076 |
| Arlington, TX, Higher Education Finance Corp. Education Rev. (Newman International Academy), “A”, 5%, 8/15/2041 | | | 900,000 | 800,485 |
| Arlington, TX, Higher Education Finance Corp. Education Rev. (Newman International Academy), “A”, 5.5%, 8/15/2046 | | | 3,680,000 | 3,386,075 |
| Arlington, TX, Higher Education Finance Corp. Education Rev. (Newman International Academy), “A”, 5%, 8/15/2051 | | | 1,500,000 | 1,253,347 |
| Arlington, TX, Higher Education Finance Corp. Education Rev. (UME Preparatory Academy), “A”, 5%, 8/15/2038 | | | 1,060,000 | 1,014,561 |
| Arlington, TX, Higher Education Finance Corp. Education Rev. (UME Preparatory Academy), “A”, 5%, 8/15/2048 | | | 1,750,000 | 1,584,888 |
| Arlington, TX, Higher Education Finance Corp. Education Rev. (UME Preparatory Academy), “A”, 5%, 8/15/2053 | | | 1,695,000 | 1,510,916 |
| Arlington, TX, Higher Education Finance Corp. Rev. (Basis Charter Schools, Inc.), 4.5%, 6/15/2056 (Put Date 6/15/2026) (n) | | | 900,000 | 897,497 |
| Austin, TX, Airport System Rev., “B”, 5%, 11/15/2041 | | | 930,000 | 946,048 |
| Austin, TX, Convention Center (Convention Enterprises, Inc.), “A”, 5%, 1/01/2029 | | | 890,000 | 912,283 |
| Austin, TX, Convention Center (Convention Enterprises, Inc.), “A”, 5%, 1/01/2031 | | | 1,325,000 | 1,359,670 |
| Austin, TX, Convention Center (Convention Enterprises, Inc.), “A”, 5%, 1/01/2034 | | | 260,000 | 261,997 |
| Austin, TX, Convention Center (Convention Enterprises, Inc.), “B”, 5%, 1/01/2026 | | | 615,000 | 614,698 |
| Austin, TX, Convention Center (Convention Enterprises, Inc.), “B”, 5%, 1/01/2028 | | | 400,000 | 402,157 |
| Austin, TX, Convention Center (Convention Enterprises, Inc.), “B”, 5%, 1/01/2030 | | | 585,000 | 589,329 |
Portfolio of Investments – continued
| Issuer | | | Shares/Par | Value ($) |
| Municipal Bonds - continued |
| Texas - continued |
| Brazos, TX, Higher Education Authority, Inc., Student Loan Program Rev., “1A”, 2.35%, 4/01/2040 | | $ | 50,000 | $49,820 |
| Brazos, TX, Higher Education Authority, Inc., Student Loan Program Rev., “1A”, 3%, 4/01/2040 | | | 1,100,000 | 919,095 |
| Brazos, TX, Higher Education Authority, Inc., Student Loan Program Rev., Taxable, “1A”, 3.414%, 4/01/2040 | | | 95,000 | 92,530 |
| Central Texas Regional Mobility Authority Senior Lien Rev., “A”, 5%, 1/01/2045 (Prerefunded 7/01/2025) | | | 1,315,000 | 1,351,183 |
| Clifton, TX, Higher Education Finance Corp. Rev. (Idea Public Schools), 6%, 8/15/2033 | | | 845,000 | 846,768 |
| Clifton, TX, Higher Education Finance Corp. Rev. (Idea Public Schools), 6%, 8/15/2043 | | | 1,850,000 | 1,852,299 |
| Clifton, TX, Higher Education Finance Corp. Rev. (Uplift Education), “A”, 3.375%, 12/01/2024 | | | 65,000 | 64,329 |
| Conroe, TX, Local Government Corp., First Lien Hotel Rev. (Convention Center Hotel), “A”, 2.5%, 10/01/2031 | | | 470,000 | 404,235 |
| Conroe, TX, Local Government Corp., First Lien Hotel Rev. (Convention Center Hotel), “A”, 4%, 10/01/2050 | | | 1,540,000 | 1,249,574 |
| Conroe, TX, Local Government Corp., Second Lien Hotel Rev. (Convention Center Hotel), “B”, 3.5%, 10/01/2031 (n) | | | 385,000 | 334,620 |
| Conroe, TX, Local Government Corp., Second Lien Hotel Rev. (Convention Center Hotel), “B”, 5%, 10/01/2050 (n) | | | 730,000 | 607,051 |
| Conroe, TX, Local Government Corp., Third Lien Hotel Rev. (Convention Center Hotel), “C”, 4%, 10/01/2046 | | | 365,000 | 351,236 |
| Cypress-Fairbanks, TX, Independent School District, Unlimited Tax School Building, Texas PSF, 4%, 2/15/2048 | | | 1,970,000 | 1,941,912 |
| Ector County, TX, Hospital District General Obligation Refunding, 5%, 9/15/2033 | | | 550,000 | 584,347 |
| Ector County, TX, Hospital District General Obligation Refunding, 4%, 9/15/2034 | | | 1,270,000 | 1,222,748 |
| Fredericksburg, TX, Independent School District, Unlimited Tax School Building, Texas PSF, 4%, 2/15/2052 | | | 4,945,000 | 4,825,986 |
| Galveston, TX, Wharves and Terminal, First Lien Rev., 6%, 8/01/2043 | | | 925,000 | 1,044,723 |
| Gulf Coast, TX, Industrial Development Authority Rev. (CITGO Petroleum Corp.), 4.875%, 5/01/2025 | | | 2,845,000 | 2,844,875 |
| Gulf Coast, TX, Industrial Development Authority Rev. (CITGO Petroleum Corp.), 8%, 4/01/2028 | | | 875,000 | 875,916 |
| Harris County, TX, Cultural Education Facilities Finance Corp., Hospital Rev. (Memorial Hermann Health System), “A”, 4.125%, 7/01/2052 | | | 10,140,000 | 9,667,214 |
| Harris County-Houston, TX, Sports Authority Rev., “C”, 5%, 11/15/2032 | | | 185,000 | 186,565 |
Portfolio of Investments – continued
| Issuer | | | Shares/Par | Value ($) |
| Municipal Bonds - continued |
| Texas - continued |
| Harris County-Houston, TX, Sports Authority Rev., “C”, 5%, 11/15/2033 | | $ | 450,000 | $453,764 |
| Harris County-Houston, TX, Sports Authority Rev., Capital Appreciation, “A”, AGM, 0%, 11/15/2034 | | | 5,165,000 | 3,227,488 |
| Harris County-Houston, TX, Sports Authority Rev., Capital Appreciation, “A”, AGM, 0%, 11/15/2038 | | | 40,280,000 | 19,031,160 |
| Harris County-Houston, TX, Sports Authority Rev., Capital Appreciation, “A”, AGM, 0%, 11/15/2041 | | | 745,000 | 339,716 |
| Harris County-Houston, TX, Sports Authority Rev., Capital Appreciation, “A”, AGM, 0%, 11/15/2046 | | | 1,865,000 | 652,106 |
| Houston, TX, Airport System Rev., Special Facilities Rev. (Continental Airlines, Inc.), 6.625%, 7/15/2038 | | | 7,680,000 | 7,684,548 |
| Houston, TX, Airport System Rev., Special Facilities Rev. (United Airlines, Inc. Terminal E Project), 5%, 7/01/2029 | | | 160,000 | 160,024 |
| Houston, TX, Airport System Rev., Special Facilities Rev. (United Airlines, Inc. Terminal E Project), “A”, 5%, 7/01/2027 | | | 730,000 | 737,943 |
| Houston, TX, Airport System Rev., Special Facilities Rev. (United Airlines, Inc. Terminal Improvement Projects), “B-1”, 5%, 7/15/2030 | | | 16,260,000 | 16,286,631 |
| Houston, TX, Airport System Rev., Special Facilities Rev. (United Airlines, Inc. Terminal Improvement Projects), “B-2”, 5%, 7/15/2027 | | | 1,005,000 | 1,016,155 |
| Houston, TX, Higher Education Finance Corp. University Rev. (Houston Baptist University Project), 3.375%, 10/01/2037 | | | 260,000 | 217,690 |
| Houston, TX, Higher Education Finance Corp. University Rev. (Houston Baptist University Project), 4%, 10/01/2051 | | | 880,000 | 699,225 |
| Irving, TX, Hotel Occupancy Tax Rev., 5%, 8/15/2038 | | | 310,000 | 318,736 |
| Irving, TX, Hotel Occupancy Tax Rev., 5%, 8/15/2043 | | | 565,000 | 573,344 |
| Mission, TX, Economic Development Corp. (NatGasoline Project), 4.625%, 10/01/2031 (n) | | | 4,240,000 | 4,206,030 |
| New Hope, TX, Cultural Education Facilities Finance Corp., Capital Improvement Rev. (CHF - Collegiate Housing Denton LLC - Texas Woman's University Housing Project), “A-1”, AGM, 5%, 7/01/2058 | | | 1,685,000 | 1,698,256 |
| New Hope, TX, Cultural Education Facilities Finance Corp., Education Rev. (Beta Academy), “A”, 3.375%, 8/15/2029 (n) | | | 705,000 | 646,971 |
| New Hope, TX, Cultural Education Facilities Finance Corp., Education Rev. (Beta Academy), “A”, 5%, 8/15/2039 (n) | | | 2,550,000 | 2,472,266 |
| New Hope, TX, Cultural Education Facilities Finance Corp., Education Rev. (Beta Academy), “A”, 5%, 8/15/2049 (n) | | | 1,555,000 | 1,423,110 |
| New Hope, TX, Cultural Education Facilities Finance Corp., Education Rev. (Cumberland Academy), “A”, 5%, 8/15/2040 (n) | | | 3,500,000 | 3,388,969 |
Portfolio of Investments – continued
| Issuer | | | Shares/Par | Value ($) |
| Municipal Bonds - continued |
| Texas - continued |
| New Hope, TX, Cultural Education Facilities Finance Corp., Education Rev. (Cumberland Academy), “A”, 5%, 8/15/2050 (n) | | $ | 3,000,000 | $2,737,315 |
| New Hope, TX, Cultural Education Facilities Finance Corp., Education Rev. (Jubilee Academic Center), 4%, 8/15/2046 (n) | | | 3,040,000 | 2,458,329 |
| New Hope, TX, Cultural Education Facilities Finance Corp., Retirement Facility Rev. (Longhorn Village Project), 5%, 1/01/2037 | | | 2,000,000 | 1,890,628 |
| New Hope, TX, Cultural Education Facilities Finance Corp., Retirement Facility Rev. (Longhorn Village Project), 5%, 1/01/2042 | | | 3,000,000 | 2,737,756 |
| New Hope, TX, Cultural Education Facilities Finance Corp., Retirement Facility Rev. (Morningside Ministries Project), 4%, 1/01/2032 | | | 430,000 | 368,360 |
| New Hope, TX, Cultural Education Facilities Finance Corp., Retirement Facility Rev. (Morningside Ministries Project), 4%, 1/01/2037 | | | 585,000 | 455,012 |
| New Hope, TX, Cultural Education Facilities Finance Corp., Retirement Facility Rev. (Morningside Ministries Project), 4%, 1/01/2042 | | | 925,000 | 659,035 |
| New Hope, TX, Cultural Education Facilities Finance Corp., Retirement Facility Rev. (Morningside Ministries Project), 4%, 1/01/2047 | | | 1,505,000 | 1,000,902 |
| New Hope, TX, Cultural Education Facilities Finance Corp., Retirement Facility Rev. (Morningside Ministries Project), 4.25%, 1/01/2057 | | | 3,225,000 | 2,086,552 |
| New Hope, TX, Cultural Education Facilities Finance Corp., Retirement Facility Rev. (Morningside Ministries Project), 5%, 1/01/2057 | | | 2,100,000 | 1,570,709 |
| New Hope, TX, Cultural Education Facilities Finance Corp., Retirement Facility Rev. (MRC Senior Living - Langford Project), “A”, 5%, 11/15/2026 | | | 210,000 | 203,987 |
| New Hope, TX, Cultural Education Facilities Finance Corp., Retirement Facility Rev. (MRC Senior Living - Langford Project), “A”, 5.375%, 11/15/2036 | | | 1,250,000 | 1,108,118 |
| New Hope, TX, Cultural Education Facilities Finance Corp., Retirement Facility Rev. (MRC Senior Living - Langford Project), “A”, 5.5%, 11/15/2046 | | | 835,000 | 692,461 |
| New Hope, TX, Cultural Education Facilities Finance Corp., Retirement Facility Rev. (MRC Senior Living - Langford Project), “A”, 5.5%, 11/15/2052 | | | 960,000 | 774,563 |
| New Hope, TX, Cultural Education Facilities Finance Corp., Retirement Facility Rev. (Wesleyan Homes, Inc. Project), 4%, 1/01/2029 | | | 440,000 | 401,079 |
Portfolio of Investments – continued
| Issuer | | | Shares/Par | Value ($) |
| Municipal Bonds - continued |
| Texas - continued |
| New Hope, TX, Cultural Education Facilities Finance Corp., Retirement Facility Rev. (Wesleyan Homes, Inc. Project), 5.5%, 1/01/2035 | | $ | 1,325,000 | $1,237,209 |
| New Hope, TX, Cultural Education Facilities Finance Corp., Retirement Facility Rev. (Wesleyan Homes, Inc. Project), 5%, 1/01/2039 | | | 655,000 | 541,244 |
| New Hope, TX, Cultural Education Facilities Finance Corp., Retirement Facility Rev. (Wesleyan Homes, Inc. Project), 5.5%, 1/01/2043 | | | 3,630,000 | 3,107,632 |
| New Hope, TX, Cultural Education Facilities Finance Corp., Retirement Facility Rev. (Wesleyan Homes, Inc. Project), 5.5%, 1/01/2049 | | | 1,470,000 | 1,193,962 |
| New Hope, TX, Cultural Education Facilities Finance Corp., Retirement Facility Rev. (Wesleyan Homes, Inc. Project), 5%, 1/01/2050 | | | 780,000 | 576,837 |
| New Hope, TX, Cultural Education Facilities Finance Corp., Retirement Facility Rev. (Wesleyan Homes, Inc. Project), 5%, 1/01/2055 | | | 2,050,000 | 1,474,374 |
| Newark, TX, Higher Education Finance Corp. Rev. (A+ Charter Schools, Inc.), “A”, 5.5%, 8/15/2035 (n) | | | 1,530,000 | 1,568,003 |
| Newark, TX, Higher Education Finance Corp. Rev. (A+ Charter Schools, Inc.), “A”, 5.75%, 8/15/2045 (n) | | | 2,250,000 | 2,290,467 |
| Peaster, TX, Independent School District, Unlimited Tax School Building Bonds, Texas PSF, 3%, 8/15/2051 | | | 3,250,000 | 2,454,213 |
| Port Beaumont, TX, Industrial Development Authority Facility Rev., Taxable (Jefferson Gulf Coast Energy Project), “B”, 4.1%, 1/01/2028 (n) | | | 23,050,000 | 19,223,582 |
| Port Beaumont, TX, Navigation District, Dock & Wharf Facility Rev. (Jefferson Gulf Coast Energy Project), “A”, 3.625%, 1/01/2035 (n) | | | 3,655,000 | 3,060,682 |
| Port Beaumont, TX, Navigation District, Dock & Wharf Facility Rev. (Jefferson Gulf Coast Energy Project), “A”, 3%, 1/01/2050 (n) | | | 1,940,000 | 1,168,865 |
| Port Beaumont, TX, Navigation District, Dock & Wharf Facility Rev. (Jefferson Gulf Coast Energy Project), “A”, 4%, 1/01/2050 (n) | | | 11,680,000 | 8,554,272 |
| Port Beaumont, TX, Navigation District, Dock & Wharf Facility Rev., Taxable (Jefferson Gulf Coast Energy Project), “A”, 6%, 1/01/2025 (n) | | | 10,945,000 | 10,334,955 |
| Red River, TX, Health Facilities Development Corp., Retirement Facilities Rev. (MRC Crossings Project), “A”, 7.5%, 11/15/2034 (Prerefunded 11/15/2024) | | | 1,075,000 | 1,109,953 |
Portfolio of Investments – continued
| Issuer | | | Shares/Par | Value ($) |
| Municipal Bonds - continued |
| Texas - continued |
| Red River, TX, Health Facilities Development Corp., Retirement Facilities Rev. (MRC Crossings Project), “A”, 7.75%, 11/15/2044 (Prerefunded 11/15/2024) | | $ | 1,970,000 | $2,037,840 |
| Red River, TX, Health Facilities Development Corp., Retirement Facilities Rev. (MRC Crossings Project), “A”, 8%, 11/15/2049 (Prerefunded 11/15/2024) | | | 1,680,000 | 1,740,415 |
| SA Energy Acquisition Public Facility Corp. (Gas Supply Revenue Bonds), 5.5%, 8/01/2027 | | | 4,000,000 | 4,181,471 |
| Tarrant County, TX, Cultural Education Facilities Finance Corp. (Christus Health), “A”, 4%, 7/01/2053 | | | 11,230,000 | 10,395,818 |
| Tarrant County, TX, Cultural Education Facilities Finance Corp., Retirement Facility Rev. (Barton Creek Senior Living Center, Inc., Querencia Project), 5%, 11/15/2030 | | | 1,500,000 | 1,492,219 |
| Tarrant County, TX, Cultural Education Facilities Finance Corp., Retirement Facility Rev. (Barton Creek Senior Living Center, Inc., Querencia Project), 5%, 11/15/2035 | | | 3,345,000 | 3,240,510 |
| Tarrant County, TX, Cultural Education Facilities Finance Corp., Retirement Facility Rev. (Stayton at Museum Way), 5.75%, 12/01/2054 (a)(d) | | | 22,954,217 | 14,920,241 |
| Tarrant County, TX, Cultural Education Facilities Finance Corp., Retirement Facility Rev. (Trinity Terrace Project), “A-1”, 5%, 10/01/2044 | | | 2,525,000 | 2,516,686 |
| Texas Cedar Port Navigation & Improvement District, Unlimited Tax, 4.5%, 9/01/2048 | | | 4,380,000 | 4,399,334 |
| Texas Cedar Port Navigation & Improvement District, Unlimited Tax, 4.5%, 9/01/2052 | | | 1,765,000 | 1,766,121 |
| Texas Department of Housing & Community Affairs, Residential Mortgage Rev., “A”, 4.75%, 1/01/2049 (u) | | | 3,405,000 | 3,434,911 |
| Texas Department of Housing & Community Affairs, Single Family Mortgage Rev., “A”, 4.75%, 3/01/2049 (u) | | | 1,785,000 | 1,801,243 |
| Texas Rockwall Independent School District, Unlimited Tax School Building, Texas PSF, 4%, 2/15/2053 | | | 2,130,000 | 2,080,418 |
| Texas State Technical College System Rev., Financing System Improvement, “A”, AGM, 5.5%, 8/01/2042 | | | 1,595,000 | 1,805,610 |
| Texas State Technical College System Rev., Financing System Improvement, “A”, AGM, 5.75%, 8/01/2047 | | | 2,275,000 | 2,577,836 |
| Texas State Technical College System Rev., Financing System Improvement, “A”, AGM, 6%, 8/01/2054 | | | 2,185,000 | 2,494,417 |
| Texas Transportation Commission, Central Texas Turnpike System Rev., Capital Appreciation, “B”, 0%, 8/15/2036 | | | 4,605,000 | 2,682,764 |
| Texas Transportation Commission, State Highway 249 System Rev., “A”, 5%, 8/01/2057 | | | 5,725,000 | 5,819,453 |
Portfolio of Investments – continued
| Issuer | | | Shares/Par | Value ($) |
| Municipal Bonds - continued |
| Texas - continued |
| Texas Transportation Commission, State Highway 249 System Rev., Capital Appreciation, “A”, 0%, 8/01/2037 | | $ | 640,000 | $355,581 |
| Texas Transportation Commission, State Highway 249 System Rev., Capital Appreciation, “A”, 0%, 8/01/2038 | | | 470,000 | 245,924 |
| Texas Transportation Commission, State Highway 249 System Rev., Capital Appreciation, “A”, 0%, 8/01/2039 | | | 520,000 | 257,163 |
| Texas Transportation Commission, State Highway 249 System Rev., Capital Appreciation, “A”, 0%, 8/01/2040 | | | 520,000 | 242,614 |
| Texas Transportation Commission, State Highway 249 System Rev., Capital Appreciation, “A”, 0%, 8/01/2041 | | | 1,040,000 | 458,714 |
| Texas Transportation Commission, State Highway 249 System Rev., Capital Appreciation, “A”, 0%, 8/01/2042 | | | 1,430,000 | 596,009 |
| Texas Transportation Commission, State Highway 249 System Rev., Capital Appreciation, “A”, 0%, 8/01/2043 | | | 1,170,000 | 461,927 |
| White Settlement, TX, Independent School District, Unlimited Tax School Building Bonds, Texas PSF, 4%, 8/15/2052 | | | 2,475,000 | 2,430,629 |
| | | | | $287,118,219 |
| U.S. Virgin Islands - 0.0% |
| Matching Fund Special Purpose Securitization Corp., “A”, 5%, 10/01/2025 | | $ | 370,000 | $376,769 |
| Matching Fund Special Purpose Securitization Corp., “A”, 5%, 10/01/2026 | | | 1,755,000 | 1,804,188 |
| | | | | $2,180,957 |
| Utah - 0.4% |
| Utah Charter School Finance Authority, Charter School Rev. (Bridge Elementary Project), “A”, 4%, 6/15/2031 (n) | | $ | 550,000 | $497,158 |
| Utah Charter School Finance Authority, Charter School Rev. (Bridge Elementary Project), “A”, 4%, 6/15/2041 (n) | | | 890,000 | 685,076 |
| Utah Charter School Finance Authority, Charter School Rev. (Bridge Elementary Project), “A”, 4.25%, 6/15/2051 (n) | | | 1,315,000 | 954,596 |
| Utah Charter School Finance Authority, Charter School Rev. (Mountain Sunrise Academy), “A”, 4%, 12/15/2041 (n) | | | 2,770,000 | 2,134,547 |
| Utah Charter School Finance Authority, Charter School Rev. (Mountain Sunrise Academy), “A”, 4%, 12/15/2051 (n) | | | 4,120,000 | 2,862,061 |
| Utah Charter School Finance Authority, Charter School Rev. (Mountain Sunrise Academy), “A”, 4%, 12/15/2056 (n) | | | 2,770,000 | 1,850,994 |
| Utah Charter School Finance Authority, Charter School Rev. (Reagan Academy Project), 5%, 2/15/2036 (n) | | | 1,530,000 | 1,520,406 |
| Utah Charter School Finance Authority, Charter School Rev. (Reagan Academy Project), 5%, 2/15/2046 (n) | | | 1,285,000 | 1,220,792 |
| Utah Charter School Finance Authority, Charter School Rev. (Reagan Academy Project), “A”, 3.5%, 2/15/2026 (n) | | | 105,000 | 102,500 |
Portfolio of Investments – continued
| Issuer | | | Shares/Par | Value ($) |
| Municipal Bonds - continued |
| Utah - continued |
| Utah Charter School Finance Authority, Charter School Rev. (Summit Academy, Inc.), “A”, 5%, 4/15/2049 | | $ | 650,000 | $672,041 |
| Utah Housing Corp., Tax Exempt Mortgage-Backed Securities, “G”, GNMA, 4.5%, 7/21/2049 | | | 873,570 | 866,432 |
| Utah Housing Corp., Tax Exempt Mortgage-Backed Securities, “H”, GNMA, 4.5%, 8/21/2049 | | | 558,948 | 553,637 |
| Utah Housing Corp., Tax Exempt Mortgage-Backed Securities, “I”, GNMA, 4%, 9/21/2049 | | | 856,649 | 865,253 |
| Utah Housing Corp., Tax Exempt Mortgage-Backed Securities, “I”, GNMA, 2.5%, 8/21/2051 | | | 3,636,092 | 3,088,131 |
| Utah Housing Corp., Tax-Exempt Mortgage-Backed Securities, “G”, GNMA, 3.5%, 2/21/2050 | | | 1,249,165 | 1,146,309 |
| | | | | $19,019,933 |
| Vermont - 0.2% |
| Vermont Economic Development Authority, Solid Waste Disposal Rev. (Casella Waste Systems, Inc.), 4.625%, 4/01/2036 (Put Date 4/03/2028) (n) | | $ | 2,445,000 | $2,430,677 |
| Vermont Student Assistance Corp., Education Loan Rev., “A”, 3.625%, 6/15/2029 | | | 175,000 | 174,278 |
| Vermont Student Assistance Corp., Education Loan Rev., “A”, 3.75%, 6/15/2030 | | | 195,000 | 194,212 |
| Vermont Student Assistance Corp., Education Loan Rev., “A”, 4%, 6/15/2033 | | | 180,000 | 179,337 |
| Vermont Student Assistance Corp., Education Loan Rev., “A”, 4%, 6/15/2034 | | | 200,000 | 197,781 |
| Vermont Student Assistance Corp., Education Loan Rev., “A”, 2.375%, 6/15/2039 | | | 965,000 | 871,645 |
| Vermont Student Assistance Corp., Education Loan Rev., “A”, 4.375%, 6/15/2040 | | | 1,440,000 | 1,375,703 |
| Vermont Student Assistance Corp., Education Loan Rev., “B”, 4.375%, 6/15/2046 | | | 755,000 | 701,722 |
| Vermont Student Assistance Corp., Education Loan Rev., “B”, 4%, 6/15/2047 | | | 1,740,000 | 1,515,243 |
| | | | | $7,640,598 |
Portfolio of Investments – continued
| Issuer | | | Shares/Par | Value ($) |
| Municipal Bonds - continued |
| Virginia - 1.1% |
| Charles City County, VA, Industrial Development Authority, Solid Waste Disposal Rev. (Waste Management, Inc. Project), 1.45%, 4/01/2027 | | $ | 440,000 | $397,800 |
| Cherry Hill Community Development Authority, Prince William County, VA (Potomac Shores Project), 5.4%, 3/01/2045 (n) | | | 1,770,000 | 1,780,476 |
| Henrico County, VA, Economic Development Authority Rev., Residential Care Facility (Westminster-Canterbury of Richmond), “A”, 5%, 10/01/2052 | | | 2,220,000 | 2,253,398 |
| James City County, VA, Economic Development Authority, Residential Care Facility Rev. (United Methodist Homes of Williamsburg, Inc.), “A”, 4%, 6/01/2041 | | | 1,250,000 | 1,053,308 |
| James City County, VA, Economic Development Authority, Residential Care Facility Rev. (United Methodist Homes of Williamsburg, Inc.), “A”, 4%, 6/01/2047 | | | 2,055,000 | 1,593,880 |
| James City County, VA, Economic Development Authority, Residential Care Facility Rev. (Williamsburg Landing), “A”, 6.75%, 12/01/2053 | | | 855,000 | 915,122 |
| James City County, VA, Economic Development Authority, Residential Care Facility Rev. (Williamsburg Landing), “A”, 6.875%, 12/01/2058 | | | 2,185,000 | 2,341,965 |
| Peninsula Town Center Community Development Authority, VA, Special Obligation Refunding, 4.5%, 9/01/2028 (n) | | | 580,000 | 578,294 |
| Peninsula Town Center Community Development Authority, VA, Special Obligation Refunding, 5%, 9/01/2037 (n) | | | 1,105,000 | 1,103,157 |
| Peninsula Town Center Community Development Authority, VA, Special Obligation Refunding, 4.5%, 9/01/2045 (n) | | | 3,440,000 | 3,101,204 |
| Peninsula Town Center Community Development Authority, VA, Special Obligation Refunding, 5%, 9/01/2045 (n) | | | 1,905,000 | 1,815,705 |
| Roanoke, VA, Economic Development Authority, Educational Facilities Rev. (Lynchburg College), “A”, 5%, 9/01/2032 | | | 1,115,000 | 1,164,590 |
| Virginia Beach, VA, Development Authority, Residential Care Facility Rev. (Westminster - Canterbury on Chesapeake Bay), 7%, 9/01/2053 | | | 3,700,000 | 4,009,606 |
| Virginia Beach, VA, Development Authority, Residential Care Facility Rev. (Westminster - Canterbury on Chesapeake Bay), “A”, 6.5%, 9/01/2043 | | | 1,320,000 | 1,424,350 |
| Virginia Beach, VA, Development Authority, Residential Care Facility Rev. (Westminster - Canterbury on Chesapeake Bay), “A”, 7%, 9/01/2059 | | | 5,515,000 | 5,941,240 |
| Virginia College Building Authority, Educational Facilities Rev. (Marymount University Project), “B”, 5.25%, 7/01/2030 (n) | | | 2,810,000 | 2,830,018 |
| Virginia College Building Authority, Educational Facilities Rev. (Marymount University Project), “B”, 5.25%, 7/01/2035 (n) | | | 2,590,000 | 2,600,718 |
Portfolio of Investments – continued
| Issuer | | | Shares/Par | Value ($) |
| Municipal Bonds - continued |
| Virginia - continued |
| Virginia Small Business Financing Authority Rev., 5%, 6/01/2047 | | $ | 1,500,000 | $1,403,846 |
| Virginia Small Business Financing Authority Rev., 5%, 6/01/2052 | | | 3,880,000 | 3,581,927 |
| Virginia Small Business Financing Authority Rev. (Obligated Group of National Senior Campuses, Inc.), “A”, 4%, 1/01/2040 | | | 3,000,000 | 2,871,611 |
| Virginia Small Business Financing Authority Rev. (Obligated Group of National Senior Campuses, Inc.), “A”, 4%, 1/01/2045 | | | 1,965,000 | 1,811,778 |
| Virginia Small Business Financing Authority Rev., Solid Waste Disposal (Covanta Project), 5%, 1/01/2048 (Put Date 7/01/2038) (n) | | | 715,000 | 679,018 |
| | | | | $45,253,011 |
| Washington - 1.9% |
| Everett, WA, Housing Authority Refunding Rev. (Huntington Park Apartments Project), 4%, 7/01/2037 | | $ | 12,345,000 | $12,196,429 |
| Grays Harbor County, WA, Public Hospital District No. 2, Limited Tax General Obligation Refunding, 5%, 12/15/2033 | | | 2,675,000 | 2,789,446 |
| Grays Harbor County, WA, Public Hospital District No. 2, Limited Tax General Obligation Refunding, 5%, 12/15/2038 | | | 3,415,000 | 3,472,573 |
| Grays Harbor County, WA, Public Hospital District No. 2, Limited Tax General Obligation Refunding, 5%, 12/15/2048 | | | 6,565,000 | 6,371,619 |
| Kalispel Tribe of Indians, WA, Priority District Rev., “A”, 5.25%, 1/01/2038 (n) | | | 2,500,000 | 2,583,494 |
| Kalispel Tribe of Indians, WA, Priority District Rev., “B”, 5%, 1/01/2032 (n) | | | 700,000 | 723,391 |
| Kalispel Tribe of Indians, WA, Priority District Rev., “B”, 5.25%, 1/01/2038 (n) | | | 900,000 | 930,058 |
| Port of Seattle, WA, Industrial Development Corp., Special Facilities Rev. (Delta Airlines, Inc.), 5%, 4/01/2030 | | | 4,000,000 | 4,000,238 |
| Seattle, WA, Port Intermediate Lien Refunding Rev., “B”, 4%, 8/01/2047 | | | 1,460,000 | 1,371,743 |
| Washington Health Care Facilities Authority Rev. (Virginia Mason Medical Center), 5%, 8/15/2035 | | | 560,000 | 577,195 |
| Washington Health Care Facilities Authority Rev. (Virginia Mason Medical Center), 4%, 8/15/2042 | | | 4,925,000 | 4,445,284 |
| Washington Housing Finance Commission Nonprofit Housing Refunding Rev. (Hearthstone Project), “A”, 5%, 7/01/2038 (n) | | | 830,000 | 680,117 |
| Washington Housing Finance Commission Nonprofit Housing Refunding Rev. (Hearthstone Project), “A”, 5%, 7/01/2048 (n) | | | 1,420,000 | 1,047,659 |
| Washington Housing Finance Commission Nonprofit Housing Refunding Rev. (Hearthstone Project), “A”, 5%, 7/01/2053 (z) | | | 1,375,000 | 985,355 |
| Washington Housing Finance Commission Nonprofit Housing Refunding Rev. (Judson Park Project), 4%, 7/01/2028 (n) | | | 225,000 | 217,822 |
Portfolio of Investments – continued
| Issuer | | | Shares/Par | Value ($) |
| Municipal Bonds - continued |
| Washington - continued |
| Washington Housing Finance Commission Nonprofit Housing Refunding Rev. (Judson Park Project), 5%, 7/01/2033 (n) | | $ | 225,000 | $223,989 |
| Washington Housing Finance Commission Nonprofit Housing Refunding Rev. (Judson Park Project), 5%, 7/01/2038 (n) | | | 325,000 | 310,825 |
| Washington Housing Finance Commission Nonprofit Housing Refunding Rev. (Judson Park Project), 5%, 7/01/2048 (n) | | | 450,000 | 393,207 |
| Washington Housing Finance Commission Nonprofit Housing Rev. (Presbyterian Retirement Communities Northwest Projects), “A”, 5%, 1/01/2036 (n) | | | 2,460,000 | 2,036,979 |
| Washington Housing Finance Commission Nonprofit Housing Rev. (Presbyterian Retirement Communities Northwest Projects), “A”, 5%, 1/01/2046 (n) | | | 4,675,000 | 3,283,911 |
| Washington Housing Finance Commission Nonprofit Housing Rev. (Presbyterian Retirement Communities Northwest Projects), “A”, 5%, 1/01/2051 (n) | | | 2,970,000 | 1,995,701 |
| Washington Housing Finance Commission Nonprofit Housing Rev. (Wesley Homes at Lea Hill Project), 5%, 7/01/2036 (n) | | | 1,000,000 | 898,700 |
| Washington Housing Finance Commission Nonprofit Housing Rev. (Wesley Homes at Lea Hill Project), 5%, 7/01/2041 (n) | | | 2,000,000 | 1,699,122 |
| Washington Housing Finance Commission Nonprofit Housing Rev. (Wesley Homes at Lea Hill Project), 5%, 7/01/2046 (n) | | | 2,385,000 | 1,946,362 |
| Washington Housing Finance Commission Nonprofit Housing Rev. (Wesley Homes at Lea Hill Project), 5%, 7/01/2051 (z) | | | 3,635,000 | 2,871,510 |
| Washington State Housing Finance Commission Municipal Certificates, “A”, 3.5%, 12/01/2035 | | | 17,111,443 | 16,112,419 |
| Washington State Housing Finance Commission Municipal Certificates, “X”, 0.725%, 12/20/2035 (i) | | | 66,449,615 | 3,040,768 |
| Washington State Housing Finance Commission Non-Profit Refunding Rev. (Seattle Academy of Arts and Sciences Project), 6.375%, 7/01/2063 (n) | | | 3,690,000 | 4,044,563 |
| Washington State Housing Finance Commission, Non-Profit Housing Rev. (Emerald Heights Project), “A”, 5%, 7/01/2043 | | | 920,000 | 945,399 |
| Washington State Housing Finance Commission, Non-Profit Housing Rev. (Emerald Heights Project), “A”, 5%, 7/01/2048 | | | 810,000 | 819,953 |
| | | | | $83,015,831 |
Portfolio of Investments – continued
| Issuer | | | Shares/Par | Value ($) |
| Municipal Bonds - continued |
| West Virginia - 0.5% |
| Monongalia County, WV, Commission Special District Excise Tax Refunding & Improvement Rev. (University Town Centre Economic Opportunity Development District), “A”, 4.125%, 6/01/2043 (n) | | $ | 1,430,000 | $1,304,012 |
| Monongalia County, WV, Special District Excise Tax Rev. (University Town Centre Economic Opportunity Development District), “A”, 7%, 6/01/2043 (n) | | | 1,934,000 | 2,082,382 |
| Monongalia County, WV, Special District Excise Tax Rev. (University Town Centre Economic Opportunity Development District), “B”, 4.875%, 6/01/2043 (n) | | | 3,660,000 | 3,603,076 |
| Monongalia County, WV, Special District Excise Tax Rev. (University Town Centre Economic Opportunity Development District), Convertible Capital Appreciation, “B”, 0% to 6/01/2043, 8.00% to 6/01/2053 (n) | | | 13,607,000 | 3,055,694 |
| Ohio County, WV, Commission Tax Increment Rev. (Fort Henry Centre), 4.75%, 6/01/2031 | | | 1,000,000 | 999,980 |
| West Virginia Hospital Finance Authority Hospital Rev. (Charleston Area Medical Center, Inc.), “A”, 5%, 9/01/2038 | | | 1,160,000 | 1,201,974 |
| West Virginia Hospital Finance Authority Hospital Rev. (Charleston Area Medical Center, Inc.), “A”, 5%, 9/01/2039 | | | 350,000 | 361,176 |
| West Virginia Hospital Finance Authority Hospital Rev. (West Virginia University Health System Obligated Group), “A”, AGM, 4%, 6/01/2051 | | | 6,660,000 | 6,400,612 |
| West Virginia Housing Development Fund, “A”, FHA, 3.75%, 11/01/2038 | | | 585,000 | 566,709 |
| | | | | $19,575,615 |
| Wisconsin - 7.0% |
| Wisconsin Center District Junior Dedicated Tax Rev., Capital Appreciation, “D”, AGM, 0%, 12/15/2032 | | $ | 725,000 | $534,835 |
| Wisconsin Center District Junior Dedicated Tax Rev., Capital Appreciation, “D”, AGM, 0%, 12/15/2033 | | | 1,105,000 | 782,865 |
| Wisconsin Center District Junior Dedicated Tax Rev., Capital Appreciation, “D”, AGM, 0%, 12/15/2034 | | | 1,050,000 | 713,271 |
| Wisconsin Center District Junior Dedicated Tax Rev., Capital Appreciation, “D”, AGM, 0%, 12/15/2035 | | | 1,580,000 | 1,023,023 |
| Wisconsin Center District Junior Dedicated Tax Rev., Capital Appreciation, “D”, AGM, 0%, 12/15/2036 | | | 1,620,000 | 992,495 |
| Wisconsin Center District Junior Dedicated Tax Rev., Capital Appreciation, “D”, AGM, 0%, 12/15/2037 | | | 2,630,000 | 1,526,680 |
| Wisconsin Center District Junior Dedicated Tax Rev., Capital Appreciation, “D”, AGM, 0%, 12/15/2038 | | | 2,845,000 | 1,560,879 |
Portfolio of Investments – continued
| Issuer | | | Shares/Par | Value ($) |
| Municipal Bonds - continued |
| Wisconsin - continued |
| Wisconsin Center District Junior Dedicated Tax Rev., Capital Appreciation, “D”, AGM, 0%, 12/15/2039 | | $ | 3,095,000 | $1,620,636 |
| Wisconsin Center District Junior Dedicated Tax Rev., Capital Appreciation, “D”, AGM, 0%, 12/15/2040 | | | 1,340,000 | 660,711 |
| Wisconsin Center District Senior Dedicated Tax Rev., Capital Appreciation, “C”, AGM, 0%, 12/15/2031 | | | 545,000 | 414,573 |
| Wisconsin Center District Senior Dedicated Tax Rev., Capital Appreciation, “C”, AGM, 0%, 12/15/2032 | | | 740,000 | 541,163 |
| Wisconsin Center District Senior Dedicated Tax Rev., Capital Appreciation, “C”, AGM, 0%, 12/15/2033 | | | 710,000 | 498,164 |
| Wisconsin Center District Senior Dedicated Tax Rev., Capital Appreciation, “C”, AGM, 0%, 12/15/2034 | | | 655,000 | 440,220 |
| Wisconsin Center District Senior Dedicated Tax Rev., Capital Appreciation, “C”, AGM, 0%, 12/15/2035 | | | 840,000 | 537,586 |
| Wisconsin Center District Senior Dedicated Tax Rev., Capital Appreciation, “C”, AGM, 0%, 12/15/2036 | | | 815,000 | 493,047 |
| Wisconsin Center District Senior Dedicated Tax Rev., Capital Appreciation, “C”, AGM, 0%, 12/15/2037 | | | 815,000 | 466,708 |
| Wisconsin Center District Senior Dedicated Tax Rev., Capital Appreciation, “C”, AGM, 0%, 12/15/2038 | | | 840,000 | 454,192 |
| Wisconsin Center District Senior Dedicated Tax Rev., Capital Appreciation, “C”, AGM, 0%, 12/15/2039 | | | 790,000 | 407,287 |
| Wisconsin Center District Senior Dedicated Tax Rev., Capital Appreciation, “C”, AGM, 0%, 12/15/2040 | | | 195,000 | 94,573 |
| Wisconsin Health & Educational Facilities Authority Refunding Rev. (American Baptist Homes), 5%, 8/01/2027 | | | 1,760,000 | 1,650,903 |
| Wisconsin Health & Educational Facilities Authority Refunding Rev. (American Baptist Homes), 5%, 8/01/2032 | | | 2,315,000 | 1,984,856 |
| Wisconsin Health & Educational Facilities Authority Refunding Rev. (American Baptist Homes), 5%, 8/01/2037 | | | 1,265,000 | 1,010,435 |
| Wisconsin Health & Educational Facilities Authority Refunding Rev. (American Baptist Homes), 5%, 8/01/2039 | | | 1,315,000 | 1,013,699 |
| Wisconsin Health & Educational Facilities Authority Refunding Rev. (Saint John's Communities, Inc.), 4%, 9/15/2036 | | | 530,000 | 481,279 |
| Wisconsin Health & Educational Facilities Authority Refunding Rev. (Saint John's Communities, Inc.), 4%, 9/15/2036 | | | 800,000 | 726,459 |
| Wisconsin Health & Educational Facilities Authority Refunding Rev. (Saint John's Communities, Inc.), 4%, 9/15/2041 | | | 770,000 | 654,661 |
| Wisconsin Health & Educational Facilities Authority Refunding Rev. (Saint John's Communities, Inc.), 4%, 9/15/2045 | | | 650,000 | 519,827 |
| Wisconsin Health & Educational Facilities Authority Rev. (American Baptist Homes of the Midwest Obligated Group), 4.375%, 8/01/2027 | | | 100,000 | 91,893 |
Portfolio of Investments – continued
| Issuer | | | Shares/Par | Value ($) |
| Municipal Bonds - continued |
| Wisconsin - continued |
| Wisconsin Health & Educational Facilities Authority Rev. (Benevolent Corp. Cedar Community), 5%, 6/01/2037 | | $ | 1,110,000 | $1,046,936 |
| Wisconsin Health & Educational Facilities Authority Rev. (Benevolent Corp. Cedar Community), 5%, 6/01/2041 | | | 1,910,000 | 1,721,013 |
| Wisconsin Health & Educational Facilities Authority Rev. (Cedar Crest, Inc. Project), 5.125%, 4/01/2057 | | | 13,945,000 | 11,003,527 |
| Wisconsin Health & Educational Facilities Authority Rev. (Marshfield Clinic Health System, Inc.), “C”, 5%, 2/15/2047 | | | 675,000 | 675,223 |
| Wisconsin Health & Educational Facilities Authority Rev. (Milwaukee Science Education Consortium, Inc.), “A”, 4.75%, 3/15/2043 | | | 465,000 | 460,735 |
| Wisconsin Health & Educational Facilities Authority Rev. (Milwaukee Science Education Consortium, Inc.), “A”, 5%, 3/15/2053 | | | 460,000 | 449,109 |
| Wisconsin Health & Educational Facilities Authority Rev. (Oakwood Lutheran Senior Ministries), 4%, 1/01/2037 | | | 2,085,000 | 1,594,378 |
| Wisconsin Health & Educational Facilities Authority Rev. (Oakwood Lutheran Senior Ministries), 4%, 1/01/2047 | | | 2,685,000 | 1,708,005 |
| Wisconsin Health & Educational Facilities Authority Rev. (Oakwood Lutheran Senior Ministries), 4%, 1/01/2057 | | | 4,580,000 | 2,646,183 |
| Wisconsin Health & Educational Facilities Authority Rev. (Sauk-Prairie Memorial Hospital), 5.25%, 2/01/2043 | | | 4,870,000 | 4,490,344 |
| Wisconsin Health & Educational Facilities Authority Rev. (Sauk-Prairie Memorial Hospital), “A”, 5.125%, 2/01/2038 | | | 5,110,000 | 4,810,442 |
| Wisconsin Health & Educational Facilities Authority Rev. (St. Camillus Health System, Inc.), “A”, 5%, 11/01/2039 | | | 1,060,000 | 924,484 |
| Wisconsin Health & Educational Facilities Authority Rev. (St. Camillus Health System, Inc.), “A”, 5%, 11/01/2046 | | | 1,995,000 | 1,623,590 |
| Wisconsin Health & Educational Facilities Authority Rev. (St. Camillus Health System, Inc.), “A”, 5%, 11/01/2054 | | | 11,510,000 | 8,961,079 |
| Wisconsin Housing & Economic Development Authority Home Ownership, “D”, 4%, 3/01/2047 | | | 3,310,000 | 3,300,319 |
| Wisconsin Public Finance Authority Affordable Housing Multi-Family Certificates, “B-1”, 7.125%, 7/25/2034 | | | 6,705,000 | 6,979,338 |
| Wisconsin Public Finance Authority Airport Facilities Rev. (Transportation Infrastructure Properties LLC), “B”, 5%, 7/01/2042 | | | 17,855,000 | 17,858,764 |
| Wisconsin Public Finance Authority Airport Facilities Rev. (Transportation Infrastructure Properties LLC), “C”, 5%, 7/01/2042 | | | 2,870,000 | 2,870,605 |
| Wisconsin Public Finance Authority Charter School Rev. (Alamance Community School Project), “A”, 4.25%, 6/15/2031 (n) | | | 170,000 | 158,136 |
Portfolio of Investments – continued
| Issuer | | | Shares/Par | Value ($) |
| Municipal Bonds - continued |
| Wisconsin - continued |
| Wisconsin Public Finance Authority Charter School Rev. (Alamance Community School Project), “A”, 5%, 6/15/2041 (n) | | $ | 515,000 | $459,359 |
| Wisconsin Public Finance Authority Charter School Rev. (Alamance Community School Project), “A”, 6.5%, 6/15/2043 | | | 1,030,000 | 1,061,939 |
| Wisconsin Public Finance Authority Charter School Rev. (Alamance Community School Project), “A”, 5%, 6/15/2051 (n) | | | 930,000 | 766,901 |
| Wisconsin Public Finance Authority Charter School Rev. (Alamance Community School Project), “A”, 7%, 6/15/2053 | | | 1,105,000 | 1,156,190 |
| Wisconsin Public Finance Authority Charter School Rev. (Alamance Community School Project), “A”, 5%, 6/15/2056 (n) | | | 900,000 | 719,446 |
| Wisconsin Public Finance Authority Charter School Rev. (Alamance Community School Project), “A”, 7%, 6/15/2058 | | | 1,400,000 | 1,452,375 |
| Wisconsin Public Finance Authority Charter School Rev. (Eno River Academy Project), “A”, 4%, 6/15/2030 (n) | | | 475,000 | 460,929 |
| Wisconsin Public Finance Authority Charter School Rev. (Eno River Academy Project), “A”, 5%, 6/15/2040 (n) | | | 815,000 | 798,010 |
| Wisconsin Public Finance Authority Charter School Rev. (Eno River Academy Project), “A”, 5%, 6/15/2054 (n) | | | 1,380,000 | 1,270,983 |
| Wisconsin Public Finance Authority Charter School Rev. (Unity Classical Charter School; A Challenge Foundation Academy), 5.75%, 7/01/2033 (n) | | | 485,000 | 498,568 |
| Wisconsin Public Finance Authority Charter School Rev. (Unity Classical Charter School; A Challenge Foundation Academy), 6.625%, 7/01/2043 (n) | | | 1,000,000 | 1,027,455 |
| Wisconsin Public Finance Authority Charter School Rev. (Unity Classical Charter School; A Challenge Foundation Academy), 6.875%, 7/01/2053 (n) | | | 1,650,000 | 1,694,935 |
| Wisconsin Public Finance Authority Charter School Rev. (Unity Classical Charter School; A Challenge Foundation Academy), 7%, 7/01/2058 (n) | | | 1,130,000 | 1,160,352 |
| Wisconsin Public Finance Authority Education Facilities Rev. (Piedmont Community Charter School), 5%, 6/15/2039 | | | 285,000 | 286,066 |
| Wisconsin Public Finance Authority Education Facilities Rev. (Piedmont Community Charter School), 5%, 6/15/2049 | | | 865,000 | 827,230 |
| Wisconsin Public Finance Authority Education Facilities Rev. (Piedmont Community Charter School), 5%, 6/15/2053 | | | 580,000 | 545,369 |
| Wisconsin Public Finance Authority Education Rev. (Mountain Island Charter School), 5%, 7/01/2037 | | | 665,000 | 665,491 |
| Wisconsin Public Finance Authority Education Rev. (Mountain Island Charter School), 5%, 7/01/2047 | | | 1,015,000 | 973,412 |
| Wisconsin Public Finance Authority Education Rev. (Pine Lake Preparatory), 4.95%, 3/01/2030 (n) | | | 1,025,000 | 1,033,650 |
Portfolio of Investments – continued
| Issuer | | | Shares/Par | Value ($) |
| Municipal Bonds - continued |
| Wisconsin - continued |
| Wisconsin Public Finance Authority Education Rev. (Pine Lake Preparatory), 5.25%, 3/01/2035 (n) | | $ | 1,005,000 | $1,016,833 |
| Wisconsin Public Finance Authority Education Rev. (Signature Preparatory), “A”, 5%, 6/15/2041 (n) | | | 1,945,000 | 1,750,371 |
| Wisconsin Public Finance Authority Education Rev. (Signature Preparatory), “A”, 5%, 6/15/2051 (n) | | | 2,435,000 | 2,077,650 |
| Wisconsin Public Finance Authority Education Rev. (Triad Educational Services, Inc.), 5%, 6/15/2042 | | | 520,000 | 503,622 |
| Wisconsin Public Finance Authority Education Rev. (Triad Educational Services, Inc.), 5.5%, 6/15/2050 | | | 675,000 | 668,178 |
| Wisconsin Public Finance Authority Education Rev. (Triad Educational Services, Inc.), 5.25%, 6/15/2052 | | | 735,000 | 697,109 |
| Wisconsin Public Finance Authority Education Rev. (Triad Educational Services, Inc.), 5.375%, 6/15/2057 | | | 705,000 | 677,370 |
| Wisconsin Public Finance Authority Education Rev. (Triad Educational Services, Inc.), 5.5%, 6/15/2062 | | | 1,100,000 | 1,068,056 |
| Wisconsin Public Finance Authority Education Rev. (Wilson Preparatory Academy), “A”, 4.125%, 6/15/2029 (n) | | | 395,000 | 378,162 |
| Wisconsin Public Finance Authority Education Rev. (Wilson Preparatory Academy), “A”, 5%, 6/15/2039 (n) | | | 500,000 | 483,313 |
| Wisconsin Public Finance Authority Education Rev. (Wilson Preparatory Academy), “A”, 5%, 6/15/2049 (n) | | | 1,100,000 | 1,002,787 |
| Wisconsin Public Finance Authority Educational Facilities Rev. (Community School of Davidson Project), 5%, 10/01/2033 (n) | | | 670,000 | 667,923 |
| Wisconsin Public Finance Authority Educational Facilities Rev. (Community School of Davidson Project), 5%, 10/01/2048 (n) | | | 3,265,000 | 3,092,147 |
| Wisconsin Public Finance Authority Entrance Fee Principal Redemption Accredited Rev. (Searstone CCRC Project), “B2”, 2.25%, 6/01/2027 (n) | | | 2,165,000 | 2,040,143 |
| Wisconsin Public Finance Authority Entrance Fee Principal Redemption Accredited Rev., Taxable (Searstone CCRC Project), “C”, 2.75%, 6/01/2026 (n) | | | 1,295,000 | 1,278,836 |
| Wisconsin Public Finance Authority Healthcare Facility Rev. (Appalachian Regional Healthcare System Obligated Group), “A”, 5%, 7/01/2039 | | | 500,000 | 511,453 |
| Wisconsin Public Finance Authority Healthcare Facility Rev. (Appalachian Regional Healthcare System Obligated Group), “A”, 4%, 7/01/2046 | | | 2,200,000 | 1,825,519 |
| Wisconsin Public Finance Authority Healthcare Facility Rev. (Blue Ridge Healthcare), “A”, 4%, 1/01/2045 | | | 715,000 | 681,838 |
| Wisconsin Public Finance Authority Healthcare Facility Rev. (Church Home of Hartford, Inc. Project), “A”, 5%, 9/01/2025 (n) | | | 245,000 | 244,365 |
Portfolio of Investments – continued
| Issuer | | | Shares/Par | Value ($) |
| Municipal Bonds - continued |
| Wisconsin - continued |
| Wisconsin Public Finance Authority Healthcare Facility Rev. (Church Home of Hartford, Inc. Project), “A”, 5%, 9/01/2030 (n) | | $ | 920,000 | $901,297 |
| Wisconsin Public Finance Authority Healthcare Facility Rev. (Church Home of Hartford, Inc. Project), “A”, 5%, 9/01/2038 (n) | | | 1,215,000 | 1,114,560 |
| Wisconsin Public Finance Authority Higher Education Facilities Rev. (Gannon University Project), 5%, 5/01/2042 | | | 595,000 | 588,695 |
| Wisconsin Public Finance Authority Higher Education Facilities Rev. (Gannon University Project), 5%, 5/01/2047 | | | 650,000 | 622,604 |
| Wisconsin Public Finance Authority Hotel & Conference Center Facilities Rev. (Foundation of the University of North Carolina at Charlotte, Inc.), “A”, 4%, 9/01/2036 (n) | | | 2,040,000 | 1,880,248 |
| Wisconsin Public Finance Authority Hotel & Conference Center Facilities Rev. (Foundation of the University of North Carolina at Charlotte, Inc.), “A”, 4%, 9/01/2041 (n) | | | 1,860,000 | 1,575,482 |
| Wisconsin Public Finance Authority Hotel & Conference Center Facilities Rev. (Foundation of the University of North Carolina at Charlotte, Inc.), “A”, 4%, 9/01/2051 (n) | | | 5,480,000 | 4,189,009 |
| Wisconsin Public Finance Authority Hotel & Conference Center Facilities Rev. (Foundation of the University of North Carolina at Charlotte, Inc.), “A”, 4%, 9/01/2056 (n) | | | 2,665,000 | 1,970,423 |
| Wisconsin Public Finance Authority Limited Obligation Grant Rev. (American Dream at Meadowlands Project), “A”, 6.25%, 8/01/2027 (a)(d)(n) | | | 27,380,000 | 21,356,400 |
| Wisconsin Public Finance Authority Limited Obligation Grant Rev., Taxable (American Dream at Meadowlands Project), ”A“, 5.625%, 8/01/2024 (a)(d)(n) | | | 5,730,000 | 4,469,400 |
| Wisconsin Public Finance Authority Limited Obligation PILOT Rev. (American Dream at Meadowlands Project), 6.5%, 12/01/2037 (n) | | | 8,355,000 | 7,697,735 |
| Wisconsin Public Finance Authority Limited Obligation PILOT Rev. (American Dream at Meadowlands Project), 7%, 12/01/2050 | | | 7,930,000 | 7,421,658 |
| Wisconsin Public Finance Authority Retirement Communities Rev. (Acts Retirement-Life Communities, Inc. Obligated Group), “A”, 5%, 11/15/2041 | | | 1,115,000 | 1,161,111 |
| Wisconsin Public Finance Authority Retirement Facilities First Mortgage Rev. (Galloway Ridge Project), “A”, 6.875%, 1/01/2043 | | | 5,125,000 | 5,245,228 |
| Wisconsin Public Finance Authority Retirement Facilities First Mortgage Rev. (United Methodist Retirement Homes), “A”, 4%, 10/01/2041 | | | 265,000 | 231,872 |
Portfolio of Investments – continued
| Issuer | | | Shares/Par | Value ($) |
| Municipal Bonds - continued |
| Wisconsin - continued |
| Wisconsin Public Finance Authority Retirement Facilities First Mortgage Rev. (United Methodist Retirement Homes), “A”, 4%, 10/01/2046 | | $ | 360,000 | $297,004 |
| Wisconsin Public Finance Authority Retirement Facilities First Mortgage Rev. (United Methodist Retirement Homes), “A”, 4%, 10/01/2051 | | | 1,010,000 | 800,722 |
| Wisconsin Public Finance Authority Retirement Facilities Rev. (Penick Village), 5%, 9/01/2039 (n) | | | 770,000 | 657,856 |
| Wisconsin Public Finance Authority Retirement Facilities Rev. (Penick Village), 5%, 9/01/2049 (z) | | | 1,455,000 | 1,120,631 |
| Wisconsin Public Finance Authority Retirement Facilities Rev. (Penick Village), 5%, 9/01/2054 (z) | | | 1,365,000 | 1,025,219 |
| Wisconsin Public Finance Authority Rev. (McLemore Hotel & Conference Center), “B”, 6.5%, 6/01/2056 (n) | | | 6,165,000 | 5,187,884 |
| Wisconsin Public Finance Authority Rev. (Obligated Group of National Senior Communities, Inc.), 4%, 1/01/2047 | | | 360,000 | 317,602 |
| Wisconsin Public Finance Authority Rev. (Obligated Group of National Senior Communities, Inc.), 4%, 1/01/2052 | | | 490,000 | 418,318 |
| Wisconsin Public Finance Authority Rev. (Roseman University of Health Sciences Project), 5%, 4/01/2030 (n) | | | 600,000 | 607,528 |
| Wisconsin Public Finance Authority Rev. (Roseman University of Health Sciences Project), 4%, 4/01/2032 (n) | | | 915,000 | 867,175 |
| Wisconsin Public Finance Authority Rev. (Roseman University of Health Sciences Project), 5.75%, 4/01/2035 | | | 2,805,000 | 2,837,776 |
| Wisconsin Public Finance Authority Rev. (Roseman University of Health Sciences Project), 5%, 4/01/2040 (Prerefunded 4/01/1930) (n) | | | 95,000 | 107,784 |
| Wisconsin Public Finance Authority Rev. (Roseman University of Health Sciences Project), 5%, 4/01/2040 (n) | | | 1,055,000 | 1,023,073 |
| Wisconsin Public Finance Authority Rev. (Roseman University of Health Sciences Project), 4%, 4/01/2042 (n) | | | 1,000,000 | 829,006 |
| Wisconsin Public Finance Authority Rev. (Roseman University of Health Sciences Project), 5%, 4/01/2050 (Prerefunded 4/01/1930) (n) | | | 100,000 | 113,457 |
| Wisconsin Public Finance Authority Rev. (Roseman University of Health Sciences Project), 5%, 4/01/2050 (n) | | | 1,900,000 | 1,732,147 |
| Wisconsin Public Finance Authority Rev. (Roseman University of Health Sciences Project), 4%, 4/01/2052 (n) | | | 1,950,000 | 1,465,638 |
| Wisconsin Public Finance Authority Rev. (Roseman University of Health Sciences Project), 4%, 4/01/2052 (Prerefunded 4/01/1932) (n) | | | 105,000 | 116,254 |
| Wisconsin Public Finance Authority Rev., Subordinate-Social Certificates, “B-1”, 4%, 12/28/2044 (n) | | | 13,297,280 | 10,652,744 |
Portfolio of Investments – continued
| Issuer | | | Shares/Par | Value ($) |
| Municipal Bonds - continued |
| Wisconsin - continued |
| Wisconsin Public Finance Authority Senior Living Refunding Bonds Rev. (Mary's Woods at Marylhurst Project), “A”, 5.25%, 5/15/2037 (n) | | $ | 2,415,000 | $2,336,311 |
| Wisconsin Public Finance Authority Senior Living Refunding Bonds Rev. (Mary's Woods at Marylhurst Project), “A”, 5.25%, 5/15/2042 (n) | | | 4,080,000 | 3,819,999 |
| Wisconsin Public Finance Authority Senior Living Refunding Bonds Rev. (Mary's Woods at Marylhurst Project), “A”, 5.25%, 5/15/2047 (n) | | | 4,360,000 | 3,937,008 |
| Wisconsin Public Finance Authority Senior Living Refunding Bonds Rev. (Mary's Woods at Marylhurst Project), “A”, 5.25%, 5/15/2052 (n) | | | 10,880,000 | 9,613,379 |
| Wisconsin Public Finance Authority Senior Living Rev. (Rose Villa Project), “A”, 5.125%, 11/15/2029 (n) | | | 1,905,000 | 1,926,958 |
| Wisconsin Public Finance Authority Senior Living Rev. (Rose Villa Project), “A”, 5.5%, 11/15/2034 (n) | | | 1,730,000 | 1,754,918 |
| Wisconsin Public Finance Authority Senior Living Rev. (Rose Villa Project), “A”, 5.75%, 11/15/2044 (n) | | | 1,685,000 | 1,712,501 |
| Wisconsin Public Finance Authority Senior Living Rev. (Rose Villa Project), “A”, 6%, 11/15/2049 (n) | | | 3,465,000 | 3,527,386 |
| Wisconsin Public Finance Authority Senior Secured Rev. (McLemore Hotel & Conference Center), “A”, 4.5%, 6/01/2056 (n) | | | 17,295,000 | 13,616,762 |
| Wisconsin Public Finance Authority Student Housing Rev. (Beyond Boone LLC - Appalachian State University Project), “A”, AGM, 5%, 7/01/2044 | | | 520,000 | 539,441 |
| Wisconsin Public Finance Authority Student Housing Rev. (Beyond Boone LLC - Appalachian State University Project), “A”, AGM, 4%, 7/01/2045 | | | 995,000 | 976,235 |
| Wisconsin Public Finance Authority Student Housing Rev. (Beyond Boone LLC - Appalachian State University Project), “A”, AGM, 4%, 7/01/2050 | | | 855,000 | 818,220 |
| Wisconsin Public Finance Authority Student Housing Rev. (Beyond Boone LLC - Appalachian State University Project), “A”, AGM, 4%, 7/01/2055 | | | 965,000 | 909,563 |
| Wisconsin Public Finance Authority Student Housing Rev. (CHF - Manoa LLC UH Residences for Graduate Students), “A”, 5.75%, 7/01/2053 (n) | | | 4,100,000 | 4,348,183 |
| Wisconsin Public Finance Authority Student Housing Rev. (CHF - Manoa LLC UH Residences for Graduate Students), “A”, 5.75%, 7/01/2063 (n) | | | 1,575,000 | 1,658,361 |
Portfolio of Investments – continued
| Issuer | | | Shares/Par | Value ($) |
| Municipal Bonds - continued |
| Wisconsin - continued |
| Wisconsin Public Finance Authority Student Housing Rev. (CHF - Manoa LLC UH Residences for Graduate Students), “B”, 6.75%, 7/01/2063 (n) | | $ | 5,080,000 | $5,324,607 |
| Wisconsin Public Finance Authority Student Housing Rev. (NC A&T Real Estate Foundation LLC Project), “B”, 5%, 6/01/2034 | | | 2,380,000 | 2,455,360 |
| Wisconsin Public Finance Authority Student Housing Rev. (NC A&T Real Estate Foundation LLC Project), “B”, 5%, 6/01/2039 | | | 1,490,000 | 1,506,763 |
| Wisconsin Public Finance Authority Student Housing Rev. (NC A&T Real Estate Foundation LLC Project), “B”, 5%, 6/01/2044 | | | 1,770,000 | 1,771,377 |
| Wisconsin Public Finance Authority Student Housing Rev. (NC A&T Real Estate Foundation LLC Project), “B”, 5%, 6/01/2049 | | | 2,540,000 | 2,472,050 |
| Wisconsin Public Finance Authority Student Housing Rev. (University of Hawai'i Foundation Project), “A-1”, 4%, 7/01/2041 (n) | | | 365,000 | 321,326 |
| Wisconsin Public Finance Authority Student Housing Rev. (University of Hawai'i Foundation Project), “A-1”, 4%, 7/01/2051 (n) | | | 1,835,000 | 1,501,264 |
| Wisconsin Public Finance Authority Student Housing Rev. (University of Hawai'i Foundation Project), “A-1”, 4%, 7/01/2061 (n) | | | 3,235,000 | 2,527,503 |
| Wisconsin Public Finance Authority Student Housing Rev. (University of Hawai'i Foundation Project), “B”, 5.25%, 7/01/2061 (n) | | | 1,795,000 | 1,511,720 |
| Wisconsin Public Finance Authority Student Housing Rev. (Western Carolina University Project), 5.25%, 7/01/2047 | | | 2,480,000 | 2,434,853 |
| Wisconsin Public Finance Authority Student Housing Rev., Taxable (University of Hawai'i Foundation Project), “A-2”, 4.85%, 7/01/2031 (n) | | | 365,000 | 321,079 |
| Wisconsin Public Finance Authority Student Housing Rev., Taxable (University of Hawai'i Foundation Project), “A-2”, 5.35%, 7/01/2040 (n) | | | 1,575,000 | 1,281,719 |
| Wisconsin Public Finance Authority, Air Cargo Obligated Group Rev. (AFCO Airport Real Estate Group), 5.5%, 7/01/2035 | | | 1,295,000 | 1,470,180 |
| Wisconsin Public Finance Authority, Air Cargo Obligated Group Rev. (AFCO Airport Real Estate Group), 5.5%, 7/01/2038 | | | 1,140,000 | 1,258,900 |
| Wisconsin Public Finance Authority, Air Cargo Obligated Group Rev. (AFCO Airport Real Estate Group), 5.25%, 7/01/2053 | | | 1,000,000 | 1,021,741 |
| | | | | $301,982,672 |
| Total Municipal Bonds (Identified Cost, $4,451,199,534) | | $4,066,579,375 |
Portfolio of Investments – continued
| Issuer | | | Shares/Par | Value ($) |
| Bonds – 0.8% |
| Consumer Services – 0.7% | |
| Toll Road Investors Partnership II LP, Capital Appreciation, NPFG, 0%, 2/15/2025 (n) | | $ | 8,970,000 | $8,342,459 |
| Toll Road Investors Partnership II LP, Capital Appreciation, NPFG, 0%, 2/15/2026 (n) | | | 8,338,000 | 7,231,690 |
| Toll Road Investors Partnership II LP, Capital Appreciation, NPFG, 0%, 2/15/2027 (n) | | | 1,149,000 | 926,696 |
| Toll Road Investors Partnership II LP, Capital Appreciation, NPFG, 0%, 2/15/2028 (n) | | | 2,923,000 | 2,192,931 |
| Toll Road Investors Partnership II LP, Capital Appreciation, NPFG, 0%, 2/15/2033 (n) | | | 4,735,000 | 2,439,620 |
| Toll Road Investors Partnership II LP, Capital Appreciation, NPFG, 0%, 2/15/2043 (n) | | | 32,524,990 | 9,900,607 |
| | | $31,034,003 |
| Medical & Health Technology & Services – 0.1% | |
| ProMedica Toledo Hospital, “B”, 5.325%, 11/15/2028 | | $ | 2,215,000 | $2,054,413 |
| Total Bonds (Identified Cost, $36,765,881) | | $33,088,416 |
| Other Municipal Bonds – 0.7% |
| Multi-Family Housing Revenue – 0.7% | |
| Affordable Housing Opportunities Trust Certificates, AH-01 “CL A”, 3.528%, 5/01/2039 (n) | | $ | 8,110,000 | $6,820,076 |
| Affordable Housing Pass-Thru Trust Certificates, 6%, 10/05/2040 | | | 11,063,429 | 11,342,081 |
| FRETE 2021-ML10 Trust, “X-CA”, FHLMC, 1.578%, 6/25/2038 (i)(n) | | | 29,837,684 | 3,454,974 |
| FRETE 2021-ML10 Trust, “X-US”, FHLMC, 2.127%, 1/25/2038 (i)(n) | | | 28,147,676 | 4,348,929 |
| FRETE 2021-ML12 Trust, “X-US”, FHLMC, 1.303%, 7/25/2041 (i)(n) | | | 17,400,291 | 1,697,026 |
| FRETE 2022-ML13 Trust, “X-CA”, 0.961%, 7/25/2036 (i) | | | 37,721,932 | 2,173,010 |
| Total Other Municipal Bonds (Identified Cost, $30,417,755) | | $29,836,096 |
| Contingent Value Instruments - 0.1% |
| General Obligations - General Purpose – 0.1% | |
| Commonwealth of Puerto Rico, General Obligation Contingent Value Instrument, 11/01/2043 (Identified Cost, $7,037,428) | | $ | 11,757,963 | $6,510,972 |
Portfolio of Investments – continued
| Issuer | | | Shares/Par | Value ($) |
| Investment Companies (h) - 3.2% |
| Money Market Funds – 3.2% | |
| MFS Institutional Money Market Portfolio, 5.4% (v) (Identified Cost, $136,799,602) | | | 136,792,239 | $136,805,918 |
|
|
| Other Assets, Less Liabilities - 0.7% | | 31,490,383 |
| Net Assets - 100.0% | | $4,304,311,160 |
| (a) | Non-income producing security. |
| (d) | In default. |
| (h) | An affiliated issuer, which may be considered one in which the fund owns 5% or more of the outstanding voting securities, or a company which is under common control. At period end, the aggregate values of the fund's investments in affiliated issuers and in unaffiliated issuers were $136,805,918 and $4,136,014,859, respectively. |
| (i) | Interest only security for which the fund receives interest on notional principal (Par amount). Par amount shown is the notional principal and does not reflect the cost of the security. |
| (n) | Securities exempt from registration under Rule 144A of the Securities Act of 1933. These securities may be sold in the ordinary course of business in transactions exempt from registration, normally to qualified institutional buyers. At period end, the aggregate value of these securities was $1,034,080,745, representing 24.0% of net assets. |
| (q) | Interest received was less than stated coupon rate. |
| (u) | Underlying security deposited into special purpose trust upon creation of self-deposited inverse floaters. |
| (v) | Affiliated issuer that is available only to investment companies managed by MFS. The rate quoted for the MFS Institutional Money Market Portfolio is the annualized seven-day yield of the fund at period end. |
| (w) | When-issued security. |
| (z) | Restricted securities are not registered under the Securities Act of 1933 and are subject to legal restrictions on resale. These securities generally may be resold in transactions exempt from registration or to the public if the securities are subsequently registered. Disposal of these securities may involve time-consuming negotiations and prompt sale at an acceptable price may be difficult. The fund holds the following restricted securities: |
| Restricted Securities | Acquisition
Date | Cost | Value |
| California Pollution Control Financing Authority, Solid Waste Disposal Rev. (CalPlant I Project), 7.5%, 7/01/2032 | 10/08/2020 | $1,800,000 | $30,375 |
| California Pollution Control Financing Authority, Solid Waste Disposal Rev. (CalPlant I Project), 8%, 7/01/2039 | 5/25/2017-6/01/208 | 11,564,858 | 153,968 |
| California Pollution Control Financing Authority, Solid Waste Disposal Rev. (CalPlant I Project), 7.5%, 12/01/2039 | 7/26/2019 | 11,288,457 | 174,015 |
| Clackamas County, OR, Hospital Facility Authority Senior Living Rev. (Rose Villa Project), “A”, 5.25%, 11/15/2050 | 6/25/2020 | 2,005,621 | 1,835,939 |
Portfolio of Investments – continued
| Restricted Securities - continued | Acquisition
Date | Cost | Value |
| Clackamas County, OR, Hospital Facility Authority Senior Living Rev. (Rose Villa Project), “A”, 5.375%, 11/15/2055 | 6/25/2020 | $3,012,897 | $2,762,754 |
| Collier County, FL, Industrial Development Authority, Continuing Care Community Rev. (Arlington of Naples Project), “A”, 5.5%, 5/15/2025 | 6/30/2015 | 157,475 | 7,229 |
| Collier County, FL, Industrial Development Authority, Continuing Care Community Rev. (Arlington of Naples Project), “A”, 6.25%, 5/15/2035 | 6/30/2015 | 148,141 | 7,229 |
| Collier County, FL, Industrial Development Authority, Continuing Care Community Rev. (Arlington of Naples Project), “A”, 7.75%, 5/15/2035 | 11/15/2017 | 511,428 | 25,175 |
| Collier County, FL, Industrial Development Authority, Continuing Care Community Rev. (Arlington of Naples Project), “A”, 8.125%, 5/15/2044 | 12/16/2013-8/29/2018 | 4,588,344 | 252,701 |
| Collier County, FL, Industrial Development Authority, Continuing Care Community Rev. (Arlington of Naples Project), “A”, 6.5%, 5/15/2049 | 6/30/2015 | 389,165 | 19,399 |
| Illinois Housing Development Authority Rev., “A”, FHLMC, 3.87%, 11/15/2035 | 2/04/2021 | 10,577,669 | 8,462,852 |
| Illinois Housing Development Authority Rev., “B”, FHLMC, 3.87%, 11/15/2035 | 2/04/2021 | 4,313,797 | 3,451,330 |
| Illinois Housing Development Authority Rev., “C”, FHLMC, 3.87%, 11/15/2035 | 2/04/2021 | 4,304,620 | 3,443,987 |
| Illinois Housing Development Authority Rev., “D”, FHLMC, 3.87%, 11/15/2035 | 2/04/2021 | 3,927,959 | 3,142,633 |
| Illinois Housing Development Authority Rev., “E”, FHLMC, 3.87%, 11/15/2035 | 2/04/2021 | 2,704,611 | 2,163,872 |
| Michigan Strategic Fund Ltd. (Canterbury Health Care, Inc.), 5%, 7/01/2046 | 9/30/2016 | 993,268 | 597,195 |
| Michigan Strategic Fund Ltd. (Canterbury Health Care, Inc.), 5%, 7/01/2051 | 9/30/2016 | 886,720 | 514,845 |
| Muscle Shoals, Sheffield, and Tuscumbia, AL, Solid Waste Disposal Authority Rev. (Cherokee Industrial Landfill Project), “A”, 6%, 5/01/2040 | 6/10/2020 | 4,349,310 | 4,543,922 |
| Muscle Shoals, Sheffield, and Tuscumbia, AL, Solid Waste Disposal Authority Rev., Taxable (Cherokee Industrial Landfill Project), “B”, 8%, 5/01/2029 | 6/10/2020 | 1,325,023 | 1,379,598 |
| Washington Housing Finance Commission Nonprofit Housing Refunding Rev. (Hearthstone Project), “A”, 5%, 7/01/2053 | 6/28/2018 | 1,403,500 | 985,355 |
| Washington Housing Finance Commission Nonprofit Housing Rev. (Wesley Homes at Lea Hill Project), 5%, 7/01/2051 | 9/23/2016 | 3,694,374 | 2,871,510 |
Portfolio of Investments – continued
| Restricted Securities - continued | Acquisition
Date | Cost | Value |
| Waterford Township, MI, Economic Development Corp. (Canterbury Health Care, Inc.), “A”, 5%, 7/01/2046 | 9/30/2016 | $2,056,065 | $1,236,194 |
| Waterford Township, MI, Economic Development Corp. (Canterbury Health Care, Inc.), “A”, 5%, 7/01/2051 | 9/30/2016 | 2,039,457 | 1,184,143 |
| Wisconsin Public Finance Authority Retirement Facilities Rev. (Penick Village), 5%, 9/01/2049 | 11/06/2019 | 1,528,813 | 1,120,631 |
| Wisconsin Public Finance Authority Retirement Facilities Rev. (Penick Village), 5%, 9/01/2054 | 11/06/2019 | 1,428,442 | 1,025,219 |
| Total Restricted Securities | | | $41,392,070 |
| % of Net assets | | | 1.0% |
| The following abbreviations are used in this report and are defined: |
| AAC | Ambac Assurance Corp. |
| AGM | Assured Guaranty Municipal |
| BAM | Build America Mutual |
| COP | Certificate of Participation |
| ETM | Escrowed to Maturity |
| FHA | Federal Housing Administration |
| FHLMC | Federal Home Loan Mortgage Corp. |
| FNMA | Federal National Mortgage Assn. |
| GNMA | Government National Mortgage Assn. |
| NPFG | National Public Finance Guarantee Corp. |
| PSF | Permanent School Fund |
See Notes to Financial Statements
Financial Statements
Statement of Assets and Liabilities
At 1/31/24
This statement represents your fund’s balance sheet, which details the assets and liabilities comprising the total value of the fund.
| Assets | |
| Investments in unaffiliated issuers, at value (identified cost, $4,525,420,598) | $4,136,014,859 |
| Investments in affiliated issuers, at value (identified cost, $136,799,602) | 136,805,918 |
| Receivables for | |
| Investments sold | 2,181,670 |
| Fund shares sold | 16,858,261 |
| Interest and dividends | 42,736,587 |
| Receivable from investment adviser | 149,741 |
| Other assets | 12,732 |
| Total assets | $4,334,759,768 |
| Liabilities | |
| Payable to custodian | $37,625 |
| Payables for | |
| Distributions | 1,976,057 |
| When-issued investments purchased | 2,585,972 |
| Fund shares reacquired | 10,303,804 |
| Interest expense and fees | 182,033 |
| Payable to the holders of the floating rate certificates | 14,085,000 |
| Payable to affiliates | |
| Administrative services fee | 3,368 |
| Shareholder servicing costs | 911,912 |
| Distribution and service fees | 3,953 |
| Payable for independent Trustees' compensation | 729 |
| Accrued expenses and other liabilities | 358,155 |
| Total liabilities | $30,448,608 |
| Net assets | $4,304,311,160 |
| Net assets consist of | |
| Paid-in capital | $4,944,694,204 |
| Total distributable earnings (loss) | (640,383,044) |
| Net assets | $4,304,311,160 |
| Shares of beneficial interest outstanding | 588,119,099 |
Statement of Assets and Liabilities – continued
| | Net assets | Shares
outstanding | Net asset value
per share (a) |
| Class A | $1,539,739,599 | 210,298,355 | $7.32 |
| Class B | 1,642,048 | 224,041 | 7.33 |
| Class C | 71,835,643 | 9,800,853 | 7.33 |
| Class I | 1,835,035,511 | 250,774,383 | 7.32 |
| Class R6 | 856,058,359 | 117,021,467 | 7.32 |
| (a) | Maximum offering price per share was equal to the net asset value per share for all share classes, except for Class A, for which the maximum offering price per share was $7.64 [100 / 95.75 x $7.32]. On sales of $100,000 or more, the maximum offering price of Class A shares is reduced. A contingent deferred sales charge may be imposed on redemptions of Class A, Class B, and Class C shares. Redemption price per share was equal to the net asset value per share for Classes I and R6. |
See Notes to Financial Statements
Financial Statements
Statement of Operations
Year ended 1/31/24
This statement describes how much your fund earned in investment income and accrued in expenses. It also describes any gains and/or losses generated by fund operations.
| Net investment income (loss) | |
| Income | |
| Interest | $202,591,551 |
| Dividends from affiliated issuers | 2,871,966 |
| Other | 1,173 |
| Total investment income | $205,464,690 |
| Expenses | |
| Management fee | $22,664,734 |
| Distribution and service fees | 820,465 |
| Shareholder servicing costs | 2,954,172 |
| Administrative services fee | 614,156 |
| Independent Trustees' compensation | 73,670 |
| Custodian fee | 345,632 |
| Shareholder communications | 181,434 |
| Audit and tax fees | 76,745 |
| Legal fees | 246,385 |
| Interest expense and fees | 756,837 |
| Miscellaneous | 327,251 |
| Total expenses | $29,061,481 |
| Fees paid indirectly | (6,520) |
| Reduction of expenses by investment adviser and distributor | (3,255,710) |
| Net expenses | $25,799,251 |
| Net investment income (loss) | $179,665,439 |
| Realized and unrealized gain (loss) |
| Realized gain (loss) (identified cost basis) | |
| Unaffiliated issuers | $(25,161,824) |
| Affiliated issuers | (5,042) |
| Net realized gain (loss) | $(25,166,866) |
| Change in unrealized appreciation or depreciation | |
| Unaffiliated issuers | $(39,743,865) |
| Affiliated issuers | (2,514) |
| Net unrealized gain (loss) | $(39,746,379) |
| Net realized and unrealized gain (loss) | $(64,913,245) |
| Change in net assets from operations | $114,752,194 |
See Notes to Financial Statements
Financial Statements
Statements of Changes in Net Assets
These statements describe the increases and/or decreases in net assets resulting from operations, any distributions, and any shareholder transactions.
| | Year ended |
| | 1/31/24 | 1/31/23 |
| Change in net assets | | |
| From operations | | |
| Net investment income (loss) | $179,665,439 | $189,937,105 |
| Net realized gain (loss) | (25,166,866) | (140,029,078) |
| Net unrealized gain (loss) | (39,746,379) | (605,332,618) |
| Change in net assets from operations | $114,752,194 | $(555,424,591) |
| Total distributions to shareholders | $(190,541,648) | $(200,636,156) |
| Change in net assets from fund share transactions | $(43,666,702) | $(1,635,060,219) |
| Total change in net assets | $(119,456,156) | $(2,391,120,966) |
| Net assets | | |
| At beginning of period | 4,423,767,316 | 6,814,888,282 |
| At end of period | $4,304,311,160 | $4,423,767,316 |
See Notes to Financial Statements
Financial Statements
Financial Highlights
The financial highlights table is intended to help you understand the fund's financial performance for the past 5 years. Certain information reflects financial results for a single fund share. The total returns in the table represent the rate that an investor would have earned (or lost) on an investment in the fund share class (assuming reinvestment of all distributions) held for the entire period.
| Class A | Year ended |
| | 1/31/24 | 1/31/23 | 1/31/22 | 1/31/21 | 1/31/20 |
| Net asset value, beginning of period | $7.44 | $8.42 | $8.62 | $8.66 | $8.09 |
| Income (loss) from investment operations |
| Net investment income (loss) (d) | $0.30 | $0.28 | $0.26 | $0.30 | $0.32 |
| Net realized and unrealized gain (loss) | (0.10) | (0.97) | (0.21) | (0.04) | 0.56 |
| Total from investment operations | $0.20 | $(0.69) | $0.05 | $0.26 | $0.88 |
| Less distributions declared to shareholders |
| From net investment income | $(0.32) | $(0.29) | $(0.25) | $(0.30) | $(0.31) |
| Net asset value, end of period (x) | $7.32 | $7.44 | $8.42 | $8.62 | $8.66 |
| Total return (%) (r)(s)(t)(x) | 2.87 | (8.11) | 0.58 | 3.24 | 11.06 |
Ratios (%) (to average net assets)
and Supplemental data: |
| Expenses before expense reductions (f) | 0.68 | 0.67 | 0.63 | 0.65 | 0.67 |
| Expenses after expense reductions (f) | 0.60 | 0.62 | 0.62 | 0.64 | 0.66 |
| Net investment income (loss) | 4.20 | 3.67 | 2.94 | 3.65 | 3.82 |
| Portfolio turnover | 13 | 18 | 17 | 30 | 12 |
| Net assets at end of period (000 omitted) | $1,539,740 | $1,585,048 | $2,066,744 | $1,971,228 | $1,999,299 |
| Supplemental Ratios (%): |
| Ratios of expenses to average net assets after expense reductions and excluding interest expense and fees (f)(l) | 0.58 | 0.60 | 0.61 | 0.62 | 0.63 |
See Notes to Financial Statements
Financial Highlights – continued
| Class B | Year ended |
| | 1/31/24 | 1/31/23 | 1/31/22 | 1/31/21 | 1/31/20 |
| Net asset value, beginning of period | $7.45 | $8.42 | $8.63 | $8.67 | $8.10 |
| Income (loss) from investment operations |
| Net investment income (loss) (d) | $0.25 | $0.22 | $0.19 | $0.25 | $0.26 |
| Net realized and unrealized gain (loss) | (0.10) | (0.95) | (0.21) | (0.05) | 0.56 |
| Total from investment operations | $0.15 | $(0.73) | $(0.02) | $0.20 | $0.82 |
| Less distributions declared to shareholders |
| From net investment income | $(0.27) | $(0.24) | $(0.19) | $(0.24) | $(0.25) |
| Net asset value, end of period (x) | $7.33 | $7.45 | $8.42 | $8.63 | $8.67 |
| Total return (%) (r)(s)(t)(x) | 2.11 | (8.67) | (0.28) | 2.49 | 10.24 |
Ratios (%) (to average net assets)
and Supplemental data: |
| Expenses before expense reductions (f) | 1.68 | 1.67 | 1.63 | 1.66 | 1.67 |
| Expenses after expense reductions (f) | 1.35 | 1.37 | 1.37 | 1.40 | 1.41 |
| Net investment income (loss) | 3.44 | 2.89 | 2.21 | 3.00 | 3.12 |
| Portfolio turnover | 13 | 18 | 17 | 30 | 12 |
| Net assets at end of period (000 omitted) | $1,642 | $2,792 | $5,096 | $6,519 | $13,733 |
| Supplemental Ratios (%): |
| Ratios of expenses to average net assets after expense reductions and excluding interest expense and fees (f)(l) | 1.33 | 1.35 | 1.36 | 1.38 | 1.38 |
See Notes to Financial Statements
Financial Highlights – continued
| Class C | Year ended |
| | 1/31/24 | 1/31/23 | 1/31/22 | 1/31/21 | 1/31/20 |
| Net asset value, beginning of period | $7.45 | $8.42 | $8.63 | $8.67 | $8.10 |
| Income (loss) from investment operations |
| Net investment income (loss) (d) | $0.23 | $0.20 | $0.17 | $0.22 | $0.24 |
| Net realized and unrealized gain (loss) | (0.10) | (0.95) | (0.21) | (0.04) | 0.56 |
| Total from investment operations | $0.13 | $(0.75) | $(0.04) | $0.18 | $0.80 |
| Less distributions declared to shareholders |
| From net investment income | $(0.25) | $(0.22) | $(0.17) | $(0.22) | $(0.23) |
| Net asset value, end of period (x) | $7.33 | $7.45 | $8.42 | $8.63 | $8.67 |
| Total return (%) (r)(s)(t)(x) | 1.85 | (8.90) | (0.53) | 2.23 | 9.96 |
Ratios (%) (to average net assets)
and Supplemental data: |
| Expenses before expense reductions (f) | 1.68 | 1.67 | 1.63 | 1.66 | 1.67 |
| Expenses after expense reductions (f) | 1.60 | 1.62 | 1.62 | 1.64 | 1.66 |
| Net investment income (loss) | 3.20 | 2.65 | 1.95 | 2.69 | 2.84 |
| Portfolio turnover | 13 | 18 | 17 | 30 | 12 |
| Net assets at end of period (000 omitted) | $71,836 | $92,366 | $148,124 | $167,087 | $242,387 |
| Supplemental Ratios (%): |
| Ratios of expenses to average net assets after expense reductions and excluding interest expense and fees (f)(l) | 1.58 | 1.60 | 1.61 | 1.63 | 1.63 |
See Notes to Financial Statements
Financial Highlights – continued
| Class I | Year ended |
| | 1/31/24 | 1/31/23 | 1/31/22 | 1/31/21 | 1/31/20 |
| Net asset value, beginning of period | $7.44 | $8.41 | $8.62 | $8.66 | $8.09 |
| Income (loss) from investment operations |
| Net investment income (loss) (d) | $0.30 | $0.28 | $0.25 | $0.30 | $0.32 |
| Net realized and unrealized gain (loss) | (0.10) | (0.96) | (0.21) | (0.04) | 0.56 |
| Total from investment operations | $0.20 | $(0.68) | $0.04 | $0.26 | $0.88 |
| Less distributions declared to shareholders |
| From net investment income | $(0.32) | $(0.29) | $(0.25) | $(0.30) | $(0.31) |
| Net asset value, end of period (x) | $7.32 | $7.44 | $8.41 | $8.62 | $8.66 |
| Total return (%) (r)(s)(t)(x) | 2.86 | (8.01) | 0.46 | 3.24 | 11.06 |
Ratios (%) (to average net assets)
and Supplemental data: |
| Expenses before expense reductions (f) | 0.68 | 0.67 | 0.63 | 0.65 | 0.67 |
| Expenses after expense reductions (f) | 0.60 | 0.62 | 0.62 | 0.64 | 0.66 |
| Net investment income (loss) | 4.19 | 3.64 | 2.94 | 3.64 | 3.82 |
| Portfolio turnover | 13 | 18 | 17 | 30 | 12 |
| Net assets at end of period (000 omitted) | $1,835,036 | $1,832,629 | $2,792,475 | $2,831,021 | $2,687,508 |
| Supplemental Ratios (%): |
| Ratios of expenses to average net assets after expense reductions and excluding interest expense and fees (f)(l) | 0.58 | 0.60 | 0.61 | 0.62 | 0.63 |
See Notes to Financial Statements
Financial Highlights – continued
| Class R6 | Year ended |
| | 1/31/24 | 1/31/23 | 1/31/22 | 1/31/21 | 1/31/20 |
| Net asset value, beginning of period | $7.43 | $8.41 | $8.62 | $8.65 | $8.08 |
| Income (loss) from investment operations |
| Net investment income (loss) (d) | $0.31 | $0.28 | $0.26 | $0.31 | $0.33 |
| Net realized and unrealized gain (loss) | (0.10) | (0.96) | (0.21) | (0.03) | 0.56 |
| Total from investment operations | $0.21 | $(0.68) | $0.05 | $0.28 | $0.89 |
| Less distributions declared to shareholders |
| From net investment income | $(0.32) | $(0.30) | $(0.26) | $(0.31) | $(0.32) |
| Net asset value, end of period (x) | $7.32 | $7.43 | $8.41 | $8.62 | $8.65 |
| Total return (%) (r)(s)(t)(x) | 3.09 | (8.06) | 0.54 | 3.44 | 11.16 |
Ratios (%) (to average net assets)
and Supplemental data: |
| Expenses before expense reductions (f) | 0.59 | 0.58 | 0.54 | 0.57 | 0.59 |
| Expenses after expense reductions (f) | 0.52 | 0.54 | 0.53 | 0.56 | 0.58 |
| Net investment income (loss) | 4.28 | 3.71 | 3.01 | 3.73 | 3.89 |
| Portfolio turnover | 13 | 18 | 17 | 30 | 12 |
| Net assets at end of period (000 omitted) | $856,058 | $910,932 | $1,802,449 | $1,398,315 | $1,195,880 |
| Supplemental Ratios (%): |
| Ratios of expenses to average net assets after expense reductions and excluding interest expense and fees (f)(l) | 0.50 | 0.52 | 0.52 | 0.54 | 0.55 |
| (d) | Per share data is based on average shares outstanding. |
| (f) | Ratios do not reflect reductions from fees paid indirectly, if applicable. See Note 2 in the Notes to Financial Statements for additional information. |
| (l) | Interest expense and fees include payments made to the holders of the floating rate certificates. |
| (r) | Certain expenses have been reduced without which performance would have been lower. |
| (s) | From time to time the fund may receive proceeds from litigation settlements, without which performance would be lower. |
| (t) | Total returns do not include any applicable sales charges. |
| (x) | The net asset values and total returns have been calculated on net assets which include adjustments made in accordance with U.S. generally accepted accounting principles required at period end for financial reporting purposes. |
See Notes to Financial Statements
Notes to Financial Statements
(1) Business and Organization
MFS Municipal High Income Fund (the fund) is a diversified series of MFS Series Trust III which is organized as a Massachusetts business trust and is registered under the Investment Company Act of 1940, as amended, as an open-end management investment company.
The fund is an investment company and accordingly follows the investment company accounting and reporting guidance of the Financial Accounting Standards Board (FASB) Accounting Standards Codification Topic 946 Financial Services - Investment Companies.
(2) Significant Accounting Policies
General — The preparation of financial statements in conformity with U.S. generally accepted accounting principles requires management to make estimates and assumptions that affect the reported amounts of assets and liabilities, and disclosure of contingent assets and liabilities at the date of the financial statements and the reported amounts of increases and decreases in net assets from operations during the reporting period. Actual results could differ from those estimates. In the preparation of these financial statements, management has evaluated subsequent events occurring after the date of the fund’s Statement of Assets and Liabilities through the date that the financial statements were issued. The fund invests primarily in municipal instruments, which generally trade in the over-the-counter market. The value of municipal instruments can be affected by changes in their actual or perceived credit quality. The credit quality of, and the ability to pay principal and interest when due by, an issuer of a municipal instrument depends on the credit quality of the entity supporting the municipal instrument, how essential any services supported by the municipal instrument are, the sufficiency of any revenues or taxes that support the municipal instrument, and/or the willingness or ability of the appropriate government entity to approve any appropriations necessary to support the municipal instrument. Municipal instruments may be supported by insurance which typically guarantees the timely payment of all principal and interest due on the underlying municipal instrument. The value of a municipal instrument can be volatile and significantly affected by adverse tax changes or court rulings, legislative or political changes, changes in specific or general market and economic conditions in the region where the instrument is issued, and the financial condition of municipal issuers and of municipal instrument insurers of which there are a limited number. Also, because many municipal instruments are issued to finance similar projects, conditions in certain industries can significantly affect the fund and the overall municipal market. If the Internal Revenue Service determines an issuer of a municipal instrument has not complied with the applicable tax requirements, interest from the security could become taxable, the security could decline in value, and distributions made by the fund could be taxable to shareholders. The fund invests in high-yield securities rated below investment grade. Investments in below investment grade quality securities can involve a substantially greater risk of default or can already be in default, and their values can decline significantly. Below investment grade quality securities tend to be more sensitive to adverse news about the issuer, or the market or economy in general, than higher quality debt instruments.
Balance Sheet Offsetting — The fund's accounting policy with respect to balance sheet offsetting is that, absent an event of default by the counterparty or a termination of the agreement, the International Swaps and Derivatives Association (ISDA) Master
Notes to Financial Statements - continued
Agreement, or similar agreement, does not result in an offset of reported amounts of financial assets and financial liabilities in the Statement of Assets and Liabilities across transactions between the fund and the applicable counterparty. The fund's right to setoff may be restricted or prohibited by the bankruptcy or insolvency laws of the particular jurisdiction to which a specific master netting agreement counterparty is subject. Balance sheet offsetting disclosures, to the extent applicable to the fund, have been included in the fund’s Significant Accounting Policies note under the captions for each of the fund’s in-scope financial instruments and transactions.
Investment Valuations — Subject to its oversight, the fund's Board of Trustees has delegated primary responsibility for determining or causing to be determined the value of the fund’s investments to MFS as the fund's adviser, pursuant to the fund’s valuation policy and procedures which have been adopted by the adviser and approved by the Board. In accordance with Rule 2a-5 under the Investment Company Act of 1940, the Board of Trustees designated the adviser as the “valuation designee” of the fund. If the adviser, as valuation designee, determines that reliable market quotations are not readily available for an investment, the investment is valued at fair value as determined in good faith by the adviser in accordance with the adviser’s fair valuation policy and procedures.
Under the fund's valuation policy and procedures, debt instruments and floating rate loans, including restricted debt instruments, are generally valued at an evaluated or composite bid as provided by a third-party pricing service. Short-term instruments with a maturity at issuance of 60 days or less may be valued at amortized cost, which approximates market value. Open-end investment companies are generally valued at net asset value per share.
Under the fund’s valuation policy and procedures, market quotations are not considered to be readily available for debt instruments, floating rate loans, and many types of derivatives. These investments are generally valued at fair value based on information from third-party pricing services or otherwise determined by the adviser in accordance with the adviser’s fair valuation policy and procedures. Securities and other assets generally valued on the basis of information from a third-party pricing service may also be valued at a broker/dealer bid quotation. In determining values, third-party pricing services can utilize both transaction data and market information such as yield, quality, coupon rate, maturity, type of issue, trading characteristics, spreads and other market data. An investment may also be valued at fair value if the adviser determines that the investment’s value has been materially affected by events occurring after the close of the exchange or market on which the investment is principally traded (such as foreign exchange or market) and prior to the determination of the fund’s net asset value, or after the halt of trading of a specific security where trading does not resume prior to the close of the exchange or market on which the security is principally traded. The adviser generally relies on third-party pricing services or other information (such as the correlation with price movements of similar securities in the same or other markets; the type, cost and investment characteristics of the security; the business and financial condition of the issuer; and trading and other market data) to assist in determining whether to fair value and at what value to fair value an investment. The value of an investment for purposes of calculating the fund’s net asset value can differ depending on the source and method used to determine value. When fair valuation is used, the value of an investment used to determine the fund’s net asset value may differ from
Notes to Financial Statements - continued
quoted or published prices for the same investment. There can be no assurance that the fund could obtain the fair value assigned to an investment if it were to sell the investment at the same time at which the fund determines its net asset value per share.
Various inputs are used in determining the value of the fund's assets or liabilities. These inputs are categorized into three broad levels. In certain cases, the inputs used to measure fair value may fall into different levels of the fair value hierarchy. In such cases, an investment's level within the fair value hierarchy is based on the lowest level of input that is significant to the fair value measurement. The fund's assessment of the significance of a particular input to the fair value measurement in its entirety requires judgment, and considers factors specific to the investment. Level 1 includes unadjusted quoted prices in active markets for identical assets or liabilities. Level 2 includes other significant observable market-based inputs (including quoted prices for similar securities, interest rates, prepayment speed, and credit risk). Level 3 includes significant unobservable inputs, which may include the adviser's own assumptions in determining the fair value of investments. The following is a summary of the levels used as of January 31, 2024 in valuing the fund's assets and liabilities:
| Financial Instruments | Level 1 | Level 2 | Level 3 | Total |
| Municipal Bonds | $— | $4,102,926,443 | $— | $4,102,926,443 |
| U.S. Corporate Bonds | — | 33,088,416 | — | 33,088,416 |
| Mutual Funds | 136,805,918 | — | — | 136,805,918 |
| Total | $136,805,918 | $4,136,014,859 | $— | $4,272,820,777 |
For further information regarding security characteristics, see the Portfolio of Investments.
Inverse Floaters — The fund invests in municipal inverse floating rate securities in the form of self-deposited secondary market inverse floaters which have variable rates of interest that typically move in the opposite direction of short-term rates. A self-deposited secondary market inverse floater is created when the fund transfers a municipal bond from its portfolio to a special purpose trust (“the trust”) and causes the trust to issue (a) inverse floaters to be held by the fund and (b) floating rate certificates to be held by third parties. The floating rate certificates usually pay tax-exempt interest at short-term rates that reset weekly and the holders of those certificates typically have the option to tender at par plus accrued interest. Self-deposited secondary market inverse floaters are accounted for as secured borrowings, with the municipal bonds transferred to the trust being reflected as fund investments and the amounts owed to floating rate certificate holders being reflected as fund liabilities in the Statement of Assets and Liabilities as “Payable to the holders of the floating rate certificates”. The carrying value of that liability as reported in the fund’s Statement of Assets and Liabilities approximates its fair value which would be considered level 2 under the fair value hierarchy.
At January 31, 2024, the fund’s payable to the holders of the floating rate certificates was $14,085,000 and the related weighted average interest rate on the settled floating rate certificates issued by the trust was 4.58%. For the year ended January 31, 2024, the average payable to the holders of the settled floating rate certificates was $19,993,781 at a weighted average interest rate of 3.65%. Interest expense and fees, which are recorded as incurred, include interest payments made to the holders of the
Notes to Financial Statements - continued
floating rate certificates and associated fees. For the year ended January 31, 2024, the related interest expense and fees amounted to $729,407 which is included in “Interest expense and fees” in the Statement of Operations.
Indemnifications — Under the fund's organizational documents, its officers and Trustees may be indemnified against certain liabilities and expenses arising out of the performance of their duties to the fund. Additionally, in the normal course of business, the fund enters into agreements with service providers that may contain indemnification clauses. The fund's maximum exposure under these agreements is unknown as this would involve future claims that may be made against the fund that have not yet occurred.
Investment Transactions and Income — Interest income is recorded on the accrual basis. All premium and discount is amortized or accreted for financial statement purposes in accordance with U.S. generally accepted accounting principles. Interest payments received in additional securities are recorded on the ex-interest date in an amount equal to the value of the security on such date. Debt obligations may be placed on non-accrual status or set to accrue at a rate of interest less than the contractual coupon when the collection of all or a portion of interest has become doubtful. Interest income for those debt obligations may be further reduced by the write-off of the related interest receivables when deemed uncollectible.
The fund may receive proceeds from litigation settlements. Any proceeds received from litigation involving portfolio holdings are reflected in the Statement of Operations in realized gain/loss if the security has been disposed of by the fund or in unrealized gain/loss if the security is still held by the fund. Any other proceeds from litigation not related to portfolio holdings are reflected as other income in the Statement of Operations.
Investment transactions are recorded on the trade date. In determining the net gain or loss on securities sold, the cost of securities is determined on the identified cost basis.
The fund may purchase or sell securities on a when-issued or delayed delivery basis. In these extended settlement transactions, the receipt or delivery of the securities by the fund and related payments occur at a future date, usually beyond the customary settlement period. The price of such security and the date that the security will be settled are generally fixed at the time the transaction is negotiated. The value of the security varies with market fluctuations and for debt securities no interest accrues to the fund until settlement takes place. When the fund sells securities on a when-issued or delayed delivery basis, the fund typically owns or has the right to acquire securities equivalent in kind and amount to the securities sold. Purchase and sale commitments for when-issued or delayed delivery securities are held at carrying amount, which approximates fair value and are categorized as level 2 within the fair value hierarchy, and included in When-issued investments purchased and When-issued investments sold in the Statement of Assets and Liabilities, as applicable. Losses may arise due to changes in the value of the underlying securities prior to settlement date or if the counterparty does not perform under the contract’s terms, or if the issuer does not issue the securities due to political, economic or other factors.
Legal fees and other related expenses incurred to preserve and protect the value of a security owned are added to the cost of the security; other legal fees are expensed. Capital infusions made directly to the security issuer, which are generally non-recurring, incurred to protect or enhance the value of high-yield debt securities, are reported as
Notes to Financial Statements - continued
additions to the cost basis of the security. Costs that are incurred to negotiate the terms or conditions of capital infusions or that are expected to result in a plan of reorganization are reported as realized losses. Ongoing costs incurred to protect or enhance an investment, or costs incurred to pursue other claims or legal actions, are expensed.
Fees Paid Indirectly — The fund's custody fee may be reduced by a credit earned under an arrangement that measures the value of U.S. dollars deposited with the custodian by the fund. The amount of the credit, for the year ended January 31, 2024, is shown as a reduction of total expenses in the Statement of Operations.
Tax Matters and Distributions — The fund intends to qualify as a regulated investment company, as defined under Subchapter M of the Internal Revenue Code, and to distribute all of its taxable and tax-exempt income, including realized capital gains. As a result, no provision for federal income tax is required. The fund’s federal tax returns, when filed, will remain subject to examination by the Internal Revenue Service for a three year period. Management has analyzed the fund’s tax positions taken on federal and state tax returns for all open tax years and does not believe that there are any uncertain tax positions that require recognition of a tax liability.
Distributions to shareholders are recorded on the ex-dividend date. Income and capital gain distributions are determined in accordance with income tax regulations, which may differ from U.S. generally accepted accounting principles. Certain capital accounts in the financial statements are periodically adjusted for permanent differences in order to reflect their tax character. These adjustments have no impact on net assets or net asset value per share. Temporary differences which arise from recognizing certain items of income, expense, gain or loss in different periods for financial statement and tax purposes will reverse at some time in the future.
Book/tax differences primarily relate to defaulted bonds and treating a portion of the proceeds from redemptions as a distribution for tax purposes.
The tax character of distributions declared to shareholders for the last two fiscal years is as follows:
| | Year ended
1/31/24 | Year ended
1/31/23 |
| Ordinary income (including any short-term capital gains) | $— | $11,156,872 |
| Tax-exempt income | 190,541,648 | 189,479,284 |
| Total distributions | $190,541,648 | $200,636,156 |
Notes to Financial Statements - continued
The federal tax cost and the tax basis components of distributable earnings were as follows:
| As of 1/31/24 | |
| Cost of investments | $4,689,894,041 |
| Gross appreciation | 76,920,694 |
| Gross depreciation | (508,078,958) |
| Net unrealized appreciation (depreciation) | $(431,158,264) |
| Undistributed tax-exempt income | 47,158,639 |
| Capital loss carryforwards | (240,215,828) |
| Other temporary differences | (16,167,591) |
| Total distributable earnings (loss) | $(640,383,044) |
As of January 31, 2024, the fund had capital loss carryforwards available to offset future realized gains. These net capital losses may be carried forward indefinitely and their character is retained as short-term and/or long-term losses. Such losses are characterized as follows:
| Short-Term | $(114,286,887) |
| Long-Term | (125,928,941) |
| Total | $(240,215,828) |
Multiple Classes of Shares of Beneficial Interest — The fund offers multiple classes of shares, which differ in their respective distribution and service fees. The fund's income and common expenses are allocated to shareholders based on the value of settled shares outstanding of each class. The fund's realized and unrealized gain (loss) are allocated to shareholders based on the daily net assets of each class. Dividends are declared separately for each class. Differences in per share dividend rates are generally due to differences in separate class expenses. Class B and Class C shares will convert to Class A shares approximately eight years after purchase. The fund’s distributions declared to shareholders as reported in the Statements of Changes in Net Assets are presented by class as follows:
| | Year ended
1/31/24 | Year ended
1/31/23 |
| Class A | $67,419,066 | $66,743,480 |
| Class B | 80,937 | 116,915 |
| Class C | 2,755,380 | 3,246,712 |
| Class I | 80,857,988 | 83,213,404 |
| Class R6 | 39,428,277 | 47,315,645 |
| Total | $190,541,648 | $200,636,156 |
Notes to Financial Statements - continued
(3) Transactions with Affiliates
Investment Adviser — The fund has an investment advisory agreement with MFS to provide overall investment management and related administrative services and facilities to the fund. The management fee is computed daily and paid monthly at the following annual rates based on the fund's average daily net assets:
| Up to $2.5 billion | 0.55% |
| In excess of $2.5 billion and up to $5 billion | 0.50% |
| In excess of $5 billion and up to $10 billion | 0.45% |
| In excess of $10 billion | 0.425% |
MFS has agreed in writing to reduce its management fee by a specified amount if certain MFS mutual fund assets exceed thresholds agreed to by MFS and the fund's Board of Trustees. MFS has also agreed in writing to waive at least 0.01% of its management fee as part of this agreement. The agreement to waive at least 0.01% of the management fee will continue until modified by the fund's Board of Trustees, but such agreement will continue at least until May 31, 2025. For the year ended January 31, 2024, this management fee reduction amounted to $546,960, which is included in the reduction of total expenses in the Statement of Operations. The management fee incurred for the year ended January 31, 2024 was equivalent to an annual effective rate of 0.52% of the fund's average daily net assets.
The investment adviser has agreed in writing to pay a portion of the fund’s total annual operating expenses, excluding interest, taxes, extraordinary expenses, brokerage and transaction costs, certain tax reclaim recovery expenses (including contingency fees and closing agreement expenses), and investment-related expenses (such as interest expense and fees associated with investments in inverse floating rate instruments), such that total fund operating expenses do not exceed the following rates annually of each class’s average daily net assets:
| Classes |
| A | B | C | I | R6 |
| 0.59% | 1.34% | 1.59% | 0.59% | 0.50% |
This written agreement will continue until modified by the fund’s Board of Trustees, but such agreement will continue at least until May 31, 2025. For the year ended January 31, 2024, this reduction amounted to $2,703,270, which is included in the reduction of total expenses in the Statement of Operations.
Distributor — MFS Fund Distributors, Inc. (MFD), a wholly-owned subsidiary of MFS, as distributor, received $42,103 for the year ended January 31, 2024, as its portion of the initial sales charge on sales of Class A shares of the fund.
The Board of Trustees has adopted a distribution plan for certain share classes pursuant to Rule 12b-1 of the Investment Company Act of 1940.
The fund's distribution plan provides that the fund will pay MFD for services provided by MFD and financial intermediaries in connection with the distribution and servicing of certain share classes. One component of the plan is a distribution fee paid to MFD and another component of the plan is a service fee paid to MFD. MFD may subsequently pay all, or a portion, of the distribution and/or service fees to financial intermediaries. The distribution and service fees are computed daily and paid monthly.
Notes to Financial Statements - continued
Distribution Plan Fee Table:
| | Distribution
Fee Rate (d) | Service
Fee Rate (d) | Total
Distribution
Plan (d) | Annual
Effective
Rate (e) | Distribution
and Service
Fee |
| Class B | 0.75% | 0.25% | 1.00% | 0.75% | $ 21,910 |
| Class C | 0.75% | 0.25% | 1.00% | 1.00% | 798,555 |
| Total Distribution and Service Fees | | | | | $820,465 |
| (d) | In accordance with the distribution plan for certain classes, the fund pays distribution and/or service fees equal to these annual percentage rates of each class’s average daily net assets. The distribution and service fee rates disclosed by class represent the current rates in effect at the end of the reporting period. Any rate changes, if applicable, are detailed below. |
| (e) | The annual effective rates represent actual fees incurred under the distribution plan for the year ended January 31, 2024 based on each class's average daily net assets. MFD has agreed in writing to reduce the Class B service fee rate to 0.00% for all Class B shares. This agreement will continue until modified by the fund’s Board of Trustees, but such agreement will continue until at least May 31, 2025. For the year ended January 31, 2024, this waiver amounted to $5,477, which is included in the reduction of total expenses in the Statement of Operations. MFD has also voluntarily agreed to rebate a portion of each class’s 0.25% service fee attributable to accounts for which there is no financial intermediary specified on the account except for accounts attributable to MFS or its affiliates’ seed money. For the year ended January 31, 2024, this rebate amounted to $3 for Class C shares and is included in the reduction of total expenses in the Statement of Operations. |
Certain Class A shares are subject to a contingent deferred sales charge (CDSC) in the event of a shareholder redemption within 18 months of purchase. Class B shares are subject to a CDSC in the event of a shareholder redemption within six years of purchase. Class C shares are subject to a CDSC in the event of a shareholder redemption within 12 months of purchase. All contingent deferred sales charges are paid to MFD and during the year ended January 31, 2024, were as follows:
| | Amount |
| Class A | $82,804 |
| Class B | 992 |
| Class C | 3,245 |
Shareholder Servicing Agent — MFS Service Center, Inc. (MFSC), a wholly-owned subsidiary of MFS, receives a fee from the fund for its services as shareholder servicing agent calculated as a percentage of the average daily net assets of the fund as determined periodically under the supervision of the fund's Board of Trustees. For the year ended January 31, 2024, the fee was $81,646, which equated to 0.0019% annually of the fund's average daily net assets. MFSC also receives reimbursement from the fund for out-of-pocket expenses, sub-accounting and other shareholder servicing costs which may be paid to affiliated and unaffiliated service providers. Class R6 shares do not incur sub-accounting fees. For the year ended January 31, 2024, these out-of-pocket expenses, sub-accounting and other shareholder servicing costs amounted to $2,872,526.
Administrator — MFS provides certain financial, legal, shareholder communications, compliance, and other administrative services to the fund. Under an administrative services agreement, the fund reimburses MFS the costs incurred to provide these services. The fund is charged an annual fixed amount of $17,500 plus a fee based on
Notes to Financial Statements - continued
average daily net assets. The administrative services fee is computed daily and paid monthly. The administrative services fee incurred for the year ended January 31, 2024 was equivalent to an annual effective rate of 0.0143% of the fund's average daily net assets.
Trustees’ and Officers’ Compensation — The fund pays compensation to independent Trustees in the form of a retainer, attendance fees, and additional compensation to Board and Committee chairpersons. Independent Trustees’ compensation is accrued daily and paid subsequent to each Trustee Board meeting. The fund does not pay compensation directly to Trustees or officers of the fund who are also officers of the investment adviser, all of whom receive remuneration from MFS for their services to the fund. Certain officers and Trustees of the fund are officers or directors of MFS, MFD, and MFSC.
Prior to December 31, 2001, the fund had an unfunded defined benefit plan (“DB plan”) for independent Trustees. As of December 31, 2001, the Board took action to terminate the DB plan with respect to then-current and any future independent Trustees, such that the DB plan covers only certain of those former independent Trustees who retired on or before December 31, 2001. The DB plan resulted in a pension expense of $1,945 and is included in “Independent Trustees’ compensation” in the Statement of Operations for the year ended January 31, 2024. The liability for deferred retirement benefits payable to those former independent Trustees under the DB plan amounted to $715 at January 31, 2024, and is included in “Payable for independent Trustees’ compensation” in the Statement of Assets and Liabilities. The deferred retirement benefits compensation fee is accrued daily and paid monthly.
Other — The fund invests in the MFS Institutional Money Market Portfolio which is managed by MFS and seeks current income consistent with preservation of capital and liquidity. This money market fund does not pay a management fee to MFS but does incur investment and operating costs.
On August 3, 2022, MFS redeemed 14 shares of Class R6 for an aggregate amount of $108.
During the year ended January 31, 2024, pursuant to a policy adopted by the Board of Trustees and designed to comply with Rule 17a-7 under the Investment Company Act of 1940 (the “Act”) and relevant guidance, the fund engaged in purchase and sale transactions with funds and accounts for which MFS serves as investment adviser or sub-adviser (“cross-trades”) which amounted to $797,631 and $16,799,570, respectively. The sales transactions resulted in net realized gains (losses) of $(929,283).
(4) Portfolio Securities
For the year ended January 31, 2024, purchases and sales of investments, other than short-term obligations, aggregated $560,720,718 and $713,171,757, respectively.
Notes to Financial Statements - continued
(5) Shares of Beneficial Interest
The fund's Declaration of Trust permits the Trustees to issue an unlimited number of full and fractional shares of beneficial interest. Transactions in fund shares were as follows:
| | Year ended
1/31/24 | | Year ended
1/31/23 |
| | Shares | Amount | | Shares | Amount |
| Shares sold | | | | | |
| Class A | 44,858,542 | $321,634,643 | | 55,296,913 | $414,788,041 |
| Class B | 569 | 4,094 | | 12,223 | 95,384 |
| Class C | 1,300,694 | 9,367,765 | | 1,461,463 | 11,017,590 |
| Class I | 129,458,747 | 923,200,790 | | 196,100,976 | 1,461,595,281 |
| Class R6 | 33,972,492 | 242,581,070 | | 85,433,027 | 659,248,790 |
| | 209,591,044 | $1,496,788,362 | | 338,304,602 | $2,546,745,086 |
Shares issued to shareholders
in reinvestment of distributions | | | | | |
| Class A | 8,836,263 | $63,125,379 | | 8,257,045 | $62,030,038 |
| Class B | 9,417 | 67,362 | | 11,938 | 89,991 |
| Class C | 360,606 | 2,580,320 | | 399,183 | 3,004,239 |
| Class I | 10,017,550 | 71,543,495 | | 9,731,779 | 73,224,857 |
| Class R6 | 3,928,361 | 28,039,099 | | 4,603,741 | 34,704,834 |
| | 23,152,197 | $165,355,655 | | 23,003,686 | $173,053,959 |
| Shares reacquired | | | | | |
| Class A | (56,427,797) | $(403,229,230) | | (96,110,584) | $(722,064,548) |
| Class B | (160,840) | (1,141,378) | | (254,286) | (1,911,981) |
| Class C | (4,261,338) | (30,530,762) | | (7,042,549) | (53,126,048) |
| Class I | (135,155,441) | (962,032,393) | | (291,406,893) | (2,179,451,919) |
| Class R6 | (43,416,764) | (308,876,956) | | (181,867,637) | (1,398,304,768) |
| | (239,422,180) | $(1,705,810,719) | | (576,681,949) | $(4,354,859,264) |
| Net change | | | | | |
| Class A | (2,732,992) | $(18,469,208) | | (32,556,626) | $(245,246,469) |
| Class B | (150,854) | (1,069,922) | | (230,125) | (1,726,606) |
| Class C | (2,600,038) | (18,582,677) | | (5,181,903) | (39,104,219) |
| Class I | 4,320,856 | 32,711,892 | | (85,574,138) | (644,631,781) |
| Class R6 | (5,515,911) | (38,256,787) | | (91,830,869) | (704,351,144) |
| | (6,678,939) | $(43,666,702) | | (215,373,661) | $(1,635,060,219) |
Effective June 1, 2019, purchases of the fund’s Class B shares were closed to new and existing investors subject to certain exceptions.
(6) Line of Credit
The fund and certain other funds managed by MFS participate in a $1.45 billion unsecured committed line of credit of which $1.2 billion is reserved for use by the fund and certain other MFS U.S. funds. The line of credit is provided by a syndicate of banks
Notes to Financial Statements - continued
under a credit agreement. Borrowings may be made for temporary financing needs. Interest is charged to each fund, based on its borrowings, generally at a rate equal to the highest of 1) Daily Simple SOFR (Secured Overnight Financing Rate) plus 0.10%, 2) the Federal Funds Effective Rate, or 3) the Overnight Bank Funding Rate, each plus an agreed upon spread. A commitment fee, based on the average daily unused portion of the committed line of credit, is allocated among the participating funds. The line of credit expires on March 14, 2024 unless extended or renewed. In addition, the fund and other funds managed by MFS have established unsecured uncommitted borrowing arrangements with certain banks for temporary financing needs. Interest is charged to each fund, based on its borrowings, at rates equal to customary reference rates plus an agreed upon spread. For the year ended January 31, 2024, the fund’s commitment fee and interest expense were $21,575 and $0, respectively, and are included in “Interest expense and fees” in the Statement of Operations.
(7) Investments in Affiliated Issuers
An affiliated issuer may be considered one in which the fund owns 5% or more of the outstanding voting securities, or a company which is under common control. For the purposes of this report, the following were affiliated issuers:
| Affiliated Issuers | Beginning
Value | Purchases | Sales
Proceeds | Realized
Gain
(Loss) | Change in
Unrealized
Appreciation or
Depreciation | Ending
Value |
| MFS Institutional Money Market Portfolio | $89,056,536 | $824,816,407 | $777,059,469 | $(5,042) | $(2,514) | $136,805,918 |
| Affiliated Issuers | Dividend
Income | Capital Gain
Distributions |
| MFS Institutional Money Market Portfolio | $2,871,966 | $— |
Report of Independent Registered Public Accounting Firm
To the Shareholders of MFS Municipal High Income Fund and the Board of Trustees of MFS Series Trust III
Opinion on the Financial Statements
We have audited the accompanying statement of assets and liabilities of MFS Municipal High Income Fund (the “Fund”) (one of the funds constituting MFS Series Trust III (the “Trust”)), including the portfolio of investments, as of January 31, 2024, and the related statement of operations for the year then ended, the statements of changes in net assets for each of the two years in the period then ended, the financial highlights for each of the five years in the period then ended and the related notes (collectively referred to as the “financial statements”). In our opinion, the financial statements present fairly, in all material respects, the financial position of the Fund (one of the funds constituting MFS Series Trust III) at January 31, 2024, the results of its operations for the year then ended, the changes in its net assets for each of the two years in the period then ended and its financial highlights for each of the five years in the period then ended, in conformity with U.S. generally accepted accounting principles.
Basis for Opinion
These financial statements are the responsibility of the Trust’s management. Our responsibility is to express an opinion on the Fund’s financial statements based on our audits. We are a public accounting firm registered with the Public Company Accounting Oversight Board (United States) (“PCAOB”) and are required to be independent with respect to the Trust in accordance with the U.S. federal securities laws and the applicable rules and regulations of the Securities and Exchange Commission and the PCAOB.
We conducted our audits in accordance with the standards of the PCAOB. Those standards require that we plan and perform the audit to obtain reasonable assurance about whether the financial statements are free of material misstatement, whether due to error or fraud. The Trust is not required to have, nor were we engaged to perform, an audit of the Trust’s internal control over financial reporting. As part of our audits, we are required to obtain an understanding of internal control over financial reporting but not for the purpose of expressing an opinion on the effectiveness of the Trust’s internal control over financial reporting. Accordingly, we express no such opinion.
Report of Independent Registered Public Accounting Firm – continued
Our audits included performing procedures to assess the risks of material misstatement of the financial statements, whether due to error or fraud, and performing procedures that respond to those risks. Such procedures included examining, on a test basis, evidence regarding the amounts and disclosures in the financial statements. Our procedures included confirmation of securities owned as of January 31, 2024, by correspondence with the custodian, brokers and others; when replies were not received from brokers and others, we performed other auditing procedures. Our audits also included evaluating the accounting principles used and significant estimates made by management, as well as evaluating the overall presentation of the financial statements. We believe that our audits provide a reasonable basis for our opinion.
/s/ Ernst & Young LLP
We have served as the auditor of one or more MFS investment companies since 1993.
Boston, Massachusetts
March 14, 2024
Trustees and Officers — Identification and Background
The Trustees and Officers of the Trust, as of March 1, 2024, are listed below, together with their principal occupations during the past five years. (Their titles may have varied during that period.) The address of each Trustee and Officer is 111 Huntington Avenue, Boston, Massachusetts 02199-7618.
| Name, Age | | Position(s) Held with Fund | | Trustee/Officer Since(h) | | Number of MFS Funds overseen by the Trustee | | Principal Occupations During
the Past Five Years | | Other Directorships During
the Past Five Years (j) |
| INTERESTED TRUSTEE | | | | | | | | | | |
Michael W. Roberge (k)
(age 57) | | Trustee | | January 2021 | | 136 | | Massachusetts Financial Services Company, Chairman (since January 2021); Chief Executive Officer (since January 2017); Director; Chairman of the Board (since January 2022) | | N/A |
| INDEPENDENT TRUSTEES | | | | | | | | | | |
John P. Kavanaugh
(age 69) | | Trustee and Chair of Trustees | | January 2009 | | 136 | | Private investor | | N/A |
Steven E. Buller
(age 72) | | Trustee | | February 2014 | | 136 | | Private investor | | N/A |
John A. Caroselli
(age 69) | | Trustee | | March 2017 | | 136 | | Private investor; JC Global Advisors, LLC (management consulting), President (since 2015) | | N/A |
Maureen R. Goldfarb
(age 68) | | Trustee | | January 2009 | | 136 | | Private investor | | N/A |
Peter D. Jones
(age 68) | | Trustee | | January 2019 | | 136 | | Private investor | | N/A |
James W. Kilman, Jr.
(age 62) | | Trustee | | January 2019 | | 136 | | Burford Capital Limited (finance and investment management), Senior Advisor (since May 3, 2021), Chief Financial Officer (2019 - May 2, 2021); KielStrand Capital LLC (family office), Chief Executive Officer (since 2016) | | Alpha-En Corporation, Director (2016-2019) |
Trustees and Officers - continued
| Name, Age | | Position(s) Held with Fund | | Trustee/Officer Since(h) | | Number of MFS Funds overseen by the Trustee | | Principal Occupations During
the Past Five Years | | Other Directorships During
the Past Five Years (j) |
Clarence Otis, Jr.
(age 67) | | Trustee | | March 2017 | | 136 | | Private investor | | VF Corporation, Director; Verizon Communications, Inc., Director; The Travelers Companies, Director |
Maryanne L. Roepke
(age 68) | | Trustee | | May 2014 | | 136 | | Private investor | | N/A |
Laurie J. Thomsen
(age 66) | | Trustee | | March 2005 | | 136 | | Private investor | | The Travelers Companies, Director; Dycom Industries, Inc., Director |
| Name, Age | | Position(s) Held with
Fund | | Trustee/Officer Since(h) | | Number of MFS Funds for which the Person is an Officer | | Principal Occupations During
the Past Five Years |
| OFFICERS | | | | | | | | |
Christopher R. Bohane (k)
(age 50) | | Assistant Secretary and Assistant Clerk | | July 2005 | | 136 | | Massachusetts Financial Services Company, Senior Vice President and Deputy General Counsel |
Kino Clark (k)
(age 55) | | Assistant Treasurer | | January 2012 | | 136 | | Massachusetts Financial Services Company, Vice President |
John W. Clark, Jr. (k)
(age 56) | | Assistant Treasurer | | April 2017 | | 136 | | Massachusetts Financial Services Company, Vice President |
David L. DiLorenzo (k)
(age 55) | | President | | July 2005 | | 136 | | Massachusetts Financial Services Company, Senior Vice President |
Heidi W. Hardin (k)
(age 56) | | Secretary and Clerk | | April 2017 | | 136 | | Massachusetts Financial Services Company, Executive Vice President and General Counsel |
Brian E. Langenfeld (k)
(age 50) | | Assistant Secretary and Assistant Clerk | | June 2006 | | 136 | | Massachusetts Financial Services Company, Vice President and Managing Counsel |
Rosa E. Licea-Mailloux (k)
(age 47) | | Chief Compliance Officer | | March 2022 | | 136 | | Massachusetts Financial Services Company, Vice President (since 2018); Director of Corporate Compliance (2018-2021), Senior Director Compliance (2021-2022), Senior Managing Director of North American Compliance & Chief Compliance Officer (since March 2022) |
Trustees and Officers - continued
| Name, Age | | Position(s) Held with
Fund | | Trustee/Officer Since(h) | | Number of MFS Funds for which the Person is an Officer | | Principal Occupations During
the Past Five Years |
Amanda S. Mooradian (k)
(age 45) | | Assistant Secretary and Assistant Clerk | | September 2018 | | 136 | | Massachusetts Financial Services Company, Vice President and Senior Counsel |
Susan A. Pereira (k)
(age 53) | | Assistant Secretary and Assistant Clerk | | July 2005 | | 136 | | Massachusetts Financial Services Company, Vice President and Managing Counsel |
Kasey L. Phillips (k)
(age 53) | | Assistant Treasurer | | September 2012 | | 136 | | Massachusetts Financial Services Company, Vice President |
Matthew A. Stowe (k)
(age 49) | | Assistant Secretary and Assistant Clerk | | October 2014 | | 136 | | Massachusetts Financial Services Company, Vice President and Senior Managing Counsel |
William B. Wilson (k)
(age 41) | | Assistant Secretary and Assistant Clerk | | October 2022 | | 136 | | Massachusetts Financial Services Company, Assistant Vice President and Senior Counsel |
James O. Yost (k)
(age 63) | | Treasurer | | September 1990 | | 136 | | Massachusetts Financial Services Company, Senior Vice President |
| (h) | Date first appointed to serve as Trustee/Officer of an MFS Fund. Each Trustee has served continuously since appointment unless indicated otherwise. From January 2012 through December 2016, Messrs. DiLorenzo and Yost served as Treasurer and Deputy Treasurer of the Funds, respectively. |
| (j) | Directorships or trusteeships of companies required to report to the Securities and Exchange Commission (i.e., “public companies”). |
| (k) | “Interested person” of the Trust within the meaning of the Investment Company Act of 1940 (referred to as the 1940 Act), which is the principal federal law governing investment companies like the fund, as a result of a position with MFS. The address of MFS is 111 Huntington Avenue, Boston, Massachusetts 02199-7618. |
Each Trustee (other than Messrs. Jones, Kilman and Roberge) has been elected by shareholders and each Trustee and Officer holds office until his or her successor is chosen and qualified or until his or her earlier death, resignation, retirement or removal. Mr. Roberge became a Trustee of the Funds on January 1, 2021 and Messrs. Jones and Kilman became Trustees of the Funds on January 1, 2019. The Trust does not hold annual meetings for the purpose of electing Trustees, and Trustees are not elected for fixed terms. Under the terms of the Board's retirement policy, an Independent Trustee shall retire at the end of the calendar year in which he or she reaches the earlier of 75 years of age or 15 years of service on the Board (or, in the case of any Independent Trustee who joined the Board prior to 2015, 20 years of service on the Board).
Messrs. Buller, Caroselli, Jones and Otis are members of the Trust’s Audit Committee.
Trustees and Officers - continued
Each of the Interested Trustees and certain Officers hold comparable officer positions with certain affiliates of MFS.
The Statement of Additional Information for a Fund includes further information about the Trustees and is available without charge upon request by calling 1-800-225-2606.
| Investment Adviser | Custodian |
Massachusetts Financial Services Company
111 Huntington Avenue
Boston, MA 02199-7618 | JPMorgan Chase Bank, NA
4 Metrotech Center
New York, NY 11245 |
| Distributor | Independent Registered Public Accounting Firm |
MFS Fund Distributors, Inc.
111 Huntington Avenue
Boston, MA 02199-7618 | Ernst & Young LLP
200 Clarendon Street
Boston, MA 02116 |
| Portfolio Manager(s) | |
Jason Kosty
Megan Poplowski
Geoffrey Schechter | |
Proxy Voting Policies and Information
MFS votes proxies on behalf of the fund pursuant to proxy voting policies and procedures that are available without charge, upon request, by calling 1-800-225-2606, by visiting mfs.com/proxyvoting, or by visiting the SEC’s Web site at http://www.sec.gov.
Information regarding how the fund voted proxies relating to portfolio securities during the most recent twelve-month period ended June 30 is available by August 31 of each year without charge by visiting mfs.com/proxyvoting, or by visiting the SEC’s Web site at http://www.sec.gov.
Quarterly Portfolio Disclosure
The fund files a complete schedule of portfolio holdings with the SEC for the first and third quarters of each fiscal year as an exhibit to its reports on Form N-PORT. The fund's Form N-PORT reports are available on the SEC's Web site at http://www.sec.gov. A shareholder can obtain the portfolio holdings report for the first and third quarters of the fund's fiscal year at mfs.com/openendfunds by choosing the fund's name and then scrolling to the “Resources” section and clicking on the “Prospectus and Reports” tab.
Further Information
From time to time, MFS may post important information about the fund or the MFS Funds on the MFS Web site (mfs.com). This information is available at https://www.mfs.com/announcements or at mfs.com/openendfunds by choosing the fund’s name and then scrolling to the “Resources” section and clicking on the “Announcements” tab, if any.
Information About Fund Contracts and Legal Claims
The fund has entered into contractual arrangements with an investment adviser, administrator, distributor, shareholder servicing agent, and custodian who each provide services to the fund. Unless expressly stated otherwise, shareholders are not parties to, or intended beneficiaries of these contractual arrangements, and these contractual arrangements are not intended to create any shareholder right to enforce them against the service providers or to seek any remedy under them against the service providers, either directly or on behalf of the fund.
Under the Trust’s By-Laws and Declaration of Trust, any claims asserted against or on behalf of the MFS Funds, including claims against Trustees and Officers, must be brought in state and federal courts located within the Commonwealth of Massachusetts.
Federal Tax Information (unaudited)
The fund will notify shareholders of amounts for use in preparing 2024 income tax forms in January 2025. The following information is provided pursuant to provisions of the Internal Revenue Code.
Of the dividends paid from net investment income during the fiscal year, 100.00% is designated as exempt interest dividends for federal income tax purposes. If the fund has earned income on private activity bonds, a portion of the dividends paid may be considered a tax preference item for purposes of computing a shareholder’s alternative minimum tax.
The fund intends to pass through the maximum amount allowable as Section 163(j) Interest Dividends as defined in Treasury Regulation §1.163(j)-1(b).
| FACTS | WHAT DOES MFS DO WITH YOUR PERSONAL INFORMATION? |
| Why? | Financial companies choose how they share your personal information. Federal law gives consumers the right to limit some but not all sharing. Federal law also requires us to tell you how we collect, share, and protect your personal information. Please read this notice carefully to understand what we do. |
| What? | The types of personal information we collect and share depend on the product or service you have with us. This information can include: |
| • Social Security number and account balances |
| • Account transactions and transaction history |
| • Checking account information and wire transfer instructions |
| When you are no longer our customer, we continue to share your information as described in this notice. |
| How? | All financial companies need to share customers' personal information to run their everyday business. In the section below, we list the reasons financial companies can share their customers' personal information; the reasons MFS chooses to share; and whether you can limit this sharing. |
Reasons we can share your
personal information | Does MFS share? | Can you limit
this sharing? |
For our everyday business purposes –
such as to process your transactions, maintain your
account(s), respond to court orders and legal
investigations, or report to credit bureaus | Yes | No |
For our marketing purposes –
to offer our products and services to you | No | We don't share |
For joint marketing with other
financial companies | No | We don't share |
For our affiliates' everyday business purposes –
information about your transactions and experiences | No | We don't share |
For our affiliates' everyday business purposes –
information about your creditworthiness | No | We don't share |
| For nonaffiliates to market to you | No | We don't share |
| Questions? | Call 800-225-2606 or go to mfs.com. |
| Who we are |
| Who is providing this notice? | MFS Funds, MFS Investment Management, MFS Institutional Advisors, Inc., and MFS Heritage Trust Company. |
| What we do |
How does MFS
protect my personal
information? | To protect your personal information from unauthorized access and use, we use security measures that comply with federal law. These measures include procedural, electronic, and physical safeguards for the protection of the personal information we collect about you. |
How does MFS
collect my personal
information? | We collect your personal information, for example, when you |
| • open an account or provide account information |
| • direct us to buy securities or direct us to sell your securities |
| • make a wire transfer |
| We also collect your personal information from others, such as credit bureaus, affiliates, or other companies. |
| Why can't I limit all sharing? | Federal law gives you the right to limit only |
| • sharing for affiliates' everyday business purposes – information about your creditworthiness |
| • affiliates from using your information to market to you |
| • sharing for nonaffiliates to market to you |
| State laws and individual companies may give you additional rights to limit sharing. |
| Definitions |
| Affiliates | Companies related by common ownership or control. They can be financial and nonfinancial companies. |
| • MFS does not share personal information with affiliates, except for everyday business purposes as described on page one of this notice. |
| Nonaffiliates | Companies not related by common ownership or control. They can be financial and nonfinancial companies. |
| • MFS does not share with nonaffiliates so they can market to you. |
| Joint marketing | A formal agreement between nonaffiliated financial companies that together market financial products or services to you. |
| • MFS doesn't jointly market. |
| Other important information |
| If you own an MFS product or receive an MFS service in the name of a third party such as a bank or broker-dealer, their privacy policy may apply to you instead of ours. |
Save paper with eDelivery.
MFS® will send you prospectuses, reports, and proxies directly via e-mail so you will get information faster with less mailbox clutter.
To sign up:
1. Go to mfs.com.
2. Log in via MFS® Access.
3. Select eDelivery.
If you own your MFS fund shares through a financial institution or a retirement plan, MFS® TALK, MFS® Access, or eDelivery may not be available to you.
CONTACT
WEB SITE
mfs.com
MFS TALK
1-800-637-8255
24 hours a day
ACCOUNT SERVICE AND LITERATURE
Shareholders
1-800-225-2606
Financial advisors
1-800-343-2829
Retirement plan services
1-800-637-1255
MAILING ADDRESS
MFS Service Center, Inc.
P.O. Box 219341
Kansas City, MO 64121-9341
OVERNIGHT MAIL
MFS Service Center, Inc.
Suite 219341
430 W 7th Street
Kansas City, MO 64105-1407
NOT FDIC INSURED • MAY LOSE VALUE • NO BANK GUARANTEE
Portfolio structure (i)
120 | | | 96.8% | | | | | |
| | | | | | |
100 | | | | | | | |
| | | | | |
80 | | | | | | | | | | |
| | | | | | | | | |
60 | | | | | | | | | | |
| | | | | | | | | |
40 | | | | | | | | | | |
| | | | | | | | | |
20 | | | | | 0.2% | 2.6% | 0.4% |
| | | |
0 | | | | |
| | | | | | | | | |
Fixed Income | | | | 96.8% |
| | | | | |
| | | | | |
| | | Equities | | | | 0.2% |
| | | | | |
| | | Cash & Cash Equivalents | 2.6% |
| | |
| | | Other | | | | 0.4% |
| | | | | |
Top five industries (i)
Cable TV | 6.9% |
Utilities - Electrical Power | 6.1% |
Medical & Health Technology & Services | 4.4% |
Wireless Communications | 3.5% |
Gaming & Lodging | 3.4% |
Composition including fixed income |
credit quality (a)(i) | |
BBB | 1.5% |
BB | 43.0% |
B | 39.9% |
CCC | 11.6% |
CC | 0.1% |
C | 0.1% |
US Government | 0.3% |
Not Rated | 0.3% |
Non-Fixed Income | 0.2% |
Cash & Cash Equivalents | 2.6% |
Other | 0.4% |
Portfolio facts
Average Duration (d) | 3.1 |
Average Effective Maturity (m) | 4.5 yrs. |
Issuer country weightings (i)(x) | |
United States | 58.7% |
Canada | 4.0% |
United Kingdom | 3.8% |
France | 3.4% |
Spain | 3.2% |
Mexico | 3.2% |
Netherlands | 2.6% |
Brazil | 2.6% |
Italy | 2.1% |
Other Countries | 16.4% |
Portfolio Composition - continued
(a)For all securities other than those specifically described below, ratings are assigned to underlying securities utilizing ratings from Moody's, Fitch, and Standard & Poor's rating agencies and applying the following hierarchy: If all three agencies provide a rating, the middle rating (after dropping the highest and lowest ratings) is assigned; if two of the three agencies rate a security, the lower of the two is assigned. If none of the 3 rating agencies above assign a rating, but the security is rated by DBRS Morningstar, then the DBRS Morningstar rating is assigned. If none of the 4 rating agencies listed above rate the security, but the security is rated by the Kroll Bond Rating Agency (KBRA), then the KBRA rating is assigned. Ratings are shown in the S&P and Fitch scale (e.g., AAA). Securities rated BBB or higher are considered investment grade. All ratings are subject to change. Not Rated includes fixed income securities and fixed income derivatives that have not been rated by any rating agency. Non-Fixed Income includes equity securities (including convertible bonds and equity derivatives), ETFs and Options on ETFs, and/or commodity-linked derivatives. The fund may or may not have held all of these instruments on this date. The fund is not rated by these agencies.
(d)Duration is a measure of how much a bond's price is likely to fluctuate with general changes in interest rates, e.g., if rates rise 1.00%, a bond with a 5-year duration is likely to lose about 5.00% of its value due to the interest rate move. The Average Duration calculation reflects the impact of the equivalent exposure of derivative positions, if any.
(i)For purposes of this presentation, the components include the value of securities, and reflect the impact of the equivalent exposure of derivative positions, if any. These amounts may be negative from time to time. Equivalent exposure is a calculated amount that translates the derivative position into a reasonable approximation of the amount of the underlying asset that the portfolio would have to hold at a given point in time to have the same price sensitivity that results from the portfolio's ownership of the derivative contract. When dealing with derivatives, equivalent exposure is a more representative measure of the potential impact of a position on portfolio performance than value. The bond component will include any accrued interest amounts.
(m)In determining each instrument's effective maturity for purposes of calculating the fund's dollar-weighted average effective maturity, MFS uses the instrument's stated maturity or, if applicable, an earlier date on which MFS believes it is probable that a maturity-shortening feature (such as a put, pre-refunding or prepayment) will cause the instrument to be repaid. Such an earlier date can be substantially shorter than the instrument's stated maturity.
(x)Represents the portfolio's exposure to issuer countries as a percentage of a portfolio's net assets. For purposes of this presentation, United States includes Cash & Cash Equivalents and Other.
Where the fund holds convertible bonds, they are treated as part of the equity portion of the portfolio.
The fund invests a portion of its assets in the MFS High Yield Pooled Portfolio. Percentages include the indirect exposure to the underlying holdings, including investments in money market funds and Other, of the MFS High Yield Pooled Portfolio and not the direct exposure from investing in the MFS High Yield Pooled Portfolio itself.
Cash & Cash Equivalents includes any direct exposure to cash, direct and indirect exposure to investments in money market funds, cash equivalents, short-term securities, and other assets less liabilities. Please see the Statement of Assets and Liabilities for additional information related to the fund's direct cash position and other assets and liabilities.
Other includes the direct and indirect equivalent exposure from currency derivatives and/or any offsets to derivative positions and may be negative.
Percentages are based on net assets as of January 31, 2024.
The portfolio is actively managed and current holdings may be different.
MANAGEMENT REVIEW
Summary of Results
For the twelve months ended January 31, 2024, Class A shares of the MFS Global High Yield Fund (fund) provided a total return of 9.17%, at net asset value. This compares with a return of 9.25% for the fund's benchmark, the ICE BofA Global High Yield - Constrained Index (USD Hedged).
In addition to investing directly in portfolio securities, the fund also invests indirectly in portfolio securities through investment in the MFS High Yield Pooled Portfolio,
a mutual fund also advised by MFS. The discussion below reflects both the fund's direct and indirect investments.
Market Environment
During the reporting period, central banks around the world had to combat the strongest inflationary pressures in four decades, fueled by the global fiscal response to the pandemic, disrupted supply chains and the dislocations to energy markets stemming from the war in Ukraine. Interest rates rose substantially, but the effects of a tighter monetary policy may not have been fully experienced yet, given that monetary policy works with long and variable lags. Strains resulting from the abrupt tightening of monetary policy began to affect some parts of the economy, most acutely among small and regional US banks, which suffered from deposit flight as depositors sought higher yields on their savings. Additionally, activity in the US housing sector has slowed as a result of higher mortgage rates. China's abandonment of its Zero-COVID policy ushered in a brief uptick in economic activity in the world's second-largest economy in early 2023, although its momentum soon stalled as the focus turned to the country's highly indebted property development sector. In developed markets, consumer demand for services remained stronger than the demand for goods.
Despite the challenging macroeconomic and geopolitical environment, central banks focused on controlling price pressures while also confronting increasing financial stability concerns. Central banks had to juggle achieving their inflation mandates while using tools aimed at safeguarding the stability of the financial system to keep banking systems liquid as banks grappled with exposures to commercial real estate. As inflationary pressures eased toward the end of the period, financial conditions loosened in anticipation of easier monetary policy, boosting the market's appetite for risk as near-term recession risks diminished. Rapid advancements in artificial intelligence were a focus for investors.
Normalizing supply chains, low levels of unemployment across developed markets and signs that inflation levels have peaked were supportive factors for the macroeconomic backdrop.
Detractors from Performance
Relative to the ICE BofA Global High Yield – Constrained Index (USD Hedged), the fund's positioning along the yield curve(y) was a primary source of underperformance. An underweight exposure to the "CC" rated(r) credit quality segment also hurt relative returns. From a sector perspective, the fund's underweight exposure to the consumer cyclicals sector weakened relative results.
Management Review - continued
Top individual detractors for the reporting period included the fund's overweight positions in wireless telecommunications carrier Total Play Telecommunications(h) (industrial communications) and natural and synthetic graphite and carbon based product manufacturer GrafTech Global (industrial basic industry).
The fund's cash and/or cash equivalents position during the reporting period was another detractor from relative performance.
Contributors to Performance
During the reporting period, favorable security selection benefited the fund's relative performance, particularly within the "BB", "B", and "CCC" rated(r) credit quality segments. From a sector perspective, bond selection within both the communications and agency government owned sectors also supported relative returns. Bond allocation was another area of relative strength led by the fund's overweight allocation to the capital goods, consumer non-cyclical, and utility electric sectors. An underweight exposure to the other financial institutions sector also strengthened relative results.
Top individual contributors for the reporting period included the fund's overweight positions in special purpose entity Summer Bidco (industrial communications) and real estate development firm Arabian Centres(h) (other financial institutions).
Respectfully,
Portfolio Manager(s)
David Cole, Matt Ryan, and Michael Skatrud
Note to Shareholders: Effective April 30, 2024, Matt Ryan will no longer be a Portfolio Manager of the fund.
(h) Security was not held in the portfolio at period end.
(r)Securities rated "BBB", "Baa", or higher are considered investment grade; securities rated "BB", "Ba", or below are considered non-investment grade. Ratings are assigned to underlying securities utilizing ratings from Moody's, Fitch, and Standard & Poor's and applying the following hierarchy: If all three agencies provide a rating, the middle rating (after dropping the highest and lowest ratings) is assigned; if two of the three agencies rate a security, the lower of the two is assigned. If none of the 3 rating agencies above assign a rating, but the security is rated by DBRS Morningstar, then the DBRS Morningstar rating is assigned. If none of the 4 rating agencies listed above rate the security, but the security is rated by the Kroll Bond Rating Agency (KBRA), then the KBRA rating is assigned. Ratings are shown in the S&P and Fitch scale (e.g., AAA). For securities that are not rated by any of the rating agencies, the security is considered Not Rated.
(y)A yield curve graphically depicts the yields of different maturity bonds of the same credit quality and type; a normal yield curve is upward sloping, with short-term rates lower than long-term rates.
The views expressed in this report are those of the portfolio manager(s) only through the end of the period of the report as stated on the cover and do not necessarily reflect the views of MFS or any other person in the MFS organization. These views are subject to change at any time based on market or other conditions, and MFS disclaims any responsibility to update such views. These views may not be relied upon as investment advice or an indication of trading intent on behalf of any MFS portfolio. References to specific securities are not recommendations of such securities, and may not be representative of any MFS portfolio's current or future investments.

PERFORMANCE SUMMARY THROUGH 1/31/24
The following chart illustrates a representative class of the fund's historical performance in comparison to its benchmark(s). Performance results include the deduction of the maximum applicable sales charge and reflect the percentage change in net asset value, including reinvestment of dividends and capital gains distributions. The performance of other share classes will be greater than or less than that of the class depicted below. Benchmarks are unmanaged and may not be invested in directly. Benchmark returns do not reflect sales charges, commissions or expenses. (See Notes to Performance Summary.)
Performance data shown represents past performance and is no guarantee of future results. Investment return and principal value fluctuate so your shares, when sold, may be worth more or less than the original cost; current performance may be lower or higher than quoted. The performance shown does not reflect the deduction of taxes, if any, that a shareholder would pay on fund distributions or the redemption of fund shares.
Growth of a Hypothetical $10,000 Investment
18,000 | | | ICE BofA Global High Yield - Constrained Index (USD Hedged) | | |
| | | |
16,000 | | | MFS Global High Yield Fund - Class A | | | | $15,542 |
| | | | |
| | | | |
| | | | | | | | | | |
| | | | | | | | | | | |
14,000 | | | | | | | | | | | | $13,590 |
| | | | | | | | | | | |
12,000 | | | | | | | | | | | | | |
10,000 | | | | | | | | | | | | | |
8,000 | | | | | | | | | | | | | |
| /1 | /1 | /1 | /1 | /1 | /20 | /2 | /2 | /2 | /24 |
/1 |
4 | 5 | 6 | 7 | 8 | 9 | | 1 | 2 | 3 | | |
1 | | 1 | | 1 | 1 | 1 | 1 | 1 | 1 | 1 | 1 | 1 | |
Performance Summary - continued
Total Returns through 1/31/24 | | | | |
Average annual without sales charge | | | | |
| Share Class | Class Inception Date | 1-yr | 5-yr | 10-yr | |
| A | 7/01/1998 | 9.17% | 3.53% | 3.56% | |
| B | 7/01/1998 | 8.35% | 2.76% | 2.78% | |
| C | 7/01/1998 | 8.56% | 2.79% | 2.81% | |
| I | 7/01/1998 | 9.43% | 3.78% | 3.81% | |
| R1 | 6/02/2008 | 8.36% | 2.75% | 2.78% | |
| R2 | 6/02/2008 | 8.89% | 3.27% | 3.29% | |
| R3 | 6/02/2008 | 9.14% | 3.64% | 3.62% | |
| R4 | 6/02/2008 | 9.62% | 3.80% | 3.80% | |
| R6 | 6/02/2008 | 9.56% | 3.89% | 3.91% | |
| | | | |
Comparative benchmark(s) | | | | |
| | | | | |
| ICE BofA Global High Yield - Constrained Index (USD | 9.25% | 3.97% | 4.51% | |
| Hedged) (f) | | |
| | | | | |
| | | | |
Average annual with sales charge | | | | |
| | | | | | |
| A | | | | | |
| With Initial Sales Charge (4.25%) | 4.53% | 2.63% | 3.12% | |
| B | | | | | |
| With CDSC (Declining over six years from 4% to 0%) (v) | 4.35% | 2.43% | 2.78% | |
| C | | | | | |
| With CDSC (1% for 12 months) (v) | 7.56% | 2.79% | 2.81% | |
| | | | | | |
CDSC – Contingent Deferred Sales Charge.
Class I, R1, R2, R3, R4, and R6 shares do not have a sales charge.
(f) Source: FactSet Research Systems Inc.
(v) Assuming redemption at the end of the applicable period.
Benchmark Definition(s)
ICE BofA Global High Yield – Constrained Index(d) (USD Hedged) – tracks the performance of below investment grade corporate debt of issuers domiciled in countries having an investment grade foreign currency long-term debt rating (based on an average of Moody's, S&P and Fitch). The Index is weighted by outstanding issuance, but constrained such that the percentage of any one issuer may not represent more than 2% of the Index.
It is not possible to invest directly in an index.
(d)Source ICE Data Indices, LLC ("ICE Data"), is used with permission. ICE Data, its affiliates and their respective third party suppliers disclaim any and all warranties and representations, express and/or implied, including any warranties of merchantability or fitness for a particular purpose or use, including the indices, index data and any data included in, related to, or derived therefrom. Neither ICE Data, its affiliates nor their respective third party suppliers shall be subject to any damages or liability with respect the adequacy, accuracy, timeliness or
Performance Summary - continued
completeness of the indices or the index data or any component thereof, and the indices and the index data and all components thereof are provided on an "as is" basis and your use is at your own risk. ICE Data, its affiliates and their respective third party suppliers do not sponsor, endorse or recommend MFS, or any of its products or services.
Notes to Performance Summary
Average annual total return represents the average annual change in value for each share class for the periods presented.
Performance results reflect any applicable expense subsidies and waivers in effect during the periods shown. Without such subsidies and waivers the fund's performance results would be less favorable. Please see the prospectus and financial statements for complete details.
Performance results do not include adjustments made for financial reporting purposes in accordance with U.S. generally accepted accounting principles and may differ from amounts reported in the financial highlights.
From time to time the fund may receive proceeds from litigation settlements, without which performance would be lower.
EXPENSE TABLE
Fund expenses borne by the shareholders during the period, August 1, 2023 through January 31, 2024
As a shareholder of the fund, you incur two types of costs: (1) transaction costs, including sales charges (loads) on certain purchase or redemption payments, and
(2)ongoing costs, including management fees; distribution and service (12b-1) fees; and other fund expenses. This example is intended to help you understand your ongoing costs (in dollars) of investing in the fund and to compare these costs with the ongoing costs of investing in other mutual funds.
In addition to the fees and expenses which the fund bears directly, the fund indirectly bears a pro rata share of the fees and expenses of the MFS High Yield Pooled Portfolio, an underlying MFS Pooled Portfolio in which the fund invests. MFS Pooled Portfolios are mutual funds advised by MFS that do not pay management fees to MFS but do incur investment and operating costs. If these transactional and indirect costs were included, your costs would have been higher.
The example is based on an investment of $1,000 invested at the beginning of the period and held for the entire period August 1, 2023 through January 31, 2024.
Actual Expenses
The first line for each share class in the following table provides information about actual account values and actual expenses. You may use the information in this line, together with the amount you invested, to estimate the expenses that you paid over the period. Simply divide your account value by $1,000 (for example, an $8,600 account value divided by $1,000 = 8.6), then multiply the result by the number in the first line under the heading entitled "Expenses Paid During Period" to estimate the expenses you paid on your account during this period.
Hypothetical Example for Comparison Purposes
The second line for each share class in the following table provides information about hypothetical account values and hypothetical expenses based on the fund's actual expense ratio and an assumed rate of return of 5% per year before expenses, which is not the fund's actual return. The hypothetical account values and expenses may not be used to estimate the actual ending account balance or expenses you paid for the period. You may use this information to compare the ongoing costs of investing in the fund and other funds. To do so, compare this 5% hypothetical example with the 5% hypothetical examples that appear in the shareholder reports of the other funds.
Please note that the expenses shown in the table are meant to highlight your ongoing costs only and do not reflect any transactional costs, such as sales charges (loads). Therefore, the second line for each share class in the table is useful in comparing ongoing costs only, and will not help you determine the relative total costs of owning different funds. In addition, if these transactional costs were included, your costs would have been higher.
Expense Table - continued
| | | | | | Expenses |
| | | Annualized | Beginning | Ending | Paid During |
| Share | | Expense | Account Value | Account Value | Period (p) |
| Class | | Ratio | 8/01/23 | 1/31/24 | 8/01/23-1/31/24 |
| | | | | | |
| A | Actual | 1.05% | $1,000.00 | $1,064.66 | $5.46 |
| | | | | |
| Hypothetical (h) | 1.05% | $1,000.00 | $1,019.91 | $5.35 |
| |
| | | | | | |
| B | Actual | 1.80% | $1,000.00 | $1,060.64 | $9.35 |
| | | | | |
| Hypothetical (h) | 1.80% | $1,000.00 | $1,016.13 | $9.15 |
| |
| | | | | | |
| C | Actual | 1.80% | $1,000.00 | $1,062.76 | $9.36 |
| | | | | |
| Hypothetical (h) | 1.80% | $1,000.00 | $1,016.13 | $9.15 |
| |
| | | | | | |
| I | Actual | 0.80% | $1,000.00 | $1,065.96 | $4.17 |
| | | | | |
| Hypothetical (h) | 0.80% | $1,000.00 | $1,021.17 | $4.08 |
| |
| | | | | | |
| R1 | Actual | 1.80% | $1,000.00 | $1,060.73 | $9.35 |
| | | | | |
| Hypothetical (h) | 1.80% | $1,000.00 | $1,016.13 | $9.15 |
| |
| | | | | | |
| R2 | Actual | 1.30% | $1,000.00 | $1,065.30 | $6.77 |
| | | | | |
| Hypothetical (h) | 1.30% | $1,000.00 | $1,018.65 | $6.61 |
| |
| | | | | | |
| R3 | Actual | 1.05% | $1,000.00 | $1,064.39 | $5.46 |
| | | | | |
| Hypothetical (h) | 1.05% | $1,000.00 | $1,019.91 | $5.35 |
| |
| | | | | | |
| R4 | Actual | 0.80% | $1,000.00 | $1,067.76 | $4.17 |
| | | | | |
| Hypothetical (h) | 0.80% | $1,000.00 | $1,021.17 | $4.08 |
| |
| | | | | | |
| R6 | Actual | 0.69% | $1,000.00 | $1,066.61 | $3.59 |
| | | | | |
| Hypothetical (h) | 0.69% | $1,000.00 | $1,021.73 | $3.52 |
| |
(h) 5% class return per year before expenses.
(p)"Expenses Paid During Period" are equal to each class's annualized expense ratio, as shown above, multiplied by the average account value over the period, multiplied by 184/365 (to reflect the one-half year period). Expenses paid do not include any applicable sales charges (loads). If these transaction costs had been included, your costs would have been higher. In addition to the fees and expenses which the fund bears directly, the fund indirectly bears a pro rata share of the fees and expenses of the underlying funds in which the fund invests. If these indirect costs were included, your costs would have been higher.
PORTFOLIO OF INVESTMENTS
1/31/24
The Portfolio of Investments is a complete list of all securities owned by your fund. It is categorized by broad-based asset classes.
Issuer | Shares/Par | | | Value ($) |
Bonds – 32.0% | | | | | |
Asset-Backed & Securitized – 0.4% | | | | | |
RAC Bond Co. PLC, 5.25%, 11/04/2027 (n) | GBP | 699,000 | $ | 819,831 |
Basic Industry – 0.3% | | | | | |
PeopleCert Wisdom Issuer PLC, 5.75%, 9/15/2026 (n) | EUR | 435,000 | $ | 461,878 |
PeopleCert Wisdom Issuer PLC, 5.75%, 9/15/2026 | | 150,000 | | | 159,268 |
| | | $ | 621,146 |
Broadcasting – 0.5% | | | | | |
Banijay Entertainment S.A.S.U., 7%, 5/01/2029 (n) | EUR | 458,000 | $ | 520,585 |
Banijay Entertainment S.A.S.U., 7%, 5/01/2029 | | 150,000 | | | 170,497 |
WMG Acquisition Corp., 2.25%, 8/15/2031 (n) | | 510,000 | | | 473,995 |
| | | $ | 1,165,077 |
Building – 0.5% | | | | | |
HT Troplast GmbH, 9.375%, 7/15/2028 (n) | EUR | 364,000 | $ | 403,832 |
HT Troplast GmbH, 9.375%, 7/15/2028 | | 229,000 | | | 254,059 |
Standard Industries, Inc., 2.25%, 11/21/2026 (n) | | 430,000 | | | 435,510 |
| | | $ | 1,093,401 |
Business Services – 0.8% | | | | | |
Engineering Ingegneria Informatica S.p.A., 11.125%, 5/15/2028 | EUR | 472,000 | $ | 548,347 |
Nexi S.p.A., 2.125%, 4/30/2029 | | 1,310,000 | | | 1,249,654 |
| | | $ | 1,798,001 |
Cable TV – 1.4% | | | | | |
Summer BidCo B.V., 9% (9% Cash or 9.75% PIK), 11/15/2025 (p) | EUR 1,077,129 | $ | 1,165,508 |
Summer BidCo B.V., 10%, 2/15/2029 (n)(w) | | 100,000 | | | 109,090 |
United Group B.V., 5.25%, 2/01/2030 | | 284,000 | | | 284,590 |
Virgin Media Vendor Financing Notes III DAC, 4.875%, 7/15/2028 | GBP | 370,000 | | | 427,872 |
Ziggo B.V., 2.875%, 1/15/2030 (n) | EUR | 760,000 | | | 745,071 |
Ziggo B.V., 2.875%, 1/15/2030 | | 100,000 | | | 98,036 |
Ziggo B.V., 3.375%, 2/28/2030 | | 235,000 | | | 215,275 |
| | | $ | 3,045,442 |
Chemicals – 0.8% | | | | | |
Lune Holdings S.à r.l., 5.625%, 11/15/2028 | EUR | 473,000 | $ | 414,417 |
SCIL IV LLC/SCIL USA Holdings LLC, 4.375%, 11/01/2026 (n) | | 715,000 | | | 755,392 |
SPCM S.A., 2.625%, 2/01/2029 | | 456,000 | | | 453,991 |
| | | $ | 1,623,800 |
Portfolio of Investments – continued
Issuer | Shares/Par | | | Value ($) |
Bonds – continued | | | | | |
Conglomerates – 1.2% | | | | | |
Grupo KUO S.A.B. de C.V., 5.75%, 7/07/2027 (n) | $ | 1,105,000 | $ | 995,873 |
RENK AG, 5.75%, 7/15/2025 | EUR | 445,000 | | | 479,759 |
Renk GmbH (Frankfurt), 5.75%, 7/15/2025 (n) | | 465,000 | | | 501,322 |
SCC Power PLC, 8% (8% Cash or 4% Cash and 4% PIK) to | | | | | |
6/15/2024, 8% Cash to 12/31/2028 (n)(p) | $ | 836,777 | | | 391,193 |
SCC Power PLC, 4% (4% Cash or 4% PIK) to 6/15/2024, 4% Cash | | | | | |
to 5/17/2032 (n)(p) | | 453,254 | | | 76,827 |
| | | $ | 2,444,974 |
Consumer Products – 0.5% | | | | | |
Coty, Inc., 5.75%, 9/15/2028 (n) | EUR | 237,000 | $ | 266,166 |
International Design Group S.p.A., 10%, 11/15/2028 (n) | | 708,000 | | | 793,706 |
| | | $ | 1,059,872 |
Consumer Services – 0.5% | | | | | |
Verisure Holding AB, 3.25%, 2/15/2027 | EUR | 315,000 | $ | 327,042 |
Verisure Midholding AB, 5.25%, 2/15/2029 | | 810,000 | | | 834,181 |
| | | $ | 1,161,223 |
Containers – 1.4% | | | | | |
Ardagh Metal Packaging Finance USA LLC, 3%, 9/01/2029 (n) | EUR | 180,000 | $ | 151,730 |
Ardagh Metal Packaging Finance USA LLC, 3%, 9/01/2029 | | 300,000 | | | 252,884 |
Can-Pack S.A./Eastern PA Land Investment Holding LLC, | | | | | |
3.875%, 11/15/2029 (n) | $ | 834,000 | | | 735,013 |
Crown European Holdings S.A., 4.75%, 3/15/2029 (n) | EUR | 495,000 | | | 542,035 |
San Miguel Industrias PET S.A., 3.5%, 8/02/2028 (n) | $ | 840,000 | | | 726,600 |
Titan Holdings II B.V., 5.125%, 7/15/2029 (n) | EUR | 635,000 | | | 606,022 |
| | | $ | 3,014,284 |
Emerging Market Quasi-Sovereign – 2.0% | | | | | |
Bulgarian Energy Holding EAD, 2.45%, 7/22/2028 | EUR | 870,000 | $ | 820,050 |
Eustream A.S. (Slovak Republic), 1.625%, 6/25/2027 | | 367,000 | | | 334,150 |
Petroleos Mexicanos, 6.5%, 3/13/2027 | $ | 545,000 | | | 511,067 |
Petroleos Mexicanos, 6.84%, 1/23/2030 | | 450,000 | | | 386,388 |
Petroleos Mexicanos, 10%, 2/07/2033 | | 560,000 | | | 553,810 |
Petroleos Mexicanos, 6.5%, 6/02/2041 | | 1,635,000 | | | 1,101,606 |
Petroleos Mexicanos, 7.69%, 1/23/2050 | | 740,000 | | | 517,339 |
| | | $ | 4,224,410 |
Energy - Integrated – 0.2% | | | | | |
Citgo Petroleum Corp., 8.375%, 1/15/2029 (n) | $ | 382,000 | $ | 396,885 |
Entertainment – 0.1% | | | | | |
Motion Finco S.à r.l., 7.375%, 6/15/2030 (n) | EUR | 210,000 | $ | 234,291 |
Portfolio of Investments – continued
Issuer | Shares/Par | | | Value ($) |
Bonds – continued | | | | | |
Financial Institutions – 1.2% | | | | | |
Citycon Treasury B.V., 1.625%, 3/12/2028 | EUR | 450,000 | $ | 399,274 |
Encore Capital Group, Inc., 5.375%, 2/15/2026 (n) | GBP | 335,000 | | | 409,283 |
Encore Capital Group, Inc., 4.25%, 6/01/2028 (n) | | 390,000 | | | 427,524 |
Globalworth Ltd., REIT, 2.95%, 7/29/2026 | EUR | 515,000 | | | 475,937 |
Heimstaden Bostad Treasury B.V., 1.375%, 7/24/2028 | | 470,000 | | | 391,284 |
Samhallsbyggnadsbolaget i Norden AB, 2.375%, 9/04/2026 | | 373,000 | | | 309,142 |
Samhallsbyggnadsbolaget i Norden AB, 2.875% to 1/30/2027, FLR | | | | | |
(EUR Swap Rate - 5yr. + 3.223%) to 1/30/2032, FLR (EUR Swap Rate | | | | | |
- 5yr. + 3.473%) to 1/30/2047, FLR (EUR Swap Rate - 5yr. + 4.473%) | | | | | |
to 1/30/2171 | | 805,000 | | | 156,593 |
| | | $ | 2,569,037 |
Food & Beverages – 0.7% | | | | | |
Aragvi Finance International DAC, 8.45%, 4/29/2026 (n) | $ | 400,000 | $ | 285,600 |
Central America Bottling Co., 5.25%, 4/27/2029 (n) | | 966,000 | | | 902,370 |
Minerva Luxembourg S.A., 4.375%, 3/18/2031 (n) | | 457,000 | | | 376,315 |
| | | $ | 1,564,285 |
Gaming & Lodging – 1.2% | | | | | |
Allwyn International, 3.875%, 2/15/2027 (n) | EUR | 665,000 | $ | 693,900 |
Allwyn International A.S., 3.875%, 2/15/2027 | | 445,000 | | | 464,339 |
NH Hotel Group S.A., 4%, 7/02/2026 (n) | | 415,000 | | | 443,064 |
NH Hotel Group S.A., 4%, 7/02/2026 | | 325,000 | | | 346,978 |
Playtech PLC, 5.875%, 6/28/2028 | | 476,000 | | | 511,841 |
| | | $ | 2,460,122 |
Industrial – 0.1% | | | | | |
Albion Financing 1 S.à r.l., 5.25%, 10/15/2026 | EUR | 228,000 | $ | 243,320 |
Machinery & Tools – 0.3% | | | | | |
Sarens Finance Co. N.V., 5.75%, 2/21/2027 | EUR | 555,000 | $ | 557,803 |
Major Banks – 0.3% | | | | | |
UniCredit S.p.A., 3.875% to 6/03/2027, FLR (EUR ICE Swap Rate - | | | | | |
5yr. + 4.081%) to 6/03/2070 | EUR | 645,000 | $ | 600,170 |
Medical & Health Technology & Services – 0.5% | | | | | |
Ephios Subco 3 S.à r.l., 7.875%, 1/31/2031 (n) | EUR | 488,000 | $ | 556,144 |
Laboratoire Eimer Selas, 5%, 2/01/2029 | | 594,000 | | | 549,163 |
| | | $ | 1,105,307 |
Portfolio of Investments – continued
Issuer | Shares/Par | | | Value ($) |
Bonds – continued | | | | | |
Metals & Mining – 0.4% | | | | | |
Baffinland Iron Mines Corp./Baffinland Iron Mines LP, | | | | | |
8.75%, 7/15/2026 (n) | $ | 140,000 | $ | 128,101 |
Novelis Sheet Ingot GmbH, 3.375%, 4/15/2029 (n) | EUR | 460,000 | | | 463,425 |
Petra Diamonds US$ Treasury PLC, 9.75%, 3/08/2026 (n)(p) | $ | 359,667 | | | 258,449 |
| | | $ | 849,975 |
Midstream – 0.2% | | | | | |
Peru LNG, 5.375%, 3/22/2030 | $ | 645,000 | $ | 530,975 |
Network & Telecom – 0.9% | | | | | |
Iliad Holding S.A.S., 5.625%, 10/15/2028 (n) | EUR | 380,000 | $ | 411,717 |
Iliad S.A., 5.625%, 2/15/2030 | | 300,000 | | | 335,942 |
Kaixo Bondco Telecom S.A., 5.125%, 9/30/2029 (n) | | 835,000 | | | 869,780 |
Kaixo Bondco Telecom S.A., 5.125%, 9/30/2029 | | 200,000 | | | 208,330 |
| | | $ | 1,825,769 |
Oils – 0.5% | | | | | |
FS Luxembourg S.à r.l., 8.875%, 2/12/2031 (n)(w) | $ | 429,000 | $ | 423,380 |
MC Brazil Downstream Trading S.à r.l., 7.25%, 6/30/2031 (n) | | 724,473 | | | 556,990 |
Puma International Financing S.A., 5%, 1/24/2026 | | 200,000 | | | 189,432 |
| | | $ | 1,169,802 |
Other Banks & Diversified Financials – 1.0% | | | | | |
Banco GNB Sudameris S.A., 7.5% to 4/16/2026, FLR (CMT - 5yr. + | | | | | |
6.66%) to 4/16/2031 | $ | 755,000 | $ | 641,372 |
BBVA Bancomer S.A. (Texas), 8.125%, 1/08/2039 (n) | | 954,000 | | | 970,576 |
Intesa Sanpaolo S.p.A., 4.125% to 2/27/2030, FLR (EUR Swap Rate - | | | | | |
5yr. + 4.274%) to 2/27/2070 | EUR | 645,000 | | | 572,387 |
| | | $ | 2,184,335 |
Pharmaceuticals – 1.3% | | | | | |
Cheplapharm Arzneimittel GmbH, 4.375%, 1/15/2028 | EUR | 457,000 | $ | 477,241 |
Cheplapharm Arzneimittel GmbH, 7.5%, 5/15/2030 (n) | | 345,000 | | | 392,050 |
Grifols S.A., 3.2%, 5/01/2025 | | 617,000 | | | 634,993 |
Organon Finance 1 LLC, 2.875%, 4/30/2028 (n) | | 235,000 | | | 236,111 |
Teva Pharmaceutical Finance Netherlands III B.V., 4.75%, 5/09/2027 | $ | 1,025,000 | | | 990,406 |
| | | $ | 2,730,801 |
Precious Metals & Minerals – 0.2% | | | | | |
Eldorado Gold Corp., 6.25%, 9/01/2029 (n) | $ | 342,000 | $ | 326,177 |
Restaurants – 0.2% | | | | | |
MIDCO GB, 7.75%, 11/01/2027 (n) | EUR | 465,000 | $ | 502,510 |
Portfolio of Investments – continued
Issuer | Shares/Par | | | Value ($) |
Bonds – continued | | | | | |
Retailers – 1.0% | | | | | |
B&M European Value Retail S.A., 8.125%, 11/15/2030 | GBP | 385,000 | $ | 517,795 |
Grupo Axo S.A.P.I. de C.V., 5.75%, 6/08/2026 (n) | $ | 1,044,000 | | | 975,502 |
Mobilux Finance S.A.S., 4.25%, 7/15/2028 (n) | EUR | 575,000 | | | 549,941 |
| | | $ | 2,043,238 |
Specialty Chemicals – 0.6% | | | | | |
Braskem Netherlands B.V., 4.5%, 1/10/2028 (n) | $ | 715,000 | $ | 620,474 |
CTEC II GmbH, 5.25%, 2/15/2030 (n) | EUR | 253,000 | | | 244,859 |
CTEC II GmbH, 5.25%, 2/15/2030 | | 325,000 | | | 314,543 |
| | | $ | 1,179,876 |
Specialty Stores – 0.5% | | | | | |
Dufry One B.V., 3.375%, 4/15/2028 | EUR 1,090,000 | $ | 1,126,427 |
Supermarkets – 1.2% | | | | | |
Eroski Sociedad Cooperativa, 10.625%, 4/30/2029 (n) | EUR | 1,185,000 | $ | 1,359,370 |
Ocado Group PLC, 3.875%, 10/08/2026 | GBP | 462,000 | | | 507,183 |
Picard Bondco S.A., 5.375%, 7/01/2027 | EUR | 594,000 | | | 609,775 |
| | | $ | 2,476,328 |
Telecommunications - Wireless – 2.8% | | | | | |
Altice France Holding S.A., 3.375%, 1/15/2028 | EUR | 143,000 | $ | 119,277 |
Altice France Holding S.A., 4%, 2/15/2028 (n) | | 130,000 | | | 59,709 |
Altice France Holding S.A., 4%, 2/15/2028 | | 100,000 | | | 45,930 |
Cellnex Finance Co. S.A., 1.5%, 6/08/2028 | | 900,000 | | | 895,919 |
Cellnex Finance Co. S.A., 2%, 2/15/2033 | | 700,000 | | | 650,221 |
Millicom International Cellular S.A., 5.125%, 1/15/2028 (n) | $ | 797,400 | | | 746,908 |
PLT VII Finance S.à r.l., 4.625%, 1/05/2026 | EUR | 642,000 | | | 689,473 |
PPF Telecom Group B.V., 2.125%, 1/31/2025 | | 270,000 | | | 285,662 |
PPF Telecom Group B.V., 3.25%, 9/29/2027 | | 733,000 | | | 768,084 |
VMED O2 UK Financing I PLC, 4%, 1/31/2029 | GBP | 299,000 | | | 336,309 |
Vodafone Group PLC, 3% to 8/27/2030, FLR (EUR Swap Rate - 5yr. + | | | | | |
3.477%) to 8/27/2050, FLR (EUR Swap Rate - 5yr. + 4.227%) to | | | | | |
8/27/2080 | EUR | 705,000 | | | 681,895 |
WP / AP Telecom Holdings III B.V., 5.5%, 1/15/2030 | | 569,000 | | | 560,344 |
| | | $ | 5,839,731 |
Transportation - Services – 1.6% | | | | | |
Acu Petroleo Luxembourg S.à r.l., 7.5%, 1/13/2032 | $ | 441,213 | $ | 422,766 |
Arena Luxembourg Finance S.à r.l., 1.875%, 2/01/2028 (n) | EUR | 1,180,000 | | | 1,128,065 |
Arena Luxembourg Finance S.à r.l., 1.875%, 2/01/2028 | | 100,000 | | | 95,599 |
Cliffton Ltd., 6.25%, 10/25/2025 (n) | $ | 663,000 | | | 658,027 |
Hidrovias International Finance S.à r.l., 4.95%, 2/08/2031 | | 440,000 | | | 361,022 |
Portfolio of Investments – continued
Issuer | Shares/Par | | | Value ($) |
Bonds – continued | | | | | |
Transportation - Services – continued | | | | | |
Q-Park Holding I B.V., 2%, 3/01/2027 | EUR | 617,000 | | $ | 624,188 |
| | | $ | 3,289,667 |
Utilities - Electric Power – 3.6% | | | | | |
Adani Green Energy (UP) Ltd./Prayatna Developers Private Ltd., | | | | | |
6.25%, 12/10/2024 (n) | $ | 761,000 | $ | 754,189 |
AES Gener S.A., 7.125% to 7/06/2024, FLR (Swap Rate - 5yr. + | | | | | |
4.644%) to 7/06/2029, FLR (Swap Rate - 5yr. + 4.894%) to | | | | | |
7/06/2044, FLR (Swap Rate - 5yr. + 5.644%) to 3/26/2079 | | 595,000 | | | 570,724 |
Azure Power Energy Ltd., 3.575%, 8/19/2026 (n) | | 470,389 | | | 431,123 |
Azure Power Solar Energy Private Ltd., 5.65%, 12/24/2024 (n) | | 302,000 | | | 293,574 |
ContourGlobal Power Holdings S.A., 2.75%, 1/01/2026 (n) | EUR | 640,000 | | | 661,388 |
ContourGlobal Power Holdings S.A., 3.125%, 1/01/2028 | | 258,000 | | | 251,604 |
Electricidad Firme de Mexico, 4.9%, 11/20/2026 (n) | $ | 752,000 | | | 693,650 |
Greenko Dutch B.V. (Republic of India), 3.85%, 3/29/2026 (n) | | 683,575 | | | 642,561 |
Investment Energy Resources Ltd., 6.25%, 4/26/2029 (n) | | 718,000 | | | 682,797 |
Mercury Chile Holdco LLC, 6.5%, 1/24/2027 (n) | | 687,000 | | | 638,868 |
Mong Duong Finance Holdings B.V., 5.125%, 5/07/2029 (n) | | 635,458 | | | 595,609 |
ReNew Wind Energy AP2/ReNew Power Private Ltd., | | | | | |
4.5%, 7/14/2028 (n) | | 729,000 | | | 665,877 |
TerraForm Global Operating LLC, 6.125%, 3/01/2026 (n) | | 836,000 | | | 825,046 |
| | | $ | 7,707,010 |
Utilities - Gas – 0.5% | | | | | |
EP Infrastructure A.S., 2.045%, 10/09/2028 | EUR | 200,000 | $ | 183,942 |
EP Infrastructure A.S., 1.816%, 3/02/2031 | | 917,000 | | | 780,176 |
| | | $ | 964,118 |
Utilities - Other – 0.6% | | | | | |
Aegea Finance S.à r.l., 6.75%, 5/20/2029 (n) | $ | 1,386,000 | $ | 1,345,060 |
Total Bonds (Identified Cost, $72,427,396) | | | $ | 67,894,480 |
Investment Companies (h) – 66.9% | | | | | |
Bond Funds – 65.5% | | | | | |
MFS High Yield Pooled Portfolio (v)(y) | | 16,848,090 | $ | 138,828,262 |
Money Market Funds – 1.4% | | | | | |
MFS Institutional Money Market Portfolio, 5.4% (v) | | 2,866,178 | $ | 2,866,464 |
Total Investment Companies (Identified Cost, $148,584,849) | | $141,694,726 |
Portfolio of Investments – continued
| | | | Par Amount/ | |
Underlying/Expiration | | | Notional | Number of | |
Date/Exercise Price | Put/Call Counterparty | Amount | Contracts Value ($) |
Purchased Options – 0.0% | | | | |
Market Index Securities – 0.0% | | | | |
Russell 2000 Index – | | | | | |
December 2024 @ $1,500 | | | | | |
(Premiums Paid, $50,113) | Put | Exchange Trade | $ 1,363,139 | 7 | $19,390 |
Other Assets, Less Liabilities – 1.1% | | | 2,247,672 |
Net Assets – 100.0% | | | | $211,856,268 |
(h)An affiliated issuer, which may be considered one in which the fund owns 5% or more of the outstanding voting securities, or a company which is under common control. At period end, the aggregate values of the fund's investments in affiliated issuers and in unaffiliated issuers were $141,694,726 and $67,913,870, respectively.
(n)Securities exempt from registration under Rule 144A of the Securities Act of 1933. These securities may be sold in the ordinary course of business in transactions exempt from registration, normally to qualified institutional buyers. At period end, the aggregate value of
these securities was $35,348,910, representing 16.7% of net assets.
(p)Payment-in-kind (PIK) security for which interest income may be received in additional securities and/or cash.
(v)Affiliated issuer that is available only to investment companies managed by MFS. The rate quoted for the MFS Institutional Money Market Portfolio is the annualized seven-day yield of the fund at period end.
(w)When-issued security.
(y)The annual report for MFS High Yield Pooled Portfolio as of January 31, 2024 has been included as Appendix A.
The following abbreviations are used in this report and are defined:
CMT | Constant Maturity Treasury |
FLR | Floating Rate. Interest rate resets periodically based on the parenthetically disclosed |
| reference rate plus a spread (if any). The period-end rate reported may not be the |
| current rate. All reference rates are USD unless otherwise noted. |
ICE | Intercontinental Exchange |
REIT | Real Estate Investment Trust |
Abbreviations indicate amounts shown in currencies other than the U.S. dollar. All amounts are stated in U.S. dollars unless otherwise indicated. A list of abbreviations is shown below:
EUR | Euro | | | |
GBP | British Pound | | | |
Derivative Contracts at 1/31/24 | | | |
Forward Foreign Currency Exchange Contracts | | |
| | | | Unrealized |
Currency | Currency | | Settlement | Appreciation |
Purchased | Sold | Counterparty | Date | (Depreciation) |
| | | |
Asset Derivatives | | | |
USD 41,249,992 EUR 37,747,380 | HSBC Bank | 4/19/2024 | $322,387 |
Portfolio of Investments – continued
Forward Foreign Currency Exchange Contracts - continued | | | | | | | |
| | | | | | | | | Unrealized |
| Currency | Currency | | | | | Settlement | Appreciation |
Purchased | | Sold | | Counterparty | | Date | (Depreciation) |
Asset Derivatives - continued | | | | | | | | | | |
USD | 109,273 | EUR | 100,000 | Morgan Stanley Capital Services, Inc. | 4/19/2024 | $848 | |
USD | 637,091 | EUR | 579,175 | State Street Bank Corp. | | 4/19/2024 | 9,122 | |
USD | 397,816 | EUR | 365,161 | UBS AG | | | 4/19/2024 | | 1,890 | |
| | | | | | | | | $334,247 | |
Liability Derivatives | | | | | | | | | | | |
EUR | 183,388 | USD | 200,360 | HSBC Bank | | | 4/19/2024 | $(1,522) |
EUR | 362,920 | USD | 394,268 | Morgan Stanley Capital Services, Inc. | 4/19/2024 | (772) |
EUR | 1,325,572 | USD | 1,443,975 | State Street Bank Corp. | | 4/19/2024 | (6,724) |
EUR | 308,991 | USD | 336,781 | UBS AG | | | 4/19/2024 | (1,757) |
GBP | 220,319 | USD | 279,547 | JPMorgan Chase Bank N.A. | | 4/19/2024 | (179) |
USD | 3,672,914 | GBP | 2,903,177 | BNP Paribas S.A. | | | 4/19/2024 | | (8,347) |
| | | | | | | | | | | | |
| | | | | | | | | | $(19,301) |
Futures Contracts | | | | | | | | | | | | |
| | | | | | | | | Value/Unrealized |
| | | | Long/ | | | Notional | Expiration | Appreciation |
Description | | | Short | Currency Contracts | Amount | Date | (Depreciation) |
| | | | | | | | | | | |
Liability Derivatives | | | | | | | | | | | |
Interest Rate Futures | | | | | | | | | | |
Long Gilt 10 yr | | | Short | GBP | 2 | $253,384 March – 2024 | | $(8,041) | | |
| | | | | | | | | | | | | |
At January 31, 2024, the fund had cash collateral of $9,400 to cover any collateral or margin obligations for certain derivative contracts. Restricted cash and/or deposits with brokers in the Statement of Assets and Liabilities are comprised of cash collateral.
See Notes to Financial Statements

Financial Statements
STATEMENT OF ASSETS AND LIABILITIES
At 1/31/24
This statement represents your fund's balance sheet, which details the assets and liabilities comprising the total value of the fund.
Assets
Investments in unaffiliated issuers, at value (identified cost, $72,477,509) | $67,913,870 | |
Investments in affiliated issuers, at value (identified cost, $148,584,849) | 141,694,726 | |
Cash | 6,445 | |
Foreign currency, at value (identified cost, $25,012) | 25,012 | |
Deposits with brokers for | | |
Futures contracts | 9,400 | |
Receivables for | | |
Forward foreign currency exchange contracts | 334,247 | |
Investments sold | 1,788,476 | |
Fund shares sold | 301,609 | |
Interest and dividends | 902,499 | |
Receivable from investment adviser | 32,627 | |
Other assets | 1,588 | |
Total assets | $213,010,499 | |
Liabilities | | |
Payables for | | |
Distributions | $29,597 | |
Forward foreign currency exchange contracts | 19,301 | |
Net daily variation margin on open futures contracts | 2,767 | |
Investments purchased | 7,983 | |
When-issued investments purchased | 531,609 | |
Fund shares reacquired | 394,276 | |
Payable to affiliates | | |
Administrative services fee | 222 | |
Shareholder servicing costs | 60,440 | |
Distribution and service fees | 1,770 | |
Payable for independent Trustees' compensation | 15 | |
Accrued expenses and other liabilities | 106,251 | |
Total liabilities | $1,154,231 | |
Net assets | $211,856,268 | |
Net assets consist of | | |
Paid-in capital | $293,446,087 | |
Total distributable earnings (loss) | (81,589,819) |
Net assets | $211,856,268 | |
Shares of beneficial interest outstanding | 39,007,143 | |
Statement of Assets and Liabilities – continued
| | Shares | Net asset value |
| Net assets | outstanding | per share (a) |
Class A | $106,279,599 | 19,566,251 | $5.43 |
Class B | 482,577 | 88,641 | 5.44 |
Class C | 4,473,930 | 824,655 | 5.43 |
Class I | 75,222,840 | 13,853,787 | 5.43 |
Class R1 | 77,453 | 14,261 | 5.43 |
Class R2 | 509,148 | 93,608 | 5.44 |
Class R3 | 1,713,160 | 313,625 | 5.46 |
Class R4 | 7,063,022 | 1,294,322 | 5.46 |
Class R6 | 16,034,539 | 2,957,993 | 5.42 |
(a)Maximum offering price per share was equal to the net asset value per share for all share classes, except for Class A, for which the maximum offering price per share was $5.67 [100 / 95.75 x $5.43]. On sales of $100,000 or more, the maximum offering price of Class A shares is reduced. A contingent deferred sales charge may be imposed on redemptions of Class A, Class B, and Class C shares. Redemption price per share was equal to the net asset value per share for Classes I, R1, R2, R3, R4, and R6.
See Notes to Financial Statements
Financial Statements
STATEMENT OF OPERATIONS
Year ended 1/31/24
This statement describes how much your fund earned in investment income and accrued in expenses. It also describes any gains and/or losses generated by fund operations.
Net investment income (loss)
Income | | |
Dividends from affiliated issuers | $8,912,114 | |
Interest | 3,937,308 | |
Other | 28,690 | |
Foreign taxes withheld | (82) |
Total investment income | $12,878,030 | |
Expenses | | |
Management fee | $1,278,268 | |
Distribution and service fees | 321,932 | |
Shareholder servicing costs | 267,098 | |
Administrative services fee | 38,559 | |
Independent Trustees' compensation | 5,362 | |
Custodian fee | 25,550 | |
Shareholder communications | 45,013 | |
Audit and tax fees | 100,093 | |
Legal fees | 1,014 | |
Registration fees | 148,906 | |
Miscellaneous | 33,588 | |
Total expenses | $2,265,383 | |
Fees paid indirectly | (1,222) |
Reduction of expenses by investment adviser and distributor | (384,702) |
Net expenses | $1,879,459 | |
Net investment income (loss) | $10,998,571 | |
Statement of Operations – continued
Realized and unrealized gain (loss)
Realized gain (loss) (identified cost basis) | | |
Unaffiliated issuers | $(3,365,907) |
Affiliated issuers | (5,272,052) |
Futures contracts | (3,611) |
Forward foreign currency exchange contracts | 345,804 | |
Foreign currency | 20,608 | |
Net realized gain (loss) | $(8,275,158) |
Change in unrealized appreciation or depreciation | | |
Unaffiliated issuers | $6,079,625 | |
Affiliated issuers | 8,862,205 | |
Futures contracts | (8,041) |
Forward foreign currency exchange contracts | 491,345 | |
Translation of assets and liabilities in foreign currencies | (20,642) |
Net unrealized gain (loss) | $15,404,492 | |
Net realized and unrealized gain (loss) | $7,129,334 | |
Change in net assets from operations | $18,127,905 | |
See Notes to Financial Statements
Financial Statements
STATEMENTS OF CHANGES IN NET ASSETS
These statements describe the increases and/or decreases in net assets resulting from operations, any distributions, and any shareholder transactions.
| | Year ended | |
| 1/31/24 | 1/31/23 | |
Change in net assets | | | | |
From operations | | | | |
Net investment income (loss) | $10,998,571 | $10,559,857 | |
Net realized gain (loss) | (8,275,158) | (14,777,410) |
Net unrealized gain (loss) | 15,404,492 | (11,546,247) |
| | | |
Change in net assets from operations | $18,127,905 | $(15,763,800) |
| | | |
Total distributions to shareholders | $(9,328,058) | $(17,296,566) |
| | | |
Change in net assets from fund share transactions | $12,953,063 | $(45,953,868) |
| | | |
Total change in net assets | $21,752,910 | $(79,014,234) |
Net assets | | | | |
At beginning of period | 190,103,358 | 269,117,592 | |
At end of period | $211,856,268 | $190,103,358 | |
See Notes to Financial Statements
Financial Statements
FINANCIAL HIGHLIGHTS
The financial highlights table is intended to help you understand the fund's financial performance for the past 5 years. Certain information reflects financial results for a single fund share. The total returns in the table represent the rate that an investor would have earned (or lost) on an investment in the fund share class (assuming reinvestment of all distributions) held for the entire period.
Class A | | | Year ended | | | |
| 1/31/24 | 1/31/23 | 1/31/22 | 1/31/21 | 1/31/20 |
Net asset value, beginning of period | $5.21 | $5.94 | $6.24 | $6.28 | $6.00 | |
Income (loss) from investment operations | | | | | |
| | | | | | |
Net investment income (loss) (d) | $0.29 | $0.25 | $0.26 | $0.27 | $0.28 | |
Net realized and unrealized gain (loss) | 0.17 | (0.54) | (0.24) | (0.04) | 0.28 | |
Total from investment operations | $0.46 | $(0.29) | $0.02 | $0.23 | $0.56 | |
Less distributions declared to shareholders | | | | | |
| | | | | | |
From net investment income | $(0.24) | $(0.44) | $(0.32) | $(0.27) | $(0.28) |
Net asset value, end of period (x) | $5.43 | $5.21 | $5.94 | $6.24 | $6.28 | |
Total return (%) (r)(s)(t)(x) | 9.17 | (4.59) | 0.31 | 3.86 | 9.59 | |
| | | | | | |
Ratios (%) (to average net assets) | | | | | | |
and Supplemental data: | | | | | | |
Expenses before expense reductions (f)(h) | 1.25 | 1.20 | 1.16 | 1.17 | 1.15 | |
Expenses after expense reductions (f)(h) | 1.05 | 1.05 | 1.05 | 1.05 | 1.05 | |
Net investment income (loss) | 5.50 | 4.68 | 4.16 | 4.47 | 4.50 | |
Portfolio turnover | 28 | 14 | 38 | 22 | 26 | |
Net assets at end of period (000 omitted) | $106,280 | $108,712 | $133,193 | $182,411 | $203,428 | |
See Notes to Financial Statements
Financial Highlights – continued
Class B | | Year ended | | | |
| 1/31/24 | 1/31/23 | 1/31/22 | 1/31/21 | 1/31/20 |
Net asset value, beginning of period | $5.22 | $5.95 | $6.25 | $6.29 | $6.01 | |
Income (loss) from investment operations | | | | | | |
| | | | | | |
Net investment income (loss) (d) | $0.25 | $0.21 | $0.21 | $0.22 | $0.23 | |
Net realized and unrealized gain (loss) | 0.17 | (0.54) | (0.23) | (0.04) | 0.29 | |
Total from investment operations | $0.42 | $(0.33) | $(0.02) | $0.18 | $0.52 | |
Less distributions declared to shareholders | | | | | | |
| | | | | | |
From net investment income | $(0.20) | $(0.40) | $(0.28) | $(0.22) | $(0.24) |
Net asset value, end of period (x) | $5.44 | $5.22 | $5.95 | $6.25 | $6.29 | |
| | | | | | |
Total return (%) (r)(s)(t)(x) | 8.35 | (5.28) | (0.44) | 3.09 | 8.77 | |
| | | | | | |
Ratios (%) (to average net assets) | | | | | | |
and Supplemental data: | | | | | | |
Expenses before expense reductions (f)(h) | 2.00 | 1.95 | 1.91 | 1.92 | 1.90 | |
Expenses after expense reductions (f)(h) | 1.80 | 1.80 | 1.80 | 1.80 | 1.80 | |
Net investment income (loss) | 4.74 | 3.89 | 3.42 | 3.74 | 3.78 | |
Portfolio turnover | 28 | 14 | 38 | 22 | 26 | |
Net assets at end of period (000 omitted) | $483 | $924 | $1,831 | $3,032 | $5,741 | |
Class C | | | Year ended | | | |
| 1/31/24 | 1/31/23 | 1/31/22 | 1/31/21 | 1/31/20 |
Net asset value, beginning of period | $5.20 | $5.93 | $6.23 | $6.28 | $5.99 | |
Income (loss) from investment operations | | | | | | |
| | | | | | |
Net investment income (loss) (d) | $0.25 | $0.21 | $0.21 | $0.22 | $0.23 | |
Net realized and unrealized gain (loss) | 0.18 | (0.54) | (0.23) | (0.05) | 0.30 | |
Total from investment operations | $0.43 | $(0.33) | $(0.02) | $0.17 | $0.53 | |
| | | | | | |
Less distributions declared to shareholders | | | | | | |
From net investment income | $(0.20) | $(0.40) | $(0.28) | $(0.22) | $(0.24) |
Net asset value, end of period (x) | $5.43 | $5.20 | $5.93 | $6.23 | $6.28 | |
| | | | | | |
Total return (%) (r)(s)(t)(x) | 8.56 | (5.33) | (0.45) | 2.92 | 8.96 | |
Ratios (%) (to average net assets) | | | | | | |
and Supplemental data: | | | | | | |
Expenses before expense reductions (f)(h) | 2.00 | 1.95 | 1.91 | 1.92 | 1.90 | |
Expenses after expense reductions (f)(h) | 1.80 | 1.80 | 1.80 | 1.80 | 1.80 | |
Net investment income (loss) | 4.75 | 3.92 | 3.42 | 3.74 | 3.79 | |
Portfolio turnover | 28 | 14 | 38 | 22 | 26 | |
Net assets at end of period (000 omitted) | $4,474 | $5,314 | $7,408 | $8,855 | $21,084 | |
See Notes to Financial Statements
Financial Highlights – continued
Class I | | | | Year ended | | | |
| | 1/31/24 | 1/31/23 | 1/31/22 | 1/31/21 | 1/31/20 |
Net asset value, beginning of period | $5.21 | $5.94 | $6.24 | $6.28 | $6.00 | |
Income (loss) from investment operations | | | | | | |
| | | | | | |
Net investment income (loss) (d) | $0.30 | $0.26 | $0.27 | $0.28 | $0.29 | |
Net realized and unrealized gain (loss) | 0.17 | (0.53) | (0.23) | (0.04) | 0.29 | |
Total from investment operations | $0.47 | $(0.27) | $0.04 | $0.24 | $0.58 | |
Less distributions declared to shareholders | | | | | | |
| | | | | | |
From net investment income | $(0.25) | $(0.46) | $(0.34) | $(0.28) | $(0.30) |
Net asset value, end of period (x) | $5.43 | $5.21 | $5.94 | $6.24 | $6.28 | |
| | | | | | |
Total return (%) (r)(s)(t)(x) | 9.43 | (4.34) | 0.56 | 4.12 | 9.86 | |
| | | | | | |
Ratios (%) (to average net assets) | | | | | | |
and Supplemental data: | | | | | | |
Expenses before expense reductions (f)(h) | 0.99 | 0.95 | 0.91 | 0.91 | 0.90 | |
Expenses after expense reductions (f)(h) | 0.80 | 0.80 | 0.80 | 0.80 | 0.80 | |
Net investment income (loss) | 5.74 | 4.87 | 4.42 | 4.69 | 4.75 | |
Portfolio turnover | 28 | 14 | 38 | 22 | 26 | |
Net assets at end of period (000 omitted) | $75,223 | $49,233 | $96,925 | $73,648 | $65,250 | |
Class R1 | | Year ended | | |
| 1/31/24 | 1/31/23 | 1/31/22 | 1/31/21 | 1/31/20 |
Net asset value, beginning of period | $5.21 | $5.94 | $6.24 | $6.28 | $6.00 | |
Income (loss) from investment operations | | | | | | |
| | | | | | |
Net investment income (loss) (d) | $0.25 | $0.21 | $0.21 | $0.22 | $0.23 | |
Net realized and unrealized gain (loss) | 0.17 | (0.54) | (0.23) | (0.04) | 0.29 | |
Total from investment operations | $0.42 | $(0.33) | $(0.02) | $0.18 | $0.52 | |
| | | | | | |
Less distributions declared to shareholders | | | | | | |
From net investment income | $(0.20) | $(0.40) | $(0.28) | $(0.22) | $(0.24) |
Net asset value, end of period (x) | $5.43 | $5.21 | $5.94 | $6.24 | $6.28 | |
| | | | | | |
Total return (%) (r)(s)(t)(x) | 8.36 | (5.30) | (0.45) | 3.09 | 8.78 | |
Ratios (%) (to average net assets) | | | | | | |
and Supplemental data: | | | | | | |
Expenses before expense reductions (f)(h) | 2.00 | 1.94 | 1.91 | 1.92 | 1.90 | |
Expenses after expense reductions (f)(h) | 1.80 | 1.80 | 1.80 | 1.80 | 1.80 | |
Net investment income (loss) | 4.75 | 3.95 | 3.42 | 3.72 | 3.75 | |
Portfolio turnover | 28 | 14 | 38 | 22 | 26 | |
Net assets at end of period (000 omitted) | $77 | $68 | $68 | $70 | $67 | |
See Notes to Financial Statements
Financial Highlights – continued
Class R2 | | Year ended | | |
| 1/31/24 | 1/31/23 | 1/31/22 | 1/31/21 | 1/31/20 |
Net asset value, beginning of period | $5.22 | $5.95 | $6.25 | $6.29 | $6.01 | |
Income (loss) from investment operations | | | | | | |
| | | | | | |
Net investment income (loss) (d) | $0.27 | $0.24 | $0.24 | $0.25 | $0.26 | |
Net realized and unrealized gain (loss) | 0.18 | (0.54) | (0.23) | (0.04) | 0.29 | |
Total from investment operations | $0.45 | $(0.30) | $0.01 | $0.21 | $0.55 | |
Less distributions declared to shareholders | | | | | | |
| | | | | | |
From net investment income | $(0.23) | $(0.43) | $(0.31) | $(0.25) | $(0.27) |
Net asset value, end of period (x) | $5.44 | $5.22 | $5.95 | $6.25 | $6.29 | |
| | | | | | |
Total return (%) (r)(s)(t)(x) | 8.89 | (4.79) | 0.06 | 3.60 | 9.31 | |
| | | | | | |
Ratios (%) (to average net assets) | | | | | | |
and Supplemental data: | | | | | | |
Expenses before expense reductions (f)(h) | 1.50 | 1.45 | 1.41 | 1.41 | 1.40 | |
Expenses after expense reductions (f)(h) | 1.30 | 1.30 | 1.30 | 1.30 | 1.30 | |
Net investment income (loss) | 5.25 | 4.44 | 3.92 | 4.17 | 4.26 | |
Portfolio turnover | 28 | 14 | 38 | 22 | 26 | |
Net assets at end of period (000 omitted) | $509 | $427 | $443 | $519 | $308 | |
Class R3 | | Year ended | | | |
| 1/31/24 | 1/31/23 | 1/31/22 | 1/31/21 | 1/31/20 |
Net asset value, beginning of period | $5.24 | $5.97 | $6.28 | $6.32 | $6.00 | |
Income (loss) from investment operations | | | | | | |
| | | | | | |
Net investment income (loss) (d) | $0.29 | $0.25 | $0.26 | $0.27 | $0.29 | |
Net realized and unrealized gain (loss) | 0.17 | (0.53) | (0.24) | (0.04) | 0.32 | |
Total from investment operations | $0.46 | $(0.28) | $0.02 | $0.23 | $0.61 | |
| | | | | | |
Less distributions declared to shareholders | | | | | | |
From net investment income | $(0.24) | $(0.45) | $(0.33) | $(0.27) | $(0.29) |
Net asset value, end of period (x) | $5.46 | $5.24 | $5.97 | $6.28 | $6.32 | |
| | | | | | |
Total return (%) (r)(s)(t)(x) | 9.14 | (4.51) | 0.17 | 3.87 | 10.28 | |
Ratios (%) (to average net assets) | | | | | | |
and Supplemental data: | | | | | | |
Expenses before expense reductions (f)(h) | 1.25 | 1.20 | 1.16 | 1.17 | 1.15 | |
Expenses after expense reductions (f)(h) | 1.05 | 1.05 | 1.05 | 1.05 | 1.05 | |
Net investment income (loss) | 5.50 | 4.70 | 4.18 | 4.47 | 4.62 | |
Portfolio turnover | 28 | 14 | 38 | 22 | 26 | |
Net assets at end of period (000 omitted) | $1,713 | $2,328 | $2,567 | $2,286 | $2,347 | |
See Notes to Financial Statements
Financial Highlights – continued
Class R4 | | Year ended | | | |
| 1/31/24 | 1/31/23 | 1/31/22 | 1/31/21 | 1/31/20 |
Net asset value, beginning of period | $5.23 | $5.97 | $6.27 | $6.31 | $6.03 | |
Income (loss) from investment operations | | | | | | |
| | | | | | |
Net investment income (loss) (d) | $0.30 | $0.27 | $0.28 | $0.28 | $0.30 | |
Net realized and unrealized gain (loss) | 0.19 | (0.55) | (0.24) | (0.04) | 0.28 | |
Total from investment operations | $0.49 | $(0.28) | $0.04 | $0.24 | $0.58 | |
Less distributions declared to shareholders | | | | | | |
| | | | | | |
From net investment income | $(0.26) | $(0.46) | $(0.34) | $(0.28) | $(0.30) |
Net asset value, end of period (x) | $5.46 | $5.23 | $5.97 | $6.27 | $6.31 | |
| | | | | | |
Total return (%) (r)(s)(t)(x) | 9.62 | (4.46) | 0.58 | 4.13 | 9.83 | |
| | | | | | |
Ratios (%) (to average net assets) | | | | | | |
and Supplemental data: | | | | | | |
Expenses before expense reductions (f)(h) | 1.00 | 0.94 | 0.91 | 0.92 | 0.90 | |
Expenses after expense reductions (f)(h) | 0.80 | 0.80 | 0.80 | 0.80 | 0.80 | |
Net investment income (loss) | 5.76 | 4.98 | 4.42 | 4.72 | 4.76 | |
Portfolio turnover | 28 | 14 | 38 | 22 | 26 | |
Net assets at end of period (000 omitted) | $7,063 | $6,804 | $6,316 | $6,406 | $6,689 | |
Class R6 | | | | Year ended | | | |
| | 1/31/24 | 1/31/23 | 1/31/22 | 1/31/21 | 1/31/20 |
Net asset value, beginning of period | $5.20 | $5.93 | $6.23 | $6.27 | $5.99 | |
Income (loss) from investment operations | | | | | | |
| | | | | | |
Net investment income (loss) (d) | $0.30 | $0.27 | $0.28 | $0.29 | $0.30 | |
Net realized and unrealized gain (loss) | 0.18 | (0.54) | (0.23) | (0.04) | 0.29 | |
Total from investment operations | $0.48 | $(0.27) | $0.05 | $0.25 | $0.59 | |
| | | | | | |
Less distributions declared to shareholders | | | | | | |
From net investment income | $(0.26) | $(0.46) | $(0.35) | $(0.29) | $(0.31) |
Net asset value, end of period (x) | $5.42 | $5.20 | $5.93 | $6.23 | $6.27 | |
| | | | | | |
Total return (%) (r)(s)(t)(x) | 9.56 | (4.27) | 0.65 | 4.23 | 9.98 | |
Ratios (%) (to average net assets) | | | | | | |
and Supplemental data: | | | | | | |
Expenses before expense reductions (f)(h) | 0.89 | 0.85 | 0.81 | 0.81 | 0.80 | |
Expenses after expense reductions (f)(h) | 0.70 | 0.70 | 0.70 | 0.70 | 0.70 | |
Net investment income (loss) | 5.85 | 5.03 | 4.53 | 4.81 | 4.84 | |
Portfolio turnover | 28 | 14 | 38 | 22 | 26 | |
Net assets at end of period (000 omitted) | $16,035 | $16,294 | $20,365 | $22,976 | $21,846 | |
See Notes to Financial Statements
Financial Highlights – continued
(d) Per share data is based on average shares outstanding.
(f)Ratios do not reflect reductions from fees paid indirectly, if applicable. See Note 2 in the Notes to Financial Statements for additional information.
(h)In addition to the fees and expenses which the fund bears directly, the fund indirectly bears a pro rata share of the fees and expenses of the underlying affiliated funds in which the fund invests. Accordingly, the expense ratio for the fund reflects only those fees and expenses borne directly by the fund. Because the underlying affiliated funds have varied expense and fee levels and the fund may own different proportions of the underlying affiliated funds at different times, the amount of fees and expenses incurred indirectly by the fund will vary.
(r)Certain expenses have been reduced without which performance would have been lower.
(s)From time to time the fund may receive proceeds from litigation settlements, without which performance would be lower.
(t)Total returns do not include any applicable sales charges.
(x)The net asset values and total returns have been calculated on net assets which include adjustments made in accordance with U.S. generally accepted accounting principles required at period end for financial reporting purposes.
See Notes to Financial Statements
NOTES TO FINANCIAL STATEMENTS
(1) Business and Organization
MFS Global High Yield Fund (the fund) is a diversified series of MFS Series Trust (the trust). The trust is organized as a Massachusetts business trust and is registered under the Investment Company Act of 1940, as amended, as an open-end management investment company.
The fund is an investment company and accordingly follows the investment company accounting and reporting guidance of the Financial Accounting Standards Board (FASB) Accounting Standards Codification Topic 946 Financial Services - Investment Companies.
(2) Significant Accounting Policies
General — The preparation of financial statements in conformity with U.S. generally accepted accounting principles requires management to make estimates and assumptions that affect the reported amounts of assets and liabilities, and disclosure of contingent assets and liabilities at the date of the financial statements and the reported amounts of increases and decreases in net assets from operations during the reporting period. Actual results could differ from those estimates. In the preparation of these financial statements, management has evaluated subsequent events occurring after the date of the fund's Statement of Assets and Liabilities through the date that the financial statements were issued. As of January 31, 2024, 65.5% of the fund's net assets was invested in the MFS High Yield Pooled Portfolio ("High Yield Pooled Portfolio"). MFS does not receive a management fee from the High Yield Pooled Portfolio. The High Yield Pooled Portfolio's investment objective is to seek total return with an emphasis on high current income, but also considering capital appreciation. The accounting policies of the High Yield Pooled Portfolio are outlined in its shareholder report. The accounting policies detailed in the Significant Accounting Policies note cover both the fund and the High Yield Pooled Portfolio. For purposes of this policy disclosure, "fund" refers to both the fund and the High Yield Pooled Portfolio in which the fund invests. The High Yield Pooled Portfolio's shareholder report is not covered by this report. The current shareholder report for the High Yield Pooled Portfolio as of January 31, 2024 has been included as Appendix A, and should be read in conjunction with the fund's financial statements. The fund and the High Yield Pooled Portfolio invest in high-yield securities rated below investment grade. Investments in below investment grade quality securities can involve a substantially greater risk of default or can already be in default, and their values can decline significantly. Below investment grade quality securities tend to be more sensitive to adverse news about the issuer, or the market or economy in general, than higher quality debt instruments. The fund and the High Yield Pooled Portfolio invest in foreign securities. Investments in foreign securities are vulnerable to the effects of changes in the relative values of the local currency and the U.S. dollar and to the effects of changes in each country's market, economic, industrial, political, regulatory, geopolitical, environmental, public health, and other conditions.
Balance Sheet Offsetting — The fund's accounting policy with respect to balance sheet offsetting is that, absent an event of default by the counterparty or a termination of the agreement, the International Swaps and Derivatives Association (ISDA) Master Agreement, or similar agreement, does not result in an offset of reported amounts of financial assets and financial liabilities in the Statement of Assets and Liabilities across transactions between the fund and the applicable counterparty. The fund's right to
Notes to Financial Statements - continued
setoff may be restricted or prohibited by the bankruptcy or insolvency laws of the particular jurisdiction to which a specific master netting agreement counterparty is subject. Balance sheet offsetting disclosures, to the extent applicable to the fund, have been included in the fund's Significant Accounting Policies note under the captions for each of the fund's in-scope financial instruments and transactions.
Investment Valuations — The investments of the fund and the High Yield Pooled Portfolio are valued as described below.
Subject to its oversight, the fund's Board of Trustees has delegated primary responsibility for determining or causing to be determined the value of the fund's investments to MFS as the fund's adviser, pursuant to the fund's valuation policy and procedures which have been adopted by the adviser and approved by the Board. In accordance with Rule 2a-5 under the Investment Company Act of 1940, the Board of Trustees designated the adviser as the "valuation designee" of the fund. If the adviser, as valuation designee, determines that reliable market quotations are not readily available for an investment, the investment is valued at fair value as determined in good faith by the adviser in accordance with the adviser's fair valuation policy and procedures.
Under the fund's valuation policy and procedures, equity securities, including restricted equity securities, are generally valued at the last sale or official closing price on their primary market or exchange as provided by a third-party pricing service. Equity securities, for which there were no sales reported that day, are generally valued at the last quoted daily bid quotation on their primary market or exchange as provided by a third-party pricing service. Debt instruments and floating rate loans, including restricted debt instruments, are generally valued at an evaluated or composite bid as provided by a third-party pricing service. Short-term instruments with a maturity at issuance of 60 days or less may be valued at amortized cost, which approximates market value. Exchange-traded options are generally valued at the last sale or official closing price on their primary exchange as provided by a third-party pricing service. Exchange-traded options for which there were no sales reported that day are generally valued at the last daily bid quotation on their primary exchange as provided by a third-party pricing service. For put options, the position may be valued at the last daily ask quotation if there are no trades reported during the day. Options not traded on an exchange are generally valued at a broker/dealer bid quotation. Foreign currency options are generally valued at valuations provided by a third-party pricing service. Futures contracts are generally valued at last posted settlement price on their primary exchange as provided by a third-party pricing service. Futures contracts for which there were no trades that day for a particular position are generally valued at the closing bid quotation on their primary exchange as provided by a third-party pricing service. Forward foreign currency exchange contracts are generally valued at the mean of bid and asked prices for the time period interpolated from rates provided by a third-party pricing service for proximate time periods. Open-end investment companies are generally valued at net asset value per share. The values of foreign securities and other assets and liabilities expressed in foreign currencies are converted to U.S. dollars using the mean of bid and asked prices for rates provided by a third-party pricing service.
Under the fund's valuation policy and procedures, market quotations are not considered to be readily available for debt instruments, floating rate loans, and many types of derivatives. These investments are generally valued at fair value based on information from third-party pricing services or otherwise determined by the adviser in
Notes to Financial Statements - continued
accordance with the adviser's fair valuation policy and procedures. Securities and other assets generally valued on the basis of information from a third-party pricing service may also be valued at a broker/dealer bid quotation. In determining values, third-party pricing services can utilize both transaction data and market information such as yield, quality, coupon rate, maturity, type of issue, trading characteristics, spreads and other market data. An investment may also be valued at fair value if the adviser determines that the investment's value has been materially affected by events occurring after the close of the exchange or market on which the investment is principally traded (such as foreign exchange or market) and prior to the determination of the fund's net asset value, or after the halt of trading of a specific security where trading does not resume prior to the close of the exchange or market on which the security is principally traded. The adviser generally relies on third-party pricing services or other information (such as the correlation with price movements of similar securities in the same or other markets; the type, cost and investment characteristics of the security; the business and financial condition of the issuer; and trading and other market data) to assist in determining whether to fair value and at what value to fair value an investment. The value of an investment for purposes of calculating the fund's net asset value can differ depending on the source and method used to determine value. When fair valuation is used, the value of an investment used to determine the fund's net asset value may differ from quoted or published prices for the same investment. There can be no assurance that the fund could obtain the fair value assigned to an investment if it were to sell the investment at the same time at which the fund determines its net asset value per share.
Various inputs are used in determining the value of the fund's assets or liabilities. These inputs are categorized into three broad levels. In certain cases, the inputs used to measure fair value may fall into different levels of the fair value hierarchy. In such cases, an investment's level within the fair value hierarchy is based on the lowest level of input that is significant to the fair value measurement. The fund's assessment of the significance of a particular input to the fair value measurement in its entirety requires judgment, and considers factors specific to the investment. Level 1 includes unadjusted quoted prices in active markets for identical assets or liabilities. Level 2 includes other significant observable market-based inputs (including quoted prices for similar securities, interest rates, prepayment speed, and credit risk). Level 3 includes significant unobservable inputs, which may include the adviser's own assumptions in determining the fair value of investments. Other financial instruments are derivative instruments, such as futures contracts and forward foreign currency exchange contracts. The following is a summary of the levels used as of January 31, 2024 in valuing the fund's assets and liabilities:
Notes to Financial Statements | - continued | | | | |
Financial Instruments | Level 1 | Level 2 | Level 3 | Total |
Equity Securities: | | | | | |
United States | $— | $19,390 | $— | $19,390 | |
Non - U.S. Sovereign Debt | — | 4,224,410 | — | 4,224,410 | |
U.S. Corporate Bonds | — | 4,810,940 | — | 4,810,940 | |
Asset-Backed Securities (including | | | | | |
CDOs) | — | 819,831 | — | 819,831 | |
Foreign Bonds | — | 58,039,299 | — | 58,039,299 | |
Mutual Funds | 141,694,726 | — | — | 141,694,726 | |
Total | $141,694,726 | $67,913,870 | $— | $209,608,596 | |
Other Financial Instruments | | | | | |
Futures Contracts – Liabilities | $(8,041) | $— | $— | $(8,041) |
Forward Foreign Currency Exchange | | | | | |
Contracts – Assets | — | 334,247 | — | 334,247 | |
Forward Foreign Currency Exchange | | | | | |
Contracts – Liabilities | — | (19,301) | — | (19,301) |
For further information regarding security characteristics, see the Portfolio of Investments. Please refer to the High Yield Pooled Portfolio's shareholder report for further information regarding the levels used in valuing its assets and liabilities.
The following is a reconciliation of level 3 assets for which significant unobservable inputs were used to determine fair value. The table presents the activity of level 3 securities held at the beginning and the end of the period.
| Equity |
| Securities |
Balance as of 1/31/23 | $228,697 | |
Realized gain (loss) | 270,760 | |
Change in unrealized appreciation or depreciation | (228,697) |
Sales | (270,760) |
Balance as of 1/31/24 | $— | |
Foreign Currency Translation — Purchases and sales of foreign investments, income, and expenses are converted into U.S. dollars based upon currency exchange rates prevailing on the respective dates of such transactions or on the reporting date for foreign denominated receivables and payables. Gains and losses attributable to foreign currency exchange rates on sales of securities are recorded for financial statement purposes as net realized gains and losses on investments. Gains and losses attributable to foreign exchange rate movements on receivables, payables, income and expenses are recorded for financial statement purposes as foreign currency transaction gains and losses. That portion of both realized and unrealized gains and losses on investments that results from fluctuations in foreign currency exchange rates is not separately disclosed.
Derivatives — The fund uses derivatives primarily to increase or decrease exposure to a particular market or segment of the market, or security, to increase or decrease interest rate or currency exposure, or as alternatives to direct investments. Derivatives are used for hedging or non-hedging purposes. While hedging can reduce or eliminate
Notes to Financial Statements - continued
losses, it can also reduce or eliminate gains. When the fund uses derivatives as an investment to increase market exposure, or for hedging purposes, gains and losses from derivative instruments may be substantially greater than the derivative's original cost.
The derivative instruments used by the fund during the period were purchased options, futures contracts, and forward foreign currency exchange contracts. Depending on the type of derivative, a fund may exit a derivative position by entering into an offsetting transaction with a counterparty or exchange, negotiating an agreement with the derivative counterparty, or novating the position to a third party. The fund may be unable to promptly close out a futures position in instances where the daily fluctuation in the price for that type of future exceeds the daily limit set by the exchange. The fund's period end derivatives, as presented in the Portfolio of Investments and the associated Derivative Contract tables, generally are indicative of the volume of its derivative activity during the period.
The following table presents, by major type of derivative contract, the fair value, on a gross basis, of the asset and liability components of derivatives held by the fund at January 31, 2024 as reported in the Statement of Assets and Liabilities:
| | Fair Value (a) | |
Risk | Derivative Contracts | Asset Derivatives | Liability Derivatives |
Equity | Purchased Option | | | | |
| Contracts | $19,390 | $— |
Interest Rate | Futures Contracts | — | (8,041) |
Foreign Exchange | Forward Foreign Currency | | | | |
| Exchange Contracts | 334,247 | (19,301) |
| | | | |
Total | | $353,637 | $(27,342) |
(a)The value of purchased options outstanding is included in investments in unaffiliated issuers, at value, within the Statement of Assets and Liabilities. Values presented in this table for futures contracts correspond to the values reported in the Portfolio of Investments. Only the current day net variation margin for futures contracts is reported separately within the Statement of Assets and Liabilities.
The following table presents, by major type of derivative contract, the realized gain (loss) on derivatives held by the fund for the year ended January 31, 2024 as reported in the Statement of Operations:
| | Forward Foreign | | |
| | Currency | Unaffiliated Issuers |
| Futures | Exchange | (Purchased |
Risk | Contracts | Contracts | Options) |
Interest Rate | $(3,611) | $ | — | $ | — |
Foreign Exchange | — | | 345,804 | | — |
Equity | — | | — | | 49,350 |
Total | $(3,611) | $ | 345,804 | $ | 49,350 |
Notes to Financial Statements - continued
The following table presents, by major type of derivative contract, the change in unrealized appreciation or depreciation on derivatives held by the fund for the year ended January 31, 2024 as reported in the Statement of Operations:
| | Forward Foreign | | |
| | Currency | Unaffiliated Issuers |
| Futures | Exchange | (Purchased |
Risk | Contracts | Contracts | Options) |
Interest Rate | $(8,041) | $ | — | $ | — |
Foreign Exchange | — | | 491,345 | | — |
Equity | — | | — | | (30,723) |
Total | $(8,041) | $ | 491,345 | $ | (30,723) |
Derivative counterparty credit risk is managed through formal evaluation of the creditworthiness of all potential counterparties. On certain, but not all, uncleared derivatives, the fund attempts to reduce its exposure to counterparty credit risk whenever possible by entering into an ISDA Master Agreement on a bilateral basis. The ISDA Master Agreement gives each party to the agreement the right to terminate all transactions traded under such agreement if there is a specified deterioration in the credit quality of the other party. Upon an event of default or a termination of the ISDA Master Agreement, the non-defaulting party has the right to close out all transactions traded under such agreement and to net amounts owed under each agreement to one net amount payable by one party to the other. This right to close out and net payments across all transactions traded under the ISDA Master Agreement could result in a reduction of the fund's credit risk to such counterparty equal to any amounts payable by the fund under the applicable transactions, if any.
Collateral and margin requirements differ by type of derivative. For cleared derivatives (e.g., futures contracts, cleared swaps, and exchange-traded options), margin requirements are set by the clearing broker and the clearing house and collateral, in the form of cash or securities, is posted by the fund directly with the clearing broker. Collateral terms are counterparty agreement specific for uncleared derivatives (e.g., forward foreign currency exchange contracts, uncleared swap agreements, and uncleared options) and collateral, in the form of cash and securities, is held in segregated accounts with the fund's custodian in connection with these agreements. For derivatives traded under an ISDA Master Agreement, which contains a credit support annex, the collateral requirements are netted across all transactions traded under such counterparty-specific agreement and an amount is posted from one party to the other to collateralize such obligations. Cash that has been segregated or delivered to cover the fund's collateral or margin obligations under derivative contracts, if any, will be reported separately in the Statement of Assets and Liabilities as restricted cash for uncleared derivatives and/or deposits with brokers for cleared derivatives. Securities pledged as collateral or margin for the same purpose, if any, are noted in the Portfolio of Investments. The fund may be required to make payments of interest on uncovered collateral or margin obligations with the broker. Any such payments are included in "Miscellaneous" expense in the Statement of Operations.
Notes to Financial Statements - continued
Purchased Options — The fund purchased put options for a premium. Purchased put options entitle the holder to sell a specified number of shares or units of a particular security, currency or index at a specified price at a specified date or within a specified period of time. Purchasing put options may hedge against an anticipated decline in the value of portfolio securities or currency or decrease the fund's exposure to an underlying instrument.
The premium paid is initially recorded as an investment in the Statement of Assets and Liabilities. That investment is subsequently marked-to-market daily with the difference between the premium paid and the market value of the purchased option being recorded as unrealized appreciation or depreciation. Premiums paid for purchased put options which have expired are treated as realized losses on investments in the Statement of Operations. Upon the exercise or closing of a purchased put option, the premium paid is offset against the proceeds on the sale of the underlying security or financial instrument in order to determine the realized gain or loss on investments.
Whether or not the option is exercised, the fund's maximum risk of loss from purchasing an option is the amount of premium paid. All option contracts involve credit risk if the counterparty to the option contract fails to perform. For uncleared options, this risk is mitigated in cases where there is an ISDA Master Agreement between the fund and the counterparty providing for netting as described above and, where applicable, by the posting of collateral by the counterparty to the fund to cover the fund's exposure to the counterparty under such ISDA Master Agreement.
Futures Contracts — The fund entered into futures contracts which may be used to hedge against or obtain broad market exposure, interest rate exposure, currency exposure, or to manage duration. A futures contract represents a commitment for the future purchase or sale of an asset at a specified price on a specified date.
Upon entering into a futures contract, the fund is required to deposit with the broker, either in cash or securities, an initial margin in an amount equal to a specified percentage of the notional amount of the contract. Subsequent payments (variation margin) are made or received by the fund each day, depending on the daily fluctuations in the value of the contract, and are recorded for financial statement purposes as unrealized gain or loss by the fund until the contract is closed or expires at which point the gain or loss on futures contracts is realized.
The fund bears the risk of interest rates, exchange rates or securities prices moving unexpectedly, in which case, the fund may not achieve the anticipated benefits of the futures contracts and may realize a loss. While futures contracts may present less counterparty risk to the fund since the contracts are exchange traded and the exchange's clearinghouse guarantees payments to the broker, there is still counterparty credit risk due to the insolvency of the broker. The fund's maximum risk of loss due to counterparty credit risk is equal to the margin posted by the fund to the broker plus any gains or minus any losses on the outstanding futures contracts.
Forward Foreign Currency Exchange Contracts — The fund entered into forward foreign currency exchange contracts for the purchase or sale of a specific foreign currency at a fixed price on a future date. These contracts may be used to hedge the fund's currency risk or for non-hedging purposes. For hedging purposes, the fund may enter into contracts to deliver or receive foreign currency that the fund will receive from or use in its normal investment activities. The fund may also use contracts to hedge against declines in the value of foreign currency denominated securities due to
Notes to Financial Statements - continued
unfavorable exchange rate movements. For non-hedging purposes, the fund may enter into contracts with the intent of changing the relative exposure of the fund's portfolio of securities to different currencies to take advantage of anticipated exchange rate changes.
Forward foreign currency exchange contracts are adjusted by the daily exchange rate of the underlying currency and any unrealized gains or losses are recorded as a receivable or payable for forward foreign currency exchange contracts until the contract settlement date. On contract settlement date, any gain or loss on the contract is recorded as realized gains or losses on forward foreign currency exchange contracts.
Risks may arise upon entering into these contracts from unanticipated movements in the value of the contract and from the potential inability of counterparties to meet the terms of their contracts. Generally, the fund's maximum risk due to counterparty credit risk is the unrealized gain on the contract due to the use of Continuous Linked Settlement, a multicurrency cash settlement system for the centralized settlement of foreign transactions. This risk is mitigated in cases where there is an ISDA Master Agreement between the fund and the counterparty providing for netting as described above and, where applicable, by the posting of collateral by the counterparty to the fund to cover the fund's exposure to the counterparty under such ISDA Master Agreement.
Indemnifications — Under the fund's organizational documents, its officers and Trustees may be indemnified against certain liabilities and expenses arising out of the performance of their duties to the fund. Additionally, in the normal course of business, the fund enters into agreements with service providers that may contain indemnification clauses. The fund's maximum exposure under these agreements is unknown as this would involve future claims that may be made against the fund that have not yet occurred.
Investment Transactions and Income — Interest income is recorded on the accrual basis. All premium and discount is amortized or accreted for financial statement purposes in accordance with U.S. generally accepted accounting principles. Dividends received in cash are recorded on the ex-dividend date. Certain dividends from foreign securities will be recorded when the fund is informed of the dividend if such information is obtained subsequent to the ex-dividend date. Dividend and interest payments received in additional securities are recorded on the ex-dividend or ex-interest date in an amount equal to the value of the security on such date. Distributions of income and capital gains from the High Yield Pooled Portfolio are recorded on the ex-dividend date.
The MFS Global High Yield Fund may receive proceeds from litigation settlements. Any proceeds received from litigation involving portfolio holdings are reflected in the Statement of Operations in realized gain/loss if the security has been disposed of by the fund or in unrealized gain/loss if the security is still held by the fund. Any other proceeds from litigation not related to portfolio holdings are reflected as other income in the Statement of Operations.
Investment transactions are recorded on the trade date. In determining the net gain or loss on securities sold, the cost of securities is determined on the identified cost basis.
The fund may purchase or sell securities on a when-issued or delayed delivery basis. In these extended settlement transactions, the receipt or delivery of the securities by the fund and related payments occur at a future date, usually beyond the customary
Notes to Financial Statements - continued
settlement period. The price of such security and the date that the security will be settled are generally fixed at the time the transaction is negotiated. The value of the security varies with market fluctuations and for debt securities no interest accrues to the fund until settlement takes place. When the fund sells securities on a when-issued or delayed delivery basis, the fund typically owns or has the right to acquire securities equivalent in kind and amount to the securities sold. Purchase and sale commitments for when-issued or delayed delivery securities are held at carrying amount, which approximates fair value and are categorized as level 2 within the fair value hierarchy and included in When-issued investments purchased and When-issued investments sold in the Statement of Assets and Liabilities, as applicable. Losses may arise due to changes in the value of the underlying securities prior to settlement date or if the counterparty does not perform under the contract's terms, or if the issuer does not issue the securities due to political, economic or other factors.
Fees Paid Indirectly — The fund's custody fee may be reduced by a credit earned under an arrangement that measures the value of U.S. dollars deposited with the custodian by the fund. The amount of the credit, for the year ended January 31, 2024, is shown as a reduction of total expenses in the Statement of Operations.
Tax Matters and Distributions — The fund intends to qualify as a regulated investment company, as defined under Subchapter M of the Internal Revenue Code, and to distribute all of its taxable income, including realized capital gains. As a result, no provision for federal income tax is required. The fund's federal tax returns, when filed, will remain subject to examination by the Internal Revenue Service for a three year period. Management has analyzed the fund's tax positions taken on federal and state tax returns for all open tax years and does not believe that there are any uncertain tax positions that require recognition of a tax liability. Foreign taxes, if any, have been accrued by the fund in the accompanying financial statements in accordance with the applicable foreign tax law. Foreign income taxes may be withheld by certain countries in which the fund invests. Additionally, capital gains realized by the fund on securities issued in or by certain foreign countries may be subject to capital gains tax imposed by those countries.
Distributions to shareholders are recorded on the ex-dividend date. Income and capital gain distributions are determined in accordance with income tax regulations, which may differ from U.S. generally accepted accounting principles. Certain capital accounts in the financial statements are periodically adjusted for permanent differences in order to reflect their tax character. These adjustments have no impact on net assets or net asset value per share. Temporary differences which arise from recognizing certain items of income, expense, gain or loss in different periods for financial statement and tax purposes will reverse at some time in the future.
Book/tax differences primarily relate to wash sale loss deferrals and derivative transactions.
The tax character of distributions declared to shareholders for the last two fiscal years is as follows:
| Year ended | Year ended |
| 1/31/24 | 1/31/23 |
Ordinary income (including | | |
any short-term capital gains) | $9,328,058 | $17,296,566 |
Notes to Financial Statements - continued
The federal tax cost and the tax basis components of distributable earnings were as follows:
As of 1/31/24 | | | |
Cost of investments | $238,104,207 | |
Gross appreciation | 4,003,683 | |
Gross depreciation | (32,192,389) |
| | |
Net unrealized appreciation (depreciation) | $ (28,188,706) |
Undistributed ordinary income | 1,328,131 | |
Capital loss carryforwards | (53,780,127) |
Other temporary differences | (949,117) |
| | |
Total distributable earnings (loss) | $ (81,589,819) |
As of January 31, 2024, the fund had capital loss carryforwards available to offset future realized gains. These net capital losses may be carried forward indefinitely and their character is retained as short-term and/or long-term losses. Such losses are characterized as follows:
Short-Term | $(4,346,303) |
Long-Term | (49,433,824) |
| | |
Total | $(53,780,127) |
Multiple Classes of Shares of Beneficial Interest — The fund offers multiple classes of shares, which differ in their respective distribution and service fees. The fund's income and common expenses are allocated to shareholders based on the value of settled shares outstanding of each class. The fund's realized and unrealized gain (loss) are allocated to shareholders based on the daily net assets of each class. Dividends are declared separately for each class. Differences in per share dividend rates are generally due to differences in separate class expenses. Class B and Class C shares will convert to Class A shares approximately eight years after purchase. The fund's distributions declared to shareholders as reported in the Statements of Changes in Net Assets are presented by class as follows:
| Year ended | Year ended |
| 1/31/24 | 1/31/23 |
Class A | $4,884,804 | $9,260,281 |
Class B | 28,308 | 91,110 |
Class C | 181,106 | 434,406 |
Class I | 3,004,693 | 5,285,914 |
Class R1 | 2,741 | 4,928 |
Class R2 | 19,579 | 33,320 |
Class R3 | 88,075 | 178,558 |
Class R4 | 342,503 | 541,415 |
Class R6 | 776,249 | 1,466,634 |
Total | $9,328,058 | $17,296,566 |

Notes to Financial Statements - continued
(3) Transactions with Affiliates
Investment Adviser — The fund has an investment advisory agreement with MFS to provide overall investment management and related administrative services and facilities to the fund. The management fee is computed daily and paid monthly at the following annual rates based on the fund's average daily net assets:
Up to $1.5 billion | 0.65% |
In excess of $1.5 billion and up to $2.5 billion | 0.60% |
In excess of $2.5 billion | 0.55% |
MFS has agreed in writing to reduce its management fee by a specified amount if certain MFS mutual fund assets exceed thresholds agreed to by MFS and the fund's Board of Trustees. MFS has also agreed in writing to waive at least 0.01% of its management fee as part of this agreement. The agreement to waive at least 0.01% of the management fee will continue until modified by the fund's Board of Trustees, but such agreement will continue at least until May 31, 2025. For the year ended January 31, 2024, this management fee reduction amounted to $25,124, which is included in the reduction of total expenses in the Statement of Operations. The management fee incurred for the year ended January 31, 2024 was equivalent to an annual effective rate of 0.64% of the fund's average daily net assets.
For the period from February 1, 2023 through July 31, 2023, the investment adviser had agreed in writing to pay a portion of the fund's total annual operating expenses, excluding interest, taxes, extraordinary expenses, brokerage and transaction costs, certain tax reclaim recovery expenses (including contingency fees and closing agreement expenses), and investment-related expenses (such as fees and expenses associated with investments in investment companies and other similar investment vehicles), such that total fund operating expenses did not exceed the following rates annually of each class's average daily net assets:
Classes
A | B | C | I | R1 | R2 | R3 | R4 | R6 |
1.05% | 1.80% | 1.80% | 0.80% | 1.80% | 1.30% | 1.05% | 0.80% | 0.73% |
This written agreement terminated on July 31, 2023. For the period from February 1, 2023 through July 31, 2023, this reduction amounted to $166,488 which is included in the reduction of total expenses in the Statement of Operations. Effective August 1, 2023 the investment adviser has agreed in writing to pay a portion of the fund's total annual operating expenses, excluding interest, taxes, extraordinary expenses, brokerage and transaction costs, certain tax reclaim recovery expenses (including contingency fees and closing agreement expenses), and investment-related expenses (such as fees and expenses associated with investments in investment companies and other similar investment vehicles), such that total fund operating expenses do not exceed the following rates annually of each class's average daily net assets:
Classes
A | B | C | I | R1 | R2 | R3 | R4 | R6 |
1.05% | 1.80% | 1.80% | 0.80% | 1.80% | 1.30% | 1.05% | 0.80% | 0.72% |
Notes to Financial Statements - continued
This written agreement will continue until modified by the fund's Board of Trustees, but such agreement will continue at least until May 31, 2025. For the period from August 1, 2023 through January 31, 2024, this reduction amounted to $193,089, which is included in the reduction of total expenses in the Statement of Operations.
Distributor — MFS Fund Distributors, Inc. (MFD), a wholly-owned subsidiary of MFS, as distributor, received $3,583 for the year ended January 31, 2024, as its portion of the initial sales charge on sales of Class A shares of the fund.
The Board of Trustees has adopted a distribution plan for certain share classes pursuant to Rule 12b-1 of the Investment Company Act of 1940.
The fund's distribution plan provides that the fund will pay MFD for services provided by MFD and financial intermediaries in connection with the distribution and servicing of certain share classes. One component of the plan is a distribution fee paid to MFD and another component of the plan is a service fee paid to MFD. MFD may subsequently pay all, or a portion, of the distribution and/or service fees to financial intermediaries. The distribution and service fees are computed daily and paid monthly.
Distribution Plan Fee Table:
| | | Total | Annual | Distribution |
| Distribution | Service | Distribution | Effective | and Service |
| Fee Rate (d) | Fee Rate (d) | Plan (d) | Rate (e) | Fee |
Class A | — | 0.25% | 0.25% | 0.25% | $261,760 |
Class B | 0.75% | 0.25% | 1.00% | 1.00% | 6,985 |
Class C | 0.75% | 0.25% | 1.00% | 1.00% | 45,654 |
Class R1 | 0.75% | 0.25% | 1.00% | 1.00% | 704 |
Class R2 | 0.25% | 0.25% | 0.50% | 0.50% | 2,236 |
Class R3 | — | 0.25% | 0.25% | 0.25% | 4,593 |
Total Distribution and Service Fees | | | | $321,932 |
(d)In accordance with the distribution plan for certain classes, the fund pays distribution and/or service fees equal to these annual percentage rates of each class's average daily net assets. The distribution and service fee rates disclosed by class represent the current rates in effect at the end of the reporting period. Any rate changes, if applicable, are detailed below.
(e)The annual effective rates represent actual fees incurred under the distribution plan for the year ended January 31, 2024 based on each class's average daily net assets. MFD has voluntarily agreed to rebate a portion of each class's 0.25% service fee attributable to accounts for which there is no financial intermediary specified on the account except for accounts attributable to MFS or its affiliates' seed money. For the year ended January 31, 2024, this rebate amounted to $1 for Class C shares and is included in the reduction of total expenses in the Statement of Operations.
Certain Class A shares are subject to a contingent deferred sales charge (CDSC) in the event of a shareholder redemption within 18 months of purchase. Class B shares are subject to a CDSC in the event of a shareholder redemption within six years of
Notes to Financial Statements - continued
purchase. Class C shares are subject to a CDSC in the event of a shareholder redemption within 12 months of purchase. All contingent deferred sales charges are paid to MFD and during the year ended January 31, 2024, were as follows:
| Amount |
Class A | $396 |
Class B | 574 |
Class C | 67 |
Shareholder Servicing Agent — MFS Service Center, Inc. (MFSC), a wholly-owned subsidiary of MFS, receives a fee from the fund for its services as shareholder servicing agent calculated as a percentage of the average daily net assets of the fund as determined periodically under the supervision of the fund's Board of Trustees. For the year ended January 31, 2024, the fee was $58,612, which equated to 0.0298% annually of the fund's average daily net assets. MFSC also receives reimbursement from the fund for out-of-pocket expenses, sub-accounting and other shareholder servicing costs which may be paid to affiliated and unaffiliated service providers. Class R6 shares do not incur sub-accounting fees. For the year ended January 31, 2024, these out-of-pocket expenses, sub-accounting and other shareholder servicing costs amounted to $208,486.
Administrator — MFS provides certain financial, legal, shareholder communications, compliance, and other administrative services to the fund. Under an administrative services agreement, the fund reimburses MFS the costs incurred to provide these services. The fund is charged an annual fixed amount of $17,500 plus a fee based on average daily net assets. The administrative services fee is computed daily and paid monthly. The administrative services fee incurred for the year ended January 31, 2024 was equivalent to an annual effective rate of 0.0196% of the fund's average daily net assets.
Trustees' and Officers' Compensation — The fund pays compensation to independent Trustees in the form of a retainer, attendance fees, and additional compensation to Board and Committee chairpersons. Independent Trustees' compensation is accrued daily and paid subsequent to each Trustee Board meeting. The fund does not pay compensation directly to Trustees or officers of the fund who are also officers of the investment adviser, all of whom receive remuneration from MFS for their services to the fund. Certain officers and Trustees of the fund are officers or directors of MFS, MFD, and MFSC.
Other — The fund invests in the MFS Institutional Money Market Portfolio which is managed by MFS and seeks current income consistent with preservation of capital and liquidity. This money market fund does not pay a management fee to MFS but does incur investment and operating costs.
The fund invests in the MFS High Yield Pooled Portfolio, which is a mutual fund advised by MFS that does not pay management fees to MFS and does not pay distribution and/or service fees to MFD, but does incur investment and operating costs. The fund invests in MFS High Yield Pooled Portfolio to gain exposure to high income debt instruments, rather than investing in high income debt instruments directly (see Appendix A). Income earned on this investment is included in "Dividends from affiliated issuers" in the Statement of Operations.
At January 31, 2024, MFS held approximately 85% of the outstanding shares of Class R1.
Notes to Financial Statements - continued
(4) Portfolio Securities
For the year ended January 31, 2024, purchases and sales of investments, other than short-term obligations, aggregated $57,799,055 and $53,116,578, respectively.
(5) Shares of Beneficial Interest
The fund's Declaration of Trust permits the Trustees to issue an unlimited number of full and fractional shares of beneficial interest. Transactions in fund shares were as follows:
| Year ended | Year ended |
| 1/31/24 | | 1/31/23 |
| Shares | Amount | Shares | Amount |
Shares sold | | | | | |
Class A | 2,308,046 | $11,983,504 | 3,580,063 | $19,470,073 |
Class B | 2,541 | 13,116 | 1,755 | 10,371 |
Class C | 121,913 | 638,396 | 73,777 | 399,216 |
Class I | 8,984,079 | 46,460,985 | 2,992,830 | 16,083,675 |
Class R1 | 872 | 4,580 | 578 | 3,056 |
Class R2 | 16,414 | 85,635 | 12,003 | 65,754 |
Class R3 | 84,645 | 438,942 | 110,236 | 588,744 |
Class R4 | 286,665 | 1,486,651 | 723,151 | 3,818,548 |
Class R6 | 501,539 | 2,592,195 | 344,686 | 1,867,076 |
| 12,306,714 | $63,704,004 | 7,839,079 | $42,306,513 |
Shares issued to shareholders | | | | | |
in reinvestment of distributions | | | | | |
Class A | 902,506 | $4,684,995 | 1,694,870 | $8,838,276 |
Class B | 5,409 | 28,053 | 17,343 | 90,794 |
Class C | 34,661 | 179,542 | 83,273 | 432,780 |
Class I | 574,448 | 2,985,861 | 998,773 | 5,247,733 |
Class R1 | 528 | 2,741 | 950 | 4,928 |
Class R2 | 3,765 | 19,579 | 6,379 | 33,202 |
Class R3 | 16,852 | 87,819 | 34,124 | 178,557 |
Class R4 | 65,611 | 342,235 | 103,763 | 541,413 |
Class R6 | 134,906 | 698,956 | 254,687 | 1,327,036 |
| 1,738,686 | $9,029,781 | 3,194,162 | $16,694,719 |
Notes to Financial Statements | - continued | | | | | |
| | Year ended | Year ended |
| | 1/31/24 | | 1/31/23 | |
| | Shares | Amount | Shares | Amount |
Shares reacquired | | | | | | | |
Class A | (4,511,189) | $(23,477,988) | (6,822,086) | $(36,711,613) |
Class B | (96,221) | (497,250) | (149,703) | (792,724) |
Class C | (353,325) | (1,819,602) | (384,101) | (2,040,151) |
Class I | (5,157,075) | (26,683,496) | (10,856,153) | (56,699,160) |
Class R1 | (181) | (939) | (15) | (77) |
Class R2 | (8,496) | (43,874) | (10,967) | (57,978) |
Class R3 | (232,357) | (1,196,605) | (129,563) | (715,704) |
Class R4 | (358,247) | (1,883,666) | (584,697) | (3,114,016) |
Class R6 | (812,865) | (4,177,302) | (899,083) | (4,823,677) |
| | | | | |
| (11,529,956) | $(59,780,722) | (19,836,368) | $(104,955,100) |
Net change | | | | | | | |
Class A | (1,300,637) | $(6,809,489) | (1,547,153) | $(8,403,264) |
Class B | (88,271) | (456,081) | (130,605) | (691,559) |
Class C | (196,751) | (1,001,664) | (227,051) | (1,208,155) |
Class I | 4,401,452 | 22,763,350 | (6,864,550) | (35,367,752) |
Class R1 | 1,219 | 6,382 | 1,513 | 7,907 |
Class R2 | 11,683 | 61,340 | 7,415 | 40,978 |
Class R3 | (130,860) | (669,844) | 14,797 | 51,597 |
Class R4 | (5,971) | (54,780) | 242,217 | 1,245,945 |
Class R6 | (176,420) | (886,151) | (299,710) | (1,629,565) |
| | | | | |
| 2,515,444 | $12,953,063 | (8,803,127) | $(45,953,868) |
Effective June 1, 2019, purchases of the fund's Class B shares were closed to new and existing investors subject to certain exceptions. Effective September 29, 2023, purchases of the fund's Class R1 and Class R2 shares were closed to new eligible investors.
(6) Line of Credit
The fund and certain other funds managed by MFS participate in a $1.45 billion unsecured committed line of credit of which $1.2 billion is reserved for use by the fund and certain other MFS U.S. funds. The line of credit is provided by a syndicate of banks under a credit agreement. Borrowings may be made for temporary financing needs. Interest is charged to each fund, based on its borrowings, generally at a rate equal to the highest of 1) Daily Simple SOFR (Secured Overnight Financing Rate) plus 0.10%, 2) the Federal Funds Effective Rate, or 3) the Overnight Bank Funding Rate, each plus an agreed upon spread. A commitment fee, based on the average daily unused portion of the committed line of credit, is allocated among the participating funds. The line of credit expires on March 14, 2024 unless extended or renewed. In addition, the fund and other funds managed by MFS have established unsecured uncommitted borrowing arrangements with certain banks for temporary financing needs. Interest is charged to each fund, based on its borrowings, at rates equal to customary reference rates plus an
Notes to Financial Statements - continued
agreed upon spread. For the year ended January 31, 2024, the fund's commitment fee and interest expense were $947 and $0, respectively, and are included in "Miscellaneous" expense in the Statement of Operations.
(7) Investments in Affiliated Issuers
An affiliated issuer may be considered one in which the fund owns 5% or more of the outstanding voting securities, or a company which is under common control. For the purposes of this report, the following were affiliated issuers:
| | | | | Change in | |
| | | | Realized | Unrealized | |
| Beginning | | Sales | Gain | Appreciation or | Ending |
Affiliated Issuers | Value | Purchases | Proceeds | (Loss) | Depreciation | Value |
MFS High Yield | | | | | | |
Pooled Portfolio | $121,247,426 | $36,906,158 | $22,916,057 | $(5,271,600) | $8,862,335 | $138,828,262 |
MFS Institutional | | | | | | |
Money Market Portfolio | 3,151,528 | 59,495,972 | 59,780,454 | (452) | (130) | 2,866,464 |
| $124,398,954 | $96,402,130 | $82,696,511 | $(5,272,052) | $8,862,205 | $141,694,726 |
| | | | | Dividend | Capital Gain |
Affiliated Issuers | | | | | Income | Distributions |
MFS High Yield Pooled Portfolio | | | | $8,558,995 | $— |
MFS Institutional Money Market Portfolio | | | | 353,119 | — |
| | | | | $8,912,114 | $— |
REPORT OF INDEPENDENT REGISTERED PUBLIC ACCOUNTING FIRM
To the Board of Trustees of MFS Series Trust III and the Shareholders of MFS Global High Yield Fund:
Opinion on the Financial Statements and Financial Highlights
We have audited the accompanying statement of assets and liabilities of MFS Global High Yield Fund (the "Fund"), including the portfolio of investments, as of January 31, 2024, the related statement of operations for the year then ended, the statements of changes in net assets for each of the two years in the period then ended, the financial highlights for each of the five years in the period then ended, and the related notes. In our opinion, the financial statements and financial highlights present fairly, in all material respects, the financial position of the Fund as of January 31, 2024, and the results of its operations for the year then ended, the changes in its net assets for each of the two years in the period then ended, and the financial highlights for each of the five years in the period then ended, in conformity with accounting principles generally accepted in the United States of America.
Basis for Opinion
These financial statements and financial highlights are the responsibility of the Fund's management. Our responsibility is to express an opinion on the Fund's financial statements and financial highlights based on our audits. We are a public accounting firm registered with the Public Company Accounting Oversight Board (United States) (PCAOB) and are required to be independent with respect to the Fund in accordance with the U.S. federal securities laws and the applicable rules and regulations of the Securities and Exchange Commission and the PCAOB.
We conducted our audits in accordance with the standards of the PCAOB. Those standards require that we plan and perform the audit to obtain reasonable assurance about whether the financial statements and financial highlights are free of material misstatement, whether due to error or fraud. The Fund is not required to have, nor were we engaged to perform, an audit of its internal control over financial reporting. As part of our audits, we are required to obtain an understanding of internal control over financial reporting but not for the purpose of expressing an opinion on the effectiveness of the Fund's internal control over financial reporting. Accordingly, we express no such opinion.
Our audits included performing procedures to assess the risks of material misstatement of the financial statements and financial highlights, whether due to error or fraud, and performing procedures that respond to those risks. Such procedures included examining, on a test basis, evidence regarding the amounts and disclosures in the financial statements and financial highlights. Our audits also included evaluating the accounting principles used and significant estimates made by management, as well as evaluating the overall presentation of the financial statements and financial highlights.
Report of Independent Registered Public Accounting Firm – continued
Our procedures included confirmation of securities owned as of January 31, 2024, by correspondence with the custodian and brokers; when replies were not received from brokers, we performed other auditing procedures. We believe that our audits provide a reasonable basis for our opinion.
DELOITTE & TOUCHE LLP
Boston, Massachusetts
March 14, 2024
We have served as the auditor of one or more of the MFS investment companies since 1924.
TRUSTEES AND OFFICERS — IDENTIFICATION AND BACKGROUND
The Trustees and Officers of the Trust, as of March 1, 2024, are listed below, together with their principal occupations during the past five years. (Their titles may have varied during that period.) The address of each Trustee and Officer is 111 Huntington Avenue, Boston, Massachusetts 02199-7618.
| | | | | | Number of | | | | Other |
| | | | | | MFS Funds | | | | Directorships |
| | Position(s) | | Trustee/ | | overseen | | Principal Occupations | | During |
| | Held with | | Officer | | by the | | During | | the Past Five |
Name, Age | | Fund | | Since(h) | | Trustee | | the Past Five Years | | Years (j) |
INTERESTED | | | | | | | | | | |
TRUSTEE | | | | | | | | | | |
Michael W. | Trustee | | January 2021 | 136 | | Massachusetts Financial | N/A |
Roberge (k) | | | | | | | | Services Company, Chairman | | |
(age 57) | | | | | | | | (since January 2021); Chief | | |
| | | | | | | | Executive Officer (since | | |
| | | | | | | | January 2017); Director; | | |
| | | | | | | | Chairman of the Board (since | | |
INDEPENDENT | | | | | | | | January 2022) | | |
| | | | | | | | | |
TRUSTEES | | | | | | | | | | |
John P. | Trustee and | | January 2009 | 136 | | Private investor | N/A |
Kavanaugh | Chair of | | | | | | | | |
(age 69) | Trustees | | | | | | | | |
Steven E. Buller | Trustee | | February 2014 | 136 | | Private investor | N/A |
(age 72) | | | | | | | | | | |
John A. Caroselli | Trustee | | March 2017 | 136 | Private investor; JC Global | N/A |
(age 69) | | | | | | | | Advisors, LLC (management | | |
| | | | | | | | consulting), President (since | | |
| | | | | | | 2015) | | |
Maureen R. | Trustee | | January 2009 | 136 | | Private investor | N/A |
Goldfarb | | | | | | | | | | |
(age 68) | | | | | | | | | | |
Peter D. Jones | Trustee | | January 2019 | 136 | | Private investor | N/A |
(age 68) | | | | | | | | | | |
James W. | Trustee | | January 2019 | 136 | | Burford Capital Limited | Alpha-En |
Kilman, Jr. | | | | | | | | (finance and investment | Corporation, Director |
(age 62) | | | | | | | | management), Senior Advisor | (2016-2019) |
| | | | | | | | (since May 3, 2021), Chief | | |
| | | | | | | | Financial Officer (2019 - | | |
| | | | | | | | May 2, 2021); KielStrand | | |
Capital LLC (family office), Chief Executive Officer (since 2016)
Trustees and Officers - continued
| | | | | | Number of | | | | Other |
| | | | | | MFS Funds | | | | Directorships |
| | Position(s) | | Trustee/ | | overseen | | Principal Occupations | | During |
| | Held with | | Officer | | by the | | During | | the Past Five |
Name, Age | | Fund | | Since(h) | | Trustee | | the Past Five Years | | Years (j) |
Clarence Otis, Jr. | Trustee | | March 2017 | 136 | Private investor | VF Corporation, |
(age 67) | | | | | | | | | Director; Verizon |
| | | | | | | | | Communications, |
| | | | | | | | | Inc., Director; The |
| | | | | | | | | Travelers Companies, |
| | | | | | | | | Director |
Maryanne L. | Trustee | | May 2014 | 136 | Private investor | N/A |
Roepke | | | | | | | | | | |
(age 68) | | | | | | | | | | |
Laurie J. | Trustee | | March 2005 | 136 | Private investor | The Travelers |
Thomsen | | | | | | | | | Companies, Director; |
(age 66) | | | | | | | | | Dycom Industries, |
| | | | | | | | | Inc., Director |
| | | | | | Number of | | |
| | | | | | MFS Funds | | |
| | Position(s) | | Trustee/ | | for which | | |
| | Held with | | Officer | | the Person is | | Principal Occupations During |
Name, Age | | Fund | | Since(h) | | an Officer | | the Past Five Years |
OFFICERS | | | | | | | | |
Christopher R. Bohane (k) | Assistant | | July 2005 | 136 | | Massachusetts Financial Services |
(age 50) | Secretary and | | | | | | Company, Senior Vice President and |
| Assistant | | | | | | Deputy General Counsel |
| Clerk | | | | | | |
Kino Clark (k) | Assistant | | January 2012 | 136 | | Massachusetts Financial Services |
(age 55) | Treasurer | | | | | | Company, Vice President |
John W. Clark, Jr. (k) | Assistant | | April 2017 | 136 | | Massachusetts Financial Services |
(age 56) | Treasurer | | | | | | Company, Vice President |
David L. DiLorenzo (k) | President | | July 2005 | 136 | | Massachusetts Financial Services |
(age 55) | | | | | | | | Company, Senior Vice President |
Heidi W. Hardin (k) | Secretary and | | April 2017 | 136 | | Massachusetts Financial Services |
(age 56) | Clerk | | | | | | Company, Executive Vice President and |
| | | | | | | | General Counsel |
Brian E. Langenfeld (k) | Assistant | | June 2006 | 136 | | Massachusetts Financial Services |
(age 50) | Secretary and | | | | | | Company, Vice President and Managing |
| Assistant | | | | | | Counsel |
| Clerk | | | | | | |
Rosa E. Licea-Mailloux (k) | Chief | | March 2022 | 136 | | Massachusetts Financial Services |
(age 47) | Compliance | | | | | | Company, Vice President (since 2018); |
| Officer | | | | | | Director of Corporate Compliance |
| | | | | | | | (2018-2021), Senior Director Compliance |
| | | | | | | | (2021-2022), Senior Managing Director |
of North American Compliance & Chief
Compliance Officer (since March 2022)
Trustees and Officers - continued
| | | | | | Number of | | |
| | | | | | MFS Funds | | |
| | Position(s) | | Trustee/ | | for which | | |
| | Held with | | Officer | | the Person is | | Principal Occupations During |
Name, Age | | Fund | | Since(h) | | an Officer | | the Past Five Years |
Amanda S. Mooradian (k) | Assistant | | September 2018 | 136 | | Massachusetts Financial Services |
(age 45) | Secretary and | | | | | | Company, Vice President and Senior |
| Assistant | | | | | | Counsel |
| Clerk | | | | | | |
Susan A. Pereira (k) | Assistant | | July 2005 | 136 | | Massachusetts Financial Services |
(age 53) | Secretary and | | | | | | Company, Vice President and Managing |
| Assistant | | | | | | Counsel |
| Clerk | | | | | | |
Kasey L. Phillips (k) | Assistant | | September 2012 | 136 | | Massachusetts Financial Services |
(age 53) | Treasurer | | | | | | Company, Vice President |
Matthew A. Stowe (k) | Assistant | | October 2014 | 136 | | Massachusetts Financial Services |
(age 49) | Secretary and | | | | | | Company, Vice President and Senior |
| Assistant | | | | | | Managing Counsel |
| Clerk | | | | | | |
William B. Wilson (k) | Assistant | | October 2022 | 136 | | Massachusetts Financial Services |
(age 41) | Secretary and | | | | | | Company, Assistant Vice President and |
| Assistant | | | | | | Senior Counsel |
| Clerk | | | | | | |
James O. Yost (k) | Treasurer | | September 1990 | 136 | | Massachusetts Financial Services |
(age 63) | | | | | | | | Company, Senior Vice President |
(h)Date first appointed to serve as Trustee/Officer of an MFS Fund. Each Trustee has served continuously since appointment unless indicated otherwise. From January 2012 through December 2016, Messrs. DiLorenzo and Yost served as Treasurer and Deputy Treasurer of the Funds, respectively.
(j)Directorships or trusteeships of companies required to report to the Securities and Exchange Commission (i.e., "public companies").
(k)"Interested person" of the Trust within the meaning of the Investment Company Act of 1940 (referred to as the 1940 Act), which is the principal federal law governing investment companies like the fund, as a result of a position with MFS. The address of MFS is 111 Huntington Avenue, Boston, Massachusetts 02199-7618.
Each Trustee (other than Messrs. Jones, Kilman and Roberge) has been elected by shareholders and each Trustee and Officer holds office until his or her successor is chosen and qualified or until his or her earlier death, resignation, retirement or removal.
Mr. Roberge became a Trustee of the Funds on January 1, 2021 and Messrs. Jones and Kilman became Trustees of the Funds on January 1, 2019. The Trust does not hold annual meetings for the purpose of electing Trustees, and Trustees are not elected for fixed terms. Under the terms of the Board's retirement policy, an Independent Trustee shall retire at the end of the calendar year in which he or she reaches the earlier of 75 years of age or 15 years of service on the Board (or, in the case of any Independent Trustee who joined the Board prior to 2015, 20 years of service on the Board).
Messrs. Buller, Caroselli, Jones and Otis are members of the Trust's Audit Committee.
Trustees and Officers - continued
Each of the Interested Trustees and certain Officers hold comparable officer positions with certain affiliates of MFS.
The Statement of Additional Information for a Fund includes further information about the Trustees and is available without charge upon request by calling 1-800-225-2606.
Investment Adviser | Custodian |
Massachusetts Financial Services Company | JPMorgan Chase Bank, NA |
111 Huntington Avenue | 4 Metrotech Center |
Boston, MA 02199-7618 | New York, NY 11245 |
Distributor | Independent Registered Public Accounting Firm |
MFS Fund Distributors, Inc. | Deloitte & Touche LLP |
111 Huntington Avenue | 200 Berkeley Street |
Boston, MA 02199-7618 | Boston, MA 02116 |
Portfolio Manager(s) | |
David Cole | |
Matt Ryan | |
Michael Skatrud | |
PROXY VOTING POLICIES AND INFORMATION
MFS votes proxies on behalf of the fund pursuant to proxy voting policies and procedures that are available without charge, upon request, by calling
1-800-225-2606, by visiting mfs.com/proxyvoting, or by visiting the SEC's Web site at http://www.sec.gov.
Information regarding how the fund voted proxies relating to portfolio securities during the most recent twelve-month period ended June 30 is available by August 31 of each year without charge by visiting mfs.com/proxyvoting, or by visiting the SEC's Web site at http://www.sec.gov.
QUARTERLY PORTFOLIO DISCLOSURE
The fund files a complete schedule of portfolio holdings with the SEC for the first and third quarters of each fiscal year as an exhibit to its reports on Form N-PORT. The fund's Form N-PORT reports are available on the SEC's Web site at http://www.sec.gov. A shareholder can obtain the portfolio holdings report for the first and third quarters of the fund's fiscal year at mfs.com/openendfunds by choosing the fund's name and then scrolling to the "Resources" section and clicking on the "Prospectus and Reports" tab.
FURTHER INFORMATION
From time to time, MFS may post important information about the fund or the MFS Funds on the MFS Web site (mfs.com). This information is available at https://www.mfs.com/announcements or at mfs.com/openendfunds by choosing the fund's name and then scrolling to the "Resources" section and clicking on the "Announcements" tab, if any.
INFORMATION ABOUT FUND CONTRACTS AND LEGAL CLAIMS
The fund has entered into contractual arrangements with an investment adviser, administrator, distributor, shareholder servicing agent, and custodian who each provide services to the fund. Unless expressly stated otherwise, shareholders are not parties to, or intended beneficiaries of these contractual arrangements, and these contractual arrangements are not intended to create any shareholder right to enforce them against the service providers or to seek any remedy under them against the service providers, either directly or on behalf of the fund.
Under the Trust's By-Laws and Declaration of Trust, any claims asserted against or on behalf of the MFS Funds, including claims against Trustees and Officers, must be brought in state and federal courts located within the Commonwealth of Massachusetts.
FEDERAL TAX INFORMATION (unaudited)
The fund will notify shareholders of amounts for use in preparing 2024 income tax forms in January 2025. The following information is provided pursuant to provisions of the Internal Revenue Code.
The fund intends to pass through the maximum amount allowable as Section 163(j) Interest Dividends as defined in Treasury Regulation §1.163(j)-1(b).
rev. 3/16
WHAT DOES MFS DO WITH YOUR
PERSONAL INFORMATION?
| Why? | | Financial companies choose how they share your personal |
| | | information. Federal law gives consumers the right to limit some but |
| | | not all sharing. Federal law also requires us to tell you how we |
| | | collect, share, and protect your personal information. Please read this |
| | | notice carefully to understand what we do. | |
| | | | | |
| What? | | The types of personal information we collect and share depend on |
| | | the product or service you have with us. This information can include: |
| | | • Social Security number and account balances | |
| | | • Account transactions and transaction history | |
| | | • Checking account information and wire transfer instructions |
| | | When you are no longer our customer, we continue to share your |
| | | information as described in this notice. | |
| | | | | |
| How? | | All financial companies need to share customers' personal |
| | | information to run their everyday business. In the section below, we |
| | | list the reasons financial companies can share their customers' |
| | | personal information; the reasons MFS chooses to share; and |
| | | whether you can limit this sharing. | | |
| | | | | |
| | Reasons we can share your | Does | Can you limit |
| | personal information | MFS share? | this sharing? |
| For our everyday business purposes – | | |
| such as to process your transactions, maintain your | Yes | No |
| account(s), respond to court orders and legal |
| | |
| investigations, or report to credit bureaus | | |
| | | |
| For our marketing purposes – | No | We don't share |
| to offer our products and services to you |
| | |
| | | |
| For joint marketing with other | No | We don't share |
| financial companies |
| | |
| | | |
| For our affiliates' everyday business purposes – | No | We don't share |
| information about your transactions and experiences |
| | |
| | | |
| For our affiliates' everyday business purposes – | No | We don't share |
| information about your creditworthiness |
| | |
| | | |
| For nonaffiliates to market to you | No | We don't share |
| | | | | |
| | | | | |
| Questions? | Call 800-225-2606 or go to mfs.com. | |
| | | |
| | | | | |

Page 2
Who we are
Who is providing this notice? MFS Funds, MFS Investment Management, MFS Institutional Advisors, Inc., and MFS Heritage Trust Company.
What we do
| How does MFS | To protect your personal information from unauthorized access |
| protect my personal | and use, we use security measures that comply with federal |
| information? | law. These measures include procedural, electronic, and |
| | physical safeguards for the protection of the personal |
| | information we collect about you. |
| | |
| How does MFS | We collect your personal information, for example, when you |
| collect my personal | • open an account or provide account information |
| information? |
| • direct us to buy securities or direct us to sell your securities |
| |
| | • make a wire transfer |
| | We also collect your personal information from others, such as |
| | credit bureaus, affiliates, or other companies. |
| | |
| Why can't I limit all sharing? | Federal law gives you the right to limit only |
| | • sharing for affiliates' everyday business purposes – |
| | information about your creditworthiness |
| | • affiliates from using your information to market to you |
| | • sharing for nonaffiliates to market to you |
| | State laws and individual companies may give you additional |
| | rights to limit sharing. |
| | |
Definitions
Affiliates | Companies related by common ownership or control. They can |
| be financial and nonfinancial companies. |
| • MFS does not share personal information with affiliates, |
| except for everyday business purposes as described on page |
| one of this notice. |
| |
Nonaffiliates | Companies not related by common ownership or control. They |
| can be financial and nonfinancial companies. |
| • MFS does not share with nonaffiliates so they can market to |
| you. |
| |
Joint marketing | A formal agreement between nonaffiliated financial |
| companies that together market financial products or services |
| to you. |
| • MFS doesn't jointly market. |
| |
Other important information
If you own an MFS product or receive an MFS service in the name of a third party such as a bank or broker-dealer, their privacy policy may apply to you instead of ours.
Save paper with eDelivery.
MFS® will send you prospectuses,
reports, and proxies directly via e-mail so you will get information faster with less mailbox clutter.
To sign up:
1.Go to mfs.com.
2.Log in via MFS® Access.
3.Select eDelivery.
If you own your MFS fund shares through a financial institution or a retirement plan, MFS® TALK, MFS® Access, or eDelivery may not be available to you.
CONTACT
WEB SITE
mfs.com
MFS TALK
1-800-637-8255
24 hours a day
ACCOUNT SERVICE AND LITERATURE
Shareholders
1-800-225-2606
Financial advisors
1-800-343-2829
Retirement plan services
1-800-637-1255
MAILING ADDRESS
MFS Service Center, Inc.
P.O. Box 219341
Kansas City, MO 64121-9341
OVERNIGHT MAIL
MFS Service Center, Inc. Suite 219341
430 W 7th Street
Kansas City, MO 64105-1407
NOT FDIC INSURED • MAY LOSE VALUE • NO BANK GUARANTEE
Portfolio structure (i)
120 | | | 98.4% | | | |
| | | | |
100 | | | | | |
| | | | | | | |
80 | | | | | | | | |
| | | | | | | |
60 | | | | | | | | |
| | | | | | | |
40 | | | | | | | | |
| | | | | | | |
20 | | | | | 0.3% | 1.0% | 0.3% |
| | | |
0 | | | | |
Fixed Income | | 98.4% |
| | | |
| | | |
| | | Equities | | 0.3% |
| | | |
| | | Cash & Cash Equivalents | 1.0% |
| | |
| | | Other | | 0.3% |
| | | |
Top five industries (i)
Cable TV | 8.2% |
Medical & Health Technology & Services | 5.9% |
Midstream | 4.8% |
Financial Institutions | 4.5% |
Consumer Services | 4.3% |
Composition including fixed income credit quality (a)(i)
BBB | 1.3% |
BB | 40.9% |
B | 41.8% |
CCC | 13.5% |
CC | 0.2% |
U.S. Government | 0.5% |
Not Rated | 0.2% |
Non-Fixed Income | 0.3% |
Cash & Cash Equivalents | 1.0% |
Other | 0.3% |
Portfolio facts | |
Average Duration (d) | 3.2 |
Average Effective Maturity (m) | 4.4 yrs. |
(a)For all securities other than those specifically described below, ratings are assigned to underlying securities utilizing ratings from Moody's, Fitch, and Standard & Poor's rating agencies and applying the following hierarchy: If all three agencies provide a rating, the middle rating (after dropping the highest and lowest ratings) is assigned; if two of the three agencies rate a security, the lower of the two is assigned. If none of the 3 rating agencies above assign a rating, but the security is rated by DBRS Morningstar, then the DBRS Morningstar rating is assigned. If none of the 4 rating agencies listed above rate the security, but the security is rated by the Kroll Bond Rating Agency (KBRA), then the KBRA rating is assigned. Ratings are shown in the S&P and Fitch scale (e.g., AAA). Securities rated BBB or higher are considered investment grade. All ratings are subject to change. U.S. Government includes securities issued by the U.S. Department of the Treasury. Not Rated includes fixed income securities and fixed income derivatives that have not been rated by any rating agency. Non-Fixed Income includes equity securities (including convertible bonds and equity derivatives), ETFs and Options on ETFs, and/or commodity-linked derivatives. The fund may or may not have held all of these instruments on this date. The fund is not rated by these agencies.
(d)Duration is a measure of how much a bond's price is likely to fluctuate with general changes in interest rates, e.g., if rates rise 1.00%, a bond with a 5-year duration is likely to lose about 5.00% of its value due to the interest rate move. The Average Duration calculation reflects the impact of the equivalent exposure of derivative positions, if any.
Portfolio Composition - continued
(i)For purposes of this presentation, the components include the value of securities, and reflect the impact of the equivalent exposure of derivative positions, if any. These amounts may be negative from time to time. Equivalent exposure is a calculated amount that translates the derivative position into a reasonable approximation of the amount of the underlying asset that the portfolio would have to hold at a given point in time to have the same price sensitivity that results from the portfolio's ownership of the derivative contract. When dealing with derivatives, equivalent exposure is a more representative measure of the potential impact of a position on portfolio performance than value. The bond component will include any accrued interest amounts.
(m)In determining each instrument's effective maturity for purposes of calculating the fund's dollar-weighted average effective maturity, MFS uses the instrument's stated maturity or, if applicable, an earlier date on which MFS believes it is probable that a maturity-shortening feature (such as a put, pre-refunding or prepayment) will cause the instrument to be repaid. Such an earlier date can be substantially shorter than the instrument's stated maturity.
Where the fund holds convertible bonds, they are treated as part of the equity portion of the portfolio.
Cash & Cash Equivalents includes any cash, investments in money market funds, short-term securities, and other assets less liabilities. Please see the Statement of Assets and Liabilities for additional information related to the fund's cash position and other assets and liabilities.
Other includes equivalent exposure from currency derivatives and/or any offsets to derivative positions and may be negative.
Percentages are based on net assets as of January 31, 2024.
The portfolio is actively managed and current holdings may be different.
MANAGEMENT REVIEW
Summary of Results
For the twelve months ended January 31, 2024, shares of the MFS High Yield Pooled Portfolio (fund) provided a total return of 9.46%, at net asset value. This compares with a return of 9.28% for the fund's benchmark, the Bloomberg U.S. Corporate High-Yield 2% Issuer Capped Index.
Market Environment
During the reporting period, central banks around the world had to combat the strongest inflationary pressures in four decades, fueled by the global fiscal response to the pandemic, disrupted supply chains and the dislocations to energy markets stemming from the war in Ukraine. Interest rates rose substantially, but the effects of a tighter monetary policy may not have been fully experienced yet, given that monetary policy works with long and variable lags. Strains resulting from the abrupt tightening of monetary policy began to affect some parts of the economy, most acutely among small and regional US banks, which suffered from deposit flight as depositors sought higher yields on their savings. Additionally, activity in the US housing sector has slowed as a result of higher mortgage rates. China's abandonment of its Zero-COVID policy ushered in a brief uptick in economic activity in the world's second-largest economy in early 2023, although its momentum soon stalled as the focus turned to the country's highly indebted property development sector. In developed markets, consumer demand for services remained stronger than the demand for goods.
Despite the challenging macroeconomic and geopolitical environment, central banks focused on controlling price pressures while also confronting increasing financial stability concerns. Central banks had to juggle achieving their inflation mandates while using tools aimed at safeguarding the stability of the financial system to keep banking systems liquid as banks grappled with exposures to commercial real estate. As inflationary pressures eased toward the end of the period, financial conditions loosened in anticipation of easier monetary policy, boosting the market's appetite for risk as near-term recession risks diminished. Rapid advancements in artificial intelligence were a focus for investors.
Normalizing supply chains, low levels of unemployment across developed markets and signs that inflation levels have peaked were supportive factors for the macroeconomic backdrop.
Contributors to Performance
Relative to the Bloomberg U.S. Corporate High-Yield 2% Issuer Capped Index, the fund's underweight allocation to both the communications and transportation sectors contributed to performance as these sectors underperformed the benchmark over the reporting period. Additionally, an overweight allocation to the brokerage sector further bolstered relative returns. The combination of favorable bond selection and an underweight allocation to the energy sector also supported relative results.
Top individual contributors for the reporting period included the fund's overweight holdings of American Irish-domiciled mass customization business operator Cimpress (communications) and British telecommunications company Virgin Media
(communications).
Management Review - continued
Detractors from Performance
During the reporting period, bond selection within both "B" and "CCC" rated(r) bonds detracted from relative performance. The fund's overweight allocation to "BBB" rated bonds and underweight allocation to "CC" rated bonds also held back relative returns. From a sector perspective, bond selection within both the technology and financial institutions sectors weighed on the fund's relative results.
Top individual detractors for the reporting period included the fund's overweight holdings of graphite electrode manufacturer GrafTech Finance (basic industry) and media and entertainment services provider iHeartMedia(h) (communications).
The fund's cash and/or cash equivalents position during the period was also a detractor from relative performance.
Respectfully,
Portfolio Manager(s)
David Cole and Michael Skatrud
(h) Security was not held in the portfolio at period end.
(r)Securities rated "BBB", "Baa", or higher are considered investment grade; securities rated "BB", "Ba", or below are considered non-investment grade. Ratings are assigned to underlying securities utilizing ratings from Moody's, Fitch, and Standard & Poor's and applying the following hierarchy: If all three agencies provide a rating, the middle rating (after dropping the highest and lowest ratings) is assigned; if two of the three agencies rate a security, the lower of the two is assigned. If none of the 3 rating agencies above assign a rating, but the security is rated by DBRS Morningstar, then the DBRS Morningstar rating is assigned. If none of the 4 rating agencies listed above rate the security, but the security is rated by the Kroll Bond Rating Agency (KBRA), then the KBRA rating is assigned. Ratings are shown in the S&P and Fitch scale (e.g., AAA). For securities that are not rated by any of the rating agencies, the security is considered Not Rated.
The views expressed in this report are those of the portfolio manager(s) only through the end of the period of the report as stated on the cover and do not necessarily reflect the views of MFS or any other person in the MFS organization. These views are subject to change at any time based on market or other conditions, and MFS disclaims any responsibility to update such views. These views may not be relied upon as investment advice or an indication of trading intent on behalf of any MFS portfolio. References to specific securities are not recommendations of such securities, and may not be representative of any MFS portfolio's current or future investments.

PERFORMANCE SUMMARY THROUGH 1/31/24
The following chart illustrates the fund's historical performance in comparison to its benchmark(s). Performance results reflect the percentage change in net asset value, including reinvestment of dividends and capital gains distributions. Benchmarks are unmanaged and may not be invested in directly. Benchmark returns do not reflect sales charges, commissions or expenses. (See Notes to Performance Summary.)
Performance data shown represents past performance and is no guarantee of future results. Investment return and principal value fluctuate so your shares, when sold, may be worth more or less than the original cost; current performance may be lower or higher than quoted. The performance shown does not reflect the deduction of taxes, if any, that a shareholder would pay on fund distributions or the redemption of fund shares.
Growth of a Hypothetical $10,000 Investment
18,000 | | Bloomberg U.S. Corporate High-Yield 2% Issuer Capped Index |
|
|
| | MFS High Yield Pooled Portfolio |
| |
| |
16,000 | $15,559 |
| $15,428 |
14,000 | | |
12,000 | | | | | | | | | | | | |
10,000 | | | | | | | | | | | | |
8,000 | | | | | | | | | | | | |
| /15 | /1 | /1 | /1 | /1 | /20 | /2 | /2 | /2 | /24 |
/1 |
4 | | 6 | 7 | 8 | 9 | | 1 | 2 | 3 | | |
1 | | 1 | 1 | 1 | 1 | 1 | 1 | 1 | 1 | 1 | 1 | |
Performance Summary - continued
| Total Returns through 1/31/24 | | | |
| Average annual without sales charge | | | |
| Fund Inception Date | 1-yr | 5-yr | 10-yr |
| 3/25/2013 | 9.46% | 4.33% | 4.43% |
| | | | |
| Comparative benchmark(s) | | | |
| | | | |
| Bloomberg U.S. Corporate High-Yield 2% Issuer Capped | 9.28% | 4.43% | 4.52% |
| Index (f) |
| | | |
| | | | |
| (f) Source: FactSet Research Systems Inc. | | | |
Benchmark Definition(s)
Bloomberg U.S. Corporate High-Yield 2% Issuer Capped Index(a) – a component of the Bloomberg U.S. Corporate High-Yield Index, which measures performance of non-investment grade, fixed rate debt. The index limits the maximum exposure to any one issuer to 2%.
It is not possible to invest directly in an index.
(a)Source: Bloomberg Index Services Limited. BLOOMBERG® is a trademark and service mark of Bloomberg Finance L.P. and its affiliates (collectively "Bloomberg"). Bloomberg or Bloomberg's licensors own all proprietary rights in the Bloomberg Indices. Bloomberg neither approves or endorses this material, or guarantees the accuracy or completeness of any information herein, or makes any warranty, express or implied, as to the results to be obtained therefrom and, to the maximum extent allowed by law, neither shall have any liability or responsibility for injury or damages arising in connection therewith.
Notes to Performance Summary
Average annual total return represents the average annual change in value for the fund for the periods presented.
Performance results reflect any applicable expense subsidies and waivers in effect during the periods shown. Without such subsidies and waivers the fund's performance results would be less favorable. Please see the prospectus and financial statements for complete details.
Performance results do not include adjustments made for financial reporting purposes in accordance with U.S. generally accepted accounting principles and may differ from amounts reported in the financial highlights.
From time to time the fund may receive proceeds from litigation settlements, without which performance would be lower.
EXPENSE TABLE
Fund expenses borne by the shareholders during the period, August 1, 2023 through January 31, 2024
As a shareholder of the fund, you incur ongoing costs, including fund expenses. This example is intended to help you understand your ongoing costs (in dollars) of investing in the fund and to compare these costs with the ongoing costs of investing in other mutual funds.
The example is based on an investment of $1,000 invested at the beginning of the period and held for the entire period August 1, 2023 through January 31, 2024.
Actual Expenses
The first line of the following table provides information about actual account values and actual expenses. You may use the information in this line, together with the amount you invested, to estimate the expenses that you paid over the period. Simply divide your account value by $1,000 (for example, an $8,600 account value divided by $1,000 = 8.6), then multiply the result by the number in the first line under the heading entitled "Expenses Paid During Period" to estimate the expenses you paid on your account during this period.
Hypothetical Example for Comparison Purposes
The second line of the following table provides information about hypothetical account values and hypothetical expenses based on the fund's actual expense ratio and an assumed rate of return of 5% per year before expenses, which is not the fund's actual return. The hypothetical account values and expenses may not be used to estimate the actual ending account balance or expenses you paid for the period. You may use this information to compare the ongoing costs of investing in the fund and other funds. To do so, compare this 5% hypothetical example with the 5% hypothetical examples that appear in the shareholder reports of the other funds.
Please note that the expenses shown in the table are meant to highlight your ongoing costs only and do not reflect any transactional costs, such as sales charges (loads). Therefore, the second line of the table is useful in comparing ongoing costs only, and will not help you determine the relative total costs of owning different funds. In addition, if these transactional costs were included, your costs would have been higher.
| | | | Expenses |
| Annualized | Beginning | Ending | Paid During |
| Expense | Account Value | Account Value | Period (p) |
| Ratio | 8/01/23 | 1/31/24 | 8/01/23-1/31/24 |
| | | | |
Actual | 0.02% | $1,000.00 | $1,062.04 | $0.10 |
| | | | |
Hypothetical (h) | 0.02% | $1,000.00 | $1,025.10 | $0.10 |
(h) 5% fund return per year before expenses.
(p)"Expenses Paid During Period" are equal to the fund's annualized expense ratio, as shown above, multiplied by the average account value over the period, multiplied by 184/365 (to reflect the one-half year period).
PORTFOLIO OF INVESTMENTS
1/31/24
The Portfolio of Investments is a complete list of all securities owned by your fund. It is categorized by broad-based asset classes.
Issuer | | Shares/Par | | | Value ($) |
Bonds – 96.9% | | | | | |
Aerospace & Defense – 3.6% | | | | | |
Bombardier, Inc., 7.125%, 6/15/2026 (n) | $ | 1,090,000 | $ | 1,099,083 |
Bombardier, Inc., 7.5%, 2/01/2029 (n) | | 1,032,000 | | | 1,051,874 |
Bombardier, Inc., 8.75%, 11/15/2030 (n) | | 714,000 | | | 749,313 |
F-Brasile S.p.A./F-Brasile U.S. LLC, 7.375%, 8/15/2026 (n) | | 2,450,000 | | | 2,422,438 |
Moog, Inc., 4.25%, 12/15/2027 (n) | | 2,461,000 | | | 2,304,284 |
Spirit AeroSystems, Inc., 9.75%, 11/15/2030 (n) | | 3,201,000 | | | 3,359,643 |
TransDigm, Inc., 6.25%, 3/15/2026 (n) | | 2,058,000 | | | 2,044,003 |
TransDigm, Inc., 5.5%, 11/15/2027 | | 2,414,000 | | | 2,348,601 |
TransDigm, Inc., 6.75%, 8/15/2028 (n) | | 1,991,000 | | | 2,023,579 |
TransDigm, Inc., 4.625%, 1/15/2029 | | 2,147,000 | | | 2,007,595 |
TransDigm, Inc., 6.875%, 12/15/2030 (n) | | 4,145,000 | | | 4,242,034 |
| | | $ | 23,652,447 |
Airlines – 0.8% | | | | | |
Air Canada, 3.875%, 8/15/2026 (n) | $ | 3,385,000 | $ | 3,219,402 |
American Airlines, Inc./AAdvantage Loyalty IP Ltd., | | | | | |
5.75%, 4/20/2029 (n) | | 2,200,096 | | | 2,160,560 |
| | | $ | 5,379,962 |
Apparel Manufacturers – 0.2% | | | | | |
Wolverine World Wide, Inc., 4%, 8/15/2029 (n) | $ | 1,601,000 | $ | 1,290,086 |
Automotive – 1.7% | | | | | |
Clarios Global LP/Clarios U.S. Finance Co., 8.5%, 5/15/2027 (n) | $ | 2,013,000 | $ | 2,007,483 |
Clarios Global LP/Clarios U.S. Finance Co., 6.75%, 5/15/2028 (n) | | 1,045,000 | | | 1,058,867 |
Dana, Inc., 5.375%, 11/15/2027 | | 1,897,000 | | | 1,851,282 |
Dana, Inc., 4.25%, 9/01/2030 | | 1,285,000 | | | 1,123,565 |
Dornoch Debt Merger Sub, Inc., 6.625%, 10/15/2029 (n) | | 2,072,000 | | | 1,880,793 |
Real Hero Merger Sub 2, Inc., 6.25%, 2/01/2029 (n) | | 1,705,000 | | | 1,479,190 |
Wabash National Corp., 4.5%, 10/15/2028 (n) | | 2,201,000 | | | 2,002,910 |
| | | $ | 11,404,090 |
Broadcasting – 0.8% | | | | | |
AMC Networks, Inc., 4.75%, 8/01/2025 | $ | 599,000 | $ | 577,153 |
Banijay Group S.A.S., 8.125%, 5/01/2029 (n) | | 2,153,000 | | | 2,226,196 |
Midas OpCo Holdings LLC, 5.625%, 8/15/2029 (n) | | 2,806,000 | | | 2,567,658 |
| | | $ | 5,371,007 |
Portfolio of Investments – continued
Issuer | | Shares/Par | | | Value ($) |
Bonds – continued | | | | | |
Brokerage & Asset Managers – 2.0% | | | | | |
AG TTMT Escrow Issuer LLC, 8.625%, 9/30/2027 (n) | $ | 1,808,000 | $ | 1,876,953 |
Aretec Escrow Issuer 2, Inc., 10%, 8/15/2030 (n) | | 2,049,000 | | | 2,212,965 |
Aretec Escrow Issuer, Inc., 7.5%, 4/01/2029 (n) | | 1,758,000 | | | 1,636,385 |
LPL Holdings, Inc., 4%, 3/15/2029 (n) | | 1,444,000 | | | 1,330,818 |
LPL Holdings, Inc., 4.375%, 5/15/2031 (n) | | 1,984,000 | | | 1,803,436 |
NFP Corp., 4.875%, 8/15/2028 (n) | | 2,230,000 | | | 2,211,937 |
NFP Corp., 6.875%, 8/15/2028 (n) | | 1,727,000 | | | 1,736,680 |
| | | $ | 12,809,174 |
Building – 4.0% | | | | | |
ABC Supply Co., Inc., 3.875%, 11/15/2029 (n) | $ | 1,283,000 | $ | 1,143,212 |
Foundation Building Materials LLC, 6%, 3/01/2029 (n) | | 2,495,000 | | | 2,192,481 |
GYP Holding III Corp., 4.625%, 5/01/2029 (n) | | 3,139,000 | | | 2,907,687 |
Interface, Inc., 5.5%, 12/01/2028 (n) | | 2,352,000 | | | 2,201,096 |
MIWD Holdco II LLC/MIWD Finance Co., 5.5%, 2/01/2030 (n) | | 2,149,000 | | | 1,955,590 |
New Enterprise Stone & Lime Co., Inc., 5.25%, 7/15/2028 (n) | | 2,658,000 | | | 2,553,806 |
New Enterprise Stone & Lime Co., Inc., 9.75%, 7/15/2028 (n) | | 840,000 | | | 844,490 |
Patrick Industries, Inc., 7.5%, 10/15/2027 (n) | | 2,885,000 | | | 2,899,425 |
SRM Concrete, 8.875%, 11/15/2031 (n) | | 2,796,000 | | | 2,937,369 |
Standard Industries, Inc., 4.75%, 1/15/2028 (n) | | 1,364,000 | | | 1,304,561 |
Standard Industries, Inc., 4.375%, 7/15/2030 (n) | | 3,063,000 | | | 2,783,509 |
White Cap Buyer LLC, 6.875%, 10/15/2028 (n) | | 2,494,000 | | | 2,441,177 |
| | | $ | 26,164,403 |
Business Services – 1.2% | | | | | |
Entegris Escrow Corp., 5.95%, 6/15/2030 (n) | $ | 1,220,000 | $ | 1,205,087 |
Iron Mountain, Inc., 4.875%, 9/15/2027 (n) | | 1,670,000 | | | 1,613,737 |
Iron Mountain, Inc., 5.25%, 3/15/2028 (n) | | 1,897,000 | | | 1,839,723 |
Verscend Escrow Corp., 9.75%, 8/15/2026 (n) | | 3,321,000 | | | 3,334,234 |
| | | $ | 7,992,781 |
Cable TV – 8.0% | | | | | |
Cable One, Inc., 4%, 11/15/2030 (n) | $ | 3,771,000 | $ | 3,035,655 |
CCO Holdings LLC/CCO Holdings Capital Corp., | | | | | |
5.125%, 5/01/2027 (n) | | 1,403,000 | | | 1,353,216 |
CCO Holdings LLC/CCO Holdings Capital Corp., | | | | | |
4.75%, 3/01/2030 (n) | | 7,598,000 | | | 6,751,639 |
CCO Holdings LLC/CCO Holdings Capital Corp., 4.5%, 8/15/2030 (n) | | 4,098,000 | | | 3,563,867 |
CCO Holdings LLC/CCO Holdings Capital Corp., | | | | | |
4.25%, 2/01/2031 (n) | | 2,101,000 | | | 1,776,493 |
CCO Holdings LLC/CCO Holdings Capital Corp., | | | | | |
4.25%, 1/15/2034 (n) | | 1,573,000 | | | 1,250,696 |
CSC Holdings LLC, 5.375%, 2/01/2028 (n) | | 3,050,000 | | | 2,620,209 |
CSC Holdings LLC, 7.5%, 4/01/2028 (n) | | 1,100,000 | | | 732,245 |
Portfolio of Investments – continued
Issuer | Shares/Par | | | Value ($) |
Bonds – continued | | | | | |
Cable TV – continued | | | | | |
CSC Holdings LLC, 11.75%, 1/31/2029 (n) | $ | 1,264,000 | $ | 1,283,883 |
CSC Holdings LLC, 5.75%, 1/15/2030 (n) | | 2,990,000 | | | 1,582,577 |
CSC Holdings LLC, 4.125%, 12/01/2030 (n) | | 975,000 | | | 704,438 |
DIRECTV Financing LLC, 8.875%, 2/01/2030 (n) | | 489,000 | | | 498,807 |
DISH DBS Corp., 7.75%, 7/01/2026 | | 1,380,000 | | | 813,131 |
DISH DBS Corp., 5.25%, 12/01/2026 (n) | | 1,815,000 | | | 1,429,322 |
DISH DBS Corp., 5.125%, 6/01/2029 | | 1,517,000 | | | 581,085 |
DISH Network Corp., 11.75%, 11/15/2027 (n) | | 1,067,000 | | | 1,113,634 |
LCPR Senior Secured Financing DAC, 6.75%, 10/15/2027 (n) | | 2,919,000 | | | 2,811,761 |
LCPR Senior Secured Financing DAC, 5.125%, 7/15/2029 (n) | | 630,000 | | | 554,438 |
Sirius XM Radio, Inc., 4%, 7/15/2028 (n) | | 1,241,000 | | | 1,126,962 |
Sirius XM Radio, Inc., 5.5%, 7/01/2029 (n) | | 4,004,000 | | | 3,803,800 |
Sirius XM Radio, Inc., 3.875%, 9/01/2031 (n) | | 1,868,000 | | | 1,557,350 |
Videotron Ltd., 5.125%, 4/15/2027 (n) | | 1,597,000 | | | 1,573,045 |
Videotron Ltd., 3.625%, 6/15/2029 (n) | | 1,483,000 | | | 1,353,163 |
Virgin Media Finance PLC, 5%, 7/15/2030 (n) | | 3,640,000 | | | 3,250,919 |
Virgin Media Vendor Financing Notes IV DAC, 5%, 7/15/2028 (n) | | 3,178,000 | | | 2,991,620 |
Ziggo Bond Finance B.V., 5.125%, 2/28/2030 (n) | | 5,300,000 | | | 4,471,422 |
| | | $ | 52,585,377 |
Chemicals – 2.6% | | | | | |
Axalta Coating Systems Ltd., 4.75%, 6/15/2027 (n) | $ | 2,274,000 | $ | 2,188,975 |
Axalta Coating Systems Ltd., 3.375%, 2/15/2029 (n) | | 701,000 | | | 622,936 |
Element Solutions, Inc., 3.875%, 9/01/2028 (n) | | 2,168,000 | | | 1,980,577 |
LSF11 A5 HoldCo LLC, 6.625%, 10/15/2029 (n) | | 2,508,000 | | | 2,123,364 |
SCIH Salt Holdings, Inc., 6.625%, 5/01/2029 (n) | | 2,425,000 | | | 2,202,759 |
SCIL IV LLC/SCIL USA Holdings LLC, 9.5%, 7/15/2028 (n) | EUR | 1,183,000 | | | 1,379,467 |
SNF Group SACA, 3.375%, 3/15/2030 (n) | $ | 3,508,000 | | | 3,012,901 |
Windsor Holdings III, LLC, 8.5%, 6/15/2030 (n) | | 3,143,000 | | | 3,235,732 |
| | | $ | 16,746,711 |
Computer Software – 0.7% | | | | | |
Central Parent LLC/CDK Global II LLC/CDK Financing Co., Inc., | | | | | |
8%, 6/15/2029 (n) | $ | 2,019,000 | $ | 2,072,140 |
Dun & Bradstreet Corp., 5%, 12/15/2029 (n) | | 2,329,000 | | | 2,165,129 |
| | | $ | 4,237,269 |
Computer Software - Systems – 1.7% | | | | | |
Fair Isaac Corp., 5.25%, 5/15/2026 (n) | $ | 4,021,000 | $ | 3,970,738 |
Sabre GLBL, Inc., 8.625%, 6/01/2027 (n) | | 1,121,000 | | | 1,048,135 |
Sabre GLBL, Inc., 11.25%, 12/15/2027 (n) | | 1,075,000 | | | 1,076,344 |
SS&C Technologies Holdings, Inc., 5.5%, 9/30/2027 (n) | | 3,979,000 | | | 3,905,938 |
Portfolio of Investments – continued
Issuer | Shares/Par | | | Value ($) |
Bonds – continued | | | | | |
Computer Software - Systems – continued | | | | | |
Virtusa Corp., 7.125%, 12/15/2028 (n) | $ | 1,275,000 | | $ | 1,118,072 |
| | | $ | 11,119,227 |
Conglomerates – 3.3% | | | | | |
BWX Technologies, Inc., 4.125%, 6/30/2028 (n) | $ | 1,658,000 | $ | 1,556,563 |
BWX Technologies, Inc., 4.125%, 4/15/2029 (n) | | 4,316,000 | | | 3,997,997 |
Chart Industries, Inc., 9.5%, 1/01/2031 (n) | | 1,330,000 | | | 1,418,481 |
Emerald Debt Merger, 6.625%, 12/15/2030 (n) | | 2,916,000 | | | 2,945,364 |
Gates Global LLC, 6.25%, 1/15/2026 (n) | | 1,737,000 | | | 1,737,174 |
Griffon Corp., 5.75%, 3/01/2028 | | 2,493,000 | | | 2,443,140 |
Madison IAQ LLC, 5.875%, 6/30/2029 (n) | | 2,165,000 | | | 1,923,797 |
Regal Rexnord Corp., 6.3%, 2/15/2030 (n) | | 1,752,000 | | | 1,800,863 |
TriMas Corp., 4.125%, 4/15/2029 (n) | | 4,496,000 | | | 4,002,883 |
| | | $ | 21,826,262 |
Construction – 0.7% | | | | | |
Mattamy Group Corp., 5.25%, 12/15/2027 (n) | $ | 1,110,000 | $ | 1,071,009 |
Mattamy Group Corp., 4.625%, 3/01/2030 (n) | | 1,727,000 | | | 1,574,502 |
Weekley Homes LLC/Weekley Finance Corp., 4.875%, 9/15/2028 (n) | | 2,387,000 | | | 2,224,722 |
| | | $ | 4,870,233 |
Consumer Products – 1.5% | | | | | |
Energizer Gamma Acquisition B.V., 3.5%, 6/30/2029 | EUR | 1,290,000 | $ | 1,234,023 |
Energizer Holdings, Inc., 4.375%, 3/31/2029 (n) | $ | 2,343,000 | | | 2,120,907 |
HFC Prestige Products, Inc./HFC Prestige International US LLC, | | | | | |
6.625%, 7/15/2030 (n) | | 2,850,000 | | | 2,902,924 |
Prestige Consumer Healthcare, Inc., 5.125%, 1/15/2028 (n) | | 2,611,000 | | | 2,555,699 |
Prestige Consumer Healthcare, Inc., 3.75%, 4/01/2031 (n) | | 1,495,000 | | | 1,296,430 |
| | | $ | 10,109,983 |
Consumer Services – 4.2% | | | | | |
Allied Universal Holdco LLC, 9.75%, 7/15/2027 (n) | $ | 2,989,000 | $ | 2,922,617 |
Allied Universal Holdco LLC, 6%, 6/01/2029 (n) | | 1,080,000 | | | 896,713 |
Arches Buyer, Inc., 6.125%, 12/01/2028 (n) | | 2,257,000 | | | 1,949,619 |
Cushman & Wakefield PLC, 6.75%, 5/15/2028 (n) | | 2,022,000 | | | 1,994,339 |
GoDaddy, Inc., 3.5%, 3/01/2029 (n) | | 3,973,000 | | | 3,597,154 |
GW B-CR Security Corp., 9.5%, 11/01/2027 (n) | | 2,451,000 | | | 2,465,793 |
Match Group Holdings II LLC, 5%, 12/15/2027 (n) | | 2,052,000 | | | 1,985,278 |
Match Group Holdings II LLC, 4.625%, 6/01/2028 (n) | | 3,115,000 | | | 2,932,212 |
Match Group Holdings II LLC, 4.125%, 8/01/2030 (n) | | 810,000 | | | 728,806 |
Match Group Holdings II LLC, 3.625%, 10/01/2031 (n) | | 385,000 | | | 329,175 |
Realogy Group LLC/Realogy Co-Issuer Corp., 5.75%, 1/15/2029 (n) | | 1,772,000 | | | 1,316,188 |
Realogy Group LLC/Realogy Co-Issuer Corp., 5.25%, 4/15/2030 (n) | | 1,760,000 | | | 1,237,418 |
TriNet Group, Inc., 3.5%, 3/01/2029 (n) | | 3,712,000 | | | 3,276,027 |
Portfolio of Investments – continued
Issuer | Shares/Par | | | Value ($) |
Bonds – continued | | | | | |
Consumer Services – continued | | | | | |
WASH Multi-Family Acquisition, Inc., 5.75%, 4/15/2026 (n) | $ | 2,073,000 | | $ | 1,992,816 |
| | | $ | 27,624,155 |
Containers – 2.9% | | | | | |
ARD Finance S.A., 6.5% (6.5% Cash or 7.25% PIK), 6/30/2027 (n)(p) | $ | 859,000 | $ | 415,060 |
Ardagh Metal Packaging Finance USA LLC, 3.25%, 9/01/2028 (n) | | 2,400,000 | | | 2,097,521 |
Ardagh Metal Packaging Finance USA LLC, 4%, 9/01/2029 (n) | | 2,677,000 | | | 2,169,632 |
Ardagh Packaging Finance PLC/Ardagh MP Holdings USA, Inc., | | | | | |
5.25%, 8/15/2027 (n) | | 3,001,000 | | | 2,243,193 |
Can-Pack S.A./Eastern PA Land Investment Holding LLC, | | | | | |
3.875%, 11/15/2029 (n) | | 4,405,000 | | | 3,882,171 |
Crown Americas LLC, 5.25%, 4/01/2030 | | 1,203,000 | | | 1,162,399 |
Crown Americas LLC/Crown Americas Capital Corp. V, | | | | | |
4.25%, 9/30/2026 | | 2,743,000 | | | 2,643,758 |
Crown Americas LLC/Crown Americas Capital Corp. VI, | | | | | |
4.75%, 2/01/2026 | | 1,280,000 | | | 1,253,347 |
Crown European Holdings S.A., 4.75%, 3/15/2029 (n) | EUR | 1,262,000 | | | 1,381,915 |
Trivium Packaging Finance B.V., 8.5%, 8/15/2027 (n) | $ | 1,765,000 | | | 1,722,283 |
| | | $ | 18,971,279 |
Electronics – 1.2% | | | | | |
Entegris, Inc., 4.375%, 4/15/2028 (n) | $ | 1,696,000 | $ | 1,599,466 |
Entegris, Inc., 3.625%, 5/01/2029 (n) | | 1,382,000 | | | 1,246,578 |
Sensata Technologies B.V., 5%, 10/01/2025 (n) | | 2,985,000 | | | 2,971,493 |
Sensata Technologies B.V., 5.875%, 9/01/2030 (n) | | 1,340,000 | | | 1,324,286 |
Sensata Technologies, Inc., 4.375%, 2/15/2030 (n) | | 673,000 | | | 620,132 |
| | | $ | 7,761,955 |
Energy - Independent – 3.9% | | | | | |
Callon Petroleum Co., 8%, 8/01/2028 (n) | $ | 1,891,000 | $ | 1,955,807 |
Callon Petroleum Co., 7.5%, 6/15/2030 (n) | | 629,000 | | | 662,618 |
Civitas Resources, Inc., 8.375%, 7/01/2028 (n) | | 1,975,000 | | | 2,077,131 |
Civitas Resources, Inc., 8.625%, 11/01/2030 (n) | | 602,000 | | | 642,069 |
Civitas Resources, Inc., 8.75%, 7/01/2031 (n) | | 1,235,000 | | | 1,312,934 |
Comstock Resources, Inc., 6.75%, 3/01/2029 (n) | | 3,394,000 | | | 3,116,537 |
CrownRock LP/CrownRock Finance, Inc., "F", 5%, 5/01/2029 (n) | | 2,296,000 | | | 2,267,461 |
Matador Resources Co., 6.875%, 4/15/2028 (n) | | 2,371,000 | | | 2,427,951 |
Moss Creek Resources Holdings, Inc., 7.5%, 1/15/2026 (n) | | 1,869,000 | | | 1,862,050 |
Permian Resources Operating LLC, 7.75%, 2/15/2026 (n) | | 445,000 | | | 452,119 |
Permian Resources Operating LLC, 5.875%, 7/01/2029 (n) | | 3,098,000 | | | 3,030,090 |
Permian Resources Operating LLC, 7%, 1/15/2032 (n) | | 1,281,000 | | | 1,322,508 |
Sitio Royalties Operating Partnership, LP, 7.875%, 11/01/2028 (n) | | 2,403,000 | | | 2,464,216 |
Portfolio of Investments – continued
Issuer | | Shares/Par | | Value ($) |
Bonds – continued | | | | |
Energy - Independent – continued | | | | |
SM Energy Co., 6.5%, 7/15/2028 | $ | 1,673,000 | $ | 1,673,000 |
| | | $ | 25,266,491 |
Energy - Integrated – 0.3% | | | | |
Citgo Petroleum Corp., 8.375%, 1/15/2029 (n) | $ | 2,031,000 | $ | 2,110,141 |
Entertainment – 3.3% | | | | |
Carnival Corp. PLC, 7.625%, 3/01/2026 (n) | $ | 1,978,000 | $ | 2,009,211 |
Carnival Corp. PLC, 5.75%, 3/01/2027 (n) | | 3,583,000 | | 3,529,979 |
Carnival Corp. PLC, 4%, 8/01/2028 (n) | | 1,282,000 | | 1,185,865 |
Carnival Corp. PLC, 6%, 5/01/2029 (n) | | 1,332,000 | | 1,290,145 |
Merlin Entertainments, 7.375%, 2/15/2031 (n) | | 1,696,000 | | 1,698,304 |
NCL Corp. Ltd., 5.875%, 3/15/2026 (n) | | 1,914,000 | | 1,866,284 |
NCL Corp. Ltd., 7.75%, 2/15/2029 (n) | | 1,200,000 | | 1,211,633 |
Royal Caribbean Cruises Ltd., 5.375%, 7/15/2027 (n) | | 1,616,000 | | 1,590,163 |
Royal Caribbean Cruises Ltd., 5.5%, 4/01/2028 (n) | | 2,594,000 | | 2,560,990 |
SeaWorld Parks & Entertainment, 5.25%, 8/15/2029 (n) | | 1,628,000 | | 1,516,189 |
Viking Cruises Ltd. Co., 5.875%, 9/15/2027 (n) | | 807,000 | | 777,803 |
Viking Ocean Cruises Ship VII Ltd., 5.625%, 2/15/2029 (n) | | 1,414,000 | | 1,376,882 |
VOC Escrow Ltd., 5%, 2/15/2028 (n) | | 1,281,000 | | 1,223,227 |
| | | $ | 21,836,675 |
Financial Institutions – 5.4% | | | | |
Avation Capital S.A., 8.25% (8.25% Cash or 9% | | | | |
PIK), 10/31/2026 (n)(p) | $ | 2,432,318 | $ | 2,082,672 |
Castlelake Aviation Finance Designated Activity Co., | | | | |
5%, 4/15/2027 (n) | | 498,000 | | 472,723 |
Credit Acceptance Corp., 6.625%, 3/15/2026 | | 296,000 | | 295,939 |
Credit Acceptance Corp., 9.25%, 12/15/2028 (n) | | 2,019,000 | | 2,119,964 |
Freedom Mortgage Corp., 7.625%, 5/01/2026 (n) | | 1,613,000 | | 1,606,431 |
Freedom Mortgage Holdings LLC, 9.25%, 2/01/2029 (n) | | 500,000 | | 506,300 |
FTAI Aviation Ltd., 5.5%, 5/01/2028 (n) | | 1,152,000 | | 1,116,267 |
FTAI Aviation Ltd., 7.875%, 12/01/2030 (n) | | 1,358,000 | | 1,432,401 |
Global Aircraft Leasing Co. Ltd., 6.5% (6.5% Cash or 7.25% | | | | |
PIK), 9/15/2024 (n)(p) | | 5,039,595 | | 4,843,734 |
Howard Hughes Corp., 4.125%, 2/01/2029 (n) | | 2,917,000 | | 2,630,689 |
Jefferson Capital Holdings LLC, 9.5%, 2/15/2029 (n)(w) | | 1,768,000 | | 1,780,684 |
Macquarie AirFinance Holdings Ltd., 8.375%, 5/01/2028 (n) | | 2,667,000 | | 2,801,550 |
Macquarie AirFinance Holdings Ltd., 8.125%, 3/30/2029 (n) | | 440,000 | | 456,531 |
Nationstar Mortgage Holdings, Inc., 6%, 1/15/2027 (n) | | 3,445,000 | | 3,377,895 |
OneMain Finance Corp., 6.875%, 3/15/2025 | | 2,011,000 | | 2,018,541 |
OneMain Finance Corp., 7.125%, 3/15/2026 | | 2,876,000 | | 2,915,210 |
OneMain Finance Corp., 5.375%, 11/15/2029 | | 1,398,000 | | 1,293,509 |
PRA Group, Inc., 8.375%, 2/01/2028 (n) | | 803,000 | | 764,889 |
Portfolio of Investments – continued
Issuer | | Shares/Par | | | Value ($) |
Bonds – continued | | | | | |
Financial Institutions – continued | | | | | |
Rocket Mortgage Co-Issuer, Inc., 3.625%, 3/01/2029 (n) | $ | 1,755,000 | $ | 1,559,944 |
Rocket Mortgage Co-Issuer, Inc., 3.875%, 3/01/2031 (n) | | 611,000 | | | 533,898 |
SLM Corp., 3.125%, 11/02/2026 | | 1,218,000 | | | 1,140,438 |
| | | $ | 35,750,209 |
Food & Beverages – 3.1% | | | | | |
B&G Foods, Inc., 5.25%, 9/15/2027 | $ | 1,018,000 | $ | 918,189 |
B&G Foods, Inc., 8%, 9/15/2028 (n) | | 1,156,000 | | | 1,205,003 |
Chobani LLC/Chobani Finance Corp., 7.625%, 7/01/2029 (n) | | 201,000 | | | 203,505 |
Fiesta Purchaser, Inc., 7.875%, 3/01/2031 (n)(w) | | 1,591,000 | | | 1,609,567 |
Performance Food Group Co., 5.5%, 10/15/2027 (n) | | 2,516,000 | | | 2,453,853 |
Post Holdings, Inc., 5.625%, 1/15/2028 (n) | | 2,130,000 | | | 2,096,138 |
Post Holdings, Inc., 4.625%, 4/15/2030 (n) | | 3,229,000 | | | 2,969,545 |
Primo Water Holding, Inc., 4.375%, 4/30/2029 (n) | | 3,556,000 | | | 3,237,391 |
TreeHouse Foods, Inc., 4%, 9/01/2028 | | 2,239,000 | | | 1,997,188 |
U.S. Foods Holding Corp., 4.75%, 2/15/2029 (n) | | 2,881,000 | | | 2,733,399 |
United Natural Foods, Inc., 6.75%, 10/15/2028 (n) | | 1,308,000 | | | 1,098,720 |
| | | $ | 20,522,498 |
Gaming & Lodging – 3.3% | | | | | |
Caesars Entertainment, Inc., 4.625%, 10/15/2029 (n) | $ | 1,047,000 | $ | 957,081 |
Caesars Entertainment, Inc., 7%, 2/15/2030 (n) | | 2,135,000 | | | 2,194,031 |
Caesars Entertainment, Inc., 6.5%, 2/15/2032 (n) | | 600,000 | | | 606,637 |
Caesars Resort Collection LLC/CRC Finco, Inc., | | | | | |
8.125%, 7/01/2027 (n) | | 2,284,000 | | | 2,343,946 |
CCM Merger, Inc., 6.375%, 5/01/2026 (n) | | 2,340,000 | | | 2,310,939 |
CDI Escrow Issuer, Inc., 5.75%, 4/01/2030 (n) | | 2,827,000 | | | 2,734,924 |
Penn National Gaming, Inc., 4.125%, 7/01/2029 (n) | | 2,631,000 | | | 2,249,465 |
Wyndham Hotels & Resorts, Inc., 4.375%, 8/15/2028 (n) | | 2,665,000 | | | 2,488,186 |
Wynn Macau Ltd., 5.5%, 10/01/2027 (n) | | 2,629,000 | | | 2,471,791 |
Wynn Macau Ltd., 5.625%, 8/26/2028 (n) | | 1,123,000 | | | 1,045,177 |
Wynn Resorts Finance LLC/Wynn Resorts Capital Corp., | | | | | |
5.125%, 10/01/2029 (n) | | 2,674,000 | | | 2,526,145 |
| | | $ | 21,928,322 |
Industrial – 1.3% | | | | | |
Albion Financing 1 S.à r.l., 6.125%, 10/15/2026 (n) | $ | 980,000 | $ | 962,682 |
Albion Financing 2 S.à r.l., 8.75%, 4/15/2027 (n) | | 1,530,000 | | | 1,528,384 |
APi Escrow Corp., 4.75%, 10/15/2029 (n) | | 3,525,000 | | | 3,300,528 |
Williams Scotsman International, Inc., 4.625%, 8/15/2028 (n) | | 3,162,000 | | | 2,993,070 |
| | | $ | 8,784,664 |
Portfolio of Investments – continued
Issuer | | Shares/Par | | | Value ($) |
Bonds – continued | | | | | |
Insurance - Property & Casualty – 3.0% | | | | | |
Acrisure LLC/Acrisure Finance, Inc., 8.25%, 2/01/2029 (n) | $ | 1,195,000 | $ | 1,198,063 |
Acrisure LLC/Acrisure Finance, Inc., 4.25%, 2/15/2029 (n) | | 641,000 | | | 574,780 |
Acrisure LLC/Acrisure Finance, Inc., 6%, 8/01/2029 (n) | | 1,214,000 | | | 1,113,646 |
Alliant Holdings Intermediate LLC/Alliant Holdings Co-Issuer, | | | | | |
6.75%, 10/15/2027 (n) | | 1,631,000 | | | 1,592,378 |
Alliant Holdings Intermediate LLC/Alliant Holdings Co-Issuer, | | | | | |
5.875%, 11/01/2029 (n) | | 3,111,000 | | | 2,946,210 |
Alliant Holdings Intermediate LLC/Alliant Holdings Co-Issuer, | | | | | |
7%, 1/15/2031 (n) | | 1,577,000 | | | 1,593,716 |
AmWINS Group Benefits, Inc., 4.875%, 6/30/2029 (n) | | 2,441,000 | | | 2,278,301 |
AssuredPartners, Inc., 5.625%, 1/15/2029 (n) | | 2,140,000 | | | 2,021,051 |
GTCR (AP) Finance, Inc., 8%, 5/15/2027 (n) | | 1,401,000 | | | 1,403,647 |
Hub International Ltd., 5.625%, 12/01/2029 (n) | | 2,034,000 | | | 1,919,302 |
Hub International Ltd., 7.25%, 6/15/2030 (n) | | 1,725,000 | | | 1,774,451 |
Hub International Ltd., 7.375%, 1/31/2032 (n) | | 1,295,000 | | | 1,326,204 |
| | | $ | 19,741,749 |
Machinery & Tools – 0.9% | | | | | |
Husky Injection Molding Systems Ltd., 9%, 2/15/2029 (n)(w) | $ | 200,000 | $ | 200,000 |
Ritchie Bros Holdings, Inc., 7.75%, 3/15/2031 (n) | | 3,378,000 | | | 3,559,804 |
Terex Corp., 5%, 5/15/2029 (n) | | 2,487,000 | | | 2,350,219 |
| | | $ | 6,110,023 |
Major Banks – 0.5% | | | | | |
Toronto-Dominion Bank, 8.125% to 10/31/2027, FLR (CMT - 5yr. + | | | | | |
4.075%) to 10/31/2082 | $ | 3,045,000 | $ | 3,162,625 |
Medical & Health Technology & Services – 5.8% | | | | | |
180 Medical, Inc., 3.875%, 10/15/2029 (n) | $ | 2,475,000 | $ | 2,212,255 |
Avantor Funding, Inc., 4.625%, 7/15/2028 (n) | | 3,520,000 | | | 3,351,184 |
Bausch & Lomb Escrow Corp., 8.375%, 10/01/2028 (n) | | 2,122,000 | | | 2,201,724 |
Charles River Laboratories International, Inc., 3.75%, 3/15/2029 (n) | | 4,163,000 | | | 3,786,128 |
CHS/Community Health Systems, Inc., 8%, 12/15/2027 (n) | | 1,400,000 | | | 1,378,692 |
CHS/Community Health Systems, Inc., 6.125%, 4/01/2030 (n) | | 2,934,000 | | | 1,909,661 |
CHS/Community Health Systems, Inc., 5.25%, 5/15/2030 (n) | | 3,001,000 | | | 2,484,598 |
Encompass Health Corp., 5.75%, 9/15/2025 | | 832,000 | | | 826,701 |
Encompass Health Corp., 4.75%, 2/01/2030 | | 2,633,000 | | | 2,469,401 |
Encompass Health Corp., 4.625%, 4/01/2031 | | 435,000 | | | 399,647 |
IQVIA, Inc., 5%, 5/15/2027 (n) | | 3,640,000 | | | 3,557,499 |
IQVIA, Inc., 6.5%, 5/15/2030 (n) | | 1,449,000 | | | 1,478,081 |
Legacy LifePoint Health LLC, 4.375%, 2/15/2027 (n) | | 1,989,000 | | | 1,852,395 |
Star Parent, Inc., 9%, 10/01/2030 (n) | | 1,776,000 | | | 1,867,470 |
Tenet Healthcare Corp., 6.125%, 10/01/2028 | | 1,606,000 | | | 1,600,090 |
Tenet Healthcare Corp., 4.375%, 1/15/2030 | | 1,432,000 | | | 1,325,057 |
Portfolio of Investments – continued
Issuer | | Shares/Par | | | Value ($) |
Bonds – continued | | | | | |
Medical & Health Technology & Services – continued | | | | | |
Tenet Healthcare Corp., 6.125%, 6/15/2030 | $ | 2,430,000 | $ | 2,429,094 |
Tenet Healthcare Corp., 6.75%, 5/15/2031 (n) | | 1,053,000 | | | 1,077,048 |
U.S. Acute Care Solutions LLC, 6.375%, 3/01/2026 (n) | | 1,950,000 | | | 1,703,929 |
| | | $ | 37,910,654 |
Medical Equipment – 1.3% | | | | | |
Embecta Corp., 5%, 2/15/2030 (n) | $ | 2,514,000 | $ | 2,057,156 |
Garden SpinCo Corp., 8.625%, 7/20/2030 (n) | | 2,167,000 | | | 2,318,690 |
Medline Borrower LP, 5.25%, 10/01/2029 (n) | | 3,052,000 | | | 2,845,712 |
Teleflex, Inc., 4.625%, 11/15/2027 | | 1,223,000 | | | 1,186,469 |
| | | $ | 8,408,027 |
Metals & Mining – 3.3% | | | | | |
Baffinland Iron Mines Corp./Baffinland Iron Mines LP, | | | | | |
8.75%, 7/15/2026 (n) | $ | 2,220,000 | $ | 2,031,315 |
FMG Resources Ltd., 4.375%, 4/01/2031 (n) | | 5,690,000 | | | 5,120,962 |
GrafTech Finance, Inc., 4.625%, 12/15/2028 (n) | | 3,119,000 | | | 2,065,181 |
GrafTech Finance, Inc., 9.875%, 12/15/2028 (n) | | 502,000 | | | 375,150 |
Kaiser Aluminum Corp., 4.625%, 3/01/2028 (n) | | 2,821,000 | | | 2,599,535 |
Kaiser Aluminum Corp., 4.5%, 6/01/2031 (n) | | 1,455,000 | | | 1,242,263 |
Novelis Corp., 3.25%, 11/15/2026 (n) | | 1,665,000 | | | 1,558,979 |
Novelis Corp., 4.75%, 1/30/2030 (n) | | 2,527,000 | | | 2,343,781 |
Novelis Corp., 3.875%, 8/15/2031 (n) | | 1,367,000 | | | 1,185,649 |
Petra Diamonds US$ Treasury PLC, 9.75%, 3/08/2026 (n) | | 1,481,632 | | | 1,200,122 |
Taseko Mines Ltd., 7%, 2/15/2026 (n) | | 2,069,000 | | | 2,032,792 |
| | | $ | 21,755,729 |
Midstream – 4.7% | | | | | |
DT Midstream, Inc., 4.125%, 6/15/2029 (n) | $ | 2,245,000 | $ | 2,062,589 |
DT Midstream, Inc., 4.375%, 6/15/2031 (n) | | 3,288,000 | | | 2,945,297 |
EQM Midstream Partners LP, 5.5%, 7/15/2028 | | 4,471,000 | | | 4,430,287 |
Kinetik Holdings, Inc., 5.875%, 6/15/2030 (n) | | 2,806,000 | | | 2,756,208 |
NuStar Logistics, LP, 6.375%, 10/01/2030 | | 2,099,000 | | | 2,109,495 |
Tallgrass Energy Partners LP, 5.5%, 1/15/2028 (n) | | 3,391,000 | | | 3,264,414 |
Tallgrass Energy Partners LP, 7.375%, 2/15/2029 (n) | | 1,180,000 | | | 1,177,066 |
Venture Global Calcasieu Pass LLC, 3.875%, 8/15/2029 (n) | | 2,848,000 | | | 2,545,438 |
Venture Global Calcasieu Pass LLC, 6.25%, 1/15/2030 (n) | | 1,028,000 | | | 1,028,816 |
Venture Global Calcasieu Pass LLC, 4.125%, 8/15/2031 (n) | | 1,990,000 | | | 1,759,799 |
Venture Global LNG, Inc., 8.125%, 6/01/2028 (n) | | 2,116,000 | | | 2,138,617 |
Venture Global LNG, Inc., 9.5%, 2/01/2029 (n) | | 2,311,000 | | | 2,454,372 |
Venture Global LNG, Inc., 8.375%, 6/01/2031 (n) | | 2,363,000 | | | 2,386,243 |
| | | $ | 31,058,641 |
Portfolio of Investments – continued
Issuer | Shares/Par | | | Value ($) |
Bonds – continued | | | | | |
Network & Telecom – 0.6% | | | | | |
Iliad Holding S.A.S., 6.5%, 10/15/2026 (n) | $ | 693,000 | $ | 679,318 |
Iliad Holding S.A.S., 7%, 10/15/2028 (n) | | 3,007,000 | | | 2,983,044 |
| | | $ | 3,662,362 |
Oil Services – 0.4% | | | | | |
Nabors Industries Ltd., 7.25%, 1/15/2026 (n) | $ | 1,528,000 | $ | 1,489,907 |
Nabors Industries Ltd., 9.125%, 1/31/2030 (n) | | 972,000 | | | 989,059 |
| | | $ | 2,478,966 |
Oils – 1.1% | | | | | |
Parkland Corp., 4.625%, 5/01/2030 (n) | $ | 4,314,000 | $ | 3,974,574 |
PBF Holding Co. LLC/PBF Finance Corp., 6%, 2/15/2028 | | 2,326,000 | | | 2,273,360 |
Puma International Financing S.A., 5%, 1/24/2026 | | 1,001,000 | | | 948,107 |
| | | $ | 7,196,041 |
Personal Computers & Peripherals – 0.6% | | | | | |
NCR Corp., 5%, 10/01/2028 (n) | $ | 2,673,000 | $ | 2,520,020 |
NCR Corp., 5.125%, 4/15/2029 (n) | | 1,559,000 | | | 1,458,642 |
| | | $ | 3,978,662 |
Pharmaceuticals – 1.0% | | | | | |
1375209 BC Ltd., 9%, 1/30/2028 (n) | $ | 1,495,000 | $ | 1,450,150 |
Bausch Health Co., Inc., 11%, 9/30/2028 (n) | | 1,582,000 | | | 1,076,234 |
Bausch Health Co., Inc., 14%, 10/15/2030 (n) | | 375,000 | | | 209,638 |
Grifols S.A., 3.2%, 5/01/2025 | EUR | 600,000 | | | 617,497 |
Organon Finance 1 LLC, 4.125%, 4/30/2028 (n) | $ | 1,634,000 | | | 1,495,028 |
Organon Finance 1 LLC, 5.125%, 4/30/2031 (n) | | 2,301,000 | | | 1,976,851 |
| | | $ | 6,825,398 |
Pollution Control – 1.2% | | | | | |
GFL Environmental, Inc., 4.25%, 6/01/2025 (n) | $ | 550,000 | $ | 540,347 |
GFL Environmental, Inc., 4%, 8/01/2028 (n) | | 2,405,000 | | | 2,206,017 |
GFL Environmental, Inc., 4.75%, 6/15/2029 (n) | | 957,000 | | | 898,381 |
GFL Environmental, Inc., 4.375%, 8/15/2029 (n) | | 985,000 | | | 903,367 |
GFL Environmental, Inc., 6.75%, 1/15/2031 (n) | | 448,000 | | | 458,205 |
Stericycle, Inc., 3.875%, 1/15/2029 (n) | | 2,936,000 | | | 2,668,912 |
| | | $ | 7,675,229 |
Precious Metals & Minerals – 0.8% | | | | | |
Coeur Mining, Inc., 5.125%, 2/15/2029 (n) | $ | 1,461,000 | $ | 1,329,876 |
Eldorado Gold Corp., 6.25%, 9/01/2029 (n) | | 1,471,000 | | | 1,402,943 |
IAMGOLD Corp., 5.75%, 10/15/2028 (n) | | 2,750,000 | | | 2,420,000 |
| | | $ | 5,152,819 |
Portfolio of Investments – continued
Issuer | Shares/Par | | | Value ($) |
Bonds – continued | | | | | |
Printing & Publishing – 0.3% | | | | | |
Cimpress PLC, 7%, 6/15/2026 | $ | 2,256,000 | $ | 2,222,160 |
Real Estate - Other – 0.8% | | | | | |
RHP Hotel Properties, LP/RHP Finance Corp., 7.25%, 7/15/2028 (n) | $ | 3,345,000 | $ | 3,448,042 |
XHR LP, REIT, 4.875%, 6/01/2029 (n) | | 1,896,000 | | | 1,748,700 |
| | | $ | 5,196,742 |
Restaurants – 0.3% | | | | | |
Fertitta Entertainment LLC, 6.75%, 1/15/2030 (n) | $ | 2,445,000 | $ | 2,198,170 |
Retailers – 1.8% | | | | | |
Asbury Automotive Group, Inc., 4.625%, 11/15/2029 (n) | $ | 1,859,000 | $ | 1,712,671 |
Lithia Motors, Inc., 3.875%, 6/01/2029 (n) | | 2,063,000 | | | 1,851,543 |
Macy's Retail Holdings LLC, 5.875%, 4/01/2029 (n) | | 2,435,000 | | | 2,361,950 |
NMG Holding Co. Inc./Neiman Marcus Group LLC, | | | | | |
7.125%, 4/01/2026 (n) | | 1,705,000 | | | 1,662,400 |
Penske Automotive Group Co., 3.75%, 6/15/2029 | | 2,702,000 | | | 2,408,090 |
Victoria's Secret & Co., 4.625%, 7/15/2029 (n) | | 2,086,000 | | | 1,763,669 |
| | | $ | 11,760,323 |
Specialty Stores – 1.0% | | | | | |
Global Auto Holdings Ltd./Aag FH UK Ltd., 8.375%, 1/15/2029 (n) | $ | 2,007,000 | $ | 1,892,359 |
Michael Cos., Inc., 5.25%, 5/01/2028 (n) | | 1,315,000 | | | 1,032,894 |
Michael Cos., Inc., 7.875%, 5/01/2029 (n) | | 1,486,000 | | | 950,436 |
PetSmart, Inc./PetSmart Finance Corp., 7.75%, 2/15/2029 (n) | | 2,915,000 | | | 2,817,879 |
| | | $ | 6,693,568 |
Supermarkets – 0.7% | | | | | |
KeHE Distributors LLC/KeHE Finance Corp., 9%, 2/15/2029 (n) | $ | 1,608,000 | $ | 1,617,045 |
Ocado Group PLC, 3.875%, 10/08/2026 | GBP 1,425,000 | | | 1,564,363 |
Picard Bondco S.A., 5.375%, 7/01/2027 | EUR | 1,429,000 | | | 1,466,950 |
| | | $ | 4,648,358 |
Telecommunications - Wireless – 1.1% | | | | | |
Altice France S.A., 5.5%, 1/15/2028 (n) | $ | 1,030,000 | $ | 804,185 |
Altice France S.A., 6%, 2/15/2028 (n) | | 1,240,000 | | | 553,563 |
Altice France S.A., 5.125%, 7/15/2029 (n) | | 717,000 | | | 524,195 |
SBA Communications Corp., 3.875%, 2/15/2027 | | 1,776,000 | | | 1,694,874 |
SBA Communications Corp., 3.125%, 2/01/2029 | | 4,014,000 | | | 3,577,409 |
| | | $ | 7,154,226 |
U.S. Treasury Obligations – 0.5% | | | | | |
U.S. Treasury Notes, 3%, 6/30/2024 | $ | 3,500,000 | $ | 3,469,102 |
Portfolio of Investments – continued
Issuer | | | Shares/Par | | | Value ($) |
Bonds – continued | | | | | | |
Utilities - Electric Power – 3.5% | | | | | | |
Calpine Corp., 4.5%, 2/15/2028 (n) | | $ | 2,925,000 | $ | 2,781,579 |
Calpine Corp., 5.125%, 3/15/2028 (n) | | | 2,175,000 | | | 2,075,420 |
Clearway Energy Operating LLC, 4.75%, 3/15/2028 (n) | | 1,747,000 | | | 1,663,323 |
Clearway Energy Operating LLC, 3.75%, 2/15/2031 (n) | | 4,925,000 | | | 4,269,147 |
Clearway Energy Operating LLC, 3.75%, 1/15/2032 (n) | | 597,000 | | | 507,061 |
NextEra Energy, Inc., 4.25%, 7/15/2024 (n) | | | 188,000 | | | 186,017 |
NextEra Energy, Inc., 4.25%, 9/15/2024 (n) | | | 488,000 | | | 477,020 |
NextEra Energy, Inc., 4.5%, 9/15/2027 (n) | | | 2,274,000 | | | 2,135,369 |
NextEra Energy, Inc., 7.25%, 1/15/2029 (n) | | | 2,357,000 | | | 2,427,720 |
TerraForm Global Operating LLC, 6.125%, 3/01/2026 (n) | | 1,955,000 | | | 1,929,384 |
TerraForm Power Operating LLC, 5%, 1/31/2028 (n) | | 3,122,000 | | | 3,009,046 |
TerraForm Power Operating LLC, 4.75%, 1/15/2030 (n) | | 1,478,000 | | | 1,364,652 |
| | | | $ | 22,825,738 |
Total Bonds (Identified Cost, $657,930,772) | | | $ | 637,400,713 |
Common Stocks – 0.4% | | | | | | |
Cable TV – 0.1% | | | | | | |
Intelsat Emergence S.A. (a) | | | 35,390 | $ | 928,987 |
Oil Services – 0.3% | | | | | | |
LTRI Holdings LP (a)(u) | | | 3,300 | $ | 1,670,361 |
Total Common Stocks (Identified Cost, $2,353,281) | | $ | 2,599,348 |
Convertible Bonds – 0.2% | | | | | | |
Utilities - Electric Power – 0.2% | | | | | | |
Pacific Gas and Electric Corp., 4.25%, 12/01/2027 (n) (Identified | | | | |
Cost, $927,000) | | $ | 927,000 | $ | 943,222 |
| Strike | First | | | | |
| Price | Exercise | | | | |
Warrants – 0.0% | | | | | | |
Other Banks & Diversified Financials – 0.0% | | | | | |
Avation Capital S.A. (1 share for 1 warrant, | | | | | | |
Expiration 10/31/26) (a) | | | | | | |
(Identified Cost, $0) | GBP 1.14 | 6/24/22 | 42,350 | $ | 8,051 |
Investment Companies (h) – 2.4% | | | | | | |
Money Market Funds – 2.4% | | | | | | |
MFS Institutional Money Market Portfolio, 5.4% (v) (Identified Cost, | | | | |
$15,793,129) | | | 15,792,268 | $ | 15,793,848 |
Portfolio of Investments – continued
| | | | Par Amount/ | |
Underlying/Expiration | | | Notional | Number of | |
Date/Exercise Price | Put/Call Counterparty | Amount | Contracts Value ($) |
Purchased Options – 0.0% | | | | |
Market Index Securities – 0.0% | | | | |
Russell 2000 Index – | | | | | |
December 2024 @ $1,500 | | | | | |
(Premiums Paid, $493,971) | Put | Exchange Traded | $ 13,436,658 | 69 | $191,130 |
Other Assets, Less Liabilities – 0.1% | | | 722,488 |
Net Assets – 100.0% | | | | $657,658,800 |
(a) Non-income producing security.
(h)An affiliated issuer, which may be considered one in which the fund owns 5% or more of the outstanding voting securities, or a company which is under common control. At period end, the aggregate values of the fund's investments in affiliated issuers and in unaffiliated issuers were $15,793,848 and $641,142,464, respectively.
(n)Securities exempt from registration under Rule 144A of the Securities Act of 1933. These securities may be sold in the ordinary course of business in transactions exempt from
registration, normally to qualified institutional buyers. At period end, the aggregate value of these securities was $567,872,064, representing 86.3% of net assets.
(p)Payment-in-kind (PIK) security for which interest income may be received in additional securities and/or cash.
(u)The security was valued using significant unobservable inputs and is considered level 3 under the fair value hierarchy. For further information about the fund's level 3 holdings, please see Note 2 in the Notes to Financial Statements.
(v)Affiliated issuer that is available only to investment companies managed by MFS. The rate quoted for the MFS Institutional Money Market Portfolio is the annualized seven-day yield of the fund at period end.
(w)When-issued security.
The following abbreviations are used in this report and are defined:
CDI | Interbank Deposit Certificates |
CMT | Constant Maturity Treasury |
FLR | Floating Rate. Interest rate resets periodically based on the parenthetically disclosed |
| reference rate plus a spread (if any). The period-end rate reported may not be the |
| current rate. All reference rates are USD unless otherwise noted. |
REIT | Real Estate Investment Trust |
Abbreviations indicate amounts shown in currencies other than the U.S. dollar. All amounts are stated in U.S. dollars unless otherwise indicated. A list of abbreviations is shown below:
Portfolio of Investments – continued
Derivative Contracts at 1/31/24 | | | | | | |
Forward Foreign Currency Exchange Contracts | | | | | |
| | | | | | Unrealized |
Currency | Currency | | Settlement | Appreciation |
Purchased | | Sold | Counterparty | Date | (Depreciation) |
Asset Derivatives | | | | | | | |
GBP | 197,752 | USD | 250,507 | State Street Bank Corp. | 4/19/2024 | $244 | |
USD | 6,854,930 | EUR 6,274,118 | JPMorgan Chase Bank N.A. | 4/19/2024 | 52,217 | |
USD | 621,489 | EUR | 572,050 | State Street Bank Corp. | 4/19/2024 | 1,244 | |
USD | 1,620,387 | GBP 1,270,566 | State Street Bank Corp. | 4/19/2024 | | 9,295 | |
| | | | | | $63,000 |
Liability Derivatives | | | | | | |
EUR | 727,836 | USD | 795,195 | HSBC Bank | 4/19/2024 | $(6,039) |
EUR | 616,062 | USD | 671,169 | JPMorgan Chase Bank N.A. | 4/19/2024 | (3,203) |
| | | | | | | | |
| | | | | | $(9,242) |
| | | | | | | | | |
See Notes to Financial Statements

Financial Statements
STATEMENT OF ASSETS AND LIABILITIES
At 1/31/24
This statement represents your fund's balance sheet, which details the assets and liabilities comprising the total value of the fund.
Assets
Investments in unaffiliated issuers, at value (identified cost, $661,705,024) | $641,142,464 | |
Investments in affiliated issuers, at value (identified cost, $15,793,129) | 15,793,848 | |
Receivables for | | |
Forward foreign currency exchange contracts | 63,000 | |
Investments sold | 3,066,547 | |
Fund shares sold | 9,208 | |
Interest and dividends | 9,760,452 | |
Other assets | 2,341 | |
Total assets | $669,837,860 | |
Liabilities | | |
Payable to custodian | $246 | |
Payables for | | |
Distributions | 197 | |
Forward foreign currency exchange contracts | 9,242 | |
Investments purchased | 6,836,386 | |
When-issued investments purchased | 3,572,823 | |
Fund shares reacquired | 1,691,239 | |
Payable to affiliates | | |
Administrative services fee | 94 | |
Shareholder servicing costs | 11 | |
Accrued expenses and other liabilities | 68,822 | |
Total liabilities | $12,179,060 | |
Net assets | $657,658,800 | |
Net assets consist of | | |
Paid-in capital | $793,334,929 | |
Total distributable earnings (loss) | (135,676,129) |
Net assets | $657,658,800 | |
Shares of beneficial interest outstanding | 79,800,592 | |
Net asset value per share (net assets of $657,658,800 / 79,800,592 shares of beneficial | | |
interest outstanding) | $8.24 | |
See Notes to Financial Statements

Financial Statements
STATEMENT OF OPERATIONS
Year ended 1/31/24
This statement describes how much your fund earned in investment income and accrued in expenses. It also describes any gains and/or losses generated by fund operations.
Net investment income (loss)
Income | | | |
Interest | $43,981,773 | |
Dividends from affiliated issuers | 822,361 | |
Other | 88,031 | |
Dividends | 66,286 | |
Total investment income | $44,958,451 | |
Expenses | | | |
Shareholder servicing costs | $36 | |
Administrative services fee | 17,500 | |
Custodian fee | 45,507 | |
Shareholder communications | 2,091 | |
Audit and tax fees | 52,350 | |
Legal fees | 3,545 | |
Pricing service fees | 8,714 | |
Form N-CEN/N-PORT preparation fees | 9,800 | |
Miscellaneous | 18,209 | |
Total expenses | $157,752 | |
Fees paid indirectly | (442) |
Net expenses | $157,310 | |
Net investment income (loss) | $44,801,141 | |
Realized and unrealized gain (loss) | | | |
Realized gain (loss) (identified cost basis) | | | |
Unaffiliated issuers | $(31,681,347) |
Affiliated issuers | 3,852 | |
Futures contracts | (492,104) |
Forward foreign currency exchange contracts | 71,581 | |
Foreign currency | (1,138) |
| | |
Net realized gain (loss) | $(32,099,156) |
Change in unrealized appreciation or depreciation | | | |
Unaffiliated issuers | $46,111,487 | |
Affiliated issuers | (602) |
Futures contracts | 106,337 | |
Forward foreign currency exchange contracts | 78,332 | |
Translation of assets and liabilities in foreign currencies | (3,140) |
Net unrealized gain (loss) | $46,292,414 | |
Net realized and unrealized gain (loss) | $14,193,258 | |
Change in net assets from operations | $58,994,399 | |
See Notes to Financial Statements
Financial Statements
STATEMENTS OF CHANGES IN NET ASSETS
These statements describe the increases and/or decreases in net assets resulting from operations, any distributions, and any shareholder transactions.
| Year ended | |
| 1/31/24 | 1/31/23 |
Change in net assets | | | |
From operations | | | |
Net investment income (loss) | $44,801,141 | $46,442,609 | |
Net realized gain (loss) | (32,099,156) | (35,574,607) |
Net unrealized gain (loss) | 46,292,414 | (55,397,358) |
| | | |
Change in net assets from operations | $58,994,399 | $(44,529,356) |
| | | |
Total distributions to shareholders | $(45,493,975) | $(47,089,882) |
| | | |
Change in net assets from fund share transactions | $(82,456,705) | $(179,131,688) |
| | | |
Total change in net assets | $(68,956,281) | $(270,750,926) |
Net assets | | | |
At beginning of period | 726,615,081 | 997,366,007 | |
At end of period | $657,658,800 | $726,615,081 | |
See Notes to Financial Statements
Financial Statements
FINANCIAL HIGHLIGHTS
The financial highlights table is intended to help you understand the fund's financial performance for the past 5 years. Certain information reflects financial results for a single fund share. The total returns in the table represent the rate that an investor would have earned (or lost) on an investment in the fund share class (assuming reinvestment of all distributions) held for the entire period.
| | | Year ended | | | |
| 1/31/24 | 1/31/23 | 1/31/22 | 1/31/21 | 1/31/20 |
Net asset value, beginning of period | $8.05 | $8.88 | $9.25 | $9.33 | $8.94 | |
Income (loss) from investment operations | | | | | |
| | | | | | |
Net investment income (loss) (d) | $0.53 | $0.47 | $0.47 | $0.50 | $0.51 | |
Net realized and unrealized gain (loss) | 0.20 | (0.82) | (0.34) | (0.06)(g) | 0.39 | |
Total from investment operations | $0.73 | $(0.35) | $0.13 | $0.44 | $0.90 | |
Less distributions declared to shareholders | | | | | |
| | | | | | |
From net investment income | $(0.54) | $(0.48) | $(0.50) | $(0.52) | $(0.51) |
Net asset value, end of period (x) | $8.24 | $8.05 | $8.88 | $9.25 | $9.33 | |
Total return (%) (s)(x) | 9.46 | (3.84) | 1.39 | 5.02 | 10.29 | |
| | | | | | |
Ratios (%) (to average net assets) | | | | | | |
and Supplemental data: | | | | | | |
Expenses (f) | 0.02 | 0.02 | 0.02 | 0.02 | 0.02 | |
Net investment income (loss) | 6.63 | 5.77 | 5.09 | 5.58 | 5.51 | |
Portfolio turnover | 44 | 25 | 60 | 66 | 59 | |
Net assets at end of period (000 omitted) | $657,659 | $726,615 | $997,366 | $1,228,318 | $889,031 | |
(d) Per share data is based on average shares outstanding.
(f)Ratios do not reflect reductions from fees paid indirectly, if applicable. See Note 2 in the Notes to Financial Statements for additional information.
(g)The per share amount varies from the net realized and unrealized gain/loss for the period because of the timing of sales of fund shares and the per share amount of realized and unrealized gains and losses at such time.
(s)From time to time the fund may receive proceeds from litigation settlements, without which performance would be lower.
(x)The net asset values and total returns have been calculated on net assets which include adjustments made in accordance with U.S. generally accepted accounting principles required at period end for financial reporting purposes.
See Notes to Financial Statements
NOTES TO FINANCIAL STATEMENTS
(1) Business and Organization
MFS High Yield Pooled Portfolio (the fund) is a diversified series of MFS Series Trust
III(the trust). The trust is organized as a Massachusetts business trust and is registered under the Investment Company Act of 1940, as amended, as an open-end management investment company. This fund is available only to certain U.S. registered investment companies managed by MFS. MFS does not receive a management fee from this fund.
The fund is an investment company and accordingly follows the investment company accounting and reporting guidance of the Financial Accounting Standards Board (FASB) Accounting Standards Codification Topic 946 Financial Services - Investment Companies.
(2) Significant Accounting Policies
General — The preparation of financial statements in conformity with U.S. generally accepted accounting principles requires management to make estimates and assumptions that affect the reported amounts of assets and liabilities, and disclosure of contingent assets and liabilities at the date of the financial statements and the reported amounts of increases and decreases in net assets from operations during the reporting period. Actual results could differ from those estimates. In the preparation of these financial statements, management has evaluated subsequent events occurring after the date of the fund's Statement of Assets and Liabilities through the date that the financial statements were issued. The fund invests in high-yield securities rated below investment grade. Investments in below investment grade quality securities can involve a substantially greater risk of default or can already be in default, and their values can decline significantly. Below investment grade quality securities tend to be more sensitive to adverse news about the issuer, or the market or economy in general, than higher quality debt instruments. The fund invests in foreign securities. Investments in foreign securities are vulnerable to the effects of changes in the relative values of the local currency and the U.S. dollar and to the effects of changes in each country's market, economic, industrial, political, regulatory, geopolitical, environmental, public health, and other conditions.
Balance Sheet Offsetting — The fund's accounting policy with respect to balance sheet offsetting is that, absent an event of default by the counterparty or a termination of the agreement, the International Swaps and Derivatives Association (ISDA) Master Agreement, or similar agreement, does not result in an offset of reported amounts of financial assets and financial liabilities in the Statement of Assets and Liabilities across transactions between the fund and the applicable counterparty. The fund's right to setoff may be restricted or prohibited by the bankruptcy or insolvency laws of the particular jurisdiction to which a specific master netting agreement counterparty is subject. Balance sheet offsetting disclosures, to the extent applicable to the fund, have been included in the fund's Significant Accounting Policies note under the captions for each of the fund's in-scope financial instruments and transactions.
Investment Valuations — Subject to its oversight, the fund's Board of Trustees has delegated primary responsibility for determining or causing to be determined the value of the fund's investments to MFS as the fund's adviser, pursuant to the fund's valuation policy and procedures which have been adopted by the adviser and approved by the Board. In accordance with Rule 2a-5 under the Investment Company Act of 1940, the Board of Trustees designated the adviser as the "valuation designee" of the fund. If the
Notes to Financial Statements - continued
adviser, as valuation designee, determines that reliable market quotations are not readily available for an investment, the investment is valued at fair value as determined in good faith by the adviser in accordance with the adviser's fair valuation policy and procedures.
Under the fund's valuation policy and procedures, equity securities, including restricted equity securities, are generally valued at the last sale or official closing price on their primary market or exchange as provided by a third-party pricing service. Equity securities, for which there were no sales reported that day, are generally valued at the last quoted daily bid quotation on their primary market or exchange as provided by a third-party pricing service. Debt instruments and floating rate loans, including restricted debt instruments, are generally valued at an evaluated or composite bid as provided by a third-party pricing service. Short-term instruments with a maturity at issuance of 60 days or less may be valued at amortized cost, which approximates market value. Exchange-traded options are generally valued at the last sale or official closing price on their primary exchange as provided by a third-party pricing service. Exchange-traded options for which there were no sales reported that day are generally valued at the last daily bid quotation on their primary exchange as provided by a third-party pricing service. For put options, the position may be valued at the last daily ask quotation if there are no trades reported during the day. Options not traded on an exchange are generally valued at a broker/dealer bid quotation. Foreign currency options are generally valued at valuations provided by a third-party pricing service. Futures contracts are generally valued at last posted settlement price on their primary exchange as provided by a third-party pricing service. Futures contracts for which there were no trades that day for a particular position are generally valued at the closing bid quotation on their primary exchange as provided by a third-party pricing service. Forward foreign currency exchange contracts are generally valued at the mean of bid and asked prices for the time period interpolated from rates provided by a third-party pricing service for proximate time periods. Open-end investment companies are generally valued at net asset value per share. The values of foreign securities and other assets and liabilities expressed in foreign currencies are converted to U.S. dollars using the mean of bid and asked prices for rates provided by a third-party pricing service.
Under the fund's valuation policy and procedures, market quotations are not considered to be readily available for debt instruments, floating rate loans, and many types of derivatives. These investments are generally valued at fair value based on information from third-party pricing services or otherwise determined by the adviser in accordance with the adviser's fair valuation policy and procedures. Securities and other assets generally valued on the basis of information from a third-party pricing service may also be valued at a broker/dealer bid quotation. In determining values, third-party pricing services can utilize both transaction data and market information such as yield, quality, coupon rate, maturity, type of issue, trading characteristics, spreads and other market data. An investment may also be valued at fair value if the adviser determines that the investment's value has been materially affected by events occurring after the close of the exchange or market on which the investment is principally traded (such as foreign exchange or market) and prior to the determination of the fund's net asset value, or after the halt of trading of a specific security where trading does not resume prior to the close of the exchange or market on which the security is principally traded. The adviser generally relies on third-party pricing services or other information (such as the correlation with price movements of similar securities in the same or other markets; the type, cost and investment characteristics of the security; the business and financial
Notes to Financial Statements - continued
condition of the issuer; and trading and other market data) to assist in determining whether to fair value and at what value to fair value an investment. The value of an investment for purposes of calculating the fund's net asset value can differ depending on the source and method used to determine value. When fair valuation is used, the value of an investment used to determine the fund's net asset value may differ from quoted or published prices for the same investment. There can be no assurance that the fund could obtain the fair value assigned to an investment if it were to sell the investment at the same time at which the fund determines its net asset value per share.
Various inputs are used in determining the value of the fund's assets or liabilities. These inputs are categorized into three broad levels. In certain cases, the inputs used to measure fair value may fall into different levels of the fair value hierarchy. In such cases, an investment's level within the fair value hierarchy is based on the lowest level of input that is significant to the fair value measurement. The fund's assessment of the significance of a particular input to the fair value measurement in its entirety requires judgment, and considers factors specific to the investment. Level 1 includes unadjusted quoted prices in active markets for identical assets or liabilities. Level 2 includes other significant observable market-based inputs (including quoted prices for similar securities, interest rates, prepayment speed, and credit risk). Level 3 includes significant unobservable inputs, which may include the adviser's own assumptions in determining the fair value of investments. Other financial instruments are derivative instruments, such as forward foreign currency exchange contracts. The following is a summary of the levels used as of January 31, 2024 in valuing the fund's assets and liabilities:
Financial Instruments | Level 1 | Level 2 | Level 3 | Total |
Equity Securities: | | | | | |
United States | $— | $191,130 | $1,670,361 | $1,861,491 | |
Luxembourg | — | 928,987 | — | 928,987 | |
United Kingdom | — | 8,051 | — | 8,051 | |
U.S. Treasury Bonds & | | | | | |
U.S. Government Agencies & | | | | | |
Equivalents | — | 3,469,102 | — | 3,469,102 | |
U.S. Corporate Bonds | — | 525,235,439 | — | 525,235,439 | |
Foreign Bonds | — | 109,639,394 | — | 109,639,394 | |
Mutual Funds | 15,793,848 | — | — | 15,793,848 | |
Total | $15,793,848 | $639,472,103 | $1,670,361 | $656,936,312 | |
Other Financial Instruments | | | | | |
Forward Foreign Currency | | | | | |
Exchange Contracts – Assets | $— | $63,000 | $— | $63,000 | |
Forward Foreign Currency | | | | | |
Exchange Contracts – Liabilities | — | (9,242) | — | (9,242) |
For further information regarding security characteristics, see the Portfolio of Investments.
Notes to Financial Statements - continued
The following is a reconciliation of level 3 assets for which significant unobservable inputs were used to determine fair value. The table presents the activity of level 3 securities held at the beginning and the end of the period.
| Equity |
| Securities |
Balance as of 1/31/23 | $1,339,032 | |
Realized gain (loss) | 275,672 | |
Change in unrealized appreciation or depreciation | 331,329 | |
Sales | (275,672) |
Balance as of 1/31/24 | $1,670,361 | |
The net change in unrealized appreciation or depreciation from investments held as level 3 at January 31, 2024 is $564,729. At January 31, 2024, the fund held one level 3 security.
Foreign Currency Translation — Purchases and sales of foreign investments, income, and expenses are converted into U.S. dollars based upon currency exchange rates prevailing on the respective dates of such transactions or on the reporting date for foreign denominated receivables and payables. Gains and losses attributable to foreign currency exchange rates on sales of securities are recorded for financial statement purposes as net realized gains and losses on investments. Gains and losses attributable to foreign exchange rate movements on receivables, payables, income and expenses are recorded for financial statement purposes as foreign currency transaction gains and losses. That portion of both realized and unrealized gains and losses on investments that results from fluctuations in foreign currency exchange rates is not separately disclosed.
Derivatives — The fund uses derivatives primarily to increase or decrease exposure to a particular market or segment of the market, or security, to increase or decrease interest rate exposure, or as alternatives to direct investments. Derivatives are used for hedging or non-hedging purposes. While hedging can reduce or eliminate losses, it can also reduce or eliminate gains. When the fund uses derivatives as an investment to increase market exposure, or for hedging purposes, gains and losses from derivative instruments may be substantially greater than the derivative's original cost.
The derivative instruments used by the fund during the period were purchased options, futures contracts, and forward foreign currency exchange contracts. Depending on the type of derivative, a fund may exit a derivative position by entering into an offsetting transaction with a counterparty or exchange, negotiating an agreement with the derivative counterparty, or novating the position to a third party. The fund's period end derivatives, as presented in the Portfolio of Investments and the associated Derivative Contract tables, generally are indicative of the volume of its derivative activity during the period.
Notes to Financial Statements - continued
The following table presents, by major type of derivative contract, the fair value, on a gross basis, of the asset and liability components of derivatives held by the fund at January 31, 2024 as reported in the Statement of Assets and Liabilities:
| | Fair Value (a) | |
Risk | Derivative Contracts | Asset Derivatives | Liability Derivatives |
Equity | Purchased Option | | | | |
| Contracts | $191,130 | $— |
Foreign Exchange | Forward Foreign Currency | | | | |
| Exchange Contracts | 63,000 | (9,242) |
| | | | |
Total | | $254,130 | $(9,242) |
(a)The value of purchased options outstanding is included in investments in unaffiliated issuers, at value, within the Statement of Assets and Liabilities.
The following table presents, by major type of derivative contract, the realized gain (loss) on derivatives held by the fund for the year ended January 31, 2024 as reported in the Statement of Operations:
| | Forward Foreign | | |
| | Currency | Unaffiliated Issuers |
| Futures | Exchange | (Purchased |
Risk | Contracts | Contracts | Options) |
Interest Rate | $(492,104) | $ | — | $ | — |
Foreign Exchange | — | | 71,581 | | — |
Equity | — | | — | | (372,401) |
Total | $(492,104) | $ | 71,581 | $ | (372,401) |
The following table presents, by major type of derivative contract, the change in unrealized appreciation or depreciation on derivatives held by the fund for the year ended January 31, 2024 as reported in the Statement of Operations:
| | Forward Foreign | | |
| | Currency | Unaffiliated Issuers |
| Futures | Exchange | (Purchased |
Risk | Contracts | Contracts | Options) |
Interest Rate | $106,337 | $ | — | $ | — |
Foreign Exchange | — | | 78,332 | | — |
Equity | — | | — | | (302,841) |
Total | $106,337 | $ | 78,332 | $ | (302,841) |
Derivative counterparty credit risk is managed through formal evaluation of the creditworthiness of all potential counterparties. On certain, but not all, uncleared derivatives, the fund attempts to reduce its exposure to counterparty credit risk whenever possible by entering into an ISDA Master Agreement on a bilateral basis. The ISDA Master Agreement gives each party to the agreement the right to terminate all transactions traded under such agreement if there is a specified deterioration in the credit quality of the other party. Upon an event of default or a termination of the ISDA Master Agreement, the non-defaulting party has the right to close out all transactions traded under such agreement and to net amounts owed under each agreement to one net amount payable by one party to the other. This right to close out and net payments
Notes to Financial Statements - continued
across all transactions traded under the ISDA Master Agreement could result in a reduction of the fund's credit risk to such counterparty equal to any amounts payable by the fund under the applicable transactions, if any.
Collateral and margin requirements differ by type of derivative. For cleared derivatives (e.g., futures contracts, cleared swaps, and exchange-traded options), margin requirements are set by the clearing broker and the clearing house and collateral, in the form of cash or securities, is posted by the fund directly with the clearing broker. Collateral terms are counterparty agreement specific for uncleared derivatives (e.g., forward foreign currency exchange contracts, uncleared swap agreements, and uncleared options) and collateral, in the form of cash and securities, is held in segregated accounts with the fund's custodian in connection with these agreements. For derivatives traded under an ISDA Master Agreement, which contains a credit support annex, the collateral requirements are netted across all transactions traded under such counterparty-specific agreement and an amount is posted from one party to the other to collateralize such obligations. Cash that has been segregated or delivered to cover the fund's collateral or margin obligations under derivative contracts, if any, will be reported separately in the Statement of Assets and Liabilities as restricted cash for uncleared derivatives and/or deposits with brokers for cleared derivatives. Securities pledged as collateral or margin for the same purpose, if any, are noted in the Portfolio of Investments. The fund may be required to make payments of interest on uncovered collateral or margin obligations with the broker. Any such payments are included in "Miscellaneous" expense in the Statement of Operations.
Purchased Options — The fund purchased put options for a premium. Purchased put options entitle the holder to sell a specified number of shares or units of a particular security, currency or index at a specified price at a specified date or within a specified period of time. Purchasing put options may hedge against an anticipated decline in the value of portfolio securities or currency or decrease the fund's exposure to an underlying instrument.
The premium paid is initially recorded as an investment in the Statement of Assets and Liabilities. That investment is subsequently marked-to-market daily with the difference between the premium paid and the market value of the purchased option being recorded as unrealized appreciation or depreciation. Premiums paid for purchased put options which have expired are treated as realized losses on investments in the Statement of Operations. Upon the exercise or closing of a purchased put option, the premium paid is offset against the proceeds on the sale of the underlying security or financial instrument in order to determine the realized gain or loss on investments.
Whether or not the option is exercised, the fund's maximum risk of loss from purchasing an option is the amount of premium paid. All option contracts involve credit risk if the counterparty to the option contract fails to perform. For uncleared options, this risk is mitigated in cases where there is an ISDA Master Agreement between the fund and the counterparty providing for netting as described above and, where applicable, by the posting of collateral by the counterparty to the fund to cover the fund's exposure to the counterparty under such ISDA Master Agreement.
Futures Contracts — The fund entered into futures contracts which may be used to hedge against or obtain broad market exposure, interest rate exposure, currency exposure, or to manage duration. A futures contract represents a commitment for the future purchase or sale of an asset at a specified price on a specified date.
Notes to Financial Statements - continued
Upon entering into a futures contract, the fund is required to deposit with the broker, either in cash or securities, an initial margin in an amount equal to a specified percentage of the notional amount of the contract. Subsequent payments (variation margin) are made or received by the fund each day, depending on the daily fluctuations in the value of the contract, and are recorded for financial statement purposes as unrealized gain or loss by the fund until the contract is closed or expires at which point the gain or loss on futures contracts is realized.
The fund bears the risk of interest rates, exchange rates or securities prices moving unexpectedly, in which case, the fund may not achieve the anticipated benefits of the futures contracts and may realize a loss. While futures contracts may present less counterparty risk to the fund since the contracts are exchange traded and the exchange's clearinghouse guarantees payments to the broker, there is still counterparty credit risk due to the insolvency of the broker. The fund's maximum risk of loss due to counterparty credit risk is equal to the margin posted by the fund to the broker plus any gains or minus any losses on the outstanding futures contracts.
Forward Foreign Currency Exchange Contracts — The fund entered into forward foreign currency exchange contracts for the purchase or sale of a specific foreign currency at a fixed price on a future date. These contracts may be used to hedge the fund's currency risk or for non-hedging purposes. For hedging purposes, the fund may enter into contracts to deliver or receive foreign currency that the fund will receive from or use in its normal investment activities. The fund may also use contracts to hedge against declines in the value of foreign currency denominated securities due to unfavorable exchange rate movements. For non-hedging purposes, the fund may enter into contracts with the intent of changing the relative exposure of the fund's portfolio of securities to different currencies to take advantage of anticipated exchange rate changes.
Forward foreign currency exchange contracts are adjusted by the daily exchange rate of the underlying currency and any unrealized gains or losses are recorded as a receivable or payable for forward foreign currency exchange contracts until the contract settlement date. On contract settlement date, any gain or loss on the contract is recorded as realized gains or losses on forward foreign currency exchange contracts.
Risks may arise upon entering into these contracts from unanticipated movements in the value of the contract and from the potential inability of counterparties to meet the terms of their contracts. Generally, the fund's maximum risk due to counterparty credit risk is the unrealized gain on the contract due to the use of Continuous Linked Settlement, a multicurrency cash settlement system for the centralized settlement of foreign transactions. This risk is mitigated in cases where there is an ISDA Master Agreement between the fund and the counterparty providing for netting as described above and, where applicable, by the posting of collateral by the counterparty to the fund to cover the fund's exposure to the counterparty under such ISDA Master Agreement.
Indemnifications — Under the fund's organizational documents, its officers and Trustees may be indemnified against certain liabilities and expenses arising out of the performance of their duties to the fund. Additionally, in the normal course of business, the fund enters into agreements with service providers that may contain indemnification clauses. The fund's maximum exposure under these agreements is unknown as this would involve future claims that may be made against the fund that have not yet occurred.
Notes to Financial Statements - continued
Investment Transactions and Income — Interest income is recorded on the accrual basis. All premium and discount is amortized or accreted for financial statement purposes in accordance with U.S. generally accepted accounting principles. Dividends received in cash are recorded on the ex-dividend date. Certain dividends from foreign securities will be recorded when the fund is informed of the dividend if such information is obtained subsequent to the ex-dividend date. Dividend and interest payments received in additional securities are recorded on the ex-dividend or ex-interest date in an amount equal to the value of the security on such date.
The fund may receive proceeds from litigation settlements. Any proceeds received from litigation involving portfolio holdings are reflected in the Statement of Operations in realized gain/loss if the security has been disposed of by the fund or in unrealized gain/loss if the security is still held by the fund. Any other proceeds from litigation not related to portfolio holdings are reflected as other income in the Statement of Operations.
Investment transactions are recorded on the trade date. In determining the net gain or loss on securities sold, the cost of securities is determined on the identified cost basis.
The fund may purchase or sell securities on a when-issued or delayed delivery basis. In these extended settlement transactions, the receipt or delivery of the securities by the fund and related payments occur at a future date, usually beyond the customary settlement period. The price of such security and the date that the security will be settled are generally fixed at the time the transaction is negotiated. The value of the security varies with market fluctuations and for debt securities no interest accrues to the fund until settlement takes place. When the fund sells securities on a when-issued or delayed delivery basis, the fund typically owns or has the right to acquire securities equivalent in kind and amount to the securities sold. Purchase and sale commitments for when-issued or delayed delivery securities are held at carrying amount, which approximates fair value and are categorized as level 2 within the fair value hierarchy, and included in When-issued investments purchased and When-issued investments sold in the Statement of Assets and Liabilities, as applicable. Losses may arise due to changes in the value of the underlying securities prior to settlement date or if the counterparty does not perform under the contract's terms, or if the issuer does not issue the securities due to political, economic or other factors.
Fees Paid Indirectly — The fund's custody fee may be reduced by a credit earned under an arrangement that measures the value of U.S. dollars deposited with the custodian by the fund. The amount of the credit, for the year ended January 31, 2024, is shown as a reduction of total expenses in the Statement of Operations.
Tax Matters and Distributions — The fund intends to qualify as a regulated investment company, as defined under Subchapter M of the Internal Revenue Code, and to distribute all of its taxable income, including realized capital gains. As a result, no provision for federal income tax is required. The fund's federal tax returns, when filed, will remain subject to examination by the Internal Revenue Service for a three year period. Management has analyzed the fund's tax positions taken on federal and state tax returns for all open tax years and does not believe that there are any uncertain tax positions that require recognition of a tax liability. Foreign taxes, if any, have been accrued by the fund in the accompanying financial statements in accordance with the
Notes to Financial Statements - continued
applicable foreign tax law. Foreign income taxes may be withheld by certain countries in which the fund invests. Additionally, capital gains realized by the fund on securities issued in or by certain foreign countries may be subject to capital gains tax imposed by those countries.
Distributions to shareholders are recorded on the ex-dividend date. Income and capital gain distributions are determined in accordance with income tax regulations, which may differ from U.S. generally accepted accounting principles. Certain capital accounts in the financial statements are periodically adjusted for permanent differences in order to reflect their tax character. These adjustments have no impact on net assets or net asset value per share. Temporary differences which arise from recognizing certain items of income, expense, gain or loss in different periods for financial statement and tax purposes will reverse at some time in the future.
Book/tax differences primarily relate to amortization of premium and accretion of discount of debt securities and wash sale loss deferrals.
The tax character of distributions declared to shareholders for the last two fiscal years is as follows:
| Year ended | Year ended |
| 1/31/24 | 1/31/23 |
Ordinary income (including | | |
any short-term capital gains) | $45,493,975 | $47,089,882 |
The federal tax cost and the tax basis components of distributable earnings were as follows:
As of 1/31/24 | | | | |
Cost of investments | $ | 679,934,214 | |
Gross appreciation | | 12,449,799 | |
Gross depreciation | | (35,393,943) |
| | | |
Net unrealized appreciation (depreciation) | $ | (22,944,144) |
Undistributed ordinary income | | 4,064,213 | |
Capital loss carryforwards | | (113,076,626) |
Other temporary differences | | (3,719,572) |
| | | |
Total distributable earnings (loss) | $ | (135,676,129) |
As of January 31, 2024, the fund had capital loss carryforwards available to offset future realized gains. These net capital losses may be carried forward indefinitely and their character is retained as short-term and/or long-term losses. Such losses are characterized as follows:
Short-Term | $(13,716,208) |
Long-Term | (99,360,418) |
| | |
Total | $(113,076,626) |
(3) Transactions with Affiliates
Investment Adviser — The fund has an investment advisory agreement with MFS to provide overall investment management and related administrative services and facilities to the fund. MFS receives no compensation under this agreement; however MFS receives management fees from MFS funds that invest in the fund.
Notes to Financial Statements - continued
Shareholder Servicing Agent — MFS Service Center, Inc. (MFSC), a wholly-owned subsidiary of MFS, provides transfer agent and recordkeeping functions in connection with the issuance, transfer, and redemption of shares of the fund under a Shareholder Servicing Agent Agreement. MFSC is not paid a fee for providing these services. MFSC receives reimbursement from the fund for out-of-pocket expenses paid by MFSC on behalf of the fund. For the year ended January 31, 2024, these costs amounted to $36.
Administrator — MFS provides certain financial, legal, shareholder communications, compliance, and other administrative services to the fund. Under an administrative services agreement, the fund reimburses MFS the costs incurred to provide these services. The fund pays an annual fixed amount of $17,500. The administrative services fee is computed daily and paid monthly. The administrative services fee incurred for the year ended January 31, 2024 was equivalent to an annual effective rate of 0.0026% of the fund's average daily net assets.
Trustees' and Officers' Compensation - The fund may pay compensation to independent Trustees in the form of a retainer, attendance fees, and additional compensation to Board and Committee chairpersons. Independent Trustees' compensation is accrued daily and paid subsequent to each Trustee Board meeting. The fund does not pay compensation directly to Trustees or officers of the fund who are also officers of the investment adviser, all of whom receive remuneration from MFS for their services to the fund. Certain officers and Trustees of the fund are officers or directors of MFS, MFS Fund Distributors, Inc. (MFD), and MFSC. The independent Trustees do not currently receive compensation from the fund.
Other — The fund invests in the MFS Institutional Money Market Portfolio which is managed by MFS and seeks current income consistent with preservation of capital and liquidity. This money market fund does not pay a management fee to MFS but does incur investment and operating costs.
(4) Portfolio Securities
For the year ended January 31, 2024, purchases and sales of investments, other than purchased options with an expiration date of less than one year from the time of purchase and short-term obligations, aggregated $290,204,227 and $372,085,944, respectively.
(5) Shares of Beneficial Interest
The fund's Declaration of Trust permits the Trustees to issue an unlimited number of full and fractional shares of beneficial interest. Transactions in fund shares were as follows:
| Year ended | Year ended |
| 1/31/24 | | 1/31/23 | |
| Shares | Amount | Shares | Amount |
Shares sold | 5,187,193 | $41,214,207 | 4,236,645 | $34,051,394 |
Shares issued to shareholders in | | | | | | |
reinvestment of distributions | 5,697,188 | 45,493,975 | 5,845,303 | 47,089,882 |
Shares reacquired | (21,310,137) | (169,164,887) | (32,206,489) | (260,272,964) |
| | | | | |
Net change | (10,425,756) | $(82,456,705) | (22,124,541) | $(179,131,688) |
Notes to Financial Statements - continued
The fund is an MFS Pooled Portfolio, which is designed to be used by certain MFS funds to invest in a particular security type rather than invest in the security type directly. The fund is solely invested in by other MFS funds for the purpose of gaining exposure to high income debt instruments, rather than investing in high income debt instruments directly. The MFS funds do not invest in this fund for the purpose of exercising management or control. At the end of the period, the MFS Diversified Income Fund and the MFS Global High Yield Fund were the owners of record of approximately 79% and 21%, respectively, of the value of outstanding voting shares of the fund. In addition, the MFS Income Portfolio was the owner of record of less than 1% of the value of outstanding voting shares of the fund.
(6) Line of Credit
The fund and certain other funds managed by MFS participate in a $1.45 billion unsecured committed line of credit of which $1.2 billion is reserved for use by the fund and certain other MFS U.S. funds. The line of credit is provided by a syndicate of banks under a credit agreement. Borrowings may be made for temporary financing needs. Interest is charged to each fund, based on its borrowings, generally at a rate equal to the highest of 1) Daily Simple SOFR (Secured Overnight Financing Rate) plus 0.10%, 2) the Federal Funds Effective Rate, or 3) the Overnight Bank Funding Rate, each plus an agreed upon spread. A commitment fee, based on the average daily unused portion of the committed line of credit, is allocated among the participating funds. The line of credit expires on March 14, 2024 unless extended or renewed. In addition, the fund and other funds managed by MFS have established unsecured uncommitted borrowing arrangements with certain banks for temporary financing needs. Interest is charged to each fund, based on its borrowings, at rates equal to customary reference rates plus an agreed upon spread. For the year ended January 31, 2024, the fund's commitment fee and interest expense were $3,572 and $0, respectively, and are included in "Miscellaneous" expense in the Statement of Operations.
(7) Investments in Affiliated Issuers
An affiliated issuer may be considered one in which the fund owns 5% or more of the outstanding voting securities, or a company which is under common control. For the purposes of this report, the following were affiliated issuers:
| | | | | Change in | |
| | | | Realized | Unrealized | |
| Beginning | | Sales | Gain | Appreciation or | Ending |
Affiliated Issuers | Value | Purchases | Proceeds | (Loss) | Depreciation | Value |
MFS Institutional Money | | | | | | |
Market Portfolio | $16,165,324 | $184,174,465 | $184,549,191 | $3,852 | $(602) | $15,793,848 |
| | | | | Dividend | Capital Gain |
Affiliated Issuers | | | | | Income | Distributions |
MFS Institutional Money Market Portfolio | | | | $822,361 | $— |
REPORT OF INDEPENDENT REGISTERED PUBLIC ACCOUNTING FIRM
To the Board of Trustees of MFS Series Trust III and the Shareholders of MFS High Yield Pooled Portfolio:
Opinion on the Financial Statements and Financial Highlights
We have audited the accompanying statement of assets and liabilities of MFS High Yield Pooled Portfolio (the "Fund"), including the portfolio of investments, as of January 31, 2024, the related statement of operations for the year then ended, the statements of changes in net assets for each of the two years in the period then ended, the financial highlights for each of the five years in the period then ended, and the related notes. In our opinion, the financial statements and financial highlights present fairly, in all material respects, the financial position of the Fund as of January 31, 2024, and the results of its operations for the year then ended, the changes in its net assets for each of the two years in the period then ended, and the financial highlights for each of the five years in the period then ended, in conformity with accounting principles generally accepted in the United States of America.
Basis for Opinion
These financial statements and financial highlights are the responsibility of the Fund's management. Our responsibility is to express an opinion on the Fund's financial statements and financial highlights based on our audits. We are a public accounting firm registered with the Public Company Accounting Oversight Board (United States) (PCAOB) and are required to be independent with respect to the Fund in accordance with the U.S. federal securities laws and the applicable rules and regulations of the Securities and Exchange Commission and the PCAOB.
We conducted our audits in accordance with the standards of the PCAOB. Those standards require that we plan and perform the audit to obtain reasonable assurance about whether the financial statements and financial highlights are free of material misstatement, whether due to error or fraud. The Fund is not required to have, nor were we engaged to perform, an audit of its internal control over financial reporting. As part of our audits, we are required to obtain an understanding of internal control over financial reporting but not for the purpose of expressing an opinion on the effectiveness of the Fund's internal control over financial reporting. Accordingly, we express no such opinion.
Our audits included performing procedures to assess the risks of material misstatement of the financial statements and financial highlights, whether due to error or fraud, and performing procedures that respond to those risks. Such procedures included examining, on a test basis, evidence regarding the amounts and disclosures in the financial statements and financial highlights. Our audits also included evaluating the accounting principles used and significant estimates made by management, as well as evaluating the overall presentation of the financial statements and financial highlights.
Report of Independent Registered Public Accounting Firm – continued
Our procedures included confirmation of securities owned as of January 31, 2024, by correspondence with the custodian and brokers; when replies were not received from brokers, we performed other auditing procedures. We believe that our audits provide a reasonable basis for our opinion.
DELOITTE & TOUCHE LLP
Boston, Massachusetts
March 14, 2024
We have served as the auditor of one or more of the MFS investment companies since 1924.
TRUSTEES AND OFFICERS — IDENTIFICATION AND BACKGROUND
The Trustees and Officers of the Trust, as of March 1, 2024, are listed below, together with their principal occupations during the past five years. (Their titles may have varied during that period.) The address of each Trustee and Officer is 111 Huntington Avenue, Boston, Massachusetts 02199-7618.
| | | | | | Number of | | | | Other |
| | | | | | MFS Funds | | | | Directorships |
| | Position(s) | | Trustee/ | | overseen | | Principal Occupations | | During |
| | Held with | | Officer | | by the | | During | | the Past Five |
Name, Age | | Fund | | Since(h) | | Trustee | | the Past Five Years | | Years (j) |
INTERESTED | | | | | | | | | | |
TRUSTEE | | | | | | | | | | |
Michael W. | Trustee | | January 2021 | 136 | | Massachusetts Financial | N/A |
Roberge (k) | | | | | | | | Services Company, Chairman | | |
(age 57) | | | | | | | | (since January 2021); Chief | | |
| | | | | | | | Executive Officer (since | | |
| | | | | | | | January 2017); Director; | | |
| | | | | | | | Chairman of the Board (since | | |
INDEPENDENT | | | | | | | | January 2022) | | |
| | | | | | | | | |
TRUSTEES | | | | | | | | | | |
John P. | Trustee and | | January 2009 | 136 | | Private investor | N/A |
Kavanaugh | Chair of | | | | | | | | |
(age 69) | Trustees | | | | | | | | |
Steven E. Buller | Trustee | | February 2014 | 136 | | Private investor | N/A |
(age 72) | | | | | | | | | | |
John A. Caroselli | Trustee | | March 2017 | 136 | Private investor; JC Global | N/A |
(age 69) | | | | | | | | Advisors, LLC (management | | |
| | | | | | | | consulting), President (since | | |
| | | | | | | 2015) | | |
Maureen R. | Trustee | | January 2009 | 136 | | Private investor | N/A |
Goldfarb | | | | | | | | | | |
(age 68) | | | | | | | | | | |
Peter D. Jones | Trustee | | January 2019 | 136 | | Private investor | N/A |
(age 68) | | | | | | | | | | |
James W. | Trustee | | January 2019 | 136 | | Burford Capital Limited | Alpha-En |
Kilman, Jr. | | | | | | | | (finance and investment | Corporation, Director |
(age 62) | | | | | | | | management), Senior Advisor | (2016-2019) |
| | | | | | | | (since May 3, 2021), Chief | | |
| | | | | | | | Financial Officer (2019 - | | |
| | | | | | | | May 2, 2021); KielStrand | | |
Capital LLC (family office), Chief Executive Officer (since 2016)
Trustees and Officers - continued
| | | | | | Number of | | | | Other |
| | | | | | MFS Funds | | | | Directorships |
| | Position(s) | | Trustee/ | | overseen | | Principal Occupations | | During |
| | Held with | | Officer | | by the | | During | | the Past Five |
Name, Age | | Fund | | Since(h) | | Trustee | | the Past Five Years | | Years (j) |
Clarence Otis, Jr. | Trustee | | March 2017 | 136 | Private investor | VF Corporation, |
(age 67) | | | | | | | | | Director; Verizon |
| | | | | | | | | Communications, |
| | | | | | | | | Inc., Director; The |
| | | | | | | | | Travelers Companies, |
| | | | | | | | | Director |
Maryanne L. | Trustee | | May 2014 | 136 | Private investor | N/A |
Roepke | | | | | | | | | | |
(age 68) | | | | | | | | | | |
Laurie J. | Trustee | | March 2005 | 136 | Private investor | The Travelers |
Thomsen | | | | | | | | | Companies, Director; |
(age 66) | | | | | | | | | Dycom Industries, |
| | | | | | | | | Inc., Director |
| | | | | | Number of | | |
| | | | | | MFS Funds | | |
| | Position(s) | | Trustee/ | | for which | | |
| | Held with | | Officer | | the Person is | | Principal Occupations During |
Name, Age | | Fund | | Since(h) | | an Officer | | the Past Five Years |
OFFICERS | | | | | | | | |
Christopher R. Bohane (k) | Assistant | | July 2005 | 136 | | Massachusetts Financial Services |
(age 50) | Secretary and | | | | | | Company, Senior Vice President and |
| Assistant | | | | | | Deputy General Counsel |
| Clerk | | | | | | |
Kino Clark (k) | Assistant | | January 2012 | 136 | | Massachusetts Financial Services |
(age 55) | Treasurer | | | | | | Company, Vice President |
John W. Clark, Jr. (k) | Assistant | | April 2017 | 136 | | Massachusetts Financial Services |
(age 56) | Treasurer | | | | | | Company, Vice President |
David L. DiLorenzo (k) | President | | July 2005 | 136 | | Massachusetts Financial Services |
(age 55) | | | | | | | | Company, Senior Vice President |
Heidi W. Hardin (k) | Secretary and | | April 2017 | 136 | | Massachusetts Financial Services |
(age 56) | Clerk | | | | | | Company, Executive Vice President and |
| | | | | | | | General Counsel |
Brian E. Langenfeld (k) | Assistant | | June 2006 | 136 | | Massachusetts Financial Services |
(age 50) | Secretary and | | | | | | Company, Vice President and Managing |
| Assistant | | | | | | Counsel |
| Clerk | | | | | | |
Rosa E. Licea-Mailloux (k) | Chief | | March 2022 | 136 | | Massachusetts Financial Services |
(age 47) | Compliance | | | | | | Company, Vice President (since 2018); |
| Officer | | | | | | Director of Corporate Compliance |
| | | | | | | | (2018-2021), Senior Director Compliance |
| | | | | | | | (2021-2022), Senior Managing Director |
of North American Compliance & Chief
Compliance Officer (since March 2022)
Trustees and Officers - continued
| | | | | | Number of | | |
| | | | | | MFS Funds | | |
| | Position(s) | | Trustee/ | | for which | | |
| | Held with | | Officer | | the Person is | | Principal Occupations During |
Name, Age | | Fund | | Since(h) | | an Officer | | the Past Five Years |
Amanda S. Mooradian (k) | Assistant | | September 2018 | 136 | | Massachusetts Financial Services |
(age 45) | Secretary and | | | | | | Company, Vice President and Senior |
| Assistant | | | | | | Counsel |
| Clerk | | | | | | |
Susan A. Pereira (k) | Assistant | | July 2005 | 136 | | Massachusetts Financial Services |
(age 53) | Secretary and | | | | | | Company, Vice President and Managing |
| Assistant | | | | | | Counsel |
| Clerk | | | | | | |
Kasey L. Phillips (k) | Assistant | | September 2012 | 136 | | Massachusetts Financial Services |
(age 53) | Treasurer | | | | | | Company, Vice President |
Matthew A. Stowe (k) | Assistant | | October 2014 | 136 | | Massachusetts Financial Services |
(age 49) | Secretary and | | | | | | Company, Vice President and Senior |
| Assistant | | | | | | Managing Counsel |
| Clerk | | | | | | |
William B. Wilson (k) | Assistant | | October 2022 | 136 | | Massachusetts Financial Services |
(age 41) | Secretary and | | | | | | Company, Assistant Vice President and |
| Assistant | | | | | | Senior Counsel |
| Clerk | | | | | | |
James O. Yost (k) | Treasurer | | September 1990 | 136 | | Massachusetts Financial Services |
(age 63) | | | | | | | | Company, Senior Vice President |
(h)Date first appointed to serve as Trustee/Officer of an MFS Fund. Each Trustee has served continuously since appointment unless indicated otherwise. From January 2012 through December 2016, Messrs. DiLorenzo and Yost served as Treasurer and Deputy Treasurer of the Funds, respectively.
(j)Directorships or trusteeships of companies required to report to the Securities and Exchange Commission (i.e., "public companies").
(k)"Interested person" of the Trust within the meaning of the Investment Company Act of 1940 (referred to as the 1940 Act), which is the principal federal law governing investment companies like the fund, as a result of a position with MFS. The address of MFS is 111 Huntington Avenue, Boston, Massachusetts 02199-7618.
Each Trustee (other than Messrs. Jones, Kilman and Roberge) has been elected by shareholders and each Trustee and Officer holds office until his or her successor is chosen and qualified or until his or her earlier death, resignation, retirement or removal.
Mr. Roberge became a Trustee of the Funds on January 1, 2021 and Messrs. Jones and Kilman became Trustees of the Funds on January 1, 2019. The Trust does not hold annual meetings for the purpose of electing Trustees, and Trustees are not elected for fixed terms. Under the terms of the Board's retirement policy, an Independent Trustee shall retire at the end of the calendar year in which he or she reaches the earlier of 75 years of age or 15 years of service on the Board (or, in the case of any Independent Trustee who joined the Board prior to 2015, 20 years of service on the Board).
Messrs. Buller, Caroselli, Jones and Otis are members of the Trust's Audit Committee.
Trustees and Officers - continued
Each of the Interested Trustees and certain Officers hold comparable officer positions with certain affiliates of MFS.
The Statement of Additional Information for a Fund includes further information about the Trustees and is available without charge upon request by calling 1-800-225-2606.
Investment Adviser | Custodian |
Massachusetts Financial Services Company | JPMorgan Chase Bank, NA |
111 Huntington Avenue | 4 Metrotech Center |
Boston, MA 02199-7618 | New York, NY 11245 |
Distributor | Independent Registered Public Accounting Firm |
MFS Fund Distributors, Inc. | Deloitte & Touche LLP |
111 Huntington Avenue | 200 Berkeley Street |
Boston, MA 02199-7618 | Boston, MA 02116 |
Portfolio Manager(s) | |
David Cole | |
Michael Skatrud | |
PROXY VOTING POLICIES AND INFORMATION
MFS votes proxies on behalf of the fund pursuant to proxy voting policies and procedures that are available without charge, upon request, by calling
1-800-225-2606, by visiting mfs.com/proxyvoting, or by visiting the SEC's Web site at http://www.sec.gov.
Information regarding how the fund voted proxies relating to portfolio securities during the most recent twelve-month period ended June 30 is available by August 31 of each year without charge by visiting mfs.com/proxyvoting, or by visiting the SEC's Web site at http://www.sec.gov.
QUARTERLY PORTFOLIO DISCLOSURE
The fund files a complete schedule of portfolio holdings with the SEC for the first and third quarters of each fiscal year as an exhibit to its reports on Form N-PORT. The fund's Form N-PORT reports are available on the SEC's Web site at http://www.sec.gov.
FURTHER INFORMATION
From time to time, MFS may post important information about the fund or the MFS Funds on the MFS Web site (mfs.com). This information is available at https://www.mfs.com/announcements.
INFORMATION ABOUT FUND CONTRACTS AND LEGAL CLAIMS
The fund has entered into contractual arrangements with an investment adviser, administrator, distributor, shareholder servicing agent, and custodian who each provide services to the fund. Unless expressly stated otherwise, shareholders are not parties to, or intended beneficiaries of these contractual arrangements, and these contractual arrangements are not intended to create any shareholder right to enforce them against the service providers or to seek any remedy under them against the service providers, either directly or on behalf of the fund.
Under the Trust's By-Laws and Declaration of Trust, any claims asserted against or on behalf of the MFS Funds, including claims against Trustees and Officers, must be brought in state and federal courts located within the Commonwealth of Massachusetts.
FEDERAL TAX INFORMATION (unaudited)
The fund will notify shareholders of amounts for use in preparing 2024 income tax forms in January 2025. The following information is provided pursuant to provisions of the Internal Revenue Code.
The fund intends to pass through the maximum amount allowable as Section 163(j) Interest Dividends as defined in Treasury Regulation §1.163(j)-1(b).
rev. 3/16
WHAT DOES MFS DO WITH YOUR
PERSONAL INFORMATION?
| Why? | | Financial companies choose how they share your personal |
| | | information. Federal law gives consumers the right to limit some but |
| | | not all sharing. Federal law also requires us to tell you how we |
| | | collect, share, and protect your personal information. Please read this |
| | | notice carefully to understand what we do. | |
| | | | | |
| What? | | The types of personal information we collect and share depend on |
| | | the product or service you have with us. This information can include: |
| | | • Social Security number and account balances | |
| | | • Account transactions and transaction history | |
| | | • Checking account information and wire transfer instructions |
| | | When you are no longer our customer, we continue to share your |
| | | information as described in this notice. | |
| | | | | |
| How? | | All financial companies need to share customers' personal |
| | | information to run their everyday business. In the section below, we |
| | | list the reasons financial companies can share their customers' |
| | | personal information; the reasons MFS chooses to share; and |
| | | whether you can limit this sharing. | | |
| | | | | |
| | Reasons we can share your | Does | Can you limit |
| | personal information | MFS share? | this sharing? |
| For our everyday business purposes – | | |
| such as to process your transactions, maintain your | Yes | No |
| account(s), respond to court orders and legal |
| | |
| investigations, or report to credit bureaus | | |
| | | |
| For our marketing purposes – | No | We don't share |
| to offer our products and services to you |
| | |
| | | |
| For joint marketing with other | No | We don't share |
| financial companies |
| | |
| | | |
| For our affiliates' everyday business purposes – | No | We don't share |
| information about your transactions and experiences |
| | |
| | | |
| For our affiliates' everyday business purposes – | No | We don't share |
| information about your creditworthiness |
| | |
| | | |
| For nonaffiliates to market to you | No | We don't share |
| | | | | |
| | | | | |
| Questions? | Call 800-225-2606 or go to mfs.com. | |
| | | |
| | | | | |

Page 2
Who we are
Who is providing this notice? MFS Funds, MFS Investment Management, MFS Institutional Advisors, Inc., and MFS Heritage Trust Company.
What we do
| How does MFS | To protect your personal information from unauthorized access |
| protect my personal | and use, we use security measures that comply with federal |
| information? | law. These measures include procedural, electronic, and |
| | physical safeguards for the protection of the personal |
| | information we collect about you. |
| | |
| How does MFS | We collect your personal information, for example, when you |
| collect my personal | • open an account or provide account information |
| information? |
| • direct us to buy securities or direct us to sell your securities |
| |
| | • make a wire transfer |
| | We also collect your personal information from others, such as |
| | credit bureaus, affiliates, or other companies. |
| | |
| Why can't I limit all sharing? | Federal law gives you the right to limit only |
| | • sharing for affiliates' everyday business purposes – |
| | information about your creditworthiness |
| | • affiliates from using your information to market to you |
| | • sharing for nonaffiliates to market to you |
| | State laws and individual companies may give you additional |
| | rights to limit sharing. |
| | |
Definitions
Affiliates | Companies related by common ownership or control. They can |
| be financial and nonfinancial companies. |
| • MFS does not share personal information with affiliates, |
| except for everyday business purposes as described on page |
| one of this notice. |
| |
Nonaffiliates | Companies not related by common ownership or control. They |
| can be financial and nonfinancial companies. |
| • MFS does not share with nonaffiliates so they can market to |
| you. |
| |
Joint marketing | A formal agreement between nonaffiliated financial |
| companies that together market financial products or services |
| to you. |
| • MFS doesn't jointly market. |
| |
Other important information
If you own an MFS product or receive an MFS service in the name of a third party such as a bank or broker-dealer, their privacy policy may apply to you instead of ours.
Save paper with eDelivery.
MFS® will send you prospectuses,
reports, and proxies directly via e-mail so you will get information faster with less mailbox clutter.
To sign up:
1.Go to mfs.com.
2.Log in via MFS® Access.
3.Select eDelivery.
If you own your MFS fund shares through a financial institution or a retirement plan, MFS® TALK, MFS® Access, or eDelivery may not be available to you.
CONTACT
WEB SITE
mfs.com
MFS TALK
1-800-637-8255
24 hours a day
ACCOUNT SERVICE AND LITERATURE
Shareholders
1-800-225-2606
Financial advisors
1-800-343-2829
Retirement plan services
1-800-637-1255
MAILING ADDRESS
MFS Service Center, Inc.
P.O. Box 219341
Kansas City, MO 64121-9341
OVERNIGHT MAIL
MFS Service Center, Inc. Suite 219341
430 W 7th Street
Kansas City, MO 64105-1407
Item 1(b):
Not applicable.
ITEM 2. CODE OF ETHICS.
The Registrant has adopted a Code of Ethics (the "Code") pursuant to Section 406 of the Sarbanes-Oxley Act and as defined in Form N-CSR that applies to the Registrant's principal executive officer and principal financial and accounting officer. During the period covered by this report, the Registrant has not amended any provision in the Code that relates to an element of the Code's definition enumerated in paragraph
(b)of Item 2 of this Form N-CSR. During the period covered by this report, the Registrant did not grant a waiver, including an implicit waiver, from any provision of the Code.
A copy of the Code is attached hereto as EX-99.COE.
ITEM 3. AUDIT COMMITTEE FINANCIAL EXPERT.
Messrs. Steven E. Buller and Clarence Otis, Jr., members of the Audit Committee, have been determined by the Board of Trustees in their reasonable business judgment to meet the definition of "audit committee financial expert" as such term is defined in Form N-CSR. In addition, Messrs. Buller and Otis are "independent" members of the Audit Committee (as such term has been defined by the Securities and Exchange Commission in regulations implementing Section 407 of the Sarbanes-Oxley Act of 2002). The Securities and Exchange Commission has stated that the designation of a person as an audit committee financial expert pursuant to this Item 3 on the Form N-CSR does not impose on such a person any duties, obligations or liability that are greater than the duties, obligations or liability imposed on such person as a member of the Audit Committee and the Board of Trustees in the absence of such designation or identification.
ITEM 4. PRINCIPAL ACCOUNTANT FEES AND SERVICES.
Items 4(a) through 4(d) and 4(g):
The Board of Trustees has appointed Deloitte & Touche LLP ("Deloitte") to serve as independent accountants to certain series of the Registrant and Ernst & Young LLP ("E&Y") to serve in the same capacity to certain other series of the Registrant (each a "Fund" and collectively the "Funds"). The tables below set forth the audit fees billed to each Fund as well as fees for non-audit services provided to each Fund and/or to each Fund's investment adviser, Massachusetts Financial Services Company ("MFS"), and to various entities either controlling, controlled by, or under common control with MFS that provide ongoing services to the Funds ("MFS Related Entities").
For the fiscal years ended January 31, 2024 and 2023, audit fees billed to each Fund by Deloitte and E&Y were as follows:
Fees billed by Deloitte: | | Audit Fees |
| 2024 | | 2023 |
MFS Global High Yield Fund | 87,437 | | 84,346 |
MFS High Income Fund | 86,869 | | 83,798 |
MFS High Yield Pooled Portfolio | 40,610 | | 39,190 |
Total | 214,916 | | 207,334 |
| | |
Fees billed by E&Y: | | Audit Fees |
| 2024 | | 2023 |
MFS Municipal High Income Fund | 67,055 | | 64,690 |
For the fiscal years ended January 31, 2024 and 2023, fees billed by Deloitte and E&Y for audit-related, tax and other services provided to each Fund and for audit-related, tax and other services provided to MFS and MFS Related Entities were as follows:
Fees billed by Deloitte: | Audit-Related Fees1 | | Tax Fees2 | | | All Other Fees3 |
| | 2024 | 2023 | | | 2024 | | 20235 | 2024 | | 2023 |
To MFS Global High Yield | 0 | 0 | | | 0 | | 0 | 0 | | 0 |
Fund | | | | | | | | | | | | |
To MFS High Income Fund | 0 | 0 | | | 0 | | 0 | 0 | | 0 |
| | | | | | | | | | | | | |
To MFS High Yield Pooled | 0 | 0 | | | 0 | | 0 | 0 | | 0 |
Portfolio | | | | | | | | | | | | |
Total fees billed by Deloitte | 0 | 0 | | | 0 | | 0 | 0 | | 0 |
To above Funds | | | | | | | | | | | | |
| | | | | | | | | | | |
| | | | | | | |
Fees billed by Deloitte: | Audit-Related Fees1 | | Tax Fees2 | | | All Other Fees3 |
| | 2024 | 2023 | | | 2024 | | 2023 | 2024 | | 2023 |
To MFS and MFS Related | | | | | | | | | | | | |
Entities of MFS Global | 0 | 0 | | | 0 | | 0 | 0 | | 3,790 |
High Yield Fund* | | | | | | | | | | | | |
To MFS and MFS Related | | | | | | | | | | | | |
Entities of MFS High | 0 | 0 | | | 0 | | 0 | 0 | | 3,790 |
Income Fund * | | | | | | | | | | | | |
To MFS and MFS Related | | | | | | | | | | | | |
Entities of MFS High | 0 | 0 | | | 0 | | 0 | 0 | | 3,790 |
Yield Pooled Portfolio* | | | | | | | | | | | | |
| | | | | | | | |
Fees billed by Deloitte: | | | | | Aggregate Fees for Non-audit Services |
| | | | | | | 2024 | | | | 2023 |
To MFS Global High Yield Fund, MFS and MFS Related | | 0 | | | | 3,790 |
Entities# | | | | | | | | | | | | |
To MFS High Income Fund, MFS and MFS Related Entities# | | 0 | | | | 3,790 |
| | | | | | | | |
To MFS High Yield Pooled Portfolio, MFS and MFS | | 0 | | | | 3,790 |
Related Entities# | | | | | | | | | | | | |
| | | | | | | |
Fees billed by E&Y: | | Audit-Related Fees1 | | Tax Fees2 | | | All Other Fees4 |
| 2024 | | 2023 | 2024 | | 20235 | 2024 | | 2023 |
To MFS Municipal High | 0 | | 0 | 0 | | 0 | 0 | | 0 |
Income Fund | | | | | | | | | | | |
| | | | | |
Fees billed by E&Y: | Audit-Related Fees1 | | Tax Fees2 | | All Other Fees4 |
| 2024 | | 2023 | 2024 | | 2023 | 2024 | | 2023 |
| | | | | | | | | | | |
To MFS and MFS Related | 0 | | 0 | 0 | | 0 | 3,600 | | 3,165 |
Entities of MFS Municipal | | | | | | | | | | | |
High Income Fund* | | | | | | | | | | | |
| | | | | | |
Fees billed by E&Y: | | | | | Aggregate Fees for Non-audit Services |
| | | | | | 2024 | | | 2023 |
To MFS Municipal High Income Fund, MFS | | | | 178,350 | | 143,165 |
and MFS Related Entities# | | | | | | | | | | | |
*This amount reflects the fees billed to MFS and MFS Related Entities for non-audit services relating directly to the operations and financial reporting of the Funds (portions of which services also related to the operations and financial reporting of other funds within the MFS Funds complex).
# This amount reflects the aggregate fees billed by Deloitte or E&Y, as the case may be, for non-audit services rendered to the Funds and for non-audit services rendered to MFS and the MFS Related Entities.
1 The fees included under "Audit-Related Fees" are fees related to assurance and related services that are reasonably related to the performance of the audit or review of financial statements, but not reported under ''Audit Fees,'' including accounting consultations, agreed-upon procedure reports, attestation reports, comfort letters and internal control reviews.
2 The fees included under "Tax Fees" are fees associated with tax compliance, tax advice and tax planning, including services relating to the filing or amendment of federal, state or local income tax returns, regulated investment company qualification reviews and tax distribution and analysis.
3 The fees included under "All Other Fees" are fees for products and services provided by Deloitte other than those reported under "Audit Fees," "Audit-Related Fees" and "Tax Fees".
4 The fees included under "All Other Fees" are fees for products and services provided by E&Y other than those reported under "Audit Fees," "Audit-Related Fees" and "Tax Fees," including fees for services related to the review of internal controls and Rule 38a-1 compliance program.
Item 4(e)(1):
Set forth below are the policies and procedures established by the Audit Committee of the Board of Trustees relating to the pre- approval of audit and non-audit related services:
To the extent required by applicable law, pre-approval by the Audit Committee of the Board is needed for all audit and permissible non-audit services rendered to the Funds and all permissible non-audit services rendered to MFS or MFS Related Entities if the services relate directly to the operations and financial reporting of the Registrant. Pre-approval is currently on an engagement-by- engagement basis. In the event pre-approval of such services is necessary between regular meetings of the Audit Committee and it is not practical to wait to seek pre-approval at the next regular meeting of the Audit Committee, pre-approval of such services may be referred to the Chair of the Audit Committee for approval; provided that the Chair may not pre-approve any individual engagement for such services exceeding $50,000 or multiple engagements for such services in the aggregate exceeding $100,000 in each period between regular meetings of the Audit Committee. Any engagement pre-approved by the Chair between regular meetings of the Audit Committee shall be presented for ratification by the entire Audit Committee at its next regularly scheduled meeting.
Item 4(e)(2):
None, or 0%, of the services relating to the Audit-Related Fees, Tax Fees and All Other Fees paid by the Fund and MFS and MFS Related Entities relating directly to the operations and financial reporting of the Registrant disclosed above were approved by the audit committee pursuant to paragraphs (c)(7)(i)(C) of Rule 2-01 of Regulation S-X (which permits audit committee approval after the start of the engagement with respect to services other than audit, review or attest services, if certain conditions are satisfied).
Item 4(f):
Not applicable.
Item 4(h):
The Registrant's Audit Committee has considered whether the provision by a Registrant's independent registered public accounting firm of non-audit services to MFS and MFS Related Entities that were not pre-approved by the Committee (because such services did not relate directly to the operations and financial reporting of the Registrant) was compatible with maintaining the independence of the independent registered public accounting firm as the Registrant's principal auditors.
Item 4(i):
Not applicable.
Item 4(j):
Not applicable.
ITEM 5. AUDIT COMMITTEE OF LISTED REGISTRANTS.
Not applicable to the Registrant.
ITEM 6. INVESTMENTS
A schedule of investments for each series covered by this Form N-CSR is included as part of the report to shareholders of such series under Item 1(a) of this Form N-CSR.
ITEM 7. DISCLOSURE OF PROXY VOTING POLICIES AND PROCEDURES FOR CLOSED-END MANAGEMENT INVESTMENT COMPANIES.
Not applicable to the Registrant.
ITEM 8. PORTFOLIO MANAGERS OF CLOSED-END MANAGEMENT INVESTMENT COMPANIES.
Not applicable to the Registrant.
ITEM 9. PURCHASES OF EQUITY SECURITIES BY CLOSED-END MANAGEMENT INVESTMENT COMPANY AND AFFILIATED PURCHASERS.
Not applicable to the Registrant.
ITEM 10. SUBMISSION OF MATTERS TO A VOTE OF SECURITY HOLDERS.
There were no material changes to the procedures by which shareholders may send recommendations to the Board for nominees to the Registrant's Board since the Registrant last provided disclosure as to such procedures in response to the requirements of Item 407 (c)(2)(iv) of Regulation S-K or this Item.
ITEM 11. CONTROLS AND PROCEDURES.
(a)Based upon their evaluation of the effectiveness of the registrant's disclosure controls and procedures (as defined in Rule 30a-3(c) under the Investment Company Act of 1940 (the "Act")) as conducted within 90 days of the filing date of this report on Form N-CSR, the Registrant's principal financial officer and principal executive officer have concluded that those disclosure controls and procedures provide reasonable assurance that the material information required to be disclosed by the Registrant on this report is recorded, processed, summarized and reported within the time periods specified in the Securities and Exchange Commission's rules and forms.
(b)There were no changes in the Registrant's internal controls over financial reporting (as defined in Rule 30a-3(d) under the Act) that occurred during the period covered by the report that have materially affected, or are reasonably likely to materially affect, the Registrant's internal control over financial reporting.
ITEM 12. DISCLOSURE OF SECURITIES LENDING ACTIVITIES FOR CLOSED-END MANAGEMENT INVESTMENT COMPANIES.
Not applicable to the Registrant.
ITEM 13. RECOVERY OF ERRONEOUSLY AWARDED COMPENSATION.
Not Applicable.
ITEM 14. EXHIBITS.
(a)(1) Any code of ethics, or amendment thereto, that is the subject of the disclosure required by Item 2, to the extent that the registrant intends to satisfy the Item 2 requirements through filing of an exhibit: Attached hereto as EX-99.COE.
(2)A separate certification for each principal executive officer and principal financial officer of the registrant as required by Rule 30a-2(a) under the Act (17 CFR 270.30a-2): Attached hereto as EX-99.302CERT.
(3)Any written solicitation to purchase securities under Rule 23c-1 under the Act (17 CFR 270.23c-1) sent or given during the period covered by the report by or on behalf of the registrant to 10 or more persons. Not applicable.
(4)Change in the registrant's independent public accountant. Not applicable.
(b)If the report is filed under Section 13(a) or 15(d) of the Exchange Act, provide the certifications required by Rule 30a-2(b) under the Act (17 CFR 270.30a-2(b)), Rule 13a-14(b) or Rule 15d-14(b) under the Exchange Act (17 CFR 240.13a-14(b) or 240.15d-14(b)) and Section 1350 of Chapter 63 of Title 18 of the United States Code (18 U.S.C. 1350) as an exhibit. A certification furnished pursuant to this paragraph will not be deemed "filed" for the purposes of Section 18 of the Exchange Act (15 U.S.C. 78r), or otherwise subject to the liability of that section. Such certification will not be deemed to be incorporated by reference into any filing under the Securities Act of 1933 or the Exchange Act, except to the extent that the registrant specifically incorporates it by reference. Attached hereto as EX-99.906CERT.
Notice
A copy of the Amended and Restated Declaration of Trust, as amended, of the Registrant is on file with the Secretary of State of The Commonwealth of Massachusetts and notice is hereby given that this instrument is executed on behalf of the Registrant by an officer of the Registrant as an officer and not individually and the obligations of or arising out of this instrument are not binding upon any of the Trustees or shareholders individually, but are binding only upon the assets and property of the respective constituent series of the Registrant.
SIGNATURES
Pursuant to the requirements of the Securities Exchange Act of 1934 and the Investment Company Act of 1940, the registrant has duly caused this report to be signed on its behalf by the undersigned, thereunto duly authorized.
(Registrant) MFS SERIES TRUST III
By (Signature and Title)*
/S/ DAVID L. DILORENZO
David L. DiLorenzo, President
Date: March 14, 2024
Pursuant to the requirements of the Securities Exchange Act of 1934 and the Investment Company Act of 1940, this report has been signed below by the following persons on behalf of the registrant and in the capacities and on the dates indicated.
By (Signature and Title)*
/S/ DAVID L. DILORENZO
David L. DiLorenzo, President (Principal Executive Officer)
Date: March 14, 2024
By (Signature and Title)*
/S/ JAMES O. YOST
James O. Yost, Treasurer (Principal Financial Officer and Accounting Officer) Date: March 14, 2024
* Print name and title of each signing officer under his or her signature.