UNITED STATES
SECURITIES AND EXCHANGE COMMISSION Washington, D.C. 20549
FORM N-CSR
CERTIFIED SHAREHOLDER REPORT OF REGISTERED MANAGEMENT INVESTMENT COMPANIES
Investment Company Act file number 811-02794
MFS SERIES TRUST III
(Exact name of registrant as specified in charter)
111 Huntington Avenue, Boston, Massachusetts 02199 (Address of principal executive offices) (Zip code)
Christopher R. Bohane
Massachusetts Financial Services Company
111Huntington Avenue Boston, Massachusetts 02199
(Name and address of agents for service)
Registrant's telephone number, including area code: (617) 954-5000
Date of fiscal year end: January 31
Date of reporting period: January 31, 2023
ITEM 1. REPORTS TO STOCKHOLDERS.
Item 1(a):


| 1 | |
| 2 | |
| 4 | |
| 6 | |
| 9 | |
| 11 | |
| 24 | |
| 26 | |
| 28 | |
| 29 | |
| 35 | |
| 51 | |
| 53 | |
| 57 | |
| 57 | |
| 57 | |
| 57 | |
| 57 | |
| 58 |
| back cover |


| Cable TV | 8.2% |
| Medical & Health Technology & Services | 7.4% |
| Technology | 7.3% |
| Gaming & Lodging | 5.1% |
| Metals & Mining | 4.5% |
| BBB | 1.7% |
| BB | 43.8% |
| B | 37.2% |
| CCC | 12.6% |
| Not Rated | (0.6)% |
| Non-Fixed Income | 1.1% |
| Cash & Cash Equivalents | 3.4% |
| Other | 0.8% |
| Average Duration (d) | 3.9 |
| Average Effective Maturity (m) | 5.5 yrs. |
| (a) | For all securities other than those specifically described below, ratings are assigned to underlying securities utilizing ratings from Moody’s, Fitch, and Standard & Poor’s rating agencies and applying the following hierarchy: If all three agencies provide a rating, the middle rating (after dropping the highest and lowest ratings) is assigned; if two of the three agencies rate a security, the lower of the two is assigned. If none of the 3 rating agencies above assign a rating, but the security is rated by DBRS Morningstar, then the DBRS Morningstar rating is assigned. If none of the 4 rating agencies listed above rate the security, but the security is rated by the Kroll Bond Rating Agency (KBRA), then the KBRA rating is assigned. Ratings are shown in the S&P and Fitch scale (e.g., AAA). Securities rated BBB or higher are considered investment grade. All ratings are subject to change. Not Rated includes fixed income securities and fixed income derivatives that have not been rated by any rating agency. Non-Fixed Income includes equity securities (including convertible bonds and equity derivatives), ETFs, and/or commodity-linked derivatives. The fund may or may not have held all of these instruments on this date. The fund is not rated by these agencies. |
| (d) | Duration is a measure of how much a bond’s price is likely to fluctuate with general changes in interest rates, e.g., if rates rise 1.00%, a bond with a 5-year duration is likely to lose about 5.00% of its value due to the interest rate move. The Average Duration calculation reflects the impact of the equivalent exposure of derivative positions, if any. |
| (f) | The fund invests a portion of its assets in Exchange-Traded Funds (ETFs) to gain fixed income exposure. Percentages include the direct exposure from investing in ETFs and not the indirect exposure to the underlying holdings. |
| (i) | For purposes of this presentation, the components include the value of securities, and reflect the impact of the equivalent exposure of derivative positions, if any. These amounts may be negative from time to time. Equivalent exposure is a calculated amount that translates the derivative position into a reasonable approximation of the amount of the underlying asset that the portfolio would have to hold at a given point in time to have the same price sensitivity that results from the portfolio’s ownership of the derivative contract. When dealing with derivatives, equivalent exposure is a more representative measure of the potential impact of a position on portfolio performance than value. The bond component will include any accrued interest amounts. |
| (m) | In determining each instrument’s effective maturity for purposes of calculating the fund’s dollar-weighted average effective maturity, MFS uses the instrument’s stated maturity or, if applicable, an earlier date on which MFS believes it is probable that a maturity-shortening device (such as a put, pre-refunding or prepayment) will cause the instrument to be repaid. Such an earlier date can be substantially shorter than the instrument’s stated maturity. |
| (d) | Duration is a measure of how much a bond’s price is likely to fluctuate with general changes in interest rates, e.g., if rates rise 1.00%, a bond with a 5-year duration is likely to lose about 5.00% of its value. |
| (h) | Security was not held in the portfolio at period end. |
| (r) | Securities rated “BBB”, “Baa”, or higher are considered investment grade; securities rated “BB”, “Ba”, or below are considered non-investment grade. Ratings are assigned to underlying securities utilizing ratings from Moody's, Fitch, and Standard & Poor's and applying the following hierarchy: If all three agencies provide a rating, the middle rating (after dropping the highest and lowest ratings) is assigned; if two of the three agencies rate a security, the lower of the two is assigned. If none of the 3 rating agencies above assign a rating, but the security is rated by DBRS Morningstar, then the DBRS Morningstar rating is assigned. If none of the 4 rating agencies listed above rate the security, but the security is rated by the Kroll Bond Rating Agency (KBRA), then the KBRA rating is assigned. Ratings are shown in the S&P and Fitch scale (e.g., AAA). For securities that are not rated by any of the rating agencies, the security is considered Not Rated. |

| Share Class | Class Inception Date | 1-yr | 5-yr | 10-yr |
| A | 2/17/78 | (4.60)% | 2.00% | 3.27% |
| B | 9/27/93 | (5.31)% | 1.23% | 2.49% |
| C | 1/03/94 | (5.29)% | 1.30% | 2.50% |
| I | 1/02/97 | (4.38)% | 2.24% | 3.52% |
| R1 | 4/01/05 | (5.32)% | 1.23% | 2.49% |
| R2 | 10/31/03 | (4.90)% | 1.66% | 2.94% |
| R3 | 4/01/05 | (4.63)% | 1.99% | 3.23% |
| R4 | 4/01/05 | (4.35)% | 2.31% | 3.52% |
| R6 | 6/01/12 | (4.25)% | 2.42% | 3.63% |
| Bloomberg U.S. Corporate High-Yield 2% Issuer Capped Index (f) | (5.22)% | 2.94% | 4.28% |
| A With Initial Sales Charge (4.25%) | (8.65)% | 1.12% | 2.82% |
| B With CDSC (Declining over six years from 4% to 0%) (v) | (8.94)% | 0.90% | 2.49% |
| C With CDSC (1% for 12 months) (v) | (6.19)% | 1.30% | 2.50% |
| (f) | Source: FactSet Research Systems Inc. |
| (v) | Assuming redemption at the end of the applicable period. |
| (a) | Source: Bloomberg Index Services Limited. BLOOMBERG® is a trademark and service mark of Bloomberg Finance L.P. and its affiliates (collectively “Bloomberg”). Bloomberg or Bloomberg's licensors own all proprietary rights in the Bloomberg Indices. Bloomberg neither approves or endorses this material, or guarantees the accuracy or completeness of any information herein, or makes any warranty, express or implied, as to the results to be obtained therefrom and, to the maximum extent allowed by law, neither shall have any liability or responsibility for injury or damages arising in connection therewith. |
August 1, 2022 through January 31, 2023
| Share Class | Annualized Expense Ratio | Beginning Account Value 8/01/22 | Ending Account Value 1/31/23 | Expenses Paid During Period (p) 8/01/22-1/31/23 | |
| A | Actual | 0.87% | $1,000.00 | $1,015.18 | $4.42 |
| Hypothetical (h) | 0.87% | $1,000.00 | $1,020.82 | $4.43 | |
| B | Actual | 1.62% | $1,000.00 | $1,011.37 | $8.21 |
| Hypothetical (h) | 1.62% | $1,000.00 | $1,017.04 | $8.24 | |
| C | Actual | 1.62% | $1,000.00 | $1,011.40 | $8.21 |
| Hypothetical (h) | 1.62% | $1,000.00 | $1,017.04 | $8.24 | |
| I | Actual | 0.62% | $1,000.00 | $1,016.42 | $3.15 |
| Hypothetical (h) | 0.62% | $1,000.00 | $1,022.08 | $3.16 | |
| R1 | Actual | 1.62% | $1,000.00 | $1,011.34 | $8.21 |
| Hypothetical (h) | 1.62% | $1,000.00 | $1,017.04 | $8.24 | |
| R2 | Actual | 1.12% | $1,000.00 | $1,013.80 | $5.68 |
| Hypothetical (h) | 1.12% | $1,000.00 | $1,019.56 | $5.70 | |
| R3 | Actual | 0.87% | $1,000.00 | $1,015.12 | $4.42 |
| Hypothetical (h) | 0.87% | $1,000.00 | $1,020.82 | $4.43 | |
| R4 | Actual | 0.62% | $1,000.00 | $1,016.47 | $3.15 |
| Hypothetical (h) | 0.62% | $1,000.00 | $1,022.08 | $3.16 | |
| R6 | Actual | 0.51% | $1,000.00 | $1,017.02 | $2.59 |
| Hypothetical (h) | 0.51% | $1,000.00 | $1,022.63 | $2.60 |
| (h) | 5% class return per year before expenses. |
| (p) | “Expenses Paid During Period” are equal to each class’s annualized expense ratio, as shown above, multiplied by the average account value over the period, multiplied by 184/365 (to reflect the one-half year period). Expenses paid do not include any applicable sales charges (loads). If these transaction costs had been included, your costs would have been higher. |
| Issuer | Shares/Par | Value ($) | ||
| Bonds – 94.0% | ||||
| Aerospace & Defense – 2.3% | ||||
| Bombardier, Inc., 7.5%, 3/15/2025 (n) | $ | 2,794,000 | $2,797,493 | |
| Bombardier, Inc., 7.125%, 6/15/2026 (n) | 3,609,000 | 3,600,375 | ||
| Bombardier, Inc., 7.5%, 2/01/2029 (n) | 2,680,000 | 2,677,400 | ||
| F-Brasile S.p.A./F-Brasile U.S. LLC, 7.375%, 8/15/2026 (n) | 5,985,000 | 4,903,989 | ||
| Moog, Inc., 4.25%, 12/15/2027 (n) | 8,283,000 | 7,682,483 | ||
| TransDigm, Inc., 6.25%, 3/15/2026 (n) | 5,657,000 | 5,655,007 | ||
| TransDigm, Inc., 6.375%, 6/15/2026 | 4,535,000 | 4,478,244 | ||
| TransDigm, Inc., 5.5%, 11/15/2027 | 5,000,000 | 4,774,879 | ||
| TransDigm, Inc., 4.625%, 1/15/2029 | 5,036,000 | 4,543,278 | ||
| $41,113,148 | ||||
| Asset-Backed & Securitized – 0.0% | ||||
| COBALT CMBS Commercial Mortgage Trust, 2006-2A, “F”, CDO, FLR, 2.291% (0% cash or 2.291% PIK) (LIBOR - 3mo. + 1.3%), 4/26/2050 (a)(n)(p) | $ | 805,296 | $81 | |
| COBALT CMBS Commercial Mortgage Trust, 2006-2A, “G”, CDO, FLR, 2.491% (0% cash or 2.491% PIK) (LIBOR - 3mo. + 1.5%), 4/26/2050 (a)(n)(p) | 2,561,411 | 256 | ||
| $337 | ||||
| Automotive – 2.3% | ||||
| Clarios Global LP/Clarios U.S. Finance Co., 8.5%, 5/15/2027 (n) | $ | 7,075,000 | $7,046,784 | |
| Dana, Inc., 5.375%, 11/15/2027 | 4,884,000 | 4,640,850 | ||
| Dana, Inc., 4.25%, 9/01/2030 | 2,740,000 | 2,318,873 | ||
| Dornoch Debt Merger Sub, Inc., 6.625%, 10/15/2029 (n) | 6,195,000 | 4,651,447 | ||
| Ford Motor Co., 5.113%, 5/03/2029 | 7,835,000 | 7,425,288 | ||
| Ford Motor Credit Co. LLC, 4.134%, 8/04/2025 | 12,220,000 | 11,669,734 | ||
| Real Hero Merger Sub 2, Inc., 6.25%, 2/01/2029 (n) | 4,710,000 | 3,497,175 | ||
| $41,250,151 | ||||
| Broadcasting – 2.1% | ||||
| Advantage Sales & Marketing, Inc., 6.5%, 11/15/2028 (n) | $ | 5,148,000 | $3,912,480 | |
| Gray Escrow II, Inc., 5.375%, 11/15/2031 (n) | 11,330,000 | 8,713,053 | ||
| iHeartCommunications, Inc., 8.375%, 5/01/2027 | 6,882,000 | 6,167,992 | ||
| Scripps Escrow II, Inc., 5.875%, 7/15/2027 (n) | 5,541,000 | 4,945,343 | ||
| Summer (BC) Bidco B LLC, 5.5%, 10/31/2026 (n) | 5,655,000 | 4,647,921 | ||
| Summer (BC) Holdco S.à r.l., “A”, 9.25%, 10/31/2027 | EUR | 1,707,495 | 1,505,740 | |
| WMG Acquisition Corp., 3.875%, 7/15/2030 (n) | $ | 6,953,000 | 6,129,070 | |
| $36,021,599 | ||||
| Brokerage & Asset Managers – 2.0% | ||||
| AG TTMT Escrow Issuer LLC, 8.625%, 9/30/2027 (n) | $ | 6,699,000 | $6,911,827 | |
| Aretec Escrow Issuer, Inc., 7.5%, 4/01/2029 (n) | 5,690,000 | 5,049,875 | ||
| LPL Holdings, Inc., 4.625%, 11/15/2027 (n) | 7,610,000 | 7,241,981 | ||
| Issuer | Shares/Par | Value ($) | ||
| Bonds – continued | ||||
| Brokerage & Asset Managers – continued | ||||
| LPL Holdings, Inc., 4%, 3/15/2029 (n) | $ | 4,943,000 | $4,423,985 | |
| LPL Holdings, Inc., 4.375%, 5/15/2031 (n) | 3,361,000 | 2,942,925 | ||
| NFP Corp., 4.875%, 8/15/2028 (n) | 4,830,000 | 4,215,286 | ||
| NFP Corp., 6.875%, 8/15/2028 (n) | 5,708,000 | 4,935,479 | ||
| $35,721,358 | ||||
| Building – 4.2% | ||||
| ABC Supply Co., Inc., 4%, 1/15/2028 (n) | $ | 11,605,000 | $10,572,967 | |
| Foundation Building Materials LLC, 6%, 3/01/2029 (n) | 5,191,000 | 4,175,433 | ||
| GYP Holding III Corp., 4.625%, 5/01/2029 (n) | 8,540,000 | 7,200,716 | ||
| Interface, Inc., 5.5%, 12/01/2028 (n) | 8,680,000 | 7,292,502 | ||
| MIWD Holdco II LLC/MIWD Finance Co., 5.5%, 2/01/2030 (n) | 4,360,000 | 3,625,209 | ||
| New Enterprise Stone & Lime Co., Inc., 9.75%, 7/15/2028 (n) | 5,042,000 | 4,781,253 | ||
| Patrick Industries, Inc., 7.5%, 10/15/2027 (n) | 7,320,000 | 7,242,774 | ||
| SRM Escrow Issuer LLC, 6%, 11/01/2028 (n) | 4,855,000 | 4,432,712 | ||
| SRS Distribution, Inc., 6.125%, 7/01/2029 (n) | 6,020,000 | 5,176,658 | ||
| Standard Industries, Inc., 2.25%, 11/21/2026 | EUR | 1,545,000 | 1,451,467 | |
| Standard Industries, Inc., 4.75%, 1/15/2028 (n) | $ | 4,758,000 | 4,458,960 | |
| Standard Industries, Inc., 4.375%, 7/15/2030 (n) | 7,580,000 | 6,479,921 | ||
| Standard Industries, Inc., 3.375%, 1/15/2031 (n) | 1,385,000 | 1,099,992 | ||
| White Cap Buyer LLC, 6.875%, 10/15/2028 (n) | 5,495,000 | 5,001,677 | ||
| $72,992,241 | ||||
| Business Services – 1.4% | ||||
| Entegris Escrow Corp., 5.95%, 6/15/2030 (n) | $ | 2,600,000 | $2,496,858 | |
| HealthEquity, Inc., 4.5%, 10/01/2029 (n) | 5,570,000 | 4,986,821 | ||
| Iron Mountain, Inc., 4.875%, 9/15/2027 (n) | 4,410,000 | 4,152,191 | ||
| Iron Mountain, Inc., 5.25%, 3/15/2028 (n) | 3,830,000 | 3,641,947 | ||
| Verscend Escrow Corp., 9.75%, 8/15/2026 (n) | 7,214,000 | 7,239,087 | ||
| ZI Technologies LLC/ZI Finance Corp. Co., 3.875%, 2/01/2029 (n) | 2,060,000 | 1,776,750 | ||
| $24,293,654 | ||||
| Cable TV – 8.0% | ||||
| Cable One, Inc., 4%, 11/15/2030 (n) | $ | 6,540,000 | $5,392,409 | |
| CCO Holdings LLC/CCO Holdings Capital Corp., 5.125%, 5/01/2027 (n) | 4,015,000 | 3,826,496 | ||
| CCO Holdings LLC/CCO Holdings Capital Corp., 4.75%, 3/01/2030 (n) | 17,572,000 | 15,354,238 | ||
| CCO Holdings LLC/CCO Holdings Capital Corp., 4.5%, 8/15/2030 (n) | 7,620,000 | 6,510,985 | ||
| CCO Holdings LLC/CCO Holdings Capital Corp., 4.25%, 2/01/2031 (n) | 7,435,000 | 6,193,727 | ||
| CCO Holdings LLC/CCO Holdings Capital Corp., 4.25%, 1/15/2034 (n) | 4,885,000 | 3,808,102 | ||
| CSC Holdings LLC, 5.375%, 2/01/2028 (n) | 4,940,000 | 4,168,125 | ||
| CSC Holdings LLC, 5.75%, 1/15/2030 (n) | 9,270,000 | 5,840,100 | ||
| CSC Holdings LLC, 4.125%, 12/01/2030 (n) | 5,880,000 | 4,346,908 | ||
| DISH DBS Corp., 7.75%, 7/01/2026 | 3,815,000 | 3,098,390 | ||
| Issuer | Shares/Par | Value ($) | ||
| Bonds – continued | ||||
| Cable TV – continued | ||||
| DISH DBS Corp., 5.25%, 12/01/2026 (n) | $ | 5,175,000 | $4,460,203 | |
| DISH DBS Corp., 5.125%, 6/01/2029 | 3,990,000 | 2,537,201 | ||
| DISH Network Corp., 11.75%, 11/15/2027 (n) | 2,540,000 | 2,639,568 | ||
| LCPR Senior Secured Financing DAC, 6.75%, 10/15/2027 (n) | 7,318,000 | 7,129,927 | ||
| LCPR Senior Secured Financing DAC, 5.125%, 7/15/2029 (n) | 1,905,000 | 1,676,400 | ||
| Sirius XM Holdings, Inc., 3.875%, 9/01/2031 (n) | 7,920,000 | 6,529,090 | ||
| Sirius XM Radio, Inc., 4%, 7/15/2028 (n) | 5,041,000 | 4,486,994 | ||
| Sirius XM Radio, Inc., 5.5%, 7/01/2029 (n) | 11,485,000 | 10,763,168 | ||
| Telenet Finance Luxembourg S.A., 5.5%, 3/01/2028 (n) | 11,000,000 | 10,219,000 | ||
| Videotron Ltd., 5.125%, 4/15/2027 (n) | 4,126,000 | 3,960,630 | ||
| Videotron Ltd., 3.625%, 6/15/2029 (n) | 2,526,000 | 2,197,759 | ||
| Virgin Media Finance PLC, 5%, 7/15/2030 (n) | 8,020,000 | 6,731,908 | ||
| Virgin Media Vendor Financing Notes IV DAC, 5%, 7/15/2028 (n) | 10,580,000 | 9,602,408 | ||
| Ziggo Bond Finance B.V., 5.125%, 2/28/2030 (n) | 11,365,000 | 9,393,172 | ||
| $140,866,908 | ||||
| Chemicals – 2.4% | ||||
| Axalta Coating Systems Ltd., 4.75%, 6/15/2027 (n) | $ | 5,414,000 | $5,116,230 | |
| Axalta Coating Systems Ltd., 3.375%, 2/15/2029 (n) | 9,025,000 | 7,761,500 | ||
| Consolidated Energy Finance S.A., 5.625%, 10/15/2028 (n) | 5,144,000 | 4,475,280 | ||
| Element Solutions, Inc., 3.875%, 9/01/2028 (n) | 8,168,000 | 7,228,680 | ||
| Ingevity Corp., 3.875%, 11/01/2028 (n) | 7,412,000 | 6,496,531 | ||
| LSF11 A5 HoldCo LLC, 6.625%, 10/15/2029 (n) | 5,964,000 | 4,894,030 | ||
| S.P.C.M. S.A., 3.375%, 3/15/2030 (n) | 7,182,000 | 6,079,563 | ||
| $42,051,814 | ||||
| Computer Software – 1.1% | ||||
| Camelot Finance S.A., 4.5%, 11/01/2026 (n) | $ | 3,715,000 | $3,533,448 | |
| Clarivate Science Holdings Corp., 3.875%, 7/01/2028 (n) | 1,950,000 | 1,739,990 | ||
| Clarivate Science Holdings Corp., 4.875%, 7/01/2029 (n) | 5,685,000 | 5,002,374 | ||
| Dun & Bradstreet Corp., 5%, 12/15/2029 (n) | 6,220,000 | 5,507,815 | ||
| Neptune Bidco U.S., Inc., 9.29%, 4/15/2029 (n) | 4,114,000 | 3,998,931 | ||
| $19,782,558 | ||||
| Computer Software - Systems – 2.2% | ||||
| Fair Isaac Corp., 5.25%, 5/15/2026 (n) | $ | 11,255,000 | $11,173,401 | |
| Fair Isaac Corp., 4%, 6/15/2028 (n) | 1,687,000 | 1,566,388 | ||
| Sabre GLBL, Inc., 7.375%, 9/01/2025 (n) | 1,546,000 | 1,516,421 | ||
| Sabre GLBL, Inc., 11.25%, 12/15/2027 (n) | 2,577,000 | 2,731,620 | ||
| SS&C Technologies Holdings, Inc., 5.5%, 9/30/2027 (n) | 9,980,000 | 9,598,207 | ||
| Viavi Solutions, Inc., 3.75%, 10/01/2029 (n) | 8,310,000 | 7,250,475 | ||
| Virtusa Corp., 7.125%, 12/15/2028 (n) | 4,720,000 | 3,964,800 | ||
| $37,801,312 | ||||
| Conglomerates – 2.9% | ||||
| BWX Technologies, Inc., 4.125%, 6/30/2028 (n) | $ | 4,184,000 | $3,776,084 | |
| BWX Technologies, Inc., 4.125%, 4/15/2029 (n) | 10,769,000 | 9,638,571 | ||
| Chart Industries, Inc., 9.5%, 1/01/2031 (n) | 2,571,000 | 2,682,813 | ||
| Issuer | Shares/Par | Value ($) | ||
| Bonds – continued | ||||
| Conglomerates – continued | ||||
| Gates Global LLC, 6.25%, 1/15/2026 (n) | $ | 7,150,000 | $7,041,588 | |
| Griffon Corp., 5.75%, 3/01/2028 | 6,524,000 | 6,174,444 | ||
| Madison IAQ LLC, 5.875%, 6/30/2029 (n) | 7,222,000 | 5,728,779 | ||
| Regal Rexnord Corp., 6.3%, 2/15/2030 (n) | 4,294,000 | 4,378,433 | ||
| TriMas Corp., 4.125%, 4/15/2029 (n) | 12,534,000 | 11,158,393 | ||
| $50,579,105 | ||||
| Construction – 1.5% | ||||
| Empire Communities Corp., 7%, 12/15/2025 (n) | $ | 4,930,000 | $4,461,650 | |
| Mattamy Group Corp., 5.25%, 12/15/2027 (n) | 2,630,000 | 2,406,450 | ||
| Mattamy Group Corp., 4.625%, 3/01/2030 (n) | 5,115,000 | 4,313,940 | ||
| Meritage Homes Corp., 3.875%, 4/15/2029 (n) | 5,410,000 | 4,794,612 | ||
| Taylor Morrison Communities, Inc., 5.75%, 1/15/2028 (n) | 7,218,000 | 7,001,568 | ||
| Weekley Homes LLC/Weekley Finance Corp., 4.875%, 9/15/2028 (n) | 4,787,000 | 4,165,887 | ||
| $27,144,107 | ||||
| Consumer Products – 2.2% | ||||
| Energizer Gamma Acquisition B.V., 3.5%, 6/30/2029 | EUR | 3,000,000 | $2,650,385 | |
| Energizer Holdings, Inc., 4.375%, 3/31/2029 (n) | $ | 5,233,000 | 4,544,442 | |
| Mattel, Inc., 3.375%, 4/01/2026 (n) | 6,008,000 | 5,602,489 | ||
| Mattel, Inc., 5.875%, 12/15/2027 (n) | 2,240,000 | 2,234,400 | ||
| Mattel, Inc., 6.2%, 10/01/2040 | 1,120,000 | 1,039,920 | ||
| Mattel, Inc., 5.45%, 11/01/2041 | 1,890,000 | 1,617,566 | ||
| Newell Brands, Inc., 6.375%, 9/15/2027 | 3,513,000 | 3,531,232 | ||
| Newell Brands, Inc., 6.625%, 9/15/2029 | 4,110,000 | 4,154,788 | ||
| Prestige Consumer Healthcare, Inc., 5.125%, 1/15/2028 (n) | 5,270,000 | 5,034,167 | ||
| Prestige Consumer Healthcare, Inc., 3.75%, 4/01/2031 (n) | 2,450,000 | 2,080,295 | ||
| Spectrum Brands, Inc., 3.875%, 3/15/2031 (n) | 4,100,000 | 3,305,543 | ||
| SWF Escrow Issuer Corp., 6.5%, 10/01/2029 (n) | 4,755,000 | 3,126,032 | ||
| $38,921,259 | ||||
| Consumer Services – 4.0% | ||||
| Allied Universal Holdco LLC, 6.625%, 7/15/2026 (n) | $ | 2,250,000 | $2,166,187 | |
| Allied Universal Holdco LLC, 9.75%, 7/15/2027 (n) | 5,945,000 | 5,677,475 | ||
| Allied Universal Holdco LLC, 6%, 6/01/2029 (n) | 3,155,000 | 2,538,513 | ||
| ANGI Group LLC, 3.875%, 8/15/2028 (n) | 7,467,000 | 5,723,680 | ||
| Arches Buyer, Inc., 6.125%, 12/01/2028 (n) | 6,680,000 | 5,626,297 | ||
| GoDaddy, Inc., 3.5%, 3/01/2029 (n) | 11,513,000 | 9,956,442 | ||
| GW B-CR Security Corp., 9.5%, 11/01/2027 (n) | 4,582,000 | 4,525,130 | ||
| Match Group Holdings II LLC, 5%, 12/15/2027 (n) | 5,040,000 | 4,832,680 | ||
| Match Group Holdings II LLC, 4.625%, 6/01/2028 (n) | 8,030,000 | 7,385,753 | ||
| Match Group Holdings II LLC, 4.125%, 8/01/2030 (n) | 2,010,000 | 1,728,600 | ||
| Match Group Holdings II LLC, 3.625%, 10/01/2031 (n) | 455,000 | 365,137 | ||
| Realogy Group LLC/Realogy Co-Issuer Corp., 5.75%, 1/15/2029 (n) | 4,355,000 | 3,386,187 | ||
| Realogy Group LLC/Realogy Co-Issuer Corp., 5.25%, 4/15/2030 (n) | 4,445,000 | 3,333,750 | ||
| Issuer | Shares/Par | Value ($) | ||
| Bonds – continued | ||||
| Consumer Services – continued | ||||
| TriNet Group, Inc., 3.5%, 3/01/2029 (n) | $ | 9,255,000 | $7,771,701 | |
| WASH Multi-Family Acquisition, Inc., 5.75%, 4/15/2026 (n) | 5,076,000 | 4,683,719 | ||
| $69,701,251 | ||||
| Containers – 2.8% | ||||
| ARD Finance S.A., 6.5% (6.5% cash or 7.25% PIK), 6/30/2027 (n)(p) | $ | 4,172,419 | $3,273,012 | |
| Ardagh Metal Packaging Finance USA LLC, 3.25%, 9/01/2028 (n) | 3,715,000 | 3,260,024 | ||
| Ardagh Metal Packaging Finance USA LLC, 4%, 9/01/2029 (n) | 6,424,000 | 5,311,749 | ||
| Ardagh Packaging Finance PLC/Ardagh MP Holdings USA, Inc., 5.25%, 8/15/2027 (n) | 8,060,000 | 6,600,213 | ||
| Can-Pack S.A./Eastern PA Land Investment Holding LLC, 3.875%, 11/15/2029 (n) | 9,554,000 | 7,933,546 | ||
| Crown Americas LLC, 5.25%, 4/01/2030 | 4,915,000 | 4,730,688 | ||
| Crown Americas LLC/Crown Americas Capital Corp. V, 4.25%, 9/30/2026 | 8,695,000 | 8,309,398 | ||
| Crown Americas LLC/Crown Americas Capital Corp. VI, 4.75%, 2/01/2026 | 3,345,000 | 3,267,864 | ||
| LABL, Inc., 5.875%, 11/01/2028 (n) | 2,065,000 | 1,866,244 | ||
| Trivium Packaging Finance B.V., 8.5%, 8/15/2027 (n) | 4,925,000 | 4,736,569 | ||
| $49,289,307 | ||||
| Electrical Equipment – 0.4% | ||||
| CommScope Technologies LLC, 5%, 3/15/2027 (n) | $ | 8,241,000 | $6,291,818 | |
| Electronics – 1.6% | ||||
| Entegris, Inc., 4.375%, 4/15/2028 (n) | $ | 2,590,000 | $2,343,950 | |
| Entegris, Inc., 3.625%, 5/01/2029 (n) | 3,723,000 | 3,175,045 | ||
| Sensata Technologies B.V., 5.625%, 11/01/2024 (n) | 2,240,000 | 2,240,517 | ||
| Sensata Technologies B.V., 5%, 10/01/2025 (n) | 8,590,000 | 8,495,467 | ||
| Sensata Technologies B.V., 5.875%, 9/01/2030 (n) | 3,585,000 | 3,517,781 | ||
| Sensata Technologies, Inc., 4.375%, 2/15/2030 (n) | 3,755,000 | 3,399,252 | ||
| Synaptics, Inc., 4%, 6/15/2029 (n) | 6,420,000 | 5,559,169 | ||
| $28,731,181 | ||||
| Energy - Independent – 3.0% | ||||
| Antero Resources Corp., 7.625%, 2/01/2029 (n) | $ | 4,440,000 | $4,540,345 | |
| CNX Resources Corp., 6%, 1/15/2029 (n) | 5,189,000 | 4,763,383 | ||
| CNX Resources Corp., 7.375%, 1/15/2031 (n) | 1,518,000 | 1,476,240 | ||
| Comstock Resources, Inc., 6.75%, 3/01/2029 (n) | 7,880,000 | 7,269,300 | ||
| CrownRock LP/CrownRock Finance, Inc., “F”, 5%, 5/01/2029 (n) | 7,105,000 | 6,507,820 | ||
| Encino Acquisition Partners Holdings LLC, 8.5%, 5/01/2028 (n) | 4,530,000 | 4,223,365 | ||
| Moss Creek Resources Holdings, Inc., 7.5%, 1/15/2026 (n) | 4,015,000 | 3,707,451 | ||
| Permian Resources Operating LLC, 7.75%, 2/15/2026 (n) | 985,000 | 984,409 | ||
| Permian Resources Operating LLC, 5.875%, 7/01/2029 (n) | 5,553,000 | 5,204,841 | ||
| SM Energy Co., 6.5%, 7/15/2028 | 5,150,000 | 4,898,780 | ||
| Southwestern Energy Co., 8.375%, 9/15/2028 | 2,595,000 | 2,725,632 | ||
| Southwestern Energy Co., 5.375%, 3/15/2030 | 4,295,000 | 3,999,719 | ||
| Issuer | Shares/Par | Value ($) | ||
| Bonds – continued | ||||
| Energy - Independent – continued | ||||
| Tap Rock Resources LLC, 7%, 10/01/2026 (n) | $ | 1,672,000 | $1,582,548 | |
| $51,883,833 | ||||
| Entertainment – 2.6% | ||||
| Carnival Corp. PLC, 7.625%, 3/01/2026 (n) | $ | 7,150,000 | $6,506,500 | |
| Carnival Corp. PLC, 5.75%, 3/01/2027 (n) | 3,705,000 | 3,075,150 | ||
| Carnival Corp. PLC, 9.875%, 8/01/2027 (n) | 2,320,000 | 2,383,800 | ||
| Life Time, Inc., 5.75%, 1/15/2026 (n) | 5,005,000 | 4,809,905 | ||
| Life Time, Inc., 8%, 4/15/2026 (n) | 1,505,000 | 1,461,708 | ||
| Merlin Entertainments, 5.75%, 6/15/2026 (n) | 3,164,000 | 3,012,458 | ||
| Motion Bondco DAC, 6.625%, 11/15/2027 (n) | 5,520,000 | 4,995,494 | ||
| NCL Corp. Ltd., 5.875%, 3/15/2026 (n) | 4,713,000 | 4,076,651 | ||
| NCL Corp. Ltd., 5.875%, 2/15/2027 (n) | 1,625,000 | 1,510,844 | ||
| Royal Caribbean Cruises Ltd., 5.375%, 7/15/2027 (n) | 3,985,000 | 3,466,480 | ||
| Royal Caribbean Cruises Ltd., 5.5%, 4/01/2028 (n) | 6,465,000 | 5,559,900 | ||
| SeaWorld Parks & Entertainment, 5.25%, 8/15/2029 (n) | 4,380,000 | 3,958,699 | ||
| $44,817,589 | ||||
| Financial Institutions – 3.1% | ||||
| Avation Capital S.A., 8.25% (8.25% cash or 9% PIK), 10/31/2026 (n)(p) | $ | 3,677,658 | $3,144,397 | |
| Credit Acceptance Corp., 5.125%, 12/31/2024 (n) | 5,825,000 | 5,439,843 | ||
| Global Aircraft Leasing Co. Ltd., 6.5% (6.5% cash or 7.25% PIK), 9/15/2024 (n)(p) | 13,389,310 | 11,813,388 | ||
| Howard Hughes Corp., 4.125%, 2/01/2029 (n) | 7,825,000 | 6,757,044 | ||
| Nationstar Mortgage Holdings, Inc., 6%, 1/15/2027 (n) | 8,760,000 | 8,124,900 | ||
| OneMain Finance Corp., 6.875%, 3/15/2025 | 3,430,000 | 3,419,230 | ||
| OneMain Finance Corp., 7.125%, 3/15/2026 | 5,375,000 | 5,339,821 | ||
| Rocket Mortgage Co-Issuer, Inc., 3.625%, 3/01/2029 (n) | 8,317,000 | 7,016,970 | ||
| SLM Corp., 3.125%, 11/02/2026 | 3,095,000 | 2,733,504 | ||
| $53,789,097 | ||||
| Food & Beverages – 3.0% | ||||
| B&G Foods, Inc., 5.25%, 4/01/2025 | $ | 4,115,000 | $3,750,205 | |
| B&G Foods, Inc., 5.25%, 9/15/2027 | 1,545,000 | 1,249,519 | ||
| BellRing Brands, Inc., 7%, 3/15/2030 (n) | 6,665,000 | 6,615,694 | ||
| Lamb Weston Holdings, Inc., 4.125%, 1/31/2030 (n) | 6,995,000 | 6,304,244 | ||
| Performance Food Group Co., 5.5%, 10/15/2027 (n) | 7,700,000 | 7,411,213 | ||
| Post Holdings, Inc., 5.625%, 1/15/2028 (n) | 5,488,000 | 5,282,200 | ||
| Post Holdings, Inc., 4.625%, 4/15/2030 (n) | 8,955,000 | 7,880,400 | ||
| Primo Water Holding, Inc., 4.375%, 4/30/2029 (n) | 8,278,000 | 7,220,402 | ||
| U.S. Foods Holding Corp., 4.75%, 2/15/2029 (n) | 7,440,000 | 6,806,070 | ||
| $52,519,947 | ||||
| Gaming & Lodging – 5.0% | ||||
| Boyd Gaming Corp., 4.75%, 12/01/2027 | $ | 3,660,000 | $3,479,443 | |
| Boyd Gaming Corp., 4.75%, 6/15/2031 (n) | 2,410,000 | 2,168,542 | ||
| Caesars Entertainment, Inc., 4.625%, 10/15/2029 (n) | 3,740,000 | 3,197,700 | ||
| Issuer | Shares/Par | Value ($) | ||
| Bonds – continued | ||||
| Gaming & Lodging – continued | ||||
| Caesars Entertainment, Inc., 7%, 2/15/2030 (n) | $ | 4,302,000 | $4,377,285 | |
| Caesars Resort Collection LLC/CRC Finco, Inc., 8.125%, 7/01/2027 (n) | 6,141,000 | 6,233,115 | ||
| CCM Merger, Inc., 6.375%, 5/01/2026 (n) | 5,550,000 | 5,369,625 | ||
| Hilton Domestic Operating Co., Inc., 3.75%, 5/01/2029 (n) | 8,741,000 | 7,762,970 | ||
| Hilton Domestic Operating Co., Inc., 3.625%, 2/15/2032 (n) | 7,185,000 | 6,033,604 | ||
| International Game Technology PLC, 4.125%, 4/15/2026 (n) | 8,715,000 | 8,257,665 | ||
| International Game Technology PLC, 6.25%, 1/15/2027 (n) | 1,885,000 | 1,885,000 | ||
| Marriott Ownership Resorts, Inc., 4.5%, 6/15/2029 (n) | 3,245,000 | 2,824,802 | ||
| Sands China Ltd., 4.3%, 1/08/2026 | 5,070,000 | 4,809,138 | ||
| Sands China Ltd., 4.875%, 6/18/2030 | 4,460,000 | 4,063,107 | ||
| Scientific Games Holdings LP/Scientific Games US Finco, Inc., 6.625%, 3/01/2030 (n) | 5,215,000 | 4,645,392 | ||
| VICI Properties LP / VICI Note Co., Inc., 4.25%, 12/01/2026 (n) | 7,460,000 | 7,040,383 | ||
| VICI Properties LP / VICI Note Co., Inc., 5.75%, 2/01/2027 (n) | 2,150,000 | 2,138,712 | ||
| Wyndham Hotels & Resorts, Inc., 4.375%, 8/15/2028 (n) | 7,258,000 | 6,694,094 | ||
| Wynn Resorts Finance LLC/Wynn Resorts Capital Corp., 5.125%, 10/01/2029 (n) | 7,125,000 | 6,359,062 | ||
| $87,339,639 | ||||
| Industrial – 1.1% | ||||
| Albion Financing 1 S.à r.l., 6.125%, 10/15/2026 (n) | $ | 2,500,000 | $2,243,066 | |
| Albion Financing 2 S.à r.l., 8.75%, 4/15/2027 (n) | 3,435,000 | 2,911,163 | ||
| APi Escrow Corp., 4.75%, 10/15/2029 (n) | 8,920,000 | 7,953,326 | ||
| Williams Scotsman International, Inc., 4.625%, 8/15/2028 (n) | 7,678,000 | 7,114,089 | ||
| $20,221,644 | ||||
| Insurance - Property & Casualty – 1.1% | ||||
| Alliant Holdings Intermediate LLC, 6.75%, 10/15/2027 (n) | $ | 2,590,000 | $2,422,505 | |
| Alliant Holdings Intermediate LLC/Alliant Holdings Co-Issuer, 5.875%, 11/01/2029 (n) | 75,000 | 65,342 | ||
| AssuredPartners, Inc., 5.625%, 1/15/2029 (n) | 5,395,000 | 4,614,775 | ||
| GTCR (AP) Finance, Inc., 8%, 5/15/2027 (n) | 1,895,000 | 1,860,719 | ||
| Hub International Ltd., 5.625%, 12/01/2029 (n) | 9,061,000 | 8,108,434 | ||
| Ryan Specialty Group, 4.375%, 2/01/2030 (n) | 3,183,000 | 2,868,679 | ||
| $19,940,454 | ||||
| Machinery & Tools – 0.4% | ||||
| Terex Corp., 5%, 5/15/2029 (n) | $ | 8,100,000 | $7,563,375 | |
| Major Banks – 0.3% | ||||
| Toronto Dominion Bank, 8.125% to 10/31/2027, FLR (CMT - 5yr. + 4.075%) to 10/31/2082 | $ | 4,560,000 | $4,839,300 | |
| Medical & Health Technology & Services – 6.3% | ||||
| 180 Medical, Inc., 3.875%, 10/15/2029 (n) | $ | 7,025,000 | $6,225,987 | |
| Avantor Funding, Inc., 4.625%, 7/15/2028 (n) | 8,644,000 | 8,147,748 | ||
| Catalent, Inc., 2.375%, 3/01/2028 | EUR | 1,975,000 | 1,776,743 | |
| Issuer | Shares/Par | Value ($) | ||
| Bonds – continued | ||||
| Medical & Health Technology & Services – continued | ||||
| Catalent, Inc., 3.125%, 2/15/2029 (n) | $ | 14,074,000 | $11,642,576 | |
| Charles River Laboratories International, Inc., 3.75%, 3/15/2029 (n) | 12,202,000 | 10,868,135 | ||
| CHS/Community Health Systems, Inc., 8%, 12/15/2027 (n) | 3,900,000 | 3,675,724 | ||
| CHS/Community Health Systems, Inc., 6.125%, 4/01/2030 (n) | 9,330,000 | 5,608,617 | ||
| CHS/Community Health Systems, Inc., 5.25%, 5/15/2030 (n) | 3,870,000 | 3,122,780 | ||
| DaVita, Inc., 4.625%, 6/01/2030 (n) | 7,090,000 | 5,973,325 | ||
| Encompass Health Corp., 5.75%, 9/15/2025 | 2,365,000 | 2,347,271 | ||
| Encompass Health Corp., 4.75%, 2/01/2030 | 5,035,000 | 4,615,383 | ||
| Encompass Health Corp., 4.625%, 4/01/2031 | 1,030,000 | 906,601 | ||
| IQVIA Holdings, Inc., 5%, 10/15/2026 (n) | 3,027,000 | 2,951,325 | ||
| IQVIA Holdings, Inc., 5%, 5/15/2027 (n) | 9,830,000 | 9,539,128 | ||
| Legacy LifePoint Health LLC, 4.375%, 2/15/2027 (n) | 2,310,000 | 2,021,250 | ||
| Regional Care/LifePoint Health, Inc., 9.75%, 12/01/2026 (n) | 4,250,000 | 3,726,528 | ||
| Syneos Health, Inc., 3.625%, 1/15/2029 (n) | 9,932,000 | 8,032,505 | ||
| Tenet Healthcare Corp., 6.125%, 10/01/2028 | 11,248,000 | 10,517,780 | ||
| Tenet Healthcare Corp., 4.375%, 1/15/2030 | 1,993,000 | 1,771,637 | ||
| Tenet Healthcare Corp., 6.125%, 6/15/2030 (n) | 3,105,000 | 3,014,055 | ||
| U.S. Acute Care Solutions LLC, 6.375%, 3/01/2026 (n) | 4,750,000 | 4,296,850 | ||
| $110,781,948 | ||||
| Medical Equipment – 1.0% | ||||
| Garden SpinCo Corp., 8.625%, 7/20/2030 (n) | $ | 6,538,000 | $6,995,676 | |
| Mozart Debt Merger Sub, Inc., 5.25%, 10/01/2029 (n) | 3,600,000 | 3,014,227 | ||
| Teleflex, Inc., 4.625%, 11/15/2027 | 7,756,000 | 7,404,750 | ||
| $17,414,653 | ||||
| Metals & Mining – 3.9% | ||||
| Baffinland Iron Mines Corp./Baffinland Iron Mines LP, 8.75%, 7/15/2026 (n) | $ | 6,993,000 | $6,790,992 | |
| Coeur Mining, Inc., 5.125%, 2/15/2029 (n) | 7,253,000 | 5,840,143 | ||
| Compass Minerals International, Inc., 6.75%, 12/01/2027 (n) | 6,503,000 | 6,344,606 | ||
| Eldorado Gold Corp., 6.25%, 9/01/2029 (n) | 3,780,000 | 3,463,946 | ||
| Ero Copper Corp., 6.5%, 2/15/2030 (n) | 4,247,000 | 3,617,011 | ||
| FMG Resources Ltd., 4.375%, 4/01/2031 (n) | 11,045,000 | 9,719,600 | ||
| GrafTech Finance, Inc., 4.625%, 12/15/2028 (n) | 7,423,000 | 6,326,459 | ||
| Kaiser Aluminum Corp., 4.625%, 3/01/2028 (n) | 8,333,000 | 7,608,029 | ||
| Kaiser Aluminum Corp., 4.5%, 6/01/2031 (n) | 2,876,000 | 2,431,974 | ||
| Novelis Corp., 3.25%, 11/15/2026 (n) | 4,050,000 | 3,666,546 | ||
| Novelis Corp., 4.75%, 1/30/2030 (n) | 6,555,000 | 5,932,275 | ||
| Novelis Corp., 3.875%, 8/15/2031 (n) | 2,807,000 | 2,369,108 | ||
| Petra Diamonds US$ Treasury PLC, 10.5% (10.5% PIK/9.75% Cash to 6/30/2023), 9.75% Cash to 3/08/2026 (n)(p) | 3,048,870 | 2,957,404 | ||
| TMS International Corp., 6.25%, 4/15/2029 (n) | 1,515,000 | 1,137,975 | ||
| $68,206,068 | ||||
| Issuer | Shares/Par | Value ($) | ||
| Bonds – continued | ||||
| Midstream – 4.5% | ||||
| Cheniere Energy Partners LP, 4.5%, 10/01/2029 | $ | 4,516,000 | $4,236,550 | |
| DT Midstream, Inc., 4.125%, 6/15/2029 (n) | 5,411,000 | 4,748,153 | ||
| DT Midstream, Inc., 4.375%, 6/15/2031 (n) | 7,956,000 | 6,959,288 | ||
| EQM Midstream Partners LP, 6%, 7/01/2025 (n) | 452,000 | 444,999 | ||
| EQM Midstream Partners LP, 6.5%, 7/01/2027 (n) | 592,000 | 581,350 | ||
| EQM Midstream Partners LP, 5.5%, 7/15/2028 | 14,601,000 | 13,469,422 | ||
| EQM Midstream Partners LP, 4.5%, 1/15/2029 (n) | 3,090,000 | 2,710,115 | ||
| Genesis Energy LP/Genesis Energy Finance Corp., 8%, 1/15/2027 | 2,059,000 | 2,032,645 | ||
| Genesis Energy LP/Genesis Energy Finance Corp., 8.875%, 4/15/2030 | 5,152,000 | 5,235,720 | ||
| Kinetik Holdings, Inc., 5.875%, 6/15/2030 (n) | 10,242,000 | 9,729,900 | ||
| Tallgrass Energy Partners LP, 5.5%, 1/15/2028 (n) | 8,990,000 | 8,278,756 | ||
| Targa Resources Partners LP/Targa Resources Finance Corp., 6.875%, 1/15/2029 | 6,945,000 | 7,132,446 | ||
| Venture Global Calcasieu Pass LLC, 3.875%, 8/15/2029 (n) | 7,555,000 | 6,723,950 | ||
| Venture Global Calcasieu Pass LLC, 4.125%, 8/15/2031 (n) | 5,370,000 | 4,760,827 | ||
| Venture Global Calcasieu Pass LLC , 6.25%, 1/15/2030 (n) | 1,603,000 | 1,633,104 | ||
| $78,677,225 | ||||
| Network & Telecom – 0.4% | ||||
| Iliad Holding S.A.S., 7%, 10/15/2028 (n) | $ | 7,662,000 | $7,195,997 | |
| Oil Services – 0.5% | ||||
| Nabors Industries Ltd., 7.25%, 1/15/2026 (n) | $ | 4,623,000 | $4,495,868 | |
| Solaris Midstream Holding LLC, 7.625%, 4/01/2026 (n) | 4,498,000 | 4,498,000 | ||
| $8,993,868 | ||||
| Oils – 0.7% | ||||
| Parkland Corp., 4.625%, 5/01/2030 (n) | $ | 10,600,000 | $9,111,779 | |
| PBF Holding Co. LLC/PBF Finance Corp., 6%, 2/15/2028 | 3,605,000 | 3,398,938 | ||
| $12,510,717 | ||||
| Personal Computers & Peripherals – 0.5% | ||||
| NCR Corp., 5%, 10/01/2028 (n) | $ | 6,910,000 | $6,086,742 | |
| NCR Corp., 5.125%, 4/15/2029 (n) | 4,146,000 | 3,611,391 | ||
| $9,698,133 | ||||
| Pharmaceuticals – 1.6% | ||||
| 1375209 BC Ltd., 9%, 1/30/2028 (n) | $ | 3,603,000 | $3,589,525 | |
| Bausch Health Co., Inc., 11%, 9/30/2028 (n) | 3,989,000 | 3,120,994 | ||
| Bausch Health Co., Inc., 14%, 10/15/2030 (n) | 799,000 | 498,751 | ||
| Jazz Securities DAC, 4.375%, 1/15/2029 (n) | 10,475,000 | 9,556,761 | ||
| Organon Finance 1 LLC, 4.125%, 4/30/2028 (n) | 7,657,000 | 6,925,374 | ||
| Organon Finance 1 LLC, 5.125%, 4/30/2031 (n) | 5,759,000 | 5,199,168 | ||
| $28,890,573 | ||||
| Issuer | Shares/Par | Value ($) | ||
| Bonds – continued | ||||
| Pollution Control – 1.0% | ||||
| GFL Environmental, Inc., 4.25%, 6/01/2025 (n) | $ | 2,160,000 | $2,083,011 | |
| GFL Environmental, Inc., 4%, 8/01/2028 (n) | 6,080,000 | 5,397,520 | ||
| GFL Environmental, Inc., 4.75%, 6/15/2029 (n) | 1,935,000 | 1,746,415 | ||
| GFL Environmental, Inc., 4.375%, 8/15/2029 (n) | 2,355,000 | 2,088,461 | ||
| Stericycle, Inc., 3.875%, 1/15/2029 (n) | 6,232,000 | 5,529,405 | ||
| $16,844,812 | ||||
| Precious Metals & Minerals – 0.6% | ||||
| IAMGOLD Corp., 5.75%, 10/15/2028 (n) | $ | 6,435,000 | $5,085,580 | |
| Taseko Mines Ltd., 7%, 2/15/2026 (n) | 5,045,000 | 4,780,138 | ||
| $9,865,718 | ||||
| Printing & Publishing – 0.3% | ||||
| Cimpress N.V., 7%, 6/15/2026 (n) | $ | 7,135,000 | $4,953,789 | |
| Real Estate - Healthcare – 0.4% | ||||
| MPT Operating Partnership LP/MPT Finance Corp., REIT, 0.993%, 10/15/2026 | EUR | 1,545,000 | $1,250,161 | |
| MPT Operating Partnership LP/MPT Finance Corp., REIT, 5%, 10/15/2027 | $ | 6,534,000 | 5,523,419 | |
| $6,773,580 | ||||
| Real Estate - Other – 0.3% | ||||
| XHR LP, REIT, 4.875%, 6/01/2029 (n) | $ | 6,690,000 | $5,937,375 | |
| Restaurants – 0.3% | ||||
| Fertitta Entertainment LLC, 6.75%, 1/15/2030 (n) | $ | 5,675,000 | $4,710,250 | |
| Retailers – 1.3% | ||||
| Asbury Automotive Group, Inc., 4.625%, 11/15/2029 (n) | $ | 7,042,000 | $6,214,142 | |
| Bath & Body Works, Inc., 5.25%, 2/01/2028 | 12,665,000 | 11,954,630 | ||
| Victoria's Secret & Co., 4.625%, 7/15/2029 (n) | 6,489,000 | 5,390,672 | ||
| $23,559,444 | ||||
| Specialty Chemicals – 0.2% | ||||
| Univar Solutions USA, Inc., 5.125%, 12/01/2027 (n) | $ | 3,100,000 | $2,997,479 | |
| Specialty Stores – 1.3% | ||||
| Group 1 Automotive, Inc., 4%, 8/15/2028 (n) | $ | 6,199,000 | $5,451,772 | |
| Michael Cos., Inc., 5.25%, 5/01/2028 (n) | 3,600,000 | 3,002,076 | ||
| Michael Cos., Inc., 7.875%, 5/01/2029 (n) | 3,830,000 | 2,910,800 | ||
| Penske Automotive Group Co., 3.75%, 6/15/2029 | 7,145,000 | 6,042,035 | ||
| PetSmart, Inc./PetSmart Finance Corp., 7.75%, 2/15/2029 (n) | 5,270,000 | 5,179,044 | ||
| $22,585,727 | ||||
| Supermarkets – 0.6% | ||||
| Albertsons Cos. LLC/Safeway, Inc., 4.625%, 1/15/2027 (n) | $ | 5,840,000 | $5,536,612 | |
| Albertsons Cos. LLC/Safeway, Inc., 3.5%, 3/15/2029 (n) | 5,210,000 | 4,493,625 | ||
| $10,030,237 | ||||
| Issuer | Shares/Par | Value ($) | ||
| Bonds – continued | ||||
| Telecommunications - Wireless – 2.2% | ||||
| Altice France S.A., 6%, 2/15/2028 (n) | $ | 8,145,000 | $5,495,524 | |
| Cellnex Finance Co. S.A., 3.875%, 7/07/2041 (n) | 3,200,000 | 2,362,103 | ||
| SBA Communications Corp., 3.875%, 2/15/2027 | 6,103,000 | 5,636,338 | ||
| SBA Communications Corp., 3.125%, 2/01/2029 | 9,720,000 | 8,234,614 | ||
| Sprint Capital Corp., 6.875%, 11/15/2028 | 9,530,000 | 10,195,546 | ||
| Sprint Corp., 7.625%, 3/01/2026 | 6,295,000 | 6,658,011 | ||
| $38,582,136 | ||||
| Tobacco – 0.2% | ||||
| Vector Group Ltd., 5.75%, 2/01/2029 (n) | $ | 3,120,000 | $2,720,609 | |
| Utilities - Electric Power – 2.9% | ||||
| Calpine Corp., 4.5%, 2/15/2028 (n) | $ | 7,739,000 | $7,141,241 | |
| Calpine Corp., 5.125%, 3/15/2028 (n) | 7,800,000 | 7,062,202 | ||
| Clearway Energy Operating LLC, 4.75%, 3/15/2028 (n) | 3,720,000 | 3,508,704 | ||
| Clearway Energy Operating LLC, 3.75%, 2/15/2031 (n) | 12,778,000 | 10,795,238 | ||
| NextEra Energy, Inc., 4.25%, 7/15/2024 (n) | 1,535,000 | 1,499,178 | ||
| NextEra Energy, Inc., 4.25%, 9/15/2024 (n) | 728,000 | 678,860 | ||
| NextEra Energy, Inc., 4.5%, 9/15/2027 (n) | 4,430,000 | 4,169,605 | ||
| TerraForm Global Operating LLC, 6.125%, 3/01/2026 (n) | 5,065,000 | 4,799,088 | ||
| TerraForm Power Operating LLC, 5%, 1/31/2028 (n) | 9,450,000 | 8,876,598 | ||
| TerraForm Power Operating LLC, 4.75%, 1/15/2030 (n) | 3,240,000 | 2,915,943 | ||
| $51,446,657 | ||||
| Total Bonds (Identified Cost, $1,808,466,301) | $1,648,844,981 | |||
| Exchange-Traded Funds – 1.0% | ||||
| Equity ETFs – 1.0% | ||||
| iShares iBoxx $ High Yield Corporate Bond ETF (Identified Cost, $18,565,538) | 223,400 | $17,052,122 | ||
| Common Stocks – 0.2% | ||||
| Cable TV – 0.1% | ||||
| Intelsat Emergence S.A. (a) | 59,152 | $1,360,496 | ||
| Construction – 0.0% | ||||
| ICA Tenedora S.A. de C.V. (a)(u) | 347,563 | $313,777 | ||
| Oil Services – 0.1% | ||||
| LTRI Holdings LP (a)(u) | 3,250 | $1,088,880 | ||
| Total Common Stocks (Identified Cost, $3,122,016) | $2,763,153 | |||
| Contingent Value Rights – 0.0% | ||||
| Cable TV – 0.0% | ||||
| Intelsat Jackson Holdings S.A. - Series A, 12/05/2025 (a) | 6,194 | $35,615 | ||
| Intelsat Jackson Holdings S.A. - Series B, 12/05/2025 (a) | 6,194 | 23,228 | ||
| Total Contingent Value Rights (Identified Cost, $0) | $58,843 | |||
| Issuer | Strike Price | First Exercise | Shares/Par | Value ($) |
| Warrants – 0.0% | ||||
| Other Banks & Diversified Financials – 0.0% | ||||
| Avation Capital S.A. (1 share for 1 warrant, Expiration 10/31/26) (a) (Identified Cost, $0) | GBP 1.14 | 3/16/21 | 62,563 | $26,996 |
| Investment Companies (h) – 3.6% | ||||
| Money Market Funds – 3.6% | ||||
| MFS Institutional Money Market Portfolio, 4.29% (v) (Identified Cost, $64,022,623) | 64,024,139 | $64,030,541 | ||
| Other Assets, Less Liabilities – 1.2% | 20,768,004 | |||
| Net Assets – 100.0% | $1,753,544,640 | |||
| (a) | Non-income producing security. | |||
| (h) | An affiliated issuer, which may be considered one in which the fund owns 5% or more of the outstanding voting securities, or a company which is under common control. At period end, the aggregate values of the fund's investments in affiliated issuers and in unaffiliated issuers were $64,030,541 and $1,668,746,095, respectively. | |||
| (n) | Securities exempt from registration under Rule 144A of the Securities Act of 1933. These securities may be sold in the ordinary course of business in transactions exempt from registration, normally to qualified institutional buyers. At period end, the aggregate value of these securities was $1,393,108,722, representing 79.4% of net assets. | |||
| (p) | Payment-in-kind (PIK) security for which interest income may be received in additional securities and/or cash. | |||
| (u) | The security was valued using significant unobservable inputs and is considered level 3 under the fair value hierarchy. For further information about the fund’s level 3 holdings, please see Note 2 in the Notes to Financial Statements. | |||
| (v) | Affiliated issuer that is available only to investment companies managed by MFS. The rate quoted for the MFS Institutional Money Market Portfolio is the annualized seven-day yield of the fund at period end. |
| The following abbreviations are used in this report and are defined: | |
| CDO | Collateralized Debt Obligation |
| CMT | Constant Maturity Treasury |
| ETF | Exchange-Traded Fund |
| FLR | Floating Rate. Interest rate resets periodically based on the parenthetically disclosed reference rate plus a spread (if any). The period-end rate reported may not be the current rate. All reference rates are USD unless otherwise noted. |
| LIBOR | London Interbank Offered Rate |
| REIT | Real Estate Investment Trust |
| Abbreviations indicate amounts shown in currencies other than the U.S. dollar. All amounts are stated in U.S. dollars unless otherwise indicated. A list of abbreviations is shown below: | |
| EUR | Euro |
| GBP | British Pound |
| Forward Foreign Currency Exchange Contracts | ||||||
| Currency Purchased | Currency Sold | Counterparty | Settlement Date | Unrealized Appreciation (Depreciation) | ||
| Liability Derivatives | ||||||
| GBP | 364,435 | USD | 450,545 | State Street Bank Corp. | 4/21/2023 | $(497) |
| USD | 9,148,275 | EUR | 8,424,059 | Brown Brothers Harriman | 4/21/2023 | (54,035) |
| $(54,532) | ||||||
| Futures Contracts | ||||||
| Description | Long/ Short | Currency | Contracts | Notional Amount | Expiration Date | Value/Unrealized Appreciation (Depreciation) |
| Asset Derivatives | ||||||
| Interest Rate Futures | ||||||
| U.S. Treasury Bond | Long | USD | 85 | $11,039,375 | March – 2023 | $285,233 |
| U.S. Treasury Ultra Bond | Long | USD | 15 | 2,126,250 | March – 2023 | 91,000 |
| $376,233 | ||||||
| Liability Derivatives | ||||||
| Interest Rate Futures | ||||||
| U.S. Treasury Note 10 yr | Short | USD | 234 | $26,796,656 | March – 2023 | $(341,063) |
| Assets | |
| Investments in unaffiliated issuers, at value (identified cost, $1,830,153,855) | $1,668,746,095 |
| Investments in affiliated issuers, at value (identified cost, $64,022,623) | 64,030,541 |
| Cash | 170,535 |
| Deposits with brokers for | |
| Futures contracts | 160,875 |
| Receivables for | |
| Investments sold | 2,574,638 |
| Fund shares sold | 2,222,233 |
| Interest and dividends | 25,334,610 |
| Other assets | 6,108 |
| Total assets | $1,763,245,635 |
| Liabilities | |
| Payables for | |
| Distributions | $230,496 |
| Forward foreign currency exchange contracts | 54,532 |
| Net daily variation margin on open futures contracts | 48,282 |
| Investments purchased | 5,390,997 |
| Fund shares reacquired | 3,430,763 |
| Payable to affiliates | |
| Investment adviser | 42,402 |
| Administrative services fee | 1,487 |
| Shareholder servicing costs | 325,619 |
| Distribution and service fees | 9,443 |
| Payable for independent Trustees' compensation | 1,445 |
| Accrued expenses and other liabilities | 165,529 |
| Total liabilities | $9,700,995 |
| Net assets | $1,753,544,640 |
| Net assets consist of | |
| Paid-in capital | $2,067,352,033 |
| Total distributable earnings (loss) | (313,807,393) |
| Net assets | $1,753,544,640 |
| Shares of beneficial interest outstanding | 585,247,030 |
| Net assets | Shares outstanding | Net asset value per share (a) | |
| Class A | $625,602,021 | 208,673,323 | $3.00 |
| Class B | 2,985,792 | 994,614 | 3.00 |
| Class C | 11,887,878 | 3,953,855 | 3.01 |
| Class I | 189,209,850 | 63,305,894 | 2.99 |
| Class R1 | 694,873 | 231,571 | 3.00 |
| Class R2 | 1,605,996 | 538,570 | 2.98 |
| Class R3 | 1,294,535 | 432,756 | 2.99 |
| Class R4 | 361,742 | 120,619 | 3.00 |
| Class R6 | 919,901,953 | 306,995,828 | 3.00 |
| (a) | Maximum offering price per share was equal to the net asset value per share for all share classes, except for Class A, for which the maximum offering price per share was $3.13 [100 / 95.75 x $3.00]. On sales of $100,000 or more, the maximum offering price of Class A shares is reduced. A contingent deferred sales charge may be imposed on redemptions of Class A, Class B, and Class C shares. Redemption price per share was equal to the net asset value per share for Classes I, R1, R2, R3, R4, and R6. |
| Net investment income (loss) | |
| Income | |
| Interest | $96,009,682 |
| Dividends from affiliated issuers | 1,227,186 |
| Dividends | 872,149 |
| Other | 284,689 |
| Total investment income | $98,393,706 |
| Expenses | |
| Management fee | $8,071,599 |
| Distribution and service fees | 1,759,240 |
| Shareholder servicing costs | 1,206,584 |
| Program manager fees | 778 |
| Administrative services fee | 285,166 |
| Independent Trustees' compensation | 30,613 |
| Custodian fee | 106,601 |
| Shareholder communications | 114,242 |
| Audit and tax fees | 92,230 |
| Legal fees | 9,400 |
| Miscellaneous | 253,914 |
| Total expenses | $11,930,367 |
| Fees paid indirectly | (1,194) |
| Reduction of expenses by investment adviser and distributor | (248,053) |
| Net expenses | $11,681,120 |
| Net investment income (loss) | $86,712,586 |
| Realized and unrealized gain (loss) | |
| Realized gain (loss) (identified cost basis) | |
| Unaffiliated issuers | $(58,279,608) |
| Affiliated issuers | (5,219) |
| Futures contracts | 574,085 |
| Forward foreign currency exchange contracts | (290,418) |
| Foreign currency | (2,125) |
| Net realized gain (loss) | $(58,003,285) |
| Change in unrealized appreciation or depreciation | |
| Unaffiliated issuers | $(119,508,581) |
| Affiliated issuers | 5,690 |
| Futures contracts | 51,994 |
| Forward foreign currency exchange contracts | (81,410) |
| Translation of assets and liabilities in foreign currencies | 3,482 |
| Net unrealized gain (loss) | $(119,528,825) |
| Net realized and unrealized gain (loss) | $(177,532,110) |
| Change in net assets from operations | $(90,819,524) |
| Year ended | ||
| 1/31/23 | 1/31/22 | |
| Change in net assets | ||
| From operations | ||
| Net investment income (loss) | $86,712,586 | $82,567,331 |
| Net realized gain (loss) | (58,003,285) | 35,785,769 |
| Net unrealized gain (loss) | (119,528,825) | (104,071,044) |
| Change in net assets from operations | $(90,819,524) | $14,282,056 |
| Total distributions to shareholders | $(94,049,766) | $(91,361,732) |
| Change in net assets from fund share transactions | $(30,606,598) | $40,915,210 |
| Total change in net assets | $(215,475,888) | $(36,164,466) |
| Net assets | ||
| At beginning of period | 1,969,020,528 | 2,005,184,994 |
| At end of period | $1,753,544,640 | $1,969,020,528 |
| Class A | Year ended | ||||
| 1/31/23 | 1/31/22 | 1/31/21 | 1/31/20 | 1/31/19 | |
| Net asset value, beginning of period | $3.31 | $3.44 | $3.44 | $3.30 | $3.44 |
| Income (loss) from investment operations | |||||
| Net investment income (loss) (d) | $0.14 | $0.13 | $0.14 | $0.15 | $0.15 |
| Net realized and unrealized gain (loss) | (0.30) | (0.11) | 0.01 | 0.15 | (0.13) |
| Total from investment operations | $(0.16) | $0.02 | $0.15 | $0.30 | $0.02 |
| Less distributions declared to shareholders | |||||
| From net investment income | $(0.15) | $(0.15) | $(0.15) | $(0.16) | $(0.16) |
| Net asset value, end of period (x) | $3.00 | $3.31 | $3.44 | $3.44 | $3.30 |
| Total return (%) (r)(s)(t)(x) | (4.60) | 0.48 | 4.71 | 9.24 | 0.68 |
| Ratios (%) (to average net assets) and Supplemental data: | |||||
| Expenses before expense reductions (f) | 0.89 | 0.90 | 0.93 | 0.94 | 0.94 |
| Expenses after expense reductions (f) | 0.87 | 0.89 | 0.91 | 0.92 | 0.92 |
| Net investment income (loss) | 4.69 | 3.88 | 4.34 | 4.46 | 4.67 |
| Portfolio turnover | 33 | 64 | 50 | 58 | 44 |
| Net assets at end of period (000 omitted) | $625,602 | $679,622 | $612,075 | $552,035 | $489,120 |
| Class B | Year ended | ||||
| 1/31/23 | 1/31/22 | 1/31/21 | 1/31/20 | 1/31/19 | |
| Net asset value, beginning of period | $3.31 | $3.44 | $3.45 | $3.30 | $3.44 |
| Income (loss) from investment operations | |||||
| Net investment income (loss) (d) | $0.12 | $0.11 | $0.12 | $0.13 | $0.13 |
| Net realized and unrealized gain (loss) | (0.30) | (0.12) | 0.00(w) | 0.15 | (0.13) |
| Total from investment operations | $(0.18) | $(0.01) | $0.12 | $0.28 | $0.00(w) |
| Less distributions declared to shareholders | |||||
| From net investment income | $(0.13) | $(0.12) | $(0.13) | $(0.13) | $(0.14) |
| Net asset value, end of period (x) | $3.00 | $3.31 | $3.44 | $3.45 | $3.30 |
| Total return (%) (r)(s)(t)(x) | (5.31) | (0.28) | 3.62 | 8.74 | (0.07) |
| Ratios (%) (to average net assets) and Supplemental data: | |||||
| Expenses before expense reductions (f) | 1.64 | 1.65 | 1.68 | 1.69 | 1.69 |
| Expenses after expense reductions (f) | 1.62 | 1.64 | 1.67 | 1.68 | 1.68 |
| Net investment income (loss) | 3.91 | 3.15 | 3.63 | 3.72 | 3.91 |
| Portfolio turnover | 33 | 64 | 50 | 58 | 44 |
| Net assets at end of period (000 omitted) | $2,986 | $4,729 | $6,914 | $10,650 | $13,361 |
| Class C | Year ended | ||||
| 1/31/23 | 1/31/22 | 1/31/21 | 1/31/20 | 1/31/19 | |
| Net asset value, beginning of period | $3.32 | $3.45 | $3.45 | $3.31 | $3.44 |
| Income (loss) from investment operations | |||||
| Net investment income (loss) (d) | $0.12 | $0.11 | $0.12 | $0.13 | $0.13 |
| Net realized and unrealized gain (loss) | (0.30) | (0.12) | 0.01 | 0.14 | (0.12) |
| Total from investment operations | $(0.18) | $(0.01) | $0.13 | $0.27 | $0.01 |
| Less distributions declared to shareholders | |||||
| From net investment income | $(0.13) | $(0.12) | $(0.13) | $(0.13) | $(0.14) |
| Net asset value, end of period (x) | $3.01 | $3.32 | $3.45 | $3.45 | $3.31 |
| Total return (%) (r)(s)(t)(x) | (5.29) | (0.27) | 3.93 | 8.42 | 0.23 |
| Ratios (%) (to average net assets) and Supplemental data: | |||||
| Expenses before expense reductions (f) | 1.64 | 1.65 | 1.68 | 1.69 | 1.69 |
| Expenses after expense reductions (f) | 1.62 | 1.64 | 1.67 | 1.68 | 1.68 |
| Net investment income (loss) | 3.92 | 3.15 | 3.61 | 3.72 | 3.91 |
| Portfolio turnover | 33 | 64 | 50 | 58 | 44 |
| Net assets at end of period (000 omitted) | $11,888 | $16,636 | $21,918 | $27,415 | $31,793 |
| Class I | Year ended | ||||
| 1/31/23 | 1/31/22 | 1/31/21 | 1/31/20 | 1/31/19 | |
| Net asset value, beginning of period | $3.30 | $3.43 | $3.43 | $3.29 | $3.43 |
| Income (loss) from investment operations | |||||
| Net investment income (loss) (d) | $0.15 | $0.14 | $0.15 | $0.16 | $0.16 |
| Net realized and unrealized gain (loss) | (0.30) | (0.11) | 0.01 | 0.15 | (0.13) |
| Total from investment operations | $(0.15) | $0.03 | $0.16 | $0.31 | $0.03 |
| Less distributions declared to shareholders | |||||
| From net investment income | $(0.16) | $(0.16) | $(0.16) | $(0.17) | $(0.17) |
| Net asset value, end of period (x) | $2.99 | $3.30 | $3.43 | $3.43 | $3.29 |
| Total return (%) (r)(s)(t)(x) | (4.38) | 0.71 | 4.97 | 9.52 | 0.92 |
| Ratios (%) (to average net assets) and Supplemental data: | |||||
| Expenses before expense reductions (f) | 0.63 | 0.65 | 0.68 | 0.69 | 0.69 |
| Expenses after expense reductions (f) | 0.62 | 0.64 | 0.66 | 0.68 | 0.68 |
| Net investment income (loss) | 4.93 | 4.13 | 4.55 | 4.67 | 4.90 |
| Portfolio turnover | 33 | 64 | 50 | 58 | 44 |
| Net assets at end of period (000 omitted) | $189,210 | $208,682 | $216,905 | $147,591 | $89,637 |
| Class R1 | Year ended | ||||
| 1/31/23 | 1/31/22 | 1/31/21 | 1/31/20 | 1/31/19 | |
| Net asset value, beginning of period | $3.31 | $3.44 | $3.44 | $3.30 | $3.44 |
| Income (loss) from investment operations | |||||
| Net investment income (loss) (d) | $0.12 | $0.11 | $0.12 | $0.13 | $0.13 |
| Net realized and unrealized gain (loss) | (0.30) | (0.12) | 0.01 | 0.14 | (0.13) |
| Total from investment operations | $(0.18) | $(0.01) | $0.13 | $0.27 | $0.00(w) |
| Less distributions declared to shareholders | |||||
| From net investment income | $(0.13) | $(0.12) | $(0.13) | $(0.13) | $(0.14) |
| Net asset value, end of period (x) | $3.00 | $3.31 | $3.44 | $3.44 | $3.30 |
| Total return (%) (r)(s)(t)(x) | (5.32) | (0.28) | 3.92 | 8.43 | (0.07) |
| Ratios (%) (to average net assets) and Supplemental data: | |||||
| Expenses before expense reductions (f) | 1.64 | 1.65 | 1.68 | 1.69 | 1.69 |
| Expenses after expense reductions (f) | 1.62 | 1.64 | 1.67 | 1.68 | 1.68 |
| Net investment income (loss) | 3.94 | 3.14 | 3.60 | 3.71 | 3.92 |
| Portfolio turnover | 33 | 64 | 50 | 58 | 44 |
| Net assets at end of period (000 omitted) | $695 | $946 | $957 | $963 | $867 |
| Class R2 | Year ended | ||||
| 1/31/23 | 1/31/22 | 1/31/21 | 1/31/20 | 1/31/19 | |
| Net asset value, beginning of period | $3.29 | $3.43 | $3.44 | $3.30 | $3.43 |
| Income (loss) from investment operations | |||||
| Net investment income (loss) (d) | $0.13 | $0.13 | $0.14 | $0.14 | $0.15 |
| Net realized and unrealized gain (loss) | (0.29) | (0.13) | (0.01) | 0.15 | (0.13) |
| Total from investment operations | $(0.16) | $0.00 | $0.13 | $0.29 | $0.02 |
| Less distributions declared to shareholders | |||||
| From net investment income | $(0.15) | $(0.14) | $(0.14) | $(0.15) | $(0.15) |
| Net asset value, end of period (x) | $2.98 | $3.29 | $3.43 | $3.44 | $3.30 |
| Total return (%) (r)(s)(t)(x) | (4.90) | (0.09) | 4.14 | 8.96 | 0.72 |
| Ratios (%) (to average net assets) and Supplemental data: | |||||
| Expenses before expense reductions (f) | 1.14 | 1.16 | 1.18 | 1.19 | 1.19 |
| Expenses after expense reductions (f) | 1.12 | 1.15 | 1.17 | 1.18 | 1.18 |
| Net investment income (loss) | 4.44 | 3.67 | 4.10 | 4.21 | 4.42 |
| Portfolio turnover | 33 | 64 | 50 | 58 | 44 |
| Net assets at end of period (000 omitted) | $1,606 | $2,029 | $13,943 | $15,270 | $14,618 |
| Class R3 | Year ended | ||||
| 1/31/23 | 1/31/22 | 1/31/21 | 1/31/20 | 1/31/19 | |
| Net asset value, beginning of period | $3.30 | $3.43 | $3.44 | $3.30 | $3.43 |
| Income (loss) from investment operations | |||||
| Net investment income (loss) (d) | $0.14 | $0.13 | $0.14 | $0.15 | $0.15 |
| Net realized and unrealized gain (loss) | (0.30) | (0.11) | 0.00(w) | 0.15 | (0.12) |
| Total from investment operations | $(0.16) | $0.02 | $0.14 | $0.30 | $0.03 |
| Less distributions declared to shareholders | |||||
| From net investment income | $(0.15) | $(0.15) | $(0.15) | $(0.16) | $(0.16) |
| Net asset value, end of period (x) | $2.99 | $3.30 | $3.43 | $3.44 | $3.30 |
| Total return (%) (r)(s)(t)(x) | (4.63) | 0.46 | 4.40 | 9.23 | 0.98 |
| Ratios (%) (to average net assets) and Supplemental data: | |||||
| Expenses before expense reductions (f) | 0.89 | 0.90 | 0.93 | 0.94 | 0.94 |
| Expenses after expense reductions (f) | 0.87 | 0.89 | 0.92 | 0.93 | 0.93 |
| Net investment income (loss) | 4.60 | 3.90 | 4.31 | 4.47 | 4.66 |
| Portfolio turnover | 33 | 64 | 50 | 58 | 44 |
| Net assets at end of period (000 omitted) | $1,295 | $2,574 | $2,929 | $2,255 | $2,193 |
| Class R4 | Year ended | ||||
| 1/31/23 | 1/31/22 | 1/31/21 | 1/31/20 | 1/31/19 | |
| Net asset value, beginning of period | $3.31 | $3.44 | $3.44 | $3.30 | $3.43 |
| Income (loss) from investment operations | |||||
| Net investment income (loss) (d) | $0.15 | $0.14 | $0.15 | $0.16 | $0.16 |
| Net realized and unrealized gain (loss) | (0.30) | (0.11) | 0.01 | 0.15 | (0.12) |
| Total from investment operations | $(0.15) | $0.03 | $0.16 | $0.31 | $0.04 |
| Less distributions declared to shareholders | |||||
| From net investment income | $(0.16) | $(0.16) | $(0.16) | $(0.17) | $(0.17) |
| Net asset value, end of period (x) | $3.00 | $3.31 | $3.44 | $3.44 | $3.30 |
| Total return (%) (r)(s)(t)(x) | (4.35) | 0.72 | 4.97 | 9.51 | 1.23 |
| Ratios (%) (to average net assets) and Supplemental data: | |||||
| Expenses before expense reductions (f) | 0.64 | 0.65 | 0.68 | 0.69 | 0.69 |
| Expenses after expense reductions (f) | 0.62 | 0.64 | 0.67 | 0.68 | 0.68 |
| Net investment income (loss) | 4.95 | 4.15 | 4.63 | 4.68 | 4.91 |
| Portfolio turnover | 33 | 64 | 50 | 58 | 44 |
| Net assets at end of period (000 omitted) | $362 | $371 | $555 | $796 | $447 |
| Class R6 | Year ended | ||||
| 1/31/23 | 1/31/22 | 1/31/21 | 1/31/20 | 1/31/19 | |
| Net asset value, beginning of period | $3.31 | $3.44 | $3.44 | $3.30 | $3.43 |
| Income (loss) from investment operations | |||||
| Net investment income (loss) (d) | $0.15 | $0.15 | $0.16 | $0.16 | $0.17 |
| Net realized and unrealized gain (loss) | (0.30) | (0.12) | 0.00(w) | 0.15 | (0.13) |
| Total from investment operations | $(0.15) | $0.03 | $0.16 | $0.31 | $0.04 |
| Less distributions declared to shareholders | |||||
| From net investment income | $(0.16) | $(0.16) | $(0.16) | $(0.17) | $(0.17) |
| Net asset value, end of period (x) | $3.00 | $3.31 | $3.44 | $3.44 | $3.30 |
| Total return (%) (r)(s)(t)(x) | (4.25) | 0.84 | 5.08 | 9.63 | 1.33 |
| Ratios (%) (to average net assets) and Supplemental data: | |||||
| Expenses before expense reductions (f) | 0.52 | 0.54 | 0.57 | 0.58 | 0.58 |
| Expenses after expense reductions (f) | 0.51 | 0.53 | 0.56 | 0.57 | 0.57 |
| Net investment income (loss) | 5.05 | 4.25 | 4.69 | 4.82 | 5.02 |
| Portfolio turnover | 33 | 64 | 50 | 58 | 44 |
| Net assets at end of period (000 omitted) | $919,902 | $1,048,137 | $1,123,867 | $942,482 | $829,451 |
| (d) | Per share data is based on average shares outstanding. |
| (f) | Ratios do not reflect reductions from fees paid indirectly, if applicable. See Note 2 in the Notes to Financial Statements for additional information. |
| (r) | Certain expenses have been reduced without which performance would have been lower. |
| (s) | From time to time the fund may receive proceeds from litigation settlements, without which performance would be lower. |
| (t) | Total returns do not include any applicable sales charges. |
| (w) | Per share amount was less than $0.01. |
| (x) | The net asset values and total returns have been calculated on net assets which include adjustments made in accordance with U.S. generally accepted accounting principles required at period end for financial reporting purposes. |
| Financial Instruments | Level 1 | Level 2 | Level 3 | Total |
| Equity Securities: | ||||
| United States | $17,052,122 | $— | $1,088,880 | $18,141,002 |
| Luxembourg | — | 1,419,339 | — | 1,419,339 |
| Mexico | — | — | 313,777 | 313,777 |
| United Kingdom | — | 26,996 | — | 26,996 |
| U.S. Corporate Bonds | — | 1,408,533,847 | — | 1,408,533,847 |
| Asset-Backed Securities (including CDOs) | — | 337 | — | 337 |
| Foreign Bonds | — | 240,310,797 | — | 240,310,797 |
| Mutual Funds | 64,030,541 | — | — | 64,030,541 |
| Total | $81,082,663 | $1,650,291,316 | $1,402,657 | $1,732,776,636 |
| Other Financial Instruments | ||||
| Futures Contracts – Assets | $376,233 | $— | $— | $376,233 |
| Futures Contracts – Liabilities | (341,063) | — | — | (341,063) |
| Forward Foreign Currency Exchange Contracts – Liabilities | — | (54,532) | — | (54,532) |
| Equity Securities | |
| Balance as of 1/31/22 | $1,231,177 |
| Change in unrealized appreciation or depreciation | 198,476 |
| Transfers out of level 3 | (26,996) |
| Balance as of 1/31/23 | $1,402,657 |
| Fair Value (a) | |||
| Risk | Derivative Contracts | Asset Derivatives | Liability Derivatives |
| Interest Rate | Futures Contracts | $376,233 | $(341,063) |
| Foreign Exchange | Forward Foreign Currency Exchange Contracts | — | (54,532) |
| Total | $376,233 | $(395,595) | |
| Risk | Futures Contracts | Forward Foreign Currency Exchange Contracts |
| Interest Rate | $574,085 | $— |
| Foreign Exchange | — | (290,418) |
| Total | $574,085 | $(290,418) |
| Risk | Futures Contracts | Forward Foreign Currency Exchange Contracts |
| Interest Rate | $51,994 | $— |
| Foreign Exchange | — | (81,410) |
| Total | $51,994 | $(81,410) |
| Year ended 1/31/23 | Year ended 1/31/22 | |
| Ordinary income (including any short-term capital gains) | $94,049,766 | $91,361,732 |
| As of 1/31/23 | |
| Cost of investments | $1,903,106,146 |
| Gross appreciation | 11,446,434 |
| Gross depreciation | (181,795,306) |
| Net unrealized appreciation (depreciation) | $(170,348,872) |
| Undistributed ordinary income | 5,599,539 |
| Capital loss carryforwards | (140,965,138) |
| Other temporary differences | (8,092,922) |
| Total distributable earnings (loss) | $(313,807,393) |
| Short-Term | $(20,610,653) |
| Long-Term | (120,354,485) |
| Total | $(140,965,138) |
| Year ended 1/31/23 | Year ended 1/31/22 | |
| Class A | $31,925,762 | $28,548,357 |
| Class B | 160,560 | 207,604 |
| Class C | 569,072 | 700,011 |
| Class I | 9,621,986 | 10,144,994 |
| Class R1 | 29,527 | 33,226 |
| Class R2 | 86,874 | 389,066 |
| Class R3 | 87,286 | 113,734 |
| Class R4 | 18,781 | 22,341 |
| Class R6 | 51,479,518 | 50,979,300 |
| Class 529A | 68,059 | 202,875 |
| Class 529B | 340 | 2,877 |
| Class 529C | 2,001 | 17,347 |
| Total | $94,049,766 | $91,361,732 |
| Up to $1.4 billion | 0.46% |
| In excess of $1.4 billion and up to $3 billion | 0.44% |
| In excess of $3 billion | 0.42% |
| Distribution Fee Rate (d) | Service Fee Rate (d) | Total Distribution Plan (d) | Annual Effective Rate (e) | Distribution and Service Fee | |
| Class A | — | 0.25% | 0.25% | 0.25% | $1,565,129 |
| Class B | 0.75% | 0.25% | 1.00% | 1.00% | 37,503 |
| Class C | 0.75% | 0.25% | 1.00% | 1.00% | 132,053 |
| Class R1 | 0.75% | 0.25% | 1.00% | 1.00% | 6,785 |
| Class R2 | 0.25% | 0.25% | 0.50% | 0.50% | 9,013 |
| Class R3 | — | 0.25% | 0.25% | 0.25% | 4,401 |
| Class 529A | — | 0.25% | 0.25% | 0.23% | 3,734 |
| Class 529B | 0.75% | 0.25% | 1.00% | 1.00% | 90 |
| Class 529C | 0.75% | 0.25% | 1.00% | 0.99% | 532 |
| Total Distribution and Service Fees | $1,759,240 |
| (d) | In accordance with the distribution plan for certain classes, the fund pays distribution and/or service fees equal to these annual percentage rates of each class’s average daily net assets. The distribution and service fee rates disclosed by class represent the current rates in effect at the end of the reporting period. Any rate changes, if applicable, are detailed below. |
| (e) | The annual effective rates represent actual fees incurred under the distribution plan for the year ended January 31, 2023 based on each class's average daily net assets. MFD has voluntarily agreed to rebate a portion of each class's 0.25% service fee attributable to accounts for which there is no financial intermediary specified on the account except for accounts attributable to MFS or its affiliates' seed money. For the year ended January 31, 2023, this rebate amounted to $2,798, $328, and $3 for Class A, Class 529A, and Class 529C shares, respectively, and is included in the reduction of total expenses in the Statement of Operations. |
| Amount | |
| Class A | $32,818 |
| Class B | 2,256 |
| Class C | 558 |
| Class 529B | — |
| Class 529C | — |
| Fee | |
| Class 529A | $747 |
| Class 529B | 4 |
| Class 529C | 27 |
| Total Program Manager Fees | $778 |
| Year ended 1/31/23 | Year ended 1/31/22 | ||||
| Shares | Amount | Shares | Amount | ||
| Shares sold | |||||
| Class A | 34,239,361 | $103,975,427 | 45,185,518 | $154,955,988 | |
| Class B | 57,318 | 172,695 | 36,268 | 123,975 | |
| Class C | 510,661 | 1,531,529 | 836,879 | 2,885,635 | |
| Class I | 38,542,522 | 115,441,933 | 23,312,134 | 79,800,708 | |
| Class R1 | 26,943 | 81,037 | 49,118 | 168,248 | |
| Class R2 | 236,743 | 739,407 | 702,264 | 2,410,270 | |
| Class R3 | 222,741 | 712,439 | 92,416 | 315,693 | |
| Class R4 | 8,221 | 25,343 | 48,503 | 166,368 | |
| Class R6 | 21,815,819 | 66,118,697 | 37,555,560 | 128,768,874 | |
| Class 529A | 194,427 | 621,092 | 346,062 | 1,186,679 | |
| Class 529B | — | — | 5,453 | 18,829 | |
| Class 529C | 4,009 | 13,074 | 25,821 | 88,552 | |
| 95,858,765 | $289,432,673 | 108,195,996 | $370,889,819 | ||
| Year ended 1/31/23 | Year ended 1/31/22 | ||||
| Shares | Amount | Shares | Amount | ||
| Shares issued to shareholders in reinvestment of distributions | |||||
| Class A | 10,385,501 | $31,089,436 | 8,093,030 | $27,669,970 | |
| Class B | 51,185 | 153,778 | 57,744 | 197,920 | |
| Class C | 183,364 | 551,602 | 194,891 | 668,754 | |
| Class I | 2,645,976 | 7,896,443 | 2,462,678 | 8,401,089 | |
| Class R1 | 9,847 | 29,511 | 9,675 | 33,122 | |
| Class R2 | 29,102 | 86,684 | 112,453 | 386,037 | |
| Class R3 | 28,937 | 87,242 | 33,235 | 113,486 | |
| Class R4 | 6,275 | 18,779 | 6,518 | 22,341 | |
| Class R6 | 17,115,265 | 51,246,373 | 14,826,438 | 50,682,925 | |
| Class 529A | 17,073 | 54,383 | 58,768 | 200,643 | |
| Class 529B | 61 | 251 | 820 | 2,808 | |
| Class 529C | 379 | 1,239 | 5,016 | 17,177 | |
| 30,472,965 | $91,215,721 | 25,861,266 | $88,396,272 | ||
| Shares reacquired | |||||
| Class A | (41,474,679) | $(124,583,060) | (25,818,531) | $(88,456,841) | |
| Class B | (542,109) | (1,625,622) | (674,723) | (2,313,771) | |
| Class C | (1,756,772) | (5,346,479) | (2,373,571) | (8,157,319) | |
| Class I | (41,165,559) | (125,307,188) | (25,770,254) | (87,960,422) | |
| Class R1 | (90,964) | (292,009) | (51,357) | (175,939) | |
| Class R2 | (344,291) | (1,055,962) | (4,257,607) | (14,705,690) | |
| Class R3 | (598,859) | (1,809,442) | (199,219) | (683,231) | |
| Class R4 | (6,028) | (18,457) | (104,348) | (357,514) | |
| Class R6 | (49,066,141) | (145,737,382) | (62,376,654) | (214,427,243) | |
| Class 529A | (1,665,310) | (4,989,975) | (258,497) | (884,688) | |
| Class 529B | (20,862) | (66,973) | (15,370) | (52,866) | |
| Class 529C | (131,973) | (422,443) | (57,085) | (195,357) | |
| (136,863,547) | $(411,254,992) | (121,957,216) | $(418,370,881) | ||
| Year ended 1/31/23 | Year ended 1/31/22 | ||||
| Shares | Amount | Shares | Amount | ||
| Net change | |||||
| Class A | 3,150,183 | $10,481,803 | 27,460,017 | $94,169,117 | |
| Class B | (433,606) | (1,299,149) | (580,711) | (1,991,876) | |
| Class C | (1,062,747) | (3,263,348) | (1,341,801) | (4,602,930) | |
| Class I | 22,939 | (1,968,812) | 4,558 | 241,375 | |
| Class R1 | (54,174) | (181,461) | 7,436 | 25,431 | |
| Class R2 | (78,446) | (229,871) | (3,442,890) | (11,909,383) | |
| Class R3 | (347,181) | (1,009,761) | (73,568) | (254,052) | |
| Class R4 | 8,468 | 25,665 | (49,327) | (168,805) | |
| Class R6 | (10,135,057) | (28,372,312) | (9,994,656) | (34,975,444) | |
| Class 529A | (1,453,810) | (4,314,500) | 146,333 | 502,634 | |
| Class 529B | (20,801) | (66,722) | (9,097) | (31,229) | |
| Class 529C | (127,585) | (408,130) | (26,248) | (89,628) | |
| (10,531,817) | $(30,606,598) | 12,100,046 | $40,915,210 | ||
| Affiliated Issuers | Beginning Value | Purchases | Sales Proceeds | Realized Gain (Loss) | Change in Unrealized Appreciation or Depreciation | Ending Value |
| MFS Institutional Money Market Portfolio | $88,969,191 | $372,129,933 | $397,069,054 | $(5,219) | $5,690 | $64,030,541 |
| Affiliated Issuers | Dividend Income | Capital Gain Distributions |
| MFS Institutional Money Market Portfolio | $1,227,186 | $— |
MFS High Income Fund:
March 17, 2023
| Name, Age | Position(s) Held with Fund | Trustee/Officer Since(h) | Number of MFS Funds overseen by the Trustee | Principal Occupations During the Past Five Years | Other Directorships During the Past Five Years (j) | |||||
| INTERESTED TRUSTEE | ||||||||||
| Michael W. Roberge (k) (age 56) | Trustee | January 2021 | 136 | Massachusetts Financial Services Company, Chairman (since January 2021); Chief Executive Officer (since January 2017); Director; Chairman of the Board (since January 2022); President (until December 2018); Chief Investment Officer (until December 2018) | N/A | |||||
| INDEPENDENT TRUSTEES | ||||||||||
| John P. Kavanaugh (age 68) | Trustee and Chair of Trustees | January 2009 | 136 | Private investor | N/A | |||||
| Steven E. Buller (age 71) | Trustee | February 2014 | 136 | Private investor | N/A | |||||
| John A. Caroselli (age 68) | Trustee | March 2017 | 136 | Private investor; JC Global Advisors, LLC (management consulting), President (since 2015) | N/A | |||||
| Maureen R. Goldfarb (age 67) | Trustee | January 2009 | 136 | Private investor | N/A | |||||
| Peter D. Jones (age 67) | Trustee | January 2019 | 136 | Private investor | N/A | |||||
| James W. Kilman, Jr. (age 61) | Trustee | January 2019 | 136 | Burford Capital Limited (finance and investment management), Senior Advisor (since May 3, 2021), Chief Financial Officer (2019 - May 2, 2021); KielStrand Capital LLC (family office), Chief Executive Officer (since 2016) | Alpha-En Corporation, Director (2016-2019) |
| Name, Age | Position(s) Held with Fund | Trustee/Officer Since(h) | Number of MFS Funds overseen by the Trustee | Principal Occupations During the Past Five Years | Other Directorships During the Past Five Years (j) | |||||
| Clarence Otis, Jr. (age 66) | Trustee | March 2017 | 136 | Private investor | VF Corporation, Director; Verizon Communications, Inc., Director; The Travelers Companies, Director | |||||
| Maryanne L. Roepke (age 67) | Trustee | May 2014 | 136 | Private investor | N/A | |||||
| Laurie J. Thomsen (age 65) | Trustee | March 2005 | 136 | Private investor | The Travelers Companies, Director; Dycom Industries, Inc., Director |
| Name, Age | Position(s) Held with Fund | Trustee/Officer Since(h) | Number of MFS Funds for which the Person is an Officer | Principal Occupations During the Past Five Years | ||||
| OFFICERS | ||||||||
| Christopher R. Bohane (k) (age 49) | Assistant Secretary and Assistant Clerk | July 2005 | 136 | Massachusetts Financial Services Company, Senior Vice President and Senior Managing Counsel | ||||
| Kino Clark (k) (age 54) | Assistant Treasurer | January 2012 | 136 | Massachusetts Financial Services Company, Vice President | ||||
| John W. Clark, Jr. (k) (age 55) | Assistant Treasurer | April 2017 | 136 | Massachusetts Financial Services Company, Vice President | ||||
| David L. DiLorenzo (k) (age 54) | President | July 2005 | 136 | Massachusetts Financial Services Company, Senior Vice President | ||||
| Heidi W. Hardin (k) (age 55) | Secretary and Clerk | April 2017 | 136 | Massachusetts Financial Services Company, Executive Vice President and General Counsel | ||||
| Brian E. Langenfeld (k) (age 49) | Assistant Secretary and Assistant Clerk | June 2006 | 136 | Massachusetts Financial Services Company, Vice President and Managing Counsel |
| Name, Age | Position(s) Held with Fund | Trustee/Officer Since(h) | Number of MFS Funds for which the Person is an Officer | Principal Occupations During the Past Five Years | ||||
| Rosa E. Licea-Mailloux (k) (age 46) | Chief Compliance Officer | March 2022 | 136 | Massachusetts Financial Services Company, Vice President (since 2018); Director of Corporate Compliance (2018-2021), Senior Director Compliance (2021-2022), Senior Managing Director of North American Compliance & Chief Compliance Officer (since March 2022); Natixis Investment Managers (investment management), Funds Chief Compliance Officer, Deputy General Counsel & Senior Vice President (until 2018) | ||||
| Amanda S. Mooradian (k) (age 44) | Assistant Secretary and Assistant Clerk | September 2018 | 136 | Massachusetts Financial Services Company, Assistant Vice President and Senior Counsel | ||||
| Susan A. Pereira (k) (age 52) | Assistant Secretary and Assistant Clerk | July 2005 | 136 | Massachusetts Financial Services Company, Vice President and Managing Counsel | ||||
| Kasey L. Phillips (k) (age 52) | Assistant Treasurer | September 2012 | 136 | Massachusetts Financial Services Company, Vice President | ||||
| Matthew A. Stowe (k) (age 48) | Assistant Secretary and Assistant Clerk | October 2014 | 136 | Massachusetts Financial Services Company, Vice President and Senior Managing Counsel | ||||
| William B. Wilson (k) (age 40) | Assistant Secretary and Assistant Clerk | October 2022 | 136 | Massachusetts Financial Services Company, Assistant Vice President and Senior Counsel | ||||
| James O. Yost (k) (age 62) | Treasurer | September 1990 | 136 | Massachusetts Financial Services Company, Senior Vice President |
| (h) | Date first appointed to serve as Trustee/Officer of an MFS Fund. Each Trustee has served continuously since appointment unless indicated otherwise. From January 2012 through December 2016, Messrs. DiLorenzo and Yost served as Treasurer and Deputy Treasurer of the Funds, respectively. |
| (j) | Directorships or trusteeships of companies required to report to the Securities and Exchange Commission (i.e., “public companies”). |
| (k) | “Interested person” of the Trust within the meaning of the Investment Company Act of 1940 (referred to as the 1940 Act), which is the principal federal law governing investment companies like the fund, as a result of a position with MFS. The address of MFS is 111 Huntington Avenue, Boston, Massachusetts 02199-7618. |
| Investment Adviser | Custodian |
| Massachusetts Financial Services Company 111 Huntington Avenue Boston, MA 02199-7618 | JPMorgan Chase Bank, NA 4 Metrotech Center New York, NY 11245 |
| Distributor | Independent Registered Public Accounting Firm |
| MFS Fund Distributors, Inc. 111 Huntington Avenue Boston, MA 02199-7618 | Deloitte & Touche LLP 200 Berkeley Street Boston, MA 02116 |
| Portfolio Manager(s) | |
| David Cole Michael Skatrud |
| FACTS | WHAT DOES MFS DO WITH YOUR PERSONAL INFORMATION? |
| Why? | Financial companies choose how they share your personal information. Federal law gives consumers the right to limit some but not all sharing. Federal law also requires us to tell you how we collect, share, and protect your personal information. Please read this notice carefully to understand what we do. |
| What? | The types of personal information we collect and share depend on the product or service you have with us. This information can include: |
| • Social Security number and account balances | |
| • Account transactions and transaction history | |
| • Checking account information and wire transfer instructions | |
| When you are no longer our customer, we continue to share your information as described in this notice. |
| How? | All financial companies need to share customers' personal information to run their everyday business. In the section below, we list the reasons financial companies can share their customers' personal information; the reasons MFS chooses to share; and whether you can limit this sharing. |
| Reasons we can share your personal information | Does MFS share? | Can you limit this sharing? |
| For our everyday business purposes – such as to process your transactions, maintain your account(s), respond to court orders and legal investigations, or report to credit bureaus | Yes | No |
| For our marketing purposes – to offer our products and services to you | No | We don't share |
| For joint marketing with other financial companies | No | We don't share |
| For our affiliates' everyday business purposes – information about your transactions and experiences | No | We don't share |
| For our affiliates' everyday business purposes – information about your creditworthiness | No | We don't share |
| For nonaffiliates to market to you | No | We don't share |
| Questions? | Call 800-225-2606 or go to mfs.com. |

| Who we are | |
| Who is providing this notice? | MFS Funds, MFS Investment Management, MFS Institutional Advisors, Inc., and MFS Heritage Trust Company. |
| What we do | |
| How does MFS protect my personal information? | To protect your personal information from unauthorized access and use, we use security measures that comply with federal law. These measures include procedural, electronic, and physical safeguards for the protection of the personal information we collect about you. |
| How does MFS collect my personal information? | We collect your personal information, for example, when you |
| • open an account or provide account information | |
| • direct us to buy securities or direct us to sell your securities | |
| • make a wire transfer | |
| We also collect your personal information from others, such as credit bureaus, affiliates, or other companies. | |
| Why can't I limit all sharing? | Federal law gives you the right to limit only |
| • sharing for affiliates' everyday business purposes – information about your creditworthiness | |
| • affiliates from using your information to market to you | |
| • sharing for nonaffiliates to market to you | |
| State laws and individual companies may give you additional rights to limit sharing. | |
| Definitions | |
| Affiliates | Companies related by common ownership or control. They can be financial and nonfinancial companies. |
| • MFS does not share personal information with affiliates, except for everyday business purposes as described on page one of this notice. | |
| Nonaffiliates | Companies not related by common ownership or control. They can be financial and nonfinancial companies. |
| • MFS does not share with nonaffiliates so they can market to you. | |
| Joint marketing | A formal agreement between nonaffiliated financial companies that together market financial products or services to you. |
| • MFS doesn't jointly market. | |
| Other important information |
| If you own an MFS product or receive an MFS service in the name of a third party such as a bank or broker-dealer, their privacy policy may apply to you instead of ours. |


Income Fund

Income Fund
| 1 | |
| 2 | |
| 4 | |
| 6 | |
| 9 | |
| 11 | |
| 120 | |
| 122 | |
| 123 | |
| 124 | |
| 129 | |
| 141 | |
| 143 | |
| 147 | |
| 147 | |
| 147 | |
| 147 | |
| 147 | |
| 148 |
| back cover |


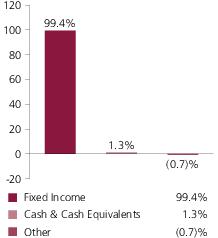
| Healthcare Revenue - Long Term Care | 14.9% |
| Healthcare Revenue - Hospitals | 11.7% |
| Universities - Secondary Schools | 9.6% |
| Miscellaneous Revenue - Other | 7.6% |
| General Obligations - General Purpose | 5.6% |
| Tax - Sales | 5.4% |
| Universities - Colleges | 4.4% |
| Multi-Family Housing Revenue | 4.3% |
| General Obligations - Schools | 3.8% |
| Universities – Dormitories | 3.6% |
| AAA | 0.9% |
| AA | 6.7% |
| A | 11.7% |
| BBB | 21.4% |
| BB | 15.5% |
| B | 3.1% |
| CCC | 1.6% |
| CC | 0.1% |
| C | 1.1% |
| D | 1.6% |
| Not Rated | 35.7% |
| Cash & Cash Equivalents | 1.3% |
| Other | (0.7)% |
| Average Duration (d) | 9.8 |
| Average Effective Maturity (m) | 19.3 yrs. |
| (a) | For all securities other than those specifically described below, ratings are assigned to underlying securities utilizing ratings from Moody’s, Fitch, and Standard & Poor’s rating agencies and applying the following hierarchy: If all three agencies provide a rating, the middle rating (after dropping the highest and lowest ratings) is assigned; if two of the three agencies rate a security, the lower of the two is assigned. If none of the 3 rating agencies above assign a rating, but the security is rated by DBRS Morningstar, then the DBRS Morningstar rating is assigned. If none of the 4 rating agencies listed above rate the security, but the security is rated by the Kroll Bond Rating Agency (KBRA), then the KBRA rating is assigned. Ratings are shown in the S&P and Fitch scale (e.g., AAA). Securities rated BBB or higher are considered investment grade. All ratings are subject to change. U.S. Government includes securities issued by the U.S. Department of the Treasury. Federal Agencies includes rated and unrated U.S. Agency fixed-income securities, U.S. Agency mortgage-backed securities, and collateralized mortgage obligations of U.S. Agency mortgage-backed securities. |
| (d) | Duration is a measure of how much a bond’s price is likely to fluctuate with general changes in interest rates, e.g., if rates rise 1.00%, a bond with a 5-year duration is likely to lose about 5.00% of its value due to the interest rate move. The Average Duration calculation reflects the impact of the equivalent exposure of derivative positions, if any. |
| (i) | For purposes of this presentation, the components include the value of securities, and reflect the impact of the equivalent exposure of derivative positions, if any. These amounts may be negative from time to time. Equivalent exposure is a calculated amount that translates the derivative position into a reasonable approximation of the amount of the underlying asset that the portfolio would have to hold at a given point in time to have the same price sensitivity that results from the portfolio’s ownership of the derivative contract. When dealing with derivatives, equivalent exposure is a more representative measure of the potential impact of a position on portfolio performance than value. The bond component will include any accrued interest amounts. |
| (m) | In determining each instrument’s effective maturity for purposes of calculating the fund’s dollar-weighted average effective maturity, MFS uses the instrument’s stated maturity or, if applicable, an earlier date on which MFS believes it is probable that a maturity-shortening device (such as a put, pre-refunding or prepayment) will cause the instrument to be repaid. Such an earlier date can be substantially shorter than the instrument’s stated maturity. |
| (d) | Duration is a measure of how much a bond’s price is likely to fluctuate with general changes in interest rates, e.g., if rates rise 1.00%, a bond with a 5-year duration is likely to lose about 5.00% of its value. |
| (r) | Securities rated “BBB”, “Baa”, or higher are considered investment grade; securities rated “BB”, “Ba”, or below are considered non-investment grade. Ratings are assigned to underlying securities utilizing ratings from Moody's, Fitch, and Standard & Poor's and applying the following hierarchy: If all three agencies provide a rating, the middle rating (after dropping the highest and lowest ratings) is assigned; if two of the three agencies rate a security, the lower of the two is assigned. If none of the 3 rating agencies above assign a rating, but the security is rated by DBRS Morningstar, then the DBRS Morningstar rating is assigned. If none of the 4 rating agencies listed above rate the security, but the security is rated by the Kroll Bond Rating Agency (KBRA), then the KBRA rating is assigned. Ratings are shown in the S&P and Fitch scale (e.g., AAA). For securities that are not rated by any of the rating agencies, the security is considered Not Rated. |

| Share Class | Class Inception Date | 1-yr | 5-yr | 10-yr | Life (t) |
| A | 2/24/84 | (8.11)% | 1.83% | 2.97% | N/A |
| B | 9/07/93 | (8.67)% | 1.10% | 2.20% | N/A |
| C | 9/25/98 | (8.90)% | 0.85% | 1.95% | N/A |
| I | 6/01/11 | (8.01)% | 1.85% | 2.97% | N/A |
| R6 | 6/02/17 | (8.06)% | 1.91% | N/A | 2.03% |
| Bloomberg Municipal Bond Index (f) | (3.25)% | 2.07% | 2.38% | N/A |
| A With Initial Sales Charge (4.25%) | (12.01)% | 0.95% | 2.53% | N/A |
| B With CDSC (Declining over six years from 4% to 0%) (v) | (12.21)% | 0.75% | 2.20% | N/A |
| C With CDSC (1% for 12 months) (v) | (9.78)% | 0.85% | 1.95% | N/A |
| (f) | Source: FactSet Research Systems Inc. |
| (t) | For the period from the class inception date through the stated period end (for those share classes with less than 10 years of performance history). No comparative benchmark performance information is provided for “life” periods. (See Notes to Performance Summary.) |
| (v) | Assuming redemption at the end of the applicable period. |
| (a) | Source: Bloomberg Index Services Limited. BLOOMBERG® is a trademark and service mark of Bloomberg Finance L.P. and its affiliates (collectively “Bloomberg”). Bloomberg or Bloomberg's licensors own all proprietary rights in the Bloomberg Indices. Bloomberg neither approves or endorses this material, or guarantees the accuracy or completeness of any information herein, or makes any warranty, express or implied, as to the results to be obtained therefrom and, to the maximum extent allowed by law, neither shall have any liability or responsibility for injury or damages arising in connection therewith. |
| Share Class | Annualized Expense Ratio | Beginning Account Value 8/01/22 | Ending Account Value 1/31/23 | Expenses Paid During Period (p) 8/01/22-1/31/23 | |
| A | Actual | 0.60% | $1,000.00 | $983.12 | $3.00 |
| Hypothetical (h) | 0.60% | $1,000.00 | $1,022.18 | $3.06 | |
| B | Actual | 1.35% | $1,000.00 | $979.47 | $6.74 |
| Hypothetical (h) | 1.35% | $1,000.00 | $1,018.40 | $6.87 | |
| C | Actual | 1.60% | $1,000.00 | $978.22 | $7.98 |
| Hypothetical (h) | 1.60% | $1,000.00 | $1,017.14 | $8.13 | |
| I | Actual | 0.60% | $1,000.00 | $984.33 | $3.00 |
| Hypothetical (h) | 0.60% | $1,000.00 | $1,022.18 | $3.06 | |
| R6 | Actual | 0.53% | $1,000.00 | $983.40 | $2.65 |
| Hypothetical (h) | 0.53% | $1,000.00 | $1,022.53 | $2.70 |
| (h) | 5% class return per year before expenses. |
| (p) | “Expenses Paid During Period” are equal to each class’s annualized expense ratio, as shown above, multiplied by the average account value over the period, multiplied by 184/365 (to reflect the one-half year period). Expenses paid do not include any applicable sales charges (loads). If these transaction costs had been included, your costs would have been higher. |
| Issuer | Shares/Par | Value ($) | ||
| Municipal Bonds - 97.3% | ||||
| Alabama - 1.3% | ||||
| Alabama Southeast Energy Authority Commodity Supply Rev. (Project No. 3), “A-1”, 5.5%, 1/01/2053 (Put Date 12/01/2029) | $ | 4,980,000 | $5,421,371 | |
| Alabama Stadium Trace Village Improvement District Development Incentive Anticipation, 3.625%, 3/01/2036 | 1,845,000 | 1,484,971 | ||
| Birmingham, AL, Airport Authority Rev., BAM, 4%, 7/01/2035 | 335,000 | 350,475 | ||
| Birmingham, AL, Airport Authority Rev., BAM, 4%, 7/01/2037 | 260,000 | 266,546 | ||
| Birmingham, AL, Airport Authority Rev., BAM, 4%, 7/01/2039 | 340,000 | 345,269 | ||
| Birmingham, AL, Airport Authority Rev., BAM, 4%, 7/01/2040 | 175,000 | 176,935 | ||
| Birmingham, AL, Special Care Facilities Financing Authority Rev. (Methodist Home for the Aging), 5.5%, 6/01/2030 | 1,630,000 | 1,564,368 | ||
| Birmingham, AL, Special Care Facilities Financing Authority Rev. (Methodist Home for the Aging), 5.75%, 6/01/2035 | 1,685,000 | 1,599,275 | ||
| Birmingham, AL, Special Care Facilities Financing Authority Rev. (Methodist Home for the Aging), 5.75%, 6/01/2045 | 6,355,000 | 5,734,712 | ||
| Birmingham, AL, Special Care Facilities Financing Authority Rev. (Methodist Home for the Aging), 6%, 6/01/2050 | 2,565,000 | 2,343,961 | ||
| Black Belt Energy Gas District, AL, Gas Project Rev., “C-1”, 5.25%, 2/01/2053 (Put Date 6/01/2029) | 10,000,000 | 10,725,105 | ||
| Black Belt Energy Gas District, AL, Gas Project Rev., “F”, 5.5%, 11/01/2053 (Put Date 12/01/2028) | 5,175,000 | 5,558,151 | ||
| Huntsville-Redstone Village, AL, Special Care Facilities Financing Authority (Redstone Village Project), 5.5%, 1/01/2028 (a)(d) | 1,485,000 | 920,700 | ||
| Huntsville-Redstone Village, AL, Special Care Facilities Financing Authority (Redstone Village Project), 5.5%, 1/01/2043 (a)(d) | 1,560,000 | 967,200 | ||
| Jefferson County, AL, Sewer Rev. Warrants, Capital Appreciation, Senior Lien, “B”, AGM, 0%, 10/01/2026 | 805,000 | 693,964 | ||
| Jefferson County, AL, Sewer Rev. Warrants, Capital Appreciation, Senior Lien, “B”, AGM, 0%, 10/01/2029 | 1,130,000 | 800,956 | ||
| Jefferson County, AL, Sewer Rev. Warrants, Capital Appreciation, Senior Lien, “B”, AGM, 0%, 10/01/2034 | 1,620,000 | 809,839 | ||
| Jefferson County, AL, Sewer Rev. Warrants, Capital Appreciation, Senior Lien, “B”, AGM, 0%, 10/01/2035 | 3,080,000 | 1,441,697 | ||
| Muscle Shoals, Sheffield, and Tuscumbia, AL, Solid Waste Disposal Authority Rev. (Cherokee Industrial Landfill Project), “A”, 6%, 5/01/2040 (n) | 4,200,000 | 4,146,289 | ||
| Muscle Shoals, Sheffield, and Tuscumbia, AL, Solid Waste Disposal Authority Rev., Taxable (Cherokee Industrial Landfill Project), “B”, 8%, 5/01/2029 (n) | 1,400,000 | 1,324,486 | ||
| Prichard, AL, Water Works & Sewer Board Rev., 4%, 11/01/2044 (d) | 1,800,000 | 904,123 | ||
| Issuer | Shares/Par | Value ($) | ||
| Municipal Bonds - continued | ||||
| Alabama - continued | ||||
| Prichard, AL, Water Works & Sewer Board Rev., 4%, 11/01/2049 (d) | $ | 3,500,000 | $1,755,908 | |
| Sumter County, AL, Industrial Development Authority Exempt Facilities Rev. (Enviva Inc. Project), 6%, 7/15/2052 (Put Date 7/15/2032) | 9,565,000 | 8,768,856 | ||
| $58,105,157 | ||||
| Alaska - 0.2% | ||||
| Alaska Industrial Development & Export Authority Power Rev. (Snettisham Hydroelectric Project), 5%, 1/01/2030 | $ | 875,000 | $905,352 | |
| Alaska Industrial Development & Export Authority Power Rev. (Snettisham Hydroelectric Project), 5%, 1/01/2031 | 1,270,000 | 1,312,993 | ||
| Northern Alaska Tobacco Securitization Corp., Tobacco Settlement Asset-Backed, Capital Appreciation, “B-2”, 0%, 6/01/2066 | 61,290,000 | 8,118,737 | ||
| $10,337,082 | ||||
| Arizona - 3.5% | ||||
| Arizona Industrial Development Authority Education Rev. (Academies of Math & Science), 4%, 7/01/2029 (n) | $ | 725,000 | $709,320 | |
| Arizona Industrial Development Authority Education Rev. (Academies of Math & Science), 5%, 7/01/2039 (n) | 870,000 | 870,907 | ||
| Arizona Industrial Development Authority Education Rev. (Academies of Math & Science), 5.25%, 7/01/2043 | 120,000 | 120,318 | ||
| Arizona Industrial Development Authority Education Rev. (Academies of Math & Science), 5%, 7/01/2049 (n) | 1,395,000 | 1,324,411 | ||
| Arizona Industrial Development Authority Education Rev. (Academies of Math & Science), 5.375%, 7/01/2053 | 440,000 | 436,394 | ||
| Arizona Industrial Development Authority Education Rev. (Academies of Math & Science), 5%, 7/01/2054 (n) | 2,185,000 | 2,040,905 | ||
| Arizona Industrial Development Authority Education Rev. (Academies of Math & Science), 5.5%, 7/01/2058 | 410,000 | 406,816 | ||
| Arizona Industrial Development Authority Education Rev. (Academies of Math & Science), “A”, 5%, 7/01/2052 | 1,140,000 | 1,161,253 | ||
| Arizona Industrial Development Authority Education Rev. (Academies of Math & Science), “B”, 5.5%, 7/01/2038 (n) | 1,065,000 | 1,088,599 | ||
| Arizona Industrial Development Authority Education Rev. (Academies of Math & Science), “B”, 5.625%, 7/01/2048 (n) | 2,050,000 | 2,073,166 | ||
| Arizona Industrial Development Authority Education Rev. (Academies of Math & Science), “B”, 5.75%, 7/01/2053 (n) | 3,190,000 | 3,236,601 | ||
| Arizona Industrial Development Authority Education Rev. (Basis Schools Projects), “D”, 5%, 7/01/2037 (n) | 450,000 | 450,510 | ||
| Arizona Industrial Development Authority Education Rev. (Basis Schools Projects), “D”, 5%, 7/01/2047 (n) | 740,000 | 698,162 | ||
| Issuer | Shares/Par | Value ($) | ||
| Municipal Bonds - continued | ||||
| Arizona - continued | ||||
| Arizona Industrial Development Authority Education Rev. (Basis Schools Projects), “D”, 5%, 7/01/2051 (n) | $ | 1,970,000 | $1,834,486 | |
| Arizona Industrial Development Authority Education Rev. (Basis Schools Projects), “G”, 5%, 7/01/2037 (n) | 770,000 | 770,872 | ||
| Arizona Industrial Development Authority Education Rev. (Basis Schools Projects), “G”, 5%, 7/01/2047 (n) | 770,000 | 726,466 | ||
| Arizona Industrial Development Authority Education Rev. (Basis Schools Projects), “G”, 5%, 7/01/2051 (n) | 735,000 | 684,440 | ||
| Arizona Industrial Development Authority Education Rev. (Benjamin Franklin Charter School Projects), “A”, 5.25%, 7/01/2053 | 440,000 | 430,817 | ||
| Arizona Industrial Development Authority Education Rev. (Benjamin Franklin Charter School Projects), “A”, 5.5%, 7/01/2058 | 440,000 | 437,258 | ||
| Arizona Industrial Development Authority Education Rev. (KIPP Nashville Projects), “A”, 5%, 7/01/2047 | 375,000 | 383,704 | ||
| Arizona Industrial Development Authority Education Rev. (KIPP Nashville Projects), “A”, 5%, 7/01/2057 | 475,000 | 480,572 | ||
| Arizona Industrial Development Authority Education Rev. (KIPP Nashville Projects), “A”, 5%, 7/01/2062 | 665,000 | 668,681 | ||
| Arizona Industrial Development Authority Education Rev. (Mater Academy of Nevada - Bonanza Campus Project), “A”, 4%, 12/15/2030 (n) | 2,455,000 | 2,388,580 | ||
| Arizona Industrial Development Authority Education Rev. (Mater Academy of Nevada - Bonanza Campus Project), “A”, 5%, 12/15/2040 (n) | 1,000,000 | 1,000,444 | ||
| Arizona Industrial Development Authority Education Rev. (Mater Academy of Nevada - Bonanza Campus Project), “A”, 5%, 12/15/2050 (n) | 1,700,000 | 1,628,447 | ||
| Arizona Industrial Development Authority Education Rev. (Pinecrest Academy of Nevada - Cadence Campus Project), “A”, 4%, 7/15/2030 (n) | 595,000 | 574,134 | ||
| Arizona Industrial Development Authority Education Rev. (Pinecrest Academy of Nevada - Cadence Campus Project), “A”, 4%, 7/15/2040 (n) | 1,425,000 | 1,240,752 | ||
| Arizona Industrial Development Authority Education Rev. (Pinecrest Academy of Nevada - Cadence Campus Project), “A”, 4%, 7/15/2050 (n) | 1,600,000 | 1,265,803 | ||
| Arizona Industrial Development Authority Education Rev. (Pinecrest Academy of Nevada - Inspirada and St. Rose Campus Projects), “A”, 5%, 7/15/2028 (n) | 1,805,000 | 1,841,665 | ||
| Issuer | Shares/Par | Value ($) | ||
| Municipal Bonds - continued | ||||
| Arizona - continued | ||||
| Arizona Industrial Development Authority Education Rev. (Pinecrest Academy of Nevada - Inspirada and St. Rose Campus Projects), “A”, 5.75%, 7/15/2038 (n) | $ | 1,810,000 | $1,879,217 | |
| Arizona Industrial Development Authority Education Rev. (Pinecrest Academy of Nevada - Inspirada and St. Rose Campus Projects), “A”, 5.75%, 7/15/2048 (n) | 3,100,000 | 3,167,880 | ||
| Arizona Industrial Development Authority Education Rev. (Somerset Academy of Las Vegas - Aliante & Skye Canyon Campus Projects), “A”, 3%, 12/15/2031 (n) | 605,000 | 542,094 | ||
| Arizona Industrial Development Authority Education Rev. (Somerset Academy of Las Vegas - Aliante & Skye Canyon Campus Projects), “A”, 4%, 12/15/2041 (n) | 680,000 | 580,414 | ||
| Arizona Industrial Development Authority Education Rev. (Somerset Academy of Las Vegas - Aliante & Skye Canyon Campus Projects), “A”, 4%, 12/15/2051 (n) | 845,000 | 659,573 | ||
| Arizona Industrial Development Authority Education Rev. (Somerset Academy of Las Vegas - Lone Mountain Campus Project), “A”, 3.75%, 12/15/2029 (n) | 410,000 | 394,332 | ||
| Arizona Industrial Development Authority Education Rev. (Somerset Academy of Las Vegas - Lone Mountain Campus Project), “A”, 5%, 12/15/2039 (n) | 340,000 | 341,437 | ||
| Arizona Industrial Development Authority Education Rev. (Somerset Academy of Las Vegas - Lone Mountain Campus Project), “A”, 5%, 12/15/2049 (n) | 600,000 | 574,329 | ||
| Arizona Industrial Development Authority National Charter School Revolving Loan Fund Rev., “A”, 4%, 11/01/2051 | 2,450,000 | 2,197,469 | ||
| Florence, AZ, Industrial Development Authority Education Rev. (Legacy Traditional School Project - Queen Creek & Casa Grande Campuses), 6%, 7/01/2043 (Prerefunded 7/01/2023) | 3,150,000 | 3,194,512 | ||
| Glendale, AZ, Industrial Development Authority Refunding Rev. (Terraces of Phoenix Project), “A”, 4%, 7/01/2028 | 300,000 | 278,631 | ||
| Glendale, AZ, Industrial Development Authority Refunding Rev. (Terraces of Phoenix Project), “A”, 5%, 7/01/2033 | 250,000 | 232,850 | ||
| Glendale, AZ, Industrial Development Authority Refunding Rev. (Terraces of Phoenix Project), “A”, 5%, 7/01/2038 | 300,000 | 268,972 | ||
| Glendale, AZ, Industrial Development Authority Refunding Rev. (Terraces of Phoenix Project), “A”, 5%, 7/01/2048 | 1,800,000 | 1,509,239 | ||
| Glendale, AZ, Industrial Development Authority, Graduate & Professional Student Loan Program Rev. (Midwestern University Foundation), “A”, 2.125%, 7/01/2033 | 1,405,000 | 1,231,997 | ||
| Glendale, AZ, Industrial Development Authority, Graduate & Professional Student Loan Program Rev. (Midwestern University Foundation), “A”, 3%, 7/01/2035 | 2,705,000 | 2,610,828 | ||
| Issuer | Shares/Par | Value ($) | ||
| Municipal Bonds - continued | ||||
| Arizona - continued | ||||
| Glendale, AZ, Industrial Development Authority, Senior Living Rev. (Royal Oaks - Inspirata Pointe Project), “A”, 5%, 5/15/2041 | $ | 1,000,000 | $947,129 | |
| Glendale, AZ, Industrial Development Authority, Senior Living Rev. (Royal Oaks - Inspirata Pointe Project), “A”, 5%, 5/15/2056 | 5,955,000 | 5,279,439 | ||
| La Paz County, AZ, Industrial Development Authority (Harmony Education Foundation-Harmony Public Schools Project), “A”, 4%, 2/15/2041 | 430,000 | 382,695 | ||
| La Paz County, AZ, Industrial Development Authority (Harmony Education Foundation-Harmony Public Schools Project), “A”, 4%, 2/15/2046 | 345,000 | 292,729 | ||
| La Paz County, AZ, Industrial Development Authority (Harmony Education Foundation-Harmony Public Schools Project), “A”, 4%, 2/15/2051 | 580,000 | 476,156 | ||
| La Paz County, AZ, Industrial Development Authority Education Facility Lease Rev. (Charter School Solutions-Harmony Public Schools Project), “A”, 5%, 2/15/2038 | 800,000 | 817,963 | ||
| La Paz County, AZ, Industrial Development Authority Education Facility Lease Rev. (Charter School Solutions-Harmony Public Schools Project), “A”, 5%, 2/15/2048 | 435,000 | 438,496 | ||
| Maricopa County, AZ, Industrial Development Authority Education Rev. (Legacy Traditional Schools Projects), “A”, 4%, 7/01/2034 | 215,000 | 219,498 | ||
| Maricopa County, AZ, Industrial Development Authority Education Rev. (Legacy Traditional Schools Projects), “A”, 5%, 7/01/2039 | 380,000 | 402,662 | ||
| Maricopa County, AZ, Industrial Development Authority Education Rev. (Legacy Traditional Schools Projects), “A”, 5%, 7/01/2039 (n) | 1,115,000 | 1,114,951 | ||
| Maricopa County, AZ, Industrial Development Authority Education Rev. (Legacy Traditional Schools Projects), “A”, 5%, 7/01/2049 (n) | 705,000 | 737,883 | ||
| Maricopa County, AZ, Industrial Development Authority Education Rev. (Legacy Traditional Schools Projects), “A”, 5%, 7/01/2049 (n) | 590,000 | 556,175 | ||
| Maricopa County, AZ, Industrial Development Authority Education Rev. (Legacy Traditional Schools Projects), “A”, 5%, 7/01/2054 | 895,000 | 932,851 | ||
| Maricopa County, AZ, Industrial Development Authority Education Rev. (Legacy Traditional Schools Projects), “A”, 5%, 7/01/2054 (n) | 2,660,000 | 2,473,269 | ||
| Maricopa County, AZ, Pollution Control Corp. Rev. (Public Service Company of New Mexico Palo Verde Project), “B”, 0.875%, 6/01/2043 (Put Date 10/01/2026) | 855,000 | 763,946 | ||
| Issuer | Shares/Par | Value ($) | ||
| Municipal Bonds - continued | ||||
| Arizona - continued | ||||
| Phoenix, AZ, Industrial Development Authority Rev. (Guam Facilities Foundation, Inc.), 5.125%, 2/01/2034 | $ | 4,545,000 | $4,573,070 | |
| Phoenix, AZ, Industrial Development Authority Rev. (Guam Facilities Foundation, Inc.), 5.375%, 2/01/2041 | 3,980,000 | 3,991,749 | ||
| Phoenix, AZ, Industrial Development Authority, Education Facility Rev. (Basis Schools Projects), “A”, 5%, 7/01/2035 (n) | 2,070,000 | 2,079,380 | ||
| Phoenix, AZ, Industrial Development Authority, Education Facility Rev. (Basis Schools Projects), “A”, 5%, 7/01/2035 (n) | 700,000 | 703,172 | ||
| Phoenix, AZ, Industrial Development Authority, Education Facility Rev. (Basis Schools Projects), “A”, 5%, 7/01/2045 (n) | 3,065,000 | 2,921,903 | ||
| Phoenix, AZ, Industrial Development Authority, Education Facility Rev. (Basis Schools Projects), “A”, 5%, 7/01/2046 (n) | 1,770,000 | 1,678,711 | ||
| Phoenix, AZ, Industrial Development Authority, Education Facility Rev. (Great Hearts Academies Project), “A”, 5%, 7/01/2034 | 6,355,000 | 6,463,988 | ||
| Phoenix, AZ, Industrial Development Authority, Education Facility Rev. (Great Hearts Academies Project), “A”, 5%, 7/01/2036 | 815,000 | 832,026 | ||
| Phoenix, AZ, Industrial Development Authority, Education Facility Rev. (Great Hearts Academies Project), “A”, 5%, 7/01/2041 | 660,000 | 668,988 | ||
| Phoenix, AZ, Industrial Development Authority, Education Facility Rev. (Great Hearts Academies Project), “A”, 5%, 7/01/2044 | 3,970,000 | 4,000,517 | ||
| Phoenix, AZ, Industrial Development Authority, Education Facility Rev. (Great Hearts Academies Project), “A”, 5%, 7/01/2046 | 1,235,000 | 1,248,411 | ||
| Phoenix, AZ, Industrial Development Authority, Education Facility Rev. (Legacy Traditional Schools Project), 6.5%, 7/01/2034 (n) | 1,970,000 | 2,032,847 | ||
| Phoenix, AZ, Industrial Development Authority, Education Facility Rev. (Legacy Traditional Schools Project), 5%, 7/01/2035 (n) | 1,430,000 | 1,440,272 | ||
| Phoenix, AZ, Industrial Development Authority, Education Facility Rev. (Legacy Traditional Schools Project), 6.75%, 7/01/2044 (n) | 3,255,000 | 3,336,559 | ||
| Phoenix, AZ, Industrial Development Authority, Education Facility Rev. (Legacy Traditional Schools Project), 5%, 7/01/2045 (n) | 1,570,000 | 1,506,585 | ||
| Phoenix, AZ, Industrial Development Authority, Education Facility Rev. (Legacy Traditional Schools Project), 5%, 7/01/2046 (n) | 3,935,000 | 3,757,219 | ||
| Phoenix, AZ, Industrial Development Authority, Hotel Rev. (Provident Group - Falcon Properties LLC, Project), “A”, 4%, 12/01/2041 (n) | 2,605,000 | 2,221,847 | ||
| Phoenix, AZ, Industrial Development Authority, Hotel Rev. (Provident Group - Falcon Properties LLC, Project), “A”, 4%, 12/01/2051 (n) | 8,630,000 | 6,838,234 | ||
| Phoenix, AZ, Industrial Development Authority, Hotel Rev. (Provident Group - Falcon Properties LLC, Project), “A”, 4.15%, 12/01/2057 (n) | 3,245,000 | 2,519,425 | ||
| Issuer | Shares/Par | Value ($) | ||
| Municipal Bonds - continued | ||||
| Arizona - continued | ||||
| Phoenix, AZ, Industrial Development Authority, Hotel Rev. (Provident Group - Falcon Properties LLC, Project), “B”, 5.75%, 12/15/2057 (n) | $ | 8,330,000 | $6,776,785 | |
| Phoenix, AZ, Industrial Development Authority, Student Housing Refunding Rev. (Downtown Phoenix Student Housing II LLC-Arizona State University Project), “A”, 5%, 7/01/2044 | 540,000 | 545,879 | ||
| Phoenix, AZ, Industrial Development Authority, Student Housing Refunding Rev. (Downtown Phoenix Student Housing II LLC-Arizona State University Project), “A”, 5%, 7/01/2049 | 1,325,000 | 1,331,437 | ||
| Phoenix, AZ, Industrial Development Authority, Student Housing Refunding Rev. (Downtown Phoenix Student Housing II LLC-Arizona State University Project), “A”, 5%, 7/01/2059 | 1,085,000 | 1,084,952 | ||
| Phoenix, AZ, Industrial Development Authority, Student Housing Refunding Rev. (Downtown Phoenix Student Housing LLC-Arizona State University Project), “A”, 5%, 7/01/2030 | 150,000 | 157,083 | ||
| Phoenix, AZ, Industrial Development Authority, Student Housing Refunding Rev. (Downtown Phoenix Student Housing LLC-Arizona State University Project), “A”, 5%, 7/01/2031 | 570,000 | 596,069 | ||
| Phoenix, AZ, Industrial Development Authority, Student Housing Refunding Rev. (Downtown Phoenix Student Housing LLC-Arizona State University Project), “A”, 5%, 7/01/2033 | 315,000 | 327,698 | ||
| Phoenix, AZ, Industrial Development Authority, Student Housing Refunding Rev. (Downtown Phoenix Student Housing LLC-Arizona State University Project), “A”, 5%, 7/01/2037 | 500,000 | 509,709 | ||
| Phoenix, AZ, Industrial Development Authority, Student Housing Refunding Rev. (Downtown Phoenix Student Housing LLC-Arizona State University Project), “A”, 5%, 7/01/2042 | 555,000 | 557,587 | ||
| Pima County, AZ, Industrial Development Authority Education Facility Rev. (American Leadership Academy Project), 5%, 6/15/2034 (n) | 730,000 | 736,282 | ||
| Pima County, AZ, Industrial Development Authority Education Facility Rev. (American Leadership Academy Project), 5%, 6/15/2039 (n) | 655,000 | 655,106 | ||
| Pima County, AZ, Industrial Development Authority Education Facility Rev. (American Leadership Academy Project), 4%, 6/15/2041 (n) | 510,000 | 431,136 | ||
| Issuer | Shares/Par | Value ($) | ||
| Municipal Bonds - continued | ||||
| Arizona - continued | ||||
| Pima County, AZ, Industrial Development Authority Education Facility Rev. (American Leadership Academy Project), 4%, 6/15/2041 (n) | $ | 2,735,000 | $2,312,072 | |
| Pima County, AZ, Industrial Development Authority Education Facility Rev. (American Leadership Academy Project), 5%, 6/15/2049 (n) | 1,235,000 | 1,167,542 | ||
| Pima County, AZ, Industrial Development Authority Education Facility Rev. (American Leadership Academy Project), 4%, 6/15/2051 (n) | 3,020,000 | 2,329,986 | ||
| Pima County, AZ, Industrial Development Authority Education Facility Rev. (American Leadership Academy Project), 4%, 6/15/2051 (n) | 780,000 | 601,785 | ||
| Pima County, AZ, Industrial Development Authority Education Facility Rev. (American Leadership Academy Project), 4%, 6/15/2057 (n) | 685,000 | 508,633 | ||
| Pima County, AZ, Industrial Development Authority Education Facility Rev. (American Leadership Academy Project), 4%, 6/15/2057 (n) | 3,420,000 | 2,539,452 | ||
| Pima County, AZ, Industrial Development Authority Senior Living Rev. (La Posada at Pusch Ridge Project), “A”, 6.75%, 11/15/2042 (n) | 1,825,000 | 1,905,761 | ||
| Pima County, AZ, Industrial Development Authority Senior Living Rev. (La Posada at Pusch Ridge Project), “A”, 6.875%, 11/15/2052 (n) | 5,160,000 | 5,358,351 | ||
| Pima County, AZ, Industrial Development Authority Senior Living Rev. (La Posada at Pusch Ridge Project), “A”, 7%, 11/15/2057 (n) | 2,320,000 | 2,407,816 | ||
| Pima County, AZ, Industrial Development Authority Senior Living Rev. (La Posada at Pusch Ridge Project), “B3”, 5.125%, 11/15/2029 (n) | 1,250,000 | 1,255,650 | ||
| Salt Verde Financial Corp., AZ, Senior Gas Rev., 5%, 12/01/2032 | 2,940,000 | 3,207,054 | ||
| $156,592,827 | ||||
| Arkansas - 0.3% | ||||
| Arkansas Development Finance Authority, Charter School Capital Improvement Rev. (LISA Academy Project), 4%, 7/01/2028 | $ | 800,000 | $784,708 | |
| Arkansas Development Finance Authority, Charter School Capital Improvement Rev. (LISA Academy Project), 4.5%, 7/01/2033 | 1,620,000 | 1,610,628 | ||
| Arkansas Development Finance Authority, Charter School Capital Improvement Rev. (LISA Academy Project), 4.5%, 7/01/2039 | 170,000 | 161,832 | ||
| Arkansas Development Finance Authority, Health Care Rev. (Baptist Memorial Health Care Corp.), “B-1”, 5%, 9/01/2036 | 930,000 | 982,432 | ||
| Arkansas Development Finance Authority, Health Care Rev. (Baptist Memorial Health Care Corp.), “B-1”, 5%, 9/01/2037 | 645,000 | 674,767 | ||
| Issuer | Shares/Par | Value ($) | ||
| Municipal Bonds - continued | ||||
| Arkansas - continued | ||||
| Arkansas Development Finance Authority, Health Care Rev. (Baptist Memorial Health Care Corp.), “B-1”, 5%, 9/01/2039 | $ | 520,000 | $539,292 | |
| Arkansas Development Finance Authority, Health Care Rev. (Baptist Memorial Health Care Corp.), “B-1”, 5%, 9/01/2040 | 570,000 | 587,492 | ||
| Arkansas Development Finance Authority, Healthcare Facilities Rev. (Carti Surgery Center Project), “B”, 3%, 7/01/2032 | 180,000 | 157,781 | ||
| Arkansas Development Finance Authority, Healthcare Facilities Rev. (Carti Surgery Center Project), “B”, 3.125%, 7/01/2036 | 520,000 | 418,415 | ||
| Arkansas Development Finance Authority, Healthcare Facilities Rev. (Carti Surgery Center Project), “B”, 4.25%, 7/01/2041 | 195,000 | 179,566 | ||
| Arkansas Development Finance Authority, Healthcare Facilities Rev. (Carti Surgery Center Project), “B”, 3.5%, 7/01/2046 | 1,185,000 | 815,096 | ||
| Arkansas Development Finance Authority, Healthcare Facilities Rev. (Carti Surgery Center Project), “B”, 4%, 7/01/2052 | 850,000 | 705,929 | ||
| Arkansas Development Finance Authority, Hospital Rev. (Washington Regional Medical Center), “A”, 5%, 2/01/2035 | 365,000 | 372,643 | ||
| Arkansas Development Finance Authority, Hospital Rev. (Washington Regional Medical Center), “C”, 5%, 2/01/2033 | 540,000 | 553,334 | ||
| Arkansas Development Finance Authority, Tobacco Settlement Rev. (Cancer Research Center Project), Capital Appreciation, AAC, 0%, 7/01/2046 | 6,455,000 | 2,201,186 | ||
| Pulaski County, AR, Public Facilities Board, Healthcare Rev. (Baptist Health), 5%, 12/01/2039 (Prerefunded 12/01/2024) | 4,510,000 | 4,715,300 | ||
| $15,460,401 | ||||
| California - 6.7% | ||||
| Acton-Agua Dulce, CA, Unified School District (Election of 2008), Capital Appreciation, AGM, 0%, 5/01/2039 | $ | 7,550,000 | $3,871,805 | |
| Beverly Hills, CA, Unified School District (Election of 2008), Capital Appreciation, 0%, 8/01/2031 | 2,060,000 | 1,615,699 | ||
| Beverly Hills, CA, Unified School District (Election of 2008), Capital Appreciation, 0%, 8/01/2032 | 2,095,000 | 1,585,865 | ||
| Beverly Hills, CA, Unified School District (Election of 2008), Capital Appreciation, 0%, 8/01/2033 | 4,185,000 | 3,050,490 | ||
| California Community College Financing Authority Student Housing Rev. (NCCD - Napa Valley Properties LLC - Napa Valley College Project), “A”, 5.75%, 7/01/2060 (n) | 12,810,000 | 12,789,674 | ||
| California Community Housing Agency, Essential Housing Rev. (Aster), “A-1”, 4%, 2/01/2056 (n) | 6,870,000 | 6,036,429 | ||
| California Community Housing Agency, Essential Housing Rev. (Aster), “A-2”, 4%, 2/01/2043 (n) | 6,945,000 | 5,994,227 | ||
| Issuer | Shares/Par | Value ($) | ||
| Municipal Bonds - continued | ||||
| California - continued | ||||
| California County Tobacco Securitization Agency Settlement (Gold Country Settlement Funding Corp.), Capital Appreciation, “B-2”, 0%, 6/01/2055 | $ | 8,415,000 | $1,868,060 | |
| California County Tobacco Securitization Agency Settlement (Los Angeles County Securitization Corp.), “A”, 5%, 6/01/2032 | 160,000 | 175,175 | ||
| California County Tobacco Securitization Agency Settlement (Los Angeles County Securitization Corp.), “A”, 4%, 6/01/2035 | 210,000 | 212,522 | ||
| California County Tobacco Securitization Agency Settlement (Los Angeles County Securitization Corp.), “A”, 4%, 6/01/2037 | 340,000 | 339,250 | ||
| California County Tobacco Securitization Agency Settlement (Los Angeles County Securitization Corp.), “A”, 4%, 6/01/2038 | 145,000 | 143,844 | ||
| California County Tobacco Securitization Agency Settlement (Los Angeles County Securitization Corp.), “A”, 4%, 6/01/2039 | 185,000 | 181,939 | ||
| California Health Facilities Financing Authority Rev. (CommonSpirit Health), “A”, 4%, 4/01/2049 | 1,005,000 | 933,510 | ||
| California Housing Finance Agency Municipal Certificates, “X”, 0.76%, 8/20/2036 (i)(n) | 27,076,964 | 1,509,679 | ||
| California M-S-R Energy Authority Gas Rev., “A”, 7%, 11/01/2034 | 1,135,000 | 1,465,716 | ||
| California Municipal Finance Authority Rev. (California Baptist University), “A”, 5%, 11/01/2046 (n) | 4,500,000 | 4,462,577 | ||
| California Municipal Finance Authority Rev. (Community Medical Centers), “A”, 5%, 2/01/2042 | 1,385,000 | 1,441,188 | ||
| California Municipal Finance Authority Rev. (NorthBay Healthcare Group), 5%, 11/01/2035 | 475,000 | 483,471 | ||
| California Municipal Finance Authority Rev. (NorthBay Healthcare Group), “A”, 5.25%, 11/01/2036 | 1,370,000 | 1,397,833 | ||
| California Municipal Finance Authority Rev. (NorthBay Healthcare Group), “A”, 5.25%, 11/01/2041 | 1,265,000 | 1,286,491 | ||
| California Municipal Finance Authority Rev. (NorthBay Healthcare Group), “A”, 5.25%, 11/01/2047 | 210,000 | 213,291 | ||
| California Municipal Finance Authority Rev. (Partnerships to Uplift Communities Project), “A”, 5%, 8/01/2032 | 1,585,000 | 1,546,410 | ||
| California Municipal Finance Authority Rev. (William Jessup University), 5%, 8/01/2039 | 6,550,000 | 6,307,772 | ||
| California Municipal Finance Authority Rev. (William Jessup University), 5%, 8/01/2048 | 2,325,000 | 2,122,131 | ||
| California Municipal Finance Authority, Charter School Lease Rev. (Palmdale Aerospace Academy Project), “A”, 3.875%, 7/01/2028 (n) | 1,000,000 | 963,249 | ||
| California Municipal Finance Authority, Charter School Lease Rev. (Palmdale Aerospace Academy Project), “A”, 5%, 7/01/2049 (n) | 1,600,000 | 1,439,913 | ||
| Issuer | Shares/Par | Value ($) | ||
| Municipal Bonds - continued | ||||
| California - continued | ||||
| California Municipal Finance Authority, COP (Palomar Health), “A”, AGM, 5.25%, 11/01/2052 | $ | 3,370,000 | $3,652,899 | |
| California Municipal Finance Authority, Multi-Family Housing Rev. (CityView Apartments), “A”, 4%, 11/01/2036 (n) | 2,120,000 | 1,968,345 | ||
| California Municipal Finance Authority, Student Housing Rev. (CHF-Davis II LLC - Orchard Park Student Housing Project), BAM, 4%, 5/15/2033 | 310,000 | 323,939 | ||
| California Municipal Finance Authority, Student Housing Rev. (CHF-Davis II LLC - Orchard Park Student Housing Project), BAM, 4%, 5/15/2038 | 425,000 | 426,876 | ||
| California Municipal Special Finance Agency XII, Essential Housing Rev. (Allure Apartments), “A-1”, 3.25%, 2/01/2057 (n) | 1,650,000 | 1,173,042 | ||
| California Municipal Special Finance Agency, Essential Housing Rev. (Solana at Grand), “A-1”, 4%, 8/01/2056 (n) | 3,380,000 | 2,967,311 | ||
| California Pollution Control Financing Authority, Solid Waste Disposal Rev. (CalPlant I Project), 7.5%, 7/01/2032 (a)(d)(z) | 2,250,000 | 112,500 | ||
| California Pollution Control Financing Authority, Solid Waste Disposal Rev. (CalPlant I Project), 8%, 7/01/2039 (a)(d)(z) | 11,405,000 | 570,250 | ||
| California Pollution Control Financing Authority, Solid Waste Disposal Rev. (CalPlant I Project), 7.5%, 12/01/2039 (a)(d)(z) | 12,890,000 | 644,500 | ||
| California Public Finance Authority Rev. (Henry Mayo Newhall Hospital), 5%, 10/15/2033 | 215,000 | 226,348 | ||
| California Public Finance Authority Rev. (Henry Mayo Newhall Hospital), 5%, 10/15/2037 | 435,000 | 449,234 | ||
| California Public Finance Authority Rev. (Henry Mayo Newhall Hospital), 5%, 10/15/2047 | 435,000 | 438,976 | ||
| California Public Finance Authority, Senior Living Refunding Rev. (Enso Village Project), “A”, 5%, 11/15/2046 (n) | 4,770,000 | 4,274,866 | ||
| California Public Finance Authority, Senior Living Refunding Rev. (Enso Village Project), “A”, 5%, 11/15/2051 (n) | 2,350,000 | 2,073,275 | ||
| California Public Finance Authority, Senior Living Refunding Rev. (Enso Village Project), “A”, 5%, 11/15/2056 (n) | 3,445,000 | 2,983,900 | ||
| California Public Finance Authority, Senior Living Rev. (Enso Village Project), “A”, 5%, 11/15/2036 (n) | 1,670,000 | 1,616,538 | ||
| California Public Finance Authority, Senior Living Rev. (Enso Village Project), “B-1”, 3.125%, 5/15/2029 (n) | 2,200,000 | 1,973,106 | ||
| California Public Finance Authority, Senior Living Rev. (Enso Village Project), “B-2”, 2.375%, 11/15/2028 (n) | 1,465,000 | 1,379,311 | ||
| California Public Finance Authority, Senior Living Rev. (Enso Village Project), “B-3”, 2.125%, 11/15/2027 (n) | 2,230,000 | 2,111,971 | ||
| California School Finance Authority, Charter School Refunding Rev. (Aspire Public Schools), 5%, 8/01/2036 (Prerefunded 8/01/2025) (n) | 75,000 | 79,898 | ||
| Issuer | Shares/Par | Value ($) | ||
| Municipal Bonds - continued | ||||
| California - continued | ||||
| California School Finance Authority, Charter School Refunding Rev. (Aspire Public Schools), 5%, 8/01/2036 (n) | $ | 790,000 | $806,556 | |
| California School Finance Authority, Charter School Refunding Rev. (Aspire Public Schools), 5%, 8/01/2041 (Prerefunded 8/01/2025) (n) | 50,000 | 53,265 | ||
| California School Finance Authority, Charter School Refunding Rev. (Aspire Public Schools), 5%, 8/01/2041 (n) | 625,000 | 632,487 | ||
| California School Finance Authority, Charter School Rev. (Aspire Public Schools - Obligated Group), “A”, 4%, 8/01/2061 (n) | 1,145,000 | 955,405 | ||
| California School Finance Authority, Charter School Rev. (Downtown Prep), 5%, 6/01/2046 (n) | 1,325,000 | 1,245,652 | ||
| California School Finance Authority, Charter School Rev. (Hawking STEAM Charter School Project)., “A”, 5%, 7/01/2042 (n) | 1,610,000 | 1,598,074 | ||
| California School Finance Authority, Charter School Rev. (Hawking STEAM Charter School Project)., “A”, 5.25%, 7/01/2052 (n) | 2,000,000 | 1,988,036 | ||
| California School Finance Authority, Charter School Rev. (Hawking STEAM Charter School Project)., “A”, 5.375%, 7/01/2056 (n) | 995,000 | 996,820 | ||
| California School Finance Authority, Charter School Rev. (Hawking STEAM Charter School Project)., “A”, 5.5%, 7/01/2062 (n) | 1,775,000 | 1,785,378 | ||
| California School Finance Authority, School Facility Rev. (Alliance for College-Ready Public Schools Projects), “A”, 4%, 7/01/2024 (n) | 730,000 | 737,340 | ||
| California School Finance Authority, School Facility Rev. (Alliance for College-Ready Public Schools Projects), “A”, 4%, 7/01/2025 (n) | 760,000 | 773,034 | ||
| California School Finance Authority, School Facility Rev. (Alliance for College-Ready Public Schools Projects), “A”, 5%, 7/01/2030 (n) | 435,000 | 451,588 | ||
| California School Finance Authority, School Facility Rev. (Alliance for College-Ready Public Schools Projects), “A”, 5%, 7/01/2045 (n) | 1,150,000 | 1,164,051 | ||
| California School Finance Authority, School Facility Rev. (Green Dot Public Schools California Projects), “A”, 5%, 8/01/2048 (n) | 750,000 | 759,414 | ||
| California School Finance Authority, School Facility Rev. (ICEF View Park Elementary and Middle Schools), “A”, 4.75%, 10/01/2024 | 140,000 | 140,884 | ||
| California School Finance Authority, School Facility Rev. (ICEF View Park Elementary and Middle Schools), “A”, 5.625%, 10/01/2034 | 575,000 | 581,724 | ||
| Issuer | Shares/Par | Value ($) | ||
| Municipal Bonds - continued | ||||
| California - continued | ||||
| California School Finance Authority, School Facility Rev. (ICEF View Park Elementary and Middle Schools), “A”, 5.875%, 10/01/2044 | $ | 545,000 | $551,526 | |
| California School Finance Authority, School Facility Rev. (ICEF View Park Elementary and Middle Schools), “A”, 6%, 10/01/2049 | 1,320,000 | 1,337,773 | ||
| California School Finance Authority, School Facility Rev. (KIPP LA Projects), “A”, 5.125%, 7/01/2044 | 430,000 | 434,504 | ||
| California School Finance Authority, School Facility Rev. (KIPP LA Projects), “A”, 4%, 7/01/2050 (n) | 3,360,000 | 3,014,707 | ||
| California Statewide Communities Development Authority Rev. (899 Charleston Project), “A”, 5.25%, 11/01/2044 (n) | 760,000 | 654,078 | ||
| California Statewide Communities Development Authority Rev. (899 Charleston Project), “A”, 5.375%, 11/01/2049 (n) | 945,000 | 810,896 | ||
| California Statewide Communities Development Authority Rev. (California Baptist University), “A”, 5.125%, 11/01/2023 | 100,000 | 100,821 | ||
| California Statewide Communities Development Authority Rev. (California Baptist University), “A”, 5%, 11/01/2032 (n) | 1,370,000 | 1,411,882 | ||
| California Statewide Communities Development Authority Rev. (California Baptist University), “A”, 6.125%, 11/01/2033 | 1,600,000 | 1,625,969 | ||
| California Statewide Communities Development Authority Rev. (California Baptist University), “A”, 5%, 11/01/2041 (n) | 2,045,000 | 2,054,269 | ||
| California Statewide Communities Development Authority Rev. (California Baptist University), “A”, 6.375%, 11/01/2043 | 1,335,000 | 1,354,059 | ||
| California Statewide Communities Development Authority Rev. (Enloe Medical Center), “A”, AGM, 5.25%, 8/15/2052 | 2,635,000 | 2,850,268 | ||
| California Statewide Communities Development Authority Rev. (Enloe Medical Center), “A”, AGM, 5.375%, 8/15/2057 | 2,515,000 | 2,724,775 | ||
| California Statewide Communities Development Authority Rev. (Lancer Plaza Project), 5.125%, 11/01/2023 | 155,000 | 155,795 | ||
| California Statewide Communities Development Authority Rev. (Lancer Plaza Project), 5.625%, 11/01/2033 | 780,000 | 785,003 | ||
| California Statewide Communities Development Authority Rev. (Lancer Plaza Project), 5.875%, 11/01/2043 | 1,315,000 | 1,322,546 | ||
| California Statewide Communities Development Authority Rev. (Loma Linda University Medical Center), “A”, 5.25%, 12/01/2034 | 3,400,000 | 3,496,691 | ||
| California Statewide Communities Development Authority Rev. (Loma Linda University Medical Center), “A”, 5%, 12/01/2041 (n) | 3,000,000 | 3,009,142 | ||
| California Statewide Communities Development Authority Rev. (Loma Linda University Medical Center), “A”, 5%, 12/01/2046 (n) | 11,095,000 | 10,810,272 | ||
| California Statewide Communities Development Authority Rev. (Loma Linda University Medical Center), “A”, 5.5%, 12/01/2058 | 8,600,000 | 8,714,377 | ||
| Issuer | Shares/Par | Value ($) | ||
| Municipal Bonds - continued | ||||
| California - continued | ||||
| California Statewide Communities Development Authority, College Housing Rev. (NCCD-Hooper Street LLC College of the Arts Project), 5%, 7/01/2029 (n) | $ | 880,000 | $870,936 | |
| California Statewide Communities Development Authority, College Housing Rev. (NCCD-Hooper Street LLC College of the Arts Project), 5.25%, 7/01/2039 (n) | 725,000 | 691,965 | ||
| California Statewide Communities Development Authority, College Housing Rev. (NCCD-Hooper Street LLC College of the Arts Project), 5.25%, 7/01/2049 (n) | 2,550,000 | 2,326,235 | ||
| California Statewide Communities Development Authority, College Housing Rev. (NCCD-Hooper Street LLC College of the Arts Project), 5.25%, 7/01/2052 (n) | 1,280,000 | 1,156,183 | ||
| California Statewide Communities Development Authority, Essential Housing Rev. (City of Orange Portfolio), “B”, 4%, 3/01/2057 (n) | 2,630,000 | 1,992,872 | ||
| California Statewide Communities Development Authority, Essential Housing Rev. (Oceanaire-Long Beach), “A-2”, 4%, 9/01/2056 (n) | 4,795,000 | 3,957,885 | ||
| Escondido, CA, Union High School District (Election of 2008), Capital Appreciation, “A”, AGM, 0%, 8/01/2030 | 4,785,000 | 3,843,264 | ||
| Escondido, CA, Union High School District (Election of 2008), Capital Appreciation, “A”, AGM, 0%, 8/01/2031 | 4,280,000 | 3,320,545 | ||
| Escondido, CA, Union High School District (Election of 2008), Capital Appreciation, “A”, AGM, 0%, 8/01/2032 | 3,010,000 | 2,250,954 | ||
| Golden State, CA, Tobacco Securitization Corp., Tobacco Settlement Rev., Taxable, “B-1”, 3.85%, 6/01/2050 | 28,000,000 | 25,362,058 | ||
| Lake Tahoe, CA, Unified School District (Election of 2008), Convertible Capital Appreciation, AGM, 0% to 8/01/2032, 6.375% to 8/01/2045 | 4,240,000 | 3,476,168 | ||
| Long Beach, CA, Marina Rev. (Alamitos Bay Marina Project), 5%, 5/15/2035 | 450,000 | 464,279 | ||
| Los Angeles County, CA, Rio Hondo Community College District, “C”, Convertible Capital Appreciation, 0% to 8/01/2024, 6.85% to 8/01/2042 | 10,000,000 | 11,978,150 | ||
| Los Angeles, CA, Department of Airports Refunding Rev. (Los Angeles International), “A”, 5%, 5/15/2036 | 1,955,000 | 2,158,397 | ||
| Los Angeles, CA, Department of Airports Refunding Rev. (Los Angeles International), “A”, 5%, 5/15/2037 | 1,455,000 | 1,595,212 | ||
| Los Angeles, CA, Department of Airports Refunding Rev. (Los Angeles International), “A”, 5%, 5/15/2040 | 2,400,000 | 2,599,961 | ||
| Los Angeles, CA, Department of Airports Rev. (Los Angeles International), “A”, 5%, 5/15/2034 | 660,000 | 716,524 | ||
| Issuer | Shares/Par | Value ($) | ||
| Municipal Bonds - continued | ||||
| California - continued | ||||
| Los Angeles, CA, Department of Airports Rev. (Los Angeles International), “A”, 5%, 5/15/2036 | $ | 775,000 | $829,863 | |
| Los Angeles, CA, Department of Airports Rev. (Los Angeles International), “A”, 5%, 5/15/2037 | 970,000 | 1,032,792 | ||
| Merced, CA, Union High School District, Capital Appreciation, “A”, AGM, 0%, 8/01/2030 | 645,000 | 521,515 | ||
| Modesto, CA, Elementary School District General Obligation, “B”, 3%, 8/01/2046 | 1,735,000 | 1,420,655 | ||
| Modesto, CA, Elementary School District General Obligation, “B”, 3%, 8/01/2050 | 1,080,000 | 860,307 | ||
| Morongo Band of Mission Indians California Rev., “A”, 5%, 10/01/2042 (n) | 4,180,000 | 4,216,840 | ||
| Morongo Band of Mission Indians California Rev., “B”, 5%, 10/01/2042 (n) | 3,605,000 | 3,636,772 | ||
| Mount San Antonio, CA, Community College District Rev. (Election of 2008), Convertible Capital Appreciation, “A”, 0% to 8/01/2028, 6.25% to 8/01/2043 | 7,025,000 | 6,540,415 | ||
| Oceanside, CA, Unified School District General Obligation, Capital Appreciation, “A”, AGM, 0%, 8/01/2027 | 1,585,000 | 1,411,044 | ||
| Oceanside, CA, Unified School District General Obligation, Capital Appreciation, “A”, AGM, 0%, 8/01/2029 | 3,170,000 | 2,650,375 | ||
| Oceanside, CA, Unified School District General Obligation, Capital Appreciation, “A”, AGM, 0%, 8/01/2030 | 4,050,000 | 3,272,207 | ||
| Oceanside, CA, Unified School District General Obligation, Capital Appreciation, “A”, ETM, AGM, 0%, 8/01/2024 | 380,000 | 366,298 | ||
| Oceanside, CA, Unified School District General Obligation, Capital Appreciation, “A”, ETM, AGM, 0%, 8/01/2027 | 205,000 | 184,321 | ||
| Oceanside, CA, Unified School District General Obligation, Capital Appreciation, “A”, ETM, AGM, 0%, 8/01/2027 | 100,000 | 89,913 | ||
| Oceanside, CA, Unified School District General Obligation, Capital Appreciation, “A”, ETM, AGM, 0%, 8/01/2027 | 180,000 | 161,843 | ||
| Oceanside, CA, Unified School District General Obligation, Capital Appreciation, “A”, ETM, AGM, 0%, 8/01/2029 | 400,000 | 342,574 | ||
| Oceanside, CA, Unified School District General Obligation, Capital Appreciation, “A”, ETM, AGM, 0%, 8/01/2029 | 285,000 | 244,084 | ||
| Oceanside, CA, Unified School District General Obligation, Capital Appreciation, “A”, ETM, AGM, 0%, 8/01/2029 | 170,000 | 145,594 | ||
| Oceanside, CA, Unified School District General Obligation, Capital Appreciation, “A”, ETM, AGM, 0%, 8/01/2030 | 235,000 | 196,343 | ||
| Oceanside, CA, Unified School District General Obligation, Capital Appreciation, “A”, ETM, AGM, 0%, 8/01/2030 | 170,000 | 142,035 | ||
| Palomar Health, CA, Refunding Rev., 5%, 11/01/2042 | 10,000,000 | 10,217,689 | ||
| Issuer | Shares/Par | Value ($) | ||
| Municipal Bonds - continued | ||||
| California - continued | ||||
| Pomona, CA, Unified School District, General Obligation, “F”, BAM, 3%, 8/01/2048 | $ | 940,000 | $759,509 | |
| Sacramento County, CA, Tobacco Securitization Corp., Tobacco Settlement Rev., Capital Appreciation, “A-1”, 0%, 6/01/2060 | 18,750,000 | 3,324,546 | ||
| San Diego County, CA, Regional Airport Authority Rev., “B”, 4%, 7/01/2046 | 2,095,000 | 2,012,223 | ||
| San Francisco, CA, City & County Redevelopment Successor Agency, Community Facilities District No. 6 (Mission Bay South Public Improvements), Capital Appreciation, “A”, 0%, 8/01/2043 | 8,725,000 | 2,641,331 | ||
| San Francisco, CA, City & County Redevelopment Successor Agency, Tax Allocation (Mission Bay South Redevelopment Project), “A”, 5%, 8/01/2043 | 225,000 | 232,633 | ||
| Tulare and Kings Counties, CA, College of the Sequoias Community District (Area Improvement District No. 3), “E”, 3%, 8/01/2051 | 2,070,000 | 1,627,320 | ||
| University of California, Hastings Campus Housing Finance Authority, Campus Housing Rev., “A”, 5%, 7/01/2045 (n) | 8,810,000 | 7,663,064 | ||
| University of California, Hastings Campus Housing Finance Authority, Campus Housing Rev., “A”, 5%, 7/01/2061 (n) | 9,125,000 | 7,493,610 | ||
| University of California, Hastings Campus Housing Finance Authority, Campus Housing Rev., Convertible Capital Appreciation, “B”, 0% to 7/01/2035, 6.75% to 7/01/2061 (n) | 12,970,000 | 4,506,700 | ||
| West Contra Costa, CA, Unified School District (Election of 2005), Capital Appreciation, “C”, AGM, 0%, 8/01/2029 | 3,665,000 | 3,044,666 | ||
| $295,325,025 | ||||
| Colorado - 2.0% | ||||
| Arvada, CO, Vauxmont Metropolitan District Rev., AGM, 5%, 12/15/2027 | $ | 73,000 | $78,683 | |
| Arvada, CO, Vauxmont Metropolitan District Rev., AGM, 5%, 12/15/2028 | 70,000 | 75,443 | ||
| Arvada, CO, Vauxmont Metropolitan District Rev., AGM, 5%, 12/15/2029 | 70,000 | 75,419 | ||
| Arvada, CO, Vauxmont Metropolitan District Rev., AGM, 5%, 12/01/2030 | 124,000 | 141,154 | ||
| Arvada, CO, Vauxmont Metropolitan District Rev., AGM, 5%, 12/01/2031 | 129,000 | 146,683 | ||
| Arvada, CO, Vauxmont Metropolitan District Rev., AGM, 5%, 12/01/2032 | 140,000 | 158,844 | ||
| Arvada, CO, Vauxmont Metropolitan District Rev., AGM, 5%, 12/15/2032 | 90,000 | 96,856 | ||
| Arvada, CO, Vauxmont Metropolitan District Rev., AGM, 5%, 12/01/2033 | 140,000 | 158,329 | ||
| Issuer | Shares/Par | Value ($) | ||
| Municipal Bonds - continued | ||||
| Colorado - continued | ||||
| Arvada, CO, Vauxmont Metropolitan District Rev., AGM, 5%, 12/01/2034 | $ | 160,000 | $179,653 | |
| Arvada, CO, Vauxmont Metropolitan District Rev., AGM, 5%, 12/01/2035 | 56,000 | 62,266 | ||
| Arvada, CO, Vauxmont Metropolitan District Rev., AGM, 5%, 12/01/2050 | 676,000 | 706,229 | ||
| Colorado Educational & Cultural Facilities Authority Rev. (Classical Academy Project), “A”, 5%, 12/01/2038 | 895,000 | 913,035 | ||
| Colorado Educational & Cultural Facilities Authority Rev. (Liberty Common Project), 5%, 1/15/2029 | 305,000 | 310,627 | ||
| Colorado Educational & Cultural Facilities Authority Rev. (Liberty Common Project), 5%, 1/15/2039 | 560,000 | 566,124 | ||
| Colorado Educational & Cultural Facilities Authority Rev. (Liberty Common Project), 5%, 1/15/2044 | 395,000 | 398,685 | ||
| Colorado Educational & Cultural Facilities Authority Rev. (Littleton Preparatory Charter School Project), 5%, 12/01/2033 | 450,000 | 450,070 | ||
| Colorado Educational & Cultural Facilities Authority Rev. (Littleton Preparatory Charter School Project), 5%, 12/01/2042 | 1,120,000 | 1,096,476 | ||
| Colorado Educational & Cultural Facilities Authority Rev. (Montessori Charter School Project), 5%, 7/15/2037 | 490,000 | 490,767 | ||
| Colorado Educational & Cultural Facilities Authority Rev. (Peak to Peak Charter School Project), 5%, 8/15/2030 | 350,000 | 360,419 | ||
| Colorado Educational & Cultural Facilities Authority Rev. (Peak to Peak Charter School Project), 5%, 8/15/2034 | 350,000 | 359,325 | ||
| Colorado Educational & Cultural Facilities Authority Rev. (Science, Technology, Engineering and Math School Project), 5%, 11/01/2044 | 1,770,000 | 1,773,670 | ||
| Colorado Educational & Cultural Facilities Authority Rev. (Science, Technology, Engineering and Math School Project), 5.125%, 11/01/2049 | 1,530,000 | 1,534,228 | ||
| Colorado Educational & Cultural Facilities Authority Rev. (Stargate Charter School Project), “A”, 4%, 12/01/2048 | 4,310,000 | 3,892,311 | ||
| Colorado Educational & Cultural Facilities Authority Rev. (Union Colony School Project), 5%, 4/01/2038 | 295,000 | 309,096 | ||
| Colorado Educational & Cultural Facilities Authority Rev. (Union Colony School Project), 5%, 4/01/2048 | 350,000 | 359,945 | ||
| Colorado Educational & Cultural Facilities Authority Rev. (Union Colony School Project), 5%, 4/01/2053 | 365,000 | 374,330 | ||
| Colorado Educational & Cultural Facilities Authority Rev. (University Lab School Project), 5%, 12/15/2035 | 2,000,000 | 2,064,476 | ||
| Colorado Educational & Cultural Facilities Authority Rev. (University Lab School Project), 5%, 12/15/2045 | 2,675,000 | 2,727,168 | ||
| Issuer | Shares/Par | Value ($) | ||
| Municipal Bonds - continued | ||||
| Colorado - continued | ||||
| Colorado Educational & Cultural Facilities Authority, Charter School Refunding and Improvement Rev. (Thomas MacLaren State Charter School Project), “A”, 5%, 6/01/2035 | $ | 570,000 | $617,250 | |
| Colorado Educational & Cultural Facilities Authority, Charter School Refunding Rev. (Windsor Charter Academy Project), 4%, 9/01/2050 | 515,000 | 484,762 | ||
| Colorado Educational & Cultural Facilities Authority, Charter School Refunding Rev. (Windsor Charter Academy Project), 4%, 9/01/2055 | 925,000 | 849,365 | ||
| Colorado Educational & Cultural Facilities Authority, Charter School Rev. (Aspen View Academy Project), 4%, 5/01/2036 | 175,000 | 165,227 | ||
| Colorado Educational & Cultural Facilities Authority, Charter School Rev. (Aspen View Academy Project), 4%, 5/01/2041 | 175,000 | 156,573 | ||
| Colorado Educational & Cultural Facilities Authority, Charter School Rev. (Aspen View Academy Project), 4%, 5/01/2051 | 350,000 | 293,916 | ||
| Colorado Educational & Cultural Facilities Authority, Charter School Rev. (Aspen View Academy Project), 4%, 5/01/2061 | 610,000 | 490,713 | ||
| Colorado Educational & Cultural Facilities Authority, Charter School Rev. (James Irwin Educational Foundation Project), 5%, 9/01/2052 | 750,000 | 774,110 | ||
| Colorado Educational & Cultural Facilities Authority, Charter School Rev. (James Irwin Educational Foundation Project), 5%, 9/01/2057 | 1,750,000 | 1,786,086 | ||
| Colorado Educational & Cultural Facilities Authority, Charter School Rev. (James Irwin Educational Foundation Project), 5%, 9/01/2062 | 2,200,000 | 2,228,441 | ||
| Colorado Educational & Cultural Facilities Authority, Charter School Rev. (New Summit Charter Academy Project), “A”, 4%, 7/01/2031 (n) | 450,000 | 436,825 | ||
| Colorado Educational & Cultural Facilities Authority, Charter School Rev. (New Summit Charter Academy Project), “A”, 4%, 7/01/2041 (n) | 600,000 | 512,135 | ||
| Colorado Educational & Cultural Facilities Authority, Charter School Rev. (New Summit Charter Academy Project), “A”, 4%, 7/01/2051 (n) | 715,000 | 557,438 | ||
| Colorado Educational & Cultural Facilities Authority, Charter School Rev. (New Summit Charter Academy Project), “A”, 4%, 7/01/2061 (n) | 2,030,000 | 1,506,817 | ||
| Colorado Health Facilities Authority Rev. (American Baptist Homes), 8%, 8/01/2043 | 2,975,000 | 3,017,415 | ||
| Colorado Health Facilities Authority Rev. (Christian Living Neighborhoods), 4%, 1/01/2042 | 2,635,000 | 2,006,650 | ||
| Issuer | Shares/Par | Value ($) | ||
| Municipal Bonds - continued | ||||
| Colorado - continued | ||||
| Colorado Health Facilities Authority Rev. (CommonSpirit Health), “A”, 5.5%, 11/01/2047 | $ | 3,210,000 | $3,480,333 | |
| Colorado Health Facilities Authority Rev. (CommonSpirit Health), “A”, 5.25%, 11/01/2052 | 4,870,000 | 5,146,955 | ||
| Colorado Health Facilities Authority Rev. (CommonSpirit Health), “A-2”, 4%, 8/01/2049 | 2,000,000 | 1,880,566 | ||
| Colorado Health Facilities Authority Rev. (Evangelical Lutheran Good Samaritan Society), 5.625%, 6/01/2043 (Prerefunded 6/01/2023) | 825,000 | 832,925 | ||
| Colorado Health Facilities Authority Rev. (Frasier Project), “A”, 4%, 5/15/2041 (w) | 1,375,000 | 1,114,549 | ||
| Colorado Health Facilities Authority Rev. (Frasier Project), “A”, 4%, 5/15/2048 (w) | 2,100,000 | 1,577,111 | ||
| Colorado Housing & Finance Authority Rev., Single Family Mortgage Class I, “C”, 4.75%, 5/01/2049 (u) | 4,960,000 | 5,096,851 | ||
| Colorado Regional Transportation District (Denver Transit Partners Eagle P3 Project), “A”, 5%, 7/15/2032 | 420,000 | 465,117 | ||
| Colorado Regional Transportation District (Denver Transit Partners Eagle P3 Project), “A”, 4%, 1/15/2033 | 395,000 | 406,273 | ||
| Colorado Regional Transportation District (Denver Transit Partners Eagle P3 Project), “A”, 4%, 7/15/2033 | 395,000 | 408,216 | ||
| Colorado Regional Transportation District (Denver Transit Partners Eagle P3 Project), “A”, 4%, 7/15/2034 | 790,000 | 805,838 | ||
| Colorado Regional Transportation District (Denver Transit Partners Eagle P3 Project), “A”, 4%, 7/15/2036 | 660,000 | 659,003 | ||
| Colorado Regional Transportation District (Denver Transit Partners Eagle P3 Project), “A”, 4%, 7/15/2038 | 470,000 | 462,200 | ||
| Denver, CO, City & County Airport System Rev., “A”, 4.125%, 11/15/2047 | 3,360,000 | 3,333,554 | ||
| Denver, CO, City & County Airport System Rev., “A”, 4.125%, 11/15/2053 | 3,150,000 | 3,072,352 | ||
| Denver, CO, Convention Center Hotel Authority Rev., 5%, 12/01/2035 | 1,070,000 | 1,092,160 | ||
| Denver, CO, Convention Center Hotel Authority Rev., 5%, 12/01/2036 | 675,000 | 685,568 | ||
| Denver, CO, Convention Center Hotel Authority Rev., 5%, 12/01/2040 | 1,800,000 | 1,811,915 | ||
| Denver, CO, Health & Hospital Authority Rev. (550 Acoma, Inc.), COP, 5%, 12/01/2048 | 2,670,000 | 2,687,534 | ||
| Denver, CO, Health & Hospital Authority Rev., “A”, 5%, 12/01/2039 | 3,660,000 | 3,678,145 | ||
| Denver, CO, Health & Hospital Authority Rev., “A”, 5.25%, 12/01/2045 | 795,000 | 801,186 | ||
| Issuer | Shares/Par | Value ($) | ||
| Municipal Bonds - continued | ||||
| Colorado - continued | ||||
| Loretto Heights, CO, Community Authority Special Rev., 4.875%, 12/01/2051 (n) | $ | 14,945,000 | $11,797,511 | |
| Tallyn's Reach, CO, Metropolitan District No. 3, 5%, 12/01/2033 (Prerefunded 12/01/2023) | 358,000 | 365,134 | ||
| $87,405,030 | ||||
| Connecticut - 1.0% | ||||
| Connecticut Health & Educational Facilities Authority Rev. (Griffin Hospital), “G-1”, 5%, 7/01/2039 (n) | $ | 900,000 | $895,163 | |
| Connecticut Health & Educational Facilities Authority Rev. (Griffin Hospital), “G-1”, 5%, 7/01/2050 (n) | 2,250,000 | 2,169,221 | ||
| Connecticut Health & Educational Facilities Authority Rev. (Masonicare), “F”, 5%, 7/01/2043 | 8,535,000 | 8,258,903 | ||
| Connecticut Health & Educational Facilities Authority Rev. (McLean Issue), “A”, 5%, 1/01/2030 (n) | 500,000 | 506,687 | ||
| Connecticut Health & Educational Facilities Authority Rev. (McLean Issue), “A”, 5%, 1/01/2045 (n) | 1,500,000 | 1,443,889 | ||
| Connecticut Health & Educational Facilities Authority Rev. (McLean Issue), “A”, 5%, 1/01/2055 (n) | 2,800,000 | 2,614,237 | ||
| Great Pond, CT, Improvement District Special Obligation Rev. (Great Pond Phase II Project), 5.5%, 10/01/2042 (n) | 2,120,000 | 2,140,186 | ||
| Great Pond, CT, Improvement District Special Obligation Rev. (Great Pond Phase II Project), 5.75%, 10/01/2052 (n) | 5,740,000 | 5,794,046 | ||
| Mohegan Tribal Finance Authority, CT, Economic Development Bonds, 7%, 2/01/2045 (n) | 18,190,000 | 18,222,487 | ||
| Steel Point Infrastructure Improvement District, CT, Special Obligation Rev. (Steel Point Harbor Project), 4%, 4/01/2031 (n) | 155,000 | 147,402 | ||
| Steel Point Infrastructure Improvement District, CT, Special Obligation Rev. (Steel Point Harbor Project), 4%, 4/01/2036 (n) | 255,000 | 229,921 | ||
| Steel Point Infrastructure Improvement District, CT, Special Obligation Rev. (Steel Point Harbor Project), 4%, 4/01/2041 (n) | 300,000 | 255,227 | ||
| Steel Point Infrastructure Improvement District, CT, Special Obligation Rev. (Steel Point Harbor Project), 4%, 4/01/2051 (n) | 860,000 | 678,352 | ||
| $43,355,721 | ||||
| Issuer | Shares/Par | Value ($) | ||
| Municipal Bonds - continued | ||||
| Delaware - 0.4% | ||||
| Delaware Economic Development Authority Rev. (Delaware Military Academy, Inc. Project), 4.625%, 9/01/2034 (Prerefunded 9/01/2024) | $ | 1,105,000 | $1,141,826 | |
| Delaware Economic Development Authority Rev. (Delaware Military Academy, Inc. Project), 5%, 9/01/2044 (Prerefunded 9/01/2024) | 1,030,000 | 1,070,277 | ||
| Delaware Economic Development Authority Rev. (Delaware Military Academy, Inc. Project), 5%, 9/01/2049 (Prerefunded 9/01/2024) | 1,210,000 | 1,257,315 | ||
| Delaware Economic Development Authority Rev. (Newark Charter School, Inc.), “A”, 5%, 9/01/2036 | 285,000 | 295,896 | ||
| Delaware Economic Development Authority Rev. (Newark Charter School, Inc.), “A”, 5%, 9/01/2046 | 620,000 | 630,568 | ||
| Delaware Economic Development Authority, Charter School Rev. (Aspira of Delaware Charter Operations, Inc. Project), “A”, 5%, 6/01/2036 | 920,000 | 927,230 | ||
| Delaware Economic Development Authority, Charter School Rev. (Aspira of Delaware Charter Operations, Inc. Project), “A”, 5%, 6/01/2046 | 1,635,000 | 1,595,298 | ||
| Delaware Health Facilities Authority Rev. (Beebe Medical Center Project), 5%, 6/01/2043 | 4,230,000 | 4,373,639 | ||
| Delaware Health Facilities Authority Rev. (Beebe Medical Center Project), 5%, 6/01/2048 | 2,115,000 | 2,161,182 | ||
| Kent County, DE, Student Housing and Dining Facility Rev. (CHF-Dover LLC-Delaware State University Project), “A”, 5%, 7/01/2040 | 750,000 | 751,261 | ||
| Kent County, DE, Student Housing and Dining Facility Rev. (CHF-Dover LLC-Delaware State University Project), “A”, 5%, 7/01/2048 | 1,025,000 | 987,829 | ||
| Kent County, DE, Student Housing and Dining Facility Rev. (CHF-Dover LLC-Delaware State University Project), “A”, 5%, 7/01/2058 | 1,165,000 | 1,093,467 | ||
| Kent County, DE, Student Housing and Dining Facility Rev. (CHF-Dover, LLC-Delaware State University Project), “A”, 5%, 7/01/2053 | 895,000 | 849,446 | ||
| $17,135,234 | ||||
| Issuer | Shares/Par | Value ($) | ||
| Municipal Bonds - continued | ||||
| District of Columbia - 0.6% | ||||
| District of Columbia Rev. (Rocketship D.C.), “A”, 5%, 6/01/2039 (n) | $ | 2,090,000 | $2,093,079 | |
| District of Columbia Rev. (Rocketship D.C.), “A”, 5%, 6/01/2049 (n) | 1,330,000 | 1,260,967 | ||
| District of Columbia Rev. (Rocketship D.C.), “A”, 5%, 6/01/2051 (n) | 1,000,000 | 942,222 | ||
| District of Columbia Rev. (Rocketship D.C.), “A”, 5%, 6/01/2056 (n) | 1,680,000 | 1,569,143 | ||
| District of Columbia Rev. (Rocketship D.C.), “A”, 5%, 6/01/2061 (n) | 1,100,000 | 1,012,413 | ||
| District of Columbia Student Dormitory Rev. (Provident Group - Howard Properties LLC), 5%, 10/01/2030 | 1,745,000 | 1,745,227 | ||
| District of Columbia Student Dormitory Rev. (Provident Group - Howard Properties LLC), 5%, 10/01/2035 | 5,605,000 | 5,604,979 | ||
| District of Columbia Student Dormitory Rev. (Provident Group - Howard Properties LLC), 5%, 10/01/2045 | 9,810,000 | 9,678,400 | ||
| District of Columbia, Tobacco Settlement, 6.75%, 5/15/2040 | 885,000 | 913,157 | ||
| Metropolitan Washington, D.C., Airport Authority, Dulles Toll Road Rev. (Dulles Metrorail and Capital Improvement Projects), “A”, AGM, 4%, 10/01/2052 | 2,670,000 | 2,597,336 | ||
| $27,416,923 | ||||
| Florida - 6.7% | ||||
| Alachua County, FL, Health Facilities Authority, Continuing Care Retirement Community Rev. (Oak Hammock, Inc. at the University of Florida), 4%, 10/01/2040 | $ | 645,000 | $548,230 | |
| Alachua County, FL, Health Facilities Authority, Continuing Care Retirement Community Rev. (Oak Hammock, Inc. at the University of Florida), 4%, 10/01/2046 | 860,000 | 690,359 | ||
| Arborwood Community Development District, FL, Capital Improvement Refunding Rev. (Subordinate Lien), “A-2”, 4.125%, 5/01/2023 | 125,000 | 124,978 | ||
| Arborwood Community Development District, FL, Capital Improvement Refunding Rev. (Subordinate Lien), “A-2”, 4.625%, 5/01/2028 | 685,000 | 689,731 | ||
| Arborwood Community Development District, FL, Capital Improvement Refunding Rev. (Subordinate Lien), “A-2”, 5%, 5/01/2036 | 865,000 | 869,453 | ||
| Arborwood Community Development District, FL, Capital Improvement Rev., “A-1”, 6.9%, 5/01/2036 | 240,000 | 240,787 | ||
| Arborwood Community Development District, FL, Capital Improvement Rev., “A-2”, 6.9%, 5/01/2036 | 20,000 | 20,018 | ||
| Issuer | Shares/Par | Value ($) | ||
| Municipal Bonds - continued | ||||
| Florida - continued | ||||
| Bellalago, FL, Educational Facilities Benefit District Capital Improvement Refunding Rev., 4.375%, 5/01/2030 | $ | 690,000 | $700,290 | |
| Bellalago, FL, Educational Facilities Benefit District Capital Improvement Refunding Rev., 4.5%, 5/01/2033 | 320,000 | 323,779 | ||
| Capital Region Community Development District, FL, Capital Improvement Rev., “A-1”, 4.125%, 5/01/2023 | 105,000 | 104,982 | ||
| Collier County, FL, Industrial Development Authority, Continuing Care Community Rev. (Arlington of Naples Project), “A”, 5.5%, 5/15/2025 (a)(d)(z) | 300,000 | 174,000 | ||
| Collier County, FL, Industrial Development Authority, Continuing Care Community Rev. (Arlington of Naples Project), “A”, 6.25%, 5/15/2035 (a)(d)(z) | 300,000 | 174,000 | ||
| Collier County, FL, Industrial Development Authority, Continuing Care Community Rev. (Arlington of Naples Project), “A”, 7.75%, 5/15/2035 (a)(d)(z) | 1,055,000 | 611,900 | ||
| Collier County, FL, Industrial Development Authority, Continuing Care Community Rev. (Arlington of Naples Project), “A”, 8.125%, 5/15/2044 (a)(d)(z) | 10,590,000 | 6,142,200 | ||
| Collier County, FL, Industrial Development Authority, Continuing Care Community Rev. (Arlington of Naples Project), “A”, 6.5%, 5/15/2049 (a)(d)(z) | 805,000 | 466,900 | ||
| Creekside Community Development District, FL, Special Assessment, 5.2%, 5/01/2038 (a)(d) | 1,400,000 | 630,000 | ||
| Daytona Beach, FL, Halifax Hospital Medical Center Rev., 5%, 6/01/2024 | 575,000 | 590,309 | ||
| Daytona Beach, FL, Halifax Hospital Medical Center Rev., 5%, 6/01/2025 | 670,000 | 702,312 | ||
| Daytona Beach, FL, Halifax Hospital Medical Center Rev., 5%, 6/01/2036 | 825,000 | 858,975 | ||
| Florida Capital Region Community Development District, Capital Improvement Rev., “A-1”, 4.625%, 5/01/2028 | 400,000 | 402,798 | ||
| Florida Capital Region Community Development District, Capital Improvement Rev., “A-1”, 5.125%, 5/01/2039 | 2,735,000 | 2,748,513 | ||
| Florida Capital Trust Agency, Educational Facilities Rev. (Florida Charter Educational Foundation, Inc. Project), “A”, 4.5%, 6/15/2028 (n) | 985,000 | 971,108 | ||
| Florida Capital Trust Agency, Educational Facilities Rev. (Florida Charter Educational Foundation, Inc. Project), “A”, 5.375%, 6/15/2038 (n) | 1,005,000 | 998,185 | ||
| Florida Capital Trust Agency, Educational Facilities Rev. (Florida Charter Educational Foundation, Inc. Project), “A”, 5.375%, 6/15/2048 (n) | 1,700,000 | 1,606,665 | ||
| Issuer | Shares/Par | Value ($) | ||
| Municipal Bonds - continued | ||||
| Florida - continued | ||||
| Florida Capital Trust Agency, Educational Facilities Rev. (Imagine School at North Manatee Project), “A”, 3.25%, 6/01/2031 (n) | $ | 240,000 | $207,639 | |
| Florida Capital Trust Agency, Educational Facilities Rev. (Imagine School at North Manatee Project), “A”, 5%, 6/01/2041 (n) | 325,000 | 302,453 | ||
| Florida Capital Trust Agency, Educational Facilities Rev. (Imagine School at North Manatee Project), “A”, 5%, 6/01/2056 (n) | 900,000 | 788,294 | ||
| Florida Capital Trust Agency, Educational Facilities Rev. (Imagine School at North Manatee Project), “C”, 5%, 6/01/2041 (n) | 230,000 | 214,044 | ||
| Florida Capital Trust Agency, Educational Facilities Rev. (Imagine School at North Manatee Project), “C”, 5%, 6/01/2056 (n) | 520,000 | 455,459 | ||
| Florida Capital Trust Agency, Educational Facilities Rev. (Liza Jackson Preparatory School, Inc. Project), “A”, 4%, 8/01/2030 | 115,000 | 116,471 | ||
| Florida Capital Trust Agency, Educational Facilities Rev. (Liza Jackson Preparatory School, Inc. Project), “A”, 5%, 8/01/2040 | 165,000 | 170,128 | ||
| Florida Capital Trust Agency, Educational Facilities Rev. (Liza Jackson Preparatory School, Inc. Project), “A”, 5%, 8/01/2055 | 515,000 | 520,151 | ||
| Florida Capital Trust Agency, Educational Facilities Rev. (Renaissance Charter School, Inc. Project), “A”, 5%, 6/15/2039 (n) | 3,090,000 | 2,953,359 | ||
| Florida Capital Trust Agency, Educational Facilities Rev. (Renaissance Charter School, Inc. Project), “A”, 5%, 6/15/2049 (n) | 11,995,000 | 10,810,525 | ||
| Florida Capital Trust Agency, Educational Facilities Rev. (Viera Charter Schools, Inc. Project), “A”, 4%, 10/15/2029 (n) | 450,000 | 437,334 | ||
| Florida Capital Trust Agency, Educational Facilities Rev. (Viera Charter Schools, Inc. Project), “A”, 5%, 10/15/2037 (n) | 510,000 | 505,250 | ||
| Florida Capital Trust Agency, Educational Facilities Rev. (Viera Charter Schools, Inc. Project), “A”, 5%, 10/15/2039 (n) | 1,130,000 | 1,108,597 | ||
| Florida Capital Trust Agency, Educational Facilities Rev. (Viera Charter Schools, Inc. Project), “A”, 5%, 10/15/2047 (n) | 1,180,000 | 1,115,935 | ||
| Florida Capital Trust Agency, Educational Facilities Rev. (Viera Charter Schools, Inc. Project), “A”, 5%, 10/15/2049 (n) | 1,860,000 | 1,750,277 | ||
| Florida Capital Trust Agency, Educational Facilities Rev. (Viera Charter Schools, Inc. Project), “A”, 5%, 10/15/2052 (n) | 1,295,000 | 1,209,618 | ||
| Florida Capital Trust Agency, Educational Facilities Rev. (Viera Charter Schools, Inc. Project), “A”, 5%, 10/15/2054 (n) | 1,345,000 | 1,250,208 | ||
| Florida Development Finance Corp. Educational Facilities Rev. (Drs. Kiran & Pallavi Patel 2017 Foundation for Global Understanding, Inc. Project), “A”, 3%, 7/01/2031 (n) | 175,000 | 159,890 | ||
| Florida Development Finance Corp. Educational Facilities Rev. (Drs. Kiran & Pallavi Patel 2017 Foundation for Global Understanding, Inc. Project), “A”, 4%, 7/01/2051 (n) | 1,005,000 | 795,600 | ||
| Issuer | Shares/Par | Value ($) | ||
| Municipal Bonds - continued | ||||
| Florida - continued | ||||
| Florida Development Finance Corp. Educational Facilities Rev. (Florida Charter Educational Foundation, Inc. Project), “A”, 6.25%, 6/15/2036 (n) | $ | 1,155,000 | $1,202,081 | |
| Florida Development Finance Corp. Educational Facilities Rev. (Florida Charter Educational Foundation, Inc. Project), “A”, 6.375%, 6/15/2046 (n) | 1,980,000 | 2,040,433 | ||
| Florida Development Finance Corp. Educational Facilities Rev. (Imagine School at Broward Project), “A”, 5%, 12/15/2034 (n) | 525,000 | 561,027 | ||
| Florida Development Finance Corp. Educational Facilities Rev. (Imagine School at Broward Project), “A”, 5%, 12/15/2039 (n) | 610,000 | 635,202 | ||
| Florida Development Finance Corp. Educational Facilities Rev. (Imagine School at Broward Project), “A”, 5%, 12/15/2049 (n) | 4,340,000 | 4,460,783 | ||
| Florida Development Finance Corp. Educational Facilities Rev. (Mater Academy Projects), “A”, 5%, 6/15/2052 | 1,135,000 | 1,109,100 | ||
| Florida Development Finance Corp. Educational Facilities Rev. (Mater Academy Projects), “A”, 5%, 6/15/2056 | 1,660,000 | 1,605,185 | ||
| Florida Development Finance Corp. Educational Facilities Rev. (Renaissance Charter School), “A”, 6.125%, 6/15/2044 | 5,000,000 | 5,087,119 | ||
| Florida Development Finance Corp. Educational Facilities Rev. (Renaissance Charter School), “C”, 4%, 9/15/2030 (n) | 240,000 | 219,085 | ||
| Florida Development Finance Corp. Educational Facilities Rev. (Renaissance Charter School), “C”, 5%, 9/15/2040 (n) | 550,000 | 490,095 | ||
| Florida Development Finance Corp. Educational Facilities Rev. (Renaissance Charter School), “C”, 5%, 9/15/2050 (n) | 1,080,000 | 891,162 | ||
| Florida Development Finance Corp. Educational Facilities Rev. (River City Science Academy Projects), “A”, 4%, 7/01/2035 | 175,000 | 170,605 | ||
| Florida Development Finance Corp. Educational Facilities Rev. (River City Science Academy Projects), “A”, 4%, 7/01/2045 | 320,000 | 280,330 | ||
| Florida Development Finance Corp. Educational Facilities Rev. (River City Science Academy Projects), “A”, 4%, 7/01/2055 | 445,000 | 372,113 | ||
| Florida Development Finance Corp. Educational Facilities Rev. (River City Science Academy Projects), “A-1”, 5%, 7/01/2042 | 220,000 | 226,414 | ||
| Florida Development Finance Corp. Educational Facilities Rev. (River City Science Academy Projects), “A-1”, 5%, 7/01/2051 | 200,000 | 202,489 | ||
| Florida Development Finance Corp. Educational Facilities Rev. (River City Science Academy Projects), “A-1”, 5%, 2/01/2057 | 235,000 | 236,229 | ||
| Florida Development Finance Corp. Educational Facilities Rev. (Southwest Charter Foundation, Inc. Project), “A”, 6%, 6/15/2037 (n) | 1,510,000 | 1,442,746 | ||
| Florida Development Finance Corp. Educational Facilities Rev. (Southwest Charter Foundation, Inc. Project), “A”, 6.125%, 6/15/2047 (n) | 4,365,000 | 4,021,064 | ||
| Issuer | Shares/Par | Value ($) | ||
| Municipal Bonds - continued | ||||
| Florida - continued | ||||
| Florida Development Finance Corp. Senior Living Rev. (Glenridge on Palmer Ranch Project), 5%, 6/01/2031 (n) | $ | 430,000 | $418,550 | |
| Florida Development Finance Corp. Senior Living Rev. (Glenridge on Palmer Ranch Project), 5%, 6/01/2035 (n) | 330,000 | 312,512 | ||
| Florida Development Finance Corp. Senior Living Rev. (Glenridge on Palmer Ranch Project), 5%, 6/01/2051 (n) | 11,890,000 | 9,845,189 | ||
| Florida Development Finance Corp. Senior Living Rev. (Mayflower Retirement Community Project), “A”, 4%, 6/01/2036 (n) | 2,905,000 | 2,423,973 | ||
| Florida Development Finance Corp. Senior Living Rev. (Mayflower Retirement Community Project), “A”, 5.125%, 6/01/2040 (n) | 3,760,000 | 3,579,252 | ||
| Florida Development Finance Corp. Senior Living Rev. (Mayflower Retirement Community Project), “A”, 4%, 6/01/2041 (n) | 2,730,000 | 2,143,127 | ||
| Florida Development Finance Corp. Senior Living Rev. (Mayflower Retirement Community Project), “A”, 4%, 6/01/2046 (n) | 3,755,000 | 2,783,985 | ||
| Florida Development Finance Corp. Senior Living Rev. (Mayflower Retirement Community Project), “A”, 5.25%, 6/01/2050 (n) | 7,500,000 | 6,946,881 | ||
| Florida Development Finance Corp. Senior Living Rev. (Mayflower Retirement Community Project), “A”, 4%, 6/01/2055 (n) | 840,000 | 584,161 | ||
| Florida Development Finance Corp. Senior Living Rev. (Mayflower Retirement Community Project), “B-1”, 2.375%, 6/01/2027 (n) | 435,000 | 392,118 | ||
| Florida Development Finance Corp. Senior Living Rev. (Mayflower Retirement Community Project), “B-2”, 1.75%, 6/01/2026 (n) | 435,000 | 394,223 | ||
| Florida Higher Educational Facilities Financing Authority Rev. (Florida Institute of Technology), 5%, 10/01/2031 | 1,235,000 | 1,332,899 | ||
| Florida Higher Educational Facilities Financing Authority Rev. (Florida Institute of Technology), 5%, 10/01/2033 | 1,700,000 | 1,819,542 | ||
| Florida Higher Educational Facilities Financing Authority Rev. (Florida Institute of Technology), 5%, 10/01/2034 | 1,395,000 | 1,482,975 | ||
| Florida Higher Educational Facilities Financing Authority Rev. (Florida Institute of Technology), 5%, 10/01/2035 | 780,000 | 821,655 | ||
| Florida Higher Educational Facilities Financing Authority Rev. (Florida Institute of Technology), 5%, 10/01/2036 | 1,070,000 | 1,119,673 | ||
| Florida Higher Educational Facilities Financing Authority Rev. (Florida Institute of Technology), 4%, 10/01/2037 | 1,490,000 | 1,405,161 | ||
| Issuer | Shares/Par | Value ($) | ||
| Municipal Bonds - continued | ||||
| Florida - continued | ||||
| Florida Higher Educational Facilities Financing Authority Rev. (Florida Institute of Technology), 4%, 10/01/2038 | $ | 2,030,000 | $1,895,768 | |
| Florida Higher Educational Facilities Financing Authority Rev. (Florida Institute of Technology), 4%, 10/01/2039 | 2,420,000 | 2,241,998 | ||
| Florida Higher Educational Facilities Financing Authority Rev. (Florida Institute of Technology), 4%, 10/01/2044 | 3,480,000 | 3,115,931 | ||
| Florida Higher Educational Facilities Financing Authority Rev. (Jacksonville University Project), “A”, 4.5%, 6/01/2033 (n) | 2,220,000 | 2,129,418 | ||
| Florida Higher Educational Facilities Financing Authority Rev. (Jacksonville University Project), “A”, 4.75%, 6/01/2038 (n) | 2,070,000 | 1,924,644 | ||
| Florida Higher Educational Facilities Financing Authority Rev. (Jacksonville University Project), “A”, 5%, 6/01/2048 (n) | 3,195,000 | 2,873,221 | ||
| Florida Housing Finance Corp., Homeowner Mortgage Rev., “1”, 4%, 7/01/2049 (u) | 2,650,000 | 2,671,825 | ||
| Hillsborough County FL, Industrial Development Authority, Hospital Rev. (Tampa General Hospital Project), “A”, 4%, 8/01/2055 | 2,315,000 | 2,122,287 | ||
| Jacksonville, FL, Cypress Bluff Community Development District, 3.75%, 5/01/2024 | 440,000 | 437,130 | ||
| Jacksonville, FL, Cypress Bluff Community Development District, 4.125%, 5/01/2029 | 1,265,000 | 1,251,841 | ||
| Jacksonville, FL, Cypress Bluff Community Development District, 4.9%, 5/01/2039 | 3,595,000 | 3,538,661 | ||
| Jacksonville, FL, Cypress Bluff Community Development District, 5.1%, 5/01/2048 | 2,600,000 | 2,545,576 | ||
| Jacksonville, FL, Educational Facilities Rev. (Jacksonville University Project), “B”, 5%, 6/01/2053 (n) | 2,345,000 | 2,066,369 | ||
| Lakewood Ranch Stewardship District, FL, Special Assessment Rev. (Lakewood Centre North Project), 4.25%, 5/01/2025 | 415,000 | 415,141 | ||
| Lakewood Ranch Stewardship District, FL, Special Assessment Rev. (Lakewood Centre North Project), 4.875%, 5/01/2035 | 1,295,000 | 1,298,307 | ||
| Lakewood Ranch Stewardship District, FL, Special Assessment Rev. (Lakewood Centre North Project), 4.875%, 5/01/2045 | 2,305,000 | 2,192,399 | ||
| Lakewood Ranch Stewardship District, FL, Special Assessment Rev. (Lakewood National and Polo Run Projects), 5.375%, 5/01/2047 | 2,820,000 | 2,825,791 | ||
| Legends Bay Community Development District, FL, “A”, 5.875%, 5/01/2038 | 920,000 | 920,652 | ||
| Live Oak Lake Community Development District, FL, Capital Improvement Rev., 4.5%, 5/01/2036 | 3,955,000 | 3,810,323 | ||
| Live Oak Lake Community Development District, FL, Capital Improvement Rev., 4.625%, 5/01/2047 | 2,720,000 | 2,447,887 | ||
| Issuer | Shares/Par | Value ($) | ||
| Municipal Bonds - continued | ||||
| Florida - continued | ||||
| Marshall Creek, FL, Community Development District Rev. (St. John's County), “A”, 5%, 5/01/2032 | $ | 1,365,000 | $1,373,388 | |
| Martin County, FL, Health Facilities Authority Hospital Rev. (Cleveland Clinic Health System), “A”, 4%, 1/01/2046 | 3,540,000 | 3,483,308 | ||
| Miami Beach, FL, Health Facilities Authority Hospital Rev. (Mount Sinai Medical Center of Florida), “B”, 4%, 11/15/2046 | 2,000,000 | 1,846,974 | ||
| Miami Beach, FL, Health Facilities Authority Hospital Rev. (Mount Sinai Medical Center of Florida), “B”, 4%, 11/15/2051 | 2,530,000 | 2,303,964 | ||
| Miami-Dade County, FL, Industrial Development Authority Rev. (Doral Academy Project), 5%, 1/15/2032 | 1,000,000 | 1,044,292 | ||
| Miami-Dade County, FL, Industrial Development Authority Rev. (Doral Academy Project), 5%, 1/15/2037 | 1,215,000 | 1,237,393 | ||
| Miami-Dade County, FL, Industrial Development Authority Rev. (Doral Academy Project), 5%, 1/15/2048 | 4,185,000 | 4,197,964 | ||
| Miami-Dade County, FL, Industrial Development Authority Rev. (Pinecrest Academy Project), 5%, 9/15/2024 | 205,000 | 208,019 | ||
| Miami-Dade County, FL, Industrial Development Authority Rev. (Pinecrest Academy Project), 5.25%, 9/15/2044 | 2,895,000 | 2,948,323 | ||
| Miami-Dade County, FL, Rickenbacker Causeway Rev., 5%, 10/01/2043 | 2,000,000 | 2,026,193 | ||
| Miami-Dade County, FL, Seaport Refunding Rev., “A”, 5.25%, 10/01/2052 (w) | 1,610,000 | 1,720,457 | ||
| Midtown Miami, FL, Community Development District Special Assessment (Infrastructure Project), “B”, 5%, 5/01/2029 | 1,195,000 | 1,195,771 | ||
| Midtown Miami, FL, Community Development District Special Assessment (Infrastructure Project), “B”, 5%, 5/01/2037 | 740,000 | 739,996 | ||
| Midtown Miami, FL, Community Development District Special Assessment (Parking Garage Project), “A”, 5%, 5/01/2037 | 1,055,000 | 1,055,021 | ||
| Naturewalk Community Development District, FL, Capital Improvement Rev., “B”, 5.3%, 5/01/2016 (a)(d) | 1,575,000 | 504,000 | ||
| North Broward, FL, Hospital District Rev. (Broward Health), “B”, 5%, 1/01/2042 | 7,340,000 | 7,462,956 | ||
| Orlando, FL, Senior Tourist Development Tax Refunding Rev. (6th Cent Contract Payments), “A”, AGM, 5%, 11/01/2034 | 405,000 | 446,112 | ||
| Osceola County, FL, Transportation Improvement and Refunding Rev. (Osceola Parkway), “A-1”, 5%, 10/01/2044 | 1,000,000 | 1,022,096 | ||
| Osceola County, FL, Transportation Improvement and Refunding Rev. (Osceola Parkway), “A-1”, 5%, 10/01/2049 | 1,295,000 | 1,319,893 | ||
| Osceola County, FL, Transportation Improvement and Refunding Rev. (Osceola Parkway), Capital Appreciation, “A-2”, 0%, 10/01/2035 | 700,000 | 373,904 | ||
| Issuer | Shares/Par | Value ($) | ||
| Municipal Bonds - continued | ||||
| Florida - continued | ||||
| Osceola County, FL, Transportation Improvement and Refunding Rev. (Osceola Parkway), Capital Appreciation, “A-2”, 0%, 10/01/2036 | $ | 840,000 | $421,916 | |
| Osceola County, FL, Transportation Improvement and Refunding Rev. (Osceola Parkway), Capital Appreciation, “A-2”, 0%, 10/01/2037 | 320,000 | 151,263 | ||
| Osceola County, FL, Transportation Improvement and Refunding Rev. (Osceola Parkway), Capital Appreciation, “A-2”, 0%, 10/01/2038 | 980,000 | 435,801 | ||
| Osceola County, FL, Transportation Improvement and Refunding Rev. (Osceola Parkway), Capital Appreciation, “A-2”, 0%, 10/01/2039 | 1,180,000 | 493,243 | ||
| Osceola County, FL, Transportation Improvement and Refunding Rev. (Osceola Parkway), Capital Appreciation, “A-2”, 0%, 10/01/2040 | 1,265,000 | 496,047 | ||
| Osceola County, FL, Transportation Improvement and Refunding Rev. (Osceola Parkway), Capital Appreciation, “A-2”, 0%, 10/01/2041 | 1,405,000 | 515,965 | ||
| Osceola County, FL, Transportation Improvement and Refunding Rev. (Osceola Parkway), Capital Appreciation, “A-2”, 0%, 10/01/2042 | 1,125,000 | 388,290 | ||
| Osceola County, FL, Transportation Improvement and Refunding Rev. (Osceola Parkway), Capital Appreciation, “A-2”, 0%, 10/01/2043 | 1,545,000 | 501,540 | ||
| Osceola County, FL, Transportation Improvement and Refunding Rev. (Osceola Parkway), Capital Appreciation, “A-2”, 0%, 10/01/2044 | 1,685,000 | 512,520 | ||
| Osceola County, FL, Transportation Improvement and Refunding Rev. (Osceola Parkway), Capital Appreciation, “A-2”, 0%, 10/01/2045 | 1,965,000 | 559,560 | ||
| Palm Beach County, FL, Health Facilities Authority Hospital Rev. (BRRH Corp. Obligated Group), 5%, 12/01/2031 (Prerefunded 12/01/2024) | 1,000,000 | 1,045,521 | ||
| Palm Beach County, FL, Health Facilities Authority Hospital Rev. (Jupiter Medical Center Project), “A”, 5%, 11/01/2047 | 940,000 | 973,993 | ||
| Palm Beach County, FL, Health Facilities Authority Hospital Rev. (Jupiter Medical Center Project), “A”, 5%, 11/01/2052 | 1,220,000 | 1,255,854 | ||
| Palm Beach County, FL, Health Facilities Authority Retirement Communities Rev. (Acts Retirement-Life Communities, Inc. Obligated Group), “B”, 5%, 11/15/2042 | 985,000 | 986,185 | ||
| Palm Beach County, FL, Health Facilities Authority Rev. (Toby & Leon Cooperman Sinai Residences of Boca Raton Expansion), “A”, 5%, 6/01/2055 | 2,770,000 | 2,526,606 | ||
| Issuer | Shares/Par | Value ($) | ||
| Municipal Bonds - continued | ||||
| Florida - continued | ||||
| Palm Beach County, FL, Health Facilities Authority Rev. (Toby & Leon Cooperman Sinai Residences of Boca Raton), 4%, 6/01/2031 | $ | 860,000 | $806,409 | |
| Palm Beach County, FL, Health Facilities Authority Rev. (Toby & Leon Cooperman Sinai Residences of Boca Raton), 4%, 6/01/2036 | 1,740,000 | 1,536,300 | ||
| Palm Beach County, FL, Health Facilities Authority Rev. (Toby & Leon Cooperman Sinai Residences of Boca Raton), 4%, 6/01/2041 | 1,450,000 | 1,196,332 | ||
| Palm Beach County, FL, Health Facilities Authority Rev. (Toby & Leon Cooperman Sinai Residences of Boca Raton), 4.25%, 6/01/2056 | 2,820,000 | 2,144,713 | ||
| Palm Beach County, FL, Provident Group Rev. (Lynn University Housing Project), “A”, 4.25%, 6/01/2031 (n) | 1,500,000 | 1,426,971 | ||
| Palm Beach County, FL, Provident Group Rev. (Lynn University Housing Project), “A”, 5%, 6/01/2057 (n) | 18,845,000 | 16,736,523 | ||
| Palm Beach County, FL, Provident Group Rev., Taxable (Lynn University Housing Project), “B”, 5%, 6/01/2027 (n) | 1,120,000 | 1,056,546 | ||
| Pasco County, FL, Bexley Community Development District, Special Assessment Rev., 4.1%, 5/01/2026 | 400,000 | 398,312 | ||
| Pasco County, FL, Bexley Community Development District, Special Assessment Rev., 4.7%, 5/01/2036 | 1,370,000 | 1,346,387 | ||
| Pasco County, FL, Bexley Community Development District, Special Assessment Rev., 4.875%, 5/01/2047 | 2,520,000 | 2,355,917 | ||
| Pasco County, FL, Concord Station Community Development District, “A-1”, 3.5%, 5/01/2032 | 1,435,000 | 1,435,132 | ||
| Pasco County, FL, Concord Station Community Development District, “A-1”, 3.625%, 5/01/2035 | 865,000 | 858,338 | ||
| Pasco County, FL, Concord Station Community Development District, “A-1”, 3.75%, 5/01/2046 | 1,000,000 | 915,000 | ||
| Pasco County, FL, Del Webb Bexley Community Development District, Special Assessment Rev., 5.3%, 5/01/2039 | 990,000 | 1,004,770 | ||
| Pasco County, FL, Del Webb Bexley Community Development District, Special Assessment Rev., 5.4%, 5/01/2049 | 1,270,000 | 1,270,771 | ||
| Pasco County, FL, Estancia at Wiregrass Community Development District, Capital Improvement, 5.25%, 11/01/2035 | 430,000 | 434,538 | ||
| Pasco County, FL, Estancia at Wiregrass Community Development District, Capital Improvement, 7%, 11/01/2045 | 1,995,000 | 2,126,892 | ||
| Pasco County, FL, Estancia at Wiregrass Community Development District, Capital Improvement, 5.375%, 11/01/2046 | 370,000 | 370,874 | ||
| Pompano Beach, FL, Refunding Rev. (John Knox Village Project), 4%, 9/01/2050 | 5,175,000 | 4,012,536 | ||
| Issuer | Shares/Par | Value ($) | ||
| Municipal Bonds - continued | ||||
| Florida - continued | ||||
| Pompano Beach, FL, Refunding Rev. (John Knox Village Project), “A”, 4%, 9/01/2051 | $ | 3,925,000 | $3,025,541 | |
| Pompano Beach, FL, Refunding Rev. (John Knox Village Project), “A”, 4%, 9/01/2056 | 5,830,000 | 4,375,319 | ||
| Pompano Beach, FL, Refunding Rev. (John Knox Village Project), “B-2”, 1.45%, 1/01/2027 | 810,000 | 717,138 | ||
| Sarasota County, FL, Health Facility Authority Retirement Facility Improvement Rev. (Village on the Isle Project), “A”, 5%, 1/01/2047 | 1,020,000 | 906,670 | ||
| Sarasota County, FL, Health Facility Authority Retirement Facility Improvement Rev. (Village on the Isle Project), “A”, 5%, 1/01/2052 | 1,875,000 | 1,637,453 | ||
| Seminole County, FL, Industrial Development Authority, Educational Facilities Rev. (Galileo Schools for Gifted Learning Project), “A”, 4%, 6/15/2036 (n) | 315,000 | 277,773 | ||
| Seminole County, FL, Industrial Development Authority, Educational Facilities Rev. (Galileo Schools for Gifted Learning Project), “A”, 4%, 6/15/2041 (n) | 425,000 | 358,395 | ||
| Seminole County, FL, Industrial Development Authority, Educational Facilities Rev. (Galileo Schools for Gifted Learning Project), “A”, 4%, 6/15/2051 (n) | 505,000 | 394,381 | ||
| Seminole County, FL, Industrial Development Authority, Educational Facilities Rev. (Galileo Schools for Gifted Learning Project), “A”, 4%, 6/15/2056 (n) | 1,310,000 | 988,545 | ||
| St. John's & Duval County, FL, Tolomato Community Development District Special Assessment Refunding, “A-2”, 3.5%, 5/01/2024 (n) | 320,000 | 317,273 | ||
| St. John's & Duval County, FL, Tolomato Community Development District Special Assessment Refunding, “A-2”, 3.85%, 5/01/2029 (n) | 700,000 | 681,821 | ||
| St. John's & Duval County, FL, Tolomato Community Development District Special Assessment Refunding, “A-2”, 4.25%, 5/01/2037 (n) | 1,000,000 | 939,709 | ||
| St. John's County, FL, Industrial Development Authority, Senior Living Rev. (Vicars Landing Project), “A”, 4%, 12/15/2027 | 110,000 | 105,201 | ||
| St. John's County, FL, Industrial Development Authority, Senior Living Rev. (Vicars Landing Project), “A”, 4%, 12/15/2028 | 105,000 | 99,557 | ||
| St. John's County, FL, Industrial Development Authority, Senior Living Rev. (Vicars Landing Project), “A”, 4%, 12/15/2029 | 120,000 | 112,823 | ||
| St. John's County, FL, Industrial Development Authority, Senior Living Rev. (Vicars Landing Project), “A”, 4%, 12/15/2030 | 105,000 | 97,908 | ||
| St. John's County, FL, Industrial Development Authority, Senior Living Rev. (Vicars Landing Project), “A”, 4%, 12/15/2031 | 110,000 | 101,596 | ||
| Issuer | Shares/Par | Value ($) | ||
| Municipal Bonds - continued | ||||
| Florida - continued | ||||
| St. John's County, FL, Industrial Development Authority, Senior Living Rev. (Vicars Landing Project), “A”, 4%, 12/15/2036 | $ | 525,000 | $453,403 | |
| St. John's County, FL, Industrial Development Authority, Senior Living Rev. (Vicars Landing Project), “A”, 4%, 12/15/2041 | 390,000 | 314,329 | ||
| St. John's County, FL, Industrial Development Authority, Senior Living Rev. (Vicars Landing Project), “A”, 4%, 12/15/2046 | 390,000 | 298,201 | ||
| St. John's County, FL, Industrial Development Authority, Senior Living Rev. (Vicars Landing Project), “A”, 4%, 12/15/2050 | 380,000 | 282,227 | ||
| Sterling Hill Community Development District, FL, Capital Improvement Rev., “B”, 5.5%, 11/01/2010 (d) | 498,908 | 269,410 | ||
| Sumter County, FL, Industrial Development Authority Hospital Rev. (Central Florida Health Alliance Projects), “A”, 5%, 7/01/2026 | 155,000 | 157,989 | ||
| Sumter County, FL, Industrial Development Authority Hospital Rev. (Central Florida Health Alliance Projects), “A”, 5%, 7/01/2029 | 145,000 | 147,357 | ||
| Sumter County, FL, Industrial Development Authority Hospital Rev. (Central Florida Health Alliance Projects), “A”, 5.125%, 7/01/2034 | 315,000 | 319,922 | ||
| Sumter County, FL, Industrial Development Authority Hospital Rev. (Central Florida Health Alliance Projects), “A”, 5.25%, 7/01/2044 | 935,000 | 941,253 | ||
| Tallahassee, FL, Health Facilities Rev. (Tallahassee Memorial Healthcare, Inc.), “A”, 5%, 12/01/2040 | 5,935,000 | 6,030,216 | ||
| Tallahassee, FL, Health Facilities Rev. (Tallahassee Memorial Healthcare, Inc.), “A”, 5%, 12/01/2044 | 2,695,000 | 2,732,655 | ||
| Tallahassee, FL, Health Facilities Rev. (Tallahassee Memorial Healthcare, Inc.), “A”, 5%, 12/01/2055 | 7,125,000 | 7,218,380 | ||
| Tampa, FL (University of Tampa Project), 5%, 4/01/2040 | 965,000 | 993,104 | ||
| Tampa, FL, Capital Improvement Cigarette Tax Allocation (H. Lee Moffitt Cancer Center Project), Capital Appreciation, “A”, 0%, 9/01/2034 | 1,570,000 | 1,037,019 | ||
| Tampa, FL, Capital Improvement Cigarette Tax Allocation (H. Lee Moffitt Cancer Center Project), Capital Appreciation, “A”, 0%, 9/01/2035 | 865,000 | 540,608 | ||
| Tampa, FL, Capital Improvement Cigarette Tax Allocation (H. Lee Moffitt Cancer Center Project), Capital Appreciation, “A”, 0%, 9/01/2036 | 1,340,000 | 793,489 | ||
| Tampa, FL, Capital Improvement Cigarette Tax Allocation (H. Lee Moffitt Cancer Center Project), Capital Appreciation, “A”, 0%, 9/01/2037 | 630,000 | 355,146 | ||
| Issuer | Shares/Par | Value ($) | ||
| Municipal Bonds - continued | ||||
| Florida - continued | ||||
| Tampa, FL, Capital Improvement Cigarette Tax Allocation (H. Lee Moffitt Cancer Center Project), Capital Appreciation, “A”, 0%, 9/01/2038 | $ | 865,000 | $463,393 | |
| Tampa, FL, Capital Improvement Cigarette Tax Allocation (H. Lee Moffitt Cancer Center Project), Capital Appreciation, “A”, 0%, 9/01/2039 | 865,000 | 437,184 | ||
| Tampa, FL, Capital Improvement Cigarette Tax Allocation (H. Lee Moffitt Cancer Center Project), Capital Appreciation, “A”, 0%, 9/01/2040 | 1,180,000 | 560,768 | ||
| Tampa, FL, Capital Improvement Cigarette Tax Allocation (H. Lee Moffitt Cancer Center Project), Capital Appreciation, “A”, 0%, 9/01/2041 | 525,000 | 233,965 | ||
| Tampa, FL, Capital Improvement Cigarette Tax Allocation (H. Lee Moffitt Cancer Center Project), Capital Appreciation, “A”, 0%, 9/01/2042 | 525,000 | 219,056 | ||
| Tampa, FL, Hospital Rev. (H. Lee Moffitt Cancer Center Project), “B”, 4%, 7/01/2038 | 340,000 | 344,648 | ||
| Tampa, FL, Hospital Rev. (H. Lee Moffitt Cancer Center Project), “B”, 4%, 7/01/2039 | 345,000 | 348,786 | ||
| Tampa, FL, Hospital Rev. (H. Lee Moffitt Cancer Center Project), “B”, 5%, 7/01/2040 | 525,000 | 555,036 | ||
| Tampa, FL, Hospital Rev. (H. Lee Moffitt Cancer Center Project), “B”, 4%, 7/01/2045 | 1,835,000 | 1,777,119 | ||
| Trout Creek Community Development District, FL, Capital Improvement Rev., 5.5%, 5/01/2035 | 2,255,000 | 2,287,317 | ||
| Trout Creek Community Development District, FL, Capital Improvement Rev., 5.625%, 5/01/2045 | 3,975,000 | 4,001,668 | ||
| Wiregrass Community Development District, FL, Capital Improvement Rev., 5.375%, 5/01/2035 | 385,000 | 390,215 | ||
| Wiregrass Community Development District, FL, Capital Improvement Rev., 4.875%, 5/01/2036 | 915,000 | 914,718 | ||
| Wiregrass Community Development District, FL, Capital Improvement Rev., 5.625%, 5/01/2045 | 1,000,000 | 1,008,835 | ||
| Wiregrass Community Development District, FL, Capital Improvement Rev., 5%, 5/01/2047 | 1,695,000 | 1,630,236 | ||
| $294,448,355 | ||||
| Issuer | Shares/Par | Value ($) | ||
| Municipal Bonds - continued | ||||
| Georgia - 1.0% | ||||
| Atlanta, GA, Geo. L. Smith II World Congress Center Authority Convention Center Hotel Rev., “B”, 3.625%, 1/01/2031 (n) | $ | 2,175,000 | $1,931,091 | |
| Atlanta, GA, Geo. L. Smith II World Congress Center Authority Convention Center Hotel Rev., “B”, 5%, 1/01/2036 (n) | 1,995,000 | 1,861,673 | ||
| Atlanta, GA, Geo. L. Smith II World Congress Center Authority Convention Center Hotel Rev., “B”, 5%, 1/01/2054 (n) | 6,200,000 | 5,094,386 | ||
| Cobb County, GA, Development Authority, Student Housing Rev. (Kennesaw State University Real Estate Foundations), “C”, 5%, 7/15/2030 | 580,000 | 590,560 | ||
| Cobb County, GA, Development Authority, Student Housing Rev. (Kennesaw State University Real Estate Foundations), “C”, 5%, 7/15/2033 | 1,025,000 | 1,038,177 | ||
| Cobb County, GA, Development Authority, Student Housing Rev. (Kennesaw State University Real Estate Foundations), “C”, 5%, 7/15/2038 | 1,100,000 | 1,108,041 | ||
| Cobb County, GA, Kennestone Hospital Authority Rev. (WellStar Health System, Inc. Project), “B”, 4%, 4/01/2032 | 365,000 | 383,731 | ||
| Cobb County, GA, Kennestone Hospital Authority Rev. (WellStar Health System, Inc. Project), “B”, 4%, 4/01/2034 | 385,000 | 400,629 | ||
| Cobb County, GA, Kennestone Hospital Authority Rev. (WellStar Health System, Inc. Project), “B”, 4%, 4/01/2036 | 340,000 | 347,247 | ||
| Cobb County, GA, Kennestone Hospital Authority Rev. (WellStar Health System, Inc. Project), “B”, 5%, 4/01/2037 | 350,000 | 378,303 | ||
| Cobb County, GA, Kennestone Hospital Authority Rev. (WellStar Health System, Inc. Project), “B”, 5%, 4/01/2038 | 370,000 | 398,648 | ||
| Fulton County, GA, Development Authority Hospital Rev. (WellStar Health System, Inc. Project), “A”, 4%, 4/01/2050 | 3,705,000 | 3,580,695 | ||
| Georgia Housing & Finance Authority Rev., Single Family Mortgage, “A-1”, 4%, 6/01/2044 | 35,000 | 35,071 | ||
| Georgia Main Street Natural Gas, Inc., Gas Project Rev., “A”, 5.5%, 9/15/2028 | 2,245,000 | 2,454,563 | ||
| Georgia Main Street Natural Gas, Inc., Gas Supply Rev., “A”, 5%, 6/01/2053 (Put Date 6/01/2030) (w) | 10,500,000 | 11,144,330 | ||
| Georgia Municipal Electric Authority (Project One), “A”, 5%, 1/01/2044 | 3,880,000 | 4,034,686 | ||
| Georgia Ports Authority Rev., 4%, 7/01/2047 | 2,340,000 | 2,319,769 | ||
| Georgia Ports Authority Rev., 4%, 7/01/2052 | 3,670,000 | 3,631,554 | ||
| Glynn-Brunswick, GA, Memorial Hospital Authority Rev., Anticipation Certificates (Southeast Georgia Health System Project), 4%, 8/01/2035 | 380,000 | 376,796 | ||
| Glynn-Brunswick, GA, Memorial Hospital Authority Rev., Anticipation Certificates (Southeast Georgia Health System Project), 4%, 8/01/2036 | 415,000 | 404,495 | ||
| Issuer | Shares/Par | Value ($) | ||
| Municipal Bonds - continued | ||||
| Georgia - continued | ||||
| Glynn-Brunswick, GA, Memorial Hospital Authority Rev., Anticipation Certificates (Southeast Georgia Health System Project), 4%, 8/01/2037 | $ | 285,000 | $274,214 | |
| Hall County and Gainesville, GA, Hospital Authority Rev. (Northeast Georgia Health System, Inc. Project), “A”, 5.5%, 8/15/2054 (Prerefunded 2/15/2025) | 3,465,000 | 3,682,416 | ||
| $45,471,075 | ||||
| Guam - 0.6% | ||||
| Guam Education Financing Foundation (Guam Public School Facilities Project), “B”, COP, 5%, 10/01/2026 (z) | $ | 12,905,000 | $12,990,519 | |
| Guam Government Business Privilege Tax Refunding, “F”, 5%, 1/01/2029 | 400,000 | 435,602 | ||
| Guam Government Business Privilege Tax Refunding, “F”, 5%, 1/01/2030 | 300,000 | 330,358 | ||
| Guam Government Business Privilege Tax Refunding, “F”, 5%, 1/01/2031 | 400,000 | 444,849 | ||
| Guam Government Business Privilege Tax Refunding, “F”, 4%, 1/01/2042 | 1,710,000 | 1,605,121 | ||
| Guam Government Department of Education (John F. Kennedy High School Energy Efficiency Project), “A”, COP, 3.625%, 2/01/2025 | 765,000 | 754,884 | ||
| Guam Government Department of Education (John F. Kennedy High School Energy Efficiency Project), “A”, COP, 4.25%, 2/01/2030 | 1,750,000 | 1,778,669 | ||
| Guam Government Department of Education (John F. Kennedy High School Energy Efficiency Project), “A”, COP, 5%, 2/01/2040 | 2,375,000 | 2,417,518 | ||
| Guam Government, Hotel Occupancy Tax Rev., “A”, 5%, 11/01/2027 | 250,000 | 268,459 | ||
| Guam Government, Hotel Occupancy Tax Rev., “A”, 5%, 11/01/2028 | 250,000 | 271,829 | ||
| Guam Government, Hotel Occupancy Tax Rev., “A”, 5%, 11/01/2029 | 325,000 | 357,241 | ||
| Guam Government, Hotel Occupancy Tax Rev., “A”, 5%, 11/01/2030 | 250,000 | 277,701 | ||
| Guam Government, Hotel Occupancy Tax Rev., “A”, 5%, 11/01/2035 | 1,000,000 | 1,086,412 | ||
| Guam Government, Hotel Occupancy Tax Rev., “A”, 5%, 11/01/2040 | 1,000,000 | 1,053,303 | ||
| Guam International Airport Authority Rev., Taxable (A.B. Won Pat Airport), “A”, 3.839%, 10/01/2036 | 930,000 | 775,724 | ||
| Guam International Airport Authority Rev., Taxable (A.B. Won Pat Airport), “A”, 4.46%, 10/01/2043 | 1,070,000 | 861,344 | ||
| Issuer | Shares/Par | Value ($) | ||
| Municipal Bonds - continued | ||||
| Guam - continued | ||||
| Guam Waterworks Authority Rev. (Water and Wastewater System), 5%, 7/01/2036 | $ | 355,000 | $365,516 | |
| Guam Waterworks Authority Rev. (Water and Wastewater System), 5%, 1/01/2046 | 1,620,000 | 1,639,767 | ||
| $27,714,816 | ||||
| Hawaii - 0.1% | ||||
| Hawaii Department of Budget & Finance, Special Purpose Rev. (Chaminade University), 5%, 1/01/2030 (n) | $ | 1,765,000 | $1,739,609 | |
| Hawaii Department of Budget & Finance, Special Purpose Rev. (Chaminade University), 5%, 1/01/2035 (n) | 1,125,000 | 1,064,960 | ||
| Hawaii Department of Budget & Finance, Special Purpose Rev. (Chaminade University), 5%, 1/01/2045 (n) | 1,140,000 | 1,010,834 | ||
| Hawaii Harbor System Rev., “A”, 4%, 7/01/2033 | 525,000 | 552,549 | ||
| Hawaii Harbor System Rev., “A”, 4%, 7/01/2034 | 460,000 | 479,707 | ||
| Hawaii Harbor System Rev., “A”, 4%, 7/01/2035 | 330,000 | 340,877 | ||
| $5,188,536 | ||||
| Idaho - 0.2% | ||||
| Idaho Health Facilities Authority Rev. (Madison Memorial Hospital Project), 5%, 9/01/2037 | $ | 830,000 | $843,824 | |
| Idaho Health Facilities Authority Rev. (St. Luke's Health System Project), “A”, 4%, 3/01/2038 | 3,880,000 | 3,851,077 | ||
| Idaho Housing and Finance Association Nonprofit Facilities Rev. (Compass Public Charter School, Inc. Project), “A”, 4.625%, 7/01/2029 (n) | 175,000 | 178,739 | ||
| Idaho Housing and Finance Association Nonprofit Facilities Rev. (Compass Public Charter School, Inc. Project), “A”, 6%, 7/01/2039 (n) | 1,100,000 | 1,173,555 | ||
| Idaho Housing and Finance Association Nonprofit Facilities Rev. (Compass Public Charter School, Inc. Project), “A”, 6%, 7/01/2049 (n) | 515,000 | 542,628 | ||
| Idaho Housing and Finance Association Nonprofit Facilities Rev. (Compass Public Charter School, Inc. Project), “A”, 6%, 7/01/2054 (n) | 565,000 | 593,940 | ||
| $7,183,763 | ||||
| Illinois - 10.5% | ||||
| Bridgeview, IL, Stadium and Redevelopment Projects, Taxable, AAC, 5.14%, 12/01/2036 | $ | 12,665,000 | $11,565,996 | |
| Burbank, IL, Educational Facility Rev. (Intercultural Montessori Language School Project), “A”, 6%, 9/01/2035 (n) | 2,170,000 | 2,184,779 | ||
| Burbank, IL, Educational Facility Rev. (Intercultural Montessori Language School Project), “A”, 6.25%, 9/01/2045 (n) | 3,565,000 | 3,581,576 | ||
| Issuer | Shares/Par | Value ($) | ||
| Municipal Bonds - continued | ||||
| Illinois - continued | ||||
| Chicago, IL, Board of Education (School Reform), Capital Appreciation, “A”, NPFG, 0%, 12/01/2029 | $ | 4,250,000 | $3,278,443 | |
| Chicago, IL, Board of Education (School Reform), Capital Appreciation, “A”, NPFG, 0%, 12/01/2030 | 1,835,000 | 1,353,672 | ||
| Chicago, IL, Board of Education (School Reform), Capital Appreciation, “B-1”, NPFG, 0%, 12/01/2026 | 4,335,000 | 3,797,280 | ||
| Chicago, IL, Board of Education (School Reform), Capital Appreciation, “B-1”, NPFG, 0%, 12/01/2028 | 5,515,000 | 4,443,827 | ||
| Chicago, IL, Board of Education, Dedicated Capital Improvement Tax Bond, 5%, 4/01/2033 | 380,000 | 392,059 | ||
| Chicago, IL, Board of Education, Dedicated Capital Improvement Tax Bond, 5%, 4/01/2033 | 280,000 | 290,806 | ||
| Chicago, IL, Board of Education, Dedicated Capital Improvement Tax Bond, 5%, 4/01/2036 | 1,110,000 | 1,133,461 | ||
| Chicago, IL, Board of Education, Dedicated Capital Improvement Tax Bond, 5%, 4/01/2037 | 1,115,000 | 1,137,824 | ||
| Chicago, IL, Board of Education, Dedicated Capital Improvement Tax Bond, 5%, 4/01/2042 | 2,015,000 | 2,037,331 | ||
| Chicago, IL, Board of Education, Dedicated Capital Improvement Tax Bond, 5%, 4/01/2046 | 2,755,000 | 2,772,142 | ||
| Chicago, IL, Board of Education, Dedicated Capital Improvement Tax Bond, 6%, 4/01/2046 | 19,865,000 | 20,815,250 | ||
| Chicago, IL, Board of Education, Unlimited Tax General Obligation Dedicated Rev., “A”, 4%, 12/01/2047 | 7,590,000 | 6,657,365 | ||
| Chicago, IL, Board of Education, Unlimited Tax General Obligation Dedicated Rev., “A”, AAC, 5.5%, 12/01/2028 | 1,550,000 | 1,681,635 | ||
| Chicago, IL, Board of Education, Unlimited Tax General Obligation Dedicated Rev., “A”, AAC, 5.5%, 12/01/2029 | 1,030,000 | 1,129,471 | ||
| Chicago, IL, Board of Education, Unlimited Tax General Obligation Dedicated Rev., “A”, AAC, 5.5%, 12/01/2030 | 775,000 | 858,871 | ||
| Chicago, IL, Board of Education, Unlimited Tax General Obligation Dedicated Rev., “A”, AAC, 5.5%, 12/01/2031 | 2,135,000 | 2,387,663 | ||
| Chicago, IL, Board of Education, Unlimited Tax General Obligation Dedicated Rev., “C”, AGM, 5%, 12/01/2032 | 6,425,000 | 6,897,759 | ||
| Chicago, IL, Board of Education, Unlimited Tax General Obligation Refunding Dedicated Rev., “A”, 5%, 12/01/2034 | 1,250,000 | 1,294,807 | ||
| Chicago, IL, Board of Education, Unlimited Tax General Obligation Refunding Dedicated Rev., “A”, 5%, 12/01/2035 | 1,500,000 | 1,543,049 | ||
| Chicago, IL, Board of Education, Unlimited Tax General Obligation Refunding Dedicated Rev., “A”, 5%, 12/01/2042 | 14,200,000 | 14,170,680 | ||
| Chicago, IL, Board of Education, Unlimited Tax General Obligation Refunding Dedicated Rev., “A”, 7%, 12/01/2046 (n) | 7,105,000 | 7,789,955 | ||
| Issuer | Shares/Par | Value ($) | ||
| Municipal Bonds - continued | ||||
| Illinois - continued | ||||
| Chicago, IL, Board of Education, Unlimited Tax General Obligation Refunding Dedicated Rev., “A”, AGM, 5%, 12/01/2030 | $ | 800,000 | $861,311 | |
| Chicago, IL, Board of Education, Unlimited Tax General Obligation Refunding Dedicated Rev., “A”, AGM, 5%, 12/01/2031 | 800,000 | 860,484 | ||
| Chicago, IL, Board of Education, Unlimited Tax General Obligation Refunding Dedicated Rev., “A”, AGM, 5%, 12/01/2032 | 800,000 | 858,865 | ||
| Chicago, IL, Board of Education, Unlimited Tax General Obligation Refunding Dedicated Rev., “A”, AGM, 5%, 12/01/2033 | 715,000 | 765,454 | ||
| Chicago, IL, Board of Education, Unlimited Tax General Obligation Refunding Dedicated Rev., “A”, AGM, 5%, 12/01/2034 | 715,000 | 760,717 | ||
| Chicago, IL, Board of Education, Unlimited Tax General Obligation Refunding Dedicated Rev., “A”, AGM, 5%, 12/01/2035 | 515,000 | 543,306 | ||
| Chicago, IL, Board of Education, Unlimited Tax General Obligation Refunding Dedicated Rev., “B”, 4%, 12/01/2036 | 1,215,000 | 1,145,837 | ||
| Chicago, IL, Board of Education, Unlimited Tax General Obligation Refunding Dedicated Rev., “B”, 4%, 12/01/2039 | 1,920,000 | 1,770,210 | ||
| Chicago, IL, Board of Education, Unlimited Tax General Obligation Refunding Dedicated Rev., “B”, 4%, 12/01/2040 | 1,255,000 | 1,144,746 | ||
| Chicago, IL, Board of Education, Unlimited Tax General Obligation Refunding Dedicated Rev., “B”, 4%, 12/01/2041 | 2,270,000 | 2,057,906 | ||
| Chicago, IL, Board of Education, Unlimited Tax General Obligation Refunding Dedicated Rev., “G”, 5%, 12/01/2034 | 5,735,000 | 5,913,091 | ||
| Chicago, IL, Board of Education, Unlimited Tax General Obligation Refunding Dedicated Rev., “H”, 5%, 12/01/2046 | 10,610,000 | 10,640,858 | ||
| Chicago, IL, General Obligation (Chicago Works), “A”, 5.5%, 1/01/2039 | 4,935,000 | 5,381,316 | ||
| Chicago, IL, General Obligation (Chicago Works), “A”, 5.5%, 1/01/2041 | 1,740,000 | 1,853,355 | ||
| Chicago, IL, General Obligation (Chicago Works), “A”, 5.5%, 1/01/2043 | 435,000 | 460,826 | ||
| Chicago, IL, General Obligation (Neighborhood Alive 21 Program), “B”, 5.5%, 1/01/2037 | 2,680,000 | 2,736,353 | ||
| Chicago, IL, General Obligation, “A”, 5%, 1/01/2025 | 1,045,000 | 1,069,922 | ||
| Chicago, IL, General Obligation, “A”, 5%, 1/01/2027 | 3,365,000 | 3,518,886 | ||
| Chicago, IL, General Obligation, “A”, 5%, 1/01/2028 | 760,000 | 802,158 | ||
| Chicago, IL, General Obligation, “A”, 5%, 1/01/2029 | 8,860,000 | 9,429,753 | ||
| Chicago, IL, General Obligation, “A”, 5%, 1/01/2033 | 23,735,000 | 25,486,501 | ||
| Issuer | Shares/Par | Value ($) | ||
| Municipal Bonds - continued | ||||
| Illinois - continued | ||||
| Chicago, IL, General Obligation, “A”, 5%, 1/01/2034 | $ | 12,000,000 | $12,840,251 | |
| Chicago, IL, General Obligation, “A”, 5.5%, 1/01/2035 | 2,925,000 | 3,116,818 | ||
| Chicago, IL, General Obligation, “A”, 5.25%, 1/01/2038 | 7,390,000 | 7,944,659 | ||
| Chicago, IL, General Obligation, “A”, 5%, 1/01/2039 | 4,170,000 | 4,236,875 | ||
| Chicago, IL, General Obligation, “A”, 5.5%, 1/01/2039 | 2,380,000 | 2,427,453 | ||
| Chicago, IL, General Obligation, “A”, 5%, 1/01/2040 | 800,000 | 810,581 | ||
| Chicago, IL, General Obligation, “A”, 5.5%, 1/01/2040 | 500,000 | 542,993 | ||
| Chicago, IL, General Obligation, “A”, 5%, 1/01/2044 | 12,975,000 | 13,023,764 | ||
| Chicago, IL, General Obligation, “D”, 5.5%, 1/01/2033 | 1,630,000 | 1,670,928 | ||
| Chicago, IL, General Obligation, “D”, 5.5%, 1/01/2040 | 1,100,000 | 1,121,203 | ||
| Chicago, IL, General Obligation, “F”, 5.5%, 1/01/2042 | 8,225,000 | 8,361,887 | ||
| Chicago, IL, Metropolitan Pier & Exposition Authority Refunding Bonds (McCormick Place Expansion Project), “A”, 4%, 6/15/2052 | 985,000 | 869,460 | ||
| Chicago, IL, Metropolitan Pier & Exposition Authority Refunding Bonds (McCormick Place Expansion Project), Capital Appreciation, “B”, BAM, 0%, 12/15/2054 | 11,735,000 | 2,572,548 | ||
| Chicago, IL, Metropolitan Pier & Exposition Authority Refunding Bonds (McCormick Place Expansion Project), Capital Appreciation, “B-1”, AGM, 0%, 6/15/2046 | 15,000,000 | 5,101,946 | ||
| Chicago, IL, Metropolitan Pier & Exposition Authority Refunding Bonds (McCormick Place Expansion Project), Capital Appreciation, “B-1”, AGM, 0%, 6/15/2047 | 29,475,000 | 9,510,501 | ||
| Chicago, IL, Metropolitan Pier & Exposition Authority Rev. (McCormick Place Expansion Project), Capital Appreciation, “A”, AGM, 0%, 12/15/2056 | 5,495,000 | 1,087,957 | ||
| Chicago, IL, O’Hare International Airport Rev., Special Facilities, 5%, 7/01/2033 | 745,000 | 777,222 | ||
| Chicago, IL, O’Hare International Airport Rev., Special Facilities, 5%, 7/01/2038 | 2,065,000 | 2,095,569 | ||
| Chicago, IL, O’Hare International Airport Rev., Special Facilities, 5%, 7/01/2048 | 6,550,000 | 6,565,739 | ||
| Chicago, IL, O'Hare International Airport Rev., Customer Facility Charge, AGM, 5.25%, 1/01/2032 | 675,000 | 676,484 | ||
| Chicago, IL, O'Hare International Airport Rev., Customer Facility Charge, AGM, 5.25%, 1/01/2033 | 335,000 | 335,725 | ||
| Chicago, IL, O'Hare International Airport Rev., Senior Lien, “A”, 4.5%, 1/01/2048 | 5,490,000 | 5,526,918 | ||
| Chicago, IL, O'Hare International Airport Rev., Senior Lien, “A”, 5%, 1/01/2048 | 4,695,000 | 4,872,799 | ||
| Chicago, IL, O'Hare International Airport Rev., Senior Lien, “A”, 4.625%, 1/01/2053 | 6,585,000 | 6,634,988 | ||
| Du Page County, IL, Special Service Area No. 31 Special Tax (Monarch Landing Project), 5.625%, 3/01/2036 | 723,000 | 719,617 | ||
| Issuer | Shares/Par | Value ($) | ||
| Municipal Bonds - continued | ||||
| Illinois - continued | ||||
| Illinois Finance Authority Rev. (Dominican University), 5%, 3/01/2034 | $ | 405,000 | $427,515 | |
| Illinois Finance Authority Rev. (Dominican University), 5%, 3/01/2038 | 500,000 | 508,881 | ||
| Illinois Finance Authority Rev. (Dominican University), 5%, 3/01/2042 | 310,000 | 311,531 | ||
| Illinois Finance Authority Rev. (Dominican University), 5%, 3/01/2047 | 565,000 | 562,943 | ||
| Illinois Finance Authority Rev. (Dominican University), 5%, 3/01/2052 | 490,000 | 480,323 | ||
| Illinois Finance Authority Rev. (Franciscan Communities), “A”, 4.75%, 5/15/2033 (Prerefunded 5/15/2023) | 350,000 | 352,139 | ||
| Illinois Finance Authority Rev. (Franciscan Communities), “A”, 4.75%, 5/15/2033 | 2,395,000 | 2,352,796 | ||
| Illinois Finance Authority Rev. (Franciscan Communities), “A”, 5.125%, 5/15/2043 (Prerefunded 5/15/2023) | 430,000 | 433,084 | ||
| Illinois Finance Authority Rev. (Franciscan Communities), “A”, 5.125%, 5/15/2043 | 5,385,000 | 5,164,925 | ||
| Illinois Finance Authority Rev. (McKinley Foundation), “A”, 5.125%, 11/01/2055 (n) | 3,570,000 | 3,102,255 | ||
| Illinois Finance Authority Rev. (Mercy Health Corp.), 5%, 12/01/2040 | 3,020,000 | 3,091,662 | ||
| Illinois Finance Authority Rev. (Plymouth Place, Inc.), “A”, 5%, 5/15/2041 | 400,000 | 354,694 | ||
| Illinois Finance Authority Rev. (Plymouth Place, Inc.), “A”, 6.5%, 5/15/2042 | 1,745,000 | 1,841,718 | ||
| Illinois Finance Authority Rev. (Plymouth Place, Inc.), “A”, 6.5%, 5/15/2047 | 2,530,000 | 2,639,440 | ||
| Illinois Finance Authority Rev. (Plymouth Place, Inc.), “A”, 5%, 5/15/2051 | 1,000,000 | 829,252 | ||
| Illinois Finance Authority Rev. (Plymouth Place, Inc.), “A”, 6.625%, 5/15/2052 | 2,060,000 | 2,147,821 | ||
| Illinois Finance Authority Rev. (Plymouth Place, Inc.), “A”, 5%, 5/15/2056 | 1,330,000 | 1,077,757 | ||
| Illinois Finance Authority Rev. (Plymouth Place, Inc.), “A”, 6.75%, 5/15/2058 | 2,690,000 | 2,815,083 | ||
| Illinois Finance Authority Rev. (Presence Health Network), 4%, 2/15/2041 (Prerefunded 2/15/2027) | 20,000 | 21,236 | ||
| Illinois Finance Authority Rev. (Presence Health Network), “C”, 4%, 2/15/2041 (Prerefunded 2/15/2027) | 435,000 | 461,886 | ||
| Illinois Finance Authority Rev. (Presence Health Network), “C”, 4%, 2/15/2041 | 9,405,000 | 9,416,174 | ||
| Issuer | Shares/Par | Value ($) | ||
| Municipal Bonds - continued | ||||
| Illinois - continued | ||||
| Illinois Finance Authority Rev. (Rehabilitation Institute of Chicago), “A”, 6%, 7/01/2043 | $ | 1,305,000 | $1,320,559 | |
| Illinois Finance Authority Rev. (Rosalind Franklin University), “A”, 5%, 8/01/2042 | 640,000 | 648,370 | ||
| Illinois Finance Authority Rev. (Rosalind Franklin University), “A”, 5%, 8/01/2047 | 1,310,000 | 1,320,697 | ||
| Illinois Finance Authority Rev. (Rosalind Franklin University, Research Building Project), “C”, 5%, 8/01/2046 | 1,005,000 | 1,012,705 | ||
| Illinois Finance Authority Rev. (Rosalind Franklin University, Research Building Project), “C”, 5%, 8/01/2049 | 970,000 | 976,857 | ||
| Illinois Finance Authority Rev., Taxable (McKinley Foundation), “B”, 7%, 11/01/2037 (n) | 1,105,000 | 1,093,816 | ||
| Illinois Finance Authority, Academic Facilities Lease Rev. (Provident Group - UIUC Properties LLC - University of Illinois at Urbana-Champaign Project), “A”, 5%, 10/01/2051 | 580,000 | 604,527 | ||
| Illinois Finance Authority, Educational Facility Rev. (Rogers Park Montessori School Project), 6%, 2/01/2034 | 700,000 | 707,269 | ||
| Illinois Finance Authority, Educational Facility Rev. (Rogers Park Montessori School Project), 6.125%, 2/01/2045 | 1,800,000 | 1,813,890 | ||
| Illinois Finance Authority, Graduate & Professional Student Loan Program Rev. (Midwestern University Foundation), “A”, 2.25%, 7/01/2033 | 610,000 | 544,491 | ||
| Illinois Finance Authority, Graduate & Professional Student Loan Program Rev. (Midwestern University Foundation), “A”, 3%, 7/01/2035 | 1,050,000 | 987,879 | ||
| Illinois Finance Authority, Student Housing and Academic Facility Rev. (CHF-Chicago LLC-University of Illinois at Chicago Project), “A”, 5%, 2/15/2028 | 210,000 | 219,961 | ||
| Illinois Finance Authority, Student Housing and Academic Facility Rev. (CHF-Chicago LLC-University of Illinois at Chicago Project), “A”, 5%, 2/15/2037 | 1,415,000 | 1,441,969 | ||
| Illinois Finance Authority, Student Housing and Academic Facility Rev. (CHF-Chicago LLC-University of Illinois at Chicago Project), “A”, 5%, 2/15/2047 | 825,000 | 825,646 | ||
| Illinois Finance Authority, Student Housing and Academic Facility Rev. (CHF-Chicago LLC-University of Illinois at Chicago Project), “A”, 5%, 2/15/2050 | 415,000 | 410,760 | ||
| Illinois Housing Development Authority Rev., “A”, FHLMC, 3.87%, 11/15/2035 (z) | 9,098,315 | 8,550,527 | ||
| Illinois Housing Development Authority Rev., “B”, FHLMC, 3.87%, 11/15/2035 (z) | 3,710,500 | 3,487,099 | ||
| Illinois Housing Development Authority Rev., “C”, FHLMC, 3.87%, 11/15/2035 (z) | 3,702,592 | 3,479,668 | ||
| Issuer | Shares/Par | Value ($) | ||
| Municipal Bonds - continued | ||||
| Illinois - continued | ||||
| Illinois Housing Development Authority Rev., “D”, FHLMC, 3.87%, 11/15/2035 (z) | $ | 3,378,609 | $3,175,191 | |
| Illinois Housing Development Authority Rev., “E”, FHLMC, 3.87%, 11/15/2035 (z) | 2,326,354 | 2,186,290 | ||
| Illinois Sales Tax Securitization Corp., Second Lien, “A”, 4%, 1/01/2038 | 1,315,000 | 1,318,405 | ||
| Illinois Sales Tax Securitization Corp., Second Lien, “A”, 4%, 1/01/2039 | 765,000 | 762,466 | ||
| Illinois Sales Tax Securitization Corp., Second Lien, “A”, 4%, 1/01/2040 | 1,315,000 | 1,319,159 | ||
| Lincolnshire, IL, Special Service Area No. 1 (Sedgebrook Project), 6.25%, 3/01/2034 | 2,064,000 | 2,065,911 | ||
| Northern Illinois University, Auxiliary Facilities System Refunding Rev., BAM, 4%, 10/01/2039 | 445,000 | 440,804 | ||
| Northern Illinois University, Auxiliary Facilities System Refunding Rev., BAM, 4%, 10/01/2041 | 430,000 | 415,820 | ||
| Northern Illinois University, Auxiliary Facilities System Refunding Rev., BAM, 4%, 10/01/2043 | 260,000 | 248,229 | ||
| Northern Illinois University, Auxiliary Facilities System Refunding Rev., “B”, BAM, 4%, 4/01/2036 | 755,000 | 763,961 | ||
| Northern Illinois University, Auxiliary Facilities System Refunding Rev., “B”, BAM, 4%, 4/01/2038 | 850,000 | 848,394 | ||
| Northern Illinois University, Auxiliary Facilities System Refunding Rev., “B”, BAM, 4%, 4/01/2040 | 810,000 | 790,598 | ||
| Northern Illinois University, Auxiliary Facilities System Refunding Rev., “B”, BAM, 4%, 4/01/2041 | 385,000 | 372,057 | ||
| Romeoville, IL, Rev. (Lewis University Project), “A”, 5%, 10/01/2042 | 1,450,000 | 1,451,545 | ||
| Romeoville, IL, Rev. (Lewis University Project), “B”, 5%, 10/01/2039 | 1,500,000 | 1,502,391 | ||
| Romeoville, IL, Rev. (Lewis University Project), “B”, 4.125%, 10/01/2041 | 1,130,000 | 1,008,646 | ||
| Romeoville, IL, Rev. (Lewis University Project), “B”, 4.125%, 10/01/2046 | 1,120,000 | 960,062 | ||
| State of Illinois, General Obligation, 5%, 11/01/2028 | 2,595,000 | 2,746,069 | ||
| State of Illinois, General Obligation, 5%, 2/01/2029 | 2,820,000 | 2,991,564 | ||
| State of Illinois, General Obligation, 4.125%, 11/01/2031 | 2,195,000 | 2,235,885 | ||
| State of Illinois, General Obligation, 5%, 1/01/2033 | 300,000 | 310,983 | ||
| State of Illinois, General Obligation, 5.5%, 5/01/2039 | 8,810,000 | 9,565,140 | ||
| State of Illinois, General Obligation, 4.5%, 11/01/2039 | 2,420,000 | 2,432,921 | ||
| State of Illinois, General Obligation, 5%, 11/01/2040 | 10,180,000 | 10,410,255 | ||
| State of Illinois, General Obligation, 5.75%, 5/01/2045 | 9,310,000 | 9,996,110 | ||
| State of Illinois, General Obligation, AGM, 4%, 2/01/2030 | 900,000 | 936,118 | ||
| Issuer | Shares/Par | Value ($) | ||
| Municipal Bonds - continued | ||||
| Illinois - continued | ||||
| State of Illinois, General Obligation, “A”, 5%, 11/01/2027 | $ | 12,495,000 | $13,465,413 | |
| State of Illinois, General Obligation, “A”, 5%, 3/01/2034 | 2,000,000 | 2,172,631 | ||
| State of Illinois, General Obligation, “A”, 5%, 3/01/2035 | 2,700,000 | 2,912,854 | ||
| State of Illinois, General Obligation, “A”, 5%, 4/01/2036 | 2,295,000 | 2,298,569 | ||
| State of Illinois, General Obligation, “A”, 5%, 3/01/2046 | 5,095,000 | 5,237,981 | ||
| State of Illinois, General Obligation, “B”, 5%, 12/01/2033 | 2,000,000 | 2,189,456 | ||
| State of Illinois, General Obligation, “B”, 4%, 11/01/2038 | 1,665,000 | 1,615,694 | ||
| State of Illinois, General Obligation, “A”, 5%, 12/01/2038 | 1,185,000 | 1,226,756 | ||
| University of Illinois, Auxiliary Facilities System Rev., “A”, BAM, 4%, 4/01/2044 | 1,055,000 | 1,031,631 | ||
| University of Illinois, Auxiliary Facilities System Rev., “A”, BAM, 4%, 4/01/2050 | 1,205,000 | 1,148,614 | ||
| Upper Illinois River Valley Development Authority Rev. (Morris Hospital), 5%, 12/01/2043 | 8,455,000 | 8,750,917 | ||
| Upper Illinois River Valley Development Authority Rev. (Morris Hospital), 5%, 12/01/2048 | 8,460,000 | 8,732,124 | ||
| $464,579,860 | ||||
| Indiana - 0.7% | ||||
| Indiana Finance Authority Refunding Rev., Taxable (BHI Senior Living), “B”, 3.21%, 11/15/2028 | $ | 785,000 | $701,089 | |
| Indiana Finance Authority Refunding Rev., Taxable (BHI Senior Living), “B”, 3.26%, 11/15/2029 | 930,000 | 820,494 | ||
| Indiana Finance Authority Refunding Rev., Taxable (BHI Senior Living), “B”, 3.3%, 11/15/2030 | 720,000 | 628,967 | ||
| Indiana Finance Authority Refunding Rev., Taxable (BHI Senior Living), “B”, 3.39%, 11/15/2031 | 570,000 | 494,802 | ||
| Indiana Finance Authority Rev. (Marquette Project), “A”, 5%, 3/01/2030 | 460,000 | 465,210 | ||
| Indiana Finance Authority Rev. (Marquette Project), “A”, 5%, 3/01/2039 | 1,155,000 | 1,157,211 | ||
| Indiana Finance Authority, Educational Facilities Multipurpose Rev. (KIPP Indianapolis, Inc. Project), “A”, 4%, 7/01/2030 | 210,000 | 201,643 | ||
| Indiana Finance Authority, Educational Facilities Multipurpose Rev. (KIPP Indianapolis, Inc. Project), “A”, 5%, 7/01/2040 | 340,000 | 336,478 | ||
| Indiana Finance Authority, Educational Facilities Multipurpose Rev. (KIPP Indianapolis, Inc. Project), “A”, 5%, 7/01/2055 | 915,000 | 864,567 | ||
| Indiana Finance Authority, Educational Facilities Tax-Exempt Rev. (Marian University Project), 5%, 9/15/2039 | 1,755,000 | 1,832,421 | ||
| Indiana Finance Authority, Educational Facilities Tax-Exempt Rev. (Marian University Project), 4%, 9/15/2044 | 470,000 | 427,391 | ||
| Indiana Finance Authority, Educational Facilities Tax-Exempt Rev. (Marian University Project), 4%, 9/15/2049 | 460,000 | 406,692 | ||
| Issuer | Shares/Par | Value ($) | ||
| Municipal Bonds - continued | ||||
| Indiana - continued | ||||
| Indiana Finance Authority, Hospital Rev. (Reid Health), AGM, 4.25%, 1/01/2047 | $ | 2,460,000 | $2,467,911 | |
| Lake County, IN, Hammond Multi-School Building Corp., 5%, 7/15/2032 | 600,000 | 663,448 | ||
| Lake County, IN, Hammond Multi-School Building Corp., 5%, 7/15/2033 | 440,000 | 484,201 | ||
| Lake County, IN, Hammond Multi-School Building Corp., 5%, 7/15/2035 | 550,000 | 596,857 | ||
| Terre Haute, IN, Rev. (Westminster Village), 6%, 8/01/2039 | 4,600,000 | 4,246,945 | ||
| Valparaiso, IN, Exempt Facilities Rev. (Pratt Paper LLC Project), 6.75%, 1/01/2034 | 4,370,000 | 4,484,527 | ||
| Valparaiso, IN, Exempt Facilities Rev. (Pratt Paper LLC Project), 7%, 1/01/2044 | 10,875,000 | 11,185,173 | ||
| $32,466,027 | ||||
| Iowa - 0.8% | ||||
| Iowa Finance Authority Senior Housing Rev. (Northcrest, Inc. Project), “A”, 5%, 3/01/2033 | $ | 1,095,000 | $1,070,386 | |
| Iowa Finance Authority Senior Housing Rev. (Northcrest, Inc. Project), “A”, 5%, 3/01/2038 | 865,000 | 826,996 | ||
| Iowa Finance Authority Senior Housing Rev. (Northcrest, Inc. Project), “A”, 5%, 3/01/2048 | 1,590,000 | 1,442,333 | ||
| Iowa Finance Authority, Single Family Mortgage Rev., “A”, FNMA, 4%, 7/01/2047 | 615,000 | 620,586 | ||
| Iowa Higher Education Loan Authority, Private College Facility Rev. (Des Moines University Project), 4.75%, 10/01/2042 | 775,000 | 780,689 | ||
| Iowa Higher Education Loan Authority, Private College Facility Rev. (Des Moines University Project), 5%, 10/01/2047 | 820,000 | 833,729 | ||
| Iowa Higher Education Loan Authority, Private College Facility Rev. (Des Moines University Project), 5.375%, 10/01/2052 | 910,000 | 944,272 | ||
| Iowa Student Loan Liquidity Corp. Rev., “B”, 3%, 12/01/2039 | 470,000 | 449,421 | ||
| Iowa Student Loan Liquidity Corp. Rev., “B”, 3.5%, 12/01/2044 | 7,710,000 | 6,539,391 | ||
| Iowa Tobacco Settlement Authority Asset-Backed, Senior Capital Appreciation, “B-2”, 0%, 6/01/2065 | 157,900,000 | 20,176,178 | ||
| $33,683,981 | ||||
| Kansas - 1.2% | ||||
| Coffeyville, KS, Electric Utility System Rev., “B”, NPFG, 5%, 6/01/2038 (Prerefunded 6/01/2025) (n) | $ | 3,600,000 | $3,791,115 | |
| Coffeyville, KS, Electric Utility System Rev., “B”, NPFG, 5%, 6/01/2042 (Prerefunded 6/01/2025) (n) | 1,500,000 | 1,579,631 | ||
| Ellis County, KS, Unified School District No. 489 General Obligation, “B”, AGM, 4%, 9/01/2052 | 1,560,000 | 1,549,603 | ||
| Issuer | Shares/Par | Value ($) | ||
| Municipal Bonds - continued | ||||
| Kansas - continued | ||||
| Hutchinson, KS, Hospital Facilities Rev. (Hutchinson Regional Medical Center, Inc.), 5%, 12/01/2036 | $ | 1,405,000 | $1,427,491 | |
| Hutchinson, KS, Hospital Facilities Rev. (Hutchinson Regional Medical Center, Inc.), 5%, 12/01/2041 | 615,000 | 619,484 | ||
| Lenexa, KS, Health Care Facility Rev. (Lakeview Village, Inc.), “A”, 5%, 5/15/2030 | 1,085,000 | 1,095,452 | ||
| Lenexa, KS, Health Care Facility Rev. (Lakeview Village, Inc.), “A”, 5%, 5/15/2032 | 985,000 | 989,921 | ||
| Lenexa, KS, Health Care Facility Rev. (Lakeview Village, Inc.), “A”, 5%, 5/15/2039 | 1,280,000 | 1,264,462 | ||
| Lenexa, KS, Health Care Facility Rev. (Lakeview Village, Inc.), “A”, 5%, 5/15/2043 | 4,000,000 | 3,875,776 | ||
| Manhattan, KS, Health Care Facilities Rev. (Meadowlark Hills), “A”, 4%, 6/01/2036 | 1,000,000 | 849,372 | ||
| Manhattan, KS, Health Care Facilities Rev. (Meadowlark Hills), “A”, 4%, 6/01/2046 | 890,000 | 679,933 | ||
| Manhattan, KS, Health Care Facilities Rev. (Meadowlark Hills), “A”, 4%, 6/01/2052 | 4,390,000 | 3,213,488 | ||
| Overland Park, KS, Development Corp. Improvement and Refunding Rev. (Overland Park Convention Center Hotel), 5%, 3/01/2032 | 1,360,000 | 1,367,089 | ||
| Overland Park, KS, Development Corp. Improvement and Refunding Rev. (Overland Park Convention Center Hotel), 5%, 3/01/2033 | 1,430,000 | 1,436,579 | ||
| Overland Park, KS, Development Corp. Improvement and Refunding Rev. (Overland Park Convention Center Hotel), 5%, 3/01/2034 | 1,500,000 | 1,506,500 | ||
| Overland Park, KS, Development Corp. Improvement and Refunding Rev. (Overland Park Convention Center Hotel), 5%, 3/01/2036 | 1,660,000 | 1,664,158 | ||
| Overland Park, KS, Development Corp. Improvement and Refunding Rev. (Overland Park Convention Center Hotel), 5%, 3/01/2038 | 1,835,000 | 1,827,931 | ||
| Overland Park, KS, Development Corp. Improvement and Refunding Rev. (Overland Park Convention Center Hotel), 5%, 3/01/2044 | 1,990,000 | 1,944,231 | ||
| Overland Park, KS, Development Corp. Improvement and Refunding Rev. (Overland Park Convention Center Hotel), 5%, 3/01/2049 | 4,150,000 | 4,030,187 | ||
| Overland Park, KS, Sales Tax Special Rev. (Bluhawk STAR Bond Project), “A”, 5.5%, 11/15/2028 (n) | 750,000 | 771,993 | ||
| Overland Park, KS, Sales Tax Special Rev. (Bluhawk STAR Bond Project), “A”, 6%, 11/15/2034 (n) | 2,415,000 | 2,513,665 | ||
| Issuer | Shares/Par | Value ($) | ||
| Municipal Bonds - continued | ||||
| Kansas - continued | ||||
| Topeka, KS, Health Care Facilities Rev. (Brewster Place), “A”, 6.25%, 12/01/2042 | $ | 1,320,000 | $1,340,188 | |
| Topeka, KS, Health Care Facilities Rev. (Brewster Place), “A”, 6.5%, 12/01/2052 | 2,420,000 | 2,456,570 | ||
| Wichita, KS, Health Care Facilities Rev. (Presbyterian Manors, Inc.), “A”, 6.375%, 5/15/2043 | 4,165,000 | 4,174,862 | ||
| Wichita, KS, Health Care Facilities Rev. (Presbyterian Manors, Inc.), “I”, 5%, 5/15/2033 | 605,000 | 580,967 | ||
| Wichita, KS, Health Care Facilities Rev. (Presbyterian Manors, Inc.), “I”, 5%, 5/15/2038 | 710,000 | 651,522 | ||
| Wichita, KS, Health Care Facilities Rev. (Presbyterian Manors, Inc.), “I”, 4.625%, 5/15/2041 | 605,000 | 506,825 | ||
| Wichita, KS, Health Care Facilities Rev. (Presbyterian Manors, Inc.), “I”, 5%, 5/15/2047 | 1,860,000 | 1,598,150 | ||
| Wichita, KS, Health Care Facilities Rev. (Presbyterian Manors, Inc.), “III”, 5%, 5/15/2034 | 1,750,000 | 1,661,477 | ||
| Wichita, KS, Health Care Facilities Rev. (Presbyterian Manors, Inc.), “IV-A”, 6.5%, 5/15/2048 | 1,500,000 | 1,503,559 | ||
| Wichita, KS, Sales Tax Special Obligations Rev. (K-96 Greenwich Star Bond Project), 4.2%, 9/01/2027 | 95,000 | 93,675 | ||
| Wyandotte County/Kansas City, KS, Unified Government Community Improvement District Sales Tax Rev. (Legends Apartments Garage & West Lawn Project), 4.5%, 6/01/2040 | 1,300,000 | 1,195,409 | ||
| $53,761,265 | ||||
| Kentucky - 1.2% | ||||
| Henderson, KY, Exempt Facilities Rev. (Pratt Paper LLC Project), “B”, 4.45%, 1/01/2042 (n) | $ | 4,005,000 | $3,855,996 | |
| Kentucky Economic Development Finance Authority Healthcare Facilities Rev. (Baptist Life Communities Project), “A”, 6%, 11/15/2036 | 2,385,000 | 2,074,990 | ||
| Kentucky Economic Development Finance Authority Healthcare Facilities Rev. (Baptist Life Communities Project), “A”, 6.25%, 11/15/2046 | 5,105,000 | 4,160,350 | ||
| Kentucky Economic Development Finance Authority Healthcare Facilities Rev. (Baptist Life Communities Project), “A”, 6.375%, 11/15/2051 | 5,415,000 | 4,378,251 | ||
| Kentucky Economic Development Finance Authority Healthcare Facilities Rev. (Masonic Homes of Kentucky, Inc.), 5.375%, 11/15/2042 | 2,915,000 | 2,520,470 | ||
| Kentucky Economic Development Finance Authority Healthcare Facilities Rev. (Masonic Homes of Kentucky, Inc.), 5.5%, 11/15/2045 | 1,325,000 | 1,140,404 | ||
| Issuer | Shares/Par | Value ($) | ||
| Municipal Bonds - continued | ||||
| Kentucky - continued | ||||
| Kentucky Economic Development Finance Authority Hospital Rev. (Baptist Healthcare System), “B”, 5%, 8/15/2037 | $ | 1,250,000 | $1,317,943 | |
| Kentucky Economic Development Finance Authority Hospital Rev. (Baptist Healthcare System), “B”, 5%, 8/15/2046 | 5,245,000 | 5,379,907 | ||
| Kentucky Economic Development Finance Authority Hospital Rev. (Owensboro Health, Inc.), “A”, 5%, 6/01/2041 | 1,995,000 | 2,033,141 | ||
| Kentucky Economic Development Finance Authority Hospital Rev. (Owensboro Health, Inc.), “A”, 5.25%, 6/01/2041 | 1,555,000 | 1,607,898 | ||
| Kentucky Economic Development Finance Authority Hospital Rev. (Owensboro Health, Inc.), “A”, 5%, 6/01/2045 | 2,490,000 | 2,532,581 | ||
| Kentucky Economic Development Finance Authority Rev. (Masonic Home Independent Living II, Inc. - Meadow Project and Grove Pointe Project), “A”, 5%, 5/15/2036 | 2,505,000 | 2,205,192 | ||
| Kentucky Economic Development Finance Authority Rev. (Masonic Home Independent Living II, Inc. - Meadow Project and Grove Pointe Project), “A”, 5%, 5/15/2046 | 6,945,000 | 5,555,678 | ||
| Kentucky Economic Development Finance Authority Rev. (Masonic Home Independent Living II, Inc. - Meadow Project and Grove Pointe Project), “A”, 5%, 5/15/2051 | 1,755,000 | 1,355,872 | ||
| Kentucky Higher Education Student Loan Corp. Rev., “B-1”, 5%, 6/01/2036 | 8,965,000 | 9,442,963 | ||
| Kentucky State University, Certificates of Participation, BAM, 4%, 11/01/2033 | 135,000 | 147,802 | ||
| Kentucky State University, Certificates of Participation, BAM, 4%, 11/01/2036 | 80,000 | 84,279 | ||
| Kentucky State University, Certificates of Participation, BAM, 4%, 11/01/2038 | 170,000 | 173,610 | ||
| Kentucky State University, Certificates of Participation, BAM, 4%, 11/01/2041 | 130,000 | 131,688 | ||
| Kentucky State University, Certificates of Participation, BAM, 4%, 11/01/2051 | 275,000 | 267,997 | ||
| Louisville & Jefferson County, KY, Metro Government College Improvement Rev. (Bellarmine University Project), “A”, 5%, 5/01/2034 | 1,440,000 | 1,417,474 | ||
| Louisville & Jefferson County, KY, Metro Government College Improvement Rev. (Bellarmine University Project), “A”, 5%, 5/01/2035 | 2,290,000 | 2,239,261 | ||
| $54,023,747 | ||||
| Issuer | Shares/Par | Value ($) | ||
| Municipal Bonds - continued | ||||
| Louisiana - 2.4% | ||||
| Louisiana Local Government, Environmental Facilities & Community Development Authority Rev. (Cameron Parish GOMESA Project), 5.65%, 11/01/2037 (n) | $ | 1,260,000 | $1,339,120 | |
| Louisiana Local Government, Environmental Facilities & Community Development Authority Rev. (CDF Healthcare), “A”, 5.625%, 6/01/2045 | 10,900,000 | 9,449,712 | ||
| Louisiana Local Government, Environmental Facilities & Community Development Authority Rev. (Jefferson Parish GOMESA Project), 4%, 11/01/2044 (n) | 4,810,000 | 4,317,824 | ||
| Louisiana Local Government, Environmental Facilities & Community Development Authority Rev. (Lafourche Parish GOMESA Project), 3.95%, 11/01/2043 (n) | 3,718,658 | 3,292,624 | ||
| Louisiana Local Government, Environmental Facilities & Community Development Authority Rev. (Ragin' Cajun Facilities, Inc. - Student Housing & Parking Project), AGM, 5%, 10/01/2043 | 560,000 | 580,602 | ||
| Louisiana Local Government, Environmental Facilities & Community Development Authority Rev. (St. Bernard Parish GOMESA Project), 4%, 11/01/2045 (n) | 4,220,000 | 3,734,124 | ||
| Louisiana Local Government, Environmental Facilities & Community Development Authority Rev. (St. James Parish GOMESA Project), 3.9%, 11/01/2044 (n) | 4,400,000 | 3,836,496 | ||
| Louisiana Local Government, Environmental Facilities & Community Development Authority Rev. (St. James Place of Baton Rouge Project), “A”, 6%, 11/15/2035 | 1,145,000 | 1,144,876 | ||
| Louisiana Local Government, Environmental Facilities & Community Development Authority Rev. (St. James Place of Baton Rouge Project), “A”, 6.25%, 11/15/2045 | 4,875,000 | 4,775,911 | ||
| Louisiana Local Government, Environmental Facilities & Community Development Authority Rev. (St. Mary's Parish GOMESA Project), 4.4%, 11/01/2044 (n) | 3,295,000 | 3,135,173 | ||
| Louisiana Local Government, Environmental Facilities & Community Development Authority Rev. (St. Tammany Parish GOMESA Project), 3.875%, 11/01/2045 (n) | 5,500,000 | 4,704,691 | ||
| Louisiana Local Government, Environmental Facilities & Community Development Authority Rev. (Tangipahoa Parish GOMESA Project), 5.375%, 11/01/2038 (n) | 1,920,000 | 2,009,054 | ||
| Louisiana Local Government, Environmental Facilities & Community Development Authority Rev. (Terrebonne Parish GOMESA Project), 5.5%, 11/01/2039 (n) | 1,410,000 | 1,480,602 | ||
| Louisiana Local Government, Environmental Facilities & Community Development Authority Rev. (Vermilion Parish GOMESA Project), 4.625%, 11/01/2038 (n) | 1,525,000 | 1,538,306 | ||
| Issuer | Shares/Par | Value ($) | ||
| Municipal Bonds - continued | ||||
| Louisiana - continued | ||||
| Louisiana Local Government, Environmental Facilities & Community Development Authority Rev. (Westside Habilitation Center Project), “A”, 5.75%, 2/01/2032 (n) | $ | 900,000 | $880,295 | |
| Louisiana Local Government, Environmental Facilities & Community Development Authority Rev. (Westside Habilitation Center Project), “A”, 6.125%, 2/01/2037 (n) | 3,480,000 | 3,417,800 | ||
| Louisiana Local Government, Environmental Facilities & Community Development Authority Rev. (Westside Habilitation Center Project), “A”, 6.25%, 2/01/2047 (n) | 2,830,000 | 2,709,837 | ||
| Louisiana Local Government, Environmental Facilities & Community Development Authority Student Housing Rev. (Provident Group - ULM Properties LLC - University of Louisiana at Monroe Project), “A”, 5%, 7/01/2029 (n) | 670,000 | 659,516 | ||
| Louisiana Local Government, Environmental Facilities & Community Development Authority Student Housing Rev. (Provident Group - ULM Properties LLC - University of Louisiana at Monroe Project), “A”, 5%, 7/01/2039 (n) | 1,660,000 | 1,448,810 | ||
| Louisiana Local Government, Environmental Facilities & Community Development Authority Student Housing Rev. (Provident Group - ULM Properties LLC - University of Louisiana at Monroe Project), “A”, 5%, 7/01/2054 (n) | 2,635,000 | 2,108,296 | ||
| Louisiana Public Facilities Authority Rev. (BBR Schools - Materra Campus Project), “A”, 4%, 6/01/2031 (n) | 580,000 | 543,857 | ||
| Louisiana Public Facilities Authority Rev. (BBR Schools - Materra Campus Project), “A”, 4%, 6/01/2041 (n) | 1,330,000 | 1,128,747 | ||
| Louisiana Public Facilities Authority Rev. (BBR Schools - Materra Campus Project), “A”, 4%, 6/01/2051 (n) | 1,865,000 | 1,465,605 | ||
| Louisiana Public Facilities Authority Rev. (BBR Schools - Materra Campus Project), “A”, 4%, 6/01/2056 (n) | 2,200,000 | 1,681,826 | ||
| Louisiana Public Facilities Authority Rev. (BBR Schools - Materra Campus Project), “C”, 4%, 6/01/2031 (n) | 485,000 | 454,777 | ||
| Louisiana Public Facilities Authority Rev. (BBR Schools - Materra Campus Project), “C”, 4%, 6/01/2041 (n) | 880,000 | 746,840 | ||
| Louisiana Public Facilities Authority Rev. (BBR Schools - Materra Campus Project), “C”, 4%, 6/01/2056 (n) | 1,160,000 | 886,781 | ||
| Louisiana Public Facilities Authority Rev. (BBR Schools - Mid City Campus Project), “C”, 4%, 6/01/2051 (n) | 1,250,000 | 982,309 | ||
| Louisiana Public Facilities Authority Rev. (GEO Academies EBR - GEO Prep Mid-City Project), 5.625%, 6/01/2037 (n) | 415,000 | 421,303 | ||
| Louisiana Public Facilities Authority Rev. (GEO Academies EBR - GEO Prep Mid-City Project), 6.125%, 6/01/2052 (n) | 1,030,000 | 1,045,316 | ||
| Louisiana Public Facilities Authority Rev. (GEO Academies EBR - GEO Prep Mid-City Project), 6.25%, 6/01/2062 (n) | 1,425,000 | 1,446,079 | ||
| Issuer | Shares/Par | Value ($) | ||
| Municipal Bonds - continued | ||||
| Louisiana - continued | ||||
| Louisiana Public Facilities Authority Rev. (Jefferson Rise Charter School Project), “A”, 6%, 6/01/2037 (n) | $ | 500,000 | $492,873 | |
| Louisiana Public Facilities Authority Rev. (Jefferson Rise Charter School Project), “A”, 6.25%, 6/01/2052 (n) | 1,000,000 | 982,744 | ||
| Louisiana Public Facilities Authority Rev. (Jefferson Rise Charter School Project), “A”, 6.375%, 6/01/2062 (n) | 1,545,000 | 1,504,692 | ||
| Louisiana Public Facilities Authority Rev. (Loyola University Project), Convertible Capital Appreciation, 0% to 10/01/2023, 5.25% to 10/01/2046 | 8,470,000 | 8,322,742 | ||
| Louisiana Public Facilities Authority Rev. (Provident Group - HSC Properties, Inc., LSU Health Foundation, New Orleans Project), “A-1”, 5.375%, 1/01/2040 (z) | 4,365,000 | 4,381,023 | ||
| Louisiana Public Facilities Authority Rev. (Provident Group - HSC Properties, Inc., LSU Health Foundation, New Orleans Project), “A-1”, 5.5%, 1/01/2050 (z) | 2,995,000 | 2,986,495 | ||
| Louisiana Public Facilities Authority Rev. (Provident Group - HSC Properties, Inc., LSU Health Foundation, New Orleans Project), “A-1”, 5.1%, 1/01/2057 (z) | 10,045,000 | 9,256,934 | ||
| Louisiana Public Facilities Authority Rev. (Provident Group - HSC Properties, Inc., LSU Health Foundation, New Orleans Project), “A-2”, 7%, 1/01/2057 (z) | 10,000,000 | 9,973,397 | ||
| New Orleans, LA, Aviation Board Special Facility Rev. (Parking Facilities Corp. Consolidated Garage System), “A”, AGM, 5%, 10/01/2043 | 1,100,000 | 1,157,847 | ||
| $106,425,856 | ||||
| Maine - 0.2% | ||||
| Maine Finance Authority Solid Waste Disposal Rev. (Casella Waste Systems, Inc.), “R-2”, 4.375%, 8/01/2035 (Put Date 8/01/2025) (n) | $ | 2,685,000 | $2,658,440 | |
| Maine Finance Authority Solid Waste Disposal Rev. (Casella Waste Systems, Inc.), “R-3”, 5.25%, 1/01/2025 (n) | 6,170,000 | 6,219,925 | ||
| $8,878,365 | ||||
| Maryland - 1.3% | ||||
| Baltimore, MD, Convention Center Hotel Rev., 5%, 9/01/2025 | $ | 1,550,000 | $1,556,119 | |
| Baltimore, MD, Convention Center Hotel Rev., 5%, 9/01/2026 | 520,000 | 524,523 | ||
| Baltimore, MD, Convention Center Hotel Rev., 5%, 9/01/2034 | 2,740,000 | 2,765,159 | ||
| Baltimore, MD, Convention Center Hotel Rev., 5%, 9/01/2042 | 2,375,000 | 2,216,302 | ||
| Baltimore, MD, Convention Center Hotel Rev., 5%, 9/01/2046 | 1,480,000 | 1,396,176 | ||
| Baltimore, MD, Special Obligation (East Baltimore Research Park Project), “A”, 5%, 9/01/2038 | 2,680,000 | 2,714,759 | ||
| Brunswick, MD, Special Obligation Refunding (Brunswick Crossing Special Taxing District), 4%, 7/01/2029 | 500,000 | 492,480 | ||
| Issuer | Shares/Par | Value ($) | ||
| Municipal Bonds - continued | ||||
| Maryland - continued | ||||
| Brunswick, MD, Special Obligation Refunding (Brunswick Crossing Special Taxing District), 5%, 7/01/2036 | $ | 550,000 | $560,705 | |
| Frederick County, MD, Limited Obligation (Jefferson Technology Park Project), “B”, 4.625%, 7/01/2043 (n) | 1,020,000 | 992,906 | ||
| Howard County, MD, Retirement Community Rev. (Vantage House Facility), 5%, 4/01/2036 | 1,225,000 | 1,136,606 | ||
| Howard County, MD, Retirement Community Rev. (Vantage House Facility), 5%, 4/01/2036 | 3,930,000 | 3,646,419 | ||
| Howard County, MD, Special Obligation (Downtown Columbia Project), “A”, 4.125%, 2/15/2034 (n) | 850,000 | 804,764 | ||
| Howard County, MD, Special Obligation (Downtown Columbia Project), “A”, 4.375%, 2/15/2039 (n) | 745,000 | 701,102 | ||
| Howard County, MD, Special Obligation (Downtown Columbia Project), “A”, 4.5%, 2/15/2047 (n) | 2,190,000 | 1,995,020 | ||
| Maryland Community Development Administration, Department of Housing & Community Development Housing Rev., “A”, 4.5%, 9/01/2048 (u) | 4,465,000 | 4,579,778 | ||
| Maryland Community Development Administration, Department of Housing & Community Development Housing Rev., “B”, 4.5%, 9/01/2048 (u) | 3,635,000 | 3,699,274 | ||
| Maryland Economic Development Corp. Senior Student Housing Rev. (Morgan State University Project), “A”, 6%, 7/01/2058 | 2,250,000 | 2,497,462 | ||
| Maryland Economic Development Corp., Special Obligation (Port Covington Project), 3.25%, 9/01/2030 (n) | 265,000 | 245,141 | ||
| Maryland Economic Development Corp., Special Obligation (Port Covington Project), 4%, 9/01/2040 (n) | 920,000 | 823,138 | ||
| Maryland Economic Development Corp., Subordinate Parking Facilities Rev. (Baltimore City Project), “C”, 4%, 6/01/2038 | 175,000 | 149,993 | ||
| Maryland Economic Development Corp., Subordinate Parking Facilities Rev. (Baltimore City Project), “C”, 4%, 6/01/2048 | 525,000 | 409,030 | ||
| Maryland Economic Development Corp., Subordinate Parking Facilities Rev. (Baltimore City Project), “C”, 4%, 6/01/2058 | 1,800,000 | 1,325,989 | ||
| Maryland Health & Higher Educational Facilities Authority Rev. (Adventist Healthcare), 5%, 1/01/2036 | 810,000 | 843,710 | ||
| Maryland Health & Higher Educational Facilities Authority Rev. (Adventist Healthcare), “A”, 5.5%, 1/01/2036 | 2,290,000 | 2,382,136 | ||
| Maryland Health & Higher Educational Facilities Authority Rev. (Doctors Community Hospital), “A”, 5%, 7/01/2034 | 860,000 | 905,799 | ||
| Maryland Stadium Authority Rev., Baltimore City Public Schools Construction and Revitalization Program, Capital Appreciation, “C”, 0%, 5/01/2051 | 6,160,000 | 1,799,946 | ||
| Issuer | Shares/Par | Value ($) | ||
| Municipal Bonds - continued | ||||
| Maryland - continued | ||||
| Maryland Stadium Authority Rev., Baltimore City Public Schools Construction and Revitalization Program, Capital Appreciation, “C”, 0%, 5/01/2052 | $ | 9,235,000 | $2,570,277 | |
| Maryland Stadium Authority Rev., Baltimore City Public Schools Construction and Revitalization Program, Capital Appreciation, “C”, 0%, 5/01/2053 | 4,515,000 | 1,196,402 | ||
| Maryland Stadium Authority Rev., Baltimore City Public Schools Construction and Revitalization Program, Capital Appreciation, “C”, 0%, 5/01/2054 | 6,775,000 | 1,712,901 | ||
| Maryland Stadium Authority Rev., Baltimore City Public Schools Construction and Revitalization Program, Capital Appreciation, “C”, 0%, 5/01/2055 | 4,185,000 | 1,009,339 | ||
| Prince George's County, MD, Special Obligation (Westphalia Town Center Project), 5.125%, 7/01/2039 (n) | 790,000 | 790,888 | ||
| Prince George's County, MD, Special Obligation (Westphalia Town Center Project), 5.25%, 7/01/2048 (n) | 775,000 | 775,432 | ||
| Rockville, MD, Mayor & Council Economic Development Refunding Rev. (Ingleside at King Farm Project), “A-1”, 5%, 11/01/2037 | 890,000 | 843,642 | ||
| Rockville, MD, Mayor & Council Economic Development Rev. (Ingleside at King Farm Project), “B”, 5%, 11/01/2042 | 1,530,000 | 1,405,602 | ||
| Rockville, MD, Mayor & Council Economic Development Rev. (Ingleside at King Farm Project), “B”, 5%, 11/01/2047 | 1,605,000 | 1,435,327 | ||
| Westminster, MD, Refunding Rev. (Carroll Lutheran Village, Inc.), 5.125%, 7/01/2040 | 2,600,000 | 2,693,262 | ||
| $55,597,508 | ||||
| Massachusetts - 1.9% | ||||
| Collegiate Charter School of Lowell, MA, Rev., 4%, 6/15/2024 | $ | 200,000 | $198,861 | |
| Collegiate Charter School of Lowell, MA, Rev., 5%, 6/15/2029 | 905,000 | 918,106 | ||
| Collegiate Charter School of Lowell, MA, Rev., 5%, 6/15/2049 | 750,000 | 715,117 | ||
| Collegiate Charter School of Lowell, MA, Rev., 5%, 6/15/2054 | 580,000 | 544,244 | ||
| Massachusetts Development Finance Agency Rev. (Adventcare), “A”, 6.75%, 10/15/2037 (a)(d) | 8,336,312 | 833,631 | ||
| Massachusetts Development Finance Agency Rev. (Emerson College), 5%, 1/01/2031 | 835,000 | 859,788 | ||
| Massachusetts Development Finance Agency Rev. (Emmanuel College), “A”, 5%, 10/01/2043 | 2,930,000 | 2,980,434 | ||
| Massachusetts Development Finance Agency Rev. (Emmanuel College), “A”, 4%, 10/01/2046 | 870,000 | 779,146 | ||
| Massachusetts Development Finance Agency Rev. (Foxborough Regional Charter School), “B”, 5%, 7/01/2037 | 1,000,000 | 1,017,392 | ||
| Issuer | Shares/Par | Value ($) | ||
| Municipal Bonds - continued | ||||
| Massachusetts - continued | ||||
| Massachusetts Development Finance Agency Rev. (Foxborough Regional Charter School), “B”, 5%, 7/01/2042 | $ | 3,000,000 | $3,015,886 | |
| Massachusetts Development Finance Agency Rev. (Lasell University), 4%, 7/01/2040 | 1,075,000 | 905,375 | ||
| Massachusetts Development Finance Agency Rev. (Lasell University), 4%, 7/01/2045 | 495,000 | 394,027 | ||
| Massachusetts Development Finance Agency Rev. (Newbridge on the Charles, Inc.), 5%, 10/01/2037 (n) | 400,000 | 406,287 | ||
| Massachusetts Development Finance Agency Rev. (Newbridge on the Charles, Inc.), 5%, 10/01/2047 (n) | 3,140,000 | 3,095,993 | ||
| Massachusetts Development Finance Agency Rev. (Newbridge on the Charles, Inc.), 5%, 10/01/2057 (n) | 7,070,000 | 6,734,580 | ||
| Massachusetts Development Finance Agency Rev. (North Hill Communities), “A”, 6.25%, 11/15/2033 (Prerefunded 11/15/2023) (n) | 1,350,000 | 1,387,192 | ||
| Massachusetts Development Finance Agency Rev. (Sabis International Charter School Issue), 5%, 4/15/2025 | 235,000 | 238,018 | ||
| Massachusetts Development Finance Agency Rev. (Salem Community Corp.), 5.125%, 1/01/2040 (n) | 515,000 | 483,102 | ||
| Massachusetts Development Finance Agency Rev. (Salem Community Corp.), 5.25%, 1/01/2050 (n) | 1,355,000 | 1,238,561 | ||
| Massachusetts Development Finance Agency Rev. (Simmons College), “K-1”, 5%, 10/01/2025 | 800,000 | 835,553 | ||
| Massachusetts Development Finance Agency Rev. (Springfield College), “B”, 4%, 6/01/2041 | 2,750,000 | 2,577,009 | ||
| Massachusetts Development Finance Agency Rev. (Springfield College), “B”, 4%, 6/01/2050 | 2,700,000 | 2,377,373 | ||
| Massachusetts Development Finance Agency Rev. (Suffolk University), 5%, 7/01/2033 | 480,000 | 509,392 | ||
| Massachusetts Development Finance Agency Rev. (Suffolk University), 5%, 7/01/2034 | 645,000 | 682,043 | ||
| Massachusetts Development Finance Agency Rev. (Wellforce, Inc.), “A”, 5%, 7/01/2039 | 1,000,000 | 1,012,300 | ||
| Massachusetts Development Finance Agency Rev. (Wellforce, Inc.), “A”, 5%, 7/01/2044 | 1,520,000 | 1,517,902 | ||
| Massachusetts Development Finance Agency Rev. (Wentworth Institute of Technology), 5%, 10/01/2046 | 985,000 | 1,007,136 | ||
| Massachusetts Development Finance Agency Rev. (Western New England University), 5%, 9/01/2028 | 960,000 | 998,421 | ||
| Massachusetts Educational Financing Authority, Education Loan Rev., “B”, 3%, 7/01/2035 | 270,000 | 269,619 | ||
| Massachusetts Educational Financing Authority, Education Loan Rev., “B”, 2%, 7/01/2037 | 485,000 | 416,490 | ||
| Issuer | Shares/Par | Value ($) | ||
| Municipal Bonds - continued | ||||
| Massachusetts - continued | ||||
| Massachusetts Educational Financing Authority, Education Loan Rev., “C”, 2.625%, 7/01/2036 | $ | 90,000 | $85,897 | |
| Massachusetts Educational Financing Authority, Education Loan Rev., “C”, 4.125%, 7/01/2046 | 9,285,000 | 8,435,355 | ||
| Massachusetts Educational Financing Authority, Education Loan Rev., “C”, 3.75%, 7/01/2047 | 10,430,000 | 9,073,750 | ||
| Massachusetts Educational Financing Authority, Education Loan Rev., “J”, 4.7%, 7/01/2026 | 415,000 | 415,274 | ||
| Massachusetts Educational Financing Authority, Education Loan Rev., “J”, 4.9%, 7/01/2028 | 430,000 | 430,299 | ||
| Massachusetts Educational Financing Authority, Education Loan Rev., “J”, 3.5%, 7/01/2033 (u) | 6,045,000 | 5,828,686 | ||
| Massachusetts Educational Financing Authority, Education Loan Rev., “J”, 3.5%, 7/01/2033 | 890,000 | 858,152 | ||
| Massachusetts Educational Financing Authority, Education Loan Subordinate Rev., “C”, 3%, 7/01/2051 | 3,215,000 | 2,277,958 | ||
| Massachusetts Educational Financing Authority, Education Loan Subordinate Rev., “C”, 4.125%, 7/01/2052 | 10,360,000 | 8,997,788 | ||
| Massachusetts Housing Finance Agency, Single Family Housing Rev., “177”, 4%, 6/01/2039 | 210,000 | 210,060 | ||
| Tisbury, MA, General Obligation, Municipal Purpose Loan, Unlimited Tax, 3%, 8/15/2047 | 5,905,000 | 5,007,173 | ||
| Tisbury, MA, General Obligation, Municipal Purpose Loan, Unlimited Tax, 3%, 8/15/2052 | 3,715,000 | 3,040,294 | ||
| $83,609,664 | ||||
| Michigan - 0.5% | ||||
| Detroit, MI, General Obligation, 5.5%, 4/01/2045 | $ | 1,250,000 | $1,293,331 | |
| Detroit, MI, General Obligation, 5.5%, 4/01/2050 | 1,850,000 | 1,904,073 | ||
| Downriver, MI, Utility Wastewater Authority, Sewer System Rev., AGM, 5%, 4/01/2036 | 725,000 | 792,825 | ||
| Downriver, MI, Utility Wastewater Authority, Sewer System Rev., AGM, 5%, 4/01/2038 | 665,000 | 717,051 | ||
| Grand Rapids, MI, Economic Development Corp. Rev. (Beacon Hill at Eastgate Project), “A”, 5%, 11/01/2037 | 1,155,000 | 1,046,047 | ||
| Grand Rapids, MI, Economic Development Corp. Rev. (Beacon Hill at Eastgate Project), “A”, 5%, 11/01/2047 | 2,660,000 | 2,240,809 | ||
| Grand Rapids, MI, Economic Development Corp. Rev. (Beacon Hill at Eastgate Project), “A”, 5%, 11/01/2052 | 1,185,000 | 970,838 | ||
| Michigan Building Authority Rev. (Facilities Program), 4%, 10/15/2052 | 1,685,000 | 1,667,253 | ||
| Michigan Finance Authority (Detroit Financial Recovery Income Tax Rev.), “F”, 3.875%, 10/01/2023 | 635,000 | 635,484 | ||
| Issuer | Shares/Par | Value ($) | ||
| Municipal Bonds - continued | ||||
| Michigan - continued | ||||
| Michigan Finance Authority (Detroit Financial Recovery Income Tax Rev.), “F”, 4%, 10/01/2024 | $ | 800,000 | $804,011 | |
| Michigan Finance Authority Hospital Rev. (Beaumont Health Credit Group), “A”, 5%, 8/01/2033 (Prerefunded 8/01/2024) | 20,000 | 20,740 | ||
| Michigan Finance Authority Local Government Loan Program Rev. (Detroit Water and Sewerage Department Sewage Disposal System Rev. Refunding Second Lien Local Project), “C”, 5%, 7/01/2033 | 875,000 | 916,382 | ||
| Michigan Finance Authority Local Government Loan Program Rev. (Detroit Water and Sewerage Department Water Supply System Rev. Refunding Local Project), “D-2”, 5%, 7/01/2034 | 885,000 | 922,862 | ||
| Michigan Finance Authority Tobacco Settlement Asset-Backed Rev. (2007 Sold Tobacco Receipts), “B-1”, 5%, 6/01/2049 | 1,045,000 | 1,076,317 | ||
| Michigan Strategic Fund Ltd. (Canterbury Health Care, Inc.), 5%, 7/01/2046 (n) | 1,000,000 | 629,750 | ||
| Michigan Strategic Fund Ltd. (Canterbury Health Care, Inc.), 5%, 7/01/2051 (n) | 900,000 | 545,556 | ||
| Waterford Township, MI, Economic Development Corp. (Canterbury Health Care, Inc.), “A”, 5%, 7/01/2046 (n) | 2,070,000 | 1,303,582 | ||
| Waterford Township, MI, Economic Development Corp. (Canterbury Health Care, Inc.), “A”, 5%, 7/01/2051 (n) | 2,070,000 | 1,254,780 | ||
| Wayne County, MI, Airport Authority Rev. (Detroit Metropolitan Wayne County Airport), “B”, BAM, 5%, 12/01/2039 | 750,000 | 773,675 | ||
| Wayne County, MI, Airport Authority Rev. (Detroit Metropolitan Wayne County Airport), “C”, 5%, 12/01/2039 | 575,000 | 583,922 | ||
| Wayne County, MI, Airport Authority Rev. (Detroit Metropolitan Wayne County Airport), “C”, 5%, 12/01/2044 | 1,240,000 | 1,253,303 | ||
| $21,352,591 | ||||
| Minnesota - 0.6% | ||||
| Deephaven, MN, Charter School Lease Rev. (Eagle Ridge Academy Project), “A”, 5.25%, 7/01/2040 | $ | 500,000 | $502,725 | |
| Deephaven, MN, Charter School Lease Rev. (Eagle Ridge Academy Project), “A”, 5.5%, 7/01/2050 | 3,000,000 | 3,019,346 | ||
| Duluth, MN, Economic Development Authority Rev. (Benedictine Health System), “A”, 4%, 7/01/2031 | 1,340,000 | 1,256,729 | ||
| Duluth, MN, Economic Development Authority Rev. (Benedictine Health System), “A”, 4%, 7/01/2036 | 3,335,000 | 2,893,323 | ||
| Duluth, MN, Economic Development Authority Rev. (Benedictine Health System), “A”, 4%, 7/01/2041 | 2,755,000 | 2,269,039 | ||
| Duluth, MN, Economic Development Authority, Health Care Facilities Rev. (Essentia Health), “A”, 4.25%, 2/15/2043 | 2,500,000 | 2,505,190 | ||
| Issuer | Shares/Par | Value ($) | ||
| Municipal Bonds - continued | ||||
| Minnesota - continued | ||||
| Duluth, MN, Economic Development Authority, Health Care Facilities Rev. (Essentia Health), “A”, 4.25%, 2/15/2048 | $ | 2,895,000 | $2,869,415 | |
| Duluth, MN, Independent School District No. 709, “A”, 4%, 3/01/2032 | 1,570,000 | 1,500,669 | ||
| Duluth, MN, Independent School District No. 709, “A”, 4.2%, 3/01/2034 | 420,000 | 402,008 | ||
| Minnesota Housing Finance Agency, Residential Housing, “A”, 4%, 1/01/2041 | 210,000 | 210,122 | ||
| Minnesota Office of Higher Education Supplemental Student Loan Program Rev., 4%, 11/01/2037 (u) | 2,370,000 | 2,376,432 | ||
| Minnesota Office of Higher Education Supplemental Student Loan Program Rev., 2.65%, 11/01/2038 | 3,145,000 | 2,700,202 | ||
| St. Paul, MN, Housing & Redevelopment Authority Charter School Lease Rev. (Great River School Project), “A”, 4.75%, 7/01/2029 (n) | 250,000 | 250,645 | ||
| St. Paul, MN, Housing & Redevelopment Authority Charter School Lease Rev. (Great River School Project), “A”, 5.25%, 7/01/2033 (n) | 420,000 | 427,419 | ||
| St. Paul, MN, Housing & Redevelopment Authority Charter School Lease Rev. (Great River School Project), “A”, 5.5%, 7/01/2052 (n) | 705,000 | 709,073 | ||
| Woodbury, MN Charter School Lease Rev. (Woodbury Leadership Academy Project), “A”, 4%, 7/01/2031 | 690,000 | 647,576 | ||
| Woodbury, MN Charter School Lease Rev. (Woodbury Leadership Academy Project), “A”, 4%, 7/01/2041 | 1,150,000 | 955,317 | ||
| Woodbury, MN Charter School Lease Rev. (Woodbury Leadership Academy Project), “A”, 4%, 7/01/2051 | 660,000 | 502,995 | ||
| Woodbury, MN Charter School Lease Rev. (Woodbury Leadership Academy Project), “A”, 4%, 7/01/2056 | 575,000 | 422,942 | ||
| $26,421,167 | ||||
| Mississippi - 0.3% | ||||
| Mississippi Development Bank Special Obligation (Hancock County GOMESA Project), 4.55%, 11/01/2039 (n) | $ | 3,700,000 | $3,709,044 | |
| Mississippi Development Bank Special Obligation (Jackson County GOMESA Project), 3.625%, 11/01/2036 (n) | 2,165,000 | 1,972,250 | ||
| Mississippi Home Corp., Single Family Mortgage Rev., “A”, 4%, 12/01/2044 | 1,605,000 | 1,623,897 | ||
| Mississippi Hospital Equipment & Facilities Authority Rev. (Baptist Memorial Healthcare), “A”, 5%, 9/01/2046 | 2,635,000 | 2,655,633 | ||
| Mississippi Hospital Equipment & Facilities Authority Rev. (Forrest County General Hospital Refunding Project), “A”, 4%, 1/01/2036 | 1,155,000 | 1,185,927 | ||
| Issuer | Shares/Par | Value ($) | ||
| Municipal Bonds - continued | ||||
| Mississippi - continued | ||||
| Mississippi Hospital Equipment & Facilities Authority Rev. (Forrest County General Hospital Refunding Project), “A”, 4%, 1/01/2037 | $ | 1,040,000 | $1,054,685 | |
| Mississippi Hospital Equipment & Facilities Authority Rev. (Forrest County General Hospital Refunding Project), “A”, 4%, 1/01/2039 | 1,040,000 | 1,047,593 | ||
| Mississippi Hospital Equipment & Facilities Authority Rev. (Forrest County General Hospital Refunding Project), “A”, 4%, 1/01/2040 | 575,000 | 577,510 | ||
| $13,826,539 | ||||
| Missouri - 1.1% | ||||
| Cape Girardeau County, MO, Industrial Development Authority, Health Facilities Rev. (SoutheastHealth), 4%, 3/01/2041 | $ | 460,000 | $420,486 | |
| Cape Girardeau County, MO, Industrial Development Authority, Health Facilities Rev. (SoutheastHealth), 4%, 3/01/2046 | 520,000 | 463,834 | ||
| Dardenne, MO, Town Square Transportation Development District, “A”, 5%, 5/01/2026 (d)(q) | 2,495,000 | 1,147,700 | ||
| Kansas City, MO, Land Clearance for Redevelopment Authority Rev. (Convention Center Hotel Project - TIF Financing), “B”, 5%, 2/01/2040 (n) | 2,140,000 | 1,714,807 | ||
| Kansas City, MO, Land Clearance for Redevelopment Authority Rev. (Convention Center Hotel Project - TIF Financing), “B”, 5%, 2/01/2050 (n) | 4,845,000 | 3,588,430 | ||
| Missouri Development Finance Board, Infrastructure Facilities Rev. (Crackerneck Creek Project), 4%, 3/01/2036 | 1,300,000 | 1,272,591 | ||
| Missouri Development Finance Board, Infrastructure Facilities Rev. (Crackerneck Creek Project), 4%, 3/01/2037 | 415,000 | 399,037 | ||
| Missouri Development Finance Board, Infrastructure Facilities Rev. (Crackerneck Creek Project), 4%, 3/01/2041 | 520,000 | 483,324 | ||
| Missouri Development Finance Board, Infrastructure Facilities Rev. (Crackerneck Creek Project), 4%, 3/01/2051 | 1,480,000 | 1,303,936 | ||
| Missouri Health & Educational Facilities Authority Rev. (A.T. Still University Health Services), 5%, 10/01/2039 (Prerefunded 10/01/2023) | 465,000 | 472,710 | ||
| Missouri Health & Educational Facilities Authority Rev. (Bethesda Health Group, Inc.), 5%, 8/01/2040 | 1,650,000 | 1,646,184 | ||
| Missouri Health & Educational Facilities Authority Rev. (Bethesda Health Group, Inc.), 5%, 8/01/2045 | 2,300,000 | 2,221,661 | ||
| Missouri Health & Educational Facilities Authority Rev. (Capital Regional Medical Center), 5%, 11/01/2035 | 1,700,000 | 1,635,626 | ||
| Missouri Health & Educational Facilities Authority Rev. (Capital Regional Medical Center), 5%, 11/01/2040 | 2,000,000 | 1,827,593 | ||
| Issuer | Shares/Par | Value ($) | ||
| Municipal Bonds - continued | ||||
| Missouri - continued | ||||
| Missouri Housing Development Commission, Single Family Mortgage Rev. (First Place Homeownership Loan Program), “A”, 3.75%, 5/01/2038 | $ | 270,000 | $270,382 | |
| Missouri Housing Development Commission, Single Family Mortgage Rev. (First Place Homeownership Loan Program), “B”, FNMA, 4.75%, 5/01/2049 | 2,650,000 | 2,728,243 | ||
| Plaza at Noah's Ark Community District, MO, Tax Increment and Improvement Rev., 3%, 5/01/2030 | 345,000 | 314,426 | ||
| Plaza at Noah's Ark Community District, MO, Tax Increment and Improvement Rev., 3.125%, 5/01/2035 | 240,000 | 203,300 | ||
| St. Louis County, MO, Industrial Development Authority Health Facilities Rev. (Nazareth Living Center), “A”, 5%, 8/15/2030 | 695,000 | 678,798 | ||
| St. Louis County, MO, Industrial Development Authority Health Facilities Rev. (Nazareth Living Center), “A”, 5%, 8/15/2035 | 490,000 | 462,915 | ||
| St. Louis County, MO, Industrial Development Authority Health Facilities Rev. (Nazareth Living Center), “A”, 5.125%, 8/15/2045 | 1,355,000 | 1,205,505 | ||
| St. Louis County, MO, Industrial Development Authority Health Facilities Rev. (Ranken-Jordan Project), 5%, 11/15/2030 | 1,015,000 | 1,043,530 | ||
| St. Louis County, MO, Industrial Development Authority Health Facilities Rev. (Ranken-Jordan Project), 4%, 11/15/2036 | 1,165,000 | 1,120,129 | ||
| St. Louis County, MO, Industrial Development Authority Rev. (Friendship Village St. Louis Obligated Group), “A”, 5.25%, 9/01/2053 | 11,920,000 | 11,001,749 | ||
| St. Louis County, MO, Industrial Development Authority Rev. (St. Andrew's Resources for Seniors Obligated Group), “A”, 5.125%, 12/01/2045 | 3,620,000 | 3,458,000 | ||
| St. Louis, MO, Industrial Development Authority Financing Rev. (Ballpark Village Development Project), “A”, 3.875%, 11/15/2029 | 1,100,000 | 962,827 | ||
| St. Louis, MO, Industrial Development Authority Financing Rev. (Ballpark Village Development Project), “A”, 4.375%, 11/15/2035 | 2,110,000 | 1,726,284 | ||
| St. Louis, MO, Industrial Development Authority Financing Rev. (Ballpark Village Development Project), “A”, 4.75%, 11/15/2047 | 4,220,000 | 3,230,027 | ||
| St. Louis, MO, Land Clearance Redevelopment Authority Rev. (Kiel Opera House Renovation Project), 3.875%, 10/01/2035 | 2,280,000 | 1,914,154 | ||
| $48,918,188 | ||||
| Montana - 0.2% | ||||
| Montana Finance Authority, Health Care Facilities Rev. (Kalispell Regional Medical Center), “B”, 5%, 7/01/2043 | $ | 3,840,000 | $3,924,996 | |
| Montana Finance Authority, Health Care Facilities Rev. (Kalispell Regional Medical Center), “B”, 5%, 7/01/2048 | 5,530,000 | 5,611,449 | ||
| $9,536,445 | ||||
| Issuer | Shares/Par | Value ($) | ||
| Municipal Bonds - continued | ||||
| Nebraska - 0.1% | ||||
| Central Plains Energy Project, NE, Gas Project Rev. (Project No. 3), “A”, 5%, 9/01/2034 | $ | 1,200,000 | $1,333,445 | |
| Central Plains Energy Project, NE, Gas Project Rev. (Project No. 3), “A”, 5%, 9/01/2036 | 1,940,000 | 2,114,920 | ||
| Nebraska Investment Finance Authority, Single Family Housing Rev., “A”, 4%, 9/01/2044 | 260,000 | 260,901 | ||
| Nebraska Investment Finance Authority, Single Family Housing Rev., “C”, 4%, 9/01/2048 (u) | 2,745,000 | 2,771,972 | ||
| $6,481,238 | ||||
| Nevada - 0.3% | ||||
| Director of the State of Nevada, Department of Business and Industry, Charter School Lease Rev. (Somerset Academy), “A”, 4.5%, 12/15/2029 (n) | $ | 525,000 | $528,064 | |
| Director of the State of Nevada, Department of Business and Industry, Charter School Lease Rev. (Somerset Academy), “A”, 5%, 12/15/2035 (n) | 1,715,000 | 1,729,482 | ||
| Director of the State of Nevada, Department of Business and Industry, Charter School Lease Rev. (Somerset Academy), “A”, 5%, 12/15/2038 (n) | 1,395,000 | 1,400,833 | ||
| Director of the State of Nevada, Department of Business and Industry, Charter School Lease Rev. (Somerset Academy), “A”, 5.125%, 12/15/2045 (n) | 2,205,000 | 2,182,889 | ||
| Director of the State of Nevada, Department of Business and Industry, Charter School Lease Rev. (Somerset Academy), “A”, 5%, 12/15/2048 (n) | 4,115,000 | 3,953,196 | ||
| Nevada Department of Business & Industry Charter School Rev. (Doral Academy of Nevada), “A”, 5%, 7/15/2037 (n) | 1,000,000 | 1,003,404 | ||
| Nevada Department of Business & Industry Charter School Rev. (Doral Academy of Nevada), “A”, 5%, 7/15/2047 (n) | 1,015,000 | 976,196 | ||
| Reno, NV, Sales Tax Rev. (Retrac-Reno Transportation Rail Access Corridor Project), “B”, AGM, 5%, 6/01/2038 | 110,000 | 118,892 | ||
| Reno, NV, Sales Tax Rev. (Retrac-Reno Transportation Rail Access Corridor Project), “B”, AGM, 4%, 6/01/2048 | 435,000 | 420,870 | ||
| Reno, NV, Sales Tax Rev. (Retrac-Reno Transportation Rail Access Corridor Project), “B”, AGM, 4.125%, 6/01/2058 | 545,000 | 527,314 | ||
| $12,841,140 | ||||
| Issuer | Shares/Par | Value ($) | ||
| Municipal Bonds - continued | ||||
| New Hampshire - 0.8% | ||||
| National Finance Authority, New Hampshire Municipal Certificates, “1-A”, 4.375%, 9/20/2036 | $ | 11,883,036 | $11,911,650 | |
| National Finance Authority, New Hampshire Municipal Certificates, “A-2”, 4%, 10/20/2036 | 7,804,484 | 7,561,738 | ||
| National Finance Authority, New Hampshire Municipal Certificates, “X”, 0.334%, 9/20/2036 (i) | 75,450,000 | 1,846,005 | ||
| National Finance Authority, New Hampshire Municipal Certificates, “X-2”, 0.674%, 10/20/2036 (i) | 34,320,000 | 1,791,995 | ||
| National Finance Authority, New Hampshire Resource Recovery Refunding Rev. (Covanta Project), “C”, 4.875%, 11/01/2042 (n) | 7,730,000 | 7,151,823 | ||
| National Finance Authority, New Hampshire Resource Recovery Refunding Rev., “B”, 3.75%, 7/01/2045 (Put Date 7/02/2040) (n) | 3,090,000 | 2,488,859 | ||
| National Finance Authority, New Hampshire Senior Living Rev. (Springpoint Senior Living Project), 4%, 1/01/2041 | 1,210,000 | 1,044,592 | ||
| $33,796,662 | ||||
| New Jersey - 3.1% | ||||
| Atlantic City, NJ, Improvement Authority Lease Rev. (Stockton University Campus Phase II Project), “A”, AGM, 5%, 7/01/2035 | $ | 170,000 | $193,185 | |
| Atlantic City, NJ, Improvement Authority Lease Rev. (Stockton University Campus Phase II Project), “A”, AGM, 4%, 7/01/2038 | 275,000 | 276,824 | ||
| Atlantic City, NJ, Improvement Authority Lease Rev. (Stockton University Campus Phase II Project), “A”, AGM, 4%, 7/01/2039 | 235,000 | 235,859 | ||
| Atlantic City, NJ, Improvement Authority Lease Rev. (Stockton University Campus Phase II Project), “A”, AGM, 4%, 7/01/2040 | 340,000 | 340,067 | ||
| Atlantic City, NJ, Tax Appeal Refunding Bonds (Qualified Pursuant to the Provisions of the Municipal Qualified Bond Act), “A”, BAM, 5%, 3/01/2042 | 490,000 | 514,396 | ||
| Bayonne, NJ, Redevelopment Agency (Royal Caribbean Project), “A”, 5.375%, 11/01/2035 | 1,955,000 | 1,654,714 | ||
| Camden County, NJ, Improvement Authority School Rev. (KIPP Cooper Norcross Academy), 6%, 6/15/2042 | 245,000 | 267,009 | ||
| Camden County, NJ, Improvement Authority School Rev. (KIPP Cooper Norcross Academy), 6%, 6/15/2047 | 665,000 | 715,575 | ||
| Camden County, NJ, Improvement Authority School Rev. (KIPP Cooper Norcross Academy), 6%, 6/15/2052 | 600,000 | 640,562 | ||
| Camden County, NJ, Improvement Authority School Rev. (KIPP Cooper Norcross Academy), 6%, 6/15/2062 | 2,000,000 | 2,115,427 | ||
| New Jersey Economic Development Authority (Motor Vehicle Surcharges Subordinate Refunding Rev.), “A”, 3.125%, 7/01/2029 | 705,000 | 705,488 | ||
| New Jersey Economic Development Authority (Motor Vehicle Surcharges Subordinate Refunding Rev.), “A”, 5%, 7/01/2033 | 400,000 | 429,403 | ||
| Issuer | Shares/Par | Value ($) | ||
| Municipal Bonds - continued | ||||
| New Jersey - continued | ||||
| New Jersey Economic Development Authority Rev. (Goethals Bridge Replacement Project), 5.5%, 1/01/2027 | $ | 325,000 | $331,022 | |
| New Jersey Economic Development Authority Rev. (Goethals Bridge Replacement Project), 5%, 1/01/2028 | 325,000 | 329,358 | ||
| New Jersey Economic Development Authority Rev. (Goethals Bridge Replacement Project), AGM, 5%, 1/01/2031 | 975,000 | 988,364 | ||
| New Jersey Economic Development Authority Rev. (Goethals Bridge Replacement Project), AGM, 5.125%, 7/01/2042 | 530,000 | 535,850 | ||
| New Jersey Economic Development Authority Rev. (Kapkowski Road Landfill Reclamation Project), 6.5%, 4/01/2028 | 3,510,243 | 3,519,143 | ||
| New Jersey Economic Development Authority Rev. (Kapkowski Road Landfill Reclamation Project), 6.5%, 4/01/2031 | 8,000,000 | 8,136,414 | ||
| New Jersey Economic Development Authority Rev. (Provident Group - Rowan Properties LLC - Rowan University Student Housing Project), “A”, 5%, 1/01/2030 | 3,485,000 | 3,488,202 | ||
| New Jersey Economic Development Authority Rev. (Provident Group - Rowan Properties LLC - Rowan University Student Housing Project), “A”, 5%, 1/01/2035 | 1,510,000 | 1,481,237 | ||
| New Jersey Economic Development Authority Rev. (School Facilities Construction), 5%, 3/01/2027 | 310,000 | 310,558 | ||
| New Jersey Economic Development Authority Rev. (School Facilities Construction), “DDD”, 5%, 6/15/2034 | 825,000 | 885,936 | ||
| New Jersey Economic Development Authority Rev. (School Facilities Construction), “DDD”, 5%, 6/15/2035 | 690,000 | 736,613 | ||
| New Jersey Economic Development Authority Rev. (School Facilities Construction), “DDD”, 5%, 6/15/2042 | 3,850,000 | 3,983,382 | ||
| New Jersey Economic Development Authority, Special Facilities Rev. (Continental Airlines, Inc.), 5.125%, 9/15/2023 | 2,155,000 | 2,164,991 | ||
| New Jersey Economic Development Authority, Special Facilities Rev. (Continental Airlines, Inc.), 5.25%, 9/15/2029 | 3,370,000 | 3,405,604 | ||
| New Jersey Economic Development Authority, Special Facilities Rev. (Continental Airlines, Inc.), “A”, 5.625%, 11/15/2030 | 6,850,000 | 7,012,371 | ||
| New Jersey Economic Development Authority, State Lease Rev. (Juvenile Justice Commission Facilities Project), “C”, 5%, 6/15/2042 | 3,685,000 | 3,825,894 | ||
| New Jersey Health Care Facilities, Financing Authority, State Contract Refunding Bonds (Hospital Asset Transformation Program), 5%, 10/01/2034 | 1,455,000 | 1,569,719 | ||
| New Jersey Health Care Facilities, Financing Authority, State Contract Refunding Bonds (Hospital Asset Transformation Program), 5%, 10/01/2035 | 1,285,000 | 1,376,167 | ||
| Issuer | Shares/Par | Value ($) | ||
| Municipal Bonds - continued | ||||
| New Jersey - continued | ||||
| New Jersey Health Care Facilities, Financing Authority, State Contract Refunding Bonds (Hospital Asset Transformation Program), 5%, 10/01/2036 | $ | 1,490,000 | $1,581,422 | |
| New Jersey Higher Education Student Assistance Authority, Senior Student Loan Rev., “B”, 3.25%, 12/01/2039 | 6,205,000 | 5,926,502 | ||
| New Jersey Higher Education Student Assistance Authority, Senior Student Loan Rev., “B”, 4%, 12/01/2041 | 14,385,000 | 14,557,903 | ||
| New Jersey Higher Education Student Assistance Authority, Senior Student Loan Rev., ”B“, 2.5%, 12/01/2040 | 2,330,000 | 1,992,212 | ||
| New Jersey Higher Education Student Assistance Authority, Senior Student Loan Rev., ”C“, 3.25%, 12/01/2051 | 960,000 | 721,187 | ||
| New Jersey Transportation Trust Fund Authority, “A”, 5%, 12/15/2039 | 625,000 | 665,349 | ||
| New Jersey Transportation Trust Fund Authority, “AA”, 5%, 6/15/2037 | 1,580,000 | 1,719,410 | ||
| New Jersey Transportation Trust Fund Authority, “AA”, 5%, 6/15/2037 | 6,515,000 | 7,181,876 | ||
| New Jersey Transportation Trust Fund Authority, “AA”, 4%, 6/15/2038 | 1,580,000 | 1,589,881 | ||
| New Jersey Transportation Trust Fund Authority, “AA”, 5%, 6/15/2038 | 1,690,000 | 1,825,993 | ||
| New Jersey Transportation Trust Fund Authority, “AA”, 5%, 6/15/2039 | 1,580,000 | 1,694,722 | ||
| New Jersey Transportation Trust Fund Authority, “AA”, 4%, 6/15/2040 | 1,755,000 | 1,749,092 | ||
| New Jersey Transportation Trust Fund Authority, “AA”, 5%, 6/15/2040 | 1,185,000 | 1,265,360 | ||
| New Jersey Transportation Trust Fund Authority, “AA”, 4%, 6/15/2045 | 3,070,000 | 2,960,309 | ||
| New Jersey Transportation Trust Fund Authority, “CC”, 5.5%, 6/15/2050 | 2,520,000 | 2,787,020 | ||
| New Jersey Transportation Trust Fund Authority, Capital Appreciation, “A”, 0%, 12/15/2037 | 50,000,000 | 26,604,590 | ||
| New Jersey Transportation Trust Fund Authority, Capital Appreciation, “C”, AAC, 0%, 12/15/2035 | 4,750,000 | 2,848,974 | ||
| New Jersey Transportation Trust Fund Authority, Capital Appreciation, “C”, AAC, 0%, 12/15/2036 | 12,405,000 | 7,025,305 | ||
| Newark, NJ, Board of Education, Energy Savings Obligation Refunding, 4%, 7/15/2034 | 413,000 | 435,725 | ||
| $137,302,166 | ||||
| Issuer | Shares/Par | Value ($) | ||
| Municipal Bonds - continued | ||||
| New Mexico - 0.2% | ||||
| Los Ranchos de Albuquerque, NM, Education Facilities Rev. (Albuquerque Academy Project), 4%, 9/01/2040 | $ | 575,000 | $576,881 | |
| New Mexico Educational Assistance Foundation, Taxable, “B-1”, 2.106%, 9/01/2051 | 6,405,000 | 6,393,076 | ||
| New Mexico Mortgage Finance Authority, Single Family Mortgage Program, “A-1”, FNMA, 4%, 1/01/2049 | 920,000 | 930,112 | ||
| Santa Fe, NM, Retirement Facility Rev. (El Castillo Retirement Residences Project), “A”, 5%, 5/15/2034 | 355,000 | 340,480 | ||
| Santa Fe, NM, Retirement Facility Rev. (El Castillo Retirement Residences Project), “A”, 5%, 5/15/2039 | 275,000 | 250,911 | ||
| Santa Fe, NM, Retirement Facility Rev. (El Castillo Retirement Residences Project), “A”, 5%, 5/15/2044 | 285,000 | 248,189 | ||
| Santa Fe, NM, Retirement Facility Rev. (El Castillo Retirement Residences Project), “A”, 5%, 5/15/2049 | 735,000 | 622,090 | ||
| $9,361,739 | ||||
| New York - 5.7% | ||||
| Buffalo & Erie County, NY, Industrial Land Development Corp. Rev. (Charter School for Applied Technologies Project), “A”, 5%, 6/01/2035 | $ | 1,000,000 | $1,036,615 | |
| Build NYC Resource Corp. Rev. (Albert Einstein School of Medicine, Inc.), 5.5%, 9/01/2045 (n) | 7,310,000 | 7,395,368 | ||
| Build NYC Resource Corp. Rev. (Grand Concourse Academy Charter School Project), “A”, 5%, 7/01/2052 | 355,000 | 361,339 | ||
| Build NYC Resource Corp. Rev. (Grand Concourse Academy Charter School Project), “B”, 5%, 7/01/2062 | 2,700,000 | 2,714,946 | ||
| Build NYC Resource Corp. Rev. (International Leadership Charter High School Project), “A”, 6.25%, 7/01/2046 (n) | 1,315,000 | 1,330,577 | ||
| Build NYC Resource Corp. Rev. (International Leadership Charter School Project), 5.75%, 7/01/2033 | 3,860,000 | 3,865,209 | ||
| Build NYC Resource Corp. Rev. (International Leadership Charter School Project), 6%, 7/01/2043 | 4,025,000 | 4,030,386 | ||
| Build NYC Resource Corp. Rev. (KIPP NYC Public Schools Facilities - Canal West Project), 5.25%, 7/01/2057 | 1,695,000 | 1,771,842 | ||
| Build NYC Resource Corp. Rev. (KIPP NYC Public Schools Facilities - Canal West Project), 5.25%, 7/01/2062 | 2,125,000 | 2,203,285 | ||
| Jefferson County, NY, Civic Development Corp. Rev. (Samaritan Medical Center), “A”, 4%, 11/01/2032 | 535,000 | 519,569 | ||
| New Rochelle, NY, Corp. for Local Development Rev. (Iona College Project), “A”, 5%, 7/01/2034 | 785,000 | 816,051 | ||
| New Rochelle, NY, Corp. for Local Development Rev. (Iona College Project), “A”, 5%, 7/01/2040 | 2,130,000 | 2,180,111 | ||
| Issuer | Shares/Par | Value ($) | ||
| Municipal Bonds - continued | ||||
| New York - continued | ||||
| New Rochelle, NY, Corp. for Local Development Rev. (Iona College Project), “A”, 5%, 7/01/2045 | $ | 990,000 | $1,007,538 | |
| New York Dormitory Authority Rev. (Northwell Health Obligated Group), “A”, 4%, 5/01/2045 | 5,630,000 | 5,565,274 | ||
| New York Dormitory Authority Rev. (Orange Regional Medical Center Obligated Group Rev.), 5%, 12/01/2033 (n) | 800,000 | 816,014 | ||
| New York Dormitory Authority Rev. (Orange Regional Medical Center Obligated Group Rev.), 5%, 12/01/2035 (n) | 1,500,000 | 1,514,145 | ||
| New York Dormitory Authority Rev. (Orange Regional Medical Center Obligated Group Rev.), 5%, 12/01/2040 (n) | 1,000,000 | 985,223 | ||
| New York Environmental Facilities Corp. Rev., Solid Waste Disposal (Casella Waste Management, Inc. Project), 2.75%, 9/01/2050 (Put Date 9/02/2025) (n) | 620,000 | 589,449 | ||
| New York Liberty Development Corp., Liberty Rev. (3 World Trade Center Project), “1”, 5%, 11/15/2044 (n) | 22,365,000 | 22,245,810 | ||
| New York Liberty Development Corp., Liberty Rev. (3 World Trade Center Project), “2”, 5.375%, 11/15/2040 (n) | 5,850,000 | 5,853,923 | ||
| New York Power Authority, Green Transmission Project Rev., “A”, AGM, 4%, 11/15/2047 | 2,015,000 | 2,001,937 | ||
| New York State Thruway Authority, Personal Income Tax Rev., “C”, 4.125%, 3/15/2057 | 7,385,000 | 7,279,496 | ||
| New York Transportation Development Corp., Special Facilities Rev. (American Airlines, Inc. John F. Kennedy International Airport Project), 3%, 8/01/2031 | 765,000 | 705,851 | ||
| New York Transportation Development Corp., Special Facilities Rev. (American Airlines, Inc. John F. Kennedy International Airport Project), 5.25%, 8/01/2031 | 1,935,000 | 1,991,891 | ||
| New York Transportation Development Corp., Special Facilities Rev. (American Airlines, Inc. John F. Kennedy International Airport Project), 5.375%, 8/01/2036 | 3,500,000 | 3,548,462 | ||
| New York Transportation Development Corp., Special Facilities Rev. (Delta Airlines, Inc. LaGuardia Airport Terminals C&D Redevelopment Project), 5%, 10/01/2035 | 1,415,000 | 1,476,723 | ||
| New York Transportation Development Corp., Special Facilities Rev. (Delta Airlines, Inc. LaGuardia Airport Terminals C&D Redevelopment Project), 4%, 1/01/2036 | 1,270,000 | 1,233,824 | ||
| New York Transportation Development Corp., Special Facilities Rev. (Delta Airlines, Inc. LaGuardia Airport Terminals C&D Redevelopment Project), 5%, 10/01/2040 | 7,245,000 | 7,401,774 | ||
| New York Transportation Development Corp., Special Facilities Rev. (Delta Airlines, Inc. LaGuardia Airport Terminals C&D Redevelopment Project), 4.375%, 10/01/2045 | 19,055,000 | 18,046,524 | ||
| Issuer | Shares/Par | Value ($) | ||
| Municipal Bonds - continued | ||||
| New York - continued | ||||
| New York Transportation Development Corp., Special Facilities Rev. (Terminal 4 John F. Kennedy International Airport Project), “A”, 5%, 12/01/2030 | $ | 395,000 | $436,879 | |
| New York Transportation Development Corp., Special Facilities Rev. (Terminal 4 John F. Kennedy International Airport Project), “A”, 5%, 12/01/2034 | 710,000 | 758,903 | ||
| New York Transportation Development Corp., Special Facilities Rev. (Terminal 4 John F. Kennedy International Airport Project), “A”, 5%, 12/01/2035 | 345,000 | 364,775 | ||
| New York Transportation Development Corp., Special Facilities Rev. (Terminal 4 John F. Kennedy International Airport Project), “A”, 5%, 12/01/2036 | 55,000 | 57,727 | ||
| New York Transportation Development Corp., Special Facilities Rev. (Terminal 4 John F. Kennedy International Airport Project), “A”, 5%, 12/01/2037 | 570,000 | 594,871 | ||
| New York Transportation Development Corp., Special Facilities Rev. (Terminal 4 John F. Kennedy International Airport Project), “A”, 4%, 12/01/2038 | 235,000 | 225,222 | ||
| New York Transportation Development Corp., Special Facilities Rev. (Terminal 4 John F. Kennedy International Airport Project), “A”, 4%, 12/01/2039 | 570,000 | 540,580 | ||
| New York, NY, Housing Development Corp., Multi-Family Housing Rev. (8 Spruce Street), “E”, 3.5%, 2/15/2048 | 6,002,643 | 5,871,694 | ||
| New York, NY, Housing Development Corp., Multi-Family Housing Rev. (8 Spruce Street), “F”, 4.5%, 2/15/2048 | 46,653,261 | 45,994,853 | ||
| New York, NY, Industrial Development Agency Pilot Refunding Rev. (Yankee Stadium Project), “A”, AGM, 4%, 3/01/2045 | 945,000 | 943,006 | ||
| New York, NY, Industrial Development Agency, Airport Facilities Rev. (Transportation Infrastructure Properties LLC), 5%, 7/01/2028 | 1,075,000 | 1,075,794 | ||
| New York, NY, Transitional Finance Authority Building Aid Rev., “S-3”, 5%, 7/15/2043 | 975,000 | 1,049,342 | ||
| Niagara County, NY, Industrial Development Agency, Solid Waste Disposal Rev. (Covanta Energy Project), “A”, 4.75%, 11/01/2042 (n) | 6,865,000 | 6,248,954 | ||
| Niagara, NY, Area Development Corp. Rev. (Catholic Health System, Inc. Project), 4.5%, 7/01/2052 | 4,115,000 | 3,075,967 | ||
| Niagara, NY, Area Development Corp. Rev. (Catholic Health System, Inc. Project), 5%, 7/01/2052 | 2,460,000 | 1,902,321 | ||
| Orange County, NY, Funding Corp. Assisted Living Residence Rev. (Hamlet at Wallkill Assisted Living Project), 6.5%, 1/01/2046 | 6,600,000 | 5,401,627 | ||
| Port Authority of NY & NJ (214th Series), 4%, 9/01/2037 | 2,780,000 | 2,781,505 | ||
| Port Authority of NY & NJ (214th Series), 4%, 9/01/2039 | 1,245,000 | 1,243,746 | ||
| Issuer | Shares/Par | Value ($) | ||
| Municipal Bonds - continued | ||||
| New York - continued | ||||
| Port Authority of NY & NJ (214th Series), 4%, 9/01/2043 | $ | 2,015,000 | $1,964,257 | |
| Port Authority of NY & NJ (221st Series), 4%, 7/15/2045 | 1,570,000 | 1,516,020 | ||
| Port Authority of NY & NJ (223th Series), 4%, 7/15/2040 | 930,000 | 924,572 | ||
| Port Authority of NY & NJ (226th Series), 5%, 10/15/2033 | 770,000 | 882,880 | ||
| Syracuse, NY, Industrial Development Agency PILOT Rev. (Carousel Center Project), “A”, 5%, 1/01/2028 | 1,905,000 | 1,670,979 | ||
| Syracuse, NY, Industrial Development Agency PILOT Rev. (Carousel Center Project), “A”, 5%, 1/01/2029 | 2,955,000 | 2,520,393 | ||
| Syracuse, NY, Industrial Development Agency PILOT Rev. (Carousel Center Project), “A”, 5%, 1/01/2030 | 2,135,000 | 1,770,134 | ||
| Syracuse, NY, Industrial Development Agency PILOT Rev. (Carousel Center Project), “A”, 5%, 1/01/2031 | 5,765,000 | 4,655,950 | ||
| Syracuse, NY, Industrial Development Agency PILOT Rev. (Carousel Center Project), “A”, 5%, 1/01/2032 | 7,900,000 | 6,229,836 | ||
| Syracuse, NY, Industrial Development Agency PILOT Rev. (Carousel Center Project), “A”, 5%, 1/01/2033 | 4,625,000 | 3,554,981 | ||
| Syracuse, NY, Industrial Development Agency PILOT Rev. (Carousel Center Project), “A”, 5%, 1/01/2034 | 17,535,000 | 13,198,230 | ||
| Syracuse, NY, Industrial Development Agency PILOT Rev. (Carousel Center Project), “A”, 5%, 1/01/2035 | 13,015,000 | 9,637,855 | ||
| Syracuse, NY, Industrial Development Agency PILOT Rev. (Carousel Center Project), “A”, 5%, 1/01/2036 | 4,435,000 | 3,218,685 | ||
| Tobacco Settlement Asset Securitization Corp., NY, “A”, 5%, 6/01/2034 | 825,000 | 867,177 | ||
| Tobacco Settlement Asset Securitization Corp., NY, “A”, 5%, 6/01/2035 | 410,000 | 428,667 | ||
| Tobacco Settlement Asset Securitization Corp., NY, “A”, 5%, 6/01/2041 | 3,020,000 | 3,099,813 | ||
| Ulster County, NY, Capital Resource Corp. Rev. (Woodland Pond at New Paltz Project), 4%, 9/15/2025 | 1,615,000 | 1,529,464 | ||
| Ulster County, NY, Capital Resource Corp. Rev. (Woodland Pond at New Paltz Project), 5%, 9/15/2037 | 7,780,000 | 6,444,282 | ||
| $253,171,097 | ||||
| Issuer | Shares/Par | Value ($) | ||
| Municipal Bonds - continued | ||||
| North Carolina - 0.8% | ||||
| North Carolina Medical Care Commission, Health Care Facilities First Mortgage Rev. (Lutheran Services for the Aging), “A”, 4%, 3/01/2030 | $ | 285,000 | $265,428 | |
| North Carolina Medical Care Commission, Health Care Facilities First Mortgage Rev. (Lutheran Services for the Aging), “A”, 4%, 3/01/2036 | 1,435,000 | 1,222,833 | ||
| North Carolina Medical Care Commission, Health Care Facilities First Mortgage Rev. (Lutheran Services for the Aging), “A”, 4%, 3/01/2041 | 505,000 | 406,432 | ||
| North Carolina Medical Care Commission, Health Care Facilities First Mortgage Rev. (Lutheran Services for the Aging), “A”, 4%, 3/01/2051 | 8,915,000 | 6,498,422 | ||
| North Carolina Medical Care Commission, Health Care Facilities First Mortgage Rev. (Lutheran Services for the Aging), “C”, 4%, 3/01/2036 | 635,000 | 543,763 | ||
| North Carolina Medical Care Commission, Health Care Facilities First Mortgage Rev. (Lutheran Services for the Aging), “C”, 4%, 3/01/2042 | 240,000 | 191,000 | ||
| North Carolina Medical Care Commission, Health Care Facilities First Mortgage Rev. (Pennybyrn at Maryfield), 5%, 10/01/2025 | 650,000 | 656,862 | ||
| North Carolina Medical Care Commission, Health Care Facilities First Mortgage Rev. (Pennybyrn at Maryfield), 5%, 10/01/2030 | 1,320,000 | 1,321,161 | ||
| North Carolina Medical Care Commission, Health Care Facilities First Mortgage Rev. (Pennybyrn at Maryfield), 5%, 10/01/2035 | 765,000 | 757,874 | ||
| North Carolina Medical Care Commission, Health Care Facilities First Mortgage Rev. (Presbyterian Homes Obligated Group), “A”, 5%, 10/01/2040 | 975,000 | 982,342 | ||
| North Carolina Medical Care Commission, Health Care Facilities First Mortgage Rev. (Presbyterian Homes Obligated Group), “A”, 5%, 10/01/2045 | 925,000 | 921,209 | ||
| North Carolina Medical Care Commission, Health Care Facilities First Mortgage Rev. (Presbyterian Homes Obligated Group), “A”, 5%, 10/01/2050 | 595,000 | 585,322 | ||
| North Carolina Medical Care Commission, Retirement Facilities First Mortgage Refunding Rev. (Plantation Village, Inc.), “A”, 4%, 1/01/2052 | 1,760,000 | 1,417,385 | ||
| North Carolina Medical Care Commission, Retirement Facilities First Mortgage Refunding Rev. (United Church Homes and Services), “C”, 5%, 9/01/2041 (Prerefunded 9/01/2023) | 1,745,000 | 1,822,473 | ||
| North Carolina Medical Care Commission, Retirement Facilities First Mortgage Rev. (Pennybyrn at Maryfield Project), “A”, 5%, 10/01/2040 | 1,075,000 | 1,045,433 | ||
| Issuer | Shares/Par | Value ($) | ||
| Municipal Bonds - continued | ||||
| North Carolina - continued | ||||
| North Carolina Medical Care Commission, Retirement Facilities First Mortgage Rev. (Pennybyrn at Maryfield Project), “A”, 5%, 10/01/2045 | $ | 1,000,000 | $943,007 | |
| North Carolina Medical Care Commission, Retirement Facilities First Mortgage Rev. (Salemtowne), “A”, 5%, 10/01/2026 | 2,500,000 | 2,526,491 | ||
| North Carolina Medical Care Commission, Retirement Facilities First Mortgage Rev. (Salemtowne), “A”, 5%, 10/01/2030 | 1,500,000 | 1,487,666 | ||
| North Carolina Medical Care Commission, Retirement Facilities First Mortgage Rev. (Sharon Towers), “A”, 5%, 7/01/2039 | 1,540,000 | 1,506,203 | ||
| North Carolina Medical Care Commission, Retirement Facilities First Mortgage Rev. (Sharon Towers), “A”, 5%, 7/01/2044 | 1,030,000 | 984,323 | ||
| North Carolina Medical Care Commission, Retirement Facilities First Mortgage Rev. (Southminster), 5%, 10/01/2037 | 2,700,000 | 2,596,649 | ||
| North Carolina Medical Care Commission, Retirement Facilities First Mortgage Rev. (United Church Homes and Services), “A”, 5%, 9/01/2037 (Prerefunded 9/01/2024) | 1,265,000 | 1,316,469 | ||
| North Carolina Medical Care Commission, Retirement Facilities First Mortgage Rev. (United Church Homes and Services), “C”, 5%, 9/01/2046 (Prerefunded 9/01/2023) | 1,815,000 | 1,895,581 | ||
| North Carolina Turnpike Authority, Monroe Expressway Toll Rev., “A”, 5%, 7/01/2042 | 505,000 | 514,101 | ||
| North Carolina Turnpike Authority, Monroe Expressway Toll Rev., “A”, 5%, 7/01/2047 | 990,000 | 1,002,155 | ||
| North Carolina Turnpike Authority, Monroe Expressway Toll Rev., “A”, 5%, 7/01/2051 | 2,015,000 | 2,037,369 | ||
| North Carolina Turnpike Authority, Monroe Expressway Toll Rev., “A”, 5%, 7/01/2054 | 1,665,000 | 1,681,599 | ||
| $37,129,552 | ||||
| North Dakota - 0.4% | ||||
| North Dakota Housing Finance Agency Rev. (Home Mortgage Finance Program), “B”, 4%, 1/01/2036 | $ | 230,000 | $230,718 | |
| North Dakota Housing Finance Agency Rev. (Home Mortgage Finance Program), “D”, 4.25%, 1/01/2049 (u) | 3,875,000 | 3,933,668 | ||
| Ward County, ND, Health Care Facilities Rev. (Trinity Obligated Group), “C”, 5%, 6/01/2034 | 5,445,000 | 5,440,105 | ||
| Ward County, ND, Health Care Facilities Rev. (Trinity Obligated Group), “C”, 5%, 6/01/2038 | 3,050,000 | 3,006,021 | ||
| Ward County, ND, Health Care Facilities Rev. (Trinity Obligated Group), “C”, 5%, 6/01/2048 | 710,000 | 662,838 | ||
| Ward County, ND, Health Care Facilities Rev. (Trinity Obligated Group), “C”, 5%, 6/01/2053 | 5,310,000 | 4,898,471 | ||
| $18,171,821 | ||||
| Issuer | Shares/Par | Value ($) | ||
| Municipal Bonds - continued | ||||
| Ohio - 4.0% | ||||
| Akron, Bath, & Copley, OH, Joint Township Hospital District Facilities Rev. (Summa Health Obligated Group), 5%, 11/15/2032 | $ | 385,000 | $426,047 | |
| Buckeye, OH, Tobacco Settlement Financing Authority Senior Asset-Backed Refunding, 2020A-2, “1”, 5%, 6/01/2035 | 550,000 | 594,118 | ||
| Buckeye, OH, Tobacco Settlement Financing Authority Senior Asset-Backed Refunding, 2020A-2, “1”, 4%, 6/01/2039 | 550,000 | 532,605 | ||
| Buckeye, OH, Tobacco Settlement Financing Authority Senior Asset-Backed Refunding, 2020A-2, “1”, 4%, 6/01/2048 | 2,225,000 | 2,045,122 | ||
| Buckeye, OH, Tobacco Settlement Financing Authority Senior Asset-Backed Refunding, 2020B-2, “2”, 5%, 6/01/2055 | 73,880,000 | 70,445,865 | ||
| Butler County, OH, Hospital Facilities Rev. (UC Health), 4%, 11/15/2035 | 1,500,000 | 1,511,800 | ||
| Butler County, OH, Hospital Facilities Rev. (UC Health), 4%, 11/15/2037 | 1,250,000 | 1,245,334 | ||
| Centerville, OH, Health Care Improvement and Refunding Rev. (Graceworks Lutheran Services), 5.25%, 11/01/2037 | 920,000 | 886,987 | ||
| Centerville, OH, Health Care Improvement and Refunding Rev. (Graceworks Lutheran Services), 5.25%, 11/01/2047 | 2,480,000 | 2,271,344 | ||
| Centerville, OH, Health Care Improvement and Refunding Rev. (Graceworks Lutheran Services), 5.25%, 11/01/2050 | 915,000 | 830,722 | ||
| Cuyahoga County, OH, Hospital Rev. (Metrohealth System), 5%, 2/15/2037 | 1,250,000 | 1,285,072 | ||
| Cuyahoga County, OH, Hospital Rev. (Metrohealth System), 5%, 2/15/2042 | 3,915,000 | 3,962,790 | ||
| Cuyahoga County, OH, Hospital Rev. (Metrohealth System), 4.75%, 2/15/2047 | 5,240,000 | 5,228,027 | ||
| Cuyahoga County, OH, Hospital Rev. (Metrohealth System), 5.25%, 2/15/2047 | 3,160,000 | 3,191,249 | ||
| Cuyahoga County, OH, Hospital Rev. (Metrohealth System), 5%, 2/15/2057 | 3,355,000 | 3,259,148 | ||
| Cuyahoga County, OH, Hospital Rev. (Metrohealth System), 5.5%, 2/15/2057 | 14,395,000 | 14,560,861 | ||
| Cuyahoga County, OH, Port Authority Tax Increment Financing Rev. (Flats East Bank Project), “A”, 4%, 12/01/2055 (n) | 910,000 | 769,808 | ||
| Cuyahoga County, OH, Port Authority Tax Increment Financing Rev. (Flats East Bank Project), “B”, 4.5%, 12/01/2055 (n) | 520,000 | 451,730 | ||
| Darke County, OH, Hospital Facilities Rev. (Wayne Healthcare Project), “A”, 4%, 9/01/2040 | 860,000 | 776,350 | ||
| Darke County, OH, Hospital Facilities Rev. (Wayne Healthcare Project), “A”, 4%, 9/01/2045 | 1,545,000 | 1,350,777 | ||
| Darke County, OH, Hospital Facilities Rev. (Wayne Healthcare Project), “A”, 5%, 9/01/2049 | 1,725,000 | 1,639,051 | ||
| Issuer | Shares/Par | Value ($) | ||
| Municipal Bonds - continued | ||||
| Ohio - continued | ||||
| Franklin County, OH, Health Care Facilities Improvement Rev. (Friendship Village of Dublin, Inc.), 5%, 11/15/2034 | $ | 1,380,000 | $1,396,112 | |
| Franklin County, OH, Health Care Facilities Improvement Rev. (Friendship Village of Dublin, Inc.), 5%, 11/15/2044 | 2,055,000 | 2,066,698 | ||
| Hickory Chase, OH, Community Authority Infrastructure Improvement Rev. (Hickory Chase Project), “A”, 5%, 12/01/2040 (n) | 1,875,000 | 1,729,898 | ||
| Middleburg Heights, OH, Hospital Facilities Improvement Rev. (Southwest General Health Center Project), “A”, 4%, 8/01/2041 | 3,455,000 | 3,398,399 | ||
| Middleburg Heights, OH, Hospital Facilities Improvement Rev. (Southwest General Health Center Project), “A”, 4%, 8/01/2047 | 1,910,000 | 1,802,734 | ||
| Montgomery County, OH, Hospital Facilities Rev. (Premier Health Partners Obligated Group), “A”, 4%, 11/15/2038 | 2,210,000 | 2,160,159 | ||
| Montgomery County, OH, Hospital Facilities Rev. (Premier Health Partners Obligated Group), “A”, 4%, 11/15/2045 | 1,100,000 | 1,007,542 | ||
| Montgomery County, OH, Hospital Facilities Rev. (Premier Health Partners Obligated Group), “A”, 5%, 11/15/2035 | 1,000,000 | 1,047,500 | ||
| Northeast Ohio Medical University, General Receipts and Refunding Bonds, “A”, 4%, 12/01/2035 | 160,000 | 160,476 | ||
| Northeast Ohio Medical University, General Receipts and Refunding Bonds, “A”, 4%, 12/01/2045 | 120,000 | 110,862 | ||
| Ohio Air Quality Development Authority Refunding Rev. (Duke Energy Corp. Project), “A”, 4.25%, 11/01/2039 (Put Date 6/01/2027) | 3,355,000 | 3,434,755 | ||
| Ohio Air Quality Development Authority, Facilities Rev. (Pratt Paper LLC Project), 3.75%, 1/15/2028 (n) | 4,200,000 | 4,184,908 | ||
| Ohio Air Quality Development Authority, Facilities Rev. (Pratt Paper LLC Project), 4.25%, 1/15/2038 (n) | 2,325,000 | 2,254,796 | ||
| Ohio Air Quality Development Authority, Facilities Rev. (Pratt Paper LLC Project), 4.5%, 1/15/2048 (n) | 3,115,000 | 2,940,908 | ||
| Ohio Educational Facility Commission Rev. (Cleveland Institute of Art Project), 5%, 12/01/2038 | 1,360,000 | 1,319,385 | ||
| Ohio Educational Facility Commission Rev. (Cleveland Institute of Art Project), 5.25%, 12/01/2043 | 1,390,000 | 1,350,468 | ||
| Ohio Educational Facility Commission Rev. (Cleveland Institute of Art Project), 5.25%, 12/01/2048 | 1,600,000 | 1,530,189 | ||
| Ohio Educational Facility Commission Rev. (Cleveland Institute of Art Project), 5.5%, 12/01/2053 | 1,000,000 | 982,429 | ||
| Ohio Higher Educational Facility Rev. (Cleveland Institute of Music 2022 Project), 5.125%, 12/01/2042 | 1,455,000 | 1,511,951 | ||
| Ohio Higher Educational Facility Rev. (Cleveland Institute of Music 2022 Project), 5.375%, 12/01/2052 | 1,480,000 | 1,539,941 | ||
| Issuer | Shares/Par | Value ($) | ||
| Municipal Bonds - continued | ||||
| Ohio - continued | ||||
| Ohio Housing Finance Agency Residential Mortgage Rev. (Mortgage-Backed Securities Program), “A”, 4.5%, 9/01/2048 (u) | $ | 5,955,000 | $6,078,615 | |
| Ohio State Hospital Rev. (Premier Health Partners Obligated Group), 5%, 11/15/2035 | 825,000 | 881,528 | ||
| Ohio State Hospital Rev. (Premier Health Partners Obligated Group), 4%, 11/15/2037 | 675,000 | 654,176 | ||
| Ohio State Hospital Rev. (Premier Health Partners Obligated Group), 4%, 11/15/2038 | 660,000 | 634,048 | ||
| Ohio State Hospital Rev. (Premier Health Partners Obligated Group), 4%, 11/15/2040 | 725,000 | 686,286 | ||
| Ohio State University, Special Purpose Rev., “A”, 5%, 6/01/2038 (u) | 3,355,000 | 3,377,265 | ||
| Ohio State University, Special Purpose Rev., “A”, 5%, 6/01/2043 (u) | 8,150,000 | 8,201,108 | ||
| Riversouth, OH, Authority Rev. (Lazarus Building), “A”, 5.75%, 12/01/2027 | 2,295,000 | 2,295,234 | ||
| $176,003,177 | ||||
| Oklahoma - 0.9% | ||||
| Catoosa, OK, Industrial Authority Sales Tax Rev., 4%, 10/01/2028 | $ | 250,000 | $242,437 | |
| Norman, OK, Regional Hospital Authority Rev., 5%, 9/01/2045 | 3,015,000 | 3,100,143 | ||
| Oklahoma Development Finance Authority, First Mortgage Rev. (Sommerset Project), 5%, 7/01/2042 | 1,390,000 | 1,198,896 | ||
| Oklahoma Development Finance Authority, Health System Rev. (OU Medicine Project), “A”, 5.5%, 8/15/2041 | 3,295,000 | 3,269,406 | ||
| Oklahoma Development Finance Authority, Health System Rev. (OU Medicine Project), “A”, 5.5%, 8/15/2044 | 3,340,000 | 3,290,115 | ||
| Oklahoma Development Finance Authority, Health System Rev. (OU Medicine Project), “B”, 5%, 8/15/2038 | 4,935,000 | 4,612,644 | ||
| Oklahoma Development Finance Authority, Health System Rev. (OU Medicine Project), “B”, 5.25%, 8/15/2043 | 4,280,000 | 4,046,811 | ||
| Oklahoma Development Finance Authority, Health System Rev. (OU Medicine Project), “B”, 5.25%, 8/15/2048 | 4,930,000 | 4,529,259 | ||
| Oklahoma Development Finance Authority, Health System Rev. (OU Medicine Project), “B”, 5.5%, 8/15/2052 | 11,495,000 | 11,134,290 | ||
| Oklahoma Development Finance Authority, Health System Rev. (OU Medicine Project), “B”, 5.5%, 8/15/2057 | 2,805,000 | 2,688,306 | ||
| Oklahoma Housing Finance Agency, Single Family Mortgage Rev. (Homeownership Loan Project), “A”, 4.75%, 9/01/2048 | 2,385,000 | 2,452,310 | ||
| Tulsa, OK, Airport Improvement Trust Rev., “A”, 5%, 6/01/2045 (Prerefunded 6/01/2024) | 660,000 | 679,407 | ||
| $41,244,024 | ||||
| Issuer | Shares/Par | Value ($) | ||
| Municipal Bonds - continued | ||||
| Oregon - 0.9% | ||||
| Clackamas County, OR, Hospital Facility Authority Senior Living Rev. (Rose Villa Project), “A”, 5.125%, 11/15/2040 (n) | $ | 1,000,000 | $957,709 | |
| Clackamas County, OR, Hospital Facility Authority Senior Living Rev. (Rose Villa Project), “A”, 5.25%, 11/15/2050 (n) | 2,000,000 | 1,848,888 | ||
| Clackamas County, OR, Hospital Facility Authority Senior Living Rev. (Rose Villa Project), “A”, 5.375%, 11/15/2055 (n) | 3,000,000 | 2,780,597 | ||
| Multnomah County, OR, Hospital Facilities Authority Refunding Rev. (Terwilliger Plaza - Parkview Project), “A”, 4%, 12/01/2041 | 2,860,000 | 2,280,268 | ||
| Multnomah County, OR, Hospital Facilities Authority Refunding Rev. (Terwilliger Plaza - Parkview Project), “A”, 4%, 12/01/2051 | 7,725,000 | 5,568,163 | ||
| Multnomah County, OR, Hospital Facilities Authority Refunding Rev. (Terwilliger Plaza - Parkview Project), “A”, 4%, 12/01/2056 | 10,440,000 | 7,293,360 | ||
| Multnomah County, OR, Hospital Facilities Authority Refunding Rev. (Terwilliger Plaza - Parkview Project), “B-1”, 1.2%, 6/01/2028 | 860,000 | 735,299 | ||
| Multnomah County, OR, Hospital Facilities Authority Refunding Rev. (Terwilliger Plaza - Parkview Project), “B-2”, 0.95%, 6/01/2027 | 2,225,000 | 1,951,885 | ||
| Multnomah County, OR, Hospital Facilities Authority Refunding Rev., Taxable (Terwilliger Plaza - Parkview Project), “C”, 1.25%, 6/01/2026 | 1,065,000 | 970,960 | ||
| Oregon Facilities Authority Rev. (Samaritan Health Services Project), “A”, 5%, 10/01/2040 | 830,000 | 864,968 | ||
| Port of Portland, OR, International Airport Rev., “24B”, 5%, 7/01/2042 | 1,160,000 | 1,201,424 | ||
| Yamhill County, OR, Hospital Authority Rev. (Friendsview Retirement), “A”, 5%, 11/15/2036 | 795,000 | 710,081 | ||
| Yamhill County, OR, Hospital Authority Rev. (Friendsview Retirement), “A”, 5%, 11/15/2046 | 2,625,000 | 2,102,875 | ||
| Yamhill County, OR, Hospital Authority Rev. (Friendsview Retirement), “A”, 5%, 11/15/2051 | 725,000 | 563,262 | ||
| Yamhill County, OR, Hospital Authority Rev. (Friendsview Retirement), “A”, 5%, 11/15/2051 | 3,115,000 | 2,420,083 | ||
| Yamhill County, OR, Hospital Authority Rev. (Friendsview Retirement), “A”, 5%, 11/15/2056 | 6,360,000 | 4,824,812 | ||
| Yamhill County, OR, Hospital Authority Rev. (Friendsview Retirement), “B-1”, 2.5%, 11/15/2028 | 965,000 | 857,141 | ||
| Yamhill County, OR, Hospital Authority Rev. (Friendsview Retirement), “B-2”, 2.125%, 11/15/2027 | 385,000 | 344,777 | ||
| Yamhill County, OR, Hospital Authority Rev. (Friendsview Retirement), “B-3”, 1.75%, 11/15/2026 | 525,000 | 485,964 | ||
| $38,762,516 | ||||
| Issuer | Shares/Par | Value ($) | ||
| Municipal Bonds - continued | ||||
| Pennsylvania - 6.3% | ||||
| Allegheny County, PA, Hospital Development Authority Rev. (Allegheny Health Network Obligated Group), “A”, 4%, 4/01/2044 | $ | 3,110,000 | $2,993,520 | |
| Allentown, PA, Neighborhood Improvement Zone Development Authority Tax Rev. (City Center Project), 5%, 5/01/2028 (n) | 900,000 | 913,940 | ||
| Allentown, PA, Neighborhood Improvement Zone Development Authority Tax Rev. (City Center Project), 5%, 5/01/2033 (n) | 765,000 | 769,481 | ||
| Allentown, PA, Neighborhood Improvement Zone Development Authority Tax Rev. (City Center Project), 5%, 5/01/2042 (n) | 2,175,000 | 2,046,676 | ||
| Allentown, PA, Neighborhood Improvement Zone Development Authority Tax Rev. (City Center Project), 5.25%, 5/01/2042 (n) | 6,500,000 | 6,408,733 | ||
| Allentown, PA, Neighborhood Improvement Zone Development Authority Tax Rev. (City Center Project), 5.375%, 5/01/2042 (n) | 6,700,000 | 6,563,975 | ||
| Allentown, PA, Neighborhood Improvement Zone Development Authority Tax Rev. (City Center Refunding Project), 5%, 5/01/2032 (n) | 2,505,000 | 2,522,380 | ||
| Allentown, PA, Neighborhood Improvement Zone Development Authority Tax Rev. (City Center Refunding Project), 5%, 5/01/2042 (n) | 1,990,000 | 1,872,591 | ||
| Berks County, PA, Industrial Development Authority Health System Rev. (Tower Health Project), 4%, 11/01/2038 | 990,000 | 636,212 | ||
| Berks County, PA, Industrial Development Authority Health System Rev. (Tower Health Project), 4%, 11/01/2047 | 1,840,000 | 1,072,974 | ||
| Berks County, PA, Industrial Development Authority Health System Rev. (Tower Health Project), 5%, 11/01/2047 | 12,200,000 | 8,438,089 | ||
| Berks County, PA, Industrial Development Authority Health System Rev. (Tower Health Project), 5%, 11/01/2050 | 22,365,000 | 15,219,801 | ||
| Berks County, PA, Municipal Authority Rev. (Tower Health Project), “B-2”, 5%, 2/01/2040 (Put Date 2/01/2027) | 8,255,000 | 7,464,055 | ||
| Berks County, PA, Municipal Authority Rev. (Tower Health Project), “B-3”, 5%, 2/01/2040 (Put Date 2/01/2030) | 2,690,000 | 2,265,393 | ||
| Blythe, PA, Solid Waste Authority Rev., 7.75%, 12/01/2037 (Prerefunded 12/01/2027) | 5,195,000 | 6,167,761 | ||
| Cambria County, PA, General Obligation, “B”, AGM, 4%, 8/01/2032 | 275,000 | 291,092 | ||
| Cambria County, PA, General Obligation, “B”, AGM, 4%, 8/01/2036 | 215,000 | 222,120 | ||
| Chester County, PA, Health & Education Facilities Authority Rev. (Simpson Senior Services Project), 4%, 12/01/2035 | 6,355,000 | 5,248,404 | ||
| Chester County, PA, Health & Education Facilities Authority Rev. (Simpson Senior Services Project), 4%, 12/01/2040 | 5,915,000 | 4,602,826 | ||
| Chester County, PA, Health & Education Facilities Authority Rev. (Simpson Senior Services Project), 4%, 12/01/2044 | 4,455,000 | 3,325,371 | ||
| Issuer | Shares/Par | Value ($) | ||
| Municipal Bonds - continued | ||||
| Pennsylvania - continued | ||||
| Chester County, PA, Health & Education Facilities Authority Rev. (Simpson Senior Services Project), 4%, 12/01/2051 | $ | 3,445,000 | $2,436,144 | |
| Chester County, PA, Health & Education Facilities Authority Rev. (Simpson Senior Services Project), 5%, 12/01/2051 | 4,550,000 | 3,907,086 | ||
| Chester County, PA, Health & Education Facilities Authority Rev. (Simpson Senior Services Project), “A”, 5%, 12/01/2030 | 815,000 | 784,278 | ||
| Chester County, PA, Health & Education Facilities Authority Rev. (Simpson Senior Services Project), “A”, 5%, 12/01/2035 | 1,000,000 | 940,294 | ||
| Chester County, PA, Health & Education Facilities Authority Rev. (Simpson Senior Services Project), “A”, 5.25%, 12/01/2045 | 1,730,000 | 1,589,792 | ||
| Chester County, PA, Industrial Development Authority Educational Facilities Rev. (Avon Grove Charter School), “A”, 4.75%, 12/15/2037 | 885,000 | 895,363 | ||
| Chester County, PA, Industrial Development Authority Educational Facilities Rev. (Avon Grove Charter School), “A”, 5%, 12/15/2047 | 2,040,000 | 2,068,380 | ||
| Chester County, PA, Industrial Development Authority Educational Facilities Rev. (Avon Grove Charter School), “A”, 5%, 12/15/2051 | 610,000 | 616,703 | ||
| Cumberland County, PA, Municipal Authority Rev. (Diakon Lutheran Social Ministries), 4%, 1/01/2033 (Prerefunded 1/01/2025) | 335,000 | 345,068 | ||
| Cumberland County, PA, Municipal Authority Rev. (Diakon Lutheran Social Ministries), 4%, 1/01/2033 (Prerefunded 1/01/2025) | 1,185,000 | 1,220,614 | ||
| Cumberland County, PA, Municipal Authority Rev. (Diakon Lutheran Social Ministries), 4%, 1/01/2033 | 865,000 | 834,043 | ||
| Cumberland County, PA, Municipal Authority Rev. (Diakon Lutheran Social Ministries), 5%, 1/01/2038 (Prerefunded 1/01/2025) | 40,000 | 41,946 | ||
| Cumberland County, PA, Municipal Authority Rev. (Diakon Lutheran Social Ministries), 5%, 1/01/2038 (Prerefunded 1/01/2025) | 155,000 | 162,541 | ||
| Cumberland County, PA, Municipal Authority Rev. (Diakon Lutheran Social Ministries), 5%, 1/01/2038 | 190,000 | 191,924 | ||
| Cumberland County, PA, Municipal Authority Rev. (Penn State Health), 4%, 11/01/2049 | 4,310,000 | 4,163,163 | ||
| Dallas, PA, Municipal Authority, University Rev. (Misericordia University Project), 5%, 5/01/2048 | 715,000 | 701,081 | ||
| Doylestown, PA, Hospital Rev. (Doylestown Hospital), “A”, 4%, 7/01/2045 | 765,000 | 554,410 | ||
| Doylestown, PA, Hospital Rev. (Doylestown Hospital), “A”, 5%, 7/01/2049 | 770,000 | 633,805 | ||
| Issuer | Shares/Par | Value ($) | ||
| Municipal Bonds - continued | ||||
| Pennsylvania - continued | ||||
| East Hempfield Township, PA, Industrial Development Authority Rev. (Student Services, Inc., Student Housing Project at Millersville University of Pennsylvania), 5%, 7/01/2030 (Prerefunded 7/01/2025) | $ | 330,000 | $349,804 | |
| East Hempfield Township, PA, Industrial Development Authority Rev. (Student Services, Inc., Student Housing Project at Millersville University of Pennsylvania), 5%, 7/01/2035 (Prerefunded 7/01/2025) | 420,000 | 445,205 | ||
| East Hempfield Township, PA, Industrial Development Authority Rev. (Student Services, Inc., Student Housing Project at Millersville University of Pennsylvania), 5%, 7/01/2039 (Prerefunded 7/01/2024) | 325,000 | 336,097 | ||
| East Hempfield Township, PA, Industrial Development Authority Rev. (Student Services, Inc., Student Housing Project at Millersville University of Pennsylvania), 5%, 7/01/2046 (Prerefunded 7/01/2024) | 180,000 | 186,146 | ||
| Erie County, PA, Water Authority Rev., “D”, BAM, 4%, 12/01/2038 | 750,000 | 768,208 | ||
| Franklin County, PA, Industrial Development Authority Rev. (Menno-Haven, Inc. Project), 5%, 12/01/2029 | 175,000 | 165,296 | ||
| Franklin County, PA, Industrial Development Authority Rev. (Menno-Haven, Inc. Project), 5%, 12/01/2032 | 1,250,000 | 1,151,958 | ||
| Franklin County, PA, Industrial Development Authority Rev. (Menno-Haven, Inc. Project), 5%, 12/01/2038 | 2,795,000 | 2,475,044 | ||
| Franklin County, PA, Industrial Development Authority Rev. (Menno-Haven, Inc. Project), 5%, 12/01/2039 | 385,000 | 336,387 | ||
| Franklin County, PA, Industrial Development Authority Rev. (Menno-Haven, Inc. Project), 5%, 12/01/2043 | 3,685,000 | 3,152,191 | ||
| Franklin County, PA, Industrial Development Authority Rev. (Menno-Haven, Inc. Project), 5%, 12/01/2048 | 3,730,000 | 3,127,506 | ||
| Franklin County, PA, Industrial Development Authority Rev. (Menno-Haven, Inc. Project), 5%, 12/01/2049 | 510,000 | 425,216 | ||
| Franklin County, PA, Industrial Development Authority Rev. (Menno-Haven, Inc. Project), 5%, 12/01/2053 | 5,560,000 | 4,555,915 | ||
| Fulton County, PA, Industrial Development Authority Hospital Rev. (Medical Center Project), 5%, 7/01/2040 | 7,745,000 | 7,844,755 | ||
| Fulton County, PA, Industrial Development Authority Hospital Rev. (Medical Center Project), “B”, 5%, 7/01/2046 | 3,450,000 | 3,480,168 | ||
| Fulton County, PA, Industrial Development Authority Hospital Rev. (Medical Center Project), “B”, 5%, 7/01/2051 | 5,280,000 | 5,312,120 | ||
| Lancaster County, PA, Hospital Authority Health System Rev. (Saint Anne's Retirement Community, Inc. Project), 5%, 3/01/2050 | 500,000 | 418,294 | ||
| Issuer | Shares/Par | Value ($) | ||
| Municipal Bonds - continued | ||||
| Pennsylvania - continued | ||||
| Lehigh County, PA, Water & Sewer Authority Rev., “A”, 5%, 12/01/2043 (Prerefunded 12/01/2023) | $ | 4,115,000 | $4,203,847 | |
| Maxatawny Township, PA, Municipal Authority Rev. (Diakon Lutheran Social Ministries), “A”, 5%, 1/01/2039 | 265,000 | 267,456 | ||
| Maxatawny Township, PA, Municipal Authority Rev. (Diakon Lutheran Social Ministries), “A”, 5%, 1/01/2040 | 930,000 | 935,944 | ||
| Maxatawny Township, PA, Municipal Authority Rev. (Diakon Lutheran Social Ministries), “A”, 5%, 1/01/2041 | 685,000 | 686,925 | ||
| Maxatawny Township, PA, Municipal Authority Rev. (Diakon Lutheran Social Ministries), “A”, 5%, 1/01/2042 | 710,000 | 709,969 | ||
| Maxatawny Township, PA, Municipal Authority Rev. (Diakon Lutheran Social Ministries), “A”, 4.5%, 1/01/2045 | 2,440,000 | 2,209,192 | ||
| Montgomery County, PA, Higher Education & Health Authority Rev. (Thomas Jefferson University), 4%, 9/01/2044 | 2,765,000 | 2,698,367 | ||
| Montgomery County, PA, Higher Education & Health Authority Rev. (Thomas Jefferson University), 4%, 9/01/2049 | 2,635,000 | 2,461,606 | ||
| Montgomery County, PA, Higher Education & Health Authority Rev. (Thomas Jefferson University), “A”, 4%, 9/01/2049 | 1,920,000 | 1,793,656 | ||
| Montgomery County, PA, Higher Education & Health Authority Rev. (Thomas Jefferson University), “B”, AGM, 3.125%, 5/01/2053 | 2,975,000 | 2,317,131 | ||
| Montgomery County, PA, Higher Education & Health Authority Rev., Taxable (Thomas Jefferson University), 4%, 9/01/2051 | 4,795,000 | 4,423,512 | ||
| Montgomery County, PA, Industrial Development Authority Retirement Communities Rev. (Acts Retirement-Life Communities, Inc. Obligated Group), “C”, 5%, 11/15/2045 | 1,525,000 | 1,518,721 | ||
| Montgomery County, PA, Industrial Development Authority Rev. (Whitemarsh Continuing Care Retirement Community Project), 5.375%, 1/01/2050 | 10,105,000 | 9,342,157 | ||
| Northeastern, PA, Hospital & Education Authority College Rev. (King's College Project), 5%, 5/01/2044 | 1,810,000 | 1,833,081 | ||
| Northeastern, PA, Hospital & Education Authority College Rev. (King's College Project), 5%, 5/01/2049 | 1,095,000 | 1,104,078 | ||
| Pennsylvania Economic Development Financing Authority Rev. (Presbyterian Senior Living Project), 4%, 7/01/2030 | 1,600,000 | 1,561,794 | ||
| Pennsylvania Economic Development Financing Authority Rev. (Presbyterian Senior Living Project), 4%, 7/01/2033 | 1,750,000 | 1,661,049 | ||
| Pennsylvania Economic Development Financing Authority Rev. (Presbyterian Senior Living Project), 4%, 7/01/2041 | 1,050,000 | 924,546 | ||
| Pennsylvania Economic Development Financing Authority Rev. (Presbyterian Senior Living Project), 4%, 7/01/2046 | 2,000,000 | 1,689,117 | ||
| Issuer | Shares/Par | Value ($) | ||
| Municipal Bonds - continued | ||||
| Pennsylvania - continued | ||||
| Pennsylvania Economic Development Financing Authority, Guaranteed Parking Rev. (Capitol Region Parking System), Capital Appreciation, “B-2”, 0%, 1/01/2035 | $ | 1,460,000 | $878,600 | |
| Pennsylvania Economic Development Financing Authority, Guaranteed Parking Rev. (Capitol Region Parking System), Capital Appreciation, “B-2”, 0%, 1/01/2036 | 1,540,000 | 865,825 | ||
| Pennsylvania Economic Development Financing Authority, Guaranteed Parking Rev. (Capitol Region Parking System), Capital Appreciation, “B-2”, 0%, 1/01/2037 | 1,490,000 | 787,521 | ||
| Pennsylvania Economic Development Financing Authority, Guaranteed Parking Rev. (Capitol Region Parking System), Capital Appreciation, “B-2”, 0%, 1/01/2038 | 1,535,000 | 763,676 | ||
| Pennsylvania Economic Development Financing Authority, Guaranteed Parking Rev. (Capitol Region Parking System), Capital Appreciation, “B-2”, 0%, 1/01/2039 | 1,675,000 | 783,953 | ||
| Pennsylvania Economic Development Financing Authority, Guaranteed Parking Rev. (Capitol Region Parking System), Capital Appreciation, “B-2”, 0%, 1/01/2040 | 1,615,000 | 709,012 | ||
| Pennsylvania Economic Development Financing Authority, Guaranteed Parking Rev. (Capitol Region Parking System), Capital Appreciation, “B-2”, 0%, 1/01/2041 | 1,555,000 | 638,898 | ||
| Pennsylvania Economic Development Financing Authority, Guaranteed Parking Rev. (Capitol Region Parking System), Capital Appreciation, “B-2”, 0%, 1/01/2042 | 1,490,000 | 573,298 | ||
| Pennsylvania Economic Development Financing Authority, Guaranteed Parking Rev. (Capitol Region Parking System), Capital Appreciation, “B-2”, 0%, 1/01/2043 | 1,425,000 | 516,318 | ||
| Pennsylvania Economic Development Financing Authority, Guaranteed Parking Rev. (Capitol Region Parking System), Capital Appreciation, “B-3”, 0%, 1/01/2049 | 7,090,000 | 1,260,353 | ||
| Pennsylvania Economic Development Financing Authority, Private Activity Rev. (PennDOT Major Bridges Package One Project), 5.25%, 6/30/2053 | 5,000,000 | 5,248,079 | ||
| Pennsylvania Economic Development Financing Authority, Private Activity Rev. (PennDOT Major Bridges Package One Project), AGM, 5%, 12/31/2057 | 14,325,000 | 14,973,868 | ||
| Pennsylvania Higher Educational Assistance Agency, Education Loan Rev., “A”, 2.625%, 6/01/2042 | 1,430,000 | 1,245,403 | ||
| Pennsylvania Higher Educational Assistance Agency, Education Loan Rev., “A”, 4.5%, 6/01/2043 | 1,070,000 | 1,103,081 | ||
| Pennsylvania Higher Educational Assistance Agency, Education Loan Rev., “B”, 3.125%, 6/01/2048 | 1,800,000 | 1,423,937 | ||
| Issuer | Shares/Par | Value ($) | ||
| Municipal Bonds - continued | ||||
| Pennsylvania - continued | ||||
| Pennsylvania Housing Finance Agency, Single Family Mortgage Rev., “128A”, 4.75%, 4/01/2033 (u) | $ | 4,395,000 | $4,456,725 | |
| Philadelphia, PA, Authority for Industrial Development Charter School Rev. (Green Woods Charter School Project), “A”, 5.125%, 6/15/2042 | 415,000 | 397,046 | ||
| Philadelphia, PA, Authority for Industrial Development Charter School Rev. (Green Woods Charter School Project), “A”, 5.25%, 6/15/2052 | 470,000 | 447,692 | ||
| Philadelphia, PA, Authority for Industrial Development Charter School Rev. (Green Woods Charter School Project), “A”, 5.375%, 6/15/2057 | 225,000 | 213,044 | ||
| Philadelphia, PA, Authority for Industrial Development Charter School Rev. (Philadelphia Performing Arts: A String Theory Charter School Project), 5%, 6/15/2050 (n) | 1,700,000 | 1,629,022 | ||
| Philadelphia, PA, Authority for Industrial Development Rev. (KIPP Charter School Project), “B”, 4%, 4/01/2026 | 865,000 | 854,591 | ||
| Philadelphia, PA, Authority for Industrial Development Rev. (KIPP Charter School Project), “B”, 5%, 4/01/2046 | 3,500,000 | 3,298,305 | ||
| Philadelphia, PA, Authority for Industrial Development Rev. (MaST Charter School Project), “A”, 5.625%, 8/01/2036 | 885,000 | 916,597 | ||
| Philadelphia, PA, Authority for Industrial Development Rev. (MaST Charter School Project), “A”, 5.75%, 8/01/2046 | 2,515,000 | 2,578,074 | ||
| Philadelphia, PA, Authority for Industrial Development Rev. (MaST Charter School Project), “A”, 5.375%, 8/01/2051 | 1,910,000 | 1,959,590 | ||
| Philadelphia, PA, Authority for Industrial Development Rev. (MaST Charter School Project), “B”, 6%, 8/01/2051 | 3,000,000 | 3,089,353 | ||
| Philadelphia, PA, Authority for Industrial Development Rev. (MaST Community Charter School II Project), 5%, 8/01/2030 | 460,000 | 483,518 | ||
| Philadelphia, PA, Authority for Industrial Development Rev. (MaST Community Charter School II Project), 5%, 8/01/2040 | 600,000 | 616,727 | ||
| Philadelphia, PA, Authority for Industrial Development Rev. (MaST Community Charter School II Project), 5%, 8/01/2050 | 575,000 | 584,408 | ||
| Philadelphia, PA, Authority for Industrial Development Rev. (Tacony Academy Charter School Project), 6.875%, 6/15/2033 | 1,145,000 | 1,159,134 | ||
| Philadelphia, PA, Authority for Industrial Development Rev. (Tacony Academy Charter School Project), 7.375%, 6/15/2043 | 1,975,000 | 2,000,019 | ||
| Philadelphia, PA, Authority for Industrial Development Rev. (Tacony Academy Charter School Project), “A-1”, 6.75%, 6/15/2033 | 850,000 | 860,107 | ||
| Philadelphia, PA, Authority for Industrial Development Rev. (Tacony Academy Charter School Project), “A-1”, 7%, 6/15/2043 | 1,670,000 | 1,688,886 | ||
| Philadelphia, PA, Authority for Industrial Development Rev. (Thomas Jefferson University), “A”, 5%, 9/01/2035 | 895,000 | 948,711 | ||
| Issuer | Shares/Par | Value ($) | ||
| Municipal Bonds - continued | ||||
| Pennsylvania - continued | ||||
| Philadelphia, PA, Authority for Industrial Development, Multi-Family Housing Rev. (University Square Apartment Project-Section 8), “I”, 5%, 12/01/2037 | $ | 2,615,000 | $2,745,164 | |
| Philadelphia, PA, Authority for Industrial Development, Multi-Family Housing Rev. (University Square Apartment Project-Section 8), “III”, 5.25%, 12/01/2047 (n) | 3,245,000 | 3,023,509 | ||
| Philadelphia, PA, Authority for Industrial Development, Multi-Family Housing Rev. (University Square Apartment Project-Section 8), “III”, 5.5%, 12/01/2058 (n) | 4,690,000 | 4,365,210 | ||
| Philadelphia, PA, Authority for Industrial Development, Senior Living Facilities Rev. (Wesley Enhanced Living Obligated Group), “A”, 5%, 7/01/2037 | 2,290,000 | 2,073,648 | ||
| Philadelphia, PA, Authority for Industrial Development, Senior Living Facilities Rev. (Wesley Enhanced Living Obligated Group), “A”, 5%, 7/01/2042 | 3,665,000 | 3,193,987 | ||
| Philadelphia, PA, Authority for Industrial Development, Senior Living Facilities Rev. (Wesley Enhanced Living Obligated Group), “A”, 5%, 7/01/2049 | 3,790,000 | 3,191,515 | ||
| Philadelphia, PA, School District General Obligation, “F”, 5%, 9/01/2038 (Prerefunded 9/01/2026) | 5,000 | 5,481 | ||
| Philadelphia, PA, School District General Obligation, “F”, 5%, 9/01/2038 | 240,000 | 251,664 | ||
| Philadelphia, PA, School District, “A”, 5%, 9/01/2033 | 405,000 | 449,622 | ||
| Philadelphia, PA, School District, “A”, 5%, 9/01/2036 | 510,000 | 555,588 | ||
| Philadelphia, PA, School District, “A”, 4%, 9/01/2037 | 1,560,000 | 1,596,191 | ||
| Philadelphia, PA, School District, “A”, 5%, 9/01/2037 | 510,000 | 553,032 | ||
| Philadelphia, PA, School District, “A”, 4%, 9/01/2038 | 2,410,000 | 2,453,221 | ||
| Philadelphia, PA, School District, “A”, 5%, 9/01/2038 | 510,000 | 551,244 | ||
| Philadelphia, PA, School District, “A”, 4%, 9/01/2039 | 1,260,000 | 1,276,292 | ||
| Philadelphia, PA, School District, “F”, 5%, 9/01/2037 | 980,000 | 1,029,313 | ||
| Scranton-Lackawanna, PA, Health and Welfare Authority, University Rev. (Marywood University Project), 5%, 6/01/2046 | 10,015,000 | 9,236,994 | ||
| Washington County, PA, Redevelopment Authority Refunding Rev. (Victory Centre Tax Increment Financing Project), 4%, 7/01/2023 | 140,000 | 139,849 | ||
| Washington County, PA, Redevelopment Authority Refunding Rev. (Victory Centre Tax Increment Financing Project), 5%, 7/01/2035 | 355,000 | 353,038 | ||
| Washington County, PA, Trinity Area School District, AGM, 4%, 11/01/2041 | 655,000 | 662,574 | ||
| Washington County, PA, Trinity Area School District, AGM, 4%, 11/01/2043 | 695,000 | 703,205 | ||
| Issuer | Shares/Par | Value ($) | ||
| Municipal Bonds - continued | ||||
| Pennsylvania - continued | ||||
| Washington County, PA, Trinity Area School District, AGM, 4%, 11/01/2046 | $ | 1,175,000 | $1,177,344 | |
| West Shore, PA, Area Authority Rev. (Messiah Village Project), “A”, 5%, 7/01/2030 | 395,000 | 396,675 | ||
| West Shore, PA, Area Authority Rev. (Messiah Village Project), “A”, 5%, 7/01/2035 | 390,000 | 390,246 | ||
| $278,332,464 | ||||
| Puerto Rico - 7.0% | ||||
| Commonwealth of Puerto Rico, General Obligation Restructured Bonds, Capital Appreciation, Series 2022A, 0%, 7/01/2024 | $ | 885,735 | $829,541 | |
| Commonwealth of Puerto Rico, General Obligation Restructured Bonds, Capital Appreciation, Series 2022A, 0%, 7/01/2033 | 3,413,676 | 1,976,997 | ||
| Commonwealth of Puerto Rico, General Obligation Restructured Bonds, Series 2022A, 5.375%, 7/01/2025 | 2,954,287 | 3,022,169 | ||
| Commonwealth of Puerto Rico, General Obligation Restructured Bonds, Series 2022A, 5.625%, 7/01/2027 | 2,927,530 | 3,066,271 | ||
| Commonwealth of Puerto Rico, General Obligation Restructured Bonds, Series 2022A, 5.625%, 7/01/2029 | 2,880,036 | 3,061,987 | ||
| Commonwealth of Puerto Rico, General Obligation Restructured Bonds, Series 2022A, 5.75%, 7/01/2031 | 5,443,355 | 5,903,443 | ||
| Commonwealth of Puerto Rico, General Obligation Restructured Bonds, Series 2022A, 4%, 7/01/2033 | 2,652,627 | 2,480,207 | ||
| Commonwealth of Puerto Rico, General Obligation Restructured Bonds, Series 2022A, 4%, 7/01/2035 | 4,289,927 | 3,896,553 | ||
| Commonwealth of Puerto Rico, General Obligation Restructured Bonds, Series 2022A, 4%, 7/01/2037 | 2,046,409 | 1,810,857 | ||
| Commonwealth of Puerto Rico, General Obligation Restructured Bonds, Series 2022A, 4%, 7/01/2041 | 5,782,333 | 4,972,403 | ||
| Commonwealth of Puerto Rico, General Obligation Restructured Bonds, Series 2022A, 4%, 7/01/2046 | 2,893,588 | 2,412,705 | ||
| Puerto Rico Electric Power Authority Refunding Rev., “DDD”, 5%, 7/01/2020 (a)(d) | 525,000 | 360,937 | ||
| Puerto Rico Electric Power Authority Refunding Rev., “DDD”, 5%, 7/01/2021 (a)(d) | 8,560,000 | 5,885,000 | ||
| Puerto Rico Electric Power Authority Refunding Rev., “DDD”, 5%, 7/01/2022 (a)(d) | 14,860,000 | 10,216,250 | ||
| Puerto Rico Electric Power Authority Rev., “A”, 5%, 7/01/2029 (a)(d) | 27,420,000 | 19,125,450 | ||
| Puerto Rico Electric Power Authority Rev., “A”, 5%, 7/01/2042 (a)(d) | 2,965,000 | 2,068,087 | ||
| Puerto Rico Electric Power Authority Rev., “AAA”, 5.25%, 7/01/2021 (a)(d) | 1,075,000 | 741,750 | ||
| Issuer | Shares/Par | Value ($) | ||
| Municipal Bonds - continued | ||||
| Puerto Rico - continued | ||||
| Puerto Rico Electric Power Authority Rev., “AAA”, 5.25%, 7/01/2030 (a)(d) | $ | 500,000 | $350,000 | |
| Puerto Rico Electric Power Authority Rev., “CCC”, 5.25%, 7/01/2027 (a)(d) | 6,605,000 | 4,623,500 | ||
| Puerto Rico Electric Power Authority Rev., “DDD”, AGM, 3.625%, 7/01/2023 | 555,000 | 552,366 | ||
| Puerto Rico Electric Power Authority Rev., “DDD”, AGM, 3.65%, 7/01/2024 | 2,345,000 | 2,307,592 | ||
| Puerto Rico Electric Power Authority Rev., “NN”, NPFG, 4.75%, 7/01/2033 | 380,000 | 380,373 | ||
| Puerto Rico Electric Power Authority Rev., “PP”, NPFG, 5%, 7/01/2024 | 240,000 | 240,287 | ||
| Puerto Rico Electric Power Authority Rev., “PP”, NPFG, 5%, 7/01/2025 | 260,000 | 260,310 | ||
| Puerto Rico Electric Power Authority Rev., “RR”, AGM, 5%, 7/01/2028 | 185,000 | 186,330 | ||
| Puerto Rico Electric Power Authority Rev., “SS”, AGM, 4.375%, 7/01/2030 | 515,000 | 498,035 | ||
| Puerto Rico Electric Power Authority Rev., “TT”, 5%, 7/01/2021 (a)(d) | 2,425,000 | 1,667,187 | ||
| Puerto Rico Electric Power Authority Rev., “TT”, 5%, 7/01/2023 (a)(d) | 3,275,000 | 2,284,312 | ||
| Puerto Rico Electric Power Authority Rev., “TT”, 5%, 7/01/2027 (a)(d) | 425,000 | 296,437 | ||
| Puerto Rico Electric Power Authority Rev., “TT”, 5%, 7/01/2037 (a)(d) | 11,890,000 | 8,293,275 | ||
| Puerto Rico Electric Power Authority Rev., “TT”, NPFG, 5%, 7/01/2024 | 1,230,000 | 1,231,469 | ||
| Puerto Rico Electric Power Authority Rev., “TT”, NPFG, 5%, 7/01/2026 | 65,000 | 65,078 | ||
| Puerto Rico Electric Power Authority Rev., “UU”, AGM, 4.25%, 7/01/2027 | 1,705,000 | 1,663,483 | ||
| Puerto Rico Electric Power Authority Rev., “VV”, NPFG, 5.25%, 7/01/2025 | 475,000 | 477,626 | ||
| Puerto Rico Electric Power Authority Rev., “VV”, NPFG, 5.25%, 7/01/2026 | 1,070,000 | 1,078,184 | ||
| Puerto Rico Electric Power Authority Rev., “VV”, NPFG, 5.25%, 7/01/2029 | 3,765,000 | 3,809,757 | ||
| Puerto Rico Electric Power Authority Rev., “VV”, NPFG, 5.25%, 7/01/2030 | 5,250,000 | 5,304,322 | ||
| Puerto Rico Electric Power Authority Rev., “VV”, NPFG, 5.25%, 7/01/2034 | 630,000 | 633,519 | ||
| Issuer | Shares/Par | Value ($) | ||
| Municipal Bonds - continued | ||||
| Puerto Rico - continued | ||||
| Puerto Rico Electric Power Authority Rev., “WW”, 5.375%, 7/01/2022 (a)(d) | $ | 445,000 | $308,719 | |
| Puerto Rico Electric Power Authority Rev., “WW”, 5.25%, 7/01/2025 (a)(d) | 1,010,000 | 707,000 | ||
| Puerto Rico Electric Power Authority Rev., “XX”, 5.75%, 7/01/2036 (a)(d) | 4,890,000 | 3,447,450 | ||
| Puerto Rico Electric Power Authority Rev., “ZZ”, 5%, 7/01/2018 (a)(d) | 4,720,000 | 3,245,000 | ||
| Puerto Rico Electric Power Authority Rev., “ZZ”, 5.25%, 7/01/2023 (a)(d) | 5,265,000 | 3,685,500 | ||
| Puerto Rico Electric Power Authority Rev., “ZZ”, 5.25%, 7/01/2024 (a)(d) | 1,180,000 | 826,000 | ||
| Puerto Rico Electric Power Authority Rev., “ZZ”, 5.25%, 7/01/2026 (a)(d) | 3,705,000 | 2,593,500 | ||
| Puerto Rico Electric Power Authority Rev., Taxable, “EEE”, 6.05%, 7/01/2032 (a)(d) | 10,450,000 | 7,262,750 | ||
| Puerto Rico Industrial, Tourist, Educational, Medical & Environmental Control Facilities Financing Authority Rev. (Cogeneration Facilities - AES Puerto Rico Project), 6.625%, 6/01/2026 | 4,335,000 | 4,407,277 | ||
| Puerto Rico Industrial, Tourist, Educational, Medical & Environmental Control Facilities Financing Authority, Educational Facilities Rev. (University Plaza Project), NPFG, 5%, 7/01/2033 | 4,475,000 | 4,409,175 | ||
| Puerto Rico Industrial, Tourist, Educational, Medical & Environmental Control Facilities Financing Authority, Higher Education Rev. (University of Sacred Heart), 4.375%, 10/01/2031 | 525,000 | 525,564 | ||
| Puerto Rico Industrial, Tourist, Educational, Medical & Environmental Control Facilities Financing Authority, Higher Education Rev. (University of Sacred Heart), 5%, 10/01/2042 | 1,330,000 | 1,333,247 | ||
| Puerto Rico Municipal Finance Agency, “A”, AGM, 5%, 8/01/2027 | 290,000 | 292,085 | ||
| Puerto Rico Sales Tax Financing Corp., Restructured Sales Tax Rev., “2019A-1”, 4.55%, 7/01/2040 | 1,542,000 | 1,516,561 | ||
| Puerto Rico Sales Tax Financing Corp., Restructured Sales Tax Rev., “2019A-1”, 4.75%, 7/01/2053 | 8,003,000 | 7,611,541 | ||
| Puerto Rico Sales Tax Financing Corp., Restructured Sales Tax Rev., “2019A-1”, 5%, 7/01/2058 | 98,138,000 | 96,690,337 | ||
| Puerto Rico Sales Tax Financing Corp., Restructured Sales Tax Rev., “2019A-2”, 4.329%, 7/01/2040 | 14,758,000 | 14,128,167 | ||
| Puerto Rico Sales Tax Financing Corp., Restructured Sales Tax Rev., “2019A-2”, 4.329%, 7/01/2040 | 9,598,000 | 9,188,382 | ||
| Puerto Rico Sales Tax Financing Corp., Restructured Sales Tax Rev., “2019A-2”, 4.536%, 7/01/2053 | 298,000 | 273,567 | ||
| Issuer | Shares/Par | Value ($) | ||
| Municipal Bonds - continued | ||||
| Puerto Rico - continued | ||||
| Puerto Rico Sales Tax Financing Corp., Restructured Sales Tax Rev., “2019A-2”, 4.784%, 7/01/2058 | $ | 3,802,000 | $3,626,311 | |
| Puerto Rico Sales Tax Financing Corp., Restructured Sales Tax Rev., Capital Appreciation, “2019A-1”, 0%, 7/01/2024 | 309,000 | 290,856 | ||
| Puerto Rico Sales Tax Financing Corp., Restructured Sales Tax Rev., Capital Appreciation, “2019A-1”, 0%, 7/01/2027 | 2,598,000 | 2,142,177 | ||
| Puerto Rico Sales Tax Financing Corp., Restructured Sales Tax Rev., Capital Appreciation, “2019A-1”, 0%, 7/01/2029 | 825,000 | 617,287 | ||
| Puerto Rico Sales Tax Financing Corp., Restructured Sales Tax Rev., Capital Appreciation, “2019A-1”, 0%, 7/01/2031 | 20,100,000 | 13,537,877 | ||
| Puerto Rico Sales Tax Financing Corp., Restructured Sales Tax Rev., Capital Appreciation, “2019A-1”, 0%, 7/01/2033 | 20,115,000 | 12,176,603 | ||
| Puerto Rico Sales Tax Financing Corp., Restructured Sales Tax Rev., Capital Appreciation, “2019A-1”, 0%, 7/01/2046 | 25,857,000 | 7,100,513 | ||
| University of Puerto Rico Rev., “P”, NPFG, 5%, 6/01/2025 | 595,000 | 595,710 | ||
| $310,573,205 | ||||
| Rhode Island - 0.1% | ||||
| Rhode Island Student Loan Authority, Education Loan Rev., “A”, 2.25%, 12/01/2039 | $ | 2,585,000 | $2,265,250 | |
| Rhode Island Student Loan Authority, Student Loan Rev., “A”, 3.5%, 12/01/2034 | 1,120,000 | 1,101,209 | ||
| $3,366,459 | ||||
| South Carolina - 1.0% | ||||
| Berkeley County, SC, Assessment Rev. (Nexton Improvement District), 4%, 11/01/2030 (n) | $ | 425,000 | $400,562 | |
| Berkeley County, SC, Assessment Rev. (Nexton Improvement District), 4.25%, 11/01/2040 (n) | 1,000,000 | 869,688 | ||
| Berkeley County, SC, Assessment Rev. (Nexton Improvement District), 4.375%, 11/01/2049 (n) | 500,000 | 415,553 | ||
| South Carolina Jobs & Economic Development Authority, Educational Facilities Rev. (Green Charter Schools Project), “A”, 4%, 6/01/2036 (n) | 520,000 | 454,118 | ||
| South Carolina Jobs & Economic Development Authority, Educational Facilities Rev. (Green Charter Schools Project), “A”, 4%, 6/01/2046 (n) | 330,000 | 255,539 | ||
| South Carolina Jobs & Economic Development Authority, Educational Facilities Rev. (Green Charter Schools Project), “A”, 4%, 6/01/2056 (n) | 130,000 | 93,698 | ||
| South Carolina Jobs & Economic Development Authority, Health Facilities Rev. (Lutheran Homes of South Carolina, Inc.), 5.125%, 5/01/2048 | 805,000 | 675,474 | ||
| Issuer | Shares/Par | Value ($) | ||
| Municipal Bonds - continued | ||||
| South Carolina - continued | ||||
| South Carolina Jobs & Economic Development Authority, Health Facilities Rev. (Lutheran Homes of South Carolina, Inc.), “B”, 5%, 5/01/2037 | $ | 925,000 | $836,330 | |
| South Carolina Jobs & Economic Development Authority, Health Facilities Rev. (Wesley Commons), 5%, 10/01/2036 (n) | 5,735,000 | 5,530,990 | ||
| South Carolina Jobs & Economic Development Authority, Hospital Facilities Rev. (Bon Secours Mercy Health, Inc.), “A”, 4%, 12/01/2044 | 6,215,000 | 6,046,656 | ||
| South Carolina Jobs & Economic Development Authority, Hospital Rev. (Hampton Regional Medical Center Project), 4%, 11/01/2029 | 3,240,000 | 3,300,423 | ||
| South Carolina Jobs & Economic Development Authority, Hospital Rev. (Hampton Regional Medical Center Project), 5%, 11/01/2033 | 3,570,000 | 3,714,951 | ||
| South Carolina Jobs & Economic Development Authority, Hospital Rev. (Hampton Regional Medical Center Project), 5%, 11/01/2037 | 1,380,000 | 1,399,052 | ||
| South Carolina Jobs & Economic Development Authority, Hospital Rev. (Hampton Regional Medical Center Project), 5%, 11/01/2042 | 3,515,000 | 3,359,980 | ||
| South Carolina Jobs & Economic Development Authority, Hospital Rev. (Hampton Regional Medical Center Project), 5%, 11/01/2046 | 1,905,000 | 1,796,654 | ||
| South Carolina Jobs & Economic Development Authority, Residential Care Facilities Rev. (Episcopal Home at Still Hopes), 5%, 4/01/2047 | 3,075,000 | 2,568,645 | ||
| South Carolina Jobs & Economic Development Authority, Residential Care Facilities Rev. (Episcopal Home at Still Hopes), 5%, 4/01/2048 | 1,500,000 | 1,247,115 | ||
| South Carolina Jobs & Economic Development Authority, Residential Care Facilities Rev. (Episcopal Home at Still Hopes), 5%, 4/01/2052 | 2,610,000 | 2,132,699 | ||
| South Carolina Jobs & Economic Development Authority, Residential Care Facilities Rev. (Episcopal Home at Still Hopes), 5.25%, 4/01/2053 | 4,060,000 | 3,439,187 | ||
| South Carolina Ports Authority Rev., 5.25%, 7/01/2050 (Prerefunded 7/01/2025) | 1,485,000 | 1,566,661 | ||
| Spartanburg County, SC, Regional Health Services District Hospital Rev., “A”, 5%, 4/15/2048 | 1,330,000 | 1,377,425 | ||
| Spartanburg County, SC, Regional Health Services District Hospital Rev., “A”, AGM, 4%, 4/15/2045 | 1,200,000 | 1,200,035 | ||
| $42,681,435 | ||||
| Issuer | Shares/Par | Value ($) | ||
| Municipal Bonds - continued | ||||
| Tennessee - 1.0% | ||||
| Knox County, TN, Health, Educational & Housing Facility Board Rev. (University Health Systems, Inc.), 5%, 4/01/2030 | $ | 680,000 | $722,691 | |
| Knox County, TN, Health, Educational & Housing Facility Board Rev. (University Health Systems, Inc.), 5%, 4/01/2031 | 800,000 | 849,671 | ||
| Knox County, TN, Health, Educational & Housing Facility Board Rev. (University Health Systems, Inc.), 5%, 4/01/2036 | 1,380,000 | 1,439,452 | ||
| Memphis-Shelby County, TN, Economic Development Growth Engine Industrial Development Board, Senior Tax Rev. (Graceland Project), “A”, 4.75%, 7/01/2027 | 590,000 | 492,981 | ||
| Memphis-Shelby County, TN, Economic Development Growth Engine Industrial Development Board, Senior Tax Rev. (Graceland Project), “A”, 5.5%, 7/01/2037 | 3,425,000 | 2,552,454 | ||
| Memphis-Shelby County, TN, Economic Development Growth Engine Industrial Development Board, Senior Tax Rev. (Graceland Project), “A”, 5.625%, 1/01/2046 | 250,000 | 158,415 | ||
| Metropolitan Government of Nashville & Davidson County, TN, Health & Educational Facilities Board Rev., Refunding & Improvement (Trevecca Nazarene University Project), 5%, 10/01/2034 | 240,000 | 251,832 | ||
| Shelby County, TN, Health, Educational & Housing Board Residential Care Facility Mortgage Rev. (Village at Germantown), 5%, 12/01/2034 | 500,000 | 500,052 | ||
| Shelby County, TN, Health, Educational & Housing Board Residential Care Facility Mortgage Rev. (Village at Germantown), 5.25%, 12/01/2044 | 1,000,000 | 996,063 | ||
| Shelby County, TN, New Memphis Arena Public Building Authority, Local Government Public Improvement (City of Memphis Project), Capital Appreciation, 0%, 4/01/2032 | 610,000 | 449,392 | ||
| Shelby County, TN, New Memphis Arena Public Building Authority, Local Government Public Improvement (City of Memphis Project), Capital Appreciation, 0%, 4/01/2033 | 875,000 | 615,232 | ||
| Shelby County, TN, New Memphis Arena Public Building Authority, Local Government Public Improvement (City of Memphis Project), Capital Appreciation, 0%, 4/01/2034 | 520,000 | 349,259 | ||
| Shelby County, TN, New Memphis Arena Public Building Authority, Local Government Public Improvement (City of Memphis Project), Capital Appreciation, 0%, 4/01/2035 | 680,000 | 431,780 | ||
| Shelby County, TN, New Memphis Arena Public Building Authority, Local Government Public Improvement (City of Memphis Project), Capital Appreciation, 0%, 4/01/2036 | 650,000 | 387,988 | ||
| Shelby County, TN, New Memphis Arena Public Building Authority, Local Government Public Improvement (City of Memphis Project), Capital Appreciation, 0%, 4/01/2037 | 780,000 | 440,585 | ||
| Issuer | Shares/Par | Value ($) | ||
| Municipal Bonds - continued | ||||
| Tennessee - continued | ||||
| Shelby County, TN, New Memphis Arena Public Building Authority, Local Government Public Improvement (City of Memphis Project), Capital Appreciation, 0%, 4/01/2038 | $ | 650,000 | $348,335 | |
| Tennergy Corp., TN, Gas Supply Rev., “A”, 5.5%, 10/01/2053 (Put Date 12/01/2030) | 13,735,000 | 14,884,802 | ||
| Tennessee Energy Acquisition Corp., Gas Project Rev., “A-1”, 5%, 5/01/2053 (Put Date 5/01/2028) (w) | 15,000,000 | 15,687,284 | ||
| Tennessee Housing Development Agency, Residential Finance Program Rev., “3”, 4.25%, 7/01/2049 | 1,535,000 | 1,557,113 | ||
| $43,115,381 | ||||
| Texas - 6.7% | ||||
| Arlington, TX, Higher Education Finance Corp. Education Rev. (Basis Texas Charter Schools, Inc.), “A”, 4%, 6/15/2030 (n) | $ | 985,000 | $934,178 | |
| Arlington, TX, Higher Education Finance Corp. Education Rev. (Basis Texas Charter Schools, Inc.), “A”, 4%, 6/15/2040 (n) | 1,810,000 | 1,537,560 | ||
| Arlington, TX, Higher Education Finance Corp. Education Rev. (Basis Texas Charter Schools, Inc.), “A”, 4%, 6/15/2050 (n) | 4,810,000 | 3,772,315 | ||
| Arlington, TX, Higher Education Finance Corp. Education Rev. (Brooks Academies of Texas), “A”, 4%, 6/15/2031 (n) | 1,000,000 | 907,929 | ||
| Arlington, TX, Higher Education Finance Corp. Education Rev. (Brooks Academies of Texas), “A”, 5%, 6/15/2041 (n) | 8,445,000 | 7,651,651 | ||
| Arlington, TX, Higher Education Finance Corp. Education Rev. (Brooks Academies of Texas), “A”, 5%, 6/15/2051 (n) | 3,500,000 | 2,983,363 | ||
| Arlington, TX, Higher Education Finance Corp. Education Rev. (Newman International Academy), “A”, 4%, 8/15/2031 | 355,000 | 330,338 | ||
| Arlington, TX, Higher Education Finance Corp. Education Rev. (Newman International Academy), “A”, 5.375%, 8/15/2036 | 820,000 | 824,037 | ||
| Arlington, TX, Higher Education Finance Corp. Education Rev. (Newman International Academy), “A”, 5%, 8/15/2041 | 900,000 | 848,088 | ||
| Arlington, TX, Higher Education Finance Corp. Education Rev. (Newman International Academy), “A”, 5.5%, 8/15/2046 | 3,680,000 | 3,608,531 | ||
| Arlington, TX, Higher Education Finance Corp. Education Rev. (Newman International Academy), “A”, 5%, 8/15/2051 | 1,500,000 | 1,348,919 | ||
| Arlington, TX, Higher Education Finance Corp. Education Rev. (UME Preparatory Academy), “A”, 5%, 8/15/2038 | 1,060,000 | 1,033,163 | ||
| Arlington, TX, Higher Education Finance Corp. Education Rev. (UME Preparatory Academy), “A”, 5%, 8/15/2048 | 1,750,000 | 1,621,638 | ||
| Arlington, TX, Higher Education Finance Corp. Education Rev. (UME Preparatory Academy), “A”, 5%, 8/15/2053 | 1,695,000 | 1,549,285 | ||
| Arlington, TX, Higher Education Finance Corp. Rev. (Basis Charter Schools, Inc.), 4.5%, 6/15/2056 (Put Date 6/15/2026) (n) | 900,000 | 871,266 | ||
| Issuer | Shares/Par | Value ($) | ||
| Municipal Bonds - continued | ||||
| Texas - continued | ||||
| Arlington, TX, Senior Lien Special Tax Rev., “A”, AGM, 5%, 2/15/2037 | $ | 800,000 | $862,775 | |
| Arlington, TX, Senior Lien Special Tax Rev., “A”, AGM, 5%, 2/15/2038 | 655,000 | 703,865 | ||
| Austin, TX, Airport System Rev., “B”, 5%, 11/15/2041 | 930,000 | 964,388 | ||
| Austin, TX, Convention Center (Convention Enterprises, Inc.), “A”, 5%, 1/01/2029 | 890,000 | 928,507 | ||
| Austin, TX, Convention Center (Convention Enterprises, Inc.), “A”, 5%, 1/01/2031 | 1,325,000 | 1,380,640 | ||
| Austin, TX, Convention Center (Convention Enterprises, Inc.), “A”, 5%, 1/01/2034 | 260,000 | 263,402 | ||
| Austin, TX, Convention Center (Convention Enterprises, Inc.), “B”, 5%, 1/01/2026 | 615,000 | 623,583 | ||
| Austin, TX, Convention Center (Convention Enterprises, Inc.), “B”, 5%, 1/01/2028 | 400,000 | 407,758 | ||
| Austin, TX, Convention Center (Convention Enterprises, Inc.), “B”, 5%, 1/01/2030 | 585,000 | 594,993 | ||
| Brazos, TX, Higher Education Authority, Inc., Student Loan Program Rev., “1A”, 2.35%, 4/01/2040 | 50,000 | 49,794 | ||
| Brazos, TX, Higher Education Authority, Inc., Student Loan Program Rev., “1A”, 3%, 4/01/2040 | 1,100,000 | 874,987 | ||
| Brazos, TX, Higher Education Authority, Inc., Student Loan Program Rev., Taxable, “1A”, 3.414%, 4/01/2040 | 95,000 | 94,857 | ||
| Central Texas Regional Mobility Authority Senior Lien Rev., “A”, 5%, 1/01/2045 (Prerefunded 7/01/2025) | 1,315,000 | 1,400,292 | ||
| Clifton, TX, Higher Education Finance Corp. Rev. (Idea Public Schools), 6%, 8/15/2033 | 845,000 | 859,152 | ||
| Clifton, TX, Higher Education Finance Corp. Rev. (Idea Public Schools), 6%, 8/15/2043 | 1,850,000 | 1,873,694 | ||
| Clifton, TX, Higher Education Finance Corp. Rev. (Uplift Education), “A”, 3.375%, 12/01/2024 | 125,000 | 123,629 | ||
| Conroe, TX, Local Government Corp., First Lien Hotel Rev. (Convention Center Hotel), “A”, 2.5%, 10/01/2031 | 470,000 | 405,355 | ||
| Conroe, TX, Local Government Corp., First Lien Hotel Rev. (Convention Center Hotel), “A”, 4%, 10/01/2050 | 1,540,000 | 1,286,600 | ||
| Conroe, TX, Local Government Corp., Second Lien Hotel Rev. (Convention Center Hotel), “B”, 3.5%, 10/01/2031 (n) | 385,000 | 335,175 | ||
| Conroe, TX, Local Government Corp., Second Lien Hotel Rev. (Convention Center Hotel), “B”, 5%, 10/01/2050 (n) | 730,000 | 619,998 | ||
| Conroe, TX, Local Government Corp., Third Lien Hotel Rev. (Convention Center Hotel), “C”, 4%, 10/01/2041 | 310,000 | 315,208 | ||
| Conroe, TX, Local Government Corp., Third Lien Hotel Rev. (Convention Center Hotel), “C”, 4%, 10/01/2046 | 365,000 | 361,118 | ||
| Issuer | Shares/Par | Value ($) | ||
| Municipal Bonds - continued | ||||
| Texas - continued | ||||
| Conroe, TX, Local Government Corp., Third Lien Hotel Rev. (Convention Center Hotel), “C”, 4%, 10/01/2050 | $ | 265,000 | $258,946 | |
| Ector County, TX, Hospital District General Obligation Refunding, 5%, 9/15/2033 | 550,000 | 594,325 | ||
| Ector County, TX, Hospital District General Obligation Refunding, 4%, 9/15/2034 | 1,270,000 | 1,280,000 | ||
| Fredericksburg, TX, Independent School District, Unlimited Tax School Building, 4%, 2/15/2052 | 4,945,000 | 4,887,918 | ||
| Gulf Coast, TX, Industrial Development Authority Rev. (CITGO Petroleum Corp.), 4.875%, 5/01/2025 | 2,845,000 | 2,845,669 | ||
| Gulf Coast, TX, Industrial Development Authority Rev. (CITGO Petroleum Corp.), 8%, 4/01/2028 | 875,000 | 875,963 | ||
| Harris County, TX, Cultural Education Facilities Finance Corp., Hospital Rev. (Memorial Hermann Health System), “A”, 4.125%, 7/01/2052 | 10,140,000 | 10,150,547 | ||
| Harris County-Houston, TX, Sports Authority Rev., “C”, 5%, 11/15/2032 | 185,000 | 190,508 | ||
| Harris County-Houston, TX, Sports Authority Rev., “C”, 5%, 11/15/2033 | 450,000 | 462,177 | ||
| Harris County-Houston, TX, Sports Authority Rev., Capital Appreciation, “A”, AGM, 0%, 11/15/2034 | 5,165,000 | 2,994,565 | ||
| Harris County-Houston, TX, Sports Authority Rev., Capital Appreciation, “A”, AGM, 0%, 11/15/2038 | 40,280,000 | 17,601,289 | ||
| Harris County-Houston, TX, Sports Authority Rev., Capital Appreciation, “A”, AGM, 0%, 11/15/2041 | 745,000 | 311,759 | ||
| Harris County-Houston, TX, Sports Authority Rev., Capital Appreciation, “A”, AGM, 0%, 11/15/2046 | 1,865,000 | 594,010 | ||
| Houston, TX, Airport System Rev., Special Facilities Rev. (Continental Airlines, Inc.), 6.625%, 7/15/2038 | 7,680,000 | 7,685,448 | ||
| Houston, TX, Airport System Rev., Special Facilities Rev. (United Airlines, Inc. Terminal E Project), 5%, 7/01/2029 | 160,000 | 161,642 | ||
| Houston, TX, Airport System Rev., Special Facilities Rev. (United Airlines, Inc. Terminal E Project), “A”, 5%, 7/01/2027 | 730,000 | 749,432 | ||
| Houston, TX, Airport System Rev., Special Facilities Rev. (United Airlines, Inc. Terminal Improvement Projects), “B-1”, 5%, 7/15/2030 | 16,260,000 | 16,539,394 | ||
| Houston, TX, Airport System Rev., Special Facilities Rev. (United Airlines, Inc. Terminal Improvement Projects), “B-2”, 5%, 7/15/2027 | 1,005,000 | 1,031,869 | ||
| Houston, TX, Higher Education Finance Corp. University Rev. (Houston Baptist University Project), 3.375%, 10/01/2037 | 260,000 | 223,396 | ||
| Houston, TX, Higher Education Finance Corp. University Rev. (Houston Baptist University Project), 4%, 10/01/2051 | 880,000 | 742,747 | ||
| Issuer | Shares/Par | Value ($) | ||
| Municipal Bonds - continued | ||||
| Texas - continued | ||||
| Irving, TX, Hotel Occupancy Tax Rev., 5%, 8/15/2035 | $ | 190,000 | $202,700 | |
| Irving, TX, Hotel Occupancy Tax Rev., 5%, 8/15/2037 | 285,000 | 299,282 | ||
| Irving, TX, Hotel Occupancy Tax Rev., 5%, 8/15/2038 | 310,000 | 324,107 | ||
| Irving, TX, Hotel Occupancy Tax Rev., 5%, 8/15/2043 | 565,000 | 581,043 | ||
| Mission, TX, Economic Development Corp. (NatGasoline Project), 4.625%, 10/01/2031 (n) | 4,240,000 | 4,211,374 | ||
| New Hope, TX, Cultural Education Facilities Finance Corp., Capital Improvement Rev. (CHF - Collegiate Housing Denton LLC - Texas Woman's University Housing Project), “A-1”, AGM, 5%, 7/01/2038 | 460,000 | 476,989 | ||
| New Hope, TX, Cultural Education Facilities Finance Corp., Capital Improvement Rev. (CHF - Collegiate Housing Denton LLC - Texas Woman's University Housing Project), “A-1”, AGM, 5%, 7/01/2058 | 1,685,000 | 1,714,993 | ||
| New Hope, TX, Cultural Education Facilities Finance Corp., Education Rev. (Beta Academy), “A”, 3.375%, 8/15/2029 (n) | 780,000 | 716,611 | ||
| New Hope, TX, Cultural Education Facilities Finance Corp., Education Rev. (Beta Academy), “A”, 5%, 8/15/2039 (n) | 2,550,000 | 2,524,496 | ||
| New Hope, TX, Cultural Education Facilities Finance Corp., Education Rev. (Beta Academy), “A”, 5%, 8/15/2049 (n) | 1,555,000 | 1,457,393 | ||
| New Hope, TX, Cultural Education Facilities Finance Corp., Education Rev. (Cumberland Academy), “A”, 5%, 8/15/2040 (n) | 3,500,000 | 3,404,335 | ||
| New Hope, TX, Cultural Education Facilities Finance Corp., Education Rev. (Cumberland Academy), “A”, 5%, 8/15/2050 (n) | 3,000,000 | 2,812,634 | ||
| New Hope, TX, Cultural Education Facilities Finance Corp., Education Rev. (Jubilee Academic Center), 4%, 8/15/2046 (n) | 3,040,000 | 2,442,063 | ||
| New Hope, TX, Cultural Education Facilities Finance Corp., Retirement Facility Rev. (Longhorn Village Project), 5%, 1/01/2037 | 2,000,000 | 1,950,978 | ||
| New Hope, TX, Cultural Education Facilities Finance Corp., Retirement Facility Rev. (Longhorn Village Project), 5%, 1/01/2042 | 3,000,000 | 2,845,131 | ||
| New Hope, TX, Cultural Education Facilities Finance Corp., Retirement Facility Rev. (Morningside Ministries Project), 4%, 1/01/2032 | 430,000 | 376,424 | ||
| New Hope, TX, Cultural Education Facilities Finance Corp., Retirement Facility Rev. (Morningside Ministries Project), 4%, 1/01/2037 | 585,000 | 477,566 | ||
| New Hope, TX, Cultural Education Facilities Finance Corp., Retirement Facility Rev. (Morningside Ministries Project), 4%, 1/01/2042 | 925,000 | 712,181 | ||
| Issuer | Shares/Par | Value ($) | ||
| Municipal Bonds - continued | ||||
| Texas - continued | ||||
| New Hope, TX, Cultural Education Facilities Finance Corp., Retirement Facility Rev. (Morningside Ministries Project), 4%, 1/01/2047 | $ | 1,505,000 | $1,100,890 | |
| New Hope, TX, Cultural Education Facilities Finance Corp., Retirement Facility Rev. (Morningside Ministries Project), 4.25%, 1/01/2057 | 3,225,000 | 2,255,941 | ||
| New Hope, TX, Cultural Education Facilities Finance Corp., Retirement Facility Rev. (Morningside Ministries Project), 5%, 1/01/2057 | 2,100,000 | 1,721,924 | ||
| New Hope, TX, Cultural Education Facilities Finance Corp., Retirement Facility Rev. (MRC Senior Living - Langford Project), “A”, 5%, 11/15/2026 | 270,000 | 262,906 | ||
| New Hope, TX, Cultural Education Facilities Finance Corp., Retirement Facility Rev. (MRC Senior Living - Langford Project), “A”, 5.375%, 11/15/2036 | 1,250,000 | 1,137,943 | ||
| New Hope, TX, Cultural Education Facilities Finance Corp., Retirement Facility Rev. (MRC Senior Living - Langford Project), “A”, 5.5%, 11/15/2046 | 835,000 | 720,084 | ||
| New Hope, TX, Cultural Education Facilities Finance Corp., Retirement Facility Rev. (MRC Senior Living - Langford Project), “A”, 5.5%, 11/15/2052 | 960,000 | 808,869 | ||
| New Hope, TX, Cultural Education Facilities Finance Corp., Retirement Facility Rev. (Wesleyan Homes, Inc. Project), 3%, 1/01/2024 | 75,000 | 73,223 | ||
| New Hope, TX, Cultural Education Facilities Finance Corp., Retirement Facility Rev. (Wesleyan Homes, Inc. Project), 4%, 1/01/2029 | 440,000 | 394,204 | ||
| New Hope, TX, Cultural Education Facilities Finance Corp., Retirement Facility Rev. (Wesleyan Homes, Inc. Project), 5.5%, 1/01/2035 | 1,325,000 | 1,240,224 | ||
| New Hope, TX, Cultural Education Facilities Finance Corp., Retirement Facility Rev. (Wesleyan Homes, Inc. Project), 5%, 1/01/2039 | 465,000 | 392,415 | ||
| New Hope, TX, Cultural Education Facilities Finance Corp., Retirement Facility Rev. (Wesleyan Homes, Inc. Project), 5.5%, 1/01/2043 | 1,420,000 | 1,249,177 | ||
| New Hope, TX, Cultural Education Facilities Finance Corp., Retirement Facility Rev. (Wesleyan Homes, Inc. Project), 5.5%, 1/01/2049 | 1,470,000 | 1,255,799 | ||
| New Hope, TX, Cultural Education Facilities Finance Corp., Retirement Facility Rev. (Wesleyan Homes, Inc. Project), 5%, 1/01/2050 | 550,000 | 425,306 | ||
| Issuer | Shares/Par | Value ($) | ||
| Municipal Bonds - continued | ||||
| Texas - continued | ||||
| New Hope, TX, Cultural Education Facilities Finance Corp., Retirement Facility Rev. (Wesleyan Homes, Inc. Project), 5%, 1/01/2055 | $ | 2,050,000 | $1,551,960 | |
| New Hope, TX, Cultural Education Facilities Finance Corp., Student Housing Rev. (CHF - Collegiate Housing Stephenville III LLC - Tarleton State University Project), 5%, 4/01/2030 (Prerefunded 4/01/2025) | 310,000 | 325,843 | ||
| New Hope, TX, Cultural Education Facilities Finance Corp., Student Housing Rev. (CHF - Collegiate Housing Stephenville III LLC - Tarleton State University Project), 5%, 4/01/2035 (Prerefunded 4/01/2025) | 310,000 | 325,843 | ||
| New Hope, TX, Cultural Education Facilities Finance Corp., Student Housing Rev. (CHF - Collegiate Housing Stephenville III LLC - Tarleton State University Project), 5%, 4/01/2047 (Prerefunded 4/01/2025) | 770,000 | 809,352 | ||
| New Hope, TX, Cultural Education Facilities Finance Corp., Student Housing Rev. (Collegiate Housing Island Campus LLC - Texas A&M University - Corpus Christi Island Campus Project), “A”, 5%, 4/01/2029 (Prerefunded 4/01/2027) | 265,000 | 292,887 | ||
| Newark, TX, Higher Education Finance Corp. Rev. (A+ Charter Schools, Inc.), “A”, 5.5%, 8/15/2035 (n) | 1,530,000 | 1,592,528 | ||
| Newark, TX, Higher Education Finance Corp. Rev. (A+ Charter Schools, Inc.), “A”, 5.75%, 8/15/2045 (n) | 2,250,000 | 2,325,984 | ||
| Peaster, TX, Independent School District, Unlimited Tax School Building Bonds, 3%, 8/15/2051 | 3,250,000 | 2,580,782 | ||
| Port Beaumont, TX, Industrial Development Authority Facility Rev., Taxable (Jefferson Gulf Coast Energy Project), “B”, 4.1%, 1/01/2028 (n) | 23,050,000 | 18,474,227 | ||
| Port Beaumont, TX, Navigation District, Dock & Wharf Facility Rev. (Jefferson Gulf Coast Energy Project), “A”, 3.625%, 1/01/2035 (n) | 3,655,000 | 2,999,895 | ||
| Port Beaumont, TX, Navigation District, Dock & Wharf Facility Rev. (Jefferson Gulf Coast Energy Project), “A”, 3%, 1/01/2050 (n) | 1,940,000 | 1,185,769 | ||
| Port Beaumont, TX, Navigation District, Dock & Wharf Facility Rev. (Jefferson Gulf Coast Energy Project), “A”, 4%, 1/01/2050 (n) | 11,680,000 | 8,704,657 | ||
| Port Beaumont, TX, Navigation District, Dock & Wharf Facility Rev. Taxable (Jefferson Gulf Coast Energy Project), “A”, 6%, 1/01/2025 (n) | 10,945,000 | 10,289,005 | ||
| Red River, TX, Education Finance Corp., Higher Education Rev. (Houston Baptist University Project), 5.5%, 10/01/2046 | 9,170,000 | 9,398,658 | ||
| Issuer | Shares/Par | Value ($) | ||
| Municipal Bonds - continued | ||||
| Texas - continued | ||||
| Red River, TX, Health Facilities Development Corp., Retirement Facilities Rev. (MRC Crossings Project), “A”, 7.5%, 11/15/2034 (Prerefunded 11/15/2024) | $ | 1,075,000 | $1,167,330 | |
| Red River, TX, Health Facilities Development Corp., Retirement Facilities Rev. (MRC Crossings Project), “A”, 7.75%, 11/15/2044 (Prerefunded 11/15/2024) | 1,970,000 | 2,147,744 | ||
| Red River, TX, Health Facilities Development Corp., Retirement Facilities Rev. (MRC Crossings Project), “A”, 8%, 11/15/2049 (Prerefunded 11/15/2024) | 1,680,000 | 1,837,315 | ||
| SA Energy Acquisition Public Facility Corp. (Tex Gas Supply), 5.5%, 8/01/2027 | 4,000,000 | 4,299,477 | ||
| San Antonio, TX, Airport System Rev., “A”, 5%, 7/01/2031 | 540,000 | 598,820 | ||
| San Antonio, TX, Airport System Rev., “A”, 5%, 7/01/2032 | 540,000 | 597,844 | ||
| San Antonio, TX, Passenger Facility Charge and Subordinate Lien Airport System Rev., “A”, 5%, 7/01/2031 | 485,000 | 535,159 | ||
| San Antonio, TX, Passenger Facility Charge and Subordinate Lien Airport System Rev., “A”, 5%, 7/01/2032 | 595,000 | 655,466 | ||
| Tarrant County, TX, Cultural Education Facilities Finance Corp. (Christus Health), “A”, 4%, 7/01/2053 | 11,230,000 | 10,903,612 | ||
| Tarrant County, TX, Cultural Education Facilities Finance Corp., Retirement Facility Rev. (Barton Creek Senior Living Center, Inc., Querencia Project), 5%, 11/15/2030 | 1,500,000 | 1,508,017 | ||
| Tarrant County, TX, Cultural Education Facilities Finance Corp., Retirement Facility Rev. (Barton Creek Senior Living Center, Inc., Querencia Project), 5%, 11/15/2035 | 3,345,000 | 3,326,017 | ||
| Tarrant County, TX, Cultural Education Facilities Finance Corp., Retirement Facility Rev. (Stayton at Museum Way), 5.75%, 12/01/2054 (a)(d) | 22,954,217 | 14,920,241 | ||
| Tarrant County, TX, Cultural Education Facilities Finance Corp., Retirement Facility Rev. (Trinity Terrace Project), “A-1”, 5%, 10/01/2044 | 1,095,000 | 1,086,304 | ||
| Temple, TX, Reinvestment Zone 1 Rev., “A”, BAM, 4%, 8/01/2040 | 415,000 | 419,796 | ||
| Texas Department of Housing & Community Affairs, Residential Mortgage Rev., “A”, 4.75%, 1/01/2049 (u) | 4,365,000 | 4,485,262 | ||
| Texas Department of Housing & Community Affairs, Single Family Mortgage Rev., “A”, 4.75%, 3/01/2049 (u) | 2,320,000 | 2,375,441 | ||
| Texas Municipal Gas Acquisition and Supply Corp. III, Gas Supply Rev., 5%, 12/15/2030 | 1,135,000 | 1,210,672 | ||
| Texas Municipal Gas Acquisition and Supply Corp. III, Gas Supply Rev., 5%, 12/15/2031 | 3,255,000 | 3,482,612 | ||
| Texas Private Activity Surface Transportation Corp., Senior Lien Rev. (NTE Mobility Partners Segments 3 LLC Segments 3A & 3B Facility), 7%, 12/31/2038 | 1,375,000 | 1,399,093 | ||
| Issuer | Shares/Par | Value ($) | ||
| Municipal Bonds - continued | ||||
| Texas - continued | ||||
| Texas Private Activity Surface Transportation Corp., Senior Lien Rev. (NTE Mobility Partners Segments 3 LLC Segments 3A & 3B Facility), 6.75%, 6/30/2043 | $ | 1,105,000 | $1,121,835 | |
| Texas State Technical College System Rev., Financing System Improvement, “A”, AGM, 5.5%, 8/01/2042 | 1,595,000 | 1,858,698 | ||
| Texas State Technical College System Rev., Financing System Improvement, “A”, AGM, 5.75%, 8/01/2047 | 2,275,000 | 2,664,319 | ||
| Texas State Technical College System Rev., Financing System Improvement, “A”, AGM, 6%, 8/01/2054 | 2,185,000 | 2,582,574 | ||
| Texas Transportation Commission, Central Texas Turnpike System Rev., Capital Appreciation, “B”, 0%, 8/15/2036 | 4,605,000 | 2,576,028 | ||
| Texas Transportation Commission, State Highway 249 System Rev., “A”, 5%, 8/01/2057 | 5,725,000 | 5,814,051 | ||
| Texas Transportation Commission, State Highway 249 System Rev., Capital Appreciation, “A”, 0%, 8/01/2037 | 640,000 | 320,183 | ||
| Texas Transportation Commission, State Highway 249 System Rev., Capital Appreciation, “A”, 0%, 8/01/2038 | 470,000 | 221,752 | ||
| Texas Transportation Commission, State Highway 249 System Rev., Capital Appreciation, “A”, 0%, 8/01/2039 | 520,000 | 231,048 | ||
| Texas Transportation Commission, State Highway 249 System Rev., Capital Appreciation, “A”, 0%, 8/01/2040 | 520,000 | 217,028 | ||
| Texas Transportation Commission, State Highway 249 System Rev., Capital Appreciation, “A”, 0%, 8/01/2041 | 1,040,000 | 407,681 | ||
| Texas Transportation Commission, State Highway 249 System Rev., Capital Appreciation, “A”, 0%, 8/01/2042 | 1,430,000 | 530,194 | ||
| Texas Transportation Commission, State Highway 249 System Rev., Capital Appreciation, “A”, 0%, 8/01/2043 | 1,170,000 | 409,044 | ||
| White Settlement, TX, Independent School District, Unlimited Tax School Building Bonds, 4%, 8/15/2052 | 2,475,000 | 2,459,966 | ||
| $295,130,853 | ||||
| U.S. Virgin Islands - 0.1% | ||||
| Matching Fund Special Purpose Securitization Corp., “A”, 5%, 10/01/2025 | $ | 370,000 | $379,336 | |
| Matching Fund Special Purpose Securitization Corp., “A”, 5%, 10/01/2026 | 1,755,000 | 1,811,750 | ||
| $2,191,086 | ||||
| Issuer | Shares/Par | Value ($) | ||
| Municipal Bonds - continued | ||||
| Utah - 0.5% | ||||
| Utah Charter School Finance Authority, Charter School Rev. (Bridge Elementary Project), “A”, 4%, 6/15/2031 (n) | $ | 560,000 | $513,265 | |
| Utah Charter School Finance Authority, Charter School Rev. (Bridge Elementary Project), “A”, 4%, 6/15/2041 (n) | 890,000 | 700,989 | ||
| Utah Charter School Finance Authority, Charter School Rev. (Bridge Elementary Project), “A”, 4.25%, 6/15/2051 (n) | 1,315,000 | 981,520 | ||
| Utah Charter School Finance Authority, Charter School Rev. (Mountain Sunrise Academy), “A”, 4%, 12/15/2041 (n) | 2,770,000 | 2,164,947 | ||
| Utah Charter School Finance Authority, Charter School Rev. (Mountain Sunrise Academy), “A”, 4%, 12/15/2051 (n) | 4,120,000 | 2,921,462 | ||
| Utah Charter School Finance Authority, Charter School Rev. (Mountain Sunrise Academy), “A”, 4%, 12/15/2056 (n) | 2,770,000 | 1,890,896 | ||
| Utah Charter School Finance Authority, Charter School Rev. (Reagan Academy Project), 5%, 2/15/2036 (n) | 1,530,000 | 1,532,955 | ||
| Utah Charter School Finance Authority, Charter School Rev. (Reagan Academy Project), 5%, 2/15/2046 (n) | 1,285,000 | 1,240,662 | ||
| Utah Charter School Finance Authority, Charter School Rev. (Reagan Academy Project), “A”, 3.5%, 2/15/2026 (n) | 185,000 | 180,006 | ||
| Utah Charter School Finance Authority, Charter School Rev. (Summit Academy, Inc.), “A”, 5%, 4/15/2039 | 400,000 | 423,602 | ||
| Utah Charter School Finance Authority, Charter School Rev. (Summit Academy, Inc.), “A”, 5%, 4/15/2044 | 355,000 | 370,735 | ||
| Utah Charter School Finance Authority, Charter School Rev. (Summit Academy, Inc.), “A”, 5%, 4/15/2049 | 650,000 | 674,027 | ||
| Utah Housing Corp., Tax Exempt Mortgage-Backed Securities, “G”, GNMA, 4.5%, 7/21/2049 | 1,069,272 | 1,069,132 | ||
| Utah Housing Corp., Tax Exempt Mortgage-Backed Securities, “H”, GNMA, 4.5%, 8/21/2049 | 613,380 | 613,299 | ||
| Utah Housing Corp., Tax Exempt Mortgage-Backed Securities, “I”, 2.5%, 8/21/2051 | 3,891,074 | 3,729,806 | ||
| Utah Housing Corp., Tax Exempt Mortgage-Backed Securities, “I”, GNMA, 4%, 9/21/2049 | 981,791 | 982,595 | ||
| Utah Housing Corp., Tax-Exempt Mortgage-Backed Securities, “G”, GNMA, 3.5%, 2/21/2050 | 1,455,581 | 1,427,469 | ||
| $21,417,367 | ||||
| Issuer | Shares/Par | Value ($) | ||
| Municipal Bonds - continued | ||||
| Vermont - 0.2% | ||||
| Vermont Economic Development Authority, Solid Waste Disposal Rev. (Casella Waste Systems, Inc.), 4.625%, 4/01/2036 (Put Date 4/03/2028) (n) | $ | 2,445,000 | $2,412,274 | |
| Vermont Student Assistance Corp., Education Loan Rev., “A”, 3.625%, 6/15/2029 | 220,000 | 218,793 | ||
| Vermont Student Assistance Corp., Education Loan Rev., “A”, 3.75%, 6/15/2030 | 245,000 | 243,737 | ||
| Vermont Student Assistance Corp., Education Loan Rev., “A”, 4%, 6/15/2033 | 225,000 | 224,137 | ||
| Vermont Student Assistance Corp., Education Loan Rev., “A”, 4%, 6/15/2034 | 245,000 | 243,996 | ||
| Vermont Student Assistance Corp., Education Loan Rev., “A”, 2.375%, 6/15/2039 | 1,120,000 | 998,638 | ||
| Vermont Student Assistance Corp., Education Loan Rev., “A”, 4.375%, 6/15/2040 | 1,815,000 | 1,873,300 | ||
| Vermont Student Assistance Corp., Education Loan Rev., “B”, 4.375%, 6/15/2046 | 755,000 | 673,296 | ||
| Vermont Student Assistance Corp., Education Loan Rev., “B”, 4%, 6/15/2047 | 1,740,000 | 1,479,812 | ||
| $8,367,983 | ||||
| Virginia - 0.9% | ||||
| Charles City County, VA, Industrial Development Authority, Solid Waste Disposal Rev. (Waste Management, Inc. Project), 1.45%, 4/01/2027 | $ | 440,000 | $394,990 | |
| Cherry Hill Community Development Authority, Prince William County, VA (Potomac Shores Project), 5.4%, 3/01/2045 (n) | 1,775,000 | 1,779,407 | ||
| Embrey Mill Community Development Authority, VA, Special Assessment Rev., 7.25%, 3/01/2043 (Prerefunded 3/01/2023) | 4,600,000 | 4,616,423 | ||
| Henrico County, VA, Economic Development Authority Rev., Residential Care Facility (Westminster-Canterbury of Richmond), “A”, 5%, 10/01/2052 | 2,220,000 | 2,336,103 | ||
| James City County, VA, Economic Development Authority, Residential Care Facility Rev. (United Methodist Homes of Williamsburg, Inc.), “A”, 4%, 6/01/2041 | 1,250,000 | 989,599 | ||
| James City County, VA, Economic Development Authority, Residential Care Facility Rev. (United Methodist Homes of Williamsburg, Inc.), “A”, 4%, 6/01/2047 | 2,055,000 | 1,523,893 | ||
| Peninsula Town Center Community Development Authority, VA, Special Obligation Refunding, 4%, 9/01/2023 (n) | 240,000 | 238,406 | ||
| Peninsula Town Center Community Development Authority, VA, Special Obligation Refunding, 4.5%, 9/01/2028 (n) | 580,000 | 558,626 | ||
| Issuer | Shares/Par | Value ($) | ||
| Municipal Bonds - continued | ||||
| Virginia - continued | ||||
| Peninsula Town Center Community Development Authority, VA, Special Obligation Refunding, 5%, 9/01/2037 (n) | $ | 1,105,000 | $1,042,801 | |
| Peninsula Town Center Community Development Authority, VA, Special Obligation Refunding, 4.5%, 9/01/2045 (n) | 3,675,000 | 2,990,067 | ||
| Peninsula Town Center Community Development Authority, VA, Special Obligation Refunding, 5%, 9/01/2045 (n) | 960,000 | 844,215 | ||
| Roanoke, VA, Economic Development Authority, Educational Facilities Rev. (Lynchburg College), “A”, 5%, 9/01/2032 | 1,140,000 | 1,221,249 | ||
| Roanoke, VA, Economic Development Authority, Educational Facilities Rev. (Lynchburg College), “A”, 5%, 9/01/2034 | 490,000 | 520,988 | ||
| Virginia College Building Authority, Educational Facilities Rev. (Marymount University Project), “B”, 5.25%, 7/01/2030 (n) | 2,810,000 | 2,873,715 | ||
| Virginia College Building Authority, Educational Facilities Rev. (Marymount University Project), “B”, 5.25%, 7/01/2035 (n) | 2,590,000 | 2,626,759 | ||
| Virginia Small Business Financing Authority Rev., 5%, 6/01/2047 | 1,500,000 | 1,475,013 | ||
| Virginia Small Business Financing Authority Rev., 5%, 6/01/2052 | 3,880,000 | 3,780,690 | ||
| Virginia Small Business Financing Authority Rev. (Obligated Group of National Senior Campuses, Inc.), “A”, 4%, 1/01/2039 | 6,020,000 | 5,760,857 | ||
| Virginia Small Business Financing Authority Rev. (Obligated Group of National Senior Campuses, Inc.), “A”, 4%, 1/01/2040 | 4,965,000 | 4,720,086 | ||
| Virginia Small Business Financing Authority Rev., Solid Waste Disposal (Covanta Project), 5%, 1/01/2048 (Put Date 7/01/2038) (n) | 715,000 | 683,138 | ||
| West Point, VA, Industrial Development Authority, Solid Waste Disposal Rev. (Chesapeake Corp.), “A”, 6.375%, 3/01/2019 (a)(d) | 769,496 | 8 | ||
| West Point, VA, Industrial Development Authority, Solid Waste Disposal Rev. (Chesapeake Corp.), “B”, 6.25%, 3/01/2019 (a)(d) | 6,569,570 | 66 | ||
| $40,977,099 | ||||
| Washington - 1.9% | ||||
| Everett, WA, Housing Authority Refunding Rev. (Huntington Park Apartments Project), 4%, 7/01/2037 | $ | 12,345,000 | $12,331,878 | |
| Grays Harbor County, WA, Public Hospital District No. 2, Limited Tax General Obligation Refunding, 5%, 12/15/2033 | 2,675,000 | 2,880,677 | ||
| Grays Harbor County, WA, Public Hospital District No. 2, Limited Tax General Obligation Refunding, 5%, 12/15/2038 | 3,415,000 | 3,587,114 | ||
| Grays Harbor County, WA, Public Hospital District No. 2, Limited Tax General Obligation Refunding, 5%, 12/15/2048 | 6,565,000 | 6,804,981 | ||
| Kalispel Tribe of Indians, WA, Priority District Rev., “A”, 5.25%, 1/01/2038 (n) | 2,500,000 | 2,609,455 | ||
| Kalispel Tribe of Indians, WA, Priority District Rev., “B”, 5%, 1/01/2032 (n) | 700,000 | 730,706 | ||
| Issuer | Shares/Par | Value ($) | ||
| Municipal Bonds - continued | ||||
| Washington - continued | ||||
| Kalispel Tribe of Indians, WA, Priority District Rev., “B”, 5.25%, 1/01/2038 (n) | $ | 900,000 | $939,404 | |
| Port of Seattle, WA, Industrial Development Corp., Special Facilities Rev. (Delta Airlines, Inc.), 5%, 4/01/2030 | 4,000,000 | 4,006,474 | ||
| Seattle, WA, Port Intermediate Lien Refunding Rev., “B”, 4%, 8/01/2047 | 1,460,000 | 1,356,034 | ||
| Washington Health Care Facilities Authority Rev. (CommonSpirit Health), “A-2”, 5%, 8/01/2044 | 5,000,000 | 5,205,123 | ||
| Washington Health Care Facilities Authority Rev. (Virginia Mason Medical Center), 5%, 8/15/2035 | 1,775,000 | 1,835,003 | ||
| Washington Health Care Facilities Authority Rev. (Virginia Mason Medical Center), 5%, 8/15/2037 | 1,805,000 | 1,843,307 | ||
| Washington Housing Finance Commission Nonprofit Housing Refunding Rev. (Hearthstone Project), “A”, 5%, 7/01/2038 (n) | 830,000 | 698,435 | ||
| Washington Housing Finance Commission Nonprofit Housing Refunding Rev. (Hearthstone Project), “A”, 5%, 7/01/2048 (n) | 1,420,000 | 1,088,927 | ||
| Washington Housing Finance Commission Nonprofit Housing Refunding Rev. (Hearthstone Project), “A”, 5%, 7/01/2053 (n) | 1,375,000 | 1,027,787 | ||
| Washington Housing Finance Commission Nonprofit Housing Refunding Rev. (Judson Park Project), 4%, 7/01/2028 (n) | 225,000 | 209,972 | ||
| Washington Housing Finance Commission Nonprofit Housing Refunding Rev. (Judson Park Project), 5%, 7/01/2033 (n) | 225,000 | 213,424 | ||
| Washington Housing Finance Commission Nonprofit Housing Refunding Rev. (Judson Park Project), 5%, 7/01/2038 (n) | 325,000 | 294,111 | ||
| Washington Housing Finance Commission Nonprofit Housing Refunding Rev. (Judson Park Project), 5%, 7/01/2048 (n) | 450,000 | 382,349 | ||
| Washington Housing Finance Commission Nonprofit Housing Rev. (Presbyterian Retirement Communities Northwest Projects), “A”, 5%, 1/01/2036 (n) | 2,460,000 | 2,200,130 | ||
| Washington Housing Finance Commission Nonprofit Housing Rev. (Presbyterian Retirement Communities Northwest Projects), “A”, 5%, 1/01/2046 (n) | 4,675,000 | 3,835,409 | ||
| Washington Housing Finance Commission Nonprofit Housing Rev. (Presbyterian Retirement Communities Northwest Projects), “A”, 5%, 1/01/2051 (n) | 2,970,000 | 2,373,711 | ||
| Washington Housing Finance Commission Nonprofit Housing Rev. (Wesley Homes at Lea Hill Project), 5%, 7/01/2036 (n) | 1,000,000 | 930,489 | ||
| Washington Housing Finance Commission Nonprofit Housing Rev. (Wesley Homes at Lea Hill Project), 5%, 7/01/2041 (n) | 2,000,000 | 1,801,462 | ||
| Washington Housing Finance Commission Nonprofit Housing Rev. (Wesley Homes at Lea Hill Project), 5%, 7/01/2046 (n) | 2,385,000 | 2,076,164 | ||
| Washington Housing Finance Commission Nonprofit Housing Rev. (Wesley Homes at Lea Hill Project), 5%, 7/01/2051 (n) | 3,635,000 | 3,098,186 | ||
| Issuer | Shares/Par | Value ($) | ||
| Municipal Bonds - continued | ||||
| Washington - continued | ||||
| Washington State Housing Finance Commission Municipal Certificates, “A”, 3.5%, 12/01/2035 | $ | 17,384,384 | $16,382,720 | |
| Washington State Housing Finance Commission Municipal Certificates, “X”, 0.725%, 12/20/2035 (i) | 67,509,538 | 3,396,601 | ||
| $84,140,033 | ||||
| West Virginia - 0.5% | ||||
| Monongalia County, WV, Commission Special District Excise Tax Refunding & Improvement Rev. (University Town Centre Economic Opportunity Development District), “A”, 4.125%, 6/01/2043 (n) | $ | 1,510,000 | $1,387,735 | |
| Monongalia County, WV, Special District Excise Tax Rev. (University Town Centre Economic Opportunity Development District), “B”, 4.875%, 6/01/2043 (n) | 2,320,000 | 2,152,788 | ||
| Ohio County, WV, Commission Tax Increment Rev. (Fort Henry Centre), 4.75%, 6/01/2031 | 1,000,000 | 996,036 | ||
| West Virginia Hospital Finance Authority Hospital Improvement Rev. (Cabell Huntington Hospital Obligated Group), “A”, 5%, 1/01/2043 | 8,615,000 | 8,848,081 | ||
| West Virginia Hospital Finance Authority Hospital Improvement Rev. (Charleston Area Medical Center, Inc.), “A”, 5%, 9/01/2038 | 1,160,000 | 1,216,480 | ||
| West Virginia Hospital Finance Authority Hospital Improvement Rev. (Charleston Area Medical Center, Inc.), “A”, 5%, 9/01/2039 | 350,000 | 367,622 | ||
| West Virginia Hospital Finance Authority Hospital Rev. (West Virginia University Health System Obligated Group), “A”, AGM, 4%, 6/01/2051 | 6,660,000 | 6,436,682 | ||
| West Virginia Housing Development Fund, “A”, FHA, 3.45%, 11/01/2033 | 610,000 | 613,101 | ||
| West Virginia Housing Development Fund, “A”, FHA, 3.75%, 11/01/2038 | 585,000 | 574,290 | ||
| Wheeling, WV, Combined Waterworks and Sewerage System Rev., “A”, BAM, 4%, 6/01/2046 | 650,000 | 643,843 | ||
| $23,236,658 | ||||
| Wisconsin - 6.4% | ||||
| Wisconsin Center District Junior Dedicated Tax Rev., Capital Appreciation, “D”, AGM, 0%, 12/15/2032 | $ | 725,000 | $507,795 | |
| Wisconsin Center District Junior Dedicated Tax Rev., Capital Appreciation, “D”, AGM, 0%, 12/15/2033 | 1,105,000 | 738,106 | ||
| Wisconsin Center District Junior Dedicated Tax Rev., Capital Appreciation, “D”, AGM, 0%, 12/15/2034 | 1,050,000 | 665,986 | ||
| Wisconsin Center District Junior Dedicated Tax Rev., Capital Appreciation, “D”, AGM, 0%, 12/15/2035 | 1,580,000 | 944,079 | ||
| Issuer | Shares/Par | Value ($) | ||
| Municipal Bonds - continued | ||||
| Wisconsin - continued | ||||
| Wisconsin Center District Junior Dedicated Tax Rev., Capital Appreciation, “D”, AGM, 0%, 12/15/2036 | $ | 1,620,000 | $917,452 | |
| Wisconsin Center District Junior Dedicated Tax Rev., Capital Appreciation, “D”, AGM, 0%, 12/15/2037 | 2,630,000 | 1,409,626 | ||
| Wisconsin Center District Junior Dedicated Tax Rev., Capital Appreciation, “D”, AGM, 0%, 12/15/2038 | 2,845,000 | 1,453,655 | ||
| Wisconsin Center District Junior Dedicated Tax Rev., Capital Appreciation, “D”, AGM, 0%, 12/15/2039 | 3,095,000 | 1,493,074 | ||
| Wisconsin Center District Junior Dedicated Tax Rev., Capital Appreciation, “D”, AGM, 0%, 12/15/2040 | 1,340,000 | 610,640 | ||
| Wisconsin Center District Senior Dedicated Tax Rev., Capital Appreciation, “C”, AGM, 0%, 12/15/2031 | 545,000 | 399,832 | ||
| Wisconsin Center District Senior Dedicated Tax Rev., Capital Appreciation, “C”, AGM, 0%, 12/15/2032 | 740,000 | 518,302 | ||
| Wisconsin Center District Senior Dedicated Tax Rev., Capital Appreciation, “C”, AGM, 0%, 12/15/2033 | 710,000 | 474,258 | ||
| Wisconsin Center District Senior Dedicated Tax Rev., Capital Appreciation, “C”, AGM, 0%, 12/15/2034 | 655,000 | 415,449 | ||
| Wisconsin Center District Senior Dedicated Tax Rev., Capital Appreciation, “C”, AGM, 0%, 12/15/2035 | 840,000 | 501,915 | ||
| Wisconsin Center District Senior Dedicated Tax Rev., Capital Appreciation, “C”, AGM, 0%, 12/15/2036 | 815,000 | 461,558 | ||
| Wisconsin Center District Senior Dedicated Tax Rev., Capital Appreciation, “C”, AGM, 0%, 12/15/2037 | 815,000 | 436,823 | ||
| Wisconsin Center District Senior Dedicated Tax Rev., Capital Appreciation, “C”, AGM, 0%, 12/15/2038 | 840,000 | 429,199 | ||
| Wisconsin Center District Senior Dedicated Tax Rev., Capital Appreciation, “C”, AGM, 0%, 12/15/2039 | 790,000 | 381,108 | ||
| Wisconsin Center District Senior Dedicated Tax Rev., Capital Appreciation, “C”, AGM, 0%, 12/15/2040 | 195,000 | 88,862 | ||
| Wisconsin Health & Educational Facilities Authority Refunding Rev. (American Baptist Homes), 5%, 8/01/2027 | 2,280,000 | 2,175,751 | ||
| Wisconsin Health & Educational Facilities Authority Refunding Rev. (American Baptist Homes), 5%, 8/01/2032 | 2,315,000 | 2,116,275 | ||
| Wisconsin Health & Educational Facilities Authority Refunding Rev. (American Baptist Homes), 5%, 8/01/2037 | 1,265,000 | 1,091,768 | ||
| Wisconsin Health & Educational Facilities Authority Refunding Rev. (American Baptist Homes), 5%, 8/01/2039 | 1,315,000 | 1,113,629 | ||
| Wisconsin Health & Educational Facilities Authority Refunding Rev. (Saint John's Communities, Inc.), 4%, 9/15/2036 | 530,000 | 479,052 | ||
| Wisconsin Health & Educational Facilities Authority Refunding Rev. (Saint John's Communities, Inc.), 4%, 9/15/2036 | 800,000 | 712,143 | ||
| Issuer | Shares/Par | Value ($) | ||
| Municipal Bonds - continued | ||||
| Wisconsin - continued | ||||
| Wisconsin Health & Educational Facilities Authority Refunding Rev. (Saint John's Communities, Inc.), 4%, 9/15/2041 | $ | 770,000 | $658,123 | |
| Wisconsin Health & Educational Facilities Authority Refunding Rev. (Saint John's Communities, Inc.), 4%, 9/15/2045 | 650,000 | 531,941 | ||
| Wisconsin Health & Educational Facilities Authority Rev. (American Baptist Homes of the Midwest Obligated Group), 4.375%, 8/01/2027 | 100,000 | 93,006 | ||
| Wisconsin Health & Educational Facilities Authority Rev. (Bellin Memorial Hospital, Inc.), “A”, 5%, 12/01/2030 | 160,000 | 178,650 | ||
| Wisconsin Health & Educational Facilities Authority Rev. (Benevolent Corp. Cedar Community), 5%, 6/01/2037 | 1,110,000 | 1,055,367 | ||
| Wisconsin Health & Educational Facilities Authority Rev. (Benevolent Corp. Cedar Community), 5%, 6/01/2041 | 1,910,000 | 1,767,193 | ||
| Wisconsin Health & Educational Facilities Authority Rev. (Cedar Crest, Inc. Project), 5.125%, 4/01/2057 | 13,945,000 | 11,325,524 | ||
| Wisconsin Health & Educational Facilities Authority Rev. (Marshfield Clinic Health System, Inc.), “C”, 5%, 2/15/2047 | 675,000 | 683,691 | ||
| Wisconsin Health & Educational Facilities Authority Rev. (Oakwood Lutheran Senior Ministries), 4%, 1/01/2037 | 2,085,000 | 1,770,861 | ||
| Wisconsin Health & Educational Facilities Authority Rev. (Oakwood Lutheran Senior Ministries), 4%, 1/01/2047 | 2,685,000 | 2,049,640 | ||
| Wisconsin Health & Educational Facilities Authority Rev. (Oakwood Lutheran Senior Ministries), 4%, 1/01/2057 | 4,580,000 | 3,289,451 | ||
| Wisconsin Health & Educational Facilities Authority Rev. (Sauk-Prairie Memorial Hospital), 5.25%, 2/01/2043 | 4,870,000 | 4,833,292 | ||
| Wisconsin Health & Educational Facilities Authority Rev. (Sauk-Prairie Memorial Hospital), “A”, 5.125%, 2/01/2038 | 5,110,000 | 5,064,893 | ||
| Wisconsin Health & Educational Facilities Authority Rev. (St. Camillus Health System, Inc.), “A”, 5%, 11/01/2039 | 1,060,000 | 941,689 | ||
| Wisconsin Health & Educational Facilities Authority Rev. (St. Camillus Health System, Inc.), “A”, 5%, 11/01/2046 | 1,995,000 | 1,677,510 | ||
| Wisconsin Health & Educational Facilities Authority Rev. (St. Camillus Health System, Inc.), “A”, 5%, 11/01/2054 | 11,510,000 | 9,331,807 | ||
| Wisconsin Health & Educational Facilities Authority Rev. (St. John's Community, Inc.), “A”, 5%, 9/15/2040 (Prerefunded 9/15/2023) | 1,195,000 | 1,213,129 | ||
| Wisconsin Health & Educational Facilities Authority Rev. (St. John's Community, Inc.), “A”, 5%, 9/15/2045 (Prerefunded 9/15/2023) | 1,595,000 | 1,619,197 | ||
| Wisconsin Health & Educational Facilities Authority Rev. (St. John's Community, Inc.), “A”, 5%, 9/15/2050 (Prerefunded 9/15/2023) | 6,430,000 | 6,527,545 | ||
| Issuer | Shares/Par | Value ($) | ||
| Municipal Bonds - continued | ||||
| Wisconsin - continued | ||||
| Wisconsin Housing & Economic Development Authority Home Ownership, “D”, 4%, 3/01/2047 (u) | $ | 5,005,000 | $5,055,960 | |
| Wisconsin Public Finance Authority Airport Facilities Rev. (Transportation Infrastructure Properties LLC), “B”, 5%, 7/01/2042 | 17,855,000 | 17,906,001 | ||
| Wisconsin Public Finance Authority Airport Facilities Rev. (Transportation Infrastructure Properties LLC), “C”, 5%, 7/01/2042 | 2,870,000 | 2,878,198 | ||
| Wisconsin Public Finance Authority Charter School Rev. (Alamance Community School Project), “A”, 5%, 6/15/2051 (n) | 930,000 | 753,334 | ||
| Wisconsin Public Finance Authority Charter School Rev. (Eno River Academy Project), “A”, 4%, 6/15/2030 (n) | 475,000 | 459,066 | ||
| Wisconsin Public Finance Authority Charter School Rev. (Eno River Academy Project), “A”, 5%, 6/15/2040 (n) | 815,000 | 801,945 | ||
| Wisconsin Public Finance Authority Charter School Rev. (Eno River Academy Project), “A”, 5%, 6/15/2054 (n) | 1,380,000 | 1,273,466 | ||
| Wisconsin Public Finance Authority Education Facilities Rev. (Piedmont Community Charter School), 5%, 6/15/2039 | 285,000 | 294,264 | ||
| Wisconsin Public Finance Authority Education Facilities Rev. (Piedmont Community Charter School), 5%, 6/15/2049 | 865,000 | 873,723 | ||
| Wisconsin Public Finance Authority Education Facilities Rev. (Piedmont Community Charter School), 5%, 6/15/2053 | 580,000 | 583,759 | ||
| Wisconsin Public Finance Authority Education Rev. (Mountain Island Charter School), 5%, 7/01/2037 | 665,000 | 670,481 | ||
| Wisconsin Public Finance Authority Education Rev. (Mountain Island Charter School), 5%, 7/01/2047 | 1,015,000 | 1,017,069 | ||
| Wisconsin Public Finance Authority Education Rev. (Pine Lake Preparatory), 4.95%, 3/01/2030 (n) | 1,025,000 | 1,045,046 | ||
| Wisconsin Public Finance Authority Education Rev. (Pine Lake Preparatory), 5.25%, 3/01/2035 (n) | 1,005,000 | 1,025,890 | ||
| Wisconsin Public Finance Authority Education Rev. (Signature Preparatory), “A”, 5%, 6/15/2041 (n) | 1,945,000 | 1,782,786 | ||
| Wisconsin Public Finance Authority Education Rev. (Signature Preparatory), “A”, 5%, 6/15/2051 (n) | 2,435,000 | 2,125,715 | ||
| Wisconsin Public Finance Authority Education Rev. (Triad Educational Services, Inc.), 5%, 6/15/2042 | 520,000 | 525,220 | ||
| Wisconsin Public Finance Authority Education Rev. (Triad Educational Services, Inc.), 5.5%, 6/15/2050 | 675,000 | 686,669 | ||
| Wisconsin Public Finance Authority Education Rev. (Triad Educational Services, Inc.), 5.25%, 6/15/2052 | 735,000 | 741,971 | ||
| Wisconsin Public Finance Authority Education Rev. (Triad Educational Services, Inc.), 5.375%, 6/15/2057 | 705,000 | 711,962 | ||
| Issuer | Shares/Par | Value ($) | ||
| Municipal Bonds - continued | ||||
| Wisconsin - continued | ||||
| Wisconsin Public Finance Authority Education Rev. (Triad Educational Services, Inc.), 5.5%, 6/15/2062 | $ | 1,100,000 | $1,111,863 | |
| Wisconsin Public Finance Authority Education Rev. (Wilson Preparatory Academy), “A”, 4.125%, 6/15/2029 (n) | 435,000 | 419,492 | ||
| Wisconsin Public Finance Authority Education Rev. (Wilson Preparatory Academy), “A”, 5%, 6/15/2039 (n) | 500,000 | 493,373 | ||
| Wisconsin Public Finance Authority Education Rev. (Wilson Preparatory Academy), “A”, 5%, 6/15/2049 (n) | 1,100,000 | 1,041,395 | ||
| Wisconsin Public Finance Authority Educational Facilities Rev. (Community School of Davidson Project), 3.75%, 10/01/2023 (n) | 75,000 | 74,793 | ||
| Wisconsin Public Finance Authority Educational Facilities Rev. (Community School of Davidson Project), 5%, 10/01/2033 (n) | 670,000 | 676,864 | ||
| Wisconsin Public Finance Authority Educational Facilities Rev. (Community School of Davidson Project), 5%, 10/01/2048 (n) | 3,265,000 | 3,168,322 | ||
| Wisconsin Public Finance Authority Entrance Fee Principal Redemption Accredited Rev. (Searstone CCRC Project), “B2”, 2.25%, 6/01/2027 (n) | 1,595,000 | 1,446,944 | ||
| Wisconsin Public Finance Authority Entrance Fee Principal Redemption Accredited Rev., Taxable (Searstone CCRC Project), “C”, 2.75%, 6/01/2026 (n) | 1,295,000 | 1,243,536 | ||
| Wisconsin Public Finance Authority Healthcare Facility Rev. (Appalachian Regional Healthcare System Obligated Group), “A”, 5%, 7/01/2039 | 500,000 | 527,431 | ||
| Wisconsin Public Finance Authority Healthcare Facility Rev. (Appalachian Regional Healthcare System Obligated Group), “A”, 4%, 7/01/2046 | 1,100,000 | 942,619 | ||
| Wisconsin Public Finance Authority Healthcare Facility Rev. (Blue Ridge Healthcare), “A”, 4%, 1/01/2045 | 715,000 | 681,919 | ||
| Wisconsin Public Finance Authority Healthcare Facility Rev. (Church Home of Hartford, Inc. Project), “A”, 5%, 9/01/2025 (n) | 345,000 | 344,079 | ||
| Wisconsin Public Finance Authority Healthcare Facility Rev. (Church Home of Hartford, Inc. Project), “A”, 5%, 9/01/2030 (n) | 920,000 | 891,201 | ||
| Wisconsin Public Finance Authority Healthcare Facility Rev. (Church Home of Hartford, Inc. Project), “A”, 5%, 9/01/2038 (n) | 1,215,000 | 1,116,119 | ||
| Wisconsin Public Finance Authority Higher Education Facilities Rev. (Gannon University Project), 5%, 5/01/2042 | 595,000 | 596,665 | ||
| Wisconsin Public Finance Authority Higher Education Facilities Rev. (Gannon University Project), 5%, 5/01/2047 | 650,000 | 642,216 | ||
| Wisconsin Public Finance Authority Hotel & Conference Center Facilities Rev. (Foundation of the University of North Carolina at Charlotte, Inc.), “A”, 4%, 9/01/2036 (n) | 2,040,000 | 1,881,194 | ||
| Issuer | Shares/Par | Value ($) | ||
| Municipal Bonds - continued | ||||
| Wisconsin - continued | ||||
| Wisconsin Public Finance Authority Hotel & Conference Center Facilities Rev. (Foundation of the University of North Carolina at Charlotte, Inc.), “A”, 4%, 9/01/2041 (n) | $ | 1,860,000 | $1,610,590 | |
| Wisconsin Public Finance Authority Hotel & Conference Center Facilities Rev. (Foundation of the University of North Carolina at Charlotte, Inc.), “A”, 4%, 9/01/2051 (n) | 3,445,000 | 2,745,103 | ||
| Wisconsin Public Finance Authority Hotel & Conference Center Facilities Rev. (Foundation of the University of North Carolina at Charlotte, Inc.), “A”, 4%, 9/01/2056 (n) | 1,825,000 | 1,419,348 | ||
| Wisconsin Public Finance Authority Limited Obligation Grant Rev. (American Dream at Meadowlands Project), “A”, 6.25%, 8/01/2027 (a)(d)(n) | 27,380,000 | 22,776,373 | ||
| Wisconsin Public Finance Authority Limited Obligation Grant Rev., Taxable (American Dream at Meadowlands Project), ”A“, 5.625%, 8/01/2024 (a)(d)(n) | 5,730,000 | 4,867,622 | ||
| Wisconsin Public Finance Authority Limited Obligation PILOT Rev. (American Dream at Meadowlands Project), 6.5%, 12/01/2037 (n) | 8,355,000 | 7,283,902 | ||
| Wisconsin Public Finance Authority Limited Obligation PILOT Rev. (American Dream at Meadowlands Project), 7%, 12/01/2050 | 7,930,000 | 6,939,510 | ||
| Wisconsin Public Finance Authority Refunding Rev. (Roseman University of Health Sciences Project), 4%, 4/01/2052 (n) | 1,105,000 | 845,782 | ||
| Wisconsin Public Finance Authority Retirement Communities Rev. (Acts Retirement-Life Communities, Inc. Obligated Group), “A”, 5%, 11/15/2041 | 1,115,000 | 1,119,913 | ||
| Wisconsin Public Finance Authority Retirement Facilities First Mortgage Rev. (Galloway Ridge Project), “A”, 6.875%, 1/01/2043 | 5,125,000 | 5,316,210 | ||
| Wisconsin Public Finance Authority Retirement Facilities First Mortgage Rev. (United Methodist Retirement Homes), “A”, 4%, 10/01/2041 | 265,000 | 225,031 | ||
| Wisconsin Public Finance Authority Retirement Facilities First Mortgage Rev. (United Methodist Retirement Homes), “A”, 4%, 10/01/2046 | 360,000 | 291,855 | ||
| Wisconsin Public Finance Authority Retirement Facilities First Mortgage Rev. (United Methodist Retirement Homes), “A”, 4%, 10/01/2051 | 1,010,000 | 793,862 | ||
| Wisconsin Public Finance Authority Retirement Facilities Rev. (Penick Village), 5%, 9/01/2039 (n) | 770,000 | 669,314 | ||
| Wisconsin Public Finance Authority Retirement Facilities Rev. (Penick Village), 5%, 9/01/2049 (n) | 1,455,000 | 1,169,594 | ||
| Issuer | Shares/Par | Value ($) | ||
| Municipal Bonds - continued | ||||
| Wisconsin - continued | ||||
| Wisconsin Public Finance Authority Retirement Facilities Rev. (Penick Village), 5%, 9/01/2054 (n) | $ | 1,365,000 | $1,073,603 | |
| Wisconsin Public Finance Authority Rev. (Alamance Community School Project), “A”, 4.25%, 6/15/2031 (n) | 170,000 | 153,763 | ||
| Wisconsin Public Finance Authority Rev. (Alamance Community School Project), “A”, 5%, 6/15/2041 (n) | 515,000 | 449,287 | ||
| Wisconsin Public Finance Authority Rev. (Alamance Community School Project), “A”, 5%, 6/15/2056 (n) | 900,000 | 709,736 | ||
| Wisconsin Public Finance Authority Rev. (McLemore Hotel & Conference Center), “B”, 6.5%, 6/01/2056 (n) | 6,165,000 | 5,105,392 | ||
| Wisconsin Public Finance Authority Rev. (Obligated Group of National Senior Communities, Inc.), 4%, 1/01/2047 | 360,000 | 323,740 | ||
| Wisconsin Public Finance Authority Rev. (Obligated Group of National Senior Communities, Inc.), 4%, 1/01/2052 | 490,000 | 425,510 | ||
| Wisconsin Public Finance Authority Rev. (Roseman University of Health Sciences Project), 3%, 4/01/2025 (n) | 130,000 | 125,783 | ||
| Wisconsin Public Finance Authority Rev. (Roseman University of Health Sciences Project), 5%, 4/01/2030 (n) | 600,000 | 613,599 | ||
| Wisconsin Public Finance Authority Rev. (Roseman University of Health Sciences Project), 4%, 4/01/2032 (n) | 915,000 | 863,140 | ||
| Wisconsin Public Finance Authority Rev. (Roseman University of Health Sciences Project), 5.75%, 4/01/2035 | 2,805,000 | 2,872,264 | ||
| Wisconsin Public Finance Authority Rev. (Roseman University of Health Sciences Project), 5%, 4/01/2040 (n) | 1,150,000 | 1,135,577 | ||
| Wisconsin Public Finance Authority Rev. (Roseman University of Health Sciences Project), 4%, 4/01/2042 (n) | 1,000,000 | 833,013 | ||
| Wisconsin Public Finance Authority Rev. (Roseman University of Health Sciences Project), 5%, 4/01/2050 (n) | 2,000,000 | 1,881,371 | ||
| Wisconsin Public Finance Authority Rev., Subordinate-Social Certificates, “B-1”, 4%, 12/28/2044 (n) | 13,297,280 | 10,910,385 | ||
| Wisconsin Public Finance Authority Senior Living Refunding Bonds Rev. (Mary's Woods at Marylhurst Project), “A”, 5.25%, 5/15/2037 (n) | 2,415,000 | 2,320,944 | ||
| Wisconsin Public Finance Authority Senior Living Refunding Bonds Rev. (Mary's Woods at Marylhurst Project), “A”, 5.25%, 5/15/2042 (n) | 4,080,000 | 3,821,171 | ||
| Wisconsin Public Finance Authority Senior Living Refunding Bonds Rev. (Mary's Woods at Marylhurst Project), “A”, 5.25%, 5/15/2047 (n) | 4,360,000 | 3,980,567 | ||
| Wisconsin Public Finance Authority Senior Living Refunding Bonds Rev. (Mary's Woods at Marylhurst Project), “A”, 5.25%, 5/15/2052 (n) | 10,880,000 | 9,787,302 | ||
| Issuer | Shares/Par | Value ($) | ||
| Municipal Bonds - continued | ||||
| Wisconsin - continued | ||||
| Wisconsin Public Finance Authority Senior Living Rev. (Rose Villa Project), “A”, 5.125%, 11/15/2029 (n) | $ | 1,905,000 | $1,979,962 | |
| Wisconsin Public Finance Authority Senior Living Rev. (Rose Villa Project), “A”, 5.5%, 11/15/2034 (n) | 1,730,000 | 1,809,290 | ||
| Wisconsin Public Finance Authority Senior Living Rev. (Rose Villa Project), “A”, 5.75%, 11/15/2044 (n) | 1,685,000 | 1,769,510 | ||
| Wisconsin Public Finance Authority Senior Living Rev. (Rose Villa Project), “A”, 6%, 11/15/2049 (n) | 3,465,000 | 3,651,896 | ||
| Wisconsin Public Finance Authority Senior Secured Rev. (McLemore Hotel & Conference Center), “A”, 4.5%, 6/01/2056 (n) | 17,295,000 | 13,231,498 | ||
| Wisconsin Public Finance Authority Student Housing Rev. (Beyond Boone LLC - Appalachian State University Project), “A”, AGM, 5%, 7/01/2044 | 520,000 | 540,699 | ||
| Wisconsin Public Finance Authority Student Housing Rev. (Beyond Boone LLC - Appalachian State University Project), “A”, AGM, 4%, 7/01/2045 | 995,000 | 934,598 | ||
| Wisconsin Public Finance Authority Student Housing Rev. (Beyond Boone LLC - Appalachian State University Project), “A”, AGM, 4%, 7/01/2050 | 855,000 | 782,092 | ||
| Wisconsin Public Finance Authority Student Housing Rev. (Beyond Boone LLC - Appalachian State University Project), “A”, AGM, 4%, 7/01/2055 | 965,000 | 871,017 | ||
| Wisconsin Public Finance Authority Student Housing Rev. (NC A&T Real Estate Foundation LLC Project), “B”, 5%, 6/01/2034 | 2,380,000 | 2,442,139 | ||
| Wisconsin Public Finance Authority Student Housing Rev. (NC A&T Real Estate Foundation LLC Project), “B”, 5%, 6/01/2039 | 1,490,000 | 1,497,120 | ||
| Wisconsin Public Finance Authority Student Housing Rev. (NC A&T Real Estate Foundation LLC Project), “B”, 5%, 6/01/2044 | 1,770,000 | 1,731,265 | ||
| Wisconsin Public Finance Authority Student Housing Rev. (NC A&T Real Estate Foundation LLC Project), “B”, 5%, 6/01/2049 | 2,540,000 | 2,434,741 | ||
| Wisconsin Public Finance Authority Student Housing Rev. (University of Hawai'i Foundation Project), “A-1”, 4%, 7/01/2041 (n) | 365,000 | 312,321 | ||
| Wisconsin Public Finance Authority Student Housing Rev. (University of Hawai'i Foundation Project), “A-1”, 4%, 7/01/2051 (n) | 1,835,000 | 1,443,790 | ||
| Wisconsin Public Finance Authority Student Housing Rev. (University of Hawai'i Foundation Project), “A-1”, 4%, 7/01/2061 (n) | 3,235,000 | 2,425,403 | ||
| Wisconsin Public Finance Authority Student Housing Rev. (University of Hawai'i Foundation Project), “B”, 5.25%, 7/01/2061 (n) | 1,795,000 | 1,419,089 | ||
| Issuer | Shares/Par | Value ($) | ||
| Municipal Bonds - continued | ||||
| Wisconsin - continued | ||||
| Wisconsin Public Finance Authority Student Housing Rev. (Western Carolina University Project), 5.25%, 7/01/2047 | $ | 2,480,000 | $2,485,445 | |
| Wisconsin Public Finance Authority Student Housing Rev., Taxable (University of Hawai'i Foundation Project), “A-2”, 4.85%, 7/01/2031 (n) | 365,000 | 324,970 | ||
| Wisconsin Public Finance Authority Student Housing Rev., Taxable (University of Hawai'i Foundation Project), “A-2”, 5.35%, 7/01/2040 (n) | 1,575,000 | 1,334,190 | ||
| $282,542,587 | ||||
| Wyoming - 0.0% | ||||
| Laramie County, WY, Hospital Refunding Rev. (Cheyenne Regional Medical Center Project), 4%, 5/01/2035 | $ | 255,000 | $264,548 | |
| Laramie County, WY, Hospital Refunding Rev. (Cheyenne Regional Medical Center Project), 4%, 5/01/2037 | 225,000 | 228,805 | ||
| $493,353 | ||||
| Total Municipal Bonds (Identified Cost, $4,646,675,596) | $4,305,052,243 | |||
| Bonds – 0.8% | ||||
| Consumer Services – 0.7% | ||||
| Toll Road Investors Partnership II LP, Capital Appreciation, NPFG, 0%, 2/15/2025 (n) | $ | 8,970,000 | $7,775,470 | |
| Toll Road Investors Partnership II LP, Capital Appreciation, NPFG, 0%, 2/15/2026 (n) | 8,338,000 | 6,738,670 | ||
| Toll Road Investors Partnership II LP, Capital Appreciation, NPFG, 0%, 2/15/2027 (n) | 1,149,000 | 865,931 | ||
| Toll Road Investors Partnership II LP, Capital Appreciation, NPFG, 0%, 2/15/2028 (n) | 2,923,000 | 2,047,049 | ||
| Toll Road Investors Partnership II LP, Capital Appreciation, NPFG, 0%, 2/15/2033 (n) | 4,735,000 | 2,311,181 | ||
| Toll Road Investors Partnership II LP, Capital Appreciation, NPFG, 0%, 2/15/2043 (z) | 33,855,257 | 9,397,441 | ||
| $29,135,742 | ||||
| Healthcare Revenue - Hospitals – 0.1% | ||||
| Oklahoma Development Finance Authority, Health System Rev., Taxable (OU Medicine Project), “C”, 5.45%, 8/15/2028 | $ | 3,318,000 | $2,716,252 | |
| Medical & Health Technology & Services – 0.0% | ||||
| ProMedica Toledo Hospital, “B”, 5.325%, 11/15/2028 | $ | 2,215,000 | $1,807,120 | |
| Total Bonds (Identified Cost, $38,317,877) | $33,659,114 | |||
| Issuer | Shares/Par | Value ($) | ||
| Other Municipal Bonds – 0.3% | ||||
| Multi-Family Housing Revenue – 0.3% | ||||
| FRETE 2021-ML10 Trust, “X-CA”, FHLMC, 1.517%, 6/25/2038 (i)(n) | $ | 30,262,344 | $3,691,715 | |
| FRETE 2021-ML10 Trust, “X-US”, FHLMC, 2.055%, 1/25/2038 (i)(n) | 28,522,134 | 4,746,129 | ||
| FRETE 2021-ML12 Trust, “X-US”, FHLMC, 1.222%, 7/25/2041 (i)(n) | 17,591,529 | 1,839,622 | ||
| FRETE 2022-ML13 Trust, “X-CA”, 0.953%, 7/25/2036 (i) | 38,682,019 | 2,302,872 | ||
| Total Other Municipal Bonds (Identified Cost, $14,177,535) | $12,580,338 | |||
| Contingent Value Instruments - 0.1% | ||||
| General Obligations - General Purpose – 0.1% | ||||
| Commonwealth of Puerto Rico, General Obligation Contingent Value Instrument, 11/01/2043 (Identified Cost, $7,324,448) | $ | 12,559,518 | $5,541,887 | |
| Investment Companies (h) - 2.0% | ||||
| Money Market Funds – 2.0% | ||||
| MFS Institutional Money Market Portfolio, 4.29% (v) (Identified Cost, $89,047,706) | 89,047,631 | $89,056,536 | ||
| Other Assets, Less Liabilities - (0.5)% | (22,122,802) | |||
| Net Assets - 100.0% | $4,423,767,316 | |||
| (a) | Non-income producing security. |
| (d) | In default. |
| (h) | An affiliated issuer, which may be considered one in which the fund owns 5% or more of the outstanding voting securities, or a company which is under common control. At period end, the aggregate values of the fund's investments in affiliated issuers and in unaffiliated issuers were $89,056,536 and $4,356,833,582, respectively. |
| (i) | Interest only security for which the fund receives interest on notional principal (Par amount). Par amount shown is the notional principal and does not reflect the cost of the security. |
| (n) | Securities exempt from registration under Rule 144A of the Securities Act of 1933. These securities may be sold in the ordinary course of business in transactions exempt from registration, normally to qualified institutional buyers. At period end, the aggregate value of these securities was $975,046,378, representing 22.0% of net assets. |
| (q) | Interest received was less than stated coupon rate. |
| (u) | Underlying security deposited into special purpose trust upon creation of self-deposited inverse floaters. |
| (v) | Affiliated issuer that is available only to investment companies managed by MFS. The rate quoted for the MFS Institutional Money Market Portfolio is the annualized seven-day yield of the fund at period end. |
| (w) | When-issued security. |
| (z) | Restricted securities are not registered under the Securities Act of 1933 and are subject to legal restrictions on resale. These securities generally may be resold in transactions exempt from registration or to the public if the securities are subsequently registered. Disposal of these securities may involve time-consuming negotiations and prompt sale at an acceptable price may be difficult. The fund holds the following restricted securities: |
| Restricted Securities | Acquisition Date | Cost | Value |
| California Pollution Control Financing Authority, Solid Waste Disposal Rev. (CalPlant I Project), 7.5%, 7/01/2032 | 10/8/2020 | $1,800,000 | $112,500 |
| California Pollution Control Financing Authority, Solid Waste Disposal Rev. (CalPlant I Project), 8%, 7/01/2039 | 5/25/2017-6/1/2018 | 11,564,858 | 570,250 |
| California Pollution Control Financing Authority, Solid Waste Disposal Rev. (CalPlant I Project), 7.5%, 12/01/2039 | 7/26/2019 | 11,288,456 | 644,500 |
| Collier County, FL, Industrial Development Authority, Continuing Care Community Rev. (Arlington of Naples Project), “A”, 5.5%, 5/15/2025 | 6/30/2015 | 300,000 | 174,000 |
| Collier County, FL, Industrial Development Authority, Continuing Care Community Rev. (Arlington of Naples Project), “A”, 6.25%, 5/15/2035 | 6/30/2015 | 300,000 | 174,000 |
| Collier County, FL, Industrial Development Authority, Continuing Care Community Rev. (Arlington of Naples Project), “A”, 7.75%, 5/15/2035 | 6/30/2015 | 1,140,291 | 611,900 |
| Collier County, FL, Industrial Development Authority, Continuing Care Community Rev. (Arlington of Naples Project), “A”, 8.125%, 5/15/2044 | 11/15/2017 | 10,935,573 | 6,142,200 |
| Collier County, FL, Industrial Development Authority, Continuing Care Community Rev. (Arlington of Naples Project), “A”, 6.5%, 5/15/2049 | 2/16/2017-8/29/2018 | 805,000 | 466,900 |
| Guam Education Financing Foundation (Guam Public School Facilities Project), “B”, COP, 5%, 10/01/2026 | 7/24/2016 | 12,977,434 | 12,990,519 |
| Illinois Housing Development Authority Rev., “A”, FHLMC, 3.87%, 11/15/2035 | 2/4/2021 | 10,708,059 | 8,550,527 |
| Illinois Housing Development Authority Rev., “B”, FHLMC, 3.87%, 11/15/2035 | 2/4/2021 | 4,366,990 | 3,487,099 |
| Illinois Housing Development Authority Rev., “C”, FHLMC, 3.87%, 11/15/2035 | 2/4/2021 | 4,357,683 | 3,479,668 |
| Illinois Housing Development Authority Rev., “D”, FHLMC, 3.87%, 11/15/2035 | 2/4/2021 | 3,976,379 | 3,175,191 |
| Illinois Housing Development Authority Rev., “E”, FHLMC, 3.87%, 11/15/2035 | 2/4/2021 | 2,737,951 | 2,186,290 |
| Louisiana Public Facilities Authority Rev. (Provident Group - HSC Properties, Inc., LSU Health Foundation, New Orleans Project), “A-1”, 5.375%, 1/01/2040 | 10/13/2020 | 4,550,015 | 4,381,023 |
| Restricted Securities - continued | Acquisition Date | Cost | Value |
| Louisiana Public Facilities Authority Rev. (Provident Group - HSC Properties, Inc., LSU Health Foundation, New Orleans Project), “A-1”, 5.5%, 1/01/2050 | 10/13/2020 | $3,116,929 | $2,986,495 |
| Louisiana Public Facilities Authority Rev. (Provident Group - HSC Properties, Inc., LSU Health Foundation, New Orleans Project), “A-1”, 5.1%, 1/01/2057 | 10/13/2020 | 10,045,000 | 9,256,934 |
| Louisiana Public Facilities Authority Rev. (Provident Group - HSC Properties, Inc., LSU Health Foundation, New Orleans Project), “A-2”, 7%, 1/01/2057 | 10/13/2020 | 10,204,219 | 9,973,397 |
| Toll Road Investors Partnership II LP, Capital Appreciation, NPFG, 0%, 2/15/2043 | 9/26/2019-10/04/2019 | 12,058,401 | 9,397,441 |
| Total Restricted Securities | $78,760,834 | ||
| % of Net assets | 1.8% |
| The following abbreviations are used in this report and are defined: | |
| AAC | Ambac Assurance Corp. |
| AGM | Assured Guaranty Municipal |
| BAM | Build America Mutual |
| COP | Certificate of Participation |
| ETM | Escrowed to Maturity |
| FHA | Federal Housing Administration |
| FHLMC | Federal Home Loan Mortgage Corp. |
| FNMA | Federal National Mortgage Assn. |
| GNMA | Government National Mortgage Assn. |
| NPFG | National Public Finance Guarantee Corp. |
| Assets | |
| Investments in unaffiliated issuers, at value (identified cost, $4,706,495,456) | $4,356,833,582 |
| Investments in affiliated issuers, at value (identified cost, $89,047,706) | 89,056,536 |
| Cash | 198,247 |
| Receivables for | |
| Investments sold | 2,017,137 |
| Fund shares sold | 14,220,027 |
| Interest | 42,657,419 |
| Receivable from investment adviser | 213,383 |
| Other assets | 13,859 |
| Total assets | $4,505,210,190 |
| Liabilities | |
| Payables for | |
| Distributions | $2,110,248 |
| Investments purchased | 1,663,093 |
| Fund shares reacquired | 11,969,455 |
| When-issued investments purchased | 32,030,260 |
| Interest expense and fees | 267,838 |
| Payable to the holders of the floating rate certificates | 32,142,724 |
| Payable to affiliates | |
| Administrative services fee | 3,537 |
| Shareholder servicing costs | 942,900 |
| Distribution and service fees | 5,166 |
| Payable for independent Trustees' compensation | 1,846 |
| Accrued expenses and other liabilities | 305,807 |
| Total liabilities | $81,442,874 |
| Net assets | $4,423,767,316 |
| Net assets consist of | |
| Paid-in capital | $4,977,148,185 |
| Total distributable earnings (loss) | (553,380,869) |
| Net assets | $4,423,767,316 |
| Shares of beneficial interest outstanding | 594,798,038 |
| Net assets | Shares outstanding | Net asset value per share (a) | |
| Class A | $1,585,048,005 | 213,031,347 | $7.44 |
| Class B | 2,792,158 | 374,895 | 7.45 |
| Class C | 92,365,611 | 12,400,891 | 7.45 |
| Class I | 1,832,629,060 | 246,453,527 | 7.44 |
| Class R6 | 910,932,482 | 122,537,378 | 7.43 |
| (a) | Maximum offering price per share was equal to the net asset value per share for all share classes, except for Class A, for which the maximum offering price per share was $7.77 [100 / 95.75 x $7.44]. On sales of $100,000 or more, the maximum offering price of Class A shares is reduced. A contingent deferred sales charge may be imposed on redemptions of Class A, Class B, and Class C shares. Redemption price per share was equal to the net asset value per share for Classes I and R6. |
| Net investment income (loss) | |
| Income | |
| Interest | $221,407,942 |
| Dividends from affiliated issuers | 1,146,685 |
| Other | 607 |
| Total investment income | $222,555,234 |
| Expenses | |
| Management fee | $27,159,175 |
| Distribution and service fees | 1,174,943 |
| Shareholder servicing costs | 3,452,827 |
| Administrative services fee | 671,514 |
| Independent Trustees' compensation | 85,354 |
| Custodian fee | 413,972 |
| Shareholder communications | 209,846 |
| Audit and tax fees | 70,809 |
| Legal fees | 99,243 |
| Interest expense and fees | 1,061,609 |
| Miscellaneous | 474,201 |
| Total expenses | $34,873,493 |
| Fees paid indirectly | (10,473) |
| Reduction of expenses by investment adviser and distributor | (2,244,891) |
| Net expenses | $32,618,129 |
| Net investment income (loss) | $189,937,105 |
| Realized and unrealized gain (loss) | |
| Realized gain (loss) (identified cost basis) | |
| Unaffiliated issuers | $(140,017,482) |
| Affiliated issuers | (11,596) |
| Net realized gain (loss) | $(140,029,078) |
| Change in unrealized appreciation or depreciation | |
| Unaffiliated issuers | $(605,341,126) |
| Affiliated issuers | 8,508 |
| Net unrealized gain (loss) | $(605,332,618) |
| Net realized and unrealized gain (loss) | $(745,361,696) |
| Change in net assets from operations | $(555,424,591) |
| Year ended | ||
| 1/31/23 | 1/31/22 | |
| Change in net assets | ||
| From operations | ||
| Net investment income (loss) | $189,937,105 | $195,015,926 |
| Net realized gain (loss) | (140,029,078) | 18,980,376 |
| Net unrealized gain (loss) | (605,332,618) | (200,389,124) |
| Change in net assets from operations | $(555,424,591) | $13,607,178 |
| Total distributions to shareholders | $(200,636,156) | $(193,615,712) |
| Change in net assets from fund share transactions | $(1,635,060,219) | $620,726,829 |
| Total change in net assets | $(2,391,120,966) | $440,718,295 |
| Net assets | ||
| At beginning of period | 6,814,888,282 | 6,374,169,987 |
| At end of period | $4,423,767,316 | $6,814,888,282 |
| Class A | Year ended | ||||
| 1/31/23 | 1/31/22 | 1/31/21 | 1/31/20 | 1/31/19 | |
| Net asset value, beginning of period | $8.42 | $8.62 | $8.66 | $8.09 | $8.16 |
| Income (loss) from investment operations | |||||
| Net investment income (loss) (d) | $0.28 | $0.26 | $0.30 | $0.32 | $0.35 |
| Net realized and unrealized gain (loss) | (0.97) | (0.21) | (0.04) | 0.56 | (0.08) |
| Total from investment operations | $(0.69) | $0.05 | $0.26 | $0.88 | $0.27 |
| Less distributions declared to shareholders | |||||
| From net investment income | $(0.29) | $(0.25) | $(0.30) | $(0.31) | $(0.34) |
| Net asset value, end of period (x) | $7.44 | $8.42 | $8.62 | $8.66 | $8.09 |
| Total return (%) (r)(s)(t)(x) | (8.11) | 0.58 | 3.24 | 11.06 | 3.31 |
| Ratios (%) (to average net assets) and Supplemental data: | |||||
| Expenses before expense reductions (f) | 0.67 | 0.63 | 0.65 | 0.67 | 0.67 |
| Expenses after expense reductions (f) | 0.62 | 0.62 | 0.64 | 0.66 | 0.66 |
| Net investment income (loss) | 3.67 | 2.94 | 3.65 | 3.82 | 4.35 |
| Portfolio turnover | 18 | 17 | 30 | 12 | 24 |
| Net assets at end of period (000 omitted) | $1,585,048 | $2,066,744 | $1,971,228 | $1,999,299 | $1,623,004 |
| Supplemental Ratios (%): | |||||
| Ratios of expenses to average net assets after expense reductions and excluding interest expense and fees (f)(l) | 0.60 | 0.61 | 0.62 | 0.63 | 0.64 |
| Class B | Year ended | ||||
| 1/31/23 | 1/31/22 | 1/31/21 | 1/31/20 | 1/31/19 | |
| Net asset value, beginning of period | $8.42 | $8.63 | $8.67 | $8.10 | $8.16 |
| Income (loss) from investment operations | |||||
| Net investment income (loss) (d) | $0.22 | $0.19 | $0.25 | $0.26 | $0.29 |
| Net realized and unrealized gain (loss) | (0.95) | (0.21) | (0.05) | 0.56 | (0.07) |
| Total from investment operations | $(0.73) | $(0.02) | $0.20 | $0.82 | $0.22 |
| Less distributions declared to shareholders | |||||
| From net investment income | $(0.24) | $(0.19) | $(0.24) | $(0.25) | $(0.28) |
| Net asset value, end of period (x) | $7.45 | $8.42 | $8.63 | $8.67 | $8.10 |
| Total return (%) (r)(s)(t)(x) | (8.67) | (0.28) | 2.49 | 10.24 | 2.68 |
| Ratios (%) (to average net assets) and Supplemental data: | |||||
| Expenses before expense reductions (f) | 1.67 | 1.63 | 1.66 | 1.67 | 1.67 |
| Expenses after expense reductions (f) | 1.37 | 1.37 | 1.40 | 1.41 | 1.41 |
| Net investment income (loss) | 2.89 | 2.21 | 3.00 | 3.12 | 3.61 |
| Portfolio turnover | 18 | 17 | 30 | 12 | 24 |
| Net assets at end of period (000 omitted) | $2,792 | $5,096 | $6,519 | $13,733 | $17,392 |
| Supplemental Ratios (%): | |||||
| Ratios of expenses to average net assets after expense reductions and excluding interest expense and fees (f)(l) | 1.35 | 1.36 | 1.38 | 1.38 | 1.40 |
| Class C | Year ended | ||||
| 1/31/23 | 1/31/22 | 1/31/21 | 1/31/20 | 1/31/19 | |
| Net asset value, beginning of period | $8.42 | $8.63 | $8.67 | $8.10 | $8.16 |
| Income (loss) from investment operations | |||||
| Net investment income (loss) (d) | $0.20 | $0.17 | $0.22 | $0.24 | $0.27 |
| Net realized and unrealized gain (loss) | (0.95) | (0.21) | (0.04) | 0.56 | (0.08) |
| Total from investment operations | $(0.75) | $(0.04) | $0.18 | $0.80 | $0.19 |
| Less distributions declared to shareholders | |||||
| From net investment income | $(0.22) | $(0.17) | $(0.22) | $(0.23) | $(0.25) |
| Net asset value, end of period (x) | $7.45 | $8.42 | $8.63 | $8.67 | $8.10 |
| Total return (%) (r)(s)(t)(x) | (8.90) | (0.53) | 2.23 | 9.96 | 2.42 |
| Ratios (%) (to average net assets) and Supplemental data: | |||||
| Expenses before expense reductions (f) | 1.67 | 1.63 | 1.66 | 1.67 | 1.67 |
| Expenses after expense reductions (f) | 1.62 | 1.62 | 1.64 | 1.66 | 1.66 |
| Net investment income (loss) | 2.65 | 1.95 | 2.69 | 2.84 | 3.35 |
| Portfolio turnover | 18 | 17 | 30 | 12 | 24 |
| Net assets at end of period (000 omitted) | $92,366 | $148,124 | $167,087 | $242,387 | $230,387 |
| Supplemental Ratios (%): | |||||
| Ratios of expenses to average net assets after expense reductions and excluding interest expense and fees (f)(l) | 1.60 | 1.61 | 1.63 | 1.63 | 1.64 |
| Class I | Year ended | ||||
| 1/31/23 | 1/31/22 | 1/31/21 | 1/31/20 | 1/31/19 | |
| Net asset value, beginning of period | $8.41 | $8.62 | $8.66 | $8.09 | $8.15 |
| Income (loss) from investment operations | |||||
| Net investment income (loss) (d) | $0.28 | $0.25 | $0.30 | $0.32 | $0.35 |
| Net realized and unrealized gain (loss) | (0.96) | (0.21) | (0.04) | 0.56 | (0.08) |
| Total from investment operations | $(0.68) | $0.04 | $0.26 | $0.88 | $0.27 |
| Less distributions declared to shareholders | |||||
| From net investment income | $(0.29) | $(0.25) | $(0.30) | $(0.31) | $(0.33) |
| Net asset value, end of period (x) | $7.44 | $8.41 | $8.62 | $8.66 | $8.09 |
| Total return (%) (r)(s)(t)(x) | (8.01) | 0.46 | 3.24 | 11.06 | 3.44 |
| Ratios (%) (to average net assets) and Supplemental data: | |||||
| Expenses before expense reductions (f) | 0.67 | 0.63 | 0.65 | 0.67 | 0.67 |
| Expenses after expense reductions (f) | 0.62 | 0.62 | 0.64 | 0.66 | 0.66 |
| Net investment income (loss) | 3.64 | 2.94 | 3.64 | 3.82 | 4.34 |
| Portfolio turnover | 18 | 17 | 30 | 12 | 24 |
| Net assets at end of period (000 omitted) | $1,832,629 | $2,792,475 | $2,831,021 | $2,687,508 | $2,145,125 |
| Supplemental Ratios (%): | |||||
| Ratios of expenses to average net assets after expense reductions and excluding interest expense and fees (f)(l) | 0.60 | 0.61 | 0.62 | 0.63 | 0.64 |
| Class R6 | Year ended | ||||
| 1/31/23 | 1/31/22 | 1/31/21 | 1/31/20 | 1/31/19 | |
| Net asset value, beginning of period | $8.41 | $8.62 | $8.65 | $8.08 | $8.15 |
| Income (loss) from investment operations | |||||
| Net investment income (loss) (d) | $0.28 | $0.26 | $0.31 | $0.33 | $0.36 |
| Net realized and unrealized gain (loss) | (0.96) | (0.21) | (0.03) | 0.56 | (0.09) |
| Total from investment operations | $(0.68) | $0.05 | $0.28 | $0.89 | $0.27 |
| Less distributions declared to shareholders | |||||
| From net investment income | $(0.30) | $(0.26) | $(0.31) | $(0.32) | $(0.34) |
| Net asset value, end of period (x) | $7.43 | $8.41 | $8.62 | $8.65 | $8.08 |
| Total return (%) (r)(s)(t)(x) | (8.06) | 0.54 | 3.44 | 11.16 | 3.40 |
| Ratios (%) (to average net assets) and Supplemental data: | |||||
| Expenses before expense reductions (f) | 0.58 | 0.54 | 0.57 | 0.59 | 0.58 |
| Expenses after expense reductions (f) | 0.54 | 0.53 | 0.56 | 0.58 | 0.57 |
| Net investment income (loss) | 3.71 | 3.01 | 3.73 | 3.89 | 4.41 |
| Portfolio turnover | 18 | 17 | 30 | 12 | 24 |
| Net assets at end of period (000 omitted) | $910,932 | $1,802,449 | $1,398,315 | $1,195,880 | $856,776 |
| Supplemental Ratios (%): | |||||
| Ratios of expenses to average net assets after expense reductions and excluding interest expense and fees (f)(l) | 0.52 | 0.52 | 0.54 | 0.55 | 0.56 |
| (d) | Per share data is based on average shares outstanding. |
| (f) | Ratios do not reflect reductions from fees paid indirectly, if applicable. See Note 2 in the Notes to Financial Statements for additional information. |
| (l) | Interest expense and fees include payments made to the holders of the floating rate certificates. |
| (r) | Certain expenses have been reduced without which performance would have been lower. |
| (s) | From time to time the fund may receive proceeds from litigation settlements, without which performance would be lower. |
| (t) | Total returns do not include any applicable sales charges. |
| (x) | The net asset values and total returns have been calculated on net assets which include adjustments made in accordance with U.S. generally accepted accounting principles required at period end for financial reporting purposes. |
| Financial Instruments | Level 1 | Level 2 | Level 3 | Total |
| Municipal Bonds | $— | $4,325,890,720 | $— | $4,325,890,720 |
| U.S. Corporate Bonds | — | 30,942,862 | — | 30,942,862 |
| Mutual Funds | 89,056,536 | — | — | 89,056,536 |
| Total | $89,056,536 | $4,356,833,582 | $— | $4,445,890,118 |
| Year ended 1/31/23 | Year ended 1/31/22 | |
| Ordinary income (including any short-term capital gains) | $11,156,872 | $2,809,813 |
| Tax-exempt income | 189,479,284 | 190,805,899 |
| Total distributions | $200,636,156 | $193,615,712 |
| As of 1/31/23 | |
| Cost of investments | $4,796,238,752 |
| Gross appreciation | 72,230,786 |
| Gross depreciation | (454,722,144) |
| Net unrealized appreciation (depreciation) | $(382,491,358) |
| Undistributed tax-exempt income | 57,484,336 |
| Capital loss carryforwards | (212,307,070) |
| Other temporary differences | (16,066,777) |
| Total distributable earnings (loss) | $(553,380,869) |
| Short-Term | $(113,570,573) |
| Long-Term | (98,736,497) |
| Total | $(212,307,070) |
| Year ended 1/31/23 | Year ended 1/31/22 | |
| Class A | $66,743,480 | $60,230,580 |
| Class B | 116,915 | 126,101 |
| Class C | 3,246,712 | 3,093,572 |
| Class I | 83,213,404 | 80,273,036 |
| Class R6 | 47,315,645 | 49,892,423 |
| Total | $200,636,156 | $193,615,712 |
| Up to $2.5 billion | 0.55% |
| In excess of $2.5 billion and up to $5 billion | 0.50% |
| In excess of $5 billion and up to $10 billion | 0.45% |
| In excess of $10 billion | 0.425% |
| Classes | ||||
| A | B | C | I | R6 |
| 0.65% | 1.40% | 1.65% | 0.65% | 0.56% |
| Classes | ||||
| A | B | C | I | R6 |
| 0.59% | 1.34% | 1.59% | 0.59% | 0.50% |
| Distribution Fee Rate (d) | Service Fee Rate (d) | Total Distribution Plan (d) | Annual Effective Rate (e) | Distribution and Service Fee | |
| Class B | 0.75% | 0.25% | 1.00% | 0.75% | $ 37,808 |
| Class C | 0.75% | 0.25% | 1.00% | 1.00% | 1,137,135 |
| Total Distribution and Service Fees | $1,174,943 |
| (d) | In accordance with the distribution plan for certain classes, the fund pays distribution and/or service fees equal to these annual percentage rates of each class’s average daily net assets. The distribution and service fee rates disclosed by class represent the current rates in effect at the end of the reporting period. Any rate changes, if applicable, are detailed below. |
| (e) | The annual effective rates represent actual fees incurred under the distribution plan for the year ended January 31, 2023 based on each class's average daily net assets. MFD has agreed in writing to reduce the Class B service fee rate to 0.00% for all Class B shares. This agreement will continue until modified by the fund’s Board of Trustees, but such agreement will continue until at least May 31, 2024. For the year ended January 31, 2023, this waiver amounted to $9,452, which is included in the reduction of total expenses in the Statement of Operations. MFD has also voluntarily agreed to rebate a portion of each class’s 0.25% service fee attributable to accounts for which there is no financial intermediary specified on the account except for accounts attributable to MFS or its affiliates’ seed money. For the year ended January 31, 2023, this rebate amounted to $38 for Class C shares and is included in the reduction of total expenses in the Statement of Operations. |
| Amount | |
| Class A | $218,084 |
| Class B | 695 |
| Class C | 13,251 |
| Purchases | Sales | |
| U.S. Government securities | $2,255,007 | $— |
| Non-U.S. Government securities | 924,750,096 | 2,557,107,633 |
| Year ended 1/31/23 | Year ended 1/31/22 | ||||
| Shares | Amount | Shares | Amount | ||
| Shares sold | |||||
| Class A | 55,296,913 | $414,788,041 | 40,037,108 | $347,009,592 | |
| Class B | 12,223 | 95,384 | 7,307 | 62,707 | |
| Class C | 1,461,463 | 11,017,590 | 2,392,645 | 20,767,125 | |
| Class I | 196,100,976 | 1,461,595,281 | 88,439,826 | 765,619,870 | |
| Class R6 | 85,433,027 | 659,248,790 | 98,856,243 | 856,361,341 | |
| 338,304,602 | $2,546,745,086 | 229,733,129 | $1,989,820,635 | ||
| Shares issued to shareholders in reinvestment of distributions | |||||
| Class A | 8,257,045 | $62,030,038 | 6,461,532 | $55,843,129 | |
| Class B | 11,938 | 89,991 | 11,364 | 98,265 | |
| Class C | 399,183 | 3,004,239 | 330,541 | 2,859,594 | |
| Class I | 9,731,779 | 73,224,857 | 8,125,477 | 70,157,314 | |
| Class R6 | 4,603,741 | 34,704,834 | 4,527,776 | 39,092,462 | |
| 23,003,686 | $173,053,959 | 19,456,690 | $168,050,764 | ||
| Shares reacquired | |||||
| Class A | (96,110,584) | $(722,064,548) | (29,461,794) | $(255,087,424) | |
| Class B | (254,286) | (1,911,981) | (168,790) | (1,460,062) | |
| Class C | (7,042,549) | (53,126,048) | (4,492,320) | (38,959,121) | |
| Class I | (291,406,893) | (2,179,451,919) | (92,977,544) | (797,612,088) | |
| Class R6 | (181,867,637) | (1,398,304,768) | (51,278,592) | (444,025,875) | |
| (576,681,949) | $(4,354,859,264) | (178,379,040) | $(1,537,144,570) | ||
| Year ended 1/31/23 | Year ended 1/31/22 | ||||
| Shares | Amount | Shares | Amount | ||
| Net change | |||||
| Class A | (32,556,626) | $(245,246,469) | 17,036,846 | $147,765,297 | |
| Class B | (230,125) | (1,726,606) | (150,119) | (1,299,090) | |
| Class C | (5,181,903) | (39,104,219) | (1,769,134) | (15,332,402) | |
| Class I | (85,574,138) | (644,631,781) | 3,587,759 | 38,165,096 | |
| Class R6 | (91,830,869) | (704,351,144) | 52,105,427 | 451,427,928 | |
| (215,373,661) | $(1,635,060,219) | 70,810,779 | $620,726,829 | ||
| Affiliated Issuers | Beginning Value | Purchases | Sales Proceeds | Realized Gain (Loss) | Change in Unrealized Appreciation or Depreciation | Ending Value |
| MFS Institutional Money Market Portfolio | $186,790,392 | $2,023,405,461 | $2,121,136,229 | $(11,596) | $8,508 | $89,056,536 |
| Affiliated Issuers | Dividend Income | Capital Gain Distributions |
| MFS Institutional Money Market Portfolio | $1,146,685 | $— |

March 17, 2023
| Name, Age | Position(s) Held with Fund | Trustee/Officer Since(h) | Number of MFS Funds overseen by the Trustee | Principal Occupations During the Past Five Years | Other Directorships During the Past Five Years (j) | |||||
| INTERESTED TRUSTEE | ||||||||||
| Michael W. Roberge (k) (age 56) | Trustee | January 2021 | 136 | Massachusetts Financial Services Company, Chairman (since January 2021); Chief Executive Officer (since January 2017); Director; Chairman of the Board (since January 2022); President (until December 2018); Chief Investment Officer (until December 2018) | N/A | |||||
| INDEPENDENT TRUSTEES | ||||||||||
| John P. Kavanaugh (age 68) | Trustee and Chair of Trustees | January 2009 | 136 | Private investor | N/A | |||||
| Steven E. Buller (age 71) | Trustee | February 2014 | 136 | Private investor | N/A | |||||
| John A. Caroselli (age 68) | Trustee | March 2017 | 136 | Private investor; JC Global Advisors, LLC (management consulting), President (since 2015) | N/A | |||||
| Maureen R. Goldfarb (age 67) | Trustee | January 2009 | 136 | Private investor | N/A | |||||
| Peter D. Jones (age 67) | Trustee | January 2019 | 136 | Private investor | N/A | |||||
| James W. Kilman, Jr. (age 61) | Trustee | January 2019 | 136 | Burford Capital Limited (finance and investment management), Senior Advisor (since May 3, 2021), Chief Financial Officer (2019 - May 2, 2021); KielStrand Capital LLC (family office), Chief Executive Officer (since 2016) | Alpha-En Corporation, Director (2016-2019) |
| Name, Age | Position(s) Held with Fund | Trustee/Officer Since(h) | Number of MFS Funds overseen by the Trustee | Principal Occupations During the Past Five Years | Other Directorships During the Past Five Years (j) | |||||
| Clarence Otis, Jr. (age 66) | Trustee | March 2017 | 136 | Private investor | VF Corporation, Director; Verizon Communications, Inc., Director; The Travelers Companies, Director | |||||
| Maryanne L. Roepke (age 67) | Trustee | May 2014 | 136 | Private investor | N/A | |||||
| Laurie J. Thomsen (age 65) | Trustee | March 2005 | 136 | Private investor | The Travelers Companies, Director; Dycom Industries, Inc., Director |
| Name, Age | Position(s) Held with Fund | Trustee/Officer Since(h) | Number of MFS Funds for which the Person is an Officer | Principal Occupations During the Past Five Years | ||||
| OFFICERS | ||||||||
| Christopher R. Bohane (k) (age 49) | Assistant Secretary and Assistant Clerk | July 2005 | 136 | Massachusetts Financial Services Company, Senior Vice President and Senior Managing Counsel | ||||
| Kino Clark (k) (age 54) | Assistant Treasurer | January 2012 | 136 | Massachusetts Financial Services Company, Vice President | ||||
| John W. Clark, Jr. (k) (age 55) | Assistant Treasurer | April 2017 | 136 | Massachusetts Financial Services Company, Vice President | ||||
| David L. DiLorenzo (k) (age 54) | President | July 2005 | 136 | Massachusetts Financial Services Company, Senior Vice President | ||||
| Heidi W. Hardin (k) (age 55) | Secretary and Clerk | April 2017 | 136 | Massachusetts Financial Services Company, Executive Vice President and General Counsel | ||||
| Brian E. Langenfeld (k) (age 49) | Assistant Secretary and Assistant Clerk | June 2006 | 136 | Massachusetts Financial Services Company, Vice President and Managing Counsel |
| Name, Age | Position(s) Held with Fund | Trustee/Officer Since(h) | Number of MFS Funds for which the Person is an Officer | Principal Occupations During the Past Five Years | ||||
| Rosa E. Licea-Mailloux (k) (age 46) | Chief Compliance Officer | March 2022 | 136 | Massachusetts Financial Services Company, Vice President (since 2018); Director of Corporate Compliance (2018-2021), Senior Director Compliance (2021-2022), Senior Managing Director of North American Compliance & Chief Compliance Officer (since March 2022); Natixis Investment Managers (investment management), Funds Chief Compliance Officer, Deputy General Counsel & Senior Vice President (until 2018) | ||||
| Amanda S. Mooradian (k) (age 44) | Assistant Secretary and Assistant Clerk | September 2018 | 136 | Massachusetts Financial Services Company, Assistant Vice President and Senior Counsel | ||||
| Susan A. Pereira (k) (age 52) | Assistant Secretary and Assistant Clerk | July 2005 | 136 | Massachusetts Financial Services Company, Vice President and Managing Counsel | ||||
| Kasey L. Phillips (k) (age 52) | Assistant Treasurer | September 2012 | 136 | Massachusetts Financial Services Company, Vice President | ||||
| Matthew A. Stowe (k) (age 48) | Assistant Secretary and Assistant Clerk | October 2014 | 136 | Massachusetts Financial Services Company, Vice President and Senior Managing Counsel | ||||
| William B. Wilson (k) (age 40) | Assistant Secretary and Assistant Clerk | October 2022 | 136 | Massachusetts Financial Services Company, Assistant Vice President and Senior Counsel | ||||
| James O. Yost (k) (age 62) | Treasurer | September 1990 | 136 | Massachusetts Financial Services Company, Senior Vice President |
| (h) | Date first appointed to serve as Trustee/Officer of an MFS Fund. Each Trustee has served continuously since appointment unless indicated otherwise. From January 2012 through December 2016, Messrs. DiLorenzo and Yost served as Treasurer and Deputy Treasurer of the Funds, respectively. |
| (j) | Directorships or trusteeships of companies required to report to the Securities and Exchange Commission (i.e., “public companies”). |
| (k) | “Interested person” of the Trust within the meaning of the Investment Company Act of 1940 (referred to as the 1940 Act), which is the principal federal law governing investment companies like the fund, as a result of a position with MFS. The address of MFS is 111 Huntington Avenue, Boston, Massachusetts 02199-7618. |
| Investment Adviser | Custodian |
| Massachusetts Financial Services Company 111 Huntington Avenue Boston, MA 02199-7618 | JPMorgan Chase Bank, NA 4 Metrotech Center New York, NY 11245 |
| Distributor | Independent Registered Public Accounting Firm |
| MFS Fund Distributors, Inc. 111 Huntington Avenue Boston, MA 02199-7618 | Ernst & Young LLP 200 Clarendon Street Boston, MA 02116 |
| Portfolio Manager(s) | |
| Jason Kosty Gary Lasman Megan Poplowski Geoffrey Schechter |
| FACTS | WHAT DOES MFS DO WITH YOUR PERSONAL INFORMATION? |
| Why? | Financial companies choose how they share your personal information. Federal law gives consumers the right to limit some but not all sharing. Federal law also requires us to tell you how we collect, share, and protect your personal information. Please read this notice carefully to understand what we do. |
| What? | The types of personal information we collect and share depend on the product or service you have with us. This information can include: |
| • Social Security number and account balances | |
| • Account transactions and transaction history | |
| • Checking account information and wire transfer instructions | |
| When you are no longer our customer, we continue to share your information as described in this notice. |
| How? | All financial companies need to share customers' personal information to run their everyday business. In the section below, we list the reasons financial companies can share their customers' personal information; the reasons MFS chooses to share; and whether you can limit this sharing. |
| Reasons we can share your personal information | Does MFS share? | Can you limit this sharing? |
| For our everyday business purposes – such as to process your transactions, maintain your account(s), respond to court orders and legal investigations, or report to credit bureaus | Yes | No |
| For our marketing purposes – to offer our products and services to you | No | We don't share |
| For joint marketing with other financial companies | No | We don't share |
| For our affiliates' everyday business purposes – information about your transactions and experiences | No | We don't share |
| For our affiliates' everyday business purposes – information about your creditworthiness | No | We don't share |
| For nonaffiliates to market to you | No | We don't share |
| Questions? | Call 800-225-2606 or go to mfs.com. |

| Who we are | |
| Who is providing this notice? | MFS Funds, MFS Investment Management, MFS Institutional Advisors, Inc., and MFS Heritage Trust Company. |
| What we do | |
| How does MFS protect my personal information? | To protect your personal information from unauthorized access and use, we use security measures that comply with federal law. These measures include procedural, electronic, and physical safeguards for the protection of the personal information we collect about you. |
| How does MFS collect my personal information? | We collect your personal information, for example, when you |
| • open an account or provide account information | |
| • direct us to buy securities or direct us to sell your securities | |
| • make a wire transfer | |
| We also collect your personal information from others, such as credit bureaus, affiliates, or other companies. | |
| Why can't I limit all sharing? | Federal law gives you the right to limit only |
| • sharing for affiliates' everyday business purposes – information about your creditworthiness | |
| • affiliates from using your information to market to you | |
| • sharing for nonaffiliates to market to you | |
| State laws and individual companies may give you additional rights to limit sharing. | |
| Definitions | |
| Affiliates | Companies related by common ownership or control. They can be financial and nonfinancial companies. |
| • MFS does not share personal information with affiliates, except for everyday business purposes as described on page one of this notice. | |
| Nonaffiliates | Companies not related by common ownership or control. They can be financial and nonfinancial companies. |
| • MFS does not share with nonaffiliates so they can market to you. | |
| Joint marketing | A formal agreement between nonaffiliated financial companies that together market financial products or services to you. |
| • MFS doesn't jointly market. | |
| Other important information |
| If you own an MFS product or receive an MFS service in the name of a third party such as a bank or broker-dealer, their privacy policy may apply to you instead of ours. |


| 1 | |
| 2 | |
| 4 | |
| 6 | |
| 8 | |
| 9 | |
| 23 | |
| 24 | |
| 25 | |
| 26 | |
| 27 | |
| 38 | |
| 40 | |
| 44 | |
| 44 | |
| 44 | |
| 44 | |
| 44 | |
| 45 |
| back cover |


| Cable TV | 8.4% |
| Medical & Health Technology & Services | 6.6% |
| Gaming & Lodging | 5.1% |
| Midstream | 4.6% |
| Building | 4.4% |
| BBB | 1.7% |
| BB | 44.6% |
| B | 37.9% |
| CCC | 13.2% |
| Not Rated | (1.8)% |
| Non-Fixed Income | 0.3% |
| Cash & Cash Equivalents | 2.1% |
| Other | 2.0% |
| Average Duration (d) | 3.8 |
| Average Effective Maturity (m) | 5.5 yrs. |
| (a) | For all securities other than those specifically described below, ratings are assigned to underlying securities utilizing ratings from Moody’s, Fitch, and Standard & Poor’s rating agencies and applying the following hierarchy: If all three agencies provide a rating, the middle rating (after dropping the highest and lowest ratings) is assigned; if two of the three agencies rate a security, the lower of the two is assigned. If none of the 3 rating agencies above assign a rating, but the security is rated by DBRS Morningstar, then the DBRS Morningstar rating is assigned. If none of the 4 rating agencies listed above rate the security, but the security is rated by the Kroll Bond Rating Agency (KBRA), then the KBRA rating is assigned. Ratings are shown in the S&P and Fitch scale (e.g., AAA). Securities rated BBB or higher are considered investment grade. All ratings are subject to change. Not Rated includes fixed income securities and fixed income derivatives that have not been rated by any rating agency. Non-Fixed Income includes equity securities (including convertible bonds and equity derivatives), ETFs, and/or commodity-linked derivatives. The fund may or may not have held all of these instruments on this date. The fund is not rated by these agencies. |
| (d) | Duration is a measure of how much a bond’s price is likely to fluctuate with general changes in interest rates, e.g., if rates rise 1.00%, a bond with a 5-year duration is likely to lose about 5.00% of its value due to the interest rate move. The Average Duration calculation reflects the impact of the equivalent exposure of derivative positions, if any. |
| (i) | For purposes of this presentation, the components include the value of securities, and reflect the impact of the equivalent exposure of derivative positions, if any. These amounts may be negative from time to time. Equivalent exposure is a calculated amount that translates the derivative position into a reasonable approximation of the amount of the underlying asset that the portfolio would have to hold at a given point in time to have the same price sensitivity that results from the portfolio’s ownership of the derivative contract. When dealing with derivatives, equivalent exposure is a more representative measure of the potential impact of a position on portfolio performance than value. The bond component will include any accrued interest amounts. |
| (m) | In determining each instrument’s effective maturity for purposes of calculating the fund’s dollar-weighted average effective maturity, MFS uses the instrument’s stated maturity or, if applicable, an earlier date on which MFS believes it is probable that a maturity-shortening device (such as a put, pre-refunding or prepayment) will cause the instrument to be repaid. Such an earlier date can be substantially shorter than the instrument’s stated maturity. |
| (h) | Security was not held in the portfolio at period end. |
| (r) | Securities rated “BBB”, “Baa”, or higher are considered investment grade; securities rated “BB”, “Ba”, or below are considered non-investment grade. Ratings are assigned to underlying securities utilizing ratings from Moody's, Fitch, and Standard & Poor's and applying the following hierarchy: If all three agencies provide a rating, the middle rating (after dropping the highest and lowest ratings) is assigned; if two of the three agencies rate a security, the lower of the two is assigned. If none of the 3 rating agencies above assign a rating, but the security is rated by DBRS Morningstar, then the DBRS Morningstar rating is assigned. If none of the 4 rating agencies listed above rate the security, but the security is rated by the Kroll Bond Rating Agency (KBRA), then the KBRA rating is assigned. Ratings are shown in the S&P and Fitch scale (e.g., AAA). For securities that are not rated by any of the rating agencies, the security is considered Not Rated. |

| Fund Inception Date | 1-yr | 5-yr | Life (t) |
| 3/25/13 | (3.84)% | 2.84% | 4.08% |
| Bloomberg U.S. Corporate High-Yield 2% Issuer Capped Index (f) | (5.22)% | 2.94% | 4.19% |
| (f) | Source: FactSet Research Systems Inc. |
| (t) | For the period from the fund inception date through the stated period end. (See Notes to Performance Summary.) |
| (a) | Source: Bloomberg Index Services Limited. BLOOMBERG® is a trademark and service mark of Bloomberg Finance L.P. and its affiliates (collectively “Bloomberg”). Bloomberg or Bloomberg's licensors own all proprietary rights in the Bloomberg Indices. Bloomberg neither approves or endorses this material, or guarantees the accuracy or completeness of any information herein, or makes any warranty, express or implied, as to the results to be obtained therefrom and, to the maximum extent allowed by law, neither shall have any liability or responsibility for injury or damages arising in connection therewith. |
August 1, 2022 through January 31, 2023
| Annualized Expense Ratio | Beginning Account Value 8/01/22 | Ending Account Value 1/31/23 | Expenses Paid During Period (p) 8/01/22-1/31/23 | |
| Actual | 0.02% | $1,000.00 | $1,019.11 | $0.10 |
| Hypothetical (h) | 0.02% | $1,000.00 | $1,025.10 | $0.10 |
| (h) | 5% fund return per year before expenses. |
| (p) | “Expenses Paid During Period” are equal to the fund’s annualized expense ratio, as shown above, multiplied by the average account value over the period, multiplied by 184/365 (to reflect the one-half year period). |
| Issuer | Shares/Par | Value ($) | ||
| Bonds – 96.2% | ||||
| Aerospace & Defense – 2.3% | ||||
| Bombardier, Inc., 7.5%, 3/15/2025 (n) | $ | 1,317,000 | $1,318,646 | |
| Bombardier, Inc., 7.125%, 6/15/2026 (n) | 1,517,000 | 1,513,375 | ||
| Bombardier, Inc., 7.5%, 2/01/2029 (n) | 935,000 | 934,093 | ||
| F-Brasile S.p.A./F-Brasile U.S. LLC, 7.375%, 8/15/2026 (n) | 2,450,000 | 2,007,481 | ||
| Moog, Inc., 4.25%, 12/15/2027 (n) | 3,495,000 | 3,241,613 | ||
| TransDigm, Inc., 6.25%, 3/15/2026 (n) | 2,352,000 | 2,351,172 | ||
| TransDigm, Inc., 6.375%, 6/15/2026 | 1,650,000 | 1,629,350 | ||
| TransDigm, Inc., 5.5%, 11/15/2027 | 2,015,000 | 1,924,276 | ||
| TransDigm, Inc., 4.625%, 1/15/2029 | 2,196,000 | 1,981,143 | ||
| $16,901,149 | ||||
| Automotive – 2.4% | ||||
| Clarios Global LP/Clarios U.S. Finance Co., 8.5%, 5/15/2027 (n) | $ | 2,975,000 | $2,963,135 | |
| Dana, Inc., 5.375%, 11/15/2027 | 1,976,000 | 1,877,625 | ||
| Dana, Inc., 4.25%, 9/01/2030 | 1,495,000 | 1,265,225 | ||
| Dornoch Debt Merger Sub, Inc., 6.625%, 10/15/2029 (n) | 2,605,000 | 1,955,935 | ||
| Ford Motor Co., 5.113%, 5/03/2029 | 3,005,000 | 2,847,861 | ||
| Ford Motor Credit Co. LLC, 4.134%, 8/04/2025 | 5,330,000 | 5,089,990 | ||
| Real Hero Merger Sub 2, Inc., 6.25%, 2/01/2029 (n) | 2,025,000 | 1,503,563 | ||
| $17,503,334 | ||||
| Broadcasting – 2.1% | ||||
| Advantage Sales & Marketing, Inc., 6.5%, 11/15/2028 (n) | $ | 2,204,000 | $1,675,040 | |
| Gray Escrow II, Inc., 5.375%, 11/15/2031 (n) | 4,746,000 | 3,649,793 | ||
| iHeartCommunications, Inc., 8.375%, 5/01/2027 | 2,908,000 | 2,606,295 | ||
| Scripps Escrow II, Inc., 5.875%, 7/15/2027 (n) | 2,321,000 | 2,071,492 | ||
| Summer (BC) Bidco B LLC, 5.5%, 10/31/2026 (n) | 2,545,000 | 2,091,770 | ||
| Summer (BC) Holdco S.à r.l., “A”, 9.25%, 10/31/2027 | EUR | 833,474 | 734,992 | |
| WMG Acquisition Corp., 3.875%, 7/15/2030 (n) | $ | 2,882,000 | 2,540,483 | |
| $15,369,865 | ||||
| Brokerage & Asset Managers – 2.1% | ||||
| AG TTMT Escrow Issuer LLC, 8.625%, 9/30/2027 (n) | $ | 2,775,000 | $2,863,162 | |
| Aretec Escrow Issuer, Inc., 7.5%, 4/01/2029 (n) | 2,420,000 | 2,147,750 | ||
| LPL Holdings, Inc., 4.625%, 11/15/2027 (n) | 3,180,000 | 3,026,215 | ||
| LPL Holdings, Inc., 4%, 3/15/2029 (n) | 2,066,000 | 1,849,070 | ||
| LPL Holdings, Inc., 4.375%, 5/15/2031 (n) | 1,343,000 | 1,175,944 | ||
| NFP Corp., 4.875%, 8/15/2028 (n) | 1,995,000 | 1,741,096 | ||
| NFP Corp., 6.875%, 8/15/2028 (n) | 2,492,000 | 2,154,733 | ||
| $14,957,970 | ||||
| Issuer | Shares/Par | Value ($) | ||
| Bonds – continued | ||||
| Building – 4.4% | ||||
| ABC Supply Co., Inc., 4%, 1/15/2028 (n) | $ | 4,945,000 | $4,505,241 | |
| Foundation Building Materials LLC, 6%, 3/01/2029 (n) | 2,193,000 | 1,763,961 | ||
| GYP Holding III Corp., 4.625%, 5/01/2029 (n) | 3,870,000 | 3,263,088 | ||
| Interface, Inc., 5.5%, 12/01/2028 (n) | 3,855,000 | 3,238,778 | ||
| MIWD Holdco II LLC/MIWD Finance Co., 5.5%, 2/01/2030 (n) | 1,930,000 | 1,604,737 | ||
| New Enterprise Stone & Lime Co., Inc., 9.75%, 7/15/2028 (n) | 2,352,000 | 2,230,366 | ||
| Patrick Industries, Inc., 7.5%, 10/15/2027 (n) | 3,110,000 | 3,077,190 | ||
| SRM Escrow Issuer LLC, 6%, 11/01/2028 (n) | 2,150,000 | 1,962,993 | ||
| SRS Distribution, Inc., 6.125%, 7/01/2029 (n) | 2,665,000 | 2,291,660 | ||
| Standard Industries, Inc., 2.25%, 11/21/2026 | EUR | 655,000 | 615,347 | |
| Standard Industries, Inc., 4.75%, 1/15/2028 (n) | $ | 2,025,000 | 1,897,729 | |
| Standard Industries, Inc., 4.375%, 7/15/2030 (n) | 3,053,000 | 2,609,921 | ||
| Standard Industries, Inc., 3.375%, 1/15/2031 (n) | 680,000 | 540,068 | ||
| White Cap Buyer LLC, 6.875%, 10/15/2028 (n) | 2,335,000 | 2,125,372 | ||
| $31,726,451 | ||||
| Business Services – 1.4% | ||||
| Entegris Escrow Corp., 5.95%, 6/15/2030 (n) | $ | 1,220,000 | $1,171,602 | |
| HealthEquity, Inc., 4.5%, 10/01/2029 (n) | 2,380,000 | 2,130,814 | ||
| Iron Mountain, Inc., 4.875%, 9/15/2027 (n) | 1,835,000 | 1,727,726 | ||
| Iron Mountain, Inc., 5.25%, 3/15/2028 (n) | 1,590,000 | 1,511,931 | ||
| Verscend Escrow Corp., 9.75%, 8/15/2026 (n) | 2,992,000 | 3,002,405 | ||
| ZI Technologies LLC/ZI Finance Corp. Co., 3.875%, 2/01/2029 (n) | 860,000 | 741,750 | ||
| $10,286,228 | ||||
| Cable TV – 8.1% | ||||
| Cable One, Inc., 4%, 11/15/2030 (n) | $ | 2,725,000 | $2,246,837 | |
| CCO Holdings LLC/CCO Holdings Capital Corp., 5.125%, 5/01/2027 (n) | 1,895,000 | 1,806,030 | ||
| CCO Holdings LLC/CCO Holdings Capital Corp., 4.75%, 3/01/2030 (n) | 7,287,000 | 6,367,308 | ||
| CCO Holdings LLC/CCO Holdings Capital Corp., 4.5%, 8/15/2030 (n) | 3,395,000 | 2,900,891 | ||
| CCO Holdings LLC/CCO Holdings Capital Corp., 4.25%, 2/01/2031 (n) | 2,860,000 | 2,382,523 | ||
| CCO Holdings LLC/CCO Holdings Capital Corp., 4.25%, 1/15/2034 (n) | 1,855,000 | 1,446,065 | ||
| CSC Holdings LLC, 5.375%, 2/01/2028 (n) | 1,900,000 | 1,603,125 | ||
| CSC Holdings LLC, 5.75%, 1/15/2030 (n) | 3,990,000 | 2,513,700 | ||
| CSC Holdings LLC, 4.125%, 12/01/2030 (n) | 2,425,000 | 1,792,730 | ||
| DISH DBS Corp., 7.75%, 7/01/2026 | 1,380,000 | 1,120,781 | ||
| DISH DBS Corp., 5.25%, 12/01/2026 (n) | 1,815,000 | 1,564,303 | ||
| DISH DBS Corp., 5.125%, 6/01/2029 | 2,015,000 | 1,281,318 | ||
| DISH Network Corp., 11.75%, 11/15/2027 (n) | 1,200,000 | 1,247,040 | ||
| LCPR Senior Secured Financing DAC, 6.75%, 10/15/2027 (n) | 2,919,000 | 2,843,982 | ||
| Issuer | Shares/Par | Value ($) | ||
| Bonds – continued | ||||
| Cable TV – continued | ||||
| LCPR Senior Secured Financing DAC, 5.125%, 7/15/2029 (n) | $ | 930,000 | $818,400 | |
| Sirius XM Holdings, Inc., 3.875%, 9/01/2031 (n) | 3,465,000 | 2,856,477 | ||
| Sirius XM Radio, Inc., 4%, 7/15/2028 (n) | 2,037,000 | 1,813,134 | ||
| Sirius XM Radio, Inc., 5.5%, 7/01/2029 (n) | �� | 4,730,000 | 4,432,719 | |
| Telenet Finance Luxembourg S.A., 5.5%, 3/01/2028 (n) | 4,600,000 | 4,273,400 | ||
| Videotron Ltd., 5.125%, 4/15/2027 (n) | 1,828,000 | 1,754,734 | ||
| Videotron Ltd., 3.625%, 6/15/2029 (n) | 1,140,000 | 991,863 | ||
| Virgin Media Finance PLC, 5%, 7/15/2030 (n) | 3,640,000 | 3,055,379 | ||
| Virgin Media Vendor Financing Notes IV DAC, 5%, 7/15/2028 (n) | 4,410,000 | 4,002,516 | ||
| Ziggo Bond Finance B.V., 5.125%, 2/28/2030 (n) | 5,030,000 | 4,157,295 | ||
| $59,272,550 | ||||
| Chemicals – 2.5% | ||||
| Axalta Coating Systems Ltd., 4.75%, 6/15/2027 (n) | $ | 2,274,000 | $2,148,930 | |
| Axalta Coating Systems Ltd., 3.375%, 2/15/2029 (n) | 3,805,000 | 3,272,300 | ||
| Consolidated Energy Finance S.A., 5.625%, 10/15/2028 (n) | 2,254,000 | 1,960,980 | ||
| Element Solutions, Inc., 3.875%, 9/01/2028 (n) | 3,619,000 | 3,202,815 | ||
| Ingevity Corp., 3.875%, 11/01/2028 (n) | 3,287,000 | 2,881,017 | ||
| LSF11 A5 HoldCo LLC, 6.625%, 10/15/2029 (n) | 2,508,000 | 2,058,053 | ||
| S.P.C.M. S.A., 3.375%, 3/15/2030 (n) | 3,325,000 | 2,814,612 | ||
| $18,338,707 | ||||
| Computer Software – 1.2% | ||||
| Camelot Finance S.A., 4.5%, 11/01/2026 (n) | $ | 1,765,000 | $1,678,744 | |
| Clarivate Science Holdings Corp., 3.875%, 7/01/2028 (n) | 745,000 | 664,765 | ||
| Clarivate Science Holdings Corp., 4.875%, 7/01/2029 (n) | 2,470,000 | 2,173,415 | ||
| Dun & Bradstreet Corp., 5%, 12/15/2029 (n) | 2,625,000 | 2,324,440 | ||
| Neptune Bidco U.S., Inc., 9.29%, 4/15/2029 (n) | 1,731,000 | 1,682,584 | ||
| $8,523,948 | ||||
| Computer Software - Systems – 2.2% | ||||
| Fair Isaac Corp., 5.25%, 5/15/2026 (n) | $ | 4,736,000 | $4,701,664 | |
| Fair Isaac Corp., 4%, 6/15/2028 (n) | 816,000 | 757,660 | ||
| Sabre GLBL, Inc., 7.375%, 9/01/2025 (n) | 634,000 | 621,870 | ||
| Sabre GLBL, Inc., 11.25%, 12/15/2027 (n) | 1,075,000 | 1,139,500 | ||
| SS&C Technologies Holdings, Inc., 5.5%, 9/30/2027 (n) | 4,139,000 | 3,980,659 | ||
| Viavi Solutions, Inc., 3.75%, 10/01/2029 (n) | 3,505,000 | 3,058,112 | ||
| Virtusa Corp., 7.125%, 12/15/2028 (n) | 2,145,000 | 1,801,800 | ||
| $16,061,265 | ||||
| Conglomerates – 3.0% | ||||
| BWX Technologies, Inc., 4.125%, 6/30/2028 (n) | $ | 1,943,000 | $1,753,569 | |
| BWX Technologies, Inc., 4.125%, 4/15/2029 (n) | 4,559,000 | 4,080,439 | ||
| Chart Industries, Inc., 9.5%, 1/01/2031 (n) | 1,084,000 | 1,131,143 | ||
| Issuer | Shares/Par | Value ($) | ||
| Bonds – continued | ||||
| Conglomerates – continued | ||||
| Gates Global LLC, 6.25%, 1/15/2026 (n) | $ | 3,225,000 | $3,176,101 | |
| Griffon Corp., 5.75%, 3/01/2028 | 2,886,000 | 2,731,368 | ||
| Madison IAQ LLC, 5.875%, 6/30/2029 (n) | 3,293,000 | 2,612,139 | ||
| Regal Rexnord Corp., 6.3%, 2/15/2030 (n) | 1,787,000 | 1,822,138 | ||
| TriMas Corp., 4.125%, 4/15/2029 (n) | 5,226,000 | 4,652,446 | ||
| $21,959,343 | ||||
| Construction – 1.6% | ||||
| Empire Communities Corp., 7%, 12/15/2025 (n) | $ | 2,300,000 | $2,081,500 | |
| Mattamy Group Corp., 5.25%, 12/15/2027 (n) | 1,110,000 | 1,015,650 | ||
| Mattamy Group Corp., 4.625%, 3/01/2030 (n) | 1,920,000 | 1,619,309 | ||
| Meritage Homes Corp., 3.875%, 4/15/2029 (n) | 2,400,000 | 2,127,000 | ||
| Taylor Morrison Communities, Inc., 5.75%, 1/15/2028 (n) | 3,046,000 | 2,954,665 | ||
| Weekley Homes LLC/Weekley Finance Corp., 4.875%, 9/15/2028 (n) | 2,048,000 | 1,782,272 | ||
| $11,580,396 | ||||
| Consumer Products – 2.2% | ||||
| Energizer Gamma Acquisition B.V., 3.5%, 6/30/2029 | EUR | 1,290,000 | $1,139,666 | |
| Energizer Holdings, Inc., 4.375%, 3/31/2029 (n) | $ | 2,123,000 | 1,843,656 | |
| Mattel, Inc., 3.375%, 4/01/2026 (n) | 2,670,000 | 2,489,788 | ||
| Mattel, Inc., 5.875%, 12/15/2027 (n) | 680,000 | 678,300 | ||
| Mattel, Inc., 6.2%, 10/01/2040 | 290,000 | 269,265 | ||
| Mattel, Inc., 5.45%, 11/01/2041 | 975,000 | 834,459 | ||
| Newell Brands, Inc., 6.375%, 9/15/2027 | 1,587,000 | 1,595,236 | ||
| Newell Brands, Inc., 6.625%, 9/15/2029 | 1,654,000 | 1,672,024 | ||
| Prestige Consumer Healthcare, Inc., 5.125%, 1/15/2028 (n) | 2,200,000 | 2,101,550 | ||
| Prestige Consumer Healthcare, Inc., 3.75%, 4/01/2031 (n) | 1,185,000 | 1,006,183 | ||
| Spectrum Brands, Inc., 3.875%, 3/15/2031 (n) | 1,735,000 | 1,398,809 | ||
| SWF Escrow Issuer Corp., 6.5%, 10/01/2029 (n) | 2,070,000 | 1,360,859 | ||
| $16,389,795 | ||||
| Consumer Services – 4.0% | ||||
| Allied Universal Holdco LLC, 6.625%, 7/15/2026 (n) | $ | 618,000 | $594,979 | |
| Allied Universal Holdco LLC, 9.75%, 7/15/2027 (n) | 2,635,000 | 2,516,425 | ||
| Allied Universal Holdco LLC, 6%, 6/01/2029 (n) | 1,480,000 | 1,190,808 | ||
| ANGI Group LLC, 3.875%, 8/15/2028 (n) | 3,064,000 | 2,348,648 | ||
| Arches Buyer, Inc., 6.125%, 12/01/2028 (n) | 2,820,000 | 2,375,173 | ||
| GoDaddy, Inc., 3.5%, 3/01/2029 (n) | 4,971,000 | 4,298,921 | ||
| GW B-CR Security Corp., 9.5%, 11/01/2027 (n) | 2,027,000 | 2,001,842 | ||
| Match Group Holdings II LLC, 5%, 12/15/2027 (n) | 1,945,000 | 1,864,992 | ||
| Match Group Holdings II LLC, 4.625%, 6/01/2028 (n) | 3,115,000 | 2,865,084 | ||
| Match Group Holdings II LLC, 4.125%, 8/01/2030 (n) | 1,030,000 | 885,800 | ||
| Match Group Holdings II LLC, 3.625%, 10/01/2031 (n) | 245,000 | 196,613 | ||
| Realogy Group LLC/Realogy Co-Issuer Corp., 5.75%, 1/15/2029 (n) | 1,995,000 | 1,551,192 | ||
| Issuer | Shares/Par | Value ($) | ||
| Bonds – continued | ||||
| Consumer Services – continued | ||||
| Realogy Group LLC/Realogy Co-Issuer Corp., 5.25%, 4/15/2030 (n) | $ | 1,760,000 | $1,320,000 | |
| TriNet Group, Inc., 3.5%, 3/01/2029 (n) | 3,943,000 | 3,311,055 | ||
| WASH Multi-Family Acquisition, Inc., 5.75%, 4/15/2026 (n) | 2,103,000 | 1,940,477 | ||
| $29,262,009 | ||||
| Containers – 2.9% | ||||
| ARD Finance S.A., 6.5% (6.5% cash or 7.25% PIK), 6/30/2027 (n)(p) | $ | 1,777,076 | $1,394,010 | |
| Ardagh Metal Packaging Finance USA LLC, 3.25%, 9/01/2028 (n) | 1,450,000 | 1,272,419 | ||
| Ardagh Metal Packaging Finance USA LLC, 4%, 9/01/2029 (n) | 2,951,000 | 2,440,064 | ||
| Ardagh Packaging Finance PLC/Ardagh MP Holdings USA, Inc., 5.25%, 8/15/2027 (n) | 3,700,000 | 3,029,875 | ||
| Can-Pack S.A./Eastern PA Land Investment Holding LLC, 3.875%, 11/15/2029 (n) | 3,905,000 | 3,242,673 | ||
| Crown Americas LLC, 5.25%, 4/01/2030 | 1,960,000 | 1,886,500 | ||
| Crown Americas LLC/Crown Americas Capital Corp. V, 4.25%, 9/30/2026 | 3,670,000 | 3,507,244 | ||
| Crown Americas LLC/Crown Americas Capital Corp. VI, 4.75%, 2/01/2026 | 1,280,000 | 1,250,483 | ||
| LABL, Inc., 5.875%, 11/01/2028 (n) | 855,000 | 772,706 | ||
| Trivium Packaging Finance B.V., 8.5%, 8/15/2027 (n) | 2,295,000 | 2,207,193 | ||
| $21,003,167 | ||||
| Electrical Equipment – 0.4% | ||||
| CommScope Technologies LLC, 5%, 3/15/2027 (n) | $ | 3,465,000 | $2,645,450 | |
| Electronics – 1.7% | ||||
| Entegris, Inc., 4.375%, 4/15/2028 (n) | $ | 1,175,000 | $1,063,375 | |
| Entegris, Inc., 3.625%, 5/01/2029 (n) | 1,382,000 | 1,178,596 | ||
| Sensata Technologies B.V., 5.625%, 11/01/2024 (n) | 930,000 | 930,215 | ||
| Sensata Technologies B.V., 5%, 10/01/2025 (n) | 3,575,000 | 3,535,657 | ||
| Sensata Technologies B.V., 5.875%, 9/01/2030 (n) | 1,640,000 | 1,609,250 | ||
| Sensata Technologies, Inc., 4.375%, 2/15/2030 (n) | 1,510,000 | 1,366,943 | ||
| Synaptics, Inc., 4%, 6/15/2029 (n) | 2,990,000 | 2,589,083 | ||
| $12,273,119 | ||||
| Energy - Independent – 3.0% | ||||
| Antero Resources Corp., 7.625%, 2/01/2029 (n) | $ | 1,845,000 | $1,886,698 | |
| CNX Resources Corp., 6%, 1/15/2029 (n) | 2,082,000 | 1,911,228 | ||
| CNX Resources Corp., 7.375%, 1/15/2031 (n) | 733,000 | 712,835 | ||
| Comstock Resources, Inc., 6.75%, 3/01/2029 (n) | 3,280,000 | 3,025,800 | ||
| CrownRock LP/CrownRock Finance, Inc., “F”, 5%, 5/01/2029 (n) | 2,955,000 | 2,706,630 | ||
| Encino Acquisition Partners Holdings LLC, 8.5%, 5/01/2028 (n) | 1,890,000 | 1,762,066 | ||
| Moss Creek Resources Holdings, Inc., 7.5%, 1/15/2026 (n) | 1,675,000 | 1,546,695 | ||
| Permian Resources Operating LLC, 7.75%, 2/15/2026 (n) | 445,000 | 444,733 | ||
| Issuer | Shares/Par | Value ($) | ||
| Bonds – continued | ||||
| Energy - Independent – continued | ||||
| Permian Resources Operating LLC, 5.875%, 7/01/2029 (n) | $ | 2,361,000 | $2,212,971 | |
| SM Energy Co., 6.5%, 7/15/2028 | 2,145,000 | 2,040,366 | ||
| Southwestern Energy Co., 8.375%, 9/15/2028 | 1,015,000 | 1,066,095 | ||
| Southwestern Energy Co., 5.375%, 3/15/2030 | 1,870,000 | 1,741,438 | ||
| Tap Rock Resources LLC, 7%, 10/01/2026 (n) | 694,000 | 656,871 | ||
| $21,714,426 | ||||
| Entertainment – 2.6% | ||||
| Carnival Corp. PLC, 7.625%, 3/01/2026 (n) | $ | 2,959,000 | $2,692,690 | |
| Carnival Corp. PLC, 5.75%, 3/01/2027 (n) | 1,550,000 | 1,286,500 | ||
| Carnival Corp. PLC, 9.875%, 8/01/2027 (n) | 965,000 | 991,538 | ||
| Life Time, Inc., 5.75%, 1/15/2026 (n) | 2,070,000 | 1,989,312 | ||
| Life Time, Inc., 8%, 4/15/2026 (n) | 705,000 | 684,721 | ||
| Merlin Entertainments, 5.75%, 6/15/2026 (n) | 1,161,000 | 1,105,393 | ||
| Motion Bondco DAC, 6.625%, 11/15/2027 (n) | 2,435,000 | 2,203,628 | ||
| NCL Corp. Ltd., 5.875%, 3/15/2026 (n) | 2,080,000 | 1,799,158 | ||
| NCL Corp. Ltd., 5.875%, 2/15/2027 (n) | 560,000 | 520,660 | ||
| Royal Caribbean Cruises Ltd., 5.375%, 7/15/2027 (n) | 1,440,000 | 1,252,630 | ||
| Royal Caribbean Cruises Ltd., 5.5%, 4/01/2028 (n) | 2,920,000 | 2,511,200 | ||
| SeaWorld Parks & Entertainment, 5.25%, 8/15/2029 (n) | 1,940,000 | 1,753,396 | ||
| $18,790,826 | ||||
| Financial Institutions – 3.2% | ||||
| Avation Capital S.A., 8.25% (8.25% cash or 9% PIK), 10/31/2026 (n)(p) | $ | 1,772,633 | $1,515,601 | |
| Credit Acceptance Corp., 5.125%, 12/31/2024 (n) | 2,735,000 | 2,554,158 | ||
| Global Aircraft Leasing Co. Ltd., 6.5% (6.5% cash or 7.25% PIK), 9/15/2024 (n)(p) | 5,567,595 | 5,080,897 | ||
| Howard Hughes Corp., 4.125%, 2/01/2029 (n) | 3,451,000 | 2,980,008 | ||
| Nationstar Mortgage Holdings, Inc., 6%, 1/15/2027 (n) | 3,669,000 | 3,402,998 | ||
| OneMain Finance Corp., 6.875%, 3/15/2025 | 1,590,000 | 1,585,007 | ||
| OneMain Finance Corp., 7.125%, 3/15/2026 | 2,310,000 | 2,294,881 | ||
| Rocket Mortgage Co-Issuer, Inc., 3.625%, 3/01/2029 (n) | 3,484,000 | 2,939,416 | ||
| SLM Corp., 3.125%, 11/02/2026 | 1,285,000 | 1,134,912 | ||
| $23,487,878 | ||||
| Food & Beverages – 3.0% | ||||
| B&G Foods, Inc., 5.25%, 4/01/2025 | $ | 1,735,000 | $1,581,192 | |
| B&G Foods, Inc., 5.25%, 9/15/2027 | 650,000 | 525,688 | ||
| BellRing Brands, Inc., 7%, 3/15/2030 (n) | 2,900,000 | 2,878,547 | ||
| Lamb Weston Holdings, Inc., 4.125%, 1/31/2030 (n) | 2,910,000 | 2,622,638 | ||
| Performance Food Group Co., 5.5%, 10/15/2027 (n) | 3,240,000 | 3,118,484 | ||
| Post Holdings, Inc., 5.625%, 1/15/2028 (n) | 2,368,000 | 2,279,200 | ||
| Post Holdings, Inc., 4.625%, 4/15/2030 (n) | 3,520,000 | 3,097,600 | ||
| Issuer | Shares/Par | Value ($) | ||
| Bonds – continued | ||||
| Food & Beverages – continued | ||||
| Primo Water Holding, Inc., 4.375%, 4/30/2029 (n) | $ | 3,505,000 | $3,057,201 | |
| U.S. Foods Holding Corp., 4.75%, 2/15/2029 (n) | 3,115,000 | 2,849,584 | ||
| $22,010,134 | ||||
| Gaming & Lodging – 5.0% | ||||
| Boyd Gaming Corp., 4.75%, 12/01/2027 | $ | 1,360,000 | $1,292,908 | |
| Boyd Gaming Corp., 4.75%, 6/15/2031 (n) | 1,250,000 | 1,124,762 | ||
| Caesars Entertainment, Inc., 4.625%, 10/15/2029 (n) | 1,655,000 | 1,415,025 | ||
| Caesars Entertainment, Inc., 7%, 2/15/2030 (n) | 1,784,000 | 1,815,220 | ||
| Caesars Resort Collection LLC/CRC Finco, Inc., 8.125%, 7/01/2027 (n) | 2,516,000 | 2,553,740 | ||
| CCM Merger, Inc., 6.375%, 5/01/2026 (n) | 2,340,000 | 2,263,950 | ||
| Hilton Domestic Operating Co., Inc., 3.75%, 5/01/2029 (n) | 3,517,000 | 3,123,483 | ||
| Hilton Domestic Operating Co., Inc., 3.625%, 2/15/2032 (n) | 3,122,000 | 2,621,699 | ||
| International Game Technology PLC, 4.125%, 4/15/2026 (n) | 3,670,000 | 3,477,410 | ||
| International Game Technology PLC, 6.25%, 1/15/2027 (n) | 830,000 | 830,000 | ||
| Marriott Ownership Resorts, Inc., 4.5%, 6/15/2029 (n) | 1,425,000 | 1,240,476 | ||
| Sands China Ltd., 4.3%, 1/08/2026 | 2,080,000 | 1,972,980 | ||
| Sands China Ltd., 4.875%, 6/18/2030 | 1,960,000 | 1,785,581 | ||
| Scientific Games Holdings LP/Scientific Games US Finco, Inc., 6.625%, 3/01/2030 (n) | 2,232,000 | 1,988,210 | ||
| VICI Properties LP / VICI Note Co., Inc., 4.25%, 12/01/2026 (n) | 2,470,000 | 2,331,065 | ||
| VICI Properties LP / VICI Note Co., Inc., 5.75%, 2/01/2027 (n) | 1,110,000 | 1,104,173 | ||
| Wyndham Hotels & Resorts, Inc., 4.375%, 8/15/2028 (n) | 2,858,000 | 2,635,949 | ||
| Wynn Resorts Finance LLC/Wynn Resorts Capital Corp., 5.125%, 10/01/2029 (n) | 3,210,000 | 2,864,925 | ||
| $36,441,556 | ||||
| Industrial – 1.2% | ||||
| Albion Financing 1 S.à r.l., 6.125%, 10/15/2026 (n) | $ | 1,180,000 | $1,058,727 | |
| Albion Financing 2 S.à r.l., 8.75%, 4/15/2027 (n) | 1,530,000 | 1,296,675 | ||
| APi Escrow Corp., 4.75%, 10/15/2029 (n) | 3,765,000 | 3,356,981 | ||
| Williams Scotsman International, Inc., 4.625%, 8/15/2028 (n) | 3,198,000 | 2,963,123 | ||
| $8,675,506 | ||||
| Insurance - Property & Casualty – 1.2% | ||||
| Alliant Holdings Intermediate LLC, 6.75%, 10/15/2027 (n) | $ | 1,090,000 | $1,019,510 | |
| Alliant Holdings Intermediate LLC/Alliant Holdings Co-Issuer, 5.875%, 11/01/2029 (n) | 30,000 | 26,137 | ||
| AssuredPartners, Inc., 5.625%, 1/15/2029 (n) | 2,440,000 | 2,087,127 | ||
| GTCR (AP) Finance, Inc., 8%, 5/15/2027 (n) | 755,000 | 741,342 | ||
| Hub International Ltd., 5.625%, 12/01/2029 (n) | 3,772,000 | 3,375,457 | ||
| Issuer | Shares/Par | Value ($) | ||
| Bonds – continued | ||||
| Insurance - Property & Casualty – continued | ||||
| Ryan Specialty Group, 4.375%, 2/01/2030 (n) | $ | 1,409,000 | $1,269,861 | |
| $8,519,434 | ||||
| Machinery & Tools – 0.4% | ||||
| Terex Corp., 5%, 5/15/2029 (n) | $ | 3,260,000 | $3,044,025 | |
| Major Banks – 0.3% | ||||
| Toronto Dominion Bank, 8.125% to 10/31/2027, FLR (CMT - 5yr. + 4.075%) to 10/31/2082 | $ | 1,880,000 | $1,995,150 | |
| Medical & Health Technology & Services – 6.5% | ||||
| 180 Medical, Inc., 3.875%, 10/15/2029 (n) | $ | 2,775,000 | $2,459,375 | |
| Avantor Funding, Inc., 4.625%, 7/15/2028 (n) | 3,585,000 | 3,379,185 | ||
| Catalent, Inc., 2.375%, 3/01/2028 | EUR | 895,000 | 805,157 | |
| Catalent, Inc., 3.125%, 2/15/2029 (n) | $ | 5,840,000 | 4,831,082 | |
| Charles River Laboratories International, Inc., 3.75%, 3/15/2029 (n) | 5,110,000 | 4,551,399 | ||
| CHS/Community Health Systems, Inc., 8%, 12/15/2027 (n) | 1,625,000 | 1,531,552 | ||
| CHS/Community Health Systems, Inc., 6.125%, 4/01/2030 (n) | 4,435,000 | 2,666,047 | ||
| CHS/Community Health Systems, Inc., 5.25%, 5/15/2030 (n) | 1,265,000 | 1,020,754 | ||
| DaVita, Inc., 4.625%, 6/01/2030 (n) | 2,970,000 | 2,502,225 | ||
| Encompass Health Corp., 5.75%, 9/15/2025 | 985,000 | 977,616 | ||
| Encompass Health Corp., 4.75%, 2/01/2030 | 2,365,000 | 2,167,901 | ||
| Encompass Health Corp., 4.625%, 4/01/2031 | 435,000 | 382,885 | ||
| IQVIA Holdings, Inc., 5%, 10/15/2026 (n) | 978,000 | 953,550 | ||
| IQVIA Holdings, Inc., 5%, 5/15/2027 (n) | 4,440,000 | 4,308,619 | ||
| Legacy LifePoint Health LLC, 4.375%, 2/15/2027 (n) | 895,000 | 783,125 | ||
| Regional Care/LifePoint Health, Inc., 9.75%, 12/01/2026 (n) | 1,960,000 | 1,718,587 | ||
| Syneos Health, Inc., 3.625%, 1/15/2029 (n) | 4,171,000 | 3,373,296 | ||
| Tenet Healthcare Corp., 6.125%, 10/01/2028 | 4,979,000 | 4,655,763 | ||
| Tenet Healthcare Corp., 4.375%, 1/15/2030 | 853,000 | 758,257 | ||
| Tenet Healthcare Corp., 6.125%, 6/15/2030 (n) | 1,128,000 | 1,094,961 | ||
| U.S. Acute Care Solutions LLC, 6.375%, 3/01/2026 (n) | 2,245,000 | 2,030,827 | ||
| $46,952,163 | ||||
| Medical Equipment – 1.0% | ||||
| Garden SpinCo Corp., 8.625%, 7/20/2030 (n) | $ | 2,720,000 | $2,910,407 | |
| Mozart Debt Merger Sub, Inc., 5.25%, 10/01/2029 (n) | 1,515,000 | 1,268,487 | ||
| Teleflex, Inc., 4.625%, 11/15/2027 | 3,239,000 | 3,092,314 | ||
| $7,271,208 | ||||
| Metals & Mining – 3.9% | ||||
| Baffinland Iron Mines Corp./Baffinland Iron Mines LP, 8.75%, 7/15/2026 (n) | $ | 2,900,000 | $2,816,227 | |
| Coeur Mining, Inc., 5.125%, 2/15/2029 (n) | 3,089,000 | 2,487,274 | ||
| Compass Minerals International, Inc., 6.75%, 12/01/2027 (n) | 2,694,000 | 2,628,382 | ||
| Issuer | Shares/Par | Value ($) | ||
| Bonds – continued | ||||
| Metals & Mining – continued | ||||
| Eldorado Gold Corp., 6.25%, 9/01/2029 (n) | $ | 1,570,000 | $1,438,729 | |
| Ero Copper Corp., 6.5%, 2/15/2030 (n) | 1,757,000 | 1,496,371 | ||
| FMG Resources Ltd., 4.375%, 4/01/2031 (n) | 4,625,000 | 4,070,000 | ||
| GrafTech Finance, Inc., 4.625%, 12/15/2028 (n) | 3,119,000 | 2,658,255 | ||
| Kaiser Aluminum Corp., 4.625%, 3/01/2028 (n) | 3,771,000 | 3,442,923 | ||
| Kaiser Aluminum Corp., 4.5%, 6/01/2031 (n) | 846,000 | 715,386 | ||
| Novelis Corp., 3.25%, 11/15/2026 (n) | 1,250,000 | 1,131,650 | ||
| Novelis Corp., 4.75%, 1/30/2030 (n) | 2,985,000 | 2,701,425 | ||
| Novelis Corp., 3.875%, 8/15/2031 (n) | 1,367,000 | 1,153,748 | ||
| Petra Diamonds US$ Treasury PLC, 10.5% (10.5% PIK/9.75% Cash to 6/30/2023), 9.75% Cash to 3/08/2026 (n)(p) | 1,452,817 | 1,409,233 | ||
| TMS International Corp., 6.25%, 4/15/2029 (n) | 685,000 | 514,530 | ||
| $28,664,133 | ||||
| Midstream – 4.6% | ||||
| Cheniere Energy Partners LP, 4.5%, 10/01/2029 | $ | 1,944,000 | $1,823,705 | |
| DT Midstream, Inc., 4.125%, 6/15/2029 (n) | 2,253,000 | 1,977,008 | ||
| DT Midstream, Inc., 4.375%, 6/15/2031 (n) | 3,493,000 | 3,055,404 | ||
| EQM Midstream Partners LP, 6%, 7/01/2025 (n) | 247,000 | 243,174 | ||
| EQM Midstream Partners LP, 6.5%, 7/01/2027 (n) | 246,000 | 241,574 | ||
| EQM Midstream Partners LP, 5.5%, 7/15/2028 | 6,209,000 | 5,727,803 | ||
| EQM Midstream Partners LP, 4.5%, 1/15/2029 (n) | 1,105,000 | 969,151 | ||
| Genesis Energy LP/Genesis Energy Finance Corp., 8%, 1/15/2027 | 857,000 | 846,030 | ||
| Genesis Energy LP/Genesis Energy Finance Corp., 8.875%, 4/15/2030 | 2,139,000 | 2,173,759 | ||
| Kinetik Holdings, Inc., 5.875%, 6/15/2030 (n) | 4,248,000 | 4,035,600 | ||
| Tallgrass Energy Partners LP, 5.5%, 1/15/2028 (n) | 3,825,000 | 3,522,385 | ||
| Targa Resources Partners LP/Targa Resources Finance Corp., 6.875%, 1/15/2029 | 2,905,000 | 2,983,406 | ||
| Venture Global Calcasieu Pass LLC, 3.875%, 8/15/2029 (n) | 3,375,000 | 3,003,750 | ||
| Venture Global Calcasieu Pass LLC, 4.125%, 8/15/2031 (n) | 2,230,000 | 1,977,029 | ||
| Venture Global Calcasieu Pass LLC , 6.25%, 1/15/2030 (n) | 605,000 | 616,362 | ||
| $33,196,140 | ||||
| Network & Telecom – 0.4% | ||||
| Iliad Holding S.A.S., 7%, 10/15/2028 (n) | $ | 3,207,000 | $3,011,950 | |
| Oil Services – 0.5% | ||||
| Nabors Industries Ltd., 7.25%, 1/15/2026 (n) | $ | 1,950,000 | $1,896,375 | |
| Solaris Midstream Holding LLC, 7.625%, 4/01/2026 (n) | 1,864,000 | 1,864,000 | ||
| $3,760,375 | ||||
| Issuer | Shares/Par | Value ($) | ||
| Bonds – continued | ||||
| Oils – 0.7% | ||||
| Parkland Corp., 4.625%, 5/01/2030 (n) | $ | 4,470,000 | $3,842,420 | |
| PBF Holding Co. LLC/PBF Finance Corp., 6%, 2/15/2028 | 1,500,000 | 1,414,260 | ||
| $5,256,680 | ||||
| Personal Computers & Peripherals – 0.6% | ||||
| NCR Corp., 5%, 10/01/2028 (n) | $ | 2,840,000 | $2,501,643 | |
| NCR Corp., 5.125%, 4/15/2029 (n) | 1,793,000 | 1,561,800 | ||
| $4,063,443 | ||||
| Pharmaceuticals – 1.7% | ||||
| 1375209 BC Ltd., 9%, 1/30/2028 (n) | $ | 1,495,000 | $1,318,830 | |
| Bausch Health Co., Inc., 11%, 9/30/2028 (n) | 1,873,000 | 1,465,435 | ||
| Bausch Health Co., Inc., 14%, 10/15/2030 (n) | 375,000 | 234,082 | ||
| Jazz Securities DAC, 4.375%, 1/15/2029 (n) | 4,390,000 | 4,005,173 | ||
| Organon Finance 1 LLC, 4.125%, 4/30/2028 (n) | 3,256,000 | 2,944,889 | ||
| Organon Finance 1 LLC, 5.125%, 4/30/2031 (n) | 2,351,000 | 2,122,460 | ||
| $12,090,869 | ||||
| Pollution Control – 1.0% | ||||
| GFL Environmental, Inc., 4.25%, 6/01/2025 (n) | $ | 550,000 | $530,396 | |
| GFL Environmental, Inc., 4%, 8/01/2028 (n) | 2,825,000 | 2,507,894 | ||
| GFL Environmental, Inc., 4.75%, 6/15/2029 (n) | 1,000,000 | 902,540 | ||
| GFL Environmental, Inc., 4.375%, 8/15/2029 (n) | 985,000 | 873,518 | ||
| Stericycle, Inc., 3.875%, 1/15/2029 (n) | 2,695,000 | 2,391,166 | ||
| $7,205,514 | ||||
| Precious Metals & Minerals – 0.6% | ||||
| IAMGOLD Corp., 5.75%, 10/15/2028 (n) | $ | 2,680,000 | $2,118,004 | |
| Taseko Mines Ltd., 7%, 2/15/2026 (n) | 2,115,000 | 2,003,962 | ||
| $4,121,966 | ||||
| Printing & Publishing – 0.3% | ||||
| Cimpress N.V., 7%, 6/15/2026 (n) | $ | 2,965,000 | $2,058,582 | |
| Real Estate - Healthcare – 0.4% | ||||
| MPT Operating Partnership LP/MPT Finance Corp., REIT, 0.993%, 10/15/2026 | EUR | 655,000 | $530,003 | |
| MPT Operating Partnership LP/MPT Finance Corp., REIT, 5%, 10/15/2027 | $ | 2,752,000 | 2,326,362 | |
| $2,856,365 | ||||
| Real Estate - Other – 0.3% | ||||
| XHR LP, REIT, 4.875%, 6/01/2029 (n) | $ | 2,810,000 | $2,493,875 | |
| Issuer | Shares/Par | Value ($) | ||
| Bonds – continued | ||||
| Restaurants – 0.3% | ||||
| Fertitta Entertainment LLC, 6.75%, 1/15/2030 (n) | $ | 2,430,000 | $2,016,900 | |
| Retailers – 1.4% | ||||
| Asbury Automotive Group, Inc., 4.625%, 11/15/2029 (n) | $ | 2,967,000 | $2,618,199 | |
| Bath & Body Works, Inc., 5.25%, 2/01/2028 | 5,395,000 | 5,092,399 | ||
| Victoria's Secret & Co., 4.625%, 7/15/2029 (n) | 2,718,000 | 2,257,951 | ||
| $9,968,549 | ||||
| Specialty Chemicals – 0.2% | ||||
| Univar Solutions USA, Inc., 5.125%, 12/01/2027 (n) | $ | 1,406,000 | $1,359,502 | |
| Specialty Stores – 1.3% | ||||
| Group 1 Automotive, Inc., 4%, 8/15/2028 (n) | $ | 2,796,000 | $2,458,970 | |
| Michael Cos., Inc., 5.25%, 5/01/2028 (n) | 1,315,000 | 1,096,592 | ||
| Michael Cos., Inc., 7.875%, 5/01/2029 (n) | 1,855,000 | 1,409,800 | ||
| Penske Automotive Group Co., 3.75%, 6/15/2029 | 2,960,000 | 2,503,068 | ||
| PetSmart, Inc./PetSmart Finance Corp., 7.75%, 2/15/2029 (n) | 2,165,000 | 2,127,634 | ||
| $9,596,064 | ||||
| Supermarkets – 0.6% | ||||
| Albertsons Cos. LLC/Safeway, Inc., 4.625%, 1/15/2027 (n) | $ | 2,509,000 | $2,378,657 | |
| Albertsons Cos. LLC/Safeway, Inc., 3.5%, 3/15/2029 (n) | 2,190,000 | 1,888,875 | ||
| $4,267,532 | ||||
| Telecommunications - Wireless – 2.3% | ||||
| Altice France S.A., 6%, 2/15/2028 (n) | $ | 3,610,000 | $2,435,708 | |
| Cellnex Finance Co. S.A., 3.875%, 7/07/2041 (n) | 1,390,000 | 1,026,038 | ||
| SBA Communications Corp., 3.875%, 2/15/2027 | 2,398,000 | 2,214,639 | ||
| SBA Communications Corp., 3.125%, 2/01/2029 | 4,360,000 | 3,693,716 | ||
| Sprint Capital Corp., 6.875%, 11/15/2028 | 4,295,000 | 4,594,949 | ||
| Sprint Corp., 7.625%, 3/01/2026 | 2,331,000 | 2,465,421 | ||
| $16,430,471 | ||||
| Tobacco – 0.2% | ||||
| Vector Group Ltd., 5.75%, 2/01/2029 (n) | $ | 1,550,000 | $1,351,585 | |
| Utilities - Electric Power – 3.0% | ||||
| Calpine Corp., 4.5%, 2/15/2028 (n) | $ | 3,148,000 | $2,904,849 | |
| Calpine Corp., 5.125%, 3/15/2028 (n) | 3,405,000 | 3,082,923 | ||
| Clearway Energy Operating LLC, 4.75%, 3/15/2028 (n) | 1,270,000 | 1,197,864 | ||
| Clearway Energy Operating LLC, 3.75%, 2/15/2031 (n) | 5,595,000 | 4,726,824 | ||
| NextEra Energy, Inc., 4.25%, 7/15/2024 (n) | 222,000 | 216,819 | ||
| NextEra Energy, Inc., 4.25%, 9/15/2024 (n) | 488,000 | 455,060 | ||
| NextEra Energy, Inc., 4.5%, 9/15/2027 (n) | 2,075,000 | 1,953,032 | ||
| TerraForm Global Operating LLC, 6.125%, 3/01/2026 (n) | 2,345,000 | 2,221,887 | ||
| Issuer | Shares/Par | Value ($) | ||
| Bonds – continued | ||||
| Utilities - Electric Power – continued | ||||
| TerraForm Power Operating LLC, 5%, 1/31/2028 (n) | $ | 3,995,000 | $3,752,593 | |
| TerraForm Power Operating LLC, 4.75%, 1/15/2030 (n) | 1,505,000 | 1,354,474 | ||
| $21,866,325 | ||||
| Total Bonds (Identified Cost, $765,119,243) | $698,593,872 | |||
| Common Stocks – 0.3% | ||||
| Cable TV – 0.1% | ||||
| Intelsat Emergence S.A. (a) | 35,312 | $812,176 | ||
| Construction – 0.0% | ||||
| ICA Tenedora S.A. de C.V. (a)(u) | 258,532 | $233,400 | ||
| Oil Services – 0.2% | ||||
| LTRI Holdings LP (a)(u) | 3,300 | $1,105,632 | ||
| Total Common Stocks (Identified Cost, $2,353,280) | $2,151,208 | |||
| Contingent Value Rights – 0.0% | ||||
| Cable TV – 0.0% | ||||
| Intelsat Jackson Holdings S.A. - Series A, 12/05/2025 (a) | 3,697 | $21,258 | ||
| Intelsat Jackson Holdings S.A. - Series B, 12/05/2025 (a) | 3,697 | 13,864 | ||
| Total Contingent Value Rights (Identified Cost, $0) | $35,122 | |||
| Strike Price | First Exercise | |||
| Warrants – 0.0% | ||||
| Other Banks & Diversified Financials – 0.0% | ||||
| Avation Capital S.A. (1 share for 1 warrant, Expiration 10/31/26) (a) (Identified Cost, $0) | GBP 1.14 | 3/16/21 | 42,350 | $18,274 |
| Investment Companies (h) – 2.2% | ||||
| Money Market Funds – 2.2% | ||||
| MFS Institutional Money Market Portfolio, 4.29% (v) (Identified Cost, $16,164,003) | 16,163,708 | $16,165,324 | ||
| Other Assets, Less Liabilities – 1.3% | 9,651,281 | |||
| Net Assets – 100.0% | $726,615,081 | |||
| (a) | Non-income producing security. | |||
| (h) | An affiliated issuer, which may be considered one in which the fund owns 5% or more of the outstanding voting securities, or a company which is under common control. At period end, the aggregate values of the fund's investments in affiliated issuers and in unaffiliated issuers were $16,165,324 and $700,798,476, respectively. |
| (n) | Securities exempt from registration under Rule 144A of the Securities Act of 1933. These securities may be sold in the ordinary course of business in transactions exempt from registration, normally to qualified institutional buyers. At period end, the aggregate value of these securities was $590,487,813, representing 81.3% of net assets. | |||
| (p) | Payment-in-kind (PIK) security for which interest income may be received in additional securities and/or cash. | |||
| (u) | The security was valued using significant unobservable inputs and is considered level 3 under the fair value hierarchy. For further information about the fund’s level 3 holdings, please see Note 2 in the Notes to Financial Statements. | |||
| (v) | Affiliated issuer that is available only to investment companies managed by MFS. The rate quoted for the MFS Institutional Money Market Portfolio is the annualized seven-day yield of the fund at period end. |
| The following abbreviations are used in this report and are defined: | |
| CMT | Constant Maturity Treasury |
| FLR | Floating Rate. Interest rate resets periodically based on the parenthetically disclosed reference rate plus a spread (if any). The period-end rate reported may not be the current rate. All reference rates are USD unless otherwise noted. |
| REIT | Real Estate Investment Trust |
| Abbreviations indicate amounts shown in currencies other than the U.S. dollar. All amounts are stated in U.S. dollars unless otherwise indicated. A list of abbreviations is shown below: | |
| EUR | Euro |
| GBP | British Pound |
| Forward Foreign Currency Exchange Contracts | ||||||
| Currency Purchased | Currency Sold | Counterparty | Settlement Date | Unrealized Appreciation (Depreciation) | ||
| Liability Derivatives | ||||||
| GBP | 197,752 | USD | 244,477 | State Street Bank Corp. | 4/21/2023 | $(270) |
| USD | 4,086,856 | EUR | 3,763,474 | State Street Bank Corp. | 4/21/2023 | (24,304) |
| $(24,574) | ||||||
| Futures Contracts | ||||||
| Description | Long/ Short | Currency | Contracts | Notional Amount | Expiration Date | Value/Unrealized Appreciation (Depreciation) |
| Asset Derivatives | ||||||
| Interest Rate Futures | ||||||
| U.S. Treasury Bond | Long | USD | 30 | $3,896,250 | March – 2023 | $100,671 |
| U.S. Treasury Ultra Bond | Long | USD | 6 | 850,500 | March – 2023 | 36,400 |
| $137,071 | ||||||
| Liability Derivatives | ||||||
| Interest Rate Futures | ||||||
| U.S. Treasury Note 10 yr | Short | USD | 167 | $19,124,109 | March – 2023 | $(243,408) |
| Assets | |
| Investments in unaffiliated issuers, at value (identified cost, $767,472,523) | $700,798,476 |
| Investments in affiliated issuers, at value (identified cost, $16,164,003) | 16,165,324 |
| Cash | 32,712 |
| Deposits with brokers for | |
| Futures contracts | 218,400 |
| Receivables for | |
| Investments sold | 1,127,354 |
| Fund shares sold | 929,419 |
| Interest and dividends | 10,822,241 |
| Other assets | 2,683 |
| Total assets | $730,096,609 |
| Liabilities | |
| Payable to custodian | $32,044 |
| Payables for | |
| Forward foreign currency exchange contracts | 24,574 |
| Net daily variation margin on open futures contracts | 36,891 |
| Investments purchased | 2,210,021 |
| Fund shares reacquired | 1,110,362 |
| Payable to affiliates | |
| Administrative services fee | 94 |
| Shareholder servicing costs | 12 |
| Accrued expenses and other liabilities | 67,530 |
| Total liabilities | $3,481,528 |
| Net assets | $726,615,081 |
| Net assets consist of | |
| Paid-in capital | $875,791,634 |
| Total distributable earnings (loss) | (149,176,553) |
| Net assets | $726,615,081 |
| Shares of beneficial interest outstanding | 90,226,348 |
| Net asset value per share (net assets of $726,615,081 / 90,226,348 shares of beneficial interest outstanding) | $8.05 |
| Net investment income (loss) | |
| Income | |
| Interest | $46,155,310 |
| Dividends from affiliated issuers | 260,507 |
| Other | 141,908 |
| Dividends | 44,861 |
| Total investment income | $46,602,586 |
| Expenses | |
| Shareholder servicing costs | $40 |
| Administrative services fee | 17,500 |
| Custodian fee | 48,471 |
| Shareholder communications | 4,071 |
| Audit and tax fees | 47,847 |
| Legal fees | 4,443 |
| Pricing service fees | 8,381 |
| Form N-CEN/N-PORT preparation fees | 9,800 |
| Miscellaneous | 20,035 |
| Total expenses | $160,588 |
| Fees paid indirectly | (611) |
| Net expenses | $159,977 |
| Net investment income (loss) | $46,442,609 |
| Realized and unrealized gain (loss) | |
| Realized gain (loss) (identified cost basis) | |
| Unaffiliated issuers | $(36,483,467) |
| Affiliated issuers | (47) |
| Futures contracts | 1,028,422 |
| Forward foreign currency exchange contracts | (117,014) |
| Foreign currency | (2,501) |
| Net realized gain (loss) | $(35,574,607) |
| Change in unrealized appreciation or depreciation | |
| Unaffiliated issuers | $(55,269,591) |
| Affiliated issuers | 1,267 |
| Futures contracts | (92,910) |
| Forward foreign currency exchange contracts | (39,113) |
| Translation of assets and liabilities in foreign currencies | 2,989 |
| Net unrealized gain (loss) | $(55,397,358) |
| Net realized and unrealized gain (loss) | $(90,971,965) |
| Change in net assets from operations | $(44,529,356) |
| Year ended | ||
| 1/31/23 | 1/31/22 | |
| Change in net assets | ||
| From operations | ||
| Net investment income (loss) | $46,442,609 | $55,880,477 |
| Net realized gain (loss) | (35,574,607) | 34,227,423 |
| Net unrealized gain (loss) | (55,397,358) | (72,488,956) |
| Change in net assets from operations | $(44,529,356) | $17,618,944 |
| Total distributions to shareholders | $(47,089,882) | $(60,026,693) |
| Change in net assets from fund share transactions | $(179,131,688) | $(188,544,337) |
| Total change in net assets | $(270,750,926) | $(230,952,086) |
| Net assets | ||
| At beginning of period | 997,366,007 | 1,228,318,093 |
| At end of period | $726,615,081 | $997,366,007 |
| Year ended | |||||
| 1/31/23 | 1/31/22 | 1/31/21 | 1/31/20 | 1/31/19 | |
| Net asset value, beginning of period | $8.88 | $9.25 | $9.33 | $8.94 | $9.31 |
| Income (loss) from investment operations | |||||
| Net investment income (loss) (d) | $0.47 | $0.47 | $0.50 | $0.51 | $0.52 |
| Net realized and unrealized gain (loss) | (0.82) | (0.34) | (0.06)(g) | 0.39 | (0.36) |
| Total from investment operations | $(0.35) | $0.13 | $0.44 | $0.90 | $0.16 |
| Less distributions declared to shareholders | |||||
| From net investment income | $(0.48) | $(0.50) | $(0.52) | $(0.51) | $(0.53) |
| Net asset value, end of period (x) | $8.05 | $8.88 | $9.25 | $9.33 | $8.94 |
| Total return (%) (s)(x) | (3.84) | 1.39 | 5.02 | 10.29 | 1.86 |
| Ratios (%) (to average net assets) and Supplemental data: | |||||
| Expenses (f) | 0.02 | 0.02 | 0.02 | 0.02 | 0.02 |
| Net investment income (loss) | 5.77 | 5.09 | 5.58 | 5.51 | 5.77 |
| Portfolio turnover | 25 | 60 | 66 | 59 | 38 |
| Net assets at end of period (000 omitted) | $726,615 | $997,366 | $1,228,318 | $889,031 | $788,437 |
| (d) | Per share data is based on average shares outstanding. |
| (f) | Ratios do not reflect reductions from fees paid indirectly, if applicable. See Note 2 in the Notes to Financial Statements for additional information. |
| (g) | The per share amount varies from the net realized and unrealized gain/loss for the period because of the timing of sales of fund shares and the per share amount of realized and unrealized gains and losses at such time. |
| (s) | From time to time the fund may receive proceeds from litigation settlements, without which performance would be lower. |
| (x) | The net asset values and total returns have been calculated on net assets which include adjustments made in accordance with U.S. generally accepted accounting principles required at period end for financial reporting purposes. |
| Financial Instruments | Level 1 | Level 2 | Level 3 | Total |
| Equity Securities: | ||||
| United States | $— | $— | $1,105,632 | $1,105,632 |
| Luxembourg | — | 847,298 | — | 847,298 |
| Mexico | — | — | 233,400 | 233,400 |
| United Kingdom | — | 18,274 | — | 18,274 |
| U.S. Corporate Bonds | — | 595,898,832 | — | 595,898,832 |
| Foreign Bonds | — | 102,695,040 | — | 102,695,040 |
| Mutual Funds | 16,165,324 | — | — | 16,165,324 |
| Total | $16,165,324 | $699,459,444 | $1,339,032 | $716,963,800 |
| Other Financial Instruments | ||||
| Futures Contracts – Assets | $137,071 | $— | $— | $137,071 |
| Futures Contracts – Liabilities | (243,408) | — | — | (243,408) |
| Forward Foreign Currency Exchange Contracts – Liabilities | — | (24,574) | — | (24,574) |
| Equity Securities | |
| Balance as of 1/31/22 | $1,168,929 |
| Change in unrealized appreciation or depreciation | 188,377 |
| Transfers out of level 3 | (18,274) |
| Balance as of 1/31/23 | $1,339,032 |
| Fair Value (a) | |||
| Risk | Derivative Contracts | Asset Derivatives | Liability Derivatives |
| Interest Rate | Futures Contracts | $137,071 | $(243,408) |
| Foreign Exchange | Forward Foreign Currency Exchange Contracts | — | (24,574) |
| Total | $137,071 | $(267,982) | |
| (a) | Values presented in this table for futures contracts correspond to the values reported in the Portfolio of Investments. Only the current day net variation margin for futures contracts is reported separately within the Statement of Assets and Liabilities. |
| Risk | Futures Contracts | Forward Foreign Currency Exchange Contracts |
| Interest Rate | $1,028,422 | $— |
| Foreign Exchange | — | (117,014) |
| Total | $1,028,422 | $(117,014) |
| Risk | Futures Contracts | Forward Foreign Currency Exchange Contracts |
| Interest Rate | $(92,910) | $— |
| Foreign Exchange | — | (39,113) |
| Total | $(92,910) | $(39,113) |
| Year ended 1/31/23 | Year ended 1/31/22 | |
| Ordinary income (including any short-term capital gains) | $47,089,882 | $60,026,693 |
| As of 1/31/23 | |
| Cost of investments | $786,090,110 |
| Gross appreciation | 5,793,531 |
| Gross depreciation | (75,050,752) |
| Net unrealized appreciation (depreciation) | $(69,257,221) |
| Undistributed ordinary income | 3,909,051 |
| Capital loss carryforwards | (79,955,813) |
| Other temporary differences | (3,872,570) |
| Total distributable earnings (loss) | $(149,176,553) |
| Short-Term | $(12,341,397) |
| Long-Term | (67,614,416) |
| Total | $(79,955,813) |
| Year ended 1/31/23 | Year ended 1/31/22 | ||||
| Shares | Amount | Shares | Amount | ||
| Shares sold | 4,236,645 | $34,051,394 | 3,868,865 | $35,660,117 | |
| Shares issued to shareholders in reinvestment of distributions | 5,845,303 | 47,089,882 | 6,526,801 | 60,026,693 | |
| Shares reacquired | (32,206,489) | (260,272,964) | (30,844,235) | (284,231,147) | |
| Net change | (22,124,541) | $(179,131,688) | (20,448,569) | $(188,544,337) | |
| Affiliated Issuers | Beginning Value | Purchases | Sales Proceeds | Realized Gain (Loss) | Change in Unrealized Appreciation or Depreciation | Ending Value |
| MFS Institutional Money Market Portfolio | $24,340,223 | $194,376,429 | $202,552,548 | $(47) | $1,267 | $16,165,324 |
| Affiliated Issuers | Dividend Income | Capital Gain Distributions |
| MFS Institutional Money Market Portfolio | $260,507 | $— |
March 17, 2023
| Name, Age | Position(s) Held with Fund | Trustee/Officer Since(h) | Number of MFS Funds overseen by the Trustee | Principal Occupations During the Past Five Years | Other Directorships During the Past Five Years (j) | |||||
| INTERESTED TRUSTEE | ||||||||||
| Michael W. Roberge (k) (age 56) | Trustee | January 2021 | 136 | Massachusetts Financial Services Company, Chairman (since January 2021); Chief Executive Officer (since January 2017); Director; Chairman of the Board (since January 2022); President (until December 2018); Chief Investment Officer (until December 2018) | N/A | |||||
| INDEPENDENT TRUSTEES | ||||||||||
| John P. Kavanaugh (age 68) | Trustee and Chair of Trustees | January 2009 | 136 | Private investor | N/A | |||||
| Steven E. Buller (age 71) | Trustee | February 2014 | 136 | Private investor | N/A | |||||
| John A. Caroselli (age 68) | Trustee | March 2017 | 136 | Private investor; JC Global Advisors, LLC (management consulting), President (since 2015) | N/A | |||||
| Maureen R. Goldfarb (age 67) | Trustee | January 2009 | 136 | Private investor | N/A | |||||
| Peter D. Jones (age 67) | Trustee | January 2019 | 136 | Private investor | N/A | |||||
| James W. Kilman, Jr. (age 61) | Trustee | January 2019 | 136 | Burford Capital Limited (finance and investment management), Senior Advisor (since May 3, 2021), Chief Financial Officer (2019 - May 2, 2021); KielStrand Capital LLC (family office), Chief Executive Officer (since 2016) | Alpha-En Corporation, Director (2016-2019) |
| Name, Age | Position(s) Held with Fund | Trustee/Officer Since(h) | Number of MFS Funds overseen by the Trustee | Principal Occupations During the Past Five Years | Other Directorships During the Past Five Years (j) | |||||
| Clarence Otis, Jr. (age 66) | Trustee | March 2017 | 136 | Private investor | VF Corporation, Director; Verizon Communications, Inc., Director; The Travelers Companies, Director | |||||
| Maryanne L. Roepke (age 67) | Trustee | May 2014 | 136 | Private investor | N/A | |||||
| Laurie J. Thomsen (age 65) | Trustee | March 2005 | 136 | Private investor | The Travelers Companies, Director; Dycom Industries, Inc., Director |
| Name, Age | Position(s) Held with Fund | Trustee/Officer Since(h) | Number of MFS Funds for which the Person is an Officer | Principal Occupations During the Past Five Years | ||||
| OFFICERS | ||||||||
| Christopher R. Bohane (k) (age 49) | Assistant Secretary and Assistant Clerk | July 2005 | 136 | Massachusetts Financial Services Company, Senior Vice President and Senior Managing Counsel | ||||
| Kino Clark (k) (age 54) | Assistant Treasurer | January 2012 | 136 | Massachusetts Financial Services Company, Vice President | ||||
| John W. Clark, Jr. (k) (age 55) | Assistant Treasurer | April 2017 | 136 | Massachusetts Financial Services Company, Vice President | ||||
| David L. DiLorenzo (k) (age 54) | President | July 2005 | 136 | Massachusetts Financial Services Company, Senior Vice President | ||||
| Heidi W. Hardin (k) (age 55) | Secretary and Clerk | April 2017 | 136 | Massachusetts Financial Services Company, Executive Vice President and General Counsel | ||||
| Brian E. Langenfeld (k) (age 49) | Assistant Secretary and Assistant Clerk | June 2006 | 136 | Massachusetts Financial Services Company, Vice President and Managing Counsel |
| Name, Age | Position(s) Held with Fund | Trustee/Officer Since(h) | Number of MFS Funds for which the Person is an Officer | Principal Occupations During the Past Five Years | ||||
| Rosa E. Licea-Mailloux (k) (age 46) | Chief Compliance Officer | March 2022 | 136 | Massachusetts Financial Services Company, Vice President (since 2018); Director of Corporate Compliance (2018-2021), Senior Director Compliance (2021-2022), Senior Managing Director of North American Compliance & Chief Compliance Officer (since March 2022); Natixis Investment Managers (investment management), Funds Chief Compliance Officer, Deputy General Counsel & Senior Vice President (until 2018) | ||||
| Amanda S. Mooradian (k) (age 44) | Assistant Secretary and Assistant Clerk | September 2018 | 136 | Massachusetts Financial Services Company, Assistant Vice President and Senior Counsel | ||||
| Susan A. Pereira (k) (age 52) | Assistant Secretary and Assistant Clerk | July 2005 | 136 | Massachusetts Financial Services Company, Vice President and Managing Counsel | ||||
| Kasey L. Phillips (k) (age 52) | Assistant Treasurer | September 2012 | 136 | Massachusetts Financial Services Company, Vice President | ||||
| Matthew A. Stowe (k) (age 48) | Assistant Secretary and Assistant Clerk | October 2014 | 136 | Massachusetts Financial Services Company, Vice President and Senior Managing Counsel | ||||
| William B. Wilson (k) (age 40) | Assistant Secretary and Assistant Clerk | October 2022 | 136 | Massachusetts Financial Services Company, Assistant Vice President and Senior Counsel | ||||
| James O. Yost (k) (age 62) | Treasurer | September 1990 | 136 | Massachusetts Financial Services Company, Senior Vice President |
| (h) | Date first appointed to serve as Trustee/Officer of an MFS Fund. Each Trustee has served continuously since appointment unless indicated otherwise. From January 2012 through December 2016, Messrs. DiLorenzo and Yost served as Treasurer and Deputy Treasurer of the Funds, respectively. |
| (j) | Directorships or trusteeships of companies required to report to the Securities and Exchange Commission (i.e., “public companies”). |
| (k) | “Interested person” of the Trust within the meaning of the Investment Company Act of 1940 (referred to as the 1940 Act), which is the principal federal law governing investment companies like the fund, as a result of a position with MFS. The address of MFS is 111 Huntington Avenue, Boston, Massachusetts 02199-7618. |
| Investment Adviser | Custodian |
| Massachusetts Financial Services Company 111 Huntington Avenue Boston, MA 02199-7618 | JPMorgan Chase Bank, NA 4 Metrotech Center New York, NY 11245 |
| Distributor | Independent Registered Public Accounting Firm |
| MFS Fund Distributors, Inc. 111 Huntington Avenue Boston, MA 02199-7618 | Deloitte & Touche LLP 200 Berkeley Street Boston, MA 02116 |
| Portfolio Manager(s) | |
| David Cole Michael Skatrud |
| FACTS | WHAT DOES MFS DO WITH YOUR PERSONAL INFORMATION? |
| Why? | Financial companies choose how they share your personal information. Federal law gives consumers the right to limit some but not all sharing. Federal law also requires us to tell you how we collect, share, and protect your personal information. Please read this notice carefully to understand what we do. |
| What? | The types of personal information we collect and share depend on the product or service you have with us. This information can include: |
| • Social Security number and account balances | |
| • Account transactions and transaction history | |
| • Checking account information and wire transfer instructions | |
| When you are no longer our customer, we continue to share your information as described in this notice. |
| How? | All financial companies need to share customers' personal information to run their everyday business. In the section below, we list the reasons financial companies can share their customers' personal information; the reasons MFS chooses to share; and whether you can limit this sharing. |
| Reasons we can share your personal information | Does MFS share? | Can you limit this sharing? |
| For our everyday business purposes – such as to process your transactions, maintain your account(s), respond to court orders and legal investigations, or report to credit bureaus | Yes | No |
| For our marketing purposes – to offer our products and services to you | No | We don't share |
| For joint marketing with other financial companies | No | We don't share |
| For our affiliates' everyday business purposes – information about your transactions and experiences | No | We don't share |
| For our affiliates' everyday business purposes – information about your creditworthiness | No | We don't share |
| For nonaffiliates to market to you | No | We don't share |
| Questions? | Call 800-225-2606 or go to mfs.com. |

| Who we are | |
| Who is providing this notice? | MFS Funds, MFS Investment Management, MFS Institutional Advisors, Inc., and MFS Heritage Trust Company. |
| What we do | |
| How does MFS protect my personal information? | To protect your personal information from unauthorized access and use, we use security measures that comply with federal law. These measures include procedural, electronic, and physical safeguards for the protection of the personal information we collect about you. |
| How does MFS collect my personal information? | We collect your personal information, for example, when you |
| • open an account or provide account information | |
| • direct us to buy securities or direct us to sell your securities | |
| • make a wire transfer | |
| We also collect your personal information from others, such as credit bureaus, affiliates, or other companies. | |
| Why can't I limit all sharing? | Federal law gives you the right to limit only |
| • sharing for affiliates' everyday business purposes – information about your creditworthiness | |
| • affiliates from using your information to market to you | |
| • sharing for nonaffiliates to market to you | |
| State laws and individual companies may give you additional rights to limit sharing. | |
| Definitions | |
| Affiliates | Companies related by common ownership or control. They can be financial and nonfinancial companies. |
| • MFS does not share personal information with affiliates, except for everyday business purposes as described on page one of this notice. | |
| Nonaffiliates | Companies not related by common ownership or control. They can be financial and nonfinancial companies. |
| • MFS does not share with nonaffiliates so they can market to you. | |
| Joint marketing | A formal agreement between nonaffiliated financial companies that together market financial products or services to you. |
| • MFS doesn't jointly market. | |
| Other important information |
| If you own an MFS product or receive an MFS service in the name of a third party such as a bank or broker-dealer, their privacy policy may apply to you instead of ours. |


| 1 | |
| 2 | |
| 4 | |
| 6 | |
| 9 | |
| 11 | |
| 18 | |
| 20 | |
| 22 | |
| 23 | |
| 29 | |
| 44 | |
| 46 | |
| 50 | |
| 50 | |
| 50 | |
| 50 | |
| 50 | |
| 51 |
| back cover |


| Utilities - Electrical Power | 6.6% |
| Cable TV | 6.5% |
| Wireless Communications | 4.9% |
| Medical & Health Technology & Services | 4.7% |
| Gaming & Lodging | 4.1% |
| BBB | 1.5% |
| BB | 48.0% |
| B | 34.7% |
| CCC | 12.6% |
| Not Rated | (1.0)% |
| Non-Fixed Income | 0.3% |
| Cash & Cash Equivalents | 2.7% |
| Other | 1.2% |
| Average Duration (d) | 3.9 |
| Average Effective Maturity (m) | 5.6 yrs. |
| United States | 57.9% |
| United Kingdom | 3.7% |
| Mexico | 3.4% |
| Canada | 3.0% |
| Brazil | 2.8% |
| France | 2.7% |
| Netherlands | 2.4% |
| Spain | 2.2% |
| Italy | 2.1% |
| Other Countries | 19.8% |
| (a) | For all securities other than those specifically described below, ratings are assigned to underlying securities utilizing ratings from Moody’s, Fitch, and Standard & Poor’s rating agencies and applying the following hierarchy: If all three agencies provide a rating, the middle rating (after dropping the highest and lowest ratings) is assigned; if two of the three agencies rate a security, the lower of the two is assigned. If none of the 3 rating agencies above assign a rating, but the security is rated by DBRS Morningstar, then the DBRS Morningstar rating is assigned. If none of the 4 rating agencies listed above rate the security, but the security is rated by the Kroll Bond Rating Agency (KBRA), then the KBRA rating is assigned. Ratings are shown in the S&P and Fitch scale (e.g., AAA). Securities rated BBB or higher are considered investment grade. All ratings are subject to change. Not Rated includes fixed income securities and fixed income derivatives that have not been rated by any rating agency. Non-Fixed Income includes equity securities (including convertible bonds and equity derivatives), ETFs, and/or commodity-linked derivatives. The fund may or may not have held all of these instruments on this date. The fund is not rated by these agencies. |
| (d) | Duration is a measure of how much a bond’s price is likely to fluctuate with general changes in interest rates, e.g., if rates rise 1.00%, a bond with a 5-year duration is likely to lose about 5.00% of its value due to the interest rate move. The Average Duration calculation reflects the impact of the equivalent exposure of derivative positions, if any. |
| (i) | For purposes of this presentation, the components include the value of securities, and reflect the impact of the equivalent exposure of derivative positions, if any. These amounts may be negative from time to time. Equivalent exposure is a calculated amount that translates the derivative position into a reasonable approximation of the amount of the underlying asset that the portfolio would have to hold at a given point in time to have the same price sensitivity that results from the portfolio’s ownership of the derivative contract. When dealing with derivatives, equivalent exposure is a more representative measure of the potential impact of a position on portfolio performance than value. The bond component will include any accrued interest amounts. |
| (m) | In determining each instrument’s effective maturity for purposes of calculating the fund’s dollar-weighted average effective maturity, MFS uses the instrument’s stated maturity or, if applicable, an earlier date on which MFS believes it is probable that a maturity-shortening device (such as a put, pre-refunding or prepayment) will cause the instrument to be repaid. Such an earlier date can be substantially shorter than the instrument’s stated maturity. |
| (x) | Represents the portfolio’s exposure to issuer countries as a percentage of a portfolio’s net assets. For purposes of this presentation, United States includes Cash & Cash Equivalents and Other. |
| (h) | Security was not held in the portfolio at period end. |
| (r) | Securities rated “BBB”, “Baa”, or higher are considered investment grade; securities rated “BB”, “Ba”, or below are considered non-investment grade. Ratings are assigned to underlying securities utilizing ratings from Moody's, Fitch, and Standard & Poor's and applying the following hierarchy: If all three agencies provide a rating, the middle rating (after dropping the highest and lowest ratings) is assigned; if two of the three agencies rate a security, the lower of the two is assigned. If none of the 3 rating agencies above assign a rating, but the security is rated by DBRS Morningstar, then the DBRS Morningstar rating is assigned. If none of the 4 rating agencies listed above rate the security, but the security is rated by the Kroll Bond Rating Agency (KBRA), then the KBRA rating is assigned. Ratings are shown in the S&P and Fitch scale (e.g., AAA). For securities that are not rated by any of the rating agencies, the security is considered Not Rated. |
| (y) | A yield curve graphically depicts the yields of different maturity bonds of the same credit quality and type; a normal yield curve is upward sloping, with short-term rates lower than long-term rates. |

| Share Class | Class Inception Date | 1-yr | 5-yr | 10-yr |
| A | 7/01/98 | (4.59)% | 1.83% | 3.16% |
| B | 7/01/98 | (5.28)% | 1.07% | 2.40% |
| C | 7/01/98 | (5.33)% | 1.06% | 2.39% |
| I | 7/01/98 | (4.34)% | 2.08% | 3.40% |
| R1 | 6/02/08 | (5.30)% | 1.03% | 2.38% |
| R2 | 6/02/08 | (4.79)% | 1.58% | 2.91% |
| R3 | 6/02/08 | (4.51)% | 1.95% | 3.22% |
| R4 | 6/02/08 | (4.46)% | 2.06% | 3.38% |
| R6 | 6/02/08 | (4.27)% | 2.18% | 3.52% |
| ICE BofA Global High Yield - Constrained Index (USD Hedged) (f) | (5.68)% | 2.43% | 4.23% |
| A With Initial Sales Charge (4.25%) | (8.64)% | 0.95% | 2.71% |
| B With CDSC (Declining over six years from 4% to 0%) (v) | (8.79)% | 0.75% | 2.40% |
| C With CDSC (1% for 12 months) (v) | (6.20)% | 1.06% | 2.39% |
| (f) | Source: FactSet Research Systems Inc. |
| (v) | Assuming redemption at the end of the applicable period. |
| (d) | Source ICE Data Indices, LLC (“ICE Data”), is used with permission. ICE Data, its affiliates and their respective third party suppliers disclaim any and all warranties and representations, express and/or implied, including any warranties of merchantability or fitness for a particular purpose or use, including the indices, index data and any data included in, related to, or derived therefrom. Neither ICE Data, its affiliates nor their respective third party suppliers shall be subject to any damages or liability with respect the adequacy, accuracy, timeliness or |
August 1, 2022 through January 31, 2023
| Share Class | Annualized Expense Ratio | Beginning Account Value 8/01/22 | Ending Account Value 1/31/23 | Expenses Paid During Period (p) 8/01/22-1/31/23 | |
| A | Actual | 1.05% | $1,000.00 | $1,029.13 | $5.37 |
| Hypothetical (h) | 1.05% | $1,000.00 | $1,019.91 | $5.35 | |
| B | Actual | 1.80% | $1,000.00 | $1,025.34 | $9.19 |
| Hypothetical (h) | 1.80% | $1,000.00 | $1,016.13 | $9.15 | |
| C | Actual | 1.80% | $1,000.00 | $1,025.22 | $9.19 |
| Hypothetical (h) | 1.80% | $1,000.00 | $1,016.13 | $9.15 | |
| I | Actual | 0.80% | $1,000.00 | $1,030.43 | $4.09 |
| Hypothetical (h) | 0.80% | $1,000.00 | $1,021.17 | $4.08 | |
| R1 | Actual | 1.80% | $1,000.00 | $1,025.28 | $9.19 |
| Hypothetical (h) | 1.80% | $1,000.00 | $1,016.13 | $9.15 | |
| R2 | Actual | 1.30% | $1,000.00 | $1,028.01 | $6.65 |
| Hypothetical (h) | 1.30% | $1,000.00 | $1,018.65 | $6.61 | |
| R3 | Actual | 1.05% | $1,000.00 | $1,029.41 | $5.37 |
| Hypothetical (h) | 1.05% | $1,000.00 | $1,019.91 | $5.35 | |
| R4 | Actual | 0.80% | $1,000.00 | $1,030.56 | $4.09 |
| Hypothetical (h) | 0.80% | $1,000.00 | $1,021.17 | $4.08 | |
| R6 | Actual | 0.71% | $1,000.00 | $1,030.82 | $3.63 |
| Hypothetical (h) | 0.71% | $1,000.00 | $1,021.63 | $3.62 |
| (h) | 5% class return per year before expenses. |
| (p) | “Expenses Paid During Period” are equal to each class’s annualized expense ratio, as shown above, multiplied by the average account value over the period, multiplied by 184/365 (to reflect the one-half year period). Expenses paid do not include any applicable sales charges (loads). If these transaction costs had been included, your costs would have been higher. In addition to the fees and expenses which the fund bears directly, the fund indirectly bears a pro rata share of the fees and expenses of the underlying funds in which the fund invests. If these indirect costs were included, your costs would have been higher. |
| Issuer | Shares/Par | Value ($) | ||
| Bonds – 34.3% | ||||
| Automotive – 1.0% | ||||
| RAC Bond Co. PLC, 5.25%, 11/04/2027 (n) | GBP | 699,000 | $703,320 | |
| Renk GmbH (Frankfurt), 5.75%, 7/15/2025 (n) | EUR | 465,000 | 492,755 | |
| TI Automotive Finance PLC, 3.75%, 4/15/2029 (n) | 815,000 | 682,241 | ||
| $1,878,316 | ||||
| Basic Industry – 0.2% | ||||
| Peoplecert Wisdom Issuer PLC, 5.75%, 9/15/2026 (n) | EUR | 435,000 | $442,171 | |
| Broadcasting – 0.7% | ||||
| Banijay Group S.A.S., 6.5%, 3/01/2026 | EUR | 475,000 | $498,477 | |
| Summer (BC) Holdco S.à r.l., “A”, 9.25%, 10/31/2027 | 292,842 | 258,240 | ||
| WMG Acquisition Corp., 2.25%, 8/31/2031 (n) | 610,000 | 517,435 | ||
| $1,274,152 | ||||
| Building – 0.3% | ||||
| Standard Industries, Inc., 2.25%, 11/21/2026 (n) | EUR | 530,000 | $497,914 | |
| Business Services – 0.8% | ||||
| Nexi S.p.A., 2.125%, 4/30/2029 | EUR | 950,000 | $823,206 | |
| StoneCo Ltd., 3.95%, 6/16/2028 (n) | $ | 1,029,000 | 780,496 | |
| $1,603,702 | ||||
| Cable TV – 1.2% | ||||
| Summer BidCo B.V., 9%, 11/15/2025 | EUR | 657,493 | $535,300 | |
| United Group B.V., 3.125%, 2/15/2026 | 220,000 | 205,498 | ||
| Virgin Media Finance PLC, 3.75%, 7/15/2030 | 470,000 | 410,201 | ||
| Virgin Media Vendor Financing Notes III DAC, 4.875%, 7/15/2028 | GBP | 370,000 | 381,459 | |
| Ziggo B.V., 2.875%, 1/15/2030 (n) | EUR | 760,000 | 675,446 | |
| $2,207,904 | ||||
| Chemicals – 1.2% | ||||
| Herens Midco S.à r.l., 5.25%, 5/15/2029 (n) | EUR | 275,000 | $202,923 | |
| Herens Midco S.à r.l., 5.25%, 5/15/2029 | 100,000 | 73,790 | ||
| HT Troplast GmbH, 9.25%, 7/15/2025 | 445,000 | 466,850 | ||
| Sasol Financing (USA) LLC, 5.5%, 3/18/2031 | $ | 940,000 | 820,150 | |
| SCIL IV LLC/SCIL USA Holdings LLC, 4.375%, 11/01/2026 (n) | EUR | 715,000 | 689,826 | |
| $2,253,539 | ||||
| Issuer | Shares/Par | Value ($) | ||
| Bonds – continued | ||||
| Conglomerates – 0.7% | ||||
| Grupo KUO S.A.B. de C.V., 5.75%, 7/07/2027 (n) | $ | 1,005,000 | $952,901 | |
| Industria Macchine Automatiche S.p.A., 3.75%, 1/15/2028 | EUR | 465,000 | 442,334 | |
| $1,395,235 | ||||
| Consumer Products – 0.2% | ||||
| Natura & Co. Luxembourg Holdings S.à r.l., 6%, 4/19/2029 (n) | $ | 510,000 | $450,101 | |
| Consumer Services – 0.3% | ||||
| Verisure Midholding AB, 5.25%, 2/15/2029 | EUR | 610,000 | $547,478 | |
| Containers – 1.7% | ||||
| ARD Finance S.A., 5%, (5% cash or 5.75% PIK) 6/30/2027 (n)(p) | EUR | 235,000 | $168,613 | |
| ARD Finance S.A., 5%, (5% cash or 5.75% PIK) 6/30/2027 (p) | 100,000 | 82,095 | ||
| Ardagh Metal Packaging Finance USA LLC, 3%, 9/01/2029 (n) | 180,000 | 151,945 | ||
| Ardagh Metal Packaging Finance USA LLC, 3%, 9/01/2029 | 300,000 | 253,242 | ||
| Can-Pack S.A./Eastern PA Land Investment Holding LLC, 3.875%, 11/15/2029 (n) | $ | 834,000 | 692,545 | |
| Huhtamaki Oyj, 4.25%, 6/09/2027 | EUR | 600,000 | 639,590 | |
| San Miguel Industrias PET S.A., 3.5%, 8/02/2028 (n) | $ | 840,000 | 722,711 | |
| Titan Holdings II B.V., 5.125%, 7/15/2029 (n) | EUR | 635,000 | 559,176 | |
| $3,269,917 | ||||
| Electronics – 0.4% | ||||
| Infineon Technologies AG, 3.625% to 4/1/2028, FLR (EUR Swap Rate - 5yr. + 3.996%) to 4/1/2033, FLR (EUR Swap Rate - 5yr. + 4.246%) to 4/01/2048, FLR (EUR Swap Rate - 5yr. + 4.99%) to 12/31/2049 | EUR | 700,000 | $699,656 | |
| Emerging Market Quasi-Sovereign – 2.5% | ||||
| Bulgarian Energy Holding EAD, 2.45%, 7/22/2028 | EUR | 870,000 | $770,995 | |
| Eskom Holdings SOC Ltd. (Republic of South Africa), 7.125%, 2/11/2025 | $ | 655,000 | 627,228 | |
| Petroleos Mexicanos, 6.5%, 3/13/2027 | 445,000 | 420,075 | ||
| Petroleos Mexicanos, 6.84%, 1/23/2030 | 450,000 | 391,510 | ||
| Petroleos Mexicanos, 10%, 2/07/2033 (n)(w) | 560,000 | 547,120 | ||
| Petroleos Mexicanos, 6.5%, 6/02/2041 | 1,335,000 | 961,734 | ||
| Petroleos Mexicanos, 7.69%, 1/23/2050 | 740,000 | 552,485 | ||
| T.C. Ziraat Bankasi A.S. (Republic of Turkey), 9.5%, 8/01/2026 (n)(w) | 461,000 | 455,689 | ||
| $4,726,836 | ||||
| Energy - Independent – 0.8% | ||||
| Energean PLC, 6.5%, 4/30/2027 (n) | $ | 581,000 | $543,700 | |
| Kosmos Energy Ltd., 7.125%, 4/04/2026 | 440,000 | 397,865 | ||
| Leviathan Bond Ltd., 6.5%, 6/30/2027 (n) | 617,000 | 606,974 | ||
| $1,548,539 | ||||
| Issuer | Shares/Par | Value ($) | ||
| Bonds – continued | ||||
| Financial Institutions – 0.9% | ||||
| Atrium European Real Estate Ltd., 3.625% to 11/4/2026, FLR (EUR Swap Rate - 5yr. + 3.625%) to 11/04/2031, FLR (EUR Swap Rate - 5yr. + 4.625%) to 5/04/2170 | EUR | 625,000 | $251,403 | |
| Encore Capital Group, Inc., 5.375%, 2/15/2026 (n) | GBP | 635,000 | 708,488 | |
| Encore Capital Group, Inc., 4.25%, 6/01/2028 (n) | 390,000 | 377,197 | ||
| Samhallsbyggnadsbolaget i Norden AB, 2.875% to 1/30/2027, FLR (EUR Swap Rate - 5yr. + 3.223%) to 1/30/32, FLR (EUR Swap Rate - 5yr. + 3.473%) to 1/30/47, FLR (EUR Swap Rate - 5yr. + 4.473%) to 1/30/2171 | EUR | 805,000 | 333,872 | |
| $1,670,960 | ||||
| Food & Beverages – 1.3% | ||||
| Aragvi Finance International DAC, 8.45%, 4/29/2026 (n) | $ | 400,000 | $298,848 | |
| Central America Bottling Co., 5.25%, 4/27/2029 (n) | 716,000 | 687,568 | ||
| Coca-Cola Icecek A.S., 4.5%, 1/20/2029 (n) | 920,000 | 803,454 | ||
| Premier Foods Finance PLC, 3.5%, 10/15/2026 | GBP | 710,000 | 783,292 | |
| $2,573,162 | ||||
| Gaming & Lodging – 0.9% | ||||
| Allwyn International, 3.875%, 2/15/2027 (n) | EUR | 665,000 | $673,974 | |
| Lottomatica S.p.A., 6.25%, 7/15/2025 | 376,000 | 404,681 | ||
| NH Hotel Group S.A., 4%, 7/02/2026 (n) | 415,000 | 422,807 | ||
| NH Hotel Group S.A., 4%, 7/02/2026 | 175,000 | 178,292 | ||
| $1,679,754 | ||||
| Industrial – 0.4% | ||||
| Arabian Centres Sukuk II Ltd., 5.625%, 10/07/2026 (n) | $ | 738,000 | $700,657 | |
| International Market Quasi-Sovereign – 0.4% | ||||
| Electricite de France S.A., 3.375% to 9/15/2030, FLR (EUR Swap Rate - 5yr. + 3.97%) to 9/15/50, FLR (EUR Swap Rate - 5yr. + 4.72%) to 9/15/2071 | EUR | 800,000 | $687,079 | |
| Machinery & Tools – 0.3% | ||||
| Sarens Finance Co. N.V., 5.75%, 2/21/2027 | EUR | 555,000 | $493,304 | |
| Major Banks – 0.3% | ||||
| UniCredit S.p.A., 3.875% to 6/03/2027, FLR (EUR ICE Swap Rate - 5yr. + 4.081%) to 6/03/2070 | EUR | 645,000 | $551,566 | |
| Medical & Health Technology & Services – 0.4% | ||||
| Chrome Holdco S.A.S., 5%, 5/31/2029 (n) | EUR | 465,000 | $390,897 | |
| Chrome Holdco S.A.S., 5%, 5/31/2029 | 100,000 | 84,064 | ||
| Laboratoire Eimer Selas, 5%, 2/01/2029 | 475,000 | 396,251 | ||
| $871,212 | ||||
| Issuer | Shares/Par | Value ($) | ||
| Bonds – continued | ||||
| Metals & Mining – 0.6% | ||||
| Baffinland Iron Mines Corp./Baffinland Iron Mines LP, 8.75%, 7/15/2026 (n) | $ | 140,000 | $135,956 | |
| Ero Copper Corp., 6.5%, 2/15/2030 (n) | 193,000 | 164,371 | ||
| Novelis Sheet Ingot GmbH, 3.375%, 4/15/2029 (n) | EUR | 460,000 | 434,497 | |
| Petra Diamonds US$ Treasury PLC, 10.5% (10.5% PIK/9.75% Cash to 6/30/2023), 9.75% Cash to 3/08/2026 (n)(p) | $ | 352,672 | 342,092 | |
| $1,076,916 | ||||
| Midstream – 0.3% | ||||
| Peru LNG, 5.375%, 3/22/2030 | $ | 645,000 | $534,860 | |
| Network & Telecom – 1.3% | ||||
| DKT Finance ApS, 7%, 6/17/2023 | EUR | 560,000 | $608,585 | |
| Iliad Holding S.A.S., 5.625%, 10/15/2028 (n) | 580,000 | 586,409 | ||
| Kaixo Bondco Telecom S.A., 5.125%, 9/30/2029 (n) | 835,000 | 782,225 | ||
| Total Play Telecomunicaciones S.A. de C.V., 6.375%, 9/20/2028 (n) | $ | 695,000 | 588,241 | |
| $2,565,460 | ||||
| Oil Services – 0.2% | ||||
| MV24 Capital B.V., 6.748%, 6/01/2034 (n) | $ | 471,075 | $449,406 | |
| Oils – 0.3% | ||||
| MC Brazil Downstream Trading S.à r.l., 7.25%, 6/30/2031 (n) | $ | 736,284 | $642,250 | |
| Other Banks & Diversified Financials – 1.1% | ||||
| Banco GNB Sudameris S.A., 7.5% to 4/16/2026, FLR (CMT - 5yr. + 6.66%) to 4/16/2031 | $ | 755,000 | $590,282 | |
| doValue S.p.A., 3.375%, 7/31/2026 (n) | EUR | 955,000 | 953,561 | |
| Intesa Sanpaolo S.p.A., 4.125% to 2/27/2030, FLR (EUR Swap Rate - 5yr. + 4.274%) to 2/27/2070 | 645,000 | 540,810 | ||
| $2,084,653 | ||||
| Pharmaceuticals – 0.5% | ||||
| Organon Finance 1 LLC, 2.875%, 4/30/2028 (n) | EUR | 235,000 | $222,600 | |
| Teva Pharmaceutical Finance Netherlands III B.V., 4.75%, 5/09/2027 | $ | 825,000 | 766,219 | |
| $988,819 | ||||
| Restaurants – 0.2% | ||||
| MIDCO GB, 7.75%, 11/01/2027 (n) | EUR | 465,000 | $454,972 | |
| Retailers – 1.6% | ||||
| BK LC Lux Finco 1 S.à r.l., 5.25%, 4/30/2029 | EUR | 575,000 | $548,660 | |
| Goldstory S.A.S., 5.375%, 3/01/2026 (n) | 450,000 | 454,972 | ||
| Grupo Axo S.A.P.I. de C.V., 5.75%, 6/08/2026 (n) | $ | 844,000 | 745,743 | |
| Marks & Spencer PLC, 4.5%, 7/10/2027 | GBP | 625,000 | 704,831 | |
| Issuer | Shares/Par | Value ($) | ||
| Bonds – continued | ||||
| Retailers – continued | ||||
| Mobilux Finance S.A.S., 4.25%, 7/15/2028 (n) | EUR | 700,000 | $595,487 | |
| $3,049,693 | ||||
| Specialty Chemicals – 0.4% | ||||
| Braskem Idesa S.A.P.I., 6.99%, 2/20/2032 | $ | 445,000 | $329,567 | |
| CTEC II GmbH, 5.25%, 2/15/2030 (n) | EUR | 453,000 | 405,803 | |
| CTEC II GmbH, 5.25%, 2/15/2030 | 100,000 | 89,581 | ||
| $824,951 | ||||
| Specialty Stores – 0.3% | ||||
| Dufry One B.V., 3.375%, 4/15/2028 | EUR | 666,000 | $626,296 | |
| Telecommunications - Wireless – 3.4% | ||||
| Altice France Holding S.A., 4%, 2/15/2028 | EUR | 100,000 | $73,165 | |
| Altice France S.A., 4%, 2/15/2028 (n) | 380,000 | 278,028 | ||
| Cellnex Finance Co. S.A., 1.5%, 6/08/2028 | 800,000 | 748,121 | ||
| Cellnex Finance Co. S.A., 2%, 2/15/2033 | 700,000 | 593,127 | ||
| Millicom International Cellular S.A., 5.125%, 1/15/2028 (n) | $ | 797,400 | 710,013 | |
| PLT VII Finance S.à r.l., 4.625%, 1/05/2026 | EUR | 655,000 | 678,160 | |
| PPF Telecom Group B.V., 2.125%, 1/31/2025 | 270,000 | 277,753 | ||
| PPF Telecom Group B.V., 3.25%, 9/29/2027 | 935,000 | 930,035 | ||
| Turkcell Iletisim Hizmetleri A.S., 5.8%, 4/11/2028 | $ | 465,000 | 404,550 | |
| Vodafone Group PLC, 3% to 8/27/2030, FLR (EUR Swap Rate - 5yr. + 3.477%) to 8/27/2050, FLR (EUR Swap Rate - 5yr. + 4.227%) to 8/27/2080 | EUR | 1,155,000 | 1,031,209 | |
| WP/AP Telecom Holdings III B.V., 5.5%, 1/15/2030 (n) | 730,000 | 663,125 | ||
| $6,387,286 | ||||
| Transportation – 0.2% | ||||
| Hidrovias International Finance S.à r.l., 4.95%, 2/08/2031 | $ | 440,000 | $337,801 | |
| Transportation - Services – 1.5% | ||||
| Arena Luxembourg Finance S.à r.l., 1.875%, 2/01/2028 (n) | EUR | 1,280,000 | $1,149,283 | |
| Delhi International Airport Ltd. (Cliffton Ltd.), 6.25%, 10/25/2025 (n) | $ | 663,000 | 629,850 | |
| Q-Park Holding I B.V., 1.5%, 3/01/2025 (n) | EUR | 915,000 | 923,618 | |
| Q-Park Operations Holding B.V., 1.5%, 3/01/2025 | 100,000 | 100,942 | ||
| $2,803,693 | ||||
| Utilities - Electric Power – 4.6% | ||||
| Adani Green Energy (UP) Ltd./Prayatna Developers Private Ltd., 6.25%, 12/10/2024 (n) | $ | 761,000 | $710,554 | |
| AES Gener S.A., 7.125% to 7/06/2024, FLR (Swap Rate - 5yr. + 4.644%) to 7/06/2029, FLR (Swap Rate - 5yr. + 4.894%) to 7/06/2044, FLR (Swap Rate - 5yr. + 5.644%) to 3/26/2079 | 395,000 | 382,459 | ||
| Azure Power Energy Ltd., 3.575%, 8/19/2026 (n) | 507,122 | 382,725 | ||
| Issuer | Shares/Par | Value ($) | ||
| Bonds – continued | ||||
| Utilities - Electric Power – continued | ||||
| Azure Power Solar Energy Private Ltd., 5.65%, 12/24/2024 (n) | $ | 302,000 | $256,060 | |
| ContourGlobal Power Holdings S.A., 2.75%, 1/01/2026 (n) | EUR | 640,000 | 635,835 | |
| Electricidad Firme de Mexico, 4.9%, 11/20/2026 (n) | $ | 752,000 | 676,016 | |
| Empresa Generadora de Electricidad Haina S.A., 5.625%, 11/08/2028 (n) | 570,000 | 514,750 | ||
| Greenko Dutch B.V. (Republic of India), 3.85%, 3/29/2026 (n) | 705,745 | 630,273 | ||
| Investment Energy Resources Ltd., 6.25%, 4/26/2029 (n) | 718,000 | 685,378 | ||
| Mercury Chile Holdco LLC, 6.5%, 1/24/2027 (n) | 687,000 | 660,035 | ||
| Public Power Corp. S.A., 3.875%, 3/30/2026 | EUR | 925,000 | 950,180 | |
| ReNew Wind Energy AP2/ReNew Power Private Ltd., 4.5%, 7/14/2028 (n) | $ | 729,000 | 627,189 | |
| SCC Power PLC, 8% (8% cash/4% cash and 4% PIK) to 6/15/2024, 8% cash to 12/31/2028 (n)(p) | 804,129 | 246,787 | ||
| SCC Power PLC, 4% (4% cash or 4% PIK) to 6/15/2024, 4% cash to 5/17/2032 (n)(p) | 435,570 | 17,858 | ||
| Termocandelaria Power Ltd., 7.875%, 1/30/2029 | 170,000 | 160,225 | ||
| TermoCandelaria Power Ltd., 7.875%, 1/30/2029 (n) | 405,238 | 381,937 | ||
| TerraForm Global Operating LLC, 6.125%, 3/01/2026 (n) | 836,000 | 792,110 | ||
| $8,710,371 | ||||
| Utilities - Gas – 0.4% | ||||
| EP Infrastructure A.S., 2.045%, 10/09/2028 | EUR | 346,000 | $281,146 | |
| EP Infrastructure A.S., 1.816%, 3/02/2031 | 670,000 | 493,083 | ||
| $774,229 | ||||
| Utilities - Water – 0.5% | ||||
| Aegea Finance S.à r.l., 6.75%, 5/20/2029 (n) | $ | 936,000 | $930,571 | |
| Total Bonds (Identified Cost, $76,137,342) | $65,265,381 | |||
| Common Stocks – 0.1% | ||||
| Construction – 0.1% | ||||
| ICA Tenedora S.A. de C.V. (a)(u) (Identified Cost, $0) | 253,322 | $228,697 | ||
| Investment Companies (h) – 65.5% | ||||
| Bond Funds – 63.8% | ||||
| MFS High Yield Pooled Portfolio (v)(y) | 15,061,792 | $121,247,426 | ||
| Money Market Funds – 1.7% | ||||
| MFS Institutional Money Market Portfolio, 4.29% (v) | 3,151,213 | $3,151,528 | ||
| Total Investment Companies (Identified Cost, $140,151,282) | $124,398,954 | |||
| Other Assets, Less Liabilities – 0.1% | 210,326 | |||
| Net Assets – 100.0% | $190,103,358 | |||
| (a) | Non-income producing security. | |||
| (h) | An affiliated issuer, which may be considered one in which the fund owns 5% or more of the outstanding voting securities, or a company which is under common control. At period end, the aggregate values of the fund's investments in affiliated issuers and in unaffiliated issuers were $124,398,954 and $65,494,078, respectively. | |||
| (n) | Securities exempt from registration under Rule 144A of the Securities Act of 1933. These securities may be sold in the ordinary course of business in transactions exempt from registration, normally to qualified institutional buyers. At period end, the aggregate value of these securities was $37,060,472, representing 19.5% of net assets. | |||
| (p) | Payment-in-kind (PIK) security for which interest income may be received in additional securities and/or cash. | |||
| (u) | The security was valued using significant unobservable inputs and is considered level 3 under the fair value hierarchy. For further information about the fund’s level 3 holdings, please see Note 2 in the Notes to Financial Statements. | |||
| (v) | Affiliated issuer that is available only to investment companies managed by MFS. The rate quoted for the MFS Institutional Money Market Portfolio is the annualized seven-day yield of the fund at period end. | |||
| (w) | When-issued security. | |||
| (y) | The annual report for MFS High Yield Pooled Portfolio as of January 31, 2023 has been included as Appendix A. |
| The following abbreviations are used in this report and are defined: | |
| CMT | Constant Maturity Treasury |
| FLR | Floating Rate. Interest rate resets periodically based on the parenthetically disclosed reference rate plus a spread (if any). The period-end rate reported may not be the current rate. All reference rates are USD unless otherwise noted. |
| ICE | Intercontinental Exchange |
| Abbreviations indicate amounts shown in currencies other than the U.S. dollar. All amounts are stated in U.S. dollars unless otherwise indicated. A list of abbreviations is shown below: | |
| EUR | Euro |
| GBP | British Pound |
| Forward Foreign Currency Exchange Contracts | ||||||
| Currency Purchased | Currency Sold | Counterparty | Settlement Date | Unrealized Appreciation (Depreciation) | ||
| Asset Derivatives | ||||||
| USD | 3,764,633 | GBP | 3,028,916 | Morgan Stanley Capital Services, Inc. | 4/21/2023 | $24,168 |
| Liability Derivatives | ||||||
| GBP | 155,310 | USD | 193,030 | HSBC Bank | 4/21/2023 | $(1,234) |
| USD | 150,366 | EUR | 137,861 | HSBC Bank | 4/21/2023 | (231) |
| USD | 33,158,788 | EUR | 30,535,204 | State Street Bank Corp. | 4/21/2023 | (197,393) |
| USD | 390,541 | EUR | 359,077 | UBS AG | 4/21/2023 | (1,709) |
| $(200,567) | ||||||
| Assets | |
| Investments in unaffiliated issuers, at value (identified cost, $76,137,342) | $65,494,078 |
| Investments in affiliated issuers, at value (identified cost, $140,151,282) | 124,398,954 |
| Cash | 48,270 |
| Receivables for | |
| Forward foreign currency exchange contracts | 24,168 |
| Investments sold | 154,252 |
| Fund shares sold | 1,716,421 |
| Interest and dividends | 940,053 |
| Receivable from investment adviser | 7,220 |
| Other assets | 925 |
| Total assets | $192,784,341 |
| Liabilities | |
| Payables for | |
| Distributions | $30,425 |
| Forward foreign currency exchange contracts | 200,567 |
| Investments purchased | 919,799 |
| Fund shares reacquired | 351,923 |
| When-issued investments purchased | 1,004,769 |
| Payable to affiliates | |
| Administrative services fee | 210 |
| Shareholder servicing costs | 67,808 |
| Distribution and service fees | 1,873 |
| Payable for independent Trustees' compensation | 73 |
| Accrued expenses and other liabilities | 103,536 |
| Total liabilities | $2,680,983 |
| Net assets | $190,103,358 |
| Net assets consist of | |
| Paid-in capital | $280,493,024 |
| Total distributable earnings (loss) | (90,389,666) |
| Net assets | $190,103,358 |
| Shares of beneficial interest outstanding | 36,491,699 |
| Net assets | Shares outstanding | Net asset value per share (a) | |
| Class A | $108,712,086 | 20,866,888 | $5.21 |
| Class B | 923,638 | 176,912 | 5.22 |
| Class C | 5,314,003 | 1,021,406 | 5.20 |
| Class I | 49,233,066 | 9,452,335 | 5.21 |
| Class R1 | 67,930 | 13,042 | 5.21 |
| Class R2 | 427,353 | 81,925 | 5.22 |
| Class R3 | 2,327,506 | 444,485 | 5.24 |
| Class R4 | 6,804,245 | 1,300,293 | 5.23 |
| Class R6 | 16,293,531 | 3,134,413 | 5.20 |
| (a) | Maximum offering price per share was equal to the net asset value per share for all share classes, except for Class A, for which the maximum offering price per share was $5.44 [100 / 95.75 x $5.21]. On sales of $100,000 or more, the maximum offering price of Class A shares is reduced. A contingent deferred sales charge may be imposed on redemptions of Class A, Class B, and Class C shares. Redemption price per share was equal to the net asset value per share for Classes I, R1, R2, R3, R4, and R6. |
| Net investment income (loss) | |
| Income | |
| Dividends from affiliated issuers | $8,213,307 |
| Interest | 4,389,040 |
| Other | 91,892 |
| Foreign taxes withheld | (4,703) |
| Total investment income | $12,689,536 |
| Expenses | |
| Management fee | $1,444,970 |
| Distribution and service fees | 371,434 |
| Shareholder servicing costs | 280,673 |
| Administrative services fee | 44,348 |
| Independent Trustees' compensation | 5,720 |
| Custodian fee | 27,908 |
| Shareholder communications | 19,879 |
| Audit and tax fees | 94,344 |
| Legal fees | 907 |
| Registration fees | 132,193 |
| Miscellaneous | 35,798 |
| Total expenses | $2,458,174 |
| Fees paid indirectly | (1,689) |
| Reduction of expenses by investment adviser and distributor | (326,806) |
| Net expenses | $2,129,679 |
| Net investment income (loss) | $10,559,857 |
| Realized and unrealized gain (loss) | |
| Realized gain (loss) (identified cost basis) | |
| Unaffiliated issuers | $(8,231,442) |
| Affiliated issuers | (10,339,581) |
| Forward foreign currency exchange contracts | 3,902,420 |
| Foreign currency | (108,807) |
| Net realized gain (loss) | $(14,777,410) |
| Change in unrealized appreciation or depreciation | |
| Unaffiliated issuers | $(4,883,500) |
| Affiliated issuers | (5,911,722) |
| Forward foreign currency exchange contracts | (786,505) |
| Translation of assets and liabilities in foreign currencies | 35,480 |
| Net unrealized gain (loss) | $(11,546,247) |
| Net realized and unrealized gain (loss) | $(26,323,657) |
| Change in net assets from operations | $(15,763,800) |
| Year ended | ||
| 1/31/23 | 1/31/22 | |
| Change in net assets | ||
| From operations | ||
| Net investment income (loss) | $10,559,857 | $12,682,800 |
| Net realized gain (loss) | (14,777,410) | 910,697 |
| Net unrealized gain (loss) | (11,546,247) | (12,122,101) |
| Change in net assets from operations | $(15,763,800) | $1,471,396 |
| Total distributions to shareholders | $(17,296,566) | $(15,713,464) |
| Change in net assets from fund share transactions | $(45,953,868) | $(16,843,338) |
| Total change in net assets | $(79,014,234) | $(31,085,406) |
| Net assets | ||
| At beginning of period | 269,117,592 | 300,202,998 |
| At end of period | $190,103,358 | $269,117,592 |
| Class A | Year ended | ||||
| 1/31/23 | 1/31/22 | 1/31/21 | 1/31/20 | 1/31/19 | |
| Net asset value, beginning of period | $5.94 | $6.24 | $6.28 | $6.00 | $6.25 |
| Income (loss) from investment operations | |||||
| Net investment income (loss) (d) | $0.25 | $0.26 | $0.27 | $0.28 | $0.28 |
| Net realized and unrealized gain (loss) | (0.54) | (0.24) | (0.04) | 0.28 | (0.25) |
| Total from investment operations | $(0.29) | $0.02 | $0.23 | $0.56 | $0.03 |
| Less distributions declared to shareholders | |||||
| From net investment income | $(0.44) | $(0.32) | $(0.27) | $(0.28) | $(0.28) |
| Net asset value, end of period (x) | $5.21 | $5.94 | $6.24 | $6.28 | $6.00 |
| Total return (%) (r)(s)(t)(x) | (4.59) | 0.31 | 3.86 | 9.59 | 0.50 |
| Ratios (%) (to average net assets) and Supplemental data: | |||||
| Expenses before expense reductions (f)(h) | 1.20 | 1.16 | 1.17 | 1.15 | 1.14 |
| Expenses after expense reductions (f)(h) | 1.05 | 1.05 | 1.05 | 1.05 | 1.05 |
| Net investment income (loss) | 4.68 | 4.16 | 4.47 | 4.50 | 4.70 |
| Portfolio turnover | 14 | 38 | 22 | 26 | 13 |
| Net assets at end of period (000 omitted) | $108,712 | $133,193 | $182,411 | $203,428 | $191,590 |
| Class B | Year ended | ||||
| 1/31/23 | 1/31/22 | 1/31/21 | 1/31/20 | 1/31/19 | |
| Net asset value, beginning of period | $5.95 | $6.25 | $6.29 | $6.01 | $6.26 |
| Income (loss) from investment operations | |||||
| Net investment income (loss) (d) | $0.21 | $0.21 | $0.22 | $0.23 | $0.24 |
| Net realized and unrealized gain (loss) | (0.54) | (0.23) | (0.04) | 0.29 | (0.26) |
| Total from investment operations | $(0.33) | $(0.02) | $0.18 | $0.52 | $(0.02) |
| Less distributions declared to shareholders | |||||
| From net investment income | $(0.40) | $(0.28) | $(0.22) | $(0.24) | $(0.23) |
| Net asset value, end of period (x) | $5.22 | $5.95 | $6.25 | $6.29 | $6.01 |
| Total return (%) (r)(s)(t)(x) | (5.28) | (0.44) | 3.09 | 8.77 | (0.25) |
| Ratios (%) (to average net assets) and Supplemental data: | |||||
| Expenses before expense reductions (f)(h) | 1.95 | 1.91 | 1.92 | 1.90 | 1.90 |
| Expenses after expense reductions (f)(h) | 1.80 | 1.80 | 1.80 | 1.80 | 1.80 |
| Net investment income (loss) | 3.89 | 3.42 | 3.74 | 3.78 | 3.94 |
| Portfolio turnover | 14 | 38 | 22 | 26 | 13 |
| Net assets at end of period (000 omitted) | $924 | $1,831 | $3,032 | $5,741 | $7,941 |
| Class C | Year ended | ||||
| 1/31/23 | 1/31/22 | 1/31/21 | 1/31/20 | 1/31/19 | |
| Net asset value, beginning of period | $5.93 | $6.23 | $6.28 | $5.99 | $6.24 |
| Income (loss) from investment operations | |||||
| Net investment income (loss) (d) | $0.21 | $0.21 | $0.22 | $0.23 | $0.24 |
| Net realized and unrealized gain (loss) | (0.54) | (0.23) | (0.05) | 0.30 | (0.26) |
| Total from investment operations | $(0.33) | $(0.02) | $0.17 | $0.53 | $(0.02) |
| Less distributions declared to shareholders | |||||
| From net investment income | $(0.40) | $(0.28) | $(0.22) | $(0.24) | $(0.23) |
| Net asset value, end of period (x) | $5.20 | $5.93 | $6.23 | $6.28 | $5.99 |
| Total return (%) (r)(s)(t)(x) | (5.33) | (0.45) | 2.92 | 8.96 | (0.26) |
| Ratios (%) (to average net assets) and Supplemental data: | |||||
| Expenses before expense reductions (f)(h) | 1.95 | 1.91 | 1.92 | 1.90 | 1.90 |
| Expenses after expense reductions (f)(h) | 1.80 | 1.80 | 1.80 | 1.80 | 1.80 |
| Net investment income (loss) | 3.92 | 3.42 | 3.74 | 3.79 | 3.93 |
| Portfolio turnover | 14 | 38 | 22 | 26 | 13 |
| Net assets at end of period (000 omitted) | $5,314 | $7,408 | $8,855 | $21,084 | $29,122 |
| Class I | Year ended | ||||
| 1/31/23 | 1/31/22 | 1/31/21 | 1/31/20 | 1/31/19 | |
| Net asset value, beginning of period | $5.94 | $6.24 | $6.28 | $6.00 | $6.25 |
| Income (loss) from investment operations | |||||
| Net investment income (loss) (d) | $0.26 | $0.27 | $0.28 | $0.29 | $0.30 |
| Net realized and unrealized gain (loss) | (0.53) | (0.23) | (0.04) | 0.29 | (0.26) |
| Total from investment operations | $(0.27) | $0.04 | $0.24 | $0.58 | $0.04 |
| Less distributions declared to shareholders | |||||
| From net investment income | $(0.46) | $(0.34) | $(0.28) | $(0.30) | $(0.29) |
| Net asset value, end of period (x) | $5.21 | $5.94 | $6.24 | $6.28 | $6.00 |
| Total return (%) (r)(s)(t)(x) | (4.34) | 0.56 | 4.12 | 9.86 | 0.75 |
| Ratios (%) (to average net assets) and Supplemental data: | |||||
| Expenses before expense reductions (f)(h) | 0.95 | 0.91 | 0.91 | 0.90 | 0.89 |
| Expenses after expense reductions (f)(h) | 0.80 | 0.80 | 0.80 | 0.80 | 0.80 |
| Net investment income (loss) | 4.87 | 4.42 | 4.69 | 4.75 | 4.93 |
| Portfolio turnover | 14 | 38 | 22 | 26 | 13 |
| Net assets at end of period (000 omitted) | $49,233 | $96,925 | $73,648 | $65,250 | $63,671 |
| Class R1 | Year ended | ||||
| 1/31/23 | 1/31/22 | 1/31/21 | 1/31/20 | 1/31/19 | |
| Net asset value, beginning of period | $5.94 | $6.24 | $6.28 | $6.00 | $6.26 |
| Income (loss) from investment operations | |||||
| Net investment income (loss) (d) | $0.21 | $0.21 | $0.22 | $0.23 | $0.24 |
| Net realized and unrealized gain (loss) | (0.54) | (0.23) | (0.04) | 0.29 | (0.27) |
| Total from investment operations | $(0.33) | $(0.02) | $0.18 | $0.52 | $(0.03) |
| Less distributions declared to shareholders | |||||
| From net investment income | $(0.40) | $(0.28) | $(0.22) | $(0.24) | $(0.23) |
| Net asset value, end of period (x) | $5.21 | $5.94 | $6.24 | $6.28 | $6.00 |
| Total return (%) (r)(s)(t)(x) | (5.30) | (0.45) | 3.09 | 8.78 | (0.42) |
| Ratios (%) (to average net assets) and Supplemental data: | |||||
| Expenses before expense reductions (f)(h) | 1.94 | 1.91 | 1.92 | 1.90 | 1.90 |
| Expenses after expense reductions (f)(h) | 1.80 | 1.80 | 1.80 | 1.80 | 1.80 |
| Net investment income (loss) | 3.95 | 3.42 | 3.72 | 3.75 | 3.95 |
| Portfolio turnover | 14 | 38 | 22 | 26 | 13 |
| Net assets at end of period (000 omitted) | $68 | $68 | $70 | $67 | $61 |
| Class R2 | Year ended | ||||
| 1/31/23 | 1/31/22 | 1/31/21 | 1/31/20 | 1/31/19 | |
| Net asset value, beginning of period | $5.95 | $6.25 | $6.29 | $6.01 | $6.26 |
| Income (loss) from investment operations | |||||
| Net investment income (loss) (d) | $0.24 | $0.24 | $0.25 | $0.26 | $0.27 |
| Net realized and unrealized gain (loss) | (0.54) | (0.23) | (0.04) | 0.29 | (0.26) |
| Total from investment operations | $(0.30) | $0.01 | $0.21 | $0.55 | $0.01 |
| Less distributions declared to shareholders | |||||
| From net investment income | $(0.43) | $(0.31) | $(0.25) | $(0.27) | $(0.26) |
| Net asset value, end of period (x) | $5.22 | $5.95 | $6.25 | $6.29 | $6.01 |
| Total return (%) (r)(s)(t)(x) | (4.79) | 0.06 | 3.60 | 9.31 | 0.25 |
| Ratios (%) (to average net assets) and Supplemental data: | |||||
| Expenses before expense reductions (f)(h) | 1.45 | 1.41 | 1.41 | 1.40 | 1.39 |
| Expenses after expense reductions (f)(h) | 1.30 | 1.30 | 1.30 | 1.30 | 1.29 |
| Net investment income (loss) | 4.44 | 3.92 | 4.17 | 4.26 | 4.46 |
| Portfolio turnover | 14 | 38 | 22 | 26 | 13 |
| Net assets at end of period (000 omitted) | $427 | $443 | $519 | $308 | $297 |
| Class R3 | Year ended | ||||
| 1/31/23 | 1/31/22 | 1/31/21 | 1/31/20 | 1/31/19 | |
| Net asset value, beginning of period | $5.97 | $6.28 | $6.32 | $6.00 | $6.25 |
| Income (loss) from investment operations | |||||
| Net investment income (loss) (d) | $0.25 | $0.26 | $0.27 | $0.29 | $0.28 |
| Net realized and unrealized gain (loss) | (0.53) | (0.24) | (0.04) | 0.32 | (0.25) |
| Total from investment operations | $(0.28) | $0.02 | $0.23 | $0.61 | $0.03 |
| Less distributions declared to shareholders | |||||
| From net investment income | $(0.45) | $(0.33) | $(0.27) | $(0.29) | $(0.28) |
| Net asset value, end of period (x) | $5.24 | $5.97 | $6.28 | $6.32 | $6.00 |
| Total return (%) (r)(s)(t)(x) | (4.51) | 0.17 | 3.87 | 10.28 | 0.50 |
| Ratios (%) (to average net assets) and Supplemental data: | |||||
| Expenses before expense reductions (f)(h) | 1.20 | 1.16 | 1.17 | 1.15 | 1.14 |
| Expenses after expense reductions (f)(h) | 1.05 | 1.05 | 1.05 | 1.05 | 1.05 |
| Net investment income (loss) | 4.70 | 4.18 | 4.47 | 4.62 | 4.70 |
| Portfolio turnover | 14 | 38 | 22 | 26 | 13 |
| Net assets at end of period (000 omitted) | $2,328 | $2,567 | $2,286 | $2,347 | $10,444 |
| Class R4 | Year ended | ||||
| 1/31/23 | 1/31/22 | 1/31/21 | 1/31/20 | 1/31/19 | |
| Net asset value, beginning of period | $5.97 | $6.27 | $6.31 | $6.03 | $6.28 |
| Income (loss) from investment operations | |||||
| Net investment income (loss) (d) | $0.27 | $0.28 | $0.28 | $0.30 | $0.30 |
| Net realized and unrealized gain (loss) | (0.55) | (0.24) | (0.04) | 0.28 | (0.26) |
| Total from investment operations | $(0.28) | $0.04 | $0.24 | $0.58 | $0.04 |
| Less distributions declared to shareholders | |||||
| From net investment income | $(0.46) | $(0.34) | $(0.28) | $(0.30) | $(0.29) |
| Net asset value, end of period (x) | $5.23 | $5.97 | $6.27 | $6.31 | $6.03 |
| Total return (%) (r)(s)(t)(x) | (4.46) | 0.58 | 4.13 | 9.83 | 0.77 |
| Ratios (%) (to average net assets) and Supplemental data: | |||||
| Expenses before expense reductions (f)(h) | 0.94 | 0.91 | 0.92 | 0.90 | 0.89 |
| Expenses after expense reductions (f)(h) | 0.80 | 0.80 | 0.80 | 0.80 | 0.80 |
| Net investment income (loss) | 4.98 | 4.42 | 4.72 | 4.76 | 4.94 |
| Portfolio turnover | 14 | 38 | 22 | 26 | 13 |
| Net assets at end of period (000 omitted) | $6,804 | $6,316 | $6,406 | $6,689 | $6,885 |
| Class R6 | Year ended | ||||
| 1/31/23 | 1/31/22 | 1/31/21 | 1/31/20 | 1/31/19 | |
| Net asset value, beginning of period | $5.93 | $6.23 | $6.27 | $5.99 | $6.24 |
| Income (loss) from investment operations | |||||
| Net investment income (loss) (d) | $0.27 | $0.28 | $0.29 | $0.30 | $0.30 |
| Net realized and unrealized gain (loss) | (0.54) | (0.23) | (0.04) | 0.29 | (0.25) |
| Total from investment operations | $(0.27) | $0.05 | $0.25 | $0.59 | $0.05 |
| Less distributions declared to shareholders | |||||
| From net investment income | $(0.46) | $(0.35) | $(0.29) | $(0.31) | $(0.30) |
| Net asset value, end of period (x) | $5.20 | $5.93 | $6.23 | $6.27 | $5.99 |
| Total return (%) (r)(s)(t)(x) | (4.27) | 0.65 | 4.23 | 9.98 | 0.85 |
| Ratios (%) (to average net assets) and Supplemental data: | |||||
| Expenses before expense reductions (f)(h) | 0.85 | 0.81 | 0.81 | 0.80 | 0.79 |
| Expenses after expense reductions (f)(h) | 0.70 | 0.70 | 0.70 | 0.70 | 0.70 |
| Net investment income (loss) | 5.03 | 4.53 | 4.81 | 4.84 | 5.04 |
| Portfolio turnover | 14 | 38 | 22 | 26 | 13 |
| Net assets at end of period (000 omitted) | $16,294 | $20,365 | $22,976 | $21,846 | $19,019 |
| (d) | Per share data is based on average shares outstanding. |
| (f) | Ratios do not reflect reductions from fees paid indirectly, if applicable. See Note 2 in the Notes to Financial Statements for additional information. |
| (h) | In addition to the fees and expenses which the fund bears directly, the fund indirectly bears a pro rata share of the fees and expenses of the underlying affiliated funds in which the fund invests. Accordingly, the expense ratio for the fund reflects only those fees and expenses borne directly by the fund. Because the underlying affiliated funds have varied expense and fee levels and the fund may own different proportions of the underlying affiliated funds at different times, the amount of fees and expenses incurred indirectly by the fund will vary. |
| (r) | Certain expenses have been reduced without which performance would have been lower. |
| (s) | From time to time the fund may receive proceeds from litigation settlements, without which performance would be lower. |
| (t) | Total returns do not include any applicable sales charges. |
| (x) | The net asset values and total returns have been calculated on net assets which include adjustments made in accordance with U.S. generally accepted accounting principles required at period end for financial reporting purposes. |
| Financial Instruments | Level 1 | Level 2 | Level 3 | Total |
| Equity Securities: | ||||
| Mexico | $— | $— | $228,697 | $228,697 |
| Non - U.S. Sovereign Debt | — | 5,413,915 | — | 5,413,915 |
| U.S. Corporate Bonds | — | 3,853,144 | — | 3,853,144 |
| Foreign Bonds | — | 55,998,322 | — | 55,998,322 |
| Mutual Funds | 124,398,954 | — | — | 124,398,954 |
| Total | $124,398,954 | $65,265,381 | $228,697 | $189,893,032 |
| Other Financial Instruments | ||||
| Forward Foreign Currency Exchange Contracts – Assets | $— | $24,168 | $— | $24,168 |
| Forward Foreign Currency Exchange Contracts – Liabilities | — | (200,567) | — | (200,567) |
| Equity Securities | |
| Balance as of 1/31/22 | $208,768 |
| Change in unrealized appreciation or depreciation | 19,929 |
| Balance as of 1/31/23 | $228,697 |
| Fair Value | |||
| Risk | Derivative Contracts | Asset Derivatives | Liability Derivatives |
| Foreign Exchange | Forward Foreign Currency Exchange Contracts | $24,168 | $(200,567) |
| Risk | Forward Foreign Currency Exchange Contracts |
| Foreign Exchange | $3,902,420 |
| Risk | Forward Foreign Currency Exchange Contracts |
| Foreign Exchange | $(786,505) |
| Year ended 1/31/23 | Year ended 1/31/22 | |
| Ordinary income (including any short-term capital gains) | $17,296,566 | $15,713,464 |
| As of 1/31/23 | |
| Cost of investments | $228,296,313 |
| Gross appreciation | 1,587,850 |
| Gross depreciation | (40,167,530) |
| Net unrealized appreciation (depreciation) | $(38,579,680) |
| Capital loss carryforwards | (50,361,062) |
| Late year ordinary loss deferral | (594,053) |
| Other temporary differences | (854,871) |
| Total distributable earnings (loss) | $(90,389,666) |
| Short-Term | $(4,672,774) |
| Long-Term | (45,688,288) |
| Total | $(50,361,062) |
| Year ended 1/31/23 | Year ended 1/31/22 | |
| Class A | $9,260,281 | $8,376,919 |
| Class B | 91,110 | 101,337 |
| Class C | 434,406 | 359,031 |
| Class I | 5,285,914 | 5,165,871 |
| Class R1 | 4,928 | 3,185 |
| Class R2 | 33,320 | 24,610 |
| Class R3 | 178,558 | 130,568 |
| Class R4 | 541,415 | 352,580 |
| Class R6 | 1,466,634 | 1,199,363 |
| Total | $17,296,566 | $15,713,464 |
| Up to $1.5 billion | 0.65% |
| In excess of $1.5 billion and up to $2.5 billion | 0.60% |
| In excess of $2.5 billion | 0.55% |
| Classes | ||||||||
| A | B | C | I | R1 | R2 | R3 | R4 | R6 |
| 1.05% | 1.80% | 1.80% | 0.80% | 1.80% | 1.30% | 1.05% | 0.80% | 0.73% |
| Distribution Fee Rate (d) | Service Fee Rate (d) | Total Distribution Plan (d) | Annual Effective Rate (e) | Distribution and Service Fee | |
| Class A | — | 0.25% | 0.25% | 0.25% | $ 288,034 |
| Class B | 0.75% | 0.25% | 1.00% | 1.00% | 13,971 |
| Class C | 0.75% | 0.25% | 1.00% | 1.00% | 61,275 |
| Class R1 | 0.75% | 0.25% | 1.00% | 1.00% | 646 |
| Class R2 | 0.25% | 0.25% | 0.50% | 0.50% | 2,071 |
| Class R3 | — | 0.25% | 0.25% | 0.25% | 5,437 |
| Total Distribution and Service Fees | $371,434 |
| (d) | In accordance with the distribution plan for certain classes, the fund pays distribution and/or service fees equal to these annual percentage rates of each class’s average daily net assets. The distribution and service fee rates disclosed by class represent the current rates in effect at the end of the reporting period. Any rate changes, if applicable, are detailed below. |
| (e) | The annual effective rates represent actual fees incurred under the distribution plan for the year ended January 31, 2023 based on each class's average daily net assets. MFD has voluntarily agreed to rebate a portion of each class's 0.25% service fee attributable to accounts for which there is no financial intermediary specified on the account except for accounts attributable to MFS or its affiliates' seed money. For the year ended January 31, 2023, this rebate amounted to $37 and $1, for Class A and Class B shares, respectively, and is included in the reduction of total expenses in the Statement of Operations. |
| Amount | |
| Class A | $3,375 |
| Class B | 1,060 |
| Class C | 101 |
| Year ended 1/31/23 | Year ended 1/31/22 | ||||
| Shares | Amount | Shares | Amount | ||
| Shares sold | |||||
| Class A | 3,580,063 | $19,470,073 | 3,464,556 | $21,572,803 | |
| Class B | 1,755 | 10,371 | 7,482 | 45,873 | |
| Class C | 73,777 | 399,216 | 146,805 | 914,045 | |
| Class I | 2,992,830 | 16,083,675 | 12,064,096 | 75,652,026 | |
| Class R1 | 578 | 3,056 | 468 | 2,923 | |
| Class R2 | 12,003 | 65,754 | 11,835 | 73,366 | |
| Class R3 | 110,236 | 588,744 | 113,303 | 707,062 | |
| Class R4 | 723,151 | 3,818,548 | 169,088 | 1,055,204 | |
| Class R6 | 344,686 | 1,867,076 | 615,739 | 3,826,706 | |
| 7,839,079 | $42,306,513 | 16,593,372 | $103,850,008 | ||
| Shares issued to shareholders in reinvestment of distributions | |||||
| Class A | 1,694,870 | $8,838,276 | 1,147,855 | $7,096,313 | |
| Class B | 17,343 | 90,794 | 16,030 | 99,360 | |
| Class C | 83,273 | 432,780 | 57,976 | 357,833 | |
| Class I | 998,773 | 5,247,733 | 833,939 | 5,145,310 | |
| Class R1 | 950 | 4,928 | 516 | 3,185 | |
| Class R2 | 6,379 | 33,202 | 3,942 | 24,427 | |
| Class R3 | 34,124 | 178,557 | 21,038 | 130,568 | |
| Class R4 | 103,763 | 541,413 | 56,752 | 352,525 | |
| Class R6 | 254,687 | 1,327,036 | 173,957 | 1,073,072 | |
| 3,194,162 | $16,694,719 | 2,312,005 | $14,282,593 | ||
| Shares reacquired | |||||
| Class A | (6,822,086) | $(36,711,613) | (11,421,204) | $(71,490,927) | |
| Class B | (149,703) | (792,724) | (200,740) | (1,250,781) | |
| Class C | (384,101) | (2,040,151) | (376,995) | (2,343,120) | |
| Class I | (10,856,153) | (56,699,160) | (8,379,025) | (51,651,218) | |
| Class R1 | (15) | (77) | (692) | (4,303) | |
| Class R2 | (10,967) | (57,978) | (24,272) | (150,870) | |
| Class R3 | (129,563) | (715,704) | (68,978) | (426,592) | |
| Class R4 | (584,697) | (3,114,016) | (189,152) | (1,181,485) | |
| Class R6 | (899,083) | (4,823,677) | (1,043,161) | (6,476,643) | |
| (19,836,368) | $(104,955,100) | (21,704,219) | $(134,975,939) | ||
| Year ended 1/31/23 | Year ended 1/31/22 | ||||
| Shares | Amount | Shares | Amount | ||
| Net change | |||||
| Class A | (1,547,153) | $(8,403,264) | (6,808,793) | $(42,821,811) | |
| Class B | (130,605) | (691,559) | (177,228) | (1,105,548) | |
| Class C | (227,051) | (1,208,155) | (172,214) | (1,071,242) | |
| Class I | (6,864,550) | (35,367,752) | 4,519,010 | 29,146,118 | |
| Class R1 | 1,513 | 7,907 | 292 | 1,805 | |
| Class R2 | 7,415 | 40,978 | (8,495) | (53,077) | |
| Class R3 | 14,797 | 51,597 | 65,363 | 411,038 | |
| Class R4 | 242,217 | 1,245,945 | 36,688 | 226,244 | |
| Class R6 | (299,710) | (1,629,565) | (253,465) | (1,576,865) | |
| (8,803,127) | $(45,953,868) | (2,798,842) | $(16,843,338) | ||
| Affiliated Issuers | Beginning Value | Purchases | Sales Proceeds | Realized Gain (Loss) | Change in Unrealized Appreciation or Depreciation | Ending Value |
| MFS High Yield Pooled Portfolio | $162,904,037 | $23,163,994 | $48,568,192 | $(10,340,270) | $(5,912,143) | $121,247,426 |
| MFS Institutional Money Market Portfolio | 2,852,095 | 65,796,656 | 65,498,333 | 689 | 421 | 3,151,528 |
| $165,756,132 | $88,960,650 | $114,066,525 | $(10,339,581) | $(5,911,722) | $124,398,954 |
| Affiliated Issuers | Dividend Income | Capital Gain Distributions |
| MFS High Yield Pooled Portfolio | $8,084,365 | $— |
| MFS Institutional Money Market Portfolio | 128,942 | — |
| $8,213,307 | $— |
March 17, 2023
| Name, Age | Position(s) Held with Fund | Trustee/Officer Since(h) | Number of MFS Funds overseen by the Trustee | Principal Occupations During the Past Five Years | Other Directorships During the Past Five Years (j) | |||||
| INTERESTED TRUSTEE | ||||||||||
| Michael W. Roberge (k) (age 56) | Trustee | January 2021 | 136 | Massachusetts Financial Services Company, Chairman (since January 2021); Chief Executive Officer (since January 2017); Director; Chairman of the Board (since January 2022); President (until December 2018); Chief Investment Officer (until December 2018) | N/A | |||||
| INDEPENDENT TRUSTEES | ||||||||||
| John P. Kavanaugh (age 68) | Trustee and Chair of Trustees | January 2009 | 136 | Private investor | N/A | |||||
| Steven E. Buller (age 71) | Trustee | February 2014 | 136 | Private investor | N/A | |||||
| John A. Caroselli (age 68) | Trustee | March 2017 | 136 | Private investor; JC Global Advisors, LLC (management consulting), President (since 2015) | N/A | |||||
| Maureen R. Goldfarb (age 67) | Trustee | January 2009 | 136 | Private investor | N/A | |||||
| Peter D. Jones (age 67) | Trustee | January 2019 | 136 | Private investor | N/A | |||||
| James W. Kilman, Jr. (age 61) | Trustee | January 2019 | 136 | Burford Capital Limited (finance and investment management), Senior Advisor (since May 3, 2021), Chief Financial Officer (2019 - May 2, 2021); KielStrand Capital LLC (family office), Chief Executive Officer (since 2016) | Alpha-En Corporation, Director (2016-2019) |
| Name, Age | Position(s) Held with Fund | Trustee/Officer Since(h) | Number of MFS Funds overseen by the Trustee | Principal Occupations During the Past Five Years | Other Directorships During the Past Five Years (j) | |||||
| Clarence Otis, Jr. (age 66) | Trustee | March 2017 | 136 | Private investor | VF Corporation, Director; Verizon Communications, Inc., Director; The Travelers Companies, Director | |||||
| Maryanne L. Roepke (age 67) | Trustee | May 2014 | 136 | Private investor | N/A | |||||
| Laurie J. Thomsen (age 65) | Trustee | March 2005 | 136 | Private investor | The Travelers Companies, Director; Dycom Industries, Inc., Director |
| Name, Age | Position(s) Held with Fund | Trustee/Officer Since(h) | Number of MFS Funds for which the Person is an Officer | Principal Occupations During the Past Five Years | ||||
| OFFICERS | ||||||||
| Christopher R. Bohane (k) (age 49) | Assistant Secretary and Assistant Clerk | July 2005 | 136 | Massachusetts Financial Services Company, Senior Vice President and Senior Managing Counsel | ||||
| Kino Clark (k) (age 54) | Assistant Treasurer | January 2012 | 136 | Massachusetts Financial Services Company, Vice President | ||||
| John W. Clark, Jr. (k) (age 55) | Assistant Treasurer | April 2017 | 136 | Massachusetts Financial Services Company, Vice President | ||||
| David L. DiLorenzo (k) (age 54) | President | July 2005 | 136 | Massachusetts Financial Services Company, Senior Vice President | ||||
| Heidi W. Hardin (k) (age 55) | Secretary and Clerk | April 2017 | 136 | Massachusetts Financial Services Company, Executive Vice President and General Counsel | ||||
| Brian E. Langenfeld (k) (age 49) | Assistant Secretary and Assistant Clerk | June 2006 | 136 | Massachusetts Financial Services Company, Vice President and Managing Counsel |
| Name, Age | Position(s) Held with Fund | Trustee/Officer Since(h) | Number of MFS Funds for which the Person is an Officer | Principal Occupations During the Past Five Years | ||||
| Rosa E. Licea-Mailloux (k) (age 46) | Chief Compliance Officer | March 2022 | 136 | Massachusetts Financial Services Company, Vice President (since 2018); Director of Corporate Compliance (2018-2021), Senior Director Compliance (2021-2022), Senior Managing Director of North American Compliance & Chief Compliance Officer (since March 2022); Natixis Investment Managers (investment management), Funds Chief Compliance Officer, Deputy General Counsel & Senior Vice President (until 2018) | ||||
| Amanda S. Mooradian (k) (age 44) | Assistant Secretary and Assistant Clerk | September 2018 | 136 | Massachusetts Financial Services Company, Assistant Vice President and Senior Counsel | ||||
| Susan A. Pereira (k) (age 52) | Assistant Secretary and Assistant Clerk | July 2005 | 136 | Massachusetts Financial Services Company, Vice President and Managing Counsel | ||||
| Kasey L. Phillips (k) (age 52) | Assistant Treasurer | September 2012 | 136 | Massachusetts Financial Services Company, Vice President | ||||
| Matthew A. Stowe (k) (age 48) | Assistant Secretary and Assistant Clerk | October 2014 | 136 | Massachusetts Financial Services Company, Vice President and Senior Managing Counsel | ||||
| William B. Wilson (k) (age 40) | Assistant Secretary and Assistant Clerk | October 2022 | 136 | Massachusetts Financial Services Company, Assistant Vice President and Senior Counsel | ||||
| James O. Yost (k) (age 62) | Treasurer | September 1990 | 136 | Massachusetts Financial Services Company, Senior Vice President |
| (h) | Date first appointed to serve as Trustee/Officer of an MFS Fund. Each Trustee has served continuously since appointment unless indicated otherwise. From January 2012 through December 2016, Messrs. DiLorenzo and Yost served as Treasurer and Deputy Treasurer of the Funds, respectively. |
| (j) | Directorships or trusteeships of companies required to report to the Securities and Exchange Commission (i.e., “public companies”). |
| (k) | “Interested person” of the Trust within the meaning of the Investment Company Act of 1940 (referred to as the 1940 Act), which is the principal federal law governing investment companies like the fund, as a result of a position with MFS. The address of MFS is 111 Huntington Avenue, Boston, Massachusetts 02199-7618. |
| Investment Adviser | Custodian |
| Massachusetts Financial Services Company 111 Huntington Avenue Boston, MA 02199-7618 | JPMorgan Chase Bank, NA 4 Metrotech Center New York, NY 11245 |
| Distributor | Independent Registered Public Accounting Firm |
| MFS Fund Distributors, Inc. 111 Huntington Avenue Boston, MA 02199-7618 | Deloitte & Touche LLP 200 Berkeley Street Boston, MA 02116 |
| Portfolio Manager(s) | |
| David Cole Matt Ryan Michael Skatrud |
| FACTS | WHAT DOES MFS DO WITH YOUR PERSONAL INFORMATION? |
| Why? | Financial companies choose how they share your personal information. Federal law gives consumers the right to limit some but not all sharing. Federal law also requires us to tell you how we collect, share, and protect your personal information. Please read this notice carefully to understand what we do. |
| What? | The types of personal information we collect and share depend on the product or service you have with us. This information can include: |
| • Social Security number and account balances | |
| • Account transactions and transaction history | |
| • Checking account information and wire transfer instructions | |
| When you are no longer our customer, we continue to share your information as described in this notice. |
| How? | All financial companies need to share customers' personal information to run their everyday business. In the section below, we list the reasons financial companies can share their customers' personal information; the reasons MFS chooses to share; and whether you can limit this sharing. |
| Reasons we can share your personal information | Does MFS share? | Can you limit this sharing? |
| For our everyday business purposes – such as to process your transactions, maintain your account(s), respond to court orders and legal investigations, or report to credit bureaus | Yes | No |
| For our marketing purposes – to offer our products and services to you | No | We don't share |
| For joint marketing with other financial companies | No | We don't share |
| For our affiliates' everyday business purposes – information about your transactions and experiences | No | We don't share |
| For our affiliates' everyday business purposes – information about your creditworthiness | No | We don't share |
| For nonaffiliates to market to you | No | We don't share |
| Questions? | Call 800-225-2606 or go to mfs.com. |

| Who we are | |
| Who is providing this notice? | MFS Funds, MFS Investment Management, MFS Institutional Advisors, Inc., and MFS Heritage Trust Company. |
| What we do | |
| How does MFS protect my personal information? | To protect your personal information from unauthorized access and use, we use security measures that comply with federal law. These measures include procedural, electronic, and physical safeguards for the protection of the personal information we collect about you. |
| How does MFS collect my personal information? | We collect your personal information, for example, when you |
| • open an account or provide account information | |
| • direct us to buy securities or direct us to sell your securities | |
| • make a wire transfer | |
| We also collect your personal information from others, such as credit bureaus, affiliates, or other companies. | |
| Why can't I limit all sharing? | Federal law gives you the right to limit only |
| • sharing for affiliates' everyday business purposes – information about your creditworthiness | |
| • affiliates from using your information to market to you | |
| • sharing for nonaffiliates to market to you | |
| State laws and individual companies may give you additional rights to limit sharing. | |
| Definitions | |
| Affiliates | Companies related by common ownership or control. They can be financial and nonfinancial companies. |
| • MFS does not share personal information with affiliates, except for everyday business purposes as described on page one of this notice. | |
| Nonaffiliates | Companies not related by common ownership or control. They can be financial and nonfinancial companies. |
| • MFS does not share with nonaffiliates so they can market to you. | |
| Joint marketing | A formal agreement between nonaffiliated financial companies that together market financial products or services to you. |
| • MFS doesn't jointly market. | |
| Other important information |
| If you own an MFS product or receive an MFS service in the name of a third party such as a bank or broker-dealer, their privacy policy may apply to you instead of ours. |

| 1 | |
| 2 | |
| 4 | |
| 6 | |
| 8 | |
| 9 | |
| 23 | |
| 24 | |
| 25 | |
| 26 | |
| 27 | |
| 38 | |
| 40 | |
| 44 | |
| 44 | |
| 44 | |
| 44 | |
| 44 | |
| 45 |
| back cover |


| Cable TV | 8.4% |
| Medical & Health Technology & Services | 6.6% |
| Gaming & Lodging | 5.1% |
| Midstream | 4.6% |
| Building | 4.4% |
| BBB | 1.7% |
| BB | 44.6% |
| B | 37.9% |
| CCC | 13.2% |
| Not Rated | (1.8)% |
| Non-Fixed Income | 0.3% |
| Cash & Cash Equivalents | 2.1% |
| Other | 2.0% |
| Average Duration (d) | 3.8 |
| Average Effective Maturity (m) | 5.5 yrs. |
| (a) | For all securities other than those specifically described below, ratings are assigned to underlying securities utilizing ratings from Moody’s, Fitch, and Standard & Poor’s rating agencies and applying the following hierarchy: If all three agencies provide a rating, the middle rating (after dropping the highest and lowest ratings) is assigned; if two of the three agencies rate a security, the lower of the two is assigned. If none of the 3 rating agencies above assign a rating, but the security is rated by DBRS Morningstar, then the DBRS Morningstar rating is assigned. If none of the 4 rating agencies listed above rate the security, but the security is rated by the Kroll Bond Rating Agency (KBRA), then the KBRA rating is assigned. Ratings are shown in the S&P and Fitch scale (e.g., AAA). Securities rated BBB or higher are considered investment grade. All ratings are subject to change. Not Rated includes fixed income securities and fixed income derivatives that have not been rated by any rating agency. Non-Fixed Income includes equity securities (including convertible bonds and equity derivatives), ETFs, and/or commodity-linked derivatives. The fund may or may not have held all of these instruments on this date. The fund is not rated by these agencies. |
| (d) | Duration is a measure of how much a bond’s price is likely to fluctuate with general changes in interest rates, e.g., if rates rise 1.00%, a bond with a 5-year duration is likely to lose about 5.00% of its value due to the interest rate move. The Average Duration calculation reflects the impact of the equivalent exposure of derivative positions, if any. |
| (i) | For purposes of this presentation, the components include the value of securities, and reflect the impact of the equivalent exposure of derivative positions, if any. These amounts may be negative from time to time. Equivalent exposure is a calculated amount that translates the derivative position into a reasonable approximation of the amount of the underlying asset that the portfolio would have to hold at a given point in time to have the same price sensitivity that results from the portfolio’s ownership of the derivative contract. When dealing with derivatives, equivalent exposure is a more representative measure of the potential impact of a position on portfolio performance than value. The bond component will include any accrued interest amounts. |
| (m) | In determining each instrument’s effective maturity for purposes of calculating the fund’s dollar-weighted average effective maturity, MFS uses the instrument’s stated maturity or, if applicable, an earlier date on which MFS believes it is probable that a maturity-shortening device (such as a put, pre-refunding or prepayment) will cause the instrument to be repaid. Such an earlier date can be substantially shorter than the instrument’s stated maturity. |
| (h) | Security was not held in the portfolio at period end. |
| (r) | Securities rated “BBB”, “Baa”, or higher are considered investment grade; securities rated “BB”, “Ba”, or below are considered non-investment grade. Ratings are assigned to underlying securities utilizing ratings from Moody's, Fitch, and Standard & Poor's and applying the following hierarchy: If all three agencies provide a rating, the middle rating (after dropping the highest and lowest ratings) is assigned; if two of the three agencies rate a security, the lower of the two is assigned. If none of the 3 rating agencies above assign a rating, but the security is rated by DBRS Morningstar, then the DBRS Morningstar rating is assigned. If none of the 4 rating agencies listed above rate the security, but the security is rated by the Kroll Bond Rating Agency (KBRA), then the KBRA rating is assigned. Ratings are shown in the S&P and Fitch scale (e.g., AAA). For securities that are not rated by any of the rating agencies, the security is considered Not Rated. |
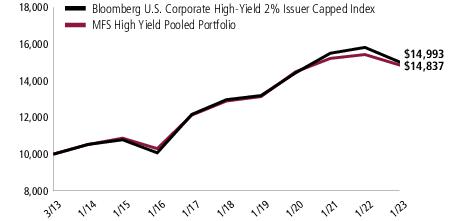
| Fund Inception Date | 1-yr | 5-yr | Life (t) |
| 3/25/13 | (3.84)% | 2.84% | 4.08% |
| Bloomberg U.S. Corporate High-Yield 2% Issuer Capped Index (f) | (5.22)% | 2.94% | 4.19% |
| (f) | Source: FactSet Research Systems Inc. |
| (t) | For the period from the fund inception date through the stated period end. (See Notes to Performance Summary.) |
| (a) | Source: Bloomberg Index Services Limited. BLOOMBERG® is a trademark and service mark of Bloomberg Finance L.P. and its affiliates (collectively “Bloomberg”). Bloomberg or Bloomberg's licensors own all proprietary rights in the Bloomberg Indices. Bloomberg neither approves or endorses this material, or guarantees the accuracy or completeness of any information herein, or makes any warranty, express or implied, as to the results to be obtained therefrom and, to the maximum extent allowed by law, neither shall have any liability or responsibility for injury or damages arising in connection therewith. |
August 1, 2022 through January 31, 2023
| Annualized Expense Ratio | Beginning Account Value 8/01/22 | Ending Account Value 1/31/23 | Expenses Paid During Period (p) 8/01/22-1/31/23 | |
| Actual | 0.02% | $1,000.00 | $1,019.11 | $0.10 |
| Hypothetical (h) | 0.02% | $1,000.00 | $1,025.10 | $0.10 |
| (h) | 5% fund return per year before expenses. |
| (p) | “Expenses Paid During Period” are equal to the fund’s annualized expense ratio, as shown above, multiplied by the average account value over the period, multiplied by 184/365 (to reflect the one-half year period). |
| Issuer | Shares/Par | Value ($) | ||
| Bonds – 96.2% | ||||
| Aerospace & Defense – 2.3% | ||||
| Bombardier, Inc., 7.5%, 3/15/2025 (n) | $ | 1,317,000 | $1,318,646 | |
| Bombardier, Inc., 7.125%, 6/15/2026 (n) | 1,517,000 | 1,513,375 | ||
| Bombardier, Inc., 7.5%, 2/01/2029 (n) | 935,000 | 934,093 | ||
| F-Brasile S.p.A./F-Brasile U.S. LLC, 7.375%, 8/15/2026 (n) | 2,450,000 | 2,007,481 | ||
| Moog, Inc., 4.25%, 12/15/2027 (n) | 3,495,000 | 3,241,613 | ||
| TransDigm, Inc., 6.25%, 3/15/2026 (n) | 2,352,000 | 2,351,172 | ||
| TransDigm, Inc., 6.375%, 6/15/2026 | 1,650,000 | 1,629,350 | ||
| TransDigm, Inc., 5.5%, 11/15/2027 | 2,015,000 | 1,924,276 | ||
| TransDigm, Inc., 4.625%, 1/15/2029 | 2,196,000 | 1,981,143 | ||
| $16,901,149 | ||||
| Automotive – 2.4% | ||||
| Clarios Global LP/Clarios U.S. Finance Co., 8.5%, 5/15/2027 (n) | $ | 2,975,000 | $2,963,135 | |
| Dana, Inc., 5.375%, 11/15/2027 | 1,976,000 | 1,877,625 | ||
| Dana, Inc., 4.25%, 9/01/2030 | 1,495,000 | 1,265,225 | ||
| Dornoch Debt Merger Sub, Inc., 6.625%, 10/15/2029 (n) | 2,605,000 | 1,955,935 | ||
| Ford Motor Co., 5.113%, 5/03/2029 | 3,005,000 | 2,847,861 | ||
| Ford Motor Credit Co. LLC, 4.134%, 8/04/2025 | 5,330,000 | 5,089,990 | ||
| Real Hero Merger Sub 2, Inc., 6.25%, 2/01/2029 (n) | 2,025,000 | 1,503,563 | ||
| $17,503,334 | ||||
| Broadcasting – 2.1% | ||||
| Advantage Sales & Marketing, Inc., 6.5%, 11/15/2028 (n) | $ | 2,204,000 | $1,675,040 | |
| Gray Escrow II, Inc., 5.375%, 11/15/2031 (n) | 4,746,000 | 3,649,793 | ||
| iHeartCommunications, Inc., 8.375%, 5/01/2027 | 2,908,000 | 2,606,295 | ||
| Scripps Escrow II, Inc., 5.875%, 7/15/2027 (n) | 2,321,000 | 2,071,492 | ||
| Summer (BC) Bidco B LLC, 5.5%, 10/31/2026 (n) | 2,545,000 | 2,091,770 | ||
| Summer (BC) Holdco S.à r.l., “A”, 9.25%, 10/31/2027 | EUR | 833,474 | 734,992 | |
| WMG Acquisition Corp., 3.875%, 7/15/2030 (n) | $ | 2,882,000 | 2,540,483 | |
| $15,369,865 | ||||
| Brokerage & Asset Managers – 2.1% | ||||
| AG TTMT Escrow Issuer LLC, 8.625%, 9/30/2027 (n) | $ | 2,775,000 | $2,863,162 | |
| Aretec Escrow Issuer, Inc., 7.5%, 4/01/2029 (n) | 2,420,000 | 2,147,750 | ||
| LPL Holdings, Inc., 4.625%, 11/15/2027 (n) | 3,180,000 | 3,026,215 | ||
| LPL Holdings, Inc., 4%, 3/15/2029 (n) | 2,066,000 | 1,849,070 | ||
| LPL Holdings, Inc., 4.375%, 5/15/2031 (n) | 1,343,000 | 1,175,944 | ||
| NFP Corp., 4.875%, 8/15/2028 (n) | 1,995,000 | 1,741,096 | ||
| NFP Corp., 6.875%, 8/15/2028 (n) | 2,492,000 | 2,154,733 | ||
| $14,957,970 | ||||
| Issuer | Shares/Par | Value ($) | ||
| Bonds – continued | ||||
| Building – 4.4% | ||||
| ABC Supply Co., Inc., 4%, 1/15/2028 (n) | $ | 4,945,000 | $4,505,241 | |
| Foundation Building Materials LLC, 6%, 3/01/2029 (n) | 2,193,000 | 1,763,961 | ||
| GYP Holding III Corp., 4.625%, 5/01/2029 (n) | 3,870,000 | 3,263,088 | ||
| Interface, Inc., 5.5%, 12/01/2028 (n) | 3,855,000 | 3,238,778 | ||
| MIWD Holdco II LLC/MIWD Finance Co., 5.5%, 2/01/2030 (n) | 1,930,000 | 1,604,737 | ||
| New Enterprise Stone & Lime Co., Inc., 9.75%, 7/15/2028 (n) | 2,352,000 | 2,230,366 | ||
| Patrick Industries, Inc., 7.5%, 10/15/2027 (n) | 3,110,000 | 3,077,190 | ||
| SRM Escrow Issuer LLC, 6%, 11/01/2028 (n) | 2,150,000 | 1,962,993 | ||
| SRS Distribution, Inc., 6.125%, 7/01/2029 (n) | 2,665,000 | 2,291,660 | ||
| Standard Industries, Inc., 2.25%, 11/21/2026 | EUR | 655,000 | 615,347 | |
| Standard Industries, Inc., 4.75%, 1/15/2028 (n) | $ | 2,025,000 | 1,897,729 | |
| Standard Industries, Inc., 4.375%, 7/15/2030 (n) | 3,053,000 | 2,609,921 | ||
| Standard Industries, Inc., 3.375%, 1/15/2031 (n) | 680,000 | 540,068 | ||
| White Cap Buyer LLC, 6.875%, 10/15/2028 (n) | 2,335,000 | 2,125,372 | ||
| $31,726,451 | ||||
| Business Services – 1.4% | ||||
| Entegris Escrow Corp., 5.95%, 6/15/2030 (n) | $ | 1,220,000 | $1,171,602 | |
| HealthEquity, Inc., 4.5%, 10/01/2029 (n) | 2,380,000 | 2,130,814 | ||
| Iron Mountain, Inc., 4.875%, 9/15/2027 (n) | 1,835,000 | 1,727,726 | ||
| Iron Mountain, Inc., 5.25%, 3/15/2028 (n) | 1,590,000 | 1,511,931 | ||
| Verscend Escrow Corp., 9.75%, 8/15/2026 (n) | 2,992,000 | 3,002,405 | ||
| ZI Technologies LLC/ZI Finance Corp. Co., 3.875%, 2/01/2029 (n) | 860,000 | 741,750 | ||
| $10,286,228 | ||||
| Cable TV – 8.1% | ||||
| Cable One, Inc., 4%, 11/15/2030 (n) | $ | 2,725,000 | $2,246,837 | |
| CCO Holdings LLC/CCO Holdings Capital Corp., 5.125%, 5/01/2027 (n) | 1,895,000 | 1,806,030 | ||
| CCO Holdings LLC/CCO Holdings Capital Corp., 4.75%, 3/01/2030 (n) | 7,287,000 | 6,367,308 | ||
| CCO Holdings LLC/CCO Holdings Capital Corp., 4.5%, 8/15/2030 (n) | 3,395,000 | 2,900,891 | ||
| CCO Holdings LLC/CCO Holdings Capital Corp., 4.25%, 2/01/2031 (n) | 2,860,000 | 2,382,523 | ||
| CCO Holdings LLC/CCO Holdings Capital Corp., 4.25%, 1/15/2034 (n) | 1,855,000 | 1,446,065 | ||
| CSC Holdings LLC, 5.375%, 2/01/2028 (n) | 1,900,000 | 1,603,125 | ||
| CSC Holdings LLC, 5.75%, 1/15/2030 (n) | 3,990,000 | 2,513,700 | ||
| CSC Holdings LLC, 4.125%, 12/01/2030 (n) | 2,425,000 | 1,792,730 | ||
| DISH DBS Corp., 7.75%, 7/01/2026 | 1,380,000 | 1,120,781 | ||
| DISH DBS Corp., 5.25%, 12/01/2026 (n) | 1,815,000 | 1,564,303 | ||
| DISH DBS Corp., 5.125%, 6/01/2029 | 2,015,000 | 1,281,318 | ||
| DISH Network Corp., 11.75%, 11/15/2027 (n) | 1,200,000 | 1,247,040 | ||
| LCPR Senior Secured Financing DAC, 6.75%, 10/15/2027 (n) | 2,919,000 | 2,843,982 | ||
| Issuer | Shares/Par | Value ($) | ||
| Bonds – continued | ||||
| Cable TV – continued | ||||
| LCPR Senior Secured Financing DAC, 5.125%, 7/15/2029 (n) | $ | 930,000 | $818,400 | |
| Sirius XM Holdings, Inc., 3.875%, 9/01/2031 (n) | 3,465,000 | 2,856,477 | ||
| Sirius XM Radio, Inc., 4%, 7/15/2028 (n) | 2,037,000 | 1,813,134 | ||
| Sirius XM Radio, Inc., 5.5%, 7/01/2029 (n) | 4,730,000 | 4,432,719 | ||
| Telenet Finance Luxembourg S.A., 5.5%, 3/01/2028 (n) | 4,600,000 | 4,273,400 | ||
| Videotron Ltd., 5.125%, 4/15/2027 (n) | 1,828,000 | 1,754,734 | ||
| Videotron Ltd., 3.625%, 6/15/2029 (n) | 1,140,000 | 991,863 | ||
| Virgin Media Finance PLC, 5%, 7/15/2030 (n) | 3,640,000 | 3,055,379 | ||
| Virgin Media Vendor Financing Notes IV DAC, 5%, 7/15/2028 (n) | 4,410,000 | 4,002,516 | ||
| Ziggo Bond Finance B.V., 5.125%, 2/28/2030 (n) | 5,030,000 | 4,157,295 | ||
| $59,272,550 | ||||
| Chemicals – 2.5% | ||||
| Axalta Coating Systems Ltd., 4.75%, 6/15/2027 (n) | $ | 2,274,000 | $2,148,930 | |
| Axalta Coating Systems Ltd., 3.375%, 2/15/2029 (n) | 3,805,000 | 3,272,300 | ||
| Consolidated Energy Finance S.A., 5.625%, 10/15/2028 (n) | 2,254,000 | 1,960,980 | ||
| Element Solutions, Inc., 3.875%, 9/01/2028 (n) | 3,619,000 | 3,202,815 | ||
| Ingevity Corp., 3.875%, 11/01/2028 (n) | 3,287,000 | 2,881,017 | ||
| LSF11 A5 HoldCo LLC, 6.625%, 10/15/2029 (n) | 2,508,000 | 2,058,053 | ||
| S.P.C.M. S.A., 3.375%, 3/15/2030 (n) | 3,325,000 | 2,814,612 | ||
| $18,338,707 | ||||
| Computer Software – 1.2% | ||||
| Camelot Finance S.A., 4.5%, 11/01/2026 (n) | $ | 1,765,000 | $1,678,744 | |
| Clarivate Science Holdings Corp., 3.875%, 7/01/2028 (n) | 745,000 | 664,765 | ||
| Clarivate Science Holdings Corp., 4.875%, 7/01/2029 (n) | 2,470,000 | 2,173,415 | ||
| Dun & Bradstreet Corp., 5%, 12/15/2029 (n) | 2,625,000 | 2,324,440 | ||
| Neptune Bidco U.S., Inc., 9.29%, 4/15/2029 (n) | 1,731,000 | 1,682,584 | ||
| $8,523,948 | ||||
| Computer Software - Systems – 2.2% | ||||
| Fair Isaac Corp., 5.25%, 5/15/2026 (n) | $ | 4,736,000 | $4,701,664 | |
| Fair Isaac Corp., 4%, 6/15/2028 (n) | 816,000 | 757,660 | ||
| Sabre GLBL, Inc., 7.375%, 9/01/2025 (n) | 634,000 | 621,870 | ||
| Sabre GLBL, Inc., 11.25%, 12/15/2027 (n) | 1,075,000 | 1,139,500 | ||
| SS&C Technologies Holdings, Inc., 5.5%, 9/30/2027 (n) | 4,139,000 | 3,980,659 | ||
| Viavi Solutions, Inc., 3.75%, 10/01/2029 (n) | 3,505,000 | 3,058,112 | ||
| Virtusa Corp., 7.125%, 12/15/2028 (n) | 2,145,000 | 1,801,800 | ||
| $16,061,265 | ||||
| Conglomerates – 3.0% | ||||
| BWX Technologies, Inc., 4.125%, 6/30/2028 (n) | $ | 1,943,000 | $1,753,569 | |
| BWX Technologies, Inc., 4.125%, 4/15/2029 (n) | 4,559,000 | 4,080,439 | ||
| Chart Industries, Inc., 9.5%, 1/01/2031 (n) | 1,084,000 | 1,131,143 | ||
| Issuer | Shares/Par | Value ($) | ||
| Bonds – continued | ||||
| Conglomerates – continued | ||||
| Gates Global LLC, 6.25%, 1/15/2026 (n) | $ | 3,225,000 | $3,176,101 | |
| Griffon Corp., 5.75%, 3/01/2028 | 2,886,000 | 2,731,368 | ||
| Madison IAQ LLC, 5.875%, 6/30/2029 (n) | 3,293,000 | 2,612,139 | ||
| Regal Rexnord Corp., 6.3%, 2/15/2030 (n) | 1,787,000 | 1,822,138 | ||
| TriMas Corp., 4.125%, 4/15/2029 (n) | 5,226,000 | 4,652,446 | ||
| $21,959,343 | ||||
| Construction – 1.6% | ||||
| Empire Communities Corp., 7%, 12/15/2025 (n) | $ | 2,300,000 | $2,081,500 | |
| Mattamy Group Corp., 5.25%, 12/15/2027 (n) | 1,110,000 | 1,015,650 | ||
| Mattamy Group Corp., 4.625%, 3/01/2030 (n) | 1,920,000 | 1,619,309 | ||
| Meritage Homes Corp., 3.875%, 4/15/2029 (n) | 2,400,000 | 2,127,000 | ||
| Taylor Morrison Communities, Inc., 5.75%, 1/15/2028 (n) | 3,046,000 | 2,954,665 | ||
| Weekley Homes LLC/Weekley Finance Corp., 4.875%, 9/15/2028 (n) | 2,048,000 | 1,782,272 | ||
| $11,580,396 | ||||
| Consumer Products – 2.2% | ||||
| Energizer Gamma Acquisition B.V., 3.5%, 6/30/2029 | EUR | 1,290,000 | $1,139,666 | |
| Energizer Holdings, Inc., 4.375%, 3/31/2029 (n) | $ | 2,123,000 | 1,843,656 | |
| Mattel, Inc., 3.375%, 4/01/2026 (n) | 2,670,000 | 2,489,788 | ||
| Mattel, Inc., 5.875%, 12/15/2027 (n) | 680,000 | 678,300 | ||
| Mattel, Inc., 6.2%, 10/01/2040 | 290,000 | 269,265 | ||
| Mattel, Inc., 5.45%, 11/01/2041 | 975,000 | 834,459 | ||
| Newell Brands, Inc., 6.375%, 9/15/2027 | 1,587,000 | 1,595,236 | ||
| Newell Brands, Inc., 6.625%, 9/15/2029 | 1,654,000 | 1,672,024 | ||
| Prestige Consumer Healthcare, Inc., 5.125%, 1/15/2028 (n) | 2,200,000 | 2,101,550 | ||
| Prestige Consumer Healthcare, Inc., 3.75%, 4/01/2031 (n) | 1,185,000 | 1,006,183 | ||
| Spectrum Brands, Inc., 3.875%, 3/15/2031 (n) | 1,735,000 | 1,398,809 | ||
| SWF Escrow Issuer Corp., 6.5%, 10/01/2029 (n) | 2,070,000 | 1,360,859 | ||
| $16,389,795 | ||||
| Consumer Services – 4.0% | ||||
| Allied Universal Holdco LLC, 6.625%, 7/15/2026 (n) | $ | 618,000 | $594,979 | |
| Allied Universal Holdco LLC, 9.75%, 7/15/2027 (n) | 2,635,000 | 2,516,425 | ||
| Allied Universal Holdco LLC, 6%, 6/01/2029 (n) | 1,480,000 | 1,190,808 | ||
| ANGI Group LLC, 3.875%, 8/15/2028 (n) | 3,064,000 | 2,348,648 | ||
| Arches Buyer, Inc., 6.125%, 12/01/2028 (n) | 2,820,000 | 2,375,173 | ||
| GoDaddy, Inc., 3.5%, 3/01/2029 (n) | 4,971,000 | 4,298,921 | ||
| GW B-CR Security Corp., 9.5%, 11/01/2027 (n) | 2,027,000 | 2,001,842 | ||
| Match Group Holdings II LLC, 5%, 12/15/2027 (n) | 1,945,000 | 1,864,992 | ||
| Match Group Holdings II LLC, 4.625%, 6/01/2028 (n) | 3,115,000 | 2,865,084 | ||
| Match Group Holdings II LLC, 4.125%, 8/01/2030 (n) | 1,030,000 | 885,800 | ||
| Match Group Holdings II LLC, 3.625%, 10/01/2031 (n) | 245,000 | 196,613 | ||
| Realogy Group LLC/Realogy Co-Issuer Corp., 5.75%, 1/15/2029 (n) | 1,995,000 | 1,551,192 | ||
| Issuer | Shares/Par | Value ($) | ||
| Bonds – continued | ||||
| Consumer Services – continued | ||||
| Realogy Group LLC/Realogy Co-Issuer Corp., 5.25%, 4/15/2030 (n) | $ | 1,760,000 | $1,320,000 | |
| TriNet Group, Inc., 3.5%, 3/01/2029 (n) | 3,943,000 | 3,311,055 | ||
| WASH Multi-Family Acquisition, Inc., 5.75%, 4/15/2026 (n) | 2,103,000 | 1,940,477 | ||
| $29,262,009 | ||||
| Containers – 2.9% | ||||
| ARD Finance S.A., 6.5% (6.5% cash or 7.25% PIK), 6/30/2027 (n)(p) | $ | 1,777,076 | $1,394,010 | |
| Ardagh Metal Packaging Finance USA LLC, 3.25%, 9/01/2028 (n) | 1,450,000 | 1,272,419 | ||
| Ardagh Metal Packaging Finance USA LLC, 4%, 9/01/2029 (n) | 2,951,000 | 2,440,064 | ||
| Ardagh Packaging Finance PLC/Ardagh MP Holdings USA, Inc., 5.25%, 8/15/2027 (n) | 3,700,000 | 3,029,875 | ||
| Can-Pack S.A./Eastern PA Land Investment Holding LLC, 3.875%, 11/15/2029 (n) | 3,905,000 | 3,242,673 | ||
| Crown Americas LLC, 5.25%, 4/01/2030 | 1,960,000 | 1,886,500 | ||
| Crown Americas LLC/Crown Americas Capital Corp. V, 4.25%, 9/30/2026 | 3,670,000 | 3,507,244 | ||
| Crown Americas LLC/Crown Americas Capital Corp. VI, 4.75%, 2/01/2026 | 1,280,000 | 1,250,483 | ||
| LABL, Inc., 5.875%, 11/01/2028 (n) | 855,000 | 772,706 | ||
| Trivium Packaging Finance B.V., 8.5%, 8/15/2027 (n) | 2,295,000 | 2,207,193 | ||
| $21,003,167 | ||||
| Electrical Equipment – 0.4% | ||||
| CommScope Technologies LLC, 5%, 3/15/2027 (n) | $ | 3,465,000 | $2,645,450 | |
| Electronics – 1.7% | ||||
| Entegris, Inc., 4.375%, 4/15/2028 (n) | $ | 1,175,000 | $1,063,375 | |
| Entegris, Inc., 3.625%, 5/01/2029 (n) | 1,382,000 | 1,178,596 | ||
| Sensata Technologies B.V., 5.625%, 11/01/2024 (n) | 930,000 | 930,215 | ||
| Sensata Technologies B.V., 5%, 10/01/2025 (n) | 3,575,000 | 3,535,657 | ||
| Sensata Technologies B.V., 5.875%, 9/01/2030 (n) | 1,640,000 | 1,609,250 | ||
| Sensata Technologies, Inc., 4.375%, 2/15/2030 (n) | 1,510,000 | 1,366,943 | ||
| Synaptics, Inc., 4%, 6/15/2029 (n) | 2,990,000 | 2,589,083 | ||
| $12,273,119 | ||||
| Energy - Independent – 3.0% | ||||
| Antero Resources Corp., 7.625%, 2/01/2029 (n) | $ | 1,845,000 | $1,886,698 | |
| CNX Resources Corp., 6%, 1/15/2029 (n) | 2,082,000 | 1,911,228 | ||
| CNX Resources Corp., 7.375%, 1/15/2031 (n) | 733,000 | 712,835 | ||
| Comstock Resources, Inc., 6.75%, 3/01/2029 (n) | 3,280,000 | 3,025,800 | ||
| CrownRock LP/CrownRock Finance, Inc., “F”, 5%, 5/01/2029 (n) | 2,955,000 | 2,706,630 | ||
| Encino Acquisition Partners Holdings LLC, 8.5%, 5/01/2028 (n) | 1,890,000 | 1,762,066 | ||
| Moss Creek Resources Holdings, Inc., 7.5%, 1/15/2026 (n) | 1,675,000 | 1,546,695 | ||
| Permian Resources Operating LLC, 7.75%, 2/15/2026 (n) | 445,000 | 444,733 | ||
| Issuer | Shares/Par | Value ($) | ||
| Bonds – continued | ||||
| Energy - Independent – continued | ||||
| Permian Resources Operating LLC, 5.875%, 7/01/2029 (n) | $ | 2,361,000 | $2,212,971 | |
| SM Energy Co., 6.5%, 7/15/2028 | 2,145,000 | 2,040,366 | ||
| Southwestern Energy Co., 8.375%, 9/15/2028 | 1,015,000 | 1,066,095 | ||
| Southwestern Energy Co., 5.375%, 3/15/2030 | 1,870,000 | 1,741,438 | ||
| Tap Rock Resources LLC, 7%, 10/01/2026 (n) | 694,000 | 656,871 | ||
| $21,714,426 | ||||
| Entertainment – 2.6% | ||||
| Carnival Corp. PLC, 7.625%, 3/01/2026 (n) | $ | 2,959,000 | $2,692,690 | |
| Carnival Corp. PLC, 5.75%, 3/01/2027 (n) | 1,550,000 | 1,286,500 | ||
| Carnival Corp. PLC, 9.875%, 8/01/2027 (n) | 965,000 | 991,538 | ||
| Life Time, Inc., 5.75%, 1/15/2026 (n) | 2,070,000 | 1,989,312 | ||
| Life Time, Inc., 8%, 4/15/2026 (n) | 705,000 | 684,721 | ||
| Merlin Entertainments, 5.75%, 6/15/2026 (n) | 1,161,000 | 1,105,393 | ||
| Motion Bondco DAC, 6.625%, 11/15/2027 (n) | 2,435,000 | 2,203,628 | ||
| NCL Corp. Ltd., 5.875%, 3/15/2026 (n) | 2,080,000 | 1,799,158 | ||
| NCL Corp. Ltd., 5.875%, 2/15/2027 (n) | 560,000 | 520,660 | ||
| Royal Caribbean Cruises Ltd., 5.375%, 7/15/2027 (n) | 1,440,000 | 1,252,630 | ||
| Royal Caribbean Cruises Ltd., 5.5%, 4/01/2028 (n) | 2,920,000 | 2,511,200 | ||
| SeaWorld Parks & Entertainment, 5.25%, 8/15/2029 (n) | 1,940,000 | 1,753,396 | ||
| $18,790,826 | ||||
| Financial Institutions – 3.2% | ||||
| Avation Capital S.A., 8.25% (8.25% cash or 9% PIK), 10/31/2026 (n)(p) | $ | 1,772,633 | $1,515,601 | |
| Credit Acceptance Corp., 5.125%, 12/31/2024 (n) | 2,735,000 | 2,554,158 | ||
| Global Aircraft Leasing Co. Ltd., 6.5% (6.5% cash or 7.25% PIK), 9/15/2024 (n)(p) | 5,567,595 | 5,080,897 | ||
| Howard Hughes Corp., 4.125%, 2/01/2029 (n) | 3,451,000 | 2,980,008 | ||
| Nationstar Mortgage Holdings, Inc., 6%, 1/15/2027 (n) | 3,669,000 | 3,402,998 | ||
| OneMain Finance Corp., 6.875%, 3/15/2025 | 1,590,000 | 1,585,007 | ||
| OneMain Finance Corp., 7.125%, 3/15/2026 | 2,310,000 | 2,294,881 | ||
| Rocket Mortgage Co-Issuer, Inc., 3.625%, 3/01/2029 (n) | 3,484,000 | 2,939,416 | ||
| SLM Corp., 3.125%, 11/02/2026 | 1,285,000 | 1,134,912 | ||
| $23,487,878 | ||||
| Food & Beverages – 3.0% | ||||
| B&G Foods, Inc., 5.25%, 4/01/2025 | $ | 1,735,000 | $1,581,192 | |
| B&G Foods, Inc., 5.25%, 9/15/2027 | 650,000 | 525,688 | ||
| BellRing Brands, Inc., 7%, 3/15/2030 (n) | 2,900,000 | 2,878,547 | ||
| Lamb Weston Holdings, Inc., 4.125%, 1/31/2030 (n) | 2,910,000 | 2,622,638 | ||
| Performance Food Group Co., 5.5%, 10/15/2027 (n) | 3,240,000 | 3,118,484 | ||
| Post Holdings, Inc., 5.625%, 1/15/2028 (n) | 2,368,000 | 2,279,200 | ||
| Post Holdings, Inc., 4.625%, 4/15/2030 (n) | 3,520,000 | 3,097,600 | ||
| Issuer | Shares/Par | Value ($) | ||
| Bonds – continued | ||||
| Food & Beverages – continued | ||||
| Primo Water Holding, Inc., 4.375%, 4/30/2029 (n) | $ | 3,505,000 | $3,057,201 | |
| U.S. Foods Holding Corp., 4.75%, 2/15/2029 (n) | 3,115,000 | 2,849,584 | ||
| $22,010,134 | ||||
| Gaming & Lodging – 5.0% | ||||
| Boyd Gaming Corp., 4.75%, 12/01/2027 | $ | 1,360,000 | $1,292,908 | |
| Boyd Gaming Corp., 4.75%, 6/15/2031 (n) | 1,250,000 | 1,124,762 | ||
| Caesars Entertainment, Inc., 4.625%, 10/15/2029 (n) | 1,655,000 | 1,415,025 | ||
| Caesars Entertainment, Inc., 7%, 2/15/2030 (n) | 1,784,000 | 1,815,220 | ||
| Caesars Resort Collection LLC/CRC Finco, Inc., 8.125%, 7/01/2027 (n) | 2,516,000 | 2,553,740 | ||
| CCM Merger, Inc., 6.375%, 5/01/2026 (n) | 2,340,000 | 2,263,950 | ||
| Hilton Domestic Operating Co., Inc., 3.75%, 5/01/2029 (n) | 3,517,000 | 3,123,483 | ||
| Hilton Domestic Operating Co., Inc., 3.625%, 2/15/2032 (n) | 3,122,000 | 2,621,699 | ||
| International Game Technology PLC, 4.125%, 4/15/2026 (n) | 3,670,000 | 3,477,410 | ||
| International Game Technology PLC, 6.25%, 1/15/2027 (n) | 830,000 | 830,000 | ||
| Marriott Ownership Resorts, Inc., 4.5%, 6/15/2029 (n) | 1,425,000 | 1,240,476 | ||
| Sands China Ltd., 4.3%, 1/08/2026 | 2,080,000 | 1,972,980 | ||
| Sands China Ltd., 4.875%, 6/18/2030 | 1,960,000 | 1,785,581 | ||
| Scientific Games Holdings LP/Scientific Games US Finco, Inc., 6.625%, 3/01/2030 (n) | 2,232,000 | 1,988,210 | ||
| VICI Properties LP / VICI Note Co., Inc., 4.25%, 12/01/2026 (n) | 2,470,000 | 2,331,065 | ||
| VICI Properties LP / VICI Note Co., Inc., 5.75%, 2/01/2027 (n) | 1,110,000 | 1,104,173 | ||
| Wyndham Hotels & Resorts, Inc., 4.375%, 8/15/2028 (n) | 2,858,000 | 2,635,949 | ||
| Wynn Resorts Finance LLC/Wynn Resorts Capital Corp., 5.125%, 10/01/2029 (n) | 3,210,000 | 2,864,925 | ||
| $36,441,556 | ||||
| Industrial – 1.2% | ||||
| Albion Financing 1 S.à r.l., 6.125%, 10/15/2026 (n) | $ | 1,180,000 | $1,058,727 | |
| Albion Financing 2 S.à r.l., 8.75%, 4/15/2027 (n) | 1,530,000 | 1,296,675 | ||
| APi Escrow Corp., 4.75%, 10/15/2029 (n) | 3,765,000 | 3,356,981 | ||
| Williams Scotsman International, Inc., 4.625%, 8/15/2028 (n) | 3,198,000 | 2,963,123 | ||
| $8,675,506 | ||||
| Insurance - Property & Casualty – 1.2% | ||||
| Alliant Holdings Intermediate LLC, 6.75%, 10/15/2027 (n) | $ | 1,090,000 | $1,019,510 | |
| Alliant Holdings Intermediate LLC/Alliant Holdings Co-Issuer, 5.875%, 11/01/2029 (n) | 30,000 | 26,137 | ||
| AssuredPartners, Inc., 5.625%, 1/15/2029 (n) | 2,440,000 | 2,087,127 | ||
| GTCR (AP) Finance, Inc., 8%, 5/15/2027 (n) | 755,000 | 741,342 | ||
| Hub International Ltd., 5.625%, 12/01/2029 (n) | 3,772,000 | 3,375,457 | ||
| Issuer | Shares/Par | Value ($) | ||
| Bonds – continued | ||||
| Insurance - Property & Casualty – continued | ||||
| Ryan Specialty Group, 4.375%, 2/01/2030 (n) | $ | 1,409,000 | $1,269,861 | |
| $8,519,434 | ||||
| Machinery & Tools – 0.4% | ||||
| Terex Corp., 5%, 5/15/2029 (n) | $ | 3,260,000 | $3,044,025 | |
| Major Banks – 0.3% | ||||
| Toronto Dominion Bank, 8.125% to 10/31/2027, FLR (CMT - 5yr. + 4.075%) to 10/31/2082 | $ | 1,880,000 | $1,995,150 | |
| Medical & Health Technology & Services – 6.5% | ||||
| 180 Medical, Inc., 3.875%, 10/15/2029 (n) | $ | 2,775,000 | $2,459,375 | |
| Avantor Funding, Inc., 4.625%, 7/15/2028 (n) | 3,585,000 | 3,379,185 | ||
| Catalent, Inc., 2.375%, 3/01/2028 | EUR | 895,000 | 805,157 | |
| Catalent, Inc., 3.125%, 2/15/2029 (n) | $ | 5,840,000 | 4,831,082 | |
| Charles River Laboratories International, Inc., 3.75%, 3/15/2029 (n) | 5,110,000 | 4,551,399 | ||
| CHS/Community Health Systems, Inc., 8%, 12/15/2027 (n) | 1,625,000 | 1,531,552 | ||
| CHS/Community Health Systems, Inc., 6.125%, 4/01/2030 (n) | 4,435,000 | 2,666,047 | ||
| CHS/Community Health Systems, Inc., 5.25%, 5/15/2030 (n) | 1,265,000 | 1,020,754 | ||
| DaVita, Inc., 4.625%, 6/01/2030 (n) | 2,970,000 | 2,502,225 | ||
| Encompass Health Corp., 5.75%, 9/15/2025 | 985,000 | 977,616 | ||
| Encompass Health Corp., 4.75%, 2/01/2030 | 2,365,000 | 2,167,901 | ||
| Encompass Health Corp., 4.625%, 4/01/2031 | 435,000 | 382,885 | ||
| IQVIA Holdings, Inc., 5%, 10/15/2026 (n) | 978,000 | 953,550 | ||
| IQVIA Holdings, Inc., 5%, 5/15/2027 (n) | 4,440,000 | 4,308,619 | ||
| Legacy LifePoint Health LLC, 4.375%, 2/15/2027 (n) | 895,000 | 783,125 | ||
| Regional Care/LifePoint Health, Inc., 9.75%, 12/01/2026 (n) | 1,960,000 | 1,718,587 | ||
| Syneos Health, Inc., 3.625%, 1/15/2029 (n) | 4,171,000 | 3,373,296 | ||
| Tenet Healthcare Corp., 6.125%, 10/01/2028 | 4,979,000 | 4,655,763 | ||
| Tenet Healthcare Corp., 4.375%, 1/15/2030 | 853,000 | 758,257 | ||
| Tenet Healthcare Corp., 6.125%, 6/15/2030 (n) | 1,128,000 | 1,094,961 | ||
| U.S. Acute Care Solutions LLC, 6.375%, 3/01/2026 (n) | 2,245,000 | 2,030,827 | ||
| $46,952,163 | ||||
| Medical Equipment – 1.0% | ||||
| Garden SpinCo Corp., 8.625%, 7/20/2030 (n) | $ | 2,720,000 | $2,910,407 | |
| Mozart Debt Merger Sub, Inc., 5.25%, 10/01/2029 (n) | 1,515,000 | 1,268,487 | ||
| Teleflex, Inc., 4.625%, 11/15/2027 | 3,239,000 | 3,092,314 | ||
| $7,271,208 | ||||
| Metals & Mining – 3.9% | ||||
| Baffinland Iron Mines Corp./Baffinland Iron Mines LP, 8.75%, 7/15/2026 (n) | $ | 2,900,000 | $2,816,227 | |
| Coeur Mining, Inc., 5.125%, 2/15/2029 (n) | 3,089,000 | 2,487,274 | ||
| Compass Minerals International, Inc., 6.75%, 12/01/2027 (n) | 2,694,000 | 2,628,382 | ||
| Issuer | Shares/Par | Value ($) | ||
| Bonds – continued | ||||
| Metals & Mining – continued | ||||
| Eldorado Gold Corp., 6.25%, 9/01/2029 (n) | $ | 1,570,000 | $1,438,729 | |
| Ero Copper Corp., 6.5%, 2/15/2030 (n) | 1,757,000 | 1,496,371 | ||
| FMG Resources Ltd., 4.375%, 4/01/2031 (n) | 4,625,000 | 4,070,000 | ||
| GrafTech Finance, Inc., 4.625%, 12/15/2028 (n) | 3,119,000 | 2,658,255 | ||
| Kaiser Aluminum Corp., 4.625%, 3/01/2028 (n) | 3,771,000 | 3,442,923 | ||
| Kaiser Aluminum Corp., 4.5%, 6/01/2031 (n) | 846,000 | 715,386 | ||
| Novelis Corp., 3.25%, 11/15/2026 (n) | 1,250,000 | 1,131,650 | ||
| Novelis Corp., 4.75%, 1/30/2030 (n) | 2,985,000 | 2,701,425 | ||
| Novelis Corp., 3.875%, 8/15/2031 (n) | 1,367,000 | 1,153,748 | ||
| Petra Diamonds US$ Treasury PLC, 10.5% (10.5% PIK/9.75% Cash to 6/30/2023), 9.75% Cash to 3/08/2026 (n)(p) | 1,452,817 | 1,409,233 | ||
| TMS International Corp., 6.25%, 4/15/2029 (n) | 685,000 | 514,530 | ||
| $28,664,133 | ||||
| Midstream – 4.6% | ||||
| Cheniere Energy Partners LP, 4.5%, 10/01/2029 | $ | 1,944,000 | $1,823,705 | |
| DT Midstream, Inc., 4.125%, 6/15/2029 (n) | 2,253,000 | 1,977,008 | ||
| DT Midstream, Inc., 4.375%, 6/15/2031 (n) | 3,493,000 | 3,055,404 | ||
| EQM Midstream Partners LP, 6%, 7/01/2025 (n) | 247,000 | 243,174 | ||
| EQM Midstream Partners LP, 6.5%, 7/01/2027 (n) | 246,000 | 241,574 | ||
| EQM Midstream Partners LP, 5.5%, 7/15/2028 | 6,209,000 | 5,727,803 | ||
| EQM Midstream Partners LP, 4.5%, 1/15/2029 (n) | 1,105,000 | 969,151 | ||
| Genesis Energy LP/Genesis Energy Finance Corp., 8%, 1/15/2027 | 857,000 | 846,030 | ||
| Genesis Energy LP/Genesis Energy Finance Corp., 8.875%, 4/15/2030 | 2,139,000 | 2,173,759 | ||
| Kinetik Holdings, Inc., 5.875%, 6/15/2030 (n) | 4,248,000 | 4,035,600 | ||
| Tallgrass Energy Partners LP, 5.5%, 1/15/2028 (n) | 3,825,000 | 3,522,385 | ||
| Targa Resources Partners LP/Targa Resources Finance Corp., 6.875%, 1/15/2029 | 2,905,000 | 2,983,406 | ||
| Venture Global Calcasieu Pass LLC, 3.875%, 8/15/2029 (n) | 3,375,000 | 3,003,750 | ||
| Venture Global Calcasieu Pass LLC, 4.125%, 8/15/2031 (n) | 2,230,000 | 1,977,029 | ||
| Venture Global Calcasieu Pass LLC , 6.25%, 1/15/2030 (n) | 605,000 | 616,362 | ||
| $33,196,140 | ||||
| Network & Telecom – 0.4% | ||||
| Iliad Holding S.A.S., 7%, 10/15/2028 (n) | $ | 3,207,000 | $3,011,950 | |
| Oil Services – 0.5% | ||||
| Nabors Industries Ltd., 7.25%, 1/15/2026 (n) | $ | 1,950,000 | $1,896,375 | |
| Solaris Midstream Holding LLC, 7.625%, 4/01/2026 (n) | 1,864,000 | 1,864,000 | ||
| $3,760,375 | ||||
| Issuer | Shares/Par | Value ($) | ||
| Bonds – continued | ||||
| Oils – 0.7% | ||||
| Parkland Corp., 4.625%, 5/01/2030 (n) | $ | 4,470,000 | $3,842,420 | |
| PBF Holding Co. LLC/PBF Finance Corp., 6%, 2/15/2028 | 1,500,000 | 1,414,260 | ||
| $5,256,680 | ||||
| Personal Computers & Peripherals – 0.6% | ||||
| NCR Corp., 5%, 10/01/2028 (n) | $ | 2,840,000 | $2,501,643 | |
| NCR Corp., 5.125%, 4/15/2029 (n) | 1,793,000 | 1,561,800 | ||
| $4,063,443 | ||||
| Pharmaceuticals – 1.7% | ||||
| 1375209 BC Ltd., 9%, 1/30/2028 (n) | $ | 1,495,000 | $1,318,830 | |
| Bausch Health Co., Inc., 11%, 9/30/2028 (n) | 1,873,000 | 1,465,435 | ||
| Bausch Health Co., Inc., 14%, 10/15/2030 (n) | 375,000 | 234,082 | ||
| Jazz Securities DAC, 4.375%, 1/15/2029 (n) | 4,390,000 | 4,005,173 | ||
| Organon Finance 1 LLC, 4.125%, 4/30/2028 (n) | 3,256,000 | 2,944,889 | ||
| Organon Finance 1 LLC, 5.125%, 4/30/2031 (n) | 2,351,000 | 2,122,460 | ||
| $12,090,869 | ||||
| Pollution Control – 1.0% | ||||
| GFL Environmental, Inc., 4.25%, 6/01/2025 (n) | $ | 550,000 | $530,396 | |
| GFL Environmental, Inc., 4%, 8/01/2028 (n) | 2,825,000 | 2,507,894 | ||
| GFL Environmental, Inc., 4.75%, 6/15/2029 (n) | 1,000,000 | 902,540 | ||
| GFL Environmental, Inc., 4.375%, 8/15/2029 (n) | 985,000 | 873,518 | ||
| Stericycle, Inc., 3.875%, 1/15/2029 (n) | 2,695,000 | 2,391,166 | ||
| $7,205,514 | ||||
| Precious Metals & Minerals – 0.6% | ||||
| IAMGOLD Corp., 5.75%, 10/15/2028 (n) | $ | 2,680,000 | $2,118,004 | |
| Taseko Mines Ltd., 7%, 2/15/2026 (n) | 2,115,000 | 2,003,962 | ||
| $4,121,966 | ||||
| Printing & Publishing – 0.3% | ||||
| Cimpress N.V., 7%, 6/15/2026 (n) | $ | 2,965,000 | $2,058,582 | |
| Real Estate - Healthcare – 0.4% | ||||
| MPT Operating Partnership LP/MPT Finance Corp., REIT, 0.993%, 10/15/2026 | EUR | 655,000 | $530,003 | |
| MPT Operating Partnership LP/MPT Finance Corp., REIT, 5%, 10/15/2027 | $ | 2,752,000 | 2,326,362 | |
| $2,856,365 | ||||
| Real Estate - Other – 0.3% | ||||
| XHR LP, REIT, 4.875%, 6/01/2029 (n) | $ | 2,810,000 | $2,493,875 | |
| Issuer | Shares/Par | Value ($) | ||
| Bonds – continued | ||||
| Restaurants – 0.3% | ||||
| Fertitta Entertainment LLC, 6.75%, 1/15/2030 (n) | $ | 2,430,000 | $2,016,900 | |
| Retailers – 1.4% | ||||
| Asbury Automotive Group, Inc., 4.625%, 11/15/2029 (n) | $ | 2,967,000 | $2,618,199 | |
| Bath & Body Works, Inc., 5.25%, 2/01/2028 | 5,395,000 | 5,092,399 | ||
| Victoria's Secret & Co., 4.625%, 7/15/2029 (n) | 2,718,000 | 2,257,951 | ||
| $9,968,549 | ||||
| Specialty Chemicals – 0.2% | ||||
| Univar Solutions USA, Inc., 5.125%, 12/01/2027 (n) | $ | 1,406,000 | $1,359,502 | |
| Specialty Stores – 1.3% | ||||
| Group 1 Automotive, Inc., 4%, 8/15/2028 (n) | $ | 2,796,000 | $2,458,970 | |
| Michael Cos., Inc., 5.25%, 5/01/2028 (n) | 1,315,000 | 1,096,592 | ||
| Michael Cos., Inc., 7.875%, 5/01/2029 (n) | 1,855,000 | 1,409,800 | ||
| Penske Automotive Group Co., 3.75%, 6/15/2029 | 2,960,000 | 2,503,068 | ||
| PetSmart, Inc./PetSmart Finance Corp., 7.75%, 2/15/2029 (n) | 2,165,000 | 2,127,634 | ||
| $9,596,064 | ||||
| Supermarkets – 0.6% | ||||
| Albertsons Cos. LLC/Safeway, Inc., 4.625%, 1/15/2027 (n) | $ | 2,509,000 | $2,378,657 | |
| Albertsons Cos. LLC/Safeway, Inc., 3.5%, 3/15/2029 (n) | 2,190,000 | 1,888,875 | ||
| $4,267,532 | ||||
| Telecommunications - Wireless – 2.3% | ||||
| Altice France S.A., 6%, 2/15/2028 (n) | $ | 3,610,000 | $2,435,708 | |
| Cellnex Finance Co. S.A., 3.875%, 7/07/2041 (n) | 1,390,000 | 1,026,038 | ||
| SBA Communications Corp., 3.875%, 2/15/2027 | 2,398,000 | 2,214,639 | ||
| SBA Communications Corp., 3.125%, 2/01/2029 | 4,360,000 | 3,693,716 | ||
| Sprint Capital Corp., 6.875%, 11/15/2028 | 4,295,000 | 4,594,949 | ||
| Sprint Corp., 7.625%, 3/01/2026 | 2,331,000 | 2,465,421 | ||
| $16,430,471 | ||||
| Tobacco – 0.2% | ||||
| Vector Group Ltd., 5.75%, 2/01/2029 (n) | $ | 1,550,000 | $1,351,585 | |
| Utilities - Electric Power – 3.0% | ||||
| Calpine Corp., 4.5%, 2/15/2028 (n) | $ | 3,148,000 | $2,904,849 | |
| Calpine Corp., 5.125%, 3/15/2028 (n) | 3,405,000 | 3,082,923 | ||
| Clearway Energy Operating LLC, 4.75%, 3/15/2028 (n) | 1,270,000 | 1,197,864 | ||
| Clearway Energy Operating LLC, 3.75%, 2/15/2031 (n) | 5,595,000 | 4,726,824 | ||
| NextEra Energy, Inc., 4.25%, 7/15/2024 (n) | 222,000 | 216,819 | ||
| NextEra Energy, Inc., 4.25%, 9/15/2024 (n) | 488,000 | 455,060 | ||
| NextEra Energy, Inc., 4.5%, 9/15/2027 (n) | 2,075,000 | 1,953,032 | ||
| TerraForm Global Operating LLC, 6.125%, 3/01/2026 (n) | 2,345,000 | 2,221,887 | ||
| Issuer | Shares/Par | Value ($) | ||
| Bonds – continued | ||||
| Utilities - Electric Power – continued | ||||
| TerraForm Power Operating LLC, 5%, 1/31/2028 (n) | $ | 3,995,000 | $3,752,593 | |
| TerraForm Power Operating LLC, 4.75%, 1/15/2030 (n) | 1,505,000 | 1,354,474 | ||
| $21,866,325 | ||||
| Total Bonds (Identified Cost, $765,119,243) | $698,593,872 | |||
| Common Stocks – 0.3% | ||||
| Cable TV – 0.1% | ||||
| Intelsat Emergence S.A. (a) | 35,312 | $812,176 | ||
| Construction – 0.0% | ||||
| ICA Tenedora S.A. de C.V. (a)(u) | 258,532 | $233,400 | ||
| Oil Services – 0.2% | ||||
| LTRI Holdings LP (a)(u) | 3,300 | $1,105,632 | ||
| Total Common Stocks (Identified Cost, $2,353,280) | $2,151,208 | |||
| Contingent Value Rights – 0.0% | ||||
| Cable TV – 0.0% | ||||
| Intelsat Jackson Holdings S.A. - Series A, 12/05/2025 (a) | 3,697 | $21,258 | ||
| Intelsat Jackson Holdings S.A. - Series B, 12/05/2025 (a) | 3,697 | 13,864 | ||
| Total Contingent Value Rights (Identified Cost, $0) | $35,122 | |||
| Strike Price | First Exercise | |||
| Warrants – 0.0% | ||||
| Other Banks & Diversified Financials – 0.0% | ||||
| Avation Capital S.A. (1 share for 1 warrant, Expiration 10/31/26) (a) (Identified Cost, $0) | GBP 1.14 | 3/16/21 | 42,350 | $18,274 |
| Investment Companies (h) – 2.2% | ||||
| Money Market Funds – 2.2% | ||||
| MFS Institutional Money Market Portfolio, 4.29% (v) (Identified Cost, $16,164,003) | 16,163,708 | $16,165,324 | ||
| Other Assets, Less Liabilities – 1.3% | 9,651,281 | |||
| Net Assets – 100.0% | $726,615,081 | |||
| (a) | Non-income producing security. | |||
| (h) | An affiliated issuer, which may be considered one in which the fund owns 5% or more of the outstanding voting securities, or a company which is under common control. At period end, the aggregate values of the fund's investments in affiliated issuers and in unaffiliated issuers were $16,165,324 and $700,798,476, respectively. |
| (n) | Securities exempt from registration under Rule 144A of the Securities Act of 1933. These securities may be sold in the ordinary course of business in transactions exempt from registration, normally to qualified institutional buyers. At period end, the aggregate value of these securities was $590,487,813, representing 81.3% of net assets. | |||
| (p) | Payment-in-kind (PIK) security for which interest income may be received in additional securities and/or cash. | |||
| (u) | The security was valued using significant unobservable inputs and is considered level 3 under the fair value hierarchy. For further information about the fund’s level 3 holdings, please see Note 2 in the Notes to Financial Statements. | |||
| (v) | Affiliated issuer that is available only to investment companies managed by MFS. The rate quoted for the MFS Institutional Money Market Portfolio is the annualized seven-day yield of the fund at period end. |
| The following abbreviations are used in this report and are defined: | |
| CMT | Constant Maturity Treasury |
| FLR | Floating Rate. Interest rate resets periodically based on the parenthetically disclosed reference rate plus a spread (if any). The period-end rate reported may not be the current rate. All reference rates are USD unless otherwise noted. |
| REIT | Real Estate Investment Trust |
| Abbreviations indicate amounts shown in currencies other than the U.S. dollar. All amounts are stated in U.S. dollars unless otherwise indicated. A list of abbreviations is shown below: | |
| EUR | Euro |
| GBP | British Pound |
| Forward Foreign Currency Exchange Contracts | ||||||
| Currency Purchased | Currency Sold | Counterparty | Settlement Date | Unrealized Appreciation (Depreciation) | ||
| Liability Derivatives | ||||||
| GBP | 197,752 | USD | 244,477 | State Street Bank Corp. | 4/21/2023 | $(270) |
| USD | 4,086,856 | EUR | 3,763,474 | State Street Bank Corp. | 4/21/2023 | (24,304) |
| $(24,574) | ||||||
| Futures Contracts | ||||||
| Description | Long/ Short | Currency | Contracts | Notional Amount | Expiration Date | Value/Unrealized Appreciation (Depreciation) |
| Asset Derivatives | ||||||
| Interest Rate Futures | ||||||
| U.S. Treasury Bond | Long | USD | 30 | $3,896,250 | March – 2023 | $100,671 |
| U.S. Treasury Ultra Bond | Long | USD | 6 | 850,500 | March – 2023 | 36,400 |
| $137,071 | ||||||
| Liability Derivatives | ||||||
| Interest Rate Futures | ||||||
| U.S. Treasury Note 10 yr | Short | USD | 167 | $19,124,109 | March – 2023 | $(243,408) |
| Assets | |
| Investments in unaffiliated issuers, at value (identified cost, $767,472,523) | $700,798,476 |
| Investments in affiliated issuers, at value (identified cost, $16,164,003) | 16,165,324 |
| Cash | 32,712 |
| Deposits with brokers for | |
| Futures contracts | 218,400 |
| Receivables for | |
| Investments sold | 1,127,354 |
| Fund shares sold | 929,419 |
| Interest and dividends | 10,822,241 |
| Other assets | 2,683 |
| Total assets | $730,096,609 |
| Liabilities | |
| Payable to custodian | $32,044 |
| Payables for | |
| Forward foreign currency exchange contracts | 24,574 |
| Net daily variation margin on open futures contracts | 36,891 |
| Investments purchased | 2,210,021 |
| Fund shares reacquired | 1,110,362 |
| Payable to affiliates | |
| Administrative services fee | 94 |
| Shareholder servicing costs | 12 |
| Accrued expenses and other liabilities | 67,530 |
| Total liabilities | $3,481,528 |
| Net assets | $726,615,081 |
| Net assets consist of | |
| Paid-in capital | $875,791,634 |
| Total distributable earnings (loss) | (149,176,553) |
| Net assets | $726,615,081 |
| Shares of beneficial interest outstanding | 90,226,348 |
| Net asset value per share (net assets of $726,615,081 / 90,226,348 shares of beneficial interest outstanding) | $8.05 |
| Net investment income (loss) | |
| Income | |
| Interest | $46,155,310 |
| Dividends from affiliated issuers | 260,507 |
| Other | 141,908 |
| Dividends | 44,861 |
| Total investment income | $46,602,586 |
| Expenses | |
| Shareholder servicing costs | $40 |
| Administrative services fee | 17,500 |
| Custodian fee | 48,471 |
| Shareholder communications | 4,071 |
| Audit and tax fees | 47,847 |
| Legal fees | 4,443 |
| Pricing service fees | 8,381 |
| Form N-CEN/N-PORT preparation fees | 9,800 |
| Miscellaneous | 20,035 |
| Total expenses | $160,588 |
| Fees paid indirectly | (611) |
| Net expenses | $159,977 |
| Net investment income (loss) | $46,442,609 |
| Realized and unrealized gain (loss) | |
| Realized gain (loss) (identified cost basis) | |
| Unaffiliated issuers | $(36,483,467) |
| Affiliated issuers | (47) |
| Futures contracts | 1,028,422 |
| Forward foreign currency exchange contracts | (117,014) |
| Foreign currency | (2,501) |
| Net realized gain (loss) | $(35,574,607) |
| Change in unrealized appreciation or depreciation | |
| Unaffiliated issuers | $(55,269,591) |
| Affiliated issuers | 1,267 |
| Futures contracts | (92,910) |
| Forward foreign currency exchange contracts | (39,113) |
| Translation of assets and liabilities in foreign currencies | 2,989 |
| Net unrealized gain (loss) | $(55,397,358) |
| Net realized and unrealized gain (loss) | $(90,971,965) |
| Change in net assets from operations | $(44,529,356) |
| Year ended | ||
| 1/31/23 | 1/31/22 | |
| Change in net assets | ||
| From operations | ||
| Net investment income (loss) | $46,442,609 | $55,880,477 |
| Net realized gain (loss) | (35,574,607) | 34,227,423 |
| Net unrealized gain (loss) | (55,397,358) | (72,488,956) |
| Change in net assets from operations | $(44,529,356) | $17,618,944 |
| Total distributions to shareholders | $(47,089,882) | $(60,026,693) |
| Change in net assets from fund share transactions | $(179,131,688) | $(188,544,337) |
| Total change in net assets | $(270,750,926) | $(230,952,086) |
| Net assets | ||
| At beginning of period | 997,366,007 | 1,228,318,093 |
| At end of period | $726,615,081 | $997,366,007 |
| Year ended | |||||
| 1/31/23 | 1/31/22 | 1/31/21 | 1/31/20 | 1/31/19 | |
| Net asset value, beginning of period | $8.88 | $9.25 | $9.33 | $8.94 | $9.31 |
| Income (loss) from investment operations | |||||
| Net investment income (loss) (d) | $0.47 | $0.47 | $0.50 | $0.51 | $0.52 |
| Net realized and unrealized gain (loss) | (0.82) | (0.34) | (0.06)(g) | 0.39 | (0.36) |
| Total from investment operations | $(0.35) | $0.13 | $0.44 | $0.90 | $0.16 |
| Less distributions declared to shareholders | |||||
| From net investment income | $(0.48) | $(0.50) | $(0.52) | $(0.51) | $(0.53) |
| Net asset value, end of period (x) | $8.05 | $8.88 | $9.25 | $9.33 | $8.94 |
| Total return (%) (s)(x) | (3.84) | 1.39 | 5.02 | 10.29 | 1.86 |
| Ratios (%) (to average net assets) and Supplemental data: | |||||
| Expenses (f) | 0.02 | 0.02 | 0.02 | 0.02 | 0.02 |
| Net investment income (loss) | 5.77 | 5.09 | 5.58 | 5.51 | 5.77 |
| Portfolio turnover | 25 | 60 | 66 | 59 | 38 |
| Net assets at end of period (000 omitted) | $726,615 | $997,366 | $1,228,318 | $889,031 | $788,437 |
| (d) | Per share data is based on average shares outstanding. |
| (f) | Ratios do not reflect reductions from fees paid indirectly, if applicable. See Note 2 in the Notes to Financial Statements for additional information. |
| (g) | The per share amount varies from the net realized and unrealized gain/loss for the period because of the timing of sales of fund shares and the per share amount of realized and unrealized gains and losses at such time. |
| (s) | From time to time the fund may receive proceeds from litigation settlements, without which performance would be lower. |
| (x) | The net asset values and total returns have been calculated on net assets which include adjustments made in accordance with U.S. generally accepted accounting principles required at period end for financial reporting purposes. |
| Financial Instruments | Level 1 | Level 2 | Level 3 | Total |
| Equity Securities: | ||||
| United States | $— | $— | $1,105,632 | $1,105,632 |
| Luxembourg | — | 847,298 | — | 847,298 |
| Mexico | — | — | 233,400 | 233,400 |
| United Kingdom | — | 18,274 | — | 18,274 |
| U.S. Corporate Bonds | — | 595,898,832 | — | 595,898,832 |
| Foreign Bonds | — | 102,695,040 | — | 102,695,040 |
| Mutual Funds | 16,165,324 | — | — | 16,165,324 |
| Total | $16,165,324 | $699,459,444 | $1,339,032 | $716,963,800 |
| Other Financial Instruments | ||||
| Futures Contracts – Assets | $137,071 | $— | $— | $137,071 |
| Futures Contracts – Liabilities | (243,408) | — | — | (243,408) |
| Forward Foreign Currency Exchange Contracts – Liabilities | — | (24,574) | — | (24,574) |
| Equity Securities | |
| Balance as of 1/31/22 | $1,168,929 |
| Change in unrealized appreciation or depreciation | 188,377 |
| Transfers out of level 3 | (18,274) |
| Balance as of 1/31/23 | $1,339,032 |
| Fair Value (a) | |||
| Risk | Derivative Contracts | Asset Derivatives | Liability Derivatives |
| Interest Rate | Futures Contracts | $137,071 | $(243,408) |
| Foreign Exchange | Forward Foreign Currency Exchange Contracts | — | (24,574) |
| Total | $137,071 | $(267,982) | |
| (a) | Values presented in this table for futures contracts correspond to the values reported in the Portfolio of Investments. Only the current day net variation margin for futures contracts is reported separately within the Statement of Assets and Liabilities. |
| Risk | Futures Contracts | Forward Foreign Currency Exchange Contracts |
| Interest Rate | $1,028,422 | $— |
| Foreign Exchange | — | (117,014) |
| Total | $1,028,422 | $(117,014) |
| Risk | Futures Contracts | Forward Foreign Currency Exchange Contracts |
| Interest Rate | $(92,910) | $— |
| Foreign Exchange | — | (39,113) |
| Total | $(92,910) | $(39,113) |
| Year ended 1/31/23 | Year ended 1/31/22 | |
| Ordinary income (including any short-term capital gains) | $47,089,882 | $60,026,693 |
| As of 1/31/23 | |
| Cost of investments | $786,090,110 |
| Gross appreciation | 5,793,531 |
| Gross depreciation | (75,050,752) |
| Net unrealized appreciation (depreciation) | $(69,257,221) |
| Undistributed ordinary income | 3,909,051 |
| Capital loss carryforwards | (79,955,813) |
| Other temporary differences | (3,872,570) |
| Total distributable earnings (loss) | $(149,176,553) |
| Short-Term | $(12,341,397) |
| Long-Term | (67,614,416) |
| Total | $(79,955,813) |
| Year ended 1/31/23 | Year ended 1/31/22 | ||||
| Shares | Amount | Shares | Amount | ||
| Shares sold | 4,236,645 | $34,051,394 | 3,868,865 | $35,660,117 | |
| Shares issued to shareholders in reinvestment of distributions | 5,845,303 | 47,089,882 | 6,526,801 | 60,026,693 | |
| Shares reacquired | (32,206,489) | (260,272,964) | (30,844,235) | (284,231,147) | |
| Net change | (22,124,541) | $(179,131,688) | (20,448,569) | $(188,544,337) | |
| Affiliated Issuers | Beginning Value | Purchases | Sales Proceeds | Realized Gain (Loss) | Change in Unrealized Appreciation or Depreciation | Ending Value |
| MFS Institutional Money Market Portfolio | $24,340,223 | $194,376,429 | $202,552,548 | $(47) | $1,267 | $16,165,324 |
| Affiliated Issuers | Dividend Income | Capital Gain Distributions |
| MFS Institutional Money Market Portfolio | $260,507 | $— |
March 17, 2023
| Name, Age | Position(s) Held with Fund | Trustee/Officer Since(h) | Number of MFS Funds overseen by the Trustee | Principal Occupations During the Past Five Years | Other Directorships During the Past Five Years (j) | |||||
| INTERESTED TRUSTEE | ||||||||||
| Michael W. Roberge (k) (age 56) | Trustee | January 2021 | 136 | Massachusetts Financial Services Company, Chairman (since January 2021); Chief Executive Officer (since January 2017); Director; Chairman of the Board (since January 2022); President (until December 2018); Chief Investment Officer (until December 2018) | N/A | |||||
| INDEPENDENT TRUSTEES | ||||||||||
| John P. Kavanaugh (age 68) | Trustee and Chair of Trustees | January 2009 | 136 | Private investor | N/A | |||||
| Steven E. Buller (age 71) | Trustee | February 2014 | 136 | Private investor | N/A | |||||
| John A. Caroselli (age 68) | Trustee | March 2017 | 136 | Private investor; JC Global Advisors, LLC (management consulting), President (since 2015) | N/A | |||||
| Maureen R. Goldfarb (age 67) | Trustee | January 2009 | 136 | Private investor | N/A | |||||
| Peter D. Jones (age 67) | Trustee | January 2019 | 136 | Private investor | N/A | |||||
| James W. Kilman, Jr. (age 61) | Trustee | January 2019 | 136 | Burford Capital Limited (finance and investment management), Senior Advisor (since May 3, 2021), Chief Financial Officer (2019 - May 2, 2021); KielStrand Capital LLC (family office), Chief Executive Officer (since 2016) | Alpha-En Corporation, Director (2016-2019) |
| Name, Age | Position(s) Held with Fund | Trustee/Officer Since(h) | Number of MFS Funds overseen by the Trustee | Principal Occupations During the Past Five Years | Other Directorships During the Past Five Years (j) | |||||
| Clarence Otis, Jr. (age 66) | Trustee | March 2017 | 136 | Private investor | VF Corporation, Director; Verizon Communications, Inc., Director; The Travelers Companies, Director | |||||
| Maryanne L. Roepke (age 67) | Trustee | May 2014 | 136 | Private investor | N/A | |||||
| Laurie J. Thomsen (age 65) | Trustee | March 2005 | 136 | Private investor | The Travelers Companies, Director; Dycom Industries, Inc., Director |
| Name, Age | Position(s) Held with Fund | Trustee/Officer Since(h) | Number of MFS Funds for which the Person is an Officer | Principal Occupations During the Past Five Years | ||||
| OFFICERS | ||||||||
| Christopher R. Bohane (k) (age 49) | Assistant Secretary and Assistant Clerk | July 2005 | 136 | Massachusetts Financial Services Company, Senior Vice President and Senior Managing Counsel | ||||
| Kino Clark (k) (age 54) | Assistant Treasurer | January 2012 | 136 | Massachusetts Financial Services Company, Vice President | ||||
| John W. Clark, Jr. (k) (age 56) | Assistant Treasurer | April 2017 | 136 | Massachusetts Financial Services Company, Vice President | ||||
| David L. DiLorenzo (k) (age 54) | President | July 2005 | 136 | Massachusetts Financial Services Company, Senior Vice President | ||||
| Heidi W. Hardin (k) (age 55) | Secretary and Clerk | April 2017 | 136 | Massachusetts Financial Services Company, Executive Vice President and General Counsel | ||||
| Brian E. Langenfeld (k) (age 50) | Assistant Secretary and Assistant Clerk | June 2006 | 136 | Massachusetts Financial Services Company, Vice President and Managing Counsel |
| Name, Age | Position(s) Held with Fund | Trustee/Officer Since(h) | Number of MFS Funds for which the Person is an Officer | Principal Occupations During the Past Five Years | ||||
| Rosa E. Licea-Mailloux (k) (age 46) | Chief Compliance Officer | March 2022 | 136 | Massachusetts Financial Services Company, Vice President (since 2018); Director of Corporate Compliance (2018-2021), Senior Director Compliance (2021-2022), Senior Managing Director of North American Compliance & Chief Compliance Officer (since March 2022); Natixis Investment Managers (investment management), Funds Chief Compliance Officer, Deputy General Counsel & Senior Vice President (until 2018) | ||||
| Amanda S. Mooradian (k) (age 44) | Assistant Secretary and Assistant Clerk | September 2018 | 136 | Massachusetts Financial Services Company, Assistant Vice President and Senior Counsel | ||||
| Susan A. Pereira (k) (age 52) | Assistant Secretary and Assistant Clerk | July 2005 | 136 | Massachusetts Financial Services Company, Vice President and Managing Counsel | ||||
| Kasey L. Phillips (k) (age 52) | Assistant Treasurer | September 2012 | 136 | Massachusetts Financial Services Company, Vice President | ||||
| Matthew A. Stowe (k) (age 48) | Assistant Secretary and Assistant Clerk | October 2014 | 136 | Massachusetts Financial Services Company, Vice President and Senior Managing Counsel | ||||
| William B. Wilson (k) (age 40) | Assistant Secretary and Assistant Clerk | October 2022 | 136 | Massachusetts Financial Services Company, Assistant Vice President and Senior Counsel | ||||
| James O. Yost (k) (age 62) | Treasurer | September 1990 | 136 | Massachusetts Financial Services Company, Senior Vice President |
| (h) | Date first appointed to serve as Trustee/Officer of an MFS Fund. Each Trustee has served continuously since appointment unless indicated otherwise. From January 2012 through December 2016, Messrs. DiLorenzo and Yost served as Treasurer and Deputy Treasurer of the Funds, respectively. |
| (j) | Directorships or trusteeships of companies required to report to the Securities and Exchange Commission (i.e., “public companies”). |
| (k) | “Interested person” of the Trust within the meaning of the Investment Company Act of 1940 (referred to as the 1940 Act), which is the principal federal law governing investment companies like the fund, as a result of a position with MFS. The address of MFS is 111 Huntington Avenue, Boston, Massachusetts 02199-7618. |
| Investment Adviser | Custodian |
| Massachusetts Financial Services Company 111 Huntington Avenue Boston, MA 02199-7618 | JPMorgan Chase Bank, NA 4 Metrotech Center New York, NY 11245 |
| Distributor | Independent Registered Public Accounting Firm |
| MFS Fund Distributors, Inc. 111 Huntington Avenue Boston, MA 02199-7618 | Deloitte & Touche LLP 200 Berkeley Street Boston, MA 02116 |
| Portfolio Manager(s) | |
| David Cole Michael Skatrud |
| FACTS | WHAT DOES MFS DO WITH YOUR PERSONAL INFORMATION? |
| Why? | Financial companies choose how they share your personal information. Federal law gives consumers the right to limit some but not all sharing. Federal law also requires us to tell you how we collect, share, and protect your personal information. Please read this notice carefully to understand what we do. |
| What? | The types of personal information we collect and share depend on the product or service you have with us. This information can include: |
| • Social Security number and account balances | |
| • Account transactions and transaction history | |
| • Checking account information and wire transfer instructions | |
| When you are no longer our customer, we continue to share your information as described in this notice. |
| How? | All financial companies need to share customers' personal information to run their everyday business. In the section below, we list the reasons financial companies can share their customers' personal information; the reasons MFS chooses to share; and whether you can limit this sharing. |
| Reasons we can share your personal information | Does MFS share? | Can you limit this sharing? |
| For our everyday business purposes – such as to process your transactions, maintain your account(s), respond to court orders and legal investigations, or report to credit bureaus | Yes | No |
| For our marketing purposes – to offer our products and services to you | No | We don't share |
| For joint marketing with other financial companies | No | We don't share |
| For our affiliates' everyday business purposes – information about your transactions and experiences | No | We don't share |
| For our affiliates' everyday business purposes – information about your creditworthiness | No | We don't share |
| For nonaffiliates to market to you | No | We don't share |
| Questions? | Call 800-225-2606 or go to mfs.com. |

| Who we are | |
| Who is providing this notice? | MFS Funds, MFS Investment Management, MFS Institutional Advisors, Inc., and MFS Heritage Trust Company. |
| What we do | |
| How does MFS protect my personal information? | To protect your personal information from unauthorized access and use, we use security measures that comply with federal law. These measures include procedural, electronic, and physical safeguards for the protection of the personal information we collect about you. |
| How does MFS collect my personal information? | We collect your personal information, for example, when you |
| • open an account or provide account information | |
| • direct us to buy securities or direct us to sell your securities | |
| • make a wire transfer | |
| We also collect your personal information from others, such as credit bureaus, affiliates, or other companies. | |
| Why can't I limit all sharing? | Federal law gives you the right to limit only |
| • sharing for affiliates' everyday business purposes – information about your creditworthiness | |
| • affiliates from using your information to market to you | |
| • sharing for nonaffiliates to market to you | |
| State laws and individual companies may give you additional rights to limit sharing. | |
| Definitions | |
| Affiliates | Companies related by common ownership or control. They can be financial and nonfinancial companies. |
| • MFS does not share personal information with affiliates, except for everyday business purposes as described on page one of this notice. | |
| Nonaffiliates | Companies not related by common ownership or control. They can be financial and nonfinancial companies. |
| • MFS does not share with nonaffiliates so they can market to you. | |
| Joint marketing | A formal agreement between nonaffiliated financial companies that together market financial products or services to you. |
| • MFS doesn't jointly market. | |
| Other important information |
| If you own an MFS product or receive an MFS service in the name of a third party such as a bank or broker-dealer, their privacy policy may apply to you instead of ours. |


Item 1(b):
Not applicable.
ITEM 2. CODE OF ETHICS.
The Registrant has adopted a Code of Ethics (the "Code") pursuant to Section 406 of the Sarbanes-Oxley Act and as defined in Form N-CSR that applies to the Registrant's principal executive officer and principal financial and accounting officer. During the period covered by this report, the Registrant has not amended any provision in the Code that relates to an element of the Code's definition enumerated in paragraph
(b)of Item 2 of this Form N-CSR. During the period covered by this report, the Registrant did not grant a waiver, including an implicit waiver, from any provision of the Code.
A copy of the Code is attached hereto as EX-99.COE.
ITEM 3. AUDIT COMMITTEE FINANCIAL EXPERT.
Messrs. Steven E. Buller, James Kilman, and Clarence Otis, Jr. and Ms. Maryanne L. Roepke, members of the Audit Committee, have been determined by the Board of Trustees in their reasonable business judgment to meet the definition of "audit committee financial expert" as such term is defined in Form N-CSR. In addition, Messrs. Buller, Kilman, and Otis and Ms. Roepke are "independent" members of the Audit Committee (as such term has been defined by the Securities and Exchange Commission in regulations implementing Section 407 of the Sarbanes-Oxley Act of 2002). The Securities and Exchange Commission has stated that the designation of a person as an audit committee financial expert pursuant to this Item 3 on the Form N-CSR does not impose on such a person any duties, obligations or liability that are greater than the duties, obligations or liability imposed on such person as a member of the Audit Committee and the Board of Trustees in the absence of such designation or identification.
ITEM 4. PRINCIPAL ACCOUNTANT FEES AND SERVICES.
Items 4(a) through 4(d) and 4(g):
The Board of Trustees has appointed Deloitte & Touche LLP ("Deloitte") to serve as independent accountants to certain series of the Registrant and Ernst & Young LLP ("E&Y") to serve in the same capacity to certain other series of the Registrant (each a "Fund" and collectively the "Funds"). The tables below set forth the audit fees billed to each Fund as well as fees for non-audit services provided to each Fund and/or to each Fund's investment adviser, Massachusetts Financial Services Company ("MFS"), and to various entities either controlling, controlled by, or under common control with MFS that provide ongoing services to the Funds ("MFS Related Entities").
For the fiscal years ended January 31, 2023 and 2022, audit fees billed to each Fund by Deloitte and E&Y were as follows:
Fees billed by Deloitte: |
| Audit Fees | |
| 2023 |
| 2022 |
MFS Global High Yield Fund | 84,346 |
| 84,346 |
MFS High Income Fund | 83,798 |
| 79,008 |
MFS High Yield Pooled Portfolio | 39,190 |
| 36,281 |
Total | 207,334 |
| 199,635 |
|
|
| |
Fees billed by E&Y: |
| Audit Fees | |
| 2023 |
| 2022 |
MFS Municipal High Income Fund | 64,690 |
| 59,849 |
For the fiscal years ended January 31, 2023 and 2022, fees billed by Deloitte and E&Y for audit-related, tax and other services provided to each Fund and for audit-related, tax and other services provided to MFS and MFS Related Entities were as follows:
Fees billed by Deloitte: | Audit-Related Fees1 |
| Tax Fees2 |
|
| All Other Fees3 | ||||||||||
|
|
| 2023 |
|
| 2022 | 2023 | 20225 | 2023 |
|
| 2022 | ||||
To MFS Global High Yield | 0 |
|
| 0 | 0 | 841 | 0 |
|
| 0 | ||||||
Fund |
|
|
|
|
|
|
|
|
|
|
|
|
|
| ||
To MFS High Income Fund | 0 |
|
| 0 | 0 | 970 | 0 |
|
| 0 | ||||||
|
|
|
|
|
|
|
|
|
|
|
|
|
|
|
|
|
To MFS High Yield Pooled | 0 |
|
| 0 | 0 | 954 | 0 |
|
| 0 | ||||||
Portfolio |
|
|
|
|
|
|
|
|
|
|
|
|
|
| ||
Total fees billed by Deloitte | 0 |
|
| 0 | 0 | 2,765 | 0 |
|
| 0 | ||||||
To above Funds |
|
|
|
|
|
|
|
|
|
|
|
|
|
| ||
|
|
|
|
|
|
|
|
|
|
|
|
| ||||
Fees billed by Deloitte: |
| Audit-Related Fees1 |
| Tax Fees2 |
|
| All Other Fees3 | |||||||||
|
|
| 2023 |
|
| 2022 |
| 2023 |
| 2022 |
|
| 2023 |
|
| 2022 |
To MFS and MFS Related |
|
|
|
|
|
|
|
|
|
|
|
|
|
|
| |
Entities of MFS Global |
| 0 |
|
| 0 |
| 0 |
| 0 |
|
| 3,790 |
|
| 5,390 | |
High Yield Fund* |
|
|
|
|
|
|
|
|
|
|
|
|
|
|
| |
To MFS and MFS Related |
|
|
|
|
|
|
|
|
|
|
|
|
|
|
| |
Entities of MFS High |
| 0 |
|
| 0 |
| 0 |
| 0 |
|
| 3,790 |
|
| 5,390 | |
Income Fund * |
|
|
|
|
|
|
|
|
|
|
|
|
|
|
| |
To MFS and MFS Related |
|
|
|
|
|
|
|
|
|
|
|
|
|
|
| |
Entities of MFS High |
| 0 |
|
| 0 |
| 0 |
| 0 |
|
| 3,790 |
|
| 5,390 | |
Yield Pooled Portfolio* |
|
|
|
|
|
|
|
|
|
|
|
|
|
|
| |
|
|
|
|
|
|
|
|
|
| |||||||
Fees billed by Deloitte: |
|
|
|
|
| Aggregate Fees for Non-audit Services |
| |||||||||
|
|
|
|
|
|
|
|
| 2023 |
|
| 20225 |
| |||
To MFS Global High Yield Fund, MFS and MFS Related |
|
| 3,790 |
|
| 6,231 |
| |||||||||
Entities# |
|
|
|
|
|
|
|
|
|
|
|
|
|
| ||
To MFS High Income Fund, MFS and MFS Related Entities# |
|
| 3,790 |
|
| 6,360 |
| |||||||||
|
|
|
|
|
|
|
|
|
|
| ||||||
To MFS High Yield Pooled Portfolio, MFS and MFS |
|
|
| 3,790 |
|
| 6,344 |
| ||||||||
Related Entities# |
|
|
|
|
|
|
|
|
|
|
|
|
|
| ||
|
|
|
|
|
|
|
|
| ||||||||
Fees billed by E&Y: |
| Audit-Related Fees1 |
| Tax Fees2 |
|
| All Other Fees4 | |||||||||
|
|
| 2023 |
|
| 2022 | 2023 | 20225 |
| 2023 |
|
| 2022 | |||
To MFS Municipal High |
|
| 0 |
|
| 0 | 0 | 2,664 |
| 0 |
|
| 2,224 | |||
Income Fund |
|
|
|
|
|
|
|
|
|
|
|
|
|
|
| |
Fees billed by E&Y: | Audit-Related Fees1 |
|
| Tax Fees2 |
| All Other Fees4 | ||||
| 2023 | 2022 | 2023 |
| 2022 | 2023 |
| 2022 | ||
|
|
|
|
|
|
|
|
|
|
|
To MFS and MFS Related | 0 | 1,795,090 | 0 |
| 0 | 3,165 |
| 111,720 | ||
Entities of MFS Municipal |
|
|
|
|
|
|
|
|
|
|
High Income Fund* |
|
|
|
|
|
|
|
|
|
|
|
|
|
|
|
| |||||
Fees billed by E&Y: |
|
|
| Aggregate Fees for Non-audit Services | ||||||
|
|
|
|
| 2023 |
|
| 20225 | ||
To MFS Municipal High Income Fund, MFS |
|
|
| 143,165 |
| 2,166,328 | ||||
and MFS Related Entities# |
|
|
|
|
|
|
|
|
|
|
*This amount reflects the fees billed to MFS and MFS Related Entities for non-audit services relating directly to the operations and financial reporting of the Funds (portions of which services also related to the operations and financial reporting of other funds within the MFS Funds complex).
# This amount reflects the aggregate fees billed by Deloitte or E&Y, as the case may be, for non-audit services rendered to the Funds and for non- audit services rendered to MFS and the MFS Related Entities.
1 The fees included under "Audit-Related Fees" are fees related to assurance and related services that are reasonably related to the performance of the audit or review of financial statements, but not reported under ''Audit Fees,'' including accounting consultations, agreed-upon procedure reports, attestation reports, comfort letters and internal control reviews.
2 The fees included under "Tax Fees" are fees associated with tax compliance, tax advice and tax planning, including services relating to the filing or amendment of federal, state or local income tax returns, regulated investment company qualification reviews and tax distribution and analysis.
3 The fees included under "All Other Fees" are fees for products and services provided by Deloitte other than those reported under "Audit Fees," "Audit-Related Fees" and "Tax Fees".
4 The fees included under "All Other Fees" are fees for products and services provided by E&Y other than those reported under "Audit Fees," "Audit-Related Fees" and "Tax Fees," including fees for services related to the review of internal controls and Rule 38a-1 compliance program.
5 Certain fees reported in 2022 have been restated in this filing from those reported in the Registrant's filing for the reporting period ended January 31, 2022.
Item 4(e)(1):
Set forth below are the policies and procedures established by the Audit Committee of the Board of Trustees relating to the pre-approval of audit and non-audit related services:
To the extent required by applicable law, pre-approval by the Audit Committee of the Board is needed for all audit and permissible non-audit services rendered to the Funds and all permissible non-audit services rendered to MFS or MFS Related Entities if the services relate directly to the operations and financial reporting of the Registrant. Pre-approval is currently on an engagement-by-engagement basis. In the event pre-approval of such services is necessary between regular meetings of the Audit Committee and it is not practical to wait to seek pre-approval at the next regular meeting of the Audit Committee, pre-approval of such services may be referred to the Chair of the Audit Committee for approval; provided that the Chair may not pre-approve any individual engagement for such services exceeding $50,000 or multiple engagements for such services in the aggregate exceeding $100,000 in each period between regular meetings of the Audit Committee. Any engagement pre-approved by the Chair between regular meetings of the Audit Committee shall be presented for ratification by the entire Audit Committee at its next regularly scheduled meeting.
Item 4(e)(2):
None, or 0%, of the services relating to the Audit-Related Fees, Tax Fees and All Other Fees paid by the Fund and MFS and MFS Related Entities relating directly to the operations and financial reporting of the Registrant disclosed above were approved by the audit committee pursuant to paragraphs (c)(7)(i)(C) of Rule 2-01 of Regulation S-X (which permits audit committee approval after the start of the engagement with respect to services other than audit, review or attest services, if certain conditions are satisfied).
Item 4(f):
Not applicable.
Item 4(h):
The Registrant's Audit Committee has considered whether the provision by a Registrant's independent registered public accounting firm of non-audit services to MFS and MFS Related Entities that were not pre-approved by the Committee (because such services did not relate directly to the operations and financial reporting of the Registrant) was compatible with maintaining the independence of the independent registered public accounting firm as the Registrant's principal auditors.
ITEM 5. AUDIT COMMITTEE OF LISTED REGISTRANTS.
Not applicable to the Registrant.
ITEM 6. INVESTMENTS
A schedule of investments for each series covered by this Form N-CSR is included as part of the report to shareholders of such series under Item 1(a) of this Form N-CSR.
ITEM 7. DISCLOSURE OF PROXY VOTING POLICIES AND PROCEDURES FOR CLOSED-END MANAGEMENT INVESTMENT COMPANIES.
Not applicable to the Registrant.
ITEM 8. PORTFOLIO MANAGERS OF CLOSED-END MANAGEMENT INVESTMENT COMPANIES.
Not applicable to the Registrant.
ITEM 9. PURCHASES OF EQUITY SECURITIES BY CLOSED-END MANAGEMENT INVESTMENT COMPANY AND AFFILIATED PURCHASERS.
Not applicable to the Registrant.
ITEM 10. SUBMISSION OF MATTERS TO A VOTE OF SECURITY HOLDERS.
There were no material changes to the procedures by which shareholders may send recommendations to the Board for nominees to the Registrant's Board since the Registrant last provided disclosure as to such procedures in response to the requirements of Item 407 (c)(2)(iv) of Regulation S-K or this Item.
ITEM 11. CONTROLS AND PROCEDURES.
(a)Based upon their evaluation of the effectiveness of the registrant's disclosure controls and procedures (as defined in Rule 30a-3(c) under the Investment Company Act of 1940 (the "Act")) as conducted within 90 days of the filing date of this report on Form N-CSR, the Registrant's principal financial officer and principal executive officer have concluded that those disclosure controls and procedures provide reasonable assurance that the material information required to be disclosed by the Registrant on this report is recorded, processed, summarized and reported within the time periods specified in the Securities and Exchange Commission's rules and forms.
(b)There were no changes in the Registrant's internal controls over financial reporting (as defined in Rule 30a-3(d) under the Act) that occurred during the period covered by the report that have materially affected, or are reasonably likely to materially affect, the Registrant's internal control over financial reporting.
ITEM 12. DISCLOSURE OF SECURITIES LENDING ACTIVITIES FOR CLOSED-END MANAGEMENT INVESTMENT COMPANIES.
Not applicable to the Registrant.
ITEM 13. EXHIBITS.
(a)(1) Any code of ethics, or amendment thereto, that is the subject of the disclosure required by Item 2, to the extent that the registrant intends to satisfy the Item 2 requirements through filing of an exhibit: Attached hereto as EX-99.COE.
(2)A separate certification for each principal executive officer and principal financial officer of the registrant as required by Rule 30a-2(a) under the Act (17 CFR 270.30a-2): Attached hereto as EX-99.302CERT.
(3)Any written solicitation to purchase securities under Rule 23c-1 under the Act (17 CFR 270.23c-1) sent or given during the period covered by the report by or on behalf of the registrant to 10 or more persons. Not applicable.
(4)Change in the registrant's independent public accountant. Not applicable.
(b)If the report is filed under Section 13(a) or 15(d) of the Exchange Act, provide the certifications required by Rule 30a-2(b) under the Act (17 CFR 270.30a-2(b)), Rule 13a-14(b) or Rule 15d-14(b) under the Exchange Act (17 CFR 240.13a-14(b) or 240.15d-14(b)) and Section 1350 of Chapter 63 of Title 18 of the United States Code (18 U.S.C. 1350) as an exhibit. A certification furnished pursuant to this paragraph will not be deemed "filed" for the purposes of Section 18 of the Exchange Act (15 U.S.C. 78r), or otherwise subject to the liability of that section. Such certification will not be deemed to be incorporated by reference into any filing under the Securities Act of 1933 or the Exchange Act, except to the extent that the registrant specifically incorporates it by reference. Attached hereto as EX-99.906CERT.
Notice
A copy of the Amended and Restated Declaration of Trust, as amended, of the Registrant is on file with the Secretary of State of The Commonwealth of Massachusetts and notice is hereby given that this instrument is executed on behalf of the Registrant by an officer of the Registrant as an officer and not individually and the obligations of or arising out of this instrument are not binding upon any of the Trustees or shareholders individually, but are binding only upon the assets and property of the respective constituent series of the Registrant.
SIGNATURES
Pursuant to the requirements of the Securities Exchange Act of 1934 and the Investment Company Act of 1940, the registrant has duly caused this report to be signed on its behalf by the undersigned, thereunto duly authorized.
(Registrant) MFS SERIES TRUST III
By (Signature and Title)*
/S/ DAVID L. DILORENZO
David L. DiLorenzo, President
Date: March 17, 2023
Pursuant to the requirements of the Securities Exchange Act of 1934 and the Investment Company Act of 1940, this report has been signed below by the following persons on behalf of the registrant and in the capacities and on the dates indicated.
By (Signature and Title)*
/S/ DAVID L. DILORENZO
David L. DiLorenzo, President (Principal Executive Officer)
Date: March 17, 2023
By (Signature and Title)*
/S/ JAMES O. YOST
James O. Yost, Treasurer (Principal Financial Officer and Accounting Officer) Date: March 17, 2023
* Print name and title of each signing officer under his or her signature.