
earnings growth, backstopped by continued policy support from the developed world’s central banks. In the U.S., the world’s largest economy, growth as measured by gross domestic product increased the most in five years, manufacturing expanded and consumer sentiment hit a three-year high after the Federal Reserve initiated a second round of quantitative easing and the Obama administration extended Bush-era tax cuts. In Europe, manufacturing accelerated at its fastest pace in more than a decade and confidence in the economic outlook improved. Results were uneven, however, with core countries such as Germany and France exhibiting strong, export-led growth, while other countries such as Greece, Portugal and Ireland suffered from fiscal spending cuts and rising unemployment. Ireland was forced to accept an 85 billion euro bailout from the European Union (EU) in November after benchmark 10-year bond yields soared and the country’s fiscal deficit ballooned. Sovereign credit concerns in the region remained high at period-end and officials agreed to double the amount of the EU’s rescue facility by the year 2013.
Emerging market growth remained robust, though regional policymakers raised interest rates and bank reserve requirements to combat inflation and discourage speculation. China, Russia, India, Brazil, South Korea, Indonesia and Thailand were among the major emerging markets that raised interest rates during the six-month period. Still, emerging market inflation remained elevated and many countries, China and India included, had negative real interest rates at period-end. Global food prices hit their highest levels on record during the period under review, helping incite a wave of protests and uprisings across North Africa and the Middle East that resulted in the ouster of Egyptian and Tunisian leaders and significant unrest in Libya. The regional instability led to a sell-off in emerging market equities at period-end, and the price of oil rose to its highest level since 2008 due to concerns of supply disruption. In currency markets, the euro advanced against the Japanese yen and U.S. dollar, and many Asian currencies also exhibited strength as central bankers tightened monetary policy. In fixed income markets, yields on most sovereign debt and investment-grade corporate bonds rose, reflecting elevated growth and inflation expectations. In equity markets, economic and commodity price-sensitive sectors such as materials, energy and industrials continued to exhibit leadership, while regionally, developed markets outpaced emerging markets.
Investment Strategy
Our investment strategy employs a bottom-up, value-oriented, long-term approach. We focus on the market price of a company’s securities relative to our evaluation of the company’s long-term earnings, asset value and cash flow potential. As we look worldwide, we consider specific companies,
4 | Semiannual Report
rather than sectors or countries, while doing in-depth research to construct a bargain list from which we buy. Before we make a purchase, we look at the company’s price/cash flow ratio, price/earnings ratio, profit margins and liquidation value.
Manager’s Discussion
In 1949, at the beginning of his investment career, Sir John Templeton wrote in a letter to investors, “The most costly errors in selecting stocks are made by people whose thinking is dominated by the question of the temporary short-term trend of earnings.” Over the past few years, through a period of crisis and recovery, the short-term outlook for corporate earnings and the global economy has appeared to be the primary driver of equity performance. This condition has disadvantaged Templeton’s style of equity investment, which values companies based on their long-term normalized earnings potential and eschews economic forecasting in favor of the more quantifiable science of fundamental analysis at the security level. Yet, Sir John also recognized that such difficulties were inherent to his style of value investing. In 1950, he wrote, “The investor who selects stocks on the basis of long-term intrinsic value must expect certain problems. In the first place, he should expect usually to purchase stocks which are thoroughly unpopular.… In the second place, [he] should not expect that the stocks selected will immediately begin to show a profit.”
In a market misaligned with Templeton’s core investment principles, Templeton World Fund moderately lagged its global benchmark since the March 2009 market bottom; nonetheless, the Fund participated actively in this remarkable market rally producing absolute gains. Encouragingly, in the semiannual period under review, some of the market trends contrasting with our investment style appeared to weaken, and though the Fund still nominally lagged its benchmark index, the gap of underperformance narrowed as the period progressed. In absolute terms, the Fund delivered robust returns in nearly all sectors and regions during the reporting period. In general, economically leveraged and commodity price-sensitive sectors such as energy, materials and industrials led market returns in an environment defined by continued economic recovery and increasing emerging market inflation. In contrast, sectors less sensitive to an economic recovery, such as telecommunications and health care, and those that traditionally suffer in inflationary environments, such as consumer staples and financials, delivered more modest gains.
A major contributor to Fund performance relative to the benchmark index was our low allocation to the weak consumer staples sector.2 We found only
2. The consumer staples sector comprises food and staples retailing and household products in the SOI.

Semiannual Report | 5
limited bargain opportunities in this sector, in which valuations, in our opinion, did not adequately reflect the difficulty these companies may have trying to pass through higher input costs and gain market share in an increasingly competitive pricing environment. Another significant underweighting that contributed to relative performance was the Fund’s allocation to the underperforming utilities sector, which we sold and effectively reduced to zero exposure by period-end. Investor concerns about the sector’s vulnerability to fiscal and regulatory reform, whereby politicians could target utilities’ earnings to shore up budget deficits, pressured sector stocks during the period. We believe that such potential for outside interference made long-term forecasting difficult, and we found few bargains that met our criteria in the utilities sector.
We felt more strongly about the consumer discretionary sector, another notable contributor.3 In particular, the Fund’s overweighted position in the media industry was a major outperformer during the period. As mentioned in our August 2010 shareholder report, we uncovered compelling value opportunities in the industry, where sustained high levels of free cash flow and market share growth were overshadowed by concerns about declining advertising revenues and competition from web-based media sources. Yet, investor sentiment appeared to shift, and the fundamental values we recognized early on were acknowledged as the best media companies reported consistently stronger earnings and continued to productively allocate cash flows. The Fund’s cable holdings, U.S.-based Comcast and Time Warner Cable, were stellar performers. The former rose considerably after increasing its dividend payout, reporting several consecutive quarters of better-than-expected earnings and finalizing its acquisition of NBC Universal. U.S.-based media conglomerate News Corp. also reported strong earnings due to higher television subscriber fees and improved advertising sales, and the stock significantly contributed to performance.
Industrials, another cyclical sector, also performed well during the period as companies throughout the global supply chain benefited from resurgent economic activity.4 The Fund’s stock selection provided a key boost to relative performance. Leading returns was the Hong Kong-based industrial holding company Hutchison Whampoa, which reported improving group operating results and announced a potentially lucrative spin-off of some of its major port assets. Capital goods manufacturers such as Germany’s Siemens and the U.S.’s General Electric were also notable performers, benefiting from growing emerging market demand and global infrastructure development. We continued to
3. The consumer discretionary sector comprises textiles, apparel, and luxury goods; media; and specialty retail in the SOI.
4. The industrials sector comprises aerospace and defense, air freight and logistics, electrical equipment, industrial conglomerates, and trading companies and distributors in the SOI.
6 | Semiannual Report
find values selectively in the industrials sector, which (similar to the Fund’s select energy sector holdings) offered investors exposure to the economic recovery at valuations we considered more attractive than other cyclically leveraged sectors such as materials.
Yet, despite their expensive valuations, materials stocks continued to rally during the period as emerging market economic growth, rising inflationary expectations, dissonant global policy regimes and near-term supply and demand imbalances buoyed commodity prices.5 Given its return to mass profitability in recent quarters, the metals and mining industry appeared euphoric in our view, and our significant underweighting in the industry was a major relative detractor from performance. However, the recent environment exhibited different nuances and surprises, and we believe the potential for extreme industry volatility could be high. With optimism driving valuations to rapturous levels, there were, in our opinion, insufficient margins of safety at the security level to justify substantial participation in metals and mining, and we remained considerably underweighted relative to the benchmark.
Elsewhere, the Fund’s notable relative detractors were among its heaviest weighted sectors. In particular, the Fund’s overweighted positions in telecommunication services and health care holdings lagged as their defensive profiles and emerging market exposures were disadvantaged in this market environment.6 The Fund’s telecommunication services position was most pressured by Turkish mobile operator Turkcell Iletisim (not an index component), whose disappointing earnings were further exacerbated by regional instability. In our analysis, while near-term volatility could stay elevated due to geopolitical factors, Turkcell appears well positioned for long-term growth if competitive dynamics in its networks improve and the company expands its lead in the promising wireless broadband services market. We believe significant value remains in this holding due to the company’s attractive competitive position, which was helped by an underleveraged balance sheet, healthy free cash flow yield and a strong dividend yield.
The pharmaceuticals industry in the health care sector, meanwhile, traded near its lowest levels ever on several valuation metrics, despite industry fundamentals that continued to improve and secular demand growth that was significantly supported by demographic and economic trends. After the overall market’s impressive rally, such a clear juxtaposition of negative near-term sentiment and
5. The materials sector comprises construction materials and metals and mining in the SOI.
6. The telecommunication services sector comprises diversified telecommunication services and wireless telecommunication services in the SOI. The health care sector comprises biotechnology, health care equipment and supplies, health care providers and services, and pharmaceuticals in the SOI.
Semiannual Report | 7
positive long-term potential seemed unique to the health care industry, and we believe it offers investors some of the most compelling long-term opportunities in the current environment.
Although the Fund’s overweighting in information technology helped relative performance, our investments overall lagged, pressured primarily by stock-specific issues among hardware holdings.7 Shares of U.S.-based Cisco, the world’s largest manufacturer of networking equipment systems, declined in value as spending cuts among corporate sector clients reduced revenues, which, combined with elevated research and development costs, squeezed profit margins. Despite the market’s negative reaction to this news, we continued to believe Cisco’s attractive positioning and dominance in a diverse array of markets were not reflected in the stock’s modest valuation, and we remained favorable toward this holding. Elsewhere in the sector, however, several holdings delivered strong gains, most notably in the software industry. Oracle, the world’s second-largest software manufacturer, was a key contributor and made an outsized gain as the economic recovery spurred corporate technology spending and savvy acquisitions helped increase company profitability.
It is important to recognize the effect of currency movements on the Fund’s performance. In general, if the value of the U.S. dollar goes up compared with a foreign currency, an investment traded in that foreign currency will go down in value because it will be worth fewer U.S. dollars. This can have a negative effect on Fund performance. Conversely, when the U.S. dollar weakens in relation to a foreign currency, an investment traded in that foreign currency will increase in value, which can contribute to Fund performance. For the six months ended February 28, 2011, the U.S. dollar declined in value relative to most currencies. As a result, the Fund’s performance was positively affected by the portfolio’s significant investment in securities with non-U.S. currency exposure. However, one cannot expect the same result in future periods.
In our August 2010 shareholder report, we highlighted the excessive influence of near-term trends and economic outlook on equity market performance. As illustrated through the sector and stock discussions in this report, such conditions have disadvantaged Templeton’s style of equity investment, which seeks to uncover long-term values through rigorous fundamental analysis at the security level. However, with a global solvency crisis averted and global equities in the MSCI World Index up nearly 90% in the span of two short years, we believe we are beginning to see signs the market has become more discriminating.1 The high level of performance correlation between stocks and asset classes has weakened noticeably during the period and the leadership of small cap, emerging market, and lower quality equities has waned. At Templeton, we find these
7. The information technology sector comprises communications equipment; computers and peripherals; electrical equipment, instruments and components; semiconductors and semiconductor equipment; and software in the SOI.
nascent trend shifts encouraging and believe if economic considerations give way to a more nuanced focus on business fundamentals as the main driver of equity markets, the broader market should begin to recognize and reward our value-oriented portfolios.
Thank you for your continued participation in Templeton World Fund.
We look forward to serving your future investment needs.

The foregoing information reflects our analysis, opinions and portfolio holdings as of February 28, 2011, the end of the reporting period. The way we implement our main investment strategies and the resulting portfolio holdings may change depending on factors such as market and economic conditions. These opinions may not be relied upon as investment advice or an offer for a particular security. The information is not a complete analysis of every aspect of any market, country, industry, security or the Fund. Statements of fact are from sources considered reliable, but the investment manager makes no representation or warranty as to their completeness or accuracy. Although historical performance is no guarantee of future results, these insights may help you understand our investment management philosophy.
Semiannual Report | 9
Norman J. Boersma assumed portfolio manager responsibilities for the Fund effective March 2011. He also became president of Templeton Global Advisors Ltd. and is portfolio manager of other Templeton funds. Mr. Boersma has over 20 years of experience in the investment industry. He joined the Templeton organization in 1991 and most recently served as director of research for the Templeton Global Equity Group before assuming his current responsibilities.
Prior to joining Templeton, Mr. Boersma was an investment officer with the Ontario Hydro Pension Fund, where he was the portfolio manager responsible for the fund’s small capitalization Canadian equity investments.
10 | Semiannual Report
Performance Summary as of 2/28/11
Your dividend income will vary depending on dividends or interest paid by securities in the Fund’s portfolio, adjusted for operating expenses of each class. Capital gain distributions are net profits realized from the sale of portfolio securities. The performance table does not reflect any taxes that a shareholder would pay on Fund dividends, capital gain distributions, if any, or any realized gains on the sale of Fund shares. Total return reflects reinvestment of the Fund’s dividends and capital gain distributions, if any, and any unrealized gains or losses.
Semiannual Report | 11
Performance Summary (continued)
Performance
Cumulative total return excludes sales charges. Average annual total returns and value of $10,000 investment include maximum sales charges. Class A: 5.75% maximum initial sales charge; Class B: contingent deferred sales charge (CDSC) declining from 4% to 1% over six years, and eliminated thereafter; Class C: 1% CDSC in first year only; Advisor Class: no sales charges.
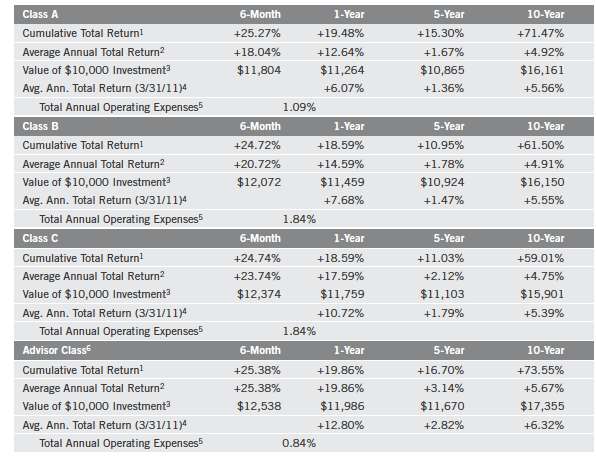
Performance data represent past performance, which does not guarantee future results. Investment return and principal value will fluctuate, and you may have a gain or loss when you sell your shares. Current performance may differ from figures shown. For most recent month-end performance, go to franklintempleton.com or call (800) 342-5236.
12 | Semiannual Report
Performance Summary (continued)
Endnotes
Special risks are associated with foreign investing, including currency fluctuations, economic instability and political developments. Investments in developing markets involve heightened risks related to the same factors, in addition to those associated with these markets’ smaller size and lesser liquidity. The manager applies various techniques and analyses in making investment decisions for the Fund, but there can be no guarantee that these decisions will produce the desired results. The Fund’s prospectus also includes a description of the main investment risks.
| | |
Class B: Class C: | | These shares have higher annual fees and expenses than Class A shares. Prior to 1/1/04, these shares were offered with an initial sales charge; thus actual total returns would have differed. These shares have higher annual fees and expenses than Class A shares. |
Advisor Class: | | Shares are available to certain eligible investors as described in the prospectus. |
1. Cumulative total return represents the change in value of an investment over the periods indicated.
2. Average annual total return represents the average annual change in value of an investment over the periods indicated. Six-month return has not been annualized.
3. These figures represent the value of a hypothetical $10,000 investment in the Fund over the periods indicated.
4. In accordance with SEC rules, we provide standardized average annual total return information through the latest calendar quarter.
5. Figures are as stated in the Fund’s prospectus current as of the date of this report. In periods of market volatility, assets may decline significantly, causing total annual Fund operating expenses to become higher than the figures shown.
6. Effective 5/15/06, the Fund began offering Advisor Class shares, which do not have sales charges or a Rule 12b-1 plan. Performance quotations for this class reflect the following methods of calculation: (a) For periods prior to 5/15/06, a restated figure is used based upon the Fund’s Class A performance, excluding the effect of Class A’s maximum initial sales charge, but reflecting the effect of the Class A Rule 12b-1 fees; and (b) for periods after 5/14/06, actual Advisor Class performance is used reflecting all charges and fees applicable to that class. Since 5/15/06 (commencement of sales), the cumulative and average annual total returns of Advisor Class shares were +11.28% and +2.25%.
Semiannual Report | 13
Your Fund’s Expenses
As a Fund shareholder, you can incur two types of costs:
Transaction costs, including sales charges (loads) on Fund purchases; and
Ongoing Fund costs, including management fees, distribution and service (12b-1) fees, and other Fund expenses. All mutual funds have ongoing costs, sometimes referred to as operating expenses.
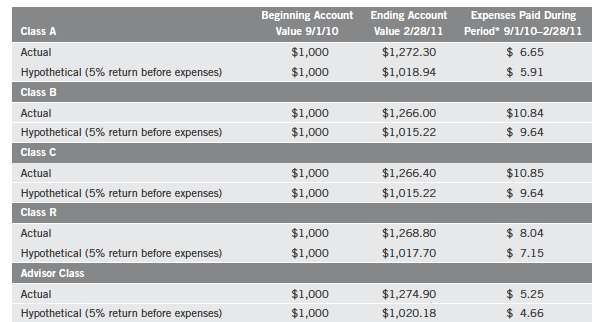
The following table shows ongoing costs of investing in the Fund and can help you understand these costs and compare them with those of other mutual funds. The table assumes a $1,000 investment held for the six months indicated.
Actual Fund Expenses
The first line (Actual) for each share class listed in the table provides actual account values and expenses. The “Ending Account Value” is derived from the Fund’s actual return, which includes the effect of Fund expenses.
You can estimate the expenses you paid during the period by following these steps. Of course, your account value and expenses will differ from those in this illustration:
| 1. | Divide your account value by $1,000. |
| | If an account had an $8,600 value, then $8,600 ÷ $1,000 = 8.6. |
| 2. | Multiply the result by the number under the heading “Expenses Paid During Period.” |
| | If Expenses Paid During Period were $7.50, then 8.6 x $7.50 = $64.50. |
In this illustration, the estimated expenses paid this period are $64.50.
Hypothetical Example for Comparison with Other Funds
Information in the second line (Hypothetical) for each class in the table can help you compare ongoing costs of investing in the Fund with those of other mutual funds. This information may not be used to estimate the actual ending account balance or expenses you paid during the period. The hypothetical “Ending Account Value” is based on the actual expense ratio for each class and an assumed 5% annual rate of return before expenses, which does not represent the Fund’s actual return. The figure under the heading “Expenses Paid During Period” shows the hypothetical expenses your account would have incurred under this scenario. You can compare this figure with the 5% hypothetical examples that appear in shareholder reports of other funds.
14 | Semiannual Report
Your Fund’s Expenses (continued)
Please note that expenses shown in the table are meant to highlight ongoing costs and do not reflect any transaction costs, such as sales charges. Therefore, the second line for each class is useful in comparing ongoing costs only, and will not help you compare total costs of owning different funds. In addition, if transaction costs were included, your total costs would have been higher. Please refer to the Fund prospectus for additional information on operating expenses.
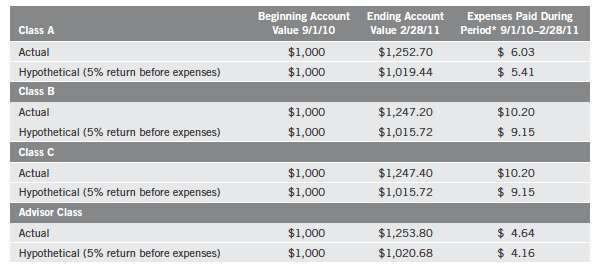
*Expenses are calculated using the most recent six-month expense ratio, annualized for each class (A: 1.08%; B: 1.83%; C: 1.83%; and Advisor: 0.83%), multiplied by the average account value over the period, multiplied by 181/365 to reflect the one-half year period.
Semiannual Report | 15
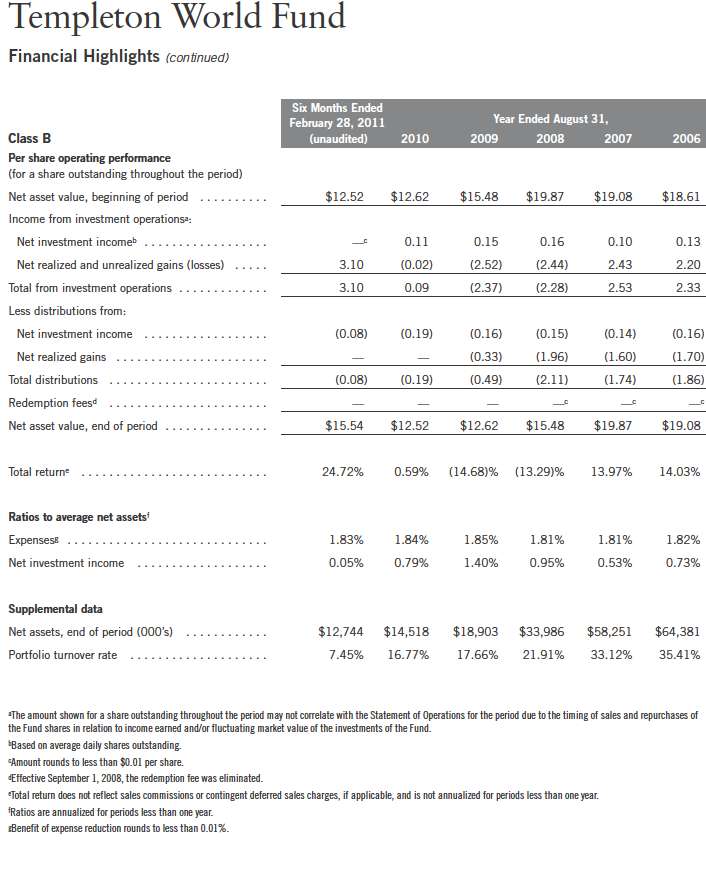
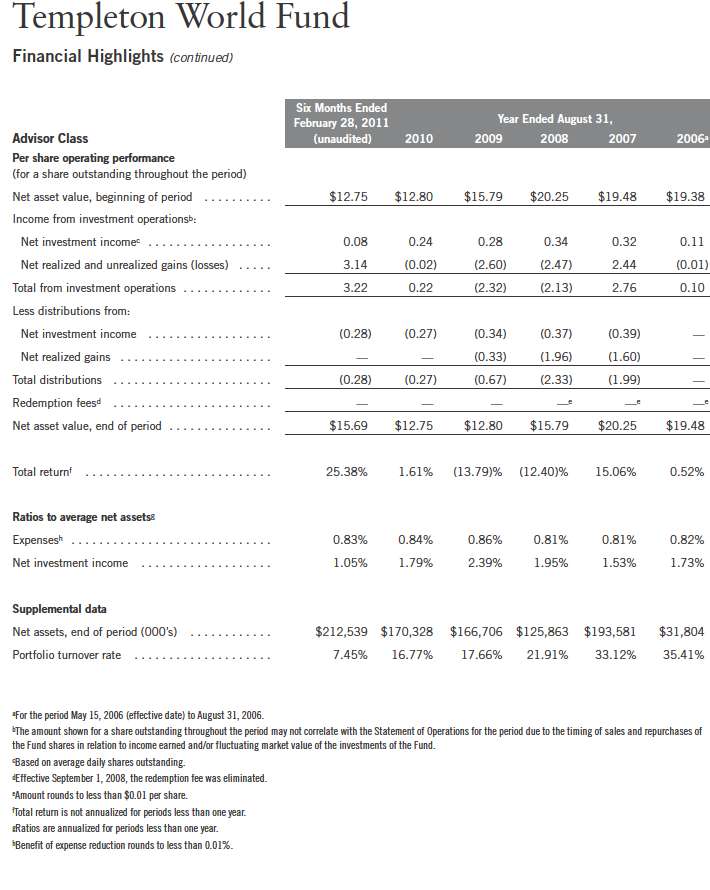
| | Templeton World Fund
Financial Highlights |

16 | The accompanying notes are an integral part of these financial statements. | Semiannual Report
Semiannual Report | The accompanying notes are an integral part of these financial statements. | 17

18 | The accompanying notes are an integral part of these financial statements. | Semiannual Report
Semiannual Report | The accompanying notes are an integral part of these financial statements. | 19
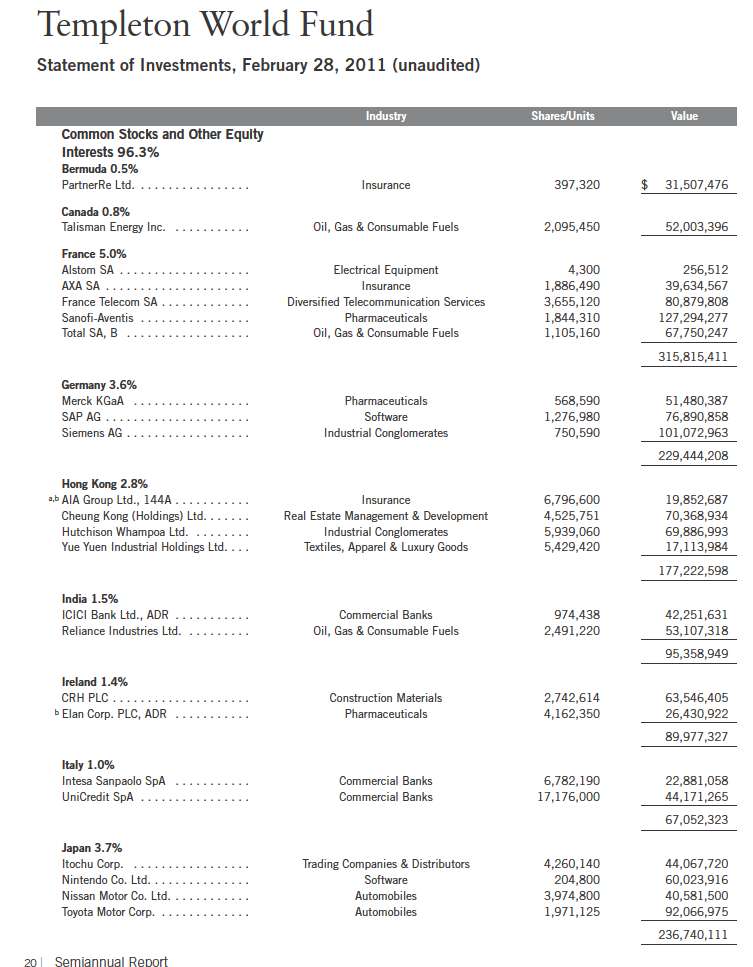
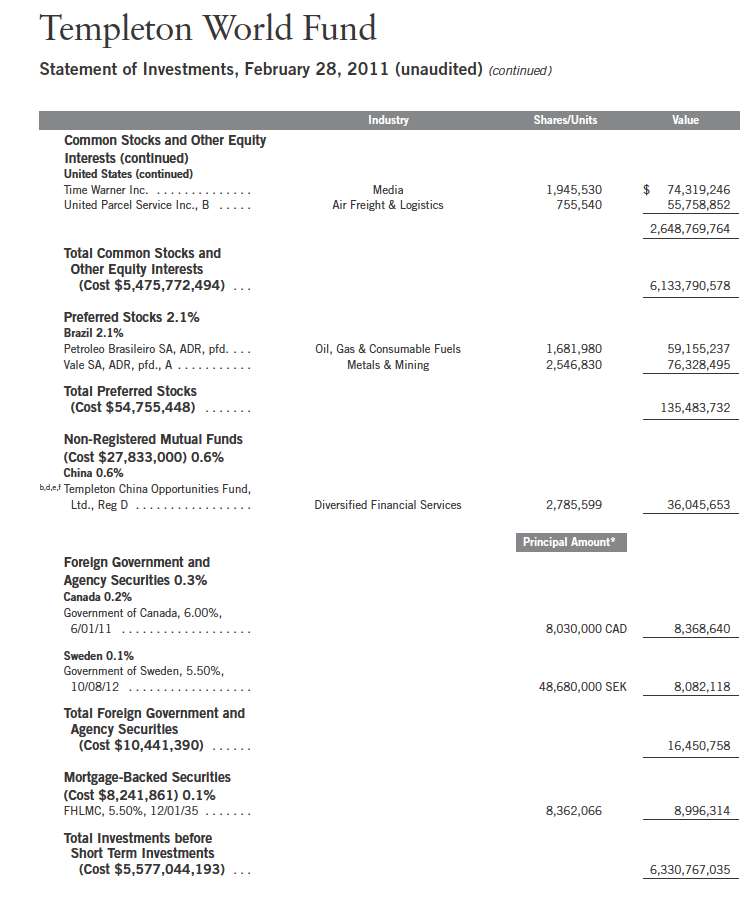
Templeton World Fund
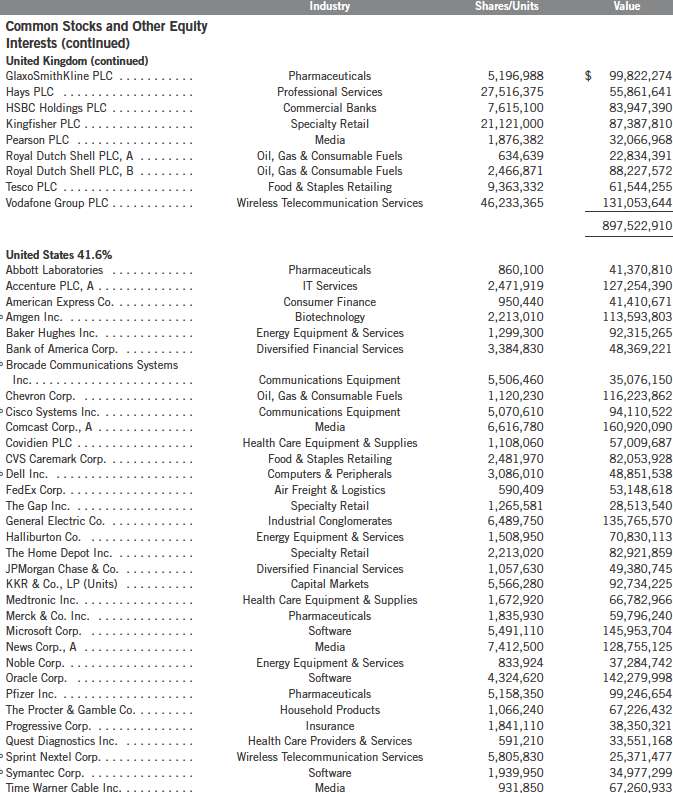
Statement of Investments, February 28, 2011 (unaudited) (continued)

Semiannual Report | 21
Templeton World Fund
Statement of Investments, February 28, 2011 (unaudited) (continued)
22 | Semiannual Report
Semiannual Report | 23
Templeton World Fund
Statement of Investments, February 28, 2011 (unaudited) (continued)
24 | The accompanying notes are an integral part of these financial statements. | Semiannual Report
Semiannual Report | The accompanying notes are an integral part of these financial statements. | 25
26 | The accompanying notes are an integral part of these financial statements. | Semiannual Report
Semiannual Report | The accompanying notes are an integral part of these financial statements. | 27
28 | The accompanying notes are an integral part of these financial statements. | Semiannual Report
Templeton World Fund
Notes to Financial Statements (unaudited)
1. ORGANIZATION AND SIGNIFICANT ACCOUNTING POLICIES
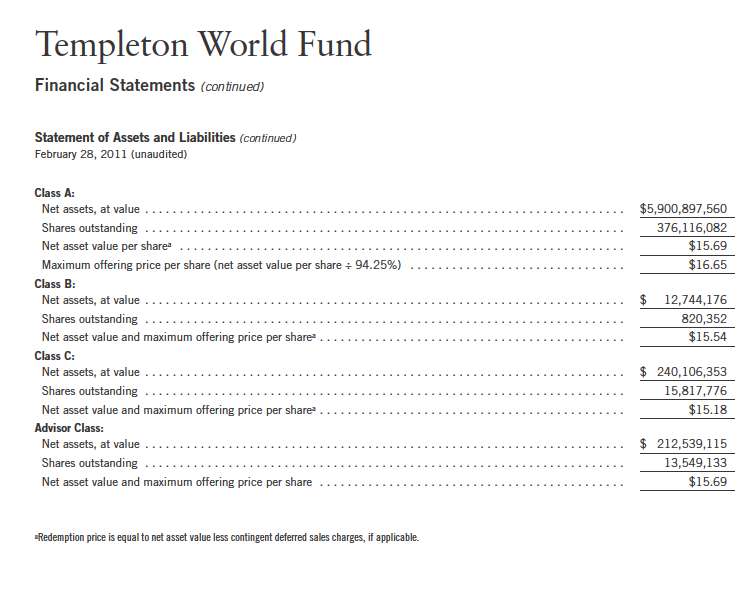
Templeton Funds (Trust) is registered under the Investment Company Act of 1940, as amended, (1940 Act) as an open-end investment company, consisting of two separate funds. The Templeton World Fund (Fund) is included in this report. The financial statements of the remaining fund in the Trust is presented separately. The Fund offers four classes of shares: Class A, Class B, Class C, and Advisor Class. Each class of shares differs by its initial sales load, contingent deferred sales charges, distribution fees, voting rights on matters affecting a single class and its exchange privilege.
The following summarizes the Fund’s significant accounting policies.
a. Financial Instrument Valuation
The Fund’s investments in securities and other financial instruments are carried at fair value daily. Fair value is the price that would be received to sell an asset or paid to transfer a liability in an orderly transaction between market participants on the measurement date. Under procedures approved by the Trust’s Board of Trustees, the Fund may utilize independent pricing services, quotations from securities and financial instrument dealers, and other market sources to determine fair value.
Equity securities listed on an exchange or on the NASDAQ National Market System are valued at the last quoted sale price or the official closing price of the day, respectively. Foreign equity securities are valued as of the close of trading on the foreign stock exchange on which the security is primarily traded, or the NYSE, whichever is earlier. The value is then converted into its U.S. dollar equivalent at the foreign exchange rate in effect at the close of the NYSE on the day that the value of the security is determined. Over-the-counter securities are valued within the range of the most recent quoted bid and ask prices. Securities that trade in multiple markets or on multiple exchanges are valued according to the broadest and most representative market. Certain equity securities are valued based upon fundamental characteristics or relationships to similar securities.
Debt securities generally trade in the over-the-counter market rather than on a securities exchange. The Fund’s pricing services use multiple valuation techniques to determine fair value. In instances where sufficient market activity exists, the pricing services may utilize a market-based approach through which quotes from market makers are used to determine fair value. In instances where sufficient market activity may not exist or is limited, the pricing services also utilize proprietary valuation models which may consider market characteristics such as benchmark yield curves, option-adjusted spreads, credit spreads, estimated default rates, coupon rates, anticipated timing of principal repayments, underlying collateral, and other unique security features in order to estimate the relevant cash flows, which are then discounted to calculate the fair value. Securities denominated in a foreign currency are converted into their U.S. dollar equivalent at the foreign exchange rate in effect at the close of the NYSE on the date that the values of the foreign debt securities are determined. Time deposits are valued at cost, which approximates market value.
Semiannual Report | 29
Templeton World Fund
Notes to Financial Statements (unaudited) (continued)
| 1. | ORGANIZATION AND SIGNIFICANT ACCOUNTING POLICIES (continued) |
| a. | Financial Instrument Valuation (continued) |
The Fund has procedures to determine the fair value of securities and other financial instruments for which market prices are not readily available or which may not be reliably priced. Under these procedures, the Fund primarily employs a market-based approach which may use related or comparable assets or liabilities, recent transactions, market multiples, book values, and other relevant information for the investment to determine the fair value of the investment. The Fund may also use an income-based valuation approach in which the anticipated future cash flows of the investment are discounted to calculate fair value. Discounts may also be applied due to the nature or duration of any restrictions on the disposition of the investments. Due to the inherent uncertainty of valuations of such investments, the fair values may differ significantly from the values that would have been used had an active market existed.
Trading in securities on foreign securities stock exchanges and over-the-counter markets may be completed before the daily close of business on the NYSE. Occasionally, events occur between the time at which trading in a foreign security is completed and the close of the NYSE that might call into question the reliability of the value of a portfolio security held by the Fund. As a result, differences may arise between the value of the Fund’s portfolio securities as determined at the foreign market close and the latest indications of value at the close of the NYSE. In order to minimize the potential for these differences, the investment manager monitors price movements following the close of trading in foreign stock markets through a series of country specific market proxies (such as baskets of American Depository Receipts, futures contracts and exchange traded funds). These price movements are measured against established trigger thresholds for each specific market proxy to assist in determining if an event has occurred that may call into question the reliability of the values of the foreign securities held by the Fund. If such an event occurs, the securities may be valued using fair value procedures, which may include the use of independent pricing services.
b. Foreign Currency Translation
Portfolio securities and other assets and liabilities denominated in foreign currencies are translated into U.S. dollars based on the exchange rate of such currencies against U.S. dollars on the date of valuation. The Fund may enter into foreign currency exchange contracts to facilitate transactions denominated in a foreign currency. Purchases and sales of securities, income and expense items denominated in foreign currencies are translated into U.S. dollars at the exchange rate in effect on the transaction date. Portfolio securities and assets and liabilities denominated in foreign currencies contain risks that those currencies will decline in value relative to the U.S. dollar. Occasionally, events may impact the availability or reliability of foreign exchange rates used to convert the U.S. dollar equivalent value. If such an event occurs, the foreign exchange rate will be valued at fair value using procedures established and approved by the Trust’s Board of Trustees.
30 | Semiannual Report
Templeton World Fund
Notes to Financial Statements (unaudited) (continued)
| 1. | ORGANIZATION AND SIGNIFICANT ACCOUNTING POLICIES (continued) |
| b. | Foreign Currency Translation (continued) |
The Fund does not separately report the effect of changes in foreign exchange rates from changes in market prices on securities held. Such changes are included in net realized and unrealized gain or loss from investments on the Statement of Operations.
Realized foreign exchange gains or losses arise from sales of foreign currencies, currency gains or losses realized between the trade and settlement dates on securities transactions and the difference between the recorded amounts of dividends, interest, and foreign withholding taxes and the U.S. dollar equivalent of the amounts actually received or paid. Net unrealized foreign exchange gains and losses arise from changes in foreign exchange rates on foreign denominated assets and liabilities other than investments in securities held at the end of the reporting period.
c. Investment in Templeton China Opportunities Fund, Ltd.
The Fund invests in Templeton China Opportunities Fund, Ltd. (China Fund), a private offering of unregistered shares in a Cayman Islands Exempt Company. The China Fund’s investment objective is to seek capital growth primarily through investments in A-shares of Chinese companies listed on the Shanghai and Shenzhen stock exchanges. Chinese A-shares are traded in Chinese Renminbi and are only available as an investment to domestic (Chinese) investors and holders of a Qualified Foreign Institutional Investors license. The China Fund is managed by Templeton Investment Counsel, LLC (an affiliate of the investment manager). No additional management or administrative fees are incurred on assets invested in the China Fund.
Shares of the China Fund were subject to a restriction on redemption which expired on March 24, 2011. Additionally, the Fund may incur delays in redeeming its investment in the China Fund. The China Fund may be subject to certain restrictions and administrative processes relating to its ability to repatriate cash balances, investment proceeds and earnings associated with its investment, as such activities are subject to approval by agencies of the Chinese government. The Fund’s investment in the China Fund is valued based upon the fair value of the China Fund’s portfolio securities and other assets and liabilities.
d. Income and Deferred Taxes
It is the Fund’s policy to qualify as a regulated investment company under the Internal Revenue Code. The Fund intends to distribute to shareholders substantially all of its taxable income and net realized gains to relieve it from federal income and excise taxes. As a result, no provision for U.S. federal income taxes is required. The Fund files U.S. income tax returns as well as tax returns in certain other jurisdictions. The Fund’s application of those tax rules is subject to its understanding. The Fund records a provision for taxes in its financial statements including penalties and interest, if any, for a tax position taken on a tax return (or expected to be taken) when it fails to meet the more likely than not (a greater than 50% probability) threshold and based on the technical merits, the tax position may not be sustained upon examination by the tax authorities. As of February 28, 2011, and for all open tax years, the Fund has determined that
Semiannual Report | 31
Templeton World Fund
Notes to Financial Statements (unaudited) (continued)
| 1. | ORGANIZATION AND SIGNIFICANT ACCOUNTING POLICIES (continued) |
| d. | Income and Deferred Taxes (continued) |
no provision for income tax is required in the Fund’s financial statements. Open tax years are those that remain subject to examination and are based on each tax jurisdiction statute of limitation. The Fund is not aware of any tax position for which it is reasonably possible that the total amounts of unrecognized tax effects will significantly change in the next twelve months.
The Fund may be subject to foreign taxation related to income received, capital gains on the sale of securities and certain foreign currency transactions in the foreign jurisdictions in which it invests. Foreign taxes, if any, are recorded based on the tax regulations and rates that exist in the foreign markets in which the Fund invests. When a capital gain tax is determined to apply the Fund records an estimated deferred tax liability for unrealized gains on these securities in an amount that would be payable if the securities were disposed of on the valuation date.
e. Security Transactions, Investment Income, Expenses and Distributions
Security transactions are accounted for on trade date. Realized gains and losses on security transactions are determined on a specific identification basis. Interest income and estimated expenses are accrued daily. Amortization of premium and accretion of discount on debt securities are included in interest income. Dividend income is recorded on the ex-dividend date except that certain dividends from foreign securities are recognized as soon as the Fund is notified of the ex-dividend date. Distributions to shareholders are recorded on the ex-dividend date and are determined according to income tax regulations (tax basis). Distributable earnings determined on a tax basis may differ from earnings recorded in accordance with accounting principles generally accepted in the United States of America. These differences may be permanent or temporary. Permanent differences are reclassified among capital accounts to reflect their tax character. These reclassifications have no impact on net assets or the results of operations. Temporary differences are not reclassified, as they may reverse in subsequent periods.
Common expenses incurred by the Trust are allocated among the funds based on the ratio of net assets of each fund to the combined net assets of the Trust. Fund specific expenses are charged directly to the fund that incurred the expense.
Realized and unrealized gains and losses and net investment income, not including class specific expenses, are allocated daily to each class of shares based upon the relative proportion of net assets of each class. Differences in per share distributions, by class, are generally due to differences in class specific expenses.
f. Accounting Estimates
The preparation of financial statements in accordance with accounting principles generally accepted in the United States of America requires management to make estimates and assumptions that affect the reported amounts of assets and liabilities at the date of the financial statements and the amounts of income and expenses during the reporting period. Actual results could differ from those estimates.
32 | Semiannual Report
Templeton World Fund
Notes to Financial Statements (unaudited) (continued)
| 1. | ORGANIZATION AND SIGNIFICANT ACCOUNTING POLICIES (continued) |
| g. | Guarantees and Indemnifications |
Under the Trust’s organizational documents, its officers and trustees are indemnified by the Trust against certain liabilities arising out of the performance of their duties to the Trust. Additionally, in the normal course of business, the Trust, on behalf of the Fund, enters into contracts with service providers that contain general indemnification clauses. The Trust’s maximum exposure under these arrangements is unknown as this would involve future claims that may be made against the Trust that have not yet occurred. Currently, the Trust expects the risk of loss to be remote.
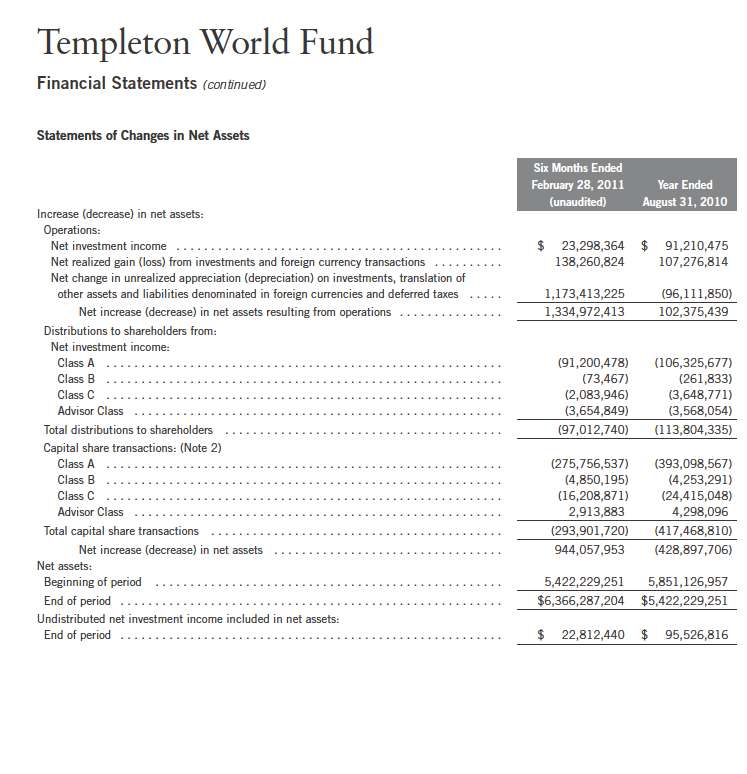
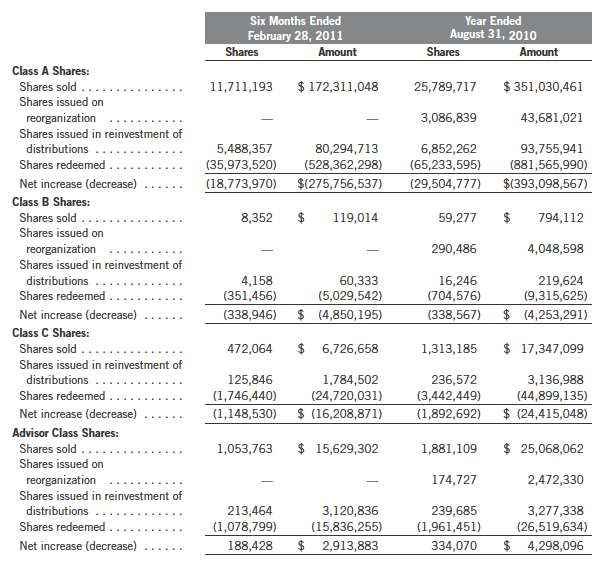
2. SHARES OF BENEFICIAL INTEREST
At February 28, 2011, there were an unlimited number of shares authorized (without par value).
Transactions in the Fund’s shares were as follows:
Semiannual Report | 33
Templeton World Fund
Notes to Financial Statements (unaudited) (continued)
3. TRANSACTIONS WITH AFFILIATES
Franklin Resources, Inc. is the holding company for various subsidiaries that together are referred to as Franklin Templeton Investments. Certain officers and trustees of the Trust are also officers and/or directors of the following subsidiaries:

a. Management Fees
The Fund pays an investment management fee to TGAL based on the average daily net assets of the Fund as follows:

b. Administrative Fees
The Fund pays its allocated share of an administrative fee to FT Services based on the Trust’s aggregate average daily net assets as follows:

c. Distribution Fees
The Trust’s Board of Trustees has adopted distribution plans for each share class, with the exception of Advisor Class shares, pursuant to Rule 12b-1 under the 1940 Act. Under the Fund’s Class A reimbursement distribution plan, the Fund reimburses Distributors for costs incurred in connection with the servicing, sale and distribution of the Fund’s shares up to the maximum annual plan rate. Under the Class A reimbursement distribution plan, costs exceeding the maximum for the current plan year cannot be reimbursed in subsequent periods.
In addition, under the Fund’s Class B and C compensation distribution plans, the Fund pays Distributors for costs incurred in connection with the servicing, sale and distribution of the Fund’s shares up to the maximum annual plan rate for each class.
34 | Semiannual Report
Templeton World Fund
Notes to Financial Statements (unaudited) (continued)
| 3. | TRANSACTIONS WITH AFFILIATES (continued) |
| c. | Distribution Fees (continued) |
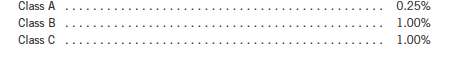
The maximum annual plan rates, based on the average daily net assets, for each class, are as follows:
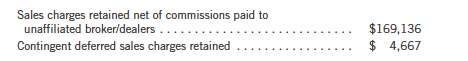
d. Sales Charges/Underwriting Agreements
Distributors has advised the Fund of the following commission transactions related to the sales and redemptions of the Fund’s shares for the period:
e. Transfer Agent Fees
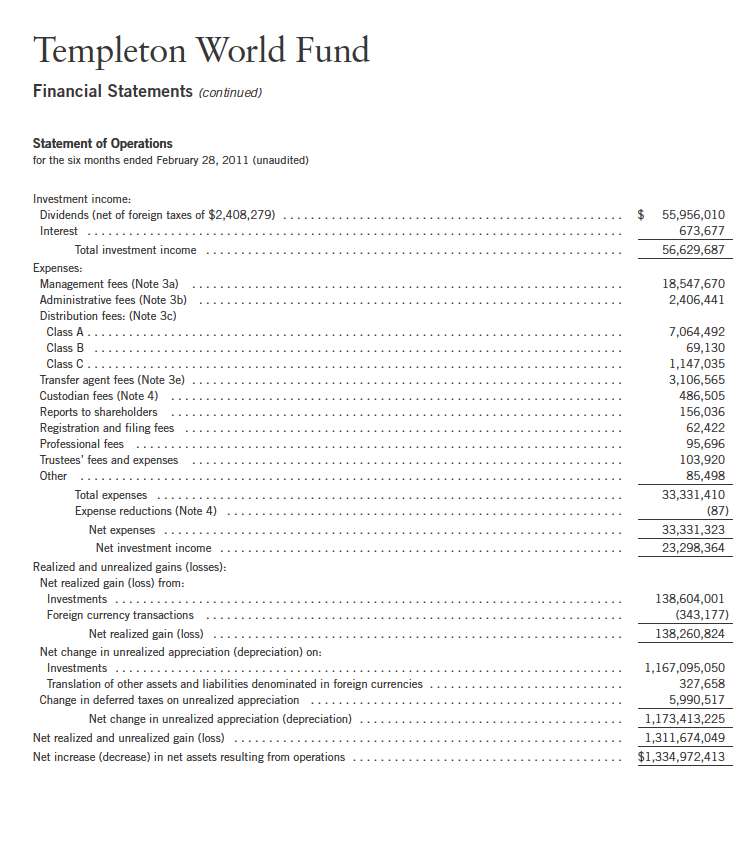
For the period ended February 28, 2011, the Fund paid transfer agent fees of $3,106,565, of which $1,871,463 was retained by Investor Services.
4. EXPENSE OFFSET ARRANGEMENT
The Fund has entered into an arrangement with its custodian whereby credits realized as a result of uninvested cash balances are used to reduce a portion of the Fund’s custodian expenses. During the period ended February 28, 2011, the custodian fees were reduced as noted in the Statement of Operations.
5. INCOME TAXES
For tax purposes, capital losses may be carried over to offset future capital gains, if any. At August 31, 2010, the capital loss carryforwards were as follows:
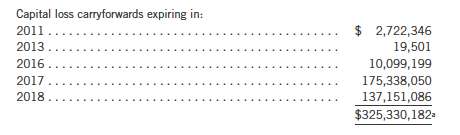
aIncludes $62,955,879 from the merged Templeton Global Long-Short Fund, which may be carried over to offset future capital gains, subject to certain limitations.
Semiannual Report | 35
Templeton World Fund
Notes to Financial Statements (unaudited) (continued)
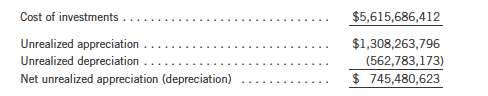
5. INCOME TAXES (continued)
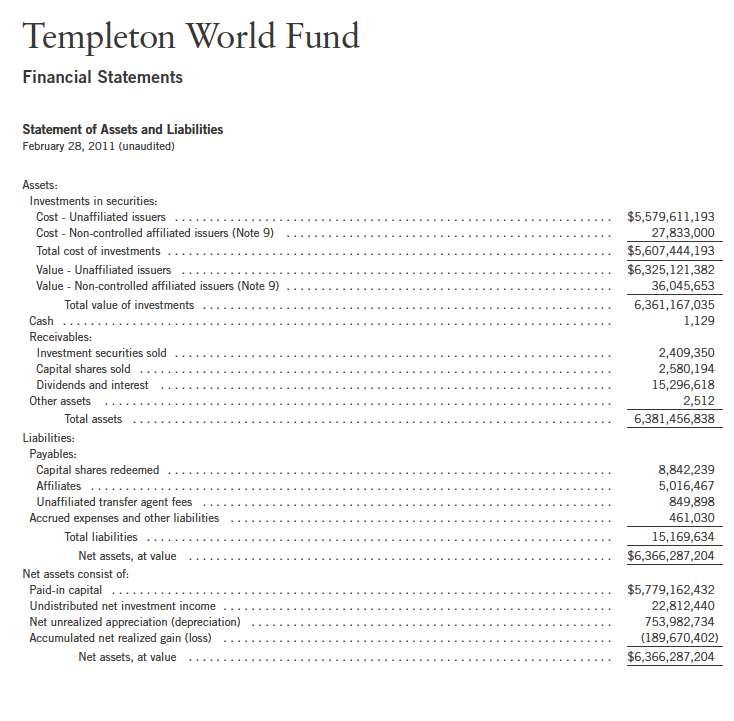
At February 28, 2011, the cost of investments and net unrealized appreciation (depreciation) for income tax purposes were as follows:
Net investment income differs for financial statement and tax purposes primarily due to differing treatments of foreign currency transactions, pass-through entity income, bond discounts and premiums, non-deductible expenses, and regulatory settlement.
Net realized gains (losses) differ for financial statement and tax purposes primarily due to differing treatments of wash sales, foreign currency transactions and pass-through entity income.
6. INVESTMENT TRANSACTIONS
Purchases and sales of investments (excluding short term securities) for the period ended February 28, 2011, aggregated $441,792,047 and $732,292,346, respectively.
7. CONCENTRATION OF RISK
Investing in foreign securities may include certain risks and considerations not typically associated with investing in U.S. securities, such as fluctuating currency values and changing local and regional economic, political and social conditions, which may result in greater market volatility. In addition, certain foreign securities may not be as liquid as U.S. securities.
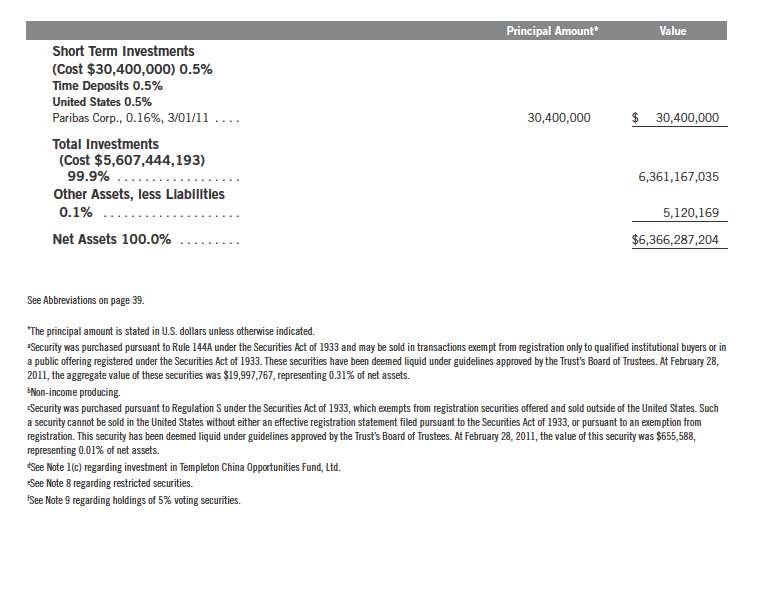
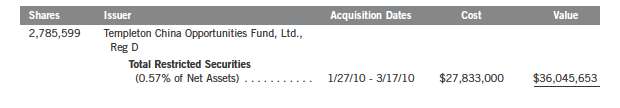
8. RESTRICTED SECURITIES
The Fund may invest in securities that are restricted under the Securities Act of 1933 (1933 Act) or which are subject to legal, contractual, or other agreed upon restrictions on resale. Restricted securities are often purchased in private placement transactions, and cannot be sold without prior registration unless the sale is pursuant to an exemption under the 1933 Act. Disposal of these securities may require greater effort and expense, and prompt sale at an acceptable price may be difficult. The Fund may have registration rights for restricted securities. The issuer generally incurs all registration costs.
36 | Semiannual Report
Templeton World Fund
Notes to Financial Statements (unaudited) (continued)
8. RESTRICTED SECURITIES (continued)
At February 28, 2011, the Fund held investments in restricted securities, excluding certain securities exempt from registration under the 1933 Act deemed to be liquid, as follows:
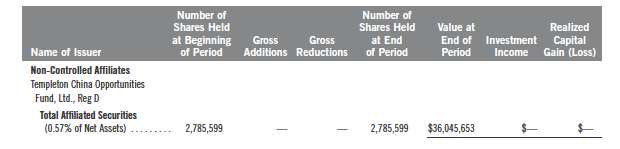
9. HOLDINGS OF 5% VOTING SECURITIES OF PORTFOLIO COMPANIES
The 1940 Act defines “affiliated companies” to include investments in portfolio companies in which a fund owns 5% or more of the outstanding voting securities. Investments in “affiliated companies” for the Fund for the period ended February 28, 2011, were as shown below.
10. CREDIT FACILITY
The Fund, together with other U.S. registered and foreign investment funds (collectively “Borrowers”), managed by Franklin Templeton Investments, are borrowers in a joint syndicated senior unsecured credit facility totaling $750 million (Global Credit Facility) which matures on January 20, 2012. This Global Credit Facility provides a source of funds to the Borrowers for temporary and emergency purposes, including the ability to meet future unanticipated or unusually large redemption requests.
Under the terms of the Global Credit Facility, the Fund shall, in addition to interest charged on any borrowings made by the Fund and other costs incurred by the Fund, pay its share of fees and expenses incurred in connection with the implementation and maintenance of the Global Credit Facility, based upon its relative share of the aggregate net assets of all of the Borrowers, including an annual commitment fee of 0.08% based upon the unused portion of the Global Credit Facility, which is reflected in other expenses on the Statement of Operations. During the period ended February 28, 2011, the Fund did not use the Global Credit Facility.
Semiannual Report | 37
Templeton World Fund
Notes to Financial Statements (unaudited) (continued)
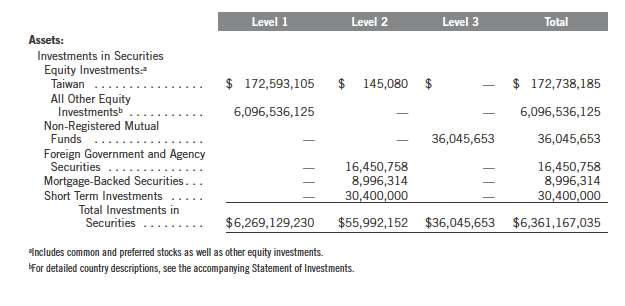
11. FAIR VALUE MEASUREMENTS
The Fund follows a fair value hierarchy that distinguishes between market data obtained from independent sources (observable inputs) and the Fund’s own market assumptions (unobservable inputs). These inputs are used in determining the value of the Fund’s investments and are summarized in the following fair value hierarchy:
Level 1 – quoted prices in active markets for identical securities
Level 2 – other significant observable inputs (including quoted prices for similar securities, interest rates, prepayment speed, credit risk, etc.)
Level 3 – significant unobservable inputs (including the Fund’s own assumptions in deter- mining the fair value of investments)
The inputs or methodology used for valuing securities are not an indication of the risk associated with investing in those securities.
For movements between the levels within the fair value hierarchy, the Fund has adopted a policy of recognizing the transfers as of the date of the underlying event which caused the movement.
The following is a summary of the inputs used as of February 28, 2011, in valuing the Fund’s assets and liabilities carried at fair value:
38 | Semiannual Report
Templeton World Fund
Notes to Financial Statements (unaudited) (continued)
11. FAIR VALUE MEASUREMENTS (continued)
At February 28, 2011, the reconciliation of assets in which significant unobservable inputs (Level 3) were used in determining fair value, is as follows:

12. SUBSEQUENT EVENTS
The Fund has evaluated subsequent events through the issuance of the financial statements and determined that no events have occurred that require disclosure other than those already disclosed in the financial statements.
Semiannual Report | 39
Templeton World Fund
Shareholder Information
Proxy Voting Policies and Procedures
The Fund’s investment manager has established Proxy Voting Policies and Procedures (Policies) that the Fund uses to determine how to vote proxies relating to portfolio securities. Shareholders may view the Fund’s complete Policies online at franklintempleton.com. Alternatively, shareholders may request copies of the Policies free of charge by calling the Proxy Group collect at (954) 527-7678 or by sending a written request to: Franklin Templeton Companies, LLC, 500 East Broward Boulevard, Suite 1500, Fort Lauderdale, FL 33394, Attention: Proxy Group. Copies of the Fund’s proxy voting records are also made available online at franklintempleton.com and posted on the U.S. Securities and Exchange Commission’s website at sec.gov and reflect the most recent 12-month period ended June 30.
Quarterly Statement of Investments
The Fund files a complete statement of investments with the U.S. Securities and Exchange Commission for the first and third quarters for each fiscal year on Form N-Q. Shareholders may view the filed Form N-Q by visiting the Commission’s website at sec.gov. The filed form may also be viewed and copied at the Commission’s Public Reference Room in Washington, DC. Information regarding the operations of the Public Reference Room may be obtained by calling (800) SEC-0330.
40 | Semiannual Report

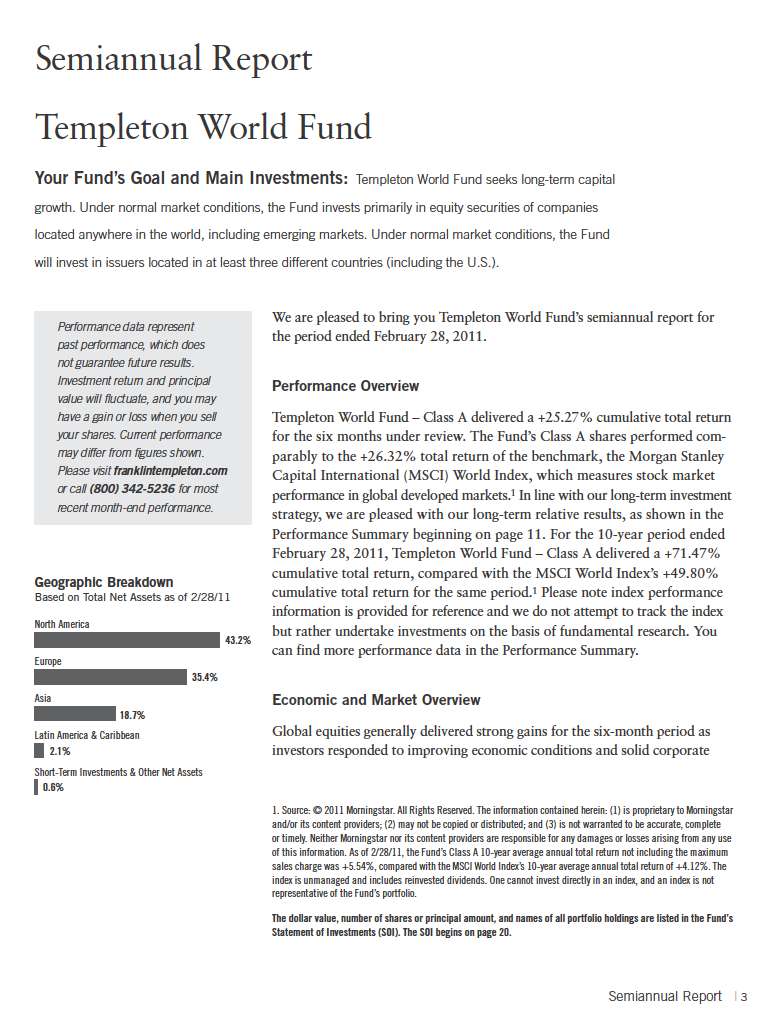
Economic and Market Overview
Global equities generally delivered strong gains for the six-month period as investors responded to improving economic conditions and solid corporate earnings growth, backstopped by continued policy support from the developed world’s central banks. In the U.S., the world’s largest economy, growth as measured by gross domestic product increased the most in five years, manufacturing expanded and consumer sentiment hit a three-year high after the Federal Reserve initiated a second round of quantitative easing and the Obama administration extended Bush-era tax cuts. In Europe, manufacturing accelerated at its fastest pace in more than a decade and confidence in the economic outlook improved. Results were uneven, however, with core countries such as Germany and France exhibiting strong, export-led growth, while other countries such as Greece, Portugal and Ireland suffered from fiscal spending cuts and rising unemployment. Ireland was forced to accept an 85 billion euro bailout from the European Union (EU) in November after benchmark 10-year bond yields soared and the country’s fiscal deficit ballooned. Sovereign credit concerns in the region remained high at period-end and officials agreed to double the amount of the EU’s rescue facility by the year 2013.
Emerging market growth remained robust, though regional policymakers raised interest rates and bank reserve requirements to combat inflation and discourage speculation. China, Russia, India, Brazil, South Korea, Indonesia and Thailand were among the major emerging markets that raised interest rates during the six-month period. Still, emerging market inflation remained elevated and many countries, China and India included, had negative real interest rates at period-end. Global food prices hit their highest levels on record during the period under review, helping incite a wave of protests and uprisings across North Africa and the Middle East that resulted in the ouster of Egyptian and Tunisian leaders and significant unrest in Libya. The regional instability led to a sell-off in emerging market equities at period-end, and the price of oil rose to its highest level since 2008 due to concerns of supply disruption. In currency markets, the euro advanced against the Japanese yen and U.S. dollar, and many Asian currencies also exhibited strength as central bankers tightened monetary policy. In fixed income markets, yields on most sovereign debt and investment-grade corporate bonds rose, reflecting elevated growth and inflation expectations. In equity markets, economic and commodity price-sensitive sectors such as materials, energy and industrials continued to exhibit leadership, while regionally, developed markets outpaced emerging markets.
4 | Semiannual Report
Investment Strategy
Our investment strategy employs a bottom-up, value-oriented, long-term approach. We focus on the market price of a company’s securities relative to our evaluation of the company’s long-term earnings, asset value and cash flow potential. As we look internationally, we consider specific companies, rather than sectors or countries, while doing in-depth research to construct a bargain list from which we buy. Before we make a purchase, we look at the company’s price/cash flow ratio, price/earnings ratio, profit margins and liquidation value.
Manager’s Discussion
The Fund delivered strong absolute gains in all sectors and regions and outperformed its benchmark during the review period. While these results were encouraging, we feel they were especially notable in a market environment fundamentally misaligned with Templeton’s core investment values. Instead of reflecting the long-term value of underlying businesses — the primary focus of Templeton’s analytical discipline — market prices recently have reflected the near-term outlook for corporate earnings and the global economic recovery.
Yet, as Sir John Templeton once explained, “Experience teaches us that one of the most common errors in selecting stocks for purchase, or for sale, is the tendency to emphasize only the most obvious factor; namely the temporary outlook for sales and profits of the company.” We have continued to look beyond fickle, short-term trends and focused instead on finding the stocks that trade at the greatest discount to their long-term intrinsic values. Although this value-based approach to equity investing has been broadly out of favor in recent quarters, Templeton Foreign Fund outpaced its benchmark during the review period and for the past one-, five- and 10-year periods on cumulative and average annual bases.2 Furthermore, some of the recent market trends appeared to weaken in the semiannual review period, and the Fund’s margin of outperformance widened as the period progressed.
In general, economically leveraged and commodity price-sensitive sectors including energy, materials and industrials led absolute market returns in an
2. Source: © 2011 Morningstar. As of 2/28/11, Templeton Foreign Fund’s Class A cumulative total returns were: 1-year +23.93%, 5-year +27.29% and 10-year +92.19%; and average annual total returns not including the maximum sales charge were: 1-year +23.93%, 5-year +4.94% and 10-year +6.75%. The MSCI EAFE Index’s cumulative total returns were: 1-year +20.54%, 5-year +15.41% and 10-year +68.27%; and average annual total returns were 1-year +20.54%, 5-year +2.91% and 10-year +5.34%. The index is unmanaged and includes reinvested dividends. One cannot invest directly in an index, and an index is not representative of the Fund’s portfolio.
Semiannual Report | 5
environment defined by continued economic recovery and increasing emerging market inflation. In contrast, sectors less sensitive to an economic recovery, such as telecommunication services and health care, and those that traditionally suffer in inflationary environments, including consumer staples and financials, delivered more modest gains. Regional leadership experienced a more pronounced rotation during the period as heightened geopolitical tensions, rising inflation and increasingly restrictive monetary policies in emerging markets drove investment capital out of the developing world and into the perceived safety of developed market equities.
Despite the financials sector’s relative weakness within the index during the review period, the Fund’s financials holdings outpaced the benchmark and were notable contributors to performance, driven primarily by stock selection.3 The Fund’s two biggest contributors to return were financials sector holdings. Private equity firm KKR’s share price soared as the market for leveraged buyouts improved. Meanwhile, financial services conglomerate ING, which was rescued by the Dutch government in 2008, posted strong gains during the review period after its banking division helped the company return to profitability. At period-end, ING traded at a discount to its tangible book value, a level we continue to believe undervalued the company’s long-term normalized earnings potential. We identified a number of interesting bargains in the global financials sector during the reporting period as ongoing uncertainty about economic developments presented what we viewed as value opportunities at the security level. The Fund’s largest new acquisition during the period was Paris-based BNP Paribas, a predominantly European bank with a strong retail presence and asset management franchises in France, Belgium and Luxembourg. Relative to its peers, the company had a higher return profile and lower operational and regulatory risks, advantages that appeared, in our analysis, significantly underappreciated at current valuations.
Another top performing sector was energy, in which a number of recent destabilizing events revealed what we viewed as selective values at the security level.4 Baker Hughes, a globally diversified oilfield services provider, was a stellar absolute performer. The company’s strong operating results highlighted the progress made on its major restructuring initiatives. In general, tightening oil supply and demand fundamentals and the increasing cost and complexity of extracting oil from the ground could enhance the industry’s structural profitability over the long term. We believe that in the near term, however, the price of oil and oil industry profit levels could remain highly volatile and subject to unpredictable influences. We found a number of companies in the sector with

3. The financials sector comprises capital markets, commercial banks, diversified financial services, insurance, and real estate management and development in the SOI.
4. The energy sector comprises energy equipment and services; and oil, gas and consumable fuels in the SOI.
6 | Semiannual Report
what we believed to be strong operating fundamentals, attractive competitive positions and undemanding valuations, and we will continue seeking to use near-term overreactions to buy these longer term values at discounted prices.
We found fewer long-term values in the consumer staples sector during the reporting period, though our resulting underweighted position supported relative performance during a period of broad sector weakness.5 Within our limited holdings, stock selection also contributed to performance, driven by a position in Premier Foods,6 Britain’s largest food producer. Share prices soared as the company continued to diversify funding sources and dispose of businesses to shore up its financial position, a strategy that earned Premier a stable credit outlook from ratings firm Moody’s during the review period. Although we welcomed the stock’s recovery, we feel the company’s recent margin pressures reflect the difficulties such businesses may have trying to pass through higher input costs and gain market share in an increasingly competitive pricing environment. We found very few consumer staples stocks whose valuations adequately discounted these structural headwinds, and we remained significantly underweighted.
We also remained underweighted in the increasingly expensive materials sector.7 Yet, despite their lofty valuations, materials stocks continued to rally during the period as emerging market economic growth, rising inflationary expectations, dissonant global policy regimes and near-term supply and demand imbalances buoyed commodity prices. Given its return to mass profitability in recent quarters, the metals and mining industry appeared euphoric in our view, and our significant underweighting in the industry was a notable relative detractor from performance. However, the recent environment exhibited different nuances and surprises, and we believe the potential for extreme industry volatility could be high. With optimism driving valuations to rapturous levels, there were, in our opinion, insufficient margins of safety at the security level to justify substantial participation in metals and mining, and we remained considerably underweighted relative to the benchmark.
We found a greater preponderance of what we considered bargain opportunities in the global telecommunication services sector, in which some of the best companies featured generous dividend and free cash-flow yields, strong brand names and globally diversified revenue streams.8 Yet, the defensive qualities and emerging market exposure of our telecommunication services holdings
5. The consumer staples sector comprises food and staples retailing and food products in the SOI. 6. This holding is not an index component.
7. The materials sector comprises construction materials, containers and packaging, and metals and mining in the SOI.
8. The telecommunication services sector comprises diversified telecommunication services and wireless telecommunication services in the SOI.
Semiannual Report | 7
contravened a market environment defined during the reporting period by cyclical leadership and emerging market turmoil. China Mobile,6 the largest mobile telephone operator in the world’s largest emerging market, especially suffered after a major shareholder sold its stake and the company missed earnings estimates. Although the market seemed to be pricing in a slow-down as the company matures, we see a substantial revenue catalyst in the increasing demand for wireless data as China’s smartphone penetration rate grows from a very low base. China is now the world’s largest Internet market, and according to our analysis, China Mobile could be the country’s first telecommunications firm to roll out 4G technology, potentially helping it capture some of the emerging demand for handheld web accessibility. Because the company’s valuation remained attractive to us on absolute and historical bases, and the company has cash that could be deployed to enhance shareholder returns, we believe additional potential value remains.
It is important to recognize the effect of currency movements on the Fund’s performance. In general, if the value of the U.S. dollar goes up compared with a foreign currency, an investment traded in that foreign currency will go down in value because it will be worth fewer U.S. dollars. This can have a negative effect on Fund performance. Conversely, when the U.S. dollar weakens in relation to a foreign currency, an investment traded in that foreign currency will increase in value, which can contribute to Fund performance. For the six months ended February 28, 2011, the U.S. dollar declined in value relative to most currencies. As a result, the Fund’s performance was positively affected by the portfolio’s predominant investment in securities with non-U.S. currency exposure. However, one cannot expect the same result in future periods.
We continued to find a number of companies with strong business fundamentals, robust pricing power and geographically diversified revenues trading at undemanding valuations in regions and sectors around the world. Although stability remains tenuous in some areas of the global financial system and geopolitical arena, and it remains to be seen how economies will fare when the inevitable pullback in excessive monetary stimulus unfolds, there are encouraging developments in economic leading indicators, corporate profitability and investor sentiment. Furthermore, stock multiples on normalized earnings remained selectively depressed at period-end, providing a market profile that has proven advantageous to long-term value investors over past economic cycles. Encouragingly, we have begun to see signs the market is becoming more discriminating. The high level of performance correlation between stocks and asset classes weakened noticeably during the review period, and the leadership of small cap, emerging market, and lower quality equities waned. At Templeton, we find these nascent trend shifts encouraging and believe if economic considerations give way to a more nuanced focus on
8 | Semiannual Report
business fundamentals as the main driver of equity markets, our value-oriented portfolios should be well positioned to deliver returns over a long-term investment horizon.
Thank you for your continued participation in Templeton Foreign Fund.
We look forward to serving your future investment needs.
The foregoing information reflects our analysis, opinions and portfolio holdings as of February 28, 2011, the end of the reporting period. The way we implement our main investment strategies and the resulting portfolio holdings may change depending on factors such as market and economic conditions. These opinions may not be relied upon as investment advice or an offer for a particular security. The information is not a complete analysis of every aspect of any market, country, industry, security or the Fund. Statements of fact are from sources considered reliable, but the investment manager makes no representation or warranty as to their completeness or accuracy. Although historical performance is no guarantee of future results, these insights may help you understand our investment management philosophy.
Semiannual Report | 9
Norman J. Boersma assumed portfolio manager responsibilities for the Fund effective March 2011. He also became president of Templeton Global Advisors Ltd. and is portfolio manager of other Templeton funds. Mr. Boersma has over 20 years of experience in the investment industry. He joined the Templeton organization in 1991 and most recently served as director of research for the Templeton Global Equity Group before assuming his current responsibilities.
Prior to joining Templeton, Mr. Boersma was an investment officer with the Ontario Hydro Pension Fund, where he was the portfolio manager responsible for the fund’s small capitalization Canadian equity investments.
10 | Semiannual Report
Performance Summary as of 2/28/11
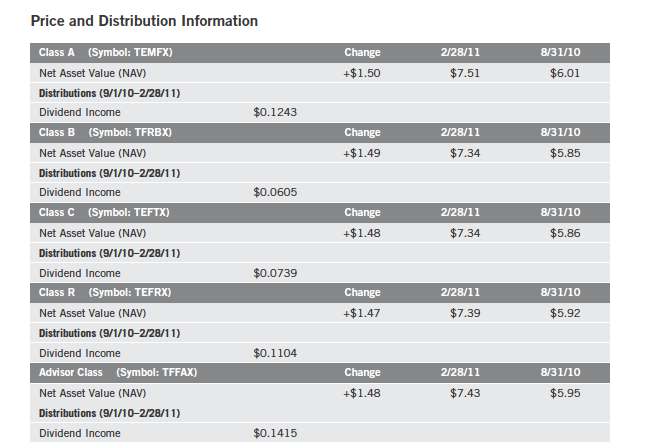
Your dividend income will vary depending on dividends or interest paid by securities in the Fund’s portfolio, adjusted for operating expenses of each class. Capital gain distributions are net profits realized from the sale of portfolio securities. The performance table does not reflect any taxes that a shareholder would pay on Fund dividends, capital gain distributions, if any, or any realized gains on the sale of Fund shares. Total return reflects reinvestment of the Fund’s dividends and capital gain distributions, if any, and any unrealized gains or losses.
Semiannual Report | 11
Performance Summary (continued)
Performance
Cumulative total return excludes sales charges. Average annual total returns and value of $10,000 investment include maximum sales charges. Class A: 5.75% maximum initial sales charge; Class B: contingent deferred sales charge (CDSC) declining from 4% to 1% over six years, and eliminated thereafter; Class C: 1% CDSC in first year only; Class R/Advisor Class: no sales charges.
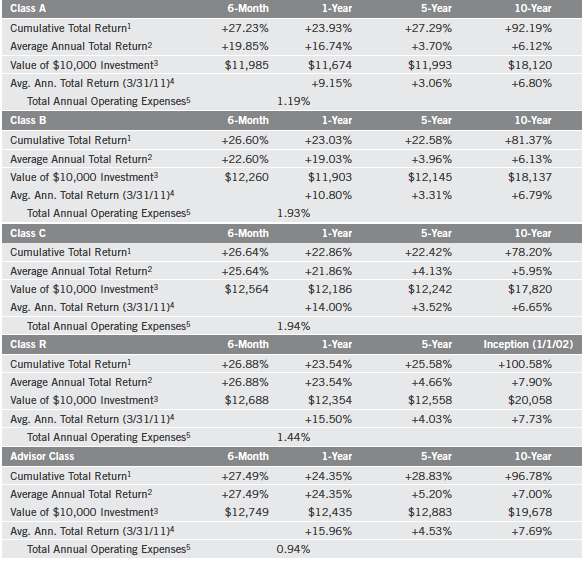
Performance data represent past performance, which does not guarantee future results. Investment return and principal value will fluctuate, and you may have a gain or loss when you sell your shares. Current performance may differ from figures shown. For most recent month-end performance, go to franklintempleton.com or call (800) 342-5236.
12 | Semiannual Report
Performance Summary (continued)
Endnotes
Special risks are associated with foreign investing, including currency fluctuations, economic instability and political developments. Investments in developing markets involve heightened risks related to the same factors, in addition to those associated with these markets’ smaller size and lesser liquidity. The manager applies various techniques and analyses in making investment decisions for the Fund, but there can be no guarantee that these decisions will produce the desired results. The Fund’s prospectus also includes a description of the main investment risks.
| | |
Class B: Class C: | | These shares have higher annual fees and expenses than Class A shares. Prior to 1/1/04, these shares were offered with an initial sales charge; thus actual total returns would have differed. These shares have higher annual fees and expenses than Class A shares. |
Class R: | | Shares are available to certain eligible investors as described in the prospectus. These shares have higher annual fees and expenses than Class A shares. |
Advisor Class: | | Shares are available to certain eligible investors as described in the prospectus. |
1. Cumulative total return represents the change in value of an investment over the periods indicated.
2. Average annual total return represents the average annual change in value of an investment over the periods indicated. Six-month return has not been annualized.
3. These figures represent the value of a hypothetical $10,000 investment in the Fund over the periods indicated.
4. In accordance with SEC rules, we provide standardized average annual total return information through the latest calendar quarter.
5. Figures are as stated in the Fund’s prospectus current as of the date of this report. In periods of market volatility, assets may decline significantly, causing total annual Fund operating expenses to become higher than the figures shown.
Semiannual Report | 13
Your Fund’s Expenses
As a Fund shareholder, you can incur two types of costs:
Transaction costs, including sales charges (loads) on Fund purchases; and
Ongoing Fund costs, including management fees, distribution and service (12b-1) fees, and other Fund expenses. All mutual funds have ongoing costs, sometimes referred to as operating expenses.
The following table shows ongoing costs of investing in the Fund and can help you understand these costs and compare them with those of other mutual funds. The table assumes a $1,000 investment held for the six months indicated.
Actual Fund Expenses
The first line (Actual) for each share class listed in the table provides actual account values and expenses. The “Ending Account Value” is derived from the Fund’s actual return, which includes the effect of Fund expenses.
You can estimate the expenses you paid during the period by following these steps. Of course, your account value and expenses will differ from those in this illustration:
| 1. | Divide your account value by $1,000. |
| | If an account had an $8,600 value, then $8,600 ÷ $1,000 = 8.6. |
| 2. | Multiply the result by the number under the heading “Expenses Paid During Period.” |
| | If Expenses Paid During Period were $7.50, then 8.6 x $7.50 = $64.50. |
In this illustration, the estimated expenses paid this period are $64.50.
Hypothetical Example for Comparison with Other Funds
Information in the second line (Hypothetical) for each class in the table can help you compare ongoing costs of investing in the Fund with those of other mutual funds. This information may not be used to estimate the actual ending account balance or expenses you paid during the period. The hypothetical “Ending Account Value” is based on the actual expense ratio for each class and an assumed 5% annual rate of return before expenses, which does not represent the Fund’s actual return. The figure under the heading “Expenses Paid During Period” shows the hypothetical expenses your account would have incurred under this scenario. You can compare this figure with the 5% hypothetical examples that appear in shareholder reports of other funds.
14 | Semiannual Report
Your Fund’s Expenses (continued)
Please note that expenses shown in the table are meant to highlight ongoing costs and do not reflect any transaction costs, such as sales charges. Therefore, the second line for each class is useful in comparing ongoing costs only, and will not help you compare total costs of owning different funds. In addition, if transaction costs were included, your total costs would have been higher. Please refer to the Fund prospectus for additional information on operating expenses.
*Expenses are calculated using the most recent six-month expense ratio, annualized for each class (A: 1.18%; B: 1.93%; C: 1.93%; R: 1.43%; and Advisor: 0.93%), multiplied by the average account value over the period, multiplied by 181/365 to reflect the one-half year period.
Semiannual Report | 15
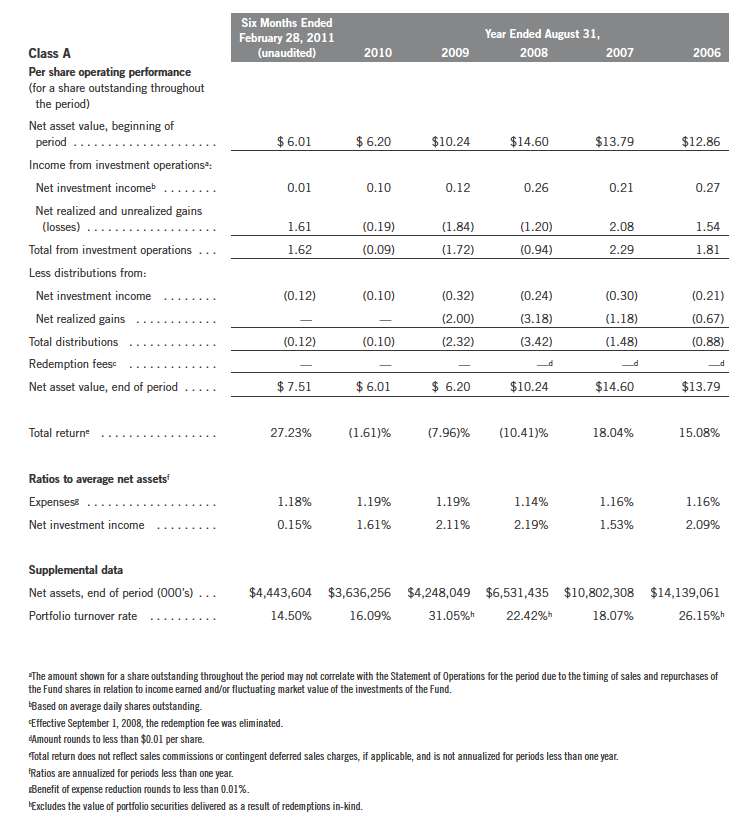
Templeton Foreign Fund
Financial Highlights
16 | The accompanying notes are an integral part of these financial statements. | Semiannual Report

Semiannual Report | The accompanying notes are an integral part of these financial statements. | 17
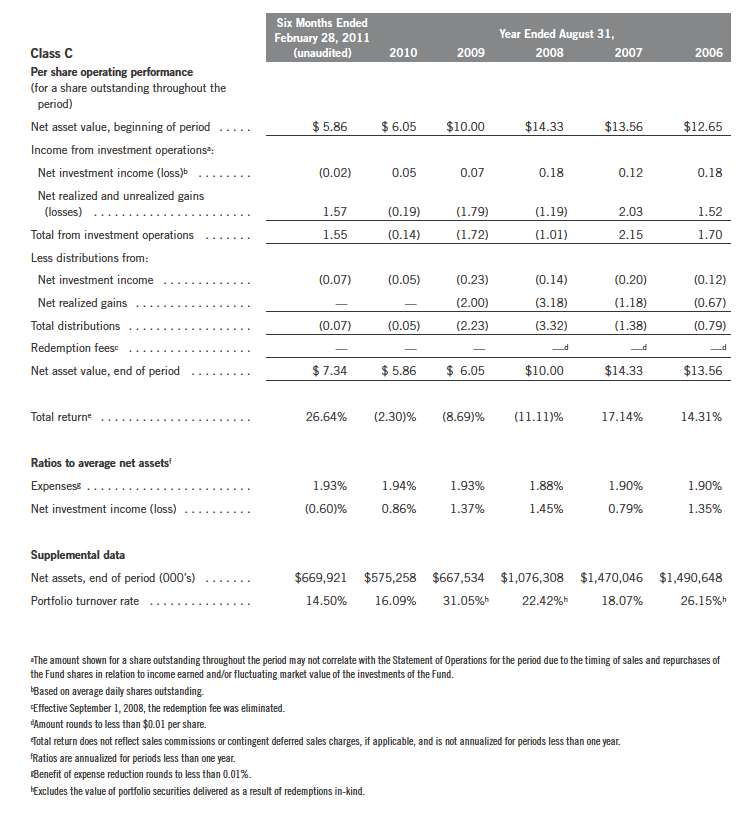
Templeton Foreign Fund
Financial Highlights (continued)
18 | The accompanying notes are an integral part of these financial statements. | Semiannual Report

Semiannual Report | The accompanying notes are an integral part of these financial statements. | 19
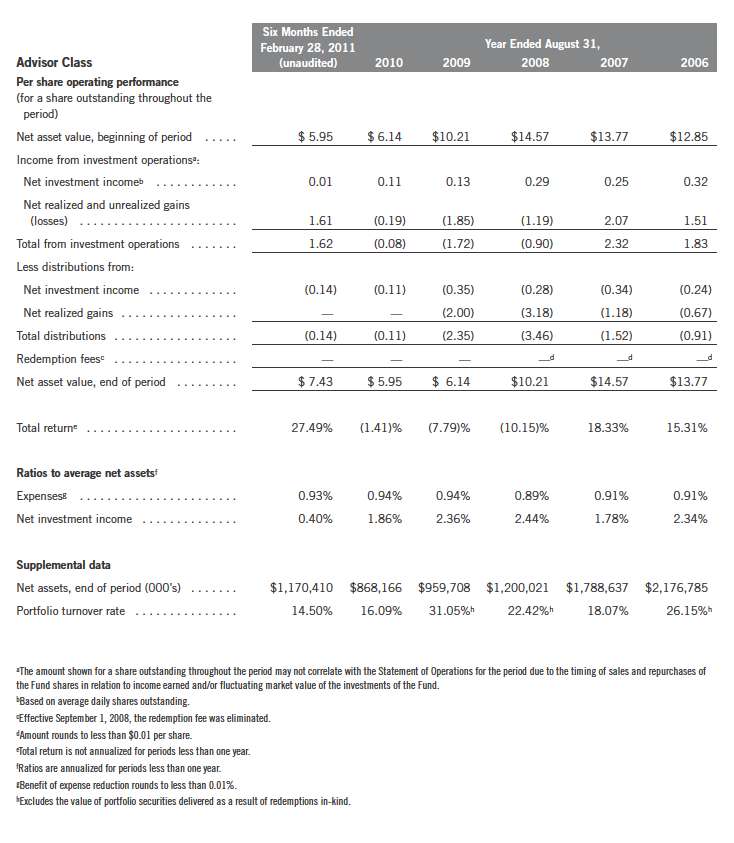
Templeton Foreign Fund
Financial Highlights (continued)
20 | The accompanying notes are an integral part of these financial statements. | Semiannual Report
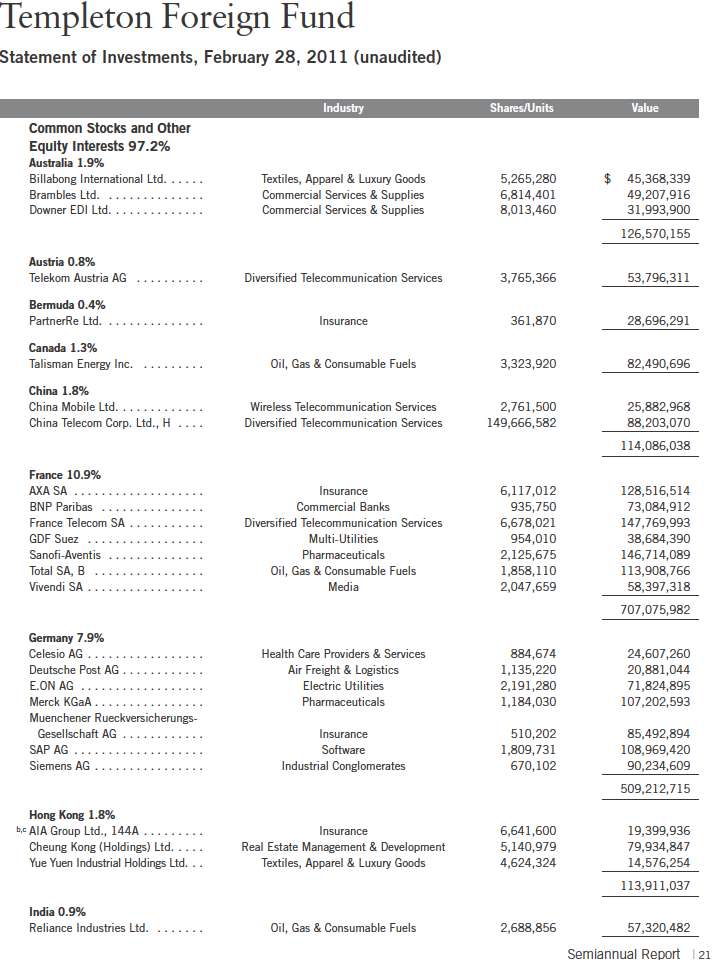
Templeton Foreign Fund
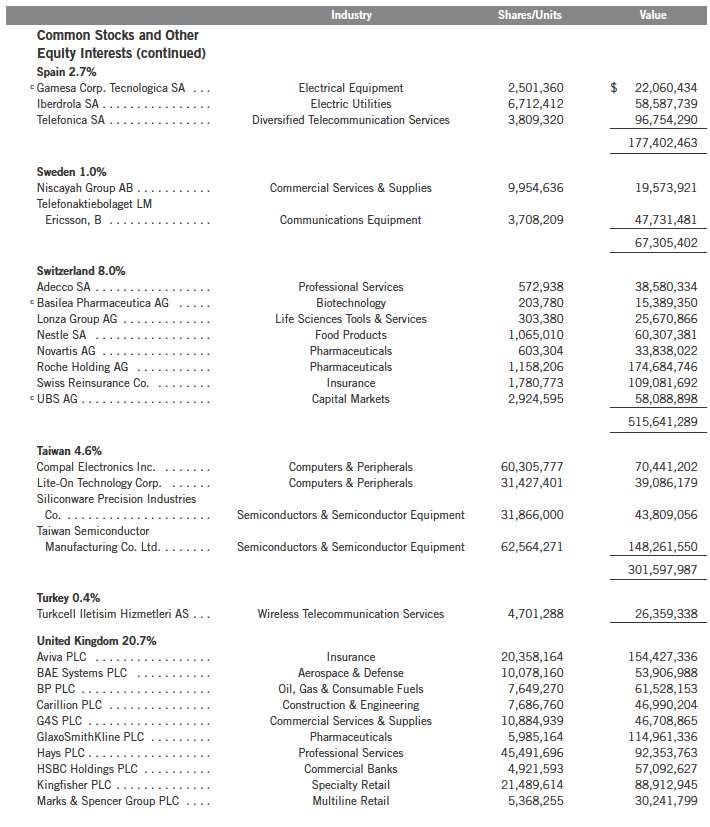
Statement of Investments, February 28, 2011 (unaudited) (continued)
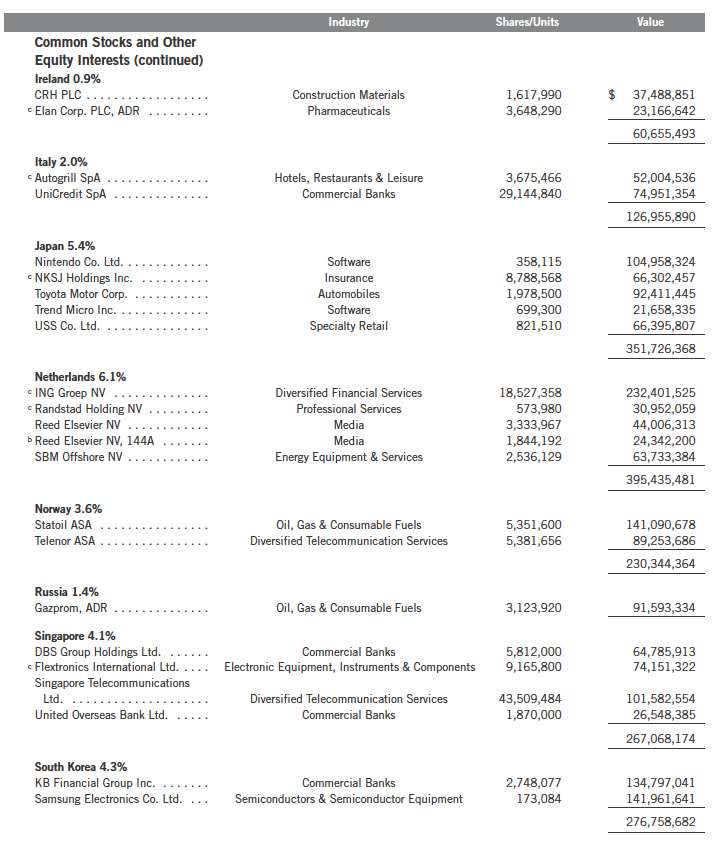
22 | Semiannual Report
Templeton Foreign Fund
Statement of Investments, February 28, 2011 (unaudited) (continued)
Semiannual Report | 23

24 | Semiannual Report
Templeton Foreign Fund
Statement of Investments, February 28, 2011 (unaudited) (continued)

Semiannual Report | The accompanying notes are an integral part of these financial statements. | 25
26 | The accompanying notes are an integral part of these financial statements. | Semiannual Report
Semiannual Report | The accompanying notes are an integral part of these financial statements. | 27

28 | The accompanying notes are an integral part of these financial statements. | Semiannual Report

Semiannual Report | The accompanying notes are an integral part of these financial statements. | 29
Templeton Foreign Fund
Notes to Financial Statements (unaudited)
1. ORGANIZATION AND SIGNIFICANT ACCOUNTING POLICIES
Templeton Funds (Trust) is registered under the Investment Company Act of 1940, as amended, (1940 Act) as an open-end investment company, consisting of two separate funds. The Templeton Foreign Fund (Fund) is included in this report. The financial statements of the remaining fund in the Trust is presented separately. The Fund offers five classes of shares: Class A, Class B, Class C, Class R, and Advisor Class. Each class of shares differs by its initial sales load, contingent deferred sales charges, distribution fees, voting rights on matters affecting a single class and its exchange privilege.
The following summarizes the Fund’s significant accounting policies.
a. Financial Instrument Valuation
The Fund’s investments in securities and financials instruments are carried at fair value daily. Fair value is the price that would be received to sell an asset or paid to transfer a liability in an orderly transaction between market participants on the measurement date. Under procedures approved by the Trust’s Board of Trustees, the Fund may utilize independent pricing services, quotations from securities and financial instrument dealers, and other market sources to determine fair value.
Equity securities listed on an exchange or on the NASDAQ National Market System are valued at the last quoted sale price or the official closing price of the day, respectively. Foreign equity securities are valued as of the close of trading on the foreign stock exchange on which the security is primarily traded, or the NYSE, whichever is earlier. The value is then converted into its U.S. dollar equivalent at the foreign exchange rate in effect at the close of the NYSE on the day that the value of the security is determined. Over-the-counter securities are valued within the range of the most recent quoted bid and ask prices. Securities that trade in multiple markets or on multiple exchanges are valued according to the broadest and most representative market. Certain equity securities are valued based upon fundamental characteristics or relationships to similar securities. Time deposits are valued at cost, which approximates market value.
The Fund has procedures to determine the fair value of securities and other financial instruments for which market prices are not readily available or which may not be reliably priced. Under these procedures, the Fund primarily employs a market-based approach which may use related or comparable assets or liabilities, recent transactions, market multiples, book values, and other relevant information for the investment to determine the fair value of the investment. The Fund may also use an income-based valuation approach in which the anticipated future cash flows of the investment are discounted to calculate fair value. Discounts may also be applied due to the nature or duration of any restrictions on the disposition of the investments. Due to the inherent uncertainty of valuations of such investments, the fair values may differ significantly from the values that would have been used had an active market existed.
30 | Semiannual Report
Templeton Foreign Fund
Notes to Financial Statements (unaudited) (continued)
| 1. | ORGANIZATION AND SIGNIFICANT ACCOUNTING POLICIES (continued) |
| a. | Financial Instrument Valuation (continued) |
Trading in securities on foreign securities stock exchanges and over-the-counter markets may be completed before the daily close of business on the NYSE. Occasionally, events occur between the time at which trading in a foreign security is completed and the close of the NYSE that might call into question the reliability of the value of a portfolio security held by the Fund. As a result, differences may arise between the value of the Fund’s portfolio securities as determined at the foreign market close and the latest indications of value at the close of the NYSE. In order to minimize the potential for these differences, the investment manager monitors price movements following the close of trading in foreign stock markets through a series of country specific market proxies (such as baskets of American Depository Receipts, futures contracts and exchange traded funds). These price movements are measured against established trigger thresholds for each specific market proxy to assist in determining if an event has occurred that may call into question the reliability of the values of the foreign securities held by the Fund. If such an event occurs, the securities may be valued using fair value procedures, which may include the use of independent pricing services.
b. Foreign Currency Translation
Portfolio securities and other assets and liabilities denominated in foreign currencies are translated into U.S. dollars based on the exchange rate of such currencies against U.S. dollars on the date of valuation. The Fund may enter into foreign currency exchange contracts to facilitate transactions denominated in a foreign currency. Purchases and sales of securities, income and expense items denominated in foreign currencies are translated into U.S. dollars at the exchange rate in effect on the transaction date. Portfolio securities and assets and liabilities denominated in foreign currencies contain risks that those currencies will decline in value relative to the U.S. dollar. Occasionally, events may impact the availability or reliability of foreign exchange rates used to convert the U.S. dollar equivalent value. If such an event occurs, the foreign exchange rate will be valued at fair value using procedures established and approved by the Trust’s Board of Trustees.
The Fund does not separately report the effect of changes in foreign exchange rates from changes in market prices on securities held. Such changes are included in net realized and unrealized gain or loss from investments on the Statement of Operations.
Realized foreign exchange gains or losses arise from sales of foreign currencies, currency gains or losses realized between the trade and settlement dates on securities transactions and the difference between the recorded amounts of dividends, interest, and foreign withholding taxes and the U.S. dollar equivalent of the amounts actually received or paid. Net unrealized foreign exchange gains and losses arise from changes in foreign exchange rates on foreign denominated assets and liabilities other than investments in securities held at the end of the reporting period.
Semiannual Report | 31
Templeton Foreign Fund
Notes to Financial Statements (unaudited) (continued)
| 1. | ORGANIZATION AND SIGNIFICANT ACCOUNTING POLICIES (continued) |
| c. | Investment in Templeton China Opportunities Fund, Ltd. |
The Fund invests in Templeton China Opportunities Fund, Ltd. (China Fund), a private offering of unregistered shares in a Cayman Islands Exempt Company. The China Fund’s investment objective is to seek capital growth primarily through investments in A-shares of Chinese companies listed on the Shanghai and Shenzhen stock exchanges. Chinese A-shares are traded in Chinese Renminbi and are only available as an investment to domestic (Chinese) investors and holders of a Qualified Foreign Institutional Investors license. The China Fund is managed by Templeton Investment Counsel, LLC (an affiliate of the investment manager). No additional management or administrative fees are incurred on assets invested in the China Fund.
Shares of the China Fund were subject to a restriction on redemption which expired on March 24, 2011. Additionally, the Fund may incur delays in redeeming its investment in the China Fund. The China Fund may be subject to certain restrictions and administrative processes relating to its ability to repatriate cash balances, investment proceeds and earnings associated with its investment, as such activities are subject to approval by agencies of the Chinese government. The Fund’s investment in the China Fund is valued based upon the fair value of the China Fund’s portfolio securities and other assets and liabilities.
d. Income and Deferred Taxes
It is the Fund’s policy to qualify as a regulated investment company under the Internal Revenue Code. The Fund intends to distribute to shareholders substantially all of its taxable income and net realized gains to relieve it from federal income and excise taxes. As a result, no provision for U.S. federal income taxes is required. The Fund files U.S. income tax returns as well as tax returns in certain other jurisdictions. The Fund’s application of those tax rules is subject to its understanding. The Fund records a provision for taxes in its financial statements including penalties and interest, if any, for a tax position taken on a tax return (or expected to be taken) when it fails to meet the more likely than not (a greater than 50% probability) threshold and based on the technical merits, the tax position may not be sustained upon examination by the tax authorities. As of February 28, 2011, and for all open tax years, the Fund has determined that no provision for income tax is required in the Fund’s financial statements. Open tax years are those that remain subject to examination and are based on each tax jurisdiction statute of limitation. The Fund is not aware of any tax position for which it is reasonably possible that the total amounts of unrecognized tax effects will significantly change in the next twelve months.
The Fund may be subject to foreign taxation related to income received, capital gains on the sale of securities and certain foreign currency transactions in the foreign jurisdictions in which it invests. Foreign taxes, if any, are recorded based on the tax regulations and rates that exist in the foreign markets in which the Fund invests. When a capital gain tax is determined to apply the Fund records an estimated deferred tax liability for unrealized gains on these securities in an amount that would be payable if the securities were disposed of on the valuation date.
32 | Semiannual Report
Templeton Foreign Fund
Notes to Financial Statements (unaudited) (continued)
| 1. | ORGANIZATION AND SIGNIFICANT ACCOUNTING POLICIES (continued) |
| e. | Security Transactions, Investment Income, Expenses and Distributions |
Security transactions are accounted for on trade date. Realized gains and losses on security transactions are determined on a specific identification basis. Interest income and estimated expenses are accrued daily. Amortization of premium and accretion of discount on debt securities are included in interest income. Dividend income is recorded on the ex-dividend date except that certain dividends from foreign securities are recognized as soon as the Fund is notified of the ex-dividend date. Distributions to shareholders are recorded on the ex-dividend date and are determined according to income tax regulations (tax basis). Distributable earnings determined on a tax basis may differ from earnings recorded in accordance with accounting principles generally accepted in the United States of America. These differences may be permanent or temporary. Permanent differences are reclassified among capital accounts to reflect their tax character. These reclassifications have no impact on net assets or the results of operations. Temporary differences are not reclassified, as they may reverse in subsequent periods.
Common expenses incurred by the Trust are allocated among the funds based on the ratio of net assets of each fund to the combined net assets of the Trust. Fund specific expenses are charged directly to the fund that incurred the expense.
Realized and unrealized gains and losses and net investment income, not including class specific expenses, are allocated daily to each class of shares based upon the relative proportion of net assets of each class. Differences in per share distributions, by class, are generally due to differences in class specific expenses.
f. Accounting Estimates
The preparation of financial statements in accordance with accounting principles generally accepted in the United States of America requires management to make estimates and assumptions that affect the reported amounts of assets and liabilities at the date of the financial statements and the amounts of income and expenses during the reporting period. Actual results could differ from those estimates.
g. Guarantees and Indemnifications
Under the Trust’s organizational documents, its officers and trustees are indemnified by the Trust against certain liabilities arising out of the performance of their duties to the Trust. Additionally, in the normal course of business, the Trust, on behalf of the Fund, enters into contracts with service providers that contain general indemnification clauses. The Trust’s maximum exposure under these arrangements is unknown as this would involve future claims that may be made against the Trust that have not yet occurred. Currently, the Trust expects the risk of loss to be remote.
Semiannual Report | 33
Templeton Foreign Fund
Notes to Financial Statements (unaudited) (continued)
2. SHARES OF BENEFICIAL INTEREST
At February 28, 2011, there were an unlimited number of shares authorized (without par value).
Transactions in the Fund’s shares were as follows:
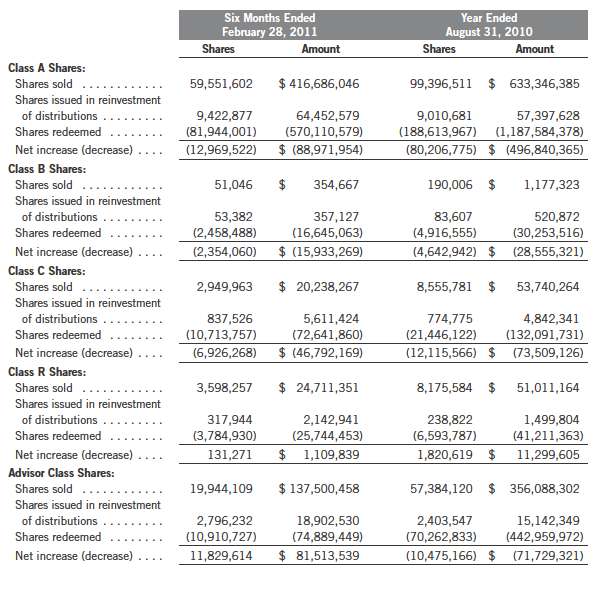
34 | Semiannual Report
Templeton Foreign Fund
Notes to Financial Statements (unaudited) (continued)
3. TRANSACTIONS WITH AFFILIATES
Franklin Resources, Inc. is the holding company for various subsidiaries that together are referred to as Franklin Templeton Investments. Certain officers and trustees of the Trust are also officers and/or directors of the following subsidiaries:
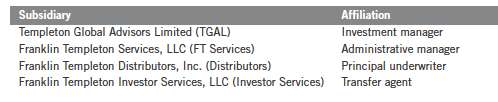
a. Management Fees
The Fund pays an investment management fee to TGAL based on the average daily net assets of the Fund as follows:
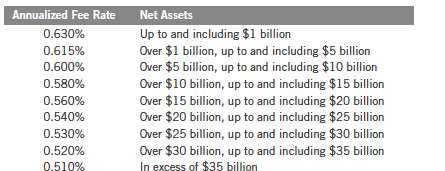
b. Administrative Fees
The Fund pays its allocated share of an administrative fee to FT Services based on the Trust’s aggregate average daily net assets as follows:
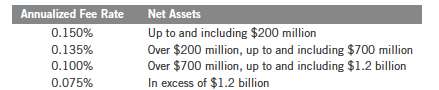
c. Distribution Fees
The Trust’s Board of Trustees has adopted distribution plans for each share class, with the exception of Advisor Class shares, pursuant to Rule 12b-1 under the 1940 Act. Under the Fund’s Class A reimbursement distribution plan, the Fund reimburses Distributors for costs incurred in connection with the servicing, sale and distribution of the Fund’s shares up to the maximum annual plan rate. Under the Class A reimbursement distribution plan, costs exceeding the maximum for the current plan year cannot be reimbursed in subsequent periods.
Semiannual Report | 35
Templeton Foreign Fund
Notes to Financial Statements (unaudited) (continued)
| 3. | TRANSACTIONS WITH AFFILIATES (continued) |
| c. | Distribution Fees (continued) |
In addition, under the Fund’s Class B, C, and R compensation distribution plans, the Fund pays Distributors for costs incurred in connection with the servicing, sale and distribution of the Fund’s shares up to the maximum annual plan rate for each class.
The maximum annual plan rates, based on the average daily net assets, for each class, are as follows:
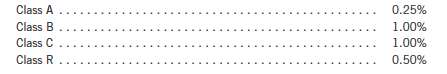
d. Sales Charges/Underwriting Agreements
Distributors has advised the Fund of the following commission transactions related to the sales and redemptions of the Fund’s shares for the period:
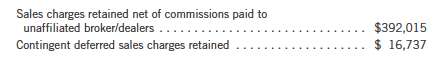
e. Transfer Agent Fees
For the period ended February 28, 2011, the Fund paid transfer agent fees of $5,649,301, of which $2,777,779 was retained by Investor Services.
4. EXPENSE OFFSET ARRANGEMENT
The Fund has entered into an arrangement with its custodian whereby credits realized as a result of uninvested cash balances are used to reduce a portion of the Fund’s custodian expenses. During the period ended February 28, 2011, the custodian fees were reduced as noted in the Statement of Operations.
5. INCOME TAXES
For tax purposes, capital losses may be carried over to offset future capital gains, if any. At August 31, 2010, the capital loss carryforwards were as follows:
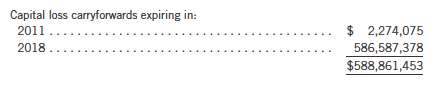
36 | Semiannual Report
Templeton Foreign Fund
Notes to Financial Statements (unaudited) (continued)
5. INCOME TAXES (continued)
At February 28, 2011, the cost of investments and net unrealized appreciation (depreciation) for income tax purposes were as follows:
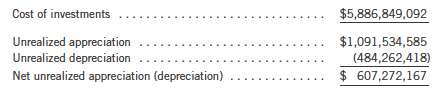
Net investment income differs for financial statement and tax purposes primarily due to differing treatments of foreign currency transactions, foreign capital gains tax, pass-through entity income, non-deductible expenses and regulatory settlements.
Net realized gains (losses) differ for financial statement and tax purposes primarily due to differing treatments of wash sales, foreign currency transactions, pass-through entity income and foreign capital gains tax.
6. INVESTMENT TRANSACTIONS
Purchases and sales of investments (excluding short term securities) for the period ended February 28, 2011, aggregated $845,480,027 and $1,002,572,633, respectively.
7. CONCENTRATION OF RISK
Investing in foreign securities may include certain risks and considerations not typically associated with investing in U.S. securities, such as fluctuating currency values and changing local and regional economic, political and social conditions, which may result in greater market volatility. In addition, certain foreign securities may not be as liquid as U.S. securities.
8. RESTRICTED SECURITIES
The Fund may invest in securities that are restricted under the Securities Act of 1933 (1933 Act) or which are subject to legal, contractual, or other agreed upon restrictions on resale. Restricted securities are often purchased in private placement transactions, and cannot be sold without prior registration unless the sale is pursuant to an exemption under the 1933 Act. Disposal of these securities may require greater effort and expense, and prompt sale at an acceptable price may be difficult. The Fund may have registration rights for restricted securities. The issuer generally incurs all registration costs.
Semiannual Report | 37
Templeton Foreign Fund
Notes to Financial Statements (unaudited) (continued)
8. RESTRICTED SECURITIES (continued)
At February 28, 2011, the Fund held investments in restricted securities, excluding certain securities exempt from registration under the 1933 Act deemed to be liquid, as follows:
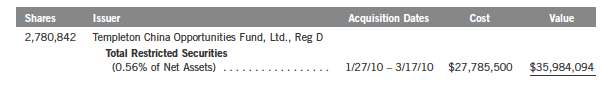
9. HOLDINGS OF 5% VOTING SECURITIES OF PORTFOLIO COMPANIES
The 1940 Act defines “affiliated companies” to include investments in portfolio companies in which a fund owns 5% or more of the outstanding voting securities. Investments in “affiliated companies” for the Fund for the period ended February 28, 2011, were as shown below.
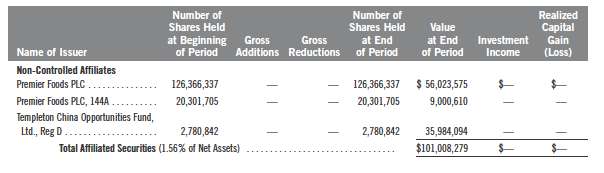
10. SPECIAL SERVICING AGREEMENT
The Fund, which is an eligible underlying investment of one or more of the Franklin Templeton Fund Allocator Series Funds (Allocator Funds), participates in a Special Servicing Agreement (SSA) with the Allocator Funds and certain service providers of the Fund and the Allocator Funds. Under the SSA, the Fund may pay a portion of the Allocator Funds’ expenses (other than any asset allocation, administrative, and distribution fees) to the extent such payments are less than the amount of the benefits realized or expected to be realized by the Fund (e.g., due to reduced costs associated with servicing accounts) from the investment in the Fund by the Allocator Funds. The Allocator Funds are either managed by Franklin Advisers, Inc. or administered by FT Services, affiliates of TGAL. For the period ended February 28, 2011, the Fund was held by one or more of the Allocator Funds and the amount of expenses borne by the Fund is noted in the Statement of Operations. At February 28, 2011, 2.67% of the Fund’s outstanding shares was held by one or more of the Allocator Funds.
38 | Semiannual Report
Templeton Foreign Fund
Notes to Financial Statements (unaudited) (continued)
11. CREDIT FACILITY
The Fund, together with other U.S. registered and foreign investment funds (collectively “Borrowers”), managed by Franklin Templeton Investments, are borrowers in a joint syndicated senior unsecured credit facility totaling $750 million (Global Credit Facility) which matures on January 20, 2012. This Global Credit Facility provides a source of funds to the Borrowers for temporary and emergency purposes, including the ability to meet future unanticipated or unusually large redemption requests.
Under the terms of the Global Credit Facility, the Fund shall, in addition to interest charged on any borrowings made by the Fund and other costs incurred by the Fund, pay its share of fees and expenses incurred in connection with the implementation and maintenance of the Global Credit Facility, based upon its relative share of the aggregate net assets of all of the Borrowers, including an annual commitment fee of 0.08% based upon the unused portion of the Global Credit Facility, which is reflected in other expenses on the Statement of Operations. During the period ended February 28, 2011, the Fund did not use the Global Credit Facility.
12. FAIR VALUE MEASUREMENTS
The Fund follows a fair value hierarchy that distinguishes between market data obtained from independent sources (observable inputs) and the Fund’s own market assumptions (unobservable inputs). These inputs are used in determining the value of the Fund’s investments and are summarized in the following fair value hierarchy:
Level 1 – quoted prices in active markets for identical securities
Level 2 – other significant observable inputs (including quoted prices for similar securities, interest rates, prepayment speed, credit risk, etc.)
Level 3 – significant unobservable inputs (including the Fund’s own assumptions in deter- mining the fair value of investments)
The inputs or methodology used for valuing securities are not an indication of the risk associated with investing in those securities.
For movements between the levels within the fair value hierarchy, the Fund has adopted a policy of recognizing the transfers as of the date of the underlying event which caused the movement.
Semiannual Report | 39
Templeton Foreign Fund
Notes to Financial Statements (unaudited) (continued)
12. FAIR VALUE MEASUREMENTS (continued)
The following is a summary of the inputs used as of February 28, 2011, in valuing the Fund’s assets and liabilities carried at fair value:
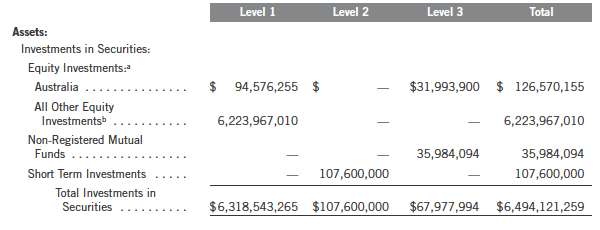
aIncludes common and preferred stocks as well as other equity investments. bFor detailed country descriptions, see the accompanying Statement of Investments.
At February 28, 2011, the reconciliation of assets in which significant unobservable inputs (Level 3) were used in determining fair value, is as follows:
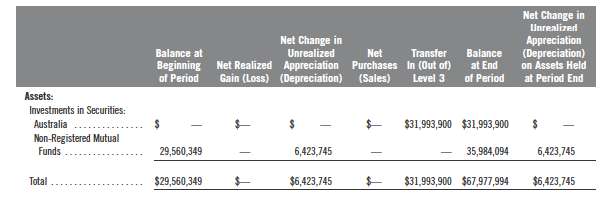
13. SUBSEQUENT EVENTS
The Fund has evaluated subsequent events through the issuance of the financial statements and determined that no events have occurred that require disclosure other than those already disclosed in the financial statements.
| | ABBREVIATIONS
Selected Portfolio
ADR - American Depository Receipt |
40 | Semiannual Report
Templeton Foreign Fund
Shareholder Information
Proxy Voting Policies and Procedures
The Fund’s investment manager has established Proxy Voting Policies and Procedures (Policies) that the Fund uses to determine how to vote proxies relating to portfolio securities. Shareholders may view the Fund’s complete Policies online at franklintempleton.com. Alternatively, shareholders may request copies of the Policies free of charge by calling the Proxy Group collect at (954) 527-7678 or by sending a written request to: Franklin Templeton Companies, LLC, 500 East Broward Boulevard, Suite 1500, Fort Lauderdale, FL 33394, Attention: Proxy Group. Copies of the Fund’s proxy voting records are also made available online at franklintempleton.com and posted on the U.S. Securities and Exchange Commission’s website at sec.gov and reflect the most recent 12-month period ended June 30.
Quarterly Statement of Investments
The Fund files a complete statement of investments with the U.S. Securities and Exchange Commission for the first and third quarters for each fiscal year on Form N-Q. Shareholders may view the filed Form N-Q by visiting the Commission’s website at sec.gov. The filed form may also be viewed and copied at the Commission’s Public Reference Room in Washington, DC. Information regarding the operations of the Public Reference Room may be obtained by calling (800) SEC-0330.
Semiannual Report | 41
This page intentionally left blank.
This page intentionally left blank.
This page intentionally left blank.

| (a) | The Registrant has adopted a code of ethics that applies to its principal executive officers and principal financial and accounting officer. |
| (c) | N/A |
| (d) | N/A |
| (f) | Pursuant to Item 12(a)(1), the Registrant is attaching as an exhibit a copy of its code of ethics that applies to its principal executive officers and principal financial and accounting officer. |
Item 3. Audit Committee Financial Expert.
(a)(1) The Registrant has an audit committee financial expert serving on its audit committee.
(2) The audit committee financial expert is David W. Niemiec and he is "independent" as defined under the relevant Securities and Exchange Commission Rules and Releases.
Item 4. Principal Accountant Fees and Services. N/A
Item 5. Audit Committee of Listed Registrants. N/A
Item 6. Schedule of Investments. N/A
Item 7. Disclosure of Proxy Voting Policies and Procedures for Closed-End Management Investment Companies. N/A
Item 8. Portfolio Managers of Closed-End Management Investment Companies. N/A
Item 9. Purchases of Equity Securities by Closed-End Management Investment Company and Affiliated Purchasers. N/A
Item 10. Submission of Matters to a Vote of Security Holders.
There have been no changes to the procedures by which shareholders may recommend nominees to the Registrant's Board of Trustees that would require disclosure herein.
Item 11. Controls and Procedures.
(a) Evaluation of Disclosure Controls and Procedures. The Registrant maintains disclosure controls and procedures that are designed to ensure that information required to be disclosed in the Registrant’s filings under the Securities Exchange Act of 1934 and the Investment Company Act of 1940 is recorded, processed, summarized and reported within the periods specified in the rules and forms of the Securities and Exchange Commission. Such information is
accumulated and communicated to the Registrant’s management, including its principal executive officer and principal financial officer, as appropriate, to allow timely decisions regarding required disclosure. The Registrant’s management, including the principal executive officer and the principal financial officer, recognizes that any set of controls and procedures, no matter how well designed and operated, can provide only reasonable assurance of achieving the desired control objectives.
Within 90 days prior to the filing date of this Shareholder Report on Form N-CSR, the Registrant had carried out an evaluation, under the supervision and with the participation of the Registrant’s management, including the Registrant’s principal executive officer and the Registrant’s principal financial officer, of the effectiveness of the design and operation of the Registrant’s disclosure controls and procedures. Based on such evaluation, the Registrant’s principal executive officer and principal financial officer concluded that the Registrant’s disclosure controls and procedures are effective.
| (b) Changes in Internal Controls. |
There have been no significant changes in
the Registrant’s internal controls or in other factors that could significantly affect the internal controls subsequent to the date of their evaluation in connection with the preparation of this Shareholder Report on Form N-CSR.
Item 12. Exhibits.
(a)(1) Code of Ethics |
(a)(2) Certifications pursuant to Section 302 of the Sarbanes-Oxley Act of 2002 of Laura F. Fergerson, Chief Executive Officer - Finance and Administration, and Mark H. Otani, Chief Financial Officer and Chief Accounting Officer
(b) Certifications pursuant to Section 906 of the Sarbanes-Oxley Act of 2002 of Laura F. Fergerson, Chief Executive Officer - Finance and Administration, and Mark H. Otani, Chief Financial Officer and Chief Accounting Officer
Pursuant to the requirements of the Securities Exchange Act of 1934 and the Investment Company Act of 1940, the registrant has duly caused this report to be signed on its behalf by the undersigned, thereunto duly authorized.
TEMPLETON FUNDS
By /s/ LAURA F. FERGERSON
Laura F. Fergerson
Chief Executive Officer –
Finance and Administration
Date: April 27, 2011 |
Pursuant to the requirements of the Securities Exchange Act of 1934 and the Investment Company Act of 1940, this report has been signed below by the following persons on behalf of the registrant and in the capacities and on the dates indicated.
By /s/ LAURA F. FERGERSON
Laura F. Fergerson
Chief Executive Officer –
Finance and Administration
Date: April 27, 2011 |
By /s/ MARK H. OTANI
Mark H. Otani
Chief Financial Officer and
Chief Accounting Officer
Date: April 27, 2011 |