UNITED STATES
SECURITIES AND EXCHANGE COMMISSION
Washington, DC 20549
FORM N-CSRS
CERTIFIED SHAREHOLDER REPORT OF REGISTERED MANAGEMENT INVESTMENT COMPANIES
Investment Company Act file number 811-02781
Templeton Funds
(Exact name of registrant as specified in charter)
300 S.E. 2nd Street, Fort Lauderdale, FL 33301-1923
(Address of principal executive offices) (Zip code)
Craig S. Tyle, One Franklin Parkway, San Mateo, CA 94403-1906
(Name and address of agent for service)
Registrant's telephone number, including area code: (954) 527-7500_
Date of fiscal year end: _8/31__
Date of reporting period: 2/28/14_
Item 1. Reports to Stockholders.
| | | | | |
| | Contents | | | |
| Shareholder Letter | 1 | Semiannual Report | | Financial Statements | 28 |
| | | Templeton World Fund. | 4 | Notes to Financial Statements | 32 |
| | | Performance Summary | 14 | Shareholder Information | 45 |
| | | Your Fund’s Expenses | 17 | | |
| | | Financial Highlights and Statement of | | | |
| | | Investments | 19 | | |
Semiannual Report
Templeton World Fund
Your Fund’s Goal and Main Investments: Templeton World Fund seeks long-term capital growth. Under normal market conditions, the Fund invests primarily in equity securities of companies located anywhere in the world, including emerging markets. Under normal circumstances, the Fund will invest in issuers located in at least three different countries (including the U.S.).
|
| Performance data represent past |
| performance, which does not |
| guarantee future results. |
| Investment return and principal |
| value will fluctuate, and you may |
| have a gain or loss when you sell |
| your shares. Current performance |
| may differ from figures shown. |
| Please visit franklintempleton.com |
| or call (800) 342-5236 for most |
| recent month-end performance. |
This semiannual report for Templeton World Fund covers the period ended February 28, 2014.
Performance Overview
Templeton World Fund – Class A delivered a +14.33% cumulative total return for the six months under review. In comparison, the MSCI World Index, which measures stock market performance in global developed markets, posted a +14.92% total return.1, 2 The Fund’s long-term results are shown in the Performance Summary beginning on page 14. For the 10-year period ended February 28, 2014, Templeton World Fund – Class A delivered a +104.99% cumulative total return, compared with the MSCI World Index’s +102.81% cumulative total return for the same period.1, 2 Please note index performance information is provided for reference and we do not attempt to track the index but rather undertake investments on the basis of fundamental research. You can find more performance data in the Performance Summary.
Economic and Market Overview
The six months under review were characterized by continued economic recovery in most developed countries, and many central banks reaffirmed their accommodative monetary stances. In contrast, growth in emerging market economies generally tended to slow, and central banks in many emerging markets raised interest rates as they sought to control inflation and currency depreciation.
In the U.S., economic data were generally positive. Manufacturing activity expanded during the review period and unemployment declined. In October 2013, the federal government temporarily shut down after Congress reached
The dollar value, number of shares or principal amount, and names of all portfolio holdings are listed in the Fund’s Statement of Investments (SOI). The SOI begins on page 23.
4 | Semiannual Report
a budget impasse. However, Congress passed a spending bill in January to fund the federal government through September 2014. Congress then approved suspension of the debt ceiling until March 2015. Encouraged by positive economic and employment reports, the Federal Reserve Board (Fed) in January 2014 began reducing its bond purchases by $10 billion a month and committed to keeping interest rates low. The new Fed Chair, Janet Yellen, confirmed that the Fed would continue to reduce its asset purchases, although it would reconsider its plan if the economic outlook changed significantly.
Outside the U.S., the U.K. enjoyed strong growth, driven by easing credit conditions and stronger consumer confidence. Elsewhere, economic activity in the eurozone and Japan showed signs of improvement. Although technically out of its recession, the eurozone experienced weak employment trends and deflationary risks. However, German Chancellor Angela Merkel’s reelection and the European Central Bank’s rate cut to a record low helped partly restore investor confidence. In Japan, improving business sentiment, personal consumption and higher exports resulting from a weaker yen supported the economy, and the unemployment rate reached its lowest level in six years. The Bank of Japan announced it would provide additional monetary stimulus, if required. Political turmoil in Ukraine surfaced in November 2013 when its government avoided firming up trade links with the European Union, raising fears of a sovereign default and investor concerns over the country’s relationship with Russia.
Growth in many emerging market economies moderated based on lower domestic demand, falling exports and weakening commodity prices. However, select emerging market economies such as those of China, Malaysia, South Korea, Poland and Hungary improved in 2013’s second half. Monetary policies tightened in several emerging market countries, including Brazil, India, Turkey and South Africa, as their central banks raised interest rates to curb inflation and support their currencies.
Stocks in Europe helped developed market equities advance for most of the period despite a January 2014 decline. Led by Asian equities, emerging market equities also gained, although weak economic data, especially in China, weighed on markets in January. Several emerging market currencies depreciated against the U.S. dollar during the period. Gold prices declined for the period despite a rally in early 2014, and international oil prices rose amid supply concerns related to political unrest and adverse U.S. weather.
Semiannual Report | 5
| | |
| Top 10 Sectors/Industries | | |
| Based on Equity Securities | | |
| 2/28/14 | | |
| % of Total | |
| Net Assets | |
| Banks | 14.1 | % |
| Pharmaceuticals | 10.7 | % |
| Oil, Gas & Consumable Fuels | 8.8 | % |
| Insurance | 5.3 | % |
| Energy Equipment & Services | 5.2 | % |
| Capital Markets | 4.5 | % |
| Diversified Telecommunication Services | 3.7 | % |
| Food & Staples Retailing | 3.2 | % |
| Media | 3.0 | % |
| Specialty Retail | 2.8 | % |
Investment Strategy
Our investment strategy employs a bottom-up, value-oriented, long-term approach. We focus on the market price of a company’s securities relative to our evaluation of the company’s long-term earnings, asset value and cash flow potential. As we look worldwide, we consider specific companies, rather than sectors or countries, while doing in-depth research to construct a bargain list from which we buy. Before we make a purchase, we look at the company’s price/earnings ratio, price/cash flow ratio, profit margins and liquidation value.
Manager’s Discussion
Many of the positive economic trends we discussed in the 2013 annual shareholder report persisted during the six-month review period, and the Fund performed well, supported by the market environment. Although the Fund’s performance slightly trailed that of the benchmark MSCI World Index for the period, all of the Fund’s major sectors and regions delivered absolute gains. The Fund’s Class A shares outperformed the benchmark for the one-, five- and 10-year annual periods ended February 28, 2014. Even so, the Fund traded at a significant valuation discount relative to the benchmark index. Positive trends included moderate global economic growth and ongoing policy support from developed market central banks. Stabilizing market conditions allowed investors to refocus on business fundamentals, creating an environment that seemed to us to reward disciplined stock picking and helped drive further value recognition for Fund positions.
Value investing generally was pressured during the global financial crisis as investors seemed to grow more concerned with overall market stability than with the relationship between stock prices and business fundamentals. However, the rise in investor confidence since Europe’s recovery from its debt crisis laid the groundwork for the resurgence of value investing, a strategy that has historically delivered compelling performance. Many of the sectors and regions most punished during the 2008–2009 global crisis and 2010–2011 European crisis have since had a dramatic recovery. As Sir John Templeton wrote, “For those properly prepared in advance, a bear market in stocks is not a calamity, but an opportunity.”
6 | Semiannual Report
|
| What is return on equity? |
| Return on equity is an amount, |
| expressed as a percentage, earned on |
| a company’s common stock investment |
| for a given period. Return on equity tells |
| common shareholders how effectually |
| their money is being employed. |
| Comparing percentages for current and |
| prior periods also reveals trends, and |
| comparison with industry composites |
| reveals how well a company is holding |
| its own against its competitors. |
The strong performance of Europe, and particularly European financials, during the review period seemed to us the latest validation of Sir John Templeton’s words.3 As the European sovereign debt crisis escalated during 2010 and 2011, investor sentiment turned largely pessimistic, with many investors anticipating the breakup of the European Monetary Union. Reflective of the negative investor sentiment for Europe, the forward price-to-earnings ratio of the EuroStoxx 50 Index, an index of European blue chips with diverse global revenue streams, fell in 2011 to the same level as its estimated dividend yield. As recently as 2012, the entire market capitalization of the eurozone banking system was worth less than one U.S. stock, Apple. At the market bottom, European banks were trading at a 60% to 70% discount to their tangible book values, a level that major global financial institutions had not reached since U.S. banks did during the Great Depression. We believed this was a classic Templeton opportunity. However, investment decisions can be very difficult in a challenging environment. As Sir John Templeton pointed out, “It is not easy to act contrary to popular opinion.” As disciplined investors, we tried to ignore the crowd and adhere to our time-tested process. Our decision to substantially increase exposure to Europe and the banking sector during this tumultuous period served our clients well, and record inflows into European stocks during the review period further accelerated regional gains.
Dutch financial services firm ING Groep was among the top contributors to performance. We established our position in ING at what we believed were distressed valuations. Our analysis indicated that the firm, which accepted a bailout from the Dutch government in 2008, could successfully restructure and reemerge as a well-capitalized European bank earning double-digit returns on equity. The company was nearing completion of its European Union-imposed bailout commitments following more than 35 disposals that raised roughly 23 billion euros, and recent results highlighted the operational gains achieved at ING’s banking business as the company cut costs and improved margins. Other financials holdings contributing to relative performance included U.S. financial services firm Morgan Stanley, U.K. insurer Aviva and lenders BNP Paribas (France) and UniCredit (Italy). Our analysis did not suggest that European banks were soon likely to return to the book value multiples enjoyed before the European sovereign debt crisis. However, we believe these companies remain undervalued relative to their global peers and could continue to improve profitability and capital ratios as economic conditions normalize.
Semiannual Report | 7
| | |
| Top 10 Countries | | |
| Based on Equity Securities | | |
| 2/28/14 | | |
| | % of Total | |
| | Net Assets | |
| U.S. | 34.0 | % |
| U.K. | 15.9 | % |
| France | 8.1 | % |
| Switzerland | 5.9 | % |
| South Korea | 5.0 | % |
| Japan | 3.7 | % |
| Germany | 2.9 | % |
| Netherlands | 2.7 | % |
| Italy | 2.6 | % |
| Singapore | 2.3 | % |
The cyclical European industrials sector also experienced significant pressure in recent years.4 European airlines were hit particularly hard. Financial sector cutbacks and private sector belt-tightening led to a steep reduction in air traffic volume, and internal labor demands and competition from low-cost carriers further pressured profit margins. In 2009 and 2011, European airlines fell to record-low price-to-book levels that averaged a 50% discount to book value. Although the airline industry has always been a challenging business in our view, it was not one that we believed could disappear. Our analysis indicated that the industry required significant restructuring and that it would need to shed a great deal of capacity but that there would be winners and losers. We decided to focus on the companies that we believed could be the long-term survivors of this industry shake-up. For example, International Consolidated Airlines Group (IAG) was a company we viewed as having a strong foothold at Heathrow Airport and attractive position in the lucrative transatlantic market. The share price of British Airways’ parent company rose to a six-year high after quarterly operating profits more than doubled and management raised its 2015 profit target. Although we remained positive given the stock’s continued discount to our projection of IAG’s long-term business value, we reduced exposure to realize significant gains after the stock more than tripled in value over the past 18 months. Stock selection in the industrials sector bolstered relative performance.
Other sector contributors to relative performance included the Fund’s underweighting and stock selection in consumer staples.5 Consumer staples stocks have offered a scarcity of bargains in recent years based on our analysis, and we believed conditions remained unfavorable for wider value creation. Unlike other sectors, consumer staples has a perceived combination of non-discretionary products and high emerging markets exposure with a defensive growth profile for which some investors were willing to pay a premium.
We also found few bargains in the materials sector in recent years, where a legacy of poor capital discipline in the mining industry resulted in overca-pacity that continued to pressure profitability.6 Buoyed by stock selection in the chemicals industry, the Fund’s materials sector holdings outperformed during the period. Although most of our materials sector investment prospects have been limited to deeper value business segments, emerging market volatility and investor pessimism could create opportunities for us in the mining industry, and we monitored the industry for new bargains.
8 | Semiannual Report
| | |
| Top 10 Equity Holdings | | |
| 2/28/14 | | |
| |
| Company | % of Total | |
| Sector/Industry, Country | Net Assets | |
| BNP Paribas SA | 2.6 | % |
| Banks, France | | |
| Roche Holding AG | 2.4 | % |
| Pharmaceuticals, Switzerland | | |
| Morgan Stanley | 2.3 | % |
| Capital Markets, U.S. | | |
| Baker Hughes Inc. | 2.2 | % |
| Energy Equipment & Services, U.S. | | |
| Total SA, B | 2.0 | % |
| Oil, Gas & Consumable Fuels, France | |
| Citigroup Inc. | 2.0 | % |
| Banks, U.S. | | |
| Microsoft Corp. | 2.0 | % |
| Software, U.S. | | |
| Credit Suisse Group AG | 2.0 | % |
| Capital Markets, Switzerland | | |
| Samsung Electronics Co. Ltd. | 2.0 | % |
| Semiconductors & Semiconductor | | |
| Equipment, South Korea | | |
| Medtronic Inc. | 1.9 | % |
| Health Care Equipment & Supplies, U.S. | |
Among defensive stocks, we favored opportunities in the telecommunication services sector.7 The Fund’s stake in Vodafone Group (U.K.), one of the world’s largest mobile telephone operators, helped relative performance after the firm announced it was selling its stake in U.S. mobile telephone operator Verizon Wireless for $130 billion.
Conversely, the Fund’s stock selection in the information technology (IT) sector pressured relative returns.8 Relative weakness was primarily attributable to losses at U.S. networking equipment firm Cisco Systems, which reported its first sales decline in four years. The stock price was relatively close to the same level as when we initiated our position in 2008 and continued to look cheap to us based on many valuation measures. From our perspective, management has made solid progress implementing a sensible restructuring plan in recent years. However, industry headwinds and new risks surfaced, including low-cost competition from emerging markets, weak corporate networking spending and a lower-than-expected correlation between Internet traffic growth and demand growth for Cisco’s routers. Overall, recent IT gains have made bargain hunting in the sector somewhat challenging for us, although we continued to search for companies whose long-term growth prospects seemed to us materially undervalued.
The health care sector was largely undervalued over the past decade, based on our analysis.9 We began increasing exposure to the sector about a decade ago. At the time, investor sentiment was hampered by fears that impending patent expirations, compounded by declining research and development productivity and rising generic competition, could depress the profitability of major pharmaceuticals manufacturers. Based on our analysis, top-tier pharmaceuticals and biotechnology companies were being valued at levels that assigned no credit for future drug development or earnings recovery. Although many investors saw an industry in decline, our analysis identified what we believed were cheap stocks with underappreciated recovery potential. Rising health care spending in the developing world represented a long-term growth catalyst, and we also identified potential for cost cutting and consolidation in a capital intensive industry. These investments took time to reward us, but with the patent cliff past and margin recovery ongoing, returns for the Fund’s overweighting in health care provided positive momentum during the period. Swiss biotechnology firm Roche Holding was one of the leading performers during the period. However, muted gains from major European drugmakers Sanofi (France) and GlaxoSmithKline (U.K.), as well as U.S. biotechnology firm Amgen, resulted in modest underperformance relative to the benchmark for our overall health care holdings.
Semiannual Report | 9
Stock selection in consumer discretionary and an overweighting in energy also weighed on relative performance, despite absolute gains for these sectors.10 In the consumer discretionary sector, Japanese car maker Nissan Motor’s share price retreated after the company attributed a profit warning to weaker emerging market volume, higher-than-expected recall costs and unfavorable currency moves. Even after we lowered our near-term earnings estimates to reflect these short-term headwinds, the stock’s long-term investment case remained attractive to us, given what we viewed as Nissan’s proven cost-cutting capability, popular new model pipeline and excellent management track record. Elsewhere in the consumer discretionary sector, we reduced exposure as soaring valuations allowed us to realize gains on contrarian investments made in periods of extreme investor pessimism. Instead, we were overweighted in the energy sector, where investor concerns about heavy capital expenditures and stagnant production growth depressed the share prices of many major oil companies to what we viewed as bargain levels. We believed some of these companies could ultimately benefit from their heavy capital expenditures as innovation accelerates and major new projects begin producing. As we wait for this to occur, the industry has provided a roughly 3% average dividend yield. We also found attractive opportunities in the oil services industry, which directly benefits from increasing demand for technology and specialization in the oil extraction process. The share price of U.S.-listed deep-water drilling contractor Noble declined based on concerns about continued oversupply in the industry. However, long-term valuations and industry dynamics remained favorable in our view.
Regionally, the Fund’s European holdings outperformed owing to a large regional overweighting and stock selection. Specifically, stock selection in the U.K. and the Netherlands and an overweighting in Ireland bolstered relative performance. Stock selection in the U.S. and an underweighting and stock selection in Australia also contributed to relative performance. In contrast, allocations to off-benchmark countries South Korea and Brazil, along with an overweighting in Singapore, hampered relative results.
It is important to recognize the effect of currency movements on the Fund’s performance. In general, if the value of the U.S. dollar goes up compared with a foreign currency, an investment traded in that foreign currency will go down in value because it will be worth fewer U.S. dollars. This can have a negative effect on Fund performance. Conversely, when the U.S. dollar weakens in relation to a foreign currency, an investment traded in that foreign currency will increase in value, which can contribute to Fund performance. For the six
10 | Semiannual Report
months ended February 28, 2014, the U.S. dollar declined in value relative to most currencies. As a result, the Fund’s performance was positively affected by the portfolio’s substantial investment in securities with non-U.S. currency exposure. However, one cannot expect the same result in future periods.
Market momentum remained positive in early 2014, although concerns persisted about emerging market volatility and the sustainability of the global economic recovery. Following a strong recovery from the post-financial crisis trough and accompanying rising valuations, some value-minded investors have expressed concerns about the sustainability of the ongoing market rally. We do not know where the market is going. However, as investors with a long-term perspective, we note that on a trailing 10-year basis, recent annualized global equity returns of slightly above 6% remained meaningfully below the nearly 9% average annualized 10-year returns for the asset class going back to 1835.11 Long-term stock returns have historically reverted to the average, so although we do not know what will happen in the near term, we believe potential remains for continued stock strength over our long-term investment horizon. Furthermore, while some parts of the market seemed to grow more expensive, other parts of the market remained decidedly cheap, in our assessment. Europe continued to trade at multi-decade low valuations relative to the U.S. based on cyclically adjusted earnings multiples, and depressed profit margins in the region could improve if companies with high operating leverage benefit from Europe’s economic recovery. Emerging markets have offered what appeared to us as a number of selective opportunities for long-term bargain hunters amid recent turmoil. With economic and policy conditions diverging around the world and correlations between markets and asset classes declining, we believe bottom-up stock pickers with a proven process, like Templeton, remained well positioned to help investors navigate an uncertain future.
Semiannual Report | 11
Thank you for your continued participation in Templeton World Fund.
We look forward to serving your future investment needs.

The foregoing information reflects our analysis, opinions and portfolio holdings as of February 28, 2014, the end
of the reporting period. The way we implement our main investment strategies and the resulting portfolio holdings
may change depending on factors such as market and economic conditions. These opinions may not be relied upon
as investment advice or an offer for a particular security. The information is not a complete analysis of every
aspect of any market, country, industry, security or the Fund. Statements of fact are from sources considered
reliable, but the investment manager makes no representation or warranty as to their completeness or accuracy.
Although historical performance is no guarantee of future results, these insights may help you understand our
investment management philosophy.
12 | Semiannual Report
|
| Heather Arnold assumed portfolio manager responsibilities for the Fund in January 2014. |
| Ms. Arnold is the director of research for the Templeton Global Equity Group, as well as a |
| portfolio manager and research analyst. Ms. Arnold manages institutional and retail equity |
| portfolios and has research responsibilities for Japan and Russia. Prior to joining Franklin |
| Templeton in 1997, she was a managing director for Goldman Sachs Asset Management, |
| head of European equities and portfolio manager for European, international and global |
| institutional and retail client portfolios. In 2001, Ms. Arnold left to start her own company |
| and returned to Franklin Templeton in 2008. |
The index is unmanaged and includes reinvested dividends. One cannot invest directly in an index, and an index is not
representative of the Fund’s portfolio.
1. Source: © 2014 Morningstar. All Rights Reserved. The information contained herein: (1) is proprietary to Morningstar
and/or its content providers; (2) may not be copied or distributed; and (3) is not warranted to be accurate, complete or
timely. Neither Morningstar nor its content providers are responsible for any damages or losses arising from any use of
this information. As of 2/28/14, the Fund’s Class A 10-year average annual total return not including the maximum
sales charge was +7.44%, compared with the MSCI World Index’s 10-year average annual total return of +7.33%.
2. Source: MSCI. MSCI makes no express or implied warranties or representations and shall have no liability whatsoev-
er with respect to any MSCI data contained herein. The MSCI data may not be further redistributed or used as a basis
for other indices or any securities or financial products. This report is not approved, reviewed or produced by MSCI.
3. The financials sector comprises banks, capital markets, diversified financial services and insurance in the SOI.
4. The industrials sector comprises aerospace and defense, air freight and logistics, airlines, commercial services
and supplies, construction and engineering, electrical equipment, industrial conglomerates, machinery, and trading
companies and distributors in the SOI.
5. The consumer staples sector comprises food and staples retailing in the SOI.
6. The materials sector comprises chemicals, construction materials, and metals and mining in the SOI.
7. The telecommunication services sector comprises diversified telecommunication services and wireless telecom-
munication services in the SOI.
8. The information technology sector comprises communications equipment; electronic equipment, instruments and
components; IT services; semiconductors and semiconductor equipment; software; and technology hardware, storage
and peripherals in the SOI.
9. The health care sector comprises biotechnology, health care equipment and supplies, and pharmaceuticals in
the SOI.
10. The consumer discretionary sector comprises automobiles, household durables, media and specialty retail in the
SOI. The energy sector comprises energy equipment and services; and oil, gas and consumable fuels in the SOI.
11. Source: Stifel Equity Strategist Barry B. Bannister, In the Spring There Will be Growth, presentation on March 1,
2010. Data as of 12/31/13.
Semiannual Report | 13
Performance Summary as of 2/28/14
Your dividend income will vary depending on dividends or interest paid by securities in the Fund’s portfolio, adjusted for operating expenses of each class. Capital gain distributions are net profits realized from the sale of portfolio securities. The performance table does not reflect any taxes that a shareholder would pay on Fund dividends, capital gain distributions, if any, or any realized gains on the sale of Fund shares. Total return reflects reinvestment of the Fund’s dividends and capital gain distributions, if any, and any unrealized gains or losses.
| | | | | | | | |
| Price and Distribution Information | | | | | | |
| |
| Class A (Symbol: TEMWX) | | | | Change | | 2/28/14 | | 8/31/13 |
| Net Asset Value (NAV) | | | +$ | 1.54 | $ | 19.56 | $ | 18.02 |
| Distributions (9/1/13–2/28/14) | | | | | | | | |
| Dividend Income | $ | 0.1860 | | | | | | |
| Short-Term Capital Gain | $ | 0.1371 | | | | | | |
| Long-Term Capital Gain | $ | 0.6902 | | | | | | |
| Total | $ | 1.0133 | | | | | | |
| Class C (Symbol: TEWTX) | | | | Change | | 2/28/14 | | 8/31/13 |
| Net Asset Value (NAV) | | | +$ | 1.52 | $ | 18.92 | $ | 17.40 |
| Distributions (9/1/13–2/28/14) | | | | | | | | |
| Dividend Income | $ | 0.0556 | | | | | | |
| Short-Term Capital Gain | $ | 0.1371 | | | | | | |
| Long-Term Capital Gain | $ | 0.6902 | | | | | | |
| Total | $ | 0.8829 | | | | | | |
| Class R6 (Symbol: FTWRX) | | | | Change | | 2/28/14 | | 8/31/13 |
| Net Asset Value (NAV) | | | +$ | 1.51 | $ | 19.53 | $ | 18.02 |
| Distributions (9/1/13–2/28/14) | | | | | | | | |
| Dividend Income | $ | 0.2473 | | | | | | |
| Short-Term Capital Gain | $ | 0.1371 | | | | | | |
| Long-Term Capital Gain | $ | 0.6902 | | | | | | |
| Total | $ | 1.0746 | | | | | | |
| Advisor Class (Symbol: TWDAX) | | | | Change | | 2/28/14 | | 8/31/13 |
| Net Asset Value (NAV) | | | +$ | 1.53 | $ | 19.54 | $ | 18.01 |
| Distributions (9/1/13–2/28/14) | | | | | | | | |
| Dividend Income | $ | 0.2294 | | | | | | |
| Short-Term Capital Gain | $ | 0.1371 | | | | | | |
| Long-Term Capital Gain | $ | 0.6902 | | | | | | |
| Total | $ | 1.0567 | | | | | | |
14 | Semiannual Report
Performance Summary (continued)
Performance
Cumulative total return excludes sales charges. Aggregate and average annual total returns and value of $10,000 investment include maximum sales charges. Class A: 5.75% maximum initial sales charge; Class C: 1% contingent deferred sales charge in first year only; Class R6/Advisor Class: no sales charges.
| | | | | | | | | | | | |
| Class A | | 6-Month | | | 1-Year | | | 5-Year | | | 10-Year | |
| Cumulative Total Return1 | + | 14.33 | % | + | 25.24 | % | + | 153.59 | % | + | 104.99 | % |
| Average Annual Total Return2 | + | 7.75 | % | + | 18.07 | % | + | 19.03 | % | + | 6.81 | % |
| Value of $10,000 Investment3 | $ | 10,775 | | $ | 11,807 | | $ | 23,891 | | $ | 19,318 | |
| Avg. Ann. Total Return (3/31/14)4 | | | | + | 17.32 | % | + | 17.29 | % | + | 7.03 | % |
| Total Annual Operating Expenses5 | | | | | 1.05 | % | | | | | | |
| Class C | | 6-Month | | | 1-Year | | | 5-Year | | | 10-Year | |
| Cumulative Total Return1 | + | 13.95 | % | + | 24.31 | % | + | 144.43 | % | + | 90.15 | % |
| Average Annual Total Return2 | + | 12.95 | % | + | 23.31 | % | + | 19.57 | % | + | 6.64 | % |
| Value of $10,000 Investment3 | $ | 11,295 | | $ | 12,331 | | $ | 24,443 | | $ | 19,015 | |
| Avg. Ann. Total Return (3/31/14)4 | | | | + | 22.58 | % | + | 17.80 | % | + | 6.85 | % |
| Total Annual Operating Expenses5 | | | | | 1.81 | % | | | | | | |
| Class R6 | | | | | | | | 6-Month | | | Inception (5/1/13) | |
| Cumulative Total Return1 | | | | | | | + | 14.59 | % | + | 20.19 | % |
| Aggregate Total Return6 | | | | | | | + | 14.59 | % | + | 20.19 | % |
| Value of $10,000 Investment3 | | | | | | | $ | 11,459 | | $ | 12,019 | |
| Aggregate Total Return (3/31/14)4, 6 | | | | | | | | | | + | 20.87 | % |
| Total Annual Operating Expenses5 | | | | | 0.72 | % | | | | | | |
| Advisor Class7 | | 6-Month | | | 1-Year | | | 5-Year | | | 10-Year | |
| Cumulative Total Return1 | + | 14.54 | % | + | 25.55 | % | + | 156.76 | % | + | 109.05 | % |
| Average Annual Total Return2 | + | 14.54 | % | + | 25.55 | % | + | 20.76 | % | + | 7.65 | % |
| Value of $10,000 Investment3 | $ | 11,454 | | $ | 12,555 | | $ | 25,676 | | $ | 20,905 | |
| Avg. Ann. Total Return (3/31/14)4 | | | | + | 24.82 | % | + | 18.98 | % | + | 7.87 | % |
| Total Annual Operating Expenses5 | | | | | 0.81 | % | | | | | | |
Performance data represent past performance, which does not guarantee future results. Investment return and principal value will fluctuate, and you may have a gain or loss when you sell your shares. Current performance may differ from figures shown. For most recent month-end performance, go to franklintempleton.com or call (800) 342-5236.
Semiannual Report | 15
Performance Summary (continued)
All investments involve risks, including possible loss of principal. Special risks are associated with foreign investing, including currency fluctuations, economic instability and political developments; investments in emerging markets involve heightened risks related to the same factors. To the extent the Fund focuses on particular countries, regions, industries, sectors or types of investment from time to time, it may be subject to greater risks of adverse developments in such areas of focus than a fund that invests in a wider variety of countries, regions, industries, sectors or investments. The Fund is actively managed but there is no guarantee that the manager’s investment decisions will produce the desired results. The Fund’s prospectus also includes a description of the main investment risks.
Class C: These shares have higher annual fees and expenses than Class A shares.
Class R6: Shares are available to certain eligible investors as described in the prospectus.
Advisor Class: Shares are available to certain eligible investors as described in the prospectus.
1. Cumulative total return represents the change in value of an investment over the periods indicated.
2. Average annual total return represents the average annual change in value of an investment over the periods indicated. Six-month return has not
been annualized.
3. These figures represent the value of a hypothetical $10,000 investment in the Fund over the periods indicated.
4. In accordance with SEC rules, we provide standardized average annual total return information through the latest calendar quarter.
5. Figures are as stated in the Fund’s current prospectus. In periods of market volatility, assets may decline significantly, causing total annual Fund
operating expenses to become higher than the figures shown.
6. Aggregate total return represents the change in value of an investment for the period indicated. Since Class R6 shares have existed for less than
one year, average annual total return is not available.
7. Effective 5/15/06, the Fund began offering Advisor Class shares, which do not have sales charges or a Rule 12b-1 plan. Performance quotations
for this class reflect the following methods of calculation: (a) For periods prior to 5/15/06, a restated figure is used based upon the Fund’s Class A
performance, excluding the effect of Class A’s maximum initial sales charge, but reflecting the effect of the Class A Rule 12b-1 fees; and (b) for
periods after 5/15/06, actual Advisor Class performance is used reflecting all charges and fees applicable to that class. Since 5/15/06 (commence-
ment of sales), the cumulative and average annual total returns of Advisor Class shares were +56.64% and +5.93%.
16 | Semiannual Report
Your Fund’s Expenses
As a Fund shareholder, you can incur two types of costs:
- Transaction costs, including sales charges (loads) on Fund purchases; and
- Ongoing Fund costs, including management fees, distribution and service (12b-1) fees, and other Fund expenses. All mutual funds have ongoing costs, sometimes referred to as operating expenses.
The following table shows ongoing costs of investing in the Fund and can help you understand these costs and compare them with those of other mutual funds. The table assumes a $1,000 investment held for the six months indicated.
Actual Fund Expenses
The first line (Actual) for each share class listed in the table provides actual account values and expenses. The “Ending Account Value” is derived from the Fund’s actual return, which includes the effect of Fund expenses.
You can estimate the expenses you paid during the period by following these steps. Of course, your account value and expenses will differ from those in this illustration:
| 1. | Divide your account value by $1,000. |
| | If an account had an $8,600 value, then $8,600 ÷ $1,000 = 8.6. |
| 2. | Multiply the result by the number under the heading “Expenses Paid During Period.” |
| | If Expenses Paid During Period were $7.50, then 8.6 x $7.50 = $64.50. |
In this illustration, the estimated expenses paid this period are $64.50.
Hypothetical Example for Comparison with Other Funds
Information in the second line (Hypothetical) for each class in the table can help you compare ongoing costs of investing in the Fund with those of other mutual funds. This information may not be used to estimate the actual ending account balance or expenses you paid during the period. The hypothetical “Ending Account Value” is based on the actual expense ratio for each class and an assumed 5% annual rate of return before expenses, which does not represent the Fund’s actual return. The figure under the heading “Expenses Paid During Period” shows the hypothetical expenses your account would have incurred under this scenario. You can compare this figure with the 5% hypothetical examples that appear in shareholder reports of other funds.
Semiannual Report | 17
Your Fund’s Expenses (continued)
Please note that expenses shown in the table are meant to highlight ongoing costs and do not reflect any transaction costs, such as sales charges. Therefore, the second line for each class is useful in comparing ongoing costs only, and will not help you compare total costs of owning different funds. In addition, if transaction costs were included, your total costs would have been higher. Please refer to the Fund prospectus for additional information on operating expenses.
| | | | | | |
| | | Beginning Account | | Ending Account | | Expenses Paid During |
| Class A | | Value 9/1/13 | | Value 2/28/14 | | Period* 9/1/13–2/28/14 |
| Actual | $ | 1,000 | $ | 1,143.30 | $ | 5.63 |
| Hypothetical (5% return before expenses) | $ | 1,000 | $ | 1,019.54 | $ | 5.31 |
| Class C | | | | | | |
| Actual | $ | 1,000 | $ | 1,139.50 | $ | 9.60 |
| Hypothetical (5% return before expenses) | $ | 1,000 | $ | 1,015.82 | $ | 9.05 |
| Class R6 | | | | | | |
| Actual | $ | 1,000 | $ | 1,145.90 | $ | 3.83 |
| Hypothetical (5% return before expenses) | $ | 1,000 | $ | 1,021.22 | $ | 3.61 |
| Advisor Class | | | | | | |
| Actual | $ | 1,000 | $ | 1,145.40 | $ | 4.31 |
| Hypothetical (5% return before expenses) | $ | 1,000 | $ | 1,020.78 | $ | 4.06 |
*Expenses are calculated using the most recent six-month expense ratio, annualized for each class (A: 1.06%; C: 1.81%; R6: 0.72%; and Advisor: 0.81%), multiplied by the average account value over the period, multiplied by 181/365 to reflect the one-half year period.
18 | Semiannual Report
Templeton World Fund
Financial Highlights
| | | | | | | | | | | | | | | | | | |
| | | �� Six Months Ended | | | | | | | | | | | | | |
| | | February 28, 2014 | | | | | | Year Ended August 31, | | | | |
| Class A | | (unaudited) | | | 2013 | | | 2012 | | | 2011 | | | 2010 | | | 2009 | |
| Per share operating performance | | | | | | | | | | | | | | | | | | |
| (for a share outstanding throughout | | | | | | | | | | | | | | | | | | |
| the period) | | | | | | | | | | | | | | | | | | |
| Net asset value, beginning of period | $ | 18.02 | | $ | 15.06 | | $ | 14.21 | | $ | 12.74 | | $ | 12.80 | | $ | 15.78 | |
| Income from investment operationsa: | | | | | | | | | | | | | | | | | | |
| Net investment incomeb | | 0.21 | c | | 0.25 | | | 0.29 | | | 0.24 | | | 0.21 | | | 0.24 | |
| Net realized and unrealized | | | | | | | | | | | | | | | | | | |
| gains (losses) | | 2.35 | | | 3.38 | | | 0.84 | | | 1.47 | | | (0.01 | ) | | (2.59 | ) |
| Total from investment operations | | 2.56 | | | 3.63 | | | 1.13 | | | 1.71 | | | 0.20 | | | (2.35 | ) |
| Less distributions from: | | | | | | | | | | | | | | | | | | |
| Net investment income | | (0.19 | ) | | (0.42 | ) | | (0.28 | ) | | (0.24 | ) | | (0.26 | ) | | (0.30 | ) |
| Net realized gains | | (0.83 | ) | | (0.25 | ) | | — | | | — | | | — | | | (0.33 | ) |
| Total distributions | | (1.02 | ) | | (0.67 | ) | | (0.28 | ) | | (0.24 | ) | | (0.26 | ) | | (0.63 | ) |
| Net asset value, end of period | $ | 19.56 | | $ | 18.02 | | $ | 15.06 | | $ | 14.21 | | $ | 12.74 | | $ | 12.80 | |
| |
| Total returnd | | 14.33 | % | | 24.71 | % | | 8.18 | % | | 13.45 | % | | 1.32 | % | | (14.04 | )% |
| |
| Ratios to average net assetse | | | | | | | | | | | | | | | | | | |
| Expenses | | 1.06 | % | | 1.05 | %f | | 1.09 | % | | 1.07 | %f | | 1.09 | %f | | 1.10 | %f |
| Net investment income | | 1.60 | %c | | 1.49 | % | | 1.99 | % | | 1.62 | % | | 1.54 | % | | 2.15 | % |
| |
| Supplemental data | | | | | | | | | | | | | | | | | | |
| Net assets, end of period (000’s) | $ | 5,905,511 | | $ | 5,278,292 | | $ | 4,857,469 | | $ | 5,067,228 | | $ | 5,029,053 | | $ | 5,431,882 | |
| Portfolio turnover rate | | 9.12 | % | | 17.57 | % | | 18.77 | % | | 16.11 | % | | 16.77 | % | | 17.66 | % |
aThe amount shown for a share outstanding throughout the period may not correlate with the Statement of Operations for the period due to the timing of sales and repurchases of
the Fund shares in relation to income earned and/or fluctuating market value of the investments of the Fund.
bBased on average daily shares outstanding.
cNet investment income per share includes approximately $0.12 per share received in the form of a special dividend paid in connection with certain Fund’s holdings. Excluding this
amount, the ratio of net investment income to average net assets would have been 1.00%.
dTotal return does not reflect sales commissions or contingent deferred sales charges, if applicable, and is not annualized for periods less than one year.
eRatios are annualized for periods less than one year.
fBenefit of expense reduction rounds to less than 0.01%.
Semiannual Report | The accompanying notes are an integral part of these financial statements. | 19
| | | | | | | | | | | | | | | | | | |
| Templeton World Fund | | | | | | | | | | | | | | | | |
| |
| Financial Highlights (continued) | | | | | | | | | | | | | | | | | | |
| |
| | | Six Months Ended | | | | | | | | | | | | | | | | |
| | | February 28, 2014 | | | Year Ended August 31, | | | | |
| Class C | | (unaudited) | | | 2013 | | | 2012 | | | 2011 | | | 2010 | | | 2009 | |
| Per share operating performance | | | | | | | | | | | | | | | | | | |
| (for a share outstanding throughout the period) | | | | | | | | | | | | | | | | | | |
| Net asset value, beginning of period | $ | 17.40 | | $ | 14.53 | | $ | 13.69 | | $ | 12.28 | | $ | 12.39 | | $ | 15.23 | |
| Income from investment operationsa: | | | | | | | | | | | | | | | | | | |
| Net investment incomeb | | 0.14 | c | | 0.12 | | | 0.17 | | | 0.13 | | | 0.10 | | | 0.15 | |
| Net realized and unrealized gains (losses) | | 2.27 | | | 3.26 | | | 0.83 | | | 1.41 | | | (0.01 | ) | | (2.49 | ) |
| Total from investment operations | | 2.41 | | | 3.38 | | | 1.00 | | | 1.54 | | | 0.09 | | | (2.34 | ) |
| Less distributions from: | | | | | | | | | | | | | | | | | | |
| Net investment income | | (0.06 | ) | | (0.26 | ) | | (0.16 | ) | | (0.13 | ) | | (0.20 | ) | | (0.17 | ) |
| Net realized gains | | (0.83 | ) | | (0.25 | ) | | — | | | — | | | — | | | (0.33 | ) |
| Total distributions | | (0.89 | ) | | (0.51 | ) | | (0.16 | ) | | (0.13 | ) | | (0.20 | ) | | (0.50 | ) |
| Net asset value, end of period | $ | 18.92 | | $ | 17.40 | | $ | 14.53 | | $ | 13.69 | | $ | 12.28 | | $ | 12.39 | |
| |
| Total returnd | | 13.95 | % | | 23.76 | % | | 7.41 | % | | 12.50 | % | | 0.60 | % | | (14.65 | )% |
| |
| Ratios to average net assetse | | | | | | | | | | | | | | | | | | |
| Expenses | | 1.81 | % | | 1.81 | %f | | 1.84 | % | | 1.82 | %f | | 1.84 | %f | | 1.85 | %f |
| Net investment income | | 0.85 | %c | | 0.73 | % | | 1.24 | % | | 0.87 | % | | 0.79 | % | | 1.40 | % |
| |
| Supplemental data | | | | | | | | | | | | | | | | | | |
| Net assets, end of period (000’s) | $ | 238,495 | | $ | 210,256 | | $ | 186,483 | | $ | 201,956 | | $ | 208,330 | | $ | 233,637 | |
| Portfolio turnover rate | | 9.12 | % | | 17.57 | % | | 18.77 | % | | 16.11 | % | | 16.77 | % | | 17.66 | % |
aThe amount shown for a share outstanding throughout the period may not correlate with the Statement of Operations for the period due to the timing of sales and repurchases of
the Fund shares in relation to income earned and/or fluctuating market value of the investments of the Fund.
bBased on average daily shares outstanding.
cNet investment income per share includes approximately $0.12 per share received in the form of a special dividend paid in connection with certain Fund’s holdings. Excluding this
amount, the ratio of net investment income to average net assets would have been 0.25%.
dTotal return does not reflect sales commissions or contingent deferred sales charges, if applicable, and is not annualized for periods less than one year.
eRatios are annualized for periods less than one year.
fBenefit of expense reduction rounds to less than 0.01%.
20 | The accompanying notes are an integral part of these financial statements. | Semiannual Report
| | | | | | |
| Templeton World Fund | | | | | | |
| |
| Financial Highlights (continued) | | | | | | |
| |
| | | Six Months Ended | | | Period Ended | |
| | | February 28, 2014 | | | August 31, | |
| Class R6 | | (unaudited) | | | 2013 | a |
| Per share operating performance | | | | | | |
| (for a share outstanding throughout the period) | | | | | | |
| Net asset value, beginning of period | $ | 18.02 | | $ | 17.17 | |
| Income from investment operationsb: | | | | | | |
| Net investment incomec | | 0.27 | d | | 0.12 | |
| Net realized and unrealized gains (losses) | | 2.32 | | | 0.73 | |
| Total from investment operations | | 2.59 | | | 0.85 | |
| Less distributions from: | | | | | | |
| Net investment income | | (0.25 | ) | | — | |
| Net realized gains | | (0.83 | ) | | — | |
| Total distributions | | (1.08 | ) | | — | |
| Net asset value, end of period | $ | 19.53 | | $ | 18.02 | |
| |
| Total returne | | 14.59 | % | | 4.95 | % |
| |
| Ratios to average net assetsf | | | | | | |
| Expenses | | 0.72 | % | | 0.72 | %g |
| Net investment income | | 1.94 | %d | | 1.82 | % |
| |
| Supplemental data | | | | | | |
| Net assets, end of period (000’s) | $ | 54,022 | | $ | 24,306 | |
| Portfolio turnover rate | | 9.12 | % | | 17.57 | % |
aFor the period May 1, 2013 (effective date) to August 31, 2013.
bThe amount shown for a share outstanding throughout the period may not correlate with the Statement of Operations for the period due to the timing of sales and repurchases of
the Fund shares in relation to income earned and/or fluctuating market value of the investments of the Fund.
cBased on average daily shares outstanding.
dNet investment income per share includes approximately $0.12 per share received in the form of a special dividend paid in connection with certain Fund’s holdings. Excluding this
amount, the ratio of net investment income to average net assets would have been 1.34%.
eTotal return does not reflect sales commissions or contingent deferred sales charges, if applicable, and is not annualized for periods less than one year.
fRatios are annualized for periods less than one year.
gBenefit of expense reduction rounds to less than 0.01%.
Semiannual Report | The accompanying notes are an integral part of these financial statements. | 21
| | | | | | | | | | | | | | | | | | |
| Templeton World Fund | | | | | | | | | | | | | | | | |
| |
| Financial Highlights (continued) | | | | | | | | | | | | | | | | | | |
| |
| | | Six Months Ended | | | | | | | | | | | | | | | | |
| | | February 28, 2014 | | | Year Ended August 31, | | | | |
| Advisor Class | | (unaudited) | | | 2013 | | | 2012 | | | 2011 | | | 2010 | | | 2009 | |
| Per share operating performance | | | | | | | | | | | | | | | | | | |
| (for a share outstanding throughout the period) | | | | | | | | | | | | | | | | | | |
| Net asset value, beginning of period | $ | 18.01 | | $ | 15.07 | | $ | 14.22 | | $ | 12.75 | | $ | 12.80 | | $ | 15.79 | |
| Income from investment operationsa: | | | | | | | | | | | | | | | | | | |
| Net investment incomeb | | 0.24 | c | | 0.30 | | | 0.33 | | | 0.29 | | | 0.24 | | | 0.28 | |
| Net realized and unrealized gains (losses) | | 2.35 | | | 3.36 | | | 0.84 | | | 1.46 | | | (0.02 | ) | | (2.60 | ) |
| Total from investment operations | | 2.59 | | | 3.66 | | | 1.17 | | | 1.75 | | | 0.22 | | | (2.32 | ) |
| Less distributions from: | | | | | | | | | | | | | | | | | | |
| Net investment income | | (0.23 | ) | | (0.47 | ) | | (0.32 | ) | | (0.28 | ) | | (0.27 | ) | | (0.34 | ) |
| Net realized gains | | (0.83 | ) | | (0.25 | ) | | — | | | — | | | — | | | (0.33 | ) |
| Total distributions | | (1.06 | ) | | (0.72 | ) | | (0.32 | ) | | (0.28 | ) | | (0.27 | ) | | (0.67 | ) |
| Net asset value, end of period | $ | 19.54 | | $ | 18.01 | | $ | 15.07 | | $ | 14.22 | | $ | 12.75 | | $ | 12.80 | |
| |
| Total returnd | | 14.54 | % | | 24.97 | % | | 8.51 | % | | 13.63 | % | | 1.61 | % | | (13.79 | )% |
| |
| Ratios to average net assetse | | | | | | | | | | | | | | | | | | |
| Expenses | | 0.81 | % | | 0.81 | %f | | 0.84 | % | | 0.82 | %f | | 0.84 | %f | | 0.86 | %f |
| Net investment income | | 1.85 | %c | | 1.73 | % | | 2.24 | % | | 1.87 | % | | 1.79 | % | | 2.39 | % |
| |
| Supplemental data | | | | | | | | | | | | | | | | | | |
| Net assets, end of period (000’s) | $ | 251,087 | | $ | 216,767 | | $ | 232,104 | | $ | 191,488 | | $ | 170,328 | | $ | 166,706 | |
| Portfolio turnover rate | | 9.12 | % | | 17.57 | % | | 18.77 | % | | 16.11 | % | | 16.77 | % | | 17.66 | % |
aThe amount shown for a share outstanding throughout the period may not correlate with the Statement of Operations for the period due to the timing of sales and repurchases of
the Fund shares in relation to income earned and/or fluctuating market value of the investments of the Fund.
bBased on average daily shares outstanding.
cNet investment income per share includes approximately $0.12 per share received in the form of a special dividend paid in connection with certain Fund’s holdings. Excluding this
amount, the ratio of net investment income to average net assets would have been 1.25%.
dTotal return is not annualized for periods less than one year.
eRatios are annualized for periods less than one year.
fBenefit of expense reduction rounds to less than 0.01%.
22 | The accompanying notes are an integral part of these financial statements. | Semiannual Report
| | | | |
| Templeton World Fund | | | |
| |
| Statement of Investments, February 28, 2014 (unaudited) | | | |
| |
| |
| | Industry | Shares | | Value |
| Common Stocks 95.1% | | | | |
| Australia 0.6% | | | | |
| a Qantas Airways Ltd. | Airlines | 39,258,599 | $ | 40,801,323 |
| |
| Austria 0.4% | | | | |
| UNIQA Insurance Group AG | Insurance | 212,000 | | 2,779,320 |
| b UNIQA Insurance Group AG, 144A | Insurance | 1,891,099 | | 24,792,307 |
| | | | | 27,571,627 |
| |
| Canada 1.8% | | | | |
| Suncor Energy Inc. | Oil, Gas & Consumable Fuels | 1,244,777 | | 41,087,651 |
| Talisman Energy Inc. | Oil, Gas & Consumable Fuels | 6,001,970 | | 61,825,660 |
| Trican Well Service Ltd. | Energy Equipment & Services | 869,300 | | 10,988,983 |
| | | | | 113,902,294 |
| |
| China 0.8% | | | | |
| Digital China Holdings Ltd. | Electronic Equipment, Instruments & Components | 25,078,000 | | 24,818,185 |
| Dongfang Electric Corp. Ltd., H | Electrical Equipment | 9,202,319 | | 14,703,978 |
| Kunlun Energy Co. Ltd. | Oil, Gas & Consumable Fuels | 594,800 | | 1,059,241 |
| Weichai Power Co. Ltd., H | Machinery | 2,171,400 | | 8,226,272 |
| | | | | 48,807,676 |
| |
| France 8.1% | | | | |
| Alstom SA | Electrical Equipment | 1,196,140 | | 32,278,914 |
| AXA SA | Insurance | 2,231,490 | | 58,324,899 |
| BNP Paribas SA | Banks | 2,071,960 | | 170,014,259 |
| Sanofi | Pharmaceuticals | 1,089,710 | | 113,281,236 |
| Technip SA | Energy Equipment & Services | 213,030 | | 20,928,535 |
| Total SA, B | Oil, Gas & Consumable Fuels | 2,016,820 | | 130,894,438 |
| | | | | 525,722,281 |
| |
| Germany 2.9% | | | | |
| a Commerzbank AG | Banks | 1,012,200 | | 18,354,425 |
| Deutsche Boerse AG | Diversified Financial Services | 18,570 | | 1,523,245 |
| Merck KGaA | Pharmaceuticals | 288,600 | | 50,580,035 |
| Metro AG | Food & Staples Retailing | 757,708 | | 31,416,164 |
| a Osram Licht AG | Electrical Equipment | 2 | | 136 |
| SAP AG | Software | 162,344 | | 13,110,511 |
| Siemens AG | Industrial Conglomerates | 546,680 | | 72,997,522 |
| | | | | 187,982,038 |
| |
| Hong Kong 0.4% | | | | |
| Hutchison Whampoa Ltd. | Industrial Conglomerates | 1,541,583 | | 20,778,514 |
| Noble Group Ltd. | Trading Companies & Distributors | 7,586,400 | | 6,164,399 |
| | | | | 26,942,913 |
| |
| India 0.4% | | | | |
| Reliance Industries Ltd. | Oil, Gas & Consumable Fuels | 1,756,441 | | 22,734,178 |
Semiannual Report | 23
| | | | |
| Templeton World Fund | | | |
| |
| Statement of Investments, February 28, 2014 (unaudited) (continued) | | | |
| |
| |
| | Industry | Shares | | Value |
| Common Stocks (continued) | | | | |
| Ireland 1.3% | | | | |
| CRH PLC | Construction Materials | 2,944,063 | $ | 87,147,207 |
| |
| Israel 0.9% | | | | |
| Teva Pharmaceutical Industries Ltd., ADR | Pharmaceuticals | 1,155,484 | | 57,647,097 |
| |
| Italy 2.6% | | | | |
| Eni SpA | Oil, Gas & Consumable Fuels | 2,505,453 | | 60,437,538 |
| Saipem SpA | Energy Equipment & Services | 535,009 | | 12,580,843 |
| UniCredit SpA | Banks | 11,762,737 | | 93,580,804 |
| | | | | 166,599,185 |
| |
| Japan 3.7% | | | | |
| ITOCHU Corp. | Trading Companies & Distributors | 4,437,211 | | 55,094,643 |
| Nikon Corp. | Household Durables | 500,200 | | 9,153,955 |
| Nissan Motor Co. Ltd. | Automobiles | 11,268,900 | | 100,844,478 |
| Toyota Motor Corp. | Automobiles | 1,268,925 | | 72,782,447 |
| | | | | 237,875,523 |
| |
| Netherlands 2.7% | | | | |
| Akzo Nobel NV | Chemicals | 374,860 | | 31,043,580 |
| Fugro NV, IDR | Energy Equipment & Services | 463,519 | | 26,935,923 |
| a ING Groep NV, IDR | Diversified Financial Services | 8,074,698 | | 117,782,387 |
| | | | | 175,761,890 |
| |
| Norway 1.2% | | | | |
| Telenor ASA | Diversified Telecommunication Services | 3,470,220 | | 76,684,194 |
| |
| Portugal 0.8% | | | | |
| Galp Energia SGPS SA, B | Oil, Gas & Consumable Fuels | 2,902,130 | | 48,780,161 |
| |
| Russia 0.8% | | | | |
| Gazprom OAO, ADR | Oil, Gas & Consumable Fuels | 934,572 | | 7,195,270 |
| Mining and Metallurgical Co. | | | | |
| Norilsk Nickel OJSC, ADR | Metals & Mining | 2,289,558 | | 38,870,971 |
| Mobile TeleSystems, ADR | Wireless Telecommunication Services | 165,226 | | 2,845,192 |
| | | | | 48,911,433 |
| |
| Singapore 2.3% | | | | |
| DBS Group Holdings Ltd. | Banks | 3,301,396 | | 43,025,451 |
| a Flextronics International Ltd. | Electronic Equipment, Instruments & Components | 4,973,635 | | 44,514,034 |
| Singapore Telecommunications Ltd. | Diversified Telecommunication Services | 22,487,261 | | 63,864,105 |
| | | | | 151,403,590 |
| |
| South Korea 5.0% | | | | |
| Hana Financial Group Inc. | Banks | 1,154,470 | | 45,160,363 |
| KB Financial Group Inc. | Banks | 1,876,166 | | 70,223,566 |
| POSCO | Metals & Mining | 293,882 | | 78,294,282 |
| Samsung Electronics Co. Ltd. | Semiconductors & Semiconductor Equipment | 100,633 | | 127,347,696 |
| | | | | 321,025,907 |
| |
| 24 | Semiannual Report | | | | |
Templeton World Fund
Statement of Investments, February 28, 2014 (unaudited) (continued)
| | | | |
| | Industry | Shares | | Value |
| Common Stocks (continued) | | | | |
| Spain 0.9% | | | | |
| Telefonica SA | Diversified Telecommunication Services | 3,802,046 | $ | 58,292,207 |
| |
| Switzerland 5.9% | | | | |
| ABB Ltd. | Electrical Equipment | 1,080,030 | | 27,614,682 |
| Credit Suisse Group AG | Capital Markets | 4,053,632 | | 127,655,305 |
| Roche Holding AG | Pharmaceuticals | 500,372 | | 154,389,451 |
| Swiss Re AG | Insurance | 762,200 | | 71,228,786 |
| | | | | 380,888,224 |
| |
| Taiwan 1.4% | | | | |
| Compal Electronics Inc. | Technology Hardware, Storage & Peripherals | 34,584,086 | | 23,395,385 |
| Taiwan Semiconductor Manufacturing Co. | | | | |
| Ltd. | Semiconductors & Semiconductor Equipment | 7,501,690 | | 26,735,168 |
| Tripod Technology Corp. | Electronic Equipment, Instruments & Components | 20,588,000 | | 39,404,171 |
| | | | | 89,534,724 |
| |
| Turkey 0.4% | | | | |
| a Turkcell Iletisim Hizmetleri AS | Wireless Telecommunication Services | 5,561,571 | | 29,009,009 |
| |
| United Kingdom 15.9% | | | | |
| Aviva PLC | Insurance | 13,300,126 | | 105,449,074 |
| BAE Systems PLC | Aerospace & Defense | 8,784,320 | | 60,426,384 |
| BP PLC | Oil, Gas & Consumable Fuels | 6,798,278 | | 57,393,197 |
| Carillion PLC | Construction & Engineering | 7,144,390 | | 45,366,442 |
| GlaxoSmithKline PLC | Pharmaceuticals | 4,294,493 | | 120,174,606 |
| HSBC Holdings PLC | Banks | 7,758,970 | | 81,790,285 |
| a International Consolidated Airlines | | | | |
| Group SA | Airlines | 11,829,900 | | 86,544,938 |
| Kingfisher PLC | Specialty Retail | 17,216,830 | | 113,562,253 |
| a Lloyds Banking Group PLC | Banks | 57,898,630 | | 79,990,041 |
| Man Group PLC | Capital Markets | 7,953,365 | | 13,812,379 |
| Royal Dutch Shell PLC, A (EUR Traded) | Oil, Gas & Consumable Fuels | 128,452 | | 4,689,513 |
| Royal Dutch Shell PLC, A (GBP Traded) | Oil, Gas & Consumable Fuels | 5,923 | | 215,913 |
| Royal Dutch Shell PLC, B | Oil, Gas & Consumable Fuels | 1,461,012 | | 56,921,056 |
| Serco Group PLC | Commercial Services & Supplies | 4,993,940 | | 38,499,012 |
| Tesco PLC | Food & Staples Retailing | 16,476,424 | | 90,806,768 |
| Vodafone Group PLC | Wireless Telecommunication Services | 16,287,079 | | 67,891,535 |
| | | | | 1,023,533,396 |
| |
| United States 33.9% | | | | |
| Abercrombie & Fitch Co., A | Specialty Retail | 121,310 | | 4,807,515 |
| Accenture PLC, A | IT Services | 164,571 | | 13,716,993 |
| American International Group Inc. | Insurance | 1,283,575 | | 63,883,528 |
| Amgen Inc. | Biotechnology | 924,300 | | 114,631,686 |
| Baker Hughes Inc. | Energy Equipment & Services | 2,245,350 | | 142,085,748 |
| a Brocade Communications Systems Inc. | Communications Equipment | 2,439,605 | | 23,347,020 |
| Chevron Corp. | Oil, Gas & Consumable Fuels | 169,276 | | 19,522,601 |
| Cisco Systems Inc. | Communications Equipment | 4,452,390 | | 97,062,102 |
| Citigroup Inc. | Banks | 2,663,930 | | 129,546,916 |
Semiannual Report | 25
| | | | |
| Templeton World Fund | | | |
| |
| Statement of Investments, February 28, 2014 (unaudited) (continued) | | | |
| |
| |
| | Industry | Shares | | Value |
| Common Stocks (continued) | | | | |
| United States (continued) | | | | |
| Comcast Corp., Special A | Media | 1,259,099 | $ | 62,822,745 |
| CVS Caremark Corp. | Food & Staples Retailing | 1,130,850 | | 82,710,369 |
| FedEx Corp. | Air Freight & Logistics | 262,667 | | 35,021,391 |
| Foot Locker Inc. | Specialty Retail | 1,476,200 | | 61,572,302 |
| Halliburton Co. | Energy Equipment & Services | 1,006,589 | | 57,375,573 |
| The Hartford Financial Services Group Inc. | Insurance | 386,300 | | 13,593,897 |
| Hewlett-Packard Co. | Technology Hardware, Storage & Peripherals | 3,459,430 | | 103,367,768 |
| ING U.S. Inc. | Diversified Financial Services | 176,020 | | 6,313,837 |
| JPMorgan Chase & Co. | Banks | 1,809,934 | | 102,840,450 |
| KBR Inc. | Construction & Engineering | 589,580 | | 16,284,200 |
| LyondellBasell Industries NV, A | Chemicals | 186,550 | | 16,431,324 |
| Medtronic Inc. | Health Care Equipment & Supplies | 2,059,090 | | 122,021,673 |
| Merck & Co. Inc. | Pharmaceuticals | 1,337,900 | | 76,246,921 |
| Microsoft Corp. | Software | 3,363,450 | | 128,853,769 |
| Morgan Stanley | Capital Markets | 4,752,350 | | 146,372,380 |
| a Navistar International Corp. | Machinery | 1,144,790 | | 42,929,625 |
| a News Corp., A | Media | 1,918,833 | | 35,172,209 |
| Noble Corp. PLC | Energy Equipment & Services | 2,107,874 | | 65,449,488 |
| Oracle Corp. | Software | 466,951 | | 18,262,454 |
| Pfizer Inc. | Pharmaceuticals | 3,659,230 | | 117,497,875 |
| PNC Financial Services Group Inc. | Banks | 160,070 | | 13,090,525 |
| a Sprint Corp. | Wireless Telecommunication Services | 2,001,967 | | 17,497,191 |
| SunTrust Banks Inc. | Banks | 1,710,680 | | 64,458,422 |
| a,c Swift Energy Co. | Oil, Gas & Consumable Fuels | 1,736,740 | | 17,367,400 |
| Time Warner Cable Inc. | Media | 315,199 | | 44,238,180 |
| Twenty-First Century Fox Inc., A | Media | 1,479,852 | | 49,634,236 |
| United Parcel Service Inc., B | Air Freight & Logistics | 257,279 | | 24,639,610 |
| Verizon Communications Inc. | Diversified Telecommunication Services | 785,312 | | 37,255,185 |
| | | | | 2,187,925,108 |
| |
| Total Common Stocks | | | | |
| (Cost $4,481,349,148) | | | | 6,135,483,185 |
| |
| Preferred Stocks 0.9% | | | | |
| Brazil 0.9% | | | | |
| Petroleo Brasileiro SA, ADR, pfd. | Oil, Gas & Consumable Fuels | 2,943,702 | | 34,323,565 |
| Vale SA, ADR, pfd., A | Metals & Mining | 2,037,464 | | 25,447,926 |
| |
| Total Preferred Stocks | | | | |
| (Cost $66,626,664) | | | | 59,771,491 |
| |
| Non-Registered Mutual Funds | | | | |
| (Cost $27,904,400) 0.5% | | | | |
| China 0.5% | | | | |
| a,d,e,f Templeton China Opportunities Fund, Ltd., | | | | |
| Reg D | Diversified Financial Services | 2,792,110 | | 30,126,869 |
26 | Semiannual Report
Templeton World Fund
Statement of Investments, February 28, 2014 (unaudited) (continued)
| | | | | |
| | | Principal Amount* | | Value | |
| Mortgage-Backed Securities (Cost $2,178,270) 0.1% | | | | | |
| United States 0.1% | | | | | |
| FHLMC Gold 30 Year, 5.50%, 12/01/35 | $ | 2,210,040 | $ | 2,438,162 | |
| |
| Total Investments before Short Term Investments | | | | | |
| (Cost $4,578,058,482) | | | | 6,227,819,707 | |
| |
| Short Term Investments 3.6% | | | | | |
| Time Deposits 3.4% | | | | | |
| Canada 3.4% | | | | | |
| Bank of Montreal, 0.04%, 3/03/14 | | 150,000,000 | | 150,000,000 | |
| Royal Bank of Canada, 0.03%, 3/03/14 | | 70,000,000 | | 70,000,000 | |
| |
| Total Time Deposits (Cost $220,000,000) | | | | 220,000,000 | |
| |
| Total Investments before Money Market Funds | | | | | |
| (Cost $4,798,058,482) | | | | 6,447,819,707 | |
| |
| | | Shares | | | |
| g Investments from Cash Collateral Received for Loaned Securities | | | | | |
| (Cost $14,532,450) 0.2% | | | | | |
| Money Market Funds 0.2% | | | | | |
| United States 0.2% | | | | | |
| h BNY Mellon Overnight Government Fund, 0.032% | | 14,532,450 | | 14,532,450 | |
| |
| Total Investments (Cost $4,812,590,932) 100.2% | | | | 6,462,352,157 | |
| Other Assets, less Liabilities (0.2)% | | | | (13,236,228 | ) |
| |
| Net Assets 100.0% | | | $ | 6,449,115,929 | |
See Abbreviations on page 44.
*The principal amount is stated in U.S. dollars unless otherwise indicated.
aNon-income producing.
bSecurity was purchased pursuant to Rule 144A under the Securities Act of 1933 and may be sold in transactions exempt from registration only to qualified institutional buyers
or in a public offering registered under the Securities Act of 1933. This security has been deemed liquid under guidelines approved by the Trust’s Board of Trustees. At February 28,
2014, the aggregate value of this security was $24,792,307, representing 0.38% of net assets.
cA portion or all of the security is on loan at February 28, 2014. See Note 1(e).
dSee Note 1(d) regarding investment in Templeton China Opportunities Fund, Ltd.
eSee Note 8 regarding restricted securities.
fSee Note 9 regarding holdings of 5% voting securities.
gSee Note 1(e) regarding securities on loan.
hThe rate shown is the annualized seven-day yield at period end.
Semiannual Report | The accompanying notes are an integral part of these financial statements. | 27
| | |
| Templeton World Fund | | |
| |
| Financial Statements | | |
| |
| |
| Statement of Assets and Liabilities | | |
| February 28, 2014 (unaudited) | | |
| |
| Assets: | | |
| Investments in securities: | | |
| Cost - Unaffiliated issuers | $ | 4,784,686,532 |
| Cost - Non-controlled affiliated issuers (Note 9) | | 27,904,400 |
| Total cost of investments | $ | 4,812,590,932 |
| Value - Unaffiliated issuers | $ | 6,432,225,288 |
| Value - Non-controlled affiliated issuers (Note 9) | | 30,126,869 |
| Total value of investments (includes securities loaned in the amount of $14,178,000) | | 6,462,352,157 |
| Cash | | 942,234 |
| Receivables: | | |
| Investment securities sold | | 2,153,650 |
| Capital shares sold | | 5,276,504 |
| Dividends and interest | | 26,850,026 |
| Other assets | | 4,404 |
| Total assets | | 6,497,578,975 |
| Liabilities: | | |
| Payables: | | |
| Investment securities purchased | | 21,575,254 |
| Capital shares redeemed | | 6,273,602 |
| Management fees | | 2,963,797 |
| Administrative fees | | 382,330 |
| Distribution fees | | 1,274,693 |
| Transfer agent fees | | 932,798 |
| Payable upon return of securities loaned | | 14,532,450 |
| Accrued expenses and other liabilities | | 528,122 |
| Total liabilities | | 48,463,046 |
| Net assets, at value | $ | 6,449,115,929 |
| Net assets consist of: | | |
| Paid-in capital | $ | 4,634,921,171 |
| Undistributed net investment income | | 64,881,376 |
| Net unrealized appreciation (depreciation) | | 1,649,993,025 |
| Accumulated net realized gain (loss) | | 99,320,357 |
| Net assets, at value | $ | 6,449,115,929 |
28 | The accompanying notes are an integral part of these financial statements. | Semiannual Report
| | | |
| Templeton World Fund | | | |
| |
| Financial Statements (continued) | | | |
| |
| |
| Statement of Assets and Liabilities (continued) | | | |
| February 28, 2014 (unaudited) | | | |
| |
| Class A: | | | |
| Net assets, at value | $ | | 5,905,511,164 |
| Shares outstanding | | | 301,853,936 |
| Net asset value per sharea | | $ | 19.56 |
| Maximum offering price per share (net asset value per share ÷ 94.25%) | | $ | 20.75 |
| Class C: | | | |
| Net assets, at value | $ | | 238,495,084 |
| Shares outstanding | | | 12,604,365 |
| Net asset value and maximum offering price per sharea | | $ | 18.92 |
| Class R6: | | | |
| Net assets, at value | $ | | 54,022,425 |
| Shares outstanding | | | 2,766,029 |
| Net asset value and maximum offering price per share | | $ | 19.53 |
| Advisor Class: | | | |
| Net assets, at value | $ | | 251,087,256 |
| Shares outstanding | | | 12,850,843 |
| Net asset value and maximum offering price per share | | $ | 19.54 |
| |
| |
| aRedemption price is equal to net asset value less contingent deferred sales charges, if applicable. | | | |
Semiannual Report | The accompanying notes are an integral part of these financial statements. | 29
| | |
| Templeton World Fund | | |
| |
| Financial Statements (continued) | | |
| |
| |
| Statement of Operations | | |
| for the six months ended February 28, 2014 (unaudited) | | |
| |
| Investment income: | | |
| Dividends (net of foreign taxes of $2,783,148) | $ | 100,345,542 |
| Interest | | 97,280 |
| Paydown gain | | 12,508 |
| Income from securities loaned | | 5,965 |
| Total investment income | | 100,461,295 |
| Expenses: | | |
| Management fees (Note 3a) | | 18,970,503 |
| Administrative fees (Note 3b) | | 2,448,926 |
| Distribution fees: (Note 3c) | | |
| Class A | | 7,125,921 |
| Class C | | 1,139,785 |
| Transfer agent fees: (Note 3e) | | |
| Class A | | 2,416,256 |
| Class C | | 96,871 |
| Class R6 | | 140 |
| Advisor Class | | 99,906 |
| Custodian fees (Note 4) | | 324,203 |
| Reports to shareholders | | 154,983 |
| Registration and filing fees | | 76,271 |
| Professional fees | | 81,500 |
| Trustees’ fees and expenses | | 53,617 |
| Other | | 49,453 |
| Total expenses | | 33,038,335 |
| Net investment income | | 67,422,960 |
| Realized and unrealized gains (losses): | | |
| Net realized gain (loss) from: | | |
| Investments | | 119,531,234 |
| Written options | | 198,000 |
| Foreign currency transactions | | 757,532 |
| Net realized gain (loss) | | 120,486,766 |
| Net change in unrealized appreciation (depreciation) on: | | |
| Investments | | 629,627,956 |
| Translation of other assets and liabilities denominated in foreign currencies | | 209,795 |
| Net change in unrealized appreciation (depreciation) | | 629,837,751 |
| Net realized and unrealized gain (loss) | | 750,324,517 |
| Net increase (decrease) in net assets resulting from operations | $ | 817,747,477 |
30 | The accompanying notes are an integral part of these financial statements. | Semiannual Report
| | | | | | |
| Templeton World Fund | | | | | | |
| |
| Financial Statements (continued) | | | | | | |
| |
| |
| Statements of Changes in Net Assets | | | | | | |
| |
| |
| |
| | | Six Months Ended | | | | |
| | | February 28, 2014 | | | Year Ended | |
| | | (unaudited) | | | August 31, 2013 | |
| Increase (decrease) in net assets: | | | | | | |
| Operations: | | | | | | |
| Net investment income | $ | 67,422,960 | | $ | 81,403,846 | |
| Net realized gain (loss) from investments, written options and foreign currency | | | | | | |
| transactions | | 120,486,766 | | | 268,907,233 | |
| Net change in unrealized appreciation (depreciation) on investments and translation of | | | | | | |
| other assets and liabilities denominated in foreign currencies and deferred taxes | | 629,837,751 | | | 861,074,243 | |
| Net increase (decrease) in net assets resulting from operations | | 817,747,477 | | | 1,211,385,322 | |
| Distributions to shareholders from: | | | | | | |
| Net investment income: | | | | | | |
| Class A | | (53,927,369 | ) | | (125,749,470 | ) |
| Class C | | (671,577 | ) | | (3,213,854 | ) |
| Class R6 | | (321,643 | ) | | — | |
| Advisor Class | | (2,783,214 | ) | | (6,995,392 | ) |
| Net realized gains: | | | | | | |
| Class A | | (239,843,544 | ) | | (76,399,449 | ) |
| Class B | | — | | | (16,935 | ) |
| Class C | | (9,992,724 | ) | | (3,102,423 | ) |
| Class R6 | | (1,076,002 | ) | | — | |
| Advisor Class | | (10,037,283 | ) | | (3,774,084 | ) |
| Total distributions to shareholders | | (318,653,356 | ) | | (219,251,607 | ) |
| Capital share transactions: (Note 2) | | | | | | |
| Class A | | 167,765,690 | | | (490,498,402 | ) |
| Class B | | — | | | (2,160,569 | ) |
| Class C | | 9,663,146 | | | (11,906,897 | ) |
| Class R6 | | 27,246,841 | | | 24,666,179 | |
| Advisor Class | | 15,725,982 | | | (60,679,854 | ) |
| Total capital share transactions | | 220,401,659 | | | (540,579,543 | ) |
| Net increase (decrease) in net assets | | 719,495,780 | | | 451,554,172 | |
| Net assets: | | | | | | |
| Beginning of period | | 5,729,620,149 | | | 5,278,065,977 | |
| End of period | $ | 6,449,115,929 | | $ | 5,729,620,149 | |
| Undistributed net investment income included in net assets: | | | | | | |
| End of period | $ | 64,881,376 | | $ | 55,162,219 | |
Semiannual Report | The accompanying notes are an integral part of these financial statements. | 31
Templeton World Fund
Notes to Financial Statements (unaudited)
1. ORGANIZATION AND SIGNIFICANT ACCOUNTING POLICIES
Templeton Funds (Trust) is registered under the Investment Company Act of 1940, as amended, (1940 Act) as an open-end investment company, consisting of two separate funds. The Templeton World Fund (Fund) is included in this report. The financial statements of the remaining fund in the Trust are presented separately. The Fund offers four classes of shares: Class A, Class C, Class R6, and Advisor Class. Each class of shares differs by its initial sales load, contingent deferred sales charges, voting rights on matters affecting a single class, its exchange privilege and fees primarily due to differing arrangements for distribution and transfer agent fees.
The following summarizes the Fund’s significant accounting policies.
a. Financial Instrument Valuation
The Fund’s investments in financial instruments are carried at fair value daily. Fair value is the price that would be received to sell an asset or paid to transfer a liability in an orderly transaction between market participants on the measurement date. The Fund calculates the net asset value (NAV) per share at the close of the New York Stock Exchange (NYSE), generally at 4 p.m. Eastern time (NYSE close) on each day the NYSE is open for trading. Under procedures approved by the Trust’s Board of Trustees (the Board), the Fund’s administrator, investment manager and other affiliates have formed the Valuation and Liquidity Oversight Committee (VLOC). The VLOC provides administration and oversight of the Fund’s valuation policies and procedures, which are approved annually by the Board. Among other things, these procedures allow the Fund to utilize independent pricing services, quotations from securities and financial instrument dealers, and other market sources to determine fair value.
Equity securities and derivative financial instruments (derivatives) listed on an exchange or on the NASDAQ National Market System are valued at the last quoted sale price or the official closing price of the day, respectively. Foreign equity securities are valued as of the close of trading on the foreign stock exchange on which the security is primarily traded, or the NYSE, whichever is earlier. The value is then converted into its U.S. dollar equivalent at the foreign exchange rate in effect at the close of the NYSE on the day that the value of the security is determined. Over-the-counter (OTC) securities are valued within the range of the most recent quoted bid and ask prices. Securities that trade in multiple markets or on multiple exchanges are valued according to the broadest and most representative market. Certain equity securities are valued based upon fundamental characteristics or relationships to similar securities. Investments in non-registered funds are valued at the closing net asset value.
Debt securities generally trade in the OTC market rather than on a securities exchange. The Fund’s pricing services use multiple valuation techniques to determine fair value. In instances where sufficient market activity exists, the pricing services may utilize a market-based approach through which quotes from market makers are used to determine fair value. In instances where sufficient market activity may not exist or is limited, the pricing services also utilize proprietary credit spreads, estimated default rates, anticipated market interest rate volatility, coupon rates, anticipated timing of principal repayments, underlying collateral, and other unique security
32 | Semiannual Report
Templeton World Fund
Notes to Financial Statements (unaudited) (continued)
| 1. | ORGANIZATION AND SIGNIFICANT ACCOUNTING POLICIES (continued) |
| a. | Financial Instrument Valuation (continued) |
features in order to estimate the relevant cash flows, which are then discounted to calculate the fair value. Securities denominated in a foreign currency are converted into their U.S. dollar equivalent at the foreign exchange rate in effect at the close of the NYSE on the date that the values of the foreign debt securities are determined. Time deposits are valued at cost, which approximates market value.
The Fund has procedures to determine the fair value of financial instruments for which market prices are not reliable or readily available. Under these procedures, the VLOC convenes on a regular basis to review such financial instruments and considers a number of factors, including significant unobservable valuation inputs, when arriving at fair value. The VLOC primarily employs a market-based approach which may use related or comparable assets or liabilities, recent transactions, market multiples, book values, and other relevant information for the investment to determine the fair value of the investment. An income-based valuation approach may also be used in which the anticipated future cash flows of the investment are discounted to calculate fair value. Discounts may also be applied due to the nature or duration of any restrictions on the disposition of the investments. Due to the inherent uncertainty of valuations of such investments, the fair values may differ significantly from the values that would have been used had an active market existed. The VLOC employs various methods for calibrating these valuation approaches including a regular review of key inputs and assumptions, transactional back-testing or disposition analysis, and reviews of any related market activity.
Trading in securities on foreign securities stock exchanges and OTC markets may be completed before the daily close of business on the NYSE. Occasionally, events occur between the time at which trading in a foreign security is completed and the close of the NYSE that might call into question the reliability of the value of a portfolio security held by the Fund. As a result, differences may arise between the value of the Fund’s portfolio securities as determined at the foreign market close and the latest indications of value at the close of the NYSE. In order to minimize the potential for these differences, the VLOC monitors price movements following the close of trading in foreign stock markets through a series of country specific market proxies (such as baskets of American Depositary Receipts, futures contracts and exchange traded funds). These price movements are measured against established trigger thresholds for each specific market proxy to assist in determining if an event has occurred that may call into question the reliability of the values of the foreign securities held by the Fund. If such an event occurs, the securities may be valued using fair value procedures, which may include the use of independent pricing services.
Also, when the last day of the reporting period is a non-business day, certain foreign markets may be open on those days that the NYSE is closed, which could result in differences between the value of the Fund’s portfolio securities on the last business day and the last calendar day of the reporting period. Any significant security valuation changes due to an open foreign market are adjusted and reflected by the Fund for financial reporting purposes.
Semiannual Report | 33
Templeton World Fund
Notes to Financial Statements (unaudited) (continued)
| 1. | ORGANIZATION AND SIGNIFICANT ACCOUNTING POLICIES (continued) |
| b. | Foreign Currency Translation |
Portfolio securities and other assets and liabilities denominated in foreign currencies are translated into U.S. dollars based on the exchange rate of such currencies against U.S. dollars on the date of valuation. The Fund may enter into foreign currency exchange contracts to facilitate transactions denominated in a foreign currency. Purchases and sales of securities, income and expense items denominated in foreign currencies are translated into U.S. dollars at the exchange rate in effect on the transaction date. Portfolio securities and assets and liabilities denominated in foreign currencies contain risks that those currencies will decline in value relative to the U.S. dollar. Occasionally, events may impact the availability or reliability of foreign exchange rates used to convert the U.S. dollar equivalent value. If such an event occurs, the foreign exchange rate will be valued at fair value using procedures established and approved by the Board.
The Fund does not separately report the effect of changes in foreign exchange rates from changes in market prices on securities held. Such changes are included in net realized and unrealized gain or loss from investments on the Statement of Operations.
Realized foreign exchange gains or losses arise from sales of foreign currencies, currency gains or losses realized between the trade and settlement dates on securities transactions and the difference between the recorded amounts of dividends, interest, and foreign withholding taxes and the U.S. dollar equivalent of the amounts actually received or paid. Net unrealized foreign exchange gains and losses arise from changes in foreign exchange rates on foreign denominated assets and liabilities other than investments in securities held at the end of the reporting period.
c. Derivative Financial Instruments
The Fund invested in derivatives in order to manage risk or gain exposure to various other investments or markets. Derivatives are financial contracts based on an underlying or notional amount, require no initial investment or an initial net investment that is smaller than would normally be required to have a similar response to changes in market factors, and require or permit net settlement. Derivatives contain various risks including the potential inability of the counterparty to fulfill their obligations under the terms of the contract, the potential for an illiquid secondary market, and/or the potential for market movements which expose the Fund to gains or losses in excess of the amounts shown on the Statement of Assets and Liabilities. Realized gain and loss and unrealized appreciation and depreciation on these contracts for the period are included in the Statement of Operations.
Collateral Requirements differ by the type of derivative. Collateral or initial margin requirements are set by the broker or exchange clearing house for exchange traded and centrally cleared derivatives. Initial margin deposited is held at the exchange and can be in the form of cash and/or securities.
34 | Semiannual Report
Templeton World Fund
Notes to Financial Statements (unaudited) (continued)
| 1. | ORGANIZATION AND SIGNIFICANT ACCOUNTING POLICIES (continued) |
| c. | Derivative Financial Instruments (continued) |
The Fund purchased or wrote exchange traded option contracts primarily to manage exposure to equity price risk. An option is a contract entitling the holder to purchase or sell a specific amount of shares or units of an asset or notional amount of a swap (swaption), at a specified price. Options purchased are recorded as an asset while options written are recorded as a liability. Upon exercise of an option, the acquisition cost or sales proceeds of the underlying investment is adjusted by any premium received or paid. Upon expiration of an option, any premium received or paid is recorded as a realized gain or loss. Upon closing an option other than through expiration or exercise, the difference between the premium and the cost to close the position is recorded as a realized gain or loss.
d. Investment in Templeton China Opportunities Fund, Ltd.
The Fund invests in Templeton China Opportunities Fund, Ltd. (China Fund), a private offering of unregistered shares in a Cayman Islands Exempt Company. The China Fund investment objective is to seek capital growth primarily through investments in A-shares of Chinese companies listed on the Shanghai and Shenzhen stock exchanges. Chinese A-shares are traded in Chinese Renminbi and are only available as an investment to domestic (Chinese) investors and holders of a Qualified Foreign Institutional Investors license. The China Fund is managed by Templeton Investment Counsel, LLC (an affiliate of the investment manager). No additional management or administrative fees are incurred on assets invested in the China Fund.
The China Fund may be subject to certain restrictions and administrative processes relating to its ability to repatriate cash balances, investment proceeds and earnings associated with its investment, as such activities are subject to approval by agencies of the Chinese government and thus the Fund may incur delays in redeeming its investment in the China Fund. The Fund’s investment in the China Fund is valued based upon the fair value of the China Fund’s portfolio securities and other assets and liabilities.
e. Securities Lending
The Fund participates in an agency based securities lending program. The Fund receives cash collateral against the loaned securities in an amount equal to at least 102% of the market value of the loaned securities. Collateral is maintained over the life of the loan in an amount not less than 100% of the market value of loaned securities, as determined at the close of fund business each day; any additional collateral required due to changes in security values is delivered to the Fund on the next business day. The collateral is invested in a non-registered money fund. The Fund receives income from the investment of cash collateral, in addition to lending fees and rebates paid by the borrower. The Fund bears the market risk with respect to the collateral investment, securities loaned, and the risk that the agent may default on its obligations to the Fund. The securities lending agent has agreed to indemnify the Fund in the event of default by a third party borrower.
Semiannual Report | 35
Templeton World Fund
Notes to Financial Statements (unaudited) (continued)
| 1. | ORGANIZATION AND SIGNIFICANT ACCOUNTING POLICIES (continued) |
| f. | Income and Deferred Taxes |
It is the Fund’s policy to qualify as a regulated investment company under the Internal Revenue Code. The Fund intends to distribute to shareholders substantially all of its taxable income and net realized gains to relieve it from federal income and excise taxes. As a result, no provision for U.S. federal income taxes is required.
The Fund may be subject to foreign taxation related to income received, capital gains on the sale of securities and certain foreign currency transactions in the foreign jurisdictions in which it invests. Foreign taxes, if any, are recorded based on the tax regulations and rates that exist in the foreign markets in which the Fund invests. When a capital gain tax is determined to apply the Fund records an estimated deferred tax liability in an amount that would be payable if the securities were disposed of on the valuation date.
The Fund recognizes the tax benefits of uncertain tax positions only when the position is “more likely than not” to be sustained upon examination by the tax authorities based on the technical merits of the tax position. As of February 28, 2014, and for all open tax years, the Fund has determined that no liability for unrecognized tax benefits is required in the Fund’s financial statements related to uncertain tax positions taken on a tax return (or expected to be taken on future tax returns). Open tax years are those that remain subject to examination and are based on each tax jurisdiction statute of limitation.
g. Security Transactions, Investment Income, Expenses and Distributions
Security transactions are accounted for on trade date. Realized gains and losses on security transactions are determined on a specific identification basis. Interest income and estimated expenses are accrued daily. Amortization of premium and accretion of discount on debt securities are included in interest income. Paydown gains and losses are recorded separately on the Statement of Operations. Dividend income is recorded on the ex-dividend date except that certain dividends from foreign securities are recognized as soon as the Fund is notified of the ex-dividend date. Distributions to shareholders are recorded on the ex-dividend date and are determined according to income tax regulations (tax basis). Distributable earnings determined on a tax basis may differ from earnings recorded in accordance with accounting principles generally accepted in the United States of America. These differences may be permanent or temporary. Permanent differences are reclassified among capital accounts to reflect their tax character. These reclassifications have no impact on net assets or the results of operations. Temporary differences are not reclassified, as they may reverse in subsequent periods.
Common expenses incurred by the Trust are allocated among the funds based on the ratio of net assets of each fund to the combined net assets of the Trust. Fund specific expenses are charged directly to the fund that incurred the expense.
36 | Semiannual Report
Templeton World Fund
Notes to Financial Statements (unaudited) (continued)
| 1. | ORGANIZATION AND SIGNIFICANT ACCOUNTING POLICIES (continued) |
| g. | Security Transactions, Investment Income, Expenses and Distributions (continued) |
Realized and unrealized gains and losses and net investment income, not including class specific expenses, are allocated daily to each class of shares based upon the relative proportion of net assets of each class. Differences in per share distributions, by class, are generally due to differences in class specific expenses.
h. Accounting Estimates
The preparation of financial statements in accordance with accounting principles generally accepted in the United States of America requires management to make estimates and assumptions that affect the reported amounts of assets and liabilities at the date of the financial statements and the amounts of income and expenses during the reporting period. Actual results could differ from those estimates.
i. Guarantees and Indemnifications
Under the Trust’s organizational documents, its officers and trustees are indemnified by the Trust against certain liabilities arising out of the performance of their duties to the Trust. Additionally, in the normal course of business, the Trust, on behalf of the Fund, enters into contracts with service providers that contain general indemnification clauses. The Trust’s maximum exposure under these arrangements is unknown as this would involve future claims that may be made against the Trust that have not yet occurred. Currently, the Trust expects the risk of loss to be remote.
2. SHARES OF BENEFICIAL INTEREST
At February 28, 2014, there were an unlimited number of shares authorized (without par value).
Transactions in the Fund’s shares were as follows:
| | | | | | | | | | |
| | Six Months Ended | | Year Ended | |
| | February 28, 2014 | | August 31, 2013 | |
| | Shares | | | Amount | | Shares | | | Amount | |
| Class A Shares: | | | | | | | | | | |
| Shares sold | 15,134,921 | | $ | 292,918,002 | | 21,020,191 | | $ | 353,575,364 | |
| Shares issued in reinvestment of | | | | | | | | | | |
| distributions | 14,121,647 | | | 268,452,517 | | 11,494,306 | | | 182,184,742 | |
| Shares redeemed | (20,345,773 | ) | | (393,604,829 | ) | (62,146,785 | ) | | (1,026,258,508 | ) |
| Net increase (decrease) | 8,910,795 | | $ | 167,765,690 | | (29,632,288 | ) | $ | (490,498,402 | ) |
| Class B Sharesa: | | | | | | | | | | |
| Shares sold | | | | | | 190 | | $ | 3,029 | |
| Shares issued in reinvestment of | | | | | | | | | | |
| distributions | | | | | | 899 | | | 14,546 | |
| Shares redeemed | | | | | | (134,986 | ) | | (2,178,144 | ) |
| Net increase (decrease) | | | | | | (133,897 | ) | $ | (2,160,569 | ) |
Semiannual Report | 37
| | | | | | | | | | |
| Templeton World Fund | | | | | | |
| |
| Notes to Financial Statements (unaudited) (continued) | | | | | | |
| |
| |
| 2. SHARES OF BENEFICIAL INTEREST (continued) | | | | | | | | | |
| | Six Months Ended | | Year Ended | |
| | February 28, 2014 | | August 31, 2013 | |
| | Shares | | | Amount | | Shares | | | Amount | |
| Class C Shares: | | | | | | | | | | |
| Shares sold | 784,952 | | $ | 14,704,358 | | 975,417 | | $ | 15,948,040 | |
| Shares issued in reinvestment of | | | | | | | | | | |
| distributions | 506,111 | | | 9,317,494 | | 358,068 | | | 5,510,662 | |
| Shares redeemed | (768,992 | ) | | (14,358,706 | ) | (2,085,565 | ) | | (33,365,599 | ) |
| Net increase (decrease) | 522,071 | | $ | 9,663,146 | | (752,080 | ) | $ | (11,906,897 | ) |
| Class R6 Sharesb: | | | | | | | | | | |
| Shares sold | 1,472,745 | | $ | 28,357,170 | | 1,363,910 | | $ | 24,935,999 | |
| Shares issued in reinvestment of | | | | | | | | | | |
| distributions | 73,699 | | | 1,397,332 | | — | | | — | |
| Shares redeemed | (129,635 | ) | | (2,507,661 | ) | (14,690 | ) | | (269,820 | ) |
| Net increase (decrease) | 1,416,809 | | $ | 27,246,841 | | 1,349,220 | | $ | 24,666,179 | |
| Advisor Class Shares: | | | | | | | | | | |
| Shares sold | 2,582,024 | | $ | 49,808,872 | | 4,793,582 | | $ | 79,599,371 | |
| Shares issued in reinvestment of | | | | | | | | | | |
| distributions | 593,105 | | | 11,251,196 | | 612,858 | | | 9,695,416 | |
| Shares redeemed | (2,358,014 | ) | | (45,334,086 | ) | (8,777,773 | ) | | (149,974,641 | ) |
| Net increase (decrease) | 817,115 | | $ | 15,725,982 | | (3,371,333 | ) | $ | (60,679,854 | ) |
| |
| aEffective March 22, 2013, all Class B Shares were converted to Class A. | | | | | | | |
| bFor the period May 1, 2013 (effective date) to August 31, 2013. | | | | | | | | | |
3. TRANSACTIONS WITH AFFILIATES
Franklin Resources, Inc. is the holding company for various subsidiaries that together are referred to as Franklin Templeton Investments. Certain officers and trustees of the Trust are also officers and/or directors of the following subsidiaries:
| |
| Subsidiary | Affiliation |
| Templeton Global Advisors Limited (TGAL) | Investment manager |
| Franklin Templeton Services, LLC (FT Services) | Administrative manager |
| Franklin Templeton Distributors, Inc. (Distributors) | Principal underwriter |
| Franklin Templeton Investor Services, LLC (Investor Services) | Transfer agent |
a. Management Fees
The Fund pays an investment management fee to TGAL based on the average daily net assets of the Fund as follows:
| | | | |
| | | Annualized Fee Rate | | Net Assets |
| | | 0.630 | % | Up to and including $1 billion |
| | | 0.615 | % | Over $1 billion, up to and including $5 billion |
| | | 0.600 | % | Over $5 billion, up to and including $10 billion |
| | | 0.580 | % | Over $10 billion, up to and including $15 billion |
| | | 0.560 | % | Over $15 billion, up to and including $20 billion |
| | | 0.540 | % | In excess of $20 billion |
| 38 | | | Semiannual Report |
Templeton World Fund
Notes to Financial Statements (unaudited) (continued)
| 3. | TRANSACTIONS WITH AFFILIATES (continued) |
| b. | Administrative Fees |
The Fund pays its allocated share of an administrative fee to FT services based on the Trust’s aggregate average daily net assets as follows:
| | |
| Annualized Fee Rate | | Net Assets |
| 0.150 | % | Up to and including $200 million |
| 0.135 | % | Over $200 million, up to and including $700 million |
| 0.100 | % | Over $700 million, up to and including $1.2 billion |
| 0.075 | % | In excess of $1.2 billion |
c. Distribution Fees
The Board has adopted distribution plans for each share class, with the exception of Class R6 and Advisor Class shares, pursuant to Rule 12b-1 under the 1940 Act. Distribution fees are not charged on shares held by affiliates. Under the Fund’s Class A reimbursement distribution plan, the Fund reimburses Distributors for costs incurred in connection with the servicing, sale and distribution of the Fund’s shares up to the maximum annual plan rate. Under the Class A reimbursement distribution plan, costs exceeding the maximum for the current plan year cannot be reimbursed in subsequent periods. In addition, under the Fund’s Class C compensation distribution plans, the Fund pays Distributors for costs incurred in connection with the servicing, sale and distribution of the Fund’s shares up to the maximum annual plan rate for each class. The plan year, for purposes of monitoring compliance with the maximum annual plan rates, is February 1 through January 31.
The maximum annual plan rates, based on the average daily net assets, for each class, are as follows:
d. Sales Charges/Underwriting Agreements
Front-end sales charges and contingent deferred sales charges (CDSC) do not represent expenses of the Fund. These charges are deducted from the proceeds of sales of Fund shares prior to investment or from redemption proceeds prior to remittance, as applicable. Distributors has advised the Fund of the following commission transactions related to the sales and redemptions of the Fund’s shares for the period:
| | |
| Sales charges retained net of commissions paid to unaffiliated | | |
| broker/dealers | $ | 377,661 |
| CDSC retained | $ | 7,193 |
Semiannual Report | 39
Templeton World Fund
Notes to Financial Statements (unaudited) (continued)
| 3. | TRANSACTIONS WITH AFFILIATES (continued) |
| e. | Transfer Agent Fees |
Each class of shares, except for Class R6, pays transfer agent fees to Investor Services for its performance of shareholder servicing obligations and reimburses Investor Services for out of pocket expenses incurred, including shareholding servicing fees paid to third parties. These fees are allocated daily based upon their relative proportion of such classes’ aggregate net assets. Class R6 pays Investor Services transfer agent fees specific to that class.
For the period ended February 28, 2014, the Fund paid transfer agent fees of $2,613,173, of which $1,327,241 was retained by Investor Services.
f. Waiver and Expense Reimbursements
Investor Services has contractually agreed to waive or limit its fees so that the Class R6 transfer agent fees do not exceed 0.01% through December 31, 2014. There were no expenses waived during the period ended February 28, 2014.
4. EXPENSE OFFSET ARRANGEMENT
The Fund has entered into an arrangement with its custodian whereby credits realized as a result of uninvested cash balances are used to reduce a portion of the Fund’s custodian expenses. During the period ended February 28, 2014, there were no credits earned.
5. INCOME TAXES
For tax purposes, capital losses may be carried over to offset future capital gains. Capital loss carry-forwards with no expiration, if any, must be fully utilized before those losses with expiration dates.
At August 31, 2013, capital loss carryforwards were as follows:
| | | |
| Capital loss carryforwards subject to expiration: | | | |
| 2016 | $ | 4,871,719 | |
| 2017 | | 2,023,740 | |
| Total capital loss carryforwards | $ | 6,895,459 | a |
aIncludes $6,895,459 from the merged Templeton Global Long-Short Fund, which may be carried over to offset future capital gains, subject to certain limitations.
At February 28, 2014, the cost of investments and net unrealized appreciation (depreciation) for income tax purposes were as follows:
| | | |
| Cost of investments | $ | 4,827,872,609 | |
| |
| Unrealized appreciation | $ | 1,876,621,166 | |
| Unrealized depreciation | | (242,141,618 | ) |
| Net unrealized appreciation (depreciation) | $ | 1,634,479,548 | |
40 | Semiannual Report
Templeton World Fund
Notes to Financial Statements (unaudited) (continued)
5. INCOME TAXES (continued)
Differences between income and/or capital gains as determined on a book basis and a tax basis are primarily due to differing treatments of regulatory settlements.
6. INVESTMENT TRANSACTIONS
Purchases and sales of investments (excluding short term securities) for the period ended February 28, 2014, aggregated $549,048,495 and $622,784,738, respectively.
Transactions in options written during the period ended February 28, 2014, were as follows:
| | | | | |
| | Number of | | | Premiums | |
| | Contracts | | | Received | |
| Options outstanding at August 31, 2013 | — | | $ | — | |
| Options written | 51,650 | | | 1,203,982 | |
| Options expired | (1,650 | ) | | (198,000 | ) |
| Options exercised | (50,000 | ) | | (1,005,982 | ) |
| Options closed | — | | | — | |
| Options outstanding at February 28, 2014 | — | | $ | — | |
See Note 1(c) regarding derivative financial instruments and other derivative information, respectively.
7. CONCENTRATION OF RISK
Investing in foreign securities may include certain risks and considerations not typically associated with investing in U.S. securities, such as fluctuating currency values and changing local and regional economic, political and social conditions, which may result in greater market volatility. In addition, certain foreign securities may not be as liquid as U.S. securities.
8. RESTRICTED SECURITIES
The Fund invests in securities that are restricted under the Securities Act of 1933 (1933 Act) or which are subject to legal, contractual, or other agreed upon restrictions on resale. Restricted securities are often purchased in private placement transactions, and cannot be sold without prior registration unless the sale is pursuant to an exemption under the 1933 Act. Disposal of these securities may require greater effort and expense, and prompt sale at an acceptable price may be difficult. The Fund may have registration rights for restricted securities. The issuer generally incurs all registration costs.
Semiannual Report | 41
Templeton World Fund
Notes to Financial Statements (unaudited) (continued)
8. RESTRICTED SECURITIES (continued)
At February 28, 2014, the Fund held investments in restricted securities, excluding certain securities exempt from registration under the 1933 Act deemed to be liquid, as follows:
| | | | | | |
| Shares | Issuer | Acquisition | | | | |
| | | Dates | | Cost | | Value |
| 2,792,110 | Templeton China Opportunities Fund, Ltd., | | | | | |
| | Reg D | | | | | |
| | Total Restricted Securities | | | | | |
| | (Value is 0.47% of Net Assets) | 1/27/10 - 10/09/13 | $ | 27,904,400 | $ | 30,126,869 |
9. HOLDINGS OF 5% VOTING SECURITIES OF PORTFOLIO COMPANIES
The 1940 Act defines “affiliated companies” to include investments in portfolio companies in which a fund owns 5% or more of the outstanding voting securities. Investments in “affiliated companies” for the Fund for the period ended February 28, 2014, were as shown below.
| | | | | | | | |
| | Number of | | | Number of | | | | |
| | Shares Held | | | Shares Held | | Value at | | Realized |
| | at Beginning | Gross | Gross | at Beginning | | End of | Investment | Capital |
| Name of Issuer | of Period | Additions | Reductions | of Period | | Period | Income | Gain (Loss) |
| Non-Controlled Affiliates | | | | | | | | |
| Templeton China Opportunities | | | | | | | | |
| Fund, Ltd., Reg D | | | | | | | | |
| Total Affiliated Securities | | | | | | | | |
| (Value is 0.47% of Net Assets) | 2,790,529 | 1,581 | — | 2,792,110 | $ | 30,126,869 | $— | $— |
10. CREDIT FACILITY
The Fund, together with other U.S. registered and foreign investment funds (collectively, Borrowers), managed by Franklin Templeton Investments, are borrowers in a joint syndicated senior unsecured credit facility totaling $1.5 billion (Global Credit Facility) which matures on February 13, 2015. This Global Credit Facility provides a source of funds to the Borrowers for temporary and emergency purposes, including the ability to meet future unanticipated or unusually large redemption requests.
Under the terms of the Global Credit Facility, the Fund shall, in addition to interest charged on any borrowings made by the Fund and other costs incurred by the Fund, pay its share of fees and expenses incurred in connection with the implementation and maintenance of the Global Credit Facility, based upon its relative share of the aggregate net assets of all of the Borrowers, including an annual commitment fee of 0.07% based upon the unused portion of the Global Credit Facility. These fees are reflected in other expenses on the Statement of Operations. During the period ended February 28, 2014, the Fund did not use the Global Credit Facility.
42 | Semiannual Report
Templeton World Fund
Notes to Financial Statements (unaudited) (continued)
11. FAIR VALUE MEASUREMENTS
The Fund follows a fair value hierarchy that distinguishes between market data obtained from independent sources (observable inputs) and the Fund’s own market assumptions (unobservable inputs). These inputs are used in determining the value of the Fund’s financial instruments and are summarized in the following fair value hierarchy:
- Level 1 – quoted prices in active markets for identical financial instruments
- Level 2 – other significant observable inputs (including quoted prices for similar financial instruments, interest rates, prepayment speed, credit risk, etc.)
- Level 3 – significant unobservable inputs (including the Fund’s own assumptions in determining the fair value of financial instruments)
The input levels are not necessarily an indication of the risk or liquidity associated with financial instruments at that level.
For movements between the levels within the fair value hierarchy, the Fund has adopted a policy of recognizing the transfers as of the date of the underlying event which caused the movement.
A summary of inputs used as of February 28, 2014, in valuing the Fund’s assets carried at fair value, is as follows:
| | | | | | | | |
| | | Level 1 | | Level 2 | | Level 3 | | Total |
| Assets: | | | | | | | | |
| Investments in Securities: | | | | | | | | |
| Equity Investments:a | | | | | | | | |
| Russia | $ | 41,716,163 | $ | 7,195,270 | $ | — | $ | 48,911,433 |
| Other Equity Investmentsb | | 6,146,343,243 | | — | | — | | 6,146,343,243 |
| Non-Registered Mutual | | | | | | | | |
| Funds | | — | | — | | 30,126,869 | | 30,126,869 |
| Mortgage-Backed | | | | | | | | |
| Securities | | — | | 2,438,162 | | — | | 2,438,162 |
| Short Term Investments | | — | | 234,532,450 | | — | | 234,532,450 |
| Total Investments | | | | | | | | |
| in Securities | $ | 6,188,059,406 | $ | 244,165,882 | $ | 30,126,869 | $ | 6,462,352,157 |
aIncludes common and preferred stocks as well as other equity investments. bFor detailed categories, see the accompanying Statement of Investments.
A reconciliation of assets in which Level 3 inputs are used in determining fair value is presented when there are significant Level 3 investments at the end of the period.
Semiannual Report | 43
Templeton World Fund
Notes to Financial Statements (unaudited) (continued)
12. NEW ACCOUNTING PRONOUNCEMENTS
In June 2013, the Financial Accounting Standards Board issued Accounting Standards Update (ASU) No. 2013-08, Investment Companies (Topic 946): Amendments to the Scope, Measurement, and Disclosure Requirements. The ASU modifies the criteria used in defining an investment company under U.S. Generally Accepted Accounting Principles and also sets forth certain measurement and disclosure requirements. Under the ASU, an entity that is registered under the 1940 Act automatically qualifies as an investment company. The ASU is effective for interim and annual reporting periods beginning after December 15, 2013. Management has reviewed the requirements and believes the adoption of this ASU will not have a material impact on the financial statements.
13. SUBSEQUENT EVENTS
The Fund has evaluated subsequent events through the issuance of the financial statements and determined that no events have occurred that require disclosure.
| | | | | |
| ABBREVIATIONS | | | |
| |
| Selected Portfolio | Selected Currencies |
| |
| ADR | - | American Depositary Receipt | EUR | - | Euro |
| FHLMC | - | Federal Home Loan Mortgage Corp. | GBP | - | British Pound |
| IDR | - | InternationalDepositary Receipt | | | |
44 | Semiannual Report
Templeton World Fund
Shareholder Information
Proxy Voting Policies and Procedures
The Trust’s investment manager has established Proxy Voting Policies and Procedures (Policies) that the Trust uses to determine how to vote proxies relating to portfolio securities. Shareholders may view the Trust’s complete Policies online at franklintempleton.com. Alternatively, shareholders may request copies of the Policies free of charge by calling the Proxy Group collect at (954) 527-7678 or by sending a written request to: Franklin Templeton Companies, LLC, 300 S.E. 2nd Street, Fort Lauderdale, FL 33301, Attention: Proxy Group. Copies of the Trust’s proxy voting records are also made available online at franklintempleton.com and posted on the U.S. Securities and Exchange Commission’s website at sec.gov and reflect the most recent 12-month period ended June 30.
Quarterly Statement of Investments
The Trust files a complete statement of investments with the U.S. Securities and Exchange Commission for the first and third quarters for each fiscal year on Form N-Q. Shareholders may view the filed Form N-Q by visiting the Commission’s website at sec.gov. The filed form may also be viewed and copied at the Commission’s Public Reference Room in Washington, DC. Information regarding the operations of the Public Reference Room may be obtained by calling (800) SEC-0330.
Semiannual Report | 45
This page intentionally left blank.
This page intentionally left blank.
This page intentionally left blank.

Semiannual Report and Shareholder Letter
TEMPLETON WORLD FUND
Investment Manager
Templeton Global Advisors Limited
Distributor
Franklin Templeton Distributors, Inc.
(800) DIAL BEN®/342-5236
franklintempleton.com
Shareholder Services
(800) 632-2301
Authorized for distribution only when accompanied or preceded by a summary prospectus and/or prospectus.
Investors should carefully consider a fund’s investment goals, risks, charges and expenses before investing.
A prospectus contains this and other information; please read it carefully before investing.
To help ensure we provide you with quality service, all calls to and from our service areas are monitored and/or recorded.
© 2014 Franklin Templeton Investments. All rights reserved. 102 S 04/14
| | | | | |
| | Contents | | | |
| Shareholder Letter | 1 | Semiannual Report | | Financial Statements | 28 |
| | | Templeton Foreign Fund | 4 | Notes to Financial Statements | 32 |
| | | Performance Summary | 13 | Shareholder Information | 44 |
| | | Your Fund’s Expenses | 16 | | |
| | | Financial Highlights and | | | |
| | | Statement of Investments | 18 | | |
Semiannual Report
Templeton Foreign Fund
Your Fund’s Goal and Main Investments: Templeton Foreign Fund seeks long-term capital growth. Under normal market conditions, the Fund invests primarily in equity securities of companies located outside the U.S., including emerging markets. The Fund will invest, under normal market circumstances, at least 80% of its net assets in “foreign securities,” as defined in the prospectus.
This semiannual report for Templeton Foreign Fund covers the period ended February 28, 2014.
|
| Performance data represent past |
| performance, which does not |
| guarantee future results. |
| Investment return and principal |
| value will fluctuate, and you may |
| have a gain or loss when you sell |
| your shares. Current performance |
| may differ from figures shown. |
| Please visit franklintempleton.com |
| or call (800) 342-5236 for most |
| recent month-end performance. |
Performance Overview
Templeton Foreign Fund – Class A delivered a +15.00% cumulative total return for the six months under review. In comparison, the MSCI Europe, Australasia, Far East (EAFE) Index, which measures global equity performance in developed countries excluding the U.S. and Canada, posted a +15.12% total return.1, 2 The Fund’s long-term results are shown in the Performance Summary beginning on page 13. For the 10-year period ended February 28, 2014, Templeton Foreign Fund – Class A delivered a +104.65% cumulative total return, compared with the MSCI EAFE Index’s +99.29% cumulative total return for the same period.1, 2 Please note index performance information is provided for reference and we do not attempt to track the index but rather undertake investments on the basis of fundamental research. You can find more performance data in the Performance Summary.
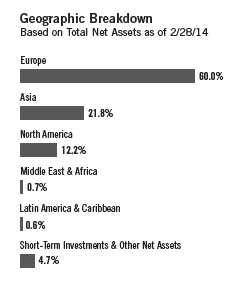
Economic and Market Overview
The six months under review were characterized by continued economic recovery in most developed countries, and many central banks reaffirmed their accommodative monetary stances. In contrast, growth in emerging market economies generally tended to slow, and central banks in many emerging markets raised interest rates as they sought to control inflation and currency depreciation.
The dollar value, number of shares or principal amount, and names of all portfolio holdings are listed in the Fund’s Statement of Investments (SOI). The SOI begins on page 23.
4 | Semiannual Report
In the U.S., economic data were generally positive. Manufacturing activity expanded during the review period and unemployment declined. In October 2013, the federal government temporarily shut down after Congress reached a budget impasse. However, Congress passed a spending bill in January to fund the federal government through September 2014. Congress then approved suspension of the debt ceiling until March 2015. Encouraged by positive economic and employment reports, the Federal Reserve Board (Fed) in January 2014 began reducing its bond purchases by $10 billion a month and committed to keeping interest rates low. The new Fed Chair, Janet Yellen, confirmed that the Fed would continue to reduce its asset purchases, although it would reconsider its plan if the economic outlook changed significantly.
Outside the U.S., the U.K. enjoyed strong growth, driven by easing credit conditions and stronger consumer confidence. Elsewhere, economic activity in the eurozone and Japan showed signs of improvement. Although technically out of its recession, the eurozone experienced weak employment trends and deflationary risks. However, German Chancellor Angela Merkel’s reelection and the European Central Bank’s rate cut to a record low helped partly restore investor confidence. In Japan, improving business sentiment, personal consumption and higher exports resulting from a weaker yen supported the economy, and the unemployment rate reached its lowest level in six years. The Bank of Japan announced it would provide additional monetary stimulus, if required. Political turmoil in Ukraine surfaced in November 2013 when its government avoided firming up trade links with the European Union, raising fears of a sovereign default and investor concerns over the country’s relationship with Russia.
Growth in many emerging market economies moderated based on lower domestic demand, falling exports and weakening commodity prices. However, select emerging market economies such as those of China, Malaysia, South Korea, Poland and Hungary improved in 2013’s second half. Monetary policies tightened in several emerging market countries, including Brazil, India, Turkey and South Africa, as their central banks raised interest rates to curb inflation and support their currencies.
Stocks in Europe helped developed market equities advance for most of the period despite a January 2014 decline. Led by Asian equities, emerging market equities also gained, although weak economic data, especially in China, weighed on markets in January. Several emerging market currencies depreciated against the U.S. dollar during the period. Gold prices declined for the period despite a rally in early 2014, and international oil prices rose amid supply concerns related to political unrest and adverse U.S. weather.
Semiannual Report | 5
| | |
| Top 10 Sectors/Industries | | |
| Based on Equity Securities | | |
| 2/28/14 | | |
| % of Total | |
| Net Assets | |
| Oil, Gas & Consumable Fuels | 12.4 | % |
| Banks | 11.9 | % |
| Pharmaceuticals | 7.9 | % |
| Insurance | 7.5 | % |
| Energy Equipment & Services | 6.9 | % |
| Diversified Telecommunication Services | 4.8 | % |
| Capital Markets | 4.5 | % |
| Food & Staples Retailing | 3.6 | % |
| Trading Companies & Distributors | 2.5 | % |
| Diversified Financial Services | 2.5 | % |
Investment Strategy
Our investment strategy employs a bottom-up, value-oriented, long-term approach. We focus on the market price of a company’s securities relative to our evaluation of the company’s long-term earnings, asset value and cash flow potential. As we look internationally, we consider specific companies, rather than sectors or countries, while doing in-depth research to construct a bargain list from which we buy. Before we make a purchase, we look at the company’s price/earnings ratio, price/cash flow ratio, profit margins and liquidation value.
Manager’s Discussion
Many of the positive economic trends we discussed in the 2013 annual shareholder report persisted during the six-month review period. Positive trends included moderate global economic growth and ongoing policy support from developed market central banks. Stabilizing market conditions allowed investors to refocus on business fundamentals, creating an environment that seemed to us to reward disciplined stock picking and helped drive further value recognition for Fund positions. The Fund’s Class A shares performed generally in line with the benchmark index during the period. Beyond the six-month period, the Fund’s Class A shares outperformed the benchmark for the one-, three-, five-, 10- and 15-year and since-inception annual periods ended February 28, 2014. Even with this favorable performance, the Fund traded at a significant valuation discount relative to the benchmark index. Positive trends included moderate global economic growth and ongoing policy support from developed market central banks. Stabilizing market conditions allowed investors to refocus on business fundamentals, creating an environment that seemed to us to reward disciplined stock picking and helped drive further value recognition for Fund positions.
Value investing generally was pressured during the global financial crisis as investors seemed to grow more concerned with overall market stability than with the relationship between stock prices and business fundamentals. However, the rise in investor confidence since Europe’s recovery from its debt crisis laid the groundwork for the resurgence of value investing, a strategy that has historically delivered compelling performance. Many of the sectors and regions most punished during the 2008–2009 global crisis and 2010–2011 European crisis have since had a dramatic recovery. As Sir John Templeton wrote, “For those properly prepared in advance, a bear market in stocks is not a calamity, but an opportunity.”
6 | Semiannual Report
|
| What is return on equity? |
| Return on equity is an amount, |
| expressed as a percentage, earned on |
| a company’s common stock investment |
| for a given period. Return on equity tells |
| common shareholders how effectually |
| their money is being employed. |
| Comparing percentages for current and |
| prior periods also reveals trends, and |
| comparison with industry composites |
| reveals how well a company is holding |
| its own against its competitors. |
The strong performance of Europe, and particularly European financials, during the review period seemed to us the latest validation of Sir John Templeton’s words.3 As the European sovereign debt crisis escalated during 2010 and 2011, investor sentiment turned largely pessimistic, with many investors anticipating the breakup of the European Monetary Union. Reflective of the negative investor sentiment for Europe, the forward price-to-earnings ratio of the EuroStoxx 50 Index, an index of European blue chips with diverse global revenue streams, fell in 2011 to the same level as its estimated dividend yield. As recently as 2012, the entire market capitalization of the eurozone banking system was worth less than one U.S. stock, Apple. At the market bottom, European banks were trading at a 60% to 70% discount to their tangible book values, a level that major global financial institutions had not reached since U.S. banks did during the Great Depression. We believed this was a classic Templeton opportunity. However, investment decisions can be very difficult in a challenging environment. As Sir John Templeton pointed out, “It is not easy to act contrary to popular opinion.” As disciplined investors, we tried to ignore the crowd and adhere to our time-tested process. Our decision to substantially increase exposure to Europe and the banking sector during this tumultuous period served our clients well, and record inflows into European stocks during the review period further accelerated regional gains.
Dutch financial services firm ING Groep was among the top contributors to performance. We established our position in ING at what we believed were distressed valuations. Our analysis indicated that the firm, which accepted a bailout from the Dutch government in 2008, could successfully restructure and reemerge as a well-capitalized European bank earning double-digit returns on equity. The company was nearing completion of its European Union-imposed bailout commitments following more than 35 disposals that raised roughly 23 billion euros, and recent results highlighted the operational gains achieved at ING’s banking business as the company cut costs and improved margins. Other European financials holdings contributing to relative performance included U.K. insurer Aviva and lenders BNP Paribas (France) and UniCredit (Italy). Our analysis did not suggest that European banks were soon likely to return to the book value multiples enjoyed before the European sovereign debt crisis. However, we believe these companies remain undervalued relative to their global peers and could continue to improve profitability and capital ratios as economic conditions normalize.
Semiannual Report | 7
The cyclical European industrials sector also experienced significant pressure in recent years.4 European airlines were hit particularly hard. Financials sector cutbacks and private sector belt-tightening led to a steep reduction in air traffic volume, and internal labor demands and competition from low-cost carriers further pressured profit margins. In 2009 and 2011, European airlines fell to record-low price-to-book levels that averaged a 50% discount to book value. Although the airline industry has always been a challenging business in our view, it was not one that we believed could disappear. Our analysis indicated that the industry required significant restructuring and that it would need to shed a great deal of capacity but that there would be winners and losers. We decided to focus on the companies that we believed could be the long-term survivors of this industry shake-up. With what we viewed as decent balance sheets, attractive industry positions and significant restructuring potential, German airline Deutsche Lufthansa seemed to us poised to weather the turmoil. Our investment in this company at distressed levels was rewarded. Lufthansa benefited from a recovery in air traffic volume and cost savings stemming from its ongoing restructuring program. Lufthansa’s share price rose during the period by the largest amount in four years after management said that lower fuel and overhead costs could contribute to future operating improvements.
Elsewhere among cyclical industries, we found few bargains in the materials sector in recent years, where a legacy of poor capital discipline in the mining industry resulted in overcapacity that continued to pressure profitability.5 Buoyed by stock selection in the chemicals industry, the Fund’s materials sector holdings outperformed during the period. Dutch paint maker Akzo Nobel was among the Fund’s top contributors after reporting a cost-saving effort significantly aided profitability. In metals and mining, where our few off-benchmark holdings detracted from relative results, declining sentiment and emerging market volatility seemed to us to create potential opportunities for value investors, and we closely monitored the industry for new bargains. Consumer staples stocks have also offered a scarcity of bargains in recent years based on our analysis, and we believed conditions remained unfavorable for wider value creation.6 Unlike other sectors, consumer staples has a perceived combination of non-discretionary products and high emerging markets exposure with a defensive growth profile for which some investors were willing to pay a premium. Our underweighting in the materials sector helped the Fund’s relative performance.
8 | Semiannual Report
Conversely, energy stocks were some of the largest detractors, pressured primarily by our overweighting in a sector that lagged the benchmark.7 Investor concerns about heavy capital expenditures and stagnant production growth depressed the share prices of many major oil companies to what we viewed as bargain levels. We believed some of these companies could ultimately benefit from their heavy capital expenditures as innovation accelerates and major new projects begin producing. As we wait for this to occur, the industry has provided a roughly 3% average dividend yield. We also found attractive opportunities in the oil services industry, which directly benefited from increasing demand for technology and specialization in the oil extraction process. Fund holdings in the industry delivered mixed results. U.S. oilfield services firm Baker Hughes was one of the top contributors.8 The company beat earnings expectations amid rising demand for rigs in North America’s shale regions.
In contrast, shares of U.S. deep-water drilling contractor Noble declined based on concerns about continued oversupply in the industry.8 However, long-term valuations and industry dynamics remained favorable, in our view.
Stock selection in the information technology (IT) sector hampered relative performance.9 Although the sector contributed some of the leading performers, including U.S. hardware manufacturer Hewlett-Packard8 and Chinese solar panel specialist Trina Solar,8 other positions declined. U.S. networking equipment firm Cisco Systems reported its first sales decline in four years.8 The stock price was relatively close to the same level as when we initiated our position in 2008 and continued to look cheap to us based on many valuation metrics. From our perspective, management has made solid progress implementing a sensible restructuring plan in recent years. However, industry headwinds and new risks surfaced, including low-cost competition from emerging markets, weak corporate networking spending and a lower-than-expected correlation between Internet traffic growth and demand growth for Cisco’s routers. Overall, recent IT gains have made bargain hunting in the sector somewhat challenging for us, although we continued to search for companies whose long-term growth prospects seem to us materially undervalued.
The Fund’s telecommunication services holdings also delivered absolute gains but underperformed the benchmark.10 The Fund’s stake in Vodafone Group, one of the world’s largest mobile telephone operators, helped relative performance after the firm announced it was selling its stake in U.S. mobile telephone operator Verizon Wireless for $130 billion. However, Chinese mobile telephone operators China Telecom8 and China Mobile8 hampered performance. China Mobile declined as a result of economic
| | |
| Top 10 Equity Holdings | | |
| 2/28/14 | | |
| |
| Company | % of Total | |
| Sector/Industry, Country | Net Assets | |
| BNP Paribas SA | 3.1 | % |
| Banks, France | | |
| Baker Hughes Inc. | 2.6 | % |
| Energy Equipment & Services, U.S. | | |
| Tesco PLC | 2.5 | % |
| Food & Staples Retailing, U.K. | | |
| Aviva PLC | 2.4 | % |
| Insurance, U.K. | | |
| Credit Suisse Group AG | 2.4 | % |
| Capital Markets, Switzerland | | |
| Total SA, B | 2.2 | % |
| Oil, Gas & Consumable Fuels, France | |
| Sanofi | 2.0 | % |
| Pharmaceuticals, France | | |
| Samsung Electronics Co. Ltd. | 2.0 | % |
| Semiconductors & Semiconductor | | |
| Equipment, South Korea | | |
| Roche Holding AG | 1.9 | % |
| Pharmaceuticals, Switzerland | | |
| AXA SA | 1.9 | % |
| Insurance, France | | |
Semiannual Report | 9
| | |
| Top 10 Countries | | |
| Based on Equity Securities | | |
| 2/28/14 | | |
| | % of Total | |
| | Net Assets | |
| U.K. | 18.7 | % |
| France | 13.8 | % |
| South Korea | 8.8 | % |
| Switzerland | 7.6 | % |
| U.S. | 6.9 | % |
| Netherlands | 6.1 | % |
| Japan | 5.8 | % |
| Canada | 5.3 | % |
| China | 4.8 | % |
| Germany | 4.3 | % |
headwinds in the world’s second-largest economy and intense competitive pressures as iPhone subsidies and intensifying 4G rivalries constrained pricing power.
Regionally, the Fund’s European holdings outperformed owing to stock selection. Specifically, stock selection in France, the U.K. and the Netherlands bolstered relative performance and more than offset a detractive underweighting in Germany and stock selection in Spain. Outside of Europe, an underweighted allocation and stock selection in Japan benefited relative results, as did the Fund’s underweighting in Australia. In contrast, allocations to off-benchmark countries Canada, China and South Korea weighed on relative performance.
It is important to recognize the effect of currency movements on the Fund’s performance. In general, if the value of the U.S. dollar goes up compared with a foreign currency, an investment traded in that foreign currency will go down in value because it will be worth fewer U.S. dollars. This can have a negative effect on Fund performance. Conversely, when the U.S. dollar weakens in relation to a foreign currency, an investment traded in that foreign currency will increase in value, which can contribute to Fund performance. For the six months ended February 28, 2014, the U.S. dollar declined in value relative to most currencies. As a result, the Fund’s performance was positively affected by the portfolio’s investment predominantly in securities with non-U.S. currency exposure. However, one cannot expect the same result in future periods.
Market momentum remained positive in early 2014, although concerns persisted about emerging market volatility and the sustainability of the global economic recovery. Following a strong recovery from the post-financial crisis trough and accompanying rising valuations, some value-minded investors have expressed concerns about the sustainability of the ongoing market rally. We do not know where the market is going. However, as investors with a long-term perspective, we note that on a trailing 10-year basis, recent annualized global equity returns of slightly above 6% remained meaningfully below the nearly 9% average annualized 10-year returns for the asset class going back to 1835.11 Long-term stock returns have historically reverted to the average, so although we do not know what will happen in the near term, we believe potential remains for continued stock strength over our long-term investment horizon. Furthermore, while some parts of the market seemed to grow more expensive, other parts of the market remained decidedly cheap, in our assessment. Europe continued to trade at multi-decade low valuations relative to the U.S. based on cyclically adjusted earnings multiples, and
10 | Semiannual Report
depressed profit margins in the region could improve if companies with high operating leverage benefit from Europe’s economic recovery. Emerging markets have offered what appeared to us as a number of selective opportunities for long-term bargain hunters amid recent turmoil. With economic and policy conditions diverging around the world and correlations between markets and asset classes declining, we believe bottom-up stock pickers with a proven process, like Templeton, remained well positioned to help investors navigate an uncertain future.
Thank you for your continued participation in Templeton Foreign Fund. We look forward to serving your future investment needs.

Semiannual Report | 11
The foregoing information reflects our analysis, opinions and portfolio holdings as of February 28, 2014, the end of the reporting period. The way we implement our main investment strategies and the resulting portfolio holdings may change depending on factors such as market and economic conditions. These opinions may not be relied upon as investment advice or an offer for a particular security. The information is not a complete analysis of every aspect of any market, country, industry, security or the Fund. Statements of fact are from sources considered reliable, but the investment manager makes no representation or warranty as to their completeness or accuracy. Although historical performance is no guarantee of future results, these insights may help you understand our investment management philosophy.
|
| Heather Arnold assumed portfolio manager responsibilities for the Fund in January 2014. |
| Ms. Arnold is the director of research for the Templeton Global Equity Group, as well as a |
| portfolio manager and research analyst. Ms. Arnold manages institutional and retail equity |
| portfolios and has research responsibilities for Japan and Russia. Prior to joining Franklin |
| Templeton in 1997, she was a managing director for Goldman Sachs Asset Management, |
| head of European equities and portfolio manager for European, international and global |
| institutional and retail client portfolios. In 2001, Ms. Arnold left to start her own company |
| and returned to Franklin Templeton in 2008. |
The index is unmanaged and includes reinvested dividends. One cannot invest directly in an index, and an index is not
representative of the Fund’s portfolio.
1. Source: © 2014 Morningstar. All Rights Reserved. The information contained herein: (1) is proprietary to Morningstar
and/or its content providers; (2) may not be copied or distributed; and (3) is not warranted to be accurate, complete or
timely. Neither Morningstar nor its content providers are responsible for any damages or losses arising from any use of
this information. As of 2/28/14, the Fund’s Class A 10-year average annual total return not including the maximum
sales charge was +7.42%, compared with the MSCI EAFE Index’s 10-year average annual total return of +7.14%.
2. Source: MSCI. MSCI makes no express or implied warranties or representations and shall have no liability whatsoev-
er with respect to any MSCI data contained herein. The MSCI data may not be further redistributed or used as a basis
for other indices or any securities or financial products. This report is not approved, reviewed or produced by MSCI.
3. The financials sector comprises banks, capital markets, diversified financial services, insurance, and thrifts and
mortgage finance in the SOI.
4. The industrials sector comprises aerospace and defense, airlines, commercial services and supplies, construction
and engineering, electrical equipment, industrial conglomerates, machinery, and trading companies and distributors
in the SOI.
5. The materials sector comprises chemicals, construction materials, containers and packaging, and metals and mining
in the SOI.
6. The consumer staples sector comprises beverages, and food and staples retailing in the SOI.
7. The energy sector comprises energy equipment and services; and oil, gas and consumable fuels in the SOI.
8. Not part of the index.
9. The information technology sector comprises communications equipment; electronic equipment, instruments and
components; Internet software and services; semiconductors and semiconductor equipment; software; and technology
hardware, storage and peripherals in the SOI.
10. The telecommunication services sector comprises diversified telecommunication services and wireless
telecommunication services in the SOI.
11. Source: Stifel Equity Strategist Barry B. Bannister, In the Spring There Will be Growth, presentation on March 1,
2010. Data as of 12/31/13.
12 | Semiannual Report
Performance Summary as of 2/28/14
Your dividend income will vary depending on dividends or interest paid by securities in the Fund’s portfolio, adjusted for operating expenses of each class. Capital gain distributions are net profits realized from the sale of portfolio securities. The performance table does not reflect any taxes that a shareholder would pay on Fund dividends, capital gain distributions, if any, or any realized gains on the sale of Fund shares. Total return reflects reinvestment of the Fund’s dividends and capital gain distributions, if any, and any unrealized gains or losses.
| | | | | | | | |
| Class A (Symbol: TEMFX) | | | | Change | | 2/28/14 | | 8/31/13 |
| Net Asset Value (NAV) | | | +$ | 0.72 | $ | 8.39 | $ | 7.67 |
| Distributions (9/1/13–2/28/14) | | | | | | | | |
| Dividend Income | $ | 0.1135 | | | | | | |
| Short-Term Capital Gain | $ | 0.1523 | | | | | | |
| Long-Term Capital Gain | $ | 0.1495 | | | | | | |
| Total | $ | 0.4153 | | | | | | |
| Class C (Symbol: TEFTX) | | | | Change | | 2/28/14 | | 8/31/13 |
| Net Asset Value (NAV) | | | +$ | 0.71 | $ | 8.19 | $ | 7.48 |
| Distributions (9/1/13–2/28/14) | | | | | | | | |
| Dividend Income | $ | 0.0593 | | | | | | |
| Short-Term Capital Gain | $ | 0.1523 | | | | | | |
| Long-Term Capital Gain | $ | 0.1495 | | | | | | |
| Total | $ | 0.3611 | | | | | | |
| Class R (Symbol: TEFRX) | | | | Change | | 2/28/14 | | 8/31/13 |
| Net Asset Value (NAV) | | | +$ | 0.70 | $ | 8.24 | $ | 7.54 |
| Distributions (9/1/13–2/28/14) | | | | | | | | |
| Dividend Income | $ | 0.0938 | | | | | | |
| Short-Term Capital Gain | $ | 0.1523 | | | | | | |
| Long-Term Capital Gain | $ | 0.1495 | | | | | | |
| Total | $ | 0.3956 | | | | | | |
| Class R6 (Symbol: FTFGX) | | | | Change | | 2/28/14 | | 8/31/13 |
| Net Asset Value (NAV) | | | +$ | 0.69 | $ | 8.28 | $ | 7.59 |
| Distributions (9/1/13–2/28/14) | | | | | | | | |
| Dividend Income | $ | 0.1480 | | | | | | |
| Short-Term Capital Gain | $ | 0.1523 | | | | | | |
| Long-Term Capital Gain | $ | 0.1495 | | | | | | |
| Total | $ | 0.4498 | | | | | | |
| Advisor Class (Symbol: TFFAX) | | | | Change | | 2/28/14 | | 8/31/13 |
| Net Asset Value (NAV) | | | +$ | 0.69 | $ | 8.28 | $ | 7.59 |
| Distributions (9/1/13–2/28/14) | | | | | | | | |
| Dividend Income | $ | 0.1317 | | | | | | |
| Short-Term Capital Gain | $ | 0.1523 | | | | | | |
| Long-Term Capital Gain | $ | 0.1495 | | | | | | |
| Total | $ | 0.4335 | | | | | | |
Semiannual Report | 13
Performance Summary (continued)
Performance
Cumulative total return excludes sales charges. Aggregate and average annual total returns and value of $10,000 investment include maximum sales charges. Class A: 5.75% maximum initial sales charge; Class C: 1% contingent deferred sales charge in first year only; Class R/R6/Advisor Class: no sales charges.
| | | | | | | | | | | | | | |
| Class A | | 6-Month | | | | | 1-Year | | | 5-Year | | | 10-Year | |
| Cumulative Total Return1 | + | 15.00 | % | | | + | 26.19 | % | + | 159.74 | % | + | 104.65 | % |
| Average Annual Total Return2 | + | 8.36 | % | | | + | 18.88 | % | + | 19.58 | % | + | 6.79 | % |
| Value of $10,000 Investment3 | $ | 10,836 | | | | $ | 11,888 | | $ | 24,450 | | $ | 19,285 | |
| Avg. Ann. Total Return (3/31/14)4 | | | | | | + | 19.11 | % | + | 17.06 | % | + | 6.78 | % |
| Total Annual Operating Expenses5 | | | | 1.19 | % | | | | | | | | | |
| Class C | | 6-Month | | | | | 1-Year | | | 5-Year | | | 10-Year | |
| Cumulative Total Return1 | + | 14.48 | % | | | + | 25.01 | % | + | 149.68 | % | + | 89.69 | % |
| Average Annual Total Return2 | + | 13.48 | % | | | + | 24.01 | % | + | 20.08 | % | + | 6.61 | % |
| Value of $10,000 Investment3 | $ | 11,348 | | | | $ | 12,401 | | $ | 24,968 | | $ | 18,969 | |
| Avg. Ann. Total Return (3/31/14)4 | | | | | | + | 24.47 | % | + | 17.62 | % | + | 6.62 | % |
| Total Annual Operating Expenses5 | | | | 1.94 | % | | | | | | | | | |
| Class R | | 6-Month | | | | | 1-Year | | | 5-Year | | | 10-Year | |
| Cumulative Total Return1 | + | 14.72 | % | | | + | 25.72 | % | + | 156.27 | % | + | 99.45 | % |
| Average Annual Total Return2 | + | 14.72 | % | | | + | 25.72 | % | + | 20.71 | % | + | 7.15 | % |
| Value of $10,000 Investment3 | $ | 11,472 | | | | $ | 12,572 | | $ | 25,627 | | $ | 19,945 | |
| Avg. Ann. Total Return (3/31/14)4 | | | | | | + | 26.18 | % | + | 18.19 | % | + | 7.16 | % |
| Total Annual Operating Expenses5 | | | | 1.44 | % | | | | | | | | | |
| Class R6 | | 6-Month | | | | | | | | | | | Inception (5/1/13) | |
| Cumulative Total Return1 | + | 15.24 | % | | | | | | | | | + | 22.16 | % |
| Aggregate Total Return2 | + | 15.24 | % | | | | | | | | | + | 22.16 | % |
| Value of $10,000 Investment3 | $ | 11,524 | | | | | | | | | | $ | 12,216 | |
| Aggregate Total Return (3/31/14)4, 6 | | | | | | | | | | | | + | 21.72 | % |
| Total Annual Operating Expenses5 | | | | 0.74 | % | | | | | | | | | |
| Advisor Class | | 6-Month | | | | | 1-Year | | | 5-Year | | | 10-Year | |
| Cumulative Total Return1 | + | 15.01 | % | | | + | 26.33 | % | + | 162.78 | % | + | 109.43 | % |
| Average Annual Total Return2 | + | 15.01 | % | | | + | 26.33 | % | + | 21.32 | % | + | 7.67 | % |
| Value of $10,000 Investment3 | $ | 11,501 | | | | $ | 12,633 | | $ | 26,278 | | $ | 20,943 | |
| Avg. Ann. Total Return (3/31/14)4 | | | | | | + | 26.76 | % | + | 18.82 | % | + | 7.69 | % |
| Total Annual Operating Expenses5 | | | | 0.94 | % | | | | | | | | | |
Performance data represent past performance, which does not guarantee future results. Investment return and principal value will fluctuate, and you may have a gain or loss when you sell your shares. Current performance may differ from figures shown. For most recent month-end performance, go to franklintempleton.com or call (800) 342-5236.
14 | Semiannual Report
Performance Summary (continued)
All investments involve risks, including possible loss of principal. Special risks are associated with foreign investing, including currency fluctuations, economic instability and political developments; investments in emerging markets involve heightened risks related to the same factors. To the extent the Fund focuses on particular countries, regions, industries, sectors or types of investment from time to time, it may be subject to greater risks of adverse developments in such areas of focus than a fund that invests in a wider variety of countries, regions, industries, sectors or investments. The Fund is actively managed but there is no guarantee that the manager’s investment decisions will produce the desired results. The Fund’s prospectus also includes a description of the main investment risks.
Class C: These shares have higher annual fees and expenses than Class A shares.
Class R: Shares are available to certain eligible investors as described in the prospectus. These shares have higher annual fees and expenses
than Class A shares.
Class R6: Shares are available to certain eligible investors as described in the prospectus.
Advisor Class: Shares are available to certain eligible investors as described in the prospectus.
1. Cumulative total return represents the change in value of an investment over the periods indicated.
2. Average annual total return represents the average annual change in value of an investment over the periods indicated. Six-month return has not
been annualized.
3. These figures represent the value of a hypothetical $10,000 investment in the Fund over the periods indicated.
4. In accordance with SEC rules, we provide standardized average annual total return information through the latest calendar quarter.
5. Figures are as stated in the Fund’s current prospectus. In periods of market volatility, assets may decline significantly, causing total annual Fund
operating expenses to become higher than the figures shown.
6. Aggregate total return represents the change in value of an investment for the period indicated. Since Class R6 shares have existed for less than
one year, average annual total return is not available.
Semiannual Report | 15
Your Fund’s Expenses
As a Fund shareholder, you can incur two types of costs:
- Transaction costs, including sales charges (loads) on Fund purchases; and
- Ongoing Fund costs, including management fees, distribution and service (12b-1) fees, and other Fund expenses. All mutual funds have ongoing costs, sometimes referred to as operating expenses.
The following table shows ongoing costs of investing in the Fund and can help you understand these costs and compare them with those of other mutual funds. The table assumes a $1,000 investment held for the six months indicated.
Actual Fund Expenses
The first line (Actual) for each share class listed in the table provides actual account values and expenses. The “Ending Account Value” is derived from the Fund’s actual return, which includes the effect of Fund expenses.
You can estimate the expenses you paid during the period by following these steps. Of course, your account value and expenses will differ from those in this illustration:
| 1. | Divide your account value by $1,000. |
| | If an account had an $8,600 value, then $8,600 ÷ $1,000 = 8.6. |
| 2. | Multiply the result by the number under the heading “Expenses Paid During Period.” |
| | If Expenses Paid During Period were $7.50, then 8.6 x $7.50 = $64.50. |
In this illustration, the estimated expenses paid this period are $64.50.
Hypothetical Example for Comparison with Other Funds
Information in the second line (Hypothetical) for each class in the table can help you compare ongoing costs of investing in the Fund with those of other mutual funds. This information may not be used to estimate the actual ending account balance or expenses you paid during the period. The hypothetical “Ending Account Value” is based on the actual expense ratio for each class and an assumed 5% annual rate of return before expenses, which does not represent the Fund’s actual return. The figure under the heading “Expenses Paid During Period” shows the hypothetical expenses your account would have incurred under this scenario. You can compare this figure with the 5% hypothetical examples that appear in shareholder reports of other funds.
16 | Semiannual Report
Your Fund’s Expenses (continued)
Please note that expenses shown in the table are meant to highlight ongoing costs and do not reflect any transaction costs, such as sales charges. Therefore, the second line for each class is useful in comparing ongoing costs only, and will not help you compare total costs of owning different funds. In addition, if transaction costs were included, your total costs would have been higher. Please refer to the Fund prospectus for additional information on operating expenses.
| | | | | | |
| | | Beginning Account | | Ending Account | | Expenses Paid During |
| Class A | | Value 9/1/13 | | Value 2/28/14 | | Period* 9/1/13–2/28/14 |
| Actual | $ | 1,000 | $ | 1,150.00 | $ | 6.18 |
| Hypothetical (5% return before expenses) | $ | 1,000 | $ | 1,019.04 | $ | 5.81 |
| Class C | | | | | | |
| Actual | $ | 1,000 | $ | 1,144.80 | $ | 10.16 |
| Hypothetical (5% return before expenses) | $ | 1,000 | $ | 1,015.32 | $ | 9.54 |
| Class R | | | | | | |
| Actual | $ | 1,000 | $ | 1,147.20 | $ | 7.51 |
| Hypothetical (5% return before expenses) | $ | 1,000 | $ | 1,017.80 | $ | 7.05 |
| Class R6 | | | | | | |
| Actual | $ | 1,000 | $ | 1,152.40 | $ | 3.84 |
| Hypothetical (5% return before expenses) | $ | 1,000 | $ | 1,021.22 | $ | 3.61 |
| Advisor Class | | | | | | |
| Actual | $ | 1,000 | $ | 1,150.10 | $ | 4.85 |
| Hypothetical (5% return before expenses) | $ | 1,000 | $ | 1,020.28 | $ | 4.56 |
*Expenses are calculated using the most recent six-month expense ratio, annualized for each class (A: 1.16%; C: 1.91%; R: 1.41%; R6: 0.72%; and Advisor: 0.91%), multiplied by the average account value over the period, multiplied by 181/365 to reflect the one-half year period.
Semiannual Report | 17
| | | | | | | | | | | | | | | | | | |
| Templeton Foreign Fund | | | | | | | | | | | | | | | | |
| |
| Financial Highlights | | | | | | | | | | | | | | | | | | |
| |
| | | Six Months Ended | | | | | | | | | | | | | | | | |
| | | February 28, 2014 | | | | | | Year Ended August 31, | | | | |
| Class A | | (unaudited) | | | 2013 | | | 2012 | | | 2011 | | | 2010 | | | 2009 | |
| Per share operating performance | | | | | | | | | | | | | | | | | | |
| (for a share outstanding throughout | | | | | | | | | | | | | | | | | | |
| the period) | | | | | | | | | | | | | | | | | | |
| Net asset value, beginning of period | $ | 7.67 | | $ | 6.26 | | $ | 6.57 | | $ | 6.01 | | $ | 6.20 | | $ | 10.24 | |
| Income from investment operationsa: | | | | | | | | | | | | | | | | | | |
| Net investment incomeb | | 0.08 | c | | 0.12 | | | 0.14 | | | 0.14 | | | 0.10 | | | 0.12 | |
| Net realized and unrealized gains (losses) | | 1.05 | | | 1.44 | | | (0.28 | ) | | 0.54 | | | (0.19 | ) | | (1.84 | ) |
| Total from investment operations | | 1.13 | | | 1.56 | | | (0.14 | ) | | 0.68 | | | (0.09 | ) | | (1.72 | ) |
| Less distributions from: | | | | | | | | | | | | | | | | | | |
| Net investment income | | (0.11 | ) | | (0.15 | ) | | (0.17 | ) | | (0.12 | ) | | (0.10 | ) | | (0.32 | ) |
| Net realized gains | | (0.30 | ) | | — | | | — | | | — | | | — | | | (2.00 | ) |
| Total distributions | | (0.41 | ) | | (0.15 | ) | | (0.17 | ) | | (0.12 | ) | | (0.10 | ) | | (2.32 | ) |
| Net asset value, end of period | $ | 8.39 | | $ | 7.67 | | $ | 6.26 | | $ | 6.57 | | $ | 6.01 | | $ | 6.20 | |
| |
| Total returnd | | 15.00 | % | | 25.17 | % | | (1.94 | )% | | 11.30 | % | | (1.61 | )% | | (7.96 | )% |
| |
| Ratios to average net assetse | | | | | | | | | | | | | | | | | | |
| Expenses | | 1.16 | % | | 1.19 | %f | | 1.21 | %f | | 1.17 | %f | | 1.19 | %f | | 1.19 | %f |
| Net investment income | | 1.42 | %c | | 1.72 | % | | 2.29 | % | | 1.97 | % | | 1.61 | % | | 2.11 | % |
| |
| Supplemental data | | | | | | | | | | | | | | | | | | |
| Net assets, end of period (000’s) | $ | 4,532,538 $3,904,719 $3,418,240 $3,775,303 $3,636,256 $4,248,049 | |
| Portfolio turnover rate | | 9.81 | % | | 32.05 | % | | 20.17 | % | | 34.97 | % | | 16.09 | % | | 31.05 | %g |
aThe amount shown for a share outstanding throughout the period may not correlate with the Statement of Operations for the period due to the timing of sales and repurchases of
the Fund shares in relation to income earned and/or fluctuating market value of the investments of the Fund.
bBased on average daily shares outstanding.
cNet investment income per share includes approximately $0.05 per share received in the form of a special dividend paid in connection with certain Fund’s holdings. Excluding this
amount, the ratio of net investment income to average net assets would been 0.84%.
dTotal return does not reflect sales commissions or contingent deferred sales charges, if applicable, and is not annualized for periods less than one year.
eRatios are annualized for periods less than one year.
fBenefit of expense reduction and reimbursement rounds to less than 0.01%.
gExcludes the value of portfolio securities delivered as a result of a redemption in-kind.
18 | The accompanying notes are an integral part of these financial statements. | Semiannual Report
| | | | | | | | | | | | | | | | | | |
| Templeton Foreign Fund | | | | | | | | | | | | | | | | |
| |
| Financial Highlights (continued) | | | | | | | | | | | | | | | | | | |
| |
| | | Six Months Ended | | | | | | | | | | | | | | | | |
| | | February 28, 2014 | | | Year Ended August 31, | | | | |
| Class C | | (unaudited) | | | 2013 | | | 2012 | | | 2011 | | | 2010 | | | 2009 | |
| Per share operating performance | | | | | | | | | | | | | | | | | | |
| (for a share outstanding throughout | | | | | | | | | | | | | | | | | | |
| the period) | | | | | | | | | | | | | | | | | | |
| Net asset value, beginning of period | $ | 7.48 | | $ | 6.11 | | $ | 6.40 | | $ | 5.86 | | $ | 6.05 | | $ | 10.00 | |
| Income from investment operationsa: | | | | | | | | | | | | | | | | | | |
| Net investment incomeb | | 0.05 | c | | 0.07 | | | 0.09 | | | 0.08 | | | 0.05 | | | 0.07 | |
| Net realized and unrealized gains (losses) | | 1.02 | | | 1.40 | | | (0.27 | ) | | 0.53 | | | (0.19 | ) | | (1.79 | ) |
| Total from investment operations | | 1.07 | | | 1.47 | | | (0.18 | ) | | 0.61 | | | (0.14 | ) | | (1.72 | ) |
| Less distributions from: | | | | | | | | | | | | | | | | | | |
| Net investment income | | (0.06 | ) | | (0.10 | ) | | (0.11 | ) | | (0.07 | ) | | (0.05 | ) | | (0.23 | ) |
| Net realized gains | | (0.30 | ) | | — | | | — | | | — | | | — | | | (2.00 | ) |
| Total distributions | | (0.36 | ) | | (0.10 | ) | | (0.11 | ) | | (0.07 | ) | | (0.05 | ) | | (2.23 | ) |
| Net asset value, end of period | $ | 8.19 | | $ | 7.48 | | $ | 6.11 | | $ | 6.40 | | $ | 5.86 | | $ | 6.05 | |
| |
| Total returnd | | 14.48 | % | | 24.21 | % | | (2.62 | )% | | 10.42 | % | | (2.30 | )% | | (8.69 | )% |
| |
| Ratios to average net assetse | | | | | | | | | | | | | | | | | | |
| Expenses | | 1.91 | % | | 1.94 | %f | | 1.96 | %f | | 1.92 | %f | | 1.94 | %f | | 1.93 | %f |
| Net investment income | | 0.67 | %c | | 0.97 | % | | 1.54 | % | | 1.22 | % | | 0.86 | % | | 1.37 | % |
| |
| Supplemental data | | | | | | | | | | | | | | | | | | |
| Net assets, end of period (000’s) | $ | 610,410 | | $ | 517,468 | | $ | 459,838 | | $ | 555,999 | | $ | 575,258 | | $ | 667,534 | |
| Portfolio turnover rate | | 9.81 | % | | 32.05 | % | | 20.17 | % | | 34.97 | % | | 16.09 | % | | 31.05 | %g |
aThe amount shown for a share outstanding throughout the period may not correlate with the Statement of Operations for the period due to the timing of sales and repurchases of
the Fund shares in relation to income earned and/or fluctuating market value of the investments of the Fund.
bBased on average daily shares outstanding.
cNet investment income per share includes approximately $0.05 per share received in the form of a special dividend paid in connection with certain Fund’s holdings. Excluding the
amount, the ratio of net investment income to average net assets would been 0.09%.
dTotal return does not reflect sales commissions or contingent deferred sales charges, if applicable, and is not annualized for periods less than one year.
eRatios are annualized for periods less than one year.
fBenefit of expense reduction and reimbursement rounds to less than 0.01%.
gExcludes the value of portfolio securities delivered as a result of a redemption in-kind.
Semiannual Report | The accompanying notes are an integral part of these financial statements. | 19
| | | | | | | | | | | | | | | | | | |
| Templeton Foreign Fund | | | | | | | | | | | | | | | | |
| |
| Financial Highlights (continued) | | | | | | | | | | | | | | | | | | |
| |
| | | Six Months Ended | | | | | | | | | | | | | | | | |
| | | February 28, 2014 | | | Year Ended August 31, | | | | |
| Class R | | (unaudited) | | | 2013 | | | 2012 | | | 2011 | | | 2010 | | | 2009 | |
| Per share operating performance | | | | | | | | | | | | | | | | | | |
| (for a share outstanding throughout | | | | | | | | | | | | | | | | | | |
| the period) | | | | | | | | | | | | | | | | | | |
| Net asset value, beginning of period | $ | 7.54 | | $ | 6.16 | | $ | 6.46 | | $ | 5.92 | | $ | 6.11 | | $ | 10.12 | |
| Income from investment operationsa: | | | | | | | | | | | | | | | | | | |
| Net investment incomeb | | 0.07 | c | | 0.10 | | | 0.13 | | | 0.12 | | | 0.09 | | | 0.10 | |
| Net realized and unrealized gains (losses) | | 1.02 | | | 1.41 | | | (0.28 | ) | | 0.53 | | | (0.20 | ) | | (1.82 | ) |
| Total from investment operations | | 1.09 | | | 1.51 | | | (0.15 | ) | | 0.65 | | | (0.11 | ) | | (1.72 | ) |
| Less distributions from: | | | | | | | | | | | | | | | | | | |
| Net investment income | | (0.09 | ) | | (0.13 | ) | | (0.15 | ) | | (0.11 | ) | | (0.08 | ) | | (0.29 | ) |
| Net realized gains | | (0.30 | ) | | — | | | — | | | — | | | — | | | (2.00 | ) |
| Total distributions | | (0.39 | ) | | (0.13 | ) | | (0.15 | ) | | (0.11 | ) | | (0.08 | ) | | (2.29 | ) |
| Net asset value, end of period | $ | 8.24 | | $ | 7.54 | | $ | 6.16 | | $ | 6.46 | | $ | 5.92 | | $ | 6.11 | |
| |
| Total returnd | | 14.72 | % | | 24.81 | % | | (2.07 | )% | | 10.91 | % | | (1.83 | )% | | (8.14 | )% |
| |
| Ratios to average net assetse | | | | | | | | | | | | | | | | | | |
| Expenses | | 1.41 | % | | 1.44 | %f | | 1.46 | %f | | 1.42 | %f | | 1.44 | %f | | 1.44 | %f |
| Net investment income | | 1.17 | %c | | 1.47 | % | | 2.04 | % | | 1.72 | % | | 1.36 | % | | 1.86 | % |
| |
| Supplemental data | | | | | | | | | | | | | | | | | | |
| Net assets, end of period (000’s) | $ | 196,776 | | $ | 172,393 | | $ | 149,061 | | $ | 139,600 | | $ | 121,834 | | $ | 114,653 | |
| Portfolio turnover rate | | 9.81 | % | | 32.05 | % | | 20.17 | % | | 34.97 | % | | 16.09 | % | | 31.05 | %g |
aThe amount shown for a share outstanding throughout the period may not correlate with the Statement of Operations for the period due to the timing of sales and repurchases of
the Fund shares in relation to income earned and/or fluctuating market value of the investments of the Fund.
bBased on average daily shares outstanding.
cNet investment income per share includes approximately $0.05 per share received in the form of a special dividend paid in connection with certain Fund’s holdings. Excluding this
amount, the ratio of net investment income to average net assets would been 0.59%.
dTotal return is not annualized for periods less than one year.
eRatios are annualized for periods less than one year.
fBenefit of expense reduction and reimbursement rounds to less than 0.01%.
gExcludes the value of portfolio securities delivered as a result of a redemption in-kind.
20 | The accompanying notes are an integral part of these financial statements. | Semiannual Report
| | | | | | |
| Templeton Foreign Fund | | | | | | |
| |
| Financial Highlights (continued) | | | | | | |
| |
| | | Six Months Ended | | | Period Ended | |
| | | February 28, 2014 | | | August 31, | |
| Class R6 | | (unaudited) | | | 2013 | a |
| Per share operating performance | | | | | | |
| (for a share outstanding throughout the period) | | | | | | |
| Net asset value, beginning of period | $ | 7.59 | | $ | 7.16 | |
| Income from investment operationsb: | | | | | | |
| Net investment incomec | | 0.11 | d | | 0.08 | |
| Net realized and unrealized gains (losses) | | 1.03 | | | 0.35 | |
| Total from investment operations | | 1.14 | | | 0.43 | |
| Less distributions from: | | | | | | |
| Net investment income | | (0.15 | ) | | — | |
| Net realized gains | | (0.30 | ) | | — | |
| Total distributions | | (0.45 | ) | | — | |
| Net asset value, end of period | $ | 8.28 | | $ | 7.59 | |
| |
| Total returnd | | 15.24 | % | | 6.01 | % |
| |
| Ratios to average net assetse | | | | | | |
| Expenses | | 0.72 | % | | 0.74 | % |
| Net investment income | | 1.86 | %d | | 2.17 | % |
| |
| Supplemental data | | | | | | |
| Net assets, end of period (000’s) | $ | 602,773 | | $ | 366,042 | |
| Portfolio turnover rate | | 9.81 | % | | 32.05 | % |
aFor the period May 1, 2013 (effective date) to August 31, 2013.
bThe amount shown for a share outstanding throughout the period may not correlate with the Statement of Operations for the period due to the timing of sales and repurchases of
the Fund shares in relation to income earned and/or fluctuating market value of the investments of the Fund.
cBased on average daily shares outstanding.
dNet investment income per share includes approximately $0.05 per share received in the form of a special dividend paid in connection with certain Fund’s holdings. Excluding this
amount, the ratio of net investment income to average net assets would have been 1.28%.
eTotal return is not annualized for periods less than one year.
fRatios are annualized for periods less than one year.
Semiannual Report | The accompanying notes are an integral part of these financial statements. | 21
| | | | | | | | | | | | | | | | | | |
| Templeton Foreign Fund | | | | | | | | | | | | | | | | |
| |
| Financial Highlights (continued) | | | | | | | | | | | | | | | | | | |
| |
| | | Six Months Ended | | | | | | | | | | | | | | | | |
| | | February 28, 2014 | | | | | | Year Ended August 31, | | | | |
| Advisor Class | | (unaudited) | | | 2013 | | | 2012 | | | 2011 | | | 2010 | | | 2009 | |
| Per share operating performance | | | | | | | | | | | | | | | | | | |
| (for a share outstanding throughout | | | | | | | | | | | | | | | | | | |
| the period) | | | | | | | | | | | | | | | | | | |
| Net asset value, beginning of period | $ | 7.59 | | $ | 6.20 | | $ | 6.51 | | $ | 5.95 | | $ | 6.14 | | $ | 10.21 | |
| Income from investment operationsa: | | | | | | | | | | | | | | | | | | |
| Net investment incomeb | | 0.09 | c | | 0.13 | | | 0.16 | | | 0.16 | | | 0.11 | | | 0.13 | |
| Net realized and unrealized gains (losses) | | 1.03 | | | 1.43 | | | (0.28 | ) | | 0.54 | | | (0.19 | ) | | (1.85 | ) |
| Total from investment operations | | 1.12 | | | 1.56 | | | (0.12 | ) | | 0.70 | | | (0.08 | ) | | (1.72 | ) |
| Less distributions from: | | | | | | | | | | | | | | | | | | |
| Net investment income | | (0.13 | ) | | (0.17 | ) | | (0.19 | ) | | (0.14 | ) | | (0.11 | ) | | (0.35 | ) |
| Net realized gains | | (0.30 | ) | | — | | | — | | | — | | | — | | | (2.00 | ) |
| Total distributions | | (0.43 | ) | | (0.17 | ) | | (0.19 | ) | | (0.14 | ) | | (0.11 | ) | | (2.35 | ) |
| Net asset value, end of period | $ | 8.28 | | $ | 7.59 | | $ | 6.20 | | $ | 6.51 | | $ | 5.95 | | $ | 6.14 | |
| |
| Total returnd | | 15.01 | % | | 25.39 | % | | (1.49 | )% | | 11.53 | % | | (1.41 | )% | | (7.79 | )% |
| |
| Ratios to average net assetse | | | | | | | | | | | | | | | | | | |
| Expenses | | 0.91 | % | | 0.94 | %f | | 0.96 | %f | | 0.92 | %f | | 0.94 | %f | | 0.94 | %f |
| Net investment income | | 1.67 | %c | | 1.97 | % | | 2.54 | % | | 2.22 | % | | 1.86 | % | | 2.36 | % |
| |
| Supplemental data | | | | | | | | | | | | | | | | | | |
| Net assets, end of period (000’s) | $ | 1,543,405 | $1,340,444 $1,430,480 $1,169,727 | $ | 868,166 | | $ | 959,708 | |
| Portfolio turnover rate | | 9.81 | % | | 32.05 | % | | 20.17 | % | | 34.97 | % | | 16.09 | % | | 31.05 | %g |
aThe amount shown for a share outstanding throughout the period may not correlate with the Statement of Operations for the period due to the timing of sales and repurchases of
the Fund shares in relation to income earned and/or fluctuating market value of the investments of the Fund.
bBased on average daily shares outstanding.
cNet investment income per share includes approximately $0.05 per share received in the form of a special dividend paid in connection with certain Fund’s holdings. Excluding this
amount, the ratio of net investment income to average net assets would have been 1.09%.
dTotal return is not annualized for periods less than one year.
eRatios are annualized for periods less than one year.
fBenefit of expense reduction and reimbursement rounds to less than 0.01%.
gExcludes the value of portfolio securities delivered as a result of a redemption in-kind.
22 | The accompanying notes are an integral part of these financial statements. | Semiannual Report
| | | | |
| Templeton Foreign Fund | | | |
| |
| Statement of Investments, February 28, 2014 (unaudited) | | | |
| |
| |
| | Industry | Shares | | Value |
| Common Stocks 94.4% | | | | |
| Brazil 0.1% | | | | |
| Centrais Eletricas Brasileiras SA | Electric Utilities | 4,648,770 | $ | 9,941,341 |
| Centrais Eletricas Brasileiras SA | | | | |
| (Eletrobras), ADR | Electric Utilities | 38,000 | | 82,840 |
| | | | | 10,024,181 |
| |
| Canada 5.3% | | | | |
| AGF Management Ltd. | Capital Markets | 1,338,790 | | 13,875,414 |
| Ensign Energy Services Inc. | Energy Equipment & Services | 4,529,930 | | 72,490,341 |
| HudBay Minerals Inc. | Metals & Mining | 7,074,590 | | 58,427,535 |
| a Suncor Energy Inc. | Oil, Gas & Consumable Fuels | 2,453,170 | | 80,974,338 |
| Talisman Energy Inc. | Oil, Gas & Consumable Fuels | 8,354,080 | | 86,054,497 |
| Trican Well Service Ltd. | Energy Equipment & Services | 6,748,990 | | 85,315,235 |
| | | | | 397,137,360 |
| |
| China 4.4% | | | | |
| China Life Insurance Co. Ltd., H | Insurance | 6,503,000 | | 19,021,971 |
| China Mobile Ltd. | Wireless Telecommunication Services | 4,412,500 | | 41,933,647 |
| China Shenhua Energy Co. Ltd., H | Oil, Gas & Consumable Fuels | 23,401,500 | | 63,627,088 |
| China Telecom Corp. Ltd., H | Diversified Telecommunication Services | 123,707,582 | | 53,880,164 |
| Digital China Holdings Ltd. | Electronic Equipment, Instruments & Components | 24,925,250 | | 24,667,017 |
| Dongfang Electric Corp. Ltd., H | Electrical Equipment | 10,000,000 | | 15,978,558 |
| Kunlun Energy Co. Ltd. | Oil, Gas & Consumable Fuels | 2,730,900 | | 4,863,285 |
| Shanghai Electric Group Co. Ltd., H | Electrical Equipment | 48,210,300 | | 16,276,350 |
| Shanghai Pharmaceuticals Holding Co. | | | | |
| Ltd., H | Health Care Providers & Services | 21,370,600 | | 55,489,097 |
| a,b Trina Solar Ltd., ADR | Semiconductors & Semiconductor Equipment | 1,886,000 | | 30,232,580 |
| | | | | 325,969,757 |
| |
| France 13.8% | | | | |
| Alstom SA | Electrical Equipment | 78,127 | | 2,108,327 |
| AXA SA | Insurance | 5,562,992 | | 145,401,031 |
| BNP Paribas SA | Banks | 2,866,553 | | 235,214,427 |
| Carrefour SA | Food & Staples Retailing | 1,053,600 | | 38,850,024 |
| Cie Generale des Etablissements | | | | |
| Michelin, B | Auto Components | 437,300 | | 53,449,691 |
| Compagnie de Saint-Gobain | Building Products | 519,460 | | 31,183,183 |
| Ipsen SA | Pharmaceuticals | 559,750 | | 24,050,386 |
| Orange SA | Diversified Telecommunication Services | 3,765,751 | | 47,129,201 |
| Sanofi | Pharmaceuticals | 1,428,635 | | 148,514,319 |
| Societe Generale | Banks | 986,796 | | 65,876,032 |
| Technip SA | Energy Equipment & Services | 202,120 | | 19,856,713 |
| Total SA, B | Oil, Gas & Consumable Fuels | 2,521,260 | | 163,633,300 |
| Vivendi SA | Diversified Telecommunication Services | 2,115,914 | | 60,486,997 |
| | | | | 1,035,753,631 |
| |
| Germany 4.3% | | | | |
| b Commerzbank AG | Banks | 1,861,430 | | 33,753,682 |
| b Deutsche Lufthansa AG | Airlines | 2,387,880 | | 61,918,204 |
| Gerresheimer AG | Life Sciences Tools & Services | 277,200 | | 18,904,929 |
| |
| | | Semiannual Report | 23 |
Templeton Foreign Fund
Statement of Investments, February 28, 2014 (unaudited) (continued)
| | | | | | |
| | | | Industry | Shares | | Value |
| | | Common Stocks (continued) | | | | |
| | | Germany (continued) | | | | |
| | | b Kloeckner & Co. SE | Trading Companies & Distributors | 1,521,460 | $ | 23,442,199 |
| | | Metro AG | Food & Staples Retailing | 1,179,304 | | 48,896,419 |
| | | Muenchener Rueckversicherungs- | | | | |
| | | Gesellschaft AG | Insurance | 240,272 | | 52,604,429 |
| | | Siemens AG | Industrial Conglomerates | 624,142 | | 83,340,930 |
| | | | | | | 322,860,792 |
| |
| | | Hong Kong 1.1% | | | | |
| | | First Pacific Co. Ltd. | Diversified Financial Services | 16,393,500 | | 16,244,783 |
| | | Kingboard Chemical Holdings Ltd. | Electronic Equipment, Instruments & Components | 27,361,904 | | 60,221,293 |
| | | Noble Group Ltd. | Trading Companies & Distributors | 7,336,800 | | 5,961,584 |
| | | Value Partners Group Ltd. | Capital Markets | 3,187,400 | | 2,037,202 |
| | | | | | | 84,464,862 |
| |
| | | India 0.7% | | | | |
| | | ICICI Bank Ltd. | Banks | 1,222,640 | | 20,665,091 |
| | | Jain Irrigation Systems Ltd. | Machinery | 10,886,360 | | 10,436,802 |
| | | LIC Housing Finance Ltd. | Thrifts & Mortgage Finance | 3,745,914 | | 12,517,722 |
| | | Power Grid Corp. of India Ltd. | Electric Utilities | 6,371,999 | | 9,761,799 |
| | | | | | | 53,381,414 |
| |
| | | Ireland 0.6% | | | | |
| | | CRH PLC | Construction Materials | 1,617,990 | | 47,894,121 |
| |
| | | Israel 0.7% | | | | |
| | | Teva Pharmaceutical Industries Ltd., | | | | |
| | | ADR | Pharmaceuticals | 1,102,810 | | 55,019,191 |
| |
| | | Italy 3.3% | | | | |
| | | Eni SpA | Oil, Gas & Consumable Fuels | 3,710,120 | | 89,496,996 |
| | | Saipem SpA | Energy Equipment & Services | 771,060 | | 18,131,630 |
| | | UniCredit SpA | Banks | 17,587,407 | | 139,920,130 |
| | | | | | | 247,548,756 |
| |
| | | Japan 5.8% | | | | |
| | | Capcom Co. Ltd. | Software | 2,302,160 | | 44,007,891 |
| | | ITOCHU Corp. | Trading Companies & Distributors | 10,194,100 | | 126,575,073 |
| | | Namco Bandai Holdings Inc. | Leisure Products | 3,481,650 | | 77,875,413 |
| | | Nikon Corp. | Household Durables | 941,000 | | 17,220,855 |
| | | Nissan Motor Co. Ltd. | Automobiles | 4,837,700 | | 43,292,188 |
| | | Suntory Beverage & Food Ltd. | Beverages | 1,057,400 | | 37,237,515 |
| | | Toyota Motor Corp. | Automobiles | 1,315,580 | | 75,458,464 |
| | | Trend Micro Inc. | Software | 342,240 | | 11,464,031 |
| | | | | | | 433,131,430 |
| |
| | | Netherlands 6.1% | | | | |
| | | Aegon NV | Insurance | 14,637,985 | | 131,888,534 |
| | | Akzo Nobel NV | Chemicals | 1,330,760 | | 110,205,290 |
| | | Fugro NV, IDR | Energy Equipment & Services | 581,686 | | 33,802,820 |
| 24 | | | Semiannual Report | | | | |
Templeton Foreign Fund
Statement of Investments, February 28, 2014 (unaudited) (continued)
| | | | |
| | Industry | Shares | | Value |
| Common Stocks (continued) | | | | |
| Netherlands (continued) | | | | |
| b ING Groep NV, IDR | Diversified Financial Services | 9,517,688 | $ | 138,830,704 |
| b SBM Offshore NV | Energy Equipment & Services | 2,684,680 | | 41,568,510 |
| | | | | 456,295,858 |
| |
| Norway 2.4% | | | | |
| Statoil ASA | Oil, Gas & Consumable Fuels | 4,586,200 | | 121,063,574 |
| Telenor ASA | Diversified Telecommunication Services | 2,649,156 | | 58,540,493 |
| | | | | 179,604,067 |
| |
| Russia 0.3% | | | | |
| c LUKOIL Holdings, ADR (London Stock | | | | |
| Exchange) | Oil, Gas & Consumable Fuels | 237,380 | | 13,057,087 |
| Mining and Metallurgical Co. Norilsk | | | | |
| Nickel OJSC, ADR | Metals & Mining | 715,630 | | 12,149,608 |
| | | | | 25,206,695 |
| |
| Singapore 0.8% | | | | |
| b Flextronics International Ltd. | Electronic Equipment, Instruments & Components | 6,321,390 | | 56,576,441 |
| |
| South Korea 8.8% | | | | |
| Daum Communication Corp. | Internet Software & Services | 240,380 | | 15,784,655 |
| Hana Financial Group Inc. | Banks | 3,571,980 | | 139,728,113 |
| Hyundai Mobis | Auto Components | 244,960 | | 72,039,624 |
| KB Financial Group Inc. | Banks | 3,652,317 | | 136,703,641 |
| KIWOOM Securities Co. Ltd. | Capital Markets | 552,080 | | 27,655,531 |
| Korea Investment Holdings Co. Ltd. | Capital Markets | 801,250 | | 28,900,350 |
| POSCO | Metals & Mining | 327,220 | | 87,175,993 |
| Samsung Electronics Co. Ltd. | Semiconductors & Semiconductor Equipment | 117,164 | | 148,267,123 |
| | | | | 656,255,030 |
| |
| Spain 1.3% | | | | |
| Telefonica SA | Diversified Telecommunication Services | 6,257,015 | | 95,931,300 |
| |
| Sweden 1.0% | | | | |
| Ericsson, B | Communications Equipment | 3,121,809 | | 40,462,664 |
| Getinge AB, B | Health Care Equipment & Supplies | 839,205 | | 30,210,019 |
| | | | | 70,672,683 |
| |
| Switzerland 7.6% | | | | |
| b Basilea Pharmaceutica AG | Biotechnology | 203,780 | | 29,955,382 |
| Credit Suisse Group AG | Capital Markets | 5,658,189 | | 178,185,352 |
| b GAM Holding Ltd. | Capital Markets | 1,249,960 | | 22,097,406 |
| Lonza Group AG | Life Sciences Tools & Services | 546,990 | | 57,833,185 |
| Nobel Biocare Holding AG | Health Care Equipment & Supplies | 1,828,510 | | 26,816,483 |
| Novartis AG | Pharmaceuticals | 912,730 | | 76,216,483 |
| Roche Holding AG | Pharmaceuticals | 471,350 | | 145,434,732 |
| Swiss Re AG | Insurance | 357,903 | | 33,446,597 |
| | | | | 569,985,620 |
Semiannual Report | 25
| | | | |
| Templeton Foreign Fund | | | |
| |
| Statement of Investments, February 28, 2014 (unaudited) (continued) | | | |
| |
| |
| | Industry | Shares | | Value |
| Common Stocks (continued) | | | | |
| Taiwan 0.2% | | | | |
| Compal Electronics Inc. | Technology Hardware, Storage & Peripherals | 15,830,617 | $ | 10,709,070 |
| |
| Turkmenistan 0.2% | | | | |
| Dragon Oil PLC | Oil, Gas & Consumable Fuels | 1,584,280 | | 16,077,302 |
| |
| United Kingdom 18.7% | | | | |
| Aviva PLC | Insurance | 22,723,974 | | 180,165,363 |
| BAE Systems PLC | Aerospace & Defense | 9,393,220 | | 64,614,941 |
| BP PLC | Oil, Gas & Consumable Fuels | 15,787,370 | | 133,281,935 |
| Carillion PLC | Construction & Engineering | 9,515,960 | | 60,425,767 |
| GlaxoSmithKline PLC | Pharmaceuticals | 4,994,344 | | 139,758,831 |
| HSBC Holdings PLC | Banks | 5,392,760 | | 56,847,156 |
| Kingfisher PLC | Specialty Retail | 11,449,794 | | 75,522,869 |
| b Lloyds Banking Group PLC | Banks | 42,815,580 | | 59,152,004 |
| Man Group PLC | Capital Markets | 37,648,150 | | 65,382,454 |
| Marks & Spencer Group PLC | Multiline Retail | 8,593,195 | | 72,352,264 |
| Rexam PLC | Containers & Packaging | 4,786,560 | | 39,560,347 |
| Royal Dutch Shell PLC, A | Oil, Gas & Consumable Fuels | 768,672 | | 28,062,600 |
| Royal Dutch Shell PLC, B | Oil, Gas & Consumable Fuels | 2,826,470 | | 110,119,326 |
| Serco Group PLC | Commercial Services & Supplies | 2,976,920 | | 22,949,510 |
| SIG PLC | Trading Companies & Distributors | 9,174,289 | | 32,449,005 |
| Tesco PLC | Food & Staples Retailing | 33,434,960 | | 184,270,607 |
| Vodafone Group PLC | Wireless Telecommunication Services | 17,884,496 | | 74,550,253 |
| | | | | 1,399,465,232 |
| |
| United States 6.9% | | | | |
| Baker Hughes Inc. | Energy Equipment & Services | 3,044,320 | | 192,644,569 |
| Cisco Systems Inc. | Communications Equipment | 4,577,090 | | 99,780,562 |
| Hewlett-Packard Co. | Technology Hardware, Storage & Peripherals | 4,380,710 | | 130,895,615 |
| Noble Corp. PLC | Energy Equipment & Services | 1,746,517 | | 54,229,353 |
| Verizon Communications Inc. | Diversified Telecommunication Services | 862,334 | | 40,909,127 |
| | | | | 518,459,226 |
| |
| Total Common Stocks | | | | |
| (Cost $6,047,398,233) | | | | 7,068,424,019 |
| |
| Preferred Stocks 0.5% | | | | |
| Brazil 0.5% | | | | |
| Petroleo Brasileiro SA, ADR, pfd. | Oil, Gas & Consumable Fuels | 1,497,790 | | 17,464,231 |
| Vale SA, ADR, pfd., A | Metals & Mining | 1,291,734 | | 16,133,758 |
| |
| Total Preferred Stocks | | | | |
| (Cost $46,420,227) | | | | 33,597,989 |
| |
| Non-Registered Mutual Funds | | | | |
| (Cost $27,858,900) 0.4% | | | | |
| China 0.4% | | | | |
| b,d,e,f Templeton China Opportunities Fund, | | | | |
| Ltd., Reg D | Diversified Financial Services | 2,787,539 | | 30,077,545 |
| |
| |
| 26 | Semiannual Report | | | | |
Templeton Foreign Fund
Statement of Investments, February 28, 2014 (unaudited) (continued)
| | | | | | |
| | | | Principal Amount* | | Value | |
| Total Investments before Short | | | | | | |
| Term Investments | | | | | | |
| (Cost $6,121,677,360) | | | | $ | 7,132,099,553 | |
| |
| Short Term Investments 4.7% | | | | | | |
| Time Deposits 4.2% | | | | | | |
| Canada 2.8% | | | | | | |
| Bank of Montreal, 0.04%, 3/03/14 | | $ | 111,000,000 | | 111,000,000 | |
| Royal Bank of Canada, 0.03%, 3/03/14 | | | 100,000,000 | | 100,000,000 | |
| | | | | | 211,000,000 | |
| United States 1.4% | | | | | | |
| Scotia Capital Markets, 0.03%, | | | | | | |
| 3/03/14 | | | 107,000,000 | | 107,000,000 | |
| |
| Total Time Deposits | | | | | | |
| (Cost $318,000,000) | | | | | 318,000,000 | |
| Total Investments before Money | | | | | | |
| Market Funds | | | | | | |
| (Cost $6,439,677,360) | | | | | 7,450,099,553 | |
| |
| | | | Shares | | | |
| g Investments from Cash Collateral | | | | | | |
| Received for Loaned Securities | | | | | | |
| (Cost $37,764,630) 0.5% | | | | | | |
| Money Market Funds 0.5% | | | | | | |
| United States 0.5% | | | | | | |
| h BNY Mellon Overnight Government | | | | | | |
| Fund, 0.032% | | | 37,764,630 | | 37,764,630 | |
| Total Investments | | | | | | |
| (Cost $6,477,441,990) | | | | | | |
| 100.0% | | | | | 7,487,864,183 | |
| Other Assets, less Liabilities† | | | | | (1,962,835 | ) |
| Net Assets 100.0% | | | | $ | 7,485,901,348 | |
See Abbreviations on page 43.
*The principal amount is stated in U.S. dollars unless otherwise indicated.
†Rounds to less than 0.1% of net assets.
aA portion or all of the security is on loan at February 28, 2014. See Note 1(d).
bNon-income producing.
cAt February 28, 2014, pursuant to the Fund’s policies and the requirements of applicable securities law, the Fund may be restricted from trading this security for a limited or
extended period of time due to ownership limits and/or potential possession of material non-public information.
dSee Note 1(c) regarding investment in Templeton China Opportunities Fund, Ltd.
eSee Note 8 regarding restricted securities.
fSee Note 9 regarding holdings of 5% voting securities.
gSee Note 1(d) regarding securities on loan.
hThe rate shown is the annualized seven-day yield at period end.
Semiannual Report | The accompanying notes are an integral part of these financial statements. | 27
| | | |
| Templeton Foreign Fund | | | |
| |
| Financial Statements | | | |
| |
| |
| Statement of Assets and Liabilities | | | |
| February 28, 2014 (unaudited) | | | |
| |
| Assets: | | | |
| Investments in securities: | | | |
| Cost - Unaffiliated issuers | $ | 6,449,583,090 | |
| Cost - Non-controlled affiliated issuers (Note 9) | | 27,858,900 | |
| Total cost of investments | $ | 6,477,441,990 | |
| Value - Unaffiliated issuers | $ | 7,457,786,638 | |
| Value - Non-controlled affiliated issuers (Note 9) | | 30,077,545 | |
| Total value of investments (includes securities loaned in the amount of $36,431,269) | | 7,487,864,183 | |
| Cash | | 117,839 | |
| Receivables: | | | |
| Investment securities sold | | 4,665,117 | |
| Capital shares sold | | 12,379,824 | |
| Dividends and interest | | 34,550,072 | |
| Other assets | | 5,068 | |
| Total assets | | 7,539,582,103 | |
| Liabilities: | | | |
| Payables: | | | |
| Investment securities purchased | | 37,043 | |
| Capital shares redeemed | | 6,604,323 | |
| Management fees | | 3,407,679 | |
| Administrative fees | | 440,955 | |
| Distribution fees | | 1,372,521 | |
| Transfer agent fees | | 2,311,792 | |
| Payable upon return of securities loaned | | 37,764,630 | |
| Deferred tax | | 939,759 | |
| Accrued expenses and other liabilities | | 802,053 | |
| Total liabilities | | 53,680,755 | |
| Net assets, at value | $ | 7,485,901,348 | |
| Net assets consist of: | | | |
| Paid-in capital | $ | 6,521,533,217 | |
| Undistributed net investment income | | 55,948,741 | |
| Net unrealized appreciation (depreciation) | | 1,009,930,149 | |
| Accumulated net realized gain (loss) | | (101,510,759 | ) |
| Net assets, at value | $ | 7,485,901,348 | |
28 | The accompanying notes are an integral part of these financial statements. | Semiannual Report
| | | |
| Templeton Foreign Fund | | | |
| |
| Financial Statements (continued) | | | |
| |
| |
| Statement of Assets and Liabilities (continued) | | | |
| February 28, 2014 (unaudited) | | | |
| |
| Class A: | | | |
| Net assets, at value | $ | | 4,532,537,799 |
| Shares outstanding | | | 540,538,628 |
| Net asset value per sharea | | $ | 8.39 |
| Maximum offering price per share (net asset value per share ÷ 94.25%) | | $ | 8.90 |
| Class C: | | | |
| Net assets, at value | $ | | 610,410,076 |
| Shares outstanding | | | 74,487,655 |
| Net asset value and maximum offering price per sharea | | $ | 8.19 |
| Class R: | | | |
| Net assets, at value | $ | | 196,775,537 |
| Shares outstanding | | | 23,873,864 |
| Net asset value and maximum offering price per share | | $ | 8.24 |
| Class R6: | | | |
| Net assets, at value | $ | | 602,772,972 |
| Shares outstanding | | | 72,790,453 |
| Net asset value and maximum offering price per share | | $ | 8.28 |
| Advisor Class: | | | |
| Net assets, at value | $ | | 1,543,404,964 |
| Shares outstanding | | | 186,300,329 |
| Net asset value and maximum offering price per share | | $ | 8.28 |
aRedemption price is equal to net asset value less contingent deferred sales charges, if applicable.
Semiannual Report | The accompanying notes are an integral part of these financial statements. | 29
| | | |
| Templeton Foreign Fund | | | |
| |
| Financial Statements (continued) | | | |
| |
| |
| Statement of Operations | | | |
| for the six months ended February 28, 2014 (unaudited) | | | |
| |
| Investment income: | | | |
| Dividends (net of foreign taxes of $4,713,130) | $ | 111,355,937 | |
| Interest | | 43,907 | |
| Income from securities loaned | | 22,806 | |
| Total investment income | | 111,422,650 | |
| Expenses: | | | |
| Management fees (Note 3a) | | 21,522,577 | |
| Administrative fees (Note 3b) | | 2,786,274 | |
| Distribution fees: (Note 3c) | | | |
| Class A | | 5,366,399 | |
| Class C | | 2,883,912 | |
| Class R | | 464,272 | |
| Transfer agent fees: (Note 3e) | | | |
| Class A | | 4,012,118 | |
| Class C | | 538,912 | |
| Class R | | 173,614 | |
| Class R6 | | 204 | |
| Advisor Class | | 1,405,388 | |
| Custodian fees (Note 4) | | 526,283 | |
| Reports to shareholders | | 269,775 | |
| Registration and filing fees | | 82,879 | |
| Professional fees | | 80,213 | |
| Trustees’ fees and expenses | | 56,871 | |
| Other | | 49,849 | |
| Total expenses | | 40,219,540 | |
| Net investment income | | 71,203,110 | |
| Realized and unrealized gains (losses): | | | |
| Net realized gain (loss) from: | | | |
| Investments | | (33,915,492 | ) |
| Foreign currency transactions | | 500,005 | |
| Net realized gain (loss) | | (33,415,487 | ) |
| Net change in unrealized appreciation (depreciation) on: | | | |
| Investments | | 915,300,728 | |
| Translation of other assets and liabilities denominated in foreign currencies | | 434,887 | |
| Change in deferred taxes on unrealized appreciation | | (939,759 | ) |
| Net change in unrealized appreciation (depreciation) | | 914,795,856 | |
| Net realized and unrealized gain (loss) | | 881,380,369 | |
| Net increase (decrease) in net assets resulting from operations | $ | 952,583,479 | |
30 | The accompanying notes are an integral part of these financial statements. | Semiannual Report
| | | | | | |
| Templeton Foreign Fund | | | | | | |
| |
| Financial Statements (continued) | | | | | | |
| |
| |
| Statements of Changes in Net Assets | | | | | | |
| |
| |
| |
| | | Six Months Ended | | | | |
| | | February 28, 2014 | | | Year Ended | |
| | | (unaudited) | | | August 31, 2013 | |
| Increase (decrease) in net assets: | | | | | | |
| Operations: | | | | | | |
| Net investment income | $ | 71,203,110 | | $ | 102,018,845 | |
| Net realized gain (loss) from investments, written options and foreign currency transactions | | (33,415,487 | ) | | 209,293,823 | |
| Net change in unrealized appreciation (depreciation) on investments, translation of other | | | | | | |
| assets and liabilities denominated in foreign currencies and deferred taxes | | 914,795,856 | | | 995,219,334 | |
| Net increase (decrease) in net assets resulting from operations | | 952,583,479 | | | 1,306,532,002 | |
| Distributions to shareholders from: | | | | | | |
| Net investment income: | | | | | | |
| Class A | | (58,100,340 | ) | | (77,761,555 | ) |
| Class C | | (4,210,052 | ) | | (6,972,711 | ) |
| Class R | | (2,101,235 | ) | | (3,129,651 | ) |
| Class R6 | | (8,190,270 | ) | | — | |
| Advisor Class | | (23,941,969 | ) | | (37,507,920 | ) |
| Net realized gains: | | | | | | |
| Class A | | (154,490,972 | ) | | — | |
| Class C | | (21,424,495 | ) | | — | |
| Class R | | (6,760,690 | ) | | — | |
| Class R6 | | (16,701,511 | ) | | — | |
| Advisor Class | | (54,864,648 | ) | | — | |
| Total distributions to shareholders | | (350,786,182 | ) | | (125,371,837 | ) |
| Capital share transactions: (Note 2) | | | | | | |
| Class A | | 254,653,560 | | | (248,431,160 | ) |
| Class B | | — | | | (5,754,524 | ) |
| Class C | | 42,721,712 | | | (39,690,927 | ) |
| Class R | | 7,971,097 | | | (8,943,072 | ) |
| Class R6 | | 200,509,759 | | | 349,729,949 | |
| Advisor Class | | 77,181,182 | | | (389,857,098 | ) |
| Total capital share transactions | | 583,037,310 | | | (342,946,832 | ) |
| Net increase (decrease) in net assets | | 1,184,834,607 | | | 838,213,333 | |
| Net assets: | | | | | | |
| Beginning of period | | 6,301,066,741 | | | 5,462,853,408 | |
| End of period | $ | 7,485,901,348 | | $ | 6,301,066,741 | |
| Undistributed net investment income included in net assets: | | | | | | |
| End of period | $ | 55,948,741 | | $ | 81,289,497 | |
Semiannual Report | The accompanying notes are an integral part of these financial statements. | 31
Templeton Foreign Fund
Notes to Financial Statements (unaudited)
1. ORGANIZATION AND SIGNIFICANT ACCOUNTING POLICIES
Templeton Funds (Trust) is registered under the Investment Company Act of 1940, as amended, (1940 Act) as an open-end investment company, consisting of two separate funds. The Templeton Foreign Fund (Fund) is included in this report. The financial statements of the remaining fund in the Trust are presented separately. The Fund offers five classes of shares: Class A, Class C, Class R, Class R6, and Advisor Class. Each class of shares differs by its initial sales load, contingent deferred sales charges, voting rights on matters affecting a single class, its exchange privilege and fees primarily due to differing arrangements for distribution and transfer agent fees.
The following summarizes the Fund’s significant accounting policies.
a. Financial Instrument Valuation
The Fund’s investments in financial instruments are carried at fair value daily. Fair value is the price that would be received to sell an asset or paid to transfer a liability in an orderly transaction between market participants on the measurement date. The Fund calculates the net asset value (NAV) per share at the close of the New York Stock Exchange (NYSE), generally at 4 p.m. Eastern time (NYSE close) on each day the NYSE is open for trading. Under procedures approved by the Trust’s Board of Trustees (the Board), the Fund’s administrator, investment manager and other affiliates have formed the Valuation and Liquidity Oversight Committee (VLOC). The VLOC provides administration and oversight of the Fund’s valuation policies and procedures, which are approved annually by the Board. Among other things, these procedures allow the Fund to utilize independent pricing services, quotations from securities and financial instrument dealers, and other market sources to determine fair value.
Equity securities listed on an exchange or on the NASDAQ National Market System are valued at the last quoted sale price or the official closing price of the day, respectively. Foreign equity securities are valued as of the close of trading on the foreign stock exchange on which the security is primarily traded or as of the NYSE close, whichever is earlier. The value is then converted into its U.S. dollar equivalent at the foreign exchange rate in effect at the NYSE close on the day that the value of the security is determined. Over-the-counter (OTC) securities are valued within the range of the most recent quoted bid and ask prices. Securities that trade in multiple markets or on multiple exchanges are valued according to the broadest and most representative market. Certain equity securities are valued based upon fundamental characteristics or relationships to similar securities. Investments in non-registered funds are valued at the closing net asset value.
Debt securities generally trade in the OTC market rather than on a securities exchange. The Fund’s pricing services use multiple valuation techniques to determine fair value. In instances where sufficient market activity exists, the pricing services may utilize a market-based approach through which quotes from market makers are used to determine fair value. In instances where sufficient market activity may not exist or is limited, the pricing services also utilize proprietary valuation models which may consider market characteristics such as benchmark yield curves, credit spreads, estimated default rates, anticipated market interest rate volatility, coupon rates, anticipated timing of principal repayments, underlying collateral, and other unique security
32 | Semiannual Report
Templeton Foreign Fund
Notes to Financial Statements (unaudited) (continued)
| 1. | ORGANIZATION AND SIGNIFICANT ACCOUNTING POLICIES (continued) |
| a. | Financial Instrument Valuation (continued) |
features in order to estimate the relevant cash flows, which are then discounted to calculate the fair value. Time deposits are valued at cost, which approximates market value.
The Fund has procedures to determine the fair value of financial instruments for which market prices are not reliable or readily available. Under these procedures, the VLOC convenes on a regular basis to review such financial instruments and considers a number of factors, including significant unobservable valuation inputs, when arriving at fair value. The VLOC primarily employs a market-based approach which may use related or comparable assets or liabilities, recent transactions, market multiples, book values, and other relevant information for the investment to determine the fair value of the investment. An income-based valuation approach may also be used in which the anticipated future cash flows of the investment are discounted to calculate fair value. Discounts may also be applied due to the nature or duration of any restrictions on the disposition of the investments. Due to the inherent uncertainty of valuations of such investments, the fair values may differ significantly from the values that would have been used had an active market existed. The VLOC employs various methods for calibrating these valuation approaches including a regular review of key inputs and assumptions, transactional back-testing or disposition analysis, and reviews of any related market activity.
Trading in securities on foreign securities stock exchanges and OTC markets may be completed before the daily NYSE close. In addition, trading in certain foreign markets may not take place on every NYSE business day. Occasionally, events occur between the time at which trading in a foreign security is completed and the close of the NYSE that might call into question the reliability of the value of a portfolio security held by the Fund. As a result, differences may arise between the value of the Fund’s portfolio securities as determined at the foreign market close and the latest indications of value at the close of the NYSE. In order to minimize the potential for these differences, the VLOC monitors price movements following the close of trading in foreign stock markets through a series of country specific market proxies (such as baskets of American Depositary Receipts, futures contracts and exchange traded funds). These price movements are measured against established trigger thresholds for each specific market proxy to assist in determining if an event has occurred that may call into question the reliability of the values of the foreign securities held by the Fund. If such an event occurs, the securities may be valued using fair value procedures, which may include the use of independent pricing services.
Also, when the last day of the reporting period is a non-business day, certain foreign markets may be open on those days that the NYSE is closed, which could result in differences between the value of the Fund’s portfolio securities on the last business day and the last calendar day of the reporting period. Any significant security valuation changes due to an open foreign market are adjusted and reflected by the Fund for financial reporting purposes.
Semiannual Report | 33
Templeton Foreign Fund
Notes to Financial Statements (unaudited) (continued)
| 1. | ORGANIZATION AND SIGNIFICANT ACCOUNTING POLICIES (continued) |
| b. | Foreign Currency Translation |
Portfolio securities and other assets and liabilities denominated in foreign currencies are translated into U.S. dollars based on the exchange rate of such currencies against U.S. dollars on the date of valuation. The Fund may enter into foreign currency exchange contracts to facilitate transactions denominated in a foreign currency. Purchases and sales of securities, income and expense items denominated in foreign currencies are translated into U.S. dollars at the exchange rate in effect on the transaction date. Portfolio securities and assets and liabilities denominated in foreign currencies contain risks that those currencies will decline in value relative to the U.S. dollar. Occasionally, events may impact the availability or reliability of foreign exchange rates used to convert the U.S. dollar equivalent value. If such an event occurs, the foreign exchange rate will be valued at fair value using procedures established and approved by the Board.
The Fund does not separately report the effect of changes in foreign exchange rates from changes in market prices on securities held. Such changes are included in net realized and unrealized gain or loss from investments on the Statement of Operations.
Realized foreign exchange gains or losses arise from sales of foreign currencies, currency gains or losses realized between the trade and settlement dates on securities transactions and the difference between the recorded amounts of dividends, interest, and foreign withholding taxes and the U.S. dollar equivalent of the amounts actually received or paid. Net unrealized foreign exchange gains and losses arise from changes in foreign exchange rates on foreign denominated assets and liabilities other than investments in securities held at the end of the reporting period.
c. Investment in Templeton China Opportunities Fund, Ltd.
The Fund invests in Templeton China Opportunities Fund, Ltd. (China Fund), a private offering of unregistered shares in a Cayman Islands Exempt Company. The China Fund investment objective is to seek capital growth primarily through investments in A-shares of Chinese companies listed on the Shanghai and Shenzhen stock exchanges. Chinese A-shares are traded in Chinese Renminbi and are only available as an investment to domestic (Chinese) investors and holders of a Qualified Foreign Institutional Investors license. The China Fund is managed by Templeton Investment Counsel, LLC (an affiliate of the investment manager). No additional management or administrative fees are incurred on assets invested in the China Fund.
The China Fund may be subject to certain restrictions and administrative processes relating to its ability to repatriate cash balances, investment proceeds and earnings associated with its investment, as such activities are subject to approval by agencies of the Chinese government and thus the Fund may incur delays in redeeming its investment in the China Fund. The Fund’s investment in the China Fund is valued based upon the fair value of the China Fund’s portfolio securities and other assets and liabilities.
34 | Semiannual Report
Templeton Foreign Fund
Notes to Financial Statements (unaudited) (continued)
| 1. | ORGANIZATION AND SIGNIFICANT ACCOUNTING POLICIES (continued) |
| d. | Securities Lending |
The Fund participates in an agency based securities lending program. The Fund receives cash collateral against the loaned securities in an amount equal to at least 102% of the market value of the loaned securities. Collateral is maintained over the life of the loan in an amount not less than 100% of the market value of loaned securities, as determined at the close of fund business each day; any additional collateral required due to changes in security values is delivered to the Fund on the next business day. The collateral is invested in a non-registered money fund as indicated on the Statement of Investments. The Fund receives income from the investment of cash collateral, in addition to lending fees and rebates paid by the borrower. The Fund bears the market risk with respect to the collateral investment, securities loaned, and the risk that the agent may default on its obligations to the Fund. The securities lending agent has agreed to indemnify the Fund in the event of default by a third party borrower.
e. Income and Deferred Taxes
It is the Fund’s policy to qualify as a regulated investment company under the Internal Revenue Code. The Fund intends to distribute to shareholders substantially all of its taxable income and net realized gains to relieve it from federal income and if applicable, excise taxes. As a result, no provision for U.S. federal income taxes is required.
The Fund may be subject to foreign taxation related to income received, capital gains on the sale of securities and certain foreign currency transactions in the foreign jurisdictions in which it invests. Foreign taxes, if any, are recorded based on the tax regulations and rates that exist in the foreign markets in which the Fund invests. When a capital gain tax is determined to apply the Fund records an estimated deferred tax liability in an amount that would be payable if the securities were disposed of on the valuation date.
The Fund recognizes the tax benefits of uncertain tax positions only when the position is “more likely than not” to be sustained upon examination by the tax authorities based on the technical merits of the tax position. As of February 28, 2014, and for all open tax years, the Fund has determined that no liability for unrecognized tax benefits is required in the Fund’s financial statements related to uncertain tax positions taken on a tax return (or expected to be taken on future tax returns). Open tax years are those that remain subject to examination and are based on each tax jurisdiction statute of limitation.
Semiannual Report | 35
Templeton Foreign Fund
Notes to Financial Statements (unaudited) (continued)
| 1. | ORGANIZATION AND SIGNIFICANT ACCOUNTING POLICIES (continued) |
| f. | Security Transactions, Investment Income, Expenses and Distributions |
Security transactions are accounted for on trade date. Realized gains and losses on security transactions are determined on a specific identification basis. Interest income and estimated expenses are accrued daily. Amortization of premium and accretion of discount on debt securities are included in interest income. Dividend income recorded on the ex-dividend date except that certain dividends from foreign securities are recognized as soon as the Fund is notified of the ex-dividend date. Distributions to shareholders are recorded on the ex-dividend date and are determined according to income tax regulations (tax basis). Distributable earnings determined on a tax basis may differ from earnings recorded in accordance with accounting principles generally accepted in the United States of America. These differences may be permanent or temporary. Permanent differences are reclassified among capital accounts to reflect their tax character. These reclassifications have no impact on net assets or the results of operations. Temporary differences are not reclassified, as they may reverse in subsequent periods.
Common expenses incurred by the Trust are allocated among the funds based on the ratio of net assets of each fund to the combined net assets of the Trust. Fund specific expenses are charged directly to the fund that incurred the expense.
Realized and unrealized gains and losses and net investment income, not including class specific expenses, are allocated daily to each class of shares based upon the relative proportion of net assets of each class. Differences in per share distributions, by class, are generally due to differences in class specific expenses.
g. Accounting Estimates
The preparation of financial statements in accordance with accounting principles generally accepted in the United States of America requires management to make estimates and assumptions that affect the reported amounts of assets and liabilities at the date of the financial statements and the amounts of income and expenses during the reporting period. Actual results could differ from those estimates.
h. Guarantees and Indemnifications
Under the Trust’s organizational documents, its officers and trustees are indemnified by the Trust against certain liabilities arising out of the performance of their duties to the Trust. Additionally, in the normal course of business, the Trust, on behalf of the Fund, enters into contracts with service providers that contain general indemnification clauses. The Trust’s maximum exposure under these arrangements is unknown as this would involve future claims that may be made against the Trust that have not yet occurred. Currently, the Trust expects the risk of loss to be remote.
36 | Semiannual Report
Templeton Foreign Fund
Notes to Financial Statements (unaudited) (continued)
2. SHARES OF BENEFICIAL INTEREST
At February 28, 2014, there were an unlimited number of shares authorized (without par value).
Transactions in the Fund’s shares were as follows:
| | | | | | | | | | | | |
| | Six Months Ended | | Year Ended | |
| | February 28, 2014 | | August 31, 2013 | |
| | Shares | | | | Amount | | Shares | | | | Amount | |
| Class A Shares: | | | | | | | | | | | | |
| Shares sold | 59,720,511 | | $ | 495,400,202 | | 81,343,137 | | $ | 578,494,573 | |
| Shares issued in reinvestment | | | | | | | | | | | | |
| of distributions | 23,668,888 | | | | 191,481,308 | | 10,093,321 | | | | 69,644,302 | |
| Shares redeemed | (52,015,482 | ) | | (432,227,950 | ) | (127,967,011 | ) | | | (896,570,035 | ) |
| Net increase (decrease) | 31,373,917 | | $ | 254,653,560 | | (36,530,553 | ) | $ | (248,431,160 | ) |
| Class B Sharesa: | | | | | | | | | | | | |
| Shares sold | | | | | | | 6,983 | | | $ | 48,215 | |
| Shares redeemed | | | | | | | (856,158 | ) | | | (5,802,739 | ) |
| Net increase (decrease) | | | | | | | (849,175 | ) | | $ | (5,754,524 | ) |
| Class C Shares: | | | | | | | | | | | | |
| Shares sold | 7,773,748 | | | $ | 63,044,621 | | 7,101,778 | | | $ | 49,802,018 | |
| Shares issued in reinvestment | | | | | | | | | | | | |
| of distributions | 2,765,421 | | | | 21,902,134 | | 880,029 | | | | 5,957,796 | |
| Shares redeemed | (5,219,504 | ) | | | (42,225,043 | ) | (14,022,357 | ) | | | (95,450,741 | ) |
| Net increase (decrease) | 5,319,665 | | | $ | 42,721,712 | | (6,040,550 | ) | | $ | (39,690,927 | ) |
| Class R Shares: | | | | | | | | | | | | |
| Shares sold | 3,640,225 | | | $ | 29,659,566 | | 6,945,473 | | | $ | 48,052,688 | |
| Shares issued in reinvestment | | | | | | | | | | | | |
| of distributions | 1,040,997 | | | | 8,286,336 | | 436,912 | | | | 2,971,002 | |
| Shares redeemed | (3,684,310 | ) | | | (29,974,805 | ) | (8,707,711 | ) | | | (59,966,762 | ) |
| Net increase (decrease) | 996,912 | | | $ | 7,971,097 | | (1,325,326 | ) | | $ | (8,943,072 | ) |
| Class R6 Sharesb: | | | | | | | | | | | | |
| Shares soldc | 23,357,931 | | $ | 191,040,217 | | 53,951,140 | | $ | 392,178,824 | |
| Shares issued in reinvestment | | | | | | | | | | | | |
| of distributions | 3,119,271 | | | | 24,891,780 | | — | | | | — | |
| Shares redeemed | (1,891,895 | ) | | | (15,422,238 | ) | (5,745,994 | ) | | | (42,448,875 | ) |
| Net increase (decrease) | 24,585,307 | | $ | 200,509,759 | | 48,205,146 | | $ | 349,729,949 | |
| Advisor Class Shares: | | | | | | | | | | | | |
| Shares sold | 45,148,908 | | $ | 371,447,649 | | 37,078,050 | | $ | 259,775,040 | |
| Shares issued in reinvestment | | | | | | | | | | | | |
| of distributions | 8,541,417 | | | | 68,245,926 | | 4,886,367 | | | | 33,325,022 | |
| Shares redeemedc | (44,038,976 | ) | | (362,512,393 | ) | (96,068,452 | ) | | | (682,957,160 | ) |
| Net increase (decrease) | 9,651,349 | | | $ | 77,181,182 | | (54,104,035 | ) | $ | (389,857,098 | ) |
aEffective March 22, 2013, all Class B Shares were converted to Class A.
bFor the period May 1, 2013 (effective date) to August 31, 2013.
cEffective May 1, 2013, a portion of Advisor Class shares were exchanged into Class R6.
Semiannual Report | 37
Templeton Foreign Fund
Notes to Financial Statements (unaudited) (continued)
3. TRANSACTIONS WITH AFFILIATES
Franklin Resources, Inc. is the holding company for various subsidiaries that together are referred to as Franklin Templeton Investments. Certain officers and trustees of the Trust are also officers and/or directors of the following subsidiaries:
| |
| Subsidiary | Affiliation |
| Templeton Global Advisors Limited (TGAL) | Investment manager |
| Franklin Templeton Services, LLC (FT Services) | Administrative manager |
| Franklin Templeton Distributors, Inc. (Distributors) | Principal underwriter |
| Franklin Templeton Investor Services, LLC (Investor Services) | Transfer agent |
a. Management Fees
The Fund pays an investment management fee to TGAL based on the average daily net assets of the Fund as follows:
| | |
| Annualized Fee Rate | | Net Assets |
| 0.630 | % | Up to and including $1 billion |
| 0.615 | % | Over $1 billion, up to and including $5 billion |
| 0.600 | % | Over $5 billion, up to and including $10 billion |
| 0.580 | % | Over $10 billion, up to and including $15 billion |
| 0.560 | % | Over $15 billion, up to and including $20 billion |
| 0.540 | % | Over $20 billion, up to and including $25 billion |
| 0.530 | % | Over $25 billion, up to and including $30 billion |
| 0.520 | % | Over $30 billion, up to and including $35 billion |
| 0.510 | % | In excess of $35 billion |
b. Administrative Fees
The Fund pays its allocated share of an administrative fee to FT Services based on the Trust’s aggregate average daily net assets as follows:
| | |
| Annualized Fee Rate | | Net Assets |
| 0.150 | % | Up to and including $200 million |
| 0.135 | % | Over $200 million, up to and including $700 million |
| 0.100 | % | Over $700 million, up to and including $1.2 billion |
| 0.075 | % | In excess of $1.2 billion |
c. Distribution Fees
The Board has adopted distribution plans for each share class, with the exception of Class R6 and Advisor Class shares, pursuant to Rule 12b-1 under the 1940 Act. Distribution fees are not charged on shares held by affiliates. Under the Fund’s Class A reimbursement distribution plan, the Fund reimburses Distributors for costs incurred in connection with the servicing, sale and distribution of the Fund’s shares up to the maximum annual plan rate. Under the Class A reimbursement distribution plan, costs exceeding the maximum for the current plan year cannot be reimbursed in subsequent periods. In addition, under the Fund’s Class C and Class R compensation distribution plans, the Fund pays Distributors for costs incurred in connection with the servicing, sale and
38 | Semiannual Report
Templeton Foreign Fund
Notes to Financial Statements (unaudited) (continued)
| 3. | TRANSACTIONS WITH AFFILIATES (continued) |
| c. | Distribution Fees (continued) |
distribution of the Fund’s shares up to the maximum annual plan rate for each class. The plan year, for purposes of monitoring compliance with the maximum annual plan rates, is February 1 through January 31.
The maximum annual plan rates, based on the average daily net assets, for each class, are as follows:
| | |
| Class A | 0.25 | % |
| Class C | 1.00 | % |
| Class R | 0.50 | % |
d. Sales Charges/Underwriting Agreements
Front-end sales charges and contingent deferred sales charges (CDSC) do not represent expenses of the Fund. These charges are deducted from the proceeds of sales of Fund shares prior to investment or from redemption proceeds prior to remittance, as applicable. Distributors has advised the Fund of the following commission transactions related to the sales and redemptions of the Fund’s shares for the period:
| | |
| Sales charges retained net of commissions paid to unaffiliated | | |
| broker/dealers | $ | 801,222 |
| CDSC retained | $ | 20,362 |
e. Transfer Agent Fees
Each class of shares, except for Class R6, pays transfer agent fees to Investor Services for its performance of shareholder servicing obligations and reimburses Investor Services for out of pocket expenses incurred, including shareholding servicing fees paid to third parties. These fees are allocated daily based upon their relative proportion of such classes’ aggregate net assets. Class R6 pays Investor Services transfer agent fees specific to that class.
For the period ended February 28, 2014, the Fund paid transfer agent fees of $6,130,236, of which $2,629,777 was retained by Investor Services.
f. Waiver and Expense Reimbursements
Investor Services has contractually agreed in advance to waive or limit its fees so that the Class R6 transfer agent fees do not exceed 0.01% until December 31, 2014. There were no expenses waived during the period ended February 28, 2014.
4. EXPENSE OFFSET ARRANGEMENT
The Fund has entered into an arrangement with its custodian whereby credits realized as a result of uninvested cash balances are used to reduce a portion of the Fund’s custodian expenses. During the period ended February 28, 2014, there were no credits earned.
Semiannual Report | 39
Templeton Foreign Fund
Notes to Financial Statements (unaudited) (continued)
5. INCOME TAXES
At February 28, 2014, the cost of investments and net unrealized appreciation (depreciation) for income tax purposes were as follows:
| | | |
| Cost of investments | $ | 6,480,750,675 | |
| |
| Unrealized appreciation | $ | 1,376,354,567 | |
| Unrealized depreciation | | (369,241,059 | ) |
| Net unrealized appreciation (depreciation) | $ | 1,007,113,508 | |
Differences between income and/or capital gains as determined on a book basis and a tax basis are primarily due to differing treatments of passive foreign investment company shares.
6. INVESTMENT TRANSACTIONS
Purchases and sales of investments (excluding short term securities) for the period ended February 28, 2014, aggregated $748,134,326 and $666,613,784, respectively.
7. CONCENTRATION OF RISK
Investing in foreign securities may include certain risks and considerations not typically associated with investing in U.S. securities, such as fluctuating currency values and changing local and regional economic, political and social conditions, which may result in greater market volatility. In addition, certain foreign securities may not be as liquid as U.S. securities.
8. RESTRICTED SECURITIES
The Fund invests in securities that are restricted under the Securities Act of 1933 (1933 Act) or which are subject to legal, contractual, or other agreed upon restrictions on resale. Restricted securities are often purchased in private placement transactions, and cannot be sold without prior registration unless the sale is pursuant to an exemption under the 1933 Act. Disposal of these securities may require greater effort and expense, and prompt sale at an acceptable price may be difficult. The Fund may have registration rights for restricted securities. The issuer generally incurs all registration costs.
40 | Semiannual Report
Templeton Foreign Fund
Notes to Financial Statements (unaudited) (continued)
8. RESTRICTED SECURITIES (continued)
At February 28, 2014, the Fund held investments in restricted securities, excluding certain securities exempt from registration under the 1933 Act deemed to be liquid, as follows:
| | | | | | |
| Shares | Issuer | Acquisition | | | | |
| | | Dates | | Cost | | Value |
| 2,787,539 | Templeton China Opportunities Fund, Ltd., Reg D | | | | | |
| | Total Restricted Securities | | | | | |
| | (Value is 0.40% of Net Assets) | 1/27/10 - 10/09/13 | $ | 27,858,900 | $ | 30,077,545 |
9. HOLDINGS OF 5% VOTING SECURITIES OF PORTFOLIO COMPANIES
The 1940 Act defines “affiliated companies” to include investments in portfolio companies in which a fund owns 5% or more of the outstanding voting securities. Investments in “affiliated companies” for the Fund for the period ended February 28, 2014, were as shown below.
| | | | | | | | |
| | Number of | | | Number of | | | | Realized |
| | Shares Held | | | Shares Held | | Value at | | Capital |
| | at Beginning | Gross | Gross | at End of | | End of | Investment | Gain |
| Name of Issuer | of Period | Additions | Reductions | of Period | | of Period | Income | (Loss) |
| Templeton Foreign Fund | | | | | | | | |
| Non-Controlled Affiliates | | | | | | | | |
| Templeton China Opportunities Fund, Ltd., | | | | | | | |
| Reg D | | | | | | | | |
| Total Affiliated Securities | | | | | | | | |
| (Value is 0.40% of Net Assets) | 2,785,958 | 1,581 | — | 2,787,539 | $ | 30,077,545 | $— | $— |
10. CREDIT FACILITY
The Fund, together with other U.S. registered and foreign investment funds (collectively, Borrowers), managed by Franklin Templeton Investments, are borrowers in a joint syndicated senior unsecured credit facility totaling $1.5 billion (Global Credit Facility) which matures on February 13, 2015. This Global Credit Facility provides a source of funds to the Borrowers for temporary and emergency purposes, including the ability to meet future unanticipated or unusually large redemption requests.
Under the terms of the Global Credit Facility, the Fund shall, in addition to interest charged on any borrowings made by the Fund and other costs incurred by the Fund, pay its share of fees and expenses incurred in connection with the implementation and maintenance of the Global Credit Facility, based upon its relative share of the aggregate net assets of all of the Borrowers, including an annual commitment fee of 0.07% based upon the unused portion of the Global Credit Facility. These fees are reflected in other expenses on the Statement of Operations. During the period ended February 28, 2014, the Fund did not use the Global Credit Facility.
Semiannual Report | 41
Templeton Foreign Fund
Notes to Financial Statements (unaudited) (continued)
11. FAIR VALUE MEASUREMENTS
The Fund follows a fair value hierarchy that distinguishes between market data obtained from independent sources (observable inputs) and the Fund’s own market assumptions (unobservable inputs). These inputs are used in determining the value of the Fund’s financial instruments and are summarized in the following fair value hierarchy:
- Level 1 - quoted prices in active markets for identical financial instruments
- Level 2 - other significant observable inputs (including quoted prices for similar financial instruments, interest rates, prepayment speed, credit risk, etc.)
- Level 3 - significant unobservable inputs (including the Fund’s own assumptions in deter- mining the fair value of financial instruments)
The input levels are not necessarily an indication of the risk or liquidity associated with financial instruments at that level.
For movements between the levels within the fair value hierarchy, the Fund has adopted a policy of recognizing the transfers as of the date of the underlying event which caused the movement.
A summary of inputs used as of February 28, 2014, in valuing the Fund’s assets carried at fair value, is as follows:
| | | | | | | | |
| | | Level 1 | | Level 2 | | Level 3 | | Total |
| Assets: | | | | | | | | |
| Investments in Securities: | | | | | | | | |
| Equity Investmentsa,b | $ | 7,102,022,008 | $ | — | $ | — | $ | 7,102,022,008 |
| Non-Registered Mutual | | | | | | | | |
| Funds | | — | | — | | 30,077,545 | | 30,077,545 |
| Short Term Investments | | — | | 355,764,630 | | — | | 355,764,630 |
| Total Investments in | | | | | | | | |
| Securities | $ | 7,102,022,008 | $ | 355,764,630 | $ | 30,077,545 | $ | 7,487,864,183 |
aIncludes common and preferred stocks as well as other equity investments.
bFor detailed categories, see the accompanying Statement of Investments.
A reconciliation of assets in which Level 3 inputs are used in determining fair value is presented
when there are significant Level 3 investments at the end of the period.
42 | Semiannual Report
Templeton Foreign Fund
Notes to Financial Statements (unaudited) (continued)
12. NEW ACCOUNTING PRONOUNCEMENTS
In June 2013, the Financial Accounting Standards Board issued Accounting Standards Update (ASU) No. 2013-08, Investment Companies (Topic 946): Amendments to the Scope, Measurement, and Disclosure Requirements. The ASU modifies the criteria used in defining an investment company under U.S. Generally Accepted Accounting Principles and also sets forth certain measurement and disclosure requirements. Under the ASU, an entity that is registered under the 1940 Act automatically qualifies as an investment company. The ASU is effective for interim and annual reporting periods beginning after December 15, 2013. Management has reviewed the requirements and believes the adoption of this ASU will not have a material impact on the financial statements.
13. SUBSEQUENT EVENTS
The Fund has evaluated subsequent events through the issuance of the financial statements and determined that no events have occurred that require disclosure.
ABBREVIATIONS
Selected Portfolio
ADR - American Depositary Receipt
IDR -International Depositary Receipt
Semiannual Report | 43
Templeton Foreign Fund
Shareholder Information
Proxy Voting Policies and Procedures
The Fund’s investment manager has established Proxy Voting Policies and Procedures (Policies) that the Fund uses to determine how to vote proxies relating to portfolio securities. Shareholders may view the Fund’s complete Policies online at franklintempleton.com. Alternatively, shareholders may request copies of the Policies free of charge by calling the Proxy Group collect at (954) 527-7678 or by sending a written request to: Franklin Templeton Companies, LLC, 300 S.E. 2nd Street, Fort Lauderdale, FL 33301, Attention: Proxy Group. Copies of the Fund’s proxy voting records are also made available online at franklintempleton.com and posted on the U.S. Securities and Exchange Commission’s website at sec.gov and reflect the most recent 12-month period ended June 30.
Quarterly Statement of Investments
The Fund files a complete statement of investments with the U.S. Securities and Exchange Commission for the first and third quarters for each fiscal year on Form N-Q. Shareholders may view the filed Form N-Q by visiting the Commission’s website at sec.gov. The filed form may also be viewed and copied at the Commission’s Public Reference Room in Washington, DC. Information regarding the operations of the Public Reference Room may be obtained by calling (800) SEC-0330.
44 | Semiannual Report

Semiannual Report and Shareholder Letter
TEMPLETON FOREIGN FUND
Investment Manager
Templeton Global Advisors Limited
Distributor
Franklin Templeton Distributors, Inc.
(800) DIAL BEN®/342-5236
franklintempleton.com
Shareholder Services
(800) 632-2301
Authorized for distribution only when accompanied or preceded by a summary prospectus and/or prospectus.
Investors should carefully consider a fund’s investment goals, risks, charges and expenses before investing.
A prospectus contains this and other information; please read it carefully before investing.
To help ensure we provide you with quality service, all calls to and from our service areas are monitored and/or recorded.
© 2014 Franklin Templeton Investments. All rights reserved. 104 S 04/14
Item 2. Code of Ethics.
(a) The Registrant has adopted a code of ethics that applies to its principal executive officers and principal financial and accounting officer.
(c) N/A
(d) N/A
(f) Pursuant to Item 12(a)(1), the Registrant is attaching as an exhibit a copy of its code of ethics that applies to its principal executive officers and principal financial and accounting officer.
Item 3. Audit Committee Financial Expert.
(a)(1) The Registrant has an audit committee financial expert serving on its audit committee.
(2) The audit committee financial expert is David W. Niemiec and he is "independent" as defined under the relevant Securities and Exchange Commission Rules and Releases.
Item 4. Principal Accountant Fees and Services. N/A
Item 5. Audit Committee of Listed Registrants. N/A
Item 6. Schedule of Investments. N/A
Item 7. Disclosure of Proxy Voting Policies and Procedures for Closed-End Management Investment Companies. N/A
Item 8. Portfolio Managers of Closed-End Management Investment Companies. N/A
Item 9. Purchases of Equity Securities by Closed-End Management Investment Company and Affiliated Purchasers. N/A
Item 10. Submission of Matters to a Vote of Security Holders.
There have been no changes to the procedures by which shareholders may recommend nominees to the Registrant's Board of Trustees that would require disclosure herein.
Item 11. Controls and Procedures.
(a) Evaluation of Disclosure Controls and Procedures. The Registrant maintains disclosure controls and procedures that are designed to ensure that information required to be disclosed in the Registrant’s filings under the Securities Exchange Act of 1934 and the Investment Company Act of 1940 is recorded, processed, summarized and reported within the periods specified in the rules and forms of the Securities and Exchange Commission. Such information is accumulated and communicated to the Registrant’s management, including its principal executive officer and principal financial officer, as appropriate, to allow timely decisions regarding required disclosure. The Registrant’s management, including the principal executive officer and the principal financial officer, recognizes that any set of controls and procedures, no matter how well designed and operated, can provide only reasonable assurance of achieving the desired control objectives.
Within 90 days prior to the filing date of this Shareholder Report on Form N-CSR, the Registrant had carried out an evaluation, under the supervision and with the participation of the Registrant’s management, including the Registrant’s principal executive officer and the Registrant’s principal financial officer, of the effectiveness of the design and operation of the Registrant’s disclosure controls and procedures. Based on such evaluation, the Registrant’s principal executive officer and principal financial officer concluded that the Registrant’s disclosure controls and procedures are effective.
(b) Changes in Internal Controls. There have been no changes in the Registrant’s internal controls or in other factors that could materially affect the internal controls over financial reporting subsequent to the date of their evaluation in connection with the preparation of this Shareholder Report on Form N-CSR.
Item 12. Exhibits.
(a)(1) Code of Ethics
(a)(2) Certifications pursuant to Section 302 of the Sarbanes-Oxley Act of 2002 of Laura F. Fergerson, Chief Executive Officer - Finance and Administration, and Mark H. Otani, Chief Financial Officer and Chief Accounting Officer
(b) Certifications pursuant to Section 906 of the Sarbanes-Oxley Act of 2002 of Laura F. Fergerson, Chief Executive Officer - Finance and Administration, and Mark H. Otani, Chief Financial Officer and Chief Accounting Officer
SIGNATURES
Pursuant to the requirements of the Securities Exchange Act of 1934 and the Investment Company Act of 1940, the registrant has duly caused this report to be signed on its behalf by the undersigned, thereunto duly authorized.
TEMPLETON FUNDS
By /s/ LAURA F. FERGERSON
Laura F. Fergerson
Chief Executive Officer - Finance and Administration
Date April 25, 2014
Pursuant to the requirements of the Securities Exchange Act of 1934 and the Investment Company Act of 1940, this report has been signed below by the following persons on behalf of the registrant and in the capacities and on the dates indicated.
By /s/ LAURA F. FERGERSON
Laura F. Fergerson
Chief Executive Officer - Finance and Administration
Date April 25, 2014
By /s/ MARK H. OTANI
Mark H. Otani
Chief Financial Officer and Chief Accounting Officer
Date April 25, 2014