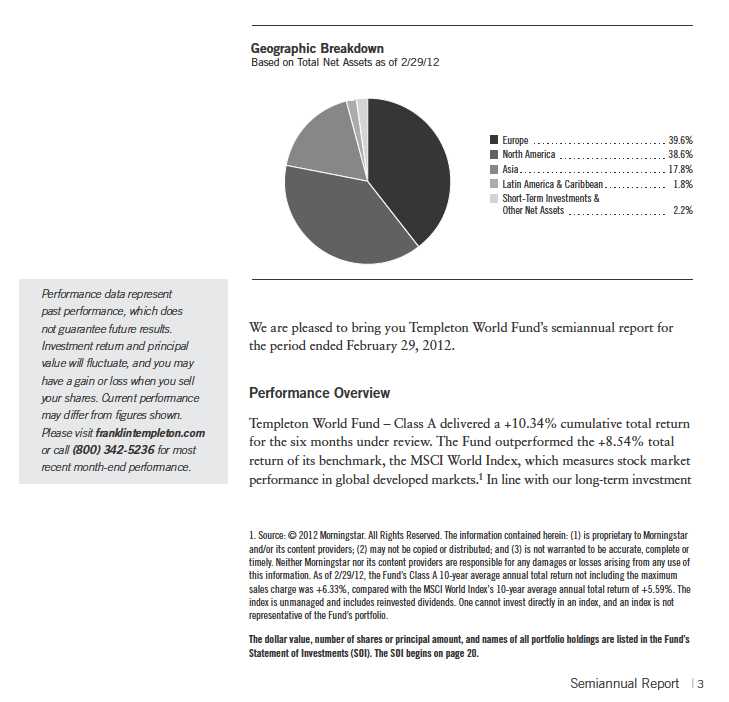
Semiannual Report
Templeton World Fund
Your Fund’s Goal and Main Investments: Templeton World Fund seeks long-term capital
growth. Under normal market conditions, the Fund invests primarily in equity securities of companies
located anywhere in the world, including emerging markets. Under normal market conditions, the Fund
will invest in issuers located in at least three different countries (including the U.S.).
strategy, we are pleased with our long-term relative results, as shown in the
Performance Summary beginning on page 11. For the 10-year period ended
February 29, 2012, Templeton World Fund – Class A delivered a cumulative
total return of +84.69%, compared with the MSCI World Index’s +72.21%
cumulative total return for the same period.1 Please note index performance
information is provided for reference and we do not attempt to track the index
but rather undertake investments on the basis of fundamental research. You
can find more performance data in the Performance Summary.
Economic and Market Overview
Global stocks, as measured by the MSCI World Index, rose from their lowest
levels in over a year to deliver solid gains for the six months under review, despite
persistent concerns surrounding Europe’s fiscal crisis and a global economic
slowdown. The period began amid elevated volatility as sovereign bond yields
in Europe spiked to record levels and policymakers scrambled to contain the
gathering debt crisis. Greek and Italian debt came under intense pressure, forcing
the dissolution of their respective governments and installment of technocrat-led
coalitions to oversee restructuring and austerity programs. Realizing the severity
of the situation, many policymakers resumed their vigilance. The European
Central Bank cut interest rates and expanded lending facilities through the
introduction of its Long-Term Refinancing Operation, which provided more
than 1 trillion euros (US$1.3 trillion) of low-cost capital to regional lenders in
two separate auctions. Greece received its second bailout toward period-end,
along with the painful provision of debt restructuring and austerity programs.
Policymakers elsewhere also came to Europe’s aid, with the International
Monetary Fund revamping its credit line and six global central banks agreeing
to lower funding costs for Europe’s distressed lenders. In the U.S., the Federal
Reserve Board initiated “Operation Twist,” a program that used the proceeds
of short-dated bond sales to fund the purchase of longer dated issues in an
effort to drive down key borrowing costs. In emerging markets, China and
India encouraged loan growth by reducing the amount of capital banks are
required to keep on hand, while Brazil cut interest rates three times during the
review period.
The cumulative effect of these decisive policy moves was a period of stabiliza-
tion that supported broad equity market gains. Resilient corporate earnings
and generally improving economic data also fueled the rally, particularly in
the U.S., where fourth quarter 2011 growth domestic product (GDP) grew at
a better-than-expected 3% annualized rate. Indicators ranging from home
sales to unemployment claims to consumer confidence all improved toward
period-end. Economic news elsewhere was mostly mixed. Fourth quarter GDP
growth of 8.9% in China and 6.1% in India, while still robust in absolute
4 | Semiannual Report
terms, disappointed investor expectations and constituted the weakest economic
advances since 2009 for the world’s two most populous countries.2 In the
eurozone, fourth quarter GDP contracted for the first time since 2009, regis-
tering -0.3% from the previous quarter.3 Such growth concerns generally
pressured commodity prices, with the exception of oil, which approached
record highs due to fears geopolitical developments in the Middle East could
strangle supply. Meanwhile, a relatively better near-term growth outlook in
the U.S. helped flatten the Treasury yield curve and supported the dollar’s rally
against the euro and yen.
Investment Strategy
Our investment strategy employs a bottom-up, value-oriented, long-term
approach. We focus on the market price of a company’s securities relative to
our evaluation of the company’s long-term earnings, asset value and cash flow
potential. As we look worldwide, we consider specific companies, rather than
sectors or countries, while doing in-depth research to construct a bargain list
from which we buy. Before we make a purchase, we look at the company’s
price/cash flow ratio, price/earnings ratio, profit margins and liquidation value.
Manager’s Discussion
Templeton World Fund – Class A sought to capitalize on stock market strength
during the six-month period under review and delivered a double-digit absolute
return while outperforming the benchmark MSCI World Index. Outperformance
was largely attributable to stock selection, an indication our bottom-up invest-
ment process added value during the reporting period.
We believe outperformance during a period of market stabilization is encouraging.
Periods of crisis such as the winter of 2008/2009 and, to lesser extents, the
summers of 2010 and 2011, generally can present more long-term opportunities
for fundamental investors because emotional factors like fear and greed tend
to replace business fundamentals as the primary market drivers. In our view,
a market that ignores fundamentals also tends to misprice them, allowing us
opportunities to buy what we consider to be long-term value at a discount. If
the Fund outperforms once conditions stabilize, as they did during the six months
in review, we see it as validating our investment philosophy and value discipline.
We cannot predict how long this stabilization period could last; major policy
challenges and systemic imbalances remain, and the trajectory of financial
2. Sources: National Bureau of Statistics (China); India Central Statistical Organization.
3. Source: Eurostat.
Semiannual Report | 5

recoveries rarely follows a straight line. However, we do not lose sleep fretting
over market forecasts. As Sir John Templeton wrote, “I never ask if the market
is going to go up or down, because I don’t know, and besides it doesn’t matter.
I search nation after nation for stocks, asking: ‘Where is the one that is the lowest
priced in relation to what I believe it’s worth?’” Equity markets fluctuate,
but, in our analysis, over time a company’s share price tends to converge with
the value of its underlying businesses. We focus on detailed analysis of individ-
ual companies to identify certain instances where a stock price fails to reflect
long-term value. We believe we can produce satisfactory long-term results
independent of market whims. This Fund review intends to illustrate our
investment approach more tangibly.
Information technology represents a sector where we believe investors have
mispriced business fundamentals in recent years amid fears that a global eco-
nomic slowdown could reduce consumer and corporate technology investment.4
In our view, the increasingly essential nature of consumer technology and the
productivity-enhancing capabilities of enterprise technology could help preserve
industry revenues in uncertain economic times. We identified a number of
technology businesses with strong balance sheets, prodigious cash flows and
sustainable competitive advantages trading at levels well below our estimation
of their long-term intrinsic value.
South Korean semiconductor and consumer electronics manufacturer Samsung
Electronics, which is not part of the index, was the period’s top contributor.
We initiated a position in 2001 after its shares lost nearly half their value during
the dot-com bubble burst. We held the stock as it appreciated through the
decade before giving back some gains in the 2008/2009 market downturn.
Pricing weakness in the semiconductor industry, where Samsung generated
most of its earnings, further compounded the downward pressure during this
period; however, we believe this challenge belied the company’s longer term
opportunities, its track record of prudent management and leadership across
a diverse product portfolio, as well as a strong balance sheet and prodigious
cash flows. The company deployed the cash flows to accelerate capital expen-
ditures and fund research and development at a time when its competitors
were constrained by the negative business environment. As the company con-
solidated market share gains in its core business, it also invested heavily in
up-and-coming products with desirable growth profiles, including smartphones
and tablets. In our view, the company achieved remarkable success in these
segments, notably surpassing Apple in 2011 to become the world’s leading
provider of smartphones based on sales. Since our initial purchase in 2001,
4. The information technology sector comprises communications equipment, computers and peripherals, IT services,
semiconductors and semiconductor equipment, and software in the SOI.
6 | Semiannual Report
Samsung’s shares have appreciated nearly 500%. We are pleased to hold the stock given our assessment of the company’s reasonable valuation, attractive growth prospects and prudent use of cash for dividends, share buybacks and internal growth initiatives.
The global media industry underwent a similar experience as the technology sector after the dotcom bubble burst, with weaker competitors edged out and surviving players consolidating market share and business value through prolific cash flow generation and astute capital investments. U.S. cable operator Comcast exemplified this trend, growing into the country’s largest cable and Internet services provider. With its ability to offer voice, data and video packages, Comcast effectively controls a large portion of America’s access to content and communication portals, a powerful competitive position we believe is not fully reflected in recent modest valuations. Investors seemingly began to acknowledge this advantage during the review period as Comcast shares rallied strongly, helping the Fund’s overweighted consumer discretionary sector outperform that of the index.5
Health care, another overweighted sector, also outperformed during the period, largely due to stock selection.6 Although fears of revenue declines stemming from generic competition, unfavorable regulation and diminishing pipeline productivity beset many of the world’s leading drug-makers, some companies addressed these concerns head-on by restructuring their research and development processes and diversifying away from patent dependent products. Recent valuations were more reflective of investor skepticism than the value potential inherent in some of the industry’s most innovative pharmaceuticals firms. In our view, this situation provided compelling opportunities at the security level. Consider U.S.-based Amgen, the world’s largest biopharmaceutical company and a top contributor during the period. We first identified the stock as undervalued in 2007/2008, when industry-wide fears of slowing top-line growth led investors to overlook Amgen’s impressive ability to generate cash and develop new products. Since then, Amgen successfully managed its maturing product portfolio while effectively developing a pipeline of new drugs with the potential to materially enhance future revenues. Our patience was rewarded by a rising stock price and management’s commitment to convert the company’s prodigious cash flow into shareholder value by pledging 60% of net income to dividends and share buybacks.
5. The consumer discretionary sector comprises automobiles, media and specialty retail in the SOI.
6. The health care sector comprises biotechnology, health care equipment and supplies, and pharmaceuticals in the SOI.
Semiannual Report | 7
Dividends historically constituted the majority of total returns for equity investors, and we believe they may grow increasingly important in an uncertain global growth environment. Therefore, we identified what we believed are excellent yield opportunities in the telecommunication services sector, where stocks on average pay a dividend in excess of 6%, or roughly triple the yield of 10-year Treasury bonds at period-end.7 Unlike Treasuries, which have little scope for sustained appreciation from recent levels, certain telecommunications stocks offer investors excellent capital gains opportunities. The increasingly nondiscretionary nature of mobile telecommunications and considerable underpenetration in rapidly modernizing emerging markets created immense growth potential in the industry. We found opportunities in this sector among firms domiciled in stable, developed markets but with elevated revenue exposure to the fast-growing developing world. For example, Vodafone, the Fund’s largest telecommunication services holding, derived less than 12% of revenues from its domestic U.K. market and more than one-third from the Asia Pacific region and emerging markets at period-end.
Vodafone delivered solid absolute gains during the period along with several of our other telecommunications holdings; however, the sector ultimately underperformed in large part due to isolated issues at U.S. wireless operator Sprint Nextel. Sprint’s capital-intensive decisions to offer Apple’s iPhone and accelerate its 4G network build-out put pressure on near-term cash flows, raising concerns that equity shares could be diluted if the company taps equity markets for additional financing. In our analysis, Sprint’s aggressive growth strategy is necessary to remain competitive over the long term, and its capital issues may likely be addressable through debt markets or potential vendor financing arrangements. Although risks remain, considerable rewards may be enjoyed if Sprint executes successfully, a scenario for which the recent share price assigns too low a probability in our assessment.
Certain energy holdings were other notable detractors from performance during the period.8 U.S. oilfield services firm Baker Hughes was one of the sector’s biggest laggards, declining due to concerns about pricing trends in the North American pressure pumping market. Fears of a collapse in that market seemed overdone in our opinion, and we remain favorable toward Baker Hughes. Historically low valuations may fail to acknowledge the benefits of strategic
7. The telecommunication services sector comprises diversified telecommunication services and wireless telecommunication services in the SOI.
8. The energy sector comprises energy equipment and services; and oil, gas and consumable fuels in the SOI.
8 | Semiannual Report
restructurings and acquisitions or the long-term demand implied by the oil industry’s targeting of increasingly complex and remote developments to increase production. Among commodity-price sensitive sectors, we found fewer opportunities in materials, where we were significantly underweighted in metals and mining stocks given the peak margins and near-record valuation levels reached in recent years.9 This value discipline was positive for the Fund during the review period as commodity prices declined due to global growth uncertainty, and the Fund’s exposure elsewhere in the sector, namely to Irish building materials supplier CRH, strongly outperformed the benchmark.
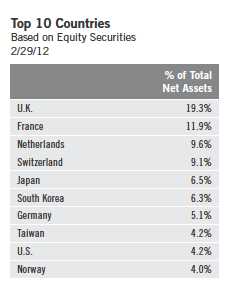
From a regional perspective, stock selection overcame a detractive underweighting in the U.S. and a detractive overweighting in Europe. Asian holdings benefited from stock selection and an underweighted position in Japan as well as exposure to faster growing markets such as South Korea and Taiwan, which are not in the index. In general, uncertainty in Europe and the global economy continued to unnerve investors even as stocks performed well in the recent market rally.
It is important to recognize the effect of currency movements on the Fund’s performance. In general, if the value of the U.S. dollar goes up compared with a foreign currency, an investment traded in that foreign currency will go down in value because it will be worth fewer U.S. dollars. This can have a negative effect on Fund performance. Conversely, when the U.S. dollar weakens in relation to a foreign currency, an investment traded in that foreign currency will increase in value, which can contribute to Fund performance. For the six months ended February 29, 2012, the U.S. dollar rose in value relative to most currencies. As a result, the Fund’s performance was negatively affected by the portfolio’s substantial investment in securities with non-U.S. currency exposure.
Although we cannot know which way markets are headed, we remain positive about the Fund. As Sir John Templeton said, “Whenever you buy a large amount of future earnings power for a low price, you have made a good investment.” To this end, we continue to search for high quality, global companies we believe possess outstanding future earnings prospects while trading at depressed levels, a situation that provides us confidence over our long-term investment horizon.
9. The materials sector comprises construction materials and metals and mining in the SOI.
Semiannual Report | 9
The foregoing information reflects our analysis, opinions and portfolio holdings as of February 29, 2012, the end
of the reporting period. The way we implement our main investment strategies and the resulting portfolio holdings
may change depending on factors such as market and economic conditions. These opinions may not be relied upon
as investment advice or an offer for a particular security. The information is not a complete analysis of every aspect
of any market, country, industry, security or the Fund. Statements of fact are from sources considered reliable,
but the investment manager makes no representation or warranty as to their completeness or accuracy. Although
historical performance is no guarantee of future results, these insights may help you understand our investment
management philosophy.
10 | Semiannual Report
Performance Summary as of 2/29/12
Your dividend income will vary depending on dividends or interest paid by securities in the Fund’s
portfolio, adjusted for operating expenses of each class. Capital gain distributions are net profits
realized from the sale of portfolio securities. The performance table does not reflect any taxes that
a shareholder would pay on Fund dividends, capital gain distributions, if any, or any realized gains
on the sale of Fund shares. Total return reflects reinvestment of the Fund’s dividends and capital
gain distributions, if any, and any unrealized gains or losses.
Semiannual Report | 11
Performance Summary (continued)
Performance
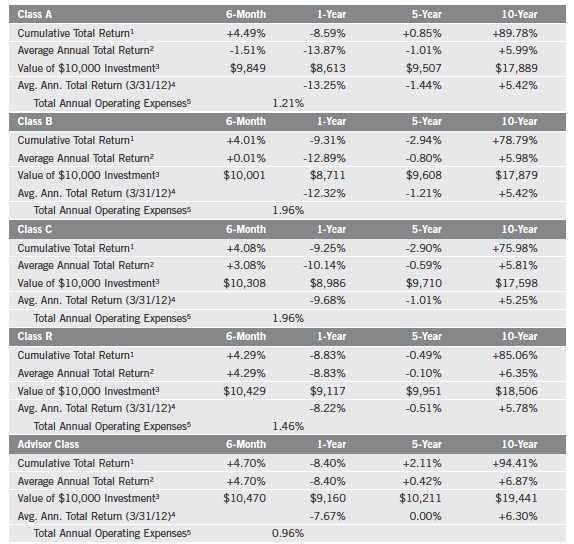
Cumulative total return excludes sales charges. Average annual total returns and value of $10,000 investment include
maximum sales charges. Class A: 5.75% maximum initial sales charge; Class B: contingent deferred sales charge (CDSC)
declining from 4% to 1% over six years, and eliminated thereafter; Class C: 1% CDSC in first year only; Advisor Class: no
sales charges.

Performance data represent past performance, which does not guarantee future results. Investment return and principal
value will fluctuate, and you may have a gain or loss when you sell your shares. Current performance may differ from
figures shown. For most recent month-end performance, go to franklintempleton.com or call (800) 342-5236.
12 | Semiannual Report
Performance Summary (continued)
Endnotes
All investments involve risks, including possible loss of principal. Special risks are associated with foreign investing, including currency fluctua-
tions, economic instability and political developments. Investments in emerging markets involve heightened risks related to the same factors, in
addition to those associated with these markets’ smaller size and lesser liquidity. The Fund is actively managed but there is no guarantee that the
manager’s investment decisions will produce the desired results. The Fund’s prospectus also includes a description of the main investment risks.
1. Cumulative total return represents the change in value of an investment over the periods indicated.
2. Average annual total return represents the average annual change in value of an investment over the periods indicated. Six-month return has not
been annualized.
3. These figures represent the value of a hypothetical $10,000 investment in the Fund over the periods indicated.
4. In accordance with SEC rules, we provide standardized average annual total return information through the latest calendar quarter.
5. Figures are as stated in the Fund’s prospectus current as of the date of this report. In periods of market volatility, assets may decline significantly,
causing total annual Fund operating expenses to become higher than the figures shown.
6. Effective 5/15/06, the Fund began offering Advisor Class shares, which do not have sales charges or a Rule 12b-1 plan. Performance quotations
for this class reflect the following methods of calculation: (a) For periods prior to 5/15/06, a restated figure is used based upon the Fund’s Class A
performance, excluding the effect of Class A’s maximum initial sales charge, but reflecting the effect of the Class A Rule 12b-1 fees; and (b) for peri-
ods after 5/15/06, actual Advisor Class performance is used reflecting all charges and fees applicable to that class. Since 5/15/06 (commencement
of sales), the cumulative and average annual total returns of Advisor Class shares were +11.46% and +1.89%.
Semiannual Report | 13
Your Fund’s Expenses
As a Fund shareholder, you can incur two types of costs:
- Transaction costs, including sales charges (loads) on Fund purchases; and
- Ongoing Fund costs, including management fees, distribution and service (12b-1) fees, and other Fund expenses. All mutual funds have ongoing costs, sometimes referred to as operating expenses.
The following table shows ongoing costs of investing in the Fund and can help you understand these costs and compare them with those of other mutual funds. The table assumes a $1,000 investment held for the six months indicated.
Actual Fund Expenses
The first line (Actual) for each share class listed in the table provides actual account values and expenses. The “Ending Account Value” is derived from the Fund’s actual return, which includes the effect of Fund expenses.
You can estimate the expenses you paid during the period by following these steps. Of course, your account value and expenses will differ from those in this illustration:
| 1. | Divide your account value by $1,000. |
| | If an account had an $8,600 value, then $8,600 ÷ $1,000 = 8.6. |
| 2. | Multiply the result by the number under the heading “Expenses Paid During Period.” |
| | If Expenses Paid During Period were $7.50, then 8.6 x $7.50 = $64.50. |
In this illustration, the estimated expenses paid this period are $64.50.
Hypothetical Example for Comparison with Other Funds
Information in the second line (Hypothetical) for each class in the table can help you compare ongoing costs of investing in the Fund with those of other mutual funds. This information may not be used to estimate the actual ending account balance or expenses you paid during the period. The hypothetical “Ending Account Value” is based on the actual expense ratio for each class and an assumed 5% annual rate of return before expenses, which does not represent the Fund’s actual return. The figure under the heading “Expenses Paid During Period” shows the hypothetical expenses your account would have incurred under this scenario. You can compare this figure with the 5% hypothetical examples that appear in shareholder reports of other funds.
14 | Semiannual Report
Your Fund’s Expenses (continued)
Please note that expenses shown in the table are meant to highlight ongoing costs and do not reflect
any transaction costs, such as sales charges. Therefore, the second line for each class is useful in com-
paring ongoing costs only, and will not help you compare total costs of owning different funds. In
addition, if transaction costs were included, your total costs would have been higher. Please refer to
the Fund prospectus for additional information on operating expenses.
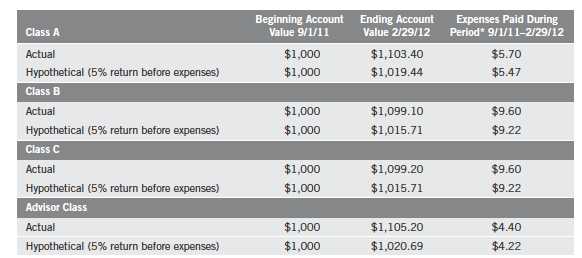
*Expenses are calculated using the most recent six-month expense ratio, annualized for each class (A: 1.09%; B: 1.84%; C: 1.84%; and
Advisor: 0.84%), multiplied by the average account value over the period, multiplied by 182/366 to reflect the one-half year period.
Semiannual Report | 15
Templeton World Fund
Financial Highlights
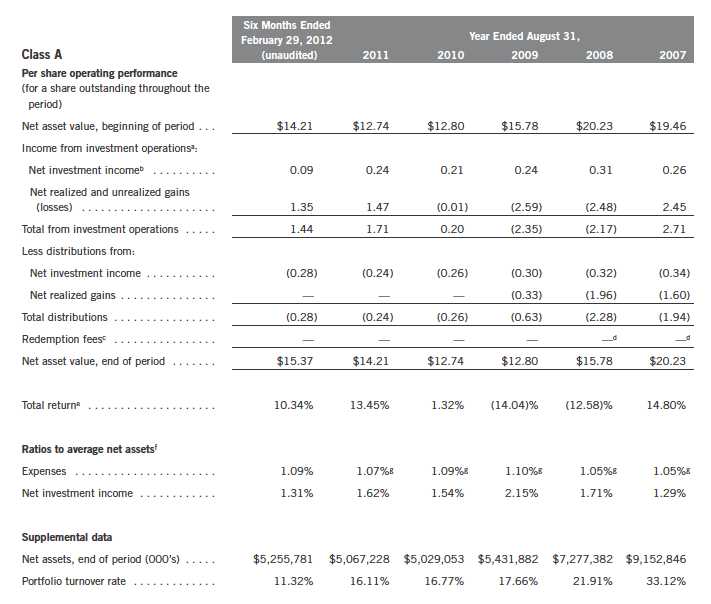
aThe amount shown for a share outstanding throughout the period may not correlate with the Statement of Operations for the period due to the timing of sales and repurchases of
the Fund shares in relation to income earned and/or fluctuating market value of the investments of the Fund.
bBased on average daily shares outstanding.
cEffective September 1, 2008, the redemption fee was eliminated.
dAmount rounds to less than $0.01 per share.
eTotal return does not reflect sales commissions or contingent deferred sales charges, if applicable, and is not annualized for periods less than one year.
fRatios are annualized for periods less than one year.
gBenefit of expense reduction rounds to less than 0.01%.
16 | The accompanying notes are an integral part of these financial statements. | Semiannual Report
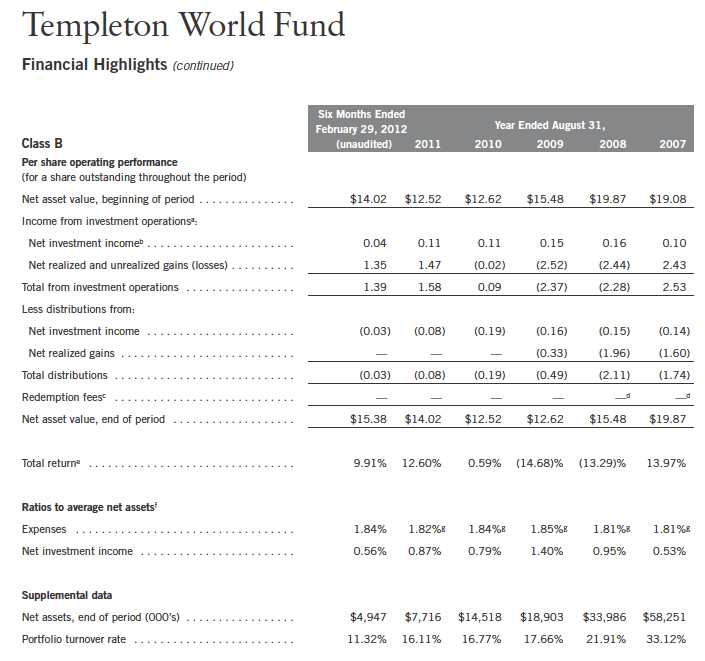
aThe amount shown for a share outstanding throughout the period may not correlate with the Statement of Operations for the period due to the timing of sales and repurchases of
the Fund shares in relation to income earned and/or fluctuating market value of the investments of the Fund.
bBased on average daily shares outstanding.
cEffective September 1, 2008, the redemption fee was eliminated.
dAmount rounds to less than $0.01 per share.
eTotal return does not reflect sales commissions or contingent deferred sales charges, if applicable, and is not annualized for periods less than one year.
fRatios are annualized for periods less than one year.
gBenefit of expense reduction rounds to less than 0.01%.
Semiannual Report | The accompanying notes are an integral part of these financial statements. | 17

aThe amount shown for a share outstanding throughout the period may not correlate with the Statement of Operations for the period due to the timing of sales and repurchases of
the Fund shares in relation to income earned and/or fluctuating market value of the investments of the Fund.
bBased on average daily shares outstanding.
cEffective September 1, 2008, the redemption fee was eliminated.
dAmount rounds to less than $0.01 per share.
eTotal return does not reflect sales commissions or contingent deferred sales charges, if applicable, and is not annualized for periods less than one year.
fRatios are annualized for periods less than one year.
gBenefit of expense reduction rounds to less than 0.01%.
18 | The accompanying notes are an integral part of these financial statements. | Semiannual Report
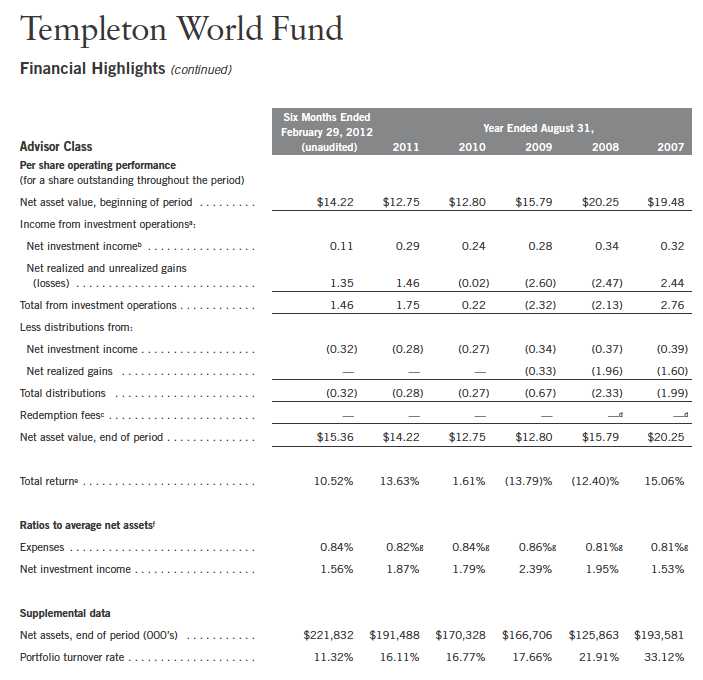
aThe amount shown for a share outstanding throughout the period may not correlate with the Statement of Operations for the period due to the timing of sales and repurchases of
the Fund shares in relation to income earned and/or fluctuating market value of the investments of the Fund.
bBased on average daily shares outstanding.
cEffective September 1, 2008, the redemption fee was eliminated.
dAmount rounds to less than $0.01 per share.
eTotal return is not annualized for periods less than one year.
fRatios are annualized for periods less than one year.
gBenefit of expense reduction rounds to less than 0.01%.
Semiannual Report | The accompanying notes are an integral part of these financial statements. | 19
20 | Semiannual Report
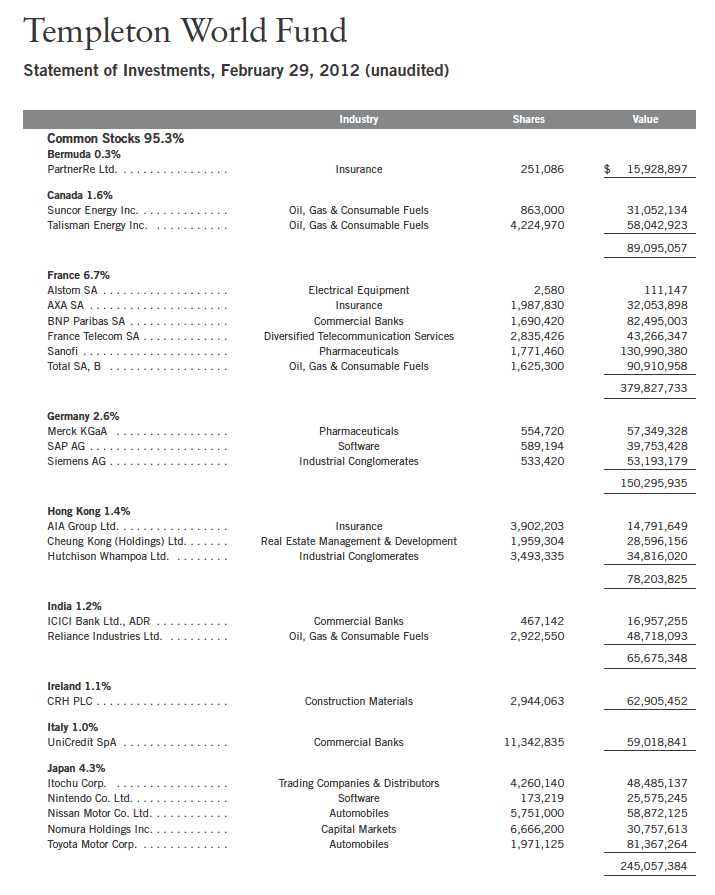
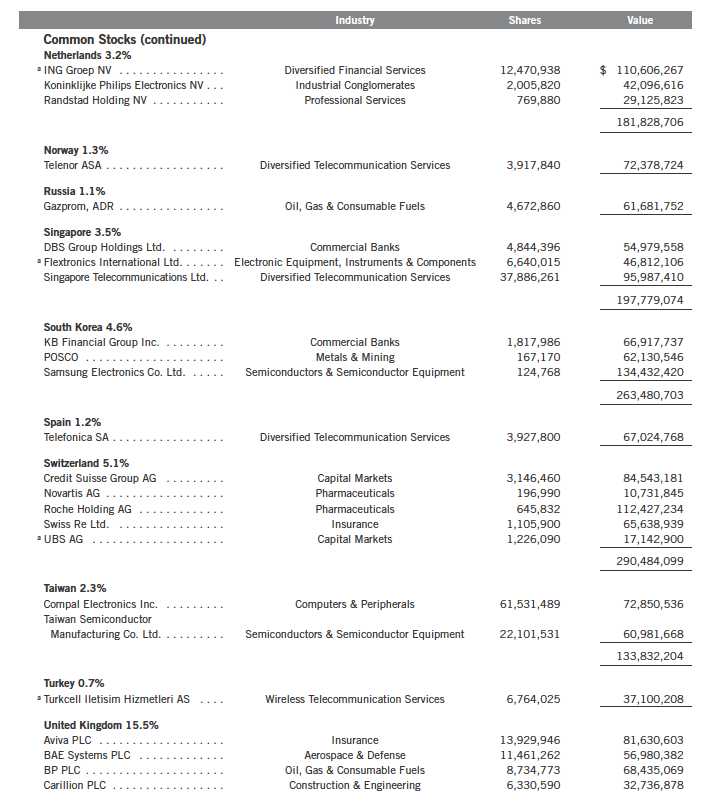
Templeton World Fund
Statement of Investments, February 29, 2012 (unaudited) (continued)
Semiannual Report | 21
22 | Semiannual Report
Semiannual Report | 23
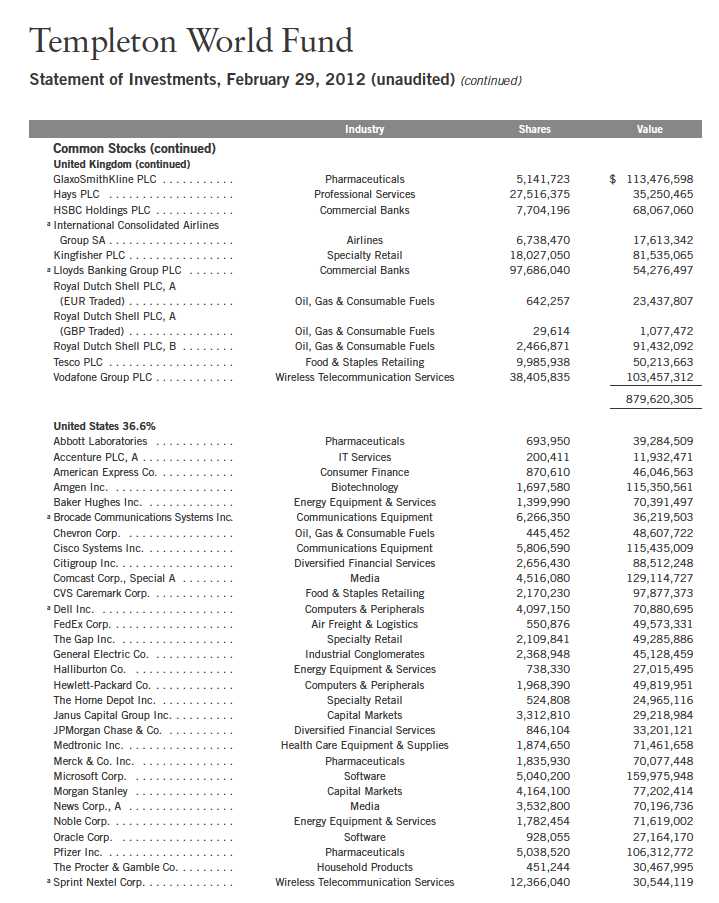
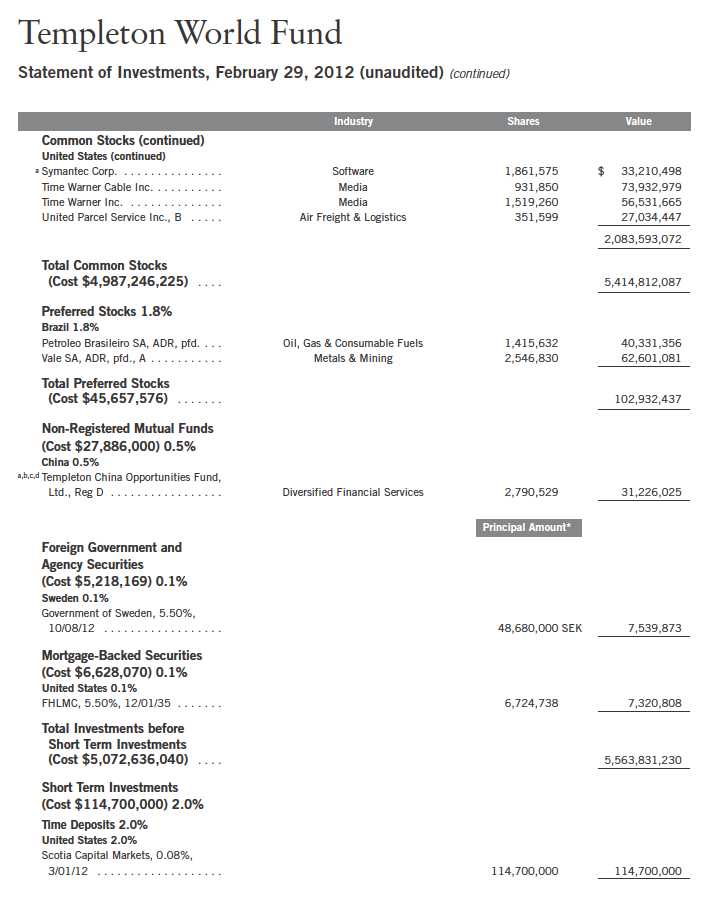
Templeton World Fund
Statement of Investments, February 29, 2012 (unaudited) (continued)
See Abbreviations on page 39.
*The principal amount is stated in U.S. dollars unless otherwise indicated.
aNon-income producing.
bSee Note 1(c) regarding investment in Templeton China Opportunities Fund, Ltd.
cSee Note 8 regarding restricted securities.
dSee Note 9 regarding holdings of 5% voting securities.
24 | The accompanying notes are an integral part of these financial statements. | Semiannual Report
Semiannual Report | The accompanying notes are an integral part of these financial statements. | 25
26 | The accompanying notes are an integral part of these financial statements. | Semiannual Report
Semiannual Report | The accompanying notes are an integral part of these financial statements. | 27
28 | The accompanying notes are an integral part of these financial statements. | Semiannual Report
Templeton World Fund
Notes to Financial Statements (unaudited)
1. ORGANIZATION AND SIGNIFICANT ACCOUNTING POLICIES
Templeton Funds (Trust) is registered under the Investment Company Act of 1940, as amended, (1940 Act) as an open-end investment company, consisting of two separate funds. The Templeton World Fund (Fund) is included in this report. The financial statements of the remaining fund in the Trust are presented separately. The Fund offers four classes of shares: Class A, Class B, Class C, and Advisor Class. Each class of shares differs by its initial sales load, contingent deferred sales charges, distribution fees, voting rights on matters affecting a single class and its exchange privilege.
The following summarizes the Fund’s significant accounting policies.
a. Financial Instrument Valuation
The Fund’s investments in securities and other financial instruments are carried at fair value daily. Fair value is the price that would be received to sell an asset or paid to transfer a liability in an orderly transaction between market participants on the measurement date. Under procedures approved by the Trust’s Board of Trustees, the Fund may utilize independent pricing services, quotations from securities and financial instrument dealers, and other market sources to determine fair value.
Equity securities listed on an exchange or on the NASDAQ National Market System are valued at the last quoted sale price or the official closing price of the day, respectively. Foreign equity securities are valued as of the close of trading on the foreign stock exchange on which the security is primarily traded, or the NYSE, whichever is earlier. The value is then converted into its U.S. dollar equivalent at the foreign exchange rate in effect at the close of the NYSE on the day that the value of the security is determined. Over-the-counter securities are valued within the range of the most recent quoted bid and ask prices. Securities that trade in multiple markets or on multiple exchanges are valued according to the broadest and most representative market. Certain equity securities are valued based upon fundamental characteristics or relationships to similar securities.
Debt securities generally trade in the over-the-counter market rather than on a securities exchange. The Fund’s pricing services use multiple valuation techniques to determine fair value. In instances where sufficient market activity exists, the pricing services may utilize a market-based approach through which quotes from market makers are used to determine fair value. In instances where sufficient market activity may not exist or is limited, the pricing services also utilize proprietary valuation models which may consider market characteristics such as benchmark yield curves, option-adjusted spreads, credit spreads, estimated default rates, coupon rates, anticipated timing of principal repayments, underlying collateral, and other unique security features in order to estimate the relevant cash flows, which are then discounted to calculate the fair value. Securities denominated in a foreign currency are converted into their U.S. dollar equivalent at the foreign exchange rate in effect at the close of the NYSE on the date that the values of the foreign debt securities are determined. Time deposits are valued at cost, which approximates market value.
Semiannual Report | 29
Templeton World Fund
Notes to Financial Statements (unaudited) (continued)
| 1. | ORGANIZATION AND SIGNIFICANT ACCOUNTING POLICIES (continued) |
| a. | Financial Instrument Valuation (continued) |
The Fund has procedures to determine the fair value of securities and other financial instruments for which market prices are not readily available or which may not be reliably priced. Under these procedures, the Fund primarily employs a market-based approach which may use related or comparable assets or liabilities, recent transactions, market multiples, book values, and other relevant information for the investment to determine the fair value of the investment. The Fund may also use an income-based valuation approach in which the anticipated future cash flows of the investment are discounted to calculate fair value. Discounts may also be applied due to the nature or duration of any restrictions on the disposition of the investments. Due to the inherent uncertainty of valuations of such investments, the fair values may differ significantly from the values that would have been used had an active market existed.
Trading in securities on foreign securities stock exchanges and over-the-counter markets may be completed before the daily close of business on the NYSE. Occasionally, events occur between the time at which trading in a foreign security is completed and the close of the NYSE that might call into question the reliability of the value of a portfolio security held by the Fund. As a result, differences may arise between the value of the Fund’s portfolio securities as determined at the foreign market close and the latest indications of value at the close of the NYSE. In order to minimize the potential for these differences, the investment manager monitors price movements following the close of trading in foreign stock markets through a series of country specific market proxies (such as baskets of American Depository Receipts, futures contracts and exchange traded funds). These price movements are measured against established trigger thresholds for each specific market proxy to assist in determining if an event has occurred that may call into question the reliability of the values of the foreign securities held by the Fund. If such an event occurs, the securities may be valued using fair value procedures, which may include the use of independent pricing services.
b. Foreign Currency Translation
Portfolio securities and other assets and liabilities denominated in foreign currencies are translated into U.S. dollars based on the exchange rate of such currencies against U.S. dollars on the date of valuation. The Fund may enter into foreign currency exchange contracts to facilitate transactions denominated in a foreign currency. Purchases and sales of securities, income and expense items denominated in foreign currencies are translated into U.S. dollars at the exchange rate in effect on the transaction date. Portfolio securities and assets and liabilities denominated in foreign currencies contain risks that those currencies will decline in value relative to the U.S. dollar. Occasionally, events may impact the availability or reliability of foreign exchange rates used to convert the U.S. dollar equivalent value. If such an event occurs, the foreign exchange rate will be valued at fair value using procedures established and approved by the Trust’s Board of Trustees.
30 | Semiannual Report
Templeton World Fund
Notes to Financial Statements (unaudited) (continued)
| 1. | ORGANIZATION AND SIGNIFICANT ACCOUNTING POLICIES (continued) |
| b. | Foreign Currency Translation (continued) |
The Fund does not separately report the effect of changes in foreign exchange rates from changes in market prices on securities held. Such changes are included in net realized and unrealized gain or loss from investments on the Statement of Operations.
Realized foreign exchange gains or losses arise from sales of foreign currencies, currency gains or losses realized between the trade and settlement dates on securities transactions and the difference between the recorded amounts of dividends, interest, and foreign withholding taxes and the U.S. dollar equivalent of the amounts actually received or paid. Net unrealized foreign exchange gains and losses arise from changes in foreign exchange rates on foreign denominated assets and liabilities other than investments in securities held at the end of the reporting period.
c. Investment in Templeton China Opportunities Fund, Ltd.
The Fund invests in Templeton China Opportunities Fund, Ltd. (China Fund), a private offering of unregistered shares in a Cayman Islands Exempt Company. The China Fund investment objective is to seek capital growth primarily through investments in A-shares of Chinese companies listed on the Shanghai and Shenzhen stock exchanges. Chinese A-shares are traded in Chinese Renminbi and are only available as an investment to domestic (Chinese) investors and holders of a Qualified Foreign Institutional Investors license. The China Fund is managed by Templeton Investment Counsel, LLC (an affiliate of the investment manager). No additional management or administrative fees are incurred on assets invested in the China Fund.
The China Fund may be subject to certain restrictions and administrative processes relating to its ability to repatriate cash balances, investment proceeds and earnings associated with its investment, as such activities are subject to approval by agencies of the Chinese government and thus the Fund may incur delays in redeeming its investment in the China Fund. The Fund’s investment in the China Fund is valued based upon the fair value of the China Fund’s portfolio securities and other assets and liabilities.
d. Securities Lending
The Fund participates in an agency based securities lending program. The Fund receives cash collateral against the loaned securities in an amount equal to at least 102% of the market value of the loaned securities. Collateral is maintained over the life of the loan in an amount not less than 100% of the market value of loaned securities, as determined at the close of fund business each day; any additional collateral required due to changes in security values is delivered to the Fund on the next business day. The collateral is invested in a non-registered money fund. The Fund receives income from the investment of cash collateral, in addition to lending fees and rebates paid by the borrower. The Fund bears the market risk with respect to the collateral investment, securities loaned, and the risk that the agent may default on its obligations to the Fund. The securities lending agent has agreed to indemnify the Fund in the event of default by a third party borrower.
Semiannual Report | 31
Templeton World Fund
Notes to Financial Statements (unaudited) (continued)
| 1. | ORGANIZATION AND SIGNIFICANT ACCOUNTING POLICIES (continued) |
| e. | Income and Deferred Taxes |
It is the Fund’s policy to qualify as a regulated investment company under the Internal Revenue Code. The Fund intends to distribute to shareholders substantially all of its taxable income and net realized gains to relieve it from federal income and excise taxes. As a result, no provision for U.S. federal income taxes is required.
The Fund may be subject to foreign taxation related to income received, capital gains on the sale of securities and certain foreign currency transactions in the foreign jurisdictions in which it invests. Foreign taxes, if any, are recorded based on the tax regulations and rates that exist in the foreign markets in which the Fund invests. When a capital gain tax is determined to apply the Fund records an estimated deferred tax liability in an amount that would be payable if the securities were disposed of on the valuation date.
The Fund recognizes the tax benefits of uncertain tax positions only when the position is “more likely than not” to be sustained upon examination by the tax authorities based on the technical merits of the tax position. As of February 29, 2012, and for all open tax years, the Fund has determined that no liability for unrecognized tax benefits is required in the Fund’s financial statements related to uncertain tax positions taken on a tax return (or expected to be taken on future tax returns). Open tax years are those that remain subject to examination and are based on each tax jurisdiction statute of limitation.
f. Security Transactions, Investment Income, Expenses and Distributions
Security transactions are accounted for on trade date. Realized gains and losses on security transactions are determined on a specific identification basis. Interest income and estimated expenses are accrued daily. Amortization of premium and accretion of discount on debt securities are included in interest income. Dividend income is recorded on the ex-dividend date except that certain dividends from foreign securities are recognized as soon as the Fund is notified of the ex-dividend date. Distributions to shareholders are recorded on the ex-dividend date and are determined according to income tax regulations (tax basis). Distributable earnings determined on a tax basis may differ from earnings recorded in accordance with accounting principles generally accepted in the United States of America. These differences may be permanent or temporary. Permanent differences are reclassified among capital accounts to reflect their tax character. These reclassifications have no impact on net assets or the results of operations. Temporary differences are not reclassified, as they may reverse in subsequent periods.
Common expenses incurred by the Trust are allocated among the funds based on the ratio of net assets of each fund to the combined net assets of the Trust. Fund specific expenses are charged directly to the fund that incurred the expense.
Realized and unrealized gains and losses and net investment income, not including class specific expenses, are allocated daily to each class of shares based upon the relative proportion of net assets of each class. Differences in per share distributions, by class, are generally due to differences in class specific expenses.
32 | Semiannual Report
Templeton World Fund
Notes to Financial Statements (unaudited) (continued)
1. ORGANIZATION AND SIGNIFICANT ACCOUNTING POLICIES (continued)
g. Accounting Estimates
The preparation of financial statements in accordance with accounting principles generally accepted
in the United States of America requires management to make estimates and assumptions that
affect the reported amounts of assets and liabilities at the date of the financial statements and
the amounts of income and expenses during the reporting period. Actual results could differ
from those estimates.
h. Guarantees and Indemnifications
Under the Trust’s organizational documents, its officers and trustees are indemnified by the Trust
against certain liabilities arising out of the performance of their duties to the Trust. Additionally,
in the normal course of business, the Trust, on behalf of the Fund, enters into contracts with
service providers that contain general indemnification clauses. The Trust’s maximum exposure
under these arrangements is unknown as this would involve future claims that may be made
against the Trust that have not yet occurred. Currently, the Trust expects the risk of loss to
be remote.
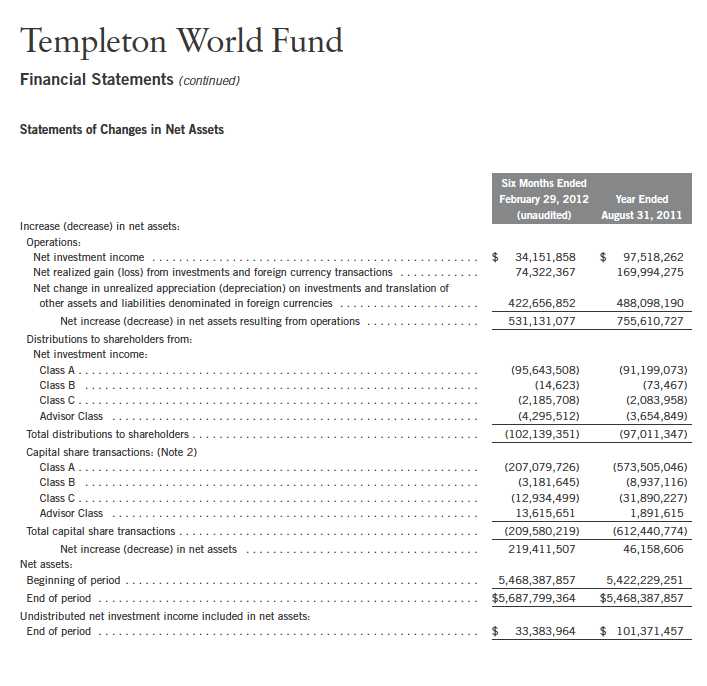
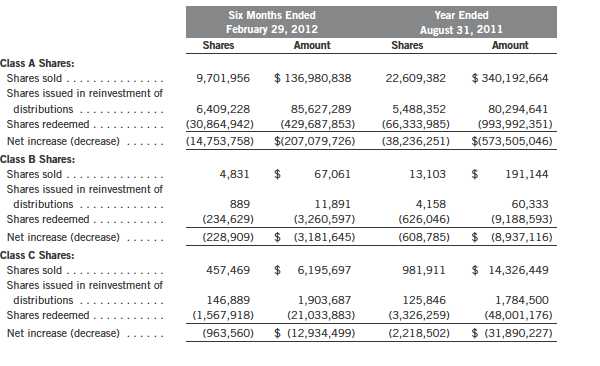
2. SHARES OF BENEFICIAL INTEREST
At February 29, 2012, there were an unlimited number of shares authorized (without par value).
Transactions in the Fund’s shares were as follows:
Semiannual Report | 33

Templeton World Fund
Notes to Financial Statements (unaudited) (continued)
| 3. | TRANSACTIONS WITH AFFILIATES (continued) |
| c. | Distribution Fees |
The Trust’s Board of Trustees has adopted distribution plans for each share class, with the exception of Advisor Class shares, pursuant to Rule 12b-1 under the 1940 Act. Under the Fund’s Class A reimbursement distribution plan, the Fund reimburses Distributors for costs incurred in connection with the servicing, sale and distribution of the Fund’s shares up to the maximum annual plan rate. Under the Class A reimbursement distribution plan, costs exceeding the maximum for the current plan year cannot be reimbursed in subsequent periods.
In addition, under the Fund’s Class B and C compensation distribution plans, the Fund pays Distributors for costs incurred in connection with the servicing, sale and distribution of the Fund’s shares up to the maximum annual plan rate for each class.
The maximum annual plan rates, based on the average daily net assets, for each class, are as follows:

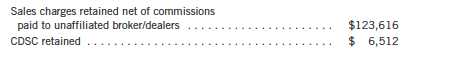
d. Sales Charges/Underwriting Agreements
Front-end sales changes and contingent deferred sales (CDSC) do not represent expenses of the Fund. These changes are deducted from the proceeds of sales prior to investment or from redemption proceeds prior to investment or from redemption proceeds prior to remittance, as applicable. Distributors has advised the Fund of the following commission transactions related to the sales and redemptions of the Fund’s shares for the period:
e. Transfer Agent Fees
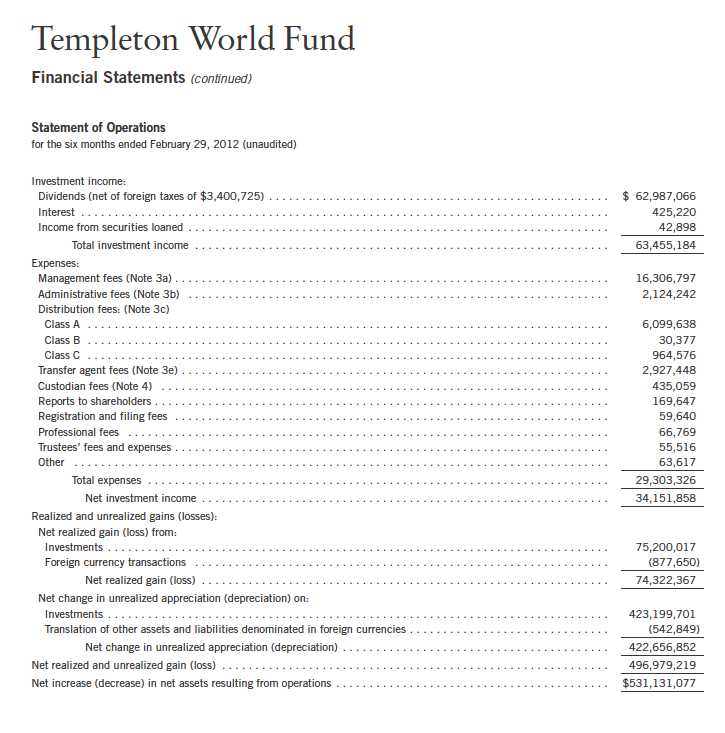
For the period ended February 29, 2012, the Fund paid transfer agent fees of $2,927,448, of which $1,665,619 was retained by Investor Services.
4. EXPENSE OFFSET ARRANGEMENT
The Fund has entered into an arrangement with its custodian whereby credits realized as a result of uninvested cash balances are used to reduce a portion of the Fund’s custodian expenses. During the period ended February 29, 2012, there were no credits earned.
Semiannual Report | 35
Templeton World Fund
Notes to Financial Statements (unaudited) (continued)
5. INCOME TAXES
For tax purposes, capital losses may be carried over to offset future capital gains, if any. At August 31, 2011, the capital loss carryforwards were as follows:
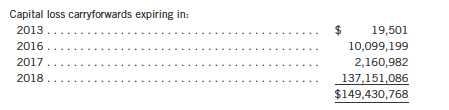
Under the Regulated Investment Company Modernization Act of 2010, the Fund will be permitted to carry forward capital losses incurred in taxable years beginning after December 22, 2010 for an unlimited period. Post-enactment capital loss carryforwards will retain their character as either short-term or long-term capital losses rather than being considered short-term as under previous law. Any post-enactment capital losses generated will be required to be utilized prior to the losses incurred in pre-enactment tax years.
At February 29, 2012, the cost of investments and net unrealized appreciation (depreciation) for income tax purposes were as follows:
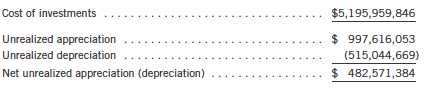
Differences between income and/or capital gains as determined on a book basis and a tax basis are primarily due to differing treatments of foreign currency transactions, pass through entity income, non-deductible expenses and regulatory settlements.
6. INVESTMENT TRANSACTIONS
Purchases and sales of investments (excluding short term securities) for the period ended February 29, 2012, aggregated $597,095,906 and $906,989,710, respectively.
7. CONCENTRATION OF RISK
Investing in foreign securities may include certain risks and considerations not typically associated with investing in U.S. securities, such as fluctuating currency values and changing local and regional economic, political and social conditions, which may result in greater market volatility. In addition, certain foreign securities may not be as liquid as U.S. securities.
36 | Semiannual Report
Templeton World Fund
Notes to Financial Statements (unaudited) (continued)
8. RESTRICTED SECURITIES
The Fund invests in securities that are restricted under the Securities Act of 1933 (1933 Act) or which are subject to legal, contractual, or other agreed upon restrictions on resale. Restricted securities are often purchased in private placement transactions, and cannot be sold without prior registration unless the sale is pursuant to an exemption under the 1933 Act. Disposal of these securities may require greater effort and expense, and prompt sale at an acceptable price may be difficult. The Fund may have registration rights for restricted securities. The issuer generally incurs all registration costs.
At February 29, 2012, the Fund held investments in restricted securities, excluding certain securities exempt from registration under the 1933 Act deemed to be liquid, as follows:

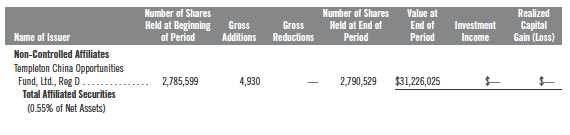
9. HOLDINGS OF 5% VOTING SECURITIES OF PORTFOLIO COMPANIES
The 1940 Act defines “affiliated companies” to include investments in portfolio companies in which a fund owns 5% or more of the outstanding voting securities. Investments in “affiliated companies” for the Fund for the period ended February 29, 2012, were as shown below.
10. CREDIT FACILITY
The Fund, together with other U.S. registered and foreign investment funds (collectively, Borrowers), managed by Franklin Templeton Investments, are borrowers in a joint syndicated senior unsecured credit facility totaling $1.5 billion (Global Credit Facility) which matures on January 18, 2013. This Global Credit Facility provides a source of funds to the Borrowers for temporary and emergency purposes, including the ability to meet future unanticipated or unusually large redemption requests.
Under the terms of the Global Credit Facility, the Fund shall, in addition to interest charged on any borrowings made by the Fund and other costs incurred by the Fund, pay its share of fees
Semiannual Report | 37
Templeton World Fund
Notes to Financial Statements (unaudited) (continued)
10. CREDIT FACILITY (continued)
and expenses incurred in connection with the implementation and maintenance of the Global Credit Facility, based upon its relative share of the aggregate net assets of all of the Borrowers, including an annual commitment fee of 0.08% based upon the unused portion of the Global Credit Facility, which is reflected in other expenses on the Statement of Operations. During the period ended February 29, 2012, the Fund did not use the Global Credit Facility.
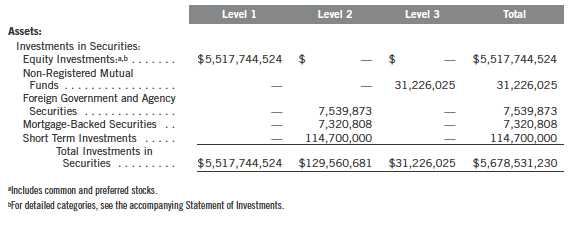
11. FAIR VALUE MEASUREMENTS
The Fund follows a fair value hierarchy that distinguishes between market data obtained from independent sources (observable inputs) and the Fund’s own market assumptions (unobservable inputs). These inputs are used in determining the value of the Fund’s investments and are summarized in the following fair value hierarchy:
- Level 1 – quoted prices in active markets for identical securities
- Level 2 – other significant observable inputs (including quoted prices for similar securities, interest rates, prepayment speed, credit risk, etc.)
- Level 3 – significant unobservable inputs (including the Fund’s own assumptions in determining the fair value of investments)
The inputs or methodology used for valuing securities are not an indication of the risk associated with investing in those securities.
For movements between the levels within the fair value hierarchy, the Fund has adopted a policy of recognizing the transfers as of the date of the underlying event which caused the movement.
The following is a summary of the inputs used as of February 29, 2012, in valuing the Fund’s assets and liabilities carried at fair value:
38 | Semiannual Report
Templeton World Fund
Notes to Financial Statements (unaudited) (continued)
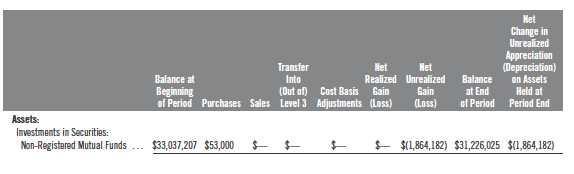
11. FAIR VALUE MEASUREMENTS (continued)
At February 29, 2012, the reconciliation of assets in which significant unobservable inputs (Level 3) were used in determining fair value, is as follows:
12. NEW ACCOUNTING PRONOUNCEMENTS
In May 2011, the Financial Accounting Standards Board (FASB) issued Accounting Standards Update (ASU) No. 2011-04, Fair Value Measurement (Topic 820): Amendments to Achieve Common Fair Value Measurement and Disclosure Requirements in U.S. GAAP and IFRSs. The amendments in the ASU will improve the comparability of fair value measurements presented and disclosed in financial statements prepared in accordance with U.S. GAAP (Generally Accepted Accounting Principles) and IFRS (International Financial Reporting Standards) and include new guidance for certain fair value measurement principles and disclosure requirements. The ASU is effective for interim and annual periods beginning after December 15, 2011. The Fund believes the adoption of this ASU will not have a material impact on its financial statements.
13. SUBSEQUENT EVENTS
The Fund has evaluated subsequent events through the issuance of the financial statements and determined that no events have occurred that require disclosure.

Semiannual Report | 39
Templeton World Fund
Shareholder Information
Proxy Voting Policies and Procedures
The Fund’s investment manager has established Proxy Voting Policies and Procedures (Policies) that the Fund uses to determine how to vote proxies relating to portfolio securities. Shareholders may view the Fund’s complete Policies online at franklintempleton.com. Alternatively, shareholders may request copies of the Policies free of charge by calling the Proxy Group collect at (954) 527-7678 or by sending a written request to: Franklin Templeton Companies, LLC, 300 S.E. 2nd Street, Fort Lauderdale, FL 33301, Attention: Proxy Group. Copies of the Fund’s proxy voting records are also made available online at franklintempleton.com and posted on the U.S. Securities and Exchange Commission’s website at sec.gov and reflect the most recent 12-month period ended June 30.
Quarterly Statement of Investments
The Fund files a complete statement of investments with the U.S. Securities and Exchange Commission for the first and third quarters for each fiscal year on Form N-Q. Shareholders may view the filed Form N-Q by visiting the Commission’s website at sec.gov. The filed form may also be viewed and copied at the Commission’s Public Reference Room in Washington, DC. Information regarding the operations of the Public Reference Room may be obtained by calling (800) SEC-0330.
40 | Semiannual Report
Semiannual Report
Templeton Foreign Fund
Your Fund’s Goal and Main Investments: Templeton Foreign Fund seeks long-term
capital growth. Under normal market conditions, the Fund invests primarily in equity securities of
companies located outside the U.S., including emerging markets. The Fund will invest, under normal
market circumstances, at least 80% of it net assets in “foreign securities,” as defined in the prospectus.
We are pleased to bring you Templeton Foreign Fund’s semiannual report for
the period ended February 29, 2012.
Performance Overview
Templeton Foreign Fund – Class A posted a +4.49% cumulative total return
for the six months under review. The Fund outperformed the +4.26% total
return of its benchmark, the MSCI Europe, Australasia, Far East (EAFE)
Index, which measures global equity performance in developed countries
excluding the U.S. and Canada.1 The Fund’s long-term relative results are
shown in the Performance Summary beginning on page 11. For the 10-year
period ended February 29, 2012, Templeton Foreign Fund – Class A deliv-
ered a cumulative total return of +89.78%, compared with the MSCI EAFE
Index’s +92.55% cumulative total return for the same period.1 Please note
index performance information is provided for reference and we do not
attempt to track the index but rather undertake investments on the basis
of fundamental research. You can find more performance data in the
Performance Summary.
1. Source: © 2012 Morningstar. All Rights Reserved. The information contained herein: (1) is proprietary to Morningstar
and/or its content providers; (2) may not be copied or distributed; and (3) is not warranted to be accurate, complete or
timely. Neither Morningstar nor its content providers are responsible for any damages or losses arising from any use of
this information. As of 2/29/12, the Fund’s Class A 10-year average annual total return not including the maximum
sales charge was +6.62%, compared with the MSCI EAFE Index’s 10-year average annual total return of +6.77%. The
index is unmanaged and includes reinvested dividends. One cannot invest directly in an index, and an index is not
representative of the Fund's portfolio.
The dollar value, number of shares or principal amount, and names of all portfolio holdings are listed in the Fund’s
Statement of Investments (SOI). The SOI begins on page 21.
Semiannual Report | 3
Economic and Market Overview
Global stocks, as measured by the MSCI World Index, rose from their lowest
levels in over a year to deliver solid gains for the six months under review,
despite persistent concerns surrounding Europe’s fiscal crisis and a global
economic slowdown. The period began amid elevated volatility as sovereign
bond yields in Europe spiked to record levels and policymakers scrambled to
contain the gathering debt crisis. Greek and Italian debt came under intense
pressure, forcing the dissolution of their respective governments and installment
of technocrat-led coalitions to oversee restructuring and austerity programs.
Realizing the severity of the situation, many policymakers resumed their
vigilance. The European Central Bank (ECB) cut interest rates and expanded
lending facilities through the introduction of its Long-Term Refinancing
Operation (LTRO), which provided more than 1 trillion euros (US$1.3 trillion)
of low-cost capital to regional lenders in two separate auctions. Greece
received its second bailout toward period-end, along with the painful provision
of debt restructuring and austerity programs. Policymakers elsewhere also
came to Europe’s aid, with the International Monetary Fund revamping its
credit line and six global central banks agreeing to lower funding costs for
Europe’s distressed lenders. In the U.S., the Federal Reserve Board initiated
“Operation Twist,” a program that used the proceeds of short-dated bond
sales to fund the purchase of longer dated issues in an effort to drive down
key borrowing costs. In emerging markets, China and India encouraged loan
growth by reducing the amount of capital banks are required to keep on hand,
while Brazil cut interest rates three times during the review period.
The cumulative effect of these decisive policy moves was a period of stabiliza-
tion that supported broad equity market gains. Resilient corporate earnings
and generally improving economic data also fueled the rally, particularly in the
U.S., where fourth quarter 2011 growth domestic product (GDP) grew at a
better-than-expected 3% annualized rate. Indicators ranging from home sales
to unemployment claims to consumer confidence all improved toward period-
end. Economic news elsewhere was mostly mixed. Fourth quarter GDP growth
of 8.9% in China and 6.1% in India, while still robust in absolute terms, dis-
appointed investor expectations and constituted the weakest economic advances
since 2009 for the world’s two most populous countries.2 In the eurozone,
fourth quarter GDP contracted for the first time since 2009, registering -0.3%
from the previous quarter.3 Such growth concerns generally pressured com-
modity prices, with the exception of oil, which approached record highs due
to fears geopolitical developments in the Middle East could strangle supply.
2. Sources: National Bureau of Statistics (China); India Central Statistical Organization.
3. Source: Eurostat.
4 | Semiannual Report
Meanwhile, a relatively better near-term growth outlook in the U.S. helped
flatten the Treasury yield curve and supported the dollar’s rally against the
euro and yen.
Investment Strategy
Our investment strategy employs a bottom-up, value-oriented, long-term
approach. We focus on the market price of a company’s securities relative to
our evaluation of the company’s long-term earnings, asset value and cash flow
potential. As we look internationally, we consider specific companies, rather
than sectors or countries, while doing in-depth research to construct a bargain
list from which we buy. Before we make a purchase, we look at the company’s
price/cash flow ratio, price/earnings ratio, profit margins and liquidation value.
Manager’s Discussion
Templeton Foreign Fund – Class A delivered absolute gains and outper-
formed its international benchmark, the MSCI EAFE Index, during the six
months under review. We view strong returns as particularly encouraging
given the headwinds confronting value investors in the recent environment.
A market that, in our opinion, swings between panic-induced sell-offs and
liquidity-fueled rallies serves as a poor gauge of long-term fundamental busi-
ness values. In periods of heightened uncertainty, share prices are often more
correlated to investors’ short-term perceptions of broader financial or eco-
nomic prospects than they are to fundamental values. Although this basic
reality of equity markets brings inherent challenges for fundamental investors,
it also creates remarkable opportunities. Sir John Templeton knew this well
when he observed, “Too many investors focus on outlook and trend.
Therefore, more profit is made by focusing on value.”
Although investors and pundits seemed preoccupied with the outlook for
Europe’s sovereign debt crisis, America’s economic growth prospects and
China’s policy maneuvers, we examined variables such as compound annual
earnings growth, amortization schedules of intangible assets and the cash
flow characteristics of various types of businesses. This disciplined, detailed
analysis helps us determine a company’s level of “normalized” profitability
achievable through an entire business cycle. Since equity investors discount
future corporate earnings streams, the process identifies companies priced at
levels below our conservative expectation of their long-term profitability.
Our focus remains squarely on business value, not the largely indiscernible
complexities of economic growth and public policy. Over the long term, as
cyclical issues play out and share prices converge with underlying business
values, we have found this approach rewarding.
Semiannual Report | 5
Our investment process worked well during the six months under review as
several holdings began to realize their value potential even amid continued
economic and political uncertainty. In the information technology sector, where
stock selection drove notable outperformance, South Korean semiconductor
and consumer electronics manufacturer Samsung Electronics provided a good
example.4, 5 We initiated a position in 2001 after its shares lost nearly half their
value during the “dot-com” bubble burst. We held the stock as it appreciated
through the decade before giving back some gains in the 2008/2009 market
downturn. Pricing weakness in the semiconductor industry, where Samsung
generated most of its earnings, further compounded the downward pressure
during this period; however, we believe this challenge belied the company’s
longer term opportunities, its track record of prudent management and leader-
ship across a diverse product portfolio, as well as a strong balance sheet and
prodigious cash flows. The company deployed the cash flows to accelerate
capital expenditures and fund research and development at a time when its
competitors were constrained by the negative business environment. As the
company consolidated market share gains in its core business, it also invested
heavily in up-and-coming products with desirable growth profiles, including
smartphones and tablets. In our view, the company achieved remarkable suc-
cess in these segments, notably surpassing Apple in 2011 to become the
world’s leading provider of smartphones based on sales. Since our initial pur-
chase in 2001, Samsung’s shares have appreciated nearly 500%. We are
pleased to hold the stock given our assessment of the company’s reasonable
valuation, attractive growth prospects and prudent use of cash for dividends,
share buybacks and internal growth initiatives.
Networking solutions firm Cisco Systems, one of the Fund’s few North American
holdings, represents another example of a stock in which we identified consider-
able value in spite of the market’s short-sighted concerns.5 When we moved
Cisco Systems onto our bargain list near the beginning of this semiannual review
period, the stock had returned a dismal 6% since the market’s trough in 2009,
compared to a 76% gain for the Standard & Poor’s® 500 Technology Index.6
Cisco Systems had strayed from its switching and routing core business and
aggressively pursued growth in the trendy consumer electronics industry,
where it was unable to compete with Samsung Electronics and Apple. After a
string of worse-than-expected losses, Cisco System’s leadership reassessed its
strategy and announced it would jettison unprofitable businesses, aggressively
4. The information technology sector comprises communications equipment; computers and peripherals; electronic
equipment, instruments and components; semiconductors and semiconductor equipment; and software in the SOI.
5. This holding is not an index component.
6. Sources: Bloomberg LP; Standard & Poor’s. STANDARD & POOR’S®, S&P® and S&P 500® are registered trademarks
of Standard & Poor’s Financial Services LLC. Standard & Poor’s does not sponsor, endorse, sell or promote any S&P
index-based product.
6 | Semiannual Report
cut costs and refocus on its core competencies. Many investors were skeptical, but our analysis indicated that tremendous value remained in the firm’s core switching and routing businesses if Cisco Systems successfully reorganized and realigned growth expectations. With shares trading at record low valuation levels and the company showing initial signs of progress in its restructuring efforts, we purchased Cisco Systems last August, and since then the stock has produced a gain and outperformed its technology peer group.
Selective value opportunities also unfolded in the global financials sector, where fears of a European credit event depressed valuations close to the lowest levels on record.7 Although considerable risks remain in the European financials sector, we believe firms are far better capitalized than a few years ago, and the ECB’s LTRO removed near-term liquidity risk. Several European financials holdings were among the Fund’s top performers during the period. Dutch financial services conglomerate ING Groep was a top contributor, gaining amid negotiations with the European community regarding an asset disposal program mandated as a precondition of ING’s 2008 government bailout. In our view, those discussions moved in ING’s favor, and the company could repay the final tranche of its loan earlier than expected, potentially reemerging as a well-run Dutch bank earning strong returns on equity with limited exposure to fee and trading income and possibly resuming dividend payments. Dutch life insurer Aegon and Danish lender Danske Bank also contributed to performance during the period.
The Fund enjoyed considerable relative outperformance from some major underweighted sectors, including materials and utilities.8 Based on our analysis, the materials sector offered few value opportunities in recent years, particularly in the metals and mining industry, where overall metals prices near 100-year highs inflated valuations and industry profits. Although our underweighting during the past six months — a period when global growth uncertainties weighed on most commodity prices — contributed to relative returns, the bulk of relative outperformance was attributable to stock selection. Notably, the Fund’s holdings in non-mining firms like Dutch paint-maker Akzo Nobel, which rallied after restructuring progress, and Irish building materials provider CRH, which gained due to better-than-expected earnings results, were key contributors to Fund performance. In the utilities sector, sluggish demand, weak pricing and continued political and regulatory uncertainty made bargain hunting difficult for us. The Fund’s modest utilities weighting supported relative outperformance during a period of continued sector weakness, as did stock selection.
7. The financials sector comprises capital markets, commercial banks, diversified financial services, insurance, and real estate management and development in the SOI.
8. The materials sector comprises chemicals, construction materials, containers and packaging, and metals and mining in the SOI. The utilities sector comprises electric utilities and multi-utilities in the SOI.
Semiannual Report | 7
However, the Fund’s biggest underweighting, consumer staples, was also its worst
relative detractor, largely due to stock-specific weakness.9 Share prices of U.K.
food retailer Tesco fell to their lowest levels since the global financial crisis after
disappointing holiday sales and reduced profit guidance sparked a wave of broker
downgrades. Despite near-term domestic pressures, Tesco retained a dominant
position in its home markets and the company has a strong track record of global
expansion, where sales growth compounded at a healthy 14% rate. In our analy-
sis, recent pedestrian valuations underestimate Tesco’s operational leadership and
historically excellent record of maintaining shareholder returns.
The Fund’s underweighted consumer discretionary position also hurt relative
performance due to certain stocks’ weakness.10 For example, a modest posi-
tion in Australian athletic apparel manufacturer Billabong detracted after the
company reported weak operating results and lowered guidance, raising con-
cerns it could possibly breach debt covenants.5 Billabong has pursued a
strategy of owning its own retail outlets, which increased financial and operat-
ing leverage via acquisition financing and higher operating expenses. Although
Billabong’s timing was unfortunate given the uncertain economic environment,
we believe this is an astute long-term strategy that could allow the company to
gain better control of its valuable brand portfolio. The near-term picture also
improved toward the end of the reporting period as Billabong agreed to a par-
tial sale of a brand, alleviating immediate balance sheet pressures, and rebuffed
an AUD$3 per-share buyout offer from a private equity firm. Ongoing negoti-
ations with the potential suitor could help limit near-term losses, and a higher
counteroffer could act as a potential catalyst.
Although overweighting in the cyclical energy sector was beneficial, the sector
modestly detracted from relative performance, largely due to stock-specific
weakness.11 Two energy holdings finished among the Fund’s 10 biggest laggards:
Canadian integrated energy company Talisman Energy5 and Dutch oilfield
services firm SBM Offshore. Both companies reported weaker-than-expected
earnings during the period, partly due to delays in a North Sea project on which
the two firms are collaborating. For SBM Offshore, an impairment to the
balance sheet was taken for the troubled project, and we are confident the
company’s incoming management team is capable of realizing value from the
company’s diverse portfolio spanning a range of attractive global markets.
9. The consumer staples sector comprises food and staples retailing and food products in the SOI.
10. The consumer discretionary sector comprises automobiles; media; multiline retail; specialty retail; and textiles,
apparel and luxury goods in the SOI.
11. The energy sector comprises energy equipment and services; and oil, gas and consumable fuels in the SOI.
8 | Semiannual Report
Talisman has aggressively reduced costs and divested capital expenditure-
heavy projects, repositioning its assets into lower cost oil and gas shales. Based
on our analysis, Talisman’s strong management team, solid balance sheet and
what we viewed as significantly undervalued assets offer attractive return
prospects over a long-term investment horizon.
From a geographical perspective, most major regions delivered absolute gains.
Our Asian holdings outperformed the MSCI EAFE Index largely due to stock
selection and allocations in high-growth emerging markets such as South
Korea and Taiwan, which are not part of the index. European holdings mod-
estly lagged mainly due to stock-specific weakness in the U.K. and Germany
and declines in Italy and Sweden. In general, uncertainty in Europe and the
entire global economy unnerved investors even as stocks performed well in
the recent market rally.
It is important to recognize the effect of currency movements on the Fund’s per-
formance. In general, if the value of the U.S. dollar goes up compared with a
foreign currency, an investment traded in that foreign currency will go down in
value because it will be worth fewer U.S. dollars. This can have a negative effect
on Fund performance. Conversely, when the U.S. dollar weakens in relation to
a foreign currency, an investment traded in that foreign currency will increase in
value, which can contribute to Fund performance. For the six months ended
February 29, 2012, the U.S. dollar rose in value relative to most currencies. As
a result, the Fund’s performance was negatively affected by the portfolio’s
investment predominantly in securities with non-U.S. currency exposure.
Although we do not pretend to know which way markets are headed in the
future, we remain positive about the Fund. As Sir John Templeton said, “I
never ask if the market is going to go up or down, because I don’t know, and
besides it doesn’t matter. I search nation after nation for stocks, asking: ‘Where
is the one that is the lowest priced in relation to what I believe it’s worth?’”
We continue to search for high-quality companies around the world, priced at
levels far below what we believe they are ultimately worth, a situation that
gives us confidence over our long-term investment horizon.
Semiannual Report | 9
Thank you for your continued participation in Templeton Foreign Fund. We
look forward to serving your future investment needs.

The foregoing information reflects our analysis, opinions and portfolio holdings as of February 29, 2012, the end
of the reporting period. The way we implement our main investment strategies and the resulting portfolio holdings
may change depending on factors such as market and economic conditions. These opinions may not be relied upon
as investment advice or an offer for a particular security. The information is not a complete analysis of every
aspect of any market, country, industry, security or the Fund. Statements of fact are from sources considered
reliable, but the investment manager makes no representation or warranty as to their completeness or accuracy.
Although historical performance is no guarantee of future results, these insights may help you understand our
investment management philosophy.
10 | Semiannual Report
Performance Summary as of 2/29/12
Your dividend income will vary depending on dividends or interest paid by securities in the Fund’s
portfolio, adjusted for operating expenses of each class. Capital gain distributions are net profits
realized from the sale of portfolio securities. The performance table does not reflect any taxes that
a shareholder would pay on Fund dividends, capital gain distributions, if any, or any realized gains
on the sale of Fund shares. Total return reflects reinvestment of the Fund’s dividends and capital
gain distributions, if any, and any unrealized gains or losses.
Semiannual Report | 11
Performance Summary (continued)
Performance
Cumulative total return excludes sales charges. Average annual total returns and value of $10,000 investment include
maximum sales charges. Class A: 5.75% maximum initial sales charge; Class B: contingent deferred sales charge (CDSC)
declining from 4% to 1% over six years, and eliminated thereafter; Class C: 1% CDSC in first year only; Class R/Advisor
Class: no sales charges.
Performance data represent past performance, which does not guarantee future results. Investment return and principal
value will fluctuate, and you may have a gain or loss when you sell your shares. Current performance may differ from
figures shown. For most recent month-end performance, go to franklintempleton.com or call (800) 342-5236.
12 | Semiannual Report
Performance Summary (continued)
Endnotes
All investments involve risks, including possible loss of principal. Special risks are associated with foreign investing, including currency fluctua-
tions, economic instability and political developments. Investments in emerging markets involve heightened risks related to the same factors, in
addition to those associated with these markets’ smaller size and lesser liquidity. The Fund is actively managed but there is no guarantee that the
manager’s investment decisions will produce the desired results. The Fund’s prospectus also includes a description of the main investment risks.
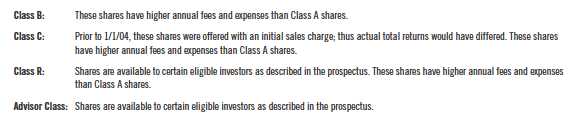
1. Cumulative total return represents the change in value of an investment over the periods indicated.
2. Average annual total return represents the average annual change in value of an investment over the periods indicated. Six-month return has not
been annualized.
3. These figures represent the value of a hypothetical $10,000 investment in the Fund over the periods indicated.
4. In accordance with SEC rules, we provide standardized average annual total return information through the latest calendar quarter.
5. Figures are as stated in the Fund’s prospectus current as of the date of this report. In periods of market volatility, assets may decline significantly,
causing total annual Fund operating expenses to become higher than the figures shown.
Semiannual Report | 13
Your Fund’s Expenses
As a Fund shareholder, you can incur two types of costs:
- Transaction costs, including sales charges (loads) on Fund purchases; and
- Ongoing Fund costs, including management fees, distribution and service (12b-1) fees, and other Fund expenses. All mutual funds have ongoing costs, sometimes referred to as operating expenses.
The following table shows ongoing costs of investing in the Fund and can help you understand these costs and compare them with those of other mutual funds. The table assumes a $1,000 investment held for the six months indicated.
Actual Fund Expenses
The first line (Actual) for each share class listed in the table provides actual account values and expenses. The “Ending Account Value” is derived from the Fund’s actual return, which includes the effect of Fund expenses.
You can estimate the expenses you paid during the period by following these steps. Of course, your account value and expenses will differ from those in this illustration:
| 1. | Divide your account value by $1,000. |
| | If an account had an $8,600 value, then $8,600 ÷ $1,000 = 8.6. |
| 2. | Multiply the result by the number under the heading “Expenses Paid During Period.” |
| | If Expenses Paid During Period were $7.50, then 8.6 x $7.50 = $64.50. |
In this illustration, the estimated expenses paid this period are $64.50.
Hypothetical Example for Comparison with Other Funds
Information in the second line (Hypothetical) for each class in the table can help you compare ongoing costs of investing in the Fund with those of other mutual funds. This information may not be used to estimate the actual ending account balance or expenses you paid during the period. The hypothetical “Ending Account Value” is based on the actual expense ratio for each class and an assumed 5% annual rate of return before expenses, which does not represent the Fund’s actual return. The figure under the heading “Expenses Paid During Period” shows the hypothetical expenses your account would have incurred under this scenario. You can compare this figure with the 5% hypothetical examples that appear in shareholder reports of other funds.
14 | Semiannual Report
Your Fund’s Expenses (continued)
Please note that expenses shown in the table are meant to highlight ongoing costs and do not reflect
any transaction costs, such as sales charges. Therefore, the second line for each class is useful in
comparing ongoing costs only, and will not help you compare total costs of owning different funds.
In addition, if transaction costs were included, your total costs would have been higher. Please refer
to the Fund prospectus for additional information on operating expenses.
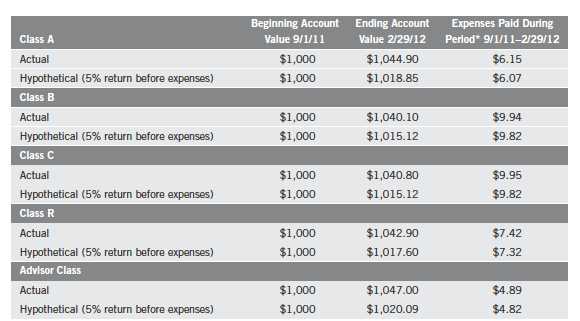
*Expenses are calculated using the most recent six-month expense ratio, annualized for each class (A: 1.21%; B: 1.96%; C: 1.96%; R: 1.46%; and
Advisor: 0.96%), multiplied by the average account value over the period, multiplied by 182/366 to reflect the one-half year period.
Semiannual Report | 15
Templeton Foreign Fund
Financial Highlights

aThe amount shown for a share outstanding throughout the period may not correlate with the Statement of Operations for the period due to the timing of sales and repurchases of
the Fund shares in relation to income earned and/or fluctuating market value of the investments of the Fund.
bBased on average daily shares outstanding.
cEffective September 1, 2008, the redemption fee was eliminated.
dAmount rounds to less than $0.01 per share.
eTotal return does not reflect sales commissions or contingent deferred sales charges, if applicable, and is not annualized for periods less than one year.
fRatios are annualized for periods less than one year.
gBenefit of expense reduction and reimbursement rounds to less than 0.01%.
hExcludes the value of portfolio securities delivered as a result of redemptions in-kind.
16 | The accompanying notes are an integral part of these financial statements. | Semiannual Report
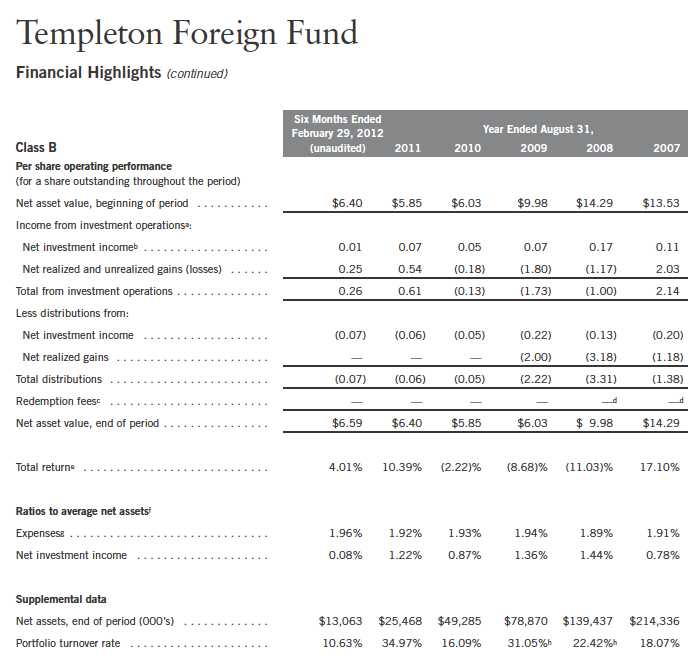
aThe amount shown for a share outstanding throughout the period may not correlate with the Statement of Operations for the period due to the timing of sales and repurchases of
the Fund shares in relation to income earned and/or fluctuating market value of the investments of the Fund.
bBased on average daily shares outstanding.
cEffective September 1, 2008, the redemption fee was eliminated.
dAmount rounds to less than $0.01 per share.
eTotal return does not reflect sales commissions or contingent deferred sales charges, if applicable, and is not annualized for periods less than one year.
fRatios are annualized for periods less than one year.
gBenefit of expense reduction and reimbursement rounds to less than 0.01%.
hExcludes the value of portfolio securities delivered as a result of redemptions in-kind.
Semiannual Report | The accompanying notes are an integral part of these financial statements. | 17
Templeton Foreign Fund
Financial Highlights (continued)
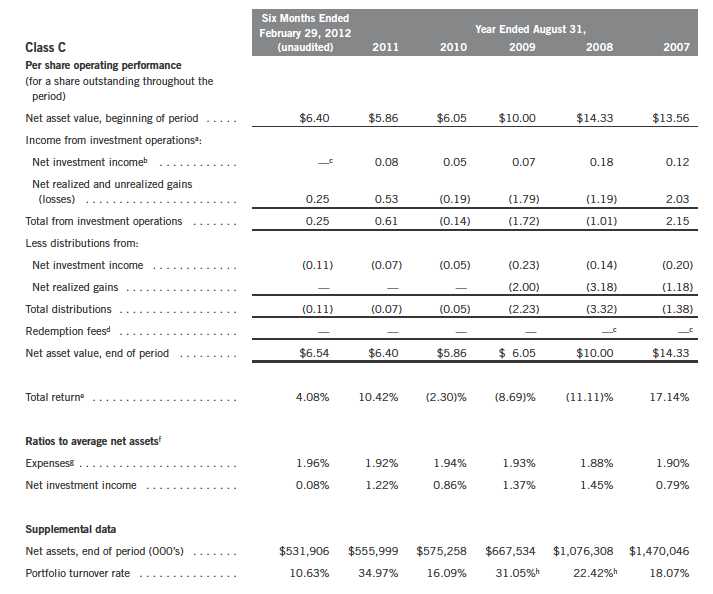
aThe amount shown for a share outstanding throughout the period may not correlate with the Statement of Operations for the period due to the timing of sales and repurchases of
the Fund shares in relation to income earned and/or fluctuating market value of the investments of the Fund.
bBased on average daily shares outstanding.
cAmount rounds to less than $0.01 per share.
dEffective September 1, 2008, the redemption fee was eliminated.
eTotal return does not reflect sales commissions or contingent deferred sales charges, if applicable, and is not annualized for periods less than one year.
fRatios are annualized for periods less than one year.
gBenefit of expense reduction and reimbursement rounds to less than 0.01%.
hExcludes the value of portfolio securities delivered as a result of redemptions in-kind.
18 | The accompanying notes are an integral part of these financial statements. | Semiannual Report
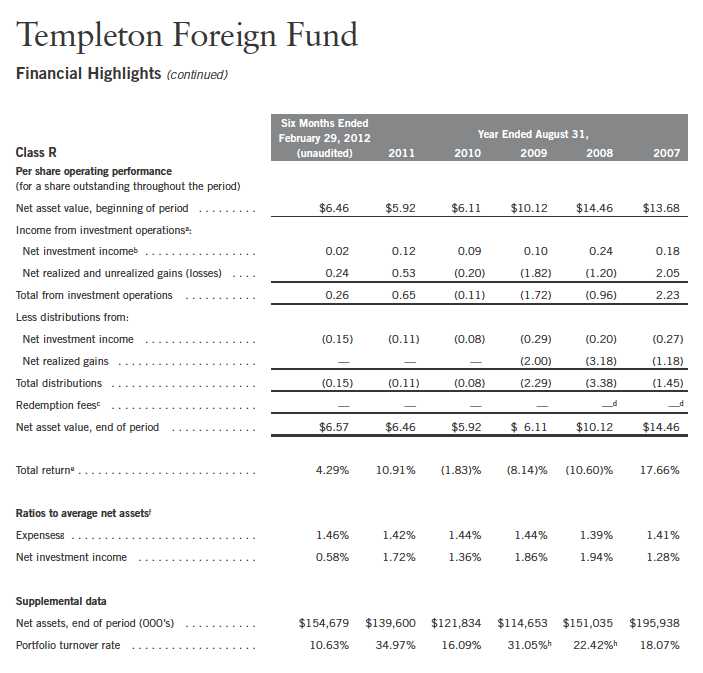
aThe amount shown for a share outstanding throughout the period may not correlate with the Statement of Operations for the period due to the timing of sales and repurchases of
the Fund shares in relation to income earned and/or fluctuating market value of the investments of the Fund.
bBased on average daily shares outstanding.
cEffective September 1, 2008, the redemption fee was eliminated.
dAmount rounds to less than $0.01 per share.
eTotal return does not reflect sales commissions or contingent deferred sales charges, if applicable, and is not annualized for periods less than one year.
fRatios are annualized for periods less than one year.
gBenefit of expense reduction and reimbursement rounds to less than 0.01%.
hExcludes the value of portfolio securities delivered as a result of redemptions in-kind.
Semiannual Report | The accompanying notes are an integral part of these financial statements. | 19
Templeton Foreign Fund
Financial Highlights (continued)

aThe amount shown for a share outstanding throughout the period may not correlate with the Statement of Operations for the period due to the timing of sales and repurchases of
the Fund shares in relation to income earned and/or fluctuating market value of the investments of the Fund.
bBased on average daily shares outstanding.
cEffective September 1, 2008, the redemption fee was eliminated.
dAmount rounds to less than $0.01 per share.
eTotal return is not annualized for periods less than one year.
fRatios are annualized for periods less than one year.
gBenefit of expense reduction and reimbursement rounds to less than 0.01%.
hExcludes the value of portfolio securities delivered as a result of redemptions in-kind.
20 | The accompanying notes are an integral part of these financial statements. | Semiannual Report
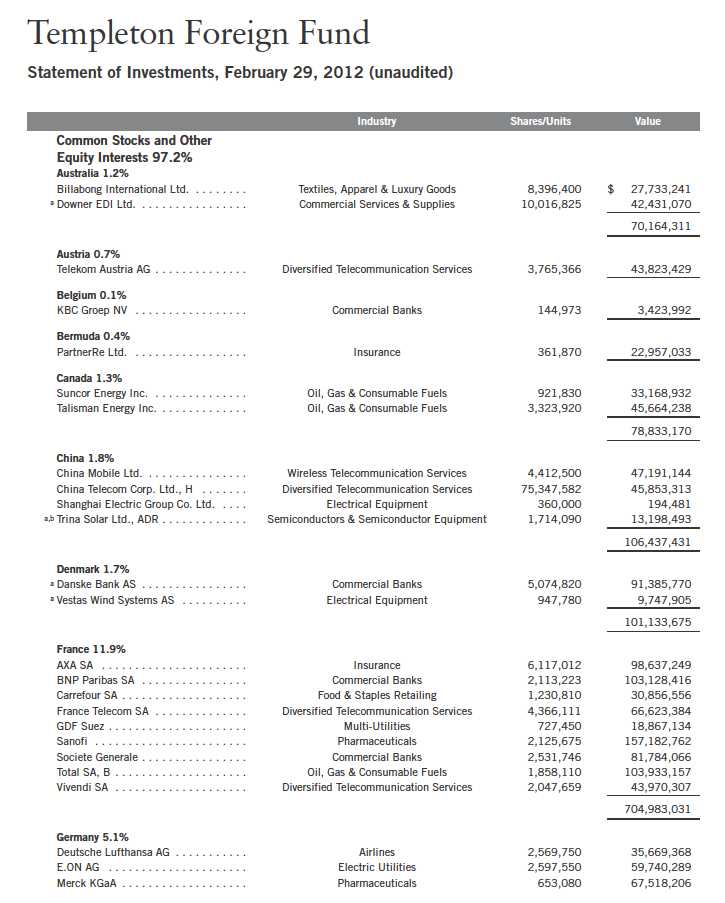
Semiannual Report | 21
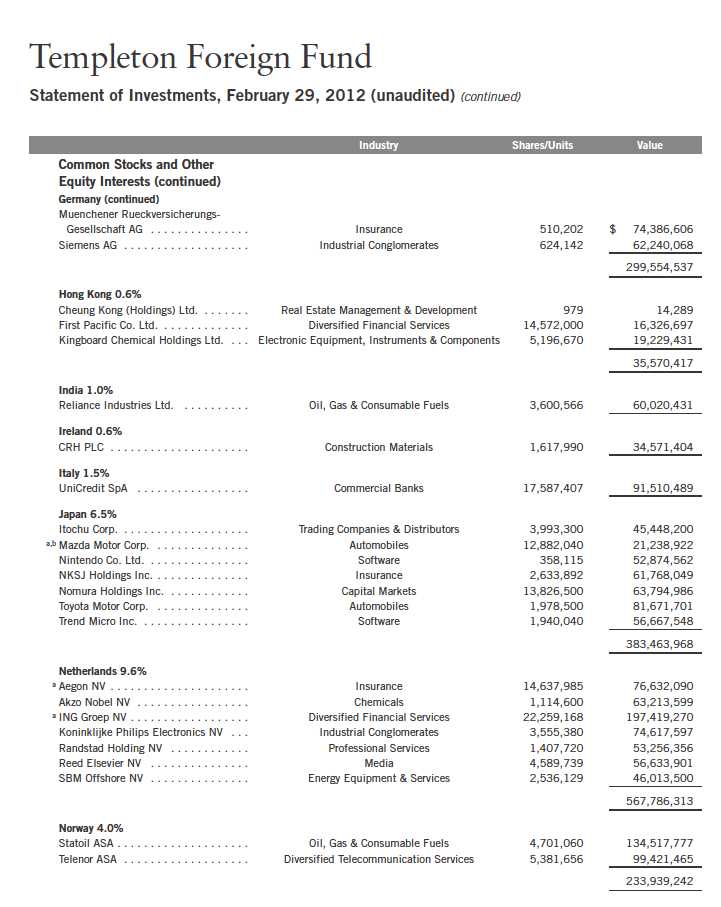
22 | Semiannual Report
Templeton Foreign Fund
Statement of Investments, February 29, 2012 (unaudited) (continued)
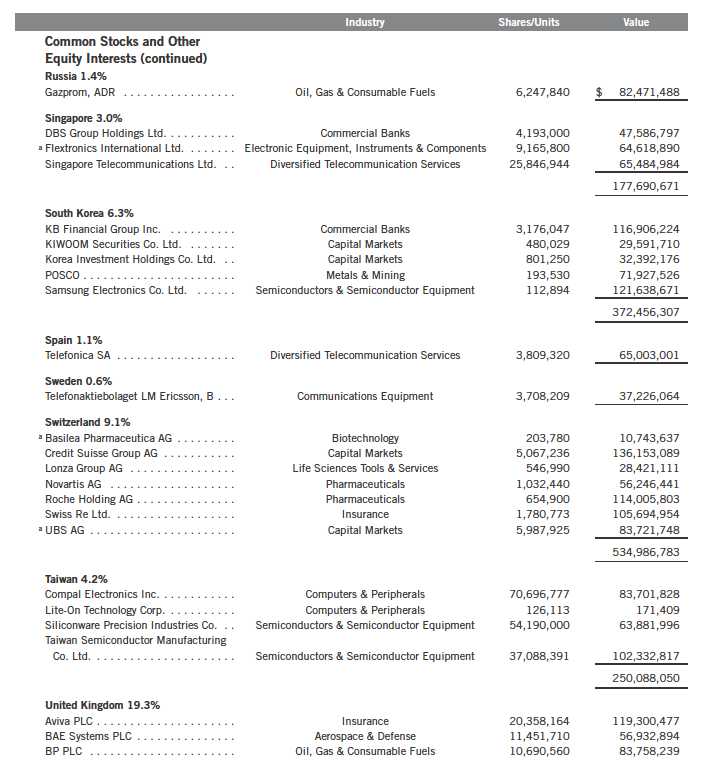
Semiannual Report | 23
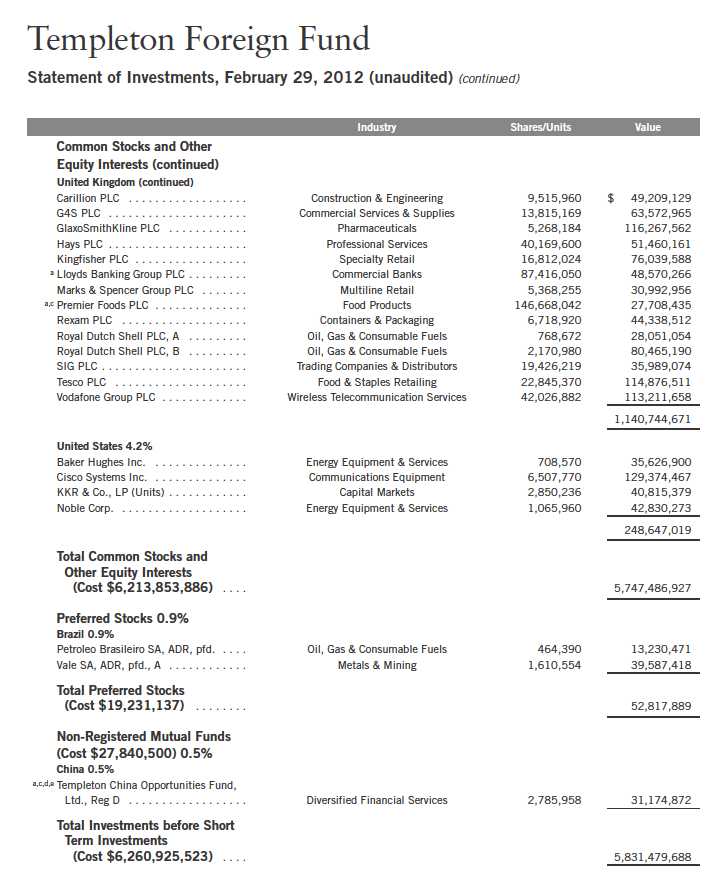
24 | Semiannual Report
Templeton Foreign Fund
Statement of Investments, February 29, 2012 (unaudited) (continued)
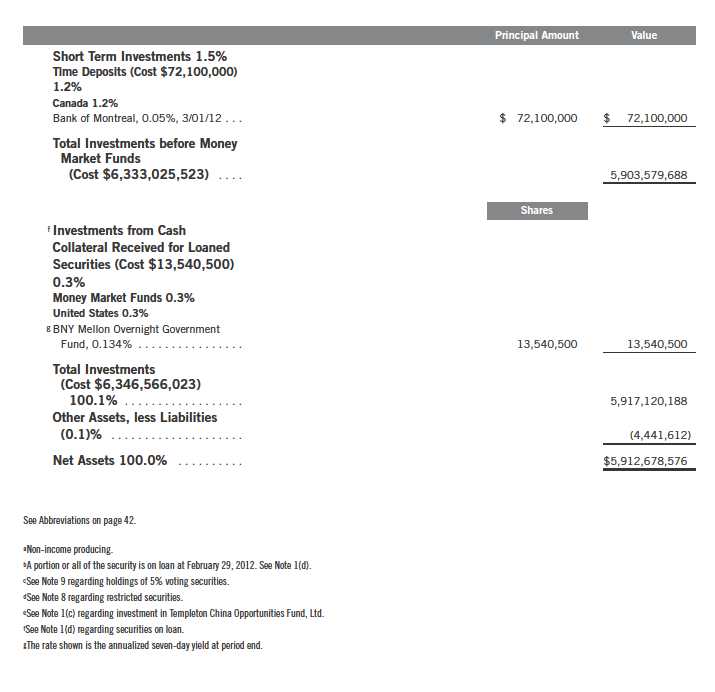
Semiannual Report | The accompanying notes are an integral part of these financial statements. | 25
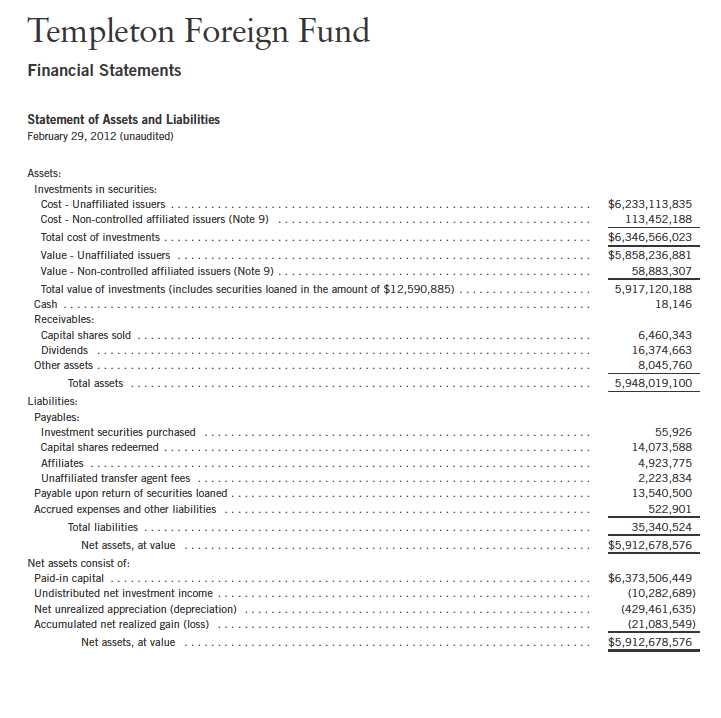
26 | The accompanying notes are an integral part of these financial statements. | Semiannual Report
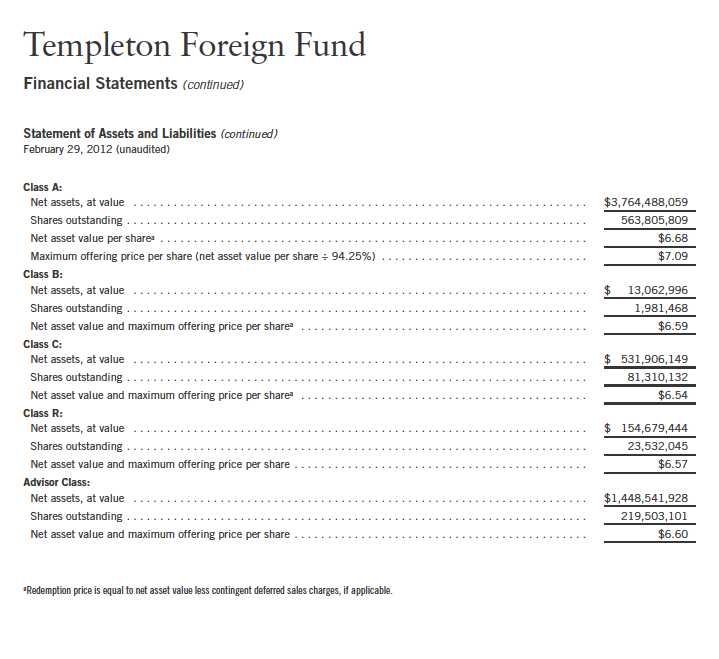
Semiannual Report | The accompanying notes are an integral part of these financial statements. | 27
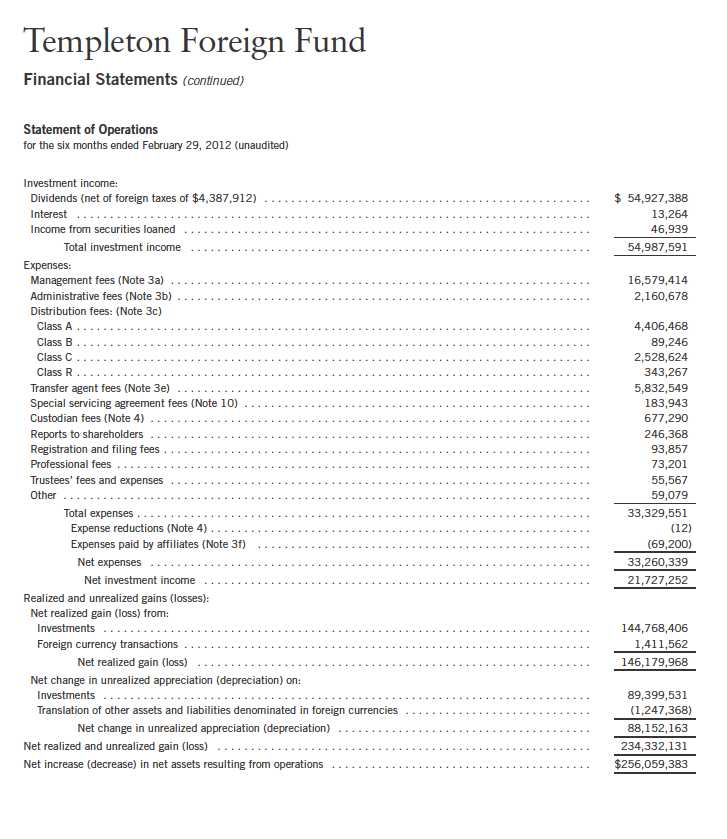
28 | The accompanying notes are an integral part of these financial statements. | Semiannual Report
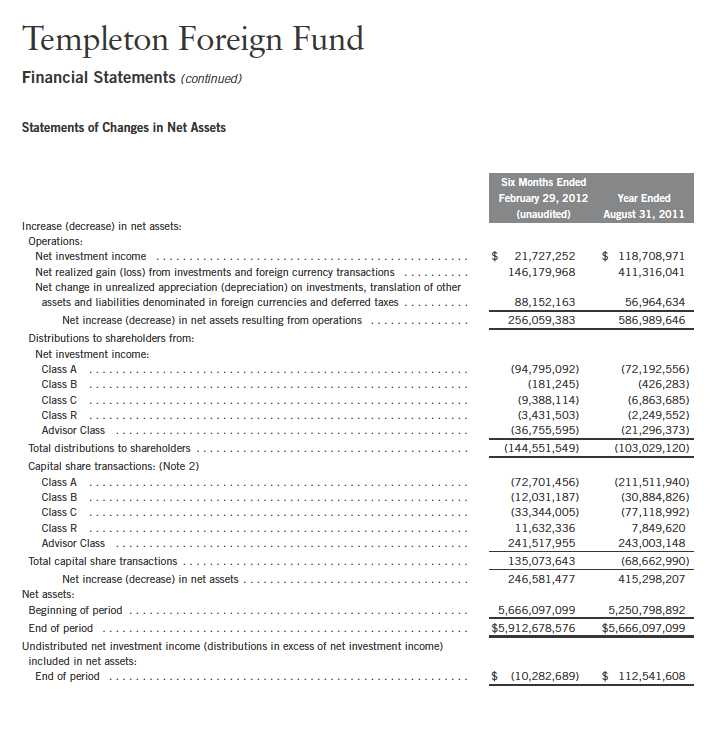
Semiannual Report | The accompanying notes are an integral part of these financial statements. | 29
Templeton Foreign Fund
Notes to Financial Statements (unaudited)
1. ORGANIZATION AND SIGNIFICANT ACCOUNTING POLICIES
Templeton Funds (Trust) is registered under the Investment Company Act of 1940, as amended, (1940 Act) as an open-end investment company, consisting of two separate funds. The Templeton Foreign Fund (Fund) is included in this report. The financial statements of the remaining fund in the Trust are presented separately. The Fund offers five classes of shares: Class A, Class B, Class C, Class R, and Advisor Class. Each class of shares differs by its initial sales load, contingent deferred sales charges, distribution fees, voting rights on matters affecting a single class and its exchange privilege.
The following summarizes the Fund’s significant accounting policies.
a. Financial Instrument Valuation
The Fund’s investments in securities and other financial instruments are carried at fair value daily. Fair value is the price that would be received to sell an asset or paid to transfer a liability in an orderly transaction between market participants on the measurement date. Under procedures approved by the Trust’s Board of Trustees, the Fund may utilize independent pricing services, quotations from securities and financial instrument dealers, and other market sources to determine fair value.
Equity securities listed on an exchange or on the NASDAQ National Market System are valued at the last quoted sale price or the official closing price of the day, respectively. Foreign equity securities are valued as of the close of trading on the foreign stock exchange on which the security is primarily traded, or the NYSE, whichever is earlier. The value is then converted into its U.S. dollar equivalent at the foreign exchange rate in effect at the close of the NYSE on the day that the value of the security is determined. Over-the-counter securities are valued within the range of the most recent quoted bid and ask prices. Securities that trade in multiple markets or on multiple exchanges are valued according to the broadest and most representative market. Certain equity securities are valued based upon fundamental characteristics or relationships to similar securities.
Debt securities generally trade in the over-the-counter market rather than on a securities exchange. The Fund’s pricing services use multiple valuation techniques to determine fair value. In instances where sufficient market activity exists, the pricing services may utilize a market-based approach through which quotes from market makers are used to determine fair value. In instances where sufficient market activity may not exist or is limited, the pricing services also utilize proprietary valuation models which may consider market characteristics such as benchmark yield curves, option-adjusted spreads, credit spreads, estimated default rates, coupon rates, anticipated timing of principal repayments, underlying collateral, and other unique security features in order to estimate the relevant cash flows, which are then discounted to calculate the fair value. Securities denominated in a foreign currency are converted into their U.S. dollar equivalent at the foreign exchange rate in effect at the close of the NYSE on the date that the values of the foreign debt securities are determined. Time deposits are valued at cost, which approximates market value.
30 | Semiannual Report
Templeton Foreign Fund
Notes to Financial Statements (unaudited) (continued)
| 1. | ORGANIZATION AND SIGNIFICANT ACCOUNTING POLICIES (continued) |
| a. | Financial Instrument Valuation (continued) |
The Fund has procedures to determine the fair value of securities and other financial instruments for which market prices are not readily available or which may not be reliably priced. Under these procedures, the Fund primarily employs a market-based approach which may use related or comparable assets or liabilities, recent transactions, market multiples, book values, and other relevant information for the investment to determine the fair value of the investment. The Fund may also use an income-based valuation approach in which the anticipated future cash flows of the investment are discounted to calculate fair value. Discounts may also be applied due to the nature or duration of any restrictions on the disposition of the investments. Due to the inherent uncertainty of valuations of such investments, the fair values may differ significantly from the values that would have been used had an active market existed.
Trading in securities on foreign securities stock exchanges and over-the-counter markets may be completed before the daily close of business on the NYSE. Occasionally, events occur between the time at which trading in a foreign security is completed and the close of the NYSE that might call into question the reliability of the value of a portfolio security held by the Fund. As a result, differences may arise between the value of the Fund’s portfolio securities as determined at the foreign market close and the latest indications of value at the close of the NYSE. In order to minimize the potential for these differences, the investment manager monitors price movements following the close of trading in foreign stock markets through a series of country specific market proxies (such as baskets of American Depositary Receipts, futures contracts and exchange traded funds). These price movements are measured against established trigger thresholds for each specific market proxy to assist in determining if an event has occurred that may call into question the reliability of the values of the foreign securities held by the Fund. If such an event occurs, the securities may be valued using fair value procedures, which may include the use of independent pricing services.
b. Foreign Currency Translation
Portfolio securities and other assets and liabilities denominated in foreign currencies are translated into U.S. dollars based on the exchange rate of such currencies against U.S. dollars on the date of valuation. The Fund may enter into foreign currency exchange contracts to facilitate transactions denominated in a foreign currency. Purchases and sales of securities, income and expense items denominated in foreign currencies are translated into U.S. dollars at the exchange rate in effect on the transaction date. Portfolio securities and assets and liabilities denominated in foreign currencies contain risks that those currencies will decline in value relative to the U.S. dollar. Occasionally, events may impact the availability or reliability of foreign exchange rates used to convert the U.S. dollar equivalent value. If such an event occurs, the foreign exchange rate will be valued at fair value using procedures established and approved by the Trust’s Board of Trustees.
Semiannual Report | 31
Templeton Foreign Fund
Notes to Financial Statements (unaudited) (continued)
| 1. | ORGANIZATION AND SIGNIFICANT ACCOUNTING POLICIES (continued) |
| b. | Foreign Currency Translation (continued) |
The Funds do not separately report the effect of changes in foreign exchange rates from changes in market prices on securities held. Such changes are included in net realized and unrealized gain or loss from investments on the Statement of Operations.
Realized foreign exchange gains or losses arise from sales of foreign currencies, currency gains or losses realized between the trade and settlement dates on securities transactions and the difference between the recorded amounts of dividends, interest, and foreign withholding taxes and the U.S. dollar equivalent of the amounts actually received or paid. Net unrealized foreign exchange gains and losses arise from changes in foreign exchange rates on foreign denominated assets and liabilities other than investments in securities held at the end of the reporting period.
c. Investment in Templeton China Opportunities Fund, Ltd.
The Fund invests in Templeton China Opportunities Fund, Ltd. (China Fund), a private offering of unregistered shares in a Cayman Islands Exempt Company. The China Fund investment objective is to seek capital growth primarily through investments in A-shares of Chinese companies listed on the Shanghai and Shenzhen stock exchanges. Chinese A-shares are traded in Chinese Renminbi and are only available as an investment to domestic (Chinese) investors and holders of a Qualified Foreign Institutional Investors license. The China Fund is managed by Templeton Investment Counsel, LLC (an affiliate of the investment manager). No additional management or administrative fees are incurred on assets invested in the China Fund.
The China Fund may be subject to certain restrictions and administrative processes relating to its ability to repatriate cash balances, investment proceeds and earnings associated with its investment, as such activities are subject to approval by agencies of the Chinese government and thus the Fund may incur delays in redeeming its investment in the China Fund. The Fund’s investment in the China Fund is valued based upon the fair value of the China Fund’s portfolio securities and other assets and liabilities.
d. Securities Lending
The Fund participates in an agency based securities lending program. The Fund receives cash collateral against the loaned securities in an amount equal to at least 102% of the market value of the loaned securities. Collateral is maintained over the life of the loan in an amount not less than 100% of the market value of loaned securities, as determined at the close of fund business each day; any additional collateral required due to changes in security values is delivered to the
32 | Semiannual Report
Templeton Foreign Fund
Notes to Financial Statements (unaudited) (continued)
| 1. | ORGANIZATION AND SIGNIFICANT ACCOUNTING POLICIES (continued) |
| d. | Securities Lending (continued) |
Fund on the next business day. The collateral is invested in a non-registered money fund as indicated on the Statement of Investments. The Fund receives income from the investment of cash collateral, in addition to lending fees and rebates paid by the borrower. The Fund bears the market risk with respect to the collateral investment, securities loaned, and the risk that the agent may default on its obligations to the Fund. The securities lending agent has agreed to indemnify the Fund in the event of default by a third party borrower.
e. Income Taxes
It is the Fund’s policy to qualify as a regulated investment company under the Internal Revenue Code. The Fund intends to distribute to shareholders substantially all of its taxable income and net realized gains to relieve it from federal income and excise taxes. As a result, no provision for U.S. federal income taxes is required.
The Fund may be subject to foreign taxation related to income received, capital gains on the sale of securities and certain foreign currency transactions in the foreign jurisdictions in which it invests. Foreign taxes, if any, are recorded based on the tax regulations and rates that exist in the foreign markets in which the Fund invests. When a capital gain tax is determined to apply the Fund records an estimated deferred tax liability in an amount that would be payable if the securities were disposed of on the valuation date.
The Fund recognizes the tax benefits of uncertain tax positions only when the position is “more likely than not” to be sustained upon examination by the tax authorities based on the technical merits of the tax position. As of February 29, 2012, and for all open tax years, the Fund has determined that no liability for unrecognized tax benefits is required in the Fund’s financial statements related to uncertain tax positions taken on a tax return (or expected to be taken on future tax returns). Open tax years are those that remain subject to examination and are based on each tax jurisdiction statute of limitation.
f. Security Transactions, Investment Income, Expenses and Distributions
Security transactions are accounted for on trade date. Realized gains and losses on security transactions are determined on a specific identification basis. Interest income and estimated expenses are accrued daily. Amortization of premium and accretion of discount on debt securities are included in interest income. Dividend income is recorded on the ex-dividend date except that certain dividends from foreign securities are recognized as soon as the Fund is notified of
Semiannual Report | 33
Templeton Foreign Fund
Notes to Financial Statements (unaudited) (continued)
| 1. | ORGANIZATION AND SIGNIFICANT ACCOUNTING POLICIES (continued) |
| f. | Security Transactions, Investment Income, Expenses and Distributions (continued) |
the ex-dividend date. Distributions to shareholders are recorded on the ex-dividend date and are determined according to income tax regulations (tax basis). Distributable earnings determined on a tax basis may differ from earnings recorded in accordance with accounting principles generally accepted in the United States of America. These differences may be permanent or temporary. Permanent differences are reclassified among capital accounts to reflect their tax character. These reclassifications have no impact on net assets or the results of operations. Temporary differences are not reclassified, as they may reverse in subsequent periods.
Common expenses incurred by the Trust are allocated among the funds based on the ratio of net assets of each fund to the combined net assets of the Trust. Fund specific expenses are charged directly to the fund that incurred the expense.
Realized and unrealized gains and losses and net investment income, not including class specific expenses, are allocated daily to each class of shares based upon the relative proportion of net assets of each class. Differences in per share distributions, by class, are generally due to differences in class specific expenses.
g. Accounting Estimates
The preparation of financial statements in accordance with accounting principles generally accepted in the United States of America requires management to make estimates and assumptions that affect the reported amounts of assets and liabilities at the date of the financial statements and the amounts of income and expenses during the reporting period. Actual results could differ from those estimates.
h. Guarantees and Indemnifications
Under the Trust’s organizational documents, its officers and trustees are indemnified by the Trust against certain liabilities arising out of the performance of their duties to the Trust. Additionally, in the normal course of business, the Trust, on behalf of the Fund, enters into contracts with service providers that contain general indemnification clauses. The Trust’s maximum exposure under these arrangements is unknown as this would involve future claims that may be made against the Trust that have not yet occurred. Currently, the Trust expects the risk of loss to be remote.
34 | Semiannual Report
Templeton Foreign Fund
Notes to Financial Statements (unaudited) (continued)
2. SHARES OF BENEFICIAL INTEREST
At February 29, 2012, there were an unlimited number of shares authorized (without par value).
Transactions in the Fund’s shares were as follows:
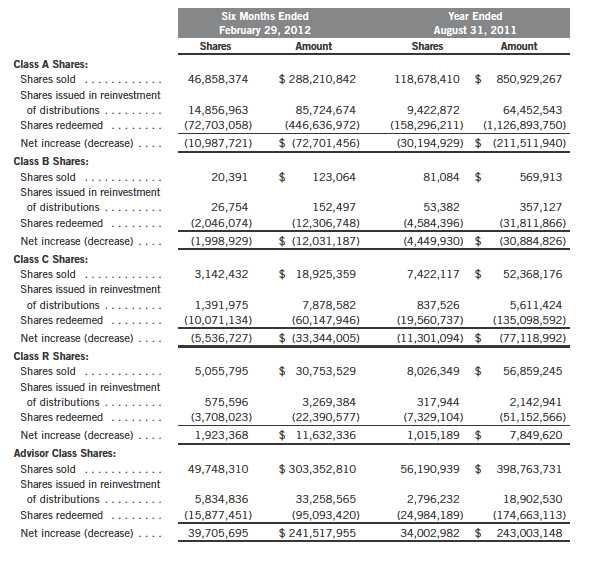
Semiannual Report | 35
Templeton Foreign Fund
Notes to Financial Statements (unaudited) (continued)
3. TRANSACTIONS WITH AFFILIATES
Franklin Resources, Inc. is the holding company for various subsidiaries that together are referred
to as Franklin Templeton Investments. Certain officers and trustees of the Trust are also officers
and/or directors of the following subsidiaries:

c. Distribution Fees
The Trust’s Board of Trustees has adopted distribution plans for each share class, with the
exception of Advisor Class shares, pursuant to Rule 12b-1 under the 1940 Act. Under the Fund’s
Class A reimbursement distribution plan, the Fund reimburses Distributors for costs incurred
in connection with the servicing, sale and distribution of the Fund’s shares up to the maximum
annual plan rate. Under the Class A reimbursement distribution plan, costs exceeding the maxi-
mum for the current plan year cannot be reimbursed in subsequent periods.
36 | Semiannual Report
Templeton Foreign Fund
Notes to Financial Statements (unaudited) (continued)
| 3. | TRANSACTIONS WITH AFFILIATES (continued) |
| c. | Distribution Fees (continued) |
In addition, under the Fund’s Class B, C, and R compensation distribution plans, the Fund pays
Distributors for costs incurred in connection with the servicing, sale and distribution of the Fund’s
shares up to the maximum annual plan rate for each class.
The maximum annual plan rates, based on the average daily net assets, for each class, are as follows:
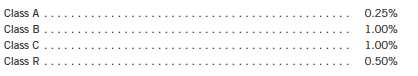
d. Sales Charges/Underwriting Agreements
Front-end sales charges and contingent deferred sales charges (CDSC) do not represent expenses
of the Fund. These charges are deducted from the proceeds of sales of Fund shares prior to
investment or from redemption proceeds prior to remittance, as applicable. Distributors has
advised the Fund of the following commission transactions related to the sales and redemptions
of the Fund’s shares for the period:
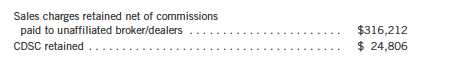
e. Transfer Agent Fees
For the period ended February 29, 2012, the Fund paid transfer agent fees of $5,832,549, of
which $2,718,979 was retained by Investor Services.
f. Expense Reimbursements
During the period ended February 29, 2012, an affiliate of the investment manager reimbursed
the Fund $69,200 as noted in the Statement of Operations. The reimbursement represents a por-
tion of the excise tax expense incurred in the prior fiscal year.
4. EXPENSE OFFSET ARRANGEMENT
The Fund has entered into an arrangement with its custodian whereby credits realized as a result
of uninvested cash balances are used to reduce a portion of the Fund’s custodian expenses. During
the period ended February 29, 2012, the custodian fees were reduced as noted in the Statement
of Operations.
Semiannual Report | 37
Templeton Foreign Fund
Notes to Financial Statements (unaudited) (continued)
5. INCOME TAXES
For tax purposes, capital losses may be carried over to offset future capital gains, if any. At August 31, 2011, the Fund had capital loss carryforwards of $163,629,012 expiring in 2018. During the year ended August 31, 2011, the Fund utilized $425,232,441 of capital loss carryforwards.
Under the Regulated Investment Company Modernization Act of 2010, the Fund will be permitted to carry forward capital losses incurred in taxable years beginning after December 22, 2010 for an unlimited period. Post-enactment capital loss carryforwards will retain their character as either short-term or long-term capital losses rather than being considered short-term as under previous law. Any post-enactment capital losses generated will be required to be utilized prior to the losses incurred in pre-enactment tax years.
At February 29, 2012, the cost of investments and net unrealized appreciation (depreciation) for income tax purposes were as follows:
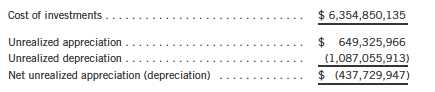
Differences between income and/or capital gains as determined on a book basis and a tax basis are primarily due to differing treatments of foreign currency transactions, pass-through entity income and regulatory settlements.
6. INVESTMENT TRANSACTIONS
Purchases and sales of investments (excluding short term securities) for the period ended February 29, 2012, aggregated $614,152,319 and $576,215,828, respectively.
7. CONCENTRATION OF RISK
Investing in foreign securities may include certain risks and considerations not typically associated with investing in U.S. securities, such as fluctuating currency values and changing local and regional economic, political and social conditions, which may result in greater market volatility. In addition, certain foreign securities may not be as liquid as U.S. securities.
8. RESTRICTED SECURITIES
The Fund invests in securities that are restricted under the Securities Act of 1933 (1933 Act) or which are subject to legal, contractual, or other agreed upon restrictions on resale. Restricted securities are often purchased in private placement transactions, and cannot be sold without
38 | Semiannual Report
Templeton Foreign Fund
Notes to Financial Statements (unaudited) (continued)
8. RESTRICTED SECURITIES (continued)
prior registration unless the sale is pursuant to an exemption under the 1933 Act. Disposal of
these securities may require greater effort and expense, and prompt sale at an acceptable price
may be difficult. The Fund may have registration rights for restricted securities. The issuer gen-
erally incurs all registration costs.

10. SPECIAL SERVICING AGREEMENT
The Fund, which is an eligible underlying investment of one or more of the Franklin Templeton
Fund Allocator Series Funds (Allocator Funds), participates in a Special Servicing Agreement (SSA)
with the Allocator Funds and certain service providers of the Fund and the Allocator Funds.
Under the SSA, the Fund may pay a portion of the Allocator Funds’ expenses (other than any
asset allocation, administrative, and distribution fees) to the extent such payments are less than
the amount of the benefits realized or expected to be realized by the Fund (e.g., due to reduced
costs associated with servicing accounts) from the investment in the Fund by the Allocator Funds.
The Allocator Funds are either managed by Franklin Advisers, Inc. or administered by FT Services,
affiliates of TGAL. For the period ended February 29, 2012, the Fund was held by one or more
of the Allocator Funds and the amount of expenses borne by the Fund is noted in the Statement
of Operations. At February 29, 2012, 4.25% of the Fund’s outstanding shares was held by one
or more of the Allocator Funds.
Semiannual Report | 39
Templeton Foreign Fund
Notes to Financial Statements (unaudited) (continued)
11. CREDIT FACILITY
The Fund, together with other U.S. registered and foreign investment funds (collectively, Borrowers), managed by Franklin Templeton Investments, are borrowers in a joint syndicated senior unsecured credit facility totaling $1.5 billion (Global Credit Facility) which matures on January 18, 2013. This Global Credit Facility provides a source of funds to the Borrowers for temporary and emergency purposes, including the ability to meet future unanticipated or unusually large redemption requests.
Under the terms of the Global Credit Facility, the Fund shall, in addition to interest charged on any borrowings made by the Fund and other costs incurred by the Fund, pay its share of fees and expenses incurred in connection with the implementation and maintenance of the Global Credit Facility, based upon its relative share of the aggregate net assets of all of the Borrowers, including an annual commitment fee of 0.08% based upon the unused portion of the Global Credit Facility, which is reflected in other expenses on the Statement of Operations. During the period ended February 29, 2012, the Fund did not use the Global Credit Facility.
12. FAIR VALUE MEASUREMENTS
The Fund follows a fair value hierarchy that distinguishes between market data obtained from independent sources (observable inputs) and the Fund’s own market assumptions (unobservable inputs). These inputs are used in determining the value of the Fund’s investments and are summarized in the following fair value hierarchy:
- Level 1 – quoted prices in active markets for identical securities
- Level 2 – other significant observable inputs (including quoted prices for similar securities, interest rates, prepayment speed, credit risk, etc.)
- Level 3 – significant unobservable inputs (including the Fund’s own assumptions in deter- mining the fair value of investments)
The inputs or methodology used for valuing securities are not an indication of the risk associated with investing in those securities.
For movements between the levels within the fair value hierarchy, the Fund has adopted a policy of recognizing the transfers as of the date of the underlying event which caused the movement.
40 | Semiannual Report
Templeton Foreign Fund
Notes to Financial Statements (unaudited) (continued)
12. FAIR VALUE MEASUREMENTS (continued)
The following is a summary of the inputs used as of February 29, 2012, in valuing the Fund’s assets carried at fair value:
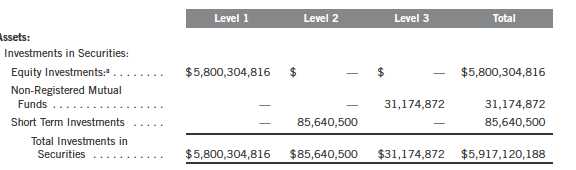
aIncludes common and preferred stocks as well as other equity investments. For detailed categories, see the accompanying Statement of Investments.
At February 29, 2012, the reconciliation of assets in which significant unobservable inputs (Level 3) were used in determining fair value, is as follows:
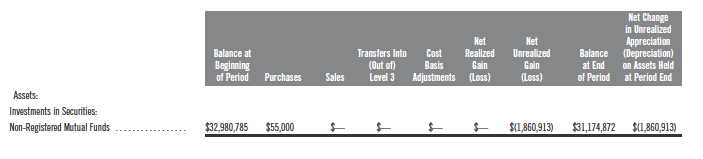
13. NEW ACCOUNTING PRONOUNCEMENTS
In May 2011, the Financial Accounting Standards Board (FASB) issued Accounting Standards Update (ASU) No. 2011-04, Fair Value Measurement (Topic 820): Amendments to Achieve Common Fair Value Measurement and Disclosure Requirements in U.S. GAAP and IFRSs. The amendments in the ASU will improve the comparability of fair value measurements presented and disclosed in financial statements prepared in accordance with U.S. GAAP (Generally Accepted Accounting Principles) and IFRS (International Financial Reporting Standards) and include new guidance for certain fair value measurement principles and disclosure requirements. The ASU is effective for interim and annual periods beginning after December 15, 2011. The Fund believes the adoption of this ASU will not have a material impact on its financial statements.
Semiannual Report | 41
Templeton Foreign Fund
Notes to Financial Statements (unaudited) (continued)
14. SUBSEQUENT EVENTS
The Fund has evaluated subsequent events through the issuance of the financial statements and
determined that no events have occurred that require disclosure.
ABBREVIATIONS
Selected Portfolio
ADR - American Depositary Receipt
42 | Semiannual Report
Templeton Foreign Fund
Shareholder Information
Proxy Voting Policies and Procedures
The Fund’s investment manager has established Proxy Voting Policies and Procedures (Policies) that the Fund uses to determine how to vote proxies relating to portfolio securities. Shareholders may view the Fund’s complete Policies online at franklintempleton.com. Alternatively, shareholders may request copies of the Policies free of charge by calling the Proxy Group collect at (954) 527-7678 or by sending a written request to: Franklin Templeton Companies, LLC, 300 S.E. 2nd Street, Fort Lauderdale, FL 33301, Attention: Proxy Group. Copies of the Fund’s proxy voting records are also made available online at franklintempleton.com and posted on the U.S. Securities and Exchange Commission’s website at sec.gov and reflect the most recent 12-month period ended June 30.
Quarterly Statement of Investments
The Fund files a complete statement of investments with the U.S. Securities and Exchange Commission for the first and third quarters for each fiscal year on Form N-Q. Shareholders may view the filed Form N-Q by visiting the Commission’s website at sec.gov. The filed form may also be viewed and copied at the Commission’s Public Reference Room in Washington, DC. Information regarding the operations of the Public Reference Room may be obtained by calling (800) SEC-0330.
Semiannual Report | 43
This page intentionally left blank.
Item 2. Code of Ethics.
| (a) | The Registrant has adopted a code of ethics that applies to its principal executive officers and principal financial and accounting officer. |
| (c) | N/A |
| (d) | N/A |
| (f) | Pursuant to Item 12(a)(1), the Registrant is attaching as an exhibit a copy of its code of ethics that applies to its principal executive officers and principal financial and accounting officer. |
Item 3. Audit Committee Financial Expert.
(a)(1) The Registrant has an audit committee financial expert serving on its audit committee.
(2) The audit committee financial expert is David W. Niemiec and he is "independent" as defined under the relevant Securities and Exchange Commission Rules and Releases.

Item 6. Schedule of Investments. N/A
Item 7. Disclosure of Proxy Voting Policies and Procedures for Closed-End Management Investment Companies. N/A
Item 8. Portfolio Managers of Closed-End Management Investment Companies. N/A
Item 9. Purchases of Equity Securities by Closed-End Management Investment Company and Affiliated Purchasers. N/A
Item 10. Submission of Matters to a Vote of Security Holders.
There have been no changes to the procedures by which shareholders may recommend nominees to the Registrant's Board of Trustees that would require disclosure herein.
Item 11. Controls and Procedures.
(a) Evaluation of Disclosure Controls and Procedures. The Registrant maintains disclosure controls and procedures that are designed to ensure that information required to be disclosed in the Registrant’s filings under the Securities Exchange Act of 1934 and the Investment Company Act of 1940 is recorded,
processed, summarized and reported within the periods specified in the rules and forms of the Securities and Exchange Commission. Such information is accumulated and communicated to the Registrant’s management, including its principal executive officer and principal financial officer, as appropriate, to allow timely decisions regarding required disclosure. The Registrant’s management, including the principal executive officer and the principal financial officer, recognizes that any set of controls and procedures, no matter how well designed and operated, can provide only reasonable assurance of achieving the desired control objectives.
Within 90 days prior to the filing date of this Shareholder Report on Form N-CSR, the Registrant had carried out an evaluation, under the supervision and with the participation of the Registrant’s management, including the Registrant’s principal executive officer and the Registrant’s principal financial officer, of the effectiveness of the design and operation of the Registrant’s disclosure controls and procedures. Based on such evaluation, the Registrant’s principal executive officer and principal financial officer concluded that the Registrant’s disclosure controls and procedures are effective.
(b) Changes in Internal Controls.
There have been no significant changes in
the Registrant’s internal controls or in other factors that could significantly affect the internal controls subsequent to the date of their evaluation in connection with the preparation of this Shareholder Report on Form N-CSR.
Item 12. Exhibits.
(a)(1) Code of Ethics
(a)(2) Certifications pursuant to Section 302 of the Sarbanes-Oxley Act of 2002 of Laura F. Fergerson, Chief Executive Officer - Finance and Administration, and Mark H. Otani, Chief Financial Officer and Chief Accounting Officer
(b) Certifications pursuant to Section 906 of the Sarbanes-Oxley Act of 2002 of Laura F. Fergerson, Chief Executive Officer - Finance and Administration, and Mark H. Otani, Chief Financial Officer and Chief Accounting Officer