UNITED STATES
SECURITIES AND EXCHANGE COMMISSION
Washington, DC 20549
FORM N-CSRS
CERTIFIED SHAREHOLDER REPORT OF REGISTERED
MANAGEMENT INVESTMENT COMPANIES
Investment Company Act file number 811-02781
Templeton Funds
(Exact name of registrant as specified in charter)
300 S.E. 2nd Street, Fort Lauderdale, FL 33301-1923
(Address of principal executive offices) (Zip code)
Craig S. Tyle, One Franklin Parkway, San Mateo, CA 94403-1906
(Name and address of agent for service)
Registrant’s telephone number, including area code: (954) 527-7500
Date of fiscal year end: 8/31
Date of reporting period: 2/28/18
| Item 1. | Reports to Stockholders. |
[INSERT SEMIANNUAL REPORT]
| | | | |
 | | | | Semiannual Report and Shareholder Letter February 28, 2018 |
Sign up for electronic delivery at franklintempleton.com/edelivery
Franklin Templeton Investments
Why choose Franklin Templeton Investments?
Successful investing begins with ambition. And achievement only comes when you reach for it. That’s why we continually strive to deliver better outcomes for investors. No matter what your goals are, our deep, global investment expertise allows us to offer solutions that can help.
During our more than 70 years of experience, we’ve managed through all kinds of markets—up, down and those in between. We’re always preparing for what may come next. It’s because of this, combined with our strength as one of the world’s largest asset managers that we’ve earned the trust of millions of investors around the world.
Dear Shareholder:
During the six months ended February 28, 2018, mostly upbeat global economic data, improved corporate earnings and generally supportive monetary policies benefited global securities markets. The European Central Bank (ECB) and the Bank of Japan (BOJ) kept their benchmark interest rates unchanged, while the US Federal Reserve (Fed) raised the target range for the federal funds rate at its December 2017 meeting amid signs of a growing US economy. The BOJ maintained its quantitative easing measures during the period, while the ECB began to reduce its bond purchases in January 2018. The Fed also began a gradual reduction in its balance sheet during the period as part of its ongoing plan to normalize US monetary policy. However, investors expressed concerns about the pace of central bankers’ monetary policy tightening amid an improving economic outlook. In this environment, stocks in global developed and emerging markets excluding the US generated strong returns, as measured by the MSCI All Country World Index ex USA Index.
We are committed to our long-term perspective and disciplined investment approach as we conduct a rigorous, fundamental analysis of securities with a regular emphasis on investment risk management.
Historically, patient investors have achieved rewarding results by evaluating their goals, diversifying their assets globally and maintaining a disciplined investment program, all hallmarks of the Templeton investment philosophy developed more than 60 years ago. We continue to recommend investors consult
their financial advisors and review their portfolios to design a long-term strategy and portfolio allocation that meet their individual needs, goals and risk tolerance.
Templeton Foreign Fund’s semiannual report includes more detail about prevailing conditions and a discussion about investment decisions during the period. Please remember all securities markets fluctuate, as do mutual fund share prices.
We thank you for investing with Franklin Templeton, welcome your questions and comments, and look forward to serving your investment needs in the years ahead.
Sincerely,

Norman J. Boersma, CFA
President and Chief Executive Officer –
Investment Management
Templeton Funds
This letter reflects our analysis and opinions as of February 28, 2018, unless otherwise indicated. The information is not a complete analysis of every aspect of any market, country, industry, security or fund. Statements of fact are from sources considered reliable.
CFA® is a trademark owned by CFA Institute.
| | |
| | Not FDIC Insured | May Lose Value | No Bank Guarantee |
| | | | |
| | | |
| franklintempleton.com | | Not part of the semiannual report | | 1 |
Contents
Visit franklintempleton.com for fund updates, to access your account, or to find helpful financial planning tools.
| | | | |
| | | |
2 | | Semiannual Report | | franklintempleton.com |
Semiannual Report
Templeton Foreign Fund
This semiannual report for Templeton Foreign Fund covers the period ended February 28, 2018.
Your Fund’s Goal and Main Investments
The Fund seeks long-term capital growth. Under normal market conditions, the Fund invests at least 80% of its net assets in “foreign securities,” as described in the prospectus. These securities are predominantly equity securities of companies located outside the US, including developing markets.
Performance Overview
The Fund’s Class A shares delivered a +3.10% cumulative total return for the six months under review. In comparison, the Fund’s benchmark, the MSCI All Country World Index (ACWI) ex USA Index, which measures stock performance in global developed and emerging markets excluding the US, generated a +7.71% total return.1 For the 10-year period ended February 28, 2018, the Fund’s Class A shares generated a +36.34% cumulative total return, compared with the MSCI ACWI ex USA Index’s +36.00% cumulative total return for the same period.1 Please note index performance information is provided for reference and we do not attempt to track the index but rather undertake investments on the basis of fundamental research. You can find more performance data in the Performance Summary beginning on page 9.
Performance data represent past performance, which does not guarantee future results. Investment return and principal value will fluctuate, and you may have a gain or loss when you sell your shares. Current performance may differ from figures shown. For most recent month-end performance, go to franklintempleton.com or call (800) 342-5236.
Economic and Market Overview
The global economy expanded during the six-month period under review amid generally upbeat economic data across regions. In this environment, global developed and emerging market stocks generated a +9.29% total return, as measured by
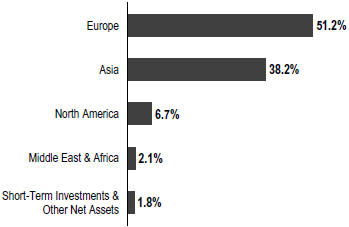
Geographic Composition
Based on Total Net Assets as of 2/28/18
the MSCI ACWI.1 Global markets were also aided by price gains in oil and other commodities, the European Central Bank’s (ECB’s) extension of its monetary easing program, encouraging corporate earnings reports and the passage of the US tax reform bill.
However, global markets reflected investor concerns about geopolitical tensions in the Korean peninsula, expectations that key central bankers around the world may potentially raise interest rates amid an improving economic outlook, and political uncertainties in the US and the European Union (EU). In early February, global markets experienced significant volatility amid concerns about stronger inflation and rising long-term interest rates in the US.
The US economy expanded in 2017’s fourth quarter, though at a slower pace compared to the third quarter as lower inventory investment and higher imports partially offset the positive contributions of growth in consumer spending, business and housing investment, exports, and government spending. The unemployment rate declined from 4.4% in August 2017 to 4.1% at period-end.2 Annual inflation, as measured by the Consumer Price Index, increased from 1.9% in August 2017 to 2.2% at period-end.2 The US Federal Reserve (Fed) began reducing its balance sheet in October and raised its target range
1. Source: Morningstar. As of 2/28/18, the Fund’s Class A 10-year average annual total return not including the maximum sales charge was +3.15%, compared with the MSCI ACWI ex USA Index’s 10-year average annual total return of +3.12%.
The index is unmanaged and includes reinvestment of any income or distributions. It does not reflect any fees, expenses or sales charges. One cannot invest directly in an index, and an index is not representative of the Fund’s portfolio.
2. Source: US Bureau of Labor Statistics.
The dollar value, number of shares or principal amount, and names of all portfolio holdings are listed in the Fund’s Statement of Investments (SOI).
The SOI begins on page 17.
| | | | |
| | | |
| franklintempleton.com | | Semiannual Report | | 3 |
TEMPLETON FOREIGN FUND
for the federal funds rate 0.25% to 1.25%–1.50% in December. The Fed left its target rate for the federal funds rate unchanged at its January 2018 meeting, but expressed that it anticipated inflation to rise in 2018 and stabilize around the 2% target over the medium term.
In Europe, the UK’s economic growth moderated in 2017’s fourth quarter over the previous quarter, due to slower growth in production output, household spending and business investment. In November, the Bank of England raised its key policy rate for the first time in a decade. The eurozone’s growth moderated in 2017’s fourth quarter over the previous quarter. The bloc’s annual inflation rate ended the period lower than in August 2017. The ECB kept its benchmark interest rate unchanged during the period. However, at its October meeting, the ECB extended the time frame for its massive bond-buying program from December 2017 to at least September 2018, while reducing the amount of monthly bond purchases in half beginning in January 2018.
In Asia, Japan’s gross domestic product (GDP) growth slowed in 2017’s fourth quarter compared to the third quarter, as a slowdown in business spending and contractions in private residential investment offset a recovery in private consumption. The Bank of Japan left its benchmark interest rate unchanged during the period and continued its monetary stimulus measures.
In emerging markets, Brazil’s quarterly GDP grew in 2017’s fourth quarter, although at a slower pace compared to the previous quarter. The country’s central bank cut its benchmark interest rate several times during the period to spur economic growth. Russia’s GDP grew in 2017’s fourth quarter compared to the prior-year period, amid the Bank of Russia’s continued policy support. China’s GDP grew at a stable rate in 2017’s fourth quarter compared to the prior-year period. The People’s Bank of China left its benchmark interest rate unchanged during the period. Overall, emerging market stocks, as measured by the MSCI Emerging Markets Index, rose substantially during the period.
Investment Strategy
Our investment strategy employs a bottom-up, value-oriented, long-term approach. We focus on the market price of a company’s securities relative to our evaluation of the company’s long-term earnings, asset value and cash flow
potential. We also consider the company’s price/earnings ratio, price/cash flow ratio, profit margins and liquidation value.
Manager’s Discussion
International equities carried positive momentum into the semiannual review period, rising every month until February, when volatility resurfaced as concerns about the pace of central bank policy tightening sparked a sharp sell-off in risk assets. In this environment, the Fund delivered absolute gains, but it underperformed its benchmark, the MSCI ACWI ex USA Index. Despite relative headwinds, we were encouraged by a number of market transitions that we believe align well with our strategy going forward. After years of official stimulus, central bankers—led by the Fed—are tightening policies. After years of tranquility, volatility is awakening. After a long period of low inflation, low global growth and ultra-low interest rates, inflationary forces are stirring, growth is accelerating and bond yields are rising. As these key underpinnings of global financial markets change, so too will the characteristics and leadership of those markets. The leaders of the last cycle—US equities, growth stocks, and consumer and internet stocks—have become priced at levels that dramatically increase the likelihood of sub-par future returns, in our view. However, we believe shifting conditions may facilitate the passing of the performance baton to the last cycle’s laggards: international equities and value stocks across a range of out-of-favor sectors such as health care, telecommunication services, energy and financials.
At Templeton, we have maintained our valuation discipline and adhered to our time-tested investment process throughout this challenging period. These strategies have led to a number of encouraging performance developments during the six months under review, such as the outperformance of overweighted energy stocks as oil prices rebounded and financials stocks as interest rates rose, but also some continued challenges.3 Notable among challenges was the continued weakness of the Fund’s overweighted health care holdings.4 Concerns about generic competition, regulatory scrutiny and a consolidating payor sector all remained headwinds for health care stocks during the review period. At the stock level, French drugmaker Sanofi was the sector’s largest detractor, declining amid concerns that the company was overpaying for acquisitions to stem a decline in revenues from existing operations. Although Sanofi has its challenges, including an admittedly poor track
3. The energy sector comprises energy equipment and services and oil, gas and consumable fuels in the SOI. The financials sector comprises banks, capital markets and insurance in the SOI.
4. The health care sector comprises biotechnology, health care equipment and supplies, health care providers and services, life sciences tools and services, and pharmaceuticals in the SOI.
| | | | |
| | | |
4 | | Semiannual Report | | franklintempleton.com |
TEMPLETON FOREIGN FUND
record of capital allocation, we believe the stock’s price has been too low. In our analysis, Sanofi’s recent share price represents a modest valuation multiple on low earnings, which could give us a significant margin of safety and considerable upside potential as the company addresses its issues and benefits from its diverse business portfolio over the long term.
We remain positive on the health care sector more generally. We believe pricing pressures and generic competition are best addressed through innovation, and innovation is fueled by research and development, which has doubled in the pharmaceuticals industry in the past 30 years. Furthermore, despite the political controversy surrounding drug pricing, prescription drug costs account for less than 15% of health care spending in the US and the EU. Given the efficacy of these drugs and their ability to reduce costs elsewhere in the health care system, we believe they likely represent good value for the money. Overall, the pharmaceuticals industry is not often cheap based on free cash flow multiples, and we are finding the best values among innovative firms that in our analysis are capable of commanding pricing power by successfully addressing unmet medical needs. It is rare to find highly cash-generative, innovative businesses with attractive growth potential trading in what we consider deep value territory, but we believe select biotechnology and pharmaceuticals firms offer just such a proposition.
Industrials stocks also detracted, led lower by UK-based professional services firm Capita (not held by period-end).5 Its stock declined sharply during the period after management announced plans to halt dividends and sell shares to raise capital. The recent bankruptcy of a competing UK outsourcing firm further compounded investor concerns about the magnitude of Capita’s woes. The emergence of new information requires a reassessment of the investment thesis, and our analysis suggests that the risk profile of Capita has increased significantly. The combination of equity issuance decreasing existing shareholders’ ownership percentages and new guidance for negative free cash flows in 2018 suggests to us that the firm’s finances are more impaired than initially portrayed by outgoing management. With fundamentals deteriorating, valuations no longer appear supportive to us. Although we remain underweighted in industrials, we are finding select opportunities in the sector, particularly among companies benefiting from restructuring or exposure to end
Top 10 Sectors/Industries
2/28/18
| | | | |
| | | % of Total
Net Assets | |
| Banks | | | 14.4% | |
| Oil, Gas & Consumable Fuels | | | 11.0% | |
| Pharmaceuticals | | | 8.7% | |
| Insurance | | | 5.4% | |
| Technology Hardware, Storage & Peripherals | | | 4.5% | |
| Metals & Mining | | | 4.4% | |
| Wireless Telecommunication Services | | | 4.1% | |
| Internet Software & Services | | | 4.0% | |
| Life Sciences Tools & Services | | | 3.6% | |
| Diversified Telecommunication Services | | | 3.1% | |
markets with better growth prospects. We have tried to avoid what we consider expensive companies that fail to reflect the maturity of their business cycles, as well as those discounting excessive optimism with regard to sustainable growth rates and returns.
Stock selection in materials also detracted, pressured by a handful of precious metals stocks.6 Canadian gold miners Alamos Gold and Barrick Gold both finished among the biggest detractors, as did Wheaton Precious Metals, a Canadian firm that finances mining activities in return for a “stream” of precious metals by-products. Although the price of gold has remained firm amid US dollar weakness and geopolitical uncertainties, mining stocks declined as gold stayed range-bound. History suggests that a modest exposure to gold and silver miners can help optimize risk-adjusted returns over time, and we view these investments as attractive portfolio hedges at a time when global debt has reached an all-time high and economic and market cycles look increasingly mature. With valuations across the precious metals industry looking cheap to us, we have maintained select investments in a handful of companies that in our analysis have resilient balance sheets, low cost positions and identifiable value catalysts.
Information technology (IT) was another relative laggard during the period.7 Although the Fund’s IT holdings delivered solid gains, they failed to keep pace with the benchmark’s IT components, and relative performance was also hindered by our underweighting in the sector. We continue to find select value in the IT sector more broadly, though not enough to justify an
5. The industrials sector comprises aerospace and defense, construction and engineering, industrial conglomerates, machinery, and trading companies and distributors in the SOI.
6. The materials sector comprises chemicals, construction materials, and metals and mining in the SOI.
7. The IT sector comprises electronic equipment, instruments and components; internet software and services; semiconductors and semiconductor equipment; software; and technology hardware, storage and peripherals in the SOI.
| | | | |
| | | |
| franklintempleton.com | | Semiannual Report | | 5 |
TEMPLETON FOREIGN FUND
even-weighted allocation relative to the index, as some pockets of the IT sector look unsustainably expensive to us. With every major tier in the tech “stack” disrupted by new technologies, our approach is to identify mature companies we believe have the ability to adapt to change, as well as new entrants we feel are likely to emerge as winners. Although we have some exposure to the dominant internet and consumer technology firms that have performed well recently, we have avoided a number of these stocks due to valuation concerns.
An overweighting in telecommunication services and an underweighting in consumer discretionary also detracted, as did stock-specific weakness.8 In the telecommunication services sector, China Telecom and China Mobile declined as investors worried about data pricing competition and the high capital expenditure forecasts associated with the buildout of China’s 5G network. Yet, data pricing in the industry has so far been rational, in our assessment, and the high levels of investment are required to create scalability and are at least partially offset by the fact that Chinese telecommunication services companies do not have to pay for access to parts of the radio frequency spectrum. Although the market continues to focus on the perceived negatives, we see companies trading at modest valuations that are growing earnings and dividends and are investing to gain scale and share in a secular growth market. In the consumer discretionary sector, shares of Luxembourg-based satellite provider SES declined after management delivered disappointing results, citing one-off headwinds and delayed revenues attributable to a changing business model. Recent adversities have caused the stock to decline and its price-to-book value to become much lower than the company’s industry peers. Our analysis implies SES has recently been trading at replacement cost for a business with very high barriers to entry and valuable orbital satellite slots that cannot be replicated. Additionally, the company’s high single-digit dividend and free cash flow yields, as well as a contract backlog equivalent to four years of revenue, lead us to believe its shares remain undervalued.
Turning to contributors, stock selection in the financials sector notably contributed, led by Dutch market-maker Flow Traders. Its shares surged late in the period as higher volatility boosted trading volumes, leading to record monthly income. We remain positive on the stock at these levels. After an unusually quiet period, we expect higher volatility going forward as central banks wind down bond purchases and raise interest rates. The firm could also potentially benefit from structural growth
Top 10 Holdings
2/28/18
| | | | |
Company Sector/Industry, Country | | % of Total
Net Assets | |
| |
Samsung Electronics Co. Ltd. Technology Hardware, Storage & Peripherals, South Korea | | | 3.3% | |
| |
Baidu Inc. Internet Software & Services, China | | | 3.1% | |
| |
BP PLC Oil, Gas & Consumable Fuels, UK | | | 2.7% | |
| |
Standard Chartered PLC Banks, UK | | | 2.6% | |
| |
Royal Dutch Shell PLC Oil, Gas & Consumable Fuels, UK | | | 2.5% | |
| |
SoftBank Group Corp. Wireless Telecommunication Services, Japan | | | 2.4% | |
| |
Aegon NV Insurance, Netherlands | | | 2.3% | |
| |
Teva Pharmaceutical Industries Ltd. Pharmaceuticals, Israel | | | 2.1% | |
| |
BNP Paribas SA Banks, France | | | 2.1% | |
| |
Roche Holding AG Pharmaceuticals, Switzerland | | | 2.0% | |
opportunities as the market for exchange-traded funds (ETFs) matures and Flow Traders develops its business in the US and Asia. Finally, we believe new European regulations that require all ETF trading volume to be conducted on transparent exchanges should further increase volumes for Flow Traders, which has a reputation for best-in-class trade executions. The Fund also benefited from investments in Asian lenders, such as South Korea-based KB Financial Group and Thailand-based Bangkok Bank. We continue to find attractive opportunities among modestly valued financials holdings in Asia, where prospects for improving corporate governance and political stability have combined with rising interest rates and genuine economic growth to benefit the regional banking sector.
The Fund’s energy holdings also benefited from stock selection and an overweighted allocation. UK oil major BP was one of the Fund’s top energy contributors. Its stock rallied after the firm reported an encouraging increase in profits and cash flow. Furthermore, the company announced plans to buy back shares in a sign it had put past incidents behind it and emerged stronger from an industry-wide downturn. BP’s potential free cash flow generation should continue to rise as costs remain muted and production comes online over the medium term,
8. The telecommunication services sector comprises diversified telecommunication services and wireless telecommunication services in the SOI. The consumer discretionary sector comprises auto components, automobiles, household durables, media, multiline retail and specialty retail in the SOI.
| | | | |
| | | |
6 | | Semiannual Report | | franklintempleton.com |
TEMPLETON FOREIGN FUND
offering additional upside from current levels in our view. More generally, a rising oil price and strong sector performance have largely rewarded our decision to stay the course despite price volatility that accompanied fears of a supply glut earlier in 2017. We expected that oil price would climb toward US$60 per barrel, beyond which it could remain range-bound as swing producers in the North American shale fields bring supply back on line. Barring any external shocks, we expected renewed supply above US$60, which will likely cap further significant price appreciation, and we have been selectively reducing exposure at this point in the cycle.
The Fund also benefited from stock selection and underweighted allocations in the consumer staples and utilities sectors.9 We continue to find only limited opportunities in these defensive sectors, which we consider to be expensive. The consumer staples sector remains more richly valued than both the broader market and its own history, a premium that we believe is unwarranted given the sector’s generally weak profit margins and scarce growth opportunities. Utilities also appear richly valued considering the potential impacts of weaker economic growth and increasing regulatory interference on power demand and industry pricing. Concerns about oversupply in developed markets also persist, further clouding the sector’s outlook.
From a regional standpoint, stock selection and an overweighting in Europe detracted from relative performance, while in Asia, stock selection offset the benefit of an overweighting. Stock selection in Canada also detracted.
It is important to recognize the effect of currency movements on the Fund’s performance. In general, if the value of the US dollar goes up compared with a foreign currency, an investment traded in that foreign currency will go down in value because it will be worth fewer US dollars. This can have a negative effect on Fund performance. Conversely, when the US dollar weakens in relation to a foreign currency, an investment traded in that foreign currency will increase in value, which can contribute to Fund performance. For the six months ended February 28, 2018, the US dollar declined in value relative to many currencies in which the Fund’s investments were traded. As a result, the Fund’s performance was positively affected by the portfolio’s investment predominantly in securities with non-US currency exposure. However, one cannot expect the same result in future periods.
Top 10 Countries
2/28/18
| | | | |
| | | % of Total
Net Assets | |
| UK | | | 20.0% | |
| Japan | | | 12.2% | |
| China | | | 10.7% | |
| France | | | 7.3% | |
| Germany | | | 6.8% | |
| Netherlands | | | 6.8% | |
| South Korea | | | 6.7% | |
| Canada | | | 5.0% | |
| Switzerland | | | 3.9% | |
| Italy | | | 2.8% | |
At Templeton, we continue to favor international markets over the US due to our view of their discounted valuations, better structural growth prospects and earlier stage economic and policy cycles. Ultimately, we remain committed to buying what we consider undervalued and mispriced stocks wherever we find them. Admittedly, this value-oriented approach has faced some headwinds. After outperforming growth in 2016, value lagged growth in 2017, with global growth outperforming value in the past 10 years. We believe value’s headwinds stem largely from unconventional monetary policies, which have depressed interest rates and sent investors out the risk curve in search of growth and yield. We believe these policies are unsustainable for three reasons. First, they increase social inequality, which has political consequences; second, they inflate asset prices, which creates stability risks; and third, rising inflation pressure and falling unemployment give data-dependent central bankers reasons to begin reversing such policies. We believe this mature cycle will eventually change, and with it the conditions that have been unfavorable to value. Against this backdrop, we have positioned the portfolio somewhat more defensively in recent quarters, taking gains among pro-cyclical stocks and reinvesting in what we consider cheaper, under-owned areas of the market. Despite some clear areas of what we deem as excessive enthusiasm and overvaluation, our bottom-up, fundamentals-oriented research has continued to uncover cheap stocks in regions and sectors around the world, and we remain constructive about the Fund’s prospects for capital appreciation and preservation over a long-term investment horizon.
9. The consumer staples sector comprises beverages, food and staples retailing, and food products in the SOI. The utilities sector comprises electric utilities and multi-utilities in the SOI.
See www.franklintempletondatasources.com for additional data provider information.
| | | | |
| | | |
| franklintempleton.com | | Semiannual Report | | 7 |
TEMPLETON FOREIGN FUND
Thank you for your continued participation in Templeton Foreign Fund. We look forward to serving your future investment needs.
| | |
 | |  |
| | Tucker Scott, CFA |

| |  |
| | Norman J. Boersma, CFA |
| | James Harper, CFA |
| | Heather Arnold, CFA |
| | Christopher James Peel, CFA |
| | Herbert J. Arnett, Jr. |
| | Portfolio Management Team |
The foregoing information reflects our analysis, opinions and portfolio holdings as of February 28, 2018, the end of the reporting period. The way we implement our main investment strategies and the resulting portfolio holdings may change depending on factors such as market and economic conditions. These opinions may not be relied upon as investment advice or an offer for a particular security. The information is not a complete analysis of every aspect of any market, country, industry, security or the Fund. Statements of fact are from sources considered reliable, but the investment manager makes no representation or warranty as to their completeness or accuracy. Although historical performance is no guarantee of future results, these insights may help you understand our investment management philosophy.
|
Christopher James Peel is a vice president, research analyst and portfolio manager for the Templeton Global Equity Group. Mr. Peel has global research responsibility for software, IT services and consulting, and integrated oils. Mr. Peel is group coordinator for the energy sector. Prior to joining Franklin Templeton in 2007, he was a commercial analyst at Lloyds TSB Group. Mr. Peel holds a B.Sc. in computer science from the University of Nottingham, UK, and is a Chartered Financial Analyst (CFA) charterholder. |
|
Herbert J. Arnett, Jr. is a senior vice president, portfolio manager and research analyst for the Templeton Global Equity Group. Mr. Arnett has global research responsibilities for large-cap and small-cap media, internet software and services, as well US telecommunication companies. He serves as coordinator for the telecommunication sector team, and previously served as coordinator for the consumer sector team. Previously, Mr. Arnett was the lead hedge fund trader with Templeton’s Global Equity Trading Group, where he traded European and North American markets. Prior to joining Franklin Templeton in 1996, Mr. Arnett worked at Union Bancarie Privee, Nassau, Bahamas, in international private banking, specializing in money market, foreign exchange and derivative instruments. Mr. Arnett holds a B.A. in Finance and an M.B.A. from the University of Miami. |
| | | | |
| | | |
8 | | Semiannual Report | | franklintempleton.com |
TEMPLETON FOREIGN FUND
Performance Summary as of February 28, 2018
The performance table does not reflect any taxes that a shareholder would pay on Fund dividends, capital gain distributions, if any, or any realized gains on the sale of Fund shares. Total return reflects reinvestment of the Fund’s dividends and capital gain distributions, if any, and any unrealized gains or losses. Your dividend income will vary depending on dividends or interest paid by securities in the Fund’s portfolio, adjusted for operating expenses of each class. Capital gain distributions are net profits realized from the sale of portfolio securities.
Performance as of 2/28/181
Cumulative total return excludes sales charges. Average annual total return includes maximum sales charges. Sales charges will vary depending on the size of the investment and the class of share purchased. The maximum is 5.75% and the minimum is 0%. Class A: 5.75% maximum initial sales charge; Advisor Class: no sales charges. For other share classes, visit franklintempleton.com.
| | | | | | | | |
| Share Class | | Cumulative Total Return2 | | | Average Annual Total Return3 | |
A | | | | | | | | |
| 6-Month | | | +3.10% | | | | -2.87% | |
| 1-Year | | | +10.75% | | | | +4.43% | |
| 5-Year | | | +33.20% | | | | +4.64% | |
| 10-Year | | | +36.34% | | | | +2.54% | |
Advisor | | | | | | | | |
| 6-Month | | | +3.33% | | | | +3.33% | |
| 1-Year | | | +11.13% | | | | +11.13% | |
| 5-Year | | | +34.90% | | | | +6.17% | |
| 10-Year | | | +39.84% | | | | +3.41% | |
Performance data represent past performance, which does not guarantee future results. Investment return and principal value will fluctuate, and you may have a gain or loss when you sell your shares. Current performance may differ from figures shown. For most recent month-end performance, go to franklintempleton.com or call (800) 342-5236.
See page 10 for Performance Summary footnotes.
| | | | |
| | | |
| franklintempleton.com | | Semiannual Report | | 9 |
TEMPLETON FOREIGN FUND
PERFORMANCE SUMMARY
Distributions (9/1/17–2/28/18)
| | | | |
| Share Class | | Net Investment Income | |
| A | | | $0.1125 | |
| C | | | $0.0524 | |
| R | | | $0.0993 | |
| R6 | | | $0.1534 | |
| Advisor | | | $0.1374 | |
Total Annual Operating Expenses4
| | | | | | |
| Share Class | | With Waiver | | Without Waiver | |
| A | | 1.10% | | | 1.19% | |
| Advisor | | 0.85% | | | 0.94% | |
Each class of shares is available to certain eligible investors and has different annual fees and expenses, as described in the prospectus.
All investments involve risks, including possible loss of principal. Special risks are associated with foreign investing, including currency fluctuations, economic instability and political developments; investments in developing markets involve heightened risks related to the same factors. Currency rates may fluctuate significantly over short periods of time, and can reduce returns. Because the Fund may invest its assets in companies in a specific region, including Europe, it is subject to greater risks of adverse developments in that region and/or the surrounding regions than a fund that is more broadly diversified geographically. Current political and financial uncertainty surrounding the European Union may increase market volatility and the economic risk of investing in companies in Europe. Derivatives, including currency management strategies, involve costs and can create economic leverage in the portfolio which may result in significant volatility and cause the Fund to participate in losses (as well as enable gains) on an amount that exceeds the Fund’s initial investment. The Fund may not achieve the anticipated benefits, and may realize losses when a counterparty fails to perform as promised. The Fund is actively managed but there is no guarantee that the manager’s investment decisions will produce the desired results. The Fund’s prospectus also includes a description of the main investment risks.
1. The Fund has an expense reduction contractually guaranteed through 12/31/19. Fund investment results reflect the expense reduction; without this reduction, the results would have been lower.
2. Cumulative total return represents the change in value of an investment over the periods indicated.
3. Average annual total return represents the average annual change in value of an investment over the periods indicated. Return for less than one year, if any, has not been annualized.
4. Figures are as stated in the Fund’s current prospectus and may differ from the expense ratios disclosed in the Your Fund’s Expenses and Financial Highlights sections in this report. In periods of market volatility, assets may decline significantly, causing total annual Fund operating expenses to become higher than the figures shown.
| | | | |
| | | |
10 | | Semiannual Report | | franklintempleton.com |
TEMPLETON FOREIGN FUND
Your Fund’s Expenses
As a Fund shareholder, you can incur two types of costs: (1) transaction costs, including sales charges (loads) on Fund purchases and redemptions; and (2) ongoing Fund costs, including management fees, distribution and service (12b-1) fees, and other Fund expenses. All mutual funds have ongoing costs, sometimes referred to as operating expenses. The table below shows ongoing costs of investing in the Fund and can help you understand these costs and compare them with those of other mutual funds. The table assumes a $1,000 investment held for the six months indicated.
Actual Fund Expenses
The table below provides information about actual account values and actual expenses in the columns under the heading “Actual.” In these columns the Fund’s actual return, which includes the effect of Fund expenses, is used to calculate the “Ending Account Value” for each class of shares. You can estimate the expenses you paid during the period by following these steps (of course, your account value and expenses will differ from those in this illustration): Divide your account value by $1,000 (if your account had an $8,600 value, then $8,600 ÷ $1,000 = 8.6). Then multiply the result by the number in the row for your class of shares under the headings “Actual” and “Expenses Paid During Period” (if Actual Expenses Paid During Period were $7.50, then 8.6 x $7.50 = $64.50). In this illustration, the actual expenses paid this period are $64.50.
Hypothetical Example for Comparison with Other Funds
Under the heading “Hypothetical” in the table, information is provided about hypothetical account values and hypothetical expenses based on the Fund’s actual expense ratio and an assumed rate of return of 5% per year before expenses, which is not the Fund’s actual return. This information may not be used to estimate the actual ending account balance or expenses you paid for the period, but it can help you compare ongoing costs of investing in the Fund with those of other funds. To do so, compare this 5% hypothetical example for the class of shares you hold with the 5% hypothetical examples that appear in the shareholder reports of other funds.
Please note that expenses shown in the table are meant to highlight ongoing costs and do not reflect any transactional costs. Therefore, information under the heading “Hypothetical” is useful in comparing ongoing costs only, and will not help you compare total costs of owning different funds. In addition, if transactional costs were included, your total costs would have been higher.
| | | | | | | | | | | | | | | | | | |
| | | | | | | Actual | | | | Hypothetical | | | | |
| | | | | | | (actual return after expenses) | | | | (5% annual return before expenses) | | | | |
| | | | | | | | | Expenses | | | | | | Expenses | | | | Net |
| | | Beginning | | | | Ending | | Paid During | | | | Ending | | Paid During | | | | Annualized |
| Share | | Account | | | | Account | | Period | | | | Account | | Period | | | | Expense |
| Class | | Value 9/1/17 | | | | Value 2/28/18 | | 9/1/17–2/28/181,2 | | | | Value 2/28/18 | | 9/1/17–2/28/181,2 | | | | Ratio2 |
A | | $1,000 | | | | $1,031.00 | | $5.89 | | | | $1,018.99 | | $5.86 | | | | 1.17% |
C | | $1,000 | | | | $1,027.90 | | $9.65 | | | | $1,015.27 | | $9.59 | | | | 1.92% |
R | | $1,000 | | | | $1,029.90 | | $7.15 | | | | $1,017.75 | | $7.10 | | | | 1.42% |
R6 | | $1,000 | | | | $1,032.80 | | $3.58 | | | | $1,021.27 | | $3.56 | | | | 0.71% |
Advisor | | $1,000 | | | | $1,033.30 | | $4.64 | | | | $1,020.23 | | $4.61 | | | | 0.92% |
1. Expenses are equal to the annualized expense ratio for the six-month period as indicated above—in the far right column—multiplied by the simple average account value over the period indicated, and then multiplied by 181/365 to reflect the one-half year period.
2. Reflects expenses after fee waivers and expense reimbursements. Does not include acquired fund fees and expenses.
| | | | |
| | | |
| franklintempleton.com | | Semiannual Report | | 11 |
TEMPLETON FUNDS
Financial Highlights
Templeton Foreign Fund
| | | | | | | | | | | | | | | | | | | | | | | | |
| | | Six Months Ended | | | | | | | | | | | | | | | | |
| | | February 28, 2018 | | | Year Ended August 31, | |
| | | (unaudited) | | | 2017 | | | 2016 | | | 2015 | | | 2014 | | | 2013 | |
| | | | | | |
Class A | | | | | | | | | | | | | | | | | | | | | | | | |
| | | | | | |
Per share operating performance | | | | | | | | | | | | | | | | | | | | | | | | |
(for a share outstanding throughout the period) | | | | | | | | | | | | | | | | | | | | | | | | |
| | | | | | |
Net asset value, beginning of period | | | $ 7.81 | | | | $ 6.87 | | | | $ 6.74 | | | | $ 8.58 | | | | $ 7.67 | | | | $ 6.26 | |
| | | | | | |
Income from investment operationsa: | | | | | | | | | | | | | | | | | | | | | | | | |
| | | | | | |
Net investment incomeb | | | 0.02 | | | | 0.11 | | | | 0.11 | | | | 0.12 | | | | 0.20 | c | | | 0.12 | |
| | | | | | |
Net realized and unrealized gains (losses) | | | 0.22 | | | | 0.96 | | | | 0.11 | | | | (1.52 | ) | | | 1.12 | | | | 1.44 | |
| | | | | | |
Total from investment operations | | | 0.24 | | | | 1.07 | | | | 0.22 | | | | (1.40 | ) | | | 1.32 | | | | 1.56 | |
| | | | | | |
Less distributions from: | | | | | | | | | | | | | | | | | | | | | | | | |
| | | | | | |
Net investment income | | | (0.11 | ) | | | (0.13 | ) | | | (0.09 | ) | | | (0.21 | ) | | | (0.11 | ) | | | (0.15 | ) |
| | | | | | |
Net realized gains | | | — | | | | — | | | | (— | )d | | | (0.23 | ) | | | (0.30 | ) | | | — | |
| | | | | | |
Total distributions | | | (0.11 | ) | | | (0.13 | ) | | | (0.09 | ) | | | (0.44 | ) | | | (0.41 | ) | | | (0.15 | ) |
| | | | | | |
Net asset value, end of period | | | $ 7.94 | | | | $ 7.81 | | | | $ 6.87 | | | | $ 6.74 | | | | $ 8.58 | | | | $ 7.67 | |
| | | | | | |
Total returne | | | 3.10% | | | | 15.83% | | | | 3.46% | | | | (16.46)% | | | | 17.61% | | | | 25.17% | |
| | | | | | |
Ratios to average net assetsf | | | | | | | | | | | | | | | | | | | | | | | | |
Expenses before waiver and payments by affiliates | | | 1.19% | | | | 1.21% | | | | 1.22% | | | | 1.18% | | | | 1.16% | | | | 1.19% | |
| | | | | | |
Expenses net of waiver and payments by affiliates | | | 1.17% | g | | | 1.21% | g,h | | | 1.22% | g,h | | | 1.18% | h | | | 1.16% | | | | 1.19% | g |
| | | | | | |
Net investment income | | | 0.46% | | | | 1.55% | | | | 1.66% | | | | 1.54% | | | | 2.39% | c | | | 1.72% | |
| | | | | | |
Supplemental data | | | | | | | | | | | | | | | | | | | | | | | | |
| | | | | | |
Net assets, end of period (000’s) | | | $3,225,414 | | | | $3,287,394 | | | | $3,644,336 | | | | $4,165,454 | | | | $4,524,854 | | | | $3,904,719 | |
| | | | | | |
Portfolio turnover rate | | | 11.81% | | | | 42.56% | | | | 22.89% | | | | 29.12% | | | | 30.82% | | | | 32.05% | |
aThe amount shown for a share outstanding throughout the period may not correlate with the Statement of Operations for the period due to the timing of sales and repurchases of the Fund’s shares in relation to income earned and/or fluctuating fair value of the investments of the Fund.
bBased on average daily shares outstanding.
cNet investment income share includes approximately $0.07 per share related to income received in the form of special dividends in connection with certain Fund holdings. Excluding this amount, the ratio of net investment income to average net assets would have been 1.57%.
dAmount rounds to less than $0.01 per share.
eTotal return does not reflect sales commissions or contingent deferred sales charges, if applicable, and is not annualized for periods less than one year.
fRatios are annualized for periods less than one year.
gBenefit of expense reduction rounds to less than 0.01%.
hBenefit of waiver and payments by affiliates rounds to less than 0.01%.
| | | | |
| | | |
12 | | Semiannual Report | The accompanying notes are an integral part of these financial statements. | | franklintempleton.com |
TEMPLETON FUNDS
FINANCIAL HIGHLIGHTS
Templeton Foreign Fund (continued)
| | | | | | | | | | | | | | | | | | | | | | | | |
| | | Six Months Ended | | | | | | | | | | | | | | | | |
| | | February 28, 2018 | | | Year Ended August 31, | |
| | | (unaudited) | | | 2017 | | | 2016 | | | 2015 | | | 2014 | | | 2013 | |
| | | | | | |
Class C | | | | | | | | | | | | | | | | | | | | | | | | |
| | | | | | |
Per share operating performance | | | | | | | | | | | | | | | | | | | | | | | | |
(for a share outstanding throughout the period) | | | | | | | | | | | | | | | | | | | | | | | | |
| | | | | | |
Net asset value, beginning of period | | | $ 7.60 | | | | $ 6.69 | | | | $ 6.56 | | | | $ 8.35 | | | | $ 7.48 | | | | $ 6.11 | |
| | | | | | |
Income from investment operationsa: | | | | | | | | | | | | | | | | | | | | | | | | |
| | | | | | |
Net investment income (loss)b | | | (0.01 | ) | | | 0.05 | | | | 0.06 | | | | 0.05 | | | | 0.13 | c | | | 0.07 | |
| | | | | | |
Net realized and unrealized gains (losses) | | | 0.22 | | | | 0.94 | | | | 0.11 | | | | (1.46 | ) | | | 1.10 | | | | 1.40 | |
| | | | | | |
Total from investment operations | | | 0.21 | | | | 0.99 | | | | 0.17 | | | | (1.41 | ) | | | 1.23 | | | | 1.47 | |
| | | | | | |
Less distributions from: | | | | | | | | | | | | | | | | | | | | | | | | |
| | | | | | |
Net investment income | | | (0.05 | ) | | | (0.08 | ) | | | (0.04 | ) | | | (0.15 | ) | | | (0.06 | ) | | | (0.10 | ) |
| | | | | | |
Net realized gains | | | — | | | | — | | | | (— | )d | | | (0.23 | ) | | | (0.30 | ) | | | — | |
| | | | | | |
Total distributions | | | (0.05 | ) | | | (0.08 | ) | | | (0.04 | ) | | | (0.38 | ) | | | (0.36 | ) | | | (0.10 | ) |
| | | | | | |
Net asset value, end of period | | | $ 7.76 | | | | $ 7.60 | | | | $ 6.69 | | | | $ 6.56 | | | | $ 8.35 | | | | $ 7.48 | |
| | | | | | |
Total returne | | | 2.79% | | | | 14.92% | | | | 2.64% | | | | (17.04)% | | | | 16.72% | | | | 24.21% | |
| | | | | | |
Ratios to average net assetsf | | | | | | | | | | | | | | | | | | | | | | | | |
| | | | | | |
Expenses before waiver and payments by affiliates | | | 1.94% | | | | 1.96% | | | | 1.97% | | | | 1.93% | | | | 1.91% | | | | 1.94% | |
| | | | | | |
Expenses net of waiver and payments by affiliates | | | 1.92% | g | | | 1.96% | g,h | | | 1.97% | g,h | | | 1.93% | h | | | 1.91% | | | | 1.94% | g |
| | | | | | |
Net investment income (loss) | | | (0.29 | )% | | | 0.80% | | | | 0.91% | | | | 0.79% | | | | 1.64% | c | | | 0.97% | |
| | | | | | |
Supplemental data | | | | | | | | | | | | | | | | | | | | | | | | |
| | | | | | |
Net assets, end of period (000’s) | | | $339,981 | | | | $346,032 | | | | $397,512 | | | | $468,128 | | | | $617,421 | | | | $517,468 | |
| | | | | | |
Portfolio turnover rate | | | 11.81% | | | | 42.56% | | | | 22.89% | | | | 29.12% | | | | 30.82% | | | | 32.05% | |
aThe amount shown for a share outstanding throughout the period may not correlate with the Statement of Operations for the period due to the timing of sales and repurchases of the Fund’s shares in relation to income earned and/or fluctuating fair value of the investments of the Fund.
bBased on average daily shares outstanding.
cNet investment income per share includes approximately $0.07 per share related to income received in the form of special dividends in connection with certain Fund holdings. Excluding this amount, the ratio of net investment income to average net assets would have been (0.82)%.
dAmount rounds to less than $0.01 per share.
eTotal return does not reflect sales commissions or contingent deferred sales charges, if applicable, and is not annualized for periods less than one year.
fRatios are annualized for periods less than one year.
gBenefit of expense reduction rounds to less than 0.01%.
hBenefit of waiver and payments by affiliates rounds to less than 0.01%.
| | | | |
| | | |
| franklintempleton.com | | The accompanying notes are an integral part of these financial statements. | Semiannual Report | | 13 |
TEMPLETON FUNDS
FINANCIAL HIGHLIGHTS
Templeton Foreign Fund (continued)
| | | | | | | | | | | | | | | | | | | | | | | | |
| | | | | | |
| | | Six Months Ended | | | | | | | | | | | | | | | | |
| | | February 28, 2018 | | | Year Ended August 31, | |
| | | (unaudited) | | | 2017 | | | 2016 | | | 2015 | | | 2014 | | | 2013 | |
| | | | | | |
Class R | | | | | | | | | | | | | | | | | | | | | | | | |
| | | | | | |
Per share operating performance | | | | | | | | | | | | | | | | | | | | | | | | |
(for a share outstanding throughout the period) | | | | | | | | | | | | | | | | | | | | | | | | |
| | | | | | |
Net asset value, beginning of period | | | $ 7.65 | | | | $ 6.73 | | | | $ 6.61 | | | | $ 8.42 | | | | $ 7.54 | | | | $ 6.16 | |
| | | | | | |
Income from investment operationsa: | | | | | | | | | | | | | | | | | | | | | | | | |
| | | | | | |
Net investment incomeb | | | 0.01 | | | | 0.09 | | | | 0.09 | | | | 0.09 | | | | 0.18 | c | | | 0.10 | |
| | | | | | |
Net realized and unrealized gains (losses) | | | 0.22 | | | | 0.94 | | | | 0.10 | | | | (1.48 | ) | | | 1.09 | | | | 1.41 | |
| | | | | | |
Total from investment operations | | | 0.23 | | | | 1.03 | | | | 0.19 | | | | (1.39 | ) | | | 1.27 | | | | 1.51 | |
| | | | | | |
Less distributions from: | | | | | | | | | | | | | | | | | | | | | | | | |
| | | | | | |
Net investment income | | | (0.10 | ) | | | (0.11 | ) | | | (0.07 | ) | | | (0.19 | ) | | | (0.09 | ) | | | (0.13 | ) |
| | | | | | |
Net realized gains | | | — | | | | — | | | | (— | )d | | | (0.23 | ) | | | (0.30 | ) | | | — | |
| | | | | | |
Total distributions | | | (0.10 | ) | | | (0.11 | ) | | | (0.07 | ) | | | (0.42 | ) | | | (0.39 | ) | | | (0.13 | ) |
| | | | | | |
Net asset value, end of period | | | $ 7.78 | | | | $ 7.65 | | | | $ 6.73 | | | | $ 6.61 | | | | $ 8.42 | | | | $ 7.54 | |
| | | | | | |
Total returne | | | 2.99% | | | | 15.57% | | | | 3.10% | | | | (16.63)% | | | | 17.22% | | | | 24.81% | |
| | | | | | |
Ratios to average net assetsf | | | | | | | | | | | | | | | | | | | | | | | | |
| | | | | | |
Expenses before waiver and payments by affiliates | | | 1.44% | | | | 1.46% | | | | 1.47% | | | | 1.43% | | | | 1.41% | | | | 1.44% | |
| | | | | | |
Expenses net of waiver and payments by affiliates | | | 1.42% | g | | | 1.46% | g,h | | | 1.47% | g,h | | | 1.43% | h | | | 1.41% | | | | 1.44% | g |
| | | | | | |
Net investment income | | | 0.21% | | | | 1.30% | | | | 1.41% | | | | 1.29% | | | | 2.14% | c | | | 1.47% | |
| | | | | | |
Supplemental data | | | | | | | | | | | | | | | | | | | | | | | | |
| | | | | | |
Net assets, end of period (000’s) | | | $153,567 | | | | $153,516 | | | | $159,802 | | | | $174,865 | | | | $207,738 | | | | $172,393 | |
| | | | | | |
Portfolio turnover rate | | | 11.81% | | | | 42.56% | | | | 22.89% | | | | 29.12% | | | | 30.82% | | | | 32.05% | |
aThe amount shown for a share outstanding throughout the period may not correlate with the Statement of Operations for the period due to the timing of sales and repurchases of the Fund’s shares in relation to income earned and/or fluctuating fair value of the investments of the Fund.
bBased on average daily shares outstanding.
cNet investment income per share includes approximately $0.07 per share related to income received in the form of special dividends in connection with certain Fund holdings. Excluding this amount, the ratio of net investment income to average net assets would have been 1.32%.
dAmount rounds to less than $0.01 per share.
eTotal return is not annualized for periods less than one year.
fRatios are annualized for periods less than one year.
gBenefit of expense reduction rounds to less than 0.01%.
hBenefit of waiver and payments by affiliates rounds to less than 0.01%.
| | | | |
| | | |
14 | | Semiannual Report | The accompanying notes are an integral part of these financial statements. | | franklintempleton.com |
TEMPLETON FUNDS
FINANCIAL HIGHLIGHTS
Templeton Foreign Fund (continued)
| | | | | | | | | | | | | | | | | | | | | | | | |
| | | Six Months Ended | | | | | | | | | | | | | | | | |
| | | February 28, 2018 | | | Year Ended August 31, | |
| | | (unaudited) | | | 2017 | | | 2016 | | | 2015 | | | 2014 | | | 2013a | |
| | | | | | |
Class R6 | | | | | | | | | | | | | | | | | | | | | | | | |
| | | | | | |
Per share operating performance | | | | | | | | | | | | | | | | | | | | | | | | |
(for a share outstanding throughout the period) | | | | | | | | | | | | | | | | | | | | | | | | |
| | | | | | |
Net asset value, beginning of period | | | $ 7.70 | | | | $ 6.78 | | | | $ 6.66 | | | | $ 8.49 | | | | $ 7.59 | | | | $ 7.16 | |
| | | | | | |
Income from investment operationsb: | | | | | | | | | | | | | | | | | | | | | | | | |
| | | | | | |
Net investment incomec | | | 0.04 | | | | 0.16 | | | | 0.14 | | | | 0.15 | | | | 0.25 | d | | | 0.08 | |
| | | | | | |
Net realized and unrealized gains (losses) | | | 0.22 | | | | 0.93 | | | | 0.11 | | | | (1.50 | ) | | | 1.10 | | | | 0.35 | |
| | | | | | |
Total from investment operations | | | 0.26 | | | | 1.09 | | | | 0.25 | | | | (1.35 | ) | | | 1.35 | | | | 0.43 | |
| | | | | | |
Less distributions from: | | | | | | | | | | | | | | | | | | | | | | | | |
| | | | | | |
Net investment income | | | (0.15 | ) | | | (0.17 | ) | | | (0.13 | ) | | | (0.25 | ) | | | (0.15 | ) | | | — | |
| | | | | | |
Net realized gains | | | — | | | | — | | | | (— | )e | | | (0.23 | ) | | | (0.30 | ) | | | — | |
| | | | | | |
Total distributions | | | (0.15 | ) | | | (0.17 | ) | | | (0.13 | ) | | | (0.48 | ) | | | (0.45 | ) | | | — | |
| | | | | | |
Net asset value, end of period | | | $ 7.81 | | | | $ 7.70 | | | | $ 6.78 | | | | $ 6.66 | | | | $ 8.49 | | | | $ 7.59 | |
| | | | | | |
Total returnf | | | 3.28% | | | | 16.52% | | | | 3.92% | | | | (16.08)% | | | | 18.16% | | | | 6.01% | |
| | | | | | |
Ratios to average net assetsg | | | | | | | | | | | | | | | | | | | | | | | | |
| | | | | | |
Expenses before waiver and payments by affiliates | | | 0.73% | | | | 0.74% | | | | 0.72% | | | | 0.72% | | | | 0.72% | | | | 0.74% | |
| | | | | | |
Expenses net of waiver and payments by affiliates | | | 0.71% | h | | | 0.73% | h | | | 0.72% | h,i | | | 0.72% | i | | | 0.72% | | | | 0.74% | h |
| | | | | | |
Net investment income | | | 0.93% | | | | 2.03% | | | | 2.16% | | | | 2.00% | | | | 2.83% | d | | | 2.17% | |
| | | | | | |
Supplemental data | | | | | | | | | | | | | | | | | | | | | | | | |
| | | | | | |
Net assets, end of period (000’s) | | | $1,694,801 | | | | $1,757,902 | | | | $880,092 | | | | $816,746 | | | | $666,249 | | | | $366,042 | |
| | | | | | |
Portfolio turnover rate | | | 11.81% | | | | 42.56% | | | | 22.89% | | | | 29.12% | | | | 30.82% | | | | 32.05% | |
aFor the period May 1, 2013 (effective date) to August 31, 2013.
bThe amount shown for a share outstanding throughout the period may not correlate with the Statement of Operations for the period due to the timing of sales and repurchases of the Fund’s shares in relation to income earned and/or fluctuating fair value of the investments of the Fund.
cBased on average daily shares outstanding.
dNet investment income per share includes approximately $0.07 per share related to income received in the form of special dividends in connection with certain Fund holdings. Excluding this amount, the ratio of net investment income to average net assets would have been 2.01%.
eAmount rounds to less than $0.01 per share.
fTotal return is not annualized for periods less than one year.
gRatios are annualized for periods less than one year.
hBenefit of expense reduction rounds to less than 0.01%.
iBenefit of waiver and payments by affiliates rounds to less than 0.01%.
| | | | |
| | | |
| franklintempleton.com | | The accompanying notes are an integral part of these financial statements. | Semiannual Report | | 15 |
TEMPLETON FUNDS
FINANCIAL HIGHLIGHTS
Templeton Foreign Fund (continued)
| | | | | | | | | | | | | | | | | | | | | | | | |
| | | Six Months Ended | | | | | | | | | | | | | | | | |
| | | February 28, 2018 | | | Year Ended August 31, | |
| | | (unaudited) | | | 2017 | | | 2016 | | | 2015 | | | 2014 | | | 2013 | |
| | | | | | |
Advisor Class | | | | | | | | | | | | | | | | | | | | | | | | |
| | | | | | |
Per share operating performance | | | | | | | | | | | | | | | | | | | | | | | | |
(for a share outstanding throughout the period) | | | | | | | | | | | | | | | | | | | | | | | | |
| | | | | | |
Net asset value, beginning of period | | | $ 7.70 | | | | $ 6.78 | | | | $ 6.66 | | | | $ 8.49 | | | | $ 7.59 | | | | $ 6.20 | |
| | | | | | |
Income from investment operationsa: | | | | | | | | | | | | | | | | | | | | | | | | |
| | | | | | |
Net investment incomeb | | | 0.03 | | | | 0.13 | | | | 0.12 | | | | 0.13 | | | | 0.22 | c | | | 0.13 | |
| | | | | | |
Net realized and unrealized gains (losses) | | | 0.23 | | | | 0.94 | | | | 0.11 | | | | (1.50 | ) | | | 1.11 | | | | 1.43 | |
| | | | | | |
Total from investment operations | | | 0.26 | | | | 1.07 | | | | 0.23 | | | | (1.37 | ) | | | 1.33 | | | | 1.56 | |
| | | | | | |
Less distributions from: | | | | | | | | | | | | | | | | | | | | | | | | |
| | | | | | |
Net investment income | | | (0.14 | ) | | | (0.15 | ) | | | (0.11 | ) | | | (0.23 | ) | | | (0.13 | ) | | | (0.17 | ) |
| | | | | | |
Net realized gains | | | — | | | | — | | | | (— | )d | | | (0.23 | ) | | | (0.30 | ) | | | — | |
| | | | | | |
Total distributions | | | (0.14 | ) | | | (0.15 | ) | | | (0.11 | ) | | | (0.46 | ) | | | (0.43 | ) | | | (0.17 | ) |
| | | | | | |
Net asset value, end of period | | | $ 7.82 | | | | $ 7.70 | | | | $ 6.78 | | | | $ 6.66 | | | | $ 8.49 | | | | $ 7.59 | |
| | | | | | |
Total returne | | | 3.33% | | | | 16.10% | | | | 3.65% | | | | (16.25 | )% | | | 17.93% | | | | 25.39% | |
| | | | | | |
Ratios to average net assetsf | | | | | | | | | | | | | | | | | | | | | | | | |
| | | | | | |
Expenses before waiver and payments by affiliates | | | 0.94% | | | | 0.96% | | | | 0.97% | | | | 0.93% | | | | 0.91% | | | | 0.94% | |
| | | | | | |
Expenses net of waiver and payments by affiliates | | | 0.92% | g | | | 0.96% | g,h | | | 0.97% | g,h | | | 0.93% | h | | | 0.91% | | | | 0.94% | g |
| | | | | | |
Net investment income | | | 0.71% | | | | 1.80% | | | | 1.91% | | | | 1.79% | | | | 2.64% | c | | | 1.97% | |
| | | | | | |
Supplemental data | | | | | | | | | | | | | | | | | | | | | | | | |
| | | | | | |
Net assets, end of period (000’s) | | | $1,667,369 | | | | $1,717,937 | | | | $1,125,431 | | | | $1,206,146 | | | | $1,727,057 | | | | $1,340,444 | |
| | | | | | |
Portfolio turnover rate | | | 11.81% | | | | 42.56% | | | | 22.89% | | | | 29.12% | | | | 30.82% | | | | 32.05% | |
aThe amount shown for a share outstanding throughout the period may not correlate with the Statement of Operations for the period due to the timing of sales and repurchases of the Fund’s shares in relation to income earned and/or fluctuating fair value of the investments of the Fund.
bBased on average daily shares outstanding.
cNet investment income per share includes approximately $0.07 per share related to income received in the form of special dividends in connection with certain Fund holdings. Excluding this amount, the ratio of net investment income to average net assets would have been 1.82%.
dAmount rounds to less than $0.01 per share.
eTotal return is not annualized for periods less than one year.
fRatios are annualized for periods less than one year.
gBenefit of expense reduction rounds to less than 0.01%.
hBenefit of waiver and payments by affiliates rounds to less than 0.01%.
| | | | |
| | | |
16 | | Semiannual Report | The accompanying notes are an integral part of these financial statements. | | franklintempleton.com |
TEMPLETON FUNDS
Statement of Investments, February 28, 2018 (unaudited)
Templeton Foreign Fund
| | | | | | | | | | | | |
| | | Industry | | | Shares | | | Value | |
| | | |
Common Stocks 98.2% | | | | | | | | | | | | |
Canada 5.0% | | | | | | | | | | | | |
Alamos Gold Inc., A | | | Metals & Mining | | | | 13,968,340 | | | $ | 70,959,167 | |
Barrick Gold Corp. | | | Metals & Mining | | | | 3,818,380 | | | | 43,987,738 | |
Cenovus Energy Inc. | | | Oil, Gas & Consumable Fuels | | | | 6,587,142 | | | | 47,945,687 | |
a Husky Energy Inc. | | | Oil, Gas & Consumable Fuels | | | | 3,829,620 | | | | 50,556,237 | |
Wheaton Precious Metals Corp. | | | Metals & Mining | | | | 7,307,912 | | | | 139,472,229 | |
| | | | | | | | | | | | |
| | | | | | | | | | | 352,921,058 | |
| | | | | | | | | | | | |
China 10.7% | | | | | | | | | | | | |
a Baidu Inc., ADR | | | Internet Software & Services | | | | 872,000 | | | | 220,040,480 | |
China Life Insurance Co. Ltd., H | | | Insurance | | | | 18,831,800 | | | | 55,947,118 | |
China Mobile Ltd. | | | Wireless Telecommunication Services | | | | 7,794,180 | | | | 73,102,027 | |
China Telecom Corp. Ltd., H | | | Diversified Telecommunication Services | | | | 219,339,292 | | | | 96,693,764 | |
Kunlun Energy Co. Ltd. | | | Oil, Gas & Consumable Fuels | | | | 40,057,050 | | | | 37,672,089 | |
NetEase Inc., ADR | | | Internet Software & Services | | | | 209,470 | | | | 61,448,025 | |
Shandong Weigao Group Medical Polymer Co. Ltd., H | | | Health Care Equipment & Supplies | | | | 42,940,060 | | | | 29,354,816 | |
Shanghai Pharmaceuticals Holding Co. Ltd., H | | | Health Care Providers & Services | | | | 22,098,290 | | | | 55,683,754 | |
Sinopec Engineering Group Co. Ltd. | | | Construction & Engineering | | | | 61,868,670 | | | | 59,924,293 | |
Sinopharm Group Co. Ltd., H | | | Health Care Providers & Services | | | | 15,295,130 | | | | 67,524,932 | |
| | | | | | | | | | | | |
| | | | | | | | | | | 757,391,298 | |
| | | | | | | | | | | | |
Denmark 0.5% | | | | | | | | | | | | |
Orsted AS | | | Electric Utilities | | | | 591,391 | | | | 36,905,620 | |
| | | | | | | | | | | | |
France 7.3% | | | | | | | | | | | | |
AXA SA | | | Insurance | | | | 3,085,182 | | | | 97,335,028 | |
BNP Paribas SA | | | Banks | | | | 1,840,973 | | | | 146,820,180 | |
Cie Generale des Etablissements Michelin SCA | | | Auto Components | | | | 294,680 | | | | 45,549,868 | |
Sanofi | | | Pharmaceuticals | | | | 1,133,075 | | | | 89,894,321 | |
Total SA | | | Oil, Gas & Consumable Fuels | | | | 1,201,950 | | | | 68,875,824 | |
Veolia Environnement SA | | | Multi-Utilities | | | | 2,861,260 | | | | 69,710,025 | |
| | | | | | | | | | | | |
| | | | | | | | | | | 518,185,246 | |
| | | | | | | | | | | | |
Germany 6.8% | | | | | | | | | | | | |
Bayer AG | | | Pharmaceuticals | | | | 704,920 | | | | 82,758,034 | |
Gerresheimer AG | | | Life Sciences Tools & Services | | | | 769,760 | | | | 59,257,667 | |
innogy SE | | | Multi-Utilities | | | | 1,720,370 | | | | 68,863,317 | |
Merck KGaA | | | Pharmaceuticals | | | | 650,094 | | | | 65,209,891 | |
a MorphoSys AG | | | Life Sciences Tools & Services | | | | 906,960 | | | | 90,898,256 | |
Siemens AG | | | Industrial Conglomerates | | | | 531,282 | | | | 70,286,911 | |
Telefonica Deutschland Holding AG | | | Diversified Telecommunication Services | | | | 9,400,530 | | | | 43,466,172 | |
| | | | | | | | | | | | |
| | | | | | | | | | | 480,740,248 | |
| | | | | | | | | | | | |
Hong Kong 1.9% | | | | | | | | | | | | |
CK Hutchison Holdings Ltd. | | | Industrial Conglomerates | | | | 8,707,000 | | | | 109,032,897 | |
Value Partners Group Ltd. | | | Capital Markets | | | | 26,572,000 | | | | 25,193,649 | |
| | | | | | | | | | | | |
| | | | | | | | | | | 134,226,546 | |
| | | | | | | | | | | | |
India 0.8% | | | | | | | | | | | | |
Hero Motocorp Ltd. | | | Automobiles | | | | 634,530 | | | | 34,997,915 | |
Jain Irrigation Systems Ltd. | | | Machinery | | | | 11,859,610 | | | | 21,269,459 | |
| | | | | | | | | | | | |
| | | | | | | | | | | 56,267,374 | |
| | | | | | | | | | | | |
Ireland 1.2% | | | | | | | | | | | | |
a Bank of Ireland Group PLC | | | Banks | | | | 4,912,886 | | | | 46,151,653 | |
CRH PLC | | | Construction Materials | | | | 1,273,950 | | | | 42,383,554 | |
| | | | | | | | | | | | |
| | | | | | | | | | | 88,535,207 | |
| | | | | | | | | | | | |
| | | | |
| | | |
| franklintempleton.com | | Semiannual Report | | 17 |
TEMPLETON FUNDS
STATEMENT OF INVESTMENTS (UNAUDITED)
Templeton Foreign Fund (continued)
| | | | | | | | | | | | |
| | | Industry | | | Shares | | | Value | |
| | | |
Common Stocks (continued) | | | | | | | | | | | | |
Israel 2.1% | | | | | | | | | | | | |
Teva Pharmaceutical Industries Ltd., ADR | | | Pharmaceuticals | | | | 7,864,800 | | | $ | 147,229,056 | |
| | | | | | | | | | | | |
Italy 2.8% | | | | | | | | | | | | |
Eni SpA | | | Oil, Gas & Consumable Fuels | | | | 7,552,934 | | | | 126,368,748 | |
Tenaris SA | | | Energy Equipment & Services | | | | 4,160,710 | | | | 72,080,143 | |
| | | | | | | | | | | | |
| | | | | | | | | | | 198,448,891 | |
| | | | | | | | | | | | |
Japan 12.2% | | | | | | | | | | | | |
Astellas Pharma Inc. | | | Pharmaceuticals | | | | 6,345,940 | | | | 93,995,203 | |
Ezaki Glico Co. Ltd. | | | Food Products | | | | 358,400 | | | | 17,566,487 | |
INPEX Corp. | | | Oil, Gas & Consumable Fuels | | | | 6,339,780 | | | | 77,921,573 | |
Kirin Holdings Co. Ltd. | | | Beverages | | | | 2,966,090 | | | | 77,234,254 | |
Panasonic Corp. | | | Household Durables | | | | 2,738,300 | | | | 43,048,576 | |
Ryohin Keikaku Co. Ltd. | | | Multiline Retail | | | | 234,530 | | | | 80,554,093 | |
Seven & i Holdings Co. Ltd. | | | Food & Staples Retailing | | | | 899,100 | | | | 37,588,539 | |
SoftBank Group Corp. | | | Wireless Telecommunication Services | | | | 2,028,670 | | | | 169,111,285 | |
Sumitomo Metal Mining Co. Ltd. | | | Metals & Mining | | | | 1,118,470 | | | | 52,744,867 | |
Sumitomo Rubber Industries Ltd. | | | Auto Components | | | | 3,966,520 | | | | 76,501,553 | |
Suntory Beverage & Food Ltd. | | | Beverages | | | | 1,415,900 | | | | 66,081,083 | |
Taiheiyo Cement Corp. | | | Construction Materials | | | | 1,876,841 | | | | 70,356,253 | |
| | | | | | | | | | | | |
| | | | | | | | | | | 862,703,766 | |
| | | | | | | | | | | | |
Luxembourg 1.3% | | | | | | | | | | | | |
SES SA, IDR | | | Media | | | | 5,579,580 | | | | 89,377,063 | |
| | | | | | | | | | | | |
Netherlands 6.8% | | | | | | | | | | | | |
Aegon NV | | | Insurance | | | | 22,983,505 | | | | 160,724,576 | |
Flow Traders | | | Capital Markets | | | | 1,703,977 | | | | 70,015,736 | |
ING Groep NV | | | Banks | | | | 2,456,418 | | | | 43,388,106 | |
a QIAGEN NV | | | Life Sciences Tools & Services | | | | 3,140,291 | | | | 106,122,998 | |
SBM Offshore NV | | | Energy Equipment & Services | | | | 5,872,711 | | | | 100,162,613 | |
| | | | | | | | | | | | |
| | | | | | | | | | | 480,414,029 | |
| | | | | | | | | | | | |
Singapore 1.9% | | | | | | | | | | | | |
Singapore Telecommunications Ltd. | | | Diversified Telecommunication Services | | | | 30,793,240 | | | | 78,569,602 | |
Singapore Telecommunications Ltd., ADR | | | Diversified Telecommunication Services | | | | 33,000 | | | | 837,705 | |
United Overseas Bank Ltd. | | | Banks | | | | 2,591,590 | | | | 54,562,878 | |
| | | | | | | | | | | | |
| | | | | | | | | | | 133,970,185 | |
| | | | | | | | | | | | |
South Korea 6.7% | | | | | | | | | | | | |
DB Insurance Co. Ltd. | | | Insurance | | | | 183,810 | | | | 11,775,741 | |
Hana Financial Group Inc. | | | Banks | | | | 2,203,300 | | | | 99,823,195 | |
KB Financial Group Inc. | | | Banks | | | | 1,968,477 | | | | 116,130,054 | |
Posco Daewoo Corp. | | | Trading Companies & Distributors | | | | 1,036,900 | | | | 19,307,345 | |
Samsung Electronics Co. Ltd. | | | Technology Hardware, Storage & Peripherals | | | | 106,154 | | | | 230,246,269 | |
| | | | | | | | | | | | |
| | | | | | | | | | | 477,282,604 | |
| | | | | | | | | | | | |
Sweden 0.6% | | | | | | | | | | | | |
Getinge AB, B | | | Health Care Equipment & Supplies | | | | 3,489,111 | | | | 44,046,031 | |
| | | | | | | | | | | | |
Switzerland 3.9% | | | | | | | | | | | | |
a Landis+Gyr Group AG | | | Electronic Equipment, Instruments & Components | | | | 355,630 | | | | 27,306,900 | |
Roche Holding AG | | | Pharmaceuticals | | | | 615,590 | | | | 142,977,004 | |
UBS Group AG | | | Capital Markets | | | | 5,530,030 | | | | 105,833,131 | |
| | | | | | | | | | | | |
| | | | | | | | | | | 276,117,035 | |
| | | | | | | | | | | | |
| | | | |
| | | |
18 | | Semiannual Report | | franklintempleton.com |
TEMPLETON FUNDS
STATEMENT OF INVESTMENTS (UNAUDITED)
Templeton Foreign Fund (continued)
| | | | | | | | | | | | |
| | | Industry | | | Shares | | | Value | |
| | | |
Common Stocks (continued) | | | | | | | | | | | | |
Taiwan 2.2% | | | | | | | | | | | | |
Catcher Technology Co. Ltd. | | | Technology Hardware, Storage & Peripherals | | | | 3,961,120 | | | $ | 46,756,777 | |
Quanta Computer Inc. | | | Technology Hardware, Storage & Peripherals | | | | 20,220,680 | | | | 40,774,170 | |
Taiwan Semiconductor Manufacturing Co. Ltd. | | | Semiconductors & Semiconductor Equipment | | | | 7,980,000 | | | | 65,920,610 | |
| | | | | | | | | | | | |
| | | | | | | | | | | 153,451,557 | |
| | | | | | | | | | | | |
Thailand 1.8% | | | | | | | | | | | | |
Bangkok Bank PCL, fgn | | | Banks | | | | 2,448,000 | | | | 17,874,286 | |
Bangkok Bank PCL, NVDR | | | Banks | | | | 9,123,830 | | | | 61,115,179 | |
Kasikornbank PCL, fgn | | | Banks | | | | 1,695,300 | | | | 12,486,019 | |
Kasikornbank PCL, NVDR | | | Banks | | | | 4,442,200 | | | | 32,717,155 | |
| | | | | | | | | | | | |
| | | | | | | | | | | 124,192,639 | |
| | | | | | | | | | | | |
United Kingdom 20.0% | | | | | | | | | | | | |
Aviva PLC | | | Insurance | | | | 7,557,114 | | | | 52,611,563 | |
BAE Systems PLC | | | Aerospace & Defense | | | | 11,438,470 | | | | 91,256,664 | |
Barclays PLC | | | Banks | | | | 29,338,430 | | | | 86,248,770 | |
BP PLC | | | Oil, Gas & Consumable Fuels | | | | 28,917,960 | | | | 189,198,002 | |
a Cobham PLC | | | Aerospace & Defense | | | | 22,941,809 | | | | 35,838,541 | |
HSBC Holdings PLC (GBP Traded) | | | Banks | | | | 11,683,650 | | | | 115,365,625 | |
HSBC Holdings PLC (HKD Traded) | | | Banks | | | | 989,600 | | | | 9,863,186 | |
Johnson Matthey PLC | | | Chemicals | | | | 2,214,526 | | | | 95,595,289 | |
Kingfisher PLC | | | Specialty Retail | | | | 23,879,104 | | | | 117,678,706 | |
Rolls-Royce Holdings PLC | | | Aerospace & Defense | | | | 5,040,818 | | | | 58,276,251 | |
Royal Dutch Shell PLC, B | | | Oil, Gas & Consumable Fuels | | | | 5,550,600 | | | | 177,391,674 | |
Shire PLC | | | Biotechnology | | | | 1,367,760 | | | | 58,552,950 | |
SIG PLC | | | Trading Companies & Distributors | | | | 26,088,083 | | | | 52,086,878 | |
a Standard Chartered PLC | | | Banks | | | | 16,424,505 | | | | 183,368,271 | |
Travis Perkins PLC | | | Trading Companies & Distributors | | | | 2,675,920 | | | | 47,347,212 | |
Vodafone Group PLC | | | Wireless Telecommunication Services | | | | 16,907,095 | | | | 47,433,456 | |
| | | | | | | | | | | | |
| | | | | | | | | | | 1,418,113,038 | |
| | | | | | | | | | | | |
United States 1.7% | | | | | | | | | | | | |
Oracle Corp. | | | Software | | | | 2,352,910 | | | | 119,221,950 | |
| | | | | | | | | | | | |
| | | |
Total Common Stocks
(Cost $5,904,639,395) | | | | | | | | | | | 6,949,740,441 | |
| | | | | | | | | | | | |
| | | | |
| | | |
| franklintempleton.com | | Semiannual Report | | 19 |
TEMPLETON FUNDS
STATEMENT OF INVESTMENTS (UNAUDITED)
Templeton Foreign Fund (continued)
| | | | | | | | |
| | | Principal | | | | |
| | | Amount | | | Value | |
| | |
Short Term Investments 1.4% | | | | | | | | |
| | |
Time Deposits 1.4% | | | | | | | | |
United States 1.4% | | | | | | | | |
National Australia Bank Ltd., 1.32%, 3/01/18 | | $ | 49,000,000 | | | $ | 49,000,000 | |
Royal Bank of Canada, 1.37%, 3/01/18 | | | 50,600,000 | | | | 50,600,000 | |
| | | | | | | | |
Total Time Deposits (Cost $99,600,000) | | | | | | | 99,600,000 | |
| | | | | | | | |
Total Investments (Cost $6,004,239,395) 99.6% | | | | | | | 7,049,340,441 | |
Other Assets, less Liabilities 0.4% | | | | | | | 31,792,478 | |
| | | | | | | | |
| | |
Net Assets 100.0% | | | | | | $ | 7,081,132,919 | |
| | | | | | | | |
See Abbreviations on page 32.
aNon-income producing.
| | | | |
| | | |
20 | | Semiannual Report | The accompanying notes are an integral part of these financial statements. | | franklintempleton.com |
TEMPLETON FUNDS
Financial Statements
Statement of Assets and Liabilities
February 28, 2018 (unaudited)
Templeton Foreign Fund
| | | | |
Assets: | | | | |
Investments in securities: | | | | |
Cost - Unaffiliated issuers | | | $6,004,239,395 | |
| | | | |
| |
Value - Unaffiliated issuers | | | $7,049,340,441 | |
Cash | | | 141,222 | |
Receivables: | | | | |
Investment securities sold | | | 18,955,475 | |
Capital shares sold | | | 9,600,254 | |
Dividends | | | 35,606,415 | |
European Union tax reclaims | | | 6,485,224 | |
Other assets | | | 7,662 | |
| | | | |
Total assets | | | 7,120,136,693 | |
| | | | |
Liabilities: | | | | |
Payables: | | | | |
Investment securities purchased | | | 18,019,798 | |
Capital shares redeemed | | | 13,270,350 | |
Management fees | | | 3,347,586 | |
Distribution fees | | | 948,336 | |
Transfer agent fees | | | 2,529,054 | |
Accrued expenses and other liabilities | | | 888,650 | |
| | | | |
Total liabilities | | | 39,003,774 | |
| | | | |
| |
Net assets, at value | | | $7,081,132,919 | |
| | | | |
| |
Net assets consist of: | | | | |
Paid-in capital | | | $6,554,544,194 | |
Distributions in excess of net investment income | | | (88,738 | ) |
Net unrealized appreciation (depreciation) | | | 1,045,922,677 | |
Accumulated net realized gain (loss) | | | (519,245,214 | ) |
| | | | |
| |
Net assets, at value | | | $7,081,132,919 | |
| | | | |
| | | | | | |
| | | |
| franklintempleton.com | | The accompanying notes are an integral part of these financial statements. | Semiannual Report | | 21 |
TEMPLETON FUNDS
FINANCIAL STATEMENTS
Statement of Assets and Liabilities (continued)
February 28, 2018 (unaudited)
Templeton Foreign Fund
| | | | |
Class A: | | | | |
Net assets, at value | | | $3,225,414,383 | |
| | | | |
Shares outstanding | | | 406,263,246 | |
| | | | |
Net asset value per sharea | | | $7.94 | |
| | | | |
Maximum offering price per share (net asset value per share ÷ 94.25%) | | | $8.42 | |
| | | | |
Class C: | | | | |
Net assets, at value | | | $ 339,981,134 | |
| | | | |
Shares outstanding | | | 43,815,785 | |
| | | | |
Net asset value and maximum offering price per sharea | | | $7.76 | |
| | | | |
Class R: | | | | |
Net assets, at value | | | $ 153,566,883 | |
| | | | |
Shares outstanding | | | 19,733,288 | |
| | | | |
Net asset value and maximum offering price per share | | | $7.78 | |
| | | | |
Class R6: | | | | |
Net assets, at value | | | $1,694,801,184 | |
| | | | |
Shares outstanding | | | 217,008,939 | |
| | | | |
Net asset value and maximum offering price per share | | | $7.81 | |
| | | | |
Advisor Class: | | | | |
Net assets, at value | | | $1,667,369,335 | |
| | | | |
Shares outstanding | | | 213,326,990 | |
| | | | |
Net asset value and maximum offering price per share | | | $7.82 | |
| | | | |
a Redemption price is equal to net asset value less contingent deferred sales charges, if applicable.
| | | | |
| | | |
22 | | Semiannual Report | The accompanying notes are an integral part of these financial statements. | | franklintempleton.com |
TEMPLETON FUNDS
FINANCIAL STATEMENTS
Statement of Operations
for the six months ended February 28, 2018 (unaudited)
Templeton Foreign Fund
| | | | |
Investment income: | | | | |
Dividends: (net of foreign taxes)* | | | | |
Unaffiliated issuers | | $ | 58,992,291 | |
Interest: | | | | |
Unaffiliated issuers | | | 1,011,769 | |
Income from securities loaned (net of fees and rebates) | | | 263 | |
Other income (Note 1d) | | | 123,845 | |
| | | | |
Total investment income | | | 60,128,168 | |
| | | | |
Expenses: | | | | |
Management fees (Note 3a) | | | 25,345,822 | |
Distribution fees: (Note 3c) | | | | |
Class A | | | 4,126,888 | |
Class C | | | 1,733,424 | |
Class R | | | 393,447 | |
Transfer agent fees: (Note 3e) | | | | |
Class A | | | 3,664,323 | |
Class C | | | 384,414 | |
Class R | | | 175,354 | |
Advisor Class | | | 1,859,493 | |
Custodian fees (Note 4) | | | 455,437 | |
Reports to shareholders | | | 263,418 | |
Registration and filing fees | | | 129,073 | |
Professional fees | | | 91,762 | |
Trustees’ fees and expenses | | | 69,904 | |
Other | | | 99,234 | |
| | | | |
Total expenses | | | 38,791,993 | |
Expense reductions (Note 4) | | | (8,785 | ) |
Expenses waived/paid by affiliates (Note 3f) | | | (547,041 | ) |
| | | | |
Net expenses | | | 38,236,167 | |
| | | | |
Net investment income | | | 21,892,001 | |
| | | | |
Realized and unrealized gains (losses): | | | | |
Net realized gain (loss) from: | | | | |
Investments: | | | | |
Unaffiliated issuers | | | (48,554,714 | ) |
Foreign currency transactions | | | 714,944 | |
| | | | |
Net realized gain (loss) | | | (47,839,770 | ) |
| | | | |
Net change in unrealized appreciation (depreciation) on: | | | | |
Investments: | | | | |
Unaffiliated issuers | | | 261,583,948 | |
Translation of other assets and liabilities denominated in foreign currencies | | | 336,917 | |
Change in deferred taxes on unrealized appreciation | | | 18,640 | |
| | | | |
Net change in unrealized appreciation (depreciation) | | | 261,939,505 | |
| | | | |
Net realized and unrealized gain (loss) | | | 214,099,735 | |
| | | | |
Net increase (decrease) in net assets resulting from operations | | $ | 235,991,736 | |
| | | | |
| |
* Foreign taxes withheld on dividends | | $ | 5,394,268 | |
| | | | | | |
| | | |
| franklintempleton.com | | The accompanying notes are an integral part of these financial statements. | Semiannual Report | | 23 |
TEMPLETON FUNDS
FINANCIAL STATEMENTS
Statements of Changes in Net Assets
Templeton Foreign Fund
| | | | | | | | | | |
| | | Six Months Ended
February 28, 2018
(unaudited) | | Year Ended
August 31, 2017 |
| | |
Increase (decrease) in net assets: | | | | | | | | | | |
Operations: | | | | | | | | | | |
Net investment income | | | $ | 21,892,001 | | | | | $ 108,202,782 | |
Net realized gain (loss) | | | | (47,839,770 | ) | | | | 14,297,012 | |
Net change in unrealized appreciation (depreciation) | | | | 261,939,505 | | | | | 826,815,827 | |
| | | | | |
Net increase (decrease) in net assets resulting from operations | | | | 235,991,736 | | | | | 949,315,621 | |
| | | | | |
Distributions to shareholders from: | | | | | | | | | | |
Net investment income: | | | | | | | | | | |
Class A | | | | (45,938,787 | ) | | | | (64,763,171 | ) |
Class C | | | | (2,307,230 | ) | | | | (4,271,133 | ) |
Class R | | | | (2,044,263 | ) | | | | (2,485,682 | ) |
Class R6 | | | | (38,039,633 | ) | | | | (18,746,684 | ) |
Advisor Class | | | | (28,775,654 | ) | | | | (26,220,193 | ) |
| | | | | |
Total distributions to shareholders. | | | | (117,105,567 | ) | | | | (116,486,863 | ) |
| | | | | |
Capital share transactions: (Note 2) | | | | | | | | | | |
Class A | | | | (118,148,135 | ) | | | | (815,372,950 | ) |
Class C | | | | (13,153,133 | ) | | | | (100,355,661 | ) |
Class R | | | | (2,801,788 | ) | | | | (26,136,626 | ) |
Class R6 | | | | (87,696,422 | ) | | | | 740,372,787 | |
Advisor Class | | | | (78,734,928 | ) | | | | 424,271,853 | |
| | | | | |
Total capital share transactions | | | | (300,534,406 | ) | | | | 222,779,403 | |
| | | | | |
Net increase (decrease) in net assets | | | | (181,648,237 | ) | | | | 1,055,608,161 | |
Net assets: | | | | | | | | | | |
Beginning of period | | | | 7,262,781,156 | | | | | 6,207,172,995 | |
| | | | | |
End of period | | | $ | 7,081,132,919 | | | | | $7,262,781,156 | |
| | | | | |
Undistributed net investment income included in net assets: | | | | | | | | | | |
End of period | | | $ | — | | | | $ | 95,124,828 | |
| | | | | |
Distributions in excess of net investment income included in net assets: | | | | | | | | | | |
End of period | | | $ | (88,738 | ) | | | $ | — | |
| | | | | |
| | | | |
| | | |
24 | | Semiannual Report | The accompanying notes are an integral part of these financial statements. | | franklintempleton.com |
TEMPLETON FUNDS
Notes to Financial Statements (unaudited)
Templeton Foreign Fund
1. Organization and Significant Accounting Policies
Templeton Funds (Trust) is registered under the Investment Company Act of 1940 (1940 Act) as an open-end management investment company, consisting of two separate funds and applies the specialized accounting and reporting guidance in U.S. Generally Accepted Accounting Principles (U.S. GAAP). Templeton Foreign Fund (Fund) is included in this report. The Fund offers five classes of shares: Class A, Class C, Class R, Class R6 and Advisor Class. Each class of shares may differ by its initial sales load, contingent deferred sales charges, voting rights on matters affecting a single class, its exchange privilege and fees due to differing arrangements for distribution and transfer agent fees.
The following summarizes the Fund’s significant accounting policies.
a. Financial Instrument Valuation
The Fund’s investments in financial instruments are carried at fair value daily. Fair value is the price that would be received to sell an asset or paid to transfer a liability in an orderly transaction between market participants on the measurement date. The Fund calculates the net asset value (NAV) per share as of 4 p.m. Eastern time each day the New York Stock Exchange (NYSE) is open for trading. Under compliance policies and procedures approved by the Trust’s Board of Trustees (the Board), the Fund’s administrator has responsibility for oversight of valuation, including leading the cross-functional Valuation Committee (VC). The VC provides administration and oversight of the Fund’s valuation policies and procedures, which are approved annually by the Board. Among other things, these procedures allow the Fund to utilize independent pricing services, quotations from securities and financial instrument dealers, and other market sources to determine fair value.
Equity securities listed on an exchange or on the NASDAQ National Market System are valued at the last quoted sale price or the official closing price of the day, respectively. Foreign equity securities are valued as of the close of trading on the foreign stock exchange on which the security is primarily traded, or as of 4 p.m. Eastern time. The value is then converted into its U.S. dollar equivalent at the foreign exchange rate in effect at 4 p.m. Eastern time on the day that the value of the security is determined. Over-the-counter (OTC) securities are valued within the range of the most recent quoted bid and ask
prices. Securities that trade in multiple markets or on multiple exchanges are valued according to the broadest and most representative market. Certain equity securities are valued based upon fundamental characteristics or relationships to similar securities.
Investments in time deposits are valued at cost, which approximates fair value.
The Fund has procedures to determine the fair value of financial instruments for which market prices are not reliable or readily available. Under these procedures, the VC convenes on a regular basis to review such financial instruments and considers a number of factors, including significant unobservable valuation inputs, when arriving at fair value. The VC primarily employs a market-based approach which may use related or comparable assets or liabilities, recent transactions, market multiples, book values, and other relevant information for the investment to determine the fair value of the investment. An income-based valuation approach may also be used in which the anticipated future cash flows of the investment are discounted to calculate fair value. Discounts may also be applied due to the nature or duration of any restrictions on the disposition of the investments. Due to the inherent uncertainty of valuations of such investments, the fair values may differ significantly from the values that would have been used had an active market existed. The VC employs various methods for calibrating these valuation approaches including a regular review of key inputs and assumptions, transactional back-testing or disposition analysis, and reviews of any related market activity.
Trading in securities on foreign securities stock exchanges and OTC markets may be completed before 4 p.m. Eastern time. In addition, trading in certain foreign markets may not take place on every Fund’s business day. Occasionally, events occur between the time at which trading in a foreign security is completed and 4 p.m. Eastern time that might call into question the reliability of the value of a portfolio security held by the Fund. As a result, differences may arise between the value of the Fund’s portfolio securities as determined at the foreign market close and the latest indications of value at 4 p.m. Eastern time. In order to minimize the potential for these differences, the VC monitors price movements following the close of trading in foreign stock markets through a series of country specific market proxies (such as baskets of American Depositary Receipts, futures contracts and exchange traded funds). These price movements are measured against established trigger thresholds for each specific market proxy to
| | | | |
| | | |
| franklintempleton.com | | Semiannual Report | | 25 |
TEMPLETON FUNDS
NOTES TO FINANCIAL STATEMENTS (UNAUDITED)
Templeton Foreign Fund (continued)
1. Organization and Significant Accounting Policies (continued)
a. Financial Instrument Valuation (continued)
assist in determining if an event has occurred that may call into question the reliability of the values of the foreign securities held by the Fund. If such an event occurs, the securities may be valued using fair value procedures, which may include the use of independent pricing services. At February 28, 2018, a market event occurred resulting in a portion of the securities held by the Fund being valued using fair value procedures.
When the last day of the reporting period is a non-business day, certain foreign markets may be open on those days that the Fund’s NAV is not calculated, which could result in differences between the value of the Fund’s portfolio securities on the last business day and the last calendar day of the reporting period. Any significant security valuation changes due to an open foreign market are adjusted and reflected by the Fund for financial reporting purposes.
b. Foreign Currency Translation
Portfolio securities and other assets and liabilities denominated in foreign currencies are translated into U.S. dollars based on the exchange rate of such currencies against U.S. dollars on the date of valuation. The Fund may enter into foreign currency exchange contracts to facilitate transactions denominated in a foreign currency. Purchases and sales of securities, income and expense items denominated in foreign currencies are translated into U.S. dollars at the exchange rate in effect on the transaction date. Portfolio securities and assets and liabilities denominated in foreign currencies contain risks that those currencies will decline in value relative to the U.S. dollar. Occasionally, events may impact the availability or reliability of foreign exchange rates used to convert the U.S. dollar equivalent value. If such an event occurs, the foreign exchange rate will be valued at fair value using procedures established and approved by the Board.
The Fund does not separately report the effect of changes in foreign exchange rates from changes in market prices on securities held. Such changes are included in net realized and unrealized gain or loss from investments in the Statement of Operations.
Realized foreign exchange gains or losses arise from sales of foreign currencies, currency gains or losses realized between the trade and settlement dates on securities transactions and the difference between the recorded amounts of dividends, interest,
and foreign withholding taxes and the U.S. dollar equivalent of the amounts actually received or paid. Net unrealized foreign exchange gains and losses arise from changes in foreign exchange rates on foreign denominated assets and liabilities other than investments in securities held at the end of the reporting period.
c. Securities Lending
The Fund participates in an agency based securities lending program to earn additional income. The Fund receives cash collateral against the loaned securities in an amount equal to at least 102% of the fair value of the loaned securities. Collateral is maintained over the life of the loan in an amount not less than 100% of the fair value of loaned securities, as determined at the close of Fund business each day; any additional collateral required due to changes in security values is delivered to the Fund on the next business day. The collateral is deposited into a joint cash account with other funds and is used to invest in a money market fund managed by Franklin Advisers, Inc., an affiliate of the Fund. The Fund may receive income from the investment of cash collateral, in addition to lending fees and rebates paid by the borrower. Income from securities loaned is reported separately in the Statement of Operations. The Fund bears the market risk with respect to the collateral investment, securities loaned, and the risk that the agent may default on its obligations to the Fund. If the borrower defaults on its obligation to return the securities loaned, the Fund has the right to repurchase the securities in the open market using the collateral received. The securities lending agent has agreed to indemnify the Fund in the event of default by a third party borrower. At February 28, 2018, the Fund had no securities on loan.
d. Income and Deferred Taxes
It is the Fund’s policy to qualify as a regulated investment company under the Internal Revenue Code. The Fund intends to distribute to shareholders substantially all of its taxable income and net realized gains to relieve it from federal income and excise taxes. As a result, no provision for U.S. federal income taxes is required.
The Fund may be subject to foreign taxation related to income received, capital gains on the sale of securities and certain foreign currency transactions in the foreign jurisdictions in which it invests. Foreign taxes, if any, are recorded based on the tax regulations and rates that exist in the foreign markets in which the Fund invests. When a capital gain tax is determined
| | | | |
| | | |
26 | | Semiannual Report | | franklintempleton.com |
TEMPLETON FUNDS
NOTES TO FINANCIAL STATEMENTS (UNAUDITED)
Templeton Foreign Fund (continued)
to apply, the Fund records an estimated deferred tax liability in an amount that would be payable if the securities were disposed of on the valuation date.
As a result of several court cases, in certain countries across the European Union, the Fund filed additional tax reclaims for previously withheld taxes on dividends earned in those countries (EU reclaims). These additional filings are subject to various administrative proceedings by the local jurisdictions’ tax authorities within the European Union, as well as a number of related judicial proceedings. Income recognized, if any, for EU reclaims is reflected as other income in the Statement of Operations and any related receivable, if any, is reflected as European Union tax reclaims in the Statement of Assets and Liabilities. When uncertainty exists as to the ultimate resolution of these proceedings, the likelihood of receipt of these EU reclaims, and the potential timing of payment, no amounts are reflected in the financial statements. For U.S. income tax purposes, EU reclaims received by the Fund, if any, reduce the amounts of foreign taxes Fund shareholders can use as tax credits in their individual income tax returns.
The Fund may recognize an income tax liability related to its uncertain tax positions under U.S. GAAP when the uncertain tax position has a less than 50% probability that it will be sustained upon examination by the tax authorities based on its technical merits. As of February 28, 2018, the Fund has determined that no tax liability is required in its financial statements related to uncertain tax positions for any open tax years (or expected to be taken in future tax years). Open tax years are those that remain subject to examination and are based on the statute of limitations in each jurisdiction in which the Fund invests.
e. Security Transactions, Investment Income, Expenses and Distributions
Security transactions are accounted for on trade date. Realized gains and losses on security transactions are determined on a specific identification basis. Interest income and estimated expenses are accrued daily. Amortization of premium and accretion of discount on debt securities are included in interest income. Dividend income is recorded on the ex-dividend date except for certain dividends from foreign securities where the
dividend rate is not available. In such cases, the dividend is recorded as soon as the information is received by the Fund. Distributions to shareholders are recorded on the ex-dividend date. Distributable earnings are determined according to income tax regulations (tax basis) and may differ from earnings recorded in accordance with U.S. GAAP. These differences may be permanent or temporary. Permanent differences are reclassified among capital accounts to reflect their tax character. These reclassifications have no impact on net assets or the results of operations. Temporary differences are not reclassified, as they may reverse in subsequent periods.
Common expenses incurred by the Trust are allocated among the Funds based on the ratio of net assets of each Fund to the combined net assets of the Trust. Fund specific expenses are charged directly to the Fund that incurred the expense.
Realized and unrealized gains and losses and net investment income, excluding class specific expenses, are allocated daily to each class of shares based upon the relative proportion of net assets of each class. Differences in per share distributions by class are generally due to differences in class specific expenses.
f. Accounting Estimates
The preparation of financial statements in accordance with U.S. GAAP requires management to make estimates and assumptions that affect the reported amounts of assets and liabilities at the date of the financial statements and the amounts of income and expenses during the reporting period. Actual results could differ from those estimates.
g. Guarantees and Indemnifications
Under the Trust’s organizational documents, its officers and trustees are indemnified by the Trust against certain liabilities arising out of the performance of their duties to the Trust. Additionally, in the normal course of business, the Trust, on behalf of the Fund enters into contracts with service providers that contain general indemnification clauses. The Trust’s maximum exposure under these arrangements is unknown as this would involve future claims that may be made against the Trust that have not yet occurred. Currently, the Trust expects the risk of loss to be remote.
| | | | |
| | | |
| franklintempleton.com | | Semiannual Report | | 27 |
TEMPLETON FUNDS
NOTES TO FINANCIAL STATEMENTS (UNAUDITED)
Templeton Foreign Fund (continued)
2. Shares of Beneficial Interest
At February 28, 2018, there were an unlimited number of shares authorized (without par value). Transactions in the Fund’s shares were as follows:
| | | | | | | | | | | | | | | | |
| | | Six Months Ended | | | Year Ended | |
| | | February 28, 2018 | | | August 31, 2017 | |
| | | Shares | | | Amount | | | Shares | | | Amount | |
| | | | |
Class A Shares: | | | | | | | | | | | | | | | | |
Shares sold | | | 40,603,328 | | | $ | 326,166,773 | | | | 69,944,632 | | | $ | 518,364,798 | |
Shares issued in reinvestment of distributions | | | 5,091,689 | | | | 40,682,593 | | | | 8,520,627 | | | | 59,218,357 | |
Shares redeemed | | | (60,437,946 | ) | | | (484,997,501 | ) | | | (188,300,572 | ) | | | (1,392,956,105 | ) |
| | | | |
Net increase (decrease) | | | (14,742,929 | ) | | $ | (118,148,135 | ) | | | (109,835,313 | ) | | $ | (815,372,950 | ) |
| | | | |
Class C Shares: | | | | | | | | | | | | | | | | |
Shares sold | | | 2,281,964 | | | $ | 17,996,381 | | | | 3,960,939 | | | $ | 28,641,978 | |
Shares issued in reinvestment of distributions | | | 285,471 | | | | 2,232,380 | | | | 554,617 | | | | 3,771,397 | |
Shares redeemed | | | (4,257,240 | ) | | | (33,381,894 | ) | | | (18,450,513 | ) | | | (132,769,036 | ) |
| | | | |
Net increase (decrease) | | | (1,689,805 | ) | | $ | (13,153,133 | ) | | | (13,934,957 | ) | | $ | (100,355,661 | ) |
| | | | |
Class R Shares: | | | | | | | | | | | | | | | | |
Shares sold | | | 3,679,469 | | | $ | 28,967,831 | | | | 5,244,477 | | | $ | 38,061,455 | |
Shares issued in reinvestment of distributions | | | 239,779 | | | | 1,879,867 | | | | 333,980 | | | | 2,277,746 | |
Shares redeemed | | | (4,246,212 | ) | | | (33,649,486 | ) | | | (9,259,421 | ) | | | (66,475,827 | ) |
| | | | |
Net increase (decrease) | | | (326,964 | ) | | $ | (2,801,788 | ) | | | (3,680,964 | ) | | $ | (26,136,626 | ) |
| | | | |
Class R6 Shares: | | | | | | | | | | | | | | | | |
Shares sold | | | 45,352,941 | | | $ | 360,891,408 | | | | 150,845,920 | | | $ | 1,114,127,521 | |
Shares issued in reinvestment of distributions | | | 4,723,492 | | | | 37,079,411 | | | | 2,617,825 | | | | 17,905,922 | |
Shares redeemed | | | (61,225,747 | ) | | | (485,667,241 | ) | | | (55,118,532 | ) | | | (391,660,656 | ) |
| | | | |
Net increase (decrease) | | | (11,149,314 | ) | | $ | (87,696,422 | ) | | | 98,345,213 | | | $ | 740,372,787 | |
| | | | |
Advisor Class Shares: | | | | | | | | | | | | | | | | |
Shares sold | | | 36,671,414 | | | $ | 289,783,554 | | | | 132,077,858 | | | $ | 979,961,944 | |
Shares issued in reinvestment of distributions | | | 3,269,695 | | | | 25,699,806 | | | | 3,306,454 | | | | 22,649,209 | |
Shares redeemed | | | (49,610,559 | ) | | | (394,218,288 | ) | | | (78,433,995 | ) | | | (578,339,300 | ) |
| | | | |
Net increase (decrease) | | | (9,669,450 | ) | | $ | (78,734,928 | ) | | | 56,950,317 | | | $ | 424,271,853 | |
3. Transactions with Affiliates
Franklin Resources, Inc. is the holding company for various subsidiaries that together are referred to as Franklin Templeton Investments. Certain officers and trustees of the Trust are also officers and/or directors of the following subsidiaries:
| | | | |
| Subsidiary | | Affiliation | | |
| | |
Templeton Global Advisors Limited (TGAL) | | Investment manager | | |
| | |
Franklin Templeton Services, LLC (FT Services) | | Administrative manager | | |
| | |
Franklin Templeton Distributors, Inc. (Distributors) | | Principal underwriter | | |
| | |
Franklin Templeton Investor Services, LLC (Investor Services) | | Transfer agent | | |
| | | | |
| | | |
28 | | Semiannual Report | | franklintempleton.com |
TEMPLETON FUNDS
NOTES TO FINANCIAL STATEMENTS (UNAUDITED)
Templeton Foreign Fund (continued)
a. Management Fees
The Fund pays an investment management fee to TGAL based on the average daily net assets of the Fund as follows:
| | |
| Annualized Fee Rate | | Net Assets |
| |
0.705% | | Up to and including $1 billion |
| |
0.690% | | Over $1 billion, up to and including $5 billion |
| |
0.675% | | Over $5 billion, up to and including $10 billion |
| |
0.655% | | Over $10 billion, up to and including $15 billion |
| |
0.635% | | Over $15 billion, up to and including $20 billion |
| |
0.615% | | Over $20 billion, up to and including $25 billion |
| |
0.605% | | Over $25 billion, up to and including $30 billion |
| |
0.595% | | Over $30 billion, up to and including $35 billion |
| |
0.585% | | In excess of $35 billion |
For the period ended February 28, 2018, the annualized gross effective investment management fee rate was 0.687% of the Fund’s average daily net assets.
b. Administrative Fees
Under an agreement with TGAL, FT Services provides administrative services to the Fund. The fee is paid by TGAL based on the Fund’s average daily net assets, and is not an additional expense of the Fund.
c. Distribution Fees
The Board has adopted distribution plans for each share class, with the exception of Class R6 and Advisor Class shares, pursuant to Rule 12b-1 under the 1940 Act. Under the Fund’s Class A reimbursement distribution plan, the Fund reimburses Distributors for costs incurred in connection with the servicing, sale and distribution of the Fund’s shares up to the maximum annual plan rate. Under the Class A reimbursement distribution plan, costs exceeding the maximum for the current plan year cannot be reimbursed in subsequent periods. In addition, under the Fund’s Class C and R compensation distribution plans, the Fund pays Distributors for costs incurred in connection with the servicing, sale and distribution of the Fund’s shares up to the maximum annual plan rate for each class. The plan year, for purposes of monitoring compliance with the maximum annual plan rates, is February 1 through January 31.
The maximum annual plan rates, based on the average daily net assets, for each class, are as follows:
| | | | |
Class A | | | 0.25 | % |
Class C | | | 1.00 | % |
Class R | | | 0.50 | % |
d. Sales Charges/Underwriting Agreements
Front-end sales charges and contingent deferred sales charges (CDSC) do not represent expenses of the Fund. These charges are deducted from the proceeds of sales of Fund shares prior to investment or from redemption proceeds prior to remittance, as applicable. Distributors has advised the Fund of the following commission transactions related to the sales and redemptions of the Fund’s shares for the period:
| | | | |
Sales charges retained net of commissions paid to unaffiliated brokers/dealers | | $ | 220,367 | |
| |
CDSC retained | | $ | 6,812 | |
| | | | |
| | | |
| franklintempleton.com | | Semiannual Report | | 29 |
TEMPLETON FUNDS
NOTES TO FINANCIAL STATEMENTS (UNAUDITED)
Templeton Foreign Fund (continued)
3. Transactions with Affiliates (continued)
e. Transfer Agent Fees
Each class of shares pays transfer agent fees to Investor Services for its performance of shareholder servicing obligations. Effective November 1, 2017, the fees are based on an annualized asset based fee of 0.02% plus a transaction based fee. Prior to November 1, 2017, the fees were account based fees that varied based on fund or account type. In addition, each class reimburses Investor Services for out of pocket expenses incurred and, except for Class R6, reimburses shareholder servicing fees paid to third parties. These fees are allocated daily based upon their relative proportion of such classes’ aggregate net assets. Class R6 pays Investor Services transfer agent fees specific to that class.
For the period ended February 28, 2018, the Fund paid transfer agent fees of $ 6,083,584, of which $1,425,755 was retained by Investor Services.
f. Waiver and Expense Reimbursements
Effective February 1, 2018, TGAL has voluntarily agreed in advance to waive or limit its fees and to assume as its own expense certain expenses otherwise payable by the Fund so that the expenses (excluding distribution fees, acquired fund fees and expenses, and dividend expense on securities sold short for Class A, Class C, Class R and Advisor Class of the Fund do not exceed 0.85%, and Class R6 does not exceed 0.65% based on the average net assets of each class (other than certain non-routine expenses or costs, including those relating to litigation, indemnification, reorganizations, and liquidations) until December 31, 2019. Total expenses waived or paid are not subject to recapture subsequent to the Fund’s fiscal year end. Additionally, Investor Services has voluntarily agreed in advance to waive or limit its fees so that the Class R6 transfer agent fees do not exceed 0.02%. Investor Services may discontinue this waiver in the future.
4. Expense Offset Arrangement
The Fund has entered into an arrangement with its custodian whereby credits realized as a result of uninvested cash balances are used to reduce a portion of the Fund’s custodian expenses. During the period ended February 28, 2018, the custodian fees were reduced as noted in the Statement of Operations.
5. Income Taxes
For tax purposes, capital losses may be carried over to offset future capital gains, if any. At August 31, 2017, the Fund had long-term capital loss carryforwards of $455,122,210.
At February 28, 2018, the cost of investments, net unrealized appreciation (depreciation) and undistributed ordinary income for income tax purposes were as follows:
| | | | |
Cost of investments | | $ | 6,021,673,437 | |
| |
Unrealized appreciation | | $ | 1,387,508,958 | |
Unrealized depreciation | | | (359,841,954 | ) |
| |
Net unrealized appreciation (depreciation) | | $ | 1,027,667,004 | |
Differences between income and/or capital gains as determined on a book basis and a tax basis are primarily due to differing treatments of passive foreign investment company shares and wash sales.
| | | | |
| | | |
30 | | Semiannual Report | | franklintempleton.com |
TEMPLETON FUNDS
NOTES TO FINANCIAL STATEMENTS (UNAUDITED)
Templeton Foreign Fund (continued)
6. Investment Transactions
Purchases and sales of investments (excluding short term securities) for the period ended February 28, 2018, aggregated $852,568,145 and $1,149,020,812, respectively.
7. Concentration of Risk
Investing in foreign securities may include certain risks and considerations not typically associated with investing in U.S. securities, such as fluctuating currency values and changing local and regional economic, political and social conditions, which may result in greater market volatility. In addition, certain foreign securities may not be as liquid as U.S. securities.
8. Credit Facility
The Fund, together with other U.S. registered and foreign investment funds (collectively, Borrowers), managed by Franklin Templeton Investments, are borrowers in a joint syndicated senior unsecured credit facility totaling $2 billion (Global Credit Facility) which matures on February 8, 2019. This Global Credit Facility provides a source of funds to the Borrowers for temporary and emergency purposes, including the ability to meet future unanticipated or unusually large redemption requests.
Under the terms of the Global Credit Facility, the Fund shall, in addition to interest charged on any borrowings made by the Fund and other costs incurred by the Fund, pay its share of fees and expenses incurred in connection with the implementation and maintenance of the Global Credit Facility, based upon its relative share of the aggregate net assets of all of the Borrowers, including an annual commitment fee of 0.15% based upon the unused portion of the Global Credit Facility. These fees are reflected in other expenses in the Statement of Operations. During the period ended February 28, 2018, the Fund did not use the Global Credit Facility.
9. Fair Value Measurements
The Fund follows a fair value hierarchy that distinguishes between market data obtained from independent sources (observable inputs) and the Fund’s own market assumptions (unobservable inputs). These inputs are used in determining the value of the Fund’s financial instruments and are summarized in the following fair value hierarchy:
| | • | | Level 1 – quoted prices in active markets for identical financial instruments |
| | • | | Level 2 – other significant observable inputs (including quoted prices for similar financial instruments, interest rates, prepayment speed, credit risk, etc.) |
| | • | | Level 3 – significant unobservable inputs (including the Fund’s own assumptions in determining the fair value of financial instruments) |
The input levels are not necessarily an indication of the risk or liquidity associated with financial instruments at that level.
For movements between the levels within the fair value hierarchy, the Fund has adopted a policy of recognizing the transfers as of the date of the underlying event which caused the movement.
| | | | |
| | | |
| franklintempleton.com | | Semiannual Report | | 31 |
TEMPLETON FUNDS
NOTES TO FINANCIAL STATEMENTS (UNAUDITED)
Templeton Foreign Fund (continued)
9. Fair Value Measurements (continued)
A summary of inputs used as of February 28, 2018, in valuing the Fund’s assets carried at fair value, is as follows:
| | | | | | | | | | | | | | | | |
| | | Level 1 | | | Level 2 | | | Level 3 | | | Total | |
| | | | |
Assets: | | | | | | | | | | | | | | | | |
Investments in Securities:a | | | | | | | | | | | | | | | | |
Equity Investments:b | | | | | | | | | | | | | | | | |
Taiwan | | $ | — | | | $ | 153,451,557 | | | $ | — | | | $ | 153,451,557 | |
All Other Equity Investments | | | 6,796,288,884 | | | | — | | | | — | | | | 6,796,288,884 | |
Short Term Investments | | | — | | | | 99,600,000 | | | | — | | | | 99,600,000 | |
Total Investments in Securities | | $ | 6,796,288,884 | | | $ | 253,051,557 | | | $ | — | | | $ | 7,049,340,441 | |
a For detailed categories, see the accompanying Statement of Investments.
bIncludes common stocks.
10. Subsequent Events
The Fund has evaluated subsequent events through the issuance of the financial statements and determined that no events have occurred that require disclosure.
Abbreviations
| | |
| Selected Portfolio |
| |
| ADR | | American Depositary Receipt |
| |
| IDR | | International Depositary Receipt |
| |
| NVDR | | Non-Voting Depositary Receipt |
| | | | |
| | | |
32 | | Semiannual Report | | franklintempleton.com |
TEMPLETON FUNDS
TEMPLETON FOREIGN FUND
Special Meeting of Shareholders
MEETING OF SHAREHOLDERS: OCTOBER 30, 2017 AND RECONVENED ON DECEMBER 15, 2017
(UNAUDITED)
A Special Meeting of Shareholders of Templeton Funds was held at the offices of Franklin Templeton Investments, One Franklin Parkway, San Mateo, California on October 30, 2017 and reconvened on December 15, 2017. The purpose of the meeting was to elect Trustees of Templeton Funds and to vote on the following proposals: to approve the use of a “manager of managers” structure whereby the Fund’s investment manager would be able to hire and replace subadvisers without shareholder approval; and to approve an amended fundamental investment restriction regarding investments in commodities for the Fund. At the meeting, (i) the following persons were elected by the shareholders to serve as Trustees of Templeton Funds: Harris J. Ashton, Ann Torre Bates, Mary C. Choksi, Edith E. Holiday, Gregory E. Johnson, Rupert H. Johnson, Jr., J. Michael Luttig, David W. Niemiec, Larry D. Thompson, Constantine D. Tseretopoulos and Robert E. Wade; and (ii) the proposals to use a “manager of managers” structure and to approve the amended fundamental investment restriction regarding investments in commodities were approved by shareholders of the Fund. No other business was transacted at the meeting.
In connection with the meeting, management is aware that some shareholders received from the proxy solicitor numerous calls and mailings that may have been distracting. Management is taking steps to ensure that, in the future, for any new shareholder meeting solicitations that occur, such activity is not repeated. Management apologizes for any inconvenience that may have been caused as a result of such calls and mailings.
The results of the voting at the meeting are as follows:
| Proposal 1. | To elect a Board of Trustees: |
| | | | | | | | |
| Name | | For | | | Withheld | |
| | |
Harris J. Ashton | | | 654,630,558 | | | | 25,820,888 | |
| | |
Ann Torre Bates | | | 655,508,550 | | | | 24,942,896 | |
| | |
Mary C. Choksi | | | 655,587,180 | | | | 24,864,266 | |
| | |
Edith E. Holiday | | | 655,452,139 | | | | 24,999,307 | |
| | |
Gregory E. Johnson | | | 655,319,916 | | | | 25,131,529 | |
| | |
Rupert H. Johnson, Jr. | | | 654,824,311 | | | | 25,627,134 | |
| | |
J. Michael Luttig | | | 655,213,382 | | | | 25,238,064 | |
| | |
David W. Niemiec | | | 655,019,957 | | | | 25,431,488 | |
| | |
Larry D. Thompson | | | 655,060,509 | | | | 25,390,936 | |
| | |
Constantine D. Tseretopoulos | | | 655,237,345 | | | | 25,214,100 | |
| | |
Robert E. Wade | | | 655,537,220 | | | | 24,914,227 | |
Total Trust Shares Outstanding*: 1,210,818,878
* As of the record date.
| | | | |
| | | |
| franklintempleton.com | | Semiannual Report | | 33 |
TEMPLETON FUNDS
TEMPLETON FOREIGN FUND
SPECIAL MEETING OF SHAREHOLDERS
| Proposal 2. | To approve the use of a “manager of managers” structure whereby the Fund’s investment manager would be able to hire and replace subadvisers without shareholder approval: |
| | | | |
| | | Shares | |
| |
For | | | 354,091,655 | |
| |
Against | | | 18,313,953 | |
| |
Abstain | | | 12,794,642 | |
| |
Broker Non-Votes | | | 114,259,004 | |
| |
Total Fund Shares Voted | | | 499,459,255 | |
| |
Total Fund Shares Outstanding* | | | 938,738,937 | |
| Proposal 3. | To approve an amended fundamental investment restriction regarding investments in commodities: |
| | | | |
| | | Shares | |
| |
For | | | 353,659,752 | |
| |
Against | | | 16,270,717 | |
| |
Abstain | | | 15,269,779 | |
| |
Broker Non-Votes | | | 114,259,004 | |
| |
Total Fund Shares Voted | | | 499,459,255 | |
| |
Total Fund Shares Outstanding* | | | 938,738,937 | |
| | | | |
| | | |
34 | | Semiannual Report | | franklintempleton.com |
TEMPLETON FUNDS
TEMPLETON FOREIGN FUND
Shareholder Information
Proxy Voting Policies and Procedures
The Fund’s investment manager has established Proxy Voting Policies and Procedures (Policies) that the Fund uses to determine how to vote proxies relating to portfolio securities. Shareholders may view the Fund’s complete Policies online at franklintempleton.com. Alternatively, shareholders may request copies of the Policies free of charge by calling the Proxy Group collect at (954) 527-7678 or by sending a written request to: Franklin Templeton Companies, LLC, 300 S.E. 2nd Street, Fort Lauderdale, FL 33301, Attention: Proxy Group. Copies of the Fund’s proxy voting records are also made available online at franklintempleton.com and posted on the US Securities and Exchange Commission’s website at sec.gov and reflect the most recent 12-month period ended June 30.
Quarterly Statement of Investments
The Trust, on behalf of the Fund, files a complete statement of investments with the US Securities and Exchange Commission for the first and third quarters for each fiscal year on Form N-Q. Shareholders may view the filed Form N-Q by visiting the Commission’s website at sec.gov. The filed form may also be viewed and copied at the Commission’s Public Reference Room in Washington, DC. Information regarding the operations of the Public Reference Room may be obtained by calling (800) SEC-0330.
| | | | |
| | | |
| franklintempleton.com | | Semiannual Report | | 35 |
| | | | | | | | |
| | | |
| | |  | | | | | Semiannual Report and Shareholder Letter |
| | | | | Templeton Foreign Fund |
| | | | | Investment Manager |
| | | | | Templeton Global Advisors Limited |
| | | | | Distributor |
| | | | | Franklin Templeton Distributors, Inc. |
| | | | | (800) DIAL BEN® / 342-5236 |
| | | | | franklintempleton.com |
| | | | | Shareholder Services |
| | | | | (800) 632-2301 |
Authorized for distribution only when accompanied or preceded by a summary prospectus and/or prospectus. Investors should carefully consider a fund’s investment goals, risks, charges and expenses before investing. A prospectus contains this and other information; please read it carefully before investing. To help ensure we provide you with quality service, all calls to and from our service areas are monitored and/or recorded. |
| © 2018 Franklin Templeton Investments. All rights reserved. | | 104 S 04/18 |
| | | | |
| | | | | Semiannual Report and Shareholder Letter February 28, 2018 |
Sign up for electronic delivery at franklintempleton.com/edelivery
Franklin Templeton Investments
Why choose Franklin Templeton Investments?
Successful investing begins with ambition. And achievement only comes when you reach for it. That’s why we continually strive to deliver better outcomes for investors. No matter what your goals are, our deep, global investment expertise allows us to offer solutions that can help.
During our more than 70 years of experience, we’ve managed through all kinds of markets—up, down and those in between. We’re always preparing for what may come next. It’s because of this, combined with our strength as one of the world’s largest asset managers that we’ve earned the trust of millions of investors around the world.
Dear Shareholder:
During the six months ended February 28, 2018, mostly upbeat global economic data, improved corporate earnings and generally supportive monetary policies benefited global securities markets. The European Central Bank (ECB) and the Bank of Japan (BOJ) kept their benchmark interest rates unchanged, while the US Federal Reserve (Fed) raised the target range for the federal funds rate at its December 2017 meeting amid signs of a growing US economy. The BOJ maintained its quantitative easing measures during the period, while the ECB began to reduce its bond purchases in January 2018. The Fed also began a gradual reduction in its balance sheet during the period as part of its ongoing plan to normalize US monetary policy. However, investors expressed concerns about the pace of central bankers’ monetary policy tightening amid an improving economic outlook. In this environment, global developed and emerging market stocks generated strong returns, as measured by the MSCI All Country World Index.
We are committed to our long-term perspective and disciplined investment approach as we conduct a rigorous, fundamental analysis of securities with a regular emphasis on investment risk management.
Historically, patient investors have achieved rewarding results by evaluating their goals, diversifying their assets globally and maintaining a disciplined investment program, all hallmarks of the Templeton investment philosophy developed more than 60 years ago. We continue to recommend investors consult their financial advisors and review their portfolios to design a
long-term strategy and portfolio allocation that meet their individual needs, goals and risk tolerance.
Templeton World Fund’s semiannual report includes more detail about prevailing conditions and a discussion about investment decisions during the period. Please remember all securities markets fluctuate, as do mutual fund share prices.
We thank you for investing with Franklin Templeton, welcome your questions and comments, and look forward to serving your investment needs in the years ahead.
Sincerely,
Norman J. Boersma, CFA
President and Chief Executive Officer –
Investment Management
Templeton Funds
This letter reflects our analysis and opinions as of February 28, 2018, unless otherwise indicated. The information is not a complete analysis of every aspect of any market, country, industry, security or fund. Statements of fact are from sources considered reliable.
CFA® is a trademark owned by CFA Institute.
| | |
| | Not FDIC Insured | May Lose Value | No Bank Guarantee |
| | | | |
| | | |
| franklintempleton.com | | Not part of the semiannual report | | 1 |
Visit franklintempleton.com for fund updates, to access your account, or to find helpful financial planning tools.
| | | | |
| | | |
2 | | Semiannual Report | | franklintempleton.com |
Semiannual Report
Templeton World Fund
This semiannual report for Templeton World Fund covers the period ended February 28, 2018.
Your Fund’s Goal and Main Investments
The Fund seeks long-term capital growth. Under normal market conditions, the Fund invests primarily in equity securities of companies located anywhere in the world, including developing markets. Under normal circumstances, the Fund will invest in issuers located in at least three different countries (including the US). The Fund regularly uses certain derivative instruments to seek to hedge against currency risks.
Performance Overview
The Fund’s Class A shares delivered a +4.87% cumulative total return for the six months under review. In comparison, the Fund’s benchmark, the MSCI All Country World Index (ACWI) 100% Hedged to USD, which measures stock performance in global developed and emerging markets, generated a +8.45% total return.1 Also in comparison, the Fund’s second benchmark, the MSCI ACWI, posted a +9.29% total return,2 and the Fund’s third benchmark, the Linked MSCI ACWI 100% Hedged to USD/World, posted a +8.45% total return.3 For the 10-year period ended February 28, 2018, the Fund’s Class A shares generated a +61.65% cumulative total return, compared with the Linked MSCI ACWI 100% Hedged to USD/World’s +90.42% cumulative total return for the same period.3 Please note index performance information is provided for reference and we do not attempt to track the index but rather undertake investments on the basis of fundamental research. You can find more performance data in the Performance Summary beginning on page 9.
Performance data represent past performance, which does not guarantee future results. Investment return and principal value will fluctuate, and you may have a gain or loss when you sell your shares. Current performance may differ from figures
Geographic Composition*
Based on Total Net Assets as of 2/28/18
*Figures reflect certain derivatives held in the portfolio (or their underlying reference assets) and may not total 100% or may be negative due to rounding, use of any derivatives, unsettled trades or other factors.
shown. For most recent month-end performance, go to franklintempleton.com or call (800) 342-5236.
Economic and Market Overview
The global economy expanded during the six-month period under review amid generally upbeat economic data across regions. In this environment, global developed and emerging market stocks generated a +9.29% total return, as measured by the MSCI ACWI.2 Global markets were also aided by price gains in oil and other commodities, the European Central Bank’s (ECB’s) extension of its monetary easing program, encouraging corporate earnings reports and the passage of the US tax reform bill.
However, global markets reflected investor concerns about geopolitical tensions in the Korean peninsula, expectations that key central bankers around the world may potentially raise interest rates amid an improving economic outlook, and political uncertainties in the US and the European Union (EU). In early February, global markets experienced significant
1. Source: FactSet.
2. Source: Morningstar.
3. Source: FactSet. The Linked MSCI ACWI 100% Hedged to USD/World reflects performance of the MSCI World Index through 6/29/2016 and performance of the MSCI ACWI 100% Hedged to USD thereafter. As of 2/28/18, the Fund’s Class A 10-year average annual total return not including the maximum sales charge was +4.92%, compared with the Linked MSCI ACWI 100% Hedged to USD/World’s 10-year average annual total return of +6.65%.
The indexes are unmanaged and include reinvestment of any income or distributions. They do not reflect any fees, expenses or sales charges. One cannot invest directly in an index, and an index is not representative of the Fund’s portfolio.
The dollar value, number of shares or principal amount, and names of all portfolio holdings are listed in the Fund’s Statement of Investments (SOI). The SOI begins on page 16.
| | | | |
| | | |
| franklintempleton.com | | Semiannual Report | | 3 |
TEMPLETON WORLD FUND
volatility amid concerns about stronger inflation and rising long-term interest rates in the US.
The US economy expanded in 2017’s fourth quarter, though at a slower pace compared to the third quarter as lower inventory investment and higher imports partially offset the positive contributions of growth in consumer spending, business and housing investment, exports, and government spending. The unemployment rate declined from 4.4% in August 2017 to 4.1% at period-end.4 Annual inflation, as measured by the Consumer Price Index, increased from 1.9% in August 2017 to 2.2% at period-end.4 The US Federal Reserve (Fed) began reducing its balance sheet in October and raised its target range for the federal funds rate 0.25% to 1.25%–1.50% in December. The Fed left its target rate for the federal funds rate unchanged at its January 2018 meeting, but expressed that it anticipated inflation to rise in 2018 and stabilize around the 2% target over the medium term.
In Europe, the UK’s economic growth moderated in 2017’s fourth quarter over the previous quarter, due to slower growth in production output, household spending and business investment. In November, the Bank of England raised its key policy rate for the first time in a decade. The eurozone’s growth moderated in 2017’s fourth quarter over the previous quarter. The bloc’s annual inflation rate ended the period lower than in August 2017. The ECB kept its benchmark interest rate unchanged during the period. However, at its October meeting, the ECB extended the time frame for its massive bond-buying program from December 2017 to at least September 2018, while reducing the amount of monthly bond purchases in half beginning in January 2018.
In Asia, Japan’s gross domestic product (GDP) growth slowed in 2017’s fourth quarter compared to the third quarter, as a slowdown in business spending and contractions in private residential investment offset a recovery in private consumption. The Bank of Japan left its benchmark interest rate unchanged during the period and continued its monetary stimulus measures.
In emerging markets, Brazil’s quarterly GDP grew in 2017’s fourth quarter, although at a slower pace compared to the previous quarter. The country’s central bank cut its benchmark interest rate several times during the period to spur economic growth. Russia’s GDP grew in 2017’s fourth quarter compared to the prior-year period, amid the Bank of Russia’s continued policy support. China’s GDP grew at a stable rate in 2017’s
fourth quarter compared to the prior-year period. The People’s Bank of China left its benchmark interest rate unchanged during
the period. Overall, emerging market stocks, as measured by the MSCI Emerging Markets Index, rose substantially during the period.
Investment Strategy
Our investment strategy employs a bottom-up, value-oriented, long-term approach. We focus on the market price of a company’s securities relative to our evaluation of the company’s long-term earnings, asset value and cash flow potential. We also consider the company’s price/earnings ratio, price/cash flow ratio, profit margins and liquidation value.
Manager’s Discussion
Global equities carried positive momentum into the semiannual review period, rising every month until February, when volatility resurfaced as concerns about the pace of central bank policy tightening sparked a sharp sell-off in risk assets. In this environment, the Fund delivered solid absolute gains, but it underperformed its benchmark, the MSCI ACWI 100% Hedged to USD. Despite relative headwinds, we were encouraged by a number of market transitions that we believe align well with our strategy going forward. After years of official stimulus, central bankers—led by the Fed—are tightening policies. After years of tranquility, volatility is awakening. After a long period of low inflation, low global growth and ultra-low interest rates, inflationary forces are stirring, growth is accelerating and bond yields are rising. As these key underpinnings of global financial markets change, so too will the characteristics and leadership of those markets. The leaders of the last cycle—US equities, growth stocks, and consumer and internet stocks—have become priced at levels that dramatically increase the likelihood of sub-par future returns, in our view. However, we believe shifting conditions may facilitate the passing of the performance baton to the last cycle’s laggards: international equities and value stocks across a range of out-of-favor sectors such as health care, telecommunication services, energy and financials.
At Templeton, we have maintained our valuation discipline and adhered to our time-tested investment process throughout this challenging period. These strategies have led to a number of encouraging performance developments during the six months under review, such as the outperformance of overweighted energy stocks as oil prices rebounded and financials stocks as
4. Source: US Bureau of Labor Statistics.
| | | | |
| | | |
4 | | Semiannual Report | | franklintempleton.com |
TEMPLETON WORLD FUND
interest rates rose, but also some continued challenges.5 Chief among challenges was the continued weakness of the Fund’s overweighted health care holdings.6 Concerns about generic competition, regulatory scrutiny and a consolidating payor sector all remained headwinds for health care stocks during the review period. However, we remain positive on the sector overall. We believe pricing pressures and generic competition are best addressed through innovation, and innovation is fueled by research and development, which has doubled in the pharmaceuticals industry in the past 30 years. Furthermore, despite the political controversy surrounding drug pricing, prescription drug costs account for less than 15% of health care spending in the US and the EU. Given the efficacy of these drugs and their ability to reduce costs elsewhere in the health care system, we believe they likely represent good value for the money. Overall, the pharmaceuticals industry is not often cheap based on free cash flow multiples, and we are finding the best values among innovative firms that in our analysis are capable of commanding pricing power by successfully addressing unmet medical needs. It is rare to find highly cash-generative, innovative businesses with attractive growth potential trading in what we consider deep value territory, but we believe select biotechnology and pharmaceuticals firms offer just such a proposition.
US biopharmaceutical firm Allergan is an example of what we consider a fundamentally solid company with good growth prospects that has been excessively impacted by investor pessimism. In addition to the broader sector headwinds, the stock has succumbed to worries about generic competition and the poor performance of its stake in beleaguered Israeli generic drugmaker Teva Pharmaceutical Industries (also a Fund holding). We take a longer term, holistic view of Allergan’s prospects; in our analysis, the overall durability and exclusivity of the firm’s drug portfolio is among the best in the business. Allergan also has among the lowest exposures to the US government as a benefits payor, compared with its peers, insulating it from one of the pharmaceuticals industry’s main sources of pricing anxiety. With strong earnings and free cash flow growth expected from its current drug portfolio and a new product pipeline offering attractive longer term growth prospects, we continue to believe Allergan is significantly undervalued at recent levels.
Top 10 Sectors/Industries*
2/28/18
| | | | |
| | | % of Total Net Assets | |
| Banks | | | 12.8% | |
| Oil, Gas & Consumable Fuels | | | 10.8% | |
| Pharmaceuticals | | | 9.1% | |
| Media | | | 4.5% | |
| Insurance | | | 4.3% | |
| Biotechnology | | | 4.2% | |
| Diversified Telecommunication Services | | | 3.8% | |
| Software | | | 3.6% | |
| Technology Hardware, Storage & Peripherals | | | 3.5% | |
| Internet Software & Services | | | 3.2% | |
*Figures reflect certain derivatives held in the portfolio (or their underlying reference assets) and may not total 100% or may be negative due to rounding, use of any derivatives, unsettled trades or other factors.
Information technology (IT) was another relative laggard during the period.7 Although the Fund’s IT holdings delivered double-digit percentage returns, they failed to keep pace with the benchmark’s IT components, and relative performance was further hindered by an underweighting in the sector. Although none of our IT holdings finished among the Fund’s biggest relative detractors, US software developer Oracle detracted. Its shares have been pressured lately by disappointing results stemming from the company’s efforts to develop its cloud business. We believe the negative near-term impact is creating an opportunity to invest in a long-term industry leader and beneficiary of major technology trends at what we consider low valuations. The firm’s core database business commands a significant global market share, which we think is defensible given Oracle’s incumbent advantage and the advanced functionality and reliability of its products. The transition to cloud services, meanwhile, should increase Oracle’s revenue and profit opportunity and grow its market over time, in our analysis. We continue to find select value in the IT sector more broadly, though not enough to justify an even-weighted allocation relative to the index, as some pockets of the IT sector look unsustainably expensive to us. With every major tier in the tech “stack” disrupted by new technologies, our approach is to identify mature companies we believe have the ability to adapt to change, as well as new entrants we feel are likely to emerge as winners. Although we have some exposure to the dominant
5. The energy sector comprises energy equipment and services and oil, gas and consumable fuels in the SOI. The financials sector comprises banks, capital markets, consumer finance, diversified financial services and insurance in the SOI.
6. The health care sector comprises biotechnology, health care equipment and supplies, health care providers and services, life sciences tools and services, and pharmaceuticals in the SOI.
7. The IT sector comprises communications equipment; electronic equipment, instruments and components; internet software and services; IT services; software; and technology hardware, storage and peripherals in the SOI.
| | | | |
| | | |
| franklintempleton.com | | Semiannual Report | | 5 |
TEMPLETON WORLD FUND
internet and consumer technology firms that have performed well recently, we have avoided a number of these stocks due to valuation concerns.
Other relative sector detractors during the period included an overweighted position in telecommunication services and stock selection in consumer discretionary and materials.8 The telecommunication services sector was also pressured by weakness among Asian operators, such as Singapore Telecommunications and China Telecom. In general, we believe some of the best structural growth opportunities in Asia are based on the long-term wealth accumulation and demand potential of the region’s consumers. Although some investors look to the manufacturers of electronic gadgets or luxury goods for exposure to this investment theme, we note that the makers of those products tend to cater to a global audience and command premium valuations. Conversely, what we consider low-valued telecommunication services companies may be better positioned to benefit from these trends, in our assessment, as owners and operators of the critical communications infrastructure are required to facilitate the rise of a new middle class.
Turning to consumer discretionary, Luxembourg-based satellite provider SES notably detracted, pressured by analyst downgrades and a launch error that caused it to lose contact with a satellite. Recent adversities have caused the stock to decline and its price-to-book value to become much lower than the company’s industry peers. Our analysis implies SES has recently been trading at replacement cost for a business with very high barriers to entry and valuable orbital satellite slots that cannot be replicated. Additionally, the company’s high single-digit dividend and free cash flow yields, as well as a contract backlog equivalent to four years of revenue, lead us to believe its shares remain undervalued. On a positive note, the Fund’s consumer discretionary position also included two of the reporting period’s top contributors: US media group Twenty-First Century Fox and UK home improvement retailer Kingfisher.
Finally, from the materials sector, shares of Canadian gold miner Barrick Gold retreated amid general weakness in precious metals mining stocks. Although the price of gold has remained firm amid US dollar weakness and geopolitical uncertainties, mining stocks declined as gold stayed range-bound. History suggests that a modest exposure to gold and silver miners can help optimize risk-adjusted returns over
Top 10 Holdings*
2/28/18
| | | | |
Company Sector/Industry, Country | | % of Total
Net Assets | |
| |
Oracle Corp. Software, US | | | 2.4% | |
| |
Citigroup Inc. Banks, US | | | 2.4% | |
| |
Royal Dutch Shell PLC Oil, Gas & Consumable Fuels, UK | | | 2.2% | |
| |
Amgen Inc. Biotechnology, US | | | 2.1% | |
| |
Samsung Electronics Co. Ltd. Technology Hardware, Storage & Peripherals, South Korea | | | 2.0% | |
| |
Eni SpA Oil, Gas & Consumable Fuels, Italy | | | 2.0% | |
| |
Teva Pharmaceutical Industries Ltd. Pharmaceuticals, Israel | | | 2.0% | |
| |
BP PLC Oil, Gas & Consumable Fuels, UK | | | 1.9% | |
| |
SES SA Media, Luxembourg | | | 1.7% | |
| |
Baidu Inc. Internet Software & Services, China | | | 1.7% | |
*Figures reflect certain derivatives held in the portfolio (or their underlying reference assets) and may not total 100% or may be negative due to rounding, use of any derivatives, unsettled trades and other factors.
time, and with valuations across the sector remaining attractive to us, we have maintained select investments in a handful of mining stocks that in our analysis have resilient balance sheets, low cost positions and identifiable value catalysts.
Among Fund contributors, we were encouraged by the outperformance of our long-standing energy overweighting. Stock selection also buoyed the Fund’s energy holdings, and three oil firms were among the period’s top contributors: US oilfield services firm Helmerich & Payne, UK oil major Royal Dutch Shell and US exploration and production firm ConocoPhillips. A rising oil price and strong sector performance have largely rewarded our decision to stay the course despite price volatility that accompanied fears of a supply glut earlier in 2017. We expected that oil price would climb toward US$60 per barrel, beyond which it could remain range-bound as swing producers in the North American shale fields bring supply back on line. Barring any external shocks, we expected renewed supply above US$60, which will likely
8. The telecommunication services sector comprises diversified telecommunication services and wireless telecommunication services in the SOI. The consumer discretionary sector comprises automobiles, household durables, leisure products, media, multiline retail and specialty retail in the SOI. The materials sector comprises chemicals and metals and mining in the SOI.
| | | | |
| | | |
6 | | Semiannual Report | | franklintempleton.com |
TEMPLETON WORLD FUND
cap further significant price appreciation, and we have been selectively reducing exposure at this point in the cycle.
Stock selection and an overweighted position contributed to the outperformance of the Fund’s financials holdings as well, led by Asian lenders, such as South Korea-based KB Financial Group and Thailand-based Bangkok Bank. We continue to find attractive opportunities among modestly valued financials holdings in Asia, where prospects for improving corporate governance and political stability have combined with rising interest rates and genuine economic growth to benefit the regional banking industry. We also remain constructive on our long-standing overweighted allocation to certain European banks. European banks outperformed the regional market in 2017 for the first time in four years, buoyed by solid earnings and the prospect of higher interest rates. Expectations for the timing and speed of interest rate increases have fluctuated, although the recent consensus view is that ECB President Draghi will raise interest rates before retiring in October 2019. Despite such expectations and the rising likelihood of a more hawkish successor, rate-sensitive banks in Europe have generally been trading on par with the broader industry. In the US, where the rising interest rate cycle has already been progressing, rate-sensitive banks have been trading at about a 20% premium, suggesting to us that shares of European lenders may have additional scope to advance as the region’s policy cycle matures. Although European banks overall are no longer abundantly cheap, trading in line with their long-term average multiples, valuations still look reasonably attractive to us based on dividend yields and relative to US banks. We expect that a combination of rising interest rates, regional economic growth and the resolution of a long-running regulatory overhaul should increase clarity on European banks’ earnings outlooks and pave the way for additional gains among select stocks.
The Fund also benefited from underweightings in the consumer staples and utilities sectors, which underperformed the broader market.9 We continue to find only limited opportunities in these defensive sectors, which we consider to be expensive. The consumer staples sector remains more richly valued than both the broader market and its own history, a premium that we believe is unwarranted given the sector’s generally weak profit margins and scarce growth opportunities. Utilities also appear richly valued considering the potential impacts of weaker economic growth and increasing regulatory interference on power demand and industry pricing. Concerns about
Top 10 Countries*
2/28/18
| | | | |
| | | % of Total
Net Assets | |
US | | | 39.5% | |
UK | | | 12.1% | |
Japan | | | 5.4% | |
France | | | 5.0% | |
South Korea | | | 5.0% | |
China | | | 4.0% | |
Germany | | | 3.4% | |
Switzerland | | | 3.2% | |
Netherlands | | | 3.0% | |
Canada | | | 2.4% | |
*Figures reflect certain derivatives held in the portfolio (or their underlying reference assets) and may not total 100% or may be negative due to rounding, use of any derivatives, unsettled trades or other factors.
oversupply in developed markets also persist, further clouding the sector’s outlook.
From a regional standpoint, stock selection and an underweighted allocation in the US detracted from relative results, while in Asia, a favorable overweighting was offset by stock-specific weakness. In Europe, the benefits of stock selection offset the negative effect of an overweighting in the region. Although we are still finding select bottom-up value in regions around the world, we continue to favor international markets over the US due to our view of their discounted valuations, better structural growth prospects and earlier stage economic and policy cycles. Ultimately, we remain committed to buying what we consider undervalued and mispriced stocks wherever we find them. Admittedly, this value-oriented approach has faced some headwinds. After outperforming growth in 2016, value lagged growth in 2017, with global growth outperforming value in the past 10 years. We believe value’s headwinds stem largely from unconventional monetary policies, which have depressed interest rates and sent investors out the risk curve in search of growth and yield. We believe these policies are unsustainable for three reasons. First, they increase social inequality, which has political consequences; second, they inflate asset prices, which creates stability risks; and third, rising inflation pressure and falling unemployment give data-dependent central bankers reasons to begin reversing such policies. We believe this mature cycle will eventually change, and with it the conditions that have been unfavorable to value. Against this backdrop, we have positioned the portfolio
9. The consumer staples sector comprises beverages, food and staples retailing, and personal products in the SOI. The utilities sector comprises multi-utilities in the SOI.
See www.franklintempletondatasources.com for additional data provider information.
| | | | |
| | | |
| franklintempleton.com | | Semiannual Report | | 7 |
TEMPLETON WORLD FUND
somewhat more defensively in recent quarters, taking gains among pro-cyclical stocks and reinvesting in what we consider cheaper, under-owned areas of the market. Despite some clear areas of what we deem as excessive enthusiasm and overvaluation, our bottom-up, fundamentals-oriented research has continued to uncover cheap stocks in regions and sectors around the world, and we remain constructive about the Fund’s prospects for capital appreciation and preservation over a long-term investment horizon.
Thank you for your continued participation in Templeton World Fund. We look forward to serving your future investment needs.
| | |
 | | |
| | |
| | |
| | |
| | |
| | |
| | Norman J. Boersma, CFA |
| |
| | Tucker Scott, CFA |
| | James Harper, CFA |
| | Heather Arnold, CFA |
| | Christopher James Peel, CFA |
| | Herbert J. Arnett, Jr. |
| |
| | Portfolio Management Team |
The foregoing information reflects our analysis, opinions and portfolio holdings as of February 28, 2018, the end of the reporting period. The way we implement our main investment strategies and the resulting portfolio holdings may change depending on factors such as market and economic conditions. These opinions may not be relied upon as investment advice or an offer for a particular security. The information is not a complete analysis of every aspect of any market, country, industry, security or the Fund. Statements of fact are from sources considered reliable, but the investment manager makes no representation or warranty as to their completeness or accuracy. Although historical performance is no guarantee of future results, these insights may help you understand our investment management philosophy.
| | | | |
| | | |
8 | | Semiannual Report | | franklintempleton.com |
TEMPLETON WORLD FUND
Performance Summary as of February 28, 2018
The performance table does not reflect any taxes that a shareholder would pay on Fund dividends, capital gain distributions, if any, or any realized gains on the sale of Fund shares. Total return reflects reinvestment of the Fund’s dividends and capital gain distributions, if any, and any unrealized gains or losses. Your dividend income will vary depending on dividends or interest paid by securities in the Fund’s portfolio, adjusted for operating expenses of each class. Capital gain distributions are net profits realized from the sale of portfolio securities.
Performance as of 2/28/18
Cumulative total return excludes sales charges. Average annual total return includes maximum sales charges. Sales charges will vary depending on the size of the investment and the class of share purchased. The maximum is 5.75% and the minimum is 0%. Class A: 5.75% maximum initial sales charge; Advisor Class: no sales charges. For other share classes, visit franklintempleton.com.
| | | | | | | | |
| Share Class | | Cumulative Total Return1 | | | Average Annual
Total Return2 | |
| | |
A | | | | | | | | |
6-Month | | | +4.87% | | | | -1.14% | |
1-Year | | | +8.06% | | | | +1.86% | |
5-Year | | | +42.27% | | | | +6.05% | |
10-Year | | | +61.65% | | | | +4.30% | |
| | |
Advisor | | | | | | | | |
6-Month | | | +4.95% | | | | +4.95% | |
1-Year | | | +8.34% | | | | +8.34% | |
5-Year | | | +43.96% | | | | +7.56% | |
10-Year | | | +65.73% | | | | +5.18% | |
Performance data represent past performance, which does not guarantee future results. Investment return and principal value will fluctuate, and you may have a gain or loss when you sell your shares. Current performance may differ from figures shown. For most recent month-end performance, go to franklintempleton.com or call (800) 342-5236.
See page 10 for Performance Summary footnotes.
| | | | |
| | | |
| franklintempleton.com | | Semiannual Report | | 9 |
TEMPLETON WORLD FUND
PERFORMANCE SUMMARY
Distributions (9/1/17–2/28/18)
| | | | | | | | | | | | | | |
| Share Class | | Net Investment
Income | | | Short-Term
Capital Gain | | | Long-Term
Capital Gain | | | Total |
A | | | $0.0204 | | | | $0.1551 | | | | $0.8321 | | | $1.0076 |
C | | | $ — | | | | $0.1551 | | | | $0.8321 | | | $0.9872 |
R6 | | | $0.0807 | | | | $0.1551 | | | | $0.8321 | | | $1.0679 |
Advisor | | | $0.0638 | | | | $0.1551 | | | | $0.8321 | | | $1.0510 |
Total Annual Operating Expenses3
| | | | |
| Share Class | | | |
| |
A | | | 1.05% | |
Advisor | | | 0.80% | |
Each class of shares is available to certain eligible investors and has different annual fees and expenses, as described in the prospectus.
All investments involve risks, including possible loss of principal. Special risks are associated with foreign investing, including currency fluctuations, economic instability and political developments; investments in developing markets involve heightened risks related to the same factors. Currency rates may fluctuate significantly over short periods of time, and can reduce returns. Because the Fund may invest its assets in companies in a specific region, including Europe, it is subject to greater risks of adverse developments in that region and/or the surrounding regions than a fund that is more broadly diversified geographically. Current political and financial uncertainty surrounding the European Union may increase market volatility and the economic risk of investing in companies in Europe. Derivatives, including currency management strategies, involve costs and can create economic leverage in the portfolio which may result in significant volatility and cause the Fund to participate in losses (as well as enable gains) on an amount that exceeds the Fund’s initial investment. The Fund may not achieve the anticipated benefits, and may realize losses when a counterparty fails to perform as promised. The Fund is actively managed but there is no guarantee that the manager’s investment decisions will produce the desired results. The Fund’s prospectus also includes a description of the main investment risks.
1. Cumulative total return represents the change in value of an investment over the periods indicated.
2. Average annual total return represents the average annual change in value of an investment over the periods indicated. Return for less than one year, if any, has not been annualized.
3. Figures are as stated in the Fund’s current prospectus and may differ from the expense ratios disclosed in the Your Fund’s Expenses and Financial Highlights sections in this report. In periods of market volatility, assets may decline significantly, causing total annual Fund operating expenses to become higher than the figures shown.
| | | | |
| | | |
10 | | Semiannual Report | | franklintempleton.com |
TEMPLETON WORLD FUND
Your Fund’s Expenses
As a Fund shareholder, you can incur two types of costs: (1) transaction costs, including sales charges (loads) on Fund purchases and redemptions; and (2) ongoing Fund costs, including management fees, distribution and service (12b-1) fees, and other Fund expenses. All mutual funds have ongoing costs, sometimes referred to as operating expenses. The table below shows ongoing costs of investing in the Fund and can help you understand these costs and compare them with those of other mutual funds. The table assumes a $1,000 investment held for the six months indicated.
Actual Fund Expenses
The table below provides information about actual account values and actual expenses in the columns under the heading “Actual.” In these columns the Fund’s actual return, which includes the effect of Fund expenses, is used to calculate the “Ending Account Value” for each class of shares. You can estimate the expenses you paid during the period by following these steps (of course, your account value and expenses will differ from those in this illustration): Divide your account value by $1,000 (if your account had an $8,600 value, then $8,600 ÷ $1,000 = 8.6). Then multiply the result by the number in the row for your class of shares under the headings “Actual” and “Expenses Paid During Period” (if Actual Expenses Paid During Period were $7.50, then 8.6 x $7.50 = $64.50). In this illustration, the actual expenses paid this period are $64.50.
Hypothetical Example for Comparison with Other Funds
Under the heading “Hypothetical” in the table, information is provided about hypothetical account values and hypothetical expenses based on the Fund’s actual expense ratio and an assumed rate of return of 5% per year before expenses, which is not the Fund’s actual return. This information may not be used to estimate the actual ending account balance or expenses you paid for the period, but it can help you compare ongoing costs of investing in the Fund with those of other funds. To do so, compare this 5% hypothetical example for the class of shares you hold with the 5% hypothetical examples that appear in the shareholder reports of other funds.
Please note that expenses shown in the table are meant to highlight ongoing costs and do not reflect any transactional costs. Therefore, information under the heading “Hypothetical” is useful in comparing ongoing costs only, and will not help you compare total costs of owning different funds. In addition, if transactional costs were included, your total costs would have been higher.
| | | | | | | | | | | | | | | | | | |
| | | | | | | Actual (actual return after expenses) | | | | Hypothetical (5% annual return before expenses) | | | | |
Share Class | | Beginning
Account
Value 9/1/17 | | | | Ending
Account
Value 2/28/18 | | Expenses Paid During
Period 9/1/17–2/28/181,2 | | | | Ending
Account
Value 2/28/18 | | Expenses Paid During Period
9/1/17–2/28/181,2 | | | | Net
Annualized
Expense
Ratio2 |
A | | $1,000 | | | | $1,048.70 | | $5.44 | | | | $1,019.49 | | $5.36 | | | | 1.07% |
C | | $1,000 | | | | $1,044.60 | | $9.28 | | | | $1,015.72 | | $9.15 | | | | 1.83% |
R6 | | $1,000 | | | | $1,050.50 | | $3.76 | | | | $1,021.12 | | $3.71 | | | | 0.74% |
Advisor | | $1,000 | | | | $1,049.50 | | $4.22 | | | | $1,020.68 | | $4.16 | | | | 0.83% |
1. Expenses are equal to the annualized expense ratio for the six-month period as indicated above—in the far right column—multiplied by the simple average account value over the period indicated, and then multiplied by 181/365 to reflect the one-half year period.
2. Reflects expenses after fee waivers and expense reimbursements. Does not include acquired fund fees and expenses.
| | | | |
| | | |
| franklintempleton.com | | Semiannual Report | | 11 |
TEMPLETON FUNDS
Financial Highlights
Templeton World Fund
| | | | | | | | | | | | | | | | | | | | | | | | |
| | | Six Months Ended | | | | | | | | | | | | | | | | |
| | | February 28, 2018 | | | Year Ended August 31, | |
| | | (unaudited) | | | 2017 | | | 2016 | | | 2015 | | | 2014 | | | 2013 | |
| | | | | | |
Class A | | | | | | | | | | | | | | | | | | | | | | | | |
| | | | | | |
Per share operating performance | | | | | | | | | | | | | | | | | | | | | | | | |
| | | | | | |
(for a share outstanding throughout the period) | | | | | | | | | | | | | | | | | | | | | | | | |
| | | | | | |
Net asset value, beginning of period | | | $16.94 | | | | $15.47 | | | | $16.51 | | | | $20.18 | | | | $18.02 | | | | $15.06 | |
| | | | |
| | | | | | |
Income from investment operationsa: | | | | | | | | | | | | | | | | | | | | | | | | |
| | | | | | |
Net investment incomeb | | | 0.08 | | | | 0.27 | | | | 0.26 | | | | 0.29 | | | | 0.43 | c | | | 0.25 | |
| | | | | | |
Net realized and unrealized gains (losses) | | | 0.76 | | | | 2.21 | | | | (0.17 | ) | | | (2.35 | ) | | | 2.75 | | | �� | 3.38 | |
| | | | |
| | | | | | |
Total from investment operations | | | 0.84 | | | | 2.48 | | | | 0.09 | | | | (2.06 | ) | | | 3.18 | | | | 3.63 | |
| | | | |
| | | | | | |
Less distributions from: | | | | | | | | | | | | | | | | | | | | | | | | |
| | | | | | |
Net investment income | | | (0.02 | ) | | | (0.57 | ) | | | (0.28 | ) | | | (0.52 | ) | | | (0.19 | ) | | | (0.42 | ) |
| | | | | | |
Net realized gains | | | (0.99 | ) | | | (0.44 | ) | | | (0.85 | ) | | | (1.09 | ) | | | (0.83 | ) | | | (0.25 | ) |
| | | | |
| | | | | | |
Total distributions | | | (1.01 | ) | | | (1.01 | ) | | | (1.13 | ) | | | (1.61 | ) | | | (1.02 | ) | | | (0.67 | ) |
| | | | |
| | | | | | |
Net asset value, end of period | | | $16.77 | | | | $16.94 | | | | $15.47 | | | | $16.51 | | | | $20.18 | | | | $18.02 | |
| | | | |
| | | | | | |
Total returnd | | | 4.87% | | | | 16.45% | | | | 0.84% | | | | (10.59 | )% | | | 17.96% | | | | 24.71% | |
| | | | | | |
Ratios to average net assetse | | | | | | | | | | | | | | | | | | | | | | | | |
| | | | | | |
Expenses | | | 1.07% | f | | | 1.06% | f,g | | | 1.07% | g | | | 1.06% | g | | | 1.05% | | | | 1.05% | f |
| | | | | | |
Net investment income | | | 0.96% | | | | 1.63% | | | | 1.73% | | | | 1.61% | | | | 2.20% | c | | | 1.49% | |
| | | | | | |
Supplemental data | | | | | | | | | | | | | | | | | | | | | | | | |
| | | | | | |
Net assets, end of period (000’s) | | | $4,139,490 | | | | $4,240,117 | | | | $4,195,518 | | | | $4,791,792 | | | | $5,917,398 | | | | $5,278,292 | |
| | | | | | |
Portfolio turnover rate | | | 8.40% | | | | 31.46% | | | | 21.62% | | | | 15.73% | | | | 18.56% | | | | 17.57% | |
aThe amount shown for a share outstanding throughout the period may not correlate with the Statement of Operations for the period due to the timing of sales and repurchases of the Fund’s shares in relation to income earned and/or fluctuating fair value of the investments of the Fund.
bBased on average daily shares outstanding.
cNet investment income per share includes approximately $0.18 per share related to income received in the form of special dividends in connection with certain Fund holdings. Excluding this amount, the ratio of net investment income to average net assets would have been 1.30%.
dTotal return does not reflect sales commissions or contingent deferred sales charges, if applicable, and is not annualized for periods less than one year. eRatios are annualized for periods less than one year, except for non-recurring expenses, if any.
fBenefit of expense reduction rounds to less than 0.01%.
gBenefit of waiver and payments by affiliates rounds to less than 0.01%.
| | | | |
| | | |
12 | | Semiannual Report | The accompanying notes are an integral part of these financial statements. | | franklintempleton.com |
TEMPLETON FUNDS
FINANCIAL HIGHLIGHTS
Templeton World Fund (continued)
| | | | | | | | | | | | | | | | | | | | | | | | |
| | | Six Months Ended | | | | | | | | | | | | | | | | |
| | | February 28, 2018 | | | Year Ended August 31, | |
| | | (unaudited) | | | 2017 | | | 2016 | | | 2015 | | | 2014 | | | 2013 | |
| | | | | | |
Class C | | | | | | | | | | | | | | | | | | | | | | | | |
| | | | | | |
Per share operating performance | | | | | | | | | | | | | | | | | | | | | | | | |
| | | | | | |
(for a share outstanding throughout the period) | | | | | | | | | | | | | | | | | | | | | | | | |
| | | | | | |
Net asset value, beginning of period | | | $16.21 | | | | $14.84 | | | | $15.86 | | | | $19.44 | | | | $17.40 | | | | $14.53 | |
| | | | |
| | | | | | |
Income from investment operationsa: | | | | | | | | | | | | | | | | | | | | | | | | |
| | | | | | |
Net investment incomeb | | | 0.02 | | | | 0.14 | | | | 0.14 | | | | 0.15 | | | | 0.27 | c | | | 0.12 | |
| | | | | | |
Net realized and unrealized gains (losses) | | | 0.72 | | | | 2.12 | | | | (0.16 | ) | | | (2.26 | ) | | | 2.66 | | | | 3.26 | |
| | | | |
| | | | | | |
Total from investment operations | | | 0.74 | | | | 2.26 | | | | (0.02 | ) | | | (2.11 | ) | | | 2.93 | | | | 3.38 | |
| | | | |
| | | | | | |
Less distributions from: | | | | | | | | | | | | | | | | | | | | | | | | |
| | | | | | |
Net investment income | | | — | | | | (0.45 | ) | | | (0.15 | ) | | | (0.38 | ) | | | (0.06 | ) | | | (0.26 | ) |
| | | | | | |
Net realized gains | | | (0.99 | ) | | | (0.44 | ) | | | (0.85 | ) | | | (1.09 | ) | | | (0.83 | ) | | | (0.25 | ) |
| | | | |
| | | | | | |
Total distributions | | | (0.99 | ) | | | (0.89 | ) | | | (1.00 | ) | | | (1.47 | ) | | | (0.89 | ) | | | (0.51 | ) |
| | | | |
| | | | | | |
Net asset value, end of period | | | $15.96 | | | | $16.21 | | | | $14.84 | | | | $15.86 | | | | $19.44 | | | | $17.40 | |
| | | | |
| | | | | | |
Total returnd | | | 4.46% | | | | 15.59% | | | | 0.11% | | | | (11.27 | )% | | | 17.08% | | | | 23.76% | |
| | | | | | |
Ratios to average net assetse | | | | | | | | | | | | | | | | | | | | | | | | |
| | | | | | |
Expenses | | | 1.83% | f | | | 1.81% | f,g | | | 1.82% | g | | | 1.81% | g | | | 1.80% | | | | 1.81% | f |
| | | | | | |
Net investment income | | | 0.20% | | | | 0.88% | | | | 0.98% | | | | 0.86% | | | | 1.45% | c | | | 0.73% | |
| | | | | | |
Supplemental data | | | | | | | | | | | | | | | | | | | | | | | | |
| | | | | | |
Net assets, end of period (000’s) | | | $132,251 | | | | $138,534 | | | | $158,126 | | | | $193,309 | | | | $241,635 | | | | $210,256 | |
| | | | | | |
Portfolio turnover rate | | | 8.40% | | | | 31.46% | | | | 21.62% | | | | 15.73% | | | | 18.56% | | | | 17.57% | |
aThe amount shown for a share outstanding throughout the period may not correlate with the Statement of Operations for the period due to the timing of sales and repurchases of the Fund’s shares in relation to income earned and/or fluctuating fair value of the investments of the Fund.
bBased on average daily shares outstanding.
cNet investment income per share includes approximately $0.18 per share related to income received in the form of special dividends in connection with certain Fund holdings. Excluding this amount, the ratio of net investment income to average net assets would have been 0.55%.
dTotal return does not reflect sales commissions or contingent deferred sales charges, if applicable, and is not annualized for periods less than one year. eRatios are annualized for periods less than one year, except for non-recurring expenses, if any.
fBenefit of expense reduction rounds to less than 0.01%.
gBenefit of waiver and payments by affiliates rounds to less than 0.01%.
| | | | | | |
| | | |
| franklintempleton.com | | The accompanying notes are an integral part of these financial statements. | Semiannual Report | | 13 |
TEMPLETON FUNDS
FINANCIAL HIGHLIGHTS
Templeton World Fund (continued)
| | | | | | | | | | | | | | | | | | | | | | | | |
| | | Six Months Ended | | | | | | | | | | | | | | | | |
| | | February 28, 2018 | | | Year Ended August 31, | |
| | | (unaudited) | | | 2017 | | | 2016 | | | 2015 | | | 2014 | | | 2013a | |
| | | | | | |
Class R6 | | | | | | | | | | | | | | | | | | | | | | | | |
| | | | | | |
Per share operating performance | | | | | | | | | | | | | | | | | | | | | | | | |
| | | | | | |
(for a share outstanding throughout the period) | | | | | | | | | | | | | | | | | | | | | | | | |
| | | | | | |
Net asset value, beginning of period | | | $16.92 | | | | $15.45 | | | | $16.50 | | | | $20.18 | | | | $18.02 | | | | $17.17 | |
| | | | |
| | | | | | |
Income from investment operationsb: | | | | | | | | | | | | | | | | | | | | | | | | |
| | | | | | |
Net investment incomec | | | 0.11 | | | | 0.32 | | | | 0.32 | | | | 0.35 | | | | 0.57 | d | | | 0.12 | |
| | | | | | |
Net realized and unrealized gains (losses) | | | 0.76 | | | | 2.22 | | | | (0.18 | ) | | | (2.35 | ) | | | 2.67 | | | | 0.73 | |
| | | | |
| | | | | | |
Total from investment operations | | | 0.87 | | | | 2.54 | | | | 0.14 | | | | (2.00 | ) | | | 3.24 | | | | 0.85 | |
| | | | |
| | | | | | |
Less distributions from: | | | | | | | | | | | | | | | | | | | | | | | | |
| | | | | | |
Net investment income | | | (0.08 | ) | | | (0.63 | ) | | | (0.34 | ) | | | (0.59 | ) | | | (0.25 | ) | | | — | |
| | | | | | |
Net realized gains | | | (0.99 | ) | | | (0.44 | ) | | | (0.85 | ) | | | (1.09 | ) | | | (0.83 | ) | | | — | |
| | | | |
| | | | | | |
Total distributions | | | (1.07 | ) | | | (1.07 | ) | | | (1.19 | ) | | | (1.68 | ) | | | (1.08 | ) | | | — | |
| | | | |
| | | | | | |
Net asset value, end of period | | | $16.72 | | | | $16.92 | | | | $15.45 | | | | $16.50 | | | | $20.18 | | | | $18.02 | |
| | | | |
| | | | | | |
Total returne | | | 5.05% | | | | 16.87% | | | | 1.18% | | | | (10.30 | )% | | | 18.40% | | | | 4.95% | |
| | | | | | |
Ratios to average net assetsf | | | | | | | | | | | | | | | | | | | | | | | | |
| | | | | | |
Expenses | | | 0.74% | g,h | | | 0.73% | g,h | | | 0.72% | g | | | 0.72% | g | | | 0.72% | | | | 0.72% | h |
| | | | | | |
Net investment income | | | 1.29% | | | | 1.96% | | | | 2.08% | | | | 1.95% | | | | 2.53% | d | | | 1.82% | |
| | | | | | |
Supplemental data | | | | | | | | | | | | | | | | | | | | | | | | |
| | | | | | |
Net assets, end of period (000’s) | | | $53,638 | | | | $55,504 | | | | $50,487 | | | | $51,733 | | | | $55,175 | | | | $24,306 | |
| | | | | | |
Portfolio turnover rate | | | 8.40% | | | | 31.46% | | | | 21.62% | | | | 15.73% | | | | 18.56% | | | | 17.57% | |
aFor the period May 1, 2013 (effective date) to August 31, 2013.
bThe amount shown for a share outstanding throughout the period may not correlate with the Statement of Operations for the period due to the timing of sales and repurchases of the Fund’s shares in relation to income earned and/or fluctuating fair value of the investments of the Fund.
cBased on average daily shares outstanding.
dNet investment income per share includes approximately $0.18 per share related to income received in the form of special dividends in connection with certain Fund holdings. Excluding this amount, the ratio of net investment income to average net assets would have been 1.63%.
eTotal return is not annualized for periods less than one year.
fRatios are annualized for periods less than one year, except for non-recurring expenses, if any.
gBenefit of waiver and payments by affiliates rounds to less than 0.01%.
hBenefit of expense reduction rounds to less than 0.01%.
| | | | |
| | | |
14 | | Semiannual Report | The accompanying notes are an integral part of these financial statements. | | franklintempleton.com |
TEMPLETON FUNDS
FINANCIAL HIGHLIGHTS
Templeton World Fund (continued)
| | | | | | | | | | | | | | | | | | | | | | | | |
| | | Six Months Ended | | | | | | | | | | | | | | | | |
| | | February 28, 2018 | | | Year Ended August 31, | |
| | | (unaudited) | | | 2017 | | | 2016 | | | 2015 | | | 2014 | | | 2013 | |
| | | | | | |
Advisor Class | | | | | | | | | | | | | | | | | | | | | | | | |
| | | | | | |
Per share operating performance | | | | | | | | | | | | | | | | | | | | | | | | |
(for a share outstanding throughout the period) | | | | | | | | | | | | | | | | | | | | | | | | |
| | | | | | |
Net asset value, beginning of period | | | $16.93 | | | | $15.46 | | | | $16.50 | | | | $20.18 | | | | $18.01 | | | | $15.07 | |
| | | | |
| | | | | | |
Income from investment operationsa: | | | | | | | | | | | | | | | | | | | | | | | | |
| | | | | | |
Net investment incomeb | | | 0.10 | | | | 0.32 | | | | 0.30 | | | | 0.33 | | | | 0.48 | c | | | 0.30 | |
| | | | | | |
Net realized and unrealized gains (losses) | | | 0.75 | | | | 2.20 | | | | (0.17 | ) | | | (2.35 | ) | | | 2.75 | | | | 3.36 | |
| | | | |
| | | | | | |
Total from investment operations | | | 0.85 | | | | 2.52 | | | | 0.13 | | | | (2.02 | ) | | | 3.23 | | | | 3.66 | |
| | | | |
| | | | | | |
Less distributions from: | | | | | | | | | | | | | | | | | | | | | | | | |
| | | | | | |
Net investment income | | | (0.06 | ) | | | (0.61 | ) | | | (0.32 | ) | | | (0.57 | ) | | | (0.23 | ) | | | (0.47 | ) |
| | | | | | |
Net realized gains | | | (0.99 | ) | | | (0.44 | ) | | | (0.85 | ) | | | (1.09 | ) | | | (0.83 | ) | | | (0.25 | ) |
| | | | |
| | | | | | |
Total distributions | | | (1.05 | ) | | | (1.05 | ) | | | (1.17 | ) | | | (1.66 | ) | | | (1.06 | ) | | | (0.72 | ) |
| | | | |
| | | | | | |
Net asset value, end of period | | | $16.73 | | | | $16.93 | | | | $15.46 | | | | $16.50 | | | | $20.18 | | | | $18.01 | |
| | | | |
| | | | | | |
Total returnd | | | 4.95% | | | | 16.74% | | | | 1.12% | | | | (10.38 | )% | | | 18.29% | | | | 24.97% | |
| | | | | | |
Ratios to average net assetse | | | | | | | | | | | | | | | | | | | | | | | | |
| | | | | | |
Expenses | | | 0.83% | f | | | 0.81% | f,g | | | 0.82% | g | | | 0.81% | g | | | 0.80% | | | | 0.81% | f |
| | | | | | |
Net investment income | | | 1.20% | | | | 1.88% | | | | 1.98% | | | | 1.86% | | | | 2.45% | c | | | 1.73% | |
| | | | | | |
Supplemental data | | | | | | | | | | | | | | | | | | | | | | | | |
| | | | | | |
Net assets, end of period (000’s) | | | $137,462 | | | | $157,237 | | | | $113,455 | | | | $181,661 | | | | $273,478 | | | | $216,767 | |
| | | | | | |
Portfolio turnover rate | | | 8.40% | | | | 31.46% | | | | 21.62% | | | | 15.73% | | | | 18.56% | | | | 17.57% | |
aThe amount shown for a share outstanding throughout the period may not correlate with the Statement of Operations for the period due to the timing of sales and repurchases of the Fund’s shares in relation to income earned and/or fluctuating fair value of the investments of the Fund.
bBased on average daily shares outstanding.
cNet investment income per share includes approximately $0.18 per share related to income received in the form of special dividends in connection with certain Fund holdings. Excluding this amount, the ratio of net investment income to average net assets would have been 1.55%.
dTotal return is not annualized for periods less than one year.
eRatios are annualized for periods less than one year, except for non-recurring expenses, if any.
fBenefit of expense reduction rounds to less than 0.01%.
gBenefit of waiver and payments by affiliates rounds to less than 0.01%.
| | | | | | |
| | | |
| franklintempleton.com | | The accompanying notes are an integral part of these financial statements. | Semiannual Report | | 15 |
TEMPLETON FUNDS
Statement of Investments, February 28, 2018 (unaudited)
Templeton World Fund
| | | | | | | | | | |
| | | Industry | | Shares | | | Value | |
| | | |
Common Stocks 96.6% | | | | | | | | | | |
Canada 2.4% | | | | | | | | | | |
Barrick Gold Corp. | | Metals & Mining | | | 2,906,780 | | | $ | 33,486,106 | |
a Husky Energy Inc. | | Oil, Gas & Consumable Fuels | | | 2,394,910 | | | | 31,616,097 | |
Wheaton Precious Metals Corp. | | Metals & Mining | | | 2,295,287 | | | | 43,805,781 | |
| | | | | | | | | | |
| | | | | | | | | 108,907,984 | |
| | | | | | | | | | |
China 4.0% | | | | | | | | | | |
a Baidu Inc., ADR | | Internet Software & Services | | | 299,800 | | | | 75,651,532 | |
China Life Insurance Co. Ltd., H | | Insurance | | | 11,080,000 | | | | 32,917,410 | |
China Mobile Ltd. | | Wireless Telecommunication Services | | | 2,135,000 | | | | 20,024,278 | |
China Telecom Corp. Ltd., H | | Diversified Telecommunication Services | | | 65,743,000 | | | | 28,982,213 | |
Kunlun Energy Co. Ltd. | | Oil, Gas & Consumable Fuels | | | 22,325,330 | | | | 20,996,100 | |
| | | | | | | | | | |
| | | | | | | | | 178,571,533 | |
| | | | | | | | | | |
Denmark 0.3% | | | | | | | | | | |
Vestas Wind Systems AS | | Electrical Equipment | | | 169,530 | | | | 12,320,971 | |
| | | | | | | | | | |
France 5.0% | | | | | | | | | | |
AXA SA | | Insurance | | | 2,300,810 | | | | 72,588,718 | |
BNP Paribas SA | | Banks | | | 827,720 | | | | 66,011,831 | |
Compagnie de Saint-Gobain | | Building Products | | | 106,100 | | | | 6,050,766 | |
Sanofi | | Pharmaceuticals | | | 489,740 | | | | 38,854,308 | |
Veolia Environnement SA | | Multi-Utilities | | | 1,613,000 | | | | 39,298,166 | |
| | | | | | | | | | |
| | | | | | | | | 222,803,789 | |
| | | | | | | | | | |
Germany 3.4% | | | | | | | | | | |
innogy SE | | Multi-Utilities | | | 1,347,900 | | | | 53,954,013 | |
Merck KGaA | | Pharmaceuticals | | | 419,790 | | | | 42,108,465 | |
Siemens AG | | Industrial Conglomerates | | | 431,120 | | | | 57,035,798 | |
| | | | | | | | | | |
| | | | | | | | | 153,098,276 | |
| | | | | | | | | | |
Hong Kong 0.9% | | | | | | | | | | |
CK Hutchison Holdings Ltd. | | Industrial Conglomerates | | | 2,781,200 | | | | 34,827,414 | |
Value Partners Group Ltd. | | Capital Markets | | | 7,006,700 | | | | 6,643,246 | |
| | | | | | | | | | |
| | | | | | | | | 41,470,660 | |
| | | | | | | | | | |
India 0.8% | | | | | | | | | | |
Hero Motocorp Ltd. | | Automobiles | | | 676,490 | | | | 37,312,246 | |
| | | | | | | | | | |
Ireland 0.3% | | | | | | | | | | |
a Bank of Ireland Group PLC | | Banks | | | 1,467,080 | | | | 13,781,750 | |
| | | | | | | | | | |
Israel 2.0% | | | | | | | | | | |
Teva Pharmaceutical Industries Ltd., ADR | | Pharmaceuticals | | | 4,656,984 | | | | 87,178,740 | |
| | | | | | | | | | |
Italy 2.0% | | | | | | | | | | |
Eni SpA | | Oil, Gas & Consumable Fuels | | | 5,225,004 | | | | 87,419,963 | |
| | | | | | | | | | |
Japan 5.4% | | | | | | | | | | |
Nissan Motor Co. Ltd. | | Automobiles | | | 3,353,800 | | | | 35,359,402 | |
Panasonic Corp. | | Household Durables | | | 4,532,240 | | | | 71,250,950 | |
Ryohin Keikaku Co. Ltd. | | Multiline Retail | | | 64,960 | | | | 22,311,832 | |
Seven & i Holdings Co. Ltd. | | Food & Staples Retailing | | | 283,300 | | | | 11,843,881 | |
SoftBank Group Corp. | | Wireless Telecommunication Services | | | 511,290 | | | | 42,621,475 | |
Sumitomo Metal Mining Co. Ltd. | | Metals & Mining | | | 463,150 | | | | 21,841,252 | |
Suntory Beverage & Food Ltd. | | Beverages | | | 722,400 | | | | 33,714,934 | |
| | | | | | | | | | |
| | | | | | | | | 238,943,726 | |
| | | | | | | | | | |
Luxembourg 1.7% | | | | | | | | | | |
SES SA, IDR | | Media | | | 4,864,450 | | | | 77,921,682 | |
| | | | | | | | | | |
| | | | |
| | | |
16 | | Semiannual Report | | franklintempleton.com |
TEMPLETON FUNDS
STATEMENT OF INVESTMENTS (UNAUDITED)
Templeton World Fund (continued)
| | | | | | | | | | |
| | | Industry | | Shares | | | Value | |
| | | |
Common Stocks (continued) | | | | | | | | | | |
Netherlands 3.0% | | | | | | | | | | |
Aegon NV | | Insurance | | | 8,719,752 | | | $ | 60,977,577 | |
Akzo Nobel NV | | Chemicals | | | 286,223 | | | | 27,851,560 | |
ING Groep NV | | Banks | | | 1,281,442 | | | | 22,634,316 | |
a QIAGEN NV | | Life Sciences Tools & Services | | | 685,905 | | | | 23,179,474 | |
| | | | | | | | | | |
| | | | | | | | | 134,642,927 | |
| | | | | | | | | | |
Norway 1.3% | | | | | | | | | | |
Telenor ASA | | Diversified Telecommunication Services | | | 2,656,020 | | | | 60,003,948 | |
| | | | | | | | | | |
Portugal 0.7% | | | | | | | | | | |
Galp Energia SGPS SA, B | | Oil, Gas & Consumable Fuels | | | 1,801,360 | | | | 32,679,193 | |
| | | | | | | | | | |
Singapore 1.5% | | | | | | | | | | |
Singapore Telecommunications Ltd. | | Diversified Telecommunication Services | | | 26,126,251 | | | | 66,661,681 | |
| | | | | | | | | | |
South Korea 5.0% | | | | | | | | | | |
Hana Financial Group Inc. | | Banks | | | 774,787 | | | | 35,102,671 | |
Hyundai Motor Co. | | Automobiles | | | 205,886 | | | | 30,650,224 | |
KB Financial Group Inc. | | Banks | | | 1,099,016 | | | | 64,836,311 | |
Samsung Electronics Co. Ltd. | | Technology Hardware, Storage & Peripherals | | | 41,996 | | | | 91,088,629 | |
| | | | | | | | | | |
| | | | | | | | | 221,677,835 | |
| | | | | | | | | | |
Spain 0.3% | | | | | | | | | | |
Telefonica SA | | Diversified Telecommunication Services | | | 1,209,736 | | | | 11,796,693 | |
| | | | | | | | | | |
Sweden 1.0% | | | | | | | | | | |
Ericsson, B | | Communications Equipment | | | 6,453,670 | | | | 43,430,000 | |
| | | | | | | | | | |
Switzerland 3.2% | | | | | | | | | | |
Roche Holding AG | | Pharmaceuticals | | | 324,842 | | | | 75,447,840 | |
UBS Group AG | | Capital Markets | | | 3,625,320 | | | | 69,380,992 | |
| | | | | | | | | | |
| | | | | | | | | 144,828,832 | |
| | | | | | | | | | |
Thailand 1.4% | | | | | | | | | | |
Bangkok Bank PCL, fgn | | Banks | | | 8,609,670 | | | | 62,864,257 | |
| | | | | | | | | | |
United Kingdom 12.1% | | | | | | | | | | |
BAE Systems PLC | | Aerospace & Defense | | | 8,996,569 | | | | 71,775,060 | |
Barclays PLC | | Banks | | | 9,035,622 | | | | 26,562,815 | |
BP PLC | | Oil, Gas & Consumable Fuels | | | 12,943,416 | | | | 84,683,306 | |
HSBC Holdings PLC | | Banks | | | 7,038,440 | | | | 69,498,318 | |
Kingfisher PLC | | Specialty Retail | | | 14,082,618 | | | | 69,400,605 | |
Man Group PLC | | Capital Markets | | | 7,928,861 | | | | 18,751,055 | |
Royal Dutch Shell PLC, B | | Oil, Gas & Consumable Fuels | | | 3,065,477 | | | | 97,969,606 | |
a Standard Chartered PLC | | Banks | | | 5,032,726 | | | | 56,186,915 | |
Vodafone Group PLC | | Wireless Telecommunication Services | | | 16,186,129 | | | | 45,410,761 | |
| | | | | | | | | | |
| | | | | | | | | 540,238,441 | |
| | | | | | | | | | |
United States 38.9% | | | | | | | | | | |
Advance Auto Parts Inc. | | Specialty Retail | | | 512,390 | | | | 58,540,558 | |
Allergan PLC | | Pharmaceuticals | | | 396,290 | | | | 61,115,844 | |
Ally Financial Inc. | | Consumer Finance | | | 1,337,590 | | | | 37,318,761 | |
a Alphabet Inc., A | | Internet Software & Services | | | 61,730 | | | | 68,144,982 | |
American International Group Inc. | | Insurance | | | 475,915 | | | | 27,288,966 | |
AmerisourceBergen Corp. | | Health Care Providers & Services | | | 577,440 | | | | 54,949,190 | |
Amgen Inc. | | Biotechnology | | | 522,700 | | | | 96,056,579 | |
Apache Corp. | | Oil, Gas & Consumable Fuels | | | 1,119,450 | | | | 38,229,218 | |
Apple Inc. | | Technology Hardware, Storage & Peripherals | | | 375,050 | | | | 66,803,906 | |
Capital One Financial Corp. | | Consumer Finance | | | 626,450 | | | | 61,348,249 | |
| | | | |
| | | |
| franklintempleton.com | | Semiannual Report | | 17 |
TEMPLETON FUNDS
STATEMENT OF INVESTMENTS (UNAUDITED)
Templeton World Fund (continued)
| | | | | | | | | | |
| | | Industry | | Shares | | | Value | |
| | | |
Common Stocks (continued) | | | | | | | | | | |
United States (continued) | | | | | | | | | | |
Cardinal Health Inc. | | Health Care Providers & Services | | | 699,340 | | | $ | 48,401,321 | |
a Celgene Corp. | | Biotechnology | | | 201,150 | | | | 17,524,188 | |
Citigroup Inc. | | Banks | | | 1,402,610 | | | | 105,883,029 | |
Comcast Corp., A | | Media | | | 1,514,448 | | | | 54,838,162 | |
a CommScope Holding Co. Inc. | | Communications Equipment | | | 619,000 | | | | 23,961,490 | |
ConocoPhillips | | Oil, Gas & Consumable Fuels | | | 1,202,040 | | | | 65,282,792 | |
Coty Inc., A | | Personal Products | | | 3,002,762 | | | | 58,013,362 | |
DXC Technology Co. | | IT Services | | | 309,217 | | | | 31,707,111 | |
Eli Lilly & Co. | | Pharmaceuticals | | | 651,970 | | | | 50,214,729 | |
Gilead Sciences Inc. | | Biotechnology | | | 955,550 | | | | 75,230,451 | |
Helmerich & Payne Inc. | | Energy Equipment & Services | | | 534,340 | | | | 34,491,647 | |
JPMorgan Chase & Co. | | Banks | | | 413,914 | | | | 47,807,067 | |
a Knowles Corp. | | Electronic Equipment, Instruments & Components | | | 2,785,470 | | | | 40,222,187 | |
Mattel Inc. | | Leisure Products | | | 679,200 | | | | 10,799,280 | |
Medtronic PLC | | Health Care Equipment & Supplies | | | 516,690 | | | | 41,278,364 | |
Microsoft Corp. | | Software | | | 562,920 | | | | 52,785,008 | |
a Navistar International Corp. | | Machinery | | | 1,470,390 | | | | 54,874,955 | |
a NetScout Systems Inc. | | Communications Equipment | | | 283,574 | | | | 7,528,890 | |
Oracle Corp. | | Software | | | 2,092,691 | | | | 106,036,653 | |
Perrigo Co. PLC | | Pharmaceuticals | | | 645,040 | | | | 52,544,958 | |
b Twenty-First Century Fox Inc., A | | Media | | | 1,869,122 | | | | 68,821,072 | |
United Parcel Service Inc., B | | Air Freight & Logistics | | | 424,560 | | | | 44,328,310 | |
Voya Financial Inc. | | Diversified Financial Services | | | 526,386 | | | | 26,856,214 | |
Walgreens Boots Alliance Inc. | | Food & Staples Retailing | | | 646,490 | | | | 44,536,696 | |
| | | | | | | | | | |
| | | | | | | | | 1,733,764,189 | |
| | | | | | | | | | |
| | | |
Total Common Stocks (Cost $3,463,234,669) | | | | | | | | | 4,312,319,316 | |
| | | | | | | | | | |
| | | |
| | | | | Principal | | | | |
| | | | | Amount | | | | |
| | | |
Corporate Bonds (Cost $20,989,222) 0.6% | | | | | | | | | | |
United States 0.6% | | | | | | | | | | |
c Chesapeake Energy Corp., secured note, second lien, 144A, 8.00%, 12/15/22 | | Oil, Gas & Consumable Fuels | | $ | 22,493,000 | | | | 24,011,277 | |
| | | | | | | | | | |
| | | |
Mortgage-Backed Securities (Cost $414,263) 0.0%† | | | | | | | | | | |
United States 0.0%† | | | | | | | | | | |
FHLMC, 5.50%, 12/01/35 | | | | | 420,305 | | | | 461,561 | |
| | | | | | | | | | |
| | | |
Total Investments before Short Term Investments (Cost $3,484,638,154) | | | | | | | | | 4,336,792,154 | |
| | | | | | | | | | |
| | | | |
| | | |
18 | | Semiannual Report | | franklintempleton.com |
TEMPLETON FUNDS
STATEMENT OF INVESTMENTS (UNAUDITED)
Templeton World Fund (continued)
| | | | | | | | | | |
| | | | | Principal
Amount | | | Value | |
| | | |
Short Term Investments 2.9% | | | | | | | | | | |
| | | |
Time Deposits 2.9% | | | | | | | | | | |
United States 2.9% | | | | | | | | | | |
National Australia Bank Ltd., 1.32%, 3/01/18 | | | | $ | 64,000,000 | | | $ | 64,000,000 | |
Royal Bank of Canada, 1.37%, 3/01/18 | | | | | 65,700,000 | | | | 65,700,000 | |
| | | | | | | | | | |
| | | |
Total Time Deposits (Cost $129,700,000) | | | | | | | | | 129,700,000 | |
| | | | | | | | | | |
| | | |
Total Investments (Cost $3,614,338,154) 100.1% | | | | | | | | | 4,466,492,154 | |
| | | |
Options Written (0.0)%† | | | | | | | | | (54,000 | ) |
| | | |
Other Assets, less Liabilities (0.1)% | | | | | | | | | (3,596,812 | ) |
| | | | | | | | | | |
| | | |
Net Assets 100.0% | | | | | | | | $ | 4,462,841,342 | |
| | | | | | | | | | |
| | | |
| | | Number of Contracts | | Notional
Amount | | | | |
| | | |
d Options Written (Premiums received $88,798) (0.0)%† | | | | | | | | | | |
Calls - Exchange-Traded | | | | | | | | | | |
Twenty-First Century Fox Inc., April Strike Price $40, Expires 4/20/18 | | 1,200 | | | 120,000 | | | $ | (54,000 | ) |
| | | | | | | | | | |
†Rounds to less than 0.1% of net assets.
aNon-income producing.
bA portion or all of the security is held in connection with written option contracts open at period end.
cSecurity was purchased pursuant to Rule 144A under the Securities Act of 1933 and may be sold in transactions exempt from registration only to qualified institutional buyers or in a public offering registered under the Securities Act of 1933. This security has been deemed liquid under guidelines approved by the Trust’s Board of Trustees.
dSee Note 1(c) regarding written options.
| | | | |
| | | |
| franklintempleton.com | | Semiannual Report | | 19 |
TEMPLETON FUNDS
STATEMENT OF INVESTMENTS (UNAUDITED)
Templeton World Fund (continued)
At February 28, 2018, the Fund had the following forward exchange contracts outstanding. See Note 1(c).
Forward Exchange Contracts
| | | | | | | | | | | | | | | | | | | | | | | | | | | | |
| Currency | | Counterpartya | | | Type | | | Quantity | | | Contract
Amount | | | Settlement
Date | | | Unrealized
Appreciation | | | Unrealized
Depreciation | |
| | | | | | |
OTC Forward Exchange Contracts | | | | | | | | | | | | | | | | | | | | | | | | | |
British Pound | | | BOFA | | | | Buy | | | | 11,172,621 | | | $ | 15,566,761 | | | | 4/10/18 | | | $ | — | | | $ | (152,025 | ) |
British Pound | | | BOFA | | | | Sell | | | | 87,683,822 | | | | 118,925,919 | | | | 4/10/18 | | | | — | | | | (2,050,436 | ) |
British Pound | | | GSCO | | | | Buy | | | | 11,172,621 | | | | 15,566,044 | | | | 4/10/18 | | | | — | | | | (151,308 | ) |
British Pound | | | GSCO | | | | Sell | | | | 87,673,616 | | | | 118,919,177 | | | | 4/10/18 | | | | — | | | | (2,043,095 | ) |
British Pound | | | HSBK | | | | Buy | | | | 11,172,621 | | | | 15,566,726 | | | | 4/10/18 | | | | — | | | | (151,989 | ) |
British Pound | | | HSBK | | | | Sell | | | | 87,681,054 | | | | 118,936,280 | | | | 4/10/18 | | | | — | | | | (2,036,254 | ) |
British Pound | | | MSCO | | | | Buy | | | | 11,172,621 | | | | 15,567,665 | | | | 4/10/18 | | | | — | | | | (152,929 | ) |
British Pound | | | MSCO | | | | Sell | | | | 87,682,559 | | | | 118,957,174 | | | | 4/10/18 | | | | — | | | | (2,017,437 | ) |
British Pound | | | UBSW | | | | Buy | | | | 11,172,621 | | | | 15,566,732 | | | | 4/10/18 | | | | — | | | | (151,996 | ) |
British Pound | | | UBSW | | | | Sell | | | | 87,680,796 | | | | 118,931,985 | | | | 4/10/18 | | | | — | | | | (2,040,194 | ) |
Canadian Dollar | | | BOFA | | | | Buy | | | | 13,342,115 | | | | 10,787,373 | | | | 4/10/18 | | | | — | | | | (381,235 | ) |
Canadian Dollar | | | BOFA | | | | Sell | | | | 31,839,140 | | | | 25,572,662 | | | | 4/10/18 | | | | 739,828 | | | | — | |
Canadian Dollar | | | GSCO | | | | Buy | | | | 13,342,115 | | | | 10,784,285 | | | | 4/10/18 | | | | — | | | | (378,146 | ) |
Canadian Dollar | | | GSCO | | | | Sell | | | | 31,840,484 | | | | 25,575,097 | | | | 4/10/18 | | | | 741,215 | | | | — | |
Canadian Dollar | | | HSBK | | | | Buy | | | | 13,342,115 | | | | 10,785,675 | | | | 4/10/18 | | | | — | | | | (379,536 | ) |
Canadian Dollar | | | HSBK | | | | Sell | | | | 31,839,723 | | | | 25,575,821 | | | | 4/10/18 | | | | 742,533 | | | | — | |
Canadian Dollar | | | MSCO | | | | Buy | | | | 13,342,115 | | | | 10,784,898 | | | | 4/10/18 | | | | — | | | | (378,759 | ) |
Canadian Dollar | | | MSCO | | | | Sell | | | | 31,838,821 | | | | 25,575,610 | | | | 4/10/18 | | | | 743,025 | | | | — | |
Canadian Dollar | | | UBSW | | | | Buy | | | | 13,342,115 | | | | 10,784,920 | | | | 4/10/18 | | | | — | | | | (378,781 | ) |
Canadian Dollar | | | UBSW | | | | Sell | | | | 31,837,148 | | | | 25,573,444 | | | | 4/10/18 | | | | 742,165 | | | | — | |
Danish Krone | | | BOFA | | | | Sell | | | | 14,806,607 | | | | 2,446,063 | | | | 4/10/18 | | | | 11,969 | | | | — | |
Danish Krone | | | GSCO | | | | Sell | | | | 14,806,775 | | | | 2,446,063 | | | | 4/10/18 | | | | 11,940 | | | | — | |
Danish Krone | | | HSBK | | | | Sell | | | | 14,808,391 | | | | 2,446,063 | | | | 4/10/18 | | | | 11,675 | | | | — | |
Danish Krone | | | MSCO | | | | Sell | | | | 14,808,570 | | | | 2,446,063 | | | | 4/10/18 | | | | 11,645 | | | | — | |
Danish Krone | | | UBSW | | | | Sell | | | | 14,806,567 | | | | 2,446,063 | | | | 4/10/18 | | | | 11,975 | | | | — | |
Euro | | | BOFA | | | | Buy | | | | 4,279,387 | | | | 5,308,408 | | | | 4/10/18 | | | | — | | | | (70,459 | ) |
Euro | | | BOFA | | | | Sell | | | | 116,290,124 | | | | 139,490,934 | | | | 4/10/18 | | | | — | | | | (2,847,614 | ) |
Euro | | | GSCO | | | | Buy | | | | 4,279,387 | | | | 5,307,672 | | | | 4/10/18 | | | | — | | | | (69,723 | ) |
Euro | | | GSCO | | | | Sell | | | | 116,304,532 | | | | 139,518,684 | | | | 4/10/18 | | | | — | | | | (2,837,500 | ) |
Euro | | | HSBK | | | | Buy | | | | 4,279,387 | | | | 5,307,501 | | | | 4/10/18 | | | | — | | | | (69,552 | ) |
Euro | | | HSBK | | | | Sell | | | | 116,285,328 | | | | 139,503,438 | | | | 4/10/18 | | | | — | | | | (2,829,240 | ) |
Euro | | | MSCO | | | | Buy | | | | 4,279,387 | | | | 5,307,691 | | | | 4/10/18 | | | | — | | | | (69,742 | ) |
Euro | | | MSCO | | | | Sell | | | | 116,281,847 | | | | 139,503,331 | | | | 4/10/18 | | | | — | | | | (2,825,086 | ) |
Euro | | | UBSW | | | | Buy | | | | 4,279,387 | | | | 5,307,617 | | | | 4/10/18 | | | | — | | | | (69,668 | ) |
Euro | | | UBSW | | | | Sell | | | | 116,283,518 | | | | 139,493,708 | | | | 4/10/18 | | | | — | | | | (2,836,755 | ) |
Hong Kong Dollar | | | BOFA | | | | Sell | | | | 221,964,140 | | | | 28,436,729 | | | | 4/10/18 | | | | 40,015 | | | | — | |
Hong Kong Dollar | | | GSCO | | | | Sell | | | | 221,955,356 | | | | 28,435,629 | | | | 4/10/18 | | | | 40,039 | | | | — | |
Hong Kong Dollar | | | HSBK | | | | Sell | | | | 221,952,742 | | | | 28,434,939 | | | | 4/10/18 | | | | 39,683 | | | | — | |
Hong Kong Dollar | | | MSCO | | | | Sell | | | | 221,966,224 | | | | 28,437,559 | | | | 4/10/18 | | | | 40,579 | | | | — | |
Hong Kong Dollar | | | UBSW | | | | Sell | | | | 221,952,923 | | | | 28,435,127 | | | | 4/10/18 | | | | 39,849 | | | | — | |
Japanese Yen | | | BOFA | | | | Buy | | | | 559,685,744 | | | | 5,122,791 | | | | 4/10/18 | | | | 138,112 | | | | — | |
Japanese Yen | | | BOFA | | | | Sell | | | | 5,253,274,757 | | | | 47,115,575 | | | | 4/10/18 | | | | — | | | | (2,263,862 | ) |
Japanese Yen | | | GSCO | | | | Buy | | | | 559,685,744 | | | | 5,122,414 | | | | 4/10/18 | | | | 138,489 | | | | — | |
Japanese Yen | | | GSCO | | | | Sell | | | | 5,253,449,006 | | | | 47,122,010 | | | | 4/10/18 | | | | — | | | | (2,259,065 | ) |
Japanese Yen | | | HSBK | | | | Buy | | | | 559,685,744 | | | | 5,122,674 | | | | 4/10/18 | | | | 138,229 | | | | — | |
Japanese Yen | | | HSBK | | | | Sell | | | | 5,253,082,229 | | | | 47,121,626 | | | | 4/10/18 | | | | — | | | | (2,256,002 | ) |
Japanese Yen | | | MSCO | | | | Buy | | | | 559,685,744 | | | | 5,122,705 | | | | 4/10/18 | | | | 138,198 | | | | — | |
Japanese Yen | | | MSCO | | | | Sell | | | | 5,252,924,407 | | | | 47,121,180 | | | | 4/10/18 | | | | — | | | | (2,254,965 | ) |
| | | | |
| | | |
20 | | Semiannual Report | | franklintempleton.com |
TEMPLETON FUNDS
STATEMENT OF INVESTMENTS (UNAUDITED)
Templeton World Fund (continued)
Forward Exchange Contracts (continued)
| | | | | | | | | | | | | | | | | | | | | | | | | | | | |
| Currency | | Counterpartya | | | Type | | | Quantity | | | Contract Amount | | | Settlement Date | | | Unrealized Appreciation | | | Unrealized Depreciation | |
| | | | | | |
OTC Forward Exchange Contracts (continued) | | | | | | | | | | | | | | | | | | | | | | | | | |
Japanese Yen | | | UBSW | | | | Buy | | | | 559,685,744 | | | $ | 5,122,347 | | | | 4/10/18 | | | $ | 138,556 | | | $ | — | |
Japanese Yen | | | UBSW | | | | Sell | | | | 5,252,767,828 | | | | 47,117,887 | | | | 4/10/18 | | | | — | | | | (2,256,785 | ) |
Norwegian Krone | | | BOFA | | | | Buy | | | | 2,854,690 | | | | 361,285 | | | | 4/10/18 | | | | 841 | | | | — | |
Norwegian Krone | | | BOFA | | | | Buy | | | | 7,803,752 | | | | 1,010,103 | | | | 4/10/18 | | | | — | | | | (20,173 | ) |
Norwegian Krone | | | BOFA | | | | Sell | | | | 8,473,116 | | | | 1,081,868 | | | | 4/10/18 | | | | 7,026 | | | | — | |
Norwegian Krone | | | BOFA | | | | Sell | | | | 89,914,293 | | | | 11,106,663 | | | | 4/10/18 | | | | — | | | | (299,251 | ) |
Norwegian Krone | | | GSCO | | | | Buy | | | | 2,854,690 | | | | 361,296 | | | | 4/10/18 | | | | 831 | | | | — | |
Norwegian Krone | | | GSCO | | | | Buy | | | | 7,803,752 | | | | 1,009,877 | | | | 4/10/18 | | | | — | | | | (19,947 | ) |
Norwegian Krone | | | GSCO | | | | Sell | | | | 8,472,988 | | | | 1,081,868 | | | | 4/10/18 | | | | 7,043 | | | | — | |
Norwegian Krone | | | GSCO | | | | Sell | | | | 89,933,898 | | | | 11,107,779 | | | | 4/10/18 | | | | — | | | | (300,623 | ) |
Norwegian Krone | | | HSBK | | | | Buy | | | | 2,854,690 | | | | 361,295 | | | | 4/10/18 | | | | 831 | | | | — | |
Norwegian Krone | | | HSBK | | | | Buy | | | | 7,803,752 | | | | 1,009,978 | | | | 4/10/18 | | | | — | | | | (20,048 | ) |
Norwegian Krone | | | HSBK | | | | Sell | | | | 8,473,937 | | | | 1,081,868 | | | | 4/10/18 | | | | 6,922 | | | | — | |
Norwegian Krone | | | HSBK | | | | Sell | | | | 89,912,949 | | | | 11,106,466 | | | | 4/10/18 | | | | — | | | | (299,278 | ) |
Norwegian Krone | | | MSCO | | | | Buy | | | | 2,854,690 | | | | 361,411 | | | | 4/10/18 | | | | 715 | | | | — | |
Norwegian Krone | | | MSCO | | | | Buy | | | | 7,803,752 | | | | 1,009,988 | | | | 4/10/18 | | | | — | | | | (20,057 | ) |
Norwegian Krone | | | MSCO | | | | Sell | | | | 8,473,112 | | | | 1,081,868 | | | | 4/10/18 | | | | 7,027 | | | | — | |
Norwegian Krone | | | MSCO | | | | Sell | | | | 89,906,638 | | | | 11,105,755 | | | | 4/10/18 | | | | — | | | | (299,189 | ) |
Norwegian Krone | | | UBSW | | | | Buy | | | | 2,854,690 | | | | 361,289 | | | | 4/10/18 | | | | 838 | | | | — | |
Norwegian Krone | | | UBSW | | | | Buy | | | | 7,803,752 | | | | 1,009,856 | | | | 4/10/18 | | | | — | | | | (19,925 | ) |
Norwegian Krone | | | UBSW | | | | Sell | | | | 8,473,096 | | | | 1,081,868 | | | | 4/10/18 | | | | 7,028 | | | | — | |
Norwegian Krone | | | UBSW | | | | Sell | | | | 89,910,114 | | | | 11,106,047 | | | | 4/10/18 | | | | — | | | | (299,337 | ) |
Singapore Dollar | | | BOFA | | | | Buy | | | | 1,417,187 | | | | 1,076,099 | | | | 4/10/18 | | | | — | | | | (5,587 | ) |
Singapore Dollar | | | BOFA | | | | Buy | | | | 6,387,122 | | | | 4,800,420 | | | | 4/10/18 | | | | 24,266 | | | | — | |
Singapore Dollar | | | BOFA | | | | Sell | | | | 24,841,416 | | | | 18,629,865 | | | | 4/10/18 | | | | — | | | | (134,771 | ) |
Singapore Dollar | | | GSCO | | | | Buy | | | | 1,417,187 | | | | 1,076,058 | | | | 4/10/18 | | | | — | | | | (5,547 | ) |
Singapore Dollar | | | GSCO | | | | Buy | | | | 6,387,122 | | | | 4,801,232 | | | | 4/10/18 | | | | 23,454 | | | | — | |
Singapore Dollar | | | GSCO | | | | Sell | | | | 24,845,426 | | | | 18,632,788 | | | | 4/10/18 | | | | — | | | | (134,877 | ) |
Singapore Dollar | | | HSBK | | | | Buy | | | | 1,417,187 | | | | 1,076,267 | | | | 4/10/18 | | | | — | | | | (5,757 | ) |
Singapore Dollar | | | HSBK | | | | Buy | | | | 6,387,122 | | | | 4,801,084 | | | | 4/10/18 | | | | 23,602 | | | | — | |
Singapore Dollar | | | HSBK | | | | Sell | | | | 24,837,815 | | | | 18,630,504 | | | | 4/10/18 | | | | — | | | | (131,412 | ) |
Singapore Dollar | | | MSCO | | | | Buy | | | | 1,417,187 | | | | 1,076,288 | | | | 4/10/18 | | | | — | | | | (5,778 | ) |
Singapore Dollar | | | MSCO | | | | Buy | | | | 6,387,122 | | | | 4,801,084 | | | | 4/10/18 | | | | 23,602 | | | | — | |
Singapore Dollar | | | MSCO | | | | Sell | | | | 24,842,350 | | | | 18,633,626 | | | | 4/10/18 | | | | — | | | | (131,716 | ) |
Singapore Dollar | | | UBSW | | | | Buy | | | | 1,417,187 | | | | 1,076,121 | | | | 4/10/18 | | | | — | | | | (5,610 | ) |
Singapore Dollar | | | UBSW | | | | Buy | | | | 6,387,122 | | | | 4,800,351 | | | | 4/10/18 | | | | 24,334 | | | | — | |
Singapore Dollar | | | UBSW | | | | Sell | | | | 24,841,429 | | | | 18,630,839 | | | | 4/10/18 | | | | — | | | | (133,807 | ) |
South Korean Won | | | BOFA | | | | Buy | | | | 4,366,630,476 | | | | 4,026,771 | | | | 4/10/18 | | | | 1,529 | | | | — | |
South Korean Won | | | BOFA | | | | Buy | | | | 6,466,516,507 | | | | 6,007,568 | | | | 4/10/18 | | | | — | | | | (42,084 | ) |
South Korean Won | | | BOFA | | | | Sell | | | | 69,012,175,703 | | | | 64,757,601 | | | | 4/10/18 | | | | 1,092,547 | | | | — | |
South Korean Won | | | GSCO | | | | Buy | | | | 3,981,584,391 | | | | 3,709,796 | | | | 4/10/18 | | | | — | | | | (36,708 | ) |
South Korean Won | | | GSCO | | | | Buy | | | | 6,851,562,592 | | | | 6,314,720 | | | | 4/10/18 | | | | 5,978 | | | | — | |
South Korean Won | | | GSCO | | | | Sell | | | | 58,615,664,757 | | | | 54,937,593 | | | | 4/10/18 | | | | 863,519 | | | | — | |
South Korean Won | | | HSBK | | | | Buy | | | | 3,981,584,391 | | | | 3,710,120 | | | | 4/10/18 | | | | — | | | | (37,032 | ) |
South Korean Won | | | HSBK | | | | Buy | | | | 6,851,562,592 | | | | 6,315,541 | | | | 4/10/18 | | | | 5,157 | | | | — | |
South Korean Won | | | HSBK | | | | Sell | | | | 56,392,258,661 | | | | 52,871,047 | | | | 4/10/18 | | | | 848,108 | | | | — | |
South Korean Won | | | MSCO | | | | Buy | | | | 3,931,584,391 | | | | 3,662,805 | | | | 4/10/18 | | | | — | | | | (35,843 | ) |
South Korean Won | | | MSCO | | | | Buy | | | | 6,851,562,592 | | | | 6,314,968 | | | | 4/10/18 | | | | 5,730 | | | | — | |
South Korean Won | | | MSCO | | | | Sell | | | | 50,864,585,156 | | | | 47,655,020 | | | | 4/10/18 | | | | 731,466 | | | | — | |
| | | | |
| | | |
| franklintempleton.com | | Semiannual Report | | 21 |
TEMPLETON FUNDS
STATEMENT OF INVESTMENTS (UNAUDITED)
Templeton World Fund (continued)
Forward Exchange Contracts (continued)
| | | | | | | | | | | | | | | | | | | | | | | | | | | | |
| Currency | | Counterpartya | | | Type | | | Quantity | | | Contract Amount | | | Settlement Date | | | Unrealized Appreciation | | | Unrealized Depreciation | |
| | | | | | |
OTC Forward Exchange Contracts (continued) | | | | | | | | | | | | | | | | | | | | | | | | | |
South Korean Won | | | UBSW | | | | Buy | | | | 4,366,630,476 | | | $ | 4,026,400 | | | | 4/10/18 | | | $ | 1,901 | | | $ | — | |
South Korean Won | | | UBSW | | | | Buy | | | | 6,466,516,507 | | | | 6,013,924 | | | | 4/10/18 | | | | — | | | | (48,438 | ) |
South Korean Won | | | UBSW | | | | Sell | | | | 60,541,401,394 | | | | 56,726,542 | | | | 4/10/18 | | | | 875,939 | | | | — | |
Swedish Krona | | | BOFA | | | | Buy | | | | 6,305,673 | | | | 805,542 | | | | 4/10/18 | | | | — | | | | (41,987 | ) |
Swedish Krona | | | BOFA | | | | Sell | | | | 79,594,557 | | | | 9,722,518 | | | | 4/10/18 | | | | 84,392 | | | | — | |
Swedish Krona | | | GSCO | | | | Buy | | | | 6,305,673 | | | | 805,508 | | | | 4/10/18 | | | | — | | | | (41,953 | ) |
Swedish Krona | | | GSCO | | | | Sell | | | | 79,594,367 | | | | 9,721,368 | | | | 4/10/18 | | | | 83,266 | | | | — | |
Swedish Krona | | | HSBK | | | | Buy | | | | 6,305,673 | | | | 805,532 | | | | 4/10/18 | | | | — | | | | (41,976 | ) |
Swedish Krona | | | HSBK | | | | Sell | | | | 79,701,666 | | | | 9,735,423 | | | | 4/10/18 | | | | 84,327 | | | | — | |
Swedish Krona | | | MSCO | | | | Buy | | | | 6,305,673 | | | | 805,513 | | | | 4/10/18 | | | | — | | | | (41,957 | ) |
Swedish Krona | | | MSCO | | | | Sell | | | | 65,759,991 | | | | 8,033,264 | | | | 4/10/18 | | | | 70,370 | | | | — | |
Swedish Krona | | | UBSW | | | | Buy | | | | 6,305,673 | | | | 805,498 | | | | 4/10/18 | | | | — | | | | (41,942 | ) |
Swedish Krona | | | UBSW | | | | Sell | | | | 79,584,339 | | | | 9,720,934 | | | | 4/10/18 | | | | 84,045 | | | | — | |
Swiss Franc | | | BOFA | | | | Sell | | | | 26,750,426 | | | | 27,389,870 | | | | 4/10/18 | | | | — | | | | (1,049,584 | ) |
Swiss Franc | | | GSCO | | | | Sell | | | | 26,768,941 | | | | 27,411,635 | | | | 4/10/18 | | | | — | | | | (1,047,504 | ) |
Swiss Franc | | | HSBK | | | | Sell | | | | 26,744,813 | | | | 27,387,881 | | | | 4/10/18 | | | | — | | | | (1,045,605 | ) |
Swiss Franc | | | MSCO | | | | Sell | | | | 26,744,588 | | | | 27,388,491 | | | | 4/10/18 | | | | — | | | | (1,044,756 | ) |
Swiss Franc | | | UBSW | | | | Sell | | | | 26,750,739 | | | | 27,393,107 | | | | 4/10/18 | | | | — | | | | (1,046,679 | ) |
Thailand Baht | | | BOFA | | | | Buy | | | | 14,570,205 | | | | 457,282 | | | | 4/10/18 | | | | 5,790 | | | | — | |
Thailand Baht | | | BOFA | | | | Sell | | | | 380,430,933 | | | | 11,832,794 | | | | 4/10/18 | | | | — | | | | (258,123 | ) |
Thailand Baht | | | GSCO | | | | Buy | | | | 14,570,205 | | | | 457,363 | | | | 4/10/18 | | | | 5,710 | | | | — | |
Thailand Baht | | | GSCO | | | | Sell | | | | 380,528,583 | | | | 11,831,720 | | | | 4/10/18 | | | | — | | | | (262,301 | ) |
Thailand Baht | | | HSBK | | | | Buy | | | | 14,570,205 | | | | 457,895 | | | | 4/10/18 | | | | 5,178 | | | | — | |
Thailand Baht | | | HSBK | | | | Sell | | | | 380,453,223 | | | | 11,832,632 | | | | 4/10/18 | | | | — | | | | (258,993 | ) |
Thailand Baht | | | MSCO | | | | Buy | | | | 14,570,205 | | | | 457,506 | | | | 4/10/18 | | | | 5,566 | | | | — | |
Thailand Baht | | | MSCO | | | | Sell | | | | 380,377,669 | | | | 11,826,197 | | | | 4/10/18 | | | | — | | | | (263,027 | ) |
Thailand Baht | | | UBSW | | | | Buy | | | | 14,570,205 | | | | 457,242 | | | | 4/10/18 | | | | 5,830 | | | | — | |
Thailand Baht | | | UBSW | | | | Sell | | | | 380,462,813 | | | | 11,829,674 | | | | 4/10/18 | | | | — | | | | (262,256 | ) |
| | | | | | | | | | | | | | | | | | | | | | | | |
Total Forward Exchange Contracts | | | | | | | | | | | | | | | | | | | | | | $ | 9,684,427 | | | $ | (47,901,576 | ) |
| | | | | | | | | | | | | | | | | | | | | | | | |
Net unrealized appreciation (depreciation) | | | | | | | | | | | | | | | | | | | | | | | $ | (38,217,149 | ) |
| | | | | | | | | | | | | | | | | | | | | | | | | | | | |
aMay be comprised of multiple contracts with the same counterparty, currency and settlement date.
See Note 8 regarding other derivative information.
See Abbreviations on page 37.
| | | | |
| | | |
22 | | Semiannual Report | The accompanying notes are an integral part of these financial statements. | | franklintempleton.com |
TEMPLETON FUNDS
Financial Statements
Statement of Assets and Liabilities
February 28, 2018 (unaudited)
Templeton World Fund
| | |
Assets: | | |
Investments in securities: | | |
Cost - Unaffiliated issuers | | $3,614,338,154 |
| | |
Value - Unaffiliated issuers | | $4,466,492,154 |
Cash | | 5,265,957 |
Receivables: | | |
Investment securities sold | | 3,083,284 |
Capital shares sold | | 2,831,155 |
Dividends and interest | | 16,546,591 |
European Union tax reclaims | | 266,180 |
Deposits with brokers for: | | |
OTC derivative contracts | | 53,135,000 |
Unrealized appreciation on OTC forward exchange contracts | | 9,684,427 |
Other assets | | 4,706 |
| | |
Total assets | | 4,557,309,454 |
| | |
Liabilities: | | |
Payables: | | |
Investment securities purchased | | 4,291,046 |
Capital shares redeemed | | 36,721,228 |
Management fees | | 2,413,283 |
Distribution fees | | 896,880 |
Transfer agent fees | | 1,363,219 |
Options written, at value (premiums received $88,798) | | 54,000 |
Unrealized depreciation on OTC forward exchange contracts | | 47,901,576 |
Deferred tax. | | 369,985 |
Accrued expenses and other liabilities. | | 456,895 |
| | |
Total liabilities | | 94,468,112 |
| | |
Net assets, at value | | $4,462,841,342 |
| | |
Net assets consist of: | | |
Paid-in capital | | $3,558,112,715 |
Undistributed net investment income | | 40,149,340 |
Net unrealized appreciation (depreciation) | | 813,626,376 |
Accumulated net realized gain (loss) | | 50,952,911 |
| | |
Net assets, at value | | $4,462,841,342 |
| | |
| | | | | | |
| | | |
| franklintempleton.com | | The accompanying notes are an integral part of these financial statements. | Semiannual Report | | 23 |
TEMPLETON FUNDS
FINANCIAL STATEMENTS
Statement of Assets and Liabilities (continued)
February 28, 2018 (unaudited)
Templeton World Fund
| | | | |
Class A: | | | | |
Net assets, at value | | $ | 4,139,490,004 | |
| | | | |
Shares outstanding | | | 246,849,345 | |
| | | | |
Net asset value per sharea | | | $16.77 | |
| | | | |
Maximum offering price per share (net asset value per share ÷ 94.25%) | | | $17.79 | |
| | | | |
Class C: | | | | |
Net assets, at value | | $ | 132,251,485 | |
| | | | |
Shares outstanding | | | 8,286,304 | |
| | | | |
Net asset value and maximum offering price per sharea | | | $15.96 | |
| | | | |
Class R6: | | | | |
Net assets, at value | | $ | 53,637,501 | |
| | | | |
Shares outstanding | | | 3,208,666 | |
| | | | |
Net asset value and maximum offering price per share | | | $16.72 | |
| | | | |
Advisor Class: | | | | |
Net assets, at value | | $ | 137,462,352 | |
| | | | |
Shares outstanding | | | 8,214,513 | |
| | | | |
Net asset value and maximum offering price per share | | | $16.73 | |
| | | | |
aRedemption price is equal to net asset value less contingent deferred sales charges, if applicable.
| | | | |
| | | |
24 | | Semiannual Report | The accompanying notes are an integral part of these financial statements. | | franklintempleton.com |
TEMPLETON FUNDS
FINANCIAL STATEMENTS
Statement of Operations
for the six months ended February 28, 2018 (unaudited)
Templeton World Fund
| | | | |
Investment income: | | | | |
Dividends: (net of foreign taxes)* | | | | |
Unaffiliated issuers | | $ | 44,637,247 | |
Interest: | | | | |
Unaffiliated issuers | | | 1,893,780 | |
Income from securities loaned (net of fees and rebates) | | | 83 | |
| | | | |
Total investment income | | | 46,531,110 | |
| | | | |
Expenses: | | | | |
Management fees (Note 3a) | | | 15,956,954 | |
Distribution fees: (Note 3c) | | | | |
Class A | | | 5,185,673 | |
Class C | | | 686,272 | |
Transfer agent fees: (Note 3e) | | | | |
Class A | | | 2,382,667 | |
Class C | | | 76,526 | |
Class R6 | | | 6,187 | |
Advisor Class | | | 80,075 | |
Custodian fees (Note 4) | | | 187,852 | |
Reports to shareholders | | | 118,585 | |
Registration and filing fees | | | 61,389 | |
Professional fees | | | 66,210 | |
Trustees’ fees and expenses | | | 50,739 | |
Other | | | 58,543 | |
| | | | |
Total expenses | | | 24,917,672 | |
Expense reductions (Note 4) | | | (128,124 | ) |
Expenses waived/paid by affiliates (Note 3f) | | | (396 | ) |
| | | | |
Net expenses | | | 24,789,152 | |
| | | | |
Net investment income | | | 21,741,958 | |
| | | | |
Realized and unrealized gains (losses): | | | | |
Net realized gain (loss) from: | | | | |
Investments:# | | | | |
Unaffiliated issuers | | | 169,761,866 | |
Foreign currency transactions | | | 211,556 | |
Forward exchange contracts | | | (78,100,815 | ) |
| | | | |
Net realized gain (loss) | | | 91,872,607 | |
| | | | |
Net change in unrealized appreciation (depreciation) on: | | | | |
Investments: | | | | |
Unaffiliated issuers | | | 89,862,815 | |
Translation of other assets and liabilities denominated in foreign currencies | | | (122,083 | ) |
Forward exchange contracts | | | 17,526,674 | |
Written options | | | 34,798 | |
Change in deferred taxes on unrealized appreciation | | | 676,257 | |
| | | | |
Net change in unrealized appreciation (depreciation) | | | 107,978,461 | |
| | | | |
Net realized and unrealized gain (loss) | | | 199,851,068 | |
| | | | |
| |
Net increase (decrease) in net assets resulting from operations | | $ | 221,593,026 | |
| | | | |
| |
*Foreign taxes withheld on dividends | | $ | 2,930,681 | |
#Net of foreign taxes | | $ | 6,590 | |
| | | | | | |
| | | |
| franklintempleton.com | | The accompanying notes are an integral part of these financial statements. | Semiannual Report | | 25 |
TEMPLETON FUNDS
FINANCIAL STATEMENTS
Statements of Changes in Net Assets
Templeton World Fund
| | | | | | | | |
| | | Six Months Ended
February 28, 2018
(unaudited) | | | Year Ended
August 31, 2017 | |
| | |
Increase (decrease) in net assets: | | | | | | | | |
Operations: | | | | | | | | |
Net investment income | | | $ 21,741,958 | | | | $ 74,979,159 | |
Net realized gain (loss) | | | 91,872,607 | | | | 322,365,433 | |
Net change in unrealized appreciation (depreciation) | | | 107,978,461 | | | | 307,952,182 | |
| | | | |
Net increase (decrease) in net assets resulting from operations | | | 221,593,026 | | | | 705,296,774 | |
| | | | |
Distributions to shareholders from: | | | | | | | | |
Net investment income: | | | | | | | | |
Class A | | | (4,934,993 | ) | | | (147,912,009 | ) |
Class C | | | — | | | | (4,531,267 | ) |
Class R6 | | | (243,447 | ) | | | (2,005,405 | ) |
Advisor Class | | | (502,930 | ) | | | (4,323,569 | ) |
Net realized gains: | | | | | | | | |
Class A | | | (238,908,725 | ) | | | (113,474,378 | ) |
Class C | | | (7,980,527 | ) | | | (4,385,709 | ) |
Class R6 | | | (2,978,075 | ) | | | (1,402,508 | ) |
Advisor Class | | | (7,782,016 | ) | | | (3,107,234 | ) |
| | | | |
Total distributions to shareholders | | | (263,330,713 | ) | | | (281,142,079 | ) |
| | | | |
Capital share transactions: (Note 2) | | | | | | | | |
Class A | | | (62,245,205 | ) | | | (349,046,846 | ) |
Class C | | | (4,444,643 | ) | | | (33,687,471 | ) |
Class R6 | | | (1,340,687 | ) | | | 234,305 | |
Advisor Class | | | (18,781,485 | ) | | | 32,150,701 | |
| | | | |
Total capital share transactions | | | (86,812,020 | ) | | | (350,349,311 | ) |
| | | | |
Net increase (decrease) in net assets | | | (128,549,707 | ) | | | 73,805,384 | |
Net assets: | | | | | | | | |
Beginning of period | | | 4,591,391,049 | | | | 4,517,585,665 | |
| | | | |
End of period | | | $4,462,841,342 | | | | $4,591,391,049 | |
| | | | |
Undistributed net investment income included in net assets: | | | | | | | | |
End of period | | | $ 40,149,340 | | | | $ 24,088,752 | |
| | | | |
| | | | |
| | | |
26 | | Semiannual Report | The accompanying notes are an integral part of these financial statements. | | franklintempleton.com |
TEMPLETON FUNDS
Notes to Financial Statements (unaudited)
Templeton World Fund
1. Organization and Significant Accounting Policies
Templeton Funds (Trust) is registered under the Investment Company Act of 1940 (1940 Act) as an open-end management investment company, consisting of two separate funds and applies the specialized accounting and reporting guidance in U.S. Generally Accepted Accounting Principles (U.S. GAAP). Templeton World Fund (Fund) is included in this report. The Fund offers four classes of shares: Class A, Class C, Class R6, and Advisor Class. Each class of shares may differ by its initial sales load, contingent deferred sales charges, voting rights on matters affecting a single class, its exchange privilege and fees due to differing arrangements for distribution and transfer agent fees.
The following summarizes the Fund’s significant accounting policies.
a. Financial Instrument Valuation
The Fund’s investments in financial instruments are carried at fair value daily. Fair value is the price that would be received to sell an asset or paid to transfer a liability in an orderly transaction between market participants on the measurement date. The Fund calculates the net asset value (NAV) per share as of 4 p.m. Eastern time each day the New York Stock Exchange (NYSE) is open for trading. Under compliance policies and procedures approved by the Trust’s Board of Trustees (the Board), the Fund’s administrator has responsibility for oversight of valuation, including leading the cross-functional Valuation Committee (VC). The VC provides administration and oversight of the Fund’s valuation policies and procedures, which are approved annually by the Board. Among other things, these procedures allow the Fund to utilize independent pricing services, quotations from securities and financial instrument dealers, and other market sources to determine fair value.
Equity securities and derivative financial instruments listed on an exchange or on the NASDAQ National Market System are valued at the last quoted sale price or the official closing price of the day, respectively. Foreign equity securities are valued as of the close of trading on the foreign stock exchange on which the security is primarily traded, or as of 4 p.m. Eastern time. The value is then converted into its U.S. dollar equivalent at the foreign exchange rate in effect at 4 p.m. Eastern time on the day that the value of the security is determined. Over-the-counter (OTC) securities are valued within the range of the most recent
quoted bid and ask prices. Securities that trade in multiple markets or on multiple exchanges are valued according to the broadest and most representative market. Certain equity securities are valued based upon fundamental characteristics or relationships to similar securities.
Debt securities generally trade in the OTC market rather than on a securities exchange. The Fund’s pricing services use multiple valuation techniques to determine fair value. In instances where sufficient market activity exists, the pricing services may utilize a market-based approach through which quotes from market makers are used to determine fair value. In instances where sufficient market activity may not exist or is limited, the pricing services also utilize proprietary valuation models which may consider market characteristics such as benchmark yield curves, credit spreads, estimated default rates, anticipated market interest rate volatility, coupon rates, anticipated timing of principal repayments, underlying collateral, and other unique security features in order to estimate the relevant cash flows, which are then discounted to calculate the fair value.
Investments in open-end mutual funds are valued at the closing NAV. Investments in time deposits are valued at cost, which approximates fair value.
Certain derivative financial instruments trade in the OTC market. The Fund’s pricing services use various techniques including industry standard option pricing models and proprietary discounted cash flow models to determine the fair value of those instruments. The Fund’s net benefit or obligation under the derivative contract, as measured by the fair value of the contract, is included in net assets.
The Fund has procedures to determine the fair value of financial instruments for which market prices are not reliable or readily available. Under these procedures, the VC convenes on a regular basis to review such financial instruments and considers a number of factors, including significant unobservable valuation inputs, when arriving at fair value. The VC primarily employs a market-based approach which may use related or comparable assets or liabilities, recent transactions, market multiples, book values, and other relevant information for the investment to determine the fair value of the investment. An income-based valuation approach may also be used in which the anticipated future cash flows of the investment are discounted to calculate fair value. Discounts may also be applied due to the nature or duration of any restrictions on the disposition of the investments. Due to the inherent uncertainty of valuations of
| | | | |
| | | |
| franklintempleton.com | | Semiannual Report | | 27 |
TEMPLETON FUNDS
NOTES TO FINANCIAL STATEMENTS (UNAUDITED)
Templeton World Fund (continued)
1. Organization and Significant Accounting Policies (continued)
a. Financial Instrument Valuation (continued)
such investments, the fair values may differ significantly from the values that would have been used had an active market existed. The VC employs various methods for calibrating these valuation approaches including a regular review of key inputs and assumptions, transactional back-testing or disposition analysis, and reviews of any related market activity.
Trading in securities on foreign securities stock exchanges and OTC markets may be completed before 4 p.m. Eastern time. In addition, trading in certain foreign markets may not take place on every Fund’s business day. Occasionally, events occur between the time at which trading in a foreign security is completed and 4 p.m. Eastern time that might call into question the reliability of the value of a portfolio security held by the Fund. As a result, differences may arise between the value of the Fund’s portfolio securities as determined at the foreign market close and the latest indications of value at 4 p.m. Eastern time. In order to minimize the potential for these differences, the VC monitors price movements following the close of trading in foreign stock markets through a series of country specific market proxies (such as baskets of American Depositary Receipts, futures contracts and exchange traded funds). These price movements are measured against established trigger thresholds for each specific market proxy to assist in determining if an event has occurred that may call into question the reliability of the values of the foreign securities held by the Fund. If such an event occurs, the securities may be valued using fair value procedures, which may include the use of independent pricing services.
When the last day of the reporting period is a non-business day, certain foreign markets may be open on those days that the Fund’s NAV is not calculated, which could result in differences between the value of the Fund’s portfolio securities on the last business day and the last calendar day of the reporting period. Any significant security valuation changes due to an open foreign market are adjusted and reflected by the Fund for financial reporting purposes.
b. Foreign Currency Translation
Portfolio securities and other assets and liabilities denominated in foreign currencies are translated into U.S. dollars based on the exchange rate of such currencies against U.S. dollars on the
date of valuation. The Fund may enter into foreign currency exchange contracts to facilitate transactions denominated in a foreign currency. Purchases and sales of securities, income and expense items denominated in foreign currencies are translated into U.S. dollars at the exchange rate in effect on the transaction date. Portfolio securities and assets and liabilities denominated in foreign currencies contain risks that those currencies will decline in value relative to the U.S. dollar. Occasionally, events may impact the availability or reliability of foreign exchange rates used to convert the U.S. dollar equivalent value. If such an event occurs, the foreign exchange rate will be valued at fair value using procedures established and approved by the Board.
The Fund does not separately report the effect of changes in foreign exchange rates from changes in market prices on securities held. Such changes are included in net realized and unrealized gain or loss from investments in the Statement of Operations.
Realized foreign exchange gains or losses arise from sales of foreign currencies, currency gains or losses realized between the trade and settlement dates on securities transactions and the difference between the recorded amounts of dividends, interest, and foreign withholding taxes and the U.S. dollar equivalent of the amounts actually received or paid. Net unrealized foreign exchange gains and losses arise from changes in foreign exchange rates on foreign denominated assets and liabilities other than investments in securities held at the end of the reporting period.
c. Derivative Financial Instruments
The Fund invested in derivative financial instruments in order to manage risk or gain exposure to various other investments or markets. Derivatives are financial contracts based on an underlying or notional amount, require no initial investment or an initial net investment that is smaller than would normally be required to have a similar response to changes in market factors, and require or permit net settlement. Derivatives contain various risks including the potential inability of the counterparty to fulfill their obligations under the terms of the contract, the potential for an illiquid secondary market, and/or the potential for market movements which expose the Fund to gains or losses in excess of the amounts shown in the Statement of Assets and Liabilities. Realized gain and loss and unrealized appreciation and depreciation on these contracts for the period are included in the Statement of Operations.
| | | | |
| | | |
28 | | Semiannual Report | | franklintempleton.com |
TEMPLETON FUNDS
NOTES TO FINANCIAL STATEMENTS (UNAUDITED)
Templeton World Fund (continued)
Derivative counterparty credit risk is managed through a formal evaluation of the creditworthiness of all potential counter-parties. The Fund attempts to reduce its exposure to counterparty credit risk on OTC derivatives, whenever possible, by entering into International Swaps and Derivatives Association (ISDA) master agreements with certain counterparties. These agreements contain various provisions, including but not limited to collateral requirements, events of default, or early termination. Termination events applicable to the counterparty include certain deteriorations in the credit quality of the counterparty. Termination events applicable to the Fund include failure of the Fund to maintain certain net asset levels and/or limit the decline in net assets over various periods of time. In the event of default or early termination, the ISDA master agreement gives the non-defaulting party the right to net and close-out all transactions traded, whether or not arising under the ISDA agreement, to one net amount payable by one counterparty to the other. However, absent an event of default or early termination, OTC derivative assets and liabilities are presented gross and not offset in the Statement of Assets and Liabilities. Early termination by the counterparty may result in an immediate payment by the Fund of any net liability owed to that counterparty under the ISDA agreement.
Collateral requirements differ by type of derivative. Collateral terms are contract specific for OTC derivatives. For OTC derivatives traded under an ISDA master agreement, posting of collateral is required by either the Fund or the applicable counterparty if the total net exposure of all OTC derivatives with the applicable counterparty exceeds the minimum transfer amount, which typically ranges from $100,000 to $250,000, and can vary depending on the counterparty and the type of the agreement. Generally, collateral is determined at the close of Fund business each day and any additional collateral required due to changes in derivative values may be delivered by the Fund or the counterparty the next business day, or within a few business days. Collateral pledged and/or received by the Fund, if any, is held in segregated accounts with the Fund’s custodian/counterparty broker and can be in the form of cash and/or securities. Unrestricted cash may be invested according to the Fund’s investment objectives. To the extent that the amounts due to the Fund from its counterparties are not subject to collateralization or are not fully collateralized, the Fund bears the risk of loss from counterparty non-performance.
The Fund entered into OTC forward exchange contracts primarily to manage and/or gain exposure to certain foreign currencies. A forward exchange contract is an agreement between the Fund and a counterparty to buy or sell a foreign currency at a specific exchange rate on a future date.
The Fund purchased or wrote exchange traded option contracts primarily to manage exposure to equity price risk. An option is a contract entitling the holder to purchase or sell a specific amount of shares or units of an asset or notional amount of a swap (swaption), at a specified price. When an option is purchased or written, an amount equal to the premium paid or received is recorded as an asset or liability, respectively. Upon exercise of an option, the acquisition cost or sales proceeds of the underlying investment is adjusted by any premium received or paid. Upon expiration of an option, any premium received or paid is recorded as a realized gain or loss. Upon closing an option other than through expiration or exercise, the difference between the premium received or paid and the cost to close the position is recorded as a realized gain or loss.
See Note 8 regarding other derivative information.
d. Securities Lending
The Fund participates in an agency based securities lending program to earn additional income. The Fund receives cash collateral against the loaned securities in an amount equal to at least 102% of the fair value of the loaned securities. Collateral is maintained over the life of the loan in an amount not less than 100% of the fair value of loaned securities, as determined at the close of Fund business each day; any additional collateral required due to changes in security values is delivered to the Fund on the next business day. The collateral is deposited into a joint cash account with other funds and is used to invest in a money market fund managed by Franklin Advisers, Inc., an affiliate of the Fund. The Fund may receive income from the investment of cash collateral, in addition to lending fees and rebates paid by the borrower. Income from securities loaned, net of fees paid to the securities lending agent and/or third-party vendor, is reported separately in the Statement of Operations. The Fund bears the market risk with respect to the collateral investment, securities loaned, and the risk that the agent may default on its obligations to the Fund. If the borrower defaults on its obligation to return the securities loaned, the Fund has the right to repurchase the securities in the open market using the
| | | | | | |
| | | |
| franklintempleton.com | | Semiannual Report | | 29 |
TEMPLETON FUNDS
NOTES TO FINANCIAL STATEMENTS (UNAUDITED)
Templeton World Fund (continued)
1. Organization and Significant Accounting Policies (continued)
d. Securities Lending (continued)
collateral received. The securities lending agent has agreed to indemnify the Fund in the event of default by a third party borrower. At February 28, 2018, the Fund had no securities on loan.
e. Income and Deferred Taxes
It is the Fund’s policy to qualify as a regulated investment company under the Internal Revenue Code. The Fund intends to distribute to shareholders substantially all of its taxable income and net realized gains to relieve it from federal income and excise taxes. As a result, no provision for U.S. federal income taxes is required.
The Fund may be subject to foreign taxation related to income received, capital gains on the sale of securities and certain foreign currency transactions in the foreign jurisdictions in which it invests. Foreign taxes, if any, are recorded based on the tax regulations and rates that exist in the foreign markets in which the Fund invests. When a capital gain tax is determined to apply, the Fund records an estimated deferred tax liability in an amount that would be payable if the securities were disposed of on the valuation date.
As a result of several court cases, in certain countries across the European Union, the Fund filed additional tax reclaims for previously withheld taxes on dividends earned in those countries (EU reclaims). These additional filings are subject to various administrative proceedings by the local jurisdictions’ tax authorities within the European Union, as well as a number of related judicial proceedings. Income recognized, if any, for EU reclaims is reflected as other income in the Statement of Operations and any related receivable, if any, is reflected as European Union tax reclaims in the Statement of Assets and Liabilities. When uncertainty exists as to the ultimate resolution of these proceedings, the likelihood of receipt of these EU reclaims, and the potential timing of payment, no amounts are reflected in the financial statements. For U.S. income tax purposes, EU reclaims received by the Fund, if any, reduce the amounts of foreign taxes Fund shareholders can use as tax credits in their individual income tax returns.
The Fund may be subject to foreign taxation related to income received, capital gains on the sale of securities and certain foreign currency transactions in the foreign jurisdictions in
which it invests. Foreign taxes, if any, are recorded based on the tax regulations and rates that exist in the foreign markets in which the Fund invests. When a capital gain tax is determined to apply, the Fund records an estimated deferred tax liability in an amount that would be payable if the securities were disposed of on the valuation date.
The Fund may recognize an income tax liability related to its uncertain tax positions under U.S. GAAP when the uncertain tax position has a less than 50% probability that it will be sustained upon examination by the tax authorities based on its technical merits. As of February 28, 2018, the Fund has determined that no tax liability is required in its financial statements related to uncertain tax positions for any open tax years (or expected to be taken in future tax years). Open tax years are those that remain subject to examination and are based on the statute of limitations in each jurisdiction in which the Fund invests.
f. Security Transactions, Investment Income, Expenses and Distributions
Security transactions are accounted for on trade date. Realized gains and losses on security transactions are determined on a specific identification basis. Interest income and estimated expenses are accrued daily. Amortization of premium and accretion of discount on debt securities are included in interest income. Paydown gains and losses are recorded as an adjustment to interest income. Dividend income is recorded on the ex-dividend date except for certain dividends from securities where the dividend rate is not available. In such cases, the dividend is recorded as soon as the information is received by the Fund. Distributions to shareholders are recorded on the ex-dividend date. Distributable earnings are determined according to income tax regulations (tax basis) and may differ from earnings recorded in accordance with U.S. GAAP. These differences may be permanent or temporary. Permanent differences are reclassified among capital accounts to reflect their tax character. These reclassifications have no impact on net assets or the results of operations. Temporary differences are not reclassified, as they may reverse in subsequent periods.
Common expenses incurred by the Trust are allocated among the Funds based on the ratio of net assets of each Fund to the combined net assets of the Trust. Fund specific expenses are charged directly to the Fund that incurred the expense.
| | | | |
| | | |
30 | | Semiannual Report | | franklintempleton.com |
TEMPLETON FUNDS
NOTES TO FINANCIAL STATEMENTS (UNAUDITED)
Templeton World Fund (continued)
Realized and unrealized gains and losses and net investment income, excluding class specific expenses, are allocated daily to each class of shares based upon the relative proportion of net assets of each class. Differences in per share distributions by class are generally due to differences in class specific expenses.
g. Accounting Estimates
The preparation of financial statements in accordance with U.S. GAAP requires management to make estimates and assumptions that affect the reported amounts of assets and liabilities at the date of the financial statements and the amounts of income and expenses during the reporting period. Actual results could differ from those estimates.
h. Guarantees and Indemnifications
Under the Trust’s organizational documents, its officers and trustees are indemnified by the Trust against certain liabilities arising out of the performance of their duties to the Trust. Additionally, in the normal course of business, the Trust, on behalf of the Fund, enters into contracts with service providers that contain general indemnification clauses. The Trust’s maximum exposure under these arrangements is unknown as this would involve future claims that may be made against the Trust that have not yet occurred. Currently, the Trust expects the risk of loss to be remote.
2. Shares of Beneficial Interest
At February 28, 2018, there were an unlimited number of shares authorized (without par value). Transactions in the Fund’s shares were as follows:
| | | | | | | | | | | | | | | | |
| | | Six Months Ended February 28, 2018 | | Year Ended August 31, 2017 | |
| | | Shares | | Amount | | | Shares | | | Amount |
Class A Shares: | | | | | | | | | | | | | | | | |
Shares sold | | | 6,002,539 | | | $ | 103,834,140 | | | | 13,622,420 | | | $ | 224,118,415 | |
Shares issued in reinvestment of distributions | | | 13,445,103 | | | | 228,297,845 | | | | 15,184,290 | | | | 242,644,949 | |
Shares redeemed | | | (22,828,464 | ) | | | (394,377,190 | ) | | | (49,762,301 | ) | | | (815,810,210 | ) |
| | | | |
| | | | |
Net increase (decrease) | | | (3,380,822 | ) | | $ | (62,245,205 | ) | | | (20,955,591 | ) | | $ | (349,046,846 | ) |
| | | | |
| | | | |
Class C Shares: | | | | | | | | | | | | | | | | |
Shares sold | | | 219,647 | | | $ | 3,631,544 | | | | 517,008 | | | $ | 8,138,998 | |
Shares issued in reinvestment of distributions | | | 477,945 | | | | 7,737,930 | | | | 511,414 | | | | 7,860,438 | |
Shares redeemed | | | (955,840 | ) | | | (15,814,117 | ) | | | (3,138,493 | ) | | | (49,686,907 | ) |
| | | | |
| | | | |
Net increase (decrease) | | | (258,248 | ) | | $ | (4,444,643 | ) | | | (2,110,071 | ) | | $ | (33,687,471 | ) |
| | | | |
| | | | |
Class R6 Shares: | | | | | | | | | | | | | | | | |
Shares sold | | | 1,618,496 | | | $ | 28,175,452 | | | | 516,394 | | | $ | 8,474,649 | |
Shares issued in reinvestment of distributions | | | 98,261 | | | | 1,662,581 | | | | 125,473 | | | | 1,997,530 | |
Shares redeemed | | | (1,787,865 | ) | | | (31,178,720 | ) | | | (629,113 | ) | | | (10,237,874 | ) |
| | | | |
| | | | |
Net increase (decrease) | | | (71,108 | ) | | $ | (1,340,687 | ) | | | 12,754 | | | $ | 234,305 | |
| | | | |
| | | | |
Advisor Class Shares: | | | | | | | | | | | | | | | | |
Shares sold | | | 1,530,729 | | | $ | 26,488,074 | | | | 6,939,523 | | | $ | 113,683,529 | |
Shares issued in reinvestment of distributions | | | 401,452 | | | | 6,800,595 | | | | 368,053 | | | | 5,866,759 | |
Shares redeemed | | | (3,003,794 | ) | | | (52,070,154 | ) | | | (5,360,483 | ) | | | (87,399,587 | ) |
| | | | |
| | | | |
Net increase (decrease) | | | (1,071,613 | ) | | $ | (18,781,485 | ) | | | 1,947,093 | | | $ | 32,150,701 | |
| | | | |
| | | | | | |
| | | |
| franklintempleton.com | | Semiannual Report | | 31 |
TEMPLETON FUNDS
NOTES TO FINANCIAL STATEMENTS (UNAUDITED)
Templeton World Fund (continued)
3. Transactions with Affiliates
Franklin Resources, Inc. is the holding company for various subsidiaries that together are referred to as Franklin Templeton Investments. Certain officers and trustees of the Trust are also officers and/or directors of the following subsidiaries:
| | | | |
| Subsidiary | | Affiliation | | |
| | |
Templeton Global Advisors Limited (TGAL) | | Investment manager | | |
| | |
Franklin Templeton Services, LLC (FT Services) | | Administrative manager | | |
| | |
Franklin Templeton Distributors, Inc. (Distributors) | | Principal underwriter | | |
| | |
Franklin Templeton Investor Services, LLC (Investor Services) | | Transfer agent | | |
a. Management Fees
The Fund pays an investment management fee to TGAL based on the average daily net assets of the Fund as follows:
| | | | |
| Annualized Fee Rate | | Net Assets | | |
| | |
0.705% | | Up to and including $1 billion | | |
| | |
0.690% | | Over $1 billion, up to and including $5 billion | | |
| | |
0.675% | | Over $5 billion, up to and including $10 billion | | |
| | |
0.655% | | Over $10 billion, up to and including $15 billion | | |
| | |
0.635% | | Over $15 billion, up to and including $20 billion | | |
| | |
0.615% | | In excess of $20 billion | | |
For the period ended February 28, 2018, the annualized gross effective investment management fee rate was 0.693% of the Fund’s average daily net assets.
b. Administrative Fees
Under an agreement with TGAL, FT Services provides administrative services to the Fund. The fee is paid by TGAL based on the Fund’s average daily net assets, and is not an additional expense of the Fund.
c. Distribution Fees
The Board has adopted distribution plans for each share class, with the exception of Class R6 and Advisor Class shares, pursuant to Rule 12b-1 under the 1940 Act. Under the Fund’s Class A reimbursement distribution plan, the Fund reimburses Distributors for costs incurred in connection with the servicing, sale and distribution of the Fund’s shares up to the maximum annual plan rate. Under the Class A reimbursement distribution plan, costs exceeding the maximum for the current plan year cannot be reimbursed in subsequent periods. In addition, under the Fund’s Class C compensation distribution plan, the Fund pays Distributors for costs incurred in connection with the servicing, sale and distribution of the Fund’s shares up to the maximum annual plan rate. The plan year, for purposes of monitoring compliance with the maximum annual plan rates, is February 1 through January 31.
The maximum annual plan rates, based on the average daily net assets, for each class, are as follows:
| | | | | | |
Class A | | | 0.25 | % | | |
Class C | | | 1.00 | % | | |
| | | | |
| | | |
32 | | Semiannual Report | | franklintempleton.com |
TEMPLETON FUNDS
NOTES TO FINANCIAL STATEMENTS (UNAUDITED)
Templeton World Fund (continued)
d. Sales Charges/Underwriting Agreements
Front-end sales charges and contingent deferred sales charges (CDSC) do not represent expenses of the Fund. These charges are deducted from the proceeds of sales of Fund shares prior to investment or from redemption proceeds prior to remittance, as applicable. Distributors has advised the Fund of the following commission transactions related to the sales and redemptions of the Fund’s shares for the period:
| | | | | | |
Sales charges retained net of commissions paid to unaffiliated brokers/dealers | | $ | 60,358 | | | |
| | |
CDSC retained | | $ | 2,091 | | | |
e. Transfer Agent Fees
Each class of shares pays transfer agent fees to Investor Services for its performance of shareholder servicing obligations. Effective November 1, 2017, the fees are based on an annualized asset based fee of 0.02% plus a transaction based fee. Prior to November 1, 2017, the fees were account based fees that varied based on fund or account type. In addition, each class reimburses Investor Services for out of pocket expenses incurred and, except for Class R6, reimburses shareholder servicing fees paid to third parties. These fees are allocated daily based upon their relative proportion of such classes’ aggregate net assets. Class R6 pays Investor Services transfer agent fees specific to that class.
For the period ended February 28, 2018, the Fund paid transfer agent fees of $2,545,455, of which $621,927.17 was retained by Investor Services.
f. Waiver and Expense Reimbursements
Investor Services has voluntarily agreed in advance to waive or limit its fees so that the Class R6 transfer agent fees do not exceed 0.02%. Investor Services may discontinue this waiver in the future.
4. Expense Offset Arrangement
The Fund has entered into an arrangement with its custodian whereby credits realized as a result of uninvested cash balances are used to reduce a portion of the Fund’s custodian expenses. During the period ended February 28, 2018, the custodian fees were reduced as noted in the Statement of Operations.
5. Income Taxes
For tax purposes, the Fund may elect to defer any portion of a late-year ordinary loss to the first day of the following fiscal year. At August 31, 2017, the Fund deferred late-year ordinary losses of $29,116,756.
At February 28, 2018, the cost of investments, net unrealized appreciation (depreciation) for income tax purposes were as follows:
| | | | | | |
Cost of investments | | $ | 3,568,700,987 | | | |
| | | | | | |
| | |
Unrealized appreciation | | $ | 1,193,568,855 | | | |
Unrealized depreciation | | | (333,994,837 | ) | | |
| | | | | | |
| | |
Net unrealized appreciation (depreciation) | | $ | 859,574,018 | | | |
| | | | | | |
Differences between income and/or capital gains as determined on a book basis and a tax basis are primarily due to differing treatments of foreign currency transactions, wash sales and foreign tax reclaims.
The Fund utilized a tax accounting practice to treat a portion of the proceeds from capital shares redeemed as a distribution from realized capital gains.
| | | | | | |
| | | |
| franklintempleton.com | | Semiannual Report | | 33 |
TEMPLETON FUNDS
NOTES TO FINANCIAL STATEMENTS (UNAUDITED)
Templeton World Fund (continued)
6. Investment Transactions
Purchases and sales of investments (excluding short term securities) for the period ended February 28, 2018, aggregated $378,309,930 and $673,149,791, respectively.
7. Concentration of Risk
Investing in foreign securities may include certain risks and considerations not typically associated with investing in U.S. securities, such as fluctuating currency values and changing local and regional economic, political and social conditions, which may result in greater market volatility. In addition, certain foreign securities may not be as liquid as U.S. securities.
8. Other Derivative Information
At February 28, 2018, the Fund’s investments in derivative contracts are reflected in the Statement of Assets and Liabilities as follows:
| | | | | | | | | | | | |
| | | Asset Derivatives | | | Liability Derivatives | |
Derivative Contracts Not Accounted for as Hedging Instruments | | Statement of
Assets and Liabilities Location | | Fair Value | | | Statement of
Assets and Liabilities
Location | | Fair Value | |
Foreign exchange contracts | | Unrealized appreciation on OTC
forward exchange contracts | | | $9,684,427 | | | Unrealized depreciation on OTC forward exchange contracts | | | $47,901,576 | |
| | | | |
Equity contracts | | Investments in securities, at value | | | — | | | Options written, at value | | | 54,000 | |
| | | | | | | | | | | | |
Totals | | | | | $9,684,427 | | | | | | $47,955,576 | |
| | | | | | | | | | | | |
For the period ended February 28, 2018, the effect of derivative contracts in the Fund’s Statement of Operations was as follows: | |
Derivative Contracts Not Accounted for as Hedging Instruments | | Statement of
Operations Location | | Net Realized
Gain (Loss) for
the Period | | | Statement of
Operations Location | | Net Change in
Unrealized
Appreciation
(Depreciation)
for the Period | |
| | Net realized gain (loss) from: | | | | | | Net change in unrealized appreciation (depreciation) on: | | | | |
Foreign exchange contracts | | Forward exchange contracts | | | $(78,100,815 | ) | | Forward exchange contracts | | | $17,526,674 | |
Equity contracts | | Written options | | | — | | | Written options | | | 34,798 | |
| | | | | | | | | | | | |
Totals | | | | | $(78,100,815 | ) | | | | | $17,561,472 | |
| | | | | | | | | | | | |
For the period ended February 28, 2018, the average month end notional amount of options contracts represented $17,143. The average month end contract value of forward exchange contracts was $2,780,113,930.
At February 28, 2018, the Fund’s OTC derivative assets and liabilities are as follows:
| | | | |
| | | Gross Amounts of Assets and Liabilities Presented
in the Statement of Assets and Liabilities |
| | | Assetsa | | Liabilitiesa |
Derivatives | | | | |
Forward exchange contracts | | $9,684,427 | | $47,901,576 |
aAbsent an event of default or early termination, OTC derivative assets and liabilities are presented gross and not offset in the Statement of Assets and Liabilities.
| | | | |
| | | |
34 | | Semiannual Report | | franklintempleton.com |
TEMPLETON FUNDS
NOTES TO FINANCIAL STATEMENTS (UNAUDITED)
Templeton World Fund (continued)
At February 28, 2018, the Fund’s OTC derivative assets, which may be offset against the Fund’s OTC derivative liabilities and collateral received from the counterparty, are as follows:
| | | | | | | | | | | | | | | | | | | | |
| | | | | | Amounts Not Offset in the
Statement of Assets and Liabilities | | | | |
| | | Gross Amounts of Assets Presented in
the Statement of
Assets and Liabilities | | | Financial
Instruments
Available for
Offset | | | Financial
Instruments
Collateral
Received | | | Cash
Collateral
Received | | | Net Amount
(Not less
than zero) | |
| | | | | |
Counterparty | | | | | | | | | | | | | | | | | | | | |
BOFA | | | $2,146,315 | | | | $(2,146,315) | | | | $ — | | | | $ — | | | | $ — | |
GSCO | | | 1,921,484 | | | | (1,921,484) | | | | — | | | | — | | | | — | |
HSBK | | | 1,906,245 | | | | (1,906,245) | | | | — | | | | — | | | | — | |
MSCO | | | 1,777,923 | | | | (1,777,923) | | | | — | | | | — | | | | — | |
UBSW | | | 1,932,460 | | | | (1,932,460) | | | | — | | | | — | | | | — | |
| | | | |
| | | | | |
Total | | | $9,684,427 | | | | $(9,684,427) | | | | $ — | | | | $ — | | | | $ — | |
| | | | |
At February 28, 2018, the Fund’s OTC derivative liabilities, which may be offset against the Fund’s OTC derivative assets and collateral pledged to the counterparty, are as follows:
| | | | | | | | | | | | | | | | | | | | |
| | | | | | Amounts Not Offset in the
Statement of Assets and Liabilities | | | | |
| | | Gross Amounts of
Liabilities Presented in
the Statement of
Assets and Liabilities | | | Financial
Instruments
Available for
Offset | | | Financial
Instruments
Collateral
Pledged | | | Cash Collateral
Pledgeda | | | Net Amount
(Not less
than zero) | |
| | | | | |
Counterparty | | | | | | | | | | | | | | | | | | | | |
BOFA | | | $9,617,191 | | | | $(2,146,315) | | | | $ — | | | | $(7,470,876) | | | | $ — | |
GSCO | | | 9,588,297 | | | | (1,921,484) | | | | — | | | | (7,666,813) | | | | — | |
HSBK | | | 9,562,674 | | | | (1,906,245) | | | | — | | | | (7,656,429) | | | | — | |
MSCO | | | 9,541,241 | | | | (1,777,923) | | | | — | | | | (7,763,318) | | | | — | |
UBSW | | | 9,592,173 | | | | (1,932,460) | | | | — | | | | (7,659,713) | | | | — | |
| | | | |
| | | | | |
Total | | | $47,901,576 | | | | $(9,684,427) | | | | $ — | | | | $(38,217,149) | | | | $ — | |
| | | | |
aIn some instances, the collateral amounts disclosed in the table above were adjusted due to the requirement to limit collateral amounts to avoid the effect of overcollateral-ization. Actual collateral received and/or pledged may be more than the amounts disclosed herein.
See Note 1(c) regarding derivative financial instruments.
See Abbreviations on page 37.
9. Credit Facility
The Fund, together with other U.S. registered and foreign investment funds (collectively, Borrowers), managed by Franklin Templeton Investments, are borrowers in a joint syndicated senior unsecured credit facility totaling $2 billion (Global Credit Facility) which matures on February 8, 2019. This Global Credit Facility provides a source of funds to the Borrowers for temporary and emergency purposes, including the ability to meet future unanticipated or unusually large redemption requests. Effective February 9, 2018, the Borrowers renewed the Global Credit Facility for a one year term, maturing February 8, 2019, for a total of $2 billion.
| | | | |
| | | |
| franklintempleton.com | | Semiannual Report | | 35 |
TEMPLETON FUNDS
NOTES TO FINANCIAL STATEMENTS (UNAUDITED)
Templeton World Fund (continued)
9. Credit Facility (continued)
Under the terms of the Global Credit Facility, the Fund shall, in addition to interest charged on any borrowings made by the Fund and other costs incurred by the Fund, pay its share of fees and expenses incurred in connection with the implementation and maintenance of the Global Credit Facility, based upon its relative share of the aggregate net assets of all of the Borrowers, including an annual commitment fee of 0.15% based upon the unused portion of the Global Credit Facility. These fees are reflected in other expenses in the Statement of Operations. During the period ended February 28, 2018, the Fund did not use the Global Credit Facility.
10. Fair Value Measurements
The Fund follows a fair value hierarchy that distinguishes between market data obtained from independent sources (observable inputs) and the Fund’s own market assumptions (unobservable inputs). These inputs are used in determining the value of the Fund’s financial instruments and are summarized in the following fair value hierarchy:
| | • | | Level 1 – quoted prices in active markets for identical financial instruments |
| | • | | Level 2 – other significant observable inputs (including quoted prices for similar financial instruments, interest rates, prepayment speed, credit risk, etc.) |
| | • | | Level 3 – significant unobservable inputs (including the Fund’s own assumptions in determining the fair value of financial instruments) |
The input levels are not necessarily an indication of the risk or liquidity associated with financial instruments at that level.
For movements between the levels within the fair value hierarchy, the Fund has adopted a policy of recognizing the transfers as of the date of the underlying event which caused the movement.
A summary of inputs used as of February 28, 2018, in valuing the Fund’s assets and liabilities carried at fair value, is as follows:
| | | | | | | | | | | | | | | | |
| | | Level 1 | | | Level 2 | | | Level 3 | | | Total | |
| | | | |
Assets: | | | | | | | | | | | | | | | | |
Investments in Securities:a | | | | | | | | | | | | | | | | |
Equity Investments | | $ | 4,312,319,316 | | | $ | — | | | $ | — | | | $ | 4,312,319,316 | |
Corporate Bonds | | | — | | | | 24,011,277 | | | | — | | | | 24,011,277 | |
Mortgage-Backed Securities | | | — | | | | 461,561 | | | | — | | | | 461,561 | |
Short Term Investments | | | — | | | | 129,700,000 | | | | — | | | | 129,700,000 | |
| | | | |
| | | | |
Total Investments in Securities | | $ | 4,312,319,316 | | | $ | 154,172,838 | | | $ | — | | | $ | 4,466,492,154 | |
| | | | |
| | | | |
Other Financial Instruments: | | | | | | | | | | | | | | | | |
Forward Exchange Contracts | | $ | — | | | $ | 9,684,427 | | | $ | — | | | $ | 9,684,427 | |
| | | | |
| | | | |
Liabilities: | | | | | | | | | | | | | | | | |
Other Financial Instruments: | | | | | | | | | | | | | | | | |
Options Written | | $ | 54,000 | | | $ | — | | | $ | — | | | $ | 54,000 | |
Forward Exchange Contracts | | | — | | | | 47,901,576 | | | | — | | | | 47,901,576 | |
| | | | |
| | | | |
Total Other Financial Instruments | | $ | 54,000 | | | $ | 47,901,576 | | | $ | — | | | $ | 47,955,576 | |
| | | | |
aFor detailed categories, see the accompanying Statement of Investments.
| | | | |
| | | |
36 | | Semiannual Report | | franklintempleton.com |
TEMPLETON FUNDS
NOTES TO FINANCIAL STATEMENTS (UNAUDITED)
Templeton World Fund (continued)
11. Subsequent Events
The Fund has evaluated subsequent events through the issuance of the financial statements and determined that no events have occurred that require disclosure.
Abbreviations
| | | | | | |
| Counterparty | | Selected Portfolio |
| | | |
BOFA | | Bank of America Corp. | | ADR | | American Depositary Receipt |
GSCO | | The Goldman Sachs Group, Inc. | | FHLMC | | Federal Home Loan Mortgage Corp. |
HSBK | | HSBC Bank PLC | | IDR | | International Depositary Receipt |
MSCO | | Morgan Stanley | | | | |
UBSW | | UBS AG | | | | |
| | | | |
| | | |
| franklintempleton.com | | Semiannual Report | | 37 |
TEMPLETON FUNDS
TEMPLETON WORLD FUND
Special Meeting of Shareholders
MEETING OF SHAREHOLDERS: OCTOBER 30, 2017 AND RECONVENED ON DECEMBER 15, 2017
(UNAUDITED)
A Special Meeting of Shareholders of Templeton Funds was held at the offices of Franklin Templeton Investments, One Franklin Parkway, San Mateo, California on October 30, 2017 and reconvened on December 15, 2017. The purpose of the meeting was to elect Trustees of Templeton Funds and to vote on the following proposals: to approve the use of a “manager of managers” structure whereby the Fund’s investment manager would be able to hire and replace subadvisers without shareholder approval; and to approve an amended fundamental investment restriction regarding investments in commodities for the Fund. At the meeting, (i) the following persons were elected by the shareholders to serve as Trustees of Templeton Funds: Harris J. Ashton, Ann Torre Bates, Mary C. Choksi, Edith E. Holiday, Gregory E. Johnson, Rupert H. Johnson, Jr., J. Michael Luttig, David W. Niemiec, Larry D. Thompson, Constantine D. Tseretopoulos and Robert E. Wade; and (ii) the proposals to use a “manager of managers” structure and to approve the amended fundamental investment restriction regarding investments in commodities were approved by shareholders of the Fund. No other business was transacted at the meeting.
In connection with the meeting, management is aware that some shareholders received from the proxy solicitor numerous calls and mailings that may have been distracting. Management is taking steps to ensure that, in the future, for any new shareholder meeting solicitations that occur, such activity is not repeated. Management apologizes for any inconvenience that may have been caused as a result of such calls and mailings.
The results of the voting at the meeting are as follows:
| Proposal 1. | To elect a Board of Trustees: |
| | | | | | | | |
| Name | | For | | | Withheld | |
| | |
Harris J. Ashton | | | 654,630,558 | | | | 25,820,888 | |
| | |
Ann Torre Bates | | | 655,508,550 | | | | 24,942,896 | |
| | |
Mary C. Choksi | | | 655,587,180 | | | | 24,864,266 | |
| | |
Edith E. Holiday | | | 655,452,139 | | | | 24,999,307 | |
| | |
Gregory E. Johnson | | | 655,319,916 | | | | 25,131,529 | |
| | |
Rupert H. Johnson, Jr. | | | 654,824,311 | | | | 25,627,134 | |
| | |
J. Michael Luttig | | | 655,213,382 | | | | 25,238,064 | |
| | |
David W. Niemiec | | | 655,019,957 | | | | 25,431,488 | |
| | |
Larry D. Thompson | | | 655,060,509 | | | | 25,390,936 | |
| | |
Constantine D. Tseretopoulos | | | 655,237,345 | | | | 25,214,100 | |
| | |
Robert E. Wade | | | 655,537,220 | | | | 24,914,227 | |
Total Trust Shares Outstanding*: 1,210,818,878
* As of the record date.
| | | | |
| | | |
38 | | Semiannual Report | | franklintempleton.com |
TEMPLETON FUNDS
TEMPLETON WORLD FUND
SPECIAL MEETING OF SHAREHOLDERS
| Proposal 2. | To approve the use of a “manager of managers” structure whereby the Fund’s investment manager would be able to hire and replace subadvisers without shareholder approval: |
| | | | |
| | | Shares | |
| |
For | | | 137,115,445 | |
| |
Against | | | 9,467,602 | |
| |
Abstain | | | 5,046,996 | |
| |
Broker Non-Votes | | | 29,362,147 | |
| |
Total Fund Shares Voted | | | 180,992,190 | |
| |
Total Fund Shares Outstanding* | | | 272,079,941 | |
| Proposal 3. | To approve an amended fundamental investment restriction regarding investments in commodities: |
| | | | |
| | | Shares | |
| |
For | | | 135,223,792 | |
| |
Against | | | 9,542,689 | |
| |
Abstain | | | 6,863,562 | |
| |
Broker Non-Votes | | | 29,362,147 | |
| |
Total Fund Shares Voted | | | 180,992,190 | |
| |
Total Fund Shares Outstanding* | | | 272,079,941 | |
| | | | |
| | | |
| franklintempleton.com | | Semiannual Report | | 39 |
TEMPLETON FUNDS
TEMPLETON WORLD FUND
Shareholder Information
Proxy Voting Policies and Procedures
The Fund’s investment manager has established Proxy Voting Policies and Procedures (Policies) that the Fund uses to determine how to vote proxies relating to portfolio securities. Shareholders may view the Fund’s complete Policies online at franklintempleton.com. Alternatively, shareholders may request copies of the Policies free of charge by calling the Proxy Group collect at (954) 527-7678 or by sending a written request to: Franklin Templeton Companies, LLC, 300 S.E. 2nd Street, Fort Lauderdale, FL 33301, Attention: Proxy Group. Copies of the Fund’s proxy voting records are also made available online at franklintempleton.com and posted on the US Securities and Exchange Commission’s website at sec.gov and reflect the most recent 12-month period ended June 30.
Quarterly Statement of Investments
The Trust, on behalf of the Fund, files a complete statement of investments with the US Securities and Exchange Commission for the first and third quarters for each fiscal year on Form N-Q. Shareholders may view the filed Form N-Q by visiting the Commission’s website at sec.gov. The filed form may also be viewed and copied at the Commission’s Public Reference Room in Washington, DC. Information regarding the operations of the Public Reference Room may be obtained by calling (800) SEC-0330.
| | | | |
| | | |
40 | | Semiannual Report | | franklintempleton.com |
| | | | | | | | |
| | | |
| | | | | | | | Semiannual Report and Shareholder Letter |
| | | | | Templeton World Fund |
| | | | | Investment Manager |
| | | | | Templeton Global Advisors Limited |
| | | | | Distributor |
| | | | | Franklin Templeton Distributors, Inc. |
| | | | | (800) DIAL BEN® / 342-5236 |
| | | | | franklintempleton.com |
| | | | | Shareholder Services |
| | | | | (800) 632-2301 |
Authorized for distribution only when accompanied or preceded by a summary prospectus and/or prospectus. Investors should carefully consider a fund’s investment goals, risks, charges and expenses before investing. A prospectus contains this and other information; please read it carefully before investing.
To help ensure we provide you with quality service, all calls to and from our service areas are monitored and/or recorded.
| | | | | | |
| © 2018 Franklin Templeton Investments. All rights reserved. | | 102 S 04/18 |
| (a) | The Registrant has adopted a code of ethics that applies to its principal executive officers and principal financial and accounting officer. |
| (f) | Pursuant to Item 12(a)(1), the Registrant is attaching as an exhibit a copy of its code of ethics that applies to its principal executive officers and principal financial and accounting officer. |
| Item 3. | Audit Committee Financial Expert. |
| | |
| (a)(1) | | The Registrant has an audit committee financial expert serving on its audit committee. |
| |
| (2) | | The audit committee financial expert is David W. Niemiec and he is “independent” as defined under the relevant Securities and Exchange Commission Rules and Releases. |
| Item 4. | Principal Accountant Fees and Services. N/A |
| Item 5. | Audit Committee of Listed Registrants. N/A |
| Item 6. | Schedule of Investments. N/A |
Item 7. Disclosure of Proxy Voting Policies and Procedures for Closed-End Management Investment Companies. N/A
| Item 8. | Portfolio Managers of Closed-End Management Investment Companies. N/A |
Item 9. Purchases of Equity Securities by Closed-End Management Investment Company and Affiliated Purchasers. N/A
| Item 10. | Submission of Matters to a Vote of Security Holders. |
There have been no changes to the procedures by which shareholders may recommend nominees to the Registrant’s Board of Trustees that would require disclosure herein.
| Item 11. | Controls and Procedures. |
(a) Evaluation of Disclosure Controls and Procedures. The Registrant maintains disclosure controls and procedures that are designed to ensure that information required to be disclosed in the Registrant’s filings under the Securities Exchange Act of 1934 and the Investment Company Act of 1940 is recorded,
processed, summarized and reported within the periods specified in the rules and forms of the Securities and Exchange Commission. Such information is accumulated and communicated to the Registrant’s management, including its principal executive officer and principal financial officer, as appropriate, to allow timely decisions regarding required disclosure. The Registrant’s management, including the principal executive officer and the principal financial officer, recognizes that any set of controls and procedures, no matter how well designed and operated, can provide only reasonable assurance of achieving the desired control objectives.
Within 90 days prior to the filing date of this Shareholder Report on Form N-CSR, the Registrant had carried out an evaluation, under the supervision and with the participation of the Registrant’s management, including the Registrant’s principal executive officer and the Registrant’s principal financial officer, of the effectiveness of the design and operation of the Registrant’s disclosure controls and procedures. Based on such evaluation, the Registrant’s principal executive officer and principal financial officer concluded that the Registrant’s disclosure controls and procedures are effective.
(b) Changes in Internal Controls. There have been no changes in the Registrant’s internal controls or in other factors that could materially affect the internal controls over financial reporting subsequent to the date of their evaluation in connection with the preparation of this Shareholder Report on Form N-CSR.
(a)(1) Code of Ethics
(a)(2) Certifications pursuant to Section 302 of the Sarbanes-Oxley Act of 2002 of Matthew T. Hinkle, Chief Executive Officer - Finance and Administration, and Robert G. Kubilis, Chief Financial Officer and Chief Accounting Officer
(b) Certifications pursuant to Section 906 of the Sarbanes-Oxley Act of 2002 of Matthew T. Hinkle, Chief Executive Officer - Finance and Administration, and Robert G. Kubilis, Chief Financial Officer and Chief Accounting Officer
SIGNATURES
Pursuant to the requirements of the Securities Exchange Act of 1934 and the Investment Company Act of 1940, the registrant has duly caused this report to be signed on its behalf by the undersigned, thereunto duly authorized.
TEMPLETON FUNDS
| | |
| By | | /s/ MATTHEW T. HINKLE |
| | Matthew T. Hinkle |
| | Chief Executive Officer - Finance and Administration |
| Date | | April 26, 2018 |
Pursuant to the requirements of the Securities Exchange Act of 1934 and the Investment Company Act of 1940, this report has been signed below by the following persons on behalf of the registrant and in the capacities and on the dates indicated.
| | |
| By | | /s/ MATTHEW T. HINKLE |
| | Matthew T. Hinkle |
| | Chief Executive Officer - Finance and Administration |
| Date | | April 26, 2018 |
| | |
| By | | /s/ ROBERT G. KUBILIS |
| | Robert G. Kubilis |
| | Chief Financial Officer and Chief Accounting Officer |
| Date | | April 26, 2018 |